UNITED STATES
SECURITIES AND EXCHANGE COMMISSION
Washington, D.C. 20549
FORM N-CSR
CERTIFIED SHAREHOLDER REPORT OF REGISTERED MANAGEMENT
INVESTMENT COMPANIES
Investment Company Act file number: 811-21763
Name of Fund: Managed Account Series
Advantage Global SmallCap Fund
Mid Cap Dividend Fund
Fund Address: 100 Bellevue Parkway, Wilmington, DE 19809
Name and address of agent for service: John M. Perlowski, Chief Executive Officer, Managed Account Series, 55 East 52nd Street, New York, NY 10055
Registrant’s telephone number, including area code: (800) 441-7762
Date of fiscal year end: 08/31/2017
Date of reporting period: 08/31/2017
Item 1 – Report to Stockholders
AUGUST 31, 2017
ANNUAL REPORT
| BLACKROCK® |
Managed Account Series
▶ Advantage Global SmallCap Fund
▶ Mid Cap Dividend Fund
| Not FDIC Insured ◾ May Lose Value ◾ No Bank Guarantee |
| The Markets in Review |
Dear Shareholder,
In the 12 months ended August 31, 2017, risk assets, such as stocks and high-yield bonds, continued to deliver strong performance. These markets showed great resilience during a period with big surprises, including the aftermath of the U.K.’s vote to leave the European Union and the outcome of the U.S. presidential election, which brought only brief spikes in equity market volatility. These expressions of isolationism and discontent were countered by the closely watched and less surprising elections in France, the Netherlands and Australia.
Interest rates rose, which worked against high-quality assets with more interest rate sensitivity. As a result, longer-term U.S. Treasuries posted negative returns, as rising energy prices, modest wage increases, and steady job growth led to expectations of higher inflation and anticipation of interest rate increases by the U.S. Federal Reserve (the “Fed”).
Market prices began to reflect reflationary expectations toward the end of 2016, as investors sensed that a global recovery was afoot. And those expectations have been largely realized in 2017, as many countries throughout the world experienced sustained and synchronized growth for the first time since the financial crisis. Growth rates and inflation are still relatively low, but they are finally rising together.
The Fed responded to these positive developments by increasing interest rates three times and setting expectations for additional interest rate increases. The Fed also appears to be approaching the implementation of its plan to reduce the vast balance sheet reserves that provided liquidity to the global economy in the aftermath of the financial crisis in 2008. Also, growing skepticism about the near-term likelihood of significant U.S. tax reform and infrastructure spending has tempered reflationary expectations in the United States.
By contrast, the European Central Bank and the Bank of Japan reiterated their commitments to economic stimulus and balance sheet expansion despite nascent signs of sustained economic growth in both countries. The Eurozone also benefited from the relatively stable political environment, which is creating momentum for economic reform and pro-growth policies.
Financial markets — and to an extent the Fed — have adopted a “wait-and-see” approach to the economic data and potential fiscal stimulus. Escalating tensions with North Korea and our nation’s divided politics are significant concerns. Nevertheless, benign credit conditions, modest inflation, and the positive outlook for growth in the world’s largest economies have kept markets relatively tranquil.
However, the capacity for rapid global growth is restrained by structural factors, including an aging population in developed countries, low productivity growth, and excess savings. Cyclical factors, such as the Fed moving toward the normalization of monetary policy and the length of the current expansion, also limit economic growth. Tempered economic growth and high valuations across most assets have laid the groundwork for muted returns going forward. At current valuation levels, potential equity gains will likely be closely tied to the pace of earnings growth, which has remained solid thus far in 2017.
In this environment, investors need to think globally, extend their scope across a broad array of asset classes, and be nimble as market conditions change. We encourage you to talk with your financial advisor and visit blackrock.com for further insight about investing in today’s markets.
Sincerely,

Rob Kapito
President, BlackRock Advisors, LLC

Rob Kapito
President, BlackRock Advisors, LLC
| Total Returns as of August 31, 2017 | ||||||||
| 6-month | 12-month | |||||||
U.S. large cap equities | 5.65 | % | 16.23 | % | ||||
U.S. small cap equities | 2.04 | 14.91 | ||||||
International equities | 12.14 | 17.64 | ||||||
Emerging market equities | 18.02 | 24.53 | ||||||
3-month Treasury bills | 0.40 | 0.62 | ||||||
U.S. Treasury securities | 3.10 | (3.26 | ) | |||||
U.S. investment grade bonds (Bloomberg Barclays U.S. Aggregate Bond Index) | 2.74 | 0.49 | ||||||
Tax-exempt municipal bonds (S&P Municipal Bond Index) | 3.51 | 0.92 | ||||||
U.S. high yield bonds | 3.03 | 8.62 | ||||||
| Past performance is no guarantee of future results. Index performance is shown for illustrative purposes only. You cannot invest directly in an index. | ||||||||
| 2 | THIS PAGE NOT PART OF YOUR FUND REPORT |
| Table of Contents |
| Page | ||||
| 2 | ||||
Annual Report: | ||||
| 4 | ||||
| 9 | ||||
| 9 | ||||
| 9 | ||||
Financial Statements: | ||||
| 10 | ||||
| 24 | ||||
| 25 | ||||
| 26 | ||||
| 28 | ||||
| 30 | ||||
| 39 | ||||
| 39 | ||||
| 40 | ||||
| 44 | ||||
| 48 |
|
Shareholders can sign up for e-mail notifications of quarterly statements, annual and semi-annual shareholder reports and prospectuses by enrolling in the electronic delivery program. Electronic copies of shareholder reports and prospectuses are also available on BlackRock’s website.
TO ENROLL IN ELECTRONIC DELIVERY:
Shareholders Who Hold Accounts with Investment Advisors, Banks or Brokerages: Please contact your financial advisor. Please note that not all investment advisors, banks or brokerages may offer this service.
Shareholders Who Hold Accounts Directly with BlackRock: 1. Access the BlackRock website at blackrock.com 2. Select “Access Your Account” 3. Next, select “eDelivery” in the “Related Resources” box and follow the sign-up instructions |

| MANAGED ACCOUNT SERIES | AUGUST 31, 2017 | 3 |
| Fund Summary as of August 31, 2017 | Advantage Global SmallCap Fund |
| Investment Objective |
Advantage Global SmallCap Fund’s (the “Fund”) investment objective is to seek long-term growth of capital.
On June 28, 2017, the Board of the Fund approved a change of the fiscal year of the Fund from April 30 to August 31.
| Portfolio Management Commentary |
How did the Fund perform?
| • | For the four-month fiscal period ended August 31, 2017, the Fund outperformed the MSCI All Country World Small Cap Index and the MSCI World Index. Shares of the Fund can be purchased or held only by or on behalf of certain separately managed account clients and represent only a portion of a broader separately managed account. Comparisons of the Fund’s performance versus its benchmarks will differ from comparisons of the benchmarks against the performance of the separately managed accounts. The following discussion of relative performance pertains to the MSCI All Country World Small Cap Index. |
What factors influenced performance?
| • | During the period from May 1, 2017 to June 12, 2017, the largest contributor to relative performance was stock selection in the information technology (“IT”) sector, which was strongest in the software and semiconductors & semiconductor equipment industry. This was followed by strong stock selection in the financials industry, especially among banks. Individual security selection was also additive to returns in the materials, consumer discretionary, consumer staples and energy sectors during the period. |
| • | The evolution of the broader reflationary regime that began in the first quarter of 2017 showed evidence of stronger sustained global growth, which continued to filter through expectations of informed market participants. In keeping with this theme, the Fund’s outperformance during the period of June 12, 2017 through August 31, 2017 was driven primarily by a composite of sentiment signals as the market continued touching new highs. Specifically, a signal that captures trends in sell-side analyst reports through text-based analyses was effective across industrials and technology stocks. In particular, the portfolio broadly benefited from an overweight to and stock selection within construction companies. Additionally, evaluating informed investor flow, such as analyzing what stocks hedge funds are shorting, was particularly effective in U.S. financials. Finally, geographic positioning within non-E.U. European countries, such as Norway and Switzerland, was additive toward period-end. |
| • | The most significant detractor from relative performance for the period from May 1, 2017 through June 12, 2017 was selection in the health care sector, which was weakest in the health care equipment & supplies industry. This was followed by selection in the industrials sector, which was notably weak within machinery, and in real estate investment trusts where selection was most detrimental in the real estate management & development industry. |
| • | During the period from June 12, 2017 to August 31, 2017, the Fund’s performance was constrained by insights that capture company fundamentals. In particular, quality-based signals struggled as the market rewarded growth assets in the broad movement higher. Evaluating company quality through efficiency in generating operating cash flows broadly detracted. Similarly, a value-based insight that compares relative valuations across cash flows was unrewarded. Both of these cash flow-based signals struggled across U.S. retail stocks. Finally, a signal that rewards companies that avoid diluting existing shareholders declined. |
Describe recent portfolio activity.
| • | Effective June 12, 2017, the Fund, a series of Managed Account Series, changed its name to Advantage Global SmallCap Fund. Concurrently, there were changes to its investment strategy. The Fund is now being managed by BlackRock’s Scientific Active Equity (“SAE”) team, which incorporates a research-driven, systematic approach to identifying differentiated performance opportunities across markets. The SAE team is a pioneer in managing scientific active equities, having run funds for institutional clients since 1985, and its robust process is backed by nearly 100 highly qualified fund managers, researchers and strategists with a diverse set of backgrounds spanning academia, data science, finance and economics. |
Describe portfolio positioning at period end.
| • | As of period-end, the Fund’s largest sector overweight relative to the MSCI All Country World Small Cap Index was consumer discretionary followed by materials and information technology. The largest sector underweights were financials, consumer staples and utilities. |
The views expressed reflect the opinions of BlackRock as of the date of this report and are subject to change based on changes in market, economic or other conditions. These views are not intended to be a forecast of future events and are no guarantee of future results.
| 4 | MANAGED ACCOUNT SERIES | AUGUST 31, 2017 |
| Advantage Global SmallCap Fund |
| Total Return Based on a $10,000 Investment |
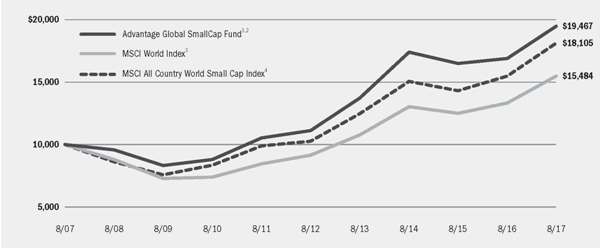
| 1 | Assuming transaction costs, if any, and other operating expenses, including investment advisory fees. |
| 2 | Under normal circumstances, at least 80% of its net assets plus the amount of any borrowings for investment purposes in small cap equity securities and derivatives that have similar economic characteristics to such securities. The Fund’s total returns prior to June 12, 2017, are the returns of the Fund when it followed different investment strategies under the name Global SmallCap Portfolio. |
| 3 | A free float-adjusted market capitalization weighted index that is designed to measure the equity market performance of developed markets. The MSCI World Index consists of the following 23 developed market country indexes: Australia, Austria, Belgium, Canada, Denmark, Finland, France, Germany, Hong Kong, Ireland, Israel, Italy, Japan, the Netherlands, New Zealand, Norway, Portugal, Singapore, Spain, Sweden, Switzerland, the United Kingdom, and the United States. |
| 4 | A free float-adjusted market capitalization index designed to measure equity market results of smaller capitalization companies in both developed and emerging markets. |
| Performance Summary for the Period Ended August 31, 2017 |
| Average Annual Total Returns2,5 | |||||||||||||||||||||||||||
| 4-Month Total Returns | 6-Month Total Returns | 1 Year | 5 Years | 10 Years | |||||||||||||||||||||||
Advantage Global SmallCap Fund | 5.43 | % | 8.26 | % | 15.34 | % | 11.87 | % | 6.89 | % | |||||||||||||||||
MSCI World Index | 5.11 | 7.80 | 16.19 | 11.10 | 4.47 | ||||||||||||||||||||||
MSCI All Country World Small Cap Index | 4.75 | 7.76 | 16.89 | 12.00 | 6.12 | ||||||||||||||||||||||
| 5 | See “About Fund Performance” on page 9. |
Past performance is not indicative of future results. |
Performance results may include adjustments made for financial reporting purposes in accordance with U.S. generally accepted accounting principles. |
| Expense Example |
| Actual | Hypothetical7 | ||||||||||||||||||||||||||||||||||
| Beginning Account Value May 1, 2017 | Ending Account Value August 31, 2017 | Expenses Paid During the Period6 | Beginning Account Value May 1, 2017 | Ending Account Value August 31, 2017 | Expenses Paid During the Period6 | Annualized Expense Ratio | |||||||||||||||||||||||||||||
Advantage Global SmallCap Fund | $ | 1,000.00 | $ | 1,082.60 | $ | 0.00 | $ | 1,000.00 | $ | 1,025.21 | $ | 0.00 | 0.00 | % | |||||||||||||||||||||
| 6 | For shares of the Fund, expenses are equal to the annualized expense ratio, multiplied by the average account value over the period, multiplied by 123/365 (to reflect the one-half year period shown). BlackRock Advisors, LLC has contractually agreed to waive all fees and pay or reimburse all direct expenses, except extraordinary expenses incurred by the Fund. This agreement has no fixed term. |
| 7 | Hypothetical 5% annual return before expenses is calculated by prorating the number of days in the most recent fiscal half year divided by 365. |
See “Disclosure of Expenses” on page 9 for further information on how expenses were calculated. |
| MANAGED ACCOUNT SERIES | AUGUST 31, 2017 | 5 |
| Advantage Global SmallCap Fund |
| Portfolio Information |
| Ten Largest Holdings | Percent of Net Assets | ||||
Aspen Technology, Inc. | 1 | % | |||
Svenska Cellulosa AB SCA, Class B | 1 | ||||
Logitech International SA, Registered Shares | 1 | ||||
NCR Corp. | 1 | ||||
Chemed Corp. | 1 | ||||
Aurubis AG | 1 | ||||
Tekfen Holding A/S | 1 | ||||
WellCare Health Plans, Inc. | 1 | ||||
RLJ Lodging Trust | 1 | ||||
Subsea 7 SA | 1 | ||||
| Geographic Allocation | Percent of Net Assets | ||||
United States | 50 | % | |||
Japan | 9 | ||||
United Kingdom | 6 | ||||
Germany | 4 | ||||
Sweden | 4 | ||||
Taiwan | 3 | ||||
Canada | 3 | ||||
China | 3 | ||||
Switzerland | 2 | ||||
Singapore | 2 | ||||
Turkey | 2 | ||||
Other1 | 13 | ||||
Liabilities in Excess of Other Assets | (1 | ) | |||
| 1 | Includes holdings within countries that are 1% or less of net assets. Please refer to the Schedule of Investments for such countries. |
| 6 | MANAGED ACCOUNT SERIES | AUGUST 31, 2017 |
| Fund Summary as of August 31, 2017 | Mid Cap Dividend Fund |
| Investment Objective |
Mid Cap Dividend Fund’s (the “Fund”) investment objective is to seek capital appreciation and, secondarily, income.
On June 28, 2017, the Board of the Fund approved a change of the fiscal year of the Fund from April 30 to August 31.
| Portfolio Management Commentary |
How did the Fund perform?
| • | For the four-month fiscal period ended August 31, 2017, the Fund underperformed its new benchmark, the Russell MidCap® Value Index, and its former benchmark, the S&P MidCap 400® Value Index. Shares of the Fund can be purchased or held only by or on behalf of certain separately managed account clients and represent only a portion of a broader separately managed account. Comparisons of the Fund’s performance versus its benchmark index will differ from comparisons of the benchmark index against the performance of the separately managed accounts. |
What factors influenced performance?
| • | The largest detractor from the Fund’s relative performance during the four-month period came from stock selection in the consumer discretionary sector. Increasing competitive pressure in the retail space negatively impacted holdings in the specialty retail industry, most notably positions in Foot Locker Inc., Dicks Sporting Goods Inc., and Bed Bath and Beyond Inc. Stock selection in the financials sector also detracted from relative performance, principally due to holdings of Assurant Inc. within insurance and Cullen/Frost Bankers, Inc. among banks. In consumer staples, stock selection detracted from relative performance as well, most notably due to portfolio positions SUPERVALU Inc. and The Kroger Co. within the food & staples retailing industry. In health care, selection among pharmaceuticals firms weighed on relative performance, as did selection among health care providers & services names. Lastly, stock selection and allocation decisions in the real estate and energy sectors also detracted from relative results. |
| • | The largest positive contribution to relative performance for the period came from stock selection in the telecommunication services (“telecom”) sector. Notably, the decision to not hold Frontier Communications Corp. and an overweight position in Telephone and Data Systems, Inc. proved to be beneficial. Additionally, overweight exposure to the information technology (“IT”) sector, specifically to the semiconductors & semiconductor equipment and internet software & services industries, bolstered relative returns. Lastly, an overweight to the materials sector added to relative performance. |
Describe recent portfolio activity.
| • | Effective June 12, 2017, Mid Cap Value Opportunities Portfolio, a series of Managed Account Series, changed its name to Mid Cap Dividend Fund of Managed Account Series. Concurrently, there were changes to the Fund’s investment strategy and benchmark, which required significant turnover to reposition the portfolio according to its new investment strategy. During the four-month period, the portfolio’s exposure to the telecom, energy, utilities, financials, IT and health care sectors was increased. Positioning in consumer staples was relatively unchanged, and allocations to the industrials, consumer discretionary, real estate and materials sectors was reduced. |
Describe portfolio positioning at period end.
| • | At the end of the period, the Fund was overweight relative to the benchmark Russell MidCap® Value Index in the IT, health care and telecom sectors, with underweight positions in real estate, industrials and consumer discretionary. |
The views expressed reflect the opinions of BlackRock as of the date of this report and are subject to change based on changes in market, economic or other conditions. These views are not intended to be a forecast of future events and are no guarantee of future results.
| Portfolio Information |
| Ten Largest Holdings | Percent of Net Assets | ||||
Analog Devices, Inc. | 2 | % | |||
FirstEnergy Corp. | 2 | ||||
Great Plains Energy, Inc. | 2 | ||||
Telephone & Data Systems, Inc. | 2 | ||||
CDW Corp. | 2 | ||||
Entergy Corp. | 2 | ||||
Regions Financial Corp. | 2 | ||||
SunTrust Banks, Inc. | 2 | ||||
Assurant, Inc. | 2 | ||||
Lamar Advertising Co., Class A | 2 | ||||
| Sector Allocation | Percent of Net Assets | ||||
Financials | 20 | % | |||
Information Technology | 16 | ||||
Utilities | 11 | ||||
Health Care | 10 | ||||
Energy | 8 | ||||
Consumer Discretionary | 8 | ||||
Industrials | 7 | ||||
Real Estate | 6 | ||||
Materials | 6 | ||||
Consumer Staples | 4 | ||||
Telecommunication Services | 3 | ||||
Short-Term Securities | 1 | ||||
For Fund compliance purposes, the Fund’s sector classifications refer to one or more of the sector sub-classifications used by one or more widely recognized market indexes or rating group indexes, and/or as defined by the investment adviser. These definitions may not apply for purposes of this report, which may combine such sector sub-classifications for reporting ease.
| MANAGED ACCOUNT SERIES | AUGUST 31, 2017 | 7 |
| Mid Cap Dividend Fund |
| Total Return Based on a $10,000 Investment |
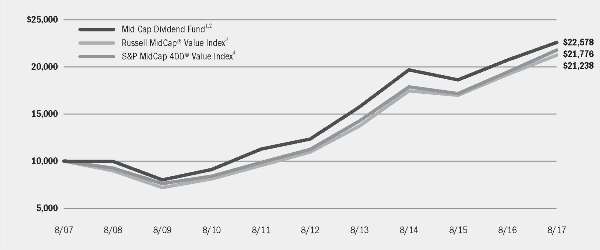
| 1 | Assuming transaction costs, if any, and other operating expenses, including investment advisory fees. |
| 2 | Under normal circumstances, at least 80% of its net assets plus the amount of any borrowings for investment purposes in equity securities of mid cap companies and at least 80% of its net assets plus the amount of any borrowings for investment purposes in dividend-paying securities. The Fund’s total returns prior to June 12, 2017, are the returns of the Fund when it followed different investment strategies under the name Mid Cap Value Opportunities Portfolio. |
| 3 | An unmanaged index that measures the performance of the mid-capitalization value sector of the U.S. equity market. It is a subset of the Russell Midcap® Index, which measures the performance of the mid-capitalization sector of the U.S. equity market. The Russell Midcap® Value Index measures the performance of equity securities of Russell Midcap® Index issuers with relatively lower price-to-book ratios and lower forecasted growth. The Russell Midcap® Index is a float-adjusted, capitalization-weighted index of approximately 793 of the smallest issuers in the Russell 1000® Index and includes securities issued by issuers which range in size between approximately $10 million and $85 billion, although this range may change from time to time. |
| 4 | An unmanaged index that measures the performance of the mid-capitalization value sector of the U.S. equity market. It is a subset of the S&P MidCap 400® Index and consists of those stocks in the S&P MidCap 400® Index exhibiting the strongest value characteristics, as determined by the index provider, representing approximately 50% of the market capitalization of the S&P MidCap 400® Index. |
| Performance Summary for the Period Ended August 31, 2017 |
| Average Annual Total Returns2,5 | |||||||||||||||||||||||||||
| 4-Month Total Returns | 6-Month Total Returns | 1 Year | 5 Years | 10 Years | |||||||||||||||||||||||
Mid Cap Dividend Fund | (1.37 | )% | (3.46 | )% | 9.08 | % | 12.88 | % | 8.48 | % | |||||||||||||||||
Russell MidCap® Value Index | 0.60 | 0.06 | 10.82 | 14.22 | 7.82 | ||||||||||||||||||||||
S&P MidCap 400® Value Index | (0.55 | ) | (1.28 | ) | 12.09 | 14.14 | 8.09 | ||||||||||||||||||||
| 5 | See “About Fund Performance” on page 9. |
Past performance is not indicative of future results. |
Performance results may include adjustments made for financial reporting purposes in accordance with U.S. generally accepted accounting principles. |
| Expense Example |
| Actual | Hypothetical7 | ||||||||||||||||||||||||||||||||||
| Beginning Account Value May 1, 2017 | Ending Account Value August 31, 2017 | Expenses Paid During the Period6 | Beginning Account Value May 1, 2017 | Ending Account Value August 31, 2017 | Expenses Paid During the Period6 | Annualized Expense Ratio | |||||||||||||||||||||||||||||
Mid Cap Dividend Fund | $ | 1,000.00 | $ | 965.40 | $ | 0.00 | $ | 1,000.00 | $ | 1,025.21 | $ | 0.00 | 0.00 | % | |||||||||||||||||||||
| 6 | For shares of the Fund, expenses are equal to the Fund’s annualized expense ratio, multiplied by the average account value over the period, multiplied by 123/365 (to reflect the one-half year period shown). BlackRock Advisors, LLC has contractually agreed to waive all fees and pay or reimburse all direct expenses, except extraordinary expenses incurred by the Fund. This agreement has no fixed term. |
| 7 | Hypothetical 5% annual return before expenses is calculated by prorating the number of days in the most recent fiscal half year divided by 365. |
See “Disclosure of Expenses” on page 9 for further information on how expenses were calculated. |
| 8 | MANAGED ACCOUNT SERIES | AUGUST 31, 2017 |
| About Fund Performance |
Performance information reflects past performance and does not guarantee future results. Current performance may be lower or higher than the performance data quoted. Refer to www.blackrock.com to obtain performance data current to the most recent month-end. Performance results do not reflect the deduction of taxes that a shareholder would pay on fund distributions or the redemption of fund shares. Figures shown in the performance tables on the previous pages assume reinvestment of all distributions, if any, at net asset value (“NAV”) on the ex-dividend date. Investment return and principal value of shares will fluctuate so that shares, when redeemed, may be worth more or less than their original cost.
BlackRock Advisors, LLC, the Funds’ investment adviser, contractually agreed to waive all fees and pay or reimburse all operating expenses of each Fund, except extraordinary expenses. This agreement has no fixed termination date. Without such waiver and/or reimbursement, each Fund’s performance would have been lower.
| Disclosure of Expenses |
Shareholders of the Funds may incur the following charges: (a) transactional expenses, such as sales charges; and (b) operating expenses, including investment advisory fees, service and distribution fees, including 12b-1 fees, acquired fund fees and expenses, and other fund expenses. The expense examples on the previous pages (which are based on a hypothetical investment of $1,000 invested on May 1, 2017 and held through August 31, 2017) are intended to assist shareholders both in calculating expenses based on an investment in each Fund and in comparing these expenses with similar costs of investing in other mutual funds.
The expense examples provide information about actual account values and actual expenses. In order to estimate the expenses a shareholder paid during the period covered by this report, shareholders can divide their account value by $1,000 and then multiply the result by the number corresponding to their Fund and share class under the heading entitled “Expenses Paid During the Period.”
The expense examples also provide information about hypothetical account values and hypothetical expenses based on a Fund’s actual expense ratio and an assumed rate of return of 5% per year before expenses. In order to assist shareholders in comparing the ongoing expenses of investing in these Funds and other funds, compare the 5% hypothetical examples with the 5% hypothetical examples that appear in shareholder reports of other funds.
The expenses shown in the expense examples are intended to highlight shareholders’ ongoing costs only and do not reflect transactional expenses, such as sales charges, if any. Therefore, the hypothetical examples are useful in comparing ongoing expenses only, and will not help shareholders determine the relative total expenses of owning different funds. If these transactional expenses were included, shareholder expenses would have been higher.
| Derivative Financial Instruments |
The Funds may invest in various derivative financial instruments. These instruments are used to obtain exposure to a security, commodity, index, market, and/or other assets without owning or taking physical custody of securities, commodities and/or other referenced assets or to manage market, equity, credit, interest rate, foreign currency exchange rate, commodity and/or other risks. Derivative financial instruments may give rise to a form of economic leverage and involve risks, including the imperfect correlation between the value of a derivative financial instrument and the underlying asset, possible default of the counterparty to the
transaction or illiquidity of the instrument. The Funds’ successful use of a derivative financial instrument depends on the investment adviser’s ability to predict pertinent market movements accurately, which cannot be assured. The use of these instruments may result in losses greater than if they had not been used, may limit the amount of appreciation a Fund can realize on an investment and/or may result in lower distributions paid to shareholders. The Funds’ investments in these instruments, if any, are discussed in detail in the Notes to Financial Statements.
| MANAGED ACCOUNT SERIES | AUGUST 31, 2017 | 9 |
| Schedule of Investments August 31, 2017 | Advantage Global SmallCap Fund | |||
| (Percentages shown are based on Net Assets) |
| Common Stocks | Shares | Value | ||||||
Australia — 1.1% | ||||||||
Ansell Ltd. | 1,583 | $ | 27,491 | |||||
Australian Pharmaceutical Industries Ltd. | 20,253 | 23,653 | ||||||
Cabcharge Australia Ltd. | 2,806 | 4,662 | ||||||
CSR Ltd. | 32,096 | 103,446 | ||||||
GDI Property Group | 26,423 | 23,105 | ||||||
OZ Minerals Ltd. | 23,363 | 151,793 | ||||||
Regis Resources Ltd. | 83,309 | 277,493 | ||||||
Sandfire Resources NL | 35,224 | 167,027 | ||||||
Sigma Healthcare Ltd. | 64,873 | 44,226 | ||||||
Southern Cross Media Group Ltd. | 12,628 | 13,021 | ||||||
St Barbara Ltd. | 102,888 | 233,237 | ||||||
Whitehaven Coal Ltd. (a) | 27,902 | 78,184 | ||||||
|
| |||||||
| 1,147,338 | ||||||||
Austria — 0.7% | ||||||||
IMMOFINANZ AG (a) | 130,918 | 347,101 | ||||||
Lenzing AG | 1,774 | 279,821 | ||||||
S IMMO AG (a) | 4,485 | 73,253 | ||||||
UNIQA Insurance Group AG | 567 | 5,762 | ||||||
|
| |||||||
| 705,937 | ||||||||
Belgium — 0.9% | ||||||||
Ackermans & van Haaren NV | 3,186 | 535,543 | ||||||
Bekaert SA | 6,882 | 328,514 | ||||||
Galapagos NV (a) | 602 | 55,620 | ||||||
Orange Belgium SA | 522 | 12,559 | ||||||
|
| |||||||
| 932,236 | ||||||||
Brazil — 0.6% | ||||||||
Banco do Estado do Rio Grande do Sul SA, Preference B Shares (a) | 26,007 | 139,294 | ||||||
BR Properties SA | 13,511 | 45,454 | ||||||
Cia de Saneamento de Minas Gerais-COPASA (a) | 6,110 | 83,638 | ||||||
Eletropaulo Metropolitana Eletricidade de Sao Paulo SA, Preference Shares | 44,497 | 224,757 | ||||||
Fleury SA (a) | 7,090 | 71,579 | ||||||
Guararapes Confeccoes SA (a) | 196 | 7,900 | ||||||
JSL SA (a) | 11,496 | 29,216 | ||||||
Multiplus SA | 3,332 | 39,694 | ||||||
|
| |||||||
| 641,532 | ||||||||
Canada — 2.8% | ||||||||
Aecon Group, Inc. | 1,039 | 14,219 | ||||||
B2Gold Corp. (a) | 46,195 | 126,886 | ||||||
BRP, Inc. | 16,743 | 556,424 | ||||||
Canaccord Genuity Group, Inc. | 1,801 | 6,779 | ||||||
Canfor Corp. (a) | 613 | 10,736 | ||||||
Canfor Pulp Products, Inc. | 1,704 | 17,916 | ||||||
Capital Power Corp. | 306 | 6,435 | ||||||
Celestica, Inc. (a) | 9,673 | 111,002 | ||||||
Choice Properties Real Estate Investment Trust | 5,243 | 55,002 | ||||||
| Common Stocks | Shares | Value | ||||||
Canada (continued) | ||||||||
Cogeco Communications, Inc. | 3,446 | $ | 257,881 | |||||
Cogeco, Inc. | 775 | 51,207 | ||||||
Colliers International Group, Inc. | 174 | 9,049 | ||||||
Dream Industrial Real Estate Investment Trust | 874 | 6,334 | ||||||
FirstService Corp. | 237 | 16,510 | ||||||
Hudbay Minerals, Inc. | 2,664 | 23,232 | ||||||
Just Energy Group, Inc. | 20,333 | 117,398 | ||||||
Lundin Mining Corp. | 72,676 | 549,398 | ||||||
Martinrea International, Inc. | 7,191 | 62,768 | ||||||
Norbord, Inc. | 3,774 | 129,956 | ||||||
Surge Energy, Inc. | 3,168 | 5,049 | ||||||
Trevali Mining Corp. (a) | 649,950 | 749,492 | ||||||
Western Forest Products, Inc. | 6,604 | 14,015 | ||||||
|
| |||||||
| 2,897,688 | ||||||||
China — 2.5% | ||||||||
361 Degrees International Ltd. | 173,000 | 74,634 | ||||||
Agile Group Holdings Ltd. | 18,000 | 21,609 | ||||||
Beijing Tong Ren Tang Chinese Medicine Co. Ltd. | 10,000 | 13,227 | ||||||
BYD Electronic International Co. Ltd. (b) | 274,500 | 760,661 | ||||||
China Aoyuan Property Group Ltd. | 171,000 | 72,459 | ||||||
China Merchants Land Ltd. | 98,000 | 19,726 | ||||||
China Overseas Property Holdings Ltd. | 35,000 | 7,445 | ||||||
China Pioneer Pharma Holdings Ltd. | 82,000 | 26,033 | ||||||
China SCE Property Holdings Ltd. | 66,000 | 33,774 | ||||||
China Shineway Pharmaceutical Group Ltd. | 40,000 | 36,556 | ||||||
China Suntien Green Energy Corp. Ltd. | 167,000 | 36,335 | ||||||
Chu Kong Shipping Enterprises Group Co. Ltd. | 134,000 | 34,610 | ||||||
CIFI Holdings Group Co. Ltd. | 98,000 | 55,218 | ||||||
Fufeng Group Ltd. (a) | 259,000 | 164,878 | ||||||
Goldpac Group Ltd. | 40,000 | 11,858 | ||||||
Greatview Aseptic Packaging Co. Ltd. | 10,000 | 6,145 | ||||||
Hisense Kelon Electrical Holdings Co. Ltd. | 58,000 | 68,925 | ||||||
Hua Hong Semiconductor Ltd. (c) | 42,000 | 55,809 | ||||||
KWG Property Holding Ltd. | 289,500 | 263,841 | ||||||
Lonking Holdings Ltd. | 353,000 | 140,898 | ||||||
NVC Lighting Holding Ltd. (a) | 48,000 | 5,968 | ||||||
Phoenix New Media Ltd. — ADR (a) | 7,238 | 32,571 | ||||||
Powerlong Real Estate Holdings Ltd. | 145,000 | 73,441 | ||||||
Qingling Motors Co. Ltd. | 50,000 | 16,117 | ||||||
Shui On Land Ltd. | 451,500 | 105,748 | ||||||
Sinotruk Hong Kong Ltd. | 190,000 | 210,711 | ||||||
Tianneng Power International Ltd. | 18,000 | 15,422 | ||||||
Welling Holding Ltd. | 24,000 | 4,362 | ||||||
Xinyuan Real Estate Co. Ltd. — ADR | 2,096 | 10,522 | ||||||
Yuexiu Transport Infrastructure Ltd. | 52,000 | 39,891 | ||||||
Yuzhou Properties Co. Ltd. | 182,000 | 117,069 | ||||||
Zhongsheng Group Holdings Ltd. | 54,000 | 117,603 | ||||||
|
| |||||||
| 2,654,066 | ||||||||
| Portfolio Abbreviations | ||||||||||
| ADR | American Depositary Receipts | GDR | Global Depositary Receipt | REIT | Real Estate Investment Trusts | |||||
| EUR | Euro | JPY | Japanese Yen | SGD | Singapore Dollar | |||||
| FTSE | Financial Times Stock Exchange | MSCI | Morgan Stanley Capital International | USD | U.S. Dollar | |||||
| GBP | British Pound | |||||||||
See Notes to Financial Statements.
| 10 | MANAGED ACCOUNT SERIES | AUGUST 31, 2017 |
| Schedule of Investments (continued) | Advantage Global SmallCap Fund | |||
| Common Stocks | Shares | Value | ||||||
Czech Republic — 0.1% | ||||||||
Philip Morris CR A/S | 87 | $ | 61,712 | |||||
Denmark — 0.1% | ||||||||
Bavarian Nordic A/S (a) | 345 | 24,031 | ||||||
GN Store Nord A/S | 408 | 13,539 | ||||||
Royal Unibrew A/S | 1,310 | 71,839 | ||||||
|
| |||||||
| 109,409 | ||||||||
Finland — 1.1% | ||||||||
Atria OYJ | 459 | 6,175 | ||||||
Finnair OYJ | 5,832 | 66,303 | ||||||
Sanoma OYJ | 4,167 | 39,139 | ||||||
Valmet OYJ | 54,927 | 1,042,332 | ||||||
|
| |||||||
| 1,153,949 | ||||||||
France — 0.2% | ||||||||
Beneteau SA | 728 | 11,656 | ||||||
Cie des Alpes | 942 | 27,474 | ||||||
DBV Technologies SA (a) | 136 | 12,034 | ||||||
Esso SA Francaise (a) | 123 | 8,214 | ||||||
GL Events | 539 | 16,170 | ||||||
Metropole Television SA | 2,915 | 64,124 | ||||||
Tarkett SA | 548 | 22,683 | ||||||
|
| |||||||
| 162,355 | ||||||||
Georgia — 0.0% | ||||||||
BGEO Group PLC | 681 | 30,422 | ||||||
Germany — 3.9% | ||||||||
Aareal Bank AG | 27,996 | 1,146,901 | ||||||
Amadeus Fire AG | 233 | 20,384 | ||||||
Aurubis AG | 14,277 | 1,276,640 | ||||||
Biotest AG (b) | 489 | 16,588 | ||||||
CECONOMY AG | 9,635 | 105,526 | ||||||
Cewe Stiftung & Co. KGaA | 1,451 | 124,606 | ||||||
DIC Asset AG | 2,175 | 24,504 | ||||||
Draegerwerk AG & Co. KGaA | 227 | 17,727 | ||||||
Draegerwerk AG & Co. KGaA, Preference Shares | 414 | 44,353 | ||||||
Evotec AG (a) | 3,327 | 64,034 | ||||||
MorphoSys AG (a) | 278 | 19,795 | ||||||
Suedzucker AG | 56,610 | 1,204,855 | ||||||
|
| |||||||
| 4,065,913 | ||||||||
Greece — 0.5% | ||||||||
Motor Oil Hellas Corinth Refineries SA | 22,602 | 508,338 | ||||||
Hong Kong — 1.4% | ||||||||
CK Life Sciences Int’l Holdings, Inc. | 184,000 | 14,404 | ||||||
Emperor Entertainment Hotel Ltd. | 35,000 | 8,689 | ||||||
Giordano International Ltd. | 48,000 | 28,481 | ||||||
G-Resources Group Ltd. (a) | 315,000 | 3,864 | ||||||
K Wah International Holdings Ltd. | 243,000 | 140,779 | ||||||
Kingboard Chemical Holdings Ltd. | 121,000 | 661,428 | ||||||
Kingboard Laminates Holdings Ltd. | 186,000 | 316,059 | ||||||
Lee & Man Paper Manufacturing Ltd. | 48,000 | 56,087 | ||||||
Regal Real Estate Investment Trust | 19,000 | 5,954 | ||||||
Road King Infrastructure Ltd. | 17,000 | 22,618 | ||||||
SSY Group Ltd. | 56,000 | 25,992 | ||||||
Sun Hung Kai & Co. Ltd. | 20,000 | 13,335 | ||||||
Texwinca Holdings Ltd. | 18,000 | 10,362 | ||||||
Yuexiu Real Estate Investment Trust | 176,000 | 115,901 | ||||||
|
| |||||||
| 1,423,953 | ||||||||
Hungary — 0.3% | ||||||||
Magyar Telekom Telecommunications PLC | 140,265 | 266,577 | ||||||
India — 0.8% | ||||||||
Chennai Petroleum Corp. Ltd. | 11,698 | 82,202 | ||||||
| Common Stocks | Shares | Value | ||||||
India (continued) | ||||||||
Federal Bank Ltd. | 28,431 | $ | 48,339 | |||||
Great Eastern Shipping Co. Ltd. | 4,174 | 26,027 | ||||||
Karur Vysya Bank Ltd. | 27,637 | 61,597 | ||||||
Motilal Oswal Financial Services Ltd. | 387 | 7,411 | ||||||
Muthoot Finance Ltd. | 3,022 | 22,541 | ||||||
NIIT Technologies Ltd. | 6,086 | 47,545 | ||||||
Rajesh Exports Ltd. | 1,605 | 18,695 | ||||||
Reliance Capital Ltd. | 33,100 | 418,110 | ||||||
Sterlite Technologies Ltd. | 26,758 | 92,594 | ||||||
Tata Investment Corp. Ltd. | 525 | 6,976 | ||||||
Vardhman Textiles Ltd. | 526 | 10,068 | ||||||
|
| |||||||
| 842,105 | ||||||||
Indonesia — 0.1% | ||||||||
Bank Bukopin Tbk PT | 165,300 | 7,387 | ||||||
Bank Tabungan Negara Persero Tbk PT | 278,500 | 62,927 | ||||||
Indo Tambangraya Megah Tbk PT | 28,900 | 42,179 | ||||||
|
| |||||||
| 112,493 | ||||||||
Ireland — 0.0% | ||||||||
Prothena Corp. PLC (a) | 454 | 27,894 | ||||||
Israel — 0.2% | ||||||||
Ituran Location and Control Ltd. | 1,637 | 54,676 | ||||||
Naphtha Israel Petroleum Corp. Ltd. | 1,110 | 7,495 | ||||||
Rami Levy Chain Stores Hashikma Marketing 2006 Ltd. | 1,453 | 70,542 | ||||||
Wix.com Ltd. (a)(b) | 1,832 | 119,263 | ||||||
|
| |||||||
| 251,976 | ||||||||
Italy — 0.4% | ||||||||
Amplifon SpA | 6,973 | 101,054 | ||||||
Ascopiave SpA | 1,364 | 5,755 | ||||||
Azimut Holding SpA | 8,985 | 189,903 | ||||||
Banca Carige SpA (a) | 36,999 | 10,152 | ||||||
DeA Capital SpA | 15,270 | 22,741 | ||||||
Falck Renewables SpA | 6,430 | 10,446 | ||||||
Societa Cattolica di Assicurazioni SCRL | 2,270 | 19,497 | ||||||
Technogym SpA (c) | 6,039 | 52,834 | ||||||
|
| |||||||
| 412,382 | ||||||||
Japan — 8.9% | ||||||||
Aisan Industry Co. Ltd. | 900 | 8,063 | ||||||
Akita Bank Ltd. | 2,000 | 6,077 | ||||||
Arcs Co. Ltd. | 600 | 13,449 | ||||||
ASKA Pharmaceutical Co. Ltd. | 1,900 | 29,654 | ||||||
Avex Group Holdings, Inc. | 12,300 | 168,647 | ||||||
Ci:z Holdings Co. Ltd. | 800 | 31,433 | ||||||
CMIC Holdings Co. Ltd. | 600 | 8,530 | ||||||
Corona Corp. | 1,100 | 11,787 | ||||||
Daiichi Jitsugyo Co. Ltd. | 8,000 | 44,358 | ||||||
Daiken Corp. | 300 | 6,909 | ||||||
Dainichiseika Color & Chemicals Manufacturing Co. Ltd. | 1,000 | 9,828 | ||||||
Denka Co. Ltd. | 7,000 | 44,587 | ||||||
DIC Corp. | 5,800 | 205,184 | ||||||
Dowa Holdings Co. Ltd. | 46,000 | 346,625 | ||||||
DTS Corp. | 300 | 8,452 | ||||||
Dunlop Sports Co. Ltd. | 1,500 | 19,360 | ||||||
Exedy Corp. | 700 | 20,994 | ||||||
Fujibo Holdings, Inc. | 400 | 12,249 | ||||||
Fukuda Denshi Co. Ltd. | 500 | 37,977 | ||||||
Geo Holdings Corp. | 7,300 | 103,516 | ||||||
Glory Ltd. | 8,500 | 289,302 | ||||||
G-Tekt Corp. | 400 | 7,714 | ||||||
Haseko Corp. | 57,500 | 713,046 | ||||||
See Notes to Financial Statements.
| MANAGED ACCOUNT SERIES | AUGUST 31, 2017 | 11 |
| Schedule of Investments (continued) | Advantage Global SmallCap Fund | |||
| Common Stocks | Shares | Value | ||||||
Japan (continued) | ||||||||
IBJ Leasing Co. Ltd. | 700 | $ | 17,885 | |||||
Inaba Denki Sangyo Co. Ltd. | 400 | 16,346 | ||||||
Ines Corp. | 9,100 | 82,759 | ||||||
Itochu Enex Co. Ltd. | 2,800 | 28,050 | ||||||
Itochu Techno-Solutions Corp. | 1,200 | 44,700 | ||||||
Jaccs Co. Ltd. | 1,000 | 4,962 | ||||||
Jafco Co. Ltd. | 4,500 | 206,100 | ||||||
Japan Pulp & Paper Co. Ltd. | 2,000 | 8,410 | ||||||
JVC Kenwood Corp. | 29,000 | 77,120 | ||||||
Kadokawa Dwango Corp. | 700 | 8,190 | ||||||
Kaga Electronics Co. Ltd. | 300 | 8,006 | ||||||
Kanematsu Corp. | 139,000 | 327,870 | ||||||
Kasai Kogyo Co. Ltd. | 800 | 11,456 | ||||||
Keihin Corp. | 6,800 | 111,964 | ||||||
Kurabo Industries Ltd. | 9,000 | 23,228 | ||||||
Kuroda Electric Co. Ltd. | 6,100 | 107,437 | ||||||
KYB Corp. | 7,000 | 38,841 | ||||||
Kyodo Printing Co. Ltd. | 3,000 | 10,094 | ||||||
KYORIN Holdings, Inc. | 3,700 | 78,059 | ||||||
Maeda Road Construction Co. Ltd. | 10,000 | 201,264 | ||||||
Mandom Corp. | 200 | 12,016 | ||||||
Mars Engineering Corp. | 300 | 6,274 | ||||||
Marudai Food Co. Ltd. | 6,000 | 28,568 | ||||||
Maruwa Co. Ltd. | 900 | 48,941 | ||||||
Maruzen Showa Unyu Co. Ltd. | 1,000 | 4,536 | ||||||
Matsuda Sangyo Co. Ltd. | 500 | 7,440 | ||||||
Mitsubishi Research Institute, Inc. | 400 | 11,430 | ||||||
Mitsui Home Co. Ltd. | 2,000 | 12,856 | ||||||
Modec, Inc. | 1,400 | 31,103 | ||||||
NEC Networks & System Integration Corp. | 17,700 | 413,470 | ||||||
Nihon Unisys Ltd. | 2,800 | 43,989 | ||||||
Nippon Flour Mills Co. Ltd. | 2,800 | 44,481 | ||||||
Nippon Road Co. Ltd. | 9,000 | 50,169 | ||||||
Nippon Soda Co. Ltd. | 9,000 | 51,707 | ||||||
Nipro Corp. | 2,500 | 33,162 | ||||||
Nishimatsu Construction Co. Ltd. | 206,000 | 1,136,333 | ||||||
Nissin Corp. | 6,000 | 29,451 | ||||||
Nittetsu Mining Co. Ltd. | 100 | 7,021 | ||||||
North Pacific Bank Ltd. | 40,000 | 120,241 | ||||||
NSD Co. Ltd. | 2,000 | 36,989 | ||||||
Okumura Corp. | 43,000 | 322,185 | ||||||
Osaka Soda Co. Ltd. | 4,000 | 19,301 | ||||||
PALTAC CORPORATION | 7,700 | 305,324 | ||||||
PeptiDream, Inc. (a) | 1,000 | 35,065 | ||||||
Press Kogyo Co. Ltd. | 5,000 | 26,229 | ||||||
Proto Corp. | 500 | 8,894 | ||||||
Riken Vitamin Co. Ltd. | 100 | 3,861 | ||||||
Rohto Pharmaceutical Co. Ltd. | 5,200 | 121,181 | ||||||
Ryobi Ltd. | 2,000 | 10,070 | ||||||
Ryoyo Electro Corp. | 1,400 | 23,605 | ||||||
Saizeriya Co. Ltd. | 500 | 14,175 | ||||||
Sangetsu Corp. | 800 | 14,309 | ||||||
Sanki Engineering Co. Ltd. | 4,800 | 53,249 | ||||||
Sato Holdings Corp. | 400 | 9,559 | ||||||
Senshu Ikeda Holdings, Inc. | 6,400 | 23,854 | ||||||
Shin-Etsu Polymer Co. Ltd. | 3,800 | 35,666 | ||||||
Shinko Electric Industries Co. Ltd. | 4,700 | 32,816 | ||||||
Shinmaywa Industries Ltd. | 1,000 | 8,677 | ||||||
Shinnihon Corp. | 5,300 | 38,813 | ||||||
Shizuoka Gas Co. Ltd. | 5,900 | 46,886 | ||||||
Showa Sangyo Co. Ltd. | 6,000 | 33,316 | ||||||
Starts Corp., Inc. | 800 | 19,979 | ||||||
Starzen Co. Ltd. | 200 | 9,416 | ||||||
Studio Alice Co. Ltd. | 800 | 19,385 | ||||||
Tachi-S Co. Ltd. | 600 | 10,252 | ||||||
| Common Stocks | Shares | Value | ||||||
Japan (continued) | ||||||||
Takasago Thermal Engineering Co. Ltd. | 6,800 | $ | 112,398 | |||||
Tanseisha Co. Ltd. | 700 | 7,268 | ||||||
Tatsuta Electric Wire and Cable Co. Ltd. | 1,200 | 7,909 | ||||||
Tenma Corp. | 500 | 9,709 | ||||||
T-Gaia Corp. | 800 | 15,711 | ||||||
TKC Corp. | 200 | 5,860 | ||||||
Toenec Corp. | 4,000 | 24,593 | ||||||
Tokai Carbon Co. Ltd. | 1,800 | 13,026 | ||||||
Tokai Corp. | 300 | 13,268 | ||||||
Tokai Holdings Corp. | 30,600 | 237,744 | ||||||
Tokai Rika Co. Ltd. | 1,700 | 32,075 | ||||||
Token Corp. | 8,400 | 1,161,700 | ||||||
Tokyo Broadcasting System Holdings, Inc. | 300 | 5,766 | ||||||
Toppan Forms Co. Ltd. | 700 | 7,385 | ||||||
Topre Corp. | 200 | 5,786 | ||||||
Toyo Kohan Co. Ltd. | 1,600 | 7,846 | ||||||
Toyota Boshoku Corp. | 3,000 | 59,369 | ||||||
TS Tech Co. Ltd. | 3,200 | 100,095 | ||||||
Tsukishima Kikai Co. Ltd. | 1,100 | 13,438 | ||||||
TV Asahi Holdings Corp. | 3,100 | 62,630 | ||||||
Ube Industries Ltd. | 103,000 | 294,840 | ||||||
Unipres Corp. | 700 | 17,925 | ||||||
Warabeya Nichiyo Holdings Co. Ltd. | 200 | 5,019 | ||||||
Xebio Holdings Co. Ltd. | 1,800 | 35,508 | ||||||
Yahagi Construction Co. Ltd. | 3,000 | 25,902 | ||||||
Yodogawa Steel Works Ltd. | 200 | 5,597 | ||||||
Yorozu Corp. | 400 | 7,910 | ||||||
Yuasa Trading Co. Ltd. | 2,100 | 70,868 | ||||||
Yurtec Corp. | 2,000 | 14,943 | ||||||
Zeon Corp. | 1,000 | 12,625 | ||||||
ZERIA Pharmaceutical Co. Ltd. | 900 | 16,540 | ||||||
|
| |||||||
| 9,347,979 | ||||||||
Jersey — 0.5% | ||||||||
Centamin PLC | 251,973 | 494,821 | ||||||
Malaysia — 0.5% | ||||||||
Bursa Malaysia Bhd | 30,300 | 72,087 | ||||||
Gas Malaysia Bhd | 104,900 | 70,253 | ||||||
IGB Real Estate Investment Trust | 38,300 | 15,426 | ||||||
Malaysian Pacific Industries Bhd | 53,700 | 177,841 | ||||||
TIME dotCom Bhd | 30,700 | 71,170 | ||||||
Tune Protect Group Bhd | 16,900 | 4,171 | ||||||
Unisem M Bhd | 176,300 | 169,814 | ||||||
|
| |||||||
| 580,762 | ||||||||
Mexico — 0.1% | ||||||||
Bolsa Mexicana de Valores SAB de CV | 46,066 | 79,459 | ||||||
Netherlands — 0.8% | ||||||||
Axfood AB | 13,145 | 232,664 | ||||||
BE Semiconductor Industries NV | 8,066 | 522,978 | ||||||
ForFarmers NV | 515 | 6,410 | ||||||
NSI NV | 2,421 | 93,379 | ||||||
|
| |||||||
| 855,431 | ||||||||
Norway — 1.1% | ||||||||
Atea ASA (a) | 7,802 | 103,212 | ||||||
Selvaag Bolig ASA | 7,415 | 34,504 | ||||||
SpareBank 1 Nord Norge | 6,186 | 49,009 | ||||||
Storebrand ASA | 1,251 | 10,355 | ||||||
TGS NOPEC Geophysical Co. ASA | 44,191 | 946,649 | ||||||
|
| |||||||
| 1,143,729 | ||||||||
Poland — 0.2% | ||||||||
Enea SA | 27,504 | 117,684 | ||||||
Energa SA (a) | 18,567 | 71,107 | ||||||
See Notes to Financial Statements.
| 12 | MANAGED ACCOUNT SERIES | AUGUST 31, 2017 |
| Schedule of Investments (continued) | Advantage Global SmallCap Fund | |||
| Common Stocks | Shares | Value | ||||||
Poland (continued) | ||||||||
Netia SA | 6,015 | $ | 6,583 | |||||
Warsaw Stock Exchange | 2,038 | 26,937 | ||||||
|
| |||||||
| 222,311 | ||||||||
Portugal — 0.0% | ||||||||
CTT-Correios de Portugal SA | 1,616 | 10,025 | ||||||
Russia — 0.0% | ||||||||
Aeroflot PJSC | 3,900 | 12,896 | ||||||
LSR Group PJSC - GDR, Registered Shares | 2,530 | 7,211 | ||||||
|
| |||||||
| 20,107 | ||||||||
Singapore — 1.7% | ||||||||
Asian Pay Television Trust | 14,400 | 6,056 | ||||||
Boustead Singapore Ltd. | 8,700 | 5,649 | ||||||
Cache Logistics Trust | 129,600 | 83,660 | ||||||
China Yuchai International Ltd. | 1,614 | 29,601 | ||||||
Far East Hospitality Trust | 41,200 | 20,054 | ||||||
Indofood Agri Resources Ltd. | 20,300 | 7,133 | ||||||
Kulicke & Soffa Industries, Inc. (a) | 354 | 6,737 | ||||||
Lippo Malls Indonesia Retail Trust | 736,300 | 236,211 | ||||||
Mapletree Industrial Trust | 544,400 | 744,763 | ||||||
Yanlord Land Group Ltd. | 496,700 | 634,491 | ||||||
|
| |||||||
| 1,774,355 | ||||||||
South Africa — 0.1% | ||||||||
Adcock Ingram Holdings Ltd. | 14,279 | 69,152 | ||||||
Alexander Forbes Group Holdings Ltd. | 12,514 | 6,484 | ||||||
Lewis Group Ltd. | 2,048 | 5,031 | ||||||
Net 1 UEPS Technologies, Inc. (a) | 1,230 | 11,476 | ||||||
|
| |||||||
| 92,143 | ||||||||
South Korea — 1.3% | ||||||||
Cell Biotech Co. Ltd. | 289 | 9,840 | ||||||
Dae Han Flour Mills Co. Ltd. | 288 | 47,506 | ||||||
Daekyo Co. Ltd. | 2,318 | 17,392 | ||||||
Dong Ah Tire & Rubber Co. Ltd. | 252 | 5,662 | ||||||
Dongkuk Steel Mill Co. Ltd. | 630 | 7,086 | ||||||
Eugene Technology Co. Ltd. | 380 | 6,219 | ||||||
Green Cross Corp. | 35 | 5,642 | ||||||
GS Home Shopping, Inc. | 1,513 | 296,098 | ||||||
Harim Co. Ltd. | 2,761 | 11,729 | ||||||
Hugel, Inc. (a) | 14 | 7,227 | ||||||
Ilshin Spinning Co. Ltd. | 172 | 17,860 | ||||||
KISCO Corp. | 1,169 | 43,406 | ||||||
KIWOOM Securities Co. Ltd. | 79 | 5,664 | ||||||
Korea Electric Terminal Co. Ltd. | 807 | 51,458 | ||||||
Korean Reinsurance Co. | 2,686 | 29,657 | ||||||
KT Skylife Co. Ltd. | 7,535 | 107,707 | ||||||
LF Corp. | 245 | 6,329 | ||||||
Meritz Fire & Marine Insurance Co. Ltd. | 2,882 | 64,746 | ||||||
Modetour Network, Inc. | 3,705 | 89,427 | ||||||
Namyang Dairy Products Co. Ltd. | 124 | 74,589 | ||||||
NICE Information Service Co. Ltd. | 758 | 5,445 | ||||||
POSCO Chemtech Co. Ltd. | 2,531 | 74,194 | ||||||
Pyeong Hwa Automotive Co. Ltd. | 1,374 | 13,979 | ||||||
Samchully Co. Ltd. | 58 | 5,529 | ||||||
Samjin Pharmaceutical Co. Ltd. | 1,905 | 56,974 | ||||||
Taekwang Industrial Co. Ltd. | 190 | 205,064 | ||||||
Tongyang Life Insurance Co. Ltd. | 5,368 | 43,661 | ||||||
ViroMed Co. Ltd. (a) | 99 | 10,993 | ||||||
Youlchon Chemical Co. Ltd. | 1,803 | 22,066 | ||||||
|
| |||||||
| 1,343,149 | ||||||||
Spain — 1.0% | ||||||||
Cia de Distribucion Integral Logista Holdings SA | 1,697 | 42,028 | ||||||
Faes Farma SA | 14,546 | 47,716 | ||||||
| Common Stocks | Shares | Value | ||||||
Spain (continued) | ||||||||
Mediaset Espana Comunicacion SA | 82,528 | $ | 958,052 | |||||
Papeles y Cartones de Europa SA | 4,584 | 39,100 | ||||||
|
| |||||||
| 1,086,896 | ||||||||
Sweden — 3.5% | ||||||||
Bilia AB | 8,043 | 83,763 | ||||||
BioGaia AB | 513 | 19,498 | ||||||
Capio AB (c) | 2,945 | 16,595 | ||||||
Com Hem Holding AB | 2,655 | 39,562 | ||||||
Hemfosa Fastigheter AB | 20,706 | 254,718 | ||||||
Hufvudstaden AB, A Shares | 5,863 | 104,232 | ||||||
JM AB | 25,021 | 802,851 | ||||||
Klovern AB | 165,485 | 229,202 | ||||||
Loomis AB, Class B | 5,933 | 216,390 | ||||||
New Wave Group AB | 2,452 | 17,208 | ||||||
Nobina AB (c) | 11,015 | 55,035 | ||||||
Peab AB | 41,068 | 471,798 | ||||||
Svenska Cellulosa AB SCA, Class B | 159,492 | 1,330,765 | ||||||
Swedish Orphan Biovitrum AB (a) | 1,928 | 28,826 | ||||||
Tethys Oil AB | 4,564 | 30,730 | ||||||
|
| |||||||
| 3,701,173 | ||||||||
Switzerland — 2.4% | ||||||||
Basilea Pharmaceutica AG, Registered Shares (a)(b) | 75 | 6,394 | ||||||
GAM Holding AG (a) | 47,920 | 736,635 | ||||||
Idorsia Ltd. (a) | 1,287 | 23,487 | ||||||
Logitech International SA, Registered Shares | 37,305 | 1,329,357 | ||||||
Oriflame Holding AG (a) | 731 | 26,730 | ||||||
Sunrise Communications Group AG (a)(c) | 764 | 65,433 | ||||||
Tecan Group AG, Registered Shares | 245 | 49,120 | ||||||
Temenos Group AG, Registered Shares (a) | 2,356 | 232,654 | ||||||
Valora Holding AG, Registered Shares | 44 | 13,272 | ||||||
|
| |||||||
| 2,483,082 | ||||||||
Taiwan — 3.4% | ||||||||
Accton Technology Corp. | 233,000 | 611,482 | ||||||
Addcn Technology Co. Ltd. | 1,000 | 8,771 | ||||||
Alpha Networks, Inc. | 468,000 | 334,682 | ||||||
Arcadyan Technology Corp. | 13,000 | 22,594 | ||||||
Charoen Pokphand Enterprise | 37,000 | 80,618 | ||||||
Chicony Power Technology Co. Ltd. | 3,015 | 6,167 | ||||||
China General Plastics Corp. | 95,790 | 111,183 | ||||||
Chong Hong Construction Co. Ltd. | 21,000 | 46,979 | ||||||
Cleanaway Co. Ltd. | 9,000 | 50,732 | ||||||
Coretronic Corp. | 96,000 | 116,829 | ||||||
CTCI Corp. | 75,000 | 121,368 | ||||||
Darwin Precisions Corp. | 50,000 | 36,988 | ||||||
E Ink Holdings, Inc. | 56,000 | 80,965 | ||||||
Formosa Advanced Technologies Co. Ltd. | 72,000 | 67,362 | ||||||
Getac Technology Corp. | 110,000 | 157,434 | ||||||
Gigabyte Technology Co. Ltd. | 42,000 | 57,307 | ||||||
Grand Pacific Petrochemical | 143,000 | 121,390 | ||||||
Great China Metal Industry | 7,000 | 5,757 | ||||||
Hong Pu Real Estate Development Co. Ltd. | 8,000 | 5,544 | ||||||
Huang Hsiang Construction Corp. | 22,000 | 23,156 | ||||||
Kindom Construction Corp. | 148,000 | 89,714 | ||||||
King’s Town Bank Co. Ltd. | 32,000 | 33,829 | ||||||
LCY Chemical Corp. | 240,000 | 322,330 | ||||||
Mercuries Life Insurance Co. Ltd. (a) | 12,540 | 6,720 | ||||||
Microlife Corp. | 6,000 | 14,939 | ||||||
Nien Hsing Textile Co. Ltd. | 11,000 | 8,085 | ||||||
Radiant Opto-Electronics Corp. | 101,000 | 255,706 | ||||||
Shinkong Synthetic Fibers Corp. | 19,000 | 5,724 | ||||||
Sigurd Microelectronics Corp. | 42,000 | 36,802 | ||||||
Soft-World International Corp. | 92,000 | 220,062 | ||||||
See Notes to Financial Statements.
| MANAGED ACCOUNT SERIES | AUGUST 31, 2017 | 13 |
| Schedule of Investments (continued) | Advantage Global SmallCap Fund | |||
| Common Stocks | Shares | Value | ||||||
Taiwan (continued) | ||||||||
Syncmold Enterprise Corp. | 69,000 | $ | 159,415 | |||||
Systex Corp. | 38,000 | 73,154 | ||||||
Ton Yi Industrial Corp. | 11,000 | 5,216 | ||||||
Topkey Corp. | 3,000 | 9,702 | ||||||
Tripod Technology Corp. | 23,000 | 86,378 | ||||||
TXC Corp. | 86,000 | 116,803 | ||||||
Wowprime Corp. | 7,000 | 42,170 | ||||||
|
| |||||||
| 3,554,057 | ||||||||
Thailand — 0.2% | ||||||||
Ananda Development PCL — NVDR | 179,900 | 27,926 | ||||||
Kiatnakin Bank PCL — NVDR | 38,700 | 81,926 | ||||||
MC Group PCL — NVDR | 106,800 | 45,351 | ||||||
Thanachart Capital PCL — NVDR | 17,300 | 24,362 | ||||||
Tisco Financial Group PCL — NVDR | 21,100 | 47,554 | ||||||
|
| |||||||
| 227,119 | ||||||||
Turkey — 1.7% | ||||||||
Aksa Akrilik Kimya Sanayii A/S | 19,301 | 70,144 | ||||||
Aygaz A/S | 60,442 | 274,222 | ||||||
Migros Ticaret A/S (a) | 6,968 | 58,389 | ||||||
Selcuk Ecza Deposu Ticaret ve Sanayi A/S | 29,477 | 33,543 | ||||||
Soda Sanayii A/S | 4,423 | 6,677 | ||||||
Tekfen Holding A/S | 340,505 | 1,264,235 | ||||||
Trakya Cam Sanayii A/S | 65,307 | 69,681 | ||||||
Vestel Elektronik Sanayi ve Ticaret A/S (a) | 2,853 | 6,917 | ||||||
|
| |||||||
| 1,783,808 | ||||||||
United Kingdom — 5.8% | ||||||||
Abcam PLC | 3,165 | 43,530 | ||||||
Acacia Mining PLC (a) | 13,352 | 35,103 | ||||||
Ashmore Group PLC | 5,855 | 27,961 | ||||||
Brewin Dolphin Holdings PLC | 4,311 | 19,911 | ||||||
BTG PLC (a) | 4,235 | 38,148 | ||||||
Costain Group PLC | 6,015 | 34,792 | ||||||
Dart Group PLC | 10,648 | 71,116 | ||||||
DS Smith PLC | 8,637 | 55,716 | ||||||
esure Group PLC | 21,332 | 75,167 | ||||||
Fenner PLC | 1,298 | 5,757 | ||||||
Fevertree Drinks PLC | 4,959 | 158,148 | ||||||
Genus PLC | 581 | 13,996 | ||||||
Go-Ahead Group PLC | 15,027 | 349,958 | ||||||
Grainger PLC | 50,347 | 165,994 | ||||||
HomeServe PLC | 68,797 | 650,304 | ||||||
Ibstock PLC (c) | 18,297 | 55,608 | ||||||
Indivior PLC (a) | 12,472 | 67,184 | ||||||
Moneysupermarket.com Group PLC | 11,175 | 46,202 | ||||||
National Express Group PLC | 10,147 | 47,104 | ||||||
NEX Group PLC | 20,614 | 176,845 | ||||||
OneSavings Bank PLC | 30,574 | 155,887 | ||||||
Pagegroup PLC | 3,830 | 25,342 | ||||||
QinetiQ Group PLC | 235,521 | 701,214 | ||||||
Rentokil Initial PLC | 14,076 | 55,458 | ||||||
Shaftesbury PLC | 50,912 | 656,893 | ||||||
Spirax-Sarco Engineering PLC | 8,044 | 585,051 | ||||||
SSP Group PLC | 1,234 | 8,820 | ||||||
Stagecoach Group PLC | 19,376 | 41,941 | ||||||
Stock Spirits Group PLC | 10,308 | 31,024 | ||||||
Subsea 7 SA | 85,127 | 1,224,684 | ||||||
Telecom Plus PLC | 819 | 11,544 | ||||||
William Hill PLC | 137,243 | 439,410 | ||||||
|
| |||||||
| 6,075,812 | ||||||||
United States — 45.3% | ||||||||
1st Source Corp. | 1,566 | 73,085 | ||||||
Abercrombie & Fitch Co., Class A | 1,687 | 21,492 | ||||||
| Common Stocks | Shares | Value | ||||||
United States (continued) | ||||||||
ACADIA Pharmaceuticals, Inc. (a)(b) | 1,026 | $ | 36,536 | |||||
ACCO Brands Corp. (a) | 1,380 | 15,111 | ||||||
Acxiom Corp. (a) | 722 | 16,815 | ||||||
Agios Pharmaceuticals, Inc. (a)(b) | 468 | 29,606 | ||||||
Allison Transmission Holdings, Inc. | 34,053 | 1,182,661 | ||||||
Alnylam Pharmaceuticals, Inc. (a)(b) | 1,063 | 91,131 | ||||||
Alpha & Omega Semiconductor Ltd. (a) | 294 | 4,669 | ||||||
Altisource Portfolio Solutions SA (a) | 5,829 | 132,785 | ||||||
Altisource Residential Corp. | 834 | 10,100 | ||||||
AMAG Pharmaceuticals, Inc. (a)(b) | 645 | 10,772 | ||||||
American Assets Trust, Inc. | 611 | 24,819 | ||||||
American Eagle Outfitters, Inc. | 47,167 | 563,646 | ||||||
American Public Education, Inc. (a) | 1,868 | 34,465 | ||||||
Amicus Therapeutics, Inc. (a) | 1,514 | 21,105 | ||||||
AngioDynamics, Inc. (a) | 3,133 | 53,355 | ||||||
Applied Industrial Technologies, Inc. | 4,852 | 276,564 | ||||||
ArcBest Corp. | 2,325 | 69,053 | ||||||
Archrock, Inc. | 1,242 | 12,668 | ||||||
Argan, Inc. | 2,407 | 152,483 | ||||||
Argo Group International Holdings Ltd. | 6,381 | 384,136 | ||||||
ARMOUR Residential REIT, Inc. | 6,055 | 159,913 | ||||||
Array BioPharma, Inc. (a)(b) | 1,261 | 12,206 | ||||||
Ashford Hospitality Trust, Inc. | 20,466 | 127,094 | ||||||
Aspen Technology, Inc. (a) | 21,298 | 1,347,099 | ||||||
Avexis, Inc. (a) | 293 | 27,352 | ||||||
Baldwin & Lyons, Inc., Class B | 1,310 | 28,689 | ||||||
BancFirst Corp. | 252 | 12,701 | ||||||
Benchmark Electronics, Inc. (a) | 13,943 | 453,148 | ||||||
Big Lots, Inc. | 10,052 | 478,475 | ||||||
Bioverativ, Inc. (a) | 1,625 | 92,121 | ||||||
Bloomin’ Brands, Inc. | 41,907 | 712,838 | ||||||
Bluebird Bio, Inc. (a)(b) | 550 | 68,668 | ||||||
Blueprint Medicines Corp. (a) | 288 | 15,615 | ||||||
Boingo Wireless, Inc. (a) | 4,577 | 94,240 | ||||||
Boston Private Financial Holdings, Inc. | 426 | 6,262 | ||||||
Brinker International, Inc. | 787 | 24,570 | ||||||
Brink’s Co. | 13,691 | 1,074,059 | ||||||
Brooks Automation, Inc. | 713 | 18,588 | ||||||
Bruker Corp. | 1,459 | 42,442 | ||||||
Brunswick Corp. | 8,365 | 438,995 | ||||||
Bryn Mawr Bank Corp. | 2,953 | 120,925 | ||||||
Burlington Stores, Inc. (a) | 605 | 52,714 | ||||||
BWX Technologies, Inc. | 17,806 | 974,344 | ||||||
Cabot Microelectronics Corp. | 9,469 | 678,170 | ||||||
CACI International, Inc., Class A (a) | 88 | 11,422 | ||||||
Cantel Medical Corp. | 209 | 16,981 | ||||||
Capella Education Co. | 200 | 13,470 | ||||||
Cardtronics PLC, Class A (a) | 1,288 | 33,462 | ||||||
Casella Waste Systems, Inc., Class A (a)(b) | 6,463 | 108,643 | ||||||
Cathay General Bancorp | 2,163 | 76,289 | ||||||
Cato Corp., Class A | 10,182 | 133,995 | ||||||
Central Garden & Pet Co. (a) | 678 | 23,900 | ||||||
Central Garden & Pet Co., Class A (a) | 551 | 18,784 | ||||||
Charles River Laboratories International, Inc. (a) | 8,223 | 894,662 | ||||||
Chemed Corp. | 6,572 | 1,296,590 | ||||||
Chico’s FAS, Inc. | 2,142 | 16,451 | ||||||
Children’s Place, Inc. | 1,438 | 152,644 | ||||||
Choice Hotels International, Inc. | 14,830 | 920,202 | ||||||
Citi Trends, Inc. | 657 | 11,911 | ||||||
Clovis Oncology, Inc. (a) | 570 | 43,360 | ||||||
Cohu, Inc. | 3,790 | 71,100 | ||||||
Colfax Corp. (a) | 3,188 | 127,137 | ||||||
Columbia Banking System, Inc. | 771 | 28,658 | ||||||
CommVault Systems, Inc. (a) | 302 | 18,437 | ||||||
Convergys Corp. | 1,654 | 38,869 | ||||||
See Notes to Financial Statements.
| 14 | MANAGED ACCOUNT SERIES | AUGUST 31, 2017 |
| Schedule of Investments (continued) | Advantage Global SmallCap Fund | |||
| Common Stocks | Shares | Value | ||||||
United States (continued) | ||||||||
CSG Systems International, Inc. | 7,331 | $ | 283,783 | |||||
Dana, Inc. | 1,642 | 39,523 | ||||||
Del Frisco’s Restaurant Group, Inc. (a) | 1,006 | 14,084 | ||||||
Diamond Offshore Drilling, Inc. (a)(b) | 15,671 | 178,023 | ||||||
DiamondRock Hospitality Co. | 14,513 | 159,498 | ||||||
Dime Community Bancshares, Inc. | 1,906 | 36,119 | ||||||
Domtar Corp. | 7,453 | 301,399 | ||||||
Donaldson Co., Inc. | 3,333 | 157,484 | ||||||
DST Systems, Inc. | 8,357 | 428,965 | ||||||
Dunkin’ Brands Group, Inc. | 13,216 | 681,417 | ||||||
El Paso Electric Co. | 1,932 | 107,323 | ||||||
Emergent BioSolutions, Inc. (a) | 572 | 21,353 | ||||||
Enbridge Energy Management LLC (a) | 620 | 8,931 | ||||||
Energizer Holdings, Inc. | 2,300 | 101,545 | ||||||
Ennis, Inc. | 1,304 | 24,906 | ||||||
Entegris, Inc. (a) | 2,024 | 51,511 | ||||||
Essendant, Inc. | 786 | 9,322 | ||||||
Euronet Worldwide, Inc. (a) | 1,243 | 122,150 | ||||||
EVERTEC, Inc. | 6,652 | 122,397 | ||||||
Exact Sciences Corp. (a)(b) | 1,366 | 57,222 | ||||||
Exactech, Inc. (a) | 973 | 29,725 | ||||||
Exelixis, Inc. (a) | 4,177 | 122,135 | ||||||
Express, Inc. (a) | 19,500 | 124,215 | ||||||
Extended Stay America, Inc. | 28,505 | 558,413 | ||||||
Exterran Corp. (a) | 1,855 | 51,458 | ||||||
FBL Financial Group, Inc., Class A | 1,801 | 122,468 | ||||||
Federal Agricultural Mortgage Corp., Class C | 2,091 | 142,439 | ||||||
FibroGen, Inc. (a) | 637 | 30,703 | ||||||
Finish Line, Inc., Class A | 5,400 | 44,982 | ||||||
First BanCorp (a) | 1,878 | 10,667 | ||||||
First Commonwealth Financial Corp. | 4,187 | 52,798 | ||||||
First Community Bancshares, Inc. | 501 | 12,896 | ||||||
First Horizon National Corp. | 2,961 | 50,959 | ||||||
First Interstate BancSystem, Inc., Class A | 106 | 3,731 | ||||||
First Merchants Corp. | 4,876 | 191,481 | ||||||
Flushing Financial Corp. | 1,132 | 30,949 | ||||||
FNFV Group (a) | 3,097 | 52,184 | ||||||
Forrester Research, Inc. | 137 | 5,583 | ||||||
Forward Air Corp. | 175 | 9,095 | ||||||
Fulton Financial Corp. | 8,296 | 144,765 | ||||||
FutureFuel Corp. | 358 | 4,826 | ||||||
GAMCO Investors, Inc., Class A | 1,400 | 41,258 | ||||||
GameStop Corp., Class A | 50,830 | 940,355 | ||||||
Gentex Corp. | 2,906 | 53,093 | ||||||
Global Blood Therapeutics, Inc. (a) | 193 | 5,867 | ||||||
Global Brass & Copper Holdings, Inc. | 420 | 12,537 | ||||||
Gorman-Rupp Co. | 560 | 17,046 | ||||||
Grand Canyon Education, Inc. (a) | 360 | 29,538 | ||||||
Great Western Bancorp, Inc. | 735 | 26,401 | ||||||
Green Dot Corp., Class A (a) | 788 | 37,966 | ||||||
Hackett Group, Inc. | 1,491 | 20,367 | ||||||
Haemonetics Corp. (a) | 333 | 14,326 | ||||||
Halcon Resources Corp. (a) | 1,256 | 7,775 | ||||||
Halozyme Therapeutics, Inc. (a)(b) | 1,144 | 14,883 | ||||||
Hanmi Financial Corp. | 3,475 | 92,783 | ||||||
Harsco Corp. (a) | 3,547 | 60,654 | ||||||
Haverty Furniture Cos, Inc. | 219 | 5,136 | ||||||
Heritage Financial Corp. | 213 | 5,570 | ||||||
Hersha Hospitality Trust | 1,105 | 20,487 | ||||||
HNI Corp. | 781 | 28,624 | ||||||
HomeTrust Bancshares, Inc. (a) | 413 | 9,582 | ||||||
HRG Group, Inc. (a) | 12,515 | 197,612 | ||||||
Huntsman Corp. | 13,598 | 361,299 | ||||||
IDACORP, Inc. | 523 | 46,537 | ||||||
IDT Corp., Class B | 2,313 | 34,024 | ||||||
| Common Stocks | Shares | Value | ||||||
United States (continued) | ||||||||
Infinity Property & Casualty Corp. | 2,981 | $ | 263,669 | |||||
Innophos Holdings, Inc. | 794 | 36,254 | ||||||
Insight Enterprises, Inc. (a) | 509 | 20,401 | ||||||
Insmed, Inc. (a) | 427 | 5,303 | ||||||
Insperity, Inc. | 316 | 25,375 | ||||||
Inter Parfums, Inc. | 5,970 | 235,517 | ||||||
Intercept Pharmaceuticals, Inc. (a) | 190 | 22,156 | ||||||
InterDigital, Inc. | 16,279 | 1,161,507 | ||||||
International Bancshares Corp. | 680 | 24,446 | ||||||
INTL. FCStone, Inc. (a)(b) | 1,610 | 57,139 | ||||||
Intrexon Corp. (a) | 516 | 10,181 | ||||||
Invesco Mortgage Capital, Inc. | 2,975 | 50,516 | ||||||
Ionis Pharmaceuticals, Inc. (a)(b) | 1,918 | 102,843 | ||||||
Ironwood Pharmaceuticals, Inc. (a)(b) | 1,468 | 23,415 | ||||||
iStar, Inc. (a) | 1,170 | 13,584 | ||||||
Jabil, Inc. | 17,685 | 554,425 | ||||||
James River Group Holdings Ltd. | 271 | 10,807 | ||||||
John Wiley & Sons, Inc., Class A | 4,795 | 258,690 | ||||||
Juno Therapeutics, Inc. (a) | 660 | 27,238 | ||||||
Kadant, Inc. | 36 | 3,127 | ||||||
KAR Auction Services, Inc. | 22,435 | 1,011,594 | ||||||
Kimball International, Inc., Class B | 365 | 6,190 | ||||||
Kirkland’s, Inc. (a) | 1,634 | 18,840 | ||||||
Kite Pharma, Inc. (a) | 542 | 96,471 | ||||||
Lakeland Financial Corp. | 8,289 | 360,240 | ||||||
Landstar System, Inc. | 6,424 | 599,680 | ||||||
LaSalle Hotel Properties | 4,321 | 122,630 | ||||||
La-Z-Boy, Inc. | 355 | 8,467 | ||||||
LCI Industries | 2,881 | 284,643 | ||||||
Legg Mason, Inc. | 1,514 | 57,820 | ||||||
LeMaitre Vascular, Inc. | 182 | 6,625 | ||||||
Lexington Realty Trust | 1,060 | 10,452 | ||||||
Ligand Pharmaceuticals, Inc. (a) | 245 | 31,573 | ||||||
Lincoln Electric Holdings, Inc. | 4,887 | 424,387 | ||||||
Loxo Oncology, Inc. (a) | 191 | 15,929 | ||||||
Luminex Corp. | 670 | 12,951 | ||||||
ManTech International Corp., Class A | 143 | 5,751 | ||||||
Marcus Corp. | 714 | 17,779 | ||||||
Marriott Vacations Worldwide Corp. | 1,526 | 177,565 | ||||||
Marten Transport Ltd. | 2,944 | 50,490 | ||||||
Masimo Corp. (a) | 13,553 | 1,143,602 | ||||||
Materion Corp. | 162 | 6,188 | ||||||
McGrath RentCorp. | 945 | 38,150 | ||||||
Medifast, Inc. | 123 | 6,964 | ||||||
Mercantile Bank Corp. | 1,292 | 39,264 | ||||||
Meredith Corp. | 9,978 | 542,304 | ||||||
Meritor, Inc. (a) | 1,446 | 28,718 | ||||||
MiMedx Group, Inc. (a) | 985 | 16,026 | ||||||
Moelis & Co., Class A | 2,124 | 83,686 | ||||||
Momenta Pharmaceuticals, Inc. (a) | 492 | 8,290 | ||||||
Monarch Casino & Resort, Inc. (a) | 527 | 18,745 | ||||||
MRC Global, Inc. (a) | 3,156 | 49,770 | ||||||
MTGE Investment Corp. | 8,171 | 156,883 | ||||||
Myriad Genetics, Inc. (a)(b) | 1,204 | 36,710 | ||||||
National Bank Holdings Corp., Class A | 6,895 | 221,881 | ||||||
National Research Corp., Class A | 226 | 7,300 | ||||||
Natural Health Trends Corp. | 946 | 19,090 | ||||||
Navigators Group, Inc. | 209 | 11,662 | ||||||
NCR Corp. (a)(b) | 35,545 | 1,298,459 | ||||||
Nelnet, Inc., Class A | 1,049 | 49,754 | ||||||
Neurocrine Biosciences, Inc. (a)(b) | 1,066 | 60,336 | ||||||
Newpark Resources, Inc. (a)(b) | 1,804 | 14,522 | ||||||
NIC, Inc. | 6,093 | 99,621 | ||||||
Northfield Bancorp, Inc. | 319 | 5,139 | ||||||
OFG Bancorp | 1,114 | 9,692 | ||||||
See Notes to Financial Statements.
| MANAGED ACCOUNT SERIES | AUGUST 31, 2017 | 15 |
| Schedule of Investments (continued) | Advantage Global SmallCap Fund | |||
| Common Stocks | Shares | Value | ||||||
United States (continued) | ||||||||
OM Asset Management PLC | 36,438 | $ | 514,869 | |||||
ONE Gas, Inc. | 1,039 | 78,174 | ||||||
OPKO Health, Inc. (a)(b) | 4,401 | 28,166 | ||||||
Oritani Financial Corp. | 1,603 | 25,728 | ||||||
Outfront Media, Inc. (b) | 45,820 | 1,008,040 | ||||||
Owens Corning | 13,180 | 977,033 | ||||||
Owens-Illinois, Inc. (a) | 1,560 | 38,438 | ||||||
Park Hotels & Resorts, Inc. | 31,790 | 848,475 | ||||||
PDL BioPharma, Inc. (a) | 7,618 | 23,768 | ||||||
Peoples Bancorp, Inc. | 354 | 10,995 | ||||||
Pier 1 Imports, Inc. | 16,890 | 70,769 | ||||||
Pinnacle Entertainment, Inc. (a) | 927 | 18,077 | ||||||
Piper Jaffray Cos. | 192 | 10,646 | ||||||
Pitney Bowes, Inc. | 664 | 8,532 | ||||||
PJT Partners, Inc., Class A | 2,221 | 85,864 | ||||||
Portola Pharmaceuticals, Inc. (a) | 715 | 45,367 | ||||||
Potlatch Corp. | 3,132 | 149,710 | ||||||
PRA Health Sciences, Inc. (a) | 4,128 | 319,507 | ||||||
Progress Software Corp. | 3,989 | 133,951 | ||||||
Proofpoint, Inc. (a) | 4,181 | 383,649 | ||||||
Provident Financial Services, Inc. | 5,694 | 141,496 | ||||||
PS Business Parks, Inc. | 1,076 | 145,378 | ||||||
Puma Biotechnology, Inc. (a) | 358 | 33,115 | ||||||
QCR Holdings, Inc. | 284 | 12,411 | ||||||
Quality Care Properties, Inc. (a) | 1,653 | 22,679 | ||||||
Quidel Corp. (a) | 145 | 5,066 | ||||||
Radius Health, Inc. (a) | 230 | 8,655 | ||||||
Raven Industries, Inc. | 1,767 | 49,476 | ||||||
Rayonier Advanced Materials, Inc. | 1,707 | 23,420 | ||||||
Regis Corp. (a) | 5,863 | 77,861 | ||||||
Reliance Steel & Aluminum Co. | 11,486 | 831,816 | ||||||
Repligen Corp. (a) | 280 | 12,228 | ||||||
Republic Bancorp, Inc., Class A | 830 | 29,531 | ||||||
Resources Connection, Inc. | 3,571 | 45,530 | ||||||
REX American Resources Corp. (a)(b) | 1,454 | 125,945 | ||||||
RigNet, Inc. (a) | 391 | 6,256 | ||||||
RLJ Lodging Trust | 60,893 | 1,228,821 | ||||||
Rowan Cos PLC, Class A (a) | 2,178 | 21,235 | ||||||
RPX Corp. (a) | 9,250 | 120,805 | ||||||
RR Donnelley & Sons Co. | 5,823 | 53,746 | ||||||
Ruth’s Hospitality Group, Inc. | 2,039 | 39,862 | ||||||
Sabra Health Care REIT, Inc. | 933 | 20,391 | ||||||
Sage Therapeutics, Inc. (a)(b) | 386 | 31,749 | ||||||
Sandy Spring Bancorp, Inc. | 4,348 | 167,702 | ||||||
Sarepta Therapeutics, Inc. (a)(b) | 607 | 24,456 | ||||||
Schnitzer Steel Industries, Inc., Class A | 2,818 | 75,804 | ||||||
Selective Insurance Group, Inc. | 1,015 | 51,156 | ||||||
Service Corp. International | 13,880 | 490,519 | ||||||
Silgan Holdings, Inc. | 11,159 | 335,774 | ||||||
SkyWest, Inc. | 864 | 29,981 | ||||||
SLM Corp. (a) | 4,643 | 47,219 | ||||||
Sotheby’s (a) | 1,699 | 76,234 | ||||||
SP Plus Corp. (a) | 2,321 | 85,645 | ||||||
Spark Therapeutics, Inc. (a)(b) | 215 | 17,701 | ||||||
SpartanNash Co. | 655 | 16,139 | ||||||
Spok Holdings, Inc. | 1,723 | 28,860 | ||||||
Sprouts Farmers Market, Inc. (a) | 6,406 | 127,736 | ||||||
Steelcase, Inc., Class A | 1,521 | 20,077 | ||||||
Steven Madden Ltd. (a) | 9,118 | 386,603 | ||||||
Stock Yards Bancorp, Inc. | 143 | 4,976 | ||||||
Stoneridge, Inc. (a) | 1,867 | 30,918 | ||||||
Sunstone Hotel Investors, Inc. | 6,081 | 96,080 | ||||||
Surmodics, Inc. (a) | 2,009 | 52,234 | ||||||
Tech Data Corp. (a) | 1,268 | 139,848 | ||||||
Tenneco, Inc. | 9,936 | 538,531 | ||||||
| Common Stocks | Shares | Value | ||||||
United States (continued) | ||||||||
Teradyne, Inc. | 25,266 | $ | 899,722 | |||||
Tetra Tech, Inc. | 1,387 | 59,086 | ||||||
Timken Co. | 13,098 | 587,445 | ||||||
Titan Machinery, Inc. (a)(b) | 2,780 | 35,862 | ||||||
Toro Co. | 12,864 | 793,451 | ||||||
Tower International, Inc. | 5,659 | 127,045 | ||||||
TriNet Group, Inc. (a) | 2,084 | 74,461 | ||||||
TriState Capital Holdings, Inc. (a) | 2,213 | 46,252 | ||||||
Trustmark Corp. | 174 | 5,154 | ||||||
Two Harbors Investment Corp. | 6,182 | 63,242 | ||||||
Ultragenyx Pharmaceutical, Inc. (a)(b) | 489 | 27,902 | ||||||
Union Bankshares Corp. | 3,016 | 94,491 | ||||||
Unisys Corp. (a)(b) | 13,087 | 101,424 | ||||||
United Financial Bancorp, Inc. | 2,233 | 38,676 | ||||||
United States Lime & Minerals, Inc. | 506 | 40,455 | ||||||
Universal Logistics Holdings, Inc. | 383 | 6,358 | ||||||
Validus Holdings Ltd. | 956 | 47,943 | ||||||
Vera Bradley, Inc. (a) | 1,095 | 9,899 | ||||||
Versum Materials, Inc. | 7,184 | 265,305 | ||||||
Village Super Market, Inc., Class A | 263 | 6,083 | ||||||
Vishay Intertechnology, Inc. | 4,103 | 72,623 | ||||||
Visteon Corp. (a) | 2,597 | 299,798 | ||||||
WageWorks, Inc. (a) | 4,907 | 289,268 | ||||||
Washington Trust Bancorp, Inc. | 1,057 | 54,171 | ||||||
Waterstone Financial, Inc. | 520 | 9,178 | ||||||
Web.Com Group, Inc. (a) | 757 | 19,152 | ||||||
WellCare Health Plans, Inc. (a) | 7,047 | 1,230,970 | ||||||
Werner Enterprises, Inc. | 713 | 23,600 | ||||||
Westwood Holdings Group, Inc. | 577 | 35,272 | ||||||
Wolverine World Wide, Inc. | 2,497 | 65,671 | ||||||
Worthington Industries, Inc. | 874 | 43,665 | ||||||
Xencor, Inc. (a) | 230 | 4,973 | ||||||
Xenia Hotels & Resorts, Inc. | 305 | 6,088 | ||||||
|
| |||||||
| 47,517,933 | ||||||||
Total Common Stocks — 96.2% | 100,802,426 | |||||||
Total Long-Term Investments (Cost — $97,756,994) — 96.2% | 100,802,426 | |||||||
| Short-Term Securities | ||||||||
Money Market Funds — 1.5% | ||||||||
SL Liquidity Series, LLC, Money Market | 1,555,085 | 1,555,241 | ||||||
| Par (000) | Value | |||||||||||
Time Deposits | ||||||||||||
Europe — 0.0% | ||||||||||||
Citibank, New York, (0.56)%, 09/01/17 | EUR | 37 | 44,109 | |||||||||
Japan — 0.0% | ||||||||||||
Sumitomo, Tokyo, (0.23)%, 09/01/17 | JPY | 2,842 | 25,855 | |||||||||
Singapore — 0.0% | ||||||||||||
Brown Brothers Harriman & Co., 0.01%, 09/04/17 | SGD | 18 | 13,474 | |||||||||
United Kingdom — 0.0% | ||||||||||||
Brown Brothers Harriman & Co., 0.05%, 09/01/17 | GBP | 10 | 13,481 | |||||||||
See Notes to Financial Statements.
| 16 | MANAGED ACCOUNT SERIES | AUGUST 31, 2017 |
| Schedule of Investments (continued) | Advantage Global SmallCap Fund | |||
| Short-Term Securities | Par (000) | Value | ||||||||||
United States — 3.1% | ||||||||||||
Sumitomo, Tokyo, 1.17%, 09/01/17 | USD | 3,212 | $ | 3,212,447 | ||||||||
Total Time Deposits — 3.1% | 3,309,366 | |||||||||||
Total Short-Term Securities (Cost — $4,864,502) — 4.6% | 4,864,607 | |||||||||||
Value | ||||||||
Total Investments (Cost — $ 102,621,496) — 100.8% | $ | 105,667,033 | ||||||
Liabilities in Excess of Other Assets — (0.8)% | (879,202 | ) | ||||||
|
| |||||||
Net Assets — 100.0% | $ | 104,787,831 | ||||||
|
| |||||||
| Notes to Schedule of Investments |
| (a) | Non-income producing security. |
| (b) | Security, or a portion of the security, is on loan. |
| (c) | Security exempt from registration pursuant to Rule 144A under the Securities Act of 1933, as amended. These securities may be resold in transactions exempt from registration to qualified institutional investors. |
| (d) | Security was purchased with the cash collateral from loaned securities. |
| (e) | Annualized 7-day yield as of period end. |
| (f) | During the period ended August 31, 2017, investments in issuers considered to be an affiliate of the Fund for purposes of Section 2(a)(3) of the Investment Company Act of 1940, as amended, were as follows: |
| Affiliate | Shares Held at April 30, 2017 | Net Activity | Shares Held at August 31, 2017 | Value at August 31, 2017 | Income | Net Realized Gain | Change in Unrealized Appreciation (Depreciation) | |||||||||
SL Liquidity Series, LLC, Money Market Series | 11,416,782 | (9,861,697) | 1,555,085 | $1,555,241 | $37,6231 | $1,721 | $(1,932 | ) | ||||||||
| 1 | Represents securities lending income earned from the reinvestment of cash collateral from loaned securities, net of fees and collateral investment expenses, and other payments to and from borrowers of securities. |
| Derivative Financial Instruments Outstanding as of Period End |
| Futures Contracts | ||||||||||||||
| Description | Number of Contracts | Expiration Date | Notional Amount (000) | Value/ Unrealized Appreciation (Depreciation) | ||||||||||
Long Contracts | ||||||||||||||
Nikkei 225 Yen Index | 6 | September 2017 | $ 537 | $ 4,417 | ||||||||||
Euro STOXX 50 Index | 13 | September 2017 | $ 530 | 2,522 | ||||||||||
FTSE 100 Index | 2 | September 2017 | $ 192 | 249 | ||||||||||
Mini MSCI Emerging Markets Index | 8 | September 2017 | $ 434 | 622 | ||||||||||
Russell 2000 E-Mini Index | 30 | September 2017 | $2,107 | 26,617 | ||||||||||
Total | $34,427 | |||||||||||||
|
| |||||||||||||
| Derivative Financial Instruments Categorized by Risk Exposure |
| As of period end, the fair values of derivative financial instruments located in the Statements of Assets and Liabilities were as follows: |
| Assets - Derivative Financial Instruments | Commodity Contracts | Credit Contracts | Equity Contracts | Foreign Currency Exchange Contracts | Interest Rate Contracts | Other Contracts | Total | |||||||||||
Futures contracts | Net unrealized appreciation1 | — | — | $34,427 | — | — | — | $34,427 | ||||||||||
| 1 | Includes cumulative appreciation (depreciation) on futures contracts and centrally cleared swaps, if any, as reported in the Schedule of Investments. Only current day’s variation margin is reported within the Statements of Assets and Liabilities. |
See Notes to Financial Statements.
| MANAGED ACCOUNT SERIES | AUGUST 31, 2017 | 17 |
| Schedule of Investments (continued) | Advantage Global SmallCap Fund |
| For the period ended August 31, 2017, the effect of derivative financial instruments in the Statements of Operations was as follows: |
| Net Realized Gain (Loss) from: | Commodity Contracts | Credit Contracts | Equity Contracts | Foreign Currency Exchange Contracts | Interest Rate Contracts | Other Contracts | Total | |||||||||||||||||||||
Futures contracts | — | — | $ | 22,325 | — | — | — | $ | 22,325 | |||||||||||||||||||
| ||||||||||||||||||||||||||||
Net Change in Unrealized Appreciation (Depreciation) on: |
| |||||||||||||||||||||||||||
Futures contracts | — | — | $ | 34,427 | — | — | — | $ | 34,427 | |||||||||||||||||||
| Average Quarterly Balances of Outstanding Derivative Financial Instruments |
Futures contracts: | ||||
Average notional value of contracts — long | $ | 3,742,813 |
| For more information about the Fund’s investment risks regarding derivative financial instruments, refer to the Notes to Financial Statements. |
| Fair Value Hierarchy as of Period End |
| Various inputs are used in determining the fair value of investments and derivative financial instruments. For information about the Fund’s policy regarding valuation of investments and derivative financial instruments, refer to the Notes to Financial Statements. |
| The following tables summarize the Fund’s investments and derivative financial instruments categorized in the disclosure hierarchy: |
| Level 1 | Level 2 | Level 3 | Total | |||||||||||||
Assets: | ||||||||||||||||
Investments: | ||||||||||||||||
Long-Term Investments: | ||||||||||||||||
Common Stocks: | ||||||||||||||||
Australia | $ | 27,767 | $ | 1,119,571 | — | $ | 1,147,338 | |||||||||
Austria | 353,074 | 352,863 | — | 705,937 | ||||||||||||
Belgium | — | 932,236 | — | 932,236 | ||||||||||||
Brazil | 641,532 | — | — | 641,532 | ||||||||||||
Canada | 2,897,688 | — | — | 2,897,688 | ||||||||||||
China | 43,093 | 2,610,973 | — | 2,654,066 | ||||||||||||
Czech Republic | 61,712 | — | — | 61,712 | ||||||||||||
Denmark | 71,839 | 37,570 | — | 109,409 | ||||||||||||
Finland | 105,442 | 1,048,507 | — | 1,153,949 | ||||||||||||
France | 63,514 | 98,841 | — | 162,355 | ||||||||||||
Georgia | — | 30,422 | — | 30,422 | ||||||||||||
Germany | 34,315 | 4,031,598 | — | 4,065,913 | ||||||||||||
Greece | — | 508,338 | — | 508,338 | ||||||||||||
Hong Kong | 3,864 | 1,420,089 | — | 1,423,953 | ||||||||||||
Hungary | — | 266,577 | — | 266,577 | ||||||||||||
India | 10,068 | 832,037 | — | 842,105 | ||||||||||||
Indonesia | — | 112,493 | — | 112,493 | ||||||||||||
Ireland | 27,894 | — | — | 27,894 | ||||||||||||
Israel | 251,976 | — | — | 251,976 | ||||||||||||
Italy | 47,993 | 364,389 | — | 412,382 | ||||||||||||
Japan | 37,977 | 9,310,002 | — | 9,347,979 | ||||||||||||
Jersey | — | 494,821 | — | 494,821 | ||||||||||||
Malaysia | 228,936 | 351,826 | — | 580,762 | ||||||||||||
Mexico | 79,459 | — | — | 79,459 | ||||||||||||
Netherlands | 99,789 | 755,642 | — | 855,431 | ||||||||||||
Norway | 34,504 | 1,109,225 | — | 1,143,729 | ||||||||||||
Poland | — | 222,311 | — | 222,311 | ||||||||||||
Portugal | — | 10,025 | — | 10,025 | ||||||||||||
Russia | 20,107 | — | — | 20,107 | ||||||||||||
Singapore | 1,037,366 | 736,989 | — | 1,774,355 | ||||||||||||
South Africa | 87,112 | 5,031 | — | 92,143 | ||||||||||||
South Korea | 309,822 | 1,033,327 | — | 1,343,149 | ||||||||||||
Spain | 39,100 | 1,047,796 | — | 1,086,896 | ||||||||||||
Sweden | 444,978 | 3,256,195 | — | 3,701,173 | ||||||||||||
See Notes to Financial Statements.
| 18 | MANAGED ACCOUNT SERIES | AUGUST 31, 2017 |
| Schedule of Investments (concluded) | Advantage Global SmallCap Fund |
| Level 1 | Level 2 | Level 3 | Total | |||||||||||||
Switzerland | $ | 36,759 | $ | 2,446,323 | — | $ | 2,483,082 | |||||||||
Taiwan | — | 3,554,057 | — | 3,554,057 | ||||||||||||
Thailand | 45,351 | 181,768 | — | 227,119 | ||||||||||||
Turkey | 33,543 | 1,750,265 | — | 1,783,808 | ||||||||||||
United Kingdom | 1,851,267 | 4,224,545 | — | 6,075,812 | ||||||||||||
United States | 47,517,933 | — | — | 47,517,933 | ||||||||||||
Short-Term Securities | — | 3,309,366 | — | 3,309,366 | ||||||||||||
|
| |||||||||||||||
Subtotal | $ | 56,545,774 | $ | 47,566,018 | — | $ | 104,111,792 | |||||||||
|
| |||||||||||||||
Investments Valued at NAV1 | 1,555,241 | |||||||||||||||
|
| |||||||||||||||
Total Investments | $ | 105,667,033 | ||||||||||||||
|
| |||||||||||||||
| ||||||||||||||||
Derivative Financial Instruments2 | ||||||||||||||||
Assets: | ||||||||||||||||
Equity contracts | $ | 34,427 | — | — | $ | 34,427 | ||||||||||
| 1 | As of August 31, 2017, certain investments of the Fund were fair valued using NAV per share as no quoted market value is available and therefore have been excluded from the fair value hierarchy. |
| 2 | Derivative financial instruments are futures contracts. Futures contracts are valued at the unrealized appreciation (depreciation) on the instrument. |
During the period ended August 31, 2017, there were no transfers between levels. |
See Notes to Financial Statements.
| MANAGED ACCOUNT SERIES | AUGUST 31, 2017 | 19 |
| Schedule of Investments August 31, 2017 | Mid Cap Dividend Fund | |||
| (Percentages shown are based on Net Assets) |
| Common Stocks | Shares | Value | ||||
Auto Components — 2.3% | ||||||
Adient PLC | 7,389 | $ | 522,255 | |||
Goodyear Tire & Rubber Co. | 13,292 | 402,748 | ||||
Lear Corp. | 4,898 | 732,447 | ||||
Magna International, Inc. | 10,080 | 484,848 | ||||
|
| |||||
| 2,142,298 | ||||||
Banks — 8.9% | ||||||
Cullen/Frost Bankers, Inc. | 14,681 | 1,236,140 | ||||
KeyCorp | 103,187 | 1,775,848 | ||||
Popular, Inc. | 36,213 | 1,445,261 | ||||
Regions Financial Corp. | 133,532 | 1,884,136 | ||||
SunTrust Banks, Inc. | 34,124 | 1,880,232 | ||||
|
| |||||
| 8,221,617 | ||||||
Beverages — 0.5% | ||||||
Dr. Pepper Snapple Group, Inc. | 5,100 | 464,355 | ||||
Biotechnology — 0.8% | ||||||
United Therapeutics Corp. (a) | 5,562 | 727,510 | ||||
Building Products — 1.2% | ||||||
Owens Corning | 14,924 | 1,106,316 | ||||
Capital Markets — 1.0% | ||||||
Invesco Ltd. | 27,955 | 916,365 | ||||
Chemicals — 3.0% | ||||||
Cabot Corp. | 8,994 | 473,804 | ||||
Eastman Chemical Co. | 17,287 | 1,490,139 | ||||
Huntsman Corp. | 20,639 | 548,378 | ||||
Praxair, Inc. | 1,760 | 231,510 | ||||
|
| |||||
| 2,743,831 | ||||||
Communications Equipment — 0.6% | ||||||
Motorola Solutions, Inc. | 6,687 | 589,258 | ||||
Construction Materials — 0.5% | ||||||
CRH PLC | 13,040 | 457,220 | ||||
Containers & Packaging — 2.6% | ||||||
International Paper Co. | 17,479 | 941,594 | ||||
Packaging Corp. of America | 4,588 | 515,737 | ||||
WestRock Co. | 16,822 | 957,340 | ||||
|
| |||||
| 2,414,671 | ||||||
Diversified Financial Services — 1.4% | ||||||
Leucadia National Corp. | 56,488 | 1,337,636 | ||||
Diversified Telecommunication Services — 0.9% | ||||||
BCE, Inc. | 10,614 | 504,802 | ||||
CenturyLink, Inc. | 18,137 | 357,662 | ||||
|
| |||||
| 862,464 | ||||||
Electric Utilities — 8.6% | ||||||
Edison International | 18,029 | 1,445,565 | ||||
Entergy Corp. | 24,122 | 1,909,739 | ||||
Exelon Corp. | 6,020 | 227,977 | ||||
FirstEnergy Corp. | 64,981 | 2,117,081 | ||||
Great Plains Energy, Inc. | 65,717 | 2,016,855 | ||||
PG&E Corp. | 3,300 | 232,254 | ||||
|
| |||||
| 7,949,471 | ||||||
Electronic Equipment, Instruments & Components — 6.1% | ||||||
Avnet, Inc. | 27,735 | 1,069,739 | ||||
CDW Corp. | 30,154 | 1,912,367 | ||||
Corning, Inc. | 19,812 | 569,793 | ||||
Dolby Laboratories, Inc., Class A | 32,510 | 1,640,455 | ||||
TE Connectivity Ltd. | 5,850 | 465,660 | ||||
|
| |||||
| 5,658,014 | ||||||
| Common Stocks | Shares | Value | ||||
Energy Equipment & Services — 2.7% | ||||||
Baker Hughes a GE Co. | 9,033 | $ | 306,219 | |||
Helmerich & Payne, Inc. | 13,079 | 553,765 | ||||
Rowan Cos., PLC, Class A (a) | 77,056 | 751,296 | ||||
Transocean Ltd. (a) | 107,297 | 875,544 | ||||
|
| |||||
| 2,486,824 | ||||||
Equity Real Estate Investment Trusts (REITs) — 6.0% | ||||||
Crown Castle International Corp. | 7,036 | 762,984 | ||||
Duke Realty Corp. | 16,836 | 500,366 | ||||
Lamar Advertising Co., Class A | 26,881 | 1,789,199 | ||||
Prologis, Inc. | 12,517 | 793,077 | ||||
Rayonier, Inc. | 24,888 | 722,001 | ||||
Welltower, Inc. | 13,013 | 952,812 | ||||
|
| |||||
| 5,520,439 | ||||||
Food & Staples Retailing — 0.8% | ||||||
Kroger Co. | 31,878 | 697,172 | ||||
Food Products — 1.3% | ||||||
General Mills, Inc. | 4,150 | 221,029 | ||||
Ingredion, Inc. | 6,497 | 804,459 | ||||
Kellogg Co. | 3,410 | 223,219 | ||||
|
| |||||
| 1,248,707 | ||||||
Health Care Equipment & Supplies — 3.1% | ||||||
Koninklijke Philips NV | 24,700 | 936,720 | ||||
Smith & Nephew PLC — ADR | 41,912 | 1,525,597 | ||||
Zimmer Biomet Holdings, Inc. | 3,710 | 423,942 | ||||
|
| |||||
| 2,886,259 | ||||||
Health Care Providers & Services — 5.9% | ||||||
Cardinal Health, Inc. | 9,565 | 645,255 | ||||
Express Scripts Holding Co. (a)(b) | 11,380 | 714,892 | ||||
Humana, Inc. | 4,220 | 1,087,156 | ||||
McKesson Corp. | 5,951 | 888,544 | ||||
Premier, Inc., Class A (a) | 20,374 | 682,529 | ||||
Quest Diagnostics, Inc. | 4,494 | 486,925 | ||||
WellCare Health Plans, Inc. (a) | 5,568 | 972,618 | ||||
|
| |||||
| 5,477,919 | ||||||
Hotels, Restaurants & Leisure — 1.0% | ||||||
Carnival Corp. | 7,150 | 496,782 | ||||
International Game Technology PLC | 22,755 | 463,519 | ||||
|
| |||||
| 960,301 | ||||||
Household Products — 0.9% | ||||||
Energizer Holdings, Inc. | 18,717 | 826,355 | ||||
Independent Power and Renewable Electricity Producers — 1.0% | ||||||
AES Corp. | 81,268 | 897,199 | ||||
Insurance — 8.7% | ||||||
Allstate Corp. | 11,162 | 1,010,161 | ||||
Assurant, Inc. | 18,922 | 1,791,724 | ||||
Assured Guaranty Ltd. | 24,110 | 1,025,639 | ||||
Everest Re Group Ltd. | 1,760 | 444,365 | ||||
Hartford Financial Services Group, Inc. | 8,910 | 481,764 | ||||
Lincoln National Corp. | 8,398 | 569,888 | ||||
Marsh & McLennan Cos., Inc. | 8,960 | 699,597 | ||||
MetLife, Inc. | 9,640 | 451,441 | ||||
Prudential Financial, Inc. | 2,250 | 229,680 | ||||
Validus Holdings Ltd. | 27,384 | 1,373,308 | ||||
|
| |||||
| 8,077,567 | ||||||
IT Services — 1.0% | ||||||
Fidelity National Information Services, Inc. | 10,124 | 940,722 | ||||
See Notes to Financial Statements.
| 20 | MANAGED ACCOUNT SERIES | AUGUST 31, 2017 |
| Schedule of Investments (continued) | Mid Cap Dividend Fund | |||
| Common Stocks | Shares | Value | ||||
Leisure Products — 1.1% | ||||||
Mattel, Inc. | 34,110 | $ | 553,264 | |||
Polaris Industries, Inc. | 5,150 | 480,134 | ||||
|
| |||||
| 1,033,398 | ||||||
Machinery — 3.9% | ||||||
Cummins, Inc. | 10,438 | 1,663,608 | ||||
Pentair PLC | 14,524 | 901,214 | ||||
Stanley Black & Decker, Inc. | 1,990 | 286,560 | ||||
Terex Corp. | 18,825 | 725,704 | ||||
|
| |||||
| 3,577,086 | ||||||
Media — 1.7% | ||||||
Discovery Communications, Inc., Class C (a) | 37,658 | 791,195 | ||||
Interpublic Group of Cos., Inc. | 39,585 | 797,242 | ||||
|
| |||||
| 1,588,437 | ||||||
Mortgage Real Estate Investment Trusts (REITs) — 0.5% | ||||||
Chimera Investment Corp. | 25,197 | 480,507 | ||||
Multiline Retail — 0.5% | ||||||
Dollar General Corp. | 6,771 | 491,304 | ||||
Multi-Utilities — 1.1% | ||||||
Public Service Enterprise Group, Inc. | 21,544 | 1,009,121 | ||||
Oil, Gas & Consumable Fuels — 5.1% | ||||||
Devon Energy Corp. | 28,629 | 898,951 | ||||
Hess Corp. | 31,670 | 1,231,963 | ||||
Marathon Oil Corp. | 56,976 | 633,573 | ||||
Marathon Petroleum Corp. | 8,863 | 464,864 | ||||
Williams Cos., Inc. | 48,696 | 1,447,732 | ||||
|
| |||||
| 4,677,083 | ||||||
Personal Products — 0.8% | ||||||
Nu Skin Enterprises, Inc., Class A | 12,258 | 745,654 | ||||
Professional Services — 1.6% | ||||||
Experian PLC | 23,690 | 476,352 | ||||
Nielsen Holdings PLC | 25,197 | 978,903 | ||||
|
| |||||
| 1,455,255 | ||||||
Real Estate Management & Development — 0.6% | ||||||
Realogy Holdings Corp. | 15,929 | 539,993 | ||||
Road & Rail — 0.3% | ||||||
Norfolk Southern Corp. | 2,016 | 242,968 | ||||
Semiconductors & Semiconductor Equipment — 3.5% | ||||||
Analog Devices, Inc. | 27,602 | 2,309,459 | ||||
| Common Stocks | Shares | Value | ||||
Semiconductors & Semiconductor Equipment (continued) | ||||||
Lam Research Corp. | 2,187 | $ | 362,998 | |||
Xilinx, Inc. | 8,973 | 592,756 | ||||
|
| |||||
| 3,265,213 | ||||||
Software — 2.8% | ||||||
CA, Inc. | 17,928 | 594,851 | ||||
Constellation Software, Inc. | 1,686 | 937,490 | ||||
Symantec Corp. | 35,822 | 1,073,944 | ||||
|
| |||||
| 2,606,285 | ||||||
Specialty Retail — 1.0% | ||||||
Bed Bath & Beyond, Inc. | 16,444 | 453,690 | ||||
Williams-Sonoma, Inc. | 9,774 | 449,604 | ||||
|
| |||||
| 903,294 | ||||||
Technology Hardware, Storage & Peripherals — 1.5% | ||||||
NetApp, Inc. | 27,187 | 1,051,049 | ||||
Western Digital Corp. | 3,553 | 313,623 | ||||
|
| |||||
| 1,364,672 | ||||||
Wireless Telecommunication Services — 2.1% | ||||||
Telephone & Data Systems, Inc. | 66,563 | 1,950,962 | ||||
Total Long-Term Investments (Cost — $92,532,238) — 98.9% | 91,541,722 | |||||
| Short-Term Securities | ||||||
Money Market Funds — 0.2% | ||||||
SL Liquidity Series, LLC, Money Market Series, 1.32% (c)(d)(e) | 213,813 | 213,834 | ||||
Par (000) | Value | |||||
Time Deposits — 1.2% | ||||||
JPMorgan Chase Bank N.A., 1.17%, 9/01/17 | 1,098 | 1,097,653 | ||||
Total Short-Term Securities (Cost — $1,311,487) — 1.4% | 1,311,487 | |||||
Total Investments (Cost — $93,843,725) — 100.3% | 92,853,209 | |||||
Liabilities in Excess of Other Assets — (0.3)% | (244,924 | ) | ||||
|
| |||||
Net Assets — 100.0% | $ | 92,608,285 | ||||
|
| |||||
| Notes to Schedule of Investments |
| (a) | Non-income producing security. |
| (b) | Security, or a portion of the security, is on loan. |
| (c) | Security was purchased with the cash collateral from loaned securities. |
| (d) | Annualized 7-day yield as of period end. |
| (e) | During the period ended August 31, 2017, investments in issuers considered to be an affiliate of the Fund for purposes of Section 2(a)(3) of the Investment Company Act of 1940, as amended, were as follows: |
| Affiliate | Shares Held at April 30, 2017 | Net Activity | Shares Held at August 31, 2017 | Value at August 31, 2017 | Income | Net Realized Gain | Change in Unrealized Appreciation (Depreciation) | |||||||||||||||||||
SL Liquidity Series, LLC, Money Market Series | 7,771,403 | (7,557,590) | 213,813 | $213,834 | $8,198 | 1 | $662 | $(859 | ) | |||||||||||||||||
| 1 | Represents securities lending income earned from the reinvestment of cash collateral from loaned securities, net of fees and collateral investment expenses, and other payments to and from borrowers of securities. |
| • | For Fund compliance purposes, the Fund’s industry classifications refer to one or more of the industry sub-classifications used by one or more widely recognized market indexes or rating group indexes, and/or as defined by the investment adviser. These definitions may not apply for purposes of this report, which may combine such industry sub-classifications for reporting ease. |
See Notes to Financial Statements.
| MANAGED ACCOUNT SERIES | AUGUST 31, 2017 | 21 |
| Schedule of Investments (continued) | Mid Cap Dividend Fund |
| Derivative Financial Instruments Categorized by Risk Exposure |
| For the period ended August 31, 2017, the effect of derivative financial instruments in the Statements of Operations was as follows: |
| Net Realized Gain from: | Commodity Contracts | Credit Contracts | Equity Contracts | Foreign Currency Exchange Contracts | Interest Rate Contracts | Other Contracts | Total | |||||||||||||||||||||
Futures contracts | — | — | $ | 31,267 | — | — | — | $ | 31,267 | |||||||||||||||||||
| Average Quarterly Balances of Outstanding Derivative Financial Instruments |
Futures contracts: | ||||
Average notional value of contracts — long | $ | 7,883,450 | 1 |
| 1 | Actual amounts for the period are shown due to limited outstanding derivative financial instruments as of each quarter end. |
| For more information about the Fund’s investment risks regarding derivative financial instruments, refer to the Notes to Financial Statements. |
| Fair Value Hierarchy as of Period End |
| Various inputs are used in determining the fair value of investments. For information about the Fund’s policy regarding valuation of investments, refer to the Notes to Financial Statements. |
| The following table summarizes the Fund’s investments categorized in the disclosure hierarchy: |
| Level 1 | Level 2 | Level 3 | Total | |||||||||||||
Assets: | ||||||||||||||||
Investments: | ||||||||||||||||
Long-Term Investments: | ||||||||||||||||
Common Stocks: | ||||||||||||||||
Auto Components | $ | 2,142,298 | — | — | $ | 2,142,298 | ||||||||||
Banks | 8,221,617 | — | — | 8,221,617 | ||||||||||||
Beverages | 464,355 | — | — | 464,355 | ||||||||||||
Biotechnology | 727,510 | — | — | 727,510 | ||||||||||||
Building Products | 1,106,316 | — | — | 1,106,316 | ||||||||||||
Capital Markets | 916,365 | — | — | 916,365 | ||||||||||||
Chemicals | 2,743,831 | — | — | 2,743,831 | ||||||||||||
Communications Equipment | 589,258 | — | — | 589,258 | ||||||||||||
Construction Materials | — | $ | 457,220 | — | 457,220 | |||||||||||
Containers & Packaging | 2,414,671 | — | — | 2,414,671 | ||||||||||||
Diversified Financial Services | 1,337,636 | — | — | 1,337,636 | ||||||||||||
Diversified Telecommunication Services | 862,464 | — | — | 862,464 | ||||||||||||
Electric Utilities | 7,949,471 | — | — | 7,949,471 | ||||||||||||
Electronic Equipment, Instruments & Components | 5,658,014 | — | — | 5,658,014 | ||||||||||||
Energy Equipment & Services | 2,486,824 | — | — | 2,486,824 | ||||||||||||
Equity Real Estate Investment Trusts (REITs) | 5,520,439 | — | — | 5,520,439 | ||||||||||||
Food & Staples Retailing | 697,172 | — | — | 697,172 | ||||||||||||
Food Products | 1,248,707 | — | — | 1,248,707 | ||||||||||||
Health Care Equipment & Supplies | 1,949,539 | 936,720 | — | 2,886,259 | ||||||||||||
Health Care Providers & Services | 5,477,919 | — | — | 5,477,919 | ||||||||||||
Hotels, Restaurants & Leisure | 960,301 | — | — | 960,301 | ||||||||||||
Household Products | 826,355 | — | — | 826,355 | ||||||||||||
Independent Power and Renewable Electricity Producers | 897,199 | — | — | 897,199 | ||||||||||||
Insurance | 8,077,567 | — | — | 8,077,567 | ||||||||||||
IT Services | 940,722 | — | — | 940,722 | ||||||||||||
Leisure Products | 1,033,398 | — | — | 1,033,398 | ||||||||||||
Machinery | 3,577,086 | — | — | 3,577,086 | ||||||||||||
Media | 1,588,437 | — | — | 1,588,437 | ||||||||||||
Mortgage Real Estate Investment Trusts (REITs) | 480,507 | — | — | 480,507 | ||||||||||||
Multiline Retail | 491,304 | — | — | 491,304 | ||||||||||||
Multi-Utilities | 1,009,121 | — | — | 1,009,121 | ||||||||||||
Oil, Gas & Consumable Fuels | 4,677,083 | — | — | 4,677,083 | ||||||||||||
Personal Products | 745,654 | — | — | 745,654 | ||||||||||||
See Notes to Financial Statements.
| 22 | MANAGED ACCOUNT SERIES | AUGUST 31, 2017 |
| Schedule of Investments (concluded) | Mid Cap Dividend Fund |
| Level 1 | Level 2 | Level 3 | Total | |||||||||||||
Professional Services | $ | 978,903 | $ | 476,352 | — | $ | 1,455,255 | |||||||||
Real Estate Management & Development | 539,993 | — | — | 539,993 | ||||||||||||
Road & Rail | 242,968 | — | — | 242,968 | ||||||||||||
Semiconductors & Semiconductor Equipment | 3,265,213 | — | — | 3,265,213 | ||||||||||||
Software | 2,606,285 | — | — | 2,606,285 | ||||||||||||
Specialty Retail | 903,294 | — | — | 903,294 | ||||||||||||
Technology Hardware, Storage & Peripherals | 1,364,672 | — | — | 1,364,672 | ||||||||||||
Wireless Telecommunication Services | 1,950,962 | — | — | 1,950,962 | ||||||||||||
Short-Term Securities | — | 1,097,653 | — | 1,097,653 | ||||||||||||
|
| |||||||||||||||
Subtotal | $ | 89,671,430 | $ | 2,967,945 | — | $ | 92,639,375 | |||||||||
|
| |||||||||||||||
Investments Valued at NAV1 | 213,834 | |||||||||||||||
|
| |||||||||||||||
Total Investments | $ | 92,853,209 | ||||||||||||||
|
| |||||||||||||||
| 1 | As of August 31, 2017, certain investments of the Fund were fair valued using NAV per share as no quoted market value is available and therefore have been excluded from the fair value hierarchy. |
| During the period ended August 31, 2017, there were no transfers between levels. |
See Notes to Financial Statements.
| MANAGED ACCOUNT SERIES | AUGUST 31, 2017 | 23 |
| Statements of Assets and Liabilities |
| August 31, 2017 | Advantage SmallCap Fund | Mid Cap Fund | ||||||
| Assets | ||||||||
Investments at value — unaffiliated1,2 | $ | 104,111,792 | $ | 92,639,375 | ||||
Investments at value — affiliated3 | 1,555,241 | 213,834 | ||||||
Cash pledged for futures contracts | 386,000 | — | ||||||
Foreign currency at value4 | 21,760 | 1,054 | ||||||
Receivables: | ||||||||
Investments sold — unaffiliated | 870,185 | — | ||||||
Securities lending income — affiliated | 1,568 | 10 | ||||||
Capital shares sold | 5,574,017 | 8,408,100 | ||||||
Dividends — unaffiliated | 188,569 | 218,054 | ||||||
From the Manager | 110,627 | 79,360 | ||||||
Variation margin on futures contracts | 58,901 | — | ||||||
Prepaid expenses | 19,850 | 22,128 | ||||||
|
| |||||||
Total assets | 112,898,510 | 101,581,915 | ||||||
|
| |||||||
| Liabilities | ||||||||
Cash collateral on securities loaned at value | 1,553,357 | 212,926 | ||||||
Payables: | ||||||||
Investments purchased — unaffiliated | 5,972,286 | 8,473,701 | ||||||
Capital shares redeemed | 430,732 | 182,946 | ||||||
Officer’s and Trustees’ fees | 5,321 | 5,314 | ||||||
Other accrued expenses | 147,926 | 97,765 | ||||||
Other affiliates | 1,057 | 978 | ||||||
|
| |||||||
Total liabilities | 8,110,679 | 8,973,630 | ||||||
|
| |||||||
Net Assets | $ | 104,787,831 | $ | 92,608,285 | ||||
|
| |||||||
| Net Assets Consist of | ||||||||
Paid-in capital | $ | 99,444,368 | $ | 93,145,041 | ||||
Undistributed net investment income | 1,581,098 | 894,028 | ||||||
Accumulated net realized gain (loss) | 678,300 | (439,433 | ) | |||||
Net unrealized appreciation (depreciation) | 3,084,065 | (991,351 | ) | |||||
|
| |||||||
Net Assets | $ | 104,787,831 | $ | 92,608,285 | ||||
|
| |||||||
Net asset value per share | $ | 12.88 | $ | 11.37 | ||||
|
| |||||||
Shares outstanding5 | 8,134,565 | 8,145,148 | ||||||
1 Investments at cost — unaffiliated | $ | 101,066,360 | $ | 93,629,891 | ||||
2 Securities loaned at value | $ | 1,524,878 | $ | 213,902 | ||||
3 Investments at cost — affiliated | $ | 1,555,136 | $ | 213,834 | ||||
4 Foreign currency at cost | $ | 21,713 | $ | 1,051 | ||||
5 Unlimited number of shares authorized, $ 0.01 par value. | ||||||||
See Notes to Financial Statements.
| 24 | MANAGED ACCOUNT SERIES | AUGUST 31, 2017 |
| Statements of Operations |
| Advantage Global SmallCap Fund | Mid Cap Dividend Fund | |||||||||||||||
Period May 1, 2017 to August 31, | Year Ended April 30, 2017 | Period May 1, 2017 to August 31, | Year Ended April 30, 2017 | |||||||||||||
| Investment Income | ||||||||||||||||
Dividends — unaffiliated | $ | 1,204,831 | $ | 1,735,416 | $ | 823,735 | $ | 1,620,137 | ||||||||
Securities lending — affiliated — net | 37,623 | 223,741 | 8,198 | 23,619 | ||||||||||||
Foreign taxes withheld | (96,762 | ) | (64,649 | ) | (378 | ) | (3,737 | ) | ||||||||
|
|
|
| |||||||||||||
Total investment income | 1,145,692 | 1,894,508 | 831,555 | 1,640,019 | ||||||||||||
|
|
|
| |||||||||||||
| Expenses | ||||||||||||||||
Investment advisory | 314,795 | 977,907 | 211,648 | 694,179 | ||||||||||||
Transfer agent | 11,720 | 35,918 | 10,430 | 34,294 | ||||||||||||
Professional | 85,454 | 77,616 | 71,663 | 58,372 | ||||||||||||
Accounting services | 11,664 | 33,303 | 8,809 | 26,104 | ||||||||||||
Custodian | 29,344 | 138,294 | 5,235 | 23,368 | ||||||||||||
Printing | 9,206 | 17,777 | 7,119 | 13,577 | ||||||||||||
Officer and Trustees | 8,192 | 17,803 | 8,124 | 17,740 | ||||||||||||
Registration | 8,956 | 35,055 | 10,042 | 33,252 | ||||||||||||
Miscellaneous | 22,196 | 29,150 | 6,522 | 11,624 | ||||||||||||
|
|
|
| |||||||||||||
Total expenses | 501,527 | 1,362,823 | 339,592 | 912,510 | ||||||||||||
Less: | ||||||||||||||||
Fees waived and/or reimbursed by the Manager | (501,527 | ) | (1,362,100 | ) | (339,592 | ) | (911,787 | ) | ||||||||
|
|
|
| |||||||||||||
Total expenses after fees waived and/or reimbursed | — | 723 | — | 723 | ||||||||||||
|
|
|
| |||||||||||||
Net investment income | 1,145,692 | 1,893,785 | 831,555 | 1,639,296 | ||||||||||||
|
|
|
| |||||||||||||
| Realized and Unrealized Gain (Loss) | ||||||||||||||||
Net realized gain (loss) from: | ||||||||||||||||
Investments — affiliated | 1,721 | 58 | 662 | 246 | ||||||||||||
Investments — unaffiliated | 21,132,401 | 9,185,056 | 13,450,028 | 13,440,990 | ||||||||||||
Futures contracts | 22,325 | — | 31,267 | — | ||||||||||||
Foreign currency transactions | 60,875 | 21,881 | (160 | ) | (15 | ) | ||||||||||
Litigation proceeds | — | 7,050 | — | 30,872 | ||||||||||||
|
|
|
| |||||||||||||
| 21,217,322 | 9,214,045 | 13,481,797 | 13,472,093 | |||||||||||||
|
|
|
| |||||||||||||
Net change in unrealized appreciation (depreciation) on: | ||||||||||||||||
Investments — affiliated | (1,932 | ) | 2,037 | (859 | ) | 859 | ||||||||||
Investments — unaffiliated | (16,081,914 | ) | 7,367,809 | 1 | (15,120,242 | ) | 4,080,335 | |||||||||
Futures contracts | 34,427 | — | — | — | ||||||||||||
Foreign currency translations | 4,398 | (7,692 | ) | (834 | ) | (3 | ) | |||||||||
|
|
|
| |||||||||||||
| (16,045,021 | ) | 7,362,154 | (15,121,935 | ) | 4,081,191 | |||||||||||
|
|
|
| |||||||||||||
Net realized and unrealized gain (loss) | 5,172,301 | 16,576,199 | (1,640,138 | ) | 17,553,284 | |||||||||||
|
|
|
| |||||||||||||
Net Increase (Decrease) in Net Assets Resulting from Operations | $ | 6,317,993 | $ | 18,469,984 | $ | (808,583 | ) | $ | 19,192,580 | |||||||
|
|
|
| |||||||||||||
| 1 | Net of $38,751 foreign capital gain tax. |
See Notes to Financial Statements.
| MANAGED ACCOUNT SERIES | AUGUST 31, 2017 | 25 |
| Statements of Changes in Net Assets |
| Advantage Global SmallCap Fund | ||||||||||||
Period May 1, 2017 to August 31, 2017 | Year Ended April 30, | |||||||||||
| Increase (Decrease) in Net Assets: | 2017 | 2016 | ||||||||||
| Operations | ||||||||||||
Net investment income | $ | 1,145,692 | $ | 1,893,785 | $ | 1,748,166 | ||||||
Net realized gain (loss) | 21,217,322 | 9,214,045 | (7,561,794 | ) | ||||||||
Net change in unrealized appreciation (depreciation) | (16,045,021 | ) | 7,362,154 | (16,668,822 | ) | |||||||
|
| |||||||||||
Net increase (decrease) in net assets resulting from operations | 6,317,993 | 18,469,984 | (22,482,450 | ) | ||||||||
|
| |||||||||||
| Distributions to Shareholders1 | ||||||||||||
From net investment income | (1,177,618 | ) | (2,437,012 | ) | (2,623,858 | ) | ||||||
From net realized gain | (13,847,318 | ) | — | (7,180,074 | ) | |||||||
|
| |||||||||||
Decrease in net assets resulting from distributions to shareholders | (15,024,936 | ) | (2,437,012 | ) | (9,803,932 | ) | ||||||
|
| |||||||||||
| Capital Share Transactions | ||||||||||||
Net increase (decrease) in net assets derived from capital share transactions | (2,673,314 | ) | (12,893,692 | ) | (30,355,532 | ) | ||||||
|
| |||||||||||
| Net Assets | ||||||||||||
Total increase (decrease) in net assets | (11,380,257 | ) | 3,139,280 | (62,641,914 | ) | |||||||
Beginning of period | 116,168,088 | 113,028,808 | 175,670,722 | |||||||||
|
| |||||||||||
End of period | $ | 104,787,831 | $ | 116,168,088 | $ | 113,028,808 | ||||||
|
| |||||||||||
Undistributed (distributions in excess of) net investment income, end of period | $ | 1,581,098 | $ | 95,120 | $ | (1,106,884 | ) | |||||
|
| |||||||||||
| 1 | Distributions for annual periods determined in accordance with U.S. federal income tax regulations. |
See Notes to Financial Statements.
| 26 | MANAGED ACCOUNT SERIES | AUGUST 31, 2017 |
| Statements of Changes in Net Assets (concluded) |
| Mid Cap Dividend Fund | ||||||||||||
Period May 1, 2017 to August 31, 2017 | Year Ended April 30, | |||||||||||
| Increase (Decrease) in Net Assets: | 2017 | 2016 | ||||||||||
| Operations | ||||||||||||
Net investment income | $ | 831,555 | $ | 1,639,296 | $ | 2,344,235 | ||||||
Net realized gain (loss) | 13,481,797 | 13,472,093 | (473,959 | ) | ||||||||
Net change in unrealized appreciation (depreciation) | (15,121,935 | ) | 4,081,191 | (13,838,407 | ) | |||||||
|
| |||||||||||
Net increase (decrease) in net assets resulting from operations | (808,583 | ) | 19,192,580 | (11,968,131 | ) | |||||||
|
| |||||||||||
| Distributions to Shareholders1 | ||||||||||||
From net investment income | (415,891 | ) | (1,658,252 | ) | (2,624,417 | ) | ||||||
From net realized gain | (18,277,021 | ) | (137,079 | ) | (17,085,067 | ) | ||||||
|
| |||||||||||
Decrease in net assets resulting from distributions to shareholders | (18,692,912 | ) | (1,795,331 | ) | (19,709,484 | ) | ||||||
|
| |||||||||||
| Capital Share Transactions | ||||||||||||
Net increase (decrease) in net assets derived from capital share transactions | 5,515,388 | (12,306,072 | ) | (32,749,707 | ) | |||||||
|
| |||||||||||
| Net Assets | ||||||||||||
Total increase (decrease) in net assets | (13,986,107 | ) | 5,091,177 | (64,427,322 | ) | |||||||
Beginning of period | 106,594,392 | 101,503,215 | 165,930,537 | |||||||||
|
| |||||||||||
End of period | $ | 92,608,285 | $ | 106,594,392 | $ | 101,503,215 | ||||||
|
| |||||||||||
Undistributed net investment income, end of period | $ | 894,028 | $ | 387,072 | $ | 412,887 | ||||||
|
| |||||||||||
| 1 | Distributions for annual periods determined in accordance with U.S. federal income tax regulations. |
See Notes to Financial Statements.
| MANAGED ACCOUNT SERIES | AUGUST 31, 2017 | 27 |
| Financial Highlights | Advantage Global SmallCap Fund |
Period to | Year Ended April 30, | |||||||||||||||||||||||
| August 31, 2017 | 2017 | 2016 | 2015 | 2014 | 2013 | |||||||||||||||||||
| Per Share Operating Performance | ||||||||||||||||||||||||
Net asset value, beginning of period | $ | 14.16 | $ | 12.32 | $ | 14.49 | $ | 16.29 | $ | 14.09 | $ | 12.66 | ||||||||||||
|
| |||||||||||||||||||||||
Net investment income1 | 0.14 | 0.22 | 0.15 | 0.22 | 0.21 | 0.20 | ||||||||||||||||||
Net realized and unrealized gain (loss) | 0.64 | 1.90 | (1.53 | ) | 0.40 | 3.58 | 1.66 | |||||||||||||||||
|
| |||||||||||||||||||||||
Net increase (decrease) from investment operations | 0.78 | 2.12 | (1.38 | ) | 0.62 | 3.79 | 1.86 | |||||||||||||||||
|
| |||||||||||||||||||||||
Distributions:2 | ||||||||||||||||||||||||
From net investment income | (0.16 | ) | (0.28 | ) | (0.21 | ) | (0.03 | ) | (0.39 | ) | (0.43 | ) | ||||||||||||
From net realized gain | (1.90 | ) | — | (0.58 | ) | (2.39 | ) | (1.20 | ) | — | ||||||||||||||
|
| |||||||||||||||||||||||
Total distributions | (2.06 | ) | (0.28 | ) | (0.79 | ) | (2.42 | ) | (1.59 | ) | (0.43 | ) | ||||||||||||
|
| |||||||||||||||||||||||
Net asset value, end of period | $ | 12.88 | $ | 14.16 | $ | 12.32 | $ | 14.49 | $ | 16.29 | $ | 14.09 | ||||||||||||
|
| |||||||||||||||||||||||
| Total Return3 | ||||||||||||||||||||||||
Based on net asset value | 5.43 | %4 | 17.33 | %5 | (9.86 | )% | 4.48 | % | 27.71 | % | 15.30 | % | ||||||||||||
|
| |||||||||||||||||||||||
| Ratios to Average Net Assets | ||||||||||||||||||||||||
Total expenses | 1.24 | %6,7 | 1.18 | % | 1.14 | % | 1.07 | % | 1.08 | % | 1.07 | % | ||||||||||||
|
| |||||||||||||||||||||||
Total expenses after fees waived and/or reimbursed | 0.00 | %6 | 0.00 | % | 0.00 | % | 0.00 | % | 0.00 | % | 0.00 | % | ||||||||||||
|
| |||||||||||||||||||||||
Net investment income | 3.09 | %6 | 1.65 | % | 1.17 | % | 1.46 | % | 1.35 | % | 1.60 | % | ||||||||||||
|
| |||||||||||||||||||||||
| Supplemental Data | ||||||||||||||||||||||||
Net assets, end of period (000) | $ | 104,788 | $ | 116,168 | $ | 113,029 | $ | 175,671 | $ | 171,594 | $ | 144,493 | ||||||||||||
|
| |||||||||||||||||||||||
Portfolio turnover rate | 143 | % | 69 | % | 86 | % | 91 | % | 81 | % | 70 | % | ||||||||||||
|
| |||||||||||||||||||||||
| 1 | Based on average shares outstanding. |
| 2 | Distributions for annual periods determined in accordance with U.S. federal income tax regulations. |
| 3 | Where applicable, assumes the reinvestment of distributions. |
| 4 | Aggregate total return. |
| 5 | Includes proceeds received from a settlement of litigation, which had no impact on the Fund’s total return. |
| 6 | Annualized. |
| 7 | Certain legal and audit expenses were not annualized in the calculation of the total expense ratio. If these expenses were annualized, the total expense ratio would have been 1.35%. |
See Notes to Financial Statements.
| 28 | MANAGED ACCOUNT SERIES | AUGUST 31, 2017 |
| Financial Highlights | Mid Cap Dividend Fund |
Period to | Year Ended April 30, | |||||||||||||||||||||||
| August 31, 2017 | 2017 | 2016 | 2015 | 2014 | 2013 | |||||||||||||||||||
| Per Share Operating Performance | ||||||||||||||||||||||||
Net asset value, beginning of period | $ | 14.32 | $ | 12.20 | $ | 14.27 | $ | 15.83 | $ | 14.10 | $ | 12.11 | ||||||||||||
|
| |||||||||||||||||||||||
Net investment income1 | 0.11 | 0.21 | 0.22 | 0.25 | 0.24 | 0.20 | ||||||||||||||||||
Net realized and unrealized gain (loss) | (0.23 | ) | 2.13 | (0.62 | ) | 0.68 | 2.83 | 1.98 | ||||||||||||||||
|
| |||||||||||||||||||||||
Net increase (decrease) from investment operations | (0.12 | ) | 2.34 | (0.40 | ) | 0.93 | 3.07 | 2.18 | ||||||||||||||||
|
| |||||||||||||||||||||||
Distributions:2 | ||||||||||||||||||||||||
From net investment income | (0.06 | ) | (0.20 | ) | (0.22 | ) | (0.23 | ) | (0.24 | ) | (0.19 | ) | ||||||||||||
From net realized gain | (2.77 | ) | (0.02 | ) | (1.45 | ) | (2.26 | ) | (1.10 | ) | — | |||||||||||||
|
| |||||||||||||||||||||||
Total distributions | (2.83 | ) | (0.22 | ) | (1.67 | ) | (2.49 | ) | (1.34 | ) | (0.19 | ) | ||||||||||||
|
| |||||||||||||||||||||||
Net asset value, end of period | $ | 11.37 | $ | 14.32 | $ | 12.20 | $ | 14.27 | $ | 15.83 | $ | 14.10 | ||||||||||||
|
| |||||||||||||||||||||||
| Total Return3 | ||||||||||||||||||||||||
Based on net asset value | (1.37 | )%4 | 19.24 | %5 | (2.62 | )% | 6.58 | % | 22.36 | % | 18.26 | % | ||||||||||||
|
| |||||||||||||||||||||||
| Ratios to Average Net Assets | ||||||||||||||||||||||||
Total expenses | 0.92 | %6,7 | 0.85 | % | 0.83 | % | 0.81 | % | 0.81 | % | 0.82 | % | ||||||||||||
|
| |||||||||||||||||||||||
Total expenses after fees waived and/or reimbursed | 0.00 | %6 | 0.00 | % | 0.00 | % | 0.00 | % | 0.00 | % | 0.00 | % | ||||||||||||
|
| |||||||||||||||||||||||
Net investment income | 2.55 | %6 | 1.53 | % | 1.72 | % | 1.66 | % | 1.58 | % | 1.64 | % | ||||||||||||
|
| |||||||||||||||||||||||
| Supplemental Data | ||||||||||||||||||||||||
Net assets, end of period (000) | $ | 92,608 | $ | 106,594 | $ | 101,503 | $ | 165,931 | $ | 167,656 | $ | 153,741 | ||||||||||||
|
| |||||||||||||||||||||||
Portfolio turnover rate | 144 | % | 82 | % | 91 | % | 83 | % | 61 | % | 57 | % | ||||||||||||
|
| |||||||||||||||||||||||
| 1 | Based on average shares outstanding. |
| 2 | Distributions for annual periods determined in accordance with U.S. federal income tax regulations. |
| 3 | Where applicable, assumes the reinvestment of distributions. |
| 4 | Aggregate total return. |
| 5 | Includes proceeds received from a settlement of litigation, which had no impact on the Fund’s total return. |
| 6 | Annualized. |
| 7 | Certain legal and audit expenses were not annualized in the calculation of the total expense ratio. If these expenses were annualized, the total expense ratio would have been 1.04%. |
See Notes to Financial Statements.
| MANAGED ACCOUNT SERIES | AUGUST 31, 2017 | 29 |
| Notes to Financial Statements |
1. Organization:
Managed Account Series (the “Trust”) is registered under the Investment Company Act of 1940, as amended (the “1940 Act”), as an open-end management investment company. The Trust is organized as a Delaware statutory trust. The following are referred to herein collectively as the “Funds” or individually, a “Fund”:
| Fund Name | Herein Referred To As | Diversification Classification | ||
Advantage Global SmallCap Fund | Advantage Global SmallCap | Diversified | ||
Mid Cap Dividend Fund | Mid Cap Dividend | Diversified |
Effective June 12, 2017, Global SmallCap Portfolio and Mid Cap Value Opportunities Portfolio changed their names to Advantage Global SmallCap Fund and Mid Cap Dividend Fund, respectively. In addition, the Fund’s changed their investment strategies. On June 28, 2017, the Board of the Funds approved a change of the fiscal year end of the Funds from April 30 to August 31.
Investors may only purchase shares in the Funds by entering into a wrap-fee program or other separately managed account. Participants in wrap-fee programs pay a single aggregate fee to the program sponsor for all costs and expenses of the wrap-fee programs including investment advice and portfolio execution.
The Funds, together with certain other registered investment companies advised by BlackRock Advisors, LLC (the “Manager”) or its affiliates, are included in a complex of open-end funds referred to as the Equity-Bond Complex.
2. Significant Accounting Policies:
The financial statements are prepared in conformity with accounting principles generally accepted in the United States of America (“U.S. GAAP”), which may require management to make estimates and assumptions that affect the reported amounts of assets and liabilities in the financial statements, disclosure of contingent assets and liabilities at the date of the financial statements and the reported amounts of increases and decreases in net assets from operations during the reporting period. Actual results could differ from those estimates. Each Fund is considered an investment company under U.S. GAAP and follows the accounting and reporting guidance applicable to investment companies. Below is a summary of significant accounting policies:
Investment Transactions and Income Recognition: For financial reporting purposes, investment transactions are recorded on the dates the transactions are entered into (the “trade dates”). Realized gains and losses on investment transactions are determined on the identified cost basis. Dividend income (in the form of cash) and non-cash dividend income (in the form of additional securities) are recorded on the ex-dividend date. Dividends from foreign securities where the ex-dividend date may have passed are subsequently recorded when the Funds are informed of the ex-dividend date. Under the applicable foreign tax laws, a withholding tax at various rates may be imposed on capital gains, dividends and interest. Upon notification from issuers, some of the dividend income received from a real estate investment trust may be redesignated as a reduction of cost of the related investment and/or realized gain.
Foreign Currency Translation: Each Fund’s books and records are maintained in U.S. dollars. Securities and other assets and liabilities denominated in foreign currencies are translated into U.S. dollars using exchange rates determined as of the close of trading on the New York Stock Exchange (“NYSE”). Purchases and sales of investments are recorded at the rates of exchange prevailing on the respective dates of such transactions. Generally, when the U.S. dollar rises in value against a foreign currency, the investments denominated in that currency will lose value; the opposite effect occurs if the U.S. dollar falls in relative value.
Each Fund does not isolate the portion of the results of operations arising as a result of changes in the exchange rates from the changes in the market prices of investments held or sold for financial reporting purposes. Accordingly, the effects of changes in exchange rates on investments are not segregated in the Statements of Operations from the effects of changes in market prices of those investments, but are included as a component of net realized and unrealized gain (loss) from investments. Each Fund reports realized currency gains (losses) on foreign currency related transactions as components of net realized gain (loss) for financial reporting purposes, whereas such components are generally treated as ordinary income for U.S. federal income tax purposes.
Segregation and Collateralization: In cases where a Fund enters into certain investments (e.g., futures contracts) that would be treated as “senior securities” for 1940 Act purposes, a Fund may segregate or designate on its books and records cash or liquid assets having a market value at least equal to the amount of its future obligations under such investments. Doing so allows the investment to be excluded from treatment as a “senior security.” Furthermore, if required by an exchange or counterparty agreement, the Funds may be required to deliver/deposit cash and/or securities to/with an exchange, or broker-dealer or custodian as collateral for certain investments or obligations.
Distributions: Distributions paid by the Funds are recorded on the ex-dividend date. The character and timing of distributions are determined in accordance with U.S. federal income tax regulations, which may differ from U.S. GAAP.
| 30 | MANAGED ACCOUNT SERIES | AUGUST 31, 2017 |
| Notes to Financial Statements (continued) |
Indemnifications: In the normal course of business, a Fund enters into contracts that contain a variety of representations that provide general indemnification. A Fund’s maximum exposure under these arrangements is unknown because it involves future potential claims against a Fund, which cannot be predicted with any certainty.
Other: Expenses directly related to a Fund are charged to that Fund. Other operating expenses shared by several funds, including other funds managed by the Manager, are prorated among those funds on the basis of relative net assets or other appropriate methods.
The Funds have an arrangement with their custodian whereby credits are earned on uninvested cash balances, which could be used to reduce custody fees and/or overdraft charges. The Funds may incur charges on certain uninvested cash balances and overdrafts, subject to certain conditions.
3. Investment Valuation and Fair Value Measurements:
Investment Valuation Policies: The Funds’ investments are valued at fair value (also referred to as “market value” within the financial statements) as of the close of trading on the NYSE (generally 4:00 p.m., Eastern time). U.S. GAAP defines fair value as the price the Funds would receive to sell an asset or pay to transfer a liability in an orderly transaction between market participants at the measurement date. The Funds determine the fair values of their financial instruments using various independent dealers or pricing services under policies approved by the Board of Trustees of the Trust (the “Board”). The BlackRock Global Valuation Methodologies Committee (the “Global Valuation Committee”) is the committee formed by management to develop global pricing policies and procedures and to oversee the pricing function for all financial instruments.
Fair Value Inputs and Methodologies: The following methods and inputs are used to establish the fair value of each Fund’s assets and liabilities:
| • | Equity investments traded on a recognized securities exchange are valued at the official closing price each day, if available. For equity investments traded on more than one exchange, the official closing price on the exchange where the stock is primarily traded is used. Equity investments traded on a recognized exchange for which there were no sales on that day may be valued at the last available bid (long positions) or ask (short positions) price. |
Generally, trading in foreign instruments is substantially completed each day at various times prior to the close of trading on the NYSE. Occasionally, events affecting the values of such instruments may occur between the foreign market close and the close of trading on the NYSE that may not be reflected in the computation of the Funds’ net assets. Each business day, the Funds use a pricing service to assist with the valuation of certain foreign exchange-traded equity securities and foreign exchange-traded and over-the-counter (“OTC”) options (the “Systematic Fair Value Price”). Using current market factors, the Systematic Fair Value Price is designed to value such foreign securities and foreign options at fair value as of the close of trading on the NYSE, which follows the close of the local markets.
| • | Investments in open-end U.S. mutual funds are valued at NAV each business day. |
| • | The Funds value their investment in SL Liquidity Series, LLC, Money Market Series (the “Money Market Series”) at fair value, which is ordinarily based upon their pro rata ownership in the underlying fund’s net assets. The Money Market Series seeks current income consistent with maintaining liquidity and preserving capital. Although the Money Market Series is not registered under the 1940 Act, its investments may follow the parameters of investments by a money market fund that is subject to Rule 2a-7 under the 1940 Act. |
| • | Futures contracts traded on exchanges are valued at their last sale price. |
If events (e.g., a company announcement, market volatility or a natural disaster) occur that are expected to materially affect the value of such investments, or in the event that the application of these methods of valuation results in a price for an investment that is deemed not to be representative of the market value of such investment, or if a price is not available, the investment will be valued by the Global Valuation Committee, or its delegate, in accordance with a policy approved by the Board as reflecting fair value (“Fair Valued Investments”). The fair valuation approaches that may be used by the Global Valuation Committee include Market approach, Income approach and Cost approach. Valuation techniques such as discounted cash flow, use of market comparables and matrix pricing are types of valuation approaches and are typically used in determining fair value. When determining the price for Fair Valued Investments, the Global Valuation Committee, or its delegate, seeks to determine the price that each Fund might reasonably expect to receive or pay from the current sale or purchase of that asset or liability in an arm’s-length transaction. Fair value determinations shall be based upon all available factors that the Global Valuation Committee, or its delegate, deems relevant and consistent with the principles of fair value measurement. The pricing of all Fair Valued Investments is subsequently reported to the Board or a committee thereof on a quarterly basis.
The Global Valuation Committee, or its delegate, employs various methods for calibrating valuation approaches for investments where an active market does not exist, including regular due diligence of each Fund’s pricing vendors, regular reviews of key inputs and assumptions, transactional back-testing or disposition analysis to compare unrealized gains and losses to realized gains and losses, reviews of missing or stale prices and large movements in market values and reviews of any market related activity. The pricing of all Fair Valued Investments is subsequently reported to the Board or a committee thereof on a quarterly basis. As a result of the inherent uncertainty in valuation of these investments, the fair values may differ from the values that would have been used had an active market existed.
| MANAGED ACCOUNT SERIES | AUGUST 31, 2017 | 31 |
| Notes to Financial Statements (continued) |
Fair Value Hierarchy: Various inputs are used in determining the fair value of investments and derivative financial instruments. These inputs to valuation techniques are categorized into a fair value hierarchy consisting of three broad levels for financial statement purposes as follows:
| • | Level 1 — Unadjusted price quotations in active markets/exchanges for identical assets or liabilities that each Fund has the ability to access |
| • | Level 2 — Other observable inputs (including, but not limited to, quoted prices for similar assets or liabilities in markets that are active, quoted prices for identical or similar assets or liabilities in markets that are not active, inputs other than quoted prices that are observable for the assets or liabilities (such as interest rates, yield curves, volatilities, prepayment speeds, loss severities, credit risks and default rates) or other market–corroborated inputs) |
| • | Level 3 — Unobservable inputs based on the best information available in the circumstances, to the extent observable inputs are not available (including each Fund’s own assumptions used in determining the fair value of investments and derivative financial instruments) |
The hierarchy gives the highest priority to unadjusted quoted prices in active markets for identical assets or liabilities (Level 1 measurements) and the lowest priority to unobservable inputs (Level 3 measurements). Accordingly, the degree of judgment exercised in determining fair value is greatest for instruments categorized in Level 3. The inputs used to measure fair value may fall into different levels of the fair value hierarchy. In such cases, for disclosure purposes, the fair value hierarchy classification is determined based on the lowest level input that is significant to the fair value measurement in its entirety. Investments classified within Level 3 have significant unobservable inputs used by the Global Valuation Committee in determining the price for Fair Valued Investments. Level 3 investments include equity or debt issued by privately-held companies or funds. There may not be a secondary market, and/or there are a limited number of investors. Level 3 investments may also be adjusted to reflect illiquidity and/or non-transferability, with the amount of such discount estimated by the Global Valuation Committee in the absence of market information.
Changes in valuation techniques may result in transfers into or out of an assigned level within the hierarchy. In accordance with each Fund’s policy, transfers between different levels of the fair value hierarchy are deemed to have occurred as of the beginning of the reporting period. The categorization of a value determined for investments and derivative financial instruments is based on the pricing transparency of the investments and derivative financial instruments and is not necessarily an indication of the risks associated with investing in those securities.
As of August 31, 2017, certain investments of the Funds were valued using NAV per share as no quoted market value is available and therefore have been excluded from the fair value hierarchy.
4. Securities and Other Investments:
Securities Lending: Certain Funds may lend their securities to approved borrowers, such as brokers, dealers and other financial institutions. The borrower pledges and maintains with the Funds collateral consisting of cash, an irrevocable letter of credit issued by a bank, or securities issued or guaranteed by the U.S. Government. The initial collateral received by each Fund is required to have a value of at least 102% of the current value of the loaned securities for securities traded on U.S. exchanges and a value of at least 105% for all other securities. The collateral is maintained thereafter at a value equal to at least 100% of the current market value of the securities on loan. The market value of the loaned securities is determined at the close of each business day of the Fund and any additional required collateral is delivered to the Fund, or excess collateral returned by the Fund, on the next business day. During the term of the loan, the Funds are entitled to all distributions made on or in respect of the loaned securities but does not receive interest income on securities received as collateral. Loans of securities are terminable at any time and the borrower, after notice, is required to return borrowed securities within the standard time period for settlement of securities transactions.
The market value of any securities on loan, all of which were classified as common stocks in the Funds’ Schedules of Investments, and the value of any related collateral are shown separately in the Statements of Assets and Liabilities as a component of investments at value-unaffiliated, and collateral on securities loaned at value, respectively. As of period end, any securities on loan were collateralized by cash and/or U.S. Government obligations. Cash collateral invested by the securities lending agent, BlackRock Investment Management, LLC (“BIM”), if any, is disclosed in the Schedules of Investments.
Securities lending transactions are entered into by the Funds under Master Securities Lending Agreements (each, an “MSLA”), which provide the right, in the event of default (including bankruptcy or insolvency), for the non-defaulting party to liquidate the collateral and calculate a net exposure to the defaulting party or request additional collateral. In the event that a borrower defaults, the Funds, as lender, would offset the market value of the collateral received against the market value of the securities loaned. When the value of the collateral is greater than that of the market value of the securities loaned, the lender is left with a net amount payable to the defaulting party. However, bankruptcy or insolvency laws of a particular jurisdiction may impose restrictions on or prohibitions against such a right of offset in the event of an MSLA counterparty’s bankruptcy or insolvency. Under the MSLA, absent an event of default, the borrower can resell or re-pledge the loaned securities, and a Fund can reinvest cash collateral received in connection with loaned securities. Upon an event of default, the parties’ obligations to return the securities or collateral to the other party are extinguished, and the parties can resell or re-pledge the loaned securities or the collateral received in connection with the loaned securities in order to satisfy the defaulting party’s net payment obligation for all transactions under the MSLA. The defaulting party remains liable for any deficiency.
| 32 | MANAGED ACCOUNT SERIES | AUGUST 31, 2017 |
| Notes to Financial Statements (continued) |
As of period end, the following tables are a summary of the Funds’ securities lending agreements by counterparty which are subject to offset under an MSLA:
| Advantage Global SmallCap | ||||||||||||
| Counterparty | Securities Loaned at Value | Cash Collateral Received1 | Net Amount2 | |||||||||
Citigroup Global Markets, Inc. | $ | 303,625 | $ | (303,625 | ) | — | ||||||
Credit Suisse Securities (USA) LLC | 77,500 | (77,500 | ) | — | ||||||||
Deutsche Bank Securities, Inc. | 659,367 | (659,367 | ) | — | ||||||||
Goldman Sachs & Co. | 49,808 | (49,808 | ) | — | ||||||||
Jefferies LLC | 146,659 | (146,659 | ) | — | ||||||||
JP Morgan Securities LLC | 82,706 | (81,053 | ) | $ | 1,653 | |||||||
Merrill Lynch, Pierce, Fenner & Smith, Inc. | 176,080 | (176,080 | ) | — | ||||||||
Morgan Stanley | 29,133 | (29,133 | ) | — | ||||||||
|
| |||||||||||
Total | $ | 1,524,878 | $ | (1,523,225 | ) | $ | 1,653 | |||||
|
| |||||||||||
| Mid Cap Dividend | ||||||||||||
| Counterparty | Securities Loaned at Value | Cash Collateral Received1 | Net Amount2 | |||||||||
Citigroup Global Markets, Inc. | $ | 213,902 | $ | (213,834 | ) | $ | 68 | |||||
| 1 | Cash collateral with a value of $1,553,357 and $212,926 has been received in connection with securities lending agreements for Advantage Global SmallCap and Mid Cap Dividend, respectively. Collateral received in excess of the value of securities loaned from the individual counterparty is not shown for financial reporting purposes in the tables above. |
| 2 | The market value of the loaned securities is determined as of August 31, 2017. Additional collateral is delivered to the Fund on the next business day in accordance with the MSLA. The net amount would be subject to the borrower default indemnity in the event of default by the counterparty. |
The risks of securities lending include the risk that the borrower may not provide additional collateral when required or may not return the securities when due. To mitigate these risks, the Funds benefit from a borrower default indemnity provided by BIM. BIM’s indemnity allows for full replacement of the securities loaned if the collateral received does not cover the value on the securities loaned in the event of borrower default. Each Fund could incur a loss if the value of an investment purchased with cash collateral falls below the market value of loaned securities or if the value of an investment purchased with cash collateral falls below the value of the original cash collateral received.
5. Derivative Financial Instruments:
The Funds engage in various portfolio investment strategies using derivative contracts both to increase the returns of the Funds and/or to manage their exposure to certain risks such as credit risk, equity risk, interest rate risk, foreign currency exchange rate risk, commodity price risk or other risks (e.g., inflation risk). Derivative financial instruments categorized by risk exposure are included in the Schedules of Investments. These contracts may be transacted on an exchange or OTC.
Futures Contracts: Futures contracts are purchased or sold to gain exposure to, or manage exposure to, changes in interest rates (interest rate risk), changes in the value of equity securities (equity risk) or foreign currencies (foreign currency exchange rate risk).
Futures contracts are agreements between the Funds and a counterparty to buy or sell a specific quantity of an underlying instrument at a specified price and on a specified date. Depending on the terms of a contract, it is settled either through physical delivery of the underlying instrument on the settlement date or by payment of a cash amount on the settlement date. Upon entering into a futures contract, the Funds are required to deposit initial margin with the broker in the form of cash or securities in an amount that varies depending on a contract’s size and risk profile. The initial margin deposit must then be maintained at an established level over the life of the contract.
Securities deposited as initial margin are designated in the Schedules of Investments and cash deposited, if any, is shown as cash pledged for futures contracts in the Statements of Assets and Liabilities. Pursuant to the contract, the Funds agree to receive from or pay to the broker an amount of cash equal to the daily fluctuation in market value of the contract (“variation margin”). Variation margin is recorded as unrealized appreciation (depreciation) and, if any, shown as variation margin receivable (or payable) on futures contracts in the Statements of Assets and Liabilities. When the contract is closed, a realized gain or loss is recorded in the Statements of Operations equal to the difference between the value of the contract at the time it was opened and the value at the time it was closed. The use of futures contracts involves the risk of an imperfect correlation in the movements in the price of futures contracts and interest, foreign currency exchange rates or underlying assets.
6. Investment Advisory Agreement and Other Transactions with Affiliates:
The PNC Financial Services Group, Inc. is the largest stockholder and an affiliate of BlackRock, Inc. (“BlackRock”) for 1940 Act purposes.
| MANAGED ACCOUNT SERIES | AUGUST 31, 2017 | 33 |
| Notes to Financial Statements (continued) |
Investment Advisory: The Trust, on behalf of the Funds, entered into an Investment Advisory Agreement with the Manager, the Funds’ investment adviser, an indirect, wholly-owned subsidiary of BlackRock, to provide investment advisory and administrative services. The Manager is responsible for the management of each Fund’s portfolio and provides the personnel, facilities, equipment and certain other services necessary to the operations of each Fund.
For such services, each Fund pays the Manager a monthly fee at an annual rate equal to the following percentages of the average daily value of each Fund’s net assets:
| Advantage Global SmallCap | Mid Cap Dividend | |||||||
| Average Daily Net Assets | Investment Advisory Fee | |||||||
Not exceeding $ 1 Billion | 0.85% | 0.65% | ||||||
Exceeding $1 Billion but not exceeding $3 Billion | 0.80% | 0.61% | ||||||
Exceeding $3 Billion but not exceeding $5 Billion | 0.77% | 0.59% | ||||||
Exceeding $5 Billion but not exceeding $10 Billion | 0.74% | 0.57% | ||||||
Exceeding $10 Billion | 0.72% | 0.55% | ||||||
Expense Limitations, Waivers, and Reimbursements: The Manager contractually agreed to waive all fees and pay or reimburse all operating expenses of each Fund, except extraordinary expenses. Extraordinary expenses may include dividend expense, interest expense, acquired fund fees and expenses and certain other Fund expenses. This agreement has no fixed termination date.
Although the Funds do not compensate the Manager directly for its services under the Investment Advisory Agreement, because each Fund is an investment option for certain wrap-fee or other separately managed account program clients, the Manager may benefit from the fees charged to such clients who have retained the Manager’s affiliates to manage their accounts. The Manager waived fees for each Fund which are included in fees waived and/or reimbursed by the Manager in the Statements of Operations. The waivers were as follows:
| Period May 1, 2017 to August 31, 2017 | Year Ended April 30, 2017 | |||
Advantage Global SmallCap | $314,795 | $977,907 | ||
Mid Cap Dividend | $211,648 | $694,179 |
Effective September 1, 2016, the Manager voluntarily agreed to waive its investment advisory fee with respect to any portion of the Fund’s assets invested in affiliated equity and fixed-income mutual funds and affiliated exchange-traded funds that have a contractual management fee. Prior to September 1, 2016, the Manager did not waive such fees. Effective August 28, 2017, the waiver became contractual through December 31, 2018. This contractual agreement may be terminated upon 90 days’ notice by a majority of the independent trustees who are not “interested persons” of the Fund, as defined in the 1940 Act (“Independent Trustees”) or by a vote of a majority of the outstanding voting securities of the Fund.
In addition, the Manager reimbursed each Fund’s operating expenses as follows, which are included in fees waived and/or reimbursed by the Manager in the Statements of Operations:
| Period May 1, 2017 to August 31, 2017 | Year Ended April 30, 2017 | |||
Advantage Global SmallCap | $186,732 | $384,193 | ||
Mid Cap Dividend | $127,944 | $217,608 |
The Funds reimbursed the Manager for certain accounting services, which are included in accounting services in the Statements of Operations. The reimbursements were as follows:
| Period May 1, 2017 to August 31, 2017 | Year Ended April 30, 2017 | |||
Advantage Global SmallCap | $407 | $979 | ||
Mid Cap Dividend | $391 | $882 |
Securities Lending: The U.S. Securities and Exchange Commission (“SEC”) has issued an exemptive order which permits BIM, an affiliate of the Manager, to serve as securities lending agent for the Funds, subject to applicable conditions. As securities lending agent, BIM bears all operational costs directly related to securities lending. The Funds are responsible for expenses in connection with the investment of cash collateral received for securities on loan (the “collateral investment expenses”). The cash collateral is invested in a private investment company managed by the Manager or its affiliates. However, BIM has agreed to cap the collateral investment expenses of the private investment company to an annual rate of 0.04%. The investment adviser to the private investment company will not charge any advisory fees with respect to shares purchased by the Funds. The private investment company in which the cash collateral has been invested may, under certain circumstances, impose a liquidity fee of up to 2% on the value
| 34 | MANAGED ACCOUNT SERIES | AUGUST 31, 2017 |
| Notes to Financial Statements (continued) |
redeemed or temporarily restrict redemptions for up to 10 business days during a 90 day period, in the event that the private investment company’s weekly liquid assets fall below certain thresholds.
Securities lending income is equal to the total of income earned from the reinvestment of cash collateral, net of fees and other payments to and from borrowers of securities, and less the collateral investment expenses. Each Fund retains a portion of securities lending income and remits a remaining portion to BIM as compensation for its services as securities lending agent.
Pursuant to a securities lending agreement, Mid Cap Dividend retains 71.5% of securities lending income, and this amount retained can never be less than 65% of the total of securities lending income plus the collateral investment expenses.
Pursuant to a securities lending agreement, Advantage Global SmallCap retains 80% of securities lending income, and this amount retained can never be less than 70% of the total of securities lending income plus the collateral investment expenses.
In addition, commencing the business day following the date that the aggregate securities lending income earned across the Equity-Bond Complex in a calendar year exceeds a specified threshold, Mid Cap Dividend, pursuant to the securities lending agreement, will retain for the remainder of that calendar year securities lending income as follows: 75% of securities lending income, and this amount retained can never be less than 65% of the total of securities lending income plus the collateral investment expenses.
In addition, commencing the business day following the date that the aggregate securities lending income earned across the Equity-Bond Complex in a calendar year exceeds a specified threshold, Advantage Global SmallCap, pursuant to the securities lending agreement, will retain for the remainder of that calendar year securities lending income as follows: 85% of securities lending income, and this amount retained can never be less than 70% of the total of securities lending income plus the collateral investment expenses.
The share of securities lending income earned by each Fund is shown as securities lending income — affiliated — net in the Statements of Operations. Each Fund paid BIM the following amounts for securities lending agent services:
| Period May 1, 2017 to August 31, 2017 | Year Ended April 30, 2017 | |||||||||
Advantage Global SmallCap | $ | 9,015 | $ | 45,057 | ||||||
Mid Cap Dividend | $ | 3,256 | $ | 8,808 | ||||||
Interfund Lending: In accordance with an exemptive order (the “Order”) from the SEC, each Fund may participate in a joint lending and borrowing facility for temporary purposes (the “Interfund Lending Program”), subject to compliance with the terms and conditions of the Order, and to the extent permitted by each Fund’s investment policies and restrictions. Each Fund is currently permitted to borrow and lend under the Interfund Lending Program.
A lending BlackRock fund may lend in aggregate up to 15% of its net assets, but may not lend more than 5% of its net assets to any one borrowing fund through the Interfund Lending Program. A borrowing BlackRock fund may not borrow through the Interfund Lending Program or from any other source more than 33 1/3% of its total assets (or any lower threshold provided for by the fund’s investment restrictions). If a borrowing BlackRock fund’s total outstanding borrowings exceed 10% of its total assets, each of its outstanding interfund loans will be subject to collateralization of at least 102% of the outstanding principal value of the loan. All interfund loans are for temporary or emergency purposes and the interest rate to be charged will be the average of the highest current overnight repurchase agreement rate available to a lending fund and the bank loan rate, as calculated according to a formula established by the Board.
During the period ended August 31, 2017, the Funds did not participate in the Interfund Lending Program.
Officers and Trustees: Certain officers and/or trustees of the Trust are officers and/or trustees of BlackRock or its affiliates. The Funds reimburse the Manager for a portion of the compensation paid to the Trust’s Chief Compliance Officer, which is included in Officer and Trustees in the Statements of Operations.
Other Transactions: The Funds may purchase securities from, or sell securities to, an affiliated fund provided the affiliation is due solely to having a common investment adviser, common officers, or common trustees. For the period ended August 31, 2017, the purchase and sale transactions which resulted in net realized gains (losses) with an affiliated fund in compliance with Rule 17a-7 under the 1940 Act were as follows:
| Purchases | Sales | Net Realized Gain | |||||||||||||
Advantage Global SmallCap | $ | 389,572 | — | — | |||||||||||
Mid Cap Dividend | $ | 23,877,436 | $ | 7,591,628 | $699,875 | ||||||||||
| MANAGED ACCOUNT SERIES | AUGUST 31, 2017 | 35 |
| Notes to Financial Statements (continued) |
7. Purchases and Sales:
For the period ended August 31, 2017, purchases and sales of investments excluding short-term securities, were as follows:
| Advantage Global SmallCap | Mid Cap Dividend | ||||||||||||||
Purchases | $ | 152,424,648 | $ | 138,895,001 | |||||||||||
Sales | $ | 169,720,646 | $ | 151,358,474 | |||||||||||
8. Income Tax Information:
It is the Funds’ policy to comply with the requirements of the Internal Revenue Code of 1986, as amended, applicable to regulated investment companies, and to distribute substantially all of its taxable income to its shareholders. Therefore, no U.S. federal income tax provision is required.
Each Fund files U.S. federal and various state and local tax returns. No income tax returns are currently under examination. The statute of limitations on each Fund’s U.S. federal tax returns generally remains open for the period ended August 31, 2017 and each of the four years ended April 30, 2017. The statutes of limitations on each Fund’s state and local tax returns may remain open for an additional year depending upon the jurisdiction.
Management has analyzed tax laws and regulations and their application to the Funds as of August 31, 2017, inclusive of the open tax return years, and does not believe that there are any uncertain tax positions that require recognition of a tax liability in the Funds’ financial statements.
U.S. GAAP requires that certain components of net assets be adjusted to reflect permanent differences between financial and tax reporting. These reclassifications have no effect on net assets or net asset values per share. As of period end, the following permanent differences attributable to foreign currency transactions, the sale of stock of passive foreign investment companies, non-deductible expenses, the use of equalization, income recognized from investments in partnerships and the character of income recognized from certain securities lending transactions were reclassified to the following accounts:
| Advantage Global SmallCap | Mid Cap Dividend | |||||||||||||||||
Paid-in capital | $ | (10,677 | ) | $ | 871,792 | |||||||||||||
Undistributed net investment income | $ | 1,517,904 | $ | 91,292 | ||||||||||||||
Accumulated net realized gain (loss) | $ | (1,507,227 | ) | $ | (963,084 | ) | ||||||||||||
The tax character of distributions paid was as follows:
| ||||||||||||||||||
| Advantage Global SmallCap | Mid Cap Dividend1 | |||||||||||||||||
Ordinary income | 8/31/17 | $ | 2,499,716 | $ | 4,418,493 | |||||||||||||
| 4/30/17 | 2,437,012 | 1,658,252 | ||||||||||||||||
| 4/30/16 | 4,164,271 | 4,619,314 | ||||||||||||||||
Long-term capital gains | 8/31/17 | 12,525,220 | 15,146,211 | |||||||||||||||
| 4/30/17 | — | 672,617 | ||||||||||||||||
| 4/30/16 | 5,639,661 | 15,090,170 | ||||||||||||||||
| ||||||||||||||||||
Total | 8/31/17 | $ | 15,024,936 | $ | 19,564,704 | |||||||||||||
| ||||||||||||||||||
| 4/30/17 | $ | 2,437,012 | $ | 2,330,869 | ||||||||||||||
| ||||||||||||||||||
| 4/30/16 | $ | 9,803,932 | $ | 19,709,484 | ||||||||||||||
| ||||||||||||||||||
1 Distribution amounts may include a portion of the proceeds from redeemed shares.
As of period end, the tax components of accumulated net earnings (losses) were as follows:
| ||||||||||||||||||
| Advantage Global SmallCap | Mid Cap Dividend | |||||||||||||||||
Undistributed ordinary income | $ | 2,407,889 | $ | 883,416 | ||||||||||||||
Undistributed long term capital gains | 548,728 | — | ||||||||||||||||
Net unrealized gains (losses)1 | 2,386,846 | (1,420,172 | ) | |||||||||||||||
| ||||||||||||||||||
Total | $ | 5,343,463 | $ | (536,756 | ) | |||||||||||||
| ||||||||||||||||||
| 1 | The differences between book-basis and tax-basis net unrealized gains (losses) were attributable primarily to the tax deferral of losses on wash sales, the realization for tax purposes of unrealized gains on investments in passive foreign investment companies, the realization for tax purposes of unrealized gains/losses on certain futures and foreign currency contracts, the timing and recognition of partnership income and the treatment of certain security lending transactions. |
| 36 | MANAGED ACCOUNT SERIES | AUGUST 31, 2017 |
| Notes to Financial Statements (continued) |
During the period ended August 31, 2017, Advantage Global SmallCap utilized $2,418,260 of its capital loss carryforward.
As of August 31, 2017, gross unrealized appreciation and depreciation for investments and derivatives based on cost for U.S. federal income tax purposes were as follows:
| Advantage Global SmallCap | Mid Cap Dividend | |||||||||||
Tax cost | $103,280,533 | $94,272,506 | ||||||||||
| ||||||||||||
Gross unrealized appreciation | $ 5,408,389 | $ 1,979,509 | ||||||||||
Gross unrealized depreciation | (3,021,889 | ) | (3,398,806 | ) | ||||||||
| ||||||||||||
Net unrealized appreciation (depreciation) | $ 2,386,500 | $ (1,419,297 | ) | |||||||||
| ||||||||||||
9. Bank Borrowings:
The Trust, on behalf of the Funds, along with certain other funds managed by the Manager and its affiliates (“Participating Funds”), is a party to a 364-day, $2.1 billion credit agreement with a group of lenders. Under this agreement, the Funds may borrow to fund shareholder redemptions. Excluding commitments designated for certain individual funds, the Participating Funds, including the Funds, can borrow up to an aggregate commitment amount of $1.6 billion at any time outstanding, subject to asset coverage and other limitations as specified in the agreement. The credit agreement has the following terms: a fee of 0.12% per annum on unused commitment amounts and interest at a rate equal to the higher of (a) one-month LIBOR (but, in any event, not less than 0.00%) on the date the loan is made plus 0.80% per annum or (b) the Fed Funds rate (but, in any event, not less than 0.00%) in effect from time to time plus 0.80% per annum on amounts borrowed. The agreement expires in April 2018 unless extended or renewed. Participating Funds paid administration, legal and arrangement fees, which, if applicable, are included in miscellaneous expenses in the Statements of Operations. These fees were allocated among such funds based upon portions of the aggregate commitment available to them and relative net assets of Participating Funds. During the period ended August 31, 2017, the Funds did not borrow under the credit agreement.
10. Principal Risks:
In the normal course of business, certain Funds invest in securities or other instruments and may enter into certain transactions, and such activities subject each Fund to various risks, including among others, fluctuations in the market (market risk) or failure of an issuer to meet all of its obligations. The value of securities or other instruments may also be affected by various factors, including, without limitation: (i) general economy; (ii) overall market as well as local, regional or global political and/or social instability; (iii) regulation, taxation or international tax treaties between various countries; or (iv) currency, interest rate and price fluctuations. Each Fund’s prospectus provides details of the risks to which each Fund is subject.
On October 11, 2016, BlackRock implemented certain changes required by amendments to Rule 2a-7 under the 1940 Act, which governs the operations of U.S. money market funds. The Funds may be exposed to additional risks when reinvesting cash collateral in money market funds that do not seek to maintain a stable NAV per share of $1.00 and which may be subject to redemption gates or liquidity fees under certain circumstances.
Valuation Risk: The market values of equities, such as common stocks and preferred securities or equity related investments, such as futures and options, may decline due to general market conditions which are not specifically related to a particular company. They may also decline due to factors which affect a particular industry or industries. A Fund may invest in illiquid investments and may experience difficulty in selling those investments in a timely manner at the price that they believe the investments are worth. Prices may fluctuate widely over short or extended periods in response to company, market or economic news. Markets also tend to move in cycles, with periods of rising and falling prices. This volatility may cause each Fund’s NAV to experience significant increases or decreases over short periods of time. If there is a general decline in the securities and other markets, the NAV of a Fund may lose value, regardless of the individual results of the securities and other instruments in which a Fund invests.
The price a Fund could receive upon the sale of any particular portfolio investment may differ from a Fund’s valuation of the investment, particularly for securities that trade in thin or volatile markets or that are valued using a fair valuation technique or a price provided by an independent pricing service. Changes to significant unobservable inputs and assumptions (i.e., publicly traded company multiples, growth rate, time to exit) due to the lack of observable inputs may significantly impact the resulting fair value and therefore a Fund’s results of operations. As a result, the price received upon the sale of an investment may be less than the value ascribed by a Fund, and a Fund could realize a greater than expected loss or lesser than expected gain upon the sale of the investment. A Fund’s ability to value its investments may also be impacted by technological issues and/or errors by pricing services or other third party service providers.
Counterparty Credit Risk: Similar to issuer credit risk, the Funds may be exposed to counterparty credit risk, or the risk that an entity may fail to or be unable to perform on its commitments related to unsettled or open transactions. The Funds manage counterparty credit risk by entering into transactions only with counterparties that the Manager believes have the financial resources to honor their obligations and by monitoring the financial stability
| MANAGED ACCOUNT SERIES | AUGUST 31, 2017 | 37 |
| Notes to Financial Statements (concluded) |
of those counterparties. Financial assets, which potentially expose the Funds to market, issuer and counterparty credit risks, consist principally of financial instruments and receivables due from counterparties. The extent of the Funds’ exposure to market, issuer and counterparty credit risks with respect to these financial assets is approximately their value recorded in the Statements of Assets and Liabilities, less any collateral held by the Funds.
A derivative contract may suffer a mark-to-market loss if the value of the contract decreases due to an unfavorable change in the market rates or values of the underlying instrument. Losses can also occur if the counterparty does not perform under the contract.
With exchange-traded futures, there is less counterparty credit risk to the Funds since the exchange or clearinghouse, as counterparty to such instruments, guarantees against a possible default. The clearinghouse stands between the buyer and the seller of the contract; therefore, credit risk is limited to failure of the clearinghouse. While offset rights may exist under applicable law, a Fund does not have a contractual right of offset against a clearing broker or clearinghouse in the event of a default (including the bankruptcy or insolvency). Additionally, credit risk exists in exchange-traded futures with respect to initial and variation margin that is held in a clearing broker’s customer accounts. While clearing brokers are required to segregate customer margin from their own assets, in the event that a clearing broker becomes insolvent or goes into bankruptcy and at that time there is a shortfall in the aggregate amount of margin held by the clearing broker for all its clients, typically the shortfall would be allocated on a pro rata basis across all the clearing broker’s customers, potentially resulting in losses to the Funds.
Concentration Risk: Advantage Global SmallCap invests a substantial amount of its assets in issuers located in a single country or a limited number of countries. When the Fund concentrates its investments in this manner, it assumes the risk that economic, political and social conditions in those countries may have a significant impact on their investment performance. Foreign issuers may not be subject to the same uniform accounting, auditing and financial reporting standards and practices as used in the United States. Foreign securities markets may also be less liquid, more volatile, and less subject to governmental supervision not typically associated with investing in U.S. securities. Investment percentages in specific countries are presented in the Schedules of Investments.
11. Capital Share Transactions:
Transactions in capital shares for each class were as follows:
| Period May 1, 2017 to August 31, 2017 | Year Ended April 30, 2017 | Year Ended April 30, 2016 | ||||||||||||||||||||||||||||||
| Shares | Amount | Shares | Amount | Shares | Amount | |||||||||||||||||||||||||||
Advantage Global SmallCap | ||||||||||||||||||||||||||||||||
Shares sold | 1,446,707 | $ | 18,703,549 | 1,278,656 | $ | 16,673,214 | 3,384,146 | $ | 41,951,584 | |||||||||||||||||||||||
Shares redeemed | (1,515,613 | ) | (21,376,863 | ) | (2,247,301 | ) | (29,566,906 | ) | (6,335,257 | ) | (72,307,116 | ) | ||||||||||||||||||||
|
|
|
|
|
| |||||||||||||||||||||||||||
Net decrease | (68,906 | ) | $ | (2,673,314 | ) | (968,645 | ) | $ | (12,893,692 | ) | (2,951,111 | ) | $ | (30,355,532 | ) | |||||||||||||||||
|
|
|
|
|
| |||||||||||||||||||||||||||
Mid Cap Dividend | ||||||||||||||||||||||||||||||||
Shares sold | 2,053,157 | $ | 23,817,315 | 1,067,826 | $ | 14,260,889 | 2,936,879 | $ | 34,884,053 | |||||||||||||||||||||||
Shares redeemed | (1,349,372 | ) | (18,301,927 | ) | (1,947,711 | ) | (26,566,961 | ) | (6,239,833 | ) | (67,633,760 | ) | ||||||||||||||||||||
|
|
|
|
|
| |||||||||||||||||||||||||||
Net increase (decrease) | 703,785 | $ | 5,515,388 | (879,885 | ) | $ | (12,306,072 | ) | (3,302,954 | ) | $ | (32,749,707 | ) | |||||||||||||||||||
|
|
|
|
|
| |||||||||||||||||||||||||||
12. Subsequent Events:
Management has evaluated the impact of all subsequent events on the Funds through the date the financial statements were issued and has determined that there were no subsequent events requiring adjustment or additional disclosure in the financial statements.
| 38 | MANAGED ACCOUNT SERIES | AUGUST 31, 2017 |
| Report of Independent Registered Public Accounting Firm |
To the Board of Trustees of Managed Account Series and the Shareholders of Advantage Global SmallCap Fund (formerly Global SmallCap Portfolio) and Mid Cap Dividend Fund (formerly Mid Cap Value Opportunities Portfolio):
We have audited the statements of assets and liabilities, including the schedule of investments, of Advantage Global SmallCap Fund (formerly Global SmallCap Portfolio) and Mid Cap Dividend Fund (formerly Mid Cap Value Opportunities Portfolio) (collectively the “Funds”), each a series of Managed Account Series, as of August 31, 2017, and the related statements of operations for the period from May 1, 2017 to August 31, 2017 and the year ended April 30, 2017, the statements of changes in net assets for the period from May 1, 2017 to August 31, 2017 and for each of the two years in the period ended April 30, 2017, and the financial highlights for each of the periods presented. These financial statements and financial highlights are the responsibility of the Funds’ management. Our responsibility is to express an opinion on these financial statements and financial highlights based on our audits.
We conducted our audits in accordance with the standards of the Public Company Accounting Oversight Board (United States). Those standards require that we plan and perform the audit to obtain reasonable assurance about whether the financial statements and financial highlights are free of material misstatement. The Funds are not required to have, nor were we engaged to perform, an audit of their internal control over financial reporting. Our audits included consideration of internal control over financial reporting as a basis for designing audit procedures that are appropriate in the circumstances, but not for the purpose of expressing an opinion on the effectiveness of the Funds’ internal control over financial reporting. Accordingly, we express no such opinion. An audit also includes examining, on a test basis, evidence supporting the amounts and disclosures in the financial statements, assessing the accounting principles used and significant estimates made by management, as well as evaluating the overall financial statement presentation. Our procedures included confirmation of securities owned as of August 31, 2017, by correspondence with the custodian, brokers and agent banks; where replies were not received from brokers or agent banks, we performed other auditing procedures. We believe that our audits provide a reasonable basis for our opinion.
In our opinion, such financial statements and financial highlights referred to above present fairly, in all material respects, the financial position of Advantage Global SmallCap Fund and Mid Cap Dividend Fund, each of Managed Account Series, as of August 31, 2017, the results of their operations for the period from May 1, 2017 to August 31, 2017 and the year ended April 30, 2017, the changes in their net assets for the period from May 1, 2017 to August 31, 2017 and each of the two years in the period ended April 30, 2017, and the financial highlights for each of the periods presented, in conformity with accounting principles generally accepted in the United States of America.
Deloitte & Touche LLP
Boston, Massachusetts
October 23, 2017
| Important Tax Information (Unaudited) |
During the fiscal period ended August 31, 2017, the following information is provided with respect to the ordinary income distributions paid by the Funds:
| Payable Date | Advantage Global SmallCap Fund | Mid Cap Dividend Fund | |||||||||||||||||
Qualified Dividend Income for Individuals1 | 7/21/2017 | 16.73 | % | 11.72% | |||||||||||||||
Dividends Qualifying for the Dividends | |||||||||||||||||||
Received Deduction for Corporations1 | 7/21/2017 | 7.14 | % | 10.15% | |||||||||||||||
Qualified Short-Term Capital Gains for Non-Residents2 | 7/21/2017 | 52.89 | % | 89.32% | |||||||||||||||
1 The Funds hereby designate the percentage indicated above or the maximum amount allowable by law.
2 Represents the percentage of the taxable ordinary income dividends eligible for exemption from U.S. withholding tax for nonresident aliens and foreign corporations.
|
| ||||||||||||||||||
Additionally, the Funds distributed long-term capital gains to shareholders as follows:
| |||||||||||||||||||
| Payable Date | Advantage Global SmallCap Fund | Mid Cap Dividend Fund | |||||||||||||||||
Long-Term Capital Gain Distributions Per Share | 7/21/2017 | $1.716236 | $2.241600 | ||||||||||||||||
| MANAGED ACCOUNT SERIES | AUGUST 31, 2017 | 39 |
| Disclosure of Investment Advisory Agreement |
The Board of Trustees (the “Board,” the members of which are referred to as “Board Members”) of Managed Account Series (the “Trust”) met in person on April 6, 2017 (the “April Meeting”) and May 9-10, 2017 (the “May Meeting”) to consider the approval of the investment advisory agreement (the “Advisory Agreement” or the “Agreement”) between the Trust, on behalf of Advantage Global SmallCap Fund and Mid Cap Dividend Fund (each, a “Fund,” and together, the “Funds”), and BlackRock Advisors, LLC (the “Manager” or “BlackRock”), each Fund’s investment advisor.
Activities and Composition of the Board
On the date of the May Meeting, the Board consisted of thirteen individuals, eleven of whom were not “interested persons” of the Trust as defined in the Investment Company Act of 1940, as amended (the “1940 Act”) (the “Independent Board Members”). The Board Members are responsible for the oversight of the operations of the Funds and perform the various duties imposed on the directors of investment companies by the 1940 Act. The Independent Board Members have retained independent legal counsel to assist them in connection with their duties. The Chair of the Board is an Independent Board Member. The Board has established five standing committees: an Audit Committee, a Governance and Nominating Committee, a Compliance Committee, a Performance Oversight Committee and an Executive Committee, each of which is chaired by an Independent Board Member and composed of Independent Board Members (except for the Performance Oversight Committee and the Executive Committee, each of which also has one interested Board Member).
The Agreement
Pursuant to the 1940 Act, the Board is required to consider the continuation of the Agreement on an annual basis. The Board has four quarterly meetings per year, each extending over two days, a fifth one-day meeting to consider specific information surrounding the consideration of renewing the Agreement and additional in-person and telephonic meetings as needed. In connection with this year-long deliberative process, the Board assessed, among other things, the nature, extent and quality of the services provided to each Fund by BlackRock, BlackRock’s personnel and affiliates, including (as applicable): investment management; administrative and shareholder services; the oversight of fund service providers; marketing; risk oversight; compliance; and ability to meet applicable legal and regulatory requirements.
The Board, acting directly and through its committees, considers at each of its meetings, and from time to time as appropriate, factors that are relevant to its annual consideration of the renewal of the Agreement, including the services and support provided by BlackRock to each Fund and its shareholders. BlackRock also furnished additional information to the Board in response to specific questions from the Board. This additional information is discussed further below in the section titled “Board Considerations in Approving the Agreements.” Among the matters the Board considered were: (a) investment performance for one-year, three-year, five-year, ten-year, and/or since inception periods, as applicable, against peer funds, applicable benchmark, and performance metrics, as applicable, as well as senior management’s and portfolio managers’ analysis of the reasons for any over-performance or underperformance relative to its peers, benchmarks, and other performance metrics, as applicable; (b) fees, including advisory, administration, if applicable, and other amounts paid to BlackRock and its affiliates by each Fund for services; (c) Fund operating expenses and how BlackRock allocates expenses to each Fund; (d) the resources devoted to, risk oversight of, and compliance reports relating to, implementation of each Fund’s investment objective(s), policies and restrictions, and meeting regulatory requirements; (e) each Fund’s adherence to its compliance policies and procedures; (f) the nature, cost and character of non-investment management services provided by BlackRock and its affiliates; (g) BlackRock’s and other service providers’ internal controls and risk and compliance oversight mechanisms; (h) BlackRock’s implementation of the proxy voting policies approved by the Board; (i) the use of brokerage commissions and execution quality of portfolio transactions; (j) BlackRock’s implementation of each Fund’s valuation and liquidity procedures; (k) an analysis of management fees for products with similar investment mandates across the open-end fund, exchange-traded fund (“ETF”), closed-end fund, sub-advised mutual fund, separately managed account, collective investment trust, and institutional separate account product channels, as applicable, and the similarities and differences between these products and the services provided as compared to each Fund; (l) BlackRock’s compensation methodology for its investment professionals and the incentives and accountability it creates, along with investment professionals’ investments in the fund(s) they manage; and (m) periodic updates on BlackRock’s business.
Board Considerations in Approving the Agreement
The Approval Process: Prior to the April Meeting, the Board requested and received materials specifically relating to the Agreement. The Board is continuously engaged in a process with its independent legal counsel and BlackRock to review the nature and scope of the information provided to better assist its deliberations. The materials provided in connection with the April Meeting included (a) information independently compiled and prepared by Broadridge Financial Solutions, Inc. (“Broadridge”) on Fund fees and expenses as compared with a peer group of funds as determined by Broadridge (“Expense Peers”) and the investment performance of each Fund as compared with a peer group of funds as determined by Broadridge1 and with respect to the Mid Cap Dividend Fund, the Morningstar Classification; (b) a discussion of fall-out benefits to BlackRock and its affiliates; (c) a general analysis provided by BlackRock concerning investment management fees charged to other clients, such as institutional clients, sub-advised mutual funds, ETFs, closed-end funds, and separately managed accounts, under similar investment mandates, as well as the performance of such other clients, as applicable; (d) review of non-management fees; (e) the existence, impact and sharing of potential economies of scale; and (f) a summary of aggregate amounts paid by each Fund to BlackRock.
| 1 | Funds are ranked by Broadridge in quartiles, ranging from first to fourth, where first is the most desirable quartile position and fourth is the least desirable. |
| 40 | MANAGED ACCOUNT SERIES | AUGUST 31, 2017 |
| Disclosure of Investment Advisory Agreement (continued) |
At the April Meeting, the Board reviewed materials relating to its consideration of the Agreement. As a result of the discussions that occurred during the April Meeting, and as a culmination of the Board’s year-long deliberative process, the Board presented BlackRock with questions and requests for additional information. BlackRock responded to these requests with additional written information in advance of the May Meeting.
At the May Meeting, the Board, including the Independent Board Members, approved the continuation of the Advisory Agreement between the Manager and the Trust, on behalf of each Fund, for a one-year term ending June 30, 2018. In approving the continuation of the Agreement, the Board considered: (a) the nature, extent and quality of the services provided by BlackRock; (b) the investment performance of each Fund; (c) the advisory fee and the cost of the services and profits to be realized by BlackRock and its affiliates from their relationship with each Fund; (d) each Fund’s costs to investors compared to the costs of Expense Peers and performance compared to the relevant performance metrics as previously discussed; (e) the sharing of potential economies of scale; (f) fall-out benefits to BlackRock and its affiliates as a result of its relationship with each Fund; and (g) other factors deemed relevant by the Board Members.
The Board also considered other matters it deemed important to the approval process, such as other payments made to BlackRock or its affiliates, securities lending and cash management, services related to the valuation and pricing of Fund portfolio holdings, and materials submitted for the Board’s review. The Board noted the willingness of BlackRock personnel to engage in open, candid discussions with the Board. The Board did not identify any particular information as determinative, and each Board Member may have attributed different weights to the various items considered.
A. Nature, Extent and Quality of the Services Provided by BlackRock: The Board, including the Independent Board Members, reviewed the nature, extent and quality of services provided by BlackRock, including the investment advisory services and the resulting performance of each Fund. Throughout the year, the Board compared Fund performance to the performance of a comparable group of mutual funds, a relevant benchmark, and performance metrics, as applicable. The Board met with BlackRock’s senior management personnel responsible for investment activities, including the senior investment officers. The Board also reviewed the materials provided by each Fund’s portfolio management team discussing each Fund’s performance and each Fund’s investment objective(s), strategies and outlook.
The Board considered, among other factors, with respect to BlackRock: the number, education and experience of investment personnel generally and each Fund’s portfolio management team; BlackRock’s research capabilities; investments by portfolio managers in the funds they manage; portfolio trading capabilities; use of technology; commitment to compliance; credit analysis capabilities; risk analysis and oversight capabilities; and the approach to training and retaining portfolio managers and other research, advisory and management personnel. The Board engaged in a review of BlackRock’s compensation structure with respect to each Fund’s portfolio management team and BlackRock’s ability to attract and retain high-quality talent and create performance incentives.
In addition to investment advisory services, the Board considered the quality of the administrative and other non-investment advisory services provided to each Fund. BlackRock and its affiliates provide each Fund with certain administrative, shareholder and other services (in addition to any such services provided to each Fund by third parties) and officers and other personnel as are necessary for the operations of the Fund. In particular, BlackRock and its affiliates provide each Fund with administrative services including, among others: (i) preparing disclosure documents, such as the prospectus, the summary prospectus (as applicable), the statement of additional information and periodic shareholder reports; (ii) oversight of daily accounting and pricing; (iii) preparing periodic filings with regulators; (iv) overseeing and coordinating the activities of other service providers; (v) organizing Board meetings and preparing the materials for such Board meetings; (vi) providing legal and compliance support; (vii) furnishing analytical and other support to assist the Board in its consideration of strategic issues such as the merger, consolidation or repurposing of certain open-end funds; and (viii) performing other administrative functions necessary for the operation of each Fund, such as tax reporting, fulfilling regulatory filing requirements and call center services. The Board reviewed the structure and duties of BlackRock’s fund administration, shareholder services, and legal & compliance departments and considered BlackRock’s policies and procedures for assuring compliance with applicable laws and regulations.
B. The Investment Performance of each Fund and BlackRock: The Board, including the Independent Board Members, also reviewed and considered the performance history of each Fund. In preparation for the April Meeting, the Board was provided with reports independently prepared by Broadridge, which included a comprehensive analysis of each Fund’s performance. The Board also reviewed a narrative and statistical analysis of the Broadridge data that was prepared by BlackRock. In connection with its review, the Board received and reviewed information regarding the investment performance of each Fund as compared to other funds in its applicable Broadridge category and with respect to the Mid Cap Dividend Fund, the Morningstar Classification. The Board was provided with a description of the methodology used by Broadridge to select peer funds and periodically meets with Broadridge representatives to review its methodology. The Board was provided with information on the composition of the Broadridge performance universes and expense universes. The Board and its Performance Oversight Committee regularly review, and meet with Fund management to discuss, the performance of each Fund throughout the year.
In evaluating performance, the Board recognized that the performance data reflects a snapshot of a period as of a particular date and that selecting a different performance period could produce significantly different results. Further, the Board recognized that it is possible that long-term performance
| MANAGED ACCOUNT SERIES | AUGUST 31, 2017 | 41 |
| Disclosure of Investment Advisory Agreement (continued) |
can be adversely affected by even one period of significant underperformance so that a single investment decision or theme has the ability to affect long-term performance disproportionately.
The Board noted that for each of the one-, three- and five-year periods reported, the Advantage Global SmallCap Fund ranked in the second quartile against its Broadridge Performance Universe. The Board noted that effective June 12, 2017, the Fund had undergone changes in its investment strategy and portfolio management team, and in connection with such changes, the Advantage Global SmallCap Fund changed its name from Global SmallCap Portfolio of Managed Account Series to Advantage Global SmallCap Fund of Managed Account Series.
The Board noted that for the one-, three- and five-year periods reported, the Mid Cap Dividend Fund ranked in the first, first and second quartiles, respectively, against its Morningstar Performance Universe. BlackRock believes that the Morningstar Performance Universe is an appropriate performance metric for the Mid Cap Dividend Fund. The Board noted that effective June 12, 2017, the Mid Cap Dividend Fund had undergone changes in its investment strategy and portfolio management team, and in connection with such changes, the Fund changed its name from Mid Cap Value Opportunities Portfolio of Managed Account Series to Mid Cap Dividend Fund of Managed Account Series.
C. Consideration of the Advisory/Management Fees and the Cost of the Services and Profits to be Realized by BlackRock and its Affiliates from their Relationship with each Fund: The Board, including the Independent Board Members, reviewed each Fund’s contractual management fee rate compared with the other funds in its Broadridge category. The contractual management fee rate represents a combination of the advisory fee and any administrative fees, before taking into account any reimbursements or fee waivers. The Board also compared each Fund’s total expense ratio, as well as its actual management fee rate, to those of other funds in its Broadridge category. The total expense ratio represents a fund’s total net operating expenses, including any 12b-1 or non 12b-1 service fees. The total expense ratio gives effect to any expense reimbursements or fee waivers that benefit a fund, and the actual management fee rate gives effect to any management fee reimbursements or waivers that benefit a fund. The Board considered the services provided and the fees charged by BlackRock and its affiliates to other types of clients with similar investment mandates, as applicable, including institutional accounts and sub-advised mutual funds (including mutual funds sponsored by third parties).
The Board received and reviewed statements relating to BlackRock’s financial condition. The Board noted that BlackRock does not charge either Fund a net advisory fee. The Board reviewed BlackRock’s profitability with respect to other funds the Board currently oversees for the year ended December 31, 2016 compared to available aggregate profitability data provided for the prior two years. The Board reviewed BlackRock’s profitability with respect to certain other U.S. fund complexes managed by the Manager and/or its affiliates. The Board reviewed BlackRock’s assumptions and methodology of allocating expenses in the profitability analysis, noting the inherent limitations in allocating costs among various advisory products. The Board recognized that profitability may be affected by numerous factors including, among other things, fee waivers and expense reimbursements by the Manager, the types of funds managed, precision of expense allocations and business mix. As a result, calculating and comparing profitability at individual fund levels is difficult.
The Board noted that, in general, individual fund or product line profitability of other advisors is not publicly available. The Board reviewed BlackRock’s overall operating margin, in general, compared to that of certain other publicly-traded asset management firms. The Board considered the differences between BlackRock and these other firms, including the contribution of technology at BlackRock, BlackRock’s expense management, and the relative product mix.
In addition, the Board considered the cost of the services provided to each Fund by BlackRock, and BlackRock’s and its affiliates’ profits relating to the management and distribution of each Fund and the other funds advised by BlackRock and its affiliates. As part of its analysis, the Board reviewed BlackRock’s methodology in allocating its costs of managing each Fund, to such Fund. The Board may receive and review information from independent third parties as part of its annual evaluation. The Board considered whether BlackRock has the financial resources necessary to attract and retain high quality investment management personnel to perform its obligations under the Agreement and to continue to provide the high quality of services that is expected by the Board. The Board further considered factors including but not limited to BlackRock’s commitment of time, assumption of risk, and liability profile in servicing each Fund in contrast to what is required of BlackRock with respect to other products with similar investment mandates across the open-end fund, ETF, closed-end fund, sub-advised mutual fund, separately managed account, collective investment trust, and institutional separate account product channels, as applicable.
The Manager has contractually agreed to waive all fees and pay or reimburse all expenses of the Advantage Global SmallCap Fund, except extraordinary expenses. Extraordinary expenses may include interest expense, dividend expense and acquired fund fees and expenses. In light of the fee waiver agreement, the Board did not consider the Advantage Global SmallCap Fund’s advisory fee rate as compared to its Expense Peers, but instead recognized that shares of the Fund may be purchased and held only by or on behalf of separately managed account clients who have retained BlackRock to manage their accounts pursuant to an investment management agreement with BlackRock and/or a managed account program sponsor. The Board also noted that the Advantage Global SmallCap Fund has an advisory fee arrangement that includes breakpoints that adjust the fee rate downward as the size of the Fund increases above certain contractually specified levels.
| 42 | MANAGED ACCOUNT SERIES | AUGUST 31, 2017 |
| Disclosure of Investment Advisory Agreement (concluded) |
The Manager has contractually agreed to waive all fees and pay or reimburse all expenses of the Mid Cap Dividend Fund, except extraordinary expenses. Extraordinary expenses may include interest expense, dividend expense and acquired fund fees and expenses. In light of the fee waiver agreement, the Board did not consider the Mid Cap Dividend Fund’s advisory fee rate as compared to its Expense Peers, but instead recognized that shares of the Fund may be purchased and held only by or on behalf of separately managed account clients who have retained BlackRock to manage their accounts pursuant to an investment management agreement with BlackRock and/or a managed account program sponsor. The Board also noted that the Mid Cap Dividend Fund has an advisory fee arrangement that includes breakpoints that adjust the fee rate downward as the size of the Fund increases above certain contractually specified levels.
D. Economies of Scale: The Board, including the Independent Board Members, considered the extent to which economies of scale might be realized as the assets of each Fund increase, as well as the existence of expense caps, as applicable. The Board also considered the extent to which each Fund benefits from such economies in a variety of ways, and whether there should be changes in the advisory fee rate or breakpoint structure in order to enable each Fund to more fully participate in these economies of scale. The Board considered each Fund’s asset levels and whether the current fee schedule was appropriate. In its consideration, the Board Members took into account the existence of any expense caps and further considered the continuation and/or implementation, as applicable, of such caps.
E. Other Factors Deemed Relevant by the Board Members: The Board, including the Independent Board Members, also took into account other ancillary or “fall-out” benefits that BlackRock or its affiliates may derive from their respective relationships with each Fund, both tangible and intangible, such as BlackRock’s ability to leverage its investment professionals who manage other portfolios and risk management personnel, an increase in BlackRock’s profile in the investment advisory community, and the engagement of BlackRock’s affiliates as service providers to each Fund, including for administrative, distribution, securities lending and cash management services. The Board also considered BlackRock’s overall operations and its efforts to expand the scale of, and improve the quality of, its operations. The Board also noted that BlackRock may use and benefit from third party research obtained by soft dollars generated by certain registered fund transactions to assist in managing all or a number of its other client accounts.
In connection with its consideration of the Agreement, the Board also received information regarding BlackRock’s brokerage and soft dollar practices. The Board received reports from BlackRock which included information on brokerage commissions and trade execution practices throughout the year.
The Board noted the competitive nature of the open-end fund marketplace, and that shareholders are able to redeem their Fund shares if they believe that a Fund’s fees and expenses are too high or if they are dissatisfied with the performance of the Fund.
Conclusion
The Board, including the Independent Board Members, approved the continuation of the Advisory Agreement between the Manager and the Trust, on behalf of each Fund, for a one-year term ending June 30, 2018. Based upon its evaluation of all of the aforementioned factors in their totality, as well as other information, the Board, including the Independent Board Members, was satisfied that the terms of the Agreement were fair and reasonable and in the best interest of each Fund and its shareholders. In arriving at its decision to approve the Agreement, the Board did not identify any single factor or group of factors as all-important or controlling, but considered all factors together, and different Board Members may have attributed different weights to the various factors considered. The Independent Board Members were also assisted by the advice of independent legal counsel in making this determination. The contractual fee arrangements for each Fund reflect the results of several years of review by the Board Members and predecessor Board Members, and discussions between such Board Members (and predecessor Board Members) and BlackRock. As a result, the Board Members’ conclusions may be based in part on their consideration of these arrangements in prior years.
| MANAGED ACCOUNT SERIES | AUGUST 31, 2017 | 43 |
| Officers and Trustees |
Name, Address1 and Year of Birth | Position(s) Held with the Trust | Length of Time Served3 | Principal Occupation(s) During Past Five Years | Number of BlackRock- Advised Registered Investment Companies (“RICs”) Consisting of Investment Portfolios (“Portfolios”) Overseen | Public Company and Other Investment Company Directorships Held During Past Five Years | |||||
| Independent Trustees2 | ||||||||||
Robert M. Hernandez 1944 | Chair of the Board and Trustee | Since 2007 | Director, Vice Chairman and Chief Financial Officer of USX Corporation (energy and steel business) from 1991 to 2001; Director, RTI International Metals, Inc. from 1990 to 2015; Director, TE Connectivity (electronics) from 2006 to 2012. | 27 RICs consisting of 98 Portfolios | Chubb Limited (insurance company); Eastman Chemical Company. | |||||
James H. Bodurtha 1944 | Trustee | Since 2007 | Director, The China Business Group, Inc. (consulting and investing firm) from 1996 to 2013 and Executive Vice President thereof from 1996 to 2003; Chairman of the Board, Berkshire Holding Corporation since 1980; Director, ICI Mutual since 2010. | 27 RICs consisting of 98 Portfolios | None | |||||
Bruce R. Bond 1946 | Trustee | Since 2007 | Trustee and Member of the Governance Committee, State Street Research Mutual Funds from 1997 to 2005; Board Member of Governance, Audit and Finance Committee, Avaya Inc. (computer equipment) from 2003 to 2007. | 27 RICs consisting of 98 Portfolios | None | |||||
Donald W. Burton 1944 | Trustee | Since 2007 | Managing General Partner, The Burton Partnership, LP (an investment partnership) from 1979 to 2017; Managing General Partner, The Burton Partnership (QP), LP (an investment partnership) since 2000; Managing General Partner, The South Atlantic Venture Funds from 1983 to 2012; Director, IDology, Inc. (technology solutions) since 2006; Director, Knology, Inc. (telecommunications) from 1996 to 2012; Director, Capital Southwest (financial) from 2006 to 2012; Director, Burtons Grill (restaurant) since 2013; Director, PDQ South Texas (restaurant) since 2013; Director, ITC/Talon (data) since 2015. | 27 RICs consisting of 98 Portfolios | None | |||||
Honorable Stuart E. Eizenstat 1943 | Trustee | Since 2007 | Partner and Head of International Practice, Covington and Burling LLP (law firm) since 2001; International Advisory Board Member, The Coca-Cola Company from 2002 to 2011; Advisory Board Member, Veracity Worldwide, LLC (risk management) from 2007 to 2012; Member of the International Advisory Board, GML Ltd. (energy) since 2003. | 27 RICs consisting of 98 Portfolios | Alcatel-Lucent (telecommunications); Global Specialty Metallurgical; UPS Corporation (delivery service); Ferroglobe (metals) | |||||
Henry Gabbay 1947 | Trustee | Since 2007 | Consultant, BlackRock, Inc. from 2007 to 2008; Managing Director, BlackRock, Inc. from 1989 to 2007; Chief Administrative Officer, BlackRock Advisors, LLC from 1998 to 2007; President of BlackRock Funds and BlackRock Allocation Target Shares (formerly, BlackRock Bond Allocation Target Shares) from 2005 to 2007 and Treasurer of certain closed-end funds in the BlackRock fund complex from 1989 to 2006. | 27 RICs consisting of 98 Portfolios | None | |||||
Lena G. Goldberg 1949 | Trustee | Since 2016 | Senior Lecturer, Harvard Business School since 2008; Executive Vice President, FMR LLC/Fidelity Investments (financial services) from 2007 to 2008, Executive Vice President and General Counsel thereof from 2002 to 2007, Senior Vice President and General Counsel thereof from 1999 to 2002, Vice President and General Counsel thereof from 1997 to 1999, Senior Vice President and Deputy General Counsel thereof in 1997, and Vice President and Corporate Counsel thereof from 1996 to 1997; Partner, Sullivan & Worcester LLP from 1985 to 1996 and Associate thereof from 1979 to 1985. | 27 RICs consisting of 98 Portfolios | None |
| 44 | MANAGED ACCOUNT SERIES | AUGUST 31, 2017 |
| Officers and Trustees (continued) |
Name, Address1 and Year of Birth | Position(s) Held with the Trust | Length of Time Served3 | Principal Occupation(s) During Past Five Years | Number of BlackRock- Advised Registered Investment Companies (“RICs”) Consisting of Investment Portfolios (“Portfolios”) Overseen | Public Company and Other Investment Company Directorships Held During Past Five Years | |||||
| Independent Trustees2 (concluded) | ||||||||||
Henry R. Keizer 1956 | Trustee | Since 2016 | Director, Park Indemnity Ltd. (captive insurer) since 2010; Director, MUFG Americas Holdings Corporation and MUFG Union Bank, N.A. (financial and bank holding company) from 2014 to 2016; Director, Montpelier Re Holdings, Ltd. (publicly held property and casual reinsurance) from 2013 to 2015; Director, American Institute of Certified Public Accountants from 2009 to 2011; Director, KPMG LLP (audit, tax and advisory services) from 2004 to 2005 and 2010 to 2012; Director, KPMG International in 2012, Deputy Chairman and Chief Operating Officer thereof from 2010 to 2012 and U.S. Vice Chairman of Audit thereof from 2005 to 2010; Global Head of Audit, KPMGI (consortium of KPMG firms) from 2006 to 2010; Director, YMCA of Greater New York from 2006 to 2010. | 27 RICs consisting of 98 Portfolios | Hertz Global Holdings (car rental); WABCO (commercial vehicle safety systems) | |||||
John F. O’Brien 1943 | Trustee | Since 2007 | Trustee Woods Hole Oceanographic Institute since 2003 and Chairman thereof from 2009 to 2015; Co-Founder and Managing Director, Board Leaders LLC (director education) since 2005. | 27 RICs consisting of 98 Portfolios | Cabot Corporation (chemicals); LKQ Corporation (auto parts manufacturing); TJX Companies, Inc. (retailer) | |||||
Donald C. Opatrny 1952 | Trustee | Since 2015 | Trustee, Member of the Executive Committee and Chair of the Investment Committee, Cornell University since 2004; Member of the Board and Investment Committee, University School since 2007; Member of the Investment Committee, Mellon Foundation from 2009 to 2015; President and Trustee, the Center for the Arts, Jackson Hole since 2011; Director, Athena Capital Advisors LLC (investment management firm) since 2013; Trustee and Chair of the Investment Committee, Community Foundation of Jackson Hole since 2014; Trustee, Artstor (a Mellon Foundation affiliate) from 2010 to 2015; President, Trustee and Member of the Investment Committee, The Aldrich Contemporary Art Museum from 2007 to 2014. | 27 RICs consisting of 98 Portfolios | None | |||||
Roberta Cooper Ramo 1942 | Trustee | Since 2007 | Shareholder and Attorney, Modrall, Sperling, Roehl, Harris & Sisk, P.A. (law firm) since 1993; Director, ECMC Group (service provider to students, schools and lenders) since 2001; President, The American Law Institute (non-profit) since 2008; Vice President, Santa Fe Opera (non-profit) since 2011; Chair, Think New Mexico (non-profit) since 2013; Chairman of the Board, Cooper’s Inc. (retail) from 1999 to 2011. | 27 RICs consisting of 98 Portfolios | None | |||||
| MANAGED ACCOUNT SERIES | AUGUST 31, 2017 | 45 |
| Officers and Trustees (continued) |
Name, Address1 and Year of Birth | Position(s) Held with the Trust | Length of Time Served3 | Principal Occupation(s) During Past Five Years | Number of BlackRock- Advised Registered Investment Companies (“RICs”) Consisting of Investment Portfolios (“Portfolios”) Overseen | Public Company and Other Investment Company Directorships Held During Past Five Years | |||||
| Interested Trustees4 | ||||||||||
Robert Fairbairn 1965 | Trustee | Since 2015 | Senior Managing Director of BlackRock, Inc. since 2010; Global Head of BlackRock’s Retail and iShares® businesses since 2012; Member of BlackRock’s Global Executive and Global Operating Committees; Head of BlackRock’s Global Client Group from 2009 to 2012; Chairman of BlackRock’s international businesses from 2007 to 2010. | 27 RICs consisting of 98 Portfolios | None | |||||
John M. Perlowski 1964 | Trustee, President and Chief Executive Officer | Since 2015 (Trustee); Since 2010 (President and Chief Executive Officer) | Managing Director of BlackRock, Inc. since 2009; Head of BlackRock Global Fund & Accounting Services since 2009; Managing Director and Chief Operating Officer of the Global Product Group at Goldman Sachs Asset Management, L.P. from 2003 to 2009; Treasurer of Goldman Sachs Mutual Funds from 2003 to 2009 and Senior Vice President thereof from 2007 to 2009; Director of Goldman Sachs Offshore Funds from 2002 to 2009; Director of Family Resource Network (charitable foundation) since 2009. | 127 RICs consisting of 316 Portfolios | None | |||||
1 The address of each Trustee is c/o BlackRock, Inc., 55 East 52nd Street, New York, NY 10055.
2 Each Independent Trustee holds office until his or her successor is duly elected and qualifies or until his or her earlier death, resignation, retirement or removal as provided by the Trust’s by-laws or charter or statute, or until December 31 of the year in which he or she turns 75. The Board may determine to extend the terms of Independent Trustees on a case-by-case basis, as appropriate. Interested Trustees serve until their successor is duly elected and qualifies or until their earlier death, resignation, retirement or removal as provided by the Trust’s by-laws or statute, or until December 31 of the year in which they turn 72.
3 Following the combination of Merrill Lynch Investment Managers, L.P. (“MLIM”) and BlackRock, Inc. in September 2006, the various legacy MLIM and legacy BlackRock fund boards were realigned and consolidated into three new fund boards in 2007. As a result, although the chart shows certain Independent Trustees as joining the Board in 2007, those Trustees first became members of the boards of other legacy MLIM or legacy BlackRock funds as follows: James H. Bodurtha, 1995; Bruce R. Bond, 2005; Donald W. Burton, 2002; Honorable Stuart E. Eizenstat, 2001; Robert M. Hernandez, 1996; John F. O’Brien, 2005; and Roberta Cooper Ramo, 1999.
4 Messrs. Fairbairn and Perlowski are both “interested persons,” as defined in the 1940 Act, of the Trust based on their positions with BlackRock, Inc. and its affiliates. Mr. Perlowski is also a board member of the BlackRock Closed-End Complex and the BlackRock Equity-Liquidity Complex. | ||||||||||
| 46 | MANAGED ACCOUNT SERIES | AUGUST 31, 2017 |
| Officers and Trustees (concluded) |
Name, Address1 and Year of Birth | Position(s) Held with the Trust | Length of Time Served | Principal Occupation(s) During Past 5 Years | |||
| Officers Who Are Not Trustees2 | ||||||
Jennifer McGovern 1977 | Vice President | Since 2014 | Managing Director of BlackRock, Inc. since 2016; Director of BlackRock, Inc. from 2011 to 2015; Head of Product Structure and Oversight for BlackRock’s U.S. Wealth Advisory Group since 2013; Vice President of BlackRock, Inc. from 2008 to 2010. | |||
Neal J. Andrews 1966 | Chief Financial Officer | Since 2007 | Managing Director of BlackRock, Inc. since 2006; Senior Vice President and Line of Business Head of Fund Accounting and Administration at PNC Global Investment Servicing (U.S.) Inc. from 1992 to 2006. | |||
Jay M. Fife 1970 | Treasurer | Since 2007 | Managing Director of BlackRock, Inc. since 2007; Director of BlackRock, Inc. in 2006; Assistant Treasurer of the MLIM and Fund Asset Management, L.P. advised funds from 2005 to 2006; Director of MLIM Fund Services Group from 2001 to 2006. | |||
Charles Park 1967 | Chief Compliance Officer | Since 2014 | Anti-Money Laundering Compliance Officer for the BlackRock-advised Funds in the Equity-Bond Complex, the Equity-Liquidity Complex and the Closed-End Complex from 2014 to 2015; Chief Compliance Officer of BlackRock Advisors, LLC and the BlackRock-advised Funds in the Equity-Bond Complex, the Equity-Liquidity Complex and the Closed-End Complex since 2014; Principal of and Chief Compliance Officer for iShares® Delaware Trust Sponsor LLC since 2012 and BlackRock Fund Advisors (“BFA”) since 2006; Chief Compliance Officer for the BFA-advised iShares® exchange traded funds since 2006; Chief Compliance Officer for BlackRock Asset Management International Inc. since 2012. | |||
Fernanda Piedra 1969 | Anti-Money Laundering Compliance Officer | Since 2015 | Director of BlackRock, Inc. since 2014; Anti-Money Laundering Compliance Officer and Regional Head of Financial Crime for the Americas at BlackRock, Inc. since 2014; Head of Regulatory Changes and Remediation for the Asset Wealth Management Division of Deutsche Bank from 2010 to 2014; Vice President of Goldman Sachs (Anti-Money Laundering/Suspicious Activities Group) from 2004 to 2010. | |||
Benjamin Archibald 1975 | Secretary | Since 2012 | Managing Director of BlackRock, Inc. since 2014; Director of BlackRock, Inc. from 2010 to 2013; Secretary of the iShares® exchange traded funds since 2015; Secretary of the BlackRock-advised mutual funds since 2012. | |||
1 The address of each Officer is c/o BlackRock, Inc., 55 East 52nd Street, New York, NY 10055.
2 Officers of the Trust serve at the pleasure of the Board. | ||||||
| Further information about the Trust’s Officers and Trustees is available in the Fund’s Statement of Additional Information, which can be obtained without charge by calling 1-800-441-7762. | ||||||
Investment Adviser BlackRock Advisors, LLC Wilmington, DE 19809 | Custodians Brown Brothers Harriman & Co. Boston, MA 02109 | Accounting Agent and Transfer BNY Mellon Investment Servicing (US) Inc. Wilmington, DE 19809 | Address of the Funds 100 Bellevue Parkway Wilmington, DE 19809 | |||
Independent Registered Public Accounting Firm Deloitte & Touche LLP Philadelphia, PA 19103 | Distributor BlackRock Investments, LLC New York, NY 10022 | Legal Counsel Willkie Farr & Gallagher LLP New York, NY 10019 | ||||
| MANAGED ACCOUNT SERIES | AUGUST 31, 2017 | 47 |
| Additional Information |
| General Information |
Householding
The Funds will mail only one copy of shareholder documents, including prospectuses, annual and semi-annual reports and proxy statements, to shareholders with multiple accounts at the same address. This practice is commonly called “householding” and is intended to reduce expenses and eliminate duplicate mailings of shareholder documents. Mailings of your shareholder documents may be householded indefinitely unless you instruct us otherwise. If you do not want the mailing of these documents to be combined with those for other members of your household, please call the Funds at (800) 441-7762.
Availability of Quarterly Schedule of Investments
The Funds file their complete schedule of portfolio holdings with the SEC for the first and third quarters of each fiscal year on Form N-Q. The Funds’ Forms N-Q are available on the SEC’s website at http://www.sec.gov and may also be reviewed and copied at the SEC’s Public Reference Room in Washington, D.C. Information on the operation of the Public Reference Room or how to access documents on the SEC’s website without charge may be obtained by calling (800) SEC-0330. The Funds’ Forms N-Q may also be obtained upon request and without charge by calling (800) 441-7762.
Availability of Proxy Voting Policies and Procedures
A description of the policies and procedures that the Funds use to determine how to vote proxies relating to portfolio securities is available upon request and without charge (1) by calling (800) 441-7762; (2) at http://www.blackrock.com; and (3) on the SEC’s website at http://www.sec.gov.
Availability of Proxy Voting Record
Information about how the Funds voted proxies relating to securities held in the Funds’ portfolios during the most recent 12-month period ended June 30 is available, upon request and without charge (1) at http://www.blackrock.com, or by calling (800) 441-7762 and (2) on the SEC’s website at http://www.sec.gov.
BlackRock’s Mutual Fund Family
BlackRock offers a diverse lineup of open-end mutual funds crossing all investment styles and managed by experts in equity, fixed income and tax-exempt investing. Visit BlackRock online at http://www.blackrock.com for more information.
| Shareholder Privileges |
Account Information
Call us at (800) 441-7762 from 8:00 AM to 6:00 PM ET on any business day to get information about your account balances, recent transactions and share prices. You can also reach us on the Web at http://www.blackrock.com.
Automatic Investment Plans
Investor Class shareholders who want to invest regularly can arrange to have $50 or more automatically deducted from their checking or savings account and invested in any of the BlackRock funds.
Systematic Withdrawal Plans
Investor Class shareholders can establish a systematic withdrawal plan and receive periodic payments of $50 or more from their BlackRock funds, as long as their account balance is at least $10,000.
Retirement Plans
Shareholders may make investments in conjunction with Traditional, Rollover, Roth, Coverdell, Simple IRAs, SEP IRAs and 403(b) Plans.
| 48 | MANAGED ACCOUNT SERIES | AUGUST 31, 2017 |
| Additional Information (concluded) |
| BlackRock Privacy Principles |
BlackRock is committed to maintaining the privacy of its current and former fund investors and individual clients (collectively, “Clients”) and to safeguarding their non-public personal information. The following information is provided to help you understand what personal information BlackRock collects, how we protect that information and why in certain cases we share such information with select parties.
If you are located in a jurisdiction where specific laws, rules or regulations require BlackRock to provide you with additional or different privacy-related rights beyond what is set forth below, then BlackRock will comply with those specific laws, rules or regulations.
BlackRock obtains or verifies personal non-public information from and about you from different sources, including the following: (i) information we receive from you or, if applicable, your financial intermediary, on applications, forms or other documents; (ii) information about your transactions with us, our affiliates, or others; (iii) information we receive from a consumer reporting agency; and (iv) from visits to our websites.
BlackRock does not sell or disclose to non-affiliated third parties any non-public personal information about its Clients, except as permitted by law or as is necessary to respond to regulatory requests or to service Client accounts. These non-affiliated third parties are required to protect the confidentiality and security of this information and to use it only for its intended purpose.
We may share information with our affiliates to service your account or to provide you with information about other BlackRock products or services that may be of interest to you. In addition, BlackRock restricts access to non-public personal information about its Clients to those BlackRock employees with a legitimate business need for the information. BlackRock maintains physical, electronic and procedural safeguards that are designed to protect the non-public personal information of its Clients, including procedures relating to the proper storage and disposal of such information.
| MANAGED ACCOUNT SERIES | AUGUST 31, 2017 | 49 |
This report is intended for current holders. It is not authorized for use as an offer of sale or a solicitation of an offer to buy shares of a Fund unless preceded or accompanied by the Fund’s current prospectus. Past performance results shown in this report should not be considered a representation of future performance. Investment returns and principal value of shares will fluctuate so that shares, when redeemed, may be worth more or less than their original cost. Statements and other information herein are as dated and are subject to change.
Shares of each Fund may be purchased and held only by or on behalf of separately managed account clients who have retained BlackRock Advisors, LLC or an affiliate (“BlackRock”) to manage their accounts pursuant to an investment management agreement with BlackRock and/or a managed account program sponsor.

MAS2-8/17-AR |  | |
| Item 2 – | Code of Ethics – Code of Ethics – The registrant (or the “Fund”) has adopted a code of ethics, as of the end of the period covered by this report, applicable to the registrant’s principal executive officer, principal financial officer, principal accounting officer or controller, or persons performing similar functions. During the period covered by this report, the code of ethics was amended to clarify an inconsistency in to whom persons covered by the code should report suspected violations of the code. The amendment clarifies that such reporting should be made to BlackRock’s General Counsel, and retains the alternative option of anonymous reporting following “whistleblower” policies. Other non-material changes were also made in connection with this amendment. During the period covered by this report, there have been no waivers granted under the code of ethics. The registrant undertakes to provide a copy of the code of ethics to any person upon request, without charge, by calling 1-800-441-7762. | |
| Item 3 – | Audit Committee Financial Expert – The registrant’s board of trustees (the “board of trustees”), has determined that (i) the registrant has the following audit committee financial experts serving on its audit committee and (ii) each audit committee financial expert is independent: | |
Robert M. Hernandez Henry R. Keizer Stuart E. Eizenstat Bruce R. Bond | ||
Under applicable securities laws, a person determined to be an audit committee financial expert will not be deemed an “expert” for any purpose, including without limitation for the purposes of Section 11 of the Securities Act of 1933, as a result of being designated or identified as an audit committee financial expert. The designation or identification of a person as an audit committee financial expert does not impose on such person any duties, obligations, or liabilities greater than the duties, obligations, and liabilities imposed on such person as a member of the audit committee and board of trustees in the absence of such designation or identification. | ||
| Item 4 – | Principal Accountant Fees and Services | |
The following table presents fees billed by Deloitte & Touche LLP (“D&T”) in each of the last two fiscal years for the services rendered to the Fund: | ||
| (a) Audit Fees | (b) Audit-Related Fees1 | (c) Tax Fees2 | (d) All Other Fees | |||||||||||||
| Entity Name | Current Fiscal Year End4 | Previous Fiscal Year End | Current Fiscal Year End | Previous Fiscal Year End | Current Fiscal Year End | Previous Fiscal Year End | Current Fiscal Year End | Previous Fiscal Year End | ||||||||
| Advantage Global SmallCap Fund | $23,970 | $28,169 | $2,000 | $0 | $6,600 | $14,058 | $0 | $0 | ||||||||
| Mid Cap Dividend Fund | $23,664 | $27,863 | $2,000 | $0 | $6,500 | $14,007 | $0 | $0 | ||||||||
The following table presents fees billed by D&T that were required to be approved by the registrant’s audit committee (the “Committee”) for services that relate directly to the operations or financial reporting of the Fund and that are rendered on behalf of BlackRock Advisors, LLC (“Investment Adviser” or “BlackRock”) and entities controlling, controlled by, or under common control with BlackRock (not including any sub-adviser whose role is primarily portfolio management and is |
2
subcontracted with or overseen by another investment adviser) that provide ongoing services to the Fund (“Affiliated Service Providers”): |
| Current Fiscal Year End4 | Previous Fiscal Year End | |||
| (b) Audit-Related Fees1 | $0 | $0 | ||
| (c) Tax Fees2 | $0 | $0 | ||
| (d) All Other Fees3 | $2,129,000 | $2,129,000 |
1 The nature of the services includes assurance and related services reasonably related to the performance of the audit or review of financial statements not included in Audit Fees, including accounting consultations, agreed-upon procedure reports, attestation reports, comfort letters, out-of-pocket expenses and internal control reviews not required by regulators.
2 The nature of the services includes tax compliance and/or tax preparation, including services relating to the filing or amendment of federal, state or local income tax returns, regulated investment company qualification reviews, taxable income and tax distribution calculations.
3 Non-audit fees of $2,129,000 and $2,154,000 for the current fiscal year and previous fiscal year, respectively, were paid to the Fund’s principal accountant in their entirety by BlackRock, in connection with services provided to the Affiliated Service Providers of the Fund and of certain other funds sponsored and advised by BlackRock or its affiliates for a service organization review and an accounting research tool subscription. These amounts represent aggregate fees paid by BlackRock and were not allocated on a per fund basis.
4 The Fund changed its fiscal year end from April to August in 2017 whereby this fiscal year consists of the four months ended August 31, 2017.
(e)(1) Audit Committee Pre-Approval Policies and Procedures:
The Committee has adopted policies and procedures with regard to the pre-approval of services. Audit, audit-related and tax compliance services provided to the registrant on an annual basis require specific pre-approval by the Committee. The Committee also must approve other non-audit services provided to the registrant and those non-audit services provided to the Investment Adviser and Affiliated Service Providers that relate directly to the operations and the financial reporting of the registrant. Certain of these non-audit services that the Committee believes are (a) consistent with the SEC’s auditor independence rules and (b) routine and recurring services that will not impair the independence of the independent accountants may be approved by the Committee without consideration on a specific case-by-case basis (“general pre-approval”). The term of any general pre-approval is 12 months from the date of the pre-approval, unless the Committee provides for a different period. Tax or other non-audit services provided to the registrant which have a direct impact on the operations or financial reporting of the registrant will only be deemed pre-approved provided that any individual project does not exceed $10,000 attributable to the registrant or $50,000 per project. For this purpose, multiple projects will be aggregated to determine if they exceed the previously mentioned cost levels.
Any proposed services exceeding the pre-approved cost levels will require specific pre-approval by the Committee, as will any other services not subject to general pre-approval (e.g., unanticipated but permissible services). The Committee is informed of each service approved subject to general pre-approval at the next regularly scheduled in-person board meeting. At this meeting, an analysis of such services is presented to the Committee for ratification. The Committee may delegate to the Committee Chairman the authority to approve the provision of and fees for any specific engagement of permitted non-audit services, including services exceeding pre-approved cost levels.
(e)(2) None of the services described in each of Items 4(b) through (d) were approved by the Committee pursuant to the de minimis exception in paragraph (c)(7)(i)(C) of Rule 2-01 of Regulation S-X.
3
(f) Not Applicable
(g) The aggregate non-audit fees, defined as the sum of the fees shown under “Audit-Related Fees,” “Tax Fees” and “All Other Fees,” paid to the accountant for services rendered by the accountant to the registrant, the Investment Adviser and the Affiliated Service Providers were:
| Entity Name | Current Fiscal Year End1 | Previous Fiscal Year End | ||||
| Advantage Global SmallCap Fund | $8,600 | $14,058 | ||||
| Mid Cap Dividend Fund | $8,500 | $14,007 |
1 The Fund changed its fiscal year end from April to August in 2017 whereby this fiscal year consists of the four
months ended August 31, 2017.
Additionally, the amounts billed by D&T in connection with services provided to the Affiliated Service Providers of the Fund and of other funds sponsored and advised by BlackRock or its affiliates during the current and previous fiscal years for a service organization review and an accounting research tool subscription were:
Current Fiscal Year End | Previous Fiscal Year End | |
| $2,129,000 | $2,129,000 |
These amounts represent aggregate fees paid by BlackRock and were not allocated on a per fund basis.
(h) The Committee has considered and determined that the provision of non-audit services that were rendered to the Investment Adviser and the Affiliated Service Providers that were not pre-approved pursuant to
paragraph (c)(7)(ii) of Rule 2-01 of Regulation S-X is compatible with maintaining the principal accountant’s independence.
Item 5 – | Audit Committee of Listed Registrants – Not Applicable | |||
Item 6 – | Investments | |||
| (a) The registrant’s Schedule of Investments is included as part of the Report to Stockholders filed under Item 1 of this Form. | ||||
| (b) Not Applicable due to no such divestments during the semi-annual period covered since the previous Form N-CSR filing. | ||||
Item 7 – | Disclosure of Proxy Voting Policies and Procedures for Closed-End Management Investment Companies – Not Applicable | |||
Item 8 – | Portfolio Managers of Closed-End Management Investment Companies – Not Applicable | |||
Item 9 – | Purchases of Equity Securities by Closed-End Management Investment Company and Affiliated Purchasers – Not Applicable | |||
Item 10 – | Submission of Matters to a Vote of Security Holders – There have been no material changes to these procedures. | |||
4
Item 11 – | Controls and Procedures
| |||
| (a) The registrant’s principal executive and principal financial officers, or persons performing similar functions, have concluded that the registrant’s disclosure controls and procedures (as defined in Rule 30a-3(c) under the Investment Company Act of 1940, as amended (the “1940 Act”)) are effective as of a date within 90 days of the filing of this report based on the evaluation of these controls and procedures required by Rule 30a-3(b) under the 1940 Act and Rule 15d-15(b) under the Securities Exchange Act of 1934, as amended. | ||||
| (b) There were no changes in the registrant’s internal control over financial reporting (as defined in Rule 30a-3(d) under the 1940 Act) that occurred during the second fiscal quarter of the period covered by this report that have materially affected, or are reasonably likely to materially affect, the registrant’s internal control over financial reporting. | ||||
Item 12 – | Disclosure of Securities Lending Activities for Closed-End Management Investment Companies – Not Applicable to the registrant. | |||
Item 13 – | Exhibits attached hereto | |||
(a)(1) Code of Ethics – See Item 2
(a)(2) Certifications – Attached hereto
(a)(3) Not Applicable
(b) Certifications – Attached hereto | ||||
5
Pursuant to the requirements of the Securities Exchange Act of 1934 and the Investment Company Act of 1940, the registrant has duly caused this report to be signed on its behalf by the undersigned, thereunto duly authorized.
Managed Account Series
By: | /s/ John M. Perlowski | |
John M. Perlowski | ||
| Chief Executive Officer (principal executive officer) of Managed Account Series |
Date: November 3, 2017
Pursuant to the requirements of the Securities Exchange Act of 1934 and the Investment Company Act of 1940, this report has been signed below by the following persons on behalf of the registrant and in the capacities and on the dates indicated.
By: | /s/ John M. Perlowski | |
John M. Perlowski | ||
| Chief Executive Officer (principal executive officer) of Managed Account Series |
Date: November 3, 2017
By: | /s/ Neal J. Andrews | |
Neal J. Andrews | ||
| Chief Financial Officer (principal financial officer) of Managed Account Series |
Date: November 3, 2017
6