UNITED STATES
SECURITIES AND EXCHANGE COMMISSION
Washington, D.C. 20549
FORM N-CSR
CERTIFIED SHAREHOLDER REPORT OF REGISTERED MANAGEMENT
INVESTMENT COMPANIES
Investment Company Act file number: 811-21763
Name of Fund: Managed Account Series
BlackRock U.S. Mortgage Portfolio
Fund Address: 100 Bellevue Parkway, Wilmington, DE 19809
Name and address of agent for service: John M. Perlowski, Chief Executive Officer, Managed Account
Series, 55 East 52nd Street, New York, NY 10055
Registrant’s telephone number, including area code: (800) 441-7762
Date of fiscal year end: 04/30/2018
Date of reporting period: 04/30/2018
Item 1 – Report to Stockholders
APRIL 30, 2018
ANNUAL REPORT |
|

Managed Account Series
| Ø | BlackRock U.S. Mortgage Portfolio |
| Not FDIC Insured • May Lose Value • No Bank Guarantee |
Dear Shareholder,
In the 12 months ended April 30, 2018, the strongest corporate profits in seven years drove the equity market higher, while rising interest rates constrained bond returns. While the market’s appetite for risk remained healthy, risk taking varied by asset class, as bond investors cautiously shifted to higher-quality securities, and stock investors continued to embrace risk by investing abroad.
The largest global economies experienced sustained, synchronized growth for the first time since the financial crisis, leading to strong equity performance worldwide. Emerging markets stocks posted the highest return, as accelerating growth in China, the second-largest economy in the world, improved the outlook for corporate profits in most developing nations.
Short-term U.S. Treasury interest rates rose the fastest, while longer-term rates slightly increased, leading to a substantial flattening of the yield curve. The annual return for the three-month Treasury bill surpassed 1.0%, but remained well below the annual headline inflation rate of 2.5%. In contrast, the ten-year U.S. Treasury — a bellwether of the bond market — posted a negative return, as rising inflation expectations drove yields higher. In credit markets, the investment-grade and high-yield bond markets posted modest returns in a relatively benign credit environment.
Even though it faced rising pressure to boost interest rates in 2017, the U.S. Federal Reserve (the “Fed”) increased short-term interest rates just three times during the reporting period. The Fed also announced plans to reduce its $4.4 trillion balance sheet by $420 billion in 2018, which began the process of gradually reversing its unprecedented stimulus measures after the financial crisis. The economy continued to gain momentum despite the Fed’s modest reduction of economic stimulus, as unemployment dipped below 4.0%, wages increased, and job openings reached a record high. Strong economic performance may justify a more rapid pace of rate hikes in 2018, as the headline inflation rate and investors’ expectations for inflation surpassed the Fed’s target of 2.0%.
By contrast, the European Central Bank (“ECB”) and the Bank of Japan (“BoJ”) continued to expand their balance sheets despite nascent signs of sustained economic growth. Rising global growth, as well as limited bond supply, pressured other central banks to follow in the Fed’s footsteps. In October 2017, the ECB pledged to cut its bond purchases in half for 2018, while the BoJ reiterated its commitment to economic stimulus, even though the size of its balance sheet almost matched the total output of the Japanese economy.
The Fed’s measured pace of stimulus reduction could lead to moderately higher inflation, steadily rising interest rates, and improving real growth in 2018. We continue to believe the primary risks to economic expansion are trade protectionism, rapidly rising interest rates, and geopolitical tension. In particular, we are closely monitoring trade protectionism and the rise of populism in Western nations.
In December 2017, Congress passed a sweeping tax reform bill. The U.S. tax overhaul is likely to accentuate the existing reflationary themes, including corporate spending on stock buybacks, mergers & acquisitions and capital investment, which could extend the economic cycle if inflation and interest rates rise at a relatively modest pace.
In this environment, investors need to think globally, extend their scope across a broad array of asset classes, and be nimble as market conditions change. We encourage you to talk with your financial advisor and visit blackrock.com for further insight about investing in today’s markets.
Sincerely,

Rob Kapito
President, BlackRock Advisors, LLC

Rob Kapito
President, BlackRock Advisors, LLC
| Total Returns as of April 30, 2018 | ||||
| 6-month | 12-month | |||
U.S. large cap equities | 3.82% | 13.27% | ||
U.S. small cap equities | 3.27 | 11.54 | ||
International equities | 3.41 | 14.51 | ||
Emerging market equities | 4.80 | 21.71 | ||
3-month Treasury bills | 0.68 | 1.17 | ||
U.S. Treasury securities | (3.79) | (3.64) | ||
U.S. investment grade bonds | (1.87) | (0.32) | ||
Tax-exempt municipal bonds | (0.76) | 1.44 | ||
U.S. high yield bonds | (0.17) | 3.27 | ||
| Past performance is no guarantee of future results. Index performance is shown for illustrative purposes only. You cannot invest directly in an index. | ||||
| 2 | THIS PAGEISNOT PARTOF YOUR FUND REPORT |
| Page | ||||
| 2 | ||||
Annual Report: | ||||
| 4 | ||||
| 6 | ||||
| 6 | ||||
| 7 | ||||
| 7 | ||||
Financial Statements: | ||||
| 8 | ||||
| 17 | ||||
| 18 | ||||
| 19 | ||||
| 20 | ||||
| 21 | ||||
| 24 | ||||
| 35 | ||||
| 35 | ||||
| 36 | ||||
| 40 | ||||
| 41 | ||||

| 3 |
| Fund Summary as of April 30, 2018 | BlackRock U.S. Mortgage Portfolio |
Investment Objective
BlackRock U.S. Mortgage Portfolio’s (the “Fund”) investment objective is to seek high total return.
Portfolio Management Commentary
How did the Fund perform?
For the 12-month period ended April 30, 2018, the Fund’s Institutional and Investor A Shares outperformed the benchmark, the Bloomberg Barclays U.S. Mortgage-Backed Securities Index, while the Fund’s Investor C Shares underperformed the benchmark.
What factors influenced performance?
The Fund’s out-of-benchmark allocations to securitized assets, specifically commercial mortgage-backed securities (“CMBS”), collateralized loan obligations (“CLOs”), non-agency residential mortgage-backed securities (“RMBS”) and agency collateralized mortgage obligations (“CMOs”) were the largest contributors to performance. Duration and yield curve positioning further aided results, but these strategies were mainly used as a means to manage risk associated with the Fund’s investments in agency MBS. (Duration is a measure of interest-rate sensitivity). Swap- and swaption-based strategies also contributed to performance, along with allocations to U.S. Treasuries.
Positioning with respect to 30-year agency MBS was the most significant detractor from the Fund’s performance during the period. Selection-based strategies within the segment lagged, mainly driven by underperformance of specified pool holdings. Allocation-based strategies within 15-year agency MBS detracted modestly from performance as well.
During the period, the Fund utilized derivatives, including options, futures contracts and swaps, as a means to manage risk against allocations in MBS and securitized assets. The use of derivatives had a positive impact on Fund performance.
Describe recent portfolio activity.
The Fund increased its allocation to agency MBS, adding exposures in both pass-throughs and CMOs. The Fund reduced exposure to legacy (i.e. issued prior to the financial crisis of 2007/2008) non-agency RMBS for which spreads tightened significantly throughout the period, instead adding exposures in CMBS where the portfolio management team saw better value. Exposure to asset-backed securities remained modest during the period, while CLO holdings were marginally reduced. With respect to duration, the Fund moved from an underweight position to end the period marginally overweight relative to the benchmark.
Describe portfolio positioning at period end.
Relative to the benchmark, the Fund was positioned with a modestly higher duration. The Fund continued to hold a constructive view on agency MBS based recent spread widening and the potential for domestic bank demand to increase. This positive view was slightly tempered given the weakened state of risk sentiment and reduced conviction with respect to near-term macro stability. A focus on 15-year agency MBS was designed to benefit from lower supply given a flatter yield curve. The Fund continues to hold a core allocation to CMBS based on the incremental income provided by the segment, with a focus on interest-only securities.
The views expressed reflect the opinions of BlackRock as of the date of this report and are subject to change based on changes in market, economic or other conditions. These views are not intended to be a forecast of future events and are no guarantee of future results.
Portfolio Information
PORTFOLIO COMPOSITION
| Asset Type | Percent of Net Assets | |||
U.S. Government Sponsored Agency Obligations | 210 | % | ||
Non-Agency Mortgage-Backed Securities | 17 | |||
Asset-Backed Securities | 7 | |||
Short-Term Securities | — | (a) | ||
Options Purchased | — | (a) | ||
TBA Sale Commitments | (85 | ) | ||
Liabilities in Excess of Other Assets | (49 | ) | ||
| (a) | Representing less than 0.5% of the Fund’s net assets. |
CREDIT QUALITY ALLOCATIONS
| Credit Rating (a) | Percent of Total Investments (b) | |||
AAA/Aaa (c) | 95 | % | ||
AA/Aa | 1 | |||
A | 1 | |||
BBB/Baa | — | (d) | ||
BB/Ba | 1 | |||
CCC/Caa | — | (d) | ||
D | — | (d) | ||
NR | 2 | |||
| (a) | For financial reporting purposes, credit quality ratings shown above reflect the highest rating assigned by either Standard & Poor’s (“S&P”) or Moody’s Investors Service if ratings differ. These rating agencies are independent, nationally recognized statistical rating organizations and are widely used. Investment grade ratings are credit ratings of BB/Baa or higher. Below investment grade ratings are credit ratings of BB/Ba or lower. Investments designated N/R are not rated by either rating agency. Unrated investments do not necessarily indicate low rating quality. Credit quality ratings are subject to change. |
| (b) | Total Investments exclude short-term securities, options purchased and TBA sale commitments. |
| (c) | The investment adviser evaluates the credit quality of unrated investments based upon certain factors including, but not limited to, credit ratings for similar investments and financial analysis of sectors, individual investments and/or issuers. Using this approach, the investment advisor has deemed unrated U.S. Government Sponsored Agency Securities and U.S. Treasury Obligations to be of similar credit quality as investments rated AAA/Aaa. |
| (d) | Representing less than 0.5% of the Fund’s total investments. |
| 4 | 2018 BLACKROCK ANNUAL REPORTTO SHAREHOLDERS |
| Fund Summary as of April 30, 2018 (continued) | BlackRock U.S. Mortgage Portfolio |
TOTAL RETURN BASED ON A $10,000 INVESTMENT
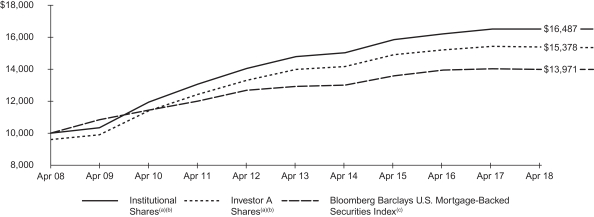
| (a) | Assuming maximum sales charges, if any, transaction costs and other operating expenses, including investment advisory fees. Institutional Shares do not have a sales charge. Prior to December 6, 2010, Investor A Shares performance results are those of Institutional Shares (which have no distribution or service fees) restated to reflect Investor A Share fees. |
| (b) | The Fund invests primarily in mortgage-related securities. |
| (c) | An unmanaged index that includes the mortgage-backed pass-through securities of Ginnie Mae, Fannie Mae and Freddie Mac that meet certain maturity and liquidity criteria. |
Performance Summary for the Period Ended April 30, 2018
| Average Annual Total Returns (a) | ||||||||||||||||||||||||||||||||||||||||||||
| 1 Year | 5 Years | 10 Years | ||||||||||||||||||||||||||||||||||||||||||
| Standardized 30-Day Yields | Unsubsidized 30-Day Yields | 6-Month Total Returns | w/o sales charge | w/sales charge | w/o sales charge | w/sales charge | w/o sales charge | w/sales charge | ||||||||||||||||||||||||||||||||||||
Institutional | 3.23 | % | 3.06 | % | (1.32 | )% | 0.00 | % | N/A | 2.20 | % | N/A | 5.13 | % | N/A | |||||||||||||||||||||||||||||
Investor A | 2.86 | 2.63 | (1.45 | ) | (0.25 | ) | (4.24 | )% | 1.93 | 1.10 | % | 4.82 | 4.40 | % | ||||||||||||||||||||||||||||||
Investor C | 2.23 | 2.02 | (1.91 | ) | (1.09 | ) | (2.06 | ) | 1.17 | 1.17 | 4.05 | 4.05 | ||||||||||||||||||||||||||||||||
Bloomberg Barclays U.S. Mortgage-Backed Securities Index | N/A | N/A | (1.51 | ) | (0.38 | ) | N/A | 1.59 | N/A | 3.40 | N/A | |||||||||||||||||||||||||||||||||
| (a) | Assuming maximum sales charges, if any. Average annual total returns with and without sales charges reflect reductions for distribution and service fees. See “About Fund Performance” on page 6 for a detailed description of share classes, including any related sales charges and fees. |
N/A — Not applicable as share class and index do not have a sales charge.
Past performance is not indicative of future results. Performance results do not reflect the deduction of taxes that a shareholder would pay on Fund distributions on the redemptions of Fund Shares.
Performance results may include adjustments for financial reporting purpose in accordance with U.S. generally accepted accounting principles.
Expense Example
| Actual | Hypothetical (a) | |||||||||||||||||||||||||||||||||||||||
| Including Interest Expense | Excluding Interest Expense | Including Interest Expense | Excluding Interest Expense | |||||||||||||||||||||||||||||||||||||
| Beginning Account Value (11/01/17) | Ending Account Value (04/30/18) | Expenses Paid During the Period (b) | Expenses Paid During the Period (c) | Beginning Account Value (11/01/17) | Ending Account Value (04/30/18) | Expenses Paid During the Period (b) | Ending Account Value (04/30/18) | Expenses Paid During the Period (c) | ||||||||||||||||||||||||||||||||
Institutional | $ | 1,000.00 | $ | 986.80 | $ | 5.37 | $ | 2.22 | $ | 1,000.00 | $ | 1,019.39 | 5.46 | $ | 1,022.56 | $ | 2.26 | |||||||||||||||||||||||
Investor A | 1,000.00 | 985.50 | 6.60 | 3.45 | 1,000.00 | 1,018.15 | 6.71 | 1,021.32 | 3.51 | |||||||||||||||||||||||||||||||
Investor C | 1,000.00 | 980.90 | 10.31 | 7.12 | 1,000.00 | 1,014.38 | 10.49 | 1,017.60 | 7.25 | |||||||||||||||||||||||||||||||
| (a) | Hypothetical 5% annual return before expenses is calculated by prorating the number of days in the most recent fiscal half year divided by 365. |
| (b) | For each class of the Fund, expenses are equal to the annualized expense ratio for the class (1.09% for Institutional, 1.34% for Investor A and 2.10% for Investor C), multiplied by the average account value over the period, multiplied by 181/365 (to reflect the one-half year period shown). |
| (c) | For each class of the Fund, expenses are equal to the annualized expense ratio for the class (0.45% for Institutional, 0.70% for Investor A and 1.45% for Investor C), multiplied by the average account value over the period, multiplied by 181/365 (to reflect the one-half year period shown). |
See “Disclosure of Expenses” on page 6 for further information on how expenses were calculated.
| FUND SUMMARY | 5 |
| About Fund Performance |
Institutional Shares are not subject to any sales charge. These shares bear no ongoing distribution or service fees and are available only to certain eligible investors.
Investor A Shares are subject to a maximum initial sales charge (front-end load) of 4.00% and a service fee of 0.25% per year (but no distribution fee). Certain redemptions of these shares may be subject to a contingent deferred sales charge (“CDSC”) where no initial sales charge was paid at the time of purchase. These shares are generally available through financial intermediaries. Prior to December 6, 2010, the Fund’s Investor A Shares performance results are those of Institutional Shares (which have no distribution or service fees) restated to reflect Investor A Share fees.
Investor C Shares are subject to a 1.00% CDSC if redeemed within one year of purchase. In addition, these shares are subject to a distribution fee of 0.75% per year and a service fee of 0.25% per year. These shares are generally available through financial intermediaries. Prior to December 6, 2010, the Fund’s Investor C Shares performance results are those of Institutional Shares (which have no distribution or service fees) restated to reflect Investor C Share fees.
Performance information reflects past performance and does not guarantee future results. Current performance may be lower or higher than the performance data quoted. Refer to www.blackrock.com to obtain performance data current to the most recent month end. Performance results do not reflect the deduction of taxes that a shareholder would pay on fund distributions or the redemption of fund shares. Figures shown in the performance tables on the previous pages assume reinvestment of all distributions, if any, at net asset value (“NAV”) on the ex-dividend date. Investment return and principal value of shares will fluctuate so that shares, when redeemed, may be worth more or less than their original cost. Distributions paid to each class of shares will vary because of different levels of service, distribution and transfer agency fees applicable to each class, which are deducted from the income available to be paid to shareholders.
BlackRock Advisors, LLC (the “Manager”), the Fund’s investment adviser, has contractually agreed to waive and/or reimburse a portion of the Fund’s expenses. Without such waiver and/or reimbursement, the Fund’s performance would have been lower. The Manager is under no obligation to continue waiving and/or reimbursing its fees after the applicable termination date of such agreement. See Note 6 of the Notes to Financial Statements for additional information on waivers and/or reimbursements. The standardized 30-day yield includes the effects of any waivers and/or reimbursements. The unsubsidized 30-day yield excludes the effects of any waivers and/or reimbursements.
Shareholders of the Fund may incur the following charges: (a) transactional expenses, such as sales charges; and (b) operating expenses, including investment advisory fees, service and distribution fees, including 12b-1 fees, acquired fund fees and expenses, and other fund expenses. The expense examples on the previous pages (which are based on a hypothetical investment of $1,000 invested on November 1, 2017 and held through April 30, 2018) are intended to assist shareholders both in calculating expenses based on an investment in the Fund and in comparing these expenses with similar costs of investing in other mutual funds.
The expense examples provide information about actual account values and actual expenses. In order to estimate the expenses a shareholder paid during the period covered by this report, shareholders can divide their account value by $1,000 and then multiply the result by the number corresponding to their share class under the heading entitled “Expenses Paid During the Period.”
The expense examples also provide information about hypothetical account values and hypothetical expenses based on the Fund’s actual expense ratio and an assumed rate of return of 5% per year before expenses. In order to assist shareholders in comparing the ongoing expenses of investing in the Funds and other funds, compare the 5% hypothetical examples with the 5% hypothetical examples that appear in shareholder reports of other funds.
The expenses shown in the expense examples are intended to highlight shareholders’ ongoing costs only and do not reflect any transactional expenses, such as sales charges, if any. Therefore, the hypothetical examples are useful in comparing ongoing expenses only, and will not help shareholders determine the relative total expenses of owning different funds. If these transactional expenses were included, shareholder expenses would have been higher.
| 6 | 2018 BLACKROCK ANNUAL REPORTTO SHAREHOLDERS |
| The Benefits and Risks of Leveraging |
The Fund may utilize leverage to seek to enhance returns and NAV. However, these objectives cannot be achieved in all interest rate environments.
The Fund may utilize leverage by entering into reverse repurchase agreements. In general, the concept of leveraging is based on the premise that the financing cost of leverage, which is based on short-term interest rates, is normally lower than the income earned by the Fund on its longer-term portfolio investments purchased with the proceeds from leverage. To the extent that the total assets of the Fund (including the assets obtained from leverage) are invested in higher-yielding portfolio investments, the Fund’s shareholders benefit from the incremental net income.
The interest earned on securities purchased with the proceeds from leverage is distributed to the Fund’s shareholders, and the value of these portfolio holdings is reflected in the Fund’s per share NAV. However, in order to benefit shareholders, the return on assets purchased with leverage proceeds must exceed the ongoing costs associated with the leverage. If interest and other ongoing costs of leverage exceed the Fund’s return on assets purchased with leverage proceeds, income to shareholders is lower than if the Fund had not used leverage.
Furthermore, the value of the Fund’s portfolio investments generally varies inversely with the direction of long-term interest rates, although other factors can also influence the value of portfolio investments. As a result, changes in interest rates can influence the Fund’s NAV positively or negatively in addition to the impact on the Fund’s performance from leverage. Changes in the direction of interest rates are difficult to predict accurately, and there is no assurance that the Fund’s leveraging strategy will be successful.
The use of leverage also generally causes greater changes in the Fund’s NAV and dividend rates than comparable portfolios without leverage. In a declining market, leverage is likely to cause a greater decline in the NAV of the Fund’s shares than if the Fund were not leveraged. In addition, the Fund may be required to sell portfolio securities at inopportune times or at distressed values in order to comply with regulatory requirements applicable to the use of leverage or as required by the terms of the leverage instruments, which may cause the Fund to incur losses. The use of leverage may limit the Fund’s ability to invest in certain types of securities or use certain types of hedging strategies. The Fund incurs expenses in connection with the use of leverage, all of which are borne by the Fund’s shareholders and may reduce income.
Derivative Financial Instruments
The Fund may invest in various derivative financial instruments. These instruments are used to obtain exposure to a security, commodity, index, market, and/or other assets without owning or taking physical custody of securities, commodities and/or other referenced assets or to manage market, equity, credit, interest rate, foreign currency exchange rate, commodity and/or other risks. Derivative financial instruments may give rise to a form of economic leverage and involve risks, including the imperfect correlation between the value of a derivative financial instrument and the underlying asset, possible default of the counterparty to the transaction or illiquidity of the instrument. The Fund’s successful use of a derivative financial instrument depends on the investment adviser’s ability to predict pertinent market movements accurately, which cannot be assured. The use of these instruments may result in losses greater than if they had not been used, may limit the amount of appreciation the Fund can realize on an investment and/or may result in lower distributions paid to shareholders. The Fund’s investments in these instruments, if any, are discussed in detail in the Notes to Financial Statements.
| THE BENEFITS AND RISKS OF LEVERAGING / DERIVATIVE FINANCIAL INSTRUMENTS | 7 |
April 30, 2018 | BlackRock U.S. Mortgage Portfolio (Percentages shown are based on Net Assets) |
| Security | Par (000) | Value | ||||||
Asset-Backed Securities — 6.9% |
| |||||||
Arbor Realty Commercial Real Estate Notes Ltd., | USD | 790 | $ | 794,134 | ||||
BSPRT Issuer Ltd.(a)(b): | ||||||||
Series 2017-FL1, Class A, 3.25%, 06/15/27 | 870 | 872,421 | ||||||
Series 2018-FL3, Class A, 2.95%, 03/15/28(c) | 1,940 | 1,941,222 | ||||||
CIFC Funding Ltd., Series 2014-V, 3.75%, 01/17/27(a)(b) | 3,300 | 3,304,306 | ||||||
CWABS, Inc. Trust, Series 2004-6, Class 2A4, 2.80%, 11/25/34(a) | 20 | 20,067 | ||||||
Dryden XXVIII Senior Loan Fund, Series 2013-28A, Class A1LR, 3.04%, | 1,000 | 1,001,916 | ||||||
Invitation Homes Trust(a)(b): | ||||||||
Series 2015-SFR1, Class A, 3.35%, 03/17/32 | 754 | 756,163 | ||||||
Series 2015-SFR2, Class A, 3.25%, 06/17/32 | 1,063 | 1,064,886 | ||||||
Series 2015-SFR3, Class A, 3.20%, 08/17/32 | 2,167 | 2,171,666 | ||||||
Litigation Fee Residual Funding LLC, Series 2015-1, 4.00%, 10/30/27(b)(c) | 578 | 575,032 | ||||||
Long Beach Mortgage Loan Trust, Series 2006-10, Class 2A2, 2.01%, 11/25/36(a) | 11 | 4,923 | ||||||
OCP CLO Ltd., Series 2012-2A, Class A1R, 3.30%, 11/22/25(a)(b) | 1,300 | 1,302,252 | ||||||
Progress Residential Trust(b): | ||||||||
Series 2015-SFR2, Class A, 2.74%, 06/12/32 | 787 | 775,963 | ||||||
Series 2017-SFR1, Class A, 2.77%, 08/17/34 | 419 | 406,115 | ||||||
Scholar Funding Trust, Series 2011-A, Class A, 3.26%, 10/28/43(a)(b) | 462 | 463,453 | ||||||
SMB Private Education Loan Trust, Series 2015-C, Class A3, 3.85%, | 500 | 523,694 | ||||||
World Financial Network Credit Card Master Trust, | 700 | 700,130 | ||||||
|
| |||||||
Total Asset-Backed Securities — 6.9% |
| 16,678,343 | ||||||
|
| |||||||
Non-Agency Mortgage-Backed Securities — 17.0% |
| |||||||
| Collateralized Mortgage Obligations — 0.2% | ||||||||
Alternative Loan Trust, Series 2004-12CB, Class 1A1, 5.00%, 07/25/19 | 39 | 39,553 | ||||||
Banc of America Mortgage Trust, Series 2005-I, Class 2A5, 3.60%, 10/25/35(a) | 274 | 264,352 | ||||||
CHL Mortgage Pass-Through Trust, Series 2005-17, Class 1A6, 5.50%, 09/25/35 | 119 | 118,884 | ||||||
CSMC Mortgage-Backed Trust, Series 2006-8, Class 1A1, 4.50%, 10/25/21 | 27 | 24,985 | ||||||
|
| |||||||
| 447,774 | ||||||||
| Commercial Mortgage-Backed Securities — 14.0% | ||||||||
1211 Avenue of the Americas Trust, Series 2015-1211, Class A1A2, 3.90%, | 370 | 375,661 | ||||||
245 Park Avenue Trust, Series 2017-245P, Class E, 3.78%, 06/05/37(a)(b) | 930 | 836,354 | ||||||
280 Park Avenue Mortgage Trust, Series 2017-280P, Class E, 4.02%, 09/15/34(a)(b) | 210 | 210,007 | ||||||
AREIT Trust, Series 2018-CRE1, Class A, 2.75%, 02/15/35(a)(b)(c) | 615 | 615,000 | ||||||
Atrium Hotel Portfolio Trust(a)(b): | ||||||||
Series 2017-ATRM, Class A, 2.83%, 12/15/36 | 1,060 | 1,061,331 | ||||||
Series 2017-ATRM, Class E, 4.95%, 12/15/36 | 330 | 330,000 | ||||||
Bancorp Commercial Mortgage Trust(a)(b): | ||||||||
Series 2016-CRE1, Class A, 3.33%, 11/15/33 | 264 | 264,540 | ||||||
Series 2018-CR3, Class A, 2.75%, 01/15/33 | 220 | 220,000 | ||||||
BHMS Mortgage Trust, Series 2014-ATLS, Class AFL, 3.39%, 07/05/33(a)(b) | 1,400 | 1,403,425 | ||||||
BSPRT Issuer Ltd., Series 2017-FL2, Class A, 2.72%, 10/15/34(a)(b) | 440 | 439,859 | ||||||
| Security | Par (000) | Value | ||||||
| Commercial Mortgage-Backed Securities (continued) | ||||||||
CCRESG Commercial Mortgage Trust(b): | ||||||||
Series 2016-HEAT, Class A, 3.36%, 04/10/29 | USD | 950 | $ | 933,429 | ||||
Series 2016-HEAT, Class D, 5.67%, 04/10/29(a) | 720 | 709,901 | ||||||
CD Mortgage Trust, Series 2006-CD3, Class AM, 5.65%, 10/15/48 | 3,020 | 3,122,812 | ||||||
CFCRE Commercial Mortgage Trust, Series 2016-C3, Class A3, 3.87%, 01/10/48 | 380 | 383,565 | ||||||
CityLine Commercial Mortgage Trust, Series 2016-CLNE, Class A, 2.87%, 11/10/31(a)(b) | 400 | 385,607 | ||||||
CLNS Trust, Series 2017-IKPR, Class E, 5.40%, 06/11/32(a)(b) | 385 | 387,650 | ||||||
Commercial Mortgage Trust: | ||||||||
Series 2013-CR13, Class A4, 4.19%, 11/10/46(a) | 780 | 807,381 | ||||||
Series 2014-CR17, Class A5, 3.98%, 05/10/47 | 100 | 102,401 | ||||||
Series 2014-TWC, Class A, 2.75%, 02/13/32(a)(b) | 1,145 | 1,146,075 | ||||||
Series 2014-UBS2, Class A5, 3.96%, 03/10/47 | 345 | 353,127 | ||||||
Series 2015-CR23, Class CMB, 3.81%, | 800 | 802,814 | ||||||
Series 2015-CR25, Class C, 4.70%, 08/10/48(a) | 50 | 49,178 | ||||||
Series 2015-CR26, Class ASB, 3.37%, 10/10/48 | 400 | 399,850 | ||||||
Series 2015-LC19, Class D, 2.87%, 02/10/48(b) | 180 | 147,798 | ||||||
Series 2017-PANW, Class A, 3.24%, 10/10/29(b) | 1,580 | 1,539,740 | ||||||
CSMC, Series 2016-MFF, Class A, 3.50%, 11/15/33(a)(b) | 222 | 223,000 | ||||||
CSMC Trust, Series 2017-CALI, Class A, 3.43%, 11/10/32(b) | 460 | 457,022 | ||||||
DBUBS Mortgage Trust, Series 2017-BRBK, Class A, 3.45%, 10/10/34(b) | 710 | 705,529 | ||||||
GRACE Mortgage Trust, Series 2014-GRCE, Class F, 3.71%, 06/10/28(a)(b) | 215 | 210,108 | ||||||
GS Mortgage Securities Corp. II, Series 2005-ROCK, Class A, 5.37%, 05/03/32(b) | 335 | 371,218 | ||||||
GS Mortgage Securities Corp. Trust, Series 2018-CHLL, Class D, 3.55%, 02/15/37(a)(b) | 100 | 100,051 | ||||||
GS Mortgage Securities Trust: | ||||||||
Series 2013-GC14, Class A4, 3.96%, 08/10/46 | 200 | 205,807 | ||||||
Series 2015-GC32, Class A4, 3.76%, 07/10/48 | 300 | 302,729 | ||||||
Series 2015-GC32, Class D, 3.35%, 07/10/48 | 500 | 403,093 | ||||||
IMT Trust, Series 2017-APTS, Class BFX, 3.61%, 06/15/34(a)(b) | 1,250 | 1,218,694 | ||||||
InTown Hotel Portfolio Trust, Series 2018-STAY, Class A, 2.60%, 01/15/33(a)(b) | 440 | 440,547 | ||||||
JPMCC Commercial Mortgage Securities Trust, Series 2017-JP5, Class D, 4.80%, 03/15/50(a)(b) | 970 | 923,966 | ||||||
JPMorgan Chase Commercial Mortgage Securities: | ||||||||
Series 2014-C20, Class A5, 3.80%, 07/15/47 | 650 | 660,053 | ||||||
Series 2015-JP1, Class E, 4.40%, 01/15/49(a)(b) | 135 | 116,989 | ||||||
Series 2015-SGP, Class A, 3.60%, 07/15/36(a)(b) | 287 | 288,862 | ||||||
Series 2016-NINE, Class A, 2.95%, 10/06/38(a)(b) | 640 | 600,351 | ||||||
Series 2017-MAUI, Class E, 4.85%, | 2,270 | 2,278,522 | ||||||
Series 2018-ASH8, Class D, 3.95%, | 260 | 260,735 | ||||||
LMREC, Inc., Series 2016-CRE2, Class A, 3.60%, 11/24/31(a)(b) | 330 | 328,350 | ||||||
Morgan Stanley Bank of America Merrill Lynch Trust, Series 2015-C23, Class A4, 3.72%, 07/15/50 | 905 | 907,973 | ||||||
Morgan Stanley Capital I, Series 2017-HR2, Class D, 2.73%, 12/15/50 | 80 | 62,883 | ||||||
Morgan Stanley Capital I Trust, Series 2014-150E, Class A, 3.91%, 09/09/32(b) | 595 | 600,853 | ||||||
Morgan Stanley Capital I, Inc., Series 2017-JWDR, Class D, 3.85%, 11/15/34(a)(b) | 580 | 582,550 | ||||||
Olympic Tower Mortgage Trust, Series 2017-OT, Class E, 4.08%, 05/10/39(a)(b) | 780 | 733,585 | ||||||
RAIT Trust, Series 2017-FL7, Class A, 2.85%, 06/15/37(a)(b) | 803 | 803,791 | ||||||
Wells Fargo Commercial Mortgage Trust(a): | ||||||||
Series 2016-NXS5, Class D, 5.04%, 01/15/59 | 1,337 | 1,283,170 | ||||||
Series 2018-BXI, Class E, 4.05%, 12/15/36(b) | 100 | 99,715 | ||||||
| 8 | 2018 BLACKROCK ANNUAL REPORTTO SHAREHOLDERS |
Schedule of Investments (continued) April 30, 2018 | BlackRock U.S. Mortgage Portfolio (Percentages shown are based on Net Assets) |
| Security | Par (000) | Value | ||||||
| Commercial Mortgage-Backed Securities (continued) | ||||||||
WFRBS Commercial Mortgage Trust: | ||||||||
Series 2014-C21, Class A4, 3.41%, 08/15/47 | USD | 675 | $ | 671,824 | ||||
Series 2014-C22, Class C, 3.91%, 09/15/57(a) | 63 | 59,585 | ||||||
Series 2014-LC14, Class A4, 3.77%, 03/15/47 | 900 | 912,423 | ||||||
|
| |||||||
| 33,841,483 | ||||||||
| Interest Only Commercial Mortgage-Backed Securities — 2.8%(a) | ||||||||
Banc of America Commercial Mortgage Trust, | 969 | 48,222 | ||||||
BANK, Series 2017-BNK9, Class XA, 0.97%, 11/15/54 | 4,362 | 263,789 | ||||||
CFCRE Commercial Mortgage Trust, Series 2016-C4, Class XA, 1.91%, 05/10/58 | 2,920 | 292,856 | ||||||
Citigroup Commercial Mortgage Trust: | ||||||||
Series 2015-GC27, Class XA, 1.54%, 02/10/48 | 17,045 | 1,212,702 | ||||||
Series 2017-P8, Class XA, 1.07%, 09/15/50 | 1,087 | 72,747 | ||||||
Commercial Mortgage Trust, Series 2015-CR24, Class XA, 0.95%, 08/10/48 | 3,882 | 177,184 | ||||||
Core Industrial Trust(b): | ||||||||
Series 2015-CALW, Class XA, 0.94%, 02/10/34 | 10,760 | 286,276 | ||||||
Series 2015-TEXW, Class XA, 0.90%, 02/10/34 | 9,200 | 233,682 | ||||||
Series 2015-WEST, Class XA, 1.08%, 02/10/37 | 4,600 | 256,383 | ||||||
CSMC OA LLC, Series 2014-USA, Class X1, 0.70%, 09/15/37(b) | 10,500 | 339,045 | ||||||
DBJPM Mortgage Trust, Series 2016-C1, Class XA, 1.65%, 05/10/49 | 4,449 | 386,845 | ||||||
JPMBB Commercial Mortgage Securities Trust, | 9,795 | 543,061 | ||||||
JPMDB Commercial Mortgage Securities Trust, | 22,748 | 1,504,122 | ||||||
Morgan Stanley Capital I, Series 2017-HR2, Class XA, 0.95%, 12/15/50 | 6,766 | 407,440 | ||||||
Wells Fargo Commercial Mortgage Trust: | ||||||||
Series 2015-C27, Class XA, 1.05%, 02/15/48 | 9,387 | 448,175 | ||||||
Series 2017-C41, Class XA, 1.39%, 11/15/50 | 3,909 | 345,598 | ||||||
|
| |||||||
| 6,818,127 | ||||||||
Total Non-Agency Mortgage-Backed Securities — 17.0% |
| 41,107,384 | ||||||
|
| |||||||
U.S. Government Sponsored Agency Securities — 210.0% |
| |||||||
| Collateralized Mortgage Obligations — 3.3% | ||||||||
Federal Home Loan Mortgage Corp.: | ||||||||
Series 4398, Class ZX, 4.00%, 09/15/54 | 288 | 289,549 | ||||||
Series 4253, Class DZ, 4.75%, 09/15/43 | 675 | 723,512 | ||||||
Federal Home Loan Mortgage Corp. Variable Rate Notes, Series 2411, Class FJ, (LIBOR USD 1 Month + 0.35%), 2.25%, 12/15/29(d) | 6 | 6,034 | ||||||
Federal National Mortgage Association: | ||||||||
Series 2017-69, Class HA, 3.00%, 06/25/46 | 2,545 | 2,505,348 | ||||||
Series 2017-87, Class UA, 3.50%, 12/25/44 | 1,223 | 1,222,166 | ||||||
Series 2011-8, Class ZA, 4.00%, 02/25/41 | 1,336 | 1,355,728 | ||||||
Government National Mortgage Association: | ||||||||
Series 2014-12, Class ZA, 3.00%, 01/20/44 | 681 | 627,732 | ||||||
Series 2014-62, Class Z, 3.00%, 04/20/44 | 564 | 522,579 | ||||||
Series 2009-122, Class PY, 6.00%, 12/20/39 | 134 | 144,491 | ||||||
Government National Mortgage Association Variable Rate Notes, Series 2014-107, Class WX, 6.79%, 07/20/39(a) | 551 | 618,488 | ||||||
|
| |||||||
| 8,015,627 | ||||||||
| Interest Only Collateralized Mortgage Obligations — 0.1% | ||||||||
Federal National Mortgage Association, Series 2013-10, Class PI, 3.00%, 02/25/43(c) | 1,438 | 156,035 | ||||||
|
| |||||||
| Security | Par (000) | Value | ||||||
| Interest Only Commercial Mortgage-Backed Securities — 2.5% | ||||||||
Federal Home Loan Mortgage Corp. Multifamily Structured Pass-Through Certificates Variable Rate Notes: | ||||||||
Series K041, Class X1(LIBOR USD 1 Month + 0.00%), 0.68%, 10/25/24(d) | USD | 5,082 | $ | 153,532 | ||||
Series K064, Class X1, 0.74%, 03/25/27(a) | 19,157 | 879,896 | ||||||
Series K718, Class X1, 0.76%, 01/25/22(a) | 1,021 | 20,650 | ||||||
Series KC01, Class X1, 0.84%, 12/25/22(a) | 4,118 | 84,483 | ||||||
Series K042, Class X1, 1.19%, 12/25/24(a) | 1,670 | 97,302 | ||||||
Series K722, Class X1(LIBOR USD 1 Month + 0.00%), 1.44%, 03/25/23(d) | 3,962 | 204,209 | ||||||
Federal Home Loan Mortgage Corp. Variable Rate Notes, Series 2015-K718, Class X2A, 0.10%, 02/25/22(a)(b) | 70,915 | 211,666 | ||||||
Federal National Mortgage Association ACES Variable Rate Notes, Series 2016-M4, Class X2, 2.68%, 01/25/39(a) | 1,658 | 175,098 | ||||||
Government National Mortgage Association Variable Rate Notes:(a) | ||||||||
Series 2017-54, 0.65%, 12/16/58 | 1,444 | 91,254 | ||||||
Series 2017-53, 0.69%, 11/16/56 | 8,648 | 521,393 | ||||||
Series 2017-127, 0.72%, 02/16/59 | 12,777 | 894,885 | ||||||
Series 2017-64, 0.72%, 11/16/57 | 12,496 | 832,686 | ||||||
Series 2013-63, 0.79%, 09/16/51 | 21,402 | 1,126,152 | ||||||
Series 2015-171, 0.89%, 11/16/55 | 12,952 | 821,211 | ||||||
|
| |||||||
| 6,114,417 | ||||||||
| Mortgage-Backed Securities — 204.1% | ||||||||
Federal Home Loan Mortgage Corp.: | ||||||||
2.50%, 09/01/27 — 02/01/32 | 3,759 | 3,663,232 | ||||||
2.50%, 05/15/33(e) | 2,981 | 2,896,687 | ||||||
3.00%, 05/01/28 — 12/01/46 | 6,127 | 5,977,622 | ||||||
3.00%, 05/15/33 — 05/15/48(e) | 13,354 | 12,968,272 | ||||||
3.50%, 02/01/33 — 01/01/48(f) | 19,280 | 19,278,191 | ||||||
3.50%, 05/15/33 — 05/15/48(e) | 3,960 | 3,955,981 | ||||||
4.00%, 01/01/40 — 09/01/47(f) | 6,773 | 6,950,656 | ||||||
4.00%, 05/15/48(e) | 10,311 | 10,505,942 | ||||||
4.50%, 01/01/19 — 01/01/48 | 4,564 | 4,815,845 | ||||||
4.50%, 05/15/48(e) | 2,127 | 2,214,905 | ||||||
5.00%, 11/01/24 — 02/01/42 | 2,042 | 2,188,218 | ||||||
5.50%, 02/01/35 — 06/01/41 | 1,022 | 1,115,907 | ||||||
6.00%, 08/01/28 — 11/01/39 | 31 | 34,517 | ||||||
Federal National Mortgage Association: | ||||||||
2.00%, 10/01/31 — 03/01/32 | 1,459 | 1,385,062 | ||||||
2.50%, 06/01/28 — 09/01/32(f) | 10,258 | 9,996,307 | ||||||
2.50%, 05/25/33 — 06/25/48(e) | 2,645 | 2,530,487 | ||||||
3.00%, 04/01/28 — 03/01/47(f) | 44,302 | 43,287,684 | ||||||
3.00%, 05/25/33 — 05/25/48(e) | 14,190 | 14,022,919 | ||||||
3.50%, 02/01/21 — 01/01/48(f) | 53,771 | �� | 53,971,295 | |||||
3.50%, 05/25/33 — 05/25/48(e) | 43,863 | 43,649,726 | ||||||
4.00%, 04/01/26 — 01/01/57(f) | 40,480 | 41,577,638 | ||||||
4.00%, 05/25/48 — 06/25/48(e) | 60,806 | 61,874,632 | ||||||
4.50%, 07/01/24 — 02/01/57(f) | 24,226 | 25,497,648 | ||||||
4.50%, 12/01/47 | 254 | 267,654 | ||||||
4.50%, 05/25/48(e) | 2,460 | 2,562,436 | ||||||
5.00%, 01/01/23 — 06/01/39(f) | 3,335 | 3,569,705 | ||||||
5.00%, 05/25/48(e) | 35 | 37,164 | ||||||
5.06%, 09/01/44 | 106 | 111,851 | ||||||
5.50%, 06/01/24 — 03/01/40 | 1,457 | 1,595,390 | ||||||
6.00%, 12/01/32 — 09/01/40 | 1,755 | 1,933,122 | ||||||
6.50%, 09/01/36 — 05/01/40 | 299 | 332,781 | ||||||
Government National Mortgage Association: | ||||||||
3.00%, 02/15/45 — 07/20/47(f) | 19,458 | 19,035,996 | ||||||
3.00%, 05/15/48(e) | 9,463 | 9,223,350 | ||||||
3.50%, 12/20/41 — 10/20/46(f) | 29,227 | 29,331,475 | ||||||
3.50%, 05/15/48(e) | 19,023 | 19,046,779 | ||||||
4.00%, 04/20/39 — 10/20/46(f) | 5,022 | 5,180,264 | ||||||
| SCHEDULE OF INVESTMENTS | 9 |
Schedule of Investments (continued) April 30, 2018 | BlackRock U.S. Mortgage Portfolio (Percentages shown are based on Net Assets) |
| Security | Par (000) | Value | ||||||
| Mortgage-Backed Securities (continued) | ||||||||
4.00%, 05/15/48 —06/15/48(e) | USD | 15,135 | $ | 15,469,658 | ||||
4.50%, 09/20/39 —11/20/44(f) | 6,112 | 6,426,064 | ||||||
4.50%, 05/15/48(e) | 72 | 74,706 | ||||||
5.00%, 12/15/34 —07/20/44(f) | 3,436 | 3,680,565 | ||||||
5.50%, 07/15/38 — 12/20/41 | 1,057 | 1,142,146 | ||||||
6.50%, 10/15/38 — 02/20/41 | 396 | 442,868 | ||||||
|
| |||||||
| 493,823,347 | ||||||||
|
| |||||||
Total U.S. Government Sponsored Agency Securities — 210.0% |
| 508,109,426 | ||||||
|
| |||||||
Total Long-Term Investments — 233.9% |
| 565,895,153 | ||||||
|
| |||||||
| Shares | ||||||||
Short-Term Securities — 0.4%(g) | ||||||||
Dreyfus Treasury Prime Cash Management Institutional Shares, 1.56% | 1,022,740 | 1,022,741 | ||||||
JPMorgan US Treasury Plus Money Market Fund, Agency Class, 1.52% | 9,532 | 9,532 | ||||||
|
| |||||||
Total Short-Term Securities — 0.4% |
| 1,032,273 | ||||||
|
| |||||||
Total Options Purchased — 0.0% |
| 3,096 | ||||||
|
| |||||||
Total Investments Before TBA Sale Commitments — 234.3% |
| 566,930,522 | ||||||
|
| |||||||
| Par (000) | ||||||||
TBA Sale Commitments — (84.9)%(e) | ||||||||
| Mortgage-Backed Securities — (84.9)% | ||||||||
Federal Home Loan Mortgage Corp.: | ||||||||
2.50%, 05/15/33 | USD | 64 | (62,190 | ) | ||||
3.00%, 05/15/33 — 05/15/48 | 458 | (449,335 | ) | |||||
3.50%, 05/15/48 | 16,005 | (15,894,581 | ) | |||||
| Security | Par (000) | Value | ||||||
| Mortgage-Backed Securities (continued) | ||||||||
4.00%, 05/15/48 | USD | 216 | $ | (220,084 | ) | |||
4.50%, 05/15/48 | 88 | (91,637 | ) | |||||
Federal National Mortgage Association: | ||||||||
2.00%, 05/25/33 | 569 | (539,828 | ) | |||||
2.50%, 05/25/33 | 4,653 | (4,525,678 | ) | |||||
3.00%, 05/25/33 — 05/25/48 | 16,764 | (16,203,349 | ) | |||||
3.50%, 05/25/33 — 06/25/48 | 109,580 | (108,970,362 | ) | |||||
4.00%, 05/25/48 | 29,512 | (30,058,434 | ) | |||||
4.50%, 05/25/48 | 5,643 | (5,878,123 | ) | |||||
5.00%, 05/25/48 — 06/25/48 | 1,193 | (1,264,848 | ) | |||||
Government National Mortgage Association: | ||||||||
3.00%, 05/15/48 | 9,094 | (8,863,676 | ) | |||||
3.50%, 05/15/48 | 8,118 | (8,128,294 | ) | |||||
4.00%, 05/15/48 | 3,852 | (3,939,874 | ) | |||||
4.50%, 05/15/48 | 359 | (372,490 | ) | |||||
|
| |||||||
Total TBA Sale Commitments — (84.9)% |
| (205,462,783 | ) | |||||
|
| |||||||
Total Investments Net of TBA Sale Commitments — 149.4% |
| 361,467,739 | ||||||
Liabilities in Excess of Other Assets — (49.4)% |
| (119,474,610 | ) | |||||
|
| |||||||
Net Assets — 100.0% |
| $ | 241,993,129 | |||||
|
| |||||||
| (a) | Variable or floating rate security, which interest rate adjusts periodically based on changes in current interest rates and prepayments on the underlying pool of assets. Rate shown is the rate in effect as of period end. |
| (b) | Security exempt from registration pursuant to Rule 144A under the Securities Act of 1933, as amended. These securities may be resold in transactions exempt from registration to qualified institutional investors. |
| (c) | Security is valued using significant unobservable inputs and is classified as Level 3 in the fair value hierarchy. |
| (d) | Variable rate security. Security may be issued at a fixed coupon rate, which converts to a variable rate at a specified date. Rate shown is the rate in effect as of period end. |
| (e) | Represents or includes a TBA transaction. |
| (f) | All or a portion of security has been pledged as collateral in connection with outstanding reverse repurchase agreements. |
| (g) | Annualized 7-day yield as of period end. |
Reverse Repurchase Agreements
| Counterparty | Interest Rate | Trade Date | Maturity Date | Face Value | Face Value Including Accrued Interest | Type of Underlying Collateral | Remaining Contractual Maturity of the Agreements | |||||||||||||||||
Citigroup Global Markets, Inc. | 1.85 | % | 4/11/2018 | 05/14/18 | $ | 1,256,000 | $ | 1,257,226 | U.S. Government Sponsored Agency Securities | Up to 30 days | ||||||||||||||
Citigroup Global Markets, Inc. | 1.85 | 4/11/2018 | 05/14/18 | 2,015,000 | 2,016,967 | U.S. Government Sponsored Agency Securities | Up to 30 days | |||||||||||||||||
Citigroup Global Markets, Inc. | 1.85 | 4/11/2018 | 05/14/18 | 1,633,000 | 1,634,594 | U.S. Government Sponsored Agency Securities | Up to 30 days | |||||||||||||||||
Citigroup Global Markets, Inc. | 1.85 | 4/11/2018 | 05/14/18 | 2,545,000 | 2,547,485 | U.S. Government Sponsored Agency Securities | Up to 30 days | |||||||||||||||||
Citigroup Global Markets, Inc. | 1.85 | 4/11/2018 | 05/14/18 | 1,302,000 | 1,303,271 | U.S. Government Sponsored Agency Securities | Up to 30 days | |||||||||||||||||
Citigroup Global Markets, Inc. | 1.85 | 4/11/2018 | 05/14/18 | 1,437,000 | 1,438,403 | U.S. Government Sponsored Agency Securities | Up to 30 days | |||||||||||||||||
Citigroup Global Markets, Inc. | 1.85 | 4/11/2018 | 05/14/18 | 3,185,000 | 3,188,110 | U.S. Government Sponsored Agency Securities | Up to 30 days | |||||||||||||||||
Citigroup Global Markets, Inc. | 1.85 | 4/11/2018 | 05/14/18 | 1,961,000 | 1,962,915 | U.S. Government Sponsored Agency Securities | Up to 30 days | |||||||||||||||||
Citigroup Global Markets, Inc. | 1.85 | 4/11/2018 | 05/14/18 | 1,398,000 | 1,399,365 | U.S. Government Sponsored Agency Securities | Up to 30 days | |||||||||||||||||
| 10 | 2018 BLACKROCK ANNUAL REPORTTO SHAREHOLDERS |
Schedule of Investments (continued) April 30, 2018 | BlackRock U.S. Mortgage Portfolio |
| Counterparty | Interest Rate | Trade Date | Maturity Date | Face Value | Face Value Including Accrued Interest | Type of Underlying Collateral | Remaining Contractual Maturity of the Agreements | |||||||||||||||||
Citigroup Global Markets, Inc. | 1.85 | % | 4/11/18 | 05/14/18 | $ | 3,688,000 | $ | 3,691,601 | U.S. Government Sponsored Agency Securities | Up to 30 days | ||||||||||||||
Citigroup Global Markets, Inc. | 1.85 | 4/11/18 | 05/14/18 | 1,265,000 | 1,266,235 | U.S. Government Sponsored Agency Securities | Up to 30 days | |||||||||||||||||
Citigroup Global Markets, Inc. | 1.85 | 4/11/18 | 05/14/18 | 1,675,000 | 1,676,635 | U.S. Government Sponsored Agency Securities | Up to 30 days | |||||||||||||||||
Citigroup Global Markets, Inc. | 1.85 | 4/11/18 | 05/14/18 | 1,416,000 | 1,417,383 | U.S. Government Sponsored Agency Securities | Up to 30 days | |||||||||||||||||
Citigroup Global Markets, Inc. | 1.85 | 4/11/18 | 05/14/18 | 2,756,000 | 2,758,691 | U.S. Government Sponsored Agency Securities | Up to 30 days | |||||||||||||||||
Citigroup Global Markets, Inc. | 1.85 | 4/11/18 | 05/14/18 | 1,434,000 | 1,435,400 | U.S. Government Sponsored Agency Securities | Up to 30 days | |||||||||||||||||
Citigroup Global Markets, Inc. | 1.85 | 4/11/18 | 05/14/18 | 3,152,000 | 3,155,078 | U.S. Government Sponsored Agency Securities | Up to 30 days | |||||||||||||||||
Citigroup Global Markets, Inc. | 1.85 | 4/11/18 | 05/14/18 | 4,811,000 | 4,815,697 | U.S. Government Sponsored Agency Securities | Up to 30 days | |||||||||||||||||
Citigroup Global Markets, Inc. | 1.85 | 4/11/18 | 05/14/18 | 1,697,000 | 1,698,657 | U.S. Government Sponsored Agency Securities | Up to 30 days | |||||||||||||||||
Citigroup Global Markets, Inc. | 1.85 | 4/11/18 | 05/14/18 | 1,936,000 | 1,937,890 | U.S. Government Sponsored Agency Securities | Up to 30 days | |||||||||||||||||
Citigroup Global Markets, Inc. | 1.85 | 4/11/18 | 05/14/18 | 1,179,000 | 1,180,151 | U.S. Government Sponsored Agency Securities | Up to 30 days | |||||||||||||||||
Citigroup Global Markets, Inc. | 1.85 | 4/11/18 | 05/14/18 | 1,162,000 | 1,163,135 | U.S. Government Sponsored Agency Securities | Up to 30 days | |||||||||||||||||
Citigroup Global Markets, Inc. | 1.85 | 4/11/18 | 05/14/18 | 1,164,000 | 1,165,137 | U.S. Government Sponsored Agency Securities | Up to 30 days | |||||||||||||||||
Citigroup Global Markets, Inc. | 1.85 | 4/11/18 | 05/14/18 | 1,921,000 | 1,922,876 | U.S. Government Sponsored Agency Securities | Up to 30 days | |||||||||||||||||
Citigroup Global Markets, Inc. | 1.85 | 4/11/18 | 05/14/18 | 1,469,000 | 1,470,434 | U.S. Government Sponsored Agency Securities | Up to 30 days | |||||||||||||||||
Citigroup Global Markets, Inc. | 1.85 | 4/11/18 | 05/14/18 | 1,157,000 | 1,158,130 | U.S. Government Sponsored Agency Securities | Up to 30 days | |||||||||||||||||
Citigroup Global Markets, Inc. | 1.85 | 4/11/18 | 05/14/18 | 1,212,000 | 1,213,183 | U.S. Government Sponsored Agency Securities | Up to 30 days | |||||||||||||||||
Citigroup Global Markets, Inc. | 1.85 | 4/11/18 | 05/14/18 | 3,438,000 | 3,441,357 | U.S. Government Sponsored Agency Securities | Up to 30 days | |||||||||||||||||
Citigroup Global Markets, Inc. | 1.85 | 4/11/18 | 05/14/18 | 1,301,000 | 1,302,270 | U.S. Government Sponsored Agency Securities | Up to 30 days | |||||||||||||||||
Citigroup Global Markets, Inc. | 1.85 | 4/11/18 | 05/14/18 | 2,574,000 | 2,576,513 | U.S. Government Sponsored Agency Securities | Up to 30 days | |||||||||||||||||
Citigroup Global Markets, Inc. | 1.85 | 4/11/18 | 05/14/18 | 1,460,000 | 1,461,426 | U.S. Government Sponsored Agency Securities | Up to 30 days | |||||||||||||||||
Citigroup Global Markets, Inc. | 1.85 | 4/11/18 | 05/14/18 | 4,216,000 | 4,220,117 | U.S. Government Sponsored Agency Securities | Up to 30 days | |||||||||||||||||
Citigroup Global Markets, Inc. | 1.85 | 4/11/18 | 05/14/18 | 3,672,000 | 3,675,585 | U.S. Government Sponsored Agency Securities | Up to 30 days | |||||||||||||||||
Citigroup Global Markets, Inc. | 1.85 | 4/11/18 | 05/14/18 | 1,221,000 | 1,222,192 | U.S. Government Sponsored Agency Securities | Up to 30 days | |||||||||||||||||
Citigroup Global Markets, Inc. | 1.85 | 4/11/18 | 05/14/18 | 1,790,000 | 1,791,748 | U.S. Government Sponsored Agency Securities | Up to 30 days | |||||||||||||||||
Citigroup Global Markets, Inc. | 1.85 | 4/11/18 | 05/14/18 | 1,558,000 | 1,559,521 | U.S. Government Sponsored Agency Securities | Up to 30 days | |||||||||||||||||
Citigroup Global Markets, Inc. | 1.85 | 4/11/18 | 05/14/18 | 1,412,000 | 1,413,379 | U.S. Government Sponsored Agency Securities | Up to 30 days | |||||||||||||||||
Citigroup Global Markets, Inc. | 1.85 | 4/11/18 | 05/14/18 | 1,204,000 | 1,205,176 | U.S. Government Sponsored Agency Securities | Up to 30 days | |||||||||||||||||
Citigroup Global Markets, Inc. | 1.85 | 4/11/18 | 05/14/18 | 3,352,000 | 3,355,273 | U.S. Government Sponsored Agency Securities | Up to 30 days | |||||||||||||||||
Citigroup Global Markets, Inc. | 1.85 | 4/11/18 | 05/14/18 | 1,182,000 | 1,183,154 | U.S. Government Sponsored Agency Securities | Up to 30 days | |||||||||||||||||
Citigroup Global Markets, Inc. | 1.85 | 4/11/18 | 05/14/18 | 1,534,000 | 1,535,498 | U.S. Government Sponsored Agency Securities | Up to 30 days | |||||||||||||||||
Citigroup Global Markets, Inc. | 1.85 | 4/11/18 | 05/14/18 | 2,614,000 | 2,616,552 | U.S. Government Sponsored Agency Securities | Up to 30 days | |||||||||||||||||
| SCHEDULE OF INVESTMENTS | 11 |
Schedule of Investments (continued) April 30, 2018 | BlackRock U.S. Mortgage Portfolio |
| Counterparty | Interest Rate | Trade Date | Maturity Date | Face Value | Face Value Including Accrued Interest | Type of Underlying Collateral | Remaining Contractual Maturity of the Agreements | |||||||||||||||||
Citigroup Global Markets, Inc. | 1.85 | % | 4/11/18 | 05/14/18 | $ | 1,300,000 | $ | 1,301,269 | U.S. Government Sponsored Agency Securities | Up to 30 days | ||||||||||||||
Citigroup Global Markets, Inc. | 1.85 | 4/11/18 | 05/14/18 | 3,205,000 | 3,208,129 | U.S. Government Sponsored Agency Securities | Up to 30 days | |||||||||||||||||
Citigroup Global Markets, Inc. | 1.87 | 4/17/18 | 05/17/18 | 8,994,000 | 9,000,541 | U.S. Government Sponsored Agency Securities | Up to 30 days | |||||||||||||||||
Citigroup Global Markets, Inc. | 1.87 | 4/19/18 | 05/21/18 | 21,986,000 | 21,999,704 | U.S. Government Sponsored Agency Securities | Up to 30 days | |||||||||||||||||
|
|
|
| |||||||||||||||||||||
| $ | 117,839,000 | $ | 117,944,053 | |||||||||||||||||||||
|
|
|
| |||||||||||||||||||||
Derivative Financial Instruments Outstanding as of Period End
Futures Contracts
| Description | Number of Contracts | Expiration Date | Notional Amount (000) | Value/ Unrealized Appreciation (Depreciation) | ||||||||||||
Long Contracts | ||||||||||||||||
90-Day Eurodollar | 102 | 06/18/18 | $ | 24,896 | $ | (12,904 | ) | |||||||||
U.S. Treasury Ultra Bond | 11 | 06/20/18 | 1,728 | (9,909 | ) | |||||||||||
U.S. Treasury 5 Year Note | 65 | 06/29/18 | 7,378 | (33,591 | ) | |||||||||||
|
| |||||||||||||||
| (56,404 | ) | |||||||||||||||
|
| |||||||||||||||
Short Contracts | ||||||||||||||||
U.S. Treasury 10 Year Note | 296 | 06/20/18 | 35,409 | 218,009 | ||||||||||||
U.S. Treasury Long Bond | 23 | 06/20/18 | 3,308 | 2,274 | ||||||||||||
U.S. Treasury 2 Year Note | 226 | 06/29/18 | 47,923 | 89,974 | ||||||||||||
90-Day Eurodollar | 102 | 12/17/18 | 24,826 | 32,996 | ||||||||||||
|
| |||||||||||||||
| 343,253 | ||||||||||||||||
|
| |||||||||||||||
| $ | 286,849 | |||||||||||||||
|
| |||||||||||||||
OTC Interest Rate Caps Purchased
| Description | Exercise Rate | Counterparty | Expiration Date | Notional Amount (000) | Value | Premiums Paid | Unrealized Appreciation/ (Depreciation) | |||||||||||||||||||
30Y-5Y CMS Index Cap | 0.30% | Barclays Bank plc | 07/30/18 | USD 95,900 | $ | 3,096 | $ | 54,663 | $ | (51,567 | ) | |||||||||||||||
|
| |||||||||||||||||||||||||
OTC Interest Rate Swaptions Written
|
| Paid by the Fund | Received by the Fund |
| Expiration | Exercise | Notional | Value | |||||||||||||||||||||||
| Description | Rate | Frequency | Rate | Frequency | Counterparty | |||||||||||||||||||||||||
Call | ||||||||||||||||||||||||||||||
2-Year Interest Rate Swap | 3 month LIBOR | Quarterly | 2.35 | % | Semi Annual | Citibank NA | 10/15/18 | 2.35 | % | USD 2,500 | $ | (643 | ) | |||||||||||||||||
2-Year Interest Rate Swap | 3 month LIBOR | Quarterly | 2.50 | % | Semi Annual | Bank of America NA | 11/16/18 | 2.50 | % | USD 8,530 | (4,550 | ) | ||||||||||||||||||
2-Year Interest Rate Swap | 3 month LIBOR | Quarterly | 2.50 | % | Semi Annual | Bank of America NA | 11/26/18 | 2.50 | % | USD 8,530 | (4,877 | ) | ||||||||||||||||||
3-Year Interest Rate Swap | 3 month LIBOR | Quarterly | 2.40 | % | Semi Annual | Bank of America NA | 03/21/19 | 2.40 | % | USD 6,050 | (4,391 | ) | ||||||||||||||||||
3-Year Interest Rate Swap | 3 month LIBOR | Quarterly | 2.40 | % | Semi Annual | Bank of America NA | 03/21/19 | 2.40 | % | USD 6,050 | (4,392 | ) | ||||||||||||||||||
5-Year Interest Rate Swap | 3 month LIBOR | Quarterly | 2.40 | % | Semi Annual | Citibank NA | 10/15/18 | 2.40 | % | USD 7,700 | (7,963 | ) | ||||||||||||||||||
10-Year Interest Rate Swap | 3 month LIBOR | Quarterly | 2.45 | % | Semi Annual | Citibank NA | 10/15/18 | 2.45 | % | USD 5,100 | (12,104 | ) | ||||||||||||||||||
|
| |||||||||||||||||||||||||||||
| (38,920 | ) | |||||||||||||||||||||||||||||
|
| |||||||||||||||||||||||||||||
Put | ||||||||||||||||||||||||||||||
2-Year Interest Rate Swap | 3.25 | % | Semi Annual | 3 month LIBOR | Quarterly | Barclays Bank plc | 10/19/18 | 3.25 | % | USD 13,300 | $ | (5,683 | ) | |||||||||||||||||
2-Year Interest Rate Swap | 2.75 | % | Semi Annual | 3 month LIBOR | Quarterly | Bank of America NA | 11/16/18 | 2.75 | % | USD 8,530 | (38,670 | ) | ||||||||||||||||||
2-Year Interest Rate Swap | 2.75 | % | Semi Annual | 3 month LIBOR | Quarterly | Bank of America NA | 11/26/18 | 2.75 | % | USD 8,530 | (40,019 | ) | ||||||||||||||||||
3-Year Interest Rate Swap | 3.20 | % | Semi Annual | 3 month LIBOR | Quarterly | Bank of America NA | 03/21/19 | 3.20 | % | USD 12,100 | (23,698 | ) | ||||||||||||||||||
|
| |||||||||||||||||||||||||||||
| (108,070 | ) | |||||||||||||||||||||||||||||
|
| |||||||||||||||||||||||||||||
| $ | (146,990 | ) | ||||||||||||||||||||||||||||
|
| |||||||||||||||||||||||||||||
| 12 | 2018 BLACKROCK ANNUAL REPORTTO SHAREHOLDERS |
Schedule of Investments (continued) April 30, 2018 | BlackRock U.S. Mortgage Portfolio |
OTC Credit Default Swaps — Buy Protection
| Reference Obligation/Index | Financing Rate Paid by the Fund | Payment Frequency | Counterparty | Termination Date | Notional Amount | Value | Upfront Premium Paid | Unrealized Appreciation (Depreciation) | ||||||||||||||||||||
CMBX.NA.9.BBB- | 3.00 | % | Monthly | JP Morgan Securities LLC | 09/17/58 | USD 3,100 | $ | 345,701 | $ | 334,949 | $ | 10,752 | ||||||||||||||||
|
|
|
|
|
| |||||||||||||||||||||||
OTC Credit Default Swaps — Sell Protection
| Reference Obligation/Index | Financing Rate Received by the Fund | Payment Frequency | Counterparty | Termination Date | Credit Rating(a) | Notional Amount | Value | Upfront Premium Paid | Unrealized Appreciation (Depreciation) | |||||||||||||||||||||||||
CMBX.NA.9.A | 2.00 | % | Monthly | Credit Suisse International | 09/17/58 | NR | USD 2,505 | $ | (72,255 | ) | $ | (53,641 | ) | $ | (18,614 | ) | ||||||||||||||||||
CMBX.NA.9.BBB- | 3.00 | % | Monthly | Deutsche Bank AG | 09/17/58 | NR | USD 3,100 | (345,701 | ) | (366,601 | ) | 20,900 | ||||||||||||||||||||||
|
|
|
|
|
| |||||||||||||||||||||||||||||
| $ | (417,956 | ) | $ | (420,242 | ) | $ | 2,286 | |||||||||||||||||||||||||||
|
|
|
|
|
| |||||||||||||||||||||||||||||
| (a) | Using S&P’s rating of the issuer or the underlying securities of the index, as applicable. |
| (b) | The maximum potential amount the Fund may pay should a negative credit event take place as defined under the terms of the agreement. |
Centrally Cleared Interest Rate Swaps
| Paid by the Fund | Received by the Fund | Termination Date | Notional Amount (000) | Value | Upfront Premium Paid | Unrealized Appreciation (Depreciation) | ||||||||||||||||||||
| Rate | Frequency | Rate | Frequency | |||||||||||||||||||||||
| 3 month LIBOR | Quarterly | 2.58% | Semi Annual | 03/29/20 | USD 12,500 | $ | (31,146 | ) | $ | — | $ | (31,146 | ) | |||||||||||||
| 3 month LIBOR | Quarterly | 2.59% | Semi Annual | 04/04/20 | USD 12,500 | (30,404 | ) | — | (30,404 | ) | ||||||||||||||||
| 3 month LIBOR | Quarterly | 2.70% | Semi Annual | 04/20/20 | USD 13,000 | (7,492 | ) | — | (7,492 | ) | ||||||||||||||||
| 3 month LIBOR | Quarterly | 1.84% | Semi Annual | 08/23/22 | USD 2,100 | (89,436 | ) | — | (89,436 | ) | ||||||||||||||||
| 3 month LIBOR | Quarterly | 1.88% | Semi Annual | 09/18/22 | USD 1,300 | (54,443 | ) | — | (54,443 | ) | ||||||||||||||||
| 3 month LIBOR | Quarterly | 1.98% | Semi Annual | 09/22/22 | USD 3,000 | (114,255 | ) | — | (114,255 | ) | ||||||||||||||||
| 3 month LIBOR | Quarterly | 2.23% | Semi Annual | 12/20/22 | USD 2,300 | (53,306 | ) | — | (53,306 | ) | ||||||||||||||||
| 2.50% | Semi Annual | 3 month LIBOR | Quarterly | 01/29/23 | USD 14,285 | 160,089 | — | 160,089 | ||||||||||||||||||
| 2.66% | Semi Annual | 3 month LIBOR | Quarterly | 02/06/23 | USD 3,700 | 31,110 | — | 31,110 | ||||||||||||||||||
| 2.71% | Semi Annual | 3 month LIBOR | Quarterly | 02/06/23 | USD 14,245 | 85,918 | — | 85,918 | ||||||||||||||||||
| 2.80% | Semi Annual | 3 month LIBOR | Quarterly | 03/15/23 | USD 4,300 | 14,656 | — | 14,656 | ||||||||||||||||||
| 2.38% | Semi Annual | 3 month LIBOR | Quarterly | 04/24/45 | USD 400 | 47,961 | — | 47,961 | ||||||||||||||||||
| 2.39% | Semi Annual | 3 month LIBOR | Quarterly | 04/24/45 | USD 400 | 47,142 | — | 47,142 | ||||||||||||||||||
| 2.42% | Semi Annual | 3 month LIBOR | Quarterly | 04/24/45 | USD 410 | 45,939 | — | 45,939 | ||||||||||||||||||
| 2.42% | Semi Annual | 3 month LIBOR | Quarterly | 04/24/45 | USD 380 | 42,387 | — | 42,387 | ||||||||||||||||||
| 3 month LIBOR | Quarterly | 2.83% | Semi Annual | 07/10/45 | USD 1,550 | (39,148 | ) | — | (39,148 | ) | ||||||||||||||||
|
|
|
|
|
| |||||||||||||||||||||
| $ | 55,572 | $ | — | $ | 55,572 | |||||||||||||||||||||
|
|
|
|
|
| |||||||||||||||||||||
The following reference rates, and their values as of period end, are used for security descriptions
| Reference index | Reference rate | |||||||
3 month LIBOR | London Interbank Offered Rate | 2.35 | % | |||||
Balances Reported in the Statements of Assets and Liabilities for Centrally Cleared Swaps and OTC Derivatives
Swap Paid | Swap Received | Unrealized Appreciation | Unrealized Depreciation | Value | ||||||||||||||||
Centrally Cleared Swaps(a) | $ | — | $ | — | $ | 475,202 | $ | (419,630 | ) | $ | — | |||||||||
OTC Swaps | 334,949 | (420,242 | ) | 31,652 | (18,614 | ) | — | |||||||||||||
OTC Options Written | N/A | N/A | 61,625 | (18,184 | ) | (146,990 | ) | |||||||||||||
| (a) | Includes cumulative appreciation (depreciation) on centrally cleared swaps, as reported in the Schedule of Investments. Only current day’s variation margin is reported within the Statements of Assets and Liabilities and is net of any previously paid (received) swap premium amounts. |
| SCHEDULE OF INVESTMENTS | 13 |
Schedule of Investments (continued) April 30, 2018 | BlackRock U.S. Mortgage Portfolio |
Derivative Financial Instruments Categorized by Risk Exposure
As of period end, the fair values of derivative financial instruments located in the Statement of Assets and Liabilities were as follows:
| Commodity Contracts | Credit Contracts | Equity Contracts | Foreign Currency Exchange Contracts | Interest Rate Contracts | Other Contracts | Total | ||||||||||||||||||||||
Assets — Derivative Financial Instruments | ||||||||||||||||||||||||||||
Future contracts | ||||||||||||||||||||||||||||
Net unrealized appreciation(a) | $ | — | $ | — | $ | — | $ | — | $ | 343,253 | $ | — | $ | 343,253 | ||||||||||||||
Options purchased | ||||||||||||||||||||||||||||
Investments at value — unaffiliated(b) | — | — | — | — | 3,096 | — | 3,096 | |||||||||||||||||||||
Swaps—centrally cleared | ||||||||||||||||||||||||||||
Net unrealized appreciation(a) | — | — | — | — | 475,202 | — | 475,202 | |||||||||||||||||||||
Swaps — OTC | ||||||||||||||||||||||||||||
Unrealized appreciation on OTC swaps; Swap premiums paid | — | 366,601 | — | — | — | — | 366,601 | |||||||||||||||||||||
|
|
|
|
|
|
|
|
|
|
|
|
|
| |||||||||||||||
| $ | — | $ | 366,601 | $ | — | $ | — | $ | 821,551 | $ | — | $ | 1,188,152 | |||||||||||||||
|
|
|
|
|
|
|
|
|
|
|
|
|
| |||||||||||||||
Liabilities — Derivative Financial Instruments | ||||||||||||||||||||||||||||
Future contracts | ||||||||||||||||||||||||||||
Net unrealized depreciation(a) | $ | — | $ | — | $ | — | $ | — | $ | 56,404 | $ | — | $ | 56,404 | ||||||||||||||
Options written | ||||||||||||||||||||||||||||
Options written, at value | — | — | — | — | 146,990 | — | 146,990 | |||||||||||||||||||||
Swaps — centrally cleared | ||||||||||||||||||||||||||||
Net unrealized depreciation(a) | — | — | — | — | 419,630 | — | 419,630 | |||||||||||||||||||||
Swaps — OTC | ||||||||||||||||||||||||||||
Unrealized depreciation on OTC swaps; Swap premiums received | — | 438,856 | — | — | — | — | 438,856 | |||||||||||||||||||||
|
|
|
|
|
|
|
|
|
|
|
|
|
| |||||||||||||||
| $ | — | $ | 438,856 | $ | — | $ | — | $ | 623,024 | $ | — | $ | 1,061,880 | |||||||||||||||
|
|
|
|
|
|
|
|
|
|
|
|
|
| |||||||||||||||
| (a) | Includes cumulative appreciation (depreciation) on futures contracts and centrally cleared swaps, if any, as reported in the Schedule of Investments. Only current day’s variation margin is reported within the Statement of Assets and Liabilities. |
| (b) | Includes options purchased at value as reported in the Schedule of Investments. |
For the year ended April 30, 2018, the effect of derivative financial instruments in the Statement of Operations were as follows:
| Commodity Contracts | Credit Contracts | Equity Contracts | Foreign Currency Exchange Contracts | Interest Rate Contracts | Other Contracts | Total | ||||||||||||||||||||||
Net Realized Gain (Loss) from: | ||||||||||||||||||||||||||||
Future contracts | $ | — | $ | — | $ | — | $ | — | $ | 966,634 | $ | — | $ | 966,634 | ||||||||||||||
Options purchased(a) | — | (26,250 | ) | — | — | 563,808 | — | 537,558 | ||||||||||||||||||||
Options written | — | 13,125 | — | — | (125,694 | ) | — | (112,569 | ) | |||||||||||||||||||
Swaps | — | (480,117 | ) | — | — | 395,214 | — | (84,903 | ) | |||||||||||||||||||
|
|
|
|
|
|
|
|
|
|
|
|
|
| |||||||||||||||
| $ | — | $ | (493,242 | ) | $ | — | $ | — | $ | 1,799,962 | $ | — | $ | 1,306,720 | ||||||||||||||
|
|
|
|
|
|
|
|
|
|
|
|
|
| |||||||||||||||
Net Change In Unrealized Appreciation (Depreciation) on: | ||||||||||||||||||||||||||||
Future contracts | $ | — | $ | — | $ | — | $ | — | $ | 465,903 | $ | — | $ | 465,903 | ||||||||||||||
Options purchased(b) | — | — | — | — | (7,143 | ) | — | (7,143 | ) | |||||||||||||||||||
Options written | — | — | — | — | (4,927 | ) | — | (4,927 | ) | |||||||||||||||||||
Swaps | — | (27,885 | ) | — | — | (186,374 | ) | — | (214,259 | ) | ||||||||||||||||||
|
|
|
|
|
|
|
|
|
|
|
|
|
| |||||||||||||||
| $ | — | $ | (27,885 | ) | $ | — | $ | — | $ | 267,459 | $ | — | $ | 239,574 | ||||||||||||||
|
|
|
|
|
|
|
|
|
|
|
|
|
| |||||||||||||||
| (a) | Options purchased are included in net realized gain (loss) from investments — unaffiliated. |
| (b) | Options purchased are included in net change in unrealized appreciation (depreciation) on investments — unaffiliated. |
| 14 | 2018 BLACKROCK ANNUAL REPORTTO SHAREHOLDERS |
Schedule of Investments (continued) April 30, 2018 | BlackRock U.S. Mortgage Portfolio |
Average Quarterly Balances of Outstanding Derivative Financial Instruments
Futures contracts: | ||||
Average notional value of contracts — long | $ | 20,668,000 | ||
Average notional value of contracts — short | $ | 64,325,500 | ||
Options: | ||||
Average value of option contracts purchased | $ | 12,718,159 | ||
Average value of option contracts written | — | (a) | ||
Average notional value of swaption contracts purchased | — | (a) | ||
Average notional value of swaption contracts written | $ | 27,980,000 | ||
Credit default swaps: | ||||
Average notional value — buy protection | $ | 16,683,000 | ||
Average notional value — sell protection | $ | 6,726,250 | ||
Interest rate swaps: | ||||
Average notional value — pays fixed rate | $ | 18,006,250 | ||
Average notional value — receives fixed rate | $ | 20,662,500 |
| (a) | Derivative not held at year end. The amount shown in the Statement of Operations reflects the results of activity during the period. |
For more information about the Fund’s investment risks regarding derivative financial instruments, refer to the Notes to Financial Statements.
Derivative Financial Instruments — Offsetting as of Period End
The Fund’s derivative assets and liabilities (by type) were as follows:
| Assets | Liabilities | |||||||
Derivative Financial Instruments: | ||||||||
Futures contracts | $ | — | $ | 33,194 | ||||
Options(a) | 3,096 | 146,990 | ||||||
Swaps — Centrally cleared | — | 30,574 | ||||||
Swaps — OTC(b) | 366,601 | 438,856 | ||||||
|
|
|
| |||||
Total derivative assets and liabilities in the Statement of Assets and Liabilities | $ | 369,697 | $ | 649,614 | ||||
Derivatives not subject to a Master Netting Agreement or similar agreement (“MNA”) | — | (63,768 | ) | |||||
|
|
|
| |||||
Total derivative assets and liabilities subject to an MNA | $ | 369,697 | $ | 585,846 | ||||
|
|
|
| |||||
| (a) | Includes options purchased at value which is included in Investments at value – unaffiliated in the Statement of Assets and Liabilities and reported in the Schedule of Investments. |
| (b) | Includes unrealized appreciation (depreciation) on OTC swaps and swap premiums (paid/received) in the Statement of Assets and Liabilities. |
The following tables present the Fund’s derivative assets and liabilities by counterparty net of amounts available for offset under an MNA and net of the related collateral received and pledged by the Fund.
| Counterparty | Derivative Assets Subject to MNA by Counterparty | Derivatives Available for Offset (a) | Non-cash Collateral Received | Cash Collateral Received (b) | Net Amount of Derivative Assets (c) | |||||||||||||||
Barclays Bank plc | $ | 3,096 | $ | (3,096 | ) | $ | — | $ | — | $ | — | |||||||||
Deutsche Bank AG | 20,900 | (20,900 | ) | — | — | — | ||||||||||||||
JP Morgan Securities LLC | 345,701 | — | — | (345,701 | ) | — | ||||||||||||||
|
|
|
|
|
|
|
|
|
| |||||||||||
| $ | 369,697 | $ | (23,996 | ) | $ | — | $ | (345,701 | ) | $ | — | |||||||||
|
|
|
|
|
|
|
|
|
| |||||||||||
| Counterparty | Derivative Liabilities Subject to MNA by Counterparty | Derivatives Available for Offset (a) | Non-cash Collateral Pledged | Cash Collateral Pledged (d) | Net Amount of Derivative Liabilities (e) | |||||||||||||||
Bank of America NA | $ | 120,597 | $ | — | $ | — | $ | — | $ | 120,597 | ||||||||||
Barclays Bank plc | 5,683 | (3,096 | ) | — | — | 2,587 | ||||||||||||||
Citibank NA | 20,710 | — | — | — | 20,710 | |||||||||||||||
Credit Suisse International | 72,255 | — | — | — | 72,255 | |||||||||||||||
Deutsche Bank AG | 366,601 | (20,900 | ) | — | (345,701 | ) | — | |||||||||||||
|
|
|
|
|
|
|
|
|
| |||||||||||
| $ | 585,846 | $ | (23,996 | ) | $ | — | $ | (345,701 | ) | $ | 216,149 | |||||||||
|
|
|
|
|
|
|
|
|
| |||||||||||
| (a) | The amount of derivatives available for offset is limited to the amount of assets and/or liabilities that are subject to an MNA. |
| (b) | Excess of collateral received from the individual counterparty is not shown for financial reporting purposes. |
| (c) | Net amount represents the net amount receivable from the counterparty in the event of default. |
| (d) | Excess of collateral pledged to the individual counterparty is not shown for financial reporting purposes. |
| (e) | Net amount represents the net amount payable to the counterparty in the event of default. |
| SCHEDULE OF INVESTMENTS | 15 |
Schedule of Investments (continued) April 30, 2018 | BlackRock U.S. Mortgage Portfolio |
Fair Value Hierarchy as of Period End
Various inputs are used in determining the fair value of investments and derivative financial instruments. For information about the Fund’s policy regarding valuation of investments and derivative financial instruments, refer to the Notes to Financial Statements.
The following table summarizes the Fund’s investments and derivative financial instruments categorized in the disclosure hierarchy:
| Level 1 | Level 2 | Level 3 | Total | |||||||||||||
Assets: | ||||||||||||||||
Investments: | ||||||||||||||||
Long-Term Investments: | ||||||||||||||||
Asset-Backed Securities | $ | — | $ | 14,162,089 | $ | 2,516,254 | $ | 16,678,343 | ||||||||
Non-Agency Mortgage-Backed Securities | — | 40,492,384 | 615,000 | 41,107,384 | ||||||||||||
U.S. Government Sponsored Agency Securities | — | 507,953,391 | 156,035 | 508,109,426 | ||||||||||||
Short-Term Securities | 1,032,273 | — | — | 1,032,273 | ||||||||||||
Options Purchased: | ||||||||||||||||
Interest rate contracts | — | 3,096 | — | 3,096 | ||||||||||||
Liabilities: | ||||||||||||||||
TBA Sale Commitments | — | (205,462,783 | ) | — | (205,462,783 | ) | ||||||||||
|
|
|
|
|
|
|
| |||||||||
| $ | 1,032,273 | $ | 357,148,177 | $ | 3,287,289 | $ | 361,467,739 | |||||||||
|
|
|
|
|
|
|
| |||||||||
Derivative Financial Instruments (a) | ||||||||||||||||
Assets: | ||||||||||||||||
Credit contracts | $ | — | $ | 31,652 | $ | — | $ | 31,652 | ||||||||
Interest rate contracts | 343,253 | 475,202 | — | 818,455 | ||||||||||||
Liabilities: | ||||||||||||||||
Credit contracts | — | (18,614 | ) | — | (18,614 | ) | ||||||||||
Interest rate contracts | (56,404 | ) | (566,620 | ) | — | (623,024 | ) | |||||||||
|
|
|
|
|
|
|
| |||||||||
| $ | 286,849 | $ | (78,380 | ) | $ | — | $ | 208,469 | ||||||||
|
|
|
|
|
|
|
| |||||||||
| (a) | Derivative financial instruments are swaps, futures contracts, and options written. Swaps and futures contracts are valued at the unrealized appreciation (depreciation) on the instrument and options written are shown at value. |
During the year ended April 30, 2018, there were no transfers between Level 1 and Level 2.
A reconciliation of Level 3 investments is presented when the Fund had a significant amount of Level 3 investments at the beginning and/or end of the year in relation to net assets. The following table is a reconciliation of Level 3 investments for which significant unobservable inputs were used in determining fair value:
| Asset- Backed Securities | Non-Agency Mortgage-Backed Securities | U.S. Government Sponsored Agency Securities | Total | |||||||||||||
Investments: | ||||||||||||||||
Assets: | ||||||||||||||||
Opening Balance, as of April 30, 2017 | $ | 1,437,337 | $ | 370,925 | $ | 280,242 | $ | 2,088,504 | ||||||||
Transfers into Level 3 | — | — | 189,850 | 189,850 | ||||||||||||
Transfers out of Level 3 | (790,000 | ) | (370,925 | ) | (280,242 | ) | (1,441,167 | ) | ||||||||
Accrued discounts/premiums | — | — | — | — | ||||||||||||
Net realized gain (loss) | (9,211 | ) | — | (1,815 | ) | (11,026 | ) | |||||||||
Net change in unrealized appreciation (depreciation)(a) | 10,924 | — | 7,343 | 18,267 | ||||||||||||
Purchases | 1,940,000 | 615,000 | — | 2,555,000 | ||||||||||||
Sales | (72,796 | ) | — | (39,343 | ) | (112,139 | ) | |||||||||
|
|
|
|
|
|
|
| |||||||||
Closing Balance, as of April 30, 2018 | $ | 2,516,254 | $ | 615,000 | $ | 156,035 | $ | 3,287,289 | ||||||||
|
|
|
|
|
|
|
| |||||||||
Net change in unrealized appreciation (depreciation) on investments still held at April 30, 2018(a)(b) | $ | 10,924 | $ | — | $ | 7,343 | $ | 18,267 | ||||||||
|
|
|
|
|
|
|
| |||||||||
| (a) | Included in the related net change in unrealized appreciation (depreciation) in the Statements of Operations. |
| (b) | Any difference between net change in unrealized appreciation (depreciation) and net change in unrealized appreciation (depreciation) on investments still held at April 30, 2018 is generally due to investments no longer held or categorized as Level 3 at period end. |
The Fund’s investments that are categorized as Level 3 were valued utilizing third party pricing information without adjustment. Such valuations are based on unobservable inputs. A significant change in third party information could result in a significantly lower or higher value of such Level 3 investments.
See notes to financial statements.
| 16 | 2018 BLACKROCK ANNUAL REPORTTO SHAREHOLDERS |
Statement of Assets and Liabilities April 30, 2018 |
| BlackRock U.S. Mortgage Portfolio | ||||
ASSETS | ||||
Investments at value — unaffiliated (cost — $575,361,287) | $ | 566,930,522 | ||
Cash | 10,968 | |||
Cash pledged: | ||||
Collateral — OTC derivatives | 420,000 | |||
Futures contracts | 363,000 | |||
Centrally cleared swaps | 250,150 | |||
Receivables: | ||||
Investments sold | 109,435,065 | |||
TBA sale commitments | 205,840,049 | |||
Capital shares sold | 223,061 | |||
Dividends — unaffiliated | 5,280 | |||
Interest — unaffiliated | 1,687,925 | |||
From the Manager | 66,201 | |||
Swap premiums paid | 334,949 | |||
Unrealized appreciation on: | ||||
OTC swaps | 31,652 | |||
Prepaid expenses | 21,379 | |||
Other assets | 2,087 | |||
|
| |||
Total assets | 885,622,288 | |||
|
| |||
LIABILITIES | ||||
Due to broker | 106,524 | |||
Cash received: | ||||
Collateral — OTC derivatives | 400,000 | |||
Collateral — TBA commitments | 35,000 | |||
Options written at value (premium received $190,431) | 146,990 | |||
TBA sale commitments at value (proceeds $205,840,049) | 205,462,783 | |||
Reverse repurchase agreements at value | 117,944,053 | |||
Payables: | ||||
Investments purchased | 317,798,700 | |||
Capital shares redeemed | 690,470 | |||
Income dividends | 221,226 | |||
Service and distribution fees | 20,213 | |||
Variation margin on futures contracts | 33,194 | |||
Variation margin on centrally cleared swaps | 30,574 | |||
Investment advisory fees | 60,166 | |||
Trustees’ and Officer’s fees | 1,573 | |||
Other affiliates | 1,718 | |||
Board consolidation | 9,255 | |||
Other accrued expenses | 227,864 | |||
Swap premiums received | 420,242 | |||
Unrealized depreciation on: | ||||
OTC swaps | 18,614 | |||
|
| |||
Total liabilities | 643,629,159 | |||
|
| |||
NET ASSETS | $ | 241,993,129 | ||
|
| |||
NET ASSETS CONSIST OF | ||||
Paid-in capital | $ | 251,489,330 | ||
Undistributed net investment income | 286,015 | |||
Accumulated net realized loss | (2,129,704 | ) | ||
Net unrealized appreciation (depreciation) | (7,652,512 | ) | ||
|
| |||
NET ASSETS | $ | 241,993,129 | ||
|
| |||
NET ASSET VALUE | ||||
Institutional — Based on net assets of $189,915,911 and 19,077,291 shares outstanding, unlimited number of shares authorized, $0.01 par value | $ | 9.96 | ||
|
| |||
Investor A — Based on net assets of $37,782,141 and 3,801,851 shares outstanding, unlimited number of shares authorized, $0.01 par value | $ | 9.94 | ||
|
| |||
Investor C — Based on net assets of $14,295,077 and 1,438,174 shares outstanding, unlimited number of shares authorized, $0.01 par value | $ | 9.94 | ||
|
| |||
See notes to financial statements.
| FINANCIAL STATEMENTS | 17 |
Year Ended April 30, 2018 |
| BlackRock U.S. Mortgage Portfolio | ||||
INVESTMENT INCOME | ||||
Dividends — unaffiliated | $ | 63,494 | ||
Interest — unaffiliated | 9,972,639 | |||
|
| |||
Total investment income | 10,036,133 | |||
|
| |||
EXPENSES | ||||
Investment advisory | 1,077,536 | |||
Service and distribution — class specific | 292,826 | |||
Transfer agent — class specific | 227,900 | |||
Professional | 87,443 | |||
Custodian | 67,571 | |||
Accounting services | 61,538 | |||
Printing | 27,332 | |||
Trustees and Officer | 21,051 | |||
Board consolidation | 9,255 | |||
Registration | 6,439 | |||
Miscellaneous | 116,844 | |||
|
| |||
Total expenses excluding interest expense | 1,995,735 | |||
Interest expense | 1,232,462 | |||
|
| |||
Total expenses | 3,228,197 | |||
Less: | ||||
Fees waived and/or reimbursed by the Manager | (266,953 | ) | ||
Transfer agent fees waived and /or reimbursed — class specific | (225,162 | ) | ||
|
| |||
Total expenses after fees waived and/or reimbursed | 2,736,082 | |||
|
| |||
Net investment income | 7,300,051 | |||
|
| |||
REALIZED AND UNREALIZED GAIN (LOSS) | ||||
Net realized gain (loss) from: | ||||
Investments — unaffiliated | 1,267,139 | |||
Foreign currency transactions | (23 | ) | ||
Futures contracts | 966,634 | |||
Options written | (112,569 | ) | ||
Swaps . . . . . | (84,903 | ) | ||
|
| |||
| 2,036,278 | ||||
|
| |||
Net change in unrealized appreciation (depreciation) on: | ||||
Investments — unaffiliated | (9,597,669 | ) | ||
Futures contracts | 465,903 | |||
Options written | (4,927 | ) | ||
Swaps . . . . . | (214,259 | ) | ||
|
| |||
| (9,350,952 | ) | |||
|
| |||
Net realized and unrealized loss | (7,314,674 | ) | ||
|
| |||
NET DECREASE IN NET ASSETS RESULTING FROM OPERATIONS | $ | (14,623 | ) | |
|
| |||
See notes to financial statements.
| 18 | 2018 BLACKROCK ANNUAL REPORTTO SHAREHOLDERS |
| Statements of Changes in Net Assets |
| BlackRock U.S. Mortgage Portfolio | ||||||||
| Year Ended April 30, | ||||||||
| 2018 | 2017 | |||||||
INCREASE (DECREASE) IN NET ASSETS | ||||||||
OPERATIONS | ||||||||
Net investment income | $ | 7,300,051 | $ | 5,986,678 | ||||
Net realized gain | 2,036,278 | 510,099 | ||||||
Net change in unrealized appreciation (depreciation) | (9,350,952 | ) | (1,482,037 | ) | ||||
|
|
|
| |||||
Net increase (decrease) in net assets resulting from operations | (14,623 | ) | 5,014,740 | |||||
|
|
|
| |||||
DISTRIBUTIONS TO SHAREHOLDERS(a) | ||||||||
From net investment income: | ||||||||
Institutional | (7,045,700 | ) | (6,607,625 | ) | ||||
Investor A | (1,492,059 | ) | (2,038,314 | ) | ||||
Investor C | (426,670 | ) | (474,935 | ) | ||||
|
|
|
| |||||
Decrease in net assets resulting from distributions to shareholders | (8,964,429 | ) | (9,120,874 | ) | ||||
|
|
|
| |||||
CAPITAL SHARE TRANSACTIONS | ||||||||
Net decrease in net assets derived from capital share transactions | (44,657,637 | ) | (5,866,105 | ) | ||||
|
|
|
| |||||
NET ASSETS | ||||||||
Total decrease in net assets | (53,636,689 | ) | (9,972,239 | ) | ||||
Beginning of year | 295,629,818 | 305,602,057 | ||||||
|
|
|
| |||||
End of year | $ | 241,993,129 | $ | 295,629,818 | ||||
|
|
|
| |||||
Undistributed net investment income, end of year | $ | 286,015 | $ | 177,270 | ||||
|
|
|
| |||||
| (a) | Distributions for annual periods determined in accordance with U.S. federal income tax regulations. |
See notes to financial statements.
| FINANCIAL STATEMENTS | 19 |
Year Ended April 30, 2018
| BlackRock U.S. Mortgage Portfolio | ||||
CASH USED FOR OPERATING ACTIVITIES | ||||
Net decrease in net assets resulting from operations | $ | (14,623 | ) | |
Adjustments to reconcile net decrease in net assets resulting from operations to net cash used by operating activities: | ||||
Proceeds from sales of long-term investments and principal paydowns | 5,323,745,890 | |||
Purchases of long term investments | (5,395,773,697 | ) | ||
Net purchases of short-term securities | (1,032,273 | ) | ||
Amortization of premium and accretion of discount on investments | 430,134 | |||
Premiums received from options written | 369,694 | |||
Premiums paid on closing options written | (669,058 | ) | ||
Net realized (gain) loss on investments and options written | (1,154,570 | ) | ||
Net unrealized (appreciation) depreciation on investments, options written and swaps | 9,630,481 | |||
| (Increase) Decrease in Assets: | ||||
Cash Pledged: | ||||
Collateral — OTC derivatives | (10,000 | ) | ||
Futures contracts | 142,040 | |||
Centrally cleared swaps | (172,000 | ) | ||
Receivables: | ||||
Dividends — unaffiliated | (5,280 | ) | ||
From the Manager | (27,005 | ) | ||
Interest | (658,283 | ) | ||
Principal paydowns | 27,640 | |||
Variation margin on futures contracts | 10,137 | |||
Swap premiums paid | 294,859 | |||
Prepaid expenses | (21,009 | ) | ||
Other assets | (46 | ) | ||
| Increase (Decrease) in Liabilities: | ||||
Cash Received: | ||||
Collateral — OTC derivatives | (200,000 | ) | ||
Payables: | ||||
Board consolidation | 9,255 | |||
Due to broker | 106,524 | |||
Investment advisory fees | (29,954 | ) | ||
Trustees' and Officer's | (122 | ) | ||
Other accrued expenses | 16,611 | |||
Other affiliates | (111 | ) | ||
Service and distribution fees | (8,204 | ) | ||
Variation margin on futures contracts | 12,177 | |||
Variation margin on centrally cleared swaps | 29,554 | |||
Interest expense and fees | 104,129 | |||
Swap premiums received | (361,247 | ) | ||
|
| |||
Net cash (used for) financing activities | (65,208,357 | ) | ||
|
| |||
CASH PROVIDED BY FINANCING ACTIVITIES | ||||
Cash dividends paid to shareholders | (2,314,521 | ) | ||
Payments on redemption of capital shares | (164,134,032 | ) | ||
Proceeds from issuance of capital shares | 112,836,307 | |||
Net borrowing of reverse repurchase agreements | 115,913,000 | |||
|
| |||
Net cash provided by financing activities | 62,300,754 | |||
|
| |||
CASH | ||||
Net increase (decrease) in cash | (2,907,603 | ) | ||
Cash at beginning of year | 2,918,571 | |||
|
| |||
Cash at end of year | $ | 10,968 | ||
|
| |||
SUPPLEMENTAL DISCLOSURE OF CASH FLOW INFORMATION | ||||
Cash paid during the year for interest expense | $ | 1,128,333 | ||
|
| |||
NON-CASH FINANCING ACTIVITIES | ||||
Capital shares issued in reinvestment of dividends and distributions paid to shareholders | $ | 6,631,714 | ||
|
| |||
See notes to financial statements.
| 20 | 2018 BLACKROCK ANNUAL REPORTTO SHAREHOLDERS |
(For a share outstanding throughout each period) |
| BlackRock U.S. Mortgage Portfolio | ||||||||||||||||||||
| Institutional | ||||||||||||||||||||
| Year Ended April 30, | ||||||||||||||||||||
| 2018 | 2017 | 2016 | 2015 | 2014 | ||||||||||||||||
Net asset value, beginning of year | $ | 10.31 | $ | 10.44 | $ | 10.55 | $ | 10.24 | $ | 10.37 | ||||||||||
|
|
|
|
|
|
|
|
|
| |||||||||||
Net investment income(a) | 0.29 | 0.21 | 0.24 | 0.23 | 0.24 | |||||||||||||||
Net realized and unrealized gain (loss) | (0.29 | ) | (0.02 | ) | (0.00 | )(b) | 0.33 | (0.09 | ) | |||||||||||
|
|
|
|
|
|
|
|
|
| |||||||||||
Net increase from investment operations | (0.00 | ) | 0.19 | 0.24 | 0.56 | 0.15 | ||||||||||||||
|
|
|
|
|
|
|
|
|
| |||||||||||
| Distributions(c) | ||||||||||||||||||||
From net investment income | (0.35 | ) | (0.32 | ) | (0.27 | ) | (0.25 | ) | (0.28 | ) | ||||||||||
From net realized gain | — | — | (0.08 | ) | — | — | ||||||||||||||
From return of capital | — | — | — | — | (0.00 | )(b) | ||||||||||||||
|
|
|
|
|
|
|
|
|
| |||||||||||
Total distributions | (0.35 | ) | (0.32 | ) | (0.35 | ) | (0.25 | ) | (0.28 | ) | ||||||||||
|
|
|
|
|
|
|
|
|
| |||||||||||
Net asset value, end of year | $ | 9.96 | $ | 10.31 | $ | 10.44 | $ | 10.55 | $ | 10.24 | ||||||||||
|
|
|
|
|
|
|
|
|
| |||||||||||
| Total Return(d) | ||||||||||||||||||||
Based on net asset value | 0.00 | % | 1.80 | %(e) | 2.27 | % | 5.50 | % | 1.53 | % | ||||||||||
|
|
|
|
|
|
|
|
|
| |||||||||||
Ratios to Average Net Assets | ||||||||||||||||||||
Total expenses | 1.08 | % | 0.59 | % | 0.62 | % | 0.65 | % | 0.69 | % | ||||||||||
|
|
|
|
|
|
|
|
|
| |||||||||||
Total expenses after fees waived and/or reimbursed and paid indirectly | 0.91 | % | 0.51 | % | 0.55 | % | 0.65 | % | 0.68 | % | ||||||||||
|
|
|
|
|
|
|
|
|
| |||||||||||
Total expenses after fees waived and/or reimbursed and paid indirectly and excluding interest expense | 0.45 | % | 0.47 | % | 0.51 | % | 0.65 | % | 0.68 | % | ||||||||||
|
|
|
|
|
|
|
|
|
| |||||||||||
Net investment income | 2.82 | % | 2.04 | % | 2.31 | % | 2.18 | % | 2.43 | % | ||||||||||
|
|
|
|
|
|
|
|
|
| |||||||||||
Supplemental Data | ||||||||||||||||||||
Net assets, end of year (000) | $ | 189,916 | $ | 222,745 | $ | 206,193 | $ | 195,169 | $ | 136,036 | ||||||||||
|
|
|
|
|
|
|
|
|
| |||||||||||
Portfolio turnover rate(f) | 1,521 | % | 1,502 | % | 2,669 | % | 1,710 | % | 1,809 | % | ||||||||||
|
|
|
|
|
|
|
|
|
| |||||||||||
| (a) | Based on average shares outstanding. |
| (b) | Amount is greater than $(0.005) per share. |
| (c) | Distributions for annual periods determined in accordance with U.S. federal income tax regulations. |
| (d) | Where applicable, assumes the reinvestment of distributions. |
| (e) | Includes payment received from a settlement of litigation, which impacted the Fund’s total return. Excluding the payment from a settlement of litigation, the Fund’s total return would have been 1.61%. |
| (f) | Includes mortgage dollar roll transactions (“MDRs”). Additional information regarding portfolio turnover rate is as follows: |
| Year Ended April 30, | ||||||||||||||||||||||||||||||||||||||||
| 2018 | 2017 | 2016 | 2015 | 2014 | ||||||||||||||||||||||||||||||||||||
Portfolio turnover rate (excluding MDRs) | 826 | % | 887 | % | 2,104 | % | 1,062 | % | 1,150 | % | ||||||||||||||||||||||||||||||
|
|
|
|
|
|
|
|
|
| |||||||||||||||||||||||||||||||
See notes to financial statements.
| FINANCIAL HIGHLIGHTS | 21 |
Financial Highlights (continued) (For a share outstanding throughout each period) |
| BlackRock U.S. Mortgage Portfolio (continued) | ||||||||||||||||||||
| Investor A | ||||||||||||||||||||
| Year Ended April 30, | ||||||||||||||||||||
| 2018 | 2017 | 2016 | 2015 | 2014 | ||||||||||||||||
Net asset value, beginning of year | $ | 10.29 | $ | 10.43 | �� | $ | 10.53 | $ | 10.22 | $ | 10.35 | |||||||||
|
|
|
|
|
|
|
|
|
| |||||||||||
Net investment income(a) | 0.26 | 0.18 | 0.21 | 0.20 | 0.22 | |||||||||||||||
Net realized and unrealized gain (loss) | (0.28 | ) | (0.03 | ) | 0.01 | 0.33 | (0.10 | ) | ||||||||||||
|
|
|
|
|
|
|
|
|
| |||||||||||
Net increase (decrease) from investment operations | (0.02 | ) | 0.15 | 0.22 | 0.53 | 0.12 | ||||||||||||||
|
|
|
|
|
|
|
|
|
| |||||||||||
| Distributions(b) | ||||||||||||||||||||
From net investment income | (0.33 | ) | (0.29 | ) | (0.24 | ) | (0.22 | ) | (0.25 | ) | ||||||||||
From net realized gain | — | — | (0.08 | ) | — | — | ||||||||||||||
From return of capital | — | — | — | — | (0.00 | )(c) | ||||||||||||||
|
|
|
|
|
|
|
|
|
| |||||||||||
Total distributions | (0.33 | ) | (0.29 | ) | (0.32 | ) | (0.22 | ) | (0.25 | ) | ||||||||||
|
|
|
|
|
|
|
|
|
| |||||||||||
Net asset value, end of year | $ | 9.94 | $ | 10.29 | $ | 10.43 | $ | 10.53 | $ | 10.22 | ||||||||||
|
|
|
|
|
|
|
|
|
| |||||||||||
| Total Return(d) | ||||||||||||||||||||
Based on net asset value | (0.25 | )% | 1.43 | %(e) | 2.06 | % | 5.22 | % | 1.28 | % | ||||||||||
|
|
|
|
|
|
|
|
|
| |||||||||||
Ratios to Average Net Assets | ||||||||||||||||||||
Total expenses | 1.37 | % | 0.91 | % | 0.94 | % | 0.95 | % | 1.05 | % | ||||||||||
|
|
|
|
|
|
|
|
|
| |||||||||||
Total expenses after fees waived and/or reimbursed and paid indirectly | 1.16 | % | 0.79 | % | 0.85 | % | 0.92 | % | 0.94 | % | ||||||||||
|
|
|
|
|
|
|
|
|
| |||||||||||
Total expenses after fees waived and/or reimbursed and paid indirectly and excluding interest expense | 0.70 | % | 0.75 | % | 0.81 | % | 0.91 | % | 0.93 | % | ||||||||||
|
|
|
|
|
|
|
|
|
| |||||||||||
Net investment income | 2.56 | % | 1.75 | % | 2.04 | % | 1.88 | % | 2.22 | % | ||||||||||
|
|
|
|
|
|
|
|
|
| |||||||||||
Supplemental Data | ||||||||||||||||||||
Net assets, end of year (000) | $ | 37,782 | $ | 51,429 | $ | 77,652 | $ | 62,677 | $ | 28,262 | ||||||||||
|
|
|
|
|
|
|
|
|
| |||||||||||
Portfolio turnover rate(f) | 1,521 | % | 1,502 | % | 2,669 | % | 1,710 | % | 1,809 | % | ||||||||||
|
|
|
|
|
|
|
|
|
| |||||||||||
| (a) | Based on average shares outstanding. |
| (b) | Distributions for annual periods determined in accordance with U.S. federal income tax regulations. |
| (c) | Amount is greater than $(0.005) per share. |
| (d) | Where applicable, excludes the effects of any sales charges and assumes the reinvestment of distributions. |
| (e) | Includes payment received from a settlement of litigation, which impacted the Fund’s total return. Excluding the payment from a settlement of litigation, the Fund’s total return would have been 1.23%. |
| (f) | Includes mortgage dollar roll transactions (“MDRs”). Additional information regarding portfolio turnover rate is as follows: |
| Year Ended April 30, | ||||||||||||||||||||||||||||||||||||||||
| 2018 | 2017 | 2016 | 2015 | 2014 | ||||||||||||||||||||||||||||||||||||
Portfolio turnover rate (excluding MDRs) | 826 | % | 887 | % | 2,104 | % | 1,062 | % | 1,150 | % | ||||||||||||||||||||||||||||||
|
|
|
|
|
|
|
|
|
| |||||||||||||||||||||||||||||||
See notes to financial statements.
| 22 | 2018 BLACKROCK ANNUAL REPORTTO SHAREHOLDERS |
Financial Highlights (continued) (For a share outstanding throughout each period) |
| BlackRock U.S. Mortgage Portfolio (continued) | ||||||||||||||||||||
| Investor C | ||||||||||||||||||||
| Year Ended April 30, | ||||||||||||||||||||
| 2018 | 2017 | 2016 | 2015 | 2014 | ||||||||||||||||
Net asset value, beginning of year | $ | 10.30 | $ | 10.43 | $ | 10.53 | $ | 10.22 | $ | 10.35 | ||||||||||
|
|
|
|
|
|
|
|
|
| |||||||||||
Net investment income(a) | 0.18 | 0.10 | 0.13 | 0.12 | 0.15 | |||||||||||||||
Net realized and unrealized gain (loss) | (0.29 | ) | (0.02 | ) | 0.01 | 0.33 | (0.10 | ) | ||||||||||||
|
|
|
|
|
|
|
|
|
| |||||||||||
Net increase (decrease) from investment operations | (0.11 | ) | 0.08 | 0.14 | 0.45 | 0.05 | ||||||||||||||
|
|
|
|
|
|
|
|
|
| |||||||||||
| Distributions(b) | ||||||||||||||||||||
From net investment income | (0.25 | ) | (0.21 | ) | (0.16 | ) | (0.14 | ) | (0.18 | ) | ||||||||||
From net realized gain | — | — | (0.08 | ) | — | — | ||||||||||||||
From return of capital | — | — | — | — | (0.00 | )(c) | ||||||||||||||
|
|
|
|
|
|
|
|
|
| |||||||||||
Total distributions | (0.25 | ) | (0.21 | ) | (0.24 | ) | (0.14 | ) | (0.18 | ) | ||||||||||
|
|
|
|
|
|
|
|
|
| |||||||||||
Net asset value, end of year | $ | 9.94 | $ | 10.30 | $ | 10.43 | $ | 10.53 | $ | 10.22 | ||||||||||
|
|
|
|
|
|
|
|
|
| |||||||||||
| Total Return(d) | ||||||||||||||||||||
Based on net asset value | (1.09 | )% | 0.77 | %(e) | 1.30 | % | 4.44 | % | 0.52 | % | ||||||||||
|
|
|
|
|
|
|
|
|
| |||||||||||
Ratios to Average Net Assets | ||||||||||||||||||||
Total expenses | 2.12 | % | 1.64 | % | 1.66 | % | 1.69 | % | 1.84 | % | ||||||||||
|
|
|
|
|
|
|
|
|
| |||||||||||
Total expenses after fees waived and/or reimbursed and paid indirectly | 1.91 | % | 1.54 | % | 1.60 | % | 1.66 | % | 1.68 | % | ||||||||||
|
|
|
|
|
|
|
|
|
| |||||||||||
Total expenses after fees waived and/or reimbursed and paid indirectly and excluding interest expense | 1.45 | % | 1.50 | % | 1.56 | % | 1.65 | % | 1.67 | % | ||||||||||
|
|
|
|
|
|
|
|
|
| |||||||||||
Net investment income | 1.80 | % | 1.00 | % | 1.29 | % | 1.17 | % | 1.46 | % | ||||||||||
|
|
|
|
|
|
|
|
|
| |||||||||||
Supplemental Data | ||||||||||||||||||||
Net assets, end of year (000) | $ | 14,295 | $ | 21,455 | $ | 21,757 | $ | 14,193 | $ | 7,196 | ||||||||||
|
|
|
|
|
|
|
|
|
| |||||||||||
Portfolio turnover rate(f) | 1,521 | % | 1,502 | % | 2,669 | % | 1,710 | % | 1,809 | % | ||||||||||
|
|
|
|
|
|
|
|
|
| |||||||||||
| (a) | Based on average shares outstanding. |
| (b) | Distributions for annual periods determined in accordance with U.S. federal income tax regulations. |
| (c) | Amount is greater than $(0.005) per share. |
| (d) | Where applicable, excludes the effects of any sales charges and assumes the reinvestment of distributions. |
| (e) | Includes payment received from a settlement of litigation, which impacted the Fund’s total return. Excluding the payment from a settlement of litigation, the Fund’s total return would have been 0.58%. |
| (f) | Includes mortgage dollar roll transactions (“MDRs”). Additional information regarding portfolio turnover rate is as follows: |
| Year Ended April 30, | ||||||||||||||||||||||||||||||||||||||||
| 2018 | 2017 | 2016 | 2015 | 2014 | ||||||||||||||||||||||||||||||||||||
Portfolio turnover rate (excluding MDRs) | 826 | % | 887 | % | 2,104 | % | 1,062 | % | 1,150 | % | ||||||||||||||||||||||||||||||
|
|
|
|
|
|
|
|
|
| |||||||||||||||||||||||||||||||
See notes to financial statements.
| FINANCIAL HIGHLIGHTS | 23 |
| 1. | ORGANIZATION |
Managed Account Series (the “Trust”) is registered under the Investment Company Act of 1940, as amended (the “1940 Act”), as an open-end management investment company. The Trust is organized as a Delaware statutory trust. BlackRock U.S. Mortgage Portfolio (the “Fund”) is a series of the Trust. The Fund is classified as diversified.
The Fund offers multiple classes of shares. All classes of shares have identical voting, dividend, liquidation and other rights and are subject to the same terms and conditions. Institutional Shares are sold without a sales charge and only to certain eligible investors. Investor A Shares are generally sold with an initial sales charge, and may be subject to a contingent deferred sales charge (“CDSC”) for certain redemptions where no initial sales charge was paid at the time of purchase. Investor C Shares may be subject to a CDSC. Investor A and Investor C Shares bear certain expenses related to shareholder servicing of such shares, and Investor C Shares also bear certain expenses related to the distribution of such shares. Investor A and Investor C Shares are generally available through financial intermediaries. Each class has exclusive voting rights with respect to matters relating to its shareholder servicing and distribution expenditures.
| Share Class | Initial Sales Charge | CDSC | Conversion Privilege | |||||
Institutional Shares | No | No | None | |||||
Investor A Shares | Yes | No | (a) | None | ||||
Investor C Shares | No | Yes | None | |||||
| (a) | Investor A Shares may be subject to a CDSC for certain redemptions where no initial sales charge was paid at the time of purchase. |
The Fund, together with certain other registered investment companies advised by BlackRock Advisors, LLC (the “Manager”) or its affiliates, is included in a complex of open-end funds referred to as the Equity-Bond Complex.
| 2. | SIGNIFICANT ACCOUNTING POLICIES |
The financial statements are prepared in conformity with accounting principles generally accepted in the United States of America (“U.S. GAAP”), which may require management to make estimates and assumptions that affect the reported amounts of assets and liabilities in the financial statements, disclosure of contingent assets and liabilities at the date of the financial statements and the reported amounts of increases and decreases in net assets from operations during the reporting period. Actual results could differ from those estimates. The Fund is considered an investment company under U.S. GAAP and follows the accounting and reporting guidance applicable to investment companies. Below is a summary of significant accounting policies:
Investment Transactions and Income Recognition: For financial reporting purposes, investment transactions are recorded on the dates the transactions are entered into (the “trade dates”). Realized gains and losses on investment transactions are determined on the identified cost basis. Interest income, including amortization and accretion of premiums and discounts on debt securities, is recognized on an accrual basis. Income, expenses and realized and unrealized gains and losses are allocated daily to each class based on its relative net assets.
Segregation and Collateralization: In cases where the Fund enters into certain investments (e.g., dollar rolls, to-be-announced (“TBA”) sale commitments, futures contracts, options written and swaps) or certain borrowings (e.g., reverse repurchase transactions) that would be treated as “senior securities” for 1940 Act purposes, the Fund may segregate or designate on its books and records cash or liquid assets having a market value at least equal to the amount of its future obligations under such investments or borrowings. Doing so allows the investment or borrowing to be excluded from treatment as a “senior security.” Furthermore, if required by an exchange or counterparty agreement, the Fund may be required to deliver/deposit cash and/or securities to/with an exchange, or broker-dealer or custodian as collateral for certain investments or obligations.
Distributions: Distributions from net investment income are declared daily and paid monthly. Distributions of capital gains are recorded on the ex-dividend date and made at least annually. The character and timing of distributions are determined in accordance with U.S. federal income tax regulations, which may differ from U.S. GAAP.
Recent Accounting Standards: In November 2016, the Financial Accounting Standards Board issued Accounting Standards Update “Restricted Cash” which will require entities to include the total of cash, cash equivalents, restricted cash, and restricted cash equivalents in the beginning and ending cash balances in the Statement of Cash Flows. The guidance will be applied retrospectively and is effective for fiscal years beginning after December 15, 2017, and interim periods within those years. Management is evaluating the impact, if any, of this guidance on the Fund’s presentation in the Statement of Cash Flows.
In March 2017, the Financial Accounting Standards Board issued Accounting Standards Update “Premium Amortization of Purchased Callable Debt Securities” which amends the amortization period for certain purchased callable debt securities. Under the new guidance, the premium amortization of purchased callable debt securities that have explicit, non-contingent call features and are callable at fixed prices will be amortized to the earliest call date. The guidance will be applied on a modified retrospective basis and is effective for fiscal years, and their interim periods, beginning after December 15, 2018. Management is currently evaluating the impact of this guidance to the Fund.
Indemnifications: In the normal course of business, the Fund enters into contracts that contain a variety of representations that provide general indemnification. The Fund’s maximum exposure under these arrangements is unknown because it involves future potential claims against the Fund, which cannot be predicted with any certainty.
Other: Expenses directly related to the Fund or its classes are charged to the Fund or the applicable class. Other operating expenses shared by several funds, including other funds managed by the Manager, are prorated among those funds on the basis of relative net assets or other appropriate methods. Expenses directly related to the Fund and other shared expenses prorated to the Fund are allocated daily to each class based on its relative net assets or other appropriate methods.
| 24 | 2018 BLACKROCK ANNUAL REPORTTO SHAREHOLDERS |
Notes to Financial Statements (continued)
| 3. | INVESTMENT VALUATION AND FAIR VALUE MEASUREMENTS |
Investment Valuation Policies: The Fund’s investments are valued at fair value (also referred to as “market value” within the financial statements) as of the close of trading on the New York Stock Exchange (“NYSE”) (generally 4:00 p.m., Eastern time). U.S. GAAP defines fair value as the price the Fund would receive to sell an asset or pay to transfer a liability in an orderly transaction between market participants at the measurement date. The Fund determines the fair values of its financial instruments using various independent dealers or pricing services under policies approved by the Board of Trustees of the Trust (the “Board”). The BlackRock Global Valuation Methodologies Committee (the “Global Valuation Committee”) is the committee formed by management to develop global pricing policies and procedures and to oversee the pricing function for all financial instruments.
Fair Value Inputs and Methodologies: The following methods and inputs are used to establish the fair value of the Fund’s assets and liabilities:
| • | Fixed-income securities for which market quotations are readily available are generally valued using the last available bid prices or current market quotations provided by independent dealers or third party pricing services. Floating rate loan interests are valued at the mean of the bid prices from one or more independent brokers or dealers as obtained from a third party pricing service. Pricing services generally value fixed-income securities assuming orderly transactions of an institutional round lot size, but a fund may hold or transact in such securities in smaller, odd lot sizes. Odd lots may trade at lower prices than institutional round lots. The pricing services may use matrix pricing or valuation models that utilize certain inputs and assumptions to derive values, including transaction data (e.g., recent representative bids and offers), credit quality information, perceived market movements, news, and other relevant information. Certain fixed-income securities, including asset-backed and mortgage related securities may be valued based on valuation models that consider the estimated cash flows of each tranche of the entity, establish a benchmark yield and develop an estimated tranche specific spread to the benchmark yield based on the unique attributes of the tranche. The amortized cost method of valuation may be used with respect to debt obligations with sixty days or less remaining to maturity unless the Manager determines such method does not represent fair value. |
| • | Futures contracts traded on exchanges are valued at their last sale price. |
| • | Exchange-traded options are valued at the mean between the last bid and ask prices at the close of the options market in which the options trade. An exchange-traded option for which there is no mean price is valued at the last bid (long positions) or ask (short positions) price. If no bid or ask price is available, the prior day’s price will be used, unless it is determined that the prior day’s price no longer reflects the fair value of the option. Over-the-counter (“OTC”) options and options on swaps (“swaptions”) are valued by an independent pricing service using a mathematical model, which incorporates a number of market data factors, such as the trades and prices of the underlying instruments. |
| • | Swap agreements are valued utilizing quotes received daily by the Fund’s pricing service or through brokers, which are derived using daily swap curves and models that incorporate a number of market data factors, such as discounted cash flows, trades and values of the underlying reference instruments. |
| • | TBA commitments are valued on the basis of last available bid prices or current market quotations provided by pricing services. |
If events (e.g., a company announcement, market volatility or a natural disaster) occur that are expected to materially affect the value of such investments, or in the event that the application of these methods of valuation results in a price for an investment that is deemed not to be representative of the market value of such investment, or if a price is not available, the investment will be valued by the Global Valuation Committee, or its delegate, in accordance with a policy approved by the Board as reflecting fair value (“Fair Valued Investments”). The fair valuation approaches that may be used by the Global Valuation Committee will include market approach, income approach and cost approach. Valuation techniques such as discounted cash flow, use of market comparables and matrix pricing are types of valuation approaches and are typically used in determining fair value. When determining the price for Fair Valued Investments, the Global Valuation Committee, or its delegate, seeks to determine the price that [each/the] Fund might reasonably expect to receive or pay from the current sale or purchase of that asset or liability in an arm’s-length transaction. Fair value determinations shall be based upon all available factors that the Global Valuation Committee, or its delegate, deems relevant and consistent with the principles of fair value measurement.
The Global Valuation Committee, or its delegate, employs various methods for calibrating valuation approaches for investments where an active market does not exist, including regular due diligence of the Fund’s pricing vendors, regular reviews of key inputs and assumptions, transactional back-testing or disposition analysis to compare unrealized gains and losses to realized gains and losses, reviews of missing or stale prices and large movements in market values and reviews of any market related activity. The pricing of all Fair Valued Investments is subsequently reported to the Board or a committee thereof on a quarterly basis. As a result of the inherent uncertainty in valuation of these investments, the fair values may differ from the values that would have been used had an active market existed.
For investments in equity or debt issued by privately held companies or funds (“Private Company” or collectively, the “Private Companies”) and other Fair Valued Investments, the fair valuation approaches that are used by third party pricing services utilize one or a combination of, but not limited to, the following inputs.
| Standard Inputs Generally Considered By Third Party Pricing Services | ||
Market approach | (i) recent market transactions, including subsequent rounds of financing, in the underlying investment or comparable issuers; (ii) recapitalizations and other transactions across the capital structure; and (iii) market multiples of comparable issuers. | |
Income approach | (i) future cash flows discounted to present and adjusted as appropriate for liquidity, credit, and/or market risks; (ii) quoted prices for similar investments or assets in active markets; and (iii) other risk factors, such as interest rates, yield curves, volatilities, prepayment speeds, loss severities, credit risks, recovery rates, liquidation amounts and/or default rates. | |
Cost approach | (i) audited or unaudited financial statements, investor communications and financial or operational metrics issued by the Private Company; (ii) changes in the valuation of relevant indices or publicly traded companies comparable to the Private Company; (iii) relevant news and other public sources; and (iv) known secondary market transactions in the Private Company’s interests and merger or acquisition activity in companies comparable to the Private Company. |
| NOTESTO FINANCIAL STATEMENTS | 25 |
Notes to Financial Statements (continued)
Investments in series of preferred stock issued by Private Companies are typically valued utilizing market approach in determining the enterprise value of the company. Such investments often contain rights and preferences that differ from other series of preferred and common stock of the same issuer. Valuation techniques such as an option pricing model (“OPM”), a probability weighted expected return model (“PWERM”) or a hybrid of those techniques are used in allocating enterprise value of the company, as deemed appropriate under the circumstances. The use of OPM and PWERM techniques involve a determination of the exit scenarios of the investment in order to appropriately allocate the enterprise value of the company among the various parts of its capital structure.
The Private Companies are not subject to the public company disclosure, timing, and reporting standards as other investments held by the Fund. Typically, the most recently available information by a Private Company is as of a date that is earlier than the date the Fund is calculating its NAV. This factor may result in a difference between the value of the investment and the price the Fund could receive upon the sale of the investment.
Fair Value Hierarchy: Various inputs are used in determining the fair value of investments and derivative financial instruments. These inputs to valuation techniques are categorized into a fair value hierarchy consisting of three broad levels for financial statement purposes as follows:
| • | Level 1 — Unadjusted price quotations in active markets/exchanges for identical assets or liabilities that the Fund has the ability to access |
| • | Level 2 — Other observable inputs (including, but not limited to, quoted prices for similar assets or liabilities in markets that are active, quoted prices for identical or similar assets or liabilities in markets that are not active, inputs other than quoted prices that are observable for the assets or liabilities (such as interest rates, yield curves, volatilities, prepayment speeds, loss severities, credit risks and default rates) or other market–corroborated inputs) |
| • | Level 3 — Unobservable inputs based on the best information available in the circumstances, to the extent observable inputs are not available (including the Fund’s own assumptions used in determining the fair value of investments and derivative financial instruments) |
The hierarchy gives the highest priority to unadjusted quoted prices in active markets for identical assets or liabilities (Level 1 measurements) and the lowest priority to unobservable inputs (Level 3 measurements). Accordingly, the degree of judgment exercised in determining fair value is greatest for instruments categorized in Level 3. The inputs used to measure fair value may fall into different levels of the fair value hierarchy. In such cases, for disclosure purposes, the fair value hierarchy classification is determined based on the lowest level input that is significant to the fair value measurement in its entirety. Investments classified within Level 3 have significant unobservable inputs used by the Global Valuation Committee in determining the price for Fair Valued Investments. Level 3 investments include equity or debt issued by Private Companies. There may not be a secondary market, and/or there are a limited number of investors. Level 3 investments may also be adjusted to reflect illiquidity and/or non-transferability, with the amount of such discount estimated by the Global Valuation Committee in the absence of market information.
Changes in valuation techniques may result in transfers into or out of an assigned level within the hierarchy. In accordance with the Fund’s policy, transfers between different levels of the fair value hierarchy are deemed to have occurred as of the beginning of the reporting period. The categorization of a value determined for investments and derivative financial instruments is based on the pricing transparency of the investments and derivative financial instruments and is not necessarily an indication of the risks associated with investing in those securities.
| 4. | SECURITIES AND OTHER INVESTMENTS |
Asset-Backed and Mortgage-Backed Securities: Asset-backed securities are generally issued as pass-through certificates or as debt instruments. Asset-backed securities issued as pass-through certificates represent undivided fractional ownership interests in an underlying pool of assets. Asset-backed securities issued as debt instruments, which are also known as collateralized obligations, are typically issued as the debt of a special purpose entity organized solely for the purpose of owning such assets and issuing such debt. Asset-backed securities are often backed by a pool of assets representing the obligations of a number of different parties. The yield characteristics of certain asset-backed securities may differ from traditional debt securities. One such major difference is that all or a principal part of the obligations may be prepaid at any time because the underlying assets (i.e., loans) may be prepaid at any time. As a result, a decrease in interest rates in the market may result in increases in the level of prepayments as borrowers, particularly mortgagors, refinance and repay their loans. An increased prepayment rate with respect to an asset-backed security will have the effect of shortening the maturity of the security. In addition, a fund may subsequently have to reinvest the proceeds at lower interest rates. If a fund has purchased such an asset-backed security at a premium, a faster than anticipated prepayment rate could result in a loss of principal to the extent of the premium paid.
For mortgage pass-through securities (the “Mortgage Assets”) there are a number of important differences among the agencies and instrumentalities of the U.S. Government that issue mortgage-related securities and among the securities that they issue. For example, mortgage-related securities guaranteed by Ginnie Mae are guaranteed as to the timely payment of principal and interest by Ginnie Mae and such guarantee is backed by the full faith and credit of the United States. However, mortgage-related securities issued by Freddie Mac and Fannie Mae, including Freddie Mac and Fannie Mae guaranteed mortgage pass-through certificates, which are solely the obligations of Freddie Mac and Fannie Mae, are not backed by or entitled to the full faith and credit of the United States, but are supported by the right of the issuer to borrow from the U.S. Treasury.
Non-agency mortgage-backed securities are securities issued by non-governmental issuers and have no direct or indirect government guarantees of payment and are subject to various risks. Non-agency mortgage loans are obligations of the borrowers thereunder only and are not typically insured or guaranteed by any other person or entity. The ability of a borrower to repay a loan is dependent upon the income or assets of the borrower. A number of factors, including a general economic downturn, acts of God, terrorism, social unrest and civil disturbances, may impair a borrower’s ability to repay its loans.
Multiple Class Pass-Through Securities: Multiple class pass-through securities, including collateralized mortgage obligations (“CMOs”) and commercial mortgage-backed securities, may be issued by Ginnie Mae, U.S. Government agencies or instrumentalities or by trusts formed by private originators of, or investors in, mortgage loans. In general, CMOs are debt obligations of a legal entity that are collateralized by a pool of residential or commercial mortgage loans or Mortgage Assets. The payments on these are used to make payments on the CMOs or multiple pass-through securities. Multiple class pass-through securities represent direct ownership
| 26 | 2018 BLACKROCK ANNUAL REPORTTO SHAREHOLDERS |
Notes to Financial Statements (continued)
interests in the Mortgage Assets. Classes of CMOs include interest only (“IOs”), principal only (“POs”), planned amortization classes and targeted amortization classes. IOs and POs are stripped mortgage-backed securities representing interests in a pool of mortgages, the cash flow from which has been separated into interest and principal components. IOs receive the interest portion of the cash flow while POs receive the principal portion. IOs and POs can be extremely volatile in response to changes in interest rates. As interest rates rise and fall, the value of IOs tends to move in the same direction as interest rates. POs perform best when prepayments on the underlying mortgages rise since this increases the rate at which the principal is returned and the yield to maturity on the PO. When payments on mortgages underlying a PO are slower than anticipated, the life of the PO is lengthened and the yield to maturity is reduced. If the underlying Mortgage Assets experience greater than anticipated prepayments of principal, a fund’s initial investment in the IOs may not fully recoup.
Stripped Mortgage-Backed Securities: Stripped mortgage-backed securities are typically issued by the U.S. Government, its agencies and instrumentalities. Stripped mortgage-backed securities are usually structured with two classes that receive different proportions of the interest (IOs) and principal (POs) distributions on a pool of Mortgage Assets. Stripped mortgage-backed securities may be privately issued.
Forward Commitments and When-Issued Delayed Delivery Securities: The fund may purchase securities on a when-issued basis and may purchase or sell securities on a forward commitment basis. Settlement of such transactions normally occurs within a month or more after the purchase or sale commitment is made. The fund may purchase securities under such conditions with the intention of actually acquiring them, but may enter into a separate agreement to sell the securities before the settlement date. Since the value of securities purchased may fluctuate prior to settlement, the fund may be required to pay more at settlement than the security is worth. In addition, the fund is not entitled to any of the interest earned prior to settlement. When purchasing a security on a delayed delivery basis, the fund assumes the rights and risks of ownership of the security, including the risk of price and yield fluctuations. In the event of default by the counterparty, the fund’s maximum amount of loss is the unrealized appreciation of unsettled when-issued transactions.
TBA Commitments: TBA commitments are forward agreements for the purchase or sale of mortgage-backed securities for a fixed price, with payment and delivery on an agreed upon future settlement date. The specific securities to be delivered are not identified at the trade date. However, delivered securities must meet specified terms, including issuer, rate and mortgage terms. When entering into TBA commitments, a fund may take possession of or deliver the underlying mortgage-backed securities but can extend the settlement or roll the transaction. TBA commitments involve a risk of loss if the value of the security to be purchased or sold declines or increases, respectively, prior to settlement date.
In order to better define contractual rights and to secure rights that will help a fund mitigate their counterparty risk, TBA commitments may be entered into by a fund under Master Securities Forward Transaction Agreements (each, an “MSFTA”). An MSFTA typically contains, among other things, collateral posting terms and netting provisions in the event of default and/or termination event. The collateral requirements are typically calculated by netting the mark-to-market amount for each transaction under such agreement and comparing that amount to the value of the collateral currently pledged by a fund and the counterparty. Cash collateral that has been pledged to cover the obligations of a fund and cash collateral received from the counterparty, if any, is reported separately on the Statement of Assets and Liabilities as cash pledged as collateral for TBA commitments or cash received as collateral for TBA commitments, respectively. Non-cash collateral pledged by a fund, if any, is noted in the Schedule of Investments. Typically, a fund is permitted to sell, re-pledge or use the collateral it receives; however, the counterparty is not permitted to do so. To the extent amounts due to a fund is not fully collateralized, contractually or otherwise, a fund bears the risk of loss from counterparty non-performance.
Mortgage Dollar Roll Transactions: The fund may sell TBA mortgage-backed securities and simultaneously contract to repurchase substantially similar (i.e., same type, coupon and maturity) securities on a specific future date at an agreed upon price. During the period between the sale and repurchase, a fund is not entitled to receive interest and principal payments on the securities sold. Mortgage dollar roll transactions are treated as purchases and sales and realize gains and losses on these transactions. Mortgage dollar rolls involve the risk that the market value of the securities that a fund is required to purchase may decline below the agreed upon repurchase price of those securities.
Reverse Repurchase Agreements: Reverse repurchase agreements are agreements with qualified third party broker dealers in which a fund sells securities to a bank or broker-dealer and agrees to repurchase the same securities at a mutually agreed upon date and price. A fund receives cash from the sale to use for other investment purposes. During the term of the reverse repurchase agreement, a fund continues to receive the principal and interest payments on the securities sold. Certain agreements have no stated maturity and can be terminated by either party at any time. Interest on the value of the reverse repurchase agreements issued and outstanding is based upon competitive market rates determined at the time of issuance. A fund may utilize reverse repurchase agreements when it is anticipated that the interest income to be earned from the investment of the proceeds of the transaction is greater than the interest expense of the transaction. Reverse repurchase agreements involve leverage risk. If a fund suffers a loss on its investment of the transaction proceeds from a reverse repurchase agreement, a fund would still be required to pay the full repurchase price. Further, a fund remains subject to the risk that the market value of the securities repurchased declines below the repurchase price. In such cases, a fund would be required to return a portion of the cash received from the transaction or provide additional securities to the counterparty.
Cash received in exchange for securities delivered plus accrued interest due to the counterparty is recorded as a liability in the Statement of Assets and Liabilities at face value including accrued interest. Due to the short-term nature of the reverse repurchase agreements, face value approximates fair value. Interest payments made by a fund to the counterparties are recorded as a component of interest expense in the Statement of Operations. In periods of increased demand for the security, a fund may receive a fee for the use of the security by the counterparty, which may result in interest income to a fund.
For the year ended April 30, 2018, the BlackRock U.S. Mortgage Portfolio’s average amount of reverse repurchase agreements and the daily weighted average interest rate was $83,393,035 and 1.41%, respectively.
Reverse repurchase transactions are entered into by a fund under Master Repurchase Agreements (each, an “MRA”), which permit a fund, under certain circumstances, including an event of default (such as bankruptcy or insolvency), to offset payables and/or receivables under the MRA with collateral held and/or posted to the counterparty and create one single net payment due to or from a fund. With reverse repurchase transactions, typically a fund and counterparty under an MRA are permitted to sell, re-pledge, or use the collateral associated with the transaction. Bankruptcy or insolvency laws of a particular jurisdiction may impose restrictions on or prohibitions against such a right of offset in the event of the MRA counterparty’s bankruptcy or insolvency. Pursuant to the terms of the MRA, a fund receives or posts securities and cash as
| NOTESTO FINANCIAL STATEMENTS | 27 |
Notes to Financial Statements (continued)
collateral with a market value in excess of the repurchase price to be paid or received by a fund upon the maturity of the transaction. Upon a bankruptcy or insolvency of the MRA counterparty, a fund is considered an unsecured creditor with respect to excess collateral and, as such, the return of excess collateral may be delayed.
As of period end, the following table is a summary of the Fund’s open reverse repurchase agreements by counterparty which are subject to offset under an MRA on a net basis:
| Counterparty | Reverse Repurchase Agreements | Fair Value of Non-cash Collateral Pledged Including Accrued Interest (a) | Cash Pledged (a) | Net Amount | ||||||||||||
Citigroup Global Markets, Inc. . . . . . . . . . . | $ | (117,944,053 | ) | $117,944,053 | $ | — | $ | — | ||||||||
| (a) | Net collateral with a value of $121,689,637 has been pledged in connection with open reverse repurchase agreements. Excess of net collateral pledged to the individual counterparty is not shown for financial reporting purposes. |
In the event the counterparty of securities under an MRA files for bankruptcy or becomes insolvent, a fund’s use of the proceeds from the agreement may be restricted while the counterparty, or its trustee or receiver, determines whether or not to enforce a fund’s obligation to repurchase the securities.
| 5. | DERIVATIVE FINANCIAL INSTRUMENTS |
The Fund engages in various portfolio investment strategies using derivative contracts both to increase the returns of the Fund and/or to manage its exposure to certain risks such as credit risk, equity risk, interest rate risk, foreign currency exchange rate risk, commodity price risk or other risks (e.g., inflation risk). Derivative financial instruments categorized by risk exposure are included in the Schedule of Investments. These contracts may be transacted on an exchange or OTC.
Futures Contracts: Futures contracts are purchased or sold to gain exposure to, or manage exposure to, changes in interest rates (interest rate risk), changes in the value of equity securities (equity risk) or foreign currencies (foreign currency exchange rate risk).
Futures contracts are agreements between the Fund and a counterparty to buy or sell a specific quantity of an underlying instrument at a specified price and on a specified date. Depending on the terms of a contract, it is settled either through physical delivery of the underlying instrument on the settlement date or by payment of a cash amount on the settlement date. Upon entering into a futures contract, the Fund is required to deposit initial margin with the broker in the form of cash or securities in an amount that varies depending on a contract’s size and risk profile. The initial margin deposit must then be maintained at an established level over the life of the contract.
Securities deposited as initial margin are designated in the Schedule of Investments and cash deposited, if any, is shown as cash pledged for futures contracts in the Statement of Assets and Liabilities. Pursuant to the contract, the Fund agrees to receive from or pay to the broker an amount of cash equal to the daily fluctuation in market value of the contract (“variation margin”). Variation margin is recorded as unrealized appreciation (depreciation) and, if any, shown as variation margin receivable (or payable) on futures contracts in the Statement of Assets and Liabilities. When the contract is closed, a realized gain or loss is recorded in the Statement of Operations equal to the difference between the notional amount of the contract at the time it was opened and the notional amount at the time it was closed. The use of futures contracts involves the risk of an imperfect correlation in the movements in the price of futures contracts and interest, foreign currency exchange rates or underlying assets.
Options: The Fund purchases and writes call and put options to increase or decrease its exposure to the risks of underlying instruments, including equity risk, interest rate risk and/or commodity price risk and/or, in the case of options written, to generate gains from options premiums.
A call option gives the purchaser (holder) of the option the right (but not the obligation) to buy, and obligates the seller (writer) to sell (when the option is exercised) the underlying instrument at the exercise or strike price at any time or at a specified time during the option period. A put option gives the holder the right to sell and obligates the writer to buy the underlying instrument at the exercise or strike price at any time or at a specified time during the option period.
Premiums paid on options purchased and premiums received on options written, as well as the daily fluctuation in market value, are included in investments at value — unaffiliated and options written at value, respectively, in the Statement of Assets and Liabilities. When an instrument is purchased or sold through the exercise of an option, the premium is offset against the cost or proceeds of the underlying instrument. When an option expires, a realized gain or loss is recorded in the Statement of Operations to the extent of the premiums received or paid. When an option is closed or sold, a gain or loss is recorded in the Statement of Operations to the extent the cost of the closing transaction exceeds the premiums received or paid. When the Fund writes a call option, such option is typically “covered,” meaning that it holds the underlying instrument subject to being called by the option counterparty. When the Fund writes a put option, such option is covered by cash in an amount sufficient to cover the obligation.
| • | Swaptions — The Fund purchases and writes options on swaps (“swaptions”) primarily to preserve a return or spread on a particular investment or portion of the Fund’s holdings, as a duration management technique or to protect against an increase in the price of securities it anticipates purchasing at a later date. The purchaser and writer of a swaption is buying or granting the right to enter into a previously agreed upon interest rate or credit default swap agreement (interest rate risk and/or credit risk) at any time before the expiration of the option. |
| • | Interest rate caps — Interest rate caps are entered into to gain or reduce exposure to interest rates (interest rate risk and/or other risk). Caps are agreements whereby one party agrees to make payments to the other, in return for a premium, to the extent that interest rate indexes exceed a specified rate, or “cap.” The maximum potential amount of future payments that the Fund would be required to make under an interest rate cap would be the notional amount times the percentage increase in interest rates determined by the difference between the interest rate index current value and the value at the time the cap was entered into. |
In purchasing and writing options, the Fund bears the risk of an unfavorable change in the value of the underlying instrument or the risk that it may not be able to enter into a closing transaction due to an illiquid market. Exercise of a written option could result in the Fund purchasing or selling a security when it otherwise would not, or at a price different from the current market value.
| 28 | 2018 BLACKROCK ANNUAL REPORTTO SHAREHOLDERS |
Notes to Financial Statements (continued)
Swaps: Swap contracts are entered into to manage exposure to issuers, markets and securities. Such contracts are agreements between the Fund and a counterparty to make periodic net payments on a specified notional amount or a net payment upon termination. Swap agreements are privately negotiated in the OTC market and may be entered into as a bilateral contract (“OTC swaps”) or centrally cleared (“centrally cleared swaps”).
For OTC swaps, any upfront premiums paid and any upfront fees received are shown as swap premiums paid and swap premiums received, respectively, in the Statement of Assets and Liabilities and amortized over the term of the contract. The daily fluctuation in market value is recorded as unrealized appreciation (depreciation) on OTC Swaps in the Statement of Assets and Liabilities. Payments received or paid are recorded in the Statement of Operations as realized gains or losses, respectively. When an OTC swap is terminated, a realized gain or loss is recorded in the Statement of Operations equal to the difference between the proceeds from (or cost of) the closing transaction and the Fund’s basis in the contract, if any. Generally, the basis of the contract is the premium received or paid.
In a centrally cleared swap, immediately following execution of the swap contract, the swap contract is novated to a central counterparty (the “CCP”) and the Fund’s counterparty on the swap agreement becomes the CCP. The Fund is required to interface with the CCP through the broker. Upon entering into a centrally cleared swap, the Fund is required to deposit initial margin with the broker in the form of cash or securities in an amount that varies depending on the size and risk profile of the particular swap. Securities deposited as initial margin are designated in the Schedule of Investments and cash deposited is shown as cash pledged for centrally cleared swaps in the Statement of Assets and Liabilities. Pursuant to the contract, the Fund agrees to receive from or pay to the broker an amount of cash equal to the daily fluctuation in market value of the contract (“variation margin”). Variation margin is recorded as unrealized appreciation (depreciation) and shown as variation margin receivable (or payable) on centrally cleared swaps in the Statement of Assets and Liabilities. Payments received from (paid to) the counterparty, including at termination, are recorded as realized gains (losses) in the Statement of Operations.
| • | Credit default swaps — Credit default swaps are entered into to manage exposure to the market or certain sectors of the market, to reduce risk exposure to defaults of corporate and/or sovereign issuers or to create exposure to corporate and/or sovereign issuers to which a fund is not otherwise exposed (credit risk). |
The Fund may either buy or sell (write) credit default swaps on single-name issuers (corporate or sovereign), a combination or basket of single-name issuers or traded indexes. Credit default swaps are agreements in which the protection buyer pays fixed periodic payments to the seller in consideration for a promise from the protection seller to make a specific payment should a negative credit event take place with respect to the referenced entity (e.g., bankruptcy, failure to pay, obligation acceleration, repudiation, moratorium or restructuring). As a buyer, if an underlying credit event occurs, the Fund will either (i) receive from the seller an amount equal to the notional amount of the swap and deliver the referenced security or underlying securities comprising the index, or (ii) receive a net settlement of cash equal to the notional amount of the swap less the recovery value of the security or underlying securities comprising the index. As a seller (writer), if an underlying credit event occurs, the Fund will either pay the buyer an amount equal to the notional amount of the swap and take delivery of the referenced security or underlying securities comprising the index or pay a net settlement of cash equal to the notional amount of the swap less the recovery value of the security or underlying securities comprising the index.
| • | Interest rate swaps — Interest rate swaps are entered into to gain or reduce exposure to interest rates or to manage duration, the yield curve or interest rate (interest rate risk). |
Interest rate swaps are agreements in which one party pays a stream of interest payments, either fixed or floating, in exchange for another party’s stream of interest payments, either fixed or floating, on the same notional amount for a specified period of time. In more complex interest rate swaps, the notional principal amount may decline (or amortize) over time.
Swap transactions involve, to varying degrees, elements of interest rate, credit and market risk in excess of the amounts recognized in the Statement of Assets and Liabilities. Such risks involve the possibility that there will be no liquid market for these agreements, that the counterparty to the agreements may default on its obligation to perform or disagree as to the meaning of the contractual terms in the agreements, and that there may be unfavorable changes in interest rates and/or market values associated with these transactions.
Master Netting Arrangements: In order to define its contractual rights and to secure rights that will help it mitigate its counterparty risk, the Fund may enter into an International Swaps and Derivatives Association, Inc. Master Agreement (“ISDA Master Agreement”) or similar agreement with its counterparties. An ISDA Master Agreement is a bilateral agreement between the Fund and a counterparty that governs certain OTC derivatives and typically contains, among other things, collateral posting terms and netting provisions in the event of a default and/or termination event. Under an ISDA Master Agreement, the Fund may, under certain circumstances, offset with the counterparty certain derivative financial instruments’ payables and/or receivables with collateral held and/or posted and create one single net payment. The provisions of the ISDA Master Agreement typically permit a single net payment in the event of default including the bankruptcy or insolvency of the counterparty. Bankruptcy or insolvency laws of a particular jurisdiction may restrict or prohibit the right of offset in bankruptcy, insolvency or other events.
Collateral Requirements: For derivatives traded under an ISDA Master Agreement, the collateral requirements are typically calculated by netting the mark-to-market amount for each transaction under such agreement and comparing that amount to the value of any collateral currently pledged by the Fund and the counterparty.
Cash collateral that has been pledged to cover obligations of the Fund and cash collateral received from the counterparty, if any, is reported separately on the Statement of Assets and Liabilities as cash pledged as collateral and cash received as collateral, respectively. Non-cash collateral pledged by the Fund, if any, is noted in the Schedule of Investments. Generally, the amount of collateral due from or to a counterparty is subject to a certain minimum transfer amount threshold before a transfer is required, which is determined at the close of business of the Fund. Any additional required collateral is delivered to/pledged by the Fund on the next business day. Typically, the counterparty is not permitted to sell, re-pledge or use cash and non-cash collateral it receives. The Fund generally agrees not to use non-cash collateral that it receives but may, absent default or certain other circumstances defined in the underlying ISDA Master Agreement, be permitted to use cash collateral received. In such cases, interest may be paid pursuant to the collateral arrangement with the counterparty. To the extent amounts due to the Fund from its counterparties are not fully collateralized, it bears the risk of loss from counterparty non-performance. Likewise, to the extent the Fund has delivered collateral to a counterparty and stands ready to perform under the terms of its agreement with such counterparty, it bears the risk of loss from a counterparty in the amount of the value of the collateral in the event the counterparty fails to return such collateral. Based on the terms of agreements, collateral may not be required for all derivative contracts.
| NOTESTO FINANCIAL STATEMENTS | 29 |
Notes to Financial Statements (continued)
For financial reporting purposes, the Fund does not offset derivative assets and derivative liabilities that are subject to netting arrangements, if any, in the Statement of Assets and Liabilities.
| 6. | INVESTMENT ADVISORY AGREEMENT AND OTHER TRANSACTIONS WITH AFFILIATES |
The PNC Financial Services Group, Inc. is the largest stockholder and an affiliate of BlackRock, Inc. (“BlackRock”) for 1940 Act purposes.
Investment Advisory: The Trust, on behalf of the Fund, entered into an Investment Advisory Agreement with the Manager, the Fund’s investment adviser, an indirect, wholly-owned subsidiary of BlackRock, to provide investment advisory and administrative services. The Manager is responsible for the management of the Fund’s portfolio and provides the personnel, facilities, equipment and certain other services necessary to the operations of the Fund.
For such services, the Fund pays the Manager a monthly fee at an annual rate equal to the following percentages of the average daily value of the Fund’s net assets:
| Average Daily Net Assets | Investment Advisory Fees | |||
First $1 Billion | 0.40 | % | ||
$1 Billion — $3 Billion | 0.38 | |||
$3 Billion — $5 Billion | 0.36 | |||
$5 Billion — $10 Billion | 0.35 | |||
Greater than $10 Billion | 0.34 | |||
Service and Distribution Fees: The Trust, on behalf of the Fund, entered into a Distribution Agreement and a Distribution and Service Plan with BlackRock Investments, LLC (“BRIL”), an affiliate of the Manager. Pursuant to the Distribution and Service Plan and in accordance with Rule 12b-1 under the 1940 Act, the Fund pays BRIL ongoing service and distribution fees. The fees are accrued daily and paid monthly at annual rates based upon the average daily net assets of the relevant share class of the Fund as follows:
| Investor A | Investor C | |||||||
Service Fees | 0.25 | % | 0.25 | % | ||||
Distribution Fees | — | 0.75 | % | |||||
BRIL and broker-dealers, pursuant to sub-agreements with BRIL, provide shareholder servicing and distribution services to the Fund. The ongoing service and/or distribution fee compensates BRIL and each broker-dealer for providing shareholder servicing and/or distribution related services to shareholders.
For the year ended April 30, 2018, the following table shows the class specific service and distribution fees borne directly by each share class of the Fund:
| Investor A | Investor C | Total | ||||||||||
Service and Distribution Fees | $ | 116,926 | $ | 175,900 | $ | 292,826 | ||||||
Transfer Agent: For the year ended April 30, 2018, the following table shows the class specific transfer agent fees borne directly by each share class of the Fund:
| Institutional | Investor A | Investor C | Total | |||||||||||||||||
| $ | 150,627 | $ | 57,096 | $ | 20,177 | $ | 227,900 | |||||||||||||
Other Fees: For the year ended April 30, 2018, affiliates earned underwriting discounts, direct commissions and dealer concessions on sales of the Fund’s Investor A Shares of $1,984.
For the year ended April 30, 2018, affiliates of the Fund received CDSCs as follows:
| Investor A | Investor C | Total | ||||||||||||
| $ | 53 | $ | 954 | $ | 1,007 | |||||||||
Expense Limitations, Waivers, and Reimbursements: The Manager has contractually agreed to waive its investment advisory fee with respect to any portion of the Fund’s assets invested in affiliated equity and fixed-income mutual funds and affiliated exchange-traded funds that have a contractual management fee. Effective August 28, 2017, the waiver became contractual through August 31, 2018. The contractual agreement may be terminated upon 90 days’ notice by a majority of the trustees who are not “interested persons” of the Fund, as defined in the 1940 Act (“Independent Trustees”), or by a vote of a majority of the outstanding voting securities of the Fund. For the year ended April 30, 2018, there were no fees waived by the Manager pursuant to this agreement.
The Fund has begun to incur expenses in connection with a potential reconfiguration of the boards of directors of certain BlackRock-advised funds, including the Fund. The Manager has voluntarily agreed to reimburse the Fund for all or a portion of such expenses, which amounts are included in fees waived and/or reimbursed by the Manager in the Statement of Operations. For the year ended April 30, 2018, the amount reimbursed was $9,255.
| 30 | 2018 BLACKROCK ANNUAL REPORTTO SHAREHOLDERS |
Notes to Financial Statements (continued)
The Manager contractually agreed to waive and/or reimburse fees or expenses in order to limit expenses, excluding interest expense, dividend expense, tax expense, acquired fund fees and expenses, and certain other fund expenses, which constitute extraordinary expenses not incurred in the ordinary course of the Fund’s business (“expense limitation”). The current expense limitations as a percentage of average daily net assets are as follows:
| Institutional | Investor A | Investor C | ||||||||||||
| 0.45 | % | 0.70 | % | 1.45 | % | |||||||||
The Manager has agreed not to reduce or discontinue this contractual expense limitation through August 31, 2018, unless approved by the Board, including a majority of Independent Trustees, or by a vote of a majority of the outstanding voting securities of the Fund. For the year ended April 30, 2018, the Manager waived $257,698 of investment advisory fees pursuant to this agreement, which is included in fees waived and/or reimbursed by the Manager in the Statement of Operations.
These amounts waived and/or reimbursed are included in fees waived by the Manager, and shown as transfer agent fees waived and/or reimbursed — class specific in the Statement of Operations. For the year ended April 30, 2018, class specific expense reimbursements are as follows:
| Institutional | Investor A | Investor C | Total | |||||||||||||
Transfer agent fees waived and/or reimbursed | $ | 148,534 | $ | 56,521 | $ | 20,107 | $ | 225,162 | ||||||||
For the year ended April 30, 2018, the Fund reimbursed the Manager $3,173 for certain accounting services, which is included in accounting services in the Statement of Operations.
Interfund Lending: In accordance with an exemptive order (the “Order”) from the U.S. Securities and Exchange Commission (“SEC”), the Fund may participate in a joint lending and borrowing facility for temporary purposes (the “Interfund Lending Program”), subject to compliance with the terms and conditions of the Order, and to the extent permitted by the Fund’s investment policies and restrictions. The Fund is currently permitted to borrow and lend under the Interfund Lending Program.
A lending BlackRock fund may lend in aggregate up to 15% of its net assets, but may not lend more than 5% of its net assets to any one borrowing fund through the Interfund Lending Program. A borrowing BlackRock fund may not borrow through the Interfund Lending Program or from any other source more than 33 1/3% of its total assets (or any lower threshold provided for by the fund’s investment restrictions). If a borrowing BlackRock fund’s total outstanding borrowings exceed 10% of its total assets, each of its outstanding interfund loans will be subject to collateralization of at least 102% of the outstanding principal value of the loan. All interfund loans are for temporary or emergency purposes and the interest rate to be charged will be the average of the highest current overnight repurchase agreement rate available to a lending fund and the bank loan rate, as calculated according to a formula established by the Board.
During the year ended April 30, 2018, the Fund did not participate in the Interfund Lending Program.
Officers and Trustees: Certain Trustees and/or officers of the Trust are trustees and/or officers of BlackRock or its affiliates. The Fund reimburses the Manager for a portion of the compensation paid to the Trust’s Chief Compliance Officer, which is included in Trustees and Officer in the Statement of Operations.
| 7. | PURCHASES AND SALES |
For the year ended April 30, 2018, purchases and sales of investments including paydowns, mortgage dollar rolls and excluding short-term securities were as follows:
| Purchases | Sales | |||||||
Non-U.S Government Securities | $ | 5,547,004,418 | $ | 5,281,307,439 | ||||
For the year ended April 30, 2018, purchases and sales related to mortgage dollar rolls were as follows:
| Purchases and Sales — MDRs | ||||
Purchases | $ | 2,414,252,278 | ||
Sales | $ | 2,414,269,261 | ||
| 8. | INCOME TAX INFORMATION |
It is the Fund’s policy to comply with the requirements of the Internal Revenue Code of 1986, as amended, applicable to regulated investment companies, and to distribute substantially all of its taxable income to its shareholders. Therefore, no U.S. federal income tax provision is required.
The Fund files U.S. federal and various state and local tax returns. No income tax returns are currently under examination. The statute of limitations on the Fund’s U.S. federal tax returns generally remains open for each of the four years ended April 30, 2018. The statutes of limitations on the Fund’s state and local tax returns may remain open for an additional year depending upon the jurisdiction.
Management has analyzed tax laws and regulations and their application to the Fund as of April 30, 2018, inclusive of the open tax return years, and does not believe that there are any uncertain tax positions that require recognition of a tax liability in the Fund’s financial statements.
| NOTESTO FINANCIAL STATEMENTS | 31 |
Notes to Financial Statements (continued)
U.S. GAAP requires that certain components of net assets be adjusted to reflect permanent differences between financial and tax reporting. These reclassifications have no effect on net assets or net asset values per share. As of period end, the following permanent differences attributable to the accounting for swap agreements, foreign currency transactions, net paydown losses and fees received on trade settlements were reclassified to the following accounts:
Undistributed net investment income | $ | 1,773,123 | ||
Accumulated net realized loss | $ | (1,773,123 | ) |
The tax character of distributions paid was as follows:
| 4/30/2018 | 4/30/2017 | |||||||
Ordinary income | $ | 8,964,429 | $ | 9,120,874 | ||||
|
|
|
| |||||
As of period end, the tax components of accumulated net earnings (losses) were as follows:
Undistributed ordinary income | $ | 286,015 | ||
Capital loss carryforwards | (1,888,401 | ) | ||
Net unrealized losses(a) | (7,893,815 | ) | ||
|
| |||
| $ | (9,496,201 | ) | ||
|
|
| (a) | The differences between book-basis and tax-basis net unrealized losses were attributable primarily to the tax deferral of losses on wash sales, the realization for tax purposes of unrealized gains/losses on certain futures and the accounting for swap agreements. |
As of April 30, 2018, the Fund had a capital loss carryforward of $1,888,401 with no expiration date, available to offset future realized capital gains.
During the year ended April 30, 2018, the Fund utilized $652,121 of its capital loss carryforward.
As of April 30, 2018, gross unrealized appreciation and depreciation for investments and derivatives based on cost for U.S. federal income tax purposes were as follows:
Tax cost | $ | 575,419,673 | ||
|
| |||
Gross unrealized appreciation | 2,439,672 | |||
Gross unrealized depreciation | (10,335,574 | ) | ||
|
| |||
Net unrealized appreciation (depreciation) | $ | (7,895,902 | ) | |
|
|
The Tax Cuts and Jobs Act (the “Act”) was enacted on December 22, 2017. Certain provisions of the Act were effective upon enactment with the remainder becoming effective for tax years beginning after December 31, 2017. Although the Act does not amend any provisions directly related to the qualification or taxation of regulated investment companies (“RICs”), the Act does change the taxation of entities in which some RICs invest, the tax treatment of income derived from those entities and the taxation of RIC shareholders. While management does not anticipate significant impact to the Fund or to their shareholders, there is uncertainty in the application of certain provisions in the Act. Specifically, provisions in the Act may increase the amount of or accelerate the recognition of taxable income and may limit the deductibility of certain expenses by RICs. Until full clarity around these provisions is obtained, the impact on the Fund’s financial statements, if any, cannot be fully determined.
| 9. | BANK BORROWINGS |
The Trust, on behalf of the Fund, along with certain other funds managed by the Manager and its affiliates (“Participating Funds”), is a party to a 364-day, $2.25 billion credit agreement with a group of lenders. Under this agreement, the Fund may borrow to fund shareholder redemptions. Excluding commitments designated for certain individual funds, the Participating Funds, including the Fund, can borrow up to an aggregate commitment amount of $1.75 billion at any time outstanding, subject to asset coverage and other limitations as specified in the agreement. The credit agreement has the following terms: a fee of 0.10% per annum on unused commitment amounts and interest at a rate equal to the higher of (a) one-month LIBOR (but, in any event, not less than 0.00%) on the date the loan is made plus 0.80% per annum or (b) the Fed Funds rate (but, in any event, not less than 0.00%) in effect from time to time plus 0.80% per annum on amounts borrowed. The agreement expires in April 2019 unless extended or renewed. Prior to April 19, 2018, the aggregate commitment amount was $2.1 billion and the fee was 0.12% per annum. Participating Funds paid an upfront commitment fee of 0.02% on the total commitment amounts, in addition to administration, legal and arrangement fees, which are included in miscellaneous expenses in the Statement of Operations. These fees were allocated among such funds based upon portions of the aggregate commitment available to them and relative net assets of Participating Funds. During the year ended April 30, 2018, the Fund did not borrow under the credit agreement.
| 10. | PRINCIPAL RISKS |
In the normal course of business, the Fund invests in securities or other instruments and may enter into certain transactions, and such activities subject the Fund to various risks, including among others, fluctuations in the market (market risk) or failure of an issuer to meet all of its obligations. The value of securities or other instruments may also be affected by various factors, including, without limitation: (i) the general economy; (ii) the overall market as well as local, regional or global political and/or social instability; (iii) regulation, taxation or international tax treaties between various countries; or (iv) currency, interest rate and price fluctuations.
The Fund may be exposed to prepayment risk, which is the risk that borrowers may exercise their option to prepay principal earlier than scheduled during periods of declining interest rates, which would force the Fund to reinvest in lower yielding securities. The Fund may also be exposed to reinvestment risk, which is the risk that income from the Fund’s portfolio will decline if the Fund invests the proceeds from matured, traded or called fixed-income securities at market interest rates that are below the Fund portfolio’s current earnings rate.
| 32 | 2018 BLACKROCK ANNUAL REPORTTO SHAREHOLDERS |
Notes to Financial Statements (continued)
Valuation Risk: The market values of equities, such as common stocks and preferred securities or equity related investments, such as futures and options, may decline due to general market conditions which are not specifically related to a particular company. They may also decline due to factors which affect a particular industry or industries. The Fund may invest in illiquid investments and may experience difficulty in selling those investments in a timely manner at the price that it believes the investments are worth. Prices may fluctuate widely over short or extended periods in response to company, market or economic news. Markets also tend to move in cycles, with periods of rising and falling prices. This volatility may cause the Fund’s NAV to experience significant increases or decreases over short periods of time. If there is a general decline in the securities and other markets, the NAV of the Fund may lose value, regardless of the individual results of the securities and other instruments in which the Fund invests.
The price the Fund could receive upon the sale of any particular portfolio investment may differ from the Fund’s valuation of the investment, particularly for securities that trade in thin or volatile markets or that are valued using a fair valuation technique or a price provided by an independent pricing service. Changes to significant unobservable inputs and assumptions (i.e., publicly traded company multiples, growth rate, time to exit) due to the lack of observable inputs may significantly impact the resulting fair value and therefore the Fund’s results of operations. As a result, the price received upon the sale of an investment may be less than the value ascribed by the Fund, and the Fund could realize a greater than expected loss or lesser than expected gain upon the sale of the investment. The Fund’s ability to value its investments may also be impacted by technological issues and/or errors by pricing services or other third party service providers.
Counterparty Credit Risk: The Fund may be exposed to counterparty credit risk, or the risk that an entity may fail to or be unable to perform on its commitments related to unsettled or open transactions. The Fund manages counterparty credit risk by entering into transactions only with counterparties that the Manager believes have the financial resources to honor their obligations and by monitoring the financial stability of those counterparties. Financial assets, which potentially expose the Fund to market, issuer and counterparty credit risks, consist principally of financial instruments and receivables due from counterparties. The extent of the Fund’s exposure to market, issuer and counterparty credit risks with respect to these financial assets is approximately their value recorded in the Statement of Assets and Liabilities, less any collateral held by the Fund.
A derivative contract may suffer a mark-to-market loss if the value of the contract decreases due to an unfavorable change in the market rates or values of the underlying instrument. Losses can also occur if the counterparty does not perform under the contract.
The Fund’s risk of loss from counterparty credit risk on OTC derivatives is generally limited to the aggregate unrealized gain less the value of any collateral held by the Fund.
For OTC options purchased, the Fund bears the risk of loss in the amount of the premiums paid plus the positive change in market values net of any collateral held by the Fund should the counterparty fail to perform under the contracts. Options written by the Fund do not typically give rise to counterparty credit risk, as options written generally obligate the Fund, and not the counterparty, to perform. The Fund may be exposed to counterparty credit risk with respect to options written to the extent the Fund deposits collateral with its counterparty to a written option.
With exchange-traded options purchased and futures and centrally cleared swaps, there is less counterparty credit risk to the Fund since the exchange or clearinghouse, as counterparty to such instruments, guarantees against a possible default. The clearinghouse stands between the buyer and the seller of the contract; therefore, credit risk is limited to failure of the clearinghouse. While offset rights may exist under applicable law, the Fund does not have a contractual right of offset against a clearing broker or clearinghouse in the event of a default (including the bankruptcy or insolvency). Additionally, credit risk exists in exchange-traded futures and centrally cleared swaps with respect to initial and variation margin that is held in a clearing broker’s customer accounts. While clearing brokers are required to segregate customer margin from their own assets, in the event that a clearing broker becomes insolvent or goes into bankruptcy and at that time there is a shortfall in the aggregate amount of margin held by the clearing broker for all its clients, typically the shortfall would be allocated on a pro rata basis across all the clearing broker’s customers, potentially resulting in losses to the Fund.
Concentration Risk: The Fund invests a significant portion of its assets in fixed-income securities and/or uses derivatives tied to the fixed-income markets. Changes in market interest rates or economic conditions may affect the value and/or liquidity of such investments. Interest rate risk is the risk that prices of bonds and other fixed-income securities will increase as interest rates fall and decrease as interest rates rise.
The Fund invests a significant portion of its assets in securities backed by commercial or residential mortgage loans or in issuers that hold mortgage and other asset-backed securities. Investment percentages in these securities are presented in the Schedule of Investments. Changes in economic conditions, including delinquencies and/or defaults on assets underlying these securities, can affect the value, income and/or liquidity of such positions.
| NOTESTO FINANCIAL STATEMENTS | 33 |
Notes to Financial Statements (continued)
| 11. | CAPITAL SHARE TRANSACTIONS |
Transactions in capital shares for each class were as follows:
| Year Ended 04/30/2018 | Year Ended 04/30/2017 | |||||||||||||||
| Shares | Amount | Shares | Amount | |||||||||||||
Institutional | ||||||||||||||||
Shares sold | 10,002,449 | $ | 101,948,116 | 12,253,733 | $ | 126,692,658 | ||||||||||
Shares issued in reinvestment of distributions | 478,222 | 4,879,817 | 445,316 | 4,620,345 | ||||||||||||
Shares redeemed | (13,003,600 | ) | (132,806,871 | ) | (10,840,918 | ) | (112,190,895 | ) | ||||||||
|
|
|
|
|
|
|
| |||||||||
Net decrease | (2,522,929 | ) | $ | (25,978,938 | ) | 1,858,131 | $ | 19,122,108 | ||||||||
|
|
|
|
|
|
|
| |||||||||
Investor A | ||||||||||||||||
Shares sold | 854,548 | $ | 8,739,089 | 2,649,867 | $ | 27,584,700 | ||||||||||
Shares issued in reinvestment of distributions | 130,418 | 1,328,437 | 182,864 | 1,894,542 | ||||||||||||
Shares redeemed | (2,178,910 | ) | (22,151,905 | ) | (5,285,209 | ) | (54,496,248 | ) | ||||||||
|
|
|
|
|
|
|
| |||||||||
Net decrease | (1,193,944 | ) | $ | (12,084,379 | ) | (2,452,478 | ) | $ | (25,017,006 | ) | ||||||
|
|
|
|
|
|
|
| |||||||||
Investor C | ||||||||||||||||
Shares sold | 149,623 | $ | 1,529,074 | 700,593 | $ | 7,292,467 | ||||||||||
Shares issued in reinvestment of distributions | 41,567 | 423,460 | 45,454 | 470,391 | ||||||||||||
Shares redeemed | (836,940 | ) | (8,546,854 | ) | (748,486 | ) | (7,734,065 | ) | ||||||||
|
|
|
|
|
|
|
| |||||||||
Net decrease | (645,750 | ) | $ | (6,594,320 | ) | (2,439 | ) | $ | 28,793 | |||||||
|
|
|
|
|
|
|
| |||||||||
Total Net Decrease | (4,362,623 | ) | $ | (44,657,637 | ) | (596,787 | ) | $ | (5,866,105 | ) | ||||||
|
|
|
|
|
|
|
| |||||||||
| 12. | SUBSEQUENT EVENTS |
Management’s evaluation of the impact of all subsequent events on the Fund’s financial statements was completed through the date the financial statements were issued and the following items were noted:
The Board has approved an Agreement and Plan of Reorganization (the “Plan”) with respect to the Fund, pursuant to which the Fund will reorganize into a newly created series (the “New Fund”) of a newly organized Delaware statutory trust. This reorganization with respect to the Fund (, the “Reorganization”) is expected to close in the third quarter of 2018. The Reorganization is not subject to approval by shareholders of the Fund.
The New Fund will have the same investment objective, strategies and policies, investment adviser, portfolio management team and service providers as the Fund. The Fund will be the performance and accounting survivor of its Reorganization, meaning that the New Fund will assume the performance and financial history of the Fund at the completion of the Reorganization. In addition, the New Fund will be subject to the same contractual arrangements, including the same contractual fees and expenses, as those of the Fund. The Reorganization is intended to be tax-free meaning that the Fund’s shareholders will become shareholders of the New Fund without realizing any gain or loss for federal income tax purposes.
Upon the consummation of the Reorganization, shareholders of the Fund will become shareholders of the New Fund. If you are a shareholder of the Fund, the cash value of your investment will not change. You will receive New Fund shares with a total dollar value equal to the Fund shares that you own at the time of the Reorganization.
| 34 | 2018 BLACKROCK ANNUAL REPORTTO SHAREHOLDERS |
Report of Independent Registered Public Accounting Firm
To the Board of Trustees of Managed Account Series and the Shareholders of BlackRock U.S. Mortgage Portfolio:
Opinion on the Financial Statements and Financial Highlights
We have audited the accompanying statement of assets and liabilities of BlackRock U.S. Mortgage Portfolio of Managed Account Series (the “Fund”), including the schedule of investments, as of April 30, 2018, the related statement of operations and cash flows for the year then ended, the statements of changes in net assets for each of the two years in the period then ended, and the financial highlights for each of the five years in the period then ended, and the related notes. In our opinion, the financial statements and financial highlights present fairly, in all material respects, the financial position of the Fund as of April 30, 2018, and the results of its operations and cash flows for the year then ended, the changes in its net assets for each of the two years in the period then ended, and the financial highlights for each of the five years in the period then ended, in conformity with accounting principles generally accepted in the United States of America.
Basis for Opinion
These financial statements and financial highlights are the responsibility of the Fund’s management. Our responsibility is to express an opinion on the Fund’s financial statements and financial highlights based on our audits. We are a public accounting firm registered with the Public Company Accounting Oversight Board (United States) (PCAOB) and are required to be independent with respect to the Fund in accordance with the U.S. federal securities laws and the applicable rules and regulations of the Securities and Exchange Commission and the PCAOB.
We conducted our audits in accordance with the standards of the PCAOB. Those standards require that we plan and perform the audit to obtain reasonable assurance about whether the financial statements and financial highlights are free of material misstatement, whether due to error or fraud. The Fund is not required to have, nor were we engaged to perform, an audit of its internal control over financial reporting. As part of our audits we are required to obtain an understanding of internal control over financial reporting but not for the purpose of expressing an opinion on the effectiveness of the Fund’s internal control over financial reporting. Accordingly, we express no such opinion.
Our audits included performing procedures to assess the risks of material misstatement of the financial statements and financial highlights, whether due to error or fraud, and performing procedures that respond to those risks. Such procedures included examining, on a test basis, evidence regarding the amounts and disclosures in the financial statements and financial highlights. Our audits also included evaluating the accounting principles used and significant estimates made by management, as well as evaluating the overall presentation of the financial statements and financial highlights. Our procedures included confirmation of securities owned as of April 30, 2018, by correspondence with the custodian and brokers; when replies were not received from brokers, we performed other auditing procedures. We believe that our audits provide a reasonable basis for our opinion.
Deloitte & Touche LLP
Boston, Massachusetts
June 27, 2018
We have served as the auditor of one or more BlackRock investment companies since 1992.
Important Tax Information (unaudited)
During the fiscal year ended April 30, 2018, the following information is provided with respect to the ordinary income distributions paid by the Fund:
| Payable Date/Months Paid | ||||||
Interest Related Dividends for Non-U.S. Residents(a) | May 2017 | 95.59 | % | |||
| June 2017 — December 2017 | 100.00 | |||||
| January 2018 — April 2018 | 76.17 | |||||
| (a) | Represents the portion of the taxable ordinary income dividends eligible for exemption from U.S. withholding tax for nonresident aliens and foreign corporations. |
| REPORTOF INDEPENDENT REGISTERED PUBLIC ACCOUNTING FIRM / TAX INFORMATION | 35 |
Trustee and Officer Information
| Independent Trustees (a) | ||||||||
Name Year of Birth (b) | Position(s) Held (Length of Service) (c) | Principal Occupation(s) During Past Five Years | Number of BlackRock-Advised Registered Investment Companies (“RICs”) Consisting of Investment Portfolios (“Portfolios”) Overseen | Public Company and Other Investment Company Directorships Held During Past Five Years | ||||
Robert M. Hernandez 1944 | Chair of the Board and Trustee (Since 2007) | Director, Vice Chairman and Chief Financial Officer of USX Corporation (energy and steel business) from 1991 to 2001; Director and non-executive Chairman, RTI International Metals, Inc. from 1990 to 2015; Director, TE Connectivity (electronics) from 2006 to 2012. | 27 RICs consisting of 95 Portfolios | Chubb Limited (insurance company); Eastman Chemical Company | ||||
James H. Bodurtha 1944 | Trustee (Since 2007) | Director, The China Business Group, Inc. (consulting and investing firm) from 1996 to 2013 and Executive Vice President thereof from 1996 to 2003; Chairman of the Board, Berkshire Holding Corporation since 1980; Director, ICI Mutual since 2010. | 27 RICs consisting of 95 Portfolios | None | ||||
Bruce R. Bond 1946 | Trustee (Since 2007) | Trustee and Member of the Governance Committee, State Street Research Mutual Funds from 1997 to 2005; Board Member of Governance, Audit and Finance Committee, Avaya Inc. (computer equipment) from 2003 to 2007. | 27 RICs consisting of 95 Portfolios | None | ||||
Honorable Stuart E. Eizenstat 1943 | Trustee (Since 2007) | Senior Counsel of Covington and Burling LLP (law firm) since 2016 Head of International Practice thereof since 2001, and Partner thereof from 2001 to 2016; Advisory Board Member, OCP S.A. (phosphates) since 2010; International Advisory Board Member, The Coca-Cola Company from 2002 to 2011; Advisory Board Member, Veracity Worldwide, LLC (risk management) from 2007 to 2012; Member of the International Advisory Board, GML Ltd. (energy) since 2003; Board of Directors, Ferroglobe (silicon metals) since 2016. | 27 RICs consisting of 95 Portfolios | Alcatel-Lucent (telecommunications); Global Specialty Metallurgical; UPS Corporation (delivery service) | ||||
Henry Gabbay 1947 | Trustee (Since 2007) | Consultant, BlackRock, Inc. from 2007 to 2008; Managing Director, BlackRock, Inc. from 1989 to 2007; Chief Administrative Officer, BlackRock Advisors, LLC from 1998 to 2007; President of BlackRock Funds and BlackRock Allocation Target Shares (formerly, BlackRock Bond Allocation Target Shares) from 2005 to 2007 and Treasurer of certain closed-end funds in the BlackRock fund complex from 1989 to 2006. | 27 RICs consisting of 95 Portfolios | None | ||||
Lena G. Goldberg 1949 | Trustee (Since 2016) | Senior Lecturer, Harvard Business School since 2008; Executive Vice President, FMR LLC/Fidelity Investments (financial services) from 2007 to 2008, Executive Vice President and General Counsel thereof from 2002 to 2007, Senior Vice President and General Counsel thereof from 1999 to 2002, Vice President and General Counsel thereof from 1997 to 1999, Senior Vice President and Deputy General Counsel thereof in 1997, and Vice President and Corporate Counsel thereof from 1996 to 1997; Partner, Sullivan & Worcester LLP from 1985 to 1996 and Associate thereof from 1979 to 1985. | 27 RICs consisting of 95 Portfolios | None | ||||
| 36 | 2018 BLACKROCK ANNUAL REPORTTO SHAREHOLDERS |
Trustee and Officer Information (continued)
Name Year of Birth (b) | Position(s) Held (Length of Service) (c) | Principal Occupation(s) During Past Five Years | Number of BlackRock-Advised Registered Investment Companies (“RICs”) Consisting of Investment Portfolios (“Portfolios”) Overseen | Public Company and Other Investment Company Directorships Held During Past Five Years | ||||
Henry R. Keizer 1956 | Trustee (Since 2016) | Director, Park Indemnity Ltd. (captive insurer) since 2010; Director, MUFG Americas Holdings Corporation and MUFG Union Bank, N.A. (financial and bank holding company) from 2014 to 2016; Director, Montpelier Re Holdings, Ltd. (publicly held property and casual reinsurance) from 2013 to 2015; Director, American Institute of Certified Public Accountants from 2009 to 2011; Director, KPMG LLP (audit, tax and advisory services) from 2004 to 2005 and 2010 to 2012; Director, KPMG International in 2012, Deputy Chairman and Chief Operating Officer thereof from 2010 to 2012 and U.S. Vice Chairman of Audit thereof from 2005 to 2010; Global Head of Audit, KPMGI (consortium of KPMG firms) from 2006 to 2010; Director, YMCA of Greater New York from 2006 to 2010. | 27 RICs consisting of 95 Portfolios | Hertz Global Holdings (car rental); WABCO (commercial vehicle safety systems); Sealed Air Corp. (packaging) | ||||
John F. O’Brien 1947 | Trustee (Since 2007) | Trustee, Woods Hole Oceanographic Institute since 2003 and Chairman thereof from 2009 to 2015; Co-Founder and Managing Director, Board Leaders LLC (director education) since 2005. | 27 RICs consisting of 95 Portfolios | Cabot Corporation (chemicals); LKQ Corporation (auto parts manufacturing); TJX Companies, Inc. (retailer) | ||||
Donald C. Opatrny 1952 | Trustee (Since 2015) | Trustee, Member of the Executive Committee and Chair of the Investment Committee, Cornell University since 2004; Member of the Board and Investment Committee, University School since 2007; Member of the Investment Committee, Mellon Foundation from 2009 to 2015; President and Trustee, the Center for the Arts, Jackson Hole since 2011; Director, Athena Capital Advisors LLC (investment management firm) since 2013; Trustee and Chair of the Investment Committee, Community Foundation of Jackson Hole since 2014; Trustee, Artstor (a Mellon Foundation affiliate) from 2010 to 2015; President, Trustee and Member of the Investment Committee, The Aldrich Contemporary Art Museum from 2007 to 2014. | 27 RICs consisting of 95 Portfolios | None | ||||
| TRUSTEEAND OFFICER INFORMATION | 37 |
Trustee and Officer Information (continued)
| Interested Trustees (a)(d) | ||||||||
Name (b) Year of Birth | Position(s) Held (Length of Service) (c) | Principal Occupation(s) During Past Five Years | Number of BlackRock-Advised Registered Investment Companies (“RICs”) Consisting of Investment Portfolios (“Portfolios”) Overseen | Public Company and Other Investment Company Directorships Held During Past Five Years | ||||
Robert Fairbairn 1965 | Trustee (Since 2015) | Senior Managing Director of BlackRock, Inc. since 2010; oversees BlackRock’s Strategic Partner Program and Strategic Product Management Group; Member of BlackRock’s Global Executive and Global Operating Committees; Co-Chair of BlackRock’s Human Capital Committee; Global Head of BlackRock’s Retail and iShares® businesses from 2012 to 2016; Head of BlackRock’s Global Client Group from 2009 to 2012; Chairman of BlackRock’s international businesses from 2007 to 2010. | 128 RICs consisting of 311 Portfolios | None | ||||
John M. Perlowski 1964 | Trustee (Since 2015) and President and Chief Executive Officer (Since 2010) | Managing Director of BlackRock, Inc. since 2009; Head of BlackRock Global Fund & Accounting Services since 2009; Managing Director and Chief Operating Officer of the Global Product Group at Goldman Sachs Asset Management, L.P. from 2003 to 2009; Treasurer of Goldman Sachs Mutual Funds from 2003 to 2009 and Senior Vice President thereof from 2007 to 2009; Director of Goldman Sachs Offshore Funds from 2002 to 2009; Director of Family Resource Network (charitable foundation) since 2009. | 128 RICs consisting of 311 Portfolios | None | ||||
(a) The address of each Trustee is c/o BlackRock, Inc., 55 East 52nd Street, New York, NY 10055. | ||||||||
(b) Each Independent Trustee holds office until his or her successor is duly elected and qualifies or until his or her earlier death, resignation, retirement or removal as provided by the Trust’s by-laws or charter or statute, or, until December 31 of the year in which he or she turns 75. The Board may determine to extend the terms of Independent Trustee on a case-by-case basis, as appropriate. Interested Trustees serve until their successor is duly elected and qualifies or until their earlier death, resignation, retirement or removal as provided by the Trust’s by-laws or statute, or until December 31 of the year in which they turn 72. | ||||||||
(c) Following the combination of Merrill Lynch Investment Managers, L.P. (“MLIM”) and BlackRock, Inc. in September 2006, the various legacy MLIM and legacy BlackRock fund boards were realigned and consolidated into three new fund boards in 2007. As a result, although the chart shows certain Independent Trustee as joining the Fund’s board in 2007, those Trustee first became members of the boards of other legacy MLIM or legacy BlackRock funds as follows: James H. Bodurtha, 1995; Bruce R. Bond, 2005; Honorable Stuart E. Eizenstat, 2001; Robert M. Hernandez, 1996; and John F. O’Brien, 2005. | ||||||||
(d) Mr. Fairbairn and Mr. Perlowski are both “interested persons,” as defined in the 1940 Act, of the Trust based on their positions with BlackRock, Inc. and its affiliates. Mr. Fairbairn and Mr. Perlowski are also board members of the BlackRock Closed-End Complex and the BlackRock Equity-Liquidity Complex. | ||||||||
| 38 | 2018 BLACKROCK ANNUAL REPORTTO SHAREHOLDERS |
Trustee and Officer Information (continued)
| Officers Who Are Not Trustees (a) | ||||
| Name (b) Year of Birth | Position(s) Held (Length of Service) | Principal Occupation(s) During Past Five Years | ||
Jennifer McGovern 1977 | Vice President (Since 2014) | Managing Director of BlackRock, Inc. since 2016; Director of BlackRock, Inc. from 2011 to 2015; Head of Product Structure and Oversight for BlackRock’s U.S. Wealth Advisory Group since 2013; Vice President of BlackRock, Inc. from 2008 to 2010. | ||
Neal J. Andrews 1966 | Chief Financial Officer (Since 2007) | Managing Director of BlackRock since 2006; Senior Vice President and Line of Business Head of Fund Accounting and Administration at PNC Global Investment Servicing (U.S.) Inc. from 1992 to 2006. | ||
Jay M. Fife 1970 | Treasurer (Since 2007) | Managing Director of BlackRock, Inc. since 2007; Director of BlackRock, Inc. in 2006; Assistant Treasurer of the MLIM and Fund Asset Management, L.P. advised funds from 2005 to 2006; Director of MLIM Fund Services Group from 2001 to 2006. | ||
Charles Park 1967 | Chief Compliance Officer (Since 2014) | Anti-Money Laundering Compliance Officer for the BlackRock-advised Funds in the Equity-Bond Complex, the Equity-Liquidity Complex and the Closed-End Complex from 2014 to 2015; Chief Compliance Officer of BlackRock Advisors, LLC and the BlackRock-advised Funds in the Equity-Bond Complex, the Equity-Liquidity Complex and the Closed-End Complex since 2014; Principal of and Chief Compliance Officer for iShares® Delaware Trust Sponsor LLC since 2012 and BlackRock Fund Advisors (“BFA”) since 2006; Chief Compliance Officer for the BFA-advised iShares® exchange traded funds since 2006; Chief Compliance Officer for BlackRock Asset Management International Inc. since 2012. | ||
Fernanda Piedra 1969 | Anti-Money Laundering Compliance Officer (Since 2015) | Director of BlackRock, Inc. since 2014; Anti-Money Laundering Compliance Officer and Regional Head of Financial Crime for the Americas at BlackRock, Inc. since 2014; Head of Regulatory Changes and Remediation for the Asset Wealth Management Division of Deutsche Bank from 2010 to 2014; Vice President of Goldman Sachs (Anti-Money Laundering/Suspicious Activities Group) from 2004 to 2010. | ||
Benjamin Archibald 1975 | Secretary (Since 2012) | Managing Director of BlackRock, Inc. since 2014; Director of BlackRock, Inc. from 2010 to 2013; Secretary of the iShares® exchange traded funds since 2015; Secretary of the BlackRock-advised mutual funds since 2012. | ||
(a) The address of each Officer is c/o BlackRock, Inc., 55 East 52nd Street, New York, NY 10055. (b) Officers of the Trust serve at the pleasure of the Board. | ||||
Further information about the Trust’s Trustees and Officers is available in the Trust’s Statement of Additional Information, which can be obtained without charge by calling (800) 441-7762.
Effective December 31, 2017, Roberta Cooper Ramo retired and Donald W. Burton resigned as Trustees of the Trust.
Effective May 8, 2018, John MacKessy replaced Fernanda Piedra as the Trust’s Anti-Money Laundering Compliance Officer of the Trust.
Investment Adviser
BlackRock Advisors, LLC
Wilmington, DE 19809
Accounting Agent
JPMorgan Chase Bank, N.A.
New York, NY 10179
Custodian
JPMorgan Chase Bank, N.A.
New York, NY 10179
Transfer Agent
BNY Mellon Investment Servicing (US) Inc.
Wilmington, DE 19809
Independent Registered Public Accounting Firm
Deloitte & Touche LLP
Boston, MA 02116
Distributor
BlackRock Investments, LLC
New York, NY 10022
Legal Counsel
Willkie Farr & Gallagher LLP
New York, NY 10019
Address of the Fund
100 Bellevue Parkway
Wilmington, DE 19809
| TRUSTEEAND OFFICER INFORMATION | 39 |
General Information
Householding
The Fund will mail only one copy of shareholder documents, including prospectuses, annual and semi-annual reports and proxy statements, to shareholders with multiple accounts at the same address. This practice is commonly called “householding” and is intended to reduce expenses and eliminate duplicate mailings of shareholder documents. Mailings of your shareholder documents may be householded indefinitely unless you instruct us otherwise. If you do not want the mailing of these documents to be combined with those for other members of your household, please call the Fund at (800) 441-7762.
Availability of Quarterly Schedule of Investments
The Fund file their complete schedule of portfolio holdings with the SEC for the first and third quarters of each fiscal year on Form N-Q. The Fund’s Forms N-Q are available on the SEC’s website at http://www.sec.gov and may also be reviewed and copied at the SEC’s Public Reference Room in Washington, D.C. Information on the operation of the Public Reference Room or how to access documents on the SEC’s website without charge may be obtained by calling (800) SEC-0330. The Fund’s Forms N-Q may also be obtained upon request and without charge by calling (800) 441-7762.
Availability of Proxy Voting Policies and Procedures
A description of the policies and procedures that the Fund use to determine how to vote proxies relating to portfolio securities is available upon request and without charge (1) by calling (800) 441-7762; (2) at http://www.blackrock.com; and (3) on the SEC’s website at http://www.sec.gov.
Availability of Proxy Voting Record
Information about how the Fund voted proxies relating to securities held in the Fund’s portfolios during the most recent 12-month period ended June 30 is available upon request and without charge (1) at http://www.blackrock.com; or by calling (800) 441-7762 and (2) on the SEC’s website at http://www.sec.gov.
BlackRock’s Mutual Fund Family
BlackRock offers a diverse lineup of open-end mutual funds crossing all investment styles and managed by experts in equity, fixed-income and tax-exempt investing. Visit http://www.blackrock.com for more information.
Shareholder Privileges
Account Information
Call us at (800) 441-7762 from 8:00 AM to 6:00 PM ET on any business day to get information about your account balances, recent transactions and share prices. You can also reach us on the Web at http://www.blackrock.com.
Automatic Investment Plans
Investor Class shareholders who want to invest regularly can arrange to have $50 or more automatically deducted from their checking or savings account and invested in any of the BlackRock funds.
Systematic Withdrawal Plans
Investor Class shareholders can establish a systematic withdrawal plan and receive periodic payments of $50 or more from their BlackRock funds, as long as their account balance is at least $10,000.
Retirement Plans
Shareholders may make investments in conjunction with Traditional, Rollover, Roth, Coverdell, Simple IRAs, SEP IRAs and 403(b) Plans.
| 40 | 2018 BLACKROCK ANNUAL REPORTTO SHAREHOLDERS |
Additional Information (continued)
BlackRock Privacy Principles
BlackRock is committed to maintaining the privacy of its current and former fund investors and individual clients (collectively, “Clients”) and to safeguarding their non-public personal information. The following information is provided to help you understand what personal information BlackRock collects, how we protect that information and why in certain cases we share such information with select parties.
If you are located in a jurisdiction where specific laws, rules or regulations require BlackRock to provide you with additional or different privacy-related rights beyond what is set forth below, then BlackRock will comply with those specific laws, rules or regulations.
BlackRock obtains or verifies personal non-public information from and about you from different sources, including the following: (i) information we receive from you or, if applicable, your financial intermediary, on applications, forms or other documents; (ii) information about your transactions with us, our affiliates, or others; (iii) information we receive from a consumer reporting agency; and (iv) from visits to our websites.
BlackRock does not sell or disclose to non-affiliated third parties any non-public personal information about its Clients, except as permitted by law or as is necessary to respond to regulatory requests or to service Client accounts. These non-affiliated third parties are required to protect the confidentiality and security of this information and to use it only for its intended purpose.
We may share information with our affiliates to service your account or to provide you with information about other BlackRock products or services that may be of interest to you. In addition, BlackRock restricts access to non-public personal information about its Clients to those BlackRock employees with a legitimate business need for the information. BlackRock maintains physical, electronic and procedural safeguards that are designed to protect the non-public personal information of its Clients, including procedures relating to the proper storage and disposal of such information.
Glossary of Terms Used in this Report
| Currency | ||
| USD | United States Dollar | |
| Portfolio Abbreviations | ||
| CLO | Collateralized Loan Obligation | |
| LIBOR | London Interbank Offered Rate | |
| OTC | Over-the-counter | |
| TBA | To-be-announced | |
| ADDITIONAL INFORMATION | 41 |
This report is intended for current holders. It is not authorized for use as an offer of sale or a solicitation of an offer to buy shares of a Fund unless preceded or accompanied by the Fund’s current prospectus. Past performance results shown in this report should not be considered a representation of future performance. Investment returns and principal value of shares will fluctuate so that shares, when redeemed, may be worth more or less than their original cost. Statements and other information herein are as dated and are subject to change.

| MAS-4/18-AR |  |
Item 2 – | Code of Ethics – The registrant (or the “Fund”) has adopted a code of ethics, as of the end of the period covered by this report, applicable to the registrant’s principal executive officer, principal financial officer, principal accounting officer or controller, or persons performing similar functions. During the period covered by this report, the code of ethics was amended to clarify an inconsistency as to whom persons covered by the code should report suspected violations of the code. The amendment clarifies that such reporting should be made to BlackRock Advisors, LLC’s (“Investment Adviser” or “BlackRock”) General Counsel, and retains the alternative option of anonymous reporting following “whistleblower” policies. Other non-material changes were also made in connection with this amendment. During the period covered by this report, there have been no waivers granted under the code of ethics. The registrant undertakes to provide a copy of the code of ethics to any person upon request, without charge, who calls 1-800-441-7762. | |
Item 3 – | Audit Committee Financial Expert – The registrant’s board of trustees (the “board of trustees”), has determined that (i) the registrant has the following audit committee financial experts serving on its audit committee and (ii) each audit committee financial expert is independent: | |
Robert M. Hernandez Henry R. Keizer Bruce R. Bond | ||
Under applicable securities laws, a person determined to be an audit committee financial expert will not be deemed an “expert” for any purpose, including without limitation for the purposes of Section 11 of the Securities Act of 1933, as a result of being designated or identified as an audit committee financial expert. The designation or identification of a person as an audit committee financial expert does not impose on such person any duties, obligations, or liabilities greater than the duties, obligations, and liabilities imposed on such person as a member of the audit committee and board of trustees in the absence of such designation or identification. | ||
Item 4 – | Principal Accountant Fees and Services | |
| The following table presents fees billed by Deloitte & Touche LLP (“D&T”) in each of the last two fiscal years for the services rendered to the Fund: | ||
(a) Audit Fees | (b) Audit-Related Fees1 | (c) Tax Fees2 | (d) All Other Fees | |||||||||||||
| Entity Name | Current Fiscal Year End | Previous Fiscal Year End | Current Fiscal Year End | Previous Fiscal Year End | Current Fiscal Year End | Previous Fiscal Year End | Current Fiscal Year End | Previous Fiscal Year End | ||||||||
BlackRock U.S. Mortgage Portfolio
| $31,200 | $31,850 | $0 | $0 | $14,800 | $14,841 | $0 | $0 | ||||||||
The following table presents fees billed by D&T that were required to be approved by the registrant’s audit committee (the “Committee”) for services that relate directly to the operations or financial reporting of the Fund and that are rendered on behalf of BlackRock and entities controlling, controlled by, or under common control with BlackRock (not including any sub-adviser whose role is primarily portfolio management and is subcontracted with or overseen by another investment adviser) that provide ongoing services to the Fund (“Affiliated Service Providers”): |
2
| Current Fiscal Year End | Previous Fiscal Year End | |||
| (b) Audit-Related Fees1 | $0 | $0 | ||
| (c) Tax Fees2 | $0 | $0 | ||
(d) All Other Fees3 | $2,274,000 | $2,129,000 |
1 The nature of the services includes assurance and related services reasonably related to the performance of the audit or review of financial statements not included in Audit Fees, including accounting consultations, agreed-upon procedure reports, attestation reports, comfort letters, out-of-pocket expenses and internal control reviews not required by regulators.
2 The nature of the services includes tax compliance and/or tax preparation, including services relating to the filing or amendment of federal, state or local income tax returns, regulated investment company qualification reviews, taxable income and tax distribution calculations.
3 Non-audit fees of $2,274,000 and $2,129,000 for the current fiscal year and previous fiscal year, respectively, were paid to the Fund’s principal accountant in their entirety by BlackRock, in connection with services provided to the Affiliated Service Providers of the Fund and of certain other funds sponsored and advised by BlackRock or its affiliates for a service organization review and an accounting research tool subscription. These amounts represent aggregate fees paid by BlackRock and were not allocated on a per fund basis.
| (e)(1) Audit Committee Pre-Approval Policies and Procedures: | ||
The Committee has adopted policies and procedures with regard to the pre-approval of services. Audit, audit-related and tax compliance services provided to the registrant on an annual basis require specific pre-approval by the Committee. The Committee also must approve other non-audit services provided to the registrant and those non-audit services provided to the Investment Adviser and Affiliated Service Providers that relate directly to the operations and the financial reporting of the registrant. Certain of these non-audit services that the Committee believes are (a) consistent with the SEC’s auditor independence rules and (b) routine and recurring services that will not impair the independence of the independent accountants may be approved by the Committee without consideration on a specific case-by-case basis (“general pre-approval”). The term of any general pre-approval is 12 months from the date of the pre-approval, unless the Committee provides for a different period. Tax or other non-audit services provided to the registrant which have a direct impact on the operations or financial reporting of the registrant will only be deemed pre-approved provided that any individual project does not exceed $10,000 attributable to the registrant or $50,000 per project. For this purpose, multiple projects will be aggregated to determine if they exceed the previously mentioned cost levels. | ||
Any proposed services exceeding the pre-approved cost levels will require specific pre-approval by the Committee, as will any other services not subject to general pre-approval (e.g., unanticipated but permissible services). The Committee is informed of each service approved subject to general pre-approval at the next regularly scheduled in-person board meeting. At this meeting, an analysis of such services is presented to the Committee for ratification. The Committee may delegate to the Committee Chairman the authority to approve the provision of and fees for any specific engagement of permitted non-audit services, including services exceeding pre-approved cost levels. | ||
| (e)(2) None of the services described in each of Items 4(b) through (d) were approved by the Committee pursuant to the de minimis exception in paragraph (c)(7)(i)(C) of Rule 2-01 of Regulation S-X. | ||
| (f) Not Applicable | ||
| (g) The aggregate non-audit fees, defined as the sum of the fees shown under “Audit-Related Fees,” | ||
3
| “Tax Fees” and “All Other Fees,” paid to the accountant for services rendered by the accountant to the registrant, the Investment Adviser and the Affiliated Service Providers were: |
| Entity Name | Current Fiscal Year End | Previous Fiscal Year End | ||||
| BlackRock U.S. Mortgage Portfolio | $14,800 | $14,841 |
| Additionally, the amounts billed by D&T in connection with services provided to the Affiliated Service Providers of the Fund and of other funds sponsored and advised by BlackRock or its affiliates during the current and previous fiscal years for a service organization review and an accounting research tool subscription were: |
Current Fiscal Year End | Previous Fiscal Year End | |
$2,274,000 | $2,129,000 |
| These amounts represent aggregate fees paid by BlackRock and were not allocated on a per fund basis. | ||
(h) The Committee has considered and determined that the provision of non-audit services that were rendered to the Investment Adviser and the Affiliated Service Providers that were not pre-approved pursuant to paragraph (c)(7)(ii) of Rule 2-01 of Regulation S-X is compatible with maintaining the principal accountant’s independence. | ||
| Item 5 – | Audit Committee of Listed Registrants – Not Applicable | |
| Item 6 – | Investments | |
| (a) The registrant’s Schedule of Investments is included as part of the Report to Stockholders filed under Item 1 of this Form. | ||
| (b) Not Applicable due to no such divestments during the semi-annual period covered since the previous Form N-CSR filing. | ||
| Item 7 – | Disclosure of Proxy Voting Policies and Procedures for Closed-End Management Investment Companies – Not Applicable | |
| Item 8 – | Portfolio Managers of Closed-End Management Investment Companies – Not Applicable | |
| Item 9 – | Purchases of Equity Securities by Closed-End Management Investment Company and Affiliated Purchasers – Not Applicable | |
| Item 10 – | Submission of Matters to a Vote of Security Holders – There have been no material changes to these procedures. | |
| Item 11 – | Controls and Procedures | |
4
| (a) The registrant’s principal executive and principal financial officers, or persons performing similar functions, have concluded that the registrant’s disclosure controls and procedures (as defined in Rule 30a-3(c) under the Investment Company Act of 1940, as amended (the “1940 Act”)) are effective as of a date within 90 days of the filing of this report based on the evaluation of these controls and procedures required by Rule 30a-3(b) under the 1940 Act and Rule 15d-15(b) under the Securities Exchange Act of 1934, as amended. | ||
| (b) There were no changes in the registrant’s internal control over financial reporting (as defined in Rule 30a-3(d) under the 1940 Act) that occurred during the second fiscal quarter of the period covered by this report that have materially affected, or are reasonably likely to materially affect, the registrant’s internal control over financial reporting. | ||
Item 12 – | Disclosure of Securities Lending Activities for Closed-End Management Investment Companies – Not Applicable | |
Item 13 – | Exhibits attached hereto | |
| (a)(1) Code of Ethics – See Item 2 | ||
| (a)(2) Certifications – Attached hereto | ||
| (a)(3) Not Applicable | ||
| (a)(4) Not Applicable | ||
| (b) Certifications – Attached hereto | ||
5
Pursuant to the requirements of the Securities Exchange Act of 1934 and the Investment Company Act of 1940, the registrant has duly caused this report to be signed on its behalf by the undersigned, thereunto duly authorized.
Managed Account Series | ||
By: | /s/ John M. Perlowski | |
| John M. Perlowski | ||
Chief Executive Officer (principal executive officer) of | ||
Managed Account Series | ||
Date: July 5, 2018 | ||
Pursuant to the requirements of the Securities Exchange Act of 1934 and the Investment Company Act of 1940, this report has been signed below by the following persons on behalf of the registrant and in the capacities and on the dates indicated.
By: | /s/ John M. Perlowski | |
| John M. Perlowski | ||
Chief Executive Officer (principal executive officer) of | ||
Managed Account Series | ||
Date: July 5, 2018 | ||
By: | /s/ Neal J. Andrews | |
Neal J. Andrews | ||
Chief Financial Officer (principal financial officer) of | ||
Managed Account Series | ||
Date: July 5, 2018 | ||
6