UNITED STATES
SECURITIES AND EXCHANGE COMMISSION
Washington, D.C. 20549
FORM N-CSR
CERTIFIED SHAREHOLDER REPORT OF REGISTERED MANAGEMENT
INVESTMENT COMPANIES
Investment Company Act file number: 811-21763
Name of Fund: Managed Account Series
Advantage Global SmallCap Fund (Formerly Global SmallCap Portfolio)
Mid Cap Dividend Fund (Formerly Mid Cap Value Opportunities Portfolio)
BlackRock U.S. Mortgage Portfolio
Fund Address: 100 Bellevue Parkway, Wilmington, DE 19809
Name and address of agent for service: John M. Perlowski, Chief Executive Officer, Managed Account Series, 55 East 52nd Street, New York, NY 10055
Registrant’s telephone number, including area code: (800) 441-7762
Date of fiscal year end: 04/30/2017
Date of reporting period: 04/30/2017
Item 1 – Report to Stockholders
APRIL 30, 2017
ANNUAL REPORT
| BLACKROCK® |
Managed Account Series
▶ BlackRock U.S. Mortgage Portfolio
▶ Global SmallCap Portfolio
▶ Mid Cap Value Opportunities Portfolio
| Not FDIC Insured ◾ May Lose Value ◾ No Bank Guarantee |
| The Markets in Review |
Dear Shareholder,
In the 12 months ended April 30, 2017, risk assets, such as stocks and high-yield bonds, delivered strong performance. These markets showed great resilience during a period with big surprises, including the United Kingdom’s vote to leave the European Union and the outcome of the U.S. presidential election, which brought only brief spikes in equity market volatility. However, high-quality assets with more interest rate sensitivity struggled. U.S. Treasuries posted negative returns as rising energy prices, modest wage increases and steady job growth led to expectations of higher inflation and anticipation of interest rate increases by the U.S. Federal Reserve (the “Fed”).
The global reflationary theme — rising nominal growth, wages and inflation — was the dominant driver of asset returns during the period, outweighing significant political upheavals and uncertainty. Reflationary expectations accelerated after the U.S. election and continued into the beginning of 2017, stoked by expectations that the new presidential administration’s policies would provide an extra boost to U.S. growth. More recently, however, growing skepticism about the likelihood of significant near-term U.S. tax reform and infrastructure spending has tempered enthusiasm around the reflation trade. Nonetheless, markets have remained generally positive thus far in 2017 and continue to exhibit low levels of volatility by historical standards. Although political uncertainty persisted, benign credit conditions and expectations for economic growth have kept markets fairly tranquil. The period ended with a global risk asset rally following centrist Emmanuel Macron’s win in the first round of the French presidential election and better-than-expected U.S. and European corporate earnings.
Although economic momentum is gaining traction, the capacity for rapid global growth is restrained by structural factors, including an aging population, low productivity growth and excess savings, as well as cyclical factors, like the Fed moving toward the normalization of monetary policy and the length of the current expansion. Tempered economic growth and high valuations across most assets have set the stage for muted returns going forward.
Equity markets still present opportunities, although the disparity between winners and losers is widening — a dynamic that increases both the risk and return potential of active investing. Fixed income investors are also facing challenges as many sectors are exhibiting higher valuations while rates remain at historically low levels.
In this environment, investors need to think globally, extend their scope across a broad array of asset classes, and be nimble as market conditions change. We encourage you to talk with your financial advisor and visit blackrock.com for further insight about investing in today’s markets.
Sincerely,

Rob Kapito
President, BlackRock Advisors, LLC

Rob Kapito
President, BlackRock Advisors, LLC
| Total Returns as of April 30, 2017 | ||||||||
| 6-month | 12-month | |||||||
U.S. large cap equities (S&P 500® Index) | 13.32 | % | 17.92 | % | ||||
U.S. small cap equities (Russell 2000® Index) | 18.37 | 25.63 | ||||||
International equities (MSCI Europe, Australasia, Far East Index) | 11.47 | 11.29 | ||||||
Emerging market equities (MSCI Emerging Markets Index) | 8.88 | 19.13 | ||||||
3-month Treasury bills (BofA Merrill Lynch 3-Month U.S. Treasury Bill Index) | 0.23 | 0.40 | ||||||
U.S. Treasury securities (BofA Merrill Lynch 10- Year U.S. Treasury Index) | (3.13 | ) | (2.68 | ) | ||||
U.S. investment grade bonds (Bloomberg Barclays U.S. Aggregate Bond Index) | (0.67 | ) | 0.83 | |||||
Tax-exempt municipal bonds (S&P Municipal Bond Index) | (0.41 | ) | 0.57 | |||||
U.S. high yield bonds (Bloomberg Barclays U.S. Corporate High Yield 2% Issuer Capped Index) | 5.30 | 13.29 | ||||||
| Past performance is no guarantee of future results. Index performance is shown for illustrative purposes only. You cannot invest directly in an index. | ||||||||
| 2 | THIS PAGE NOT PART OF YOUR FUND REPORT |
| Table of Contents |
| Page | ||||
| 2 | ||||
Annual Report: | ||||
| 4 | ||||
| 10 | ||||
| 10 | ||||
| 11 | ||||
| 11 | ||||
Financial Statements: | ||||
| 12 | ||||
| 28 | ||||
| 30 | ||||
| 31 | ||||
| 32 | ||||
| 37 | ||||
| 54 | ||||
| 54 | ||||
| 55 | ||||
| 58 |
|
Shareholders can sign up for e-mail notifications of quarterly statements, annual and semi-annual shareholder reports and prospectuses by enrolling in the electronic delivery program. Electronic copies of shareholder reports and prospectuses are also available on BlackRock’s website.
TO ENROLL IN ELECTRONIC DELIVERY:
Shareholders Who Hold Accounts with Investment Advisors, Banks or Brokerages: Please contact your financial advisor. Please note that not all investment advisors, banks or brokerages may offer this service.
Shareholders Who Hold Accounts Directly with BlackRock: 1. Access the BlackRock website at blackrock.com 2. Select “Access Your Account” 3. Next, select “eDelivery” in the “Related Resources” box and follow the sign-up instructions |

| MANAGED ACCOUNT SERIES | APRIL 30, 2017 | 3 |
| Fund Summary as of April 30, 2017 | BlackRock U.S. Mortgage Portfolio |
| Investment Objective |
BlackRock U.S. Mortgage Portfolio’s (the “Fund”) investment objective is to seek high total return.
| Portfolio Management Commentary |
How did the Fund perform?
| • | For the 12-month period ended April 30, 2017, the Fund outperformed its benchmark, the Bloomberg Barclays U.S. Mortgage-Backed Securities Index. |
What factors influenced performance?
| • | The Fund’s out-of-benchmark allocations to securitized assets, specifically commercial mortgage-backed securities (“CMBS”) and non-agency residential mortgage-backed securities (“MBS”), were the largest contributors to performance. Duration and yield curve positioning further aided results, but these strategies were mainly used as a means to manage risk associated with the Fund’s investments in agency mortgage-backed securities. (Duration is a measure of interest-rate sensitivity.) An allocation to U.S. Treasuries was also additive to performance, with a marginal contribution coming from Treasury Inflation Protected Securities (“TIPS”). |
| • | The most significant detractor from the Fund’s performance during the period was selection-based strategies within agency MBS, mainly driven |
by underperformance of specified pool holdings. Allocation-based strategies within agency MBS detracted from performance as well, most notably during the third quarter of 2016 when an underweight to the asset class hurt performance as agency mortgages outperformed. |
Describe recent portfolio activity.
| • | The Fund increased its exposure to agency MBS, primarily through generic 30-year pass-throughs. The Fund slightly reduced exposure to CMBS, specifically interest-only securities, following strong performance. The Fund added some exposure in collateralized loan obligations while reducing exposure to legacy (i.e., issued under pre-financial crisis underwriting standards) non-agency MBS. The Fund’s small allocation to TIPS was closed during the period. |
Describe portfolio positioning at period end.
| • | Relative to the benchmark, the Fund was positioned with a marginally lower duration and an underweight in agency MBS. The Fund maintained non-benchmark exposure to CMBS and continued to hold a small allocation to legacy non-agency MBS. |
The views expressed reflect the opinions of BlackRock as of the date of this report and are subject to change based on changes in market, economic or other conditions. These views are not intended to be a forecast of future events and are no guarantee of future results.
| Portfolio Information |
| Portfolio Composition | Percent of Total Investments1 | ||||
U.S. Government Sponsored Agency Securities | 87 | % | |||
Non-Agency Mortgage-Backed Securities | 7 | ||||
Asset-Backed Securities | 6 | ||||
| 1 | Total investments exclude options purchased. |
| Credit Quality Allocation2 | Percent of Total Investments1 | ||||
AAA/Aaa3 | 93 | % | |||
AA/Aa | 2 | ||||
BBB/Baa | 1 | ||||
BB/Ba | 1 | ||||
CCC/Caa | 1 | ||||
N/R | 2 | ||||
| 2 | For financial reporting purposes, credit quality ratings shown above reflect the highest rating assigned by either S&P Global Rating’s (“S&P”) or Moody’s Investors Service (“Moody’s”) if ratings differ. These rating agencies are independent, nationally recognized statistical rating organizations and are widely used. Investment grade ratings are credit ratings of BBB/Baa or higher. Below investment grade ratings are credit ratings of BB/Ba or lower. Investments designated N/R are not rated by either rating agency. Unrated investments do not necessarily indicate low credit quality. Credit quality ratings are subject to change. |
| 3 | The investment adviser evaluates the credit quality of not-rated investments based upon certain factors including, but not limited to, credit ratings for similar investments and financial analysis of sectors, individual investments and/or issuers. Using this approach, the investment adviser has deemed U.S. Government Sponsored Agency Securities and U.S. Treasury Obligations as AAA/Aaa. |
| 4 | MANAGED ACCOUNT SERIES | APRIL 30, 2017 |
| BlackRock U.S. Mortgage Portfolio |
| Total Return Based on a $10,000 Investment |
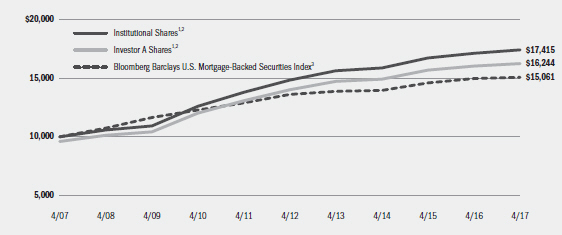 |
| 1 | Assuming maximum sales charges, if any, transaction costs and other operating expenses, including investment advisory fees. Institutional Shares do not have a sales charge. Prior to December 6, 2010, Investor A Shares performance results are those of Institutional Shares (which have no distribution or service fees) restated to reflect Investor A Share fees. |
| 2 | The Fund invests primarily in mortgage-related securities. |
| 3 | An unmanaged index that includes the mortgage-backed pass-through securities of Ginnie Mae, Fannie Mae and Freddie Mac that meet certain maturity and liquidity criteria. |
| Performance Summary for the Period Ended April 30, 2017 | |||||||||||||||||||||||||||||||||||||||||||||
| Average Annual Total Returns4 | |||||||||||||||||||||||||||||||||||||||||||||
| 1 Year | 5 Years | 10 Years | |||||||||||||||||||||||||||||||||||||||||||
Standardized 30-Day Yield | Unsubsidized 30-Day Yield | 6-Month Total Returns | w/o sales charge | w/sales charge | w/o sales charge | w/sales charge | w/o sales charge | w/sales charge | |||||||||||||||||||||||||||||||||||||
Institutional | 2.50 | % | 2.41 | % | (0.20 | )% | 1.80 | % | N/A | 3.28 | % | N/A | 5.70 | % | N/A | ||||||||||||||||||||||||||||||
Investor A | 2.16 | 2.00 | (0.33 | ) | 1.43 | (2.63 | )% | 3.00 | 2.16 | % | 5.40 | 4.97 | % | ||||||||||||||||||||||||||||||||
Investor C | 1.51 | 1.36 | (0.60 | ) | 0.77 | (0.22 | ) | 2.25 | 2.25 | 4.63 | 4.63 | ||||||||||||||||||||||||||||||||||
Bloomberg Barclays U.S. Mortgage-Backed Securities Index | — | — | (0.61 | ) | 0.66 | N/A | 2.04 | N/A | 4.18 | N/A | |||||||||||||||||||||||||||||||||||
| 4 | Assuming maximum sales charges, if any. Average annual total returns with and without sales charges reflect reductions for distribution and service fees. See “About Fund Performance” on page 10 for a detailed description of share classes, including any related sales charges and fees. |
| N/A - Not applicable as share class and index do not have a sales charge. |
| Past performance is not indicative of future results. |
| Performance results may include adjustments made for financial reporting purposes in accordance with U.S. generally accepted accounting principles. |
| Expense Example | |||||||||||||||||||||||||||||||||||||||||||||
| Actual | Hypothetical7 | ||||||||||||||||||||||||||||||||||||||||||||
| Including Interest Expense and Fees | Excluding Interest Expense and Fees | Including Interest Expense and Fees | Excluding Interest Expense and Fees | ||||||||||||||||||||||||||||||||||||||||||
| Beginning Account Value November 1, 2016 | Ending Account Value | Expenses Paid During the Period5 | Expenses Paid During the Period6 | Beginning Account Value November 1, 2016 | Ending Account Value 2017 | Expenses Paid During the Period5 | Ending Account Value 2017 | Expenses Paid During the Period6 | |||||||||||||||||||||||||||||||||||||
Institutional | $1,000.00 | $998.00 | $2.38 | $2.23 | $1,000.00 | $1,022.41 | $2.41 | $1,022.56 | $2.26 | ||||||||||||||||||||||||||||||||||||
Investor A | $1,000.00 | $996.70 | $3.61 | $3.47 | $1,000.00 | $1,021.17 | $3.66 | $1,021.32 | $3.51 | ||||||||||||||||||||||||||||||||||||
Investor C | $1,000.00 | $994.00 | $7.32 | $7.17 | $1,000.00 | $1,017.46 | $7.40 | $1,017.60 | $7.25 | ||||||||||||||||||||||||||||||||||||
| 5 | For each class of the Fund, expenses are equal to the annualized expense ratio for the class (0.48% for Institutional, 0.73% for Investor A and 1.48% for Investor C), multiplied by the average account value over the period, multiplied by 181/365 (to reflect the one-half year period shown). |
| 6 | For each class of the Fund, expenses are equal to the annualized expense ratio for the class (0.45% for Institutional, 0.70% for Investor A and 1.45% for Investor C), multiplied by the average account value over the period, multiplied by 181/365 (to reflect the one-half year period shown). |
| 7 | Hypothetical 5% annual return before expenses is calculated by prorating the number of days in the most recent fiscal half year divided by 365. |
| See “Disclosure of Expenses” on page 10 for further information on how expenses were calculated. |
| MANAGED ACCOUNT SERIES | APRIL 30, 2017 | 5 |
| Fund Summary as of April 30, 2017 | Global SmallCap Portfolio |
| Investment Objective |
Global SmallCap Portfolio’s (the “Fund”) investment objective is to seek long-term growth of capital.
On March 27, 2017, the Board approved a proposal to change the name of Global SmallCap Portfolio to Advantage Global SmallCap Fund. The Board also approved certain changes to the Fund’s investment strategies. These changes became effective on June 12, 2017.
| Portfolio Management Commentary |
How did the Fund perform?
| • | For the 12-month period ended April 30, 2017, the Fund outperformed the MSCI All Country World Small Cap Index and the MSCI World Index. Shares of the Fund can be purchased or held only by or on behalf of certain separately managed account clients and represent only a portion of a broader separately managed account. Comparisons of the Fund’s performance versus its benchmarks will differ from comparisons of the benchmarks against the performance of the separately managed accounts. The following discussion of relative performance pertains to the MSCI All Country World Small Cap Index. |
What factors influenced performance?
| • | Stock selection in the consumer discretionary sector, particularly within the hotels, restaurants & leisure industries, made the most significant contribution to Fund performance. Positive selection in the media and retail industries further benefited the Fund’s return in the sector. |
| • | Favorable stock selection in the information technology (“IT”) sector, especially within the internet software & services and software industries, also helped bolster Fund performance. Strong stock selection in industrials and an underweight in real estate further added to the Fund’s results. |
| • | Stock selection in the health care sector, which was weakest in the biotechnology and life sciences & tools industries, was the leading detractor to Fund performance. The combination of an underweight and stock selection in the financials sector also detracted. Stock selection in consumer staples further weighed on performance due to weakness in the food & staples retailing segment. Lastly, selection in the energy and utilities sectors modestly detracted from Fund returns. |
Describe recent portfolio activity.
| • | The Fund increased its weightings in the industrials sector, especially among road & rail companies, and in the consumer discretionary sector, through additions in the consumer services area. The Fund decreased its allocations to health care and financials by reducing its weightings in the health care equipment & services and diversified financials industries, respectively. |
Describe portfolio positioning at period end.
| • | Relative to the MSCI All Country World Small Cap Index, the Fund was overweight in the industrials, consumer staples, consumer discretionary, health care, IT and real estate sectors, while it was underweight in the financials, materials, energy, utilities and telecommunications services sectors. |
The views expressed reflect the opinions of BlackRock as of the date of this report and are subject to change based on changes in market, economic or other conditions. These views are not intended to be a forecast of future events and are no guarantee of future results.
| Portfolio Information |
| Ten Largest Holdings | Percent of Net Assets |
Cable One, Inc. | 2 | % | ||
Bob Evans Farms, Inc. | 2 | |||
Merit Medical Systems, Inc. | 1 | |||
Insulet Corp. | 1 | |||
Halyard Health, Inc. | 1 | |||
National Instruments Corp. | 1 | |||
Elis SA | 1 | |||
Allison Transmission Holdings, Inc. | 1 | |||
UNITE Group PLC | 1 | |||
IDEX Corp. | 1 |
| Geographic Allocation | Percent of Net Assets |
United States | 57 | % | ||
United Kingdom | 8 | |||
Japan | 6 | |||
Canada | 6 | |||
India | 4 | |||
France | 3 | |||
Brazil | 2 | |||
Netherlands | 2 | |||
Switzerland | 2 | |||
Hong Kong | 2 | |||
Other1 | 18 | |||
Liabilities in Excess of Other Assets | (10 | ) |
| 1 | Includes holdings within countries that are 1% or less of net assets. Please refer to the Schedule of Investments for such countries. |
| 6 | MANAGED ACCOUNT SERIES | APRIL 30, 2017 |
| Global SmallCap Portfolio |
| Total Return Based on a $10,000 Investment |
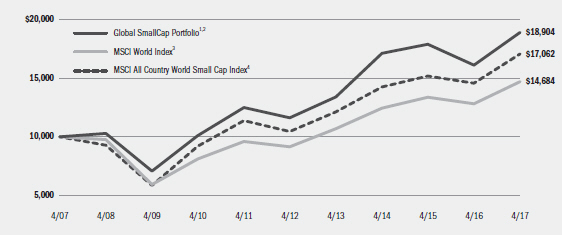
| 1 | Assuming transaction costs, if any, and other operating expenses, including investment advisory fees. |
| 2 | The Fund invests in a diversified portfolio primarily consisting of equity securities of small cap issuers in various foreign countries and in the United States. |
| 3 | A free float-adjusted market capitalization weighted index that is designed to measure the equity market performance of developed markets. The MSCI World Index consists of the following 23 developed market country indexes: Australia, Austria, Belgium, Canada, Denmark, Finland, France, Germany, Hong Kong, Ireland, Israel, Italy, Japan, the Netherlands, New Zealand, Norway, Portugal, Singapore, Spain, Sweden, Switzerland, the United Kingdom, and the United States. |
| 4 | A free float-adjusted market capitalization index designed to measure equity market results of smaller capitalization companies in both developed and emerging markets. |
| Performance Summary for the Period Ended April 30, 2017 | |||||||||||||||||||||||||||||||||||
| Average Annual Total Returns5 | ||||||||||||||||||||||
| 6-Month Total Returns | 1 Year | 5 Years | 10 Years | |||||||||||||||||||
Global SmallCap Portfolio | 12.57 | % | 17.33 | % | 10.23 | % | 6.57 | % | ||||||||||||||
MSCI World Index | 12.12 | 14.65 | 9.94 | 3.92 | ||||||||||||||||||
MSCI All Country World Small Cap Index | 13.88 | 17.10 | 10.33 | 5.49 | ||||||||||||||||||
| 5 | See “About Fund Performance” on page 10. |
| Past performance is not indicative of future results. |
| Performance results may include adjustments made for financial reporting purposes in accordance with U.S. generally accepted accounting principles. |
| Expense Example | ||||||||||||||
| Actual | Hypothetical7 | |||||||||||||
| Beginning Account Value November 1, 2016 | Ending Account Value April 30, 2017 | Expenses Paid During the Period6 | Beginning Account Value November 1, 2016 | Ending Account Value April 30, 2017 | Expenses Paid During the Period6 | Annualized Expense Ratio | ||||||||
Global SmallCap Portfolio | $1,000.00 | $1,125.70 | $0.00 | $1,000.00 | $1,024.79 | $0.00 | 0.00% | |||||||
| 6 | For shares of the Fund, expenses are equal to the annualized expense ratio, multiplied by the average account value over the period, multiplied by 181/365 (to reflect the one-half year period shown). BlackRock Advisors, LLC has contractually agreed to waive all fees and pay or reimburse all direct expenses, except extraordinary expenses incurred by the Fund. This agreement has no fixed term. |
| 7 | Hypothetical 5% annual return before expenses is calculated by prorating the number of days in the most recent fiscal half year divided by 365. |
| See “Disclosure of Expenses” on page 10 for further information on how expenses were calculated. |
| MANAGED ACCOUNT SERIES | APRIL 30, 2017 | 7 |
| Fund Summary as of April 30, 2017 | Mid Cap Value Opportunities Portfolio |
| Investment Objective |
Mid Cap Value Opportunities Portfolio’s (the “Fund”) investment objective is to seek capital appreciation and, secondarily, income.
On March 27, 2017, the Board approved a proposal to change the name of Mid Cap Value Opportunities Portfolio to Mid Cap Dividend Fund. The Board also approved certain changes to the Fund’s investment strategies. In addition, Fund management has determined to change the benchmark index against which the Fund compares its performance. These changes became effective on June 12, 2017.
| Portfolio Management Commentary |
How did the Fund perform?
| • | For the 12-month period ended April 30, 2017, the Fund underperformed its benchmark, the S&P MidCap 400® Value Index. Shares of the Fund can be purchased or held only by or on behalf of certain separately managed account clients and represent only a portion of a broader separately managed account. Comparisons of the Fund’s performance versus its benchmark index will differ from comparisons of the benchmark index against the performance of the separately managed accounts. |
What factors influenced performance?
| • | Stock selection in the consumer staples sector, which was weakest in the food products and food & staples retailing industries, was the primary detractor from the Fund’s relative performance. The combination of an underweight and stock selection in the information technology (“IT”) sector further detracted. Stock selection in industrials also weighed on results due to a shortfall in the aerospace & defense segment. Lastly, an overweight in the consumer discretionary sector modestly detracted from Fund returns. |
| • | Stock selection in the materials sector, most notably within the chemicals and metals and mining industries, made the most significant |
contribution to Fund performance. The Fund’s zero weighting in the telecommunications services sector was an additional plus. Strong stock selection in financials, specifically in banks, also helped bolster performance, as did selection in energy. |
Describe recent portfolio activity.
| • | The Fund increased its weighting in the IT sector, especially in the electronic equipment, instruments and components industry. It also boosted its position in the consumer discretionary sector by adding to the hotels, restaurants and leisure industry. The Fund decreased its allocation to industrials, mostly among aerospace and defense companies, and to the utilities sector, particularly in the electric utilities industry. |
Describe portfolio positioning at period end.
| • | The Fund was overweight relative to the S&P MidCap 400® Value Index in the health care, IT, consumer discretionary and industrials sectors, and it was underweight in the financials, materials, consumer staples, telecommunications services, energy, real estate and utilities sectors. |
The views expressed reflect the opinions of BlackRock as of the date of this report and are subject to change based on changes in market, economic or other conditions. These views are not intended to be a forecast of future events and are no guarantee of future results.
| Portfolio Information |
| Ten Largest Holdings | Percent of Net Assets | |||
Halyard Health, Inc. | 2 | % | ||
Owens & Minor, Inc. | 2 | |||
Wabtec Corp. | 2 | |||
OGE Energy Corp. | 2 | |||
Alexander & Baldwin, Inc. | 2 | |||
LifePoint Health, Inc. | 2 | |||
UGI Corp. | 2 | |||
Leidos Holdings, Inc. | 2 | |||
AMETEK, Inc. | 2 | |||
Outfront Media, Inc. | 1 | |||
| Sector Allocation | Percent of Net Assets | |||
Financials | 20 | % | ||
Information Technology | 14 | |||
Industrials | 12 | |||
Consumer Discretionary | 12 | |||
Utilities | 9 | |||
Health Care | 8 | |||
Real Estate | 8 | |||
Materials | 7 | |||
Energy | 5 | |||
Consumer Staples | 4 | |||
Short-Term Securities | 9 | |||
Liabilities in Excess of Other Assets | (8 | ) | ||
For Fund compliance purposes, the Fund’s sector classifications refer to one or more of the sector sub-classifications used by one or more widely recognized market indexes or rating group indexes, and/or as defined by the investment adviser. These definitions may not apply for purposes of this report, which may combine such sector sub-classifications for reporting ease.
| 8 | MANAGED ACCOUNT SERIES | APRIL 30, 2017 |
| Mid Cap Value Opportunities Portfolio |
| �� Total Return Based on a $10,000 Investment |
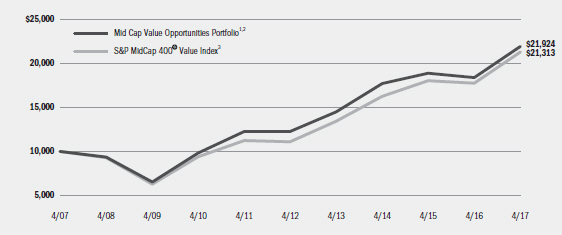
| 1 | Assuming transaction costs, if any, and other operating expenses, including investment advisory fees. |
| 2 | The Fund normally invests at least 80% of its assets in equity securities of mid capitalization companies. |
| 3 | An unmanaged index that measures the performance of the mid-capitalization value sector of the U.S. equity market. It is a subset of the S&P MidCap 400® Index and consists of those stocks in the S&P MidCap 400® Index exhibiting the strongest value characteristics, as determined by the index provider, representing approximately 50% of the market capitalization of the S&P MidCap 400® Index. |
| Performance Summary for the Period Ended April 30, 2017 |
| Average Annual Total Returns4 | ||||||||||||||||||||
6-Month Total Returns | 1 Year | 5 Years | 10 Years | |||||||||||||||||
Mid Cap Value Opportunities Portfolio | 13.72 | % | 19.24 | % | 12.36 | % | 8.17 | % | ||||||||||||
S&P MidCap 400® Value Index | 15.09 | 20.03 | 13.97 | 7.86 | ||||||||||||||||
| 4 | See “About Fund Performance” on page 10. |
| Past performance is not indicative of future results. |
| Performance results may include adjustments made for financial reporting purposes in accordance with U.S. generally accepted accounting principles. |
| Expense Example |
| Actual | Hypothetical6 | ||||||||||||||||||||||||||||||||||
| Beginning Account Value November 1, 2016 | Ending Account Value April 30, 2017 | Expenses Paid During the Period5 | Beginning Account Value November 1, 2016 | Ending Account Value April 30, 2017 | Expenses Paid During the Period5 | Annualized Expense Ratio | |||||||||||||||||||||||||||||
Mid Cap Value | |||||||||||||||||||||||||||||||||||
Opportunities Portfolio | $ | 1,000.00 | $ | 1,137.20 | $ | 0.00 | $ | 1,000.00 | $ | 1,024.79 | $ | 0.00 | 0.00 | % | |||||||||||||||||||||
| 5 | For shares of the Fund, expenses are equal to the Fund’s annualized expense ratio, multiplied by the average account value over the period, multiplied by 181/365 (to reflect the one-half year period shown). BlackRock Advisors, LLC has contractually agreed to waive all fees and pay or reimburse all direct expenses, except extraordinary expenses incurred by the Fund. This agreement has no fixed term. |
| 6 | Hypothetical 5% annual return before expenses is calculated by prorating the number of days in the most recent fiscal half year divided by 365. |
| See “Disclosure of Expenses” on page 10 for further information on how expenses were calculated. |
| MANAGED ACCOUNT SERIES | APRIL 30, 2017 | 9 |
| About Fund Performance |
| • | Institutional Shares (available only in BlackRock U.S. Mortgage Portfolio) are not subject to any sales charge. These shares bear no ongoing distribution or service fees and are available only to eligible investors. |
| • | Investor A Shares (available only in BlackRock U.S. Mortgage Portfolio) are subject to a maximum initial sales charge (front-end load) of 4.00% and a service fee of 0.25% per year (but no distribution fee). Certain redemptions of these shares may be subject to a contingent deferred sales charge (“CDSC”) where no initial sales charge was paid at the time of purchase. These shares are generally available through financial intermediaries. For the BlackRock U.S. Mortgage Portfolio prior to December 6, 2010, Investor A Shares performance results are those of Institutional Shares (which have no distribution or service fees) restated to reflect Investor A Share fees. |
| • | Investor C Shares (available only in BlackRock U.S. Mortgage Portfolio) are subject to a 1.00% CDSC if redeemed within one year of purchase. In addition, these shares are subject to a distribution fee of 0.75% per year and a service fee of 0.25% per year. These shares are generally available through financial intermediaries. For the BlackRock U.S. Mortgage Portfolio prior to December 6, 2010, Investor C Shares performance results are those of Institutional Shares (which have no distribution or service fees) restated to reflect Investor C Share fees. |
Performance information reflects past performance and does not guarantee future results. Current performance may be lower or higher than the
performance data quoted. Refer to www.blackrock.com/funds to obtain performance data current to the most recent month end. Performance results do not reflect the deduction of taxes that a shareholder would pay on fund distributions or the redemption of fund shares. Figures shown in the performance tables on the previous pages assume reinvestment of all distributions, if any, at net asset value (“NAV”) on the ex-dividend date. Investment return and principal value of shares will fluctuate so that shares, when redeemed, may be worth more or less than their original cost. Distributions paid to each class of shares will vary because of different levels of service, distribution and transfer agency fees applicable to each class, which are deducted from the income available to be paid to shareholders.
BlackRock Advisors, LLC (the “Manager”), the Funds’ investment adviser, has contractually agreed to waive and/or reimburse a portion of the Funds’ expenses. Without such waiver and/or reimbursement, the Funds’ performance would have been lower. The Manager is under no obligation to continue waiving and/or reimbursing its fees after the applicable termination date of such agreement. See Note 6 of the Notes to Financial Statements for additional information on waivers and/or reimbursements. For the BlackRock U.S. Mortgage Portfolio, the standardized 30-day yield includes the effects of any waivers and/or reimbursements. The unsubsidized 30-day yield excludes the effects of any waivers and/or reimbursements.
| Disclosure of Expenses |
Shareholders of these Funds may incur the following charges: (a) transactional expenses, such as sales charges; and (b) operating expenses, including investment advisory fees, service and distribution fees, including 12b-1 fees, acquired fund fees and expenses, and other fund expenses. The expense examples on the previous pages (which are based on a hypothetical investment of $1,000 invested on November 1, 2016 and held through April 30, 2017) are intended to assist shareholders both in calculating expenses based on an investment in each Fund and in comparing these expenses with similar costs of investing in other mutual funds.
The expense examples provide information about actual account values and actual expenses. In order to estimate the expenses a shareholder paid during the period covered by this report, shareholders can divide their account value by $1,000 and then multiply the result by the number corresponding to their Fund and share class under the heading entitled “Expenses Paid During the Period.”
The expense examples also provide information about hypothetical account values and hypothetical expenses based on a Fund’s actual expense ratio and an assumed rate of return of 5% per year before expenses. In order to assist shareholders in comparing the ongoing expenses of investing in these Funds and other funds, compare the 5% hypothetical examples with the 5% hypothetical examples that appear in shareholder reports of other funds.
The expenses shown in the expense examples are intended to highlight shareholders’ ongoing costs only and do not reflect any transactional expenses, such as sales charges, if any. Therefore, the hypothetical examples are useful in comparing ongoing expenses only, and will not help shareholders determine the relative total expenses of owning different funds. If these transactional expenses were included, shareholder expenses would have been higher.
| 10 | MANAGED ACCOUNT SERIES | APRIL 30, 2017 |
| The Benefits and Risks of Leveraging |
The Funds may utilize leverage to seek to enhance returns and NAV. However, these objectives cannot be achieved in all interest rate environments.
The Funds may utilize leverage by entering into reverse repurchase agreements. In general, the concept of leveraging is based on the premise that the financing cost of leverage, which is based on short-term interest rates, is normally lower than the income earned by each Fund on its longer-term portfolio investments purchased with the proceeds from leverage. To the extent that the total assets of each Fund (including the assets obtained from leverage) are invested in higher-yielding portfolio investments, the Funds’ shareholders benefit from the incremental net income.
The interest earned on securities purchased with the proceeds from leverage is distributed to the Funds’ shareholders, and the value of these portfolio holdings is reflected in the Funds’ per share NAV. However, in order to benefit shareholders, the return on assets purchased with leverage proceeds must exceed the ongoing costs associated with the leverage. If interest and other ongoing costs of leverage exceed a Fund’s return on assets purchased with leverage proceeds, income to shareholders is lower than if the Funds had not used leverage.
Furthermore, the value of each Fund’s portfolio investments generally varies inversely with the direction of long-term interest rates, although other factors can also influence the value of portfolio investments. As a result, changes in interest rates can influence each Fund’s NAV positively or negatively in addition to the impact on each Fund’s performance from leverage. Changes in the direction of interest rates are difficult to predict accurately, and there is no assurance that a Fund’s leveraging strategy will be successful.
The use of leverage also generally causes greater changes in each Fund’s NAV and dividend rates than comparable portfolios without leverage. In a declining market, leverage is likely to cause a greater decline in the NAV of a Fund’s shares than if the Fund were not leveraged. In addition, each Fund may be required to sell portfolio securities at inopportune times or at distressed values in order to comply with regulatory requirements applicable to the use of leverage or as required by the terms of the leverage instruments, which may cause the Funds to incur losses. The use of leverage may limit a Fund’s ability to invest in certain types of securities or use certain types of hedging strategies. Each Fund incurs expenses in connection with the use of leverage, all of which are borne by the Funds’ shareholders and may reduce income.
| Derivative Financial Instruments |
The Funds may invest in various derivative financial instruments. These instruments are used to obtain exposure to a security, commodity, index, market, and/or other asset without owning or taking physical custody of securities, commodities and/or other referenced assets or to manage market, equity, credit, interest rate, foreign currency exchange rate, commodity and/or other risks. Derivative financial instruments may give rise to a form of economic leverage and involve risks, including the imperfect correlation between the value of a derivative financial instrument and the underlying asset, possible default of the counterparty to the
transaction or illiquidity of the instrument. The Funds’ successful use of a derivative financial instrument depends on the investment adviser’s ability to predict pertinent market movements accurately, which cannot be assured. The use of these instruments may result in losses greater than if they had not been used, may limit the amount of appreciation a Fund can realize on an investment and/or may result in lower distributions paid to shareholders. The Funds’ investments in these instruments, if any, are discussed in detail in the Notes to Financial Statements.
| MANAGED ACCOUNT SERIES | APRIL 30, 2017 | 11 |
| Schedule of Investments April 30, 2017 | BlackRock U.S. Mortgage Portfolio | |||
| (Percentages shown are based on Net Assets) |
| Asset-Backed Securities | Par (000) | Value | ||||||
Arbor Realty Commercial Real Estate Notes Ltd., | $ | 790 | $ | 790,000 | ||||
Bear Stearns Asset Backed Securities I Trust, Series 2006-HE7, Class 1A2, 1.16%, 9/25/36 (b) | 60 | 59,780 | ||||||
Carrington Mortgage Loan Trust: | ||||||||
Series 2006-FRE1, Class A4, 1.24%, 4/25/36 (b) | 100 | 66,807 | ||||||
Series 2006-NC5, Class A3, 1.14%, 1/25/37 (b) | 200 | 137,036 | ||||||
Series 2007-RFC1, Class A3, 1.13%, 12/25/36 (b) | 100 | 80,687 | ||||||
CIFC Funding Ltd.: | ||||||||
Series 2014-5A, Class A1R, 2.56%, 1/17/27 (a)(b) | 3,300 | 3,311,045 | ||||||
Series 2015-3A, Class A, 2.58%, 10/19/27 (a)(b) | 3,100 | 3,100,770 | ||||||
Citigroup Mortgage Loan Trust, Series 2007-FS1, Class 2A1A, 1.99%, 10/25/37 (a)(b) | 1,464 | 1,142,814 | ||||||
Conseco Financial Corp., Series 1999-5, Class A6, | 475 | 371,974 | ||||||
Countrywide Asset-Backed Certificates: | ||||||||
Series 2004-6, Class 2A4, 1.89%, 11/25/34 (b) | 28 | 27,267 | ||||||
Series 2006-13, Class 3AV2, 1.14%, 1/25/37 (b) | 44 | 42,648 | ||||||
Dryden XXVIII Senior Loan Fund, Series 2013-28A, | 1,000 | 1,000,614 | ||||||
First Franklin Mortgage Loan Trust, Series 2006-FF12, | 198 | 193,185 | ||||||
Invitation Homes Trust: | ||||||||
Series 2014-SFR1, Class A, 1.99%, 6/17/31 (a)(b) | 165 | 164,627 | ||||||
Series 2014-SFR2, Class A, 2.09%, 9/17/31 (a)(b) | 1,329 | 1,329,316 | ||||||
Series 2014-SFR3, Class A, 2.19%, 12/17/31 (a)(b) | 322 | 321,752 | ||||||
Series 2015-SFR1, Class A, 2.44%, 3/17/32 (a)(b) | 766 | 767,452 | ||||||
Series 2015-SFR2, Class A, 2.34%, 6/17/32 (a)(b) | 1,075 | 1,077,663 | ||||||
Series 2015-SFR3, Class A, 2.29%, 8/17/32 (a)(b) | 2,257 | 2,268,481 | ||||||
Litigation Fee Residual Funding LLC, Series 2015-1, Class A, | 661 | 647,337 | ||||||
Long Beach Mortgage Loan Trust: | ||||||||
Series 2006-10, Class 2A2, 1.10%, 11/25/36 (b) | 12 | 5,440 | ||||||
Series 2006-10, Class 2A3, 1.15%, 11/25/36 (b) | 117 | 53,693 | ||||||
Series 2006-10, Class 2A4, 1.21%, 11/25/36 (b) | 25 | 11,495 | ||||||
| Asset-Backed Securities | Par (000) | Value | ||||||
Series 2006-2, Class 1A, 1.17%, 3/25/46 (b) | $ | 107 | $ | 76,620 | ||||
Morgan Stanley ABS Capital I, Inc. Trust, Series 2006-HE4, Class A4, 1.23%, 6/25/36 (b) | 1,182 | 780,140 | ||||||
OCP CLO Ltd., Series 2012-2A, Class A1R, | 1,300 | 1,302,005 | ||||||
Progress Residential Trust, Series 2015-SFR2, Class A, | 791 | 790,242 | ||||||
Residential Asset Mortgage Products Trust, Series 2006-RZ2, Class A3, 1.26%, 5/25/36 (b) | 296 | 280,925 | ||||||
Scholar Funding Trust, Series 2011-A, Class A, | 543 | 536,890 | ||||||
Silver Bay Realty Trust, Series 2014-1, Class A, | 999 | 1,000,120 | ||||||
SMB Private Education Loan Trust, Series 2015-C, Class A3, 2.94%, 8/16/32 (a)(b) | 500 | 525,455 | ||||||
Structured Asset Securities Corp. Mortgage Loan Trust, Series 2007-BC1, Class A4, 1.12%, 2/25/37 (b) | 510 | 480,963 | ||||||
Tricon American Homes Trust, Series 2015-SFR1, Class A, | 550 | 550,946 | ||||||
Venture XVIII CLO Ltd., Series 2014-18A, Class A, | 3,300 | 3,300,662 | ||||||
World Financial Network Credit Card Master Trust, | 700 | 712,219 | ||||||
Total Asset-Backed Securities — 9.3% | 27,309,070 | |||||||
| Non-Agency Mortgage-Backed Securities | ||||||||
Collateralized Mortgage Obligations — 1.2% | ||||||||
Banc of America Funding Trust, Series 2006-A, Class 3A2, | 67 | 53,414 | ||||||
Banc of America Mortgage Trust: | ||||||||
Series 2005-G, Class 2A4, 3.26%, 8/25/35 (b) | 489 | 444,386 | ||||||
Series 2005-I, Class 2A5, 3.24%, 10/25/35 (b) | 356 | 327,280 | ||||||
Bear Stearns Asset Backed Securities I Trust: | ||||||||
Series 2005-AC9, Class A5, 6.25%, 12/25/35 (c) | 47 | 40,994 | ||||||
Series 2006-AC1, Class 1A2, 6.25%, 2/25/36 (c) | 55 | 41,921 | ||||||
Countrywide Alternative Loan Trust: | ||||||||
Series 2004-12CB, Class 1A1, 5.00%, 7/25/19 | 89 | 90,646 | ||||||
Series 2005-3CB, Class 1A4, 5.25%, 3/25/35 | 24 | 23,457 | ||||||
Series 2005-47CB, Class A2, 1.49%, 10/25/35 (b) | 92 | 55,475 | ||||||
| Portfolio Abbreviations | ||||||
| ADR | American Depositary Receipts | TBA | To-Be-Announced | |||
| LIBOR | London Interbank Offered Rate | USD | U.S. Dollar | |||
| OTC | Over-the-counter | |||||
See Notes to Financial Statements.
| 12 | MANAGED ACCOUNT SERIES | APRIL 30, 2017 |
| Schedule of Investments (continued) | BlackRock U.S. Mortgage Portfolio | |||
| Non-Agency Mortgage-Backed Securities | Par (000) | Value | ||||||
Collateralized Mortgage Obligations (continued) | ||||||||
Series 2006-15CB, Class A1, 6.50%, 6/25/36 | $ | 414 | $ | 319,439 | ||||
Series 2006-19CB, Class A15, 6.00%, 8/25/36 | 260 | 226,250 | ||||||
Series 2006-45T1, Class 2A2, 6.00%, 2/25/37 | 519 | 405,073 | ||||||
Series 2007-9T1, Class 1A1, 6.00%, 5/25/37 | 67 | 47,267 | ||||||
Countrywide Home Loan Mortgage Pass-Through Trust: | ||||||||
Series 2005-17, Class 1A6, 5.50%, 9/25/35 | 153 | 152,034 | ||||||
Series 2006-HYB2, Class 3A1, 3.19%, 4/20/36 (b) | 160 | 141,106 | ||||||
Credit Suisse Commercial Mortgage-Backed Trust, | 66 | 60,398 | ||||||
HarborView Mortgage Loan Trust, Series 2006-6, Class 3A1A, 3.45%, 8/19/36 (b) | 1,011 | 844,307 | ||||||
IndyMac INDA Mortgage Loan Trust, Series 2007-AR1, Class 3A1, 3.36%, 3/25/37 (b) | 205 | 179,362 | ||||||
Wells Fargo Mortgage Backed Securities Trust, | 61 | 60,721 | ||||||
|
| |||||||
| 3,513,530 | ||||||||
Commercial Mortgage-Backed Securities — 6.9% | ||||||||
Banc of America Commercial Mortgage Trust, | 1,300 | 1,385,510 | ||||||
Bancorp Commercial Mortgage Trust, Series 2016-CRE1, Class A, 2.42%, 11/15/33 (a)(b) | 370 | 370,925 | ||||||
BHMS Mortgage Trust, Series 2014-ATLS, Class AFL, 2.48%, 7/05/33 (a)(b) | 1,400 | 1,402,195 | ||||||
CCRESG Commercial Mortgage Trust: | ||||||||
Series 2016-HEAT, Class A, 3.36%, 4/10/29 (a) | 950 | 962,655 | ||||||
Series 2016-HEAT, Class D, 5.49%, 4/10/29 (a)(b) | 720 | 731,827 | ||||||
CD Commercial Mortgage Trust, Series 2006-CD3, Class AM, 5.65%, 10/15/48 | 3,296 | 3,359,709 | ||||||
CFCRE Commercial Mortgage Trust, Series 2016-C3, Class D, 3.05%, 1/10/48 (a)(b) | 340 | 241,215 | ||||||
Chicago Skyscraper Trust, Series 2017-SKY, Class E, 4.29%, 2/15/30 (a)(b) | 2,990 | 3,027,489 | ||||||
Citigroup Commercial Mortgage Trust, Series 2016-C1, Class C, 4.95%, 5/10/49 (b) | 430 | 431,456 | ||||||
Commercial Mortgage Trust: | ||||||||
Series 2014-TWC, Class A, 1.84%, 2/13/32 (a)(b) | 1,145 | 1,147,873 | ||||||
Series 2015-CR25, Class C, 4.55%, 8/10/48 (b) | 90 | 91,013 | ||||||
Credit Suisse Mortgage Capital Trust, Series 2016-MFF, Class A, 2.59%, 11/15/33 (a)(b) | 320 | 320,804 | ||||||
GAHR Commercial Mortgage Trust, Series 2015-NRF, | 1,500 | 1,518,371 | ||||||
GS Mortgage Securities Trust, Series 2015-GC32, Class D, 3.35%, 7/10/48 | 500 | 392,152 | ||||||
| Non-Agency Mortgage-Backed Securities | Par (000) | Value | ||||||
Commercial Mortgage-Backed Securities (continued) |
| |||||||
JPMorgan Chase Commercial Mortgage Securities Trust: | ||||||||
Series 2015-SGP, Class A, | $ | 400 | $ | 402,132 | ||||
Series 2016-ATRM, Class D, | 1,000 | 1,019,177 | ||||||
Series 2017-JP5, Class D | 970 | 934,167 | ||||||
LMREC, Inc., Series 2016-CRE2, Class A, 2.68%, 11/24/31 (a)(b) | 330 | 329,267 | ||||||
Wells Fargo Commercial Mortgage Trust: | ||||||||
Series 2015-C31, Class D, 3.85%, 11/15/48 | 135 | 100,505 | ||||||
Series 2015-NXS3, Class C, 4.64%, 9/15/57 (b) | 900 | 866,655 | ||||||
Series 2016-NXS5, Class D, 5.04%, 1/15/59 (b) | 1,337 | 1,313,386 | ||||||
WFRBS Commercial Mortgage Trust, Series 2014-C22, Class C, 3.91%, 9/15/57 (b) | 63 | 58,590 | ||||||
|
| |||||||
| 20,407,073 | ||||||||
Interest Only Commercial Mortgage-Backed Securities — 2.3% |
| |||||||
Banc of America Commercial Mortgage Trust, Series 2015-UBS7, Class XA, 1.06%, 9/15/48 (b) | 982 | 56,194 | ||||||
CFCRE Commercial Mortgage Trust, Series 2016-C4, Class XA, 1.76%, 5/10/58 (b) | 2,951 | 343,958 | ||||||
Citigroup Commercial Mortgage Trust, Series 2014-GC23, Class XA, 1.20%, 7/10/47 (b) | 1,508 | 88,969 | ||||||
Commercial Mortgage Pass-Through Certificates, Series 2014-CR14, Class XA, 0.82%, 2/10/47 (b) | 2,151 | 68,115 | ||||||
Commercial Mortgage Trust: | ||||||||
Series 2015-CR24, Class XA, 1.02%, 8/10/48 (b) | 4,026 | 217,310 | ||||||
Series 2015-LC21, Class XA, 1.01%, 7/10/48 (b) | 6,887 | 300,683 | ||||||
Core Industrial Trust: | ||||||||
Series 2015-CALW, Class XA, 0.94%, 2/10/34 (a)(b) | 10,760 | 371,960 | ||||||
Series 2015-TEXW, Class XA, 0.90%, 2/10/34 (a)(b) | 9,200 | 303,847 | ||||||
Series 2015-WEST, Class XA, 1.08%, 2/10/37 (a)(b) | 4,600 | 282,279 | ||||||
Credit Suisse Mortgage Capital Trust, Series 2014-USA, Class X1, 0.70%, 9/17/37 (a)(b) | 10,500 | 398,160 | ||||||
Deutsche Bank Commercial Mortgage Trust, | 4,477 | 452,172 | ||||||
FREMF Mortgage Trust, Series 2015-K718, Class X2A, 0.10%, 2/25/22 (a)(b) | 71,854 | 278,391 | ||||||
JPMBB Commercial Mortgage Securities Trust: | ||||||||
Series 2015-C27, Class XA, 1.51%, 2/15/48 (b) | 9,985 | 688,497 | ||||||
Series 2015-C28, Class XA, 1.33%, 10/15/48 (b) | 9,636 | 557,072 | ||||||
JPMDB Commercial Mortgage Securities Trust, | 22,859 | 1,711,883 | ||||||
See Notes to Financial Statements.
| MANAGED ACCOUNT SERIES | APRIL 30, 2017 | 13 |
| Schedule of Investments (continued) | BlackRock U.S. Mortgage Portfolio | |||
| Non-Agency Mortgage-Backed Securities | Par (000) | Value | ||||||
Interest Only Commercial Mortgage-Backed Securities (continued) |
| |||||||
Morgan Stanley Bank of America Merrill Lynch Trust: | ||||||||
Series 2014-C18, Class XA, 1.12%, 10/15/47 (b) | $ | 582 | $ | 20,333 | ||||
Series 2016-C29, Class XA, 1.81%, 5/15/49 (b) | 1,886 | 203,204 | ||||||
Wells Fargo Commercial Mortgage Trust, Series 2015-C27, Class XA, 1.13%, 2/15/48 (b) | 9,834 | 554,962 | ||||||
|
| |||||||
| 6,897,989 | ||||||||
Total Non-Agency Mortgage-Backed Securities — 10.4% |
| 30,818,592 | ||||||
| U.S. Government Sponsored Agency Securities | ||||||||
Collateralized Mortgage Obligations — 1.5% | ||||||||
Fannie Mae, Series 2011-8, Class ZA 4.00%, 2/25/41 | 1,283 | 1,368,815 | ||||||
Freddie Mac: | ||||||||
Series 2411, Class FJ, 1.34%, 12/15/29 (b) | 7 | 7,082 | ||||||
Series 4253, Class DZ 4.75%, 9/15/43 | 644 | 694,510 | ||||||
Series 4398, Class ZX, 4.00%, 9/15/54 | 276 | 295,349 | ||||||
Ginnie Mae: | ||||||||
Series 2009-122, Class PY, 6.00%, 12/20/39 | 169 | 188,343 | ||||||
Series 2014-107, Class WX, 6.80%, 7/20/39 (b) | 685 | 783,164 | ||||||
Series 2014-12, Class ZA, 3.00%, 1/20/44 | 661 | 639,294 | ||||||
Series 2014-62, Class Z, 3.00%, 4/20/44 | 547 | 554,428 | ||||||
|
| |||||||
| 4,530,985 | ||||||||
Interest Only Commercial Mortgage-Backed Securities — 1.3% |
| |||||||
Fannie Mae: | ||||||||
Series 2012-M9, Class X1, 3.98%, 12/25/17 (b) | 1,747 | 14,293 | ||||||
Series 2013-10, Class PI 3.00%, 2/25/43 | 1,682 | 189,850 | ||||||
Freddie Mac: | ||||||||
Series K041, Class X1, 0.69%, 10/25/24 (b) | 5,131 | 180,604 | ||||||
Series K042, Class X1, 1.19%, 12/25/24 (b) | 1,682 | 111,748 | ||||||
Series K718, Class X1, 0.77%, 1/25/22 (b) | 1,035 | 26,392 | ||||||
Series K722, Class X1, 1.44%, 3/25/23 (b) | 3,987 | 251,725 | ||||||
Series KC01, Class X1, 0.85%, 12/25/22 (b) | 4,136 | 110,004 | ||||||
Ginnie Mae: | ||||||||
Series 2016-113, Class IO, 1.19%, 2/16/58 (b) | 4,463 | 401,011 | ||||||
Series 2016-137, Class IO, 0.95%, 5/16/58 (b) | 3,173 | 246,964 | ||||||
Series 2016-140, Class IO, 0.94%, 5/16/58 (b) | 3,176 | 242,550 | ||||||
Series 2016-143, Class IO, 0.98%, 10/16/56 | 2,878 | �� | 233,319 | |||||
Series 2016-152, Class IO, 0.98%, 8/15/58 (b) | 9,369 | 777,419 | ||||||
Series 2017-35, Class IO 0.71%, 5/16/59 (b) | 1,332 | 93,059 | ||||||
Series 2017-53, Class IO 0.69%, 12/15/56 (b) | 8,800 | 598,311 | ||||||
| U.S. Government Sponsored Agency Securities | Par (000) | Value | ||||||
Interest Only Commercial Mortgage-Backed Securities (continued) |
| |||||||
Series 2017-54, Class IO 0.68%, 12/16/58 (b) | $ | 3,900 | $ | 280,242 | ||||
|
| |||||||
| 3,757,491 | ||||||||
Mortgage-Backed Securities — 133.3% | ||||||||
Fannie Mae Mortgage-Backed Securities: | ||||||||
2.00%, 5/01/31 (d) | 900 | 881,543 | ||||||
2.50%, 4/01/30-3/01/32 (d) | 10,071 | 10,150,635 | ||||||
3.00%, 5/01/27-6/19/47 (d) | 74,838 | 75,600,776 | ||||||
3.50%, 11/01/27-2/01/47 (d) | 58,364 | 60,346,328 | ||||||
4.00%, 4/01/26-11/01/46 (d) | 37,663 | 39,993,475 | ||||||
4.50%, 7/01/24-3/01/47 | 11,104 | 11,974,829 | ||||||
5.00%, 1/01/23-6/01/39 | 4,235 | 4,637,203 | ||||||
5.50%, 6/01/24-5/01/46 (d) | 2,667 | 2,979,450 | ||||||
6.00%, 12/01/32-6/01/41 | 2,683 | 3,036,219 | ||||||
6.50%, 9/01/36-5/01/40 | 376 | 428,398 | ||||||
Freddie Mac Mortgage-Backed Securities: | ||||||||
2.50%, 3/01/30-5/01/31 (d) | 6,754 | 6,801,820 | ||||||
2.93%, 11/01/44 (b) | 1,488 | 1,532,292 | ||||||
3.00%, 10/01/27-2/01/47 (d)(e) | 21,731 | 21,981,252 | ||||||
3.50%, 7/01/26-12/01/46 (d) | 22,740 | 23,458,874 | ||||||
4.00%, 8/01/40-6/01/46 (d) | 11,698 | 12,339,258 | ||||||
4.50%, 1/01/19-9/01/44 | 3,329 | 3,588,867 | ||||||
5.00%, 11/01/24-2/01/42 | 2,597 | 2,847,490 | ||||||
5.50%, 2/01/35-6/01/41 | 1,446 | 1,609,103 | ||||||
6.00%, 6/01/27-11/01/39 | 402 | 455,246 | ||||||
Ginnie Mae Mortgage-Backed Securities: | ||||||||
3.00%, 5/15/46 (d) | 25,740 | 26,084,363 | ||||||
3.50%, 12/20/41-4/20/47 (d) | 52,000 | 54,085,574 | ||||||
4.00%, 7/20/39-2/21/47 (d) | 13,476 | 14,293,571 | ||||||
4.50%, 9/20/39-1/20/46 | 7,587 | 8,167,520 | ||||||
5.00%, 12/15/34-7/20/44 | 4,314 | 4,778,683 | ||||||
5.50%, 7/15/38-12/20/41 | 1,326 | 1,469,893 | ||||||
6.50%, 10/15/38-2/20/41 | 544 | 630,338 | ||||||
|
| |||||||
| 394,153,000 | ||||||||
Total U.S. Government Sponsored Agency Securities — 136.1% |
| 402,441,476 | ||||||
| Options Purchased | ||||||||
(Cost — $67,097) — 0.0% | 22,673 | |||||||
Total Investments Before TBA Sale Commitments and Options Written (Cost — $ 458,869,535) — 155.8% |
| 460,591,811 | ||||||
| TBA Sale Commitments (d) | ||||||||
Fannie Mae Mortgage-Backed Securities: | ||||||||
2.50%, 5/01/31 | 3,860 | (3,882,165 | ) | |||||
3.00%, 5/01/30-5/01/46 | 16,867 | (17,082,680 | ) | |||||
3.50%, 5/01/31-5/01/46 | 11,442 | (11,858,353 | ) | |||||
4.00%, 5/01/46 | 15,887 | (16,730,995 | ) | |||||
4.50%, 5/01/46 | 1,155 | (1,242,527 | ) | |||||
5.00%, 5/01/46 | 474 | (519,174 | ) | |||||
5.50%, 5/01/45 | 277 | (307,819 | ) | |||||
Freddie Mac Mortgage-Backed Securities: | ||||||||
2.50%, 5/01/46 | 50 | (50,323 | ) | |||||
3.00%, 8/01/43-5/01/46 | 9,419 | (9,401,976 | ) | |||||
3.50%, 5/01/45 | 457 | (469,907 | ) | |||||
4.00%, 5/01/46 | 260 | (273,691 | ) | |||||
4.50%, 5/01/46 | 510 | (548,368 | ) | |||||
See Notes to Financial Statements.
| 14 | MANAGED ACCOUNT SERIES | APRIL 30, 2017 |
| Schedule of Investments (continued) | BlackRock U.S. Mortgage Portfolio | |||
| TBA Sale Commitments(d) | Par (000) | Value | ||||||
Ginnie Mae Mortgage-Backed Securities: | ||||||||
3.00%, 5/15/46 | $ | 431 | $ | (436,792 | ) | |||
3.50%, 5/15/46 | 22,514 | (23,398,834 | ) | |||||
4.00%, 5/15/46 | 424 | (448,347 | ) | |||||
4.50%, 5/15/46 | 201 | (214,473 | ) | |||||
Total TBA Sale Commitments (Proceeds — $86,688,364) — (29.4)% |
| (86,866,424 | ) | |||||
| Options Written | Value | |||
(Premiums Received — $377,225) — (0.1)% | $ | (328,857 | ) | |
Total Investments Net of TBA Sale Commitments and Options | 373,396,530 | |||
Liabilities in Excess of Other Assets — (26.3)% | (77,766,712 | ) | ||
|
| |||
Net Assets — 100.0% | $ | 295,629,818 | ||
|
| |||
| Notes to Schedule of Investments |
| (a) | Security exempt from registration pursuant to Rule 144A under the Securities Act of 1933, as amended. These securities may be resold in transactions exempt from registration to qualified institutional investors. |
| (b) | Variable rate security. Rate as of period end. |
| (c) | Step-up bond that pays an initial coupon rate for the first period and then a higher coupon rate for the following periods. Rate as of period end. |
| (d) | Represents or includes a TBA transaction. As of period end, unsettled TBA transactions were as follows: |
| Counterparty | Value | Unrealized Appreciation (Depreciation) | ||||||
Barclays Capital, Inc. | $ | (5,429,183 | ) | $ | (21,280 | ) | ||
BNP Paribas Securities Corp. | $ | (1,366,332 | ) | $ | (480 | ) | ||
Citigroup Global Markets. Inc. | $ | 10,515,986 | $ | 39,692 | ||||
Credit Suisse Securities (USA) LLC | $ | 14,730,857 | $ | 15,251 | ||||
Daiwa Capital Markets America, Inc. | $ | 4,104,422 | $ | 17,719 | ||||
Deutsche Bank Securities, Inc. | $ | 5,796,269 | $ | 26,215 | ||||
Goldman Sachs & Co. | $ | 13,000,938 | $ | 44,929 | ||||
J.P. Morgan Securities LLC | $ | 7,510,091 | $ | 28,831 | ||||
Jefferies LLC | $ | 304,360 | $ | 1,515 | ||||
Merrill Lynch, Pierce, Fenner & Smith, Inc. | $ | 12,076,069 | $ | 59,497 | ||||
Morgan Stanley & Co. LLC | $ | 414,465 | $ | 28,677 | ||||
Nomura Securities International, Inc. | $ | (7,916,872 | ) | $ | 1,567 | |||
RBC Capital Markets, LLC | $ | (3,044,374 | ) | $ | (14,704 | ) | ||
Wells Fargo Securities LLC | $ | (1,747,758 | ) | $ | (5,223 | ) | ||
| (e) | All or a portion of the security has been pledged as collateral in connection with outstanding reverse repurchase agreements. |
Reverse Repurchase Agreements
| Counterparty | Interest Rate | Trade Date | Maturity Date | Face Value | Face Value Including Accrued Interest | Type of Non-Cash | Remaining Contractual Maturity of the Agreements | |||||||||||||||||||
| Citigroup Global Markets, Inc. | 0.96 | % | 4/13/17 | 5/11/17 | $ | 1,926,000 | $ | 1,926,924 | U.S. Government Sponsored Agency Securities | Up to 30 Days | ||||||||||||||||
| Derivative Financial Instruments Outstanding as of Period End |
Futures Contracts
| Contracts Short | Issue | Expiration | Notional Value | Unrealized Appreciation (Depreciation) | ||||||||||||||
| (2 | ) | U.S. Treasury Bonds | (30 Year) | June 2017 | USD | 305,938 | $ (2,469) | |||||||||||
| (195 | ) | U.S. Treasury Notes | (10 Year) | June 2017 | USD | 24,515,156 | 15,857 | |||||||||||
| (148 | ) | U.S. Treasury Notes | (2 Year) | June 2017 | USD | 32,058,188 | (59,708 | ) | ||||||||||
| (151 | ) | U.S. Treasury Notes | (5 Year) | June 2017 | USD | 17,879,344 | (85,166 | ) | ||||||||||
| (63 | ) | Euro Dollar | June 2018 | USD | 15,487,763 | (42,611 | ) | |||||||||||
| (65 | ) | Euro Dollar | March 2019 | USD | 15,938,813 | (4,957 | ) | |||||||||||
| Total | $ | (179,054 | ) | |||||||||||||||
|
| |||||||||||||||||
See Notes to Financial Statements.
| MANAGED ACCOUNT SERIES | APRIL 30, 2017 | 15 |
| Schedule of Investments (continued) | BlackRock U.S. Mortgage Portfolio |
Exchange-Traded Options Purchased
| Description | Put/ Call | Expiration Date | Strike Price | Contracts | Value | |||||||||||||
U.S. Treasury Notes (10 Year) | Put | 5/26/17 | USD | 125.5 | 40 | $ | 20,000 | |||||||||||
OTC Interest Rate Swaptions Purchased
| Description | Counterparty | Put/ Call | Exercise Rate | Pay/Receive Exercise Rate | Floating Rate Index | Expiration Date | Notional Amount (000) | Value | ||||||||||||
10-Year Interest Rate Swap | Bank of America N.A. | Put | 2.63% | Pay | 3-month LIBOR | 6/15/17 | USD 3,500 | $ | 2,673 | |||||||||||
OTC Interest Rate Swaptions Written
| Description | Counterparty | Put/ Call | Exercise Rate | Pay/Receive Exercise Rate | Floating Rate Index | Expiration Date | Notional Amount (000) | Value | ||||||||||||||||||||||||
2-Year Interest Rate Swap | Citibank N.A. | Call | 2.20% | Pay | 6-month LIBOR | 2/11/19 | USD | 12,600 | $ | (110,333 | ) | |||||||||||||||||||||
2-Year Interest Rate Swap | Deutsche Bank AG | Call | 1.70% | Pay | 6-month LIBOR | 4/01/19 | USD | 17,900 | (80,139 | ) | ||||||||||||||||||||||
2-Year Interest Rate Swap | Citibank N.A. | Put | 2.20% | Receive | 6-month LIBOR | 2/11/19 | USD | 12,600 | (76,112 | ) | ||||||||||||||||||||||
2-Year Interest Rate Swap | Deutsche Bank AG | Put | 2.70% | Receive | 6-month LIBOR | 4/01/19 | USD | 17,900 | (62,273 | ) | ||||||||||||||||||||||
Total | $ | (328,857 | ) | |||||||||||||||||||||||||||||
|
| |||||||||||||||||||||||||||||||
Centrally Cleared Interest Rate Swaps
| Fixed Rate | Floating Rate | Expiration Date | Notional Amount (000) | Unrealized Appreciation (Depreciation) | ||||||||||
| 1.64%1 | 3-month LIBOR | 3/09/19 | USD | 11,500 | $ 27,703 | |||||||||
| 1.65%1 | 3-month LIBOR | 3/21/19 | USD | 14,300 | 32,494 | |||||||||
| 1.49%2 | 3-month LIBOR | 4/20/20 | USD | 4,500 | 28,739 | |||||||||
| 1.99%2 | 3-month LIBOR | 9/10/20 | USD | 1,200 | (783 | ) | ||||||||
| 1.96%2 | 3-month LIBOR | 9/10/20 | USD | 700 | 274 | |||||||||
| 1.96%2 | 3-month LIBOR | 9/10/20 | USD | 400 | 170 | |||||||||
| 2.42%2 | 3-month LIBOR | 4/24/45 | USD | 410 | 8,096 | |||||||||
| 2.38%2 | 3-month LIBOR | 4/24/45 | USD | 400 | 11,332 | |||||||||
| 2.39%2 | 3-month LIBOR | 4/24/45 | USD | 400 | 10,436 | |||||||||
| 2.42%2 | 3-month LIBOR | 4/24/45 | USD | 380 | 7,296 | |||||||||
| 2.83%1 | 3-month LIBOR | 7/10/45 | USD | 1,550 | 116,189 | |||||||||
| Total | $ 241,946 | |||||||||||||
|
| |||||||||||||
| 1 | The Fund pays the floating rate and receives the fixed rate. |
| 2 | The Fund pays the fixed rate and receives the floating rate. |
OTC Credit Default Swaps — Buy Protection | ||||||||||||||||||||||||||||||||
| Index | Pay Fixed Rate | Counterparty | Expiration Date | Notional (000) | Value | Premiums Paid | Unrealized Depreciation | |||||||||||||||||||||||||
CMBX.NA.9 BBB- | 3.00 | % | J.P. Morgan Securities LLC | 9/17/58 | USD | 3,100 | $ | 336,954 | $ | 348,492 | $ | (11,538 | ) | |||||||||||||||||||
CMBX.NA.9 AAA | 0.50 | % | | Morgan Stanley & Co. International PLC | | 9/17/58 | USD | 9,000 | 179,550 | 193,430 | (13,880 | ) | ||||||||||||||||||||
CMBX.NA.9 AAA | 0.50 | % | | Morgan Stanley & Co. International PLC | | 9/17/58 | USD | 3,000 | 59,850 | 86,310 | (26,460 | ) | ||||||||||||||||||||
See Notes to Financial Statements.
| 16 | MANAGED ACCOUNT SERIES | APRIL 30, 2017 |
| Schedule of Investments (continued) | BlackRock U.S. Mortgage Portfolio |
| Index | Pay Fixed Rate | Counterparty | Expiration Date | Notional | Value | Premiums Paid | Unrealized Depreciation | |||||||||||||||||||||||||
CMBX.NA.6.AAA | 0.50 | % | Deutsche Bank AG | 5/11/63 | USD | 2,981 | $ 145 | $ 593 | $ | (448 | ) | |||||||||||||||||||||
CMBX.NA.6.AAA | 0.50 | % | Deutsche Bank AG | 5/11/63 | USD | 2,981 | 145 | 983 | (838 | ) | ||||||||||||||||||||||
Total | $576,644 | $629,808 | $ | (53,164 | ) | |||||||||||||||||||||||||||
|
| |||||||||||||||||||||||||||||||
OTC Credit Default Swaps — Sell Protection
|
| |||||||||||||||||||||||||||||||||
| Index | Receive Fixed Rate | Counterparty | Expiration Date | Credit Rating1 | Notional (000)2 | Value | Premiums Received | Unrealized Appreciation | ||||||||||||||||||||||||||
CMBX.NA.9.BBB- | 3.00 | % | Deutsche Bank AG | 9/17/58 | Not Rated | USD | 3,100 | $ | (336,954 | ) | $ | (380,682 | ) | $43,728 | ||||||||||||||||||||
CMBX.NA.9.BBB- | 3.00 | % | | Morgan Stanley & Co. International PLC | | 9/17/58 | Not Rated | USD | 3,000 | (326,085 | ) | (373,275 | ) | 47,190 | ||||||||||||||||||||
CMBX.NA.10.BBB- | 3.00 | % | Deutsche Bank AG | 11/17/59 | BBB- | USD | 250 | (24,363 | ) | (27,532 | ) | 3,169 | ||||||||||||||||||||||
Total | $ | (687,402 | ) | $ | (781,489 | ) | $94,087 | |||||||||||||||||||||||||||
|
| |||||||||||||||||||||||||||||||||
| 1 | Using S&P’s rating of the issuer or the underlying securities of the index, as applicable. |
| 2 | The maximum potential amount the Fund may pay should a negative credit event take place as defined under the terms of the agreement. |
| Transactions in Options Written for the Year Ended April 30, 2017 | ||||||||||||||||||||||
| Calls | Puts | |||||||||||||||||||||
| Notional (000) | Notional (000) | |||||||||||||||||||||
| USD | Premiums Received | Contracts | USD | Premiums Received | ||||||||||||||||||
Outstanding options, beginning of year | — | — | — | — | ||||||||||||||||||
Options written | 43,500 | $ | 281,180 | 65 | 30,500 | $ | 216,851 | |||||||||||||||
Options exercised | (6,500 | ) | (52,325 | ) | — | — | — | |||||||||||||||
Options expired | (6,500 | ) | (52,325 | ) | (65 | ) | — | (16,156 | ) | |||||||||||||
|
|
|
| |||||||||||||||||||
Outstanding options, end of year | 30,500 | $ | 176,530 | — | 30,500 | $ | 200,695 | |||||||||||||||
|
|
|
| |||||||||||||||||||
| Derivative Financial Instruments Categorized by Risk Exposure |
As of period end, the fair values of derivative financial instruments located in the Statements of Assets and Liabilities were as follows:
| Assets — Derivative Financial Instruments | Commodity Contracts | Credit Contracts | Equity Contracts | Foreign Currency Exchange Contracts | Interest Rate Contracts | Other Contracts | Total | |||||||||||||||
Futures contracts | Net unrealized appreciation1 | — | — | — | — | $ | 15,857 | — | $ | 15,857 | ||||||||||||
Options purchased | Investments at value — unaffiliated2 | — | — | — | — | 22,673 | — | 22,673 | ||||||||||||||
Swaps — centrally cleared | Net unrealized appreciation1 | — | — | — | — | 242,729 | — | 242,729 | ||||||||||||||
| Unrealized appreciation on OTC swaps; | ||||||||||||||||||||||
Swaps — OTC | Swap premiums paid | — | $ | 723,895 | — | — | — | — | 723,895 | |||||||||||||
Total | — | $ | 723,895 | — | — | $ | 281,259 | — | $ | 1,005,154 | ||||||||||||
| Liabilities — Derivative Financial Instruments | ||||||||||||||||||||||
Futures contracts | Net unrealized depreciation1 | — | — | — | — | $ | 194,911 | — | $ | 194,911 | ||||||||||||
Options written | Options written, at value | — | — | — | — | 328,857 | — | 328,857 | ||||||||||||||
Swaps — centrally cleared | Net unrealized depreciation1 | — | — | — | — | 783 | — | 783 | ||||||||||||||
| Unrealized depreciation on OTC swaps; | ||||||||||||||||||||||
Swaps — OTC | Swap premiums received | — | $ | 834,653 | — | — | — | — | 834,653 | |||||||||||||
Total | — | $ | 834,653 | — | — | $ | 524,551 | — | $ | 1,359,204 | ||||||||||||
| 1 | Includes cumulative appreciation (depreciation) on futures contracts and centrally cleared swaps, if any, as reported in the Schedule of Investments. Only current day’s variation margin is reported within the Statements of Assets and Liabilities. |
| 2 | Includes options purchased at value as reported in the Schedule of Investments. |
See Notes to Financial Statements.
| MANAGED ACCOUNT SERIES | APRIL 30, 2017 | 17 |
| Schedule of Investments (continued) | BlackRock U.S. Mortgage Portfolio |
For the year ended April 30, 2017, the effect of derivative financial instruments in the Statements of Operations were as follows:
| Net Realized Gain (Loss) from: | Commodity Contracts | Credit Contracts | Equity Contracts | Foreign Currency Exchange Contracts | Interest Rate Contracts | Other Contracts | Total | |||||||||||||||||||||
Futures contracts | — | — | — | — | $ | (683,610 | ) | — | $ | (683,610 | ) | |||||||||||||||||
Options purchased1 | — | — | — | — | 64,013 | — | 64,013 | |||||||||||||||||||||
Options written | — | — | — | — | 68,481 | — | 68,481 | |||||||||||||||||||||
Swaps | — | $470,066 | — | — | (724,938 | ) | — | (254,872 | ) | |||||||||||||||||||
Total | — | $470,066 | — | — | $ | (1,276,054 | ) | — | $ | (805,988 | ) | |||||||||||||||||
| Net Change in Unrealized Appreciation (Depreciation) on: | ||||||||||||||||||||||||||||
Futures contracts | — | — | — | — | $ | (129,929 | ) | — | $ | (129,929 | ) | |||||||||||||||||
Options purchased2 | — | — | — | — | (44,424 | ) | — | (44,424 | ) | |||||||||||||||||||
Options written | — | — | — | — | 48,368 | — | 48,368 | |||||||||||||||||||||
Swaps | — | $ | (356,270 | ) | — | — | 483,511 | — | 127,241 | |||||||||||||||||||
Total | — | $ | (356,270 | ) | — | — | $ | 357,526 | — | $ | 1,256 | |||||||||||||||||
| 1 | Options purchased are included in net realized gain (loss) from investments — unaffiliated. |
| 2 | Options purchased are included in net change in unrealized appreciation (depreciation) on investments — unaffiliated. |
Average Quarterly Balances of Outstanding Derivative Financial Instruments |
Futures contracts: | ||||
Average notional value of contracts - long | $ | 6,147,034 | ||
Average notional value of contracts - short | $ | 60,060,360 | ||
Options: | ||||
Average value of option contracts purchased | $ | 5,000 | ||
Average value of option contracts written | $ | 16,250 | 1 | |
Average notional value of swaption contracts purchased | $ | 6,410,000 | ||
Average notional value of swaption contracts written | $ | 15,250,000 | ||
Credit default swaps: | ||||
Average notional value - buy protection | $ | 12,014,500 | ||
Average notional value - sell protection | $ | 1,587,500 | ||
Interest rate swaps: | ||||
Average notional value - pays fixed rate | $ | 8,390,000 | ||
Average notional value - receives fixed rate | $ | 11,600,000 | ||
Total return swaps: | ||||
Average notional value | $ | 169,000 |
| 1 | Actual amounts for the period are shown due to limited outstanding derivative financial instruments as of each quarter end. |
For more information about the Fund’s investment risks regarding derivative financial instruments, refer to the Notes to Financial Statements.
Derivative Financial Instruments — Offsetting as of Period End |
The Fund’s derivative assets and liabilities (by type) were as follows:
| Assets | Liabilities | |||||||||||
Derivative Financial Instruments: | ||||||||||||
Futures contracts | $ | 10,137 | $ | 21,017 | ||||||||
Options | 22,673 | 1 | 328,857 | |||||||||
Swaps - Centrally cleared | — | 1,020 | ||||||||||
Swaps - OTC2 | 723,895 | 834,653 | ||||||||||
Total derivative assets and liabilities in the Statements of Assets and Liabilities | $ | 756,705 | $ | 1,185,547 | ||||||||
Derivatives not subject to a Master Netting Agreement or similar agreement (“MNA”) | (30,137 | ) | (22,037 | ) | ||||||||
Total derivative assets and liabilities subject to an MNA | $ | 726,568 | $ | 1,163,510 | ||||||||
| 1 | Includes options purchased at value which is included in Investments at value — unaffiliated in the Statements of Assets and Liabilities and reported in the Schedule of Investments. |
| 2 | Includes unrealized appreciation (depreciation) on OTC swaps and swap premiums paid/received in the Statements of Assets and Liabilities. |
See Notes to Financial Statements.
| 18 | MANAGED ACCOUNT SERIES | APRIL 30, 2017 |
| Schedule of Investments (continued) | BlackRock U.S. Mortgage Portfolio |
The following tables present the Fund’s derivative assets and liabilities by counterparty net of amounts available for offset under an MNA and net of the related collateral received and pledged by the Fund.
| Counterparty | Derivative Assets Subject to an MNA by Counterparty | Derivatives Available for Offset1 | Non-cash Collateral Received | Cash Collateral Received2 | Net Amount of Derivative Assets3 | |||||||||||||
Bank of America N.A. | $ 2,673 | — | — | — | $2,673 | |||||||||||||
Deutsche Bank AG | 48,473 | $ | (48,473) | — | — | — | ||||||||||||
J.P. Morgan Securities LLC | 348,492 | (11,538) | — | $(336,954) | — | |||||||||||||
Morgan Stanley & Co. International PLC | 326,930 | (326,930) | — | — | — | |||||||||||||
Total | $726,568 | $ | (386,941) | — | $(336,954) | $2,673 | ||||||||||||
| Counterparty | Derivative Liabilities Subject to an MNA by Counterparty | Derivatives Available for Offset1 | Non-cash Collateral Pledged | Cash Collateral Pledged | Net Amount of Derivative Liabilities4 | |||||||||||||
Citibank N.A. | $ 186,445 | — | — | — | $186,445 | |||||||||||||
Deutsche Bank AG | 551,912 | $ | (48,473) | — | $(410,000) | 93,439 | ||||||||||||
J.P. Morgan Securities LLC | 11,538 | (11,538) | — | — | — | |||||||||||||
Morgan Stanley & Co. International PLC | 413,615 | (326,930) | — | — | 86,685 | |||||||||||||
Total | $1,163,510 | $ | (386,941) | — | $(410,000) | $366,569 | ||||||||||||
| 1 | The amount of derivatives available for offset is limited to the amount of derivative assets and/or liabilities that are subject to an MNA. |
| 2 | Excess of collateral received from the individual counterparty is not shown for financial reporting purposes. |
| 3 | Net amount represents the net amount receivable from the counterparty in the event of default. |
| 4 | Net amount represents the net amount payable due to the counterparty in the event of default. Net amount may be offset further by the options written receivable/payable on the Statements of Assets and Liabilities. |
| Fair Value Hierarchy as of Period End |
Various inputs are used in determining the fair value of investments and derivative financial instruments. For information about the Fund’s policy regarding valuation of investments and derivative financial instruments, refer to the Notes to Financial Statements.
The following tables summarize the Fund’s investments and derivative financial instruments categorized in the disclosure hierarchy:
| Level 1 | Level 2 | Level 3 | Total | |||||||||||||
Assets: | ||||||||||||||||
Investments: | ||||||||||||||||
Long-Term Investments: | ||||||||||||||||
Asset-Backed Securities | — | $ | 25,871,733 | $ | 1,437,337 | $ | 27,309,070 | |||||||||
Non-Agency Mortgage-Backed Securities | — | 30,447,667 | 370,925 | 30,818,592 | ||||||||||||
U.S. Government Sponsored Agency Securities | — | 402,161,234 | 280,242 | 402,441,476 | ||||||||||||
Options Purchased: | ||||||||||||||||
Interest rate contracts | $ | 20,000 | 2,673 | — | 22,673 | |||||||||||
Liabilities: | ||||||||||||||||
Investments: | ||||||||||||||||
TBA Sale Commitments | — | (86,866,424 | ) | — | (86,866,424 | ) | ||||||||||
Total | $ | 20,000 | $ | 371,616,883 | $ | 2,088,504 | $ | 373,725,387 | ||||||||
Derivative Financial Instruments1 | ||||||||||||||||
Assets: | ||||||||||||||||
Credit contracts | — | $ | 94,087 | — | $ | 94,087 | ||||||||||
Interest rate contracts | $ | 15,857 | 242,729 | — | 258,586 | |||||||||||
Liabilities: | ||||||||||||||||
Credit contracts | — | (53,164 | ) | — | (53,164 | ) | ||||||||||
Interest rate contracts | (194,911 | ) | (329,640 | ) | — | (524,551 | ) | |||||||||
Total | $ | (179,054 | ) | $ | (45,988 | ) | — | $ | (225,042 | ) | ||||||
| 1 | Derivative financial instruments are swaps, futures contracts and options written. Swaps and futures contracts are valued at the unrealized appreciation (depreciation) on the instrument and options written are shown at value. |
The Fund may hold assets and/or liabilities in which the fair value approximates the carrying amount or face value, including accrued interest for financial statement purposes. As of period end, reverse repurchase agreements of $1,926,924 are categorized as Level 2 within the disclosure hierarchy.
See Notes to Financial Statements.
| MANAGED ACCOUNT SERIES | APRIL 30, 2017 | 19 |
| Schedule of Investments (concluded) | BlackRock U.S. Mortgage Portfolio |
During the year ended April 30, 2017, there were no transfers between Level 1 and Level 2.
A reconciliation of Level 3 investments is presented when the Fund had a significant amount of Level 3 investments at the beginning and/or end of the year in relation to net assets. The following table is a reconciliation of Level 3 investments for which significant unobservable inputs were used in determining fair value:
| Asset-Backed Securities | Non-Agency Mortgage-Backed Securities | U.S. Government Sponsored Agency Securities | Total | |||||||||||||
Assets: | ||||||||||||||||
Opening balance, as of April 30, 2016 | $ | 737,897 | $ | 2,576,005 | — | $ | 3,313,902 | |||||||||
Transfers into Level 3 | — | — | — | |||||||||||||
Transfers out of Level 3 | — | (1,695,919 | ) | — | (1,695,919 | ) | ||||||||||
Accrued discounts/premiums | 4,391 | (433 | ) | — | 3,958 | |||||||||||
Net realized gain (loss) | (19,907 | ) | 9,837 | — | (10,070 | ) | ||||||||||
Net change in unrealized appreciation (depreciation)1,2 | 4,905 | 12,660 | $ | (2,051 | ) | 15,514 | ||||||||||
Purchases | 790,000 | 370,000 | 282,293 | 1,442,293 | ||||||||||||
Sales | (79,949 | ) | (901,225 | ) | — | (981,174 | ) | |||||||||
|
| |||||||||||||||
Closing Balance, as of April 30, 2017 | $ | 1,437,337 | $ | 370,925 | $ | 280,242 | $ | 2,088,504 | ||||||||
|
| |||||||||||||||
Net change in unrealized appreciation (depreciation) on investments held as of April 30, 20172 | $ | 4,905 | $ | 925 | $ | (2,051 | ) | $ | 3,779 | |||||||
|
| |||||||||||||||
| 1 | Included in the related net change in unrealized appreciation (depreciation) in the Statements of Operations. |
| 2 | Any difference between net change in unrealized appreciation (depreciation) and net change in unrealized appreciation (depreciation) on investments still held at April 30, 2017 is generally due to investments no longer held or categorized as Level 3 at period end. |
The Fund’s investments that are categorized as Level 3 were valued utilizing third party pricing information without adjustment. Such valuations are based on unobservable inputs. A significant change in third party information could result in a significantly lower or higher value of such Level 3 investments.
See Notes to Financial Statements.
| 20 | MANAGED ACCOUNT SERIES | APRIL 30, 2017 |
| Schedule of Investments April 30, 2017 | Global SmallCap Portfolio | |||
| (Percentages shown are based on Net Assets) |
| Common Stocks | Shares | Value | ||||||
Argentina — 0.7% | ||||||||
Grupo Supervielle SA (a) | 46,641 | $ | 792,431 | |||||
Australia — 1.4% | ||||||||
Metals X Ltd. (a) | 502,625 | 276,980 | ||||||
Orocobre Ltd. (a)(b) | 349,087 | 823,124 | ||||||
Western Areas Ltd. (a) | 58,000 | 96,260 | ||||||
Westgold Resources Ltd. (a) | 280,146 | 409,704 | ||||||
|
| |||||||
| 1,606,068 | ||||||||
Austria — 0.6% | ||||||||
Schoeller-Bleckmann Oilfield Equipment AG (a) | 9,880 | 689,758 | ||||||
Belgium — 1.3% | ||||||||
Nyrstar NV (a)(b) | 21,390 | 121,137 | ||||||
Ontex Group NV | 20,247 | 675,544 | ||||||
Warehouses de Pauw CVA | 7,547 | 722,187 | ||||||
|
| |||||||
| 1,518,868 | ||||||||
Brazil — 2.1% | ||||||||
Cia de Saneamento Basico do Estado de Sao Paulo — ADR | 63,440 | 583,648 | ||||||
Cia Hering | 116,731 | 812,029 | ||||||
Porto Seguro SA | 44,200 | 400,078 | ||||||
TOTVS SA | 79,438 | 693,758 | ||||||
|
| |||||||
| 2,489,513 | ||||||||
British Virgin Islands — 0.2% | ||||||||
Atlas Mara Ltd. (a)(b) | 91,593 | 192,345 | ||||||
Canada — 6.0% | ||||||||
Africa Oil Corp. (a)(b) | 663,273 | 1,030,101 | ||||||
Canadian Western Bank | 18,360 | 360,865 | ||||||
Canfor Corp. (a) | 59,886 | 899,354 | ||||||
Continental Gold, Inc. (a)(b) | 282,222 | 636,785 | ||||||
Descartes Systems Group, Inc. (a) | 19,813 | 457,206 | ||||||
Dollarama, Inc. | 7,730 | 676,704 | ||||||
Entertainment One Ltd. | 247,868 | 793,930 | ||||||
Kinross Gold Corp. (a) | 106,744 | 371,440 | ||||||
Lithium Americas Corp. (a)(b) | 160,285 | 113,898 | ||||||
Methanex Corp. | 7,610 | 349,299 | ||||||
Painted Pony Petroleum Ltd. (a)(b) | 177,463 | 650,024 | ||||||
Trevali Mining Corp. (a) | 649,950 | 571,364 | ||||||
|
| |||||||
| 6,910,970 | ||||||||
China — 0.7% | ||||||||
Colour Life Services Group Co. Ltd. | 495,000 | 292,255 | ||||||
KWG Property Holding Ltd. | 625,000 | 472,132 | ||||||
|
| |||||||
| 764,387 | ||||||||
Denmark — 0.7% | ||||||||
Nets A/S (a) | 42,000 | 763,944 | ||||||
France — 3.2% | ||||||||
Elior Group | 34,564 | 862,337 | ||||||
Elis SA | 58,669 | 1,214,256 | ||||||
Ubisoft Entertainment SA (a) | 17,810 | 843,703 | ||||||
Virbac SA (a) | 5,295 | 833,742 | ||||||
|
| |||||||
| 3,754,038 | ||||||||
Georgia — 0.6% | ||||||||
BGEO Group PLC | 14,643 | 681,479 | ||||||
Germany — 1.5% | ||||||||
Aareal Bank AG | 8,400 | 337,855 | ||||||
AIXTRON SE (a)(b) | 118,475 | 649,553 | ||||||
Rheinmetall AG | 7,890 | 724,222 | ||||||
|
| |||||||
| 1,711,630 | ||||||||
| Common Stocks | Shares | Value | ||||||
Hong Kong — 1.6% | ||||||||
Clear Media Ltd. | 263,000 | $ | 290,781 | |||||
Lee & Man Paper Manufacturing Ltd. | 837,000 | 655,376 | ||||||
Melco International Development Ltd. | 454,000 | 932,092 | ||||||
|
| |||||||
| 1,878,249 | ||||||||
India — 4.0% | ||||||||
Azure Power Global Ltd. (a)(b) | 29,176 | 488,114 | ||||||
Container Corp. of India Ltd. | 39,500 | 748,073 | ||||||
Jubilant Foodworks Ltd. | 44,200 | 715,199 | ||||||
Kaveri Seed Co. Ltd. (a) | 55,630 | 487,994 | ||||||
MakeMyTrip Ltd. (a)(b) | 24,010 | 921,984 | ||||||
Oberoi Realty Ltd. (a) | 156,090 | 963,716 | ||||||
Zee Entertainment Enterprises Ltd. | 44,170 | 361,678 | ||||||
|
| |||||||
| 4,686,758 | ||||||||
Indonesia — 1.1% | ||||||||
Bank Tabungan Negara Persero Tbk PT | 4,750,200 | 817,853 | ||||||
Tower Bersama Infrastructure Tbk PT | 966,100 | 423,846 | ||||||
|
| |||||||
| 1,241,699 | ||||||||
Ireland — 0.7% | ||||||||
Ryanair Holdings PLC — ADR (a) | 9,227 | 848,238 | ||||||
Italy — 0.8% | ||||||||
Beni Stabili SpA SIIQ (a) | 1,545,150 | 981,267 | ||||||
Japan — 6.4% | ||||||||
Don Quijote Holdings Co. Ltd. | 11,800 | 429,920 | ||||||
Gree, Inc. | 112,200 | 899,696 | ||||||
GS Yuasa Corp. | 159,000 | 736,676 | ||||||
Horiba Ltd. | 3,500 | 206,348 | ||||||
JGC Corp. | 59,100 | 1,032,008 | ||||||
Nippon Shokubai Co. Ltd. | 3,400 | 228,394 | ||||||
NOK Corp. | 27,600 | 657,856 | ||||||
NTN Corp. | 36,000 | 183,501 | ||||||
Pioneer Corp. (a) | 200,400 | 361,720 | ||||||
Rohm Co. Ltd. | 13,100 | 919,986 | ||||||
Seven Bank Ltd. | 208,400 | 699,946 | ||||||
Tokyo Tatemono Co. Ltd. | 79,700 | 1,088,866 | ||||||
|
| |||||||
| 7,444,917 | ||||||||
Luxembourg — 1.3% | ||||||||
B&M European Value Retail SA | 129,800 | 566,442 | ||||||
Eurofins Scientific SE | 743 | 365,948 | ||||||
Stabilus SA (a) | 8,736 | 632,728 | ||||||
|
| |||||||
| 1,565,118 | ||||||||
Malaysia — 0.5% | ||||||||
AirAsia BHD | 718,400 | 554,105 | ||||||
Netherlands — 1.8% | ||||||||
Boskalis Westminster | 18,320 | 673,862 | ||||||
Intertrust NV | 22,290 | 446,630 | ||||||
TomTom NV (a)(b) | 96,160 | 977,681 | ||||||
|
| |||||||
| 2,098,173 | ||||||||
Norway — 0.5% | ||||||||
Stolt-Nielsen Ltd. | 37,020 | 571,296 | ||||||
Panama — 0.5% | ||||||||
Copa Holdings SA, Class A | 4,980 | 579,772 | ||||||
Russia — 0.9% | ||||||||
Globaltrans Investment PLC, Registered Shares | 143,870 | 1,089,096 | ||||||
South Africa — 0.4% | ||||||||
MMI Holdings Ltd. | 271,600 | 473,744 | ||||||
See Notes to Financial Statements.
| MANAGED ACCOUNT SERIES | APRIL 30, 2017 | 21 |
| Schedule of Investments (continued) | Global SmallCap Portfolio | |||
| Common Stocks | Shares | Value | ||||||
South Korea — 0.2% | ||||||||
Korea Gas Corp. (a) | 5,680 | $ | 232,651 | |||||
Viatron Technologies, Inc. | 1,624 | 29,365 | ||||||
|
| |||||||
| 262,016 | ||||||||
Spain — 1.2% | ||||||||
Atento SA (a) | 38,444 | 344,074 | ||||||
Merlin Properties Socimi SA | 84,181 | 995,485 | ||||||
|
| |||||||
| 1,339,559 | ||||||||
Sweden — 0.6% | ||||||||
Hoist Finance AB (b) | 18,980 | 178,394 | ||||||
SSAB AB, A Shares (a)(b) | 91,730 | 399,068 | ||||||
SSAB AB, B Shares (a) | 40,707 | 144,423 | ||||||
|
| |||||||
| 721,885 | ||||||||
Switzerland — 1.7% | ||||||||
Aryzta AG | 13,908 | 451,535 | ||||||
GAM Holding AG | 49,650 | 636,221 | ||||||
Leonteq AG (a)(b) | 6,230 | 275,310 | ||||||
Sulzer AG, Registered Shares | 5,480 | 639,425 | ||||||
|
| |||||||
| 2,002,491 | ||||||||
Thailand — 0.7% | ||||||||
Indorama Ventures PCL | 751,100 | 796,410 | ||||||
United Kingdom — 7.9% | ||||||||
Arrow Global Group PLC | 222,345 | 1,054,733 | ||||||
Britvic PLC | 88,000 | 757,135 | ||||||
Dialog Semiconductor PLC (a) | 1,430 | 66,911 | ||||||
Exova Group PLC | 214,520 | 662,665 | ||||||
Grainger PLC | 234,983 | 760,572 | ||||||
Henderson Group PLC | 137,437 | 411,089 | ||||||
IMI PLC | 34,170 | 565,917 | ||||||
Intertek Group PLC | 15,440 | 812,629 | ||||||
Man Group PLC | 234,700 | 467,082 | ||||||
Nomad Foods Ltd. (a) | 61,206 | 722,231 | ||||||
Rentokil Initial PLC | 242,950 | 783,293 | ||||||
Senior PLC | 176,600 | 490,640 | ||||||
Serco Group PLC (a) | 368,909 | 552,063 | ||||||
UNITE Group PLC | 133,062 | 1,115,054 | ||||||
|
| |||||||
| 9,222,014 | ||||||||
United States — 44.7% | ||||||||
Actuant Corp., Class A | 18,830 | 514,059 | ||||||
Allison Transmission Holdings, Inc. | 29,050 | 1,123,654 | ||||||
Bob Evans Farms, Inc. | 23,170 | 1,546,366 | ||||||
Boston Beer Co., Inc., Class A (a) | 6,791 | 980,281 | ||||||
Bottomline Technologies, Inc. (a) | 31,164 | 726,121 | ||||||
BroadSoft, Inc. (a) | 23,155 | 889,152 | ||||||
Burlington Stores, Inc. (a) | 7,637 | 755,452 | ||||||
Cable One, Inc. | 2,438 | 1,662,375 | ||||||
CARBO Ceramics, Inc. (a) | 16,663 | 114,475 | ||||||
Chart Industries, Inc. (a) | 16,516 | 602,999 | ||||||
Ciena Corp. (a) | 33,270 | 762,216 | ||||||
Ellie Mae, Inc. (a) | 5,300 | 539,328 | ||||||
Energen Corp. (a) | 6,210 | 322,858 | ||||||
Etsy, Inc. (a)(b) | 15,700 | 168,932 | ||||||
Financial Engines, Inc. | 15,500 | 658,750 | ||||||
Five Below, Inc. (a)(b) | 14,210 | 697,995 | ||||||
Generac Holdings, Inc. (a) | 16,010 | 563,072 | ||||||
Genesee & Wyoming, Inc., Class A (a)(b) | 7,100 | 481,096 | ||||||
G-III Apparel Group Ltd. (a)(b) | 14,520 | 344,124 | ||||||
Greenhill & Co, Inc. | 24,800 | 627,440 | ||||||
Hain Celestial Group, Inc. (a) | 13,930 | 515,271 | ||||||
Halyard Health, Inc. (a) | 31,925 | 1,261,037 | ||||||
| Common Stocks | Shares | Value | ||||||
United States (continued) | ||||||||
Haynes International, Inc. | 9,537 | $ | 403,320 | |||||
Heritage Insurance Holdings, Inc. | 36,850 | 445,885 | ||||||
IBERIABANK Corp. | 5,850 | 464,197 | ||||||
IDEX Corp. | 10,500 | 1,099,980 | ||||||
Insulet Corp. (a)(b) | 31,901 | 1,384,822 | ||||||
Integrated Device Technology, Inc. (a) | 32,420 | 777,756 | ||||||
Invacare Corp. | 74,819 | 1,099,839 | ||||||
KBR, Inc. | 61,620 | 865,761 | ||||||
Kraton Performance Polymers, Inc. (a) | 19,316 | 631,826 | ||||||
LKQ Corp. (a) | 26,847 | 838,700 | ||||||
Marcus & Millichap, Inc. (a) | 40,105 | 1,034,709 | ||||||
Merit Medical Systems, Inc. (a) | 41,478 | 1,397,809 | ||||||
MSC Industrial Direct Co., Inc., Class A | 9,590 | 858,593 | ||||||
National Fuel Gas Co. | 8,500 | 470,730 | ||||||
National Instruments Corp. | 35,556 | 1,241,260 | ||||||
NetScout Systems, Inc. (a) | 21,227 | 799,196 | ||||||
Nordson Corp. | 8,400 | 1,051,680 | ||||||
Oceaneering International, Inc. | 13,200 | 348,348 | ||||||
OPKO Health, Inc. (a)(b) | 101,170 | 786,091 | ||||||
Opus Bank | 20,410 | 460,245 | ||||||
Outfront Media, Inc. | 41,251 | 1,079,126 | ||||||
Owens & Minor, Inc. | 27,934 | 967,913 | ||||||
Owens-Illinois, Inc. (a) | 18,600 | 405,852 | ||||||
Pacific Biosciences of California, Inc. (a) | 86,001 | 338,844 | ||||||
Patterson Cos., Inc. | 24,566 | 1,092,941 | ||||||
Pebblebrook Hotel Trust (b) | 34,004 | 1,011,959 | ||||||
Pfenex, Inc. (a) | 88,611 | 426,219 | ||||||
PTC, Inc. (a) | 15,890 | 858,855 | ||||||
Qorvo, Inc. (a)(b) | 9,350 | 636,080 | ||||||
Quotient Ltd. (a)(b) | 73,859 | 502,980 | ||||||
Rambus, Inc. (a) | 45,510 | 569,785 | ||||||
Seritage Growth Properties, Class A (b) | 23,639 | 981,018 | ||||||
Skechers U.S.A., Inc., Class A (a) | 32,360 | 817,090 | ||||||
SM Energy Co. | 4,830 | 109,110 | ||||||
Smart & Final Stores, Inc. (a)(b) | 42,280 | 498,904 | ||||||
SUPERVALU, Inc. (a) | 201,669 | 826,843 | ||||||
Tanger Factory Outlet Centers, Inc. | 33,562 | 1,046,799 | ||||||
Teradyne, Inc. | 1,800 | 63,486 | ||||||
Texas Capital Bancshares, Inc. (a) | 4,550 | 346,255 | ||||||
TreeHouse Foods, Inc. (a)(b) | 6,770 | 593,052 | ||||||
Tyler Technologies, Inc. (a) | 4,100 | 670,719 | ||||||
Ultimate Software Group, Inc. (a)(b) | 2,450 | 496,541 | ||||||
Umpqua Holdings Corp. | 32,900 | 581,343 | ||||||
United Therapeutics Corp. (a)(b) | 3,529 | 443,595 | ||||||
Urban Outfitters, Inc. (a) | 11,632 | 266,140 | ||||||
Verint Systems, Inc. (a) | 20,808 | 817,754 | ||||||
VWR Corp. (a)(b) | 29,450 | 832,257 | ||||||
Whiting Petroleum Corp. (a) | 41,710 | 346,193 | ||||||
Yelp, Inc. (a) | 18,074 | 640,000 | ||||||
Zions Bancorporation | 17,220 | 689,317 | ||||||
Zynga, Inc., Class A (a) | 215,710 | 623,402 | ||||||
|
| |||||||
| 51,898,172 | ||||||||
Uruguay — 0.8% | ||||||||
Arcos Dorados Holdings, Inc., Class A (a) | 116,698 | 956,924 | ||||||
Total Common Stocks — 97.3% | 113,087,334 | |||||||
See Notes to Financial Statements.
| 22 | MANAGED ACCOUNT SERIES | APRIL 30, 2017 |
| Schedule of Investments (continued) | Global SmallCap Portfolio | |||
Warrants | Shares | Value | ||||||
British Virgin Islands — 0.0% | ||||||||
Atlas Mara Ltd. (Issued/Exercisable 12/17/13, 1 Share for 1 Warrant, Expires 12/17/17, Strike Price USD 11.50)(a) | 77,800 | $ | 393 | |||||
Total Long-Term Investments (Cost — $93,921,630) — 97.3% | 113,087,727 | |||||||
| Short-Term Securities | ||||||||
Money Market Funds — 9.9% | ||||||||
SL Liquidity Series LLC, Money Market Series, 1.09% (c)(d)(e) | 11,416,782 | 11,419,065 | ||||||
| Short-Term Securities | Par (000) | Value | ||||||
Time Deposits | ||||||||
United States — 2.5% | ||||||||
JPMorgan Chase Bank N.A., 0.92%, 5/01/17 | $ | 2,928 | $ | 2,927,855 | ||||
Total Short-Term Securities (Cost — $14,344,883) — 12.4% | 14,346,920 | |||||||
Total Investments (Cost — $108,266,513) — 109.7% | 127,434,647 | |||||||
Liabilities in Excess of Other Assets — (9.7)% | (11,266,559 | ) | ||||||
|
| |||||||
Net Assets — 100.0% | $ | 116,168,088 | ||||||
|
| |||||||
| Notes to Schedule of Investments |
| (a) | Non-income producing security. |
| (b) | Security, or a portion of the security, is on loan. |
| (c) | Security was purchased with the cash collateral from loaned securities. |
| (d) | During the year ended April 30, 2017, investments in issuers considered to be an affiliate of the Fund for purposes of Section 2(a)(3) of the Investment Company Act of 1940, as amended, were as follows: |
| Affiliate | Shares Held at April 30, 2016 | Net Activity | Shares Held at April 30, 2017 | Value at April 30, 2017 | Income | Net Realized Gain | Change in Unrealized Appreciation | |||||||||||||||||||||
SL Liquidity Series, LLC, Money Market Series | 8,455,198 | 2,961,584 | 11,416,782 | $11,419,065 | $223,741 | 1 | $58 | $2,037 | ||||||||||||||||||||
| 1 | Represents securities lending income earned from the reinvestment of cash collateral from loaned securities, net of fees and collateral investment expenses, and other payments to and from borrowers of securities. |
| (e) | Current yield as of period end. |
| Fair Value Hierarchy as of Period End |
Various inputs are used in determining the fair value of investments. For information about the Fund’s policy regarding valuation of investments, refer to the Notes to Financial Statements.
The following table summarizes the Fund’s investments categorized in the disclosure hierarchy:
| Level 1 | Level 2 | Level 3 | Total | |||||||||||||
Assets: | ||||||||||||||||
Investments: | ||||||||||||||||
Long-Term Investments: | ||||||||||||||||
Common Stocks: | ||||||||||||||||
Argentina | $ | 792,431 | — | — | $ | 792,431 | ||||||||||
Australia | — | $ | 1,606,068 | — | 1,606,068 | |||||||||||
Austria | — | 689,758 | — | 689,758 | ||||||||||||
Belgium | 121,137 | 1,397,731 | — | 1,518,868 | ||||||||||||
Brazil | 2,489,513 | — | — | 2,489,513 | ||||||||||||
British Virgin Islands | 192,345 | — | — | 192,345 | ||||||||||||
Canada | 6,910,970 | — | — | 6,910,970 | ||||||||||||
China | — | 764,387 | — | 764,387 | ||||||||||||
Denmark | 763,944 | — | — | 763,944 | ||||||||||||
France | 2,047,998 | 1,706,040 | — | 3,754,038 | ||||||||||||
Georgia | — | 681,479 | — | 681,479 | ||||||||||||
Germany | — | 1,711,630 | — | 1,711,630 | ||||||||||||
Hong Kong | 290,781 | 1,587,468 | — | 1,878,249 | ||||||||||||
India | 1,410,098 | 3,276,660 | — | 4,686,758 | ||||||||||||
Indonesia | — | 1,241,699 | — | 1,241,699 | ||||||||||||
Ireland | 848,238 | — | — | 848,238 | ||||||||||||
Italy | 981,267 | — | — | 981,267 | ||||||||||||
Japan | — | 7,444,917 | — | 7,444,917 | ||||||||||||
Luxembourg | 632,728 | 932,390 | — | 1,565,118 | ||||||||||||
See Notes to Financial Statements.
| MANAGED ACCOUNT SERIES | APRIL 30, 2017 | 23 |
| Schedule of Investments (concluded) | Global SmallCap Portfolio |
| Level 1 | Level 2 | Level 3 | Total | |||||||||||||
Malaysia | — | $ | 554,105 | — | $ | 554,105 | ||||||||||
Netherlands | — | 2,098,173 | — | 2,098,173 | ||||||||||||
Norway | $ | 571,296 | — | — | 571,296 | |||||||||||
Panama | 579,772 | — | — | 579,772 | ||||||||||||
Russia | 1,089,096 | — | — | 1,089,096 | ||||||||||||
South Africa | 473,744 | — | — | 473,744 | ||||||||||||
South Korea | — | 262,016 | — | 262,016 | ||||||||||||
Spain | 344,074 | 995,485 | — | 1,339,559 | ||||||||||||
Sweden | 178,394 | 543,491 | — | 721,885 | ||||||||||||
Switzerland | 639,425 | 1,363,066 | — | 2,002,491 | ||||||||||||
Thailand | — | 796,410 | — | 796,410 | ||||||||||||
United Kingdom | 4,315,255 | 4,906,759 | — | 9,222,014 | ||||||||||||
United States | 51,898,172 | — | — | 51,898,172 | ||||||||||||
Uruguay | 956,924 | — | — | 956,924 | ||||||||||||
Warrants | 393 | — | — | 393 | ||||||||||||
Short-Term Securities | — | 2,927,855 | — | 2,927,855 | ||||||||||||
|
| |||||||||||||||
Subtotal | $ | 78,527,995 | $ | 37,487,587 | — | $ | 116,015,582 | |||||||||
|
| |||||||||||||||
Investments Valued at NAV1 | 11,419,065 | |||||||||||||||
|
| |||||||||||||||
Total Investments | $ | 127,434,647 | ||||||||||||||
|
| |||||||||||||||
| 1 | As of April 30, 2017, certain investments of the Fund were fair valued using NAV per share as no quoted market value is available and therefore have been excluded from the fair value hierarchy. |
Transfers between Level 1 and Level 2 were as follows:
| Transfers into Level 11 | Transfers out of Level 12 | Transfers into Level 22 | Transfers out of Level 21 | |||||||||||||
Assets: | ||||||||||||||||
Long-Term Investments: | ||||||||||||||||
France | $ | 676,578 | — | — | $ | (676,578 | ) | |||||||||
Georgia | — | $ | (741,149 | ) | $ | 741,149 | ||||||||||
Hong Kong | 224,918 | — | — | (224,918 | ) | |||||||||||
Italy | 768,899 | — | — | (768,899 | ) | |||||||||||
Luxembourg | 654,123 | — | — | (654,123 | ) | |||||||||||
Netherlands | — | (417,308 | ) | 417,308 | — | |||||||||||
Sweden | 621,155 | — | — | (621,155 | ) | |||||||||||
United Kingdom | 527,862 | — | — | (527,862 | ) | |||||||||||
|
| |||||||||||||||
Total | $ | 3,473,535 | $ | (1,158,457 | ) | $ | 1,158,457 | $ | (3,473,535 | ) | ||||||
|
| |||||||||||||||
| 1 | Systematic Fair Value Prices were not utilized at period end for these investments. |
| 2 | External pricing service used to reflect any significant market movements between the time the Fund valued such foreign securities and the earlier closing of foreign markets. |
See Notes to Financial Statements.
| 24 | MANAGED ACCOUNT SERIES | APRIL 30, 2017 |
| Schedule of Investments April 30, 2017 | Mid Cap Value Opportunities Portfolio | |||
| (Percentages shown are based on Net Assets) |
| Common Stocks | Shares | Value | ||||||
Aerospace & Defense — 0.7% | ||||||||
Spirit AeroSystems Holdings, Inc., Class A | 12,450 | $ | 711,642 | |||||
Banks — 7.0% | ||||||||
Comerica, Inc. | 4,710 | 332,997 | ||||||
Cullen/Frost Bankers, Inc. | 7,320 | 690,935 | ||||||
FNB Corp. | 21,300 | 303,312 | ||||||
Fulton Financial Corp. | 28,180 | 519,921 | ||||||
Hancock Holding Co. | 22,200 | 1,036,740 | ||||||
Huntington Bancshares, Inc. | 32,906 | 423,171 | ||||||
International Bancshares Corp. | 11,720 | 438,328 | ||||||
Prosperity Bancshares, Inc. | 14,690 | 987,168 | ||||||
Regions Financial Corp. | 27,370 | 376,337 | ||||||
Umpqua Holdings Corp. | 54,700 | 966,549 | ||||||
Valley National Bancorp | 83,900 | 986,664 | ||||||
Zions Bancorporation | 9,400 | 376,282 | ||||||
|
| |||||||
| 7,438,404 | ||||||||
Beverages — 1.1% | ||||||||
Boston Beer Co., Inc., Class A (a)(b) | 7,972 | 1,150,758 | ||||||
Biotechnology — 0.6% | ||||||||
United Therapeutics Corp. (a)(b) | 4,703 | 591,167 | ||||||
Capital Markets — 2.3% | ||||||||
Affiliated Managers Group, Inc. | 4,370 | 723,628 | ||||||
Eaton Vance Corp. | 23,010 | 987,819 | ||||||
Lazard Ltd., Class A | 11,700 | 502,398 | ||||||
Stifel Financial Corp. (a) | 4,510 | 220,404 | ||||||
|
| |||||||
| 2,434,249 | ||||||||
Chemicals — 3.5% | ||||||||
Albemarle Corp. | 3,859 | 420,284 | ||||||
Ashland Global Holdings, Inc. | 5,900 | 728,650 | ||||||
CF Industries Holdings, Inc. | 27,540 | 736,420 | ||||||
FMC Corp. | 9,560 | 700,079 | ||||||
Methanex Corp. | 6,950 | 319,005 | ||||||
Westlake Chemical Corp. | 13,570 | 844,733 | ||||||
|
| |||||||
| 3,749,171 | ||||||||
Commercial Services & Supplies — 1.2% | ||||||||
Clean Harbors, Inc. (a) | 22,700 | 1,319,097 | ||||||
Communications Equipment — 1.6% | ||||||||
Ciena Corp. (a) | 29,200 | 668,972 | ||||||
NetScout Systems, Inc. (a) | 26,769 | 1,007,853 | ||||||
|
| |||||||
| 1,676,825 | ||||||||
Construction & Engineering — 2.8% | ||||||||
AECOM (a) | 41,000 | 1,402,610 | ||||||
Fluor Corp. | 15,400 | 790,328 | ||||||
KBR, Inc. | 59,620 | 837,661 | ||||||
|
| |||||||
| 3,030,599 | ||||||||
Containers & Packaging — 1.5% | �� | |||||||
Owens-Illinois, Inc. (a) | 14,800 | 322,936 | ||||||
Packaging Corp. of America | 3,480 | 343,754 | ||||||
Silgan Holdings, Inc. | 15,520 | 940,822 | ||||||
|
| |||||||
| 1,607,512 | ||||||||
Distributors — 0.7% | ||||||||
LKQ Corp. (a) | 24,991 | 780,719 | ||||||
Diversified Financial Services — 0.8% | ||||||||
Voya Financial, Inc. | 24,130 | 901,979 | ||||||
Electric Utilities — 3.0% | ||||||||
Hawaiian Electric Industries, Inc. | 24,500 | 821,240 | ||||||
OGE Energy Corp. | 47,230 | 1,642,659 | ||||||
PNM Resources, Inc. | 19,300 | 718,925 | ||||||
|
| |||||||
| 3,182,824 | ||||||||
| Common Stocks | Shares | Value | ||||||
Electrical Equipment — 1.4% | ||||||||
AMETEK, Inc. | 26,565 | $ | 1,519,518 | |||||
Electronic Equipment, Instruments & Components — 5.0% |
| |||||||
Avnet, Inc. | 30,300 | 1,172,307 | ||||||
Flex Ltd. (a) | 48,850 | 755,221 | ||||||
National Instruments Corp. | 34,890 | 1,218,010 | ||||||
Tech Data Corp. (a) | 13,500 | 1,291,275 | ||||||
VeriFone Systems, Inc. (a)(b) | 49,990 | 926,815 | ||||||
|
| |||||||
| 5,363,628 | ||||||||
Energy Equipment & Services — 1.9% | ||||||||
Dril-Quip, Inc. (a)(b) | 10,360 | 534,058 | ||||||
Ensco PLC, Class A | 38,800 | 306,132 | ||||||
Oceaneering International, Inc. | 31,290 | 825,743 | ||||||
Patterson-UTI Energy, Inc. | 15,020 | 325,108 | ||||||
|
| |||||||
| 1,991,041 | ||||||||
Equity Real Estate Investment Trusts (REITs) — 7.6% | ||||||||
Highwoods Properties, Inc. | 28,148 | 1,432,170 | ||||||
LTC Properties, Inc. | 30,093 | 1,439,649 | ||||||
Outfront Media, Inc. | 55,542 | 1,452,979 | ||||||
Pebblebrook Hotel Trust (b) | 40,551 | 1,206,798 | ||||||
Seritage Growth Properties, Class A (b) | 30,979 | 1,285,628 | ||||||
Tanger Factory Outlet Centers, Inc. | 41,133 | 1,282,938 | ||||||
|
| |||||||
| 8,100,162 | ||||||||
Food & Staples Retailing — 0.6% | ||||||||
SUPERVALU, Inc. (a) | 153,525 | 629,452 | ||||||
Food Products — 2.3% | ||||||||
Hain Celestial Group, Inc. (a) | 25,260 | 934,367 | ||||||
Pinnacle Foods, Inc. | 7,116 | 413,795 | ||||||
TreeHouse Foods, Inc. (a)(b) | 12,449 | 1,090,532 | ||||||
|
| |||||||
| 2,438,694 | ||||||||
Gas Utilities — 2.8% | ||||||||
National Fuel Gas Co. | 15,130 | 837,899 | ||||||
UGI Corp. | 30,600 | 1,534,896 | ||||||
WGL Holdings, Inc. | 7,800 | 643,188 | ||||||
|
| |||||||
| 3,015,983 | ||||||||
Health Care Equipment & Supplies ��� 1.8% | ||||||||
Halyard Health, Inc. (a) | 48,200 | 1,903,900 | ||||||
Health Care Providers & Services — 4.0% | ||||||||
LifePoint Health, Inc. (a) | 25,377 | 1,577,180 | ||||||
Owens & Minor, Inc. | 49,244 | 1,706,305 | ||||||
Patterson Cos., Inc. | 21,270 | 946,302 | ||||||
|
| |||||||
| 4,229,787 | ||||||||
Hotels, Restaurants & Leisure — 1.3% | ||||||||
Hyatt Hotels Corp., Class A (a) | 24,716 | 1,371,738 | ||||||
Household Durables — 0.5% | ||||||||
Mohawk Industries, Inc. (a) | 2,349 | 551,522 | ||||||
Independent Power and Renewable Electricity Producers — 0.7% |
| |||||||
NRG Energy, Inc. | 44,200 | 746,980 | ||||||
Insurance — 8.1% | ||||||||
Alleghany Corp. (a) | 2,093 | 1,278,195 | ||||||
American Financial Group, Inc. | 13,700 | 1,333,147 | ||||||
Arch Capital Group Ltd. (a) | 3,480 | 337,456 | ||||||
Arthur J Gallagher & Co. | 12,410 | 692,602 | ||||||
Genworth Financial, Inc., Class A (a) | 40,254 | 162,626 | ||||||
Mercury General Corp. | 10,100 | 621,049 | ||||||
Reinsurance Group of America, Inc. | 9,400 | 1,175,376 | ||||||
RenaissanceRe Holdings Ltd. | 3,100 | 440,727 | ||||||
Unum Group | 9,805 | 454,266 | ||||||
See Notes to Financial Statements.
| MANAGED ACCOUNT SERIES | APRIL 30, 2017 | 25 |
| Schedule of Investments (continued) | Mid Cap Value Opportunities Portfolio | |||
| Common Stocks | Shares | Value | ||||||
Insurance (continued) | ||||||||
W.R. Berkley Corp. | 18,150 | $ | 1,233,837 | |||||
XL Group Ltd. | 20,700 | 866,295 | ||||||
|
| |||||||
| 8,595,576 | ||||||||
IT Services — 2.7% | ||||||||
DXC Technology Co. (a) | 17,600 | 1,325,984 | ||||||
Leidos Holdings, Inc. | 28,900 | 1,521,874 | ||||||
|
| |||||||
| 2,847,858 | ||||||||
Life Sciences Tools & Services — 0.7% | ||||||||
VWR Corp. (a)(b) | 27,348 | 772,854 | ||||||
Machinery — 3.9% | ||||||||
Allison Transmission Holdings, Inc. | 26,570 | 1,027,728 | ||||||
Colfax Corp. (a) | 21,040 | 851,489 | ||||||
Kennametal, Inc. | 16,240 | 675,259 | ||||||
Wabtec Corp. (b) | 19,660 | 1,649,277 | ||||||
|
| |||||||
| 4,203,753 | ||||||||
Marine — 0.9% | ||||||||
Kirby Corp. (a)(b) | 13,260 | 936,156 | ||||||
Media — 2.0% | ||||||||
Cable One, Inc. | 2,093 | 1,427,133 | ||||||
Scripps Networks Interactive, Inc., Class A | 8,880 | 663,514 | ||||||
|
| |||||||
| 2,090,647 | ||||||||
Metals & Mining — 1.6% | ||||||||
Carpenter Technology Corp. | 15,110 | 613,466 | ||||||
Steel Dynamics, Inc. | 15,430 | 557,640 | ||||||
United States Steel Corp. | 21,760 | 485,683 | ||||||
|
| |||||||
| 1,656,789 | ||||||||
Multiline Retail — 1.6% | ||||||||
Dollar Tree, Inc. (a) | 9,857 | 815,864 | ||||||
Nordstrom, Inc. | 17,874 | 862,778 | ||||||
|
| |||||||
| 1,678,642 | ||||||||
Multi-Utilities — 1.9% | ||||||||
Black Hills Corp. | 15,510 | 1,054,990 | ||||||
Vectren Corp. | 16,500 | 980,430 | ||||||
|
| |||||||
| 2,035,420 | ||||||||
Oil, Gas & Consumable Fuels — 3.4% | ||||||||
Concho Resources, Inc. (a) | 4,015 | 508,540 | ||||||
Energen Corp. (a) | 14,835 | 771,272 | ||||||
HollyFrontier Corp. | 40,480 | 1,139,107 | ||||||
SM Energy Co. | 10,940 | 247,135 | ||||||
Whiting Petroleum Corp. (a) | 36,150 | 300,045 | ||||||
World Fuel Services Corp. | 19,220 | 707,873 | ||||||
|
| |||||||
| 3,673,972 | ||||||||
Paper & Forest Products — 0.8% | ||||||||
Domtar Corp. | 20,300 | 804,895 | ||||||
Personal Products — 0.3% | ||||||||
Edgewell Personal Care Co. (a) | 4,760 | 340,292 | ||||||
Pharmaceuticals — 1.4% | ||||||||
Jazz Pharmaceuticals PLC (a) | 9,028 | 1,437,980 | ||||||
Real Estate Management & Development — 1.5% | ||||||||
Alexander & Baldwin, Inc. | 34,463 | 1,585,643 | ||||||
Road & Rail — 0.6% | ||||||||
Genesee & Wyoming, Inc., Class A (a)(b) | 10,180 | 689,797 | ||||||
Semiconductors & Semiconductor Equipment — 2.0% | ||||||||
Cypress Semiconductor Corp. | 59,510 | 833,735 | ||||||
ON Semiconductor Corp. (a)(b) | 49,150 | 696,947 | ||||||
Skyworks Solutions, Inc. | 5,390 | 537,599 | ||||||
| Common Stocks | Shares | Value | ||||||
Semiconductors & Semiconductor Equipment (continued) |
| |||||||
Teradyne, Inc. | 1,700 | $ | 59,959 | |||||
|
| |||||||
| 2,128,240 | ||||||||
Software — 1.5% | ||||||||
PTC, Inc. (a) | 17,563 | 949,280 | ||||||
Verint Systems, Inc. (a) | 17,510 | 688,143 | ||||||
|
| |||||||
| 1,637,423 | ||||||||
Specialty Retail — 3.4% | ||||||||
Advance Auto Parts, Inc. | 3,870 | 550,082 | ||||||
Dick’s Sporting Goods, Inc. | 20,820 | 1,052,451 | ||||||
Foot Locker, Inc. | 12,681 | 980,749 | ||||||
Staples, Inc. | 57,905 | 565,732 | ||||||
Tiffany & Co. | 5,120 | 469,248 | ||||||
|
| |||||||
| 3,618,262 | ||||||||
Technology Hardware, Storage & Peripherals — 1.0% |
| |||||||
Diebold Nixdorf, Inc. | 38,850 | 1,095,570 | ||||||
Textiles, Apparel & Luxury Goods — 2.2% | ||||||||
Coach, Inc. | 23,758 | 935,828 | ||||||
PVH Corp. | 3,150 | 318,244 | ||||||
Ralph Lauren Corp. | 4,680 | 377,770 | ||||||
Skechers U.S.A., Inc., Class A (a) | 29,910 | 755,227 | ||||||
|
| |||||||
| 2,387,069 | ||||||||
Thrifts & Mortgage Finance — 0.4% | ||||||||
New York Community Bancorp, Inc. | 32,530 | 432,324 | ||||||
Trading Companies & Distributors — 0.6% | ||||||||
MSC Industrial Direct Co., Inc., Class A | 6,620 | 592,689 | ||||||
Total Long-Term Investments (Cost — $91,549,476) — 99.2% | 105,679,202 | |||||||
| Short-Term Securities | ||||||||
Money Market Funds — 7.3% | ||||||||
SL Liquidity Series LLC, Money Market Series, 1.09% (c)(d)(e) | 7,771,403 | 7,772,958 | ||||||
Par (000) | ||||||||
Time Deposits — 1.2% | ||||||||
Deutsche Bank, Frankfurt, 0.92%, 5/01/17 | $ | 1,324 | 1,324,130 | |||||
Total Short-Term Securities (Cost — $9,096,229) — 8.5% | 9,097,088 | |||||||
Total Investments (Cost — $100,645,705) — 107.7% |
| 114,776,290 | ||||||
Liabilities in Excess of Other Assets — (7.7)% | (8,181,898 | ) | ||||||
|
| |||||||
Net Assets — 100.0% | $ | 106,594,392 | ||||||
|
| |||||||
See Notes to Financial Statements.
| 26 | MANAGED ACCOUNT SERIES | APRIL 30, 2017 |
| Schedule of Investments (concluded) | Mid Cap Value Opportunities Portfolio |
| Notes to Schedule of Investments |
| (a) | Non-income producing security. |
| (b) | Security, or a portion of the security, is on loan. |
| (c) | Security was purchased with the cash collateral from loaned securities. |
| (d) | During the year ended April 30, 2017, investments in issuers considered to be an affiliate of the Fund for purposes of Section 2(a)(3) of the Investment Company Act of 1940, as amended, were as follows: |
| Affiliate | Shares Held at April 30, 2016 | Net Activity | Shares Held at April 30, 2017 | Value at April 30, 2017 | Income | Realized Gain | Change in Unrealized Appreciation | |||||||||||||||||||||
SL Liquidity Series, LLC, Money Market Series | 4,081,846 | 3,689,557 | 7,771,403 | $7,772,958 | $23,6191 | $246 | $859 | |||||||||||||||||||||
| 1 | Represents securities lending income earned from the reinvestment of cash collateral from loaned securities, net of fees and collateral investment expenses, and other payments to and from borrowers of securities. |
| (e) | Current yield as of period end. |
| • | For Fund compliance purposes, the Fund’s industry classifications refer to one or more of the industry sub-classifications used by one or more widely recognized market indexes or rating group indexes, and/or as defined by the investment adviser. These definitions may not apply for purposes of this report, which may combine such industry sub-classifications for reporting ease. |
| Fair Value Hierarchy as of Period End |
Various inputs are used in determining the fair value of investments. For information about the Fund’s policy regarding valuation of investments, refer to the Notes to Financial Statements.
The following table summarizes the Fund’s investments categorized in the disclosure hierarchy:
| Level 1 | Level 2 | Level 3 | Total | |||||||||||||
Assets: | ||||||||||||||||
Investments: | ||||||||||||||||
Long-Term Investments1 | $ | 105,679,202 | — | — | $ | 105,679,202 | ||||||||||
Short-Term Securities | — | $ | 1,324,130 | — | 1,324,130 | |||||||||||
|
| |||||||||||||||
Subtotal | $ | 105,679,202 | $ | 1,324,130 | — | $ | 107,003,332 | |||||||||
|
| |||||||||||||||
Investments Valued at NAV2 | 7,772,958 | |||||||||||||||
|
| |||||||||||||||
Total Investments | $ | 114,776,290 | ||||||||||||||
|
| |||||||||||||||
| 1 | See above Schedule of Investments for values in each industry. |
| 2 | As of April 30, 2017, certain investments of the Fund were fair valued using NAV per share as no quoted market value is available and therefore have been excluded from the fair value hierarchy. |
During the year ended April 30, 2017, there were no transfers between levels.
See Notes to Financial Statements.
| MANAGED ACCOUNT SERIES | APRIL 30, 2017 | 27 |
| Statements of Assets and Liabilities |
| April 30, 2017 | BlackRock U.S. Mortgage Portfolio | Global SmallCap | Mid Cap Value Opportunities Portfolio | |||||||||
| Assets | ||||||||||||
Investments at value — unaffiliated1,2 | $ | 460,591,811 | $ | 116,015,582 | $ | 107,003,332 | ||||||
Investments at value — affiliated3 | — | 11,419,065 | 7,772,958 | |||||||||
Cash | 2,918,571 | — | — | |||||||||
Cash pledged: | ||||||||||||
Collateral — OTC derivatives | 410,000 | — | — | |||||||||
Futures contracts | 505,040 | — | — | |||||||||
Centrally cleared swaps | 78,150 | — | — | |||||||||
Receivables: | ||||||||||||
Investments sold — unaffiliated | 37,600 | 1,366,609 | 905,660 | |||||||||
Securities lending income — affiliated | — | 16,326 | 5,152 | |||||||||
TBA sale commitments | 86,688,364 | — | — | |||||||||
Capital shares sold | 843,089 | 15,058 | 9,954 | |||||||||
Dividends — unaffiliated | — | 337,016 | 39,092 | |||||||||
Interest — unaffiliated | 1,029,642 | — | — | |||||||||
From the Manager | 39,196 | 64,835 | 36,884 | |||||||||
Principal paydowns | 27,640 | — | — | |||||||||
Variation margin on futures contracts | 10,137 | — | — | |||||||||
Swap premiums paid | 629,808 | — | — | |||||||||
Unrealized appreciation on OTC swaps | 94,087 | — | — | |||||||||
Prepaid expenses | 370 | 7,487 | 10,481 | |||||||||
Other assets | 2,041 | — | — | |||||||||
|
| |||||||||||
Total assets | 553,905,546 | 129,241,978 | 115,783,513 | |||||||||
|
| |||||||||||
| Liabilities | ||||||||||||
Foreign bank overdraft4 | — | 266,974 | — | |||||||||
Cash received: | ||||||||||||
Collateral — OTC derivatives | 600,000 | — | — | |||||||||
Collateral — TBA commitments | 35,000 | — | — | |||||||||
Cash collateral on securities loaned at value | — | 11,416,969 | 7,771,853 | |||||||||
Options written at value5 | 328,857 | — | — | |||||||||
TBA sale commitments at value6 | 86,866,424 | — | — | |||||||||
Reverse repurchase agreements | 1,926,924 | — | — | |||||||||
Payables: | ||||||||||||
Investments purchased — unaffiliated | 165,806,615 | 1,077,163 | 1,192,676 | |||||||||
Capital shares redeemed | 1,318,872 | 158,191 | 145,067 | |||||||||
Deferred foreign capital gain tax | — | 38,751 | — | |||||||||
Income dividends | 203,032 | — | — | |||||||||
Investment advisory fees | 90,120 | — | — | |||||||||
Officer’s and Trustees’ fees | 1,695 | 1,513 | 1,532 | |||||||||
Other accrued expenses | 211,253 | 113,679 | 77,406 | |||||||||
Other affiliates | 1,829 | 650 | 587 | |||||||||
Service and distribution fees | 28,417 | — | — | |||||||||
Variation margin on futures contracts | 21,017 | — | — | |||||||||
Variation margin on centrally cleared swaps | 1,020 | — | — | |||||||||
Swap premiums received | 781,489 | — | — | |||||||||
Unrealized depreciation on OTC swaps | 53,164 | — | — | |||||||||
|
| |||||||||||
Total liabilities | 258,275,728 | 13,073,890 | 9,189,121 | |||||||||
|
| |||||||||||
Net Assets | $ | 295,629,818 | $ | 116,168,088 | $ | 106,594,392 | ||||||
|
| |||||||||||
1 Investments at cost — unaffiliated | $ | 458,869,535 | $ | 96,849,485 | $ | 92,873,606 | ||||||
2 Securities loaned at value | — | $ | 10,780,521 | $ | 7,500,806 | |||||||
3 Investments at cost — affiliated | — | $ | 11,417,028 | $ | 7,772,099 | |||||||
4 Foreign bank overdraft at cost | — | $ | 267,307 | — | ||||||||
5 Premiums received | $ | 377,225 | — | — | ||||||||
6 Proceeds from TBA sale commitments | $ | 86,688,364 | — | — | ||||||||
See Notes to Financial Statements.
| 28 | MANAGED ACCOUNT SERIES | APRIL 30, 2017 |
| Statements of Assets and Liabilities (concluded) |
| April 30, 2017 | BlackRock U.S. Mortgage Portfolio | Global SmallCap | Mid Cap Value Opportunities Portfolio | |||||||||
| Net Assets Consist of | ||||||||||||
Paid-in capital | $ | 296,146,967 | $ | 102,128,359 | $ | 86,757,861 | ||||||
Undistributed net investment income | 177,270 | 95,120 | 387,072 | |||||||||
Accumulated net realized gain (loss) | (2,392,859 | ) | (5,184,477 | ) | 5,318,875 | |||||||
Net unrealized appreciation (depreciation) | 1,698,440 | 19,129,086 | 14,130,584 | |||||||||
|
| |||||||||||
Net Assets | $ | 295,629,818 | $ | 116,168,088 | $ | 106,594,392 | ||||||
|
| |||||||||||
Net asset value per share | — | $ | 14.16 | $ | 14.32 | |||||||
|
| |||||||||||
Shares outstanding7 | — | 8,203,471 | 7,441,363 | |||||||||
| Net Asset Value | ||||||||||||
Institutional | ||||||||||||
Net assets | $ | 222,745,069 | — | — | ||||||||
|
| |||||||||||
Shares outstanding7 | 21,600,220 | — | — | |||||||||
|
| |||||||||||
Net asset value | $ | 10.31 | — | — | ||||||||
|
| |||||||||||
Investor A | ||||||||||||
Net assets | $ | 51,429,392 | — | — | ||||||||
|
| |||||||||||
Shares outstanding7 | 4,995,795 | — | — | |||||||||
|
| |||||||||||
Net asset value | $ | 10.29 | — | — | ||||||||
|
| |||||||||||
Investor C | ||||||||||||
Net assets | $ | 21,455,357 | — | — | ||||||||
|
| |||||||||||
Shares outstanding7 | 2,083,924 | — | — | |||||||||
|
| |||||||||||
Net asset value | $ | 10.30 | — | — | ||||||||
|
| |||||||||||
| 7 | Unlimited number of shares authorized, $ 0.01 par value. |
See Notes to Financial Statements.
| MANAGED ACCOUNT SERIES | APRIL 30, 2017 | 29 |
| Statements of Operations |
| Year Ended April 30, 2017 | BlackRock U.S. Mortgage Portfolio | Global SmallCap Portfolio | Mid Cap Value Opportunities Portfolio | |||||||||
| Investment Income | ||||||||||||
Interest — unaffiliated | $ | 8,058,022 | — | — | ||||||||
Dividends — unaffiliated | — | $ | 1,735,416 | $ | 1,620,137 | |||||||
Securities lending — affiliated — net | — | 223,741 | 23,619 | |||||||||
Foreign taxes withheld | — | (64,649 | ) | (3,737 | ) | |||||||
|
| |||||||||||
Total investment income | 8,058,022 | 1,894,508 | 1,640,019 | |||||||||
|
| |||||||||||
| Expenses | ||||||||||||
Investment advisory | 1,263,662 | 977,907 | 694,179 | |||||||||
Service and distribution — class specific | 421,648 | — | — | |||||||||
Transfer agent | — | 35,918 | 34,294 | |||||||||
Transfer agent — class specific | 248,034 | — | — | |||||||||
Professional | 83,587 | 77,616 | 58,372 | |||||||||
Accounting services | 73,841 | 33,303 | 26,104 | |||||||||
Custodian | 71,926 | 138,294 | 23,368 | |||||||||
Printing | 21,868 | 17,777 | 13,577 | |||||||||
Officer and Trustees | 21,211 | 17,803 | 17,740 | |||||||||
Registration | 5,200 | 35,055 | 33,252 | |||||||||
Miscellaneous | 13,968 | 29,150 | 11,624 | |||||||||
|
| |||||||||||
Total expenses excluding interest expense | 2,224,945 | 1,362,823 | 912,510 | |||||||||
Interest expense | 129,224 | — | — | |||||||||
|
| |||||||||||
Total expenses | 2,354,169 | 1,362,823 | 912,510 | |||||||||
Less: | ||||||||||||
Fees waived and/or reimbursed by the Manager | (66,030 | ) | (1,362,100 | ) | (911,787 | ) | ||||||
Transfer agent fees reimbursed — class specific | (216,795 | ) | — | — | ||||||||
|
| |||||||||||
Total expenses after fees waived and/or reimbursed | 2,071,344 | 723 | 723 | |||||||||
|
| |||||||||||
Net investment income | 5,986,678 | 1,893,785 | 1,639,296 | |||||||||
|
| |||||||||||
| Realized and Unrealized Gain (Loss) | ||||||||||||
Net realized gain (loss) from: | ||||||||||||
Investments — affiliated | — | 58 | 246 | |||||||||
Investments — unaffiliated | 668,419 | 9,185,056 | 13,440,990 | |||||||||
Futures contracts | (683,610 | ) | — | — | ||||||||
Foreign currency transactions | — | 21,881 | (15 | ) | ||||||||
Litigation proceeds | 711,681 | 7,050 | 30,872 | |||||||||
Options written | 68,481 | — | — | |||||||||
Swaps | (254,872 | ) | — | — | ||||||||
|
| |||||||||||
| 510,099 | 9,214,045 | 13,472,093 | ||||||||||
|
| |||||||||||
Net change in unrealized appreciation (depreciation) on: | ||||||||||||
Investments — affiliated | — | 2,037 | 859 | |||||||||
Investments — unaffiliated | (1,527,717 | ) | 7,367,8091 | 4,080,335 | ||||||||
Futures contracts | (129,929 | ) | — | — | ||||||||
Foreign currency translations | — | (7,692 | ) | (3 | ) | |||||||
Options written | 48,368 | — | — | |||||||||
Swaps | 127,241 | — | — | |||||||||
|
| |||||||||||
| (1,482,037 | ) | 7,362,154 | 4,081,191 | |||||||||
|
| |||||||||||
Net realized and unrealized gain (loss) | (971,938 | ) | 16,576,199 | 17,553,284 | ||||||||
|
| |||||||||||
Net Increase in Net Assets Resulting from Operations | $ | 5,014,740 | $ | 18,469,984 | $ | 19,192,580 | ||||||
|
| |||||||||||
| 1 | Net of $38,751 foreign capital gain tax. |
See Notes to Financial Statements.
| 30 | MANAGED ACCOUNT SERIES | APRIL 30, 2017 |
| Statements of Changes in Net Assets |
| BlackRock U.S. Mortgage Portfolio | Global SmallCap Portfolio | Mid Cap Value Opportunities Portfolio | ||||||||||||||||||||||||||||||
| Year Ended April 30, | Year Ended April 30, | Year Ended April 30, | ||||||||||||||||||||||||||||||
| Increase (Decrease) in Net Assets: | 2017 | 2016 | 2017 | 2016 | 2017 | 2016 | ||||||||||||||||||||||||||
| Operations | ||||||||||||||||||||||||||||||||
Net investment income | $ | 5,986,678 | $ | 6,327,595 | $ | 1,893,785 | $ | 1,748,166 | $ | 1,639,296 | $ | 2,344,235 | ||||||||||||||||||||
Net realized gain (loss) | 510,099 | 1,294,425 | 9,214,045 | (7,561,794 | ) | 13,472,093 | (473,959 | ) | ||||||||||||||||||||||||
Net change in unrealized appreciation (depreciation) | (1,482,037 | ) | (1,306,647 | ) | 7,362,154 | (16,668,822 | ) | 4,081,191 | (13,838,407 | ) | ||||||||||||||||||||||
|
|
|
|
|
| |||||||||||||||||||||||||||
Net increase (decrease) in net assets resulting from operations | 5,014,740 | 6,315,373 | 18,469,984 | (22,482,450 | ) | 19,192,580 | (11,968,131 | ) | ||||||||||||||||||||||||
|
|
|
|
|
| |||||||||||||||||||||||||||
| Distributions to Shareholders1 | ||||||||||||||||||||||||||||||||
From net investment income | — | — | (2,437,012 | ) | (2,623,858 | ) | (1,658,252 | ) | (2,624,417 | ) | ||||||||||||||||||||||
From net investment income: | ||||||||||||||||||||||||||||||||
Institutional | (6,607,625 | ) | (5,097,219 | ) | — | — | — | — | ||||||||||||||||||||||||
Investor A | (2,038,314 | ) | (1,705,425 | ) | — | — | — | — | ||||||||||||||||||||||||
Investor C | (474,935 | ) | (292,708 | ) | — | — | — | — | ||||||||||||||||||||||||
From net realized gain | — | — | — | (7,180,074 | ) | (137,079 | ) | (17,085,067 | ) | |||||||||||||||||||||||
From net realized gain: | ||||||||||||||||||||||||||||||||
Institutional | — | (1,337,449 | ) | — | — | — | — | |||||||||||||||||||||||||
Investor A | — | (530,774 | ) | — | — | — | — | |||||||||||||||||||||||||
Investor C | — | (137,669 | ) | — | — | — | — | |||||||||||||||||||||||||
|
|
|
|
|
| |||||||||||||||||||||||||||
Decrease in net assets resulting from distributions to shareholders | (9,120,874 | ) | (9,101,244 | ) | (2,437,012 | ) | (9,803,932 | ) | (1,795,331 | ) | (19,709,484 | ) | ||||||||||||||||||||
|
|
|
|
|
| |||||||||||||||||||||||||||
| Capital Share Transactions | ||||||||||||||||||||||||||||||||
Net increase (decrease) in net assets derived from capital share transactions | (5,866,105 | ) | 36,349,062 | (12,893,692 | ) | (30,355,532 | ) | (12,306,072 | ) | (32,749,707 | ) | |||||||||||||||||||||
|
|
|
|
|
| |||||||||||||||||||||||||||
| Net Assets | ||||||||||||||||||||||||||||||||
Total increase (decrease) in net assets | (9,972,239 | ) | 33,563,191 | 3,139,280 | (62,641,914 | ) | 5,091,177 | (64,427,322 | ) | |||||||||||||||||||||||
Beginning of year | 305,602,057 | 272,038,866 | 113,028,808 | 175,670,722 | 101,503,215 | 165,930,537 | ||||||||||||||||||||||||||
|
|
|
|
|
| |||||||||||||||||||||||||||
End of year | $ | 295,629,818 | $ | 305,602,057 | $ | 116,168,088 | $ | 113,028,808 | $ | 106,594,392 | $ | 101,503,215 | ||||||||||||||||||||
|
|
|
|
|
| |||||||||||||||||||||||||||
Undistributed (distributions in excess of) net investment income, end of year | $ | 177,270 | $ | 442,883 | $ | 95,120 | $ | (1,106,884 | ) | $ | 387,072 | $ | 412,887 | |||||||||||||||||||
|
|
|
|
|
| |||||||||||||||||||||||||||
| 1 | Distributions for annual periods determined in accordance with U.S. federal income tax regulations. |
See Notes to Financial Statements.
| MANAGED ACCOUNT SERIES | APRIL 30, 2017 | 31 |
| Financial Highlights | BlackRock U.S. Mortgage Portfolio |
| Institutional | ||||||||||||||||||||
| Year Ended April 30, | ||||||||||||||||||||
| 2017 | 2016 | 2015 | 2014 | 2013 | ||||||||||||||||
| Per Share Operating Performance | ||||||||||||||||||||
Net asset value, beginning of year | $ | 10.44 | $ | 10.55 | $ | 10.24 | $ | 10.37 | $ | 10.31 | ||||||||||
Net investment income1 | 0.21 | 0.24 | 0.23 | 0.24 | 0.20 | |||||||||||||||
Net realized and unrealized gain (loss) | (0.02 | ) | (0.00 | )2 | 0.33 | (0.09 | ) | 0.34 | ||||||||||||
|
| |||||||||||||||||||
Net increase from investment operations | 0.19 | 0.24 | 0.56 | 0.15 | 0.54 | |||||||||||||||
|
| |||||||||||||||||||
Distributions:3 | ||||||||||||||||||||
From net investment income | (0.32 | ) | (0.27 | ) | (0.25 | ) | (0.28 | ) | (0.29 | ) | ||||||||||
From return of capital | — | — | — | (0.00 | )2 | (0.05 | ) | |||||||||||||
From net realized gain | — | (0.08 | ) | — | — | (0.14 | ) | |||||||||||||
|
| |||||||||||||||||||
Total distributions | (0.32 | ) | (0.35 | ) | (0.25 | ) | (0.28 | ) | (0.48 | ) | ||||||||||
|
| |||||||||||||||||||
Net asset value, end of year | $ | 10.31 | $ | 10.44 | $ | 10.55 | $ | 10.24 | $ | 10.37 | ||||||||||
|
| |||||||||||||||||||
| Total Return4 | ||||||||||||||||||||
Based on net asset value | 1.80 | %5 | 2.27 | % | 5.50 | % | 1.53 | % | 5.39 | % | ||||||||||
|
| |||||||||||||||||||
| Ratios to Average Net Assets | ||||||||||||||||||||
Total expenses | 0.59 | % | 0.62 | % | 0.65 | % | 0.69 | % | 0.63 | % | ||||||||||
|
| |||||||||||||||||||
Total expenses after fees waived and/or reimbursed and paid indirectly | 0.51 | % | 0.55 | % | 0.65 | % | 0.68 | % | 0.63 | % | ||||||||||
|
| |||||||||||||||||||
Total expenses after fees waived and/or reimbursed and paid indirectly and excluding interest expense | 0.47 | % | 0.51 | % | 0.65 | % | 0.68 | % | 0.61 | % | ||||||||||
|
| |||||||||||||||||||
Net investment income | 2.04 | % | 2.31 | % | 2.18 | % | 2.43 | % | 1.93 | % | ||||||||||
|
| |||||||||||||||||||
| Supplemental Data | ||||||||||||||||||||
Net assets, end of year (000) | $ | 222,745 | $ | 206,193 | $ | 195,169 | $ | 136,036 | $ | 204,546 | ||||||||||
|
| |||||||||||||||||||
Portfolio turnover rate6 | 1,502 | % | 2,669 | % | 1,710 | % | 1,809 | % | 3,166 | % | ||||||||||
|
| |||||||||||||||||||
| 1 | Based on average shares outstanding. |
| 2 | Amount is greater than $(0.005) per share. |
| 3 | Distributions for annual periods determined in accordance with U.S. federal income tax regulations. |
| 4 | Where applicable, assumes the reinvestment of distributions. |
| 5 | Includes payment received from a settlement of litigation, which impacted the Fund’s total return. Excluding the payment from a settlement of litigation, the Fund’s total return would have been 1.61%. |
| 6 | Includes mortgage dollar roll transactions. Additional information regarding portfolio turnover rate is as follows: |
| ||||||||||||||||||||
| Year Ended April 30, | ||||||||||||||||||||
| 2017 | 2016 | 2015 | 2014 | 2013 | ||||||||||||||||
| ||||||||||||||||||||
Portfolio turnover rate (excluding mortgage dollar roll transactions) | 887 | % | 2,104 | % | 1,062 | % | 1,150 | % | 2,169% | |||||||||||
| ||||||||||||||||||||
See Notes to Financial Statements.
| 32 | MANAGED ACCOUNT SERIES | APRIL 30, 2017 |
| Financial Highlights (continued) | BlackRock U.S. Mortgage Portfolio |
| Investor A | ||||||||||||||||||||
| Year Ended April 30, | ||||||||||||||||||||
| 2017 | 2016 | 2015 | 2014 | 2013 | ||||||||||||||||
| Per Share Operating Performance | ||||||||||||||||||||
Net asset value, beginning of year | $ | 10.43 | $ | 10.53 | $ | 10.22 | $ | 10.35 | $ | 10.29 | ||||||||||
|
| |||||||||||||||||||
Net investment income1 | 0.18 | 0.21 | 0.20 | 0.22 | 0.14 | |||||||||||||||
Net realized and unrealized gain (loss) | (0.03 | ) | 0.01 | 0.33 | (0.10 | ) | 0.37 | |||||||||||||
|
| |||||||||||||||||||
Net increase from investment operations | 0.15 | 0.22 | 0.53 | 0.12 | 0.51 | |||||||||||||||
|
| |||||||||||||||||||
Distributions:2 | ||||||||||||||||||||
From net investment income | (0.29 | ) | (0.24 | ) | (0.22 | ) | (0.25 | ) | (0.27 | ) | ||||||||||
From return of capital | — | — | — | (0.00 | )3 | (0.04 | ) | |||||||||||||
From net realized gain | — | (0.08 | ) | — | — | (0.14 | ) | |||||||||||||
|
| |||||||||||||||||||
Total distributions | (0.29 | ) | (0.32 | ) | (0.22 | ) | (0.25 | ) | (0.45 | ) | ||||||||||
|
| |||||||||||||||||||
Net asset value, end of year | $ | 10.29 | $ | 10.43 | $ | 10.53 | $ | 10.22 | $ | 10.35 | ||||||||||
|
| |||||||||||||||||||
| Total Return4 | ||||||||||||||||||||
Based on net asset value | 1.43 | %5 | 2.06 | % | 5.22 | % | 1.28 | % | 5.08 | % | ||||||||||
|
| |||||||||||||||||||
| Ratios to Average Net Assets | ||||||||||||||||||||
Total expenses | 0.91 | % | 0.94 | % | 0.95 | % | 1.05 | % | 0.91 | % | ||||||||||
|
| |||||||||||||||||||
Total expenses after fees waived and/or reimbursed and paid indirectly | 0.79 | % | 0.85 | % | 0.92 | % | 0.94 | % | 0.91 | % | ||||||||||
|
| |||||||||||||||||||
Total expenses after fees waived and/or reimbursed and paid indirectly and excluding interest expense | 0.75 | % | 0.81 | % | 0.91 | % | 0.93 | % | 0.89 | % | ||||||||||
|
| |||||||||||||||||||
Net investment income | 1.75 | % | 2.04 | % | 1.88 | % | 2.22 | % | 1.32 | % | ||||||||||
|
| |||||||||||||||||||
| Supplemental Data | ||||||||||||||||||||
Net assets, end of year (000) | $ | 51,429 | $ | 77,652 | $ | 62,677 | $ | 28,262 | $ | 39,392 | ||||||||||
|
| |||||||||||||||||||
Portfolio turnover rate6 | 1,502 | % | 2,669 | % | 1,710 | % | 1,809 | % | 3,166 | % | ||||||||||
|
| |||||||||||||||||||
| 1 | Based on average shares outstanding. |
| 2 | Distributions for annual periods determined in accordance with U.S. federal income tax regulations. |
| 3 | Amount is greater than $(0.005) per share. |
| 4 | Where applicable, excludes the effects of any sales charges and assumes the reinvestment of distributions. |
| 5 | Includes payment received from a settlement of litigation, which impacted the Fund’s total return. Excluding the payment from a settlement of litigation, the Fund’s total return would have been 1.23%. |
| 6 | Includes mortgage dollar roll transactions. Additional information regarding portfolio turnover rate is as follows: |
| ||||||||||||||||||||
| Year Ended April 30, | ||||||||||||||||||||
| 2017 | 2016 | 2015 | 2014 | 2013 | ||||||||||||||||
| ||||||||||||||||||||
Portfolio turnover rate (excluding mortgage dollar roll transactions) | 887 | % | 2,104 | % | 1,062 | % | 1,150 | % | 2,169% | |||||||||||
| ||||||||||||||||||||
See Notes to Financial Statements.
| MANAGED ACCOUNT SERIES | APRIL 30, 2017 | 33 |
| Financial Highlights (concluded) | BlackRock U.S. Mortgage Portfolio |
| Investor C | ||||||||||||||||||||
| Year Ended April 30, | ||||||||||||||||||||
| 2017 | 2016 | 2015 | 2014 | 2013 | ||||||||||||||||
| Per Share Operating Performance | ||||||||||||||||||||
Net asset value, beginning of year | $ | 10.43 | $ | 10.53 | $ | 10.22 | $ | 10.35 | $ | 10.29 | ||||||||||
|
| |||||||||||||||||||
Net investment income1 | 0.10 | 0.13 | 0.12 | 0.15 | 0.06 | |||||||||||||||
Net realized and unrealized gain (loss) | (0.02 | ) | 0.01 | 0.33 | (0.10 | ) | 0.37 | |||||||||||||
|
| |||||||||||||||||||
Net increase from investment operations | 0.08 | 0.14 | 0.45 | 0.05 | 0.43 | |||||||||||||||
|
| |||||||||||||||||||
Distributions:2 | ||||||||||||||||||||
From net investment income | (0.21 | ) | (0.16 | ) | (0.14 | ) | (0.18 | ) | (0.20 | ) | ||||||||||
From return of capital | — | — | — | (0.00 | )3 | (0.03 | ) | |||||||||||||
From net realized gain | — | (0.08 | ) | — | — | (0.14 | ) | |||||||||||||
|
| |||||||||||||||||||
Total distributions | (0.21 | ) | (0.24 | ) | (0.14 | ) | (0.18 | ) | (0.37 | ) | ||||||||||
|
| |||||||||||||||||||
Net asset value, end of year | $ | 10.30 | $ | 10.43 | $ | 10.53 | $ | 10.22 | $ | 10.35 | ||||||||||
|
| |||||||||||||||||||
| Total Return4 | ||||||||||||||||||||
Based on net asset value | 0.77 | %5 | 1.30 | % | 4.44 | % | 0.52 | % | 4.31 | % | ||||||||||
|
| |||||||||||||||||||
| Ratios to Average Net Assets | ||||||||||||||||||||
Total expenses | 1.64 | % | 1.66 | % | 1.69 | % | 1.84 | % | 1.63 | % | ||||||||||
|
| |||||||||||||||||||
Total expenses after fees waived and/or reimbursed and paid indirectly | 1.54 | % | 1.60 | % | 1.66 | % | 1.68 | % | 1.63 | % | ||||||||||
|
| |||||||||||||||||||
Total expenses after fees waived and/or reimbursed and paid indirectly and excluding interest expense | 1.50 | % | 1.56 | % | 1.65 | % | 1.67 | % | 1.61 | % | ||||||||||
|
| |||||||||||||||||||
Net investment income | 1.00 | % | 1.29 | % | 1.17 | % | 1.46 | % | 0.62 | % | ||||||||||
|
| |||||||||||||||||||
| Supplemental Data | ||||||||||||||||||||
Net assets, end of year (000) | $ | 21,455 | $ | 21,757 | $ | 14,193 | $ | 7,196 | $ | 8,476 | ||||||||||
|
| |||||||||||||||||||
Portfolio turnover rate6 | 1,502 | % | 2,669 | % | 1,710 | % | 1,809 | % | 3,166 | % | ||||||||||
|
| |||||||||||||||||||
| 1 | Based on average shares outstanding. |
| 2 | Distributions for annual periods determined in accordance with U.S. federal income tax regulations. |
| 3 | Amount is greater than $(0.005) per share. |
| 4 | Where applicable, excludes the effects of any sales charges and assumes the reinvestment of distributions. |
| 5 | Includes payment received from a settlement of litigation, which impacted the Fund’s total return. Excluding the payment from a settlement of litigation, the Fund’s total return would have been 0.58%. |
| 6 | Includes mortgage dollar roll transactions. Additional information regarding portfolio turnover rate is as follows: |
| ||||||||||||||||||||
| Year Ended April 30, | ||||||||||||||||||||
| 2017 | 2016 | 2015 | 2014 | 2013 | ||||||||||||||||
| ||||||||||||||||||||
Portfolio turnover rate (excluding mortgage dollar roll transactions) | 887 | % | 2,104 | % | 1,062 | % | 1,150 | % | 2,169% | |||||||||||
| ||||||||||||||||||||
See Notes to Financial Statements.
| 34 | MANAGED ACCOUNT SERIES | APRIL 30, 2017 |
| Financial Highlights | Global SmallCap Portfolio |
| Year Ended April 30, | ||||||||||||||||||||
| 2017 | 2016 | 2015 | 2014 | 2013 | ||||||||||||||||
| Per Share Operating Performance | ||||||||||||||||||||
Net asset value, beginning of year | $ | 12.32 | $ | 14.49 | $ | 16.29 | $ | 14.09 | $ | 12.66 | ||||||||||
|
| |||||||||||||||||||
Net investment income1 | 0.22 | 0.15 | 0.22 | 0.21 | 0.20 | |||||||||||||||
Net realized and unrealized gain (loss) | 1.90 | (1.53 | ) | 0.40 | 3.58 | 1.66 | ||||||||||||||
|
| |||||||||||||||||||
Net increase (decrease) from investment operations | 2.12 | (1.38 | ) | 0.62 | 3.79 | 1.86 | ||||||||||||||
|
| |||||||||||||||||||
Distributions:2 | ||||||||||||||||||||
From net investment income | (0.28 | ) | (0.21 | ) | (0.03 | ) | (0.39 | ) | (0.43 | ) | ||||||||||
From net realized gain | — | (0.58 | ) | (2.39 | ) | (1.20 | ) | — | ||||||||||||
|
| |||||||||||||||||||
Total distributions | (0.28 | ) | (0.79 | ) | (2.42 | ) | (1.59 | ) | (0.43 | ) | ||||||||||
|
| |||||||||||||||||||
Net asset value, end of year | $ | 14.16 | $ | 12.32 | $ | 14.49 | $ | 16.29 | $ | 14.09 | ||||||||||
|
| |||||||||||||||||||
| Total Return3 | ||||||||||||||||||||
Based on net asset value | 17.33 | %4 | (9.86 | )% | 4.48 | % | 27.71 | % | 15.30 | % | ||||||||||
|
| |||||||||||||||||||
| Ratios to Average Net Assets | ||||||||||||||||||||
Total expenses | 1.18 | % | 1.14 | % | 1.07 | % | 1.08 | % | 1.07 | % | ||||||||||
|
| |||||||||||||||||||
Total expenses after fees waived and/or reimbursed | 0.00 | % | 0.00 | % | 0.00 | % | 0.00 | % | 0.00 | % | ||||||||||
|
| |||||||||||||||||||
Net investment income | 1.65 | % | 1.17 | % | 1.46 | % | 1.35 | % | 1.60 | % | ||||||||||
|
| |||||||||||||||||||
| Supplemental Data | ||||||||||||||||||||
Net assets, end of year (000) | $ | 116,168 | $ | 113,029 | $ | 175,671 | $ | 171,594 | $ | 144,493 | ||||||||||
|
| |||||||||||||||||||
Portfolio turnover rate | 69 | % | 86 | % | 91 | % | 81 | % | 70 | % | ||||||||||
|
| |||||||||||||||||||
| 1 | Based on average shares outstanding. |
| 2 | Distributions for annual periods determined in accordance with U.S. federal income tax regulations. |
| 3 | Where applicable, assumes the reinvestment of distributions. |
| 4 | Includes proceeds received from a settlement of litigation, which had no impact on the Fund’s total return. |
See Notes to Financial Statements.
| MANAGED ACCOUNT SERIES | APRIL 30, 2017 | 35 |
| Financial Highlights | Mid Cap Value Opportunities Portfolio |
| Year Ended April 30, | ||||||||||||||||||||
| 2017 | 2016 | 2015 | 2014 | 2013 | ||||||||||||||||
| Per Share Operating Performance | ||||||||||||||||||||
Net asset value, beginning of year | $ | 12.20 | $ | 14.27 | $ | 15.83 | $ | 14.10 | $ | 12.11 | ||||||||||
|
| |||||||||||||||||||
Net investment income1 | 0.21 | 0.22 | 0.25 | 0.24 | 0.20 | |||||||||||||||
Net realized and unrealized gain (loss) | 2.13 | (0.62 | ) | 0.68 | 2.83 | 1.98 | ||||||||||||||
|
| |||||||||||||||||||
Net increase (decrease) from investment operations | 2.34 | (0.40 | ) | 0.93 | 3.07 | 2.18 | ||||||||||||||
|
| |||||||||||||||||||
Distributions:2 | ||||||||||||||||||||
From net investment income | (0.20 | ) | (0.22 | ) | (0.23 | ) | (0.24 | ) | (0.19 | ) | ||||||||||
From net realized gain | (0.02 | ) | (1.45 | ) | (2.26 | ) | (1.10 | ) | — | |||||||||||
|
| |||||||||||||||||||
Total distributions | (0.22 | ) | (1.67 | ) | (2.49 | ) | (1.34 | ) | (0.19 | ) | ||||||||||
|
| |||||||||||||||||||
Net asset value, end of year | $ | 14.32 | $ | 12.20 | $ | 14.27 | $ | 15.83 | $ | 14.10 | ||||||||||
|
| |||||||||||||||||||
| Total Return3 | ||||||||||||||||||||
Based on net asset value | 19.24 | %4 | (2.62 | )% | 6.58 | % | 22.36 | % | 18.26 | % | ||||||||||
|
| |||||||||||||||||||
| Ratios to Average Net Assets | ||||||||||||||||||||
Total expenses | 0.85 | % | 0.83 | % | 0.81 | % | 0.81 | % | 0.82 | % | ||||||||||
|
| |||||||||||||||||||
Total expenses after fees waived and/or reimbursed | 0.00 | % | 0.00 | % | 0.00 | % | 0.00 | % | 0.00 | % | ||||||||||
|
| |||||||||||||||||||
Net investment income | 1.53 | % | 1.72 | % | 1.66 | % | 1.58 | % | 1.64 | % | ||||||||||
|
| |||||||||||||||||||
| Supplemental Data | ||||||||||||||||||||
Net assets, end of year (000) | $ | 106,594 | $ | 101,503 | $ | 165,931 | $ | 167,656 | $ | 153,741 | ||||||||||
|
| |||||||||||||||||||
Portfolio turnover rate | 82 | % | 91 | % | 83 | % | 61 | % | 57 | % | ||||||||||
|
| |||||||||||||||||||
| 1 | Based on average shares outstanding. |
| 2 | Distributions for annual periods determined in accordance with U.S. federal income tax regulations. |
| 3 | Where applicable, assumes the reinvestment of distributions. |
| 4 | Includes proceeds received from a settlement of litigation, which had no impact on the Fund’s total return. |
See Notes to Financial Statements.
| 36 | MANAGED ACCOUNT SERIES | APRIL 30, 2017 |
| Notes to Financial Statements |
1. Organization:
Managed Account Series (the “Trust”) is registered under the Investment Company Act of 1940, as amended (the “1940 Act”), as an open-end management investment company. The Trust is organized as a Delaware statutory trust. The following are referred to herein collectively as the “Funds” or individually, a “Fund”:
| Fund Name | Herein Referred To As | Diversification Classification | ||
BlackRock U.S. Mortgage Portfolio | BlackRock U.S. Mortgage Portfolio | Diversified | ||
Global SmallCap Portfolio | Global SmallCap Portfolio | Diversified | ||
Mid Cap Value Opportunities Portfolio | Mid Cap Value Opportunities Portfolio | Diversified |
BlackRock U.S. Mortgage Portfolio offers multiple classes of shares. All classes of shares have identical voting, dividend, liquidation and other rights and are subject to the same terms and conditions. Each class bears certain expenses and may have a conversion privilege as outlined below. Investor A and Investor C Shares bear certain expenses related to shareholder servicing of such shares, and Investor C Shares also bear certain expenses related to the distribution of such shares. Institutional Shares are sold only to certain eligible investors. Investor A and Investor C Shares are generally available through financial intermediaries. Each class has exclusive voting rights with respect to matters relating to its shareholder servicing and distribution expenditures. Investors may only purchase shares in Global SmallCap Portfolio and Mid Cap Value Opportunities Portfolio by entering into a wrap-fee program or other managed account. Participants in wrap-fee programs pay a single aggregate fee to the program sponsor for all costs and expenses of the wrap-fee programs including investment advice and portfolio execution.
| Share Class | Initial Sales Charge | CDSC | Conversion Privilege | |||
Institutional Shares | No | No | None | |||
Investor A Shares | Yes | No1 | None | |||
Investor C Shares | No | Yes | None |
| 1 | Investor A Shares may be subject to a contingent deferred sales charge (“CDSC”) for certain redemptions where no initial sales charge was paid at the time of purchase. |
The Funds, together with certain other registered investment companies advised by BlackRock Advisors, LLC (the “Manager”) or its affiliates, are included in a complex of open-end funds referred to as the Equity-Bond Complex.
2. Significant Accounting Policies:
The financial statements are prepared in conformity with accounting principles generally accepted in the United States of America (“U.S. GAAP”), which may require management to make estimates and assumptions that affect the reported amounts of assets and liabilities in the financial statements, disclosure of contingent assets and liabilities at the date of the financial statements and the reported amounts of increases and decreases in net assets from operations during the reporting period. Actual results could differ from those estimates. Each Fund is considered an investment company under U.S. GAAP and follows the accounting and reporting guidance applicable to investment companies. Below is a summary of significant accounting policies:
Investment Transactions and Investment Income: For financial reporting purposes, investment transactions are recorded on the dates the transactions are entered into (the trade dates). Realized gains and losses on investment transactions are determined on the identified cost basis. Dividend income is recorded on the ex-dividend date. Dividends from foreign securities where the ex-dividend date may have passed are subsequently recorded when the Funds are informed of the ex-dividend date. Under the applicable foreign tax laws, a withholding tax at various rates may be imposed on capital gains, dividends and interest. Upon notification from issuers, some of the dividend income received from a real estate investment trust may be redesignated as a reduction of cost of the related investment and/or realized gain. Interest income, including amortization and accretion of premiums and discounts on debt securities, is recognized on the accrual basis. Income, expenses and realized and unrealized gains and losses are allocated daily to each class based on its relative net assets.
Foreign Currency: Each Fund’s books and records are maintained in U.S. dollars. Purchases and sales of investments are recorded at the rates of exchange prevailing on the respective dates of such transactions. Generally, when the U.S. dollar rises in value against a foreign currency, the investments denominated in that currency will lose value; the opposite effect occurs if the U.S. dollar falls in relative value.
Each Fund does not isolate the portion of the results of operations arising as a result of changes in the exchange rates from the changes in the market prices of investments held or sold for financial reporting purposes. Accordingly, the effects of changes in exchange rates on investments are not segregated in the Statements of Operations from the effects of changes in market prices of those investments, but are included as a component of net realized and unrealized gain (loss) from investments. Each Fund reports realized currency gains (losses) on foreign currency related transactions as components of net realized gain (loss) for financial reporting purposes, whereas such components are generally treated as ordinary income for U.S. federal income tax purposes.
Segregation and Collateralization: In cases where a Fund enters into certain investments (e.g., dollar rolls, TBA sale commitments, futures contracts, options written and swaps), or certain borrowings (e.g., reverse repurchase transactions) that would be treated as “senior securities” for 1940 Act purposes, a Fund may segregate or designate on its books and records cash or liquid assets having a market value at least equal to the amount of its
| MANAGED ACCOUNT SERIES | APRIL 30, 2017 | 37 |
| Notes to Financial Statements (continued) |
future obligations under such investments or borrowings. Doing so allows the investment or borrowing to be excluded from treatment as a “senior security.” Furthermore, if required by an exchange or counterparty agreement, the Funds may be required to deliver/deposit cash and/or securities to/with an exchange, or broker-dealer or custodian as collateral for certain investments or obligations.
Distributions: For Global SmallCap Portfolio and Mid Cap Value Opportunities Portfolio, distributions paid by the Funds are recorded on the ex-dividend date. For BlackRock U.S. Mortgage Portfolio, distributions from net investment income are declared daily and paid monthly. Distributions of capital gains are recorded on the ex-dividend date and made at least annually. The character and timing of distributions are determined in accordance with U.S. federal income tax regulations, which may differ from U.S. GAAP.
Recent Accounting Standards: In April 2015, the Financial Accounting Standards Board issued “Disclosures for Investments in Certain Entities that Calculate Net Asset Value (“NAV”) per Share” which eliminates the requirement to categorize investments within the fair value hierarchy when fair value is based on the NAV per share and no quoted market value is available. As of April 30, 2017, certain investments of the Funds were valued using NAV per share as no quoted market value is available and therefore have been excluded from the fair value hierarchy.
In November 2016, the Financial Accounting Standards Board issued Accounting Standards Update “Restricted Cash” which will require entities to include the total of cash, cash equivalents, restricted cash, and restricted cash equivalents in the beginning and ending cash balances in the Statements of Cash Flows. The guidance will be applied retrospectively and is effective for fiscal years beginning after December 15, 2017, and interim periods within those years. Management is evaluating the impact, if any, of this guidance on the Funds’ presentation in the Statements of Cash Flows.
In March 2017, the Financial Accounting Standards Board issued Accounting Standards Update “Premium Amortization of Purchased Callable Debt Securities” which amends the amortization period for certain purchased callable debt securities. Under the new guidance, premium amortization of purchased callable debt securities that have explicit, non-contingent call features and are callable at fixed prices will be amortized to the earliest call date. The guidance will be applied on a modified retrospective basis and is effective for fiscal years, and their interim periods, beginning after December 15, 2018. Management is currently evaluating the impact of this guidance to the Funds.
SEC Reporting Modernization: The Securities and Exchange Commission (“SEC”) adopted new rules and forms and amended other rules to enhance the reporting and disclosure of information by registered investment companies. As part of these changes, the SEC amended Regulation S-X to standardize and enhance disclosures in investment company financial statements. The compliance date for implementing the new or amended rules is August 1, 2017.
Indemnifications: In the normal course of business, a Fund enters into contracts that contain a variety of representations that provide general indemnification. A Fund’s maximum exposure under these arrangements is unknown because it involves future potential claims against a Fund, which cannot be predicted with any certainty.
Other: Expenses directly related to a Fund or its classes are charged to that Fund or the applicable class. Other operating expenses shared by several funds, including other funds managed by the Manager, are prorated among those funds on the basis of relative net assets or other appropriate methods. Expenses directly related to the Funds and other shared expenses prorated to the Funds are allocated daily to each class based on their relative net assets or other appropriate methods.
The Funds have an arrangement with their custodian whereby credits are earned on uninvested cash balances, which could be used to reduce custody fees and/or overdraft charges. The Funds may incur charges on certain uninvested cash balances and overdrafts, subject to certain conditions.
3. Investment Valuation and Fair Value Measurements:
Investment Valuation Policies: The Funds’ investments are valued at fair value (also referred to as “market value” within the financial statements) as of the close of trading on the New York Stock Exchange (“NYSE”) (generally 4:00 p.m., Eastern time) (or if the reporting date falls on a day the NYSE is closed, investments are valued at fair value as of the period end). U.S. GAAP defines fair value as the price the Funds would receive to sell an asset or pay to transfer a liability in an orderly transaction between market participants at the measurement date. The Funds determine the fair values of their financial instruments using various independent dealers or pricing services under policies approved by the Board of Trustees of the Trust (the “Board”). The BlackRock Global Valuation Methodologies Committee (the “Global Valuation Committee”) is the committee formed by management to develop global pricing policies and procedures and to oversee the pricing function for all financial instruments.
Fair Value Inputs and Methodologies: The following methods and inputs are used to establish the fair value of each Fund’s assets and liabilities:
| • | Equity investments traded on a recognized securities exchange are valued at the official closing price each day, if available. For equity investments traded on more than one exchange, the official closing price on the exchange where the stock is primarily traded is used. Equity investments traded on a recognized exchange for which there were no sales on that day may be valued at the last available bid (long positions) or ask (short positions) price. |
| 38 | MANAGED ACCOUNT SERIES | APRIL 30, 2017 |
| Notes to Financial Statements (continued) |
| • | Fixed-income securities for which market quotations are readily available are generally valued using the last available bid prices or current market quotations provided by independent dealers or third party pricing services. Floating rate loan interests are valued at the mean of the bid prices from one or more independent brokers or dealers as obtained from a third party pricing service. Pricing services generally value fixed-income securities assuming orderly transactions of an institutional round lot size, but the Funds may hold or transact in such securities in smaller, odd lot sizes. Odd lots often trade at lower prices than institutional round lots. The pricing services may use matrix pricing or valuation models that utilize certain inputs and assumptions to derive values, including transaction data (e.g., recent representative bids and offers), credit quality information, perceived market movements, news, and other relevant information. Certain fixed-income securities, including asset-backed and mortgage related securities may be valued based on valuation models that consider the estimated cash flows of each tranche of the entity, establish a benchmark yield and develop an estimated tranche specific spread to the benchmark yield based on the unique attributes of the tranche. The amortized cost method of valuation may be used with respect to debt obligations with sixty days or less remaining to maturity unless the Manager determines such method does not represent fair value. |
Generally, trading in foreign instruments is substantially completed each day at various times prior to the close of trading on the NYSE. Occasionally, events affecting the values of such instruments may occur between the foreign market close and the close of trading on the NYSE that may not be reflected in the computation of the Funds’ net assets. Each business day, the Funds use a pricing service to assist with the valuation of certain foreign exchange-traded equity securities and foreign exchange-traded over-the-counter (“OTC”) options (the “Systematic Fair Value Price”). Using current market factors, the Systematic Fair Value Price is designed to value such foreign securities and foreign options at fair value as of the close of trading on the NYSE, which follows the close of the local markets.
| • | Investments in open-end U.S. mutual funds are valued at NAV each business day. |
| • | The Funds value their investment in SL Liquidity Series, LLC, Money Market Series (the “Money Market Series”) at fair value, which is ordinarily based upon their pro rata ownership in the underlying fund’s net assets. The Money Market Series seeks current income consistent with maintaining liquidity and preserving capital. Although the Money Market Series is not registered under the 1940 Act, its investments may follow the parameters of investments by a money market fund that is subject to Rule 2a-7 under the 1940 Act. |
| • | Futures contracts traded on exchanges are valued at their last sale price. |
| • | Securities and other assets and liabilities denominated in foreign currencies are translated into U.S. dollars using exchange rates determined as of the close of trading on the NYSE. Forward foreign currency exchange contracts are valued at the mean between the bid and ask prices and are determined as of the close of trading on the NYSE. Interpolated values are derived when the settlement date of the contract is an interim date for which quotations are not available. |
| • | Exchange-traded options are valued at the mean between the last bid and ask prices at the close of the options market in which the options trade. An exchange-traded option for which there is no mean price is valued at the last bid (long positions) or ask (short positions) price. If no bid or ask price is available, the prior day’s price will be used, unless it is determined that the prior day’s price no longer reflects the fair value of the option. OTC options and options on swaps (“swaptions”) are valued by an independent pricing service using a mathematical model, which incorporates a number of market data factors, such as the trades and prices of the underlying instruments. |
| • | Swap agreements are valued utilizing quotes received daily by the Funds’ pricing service or through brokers, which are derived using daily swap curves and models that incorporate a number of market data factors, such as discounted cash flows, trades and values of the underlying reference instruments. |
| • | To-be-announced (“TBA”) commitments are valued on the basis of last available bid prices or current market quotations provided by pricing services. |
If events (e.g., a company announcement, market volatility or a natural disaster) occur that are expected to materially affect the value of such investments, or in the event that the application of these methods of valuation results in a price for an investment that is deemed not to be representative of the market value of such investment, or if a price is not available, the investment will be valued by the Global Valuation Committee, or its delegate, in accordance with a policy approved by the Board as reflecting fair value (“Fair Valued Investments”). The fair valuation approaches that may be used by the Global Valuation Committee will include Market approach, Income approach and Cost approach. Valuation techniques such as discounted cash flow, use of market comparables and matrix pricing are types of valuation approaches and typically used in determining fair value. When determining the price for Fair Valued Investments, the Global Valuation Committee, or its delegate, seeks to determine the price that each Fund might reasonably expect to receive or pay from the current sale or purchase of that asset or liability in an arm’s-length transaction. Fair value determinations shall be based upon all available factors that the Global Valuation Committee, or its delegate, deems relevant and consistent with the principles of fair value measurement.
The Global Valuation Committee, or its delegate, employs various methods for calibrating valuation approaches for investments where an active market does not exist, including regular due diligence of each Fund’s pricing vendors, regular reviews of key inputs and assumptions, transactional back-testing or disposition analysis to compare unrealized gains and losses to realized gains and losses, reviews of missing or stale prices and large movements in market values and reviews of any market related activity. The pricing of all Fair Valued Investments is subsequently reported to the Board or a
| MANAGED ACCOUNT SERIES | APRIL 30, 2017 | 39 |
| Notes to Financial Statements (continued) |
committee thereof on a quarterly basis. As a result of the inherent uncertainty in valuation of these investments, the fair values may differ from the values that would have been used had an active market existed.
For investments in equity or debt issued by privately-held companies or funds (“Private Company” or collectively, the “Private Companies”) and other Fair Valued Investments, the fair valuation approaches that are used by third party pricing services utilize one or a combination of, but not limited to, the following inputs.
Standard Inputs Generally Considered By Third Party Pricing Services
| ||||
| Market approach | (i) | recent market transactions, including subsequent rounds of financing, in the underlying investment or comparable issuers; | ||
| (ii) | recapitalizations and other transactions across the capital structure; and | |||
| (iii) | market multiples of comparable issuers.
| |||
| Income approach | (i) | future cash flows discounted to present and adjusted as appropriate for liquidity, credit, and/or market risks; | ||
| (ii) | quoted prices for similar investments or assets in active markets; and | |||
(iii) | other risk factors, such as interest rates, yield curves, volatilities, prepayment speeds, loss severities, credit risks, recovery rates, liquidation amounts and/or default rates.
| |||
| Cost approach | (i) | audited or unaudited financial statements, investor communications and financial or operational metrics issued by the Private Company; | ||
| (ii) | changes in the valuation of relevant indices or publicly traded companies comparable to the Private Company; | |||
| (iii) | relevant news and other public sources; and | |||
(iv) | known secondary market transactions in the Private Company’s interests and merger or acquisition activity in companies comparable to the Private Company.
| |||
Investments in series of preferred stock issued by Private Companies are typically valued utilizing Market approach in determining the enterprise value of the company. Such investments often contain rights and preferences that differ from other series of preferred and common stock of the same issuer. Valuation techniques such as an option pricing model (“OPM”), a probability weighted expected return model (“PWERM”) or a hybrid of those techniques are used in allocating enterprise value of the company, as deemed appropriate under the circumstances. The use of OPM and PWERM techniques involve a determination of the exit scenarios of the investment in order to appropriately allocate the enterprise value of the company among the various parts of its capital structure.
The Private Companies are not subject to the public company disclosure, timing, and reporting standards as other investments held by a Fund. Typically, the most recently available information by a Private Company is as of a date that is earlier than the date a Fund is calculating its NAV. This factor may result in a difference between the value of the investment and the price a Fund could receive upon the sale of the investment.
Fair Value Hierarchy: Various inputs are used in determining the fair value of investments and derivative financial instruments. These inputs to valuation techniques are categorized into a fair value hierarchy consisting of three broad levels for financial statement purposes as follows:
| • | Level 1 — unadjusted price quotations in active markets/exchanges for identical assets or liabilities that each Fund has the ability to access |
| • | Level 2 — other observable inputs (including, but not limited to, quoted prices for similar assets or liabilities in markets that are active, quoted prices for identical or similar assets or liabilities in markets that are not active, inputs other than quoted prices that are observable for the assets or liabilities (such as interest rates, yield curves, volatilities, prepayment speeds, loss severities, credit risks and default rates) or other market–corroborated inputs) |
| • | Level 3 — unobservable inputs based on the best information available in the circumstances, to the extent observable inputs are not available (including each Fund’s own assumptions used in determining the fair value of investments and derivative financial instruments) |
The hierarchy gives the highest priority to unadjusted quoted prices in active markets for identical assets or liabilities (Level 1 measurements) and the lowest priority to unobservable inputs (Level 3 measurements). Accordingly, the degree of judgment exercised in determining fair value is greatest for instruments categorized in Level 3. The inputs used to measure fair value may fall into different levels of the fair value hierarchy. In such cases, for disclosure purposes, the fair value hierarchy classification is determined based on the lowest level input that is significant to the fair value measurement in its entirety. Investments classified within Level 3 have significant unobservable inputs used by the Global Valuation Committee in determining the price for Fair Valued Investments. Level 3 investments include equity or debt issued by Private Companies. There may not be a secondary market, and/or there are a limited number of investors. Level 3 investments may also be adjusted to reflect illiquidity and/or non-transferability, with the amount of such discount estimated by the Global Valuation Committee in the absence of market information.
Changes in valuation techniques may result in transfers into or out of an assigned level within the hierarchy. In accordance with each Fund’s policy, transfers between different levels of the fair value hierarchy are deemed to have occurred as of the beginning of the reporting period. The categorization
| 40 | MANAGED ACCOUNT SERIES | APRIL 30, 2017 |
| Notes to Financial Statements (continued) |
of a value determined for investments and derivative financial instruments is based on the pricing transparency of the investments and derivative financial instruments and is not necessarily an indication of the risks associated with investing in those securities.
As of April 30, 2017, certain investments of Global SmallCap Portfolio and Mid Cap Value Opportunities Portfolio were valued using NAV per share as no quoted market value is available and therefore have been excluded from the fair value hierarchy.
4. Securities and Other Investments:
Asset-Backed and Mortgage-Backed Securities: Asset-backed securities are generally issued as pass-through certificates or as debt instruments. Asset-backed securities issued as pass-through certificates represent undivided fractional ownership interests in an underlying pool of assets. Asset-backed securities issued as debt instruments, which are also known as collateralized obligations, are typically issued as the debt of a special purpose entity organized solely for the purpose of owning such assets and issuing such debt. Asset-backed securities are often backed by a pool of assets representing the obligations of a number of different parties. The yield characteristics of certain asset-backed securities may differ from traditional debt securities. One such major difference is that all or a principal part of the obligations may be prepaid at any time because the underlying assets (i.e., loans) may be prepaid at any time. As a result, a decrease in interest rates in the market may result in increases in the level of prepayments as borrowers, particularly mortgagors, refinance and repay their loans. An increased prepayment rate with respect to an asset-backed security will have the effect of shortening the maturity of the security. In addition, a Fund may subsequently have to reinvest the proceeds at lower interest rates. If a Fund has purchased such an asset-backed security at a premium, a faster than anticipated prepayment rate could result in a loss of principal to the extent of the premium paid.
For mortgage pass-through securities (the “Mortgage Assets”) there are a number of important differences among the agencies and instrumentalities of the U.S. Government that issue mortgage-related securities and among the securities that they issue. For example, mortgage-related securities guaranteed by Ginnie Mae are guaranteed as to the timely payment of principal and interest by Ginnie Mae and such guarantee is backed by the full faith and credit of the United States. However, mortgage-related securities issued by Freddie Mac and Fannie Mae, including Freddie Mac and Fannie Mae guaranteed mortgage pass-through certificates, which are solely the obligations of Freddie Mac and Fannie Mae, are not backed by or entitled to the full faith and credit of the United States, but are supported by the right of the issuer to borrow from the U.S. Treasury.
Non-agency mortgage-backed securities are securities issued by non-governmental issuers and have no direct or indirect government guarantees of payment and are subject to various risks. Non-agency mortgage loans are obligations of the borrowers thereunder only and are not typically insured or guaranteed by any other person or entity. The ability of a borrower to repay a loan is dependent upon the income or assets of the borrower. A number of factors, including a general economic downturn, acts of God, terrorism, social unrest and civil disturbances, may impair a borrower’s ability to repay its loans.
Inflation-Indexed Bonds: Inflation-indexed bonds (other than municipal inflation-indexed and certain corporate inflation-indexed bonds) are fixed-income securities whose principal value is periodically adjusted according to the rate of inflation. If the index measuring inflation rises or falls, the principal value of inflation-indexed bonds (other than municipal inflation-indexed and certain corporate inflation-indexed bonds) will be adjusted upward or downward, and consequently the interest payable on these securities (calculated with respect to a larger or smaller principal amount) will be increased or reduced, respectively. Any upward or downward adjustment in the principal amount of an inflation-indexed bond will be included as interest income in the Statements of Operations, even though investors do not receive their principal until maturity. Repayment of the original bond principal upon maturity (as adjusted for inflation) is guaranteed in the case of U.S. Treasury inflation-indexed bonds. For bonds that do not provide a similar guarantee, the adjusted principal value of the bond repaid at maturity may be less than the original principal. With regard to municipal inflation-indexed bonds and certain corporate inflation-indexed bonds, the inflation adjustment is typically reflected in the semi-annual coupon payment. As a result, the principal value of municipal inflation-indexed bonds and such corporate inflation-indexed bonds does not adjust according to the rate of inflation.
Multiple Class Pass-Through Securities: Multiple class pass-through securities, including collateralized mortgage obligations (“CMOs”) and commercial mortgage-backed securities, may be issued by Ginnie Mae, U.S. Government agencies or instrumentalities or by trusts formed by private originators of, or investors in, mortgage loans. In general, CMOs are debt obligations of a legal entity that are collateralized by a pool of residential or commercial mortgage loans or Mortgage Assets. The payments on these are used to make payments on the CMOs or multiple pass-through securities. Multiple class pass-through securities represent direct ownership interests in the Mortgage Assets. Classes of CMOs include interest only (“IOs”), principal only (“POs”), planned amortization classes and targeted amortization classes. IOs and POs are stripped mortgage-backed securities representing interests in a pool of mortgages, the cash flow from which has been separated into interest and principal components. IOs receive the interest portion of the cash flow while POs receive the principal portion. IOs and POs can be extremely volatile in response to changes in interest rates. As interest rates rise and fall, the value of IOs tends to move in the same direction as interest rates. POs perform best when prepayments on the underlying mortgages rise since this increases the rate at which the principal is returned and the yield to maturity on the PO. When payments on mortgages underlying a PO are slower than anticipated, the life of the PO is lengthened and the yield to maturity is reduced. If the underlying Mortgage Assets experience greater than anticipated prepayments of principal, a Fund’s initial investment in the IOs may not fully recoup.
| MANAGED ACCOUNT SERIES | APRIL 30, 2017 | 41 |
| Notes to Financial Statements (continued) |
Stripped Mortgage-Backed Securities: Stripped mortgage-backed securities are typically issued by the U.S. Government, its agencies and instrumentalities. Stripped mortgage-backed securities are usually structured with two classes that receive different proportions of the interest (IOs) and principal (POs) distributions on a pool of Mortgage Assets. Stripped mortgage-backed securities may be privately issued.
Warrants: Warrants entitle a Fund to purchase a specified number of shares of common stock and are non-income producing. The purchase price and number of shares are subject to adjustment under certain conditions until the expiration date of the warrants, if any. If the price of the underlying stock does not rise above the strike price before the warrant expires, the warrant generally expires without any value and a Fund will lose any amount it paid for the warrant. Thus, investments in warrants may involve more risk than investments in common stock. Warrants may trade in the same markets as their underlying stock; however, the price of the warrant does not necessarily move with the price of the underlying stock.
Forward Commitments and When-Issued Delayed Delivery Securities: Certain Funds may purchase securities on a when-issued basis and may purchase or sell securities on a forward commitment basis. Settlement of such transactions normally occurs within a month or more after the purchase or sale commitment is made. A Fund may purchase securities under such conditions with the intention of actually acquiring them, but may enter into a separate agreement to sell the securities before the settlement date. Since the value of securities purchased may fluctuate prior to settlement, a Fund may be required to pay more at settlement than the security is worth. In addition, a Fund is not entitled to any of the interest earned prior to settlement. When purchasing a security on a delayed delivery basis, a Fund assumes the rights and risks of ownership of the security, including the risk of price and yield fluctuations. In the event of default by the counterparty, a Fund’s maximum amount of loss is the unrealized appreciation of unsettled when-issued transactions.
TBA Commitments: TBA commitments are forward agreements for the purchase or sale of mortgage-backed securities for a fixed price, with payment and delivery on an agreed upon future settlement date. The specific securities to be delivered are not identified at the trade date. However, delivered securities must meet specified terms, including issuer, rate and mortgage terms. When entering into TBA commitments, a Fund may take possession of or deliver the underlying mortgage-backed securities but can extend the settlement or roll the transaction. TBA commitments involve a risk of loss if the value of the security to be purchased or sold declines or increases, respectively, prior to settlement date.
In order to better define contractual rights and to secure rights that will help a Fund mitigate its counterparty risk, TBA commitments may be entered into by a Fund under Master Securities Forward Transaction Agreements (each, an “MSFTA”). An MSFTA typically contains, among other things, collateral posting terms and netting provisions in the event of default and/or termination event. The collateral requirements are typically calculated by netting the mark-to-market amount for each transaction under such agreement and comparing that amount to the value of the collateral currently pledged by a Fund and the counterparty. Cash collateral that has been pledged to cover the obligations of a Fund and cash collateral received from the counterparty, if any, is reported separately on the Statements of Assets and Liabilities as cash pledged as collateral for TBA commitments or cash received as collateral for TBA commitments, respectively. Non-cash collateral pledged by a Fund, if any, is noted in the Schedules of Investments. Typically, a Fund is permitted to sell, re-pledge or use the collateral it receives; however, the counterparty is not permitted to do so. To the extent amounts due to a Fund are not fully collateralized, contractually or otherwise, a Fund bears the risk of loss from counterparty non-performance.
Mortgage Dollar Roll Transactions: Certain Funds may sell TBA mortgage-backed securities and simultaneously contract to repurchase substantially similar (i.e., same type, coupon and maturity) securities on a specific future date at an agreed upon price. During the period between the sale and repurchase, a Fund is not entitled to receive interest and principal payments on the securities sold. Mortgage dollar roll transactions are treated as purchases and sales and realize gains and losses on these transactions. Mortgage dollar rolls involve the risk that the market value of the securities that a Fund is required to purchase may decline below the agreed upon repurchase price of those securities.
Reverse Repurchase Agreements: Reverse repurchase agreements are agreements with qualified third party broker dealers in which a Fund sells securities to a bank or broker-dealer and agrees to repurchase the same securities at a mutually agreed upon date and price. A Fund receives cash from the sale to use for other investment purposes. During the term of the reverse repurchase agreement, a Fund continues to receive the principal and interest payments on the securities sold. Certain agreements have no stated maturity and can be terminated by either party at any time. Interest on the value of the reverse repurchase agreements issued and outstanding is based upon competitive market rates determined at the time of issuance. A Fund may utilize reverse repurchase agreements when it is anticipated that the interest income to be earned from the investment of the proceeds of the transaction is greater than the interest expense of the transaction. Reverse repurchase agreements involve leverage risk. If a Fund suffers a loss on its investment of the transaction proceeds from a reverse repurchase agreement, a Fund would still be required to pay the full repurchase price. Further, a Fund remains subject to the risk that the market value of the securities repurchased declines below the repurchase price. In such cases, a Fund would be required to return a portion of the cash received from the transaction or provide additional securities to the counterparty.
Cash received in exchange for securities delivered plus accrued interest due to the counterparty is recorded as a liability in the Statements of Assets and Liabilities at face value including accrued interest. Due to the short-term nature of the reverse repurchase agreements, face value approximates fair value. Interest payments made by a Fund to the counterparties are recorded as a component of interest expense in the Statements of Operations. In periods of increased demand for the security, a Fund may receive a fee for use of the security by the counterparty, which may result in interest income to a Fund.
| 42 | MANAGED ACCOUNT SERIES | APRIL 30, 2017 |
| Notes to Financial Statements (continued) |
For the year ended April 30, 2017, the BlackRock U.S. Mortgage Portfolio’s average amount of reverse repurchase agreements and the daily weighted average interest rate was $20,063,187 and 0.60%, respectively.
Reverse repurchase transactions are entered into by a Fund under Master Repurchase Agreements (each, an “MRA”), which permit a Fund, under certain circumstances, including an event of default (such as bankruptcy or insolvency), to offset payables and/or receivables under the MRA with collateral held and/or posted to the counterparty and create one single net payment due to or from a Fund. With reverse repurchase transactions, typically a Fund and counterparty under an MRA are permitted to sell, re-pledge, or use the collateral associated with the transaction. Bankruptcy or insolvency laws of a particular jurisdiction may impose restrictions on or prohibitions against such a right of offset in the event of the MRA counterparty’s bankruptcy or insolvency. Pursuant to the terms of the MRA, a Fund receives or posts securities as collateral with a market value in excess of the repurchase price to be paid or received by a Fund upon the maturity of the transaction. Upon a bankruptcy or insolvency of the MRA counterparty, a Fund is considered an unsecured creditor with respect to excess collateral and, as such, the return of excess collateral may be delayed.
As of period end, the following table is a summary of BlackRock U.S. Mortgage Portfolio’s open reverse repurchase agreements by counterparty which are subject to offset under an MRA on a net basis:
| Counterparty | Reverse Repurchase Agreements | Fair Value of Non-cash Collateral Pledged Including Accrued Interest1 | Net Amount | |||
Citigroup Global Markets, Inc. | $1,926,924 | $(1,926,924) | — |
| 1 | Collateral with a value of $2,003,593 has been pledged in connection with open reverse repurchase agreements. Excess of collateral pledged to the individual counterparty is not shown for financial reporting purposes. |
In the event the counterparty of securities under an MRA files for bankruptcy or becomes insolvent, a Fund’s use of the proceeds from the agreement may be restricted while the counterparty, or its trustee or receiver, determines whether or not to enforce a Fund’s obligation to repurchase the securities.
Securities Lending: Certain Funds may lend their securities to approved borrowers, such as brokers, dealers and other financial institutions. The borrower pledges and maintains with the Funds collateral consisting of cash, an irrevocable letter of credit issued by a bank, or securities issued or guaranteed by the U.S. Government. The initial collateral received by each Fund is required to have a value of at least 102% of the current value of the loaned securities for securities traded on U.S. exchanges and a value of at least 105% for all other securities. The collateral is maintained thereafter at a value equal to at least 100% of the current market value of the securities on loan. The market value of the loaned securities is determined at the close of each business day of the Fund and any additional required collateral is delivered to the Fund, or excess collateral returned by the Fund, on the next business day. During the term of the loan, the Funds are entitled to all distributions made on or in respect of the loaned securities but does not receive interest income on securities received as collateral. Loans of securities are terminable at any time and the borrower, after notice, is required to return borrowed securities within the standard time period for settlement of securities transactions.
The market value of any securities on loan, all of which were classified as common stocks in the Funds’ Schedules of Investments, and the value of any related collateral are shown separately in the Statements of Assets and Liabilities as a component of investments at value-unaffiliated, and collateral on securities loaned at value, respectively. As of period end, any securities on loan were collateralized by cash and/or U.S. Government obligations. Cash collateral invested by the securities lending agent, BlackRock Investment Management, LLC (“BIM”), if any, is disclosed in the Schedules of Investments.
Securities lending transactions are entered into by the Funds under Master Securities Lending Agreements (each, an “MSLA”), which provide the right, in the event of default (including bankruptcy or insolvency), for the non-defaulting party to liquidate the collateral and calculate a net exposure to the defaulting party or request additional collateral. In the event that a borrower defaults, the Funds, as lender, would offset the market value of the collateral received against the market value of the securities loaned. When the value of the collateral is greater than that of the market value of the securities loaned, the lender is left with a net amount payable to the defaulting party. However, bankruptcy or insolvency laws of a particular jurisdiction may impose restrictions on or prohibitions against such a right of offset in the event of an MSLA counterparty’s bankruptcy or insolvency. Under the MSLA, absent an event of default, the borrower can resell or re-pledge the loaned securities, and a Fund can reinvest cash collateral received in connection with loaned securities. Upon an event of default, the parties’ obligations to return the securities or collateral to the other party are extinguished, and the parties can resell or re-pledge the loaned securities or the collateral received in connection with the loaned securities in order to satisfy the defaulting party’s net payment obligation for all transactions under the MSLA. The defaulting party remains liable for any deficiency.
| MANAGED ACCOUNT SERIES | APRIL 30, 2017 | 43 |
| Notes to Financial Statements (continued) |
As of period end, the following tables are a summary of the Funds’ securities lending agreements by counterparty which are subject to offset under an MSLA:
| Global SmallCap Portfolio | ||||||||||||||
| Counterparty | Securities Loaned at Value | Cash Collateral Received1 | Net Amount | |||||||||||
Citigroup Global Markets, Inc. | $ | 1,985,509 | $ | (1,985,509 | ) | — | ||||||||
Credit Suisse Securities (USA) LLC | 828,424 | (828,424 | ) | — | ||||||||||
Deutsche Bank Securities, Inc. | 875,074 | (875,074 | ) | — | ||||||||||
Goldman Sachs & Co. | 2,507,430 | (2,507,430 | ) | — | ||||||||||
Jefferies LLC | 14,982 | (14,982 | ) | — | ||||||||||
JP Morgan Securities LLC | 2,074,029 | (2,074,029 | ) | — | ||||||||||
Merrill Lynch, Pierce, Fenner & Smith, Inc. | 9,910 | (9,910 | ) | — | ||||||||||
Morgan Stanley | 2,005,488 | (2,005,488 | ) | — | ||||||||||
UBS Securities LLC | 479,675 | (479,675 | ) | — | ||||||||||
Total | $ | 10,780,521 | $ | (10,780,521 | ) | — | ||||||||
| Mid Cap Value Opportunities Portfolio | ||||||||||||||
| Counterparty | Securities Loaned at Value | Cash Collateral Received1 | Net Amount2 | |||||||||||
Barclays Capital Inc. | $ | 207,500 | $ | (207,500 | ) | — | ||||||||
Citigroup Global Markets, Inc. | 3,554,013 | (3,554,013 | ) | — | ||||||||||
Deutsche Bank Securities, Inc. | 1,520,623 | (1,520,623 | ) | — | ||||||||||
Goldman Sachs & Co. | 1,013,181 | (1,013,181 | ) | — | ||||||||||
Merrill Lynch, Pierce, Fenner & Smith | 245,395 | (244,410 | ) | $ | 985 | |||||||||
Morgan Stanley | 960,094 | (960,094 | ) | — | ||||||||||
Total | $ | 7,500,806 | $ | (7,499,821 | ) | $ | 985 | |||||||
| 1 | Cash collateral with a value of $11,416,969 and $7,771,853 has been received in connection with securities lending agreements for Global SmallCap Portfolio and Mid Cap Value Opportunities Portfolio, respectively. Collateral received in excess of the value of securities loaned from the individual counterparty is not shown for financial reporting purposes in the tables above. |
| 2 | The market value of the loaned securities is determined as of April 30, 2017. Additional collateral is delivered to the Fund on the next business day in accordance with the MSLA. The net amount would be subject to the borrower default indemnity in the event of default by the counterpart. |
The risks of securities lending include the risk that the borrower may not provide additional collateral when required or may not return the securities when due. To mitigate these risks, the Funds benefit from a borrower default indemnity provided by BIM. BIM’s indemnity allows for full replacement of the securities loaned if the collateral received does not cover the value on the securities loaned in the event of borrower default. Each Fund could incur a loss if the value of an investment purchased with cash collateral falls below the market value of loaned securities or if the value of an investment purchased with cash collateral falls below the value of the original cash collateral received.
5. Derivative Financial Instruments:
The Funds engage in various portfolio investment strategies using derivative contracts both to increase the returns of the Funds and/or to manage their exposure to certain risks such as credit risk, equity risk, interest rate risk, foreign currency exchange rate risk, commodity price risk or other risks (e.g., inflation risk). Derivative financial instruments categorized by risk exposure are included in the Schedules of Investments. These contracts may be transacted on an exchange or OTC.
Futures Contracts: Certain Funds invest in long and/or short positions in futures and options on futures contracts to gain exposure to, or manage exposure to, changes in interest rates (interest rate risk), changes in the value of equity securities (equity risk) or foreign currencies (foreign currency exchange rate risk).
Futures contracts are agreements between the Funds and a counterparty to buy or sell a specific quantity of an underlying instrument at a specified price and on a specified date. Depending on the terms of a contract, it is settled either through physical delivery of the underlying instrument on the settlement date or by payment of a cash amount on the settlement date. Upon entering into a futures contract, the Funds are required to deposit initial margin with the broker in the form of cash or securities in an amount that varies depending on a contract’s size and risk profile. The initial margin deposit must then be maintained at an established level over the life of the contract.
Securities deposited as initial margin are designated in the Schedules of Investments and cash deposited, if any, is shown as cash pledged for futures contracts in the Statements of Assets and Liabilities. Pursuant to the contract, the Funds agree to receive from or pay to the broker an amount of cash equal to the daily fluctuation in market value of the contract (“variation margin”). Variation margin is recorded as unrealized appreciation (depreciation) and, if any, shown as variation margin receivable (or payable) on futures contracts in the Statements of Assets and Liabilities. When the contract is closed, a realized gain or loss is recorded in the Statements of Operations equal to the difference between the value of the contract at the time it was
| 44 | MANAGED ACCOUNT SERIES | APRIL 30, 2017 |
| Notes to Financial Statements (continued) |
opened and the value at the time it was closed. The use of futures contracts involves the risk of an imperfect correlation in the movements in the price of futures contracts and interest, foreign currency exchange rates or underlying assets.
Options: Certain Funds purchase and write call and put options to increase or decrease their exposure to the risks of underlying instruments, including equity risk, interest rate risk and/or commodity price risk and/or, in the case of options written, to generate gains from options premiums.
A call option gives the purchaser (holder) of the option the right (but not the obligation) to buy, and obligates the seller (writer) to sell (when the option is exercised) the underlying instrument at the exercise or strike price at any time or at a specified time during the option period. A put option gives the holder the right to sell and obligates the writer to buy the underlying instrument at the exercise or strike price at any time or at a specified time during the option period.
Premiums paid on options purchased and premiums received on options written, as well as the daily fluctuation in market value, are included in investments at value — unaffiliated and options written at value, respectively, in the Statements of Assets and Liabilities. When an instrument is purchased or sold through the exercise of an option, the premium is offset against the cost or proceeds of the underlying instrument. When an option expires, a realized gain or loss is recorded in the Statements of Operations to the extent of the premiums received or paid. When an option is closed or sold, a gain or loss is recorded in the Statements of Operations to the extent the cost of the closing transaction exceeds the premiums received or paid. When the Funds write a call option, such option is typically “covered,” meaning that they hold the underlying instrument subject to being called by the option counterparty. When the Funds write a put option, such option is covered by cash in an amount sufficient to cover the obligation.
| • | Swaptions — Certain Funds purchase and write swaptions primarily to preserve a return or spread on a particular investment or portion of the Funds’ holdings, as a duration management technique or to protect against an increase in the price of securities it anticipates purchasing at a later date. The purchaser and writer of a swaption is buying or granting the right to enter into a previously agreed upon interest rate or credit default swap agreement (interest rate risk and/or credit risk) at any time before the expiration of the option. |
In purchasing and writing options, the Funds bear the risk of an unfavorable change in the value of the underlying instrument or the risk that they may not be able to enter into a closing transaction due to an illiquid market. Exercise of a written option could result in the Funds purchasing or selling a security when it otherwise would not, or at a price different from the current market value.
Swaps: Certain Funds enter into swap contracts to manage exposure to issuers, markets and securities. Such contracts are agreements between the Funds and a counterparty to make periodic net payments on a specified notional amount or a net payment upon termination. Swap agreements are privately negotiated in the OTC market and may be entered into as a bilateral contract (“OTC swaps”) or centrally cleared (“centrally cleared swaps”).
For OTC swaps, any upfront premiums paid and any upfront fees received are shown as swap premiums paid and swap premiums received, respectively, in the Statements of Assets and Liabilities and amortized over the term of the contract. The daily fluctuation in market value is recorded as unrealized appreciation (depreciation) on OTC Swaps in the Statements of Assets and Liabilities. Payments received or paid are recorded in the Statements of Operations as realized gains or losses, respectively. When an OTC swap is terminated, a realized gain or loss is recorded in the Statements of Operations equal to the difference between the proceeds from (or cost of) the closing transaction and the Funds’ basis in the contract, if any. Generally, the basis of the contract is the premium received or paid.
In a centrally cleared swap, immediately following execution of the swap contract, the swap contract is novated to a central counterparty (the “CCP”) and the Funds’ counterparty on the swap agreement becomes the CCP. The Funds are required to interface with the CCP through the broker. Upon entering into a centrally cleared swap, the Funds are required to deposit initial margin with the broker in the form of cash or securities in an amount that varies depending on the size and risk profile of the particular swap. Securities deposited as initial margin are designated in the Schedules of Investments and cash deposited is shown as cash pledged for centrally cleared swaps in the Statements of Assets and Liabilities. Pursuant to the contract, the Funds agree to receive from or pay to the broker a variation margin. Variation margin is recorded as unrealized appreciation (depreciation) and shown as variation margin receivable (or payable) on centrally cleared swaps in the Statements of Assets and Liabilities. Payments received from (paid to) the counterparty, including at termination, are recorded as realized gains (losses) in the Statements of Operations.
| • | Credit default swaps — Certain Funds enter into credit default swaps to manage their exposure to the market or certain sectors of the market, to reduce their risk exposure to defaults of corporate and/or sovereign issuers or to create exposure to corporate and/or sovereign issuers to which they are not otherwise exposed (credit risk). |
The Funds may either buy or sell (write) credit default swaps on single-name issuers (corporate or sovereign), a combination or basket of single-name issuers or traded indexes. Credit default swaps are agreements in which the protection buyer pays fixed periodic payments to the seller in consideration for a promise from the protection seller to make a specific payment should a negative credit event take place with respect to the referenced entity (e.g., bankruptcy, failure to pay, obligation acceleration, repudiation, moratorium or restructuring). As a buyer, if an underlying credit event occurs, the Funds will either (i) receive from the seller an amount equal to the notional amount of the swap and deliver the referenced security or underlying securities comprising the index, or (ii) receive a net settlement of cash equal to the notional amount of the swap less the
| MANAGED ACCOUNT SERIES | APRIL 30, 2017 | 45 |
| Notes to Financial Statements (continued) |
recovery value of the security or underlying securities comprising the index. As a seller (writer), if an underlying credit event occurs, the Funds will either pay the buyer an amount equal to the notional amount of the swap and take delivery of the referenced security or underlying securities comprising the index or pay a net settlement of cash equal to the notional amount of the swap less the recovery value of the security or underlying securities comprising the index.
| • | Total return swaps — Certain Funds enter into total return swaps to obtain exposure to a security or market without owning such security or investing directly in such market or to exchange the risk/return of one market (e.g., fixed-income) with another market (e.g., equity or commodity prices) (equity risk, commodity price risk and/or interest rate risk). |
Total return swaps are agreements in which there is an exchange of cash flows whereby one party commits to make payments based on the total return (distributions plus capital gains/losses) of an underlying instrument in exchange for fixed or floating rate interest payments. If the total return of the instrument or index underlying the transaction exceeds or falls short of the offsetting fixed or floating interest rate obligation, the Funds receive payment from or make a payment to the counterparty.
| • | Interest rate swaps — Certain Funds enter into interest rate swaps to gain or reduce exposure to interest rates or to manage duration, the yield curve or interest rate (interest rate risk). |
Interest rate swaps are agreements in which one party pays a stream of interest payments, either fixed or floating, in exchange for another party’s stream of interest payments, either fixed or floating, on the same notional amount for a specified period of time. In more complex interest rate swaps, the notional principal amount may decline (or amortize) over time.
Swap transactions involve, to varying degrees, elements of interest rate, credit and market risk in excess of the amounts recognized in the Statements of Assets and Liabilities. Such risks involve the possibility that there will be no liquid market for these agreements, that the counterparty to the agreements may default on its obligation to perform or disagree as to the meaning of the contractual terms in the agreements, and that there may be unfavorable changes in interest rates and/or market values associated with these transactions.
Master Netting Arrangements: In order to define their contractual rights and to secure rights that will help them mitigate their counterparty risk, the Funds may enter into an International Swaps and Derivatives Association, Inc. Master Agreement (“ISDA Master Agreement”) or similar agreement with their counterparties. An ISDA Master Agreement is a bilateral agreement between each Fund and a counterparty that governs certain OTC derivatives and typically contains, among other things, collateral posting terms and netting provisions in the event of a default and/or termination event. Under an ISDA Master Agreement, each Fund may, under certain circumstances, offset with the counterparty certain derivative financial instruments’ payables and/or receivables with collateral held and/or posted and create one single net payment. The provisions of the ISDA Master Agreement typically permit a single net payment in the event of default including the bankruptcy or insolvency of the counterparty. Bankruptcy or insolvency laws of a particular jurisdiction may restrict or prohibit the right of offset in bankruptcy, insolvency or other events. In addition, certain ISDA Master Agreements allow counterparties to terminate derivative contracts prior to maturity in the event the Funds’ net assets decline by a stated percentage or the Funds fail to meet the terms of their ISDA Master Agreements. The result would cause the Funds to accelerate payment of any net liability owed to the counterparty.
Collateral Requirements: For derivatives traded under an ISDA Master Agreement, the collateral requirements are typically calculated by netting the mark-to-market amount for each transaction under such agreement and comparing that amount to the value of any collateral currently pledged by the Fund and the counterparty.
Cash collateral that has been pledged to cover obligations of the Funds and cash collateral received from the counterparty, if any, is reported separately on the Statements of Assets and Liabilities as cash pledged as collateral and cash received as collateral, respectively. Non-cash collateral pledged by the Funds, if any, is noted in the Schedules of Investments. Generally, the amount of collateral due from or to a counterparty is subject to a certain minimum transfer amount threshold before a transfer is required, which is determined at the close of business of the Funds. Any additional required collateral is delivered to/pledged by the Funds on the next business day. Typically, the counterparty is not permitted to sell, re-pledge or use cash and non-cash collateral it receives. A Fund generally agrees not to use non-cash collateral that it receives but may, absent default or certain other circumstances defined in the underlying ISDA Master Agreement, be permitted to use cash collateral received. In such cases, interest may be paid pursuant to the collateral arrangement with the counterparty. To the extent amounts due to the Funds from their counterparties are not fully collateralized, they bear the risk of loss from counterparty non-performance. Likewise, to the extent the Funds have delivered collateral to a counterparty and stand ready to perform under the terms of their agreement with such counterparty, they bear the risk of loss from a counterparty in the amount of the value of the collateral in the event the counterparty fails to return such collateral. Based on the terms of agreements, collateral may not be required for all derivative contracts.
For financial reporting purposes, the Funds do not offset derivative assets and derivative liabilities that are subject to netting arrangements, if any, in the Statements of Assets and Liabilities.
| 46 | MANAGED ACCOUNT SERIES | APRIL 30, 2017 |
| Notes to Financial Statements (continued) |
6. Investment Advisory Agreement and Other Transactions with Affiliates:
The PNC Financial Services Group, Inc. is the largest stockholder and an affiliate of BlackRock, Inc. (“BlackRock”) for 1940 Act purposes.
Investment Advisory: The Trust, on behalf of the Funds, entered into an Investment Advisory Agreement with the Manager, the Funds’ investment adviser, an indirect, wholly-owned subsidiary of BlackRock, to provide investment advisory and administration services. The Manager is responsible for the management of each Fund’s portfolio and provides the personnel, facilities, equipment and certain other services necessary to the operations of each Fund.
For such services, each Fund pays the Manager a monthly fee at an annual rate equal to the following percentages of the average daily value of each Fund’s net assets:
| BlackRock U.S. Mortgage Portfolio | Global SmallCap Portfolio | Mid Cap Value Opportunities Portfolio | ||||
| Average Daily Net Assets | Investment Advisory Fee | |||||
First $1 Billion | 0.40% | 0.85% | 0.65% | |||
$1 Billion - $3 Billion | 0.38% | 0.80% | 0.61% | |||
$3 Billion - $5 Billion | 0.36% | 0.77% | 0.59% | |||
$5 Billion - $10 Billion | 0.35% | 0.74% | 0.57% | |||
Greater than $10 Billion | 0.34% | 0.72% | 0.55% | |||
Service and Distribution Fees: The Trust, on behalf of BlackRock U.S. Mortgage Portfolio, entered into a Distribution Agreement and a Distribution and Service Plan with BlackRock Investments, LLC (“BRIL“), an affiliate of the Manager. Pursuant to the Distribution and Service Plan and in accordance with Rule 12b-1 under the 1940 Act, BlackRock U.S. Mortgage Portfolio pays BRIL ongoing service and distribution fees. The fees are accrued daily and paid monthly at annual rates based upon the average daily net assets of the relevant share class of the Fund as follows:
| Service Fee | Distribution Fee | |||
Investor A | 0.25% | — | ||
Investor C | 0.25% | 0.75% |
BRIL and broker-dealers, pursuant to sub-agreements with BRIL, provide shareholder servicing and distribution services to the Fund. The ongoing service and/or distribution fee compensates BRIL and each broker-dealer for providing shareholder servicing and/or distribution related services to the shareholders.
For the year ended April 30, 2017, the following table shows the class specific service and distribution fees borne directly by each share class of BlackRock U.S. Mortgage Portfolio:
| Investor A | Investor C | Total | ||
$184,886 | $236,762 | $421,648 |
Transfer Agent: For the year ended April 30, 2017, the following table shows the class specific transfer agent fees borne directly by each class of BlackRock U.S. Mortgage Portfolio:
| Institutional | Investor A | Investor C | Total | |||
$132,897 | $88,889 | $26,248 | $248,034 |
Other Fees: For the year ended April 30, 2017, affiliates earned underwriting discounts, direct commissions and dealer concessions on sales of BlackRock U.S. Mortgage Portfolio’s Investor A Shares of $3,896.
For the year ended April 30, 2017, affiliates of BlackRock U.S. Mortgage Portfolio received CDSCs as follows:
| Investor A | $1,606 | |||
Investor C | $ | 6,261 | ||
Expense Limitations, Waivers, and Reimbursements: The Manager contractually agreed to waive all fees and pay or reimburse all operating expenses of Global SmallCap Portfolio and Mid Cap Value Opportunities Portfolio, except extraordinary expenses. Extraordinary expenses may include dividend expense, interest expense, acquired fund fees and expenses and certain other Fund expenses. This agreement has no fixed termination date.
Although Global SmallCap Portfolio and Mid Cap Value Opportunities Portfolio do not compensate the Manager directly for its services under the Investment Advisory Agreement, because each Fund is an investment option for certain wrap-fee or other separately managed account program clients, the
| MANAGED ACCOUNT SERIES | APRIL 30, 2017 | 47 |
| Notes to Financial Statements (continued) |
Manager may benefit from the fees charged to such clients who have retained the Manager’s affiliates to manage their accounts. The Manager waived fees for each Fund which are included in fees waived and/or reimbursed by the Manager in the Statements of Operations. The waivers were as follows:
| Global SmallCap Portfolio | $977,907 | |||
Mid Cap Value Opportunities Portfolio | $ | 694,179 | ||
With respect to BlackRock U.S. Mortgage Portfolio, the Manager voluntarily agreed to waive its investment advisory fees by the amount of investment advisory fees the Fund pays to the Manager indirectly through its investment in affiliated money market funds (the ”affiliated money market waiver“). This amount is shown as fees waived by the Manager in the Statements of Operations. The amount of waivers and/or reimbursements of fees and expenses made pursuant to the expense limitation caps, as applicable, will be reduced by the amount of the affiliated money market fund waiver. For the year ended April 30, 2017, the amount waived was $66,030.
Effective September 1, 2016, the Manager voluntarily agreed to waive its investment advisory fee with respect to any portion of each Fund’s assets invested in affiliated equity and fixed-income mutual funds and affiliated exchange-traded funds that have a contractual management fee. Prior to September 1, 2016, the Manager did not waive such fees. This voluntary waiver may be reduced or discontinued at any time without notice. For the year ended April 30, 2017, there were no fees waived by the Manager.
In addition, for the year ended April 30, 2017, the Manager reimbursed each Fund’s operating expenses as follows, which are included in fees waived and/or reimbursed by the Manager in the Statements of Operations:
| Global SmallCap Portfolio | $384,193 | |||
Mid Cap Value Opportunities Portfolio | $ | 217,608 | ||
For the year ended April 30, 2017, the Funds reimbursed the Manager for certain accounting services, which are included in accounting services in the Statements of Operations. The reimbursements were as follows:
| BlackRock U.S. Mortgage Portfolio | $3,393 | |||
Global SmallCap Portfolio | $ | 979 | ||
Mid Cap Value Opportunities Portfolio | $ | 882 | ||
With respect to BlackRock U.S. Mortgage Portfolio, the Manager contractually agreed to waive and/or reimburse fees or expenses in order to limit expenses, excluding interest expense, dividend expense, tax expense, acquired fund fees and expenses, and certain other fund expenses, which constitute extraordinary expenses not incurred in the ordinary course of the Fund’s business (”expense limitation“). The current expense limitations as a percentage of average daily net assets are as follows:
| Institutional | Investor A | Investor C | ||
0.45% | 0.70% | 1.45% |
Prior to October 14, 2016, the expense limitations as a percentage of average daily net assets were as follows:
| Institutional | Investor A | Investor C | ||
0.50% | 0.80% | 1.55% |
The Manager has agreed not to reduce or discontinue these contractual expense limitations through August 31, 2018, unless approved by the Board, including a majority of the Independent Trustees who are not “interested persons” of the Fund, as defined in the 1940 Act (“Independent Trustees”), or by a vote of a majority of the outstanding voting securities of the Fund.
These amounts are shown as fees waived by the Manager and transfer agent fees reimbursed — class specific in the Statements of Operations. Class specific expense reimbursements for BlackRock U.S. Mortgage Portfolio are as follows:
| Institutional | Investor A | Investor C | Total | |||||
Transfer agent fees reimbursed | $127,550 | $69,057 | $20,188 | $216,795 |
Securities Lending: The U.S. Securities and Exchange Commission has issued an exemptive order which permits BIM, an affiliate of the Manager, to serve as securities lending agent for the Funds, subject to applicable conditions. As securities lending agent, BIM bears all operational costs directly related to securities lending. The Funds are responsible for expenses in connection with the investment of cash collateral received for securities on loan (the “collateral investment expenses”). The cash collateral is invested in a private investment company managed by the Manager or its affiliates. However, BIM has agreed to cap the collateral investment expenses of the private investment company to an annual rate of 0.04%. The investment adviser to the private investment company will not charge any advisory fees with respect to shares purchased by the Funds. If the private investment company’s weekly liquid assets fall below 30% of its total assets, BIM, as managing member of the private investment company, is permitted at any time, if it determines it to be in the best interests of the private investment company, to impose a liquidity fee of up to 2% of the value of units withdrawn or
| 48 | MANAGED ACCOUNT SERIES | APRIL 30, 2017 |
| Notes to Financial Statements (continued) |
impose a redemption gate that temporarily suspends the right of withdrawal out of the private investment company. In addition, if the private investment company’s weekly liquid assets fall below 10% of its total assets at the end of any business day, the private investment company will impose a liquidity fee in the default amount of 1% of the amount withdrawn, generally effective as of the next business day, unless BIM determines that a higher (not to exceed 2%) or lower fee level or not imposing a liquidity fee is in the best interests of the private investment company. The shares of the private investment company purchased by the Funds would be subject to any such liquidity fee or redemption gate imposed.
Securities lending income is equal to the total of income earned from the reinvestment of cash collateral, net of fees and other payments to and from borrowers of securities, and less the collateral investment expenses. Each Fund retains a portion of securities lending income and remits a remaining portion to BIM as compensation for its services as securities lending agent.
Pursuant to a securities lending agreement, Mid Cap Value Opportunities Portfolio retains 71.5% of securities lending income, and this amount retained can never be less than 65% of the total of securities lending income plus the collateral investment expenses.
Pursuant to a securities lending agreement, Global SmallCap Portfolio retains 80% of securities lending income, and this amount retained can never be less than 70% of the total of securities lending income plus the collateral investment expenses.
In addition, commencing the business day following the date that the aggregate securities lending income earned across the Equity-Bond Complex in a calendar year exceeds a specified threshold, Mid Cap Value Opportunities Portfolio, pursuant to the securities lending agreement, will retain for the remainder of that calendar year securities lending income as follows: 75% of securities lending income, and this amount retained can never be less than 65% of the total of securities lending income plus the collateral investment expenses.
In addition, commencing the business day following the date that the aggregate securities lending income earned across the Equity-Bond Complex in a calendar year exceeds a specified threshold, Global SmallCap Portfolio, pursuant to the securities lending agreement, will retain for the remainder of that calendar year securities lending income as follows: 85% of securities lending income, and this amount retained can never be less than 70% of the total of securities lending income plus the collateral investment expenses.
The share of securities lending income earned by each Fund is shown as securities lending income — affiliated — net in the Statements of Operations. For the year ended April 30, 2017, each Fund paid BIM the following amounts for securities lending agent services:
| Global SmallCap Portfolio | $45,057 | |||
Mid Cap Value Opportunities Portfolio | $ | 8,808 | ||
Interfund Lending: In accordance with an exemptive order (the “Order”) from the U.S. Securities and Exchange Commission, each Fund may participate in a joint lending and borrowing facility for temporary purposes (the “Interfund Lending Program”), subject to compliance with the terms and conditions of the Order, and to the extent permitted by each Fund’s investment policies and restrictions. Each Fund is currently permitted to borrow and lend under the Interfund Lending Program.
A lending BlackRock fund may lend in aggregate up to 15% of its net assets, but may not lend more than 5% of its net assets to any one borrowing fund through the Interfund Lending Program. A borrowing BlackRock fund may not borrow through the Interfund Lending Program or from any other source more than 33 1/3% of its total assets (or any lower threshold provided for by the fund’s investment restrictions). If a borrowing BlackRock fund’s total outstanding borrowings exceed 10% of its total assets, each of its outstanding interfund loans will be subject to collateralization of at least 102% of the outstanding principal value of the loan. All interfund loans are for temporary or emergency purposes and the interest rate to be charged will be the average of the highest current overnight repurchase agreement rate available to a lending fund and the bank loan rate, as calculated according to a formula established by the Board.
During the year ended April 30, 2017, the Funds did not participate in the Interfund Lending Program.
Officers and Trustees: Certain officers and/or trustees of the Trust are officers and/or trustees of BlackRock or its affiliates. The Funds reimburse the Manager for a portion of the compensation paid to the Trust’s Chief Compliance Officer, which is included in Officer and Trustees in the Statements of Operations.
Other Transactions: The Funds may purchase securities from, or sell securities to, an affiliated fund provided the affiliation is due solely to having a common investment adviser, common officers, or common trustees. For the year ended April 30, 2017, the purchase and sale transactions which resulted in net realized gains (losses) with an affiliated fund in compliance with Rule 17a-7 under the 1940 Act were as follows:
| Purchases | Sales | Net Realized Gain (Loss) | ||||||||||
Global SmallCap Portfolio | $ | 1,487,323 | $ | 384,521 | $ | 101,925 | ||||||
Mid Cap Value Opportunities Portfolio | $ | 130,283 | $ | 433,678 | $ | (58,144 | ) | |||||
| MANAGED ACCOUNT SERIES | APRIL 30, 2017 | 49 |
| Notes to Financial Statements (continued) |
7. Purchases and Sales:
For the year ended April 30, 2017, purchases and sales of investments including paydowns, mortgage dollar rolls and excluding short-term securities, were as follows:
| Purchases | ||||||||||||||||||||
| BlackRock U.S. Mortgage Portfolio | Global SmallCap Portfolio | Mid Cap Value Opportunities Portfolio | ||||||||||||||||||
Non-U.S. Government Securities | $ | 5,486,218,660 | $ | 77,926,128 | $87,159,088 | |||||||||||||||
U.S. Government Securities | 36,643,851 | — | — | |||||||||||||||||
|
| |||||||||||||||||||
Total Purchases | $ | 5,522,862,511 | $ | 77,926,128 | $87,159,088 | |||||||||||||||
|
| |||||||||||||||||||
| Sales | ||||||||||||||||||||
| BlackRock U.S. Mortgage Portfolio | Global SmallCap Portfolio | Mid Cap Value Opportunities Portfolio | ||||||||||||||||||
Non-U.S. Government Securities | ||||||||||||||||||||
(includes paydowns) | $ | 5,726,714,217 | $ | 91,656,866 | $99,094,883 | |||||||||||||||
U.S. Government Securities | 40,262,791 | — | — | |||||||||||||||||
|
| |||||||||||||||||||
Total Sales | $ | 5,766,977,008 | $ | 91,656,866 | $99,094,883 | |||||||||||||||
|
| |||||||||||||||||||
For the year ended April 30, 2017, purchases and sales related to mortgage dollar rolls were as follows:
| BlackRock U.S. Mortgage Portfolio | ||||
Purchases | $ | 2,261,214,158 | ||
Sales | $ | 2,261,821,646 | ||
8. Income Tax Information:
It is the Funds’ policy to comply with the requirements of the Internal Revenue Code of 1986, as amended, applicable to regulated investment companies, and to distribute substantially all of their taxable income to their shareholders. Therefore, no U.S. federal income tax provision is required.
Each Fund files U.S. federal and various state and local tax returns. No income tax returns are currently under examination. The statute of limitations on each Fund’s U.S. federal tax returns generally remains open for each of the four years ended April 30, 2017. The statutes of limitations on each Fund’s state and local tax returns may remain open for an additional year depending upon the jurisdiction.
Management has analyzed tax laws and regulations and their application to the Funds as of April 30, 2017, inclusive of the open tax return years, and does not believe that there are any uncertain tax positions that require recognition of a tax liability in the Funds’ financial statements.
U.S. GAAP requires that certain components of net assets be adjusted to reflect permanent differences between financial and tax reporting. These reclassifications have no effect on net assets or net asset values per share. As of period end, the following permanent differences attributable to the accounting for swap agreements, foreign currency transactions, the sale of stock of passive foreign investment companies, the characterization of expenses, the use of equalization, net paydown losses, the characterization of corporate actions, fees received on trade settlements, income recognized from investments in partnerships and the character of income recognized from certain securities lending transactions were reclassified to the following accounts:
| BlackRock U.S. Mortgage Portfolio | Global SmallCap Portfolio | Mid Cap Value Opportunities Portfolio | ||||||||||
Paid-in capital | — | — | $ | 535,538 | ||||||||
Undistributed net investment income | $ | 2,868,583 | $ | 1,745,231 | $ | (6,859 | ) | |||||
Accumulated net realized gain (loss) | $ | (2,868,583 | ) | $ | (1,745,231 | ) | $ | (528,679 | ) | |||
| 50 | MANAGED ACCOUNT SERIES | APRIL 30, 2017 |
| Notes to Financial Statements (continued) |
The tax character of distributions paid was as follows:
| BlackRock U.S. Mortgage Portfolio | Global SmallCap Portfolio | Mid Cap Value Opportunities Portfolio1 | ||||||||||||||
Ordinary income | 4/30/17 | $ | 9,120,874 | $ | 2,437,012 | $ | 1,658,252 | |||||||||
| 4/30/16 | 7,907,563 | 4,164,271 | 4,619,314 | |||||||||||||
Long-term capital gains | 4/30/17 | — | — | 672,617 | ||||||||||||
| 4/30/16 | 1,193,681 | 5,639,661 | 15,090,170 | |||||||||||||
|
| |||||||||||||||
Total | 4/30/17 | $ | 9,120,874 | $ | 2,437,012 | $ | 2,330,869 | |||||||||
|
| |||||||||||||||
| 4/30/16 | $ | 9,101,244 | $ | 9,803,932 | $ | 19,709,484 | ||||||||||
|
| |||||||||||||||
| 1 | Distribution amounts may include a portion of the proceeds from redeemed shares. |
As of period end, the tax components of accumulated net earnings (losses) were as follows:
| BlackRock U.S. Mortgage Portfolio | Global SmallCap Portfolio | Mid Cap Value Opportunities Portfolio | ||||||||||
Undistributed ordinary income | $ | 177,270 | $ | 1,154,631 | $ | 455,352 | ||||||
Capital loss carryforwards | (2,540,522 | ) | (2,413,392 | ) | — | |||||||
Undistributed long term capital gains | — | — | 7,782,601 | |||||||||
Net unrealized gains1 | 1,846,103 | 15,298,490 | 11,598,578 | |||||||||
|
| |||||||||||
Total | $ | (517,149 | ) | $ | 14,039,729 | $ | 19,836,531 | |||||
|
| |||||||||||
| 1 | The differences between book-basis and tax-basis net unrealized gains were attributable primarily to the tax deferral of losses on wash sales, the realization for tax purposes of unrealized gains on investments in passive foreign investment companies, the realization for tax purposes of unrealized gains/losses on certain options, futures and foreign currency contracts, the timing and recognition of partnership income, the accounting for swap agreements and the treatment of certain security lending transactions. |
As of April 30, 2017, BlackRock U.S. Mortgage Portfolio and Global SmallCap Portfolio had capital loss carryforwards of $2,540,522 and $2,413,392, respectively, with no expiration date, available to offset future realized capital gains.
As of April 30, 2017, gross unrealized appreciation and depreciation based on cost for U.S. federal income tax purposes were as follows:
| BlackRock U.S. Mortgage Portfolio | Global SmallCap Portfolio | Mid Cap Value Opportunities Portfolio | ||||||||||
Tax cost | $ | 458,875,091 | $ | 112,159,323 | $ | 103,209,626 | ||||||
|
| |||||||||||
Gross unrealized appreciation | $ | 3,636,901 | $ | 20,198,095 | $ | 13,656,156 | ||||||
Gross unrealized depreciation | (1,920,181 | ) | (4,922,771 | ) | (2,089,492 | ) | ||||||
|
| |||||||||||
Net unrealized appreciation | $ | 1,716,720 | $ | 15,275,324 | $ | 11,566,664 | ||||||
|
| |||||||||||
9. Bank Borrowings:
The Funds, along with certain other funds managed by the Manager and its affiliates (“Participating Funds”), is a party to a 364-day, $2.1 billion credit agreement with a group of lenders. Under this agreement, the Funds may borrow to fund shareholder redemptions. Excluding commitments designated for certain individual funds, the Participating Funds, including the Funds, can borrow up to an aggregate commitment amount of $1.6 billion at any time outstanding, subject to asset coverage and other limitations as specified in the agreement. The credit agreement has the following terms: a fee of 0.12% per annum on unused commitment amounts and interest at a rate equal to the higher of (a) one-month LIBOR (but, in any event, not less than 0.00%) on the date the loan is made plus 0.80% per annum or (b) the Fed Funds rate (but, in any event, not less than 0.00%) in effect from time to time plus 0.80% per annum on amounts borrowed. The agreement expires in April 2018 unless extended or renewed. Participating Funds paid administration, legal and arrangement fees, which, if applicable, are included in miscellaneous expenses in the Statements of Operations. These fees were allocated among such funds based upon portions of the aggregate commitment available to them and relative net assets of Participating Funds. During the year ended April 30, 2017, the Funds did not borrow under the credit agreement.
10. Principal Risks:
In the normal course of business, certain Funds invest in securities and enter into transactions where risks exist due to fluctuations in the market (market risk) or failure of the issuer to meet all its obligations, including the ability to pay principal and interest when due (issuer credit risk). The value of securities held by the Funds may decline in response to certain events, including those directly involving the issuers of securities owned by the Funds. Changes arising from the general economy, the overall market and local, regional or global political and/or social instability, as well as currency, interest rate and price fluctuations, may also affect the securities’ value.
BlackRock U.S. Mortgage Portfolio may be exposed to prepayment risk, which is the risk that borrowers may exercise their option to prepay principal earlier than scheduled during periods of declining interest rates, which would force the Fund to reinvest in lower yielding securities. The Fund may also
| MANAGED ACCOUNT SERIES | APRIL 30, 2017 | 51 |
| Notes to Financial Statements (continued) |
be exposed to reinvestment risk, which is the risk that income from the Fund’s portfolio will decline if the Fund invests the proceeds from matured, traded or called fixed-income securities at market interest rates that are below the Fund portfolio’s current earnings rate.
On October 11, 2016, BlackRock implemented certain changes required by amendments to Rule 2a-7 under the 1940 Act, which governs the operations of U.S. money market funds. The Funds may be exposed to additional risks when reinvesting cash collateral in money market funds that do not seek to maintain a stable NAV per share of $1.00 and which may be subject to redemption gates or liquidity fees under certain circumstances.
Valuation Risk: The market values of equities, such as common stocks and preferred securities or equity related investments, such as futures and options, may decline due to general market conditions which are not specifically related to a particular company. They may also decline due to factors which affect a particular industry or industries. A Fund may invest in illiquid investments and may experience difficulty in selling those investments in a timely manner at the price that they believe the investments are worth. Prices may fluctuate widely over short or extended periods in response to company, market or economic news. Markets also tend to move in cycles, with periods of rising and falling prices. This volatility may cause each Fund’s NAV to experience significant increases or decreases over short periods of time. If there is a general decline in the securities and other markets, the NAV of a Fund may lose value, regardless of the individual results of the securities and other instruments in which a Fund invests.
The price a Fund could receive upon the sale of any particular portfolio investment may differ from a Fund’s valuation of the investment, particularly for securities that trade in thin or volatile markets or that are valued using a fair valuation technique or a price provided by an independent pricing service. Changes to significant unobservable inputs and assumptions (i.e., publicly traded company multiples, growth rate, time to exit) due to the lack of observable inputs may significantly impact the resulting fair value and therefore a Fund’s results of operations. As a result, the price received upon the sale of an investment may be less than the value ascribed by a Fund, and a Fund could realize a greater than expected loss or lesser than expected gain upon the sale of the investment. A Fund’s ability to value its investments may also be impacted by technological issues and/or errors by pricing services or other third party service providers.
Counterparty Credit Risk: Similar to issuer credit risk, the Funds may be exposed to counterparty credit risk, or the risk that an entity may fail to or be unable to perform on its commitments related to unsettled or open transactions. The Funds manage counterparty credit risk by entering into transactions only with counterparties that the Manager believes have the financial resources to honor their obligations and by monitoring the financial stability of those counterparties. Financial assets, which potentially expose the Funds to market, issuer and counterparty credit risks, consist principally of financial instruments and receivables due from counterparties. The extent of the Funds’ exposure to market, issuer and counterparty credit risks with respect to these financial assets is approximately their value recorded in the Statements of Assets and Liabilities, less any collateral held by the Funds.
A derivative contract may suffer a mark-to-market loss if the value of the contract decreases due to an unfavorable change in the market rates or values of the underlying instrument. Losses can also occur if the counterparty does not perform under the contract.
BlackRock U.S. Mortgage Portfolio’s risk of loss from counterparty credit risk on OTC derivatives is generally limited to the aggregate unrealized gain less the value of any collateral held by such Fund.
For OTC options purchased, each Fund bears the risk of loss in the amount of the premiums paid plus the positive change in market values net of any collateral held by the Funds should the counterparty fail to perform under the contracts. Options written by the Funds do not typically give rise to counterparty credit risk, as options written generally obligate the Funds, and not the counterparty, to perform. The Funds may be exposed to counterparty credit risk with respect to options written to the extent the Funds deposit collateral with its counterparty to a written option.
With exchange-traded options purchased, futures and centrally cleared swaps, there is less counterparty credit risk to the Funds since the exchange or clearinghouse, as counterparty to such instruments, guarantees against a possible default. The clearinghouse stands between the buyer and the seller of the contract; therefore, credit risk is limited to failure of the clearinghouse. While offset rights may exist under applicable law, the Funds do not have a contractual right of offset against a clearing broker or clearinghouse in the event of a default (including the bankruptcy or insolvency). Additionally, credit risk exists in exchange-traded futures and centrally cleared swaps with respect to initial and variation margin that is held in a clearing broker’s customer accounts. While clearing brokers are required to segregate customer margin from their own assets, in the event that a clearing broker becomes insolvent or goes into bankruptcy and at that time there is a shortfall in the aggregate amount of margin held by the clearing broker for all its clients, typically the shortfall would be allocated on a pro rata basis across all the clearing broker’s customers, potentially resulting in losses to the Funds.
Concentration Risk: BlackRock U.S. Mortgage Portfolio invests a significant portion of its assets in fixed-income securities and/or uses derivatives tied to the fixed-income markets. Changes in market interest rates or economic conditions may affect the value and/or liquidity of such investments. Interest rate risk is the risk that prices of bonds and other fixed-income securities will increase as interest rates fall and decrease as interest rates rise. The Fund may be subject to a greater risk of rising interest rates due to the current period of historically low rates.
Global SmallCap Portfolio invests a substantial amount of its assets in issuers located in a single country or a limited number of countries. When the
| 52 | MANAGED ACCOUNT SERIES | APRIL 30, 2017 |
| Notes to Financial Statements (concluded) |
Fund concentrates its investments in this manner, it assumes the risk that economic, political and social conditions in those countries may have a significant impact on their investment performance. Foreign issuers may not be subject to the same uniform accounting, auditing and financial reporting standards and practices as used in the United States. Foreign securities markets may also be less liquid, more volatile, and less subject to governmental supervision not typically associated with investing in U.S. securities. Investment percentages in specific countries are presented in the Schedules of Investments.
BlackRock U.S. Mortgage Portfolio invests a significant portion of its assets in securities backed by commercial or residential mortgage loans or in issuers that hold mortgage and other asset-backed securities. Investment percentages in these securities are presented in the Schedule of Investments. Changes in economic conditions, including delinquencies and/or defaults on assets underlying these securities, can affect the value, income and/or liquidity of such positions.
11. Capital Share Transactions:
Transactions in capital shares for each class were as follows:
| Year Ended April 30, 2017 | Year Ended April 30, 2016 | |||||||||||||||||
| BlackRock U.S. Mortgage Portfolio | Shares | Amount | Shares | Amount | ||||||||||||||
| Institutional | ||||||||||||||||||
Shares sold | 12,253,733 | $ | 126,692,658 | 8,488,660 | $ | 88,560,458 | ||||||||||||
Shares issued in reinvestment of distributions | 445,316 | 4,620,345 | 405,835 | 4,226,093 | ||||||||||||||
Shares redeemed | (10,840,918 | ) | (112,190,895 | ) | (7,651,908 | ) | (79,760,385 | ) | ||||||||||
|
|
|
| |||||||||||||||
Net increase | 1,858,131 | $ | 19,122,108 | 1,242,587 | $ | 13,026,166 | ||||||||||||
|
|
|
| |||||||||||||||
Investor A | ||||||||||||||||||
Shares sold | 2,649,867 | $ | 27,584,700 | 4,754,758 | $ | 49,519,825 | ||||||||||||
Shares issued in reinvestment of distributions | 182,864 | 1,894,542 | 200,990 | 2,088,642 | ||||||||||||||
Shares redeemed | (5,285,209 | ) | (54,496,248 | ) | (3,458,964 | ) | (36,006,208 | ) | ||||||||||
|
|
|
| |||||||||||||||
Net increase (decrease) | (2,452,478 | ) | $ | (25,017,006 | ) | 1,496,784 | $ | 15,602,259 | ||||||||||
|
|
|
| |||||||||||||||
Investor C | ||||||||||||||||||
Shares sold | 700,593 | $ | 7,292,467 | 1,180,451 | $ | 12,316,399 | ||||||||||||
Shares issued in reinvestment of distributions | 45,454 | 470,391 | 41,092 | 426,759 | ||||||||||||||
Shares redeemed | (748,486 | ) | (7,734,065 | ) | (482,569 | ) | (5,022,521 | ) | ||||||||||
|
|
|
| |||||||||||||||
Net increase (decrease) | (2,439 | ) | $ | 28,793 | 738,974 | $ | 7,720,637 | |||||||||||
|
|
|
| |||||||||||||||
Total Net Increase (Decrease) | (596,787 | ) | $ | (5,866,105 | ) | 3,478,345 | $ | 36,349,062 | ||||||||||
|
|
|
| |||||||||||||||
Global SmallCap Portfolio | ||||||||||||||||||
Shares sold | 1,278,656 | $ | 16,673,214 | 3,384,146 | $ | 41,951,584 | ||||||||||||
Shares redeemed | (2,247,301 | ) | (29,566,906 | ) | (6,335,257 | ) | (72,307,116 | ) | ||||||||||
|
|
|
| |||||||||||||||
Net decrease | (968,645 | ) | $ | (12,893,692 | ) | (2,951,111 | ) | $ | (30,355,532 | ) | ||||||||
|
|
|
| |||||||||||||||
Mid Cap Value Opportunities Portfolio | ||||||||||||||||||
Shares sold | 1,067,826 | $ | 14,260,889 | 2,936,879 | $ | 34,884,053 | ||||||||||||
Shares redeemed | (1,947,711 | ) | (26,566,961 | ) | (6,239,833 | ) | (67,633,760 | ) | ||||||||||
|
|
|
| |||||||||||||||
Net decrease | (879,885 | ) | $ | (12,306,072 | ) | (3,302,954 | ) | $ | (32,749,707 | ) | ||||||||
|
|
|
| |||||||||||||||
12. Subsequent Events:
Management’s evaluation of the impact of all subsequent events on the Funds’ financial statements was completed through the date the financial statements were issued and the following items were noted:
On March 27, 2017, the Board approved a proposal to change the name of Global SmallCap Portfolio to Advantage Global SmallCap Fund. The Board also approved certain changes to the Fund’s investment strategies. These changes became effective on June 12, 2017.
On March 27, 2017, the Board approved a proposal to change the name of Mid Cap Value Opportunities Portfolio to Mid Cap Dividend Fund. The Board also approved certain changes to the Fund’s investment strategies. In addition, Fund management has determined to change the benchmark index against which the Fund compares its performance. These changes became effective on June 12, 2017.
| MANAGED ACCOUNT SERIES | APRIL 30, 2017 | 53 |
| Report of Independent Registered Public Accounting Firm |
To the Board of Trustees of Managed Account Series and the Shareholders of BlackRock U.S. Mortgage Portfolio, Global SmallCap Portfolio and Mid Cap Value Opportunities Portfolio:
We have audited the accompanying statements of assets and liabilities, including the schedules of investments, of BlackRock U.S. Mortgage Portfolio, Global SmallCap Portfolio and Mid Cap Value Opportunities Portfolio (collectively the “Funds”), each a series of Managed Account Series, as of April 30, 2017, and the related statements of operations for the year then ended, the statements of changes in net assets for each of the two years in the period then ended, and the financial highlights for each of the five years in the period then ended. These financial statements and financial highlights are the responsibility of the Funds’ management. Our responsibility is to express an opinion on these financial statements and financial highlights based on our audits.
We conducted our audits in accordance with the standards of the Public Company Accounting Oversight Board (United States). Those standards require that we plan and perform the audit to obtain reasonable assurance about whether the financial statements and financial highlights are free of material misstatement. The Funds are not required to have, nor were we engaged to perform, an audit of their internal control over financial reporting. Our audits included consideration of internal control over financial reporting as a basis for designing audit procedures that are appropriate in the circumstances, but not for the purpose of expressing an opinion on the effectiveness of the Funds’ internal control over financial reporting. Accordingly, we express no such opinion. An audit also includes examining, on a test basis, evidence supporting the amounts and disclosures in the financial statements, assessing the accounting principles used and significant estimates made by management, as well as evaluating the overall financial statement presentation. Our procedures included confirmation of securities owned as of April 30, 2017, by correspondence with the custodians and brokers; where replies were not received from brokers, we performed other auditing procedures. We believe that our audits provide a reasonable basis for our opinion.
In our opinion, the financial statements and financial highlights referred to above present fairly, in all material respects, the financial position of BlackRock U.S. Mortgage Portfolio, Global SmallCap Portfolio and Mid Cap Value Opportunities Portfolio as of April 30, 2017, the results of their operations for the year then ended, the changes in their net assets for each of the two years in the period then ended, and the financial highlights for each of the five years in the period then ended, in conformity with accounting principles generally accepted in the United States of America.
Deloitte & Touche LLP
Philadelphia, Pennsylvania
June 22, 2017
| Important Tax Information (Unaudited) |
During the fiscal year ended April 30, 2017, the following information is provided with respect to distributions paid:
Payable Date/ Month(s) Paid | BlackRock U.S. Mortgage Portfolio | Global SmallCap Portfolio | Mid Cap Value Opportunities Portfolio | |||||||||||
Qualified Dividend Income for Individuals1 | ||||||||||||||
| 7/22/2016 | — | 36.81 | % | 91.76 | % | |||||||||
| 12/12/2016 | — | 41.36 | % | 76.41 | % | |||||||||
Dividends Qualifying for the Dividends | ||||||||||||||
Received Deduction for Corporations1 | 7/22/2016 | — | 14.09 | % | 79.22 | % | ||||||||
| 12/12/2016 | — | 14.09 | % | 79.22 | % | |||||||||
Interest Related Dividends for Non-U.S. Residents2 | May 2016 - December 2016 | 92.82 | % | — | — | |||||||||
| January 2017 - April 2017 | 89.97 | % | — | — | ||||||||||
Long Term Capital Gain Distributions Per Share | ||||||||||||||
| 12/12/2016 | — | — | 0.016944 | |||||||||||
| 1 | The Funds hereby designate the percentage indicated above or the maximum amount allowable by law. |
| 2 | Represents the portion of the taxable ordinary income dividends eligible for exemption from U.S. withholding tax for nonresident aliens and foreign corporations. |
| 54 | MANAGED ACCOUNT SERIES | APRIL 30, 2017 |
| Officers and Trustees |
Name, Address1 and Year of Birth | Position(s) the Trust | Length of Time Served3 | Principal Occupation(s) During Past Five Years | Number of BlackRock- Advised Registered Investment Companies (“RICs”) Consisting of Investment Portfolios (“Portfolios”) Overseen | Public Company and Other Investment Company Directorships Held During Past Five Years | |||||
| Independent Trustees2 | ||||||||||
Robert M. Hernandez 1944 | Chair of the Board and Trustee | Since 2007 | Director, Vice Chairman and Chief Financial Officer of USX Corporation (energy and steel business) from 1991 to 2001; Director, RTI International Metals, Inc. from 1990 to 2015; Director, TE Connectivity (electronics) from 2006 to 2012. | 28 RICs consisting of 98 Portfolios | Chubb Limited (insurance company); Eastman Chemical Company | |||||
James H. Bodurtha 1944 | Trustee | Since 2007 | Director, The China Business Group, Inc. (consulting and investing firm) from 1996 to 2013 and Executive Vice President thereof from 1996 to 2003; Chairman of the Board, Berkshire Holding Corporation since 1980; Director, ICI Mutual since 2010. | 28 RICs consisting of 98 Portfolios | None | |||||
Bruce R. Bond 1946 | Trustee | Since 2007 | Trustee and Member of the Governance Committee, State Street Research Mutual Funds from 1997 to 2005; Board Member of Governance, Audit and Finance Committee, Avaya Inc. (computer equipment) from 2003 to 2007. | 28 RICs consisting of 98 Portfolios | None | |||||
Donald W. Burton 1944 | Trustee | Since 2007 | Managing General Partner, The Burton Partnership, LP (an investment partnership) from 1979 to 2017; Managing General Partner, The Burton Partnership (QP), LP (an investment partnership) since 2000; Managing General Partner, The South Atlantic Venture Funds from 1983 to 2012; Director, IDology, Inc. (technology solutions) since 2006; Director, Knology, Inc. (telecommunications) from 1996 to 2012; Director, Capital Southwest (financial) from 2006 to 2012; Director, Burtons Grill (restaurant) since 2013; Director, PDQ South Texas (restaurant) since 2013; Director, ITC/Talon (data) since 2015. | 28 RICs consisting of 98 Portfolios | None | |||||
Honorable Stuart E. Eizenstat 1943 | Trustee | Since 2007 | Partner and Head of International Practice, Covington and Burling LLP (law firm) since 2001; International Advisory Board Member, The Coca-Cola Company from 2002 to 2011; Advisory Board Member, Veracity Worldwide, LLC (risk management) from 2007 to 2012; Member of the International Advisory Board, GML Ltd. (energy) since 2003. | 28 RICs consisting of 98 Portfolios | Alcatel-Lucent (telecom- munications); Global Specialty Metallurgical; UPS Corporation (delivery service); Ferroglobe (metals) | |||||
Henry Gabbay 1947 | Trustee | Since 2007 | Consultant, BlackRock, Inc. from 2007 to 2008; Managing Director, BlackRock, Inc. from 1989 to 2007; Chief Administrative Officer, BlackRock Advisors, LLC from 1998 to 2007; President of BlackRock Funds and BlackRock Allocation Target Shares (formerly, BlackRock Bond Allocation Target Shares) from 2005 to 2007 and Treasurer of certain closed-end funds in the BlackRock fund complex from 1989 to 2006. | 28 RICs consisting of 98 Portfolios | None | |||||
Lena G. Goldberg 1949 | Trustee | Since 2016 | Senior Lecturer, Harvard Business School since 2008; Executive Vice President, FMR LLC/Fidelity Investments (financial services) from 2007 to 2008, Executive Vice President and General Counsel thereof from 2002 to 2007, Senior Vice President and General Counsel thereof from 1999 to 2002, Vice President and General Counsel thereof from 1997 to 1999, Senior Vice President and Deputy General Counsel thereof in 1997, and Vice President and Corporate Counsel thereof from 1996 to 1997; Partner, Sullivan & Worcester LLP from 1985 to 1996 and Associate thereof from 1979 to 1985. | 28 RICs consisting of 98 Portfolios | None | |||||
Henry R. Keizer 1956 | Trustee | Since 2016 | Director, Park Indemnity Ltd. (captive insurer) since 2010; Director, MUFG Americas Holdings Corporation and MUFG Union Bank, N.A. (financial and bank holding company) from 2014 to 2016; Director, Montpelier Re Holdings, Ltd. (publicly held property and casual reinsurance) from 2013 to 2015; Director, American Institute of Certified Public Accountants from 2009 to 2011; Director, KPMG LLP (audit, tax and advisory services) in 2004 to 2005 and 2010 to 2012; Director, KPMG International in 2012, Deputy Chairman and Chief Operating Officer thereof from 2010 to 2012 and U.S. Vice Chairman of Audit thereof from 2005 to 2010; Global Head of Audit, KPMGI (consortium of KPMG firms) from 2006 to 2010; Director, YMCA of Greater New York from 2006 to 2010. | 28 RICs consisting of 98 Portfolios | Hertz Global Holdings (car rental); WABCO (commercial vehicle safety systems) |
| MANAGED ACCOUNT SERIES | APRIL 30, 2017 | 55 |
| Officers and Trustees (continued) |
| Name, Address1 and Year of Birth | Position(s) Held with the Trust | Length of Time Served3 | Principal Occupation(s) During Past Five Years | Number of BlackRock- Advised Registered Investment Companies (“RICs”) Consisting of Investment Portfolios (“Portfolios”) Overseen | Public Company and Other Investment Company Directorships Held During Past Five Years | |||||
| Independent Trustees2 (concluded) | ||||||||||
John F. O’Brien 1943 | Trustee | Since 2007 | Trustee, Woods Hole Oceanographic Institute since 2003 and Chairman thereof from 2009 to 2015; Co-Founder and Managing Director, Board Leaders LLC (director education) since 2005. | 28 RICs consisting of 98 Portfolios | Cabot Corporation (chemicals); LKQ Corporation (auto parts manufacturing); TJX Companies, Inc. (retailer) | |||||
Donald C. Opatrny 1952 | Trustee | Since 2015 | Trustee, Member of the Executive Committee and Chair of the Investment Committee, Cornell University since 2004; Member of the Board and Investment Committee, University School since 2007; Member of the Investment Committee, Mellon Foundation from 2009 to 2015; President and Trustee, the Center for the Arts, Jackson Hole since 2011; Director, Athena Capital Advisors LLC (investment management firm) since 2013; Trustee and Chair of the Investment Committee, Community Foundation of Jackson Hole since 2014; Trustee, Artstor (a Mellon Foundation affiliate) from 2010 to 2015; President, Trustee and Member of the Investment Committee, The Aldrich Contemporary Art Museum from 2007 to 2014. | 28 RICs consisting of 98 Portfolios | None | |||||
Roberta Cooper Ramo 1942 | Trustee | Since 2007 | Shareholder and Attorney, Modrall, Sperling, Roehl, Harris & Sisk, P.A. (law firm) since 1993; Director, ECMC Group (service provider to students, schools and lenders) since 2001; President, The American Law Institute (non-profit) since 2008; Vice President, Santa Fe Opera (non-profit) since 2011; Chair, Think New Mexico (non-profit) since 2013; Chairman of the Board, Cooper’s Inc. (retail) from 1999 to 2011. | 28 RICs consisting of 98 Portfolios | None | |||||
| Interested Trustees4 | ||||||||||
Robert Fairbairn 1965 | Trustee | Since 2015 | Senior Managing Director of BlackRock, Inc. since 2010; Global Head of BlackRock’s Retail and iShares® businesses since 2012; Member of BlackRock’s Global Executive and Global Operating Committees; Head of BlackRock’s Global Client Group from 2009 to 2012; Chairman of BlackRock’s international businesses from 2007 to 2010. | 28 RICs consisting of 98 Portfolios | None | |||||
John M. Perlowski 1964 | Trustee, President and Chief Executive Officer | Since 2015 (Trustee); Since 2010 (President and Chief Executive Officer) | Managing Director of BlackRock, Inc. since 2009; Head of BlackRock Global Fund & Accounting Services since 2009; Managing Director and Chief Operating Officer of the Global Product Group at Goldman Sachs Asset Management, L.P. from 2003 to 2009; Treasurer of Goldman Sachs Mutual Funds from 2003 to 2009 and Senior Vice President thereof from 2007 to 2009; Director of Goldman Sachs Offshore Funds from 2002 to 2009; Advisory Director of Family Resource Network (charitable foundation) since 2009. | 129 RICs consisting of 318 Portfolios | None | |||||
1 The address of each Trustee is c/o BlackRock, Inc., 55 East 52nd Street, New York, NY 10055.
2 Each Independent Trustee holds office until his or her successor is duly elected and qualifies or until his or her earlier death, resignation, retirement or removal as provided by the Trust’s by-laws or charter or statute, or until December 31 of the year in which he or she turns 75. The Board may determine to extend the terms of Independent Trustees on a case-by-case basis, as appropriate. Interested Trustees serve until their successor is duly elected and qualifies or until their earlier death, resignation, retirement or removal as provided by the Trust’s by-laws or statute, or until December 31 of the year in which they turn 72.
3 Following the combination of Merrill Lynch Investment Managers, L.P. (“MLIM”) and BlackRock, Inc. in September 2006, the various legacy MLIM and legacy BlackRock fund boards were realigned and consolidated into three new fund boards in 2007. As a result, although the chart shows certain Independent Trustees as joining the Trust’s board in 2007, those Trustees first became members of the boards of other legacy MLIM or legacy BlackRock funds as follows: James H.Bodurtha, 1995; Bruce R. Bond, 2005; Donald W. Burton, 2002; Honorable Stuart E. Eizenstat, 2001; Robert M. Hernandez, 1996; John F. O’Brien, 2005; and Roberta Cooper Ramo, 1999.
4 Messrs. Fairbairn and Perlowski are both “interested persons,” as defined in the 1940 Act, of the Trust based on their positions with BlackRock, Inc. and its affiliates. Mr. Perlowski is also a board member of the BlackRock Closed-End Complex and the BlackRock Equity-Liquidity Complex. | ||||||||||
| 56 | MANAGED ACCOUNT SERIES | APRIL 30, 2017 |
| Officers and Trustees (concluded) |
| Name, Address1 and Year of Birth | Position(s) Held with the Trust | Length of Time Served as an Officer | Principal Occupation(s) During Past Five Years | |||
| Officers Who Are Not Trustees2 | ||||||
Jennifer McGovern 1977 | Vice President | Since 2014 | Managing Director of BlackRock, Inc. since 2016; Director of BlackRock, Inc. from 2011 to 2015; Head of Product Structure and Oversight for BlackRock’s U.S. Wealth Advisory Group since 2013; Vice President of BlackRock, Inc. from 2008 to 2010. | |||
| Neal J. Andrews 1966 | Chief Financial Officer | Since 2007 | Managing Director of BlackRock, Inc. since 2006; Senior Vice President and Line of Business Head of Fund Accounting and Administration at PNC Global Investment Servicing (U.S.) Inc. from 1992 to 2006. | |||
Jay M. Fife 1970 | Treasurer | Since 2007 | Managing Director of BlackRock, Inc. since 2007; Director of BlackRock, Inc. in 2006; Assistant Treasurer of the MLIM and Fund Asset Management, L.P. advised funds from 2005 to 2006; Director of MLIM Fund Services Group from 2001 to 2006. | |||
Charles Park 1967 | Chief Compliance Officer | Since 2014 | Anti-Money Laundering Compliance Officer for the BlackRock-advised Funds in the Equity-Bond Complex, the Equity-Liquidity Complex and the Closed-End Complex from 2014 to 2015; Chief Compliance Officer of BlackRock Advisors, LLC and the BlackRock-advised Funds in the Equity-Bond Complex, the Equity-Liquidity Complex and the Closed-End Complex since 2014; Principal of and Chief Compliance Officer for iShares® Delaware Trust Sponsor LLC since 2012 and BlackRock Fund Advisors (“BFA”) since 2006; Chief Compliance Officer for the BFA-advised iShares® exchange traded funds since 2006; Chief Compliance Officer for BlackRock Asset Management International Inc. since 2012. | |||
Fernanda Piedra 1969 | Anti-Money Laundering Compliance Officer | Since 2015 | Director of BlackRock, Inc. since 2014; Anti-Money Laundering Compliance Officer and Regional Head of Financial Crime for the Americas at BlackRock, Inc. since 2014; Head of Regulatory Changes and Remediation for the Asset Wealth Management Division of Deutsche Bank from 2010 to 2014; Vice President of Goldman Sachs (Anti-Money Laundering/Suspicious Activities Group) from 2004 to 2010. | |||
Benjamin Archibald 1975 | Secretary | Since 2012 | Managing Director of BlackRock, Inc. since 2014; Director of BlackRock, Inc. from 2010 to 2013; Secretary of the iShares® exchange traded funds since 2015; Secretary of the BlackRock-advised mutual funds since 2012. | |||
1 The address of each Officer is c/o BlackRock, Inc., 55 East 52nd Street, New York, NY 10055.
2 Officers of the Trust serve at the pleasure of the Board. | ||||||
| Further information about the Trust’s Officers and Trustees is available in the Funds’ Statement of Additional Information, which can be obtained without charge by calling (800) 441-7762. | ||||||
Effective January 31, 2017, David H. Walsh and Fred G. Weiss retired as Trustees of the Trust.
Investment Adviser BlackRock Advisors, LLC Wilmington, DE 19809 | Custodians The Bank of New York Mellon1 New York, NY 10286 | Accounting Agent and Transfer Agent BNY Mellon Investment Servicing (US) Inc. Wilmington, DE 19809 | Address of the Funds 100 Bellevue Parkway Wilmington, DE 19809 | |||
Brown Brothers Harriman & Co.2 Boston, MA 02109 | ||||||
Independent Registered Public Deloitte & Touche LLP Philadelphia, PA 19103 | Distributor BlackRock Investments, LLC New York, NY 10022 | Legal Counsel Willkie Farr & Gallagher LLP New York, NY 10019 | ||||
1 For BlackRock U.S. Mortgage Portfolio.
2 For Global SmallCap Portfolio and Mid Cap Value Opportunities Portfolio. | ||||||
| MANAGED ACCOUNT SERIES | APRIL 30, 2017 | 57 |
| Additional Information |
| General Information |
Householding
The Funds will mail only one copy of shareholder documents, including prospectuses, annual and semi-annual reports and proxy statements, to shareholders with multiple accounts at the same address. This practice is commonly called “householding” and is intended to reduce expenses and eliminate duplicate mailings of shareholder documents. Mailings of your shareholder documents may be householded indefinitely unless you instruct us otherwise. If you do not want the mailing of these documents to be combined with those for other members of your household, please call the Funds at (800) 441-7762.
Availability of Quarterly Schedule of Investments
The Funds file their complete schedule of portfolio holdings with the SEC for the first and third quarters of each fiscal year on Form N-Q. The Funds’ Forms N-Q are available on the SEC’s website at http://www.sec.gov and may also be reviewed and copied at the SEC’s Public Reference Room in Washington, D.C. Information on the operation of the Public Reference Room or how to access documents on the SEC’s website without charge may be obtained by calling (800) SEC-0330. The Funds’ Forms N-Q may also be obtained upon request and without charge by calling (800) 441-7762.
Availability of Proxy Voting Policies and Procedures
A description of the policies and procedures that the Funds use to determine how to vote proxies relating to portfolio securities is available upon request and without charge (1) by calling (800) 441-7762; (2) at http://www.blackrock.com; and (3) on the SEC’s website at http://www.sec.gov.
Availability of Proxy Voting Record
Information about how the Funds voted proxies relating to securities held in the Funds’ portfolios during the most recent 12-month period ended June 30 is available, upon request and without charge (1)at http://www.blackrock.com, or by calling (800) 441-7762 and (2) on the SEC’s website at http://www.sec.gov.
BlackRock’s Mutual Fund Family
BlackRock offers a diverse lineup of open-end mutual funds crossing all investment styles and managed by experts in equity, fixed income and tax-exempt investing. Visit BlackRock online at http://www.blackrock.com for more information.
| Shareholder Privileges |
Account Information
Call us at (800) 441-7762 from 8:00 AM to 6:00 PM ET on any business day to get information about your account balances, recent transactions and share prices. You can also reach us on the Web at http://www.blackrock.com/funds.
Automatic Investment Plans
Investor Class shareholders who want to invest regularly can arrange to have $50 or more automatically deducted from their checking or savings account and invested in any of the BlackRock funds.
Systematic Withdrawal Plans
Investor Class shareholders can establish a systematic withdrawal plan and receive periodic payments of $50 or more from their BlackRock funds, as long as their account balance is at least $10,000.
Retirement Plans
Shareholders may make investments in conjunction with Traditional, Rollover, Roth, Coverdell, Simple IRAs, SEP IRAs and 403(b) Plans.
| 58 | MANAGED ACCOUNT SERIES | APRIL 30, 2017 |
| Additional Information (concluded) |
| BlackRock Privacy Principles |
BlackRock is committed to maintaining the privacy of its current and former fund investors and individual clients (collectively, “Clients”) and to safeguarding their non-public personal information. The following information is provided to help you understand what personal information BlackRock collects, how we protect that information and why in certain cases we share such information with select parties.
If you are located in a jurisdiction where specific laws, rules or regulations require BlackRock to provide you with additional or different privacy-related rights beyond what is set forth below, then BlackRock will comply with those specific laws, rules or regulations.
BlackRock obtains or verifies personal non-public information from and about you from different sources, including the following: (i) information we receive from you or, if applicable, your financial intermediary, on applications, forms or other documents; (ii) information about your transactions with us, our affiliates, or others; (iii) information we receive from a consumer reporting agency; and (iv) from visits to our websites.
BlackRock does not sell or disclose to non-affiliated third parties any non-public personal information about its Clients, except as permitted by law or as is necessary to respond to regulatory requests or to service Client accounts. These non-affiliated third parties are required to protect the confidentiality and security of this information and to use it only for its intended purpose.
We may share information with our affiliates to service your account or to provide you with information about other BlackRock products or services that may be of interest to you. In addition, BlackRock restricts access to non-public personal information about its Clients to those BlackRock employees with a legitimate business need for the information. BlackRock maintains physical, electronic and procedural safeguards that are designed to protect the non-public personal information of its Clients, including procedures relating to the proper storage and disposal of such information.
| MANAGED ACCOUNT SERIES | APRIL 30, 2017 | 59 |
This report is intended for current holders. It is not authorized for use as an offer of sale or a solicitation of an offer to buy shares of a Fund unless preceded or accompanied by the Fund’s current prospectus. Past performance results shown in this report should not be considered a representation of future performance. Investment returns and principal value of shares will fluctuate so that shares, when redeemed, may be worth more or less than their original cost. Statements and other information herein are as dated and are subject to change.
Shares of each Fund, except BlackRock U.S. Mortgage Portfolio, may be purchased and held only by or on behalf of separately managed account clients who have retained BlackRock Advisors, LLC or an affiliate (“BlackRock”) to manage their accounts pursuant to an investment management agreement with BlackRock and/or a managed account program sponsor.

MAS-4/17-AR |  | |
| Item 2 – | Code of Ethics – The registrant (or the “Fund”) has adopted a code of ethics, as of the end of the period covered by this report, applicable to the registrant’s principal executive officer, principal financial officer, principal accounting officer or controller, or persons performing similar functions. During the period covered by this report, the code of ethics was amended to update certain information and to make other non-material changes. During the period covered by this report, there have been no waivers granted under the code of ethics. The registrant undertakes to provide a copy of the code of ethics to any person upon request, without charge, by calling 1-800-441-7762. |
| Item 3 – | Audit Committee Financial Expert – The registrant’s board of trustees (the “board of trustees”), has determined that (i) the registrant has the following audit committee financial experts serving on its audit committee and (ii) each audit committee financial expert is independent: |
Robert M. Hernandez
Henry P. Keizer
Stuart E. Eizenstat
Bruce R. Bond
Under applicable securities laws, a person determined to be an audit committee financial expert will not be deemed an “expert” for any purpose, including without limitation for the purposes of Section 11 of the Securities Act of 1933, as a result of being designated or identified as an audit committee financial expert. The designation or identification of a person as an audit committee financial expert does not impose on such person any duties, obligations, or liabilities greater than the duties, obligations, and liabilities imposed on such person as a member of the audit committee and board of trustees in the absence of such designation or identification.
| Item 4 – | Principal Accountant Fees and Services |
The following table presents fees billed by Deloitte & Touche LLP (“D&T”) in each of the last two fiscal years for the services rendered to the Fund:
| (a) Audit Fees | (b) Audit-Related Fees1 | (c) Tax Fees2 | (d) All Other Fees | |||||||||||||
| Entity Name | Current Fiscal Year | Previous Fiscal Year | Current Fiscal Year End | Previous Fiscal Year End | Current Fiscal Year End | Previous Fiscal Year End | Current Fiscal Year End | Previous Fiscal Year End | ||||||||
| Advantage Global SmallCap Fund (Formerly Global SmallCap Portfolio) | $28,169 | $29,389 | $0 | $0 | $14,058 | $13,596 | $0 | $0 | ||||||||
| Mid Cap Dividend Fund (Formerly Mid Cap Value Opportunities Portfolio) | $27,863 | $29,083 | $0 | $0 | $14,007 | $13,107 | $0 | $0 | ||||||||
| BlackRock U.S. Mortgage Portfolio | $31,850 | $36,198 | $0 | $0 | $14,841 | $14,841 | $0 | $0 | ||||||||
The following table presents fees billed by D&T that were required to be approved by the registrant’s audit committee (the “Committee”) for services that relate directly to the operations or financial reporting of the Fund and that are rendered on behalf of BlackRock Advisors, LLC (“Investment Adviser” or “BlackRock”) and entities controlling, controlled by, or under common control with BlackRock (not including any sub-adviser whose role is primarily portfolio management and is
2
subcontracted with or overseen by another investment adviser) that provide ongoing services to the Fund (“Affiliated Service Providers”):
| Current Fiscal Year End | Previous Fiscal Year End | |||
(b) Audit-Related Fees1 | $0 | $0 | ||
(c) Tax Fees2 | $0 | $0 | ||
(d) All Other Fees3 | $2,129,000 | $2,154,000 |
1 The nature of the services includes assurance and related services reasonably related to the performance of the audit or review of financial statements not included in Audit Fees, including accounting consultations, agreed-upon procedure reports, attestation reports, comfort letters, out-of-pocket expenses and internal control reviews not required by regulators.
2 The nature of the services includes tax compliance and/or tax preparation, including services relating to the filing or amendment of federal, state or local income tax returns, regulated investment company qualification reviews, taxable income and tax distribution calculations.
3 Non-audit fees of $2,129,000 and $2,154,000 for the current fiscal year and previous fiscal year, respectively, were paid to the Fund’s principal accountant in their entirety by BlackRock, in connection with services provided to the Affiliated Service Providers of the Fund and of certain other funds sponsored and advised by BlackRock or its affiliates for a service organization review and an accounting research tool subscription. These amounts represent aggregate fees paid by BlackRock and were not allocated on a per fund basis.
(e)(1) Audit Committee Pre-Approval Policies and Procedures:
The Committee has adopted policies and procedures with regard to the pre-approval of services. Audit, audit-related and tax compliance services provided to the registrant on an annual basis require specific pre-approval by the Committee. The Committee also must approve other non-audit services provided to the registrant and those non-audit services provided to the Investment Adviser and Affiliated Service Providers that relate directly to the operations and the financial reporting of the registrant. Certain of these non-audit services that the Committee believes are (a) consistent with the SEC’s auditor independence rules and (b) routine and recurring services that will not impair the independence of the independent accountants may be approved by the Committee without consideration on a specific case-by-case basis (“general pre-approval”). The term of any general pre-approval is 12 months from the date of the pre-approval, unless the Committee provides for a different period. Tax or other non-audit services provided to the registrant which have a direct impact on the operations or financial reporting of the registrant will only be deemed pre-approved provided that any individual project does not exceed $10,000 attributable to the registrant or $50,000 per project. For this purpose, multiple projects will be aggregated to determine if they exceed the previously mentioned cost levels.
Any proposed services exceeding the pre-approved cost levels will require specific pre-approval by the Committee, as will any other services not subject to general pre-approval (e.g., unanticipated but permissible services). The Committee is informed of each service approved subject to general pre-approval at the next regularly scheduled in-person board meeting. At this meeting, an analysis of such services is presented to the Committee for ratification. The Committee may delegate to the Committee Chairman the authority to approve the provision of and fees for any specific engagement of permitted non-audit services, including services exceeding pre-approved cost levels.
(e)(2) None of the services described in each of Items 4(b) through (d) were approved by the Committee pursuant to the de minimis exception in paragraph (c)(7)(i)(C) of Rule 2-01 of Regulation S-X.
(f) Not Applicable
3
(g) The aggregate non-audit fees, defined as the sum of the fees shown under “Audit-Related Fees,” “Tax Fees” and “All Other Fees,” paid to the accountant for services rendered by the accountant to the registrant, the Investment Adviser and the Affiliated Service Providers were:
| Entity Name | Current Fiscal Year End | Previous Fiscal Year End | ||
| Advantage Global SmallCap Fund (Formerly Global SmallCap Portfolio) | $14,058 | $13,596 | ||
| Mid Cap Dividend Fund (Formerly Mid Cap Value Opportunities Portfolio) | $14,007 | $13,107 | ||
| BlackRock U.S. Mortgage Portfolio | $14,841 | $14,841 |
Additionally, the amounts billed by D&T in connection with services provided to the Affiliated Service Providers of the Fund and of other funds sponsored and advised by BlackRock or its affiliates during the current and previous fiscal years for a service organization review and an accounting research tool subscription were:
Current Fiscal Year End | Previous Fiscal Year End | |
$2,129,000 | $2,154,000 |
These amounts represent aggregate fees paid by BlackRock and were not allocated on a per fund basis.
(h) The Committee has considered and determined that the provision of non-audit services that were rendered to the Investment Adviser and the Affiliated Service Providers that were not pre-approved pursuant to paragraph (c)(7)(ii) of Rule 2-01 of Regulation S-X is compatible with maintaining the principal accountant’s independence.
| Item 5 – | Audit Committee of Listed Registrants – Not Applicable |
| Item 6 – | Investments |
(a) The registrant’s Schedule of Investments is included as part of the Report to Stockholders filed under Item 1 of this Form.
(b) Not Applicable due to no such divestments during the semi-annual period covered since the previous Form N-CSR filing.
| Item 7 – | Disclosure of Proxy Voting Policies and Procedures for Closed-End Management Investment Companies – Not Applicable |
| Item 8 – | Portfolio Managers of Closed-End Management Investment Companies – Not Applicable |
| Item 9 – | Purchases of Equity Securities by Closed-End Management Investment Company and Affiliated Purchasers – Not Applicable |
4
| Item 10 – | Submission of Matters to a Vote of Security Holders – There have been no material changes to these procedures. |
| Item 11 – | Controls and Procedures |
(a) The registrant’s principal executive and principal financial officers, or persons performing similar functions, have concluded that the registrant’s disclosure controls and procedures (as defined in Rule 30a-3(c) under the Investment Company Act of 1940, as amended (the “1940 Act”)) are effective as of a date within 90 days of the filing of this report based on the evaluation of these controls and procedures required by Rule 30a-3(b) under the 1940 Act and Rule 15d-15(b) under the Securities Exchange Act of 1934, as amended.
(b) There were no changes in the registrant’s internal control over financial reporting (as defined in Rule 30a-3(d) under the 1940 Act) that occurred during the second fiscal quarter of the period covered by this report that have materially affected, or are reasonably likely to materially affect, the registrant’s internal control over financial reporting.
| Item 12 – | Exhibits attached hereto |
(a)(1) Code of Ethics – See Item 2
(a)(2) Certifications – Attached hereto
(a)(3) Not Applicable
(b) Certifications – Attached hereto
5
Pursuant to the requirements of the Securities Exchange Act of 1934 and the Investment Company Act of 1940, the registrant has duly caused this report to be signed on its behalf by the undersigned, thereunto duly authorized.
| Managed Account Series | ||||||
| By: | /s/ John M. Perlowski | |||||
| John M. Perlowski | ||||||
| Chief Executive Officer (principal executive officer) of | ||||||
| Managed Account Series | ||||||
| Date: July 5, 2017 | ||||||
| Pursuant to the requirements of the Securities Exchange Act of 1934 and the Investment Company Act of 1940, this report has been signed below by the following persons on behalf of the registrant and in the capacities and on the dates indicated. | ||||||
| By: | /s/ John M. Perlowski | |||||
| John M. Perlowski | ||||||
| Chief Executive Officer (principal executive officer) of | ||||||
| Managed Account Series | ||||||
| Date: July 5, 2017 | ||||||
| By: | /s/ Neal J. Andrews | |||||
| Neal J. Andrews | ||||||
| Chief Financial Officer (principal financial officer) of | ||||||
| Managed Account Series | ||||||
| Date: July 5, 2017 | ||||||
6