Table of Contents
As filed with the Securities and Exchange Commission on May 15, 2006
Registration No. 333-124287
SECURITIES AND EXCHANGE COMMISSION
Washington, D.C. 20549
Amendment No. 8
to
Form S-1
REGISTRATION STATEMENT
UNDER
THE SECURITIES ACT OF 1933
HEXION SPECIALTY CHEMICALS, INC.
(Exact name of registrant as specified in charter)
| New Jersey | 2821 | 13-0511250 | ||
(State or other jurisdiction of incorporation or organization) | (Primary Standard Industrial Classification Code Number) | (I.R.S. Employer Identification Number) |
180 East Broad Street
Columbus, Ohio 43215
(614) 225-4000
(Address, including zip code, and telephone number, including area code, of registrants’ principal executive offices)
Ellen German Berndt, Esq.
180 East Broad Street
Columbus, Ohio 43215
(614) 225-4000
(Name, address, including zip code, and telephone number, including area code, of agent for service of process)
With a copy to:
William B. Kuesel, Esq. O’Melveny & Myers LLP 7 Times Square New York, New York 10036 (212) 326-2000 | Kris F. Heinzelman, Esq. LizabethAnn R. Eisen, Esq. Cravath, Swaine & Moore LLP 825 Eighth Avenue New York, New York 10019 (212) 474-1000 |
Approximate date of commencement of proposed sale to the public: As soon as practicable after this Registration Statement becomes effective.
If any of the securities being registered on this Form are to be offered on a delayed or continuous basis pursuant to Rule 415 under the Securities Act of 1933, check the following box. ¨
If this Form is filed to register additional securities for an offering pursuant to Rule 462(b) under the Securities Act, please check the following box and list the Securities Act registration statement number of the earlier effective registration statement for the same offering. ¨
If this Form is a post-effective amendment filed pursuant to Rule 462(c) under the Securities Act, check the following box and list the Securities Act registration statement number of the earlier effective registration statement for the same offering. ¨
If this Form is a post-effective amendment filed pursuant to Rule 462(d) under the Securities Act, check the following box and list the Securities Act registration statement number of the earlier effective registration statement for the same offering. ¨
CALCULATION OF REGISTRATION FEE
Title of each Class of Securities to be Registered | Proposed Maximum Aggregate Offering Price(1)(2) | Amount of Registration Fee(3) | ||
Common Stock, par value $0.01 per share (4) | $596,296,312 | $63,803.71 |
| (1) | Estimated solely for the purpose of calculating the amount of the registration fee pursuant to Rule 457(o) under the Securities Act. |
| (2) | The proposed maximum offering price of each security will be determined by the registrant in connection with, and at the time of, the issuance of the securities. |
| (3) | Previously paid $94,160 by wire transfer on April 22, 2005. |
| (4) | Includes shares of common stock that the underwriters have the option to purchase to cover over-allotments, if any. |
The registrant hereby amends this registration statement on such date or dates as may be necessary to delay its effective date until the registrant shall file a further amendment which specifically states that this registration statement shall thereafter become effective in accordance with Section 8(a) of the Securities Act of 1933 or until the registration statement shall become effective on such date as the Commission acting pursuant to said Section 8(a), may determine.
Table of Contents
The information in this prospectus is not complete and may be changed. We and the selling shareholder may not sell these securities until the registration statement filed with the Securities and Exchange Commission is effective. This prospectus is not an offer to sell these securities and it is not soliciting an offer to buy these securities in any state where the offer or sale is not permitted.
SUBJECT TO COMPLETION, DATED MAY 15, 2006
18,518,519 Shares

HEXION SPECIALTY CHEMICALS, INC.
Common Stock
Prior to this offering, there has been no public market for our common stock. The initial public offering price of our common stock is expected to be between $26.00 and $28.00. Our common stock has been approved for listing on the New York Stock Exchange under the symbol “HXN.”
We are selling 3,703,704 shares of common stock, and Hexion LLC, our parent (the “selling shareholder”), is selling 14,814,815 shares. We will not receive any of the proceeds from the sale of the shares being sold by the selling shareholder. We intend to use all of the net proceeds from the sale of common stock being sold by us together with available cash to repay certain indebtedness.
The underwriters have an option to purchase a maximum of 2,777,778 additional shares of common stock from the selling shareholder to cover over-allotments of shares of common stock.
Investing in our common stock involves risks. See “Risk Factors” beginning on page 19.
| Price to Public | Underwriting Discounts and Commissions | Proceeds to Hexion Specialty | Proceeds to Selling Shareholder | |||||
Per Share | $ | $ | $ | $ | ||||
Total | $ | $ | $ | $ |
Delivery of the shares of common stock will be made on or about , 2006.
Neither the Securities and Exchange Commission nor any state securities commission has approved or disapproved of these securities or determined if this prospectus is truthful or complete. Any representation to the contrary is a criminal offense.
| Credit Suisse | Goldman, Sachs & Co. | |||||
| JPMorgan | Lehman Brothers | |||||
Bear, Stearns & Co. Inc.
Citigroup
Deutsche Bank Securities
Morgan Stanley
UBS Investment Bank
William Blair & Company
KeyBanc Capital Markets
The date of this prospectus is , 2006.
Table of Contents

Table of Contents
| 1 | ||
| 19 | ||
| 36 | ||
| 38 | ||
| 39 | ||
| 40 | ||
| 41 | ||
| 43 | ||
| 53 | ||
MANAGEMENT’S DISCUSSIONAND ANALYSISOF FINANCIAL CONDITIONAND RESULTSOF OPERATIONS | 56 | |
| 89 |
| 111 | ||
| 127 | ||
| 130 | ||
| 140 | ||
| 149 | ||
| 154 | ||
| 156 | ||
| 159 | ||
| 166 | ||
| 166 | ||
| 167 | ||
| F-1 |
You should rely only on the information contained in this document or to which we have referred you. We have not authorized anyone to provide you with information that is different. This document may only be used where it is legal to sell these securities. The information in this document may only be accurate on the date of this document.
Dealer Prospectus Delivery Obligation
Until , 2006 (25 days after commencement of the offering), all dealers that effect transactions in these securities, whether or not participating in this offering, may be required to deliver a prospectus. This is in addition to the dealers’ obligations to deliver a prospectus when acting as underwriters and with respect to unsold allotments or subscriptions.
i
Table of Contents
Market, Industry and Financial Data
This prospectus includes industry data that we obtained from periodic industry publications and internal company surveys. This prospectus includes market share and industry data that we prepared primarily based on management’s knowledge of the industry and industry data. Industry publications and surveys generally state that the information contained therein has been obtained from sources believed to be reliable.
Unless otherwise noted, statements as to our market share and market position relative to our competitors are approximated and based on management estimates using the above-mentioned latest-available third-party data and internal analysis and estimates. The global thermoset resins market is approximately $34 billion in annual sales. We based our market estimates on the $19 billion market for the product areas of the global thermoset resins market upon which we focus.
We determined our market share and market positions utilizing periodic industry publications. If we were unable to obtain relevant periodic industry publications, we based our estimates on our knowledge of the size of our markets, our sales in each of these markets and publicly available information regarding our competitors, as well as internal estimates of competitors’ sales based on discussion with our sales force and other industry participants.
Except as may otherwise be noted in this prospectus, all financial and other data for the year ended December 31, 2005 and the three months ended March 31, 2005 and 2006 presented herein give pro forma effect to the Hexion Formation, the Hexion Refinancings and the offering (each, as defined in “Prospectus Summary—Hexion Specialty Chemicals, Inc.—The Prior Transactions, the Hexion Formation and the Hexion Refinancings”), including the application of the net proceeds to the Company therefrom, as if they each had occurred on January 1, 2005, and all financial and other data as of March 31, 2006 presented herein give pro forma effect to the Hexion Refinancings and the offering, including the application of the net proceeds to the Company therefrom, as if they each had occurred on March 31, 2006 (with the financial and other data as of March 31, 2006 already reflecting the Hexion Formation, the Rhodia Acquisition, the Rohm and Haas Acquisition and the Brazilian Consumer Divestiture (each as defined in “Prospectus Summary—Recent Acquisitions and Divestiture”)). Except as may otherwise be noted in this prospectus, all financial and other data for the year ended December 31, 2005 and the three months ended March 31, 2005 does not give effect to the Akzo Acquisition, the Rhodia Acquisition, the Rohm and Haas Acquisition or the Brazilian Consumer Divestiture. Except as may otherwise be noted in this prospectus, all financial and other data for the three months ended and as of March 31, 2006 gives effect to the Rhodia Acquisition and the Rohm and Haas Acquisition from the respective dates of acquisition, but does not give effect to the Akzo Acquisition, which is expected to be completed during the second quarter.
ii
Table of Contents
This summary highlights information about Hexion Specialty Chemicals, Inc. and the offering contained elsewhere in this prospectus. It is not complete and may not contain all the information that may be important to you. You should carefully read the entire prospectus before making an investment decision, especially the information presented under the heading “Risk Factors.” In this prospectus, except as otherwise indicated herein, or as the context may otherwise require (i) all references to “Borden Chemical” refer to Borden Chemical, Inc. and its subsidiaries prior to the Hexion Formation (as defined in “—Hexion Specialty Chemicals, Inc.—The Prior Transactions, the Hexion Formation and the Hexion Refinancings”), (ii) all references to “Resolution Performance” refer to Resolution Performance Products Inc. and its subsidiaries prior to the Hexion Formation, provided that with respect to financial data, all references to “Resolution Performance” refer to Resolution Performance Products LLC, a former wholly-owned operating subsidiary of Resolution Performance Products Inc., and its subsidiaries, (iii) all references to “Resolution Specialty” refer to Resolution Specialty Materials Inc. and its subsidiaries prior to the Hexion Formation and (iv) all references to “Bakelite” refer to Bakelite Aktiengesellschaft and its subsidiaries prior to the Bakelite Transaction.
Hexion Specialty Chemicals, Inc.
Overview
We are the world’s largest producer of thermosetting resins, or thermosets. Thermosets are a critical ingredient for virtually all paints, coatings, glues and other adhesives produced for consumer or industrial uses. We are focused on providing a broad array of thermosets and associated technologies, with leading market positions in all key markets served. Our breadth of related products provides us with significant advantages across our operations, technologies and commercial organizations, while our scale provides us with significant efficiencies in our fixed and variable cost structure, allowing us to compete effectively throughout the value chain. In areas where it is advantageous, we are able to internally produce strategic raw materials, providing us with a lower cost operating structure and security of supply. Our value-added, technical service-oriented business model enables us to effectively participate in high-end specialty markets, while our scale enables us to extract value from higher volume applications.
Thermosets are developed to meet the performance characteristics required for each specific end use product. The type of thermoset used and how it is formulated, applied and cured determines the key attributes, such as durability, gloss, heat resistance, adhesion or strength of the final product. Hexion has the broadest range of thermoset resin technologies, with world class research, applications development and technical service capabilities. The total global thermoset resins market is approximately $34 billion in annual sales and includes products such as polyurethanes, urea-formaldehyde, phenol-formaldehyde, unsaturated polyesters, epoxies and melamine-formaldehyde. The key product areas of the global thermoset resins market upon which we focus and in which we have leading market positions is approximately $19 billion in annual sales, which excludes polyurethanes, unsaturated polyesters and furans/other.
Our products are used in thousands of applications and are sold into diverse markets, such as forest products, architectural and industrial paints, packaging, consumer products and automotive coatings, as well as higher growth markets, such as composites, UV cured coatings and electrical laminates. As of March 31, 2006, we had 94 production sites globally, and produce many of our key products locally in North America, Latin America, Europe and Asia. Through our worldwide network of strategically located production facilities, we serve more than 10,000 customers in over 100 countries. Our global customers include leading companies in their respective industries, such as 3M, Ainsworth, Ashland Inc., BASF, Bayer, DuPont, GE, Halliburton, Honeywell, Huntsman, Louisiana- Pacific, Owens Corning, PPG Industries, Sumitomo, Sun Chemical, Valspar and Weyerhaeuser.
Hexion was formed on May 31, 2005 through the combination of Borden Chemical (including Bakelite), Resolution Performance and Resolution Specialty. We believe the consolidation of these entities will provide us
1
Table of Contents
with significant opportunities for growth through global product line management, as well as considerable opportunities to increase operational efficiencies, reduce fixed costs, optimize manufacturing assets and improve the efficiency of capital spending. In 2005 and for the three months ended March 31, 2006, on a pro forma basis, we generated pro forma net sales of $4.7 billion and $1.2 billion, respectively. In 2005, 58% of our pro forma net sales were derived from sales to North America, 32% to Western Europe and 10% to Asia-Pacific, Latin America, Eastern Europe and other emerging markets. As of March 31, 2006, after giving pro forma effect to the Hexion Refinancings and the offering, we would have had $2.7 billion principal amount of outstanding indebtedness and $0.1 billion of cash and equivalents.
Our Business
Our organizational structure is based on the products we offer and the markets we serve and at March 31, 2006 consisted of four operating divisions that are directly aligned with our reportable segments: Epoxy and Phenolic Resins, Formaldehyde and Forest Products Resins, Coatings and Inks, and Performance Products. The thermosets produced in each of our operating divisions and segments are used in two primary applications: adhesive & structural and coating. The table below illustrates our pro forma net sales to external customers for the year ended December 31, 2005 segregated by our two primary applications as well as the major product lines, major industry sectors, major end-use markets and key differentiating characteristics relative to each primary application.
Adhesive & Structural | Coating | |||
2005 Pro Forma Net Sales | $3.4 billion | $1.3 billion | ||
Major Products | • Formaldehyde based resins and intermediates • Epoxy resins and intermediates • Composite resins • Phenolic encapsulated substrates • Molding compounds | • Epoxy coating resins • Polyester resins • Alkyd resins • Acrylic resins • Ink resins and additives • Versatic acids and derivatives | ||
Major Industry Sectors Served | • Wood products and furniture • Transportation and industrial • Electrical equipment and appliances • Electronic products • Oil and gas field support • Marine and recreational (boats, RVs) • Chemical manufacturing | • Home building and maintenance • Transportation and industrial • Electrical equipment and appliances • Furniture • Printing • Chemical manufacturing | ||
Major End-Use Markets | • Plywood, particleboard, OSB, MDF • Carbon and glass fiber composites • Automotive friction materials • Furniture • Construction • Electrical laminates • Foundry • Oil and gas field proppants | • Decorative paints • Auto coatings • Marine and industrial coatings • Construction and maintenance coatings • Printing inks • Specialty coatings | ||
Key Characteristics of Resins | • Strength • Adhesion • Resistance (heat, water, electricity) | • Durability • Gloss and color retention • Resistance (water, UV, corrosion, temperature) • Strength | ||
2
Table of Contents
Adhesive & Structural Products and Market Applications
We are a leading global supplier of thermosets used in adhesive and structural applications. These products are used in a variety of end-markets including residential, commercial and industrial construction and repair/remodeling, furniture manufacture, automotive, oil and gas, chemicals and electronics. In 2005, sales of products used in adhesive & structural applications contributed approximately $3.4 billion to our total pro forma net sales. Our key products serving adhesive & structural applications include:
| • | Formaldehyde Based Resins and Intermediates. We are the leading producer of formaldehyde based resins for the forest products industry in North America with a 44% market share by volume and also hold significant positions in Europe, Latin America and Australia. Our products are used in a wide range of applications in the construction, automotive, electronics, oil drilling and steel industries. We are also the world’s largest producer of specialty phenolic resins and formaldehyde. We internally consume the majority of our formaldehyde production, giving us a significant competitive advantage. |
| • | Epoxy Resins and Intermediates. We are the world’s largest supplier of epoxy resins. Epoxy resins comprise the fundamental building blocks of many types of materials, such as formulated composite resins and structural adhesives and are often used in the auto, aerospace and electronics industries due to their unparalleled strength and durability. We also provide complementary products such as epoxy modifiers, curing agents, reactive diluents and specialty liquids. |
| • | Composite Resins. We are a leading producer of resins used in composites. Composites are a fast growing class of materials which are used in a wide variety of applications ranging from airframes and windmill blades to golf clubs. We supply epoxy resins to fabricators in the aerospace, sporting goods and pipe markets with a 50% market share in the United States and a 44% market share in Europe. In addition to epoxy, we manufacture resins from unsaturated polyester (UPR), which are generally combined with fiberglass for applications ranging from boat hulls to bathroom fixtures. |
| • | Phenolic Encapsulated Substrates. We are a leading producer of phenolic encapsulated sand and ceramic substrates used in oil field services and foundry applications. Our highly specialized compounds are designed to perform under extreme conditions, such as intense heat, high-stress and corrosive environments. In the oil field services industry we have a 45% global market share in resin encapsulated proppants, which are used to enhance oil and gas recovery rates and extend well life. We are also the leading producer by volume of foundry resins in North America with a 48% market share. Our foundry resin systems are used by major automotive and industrial companies for precision casting. |
| • | Molding Compounds. We are the leading producer of molding compounds in Europe, with an estimated market share of 64%. We formulate and produce a wide range of phenolic, polyester and epoxy compounds used to manufacture components requiring heat stability, electrical insulation, fire resistance and durability. |
Coating Products and Market Applications
We are also a leading global supplier of resins used in surface coating applications. Our coating products are used by customers in a variety of end-markets including architectural coatings, civil engineering, electronics, automotive and a wide variety of applications in the industrial and consumer markets. In 2005, sales of products used in coating applications contributed approximately $1.3 billion to our total pro forma net sales. Our key products serving coating applications include:
| • | Epoxy Coating Resins. In addition to the adhesive uses mentioned previously, epoxy resins are used for a variety of high-end coating applications which require the superior strength and durability of epoxy. Examples include protective coating for industrial and domestic flooring, pipe, marine and construction applications, powder coatings and automotive coatings. |
| • | Polyester Resins.We are a leading supplier of polyester coatings resins in North America with a market share of 10% and are also a major producer in Europe with a powder coatings market share of 10%. We |
3
Table of Contents
provide custom polyester resins, both liquid and powder, to customers for use in industrial coatings requiring specific properties such as gloss and color retention, resistance to corrosion and flexibility. Polyester coatings are typically used in transportation, automotive, machinery, appliances and metal office furniture. |
| • | Alkyd Resins.We share the leading position in alkyd resins in North America with a market share of 31% and are a major producer in Europe, specifically in Scandinavia and Italy. We provide alkyd resins to customers for use in the manufacture of professional grade paints and coatings. Our alkyd resins business shares an integrated production platform with our polyester resins business, which allows for flexible sourcing, plant balancing and economies of scale. |
| • | Acrylic Resins.We are a supplier of acrylic resins (solvent and water-based) in North America and Europe. Acrylic resins are used for interior trim paints and exterior applications where weathering protection, color and gloss retention are critical. In addition, we produce a wide range of specialty acrylic resins for marine and maintenance paints and automotive topcoats. We are also a low cost producer of acrylic monomer, the key raw material for our acrylic resins. This ability to produce key raw materials gives us a competitive cost advantage relative to our competitors and ensures adequacy of supply. |
| • | Ink Resins and Additives. We are the world’s largest producer of ink resins and associated products with a market share of 15%. Ink resins are used to apply ink to a variety of different substrates including paper, cardboard, metal foil and plastic. We are also a provider of formulated UV-cure coatings and inks. Our proprietary technology has enabled us to gain a leading position in the global fiber optic market. |
| • | Versatic Acids and Derivatives. We are the world’s largest producer of versatic acids and derivatives, with a market share of 76%. Versatic acids and derivatives are specialty monomers which provide significant performance advantages to finished coatings, including superior adhesion, flexibility, ease of application and other high performance characteristics. Applications for versatic acids and derivatives include decorative, automotive and protective coatings as well as other uses, such as pharmaceuticals and personal care products. |
Competitive Strengths
We are one of the leading specialty chemical companies in the world based on the following competitive strengths:
World’s Largest Thermoset Resins Producer. We are the world’s largest producer of thermoset resins with leading positions across various end-markets and geographies. Our global scale and breadth of product line provide us with significant advantages over many of our competitors. We are first or second in market position by volume in our key product areas, which collectively represent more than 75% of our pro forma 2005 net sales.
Unique Selling Proposition. The majority of our customers require solutions that are tailored to their individual production needs and require a high degree of technical service and customized product formulations. Our diverse thermoset product offering allows us to leverage related technologies across geographies, customers and end-markets in order to provide a broad range of product and technical service solutions. As a result, we have cultivated stable, longstanding customer relationships.
Global Infrastructure. We believe our global scope and our ability to internally produce key raw materials give us an advantage compared with many of our smaller competitors. We believe that we are well positioned in higher growth regions and will continue to grow internationally.
Low Cost Position. Our low cost manufacturing position is the result of our 94 production sites strategically located throughout the world and our selectively integrated supply position in critical intermediate materials. Our ability to internally produce key raw materials provides us a significant cost advantage over our competitors. Furthermore, our large market position and scale in each of our key product markets provides us with significant purchasing and manufacturing efficiencies.
4
Table of Contents
Well Positioned in Diverse End-Markets and Higher Growth Sectors. We have a diversified revenue and customer base in a variety of end-markets and geographies. Our products are used in a broad range of applications and are sold into stable markets, as well as higher growth markets.
Strong Free Cash Flow.We expect to generate strong free cash flow (cash flow from operating activities less anticipated capital expenditures) due to our size and position within the thermoset resins industry, and the industry leading cost structure we have in place. Additionally, we expect to realize significant synergies from the Hexion Formation which should further improve free cash flow.
Strong Management Team. We believe that we have a world-class management team led by Craig O. Morrison, our President and Chief Executive Officer, and William H. Carter, our Chief Financial Officer. Marvin O. Schlanger, former Chief Executive Officer of Arco Chemical and Resolution Performance, is our Vice Chairman. Our management team has demonstrated expertise in growing our businesses organically, integrating acquisitions and executing on significant cost cutting programs.
Strategy
We are focused on augmenting our growth, as well as increasing shareholder value, return on investment, cash flows and profitability. We believe we can achieve these related goals through the following strategies:
Utilize Our Integrated Platform Across Product Offerings.As the world’s largest producer of thermoset resins, we have an opportunity to provide our customers with a broad range of resins products on a global basis. We believe this provides us the opportunity to become a global, comprehensive solutions provider to our customers rather than simply offering a particular product, selling in a single geography or competing on price.
Develop and Market New Products. We will continue to expand our product offerings through internal innovation, joint research and development initiatives with our customers and research partnership formations. In 2005, on a pro forma basis, we incurred approximately $67 million in research and development expenses, which represented approximately 1.4% of our pro forma net sales during that period.
Expand Our Global Reach In Faster Growing Regions. We are focused on growing our business in the Asia-Pacific, Eastern Europe and Latin American markets, where the usage of our products is increasing. Furthermore, by combining sales and distribution infrastructures, we expect to accelerate the penetration of our high-end, value-added products into new markets.
Increase Margins Through Focus on Operational Excellence. We believe that through the combination of four stand-alone global resin companies, there will be opportunities to extract substantial cost savings in the near future. Management is currently targeting $250 million in synergies from the Hexion Formation, of which $125 million of net cost savings have been specifically identified. Management has developed detailed implementation plans to achieve the $125 million of cost savings. We achieved cost savings of $20 million in 2005 and $11 million in the first quarter of 2006. We expect that approximately 60% of the $125 million near term cost savings will be achieved by the end of 2006 with the remainder expected to be achieved in the following year. Through March 31, 2006, we have incurred one-time costs of approximately $13 million in connection with implementing these synergies and we expect to incur additional one-time costs of $62 million through 2007. Management has specifically identified a number of areas for savings and is actively pursuing key components of this strategy.
Pursue Targeted Add-On Acquisitions and Joint Ventures. The global thermoset resin industry is highly fragmented and is comprised of numerous small and mid-sized specialty companies focusing on niche markets, as well as small non-core divisions of large chemical conglomerates. As the largest company focused primarily on the thermoset resins space, we have a significant advantage in pursuing add-on acquisitions and joint ventures in areas that allow us to build upon our core strengths, expand our product, technology and geographic portfolio, and better serve our customers. We believe we can consummate a number of these acquisitions at relatively low valuations due to the scalability of our existing global operations.
5
Table of Contents
Risk Factors
Despite our competitive strengths discussed elsewhere in this prospectus, investing in our stock involves substantial risk. In addition, our ability to execute our strategy is subject to certain risks. The risks described under the heading “Risk Factors” immediately following this summary may cause us not to realize the full benefits of our strengths or may cause us to be unable to successfully execute all or part of our strategy. Before you invest in our stock, you should carefully consider all the information in this prospectus, including matters set forth under the heading “Risk Factors.”
The Prior Transactions, the Hexion Formation and the Hexion Refinancings
The Hexion Refinancings. In May 2006, we amended and restated our senior secured credit facilities. We refer to these senior secured credit facilities as the “new senior secured credit facilities” in this prospectus. Our new senior secured credit facilities are described under the heading “Description of Certain Indebtedness—First-Priority Lien Obligations—New Senior Secured Credit Facilities.” Upon entering into these new senior secured credit facilities, we repaid all amounts outstanding under our May 2005 term loan and synthetic letter of credit facilities. In addition, we made tender offers to repurchase all of our outstanding 8% Senior Secured Notes, 9½% Senior Second Secured Notes and 13½% Senior Subordinated Notes. On May 5, 2006, we accepted tenders from holders of 100% of the outstanding principal amount of the 8% Senior Secured Notes, 99.9% of the outstanding principal amount of the 9 1/2% Senior Second Secured Notes and 88.7% of the outstanding principal amount of the 13 1/2% Senior Subordinated Notes. In the event that not all of the 9 1/2% Senior Second Secured Notes or 13 1/2% Senior Subordinated Notes are repurchased pursuant to the tender offers, we expect to borrow under our new senior secured credit facilities to redeem any outstanding 9 1/2% Senior Second Secured Notes and 13 1/2% Senior Subordinated Notes shortly after the completion of the tender offers. We do not expect to incur any material additional costs in connection with any such redemptions. In connection with the tender offers, we received the required consents with respect to each series of notes to eliminate substantially all of the restrictive covenants and certain events of default included in the indentures under which such notes were issued. This prospectus is not an offer to purchase, a solicitation of an offer to purchase or a solicitation of consent with respect to our 8% Senior Notes, 9 1/2% Senior Second Secured Notes, and 13 1/2% Senior Subordinated Notes. The tender offers and consent solicitations have been made solely by the Offer to Purchase and Consent Solicitation Statement. On May 10, 2006, we entered into a $1 billion interest rate swap agreement. The swap is a three-year agreement designed to offset cash flow variability associated with interest rate fluctuations on our variable rate debt. The initial notional amount of the swap is $1 billion, which amortizes on a quarterly basis based on expected payments on our term loan in order to maintain a fixed to variable debt ratio of approximately 70% fixed to 30% variable. On May 12, 2006, we redeemed all of our outstanding Series A Preferred Stock with the proceeds of borrowings under our new senior secured credit facilities. We refer to the swap, the refinancing and the repurchases and redemptions of notes and preferred stock as the “Hexion Refinancings.”
The Combinations. On May 31, 2005, Resolution Performance and Resolution Specialty were combined with and into Borden Chemical (the “Combinations”), all of which were controlled by Apollo Management, L.P. and its affiliates (“Apollo”). As of December 31, 2004, Apollo and its affiliated funds held approximately 98%, 72% and 95% of the then outstanding capital stock of Borden Chemical, Resolution Performance and Resolution Specialty, respectively. In connection with the Combinations, the minority interests in Resolution Performance and Resolution Specialty were eliminated. Upon the consummation of the Combinations, Borden Chemical changed its name to Hexion Specialty Chemicals, Inc. and BHI Acquisition LLC, Borden Chemical’s parent, changed its name to Hexion LLC. Immediately following completion of this offering, Apollo, through Hexion LLC, will hold approximately 70.9% of the outstanding common stock of Hexion.
The Borden Transaction. On August 12, 2004, an affiliate of Apollo acquired all of the outstanding capital stock of Borden Chemical (the “Borden Acquisition”). The Borden Acquisition, the related offering of second-priority senior secured floating rate notes (the “Original Floating Rate Notes”) and 9% second-priority senior secured notes (the “Fixed Rate Notes”) and the related transactions are collectively referred to in this prospectus as the “Borden Transaction.”
6
Table of Contents
The Resolution Performance Transaction. On November 14, 2000, an affiliate of Apollo acquired control of Resolution Performance in a recapitalization transaction (the “Resolution Performance Transaction”). Prior to the recapitalization, Resolution Performance was a wholly owned subsidiary of the Royal Dutch/Shell Group of Companies (“Shell”).
The Resolution Specialty Transaction. On August 2, 2004, Resolution Specialty, an affiliate of Apollo, acquired the resins, inks and monomers division (the “Resolution Specialty Acquisition”) of Eastman Chemical Company (“Eastman”). The Resolution Specialty Acquisition and the related transactions are collectively referred to in this prospectus as the “Resolution Specialty Transaction.”
The Bakelite Transaction.On April 29, 2005, a subsidiary of Borden Chemical acquired Bakelite (the “Bakelite Acquisition”). Upon the consummation of the Bakelite Acquisition, Bakelite became an indirect, wholly-owned subsidiary of Hexion Specialty Chemicals Canada, Inc. (“Hexion Canada”). The Bakelite Acquisition was financed through a combination of available cash and borrowings under a bridge loan facility, which was refinanced with the proceeds of our second-priority senior secured floating rate notes issued on May 20, 2005 (the “New Floating Rate Notes”) and borrowings under our May 2005 senior secured credit facilities (collectively, the “Bakelite Financing”). The Bakelite Acquisition, the repayment or assumption of certain of Bakelite’s debt in connection therewith and the Bakelite Financing are collectively referred to in this prospectus as the “Bakelite Transaction.”
We refer to the Borden Transaction, the Resolution Performance Transaction and the Resolution Specialty Transaction collectively as the “Prior Transactions.” We refer to the borrowings under our May 2005 senior secured credit facilities, the issuance of our Series A Preferred Stock and the application of the net proceeds therefrom to repay then-existing debt and pay a dividend on our common stock in May 2005 as described elsewhere in this prospectus, collectively, as the “Hexion Financings.” We refer to the Original Floating Rate Notes, the Fixed Rate Notes and the New Floating Rate Notes as the “Second-Priority Senior Secured Notes.” We refer to the offering of our common stock pursuant to this prospectus as “the offering.” We refer to the Combinations, the Hexion Financings and the Bakelite Transaction as the “Hexion Formation.” We refer to the Prior Transactions, the Hexion Formation, the Hexion Refinancings and the offering, including the application of the net proceeds to the Company therefrom, as the “Transactions.”
7
Table of Contents
Ownership Structure
The chart below illustrates our beneficial ownership structure after giving effect to the Transactions. Our ownership is presented on a fully-diluted basis.
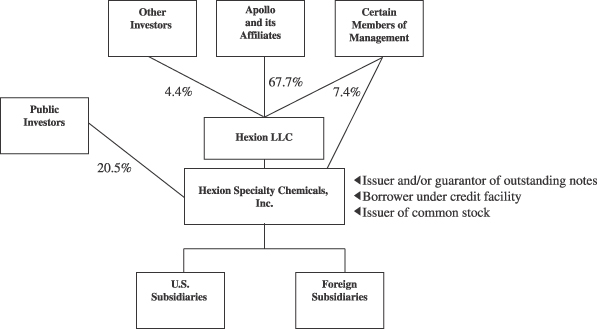
We are a New Jersey corporation, with predecessors dating back to 1899. Our principal executive offices are located at 180 East Broad Street, Columbus, Ohio 43215. Our telephone number is (614) 225-4000. We maintain a website atwww.hexion.com where general information about our business is available.The information contained on our website is not a part of this prospectus.
8
Table of Contents
Recent Acquisitions and Divestiture
Acquisition of the Global Ink and Adhesive Resins Business of Akzo Nobel
On November 25, 2005, we agreed to acquire the global ink and adhesive resins business of Akzo Nobel (the “Akzo Acquisition”). The business produces resins used to manufacture inks for commercial printing and packaging, digital inks for laser and photocopying printing, and pressure sensitive adhesives used in tape and labeling applications. The business generated 2005 sales of approximately $215 million, and includes 10 manufacturing facilities in Europe, North America, Argentina, Asia and New Zealand. Closing should occur upon the successful completion of normal governmental reviews and consultations with employee workers’ councils, which we expect to occur during the second quarter of 2006. The acquisition will be funded through a combination of available cash and existing credit lines. We cannot assure you that the Akzo Acquisition will be completed on the timeframe anticipated or at all.
Acquisition of Decorative Coatings and Adhesives Business Unit of The Rhodia Group
On January 31, 2006, we acquired the decorative coatings and adhesives business unit of The Rhodia Group (the “Rhodia Acquisition”). The business generated 2005 sales of approximately $200 million, with 8 manufacturing facilities in Europe, Australia and Thailand. The acquisition was funded through a combination of available cash and existing credit lines.
Acquisition of Global Wax Compounds Business of Rohm and Haas
On March 1, 2006, we acquired the global wax compounds business of Rohm and Haas (the “Rohm and Haas Acquisition”). The business generated 2005 sales of approximately $10 million. The purchase included Rohm and Haas’ wax compounds technology and product lines, manufacturing equipment and other business assets. The acquisition was funded through available cash.
Divestiture of Alba Adesivos
On March 31, 2006, we sold Alba, Adesivos Industria e Comercio Ltda. (“Alba Adesivos”), a consumer adhesives company based in Boituva, Brazil, to the Henkel Group (the “Brazilian Consumer Divestiture”). Alba Adesivos is a producer of branded consumer and professional grade adhesives. The company generated 2005 sales of $38 million and has approximately 140 employees. The purchase price was paid in cash.
We expect the aggregate purchase price for these three acquisitions, net of proceeds from the divestiture, to be approximately $117 million.
9
Table of Contents
The Offering
Common stock offered by us | 3,703,704 shares |
Common stock offered by the selling shareholder | 14,814,815 shares |
Common stock to be outstanding after this offering | 86,260,551 shares(a) |
Use of Proceeds | We estimate that we will receive proceeds from our offering of our common stock, after deducting underwriting discounts and other expenses, of approximately $86 million, assuming the shares are offered at $27.00 per share, which is the midpoint of the estimated offering price range set forth on the cover page of this prospectus. We intend to use all of the net proceeds from the sale of the shares of our common stock being sold by us together with available cash to repay $100 million of our term loan under our new senior secured credit facilities. For sensitivity analysis as to the offering price and other information, see “Use of Proceeds” and “Dividend Policy.” |
We will not receive any proceeds from the sale of our common stock by the selling shareholder, including if the underwriters exercise their option to purchase additional shares. In the aggregate, the selling shareholder will receive approximately $380 million of the net proceeds of this offering, or approximately $451 million if the underwriters’ option to purchase additional shares is exercised in full, assuming the shares are offered at $27.00 per share, which is the midpoint of the estimated offering price range set forth on the cover page of this prospectus. See “Use of Proceeds” and “Underwriting.” |
Dividend Policy | We do not currently intend to pay any cash dividends on our common stock. See “Dividend Policy” and “Description of Capital Stock—Common Stock.” |
Listing | Our common stock has been approved for listing on the New York Stock Exchange under the symbol “HXN.” |
All information in this prospectus, unless otherwise indicated or the context otherwise requires:
| • | gives effect to a 0.853-for-1 reverse stock split of our common stock; and |
| • | does not give effect to the issuance of the following: |
(1) 4,105,148 shares of common stock issuable upon the exercise of options outstanding as of March 31, 2006, at a weighted average exercise price of approximately $6.39 per share (split adjusted and giving effect to the assumption of the applicable option plans from Hexion LLC by the Company prior to the consummation of the offering); or
(2) 14,000,000 shares of common stock which may be issued upon the exercise of options reserved for future grant.
| (a) | Includes 954,378 shares related to deferred compensation units. |
10
Table of Contents
Summary Historical and Pro Forma Financial and Other Data
The combination of Borden Chemical, Resolution Performance and Resolution Specialty has been treated, for accounting purposes, as a combination of entities under common control due to Apollo’s controlling interest in each of the companies. The audited consolidated financial statements presented herein reflect the results of operations of each company from the date such company was acquired by Apollo.
The following table summarizes certain historical and pro forma financial and other data for Hexion. The summary historical and pro forma financial and other data for Hexion as of December 31, 2004 and 2005, and for the years ended December 31, 2003, 2004 and 2005 have been derived from the audited consolidated financial statements of Hexion, included elsewhere in this prospectus. The summary historical and pro forma financial and other data for Hexion as of and for the three months ended March 31, 2005 and 2006 have been derived from the unaudited consolidated financial statements of Hexion, included elsewhere in this prospectus, and include all adjustments that management considers necessary for a fair presentation of our financial position and results of operations as of the date and for the period indicated. Results for the three months ended March 31, 2006 are not necessarily indicative of the results that may be expected for the entire year. The summary historical financial data of Hexion for the years ended December 31, 2003, 2004 and 2005 and the three months ended March 31, 2005 include:
| • | the results of operations of Resolution Performance for the years ended December 31, 2003, 2004 and 2005 and the three months ended March 31, 2005, which reflect purchase accounting adjustments from the date of acquisition of Resolution Performance by Apollo on November 14, 2000; |
| • | the results of operations of Borden Chemical for the period from August 12, 2004 to December 31, 2004, the year ended December 31, 2005 and the three months ended March 31, 2005, on a historical basis (because Borden Chemical is a public reporting registrant as a result of public debt that was outstanding prior to the Borden Transaction and which debt remains outstanding, Borden Chemical has elected to present its financial statements from the date of its acquisition by Apollo on the historical basis of accounting permitted under the SEC’s public debt exemptions); |
| • | the results of operations of Resolution Specialty for the period from August 2, 2004 to December 31, 2004, the year ended December 31, 2005 and the three months ended March 31, 2005, which reflect purchase accounting adjustments from the date of acquisition of Resolution Specialty by Apollo on August 2, 2004; and |
| • | the results of operations of Bakelite for the period from April 30, 2005 to December 31, 2005, which reflect purchase accounting adjustments from the date of the acquisition of Bakelite on April 29, 2005. |
The financial data for Hexion for the three months ended March 31, 2006 includes the results of the Rhodia Acquisition and Rohm and Haas Acquisition since January 31, 2006 and March 1, 2006, the respective dates of acquisition.
Accordingly, the results of operations of Hexion for periods prior to the Borden Acquisition, the Resolution Specialty Acquisition and the Bakelite Acquisition are not comparable to results for subsequent periods.
The summary unaudited pro forma financial data of Hexion gives effect, in the manner described under “Unaudited Pro Forma Financial Information,” to the Hexion Formation, the Hexion Refinancings and the offering, including the application of the net proceeds to the Company therefrom. Our unaudited pro forma balance sheet as of March 31, 2006, which already reflects the Prior Transactions, the Hexion Formation, the Rhodia Acquisition, the Rohm and Haas Acquisition and the Brazilian Consumer Divestiture, gives pro forma effect to the Hexion Refinancings and the offering, including the application of the net proceeds to the Company therefrom, as if they had occurred on such date but does not give effect to the Akzo Acquisition which is not considered significant under the provisions of Article 11-01(b) of Regulation S-X.Our unaudited pro forma statements of operations for the year ended December 31, 2005 and the three months ended March 31, 2005 give pro forma effect to the Hexion Formation, the Hexion Refinancings and the offering and our unaudited pro forma statement of operations for the
11
Table of Contents
three months ended March 31, 2006 gives pro forma effect to the Hexion Refinancings and the offering, including the application of the net proceeds to the Company therefrom, as if they had each occurred on January 1, 2005, as described under “Unaudited Pro Forma Financial Information”, but does not give effect to the Akzo Acquisition, the Rhodia Acquisition, the Rohm and Haas Acquisition and the Brazilian Consumer Divestiture which are not considered significant under the provisions of Article 11-01(b) of Regulation S-X. We have included pro forma data related to EBITDA and transaction costs, impairments and unusual items included in EBITDA for the last twelve months ended March 31, 2006 (the “LTM Period”) as we are required to measure compliance with the financial covenants in certain of our indentures based on Adjusted EBITDA for the most recent four quarter period.
The pro forma adjustments relating to the Bakelite Transaction and the minority interest acquisitions of Resolution Performance and Resolution Specialty as part of the Combinations are based on preliminary estimates of the fair value of the consideration provided, estimates of the fair values of assets acquired and liabilities assumed and available information and assumptions. The final determination of fair value could result in changes to the pro forma adjustments and the pro forma data included herein.
12
Table of Contents
The unaudited pro forma financial data for the year ended December 31, 2005, for the three months ended March 31, 2005 and 2006 and as of March 31, 2006 and for the LTM Period is presented for informational purposes only, and does not purport to represent what our results of operations would actually have been if the transactions had occurred on the dates indicated, nor does it purport to project our results of operations or financial condition that we may achieve in the future.
You should read this summary historical and pro forma financial and other data in conjunction with “Selected Historical Financial and Other Information,” “Management’s Discussion and Analysis of Financial Condition and Results of Operations” and “Unaudited Pro Forma Financial Information,” together with all of the financial statements and related notes included elsewhere in this prospectus.
| Historical | Pro Forma | |||||||||||||||||||||||||||||||
Year Ended December 31, | Three Months Ended March 31, | Year Ended 2005 | Three Months March 31, | |||||||||||||||||||||||||||||
| 2003 | 2004 | 2005 | 2005 | 2006 | 2005 | 2006 | ||||||||||||||||||||||||||
| (dollars in millions) | ||||||||||||||||||||||||||||||||
Statement of Operations | ||||||||||||||||||||||||||||||||
Net sales(1) | $ | 782 | $ | 2,019 | $ | 4,470 | $ | 1,012 | $ | 1,245 | $ | 4,717 | $ | 1,194 | $ | 1,245 | ||||||||||||||||
Cost of sales | 714 | 1,785 | 3,808 | 863 | 1,060 | 4,006 | 1,017 | 1,060 | ||||||||||||||||||||||||
Gross profit | 68 | 234 | 662 | 149 | 185 | 711 | 177 | 185 | ||||||||||||||||||||||||
Selling, general & administrative expense | 81 | 163 | 400 | 86 | 101 | 431 | 108 | 101 | ||||||||||||||||||||||||
Transaction costs | — | 56 | 44 | 7 | 4 | 44 | 7 | 4 | ||||||||||||||||||||||||
Other operating (income) expense(2) | 10 | 6 | 10 | (3 | ) | (30 | ) | 7 | (4 | ) | (31 | ) | ||||||||||||||||||||
Operating income (loss) | (23 | ) | 9 | 208 | 59 | 110 | 229 | 66 | 111 | |||||||||||||||||||||||
Interest expense, net | 77 | 117 | 204 | 45 | 54 | 219 | 55 | 55 | ||||||||||||||||||||||||
Write-off of deferred financing fees | — | — | 17 | — | — | — | — | — | ||||||||||||||||||||||||
Other non-operating expense, net | — | 5 | 16 | 9 | 1 | 16 | 9 | 1 | ||||||||||||||||||||||||
Income (loss) from continuing operations before income tax and minority interest | (100 | ) | (113 | ) | (29 | ) | 5 | 55 | (6 | ) | 2 | 55 | ||||||||||||||||||||
Income tax expense (benefit) | (37 | ) | — | 48 | 13 | 19 | 61 | 14 | 19 | |||||||||||||||||||||||
Income (loss) from continuing operations before minority interest | (63 | ) | (113 | ) | (77 | ) | (8 | ) | 36 | (67 | ) | (12 | ) | 36 | ||||||||||||||||||
Earnings for unconsolidated entities, net of taxes | — | — | 2 | — | 1 | 2 | — | 1 | ||||||||||||||||||||||||
Minority interest in net (income) loss of consolidated subsidiaries | 13 | 8 | (3 | ) | (2 | ) | (2 | ) | (4 | ) | (1 | ) | (2 | ) | ||||||||||||||||||
Income (loss) from continuing operations | (50 | ) | (105 | ) | (78 | ) | (10 | ) | 35 | (69 | ) | (13 | ) | 35 | ||||||||||||||||||
Loss from discontinued operations | — | — | 9 | — | — | — | — | — | ||||||||||||||||||||||||
Net income (loss) | (50 | ) | (105 | ) | (87 | ) | (10 | ) | 35 | (69 | ) | (13 | ) | 35 | ||||||||||||||||||
Redeemable preferred stock accretion | — | — | 30 | — | 13 | — | — | — | ||||||||||||||||||||||||
Net income (loss) available to common shareholders | $ | (50 | ) | $ | (105 | ) | $ | (117 | ) | $ | (10 | ) | $ | 22 | $ | (69 | ) | $ | (13 | ) | $ | 35 | ||||||||||
Cash Flow Data | ||||||||||||||||||||||||||||||||
Cash flows (used in) from operating activities | $ | (43 | ) | $ | (32 | ) | $ | 171 | $ | 24 | $ | 44 | — | — | — | |||||||||||||||||
Cash flows (used in) from investing activities | 7 | (20 | ) | (354 | ) | (20 | ) | (42 | ) | — | — | — | ||||||||||||||||||||
Cash flows from (used in) financing activities | 80 | 148 | 219 | 3 | (16 | ) | — | — | — | |||||||||||||||||||||||
Depreciation and amortization(3) | 58 | 86 | 148 | 36 | 38 | $ | 158 | $ | 42 | $ | 38 | |||||||||||||||||||||
Capital expenditures | 18 | 57 | 105 | 13 | 27 | 111 | 17 | 27 | ||||||||||||||||||||||||
13
Table of Contents
| Historical | Pro Forma | ||||||||||||||||||||||||||||||
Year Ended December 31, | Three Months Ended March 31, | Year Ended December 31, 2005 | Three Months Ended March 31, | LTM Period | |||||||||||||||||||||||||||
| 2003 | 2004 | 2005 | 2005 | 2006 | 2005 | 2006 | |||||||||||||||||||||||||
| (dollars in millions) | |||||||||||||||||||||||||||||||
Other Financial Data | |||||||||||||||||||||||||||||||
EBITDA (4) | — | — | — | — | — | $ | 369 | $ | 98 | $ | 147 | $ | 418 | ||||||||||||||||||
Transaction costs and non-cash charges included in EBITDA (5) | — | — | — | — | — | 76 | 7 | 10 | 79 | ||||||||||||||||||||||
Unusual items included in EBITDA (6) | — | — | — | — | — | 36 | 16 | (25 | ) | (5 | ) | ||||||||||||||||||||
Balance Sheet Data (at end of period) | |||||||||||||||||||||||||||||||
Cash and equivalents | $ | 49 | $ | 152 | $ | 183 | — | $ | 168 | — | — | $ | 141 | — | |||||||||||||||||
Working capital (7) | 177 | 433 | 427 | — | 423 | — | — | 379 | — | ||||||||||||||||||||||
Total assets | 1,191 | 2,696 | 3,209 | — | 3,307 | — | — | 3,263 | — | ||||||||||||||||||||||
Total debt | 683 | 1,850 | 2,354 | — | 2,340 | — | — | 2,690 | — | ||||||||||||||||||||||
Total liabilities and minority interest | 1,039 | 3,005 | 3,769 | — | 3,819 | — | — | 4,163 | — | ||||||||||||||||||||||
Redeemable preferred stock | — | — | 364 | — | 377 | — | — | — | — | ||||||||||||||||||||||
Total common stock and other shareholder’s equity (deficit) | 152 | (309 | ) | (924 | ) | — | (889 | ) | — | — | (900 | ) | — | ||||||||||||||||||
| (1) | Net sales included in the consolidated statement of operations for the year ended December 31, 2004 is comprised of: |
| Year Ended December 31, 2004 | ||||
| (dollars in millions) | ||||
Resolution Performance—For the year ended December 31, 2004 | $ | 996 | ||
Borden—For the period from August 12, 2004 to December 31, 2004 | 702 | |||
Resolution Specialty—For the period from August 2, 2004 to December 31, 2004 | 325 | |||
Eliminations | (4 | ) | ||
Total consolidated net sales for the year ended December 31, 2004 | $ | 2,019 | ||
| (2) | Other operating (income) expense for the three months ended March 31, 2006 (historical and pro forma) includes net gain of $37 recognized primarily on the Brazilian Consumer Divestiture. |
| (3) | Depreciation and amortization included in the pro forma statement of operations for the year ended December 31, 2005 and for the three months ended March 31, 2005 and 2006 is comprised of: |
| Year Ended December 31, 2005 | Three Months Ended March 31, | ||||||||||
| 2005 | 2006 | ||||||||||
| (dollars in millions) | |||||||||||
Hexion—For the year ended December 31, 2005 and for the three months ended March 31, 2005 and 2006 | $ | 148 | $ | 36 | $ | 38 | |||||
Bakelite—For the period from January 1, 2005 to April 29, 2005 and for the three months ended March 31, 2005 and 2006 | 11 | 7 | — | ||||||||
Total pro forma adjustment | (1 | ) | (1 | ) | — | ||||||
Total pro forma depreciation and amortization expense for the year ended December 31, 2005 and for the three months ended March 31, 2005 and 2006 | $ | 158 | $ | 42 | $ | 38 | |||||
| (4) | EBITDA is defined as net income (loss) before interest, taxes, depreciation and amortization and is used by management as a performance measure for certain performance-based cash bonus plans and measuring triggering events of certain performance-based stock options. We have presented EBITDA on a pro forma basis since management plans on using EBITDA as a benchmark for developing its ongoing performance measures for its cash bonus plans and certain performance-based stock option plans. We believe that pro forma EBITDA is more representative of our performance since it gives the full year effect to the Bakelite Acquisition which was completed in April 2005 whereas historical EBITDA gives effect to our acquisitions only as of the date we acquired such entity. We also believe that EBITDA is useful to investors because it is |
14
Table of Contents
frequently used by securities analysts, investors and other interested parties to evaluate companies in our industry. EBITDA is not a recognized term under GAAP, should not be viewed in isolation and does not purport to be an alternative to net income (loss) as an indicator of operating performance or cash flows from operating activities as a measure of liquidity. There are material limitations associated with making the adjustments to our earnings to calculate EBITDA and using this non-GAAP financial measure as compared to the most directly comparable U.S. GAAP financial measures. For instance, EBITDA does not include: |
| • | interest expense, and because we have borrowed money in order to finance our operations, interest expense is a necessary element of our costs and ability to generate revenue; |
| • | depreciation and amortization expense, and because we use capital assets, depreciation and amortization expense is a necessary element of our costs and ability to generate revenue; and |
| • | tax expense, and because the payment of taxes is part of our operations, tax expense is a necessary element of our costs and ability to operate. |
Additionally, EBITDA is not intended to be a measure of free cash flow for management’s discretionary use, as it does not consider certain cash requirements such as capital expenditures, contractual commitments, interest payments, tax payments and debt service requirements. Because not all companies use identical calculations, this presentation of EBITDA may not be comparable to other similarly titled measures for other companies. Also the amounts shown for EBITDA as presented herein differ from the amounts calculated under the definition of Adjusted EBITDA used in our debt instruments, which further adjust for certain cash and non-cash charges and is used to determine compliance with financial covenants and our ability to engage in certain activities such as incurring additional debt and making acquisitions.
The following table is a reconciliation of pro forma net income (loss) to pro forma EBITDA for Hexion:
| Pro Forma | |||||||||||||||
Year Ended December 31, 2005 | Three Months Ended March 31, | LTM | |||||||||||||
| 2005 | 2006 | ||||||||||||||
| (dollars in millions) | |||||||||||||||
Pro forma net income (loss) | $ | (69 | ) | $ | (13 | ) | $ | 35 | $ | (21 | ) | ||||
Pro forma interest expense, net(a) | 219 | 55 | 55 | 219 | |||||||||||
Pro forma income tax expense | 61 | 14 | 19 | 66 | |||||||||||
Pro forma depreciation and amortization | 158 | 42 | 38 | 154 | |||||||||||
Pro forma EBITDA | $ | 369 | $ | 98 | $ | 147 | $ | 418 | |||||||
| (a) | Includes $7 of amortization of deferred financing fees for the year ended December 31, 2005, and $2 for the three months ended March 31, 2005 and 2006. |
| (5) | Transaction costs and non-cash charges for Hexion are further detailed on the following table: |
| Pro Forma | ||||||||||||
Year Ended December 31, 2005 | Three Months Ended March 31, | LTM | ||||||||||
| 2005 | 2006 | |||||||||||
| (dollars in millions) | ||||||||||||
Transaction costs (a) | $ | 44 | $ | 7 | $ | 4 | $ | 41 | ||||
Non-cash charges (b) | 32 | — | 6 | 38 | ||||||||
| $ | 76 | $ | 7 | $ | 10 | $ | 79 | |||||
| (a) | Represents merger costs principally related to the Hexion Formation and expenses related to terminated acquisition activities. |
| (b) | Represents impairments of fixed assets of $9 and $4, non-cash stock based compensation of $13 and $2 and unrealized foreign currency exchange losses of $10 and $0 on debt instruments denominated in currencies other than the functional currency of the holder, for the year ended December 31, 2005 and the three months ended March 31, 2006, respectively. |
15
Table of Contents
| (6) | Unusual items that do not relate to the core operations of Hexion are further detailed on the following table: |
| Pro Forma | ||||||||||||||
Year Ended December 31, 2005 | Three Months Ended March 31, | LTM | ||||||||||||
| 2005 | 2006 | |||||||||||||
| (dollars in millions) | ||||||||||||||
Business realignment expenses (a) | $ | 9 | $ | 1 | $ | 3 | $ | 11 | ||||||
Other expenses (b) | 27 | 15 | (28 | ) | (16 | ) | ||||||||
Unusual items | $ | 36 | $ | 16 | $ | (25 | ) | $ | (5 | ) | ||||
| (a) | Business realignment expenses for the year ended December 31, 2005 included in EBITDA for Hexion relate to the excess of historical costs over current business staffing levels and comprises employee related costs of $4 including (i) historical salaries and benefits of employees terminated in 2005 at Resolution Specialty and Borden Chemical and (ii) the excess cost of employee benefit programs prior to the revision of such plans in 2005. Business realignment expenses include plant closure and non-recurring severance and other one time benefits paid to employees of $5, $1, $3 and $11 for the year ended December 31, 2005, the three months ended March 31, 2005 and 2006 and the LTM period, respectively. |
| (b) | Amounts include the following: |
Year Ended December 31, 2005 | Three Months Ended March 31, | LTM | |||||||||||||
| 2005 | 2006 | ||||||||||||||
Non-recurring litigation expenses | $ | 10 | $ | 2 | $ | 1 | $ | 9 | |||||||
Foreign currency loss on an exchange rate hedge relating to the Bakelite Acquisition | 11 | 11 | — | — | |||||||||||
Integration costs, transition fees and other non-recurring expenses | 6 | 4 | 8 | 10 | |||||||||||
Gain on divestitures of businesses | — | (2 | ) | (37 | ) | (35 | ) | ||||||||
| $ | 27 | $ | 15 | $ | (28 | ) | $ | (16 | ) | ||||||
| (7) | Working capital is defined as current assets less current liabilities. |
Senior Secured Credit Facilities
In May 2006, we amended and restated our senior secured credit facilities. Our new senior secured credit facilities consist of a seven-year $1,625 term loan facility, a seven-year $50 synthetic letter of credit facility and a five-year $225 revolving credit facility, each subject to an earlier maturity date, under certain circumstances. Upon entering into these new senior secured credit facilities, we repaid all amounts outstanding under our May 2005 term loan and synthetic letter of credit facilities. In addition, we made tender offers to repurchase all of our 8% Senior Secured Notes, 9 1/2% Senior Second Secured Notes and 13 1/2% Senior Subordinated Notes. On May 5, 2006, we accepted tenders from holders of 100% of the outstanding principal amount of the 8% Senior Secured Notes, 99.9% of the outstanding principal amount of the 9 1/2% Senior Second Secured Notes and 88.7% of the outstanding principal amount of the 13 1/2% Senior Subordinated Notes. On May 12, 2006, we redeemed all of our outstanding Series A Preferred Stock with the proceeds of borrowings under our new senior secured credit facilities. As of March 31, 2006, after giving pro forma effect to the Hexion Refinancings and the offering, we would have had $2,690 principal amount of outstanding indebtedness, including amounts outstanding under the new senior secured credit facilities and $141 of cash. See “Description of Certain Indebtedness—First-Priority Lien Obligations—New Senior Secured Credit Facilities.”
On May 10, 2006, we entered into a $1 billion interest rate swap agreement. The swap is a three-year agreement designed to offset cash flow variability associated with interest rate fluctuations on our variable rate debt. The initial notional amount of the swap is $1 billion, which amortizes on a quarterly basis based on expected payments on our term loan in order to maintain a fixed to variable debt ratio of approximately 70% fixed to 30% variable.
16
Table of Contents
Covenant Compliance
Certain covenants contained in the credit agreement governing our new senior secured credit facilities and the indentures governing the Second-Priority Senior Secured Notes (i) require the maintenance of a senior secured debt to Adjusted EBITDA ratio and (ii) restrict our ability to take certain actions such as incurring additional debt or making certain acquisitions if we are unable to meet defined Adjusted EBITDA to Fixed Charges, senior secured debt to Adjusted EBITDA and consolidated debt to Adjusted EBITDA ratios. Upon completion of the Hexion Refinancings, the most restrictive of these indenture covenants, the covenants to incur additional indebtedness and the ability to make future acquisitions, will require an Adjusted EBITDA to Fixed Charges ratio (measured on a trailing four-quarter basis) of 2.0 to 1.0. Failure to comply with these covenants can result in limiting our long-term growth prospects by hindering our ability to incur future indebtedness or grow through acquisitions.
Fixed Charges are defined as interest expense excluding the amortization or write-off of deferred financing costs. Adjusted EBITDA is defined as EBITDA further adjusted to exclude certain non-cash, non-recurring and realized or expected future cost savings directly related to prior acquisitions and the Combinations. We believe that the inclusion of the supplemental adjustments applied in calculating Adjusted EBITDA is appropriate to provide additional information to investors to demonstrate compliance with our financial covenants and assess our ability to incur additional indebtedness in the future. Adjusted EBITDA and Fixed Charges are not defined terms under GAAP. Adjusted EBITDA should not be considered an alternative to operating income or net income as a measure of operating results or an alternative to cash flows as a measure of liquidity. Fixed Charges should not be considered an alternative to interest expense.
See “Description of Certain Indebtedness” and “Management’s Discussion and Analysis of Financial Condition and Results of Operations—Liquidity and Capital Resources” for further information on our indebtedness and covenants.
17
Table of Contents
| Pro Forma | |||||||
Year Ended December 31, 2005 | LTM | ||||||
| (dollars in millions) | |||||||
Pro Forma EBITDA(1) | $ | 369 | $ | 418 | |||
Transaction costs and non-cash charges(1) | 76 | 79 | |||||
Unusual items(1) | 36 | (5 | ) | ||||
Effect of acquisitions, net of divestiture(2) | 11 | 11 | |||||
In process synergies(3) | 105 | 94 | |||||
Pro Forma Adjusted EBITDA(4) | $ | 597 | $ | 597 | |||
Pro Forma Fixed Charges | $ | 200 | $ | 208 | |||
Ratio of Pro Forma Adjusted EBITDA to Fixed Charges | 2.99 | 2.87 | |||||
| (1) | See footnotes (4) - (6) on pages 14-16 for more information on EBITDA, transaction costs and non-cash charges and unusual items. |
| (2) | Amount represents the incremental EBITDA impact for the Rhodia Acquisition, the Rohm and Haas Acquisition less the Brazilian Consumer Divestiture as if they had taken place at the beginning of the year. These acquisitions and the divestiture closed after December 31, 2005 and are included in our calculation of pro forma Adjusted EBITDA as permitted by our indenture covenants. |
| (3) | Represents $125 in estimated net cost savings specifically identified in connection with the Hexion Formation. We achieved cost savings of $20 in 2005 and $11 million in the first quarter of 2006. We expect that approximately 60% of the $125 near term cost savings will be achieved by the end of 2006 with the remainder expected to be achieved in the following year. Through March 31, 2006, we have incurred one-time costs of approximately $13 in connection with implementing these synergies and we expect to incur additional one-time costs of $62 through 2007. These estimated synergies include cost savings from rationalization of manufacturing facilities, removal of duplicative corporate and administrative functions, alignment of benefit plans and raw material purchasing initiatives. The estimated in process synergies by category are as follows: |
| Year Ended December 31, 2005 | LTM Period | |||||
Rationalization of manufacturing facilities | $ | 43 | $ | 41 | ||
Overhead synergies | 17 | 13 | ||||
Raw material savings | 45 | 40 | ||||
| $ | 105 | $ | 94 | |||
| (4) | We are required to have an Adjusted EBITDA to Fixed Charges ratio of greater than 2.0 to 1.0 to incur additional indebtedness under certain of our indentures. As of March 31, 2006, we are able to satisfy this covenant and incur additional indebtedness under our indentures. In addition, we expect to be able to satisfy our Fixed Charges ratio covenant upon the closing of the Akzo Acquisition, which we expect to occur in the second quarter of 2006. After giving effect to the Akzo Acquisition as if it had taken place at the beginning of 2005, our 2005 pro forma net loss would be $59, our 2005 pro forma Adjusted EBITDA would be $618, our Pro Forma Fixed Charges would be $213 and our ratio of Adjusted EBITDA to Fixed Charges would be 2.90. See “—Recent Acquisitions and Divestiture.” |
18
Table of Contents
An investment in our stock involves a high degree of risk. You should carefully consider the following information, together with other information in this prospectus, before buying shares of our stock. If any of the following risks or uncertainties occur, our business, financial condition and results of operations could be materially and adversely affected, the trading price of our stock could decline and you may lose all or a part of the money you paid to buy our stock.
Risks Relating to Our Business
Borden Chemical, Resolution Performance, Resolution Specialty and Bakelite have a limited history of working together as a single company. Should we fail to integrate the operations of Borden Chemical, Resolution Performance, Resolution Specialty and Bakelite and achieve cost savings and synergies, our results of operations and profitability would be negatively impacted.
We may not be successful integrating Borden Chemical, Resolution Performance, Resolution Specialty and Bakelite, and the combined company may not perform as we expect or achieve the net cost savings and synergies we anticipate. A significant element of our business strategy is the improvement of our operating efficiencies and a reduction of our operating costs. Management is currently targeting $250 million in synergies from the Hexion Formation, of which $125 million of net cost savings have been specifically identified. We achieved cost savings of $20 million in 2005 and $11 million in the first quarter of 2006. Through March 31, 2006, we have incurred one-time costs of approximately $13 in connection with implementing these synergies and we expect to incur additional one-time costs of $62 million through 2007. A variety of factors could cause us not to achieve the benefits of the cost savings plan, or could result in harm to our business. For example, certain of our European operations utilize IT systems with limited systems support. In the event we are not able to integrate these systems with our more advanced IT systems, our ability to efficiently operate in certain European countries could be diminished. In addition, the impact of Hurricanes Katrina and Rita on our business (negative cost impact of $27 million in the second half of 2005), along with future hurricanes and natural disasters, may affect our ability to achieve our cost savings plan in the near term. Additional factors include:
| • | delays in the anticipated timing of activities related to our cost savings plan; |
| • | higher than expected or unanticipated costs to implement the plan and to operate the business; |
| • | inadequate resources to implement the plan and to operate the business; |
| • | our inability to optimize manufacturing processes between the companies; |
| • | our inability to obtain lower raw material prices; |
| • | our inability to utilize new geographic distribution channels; |
| • | our inability to reduce corporate and administrative expenses; and |
| • | our inability to identify an additional $125 million of cost savings consistent with our synergy target. |
As a result, we may not achieve our expected cost savings in the time anticipated, or at all. In such case, our results of operations and profitability would be negatively impaired.
The Hexion Formation may prove disruptive and could result in the combined business failing to meet our expectations.
The continuing process of integrating the operations of Borden Chemical, Resolution Performance, Resolution Specialty and Bakelite may continue to require a disproportionate amount of resources and management attention. Our future operations and cash flows will depend largely upon our ability to operate Hexion efficiently, achieve the strategic operating objectives for our business and realize significant cost savings and synergies. Our management team may encounter unforeseen difficulties in managing the integration of our four businesses. In order to successfully combine and operate our businesses, our management team will need to
19
Table of Contents
continue to focus on realizing anticipated synergies and cost savings on a timely basis while maintaining the efficiency of our operations. Any substantial diversion of management attention or difficulties in operating the combined business could affect our sales and ability to achieve operational, financial and strategic objectives. For example, we expect to devote substantial management attention in order to implement financial reporting and other systems that will permit us to utilize a shared service business model (for certain processes) along with a single company wide management information and accounting system.
Our historical and pro forma financial information may not reflect what our actual results of operations and financial condition would have been had we been a combined company for the periods presented and thus these results may not be indicative of our future operating performance.
The historical financial information included in this prospectus is constructed from the separate financial statements of Resolution Performance, Borden Chemical and Resolution Specialty for periods prior to the consummation of the Hexion Formation. In addition, Bakelite has historically prepared its financial statements in accordance with German GAAP, which differs in certain respects from US GAAP. The Bakelite financial statement presentation included in this prospectus has been converted from the local GAAP of Bakelite and its subsidiaries to US GAAP. The pro forma financial information presented in this prospectus is based in part on certain assumptions regarding the Hexion Formation that we believe are reasonable. Our assumptions may prove to be inaccurate over time. Accordingly, the historical and pro forma financial information included in this prospectus may not reflect what our results of operations and financial condition would have been had we been a combined entity during the periods presented, or what our results of operations and financial condition will be in the future.
Our limited operating history and the challenge of integrating previously independent businesses make evaluating our business and our future financial prospects difficult. Our potential for future business success and operating profitability must be considered in light of the risks, uncertainties, expenses and difficulties typically encountered by recently organized or combined companies.
Although EBITDA is derived from the financial statements (pro forma or historical, as the case may be) of Hexion, the calculation of Adjusted EBITDA contains a number of estimates and assumptions that may prove to be incorrect. For example, the synergies assume we can obtain improved raw materials pricing, the determination of legacy corporate expenses, net contains an estimate as to the cost of replacement services and business realignment expenses contains a number of assumptions as to excess costs. Although management of Hexion believes these estimates and assumptions are reasonable and correct and are consistent with the definition of Adjusted EBITDA in our indentures, investors should not place undue reliance upon Adjusted EBITDA as an indicator of current and future performance.
Our substantial indebtedness could adversely affect our ability to raise additional capital to fund our operations, limit our ability to react to changes in the economy or our industry and prevent us from fulfilling our obligations under our existing or future indebtedness.
We are a highly leveraged company. As of March 31, 2006, after giving pro forma effect to the Hexion Refinancings and the offering, we would have had $2.7 billion of outstanding indebtedness. In fiscal 2006, after giving pro forma effect to the Hexion Refinancings and the offering, our cash debt service is expected to be approximately $269 million (including $52 million of short term debt maturities) based on current interest rates, of which $72 million represents debt service on fixed-rate obligations. Our ability to generate sufficient cash flow from operations to make scheduled payments on our debt depends on a range of economic, competitive and business factors, many of which are outside our control. Our business may not generate sufficient cash flow from operations to meet our debt service and other obligations, and currently anticipated cost savings and operating improvements may not be realized on schedule, or at all. If we are unable to meet our expenses and debt service obligations, we may need to refinance all or a portion of our indebtedness on or before maturity, sell assets or raise equity. We may not be able to refinance any of our indebtedness, sell assets or raise equity on commercially reasonable terms or at all, which could cause us to default on our obligations and impair our liquidity.
20
Table of Contents
Our substantial indebtedness could have important consequences for you, including the following:
| • | it may limit our ability to borrow money or sell stock for our working capital, capital expenditures, dividend payments, debt service requirements, strategic initiatives or other purposes; |
| • | it may limit our flexibility in planning for, or reacting to, changes in our operations or business; |
| • | it may increase the amount of our interest expense, because certain of our borrowings are at variable rates of interest, which, if interest rates increase, could result in higher interest expense; |
| • | we are more highly leveraged than some of our competitors, which may place us at a competitive disadvantage; |
| • | it may make us more vulnerable to downturns in our business or the economy; |
| • | a substantial portion of our cash flow from operations will be dedicated to the repayment of our indebtedness and will not be available for other purposes; |
| • | it may restrict us from making strategic acquisitions, introducing new technologies or exploiting business opportunities; |
| • | it may make it more difficult for us to satisfy our obligations with respect to our existing indebtedness; and |
| • | it may limit, along with the financial and other restrictive covenants in our indebtedness, among other things, our ability to borrow additional funds or dispose of assets. |
Our variable-rate indebtedness subjects us to interest rate risk, which could cause our annual debt service obligations to increase significantly.
Certain of our indebtedness, including indebtedness under our floating rate notes and borrowings under our new senior secured credit facilities, are or will be at variable rates of interest and expose us to interest rate risk. See “Description of Certain Indebtedness.” If interest rates increase, our debt service obligations on the variable rate indebtedness would increase even though the amount borrowed remained the same. Assuming the amount of variable rate indebtedness remains the same, after giving pro forma effect to the Hexion Refinancings and the offering, an increase of 1% in the interest rates payable on our variable rate indebtedness would increase our fiscal 2006 estimated debt service requirements by approximately $9 million. Accordingly, an increase in interest rates from current levels could cause our annual debt-service obligations to increase significantly.
Despite our substantial indebtedness we may still be able to incur significantly more debt. This could intensify the risks described above.
The terms of the indentures governing our notes, our new senior secured credit facilities and the instruments governing our other indebtedness contain restrictions on our ability to incur additional indebtedness. These restrictions are subject to a number of important qualifications and exceptions and the indebtedness incurred in compliance with these restrictions could be substantial. Accordingly, we could incur significant additional indebtedness in the future. As of March 31, 2006, after giving pro forma effect to the Hexion Refinancings and the offering, we would have had $220 million available for additional borrowing under our new senior secured credit facilities, including the subfacility for letters of credit, and the covenants under our debt agreements would allow us to borrow a significant amount of additional indebtedness. The more we become leveraged, the more we, and in turn our securityholders, become exposed to the risks described above under “—Our substantial indebtedness could adversely affect our ability to raise additional capital to fund our operations, limit our ability to react to changes in the economy or our industry and prevent us from fulfilling our obligations under our existing or future indebtedness.”
21
Table of Contents
The terms of our new senior secured credit facilities and our existing indebtedness may restrict our current and future operations.
Our new senior secured credit facilities and our existing indebtedness contain, and any future indebtedness we incur would likely contain, a number of restrictive covenants that will impose significant operating and financial restrictions on our ability to, among other things:
| • | incur or guarantee additional debt; |
| • | pay dividends and make other distributions to our shareholders; |
| • | create or incur certain liens; |
| • | make certain loans, acquisitions, capital expenditures or investments; |
| • | engage in sales of assets and subsidiary stock; |
| • | enter into sale/leaseback transactions; |
| • | enter into transactions with affiliates; |
| • | transfer all or substantially all of our assets or enter into merger or consolidation transactions; and |
| • | make capital expenditures. |
In addition, our new senior secured credit facilities require us to maintain a maximum senior secured bank leverage ratio. As a result of these covenants and this ratio, we are limited in the manner in which we conduct our business and we may be unable to engage in favorable business activities or finance future operations or capital needs. While we are currently in compliance with all of the terms of our outstanding indebtedness, including the financial covenants contained therein, a downturn in our business could cause us to fail to comply with the financial or other covenants in our new senior secured credit facilities.
A failure to comply with the covenants contained in our new senior secured credit facilities or our existing indebtedness could result in an event of default under the facilities or the existing agreements. In the event of any default under our new senior secured credit facilities or our other indebtedness, the lenders thereunder:
| • | will not be required to lend any additional amounts to us; |
| • | could elect to declare all borrowings outstanding, together with accrued and unpaid interest and fees, to be due and payable; or |
| • | require us to apply all of our available cash to repay these borrowings. |
If the indebtedness under our new senior secured credit facilities or our other indebtedness were to be accelerated, our assets may not be sufficient to repay such indebtedness in full. See “Description of Certain Indebtedness.”
Demand for many of our products is cyclical and we may experience prolonged depressed market conditions for our products, which may decrease our net sales and operating margins.
Many of our products are used in industries that are cyclical in nature, such as the new home construction, automotive, oil and gas, chemicals and electronics industries. We sell our products to manufacturers in those industries who incorporate them into their own products. Sales to the construction industry are driven by trends in commercial and residential construction, housing starts and trends in residential repair and remodeling. Consumer confidence, mortgage rates and income levels play a significant role in driving demand in the residential construction, repair and remodeling sector. A drop in consumer confidence or an increase in mortgage rates or unemployment could cause a slowdown in the construction industry, and in particular the residential construction, repair and remodeling industry. These and other similar adverse developments could cause a material decrease in our net sales and operating margins.
22
Table of Contents
Downturns in one or more of the other businesses that use our products can adversely affect our net sales and operating margins. Many of our customers are in businesses that are cyclical in nature and sensitive to changes in general economic conditions. In 2002, sales of Borden Chemical’s oil field services products declined 29% as a result of reduced drilling activity. Demand for our products depends, in part, on general economic conditions, and a decline in economic conditions in the industries served by our customers has, and may continue to have, a material adverse effect on our business. An economic downturn in one or more of the businesses or geographic regions in which we sell our products could cause a material decrease in our net sales and operating margins.
We rely significantly on raw materials in the production of our products and fluctuations in costs would increase our operating expenses.
Our manufacturing operations depend upon obtaining adequate supplies of our raw materials on a timely basis. We rely on long-term agreements with key suppliers for most of our raw materials. The loss of a key source of supply or a delay in shipments could have an adverse effect on our business. Should any of our suppliers fail to deliver or should any of the key long-term supply contracts be cancelled, we would be forced to purchase raw materials in the open market, and no assurances can be given that we would be able to make these purchases or make them at prices that would allow us to remain competitive. One supplier provides over 10% of certain raw material purchases, and we could incur significant time and expense if we had to replace the supplier. In addition, several of our feedstocks at various facilities are transported through a pipeline from one supplier. If we were unable to receive these feedstock through these pipeline arrangements, we may not be able to obtain them from other suppliers at competitive prices or in a timely manner. During the past three years, the prices of these materials have been volatile. We are exposed to price risks associated with these raw material purchases. The availability and prices of raw materials may be subject to curtailment or change due to, among other things, new laws or regulations, suppliers’ allocations to other purchasers, interruptions in production by suppliers, changes in exchange rates, cost components of raw materials and worldwide price levels. In addition, we may be subject to increasing raw material prices and fuel surcharges due to hurricanes, such as Hurricanes Katrina and Rita in 2005, and other natural disasters and the associated damage to our suppliers. In 2005, approximately $27 million of incremental expenses associated with Hurricanes Katrina and Rita negatively impacted our results. Our ability to manufacture products depends on our ability to obtain an adequate supply of raw materials in a timely manner. Furthermore, if the cost of raw materials increases significantly and we are unable to offset the increased costs with higher selling prices, our profitability will decline.
From time to time, suppliers may extend lead times, limit supplies or increase prices due to capacity constraints or other factors. Although certain of our contracts include competitive price clauses that allow us to buy outside the contract if market pricing falls below contract pricing and other contracts have minimum-maximum monthly volume commitments that allow us to take advantage of spot pricing, we may not be able to purchase raw materials at market price. In addition, some of our customer contracts include selling price provisions that are indexed to publicly available indices for these commodity raw materials; however, we may not be able to immediately pass on raw material price increases to our customers, if at all. Due to differences in timing of the pricing mechanism trigger points between our sales and purchase contracts, there is often a “lead-lag” impact during which margins are negatively impacted for the short term in periods of rising raw material prices and positively impacted in periods of falling raw material prices. Raw material prices may not decrease from currently high levels or, if they do, we may not be able to capitalize on any such reductions in a timely manner, if at all.
Rising energy costs have previously increased our operating expenses and reduced net income and may in the future continue to do so, which could have a negative impact on our financial condition.
Natural gas is essential in our manufacturing processes, and its cost can vary widely and unpredictably. Our energy costs represented approximately 4% of our total cost of sales in 2005. Energy costs have risen significantly over the past several years due to the increase in the cost of oil and natural gas and the recent shortages of energy in various states, including those caused by Hurricanes Katrina and Rita. Our operating expenses increased in 2005 and will continue to increase if these costs continue to rise or do not return to
23
Table of Contents
historical levels. Rising energy costs may also increase our raw material costs. If we cannot pass these costs through to our customers, our profitability may decline. In addition, rising energy costs also negatively impact our customers and the demand for our products. These risks will be exacerbated if our customers or production facilities are in locations experiencing severe energy shortages.
Environmental obligations and liabilities could have a substantial negative impact on our financial condition, cash flows and profitability.
Our operations involve the use, handling, processing, storage, transportation and disposal of hazardous materials and are subject to extensive environmental laws and regulations at the national, state, local and international level. Such environmental laws and regulations include those governing the discharge of pollutants into the air and water, the management and disposal of hazardous materials and wastes, the cleanup of contaminated sites and occupational health and safety. We have incurred, and will continue to incur, significant costs and capital expenditures in complying with these laws and regulations. In 2005, we incurred related capital expenditures of $18 million including costs for other environmental improvements. In addition, violations of environmental laws or permits may result in restrictions being imposed on our operating activities or in our being subjected to substantial fines, penalties, criminal proceedings, third party property damage or personal injury claims or other costs. In addition, future developments or increasingly stringent regulation could require us to make additional unforeseen environmental expenditures. For example, the Louisville Metro Air Pollution control district has proposed new regulations that, if promulgated in their current form, could result in increased costs at our Louisville, Kentucky facility. In addition, potential air compliance issues at the Louisville facility could adversely affect our ability to achieve operational synergies in a timely fashion.
Even if we fully comply with environmental laws, we are subject to liability associated with hazardous substances in soil, groundwater and elsewhere at a number of sites. These include sites that we formerly owned or operated, and sites where hazardous wastes and other substances from our current and former facilities and operations have been treated, stored or disposed of, as well as sites that we currently own or operate. Depending upon the circumstances, our liability may be joint and several, meaning that we may be held responsible for more than our proportionate share, or even all, of the liability involved. Environmental conditions at such sites can lead to claims against us for personal injury or wrongful death, property damages, and natural resource damage, as well as to claims and obligations for the investigation and cleanup of environmental conditions. The extent of any such liabilities can be difficult to predict.
We have been notified that we are or may be responsible for environmental remediation at a number of sites in the United States, Europe and South America, and we are also undertaking a number of voluntary cleanups. We believe the most significant of these and the site that makes up approximately half of our remediation accrual is the site formerly owned by us in Geismar, Louisiana. As a result of former, current or future operations, there are likely to be additional environmental remediation or restoration liabilities or claims of personal injury by employees or members of the public due to exposure or alleged exposure to hazardous materials in connection with our operations, properties or products. We are aware of several sites, sold by us over 20 years ago, that may have significant site closure or remediation costs. Actual costs at these sites, as well as our share, if any, are unknown to us at this time. In addition, we have been served in two tort actions relating to one of these sites. If we fail to mount a successful defense against legal proceedings involving former sites, any significant finding of liability could have a negative impact on our financial condition, cash flows and profitability.
These environmental liabilities or obligations, or any that may arise or become known to us in the future, could have a material adverse effect on our financial condition, cash flows and profitability.
Because we manufacture and use materials that are known to be hazardous, we are subject to comprehensive product and manufacturing regulations, for which compliance can be costly and time consuming.
We produce hazardous chemicals that require care in handling and use and are subject to regulation by many U.S. and non-U.S. national, supra-national, state and local governmental authorities. In some circumstances, before we may sell some of our products these authorities must approve these products and our manufacturing
24
Table of Contents
processes and facilities. As our facilities grow, we may become subject to additional regulation or higher compliance standards. We are also subject to ongoing reviews of our products and manufacturing processes. For example, formaldehyde is an extensively regulated chemical, which various public health agencies continue to evaluate. The International Agency for Research on Cancer, or IARC, has recently reclassified formaldehyde as “carcinogenic to humans,” a higher classification than previous IARC evaluations, based principally on a study conducted by the National Cancer Institute (NCI) linking formaldehyde exposure to nasopharyngeal cancer, a rare form of cancer in humans. IARC also concluded that there was strong but not sufficient evidence for a finding of a causal association between leukemia and occupational exposure to formaldehyde, although IARC could not identify a mechanism for leukemia induction. IARC’s monograph reporting this decision has not yet been published. It is possible that this reclassification will lead to further governmental review of existing regulations and may result in additional costly requirements. In addition, BPA, which is used as an intermediate at our Deer Park and Pernis manufacturing facilities and is also sold directly to third parties, is currently under evaluation as an “endocrine disrupter.” Endocrine disrupters are chemicals that have been alleged to interact with the endocrine systems of humans and wildlife and disrupt normal processes. Pursuant to EU regulation 793/93/EC, BPA producers are currently conducting an extensive toxicology testing program of the chemical. In the event that BPA is further regulated, additional operating costs would likely be incurred to meet more stringent regulation of the chemical.
In order to obtain regulatory approval of certain new products, we must, among other things, demonstrate to the relevant authority that the product is safe for its intended uses and that we are capable of manufacturing the product in accordance with current regulations. The process of seeking approvals can be costly, time consuming and subject to unanticipated and significant delays. Approvals may not be granted to us on a timely basis, or at all. Any delay in obtaining, or any failure to obtain or maintain, these approvals would adversely affect our ability to introduce new products and to generate revenue from those products. New laws and regulations may be introduced in the future that could result in additional compliance costs, seizures, confiscation, recall or monetary fines, any of which could prevent or inhibit the development, distribution or sale of our products. For example, we produce resin-coated sand. Because sand consists primarily of crystalline silica, it creates the potential for silica exposure, which is a recognized health hazard. The Occupational Safety and Health Administration, or OSHA, will likely propose in 2006 a comprehensive occupational health standard for crystalline silica to provide for lower permissible exposure limits, exposure monitoring, medical surveillance and worker training. We may have to incur substantial additional costs over time to comply with any new OSHA regulations. In addition, the European Commission is finalizing a new regulatory system, known as Registration, Evaluation and Authorization of Chemicals, or REACH, which would require manufacturers, importers and consumers of certain chemicals to register such chemicals and evaluate their potential impacts on human health and the environment. Based on the results of the evaluation, a newly created regulatory body would then determine if the chemical should be further tested, regulated, restricted or banned from use. If REACH is enacted in its current form, significant market restrictions could be imposed on the current and future uses of chemical products sold by us in the European Union. Because the timing and ultimate form of the potential REACH regulation is not yet known, we cannot accurately predict future compliance costs, which could be significant. If we fail to comply with applicable laws and regulations, we may be subject to civil remedies, including fines, injunctions, recalls or seizures, which would have an adverse effect on our financial condition, cash flows and profitability.
Because we manufacture and use materials that are known to be hazardous, our production facilities are subject to significant operating hazards which could cause personal injury and loss of life, severe damage to, or destruction of, property and equipment and environmental contamination.
We are dependent on the continued operation of our 94 production facilities. These facilities are subject to hazards associated with the manufacture, handling, storage and transportation of chemical materials and products, including pipeline leaks and ruptures, explosions, fires, inclement weather and natural disasters, mechanical failure, unscheduled downtime, labor difficulties, transportation interruptions, and environmental hazards, such as spills, discharges or releases of toxic or hazardous substances and gases, storage tank leaks and remediation complications. These hazards can cause personal injury and loss of life, severe damage to, or destruction of, property and equipment and environmental contamination and other environmental damage and
25
Table of Contents
could have a material adverse effect on our financial condition. In addition, due to the nature of our business operations, we have been and may continue to be subject to scrutiny from environmental action groups. For example, currently there is an environmental group in the vicinity of our Louisville facility led by residents of the “Rubbertown” area, in which there are many chemical facilities, including our plant. As is typical for such groups, residents are claiming that the chemical facilities have caused health and property damage, and we have been named as a defendant in a lawsuit alleging such claims. In addition, in another state, we have been named as a defendant in a lawsuit involving one of our divested facilities that alleges residents living nearby suffered health issues as a result of exposure to chemicals used at that plant. In addition, a group has challenged the use of toluene di-isocyanate (“TDI”) at our Môlndal, Sweden facility. As a result, a court has ruled that TDI use under the current permit must be reduced. Although we are appealing the court’s ruling, a limit on TDI use would restrict certain operations at that facility. The activities by the environmental groups could result in additional litigation and damage to our reputation. We may incur losses beyond the limits of, or outside the coverage of, our insurance policies, in particular for liabilities associated with environmental cleanup that may arise out of such hazards. In addition, from time to time, various types of insurance for companies in the chemical industry, such as coverage for silica claims, have not been available on commercially acceptable terms, or, in some cases, have been unavailable. In the future, we may not be able to obtain coverage at current levels, and our premiums may increase significantly on coverage that we maintain.
We are subject to adverse claims from our customers and their employees as a result of the hazardous nature of our products.
We produce hazardous chemicals that require appropriate procedures and care to be used in handling them or using them to manufacture other products. As a result of the hazardous nature of some of the products we use and produce, we may face exposure relating to incidents involving our customers’ improper handling, storage and use of our products. On February 20, 2003, an explosion occurred at the facility of one of our customers, CTA Acoustics, Inc., which we refer to as CTA. Seven plant workers were killed and more than 40 workers were injured. There are six lawsuits in Laurel County, Kentucky, arising out of this incident, primarily seeking recovery for wrongful death, personal injury, emotional distress, loss of consortium, property damage and indemnity. On October 20, 2005, a settlement was reached with representatives of seven deceased plant workers and twelve seriously injured workers. We also settled claims for emotional distress and minor injuries from 75 current and former CTA workers. Our share of the settlement amounts are covered by insurance. The property damage claims remain to be resolved. Although we believe that we have adequate insurance coverage to address any additional payments and/or legal fees in excess of $5 million involved in any single incident, we could be subject to additional significant judgments given the nature of this litigation. We have historically faced a substantial number of lawsuits, including class action lawsuits, claiming liability for death, injury or property damage caused by products we manufacture or those that contain our components. These lawsuits, and any future lawsuits, could result in substantial damage awards against us, which in turn could encourage additional lawsuits. The classification of formaldehyde as “carcinogenic to humans” by IARC could become the basis in product liability litigation, particularly if there are any definitive studies demonstrating a causal association with leukemia. In addition, in large part as a result of the bankruptcies of many producers of asbestos containing products, plaintiffs’ attorneys are increasing their focus on peripheral defendants, including us, and asserting that even products that contained a small amount of asbestos caused injury. Plaintiffs’ attorneys are also focusing on alleged harm caused by other products we have made or used, including silica-containing resin coated sands and vinyl chloride monomer, or VCM. While we cannot predict the outcome of pending suits and claims, we believe that we have adequate reserves to address currently pending litigation and adequate insurance to cover currently pending and foreseeable future claims. An unfavorable outcome in these litigation matters may cause our profitability, business, financial condition and reputation to decline.
Our substantial international operations subject us to risks not faced by domestic competitors, which include unfavorable political, regulatory, labor and tax conditions in other countries.
We have significant manufacturing operations outside the United States. In 2005, our net sales outside the United States represented approximately 50% of our total sales. We have 57 production facilities located
26
Table of Contents
outside the United States, primarily concentrated in Australia, Brazil, Canada, China, the Czech Republic, Germany, Italy, Korea, Malaysia, the Netherlands and the United Kingdom. Accordingly, our business is subject to the differing legal, political, social and regulatory requirements and economic conditions of many jurisdictions. Risks are inherent in international operations, including, but not limited to, the following:
| • | difficulty in enforcing agreements through foreign legal systems; |
| • | foreign customers may have longer payment cycles; |
| • | foreign countries may impose additional withholding taxes or otherwise tax our foreign income, impose tariffs or adopt other restrictions on foreign trade and investment, including currency exchange controls; |
| • | fluctuations in exchange rates may affect product demand and may adversely affect the profitability in U.S. dollars of products and services provided by us in foreign markets where payment for our products and services is made in the local currency; |
| • | increased costs of transportation or shipping; |
| • | risk of nationalization of private enterprises; |
| • | changes in general economic and political conditions in the countries in which we operate; |
| • | unexpected adverse changes in foreign laws or regulatory requirements, including those with respect to environmental protection, export duties and quotas; |
| • | difficulty with staffing and managing widespread operations; and |
| • | required compliance with a variety of foreign laws and regulations. |
In addition, intellectual property rights may be more difficult to enforce in foreign countries. We currently have joint ventures in China, where we license technology to our joint venture partners. We may not be able to adequately protect our intellectual property in China or elsewhere. Our business in emerging markets requires us to respond to rapid changes in market conditions in these countries. Our overall success as a global business depends, in part, upon our ability to succeed in differing legal, regulatory, economic, social and political conditions. We may not continue to succeed in developing and implementing policies and strategies that will be effective in each location where we do business. Furthermore, each of the foregoing risks is likely to take on increased significance as we implement our plans to expand our foreign operations.
Currency translation risk and currency transaction risk may negatively affect our net sales, cost of sales and operating margins and could result in exchange losses.
We conduct our business and incur costs in the local currency of most countries in which we operate. In 2005, our net sales outside the United States represented approximately 50% of our total sales. Accordingly, our results of operations are reported in the relevant local currency and then translated to U.S. dollars at the applicable currency exchange rate for inclusion in our financial statements. Changes in exchange rates between those foreign currencies and the U.S. dollar will affect our net sales, cost of sales and operating margins and could result in exchange losses. In addition to currency translation risks, we incur currency transaction risk whenever one of our operating subsidiaries enters into either a purchase or a sales transaction using a different currency from the currency in which it receives revenues. In an effort to mitigate the impact of exchange rate fluctuations we engage in exchange rate hedging activities. However, the hedging transactions we enter into may not be effective or could result in foreign exchange hedging loss. The impact of future exchange rate fluctuations on our results of operations cannot be accurately predicted. Given the volatility of exchange rates, we may not be able to effectively manage our currency transaction and/or translation risks, and any volatility in currency exchange rates may have an adverse effect on our financial condition, cash flows and profitability.
We operate our business in countries that historically have been and may continue to be susceptible to recessions or currency devaluation, including Brazil and Malaysia. In addition, as we expand our business in emerging markets, particularly China and Russia, the uncertain regulatory environment relating to currency policy in these countries could have a negative impact on our operations there.
27
Table of Contents
Failure to develop new products will make us less competitive.
Our results of operations depend to a significant extent on our ability to expand our product offerings, and to continue to develop our production processes to be a competitive producer. We are committed to remaining a competitive producer and believe that our portfolio of new or re-engineered products is strong. However, we may not be able to continue to develop new products, re-engineer our existing products successfully or bring them to market in a timely manner. For example, our historical research and development efforts generally have focused on customer service, and we may be unsuccessful in shifting our focus to the type of research that will lead to significant new product development. In addition, some of our research and development scientists are located at our individual plants rather than at a research facility, which may impede their ability to share ideas and create new products. While we believe that the products, pricing and services we offer customers are competitive, we may not be able to continue to attract and retain customers to which to sell our products.
We face competition from other chemical companies, which could force us to lower our prices, thereby adversely affecting our operating margins, financial condition, cash flows and profitability.
The markets in which we operate are highly competitive, and this competition could harm our business, results of operations, cash flow and financial condition. Our competitors include major international producers as well as smaller regional competitors. We believe that the most significant competitive factor for our products is selling price and we may be forced to lower our selling price based on our competitors’ pricing decisions, thereby reducing our profitability. In addition, current and anticipated future consolidation among our competitors and customers may cause us to lose market share as well as put downward pressure on pricing. Furthermore, there is a trend in the chemical industry toward relocation of manufacturing facilities to lower-cost regions such as Asia. Such relocation may permit some of our competitors to lower their costs and improve their competitive position. Some of our competitors are larger, have greater financial resources and have less debt than we do. As a result, those competitors may be better able to withstand a change in conditions within our industry and throughout the economy as a whole. If we do not compete successfully, our business, operating margins, financial condition, cash flows and profitability could be adversely affected.
Competition from producers of materials that are substitutes for formaldehyde-based resins could lead to declines in our net sales attributable to these products.
We face competition from a number of products that are potential substitutes for formaldehyde-based resins. Currently, we estimate that formaldehyde-based resins make up most of the resins used as panelboard resins, wood and specialty adhesives and industrial resins. Decreases in the average selling price of formaldehyde may cause our profitability to decline. For example, competition among producers of foundry and specialty resins has led to erosion in certain product prices in the past. Our ability to maintain or increase our profitability will continue to be dependent, in large part, upon our ability to offset decreases in average selling prices by improving production efficiency or by shifting to higher margin chemical products. In addition, in some markets, non-formaldehyde based resins may be an alternative to our formaldehyde-based resins. Considerable growth in these substitutes for formaldehyde-based resins could adversely affect our market share, net sales and profit margins. Furthermore, the movement towards substitute products could be exacerbated as a result of the IARC recent reclassification of formaldehyde from a “probable human carcinogen” to “carcinogenic to humans” based on studies linking formaldehyde exposure to nasopharyngeal cancer, and a possible causal association between leukemia and occupational exposure to formaldehyde.
Acquisitions and joint ventures that we pursue may present unforeseen integration obstacles and costs, increase our leverage and negatively impact our performance.
We have made acquisitions of related businesses, and entered into joint ventures in the recent past and intend to selectively pursue acquisitions of, and joint ventures with, related businesses as one element of our growth strategy. We are evaluating several potential tuck-in acquisitions and are in various stages of due diligence and negotiations with respect thereto. These transactions may not be consummated in the foreseeable future, if at all, and
28
Table of Contents
we may not consummate significant acquisitions in the future. We may, in the future, pursue acquisitions of a significantly larger scale than in the past. If such acquisitions are consummated, the risk factors we describe below, and for our business generally, may be intensified.
Our ability to implement our growth strategy is limited by covenants in our new senior secured credit facilities, indentures and other indebtedness, our financial resources, including available cash and borrowing capacity, and our ability to integrate or identify appropriate acquisition and joint venture candidates. Moreover, acquisitions of businesses may require us to assume or incur additional debt financing, resulting in additional leverage and complex debt structures.
The expense incurred in consummating acquisitions of related businesses, or our failure to integrate such businesses successfully into our existing businesses, could result in our incurring unanticipated expenses and losses. Furthermore, we may not be able to realize any anticipated benefits from acquisitions or joint ventures. The process of integrating acquired operations into our existing operations may result in unforeseen operating difficulties and may require significant financial resources that would otherwise be available for the ongoing development or expansion of existing operations. Some of the risks associated with our acquisition and joint venture strategy include:
| • | potential disruption of our ongoing business and distraction of management; |
| • | unexpected loss of key employees or customers of the acquired company; |
| • | conforming the acquired company’s standards, processes, procedures and controls with our operations; |
| • | coordinating new product and process development; |
| • | hiring additional management and other critical personnel; and |
| • | increasing the scope, geographic diversity and complexity of our operations. |
In addition, we may encounter unforeseen obstacles or costs in the integration of acquired businesses. For example, the preparation of the US GAAP financial statements for Bakelite required significant management resources. Also, the presence of one or more material liabilities of an acquired company that are unknown to us at the time of acquisition may have a material adverse effect on our business. Our acquisition and joint venture strategy may not be successfully received by customers, and we may not realize any anticipated benefits from acquisitions or joint ventures.
Our future success depends on our ability to retain our key employees.
We are dependent on the services of Craig O. Morrison, our President and Chief Executive Officer, William H. Carter, our Chief Financial Officer and other members of our senior management team, who collectively have over 130 years of experience in the chemical and plastics industries, to remain competitive in our industry. The loss of Mr. Morrison or any other member of our senior management team could have an adverse effect on us. There is a risk that we will not be able to retain or replace these key employees. All of our current key employees are subject to employment conditions or arrangements that contain post employment non-competition provisions. However, these arrangements permit the employees to terminate their employment with little or no notice.
We may be required to expend greater time and expense than other companies in dealing with our employees, some of whom are unionized, represented by workers’ councils or are employed subject to local laws that are less favorable to employers than the laws of the United States.
As of December 31, 2005, approximately 46% of our employees were unionized or represented by workers’ councils that have collective bargaining agreements. In addition, some of our employees are employed in countries in which employment laws provide greater bargaining or other rights to employees than the laws of the United States. Such favorable employment rights require us to expend greater time and expense in making
29
Table of Contents
changes to employees’ terms of employment or making staff reductions. For example, most of our employees in Europe are represented by workers’ councils which must approve any changes in conditions of employment, including salaries and benefits. “Protection against dismissal” claims have been brought by certain of such workers’ councils in connection with Bakelite’s cost-saving initiatives. A significant dispute with our employees may divert management’s attention and otherwise hinder our ability to conduct our business and achieve planned cost savings.
We rely on patents and confidentiality agreements to protect our intellectual property. Our failure to protect our intellectual property rights could adversely affect our future performance and growth.
Protection of our proprietary processes, methods and compounds and other technology is important to our business. Failure to protect our existing intellectual property rights may result in the loss of valuable technologies or having to pay other companies for infringing on their intellectual property rights. We rely on patent, trade secret, trademark and copyright law as well as judicial enforcement to protect such technologies. A majority of our patents relate to the development of new products and processes for manufacturing and use thereof and expire at various times between 2006 and 2026. Some of our technologies are not covered by any patent or patent application. In addition, our patents could be challenged, invalidated, circumvented or rendered unenforceable. Furthermore, pending patent applications may not result in an issued patent, or if patents are issued to us, such patents may not provide meaningful protection against competitors or against competitive technologies.
Our production processes and products are specialized. However, we could face patent infringement claims from our competitors or others alleging that our processes or products infringe on their proprietary technology. If we were subject to an infringement suit, we may be required to change our processes or products or stop using certain technologies or producing the infringing product entirely. Even if we ultimately prevail in an infringement suit, the existence of the suit could cause our customers to seek other products that are not subject to infringement suits. Any infringement suit could result in significant legal costs and damages and impede our ability to produce key products, which could have a material adverse effect on our business, financial condition and results of operations.
In addition, effective patent, trademark, copyright and trade secret protection may be unavailable or limited in some foreign countries. In some countries we do not apply for patent, trademark or copyright protection. We also rely upon unpatented proprietary manufacturing expertise, continuing technological innovation and other trade secrets to develop and maintain our competitive position. While we generally enter into confidentiality agreements with our employees and third parties to protect our intellectual property, such confidentiality agreements are limited in duration and could be breached, and may not provide meaningful protection for our trade secrets or proprietary manufacturing expertise. Adequate remedies may not be available in the event of an unauthorized use or disclosure of our trade secrets and manufacturing expertise. In addition, others may obtain knowledge of our trade secrets through independent development or other access by legal means. The failure of our patents or confidentiality agreements to protect our processes, apparatuses, technology, trade secrets and proprietary manufacturing expertise, methods and compounds could have an adverse effect on our business by jeopardizing critical intellectual property.
If we are unable to access funds generated by our subsidiaries we may not be able to meet our financial obligations.
Because Hexion conducts many of its operations through its subsidiaries, Hexion depends on those entities for dividends, distributions and other payments to generate the funds necessary to meet its financial obligations. Legal and contractual restrictions in certain agreements governing current and future indebtedness of Hexion’s subsidiaries, as well as the financial condition and operating requirements of Hexion’s subsidiaries, may limit Hexion’s ability to obtain cash from its subsidiaries. All of Hexion’s subsidiaries are separate and independent legal entities and have no obligation whatsoever to pay any dividends, distributions or other payments to Hexion.
30
Table of Contents
Significant changes in pension fund investment performance or assumptions relating to pension costs may increase the valuation of pension obligations, alter the funded status of pension plans and increase our pension costs.
Our funding policy for pension plans is to accumulate plan assets that, over the long run, will approximate the present value of projected benefit obligations. Our pension cost is materially affected by the discount rate used to measure pension obligations, the level of plan assets available to fund those obligations at the measurement date and the expected long-term rate of return on plan assets. Significant changes in investment performance or a change in the portfolio mix of invested assets can result in corresponding increases and decreases in the valuation of plan assets, particularly equity securities, or in a change of the expected rate of return on plan assets. A change in the discount rate would result in a significant increase or decrease in the valuation of pension obligations, affecting the reported funded status of our pension plans as well as the net periodic pension cost in the following financial years. Similarly, changes in the expected return on plan assets assumption can result in significant changes in the net periodic pension cost of the following financial years.
One of the Company’s pension plans is currently underfunded and we may have to make significant cash payments to the plan and/or incur a liability to the Pension Benefit Guaranty Corporation. Termination by the Pension Benefit Guaranty Corporation would further increase our pension expense and could result in liens on material amounts of our assets.
On April 17, 2006, the Company notified the Pension Benefit Guaranty Corporation, or PBGC, that a legacy Borden Chemical defined benefit pension plan (the “Borden Plan”) was underfunded by approximately $91 million on a termination basis. IRS regulations require us to increase our contributions to the Borden Plan to reduce this underfunding. Based on current IRS regulations and plan provisions, we expect that our total minimum funding requirements for the five years ended in 2010 for the Borden Plan will be approximately $55 million. If the performance of the assets in the Borden Plan does not meet our expectations, if the PBGC requires additional contributions to the Borden Plan as a result of the Hexion Formation or the Hexion Refinancings, if there are changes to IRS regulations or other applicable law, or if other actuarial assumptions are modified, our contributions for those years could be higher than we expect.
The need to make these cash contributions may reduce the cash available to meet our other obligations or to meet the needs of our business. In addition, the PBGC may terminate the Borden Plan under limited circumstances, including in the event the PBGC concludes that its risk may increase unreasonably if the Borden Plan continues. In the event the Borden Plan is terminated for any reason while it is underfunded, we could be required to make an immediate payment to the PBGC of all or a substantial portion of the Borden Plan’s underfunding, as calculated by the PBGC based on its own assumptions (which might result in a larger pension obligation than that based on the assumptions we have used to fund the Borden Plan), and the PBGC could assert a lien on material amounts of our assets.
In addition, in 2003, the IRS notified the Company that cash balance plans such as the Borden Plan may be required to be amended because of recent ERISA rulings that found cash balance plans to be discriminatory. The IRS indicated that the Borden Plan should continue to operate as currently designed until new guidance is available. Although the effect of any future guidance is not known, it is possible that such guidance may increase our obligations under the Borden Plan.
Our equity sponsor controls us and its interests may conflict with or differ from your interests.
After the consummation of this offering, our equity sponsor, Apollo, will beneficially own approximately 70.9% of our common stock, assuming the underwriters do not exercise their over-allotment option. If the underwriters exercise in full their over-allotment option, Apollo will beneficially own approximately 67.9% of our common stock. In addition, representatives of Apollo will have the ability to prevent any transaction that requires the approval of directors. As a result, Apollo will have the ability to substantially influence all matters
31
Table of Contents
requiring shareholder approval, including the election of our directors and the approval of significant corporate transactions such as mergers, tender offers and the sale of all or substantially all of our assets. For example, the approval of two-thirds of the members of our board of directors will be required by our amended and restated certificate of incorporation under certain circumstances including, without limitation, amendments to our organizational documents in a manner that adversely affects Apollo. These provisions shall terminate at such time as affiliates of Apollo no longer beneficially own at least one-third of our outstanding common stock and have sold at least one share of our common stock other than in this offering. See “Management—Supermajority Board Approval of Certain Matters.” The interests of Apollo and its affiliates could conflict with or differ from your interests as a holder of our common stock. For example, the concentration of ownership held by Apollo could delay, defer or prevent a change of control of our company or impede a merger, takeover or other business combination which you may otherwise view favorably. Apollo may also pursue acquisition opportunities that may be complementary to our business, and as a result, those acquisition opportunities may not be available to us. A sale of a substantial number of shares of stock in the future by funds affiliated with our equity sponsor could cause our stock price to decline in the future.
We are a “controlled company” within the meaning of the New York Stock Exchange rules and, as a result, will qualify for, and intend to rely on, exemptions from certain corporate governance requirements.
Upon the closing of this offering, affiliates of Apollo will continue to control a majority of our outstanding common stock. As a result, we are a “controlled company” within the meaning of the New York Stock Exchange corporate governance standards. Under the New York Stock Exchange rules, a company of which more than 50% of the voting power is held by an individual, group or another company is a “controlled company” and may elect not to comply with certain New York Stock Exchange corporate governance requirements, including:
| • | the requirement that a majority of the board of directors consist of independent directors; |
| • | the requirement that we have a nominating/corporate governance committee that is composed entirely of independent directors with a written charter addressing the committee’s purpose and responsibilities; |
| • | the requirement that we have a compensation committee that is composed entirely of independent directors with a written charter addressing the committee’s purpose and responsibilities; and |
| • | the requirement for an annual performance evaluation of the nominating/corporate governance and compensation committees. |
Following this offering, we intend to utilize these exemptions. As a result, we will not have a majority of independent directors nor will our nominating/corporate governance and compensation committees consist entirely of independent directors. Accordingly, you will not have the same protections afforded to shareholders of companies that are subject to all of the New York Stock Exchange corporate governance requirements.
Our internal control over financial reporting may not be effective and our independent auditors may not be able to certify as to their effectiveness, which could have a significant and adverse effect on our business and reputation.
We will be subject to the requirements of Section 404 of the Sarbanes-Oxley Act of 2002 and the rules and regulations of the SEC thereunder (which we refer to as Section 404) as of December 31, 2007. Section 404 requires us to report on, and attest to, the design and effectiveness of our internal control over financial reporting. Prior to the Combinations, Borden Chemical and Resolution Performance had performed the system and process evaluation in an effort to comply with management certification and auditor attestation requirements of Section 404. However, prior to the Combinations, Bakelite and Resolution Specialty were not required to meet these regulations. In the course of our ongoing Section 404 evaluation, we have identified areas of internal controls that need improvement, including closing, tax accounting and consolidation procedures.
For example, Bakelite’s original system of financial reporting was designed to comply with German GAAP; accordingly, Bakelite’s management determined that Bakelite did not have sufficient internal controls and
32
Table of Contents
resources relating to the preparation of US GAAP financial statements. As Resolution Specialty began the process of developing a stand-alone infrastructure, Resolution Specialty’s management determined that Resolution Specialty did not have sufficient internal controls and resources relating to the preparation of US GAAP financial statements. In addition, as our international operations have expanded and the complexity of our business has increased, we have determined that, in some instances, local resources are not adequately familiar with US GAAP areas such as income tax accounting. As a result of such determinations, we have utilized additional outside advisors, as appropriate, to assess and to assist with the US GAAP closing and consolidation processes associated with preparing the financial statements included herein, including the conversion of local and German GAAP to US GAAP. While we have added additional resources to assist with the US GAAP closing, tax accounting and consolidation processes, for future reporting periods, such closing and consolidation processes may result in delays in reporting our results.
In order to improve our internal controls, we have changed and expanded the roles and responsibilities of key personnel and made changes to certain processes related to financial reporting. As part of the integration of Resolution Specialty and Resolution Performance, we continue the process of consolidating some of the transaction processing and general accounting activities of Resolution Specialty, and Resolution Performance to a lesser extent, into a common shared services transaction processing environment with the Corporate and North American activity related to the former Borden Chemical operation. We have also recently launched a project to consolidate multiple legacy systems and multiple management information and accounting systems. Once fully implemented, this change to a shared services business model (for certain processes) along with a single management information and accounting system is intended to further enhance our internal control over financial reporting and our operating efficiencies. We have also expanded the scope of the services of the international accounting firm that provides tax accounting and compliance services and support to include Resolution Performance, Resolution Specialty and Bakelite. Management has also added additional tax personnel to assist current personnel in monitoring the tax reporting process and continues to evaluate the need for additional tax, US GAAP and financial reporting resource needs based on the Combinations and recent acquisitions.
However, as the evaluation process is ongoing, we may identify additional conditions that may be categorized as areas of internal control that need improvement in the future. We cannot be certain as to the timing of completion of our evaluation, documentation, testing and any remediation actions or the impact of the same on our operations. If our remediation actions described above are insufficient and we are not able to obtain reports or institute controls on a timely basis, the chief financial officer or chief executive officer may conclude that our controls are ineffective for purposes of Section 404, our independent auditors may conclude that our assessment process or our internal controls over financial reporting are not effective and we may be subject to sanctions or investigations by regulatory authorities, such as the SEC. As a result, there could be a negative reaction in the financial markets due to a loss of confidence in the reliability of our financial statements or our financial statements could change. In addition, we may be required to incur costs in improving our internal control system and the hiring of additional personnel. Any such action could negatively affect our results of operations.
Risks Relating to This Offering
There is no existing public market for our common stock, and we do not know if one will develop, which could impede your ability to sell your shares and depress the market price of our common stock.
Prior to this offering, there has been no public market for our common stock. We cannot predict the extent to which investor interest will lead to the development of an active and liquid trading market in our common stock. The failure of an active trading market to develop could affect your ability to sell your shares and depress the market price of your shares. The initial public offering price for our shares of common stock will be determined by negotiations among us, the selling shareholder and the representatives of the underwriters. The initial public offering price of our shares of common stock will be based on numerous factors and may not be indicative of the market price of the common stock that will prevail in the trading market. The market price of your shares may fall below the initial public offering price.
33
Table of Contents
The market price of our common stock may be volatile, which could cause the value of your investment to decline.
The market price of our common stock could fluctuate significantly, in which case you may not be able to resell your shares at or above the initial public offering price. Some companies that have had volatile market prices for their securities have had securities class action suits filed against them. If a suit were to be filed against us, regardless of the outcome, it could result in substantial costs and a diversion of management’s attention and resources. This could have a material adverse effect on our business, results of operations and financial condition.
The market price of our common stock may fluctuate in response to a number of events, including:
| • | our quarterly operating results; |
| • | future announcements concerning our business; |
| • | changes in financial estimates and recommendations by securities analysts; |
| • | the number of shares to be publicly traded after this offering; |
| • | actions of competitors; |
| • | our involvement in acquisitions, strategic alliances or joint ventures; |
| • | market and industry perception of our success, or lack thereof, in pursuing our growth strategy; |
| • | changes in government and environmental regulation; |
| • | arrival and departure of key personnel; |
| • | general market, economic and political conditions; and |
| • | natural disasters, terrorist attacks and acts of war. |
In addition, in recent years the stock market has experienced significant price and volume fluctuations. These fluctuations are often unrelated to the operating performance of particular companies. These broad market fluctuations may cause declines in the market price of our common stock. The price of our common stock could fluctuate based upon factors that have little or nothing to do with our company, and these fluctuations could materially reduce the market price of our common stock.
You will experience immediate and substantial dilution as the net tangible book deficit per share of common stock will be substantially lower than the initial public offering price.
The initial public offering price of the shares of common stock is substantially higher than the net tangible book deficit per share of the outstanding common stock. As a result, if we were liquidated immediately following this offering, you would experience immediate and substantial dilution of $41.54 per share of common stock. Dilution is the difference between the initial public offering price per share and the net tangible book deficit per share of our common stock. See “Dilution”, including the discussion of the effects on dilution from a change in the price of the offering.
Future sales or the possibility or perception of future sales of a substantial amount of our common stock could adversely affect the market price of our common stock.
The market price of our common stock could decline as a result of sales of a large number of shares of our common stock in the public market after this offering or the perception that these sales could occur. The sales, or the possibility that these sales may occur, also might make it more difficult for us to sell equity securities in the future at a time and at a price that we deem appropriate.
34
Table of Contents
Upon consummation of this offering, there will be 86,260,551 shares of our common stock outstanding (including 954,378 shares related to deferred compensation units). All shares of common stock sold in this offering will be freely transferable without restriction or further registration under the Securities Act of 1933, as amended (the “Securities Act”). Of the remaining shares of common stock outstanding, 66,787,654 will be restricted securities within the meaning of Rule 144 under the Securities Act, but will be eligible for resale subject to applicable volume, manner of sale, holding period and other limitations of Rule 144. We and certain of our shareholders have agreed to a “lock-up,” pursuant to which neither we nor they will sell any shares without the prior consent of Credit Suisse Securities (USA) LLC for 180 days after the date of this prospectus, subject to certain exceptions and extension under certain circumstances. Following the expiration of the applicable lock-up period, all these shares of our common stock will be eligible for future sale, subject to the applicable volume, manner of sale, holding period and other limitations of Rule 144. In addition, Apollo and our other existing shareholders have certain registration rights with respect to the common stock that they will retain following this offering. See “Shares Eligible for Future Sale” for a discussion of the shares of common stock that may be sold into the public market in the future.
We may issue shares of our common stock or other securities from time to time as consideration for future acquisitions and investments. If any such acquisition or investment is significant, the number of shares of our common stock, or the number or aggregate principal amount, as the case may be, of other securities that we may issue may in turn be substantial. We may also grant registration rights covering those shares of our common stock or other securities in connection with any such acquisitions and investments.
Our organizational documents may impede or discourage a takeover, which could deprive our investors of the opportunity to receive a premium for their shares.
We intend to amend and restate our certificate of incorporation and bylaws to incorporate provisions that may make it more difficult for, or prevent a third party from, acquiring control of us without the approval of our board of directors. These provisions will include:
| • | a classified board of directors (from and after the first annual meeting of shareholders held after the offering); |
| • | the sole power of a majority of the board of directors to fix the number of directors; |
| • | limitations on the removal of directors; |
| • | the ability of our board of directors to designate one or more series of preferred stock and issue shares of preferred stock without shareholder approval; |
| • | the inability of shareholders to act by written consent; |
| • | advance notice requirements for nominating directors or introducing other business to be conducted at shareholder meetings; and |
| • | the requirement to obtain approval of two-thirds of our directors to approve certain transactions, including a merger. |
The foregoing factors could impede a merger, takeover or other business combination or discourage a potential investor from making a tender offer for our common stock, which could make it more difficult for a third party to acquire control of our company, even if some of our shareholders consider such a change of control to be beneficial and under certain circumstances, could reduce the market value of our common stock. Such provisions also may have the effect of preventing changes in our management. See “Description of Capital Stock.”
35
Table of Contents
CAUTIONARY STATEMENT CONCERNING FORWARD-LOOKING STATEMENTS
This prospectus includes “forward-looking statements” that involve risks and uncertainties. Forward-looking statements include statements concerning our plans, objectives, goals, strategies, future events, future revenue or performance, capital expenditures, financing needs, plans or intentions relating to acquisitions, business trends and other information that is not historical information and, in particular, appear under the headings “Prospectus Summary,” “Management’s Discussion and Analysis of Financial Condition and Results of Operations” and “Business.” When used in this prospectus, the words “estimates,” “expects,” “anticipates,” “projects,” “plans,” “intends,” “believes,” “forecasts,” “foresees,” “likely,” “may,” “should,” “goal,” “target” and variations of such words or similar expressions are intended to identify forward-looking statements. All forward-looking statements are based upon information available to us on the date of this prospectus.
These forward-looking statements are subject to risks, uncertainties and other factors, many of which are outside of our control, that could cause actual results to differ materially from the results discussed in the forward-looking statements, including, among other things, the matters discussed in this prospectus in the sections captioned” “Prospectus Summary,” “Risk Factors” and “Management’s Discussion and Analysis of Financial Condition and Results of Operations.” Such factors may include:
| • | our ability to integrate Borden Chemical, Resolution Performance, Resolution Specialty, Bakelite and our subsequent acquisitions and achieve cost savings; |
| • | general economic and business conditions including those influenced by international and geopolitical events such as the wars in Iraq and Afghanistan and any future terrorist attacks; |
| • | industry trends; |
| • | the highly cyclical nature of the end-use markets in which we participate; |
| • | raw material costs and availability; |
| • | restrictions contained in our debt agreements; |
| • | our substantial leverage, including the inability to generate the necessary amount of cash to service our existing debt and the incurrence of substantial indebtedness in the future; |
| • | the possibility of liability for pollution and other damage that is not covered by insurance or that exceeds our insurance coverage; |
| • | increased competition in the markets in which we operate; |
| • | changes in demand for our products; |
| • | the loss of any of our major customers; |
| • | our dependence on a limited number of key executives who we may not be able to adequately replace if they leave our company; |
| • | changes in, or the failure or inability to comply with, government regulations, agricultural policy and environmental, health and safety requirements; |
| • | changes in pension fund investment performance, required pension contributions or assumptions relating to pension costs or expected return on plan assets; |
| • | changes in business strategy, development plans or cost savings plans; |
| • | the loss of any of our major suppliers or the bankruptcy or financial distress of our customers; |
| • | the ability to attain and maintain any price increases for our products; |
| • | foreign currency fluctuations and devaluations and political instability in our foreign markets; |
| • | the loss of our intellectual property rights; |
36
Table of Contents
| • | availability, terms and deployment of capital; and |
| • | other factors over which we have little or no control, including events like hurricanes and other natural disasters, such as Hurricanes Katrina and Rita. |
There may be other factors that could cause our actual results to differ materially from the results referred to in the forward-looking statements. We undertake no obligation to publicly update or revise forward-looking statements to reflect events or circumstances after the date made or to reflect the occurrence of unanticipated events, except as required by law.
37
Table of Contents
We estimate that we will receive net proceeds from our offering of our common stock, after deducting underwriting discounts and other expenses, of approximately $86 million, assuming the shares are offered at $27.00 per share, which is the midpoint of the estimated offering price range set forth on the cover of this prospectus. We intend to use all of our net proceeds from the sale of common stock being sold by us together with available cash to repay $100 million of our term loan under our new senior secured credit facilities. The interest rates with respect to term loans under our new senior secured credit facilities are based on, at our option, adjusted LIBOR plus 2.00% or a Dollar base rate plus 0.50%. Our term loan facility has a seven-year term, subject to an earlier maturity date under certain circumstances. We used borrowings from our term loan facility to refinance our previously existing term loan facility, repurchase and redeem notes and preferred stock in the Hexion Refinancings and to pay related fees and expenses. See “Description of Certain Indebtedness—First-Priority Lien Obligations—New Senior Secured Credit Facilities.” Certain of the underwriters or their affiliates are or may become lenders under our new senior secured credit facilities and as such, will or may, as applicable, receive a portion of the proceeds of this offering, which will be used to partially repay term loans thereunder.
Assuming the number of shares offered by us, as set forth on the cover page of this prospectus, remains the same, after deducting the estimated underwriting discounts and commissions and estimated offering expenses payable by us in connection with the offering, a $1.00 increase (decrease) in the assumed public offering price of $27.00 per share of common stock would decrease (increase) the amount of available cash used to repay $100 million under our term loan on our new senior secured credit facilities by $4 million.
On May 31, 2005, we used all of the proceeds that we received from the offering of shares of our Series A Preferred Stock and a portion of the proceeds from borrowings under our May 2005 senior secured credit facilities to declare a special dividend of approximately $550 million (of which $27 million remains to be paid) to our parent, Hexion LLC, which in turn paid a pro rata special dividend to its equity holders, which included Apollo and other investors, including certain members of our management.
We will not receive any proceeds for the sale of our common stock by the selling shareholder, including if the underwriters exercise their option to purchase additional shares. In the aggregate, the selling shareholder will receive approximately $380 million of the net proceeds of this offering, or approximately $451 million if the underwriters’ option to purchase additional shares is exercised in full, assuming the shares are offered at $27.00 per share, which is the midpoint of the estimated offering price range set forth on the cover of this prospectus. J.P. Morgan Securities Inc., an underwriter in this offering, is an affiliate of JPMorgan Chase Bank, N.A., a trustee for a certain New York trust which owns an interest in the selling shareholder. An affiliate of Goldman, Sachs & Co., an underwriter in this offering, owns an interest in the selling shareholder. See “Principal and Selling Shareholders” and “Underwriting.”
38
Table of Contents
We do not currently intend to pay any cash dividends on our common stock, and instead intend to retain earnings, if any, for future operations and debt reduction. Our new senior secured credit facilities and the indentures governing our notes impose restrictions on our ability to pay dividends, and thus our ability to pay dividends on our common stock will depend upon, among other things, our level of indebtedness at the time of the proposed dividend and whether we are in default under any of our debt instruments. See “Description of Certain Indebtedness.” Our future dividend policy will also depend on the requirements of any future financing agreements to which we may be a party and other factors considered relevant by our board of directors. Any decision to declare and pay dividends in the future will be made at the discretion of our board of directors and will depend on, among other things, our results of operations, cash requirements, financial condition, business opportunities, provision of applicable law and other factors that our board of directors may deem relevant. For a discussion of our cash resources and needs, see “Management’s Discussion and Analysis of Financial Condition and Results of Operations—Liquidity and Capital Resources.”
On May 31, 2005, we used all of the proceeds that we received from the offering of shares of our Series A Preferred Stock and a portion of the proceeds from borrowings under our May 2005 senior secured credit facilities to declare a special dividend of approximately $550 million (of which $27 million remains to be paid) to our parent, Hexion LLC, which in turn paid a pro rata special dividend to its equity holders, which included Apollo and other investors, including certain members of our management.
39
Table of Contents
The following table sets forth our cash and equivalents and our capitalization as of March 31, 2006 (i) on an actual consolidated basis for Hexion and (ii) on an as adjusted basis giving effect to the Hexion Refinancings, including the application of the net proceeds to the Company therefrom, and the offering, including the application of the net proceeds to partially repay the new senior secured credit facilities. You should read this table in conjunction with “Selected Historical Financial and Other Information,” “Unaudited Pro Forma Financial Information,” “Use of Proceeds,” “Management’s Discussion and Analysis of Financial Condition and Results of Operations” and all of the financial statements and the related notes included elsewhere in this prospectus.
| As of March 31, 2006 | ||||||||||||||||
| Adjustments | ||||||||||||||||
| Actual | Hexion Refinancings | The Offering | As Adjusted (1) | |||||||||||||
Cash and equivalents | $ | 168 | $ | 6 | $ | (33 | ) | $ | 141 | |||||||
Debt: | ||||||||||||||||
Senior credit facilities (including current maturities) | $ | 496 | $ | 1,129 | $ | (100 | ) | $ | 1,525 | |||||||
Senior secured notes | 967 | (343 | ) | — | 624 | |||||||||||
Senior unsecured debentures | 440 | — | — | 440 | ||||||||||||
Senior subordinated notes | 336 | (336 | ) | — | — | |||||||||||
Industrial revenue bonds | 34 | — | — | 34 | ||||||||||||
Other debt and capital leases | 40 | — | — | 40 | ||||||||||||
Short-term debt | 27 | — | — | 27 | ||||||||||||
Total debt | 2,340 | 450 | (100 | ) | 2,690 | |||||||||||
Preferred Stock: | ||||||||||||||||
Series A Preferred Stock, par value $0.01 per share, liquidation preference $350 millionactual: 60,000,000 shares authorized, 14,000,000 shares issued and outstanding;as adjusted: 14,000,000 shares authorized, no shares issued and outstanding | 377 | (377 | ) | — | — | |||||||||||
Shareholders’ Deficit: | ||||||||||||||||
Common stock, par value $0.01 per share:actual 300,000,000 shares authorized, 82,629,906 shares issued and outstanding;as adjusted: 500,000,000 shares authorized, 86,260,551(2) shares issued and outstanding | 1 | — | — | 1 | ||||||||||||
Paid-in capital | 504 | (20 | ) | 80 | 564 | |||||||||||
Treasury stock | (296 | ) | — | — | (296 | ) | ||||||||||
Accumulated other comprehensive loss | (59 | ) | — | — | (59 | ) | ||||||||||
Accumulated deficit | (1,039 | ) | (51 | ) | (20 | ) | (1,110 | ) | ||||||||
Total common stock and other shareholders’ deficit | (889 | ) | (71 | ) | 60 | (900 | ) | |||||||||
Total capitalization | $ | 1,828 | $ | 2 | $ | (40 | ) | $ | 1,790 | |||||||
| (1) | Reflects the sale of 3,703,704 shares of our common stock by us in the offering at an assumed initial public offering price of $27.00 per common share, which represents the mid-point of the estimated offering price range shown on the cover of this prospectus, and the application of the net proceeds to the Company together with available cash to repay $100 million of our term loan under our new senior secured credit facilities as described further under “Use of Proceeds.” |
| Assuming the number of shares offered by us, as set forth on the cover page of this prospectus, remains the same, after deducting the estimated underwriting discounts and commissions and estimated offering expenses payable by us in connection with the offering a $1.00 increase (decrease) in the assumed public offering price of $27.00 per share of common stock would increase (decrease) cash and equivalents by $4 million, paid-in capital by $4 million and total capitalization by $4 million and decrease (increase) total common stock and other shareholders’ deficit by $4 million. |
| (2) | Includes 954,378 shares relating to deferred compensation units. |
40
Table of Contents
Dilution is the amount by which the offering price paid by the purchasers of the common stock to be sold in this offering will exceed the pro forma net tangible book value per share of common stock after the offering. Our net tangible book deficit as of March 31, 2006 was $1,243, or $15.06 per share of common stock. We have calculated this amount by:
| • | subtracting our total liabilities, minority interest and Series A preferred stock from our total tangible assets; and |
| • | dividing the difference by the number of shares of common stock outstanding. |
If we give effect to the sale of 3,703,704 shares of common stock by us in this offering at the initial public offering price of $27.00 per share, which is the midpoint of the estimated offering price range set forth on the cover of this prospectus, after deducting the underwriting discounts and commissions and the estimated offering expenses payable by us, our pro forma net tangible book deficit as of March 31, 2006 would have been $1,254, or $14.54 per share. This amount represents an immediate dilution of $41.54 per share to new investors. The following table illustrates this dilution per share:
| Per Share | ||||||||
Assumed initial public offering price | $ | 27.00 | ||||||
Net tangible book deficit as of March 31, 2006 | $ | (15.06 | ) | |||||
Increase in net tangible book value attributable to this offering | 0.52 | |||||||
Pro forma net tangible book deficit after this offering | (14.54 | ) | ||||||
Dilution to new investors | $ | 41.54 | ||||||
Assuming the number of shares offered by us, as set forth on the cover page of this prospectus, remains the same, after deducting the estimated underwriting discounts and commissions and estimated offering expenses payable by us in connection with the offering, a $1.00 increase (decrease) in the assumed public offering price of $27.00 per share of common stock would increase (decrease) the increase in net tangible book value attributable to this offering by $0.05 per share and the dilution to new investors by $0.95 per share and decrease (increase) the pro forma net tangible book deficit after this offering by $0.05 per share.
The following table summarizes on the basis described above, as of March 31, 2006 , the difference between the number of shares of common stock purchased from us, the total consideration paid to us, and the average price per share paid by Hexion LLC and by new investors, at the initial public offering price of $27.00 per share, which is the midpoint of the estimated offering price range set forth on the cover of this prospectus, before deducting underwriting discounts and commissions and estimated offering expenses payable by us:
| Shares Purchased | Total Consideration | Average Price | ||||||||||||
| (total consideration amount in millions) | Number | Percent | Amount | Percent | ||||||||||
Hexion LLC(1)(2) | 82,556,847 | 95.7 | % | $ | 2 | 2.0 | % | $ | 0.02 | |||||
New investors(3) | 3,703,704 | 4.3 | 100 | 98.0 | $ | 27.00 | ||||||||
Total | 86,260,551 | 100.0 | % | $ | 102 | 100.0 | % | |||||||
41
Table of Contents
| (1) | As of March 31, 2006, the number of shares of common stock owned by Hexion LLC was 82,629,906. On May 12, 2006, Hexion LLC contributed 73,059 shares of common stock to Hexion. |
| (2) | Total consideration and average price per share paid by Hexion LLC give effect to the $523 million dividend paid to Hexion LLC through March 31, 2006. This table does not give effect to the $27 million dividend declared but not paid. |
| (3) | Excludes 14,814,815 shares of our common stock (or if the over-allotment option is exercised, 17,592,593) to be sold by Hexion LLC to the new investors in the offering for which we will not receive any net proceeds. After the consummation of this offering, Hexion LLC will beneficially own approximately 78.5% of our common stock (or 75.3% if the underwriters exercise in full their over-allotment option). |
Assuming the number of shares offered by us, as set forth on the cover page of this prospectus, remains the same, after deducting the estimated underwriting discounts and commissions and estimated offering expenses payable by us in connection with the offering, a $1.00 increase (decrease) in the assumed public offering price of $27.00 per share of common stock would increase (decrease) the total consideration paid by new investors by $4 million, the total consideration paid by all stockholders by $4 million and the average price per share by $1.00 per share.
The tables above assume no exercise or conversion of the 4,105,148 outstanding stock options at March 31, 2006 with a weighted average exercise price of approximately $6.39 per share, which includes 4,087,128 options to purchase shares of common stock that are in-the-money compared to the midpoint of the estimated offering price range set forth on the cover of this prospectus because the exercise or conversion of such options would have an anti-dilutive effect on the net tangible book value. See “Management.”
42
Table of Contents
UNAUDITED PRO FORMA FINANCIAL INFORMATION
We derived the unauditedpro forma financial data set forth below by the application of the pro forma adjustments to the historical audited consolidated financial statements of Hexion, appearing elsewhere in this prospectus.
The unaudited pro forma balance sheet as of March 31, 2006, gives pro forma effect only to the Hexion Refinancings, including the application of the net proceeds to the Company therefrom and the offering of common stock, including the application of net proceeds to partially repay the new senior secured credit facilities as if the Hexion Refinancings and the offering occurred on March 31, 2006. The unaudited pro forma balance sheet does not give effect to the Akzo Acquisition which is not considered significant per the provisions of Article 11-01(b) of Regulation S-X.
The unaudited pro forma statements of operations for the year ended December 31, 2005 and the three months ended March 31, 2005 give pro forma effect to the Hexion Formation, the Hexion Refinancings and the offering and the unaudited pro forma statement of operations for the three months ended March 31, 2006 gives pro forma effect to the Hexion Refinancings and the offering, including the application of the net proceeds to the Company therefrom, as if they occurred on January 1, 2005. The unaudited pro forma statements of operations do not give effect to the Akzo Acquisition, the Rhodia Acquisition, the Rohm and Haas Acquisition or the Brazilian Consumer Divestiture which are not considered significant per the provisions of Article 11-01(b) of Regulation S-X.
The pro forma adjustments relating to the Bakelite Transaction and the minority interest acquisitions as part of the Combinations are based on preliminary estimates of the fair value of the consideration provided, estimates of the fair values of assets acquired and liabilities assumed and available information and assumptions. The final purchase price allocations are dependent on whether there are any post-closing adjustments on the finalization of asset and liability valuations. These final valuations will be based on the actual net tangible and intangible assets that existed as of the closing dates of the Bakelite Transaction and the Combinations. Any final adjustment may change the allocations of purchase price, which could affect the fair value assigned to the assets and liabilities and could result in a change to the unaudited pro forma financial information, including the adjustment of goodwill.
The unaudited pro forma financial information is presented for informational purposes only and does not purport to represent what our results of operations would actually have been if they had occurred on the date indicated nor do they purport to project our results of operations for any future period.
You should read our unaudited pro forma financial information and the accompanying notes in conjunction with all of the historical financial statements and related notes included in this prospectus and other financial information appearing elsewhere in this prospectus, including information contained in “Capitalization” and “Management’s Discussion and Analysis of Financial Condition and Results of Operations.”
43
Table of Contents
HEXION SPECIALTY CHEMICALS, INC.
Unaudited Pro Forma Balance Sheet
as of March 31, 2006
(dollars in millions)
Hexion Refinancings | The offering | |||||||||||||||||||
| Actual | Adjustments (1) | Subtotal | Adjustments (2) | Pro Forma | ||||||||||||||||
Assets | ||||||||||||||||||||
Current assets: | ||||||||||||||||||||
Cash and equivalents | $ | 168 | $ | 6 | (a) | $ | 174 | $ | (33 | )(a) | $ | 141 | ||||||||
Accounts receivable | 684 | — | 684 | — | 684 | |||||||||||||||
Inventories | 470 | — | 470 | — | 470 | |||||||||||||||
Other current assets | 88 | — | 88 | (13 | )(b) | 75 | ||||||||||||||
| 1,410 | 6 | 1,416 | (46 | ) | 1,370 | |||||||||||||||
Property and equipment | 1,440 | — | 1,440 | — | 1,440 | |||||||||||||||
Goodwill | 172 | — | 172 | — | 172 | |||||||||||||||
Other intangible assets | 182 | — | 182 | — | 182 | |||||||||||||||
Other non-current assets | 103 | (4 | )(b) | 99 | — | 99 | ||||||||||||||
Total assets | $ | 3,307 | $ | 2 | $ | 3,309 | $ | (46 | ) | $ | 3,263 | |||||||||
Liabilities, redeemable preferred stock, common stock and other shareholders’ deficit | ||||||||||||||||||||
Current liabilities: | ||||||||||||||||||||
Accounts and drafts payable | $ | 547 | $ | — | $ | 547 | $ | — | $ | 547 | ||||||||||
Debt payable within one year | 41 | 11 | (c) | 52 | (1 | )(c) | 51 | |||||||||||||
Other current liabilities | 399 | — | 399 | (6 | )(d) | 393 | ||||||||||||||
| 987 | 11 | 998 | (7 | ) | 991 | |||||||||||||||
Other liabilities: | ||||||||||||||||||||
Long-term debt | 2,299 | 439 | (d) | 2,738 | (99 | )(c) | 2,639 | |||||||||||||
Non-pension postemployment benefit obligations | 115 | — | 115 | — | 115 | |||||||||||||||
Deferred income taxes | 135 | — | 135 | — | 135 | |||||||||||||||
Other long-term liabilities | 274 | — | 274 | — | 274 | |||||||||||||||
| 2,823 | 439 | 3,262 | (99 | ) | 3,163 | |||||||||||||||
Minority interest | 9 | — | 9 | — | 9 | |||||||||||||||
Series A Preferred Stock | 377 | (377 | )(e) | — | — | — | ||||||||||||||
Shareholders’ deficit: | ||||||||||||||||||||
Common stock and additional paid-in capital | 505 | (20 | )(f) | 485 | 80 | (e) | 565 | |||||||||||||
Treasury stock and other | (355 | ) | — | (355 | ) | — | (355 | ) | ||||||||||||
Accumulated deficit | (1,039 | ) | (51 | )(g) | (1,090 | ) | (20 | )(f) | (1,110 | ) | ||||||||||
| (889 | ) | (71 | ) | (960 | ) | 60 | (900 | ) | ||||||||||||
Total liabilities, redeemable preferred stock, common stock and other shareholders’ deficit | $ | 3,307 | $ | 2 | $ | 3,309 | $ | (46 | ) | $ | 3,263 | |||||||||
See Notes to Unaudited Pro Forma Balance Sheet
44
Table of Contents
Notes to Unaudited Pro Forma Balance Sheet
| (1) | Set forth below are the estimated sources and uses of funds pertaining to the Hexion Refinancings. |
Sources | |||
Proceeds from new senior secured credit facilities | $ | 1,625 | |
Synthetic letter of credit facility | 50 | ||
Total sources | $ | 1,675 | |
Uses | |||
Available cash | $ | 6 | |
Redemption of Series A Preferred Stock | 397 | ||
Repayment of: | |||
Existing Senior Secured Term Loan | 496 | ||
8% Senior Secured Notes | 140 | ||
9 1/2% Senior Second Secured Notes | 200 | ||
13 1/2% Senior Subordinated Notes | 328 | ||
Synthetic letter of credit facility | 50 | ||
Transaction costs | 58 | ||
Total uses | $ | 1,675 | |
The Hexion Refinancings will generate net proceeds of $1,609 (net of estimated fees and expenses of $16) to the Company which will be used to repay existing debt of $1,164, pay debt redemption cost of $42 and redeem the Series A Preferred Stock at its accreted amount which is estimated to be $397 as of the redemption date. In addition, the new senior secured credit facilities will also provide for a $50 synthetic letter of credit facility, which will replace the existing letter of credit facility of an equivalent amount. As of March 31, 2006, the Series A Preferred Stock had accreted to $377. It is estimated that an additional amount of $20 will be incurred through the redemption date in respect of a redemption premium, dividends, accretion and fees prior to redemption. The Series A Preferred Stock was redeemed in full for cash on May 12, 2006.
| (a) | Reflects net cash available from the Hexion Refinancings. |
| (b) | Reflects the write-off of deferred debt issue costs of $20 related to the existing debt repaid from the proceeds of the Hexion Refinancings, offset by the capitalized debt issue cost of $16 related to the new senior secured credit facilities. |
| (c) | Reflects the current portion of the new senior secured credit facilities of $16 reduced by the current portion of the debt of $5 repaid in the Hexion Refinancings. |
| (d) | Reflects the net increase in long-term debt as follows: |
New senior secured credit facilities | $ | 1,625 | ||
Existing debt repaid | ||||
Face value | (1,164 | ) | ||
Premium | (11 | ) | ||
Less: Net change in current portion | (11 | ) | ||
Net change | $ | 439 | ||
| (e) | Reflects the redemption of Series A Preferred Stock. It is estimated that an additional amount of $20 will be incurred through the redemption date in respect of a redemption premium, dividends, accretion and fees prior to redemption. The Series A Preferred Stock was redeemed in full for cash on May 12, 2006. |
| (f) | Reflects accrued and unpaid Series A Preferred Stock dividends and a redemption premium which total $20 (including accretion of issuance costs). |
| (g) | Reflects the estimated loss on debt redemption of $31 (consisting of redemption cost of $42 less debt premium of $11) and write-off of deferred debt issue cost of $20 related to existing debt repaid from the proceeds of the Hexion Refinancings. |
45
Table of Contents
| (2) | Set forth below are the estimated sources and uses of funds pertaining to the offering. |
Sources | |||
Available cash | $ | 13 | |
Offering of common stock | 100 | ||
Total sources | $ | 113 | |
Uses | |||
Partial repayment of new senior secured credit facilities | $ | 100 | |
Transaction costs of the offering* | 13 | ||
Total uses | $ | 113 | |
(*) Include $6 accrued as other current liabilities and exclude $7 paid through March 31, 2006.
The offering is expected to raise proceeds of $87 (net of estimated fees and expenses) to the Company which will be used together with available cash to repay $100 of the new senior secured credit facilities.
| (a) | Reflects the payment of a buyout of the Apollo management consulting agreement and the payment of a structuring and advisory fee to Apollo related to the offering and the use of available cash of $13 for the partial repayment of the new senior secured credit facilities. |
| (b) | Reflects the elimination of deferred assets recorded for transaction costs relating to this offering which include $6 recorded in other current liabilities and $7 paid through March 31, 2006. |
| (c) | Reflects the partial repayment of new senior secured credit facilities, of which $1 would have been payable within one year. |
| (d) | Reflects the payment of accrued transaction costs relating to this offering. |
| (e) | Reflects the net proceeds of the offering of common stock by us of $87 reduced by $7 of offering costs paid through March 31, 2006. |
| (f) | Reflects the use of available cash for the payment of a buyout of the Apollo management consulting agreement and the payment of a structuring and advisory fee to Apollo related to the offering. |
Assuming the number of shares offered by us, as set forth on the cover page of this prospectus, remains the same, after deducting the estimated underwriting discounts and commissions and estimated offering expenses payable by us in connection with the offering, a $1.00 increase (decrease) in the assumed public offering price of $27.00 per share of common stock would increase (decrease) cash and equivalents by $4 million and common stock and additional paid-in capital by $4 million and total liabilities, redeemable preferred stock, common stock and other shareholders’ deficit by $4 million.
46
Table of Contents
HEXION SPECIALTY CHEMICALS
Unaudited Pro Forma Statement of Operations
For the year ended December 31, 2005
(dollars in millions, except per share data)
| Hexion Formation | Hexion Refinancings | The offering | ||||||||||||||||||||||||||
| Actual | ||||||||||||||||||||||||||||
| Preacquisition | ||||||||||||||||||||||||||||
| Hexion | Bakelite (1) | Adjustments (2) | Adjustments (3) | Subtotal | Adjustments (4) | Pro Forma | ||||||||||||||||||||||
Net sales | $ | 4,470 | $ | 261 | $ | (14 | )(a) | $ | — | $ | 4,717 | $ | — | $ | 4,717 | |||||||||||||
Cost of sales | 3,808 | 229 | (31 | )(a) | — | 4,006 | — | 4,006 | ||||||||||||||||||||
Gross profit | 662 | 32 | 17 | — | 711 | — | 711 | |||||||||||||||||||||
Selling, general & administrative expense | 400 | 30 | (1 | )(b) | — | 429 | 2 | (a) | 431 | |||||||||||||||||||
Transaction costs | 44 | — | — | — | 44 | — | 44 | |||||||||||||||||||||
Other operating (income) expense | 10 | 1 | (1 | )(c) | — | 10 | (3 | )(b) | 7 | |||||||||||||||||||
Operating income | 208 | 1 | 19 | — | 228 | 1 | 229 | |||||||||||||||||||||
Interest expense, net | 221 | 2 | (3 | )(d) | 6 | (a) | 226 | (7 | )(c) | 219 | ||||||||||||||||||
Other non-operating (income) expense | 16 | — | — | — | 16 | — | 16 | |||||||||||||||||||||
Income (loss) from continuing operations before income tax and minority interest | (29 | ) | (1 | ) | 22 | (6 | ) | (14 | ) | 8 | (6 | ) | ||||||||||||||||
Income tax expense | 48 | 2 | 10 | (e) | (2 | )(b) | 58 | 3 | (d) | 61 | ||||||||||||||||||
Income (loss) from continuing operations before minority interest | (77 | ) | (3 | ) | 12 | (4 | ) | (72 | ) | 5 | (67 | ) | ||||||||||||||||
Equity in earnings of investees | 2 | — | — | — | 2 | — | 2 | |||||||||||||||||||||
Minority interest in net (income) of consolidated subsidiaries | (3 | ) | — | (1 | )(f) | — | (4 | ) | — | (4 | ) | |||||||||||||||||
Net income (loss) from continuing operations | (78 | ) | (3 | ) | 11 | (4 | ) | (74 | ) | 5 | (69 | ) | ||||||||||||||||
Dividends on Series A Preferred Stock | 30 | — | — | (30 | )(c) | — | — | — | ||||||||||||||||||||
Net income (loss) available to common shareholders before nonrecurring charges directly attributable to the transactions (5) | $ | (108 | ) | $ | (3 | ) | $ | 11 | $ | 26 | $ | (74 | ) | $ | 5 | $ | (69 | ) | ||||||||||
Pro Forma loss per share (6) | ||||||||||||||||||||||||||||
Basic and Diluted | $ | (0.80 | ) | |||||||||||||||||||||||||
Pro Forma weighted average number of common shares outstanding (6) | ||||||||||||||||||||||||||||
Basic and Diluted | 86,260,551 | |||||||||||||||||||||||||||
See Notes to Unaudited Pro Forma Statement of Operations
47
Table of Contents
HEXION SPECIALTY CHEMICALS
Unaudited Pro Forma Statement of Operations
For the three months ended March 31, 2006
(dollars in millions, except per share data)
| Hexion Refinancings | The offering | |||||||||||||||||||
| Actual | ||||||||||||||||||||
| Hexion | Adjustments (3) | Subtotal | Adjustments (4) | Pro Forma | ||||||||||||||||
Net sales | $ | 1,245 | $ | — | $ | 1,245 | $ | — | $ | 1,245 | ||||||||||
Cost of sales | 1,060 | — | 1,060 | — | 1,060 | |||||||||||||||
Gross profit | 185 | — | 185 | — | 185 | |||||||||||||||
Selling, general & administrative expense | 101 | — | 101 | — | 101 | |||||||||||||||
Transaction costs | 4 | — | 4 | — | 4 | |||||||||||||||
Other operating (income) expense | (30 | ) | — | (30 | ) | (1 | )(b) | (31 | ) | |||||||||||
Operating income | 110 | — | 110 | 1 | 111 | |||||||||||||||
Interest expense, net | 54 | 3 | (a) | 57 | (2 | )(c) | 55 | |||||||||||||
Other non-operating expense | 1 | — | 1 | — | 1 | |||||||||||||||
Income (loss) from continuing operations before income tax and minority interest | 55 | (3 | ) | 52 | 3 | 55 | ||||||||||||||
Income tax expense | 19 | (1 | )(b) | 18 | 1 | (d) | 19 | |||||||||||||
Income (loss) from continuing operations before minority interest | 36 | (2 | ) | 34 | 2 | 36 | ||||||||||||||
Equity in earnings of investees | 1 | — | 1 | — | 1 | |||||||||||||||
Minority interest in net (income) of consolidated subsidiaries | (2 | ) | — | (2 | ) | — | (2 | ) | ||||||||||||
Net income (loss) from continuing operations | 35 | (2 | ) | 33 | 2 | 35 | ||||||||||||||
Dividends on Series A Preferred Stock | 13 | (13 | )(c) | — | — | — | ||||||||||||||
Net income available to common shareholders before nonrecurring charges directly attributable to the transactions (5) | $ | 22 | $ | 11 | $ | 33 | $ | 2 | $ | 35 | ||||||||||
Pro Forma earnings per share (6) | ||||||||||||||||||||
Basic | $ | 0.41 | ||||||||||||||||||
Diluted | $ | 0.39 | ||||||||||||||||||
Pro Forma weighted average number of common shares outstanding (6) | ||||||||||||||||||||
Basic | 86,260,551 | |||||||||||||||||||
Diluted | 89,433,009 | |||||||||||||||||||
See Notes to Unaudited Pro Forma Statement of Operations
48
Table of Contents
HEXION SPECIALTY CHEMICALS
Unaudited Pro Forma Statement of Operations
For the three months ended March 31, 2005
(dollars in millions, except per share data)
| Hexion Formation | Hexion Refinancings | The offering | |||||||||||||||||||||||||
| Actual | |||||||||||||||||||||||||||
| Preacquisition | |||||||||||||||||||||||||||
| Hexion | Bakelite (1) | Adjustments (2) | Adjustments (3) | Subtotal | Adjustments (4) | Pro Forma | |||||||||||||||||||||
Net sales | $ | 1,012 | $ | 193 | $ | (11 | )(a) | $ | — | $ | 1,194 | $ | — | $ | 1,194 | ||||||||||||
Cost of sales | 863 | 165 | (11 | )(a) | — | 1,017 | — | 1,017 | |||||||||||||||||||
Gross profit | 149 | 28 | — | — | 177 | — | 177 | ||||||||||||||||||||
Selling, general & administrative expense | 86 | 21 | — | — | 107 | 1 | (a) | 108 | |||||||||||||||||||
Transaction costs | 7 | — | — | — | 7 | — | 7 | ||||||||||||||||||||
Other operating (income) expense | (3 | ) | 1 | (1 | )(c) | — | (3 | ) | (1 | )(b) | (4 | ) | |||||||||||||||
Operating income | 59 | 6 | 1 | — | 66 | — | 66 | ||||||||||||||||||||
Interest expense, net | 45 | 1 | 9 | (d) | 2 | (a) | 57 | (2 | )(c) | 55 | |||||||||||||||||
Other non-operating expense | 9 | — | — | — | 9 | — | 9 | ||||||||||||||||||||
Income (loss) from continuing operations before income tax and minority interest | 5 | 5 | (8 | ) | (2 | ) | — | 2 | 2 | ||||||||||||||||||
Income tax expense | 13 | 2 | (2 | )(e) | — | (b) | 13 | 1 | (d) | 14 | |||||||||||||||||
Income (loss) from continuing operations before minority interest | (8 | ) | 3 | (6 | ) | (2 | ) | (13 | ) | 1 | (12 | ) | |||||||||||||||
Equity in earnings of investees | — | — | — | — | — | — | — | ||||||||||||||||||||
Minority interest in net (income) of consolidated subsidiaries | (2 | ) | — | 1 | (f) | — | (1 | ) | — | (1 | ) | ||||||||||||||||
Net income (loss) from continuing operations | (10 | ) | 3 | (5 | ) | (2 | ) | (14 | ) | 1 | (13 | ) | |||||||||||||||
Dividends on Series A Preferred Stock | — | — | — | — | — | — | — | ||||||||||||||||||||
Net income (loss) available to common shareholders before nonrecurring charges directly attributable to the | $ | (10 | ) | $ | 3 | $ | (5 | ) | $ | (2 | ) | $ | (14 | ) | $ | 1 | $ | (13 | ) | ||||||||
Pro Forma loss per share (6) | |||||||||||||||||||||||||||
Basic and Diluted | $ | (0.15 | ) | ||||||||||||||||||||||||
Pro Forma weighted average number of common shares outstanding (6) | |||||||||||||||||||||||||||
Basic and Diluted | 86,260,551 | ||||||||||||||||||||||||||
See Notes to Unaudited Pro Forma Statement of Operations
49
Table of Contents
Notes to Unaudited Pro Forma Statement of Operations
(1) The Bakelite Transaction occurred on April 29, 2005. The historical data with respect to the Resins Business of the Bakelite Group, the predecessor to Bakelite, is presented in the unaudited pro forma statement of operations for the year ended December 31, 2005 and for the three months ended March 31, 2005 and relates to the period from January 1, 2005 to April 29, 2005 and the three month period from January 1, 2005 to March 31, 2005, respectively. From April 30, 2005, data with respect to Bakelite is included in the Hexion historical data. The historical combined statement of operations of Bakelite for the four months ended April 29, 2005 and the three months ended March 31, 2005 has been translated into U.S. dollars at the average exchange rate for the period of 1.3053 and 1.3097 U.S. dollars to one euro, respectively. It should be noted that such translations should not be construed as representations that the U.S. dollar amounts actually represent such euro amounts, or could have been or will be converted into euros at the rate indicated or at all. The historical combined statements of operations of Bakelite are as follows:
Four months April 29, | Three months March 31, | ||||||
Net sales | € | 200 | € | 147 | |||
Cost of sales | 176 | 126 | |||||
Gross profit | 24 | 21 | |||||
Selling, general and administrative expense | 23 | 16 | |||||
Other operating expense | 1 | 1 | |||||
Operating income | — | 4 | |||||
Interest expense | 1 | 1 | |||||
Income (loss) before income tax | (1 | ) | 3 | ||||
Income tax expense | 1 | 1 | |||||
Net income (loss) | € | (2 | ) | € | 2 | ||
To conform the presentation of Bakelite’s statements of operations with Hexion’s for the four months ended April 29, 2005 and the three months ended March 31, 2005, Bakelite’s distribution expenses of €6 and €4, respectively, have been included in Cost of sales, and marketing expenses of €12 and €8, respectively, have been included in Selling, general and administrative expense.
(2) Reflects the following adjustments:
| (a) | Elimination of intercompany activity resulted in the reduction of net sales and cost of sales. Additionally, cost of sales reflects an adjustment to reverse an amount which represents the write-up of inventory that was recorded as part of the purchase price allocations for Bakelite and the minority interest exchanges, and subsequently expensed through cost of sales. These entries are summarized as follows: |
| Year ended December 31, 2005 | Three months ended March 31, 2005 | |||||||
Sales | ||||||||
Elimination of intercompany activity | $ | (14 | ) | $ | (11 | ) | ||
Cost of Sales | ||||||||
Elimination of intercompany activity | $ | (15 | ) | $ | (11 | ) | ||
Reverse expensing of inventory write-up | (16 | ) | — | |||||
| $ | (31 | ) | $ | (11 | ) | |||
| (b) | Reflects an adjustment to decrease amortization expense resulting from fair value adjustments to amortizable intangible assets. |
| (c) | Reflects the elimination of management fees. |
50
Table of Contents
| (d) | Represents the new debt issued and the effect of a full year of interest expense related to the debt outstanding as a result of the Hexion Formation: |
| Year ended December 31, | Three months ended March 31, | |||||||
| 2005 | 2005 | |||||||
Second-priority senior secured notes | $ | 44 | $ | 11 | ||||
New Floating Rate Notes | 16 | 4 | ||||||
Existing Senior Secured Term Loan | 40 | 10 | ||||||
8% Senior Secured Notes | 11 | 3 | ||||||
9 1/2% Senior Second Secured Notes | 19 | 5 | ||||||
13 1/2% Senior Subordinated Notes | 44 | 11 | ||||||
All other | 39 | 9 | ||||||
Total cash interest | 213 | 53 | ||||||
Amortization of debt issuance cost and debt premium or discount | 7 | 2 | ||||||
Pro forma interest expense | 220 | 55 | ||||||
Less historical interest | (223 | ) | (46 | ) | ||||
Net adjustment to interest expense | $ | (3 | ) | $ | 9 | |||
The interest rates in effect at May 10, 2006 were used to compute the pro forma adjustments to interest expense for newly issued variable rate debt, including debt issued in the Borden Transaction. Each one-eighth point change in the assumed interest rates would result in a $1 change in annual interest expense.
| (e) | The appropriate statutory tax rates of the respective tax jurisdictions to which adjustments relate have been applied. |
| (f) | Reflects the elimination of minority interests in Resolution Performance and Resolution Specialty resulting from the exchange of such interests as part of the Combinations. |
| (3) | Reflects the following adjustments: |
| (a) | Reflects the reduction of interest expense as a result of the Hexion Refinancings |
Year ended 2005 | Three months ended March 31, | |||||||||||
| 2005 | 2006 | |||||||||||
New Senior Secured Credit Facilities | $ | 120 | $ | 31 | $ | 31 | ||||||
Repayment of | ||||||||||||
Existing Senior Secured Term Loan | (40 | ) | (10 | ) | (9 | ) | ||||||
8% Senior Secured Notes | (11 | ) | (3 | ) | (3 | ) | ||||||
9 1/2% Senior Second Secured Notes | (19 | ) | (5 | ) | (5 | ) | ||||||
13 1/2% Senior Subordinated Notes | (44 | ) | (11 | ) | (11 | ) | ||||||
Total net cash interest | 6 | 2 | 3 | |||||||||
Change in amortization of debt issuance cost and debt premium or discount | — | — | — | |||||||||
Net adjustment to interest expense | $ | 6 | $ | 2 | $ | 3 | ||||||
The interest rates in effect at May 10, 2006, including the $1 billion notional amount swap, were used to compute pro forma adjustments to interest expense for newly issued variable rate debt, including the new senior secured credit facilities. Each one-eighth point change in the assumed interest rates would result in $1 change in annual interest expense. See “Description of Certain Indebtedness—First-Priority Lien Obligations—New Senior Secured Credit Facilities.”
| (b) | The appropriate statutory tax rates of the respective tax jurisdictions to which adjustments relate have been applied. |
| (c) | Reflects the elimination of accretion related to Series A Preferred Stock for the year ended December 31, 2005 and the three months ended March 31, 2006. It is estimated that an additional amount of $20 will be incurred through the redemption date in respect of a redemption premium, dividends, accretion and fees. The Series A Preferred Stock was redeemed in full for cash on May 12, 2006. |
51
Table of Contents
(4) Reflects the following adjustments:
| (a) | Reflects the cost resulting from the modification of existing option agreements. |
| (b) | Reflects the elimination of management fees resulting from the buyout of the Apollo management consulting agreement in connection with the offering. The unaudited pro forma statement of operations does not reflect a one time charge relating to the buyout of the Apollo management consulting agreement or the payment of a $10 fee to Apollo for its structuring and advisory services relating to the offering. |
| (c) | Reflects the reduction of interest expense as a result of partial repayment of new senior secured credit facilities of $100. |
| (d) | The appropriate statutory tax rates of the respective tax jurisdictions to which adjustments relate have been applied. |
(5) Net income (loss) available to common shareholders does not include estimated nonrecurring charges directly attributable to the transactions of approximately $71, consisting of a loss on debt redemption of $31 (representing redemption cost of $42 less debt premium of $11), write off of unamortized debt issuance costs of $20, payment of $10 for the buy-out of the Apollo management consulting agreement and payment to Apollo of $10 for structuring and advisory services.
(6) Pro forma basic and diluted earnings (loss) per common share is computed by dividing earnings (loss) available to common stockholders by the weighted average number of common shares outstanding during the period. The share amounts have, as appropriate, been adjusted for the contribution of 73,059 shares by Hexion LLC, Hexion’s parent company, on May 12, 2006 and the effects of the contribution of the deferred compensation and option plans and shares related thereto which will occur immediately prior to the offering. The number of deferred compensation units of 954,378 contributed are included in the calculation of basic earnings per share, but are fully offset by the number of shares contributed by Hexion LLC.
Since we had a net loss for the year ended December 31, 2005 and for three months ended March 31, 2005, any shares issuable upon the exercise of employee stock options would have an antidilutive effect. Therefore the unaudited pro forma diluted loss per share for each of these periods is the same as the unaudited pro forma basic loss per share. Since we had a net income for the three months ended March 31, 2006, any shares issuable upon the exercise of employee stock options would have a dilutive impact. Therefore the number of shares for the calculation of the unaudited pro forma diluted earnings per share for the three months ended March 31, 2006 has been adjusted to reflect the dilutive effect of 4,087,128 in-the-money stock options outstanding as at March 31, 2006 with a weighted average exercise price of approximately $6.39 per share issued in prior years in shares of Hexion LLC. After the contributions mentioned above, these options will become options for the common stock of Hexion.
Unaudited pro forma basic and diluted earnings (loss) per share have been calculated in accordance with the SEC rules for initial public offerings. These rules require that the weighted average share calculation give retroactive effect to any changes in our capital structure. Therefore, pro forma weighted average shares for purposes of the unaudited pro forma basic earnings (loss) per share calculation have been adjusted to reflect the sale of 3,703,704 shares by us in this offering.
52
Table of Contents
SELECTED HISTORICAL FINANCIAL AND OTHER INFORMATION
The combination of Borden Chemical, Resolution Performance and Resolution Specialty has been treated, for accounting purposes, as a combination of entities under common control due to Apollo’s controlling interest in each of the companies. The audited consolidated financial statements presented herein reflect the results of operations of each company from the date such company was acquired by Apollo.
The following table presents selected historical financial and other data of Hexion. The selected historical financial and other data of Hexion as of December 31, 2004 and 2005, and for the years ended December 31, 2003, 2004 and 2005 has been derived from the audited consolidated financial statements of Hexion, included elsewhere in this prospectus. The selected historical financial and other data of Hexion as of and for the three months ended March 31, 2005 and 2006 have been derived from the unaudited condensed consolidated financial statements of Hexion, included elsewhere in this prospectus and include all adjustments that management considers necessary for a fair presentation of our financial position and results of operations as of the dates and for the periods indicated. Results for the three months ended March 31, 2006 are not necessarily indicative of the results that may be expected for the entire year. The financial data of Hexion for the years ended December 31, 2001 and 2002 represent the operating results of Resolution Performance, not included herein, which reflect purchase accounting adjustments following the acquisition of Resolution Performance by Apollo on November 14, 2000. The financial data for Hexion for the years ended December 31, 2003, 2004 and 2005 and the three months ended March 31, 2005, includes:
| • | the results of operations of Resolution Performance for the years ended December 31, 2003, 2004 and 2005 and the three months ended March 31, 2005, which reflect purchase accounting adjustments from the date of acquisition of Resolution Performance by Apollo on November 14, 2000; |
| • | the results of operations of Borden Chemical for the period from August 12, 2004 to December 31, 2004, the year ended December 31, 2005 and the three months ended March 31, 2005, on a historical basis (because Borden Chemical is a public reporting registrant as a result of public debt that was outstanding prior to the Borden Transaction and which debt remains outstanding, Borden Chemical has elected to present its financial statements from the date of its acquisition by Apollo on the historical basis of accounting permitted under the SEC’s public debt exemption); |
| • | the results of operations of Resolution Specialty for the period from August 2, 2004 to December 31, 2004, the year ended December 31, 2005 and the three months ended March 31, 2005 which reflect purchase accounting adjustments from the date of acquisition of Resolution Specialty by Apollo on August 2, 2004; and |
| • | the results of operations of Bakelite for the period from April 30, 2005 to December 31, 2005, which reflect purchase accounting adjustments from the date of the acquisition of Bakelite on April 29, 2005. |
The financial data for Hexion for the three months ended March 31, 2006 includes the results of the Rhodia Acquisition and Rohm and Haas Acquisition since January 31, 2006 and March 1, 2006, the respective dates of acquisition.
You should read this data in conjunction with “Management’s Discussion and Analysis of Financial Condition and Results of Operations” and all the financial statements and the related notes included elsewhere in this prospectus.
53
Table of Contents
| Year ended December 31, | Three months ended March 31, | |||||||||||||||||||||||||||
| 2001 | 2002 | 2003 | 2004(1) | 2005(2) | 2005 | 2006(2) | ||||||||||||||||||||||
| (dollars in millions) | ||||||||||||||||||||||||||||
Statement of Operations: | ||||||||||||||||||||||||||||
Net sales | $ | 863 | $ | 740 | $ | 782 | $ | 2,019 | $ | 4,470 | $ | 1,012 | $ | 1,245 | ||||||||||||||
Cost of sales | 695 | 601 | 714 | 1,785 | 3,808 | 863 | 1,060 | |||||||||||||||||||||
Gross profit (loss) | 168 | 139 | 68 | 234 | 662 | 149 | 185 | |||||||||||||||||||||
Selling, general & administrative expense | 90 | 82 | 81 | 163 | 400 | 86 | 101 | |||||||||||||||||||||
Transaction costs | — | — | — | 56 | 44 | 7 | 4 | |||||||||||||||||||||
Other operating (income) expense(3) | — | 16 | 10 | 6 | 10 | (3 | ) | (30 | ) | |||||||||||||||||||
Operating income (loss) | 78 | 41 | (23 | ) | 9 | 208 | 59 | 110 | ||||||||||||||||||||
Interest expense, net | 70 | 65 | 77 | 117 | 204 | 45 | 54 | |||||||||||||||||||||
Write-off of deferred financing fees | — | — | — | — | 17 | — | — | |||||||||||||||||||||
Other non-operating expense | 14 | — | — | 5 | 16 | 9 | 1 | |||||||||||||||||||||
Income (loss) from continuing operations before income tax and minority interest | (6 | ) | (24 | ) | (100 | ) | (113 | ) | (29 | ) | 5 | 55 | ||||||||||||||||
Income tax expense (benefit) | — | (10 | ) | (37 | ) | — | 48 | 13 | 19 | |||||||||||||||||||
Income (loss) from continuing operations before minority interest | (6 | ) | (14 | ) | (63 | ) | (113 | ) | (77 | ) | (8 | ) | 36 | |||||||||||||||
Earnings from unconsolidated entities, net of taxes | — | — | — | — | 2 | — | 1 | |||||||||||||||||||||
Minority interest in net (income) loss of consolidated subsidiaries | 1 | 3 | 13 | 8 | (3 | ) | (2 | ) | (2 | ) | ||||||||||||||||||
Income (loss) from continuing operations | (5 | ) | (11 | ) | (50 | ) | (105 | ) | (78 | ) | (10 | ) | 35 | |||||||||||||||
Loss from discontinued operations | — | — | — | — | 9 | — | — | |||||||||||||||||||||
Net income (loss) | (5 | ) | (11 | ) | (50 | ) | (105 | ) | (87 | ) | (10 | ) | 35 | |||||||||||||||
Redeemable preferred stock accretion | — | — | — | — | 30 | — | 13 | |||||||||||||||||||||
Net income (loss) available to common shareholders | $ | (5 | ) | $ | (11 | ) | $ | (50 | ) | $ | (105 | ) | $ | (117 | ) | $ | (10 | ) | $ | 22 | ||||||||
Basic and Diluted Per Share Data: | ||||||||||||||||||||||||||||
Income (loss) from continuing operations | $ | (0.06 | ) | $ | (0.13 | ) | $ | (0.61 | ) | $ | (1.27 | ) | $ | (1.30 | ) | $ | (0.12 | ) | $ | 0.27 | ||||||||
Loss from discontinued operations | — | — | — | — | (0.11 | ) | — | — | ||||||||||||||||||||
Net income (loss) available to common shareholders | $ | (0.06 | ) | $ | (0.13 | ) | $ | (0.61 | ) | $ | (1.27 | ) | $ | (1.41 | ) | $ | (0.12 | ) | $ | 0.27 | ||||||||
Cash Flow Data: | ||||||||||||||||||||||||||||
Cash flows (used in) from operating activities | $ | 64 | $ | (43 | ) | $ | (32 | ) | $ | 171 | $ | 24 | $ | 44 | ||||||||||||||
Cash flows (used in) from investing activities | (45 | ) | 7 | (20 | ) | (354 | ) | (20 | ) | (42 | ) | |||||||||||||||||
Cash flows (used in) from financing activities | (21 | ) | 80 | 148 | 219 | 3 | (16 | ) | ||||||||||||||||||||
Balance Sheet Data (at end of period): | ||||||||||||||||||||||||||||
Cash and equivalents | $ | 6 | $ | 5 | $ | 49 | $ | 152 | $ | 183 | $ | — | $ | 168 | ||||||||||||||
Working capital(4) | 142 | 99 | 177 | 433 | 427 | — | 423 | |||||||||||||||||||||
Total assets | 1,101 | 1,179 | 1,191 | 2,696 | 3,209 | — | 3,307 | |||||||||||||||||||||
Total long-term debt | 581 | 567 | 675 | 1,834 | 2,303 | — | 2,299 | |||||||||||||||||||||
Total net debt(5) | 587 | 572 | 634 | 1,698 | 2,171 | — | 2,172 | |||||||||||||||||||||
Total liabilities and minority interest | 907 | 949 | 1,039 | 3,005 | 3,769 | — | 3,819 | |||||||||||||||||||||
Redeemable preferred stock | — | — | — | — | 364 | — | 377 | |||||||||||||||||||||
Total common stock and other shareholder’s equity (deficit) | 194 | 230 | 152 | (309 | ) | (924 | ) | — | (889 | ) | ||||||||||||||||||
Other Financial Data: | ||||||||||||||||||||||||||||
Ratio of earnings to fixed charges and preferred stock dividends(6) | — | — | — | — | — | 1.1 | 1.6 | |||||||||||||||||||||
54
Table of Contents
| (1) | Includesdata for Resolution Specialty from August 2, 2004 and for Borden Chemical from August 12, 2004, their respective dates of acquisition by Apollo. |
| (2) | Includesdata for Bakelite from its date of acquisition, April 30, 2005. |
| (3) | Other operating (income) expense for the three months ended March 31, 2006 includes net gain of $37 recognized primarily on the Brazilian Consumer Divestiture. |
| (4) | Workingcapital is defined as current assets less current liabilities. |
| (5) | Netdebt is defined as long-term debt plus short-term debt less cash and equivalents. |
| (6) | Dueto the net losses in the years 2001 to 2005, the ratio of earnings to fixed charges and preferred stock dividends was less than 1. Our earnings were insufficient to cover fixed charges and preferred stock dividend requirements by $6, $25, $102, $113 and $59 for the years ended December 31, 2001, 2002, 2003, 2004 and 2005, respectively. The ratio of earnings to fixed charges was 1.96 for the three-month period ended March 31, 2006, on a pro forma basis. |
55
Table of Contents
MANAGEMENT’S DISCUSSION AND ANALYSIS OF FINANCIAL
CONDITION AND RESULTS OF OPERATIONS
The following discussion and analysis of our historical consolidated financial statements covers periods before consummation of the offering, including the application of the proceeds therefrom and the Hexion Formation. Accordingly, the discussion and analysis of such periods does not reflect the significant impact these transactions have had and will have on the Company except as set forth in “—Supplemental Data” herein. See “Risk Factors,” “Unaudited Pro Forma Financial Information” and “—Liquidity and Capital Resources” for further discussion relating to the impact of these transactions on the Company. The following discussion should be read in conjunction with “Selected Historical Financial and Other Information” and all the financial statements and the related notes included elsewhere in this prospectus. All dollar amounts are in millions, except per share data or where otherwise indicated. In addition, the statements in the discussion and analysis regarding industry outlook, our expectations regarding the performance of our business, our liquidity and capital resources and the other non-historical statements in the discussion and analysis are forward-looking statements. These forward-looking statements are subject to numerous risks and uncertainties, including, but not limited to, the risks and uncertainties described in “Risk Factors.” Our actual results may differ materially from those contained in or implied by the forward-looking statements. You should read the following discussion together with the sections entitled “Risk Factors,” “Unaudited Pro Forma Financial Information” and “Selected Historical Financial and Other Information.”
Overview
We are the world’s largest producer of thermosetting resins, or thermosets. Thermosets are a critical ingredient for virtually all paints, coatings, glues and other adhesives produced for consumer or industrial uses. We are focused on providing a broad array of thermosets and associated technologies, with leading market positions in all key markets served.
The total global thermoset resins market is approximately $34 billion in annual sales, of which our primary markets represent approximately $19 billion in annual sales.
Our products are used in thousands of applications and are sold into diverse markets, such as forest products, architectural and industrial paints, packaging, consumer products and automotive coatings, as well as higher growth markets, such as composites, UV cured coatings and electrical laminates. As of March 31, 2006, we had 94 production sites globally and produce many of our key products locally in North America, Latin America, Europe and Asia. Through our worldwide network of strategically located production facilities, we serve more than 10,000 customers in 100 countries. We believe our global scale provides us with significant advantages over many of our competitors. In areas where it is advantageous, we are able to internally produce strategic raw materials, providing us with a lower cost operating structure and security of supply. In other areas, where we can capitalize on our technical know-how and market presence to capture additional value, we are integrated downstream into product formulations. Our position in certain additives, complementary materials and services further enables us to leverage our core thermoset technologies and provide customers a broad range of product solutions. Our global customers include leading companies in their respective industries, such as 3M, Ainsworth, Ashland Inc., BASF, Bayer, DuPont, GE, Halliburton, Honeywell, Huntsman, Louisiana-Pacific Owens Corning, PPG Industries, Sumitomo, Sun Chemical, Valspar and Weyerhaeuser.
Our organizational structure is based on the products we offer and the markets we serve. During the fourth quarter of 2005, we changed our reportable segments to better reflect the stage of the transition from the previous organization of our pre-merger companies to our organizational structure during the latter half of 2005. The transition provides greater alignment with the respective operating divisions and reporting segments. At December 31, 2005, our organizational structure consisted of four operating divisions: Epoxy and Phenolic Resins, Formaldehyde and Forest Products Resins, Coatings and Inks, and Performance Products. A brief summary of the operating divisions, which are aligned with our reportable segments, is as follows:
| • | Epoxy and Phenolic Resins: Includes the operations primarily from the Resolution Performance and Bakelite legacy companies and the phenolic resins operation from the Borden Chemical legacy company. |
56
Table of Contents
Major products include epoxy resins and intermediates, molding compounds, versatic acids and derivatives, specialty phenolic resins and epoxy coating resins. |
| • | Formaldehyde and Forest Products Resins: Includes the formaldehyde and forest products operations primarily from the Borden Chemical legacy company. Major products include forest products resins and formaldehyde applications. |
| • | Coatings and Inks: Includes the operations from the Resolution Specialty legacy company. Major products include composite resins, polyester resins, acrylic resins, alkyd resins, and ink resins and additives. |
| • | Performance Products: Includes the oil field products and foundry applications operations from the Borden Chemical legacy company. Major products include phenolic encapsulated substrates for oil field services applications and foundry applications. |
All historical segment information included herein has been restated to conform with our current segment reporting. The changes to previously reported segment information are simply a reclassification of activity among our segments and they do not impact any of our previously reported consolidated results.
We began implementing additional refinements to our operating divisions in 2006 to more closely link similar products, minimize divisional boundaries and improve our ability to serve common customers from pre-merger legacy company relationships which may result in additional refinements to our reporting segments.
Industry Conditions. As is true for many industries, our results are impacted by the effect on our customers of economic upturns or downturns, as well as the impact on our own costs to produce, sell and deliver our products. Our customers use most of our products in their production processes; therefore, factors impacting their industries could significantly affect our results.
Major industry sectors served by us include industrial/marine, construction, consumer/durable goods, automotive, electronics, architectural, civil engineering, repair/remodeling, graphic arts and oil and gas field support. Key drivers for our business are general economic and industrial growth, housing starts, auto builds, furniture demand, active gas drilling rigs, print advertising demand and chemical intermediates sector operating conditions.
After a relatively flat demand for our epoxy resins in 2002 and 2003, demand for our epoxy resins in 2004 increased significantly and demand through 2005 was strong. Similarly, the pricing environment for our epoxy resins was positively impacted by increased demand and lack of availability of raw materials in some segments of the market.
From 1997 to 2000, demand for bisphenol-A (“BPA”), a key precursor in the manufacture of epoxy resins, grew by approximately 13% per year driven primarily by the polycarbonate end-uses (electronics, computer, telecommunications and data equipment), whereas from 2000 to 2004, the average growth rate was approximately 6%. In 2004 there was a strong recovery in global BPA demand primarily driven by stronger production rates. Compared to 2003, the estimated demand growth has again approached 13%. More importantly, in the second half of 2004, the resulting tightness in supply and demand allowed for margin expansion despite the fact that the prices for phenol (BPA’s key feedstock) have seen significant increases in 2004. Global demand through 2005 was strong and we activated a previously idle reactor in 2005 to help meet this demand.
Raw Material Costs.Raw material costs make up approximately 80% of our product costs. In 2005, we purchased approximately $3 billion of raw materials. The three largest raw materials utilized in our production process are phenol, methanol and urea, which represents half of our total raw material expenditures. High energy costs such as the increasing price of crude oil and related petrochemical products and the higher cost of natural gas have translated into significant increases in raw material costs. For example, in the first quarter of 2006, the average prices of phenol and methanol increased approximately 7% and 13%, respectively, while the average price of urea in North America decreased approximately 9%. Compared to the average prices in 2004, the average prices of phenol, methanol, and urea increased approximately 15%, 16% and 26%, respectively, in 2005. In 2004 the average prices of phenol, methanol and urea increased by 48%, 7% and 19% respectively.
57
Table of Contents
To help mitigate this volatility, we have purchase and sale contracts with many of our vendors and customers with periodic price adjustment mechanisms. For example, in our North American forest products business, approximately 60% of our sales are to customers that have contracts that allow for the passing through of increases in raw material costs on average within 30 days. Due to differences in timing of the pricing mechanism trigger points between our sales and purchase contracts there is often a “lead-lag” impact during which margins are negatively impacted for the short term in periods of rising raw material prices and positively impacted in periods of falling raw material prices. During the first quarter of 2006, there was a $3 negative “lead-lag” impact on Segment EBITDA. In addition, the pass through of raw material price changes can result in significant variances in sales comparisons from year to year. In the first three months of 2006 and throughout 2005, we had a favorable impact on sales as raw material price increases throughout 2005 and in the first three months of 2006 were passed through to customers.
Regulatory Environment.National and international laws regulate the production and marketing of chemical substances. Although almost every country has its own legal procedure for registration and import, laws and regulations in the European Union and the United States are most significant to our business, including the European inventory of existing commercial chemical substances, the European list of notified chemical substances, and the United States Toxic Substances Control Act inventory. Chemicals which are on one or more of the above lists can usually be registered and imported without additional testing in other countries, although additional administrative hurdles may exist.
We are also subject to extensive regulation under the environmental and occupational health and safety laws by federal, state and local governmental entities and foreign authorities, such as the European Union. These laws are designed to protect workers and the public from exposure to certain hazardous chemicals and dangerous work conditions, to protect natural resources and to limit discharges of hazardous substances to the environment from ongoing operations. They provide for substantial fines and potential criminal sanctions for violations. They also establish requirements to remediate contamination. The laws are complex, change frequently and have tended to become more stringent over time.
For example, statutes such as the federal Comprehensive Environmental Response, Compensation, and Liability Act and comparable state and foreign laws impose strict, joint and several liability for investigating and remediating the consequences of spills and other releases of hazardous materials, substances and wastes at current and former facilities, and at third-party disposal sites. Therefore, notwithstanding our commitment to environmental management, we cannot assure you that environmental, health and safety liabilities will not be incurred in the future, nor that such liabilities will not result in a material adverse effect on our financial condition, results of operations or business reputation.
Certain chemicals have been alleged to interact with the endocrine systems of humans and wildlife and disrupt normal processes (i.e., endocrine disrupters). BPA, which is used as an intermediate at our Deer Park and Pernis manufacturing facilities and is also sold directly to third parties, is currently under evaluation as an “endocrine disrupter.” Pursuant to EU regulation 793/93/EC, BPA producers are currently conducting an extensive toxicology testing program of the chemical. In addition, new legislation in Europe took effect in 2005 and requires that risk labels be used for BPA indicating “possible risk of impaired fertility.” In the event that BPA is further regulated, additional operating costs would likely be incurred to meet more stringent regulation of the chemical.
Various government agencies are conducting formaldehyde health assessments and evaluating the need for additional regulations. Although formaldehyde has been heavily regulated for several years, further regulation of formaldehyde could follow over time. In 2004, the International Agency for Research on Cancer (“IARC”) reclassified formaldehyde as “carcinogenic to humans,” a higher classification than previous IARC evaluations based principally on a study linking formaldehyde exposure to nasopharyngeal cancer, a rare form of cancer in humans. IARC also concluded that there was strong but not sufficient evidence for a finding of an association between leukemia and occupational exposure to formaldehyde, although IARC could not identify a mechanism for leukemia induction. We believe that our production facilities will be able to comply with any likely regulatory impact without any material impact on the business.
58
Table of Contents
We support appropriate scientific research and risk-based policy decision-making, and we are working with industry groups, including the Formaldehyde Council, Inc. (“FCI”), to ensure that governmental assessments and regulations are based on sound scientific information. As a part of that effort, the FCI is currently funding additional health research to supplement the existing science database. Results from some of this work will be available in 2006. We have leading product development technologies and processes and credible stewardship programs in place to provide compliant and cost-effective resin systems to our customers.
We also actively petition the U.S. Food and Drug Administration to sanction the use of certain specialty chemicals produced by us, principally where we believe that these specialty chemicals will or may be used by our customers in the manufacture of products that will come in direct or indirect contact with food. Delays in getting our product to the market may be incurred.
Competitive Environment.The chemical industry has been historically very competitive, and we expect this competitive environment to continue in the foreseeable future. We compete with companies of varying size, financial strength and availability of resources. Price, customer service and product performance are the primary areas in which we compete.
Impact of Hurricanes Katrina and Rita.During the third quarter of 2005, our operations in the Gulf Coast region of the United States were impacted by Hurricanes Katrina and Rita. Our Norco, LA and Deer Park, TX facilities incurred minimal damage from the hurricanes; however, the facilities were closed for 45 and 14 days after the hurricanes, respectively, due to repairs at facilities that provide us with utilities. Our facilities in the Gulf Coast escaped significant damage from Hurricane Rita, and though our facilities in the region were shut down in anticipation of Hurricane Rita, none remained closed for repair after the storm.
Our 2005 results were significantly impacted by the hurricanes as well. Approximately $27 of lost sales and incremental expenses associated with the hurricanes negatively impacted our operating income in the second half of 2005 of which $17 was incurred in the fourth quarter. These incremental expenses included higher cost of key raw materials, plant downtime, supply chain and other logistical disruptions and dislocated employees.
Other Factors Impacting Our Results.Other pressures on our profit margins include rising utility costs and increasing employee benefit, general insurance and legal costs. We are taking a number of steps to control these costs. In addition, we are continuing to analyze our business structure, consolidating plants and functions where we can realize significant cost savings and productivity gains. Future consolidations or productivity initiatives may include asset impairment charges and severance costs.
We believe that these factors will continue in the foreseeable future. These market dynamics will require us to continue to focus on productivity improvements and risk mitigation strategies to enhance and protect our margins. For a discussion of certain steps we are taking to manage factors impacting our margins through hedges of natural gas and foreign exchange exposures, see “—Quantitative and Qualitative Disclosures About Market Risk.”
Hexion Formation
The Combinations. On May 31, 2005, Resolution Performance and Resolution Specialty were combined with and into Borden Chemical (the “Combinations”), all of which were controlled by Apollo Management, L.P. and its affiliates (“Apollo”). As of December 31, 2004, Apollo and its affiliated funds held approximately 98%, 72% and 95% of the then outstanding capital stock of Borden Chemical, Resolution Performance and Resolution Specialty, respectively. In connection with the Combinations, the minority interests in Resolution Performance and Resolution Specialty were eliminated. Upon the consummation of the Combinations, Borden Chemical changed its name to Hexion Specialty Chemicals, Inc. and BHI Acquisition LLC, Borden Chemical’s parent, changed its name to Hexion LLC. Immediately following completion of this offering, Apollo, through Hexion LLC, will hold approximately 70.9% of the outstanding common stock of Hexion.
The Borden Transaction. On August 12, 2004, an affiliate of Apollo acquired all of the outstanding capital stock of Borden Chemical (the “Borden Acquisition”). The Borden Acquisition, the related offering of second-
59
Table of Contents
priority senior secured floating rate notes (the “Original Floating Rate Notes”) and 9% second-priority senior secured notes (the “Fixed Rate Notes”) and the related transactions are collectively referred to in this prospectus as the “Borden Transaction.”
The Resolution Performance Transaction. On November 14, 2000, an affiliate of Apollo acquired control of Resolution Performance in a recapitalization transaction (the “Resolution Performance Transaction”). Prior to the recapitalization, Resolution Performance was a wholly owned subsidiary of the Royal Dutch/Shell Group of Companies (“Shell”).
The Resolution Specialty Transaction. On August 2, 2004, Resolution Specialty, an affiliate of Apollo, acquired the resins, inks and monomers division (the “Resolution Specialty Acquisition”) of Eastman Chemical Company (“Eastman”). The Resolution Specialty Acquisition and the related transactions are collectively referred to in this prospectus as the “Resolution Specialty Transaction.”
The Bakelite Transaction.On April 29, 2005, a subsidiary of Borden Chemical acquired Bakelite (the “Bakelite Acquisition”). Upon the consummation of the Bakelite Acquisition, Bakelite became an indirect, wholly-owned subsidiary of Hexion Specialty Chemicals Canada, Inc. (“Hexion Canada”). The Bakelite Acquisition was financed through a combination of available cash and borrowings under a bridge loan facility, which was refinanced with the proceeds of our second-priority senior secured floating rate notes issued on May 20, 2005 (the “New Floating Rate Notes”) and borrowings under our May 2005 senior secured credit facilities (collectively the “Bakelite Financing”). The Bakelite Acquisition, the repayment or assumption of certain of Bakelite’s debt in connection therewith and the Bakelite Financing are collectively referred to in this prospectus as the “Bakelite Transaction.”
2006 Completed Acquisitions and Divestiture
On January 31, 2006, we completed the purchase of the decorative coatings and adhesives business unit of The Rhodia Group. The business generated 2005 sales of approximately $200, with 8 manufacturing facilities in Europe, Australia and Thailand. The acquisition was funded through a combination of available cash and existing credit lines.
On March 1, 2006, we acquired the global wax compounds business of Rohm and Haas. The business generated 2005 sales of approximately $10. The purchase included Rohm and Haas’ wax compounds technology and product lines, manufacturing equipment and other business assets. The acquisition was funded through available cash.
On March 31, 2006, we sold Alba Adesivos, a consumer adhesives company based in Boituva, Brazil, to the Henkel Group. Alba Adesivos is a producer of branded consumer and professional grade adhesives. The company generated 2005 sales of $38 million and has approximately 140 employees. The purchase price was paid in cash.
Matters Impacting Comparability of Results
Basis of Presentation.The audited Consolidated Financial Statements include the accounts of the Company and its majority-owned subsidiaries, in which minority shareholders hold no substantive participating rights, after elimination of intercompany accounts and transactions. The Company’s share of the net earnings of 20% to 50% owned companies, over which it has the ability to exercise significant influence regarding operating and financial policies (but do not control), are included in income on an equity basis.Investments in the other companies are carried at cost.
Resolution Performance, Borden Chemical and Resolution Specialty were considered entities under the common control of Apollo as defined in EITF 02-5 “Definition of Common Control in Relation to FASB Statement of Financial Accounting Standards (“SFAS”) No. 141, “Business Combinations.” As a result of the
60
Table of Contents
Combinations, the financial statements of these entities are presented retroactively on a consolidated basis in a manner similar to a pooling of interests, and include the results of operations of each business only from the date of acquisition by Apollo.
The financial data for Hexion for the year ended December 31, 2003 include the results of operations of Resolution Performance only.
The financial data for Hexion for the year ended December 31, 2004, includes:
| • | The results of operations of Resolution Performance for the full year ended December 31, 2004, |
| • | The results of operations of Resolution Specialty since the date of the acquisition of Resolution Specialty by Apollo on August 2, 2004; and |
| • | The results of operations of Borden Chemical since the acquisition of Borden Chemical by Apollo on August 12, 2004. |
The financial data for Hexion for the year ended December 31, 2005 includes:
| • | The results of operations of Resolution Performance for the full year ended December 31, 2005, |
| • | The results of operations of Borden Chemical for the full year ended December 31, 2005, |
| • | The results of operations of Resolution Specialty for the full year ended December 31, 2005, and |
| • | The results of operations of Bakelite since the completion of the Bakelite Acquisition on April 29, 2005. |
The financial data for Hexion for the three months ended March 31, 2005 includes:
| • | The results of operations of Resolution Performance for the three months ended March 31, 2005, |
| • | The results of operations of Borden Chemical for the three months ended March 31, 2005, and |
| • | The results of operations of Resolution Specialty for the three months ended March 31, 2005. |
The financial data for Hexion for the three months ended March 31, 2006 includes:
| • | The results of the Rhodia Acquisition and Rohm and Haas Acquisition have been included since January 31, 2006 and March 1, 2006, the respective dates of acquisition. |
Accordingly, the results of operations of Hexion for periods prior to the Borden Chemical and Resolution Specialty acquisitions and the Bakelite Acquisition are not comparable to results for subsequent periods. In order to enhance comparability, management’s discussion and analysis of financial condition and results of operations includes additional supplemental data regarding our reportable segments for the years ended December 31, 2004 and 2005.
Outlook
We have experienced an improvement in demand in the markets we serve and expect to see continued improvement in demand in 2006. Supply/demand fundamentals are expected to improve, both in industrialized and developing nations. We expect this trend to result in higher utilization rates for the thermosetting resins industry, which in turn will lead to continued price increases. Furthermore, we believe that the formation of Hexion will continue to lead to improved technical capabilities for the combined entities and an ability to service our customers better.
61
Table of Contents
However, raw material volatility could continue through 2006 because of, among other things, political instability in the Middle East or supply disruptions elsewhere, including as a result of hurricanes and other natural disasters, such as Hurricanes Katrina and Rita. There can be no assurances that (i) any global recovery will continue during 2006, (ii) we will be able to realize margins we have historically achieved as feedstock costs decline or (iii) our feedstock costs will not rise faster than our product prices and, therefore, reduce our margins.
We believe we will be able to mitigate such volatility due to a number of factors: (i) our actions taken in 2005 to implement monthly or quarterly pricing mechanisms in many product lines will improve our ability to react to changing market conditions in 2006; (ii) the value-added nature of many of our product lines will allow us to continue to pass through additional feedstock price increases; and (iii) the roll-off of several long-term raw material contracts should have a step-change effect in lowering our feedstock costs.
There can be no assurances that (i) demand for our products will increase during 2006 or (ii) past or future price increases by us or our competitors will be accepted by our customers or that we will not lose any significant customers or volumes in the future as a result of these price increases.
We expect free cash flow (cash flow from operating activities less anticipated capital expenditures) to increase in the future due to improving operating characteristics and the absence of one-time costs associated with the Hexion Formation. Our products are generally less capital intensive to manufacture than many other products in the chemical industry and, as a result, we have relatively low maintenance capital and moderate working capital requirements. Furthermore, due to our tax assets and other structuring considerations, we expect to have very low cash tax requirements for the foreseeable future. Additionally, management is currently targeting $250 in synergies from the Hexion Formation, of which $125 of net cost savings have been specifically identified. Management has developed detailed implementation plans to achieve the $125 of cost savings. We achieved cost savings of $20 in 2005 and $11 in the first three months of 2006. We expect that approximately 60% of the $125 near term cost savings will be achieved by the end of 2006 with the remainder expected to be achieved in the following year. Through March 31, 2006, we have incurred one-time costs of approximately $13 in connection with implementing these synergies, and expect to incur one-time costs of approximately $62 through 2007. We expect that all of these factors will enable us to generate increased free cash flow, which we anticipate will be available to reduce indebtedness or for other strategic purposes.
Overview of Results
Our net sales increased to $1,245 in the first quarter of 2006 from $1,012 in the first quarter of 2005, an increase of $233. In 2006, the Bakelite Acquisition and the Rhodia Acquisition added $223 in incremental net sales. Excluding the incremental impact of these acquisitions, our net sales increased $10 in the first quarter of 2006, or approximately 1%. Favorable volumes across our Epoxy and Phenolic Resins products and in our oilfield products, strong pricing for our Formaldehyde and Forest Products, Coating and Inks and foundry resins products and favorable oilfield products mix all contributed to the increase in our net sales. Partially offsetting these positive factors were unfavorable formaldehyde and foundry resins volumes, pricing for our intermediates and base epoxy resins, product mix in our European coatings business and foreign currency translation. Unfavorable currency translation related to the weakened Euro that more than offset the strengthened Canadian dollar and Brazilian Real versus the U.S. dollar.
Our gross profit increased $36 in the first quarter of 2006 to $185 from $149 in the first quarter of 2005. In 2006, the Bakelite Acquisition and the Rhodia Acquisition added $38 in gross profit. Excluding the incremental impact of these acquisitions, our gross profit declined $2 in the first quarter of 2006, or approximately 1%. Rising raw material costs that could not be fully passed along to our customers, resulting in a negative lead-lag impact of $3, and competitive pricing pressures were the primary causes of the decline in our gross profit. These negative factors were partially offset by the realization of synergies from the Combinations.
Our operating income increased $51 in the first quarter of 2006 from $59 in the first quarter of 2005 to $110. The improvement was primarily driven by the increase in gross profit discussed above, net gains of $37
62
Table of Contents
recognized primarily on the Brazilian Consumer Divestiture, which is included in Other operating income and a reduction in transaction related costs of $3. These positive factors were partially offset by increased selling, general and administrative (SG&A) expense of $15. Contributing to the increase in SG&A expense were the incremental expenses added by the Bakelite Acquisition and the Rhodia Acquisition and integration costs. Partially offsetting these increases in SG&A expense was the realization of synergies from the Combinations.
We generated net income of $35 in the first quarter in 2006 versus a net loss of $10 in the first quarter of 2005, an improvement of $45. This improvement was primarily due to the improvement in operating income discussed above. Also contributing to the net income improvement was a reduction in other non-operating expense due to the absence of an unrealized foreign exchange loss of $10. Partially offsetting these positive factors was increased interest expense, net, of $9 and higher income tax expense of $6.
Our net sales increased to $4,470 in 2005 from $2,019 in 2004, an increase of $2,451. In 2005, the Borden Transaction, the Resolution Specialty Transaction and the Bakelite Acquisition (“the 2005 acquisitions”) added $2,196 in incremental net sales. Excluding the incremental impact of the 2005 acquisitions, our net sales increased $255 in 2005, or approximately 13%. This increase was primarily due to increased average selling prices, as a result of pricing improvement and the pass through of raw material price increases, and favorable product mix.
Our gross profit increased $428 in 2005 from $234 in 2004 to $662. The 2005 acquisitions added $309 in incremental gross profit in 2005. Excluding the impact of these acquisitions, our gross profit increased $119 in 2005, or approximately 51%, as the impact of increased average selling prices and favorable product mix more than offset the increase in raw material prices and the higher cost of natural gas.
Our operating income increased $199 in 2005 from $9 in 2004 to $208. This improvement was primarily driven by the improvement in gross profit discussed above. Also contributing to the improvement was a $12 reduction in transaction costs. Offsetting these improvements was an increase in selling, general and administrative expense (SG&A) of $237. The 2005 acquisitions accounted for $188 of this increase in SG&A. We also recognized stock-based compensation expense of $12 in 2005.
Our net loss improved by $18 to a loss of $87 in 2005 from a loss of $105 in 2004. This improvement was primarily due to the improvement in operating income discussed above. Partially offsetting the increase in operating income was increased interest expense of $87 due to high average debt levels and higher interest rates, a $17 write-off of deferred financing fees and an increase in non-operating expense primarily due to foreign exchange losses. We also incurred income tax expense of $48 in 2005. Additionally, we incurred a $9 loss related to discontinued operations.
63
Table of Contents
Results of Operations by Segment
Following is a comparison of Net sales and Segment EBITDA. Segment EBITDA is defined as EBITDA adjusted to exclude certain non-cash and non-recurring expenses. Segment EBITDA is the primary performance measure used by the Company in the evaluation of its operating results and in determining allocations of capital resources among our segments. Segment EBITDA is also the profitability measure used to set management and executive incentive compensation. Corporate and Other primarily represents certain corporate general and administrative expenses that are not allocated to the segments.
| Year Ended December 31, | Three Months Ended March 31, | ||||||||||||||||||||||
| 2003 | 2004(2) | 2005(3) | 2005 | 2006(4) | Supplemental 2005(5) | ||||||||||||||||||
Net Sales to Unaffiliated Customers:(1) | |||||||||||||||||||||||
Epoxy and Phenolic Resins | $ | 782 | $ | 1,096 | $ | 1,909 | $ | 384 | $ | 538 | $ | 553 | |||||||||||
Formaldehyde and Forest Products Resins | — | 458 | 1,281 | 313 | 342 | 326 | |||||||||||||||||
Coatings and Inks | — | 325 | 886 | 217 | 259 | 217 | |||||||||||||||||
Performance Products | — | 140 | 394 | 98 | 106 | 98 | |||||||||||||||||
| $ | 782 | $ | 2,019 | $ | 4,470 | $ | 1,012 | $ | 1,245 | $ | 1,194 | ||||||||||||
Segment EBITDA: | |||||||||||||||||||||||
Epoxy and Phenolic Resins | $ | 61 | $ | 93 | $ | 245 | $ | 54 | $ | 74 | $ | 64 | |||||||||||
Formaldehyde and Forest Products Resins | — | 51 | 152 | 36 | 33 | 39 | |||||||||||||||||
Coatings and Inks | — | 26 | 63 | 18 | 20 | 18 | |||||||||||||||||
Performance Products | — | 16 | 52 | 11 | 16 | 11 | |||||||||||||||||
Corporate and Other | — | (10 | ) | (43 | ) | (10 | ) | (11 | ) | (10 | ) | ||||||||||||
| (1) | Intersegment sales are not significant and, as such, are eliminated within the selling segment. |
| (2) | Net sales and Segment EBITDA in 2004 includes Resolution Specialty results from August 2, 2004 and Borden Chemical results from August 12, 2004, their respective dates of acquisition by Apollo. |
| (3) | Net sales and Segment EBITDA in 2005 includes Bakelite results from the date of acquisition, April 29, 2005. |
| (4) | Net sales and Segment EBITDA in 2006 include results from the Rhodia Acquisition and Rohm and Haas Acquisition from the dates of their acquisition, January 31, 2006 and March 1, 2006, respectively. |
| (5) | Net sales and Segment EBITDA include Bakelite results as if the acquisition occurred at the beginning of the year. |
Three Months Ended March 31, 2006 vs. 2005 Segment Results
Epoxy and Phenolic Resins
In the first quarter of 2006, Epoxy and Phenolic Resins’ net sales increased by $154 to $538 compared to the first quarter of 2005. The Bakelite Acquisition contributed $181 of incremental net sales in 2006. In 2005, Epoxy and Phenolic Resins had sales of $11 to Bakelite prior to the Bakelite Acquisition. Excluding the incremental net sales of the Bakelite Acquisition, net sales declined $16, or 4%. The decrease in net sales is due to unfavorable currency translation of approximately $16 as the Euro weakened versus the U.S. dollar and competitive pricing, of approximately $23, primarily in our intermediates and base epoxy resins. These unfavorable impacts were partially offset by improved volume across all segments of approximately $23.
Epoxy and Phenolic Resins’ Segment EBITDA increased in the first quarter of 2006 by $20 to $74 compared to the first quarter of 2005. The Bakelite Acquisition contributed $21 of incremental Segment EBITDA in the first quarter of 2006. Excluding the incremental impact of the Bakelite Acquisition, Segment EBITDA declined $1. Segment EBITDA was negatively impacted by unfavorable currency translation of approximately $4 and lower pricing in intermediates and base epoxy resins. Improved volumes across all segments and lower costs driven from synergy and cost reduction programs substantially offset these negative factors.
64
Table of Contents
Formaldehyde and Forest Products Resins
��
Formaldehyde and Forest Products Resins’ net sales increased in the first quarter of 2006 by $29 to $342 compared to the first quarter of 2005. The Bakelite Acquisition and the Rhodia Acquisition contributed $17 of incremental net sales in 2006. Excluding the incremental impact of these acquisitions, net sales increased $12, or 4%. The increase in net sales was a result of strong pricing of $10 and favorable currency translation of $9 partially offset by a decline in volumes of $7. The strong pricing, compared to 2005, primarily for our resins and formaldehyde products, is due to the pass through of raw material price increases. Favorable currency translation was a result of both the Canadian dollar and the Brazilian Real strengthening versus the U.S. dollar. The decline in volumes was primarily in our formaldehyde products as a result of temporary production curtailments at a few large customers.
Formaldehyde and Forest Products Resins’ Segment EBITDA decreased in the first quarter of 2006 by $3 to $33 compared to the first quarter of 2005. The decrease is primarily due to an increase in phenol prices in the first quarter of 2006 that we were not yet able to pass through to our customers due to contractual delays and competitive pricing pressures for our forest products resins. The decline in formaldehyde products volumes discussed above was partially offset by favorable product mix. The Bakelite Acquisition contributed $3 of incremental Segment EBITDA in 2006.
Coatings and Inks
First quarter 2006 net sales for Coatings and Inks increased by $42 to $259 compared to the first quarter of 2005. The Rhodia Acquisition contributed $36 of incremental net sales in 2006. Excluding the incremental impact of the acquisition, net sales increased $6, or 3%. Primarily driving the increase in net sales was stronger pricing of approximately $9 across most our products and a slight volume improvement of $1. Positive factors were partially offset by unfavorable product mix in our European coatings business, resulting from bad weather delaying the decorative season, lower monomers pricing, as industry capacity utilization decreased with the opening of new competitor manufacturing facilities predominately in Asia, and unfavorable currency translation of $4 primarily due to the weakened Euro.
Coatings and Inks first quarter 2006 Segment EBITDA increased by $2 to $20 compared to the first quarter of 2005. The Rhodia Acquisition contributed $3 of incremental Segment EBITDA in 2006. Excluding the incremental impact of the acquisition, Segment EBITDA declined $1 as stronger pricing was offset by higher raw material costs for our inks and European coatings products and the unfavorable factors discussed above.
Performance Products
In the first quarter of 2006, Performance Products’ net sales increased by $8 to $106, or 8% compared to the first quarter of 2005. The increase in net sales was a result of higher volumes of $5 and strong pricing of $3. Higher volumes, primarily in our oilfield products, were due to strong demand and favorable product mix. Our new plant in Canada came on stream in the first quarter of 2006. Strong pricing, primarily in our foundry products, resulted from the pass through of raw material price increases.
Segment EBITDA in the first quarter of 2006 for Performance Products increased $5 to $16 compared to the first quarter of 2005. The increase in Segment EBITDA is due to the factors discussed above. Also contributing to the improvement was favorable product mix in our foundry products and lower processing and lower raw material costs in Asia Pacific.
Corporate and Other
Corporate and Other expenses were $11 in the first quarter of 2006, an increase of $1 from the first quarter of 2005. The increase is primarily a result of the Combinations. Upon consummation of the Combinations, we began to consolidate the corporate functions of the four former legacy businesses, and certain corporate general and administrative expenses previously included in the business segments are now centralized and reported separately. In 2006, we continued this consolidation of corporate functions.
65
Table of Contents
2005 vs. 2004 Segment Results
Epoxy and Phenolic Resins
Epoxy and Phenolic Resins’ net sales increased by $813 to $1,909 compared to 2004. The Bakelite Acquisition and the Borden Transaction contributed $630 of incremental net sales in 2005. Excluding the incremental impact of the acquisitions, net sales increased $183, or 17%. Increased average selling prices and favorable product mix accounted for the increase in net sales. Overall average selling prices increased by 25% from prior year due to an increased emphasis on pricing. Overall volumes decreased from the prior year due to an increased emphasis on pricing improvement versus volume growth. Volume declines negatively impacted net sales by $1, but the declines were completely offset by favorable currency translation of $1. Epoxy and Phenolic Resins’ Segment EBITDA increased by $152 to $245 compared to 2004. The Bakelite Acquisition and the Borden Transaction contributed $59 of incremental Segment EBITDA in 2005. Excluding the incremental impact of these acquisitions, Segment EBITDA increased $93, or 100%, as a result of increased average selling prices and favorable product mix, as discussed above. Hurricanes Katrina and Rita negatively impacted results by approximately $13 due to incremental costs associated with shutting down and restarting plants and higher utility and raw material costs.
Formaldehyde and Forest Products Resins
Formaldehyde and Forest Products Resins’ net sales increased by $823 to $1,281 compared to 2004. The Borden Transaction and the Bakelite Acquisition contributed $802 of incremental net sales in 2005. Excluding the incremental impact of these acquisitions, net sales increased $21, or 5%. Approximately $20 of this increase in net sales is a result of strong pricing for our resins and formaldehyde products due to the pass through of raw material price increases. Favorable currency translation of approximately $16, as both the Canadian dollar and the Brazilian Real strengthened versus the U.S. dollar, also contributed to the net sales increase. Partially offsetting these favorable items was a decrease in volumes, of approximately $15, primarily in our formaldehyde products caused by hurricane related customer outages. Formaldehyde and Forest Products Resins’ Segment EBITDA increased by $101 to $152 compared to 2004. The Borden Transaction and the Bakelite Acquisition contributed $97 of incremental Segment EBITDA in 2005. Excluding the impact of these acquisitions, Segment EBITDA increased $4, or 8%, as a result of strong pricing for our resins and formaldehyde products due to the pass through of raw material price increases. In 2004, we experienced unfavorable lead/lag as raw material prices increased, and we were not able to pass these price increases through to our customers. The positive pricing impact more than offset the impact of lower formaldehyde volumes as discussed above.Hurricanes Katrina and Rita negatively impacted Segment EBITDA by approximately $10 in 2005 due to lost sales and incremental costs associated with shutting down and restarting plants and higher utility and raw material costs.
Coatings and Inks
Coatings and Inks’ net sales increased by $561 to $886 compared to 2004. The Resolution Specialty Transaction contributed $526 of incremental sales in 2005. Excluding the impact of the Resolution Specialty Transaction, net sales increased $35, or 11%. This increase in net sales is a result of strong pricing across all our products, as well as favorable product mix which increased net sales approximately $38. Unfavorable currency translation of approximately $3 partially offset the impact of strong pricing. Coatings and Inks’ Segment EBITDA increased by $37 to $63 compared to 2004. The Resolution Specialty Transaction contributed $42 of incremental Segment EBITDA in 2005. Excluding the impact of the Resolution Specialty Transaction, Segment EBITDA decreased $5, or 19%.Hurricanes Katrina and Rita negatively impacted 2005 Segment EBITDA by approximately $3 due to incremental costs associated with higher utility and raw material costs.
Performance Products
Performance Products’ net sales increased by $254 to $394 compared to 2004. The Borden Transaction contributed $239 of incremental sales in 2005. Excluding the impact of the Borden Transaction, net sales increased $15, or 11%. This increase in net sales was a result of higher average selling prices of $8 and improved
66
Table of Contents
volumes of $7. This increase in average selling prices was primarily due to the pass through of raw material price increases. Strong demand for our oil field products and our products in Asia Pacific drove the increase in volumes. Performance Product’s Segment EBITDA increased by $36 to $52 compared to 2004. The Borden Transaction contributed $28 of incremental Segment EBITDA in 2005. Excluding the impact of the Borden Transaction, Segment EBITDA increased $8, or 50%, due to factors discussed above as well as lower processing costs in Asia Pacific. Hurricanes Katrina and Rita negatively impacted Segment EBITDA by approximately $1.
Corporate and Other
Corporate and Other expenses increased by $33 to $43 compared to 2004 as a result of the Borden Transaction and the Combinations. Prior to the Combinations, Resolution Performance and Resolution Specialty included their corporate and other expenses in their prior reportable segments’ profitability measure used in the evaluation of their operating results and in determining allocations of capital resources. Upon consummation of the Combinations, we began to consolidate the corporate functions of the four former legacy businesses, and certain corporate general and administrative expenses are not allocated to our segments.
2004 vs. 2003 Segment Results
Epoxy and Phenolic Resins
Epoxy and Phenolic Resins’ net sales increased by $314 to $1,096 compared to 2003. The Borden Transaction contributed $100 of incremental net sales in 2004. Excluding the impact of the Borden Transaction, net sales increased $214, or 27%. The increase in net sales (net of the impact of the Borden Transaction) was a result of higher average prices of $157 and increased volumes of $57. The increase in average prices was primarily attributable to price increases on certain products and the impact of a weaker dollar on our Euro- denominated sales. Segment EBITDA increased by $32 to $93 for the year ended December 31, 2004. The Borden Transaction contributed $10 of incremental Segment EBITDA. Excluding the impact of the Borden Transaction, Segment EBITDA improved $22. The increase was primarily due to higher selling prices across all major product lines. Also contributing to the increase was higher overall volumes in 2004. Partially offsetting these improvements were increased cost of feedstocks due to the increasing price of crude oil and related petrochemical products.
Formaldehyde and Forest Products Resins
Formaldehyde and Forest Products Resins’ 2004 net sales and Segment EBITDA are a result of the Borden Transaction.
Coatings and Inks
Coatings and Inks’ 2004 net sales and Segment EBITDA are a result of the Resolution Specialty Transaction.
Performance Products
Performance Products’ 2004 net sales and Segment EBITDA are a result of the Borden Transaction.
Corporate and Other
Corporate and Other expenses in 2004 are a result of the Borden Transaction. Resolution Performance, in the past, included their corporate and other expenses in their prior reportable segments’ profitability measure used in the evaluation of their operating results and in determining allocations of capital resources. Upon consummation of the Combinations, we began to consolidate the corporate functions of the four former legacy businesses and certain corporate general and administrative expenses are not allocated to our segments.
67
Table of Contents
Reconciliation of Segment EBITDA to Net Income (Loss):
| Year Ended December 31, | Three Months Ended March 31, | |||||||||||||||||||
| 2003 | 2004 | 2005 | 2005 | 2006 | ||||||||||||||||
Segment EBITDA: | ||||||||||||||||||||
Epoxy and Phenolic Resins | $ | 61 | $ | 93 | $ | 245 | $ | 54 | $ | 74 | ||||||||||
Formaldehyde and Forest Products Resins | — | 51 | 152 | 36 | 33 | |||||||||||||||
Coatings and Inks | — | 26 | 63 | 18 | 20 | |||||||||||||||
Performance Products | — | 16 | 52 | 11 | 16 | |||||||||||||||
Corporate and Other | — | (10 | ) | (43 | ) | (10 | ) | (11 | ) | |||||||||||
Reconciliation: | ||||||||||||||||||||
Items not included in Segment EBITDA | ||||||||||||||||||||
Transaction costs | — | (56 | ) | (44 | ) | (7 | ) | (4 | ) | |||||||||||
Non-cash charges | (13 | ) | (2 | ) | (30 | ) | — | (6 | ) | |||||||||||
Unusual items: | ||||||||||||||||||||
Gain on the divestiture of business | — | — | — | 2 | 37 | |||||||||||||||
Purchase accounting effects/inventory step-up | — | (10 | ) | (16 | ) | — | (1 | ) | ||||||||||||
Discontinued operations | — | — | (9 | ) | — | — | ||||||||||||||
Business realignments | — | (3 | ) | (9 | ) | (1 | ) | (3 | ) | |||||||||||
Other | — | (7 | ) | (31 | ) | (19 | ) | (9 | ) | |||||||||||
Total unusual items | — | (20 | ) | (65 | ) | (18 | ) | 24 | ||||||||||||
Total adjustments | (13 | ) | (78 | ) | (139 | ) | (25 | ) | 14 | |||||||||||
Interest expense, net | (77 | ) | (117 | ) | (204 | ) | (45 | ) | (54 | ) | ||||||||||
Write-off of deferred financing fees | — | — | (17 | ) | — | — | ||||||||||||||
Income tax benefit (expense) | 37 | — | (48 | ) | (13 | ) | (19 | ) | ||||||||||||
Depreciation and amortization | (58 | ) | (86 | ) | (148 | ) | (36 | ) | (38 | ) | ||||||||||
Net income (loss) | $ | (50 | ) | $ | (105 | ) | $ | (87 | ) | $ | (10 | ) | $ | 35 | ||||||
Items not included in Segment EBITDA
Transaction costs include merger costs related to the Bakelite Acquisition and the Combinations and expenses associated with terminated acquisition activities. Non-cash charges represent impairments of fixed assets and goodwill, stock based compensation and unrealized foreign currency exchange losses on debt instruments denominated in currencies other than the functional currency of the holder. The 2006 Gain on divestiture of business primarily represents the gain realized on the Brazilian Consumer Divestiture. The 2005 purchase accounting effects/inventory step-up adjustment relates to the fair value step-up of Resolution Performance’s inventory carrying value as a result of the Combinations and the fair value step-up of Bakelite’s inventory carrying value as a result of the Bakelite Acquisition. The 2004 purchase accounting effects/inventory step-up adjustment relates to the fair value step-up of Resolution Specialty’s inventory carrying value as a result of the Resolution Specialty Transaction. The results of discontinued operations are not included in our Segment EBITDA measure (see Note 4 to the audited Consolidated Financial Statements). The business realignment adjustment represents plant closure costs, including plant employee severance, and environmental remediation costs associated with closing plants, as well as other employee severance. Other unusual items not included in Segment EBITDA represent expenses deemed by management to be non-recurring in nature. In 2006 these items principally consisted of integration costs, purchase accounting/inventory step-up adjustments related to the Rhodia Acquisition and certain non-recurring litigation expenses. In 2005, these items principally consisted of certain non-recurring litigation expenses, a foreign currency loss on an exchange rate hedge related to the Bakelite Acquisition, integration costs and incremental non-recurring advisor and external audit fees related to the Bakelite Acquisition and the Combinations. In 2004, other unusual items included incremental expenses incurred as a result of a mechanical failure at a Brazilian formaldehyde plant and costs related to the integration of the Resolution Specialty Transaction.
68
Table of Contents
Non-Operating Expenses and Income Tax Expense
Non-operating expense
| Year Ended December 31, | Three Months Ended March 31, | ||||||||||||||
| 2003 | 2004 | 2005 | 2005 | 2006 | |||||||||||
Interest expense, net | $ | 77 | $ | 117 | $ | 204 | $ | 45 | $ | 54 | |||||
Write-off of deferred financing fees | — | — | 17 | — | — | ||||||||||
Other non-operating expense, net | — | 5 | 16 | 9 | 1 | ||||||||||
| $ | 77 | $ | 122 | $ | 237 | $ | 54 | $ | 55 | ||||||
Our total non-operating expense, net, of $55 in the first quarter of 2006 increased $1 as compared to the first quarter of 2005 net expense of $54. Net interest expense increased $9 over 2005 due to higher average debt levels resulting from the Bakelite Acquisition and higher average interest rates. Included in other non-operating expense in 2005 was an unrealized foreign exchange loss of $10 on the mark-to-market of a deal contingent forward exchange contract held by us relating to the Bakelite Acquisition.
Our total non-operating expenses, net, increased $115 in 2005 as compared to 2004. Net interest expense increased $87 over 2004 due to higher interest rates and higher average debt levels resulting from the Borden Transaction, the Resolution Specialty Transaction, the Bakelite Acquisition and the Hexion Financing. In the second quarter of 2005, we wrote-off deferred financing fees of $17. Of this amount, $6 was related to the Bakelite Acquisition bridge financing arrangement and $11 related to the early termination of the Resolution Performance, Resolution Specialty and Borden Chemical credit facilities. Included in other non-operating expense in 2005 was $9 of foreign exchange losses on the settlement of a contingent forward contract held by us relating to the Bakelite Acquisition and an unrealized loss of $10 related to a U.S. dollar denominated $290 term loan on a Dutch subsidiary’s books.
Our total non-operating expenses increased $45 in 2004 as compared to 2003. Interest expense increased $40 over 2003 due to higher average debt balances and interest rates resulting from our issuance of the Original Floating Rate Notes and the Fixed Rate Notes in August 2004 as part of the Borden Transaction and Resolution Specialty Transaction (see “—Liquidity and Capital Resources”), the April 2003 issuance of $200 of 9 1/2% Senior Second Secured Notes due 2010 and the refinancing of the credit agreement in the second and fourth quarters of 2003.
Income tax expense (benefit)
| Year Ended December 31, | Three Ended March 31, | |||||||||||||||
| 2003 | 2004 | 2005 | 2005 | 2006 | ||||||||||||
Income tax expense (benefit) | $ | (37 | ) | $ | — | $ | 48 | 13 | 19 | |||||||
Effective tax rate | — | — | — | 270 | % | 35 | % | |||||||||
The 2006 consolidated tax rate reflects a higher portion of net income derived from foreign operations and the effect of lower tax rates in foreign jurisdictions as well as the impact of foreign withholding tax related to the sale of a foreign business. These expenses are offset by increases in domestic valuation allowances due to the inability to utilize net operating losses.
The 2005 consolidated tax rate in excess of the U.S. statutory rate of 35% primarily relates to increases in valuation allowances related to net operating losses and capital loss carryforwards in various tax jurisdictions that may or may not be realized, income taxes on earnings in international jurisdictions, as well as withholding taxes related to the unremitted earnings of foreign subsidiaries.
69
Table of Contents
Despite a loss from continuing operations before income tax of $29, the Company recognized $48 of income tax expense in 2005. The federal income tax benefit on the Company’s domestic loss (computed at the federal statutory tax rate) and the release of foreign valuation allowances were more than offset by (i) an increase in the domestic valuation allowance, (ii) foreign income tax on a foreign currency exchange gain on the settlement of an intercompany loan, (iii) increases in accruals related to state and foreign tax contingencies and (iv) nondeductible expenses, primarily related to the Combinations.
The income tax expense in 2004 reflects a federal income tax benefit computed at the federal statutory rate, offset by a provision for taxes associated with the unrepatriated earnings of foreign subsidiaries. This provision was based on management’s decision that foreign earnings could no longer be considered permanently invested after the Borden Transaction. This additional provision allowed the Company to release previously provided valuation allowances against our deferred tax assets. The provision also reflects a write-off of net operating losses, offset by a benefit relating to a change in a foreign enacted tax rate.
The 2003 consolidated tax expense reflects a federal income tax benefit computed at the federal statutory rate.
Tax Legislation. In 2004, the American Jobs Creation Act of 2004 was signed into law. This Act effectively phases out benefits from the utilization of foreign sales corporations, reduces the number of foreign tax credit limitation categories, creates a temporary incentive for U.S. companies to repatriate foreign earnings at a significantly reduced effective U.S. tax rate and domestically provides a number of revenue enhancing and reducing provisions in the taxation of corporations. Our management does not anticipate a material impact on the Company as a result of this legislation.
Supplemental Data
The supplemental segment information presented and discussed below includes the combination of predecessor and successor financial statements for the individual entities that were the predecessors to the combined company, Hexion, and provides what management believes is a meaningful way of analyzing the results of the combined companies on a comparable period basis.
| Year ended December 31, 2005(a) | ||||||||||||||||
| Epoxy and Phenolic Resins | Formaldehyde and Forest Products Resins | Coatings and Inks | Performance Products | Corporate and Other | ||||||||||||
Net sales | $ | 2,139 | $ | 1,298 | $ | 886 | $ | 394 | $ | — | ||||||
Segment EBITDA | 253 | 156 | 63 | 52 | (43 | ) | ||||||||||
| Year ended December 31, 2004(a) | ||||||||||||||||
Net sales | $ | 1,857 | $ | 1,141 | $ | 765 | $ | 342 | $ | — | ||||||
Segment EBITDA | 152 | 143 | 60 | 38 | (29 | ) | ||||||||||
| (a) | Includes the combination of predecessor and successor financial statements for the individual entities that were predecessors to the combined company. |
Epoxy and Phenolic Resins
Net sales increased $282, or 15%, to $2,139 in 2005 as compared to the prior year. This increase in Net sales is a result of increased average prices, partially offset by decreased volume. Average prices increased while volumes decreased due to an increased emphasis by management on pricing versus volume. Segment EBITDA increased $101, or 66%, to $253 in 2005 compared to 2004. This Segment EBITDA improvement was driven by the increase in average selling prices discussed above that more than offset higher prices for raw material feedstocks due to the increasing prices of crude oil and related petrochemical products and natural gas. Hurricanes Katrina and Rita negatively impacted 2005 results by approximately $13 due to incremental costs associated with shutting down and restarting plants and higher utility and raw material costs.
70
Table of Contents
Formaldehyde and Forest Products Resins
Net sales increased $157, or 14%, to $1,298 in 2005 as compared to 2004 driven by increased pricing and favorable currency translation, partially offset by lower volumes. The increase in pricing was due to the pass through of higher raw material costs to our customers. The favorable currency translation was due to the strengthening of the Canadian dollar and the Brazilian Real versus the U.S. dollar. The decline in volumes was primarily in our formaldehyde products caused by hurricane related customer outages. Segment EBITDA increased $13, or 9%, to $156 in 2005 compared to 2004. Segment EBITDA improvement was driven by the factors discussed above. Hurricanes Katrina and Rita negatively impacted Segment EBITDA by approximately $10 in 2005 due to incremental costs associated with shutting down and restarting plants and higher utility and raw material costs.
Coatings and Inks
Net sales increased $121 in 2005 to $886 from 2004, a 16% increase. This increase in Net sales was primarily due to higher average selling prices across all of our products as well as favorable product mix. Segment EBITDA increased $3 in 2005 from 2004. This improvement in Segment EBITDA was driven by the positive factors discussed above partially offset by approximately $3 of incremental costs associated with higher utility and raw material costs as a result of Hurricanes Katrina and Rita.
Performance Products
Net sales increased $52 in 2005 compared to 2004, an increase of 15% as a result of improved volumes, higher average selling prices and favorable product mix. Our foundry products volumes increased driven by higher non-automotive demand. Higher average selling prices, primarily in Asia Pacific, was due to the pass through of raw material price increases. Our sales were positively impacted by favorable product mix in our oil field products. Segment EBITDA increased $14 in 2005, an increase of 37% compared to 2004. This increase in Segment EBITDA was primarily a result of the positive factors discussed above as well as lower processing costs in Asia Pacific. Hurricanes Katrina and Rita negatively impacted Segment EBITDA by approximately $1.
Cash Flows
Cash provided by (used in): | ||||||||||||||||||||
| Year Ended December 31, | Three Months March 31, | |||||||||||||||||||
| 2003 | 2004 | 2005 | 2005 | 2006 | ||||||||||||||||
Operating activities | $ | (43 | ) | $ | (32 | ) | $ | 171 | $ | 24 | $ | 44 | ||||||||
Investing activities | 7 | (20 | ) | (354 | ) | (20 | ) | (42 | ) | |||||||||||
Financing activities | 80 | 148 | 219 | 3 | (16 | ) | ||||||||||||||
Effect of exchange rates on cash flow | 1 | 7 | (5 | ) | (1 | ) | (1 | ) | ||||||||||||
Net change in cash and equivalents | $ | 45 | $ | 103 | $ | 31 | $ | 6 | $ | (15 | ) | |||||||||
Operating Activities
In the first quarter of 2006, net operating activities provided cash of $44. Net income, when adjusted for non-cash items, including gain on sale of businesses, totaled $50. Working capital used cash of $42 due to the timing of cash collections versus cash payments and the working capital build related to acquisitions. In the first quarter of 2006, we collected an insurance reimbursement of approximately $33 related to payments made in 2005 for the settlement of a legal case.
In the first quarter of 2005, net operating activities provided cash of $24. Net loss, when adjusted for non-cash items, totaled $44. Working capital used cash of $10 due to the timing of cash collections versus cash payments.
71
Table of Contents
In 2005, our operating activities generated cash of $171. Net loss when adjusted for non-cash items totaled $120 and net trading capital generated cash of $37, due to improved accounts receivable. We made net cash tax payments of $8 in 2005.
In 2004, we used net cash for operating activities of $32. Costs associated with the Borden Transaction of $46 more than offset improvements in other operating income. Increases in other assets, which were partially offset by increases in other liabilities, used net cash of $12. Working capital remained flat as increases in accounts receivables and inventories were offset by increases in accounts payable.
Our 2003 operating activities used cash of $43. This includes cash used by operations of $24 and by net trading capital (accounts receivable, inventory and accounts payable) of $27. Our negative cash flow in net trading capital resulted from increasing raw material costs in 2003.
Investing Activities
In the first quarter of 2006, our investing activities used cash of $42. We used $56 for the Rhodia Acquisition and the Rohm and Haas Acquisition. We also used $27 for capital expenditures, primarily for plant expansions and improvements. We received proceeds of $41 for business divestitures, primarily from the Brazilian Consumer Divestiture.
Our investing activities used cash of $20 in the first quarter of 2005. We used $13 for capital expenditures, primarily for plant expansions and improvements. In addition, we used $9 for deferred acquisition costs associated with the Bakelite acquisition. We received proceeds of $2 on Borden Chemical’s sale of a partial ownership in a joint venture.
Our investing activities used cash of $354 in 2005. We used $252 for the acquisitions of the Bakelite and Pacific Epoxy businesses and $105 for capital expenditures, primarily for plant expansions and improvements.
Our 2004 net investing activities used cash of $20. We used cash of $57 for capital expenditures primarily for plant expansions, management information and accounting system implementation at Resolution Specialty and other improvements. We paid $152 relating to Resolution Specialty acquisition activity, net of cash acquired, and received $185 relating to cash held by Borden Chemical at the time it became a member of the combined group.
Our 2003 net investing activities provided cash of $7. We spent $18 for capital expenditures, primarily for plant expansions and improvements. We realized proceeds of $23 on the sale of forty percent of the outstanding shares in Japan Epoxy Resins Co., Ltd to Resolution Performance joint venture partner, Mitsubishi Chemical Company.
Financing Activities
In the first quarter of 2006, our financing activities used cash of $16. We made net long-term debt repayments of $5, primarily related to borrowings during the quarter under our May 2005 senior secured credit facilities. We also made net short-term debt repayments of $9 during the first three months of 2006.
Our financing activities provided cash of $3 in the first quarter of 2005. We received an $8 purchase price adjustment related to the acquisition of Borden Chemical by Apollo, which we subsequently paid to Borden Chemical’s parent in the second quarter of 2005. We had net debt borrowings of $2 in the first quarter of 2005.
In 2005, our financing activities provided cash of $219. Net cash generated by financing activities was primarily due to long-term debt borrowings of $1,193 consisting of the $150 senior secured notes and the $500 term loan under the Hexion Credit Facility and borrowings under a bridge facility for the Bakelite Acquisition (see “—Liquidity and Capital Resources”). These borrowings were partially offset by net debt repayment of $752
72
Table of Contents
and debt financing fees paid of $22 related to the financings. We paid a dividend of $523, which was funded through the net proceeds received from the issuance of preferred stock of $334 and from amounts borrowed under the Hexion Credit Facility. We also made payments of $11 for costs related to our proposed IPO.
Our financing activities in 2004 provided cash of $148. Net cash generated by financing activities was primarily due to the issuance of debt related to the Resolution Specialty Transaction of $121, offset by net debt repayments by Resolution Performance and Borden Chemical of $23. Also, we received a cash inflow of $60 related to the Resolution Specialty Transaction.
Our 2003 financing activities provided cash of $80. This amount includes net debt borrowing of $103, offset by the payment of a constructive distribution related to certain pension costs to Shell on behalf of Resolution Performance.
Liquidity and Capital Resources
Our primary source of liquidity is cash flow generated from operations. We also have availability under our senior secured credit facilities (see below), subject to certain conditions. Our primary liquidity requirements are debt service, working capital requirements, contractual obligations and capital expenditures.
We are a highly leveraged company. Our liquidity requirements are significant, primarily due to our debt service requirements. At March 31, 2006, we had $2,340 principal amount of outstanding indebtedness, of which approximately $800 constituted floating rate debt and bank loans and the remainder constituted fixed rate indebtedness. In May 2006, we completed the Hexion Refinancings pursuant to which we refinanced certain of our outstanding indebtedness and redeemed our Series A Preferred Stock with proceeds of borrowings under our new senior secured credit facilities. On a pro forma basis for the Hexion Refinancings, at March 31, 2006, we would have had $2,690 principal amount of outstanding indebtedness, of which approximately $900 constituted floating rate debt and bank loans, net of the $1,000 interest rate swap, and the remainder constituted fixed rate indebtedness. On a pro forma basis for the Hexion Refinancings, at March 31, 2006, we would have had $141 in cash.
Effective October 11, 2005, we entered into a $289 cross-currency and interest rate swap agreement structured for a non-U.S. subsidiary’s $290 U.S. dollar denominated term loan. The swap is a three-year agreement designed to offset balance sheet and interest rate exposures and cash flow variability associated with exchange rate fluctuations on the term loan.
In connection with the Hexion Formation, we have declared but not yet paid a dividend of $27 to our shareholder, which is expected to be principally paid in the second quarter of 2007 and is classified in Other long-term liabilities.
Senior Credit Facilities
In May 2006 as part of the Hexion Refinancings, we amended and restated our senior secured credit facilities. The seven-year $1,625 term loan facility, seven-year $50 synthetic letter of credit facility (“LOC”), and five-year $225 revolving credit facility (the “new senior secured credit facilities”), are each subject to an earlier maturity date on any date that greater than $200 in the aggregate principal amount of certain of our and our subsidiaries’ indebtedness will mature within 91 days of such date.
The interest rates with respect to term loans to the Company under the new senior secured credit facilities are based on, at the Company’s option, (a) adjusted LIBOR plus 2.00% or (b) the higher of (i) JPMorgan Chase Bank, N.A.’s (JPMCB) prime rate or (ii) the Federal Funds Rate plus 0.50%, in each case plus 0.50%. Term loans to the Netherlands subsidiary are at the Company’s option, (a) EURO LIBOR plus 2.00% or (b) the rate quoted by JPMCB as its base rate for such loans plus 0.50%. The foregoing margins are subject to reduction if certain corporate credit ratings are achieved.
73
Table of Contents
The new senior secured credit facility has commitment fees (other than with respect to the LOC) equal to 0.50% per annum of the unused line plus a fronting fee of 0.25% of the aggregate face amount of outstanding letters of credit. The LOC has a commitment fee of 0.10% per annum.
At March 31, 2006, we had no outstanding borrowings under the previously existing revolving credit facility, $55 outstanding letters of credit, had unused borrowing availability of $220 and $168 of cash and equivalents on our balance sheet. At March 31, 2006, we were in compliance with the covenants and restrictions in all credit facilities.
On May 10, 2006, we entered into a $1,000 interest rate swap agreement. The swap is a three-year agreement designed to offset cash flow variability associated with interest rate fluctuations on our variable rate debt. The initial notional amount of the swap is $1,000, which amortizes on a quarterly basis based on expected payments on our term loan in order to maintain a fixed to variable debt ratio of approximately 70% fixed to 30% variable.
Upon completion of the tender offers described in this prospectus and amendment of the senior secured credit facilities, we recognized a loss on the extinguishment of debt of approximately $31 (redemption cost net of debt premium) and an additional charge of approximately $20 for the write-off of deferred financing costs, which will be reflected in our second quarter financial statements.
In the second quarter of 2005, we wrote off deferred financing costs of $17. Of this amount, $6 was related to the Bakelite Acquisition bridge financing arrangement, and $11 related to the early termination of the Resolution Performance, Resolution Specialty and Borden Chemical credit facilities. This expense is included in Write-off of deferred financing fees on the audited Consolidated Statements of Operations.
Our Australian subsidiary entered into a five-year secured credit facility in the fourth quarter of 2003 (the “Australian Facility”), which provides for a maximum borrowing of AUD$15, or approximately $11. At December 31, 2005, outstanding debt under this facility was $6, of which $5 is classified as long-term. In addition, there was approximately $3 of short-term debt under the facility. The Australian Facility is secured by liens against substantially all of the assets of the Australian business including the stock of the Australian subsidiaries. At December 31, 2005, the net book value of the collateral securing the Australian Facility was approximately $34. In addition, we pledged the stock of the Australian subsidiaries as collateral for borrowing under the Australian Facility. This facility includes a fixed rate facility used for the acquisition, as well as a revolver. At December 31, 2005, $6 was outstanding under the fixed rate facility at an interest rate of 6.4%. The Australian Facility contains restrictions relative to the Australian businesses on dividends, the sale of assets and additional borrowings. The Australian Facility also contains financial covenants applying to the Australian subsidiaries including current ratio, interest coverage, debt service coverage and leverage. The fixed portion of the Australian Facility requires minimum quarterly principal reductions totaling AUD$0.5 (approximately $0.4). The Australian Facility requires semi-annual principal reductions based on a portion of excess cash as defined in the agreement. At March 31, 2006, the maximum borrowing allowable under the Australian Facility was AUD$15 (approximately $11), of which about AUD$3 (approximately $2), after outstanding LOCs and other draws, was unused and available.
Additional international credit facilities provide availability totaling approximately $115 as of March 31, 2006. Of this amount, approximately $67 was available to fund working capital needs and capital expenditures at March 31, 2006. These credit facilities have various expiration dates ranging from 2006 through 2008. While these facilities are primarily unsecured, portions of the lines are secured by equipment. At March 31, 2006, the net book value of collateral securing a portion of these facilities was approximately $10. We guarantee up to $7 of the debt of one of our Brazilian subsidiaries, included in these facilities.
HAI entered into a three-year asset based revolving credit facility in 2004, which provides for a maximum borrowing of $15 (the “HAI Facility”). Maximum borrowing allowable under the HAI Facility is based upon specific percentages of eligible accounts receivable and inventory and is secured with inventory, accounts
74
Table of Contents
receivable and property and equipment of HAI. At March 31, 2006, the net book value of collateral securing the HAI Facility was approximately $42. The HAI Facility provides up to $2 for LOCs. The HAI Facility contains restrictions relative to HAI on dividends, affiliate transactions, minimum availability ($2 in 2005), additional debt and capital expenditures ($2 in 2005). In addition, HAI is required to maintain a minimum trailing twelve-month debt coverage ratio of 1.5 to 1.0 and a monthly debt to tangible capital ratio of less than 2.5 to 1.0. At March 31, 2006, borrowings allowable under the HAI Facility was $15 of which $13 was unused and available, after the minimal availability requirement.
Senior Secured Notes and Debentures
The following describes our senior secured notes and debentures prior to the Hexion Refinancings. In connection with the Hexion Refinancings, we made tender offers to repurchase all of our 8% Senior Secured Notes, 9 1/2% Senior Second Secured Notes and 13 1/2% Senior Subordinated Notes. On May 5, 2006, we accepted tenders from holders of 100% of the outstanding principal amount of the 8% Senior Secured Notes, 99.9% of the outstanding principal amount of the 9 1/2% Senior Second Secured Notes and 88.7% of the outstanding principal amount of the 13 1/2% Senior Subordinated Notes. In the event that not all of the 9 1/2% Senior Second Secured Notes or 13 1/2% Senior Subordinated Notes are repurchased pursuant to the tender offers, we expect to borrow under our new senior secured credit facilities to redeem any outstanding 9 1/2% Senior Second Secured Notes and 13 1/2% Senior Subordinated Notes shortly after the completion of the tender offers. The Hexion Refinancings, including the tender offers, are expected to be completed prior to this offering. This prospectus is not an offer to purchase, a solicitation of an offer to purchase or a solicitation of consent with respect to our 8% Senior Notes, 9 1/2% Senior Second Secured Notes, and 13 1/2% Senior Subordinated Notes. The tender offers and consent solicitations will be made solely by the Offer to Purchase and Consent Solicitation Statement.
Upon completion of the tender offers and amendment of the senior secured credit facilities, we recognized a loss on the extinguishment of debt of approximately $31 (redemption cost net of debt premium) and an additional charge of approximately $20 for the write-off of deferred financing costs, which will be reflected in our second quarter financial statements.
Senior Secured Notes
In 2003, Resolution Performance and RPP Capital Corporation issued $140 aggregate principal amount of 8% Senior Secured Notes due 2009 in a private offering. Hexion assumed the obligations of Resolution Performance under the 8% Senior Secured Notes in connection with the consummation of the Combinations. The $140 of 8% Senior Secured Notes are senior secured obligations ranking equal in right of payment to all of our existing and future senior debt and senior in right of payment with all existing and future subordinated indebtedness. The 8% Senior Secured Notes are secured by a second-priority lien subject to permitted liens, on all of the domestic assets (subject to certain exceptions) that secure obligations under our new senior secured credit facilities and a portion of the capital stock of direct and indirect domestic subsidiaries and direct foreign subsidiaries. Interest is payable semi-annually in cash on December 15 and June 15, beginning June 15, 2004. The 8% Senior Secured Notes mature on December 15, 2009 and may be redeemed in whole at any time or in part from time to time, on and after December 15, 2006, at the specified redemption prices set forth under the related indenture.
In 2003, Resolution Performance and RPP Capital Corporation issued $200 aggregate principal amount of 9 1/2% Senior Second Secured Notes due 2010 in private offerings. Hexion assumed the obligations of Resolution Performance under the 9 1/2% Senior Second Secured Notes in connection with the consummation of the Combinations. The 9 ½% Senior Second Secured Notes were subsequently exchanged for registered notes in a registered exchange offer. The $200 of 9 1/2% Senior Second Secured Notes are senior secured obligations ranking equal in right of payment to all of Hexion’s existing and future senior debt and senior in right of payment with all existing and future subordinated indebtedness. The 9 1/2% Senior Second Secured Notes are secured by a second-priority lien, subject to permitted liens, on all of our domestic assets (subject to certain exceptions) that secure obligations under our new senior secured credit facilities and a portion of the capital stock of direct and indirect domestic subsidiaries and direct foreign subsidiaries. Interest is payable semi-annually in cash on April 15 and October 15, beginning October 15, 2003. The 9 1/2% Senior Second Secured Notes mature on
75
Table of Contents
April 15, 2010 and may be redeemed in whole at any time or in part from time to time, on and after April 15, 2006, at the specified redemption prices set forth under the related indenture.
In conjunction with the Borden Chemical Transaction, Borden Chemical formed two wholly owned finance subsidiaries that borrowed a total of $475 through a private debt offering. Of the debt, $325 is second-priority senior secured notes due 2014 (the “Fixed Rate Notes”), which bear an interest rate of 9%. The remaining $150 of debt is second-priority senior secured floating rate notes due 2010 (the “Original Floating Rate Notes”).
The Original Floating Rate Notes and Fixed Rate Notes and guarantees rank equally with all of Hexion’s and the guarantor’s existing and future senior indebtedness, including debt under our new senior secured credit facilities and the guarantees thereof. The Original Floating Rate Notes and Fixed Rate Notes remain obligations of Hexion after consummation of the Combinations. The Original Floating Rate Notes and Fixed Rate Notes are effectively subordinated to such senior secured credit facilities, our 8% Senior Secured Notes and any other future obligations secured by a first-priority lien (as defined in the indentures governing such notes) on the collateral to the extent of the value of the collateral securing such obligations. The Original Floating Rate Notes and Fixed Rate Notes will rank senior to all of Hexion’s and its guarantors’ existing and future subordinated indebtedness, except as described in the preceding sentence. The Original Floating Rate Notes and Fixed Rate Notes are also effectively subordinated to the liabilities of the non-guarantor subsidiaries, which includes HAI.
Interest on the Original Floating Rate Notes will be paid each January 15, April 15, July 15 and October 15. Interest on the Original Floating Rate Notes accrues at an annual rate, reset quarterly, equal to LIBOR plus 475 basis points. At December 31, 2005, the interest rate on the Original Floating Rate Notes was 9.71%. The notes mature July 15, 2010. These notes may be redeemed at any time on or after July 15, 2006 at the applicable redemption price set forth in the indenture for the notes. In addition, up to 35% of these notes may be redeemed prior to July 15, 2006 with cash proceeds from certain equity offerings at the applicable redemption price set forth in the indenture for the notes. The Original Floating Rate Notes may also be redeemed upon certain changes in tax laws or upon a change in control. There is no sinking fund for the Original Floating Rate Notes.
Interest on the Fixed Rate Notes will be paid each January 15 and July 15. The notes mature July 15, 2014. These notes may be redeemed at any time on or after July 15, 2009 at the applicable redemption price set forth in the indenture for the notes. In addition, up to 35% of these notes may be redeemed prior to July 15, 2007 with cash proceeds from certain equity offerings at the applicable redemption price set forth in the indenture for the notes. Prior to July 15, 2009, the Fixed Rate Notes may be redeemed at a price equal to 100% of the principal amount plus accrued interest plus the “make-whole” premium as defined in the indenture for the notes. The Fixed Rate Notes may also be redeemed upon certain changes in tax laws or upon a change in control. There is no sinking fund for the Fixed Rate Notes.
In May 2005, we issued $150 Second-Priority Senior Secured Floating Rate Notes due 2010 (the “New Floating Rate Notes”). The New Floating Rate Notes have substantially the same covenants and events of default as the Original Floating Rate Notes. The New Floating Rate Notes were issued at a price of 98.846%. Interest on the New Floating Rate Notes accrues at a rate per annum, reset quarterly, equal to LIBOR plus 5.50% and is payable on January 15, April 15, July 15 and October 15, commencing on July 15, 2005. These notes may be redeemed at any time on or after July 15, 2006 at the applicable redemption price set forth in the indenture for the notes. In addition, up to 35% of these notes may be redeemed prior to July 15, 2006 with cash proceeds from certain equity offerings at the applicable redemption price set forth in the indenture for the notes. The New Floating Rate Notes are collateralized by a second-priority security interest in the same collateral as the remaining $150 of our Second-Priority Senior Secured Floating Rate Notes, our 9% Second Priority Senior Secured Notes and our 9 1/2% Senior Second Secured Notes which are all second in priority (subject to Permitted Liens) to our new senior secured credit facilities.
Following the Combinations, the Company, certain of our U.S. subsidiaries and Hexion U.S. Finance Corporation (formerly known as Borden U.S. Finance) have guaranteed the senior secured debt previously issued by Resolution Performance.
76
Table of Contents
In December 2005, we filed a registration statement with the SEC to consummate an exchange offer on the Fixed Rate Notes and the New Floating Rate Notes. Effective February 2006, a premium of 75 basis points was eliminated upon the exchange.
Debentures
In 2000, $328 aggregate principal amount of 13 1/2% Senior Subordinated Notes due 2010 were issued in private offerings by Resolution Performance and RPP Capital Corporation. Hexion assumed the obligations of Resolution Performance under the 13 1/2% Senior Subordinated Notes in connection with the consummation of the Combinations. These notes were subsequently exchanged for registered notes. The $328 of 13 1/2% Senior Subordinated Notes are senior subordinated unsecured obligations ranking junior in right of payment to all of existing and future senior debt and all liabilities of subsidiaries that do not guarantee the notes. The proceeds from the issuance of $200 of the 13 1/2% Senior Subordinated Notes in November 2000 were used to finance in part the recapitalization and related transaction costs and expenses. Interest on the 13 1/2% Senior Subordinated Notes is payable semi-annually in cash on each May 15 and November 15. The 13 1/2% Senior Subordinated Notes mature on November 15, 2010 and may be redeemed in whole at any time or in part from time to time, on and after November 15, 2005, at the specified redemption prices set forth under the related indenture.
In connection with the Resolution Specialty Transaction, Resolution Specialty executed a Senior Subordinated Note Purchase Agreement (“Seller Note Financing”) with Eastman on August 2, 2004, which provided for the sale of $50 aggregate principal amount of Senior Subordinated Notes of Resolution Specialty to Eastman due and payable in 2011. Such notes were delivered to Eastman as partial consideration of the Resolution Specialty Transaction. Interest was payable at a base rate equal to the seven year Treasury plus additional basis points ranging from 350 to 550, payable semi-annually on February 1 and August 1. The Seller Note Financing provided for payments-in-kind, whereby Resolution Specialty was permitted to pay interest in either dollars or Notes until the third anniversary. The Seller Note Financing was subordinate to the credit agreement, and contained restrictive covenants which could trigger acceleration of repayment in the event of default absent a waiver. Such restrictive covenants included, among other provisions, restrictions on payments and distributions, mergers and acquisitions and transactions with affiliates. We repaid the Senior Subordinated Notes of Resolution Specialty on May 31, 2005 in connection with the consummation of the Combinations.
The 9 1/5% debentures due in 2021, the 7 7/8% debentures due in 2023 and the 8 3/8% sinking fund debentures due in 2016 were outstanding prior to the Borden Transaction. These debentures are senior obligations of Hexion and rank equally with all of Hexion’s existing and future senior indebtedness. However, because these debentures are unsecured, they are effectively subordinated to Hexion’s senior secured indebtedness, including our new senior secured credit facilities, the 8% Senior Secured Notes, the 9 1/2% Senior Second Secured Notes, the Original Floating Rate Notes, the Fixed Rate Notes and the New Floating Rate Notes.
Other Borrowings
In addition, the Company finances certain insurance premiums. Short-term borrowings under this arrangement include $9 and $6 at December 31, 2005 and 2004, respectively.
The $34 Parish of Ascension Industrial Revenue Bonds (IRBs) are related to the purchase, construction and installation of air and water pollution control facilities that are no longer owned by Borden Chemical. The tax-exempt status of the IRBs is based upon their being no change in the use of the facilities, as defined by the Internal Revenue Code. Borden Chemical continues to monitor the use of the facilities by the current owner. If a change in use were to occur, Borden Chemical could be required to take remedial action, including redeeming all of the bonds.
On October 6, 2004, we entered into an agreement to acquire Bakelite Aktiengesellschaft (“Bakelite”). We consummated the Bakelite Acquisition on April 29, 2005. As discussed in Note 3 to the audited Consolidated Financial Statements, we financed the acquisition through a combination of debt and cash.
77
Table of Contents
Series A Preferred Stock
On May 12, 2006, the Company used a portion of the borrowings under its new senior secured credit facilities to redeem all of the outstanding Series A Preferred Stock.
In May 2005, Hexion Escrow Corp., a subsidiary of Hexion which merged into Hexion coincidental with the Combinations, offered 14 million shares of Redeemable Series A Floating Rate Preferred Stock, which we refer to as the Series A Preferred Stock, par value $0.01 per share, and a liquidation preference of $25 per share. The net proceeds from the Series A Preferred Stock were used to pay a dividend to the Company’s parent. The Series A Preferred Stock accumulate cumulative preferential dividends from the issue date at an initial rate of LIBOR plus 8.0%, compounded semi-annually. The dividend rate increases 75 basis points every six months beginning November 15, 2005 until May 15, 2007, at which time the rate is LIBOR plus 11.0%. As of December 31, 2005, the dividend rate was 13.3%. Dividends will be paid by issuing additional shares of Series A Preferred Stock through May 15, 2010. Thereafter, dividends will be required to be paid in cash. On or after May 15, 2007, the Company may convert the Series A Preferred Stock from a floating rate security to a fixed rate security, with dividends payable at an annual rate equal to 14.0%. After November 15, 2005, the Company has the option to redeem all or a portion of the Series A Preferred Stock at between 101% and 103% of the aggregate liquidation value plus accrued and unpaid dividends. On October 14, 2014, or upon a change in control of the Company, the Series A Preferred Stock shareholders have the option to require the Company to repurchase all or a portion of the Series A Preferred Stock.
Capital Expenditures
We plan to spend approximately $118 on capital expenditures in 2006 and approximately $110 annually thereafter. This amount was determined through the budget process and is subject to change in all respects at the discretion of the board. Consideration was given to future product demand projections, existing plant capacity and external customer trends. Of the $118 anticipated future capital expenditures, based on our historical experience we expect approximately $65 will be used for maintenance and environmental projects. We expect the remaining $53 will be used to expand plant capacity as necessary to meet expected demand. We plan to fund capital expenditures through operations and, if necessary, through available lines of credit. We have no material firm commitments relating to these anticipated capital expenditures at March 31, 2006.
Contractual Obligations
The following table presents our contractual cash obligations as adjusted for the Hexion Refinancings and the offering at March 31, 2006. Our actual contractual cash obligations consist of legal commitments at December 31, 2005, requiring us to make fixed or determinable cash payments, regardless of the contractual requirements of the vendor to provide future goods or services. This table does not include information on most of our recurring purchases of materials for use in production, as our raw materials purchase contracts do not meet this definition because they generally do not require fixed or minimum quantities. Contracts with cancellation clauses are not included, unless such cancellation would result in major disruption to our business. For example, we have contracts for information technology support that are cancelable, but this support is essential to the operation of our business and administrative functions; therefore, amounts payable under these contracts are included.
78
Table of Contents
Our long-term debt and related interest expense on fixed rate debt are reported as of March 31, 2006, due to significant changes in our obligations subsequent to December 31, 2005. We do not believe our other obligations disclosed in this table have changed materially since December 31, 2005.
| Payments Due By Year | |||||||||||||||||||||
Contractual Obligations | 2006 | 2007 | 2008 | 2009 | 2010 | 2011 and beyond | Total | ||||||||||||||
Long-term debt, including current maturities (a)(e) | $ | 51 | $ | 23 | $ | 29 | $ | 51 | $ | 314 | $ | 2,210 | $ | 2,678 | |||||||
Capital lease obligations (b) | 1 | 1 | — | — | 3 | 7 | 12 | ||||||||||||||
Operating leases | 26 | 23 | 19 | 14 | 11 | 13 | 106 | ||||||||||||||
Unconditional purchase obligations (c) | 234 | 131 | 107 | 99 | 19 | 110 | 700 | ||||||||||||||
Interest on fixed rate debt (d)(f) | 72 | 71 | 71 | 70 | 67 | 503 | 854 | ||||||||||||||
Interest on variable rate debt (e)(f) | 145 | 144 | 143 | 142 | 127 | 250 | 951 | ||||||||||||||
Total | $ | 529 | $ | 393 | $ | 369 | $ | 376 | $ | 541 | $ | 3,093 | $ | 5,301 | |||||||
| (a) | Amounts include $1,625 of new debt and the repayment of existing debt of $1,175 from the Hexion Refinancings and the repayment of $100 of existing debt from the offering. Current maturities at March 31, 2006 were $40. |
| (b) | Current maturities at March 31, 2006 were $1. |
| (c) | Unconditional purchase obligations are composed of the fixed or minimum amounts of goods and/or services under long-term contracts and assumes that certain contracts are terminated in accordance with their terms after giving the requisite notice which is generally two to three years for most of these contracts; however, under certain circumstances, some of these minimum commitment term periods could be further reduced which would significantly decrease these contractual obligations. This table excludes payments relating to income tax, pension and OPEB benefits and environmental obligations due to the fact that, at this time, we cannot determine either the timing or the amounts of payments for all periods beyond 2005 for certain of these liabilities. See Notes 10, 12, 13 and 16 to the audited Consolidated Financial Statements and the following discussions on our environmental, pension, OPEB and income tax liabilities, respectively, for more information on these obligations. |
| (d) | This table excludes interest expense for debt instruments with variable interest rates including the senior secured credit facilities. For the year ended December 31, 2005 and the three months ended March 31, 2006, this expense was approximately $56 and $18, respectively. |
| (e) | Based on variable interest rates of Adjusted LIBOR plus 2.0% in effect at May 10, 2006. |
| (f) | See “Description of Certain Indebtedness” for more information on the Hexion Refinancings. |
Our current projections for future annual cash payments to our defined benefit pension plans range from approximately $17 to $37 per year, with a total funding requirement for the five years ended in 2010 of $131. The assumptions used by our actuaries in calculating these projections included an 8.2% weighted average annual return on assets for the years 2006 – 2010 and the continuation of current law and plan provisions. We plan to make cash payments of $37 relating to our defined benefit pension plans in 2006. These amounts include benefit payments to be made under unfunded defined benefit pension plans.
Our projected annual future plan benefit payments for our non-pension postretirement plans are approximately $2, with total benefit payments for the five years ended in 2010 of approximately $10 and $8 for the years ended 2011 and beyond.
We estimate we will pay current year cash taxes totaling approximately $31 in 2006 for local, state and international liabilities.
We expect expenditures for environmental remediation, indemnification and restoration liabilities for 2006 – 2010 to total approximately $18.
We maintain three stock option plans for our employees: the RPP 2000 Stock Option Plan (which we refer to as the RPP plan), the RSM 2004 Stock Option Plan (which we refer to as the RSM plan) and the BHI Acquisition 2004
79
Table of Contents
Stock Incentive Plan (which we refer to as the 2004 incentive plan). In addition to these option plans, we maintain a stock-based deferred compensation plan. The fair market value of the options granted under the option plans and deferred common stock units granted under the stock-based deferred compensation plan was determined contemporaneously at the date of grant based upon the fair market value of the underlying stock at the date of grant. The options and deferred common stock units granted under the RSM plan and the 2004 incentive plan were granted contemporaneously with the acquisition of Resolution Specialty and Borden Chemical by Apollo in August 2004 and the fair market value of those options and deferred common stock units is equal to the acquisition price paid by Apollo. Substantially all of the options granted under the RPP plan were granted contemporaneously with the acquisition of Resolution Performance by Apollo in November 2000 and the fair market value of those options is equal to the acquisition price paid by Apollo. In 2004, a limited number of options were issued to a new employee under the RPP plan at fair market value as determined by the Board of Directors of Resolution Performance.
On May 11, 2005, BHI Acquisition issued options to purchase 84,424 membership units to our non-management directors. These options have a ten-year life with immediate vesting and exercise upon an IPO. Upon the consummation of an IPO, we will recognize expense of $1, which represents the fair value of the options at the date of grant as determined by the Black-Scholes pricing model. In addition, on October 1, 2005, we issued options to purchase 28,141 membership units to an additional non-management director. These options have a ten-year life and were immediately vested upon the date of the grant.
At March 31, 2006, on an as converted basis, there were 4,105,148 options outstanding under all of our employee and director option plans, which include the Resolution Performance 2000 Non-Employee Directors Option Plan and 970,467 deferred common stock units under the deferred compensation plan. All outstanding awards at March 31, 2006 are denominated in Hexion LLC common units.
As a result of modifications to the RPP plan, the RSM plan, the 2004 incentive plan and the deferred compensation plan resulting from the Combinations, as well as the acceleration of vesting of certain participants’ awards, we recognized a compensation charge of $2 for the three months ended March 31, 2006, which is included in selling, general & administrative expense. The total compensation cost to be recognized as a result of the modifications was $31 based on an estimated fair value per share of $17.52, the value at the time of the modifications. We expect to recognize the additional compensation expense of $18, which will be recognized over the vesting period of the underlying stock based awards. The cost is expected to be recognized ratably over a weighted-average period of 4.9 years. Such expense is based on current grants of stock based awards and will change as new grants are made.
Subsequent to the Combinations on May 31, 2005, the estimated fair value per share of the Company has increased from $17.52 as a result of the identification of additional synergy opportunities resulting from the Combinations, continued improved operating results and increased market share in certain business segments. For example, we added new plant capacity at the end of 2005 in our Epoxy and Phenolic Resins business to meet additional demand. We have also increased plant capacity in the first quarter of 2006 in our Performance Products businesses to address the increase in demand from our oil field customers. Additional income and synergy opportunities resulting from recent acquisitions and overall improved market conditions also are factors in our increase in estimated fair value per share amount.
We expect to have adequate liquidity to fund working capital requirements, contractual obligations and capital expenditures over the remainder of the term of our credit facilities with cash received from operations and amounts available under credit facilities.
Off-Balance Sheet Arrangements
We had no off-balance sheet arrangements as of March 31, 2006.
Covenant Compliance
Certain covenants contained in the credit agreement governing our new senior secured credit facilities and the indentures governing the Second-Priority Senior Secured Notes will (i) require the maintenance of a senior
80
Table of Contents
secured debt to Adjusted EBITDA ratio and (ii) restrict our ability to take certain actions such as incurring additional debt or making certain acquisitions if we are unable to meet defined Adjusted EBITDA to Fixed Charges, senior secured debt to Adjusted EBITDA and consolidated debt to Adjusted EBITDA ratios. Upon completion of the Hexion Refinancings, the most restrictive of these indenture covenants, the covenants to incur additional indebtedness and the ability to make future acquisitions, will require an Adjusted EBITDA to Fixed Charges ratio (measured on a trailing four-quarter basis) of 2.0 to 1.0. Failure to comply with these covenants can result in limiting our long-term growth prospects by hindering our ability to incur future indebtedness or grow through acquisitions.
Fixed Charges are defined as interest expense excluding the amortization or write-off of deferred financing costs. Adjusted EBITDA is defined as EBITDA further adjusted to exclude certain non-cash, non-recurring and realized or expected future cost savings directly related to prior acquisitions and the Combinations. We believe that the inclusion of the supplemental adjustments applied in calculating Adjusted EBITDA is appropriate to provide additional information to investors to demonstrate compliance with our financial covenants and assess our ability to incur additional indebtedness in the future. Adjusted EBITDA and Fixed Charges are not defined terms under GAAP. Adjusted EBITDA should not be considered an alternative to operating income or net income as a measure of operating results or an alternative to cash flows as a measure of liquidity. Fixed Charges should not be considered an alternative to interest expense. Because we are highly leveraged, we believe that the inclusion of supplementary adjustments to EBITDA applied in presenting Adjusted EBITDA are appropriate to provide additional information to investors to demonstrate compliance with our financing covenants. As of March 31, 2006, we were in compliance with all financial covenants contained in the indentures governing the notes and all our credit facilities.
Year Ended December 31, 2005 | LTM Period | |||||||
Reconciliation of Pro Forma Net Loss to Pro Forma Adjusted EBITDA | ||||||||
EBITDA | ||||||||
Pro Forma net loss before nonrecurring charges directly attributable to the transaction | $ | (69 | ) | $ | (21 | ) | ||
Pro Forma income taxes | 61 | 66 | ||||||
Pro Forma interest expense, net | 219 | 219 | ||||||
Pro Forma depreciation and amortization expense | 158 | 154 | ||||||
Pro Forma EBITDA | 369 | 418 | ||||||
Adjustments to EBITDA | ||||||||
Transaction costs and non-cash charges(1) | 76 | 79 | ||||||
Unusual items(2) | 36 | (5 | ) | |||||
Effect of acquisitions, net of divestiture(3) | 11 | 11 | ||||||
In process synergies(4) | 105 | 94 | ||||||
Pro Forma Adjusted EBITDA(5) | $ | 597 | $ | 597 | ||||
Pro Forma Fixed Charges | $ | 200 | 208 | |||||
Ratio of Pro Forma Adjusted EBITDA to Fixed Charges | 2.99 | 2.87 | ||||||
(1) Transaction costs and non-cash charges for Hexion are further detailed on the following table: | ||||||
| Pro Forma | ||||||
Year Ended December 31, 2005 | LTM Period | |||||
| (dollars in millions) | ||||||
Transaction costs(a) | $ | 44 | $ | 41 | ||
Non-cash charges(b) | 32 | 38 | ||||
| $ | 76 | $ | 79 | |||
(a) Represents merger costs principally related to the Hexion Formation and expenses related to terminated acquisition activities. | ||||||
81
Table of Contents
(b) Represents impairments of fixed assets of $9 and $13, non-cash stock based compensation of $13 and $15 and unrealized foreign currency exchange loss of $10 and $10 on debt instruments denominated in currencies other than the functional currency of the holder, for the year ended December 31, 2005 and the LTM Period, respectively. | ||||
| (2) | Unusual items that do not relate to the core operations of Hexion are further detailed on the following table: |
| Pro Forma | |||||||
Year Ended December 31, 2005 | LTM Period | ||||||
| (dollars in millions) | |||||||
Business realignment expenses(a) | $ | 9 | $ | 11 | |||
Other expenses(b) | 27 | (16 | ) | ||||
Unusual items | $ | 36 | $ | (5 | ) | ||
| (a) | Business realignment expenses for the year ended December 31, 2005 included in EBITDA for Hexion relate to the excess of historical costs over current business staffing levels and comprises employee related costs of $4 including (i) historical salaries and benefits of employees terminated in 2005 at Resolution Specialty and Borden Chemical and (ii) the excess cost of employee benefit programs prior to the revision of such plans in 2005. Business realignment expenses include plant closure and non-recurring severance and other one time benefits paid to employees of $5 and $11 for the year ended December 31, 2005 and the LTM period, respectively. |
| (b) | Amounts include the following: |
Year Ended December 31, 2005 | LTM Period | ||||||
Non-recurring litigation expenses | $ | 10 | $ | 9 | |||
Foreign currency loss on an exchange rate hedge relating to the Bakelite Acquisition | 11 | — | |||||
Integration costs, transition fees and other non-recurring expenses | 6 | 10 | |||||
Gain on divestitures of businesses | — | (35 | ) | ||||
| $ | 27 | $ | (16 | ) | |||
| (3) | Amount represents the incremental EBITDA impact for the Rhodia Acquisition, the Rohm and Haas Acquisition less the Brazilian Consumer Divestiture as if they had taken place at the beginning of the year. These acquisitions and the divestiture closed after December 31, 2005 and are included in our calculation of pro forma Adjusted EBITDA as permitted by our indenture covenants. |
| (4) | Represents estimated net unrealized cost synergies resulting from the Hexion Formation and the Bakelite Acquisition. |
| (5) | We are required to have an Adjusted EBITDA to Fixed Charges ratio of greater to 2.0 to 1.0 to incur additional indebtedness under certain of our indentures. As of March 31, 2006, we are able to satisfy this covenant and incur additional indebtedness under our indentures. In addition, we expect to be able to satisfy our Fixed Charges ratio covenant upon the closing of the Akzo Acquisition, which we expect to occur in the second quarter of 2006. After giving effect to the Akzo Acquisition as if it had taken place at the beginning of 2005, our 2005 pro forma net loss would be $59, our 2005 pro forma Adjusted EBITDA would be $618, our Pro Forma Fixed Charges would be $213 and our ratio of Adjusted EBITDA to Fixed Charges would be 2.90. See “Prospectus Summary—Recent Acquisitions and Divestiture.” |
Quantitative and Qualitative Disclosures About Market Risk
Risk Management. We use various financial instruments, including some derivatives, to help us hedge our foreign currency exchange risk. We also use raw material purchasing contracts and pricing contracts with customers to mitigate commodity price risks. These contracts generally do not contain minimum purchase requirements.
Foreign Exchange Risk. Our international operations accounted for approximately 50% of our sales in 2005 and 49% in 2004. As a result, we have exposure to foreign exchange risk on transactions potentially denominated in many foreign currencies. These transactions include foreign currency denominated imports and exports of raw
82
Table of Contents
materials and finished goods (both intercompany and third party) and loan repayments. In all cases, the functional currency is the business unit’s local currency.
It is our policy to reduce foreign currency cash flow exposure due to exchange rate fluctuations by hedging firmly committed foreign currency transactions wherever economically feasible. Our use of forward and option contracts is designed to protect our cash flows against unfavorable movements in exchange rates, to the extent of the amount under contract. We do not attempt to hedge foreign currency exposure in a manner that would entirely eliminate the effect of changes in foreign currency exchange rates on net income and cash flow. We do not speculate in foreign currency nor do we hedge the foreign currency translation of our international businesses to the U.S. dollar for purposes of consolidating our financial results or other foreign currency net asset or liability positions. The counter-parties to our forward contracts are financial institutions with investment grade credit ratings.
Effective October 11, 2005, we entered into a $289 cross-currency and interest rate swap agreement structured for a non-U.S. subsidiary’s $290 U.S. dollar denominated term loan. The swap is a three-year agreement designed to offset balance sheet and interest rate exposures and cash flow variability associated with exchange rate fluctuations on the term loan. The Euro to U.S. dollar exchange rate under the swap agreement is 1.2038. We pay a variable rate equal to the Euro LIBOR plus 271 basis points. We receive a variable rate equal to the U.S. Dollar LIBOR plus 250 basis points. The amount we receive under this agreement is equal to our non-U.S. subsidiary’s interest rate on its $290 term loan.
Our foreign exchange risk is also mitigated because we operate in many foreign countries, reducing the concentration of risk in any one currency. In addition, our foreign operations have limited imports and exports, reducing the potential impact of foreign currency exchange rate fluctuations. With other factors being equal, such as the performance of individual foreign economies, an average 10% foreign exchange increase or decrease in any one country would not materially impact our operating results or cash flow. However, an average 10% foreign exchange increase or decrease in all countries may materially impact our operating results.
As required by current accounting standards, our audited Consolidated Statements of Operations includes any gains and losses arising from forward and option contracts.
The following table summarizes forward currency, option and commodity contracts outstanding as of December 31, 2005 and 2004. Fair values are determined from quoted market prices at these dates.
| 2005 | 2004 | |||||||||||||||||
Average Days To Maturity | Average Contract Rate | Notional Amount | Fair Value Gain (Loss) | Average Days To Maturity | Average Contract Rate | Notional Amount | Fair Value Gain (Loss) | |||||||||||
Currency to sell for Euros | ||||||||||||||||||
U.S. Dollars(1) | 27 | 1.1890 | 45 | — | — | — | — | — | ||||||||||
U.S. Dollars(1) | 990 | 1.2038 | 289 | 5 | — | — | — | — | ||||||||||
British Pound(1) | 90 | 0.6987 | 41 | (1 | ) | — | — | — | — | |||||||||
U.S. Dollars(1) | 60 | 1.2122 | 3 | — | — | — | — | — | ||||||||||
U.S. Dollars(2) | 122 | 1.2031 | 24 | — | — | — | — | — | ||||||||||
U.S. Dollars(2) | — | — | — | — | 90 | 1.3430 | 235 | 2 | ||||||||||
Currency to sell for U.S. Dollars | ||||||||||||||||||
Canadian Dollars(3) | — | — | — | — | 183 | 1.3200 | 36 | — | ||||||||||
Canadian Dollars(4) | — | — | — | — | 183 | 1.2300 | 36 | (2 | ) | |||||||||
Currency to sell for CDN Dollars | ||||||||||||||||||
British Pound(1) | — | — | — | — | 31 | 2.3255 | 42 | 1 | ||||||||||
Commodity Future Contracts | ||||||||||||||||||
Natural gas futures | — | — | 3 | 1 | — | — | 3 | — | ||||||||||
83
Table of Contents
| (1) | Forward contracts |
| (2) | Deal contingent forward contracts (for pending and completed acquisitions) |
| (3) | Put options purchased |
| (4) | Call options sold |
Interest Rate Risk. We have used interest rate swaps to minimize our interest rate exposures between fixed and floating rates on long-term debt. We do not enter into speculative financial contracts of any type. The fair values of the swaps are determined using estimated market values. Under interest rate swaps, we agree with other parties to exchange at specified intervals the difference between the fixed rate and floating rate interest amounts calculated by reference to the agreed notional principal amount.
Certain of our indebtedness, including indebtedness under our floating rate notes and borrowings under our new senior secured credit facilities, are or will be at variable rates of interest and expose us to interest rate risk. If interest rates increase, our debt service obligations on the variable rate indebtedness would increase even though the amount borrowed remained the same. Assuming the amount of variable indebtedness remains the same after giving pro forma effect to the Hexion Refinancings and the offering, an increase of 1% in the interest rates payable on our variable rate indebtedness would increase our fiscal 2006 estimated debt service requirements by approximately $9 million. See “Risk Factors—Risks Relating to Our Business—Our variable-rate indebtedness subjects us to interest rate risk, which could cause our annual debt service obligations to increase significantly.”
On May 10, 2006, we entered into a $1 billion interest rate swap agreement. The swap is a three-year agreement designed to offset cash flow variability associated with interest rate fluctuations on our variable rate debt. The initial notional amount of the swap is $1 billion, which amortizes on a quarterly basis based on expected payments on our term loan in order to maintain a fixed to variable debt ratio of approximately 70% fixed to 30% variable.
Following is a summary of our outstanding debt as of December 31, 2005 and 2004 (See Note 8 to the audited Consolidated Financial Statements for additional information on our debt). The fair value of our publicly held debt is based on the price at which the bonds are traded or quoted at December 31, 2005 and 2004. All other debt fair values are determined from quoted market interest rates at December 31, 2005 and 2004.
| 2005 | 2004 | |||||||||||||||||
Year | Debt | Weighted Interest | Fair Value | Debt | Weighted Interest Rate | Fair Value | ||||||||||||
2005 | $ | 17 | 9.1 | % | $ | 17 | ||||||||||||
2006 | $ | 51 | 9.1 | % | $ | 51 | 4 | 9.1 | % | 4 | ||||||||
2007 | 15 | 9.2 | % | 15 | 4 | 9.1 | % | 4 | ||||||||||
2008 | 18 | 9.2 | % | 18 | 5 | 9.1 | % | 5 | ||||||||||
2009 | 181 | 9.2 | % | 189 | 175 | 9.1 | % | 187 | ||||||||||
2010 | 845 | 9.3 | % | 870 | 801 | 9.9 | % | 851 | ||||||||||
2011 and beyond | 1,244 | 8.0 | % | 1,176 | 844 | 8.5 | % | 832 | ||||||||||
| $ | 2,354 | $ | 2,319 | $ | 1,850 | $ | 1,900 | |||||||||||
We do not use derivative financial instruments in our investment portfolios. We place any cash equivalent investments in instruments that meet the credit quality standards established within our investment policies, which also limit the exposure to any one issue. At December 31, 2005 and 2004, we had $29 and $72, respectively, invested at average rates of 7% and 2%, respectively, primarily in a prime money market account and marketable securities with maturity periods of 30 days or less. Due to the short maturity of our cash equivalents, the carrying value on these investments approximates fair value and our interest rate risk is not significant. A 10% increase or decrease in interest returns on invested cash would not have a material effect on our net income and cash flows at December 31, 2005 and 2004.
84
Table of Contents
Commodity Risk. We are exposed to price risks associated with raw material purchases, most significantly with phenol, methanol, urea, acetone, propylene and chlorine. For our commodity raw materials, we have purchase contracts, with periodic price adjustment provisions. Commitments with certain suppliers, including our phenol and urea suppliers, provide up to 100% of our estimated requirements but also provide the flexibility to purchase a certain percentage of our needs in the spot market, when favorable to us. We rely on long-term agreements with key suppliers for most of our raw materials. The loss of a key source of supply or a delay in shipments could have an adverse effect on business. Should any of our suppliers fail to deliver or should any of the key long-term supply contracts be cancelled, we would be forced to purchase raw materials in the open market, and no assurances can be given that we would be able to make these purchases or make them at prices that would allow us to remain competitive. One supplier provides over 10% of certain raw material purchases, and we could incur significant time and expense if we had to replace the supplier. In addition, several of the feedstocks at various facilities are transported through a pipeline from one supplier. If we were unable to receive these feedstocks through these pipeline arrangements, we may not be able to obtain them from other suppliers at competitive prices or in a timely manner. See “Risk Factors—Risks Relating to Our Business—We rely significantly on raw materials in the production of our products and fluctuations in costs would increase our operating expenses.”
Natural gas is essential in our manufacturing processes, and its cost can vary widely and unpredictably. In order to control our costs for natural gas, we hedge a portion of our natural gas purchases for North America by entering into futures contracts for natural gas. The contracts are settled for cash each month based on the closing market price on the last day the contract trades on the New York Mercantile Exchange. We recognize gains and losses on commodity futures contracts each month as gas is used. Our future commitments are marked to market on a quarterly basis. Our board of directors approves all commodity futures contracts that we enter based on delegations of authority.
Our commodity risk also is moderated through our selected use of customer contracts with selling price provisions that are indexed to publicly available indices for these commodity raw materials.
Other Matters. Our operations are subject to the usual hazards associated with chemical manufacturing and the related storage and transportation of feedstocks, products and wastes, including, but not limited to, combustion, inclement weather and natural disasters, mechanical failure, unscheduled downtime, transportation interruptions, chemical spills, discharges or releases of toxic or hazardous substances or gases and other environmental risks. These potential hazards could cause personal injury or loss of life, severe damage to or destruction of property and equipment and environmental damage and could result in suspension of our operations and the imposition of civil or criminal penalties. We have significant operational management systems, preventive procedures and protective safeguards to minimize the risk of an incident and to ensure the safe continuous operation of our facilities. In addition, we maintain property, business interruption and casualty insurance that we believe is in accordance with customary industry practices, but we are not fully insured against all potential hazards incidental to our business.
Due to the nature of our business and the current litigious climate, product liability litigation, including class action lawsuits claiming liability for death, injury or property damage caused by our products, or by other manufacturers’ products that include our components, is inherent to our business but historically has been immaterial. However, our current product liability claims, and any future lawsuits, could result in damage awards against us, which in turn could encourage additional litigation.
Critical Accounting Policies and Estimates
In preparing our financial statements in conformity with US GAAP, we have to make estimates and assumptions about future events that affect the amounts of reported assets, liabilities, revenues and expenses, as well as the disclosure of contingent assets and liabilities in the financial statements and accompanying notes. Some of these accounting policies require the application of significant judgment by management in the selection
85
Table of Contents
of appropriate assumptions for determining these estimates. By their nature, these judgments are subject to an inherent degree of uncertainty; therefore, we cannot assure you that actual results will not differ significantly from estimated results. We base these judgments on our historical experience, advice from experienced consultants, forecasts and other available information, as appropriate. Our significant accounting policies are more fully described in Note 2 to the audited Consolidated Financial Statements.
Our most critical accounting policies, which reflect significant management estimates and judgment in determining reported amounts in the audited Consolidated Financial Statements, are as follows:
Environmental Remediation and Restoration Liabilities. Accruals for environmental matters are recorded when we believe it is probable that a liability has been incurred and we can reasonably estimate the amount of the liability. Our accruals are established following the guidelines of Statement of Position 96-1,“EnvironmentalRemediation Liabilities.” We have accrued approximately $39, $41 and $37 at December 31, 2005 and 2004 and March 31, 2006, respectively, for all probable environmental remediation and restoration liabilities, which is our best estimate of these liabilities. Based on currently available information and analysis, we believe that it is reasonably possible that the costs associated with such liabilities may fall within a range of $26 to $75. This estimate of the range of reasonably possible costs is less certain than the estimates upon which reserves are based, and in order to establish the upper limit of this range, we used assumptions that are less favorable to Hexion among the range of reasonably possible outcomes, but we did not assume we would bear full responsibility for all sites, to the exclusion of other potentially responsible parties.
We have entered into environmental indemnification agreements with each of the sellers in the Bakelite Transaction, Resolution Performance Transaction, Resolution Specialty Transaction and the Rhodia Acquisition. Under the terms of the Rhodia Acquisition agreement, the seller will generally indemnify us for environmental conditions that occurred or existed before the closing date of the acquisition, subject to certain limitations. Under the Bakelite environmental indemnification agreement, the sellers have agreed to indemnify us for certain pre-existing environmental liabilities, including those related to our facility in Duisburg, Germany.
For environmental conditions that existed prior to the Resolution Performance Transaction, environmental remediation liability is influenced by agreements associated with the transactions whereby Shell generally will indemnify us for environmental damages associated with environmental conditions that occurred or existed before the closing date of the acquisition, subject to certain limitations. In addition, for incidents occurring after the closing date of the acquisition, management believes that we maintain adequate insurance coverage, subject to deductibles, for environmental remediation activities.
According to the terms of the Resolution Specialty Transaction, Eastman retained the liability and indemnified Resolution Specialty for pre-existing unknown environmental conditions at facilities that were transferred to us as well as the pre-existing known environmental conditions at the Roebuck, South Carolina facility, subject to certain limitations.
Income Tax Assets and Liabilities. At December 31, 2005 and 2004 and March 31, 2006, we had valuation allowances against all of our net U.S. federal and state and some of our net foreign deferred income tax assets. The valuation allowance was calculated in accordance with U.S. GAAP which requires an assessment of both negative and positive evidence when measuring the need for a valuation allowance. In accordance with SFAS 109, evidence, such as operating results during the most recent three-year period, is given more weight than our expectations of future profitability, which are inherently uncertain. Our losses in the U.S. and certain foreign operations in recent periods represented sufficient negative evidence to require a full valuation allowance against our net federal, state and certain of our net foreign deferred income tax assets. We intend to maintain a valuation allowance against our net deferred income tax assets until sufficient positive evidence exists to support the realization of such assets.
The calculation of our income tax liabilities involves dealing with uncertainties in the application of complex domestic and foreign income tax regulations. We recognize liabilities for anticipated income tax audit
86
Table of Contents
issues based on our estimate of whether, and the extent to which, additional income taxes will be due. If we ultimately determine that payment of these amounts is not necessary, we reverse the liability and recognize an income tax benefit during the period in which we determine that the liability is no longer necessary. We also recognize income tax benefits to the extent that it is probable that our positions will be sustained when challenged by the respective taxing authorities. To the extent we prevail in matters for which liabilities have been established, or are required to pay amounts in excess of our liabilities, our effective income tax rate in a given period could be materially impacted. An unfavorable income tax settlement would require use of the Company’s cash and result in an increase in our effective income tax rate in the year of resolution. A favorable income tax settlement would be recognized as a reduction in the effective income tax rate in the year of resolution.
Pension Assets and Liabilities. The amounts recognized in our financial statements related to pension benefit obligations are determined from actuarial valuations. Inherent in these valuations are certain assumptions, the more significant of which include:
| • | The weighted average rate to use for discounting the liability (5.0% for 2005 and 5.4% for 2004); |
| • | The weighted average expected long-term rate of return on pension plan assets (8.2% for 2005 and 2004); |
| • | The weighted average rate of future salary increases (3.6% for 2005 and 4.1% for 2004); and |
| • | The anticipated mortality rate table (used RP 2000 Table). |
The following table presents the sensitivity of our projected pension benefit obligation (“PBO”), accumulated benefit obligation (“ABO”), shareholder’s deficit and 2006 expense to the indicated increase/decrease in key assumptions:
| Change | +/– Change at December 31, 2005 | |||||||||||||
| PBO | ABO | Deficit | 2006 Expense | |||||||||||
Assumption: | ||||||||||||||
Discount rate | +/– 0.5% | $ | 26 | $ | 23 | $ | 16 | $ | 2 | |||||
Estimated return on assets | +/– 1.0% | N/A | N/A | N/A | $ | 3 | ||||||||
The actual return of our pension plan assets in 2005 was approximately 10%. Future returns on plan assets are subject to the strength of the financial markets, which we cannot predict with any accuracy. These assumptions are regularly reviewed and revised when appropriate, and changes in one or more of them could affect the amount of our recorded net expenses and/or liabilities related to these pension obligations. Other assumptions involving demographic factors such as mortality, retirement age and turnover are also evaluated periodically and updated to reflect our experience and expectations for the future. Actual results that differ from our assumptions are accumulated and amortized over future periods; therefore, these variances affect our expenses and obligations recorded in future periods. Future pension expense and required contributions will also depend on future investment performance, changes in future discount rates and various other factors related to the demographic characteristics of participants in our pension plans.
Long-Lived Assets and Depreciation and Amortization. With respect to long-lived assets, key assumptions include the estimate of useful lives and the recoverability of carrying values of fixed assets, and other intangible assets. The recovery of assets to be held and used is measured by a comparison of the carrying amount of an asset to future undiscounted net cash flows expected to be generated by the asset, which is subject to considerable judgment. If the useful lives of the assets were found to be shorter than originally estimated, depreciation and amortization charges would be accelerated.
Impairment of Long-Lived Assets. As events warrant, the Company evaluates the recoverability of long-lived assets by assessing whether the carrying value can be recovered over their remaining useful lives through the expected future undiscounted operating cash flows of the underlying business. Any impairment loss required is determined by comparing the carrying value of the assets to operating cash flows on a discounted basis.
87
Table of Contents
Recently Issued Accounting Standards
In November 2004, the Financial Accounting Standards Board (“FASB”) issued Statement of Financial Accounting Standards (“SFAS”) No. 151,Inventory Costs. The statement amends Accounting Research Bulletin (“ARB”) No. 43,Inventory Pricing, to clarify the accounting for abnormal amounts of idle facility expense, freight, handling costs and wasted material. ARB No. 43 previously stated that these costs must be “so abnormal as to require treatment as current-period charges.” SFAS No. 151 requires that those items be recognized as current-period charges regardless of whether they meet the criterion of “so abnormal.” In addition, this statement requires that allocation of fixed production overhead to the costs of conversion be based on the normal capacity of the production facilities. The statement is effective for inventory costs incurred during fiscal years beginning after June 15, 2005. The Company believes that implementing SFAS No. 151 should not have a material impact on its consolidated financial position, results of operations or cash flows.
In March 2005, the FASB issued Interpretation No. 47,Accounting for Conditional Asset Retirement Obligations, an interpretation of FASB Statement No. 143. This Interpretation clarifies that the term “conditional asset retirement obligation” as used in FASB No. 143,Accounting for Asset Retirement Obligations, refers to a legal obligation to perform an asset retirement activity in which the timing and (or) method of settlement are conditional on a future event that may or may not be within the control of the entity. Accordingly, an entity is required to recognize a liability for the fair value of a conditional asset retirement obligation, when incurred, if the fair value of the liability can be reasonably estimated. The Interpretation is effective for the Company no later
than the end of the fiscal year ending on December 31, 2005. The implementation of this Interpretation did not have a material effect on the Company’s consolidated financial position, results of operations or cash flows.
In September 2005, the FASB issued EITF Issue No. 04-13,Accounting for Purchases and Sales of Inventory with the Same Counterparty (“EITF 04-13”). The issue provided guidance on the circumstances under which two or more inventory transactions with the same counterparty should be viewed as a single nonmonetary transaction within the scope of APB Opinion No. 29,Accounting for Nonmonetary Transactions. The issue also provided guidance on circumstances under which nonmonetary exchanges of inventory within the same line of business should be recognized at fair value. EITF 04-13 will be effective for transactions completed in reporting periods beginning after March 15, 2006. The Company is evaluating the impact that this issue will have on our consolidated financial statements.
In November 2005, the FASB issued FSP FAS 123(R)-3,Transition Election Related to Accounting for the Tax Effects of Share-Based Payment Awards (“FSP 123(R)-3”). FSP 123(R)-3 provides an elective alternative method that establishes a computational component to arrive at the beginning balance of the accumulated paid-in capital pool related to employee compensation and a simplified method to determine the subsequent impact on the accumulated paid-in capital pool of employee awards that are fully vested and outstanding upon the adoption of SFAS No. 123(R). The implementation of this FSP has no material effect on our consolidated financial statements.
88
Table of Contents
Overview
We are the world’s largest producer of thermosetting resins, or thermosets. Thermosets are a critical ingredient for virtually all paints, coatings, glues and other adhesives produced for consumer or industrial uses. We are focused on providing a broad array of thermosets and associated technologies, with leading market positions in all key markets served. Our breadth of related products provides us with significant advantages across our operations, technologies and commercial organizations, while our scale provides us with significant efficiencies in our fixed and variable cost structure, allowing us to compete effectively throughout the value chain with a lower cost operating structure and security of supply. In areas where it is advantageous, we are able to internally produce strategic raw materials, providing us with a lower cost operating structure and security of supply. Our value-added, technical service-oriented business model enables us to effectively participate in high-end specialty markets, while our scale enables us to extract value from higher volume applications.
Thermosets are developed to meet the performance characteristics required for each specific end use product. The type of thermoset used and how it is formulated, applied and cured determines the key attributes, such as durability, gloss, heat resistance, adhesion or strength of the final product. Hexion has the broadest range of thermoset resin technologies, with world class research, applications development and technical service capabilities. Our thermosets are sold under a variety of well-recognized brand names including BORDEN® (phenolic and amino resins), EPIKOTE® (epoxy resins), EPIKURE® (epoxy curatives), BAKELITE (phenolic and epoxy resins), LAWTER™ (inks) and CARDURA® (high-end automotive coatings). The total global thermoset resins market is approximately $34 billion in annual sales and includes products such as polyurethanes, urea-formaldehyde, phenol-formaldehyde, unsaturated polyesters, epoxies and melamine-formaldehyde. The key product areas of the global thermoset resins market upon which we focus and in which we have leading market positions is approximately $19 billion in annual sales, which excludes polyurethanes, unsaturated polyesters and furans/other.
Our products are used in thousands of applications and are sold into diverse markets, such as forest products, architectural and industrial paints, packaging, consumer products and automotive coatings, as well as higher growth markets, such as composites, UV cured coatings and electrical laminates. We have a history of product innovation and success in introducing new products to new markets. Our product innovation is evidenced by more than 1,000 patents, a majority of which relate to the devolvement of new products and processes for manufacturing. More specifically, in 2003, we developed and began marketing XRT®, a patent pending family of proppants made for the oil field products end-market, which generated approximately $30 million in net sales in 2005. In 2004, we developed and began conducting customer trials with Archemis, a resin used to formulate quick-dry alkyd paint. We are currently developing a family of customized resins tailored for the high-end lamination market.
Our organizational structure is based on the products we offer and the markets we serve. During the fourth quarter of 2005, we changed our reportable segments to better reflect the stage of the transition from the previous organization of our pre-merger companies to our organizational structure during the latter half of 2005. The transition provides greater alignment with the respective operating divisions and reporting segments. At March 31, 2006, our organizational structure consists of four operating divisions that are directly aligned with our reportable segments: Epoxy and Phenolic Resins, Formaldehyde and Forest Products Resins, Coatings and Inks, and Performance Products. We began implementing additional refinements to our operating divisions in 2006 to more closely link similar products, minimize divisional boundaries and improve our ability to serve common customers from pre-merger legacy company relationships which may result in additional refinements to our reporting segments.
As of March 31, 2006, we had 94 production sites globally, and produce many of our key products locally in North America, Latin America, Europe and Asia. Through our worldwide network of strategically located production facilities, we serve more than 10,000 customers in over 100 countries. We believe our global
89
Table of Contents
scale provides us with significant advantages over many of our competitors. In areas where it is advantageous, we are able to internally produce strategic raw materials, providing us a lower cost operating structure and security of supply. In other areas, where we can capitalize on our technical know-how and market presence to capture additional value, we are integrated downstream into product formulations. Our position in certain additives, complementary materials and services further enables us to leverage our core thermoset technologies and provide customers a broad range of product solutions. As a result of our focus on innovation and the high level of technical service that results from our “Total Systems Approach,” we have cultivated long-standing customer relationships. Our global customers include leading companies in their respective industries, such as 3M, Ainsworth, Ashland Inc., BASF, Bayer, DuPont, GE, Halliburton, Honeywell, Huntsman, Louisiana-Pacific, Owens Corning, PPG Industries, Sumitomo, Sun Chemical, Valspar and Weyerhaeuser.
Hexion was formed on May 31, 2005 through the combination of Borden Chemical (including Bakelite), Resolution Performance and Resolution Specialty. We believe the consolidation of these entities will provide us with significant opportunities for growth through global product line management, as well as considerable opportunities to increase operational efficiencies, reduce fixed costs, optimize manufacturing assets and improve the efficiency of capital spending. In 2005 and for the three months ended March 31, 2006, on a pro forma basis, we generated pro forma net sales of $4.7 billion and $1.2 billion, respectively. In 2005, 58% of our pro forma net sales were derived from sales to North America, 32% to Western Europe and 10% to Asia-Pacific, Latin America, Eastern Europe and other emerging markets. As of March 31, 2006, after giving pro forma effect to the Hexion Refinancings and the offering, we would have had $2.7 billion principal amount of outstanding indebtedness and $0.1 billion of cash and equivalents.
Industry
The thermoset resins industry is an approximately $34 billion market in annual sales. Thermoset resins include materials such as phenolic resins, epoxy resins, polyester resins, acrylic resins, alkyd resins and urethane resins. Thermoset resins are used for a wide variety of applications due to their superior adhesion and bonding properties, as well as their heat resistance, protective and aesthetic characteristics, compared to other materials. The key product areas of the global thermoset resins market upon which we focus and in which we have leading market positions have an estimated $19 billion in annual sales. The thermoset resin market has grown at an estimated annual rate of over 4% by volume during the past five years. We expect that certain segments of the thermoset resin industry, including composites and UV resins, will grow at substantially faster rates.
Thermosets are sold into the global coatings, composites and adhesives markets, which have combined annual sales of over $100 billion. Thermoset resins are generally considered specialty chemical products because they are principally sold on the basis of performance, technical support, product innovation and customer service. Although the thermoset resins market has undergone consolidation in recent years, the thermoset resins market remains fragmented with many small and medium sized companies providing a relatively high level of customization and service to the end markets and with many small non-core divisions of large chemical conglomerates. The principal factors contributing to success in the specialty chemicals market are (1) consistent delivery of high-quality products, (2) favorable process economics, (3) the ability to provide value to customers through both product attributes and strong technical service and (4) a presence in large and growing markets. We believe Hexion is the third largest North American based specialty chemicals company.
90
Table of Contents
Competitive Strengths
We are one of the leading specialty chemical companies in the world based on the following competitive strengths:
World’s Largest Thermoset Resins Producer. We are the world’s largest producer of thermoset resins with leading positions across various end-markets and geographies. Our global scale and breadth of product line provide us with significant advantages over many of our competitors. The following table illustrates our market position by volume in our key product areas, which collectively represent more than 75% of our pro forma 2005 net sales:
Key Product | Market Position | |
Forest Products Resins | #1 Globally | |
Formaldehyde | #1 Globally | |
Phenolic Resins | #1 Globally | |
Epoxy Resins | #1 Globally | |
Foundry Resins | #1 in North America | |
Oil Field Resins | #2 Globally | |
Composite Resins (epoxy-based) | #1 in Europe, #2 in North America | |
Molding Compounds | #1 in Europe | |
Ink Resins | #1 Globally | |
Alkyd Resins | Co-leader in North America | |
Versatic Acids and Derivatives | #1 Globally |
Unique Selling Proposition. The majority of our customers require solutions that are tailored to their individual production needs and require a high degree of technical service and customized product formulations. Our diverse thermoset product offering allows us to leverage related technologies across geographies, customers and end-markets in order to provide a broad range of product and technical service solutions. As a result of our focus on developing innovative products with a high level of technical service and our “Total Systems Approach,” whereby we sell multiple components of a coating or adhesive resin system, we have cultivated stable, longstanding customer relationships. Our top ten customers have been using our products and services for an average of 24 years.
Global Infrastructure. We develop, manufacture and sell our products around the world. We believe our global scope and our ability to internally produce key raw materials give us an advantage compared with many of our smaller competitors. We believe that we are well positioned in higher growth regions and will continue to grow internationally by expanding our product sales to our multi-national customers and by entering new markets. We also have opportunities to increase sales of products by introducing them to new geographies; for example, we plan to introduce several resin products developed for the European market to our customer base in North America. We have a significant presence in the two fastest growing regions in the coating and adhesives industries, with 16 plants currently operating in Asia-Pacific and Latin America.
Low Cost Position. We support our leading global market presence with our strategically located, low cost manufacturing presence. Our low cost position is the result of our 94 production sites strategically located throughout the world and our selectively integrated supply position in critical intermediate materials. We consume large amounts of our internally produced formaldehyde, BPA and ECH, and our polyester and alkyd resins businesses share an integrated production platform with each other. Our ability to internally produce key raw materials provides us a significant cost advantage over our competitors, allowing us to eliminate certain finishing steps, reduce logistical costs, ensure reliable long-term supply of critical raw materials and improve our production scheduling and capacity utilization rates. Furthermore, our large market position and scale in each of our key product markets provides us with significant purchasing and manufacturing efficiencies. We are North America’s lowest cost producer of formaldehyde and formaldehyde-based resins. In addition, we operate two of the three largest epoxy resins manufacturing facilities in the world, including the world’s only continuous-flow manufacturing process facility.
91
Table of Contents
Well Positioned in Diverse End-Markets and Higher Growth Sectors. We have a diversified revenue and customer base in a variety of end-markets and geographies. Our products are used in a broad range of applications and are sold into stable markets such as those for forest products, architectural coatings, industrial coatings and automotive coatings, as well as higher growth markets such as composites, UV resins and electrical laminates. We have a strong position in products such as composites which benefit from favorable product substitution demand dynamics as they replace traditional materials (i.e., wood and metal) in aerospace, automotive, recreational and sporting goods applications. In addition, no single customer accounted for more than 3% of our total annual sales in 2005. Our pro forma net sales by end-market for 2005 are illustrated below:
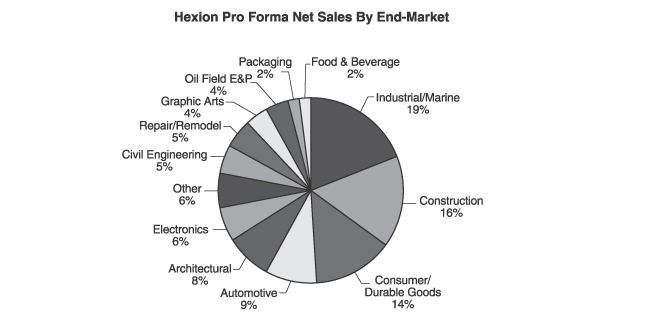
Strong Free Cash Flow.We expect to generate strong free cash flow (cash flow from operating activities less anticipated capital expenditures) due to our favorable operating characteristics and the nature of the industry in which we operate. This strength is due in large part to our size and position within the thermoset resins industry, and the industry leading cost structure we have in place. Our products are generally less capital intensive to manufacture than many other products in the chemical industry and, as a result, we have relatively low maintenance capital and working capital requirements. Furthermore, due to our tax assets and other structuring considerations, we expect to have very low cash tax requirements for the foreseeable future. Additionally, management is currently targeting $250 million in synergies from the Hexion Formation, of which $125 million of net cost savings have been specifically identified, which should further improve free cash flow. Our plan indicates that our $250 million synergy target will consist of approximately 40% in purchasing savings, 20% in manufacturing efficiencies, 15% in selling, general and administrative expense savings and 25% in new product development and global product line management. Management has developed detailed implementation plans to achieve the $125 million of cost savings. We achieved cost savings of $20 million in 2005 and $11 million in the first quarter of 2006. We expect that approximately 60% of the $125 million near term cost savings will be achieved by the end of 2006 with the remainder expected to be achieved in the following year. Through March 31, 2006, we have incurred one-time costs of approximately $13 million in connection with implementing these synergies and we expect to incur additional one-time costs of $62 million through 2007. We expect that all of these factors will enable us to generate strong free cash flow, which we anticipate will be available to reduce indebtedness or for other strategic purposes.
Strong Management Team. We believe that we have a world-class management team led by Craig O. Morrison, our President and Chief Executive Officer, and William H. Carter, our Chief Financial Officer. Our
92
Table of Contents
divisional management teams are composed of experienced managers from Borden Chemical, Resolution Performance, Resolution Specialty and Bakelite. Marvin O. Schlanger, former Chief Executive Officer of Arco Chemical and Resolution Performance, with over 30 years of chemical industry experience is our Vice Chairman. Our management team has demonstrated expertise in growing our businesses organically, integrating acquisitions and executing on significant cost cutting programs.
Strategy
We are focused on augmenting our growth, as well as increasing shareholder value, return on investment, cash flows and profitability. We believe we can achieve these related goals through the following strategies:
Utilize Our Integrated Platform Across Product Offerings.As the world’s largest producer of thermoset resins, we have an opportunity to provide our customers with a broad range of resins products on a global basis. We believe this provides us the opportunity to become a global, comprehensive solutions provider to our customers rather than simply offering a particular product, selling in a single geography or competing on price. We will also be able to offer a more diverse product line to all of our customers, utilizing the existing product lines of each of our acquired businesses. We believe we have substantial opportunities through global product line management to capitalize on these capabilities in order to increase our sales volumes and margins. Examples of the opportunity to utilize our integrated platform include:
| • | We produce many value-added, innovative products developed by Bakelite for the European market which we plan to introduce to our broader customer base. |
| • | We expect to expand the sales of our versatic acid coatings product line, which has historically been nearly exclusively a European product, into the Americas by utilizing Resolution Specialty’s existing coatings sales force. |
| • | We expect to capitalize on Borden Chemical’s strength in forest products resins by expanding such product offerings into Bakelite’s European markets, including Russia’s wood products market, the largest market in the world. |
| • | We are a leading resins supplier to many of the world’s largest coatings companies, allowing us to accelerate new and specialty product development for our customers, thereby further strengthening our relationships and enhancing our ability to retain and grow customers based on attributes other than price. |
Develop and Market New Products. We will continue to expand our product offerings through internal innovation, joint research and development initiatives with our customers and research partnership formations. In 2005, on a pro forma basis, we incurred approximately $67 million in research and development expenses, which represented approximately 1.4% of our pro forma net sales during that period. We will continue to implement a systematic approach to new product development and have identified promising new technologies that have begun to yield significant results. Examples of new products and product development initiatives include:
| • | In 2003, we developed and began marketing XRT®, a family of proppants made for the oil field products end-market, which generated approximately $30 million in net sales in 2005. |
| • | We have increased our investments in UV light-curable products for the display, ink jet and electronics products markets. |
| • | We have increased our investments in specialty epoxidized phenolic products for the electronics market. |
| • | We are developing a family of customized resins tailored for the high-end electrical lamination market. This family of products is expected to generate approximately $8 to $10 million in annual net sales by 2007. |
| • | In 2004, we developed and began conducting customer trials with Archemis, a resin used to formulate quick-dry alkyd paint. These coatings will be targeted for the contractors market where the quick dry properties allow two coats of paint to be applied in one work shift. It is expected to generate approximately $5 to $10 million in annual net sales by 2007. |
93
Table of Contents
Expand Our Global Reach In Faster Growing Regions. We will continue to grow internationally by expanding our product sales to our multi-national customers outside of North America and Western Europe, and by entering new international markets. Specifically, we are focused on growing our business in the Asia-Pacific, Eastern Europe and Latin American markets, where the usage of our products is increasing. Furthermore, by combining sales and distribution infrastructures, we expect to accelerate the penetration of our high-end, value-added products into new markets, thus further leveraging our research and applications efforts. Some examples of our increased presence in developing regions are as follows:
| • | Our twelve plants in Asia-Pacific represent most of our key product lines, give us a critical mass to serve those markets and provide a platform for continued expansion in that region. |
| • | We have significant operations in Eastern Europe and expect to leverage this footprint to increase our business in Russia and Eastern Europe. |
| • | We have expanded our Latin American presence as evidenced by the growth in Borden Chemical’s net sales of 34% from 2001 to 2004. We expect to continue growing in this region. |
Increase Margins Through Focus On Operational Excellence. We believe that through the combination of four standalone global resin companies, there will be opportunities to extract substantial cost savings in the near future. Management is currently targeting $250 million in synergies from the Hexion Formation, of which $125 million of net cost savings have been specifically identified. Management has developed detailed implementation plans to achieve the $125 million of cost savings. We achieved cost savings of $20 million in 2005 and $11 million in the first quarter of 2006. We expect that approximately 60% of the $125 million near term cost savings will be achieved by the end of 2006 with the remainder expected to be achieved in the following year. Through March 31, 2006, we have incurred one-time costs of approximately $13 million in connection with implementing these synergies and we expect to incur additional one-time costs of $62 million through 2007. Management has specifically identified a number of areas for savings and is actively pursuing key components of this strategy. Primary components are as follows:
| • | Manufacturing rationalization and optimization across the entire facility footprint. |
| • | Reduction of fixed cost structure through the elimination of overhead redundancies. |
| • | Raw material and other purchasing savings. |
| • | Streamlined logistics processes. |
| • | More efficient management of capital spending. |
| • | Rollout of Borden Chemical’s Six Sigma management approach, and other operational best practices, throughout the organization. |
In addition, each of our companies have significant experience in implementing cost reduction and working capital management programs, including ongoing programs at each of the companies.
Pursue Targeted Add-On Acquisitions and Joint Ventures. The global thermoset resin industry is highly fragmented and is comprised of numerous small and mid-sized specialty companies focusing on niche markets, as well as small non-core divisions of large chemical conglomerates. As the largest company focused primarily on the thermoset resins space, we have a significant advantage in pursuing add-on acquisitions and joint ventures in areas that allow us to build upon our core strengths, expand our product, technology and geographic portfolio, and better serve our customers. We believe we can consummate a number of these acquisitions at relatively low valuations due to the scalability of our existing global operations. Some examples of these opportunities include:
| • | We recently acquired the decorative coatings and adhesive business of The Rhodia Group and expect to close the Akzo Acquisition in the second quarter of 2006. |
| • | We are currently evaluating and pursuing several potential tuck-in acquisitions which, if consummated, should provide Hexion with product line extensions. We expect these acquisitions to be accretive in leveraging Hexion’s manufacturing footprint and existing corporate infrastructure. |
| • | We are also pursuing various joint ventures to expand our geographic footprint. |
94
Table of Contents
Our History
Business Realignment and Corporate Reorganization. We have undertaken numerous plant consolidations and other business realignment initiatives. These initiatives are designed to improve efficiency and to focus resources on our core strengths. The associated business realignment charges consist primarily of employee severance, plant consolidation and related environmental remediation costs and asset impairment expense. Following is a brief overview of our significant business realignment activities since 2001.
In 2001, Borden Chemical completed a significant capital restructuring to eliminate future required annual preferred dividend payments and recorded $126 million of business realignment and impairment charges related primarily to the closures of its melamine crystal business, which we refer to as Melamine, and two forest products plants in the United States, realignment of its workforce organization, reorganization of its corporate headquarters and the discontinuation of a plant construction project. The largest component of the 2001 charge is a $98 million impairment of Melamine fixed assets, goodwill and spare parts. This impairment was the result of Borden Chemical’s strategic decision late in 2001 to sell or close Melamine and to enter into a long-term contractual arrangement with a supplier for its future melamine crystal needs.
In June 2003, we initiated our 2003 realignment designed to reduce operating expenses and increase organizational efficiency. To achieve these goals, we reduced our workforce, streamlined processes, consolidated manufacturing processes and reduced general and administrative expenses.
On May 31, 2005, Borden Chemical combined with Resolution Performance and Resolution Specialty. Upon the consummation of the Combinations, Borden Chemical changed its name to Hexion Specialty Chemicals, Inc. and BHI Acquisition LLC, Borden Chemical’s parent, changed its name to Hexion LLC. Immediately upon completion of this offering, Apollo, through Hexion LLC, will hold approximately 70.9% of the outstanding common stock of Hexion.
We have begun and will continue to integrate the four predecessor companies including considering opportunities to consolidate our manufacturing plants, leverage our raw material purchasing power, cross-sell to our broader customer base and implement programs to continue to lower our operating and overhead expenses. We have also consolidated the management teams and centralized corporate functions of the four companies under the leadership of the current Hexion management team.
Acquisitions and Divestitures. We are a New Jersey corporation with predecessors dating back to 1899. The following is a summary of acquisitions and divestitures we made in the past five years.
In 2001, we merged our foundry resins and coatings businesses with similar businesses of Delta-HA, Inc., or Delta, to form HA-International, or HAI, in which, at the time of its formation, we had a 75% economic interest. The Limited Liability Agreement of HAI provides Delta the right to purchase between 3% and 5% (up to a maximum of 25%) of additional economic interest in HAI each year beginning in 2004. Pursuant to this provision, in 2004, Delta purchased an additional 5% interest, thereby reducing our economic interest to 70%. In March 2005, Delta purchased an additional 5% interest, which reduced our economic interest to 65%. In March 2006, Delta provided us with written notice of its intention to purchase an additional 5% interest in 2006.
Also in 2001, through a series of transactions with affiliates, Borden Chemical sold its Elmer’s consumer adhesives business for total proceeds of $94 million.
In the fourth quarter of 2003, we acquired Fentak in Australia and Malaysia, a producer of specialty chemical products for engineered wood, laminating and paper impregnation markets. We also acquired the business and technology assets of SEACO, a domestic producer of specialty adhesives. We undertook these tuck-in acquisitions to expand our existing product lines.
95
Table of Contents
On November 14, 2000, an affiliate of Apollo acquired control of Resolution Performance in a recapitalization transaction. Prior to the recapitalization, Resolution Performance was a wholly owned subsidiary of Shell. Resolution Performance is a worldwide manufacturer and developer of epoxy resins and also a leading global manufacturer of versatic acids and derivatives.
On August 2, 2004, Resolution Specialty, an affiliate of Apollo, acquired the resins, inks and monomers division of Eastman. Resolution Specialty is a producer of coating resins, inks, composite polymers, textile chemicals and acrylic monomers with facilities in the U.S., Europe and China.
On August 12, 2004, an affiliate of Apollo acquired all of the outstanding capital stock of Borden Chemical, Inc. On April 29, 2005, Borden Chemical acquired Bakelite. Bakelite is a leading European producer of thermosets, with headquarters in Germany and significant production facilities in Germany, Italy and Spain. Bakelite was Europe’s largest producer of phenolic resins, the largest formulator of epoxy composite resins and one of the world’s largest producers of molding compounds.
On January 31, 2006, Hexion acquired the decorative coatings and adhesives business unit of The Rhodia Group. The business generated 2005 sales of approximately $200 million, with 8 manufacturing facilities in Europe, Australia and Thailand. The acquisition was funded through a combination of available cash and existing credit lines.
On March 1, 2006, we acquired the global wax compounds business of Rohm and Haas. The business generated 2005 sales of approximately $10 million. The purchase included Rohm and Haas’ wax compounds technology and product lines, manufacturing equipment and other business assets. The acquisition was funded through available cash.
On March 31, 2006, we sold Alba Adesivos, a consumer adhesives company based in Boituva, Brazil, to the Henkel Group. Alba Adesivos is a producer of branded consumer and professional grade adhesives. The company generated 2005 sales of $38 million and has approximately 140 employees. The purchase price was paid in cash.
Products and Market Applications
The thermosets produced in each of our operating divisions and segments are used in two primary applications: adhesive & structural and coating. Within each primary application we operate in a diverse range of specialty chemical applications. Our primary products serving adhesive & structural applications include forest products resins, specialty phenolic resins, formaldehyde, epoxy resins, composite resins, phenolic encapsulated substrates and molding compounds. Our primary products serving coating applications include epoxy resins, polyester resins, alkyd resins, acrylic resins, ink resins and versatic acids and derivatives.
96
Table of Contents
Adhesive & Structural Products and Market Applications
Formaldehyde Based Resins and Intermediates
We are the leading producer of formaldehyde based resins for the forest products industry in North America with a 44% market share by volume and also hold significant positions in Europe, Latin America and Australia. Our products are used in a wide range of applications in the construction, automotive, electronics and steel industries. We are also the world’s largest producer of specialty phenolic resins, which are used in applications that require extreme heat resistance and strength, such as automotive brake pads, foundry materials and oil field applications. In addition, we are the world’s largest producer of formaldehyde, a key building block chemical used in the manufacture of thousands of products. We internally consume the majority of our formaldehyde production, giving us a significant competitive advantage versus our non-integrated competitors.
Products | Key Applications | |
Forest Products Resins | ||
Engineered Wood Resins | Softwood and hardwood plywood, OSB, laminated veneer lumber, strand lumber and wood fiber resins such as particleboard, medium density fiberboard and finished veneer lumber | |
Special Wood Adhesives | Laminated beams, structural and nonstructural fingerjoints, wood composite I-beams, cabinets, doors, windows, furniture, mold and millwork and paper laminations | |
Wax Emulsions | Impacts moisture resistance for panel boards | |
Specialty Phenolic Resins | ||
Composites and Electronic Resins | Aircraft components, brakes, ballistic applications, industrial grating, pipe, jet engine components, electrical laminates, computer chip encasement and photolithography | |
Automotive PF Resins | Acoustical insulation, engine filters, friction materials, interior components, molded electrical parts and assemblies | |
| Construction PF Resins, UF Resins, Ketone Formaldehyde and Melamine Colloid | Decorative laminates, fiberglass insulation, floral foam, lamp cement for light bulbs, molded appliance and electrical parts, molding compounds, sandpaper, fiberglass mat, laminates, coatings, crosslinker for thermoplastic emulsions and specialty wet strength paper | |
Formaldehyde Applications | ||
Formaldehyde | Herbicides and fungicides, fabric softeners, sulphur scavengers for oil and gas production, urea formaldehyde, melamine formaldehyde, phenol formaldehyde, MDI and other catalysts | |
97
Table of Contents
Epoxy Resins and Intermediates
We are the world’s largest supplier of epoxy resins. Epoxy resins comprise the fundamental building blocks of many types of materials, such as formulated composite resins and structural adhesives. Epoxy resins are often used in the auto, aerospace and electronics industries due to their unparalleled strength and durability. We also provide the industry with a variety of complementary products such as epoxy modifiers, curing agents, reactive diluents and specialty liquids. We are also a major producer of bisphenol-A (BPA) and epichlorohydrin (ECH), key precursors in the manufacture of epoxy resins. We internally consume the majority of our BPA and virtually all of our ECH, giving us a significant competitive advantage versus our non-integrated competitors.
Products | Key Applications | |
Composites | Automotive (structural interior), sports (ski, snowboard), boat construction, aerospace, wind energy and industrial applications | |
Civil Engineering | Bridge and canal construction, concrete enhancement and corrosion protection | |
Electrical Casting | Generators and bushings, transformers, medium- and high-voltage switch gear components, post insulators, capacitors and automotive ignition coils | |
Adhesives | Automotive: hem flange adhesives and panel reinforcement in car components | |
| Construction: ceramic tiles, chemical dowels and marble | ||
| Aerospace: metal and composite laminates | ||
| Electronics: chip adhesives, solder masks and electronic inks | ||
Electrical Laminates | Industrial laminates: unclad sheets, tube and molding, impregnation of paper, cotton and glass filament and printed circuit boards | |
Composite Resins
We are a leading producer of resins used in composites. Composites are a fast growing class of materials which are used in a wide variety of applications ranging from airframes and windmill blades to golf clubs. We supply epoxy resins to fabricators in the aerospace, sporting goods and pipe markets with a 50% market share in the United States and a 44% market share in Europe. Our leadership position in epoxy resins, along with our technology and service expertise, enables us to selectively forward integrate into custom formulations for specialty composites, such as turbine blades used in the wind energy market. In addition to epoxy, we manufacture resins from unsaturated polyester (UPR), which are generally combined with fiberglass to produce cost-effective finished structural parts for applications ranging from boat hulls to recreational vehicles to bathroom fixtures.
Products | Key Applications | |
| Reinforced-Epoxy unsaturated polyester and vinyl ester resins | Marine, transportation, construction, consumer products, recreational vehicles, spas, bath and shower surrounds | |
| Non-reinforced-unsaturated polyester and vinyl ester resins | Cultured marble, construction, gel coat and surface coating and automotive putty | |
98
Table of Contents
Phenolic Encapsulated Substrates
We are a leading producer of phenolic encapsulated sand and ceramic substrates used in oil field services and foundry applications. Our highly specialized compounds are designed to perform under extreme conditions, such as intense heat, high-stress and corrosive environments, that characterize the oil and gas drilling and foundry industries. In the oil field services industry we have a 45% global market share in resin encapsulated proppants, which are used to enhance oil and gas recovery rates and extend well life. We are also the leading producer by volume of foundry resins in North America with a 48% market share. Our foundry resin systems are used by major automotive and industrial companies for precision casting of engine blocks, transmissions, brake and drive train components. In addition to encapsulated substrates, our foundry resins business provides phenolic resin systems and ancillary products used to produce finished metal castings.
Products | Key Applications | |
Oil Field Service Applications | ||
XRT® Resin Systems | Patent pending resin technology for extreme flowback and fracture conductivity conditions for ceramics, bauxite and premium sands | |
| Curable Resin-Coated Sand, ACFRAC® SB Excel, Black Plus CR 4000 | Systems that increase strength and control proppant flowback on medium grade sand systems | |
Precured Resin-Coated Sand PR 6000 | System to gently enhance crush resistance and high flow capacities with all grades of sand proppants | |
Foundry Applications | ||
Refractory Coatings | General purpose products for ferrous and nonferrous applications | |
| RESINS-SIGMACURE®, SIGMASET®, SUPER SET®, ALpHASET®, BETASET® and PLASTIFLAKE® | A comprehensive selection of synthetic resins for bonding sand cores and molds in a variety of applications including phenolic urethane cold box resins, phenolic urethane nobake resins, furan and phenolic acid curing resins, ester cured phenolic nobake resins, methyl formate cured phenolic cold box resins and phenolic resins for shell process | |
Molding Compounds
We are the leading producer of molding compounds in Europe, with an estimated market share of 64%. We formulate and produce a wide range of phenolic, polyester and epoxy compounds used to manufacture components requiring heat stability, electrical insulation, fire resistance and durability. Applications range from automotive underhood components to appliance knobs and cookware handles.
Products | Key Applications | |
Phenolic, Epoxy, Vinylester | Automotive ashtrays and under hood components, heat resistant knobs and bases, switches and breaker components and pot handles | |
Long Fiber Reinforced MC | High load, dimensionally stable automotive underhood parts and commutators | |
PBT, PET, PC, PC-ABS, PA6 and PA66 | Connectors, switches, bobbins, wheel covers, power tool internal components and bodies | |
99
Table of Contents
Coating Products and Market Applications
Epoxy Coating Resins
In addition to the adhesive uses mentioned previously, epoxy resins are used for a variety of high-end coating applications which require the superior strength and durability of epoxy. Examples include protective coating for industrial and domestic flooring, pipe, marine and construction applications, powder coatings and automotive coatings. Where advantageous, we leverage our resin and additives position to supply custom resins for specialty coatings formulators.
Products | Key Applications | |
Electrocoat (LER, SER, BPA) | Automotive, general industry (heating radiators), white goods | |
Powder Coatings (SER, Performance Products) | White goods (appliances), pipes (oil and gas transportation), general industry (heating radiators, all types of metal objects) and automotive (interior parts and small components) | |
Heat Cured Coatings (LER, SER) | Metal packaging, coil coated steel for construction and general industry | |
| Floor Coatings (LER, Solutions, Performance Products) | Chemically resistant, antistatic and heavy duty flooring in hospitals, chemical industry, electronics workshops, retail areas and warehouses | |
| Ambient Cured Coatings (LER, SER, Solutions, Performance Products) | Marine (new build and maintenance), shipping containers and large steel structures (bridges, pipes, plants and offshore equipment) | |
Waterborne Coatings | Replacing solvent-borne products in both heat cured and ambient cured applications | |
Polyester Resins
We are a leading supplier of polyester coatings resins in North America with a market share of 10% and are also a major producer in Europe with a powder coatings market share of 10%. We provide custom polyester resins, both liquid and powder, to customers for use in industrial coatings requiring specific properties such as gloss and color retention, resistance to corrosion and flexibility. Polyester coatings are typically used in transportation, automotive, machinery, appliances and metal office furniture. Our polyester resins business shares an integrated production platform with our alkyd business, which allows for flexible sourcing, plant balancing and economies of scale.
Products | Key Applications | |
Powder Polyesters | Outdoor durable systems for architectural window frames, facades and transport; indoor systems for domestic appliances and general industrial applications | |
Liquid Polyesters and polyester dispersions | Automotive, coil and exterior can coating applications | |
100
Table of Contents
Alkyd Resins
We share the leading position in alkyd resins in North America with a market share of 31% and are a major producer in Europe, specifically in Scandinavia and Italy. We provide alkyd resins to customers for use in the manufacture of professional grade paints and coatings. Alkyd resins are formulated and engineered according to customer specifications, and can be modified with other raw materials to improve performance. Applications include industrial coatings (e.g., protective coatings used on machinery, metal coil, equipment, tools and furniture), special purpose coatings (e.g., highway-striping paints, automotive refinish coatings and industrial maintenance coatings) and decorative paints (e.g., house paint and deck stains). Our alkyd resins business shares an integrated production platform with our polyester resins business, which allows for flexible sourcing, plant balancing and economies of scale.
Products | Key Applications | |
Alkyd and Alkyd Emulsions | Architectural Markets: Exterior enamels, interior semi-gloss and trim, interior/exterior stains and wood primers | |
| Industrial Markets: Metal primers, general metal, transportation, machinery and equipment, industrial maintenance and marine, metal container and wood furniture | ||
Alkyd Copolymer | Architectural Markets: Stain blocking primer, sanding sealers and aerosol | |
| Industrial Markets: Machinery and equipment, transportation, general metal and drywall coating | ||
Urethane Modified | Architectural Markets: Clear varnishes (DIY) and floor coatings | |
| Industrial Markets: Wood coatings | ||
Silicone Alkyd | Industrial Markets: Industrial maintenance and marine and heat resistance coatings | |
Acrylic Resins
We are a supplier of acrylic resins (solvent and water-based) in North America and Europe. Acrylic resins are used for interior trim paints and exterior applications where weathering protection, color and gloss retention are critical. In addition, we produce a wide range of specialty acrylic resins for marine and maintenance paints and automotive topcoats. We are also a low cost producer of acrylic monomer, the key raw material for our acrylic resins. This ability to internally produce key raw materials gives us a competitive cost advantage relative to our competitors and ensures adequacy of supply.
Products | Key Applications | |
Acrylic Dispersions | Architectural Markets: Interior semi-gloss & high gloss, interior and exterior paints, stains and sealers, drywall primer, masonry coatings and general purpose | |
| Industrial Markets: Automotive OEM, packaging, general metal, wood, plastic coatings, traffic marking paint, industrial maintenance and transportation, adhesives and textiles | ||
Solutions Acrylics | Architectural Markets: Aerosol, masonry and tile sealer | |
| Industrial Markets: Transportation, packaging, aerosol, automotive OEM, appliance, industrial maintenance and marine and road marking | ||
101
Table of Contents
Ink Resins and Additives
We are the world’s largest producer of ink resins and associated products, with a market share of 15%. Ink resins are used to apply ink to a variety of different substrates including paper, cardboard, metal foil and plastic. We provide resins, liquid components and additives, sold primarily under the globally recognized Lawter™ brand name to customers formulating inks for a variety of substrates and printing processes. Our products offer such performance enhancements as durability, printability, substrate application, drying speed and security. Typical end use applications include brochures, newspapers, magazines, food packages, beverage cans and flexible packaging. We are also a provider of formulated UV-cure coatings and inks. Our proprietary technology has enabled us to gain a leading position in the global fiber optic market.
Products | Key Applications | |
Resins | Graphic arts, commercial, publication and packaging | |
Vehicles and waxes | Sheet-fed, heatset, gloss and wetting vehicles and wax products | |
Liquid Inks | Polymer films, paper and corrugated boards | |
Versatic Acids and Derivatives
We are the world’s largest producer of versatic acids and derivatives, with a market share of 76%. Versatic acids and derivatives are specialty monomers which provide significant performance advantages to finished coatings, including superior adhesion, flexibility, ease of application and other high performance characteristics. The products include basic versatic acids and derivatives sold under the Versatic, VEOVA® and CARDURA® names. Applications for versatic acids and derivatives include decorative, automotive and protective coatings as well as other uses, such as pharmaceuticals and personal care products. We manufacture versatic acids and derivatives using our integrated manufacturing sites and our internally produced ECH.
Products | Key Applications | |
Cardura | Automotive repair/refinishing, automotive OEM and industrial coating | |
Versatic | Chemical building block, peroxides, pharmaceuticals and agrochemicals | |
VeoVa | Architectural coatings and construction | |
102
Table of Contents
Segments
The products and market applications discussion above provides information organized around our primary applications (adhesives & structural and coating), while our organizational structure is based on the thermoset products we offer and the markets we serve. During the fourth quarter of 2005, we changed our reportable segments to better reflect the stage of the transition from the previous organization of our pre-merger companies to the Company’s organizational structure during the latter half of 2005. The transition provides greater alignment with the respective operating divisions and reporting segments. At March 31, 2006, our organizational structure consisted of four operating divisions that are directly aligned with our reportable segments: Epoxy and Phenolic Resins, Formaldehyde and Forest Products Resins, Coatings and Inks, and Performance Products. A brief summary of the major products and primary applications of our operating divisions, which aligned with the Company’s reportable segments, is as follows:
| Epoxy and Phenolic Resins | ||
| 2005 Pro Forma Net Sales | $2,139 | |
Major Products: Epoxy resins and intermediates Molding compounds Versatic acids and derivatives Formaldehyde based resins and intermediates: | Primary Application: Adhesive & Structural Adhesive & Structural Coating | |
• Specialty phenolic resins | Adhesive & Structural | |
Epoxy coating resins | Coating | |
| Formaldehyde and Forest Products Resins | ||
| 2005 Pro Forma Net Sales | $1,298 | |
Major Products: Formaldehyde based resins and intermediates: | Primary Application: | |
• Forest products resins | Adhesive & Structural | |
• Formaldehyde applications | Adhesive & Structural | |
| Coatings and Inks | ||
| 2005 Pro Forma Net Sales | $886 | |
Major Products: Composite resins Polyester resins Acrylic resins Alkyd Resins Ink resins and additives | Primary Application: Adhesive & Structural Coating Coating Coating Coating | |
| Performance Products | ||
| 2005 Pro Forma Net Sales | $394 | |
Major Products: Phenolic Encapsulated Substrates: | Primary Application: | |
• Oil field service applications | Adhesive & Structural | |
• Foundry applications | Adhesive & Structural | |
103
Table of Contents
All historical segment information included herein has been restated to conform with our current segment reporting. The changes to previously reported segment information are simply a reclassification of activity among the Company’s segments and they do not impact any of the Company’s previously reported consolidated results.
We began implementing additional refinements to our operating divisions in 2006 to more closely link similar products, minimize divisional boundaries and improve our ability to serve common customers from pre-merger legacy company relationships which may result in additional refinements to our reporting segments.
Marketing and Distribution
We market an extensive product line to meet a wide variety of customer needs. We focus on customers who are, or have the potential to be, leaders in their industries and have growth objectives which support our own growth objectives. In addition, we focus on customers who value our “Total Systems Approach”. This package includes high-quality, reliable products backed by local sales support and technical expertise offered at an attractive price. An important component of our strategy is to leverage our broad product capabilities to win high-end specialty business from our customers. In the coatings industry, for example, after having established our position as a reliable supplier of high-quality basic resins to our customers, we have leveraged our relationship to understand and develop solutions for customer needs in higher-end products such as performance resins, curing agents and modifiers. As a result of this strategy, we are able to become a supplier-of-choice for our key customers.
Products are sold to industrial users throughout the world through our direct sales force to larger customers and through third-party distributors to serve our smaller customers more cost effectively. Our direct sales force, customer service and support network consists of 319 employees in the Americas, 202 employees in Europe/ Africa/Middle East and 36 employees in Asia-Pacific. Our customer service and support network is organized into key regional customer service centers. We have global account teams that focus on coordination for major global customers, including technical service, supply and commercial terms. Furthermore, where operational and regulatory factors vary meaningfully from country to country, we organize locally.
Competition
We compete with a variety of companies, including large global chemical companies and small specialty chemical companies, in each of our product lines. In addition, we face competition from a number of products that are potential substitutes for formaldehyde-based resins. The principal factors of competition in our industry include technical service, breadth of product offering, product innovation, and price. Some of our competitors are larger, have great financial resources and have less debt than we do and may, as a result, be better able to withstand changes in conditions throughout our industry relating to pricing or otherwise and the economy as a whole. We are able to compete with smaller niche specialty chemical companies due to our significant investment in research and development and our customer service model which provides for on-site value added technical service for our customers. In addition, our size and scale provides us significant efficiencies in our cost structure.
We believe that no single company competes with us across all of our existing product lines. The following charts sets forth our principal competitors by market application.
104
Table of Contents
Adhesive & Structural Products and Market Application
Major Products | Principal Competitors | |||
| Forest Products Resins | Dynea International, Georgia-Pacific and Kronospan | |||
| Specialty Phenolic Resins | Dynea International, Occidental Petroleum, Schenectady, Ashland and PA Resins | |||
| Formaldehyde Applications | Dynea International and Georgia-Pacific | |||
| Epoxy Resins and Intermediates | Huntsman, Dow Chemical, Nan Ya and the Formosa Plastics Group, Chang Chun Polymers and Thai Epoxy | |||
| Composite Resins | Huntsman, Dow Chemical, Ashland, AOC, Reichhold and CCP/Atofina | |||
| Phenolic Encapsulated Substrates | Ashland, Carbo Ceramics, Santrol and Dynea International | |||
| Molding Compounds | Dynea International, FAR and Sumitomo | |||
Coating Products and Market Application
Major Products | Principal Competitors | |||
| Epoxy Coating Resins | Dow Chemical, Huntsman, Nan Ya and the Formosa Plastics Group, Leuna and Kuk-do | |||
| Polyester Resins | DSM, Cytec, Cray Valley/CCP, Reichhold, Nuplex and EPS (owned by Valspar) | |||
| Alkyd Resins | Reichhold, CCP/Atofina/Cray Valley, DSM, Nuplex and EPS (owned by Valspar) | |||
| Acrylic Resins | Rohm & Haas, BASF, Dow Chemical, Cognis and DSM (Neoresins) | |||
| Ink Resins and Additives | Mead Westvaco, Akzo Nobel, Arizona, Resinall, Arakawa and Harima | |||
| Versatic Acids and Derivatives | ExxonMobil and Tianjin Shield | |||
105
Table of Contents
Raw Materials
Raw material costs make up approximately 80% of our product costs. In 2005, on a pro forma basis, we purchased approximately $3 billion of raw materials. The three largest raw materials utilized in our production processes are phenol, methanol and urea, which represented 49% of our total raw material expenditures. The majority of raw materials used in the manufacturing of our products are available from more than one source and are readily available in the open market. We use long-term purchase agreements for our primary and certain other raw materials to ensure availability of adequate supplies. These agreements generally have periodic price adjustment mechanisms and do not have minimum annual purchase requirements. Those smaller quantity materials that are single sourced generally have long-term supply contracts as a basis to guarantee a maximum of supply reliability. Prices for our main feedstocks are generally driven by underlying petrochemical benchmark prices and energy costs. These raw materials are subject to price fluctuations. Although we seek to offset increases in raw material prices with increases in our product prices, we may not always be able to do so, and there may be periods when such product price increases lag behind raw material price increases.
Customers
In 2005, on a pro forma basis, our largest customer accounted for 3% of our net sales and our top ten customers accounted for 18% of our net sales. Neither our business nor any of our reporting segments depend on any single customer or a particular group of customers, the loss of which would have a material adverse effect on such a reporting group. Our primary customers consist of manufacturers, and the demand for our products is generally not seasonal.
Patents and Trademarks
We own, license or have rights to over 1,000 patents, over 1,500 trademarks and various patent and trademark applications and technology licenses in our reporting groups around the world, which are held for use or currently used in our operations. Our most significant trademarks are BORDEN®, RESOLUTION®, EPIKOTE® Resins, EPON® Resins, EPIKURE® Curing Agents, EPI-REZ® Waterborne Resins, AQUAMAC®, DURAMAC®, POLYMAC®, ACRYLIMAC®, HELOXY® Modifiers, CARDURA® Glycidyl Ester, VEOVA® Monomers, VERSATIC acids, LAWTER™, McWhorter® and ERNST JAEGER®. We use BORDEN® in our operations and license the trademark to third parties for use on non-chemical products. A majority of our patents relate to the development of new products and processes for manufacturing and use thereof and will expire at various times between 2006 and 2026. We renew our trademarks on a regular basis. Bakelite owns numerous foreign registrations of the trademark Bakelite, which it uses in its operations and has licensed to a limited number of third parties on a non-exclusive basis. No individual patent or trademark is considered to be material; however, our overall portfolios of patents and trademarks are valuable assets.
Environmental Regulations
Our operations involve the use, handling, processing, storage, transportation and disposal of hazardous materials and are subject to extensive environmental regulation at the federal, state and international level and are exposed to the risk of claims for environmental remediation or restoration. Our production facilities require operating permits that are subject to renewal or modification. Violations of environmental laws or permits may result in restrictions being imposed on operating activities, substantial fines, penalties, damages or other costs. In addition, statutes such as the federal Comprehensive Environmental Response, Compensation, and Liability Act and comparable state and foreign laws impose strict, joint and several liability for investigating and remediating the consequences of spills and other releases of hazardous materials, substances and wastes at current and former facilities, and at third-party disposal sites. Other laws permit individuals to seek recovery of damages for alleged personal injury or property damage due to exposure to hazardous substances and conditions at our facilities or to hazardous substances otherwise owned, sold or controlled by us. Therefore, notwithstanding our commitment to environmental management, environmental, health and safety liabilities may be incurred in the future, and such liabilities may result in a material adverse effect on our business, financial condition, results of operations or cash flows.
106
Table of Contents
Accruals for environmental matters are recorded in accordance with the guidelines of the AICPA Statement of Position 96-1,“Environmental Remediation Liabilities,” when it is probable that a liability has been incurred and the amount of the liability can be reasonably estimated. Although our environmental policies and practices are designed to ensure compliance with international, federal and state laws and environmental regulations, future developments and increasingly stringent regulation could require us to make additional unforeseen environmental expenditures. In addition, our former operations, including our ink, wall coverings, film, phosphate mining and processing, thermoplastics, food and dairy operations, may give rise to claims relating to our period of ownership. We cannot assure you that, as a result of former, current or future operations, there will not be some future impact on us relating to new regulations or additional environmental remediation or restoration liabilities.
We have adopted and implemented health, safety and environmental policies, which include systems and procedures governing environmental emissions, waste generation, process safety management, handling, storage and disposal of hazardous substances, worker health and safety requirements, emergency planning and response, and product stewardship. We anticipate incurring future costs for capital improvements and general compliance under environmental laws, including costs to acquire, maintain and repair pollution control equipment. In 2005, 2004 and 2003, we incurred related capital expenditures of $18 million, $16 million and $22 million, respectively. We estimate that $27 million will be spent for capital expenditures in 2006 for environmental controls at our facilities. This estimate is based on current regulations and other requirements, but it is possible that material capital expenditures in addition to those currently anticipated could be required if regulations or other requirements change.
Industry Regulatory Matters
The production and marketing of chemical substances are regulated by national and international laws. Although almost every country has its own legal procedure for registration and import, laws and regulations in the European Union, the United States and China are most significant to our business, including the European inventory of existing commercial chemical substances, the European list of notified chemical substances and the United States Toxic Substances Control Act inventory. Chemicals which are on one or more of the above lists can usually be registered and imported without additional testing in other countries, although additional administrative hurdles may exist.
We also actively seek approvals from the U.S. Food and Drug Administration for certain specialty chemicals produced by us, principally where we believe that these specialty chemicals will or may be used by our customers in the manufacture of products that will come in direct or indirect contact with food.
Research and Development
Our research and development activities are aimed at developing and enhancing products, processes, applications and technologies to maintain our position as the world’s largest producer of thermoset resins. We focus on:
| • | developing new or improved applications based on our existing product line and identified customer needs; |
| • | developing new resin products and applications for customers in order to improve their competitive advantage and profitability; |
| • | providing premier technical service for customers of specialty products; |
| • | providing technical support for manufacturing locations and assisting in plant optimization; |
| • | ensuring that our products are manufactured in accordance with our global environmental, health and safety policies and objectives; |
| • | developing lower cost manufacturing processes globally; and |
| • | expanding production capacity. |
107
Table of Contents
In 2005, 2004 and 2003, our research and development and technical services expenses were $67 million, $65 million and $77 million, respectively. Development and marketing of new products are carried out by our reporting groups and are integrated with quality control for existing product lines. We emphasize a customer driven, “systems and solutions” approach in discovering new applications and processes and providing excellent customer service through our technical staff. Through regular direct contact with our key customers, our research and development personnel can become aware of evolving customer needs in advance and can anticipate their requirements in planning customer programs. We also focus on on-going improvement of plant yields, fixed costs and capacity. These continuous integrated streams are characterized by exceptional product consistency, low cost economics and high quality resin that is valued by the customer for demanding applications. We estimate that this process provides us with a sustainable cost advantage over conventional batch technology, which is the traditional method of manufacturing certain resins.
We have over 600 scientists and technicians worldwide. We conduct research and development activities primarily at our facilities located in Carpentersville, Illinois; Louisville, Kentucky; Cincinnati, Ohio; Springfield, Oregon; Roebuck, South Carolina; Houston, Texas; Pleasant Prairie, Wisconsin; Kallo, Belgium; Louvian-la-Neuve, Belgium; Tianjin, China; Sokolov, Czech Republic; Duisburg, Germany; Iserlohn, Germany; Sant’ Albano, Italy; Pernis, The Netherlands and Barry, South Wales, UK. Our research and development facilities include a broad range of synthesis, testing and formulating equipment, and small scale versions of customer manufacturing processes for applications development and demonstration. In addition, we have an agreement with a not-for-profit research center to assist in certain research projects and new product development initiatives.
Legal Proceedings
Environmental Proceedings. We have recorded liabilities of approximately $39 million relating to 69 locations at December 31, 2005 for all probable environmental remediation, indemnification and restoration liabilities. At December 31, 2004, we recorded liabilities of approximately $41 million relating to 63 locations for all probable environmental remediation, indemnification and restoration liabilities. These locations include existing and former manufacturing locations, as well as third-party disposal or Superfund sites where we have been named a potentially responsible party.
The Sokolov, Czech Republic facility has soil and groundwater contamination which pre-dates privatization and acquisition of the facility by Eastman in 2000. The investigation phase of a site remediation project is underway, directed by a steering committee which includes the Company, the National Property Fund and local regulators. The National Property Fund has provided its written commitment to reimburse all site investigation and remediation costs up to approximately $73 million. The current estimate for known site remediation is $16 million, but may increase following additional site investigation.
On August 8, 2005, Governo Do Parana and the Environmental Institution of Paraná IAP, an environmental agency of the Brazilian government, provided Borden Quimica Industrias, our Brazilian subsidiary, with notice of a potential fine of up to $5.4 million in connection with alleged environmental damages to the Port of Paranagua caused in November 2004 by an oil spill by a shipping vessel carrying methanol purchased by Hexion. The investigation is ongoing and no final determination has been made with respect to damages or the liability of our Brazilian subsidiary. We are disputing this claim.
We have entered into environmental indemnification agreements with each of the sellers in the Bakelite Transaction, Resolution Performance Transaction, Resolution Specialty Transaction and the Rhodia Acquisition. Under the terms of the Rhodia Acquisition agreement, the seller will generally indemnify us for environmental conditions that occurred or existed before the closing date of the acquisition, subject to certain limitations. Under the Bakelite environmental indemnification agreement, the sellers have agreed to indemnify us for certain pre-existing environmental liabilities, including those related to our facility in Duisburg, Germany. Under the Resolution Performance environmental indemnification agreement, Shell will generally remain liable for pre-
108
Table of Contents
existing environmental conditions at facilities that were transferred to us in connection with the Resolution Performance Transaction and, under the Resolution Specialty environmental indemnification agreement, Eastman generally will remain liable for pre-existing unknown environmental conditions at facilities that were transferred to us in connection with the Resolution Specialty Transaction, as well as the pre-existing known environmental conditions at the Roebuck, South Carolina facility. The indemnities under each of these agreements are subject to certain exceptions and limitations. In addition, our claims under each of the environmental indemnity agreements are subject to deductibles, ranging from $0.1 million for the Resolution Specialty agreement to € 1 million for certain claims under the Bakelite agreement, and indemnity caps, ranging from $10 million for certain liabilities under the Resolution Performance agreement to € 275 million for certain liabilities under the Bakelite agreement.
Other Legal Proceedings. We are involved in various product liability, commercial litigation, personal injury, property damage and other legal proceedings which are considered to be in the ordinary course of our business. In large part, as a result of the bankruptcies of many asbestos producers, plaintiff’s attorneys are increasing their focus on peripheral defendants, including us, and asserting that even products that contained a small amount of asbestos caused injury. Plaintiffs are also focusing on alleged harm caused by other products we have made or used, including those containing silica and vinyl chloride monomer. We believe we have adequate reserves and insurance to cover currently pending and foreseeable future claims.
We have reserved approximately $12 million at December 31, 2005 relating to all non-environmental legal matters for legal defense and settlement costs that we believe are probable and estimable at this time. At December 31, 2004, we reserved approximately $21 million relating to all non-environmental legal matters for legal defense and settlement costs which were believed to be probable and estimable at this time.
Manufacturing and Facilities
As of March 31, 2006, we operated 37 domestic production and manufacturing facilities in 19 states. In addition, we operated 57 foreign production and manufacturing facilities primarily in Australia, Brazil, Canada, the Czech Republic, China, Germany, Italy, Korea, Malaysia, the Netherlands, Spain and the United Kingdom. Our production and manufacturing facilities are generally well-maintained and effectively utilized. We believe our production and manufacturing facilities are adequate to operate our business.
The majority of our facilities are used for the production of thermosetting resins, and most of our facilities produce more than one type of thermoset resin. The resins produced vary by site, but include all of our technologies: amino resins (urea and melamine), phenolic resins, epoxy resins, alkyd resins, polyester resins, acrylic resins, urethane resins, ink resins, composite resins, powder resins, versatic derivatives and U/V resins. These facilities typically utilize batch technology, and range in size from small sites with a limited number of reactors to larger, core sites with dozens of reactors. Two exceptions to this are the plants in Solbiate, Italy and Deer Park, Texas (the only “continuous” process epoxy resins plant in the world) which provide us with a cost advantage over conventional technology.
In addition, we have the ability to internally produce key intermediate materials such as formaldehyde, BPA, ECH, versatic acid, acrylic acid and gum rosin. This provides us with a competitive cost advantage relative to our competitors and facilitates our adequacy of supply. These facilities are usually co-located with the thermoset resin facilities they serve, and the process technology utilized in the production process is generally more complicated. These intermediate materials facilities are often much larger than a typical resins plant, in order to capture the benefits of manufacturing efficiency and scale; as a result, these facilities typically also have the ability to sell material not used internally to third parties.
109
Table of Contents
We are headquartered in Columbus, Ohio and our major manufacturing facilities are primarily located in North America and Europe. At December 31, 2005, our more significant production and manufacturing facilities include:
Location | Nature of Ownership | Reporting Segment | ||
| Pernis, The Netherlands* | Owned | Epoxy and Phenolic Resins | ||
Duisburg-Meiderich, Germany | Owned/Leased | Epoxy and Phenolic Resins | ||
| Deer Park, TX | Owned | Epoxy and Phenolic Resins | ||
Iserlohn-Letmathe, Germany | Owned/Leased | Epoxy and Phenolic Resins | ||
| Norco, LA* | Owned | Epoxy and Phenolic Resins | ||
| Louisville, KY | Owned | Epoxy and Phenolic Resins | ||
| Sokolov, Czech Republic | Owned | Coatings and Inks | ||
| Edmonton, AB, Canada | Owned | Formaldehyde and Forest Products | ||
| Gonzales, LA | Owned | Formaldehyde and Forest Products | ||
| Kitee, Finland | Owned | Formaldehyde and Forest Products | ||
| Geismar, LA | Owned | Formaldehyde and Forest Products | ||
| Lakeland, FL | Owned | Epoxy and Phenolic Resins | ||
| Brady, TX | Owned | Performance Products | ||
| * | All of the assets at this facility are owned. The land is occupied pursuant to a ground lease. |
Employees
At December 31, 2005, we had approximately 7,000 employees. Approximately 46% of our employees are members of a labor union or represented by workers’ councils that have collective bargaining agreements. Most of our European employees are represented by workers’ councils. Relationships with our union and non-union employees are generally satisfactory.
110
Table of Contents
Directors and Executive Officers
Set forth below are the names and current positions of our expected executive officers and directors at the completion of this offering. All ages are as of December 31, 2005.
Name | Age | Position | ||
Craig O. Morrison | 50 | Director, Chairman, President and Chief Executive Officer | ||
William H. Carter | 52 | Director, Executive Vice President and Chief Financial Officer | ||
Marvin O. Schlanger | 57 | Director, Vice Chairman | ||
Joseph P. Bevilaqua | 50 | Executive Vice President, President—Phenolic and Forest Products Resins | ||
Cornelis Kees Verhaar | 52 | Executive Vice President, President—Epoxy and Coating Resins | ||
Sarah R. Coffin | 53 | Executive Vice President, President—Performance Products & Inks Resins | ||
Richard A. Lamond | 59 | Executive Vice President—Human Resources | ||
Richard L. Monty | 58 | Executive Vice President—Environmental Health and Safety | ||
George F. Knight | 48 | Senior Vice President—Finance and Treasurer | ||
Nigel D. T. Andrews | 58 | Director | ||
David C. House | 56 | Director | ||
Robert M. Agate | 69 | Director | ||
Joshua J. Harris | 41 | Director | ||
Scott M. Kleinman | 32 | Director | ||
Robert V. Seminara | 33 | Director | ||
Jordan C. Zaken | 31 | Director |
Craig O. Morrison was elected President and Chief Executive Officer effective March 25, 2002 and Chairman of the Board of Directors on June 29, 2005. Prior to joining our Company, he served as President and General Manager of Alcan Packaging’s Pharmaceutical and Cosmetic Packaging business from 1999 to 2002. From 1993 to 1998 he was President and General Manager for Van Leer Containers, Inc. Prior to joining Van Leer Containers, Mr. Morrison served in a number of management positions with General Electric’s Plastics division from March 1990 to November 1993, and as a consultant with Bain and Company from 1987 to 1990. Upon consummation of this offering, he will be a member of the Environmental, Health and Safety, Executive and Nominating Committees of the Board of Directors.
William H. Carter was elected Executive Vice President and Chief Financial Officer effective April 3, 1995 and a director November 20, 2001. Throughout his tenure with us, Mr. Carter has been instrumental in the restructuring of our holdings, including serving as a director and interim President and Chief Executive Officer of a former subsidiary, BCP Management Inc., from January to June 2000. Prior to joining our Company in 1995, Mr. Carter was a partner with Price Waterhouse LLP, which he joined in 1975. In addition, Mr. Carter was a director of BCP Management, Inc. and WKI Holding Company, Inc., both of which filed a voluntary petition for reorganization under Chapter 11 of the Bankruptcy Code in 2002. Upon consummation of this offering, he will be a member of the Environmental, Health and Safety Committee of the Board of Directors.
Marvin O. Schlanger was elected Director and Vice Chairman of the Board of Directors of the Company on June 29, 2005. Mr. Schlanger served as Chairman and Chief Executive Officer of Resolution Performance and RPP Capital Corporation since November 2001 until the closing of the Combinations. Since October 1998, Mr. Schlanger has been a principal in the firm of Cherry Hill Chemical Investments, LLC, which provides management services and capital to the chemical and allied industries. Mr. Schlanger is also a director of UGI
111
Table of Contents
Corporation and, prior to the Combinations, he was a director and Chairman of the Board of RPP Capital and Resolution Specialty Materials, Inc. Mr. Schlanger is also the Chairman of the Board of Directors of Covalence Specialty Materials. Upon completion of this offering, he will be Chairman of the Environmental, Health and Safety Committee of the Board of Directors.
Joseph P. Bevilaqua is an Executive Vice President and President of Phenolic and Forest Products Resins, a position he has held since January 2004. Mr. Bevilaqua joined the Company in April 2002 as Vice President—Corporate Strategy and Development. From February 2000 to March 2002, he was the Vice President and General Manager of Alcan’s global plastics packaging business. Prior to Alcan, Mr. Bevilaqua served in leadership positions with companies such as General Electric, Woodbridge Foam Corporation and Russell-Stanley Corporation.
Cornelis Kees Verhaar was appointed Executive Vice President and President of the Epoxy and Coating Resins Division of the Company effective May 15, 2006. Most recently Mr. Verhaar served as Senior Vice President for the Performance Coatings business of Noveon Inc., a global producer of performance polymer systems and adhesives, from January 2003 to October 2004. Since 2004, Mr. Verhaar has been working on various investment opportunities in cooperation with several private equity groups as an industrial advisor and potential leading executive. Prior to 2004, from October 1999 to December 2002, he was President and Chief Operating Officer for Johnson Polymer, Inc., and Regional Director, Europe for Johnson Polymer B.V. in The Netherlands from March 1997 to October 1999. From 1984 to 1997, Mr. Verhaar held leadership roles with Devoe Coatings B.V., the ESHA Group, and Saudi Industrial Paint Company (the part of AKZO Coatings).
Sarah R. Coffin was appointed Executive Vice President and President of Performance Products & Inks Resins effective February 14, 2005 to oversee our oil field, foundry, electronics and wood products industries, including operations in the Asia-Pacific region. Prior to joining the Company, she was employed by Seaman Corporation where she had the position of Vice President Sales and Marketing from May 31, 2004 to February 2005. From August 2002 to March 2003, Ms. Coffin was Senior Vice President Global Sourcing, Human Resources and Information Technology of Noveon, Inc., a global producer of performance polymer systems and adhesives. From 1998 to 2002, she was Group President Specialty Plastics and Polymer Additives, Senior Vice President and General Manager Performance Coatings with BF Goodrich Performance Materials Company/Noveon, Inc. She is a director of SPX Corporation.
Richard A. Lamond was appointed Executive Vice President—Human Resources effective May 30, 2006. Mr. Lamond served as Senior Vice President and Chief Human Resources officer of Spherion Corporation from November 2002 to May 2006. Prior to joining Spherion, from March 1973 to July 2002, Mr. Lamond held various human resources management roles at Millennium Chemicals, Inc., including serving as Senior Vice President of Human Resources and Administration from March 2000 to July 2002.
Richard L. Monty was appointed Executive Vice President—Environmental, Health & Safety effective January 26, 2004. Prior to joining the Company, he was employed by Huntsman Corporation from July 1992 to January 2004 in various Environmental, Health and Safety positions, ultimately serving as Director, Global Environmental Health & Safety from 2001 to January 2004.
George F. Knight joined the Company in 1997. From 1999-2001 he served as Vice President of Finance for Borden Foods Corporation, an affiliate of the Company. In 2001, he re-joined the Company and was appointed Vice President—Finance and Treasurer of the Company in July 2002. He was promoted to Senior Vice President in June 2005.
Nigel D.T. Andrews will be elected as a director of the Company upon consummation of the offering. Since his retirement in 2000, he was managing director of Internet Capital Group from 2000 to 2001 and is currently a venture partner of Internet Capital Group. He served as executive vice president of GE Capital from 1993 to 2000
112
Table of Contents
and prior to that, as vice president and general manager of GE Plastics Americas, and as vice president for corporate business development reporting to the chairman. Mr. Andrews is also a director of Chemtura Corporation, Old Mutual plc, and a trustee of the Victory Funds, an affiliate of KeyBanc Capital Markets, a division of McDonald Investments Inc. Upon completion of this offering, he will be a member of the Audit and Nominating Committees of the Board of Directors.
David C. House will be elected as a director of the Company upon consummation of the offering. He currently serves as Advisor to the Chairman for American Express Company. From June 2000 to July 2005, Mr. House served as group president, Global Network and Establishment Services and Travelers Cheque and Prepaid Services Group for American Express. From 1995 to 2000, Mr. House was president of the Establishment Services Group of American Express in the U.S. Upon completion of this offering, he will be a member of the Audit and Compensation Committees of the Board of Directors.
Robert M. Agate will be elected as a director of the Company upon consummation of the offering. Mr. Agate retired in 1996 from Colgate-Palmolive Company after a 35-year career. He held the position of Senior Executive Vice President and was Chief Financial Officer of Colgate-Palmolive Company from 1987 to 1996. Prior to that, he served in a series of senior financial management positions in the U.S., Europe, Asia and Australia. These included Vice President and Corporate Controller of Colgate-Palmolive Company, Controller of The Kendall Company, a former Colgate-Palmolive subsidiary, and Controller of the European Division. Mr. Agate began his career at Colgate-Palmolive in 1961 as an Assistant Accountant in the United Kingdom and subsequently served as CFO of Colgate operations in India, Malaysia, the UK and Australia. Mr. Agate is also a director and Chair of the Audit Committee of Allied Waste Industries Inc. Upon completion of this offering, he will be Chairman of the Audit Committee of the Board of Directors.
Joshua J. Harris was elected a director of the Company on August 12, 2004. Mr. Harris is a founding Senior Partner at Apollo and has served as an officer of certain affiliates of Apollo since 1990. Prior to that time, Mr. Harris was a member of the Mergers and Acquisitions Department of Drexel Burnham Lambert Incorporated. Mr. Harris is also a director of Allied Waste Industries, Inc., Metals USA, Inc., Nalco Corporation, Covalence Specialty Materials Corp., Quality Distribution Inc. and United Agri Products. Prior to the Combinations, Mr. Harris was a director of Resolution Performance Products LLC and Resolution Specialty Materials, Inc. Upon completion of this offering, he will be a member of the Executive Committee and Chair of the Compensation Committee of the Board of Directors.
Scott M. Kleinman was elected a director of the Company on August 12, 2004. Mr. Kleinman is a Partner at Apollo, where he has worked since February 1996. Prior to that time, Mr. Kleinman was employed by Smith Barney Inc. in its Investment Banking division. Prior to the Combinations, Mr. Kleinman was also a director of Resolution Performance Products LLC and Resolution Specialty Materials, Inc. Upon completion of this offering, he will be a member of the Environmental, Health and Safety Committee of the Board of Directors.
Robert V. Seminara was elected a director of the Company on August 12, 2004. Mr. Seminara is a Partner at Apollo, where he has worked since January 2003. From June 1996 to January 2003, Mr. Seminara served as an officer in the private equity investment group at Evercore Partners LLC, where he held the title Managing Director. Mr. Seminara is also a director of Covalence Specialty Materials Corp. and World Kitchen Inc. Upon completion of this offering, he will be a member of the Executive Committee of the Board of Directors.
Jordan C. Zaken was elected a director of the Company on June 29, 2005. Mr. Zaken is a Partner at Apollo, where he has worked since 1999. Prior to that time, Mr. Zaken was employed by Goldman, Sachs & Co. in its Mergers and Acquisitions Department. Upon completion of this offering, he will be a member of the Compensation and Environmental, Health and Safety Committees of the Board of Directors.
113
Table of Contents
Board of Directors
Our board of directors is currently comprised of seven directors. We intend to avail ourselves of the “controlled company” exception under the New York Stock Exchange rules which eliminates the requirements that we have a majority of independent directors on our board of directors and that we have compensation and nominating committees composed entirely of independent directors, but retains the requirement that we have an audit committee composed entirely of independent members. We will add three independent members to our board of directors prior to the consummation of this offering. After giving effect to these additions, we expect our board of directors to consist of ten members.
Our board of directors is not currently classified, nor will it be immediately after the consummation of the offering. However, our amended and restated certificate of incorporation will provide that, from and after the first annual meeting of shareholders subsequent to the offering, our board will be divided into three classes. The members of each class will serve staggered, three-year terms (other than with respect to the initial terms of the Class I and Class II directors, which will be one and two years, respectively). Upon the expiration of the term of a class of directors, directors in that class will be elected for three-year terms at the annual meeting of shareholders in the year in which their term expires. At the first annual meeting of shareholders following the offering:
| • | Class I directors, whose terms will expire at the second annual meeting of shareholders following this offering, will be newly elected; |
| • | Current or then-current directors Marvin O. Schlanger, Nigel D.T. Andrews and Scott M. Kleinman will become Class II directors, whose terms will expire at the third annual meeting of shareholders following this offering; and |
| • | Current or then-current directors Craig O. Morrison, David C. House and Joshua Harris will become Class III directors, whose term will expire at the fourth annual meeting of shareholders following this offering. |
Any additional directorships resulting from an increase in the number of directors will be distributed among the three classes so that, as nearly as possible, each class will consist of one-third of our directors. This classification of our board of directors may have the effect of delaying or preventing changes in control of our company.
Supermajority Board Approval of Certain Matters
We intend to amend and restate our certificate of incorporation to require the approval of two-thirds of the members of our board of directors under certain circumstances. These include, as to us and each of our subsidiaries:
| • | amendment, modification or repeal of any provision of the certificate of incorporation, bylaws or similar organizational documents in a manner that adversely affects Apollo; |
| • | the redemption, purchase or acquisition of any of our securities or those of our subsidiaries; |
| • | the issuance of additional shares of any class of capital stock (other than the grant of options or the issuance of shares upon the exercise of options); |
| • | the payment or declaration of any dividend or other distribution, with respect to any shares of any class or series of capital stock; |
| • | a consolidation or merger with or into any other entity, or transfer (by lease, assignment, sale or otherwise) of all or substantially all of our assets to another entity; |
114
Table of Contents
| • | a complete or partial liquidation, dissolution, winding-up, recapitalization, reclassification or reorganization; |
| • | a split, combination or reclassification of any shares of capital stock; |
| • | a disposition of any assets in excess of $25 million in the aggregate; |
| • | consummation of any acquisition of the stock or assets of any other entity involving consideration in excess of $25 million in the aggregate; |
| • | the incurrence of indebtedness aggregating more than $25 million, except for borrowings under a revolving credit facility that has previously been approved or is in existence (with no increase in maximum availability) on the date of closing of this offering; |
| • | change in our chief executive officer; and |
| • | change in size of our board of directors. |
This provision of our amended and restated certificate of incorporation shall terminate at such time as affiliates of Apollo no longer beneficially own at least one-third of our outstanding common stock and have sold at least one share of our common stock other than in this offering.
Director Compensation
We plan to pay our non-employee directors an annual cash retainer of $40,000, paid quarterly after each fiscal quarter of service, and a fee of $1,000 per board meeting and each committee meeting attended, and 50% of such meeting fee for board meetings attended via teleconference. We also plan to pay our non-employee directors a fee for acting as committee chair and to grant stock options and/or restricted stock awards under our benefit plans. Messrs. Zaken, Seminara, Kleinman and Harris currently hold options covering 28,141 shares, 28,141 shares, 86,748 shares and 86,748 shares, respectively, of our common stock. The options were granted for their services as directors on the boards of Resolution Performance, Resolution Specialty and/or Borden Chemical. The stock options granted to Messrs. Seminara, Kleinman and Harris will become fully vested upon the earlier of a termination of service in connection with the Combinations or the consummation of this offering and will be automatically exercised upon the consummation of this offering. The stock options granted to Mr. Zaken were fully vested on the date of grant.
Committees of the Board of Directors
Audit Committee
Upon consummation of this offering, our audit committee will consist of Messrs. Andrews, House and Agate. The board of directors has determined that Mr. Agate qualifies as an audit committee financial expert as defined in Item 401(h) of Regulation S-K. Each of Messrs. Andrews, House and Agate is independent as independence is defined in Rule 10A-3(b)(i) under the Exchange Act or under the New York Stock Exchange listing standards.
The principal duties and responsibilities of our audit committee are as follows:
| • | to monitor our financial reporting process and internal control system; |
| • | to appoint and replace our independent registered public accounting firm from time to time, determine their compensation and other terms of engagement and oversee their work; |
| • | to oversee the performance of our internal audit function; and |
| • | to oversee our compliance with legal, ethical and regulatory matters. |
115
Table of Contents
The audit committee will have the power to investigate any matter brought to its attention within the scope of its duties. It will also have the authority to retain counsel and advisors to fulfill its responsibilities and duties.
Compensation Committee
Upon consummation of this offering, our compensation committee will consist of Messrs. House, Harris and Zaken. We intend to avail ourselves of the “controlled company” exception under the New York Stock Exchange rules which eliminates the requirement that we have a compensation committee composed entirely of independent directors.
The principal duties and responsibilities of our compensation committee are as follows:
| • | to provide oversight on the development and implementation of the compensation policies, strategies, plans and programs for our key employees and outside directors and disclosure relating to these matters; |
| • | to review and approve the compensation of our chief executive officer and the other executive officers of us and our subsidiaries; and |
| • | to provide oversight concerning selection of officers, management succession planning, performance of individual executives and related matters. |
Nominating Committee
Upon consummation of this offering, our nominating committee will consist of Messrs. Andrews, Morrison, Harris and Seminara. We intend to avail ourselves of the “controlled company” exception under the New York Stock Exchange rules which eliminates the requirement that we have a nominating committee composed entirely of independent directors.
The principal duties and responsibilities of the nominating committee will be as follows:
| • | to establish criteria for board and committee membership and recommend to our board of directors proposed nominees for election to the board of directors and for membership on committees of the board of directors; |
| • | to make recommendations regarding proposals submitted by our shareholders; and |
| • | to make recommendations to our board of directors regarding board governance matters and practices. |
Environmental, Health and Safety Committee
Upon consummation of this offering, our environmental, health and safety committee will consist of Messrs. Carter, Morrison, Schlanger, Kleinman and Zaken.
The principal duties and responsibilities of the environmental, health and safety committee will be as follows:
| • | to oversee the environmental, health and safety compliance program; |
| • | to oversee compliance with environmental, health and safety indemnifications; |
| • | to monitor our environmental, health and safety performance statistics; and |
| • | to recommend the general budget for environmental, health and safety capital spending. |
116
Table of Contents
Compensation Committee Interlocks and Insider Participation
Messrs. Harris and Zaken are members of the compensation committee of the board of directors and both are employees of Apollo. See “Certain Relationships and Related Party Transactions.”
Executive Committee
Upon consummation of this offering, our executive committee will consist of Messrs. Morrison, Harris and Seminara. The executive committee may exercise the powers of the board of directors during intervals between meetings, except for those powers delegated to other committees of the board of directors and powers which may not be delegated to a committee of the board of directors under New Jersey law or our certificate of incorporation or bylaws.
Other Committees
Our amended and restated bylaws will provide that the Board may establish one or more additional committees.
Code of Ethics
We have a Code of Business Ethics that applies to all associates, including our Chief Executive Officer and senior financial officers. These standards are designed to deter wrongdoing and to promote the honest and ethical conduct of all employees. Excerpts from the Code of Business Ethics, which address the subject areas covered by the SEC’s rules, are posted on our website: www.hexion.com under “Investor Relations—Corporate Governance”. Any substantive amendment to, or waiver from, any provision of the Code of Business Ethics with respect to any senior executive or financial officer shall be posted on this website.The information contained on our website is not part of this prospectus.
Executive Compensation
The following table sets forth information with respect to compensation earned by our Chief Executive Officer and our four next most highly compensated executive officers, whom we refer to as our named executive officers for the period ended December 31, 2005.
Names and Principal Position | Annual Compensation | Long-Term Compensation | All Other Compensation(1) | |||||||||||||||
| Year | Salary ($) | Bonus ($) | All Other Annual Compensation ($) | Awards | Payouts | |||||||||||||
Restricted ($) | Securities (#) | LTIP Payouts ($) | ||||||||||||||||
Craig O. Morrison | 2005 | 656,533 | 941,500 | — | — | — | — | 36,134 | ||||||||||
President and Chief Executive Officer | 2004 | 659,230 | 774,030 | — | — | 603,028 | (4) | — | 3,098,294 | |||||||||
| 2003 | 524,230 | 320,000 | — | — | — | 39,173 | ||||||||||||
William H. Carter | 2005 | 543,803 | 505,411 | — | — | — | — | 33,216 | ||||||||||
Executive Vice President and Chief Financial Officer | 2004 | 567,277 | 407,161 | — | — | 482,422 | (4) | — | 3,016,446 | |||||||||
| 2003 | 525,300 | 627,100 | (2) | — | — | 480,000 | (3) | — | 56,584 | |||||||||
Joseph P. Bevilaqua | 2005 | 338,688 | 211,764 | — | — | — | — | 16,166 | ||||||||||
Executive Vice President | 2004 | 347,899 | 230,296 | — | — | 201,009 | (4) | — | 1,548,216 | |||||||||
| 2003 | 266,456 | 126,717 | — | — | — | — | 15,719 | |||||||||||
Layle K. Smith(5) | 2005 | 233,333 | 342,291 | — | — | — | — | — | ||||||||||
Executive Vice President | ||||||||||||||||||
Sarah R. Coffin | 2005 | 221,154 | 241,950 | — | — | — | — | 44,726 | ||||||||||
Executive Vice President | ||||||||||||||||||
117
Table of Contents
| (1) | All Other Compensation includes matching company contributions to our Retirement Savings Plan and our executive supplemental benefit plans. For 2004 these matching contributions were: Mr. Morrison $40,728; Mr. Carter $43,358 and Mr. Bevilaqua $19,434. For Messrs. Morrison and Bevilaqua, their amounts also include payments of $3,057,566 and $1,528,782, respectively, for the cancellation of their restricted stock at the time of the Borden Transaction. Of these payments, Messrs. Morrison and Bevilaqua received cash payments of $1,557,566 and $1,028,781, respectively, and the balance of the payments was credited in the form of deferred shares under the deferred compensation plan described below. In addition, for Mr. Carter, the amounts shown include one-time sale bonuses of $2,573,088, paid at the time of the Borden Transaction. A portion of the sale bonuses paid to Mr. Carter was credited in the form of deferred shares under the deferred compensation plan. For Mr. Carter, the amount also includes the final installment ($400,000) of his retention bonus. The 2005 amount shown for Ms. Coffin includes $35,438 for moving and relocation expenses. |
| (2) | A portion of the bonus payments made in 2003 to Mr. Carter of $380,000 relates to installments paid for a one-time retention bonus and was paid by affiliates funded by fees paid by Borden Chemical. |
| (3) | In connection with the Borden Transaction, these options were settled in cash. |
| (4) | Represents options to purchase Hexion LLC units. |
| (5) | Mr. Smith became an executive of the Company at the time of the Combinations. His compensation represents only compensation paid by the Company since June 1, 2005. Mr. Smith has resigned and will be leaving the Company in June 2006. |
Option/SAR Grants in Last Fiscal Year
There were no options for shares of our common stock granted to named executive officers during fiscal year 2005.
Aggregated Option/SAR Exercises in Last Fiscal Year and FY-End Option/SAR Values
The following table provides information on options exercised in 2005 by each of our named executive officers and the value of their unexercised options at December 31, 2005.
Name | Shares Acquired on Exercise (#) | Value Realized ($) | Number Of Securities Unexercised Options/SARs At Fiscal Year End | Value Of Unexercised In-The-Money Options/SARs At Fiscal Year End ($) | ||||||||
| Exercisable | Unexercisable(1) | Exercisable(2) | Unexercisable(2) | |||||||||
C.O. Morrison | — | — | 60,303 | 542,725 | 681,424 | 6,132,793 | ||||||
W.H. Carter | — | — | 48,242 | 434,180 | 545,135 | 4,906,234 | ||||||
J.P. Bevilaqua | — | — | 20,101 | 180,908 | 227,141 | 2,044,260 | ||||||
L.K. Smith | — | — | 31,073 | 78,360 | 405,916 | 686,115 | ||||||
S.R. Coffin | — | — | — | — | — | — | ||||||
| (1) | Represents options for units of Hexion LLC. |
| (2) | There is no established trading market for the units of Hexion LLC. The value used is the estimated market value at December 12, 2005, as determined by the Board of Directors. |
In 1999, 2003 and 2004, members of our management team were granted options to purchase shares of Borden Chemical common stock under the Amended and Restated 1996 Stock Purchase and Option Plan for Key Employees, which we refer to as the 1996 Equity Plan. As part of the Borden Transaction, the 1996 Equity Plan was terminated and the holders of the options outstanding under the 1996 Equity Plan became entitled to receive an aggregate cash amount equal to approximately $3.9 million. As of March 31, 2006, no options remained outstanding under the 1996 Equity Plan.
Hexion 2006 Long-Term Incentive Plan
In conjunction with the closing of this offering, Hexion adopted a long-term incentive plan (which we refer to as the 2006 incentive plan) as an additional means to attract, motivate, retain and reward directors, officers, employees and other eligible persons through the grant of awards and incentives for high levels of individual performance and improved financial performance of Hexion. These equity-based awards are also intended to further align the interests of award recipients and Hexion’s stockholders. After the closing of the offering, we expect that all of our equity incentive awards to directors, officers and other eligible persons will be granted under the 2006 incentive plan or a successor plan and not under our previously existing plans.
118
Table of Contents
A total of14,000,000 shares of Hexion’s common stock will initially be available for awards granted under the 2006 incentive plan.Any shares subject to awards that are not paid or exercised before they expire or are terminated, as well as shares tendered or withheld to pay the exercise or purchase price of an award or related tax withholding obligations, will become available for other award grants under the plan. As of the date of this prospectus, no awards have been granted under the 2006 incentive plan.
Hexion’s board of directors, or a committee of directors appointed by the board, will have the authority to administer the 2006 incentive plan. A committee may delegate some or all of its authority with respect to the plan to another committee of directors, and certain limited authority to grant awards to officers and employees may be delegated to one or more of Hexion’s officers. (The appropriate acting body is referred to in this prospectus as the “administrator.”) The administrator of the plan will have broad authority to:
| • | select participants and determine the type(s) of award(s) they are to receive; |
| • | determine the number of shares that are subject to awards and the terms and conditions of awards, including the price (if any) to be paid for the shares or the award; |
| • | cancel, modify or waive Hexion’s rights with respect to, or modify, discontinue, suspend or terminate any or all outstanding awards, subject to any required consents; and |
| • | accelerate or extend the vesting or exercisability or extend the term of any or all outstanding awards, subject to any required consents. |
The number and kind of shares available under the 2006 incentive plan and any outstanding awards, as well as the exercise or purchase prices of awards, will be subject to adjustment in the event of certain reorganizations, mergers, combinations, recapitalizations, stock splits, stock dividends or other similar events that change the number or kind of shares outstanding, and extraordinary dividends or distributions of property to the shareholders. In no case (except due to an adjustment referred to above or any repricing that may be approved by Hexion’s shareholders) will any adjustment be made to a stock option or stock appreciation right award under the 2006 incentive plan (by amendment, cancellation and regrant, exchange or other means) that would constitute a repricing of the per-share exercise or base price of the award.
Awards under the 2006 incentive plan may be in the form of stock options (nonqualified or incentive), stock appreciation rights (SARs), restricted stock, stock bonuses and other forms of awards granted or denominated in Hexion’s common stock or units representing common stock. Awards under the plan generally will not be transferable other than by will or the laws of descent and distribution and will generally be exercisable, during the participant’s lifetime, only by the participant. The administrator will have discretion, however, to establish written conditions and procedures for the transfer of awards to other persons or entities, provided that such transfers comply with applicable federal and state securities laws.
Nonqualified stock options and other awards may be granted at prices below the fair market value of the common stock on the date of grant. Incentive stock options must have an exercise price that is at least equal to the fair market value of the common stock, or 110% of fair market value of the common stock for any 10% owner of our common stock, on the date of grant. Restricted stock awards can be issued for nominal or the minimum lawful consideration. These and other awards may also be issued solely or in part for services. The maximum term of options, SARs and other rights to acquire common stock under the plan will be ten years after the initial date of the award, subject to provisions for further deferred payment in certain circumstances. The exercise price of options or other awards may generally be paid in cash or, subject to certain restrictions and approval by the administrator, shares of common stock. Subject to any applicable limits, we may finance or offset shares to cover any minimum withholding taxes due in connection with an award.
Generally, and subject to limited exceptions set forth in the 2006 incentive plan, if any person acquires a majority of Hexion’s outstanding common stock or combined voting power, if certain changes in a majority of Hexion’s board of directors occur over a period of not longer than two years, if stockholders prior to a transaction
119
Table of Contents
do not continue to own more than 50% of Hexion’s voting securities (or those of a successor or a parent) following a reorganization, merger, statutory share exchange or consolidation or similar corporate transaction involving Hexion or any of its subsidiaries, a sale or other disposition of all or substantially all of Hexion’s assets or the acquisition of assets or stock of another entity by Hexion or any of its subsidiaries, or if Hexion’s stockholders approve a complete liquidation or dissolution of Hexion, then awards then-outstanding under the 2006 incentive plan may, in the discretion of the administrator, become fully vested or paid, as applicable, and may terminate or be terminated in such circumstances. The administrator also will have the discretion to establish other change in control provisions with respect to awards granted under the 2006 incentive plan. For example, the administrator could provide for the acceleration of vesting or payment of an award in connection with a change in control event that is not described above and provide that any such acceleration shall be automatic upon the occurrence of any such event. In the event of a dissolution of Hexion or certain reorganizations, mergers, combinations or similar events in which Hexion does not survive, any awards then-outstanding under the 2006 incentive plan automatically become vested or paid, as applicable, unless the administrator has expressly provided for the substitution, assumption, exchange or other continuation or settlement of such awards, or the award would otherwise continue in accordance with its terms.
Hexion’s board of directors may amend or terminate the 2006 incentive plan at any time, but no such action may affect any outstanding award in any manner materially adverse to a participant without the consent of the participant. Shareholder approval for an amendment will be required only to the extent then required by applicable law or any applicable listing agency or required under the Internal Revenue Code to preserve the intended tax consequences of the plan. The 2006 incentive plan will terminate on the tenth anniversary of the implementation of the plan; however, the administrator will retain its authority until all outstanding awards are exercised or terminated. The plan will not be exclusive; Hexion’s board of directors and compensation committee may grant stock and performance incentives or other compensation, in stock or cash, under other plans or authority.
2005 and 2006 Management Incentive Plans
Hexion maintains a 2005 and 2006 management incentive plan (which we refer to as the management incentive plans). Under these management incentive plans, participants earn cash bonus compensation based upon the achievement of certain individual performance goals and Hexion’s achievement of certain financial measures. Each participant’s target award is based on a percentage of base salary. Under the management incentive plans, our named executive officers’ and other senior managers’ bonuses are paid under the plans only if at least 90% of the specified target level of EBITDA (as this term is defined in the management incentive plans) is achieved. If the individual performance goals are met and at least 90% of the EBITDA target is achieved, bonuses for these senior managers range from 66% of the target award in 2005 and 25% in 2006 up to a maximum of 200% of the target award based on the actual EBITDA level achieved.
Long-Term Value Creation Reward Program
On July 28, 2005, our compensation committee approved the Long-Term Value Creation Reward Program (which we refer to as the reward program) for certain executive officers and key managers. The reward program has two components—a cash bonus component and a stock appreciation right (SAR) component. Certain participants will only receive SARs. The cash bonus awards and the SARs will vest in one-third installments over a three-year period. An individual who is granted a cash-bonus award under the reward program will have a maximum aggregate bonus opportunity of 40% or 50% of the individual’s current annualized base salary rate. One hundred percent of the individual’s cash bonus opportunity will be paid if the individual remains continuously employed by us for the three-year vesting period. The SARs will be granted with a base price equal to the price of a share of our common stock in this offering. Individuals who are granted SARs will, at the end of the three-year vesting period, receive a cash payment for each vested SAR equal to the amount (if any) that the then current market price of our common stock (based on the average market price for the preceding ten trading days) exceeds the base price of the SAR. Subject to final approval of the terms of awards under the reward
120
Table of Contents
program by the committee, it is expected that any portion of the cash bonus opportunity and any SARs that have not vested as of the date an individual’s employment terminates for any reason (including the individual’s death or disability) will be cancelled. Any portion of the cash bonus opportunity and any SARs that have vested as of the date the individual’s employment terminates will be paid at the end of the three-year vesting period (although payment of vested awards may be made earlier in the case of an individual’s death to his or her estate), except that if the individual’s employment is terminated by us for cause (as defined in the reward program), the individual’s entire cash bonus opportunity and all of his or her SARs, whether or not vested, will be immediately cancelled, and no payment will be made. There are currently 52 participants in this program.
Sarah R. Coffin is eligible to participate in the reward program. It is expected Ms. Coffin will be granted a cash bonus opportunity of 50% of her 2005 base salary and an award of SARs targeted at 50% of her 2005 base salary subject to the rules of the program. None of the other named executive officers are eligible to participate in the reward program. The awards described in this paragraph will be effective only upon the consummation of this offering.
Hexion LLC 2004 Deferred Compensation Plan
In connection with the Borden Transaction, Hexion LLC adopted the 2004 deferred compensation plan, which we refer to as the deferred compensation plan, for the benefit of certain of our former Borden Chemical executives. As described above, these executives became entitled to payment of either a sale bonus or proceeds in respect of cancelled restricted stock pursuant to the Borden Transaction. Individual deferred compensation accounts were created for these executives under the deferred compensation plan, and a portion of these payments were credited to these accounts in the form of deferred common stock units. The deferred compensation plan was assumed by us in connection with the Combinations, and each deferred common stock unit represents the right to receiveone share of Hexion common stock on the applicable payment date. Participants do not have any voting rights with respect to their deferred common stock units held under the plan. The deferred compensation plan is an unfunded plan.
As of March 31, 2006, 970,467 deferred common stock units were outstanding under the deferred compensation plan, of which all were vested. As of March 31, 2006, the accounts of our named executive officers have been credited with the number of deferred common stock units as set forth opposite such executive’s name below.
Name | Deferred Common Stock Units | |
Craig O. Morrison | 241,211 | |
William H. Carter | 192,969 | |
Joseph P. Bevilaqua | 80,404 | |
Layle K. Smith | — | |
Sarah R. Coffin | — |
Under the deferred compensation plan, if Hexion pays a dividend or other distribution on its common stock, it will contemporaneously pay a cash bonus to each executive holding deferred common stock units. Such cash bonus amount with respect to any such dividend payment will be equal to the applicable per share dividend paid on the common stock multiplied by the number of deferred common stock units that such executive’s deferred compensation account is credited with as of the record date for such dividend payment (or the payment date if there is no record date). The number and kind of deferred common stock units subject to awards granted under the deferred compensation plan will be subject to adjustment in the event of reorganizations, mergers, combinations, recapitalizations, stock splits, stock dividends or other similar events that change the number or kind of shares outstanding, and extraordinary dividends or distributions of property to the stockholders. The deferred compensation plan prohibits the assignment of the deferred common stock units except upon an executive’s death.
121
Table of Contents
Hexion LLC 2004 Stock Incentive Plan
In connection with the Borden Transaction, Hexion LLC adopted a stock incentive plan for the benefit of certain employees, which we refer to as the 2004 incentive plan. The 2004 incentive plan and outstanding awards thereunder were assumed by us in connection with the Combinations. The purpose of the 2004 incentive plan is to further our growth and success, to enable our employees, directors and consultants to acquire shares of our common stock, thereby increasing their personal interest in our growth and success, and to provide a means of rewarding outstanding performance by such persons. The 2004 incentive plan provides for the issuance of non-qualified stock options and rights to purchase shares of common stock. The 2004 incentive plan is administered by our compensation committee.
As ofMarch 31, 2006,2,426,168 shares were subject to awards granted under the plan. Awards granted under the 2004 incentive plan may not be assigned or transferred, except upon the participant’s death. The 2004 incentive plan will terminate ten years after its adoption and no awards may be granted under the plan thereafter. The number and kind of securities issuable under the 2004 incentive plan or subject to awards granted under the 2004 incentive plan, as well as the exercise or purchase prices of awards, will be subject to adjustment in the event of reorganizations, mergers, combinations, recapitalizations, stock splits, stock dividends or other similar events that change the number or kind of shares outstanding, and extraordinary dividends or distributions of property to the stockholders.
The employees participating in the 2004 incentive plan receive stock options under the plan pursuant to individual stock option agreements, the terms and conditions of which will be substantially identical. Each agreement provides for the issuance of two tranches of options to purchase our common stock. The Tranche A Options will vest 20% on each of the first five anniversaries of the grant date or, to the extent not yet vested, on the first anniversary of the closing of a sale of Hexion. Following a sale of Hexion, upon exercise of each Tranche A Option, the optionee will receive the same consideration per share as is received by Apollo in connection with such sale. All of the Tranche B Options will vest in whole or in part upon the earlier to occur of the eighth anniversary of the grant date or the date occurring six months after the date on which a sale of Hexion has been completed in the event certain financial milestones are met. Following a sale of Hexion in which such financial milestones are met, upon exercise of each Tranche B Option, the optionee will receive the same consideration per share as is received by Apollo in connection with such sale. Of the awards outstanding under the 2004 incentive plan as of March 31, 2006, 1,213,084 shares were subject to Tranche A Options and 1,213,084 shares were subject to Tranche B Options. In the event that we, or our successor, terminate a participant’s employment without cause (or the participant resigns under certain circumstances) at any time within a specified period following the sale, the participant’s options under the 2004 incentive plan may become vested and exercisable as of the date of the termination. For purposes of the 2004 incentive plan, a “sale of Hexion” generally means a sale of Hexion to one or more independent third parties, pursuant to which such party or parties acquire capital stock possessing the voting power to elect a majority of our board of directors, or a sale of all or substantially all of our assets. Furthermore, upon a realization event, we may, but are not obligated to, purchase each outstanding vested 2004 incentive plan option for an amount equal to the amount per share received in respect of the shares sold in such transaction constituting the realization event less the exercise price of the option. For purposes of the 2004 incentive plan, a “realization event” generally means a sale of Hexion as described above or any transaction or series of related transactions in which Apollo sells at least 50% of its interest in Hexion. Options granted under the 2004 incentive plan generally have a term of ten years.
Other Assumed Plans
In addition to the deferred compensation plan and the 2004 incentive plan, we maintain the following plans: the Resolution Performance 2000 Stock Option Plan (which we refer to as the Resolution Performance option plan), the Resolution Performance 2000 Non-Employee Directors Option Plan (which we refer to as the Resolution Performance director plan), the Resolution Performance Restricted Unit Plan (which we refer to as the Resolution Performance unit plan) and the Resolution Specialty 2004 Stock Option Plan (which we refer to as the Resolution Specialty plan).
122
Table of Contents
These plans are administered by our board of directors or its compensation committee. The number and kind of securities subject to options granted under these plans will be subject to adjustment in the event of reorganizations, mergers, combinations, recapitalizations, stock splits, stock dividends or other similar events that change the number or kind of shares outstanding, and extraordinary dividends or distributions of property to the stockholders. No options granted under these plans may be assigned or transferred, except upon the participant’s death. Each of the plans will terminate on the tenth anniversary of its adoption. Options granted under any of these plans generally have an eight-year term. Each of the Resolution Specialty plan, the Resolution Performance option plan and the Resolution Performance director plan permits the committee to reduce the exercise price of outstanding stock options granted under that plan.
The Resolution Performance option plan provides that non-qualified or incentive stock options may be granted under the plan. As ofMarch 31, 2006, 541,430 shares were subject to awards granted under the Resolution Performance option plan. The Resolution Performance director plan provides for the grant of non-qualified stock options to non-employee directors of Resolution Performance Inc. As ofMarch 31, 2006, 96,941 shares were subject to awards granted under the Resolution Performance director plan.The Resolution Specialty plan provides that only non-qualified stock options may be granted under the plan. As ofMarch 31, 2006,970,844 shares were subject to awards granted under the Resolution Specialty plan (of which 756,845 shares were subject to awards granted to employees).
Mr. Schlanger is the sole participant in the Resolution Performance unit plan. As of March 31, 2006, Mr. Schlanger held 191,276 stock units under the Resolution Performance unit plan. These stock units will be distributed in an equivalent number of shares of Hexion common stock upon the earliest to occur of a termination of Mr. Schlanger’s employment or services, a change in control event or January 1, 2009. Mr. Schlanger’s rights under the Resolution Performance unit plan are fully vested and nonforfeitable. The Resolution Performance unit plan is administered by our board of directors or its compensation committee. The number and kind of securities will be subject to adjustment in the event of reorganizations, mergers, combinations, recapitalizations, stock splits, stock dividends or other similar events that change the number or kind of shares outstanding, and extraordinary dividends or distributions of property to the stockholders. The stock units may not be assigned or transferred except in the event of Mr. Schlanger’s death.
Employment Contracts, Termination of Employment and Change-in-Control Arrangements
In connection with the Borden Transaction, Borden Chemical entered into employment agreements with Craig O. Morrison, Joseph P. Bevilaqua and William H. Carter. Under the terms of each of these employment agreements, the executive has agreed not to disclose any confidential information concerning our business. In addition, the executive has agreed not to solicit or hire any of our employees or solicit any of our customers, suppliers, licensees or other business relations until one year after he ceases to receive any payments under the agreement. Furthermore, the executive has agreed not to engage in any business competing with our business or products anywhere in the world where we are doing business until after he ceases to receive any payments pursuant to the agreement (or in certain circumstances, the first anniversary of such date).
Mr. Morrison’s employment agreement provides for an annual base salary of $630,000 and a target management incentive plan bonus of 100% of base salary. The agreement also provides for a perquisite payment in the amount of $40,000 annually, usual and customary health and pension benefits and a grant of 603,028 stock options at an exercise price of $6.22 per share. Mr. Morrison will be entitled to eighteen months’ severance based on his monthly base salary in the event of termination of employment by us for reasons other than for cause, death or disability or a resignation by Mr. Morrison for good reason.
Mr. Bevilaqua’s employment agreement provides for an annual base salary of $325,000 and a target management incentive plan bonus of 60% of base salary. The agreement also provides for a perquisite payment in the amount of $30,000 annually, usual and customary health and pension benefits and a grant of 201,009 stock options at an exercise price of $6.22 per share. Mr. Bevilaqua will be entitled to twelve months’ severance based on his monthly base salary in the event of termination of employment by us for reasons other than for cause, death or disability or a resignation by Mr. Bevilaqua for good reason.
123
Table of Contents
Mr. Carter’s employment agreement provides for an annual base salary of $530,400 and a target management incentive plan bonus of 65% of base salary. The agreement also provides for a perquisite payment in the amount of $30,000 annually, usual and customary health and pension plan benefits and a grant of 482,422 stock options at an exercise price of $6.22 per share. Mr. Carter will be entitled to twenty-four months’ severance based on his monthly base salary in the event of termination of employment by us for reasons other than for cause, death or disability or a resignation by Mr. Carter for good reason.
Mr. Smith’s employment agreement provides for an annual base salary of $400,000 and a target bonus of 50% of base salary. The agreement also provides that we will provide usual and customary health and pension benefits. Mr. Smith will be entitled to twelve months’ severance based on his annual salary in the event of termination of employment by us for reasons other than for cause, death or disability or in the event of a resignation by Mr. Smith for good reason. Under the terms of the agreement, Mr. Smith has agreed not to disclose any confidential information concerning our business. In addition, he has agreed not to solicit or hire any of our employees until after he ceases to receive any payments under the agreement or to engage in any business that is in competition with our business until after he ceases to receive any payments pursuant to the agreement. Mr. Smith has resigned and will be leaving the Company in June 2006.
We intend to enter into a separation agreement with Mr. Smith in connection with his leaving the Company in June 2006. We expect that the agreement will provide for Mr. Smith to receive aggregate severance payments in an amount equal to approximately one year’s base salary, continued medical coverage and outplacement benefits for a one-year period at our expense, and accelerated vesting of his outstanding options to purchase shares of our common stock. We also expect that the agreement will include covenants not to compete with us or solicit our customers or employees for one year following termination of his employment and Mr. Smith’s release of any employment-related claims.
Ms. Coffin’s employment agreement provides for a base salary of $250,000, a target management incentive plan bonus of 50% of base salary, participation in a management equity purchase program, and four weeks paid vacation annually. The agreement also entitles her to receive an executive perquisite payment of $25,000 annually, subject to board approval, and a signing bonus of $20,000, both to be paid following the first 30 days of her employment. In addition, the agreement provides that Ms. Coffin will be eligible to participate in the Company’s customary health, pension and other benefit programs in addition to the executive relocation program. To assist with her relocation to Columbus, the Company agreed to pay Ms. Coffin up to $50,000 (grossed-up for taxes) on any shortfall in the sale of her home against its appraised value, the cost of the lesser of two mortgage payments, if any, from July 2005 through September 2005, and to provide 60 days of temporary housing.
In June 2005, we entered into an employment agreement and a consulting agreement with Mr. Schlanger, both of which were amended in January 2006. Under the terms of the amended employment agreement and the amended consulting agreement, Mr. Schlanger has agreed not to disclose any confidential information concerning our business. Under the terms of Mr. Schlanger’s consulting agreement, Mr. Schlanger has agreed not to solicit or hire any of our employees or solicit any of our customers until 24 months after termination of his consulting engagement. Furthermore, he has agreed not to engage in any business that is in competition with our business until after he ceases to receive any payments pursuant to the employment agreement (or in certain circumstances, the first anniversary of such date) or at any time during the term of the consulting agreement.
Mr. Schlanger’s amended employment agreement was effective from the closing of the Combinations through March 31, 2006 and provided for an annual base salary of $400,000 through December 31, 2005 and $12,500 per month from January 1 through March 31, 2006. The agreement also provided for a target bonus with respect to the 2005 fiscal year of 75% of base salary. The agreement provided for Mr. Schlanger to be paid a quarterly bonus of $62,500 on each of July 1, 2005 and October 1, 2005 and to be provided with usual and customary health and pension benefits. Both the target bonus and the quarterly bonus were conditioned on Mr. Schlanger being employed by us on the applicable payment date.
124
Table of Contents
Mr. Schlanger’s consulting agreement extends for the period commencing April 1, 2006 and ending December 31, 2008. The agreement provides for Mr. Schlanger (i) to be paid a monthly consulting fee of $12,500, (ii) to be paid or reimbursed for his costs to maintain health insurance coverage for himself and his dependents that is similar to the coverage we provided during his employment, (iii) to be paid an amount equal to the normal fees paid to non-employee directors for first quarter 2006, which he would have received had his employment agreement not been extended to March 31, 2006, and (iv) to continue to be eligible to vest in options during the consulting period as he would have during his employment.
We expect to enter into additional employment agreements with our executives from time to time.
Retirement Benefits
Our Employees Retirement Income Plan, or ERIP, covers U.S. employees of the former Borden Chemical. This plan was amended as of January 1, 1987 to provide benefit credits equal to 3% of earnings to the extent that such credit does not exceed the Social Security wage base for the year plus 6% of eligible earnings in excess of the wage base. Earnings include annual incentive awards paid currently, but exclude any long-term incentive awards. Benefits for service through December 31, 1986 are based on the plan formula then in effect and have been converted to opening balances under the plan. Both opening balances and benefit credits receive interest credits at one-year Treasury bill rates until the participant commences receiving benefit payments. For the year 2005, the interest rate as determined in accordance with the plan language was 2.49%. Benefits vest after completion of five years of employment for employees hired on or after July 1, 1990.
The RPP pension plan, a defined benefit pension plan, covers employees of the former Resolution Performance group. Benefits under this plan are determined by formula based on average pay and years of employment minus an offset for social security. Compensation under the plan includes base, incentive bonus and shift premiums. Benefits vest after 5 full years of service and benefits are computed and displayed to participants based on a single life annuity.
Employees of the former Resolution Specialty group are covered by a defined contribution profit sharing plan. This plan provides a benefit determined by a schedule which considers years of service and age. The contributions range from benefit credits of 1% to 15% of earnings that are less than the Social Security wage base for the year plus an incremental 1% to 5% of earnings in excess of the wage base. Contributions are made to the accounts of eligible participants annually.
The pension benefit for certain employees represented by collective bargaining agreements is calculated using a formula based on the number of years of credited service multiplied by the fixed benefit multiplier amount established in the union contract. Some employees, such as employees of Resolution Specialty, Resolution Performance and employees outside the United States, are covered by other retirement plans.
The total projected annual benefits payable upon retirement age of 65 under the formulas of the ERIP without regard to the limits on benefits imposed under Sections 415 and 401(a)(17) of the Internal Revenue Code and recognizing supplemental pensions, as described below, are as follows for the named executive officers as of 2005: Craig O. Morrison, $108,803; William H. Carter, $127,953; Joseph P. Bevilaqua, $47,628; Layle K. Smith, $82,325; and Sarah R. Coffin, $17,047.
In addition to the pension plans described above, all eligible full-time employees are offered participation in the Retirement Savings Plan, which is a defined contribution plan. This plan allows former Borden Chemical employees to make pre-tax contributions from 1% to 15% of eligible earnings for highly compensated employees and 25% for all other employees. Former Borden Chemical employees are eligible to receive matching contributions from the Company ranging from 50% to 100% on contributions of up to 5% of eligible earnings. Former Borden Chemical employees who were hired prior to January 1, 1987 and have at least 120 months of
125
Table of Contents
service are eligible to receive company matching contributions on contributions of up to 7% of eligible earnings. Additional company contributions may be made if we achieve specified annual financial measures established at the beginning of the plan year.
Former Resolution Performance employees and former Resolution Specialty employees can make contributions to the Retirement Savings Plan ranging from 1% to 60% and 1% to 10%, respectively. Company contributions range from 3% to 6% after completion of service of 1 and 5 years, respectively.
For certain former Borden Chemical employees, the Executive Supplemental Pension Plan provides for supplemental pension benefits above the limits imposed by Sections 401(a)(17) and 415 of the Internal Revenue Code and for pension benefits with respect to any deferred compensation not considered under the ERIP, in each case, using the same formula as the ERIP. The amounts of the projected annual benefits shown above for Messrs. Morrison, Carter and Bevilaqua and Ms. Coffin under the ERIP include these supplemental pension benefits. The supplemental plan also provides an opportunity for employees whose compensation exceeds the limit under Section 401(a)(17) of the Internal Revenue Code to voluntarily elect to defer compensation, and also provides other employees with an opportunity to elect a “make-up benefit” for the benefits limited under Section 415 of the Internal Revenue Code as it relates to defined contribution plans, in each case, using the same formula as the Retirement Savings Plan. The supplemental plan benefits are unfunded and paid from our general assets.
The Company provides a nonqualified deferred compensation plan for former Resolution Performance U.S. employees who are participants in the RPP Inc. stock option plan. Participants may elect to defer up to 50% of base wages and 100% of bonus pay. The Company’s obligations under this plan are unfunded; however, the participant’s deferred compensation contributions are made to a rabbi trust.
126
Table of Contents
PRINCIPAL AND SELLING SHAREHOLDERS
The following table sets forth information regarding the beneficial ownership of Hexion common stock, before and after the completion of the offering, giving effect to the Hexion Formation, and shows the number of shares and percentage owned by:
| • | each person known to beneficially own more than 5% of the common stock of Hexion before and after completion of this offering; |
| • | each of Hexion’s named executive officers; |
| • | each member of and nominee for the Board of Directors of Hexion; |
| • | each person or entity owning interests in Hexion LLC other than current or former employees; and |
| • | all of the executive officers and members of the Board of Directors of Hexion as a group. |
Prior to this offering, Hexion LLC owned 100% of our outstanding common stock. Apollo, other investors and certain members of our management own their interests in our common stock set forth below through their ownership of Hexion LLC. Apollo has sole voting power and investment power with respect to the shares of the Company owned by Hexion LLC. Hexion LLC, the selling shareholder, will sell 14,814,815 shares in this offering. The column below titled “Shares to be Sold in this Offering” represents the ownership interest of the persons and entities owning interests in Hexion LLC in the shares being sold in this offering by Hexion LLC (not including shares to be sold upon the exercise of the overallotment option). Hexion LLC acquired its shares in the transactions described under “Prospectus Summary—The Prior Transactions, the Hexion Formation and the Hexion Refinancings” and the Combinations. Additional information with respect to Hexion LLC and its material relationship with us is provided under the caption “Certain Relationships and Related Party Transactions.” Leon D. Black and John J. Hannan are the directors and executive officers of entities which have dispositive voting or investment control over the other entities or funds affiliated with Apollo that control Hexion LLC. Although Messrs. Black and Hannan may each be deemed a beneficial owner of shares of Hexion beneficially owned by Apollo, each such person disclaims beneficial ownership of such shares.
The amounts and percentages of common stock beneficially owned are reported on the basis of regulations of the SEC governing the determination of beneficial ownership of securities. Under the rules of the SEC, a person is deemed to be a “beneficial owner” of a security if that person has or shares “voting power,” which includes the power to vote or to direct the voting of such security, or “investment power,” which includes the power to dispose of or to direct the disposition of such security. A person is also deemed to be a beneficial owner of any securities of which that person has a right to acquire beneficial ownership within 60 days. Under these rules, more than one person may be deemed a beneficial owner of the same securities and a person may be deemed a beneficial owner of securities as to which he has no economic interest. Except as otherwise indicated in the footnotes below, each of the beneficial owners has, to our knowledge, sole voting and investment power with respect to the indicated shares of common stock.
127
Table of Contents
Number and Percent of Shares Prior to this Offering | Shares to be Sold in this | Number and Beneficially Owned | Number and Percent of Shares Beneficially Owned After this Offering Assuming Full Exercise of the Over-Allotment Option | ||||||||||||||
| Number | Percent | Number | Number | Percent | Number | Percent | |||||||||||
Apollo Management, L.P.(1) | 75,154,789 | 91.0 | % | 13,911,934 | 61,242,855 | 71.0 | % | 58,634,369 | 68.0 | % | |||||||
JPMorgan Chase Bank as trustee for First Plaza Group Trust(2) | 1,721,483 | 2.1 | % | 318,664 | 1,402,819 | 1.6 | % | 1,343,069 | 1.6 | % | |||||||
Goldman, Sachs & Co.(3) | 1,721,483 | 2.1 | % | 318,664 | 1,402,819 | 1.6 | % | 1,343,069 | 1.6 | % | |||||||
Shell Oil Company(4) | 1,434,569 | 1.7 | % | 265,553 | 1,169,016 | 1.4 | % | 1,119,224 | 1.3 | % | |||||||
Robert Seminara(1)(5) | 28,141 | * | — | 28,141 | * | 28,141 | * | ||||||||||
Scott Kleinman(1)(5) | 86,748 | * | — | 86,748 | * | 86,748 | * | ||||||||||
Joshua Harris(1)(5) | 86,748 | * | — | 86,748 | * | 86,748 | * | ||||||||||
Jordan C. Zaken(1)(5) | 28,141 | * | — | 28,141 | * | 28,141 | * | ||||||||||
Marvin O. Schlanger(6) | 433,169 | * | — | 433,169 | * | 433,169 | * | ||||||||||
Craig O. Morrison(7) | 60,303 | * | — | 60,303 | * | 60,303 | * | ||||||||||
William H. Carter(8) | 48,242 | * | — | 48,242 | * | 48,242 | * | ||||||||||
Nigel D. T. Andrews | — | * | — | — | * | — | * | ||||||||||
David C. House | — | * | — | — | * | — | * | ||||||||||
Robert M. Agate | — | * | — | — | * | — | * | ||||||||||
Joseph P. Bevilaqua(9) | 20,101 | * | — | 20,101 | * | 20,101 | * | ||||||||||
Layle K. Smith(10) | 110,373 | * | — | 110,373 | * | 110,373 | * | ||||||||||
Sarah R. Coffin | — | * | — | — | * | — | * | ||||||||||
All Directors and Executive Officers as a group (16 persons)(11) | 916,714 | 1.1 | % | — | 916,714 | 1.1 | % | 916,714 | 1.1 | % | |||||||
| * | less than 1% |
| (1) | Represents the ownership interest in the Company indirectly attributable to Apollo through Apollo’s ownership of Hexion LLC. The address of each of Apollo Investment Fund IV, L.P., Apollo Investment Fund V. L.P.,and Apollo is c/o Apollo Management, L.P., 9 West 57th Street, New York, New York 10019. |
| (2) | Represents the ownership interest in the Company indirectly attributable to First Plaza Group Trust through First Plaza Group Trust’s ownership of Hexion LLC. First Plaza Group Trust is a New York trust containing assets of certain employee benefit plans of General Motors, its subsidiaries and unrelated employers. The principal address of First Plaza Group is 767 Fifth Avenue, New York, New York 10153. |
| (3) | Represents the ownership interest in the Company indirectly attributable to funds affiliated with Goldman, Sachs & Co. and its affiliates through their ownership of Hexion LLC. The principal address of Goldman, Sachs & Co. is 85 Broad Street, New York, New York 10004. |
| (4) | Represents the ownership interest in the Company indirectly attributable to Shell Oil Company through Shell Oil Company’s ownership of Hexion LLC. The address of Shell Oil Company is 910 Louisiana Street, One Shell Plaza, Houston Texas 77252. |
| (5) | Although each of Messrs. Harris, Kleinman, Seminara and Zaken may be deemed a beneficial owner of shares of Hexion beneficially owned by Apollo due to his status as a partner or senior partner of Apollo, each such person disclaims beneficial ownership of any such shares. For Messrs. Harris and Kleinman, includes 86,748 shares of common stock issuable upon the exercise of options granted to each of Messrs. Harris and Kleinman that were vested as of the date hereof. For Messrs. Zaken and Seminara, includes 28,141 shares of common stock issuable upon the exercise of options granted to each of Messrs. Zaken and Seminara that were vested as of the date hereof. The address of Messrs. Harris, Kleinman and Seminara is c/o Apollo Management, L.P., 9 West 57th Street, New York, New York 10019. |
| (6) | Does not include unvested options to purchase 179,184 shares of common stock issued to Mr. Schlanger and 191,276 restricted stock units issued to Mr. Schlanger. The unvested options are subject to time and performance vesting conditions. The restricted stock units represent a conditional right to receive 191,276 shares of common stock of Hexion upon the occurrence of certain events. The address of Mr. Schlanger is c/o Hexion Specialty Chemicals, Inc., 180 East Broad Street, Columbus, Ohio 43215. |
128
Table of Contents
| (7) | Does not include 542,725 shares of common stock issuable upon the exercise of options granted to Mr. Morrison (such options are subject to time and performance vesting conditions) and 241,211 deferred common stock units credited to Mr. Morrison’s account. The address of Mr. Morrison is c/o Hexion Specialty Chemicals, Inc., 180 East Broad Street, Columbus, Ohio 43215. |
| (8) | Does not include 434,180 shares of common stock issuable upon the exercise of options granted to Mr. Carter (such options are subject to time and performance vesting conditions) and 192,969 deferred common stock units credited to Mr. Carter’s account. The address of Mr. Carter is c/o Hexion Specialty Chemicals, Inc., 180 East Broad Street, Columbus, Ohio 43215. |
| (9) | Does not include 180,908 shares of common stock issuable upon the exercise of options granted to Mr. Bevilaqua (such options are subject to time and performance vesting conditions) and 80,404 deferred common stock units credited to Mr. Bevilaqua’s account. The address of Mr. Bevilaqua is c/o Hexion Specialty Chemicals, Inc., 180 East Broad Street, Columbus, Ohio 43215. |
| (10) | Does not include 78,360 shares of common stock issuable upon the exercise of options granted to Mr. Smith (such options are subject to time and performance vesting conditions). The address of Mr. Smith is c/o Hexion Specialty Chemicals, Inc., 1600 Smith Street, Houston, Texas 77002. |
| (11) | Includes 503,472 shares of common stock issuable upon the exercise of options granted to our directors and executive officers that were vested as of the date hereof. Does not include options to purchase 1,548,095 shares of common stock, 191,276 shares issued to Mr. Schlanger under the Resolution Performance unit plan and 573,580 deferred common stock units. |
129
Table of Contents
CERTAIN RELATIONSHIPS AND RELATED PARTY TRANSACTIONS
Combinations
Transaction Agreement
As of April 22, 2005, Borden Chemical entered into a transaction agreement with affiliates of Resolution Performance and Resolution Specialty pursuant to which Borden Chemical agreed to combine with Resolution Performance and Resolution Specialty. Borden Chemical, Resolution Performance and Resolution Specialty are each controlled by Apollo. In connection with the consummation of the Combinations on May 31, 2005, Borden Chemical changed its name to Hexion Specialty Chemicals, Inc.
Investor Rights Agreement
On May 31, 2005, we entered into an investor rights agreement with Hexion LLC, our parent, and certain other parties (the “Investor Rights Agreement”), which governs certain aspects of our relationship with our security holders and replaces the investor rights agreements between us, Resolution Performance and Resolution Specialty, respectively, and Apollo, described below. The Investor Rights Agreement, among other things, provides for the following:
| • | restricts the ability of certain security holders to transfer, assign, sell, gift, pledge, hypothecate or encumber, or otherwise dispose of, our common stock or of all or part of the voting power associated with the common stock, including precluding employee-holders of common stock from selling any shares within 12 months of a qualified public offering; |
| • | allows us to repurchase all or any portion of our common stock held by our employees upon the termination of their employment with us or our affiliates; |
| • | contains a provision that any meeting of our shareholders and in any action by written consent of our shareholders, Hexion LLC will have the ability to vote the shares of our employee-holders of common stock; and |
| • | permits those holders of our common stock to include their shares in a registration statement filed by us with respect to an offering of common stock (i) in connection with the exercise of any demand rights by Hexion LLC or (ii) in connection with exercise of “piggyback” registration rights by Hexion LLC. |
This “piggyback” right is subject to customary cutback provisions, and furthermore, those employee-holders of our common stock will be subject to customary lock-up provisions in connection with their participation in any such offering.
The Investor Rights Agreement prohibits those of our employees or the employees of our affiliates who are parties to the agreement from soliciting or hiring any of our other employees or soliciting any of our customers, suppliers, licensees or other business relations until one year after they cease to receive any payments from us or any of our affiliates. Furthermore, the Investor Rights Agreement prohibits those employees from competing with our business or products anywhere in the world where we are doing business until they cease to receive any payments from us or our affiliates (or, in certain cases, until the first anniversary of the date on which they cease to receive payments).
The Investor Rights Agreement terminates with respect to all rights or obligations related to our common stock upon the earliest to occur of our dissolution, the sale of all or substantially all of our assets to a person or group other than Apollo and its affiliates and the transfer to a person or group other than Apollo and its affiliates of a number of shares of common stock having the power to elect a majority of our board of directors.
Registration Rights Agreement
On May 31, 2005, we entered into a registration rights agreement with Hexion LLC pursuant to which Hexion LLC has certain demand registration rights with respect to our common stock. Under this agreement, we
130
Table of Contents
agreed to assume the fees and expenses associated with registration. The registration rights agreement also contains customary provisions with respect to registration proceedings, underwritten offerings and indemnity and contribution rights.
Borden Chemical Amended and Restated Management Consulting Agreement
On May 31, 2005, we entered into an amended and restated management consulting agreement with Apollo (the “Amended Management Consulting Agreement”). The terms of the Amended Management Consulting Agreement are identical to those of the previous management consulting agreement between Borden Chemical and Apollo, described below, except that the Amended Management Consulting Agreement provides that upon termination of the Amended Management Consulting Agreement in connection with a sale of the company or an initial public offering, we will pay Apollo a lump-sum amount equal to the net present value of the remaining annual management fees owing and payable by us until the expiration of the Amended Management Consulting Agreement determined using an applicable discount rate. In connection with the consummation of the offering, the Amended Management Consulting Agreement will terminate, and we will pay Apollo a lump-sum amount equal to $10 million. In addition, in connection with the consummation of the offering, we will pay Apollo $10 million for its structuring and advisory services relating to the offering.
Resolution Performance Management Services Termination Agreement
On May 31, 2005, Resolution Performance entered into a management services termination agreement with Apollo (the “Resolution Performance Management Termination Agreement”). The Resolution Performance Management Termination Agreement provided that immediately prior to the closing of the Combinations, Apollo and Resolution Performance would be released from any and all obligations and liabilities to provide management services and pay fees under the Resolution Performance management agreement, dated as of November 14, 2000, as amended, and the Resolution Performance management agreement would have no further force and effect. In consideration of the termination, Resolution Performance paid Apollo a termination fee of $4.4 million.
Resolution Specialty—Termination of Resolution Specialty Management Consulting Agreement
The Resolution Specialty Management Consulting Agreement (as described below) was terminated in connection with the Combinations. The amount required to terminate the Resolution Specialty Management Consulting Agreement was determined by discounting the remaining annual payments under the agreement from the date of termination until the expiration of the then-current term at an annual discount rate equal to the Resolution Specialty’s then-current rate of interest on its revolving credit facility. Resolution Specialty paid Apollo a fee equal to $6.75 million on May 31, 2005, representing the amount required to terminate the Resolution Specialty Management Agreement with Apollo.
The annual management fees payable to Apollo under each of the management consulting agreements were determined through arms’-length negotiations between each of the relevant companies and Apollo, and were based on the understanding of Apollo and each relevant company of the fair value for such services, based in part on market conditions and what similarly-situated companies have paid for similar services.
Certain Relationships and Related Party Transactions Prior to the Combinations
Investor Rights Agreement
On August 12, 2004, all employees who own deferred stock and stock options of BHI Acquisition Corp., our parent and the predecessor to Hexion LLC, entered into an investor rights agreement with Apollo and BHI Acquisition Corp., which governs certain aspects of BHI Acquisition Corp.’s relationship with its security holders. The investor rights agreement, among other things, provides for the following:
| • | allows security holders to join, and allows Apollo and its affiliates to require security holders to join, in any sale or transfer of shares of common stock to any third party prior to a qualified public offering of |
131
Table of Contents
common stock, following which (when aggregated with all prior such sales or transfers) Apollo and its affiliates shall have disposed of at least 10% of the number of shares of common stock that Apollo and its affiliates owned as of the closing date of the Borden Transaction; provided that Apollo may dispose of up to 25% of such number of shares of common stock during the first twelve months after consummation of the Borden Acquisition without triggering these co-sale rights; |
| • | restricts the ability of security holders, other than Apollo and its affiliates, to transfer, assign, sell, gift, pledge, hypothecate or encumber, or otherwise dispose of, common stock or of all or part of the voting power associated with common stock; |
| • | allows the Company and Apollo to repurchase all or any portion of the common stock held by employees of the Company upon the termination of their employment with the Company; |
| • | allows an employee of the Company to force the Company to acquire all (but not less than all) of the shares of common stock held by the employee upon the termination of their employment with the Company for certain specified reasons; and |
| • | contains a provision that at any meeting of the BHI Acquisition Corp. stockholders and in any action by written consent of BHI Acquisition Corp.’s stockholders, Apollo will have the ability to vote the shares of common stock. |
The investor rights agreement prohibits Borden Chemical’s employees who are parties to the agreement from soliciting or hiring any of its employees or soliciting any of its customers, suppliers, licensees or other business relations until one year after they cease to receive any payments from Borden Chemical or its affiliates. Furthermore, the investor rights agreement prohibits Borden Chemical’s employees from competing with its business or products anywhere in the world where Borden Chemical is doing business until they cease to receive any payments from Borden Chemical or its affiliates (or, in certain cases, until the first anniversary of the date on which they cease to receive payments).
This investor rights agreement has been amended and restated by the investor rights agreement described under “—Combinations.”
Registration Rights Agreement
On August 12, 2004, Apollo and its affiliates entered into a registration rights agreement with BHI Acquisition Corp. pursuant to which Apollo and its affiliates have certain demand and Apollo, its affiliates and all employees who receive deferred stock and stock options will have certain incidental registration rights with respect to BHI Acquisition Corp.’s common stock. Under this agreement, BHI Acquisition Corp. agreed to assume the fees and expenses associated with registration. The registration rights agreement also contains customary provisions with respect to registration proceedings, underwritten offerings and indemnity and contribution rights.
This registration rights agreement allows employees holding common stock to include their shares in a registration statement filed by the Company with respect to an offering of common stock (i) in connection with the exercise of any demand rights by Apollo and its affiliates, or (ii) in connection with which Apollo and its affiliates exercise “piggyback” registration rights.
This registration rights agreement has been amended and restated by the registration rights agreement described under “—Combinations.”
Transaction Fee and Management Consulting Agreements
On August, 12, 2004, in connection with the Borden Transaction, Borden Chemical entered into a transaction fee agreement with Apollo and its affiliates for the provision of certain structuring and advisory services. Upon closing of the Borden Transaction, Borden Chemical paid $10 million of aggregate transaction
132
Table of Contents
and advisory fees under this agreement, and reimbursed expenses of $0.8 million. In addition, Borden Chemical and Apollo entered into a management consulting agreement. The management consulting agreement allows Apollo and its affiliates to provide certain advisory services to Borden Chemical for a seven year period, with an automatic extension of the term for a one year period beginning on the fourth anniversary of the commencement of the agreement and at the end of each year thereafter, unless notice to the contrary is given by either party. The agreement, as later supplemented and amended, provides for an annual fee equal to the greater of $3 million and 2% of Adjusted EBITDA, as defined in the indentures governing Borden Chemical’s notes. In addition, Borden Chemical is also required to pay Apollo a transaction fee if Borden Chemical engages in any merger, acquisition or similar transaction unless Borden Chemical and Apollo are unable to mutually agree upon the terms of Apollo’s engagement, in which case, Borden Chemical will be able to retain another special advisor. In the fourth quarter of 2004, Borden Chemical paid $975,000 of fees pursuant to the management consulting agreement. Borden Chemical paid Apollo annual fees of $2.5 million in the first quarter of 2005 pursuant to the agreement. Upon closing of the Bakelite Transaction in the second quarter of 2005, Borden Chemical paid a transaction fee equal to $3.7 million pursuant to the management consulting agreement. Under the management consulting agreement, Borden Chemical has also agreed to indemnify Apollo and its affiliates and their directors, officers and representatives for potential losses relating to the services contemplated under this agreement.
The management consulting agreement has been amended and restated by the Amended Management Consulting Agreement described under “—Combinations.”
Certain Relationships and Related Party Transactions Prior to the Borden Transaction
Financing and Investing Arrangements
Borden Chemical had a borrowing arrangement with BW Holdings, LLC (“BWHLLC”), a former affiliate, evidenced by a demand promissory note bearing interest at a variable rate, which terminated upon the completion of the Borden Acquisition. Interest expense under the BWHLLC arrangement totaled $138,000 for the period prior to the Borden Transaction.
In 2003, Borden Chemical, along with its subsidiary HAI, had similar arrangements with Borden Foods Holdings Corporation (“Foods”), a former affiliate, evidenced by demand promissory notes bearing interest at variable rates. The loans were reported as loans payable to affiliates on the Condensed Consolidated Balance Sheets and totaled approximately $18 million at December 31, 2003. Of the total loans outstanding, HAI owed $6 million at December 31, 2003. Interest rates on these loans ranged from 1.0% to 4.75%. In early 2004, Borden Chemical entered into the arrangement with BWHLLC described above and terminated its affiliated borrowing relationship with Foods. In early 2004, HAI obtained a $20 million credit facility with an external bank and terminated its affiliated borrowing relationship with Foods. Interest expense under the Foods arrangement totaled $0.5 million for the period of 2004 prior to the termination of this arrangement.
In addition, Borden Chemical held a note receivable in an aggregate principal amount of approximately $405 million and accrued interest of $156 million as of December 31, 2004 from BHI Acquisition Corp., which has been accounted for as a reduction of equity. Borden Chemical accrued interest quarterly on the note receivable in paid-in capital. Historically, Borden Holdings, Inc. funded the interest due on the note through common stock dividends that Borden Holdings, Inc. paid to them, however, Borden Holdings, Inc. had neither received quarterly interest nor declared an associated dividend since October 15, 2001. In connection with the Combinations, the note (including accrued interest of $176 to the date of the Combinations) was reclassified to paid-in capital.
Administrative Service, Management, Consulting Arrangements
Commencing in 2003, Borden Chemical assumed certain management, consulting and board services previously provided to it by Borden Capital, Inc., or Capital, as described below, while other such services were assumed by KKR. During the year ended December 31, 2003, Borden Chemical recorded $3 million for the fixed
133
Table of Contents
fee due to KKR under this arrangement. During 2002, Capital provided to Borden Chemical management, consulting and board services, and Borden Chemical provided certain administrative services to Capital. Capital charged Borden Chemical an annual fee of $9 million, payable quarterly in arrears, which represented the net amount of the cost of Capital’s services less Borden Chemical’s fee for providing administrative services to Capital. During 2002, Borden Holdings, Inc. made a decision to cease the operations of Capital by the end of the first quarter of 2003. Borden Chemical’s services arrangements with KKR were terminated in connection with the consummation of the Borden Acquisition.
Borden Chemical has provided certain administrative services to BW Holdings, LLC and other affiliates under service agreements, which commenced on January 1, 2003 and were renewable annually. During the year ended December 31, 2003, Borden Chemical charged BW Holdings, LLC $0.5 million for such services based on actual costs and time incurred. Borden Holdings, Inc.’s services arrangements with BW Holdings, LLC and such other affiliates were terminated in connection with the consummation of the Borden Acquisition.
Borden Chemical provided administrative services to Foods under an annual service agreement. Fees received for these services were based on actual costs and time incurred and totaled $0.05 million for the year ended December 31, 2003. In addition, Borden Chemical paid certain costs on behalf of Foods and was reimbursed by Foods for 100% of these costs.
With respect to the above-described agreements, the fees charged were determined based upon factors including the nature of the services provided, total compensation and benefits of the employees involved in providing the services, the estimated percentage of time required to perform the services, the knowledge, expertise, experience and availability of the employees and the value of the services performed to the parties involved.
The agreement with Foods terminates upon the liquidation of all the Foods companies.
Other Transactions and Arrangements
Capital contributions to Borden Chemical from Borden Holdings, Inc. and Foods totaled $26 million for the year ended December 31, 2003.
In 2001, Borden Chemical merged its foundry resins and coatings businesses with similar businesses of Delta to form HAI, in which, at the time of its formation, Borden Chemical had a 75% economic interest. The Limited Liability Agreement of HAI provides Delta the right to purchase between 3% and 5% of additional economic interest in HAI each year beginning in 2004. Pursuant to this provision, in 2004, Delta purchased an additional 5% interest, another 5% in March 2005, thereby reducing Borden Chemical’s economic interest to 70% and 65% at December 31, 2004 and 2005 respectively. In March 2006, Delta provided written notice of its intention to purchase an additional 5% in 2006. Delta’s purchase price of the interest was based on the enterprise value of HAI determined by applying a contractually agreed upon multiple to EBITDA, as defined in the agreement. Delta is limited to acquiring a maximum of 15% of additional interest in HAI under this arrangement.
In the first quarter of 2005, the Company received a payment of $7.5 million on behalf of BHI Acquisition from KKR for adjustments made to the purchase price of the Company in the Apollo Transaction.
From time to time, Borden Chemical sold finished goods to certain Apollo affiliates. These sales totaled $3 million (of which $2 million were sales to Resolution Performance) from the date of the Borden Transaction through December 31, 2004. Accounts receivable from these affiliates totaled $2.3 million at December 31, 2004, of which $1.8 million was receivable from Resolution Performance. The foregoing transactions were on terms that were at least as favorable as the terms Borden Chemical could have obtained from an unaffiliated third party at the time of such transactions.
134
Table of Contents
Resolution Performance Products LLC
Agreements in Connection with the Resolution Performance Transaction
Apollo Management Agreement
On November 14, 2000, Resolution Performance entered into a management consulting agreement with Apollo Management IV, L.P. Under the terms of the management consulting agreement, Resolution Performance retained Apollo Management to provide management consulting and financial advisory services to Resolution Performance and pay Apollo Management an annual management fee of $1 million for providing those services. In particular, Apollo Management will provide at Resolution Performance’s request consulting and advisory services relating to proposed financial transactions, acquisitions and other senior management matters relating to Resolution Performance’s business. In addition, as consideration for arranging the recapitalization and the related financing thereof, Resolution Performance paid Apollo Management a fee of $5 million on November 14, 2000.
Resolution Performance was also required to pay Apollo Management a transaction fee if Resolution Performance engaged in any merger, acquisition or similar transaction unless Resolution Performance and Apollo Management were unable to mutually agree upon the terms of Apollo Management’s engagement, in which case Resolution Performance would have been able to retain another special advisor. Since Apollo Management beneficially owned approximately 91% of Resolution Performance and a majority of the members of Resolution Performance’s Board of Managers were affiliated with Apollo, it had the power, through its representatives and equity ownership, to approve on Resolution Performance’s behalf and set the terms of Apollo Management’s engagement, even if the independent members of the Board of Managers were opposed. However, the members of the Board of Managers of Resolution Performance who are affiliated with Apollo Management are aware that they have fiduciary obligations to Resolution Performance, not Apollo, and Resolution Performance expects that each member of its Board of Managers will comply with his fiduciary duties under Delaware law. The management consulting agreement has an initial ten-year term and, commencing on November 14, 2005 and at the end of each year thereafter, will automatically extend for an additional year unless notice to the contrary is given by either party at least thirty, but no more than sixty, days prior to the end of any such year commencing on November 14, 2005.
On March 15, 2002, the terms of the management consulting agreement were amended to reduce the annual management fee payable to Apollo from $1 million to $0.75 million. In addition, Resolution Performance agreed to pay Apollo Management an advisory fee of approximately $1 million (i) immediately prior to a sale of Resolution Performance Products Inc., or Resolution Performance Inc., for cash, (ii) when Apollo Investment Fund IV, L.P., Apollo Overseas Partners IV, L.P., or any investment fund managed by Apollo Management or any of its affiliates sells at least 50% of the shares of common stock of Resolution Performance Inc. that they acquired and at least 50% in the aggregate of their investment in securities of Resolution Performance Inc. made on or after November 14, 2000 or (iii) at such time as Apollo Management and its affiliates cease to own in the aggregate at least 50% of the outstanding shares of common stock of Resolution Performance Inc. on a fully diluted basis.
Effective January 1, 2003, the terms of the management consulting agreement were amended to waive payment of the annual management fee to Apollo during 2003 only; provided, that if, during any twelve month period ending on the last day of any fiscal quarter during 2003 or 2004, Resolution Performance and its subsidiaries’ consolidated adjusted earnings before interest, taxes, depreciation and amortization (as determined in accordance with Resolution Performance’s historical practices) was $116 million or more, Resolution Performance shall pay to Apollo (i) the quarterly installments of the annual management fee for the remainder of 2003 and thereafter and (ii) 125% of the amount of the quarterly installments of the annual management fee which were waived during 2003.
This agreement was terminated in connection with the Combinations. See “—Combinations.”
135
Table of Contents
Shareholders’ Agreement
On November 14, 2000, Resolution Performance, entered into a shareholders’ agreement with RPP Holdings LLC, an affiliate of Apollo, and Shell which governed certain aspects of the relationship among Resolution Performance, RPP Holdings and Shell. The shareholders’ agreement contained, among other matters:
| • | restrictions on the transfer of shares of common stock by Shell; |
| • | preemptive rights granted to Shell to purchase equity securities issued by Resolution Performance to RPP Holdings or its affiliates in the amounts required to maintain Shell’s percentage ownership; |
| • | agreement by Shell to consent to the sale of more than 50% of the equity securities of Resolution Performance or substantially all of its assets to a third party if such sale is approved by the Board of Directors of Resolution Performance, and to sell its shares of common stock if so required; |
| • | rights of Shell to participate in certain transfers of common stock by RPP Holdings other than to an affiliate; |
| • | rights of Shell to receive financial information; and |
| • | prohibitions on transactions between Resolution Performance and its affiliates, subject to certain exceptions. |
The shareholders’ agreement terminates upon the earlier of a sale of Resolution Performance and the consummation of a public equity offering that raises net proceeds of at least $100 million.
Investor Rights Agreement
On November 14, 2000, Resolution Performance entered into an investor rights agreement with RPP Holdings and members of management who own stock, options and/or junior subordinated notes of Resolution Performance which governs certain aspects of the relationship among Resolution Performance, RPP Holdings and the management holders. The investor rights agreement contains, among other matters:
| • | restrictions on the transfer of shares of common stock, options and junior subordinated notes by the management holders; |
| • | rights of Resolution Performance and RPP Holdings to purchase common stock and junior subordinated notes in the event of certain permitted transfers by the management holders; |
| • | agreement by the management holders to consent to the sale of more than 50% of the equity securities of Resolution Performance or substantially all of its assets to a third party and to sell their shares of common stock if so required; |
| • | rights of the management holders to participate in certain transfers of common stock and junior subordinated notes by RPP Holdings other than to an affiliate; |
| • | repurchase rights of Resolution Performance and RPP Holdings in the event of termination of employment of the management holders; and |
| • | restrictions on sales of common stock and junior subordinated notes by the management holders in the event of an initial public offering. |
The investor rights agreement terminates upon the earlier of a sale of Resolution Performance or approval by holders holding a majority of the common stock of Resolution Performance and the vote of the common stock of Resolution Performance owned by RPP Holdings.
This agreement was amended and restated by the Investor Rights Agreement described under “—Combinations.”
136
Table of Contents
Shell Registration Rights Agreement
On November 14, 2000, Resolution Performance entered into a registration rights agreement with Shell pursuant to which Shell had incidental registration rights to include its Resolution Performance common stock in the same or concurrent registration statement filed by Resolution Performance for the registration of Resolution Performance common stock under the Securities Act. Resolution Performance would have bore all expenses, other than selling expenses, incurred in the registration process. The registration rights agreement also contained customary provisions with respect to registration procedures, underwritten offerings and indemnification and contribution rights.
This agreement was terminated in connection with the Combinations.
Resolution Performance Holdings Registration Rights Agreement
On November 14, 2000, Resolution Performance entered into a registration rights agreement with RPP Holdings pursuant to which RPP Holdings had demand and incidental registration rights. As a result, at RPP Holdings’ request, Resolution Performance was obliged to prepare and file a registration statement covering the securities so requested to be registered by RPP Holdings. In addition, should Resolution Performance propose to register any of its common stock for sale to the public, RPP Holdings had the right to include its Resolution Performance common stock in the same or concurrent registration statement filed by Resolution Performance for the registration of Resolution Performance common stock under the Securities Act. Resolution Performance would have bore all expenses, other than selling expenses, incurred in the registration process. The registration rights agreement also contained customary provisions with respect to registration procedures, underwritten offerings and indemnification and contribution rights.
This agreement has been amended and restated by the Investor Rights Agreement described under “—Combinations” and is no longer in effect.
Management Promissory Notes and Other Indebtedness
In June 2001, Mark Antonvich borrowed $100,000 from Resolution Performance to finance in part his purchase of 600 shares of Resolution Performance stock and $140,000 principal amount of Resolution Performance junior subordinated notes; and in August 2001, Jeffrey M. Nodland borrowed $250,000 from Resolution Performance to finance in part his purchase of 545.4545 shares of Resolution Performance stock and $350,000 principal amount of Resolution Performance junior subordinated notes. Interest payable on each promissory note accrued at an annual rate of 10.75%. At December 31, 2005, 100% of principal and accrued interest of both loans was paid.
Other Payments or Dividends to Affiliates
Resolution Performance paid approximately $5 million and $4 million related to certain freight costs to Quality Distribution, an affiliate of Apollo, for the year ended December 31, 2003 and 2002, respectively. Resolution Performance believes the amounts paid to Quality Distribution were fair and at arm’s length terms.
During 2003, Resolution Performance paid approximately $4 million to Shell on behalf of Resolution Performance, of which $2 million was previously accrued, for certain pension costs in accordance the Master Sales Agreement and related ancillary agreements. During 2001, Resolution Performance paid $0.6 million for legal and external audit services rendered in the ordinary course of business on behalf of Resolution Performance for legal and external audit services rendered in the ordinary course of business.
During 2003 and 2002, Resolution Performance made payments to Cherry Hill Chemical Investments LLC, an affiliate of Mr. Schlanger, in the amount of $0.1 million each year for administrative support and office space used by Mr. Schlanger and other employees of Resolution Performance. The foregoing transactions were on terms at least as favorable as the terms Resolution Performance could have obtained from an unaffiliated third party at the times of such transactions.
137
Table of Contents
Ongoing Relationship with Shell
In connection with the recapitalization, Resolution Performance, and Shell or their respective affiliates entered into several additional agreements providing for the continuation or transfer and transition of certain aspects of Resolution Performance’s business operations. These agreements were the result of arm’s-length negotiations in connection with the recapitalization, and Resolution Performance believes they are on terms at least as favorable to Resolution Performance as those it could have obtained from unaffiliated third parties at that time. As several of Resolution Performance’s operations are located within or adjacent to sites occupied by Shell’s refinery business and its chemical business many of the agreements provide for Resolution Performance and Shell to supply to each other certain site services, utilities, materials and facilities, or “SUMF” items. The other agreements include ground leases, human resources agreements, environmental indemnity agreements, and intellectual property transfer and license agreements. The terms of these agreements vary widely. For example, certain SUMF items are provided to us by Shell pursuant to SUMF agreements, which have terms ranging from less than five years, for items which we believe we can easily obtain from other third-parties, to twenty years with renewal terms, for items such as the provision of utilities. Similarly, the initial term of our supply agreements with Shell vary from three to ten years. As our supply agreements with Shell expire upon completion of their terms or otherwise, we are uncertain as to the terms upon which we may renew these supply agreements either with Shell or a third party and therefore the duration and level of payments that will be made to Shell pursuant to the supply agreements in the future are not determinable at this time.
For the years ended December 31, 2005, 2004 and 2003 Resolution Performance paid Shell approximately $372 million, $325 million and $289 million, respectively, under the various agreements described above, net of payments made by Shell to us.
Resolution Specialty
Agreements in Connection with Resolution Specialty Transaction
Participation Agreement
All employees and directors that own common stock of Resolution Specialty executed a Participation Agreement with Resolution Specialty Materials Holdings LLC, or Resolution Specialty Holdings, an affiliate of Apollo, pursuant to which they purchased common stock of Resolution Specialty (the “Participation Agreement”).
Investor Rights Agreement
Resolution Specialty entered into an investor rights agreement with Resolution Specialty Holdings, and each of the officers and employees of Resolution Specialty and members of management who own common stock or options of Resolution Specialty, which governs certain aspects of the relationship among Resolution Specialty, Resolution Specialty Holdings and the management holders (the “Investor Rights Agreement”). The Investor Rights Agreement contains, among other matters:
| • | restrictions on the transfer of shares of common stock and options by the management holders; |
| • | rights of Resolution Specialty and Resolution Specialty Holdings to purchase common stock in the event of certain permitted transfers by the management holders; |
| • | agreement by the management holders to consent to the sale of more than 50% of the equity securities of Resolution Specialty or substantially all of its assets to a third party and to sell their shares of common stock if so required; |
| • | rights of the management holders to participate in certain transfers of common stock by Resolution Specialty Holdings other than to an affiliate; |
138
Table of Contents
| • | repurchase rights of Resolution Specialty and Resolution Specialty Holdings in the event of termination of employment of the management holders; and |
| • | restrictions on sales of common stock by the management holders in the event of an initial public offering. |
This agreement has been amended and restated by the Investor Rights Agreement described under “—Combinations” and is no longer in effect.
Registration Rights Agreement
Resolution Specialty entered into a registration rights agreement with Resolution Specialty Holdings pursuant to which Resolution Specialty Holdings has demand and incidental registration rights. As a result, at Resolution Specialty Holdings’ request, Resolution Specialty will be obliged to prepare and file a registration statement covering the securities so requested to be registered by Resolution Specialty Holdings. In addition, should Resolution Specialty propose to register any of its common stock for sale to the public, Resolution Specialty Holdings will have the right to include its common stock in the same or concurrent registration statement filed by Resolution Specialty for the registration of the common stock under the Securities Act. Resolution Specialty will bear all expenses, other than selling expenses, incurred in the registration process. The registration rights agreement also contains customary provisions with respect to registration procedures, underwritten offerings and indemnification and contribution rights.
This agreement was terminated in connection with the Combinations. See “—Combinations.”
Apollo Management Agreement
As of April 1, 2005, Resolution Specialty entered into a management consulting agreement with Apollo (the “Resolution Specialty Management Consulting Agreement”). The Resolution Specialty Management Consulting Agreement provides that Apollo and its affiliates will provide certain advisory services to Resolution Specialty for a ten year period, with an automatic extension of the term for a one year period beginning on the fourth anniversary of the commencement of the agreement and at the end of each year thereafter, unless notice to the contrary is given, provided, however, that the agreement shall automatically terminate upon the sale of the company or an initial public offering of Resolution Specialty’s equity securities meeting certain criteria. Upon termination of the Resolution Specialty Management Consulting Agreement in connection with a sale of the company or an initial public offering, Resolution Specialty shall pay Apollo a lump-sum amount equal to the net present value of the remaining annual management fees owing and payable by Resolution Specialty until the expiration of the Resolution Specialty Management Consulting Agreement determined using an applicable discount rate. The Resolution Specialty Management Consulting Agreement provides a quarterly fee to Apollo equal to $250,000. In addition, Resolution Specialty is also required to pay Apollo a transaction fee if Resolution Specialty engages in any merger (other than the Combinations), acquisition or similar transaction unless Resolution Specialty and Apollo are unable to mutually agree upon the terms of Apollo’s engagement, in which case, Resolution Specialty will be able to retain another special advisor. Under the Resolution Specialty Management Consulting Agreement, Resolution Specialty has also agreed to indemnify Apollo and its affiliates and their directors, officers and representatives for potential losses relating to the services contemplated under this agreement.
This agreement was terminated in connection with the Combinations. See “—Combinations.”
139
Table of Contents
DESCRIPTION OF CERTAIN INDEBTEDNESS
In connection with the Combinations, Hexion assumed all the outstanding indebtedness of Resolution Performance. To the extent such indebtedness is secured, the assets of Hexion and its subsidiaries secure such indebtedness as described below. In connection with the Hexion Refinancings, we made tender offers to repurchase all of our outstanding 8% Senior Secured Notes, 9 1/2% Senior Second Secured Notes and 13 1/2% Senior Subordinated Notes.On May 5, 2006, we accepted tenders from holders of 100% of the outstanding principal amount of the 8% Senior Secured Notes, 99.9% of the outstanding principal amount of the 9 1/2% Senior Second Secured Notes and 88.7% of the outstanding principal amount of the 13 1/2% Senior Subordinated Notes. In the event that not all of the 9 1/2% Senior Second Secured Notes or 13 1/2% Senior Subordinated Notes are repurchased pursuant to the tender offers, we expect to borrow under our new senior secured credit facilities to redeem any outstanding 9 1/2% Senior Second Secured Notes and 13 1/2% Senior Subordinated Notes shortly after the completion of the tender offers. We do not expect to incur any material additional costs in connection with any such redemptions. In connection with the tender offers, we received the required consents with respect to each series of notes to eliminate substantially all of the restrictive covenants and certain events of default included in the indentures under which such notes were issued. We expect that after giving effect to the Hexion Refinancings, Hexion will have the following secured indebtedness outstanding:
| • | the New Senior Secured Credit Facilities; and |
| • | the Original Floating Rate Notes, the New Floating Rates Notes and the Fixed Rate Notes, collectively the “Other Second-Priority Indebtedness.” |
Each of the foregoing are secured by separate collateral agreements with substantially identical terms and covering substantially identical collateral subject to exceptions for foreign collateral pledged in favor of lenders under the senior secured credit facilities. In addition, HA-International, LLC and non-U.S. subsidiaries in countries including Australia, Brazil, Italy, Finland and Korea have various secured credit facilities and other arrangements with lenders.
First-Priority Lien Obligations
New Senior Secured Credit Facilities
In May 2006, we obtained new senior secured credit facilities, replacing our previously existing term loan and synthetic letter of credit facilities, as described below. In addition, we continue to have access to our previously existing revolving credit facility on the amended terms described below. We refer to these senior secured credit facilities (including the revolving credit facility, as amended) as the “new senior secured credit facilities” in this prospectus. The key terms of our new senior secured credit facilities are described below.
Our new senior secured credit facilities provide for a five-year, subject to adjustment as described below, $225 million revolving credit facility, which includes:
| • | revolving credit subfacilities for Hexion, Hexion Canada, as the Canadian subsidiary borrower, Hexion Specialty Chemicals UK Limited and Borden Chemical UK Limited, as the U.K. subsidiary borrowers and Hexion Specialty Chemicals B.V., as the Dutch subsidiary borrower; |
| • | a letter of credit subfacility of $100 million to be made available for our account and the accounts of Hexion and our Canadian, U.K., and Dutch subsidiary borrowers; and |
| • | a $30 million swingline loan subfacility to be made available for our account and the accounts of Hexion and the U.K. and Dutch subsidiary borrowers. |
We and our Canadian, U.K. and Dutch subsidiary borrowers will use our revolving credit facility for, among other things, our and our respective subsidiaries’ working capital and other general corporate purposes, including, without limitation, effecting permitted acquisitions and investments.
140
Table of Contents
Our new senior secured credit facilities also provide for a seven-year, subject to adjustment as described below, $1,625 million term loan facility.
Our new senior secured credit facilities also provide for a seven-year, subject to adjustment as described below, $50 million synthetic letter of credit facility under which $50 million was deposited by lenders to be used to fund any drawn letters of credit under the facility. This facility is available for letters of credit for our account, and we will use this facility to replace the previously existing $50 million synthetic letter of credit facility.
Our new senior secured credit facilities are subject to early maturity on any date that greater than $200 million in the aggregate principal amount of certain of our and our subsidiaries’ indebtedness will mature within 91 days of such date.
Our new senior secured credit facilities also permit us to obtain up to an additional $200 million of credit facilities (the “additional credit facilities”) from lenders reasonably satisfactory to the administrative agent and us, without the consent of the existing lenders under our new senior secured credit facilities.
Scheduled Amortization Payments and Mandatory Prepayments
Our term loan facility and our synthetic letter of credit facility under the new senior secured credit facilities provide for quarterly and annual amortization payments, respectively, in each case totaling 1% per annum, with the balance payable or returnable, respectively, upon the final maturity date.
In addition, our new senior secured credit facilities require us to prepay outstanding term loans subject to certain exclusions, with:
| • | 100% of the net cash proceeds of asset sales and dispositions; |
| • | if our senior secured bank leverage ratio is greater than 2.75:1.0, 50% of our excess cash flow; |
| • | if our senior secured bank leverage ratio is greater than 2.75:1.0, 100% of the net cash proceeds received from issuances of debt, subject to exclusions with respect to debt that we and our subsidiaries may incur under the negative covenants. |
Voluntary Prepayments and Reduction and Termination of Commitments
We may voluntarily prepay loans and permanently reduce the loan commitments or return synthetic letter of credit deposits under our new senior secured credit facilities at any time without premium or penalty, subject to the payment of customary LIBOR or EURO LIBOR breakage costs, if any. The revolving loan commitment and the synthetic letter of credit facility commitment may not be reduced to less than the outstanding balance of loans (in the case of the revolving loan commitment) and letter of credit obligations under such commitment on the date of such reduction. In addition, we may terminate our new senior secured credit facilities without paying a premium or penalty upon prior written notice, and, in some cases, we may revoke such notice. Upon termination, we will be required to repay all obligations outstanding under our new senior secured credit facilities and to satisfy all outstanding letter of credit obligations.
Interest and Applicable Margins
The interest rates with respect to term loans to Hexion and to the Dutch subsidiary borrower under our new senior secured credit facilities are based on, at our option, adjusted LIBOR (or EURO LIBOR for the Dutch subsidiary borrower) plus 2.00% or a Dollar base rate plus 0.50%.
The interest rates with respect to revolving loans to Hexion under our new senior secured credit facilities are based on, at our option, adjusted LIBOR plus 2.50% or a Dollar base rate plus 1.00%.
141
Table of Contents
The interest rates with respect to revolving loans to the Canadian subsidiary borrower under our new senior secured credit facilities are based on (a) for loans made in dollars, at our option, adjusted LIBOR plus 2.50% or a base rate (based on a reference rate for Dollar denominated loans made in Canada) plus 1.00%, or (b) for loans made in Canadian Dollars, at our option, a Canadian Bankers’ Acceptances rate plus 2.50% or a Canadian Dollar base rate plus 1.00%.
The interest rates with respect to revolving loans to the U.K. subsidiary borrowers under our new senior secured credit facilities are based on (a) for loans made in dollars, at our option, adjusted LIBOR plus 2.50% or a Dollar base rate plus 1.00%, (b) for loans made in Sterling, at our option, adjusted LIBOR plus 2.50% or a Sterling base rate plus 1.00% or (c) for loans made in euros, at our option, EURO LIBOR plus 2.50% or a Euro base rate plus 1.00%.
The interest rates with respect to revolving loans to the Dutch subsidiary borrower under our new senior secured credit facilities are based on, at our option, EURO LIBOR plus 2.50% or a Euro base rate plus 1.00%.
These applicable margins are, with respect to loans under our revolving credit facility, subject to prospective adjustment on a quarterly basis depending on our consolidated leverage ratio and, with respect to term loans under our new senior secured credit facilities, subject to prospective adjustment depending on our corporate credit ratings. Following and during the continuance of an event of default, overdue amounts owing under our new senior secured credit facilities will bear interest at a rate per annum equal to the rate otherwise applicable thereto plus an additional 2.0%.
Guarantees and Collateral
Our obligations under our new senior secured credit facilities and under any interest rate protection or other hedging arrangements entered into with a lender or any affiliate thereof and under cash management lines of credit with a lender, any affiliate thereof or certain other financial institutions are guaranteed (i) prior to the initial public offering of our common stock, by our immediate parent, Hexion LLC (the successor by conversion to BHI Acquisition Corp.), and (ii) at all times, by each of our existing and subsequently acquired or organized material domestic subsidiaries, excluding HA-International, LLC. All obligations of the foreign subsidiary borrowers are guaranteed (i) prior to the initial public offering of our common stock, by Hexion LLC and (ii) at all times, by us, the U.S. subsidiary guarantors, the other foreign subsidiary borrowers and our and their respective material subsidiaries in the United States, the United Kingdom, Germany, the Netherlands and Canada (excluding subsidiaries in the United Kingdom, Germany and the United States that are unrestricted subsidiaries) and Resolution lberica Performance Products S.A.
Our new senior secured credit facilities are secured by substantially all the assets of (i) prior to the initial public offering of our common stock, Hexion LLC, which consists of a perfected first-priority pledge of all our capital stock and (ii) at all times, us and the subsidiary guarantors, including but not limited to: (a) a first-priority pledge of substantially all capital stock held by us or any subsidiary guarantor (which pledge, with respect to obligations in respect of the U.S. borrowings secured by a pledge of the stock of any first-tier foreign subsidiary, shall be limited to 100% of the non-voting stock (if any) and 65% of the voting stock of such foreign subsidiary) and (b) perfected first-priority security interests in, and mortgages on, substantially all tangible and intangible assets of us and each subsidiary guarantor.
Notwithstanding the foregoing, (i) assets of foreign subsidiary guarantors only secure obligations in respect of the foreign borrowings, (ii) subject to certain exceptions, the collateral does not include (A) any real estate, fixtures or equipment of us or any of our subsidiaries located within the United States (except for assets that our board of directors determines do not constitute principal property under the indentures for our debentures due 2016, 2021 and 2023) and (B) any capital stock or evidence of indebtedness for borrowed money of certain subsidiaries held by us or our subsidiaries and (iii) assets of Hexion LLC, us or our domestic subsidiaries do not secure term loan obligations of our Dutch subsidiary borrower.
142
Table of Contents
Covenants
Our new senior secured credit facilities contain financial, affirmative and negative covenants that we believe are usual and customary for a senior secured credit agreement. The negative covenants in the new senior secured credit facilities include, among other things, limitations (none of which are absolute) on our ability to:
| • | declare dividends and make other distributions; |
| • | redeem or repurchase our capital stock; |
| • | prepay, redeem or repurchase certain of our subordinated indebtedness; |
| • | make loans or investments (including acquisitions); |
| • | incur additional indebtedness, except that we may incur indebtedness (other than first-lien indebtedness) so long as our consolidated leverage ratio is not greater than 5.0:1.0; |
| • | grant liens so long as our senior secured bank leverage ratio is not greater than 2.75:1.0 and certain other limitations are complied with; |
| • | enter into sale-leaseback transactions; |
| • | modify the terms of subordinated debt or other material agreements; |
| • | change our fiscal year; |
| • | restrict dividends from our subsidiaries or restrict liens; |
| • | enter into new lines of business; |
| • | recapitalize, merge, consolidate or enter into acquisitions; |
| • | sell our assets; and |
| • | enter into transactions with our affiliates. |
In addition, our new senior secured credit facilities require us to maintain the following financial covenants:
| • | a maximum senior secured bank leverage ratio; and |
| • | a maximum capital expenditure limitation. |
Events of Default
Events of default under our new senior secured credit facilities include, without limitation, nonpayment, misrepresentations, breach of covenants, insolvency, bankruptcy, certain judgments, change of control (as defined in the credit agreement that governs our new senior secured credit facilities) and cross-defaults.
International Credit Facilities
We also have additional international credit facilities that provide liquidity to our local businesses in local currencies, in countries including Australia, Brazil, Finland, Italy and Korea. As of March 31, 2006, our international facilities provided availability totaling approximately $126 million, based on exchange rates as of such date, of which $69 million is available.
In connection with the Bakelite Transaction, we assumed $61 million of international credit facilities, primarily in Finland, Italy and Korea. The assumption of this debt reduced the Bakelite Acquisition cash purchase price dollar-for-dollar.
143
Table of Contents
Other Second-Priority Indebtedness
Original Notes
General
On August 12, 2004, two finance subsidiaries of Borden Chemical (the “Original Note Issuers”) issued $150 million in aggregate principal amount of the Original Floating Rate Notes and $325 million in aggregate principal amount of the Fixed Rate Notes. The Original Floating Rate Notes bear interest at a floating rate based on the London Interbank Rate payable quarterly in arrears, on January 15, April 15, July 15 and October 15 of each year. The Fixed Rate Notes bear interest at a rate per annum equal to 9%, payable semi-annually in arrears, on January 15 and July 15 of each year. The Original Floating Rate Notes mature on July 15, 2010. The Fixed Rate Notes mature on July 15, 2014. As of March 31, 2006, the total amount of principal and accrued interest outstanding under the Original Floating Rate Notes and Original Fixed Rate Notes was $153 million and $331 million, respectively. The Fixed Rate Notes and the Original Floating Rate Notes are guaranteed, jointly and severally, on a senior secured basis, by Hexion and certain of its existing and future domestic subsidiaries that guarantee our obligations under our senior secured credit facilities. The Fixed Rate Notes and the Original Floating Rate Notes and the related guarantees are secured by a second-priority lien, subject to permitted liens, on all of Hexion’s domestic assets (subject to certain exceptions) that secure its obligations under the senior secured credit facilities and a portion of the capital stock of its direct and indirect domestic subsidiaries and direct foreign subsidiaries. The liens securing the Fixed Rate Notes and the Original Floating Rate Notes will be equal in priority to, and cover the same collateral as, the liens securing our 9 1/2% Senior Second Secured Notes and our Fixed Rate Notes. By virtue of the lien priority, the Fixed Rate Notes and the Original Floating Rate Notes are effectively subordinated to the obligations under our senior secured credit facilities and our 8% Senior Secured Notes to the extent of the value of the collateral securing such obligations.
Optional Redemption
Original Floating Rate Notes
On and after July 15, 2006, the Original Note Issuers may redeem the Original Floating Rate Notes at their option, in whole at any time or in part from time to time, upon not less than 30 nor more than 60 days’ prior notice mailed by first-class mail to each holder’s registered address, at the following redemption prices (expressed as a percentage of principal amount), plus accrued and unpaid interest and additional interest, if any, to the redemption date (subject to the right of holders of record on the relevant record date to receive interest due on the relevant interest payment date), if redeemed during the 12-month period commencing on July 15 of the years set forth below:
Period Redemption Price | |||
2006 | 102.00 | % | |
2007 | 101.00 | % | |
2008 and thereafter | 100.00 | % |
144
Table of Contents
Fixed Rate Notes
On and after July 15, 2009, the Original Note Issuers may redeem the Fixed Rate Notes at their option, in whole at any time or in part from time to time, upon not less than 30 nor more than 60 days’ prior notice mailed by first-class mail to each holder’s registered address, at the following redemption prices (expressed as a percentage of principal amount), plus accrued and unpaid interest and additional interest, if any, to the redemption date (subject to the right of holders of record on the relevant record date to receive interest due on the relevant interest payment date), if redeemed during the 12-month period commencing on July 15 of the years set forth below:
Period Redemption Price | |||
2009 | 104.50 | % | |
2010 | 103.00 | % | |
2011 | 101.50 | % | |
2012 and thereafter | 100.00 | % |
In addition, prior to July 15, 2009, the Original Note Issuers may redeem the Fixed Rate Notes at their option, in whole at any time or in part from time to time, upon not less than 30 nor more than 60 days’ prior notice mailed by first-class mail to each holder’s registered address, at a redemption price equal to 100% of the principal amount of the Fixed Rate Notes redeemed plus make-whole premium as of, and accrued and unpaid interest and additional interest, if any, to, the applicable redemption date (subject to the right of holders of record on the relevant record date to receive interest due on the relevant interest payment date).
Change of Control
If we experience a change of control, we will be required to make an offer to repurchase the Fixed Rate Notes and the Original Floating Rate Notes at a price equal to 101% of their principal amount, plus accrued and unpaid interest, if any, to the date of repurchase.
Covenants
The indenture that governs the Fixed Rate Notes and the Original Floating Rate Notes contains covenants that, among other things, limits our ability and the ability of certain of our subsidiaries to:
| • | incur or guarantee additional indebtedness or issue preferred stock; |
| • | grant liens on assets; |
| • | pay dividends or make distributions to our stockholders; |
| • | repurchase or redeem capital stock or subordinated indebtedness; |
| • | make investments or acquisitions; |
| • | enter into sale/leaseback transactions; |
| • | incur restrictions on the ability of our subsidiaries to pay dividends or to make other payments to us; |
| • | enter into transactions with our affiliates; |
| • | merge or consolidate with other companies or transfer all or substantially all of our assets; and |
| • | transfer or sell assets. |
In addition, the Fixed Rate Notes and the Original Floating Rate Notes specify events of default including failure to pay principal and interest on the Fixed Rate Notes and the Original Floating Rate Notes, a failure to comply with covenants and certain bankruptcy, insolvency or reorganization events with respect to Hexion.
145
Table of Contents
On May 20, 2005, we issued $150 million aggregate principal amount of New Floating Rate Notes with, except as described below, substantially identical terms to the Original Floating Rate Notes described above. The New Floating Rate Notes are not fungible with the Original Floating Rate Notes described above.
The New Floating Rate Notes bear interest at LIBOR plus 5.50%. We will pay interest on the New Floating Rate Notes semiannually on each January 15, April 15, July 15, October 15 commencing on July 15, 2005.
Unsecured Indebtedness
Industrial Revenue Bonds
General
The Industrial Revenue Bonds, or IRBs, consist of a $34 million Parish of Ascension, State of Louisiana Pollution Control Revenue Refunding Bond issued in connection with the funding of certain environmental compliance equipment at one of Hexion’s former facilities. The IRBs are due on December 1, 2009 and are tax exempt for as long as the equipment can be used for its original environmental compliance purpose.
Guaranty
Hexion’s obligations under the IRBs are unconditionally guaranteed by Hexion and its U.K. and Canadian subsidiaries. The guarantee of the U.K. subsidiaries is limited to $30 million for each U.K. subsidiary.
Rankings
The IRBs rank equally in right of payment with all of Hexion’s existing and future senior indebtedness and rank senior in right of payment to all of its existing and future subordinated indebtedness. The IRBs have no underlying assets to secure the payment of principal or interest related thereto.
Interest Rates
The IRBs bear interest at an annual rate of 10% and are intended to be tax exempt to the holder.
Optional Redemption
None.
Mandatory Redemption
The IRBs are subject to mandatory redemption at face amount plus accrued interest through the date of redemption, 180 days after a determination by a court as to a loss in tax exemption of the IRBs.
Change of Control
The change of control provisions with respect to the IRB guarantees are the same as the 8 3/8% Debentures, except certain provisions also apply to the guarantors of the IRBs.
In addition, in the event of both (a) a Designated Event (as defined below) and (b) a Rating Decline (as defined below), each holder has the right to require Hexion to purchase such holder’s IRBs at 100% of the principal amount thereof, plus accrued interest.
“Designated Event” means (i) a person becomes the beneficial owner of more than 30% of Hexion’s voting stock, (ii) during any period of two consecutive years, continuing directors cease to constitute a majority, (iii) consolidation, merger or transfer or lease of all or substantially all of its assets and its voting stock is changed
146
Table of Contents
into or exchanged for cash securities or other property, except for transaction with subsidiaries or involving exchange of Hexion’s voting stock as consideration in the acquisition of another business without change of its outstanding voting stock into or for cash, securities or other property, (iv) Hexion acquires 30% or more of its voting stock within any 12-month period, or (v) any distribution and the sum of the fair market value of such distribution, plus the fair market value of all other such distributions occurring during the preceding 12-month period, is at least 30% of the fair market value of Hexion’s voting stock.
“Rating Decline” shall be deemed to have occurred if on any date within the 90-day period following public notice of the occurrence of a Designated Event, in the event the IRBs are (i) investment grade, the rating falls below investment grade, or (ii) below investment grade, falls at least one full rating category. The 90-day period would be extended so long as the IRBs were under publicly announced consideration for possible downgrade by a rating agency, if applicable.
Covenants
The IRB guarantees are subject to substantially the same covenants described above with respect to the 8 3/8% Debentures. There are also other covenants applicable to the guarantors, including restrictions with respect to mergers, consolidations and conveyances of all or substantially all of their assets, and limitations on the payment of intercompany obligations upon an event of default with respect to the guarantees. The IRB guarantees restrict the foreign guarantors from entering into guarantees of the debts or obligations of other entities.
Events of Default
The IRBs and the related guarantees specify events of default including failure to pay principal and interest on the IRBs, a failure to comply with covenants, subject to a 30-day grace period in certain instances, certain bankruptcy events, loss of tax exempt status and certain cross defaults.
Senior Unsecured Debentures
General
Borden Chemical has sold, on four occasions, senior unsecured debentures, which are referred to collectively as the Debentures, each with separate maturity dates and interest rates. Borden Chemical redeemed its 9 1/4% Debentures concurrently with the closing of the Borden Acquisition. The following table sets forth certain information about the Debentures that remain outstanding:
| Rate | Maturity Date | Original Face Value | Outstanding as of December 31, 2005 | Sinking Fund Requirements | ||||||
| 7 7/8% | February 15, 2023 | $ | 250,000,000 | $ | 246,782,000 | None | ||||
| 8 3/8% | April 15, 2016 | 200,000,000 | 78,000,000 | 2007 to 2015 $20 million per year(1) | ||||||
| 9 2/10% | March 15, 2021 | 200,000,000 | 114,800,000 | None | ||||||
| (1) | Previous buybacks of Borden Chemical’s Debentures will allow us to fulfill our sinking fund requirements through 2013 for its 8 3/8% Debentures. |
Rankings
The Debentures rank equally in right of payment with all of Hexion’s existing and future senior indebtedness and rank senior in right of payment to all of Hexion’s existing and future subordinated indebtedness. These Debentures are not secured and, as such, have no underlying assets to secure the payment of principal or interest.
147
Table of Contents
Optional Redemption
The 8 3/8% Debentures may not be redeemed prior to April 15, 2006. Thereafter the 8 3/8% Debentures may be redeemed at par, plus accrued and unpaid interest. The 9 2/10% Debentures and the 7 7/8% Debentures are not redeemable prior to their respective maturity dates.
Mandatory Redemption
Except as described above in “—General,” Hexion is not required to make mandatory redemption or sinking fund payments with respect to the Debentures.
Change of Control
In the event of a Change in Control (as defined below), a holder has the right to require us to buy such holder’s 8 3/8% Debentures at 100% of their principal amount, plus accrued and unpaid interest.
“Change in Control” shall be deemed to have occurred at such time as any person is or becomes the beneficial owner of shares of Hexion’s stock entitling such person to exercise 20% or more of the total voting power of all classes of Hexion’s stock entitled to vote in elections of directors; provided, however, that a Change in Control shall not be deemed to have occurred if such event is approved by a majority of the continuing directors (as defined in the prospectus related to the 8 3/8% Debentures).
The 9 2/10% Debentures and the 7 7/8% Debentures do not contain provisions relating to a Change in Control.
Covenants
Under the terms of the indentures governing the Debentures, Hexion is subject to covenants that, among other things, restrict its ability to create liens on its assets, incur debt at its subsidiaries or enter into sale leaseback transactions.
Events of Default
The Debentures specify events of default including failure to pay principal and interest on the Debentures, a failure to comply with covenants, subject to a 90-day grace period in certain instances, and certain bankruptcy, insolvency or reorganization events with respect to us.
148
Table of Contents
The following is a description of the material provisions of our capital stock, as well as other material terms of our amended and restated certificate of incorporation and bylaws as they will be in effect as of the consummation of the offering. We expect to amend and restate our certificate of incorporation shortly before completion of the offering to establish the terms of the common stock as described below. We refer you to the form of our amended and restated certificate of incorporation and the form of our amended and restated bylaws, copies of which will be filed as exhibits to the registration statement of which this prospectus forms a part.
General
Upon completion of the offering, our authorized capital stock will consist of (i) 500,000,000 shares of common stock, par value $0.01 per share, of which 86,260,551 shares will be issued and outstanding, and (ii) 100,000,000 shares of preferred stock, par value $0.01 per share. Upon completion of the offering, 100,000,000 shares of authorized preferred stock will be undesignated of which no shares will be issued and outstanding. On May 12, 2006, we used a portion of the borrowings under our new senior secured credit facilities to redeem all of our issued and outstanding Series A Preferred Stock and pay related premiums, fees and expenses.
Common Stock
The holders of our common stock are entitled to dividends as our board of directors may declare from time to time from funds legally available therefor. See “Dividend Policy.”
The holders of our common stock are entitled to one vote for each share held of record on any matter to be voted upon by shareholders. Our amended and restated certificate of incorporation does not provide for cumulative voting in connection with the election of directors, and, accordingly, holders of more than 50% of the shares voting will be able to elect all the directors. There are no preemptive, conversion, redemption or sinking fund provisions applicable to our common stock.
Upon any voluntary or involuntary liquidation, dissolution or winding up of our affairs, the holders of our common stock are entitled to share ratably in all assets remaining after payment to creditors and subject to prior distribution rights of any outstanding shares of preferred stock. All the outstanding shares of common stock are, and the shares offered by us will be, fully paid and non-assessable.
Preferred Stock
Our amended and restated certificate of incorporation authorizes our board of directors to establish one or more series of preferred stock and to determine, with respect to any series of preferred stock, the terms and rights of that series, including:
| • | the designation of the series; |
| • | the number of shares of the series, which our board of directors may, except where otherwise provided in the preferred stock designation, increase (but not above the total number of authorized shares of the class) or decrease (but not below the number of shares then outstanding); |
| • | whether dividends, if any, will be cumulative or non-cumulative and the dividend rate of the series; |
| • | the dates at which dividends, if any, will be payable; |
| • | the redemption rights and price or prices, if any, for shares of the series; |
| • | the terms and amounts of any sinking fund provided for the purchase or redemption of shares of the series; |
149
Table of Contents
| • | the amounts payable on shares of the series in the event of any voluntary or involuntary liquidation, dissolution or winding-up of the affairs of our company; |
| • | whether the shares of the series will be convertible into shares of any other class or series, or any other security, of our company or any other corporation, and, if so, the specification of the other class or series or other security, the conversion price or prices or rate or rates, any rate adjustments, the date or dates as of which the shares will be convertible and all other terms and conditions upon which the conversion may be made; |
| • | restrictions on the issuance of shares of the same series or of any other class or series; and |
| • | the voting rights, if any, of the holders of the series. |
Series A Floating Rate Preferred Stock
On May 20, 2005, we issued 14,000,000 shares of Series A Floating Rate Preferred Stock, par value $0.01 per share with a liquidation preference of $25 per share (the “Series A Preferred Stock”). On May 12, 2006, we redeemed all of the outstanding shares of the Series A Floating Rate Preferred Stock with a portion of the borrowings under our new senior secured credit facilities.
Composition of Board of Directors; Election and Removal of Directors
In accordance with our amended and restated by-laws, the number of directors comprising our board of directors will be as determined from time to time by our board of directors. Upon the closing of the offering, it is anticipated that we will have ten directors. We currently expect to add three additional independent directors prior to the completion of this offering. Each director is to hold office until his or her successor is duly elected and qualified or until his or her earlier death, resignation or removal. At any meeting of our board of directors, a majority of the total number of directors then in office will constitute a quorum for all purposes.
Our amended and restated certificate of incorporation will provide that, from and after the first annual meeting of shareholders subsequent to the offering, our board of directors will be divided into three classes of directors, with the classes to be as nearly equal in number as possible. As a result, approximately one-third of our board of directors will be elected each year. The classification of directors will have the effect of making it more difficult for shareholders to change the composition of our board.
Under the New Jersey Business Corporation Act, unless otherwise provided in our amended and restated certificate of incorporation, directors serving on a classified board may be removed by the shareholders only for cause. Our amended and restated certificate of incorporation will not make an exception to this rule. In addition, our amended and restated certificate of incorporation and bylaws will provide that any vacancies on our board of directors will be filled only by the affirmative vote of a majority of the remaining directors, although less than a quorum.
Special Meetings of Shareholders
Our amended and restated certificate of incorporation and amended and restated bylaws will provide that special meetings of the shareholders may be called by the board of directors, the chairman, the chief executive officer or the president.
Provisions of our Amended and Restated Certificate of Incorporation, Amended and Restated Bylaws that May Have an Anti-Takeover Effect
Certain provisions in our amended and restated certificate of incorporation and amended and restated bylaws summarized below may be deemed to have an anti-takeover effect and may delay, deter or prevent a tender offer or takeover attempt that a shareholder might consider to be in its best interests, including attempts that might result in a premium being paid over the market price for the shares held by shareholders.
150
Table of Contents
No Shareholders Action by Written Consent
Our amended and restated certificate of incorporation and amended and restated bylaws will prohibit shareholder action by written consent.
Advance Notice Requirements for Shareholder Proposals and Director Nominations
Our amended and restated bylaws will provide that shareholders seeking to nominate candidates for election as directors or to bring business before an annual meeting of shareholders must provide timely notice of their proposal in writing to the corporate secretary.
Generally, to be timely, a shareholder’s notice must be received at our principal executive offices not less than 90 days nor more than 120 days prior to the first anniversary date of the previous year’s annual meeting. Our amended and restated bylaws also specify requirements as to the form and content of a shareholder’s notice. These provisions may impede shareholders’ ability to bring matters before an annual meeting of shareholders or make nominations for directors at an annual meeting of shareholders.
Supermajority Board Voting Requirements
See the discussion under the heading “Management—Supermajority Board Approval of Certain Matters,” relating to circumstances under which more than a simple majority of our board of directors may be required under our amended and restated certificate of incorporation to approve certain matters.
All the foregoing proposed provisions of our amended and restated certificate of incorporation and amended and restated bylaws could discourage potential acquisition proposals and could delay or prevent a change in control. These provisions are intended to enhance the likelihood of continuity and stability in the composition of the board of directors and in the policies formulated by the board of directors and to discourage certain types of transactions that may involve an actual or threatened change of control. These provisions are designed to reduce our vulnerability to an unsolicited acquisition proposal. The provisions also are intended to discourage certain tactics that may be used in proxy fights. These same provisions may delay, deter or prevent a tender offer or takeover attempt that a shareholder might consider to be in its best interest. Such provisions could have the effect of discouraging others from making tender offers for our shares and, as a consequence, they also may inhibit fluctuations in the market price of our common stock that could result from actual or rumored takeover attempts. Such provisions also may have the effect of preventing changes in our management.
Board Authority to Designate and Issue Preferred Stock Without Shareholder Approval
Our amended and restated certificate of incorporation will provide that our board of directors may authorize one or more series of preferred stock, may designate the voting rights (if any), preferences and relative, participating, optional or other special rights and qualifications, limitations or restrictions of such preferred stock, and may further fix or alter the number of shares comprising any series of such preferred stock, all subject to the requirements of the New Jersey Business Corporation Act.
Shareholders Protection Act
A provision of New Jersey law, the New Jersey Shareholders Protection Act, prohibits certain transactions involving an “interested shareholder” and a New Jersey corporation that has its principal executive office or significant business operations in New Jersey. An “interested shareholder” is generally defined as one who is the beneficial owner, directly or indirectly, of 10% or more of the voting power of the outstanding stock of the corporation. If the Shareholders Protection Act is deemed to apply to Hexion, it would prohibit certain business combinations between an interested shareholder and Hexion for a period of five years after the date the interested shareholder first acquired 10% of the voting power of our outstanding shares, unless the transaction was approved by our board of directors prior to the time the interested shareholder acquired his, her or its shares. After the five year period expires, the prohibition on business combinations with an interested shareholder
151
Table of Contents
continues unless certain conditions are met. The conditions include: (1) the approval of the business combination by our board of directors; (2) the approval of the business combination by a vote of two-thirds of our voting stock not owned by the interested shareholder; and (3) the receipt by our shareholders of a price determined in accordance with a fair price formula set forth in the statute.
Amendment of our Certificate of Incorporation
Under applicable law, our amended and restated certificate of incorporation may be amended only with the affirmative vote of a majority of the outstanding stock entitled to vote thereon; provided that a supermajority vote of the outstanding stock will be required to amend the provisions in our amended and restated certificate of incorporation requiring a supermajority vote of the directors for certain transactions.
Amendment of our By-Laws
Our amended and restated by-laws can be amended by the vote of the holders of a majority of the shares then entitled to vote or by the vote of a majority of our board of directors.
Limitation of Liability and Indemnification
Our amended and restated certificate of incorporation will provide that no director shall be personally liable for monetary damages for breach of any fiduciary duty as a director, except with respect to liability:
| • | for any breach of the director’s duty of loyalty to us or our shareholders; |
| • | for acts or omissions not in good faith or that involve intentional misconduct or a knowing violation of law; |
| • | under Section 14A:6-12 of the New Jersey Business Corporation Act (governing distributions to shareholders); or |
| • | for any transaction from which the director derived any improper personal benefit. |
However, if the New Jersey Business Corporation Act is amended to authorize corporate action further eliminating or limiting the personal liability of directors, then the liability of our directors will be eliminated or limited to the fullest extent permitted by the New Jersey Business Corporation Act, as so amended. The modification or repeal of this provision of our amended and restated certificate of incorporation shall not adversely affect any right or protection of a director existing at the time of such modification or repeal.
Our amended and restated by-laws will provide that we shall, to the fullest extent from time to time permitted by law, indemnify our directors, officers and employees against all liabilities and expenses in any suit or proceeding, arising out of their status as an officer or director or their activities in these capacities. We shall also indemnify any person who, at our request, is or was serving as a director, officer or employee of another corporation, partnership, joint venture, trust or other enterprise.
The right to be indemnified shall include the right of an officer or a director to be paid expenses in advance of the final disposition of any proceeding, provided that, if required by law, we receive an undertaking to repay such amount if it shall be determined that he or she is not entitled to be indemnified.
Our board of directors may take such action as it deems necessary to carry out these indemnification provisions, including adopting procedures for determining and enforcing indemnification rights and purchasing insurance policies. Our board of directors may also adopt by-laws, resolutions or contracts implementing indemnification arrangements as may be permitted by law. Neither the amendment or repeal of these indemnification provisions, nor the adoption of any provision of our amended and restated certificate of incorporation inconsistent with these indemnification provisions, shall eliminate or reduce any rights to indemnification relating to their status or any activities prior to such amendment, repeal or adoption.
We believe these provisions will assist in attracting and retaining qualified individuals to serve as directors.
152
Table of Contents
Listing
Our common stock has been approved for listing on the New York Stock Exchange under the trading symbol “HXN.”
Transfer Agent and Registrar
The transfer agent and registrar for our common stock is National City Bank.
153
Table of Contents
SHARES ELIGIBLE FOR FUTURE SALE
Prior to this offering, there was no market for our common stock. We can make no predictions as to the effect, if any, that sales of shares of common stock or the availability of shares of common stock for sale will have on the market price prevailing from time to time. Nevertheless, future sales or the availability for sale of substantial amounts of our common stock in the public market could adversely affect prevailing market prices and could impair our ability to raise capital through future sales of our securities.
Upon completion of this offering, 86,260,551 shares of common stock will be outstanding (including 954,378 shares related to deferred compensation units), excluding 4,105,148 shares reserved at March 31, 2006 for issuance upon exercise of options that have been granted under our stock option plans. Of these shares, the 18,518,519 shares of common stock sold in this offering will be freely tradable without restriction or further registration under the Securities Act, except for any shares which may be acquired by an affiliate of ours as that term is defined in Rule 144 under the Securities Act, which will be subject to the resale limitations of Rule 144. Of the remaining shares of common stock outstanding, 66,787,654 will be restricted securities, as that term is defined in Rule 144, and may in the future be sold without restriction under the Securities Act to the extent permitted by Rule 144 or any applicable exemption under the Securities Act.
In general, under Rule 144 as currently in effect, a person (or persons whose shares are aggregated) who has beneficially owned its, his or her shares of common stock for at least one year from the date such securities were acquired from us or an affiliate of ours would be entitled to sell within any three-month period a number of shares that does not exceed the greater of one percent of the then-outstanding shares of common stock (approximately 862,606 shares immediately after this offering) and the average weekly trading volume of the common stock during the four calendar weeks preceding a sale by such person. Sales under Rule 144 are also subject to certain manner-of-sale provisions, notice requirements and the availability of current public information about us. Under Rule 144, however, a person who has held restricted securities for a minimum of two years from the later of the date of such securities were acquired from us or an affiliate of ours and who is not, and for the three months prior to the sale of such restricted securities has not been, an affiliate of ours, is free to sell such shares of common stock without regard to the volume, manner-of-sale and the other limitations contained in Rule 144. The foregoing summary of Rule 144 is not intended to be a complete discussion thereof.
Commencing 180 days after the date of this prospectus, approximately 66,787,654 outstanding restricted securities will be eligible for sale under Rule 144 subject to applicable volume limitations, manner of sale and notice requirements.
Following the completion of this offering, we intend to file a registration statement on Form S-8 with the SEC to register approximately 19,059,526 shares of our common stock reserved for issuance or sale under our stock option plans, long-term incentive plan and deferred compensation plan. As of March 31, 2006, there were outstanding options to purchase a total of 4,105,148 shares of common stock. Shares of common stock issuable upon the exercise of options granted or to be granted under our plans will be freely tradable without restriction under the Securities Act, unless such shares are held by an affiliate of ours.
We have agreed that we will not offer, sell, contract to sell, pledge or otherwise dispose of, directly or indirectly, or file with the Securities and Exchange Commission a registration statement under the Securities Act relating to, any shares of our common stock or any securities convertible into or exchangeable or exercisable for any such shares, or publicly disclose the intention to make any offer, sale, pledge, disposition or filing, without the prior written consent of Credit Suisse Securities (USA) LLC for a period of 180 days after the date of this prospectus, subject to specified exceptions.
Our officers, directors and certain existing shareholders have agreed that they will not offer, sell, contract to sell, pledge or otherwise dispose of, directly or indirectly, shares of our common stock or any securities convertible into or exchangeable or exercisable for any such securities, enter into a transaction that would have the same effect, or enter into any swap, hedge or other arrangement that transfers, in whole or in part, any of the
154
Table of Contents
economic consequences of ownership of our common stock, whether any of these transactions are to be settled by delivery of our common stock or other securities, in cash or otherwise, or publicly disclose the intention to make any offer, sale, pledge or disposition, or to enter into any transaction, swap, hedge or other arrangement without, in each case, the prior written consent of Credit Suisse Securities (USA) LLC for a period of 180 days after the date of this prospectus. In addition, it does not restrict transfers of common stock (or any securities convertible into or exercisable or exchangeable for common stock) to any of the following transferees who agree to be bound in writing by the terms of the “lock-up” and who receive such securities in a transfer not involving a disposition for value: (i) any donee of one or more bona fide gifts of common stock; (ii) any trust for the direct or indirect benefit of the locked-up party or a family member whose familial relation is not more remote than first cousin, whether by blood, marriage or adoption; (iii) any beneficiary pursuant to a will or other testamentary document or applicable laws of descent who will remain subject to the lockup; (iv) with respect to any locked-up party that is an investment fund entity that is a limited partnership, limited liability company or equivalent foreign entity, to any other such entity under the control of the locked-up party or its general partner or managing member and/or, (v) with respect to the selling shareholder, the partners, members or stockholders of the selling shareholder, in each case, subject to no further transfer during the “lock-up” period; provided further, however, (1) with respect to any securities involved in any transfers pursuant to the exceptions in (i), (ii) or (iii) above, no filing by any party (transferor or transferee) under the Exchange Act shall be required or voluntarily made in connection with such transfer (other than on Form 5 under the Exchange Act) and (2) with respect to any securities involved in any transfers pursuant to the exceptions in (iv) or (v) above, the transferor shall give notice to Credit Suisse Securities (USA) LLC prior to the filing of any reports on Form 4 under the Exchange Act in connection with such transfer.
The 180-day restricted period described in the two preceding paragraphs will be automatically extended if: (1) during the last 17 days of the 180-day restricted period we issue an earnings release or announce material news or a material event; or (2) prior to the expiration of the 180-day restricted period, we announce that we will release earnings results during the 16-day period beginning on the last day of the 180-day period, in which case the restrictions described in the preceding paragraph will continue to apply until the expiration of the 18-day period beginning on the issuance of the earnings release of the announcement of the material news or material event.
Credit Suisse Securities (USA) LLC has advised us that it has no present intent or arrangement to release any shares subject to a lock-up, and will consider the release of any lock-up on a case-by-case basis. Upon a request to release any shares subject to a lock-up, Credit Suisse Securities (USA) LLC would consider the particular circumstances surrounding the request, including, but not limited to, the length of time before the lock-up expires, the number of shares requested to be released, reasons for the request, the possible impact on the market or our common stock and whether the holder of our shares requesting the release is an officer, director or other affiliate of ours.
We have granted Hexion LLC demand and incidental registration rights with respect to the 66,787,654 shares of common stock owned by it after this offering (64,009,876 shares if the underwriters exercise the over-allotment option in full). See “Certain Relationships and Related Party Transactions.” Prior to this offering, there has been no established market for our common stock, and no predictions can be made about the effect, if any, that market sales of shares of common stock or the availability of such shares for sale will have on the market price prevailing from time to time. Nevertheless, the actual sale of, or the perceived potential for the sale of, common stock in the public market may have an adverse effect on the market price for the common stock.
155
Table of Contents
MATERIAL U.S. FEDERAL TAX CONSEQUENCES
The following discussion describes the material U.S. federal income tax consequences associated with the purchase, ownership, and disposition of our common stock as of the date hereof by Non-U.S. Holders (as defined below). Except where noted, this discussion deals only with common stock held as capital assets and does not address special situations, such as those of:
| • | dealers in securities or currencies, |
| • | financial institutions, |
| • | regulated investment companies, |
| • | real estate investment trusts, |
| • | tax-exempt entities, |
| • | insurance companies, |
| • | persons holding common stock as a part of a hedging, integrated, conversion or constructive sale transaction or a straddle, |
| • | traders in securities that elect to use a mark-to-market method of accounting for their securities holdings, |
| • | persons liable for alternative minimum tax, |
| • | investors in pass-through entities. |
Furthermore, the discussion below is based upon the provisions of the Internal Revenue Code of 1986, as amended (the “Code”), the Treasury regulations promulgated thereunder and administrative and judicial interpretations thereof, all as of the date hereof, and such authorities may be repealed, revoked, modified or subject to differing interpretations, possibly on a retroactive basis, so as to result in U.S. federal income tax consequences different from those discussed below.
A “U.S. Holder” of common stock means a holder that is for U.S. federal income tax purposes:
| • | an individual citizen or resident of the United States, |
| • | a corporation (or other entity taxable as a corporation) created or organized in or under the laws of the United States or any state thereof or the District of Columbia, |
| • | an estate the income of which is subject to U.S. federal income taxation regardless of its source, or |
| • | a trust if it (1) is subject to the primary supervision of a court within the United States and one or more U.S. persons have the authority to control all substantial decisions of the trust or (2) has a valid election in effect under applicable Treasury regulations to be treated as a U.S. person. |
If a partnership or other entity or arrangement treated as a partnership for U.S. federal income tax purposes holds common stock, the tax treatment of a partner will generally depend upon the status of the partner and the activities of the partnership. If you are a partner of a partnership purchasing common stock, we urge you to consult your own tax advisor.
Consequences to Non-U.S. Holders
A “Non-U.S. Holder” is a holder, other than an entity or arrangement classified as a partnership for U.S. federal income tax purposes, that is not a U.S. Holder. Special rules may apply to certain Non-U.S. Holders, such as:
| • | U.S. expatriates, |
| • | “controlled foreign corporations,” |
156
Table of Contents
| • | “passive foreign investment companies,” |
| • | corporations that accumulate earnings to avoid U.S. federal income tax, and investors in pass-through entities that are subject to special treatment under the Code. |
Such Non-U.S. Holders are urged to consult their own tax advisors to determine the U.S. federal, state, local and other tax consequences that may be relevant to them.
Dividends. Dividends paid to you generally will be subject to withholding of U.S. federal income tax at a 30% rate or such lower rate as may be specified by an applicable income tax treaty. However, dividends that are effectively connected with your conduct of a trade or business within the United States and, if a tax treaty applies, are attributable to your U.S. permanent establishment, are not subject to the withholding tax, but instead are subject to U.S. federal income tax on a net income basis in the same manner as if you were a U.S. Holder. Special certification and disclosure requirements must be satisfied for effectively connected income to be exempt from withholding. If you are a foreign corporation, any such effectively connected dividends received by you may be subject to an additional branch profits tax at a 30% rate or such lower rate as may be specified by an applicable income tax treaty.
If you wish to claim the benefit of an applicable treaty rate (and also avoid backup withholding as discussed below) for dividends, you will be required to:
| • | complete IRS Form W-8BEN (or other applicable form) and certify under penalties of perjury that you are not a U.S. person and that you are entitled to the benefits of the applicable treaty, or |
| • | if the shares of our common stock are held through certain foreign intermediaries, satisfy the relevant certification requirements of applicable U.S. Treasury regulations. |
Special certification and other requirements may apply to certain Non-U.S. Holders that are entities rather than individuals.
If you are eligible for a reduced rate of U.S. withholding tax pursuant to an income tax treaty, you may obtain a refund of any excess amounts withheld by filing an appropriate claim for refund with the IRS.
Sale or Exchange of Common Stock. You generally will not be subject to U.S. federal income tax with respect to gain recognized on a sale or other disposition of shares of our common stock unless:
| • | the gain is effectively connected with your conduct of a trade or business in the United States, and if a tax treaty applies, is attributable to your U.S. permanent establishment, |
| • | if you are an individual and hold shares of our common stock as a capital asset, you are present in the United States for 183 or more days in the taxable year of the sale or other disposition, and certain other conditions are met, or |
| • | we are or have been a “U.S. real property holding corporation” for U.S. federal income tax purposes. |
If you are an individual and are described in the first bullet above, you will be subject to tax on the net gain derived from the sale under regular graduated U.S. federal income tax rates in the same manner as if you were a U.S. Holder. If you are an individual and are described in the second bullet above, you will be subject to a flat 30% tax on the gain derived from the sale, which may be offset by U.S. source capital losses (even though you are not considered a resident of the United States). If you are a foreign corporation and are described in the first bullet above, you will be subject to tax on your gain under regular graduated U.S. federal income tax rates in the same manner as if you were a U.S. Holder and, in addition, may be subject to the branch profits tax on your effectively connected earnings and profits at a rate of 30% or at such lower rate as may be specified by an applicable income tax treaty.
157
Table of Contents
We believe we are not, and do not anticipate becoming, a “U.S. real property holding corporation” for U.S. federal income tax purposes.
Information Reporting and Backup Withholding. Under certain circumstances, Treasury regulations require information reporting and backup withholding on certain payments on common stock.
Dividends on common stock paid to a Non-U.S. Holder will generally be exempt from backup withholding, provided the Non-U.S. Holder meets applicable certification requirements or otherwise establishes an exemption. We must report annually to the IRS and to each Non-U.S. Holder the amount of dividends paid to that holder and the U.S. federal withholding tax, if any, withheld with respect to those dividends.
Under United States Treasury Regulations, payments on the sale or redemption of our common stock effected through a foreign office of a broker to its customer generally are not subject to information reporting or backup withholding. However, if the broker is a U.S. person, a controlled foreign corporation, a foreign person 50% or more of whose gross income is effectively connected with a United States trade or business for a specified three-year period, a foreign partnership with significant United States ownership, or a United States branch of a foreign bank or insurance company, then information reporting (but not backup withholding) will be required, unless the broker has in its records documentary evidence that the beneficial owner of the payment is not a U.S. person or is otherwise entitled to an exemption, and other applicable certification requirements are met. Information reporting and backup withholding generally will apply to sale or redemption payments effected at a United States office of any United States or foreign broker, unless the broker has in its records documentary evidence that the beneficial owner of the payment is not a U.S. person or is otherwise entitled to an exemption, and other applicable certification requirements are met.
Backup withholding does not represent an additional income tax. Any amounts withheld from a payment to a holder under the backup withholding rules will be allowed as a credit against the holder’s United States federal income tax liability and may entitle the holder to a refund, provided that the required information or returns are timely furnished by the holder to the IRS.
158
Table of Contents
Under the terms and subject to the conditions contained in an underwriting agreement dated , 2006, we and the selling shareholder have agreed to sell to the underwriters named below, for whom Credit Suisse Securities (USA) LLC, Goldman, Sachs & Co., J.P. Morgan Securities Inc. and Lehman Brothers Inc. are acting as representatives and joint bookrunning managers, and each underwriter has severally agreed to purchase, the following respective numbers of shares of common stock:
Underwriter | Number of Shares | |
Credit Suisse Securities (USA) LLC | ||
Goldman, Sachs & Co. | ||
J.P. Morgan Securities Inc. | ||
Lehman Brothers Inc. | ||
Bear, Stearns & Co. Inc. | ||
Citigroup Global Markets Inc. | ||
Deutsche Bank Securities Inc. | ||
Morgan Stanley & Co. Incorporated | ||
UBS Securities LLC | ||
William Blair & Company, L.L.C. | ||
KeyBanc Capital Markets, a division of McDonald Investments Inc. | ||
Total | 18,518,519 | |
The underwriting agreement provides that the underwriters are obligated to purchase all the shares of common stock in the offering if any are purchased, other than those shares covered by the over-allotment option described below. The underwriting agreement also provides that if an underwriter defaults, the purchase commitments of non-defaulting underwriters may be increased or the offering may be terminated.
The selling shareholder has granted to the underwriters a 30-day option to purchase on a pro rata basis up to 2,777,778 additional shares from the selling shareholder at the initial public offering price less the underwriting discounts and commissions. The option may be exercised only to cover any over-allotments of common stock.
The underwriters propose to offer the shares of common stock initially at the public offering price on the cover page of this prospectus and to selling group members at that price less a selling concession of $ per share. The underwriters and selling group members may allow a discount of $ per share on sales to other broker/dealers. After the initial public offering the representatives may change the public offering price and concession and discount to broker/dealers.
The following table summarizes the compensation and estimated expenses we and the selling shareholder will pay:
| Per Share | Total | |||||||||||
Without Over-allotment | With Over-allotment | Without Over-allotment | With Over-allotment | |||||||||
Underwriting Discounts and Commissions paid by us | $ | $ | $ | $ | ||||||||
Expenses payable by us | $ | $ | $ | $ | ||||||||
Underwriting Discounts and Commissions paid by the selling stockholder | $ | $ | $ | $ | ||||||||
Expenses payable by the selling stockholder | $ | $ | $ | $ | ||||||||
We estimate that our out of pocket expenses for this offering will be approximately $ .
159
Table of Contents
The underwriters will not confirm sales to any accounts over which they exercise discretionary authority without first receiving a written consent from those accounts.
Credit Suisse Securities (USA) LLC, Goldman, Sachs & Co., J.P. Morgan Securities Inc. and Lehman Brothers Inc., four of the underwriters, are our affiliates. The offering therefore is being conducted in accordance with the applicable provisions of Rule 2720 of the National Association of Securities Dealers, Inc. Conduct Rules. Rule 2720 requires that the initial public offering price of the shares of common stock not be higher than that recommended by a “qualified independent underwriter” meeting certain standards. Accordingly, Citigroup Global Markets Inc. is assuming the responsibilities of acting as the qualified independent underwriter in pricing the offering and conducting due diligence. The initial public offering price of the shares of common stock is no higher than that recommended by Citigroup Global Markets Inc. In its role as a qualified independent underwriter, Citigroup Global Markets Inc. has performed a due diligence investigation and participated in the preparation of this prospectus and the registration statement of which this prospectus is a part. Citigroup Global Markets Inc. will not receive any additional compensation in connection with its acting as a qualified independent underwriter in connection with this offering. We have agreed to indemnify Citigroup Global Markets Inc. against liabilities incurred in connection with acting as a qualified independent underwriter, including liabilities under the Securities Act.
We have agreed that we will not offer, sell, contract to sell, pledge or otherwise dispose of, directly or indirectly, or file with the Securities and Exchange Commission a registration statement under the Securities Act of 1933 (the “Securities Act”) relating to, any additional shares of our common stock or securities convertible into or exchangeable or exercisable for any shares of our common stock, or publicly disclose the intention to make any offer, sale, pledge, disposition or filing, without the prior written consent of Credit Suisse Securities (USA) LLC for a period of 180 days after the date of this prospectus except that we may (i) issue shares of our common stock in the offering; (ii) issue shares of our common stock pursuant to the conversion or exchange of convertible or exchangeable securities or the exercise of warrants or options, in each case outstanding on the date of this prospectus; (iii) issue shares of our common stock pursuant to the exercise of such options or other equity awards; (iv) issuances of securities (or options, warrants or convertible securities in respect thereof) in connection with a bona fide merger or acquisition transaction; provided that such securities (or such options, warrants or convertible securities) so issued are subject to the terms of a lock-up letter having provisions substantially the same as the lock-up letters described in the next succeeding paragraph, (v) the issuance of securities as contemplated by the transaction agreement governing the Combinations; provided that the Company shall cause any securities issued pursuant to this sub-clause (v) to be subject to the lock-up provisions of the next succeeding paragraph; and/or (vi) file with the SEC one or more registration statements on Form S-8 registering the shares of our common stock issuable under our equity compensation plans in effect on the date of this prospectus, in each case subject to no further transfer during the “lock-up” period. However, in the event that either (1) during the last 17 days of the “lock-up” period, we release earnings results or material news or a material event relating to us occurs or (2) prior to the expiration of the “lock-up” period, we announce that we will release earnings results during the 16-day period beginning on the last day of the “lock-up” period, then in either case the expiration of the “lock-up” will be extended until the expiration of the 18-day period beginning on the date of the release of the earnings results or the occurrence of the material news or event, as applicable, unless Credit Suisse Securities (USA) LLC waives, in writing, such an extension.
Our officers, directors and shareholder have agreed that they will not offer, sell, contract to sell, pledge or otherwise dispose of, directly or indirectly, any shares of our common stock or securities convertible into or exchangeable or exercisable for any shares of our common stock, enter into a transaction that would have the same effect, or enter into any swap, hedge or other arrangement that transfers, in whole or in part, any of the economic consequences of ownership of our common stock, whether any of these transactions are to be settled by delivery of our common stock or other securities, in cash or otherwise, or publicly disclose the intention to make any such offer, sale, pledge or disposition, or to enter into any transaction, swap, hedge or other arrangement, without, in each case, the prior written consent of Credit Suisse Securities (USA) LLC for a period of 180 days after the date of this prospectus except the issuance of securities as contemplated by the transaction
160
Table of Contents
agreement governing the Combinations; provided that such securities shall be subject to the lock-up provisions of this paragraph. However, in the event that either (1) during the last 17 days of the “lock-up” period, we release earnings results or material news or a material event relating to us occurs or (2) prior to the expiration of the “lock-up” period, we announce that we will release earnings results during the 16-day period beginning on the last day of the “lock-up” period, then in either case the expiration of the “lock-up” will be extended until the expiration of the 18-day period beginning on the date of the release of the earnings results or the occurrence of the material news or event, as applicable, unless Credit Suisse Securities (USA) LLC waives, in writing, such an extension. The foregoing agreement does not restrict sales of our common stock in the offering made by the selling shareholder pursuant to the underwriting agreement or sales of common stock acquired in the open market. In addition, it does not restrict transfers of common stock (or any securities convertible into or exercisable or exchangeable for common stock) to any of the following transferees who agree to be bound in writing by the terms of the “lock-up” and who receive such securities in a transfer not involving a disposition for value: (i) any donee of one or more bona fide gifts of common stock; (ii) any trust for the direct or indirect benefit of the locked-up party or a family member whose familial relation is not more remote than first cousin, whether by blood, marriage or adoption; (iii) any beneficiary pursuant to a will or other testamentary document or applicable laws of descent who will remain subject to the lockup; (iv) with respect to any locked-up party that is an investment fund entity that is a limited partnership, limited liability company or equivalent foreign entity, to any other such entity under the control of the locked-up party or its general partner or managing member and/or, (v) with respect to the selling shareholder, the partners, members or stockholders of the selling shareholder, in each case, subject to no further transfer during the “lock-up” period; provided further, however, (1) with respect to any securities involved in any transfers pursuant to the exceptions in (i), (ii) or (iii) above, no filing by any party (transferor or transferee) under the Exchange Act shall be required or voluntarily made in connection with such transfer (other than on Form 5 under the Exchange Act) and (2) with respect to any securities involved in any transfers pursuant to the exceptions in (iv) or (v) above, the transferor shall give notice to Credit Suisse Securities (USA) LLC prior to the filing of any reports on Form 4 under the Exchange Act in connection with such transfer.
Credit Suisse Securities (USA) LLC has advised us that it has no present intent or arrangement to release any shares subject to a lock-up, and will consider the release of any lock-up on a case-by-case basis. Upon a request to release any shares subject to a lock-up, Credit Suisse Securities (USA) LLC would consider the particular circumstances surrounding the request, including, but not limited to, the length of time before the lock-up expires, the number of shares requested to be released, reasons for the request, the possible impact on the market or our common stock and whether the holder of our shares requesting the release is an officer, director or other affiliate of ours.
The underwriters have reserved for sale at the initial public offering price up to 1,000,000 shares of the common stock for employees, directors and other persons associated with us who have expressed an interest in purchasing common stock in the offering. The number of shares available for sale to the general public in the offering will be reduced to the extent these persons purchase the reserved shares. Any reserved shares not so purchased will be offered by the underwriters to the general public on the same terms as the other shares.
We and the selling shareholder have agreed to indemnify the underwriters against certain liabilities, including liabilities under the Securities Act and liabilities incurred in connection with the directed share program referred to herein, and to contribute to payments that the underwriters may be required to make in that respect.
Our common stock has been approved for listing on the New York Stock Exchange under the symbol “HXN.”
Each of the underwriters has represented and agreed that:
(a) it has not made or will not make an offer of shares to the public in the United Kingdom within the meaning of section 102B of the Financial Services and Markets Act 2000 (as amended) (“FSMA”) except to
161
Table of Contents
legal entities which are authorized or regulated to operate in the financial markets or, if not so authorized or regulated, whose corporate purpose is solely to invest in securities or otherwise in circumstances which do not require the publication by the company of a prospectus pursuant to the Prospectus Rules of the Financial Services Authority (“FSA”);
(b) it has only communicated or caused to be communicated and will only communicate or cause to be communicated an invitation or inducement to engage in investment activity (within the meaning of section 21 of FSMA) to persons who have professional experience in matters relating to investments falling within Article 19(5) of the Financial Services and Markets Act 2000 (Financial Promotion) Order 2005 or in circumstances in which section 21 of FSMA does not apply to the company; and
(c) it has complied with, and will comply with all applicable provisions of FSMA with respect to anything done by it in relation to the shares in, from or otherwise involving the United Kingdom.
In relation to each Member State of the European Economic Area which has implemented the Prospectus Directive (each, a “Relevant Member State”), each Underwriter has represented and agreed that with effect from and including the date on which the Prospectus Directive is implemented in that Relevant Member State (the “Relevant Implementation Date”) it has not made and will not make an offer of shares to the public in that Relevant Member State prior to the publication of a prospectus in relation to the shares which has been approved by the competent authority in that Relevant Member State or, where appropriate, approved in another Relevant Member State and notified to the competent authority in that Relevant Member State, all in accordance with the Prospectus Directive, except that it may, with effect from and including the Relevant Implementation Date, make an offer of Shares to the public in that Relevant Member State at any time:
(a) to legal entities which are authorised or regulated to operate in the financial markets or, if not so authorized or regulated, whose corporate purpose is solely to invest in securities;
(b) to any legal entity which has two or more of (1) an average of at least 250 employees during the last financial year; (2) a total balance sheet of more than€43,000,000 and (3) an annual net turnover of more than€50,000,000, as shown in its last annual or consolidated accounts; or
(c) in any other circumstances which do not require the publication by the Issuer of a prospectus pursuant to Article 3 of the Prospectus Directive.
For the purposes of this provision, the expression an “offer of Shares to the public” in relation to any shares in any Relevant Member State means the communication in any form and by any means of sufficient information on the terms of the offer and the shares to be offered so as to enable an investor to decide to purchase or subscribe the shares, as the same may be varied in that Relevant Member State by any measure implementing the Prospectus Directive in that Relevant Member State and the expression Prospectus Directive means Directive 2003/71/EC and includes any relevant implementing measure in each Relevant Member State.
The shares may not be offered or sold by means of any document other than to persons whose ordinary business is to buy or sell shares or debentures, whether as principal or agent, or in circumstances which do not constitute an offer to the public within the meaning of the Companies Ordinance (Cap. 32) of Hong Kong, and no advertisement, invitation or document relating to the shares may be issued, whether in Hong Kong or elsewhere, which is directed at, or the contents of which are likely to be accessed or read by, the public in Hong Kong (except if permitted to do so under the securities laws of Hong Kong) other than with respect to shares which are or are intended to be disposed of only to persons outside Hong Kong or only to “professional investors” within the meaning of the Securities and Futures Ordinance (Cap. 571) of Hong Kong and any rules made thereunder.
This prospectus has not been registered as a prospectus with the Monetary Authority of Singapore. Accordingly, this prospectus and any other document or material in connection with the offer or sale, or invitation or subscription or purchase, of the securities may not be circulated or distributed, nor may the securities be offered or sold, or be made the subject of an invitation for subscription or purchase, whether directly
162
Table of Contents
or indirectly, to persons in Singapore other than under circumstances in which such offer, sale or invitation does not constitute an offer or sale, or invitation for subscription or purchase, of the securities to the public in Singapore.
The securities have not been and will not be registered under the Securities and Exchange Law of Japan (the Securities and Exchange Law) and each underwriter has agreed that it will not offer or sell any securities, directly or indirectly, in Japan or to, or for the benefit of, any resident of Japan (which term as used herein means any person resident in Japan, including any corporation or other entity organized under the laws of Japan), or to others for re-offering or resale, directly or indirectly, in Japan or to a resident of Japan, except pursuant to an exemption from the registration requirements of, and otherwise in compliance with, the Securities and Exchange Law and any other applicable laws, regulations and ministerial guidelines of Japan.
Certain of the underwriters and their respective affiliates have performed and may in the future perform investment banking, financial advisory and lending services for us and our affiliates from time to time, for which they have received customary compensation, and may do so in the future.
An affiliate of Credit Suisse Securities (USA) LLC was a lender under our May 2005 senior secured credit facilities and Credit Suisse Securities (USA) LLC was a joint bookrunner and joint lead arranger under our May 2005 senior secured credit facilities, which we entered into concurrently with the closing of the Combinations. In order to consummate the Bakelite Transaction, an affiliate of Credit Suisse Securities (USA) LLC provided us approximately $128 million as bridge financing and acted as administrative agent and lender in connection with such financing. Credit Suisse Securities (USA) LLC also served as joint bookrunner and initial purchaser in connection with the offering of the New Floating Rate Notes. We used the proceeds of such offering to repay a portion of the bridge loan facility provided by an affiliate of Credit Suisse Securities (USA) LLC in connection with the Bakelite Transaction. The bridge loan facility was repaid in full upon consummation of the Combinations. Credit Suisse Securities (USA) LLC acted as a joint bookrunner and initial purchaser in connection with the offering of our Series A Preferred Stock and was a holder of our Series A Preferred Stock prior to its redemption as part of the Hexion Refinancings. Credit Suisse Securities (USA) LLC is a joint bookrunner and joint lead arranger under our new secured senior credit facilities and an affiliate of Credit Suisse Securities (USA) LLC is syndication agent and a lender under our new secured senior credit facilities. On May 12, 2006, we used a portion of the borrowings under our new senior secured credit facilities to redeem all of our outstanding Series A Preferred Stock. Credit Suisse Securities (USA) LLC is also acting as a dealer manager and consent solicitation agent for the tender offers to repurchase all of our outstanding 8% Senior Secured Notes, 9½% Senior Second Secured Notes and 13½% Senior Subordinated Notes.
An affiliate of Goldman, Sachs & Co. owns an interest in Hexion LLC of approximately 2%. As a result of this holding, such affiliate of Goldman, Sachs & Co. has a passive, indirect ownership interest in an aggregate of approximately 2% of our outstanding common stock as of March 31, 2006. Goldman, Sachs & Co. acted as a joint bookrunner and initial purchaser in connection with the offering of our Series A Preferred Stock and was a holder of our Series A Preferred Stock prior to its redemption as part of the Hexion Refinancings. An affiliate of Goldman, Sachs & Co. is a lender under our new senior secured credit facilities. On May 12, 2006, we used a portion of the borrowings under our new senior secured credit facilities to redeem all of our outstanding Series A Preferred Stock.
Under our Resolution Specialty credit facility, J.P. Morgan Securities Inc. was joint lead arranger and joint bookrunner and an affiliate of J.P. Morgan Securities Inc. was a lender and administrative agent. J.P. Morgan Securities Inc. was a joint bookrunner and joint lead arranger in connection with our May 2005 senior secured credit facilities and an affiliate of J.P. Morgan Securities Inc. was an administrative agent and a lender under our May 2005 senior secured credit facilities, entered into concurrently with the closing of the Combinations. In order to consummate the Bakelite Transaction, an affiliate of J.P. Morgan Securities Inc. provided us approximately $85 million as bridge financing and acted as syndication agent in connection with such financing. J.P. Morgan Securities Inc. also served as joint bookrunner and initial purchaser in connection with the offering of the New Floating Rate Notes. We used the proceeds of such offering to repay a portion of the bridge loan facility provided by an affiliate of J.P. Morgan Securities Inc. in connection with the Bakelite Transaction. The
163
Table of Contents
bridge loan facility was repaid in full upon consummation of the Combinations. J.P. Morgan Securities Inc. acted as a joint bookrunner and initial purchaser in connection with the offering of Series A Preferred Stock and was a holder of our Series A Preferred Stock prior to its redemption as part of the Hexion Refinancings. J.P. Morgan Securities Inc. is a joint bookrunner and joint lead arranger under our new senior secured credit facilities and an affiliate of J.P. Morgan Securities Inc. is administrative agent, collateral agent and a lender under our new secured senior credit facilities. On May 12, 2006, we used a portion of the borrowings under our new senior secured credit facilities to redeem all of our outstanding Series A Preferred Stock. JPMorgan Chase Bank, N.A., an affiliate of J.P. Morgan Securities Inc., is a trustee for First Plaza Group Trust, a New York trust which owns an interest in Hexion LLC.
Lehman Brothers Inc. acted as a joint bookrunner and initial purchaser in connection with the offering of our Series A Preferred Stock. On May 12, 2006, we used a portion of the borrowings under our new senior secured credit facilities to redeem all of our outstanding Series A Preferred Stock.
Citigroup Global Markets Inc. is a joint book runner and joint lead arranger in connection with our new senior secured credit facilities and an affiliate of Citigroup Global Markets Inc. is documentation agent and a lender under our new senior secured credit facilities. In addition, Citigroup Global Markets Inc. was a joint book runner and joint lead arranger in connection with our May 2005 senior secured credit facilities and an affiliate of Citigroup Global Markets Inc. was the syndication agent and a lender under our May 2005 senior secured credit facilities.
Morgan Stanley & Co. Incorporated served as a joint book runner and initial purchaser in connection with the offering of the New Floating Rated Notes.
An affiliate of UBS Securities LLC is a lender under our new senior secured credit facilities. In addition, an affiliate of UBS Securities LLC was a lender under our May 2005 senior secured credit facilities.
Nigel D.T. Andrews, who will be elected as a director of the Company upon consummation of the offering, is a trustee of the Victory Funds, an affiliate of KeyBanc Capital Markets, a division of McDonald Investments Inc.
Prior to the offering, there has been no public market for our common stock. The initial public offering price will be determined by a negotiation among us, the selling shareholder and the underwriters and will not necessarily reflect the market price of the common stock following the offering. The principal factors that will be considered in determining the public offering price will include:
| • | the information presented in this prospectus and otherwise available to the underwriters; |
| • | the history of and the prospects for the industry in which we will compete; |
| • | the ability of our management; |
| • | the prospects for our future earnings; |
| • | the present state of our development and our current financial condition; |
| • | the recent market prices of, and the demand for, publicly traded common stock of generally comparable companies; and |
| • | the general condition of the securities markets at the time of the offering. |
We cannot assure you that the initial public offering price will correspond to the price at which the common stock will trade in the public market subsequent to the offering or that an active trading market for the common stock will develop and continue after the offering.
164
Table of Contents
In connection with the offering the underwriters may engage in stabilizing transactions, over-allotment transactions, syndicate covering transactions, and penalty bids in accordance with Regulation M under the Securities Exchange Act of 1934.
| • | Stabilizing transactions permit bids to purchase the underlying security so long as the stabilizing bids do not exceed a specified maximum. |
| • | Over-allotment involves sales by the underwriters of shares in excess of the number of shares the underwriters are obligated to purchase, which creates a syndicate short position. The short position may be either a covered short position or a naked short position. In a covered short position, the number of shares over-allotted by the underwriters is not greater than the number of shares, that they may purchase in the over-allotment option. In a naked short position, the number of shares involved is greater than the number of shares in the over-allotment option. The underwriters may close out any short position by either exercising their over-allotment option and/or purchasing shares in the open market. |
| • | Syndicate covering transactions involve purchases of the common stock in the open market after the distribution has been completed in order to cover syndicate short positions. In determining the source of the shares to close out the short position, the underwriters will consider, among other things, the price of the shares available for purchase in the open market as compared to the price at which they may purchase the shares through the over-allotment option. If the underwriters sell more shares than could be covered by the over-allotment option, a naked short position, that position can only be closed out by buying shares in the open market. A naked short position is more likely to be created if the underwriters are concerned that there may be downward pressure on the price of the shares in the open market after pricing that could adversely affect investors who purchase in the offering. |
| • | Penalty bids permit the representatives to reclaim a selling concession from a syndicate member when the common stock originally sold by the syndicate member is purchased in a stabilizing or syndicate covering transaction to cover syndicate short positions. |
Neither we nor any of the underwriters make any representation or prediction as to the direction or magnitude of any effect that the transactions described above may have on the price of the common stock. In addition, neither we nor any of the underwriters make any representation that the underwriters will engage in these stabilizing transactions or that any transaction, once commenced, will not be discontinued without notice.
These stabilizing transactions, syndicate covering transactions and penalty bids may have the effect of raising or maintaining the market price of our common stock or preventing or retarding a decline in the market price of the common stock. As a result the price of our common stock may be higher than the price that might otherwise exist in the open market. These transactions may be effected on the New York Stock Exchange or otherwise and, if commenced, may be discontinued at any time.
A prospectus in electronic format may be made available on the web sites maintained by one or more of the underwriters, or selling group members, if any, participating in the offering and one or more of the underwriters participating in the offering may distribute prospectuses electronically. The representatives may agree to allocate a number of shares to underwriters and selling group members for sale to their online brokerage account holders. Internet distributions will be allocated by the underwriters and selling group members that will make internet distributions on the same basis as other allocations.
165
Table of Contents
The validity of the issuance of the shares to be sold in the offering will be passed upon for us by our special New Jersey counsel, Connell Foley LLP. Certain legal matters in connection with the issuance of the common stock to be sold in this offering will be passed upon by our counsel, O’Melveny & Myers LLP, New York, New York. The underwriters have been represented by Cravath, Swaine & Moore LLP.
The consolidated financial statements of Hexion Specialty Chemicals, Inc. as of December 31, 2005 and 2004 and for each of the three years in the period ended December 31, 2005, included in this prospectus, except as they relate to Borden Chemical, Inc. as of December 31, 2004 and for the period from August 12, 2004 to December 31, 2004 and except as they relate to Hexion Specialty Chemicals Canada, Inc. (formerly Borden Chemical Canada, Inc.) as of and for the year ended December 31, 2005, have been audited by PricewaterhouseCoopers LLP, an independent registered public accounting firm, whose report thereon appears herein. Such financial statements have been so included in reliance on the report of such registered public accounting firm given on the authority of said firm as experts in auditing and accounting.
The consolidated financial statements of Borden Chemical, Inc. as of December 31, 2003 and 2002, and for each of the three years in the period ended December 31, 2003, and the consolidated financial statements of Hexion Specialty Chemicals Canada, Inc. (formerly Borden Chemical Canada, Inc.) as of December 31, 2005 and 2004, and for each of the three years in the period ended December 31, 2005, included in this prospectus; the consolidated financial statements of Borden Chemical, Inc. as of December 31, 2004, and for the period from August 12, 2004 to December 31, 2004, not presented separately herein; and the related financial statement schedule of Borden Chemical, Inc. included elsewhere in the registration statement, have been audited by Deloitte & Touche LLP, an independent registered public accounting firm, as stated in their reports appearing herein and elsewhere in the registration statement (which report as to Borden Chemical, Inc. for each of the three years in the period ended December 31, 2003, expresses an unqualified opinion and includes an explanatory paragraph referring to the adoption in 2002 of Statement of Financial Accounting Standards No. 142; and which report as to Borden Chemical, Inc. for the period from August 12, 2004 to December 31, 2004, expresses an unqualified opinion and includes an explanatory paragraph regarding the restatement of the balance sheet) and have been so included in reliance upon the reports of such firm given upon their authority as experts in accounting and auditing.
The financial statements of the Resins, Inks and Monomers Business of Eastman Chemical Company as of December 31, 2003 and for each of the two years in the period ended December 31, 2003 and the seven months ended July 31, 2004 included in this prospectus have been so included in reliance on the report of PricewaterhouseCoopers LLP, an independent registered public accounting firm, given on the authority of said firm as experts in auditing and accounting.
The combined financial statements of the Resin Business of the Bakelite Group as of December 31, 2004 and 2003 and for each of the three years in the period ended December 31, 2004, included in this prospectus, have been so included in reliance on the report of PricewaterhouseCoopers Aktiengesellschaft Wirtschaftsprüfungsgesellschaft (formerly known as PwC Deutsche Revision Aktiengesellschaft Wirtschaftsprüfungsgesellschaft), an independent registered public accounting firm, given on the authority of said firm as experts in auditing and accounting.
The consolidated financial statements of National Borden Chemical Germany GmbH, as of and for the year ended December 31, 2005, not separately presented in this prospectus, have been audited by PricewaterhouseCoopers LLP, an independent registered public accounting firm, whose report thereon appears herein. Such financial statements, to the extent they have been included in the financial statements of Hexion Specialty Chemicals Canada, Inc. (formerly Borden Chemical Canada, Inc.) have been so included in reliance on the report of such independent registered public accounting firm given on the authority of said firm as experts in auditing and accounting.
166
Table of Contents
WHERE YOU CAN FIND MORE INFORMATION
We have filed a registration statement on Form S-1 with the SEC with respect to this offering. This prospectus, which is part of the registration statement, does not include all of the information contained in the registration statement. You should refer to the registration statement and its exhibits and schedules for additional information. Whenever we make reference in this prospectus to any of our contracts, agreements or other documents, the references are not necessarily complete and you should refer to the exhibits and schedules attached to the registration statement for copies of the actual contract, agreement or other document.
You may read and copy the registration statement, the related exhibits and schedules without charge at the SEC’s Public Reference Room at 100 F Street, N.E., Room 1580, Washington, D.C. 20549. You may call the SEC at 1-800-SEC-0330 for further information on the operation of the Public Reference Room. You may obtain copies of the documents at prescribed rates by writing to the Public Reference Section of the SEC at 100 F Street, N.E., Room 1580, Washington, D.C. 20549. The SEC also maintains an Internet site,http://www.sec.gov, which contains reports, proxy and information statements and other information regarding issuers that file electronically with the SEC.The other information we file with the SEC is not part of the registration statement of which this prospectus forms a part. Our reports and other information that we have filed, or may in the future file, with the SEC are not incorporated by reference into and do not constitute part of this prospectus.
167
Table of Contents
| Page | ||
Hexion Specialty Chemicals, Inc. | ||
Unaudited Condensed Consolidated Financial Statements | ||
Condensed Consolidated Statements of Operations and Comprehensive Income (Loss): | ||
For the three months ended March 31, 2006 and 2005 | F-4 | |
As of March 31, 2006 and 2005 and December 31, 2005 | F-5 | |
For the three months ended March 31, 2006 and 2005 | F-7 | |
Condensed Consolidated Statements of Common Stock and Other Shareholder’s Deficit: | ||
For the three months ended March 31, 2006 | F-8 | |
For the three months ended March 31, 2006 and 2005 | F-9 | |
Audited Financial Statements | ||
| F-29 | ||
For the years ended December 31, 2005, 2004 and 2003 | F-30 | |
As of December 31, 2005 and 2004 | F-31 | |
For the years ended December 31, 2005, 2004 and 2003 | F-33 | |
Consolidated Statements of Common Stock and Other Shareholder’s (Deficit) Equity: | ||
For the years ended December 31, 2005, 2004 and 2003 | F-34 | |
For the years ended December 31, 2005, 2004, and 2003 | F-35 | |
| F-90 | ||
Borden Chemical, Inc. | ||
Unaudited Condensed Consolidated Financial Statements | ||
Condensed Consolidated Statements of Operations and Comprehensive (Loss) Income: | ||
For the six months ended June 30, 2004 and 2003 | F-92 | |
As of June 30, 2004 | F-93 | |
For the six months ended June 30, 2004 and 2003 | F-95 | |
For the six months ended June 30, 2004 | F-96 | |
For the six months ended June 30, 2004 and 2003 | F-97 | |
F-1
Table of Contents
| Page | ||
Audited Consolidated Financial Statements | ||
| F-118 | ||
Consolidated Statements of Operations and Comprehensive Income (Loss): | ||
For the years ended December 31, 2003, 2002 and 2001 | F-119 | |
As of December 31, 2003 and 2002 | F-120 | |
For the years ended December 31, 2003, 2002 and 2001 | F-122 | |
For the years ended December 31, 2003, 2002 and 2001 | F-123 | |
For the years ended December 31, 2003, 2002, and 2001 | F-125 | |
For the period from August 12, 2004 to December 31, 2004 | F-181 | |
Hexion Specialty Chemicals Canada, Inc. and Subsidiaries | ||
| F-183 | ||
For the years ended December 31, 2005, 2004 and 2003 | F-184 | |
As of December 31, 2005 and 2004 | F-185 | |
For the years ended December 31, 2005, 2004 and 2003 | F-187 | |
For the years ended December 31, 2005, 2004 and 2003 | F-188 | |
For the years ended December 31, 2005, 2004 and 2003 | F-189 | |
| F-212 | ||
Resins, Inks and Monomers Business of Eastman Chemical Company Combined Financial Statements | ||
| F-213 | ||
For the years ended December 31, 2002 and 2003 and for the period from January 1, 2004 through July 31, 2004 | F-214 | |
As of December 31, 2003 | F-215 | |
For the years ended December 31, 2002 and 2003 and for the period from January 1, 2004 through July 31, 2004 | F-216 | |
Combined Statements of Owner’s Equity (Deficit) and Comprehensive Income (Loss): | ||
For the years ended December 31, 2002 and 2003 and for the period from January 1, 2004 through July 31, 2004 | F-217 | |
| F-218 | ||
F-2
Table of Contents
| Page | ||
Resin Business of the Bakelite Group | ||
Unaudited Combined Financial Statements | ||
Unaudited Combined Statements of Operations for the three months ended March 31, 2005 and 2004 | F-236 | |
| F-237 | ||
| F-238 | ||
Unaudited Combined Statements of Cash Flows for the three months ended March 31, 2005 and 2004 | F-239 | |
Notes to the Unaudited Combined Interim Financial Statements | F-240 | |
Audited Combined Financial Statements | ||
| F-246 | ||
Combined Statements of Operations for the years ended December 31, 2004, 2003 and 2002 | F-247 | |
| F-248 | ||
| F-249 | ||
Combined Statements of Cash Flows for the years ended December 31, 2004, 2003 and 2002 | F-250 | |
| F-251 | ||
F-3
Table of Contents
HEXION SPECIALTY CHEMICALS, INC.
CONDENSED CONSOLIDATED STATEMENTS OF OPERATIONS
AND COMPREHENSIVE INCOME (LOSS) (Unaudited)
| Three Months ended March 31, | ||||||||
(In millions, except share and per share data) | 2006 | 2005 | ||||||
Net sales | $ | 1,245 | $ | 1,012 | ||||
Cost of sales | 1,060 | 863 | ||||||
Gross profit | 185 | 149 | ||||||
Selling, general & administrative expense | 101 | 86 | ||||||
Transaction related costs (See Note 1) | 4 | 7 | ||||||
Other operating (income) expense | (30 | ) | (3 | ) | ||||
Operating income | 110 | 59 | ||||||
Interest expense, net | 54 | 45 | ||||||
Other non-operating expense, net | 1 | 9 | ||||||
Income before income tax and minority interest | 55 | 5 | ||||||
Income tax expense | 19 | 13 | ||||||
Income (loss) before minority interest | 36 | (8 | ) | |||||
Earnings from unconsolidated entities, net of taxes | 1 | — | ||||||
Minority interest in net income of consolidated subsidiaries | (2 | ) | (2 | ) | ||||
Net income (loss) | 35 | (10 | ) | |||||
Redeemable preferred stock accretion (See Note 6) | 13 | — | ||||||
Net income (loss) available to common shareholders | $ | 22 | $ | (10 | ) | |||
Comprehensive income (loss) | $ | 46 | $ | (40 | ) | |||
Basic and Diluted Per Share Data | ||||||||
Net income (loss) available to common shareholders | $ | 0.27 | $ | (0.12 | ) | |||
Average number of common shares outstanding during the period – basic and diluted | 82,629,906 | 82,629,906 | ||||||
See Notes to Condensed Consolidated Financial Statements
F-4
Table of Contents
HEXION SPECIALTY CHEMICALS, INC.
CONDENSED CONSOLIDATED BALANCE SHEETS (Unaudited)
(In millions) | March 31, 2006 | December 31, 2005 | ||||||
ASSETS | ||||||||
Current Assets | ||||||||
Cash and equivalents | $ | 168 | $ | 183 | ||||
Accounts receivable (less allowance for doubtful accounts of $20 at March 31, 2006 and $19 at December 31, 2005) | 684 | 605 | ||||||
Inventories: | ||||||||
Finished and in-process goods | 297 | 292 | ||||||
Raw materials and supplies | 173 | 153 | ||||||
Other current assets | 88 | 132 | ||||||
| 1,410 | 1,365 | |||||||
Other Assets | 103 | 103 | ||||||
Property and Equipment | ||||||||
Land | 69 | 63 | ||||||
Buildings | 219 | 209 | ||||||
Machinery and equipment | 1,837 | 1,777 | ||||||
| 2,125 | 2,049 | |||||||
Less accumulated depreciation | (685 | ) | (653 | ) | ||||
| 1,440 | 1,396 | |||||||
Goodwill | 172 | 169 | ||||||
Other Intangible Assets, net | 182 | 176 | ||||||
Total Assets | $ | 3,307 | $ | 3,209 | ||||
See Notes to Condensed Consolidated Financial Statements
F-5
Table of Contents
HEXION SPECIALTY CHEMICALS, INC.
CONDENSED CONSOLIDATED BALANCE SHEETS (Unaudited)
(In millions, except share and per share data) | March 31, 2006 | December 31, 2005 | ||||||
LIABILITIES, REDEEMABLE PREFERRED STOCK, COMMON STOCK AND OTHER SHAREHOLDER’S DEFICIT | ||||||||
Current Liabilities | ||||||||
Accounts and drafts payable | $ | 547 | $ | 503 | ||||
Debt payable within one year | 41 | 51 | ||||||
Interest payable | 50 | 45 | ||||||
Income taxes payable | 107 | 91 | ||||||
Other current liabilities | 242 | 248 | ||||||
| 987 | 938 | |||||||
| Other Liabilities | ||||||||
Long-term debt | 2,299 | 2,303 | ||||||
Long-term pension obligations | 176 | 167 | ||||||
Non-pension post employment benefit obligations | 115 | 119 | ||||||
Deferred income taxes | 135 | 139 | ||||||
Other long-term liabilities | 98 | 92 | ||||||
| 2,823 | 2,820 | |||||||
Minority interest in consolidated subsidiaries | 9 | 11 | ||||||
Commitments and Contingencies (See Note 5) | ||||||||
Redeemable Preferred Stock - $0.01 par value; liquidation preference $25 per share; 60,000,000 shares authorized, 14,781,959 issued and outstanding at March 31, 2006 and December 31, 2005 (See Note 6) | 377 | 364 | ||||||
Common Stock and Other Shareholder’s Deficit | ||||||||
Common stock - $0.01 par value; 300,000,000 shares authorized, 170,678,965 issued, 88,049,059 treasury and 82,629,906 outstanding at March 31, 2006 and December 31, 2005 | 1 | 1 | ||||||
Paid-in capital | 504 | 515 | ||||||
Treasury stock | (296 | ) | (296 | ) | ||||
Accumulated other comprehensive loss | (59 | ) | (70 | ) | ||||
Accumulated deficit | (1,039 | ) | (1,074 | ) | ||||
| (889 | ) | (924 | ) | |||||
Total Liabilities, Redeemable Preferred Stock, Common Stock and Other Shareholder’s Deficit | $ | 3,307 | $ | 3,209 | ||||
See Notes to Condensed Consolidated Financial Statements
F-6
Table of Contents
HEXION SPECIALTY CHEMICALS, INC.
CONDENSED CONSOLIDATED STATEMENTS OF CASH FLOWS (Unaudited)
| Three months ended March 31, | ||||||||
(In millions) | 2006 | 2005 | ||||||
Cash Flows from (used in) Operating Activities | ||||||||
Net income (loss) | $ | 35 | $ | (10 | ) | |||
Adjustments to reconcile net income (loss) to net cash from (used in) operating activities: | ||||||||
Depreciation and amortization | 38 | 36 | ||||||
Unrealized loss on derivative instruments | — | 10 | ||||||
Minority interest in net income of consolidated subsidiaries | 2 | 2 | ||||||
Stock-based compensation | 2 | — | ||||||
Gain on sale of businesses and assets | (37 | ) | (2 | ) | ||||
Deferred tax provision | 3 | 8 | ||||||
Non-cash restructuring | 3 | — | ||||||
Impairments | 4 | — | ||||||
Net change in assets and liabilities: | ||||||||
Accounts receivable | (76 | ) | (30 | ) | ||||
Inventories | (10 | ) | 7 | |||||
Accounts and drafts payable | 44 | 13 | ||||||
Income taxes payable | 16 | 2 | ||||||
Other assets | 28 | 10 | ||||||
Other liabilities | (8 | ) | (22 | ) | ||||
| 44 | 24 | |||||||
Cash Flows (used in) from Investing Activities | ||||||||
Capital expenditures | (27 | ) | (13 | ) | ||||
Acquisition of businesses, net of cash acquired | (56 | ) | — | |||||
Proceeds from the sale of businesses, net of cash divested | 41 | 2 | ||||||
Deferred acquisition costs | — | (9 | ) | |||||
| (42 | ) | (20 | ) | |||||
Cash Flows from (used in) Financing Activities | ||||||||
Net short-term repayments | (9 | ) | (3 | ) | ||||
Borrowings of long-term debt | 34 | 144 | ||||||
Repayments of long-term debt | (39 | ) | (139 | ) | ||||
IPO related costs (See Note 1) | (2 | ) | — | |||||
Purchase price adjustment payable to parent (See Note 4) | — | 8 | ||||||
Repayments of cash overdrafts | — | (2 | ) | |||||
Other | — | (5 | ) | |||||
| (16 | ) | 3 | ||||||
Effect of exchange rates on cash and equivalents | (1 | ) | (1 | ) | ||||
(Decrease) increase in cash and equivalents | (15 | ) | 6 | |||||
Cash and equivalents at beginning of period | 183 | 152 | ||||||
Cash and equivalents at end of period | $ | 168 | $ | 158 | ||||
Supplemental Disclosures of Cash Flow Information | ||||||||
Cash paid: | ||||||||
Interest, net | $ | 48 | $ | 34 | ||||
Income taxes, net | 5 | 1 | ||||||
Non-cash activity: | ||||||||
Redeemable preferred stock accretion (See Note 6) | 13 | — | ||||||
See Notes to Condensed Consolidated Financial Statements
F-7
Table of Contents
HEXION SPECIALTY CHEMICALS, INC.
CONDENSED CONSOLIDATED STATEMENT OF COMMON STOCK
AND OTHER SHAREHOLDER’S DEFICIT (Unaudited)
(In millions) | Common Stock | Paid-in Capital | Treasury Stock | Accumulated Other Comprehensive Income (Loss) (a) | Accumulated Deficit | Total | |||||||||||||||||
Balance, December 31, 2005 | $ | 1 | $ | 515 | $ | (296 | ) | $ | (70 | ) | $ | (1,074 | ) | $ | (924 | ) | |||||||
Net income | — | — | — | — | 35 | 35 | |||||||||||||||||
Translation adjustments | — | — | — | 11 | — | 11 | |||||||||||||||||
Comprehensive income | — | — | — | — | — | 46 | |||||||||||||||||
Stock based compensation expense | — | 2 | — | — | — | 2 | |||||||||||||||||
Redeemable preferred stock accretion (See Note 6) | — | (13 | ) | — | — | — | (13 | ) | |||||||||||||||
Balance, March 31, 2006 | $ | 1 | $ | 504 | $ | (296 | ) | $ | (59 | ) | $ | (1,039 | ) | $ | (889 | ) | |||||||
| (a) | Accumulated other comprehensive loss at March 31, 2006 represents $38 of net foreign currency translation gains, a $5 net loss from purchase accounting adjustments related to acquisition of minority interests and a $92 net loss relating to the Company’s minimum pension liability adjustment. Accumulated other comprehensive loss at December 31, 2005 represents $27 of net foreign currency translation gains, a $5 net loss from purchase accounting adjustments related to the acquisition of minority interests and a $92 net loss relating to the Company’s minimum pension liability adjustment. |
See Notes to Condensed Consolidated Financial Statements
F-8
Table of Contents
HEXION SPECIALTY CHEMICALS, INC.
Notes to Condensed Consolidated Financial Statements (Unaudited)
(In millions, except share data)
1. Background and Basis of Presentation
Hexion Specialty Chemicals, Inc. (“Hexion” or “the Company”) is engaged in the manufacture and marketing of resins, inks, coating and adhesive resins, formaldehyde, oil field products and other specialty and industrial chemicals worldwide. At March 31, 2006, the Company has 94 production and manufacturing facilities, of which 37 are located in the U.S. Hexion was formed on May 31, 2005 upon the combination of three Apollo Management, L.P. (“Apollo”) controlled companies (the “Combinations”), Resolution Performance Products, LLC (“Resolution Performance”), Resolution Specialty Materials, Inc. (“Resolution Specialty”) and Borden Chemical, Inc. (“Borden Chemical”). Upon consummation of the Combinations, Borden Chemical changed its name to Hexion Specialty Chemicals, Inc., and BHI Acquisition LLC (“BHI Acquisition”), Borden Chemical’s parent, changed its name to Hexion LLC. Prior to the Combinations, on April 29, 2005, a subsidiary of Borden Chemical completed its acquisition of Bakelite Aktiengesellschaft (“Bakelite”) (See Note 3).
The Company has incurred costs totaling approximately $4 and $7 in connection with the Combinations and terminated acquisition activities during the three months ended March 31, 2006 and 2005, respectively, primarily for accounting, consulting, legal and contract termination fees. As the Combinations transaction was considered a merger of entities under common control, in accordance with Financial Accounting Standard Board (“FASB”) Statement of Financial Accounting Standards (“SFAS”) No. 141,Business Combinations, related costs have been expensed as incurred and are included in the Condensed Consolidated Statements of Operations as Transaction related costs.
On April 25, 2005, the Company filed a registration statement, which is not yet effective, with the U.S. Securities and Exchange Commission (the “SEC”) for a proposed initial public offering (“IPO”) of its common stock. The Company subsequently filed seven amendments to its registration statement from May 2, 2005 through April 14, 2006.
The Company has incurred accounting, legal, and printing costs in connection with the proposed IPO. As the costs of issuing common stock are considered a reduction of the related proceeds of the offering, these costs, which were $13 at March 31, 2006 and $11 at December 31, 2005 have been deferred within Other current assets on the Condensed Consolidated Balance Sheets until the IPO is effected.
Basis of Presentation— Prior to the Combinations, Resolution Performance, Resolution Specialty and Borden Chemical were considered entities under the common control of Apollo affiliates as defined in Emerging Issues Task Force (“EITF”) Issue No. 02-5,Definition of Common Control in Relation to FASB Statement of Financial Accounting Standards No. 141, “Business Combinations.” As a result of the Combinations the financial statements of these entities are presented retroactively on a consolidated basis in a manner similar to a pooling of interests, and include the results of operations of each business only from the date of acquisition by the Apollo affiliates.
In the opinion of management, all adjustments, consisting only of normal, recurring adjustments considered necessary for a fair presentation, have been included. Certain information and footnote disclosures normally included in financial statements prepared in accordance with accounting principles generally accepted in the United States of America have been condensed or omitted. These unaudited Financial Statements should be read in conjunction with the financial statements, accounting policies and notes included in the Company’s audited financial statements for the year ended December 31, 2005. Results for the interim periods are not necessarily indicative of results for the full year.
F-9
Table of Contents
HEXION SPECIALTY CHEMICALS, INC.
Notes to Condensed Consolidated Financial Statements (Unaudited)—(Continued)
(In millions, except share data)
2. Summary of Significant Accounting Policies
The following is an update of the significant accounting policies followed by the Company:
Principles of Consolidation—The Condensed Consolidated Financial Statements include the accounts of the Company and its majority-owned subsidiaries in which no substantive participating rights are held by minority shareholders, after elimination of intercompany accounts and transactions. The Company’s share of the net earnings of 20% to 50% owned companies, for which it has the ability to exercise significant influence over operating and financial policies, are included in income on an equity basis. Investments of other companies are carried at cost.
The Company has recorded a minority interest for the equity interests in subsidiaries that are not 100% owned by the Company. On May 31, 2005, the Resolution Performance and Resolution Specialty minority interests were purchased in connection with the Combinations and recorded as a step acquisition. At March 31, 2006 and December 31, 2005, the minority interest primarily reflects the Company’s joint venture partner’s ownership interest in HA-International, LLC (“HAI”), a joint venture between the Company and Delta-HA, Inc.
Earnings Per Share –As a result of the Combinations, the Company’s capital structure consists of 82,629,906 shares outstanding. For purposes of calculating earnings per share, 82,629,906 was used as the number of outstanding shares for all periods presented as no new shares were issued as a result of the legal merger of Resolution Performance, Resolution Specialty and Borden Chemical. This presentation reflects the post-merger capital structure of the Company for all periods on a consistent basis. The Company did not have any potentially dilutive instruments outstanding for any periods.
Stock-Based Compensation—Effective January 1, 2005, the Company elected to adopt SFAS No. 123(R) (revised 2004),Share-Based Payment. Under the provisions of SFAS No. 123(R), stock-based compensation cost is measured at the grant date based on the value of the award and is recognized as expense over the requisite service period. As the Company was considered a nonpublic entity, at the date of adoption, that used the minimum value method for pro forma disclosures under SFAS No. 123,Accounting for Stock-Based Compensation, the Company is required to apply the prospective transition method. As such, the Company applies the statement to any new awards and to any awards modified, repurchased or cancelled since January 1, 2005.
3. Acquisitions and Divestitures
Acquisitions
The Company accounts for acquisitions using the purchase method of accounting. Accordingly, results of operations of the acquired entities have been included from the date of acquisition, and any excess of purchase price over the sum of amounts assigned to identified assets and liabilities has been recorded as goodwill. Fair values are based upon preliminary appraisals, internal studies and analyses and are subject to final adjustments.
On January 31, 2006, the Company completed the purchase of the decorative coatings and adhesives business unit of The Rhodia Group (the “Coatings Acquisition”). The business generated 2005 sales of approximately $200, with 8 manufacturing facilities in Europe, Australia and Thailand. On March 1, 2006, the Company acquired the global wax compounds business of Rohm and Haas (the “Wax Compound Acquisition”). The business generated 2005 sales of approximately $10. The purchase included Rohm and Haas’ wax compounds technology and product lines, manufacturing equipment and other business assets. The aggregate purchase price for the two acquisitions, including related direct costs, was $56. The proforma effects of the acquisitions are not material.
F-10
Table of Contents
HEXION SPECIALTY CHEMICALS, INC.
Notes to Condensed Consolidated Financial Statements (Unaudited)—(Continued)
(In millions, except share data)
Divestitures
On March 31, 2006, the Company sold Alba Adesivos Industria e Comercio Ltda. (“Alba Adesivos”), a consumer adhesives company based in Boituva, Brazil (the “Brazilian Consumer Divestiture”). Alba Adesivos is a producer of branded consumer and professional grade adhesives. The company generated 2005 sales of $38 and has approximately 140 employees. On March 31, 2006, the Company also completed the sale of its remaining 10% interest in Japan Epoxy Resin Co., Ltd., to its joint venture partner. The joint venture interest was accounted for using the cost method. The Company recognized gains totaling $37 related to these divestitures ($31 million on an after tax basis) that are included in Other operating income for the three months ended March 31, 2006.
4. Related Party Transactions
Administrative Service, Management and Consulting Arrangements
In connection with their respective acquisitions by Apollo, Resolution Performance, Resolution Specialty and Borden Chemical entered into certain management, consulting and transaction fee agreements with Apollo and its affiliates for the provision of certain structuring and advisory services. These agreements allowed Apollo and its affiliates to provide certain advisory services to the companies for terms up to ten years. The companies also agreed to indemnify Apollo and its affiliates and their directors, officers and representatives for potential losses relating to the services contemplated under these agreements. Prior to the Combinations, on May 31, 2005, Resolution Performance and Resolution Specialty terminated their agreements with Apollo, thereby releasing any and all obligations and liabilities by all parties under the respective agreements.
At the time of the Combinations, the Company entered into a seven-year, amended and restated version of the former Borden Chemical management consulting agreement with Apollo (the “Amended Management Consulting Agreement”). The terms of the Amended Management Consulting Agreement currently provide for annual fees of approximately $3 and provide for a lump-sum settlement equal to the net present value of the remaining annual management fees payable under the remaining term of the agreement in connection with a sale of the Company or an IPO.
Pursuant to the agreements in effect during the three months ended March 31, 2006 and 2005, the Company made payments of $0 and $3, respectively, and expensed fees of $1 for each of the three months ended March 31, 2006 and 2005, which are included within Other operating income in the Company’s Consolidated Statements of Operations.
Other Transactions and Arrangements
The Company sells finished goods to a former unconsolidated joint venture of the Company and certain Apollo affiliates. These sales totaled $4 and $8 for the three months ended March 31, 2006 and 2005, respectively. Accounts receivable from these affiliates totaled $2 at March 31, 2006 and December 31, 2005. The Company also purchases raw materials and services from certain Apollo affiliates. These purchases totaled $1 and $2 for the three months ended March 31, 2006 and 2005, respectively. The Company had accounts payable to Apollo and affiliates of less than $1 at March 31, 2006 and December 31, 2005.
In the first quarter of 2005, Borden Chemical received a payment of $8 from its previous owner, Kohlberg Kravis Roberts & Co., for adjustments made to the purchase price of the Apollo acquisition of Borden Chemical. This amount was subsequently paid to Borden Chemical’s parent, BHI Acquisition, in the second quarter of 2005.
F-11
Table of Contents
HEXION SPECIALTY CHEMICALS, INC.
Notes to Condensed Consolidated Financial Statements (Unaudited)—(Continued)
(In millions, except share data)
5. Commitments and Contingencies
Environmental Matters
Because the Company’s operations involve the use, handling, processing, storage, transportation and disposal of hazardous materials, the Company is subject to extensive environmental regulation at the Federal, state and local levels as well as foreign laws and regulations, and therefore is exposed to the risk of claims for environmental remediation or restoration. In addition, violations of environmental laws or permits may result in restrictions being imposed on operating activities, substantial fines, penalties, damages or other costs, any of which could have a material adverse effect on the Company’s business, financial condition, results of operations or cash flows.
Accruals for environmental matters are recorded following the guidelines of Statement of Position 96-1, “Environmental Remediation Liabilities,” when it is probable that a liability has been incurred and the amount of the liability can be reasonably estimated. Environmental accruals are reviewed on an interim basis and as events and developments warrant.
The Company has recorded liabilities, relating to 65 locations (69 at December 31, 2005), of approximately $37 and $39 at March 31, 2006 and December 31, 2005, respectively, for all probable environmental remediation, indemnification and restoration liabilities. These amounts include estimates of unasserted claims the Company believes are probable of loss and reasonably estimable. Based on the factors discussed below and currently available information and analysis, the Company believes that it is reasonably possible that costs associated with such sites may fall within a range of $26 to $75, in the aggregate, at March 31, 2006. This estimate of the range of reasonably possible costs is less certain than the estimates upon which the liabilities are based, and in order to establish the upper end of such range, assumptions less favorable to the Company among the range of reasonably possible outcomes were used. As with any estimate, if facts or circumstances change, the final outcome could differ materially from these estimates.
Following is a more detailed discussion of the Company’s environmental liabilities and related assumptions at March 31, 2006:
BCP Geismar Site—The Company formerly owned a basic chemicals and polyvinyl chloride business which was taken public as Borden Chemicals and Plastics Operating Limited Partnership (“BCPOLP”) in 1987. Borden Chemical retained a 1% interest and the general partner interest, which were held by its subsidiary, BCP Management (“BCPM”). Borden Chemical also retained the liability for certain environmental matters after BCPOLP’s formation. Under a Settlement Agreement approved by the United States Bankruptcy Court for the District of Delaware among Borden Chemical, BCPOLP, BCPM, the United States Environmental Protection Agency and the Louisiana Department of Environmental Quality, Borden Chemical agreed to perform certain of BCPOLP’s obligations with respect to environmental conditions at BCPOLP’s Geismar, Louisiana site. These obligations are related to soil and groundwater contamination at the Geismar site. The Company bears the sole responsibility for these obligations, as there are no other potentially responsible parties (“PRPs”) or third parties from which the Company can seek reimbursement, and no additional insurance recoveries are expected.
A groundwater pump and treat system for the removal of contaminants is operational, and natural attenuation studies are proceeding. The Company has performed extensive soil and groundwater testing. Regulatory agencies are reviewing the current findings and remediation efforts. If closure procedures and remediation systems prove inadequate, or if additional contamination is discovered, this could result in the costs approaching the higher end of the range of possible outcomes discussed below.
The Company has recorded a liability of approximately $20 at March 31, 2006 and December 31, 2005 related to the BCP Geismar site. Based on currently available information and analysis, the Company believes
F-12
Table of Contents
HEXION SPECIALTY CHEMICALS, INC.
Notes to Condensed Consolidated Financial Statements (Unaudited)—(Continued)
(In millions, except share data)
that it is reasonably possible that costs associated with this site may fall within a range of $13 to $32, depending upon the factors discussed above. Due to the long-term nature of the project, the reliability of timing and the ability to estimate remediation payments, this liability was recorded at its net present value, assuming a 3% discount rate and a time period of thirty years and the range of possible outcomes is discounted similarly. The undiscounted liability is approximately $30 over thirty years with payments of $7 to be paid ratably between 2006 and 2010.
Superfund Sites / Offsite Landfills—The Company is currently involved in environmental remediation activities at 30 sites (29 at December 31, 2005) in which it has been notified that it is, or may be, a PRP under the United States Comprehensive Environmental Response, Compensation and Liability Act or similar state “superfund” laws. The Company has recorded a liability of approximately $8 at March 31, 2006 and approximately $9 at December 31, 2005 related to these sites. The Company anticipates approximately 60% of this liability will be paid within the next five years, with the remaining payments occurring over the next twenty-five years. The Company generally does not bear a significant level of responsibility for these sites, and therefore, has little control over the costs and timing of cash flows. At 17 of the 30 sites, the Company’s share is less than 1%. At some of the remaining 13 sites, the Company has negotiated allocations ranging from 1% to 9% of the total liability which accounts for $7 of the total amount reserved for superfund / offsite landfill sites at March 31, 2006 and December 31, 2005. Based on currently available information and analysis, the Company believes that it is reasonably possible that costs associated with such sites may be as low as $6 or as high as $16, in the aggregate. In estimating both its current reserves for environmental remediation at these sites and the possible range of additional costs, the Company has not assumed that it will bear the entire cost of remediation of every site to the exclusion of other known PRPs who may be jointly and severally liable. The Company has limited information to assess the viability of other PRPs and their probable contribution on a per site basis. The range of possible outcomes also takes into account the maturity of each project, which results in a more narrow range as the project progresses. The Company’s ultimate liability will depend on many factors including its volumetric share of waste, the financial viability of other PRPs, the remediation methods and technology used, the amount of time necessary to accomplish remediation, and the availability of insurance coverage. The Company’s insurance provides very limited, if any, coverage for these environmental matters.
Sites Under Current Ownership—The Company is conducting environmental remediation at 11 locations (14 at December 31, 2005) currently owned by the Company, of which 2 sites are no longer operating. There are no other parties responsible for remediation at these sites. Much of the remediation is being performed by the Company on a voluntary basis; therefore, the Company has greater control over the costs to be incurred and the timing of cash flows. The Company has accrued approximately $5 and $6 at March 31, 2006 and December 31, 2005, respectively, for remediation and restoration liabilities at these locations. The Company anticipates approximately $3 of these liabilities will be paid within the next three years, with the remaining amounts being paid over the next ten years. Based on currently available information and analysis, the Company believes that it is reasonably possible that costs associated with such sites may fall within a range of $4 to $11, in the aggregate. The factors influencing the ultimate outcome include the methods of remediation to be elected, the conclusions and assessment of site studies remaining to be completed and the time period required to complete the work.
Other Sites—The Company is conducting environmental remediation at 10 locations that it formerly owned. The Company has accrued approximately $3 at March 31, 2006 and December 31, 2005 for remediation and restoration liabilities at these locations. Based on currently available information and analysis, the Company believes that it is reasonably possible that costs associated with such sites may fall within a range of $2 to $12, in the aggregate. The primary drivers in determining the final costs to the Company on these matters are the method of remediation selected and the level of participation of third parties.
F-13
Table of Contents
HEXION SPECIALTY CHEMICALS, INC.
Notes to Condensed Consolidated Financial Statements (Unaudited)—(Continued)
(In millions, except share data)
In addition, the Company is responsible for 12 sites (14 at December 31, 2005) that require monitoring where no additional remediation is expected and has also established accruals for other related costs, such as fines and penalties. The Company has accrued approximately $1 at March 31, 2006 and December 31, 2005 related to these sites. Based on currently available information and analysis, the Company believes that it is reasonably possible that costs associated with such sites may fall within a range of $1 to $4 in the aggregate. Payment of these liabilities is anticipated to occur over the next ten years. The ultimate cost to the Company will be influenced by any variations in projected monitoring periods or by findings that are better or worse than anticipated.
The Company formerly operated the Smith Douglass fertilizer business, which included a phosphate processing operation in Manatee County, Florida and an animal food processing operation in Hillsborough County, Florida. Both operations were sold in 1980. The EPA sent the Company and another former owner of the Manatee County facility a request for $0.1 relating to oversight costs incurred when the site was abandoned by its current owner. The Company is disputing the charge. The Company is aware that state and Federal environmental agencies have taken measures to prevent the off-site release of water from rainfall that accumulated in the drainage ditches and lagoons surrounding the gypsum piles located on this site. The Company is aware that the current owner of the Hillsborough County site ceased operations in March 2004 and is working with governmental agencies to effect closure of that site. At this time, the Company has received an information request from the EPA but has not received any demands from any governmental agencies or others regarding the closure and environmental cleanup at this site, which the Company believes is the responsibility of the current owner. While it is reasonably possible some costs could be incurred related to these sites, the Company has inadequate information to enable it to estimate a potential range of liability, if any.
As a result of the Bakelite Acquisition, the Company acquired a site in Duisburg, Germany with significant soil and groundwater contamination beneath a facility that is shared with Rütgers Chemicals AG (“Rütgers”). Rütgers is in discussions with the local authorities concerning a proposed remediation plan; however, the scope and extent of that plan and the costs of its possible implementation are not yet reasonably estimable. Rütgers has contractually agreed to provide indemnifications to the Company with respect to this matter until 2025, subject to certain exceptions and limitations. Management believes that it is unlikely that the Company will have to take extensive actions for remediation. While it is reasonably possible some costs could be incurred related to this site, the Company has inadequate information to enable it to estimate a potential range of liability, if any.
For environmental conditions that existed at Resolution Performance sites prior to November 2000, the Royal Dutch/Shell Group of Companies (“Shell”) generally will indemnify the Company for environmental damages associated with environmental conditions that occurred or existed before the recapitalization in November 2000, subject to certain limitations. There have been no claims against Resolution Performance since November 2000 relating to such environmental matters; therefore, the Company has no accruals at March 31, 2006 and December 31, 2005 relating to Resolution Performance environmental matters.
According to the terms of the Resolution Specialty purchase agreement, Eastman Chemical Company retained the liability and indemnified Resolution Specialty for pre-existing unknown environmental conditions at facilities that were transferred to the Company, as well as for the pre-existing known environmental condition at the Roebuck, South Carolina facility, subject to certain limitations.
Non-Environmental Legal Matters
The Company has reserved approximately $12 at March 31, 2006 and December 31, 2005 relating to all non-environmental legal matters for legal defense and settlement costs that it believes are probable and estimable at this time.
F-14
Table of Contents
HEXION SPECIALTY CHEMICALS, INC.
Notes to Condensed Consolidated Financial Statements (Unaudited)—(Continued)
(In millions, except share data)
Following is a discussion of non-environmental legal proceedings that are not in the ordinary course of business:
Brazil Tax Claim—In 1992, the State of Sao Paulo Administrative Tax Bureau issued an assessment against the Company’s Brazilian subsidiary claiming that excise taxes were owed on certain intercompany loans made for centralized cash management purposes, characterized by the Tax Bureau as intercompany sales. Since that time, management and the Tax Bureau have held discussions and the subsidiary has filed an administrative appeal seeking cancellation of the assessment. The Administrative Court upheld the assessment in December 2001. In 2002, the subsidiary filed a second appeal with the highest-level Administrative Court, again seeking cancellation of the assessment. Argument was made to the court in September 2004; the Company is awaiting its ruling. At March 31, 2006, the amount of the assessment, including tax, penalties, monetary correction and interest, is 56 million Brazilian Reais, or approximately $26. The Company believes it has a strong defense against the assessment and will pursue the appeal vigorously, including appealing to the judicial level; however, there is no assurance that the assessment will not be upheld. At this time, the Company does not believe a loss is probable; therefore, only related legal fees have been accrued.
CTA Acoustics—From the third quarter 2003 to the first quarter 2004, six lawsuits were filed against Borden Chemical in the 27th Judicial District, Laurel County Circuit Court, in Kentucky, arising from an explosion at a customer’s plant where seven plant workers were killed and other workers were injured. The lawsuits primarily seek recovery for wrongful death, emotional and personal injury, loss of consortium, property damage and indemnity. The litigation also includes claims by the Company’s customer against the Company for property damage. On October 20, 2005, a settlement was reached with representatives of the seven deceased plant workers and twelve seriously injured workers. The Company also settled claims for emotional distress and minor injuries from 75 current and former CTA workers. The Company’s share of the settlement amounts is covered by insurance. The property damage claims remain to be resolved. The Company previously accrued and spent $5, the amount of its insurance deductible, relating to these actions and has insurance coverage expected to address any additional payments and legal fees.
Other Legal Matters— The Company is involved in various product liability, commercial and employment litigation, personal injury, property damage and other legal proceedings, which are considered to be in the ordinary course of business. There has been increased publicity about asbestos liabilities faced by manufacturing companies. In large part, as a result of the bankruptcies of many asbestos producers, plaintiffs’ attorneys are increasing their focus on peripheral defendants, including the Company, and asserting that even products that contained a small amount of asbestos caused injury. Plaintiffs are also focusing on alleged harm caused by other products the Company has made or used, including those containing silica and vinyl chloride monomer. The Company does not believe that it has a material exposure relating to these claims and believes it has adequate reserves and insurance to cover currently pending and foreseeable future claims.
The Company is named in a lawsuit filed in Hillsborough County, Florida Circuit Court, relating to an animal feed supplement processing site formerly operated by Borden Chemical and sold in 1980. The lawsuit is filed on behalf of multiple residents of Hillsborough County living near the site and alleges various injuries related to exposure to toxic chemicals. At this time, the Company has inadequate information from which to estimate a potential range of liability, if any. A similar lawsuit brought on behalf of a class of plaintiffs was dismissed by the court in November 2005.
Other Commitments and Contingencies
The Company entered into contractual agreements with Shell and other third parties for the supply of site services, utilities, materials and facilities and for operation and maintenance services necessary to operate certain of the Company’s facilities on a stand-alone basis. The duration of the contracts range from less than one year to
F-15
Table of Contents
HEXION SPECIALTY CHEMICALS, INC.
Notes to Condensed Consolidated Financial Statements (Unaudited)—(Continued)
(In millions, except share data)
20 years, depending on the nature of services. Such contracts may be terminated by either party under certain conditions as provided for in the respective agreements; generally, 90 days notice is required for short-term contracts and three years notice is required for longer-term contracts (generally those contracts in excess of five years). Contractual pricing generally includes a fixed and variable component.
In addition, the Company entered into contractual agreements with Shell and other third parties for the purchase of feedstocks. The terms of the agreements vary from three to ten years, extendable at the Company’s request and cancelable by either party as provided for in the respective agreements. Feedstock prices are based on market prices less negotiated volume discounts or cost input formulas.
6. Redeemable Preferred Stock
In May 2005, Hexion Escrow Corp., a subsidiary of Hexion which merged into Hexion coincidental with the Combinations, offered 14 million shares of Redeemable Series A Floating Rate Preferred Stock, par value $0.01 per share, and a liquidation preference of $25 per share (the “Preferred Stock”). For accounting purposes, the Preferred Stock is considered increasing rate preferred stock issued at an implied premium. As such, the implied premium is being accreted using the effective interest method from the issue date through May 15, 2007, which is the commencement of the perpetual dividend. For the three months ended March 31, 2006, the Company has recognized accreted dividends, including accretion of the implied premium, of $13.
On May 12, 2006, the Company used a portion of the proceeds it received from the amended and restated senior secured credit facilities (See Note 10) to redeem the Preferred Stock.
7. Pension and Postretirement Expense
Following are the components of net pension and postretirement expense (benefit) recognized by the Company for the three months ended March 31, 2006 and 2005:
| Pension | Postretirement | |||||||||||||||
| Three months ended March 31, | Three months ended March 31, | |||||||||||||||
| 2006 | 2005 | 2006 | 2005 | |||||||||||||
Service cost | $ | 3 | $ | 3 | $ | — | $ | — | ||||||||
Interest cost | 7 | 5 | — | — | ||||||||||||
Expected return on plan assets | (6 | ) | (7 | ) | — | — | ||||||||||
Amortization of prior service cost | — | — | (3 | ) | (3 | ) | ||||||||||
Recognized net actuarial loss (gain) | 3 | 2 | — | (1 | ) | |||||||||||
| $ | 7 | $ | 3 | $ | (3 | ) | $ | (4 | ) | |||||||
The amortization of prior service cost included in the postretirement benefit relates to plan amendments made in 2004 and 2003.
8. Segment Information
The Company’s organizational structure is based on the products the Company offers and the markets the Company serves. During the fourth quarter of 2005, the Company changed its reportable segments to better reflect the stage of the transition from the previous organization of the pre-merger companies to the Company’s organizational structure during the latter half of 2005. The transition provides greater alignment of the respective operating divisions and reporting segments. At March 31, 2006, the Company’s organizational structure consisted of four operating divisions: Epoxy and Phenolic Resins, Formaldehyde and Forest Products Resins,
F-16
Table of Contents
HEXION SPECIALTY CHEMICALS, INC.
Notes to Condensed Consolidated Financial Statements (Unaudited)—(Continued)
(In millions, except share data)
Coatings and Inks, and Performance Products. A brief summary of the operating divisions, which are aligned with the Company’s reportable segments, is as follows:
| • | Epoxy and Phenolic Resins: Includes the operations primarily from the Resolution Performance and Bakelite legacy companies and the phenolic resin operation of the Borden Chemical legacy company. Major products include epoxy resins and intermediates, molding compounds, versatic acids and derivatives, specialty phenolic resins and epoxy coating resins. |
| • | Formaldehyde and Forest Products Resins: Includes the formaldehyde and forest product operations primarily from the Borden Chemical legacy company. Major products include forest product resins and formaldehyde applications. |
| • | Coatings and Inks: Includes the operations of the Resolution Specialty legacy company. Major products include composite resins, polyester resins, acrylic resins, alkyd resins and ink resins and additives. |
| • | Performance Products: Includes the oil field products and foundry applications from the Borden Chemical legacy company. Major products include phenolic encapsulated substrates for oil field service applications and foundry applications. |
All historical segment information included herein has been restated to conform with the Company’s current segment reporting. The changes to previously reported segment information are simply a reclassification of activity among the Company’s segments and they do not impact any of the Company’s previously reported consolidated results.
The Company began implementing additional refinements to its operating divisions in 2006 to more closely link similar products, minimize divisional boundaries and improve the Company’s ability to serve common customers from pre-merger legacy company relationships, which may result in additional refinements to the Company’s reporting segments.
F-17
Table of Contents
HEXION SPECIALTY CHEMICALS, INC.
Notes to Condensed Consolidated Financial Statements (Unaudited)—(Continued)
(In millions, except share data)
Operating Segments:
Following is a comparison of Net sales and Segment EBITDA by reportable segment for the three months ended March 31, 2006 and 2005. Segment EBITDA is defined as EBITDA adjusted to exclude certain non-cash and non-recurring expenses. Segment EBITDA is the primary performance measure used by the Company in the evaluation of its operating results and in determining allocations of capital resources among its segments. Segment EBITDA is also the profitability measure used to set management and executive incentive compensation. Corporate and Other primarily represents certain corporate general and administrative expenses that are not allocated to the segments.
| 2006(2) | 2005 | |||||||
Net Sales to Unaffiliated Customers(1): | ||||||||
Epoxy and Phenolic Resins | $ | 538 | $ | 384 | ||||
Formaldehyde and Forest Product Resins | 342 | 313 | ||||||
Coatings and Inks | 259 | 217 | ||||||
Performance Products | 106 | 98 | ||||||
| $ | 1,245 | $ | 1,012 | |||||
| 2006(2) | 2005 | |||||||
Segment EBITDA(1): | ||||||||
Epoxy and Phenolic Resins | $ | 74 | $ | 54 | ||||
Formaldehyde and Forest Product Resins | 33 | 36 | ||||||
Coatings and Inks | 20 | 18 | ||||||
Performance Products | 16 | 11 | ||||||
Corporate and Other | (11 | ) | (10 | ) | ||||
| (1) | Intersegment sales and EBITDA are not significant and, as such, are eliminated within the selling segment |
| (2) | Net sales and segment EBITDA in 2006 include the Coatings Acquisition and the Wax Compound Acquisition results from the dates of their acquisition, January 31, 2006 and March 1, 2006, respectively. |
F-18
Table of Contents
HEXION SPECIALTY CHEMICALS, INC.
Notes to Condensed Consolidated Financial Statements (Unaudited)—(Continued)
(In millions, except share data)
Reconciliation of Segment EBITDA to Net Income (Loss) for the three months ended March 31, 2006 and 2005:
| 2006 | 2005 | |||||||
Segment EBITDA: | ||||||||
Epoxy and Phenolic Resins | $ | 74 | $ | 54 | ||||
Formaldehyde and Forest Product Resins | 33 | 36 | ||||||
Coatings and Inks | 20 | 18 | ||||||
Performance Products | 16 | 11 | ||||||
Corporate and Other | (11 | ) | (10 | ) | ||||
| Reconciliation: | ||||||||
Items not included in Segment EBITDA | ||||||||
Transaction related costs | (4 | ) | (7 | ) | ||||
Non-cash charges | (6 | ) | — | |||||
Unusual items: | ||||||||
Gain on divestiture of business | 37 | 2 | ||||||
Business realignments | (3 | ) | (1 | ) | ||||
Other | (10 | ) | (19 | ) | ||||
Total unusual items | 24 | (18 | ) | |||||
Total adjustments | 14 | (25 | ) | |||||
Interest expense, net | (54 | ) | (45 | ) | ||||
Income tax expense | (19 | ) | (13 | ) | ||||
Depreciation and amortization | (38 | ) | (36 | ) | ||||
Net income (loss) | $ | 35 | $ | (10 | ) | |||
Items not included in Segment EBITDA
Transaction related costs include merger costs related to the Combinations and expenses associated with terminated acquisition activities. Non-cash charges in 2006 primarily represent impairments of fixed assets and stock-based compensation expense. The 2006 Gain on divestiture of business primarily represents the gain realized on the Brazilian Consumer Divestiture. Other unusual items not included in Segment EBITDA represent expenses deemed by management to be non-recurring in nature. In 2006, these items principally consisted of integration costs, purchase accounting/inventory step-up adjustments related to the Coatings Acquisition and certain non-recurring litigation expenses. In 2005, these items principally consisted of an unrealized foreign currency loss on an exchange rate hedge related to the Bakelite Acquisition, certain non-recurring litigation expenses and integration costs.
9. Guarantor/Non-Guarantor Subsidiary Financial Information
The Company and certain of its U.S. subsidiaries guarantee the debt issued by its wholly-owned subsidiaries Hexion Nova Scotia, ULC (“Nova Scotia, ULC”) and Hexion U.S. Finance Corporation, which includes the $325 second-priority notes due 2014 and the $298 floating rate second-priority senior secured notes due 2010. In addition, the Company, these same U.S. subsidiaries, and Hexion U.S. Finance Corporation also guarantee the senior secured debt previously issued by Resolution Performance totaling $343 (“the Resolution Performance guaranteed debt”) which subsequent to March 31, 2006, the Company repurchased (see Note 10).
The following information contains the condensed consolidating financial information for the parent, Hexion, the subsidiary issuers (Hexion U.S. Finance Corporation, Nova Scotia, ULC and HSC Capital Corporation, formerly known as Resolution Performance Capital Corporation (“HSC Capital”)), the combined
F-19
Table of Contents
HEXION SPECIALTY CHEMICALS, INC.
Notes to Condensed Consolidated Financial Statements (Unaudited)—(Continued)
(In millions, except share data)
subsidiary guarantors (Borden Chemical Investments, Inc., Borden Chemical Foundry, Inc., Lawter International, Inc., Borden Chemical International, Inc., Hexion CI Holding Company (China) LLC and Oilfield Technology Group, Inc.) and the combined non-guarantor subsidiaries, which includes all of the Company’s foreign subsidiaries and HAI. Borden Services Company, a subsidiary guarantor, was merged into the Company in the fourth quarter of 2005, while three additional subsidiary guarantors, BDS Two, Inc., Bakelite North America Holding Company and Bakelite Epoxy Polymers Corporate, were merged into the Company on February 28, 2006; all of these former subsidiary guarantors are included in the parent for all periods presented.
All of the subsidiary issuers and subsidiary guarantors are owned 100% by Hexion. All guarantees are full and unconditional and are joint and several. There are no significant restrictions on the ability of the Company to obtain funds from its domestic subsidiaries by dividend or loan. While the Company’s Australian subsidiary and HAI are restricted in the payment of dividends and intercompany loans due to the terms of their credit facilities, there are no material restrictions on the Company’s ability to obtain cash from the remaining U.S. non-guarantor subsidiaries.
This information includes allocations of corporate overhead to the combined non-guarantor subsidiaries based on net sales. Income tax expense has been provided on the combined non-guarantor subsidiaries based on actual effective tax rates. All other tax expense is reflected in the parent.
F-20
Table of Contents
HEXION SPECIALTY CHEMICALS, INC.
Notes to Condensed Consolidated Financial Statements (Unaudited)—(Continued)
(In millions, except share data)
HEXION SPECIALTY CHEMICALS, INC.
THREE MONTHS ENDED MARCH 31, 2006
CONDENSED CONSOLIDATING STATEMENT OF OPERATIONS (Unaudited)
| Hexion Specialty Chemicals, Inc. | Subsidiary Issuers (1) | Combined Subsidiary Guarantors | Combined Non- Guarantor Subsidiaries | Eliminations | Consolidated | |||||||||||||||||||
Net sales | $ | 563 | $ | — | $ | 21 | $ | 755 | $ | (94 | ) | $ | 1,245 | |||||||||||
Cost of sales | 494 | — | 20 | 639 | (93 | ) | 1,060 | |||||||||||||||||
Gross profit | 69 | — | 1 | 116 | (1 | ) | 185 | |||||||||||||||||
Selling, general & administrative expense | 47 | — | — | 54 | — | 101 | ||||||||||||||||||
Transaction related costs | (2 | ) | — | — | 6 | — | 4 | |||||||||||||||||
Intercompany royalty expense (income) | 6 | — | (6 | ) | — | — | — | |||||||||||||||||
Other operating (income) expense | 6 | — | — | (36 | ) | — | (30 | ) | ||||||||||||||||
Operating income | 12 | — | 7 | 92 | (1 | ) | 110 | |||||||||||||||||
Interest expense, net | 33 | 16 | — | 5 | — | 54 | ||||||||||||||||||
Intercompany interest expense (income) | 6 | (17 | ) | — | 11 | — | — | |||||||||||||||||
Other non-operating (income) expense | (2 | ) | 1 | — | 2 | — | 1 | |||||||||||||||||
Income (loss) from continuing operations before income tax and minority interest | (25 | ) | — | 7 | 74 | (1 | ) | 55 | ||||||||||||||||
Income tax expense | 2 | — | — | 17 | — | 19 | ||||||||||||||||||
Income (loss) from continuing operations before equity earnings and minority interest | (27 | ) | — | 7 | 57 | (1 | ) | 36 | ||||||||||||||||
Equity in earnings of subsidiaries, net | 64 | — | 3 | 1 | (67 | ) | 1 | |||||||||||||||||
Minority interest in net income of consolidated subsidiaries | (2 | ) | — | — | — | — | (2 | ) | ||||||||||||||||
Net income | $ | 35 | $ | — | $ | 10 | $ | 58 | $ | (68 | ) | $ | 35 | |||||||||||
| (1) | Subsidiary issuers include Hexion U.S. Finance Corporation, HSC Capital and Nova Scotia, ULC. Hexion U.S. Finance Corporation is also a guarantor of the Resolution Performance guaranteed debt. HSC Capital is also a subsidiary guarantor of the debt issued by Hexion U.S. Finance Corporation and Nova Scotia, ULC. The primary asset of the Hexion U.S. Finance Corporation is an intercompany receivable from Hexion (the parent) for $203, which is essentially offset by the debt payable. HSC Capital has no significant assets. |
F-21
Table of Contents
HEXION SPECIALTY CHEMICALS, INC.
Notes to Condensed Consolidated Financial Statements (Unaudited)—(Continued)
(In millions, except share data)
HEXION SPECIALTY CHEMICALS, INC.
THREE MONTHS ENDED MARCH 31, 2005
CONDENSED CONSOLIDATING STATEMENT OF OPERATIONS (Unaudited)
| Hexion Specialty Chemicals, Inc. | Subsidiary Issuers | Combined Subsidiary Guarantors | Combined Non- Guarantor | Eliminations | Consolidated | |||||||||||||||||||
Net sales | $ | 537 | $ | — | $ | 20 | $ | 519 | $ | (64 | ) | $ | 1,012 | |||||||||||
Cost of sales | 475 | — | 19 | 433 | (64 | ) | 863 | |||||||||||||||||
Gross profit | 62 | — | 1 | 86 | — | 149 | ||||||||||||||||||
Selling, general & administrative expense | 50 | — | 1 | 35 | — | 86 | ||||||||||||||||||
Transaction related costs | 6 | — | — | 1 | — | 7 | ||||||||||||||||||
Intercompany royalty expense (income) | 6 | — | (6 | ) | — | — | — | |||||||||||||||||
Other operating expense (income) | 2 | (1 | ) | (1 | ) | (3 | ) | — | (3 | ) | ||||||||||||||
Operating income (loss) | (2 | ) | 1 | 7 | 53 | — | 59 | |||||||||||||||||
Interest expense, net | 33 | 11 | — | 1 | — | 45 | ||||||||||||||||||
Intercompany interest expense (income) | 2 | (11 | ) | — | 9 | — | — | |||||||||||||||||
Other non-operating (income) expense | 9 | 1 | — | (1 | ) | — | 9 | |||||||||||||||||
Income (loss) from continuing operations before income tax and minority interest | (46 | ) | — | 7 | 44 | — | 5 | |||||||||||||||||
Income tax expense (benefit) | (1 | ) | — | — | 14 | — | 13 | |||||||||||||||||
Income (loss) from continuing operations before equity earnings and minority interest | (45 | ) | — | 7 | 30 | — | (8 | ) | ||||||||||||||||
Equity in earnings of subsidiaries, net | 37 | — | 2 | — | (39 | ) | — | |||||||||||||||||
Minority interest in net income of consolidated subsidiaries | (2 | ) | — | — | — | — | (2 | ) | ||||||||||||||||
Net income (loss) | $ | (10 | ) | $ | — | $ | 9 | $ | 30 | $ | (39 | ) | $ | (10 | ) | |||||||||
F-22
Table of Contents
HEXION SPECIALTY CHEMICALS, INC.
Notes to Condensed Consolidated Financial Statements (Unaudited)—(Continued)
(In millions, except share data)
HEXION SPECIALTY CHEMICALS, INC.
MARCH 31, 2006
CONDENSED CONSOLIDATING BALANCE SHEET (Unaudited)
| Hexion Specialty Chemicals, Inc. | Subsidiary Issuers (1) | Combined Subsidiary Guarantors | Combined Non- Guarantor Subsidiaries | Eliminations | Consolidated | |||||||||||||||||||
ASSETS | ||||||||||||||||||||||||
Current Assets | ||||||||||||||||||||||||
Cash and equivalents | $ | 6 | $ | — | $ | 1 | $ | 161 | $ | — | $ | 168 | ||||||||||||
Accounts receivable, net | 215 | — | 10 | 459 | — | 684 | ||||||||||||||||||
Inventories: | ||||||||||||||||||||||||
Finished and in-process goods | 123 | — | 7 | 167 | — | 297 | ||||||||||||||||||
Raw materials and supplies | 67 | — | 6 | 100 | — | 173 | ||||||||||||||||||
Other current assets | 59 | — | 1 | 27 | 1 | 88 | ||||||||||||||||||
| 470 | — | 25 | 914 | 1 | 1,410 | |||||||||||||||||||
Other Assets | ||||||||||||||||||||||||
Investment in subsidiaries | 552 | — | 12 | — | (564 | ) | — | |||||||||||||||||
Other assets | 22 | 20 | — | 61 | — | 103 | ||||||||||||||||||
| 574 | 20 | 12 | 61 | (564 | ) | 103 | ||||||||||||||||||
Property and Equipment, net | 663 | — | 8 | 769 | — | 1,440 | ||||||||||||||||||
Goodwill | 68 | — | — | 104 | — | 172 | ||||||||||||||||||
Other Intangible Assets, net | 93 | — | — | 89 | — | 182 | ||||||||||||||||||
Total Assets | $ | 1,868 | $ | 20 | $ | 45 | $ | 1,937 | $ | (563 | ) | $ | 3,307 | |||||||||||
LIABILITIES, REDEEMABLE PREFERRED STOCK, COMMON STOCK AND OTHER SHAREHOLDER’S (DEFICIT) EQUITY | ||||||||||||||||||||||||
Current Liabilities | ||||||||||||||||||||||||
Accounts and drafts payable | $ | 223 | $ | — | $ | 8 | $ | 316 | $ | — | $ | 547 | ||||||||||||
Intercompany accounts payable (receivable) | 114 | (14 | ) | (22 | ) | (79 | ) | 1 | — | |||||||||||||||
Debt payable within one year | 7 | — | — | 34 | — | 41 | ||||||||||||||||||
Interest payable | 37 | 13 | — | — | — | 50 | ||||||||||||||||||
Income taxes payable | 48 | — | 1 | 58 | — | 107 | ||||||||||||||||||
Other current liabilities | 137 | — | 1 | 104 | — | 242 | ||||||||||||||||||
| 566 | (1 | ) | (12 | ) | 433 | 1 | 987 | |||||||||||||||||
Other Liabilities | ||||||||||||||||||||||||
Long-term debt | 1,366 | 625 | — | 308 | — | 2,299 | ||||||||||||||||||
Intercompany loans payable | 182 | (653 | ) | — | 471 | — | — | |||||||||||||||||
Long-term pension obligations | 53 | — | — | 123 | — | 176 | ||||||||||||||||||
Non-pension post employment benefit obligations | 103 | — | — | 12 | — | 115 | ||||||||||||||||||
Deferred income taxes | 27 | (2 | ) | — | 110 | — | 135 | |||||||||||||||||
Other long-term liabilities | 77 | — | — | 21 | — | 98 | ||||||||||||||||||
| 1,808 | (30 | ) | — | 1,045 | — | 2,823 | ||||||||||||||||||
Minority interest in consolidated subsidiaries | 6 | — | — | 3 | — | 9 | ||||||||||||||||||
Redeemable preferred stock | 377 | — | — | — | — | 377 | ||||||||||||||||||
Common Stock and Other Shareholder’s (Deficit) Equity | (889 | ) | 51 | 57 | 456 | (564 | ) | (889 | ) | |||||||||||||||
Total Liabilities, Redeemable Preferred Stock, Common Stock and Other Shareholder’s (Deficit) Equity | $ | 1,868 | $ | 20 | $ | 45 | $ | 1,937 | $ | (563 | ) | $ | 3,307 | |||||||||||
| (1) | Subsidiary issuers include Hexion U.S. Finance Corporation, HSC Capital and Nova Scotia, ULC. Hexion U.S. Finance Corporation is also a guarantor of the Resolution Performance guaranteed debt. HSC Capital is also a subsidiary guarantor of the debt issued by Hexion U.S. Finance Corporation and Nova Scotia, ULC. The primary asset of the Hexion U.S. Finance Corporation is an intercompany receivable from Hexion (the parent) for $203, which is essentially offset by the debt payable. HSC Capital has no significant assets. |
F-23
Table of Contents
HEXION SPECIALTY CHEMICALS, INC.
Notes to Condensed Consolidated Financial Statements (Unaudited)—(Continued)
(In millions, except share data)
HEXION SPECIALTY CHEMICALS, INC.
DECEMBER 31, 2005
CONDENSED CONSOLIDATING BALANCE SHEET
Hexion Chemicals, | Subsidiary Issuers (1) | Combined Subsidiary Guarantors | Combined Non- Guarantor | Eliminations | Consolidated | |||||||||||||||||||
ASSETS | ||||||||||||||||||||||||
Current Assets | ||||||||||||||||||||||||
Cash and equivalents | $ | 8 | $ | — | $ | — | $ | 175 | $ | — | $ | 183 | ||||||||||||
Accounts receivable, net | 205 | — | 14 | 386 | — | 605 | ||||||||||||||||||
Inventories: | ||||||||||||||||||||||||
Finished and in-process goods | 132 | — | 7 | 153 | — | 292 | ||||||||||||||||||
Raw materials and supplies | 60 | — | 5 | 88 | — | 153 | ||||||||||||||||||
Other current assets | 95 | — | 1 | 36 | — | 132 | ||||||||||||||||||
| 500 | — | 27 | 838 | — | 1,365 | |||||||||||||||||||
Other Assets | ||||||||||||||||||||||||
Investment in subsidiaries | 482 | — | 17 | — | (499 | ) | — | |||||||||||||||||
Other assets | 4 | 21 | — | 78 | — | 103 | ||||||||||||||||||
| 486 | 21 | 17 | 78 | (499 | ) | 103 | ||||||||||||||||||
Property and Equipment, net | 656 | — | 9 | 731 | — | 1,396 | ||||||||||||||||||
Goodwill | 63 | — | — | 106 | — | 169 | ||||||||||||||||||
Other Intangible Assets, net | 94 | — | — | 82 | — | 176 | ||||||||||||||||||
Total Assets | $ | 1,799 | $ | 21 | $ | 53 | $ | 1,835 | $ | (499 | ) | $ | 3,209 | |||||||||||
LIABILITIES AND SHAREHOLDER’S (DEFICIT) EQUITY | ||||||||||||||||||||||||
Current Liabilities | ||||||||||||||||||||||||
Accounts and drafts payable | $ | 215 | $ | — | $ | 10 | $ | 278 | $ | — | $ | 503 | ||||||||||||
Intercompany accounts payable (receivable) | 55 | (22 | ) | (13 | ) | (20 | ) | — | — | |||||||||||||||
Debt payable within one year | 13 | — | — | 38 | — | 51 | ||||||||||||||||||
Interest payable | 24 | 20 | — | 1 | — | 45 | ||||||||||||||||||
Income taxes payable | 45 | — | — | 46 | — | 91 | ||||||||||||||||||
Other current liabilities | 158 | — | 2 | 88 | — | 248 | ||||||||||||||||||
| 510 | (2 | ) | (1 | ) | 431 | — | 938 | |||||||||||||||||
Other Liabilities | ||||||||||||||||||||||||
Long-term debt | 1,368 | 625 | — | 310 | — | 2,303 | ||||||||||||||||||
Intercompany loans payable (receivable) | 217 | (652 | ) | — | 435 | — | — | |||||||||||||||||
Long-term pension obligations | 51 | — | — | 116 | — | 167 | ||||||||||||||||||
Non-pension postemployment benefit obligations | 104 | — | — | 15 | — | 119 | ||||||||||||||||||
Deferred income taxes | 26 | — | — | 113 | — | 139 | ||||||||||||||||||
Other long-term liabilities | 75 | — | — | 17 | — | 92 | ||||||||||||||||||
| 1,841 | (27 | ) | — | 1,006 | — | 2,820 | ||||||||||||||||||
Minority interest in consolidated subsidiaries | 8 | — | — | 3 | — | 11 | ||||||||||||||||||
Redeemable Preferred Stock | 364 | — | — | — | — | 364 | ||||||||||||||||||
Common Stock and Other Shareholder’s (Deficit) Equity | (924 | ) | 50 | 54 | 395 | (499 | ) | (924 | ) | |||||||||||||||
Total Liabilities, Redeemable Preferred Stock, Common Stock and Other Shareholder’s (Deficit) Equity | $ | 1,799 | $ | 21 | $ | 53 | $ | 1,835 | $ | (499 | ) | $ | 3,209 | |||||||||||
| (1) | Subsidiary issuers include Hexion U.S. Finance Corporation, HSC Capital and Nova Scotia, ULC. Hexion U.S. Finance Corporation is also a guarantor of the Resolution Performance guaranteed debt. HSC Capital is also a subsidiary guarantor of the debt issued by Hexion U.S. Finance Corporation and Nova Scotia, ULC. The primary asset of the Hexion U.S. Finance Corporation is an intercompany receivable from Hexion (the parent) for $203, which is essentially offset by the debt payable. HSC Capital has no significant assets. |
F-24
Table of Contents
HEXION SPECIALTY CHEMICALS, INC.
Notes to Condensed Consolidated Financial Statements (Unaudited)—(Continued)
(In millions, except share data)
HEXION SPECIALTY CHEMICALS, INC.
THREE MONTHS ENDED MARCH 31, 2006
CONDENSED CONSOLIDATING STATEMENT OF CASH FLOWS (Unaudited)
Hexion Chemicals, | Subsidiary Issuers (1) | Combined Subsidiary Guarantors | Combined Non- Guarantor Subsidiaries | Eliminations | Consolidated | ||||||||||||||||||
Cash Flows from (used in) Operating Activities | $ | 21 | $ | (5 | ) | $ | 7 | $ | 21 | $ | — | $ | 44 | ||||||||||
Cash Flows (used in) from Investing Activities | |||||||||||||||||||||||
Capital expenditures | (20 | ) | — | — | (7 | ) | — | (27 | ) | ||||||||||||||
Acquisition of businesses | — | — | — | (56 | ) | — | (56 | ) | |||||||||||||||
Proceeds from sale of businesses | — | — | — | 41 | — | 41 | |||||||||||||||||
| (20 | ) | — | — | (22 | ) | — | (42 | ) | |||||||||||||||
| �� | |||||||||||||||||||||||
Cash flows (used in) from Financing Activities | |||||||||||||||||||||||
Net short-term debt repayments | (6 | ) | — | — | (3 | ) | — | (9 | ) | ||||||||||||||
Borrowings of long-term debt | 15 | — | — | 19 | — | 34 | |||||||||||||||||
Repayments of long-term debt | (15 | ) | — | — | (24 | ) | — | (39 | ) | ||||||||||||||
Affiliated loan (repayments) borrowings | 5 | 5 | (6 | ) | (4 | ) | — | — | |||||||||||||||
IPO related costs | (2 | ) | — | — | — | — | (2 | ) | |||||||||||||||
| (3 | ) | 5 | (6 | ) | (12 | ) | — | (16 | ) | ||||||||||||||
Effect of exchange rates on cash and equivalents | — | — | — | (1 | ) | — | (1 | ) | |||||||||||||||
Decrease (increase) in cash and equivalents | (2 | ) | — | 1 | (14 | ) | — | (15 | ) | ||||||||||||||
Cash and equivalents at beginning of period | 8 | — | — | 175 | — | 183 | |||||||||||||||||
Cash and equivalents at end of period | $ | 6 | $ | — | $ | 1 | $ | 161 | $ | — | $ | 168 | |||||||||||
| (1) | Subsidiary issuers include Hexion U.S. Finance Corporation, HSC Capital and Nova Scotia, ULC. Hexion U.S. Finance Corporation is also a guarantor of the Resolution Performance guaranteed debt. HSC Capital is also a subsidiary guarantor of the debt issued by Hexion U.S. Finance Corporation and Nova Scotia, ULC. The primary asset of the Hexion U.S. Finance Corporation is an intercompany receivable from Hexion (the parent) for $203, which is essentially offset by the debt payable. HSC Capital has no significant assets. |
F-25
Table of Contents
HEXION SPECIALTY CHEMICALS, INC.
Notes to Condensed Consolidated Financial Statements (Unaudited)—(Continued)
(In millions, except share data)
HEXION SPECIALTY CHEMICALS, INC.
THREE MONTHS ENDED MARCH 31, 2005
CONDENSED CONSOLIDATING STATEMENT OF CASH FLOWS (Unaudited)
Hexion Chemicals, | Subsidiary Issuers(1) | Combined Subsidiary Guarantors | Combined Non- Guarantor | Eliminations | Consolidated | ||||||||||||||||||
Cash Flows from (used in) Operating Activities | $ | 36 | $ | (1 | ) | $ | — | $ | (11 | ) | $ | — | $ | 24 | |||||||||
Cash Flows (used in) from Investing Activities | |||||||||||||||||||||||
Capital expenditures | (9 | ) | — | — | (4 | ) | — | (13 | ) | ||||||||||||||
Proceeds from the sale of business | — | — | 2 | — | — | 2 | |||||||||||||||||
Deferred acquisition costs | (9 | ) | — | — | — | — | (9 | ) | |||||||||||||||
| (18 | ) | — | 2 | (4 | ) | — | (20 | ) | |||||||||||||||
Cash flows (used in) from Financing Activities | |||||||||||||||||||||||
Net short-term repayments | (1 | ) | — | — | (2 | ) | — | (3 | ) | ||||||||||||||
Borrowings of long-term debt | 144 | — | — | — | — | 144 | |||||||||||||||||
Repayments of long-term debt | (138 | ) | — | — | (1 | ) | — | (139 | ) | ||||||||||||||
Affiliated loans (repayments) borrowings | (19 | ) | 1 | (6 | ) | 24 | — | — | |||||||||||||||
Dividends received (paid) | 3 | — | (2 | ) | (1 | ) | — | — | |||||||||||||||
Purchase price adjustment payable to parent | 8 | — | — | — | — | 8 | |||||||||||||||||
Repayments of cash overdrafts | (2 | ) | — | — | — | — | (2 | ) | |||||||||||||||
Other | (5 | ) | — | — | — | — | (5 | ) | |||||||||||||||
| (10 | ) | 1 | (8 | ) | 20 | — | 3 | ||||||||||||||||
Effect of exchange rates on cash and equivalents | — | — | — | (1 | ) | — | (1 | ) | |||||||||||||||
Increase (decrease) in cash and equivalents | 8 | — | (6 | ) | 4 | — | 6 | ||||||||||||||||
Cash and equivalents at beginning of period | 63 | — | 9 | 80 | — | 152 | |||||||||||||||||
Cash and equivalents at end of period | $ | 71 | $ | — | $ | 3 | $ | 84 | $ | — | $ | 158 | |||||||||||
| (1) | Subsidiary issuers include Hexion U.S. Finance Corporation, HSC Capital and Nova Scotia, ULC. Hexion U.S. Finance Corporation is also a guarantor of the Resolution Performance guaranteed debt. HSC Capital is also a subsidiary guarantor of the debt issued by Hexion U.S. Finance Corporation and Nova Scotia, ULC. The primary asset of the Hexion U.S. Finance Corporation is an intercompany receivable from Hexion (the parent) for $203, which is essentially offset by the debt payable. HSC Capital has no significant assets. |
F-26
Table of Contents
HEXION SPECIALTY CHEMICALS, INC.
Notes to Condensed Consolidated Financial Statements (Unaudited)—(Continued)
(In millions, except share data)
10. Subsequent Events
Senior Secured Credit Facilities
In May 2006, the Company amended and restated its senior secured credit facilities. The seven-year $1,625 term loan facility, seven-year $50 synthetic letter of credit facility (“LOC”), and five-year $225 revolving credit facility (the “new senior secured credit facilities”), are each subject to an earlier maturity date, on any date that greater than $200 in the aggregate principal amount of certain of the Company’s and its subsidiaries’ indebtedness will mature within 91 days of such date. Repayment of 1% total per annum of the term loan and LOCs must be made (in the case of the term loan facility, quarterly, in the case of the LOC, annually) with the balance payable upon the final maturity date. Further, the Company may be required to make additional repayments on the term loan beginning in 2008 if excess cash flow is generated and upon specified events.
The interest rates with respect to term loans to the Company under the new senior secured credit facilities are based on, at the Company’s option, (a) adjusted LIBOR plus 2.00% or (b) the higher of (i) JPMorgan Chase Bank, N.A.’s (JPMCB) prime rate or (ii) the Federal Funds Rate plus 0.50%, in each case plus 0.50%. Term loans to the Netherlands subsidiary are at the Company’s option, (a) EURO LIBOR plus 2.00% or (b) the rate quoted by JPMCB as its base rate for such loans plus 0.50%. The foregoing margins are subject to reduction if certain corporate credit ratings are achieved.
The new senior secured credit facility has commitment fees (other than with respect to the LOC) equal to 0.50% per annum of the unused line plus a fronting fee of 0.25% of the aggregate face amount of outstanding letters of credit. The LOC has a commitment fee of 0.10% per annum.
The obligations under the new senior secured credit facility are guaranteed (i) prior to the initial public offering of the Company’s common stock, by parent Hexion LLC, (ii) at all times, by each of the Company’s existing and subsequently acquired or organized material domestic subsidiaries, excluding HA-International, LLC. Subject to certain exceptions, all obligations of the foreign subsidiary borrowers will be guaranteed (i) prior to the initial public offering of the common stock, by Hexion LLC and (ii) at all times, by the Company, the U.S. subsidiary guarantors, the other foreign subsidiary borrowers and the respective material subsidiaries in the United States, the United Kingdom, Germany, the Netherlands and Canada (excluding subsidiaries in the United Kingdom, Germany and the United States that are unrestricted subsidiaries) and Hexion Specialty Chemicals Barbastro S.A.
The new senior secured credit facilities are secured by substantially all the assets of (i) prior to the initial public offering of the Company’s common stock, Hexion LLC, which will consist of a perfected first-priority pledge of all of the Company’s capital stock and (ii) at all times, the Company and the subsidiary guarantors, including but not limited to: (a) a first-priority pledge, subject to certain exceptions, of all capital stock held by the Company or any subsidiary guarantor (which pledge, with respect to obligations in respect of the U.S. borrowings secured by a pledge of the stock of any first-tier foreign subsidiary, shall be limited to 100% of the non-voting stock, if any, and 65% of the voting stock of such foreign subsidiary) and (b) perfected first-priority security interests in, and mortgages on, substantially all tangible and intangible assets of the Company and each subsidiary guarantor.
Notwithstanding the foregoing, (i) assets of foreign subsidiary guarantors only secure obligations in respect of the foreign borrowings, (ii) the collateral does not include (a) any real estate, fixtures or equipment of the Company or any subsidiaries located within the United States (except, subject to certain exceptions, for assets that the Company’s board of directors determines do not constitute principal property under the indentures for its debentures due 2016, 2021 and 2023) and (b) any capital stock or evidence of indebtedness for borrowed money
F-27
Table of Contents
HEXION SPECIALTY CHEMICALS, INC.
Notes to Condensed Consolidated Financial Statements (Unaudited)—(Continued)
(In millions, except share data)
of certain subsidiaries held by the Company or any subsidiaries and (iii) assets of Hexion LLC, the Company or domestic subsidiaries will not secure obligations of the Netherlands subsidiary borrower.
The credit agreement contains, among other provisions, restrictive covenants regarding indebtedness, payments and distributions, mergers and acquisitions, asset sales, affiliate transactions, capital expenditures and the maintenance of a certain financial ratio. Payment of borrowings under the new senior secured credit facilities may be accelerated if there is an event of default. Events of default include the failure to pay principal and interest when due, a material breach of representation or warranty, covenant defaults, events of bankruptcy and a change of control.
Senior Secured Notes, Senior Subordinated Notes and Series A Preferred Stock
On April 20, 2006, the Company announced tender offers and consent solicitations, subject to customary terms and conditions, for its 8% Senior Secured Notes due 2009, 9 1/2% Senior Second Secured Notes due 2010 and 13 1/2% Senior Subordinated Notes due 2010. On May 5, 2006, the Company exercised its early acceptance rights under the tender offers and repurchased 100% of the outstanding principal amount of its 8% Senior Secured Notes, 99.9% of its 9 1/2% Senior Second Secured Notes and 88.7% of its 13 1/2% Senior Subordinated Notes. The tender offers will expire at midnight May 17, 2006, unless extended or terminated by the Company.
On May 12, 2006, the Company redeemed all of the outstanding Series A Preferred Stock with a portion of the proceeds from the new senior secured credit facilities.
Upon completion of the tender and amendment of the senior secured credit facilities, the Company expects to recognize a loss on the extinguishment of debt of approximately $31 (redemption cost net of debt premium) and an additional charge of approximately $20 for the write-off of deferred financing costs, which will be reflected in our second quarter financial statements.
Interest Rate Swap Agreement
On May 10, 2006, we entered into a $1 billion interest rate swap agreement. The swap is a three-year agreement designed to offset cash flow variability associated with interest rate fluctuations on our variable rate debt. The initial notional amount of the swap is $1 billion, which amortizes on a quarterly basis based on expected payments on our term loan in order to maintain a fixed to variable debt ratio of approximately 70% fixed to 30% variable.
F-28
Table of Contents
REPORT OF INDEPENDENT REGISTERED PUBLIC ACCOUNTING FIRM
To theBoard of Directors and Shareholder of
Hexion Specialty Chemicals, Inc.:
In our opinion, based on our audits and the reports of other auditors, the consolidated financial statements listed in the accompanying index present fairly, in all material respects, the financial position of Hexion Specialty Chemicals, Inc. and its subsidiaries at December 31, 2005 and 2004, and the results of their operations and their cash flows for each of the three years in the period ended December 31, 2005 in conformity with accounting principles generally accepted in the United States of America. In addition, in our opinion, based on our audits and the reports of other auditors, the financial statement schedule listed in the accompanying index presents fairly, in all material respects, the information set forth therein when read in conjunction with the related consolidated financial statements. These financial statements and financial statement schedule are the responsibility of the Company’s management. Our responsibility is to express an opinion on these financial statements and financial statement schedule based on our audits. We did not audit the financial statements of Hexion Specialty Chemicals Canada, Inc., a wholly-owned subsidiary, which statements reflect total assets of $953 million as of December 31, 2005 and total revenues of $1,181 million, for the year ended December 31, 2005 nor did we audit the financial statements and financial statement schedule of Borden Chemical, Inc., a company which has been consolidated with other entities to form the Company, which statements reflect total assets of $1,044 million as of December 31, 2004, and total revenues of $702 million for the period August 12, 2004 to December 31, 2004. Those statements and schedule were audited by other auditors whose reports thereon have been furnished to us, and our opinion expressed herein, insofar as it relates to the amounts included for Hexion Specialty Chemicals Canada, Inc. and Borden Chemical, Inc., is based solely on the reports of the other auditors. We conducted our audits of these statements in accordance with the standards of the Public Company Accounting Oversight Board (United States). Those standards require that we plan and perform the audit to obtain reasonable assurance about whether the financial statements are free of material misstatement. An audit includes examining, on a test basis, evidence supporting the amounts and disclosures in the financial statements, assessing the accounting principles used and significant estimates made by management, and evaluating the overall financial statement presentation. We believe that our audits and the reports of other auditors provide a reasonable basis for our opinion.
PRICEWATERHOUSECOOPERS LLP
Columbus, Ohio
March 16, 2006
F-29
Table of Contents
HEXION SPECIALTY CHEMICALS, INC.
CONSOLIDATED STATEMENTS OF OPERATIONS
| Year Ended December 31, | ||||||||||||
| 2005 | 2004 | 2003 | ||||||||||
| (In millions, except share and per share data) | ||||||||||||
Net sales | $ | 4,470 | $ | 2,019 | $ | 782 | ||||||
Cost of sales | 3,808 | 1,785 | 714 | |||||||||
Gross profit | 662 | 234 | 68 | |||||||||
Selling, general & administrative expense | 400 | 163 | 81 | |||||||||
Transaction related costs (See Note 1) | 44 | 56 | — | |||||||||
Other operating expense | 10 | 6 | 10 | |||||||||
Operating income (loss) | 208 | 9 | (23 | ) | ||||||||
Interest expense, net | 204 | 117 | 77 | |||||||||
Write-off of deferred financing fees (See Note 8) | 17 | — | — | |||||||||
Other non-operating expense, net | 16 | 5 | — | |||||||||
Loss from continuing operations before income tax, earnings from unconsolidated entities and minority interest | (29 | ) | (113 | ) | (100 | ) | ||||||
Income tax expense (benefit) (See Note 16) | 48 | — | (37 | ) | ||||||||
Loss from continuing operations before earnings from unconsolidated entities and minority interest | (77 | ) | (113 | ) | (63 | ) | ||||||
Earnings from unconsolidated entities, net of taxes | 2 | — | — | |||||||||
Minority interest in net (income) loss of consolidated subsidiaries | (3 | ) | 8 | 13 | ||||||||
Loss from continuing operations | (78 | ) | (105 | ) | (50 | ) | ||||||
Loss from discontinued operations (See Note 4) | 9 | — | — | |||||||||
Net loss | (87 | ) | (105 | ) | (50 | ) | ||||||
Redeemable preferred stock accretion (See Note 11) | 30 | — | — | |||||||||
Net loss available to common shareholders | $ | (117 | ) | $ | (105 | ) | $ | (50 | ) | |||
Comprehensive loss | $ | (172 | ) | $ | (36 | ) | $ | (9 | ) | |||
Basic and Diluted Per Share Data | ||||||||||||
Loss from continuing operations | $ | (1.30 | ) | $ | (1.27 | ) | $ | (0.61 | ) | |||
Loss from discontinued operations | (0.11 | ) | — | — | ||||||||
Net loss available to common shareholders | $ | (1.41 | ) | $ | (1.27 | ) | $ | (0.61 | ) | |||
Dividends (See Note 14) | $ | 6.66 | $ | — | $ | — | ||||||
Average number of common shares outstanding during the period— basic and diluted | 82,629,906 | 82,629,906 | 82,629,906 | |||||||||
See Notes to Consolidated Financial Statements
F-30
Table of Contents
HEXION SPECIALTY CHEMICALS, INC.
| December 31, | ||||||||
| 2005 | 2004 | |||||||
| (In millions) | ||||||||
ASSETS | ||||||||
Current Assets | ||||||||
Cash and equivalents | $ | 183 | $ | 152 | ||||
Accounts receivable (less allowance for doubtful accounts of $19 in 2005 and $15 in 2004) | 605 | 518 | ||||||
Inventories: | ||||||||
Finished and in-process goods | 292 | 290 | ||||||
Raw materials and supplies | 153 | 115 | ||||||
Other current assets | 132 | 64 | ||||||
| 1,365 | 1,139 | |||||||
Other Assets | 103 | 95 | ||||||
Property and Equipment | ||||||||
Land | 63 | 44 | ||||||
Buildings | 209 | 201 | ||||||
Machinery and equipment | 1,777 | 1,706 | ||||||
| 2,049 | 1,951 | |||||||
Less accumulated depreciation | (653 | ) | (628 | ) | ||||
| 1,396 | 1,323 | |||||||
Goodwill (See Note 6) | 169 | 51 | ||||||
Other Intangible Assets, net (See Note 6) | 176 | 88 | ||||||
Total Assets | $ | 3,209 | $ | 2,696 | ||||
See Notes to Consolidated Financial Statements
F-31
Table of Contents
HEXION SPECIALTY CHEMICALS, INC.
CONSOLIDATED BALANCE SHEETS
| December 31, | ||||||||
| 2005 | 2004 | |||||||
| (In millions, except share and per share data) | ||||||||
LIABILITIES, REDEEMABLE PREFERRED STOCK, COMMON STOCK AND OTHER SHAREHOLDER’S DEFICIT | ||||||||
Current Liabilities | ||||||||
Accounts and drafts payable | $ | 503 | $ | 488 | ||||
Debt payable within one year | 51 | 16 | ||||||
Interest payable | 45 | 36 | ||||||
Income taxes payable | 91 | 33 | ||||||
Other current liabilities | 248 | 133 | ||||||
| 938 | 706 | |||||||
Other Liabilities | ||||||||
Long-term debt | 2,303 | 1,834 | ||||||
Long-term pension obligations | 167 | 73 | ||||||
Non-pension postemployment benefit obligations | 119 | 142 | ||||||
Deferred income taxes | 139 | 131 | ||||||
Other long-term liabilities | 92 | 65 | ||||||
| 2,820 | 2,245 | |||||||
Minority interest in consolidated subsidiaries | 11 | 54 | ||||||
Commitments and Contingencies (See Notes 8 and 10) | ||||||||
Redeemable Preferred Stock - $0.01 par value; liquidation preference $25 per share; 60,000,000 shares authorized, 14,781,959 issued and outstanding at December 31, 2005 (See Note 11) | 364 | — | ||||||
Common Stock and Other Shareholder’s Deficit | ||||||||
Common stock - $0.01 par value; 300,000,000 shares authorized, | ||||||||
170,678,965 issued, 88,049,059 treasury and 82,629,906 outstanding at December 31, 2005 and 2004 | 1 | 1 | ||||||
Paid-in capital | 515 | 1,523 | ||||||
Treasury stock | (296 | ) | (296 | ) | ||||
Receivable from parent | — | (561 | ) | |||||
Accumulated other comprehensive (loss) income | (70 | ) | 20 | |||||
Accumulated deficit | (1,074 | ) | (996 | ) | ||||
| (924 | ) | (309 | ) | |||||
Total Liabilities, Redeemable Preferred Stock, Common Stock and Other Shareholder’s Deficit | $ | 3,209 | $ | 2,696 | ||||
See Notes to Consolidated Financial Statements
F-32
Table of Contents
HEXION SPECIALTY CHEMICALS, INC.
CONSOLIDATED STATEMENTS OF CASH FLOWS
| Year ended December 31, | ||||||||||||
| 2005 | 2004 | 2003 | ||||||||||
| (In millions) | ||||||||||||
Cash Flows from (used in) Operating Activities | ||||||||||||
Net loss | $ | (87 | ) | $ | (105 | ) | $ | (50 | ) | |||
Adjustments to reconcile net loss to net cash from (used in) operating activities: | ||||||||||||
Depreciation and amortization | 148 | 86 | 58 | |||||||||
Minority interest in net income (loss) of consolidated subsidiaries | 3 | (8 | ) | (13 | ) | |||||||
Stock-based compensation (See Note 15) | 12 | 4 | — | |||||||||
Deferred tax benefit | (3 | ) | (3 | ) | (37 | ) | ||||||
Unrealized foreign exchange loss | 13 | — | — | |||||||||
Amortization of deferred financing fees | 9 | 5 | 10 | |||||||||
Write-off of deferred financing fees (See Note 8) | 11 | — | — | |||||||||
Non-cash restructuring | 9 | — | — | |||||||||
Impairments | 8 | 2 | 13 | |||||||||
Other non-cash adjustments | (3 | ) | — | (5 | ) | |||||||
Net change in assets and liabilities: | ||||||||||||
Accounts receivable | 7 | (81 | ) | 9 | ||||||||
Inventories | 59 | (53 | ) | 10 | ||||||||
Accounts and drafts payable | (29 | ) | 133 | (46 | ) | |||||||
Income taxes payable | 58 | — | 10 | |||||||||
Other assets | (50 | ) | (20 | ) | 4 | |||||||
Other liabilities | 6 | 8 | (6 | ) | ||||||||
| 171 | (32 | ) | (43 | ) | ||||||||
Cash Flows (used in) from Investing Activities | ||||||||||||
Capital expenditures | (105 | ) | (57 | ) | (18 | ) | ||||||
Acquisition of businesses, net of cash acquired | (252 | ) | (152 | ) | — | |||||||
Proceeds from the sale of business, net of cash | 3 | — | — | |||||||||
Cash combination of Borden Chemical | — | 185 | — | |||||||||
Proceeds from the sale of assets | — | 4 | 23 | |||||||||
Distributions from equity affiliates | — | — | 2 | |||||||||
| (354 | ) | (20 | ) | 7 | ||||||||
Cash Flows from (used in) Financing Activities | ||||||||||||
Net short-term debt repayments | (2 | ) | (6 | ) | — | |||||||
Borrowings of long-term debt | 1,193 | 293 | 748 | |||||||||
Repayments of long-term debt | (750 | ) | (195 | ) | (645 | ) | ||||||
Payment of dividends | (523 | ) | — | — | ||||||||
Proceeds from the issue of preferred stock, net of issuance costs (See Note 11) | 334 | — | — | |||||||||
Long-term debt and credit facility financing fees paid | (22 | ) | — | — | ||||||||
IPO related costs (See Note 1) | (11 | ) | — | — | ||||||||
Proceeds related to Resolution Specialty Transaction | — | 60 | — | |||||||||
Other | — | (4 | ) | (23 | ) | |||||||
| 219 | 148 | 80 | ||||||||||
Effect of exchange rates on cash and equivalents | (5 | ) | 7 | 1 | ||||||||
Increase in cash and equivalents | 31 | 103 | 45 | |||||||||
Cash and equivalents at beginning of year | 152 | 49 | 4 | |||||||||
Cash and equivalents at end of year | $ | 183 | $ | 152 | $ | 49 | ||||||
Supplemental Disclosures of Cash Flow Information | ||||||||||||
Cash paid (received): | ||||||||||||
Interest, net | $ | 192 | $ | 102 | $ | 63 | ||||||
Income taxes, net | 8 | 3 | (19 | ) | ||||||||
Non-cash activity: | ||||||||||||
Settlement of note receivable from parent | 581 | — | — | |||||||||
Unpaid common stock dividends declared | 27 | — | — | |||||||||
Redeemable preferred stock accretion (See Note 11) | 30 | — | — | |||||||||
Reclassification of minimum pension liability adjustment from (to) shareholder’s deficit | (16 | ) | 2 | — | ||||||||
Issuance of Note in Resolution Specialty Transaction | — | 50 | — | |||||||||
See Notes to Consolidated Financial Statements
F-33
Table of Contents
HEXION SPECIALTY CHEMICALS, INC.
CONSOLIDATED STATEMENT OF COMMON STOCK AND OTHER SHAREHOLDER’S (DEFICIT) EQUITY
| Common Stock | Paid-in Capital | Treasury Stock | Receivable from Parent | Accumulated Other | Accumulated (Deficit) Equity | Total | |||||||||||||||||||||
| (In millions) | |||||||||||||||||||||||||||
Balance, December 31, 2002 | $ | 1 | $ | 143 | $ | — | $ | — | $ | 41 | $ | (22 | ) | $ | 163 | ||||||||||||
Net loss | — | — | — | — | — | (50 | ) | (50 | ) | ||||||||||||||||||
Translation adjustments | — | — | — | — | 40 | — | 40 | ||||||||||||||||||||
Interest rate swap, net of tax | — | — | — | — | 1 | — | 1 | ||||||||||||||||||||
Comprehensive loss | — | — | — | — | — | — | (9 | ) | |||||||||||||||||||
Constructive distribution | — | — | — | — | — | (2 | ) | (2 | ) | ||||||||||||||||||
Balance, December 31, 2003 | $ | 1 | $ | 143 | — | — | $ | 82 | $ | (74 | ) | $ | 152 | ||||||||||||||
Net loss | — | — | — | — | — | (105 | ) | (105 | ) | ||||||||||||||||||
Translation adjustments | — | — | — | — | 67 | — | 67 | ||||||||||||||||||||
Minimum pension liability adjustment, net of tax | — | — | — | — | 2 | — | 2 | ||||||||||||||||||||
Comprehensive loss | — | — | — | — | — | — | (36 | ) | |||||||||||||||||||
Acquisition of Resolution Specialty to Consolidated group | — | 57 | — | — | — | — | 57 | ||||||||||||||||||||
Acquisition of Borden Chemical to Consolidated group | — | 1,252 | (296 | ) | (542 | ) | (131 | ) | (817 | ) | (534 | ) | |||||||||||||||
Interest accrued on notes from parent of Borden Chemical | — | 19 | — | (19 | ) | — | — | — | |||||||||||||||||||
Compensation expense under deferred compensation plan | — | 4 | — | — | — | — | 4 | ||||||||||||||||||||
Deferred tax adjustments as a result of Combination | — | 48 | — | — | — | — | 48 | ||||||||||||||||||||
Balance, December 31, 2004 | $ | 1 | $ | 1,523 | $ | (296 | ) | $ | (561 | ) | $ | 20 | $ | (996 | ) | $ | (309 | ) | |||||||||
Net loss | — | — | — | — | — | (87 | ) | (87 | ) | ||||||||||||||||||
Translation adjustments | — | — | — | — | (69 | ) | — | (69 | ) | ||||||||||||||||||
Minimum pension liability adjustment, net of tax of $8 | — | — | — | — | (16 | ) | — | (16 | ) | ||||||||||||||||||
Comprehensive loss | (172 | ) | |||||||||||||||||||||||||
Effect of Combinations (See Note 14) | — | (581 | ) | — | 581 | — | — | — | |||||||||||||||||||
Purchase accounting related to acquisition of minority interest (See Note 3) | — | 121 | — | — | (5 | ) | 11 | 127 | |||||||||||||||||||
Dividends declared (See Note 11) | — | (550 | ) | — | — | — | — | (550 | ) | ||||||||||||||||||
Stock based compensation expense (See Note 15) | — | 12 | — | — | — | — | 12 | ||||||||||||||||||||
Redeemable preferred stock accretion (See Note 11) | — | (30 | ) | — | — | — | — | (30 | ) | ||||||||||||||||||
Interest accrued on notes from parent of Borden Chemical (See Note 14) | — | 20 | — | (20 | ) | — | — | — | |||||||||||||||||||
Other | — | — | — | — | — | (2 | ) | (2 | ) | ||||||||||||||||||
Balance, December 31, 2005 | $ | 1 | $ | 515 | $ | (296 | ) | $ | — | $ | (70 | ) | $ | (1,074 | ) | $ | (924 | ) | |||||||||
| (a) | Accumulated other comprehensive loss at December 31, 2005 represents $27 of net foreign currency translation gains, a $5 net loss from purchase accounting adjustments related to the acquisition of minority interests and a $92 net loss relating to the Company’s minimum pension liability adjustment. Accumulated other comprehensive income at December 31, 2004 represents $96 of net foreign currency translation gains and a $76 net loss relating to the Company’s minimum pension liability adjustment. Accumulated other comprehensive income at December 31, 2003 represents $82 of net foreign currency translation gains. |
See Notes to Consolidated Financial Statements
F-34
Table of Contents
HEXION SPECIALTY CHEMICALS, INC.
Notes to Consolidated Financial Statements
(In millions, except share and per share data)
1. Background and Basis of Presentation
Hexion Specialty Chemicals, Inc. (“Hexion” or “the Company”) is engaged in the manufacture and marketing of resins, inks, coating and adhesive resins, formaldehyde, oil field products and other specialty and industrial chemicals worldwide. At December 31, 2005, the Company has 86 production and manufacturing facilities, of which 37 are located in the U.S. Hexion was formed on May 31, 2005 upon the combination of three Apollo Management, L.P. (“Apollo”) controlled companies (the “Combinations”), Resolution Performance Products, LLC (“Resolution Performance”), Resolution Specialty Materials, Inc. (“Resolution Specialty Inc.”) and Borden Chemical, Inc. (“Borden Chemical”). Apollo acquired Resolution Performance on November 14, 2000, formed Resolution Specialty Inc. and purchased the Specialty Resins and Monomers and Ink business of Eastman Chemical Company (“Eastman”) on August 2, 2004 through a subsidiary (the “Resolution Specialty Transaction”), Resolution Specialty Materials, LLC (“Resolution Specialty”), and acquired Borden Chemical on August 12, 2004. Upon consummation of the Combinations, Borden Chemical changed its name to Hexion Specialty Chemicals, Inc., and BHI Acquisition LLC (“BHI Acquisition”), Borden Chemical’s parent, changed its name to Hexion LLC. Prior to the Combinations, on April 29, 2005, a subsidiary of Borden Chemical completed its acquisition of Bakelite Aktiengesellschaft (“Bakelite”) (See Note 3).
The Company has incurred costs totaling approximately $44 in connection with the Combinations and terminated acquisition activities during the year ended December 31, 2005, primarily for accounting, consulting, legal and contract termination fees. As this transaction is considered a merger of entities under common control, in accordance with Financial Accounting Standard Board (“FASB”) Statement of Financial Accounting Standards (“SFAS”) No. 141, Business Combinations, these costs have been expensed as incurred and are included in the 2005 Consolidated Statement of Operations as Transaction related costs.
In the 2004, as a result of the acquisitions of Resolution Specialty and Borden Chemical by Apollo, the Company incurred Transaction related costs of $56. This amount included charges for accounting and legal fees, fees paid to Apollo, payments for cancellation of restricted stock and management bonuses pertaining to the activity.
On April 25, 2005, the Company filed a registration statement, which is not yet effective, with the U.S. Securities and Exchange Commission (the “SEC”) for a proposed IPO of its common stock. The Company subsequently filed six amendments to its registration statement on May 2, 2005, June 13, 2005, July 15, 2005, August 26, 2005, September 19, 2005 and November 21, 2005.
The Company has incurred costs totaling approximately $11 in connection with the proposed IPO during the year ended December 31, 2005, primarily for accounting and legal fees and printing costs. As the costs of issuing common stock are considered a reduction of the related proceeds of the offering, these costs have been deferred within Other current assets on the December 31, 2005 Consolidated Balance Sheet until the IPO is effected.
Basis of Presentation—Prior to the Combinations, Resolution Performance, Resolution Specialty Inc. and Borden Chemical were considered entities under the common control of Apollo affiliates as defined in Emerging Issues Task Force (“EITF”) Issue No. 02-5,Definition of Common Control in Relation to FASB Statement of Financial Accounting Standards No. 141, “Business Combinations”. As a result of the Combinations, the financial statements of these entities are presented retroactively on a consolidated basis, in a manner similar to a pooling of interests, and include the results of operations of each business only from the date of acquisition by the Apollo affiliates.
The accompanying Hexion Consolidated Financial Statements include the following entities: the former Resolution Performance and its majority-owned subsidiaries as of December 31, 2005 and 2004 and for the years
F-35
Table of Contents
HEXION SPECIALTY CHEMICALS, INC.
Notes to Consolidated Financial Statements—(Continued)
(In millions, except share and per share data)
ended December 31, 2005, 2004 and 2003; the former Resolution Specialty Inc. and its majority-owned subsidiaries as of December 31, 2005 and 2004, for the year ended December 31, 2005, and from the date of acquisition for 2004; and the former Borden Chemical and its majority-owned subsidiaries (which includes Bakelite since the date of acquisition) as of December 31, 2005 and 2004, for the year ended December 31, 2005, and from the date of acquisition in 2004. Resolution Performance, Resolution Specialty, Inc. and Bakelite reflect the purchase method of accounting. Borden Chemical elected not to apply push-down accounting because it was a public reporting registrant as a result of public debt that was outstanding prior and subsequent to the acquisition by Apollo.
2. Summary of Significant Accounting Policies
Significant accounting policies followed by the Company, as summarized below, are in conformity with generally accepted accounting principles.
Principles of Consolidation—The Consolidated Financial Statements include the accounts of Resolution Performance, Resolution Specialty Inc., Borden Chemical and Bakelite and their majority-owned subsidiaries, in which no substantive participating rights are held by minority shareholders, after elimination of intercompany accounts and transactions. The Company’s share of the net earnings of 20% to 50% owned companies, for which it has the ability to exercise significant influence over operating and financial policies, are included in income on an equity basis. Investments of other companies are carried at cost.
The Company has a 50% ownership interest in two joint venture companies that produce formaldehyde, resins and UV-curable coatings and adhesives in China. The joint ventures are accounted for using the equity method of accounting for investments. However, as the Company does not have the ability to exercise significant influence over the operating and financial policies, the Company’s share of net earnings are presented as Earnings from unconsolidated entities on the Consolidated Statements of Operations.
The Company has recorded a minority interest for the equity interests in subsidiaries that are not 100% owned by the Company. At December 31, 2004, the minority interest primarily reflected the equity interest in Resolution Performance and Resolution Specialty held by management and other third-parties. On May 31, 2005, the Resolution Performance and Resolution Specialty minority interests were purchased in connection with the Combinations and recorded as a step acquisition (See Note 3). At December 31, 2005, the minority interest primarily reflects the Company’s ownership interest in HA-International, LLC (“HAI”), a joint venture between the Company and Delta-HA, Inc.
Use of Estimates—The preparation of financial statements in conformity with generally accepted accounting principles requires management to make estimates and assumptions that affect the reported amounts of assets and liabilities and disclosure of contingent assets and liabilities at the date of the financial statements, as well as the reported amounts of revenues and expenses during the reporting period. The most significant estimates reflected in the financial statements include environmental remediation, legal liabilities, deferred tax assets and liabilities and related valuation allowances, income tax accruals, pension and postretirement assets and liabilities, valuation allowances for accounts receivable and inventories, general insurance liabilities, asset impairments, and fair values of assets acquired and liabilities assumed in business acquisitions. Actual results could differ from estimated amounts.
Cash and Equivalents—The Company considers all highly liquid investments purchased with an original maturity of three months or less to be cash equivalents. At December 31, 2005 and 2004, the Company had interest bearing time deposits and other cash equivalent investments of $29 and $72, respectively, included on the Consolidated Balance Sheets as Cash and equivalents.
F-36
Table of Contents
HEXION SPECIALTY CHEMICALS, INC.
Notes to Consolidated Financial Statements—(Continued)
(In millions, except share and per share data)
Inventories—Inventories are stated at lower of cost or market. Cost is determined using the first-in, first-out method.
Property and Equipment—Land, buildings and machinery and equipment are valued at cost. Depreciation is recorded on the straight-line basis by charges to expense at rates based on estimated useful lives of properties (average estimated useful life for buildings is 20 years; average useful life for machinery and equipment is 15 years). Major renewals and betterments are capitalized. Maintenance, repairs and minor renewals are expensed as incurred. Depreciation expense was $136, $81 and $54 for the years ended December 31, 2005, 2004 and 2003, respectively.
Deferred Expenses—Deferred financing costs are classified as Other assets on the Consolidated Balance Sheets and are amortized over the life of the related debt or credit facility using the straight-line method since no installment payments are required. Upon retirement of any of the related debt, a proportional share of debt issuance costs is expensed. At December 31, 2005 and 2004, the Company’s unamortized deferred financing costs were $54 and $54, respectively. See Note 8.
Goodwill and Intangibles—The excess of purchase price over net tangible and identifiable intangible assets of businesses acquired is carried as Goodwill on the Consolidated Balance Sheets. The Company does not amortize goodwill or indefinite-lived intangible assets. Separately identifiable intangible assets used in the operations of the business (e.g. formulae and technology, customer lists and contracts, etc.) are recorded at cost and carried as Other intangible assets on the Consolidated Balance Sheets. Intangible assets with determinable lives are amortized on a straight-line basis over the shorter of the legal or useful life of the asset, which ranges from 4 to 30 years. See Note 6.
Impairment—As events warrant, the Company evaluates the recoverability of long-lived assets by assessing whether the carrying value of the assets can be recovered over their remaining useful lives through the expected future undiscounted operating cash flows of the underlying business. Any impairment loss required is determined by comparing the carrying value of the assets to operating cash flows on a discounted basis.
The Company performs an annual impairment test for goodwill and indefinite-lived intangible assets. See Note 6.
General Insurance—The Company is generally self-insured for losses and liabilities relating to workers’ compensation, health and welfare claims, physical damage to property, business interruption and comprehensive general, product and vehicle liability but maintains insurance policies for certain items exceeding deductible limits. Losses are accrued for the estimated aggregate liability for claims using certain actuarial assumptions followed in the insurance industry and the Company’s experience. The Company maintains a liability for certain self-insured claims incurred but not yet recorded, based on actuarial estimates. The Company’s reserves for self-insurance totaled $6 and $4 at December 31, 2005 and 2004, respectively.
Legal Costs—The Company accrues for legal costs in the period in which a claim is made or an event becomes known, if the amounts are probable and reasonably estimable. Each claim is assigned a range of potential liability, with the most likely amount being accrued. The amount accrued includes all costs associated with a claim, including settlements, assessments, judgments, fines and legal fees.
Revenue Recognition—Revenue for product sales, net of estimated allowances and returns, is recognized as risk and title to the product transfer to the customer, which either occurs at the time shipment is made or upon delivery. In situations where product is delivered by pipeline, risk and title transfers when the product moves
F-37
Table of Contents
HEXION SPECIALTY CHEMICALS, INC.
Notes to Consolidated Financial Statements—(Continued)
(In millions, except share and per share data)
across an agreed transfer point, which is typically the customers’ property line. Product sales delivered by pipeline are measured based on daily flow meter readings. The Company’s standard terms of delivery are included in its contracts of sale and invoices.
Shipping and Handling—The Company records freight billed to customers in net sales. Shipping costs are incurred to move the Company’s products from production and storage facilities to the customer. Handling costs are incurred from the point the product is removed from inventory until it is provided to the shipper and generally include costs to store, move and prepare the products for shipment. Shipping and handling costs are recorded in Cost of sales in the Consolidated Statements of Operations.
Research and Development Costs—Funds are committed to research and development for technical improvement of products and processes that are expected to contribute to operating profits in future years. All costs associated with research and development are charged to expense as incurred. Research and development and technical service expenditures were $62, $30 and $16 for the years ended December 31, 2005, 2004 and 2003, respectively.
Foreign Currency Translations—Assets and liabilities of foreign affiliates are translated at the exchange rates in effect at the balance sheet date, and income and expenses are translated at average exchange rates prevailing during the year. The effect of translation is accounted for as an adjustment to Common Stock and Other Shareholder’s Equity (Deficit) and is included in Other comprehensive income (loss).
Income Taxes—The Company provides for income taxes in accordance with SFAS No. 109,“Accounting for Income Taxes”. SFAS 109 requires the recognition of deferred tax assets and liabilities for the expected future tax consequences of temporary differences between the financial statement carrying amounts and the tax bases of the assets and liabilities. See Note 16.
Deferred tax balances are adjusted to reflect tax rates, based on current tax laws, that will be in effect in the years in which temporary differences are expected to reverse. Deferred tax assets are reduced by a valuation allowance when, in the opinion of management, it is more likely than not that some portion or all of the deferred tax assets will not be realized.
Derivative Financial Instruments—The Company is party to forward exchange contracts and options, interest rate swaps, cross-currency swaps and natural gas futures to reduce its cash flow exposure to changes in foreign exchange rates and natural gas prices. The Company does not hold or issue derivative financial instruments for trading purposes. These instruments are not accounted for using hedge accounting, but are measured at fair value and recorded on the balance sheet as an asset or liability, depending upon the Company’s underlying rights or obligations. See Note 7.
Loss Per Share—As a result of the Combinations, the Company’s capital structure consists of 82,629,906 shares outstanding (See Note 14). For purposes of calculating loss per share, 82,629,906 was used as the number of outstanding shares for all periods presented as no new shares were issued as a result of the legal merger of Resolution Performance, Resolution Specialty and Borden Chemical. This presentation reflects the post-merger capital structure of the Company for all periods on a consistent basis. The Company did not have any potentially dilutive instruments outstanding for any periods.
F-38
Table of Contents
HEXION SPECIALTY CHEMICALS, INC.
Notes to Consolidated Financial Statements—(Continued)
(In millions, except share and per share data)
The Company’s loss per share is calculated as follows:
| Year ended December 30, | ||||||||||||
| 2005 | 2004 | 2003 | ||||||||||
Loss from continuing operations | $ | (78 | ) | $ | (105 | ) | $ | (50 | ) | |||
Deduct: Redeemable preferred stock accretion | (30 | ) | — | — | ||||||||
Loss from continuing operations available to common shareholders | $ | (108 | ) | $ | (105 | ) | $ | (50 | ) | |||
Per share - Loss from continuing operations available to common shareholders | $ | (1.30 | ) | $ | (1.27 | ) | $ | (0.61 | ) | |||
Average number of common shares outstanding during the period - basic and diluted | 82,629,906 | 82,629,906 | 82,629,906 | |||||||||
Stock-Based Compensation—Effective January 1, 2005, the Company elected to adopt SFAS No. 123(R) (revised 2004),Share-Based Payment. Under the provisions of SFAS No. 123(R), stock-based compensation cost is measured at the grant date based on the value of the award and is recognized as expense over the requisite service period. As the Company was considered a nonpublic entity, at the date of adoption, that used the minimum value method for pro forma disclosures under SFAS No. 123,Accounting for Stock-Based Compensation, the Company is required to apply the prospective transition method. As such, the Company applies the statement to any new awards and to any awards modified, repurchased or cancelled since January 1, 2005. The adoption of SFAS No. 123(R) had no initial impact on the Company’s financial condition and results of operations.
Previously, the Company accounted for stock based awards under APB No. 25 and applied the minimum value method to determine fair value for disclosure requirements under SFAS No. 123. As of December 31, 2005, all awards outstanding are accounted for under SFAS No. 123(R). See Note 15.
The following tables sets forth the required reconciliation of reported and pro forma net loss and earnings per share (“EPS”) under SFAS No. 148:
| Year ended December 31, | ||||||||
| 2004 | 2003 | |||||||
Net loss, as reported | $ | (105 | ) | $ | (50 | ) | ||
Add: Stock-based employee compensation expense included in reported net income, net of related tax effects | 8 | — | ||||||
Deduct: Total stock-based employee compensation expense determined under fair value based method for all awards, net of related tax effect | (6 | ) | — | |||||
Pro forma net loss | $ | (103 | ) | $ | (50 | ) | ||
Average number of common shares outstanding—basic and diluted | 82,629,906 | 82,629,906 | ||||||
Per share, as reported (basic and diluted) | $ | (1.27 | ) | $ | (0.61 | ) | ||
Per share, pro forma (basic and diluted) | $ | (1.25 | ) | $ | (0.61 | ) | ||
F-39
Table of Contents
HEXION SPECIALTY CHEMICALS, INC.
Notes to Consolidated Financial Statements—(Continued)
(In millions, except share and per share data)
To determine pro forma compensation cost for the plans in accordance with SFAS No. 123, the fair value of each option grant was estimated at the date of the grant using the minimum value method and the Black-Scholes options pricing model with the following weighted average rates, dividend rates and expected lives for each of the Company’s respective plans:
| 2004 | 2003 | |||||||||||||||
| Resolution Performance | Resolution Specialty | Borden Chemical | Resolution Performance | |||||||||||||
Risk-free weighted average interest rate | 4.50 | % | 3.90 | % | 3.54 | % | 4.23 | % | ||||||||
Dividend Rate | 0 | % | 0 | % | 0 | % | 0 | % | ||||||||
Expected life | 7.0 years | 6.3 years | 5.0 years | 6.0 years | ||||||||||||
Estimated fair value of option grants (a) | $ | — | $ | 0.77 | $ | 1.01 | $ | — | ||||||||
| (a) | Fair value of option grants reflects the post-combination equivalent Hexion LLC common units giving effect to the reverse split (Note 15) |
Concentrations of Credit Risk—Financial instruments that potentially subject the Company to concentrations of credit risk consist principally of temporary cash investments and accounts receivable. The Company places its temporary cash investments with high quality institutions and, by policy, limits the amount of credit exposure to any one institution. At December 31, 2005 and 2004, investments included $0 and $52, respectively, in a prime money market account, $0 and $18, respectively, in a guaranteed investment certificate and $29 and $3, respectively, of other marketable securities. Remaining cash is held in several financial institutions. Concentrations of credit risk with respect to accounts receivable are limited, due to the large number of customers comprising the Company’s customer base and their dispersion across many different industries and geographies. The Company generally does not require collateral or other security to support customer receivables. See Note 7.
Concentrations of Supplier Risk—The Company relies on long-term agreements with key suppliers for most of its raw materials. The loss of a key source of supply or a delay in shipments could have an adverse effect on business. Should any of the suppliers fail to deliver or should any of the key long-term supply contracts be cancelled, the Company would be forced to purchase raw materials in the open market, and no assurances can be given that the Company would be able to make these purchases or make them at prices that would allow it to remain competitive. One supplier provides over 10% of certain raw material purchases, and we could incur significant time and expense if we had to replace the supplier. In addition, several of the feedstocks at various facilities are transported through a pipeline from one supplier. If we were unable to receive these feedstocks through these pipeline arrangements, the Company may not be able to obtain them from other suppliers at competitive prices or in a timely manner.
Recently Issued Accounting Standards
In November 2004, the FASB issued SFAS No. 151,Inventory Costs. The statement amends Accounting Research Bulletin (“ARB”) No. 43,Inventory Pricing, to clarify the accounting for abnormal amounts of idle facility expense, freight, handling costs and wasted material. ARB No. 43 previously stated that these costs must be “so abnormal as to require treatment as current-period charges.” SFAS No. 151 requires that those items be recognized as current-period charges regardless of whether they meet the criterion of “so abnormal.” In addition, this statement requires that allocation of fixed production overhead to the costs of conversion be based on the normal capacity of the production facilities. The statement is effective for inventory costs incurred during fiscal years beginning after June 15, 2005. The Company believes that implementing SFAS No. 151 should not have a material impact on its consolidated financial position, results of operations or cash flows.
F-40
Table of Contents
HEXION SPECIALTY CHEMICALS, INC.
Notes to Consolidated Financial Statements—(Continued)
(In millions, except share and per share data)
In March 2005, the FASB issued Interpretation No. 47,Accounting for Conditional Asset Retirement Obligations, an interpretation of FASB Statement No. 143. This Interpretation clarifies that the term “conditional asset retirement obligation” as used in FASB No. 143,Accounting for Asset Retirement Obligations, refers to a legal obligation to perform an asset retirement activity in which the timing and (or) method of settlement are conditional on a future event that may or may not be within the control of the entity. Accordingly, an entity is required to recognize a liability for the fair value of a conditional asset retirement obligation, when incurred, if the fair value of the liability can be reasonably estimated. The Interpretation is effective for the Company no later than the end of the fiscal year ending on December 31, 2005. The implementation of this Interpretation did not have a material effect on the Company’s consolidated financial position, results of operations or cash flows.
In September 2005, the FASB issued EITF Issue No. 04-13,Accounting for Purchases and Sales of Inventory with the Same Counterparty (“EITF 04-13”). The issue provided guidance on the circumstances under which two or more inventory transactions with the same counterparty should be viewed as a single nonmonetary transaction within the scope of APB Opinion No. 29,Accounting for Nonmonetary Transactions. The issue also provided guidance on circumstances under which nonmonetary exchanges of inventory within the same line of business should be recognized at fair value. EITF 04-13 will be effective for transactions completed in reporting periods beginning after March 15, 2006. The Company is evaluating the impact that this issue will have on our consolidated financial statements.
In November 2005, the FASB issued FSP FAS 123(R)-3,Transition Election Related to Accounting for the Tax Effects of Share-Based Payment Awards(“FSP 123(R)-3”). FSP 123(R)-3 provides an elective alternative method that establishes a computational component to arrive at the beginning balance of the accumulated paid-in capital pool related to employee compensation and a simplified method to determine the subsequent impact on the accumulated paid-in capital pool of employee awards that are fully vested and outstanding upon the adoption of SFAS No. 123(R). The implementation of this FSP had no material effect on the Company’s consolidated financial statements.
3. Business Acquisitions
2004 Acquisition of Resolution Specialty
On August 2, 2004 (the closing date) Resolution Specialty, as assignee of Resolution Specialty Inc., purchased the Specialty Resins and Monomers and Ink businesses of Eastman Chemical Company (“Eastman”) for $192, including direct acquisition costs (“Resolution Specialty Transaction”).
The Resolution Specialty Transaction has been accounted for under the purchase method of accounting. The cost of the Resolution Specialty Transaction was allocated to the assets acquired and liabilities assumed based on estimates of their respective fair values at the date of acquisition. Fair values were determined based upon appraisals and internal studies. As the fair value of net assets acquired exceeded cost, no goodwill was recorded in the transaction.
In connection with the Resolution Specialty Transaction, Resolution Specialty Inc. executed a Senior Subordinated Note Purchase Agreement (“Seller Note Financing”) with Eastman on August 2, 2004, which provided for the sale of $50 aggregate principal amount of Senior Subordinated Notes of Resolution Specialty Inc. to Eastman that are due and payable in 2011. Such notes were delivered to Eastman as partial consideration of the Resolution Specialty Transaction. These notes were subsequently repaid on May 31, 2005 when the Company entered a senior secured credit facility. See Note 8.
F-41
Table of Contents
HEXION SPECIALTY CHEMICALS, INC.
Notes to Consolidated Financial Statements—(Continued)
(In millions, except share and per share data)
The following table summarizes the assets acquired and liabilities assumed at the date of acquisition of Resolution Specialty.
Fair Value at August 2, 2004 | |||
Current assets | $ | 196 | |
Property, plant and equipment | 87 | ||
Other assets | 1 | ||
Intangible assets | — | ||
Goodwill | — | ||
Total assets acquired | 284 | ||
Current liabilities | 80 | ||
Long-term debt | 3 | ||
Other liabilities | 9 | ||
Total liabilities assumed | 92 | ||
Net assets acquired | $ | 192 | |
2004 Acquisition of Borden Chemical by Apollo
On August 12, 2004, BHI Investment LLC, an affiliate of Apollo, acquired all of the outstanding capital stock of Borden Holdings, Inc. (“BHI”), Borden Chemical’s parent at that time, for total consideration of approximately $1.2 billion, including assumption of debt.
The acquisition of BHI, and the payment of transaction fees and expenses, was financed with the net proceeds of a $475 second-priority senior secured private debt offering (the “Second Priority Notes”) by two newly formed, wholly owned subsidiaries of Borden Chemical and certain equity contributions to BHI Acquisition from Apollo. Collectively, these transactions are referred to as the “Borden Transaction.”
2005 Acquisition of Bakelite
On April 29, 2005, Hexion Specialty Chemicals Canada, Inc., a subsidiary of Hexion, through its wholly owned subsidiary, National Borden Chemical Germany GmbH, completed its acquisition of Bakelite pursuant to a share purchase agreement with RÜTGERS AG and RÜTGERS Bakelite Projekt GmbH (collectively, the “Sellers”) dated October 6, 2004 (the “Bakelite Acquisition”) for a net purchase price of approximately €206, or approximately $266, subject to certain adjustments. The Company incurred direct costs associated with the acquisition of $42, which have been capitalized as part of the purchase in accordance with SFAS 141 and are included in the net purchase price. Based in Iserlohn-Letmathe, Germany, Bakelite is a producer of phenolic and epoxy thermosetting resins and molding compounds with 13 manufacturing facilities and 1,700 employees, primarily in Europe and Asia. The acquisition provided the Company with additional phenolic resin technology and products and a new epoxy resin technology platform.
The Company financed the Bakelite Acquisition through a combination of available cash and a second-priority senior secured bridge loan facility in the amount of $250. The bridge financing arrangement had a variable interest rate equal to LIBOR plus an applicable margin and had a final maturity date of July 15, 2014. The bridge financing arrangement was settled and cancelled on May 31, 2005 using proceeds from the $150 Second-priority senior secured floating rate notes due 2010 and $100 of term loan debt borrowed under the Company’s credit facility (See Note 8). The Bakelite Acquisition has been accounted for under the purchase method of accounting. As such, Bakelite’s results of operations are included in the Company’s Consolidated Financial Statements (the “Financial Statements”) from the date of acquisition.
F-42
Table of Contents
HEXION SPECIALTY CHEMICALS, INC.
Notes to Consolidated Financial Statements—(Continued)
(In millions, except share and per share data)
On December 14, 2004, in order to mitigate the risk of foreign currency exposure related to the Bakelite Acquisition, the Company entered into a foreign currency forward position of $235 to purchase Euros with U.S. Dollars at a rate of 1.3430, contingent upon the close of the transaction. On March 31, 2005, the Company adjusted the contract to have a target settlement date of April 29, 2005 and a new exchange rate of 1.3446. In conjunction with the consummation of the Bakelite Acquisition, the Company realized an aggregate loss of approximately $9 on this contract, the current year portion of which is included as Other non-operating expense in the Consolidated Statement of Operations.
The following table summarizes the fair values of the assets acquired and liabilities assumed at the date of acquisition. Fair values are based upon appraisals, and internal studies and analyses and are subject to final adjustments.
Fair value at April 29, 2005 | |||
Current assets | $ | 290 | |
Property, plant and equipment | 166 | ||
Other assets | 4 | ||
Intangible assets | 72 | ||
Goodwill | 63 | ||
Total assets acquired | 595 | ||
Current liabilities | 172 | ||
Long-term debt | 21 | ||
Other liabilities | 136 | ||
Total liabilities assumed | 329 | ||
Net assets acquired | $ | 266 | |
Of the $72 of acquired intangible assets, $19 was assigned to tradenames, $16 was assigned to technology and $37 was assigned to customer relationships. The acquired intangible assets have a weighted average useful life of approximately 18 years. The tradenames have a 30-year useful life, technology has a 13-year useful life and customer relationships have a 14-year weighted average useful life.
Of the $63 of goodwill, $42 was assigned to the Epoxy and Phenolic Resins segment and $21 was assigned to the Formaldehyde and Forest Products segment. No goodwill is expected to be deductible for tax purposes.
The Company plans several actions to enhance the profitability of Bakelite including completion of headcount reductions previously initiated by Bakelite. These actions include headcount reductions, primarily in Germany, Italy and Spain, and the closure of two facilities. The Company anticipates the headcount reductions and plant closures will be complete by 2007. Expenditures related to these actions will be substantially complete by 2009. The purchase price allocation includes a liability of $23 reflecting the estimated cost of the activities (principally relating to headcount reductions). This liability at December 31, 2005 is $19, reflecting severance payments of $2 and a foreign currency translation of $2.
2005 Acquisition of Resolution Performance and Resolution Specialty Minority Interests
Upon the Combinations, shares of Resolution Performance Inc., the former parent of Resolution Performance, and Resolution Specialty Inc. held by minority shareholders and management were exchanged for shares in Hexion LLC. The minority shareholders and management held ownership interests of 28.2% and 5%
F-43
Table of Contents
HEXION SPECIALTY CHEMICALS, INC.
Notes to Consolidated Financial Statements—(Continued)
(In millions, except share and per share data)
for Resolution Performance and Resolution Specialty, respectively, on a fully diluted basis. The acquisition of these ownership interests was accounted for under the purchase method of accounting and pushed-down to the respective acquired businesses.
The following table summarizes the step-up to fair value of the assets acquired and liabilities assumed at the date of acquisition based upon the percentage ownership acquired from the minority shareholders. Fair values are based upon preliminary third party appraisals and internal studies and are subject to final adjustments.
Incremental fair value at May 31, 2005 | |||
Current assets | $ | 9 | |
Property, plant and equipment | 26 | ||
Intangible assets | 20 | ||
Goodwill | 56 | ||
Other assets | 11 | ||
Total asset step-up | 122 | ||
Current liabilities | 3 | ||
Long-term debt | 8 | ||
Other liabilities | 21 | ||
Total liability step-up | 32 | ||
Net assets stepped-up | $ | 90 | |
As a result of the exchange of minority interest shares, Shareholder’s Deficit was adjusted by $127, consisting of the $90 step-up to fair value of net assets and a $37 reclassification from minority interest to Paid-in capital. Additionally, $5 and $11 of Accumulated other comprehensive income and Accumulated deficit were reclassified to Paid-in capital to recognize an accumulated negative basis by minority interest holders whose shares were exchanged.
Of the $20 of acquired intangible assets, approximately $17 was assigned to patents and $3 was assigned to tradenames. The acquired intangible assets have a weighted average useful life of 17 years.
Of the $56 of goodwill, $7 was assigned to the Coatings & Inks segment, and $49 was assigned to the Epoxy and Phenolic Resins segment. No goodwill is expected to be deductible for tax purposes.
F-44
Table of Contents
HEXION SPECIALTY CHEMICALS, INC.
Notes to Consolidated Financial Statements—(Continued)
(In millions, except share and per share data)
The following unaudited pro forma financial information combines the consolidated results of operations as if the Bakelite Acquisition and the combination of Resolution Performance, Resolution Specialty Inc. and Borden Chemical had occurred as of the beginning of the periods presented. Pro forma adjustments include only the effects of events directly attributable to the acquisitions. The pro forma adjustments reflected in the tables below include amortization of intangibles, depreciation adjustments due to the write-up of property, plant and equipment to estimated fair market value, and interest expense on the acquisition debt for the Bakelite Acquisition and related income tax effects.
| 2005 | 2004 | |||||||
Net sales | $ | 4,717 | $ | 4,105 | ||||
Loss from continuing operations | (86 | ) | (357 | ) | ||||
Net loss | (95 | ) | (357 | ) | ||||
Basic and Diluted Share Data | ||||||||
Loss from continuing operations | $ | (1.04 | ) | $ | (4.32 | ) | ||
Net loss | (1.15 | ) | (4.32 | ) | ||||
The following are included in the pro forma Loss from continuing operations:
| 2005 | 2004 | |||||
Payment to Apollo to cancel fee agreements | $ | 11 | $ | — | ||
Cost of sales related to inventory sold that was stepped-up at the acquisition date | 16 | 9 | ||||
| $ | 27 | $ | 9 | |||
The pro forma financial information does not necessarily reflect the operating results that would have occurred had the acquisitions been consummated as of the beginning of the periods presented, nor is such information indicative of future operating results.
4. Discontinued Operations
In 1998, pursuant to a merger and recapitalization transaction sponsored by The Blackstone Group (“Blackstone”) and financing arranged by The Chase Manhattan Bank (“Chase”), Borden Decorative Products Holdings, Inc. (“BDPH”), a wholly owned subsidiary of the Company, was acquired by Blackstone, which subsequently merged with Imperial Wallcoverings to create Imperial Home Décor Group (“IHDG”). The Company received approximately $309 in cash and 11% of IHDG common stock for its interest in BDPH. On January 5, 2000, IHDG filed for reorganization under Chapter 11 of the U.S. Bankruptcy Code. IHDG emerged from bankruptcy in April 2001. The IHDG Litigation Trust (the “Trust”) was created pursuant to the plan of reorganization in the IHDG bankruptcy to pursue preference and other avoidance claims on behalf of the unsecured creditors of IHDG. In November 2001, the Trust filed a lawsuit against the Company and certain of its affiliates seeking to have the IHDG transaction voided as a fraudulent conveyance and asking for a judgment to be entered against the Company for $314 plus interest, costs and attorney fees. On June 8, 2005, the Company reached an agreement with the parties to settle and release all claims against the Company for $15. This amount was subsequently paid by the Company in July 2005. As the settlement directly related to a divested business which was accounted for as a discontinued operation in 1997, the Company has included the settlement cost in Loss from discontinued operations in its Financial Statements.
In 1996 and 1997, the Company sold its Dairy and Foods businesses. Both disposals were accounted for as discontinued operations in those years. In 2005, the Company received $6 as settlement from a class action suit
F-45
Table of Contents
HEXION SPECIALTY CHEMICALS, INC.
Notes to Consolidated Financial Statements—(Continued)
(In millions, except share and per share data)
related to raw material purchases by the divested businesses between July 21, 1991 and June 30, 1995. As the settlement directly related to the previously divested businesses, the Company has included the settlement proceeds in Loss from discontinued operations in its Financial Statements.
Typically, losses from discontinued operations are recorded in the Financial Statements net of tax; however, because the Company has a full valuation allowance on its domestic deferred tax assets and is unable to realize an income tax benefit from these losses, the corresponding benefit has been offset by a full valuation allowance.
5. Related Party Transactions
Administrative Service, Management and Consulting Arrangements
In connection with their respective acquisitions by Apollo, Resolution Performance, Resolution Specialty and Borden Chemical entered into certain management, consulting and transaction fee agreements with Apollo and its affiliates for the provision of certain structuring and advisory services. These agreements allowed Apollo and its affiliates to provide certain advisory services to the companies for terms up to ten years. The companies also agreed to indemnify Apollo and its affiliates and their directors, officers and representatives for potential losses relating to the services contemplated under these agreements. In addition, upon the closing of the Resolution Specialty and Borden Chemical transactions in the third quarter of 2004, the Company paid $12 for transaction and advisory services, and reimbursed expenses of $1. Prior to the Combinations, on May 31, 2005, Resolution Performance and Resolution Specialty terminated their agreements with Apollo, thereby releasing any and all obligations and liabilities by all parties under the respective agreements. In consideration of the terminations, Resolution Performance and Resolution Specialty paid Apollo $4 and $7, respectively. These amounts are included within Transaction related costs in the Company’s Consolidated Statements of Operations.
At the time of the Combinations, the Company entered into a seven-year, amended and restated version of the former Borden Chemical management consulting agreement with Apollo (the “Amended Management Consulting Agreement”). The terms of the Amended Management Consulting Agreement currently provide for annual fees of approximately $3 and provide for a lump-sum settlement equal to the net present value of the remaining annual management fees payable under the remaining term of the agreement in connection with a sale of the Company or an IPO.
Pursuant to the agreements in effect during the years ended December 31, 2005, 2004 and 2003, the Company paid fees of $4, $2 and $0, respectively. The 2003 management fee of less than $1 was paid in 2005. These amounts are included within Other operating expense in the Company’s Consolidated Statements of Operations. There were no amounts payable to Apollo at December 31, 2005 or 2004.
In connection with the Bakelite Acquisition, in exchange for deal structuring and negotiating provided by Apollo, the Company made payments to Apollo in the amount of $4. These amounts are considered direct costs of the acquisition and have been capitalized as part of the purchase.
Other Transactions and Arrangements
The Company sells finished goods to an unconsolidated joint venture of the Company and certain Apollo affiliates. These sales totaled $25, $11 and $15 for the years ended December 31, 2005, 2004 and 2003, respectively. Accounts receivable from these affiliates were $2 and $1 at December 31, 2005 and 2004, respectively. The Company also purchases raw materials and services from certain Apollo affiliates. These purchases totaled $12, $12 and $5 for the years ended December 31, 2005, 2004 and 2003. The Company had accounts payable to Apollo affiliates of less than $1 at December 31, 2005 and 2004 related to these purchases.
F-46
Table of Contents
HEXION SPECIALTY CHEMICALS, INC.
Notes to Consolidated Financial Statements—(Continued)
(In millions, except share and per share data)
Upon closing the Borden Transaction in 2004, Borden Chemical paid transaction-related costs of $9 on behalf of BHI Investment LLC, $22 on behalf of BW Holdings, LLC and shared deal incentive costs of $14. These amounts are included within Transaction related costs.
Financing and Investing Arrangements
In November 2000, Resolution Performance provided loans to certain officers of Resolution Performance totaling $1 to purchase stock of Resolution Performance, Inc.
6. Goodwill and Intangible Assets
At December 31, 2005 and 2004, the Company’s management performed the annual goodwill impairment test. As required by SFAS No. 142, “Goodwill and Other Intangible Assets,” the Company identified the assets (including goodwill) and liabilities of the reporting units. The Company determined estimated fair values of the reporting units to assess whether the estimated fair value of each reporting unit was less than the carrying amount of the units net assets.
Fair values were determined using a standard methodology based upon comparing certain operating metrics of the entity to those of a set of comparable companies in the same industry. Using this method, market multiples and ratios based on operating, financial and stock market performance are compared across different companies and to the entity being valued. The Company employed a comparable analysis technique commonly used in the investment banking and private equity industries to estimate the values of its reporting units based on the EBITDA (earnings before interest, taxes, depreciation and amortization) multiple technique. Under this technique, estimated values are the result of an EBITDA multiple derived from this process applied to an appropriate historical EBITDA amount. At December 31, 2005 and 2004, the fair value of each reporting unit exceeded the carrying amount of assets and liabilities assigned to the units.
The changes in the carrying amount of goodwill by segment for the years ended December 31, 2005 and 2004 are as follows:
| Epoxy and Phenolic Resins | Formaldehyde and Forest Products | Performance Products | Coatings and Inks | Total | ||||||||||||||
Goodwill balance at December 31, 2003 | $ | — | $ | — | $ | — | $ | — | $ | — | ||||||||
Acquisitions | 4 | 23 | 23 | — | 50 | |||||||||||||
Foreign currency translation | — | — | 1 | — | 1 | |||||||||||||
Goodwill balance at December 31, 2004 | $ | 4 | $ | 23 | $ | 24 | $ | — | $ | 51 | ||||||||
Acquisitions | 95 | 21 | — | 7 | 123 | |||||||||||||
Foreign currency translation | (4 | ) | (1 | ) | — | — | (5 | ) | ||||||||||
Goodwill balance at December 31, 2005 | $ | 95 | $ | 43 | $ | 24 | $ | 7 | $ | 169 | ||||||||
F-47
Table of Contents
HEXION SPECIALTY CHEMICALS, INC.
Notes to Consolidated Financial Statements—(Continued)
(In millions, except share and per share data)
The Company’s intangible assets with identifiable useful lives consist of the following:
| At December 31, 2005 | At December 31, 2004 | |||||||||||||||||
| Gross Carrying Amount | Accumulated Amortization | Net Book Value | Gross Carrying Amount | Accumulated Amortization | Net Book Value | |||||||||||||
Intangible assets: | ||||||||||||||||||
Formulae and technology | $ | 114 | $ | 27 | $ | 87 | $ | 82 | $ | 20 | $ | 62 | ||||||
Customer lists and contracts | 55 | 12 | 43 | 20 | 7 | 13 | ||||||||||||
Other | 33 | 2 | 31 | 2 | 1 | 1 | ||||||||||||
| $ | 202 | $ | 41 | $ | 161 | $ | 104 | $ | 28 | $ | 76 | |||||||
The Company has $15 and $12 of tradenames at December 31, 2005 and 2004, respectively, with indefinite lives. The impact of foreign currency translation is included in accumulated amortization.
Total intangible amortization expense for the years ended December 31, 2005, 2004 and 2003 was $12, $5 and $4, respectively.
Estimated annual intangible amortization expense for 2006 through 2010 is as follows:
2006 | $ | 13 | |
2007 | 12 | ||
2008 | 12 | ||
2009 | 11 | ||
2010 | 9 |
7. Financial Instruments
The following tables present the carrying or notional amounts and fair values of the Company’s financial instruments at December 31, 2005 and 2004. The fair value of a financial instrument is the estimated amount at which the instrument could be exchanged in a current transaction between willing parties, other than in a forced or liquidation sale. Fair values are determined from quoted market prices, where available, or based on other similar financial instruments.
The following table includes the carrying amount and fair value of the Company’s nonderivative financial instruments as of December 31, 2005 and 2004:
| 2005 | 2004 | |||||||||||
| Carrying Amount | Fair Value | Carrying Amount | Fair Value | |||||||||
Debt | $ | 2,354 | $ | 2,319 | $ | 1,850 | $ | 1,900 | ||||
The carrying amounts of cash and equivalents, accounts receivable, accounts payable and other accruals are considered reasonable estimates of their fair values.
F-48
Table of Contents
HEXION SPECIALTY CHEMICALS, INC.
Notes to Consolidated Financial Statements—(Continued)
(In millions, except share and per share data)
The following table summarizes the Company’s derivative financial instruments as of December 31, 2005 and 2004:
| 2005 | 2004 | |||||||||||||||||
Average Days To Maturity | Average Contract Rate | Notional Amount | Fair Value Gain (Loss) | Average Days to Maturity | Average Contract Rate | Notional Amount | Fair Value Gain (Loss) | |||||||||||
Currency to sell | ||||||||||||||||||
U.S. Dollars(1) | 27 | 1.1890 | 45 | — | — | — | — | — | ||||||||||
U.S. Dollars(1) | 990 | 1.2038 | 289 | 5 | — | — | — | — | ||||||||||
British Pound(1) | 90 | 0.6987 | 41 | (1 | ) | — | — | — | — | |||||||||
U.S. Dollars(1) | 60 | 1.2122 | 3 | — | — | — | — | — | ||||||||||
U.S. Dollars(2) | 122 | 1.2031 | 24 | — | — | — | — | — | ||||||||||
U.S. Dollars(2) | — | — | — | — | 90 | 1.3430 | 235 | 2 | ||||||||||
Currency to sell | ||||||||||||||||||
Canadian Dollars(3) | — | — | — | — | 183 | 1.3200 | 36 | — | ||||||||||
Canadian Dollars(4) | — | — | — | — | 183 | 1.2300 | 36 | (2 | ) | |||||||||
Currency to sell For CDN Dollars | ||||||||||||||||||
British Pound(1) | — | — | — | — | 31 | 2.3255 | 42 | 1 | ||||||||||
Commodity | ||||||||||||||||||
Natural gas futures | — | — | 3 | 1 | — | — | 3 | — | ||||||||||
| (1) | Forward contracts |
| (2) | Deal contingent forward contracts (for pending or completed acquisitions) |
| (3) | Put options purchased |
| (4) | Call options sold |
At December 31, 2005, the Company had derivative losses of $1 classified as Other current liabilities and derivative gains of $5 classified as Other assets. At December 31, 2004, the Company had derivative losses of $2 classified as Other current liabilities and derivative gains of $3 classified as Other assets. Gains and losses are recognized on a quarterly basis, through the Consolidated Statements of Operations. The Company does not hold or issue derivative financial instruments for trading purposes.
Foreign Exchange and Interest Rate Swaps
International operations account for a significant portion of the Company’s revenue and operating income. It is the policy of the Company to reduce foreign currency cash flow exposure due to exchange rate fluctuations by hedging anticipated and firmly committed transactions when economically feasible. The Company enters into forward and option contracts to buy and sell foreign currencies to reduce foreign exchange exposure and protect the U.S. dollar value of such transactions to the extent of the amount under contract. These contracts are designed to minimize the impact from foreign currency exchange on operating income and on certain balance sheet exposures. The Company is exposed to credit loss in the event of non-performance by other parties to the contract. The Company evaluates the credit worthiness of the counterparties’ financial condition and does not expect default by the counterparties.
F-49
Table of Contents
HEXION SPECIALTY CHEMICALS, INC.
Notes to Consolidated Financial Statements—(Continued)
(In millions, except share and per share data)
The Company periodically uses interest rate swaps to alter interest rate exposures between fixed and floating rates on certain long-term debt. Under interest rate swaps, the Company agrees with other parties to exchange, at specified intervals, the difference between fixed rate and floating rate interest amounts calculated by reference to an agreed notional principal amount.
Effective October 11, 2005, the Company entered into a $289 cross-currency and interest rate swap agreement structured for a non-U.S. subsidiary’s $290 U.S. dollar denominated term loan. The swap is a three-year agreement designed to offset balance sheet and interest rate exposures and cash flow variability associated with the exchange rate fluctuations on the term loan. The Euro to U.S. dollar exchange rate under the swap agreement is 1.2038. The Company pays a variable rate equal to the Euro LIBOR plus 271 basis points. The Company receives a variable rate equal to the U.S. Dollar LIBOR plus 250 basis points. The amount the Company receives under this agreement is equal to the non-U.S. subsidiary’s interest rate on its $290 term loan. The net impact of interest rate swaps was a decrease in the Company’s interest expense of $1 in 2005. In 2005, the Company paid a weighted average interest rate of 4.89% and received a weighted average interest rate of 6.61% related to the $289 cross-currency and interest rate swap agreement.
Deal Contingent Forwards
On December 6, 2005, the Company entered into a foreign currency forward position of $24 to purchase Euros with U.S. dollars at a rate of 1.2031. The contract is contingent upon the close of a potential acquisition and has a target settlement date of May 2, 2006. The purpose of the hedge is to mitigate the risk of foreign currency exposure related to the pending transaction.
On December 14, 2004, the Company entered into a foreign currency forward position of $235 to purchase Euros with U.S. Dollars at a rate of 1.3430. The contract was contingent upon the close of the Bakelite share purchase agreement (see Note 3) and had an initial target settlement date of March 31, 2005 and provided for an extension and adjustments through July 6, 2005. The purpose of the hedge was to mitigate the risk of foreign currency exposure related to the pending transaction. At December 31, 2004, the Company recorded a gain of $2 related to its deal contingent forward contract. This amount is included as Other non-operating income in the 2004 Consolidated Statement of Operations. Upon the acquisition of Bakelite on April 29, 2005, the Company recognized a loss of $9 on the settlement of the deal contingent forward contract.
Commodity Future Contracts
The Company is exposed to price fluctuations associated with raw materials purchases, most significantly with methanol, phenol, urea, acetone, propylene and chlorine. For these commodity raw materials, the Company has purchase contracts, with periodic price adjustment provisions. For certain contracts, the Company also adds to customer contracts selling price provisions that are indexed to publicly available indices for these commodity raw materials. The Board of Directors approves all commodity futures and commodity commitments based on delegations of authority documents.
The Company hedges a portion of its natural gas purchases for certain of its North American plants. The Company used futures contracts to hedge 66% and 46% of its 2005 and 2004 natural gas usage at these plants, respectively. The contracts are settled for cash each month based on the closing market price on the last day the contract trades on the New York Mercantile Exchange. Commitments settled under these contracts totaled $5 and $2 in 2005 and 2004, respectively. The Company recorded net gains relating to these commitments of $2 and less than $1 in 2005 and 2004, respectively, which are recognized each month as the gas is used. Remaining obligations are marked to market on a quarterly basis. The Company had future commitments under these contracts of $3 at December 31, 2005 and 2004, and recorded an unrealized gain of $1 at December 31, 2005 related to future commitments.
F-50
Table of Contents
HEXION SPECIALTY CHEMICALS, INC.
Notes to Consolidated Financial Statements—(Continued)
(In millions, except share and per share data)
8. Debt and Lease Obligations
Debt outstanding at December 31, 2005 and 2004 is as follows:
| December 31, 2005 | December 31, 2004 | |||||||||||
| Long-Term | Due Within One Year | Long-Term | Due Within One Year | |||||||||
Revolving Credit Facilities at an average rate of 6.4% at December 31, 2004 | $ | — | $ | — | $ | 28 | $ | — | ||||
Senior Secured Notes: | ||||||||||||
8% Senior secured notes due 2009 (includes $1 of unamortized debt premium at December 31, 2005 and $0 at December 31, 2004) (a) | 141 | — | 140 | — | ||||||||
9.5% Senior second secured notes due 2010 (includes $2 of unamortized debt premium at December 31, 2005 and $1 at December 31, 2004)(a) | 202 | — | 201 | — | ||||||||
9% Second-priority senior secured notes due 2014 | 325 | — | 325 | — | ||||||||
Floating rate second-priority senior secured notes due 2010 at 9.8% and 6.8% at December 31, 2005 and 2004, respectively (includes $2 of unamortized debt discount at December 31, 2005 and $0 at December 31, 2004) | 298 | — | 150 | — | ||||||||
Credit Agreement: term loans due 2010 at 6.2% and 5.1% at December 31, 2005 and 2004, respectively | 493 | 5 | 123 | 2 | ||||||||
Debentures: | ||||||||||||
9.2% debentures due 2021 | 115 | — | 115 | — | ||||||||
7.875% debentures 2023 | 247 | — | 247 | — | ||||||||
Sinking fund debentures: 8.375% due 2016 | 78 | — | 78 | — | ||||||||
13.5% Senior subordinated notes due 2010 (includes $8 of unamortized debt premium at December 31, 2005 and $4 at December 31, 2004) (a) | 336 | — | 332 | — | ||||||||
Seller senior subordinated notes due 2011 (at 7.6% at December 31, 2004) | — | — | 50 | — | ||||||||
Other: | ||||||||||||
Industrial Revenue Bonds due 2009 (at a fixed rate of 10% in 2005 and 2004) | 34 | — | 34 | — | ||||||||
Other (at 4.8% and 4.1% at December 31, 2005 and 2004, respectively) | 23 | 8 | 7 | 5 | ||||||||
Capital Leases | 11 | 1 | 4 | — | ||||||||
Total current maturities of long-term debt | 14 | 7 | ||||||||||
Short-term debt (primarily foreign bank loans at an average rate of 6.3% and 8.4% at December 31, 2005 and 2004, respectively) | — | 37 | — | 9 | ||||||||
Total debt | $ | 2,303 | $ | 51 | $ | 1,834 | $ | 16 | ||||
| (a) | December 31, 2005 balance includes purchase accounting adjustments as a result of the acquisition of minority interests. These adjustments have been reflected as unamortized debt premiums. (See Note 3) |
F-51
Table of Contents
HEXION SPECIALTY CHEMICALS, INC.
Notes to Consolidated Financial Statements—(Continued)
(In millions, except share and per share data)
At December 31, 2005 and 2004, the Company was in compliance with the material covenants and restrictions in all of the Company’s credit facilities and indentures.
Senior Secured Notes
Origination Date | Interest Payable | Early Redemption | Collateral / Priority | |||||
8% Senior secured notes due 2009 | December 2003 | December 15 June 15 | December 2006 | Hexion—Inventory, accounts receivable and certain stock Equal to all senior debt, second to credit facility | ||||
9.5% Senior second secured notes due 2010 | April 2003 | April 15 October 15 | April 2006 | Hexion—Inventory, accounts receivable and certain stock Equal to all senior debt, second to credit facility and 8% notes | ||||
9% Second-priority senior secured notes due 2014 | August 2004 | January 15 July 15 | July 2007 (b) | Hexion—Inventory, accounts receivable and certain stock Equal to all senior debt, second to credit facility | ||||
Floating Rate second-priority senior secured notes due 2010—at 10% and 6.8% at December 31, 2005 and 2004, respectively (a) | August 2004 and May 2005 | January 15 April 15 July 15 October 15 | July 2006 (b) | Hexion—Inventory, accounts receivable and certain stock, second to credit facility and 8% Senior secured notes | ||||
Credit Agreement: term notes due 2010—at 6.2% and 5.1% at December 31, 2005 and 2004, respectively (c) | May 2005 | At least Every 90 days | (d) | Substantially all the assets of Hexion, subject to certain exceptions | ||||
| (a) | Interest on the Floating Rate Notes accrues at an annual rate, reset quarterly, equal to LIBOR plus 550 basis points. There is no sinking fund for the Floating Rate Notes. |
| (b) | Redemption of 35% with equity offering proceeds. Redemption of 100% permitted in July 2009. |
| (c) | Interest on the term and revolving loan facilities is LIBOR plus 2.5% or the higher of prime rate plus 1% or the Federal Funds Rate plus 1.5%. Loans made in Canadian dollars will carry interest at the Canadian Bankers’ Acceptance rate plus 2.5% or the higher of prime rate plus 1% or average banker’s acceptance rate plus 1.5%. Loans made in sterling will carry interest at LIBOR plus 2.5% or the rate quoted by JPMorgan Chase Bank, N.A. (“JPMCB”) as its base rate for such loans plus 1%. Loans denominated in euros will carry interest at EURO LIBOR plus 2.5% or the rate quoted by JPMCB as its base rate for such loans plus 1%. Interest rates are subject to reduction based on an improved leverage ratio. |
| (d) | Repayment of 1% of the term loan per annum must be made quarterly with the balance payable upon the final maturity date. Repayment of 1% of the term loan per annum must be made quarterly with the balance payable upon the final maturity date. Additional payments required beginning in the second quarter of 2007 if the Company generates excess cash flow, as defined in the agreement. |
F-52
Table of Contents
HEXION SPECIALTY CHEMICALS, INC.
Notes to Consolidated Financial Statements—(Continued)
(In millions, except share and per share data)
In May 2005, the Company entered into a senior secured credit facility (“Hexion Credit Facility”) and replaced and repaid the Resolution Performance and Resolution Specialty credit facilities, including the Resolution Performance $150 revolving credit facility entered into on January 24, 2005, $100 of the Bakelite bridge loan facility (See Note 3) and the Seller senior subordinated notes. The Hexion Credit Facility has a $225 revolving credit facility, a $500 term loan facility and a $50 synthetic letter of credit facility (“LOC”). Repayment of 1% total per annum of the term loan and synthetic LOC must be made (in the case of the term loan facility quarterly, and in the case of the LOC, annually) with the balance payable upon the final maturity date. Further, we may be required to make additional repayments on the term loan beginning in the second quarter of 2007 if we generate excess cash flow, as defined in the agreement.
On May 31, 2005, the Company issued $500 term loans under the Hexion Credit Facility of which approximately $300 of the proceeds were used to repay existing debt including borrowings under the Resolution Performance $150 revolving credit facility entered into January 24, 2005, $125 term note under the Resolution Specialty facility, $100 of the Bakelite bridge loan facility (See Note 3) and the Seller senior subordinated notes. The remainder was used to pay a dividend to the Company’s parent and transaction expenses. The Company incurred financing costs of $18 related to the Hexion Credit Facility. These costs are included within Other assets on the Financial Statements and will be amortized over the life of the related debt.
The Hexion Credit Facility has commitment fees (other than with respect to the synthetic LOC equal to 0.5% per annum of the unused line fee plus a fronting fee of 0.25% of the aggregate face amount of outstanding LOCs. The synthetic LOC facility has a commitment fee of 0.1% per annum. At December 31, 2005, we had no outstanding borrowings under the revolving credit facility and $54 outstanding LOCs and had additional borrowing capacity of $221.
Certain senior secured notes and the Hexion credit facility contain, among other provisions, restrictive covenants regarding indebtedness, payments and distributions, mergers and acquisitions, asset sales, affiliate transactions, capital expenditures, and the maintenance of certain financial ratios. Payment of borrowings under the senior secured notes and the Hexion credit facility may be accelerated in the event of a default. Events of default include the failure to pay principal and interest when due, a material breach of representation or warranty, covenant defaults, events of bankruptcy and a change of control.
In the second quarter of 2005, the Company incurred a charge for the write-off of deferred financing costs totaling $17. Of this amount, $6 was related to the Bakelite Acquisition bridge loan facility, which was entered into and repaid during the quarter, and $11 was related to the early termination of the Resolution Performance, Resolution Specialty and Borden Chemical credit facilities. The $17 expense is included in Write-off of deferred financing fees on the Consolidated Statements of Operations.
For the year ended December 31, 2005, the Company incurred an unrealized loss of $10, related to a foreign subsidiary’s $290 U.S. dollar denominated term loan. The loss is included as Other non-operating expense on the Consolidated Statement of Operations. On October 11, 2005, the Company entered into a three-year swap agreement to offset balance sheet and interest rate exposures and cash flow variability associated with exchange rate fluctuations on the term loan.
In May 2005, the Company issued $150 Second-Priority Senior Secured Floating Rate Notes due 2010. The proceeds from the notes were used to repay in part the bridge loan facility used to finance the Bakelite Acquisition (See Note 3). The Company incurred financing costs of $4 related to the issuance of the Senior Secured Notes. These costs are included within Other assets on the Consolidated Balance Sheet and will be amortized over the life of the notes.
F-53
Table of Contents
HEXION SPECIALTY CHEMICALS, INC.
Notes to Consolidated Financial Statements—(Continued)
(In millions, except share and per share data)
Debentures
Origination Date | Interest Payable | Early Redemption | ||||
9.2% debentures due 2021 | March 1991 | March 15 September 15 | None | |||
7.875% debentures due 2023 | May 1993 | February 15 August 15 | None | |||
8.375% Sinking fund debentures | April 1986 | April 15 October 15 | April 2006 | |||
13.5% Senior subordinated notes due 2010 | 2000 | May 15 November 15 | November 2005 | |||
Other Borrowings
The $34 Parish of Ascension Industrial Revenue Bonds (IRBs) are related to the purchase, construction and installation of air and water pollution control facilities that are no longer owned by us. The tax-exempt status of the IRBs is based upon there being no change in the use of the facilities, as defined by the Internal Revenue Code. We continue to monitor the use of the facilities by the current owner. If a change in use were to occur, we could be required to take remedial action, including redeeming all of the bonds.
In addition, the Company finances certain insurance premiums. Short-term borrowings under this arrangement include $9 and $6 at December 31, 2005 and 2004, respectively.
The Company’s capital leases are included in debt on the Consolidated Balance Sheets and range from one to forty-nine year terms for vehicle, equipment, pipeline, land and buildings.
Aggregate maturities of total debt, minimum annual rentals under operating leases, and minimum payments under capital leases at December 31, 2005, for the Company are as follows:
Year | Debt | Minimum Payments Under Capital Leases | Minimum Rentals Under Operating Leases | ||||||
2006 | $ | 50 | $ | 1 | $ | 26 | |||
2007 | 14 | 1 | 23 | ||||||
2008 | 18 | — | 19 | ||||||
2009 | 181 | — | 14 | ||||||
2010 | 842 | 3 | 11 | ||||||
2011 and beyond | 1,237 | 7 | 13 | ||||||
| $ | 2,342 | $ | 12 | $ | 106 | ||||
Rental expense amounted to $27, $15 and $10 in the years ended December 31, 2005, 2004 and 2003, respectively.
F-54
Table of Contents
HEXION SPECIALTY CHEMICALS, INC.
Notes to Consolidated Financial Statements—(Continued)
(In millions, except share and per share data)
9. Guarantees, Indemnifications and Warranties
Standard Guarantees / Indemnifications
In the ordinary course of business, the Company enters into numerous agreements that contain standard guarantees and indemnities whereby the Company indemnifies another party for, among other things, breaches of representations and warranties. Such guarantees or indemnifications are granted under various agreements, including those governing (i) purchases and sales of assets or businesses, (ii) leases of real property, (iii) licenses of intellectual property, (iv) long-term supply agreements, (v) employee benefits services agreements and (vi) agreements with public authorities on subsidies for designated research and development projects. The guarantees or indemnifications issued are for the benefit of the (i) buyers in sale agreements and sellers in purchase agreements, (ii) landlords or lessors in lease contracts, (iii) licensors or licensees in license agreements, (iv) vendors or customers in long-term supply agreements, (v) service providers in employee benefits services agreements and (vi) governments or agencies subsidizing research or development. In addition, the Company guarantees certain payables of its subsidiaries for the purchase of raw materials in the ordinary course of business.
These parties may also be indemnified against any third party claim resulting from the transaction that is contemplated in the underlying agreement. Additionally, in connection with the sale of assets and the divestiture of businesses, the Company may agree to indemnify the buyer with respect to liabilities related to the pre-closing operations of the assets or businesses sold. Indemnities related to pre-closing operations generally include tax liabilities, environmental liabilities and employee benefit liabilities not assumed by the buyer in the transaction.
Indemnities related to the pre-closing operations of sold assets normally do not represent additional liabilities to the Company, but simply serve to protect the buyer from potential liability associated with the Company’s existing obligations at the time of sale. As with any liability, the Company has accrued for those pre-closing obligations that are considered probable and reasonably estimable. Amounts recorded are not significant at December 31, 2005.
While some of these guarantees extend only for the duration of the underlying agreement, many survive the expiration of the term of the agreement or extend into perpetuity (unless subject to a legal statute of limitations). There are no specific limitations on the maximum potential amount of future payments that the Company could be required to make under its guarantees nor is the Company able to develop an estimate of the maximum potential amount of future payments to be made under these guarantees as the triggering events are not predictable. With respect to certain of the aforementioned guarantees, the Company maintains limited insurance coverage that mitigates potential payments to be made.
Warranties
The Company does not make express warranties on its products, other than that they comply with the Company’s specifications; therefore, the Company does not record a warranty liability. Adjustments for product quality claims are not material and are charged against sales revenues.
10. Commitments and Contingencies
Environmental Matters
Because the Company’s operations involve the use, handling, processing, storage, transportation and disposal of hazardous materials, the Company is subject to extensive environmental regulation at the federal,
F-55
Table of Contents
HEXION SPECIALTY CHEMICALS, INC.
Notes to Consolidated Financial Statements—(Continued)
(In millions, except share and per share data)
state and local levels as well as foreign laws and regulations, and therefore is exposed to the risk of claims for environmental remediation or restoration. In addition, violations of environmental laws or permits may result in restrictions being imposed on operating activities, substantial fines, penalties, damages or other costs, any of which could have a material adverse effect on the Company’s business, financial condition, results of operations or cash flows.
Accruals for environmental matters are recorded following the guidelines of Statement of Position 96-1, “Environmental Remediation Liabilities,” when it is probable that a liability has been incurred and the amount of the liability can be reasonably estimated. Environmental accruals are reviewed on a quarterly basis and as events and developments warrant.
The Company has recorded liabilities, relating to 69 locations (63 at December 31, 2004), of approximately $39 and $41 at December 31, 2005 and 2004, respectively, for all probable environmental remediation, indemnification and restoration liabilities. These amounts include estimates of unasserted claims the Company believes are probable of loss and reasonably estimable. Based on the factors discussed below and currently available information and analysis, the Company believes that it is reasonably possible that costs associated with such sites may fall within a range of $27 to $79, in the aggregate, at December 31, 2005. This estimate of the range of reasonably possible costs is less certain than the estimates upon which the liabilities are based, and in order to establish the upper end of such range, assumptions less favorable to the Company among the range of reasonably possible outcomes were used. As with any estimate, if facts or circumstances change, the final outcome could differ materially from these estimates.
Following is a more detailed discussion of the Company’s environmental liabilities and related assumptions at December 31, 2005:
BCP Geismar Site—The Company formerly owned a basic chemicals and polyvinyl chloride business which was taken public as Borden Chemicals and Plastics Operating Limited Partnership (“BCPOLP”) in 1987. Borden Chemical retained a 1% interest and the general partner interest, which were held by its subsidiary, BCP Management (“BCPM”). Borden Chemical also retained the liability for certain environmental matters after BCPOLP’s formation. Under a Settlement Agreement approved by the United States Bankruptcy Court for the District of Delaware among Borden Chemical, BCPOLP, BCPM, the United States Environmental Protection Agency and the Louisiana Department of Environmental Quality, Borden Chemical agreed to perform certain of BCPOLP’s obligations with respect to environmental conditions at BCPOLP’s Geismar, Louisiana site. These obligations are related to soil and groundwater contamination at the Geismar site. The Company bears the sole responsibility for these obligations, as there are no other potentially responsible parties (“PRPs”) or third parties from which the Company can seek reimbursement, and no additional insurance recoveries are expected.
A groundwater pump and treat system for the removal of contaminants is operational, and natural attenuation studies are proceeding. The Company has performed extensive soil and groundwater testing. Regulatory agencies are reviewing the current findings and remediation efforts. If closure procedures and remediation systems prove inadequate, or if additional contamination is discovered, this could result in the costs approaching the higher end of the range of possible outcomes discussed below.
The Company has recorded a liability of $20 and $21 at December 31, 2005 and 2004, respectively, related to the BCP Geismar site. Based on currently available information and analysis, the Company believes that it is reasonably possible that costs associated with this site may fall within a range of $14 to $32, depending upon the factors discussed above. Due to the long-term nature of the project, the reliability of timing and the ability to estimate remediation payments, this liability was recorded at its net present value, assuming a 3% discount rate and a time period of thirty years, and the range of possible outcomes is discounted similarly. The undiscounted liability is approximately $30 over thirty years with payments of $7 to be paid ratably between 2006 and 2010.
F-56
Table of Contents
HEXION SPECIALTY CHEMICALS, INC.
Notes to Consolidated Financial Statements—(Continued)
(In millions, except share and per share data)
Superfund Sites / Offsite Landfills—The Company is currently involved in environmental remediation activities at 29 sites (26 at December 31, 2004) in which it has been notified that it is, or may be, a PRP under the United States Comprehensive Environmental Response, Compensation and Liability Act or similar state “superfund” laws. The Company has recorded a liability of approximately $9 and $8 at December 31, 2005 and 2004, respectively, related to these sites. The Company anticipates approximately 60% of this liability will be paid within the next five years, with the remaining payments occurring over the next twenty-five years. The Company generally does not bear a significant level of responsibility for these sites, and therefore, has little control over the costs and timing of cash flows. At 17 of the 29 sites, the Company’s share is less than 1%. At the remaining 12 sites, the Company has a share of up to 8.8% of the total liability which accounts for $7 of the total amount reserved for superfund / offsite landfill sites at December 31, 2005 and 2004. Based on currently available information and analysis, the Company believes that it is reasonably possible that costs associated with such sites may be as low as $6 or as high as $19, in the aggregate. In estimating both its current reserves for environmental remediation at these sites and the possible range of additional costs, the Company has not assumed that it will bear the entire cost of remediation of every site to the exclusion of other known PRPs who may be jointly and severally liable. The Company has limited information to assess the viability of other PRPs and their probable contribution on a per site basis. The range of possible outcomes also takes into account the maturity of each project, which results in a more narrow range as the project progresses. The Company’s ultimate liability will depend on many factors including its volumetric share of waste, the financial viability of other PRPs, the remediation methods and technology used, the amount of time necessary to accomplish remediation, and the availability of insurance coverage. The Company’s insurance provides very limited, if any, coverage for these environmental matters.
Sites Under Current Ownership—The Company is conducting environmental remediation at 14 locations (15 at December 31, 2004) currently owned by the Company, of which 2 sites are no longer operating. There are no other parties responsible for remediation at these sites. Much of the remediation is being performed by the Company on a voluntary basis; therefore, the Company has greater control over the costs to be incurred and the timing of cash flows. The Company has accrued approximately $6 and $8 at December 31, 2005 and 2004, respectively, for remediation and restoration liabilities at these locations. The Company anticipates approximately $4 of these liabilities will be paid within the next three years, with the remaining amounts being paid over the next ten years. Based on currently available information and analysis, the Company believes that it is reasonably possible that costs associated with such sites may fall within a range of $4 to $12, in the aggregate. The factors influencing the ultimate outcome include the methods of remediation to be elected, the conclusions and assessment of site studies remaining to be completed and the time period required to complete the work.
Other Sites—The Company is conducting environmental remediation at 10 locations (at December 31, 2004) formerly owned by Borden Chemical. The Company has accrued approximately $3 at December 31, 2005 and 2004 for remediation and restoration liabilities at these locations. Based on currently available information and analysis, the Company believes that it is reasonably possible that costs associated with such sites may fall within a range of $2 to $14, in the aggregate. The primary drivers in determining the final costs to the Company on these matters are the method of remediation selected and the level of participation of third parties.
In addition, the Company is responsible for 14 sites (11 at December 31, 2004) that require monitoring where no additional remediation is expected and has also established accruals for other related costs, such as fines and penalties. The Company has accrued approximately $1 at December 31, 2005 and 2004 related to these sites. Based on currently available information and analysis, the Company believes that it is reasonably possible that costs associated with such sites may fall within a range of $1 to $2, in the aggregate. Payment of these liabilities is anticipated to occur over the next ten years. The ultimate cost to the Company will be influenced by any variations in projected monitoring periods or by findings that are better or worse than anticipated findings.
F-57
Table of Contents
HEXION SPECIALTY CHEMICALS, INC.
Notes to Consolidated Financial Statements—(Continued)
(In millions, except share and per share data)
Borden Chemical formerly operated the Smith Douglass fertilizer business, which included a phosphate processing operation in Manatee County, Florida and an animal food processing operation in Hillsborough County, Florida. Both operations were sold in 1980. The EPA sent the Company and another former owner of the Manatee County facility a request for $0.1 relating to oversight costs incurred when the site was abandoned by its current owner. The Company is disputing the charge. The Company is aware that state and federal environmental agencies have taken measures to prevent the off-site release of water from rainfall that accumulated in the drainage ditches and lagoons surrounding the gypsum piles located on this site. The Company is aware that the current owner of the Hillsborough County site ceased operations in March 2004 and is working with governmental agencies to effect closure of that site. At this time, the Company has received an information request from the EPA but has not received any demands from any governmental agencies or others regarding the closure and environmental cleanup at this site, which the Company believes is the responsibility of the current owner. While it is reasonably possible some costs could be incurred related to these sites, the Company has inadequate information to enable it to estimate a potential range of liability, if any.
As a result of the Bakelite Acquisition, the Company acquired a site in Duisburg, Germany with significant soil and groundwater contamination beneath a facility that is shared with Rütgers Chemicals AG (“Rütgers”). Rütgers is in discussions with the local authorities concerning a proposed remediation plan; however, the scope and extent of that plan and the costs of its possible implementation are not yet reasonably estimable. Rütgers has contractually agreed to provide indemnifications to the Company with respect to this matter until 2025, subject to certain exceptions and limitations. Management believes that it is unlikely that the Company will have to take extensive actions for remediation. While it is reasonably possible some costs could be incurred related to this site, the Company has inadequate information to enable it to estimate a potential range of liability, if any.
For environmental conditions that existed at Resolution Performance related sites prior to November 2000, the Royal Dutch/Shell Group of Companies (“Shell”) generally will indemnify the Company for environmental damages associated with environmental conditions that occurred or existed before the recapitalization in November 2000, subject to certain limitations. There have been no claims against Resolution Performance since November 2000 relating to Resolution Performance environmental matters; therefore, the Company has no accruals at December 31, 2005 and 2004 relating to Resolution Performance environmental matters.
According to the terms of the Resolution Specialty Transaction, Eastman retained the liability and indemnified Resolution Specialty pre-existing unknown environmental conditions at facilities that were transferred to us, as well as the pre-existing known environmental condition at the Roebuck, South Carolina facility, subject to certain limitations.
Non-Environmental Legal Matters
The Company has reserved approximately $12 and $21 at December 31, 2005 and 2004, respectively, relating to all non-environmental legal matters for legal defense and settlement costs that it believes are probable and estimable at this time.
Following is a discussion of non-environmental legal proceedings that are not in the ordinary course of business:
Brazil Tax Claim—In 1992, the State of Sao Paulo Administrative Tax Bureau issued an assessment against our Brazilian subsidiary claiming that excise taxes were owed on certain intercompany loans made for centralized cash management purposes, characterized by the Tax Bureau as intercompany sales. Since that time,
F-58
Table of Contents
HEXION SPECIALTY CHEMICALS, INC.
Notes to Consolidated Financial Statements—(Continued)
(In millions, except share and per share data)
management and the Tax Bureau have held discussions and the subsidiary has filed an administrative appeal seeking cancellation of the assessment. The Administrative Court upheld the assessment in December 2001. In 2002, the subsidiary filed a second appeal with the highest-level Administrative Court, again seeking cancellation of the assessment. Argument was made to the court in September 2004; the Company is awaiting its ruling. At December 31, 2005, the amount of the assessment, including tax, penalties, monetary correction and interest, is 54 million Brazilian Reais, or approximately $23. The Company believes it has a strong defense against the assessment and will pursue the appeal vigorously, including appealing to the judicial level; however, there is no assurance that the assessment will not be upheld. At this time, the Company does not believe a loss is probable; therefore, only related legal fees have been accrued.
HAI Grand Jury Investigation—HAI received a grand jury subpoena dated November 5, 2003 from the U.S. Department of Justice Antitrust Division relating to a foundry resins Grand Jury investigation. HAI has provided documentation in response to the subpoena. As is frequently the case when such investigations are in progress, various antitrust lawsuits have been brought against the Company alleging that we and HAI, along with various other entities, engaged in a price fixing conspiracy. In the fourth quarter of 2005, the grand jury completed its inquiry, and the Company and HAI were notified by the U.S. Department of Justice that no indictments would be issued and the investigation had been closed.
CTA Acoustics—From the third quarter 2003 to the first quarter 2004, six lawsuits were filed against Borden Chemical and others in the 27th Judicial District, Laurel County Circuit Court, in Kentucky, arising from an explosion at a customer’s plant where seven plant workers were killed and other workers were injured. The lawsuits primarily seek recovery for wrongful death, emotional and personal injury, loss of consortium, property damage and indemnity. The litigation also includes claims by the Company’s customer against its insurer and the Company for property damage. On October 20, 2005, a settlement was reached with representatives of the seven deceased plant workers and twelve seriously injured workers. The Company’s share of the settlement amount is covered by insurance. The property damage claim and suits by workers for emotional distress and minor injuries remain to be resolved. The Company previously accrued and has spent $5, the amount of its insurance deductible, relating to these actions and has insurance coverage expected to address any additional payments and legal fees.
Other Legal Matters—The Company is involved in various product liability, commercial and employment litigation, personal injury, property damage and other legal proceedings which are considered to be in the ordinary course of business. There has been increased publicity about asbestos liabilities faced by manufacturing companies. In large part, as a result of the bankruptcies of many asbestos producers, plaintiffs’ attorneys are increasing their focus on peripheral defendants, including the Company, and asserting that even products that contained a small amount of asbestos caused injury. Plaintiffs are also focusing on alleged harm caused by other products the Company has made or used, including those containing silica and vinyl chloride monomer. The Company does not believe that it has a material exposure relating to these claims and believes it has adequate reserves and insurance to cover currently pending and foreseeable future claims.
The Company is named in a lawsuit filed in Hillsborough County, Florida Circuit Court, relating to an animal feed supplement processing site formerly operated by Borden Chemical and sold in 1980. The lawsuit is filed on behalf of multiple residents of Hillsborough County living near the site and allege various injuries related to exposure to toxic chemicals. At this time, the Company has inadequate information from which to estimate a potential range of liability, if any. A similar lawsuit brought on behalf of a class of plaintiffs was dismissed by the court in November 2005.
F-59
Table of Contents
HEXION SPECIALTY CHEMICALS, INC.
Notes to Consolidated Financial Statements—(Continued)
(In millions, except share and per share data)
Other Commitments and Contingencies
The Company entered into contractual agreements with Shell and other third parties for the supply of site services, utilities, materials and facilities and for operation and maintenance services necessary to operate certain Resolution Performance facilities on a stand-alone basis. The duration of the contracts range from less than one year to 20 years, depending on the nature of services. Such contracts may be terminated by either party under certain conditions as provided for in the respective agreements; generally, 90 days notice is required for short-term contracts and three years notice is required for longer-term contracts (generally those contracts in excess of five years). Contractual pricing generally includes a fixed and variable component.
In addition, the Company entered into contractual agreements with Shell and other third parties for the purchase of feedstocks. The terms of the agreements vary from three to ten years, extendable at the Company’s request and cancelable by either party as provided for in the respective agreements. Feedstock prices are based on market prices less negotiated volume discounts or cost input formulas.
11. Redeemable Preferred Stock
In May 2005, Hexion Escrow Corp., a subsidiary of Hexion which merged into Hexion coincidental with the Combinations, offered 14 million shares of Redeemable Series A Floating Rate Preferred Stock, par value $0.01 per share, and a liquidation preference of $25 per share (the “Preferred Stock”). The Preferred Stock will accumulate cumulative preferential dividends from the issue date at an initial rate of LIBOR plus 8.0%, compounded semi-annually. The dividend rate increases 75 basis points every six months beginning November 15, 2005 until May 15, 2007, at which time the rate is LIBOR plus 11.0%. As of December 31, 2005, the dividend rate was 13.3%. Dividends will be paid by issuing additional shares of Preferred Stock through May 15, 2010. Thereafter, dividends will be required to be paid in cash. After November 15, 2005, the Company has the option to redeem all or a portion of the Preferred Stock at between 101% and 103% of the aggregate liquidation value plus accrued and unpaid dividends. On or after May 15, 2007, the Company may convert the Preferred Stock from a floating rate security to a fixed rate security, with dividends payable at an annual rate equal to 14.0%. On October 15, 2014, or upon a change in control of the Company, the Preferred Stock shareholders have the option to require the Company to repurchase all or a portion of the Preferred Stock. Because of this mandatory redemption clause, the Preferred Stock is considered a mezzanine financing and is recorded outside of Common Stock and Other Shareholder’s Deficit.
The Company expects to use a portion of the proceeds it receives from its refinancing (See Note 20) to redeem the Preferred Stock. In the event that the Preferred Stock is not redeemed by November 15, 2006, the initial purchasers of the Preferred Stock are entitled to receive a rollover fee of 1.5% of the aggregate initial liquidation preference of the Preferred Stock held on that date, which will result in a cash payment of up to $5. The net proceeds from the Preferred Stock issuance were $334, after deducting underwriting expenses and expenses of the offering of $16, and were used along with term loan debt borrowed under the Hexion Credit Facility to pay a dividend to its parent on May 31, 2005 (See Note 14). For presentation purposes, the issuance costs of $16 offset the carrying amount of the Preferred Stock. These costs are amortized using the effective interest method from the issue date through October 15, 2014. For accounting purposes, the Preferred Stock is considered increasing rate preferred stock issued at an implied premium. As such, the implied premium is being accreted using the effective interest method from the issue date through May 15, 2007, which is the commencement of the perpetual dividend. For the year ended December 31, 2005, the Company recognized accreted dividends, including accretion of the implied premium, of $30. During the fourth quarter of 2005 the Company issued 781,959 shares of preferred stock in payment of the first semi-annual dividend.
F-60
Table of Contents
HEXION SPECIALTY CHEMICALS, INC.
Notes to Consolidated Financial Statements—(Continued)
(In millions, except share and per share data)
12. Pension and Retirement Savings Plans
The Company sponsors domestic and foreign non-contributory defined-benefit pension plans that cover most U.S. and Canadian employees, and foreign employees in certain countries. Depending on the plan, benefits are based on eligible compensation and / or years of credited service. The benefits for certain hourly employees who are covered under collective bargaining agreements are calculated using a formula based on years of credited service multiplied by the fixed benefit multiplier amount established in the respective union contract.
Prior to the Combination, the measurement dates for the plans were December 31 for Resolution Performance plans and September 30 for Borden Chemical plans. Beginning in 2005, the Company has elected to make December 31 the measurement date for all pension obligations. We are making the change to conform accounting policies across the Company. We believe the change will result in pension disclosures that better reflect the pension balances at the December 31 balance sheet date. This change in measurement date, which impacted the Borden Chemical plans, had an immaterial effect on the benefit obligation and expense recognized for 2005.
Following is a rollforward of the projected benefit obligation and assets for the Company’s defined benefit plans for the year’s ended December 31, 2005 and 2004.
| 2005 | 2004 | |||||||
Change in Benefit Obligation | ||||||||
Benefit obligation at beginning of year | $ | 394 | $ | 370 | ||||
Service cost | 13 | 9 | ||||||
Interest cost | 24 | 20 | ||||||
Actuarial losses | 42 | 21 | ||||||
Foreign currency exchange rate changes | (26 | ) | 9 | |||||
Benefits paid | (29 | ) | (35 | ) | ||||
Acquisitions / divestitures | 114 | — | ||||||
Plan amendments | 12 | — | ||||||
| 544 | 394 | |||||||
Change in Plan Assets | ||||||||
Fair value of plan assets at beginning of year | 300 | 292 | ||||||
Actual return on plan assets | 31 | 25 | ||||||
Foreign currency exchange rate changes | (14 | ) | 8 | |||||
Employer contribution | 31 | 10 | ||||||
Benefits paid | (29 | ) | (35 | ) | ||||
Fair value of plan assets at end of year | 319 | 300 | ||||||
Plan assets less than benefit obligation | (225 | ) | (94 | ) | ||||
Unrecognized net actuarial loss | 167 | 156 | ||||||
Unrecognized prior service cost | 9 | (3 | ) | |||||
Net amount recognized | $ | (49 | ) | $ | 59 | |||
F-61
Table of Contents
HEXION SPECIALTY CHEMICALS, INC.
Notes to Consolidated Financial Statements—(Continued)
(In millions, except share and per share data)
Amounts recognized in the balance sheets, after reclassification of the prepaid pension asset to reflect a minimum pension liability adjustment for certain plans, consist of:
| 2005 | 2004 | |||||||
Accrued benefit liability | $ | (204 | ) | $ | (80 | ) | ||
Prepaid benefit cost | — | 19 | ||||||
Intangible asset | 12 | 1 | ||||||
Accumulated other comprehensive loss | 143 | 119 | ||||||
Net amount recognized | $ | (49 | ) | $ | 59 | |||
The Company’s accrued benefit liability of $204 includes $37 recorded in Other current liabilities at December 31, 2005. At December 31, 2004, the Company’s accrued benefit liability of $80 included $7 recorded in Other current liabilities.
The Company’s acquisition of Bakelite in the second quarter of 2005 included two unfunded defined benefit plans in Germany, with a total projected benefit obligation of $114 at the date of acquisition.
Changes in statutory requirements for the Netherlands plan relating to indexation resulted in an actuarial loss during 2005. Also, in connection with the acquisition of minority interest owners of Resolution Performance and Resolution Specialty, the Resolution Performance pension plans were remeasured as of May 31, 2005. The accounting for this acquisition resulted in an increase to the net pension liability of approximately $7 due to the recognition of a portion of the previously unrecognized actuarial losses and prior service costs. The impact of these items on the Company’s pension expense was approximately $1.
The Company amended the Netherlands plan pursuant to changes in statutory requirements so that participants now can continue to accrue benefits up to age 65, versus age 60 prior to the amendment.
The foreign currency impact reflected in the rollforward relates to changes in the Euro versus the U.S. dollar.
The following summarizes defined benefit pension plans with an accumulated benefit obligation in excess of plan assets:
| 2005 | 2004 | |||||
Projected benefit obligation | $ | 544 | $ | 292 | ||
Accumulated benefit obligation | 503 | 283 | ||||
Fair value of plan assets | 319 | 207 | ||||
At December 31, 2004, defined benefit plans with assets exceeding the accumulated benefit obligation had a projected benefit obligation of $102, an accumulated benefit obligation of $84 and fair value of plan assets of $93.
F-62
Table of Contents
HEXION SPECIALTY CHEMICALS, INC.
Notes to Consolidated Financial Statements—(Continued)
(In millions, except share and per share data)
Following are the components of net pension expense recognized by the Company for the years ended December 31:
| 2005 | 2004 | 2003 | ||||||||||
Service cost | $ | 13 | $ | 7 | $ | 5 | ||||||
Interest cost on projected benefit obligation | 24 | 11 | 5 | |||||||||
Expected return on assets | (26 | ) | (15 | ) | (7 | ) | ||||||
Recognized actuarial loss | 8 | 3 | — | |||||||||
Net pension expense | $ | 19 | $ | 6 | $ | 3 | ||||||
Determination of actuarial assumptions
The Company’s actuarial assumptions are determined separately for each plan, taking into account the demographics of the population, the target asset allocations for funded plans, the regional economic trends, statutory requirements and other factors that could impact the benefit obligation and assets of the plan.
The discount rate selected reflects the rate at which pension obligations could be effectively settled. When selecting a discount rate, the Company takes into consideration yields on government bonds and high-grade corporate bonds, as well as annuity pricing information furnished by the Pension Benefit Guarantee Corporation (for U.S. plans) and insurance carriers in the specific countries (for foreign plans), for instruments with durations consistent with the duration of the liabilities being measured.
The rate of increase in future compensation levels is determined based on salary and wage trends in the chemical and other similar industries, as well as the Company’s specific compensation targets by country. Input is obtained from the Company’s internal Human Resources group, and outside actuaries. The rate includes components for both wage rate inflation, and merit increases.
The expected long-term rate of return on plan assets is determined based on the plan’s current and projected asset mix. In determining the expected overall long-term rate of return on assets, the Company takes into account the rates on long-term debt investments held within the portfolio, as well as expected trends in the equity markets, for plans including equity securities. Peer data and historical returns are reviewed, and the Company consults with its actuaries, as well as investment professionals, to confirm that the Company’s assumptions are reasonable.
The weighted average rates used to determine the benefit obligations for the Company were as follows:
| 2005 | 2004 | |||||
Discount rate | 5.0 | % | 5.4 | % | ||
Rate of increase in future compensation levels | 3.6 | % | 4.1 | % |
The weighted average rates used to determine net pension expense for the Company were as follows:
| 2005 | 2004 | 2003 | |||||||
Discount rate | 5.2 | % | 5.7 | % | 6.8 | % | |||
Rate of increase in future compensation levels | 3.7 | % | 3.9 | % | 4.1 | % | |||
Expected long-term rate of return on plan assets | 8.2 | % | 8.2 | % | 8.3 | % |
F-63
Table of Contents
HEXION SPECIALTY CHEMICALS, INC.
Notes to Consolidated Financial Statements—(Continued)
(In millions, except share and per share data)
Investment Policies and Strategies
The Company’s investment strategy for the assets of its North American defined benefit pension plans is to maximize the long-term return on plan assets using a mix of equities and fixed income investments and accepting a prudent level of risk. Risk tolerance is established through careful consideration of plan liabilities, plan funded status and expected timing of future cash flow requirements. The investment portfolio contains a diversified blend of equity and fixed-income investments. Furthermore, equity investments are diversified across U.S. and non-U.S. stocks, as well as growth, value and small and large capitalization investments. Investment risk and performance is measured and monitored on an ongoing basis through quarterly investment portfolio reviews, annual liability measurements and periodic asset / liability studies.
The Company periodically reviews its target allocation of North American plan assets among various asset classes. The targeted allocations are based on anticipated asset performance, discussions with investment professionals, and on the projected timing of future benefit payments.
Following is a summary of weighted average allocations of plan assets for the Company’s North American plans by investment type at the 2005 and 2004 measurement dates, and weighted average target 2006 allocations:
| Actual | Target | ||||||||
| 2005 | 2004 | 2006 | |||||||
North American pension assets | |||||||||
Equity securities | 62 | % | 63 | % | 61 | % | |||
Debt securities | 34 | % | 34 | % | 39 | % | |||
Cash, short-term investments and other | 4 | % | 3 | % | — | % | |||
| 100 | % | 100 | % | 100 | % | ||||
The Company observes local regulations governing its European plans in determining asset allocations. Following is a summary of weighted average allocations of plan assets for the Company’s funded European plans by investment type at the 2005 and 2004 measurement dates, and weighted average target 2006 allocations:
| Actual | Target | ||||||||
| 2005 | 2004 | 2006 | |||||||
European pension assets | |||||||||
Equity securities | — | % | — | % | 10 | % | |||
Debt securities | 98 | % | 97 | % | 88 | % | |||
Cash, short-term investments and other | 2 | % | 3 | % | 2 | % | |||
| 100 | % | 100 | % | 100 | % | ||||
Projections of Plan Contributions and Benefit Payments
The Company expects to make contributions totaling $37 to its defined benefit plans in 2006.
Estimated future plan benefit payments as of December 31, 2005 are as follows:
2006 | $ | 34 | |
2007 | 33 | ||
2008 | 33 | ||
2009 | 33 | ||
2010 | 32 | ||
2011 to 2015 | 160 |
F-64
Table of Contents
HEXION SPECIALTY CHEMICALS, INC.
Notes to Consolidated Financial Statements—(Continued)
(In millions, except share and per share data)
In 2003 Borden Chemical was informed by the IRS that cash balance plans may be required to be amended because of recent ERISA rulings that found some cash balance plans to be discriminatory. The IRS indicated that the U.S. Plan should continue to operate as currently designed until new guidance is available. There is insufficient information to assess any potential impact on us of the ERISA ruling at this time.
Some U.S. employees not covered by the Company’s U.S. and foreign defined benefit pension plans are covered by collective bargaining agreements, which are generally effective for five years. Under federal pension law, there would be continuing liability to these pension trusts if the Company ceased all or most participation in any such trust, and under certain other specified conditions.
Defined Contribution Plans
The Company sponsors defined contribution plans for its U.S. and Canadian employees. Full time employees are eligible to participate immediately. Employees may make pre-tax contributions ranging from 1% to 60% and after-tax contributions ranging from 1% to 10% of their pay subject to Internal Revenue Service limitations. The Company provides matching contributions of up to 6%. The Company has the option to make additional contributions based upon financial performance. Additionally, the Company provides benefits under various defined contribution plans to employees in certain international locations. Total charges to operations for matching contributions under these plans in 2005, 2004 and 2003 were $9, $4 and $1, respectively.
Non-Qualified and Profit-Sharing Plans
The company provides key executives with nonqualified benefit plans that provides participants with an opportunity to elect deferral of compensation and also provides retirement benefits in cases where executives cannot fully participate in the defined benefit or defined contribution plans because of plan and Internal Revenue Service limitations. Most of the Company’s non-qualified benefit plans are unfunded, however, certain participants may elect to defer up to 50% of base wages and 100% of bonus pay in a funded Rabbi trust. Depending on the plan, certain deferrals are matched by the Company based on years of service.
Certain of the Company’s employees also receive profit sharing contributions based on age and years of service. Contributions range from 1 to 15% on wages up to FICA limits and 2 to 20% on wages in excess of FICA limits. The Company’s contributions amounted to $1 in 2005 and less than $1 in 2004.
13. Non-Pension Postretirement Benefits
The Company provides other postretirement benefit plans to most North American employees and to employees in the Netherlands. These plans provide retirees and their dependents certain medical and (for the legacy Borden Chemical plan) life insurance benefits. All of the Company’s postretirement benefits are funded on a pay-as-you-go basis.
Certain Company participants who are not eligible for Medicare are generally provided with the same medical benefits as active employees, while those eligible for Medicare received a subsidy under the Plan. In 2004, the Company amended one of its retiree medical benefit plans to reduce subsidies provided to retirees eligible for Medicare effective January 1, 2005, and to eliminate these subsidies effective January 1, 2006, except in certain cases where contractual obligations exist. As a result of this amendment, the Company’s liability for postretirement medical benefits was reduced by $8 in 2004, which is reflected in prior service cost, and is being amortized over the remaining service life through 2013.
F-65
Table of Contents
HEXION SPECIALTY CHEMICALS, INC.
Notes to Consolidated Financial Statements—(Continued)
(In millions, except share and per share data)
Canadian participants are provided with supplemental benefits to the respective provincial healthcare plan in Canada. The domestic postretirement medical benefits are contributory; the Canadian medical benefits are non-contributory. The domestic and Canadian postretirement life insurance benefits are non-contributory.
Prior to the Combination, the measurement dates for the plans were December 31 for Resolution Performance plans and September 30 for Borden Chemical plans. Beginning in 2005, the Company has elected to make December 31 the measurement date for all postretirement obligations. We are making the change to conform accounting policies across the Company. We believe the change will result in post retirement obligation disclosures that better reflect the post retirement obligation balances at the December 31 balance sheet date. This change in measurement date, which impacted the Borden Chemical plans, had an immaterial effect on the benefit obligation and expense recognized for 2005.
The following represents amounts for the years ended December 31, 2005 and 2004.
| 2005 | 2004 | |||||||
Change in Benefit Obligation | ||||||||
Benefit obligation at beginning of year | $ | 25 | $ | 39 | ||||
Service cost | 1 | — | ||||||
Interest cost | 1 | 3 | ||||||
Actuarial (gains)/losses | 4 | (4 | ) | |||||
Plan amendments | — | (8 | ) | |||||
Benefits paid | (5 | ) | (5 | ) | ||||
Benefit obligation at end of year | 26 | 25 | ||||||
Unrecognized net actuarial gain | 10 | 22 | ||||||
Unrecognized prior service benefit | 76 | 88 | ||||||
Accrued postretirement obligation at end of year | $ | 112 | $ | 135 | ||||
Following are the components of net postretirement benefit recognized by the Company for:
| 2005 | 2004 | 2003 | ||||||||||
Service cost | $ | 1 | $ | — | $ | — | ||||||
Interest cost on projected benefit obligation | 1 | 1 | — | |||||||||
Amortization of prior service benefit | (12 | ) | (4 | ) | — | |||||||
Recognized actuarial gain | (2 | ) | (1 | ) | (1 | ) | ||||||
Net postretirement benefit | $ | (12 | ) | $ | (4 | ) | $ | (1 | ) | |||
In connection with the acquisition of minority interest owners of Resolution Performance and Resolution Specialty, the Resolution Performance postretirement liabilities were remeasured as of May 31, 2005 and adjusted for the related purchase accounting. This resulted in a decrease to the liability of approximately $4 million due to the recognition of a portion of the previously unrecognized actuarial gains resulting from this adjustment. The impact of this adjustment on the Company’s postretirement expense was approximately $1.
The weighted average discount rates used to determine the benefit obligations for the Company were 5.7% for both periods presented.
The weighted average discount rates used to determine net postretirement (benefit) expense for the Company were 5.7%, 5.7% and 5.8% for the years ended December 31, 2005, 2004 and 2003, respectively.
F-66
Table of Contents
HEXION SPECIALTY CHEMICALS, INC.
Notes to Consolidated Financial Statements—(Continued)
(In millions, except share and per share data)
Following are the weighted average assumed health care cost trend rates at December 31, 2005 and 2004:
| 2005 | 2004 | |||||
Health care cost trend rate assumed for next year | 8.9 | % | 7.5 | % | ||
Rate to which the cost trend rate is assumed to decline (the ultimate trend rate) | 4.8 | % | 4.9 | % | ||
Year that the rate reaches the ultimate trend rate | 2014 | 2013 |
A one-percentage-point change in the assumed health care cost trend rates would have the following impact on the Company’s postretirement benefits:
| 1% increase | 1% decrease | ||||||
Effect on total service cost and interest cost components | $ | — | $ | — | |||
Effect on postretirement benefit obligation | 2 | (2 | ) | ||||
Projected benefit payments under the Company’s postretirement plans as of December 31, 2005 are as follows:
2006 | $ | 2 | |
2007 | 2 | ||
2008 | 2 | ||
2009 | 2 | ||
2010 | 2 | ||
2011 – 2015 | 8 |
Also included in the Consolidated Balance Sheets at December 31, 2005 and 2004 are other postemployment benefit obligations of $7 and $7, respectively.
14. Common Stock and Other Shareholder’s (Deficit) Equity
On September 19, 2005, the Board of Directors approved a 0.85268157-to-1 reverse stock split. The reverse stock split was effective September 19, 2005, and the par value of the common stock remained at $0.01 per share. All share and per share amounts have been retroactively adjusted for all periods presented to reflect the 0.85268157-to-1 reverse stock split.
As a result of the Combinations and subsequent reverse stock split, the Company’s capital structure consists of 82,629,906 shares outstanding. The Company’s capital structure has been retroactively consolidated for all periods presented. No new shares were issued as a result of the legal merger of Resolution Performance, Resolution Specialty and Borden Chemical.
In conjunction with the Combinations, Hexion declared a dividend to its parent of $550 and paid $517 on May 31, 2005. Approximately $6 of the unpaid amount was distributed in the third quarter of 2005, and the remainder is expected to be paid in the second quarter of 2007 and is classified in Other long-term liabilities. The dividend was funded through the proceeds from the issuance of preferred stock and from amounts borrowed under the Company’s credit facility.
At December 31, 2004, Borden Chemical held a note receivable in an aggregate principal amount of $405 and accrued interest of $156 from BHI Acquisition, which was accounted for as a reduction of equity. The note accrued interest at 12% per year, payable quarterly, and Borden Chemical accrued interest quarterly in paid-in capital. The notes were previously due from Borden Holdings, Inc., Borden Chemical’s parent prior to
F-67
Table of Contents
HEXION SPECIALTY CHEMICALS, INC.
Notes to Consolidated Financial Statements—(Continued)
(In millions, except share and per share data)
August 12, 2004. Historically, Borden Holdings, Inc. funded the payment of the interest on the note through common dividends received from Borden Chemical. Borden Chemical had not received a payment on the accrued interest, nor had Borden Chemical paid an associated dividend, since October 15, 2001. In connection with the Combinations, the note (including $176 of accrued interest to the date of the Combinations) was reclassified to Paid-in capital.
15. Stock Option Plans and Stock Based Compensation
Prior to the Combinations, Resolution Performance, Resolution Specialty and BHI Acquisition (now Hexion LLC) maintained five stock based compensation plans: the Resolution Performance 2000 Stock Option Plan (the “Resolution Performance Plan”), the Resolution Performance 2000 Non-Employee Directors Option Plan (the “Resolution Performance Director Plan”), the Resolution Performance Restricted Unit Plan (the “Resolution Performance Unit Plan”), the Resolution Specialty 2004 Stock Option Plan (the “Resolution Specialty Plan”) and the BHI Acquisition 2004 Stock Incentive Plan (the “2004 Incentive Plan”). In addition to these plans, the Company’s parent maintains a stock-based deferred compensation plan. The options granted under each of these plans were for the purchase of the common stock of the parent company of each of the respective companies; upon the Combinations, the stock options under the Resolution Performance Plan, the Resolution Performance Director Plan, the Resolution Performance Unit Plan and Resolution Specialty Plan were exchanged for equivalent options under the 2004 Incentive Plan based upon relative fair value. As such, none of these options are denominated in the Company’s stock as of the date of the Hexion Combination. The Company does not intend to make future option grants from these plans subsequent to the Combinations, but plans to adopt a new plan from which future grants of options to purchase the Company’s stock will be made.
On September 20, 2005, a 0.464637297-to-1 reverse stock split of Hexion LLC common units was made effective. All common unit amounts relating to options issued by Hexion LLC to the Company’s employees and directors have been retroactively adjusted for all periods presented to reflect the 0.464637297-to-1 reverse stock split.
Resolution Performance Plan, Resolution Performance Director Plan
Resolution Performance Inc. adopted stock option plans pursuant to which options with respect to a total of 727,134 shares on a post-combination and reverse split basis are available for grant. The right to grant options under the option plans will expire in 2010. Options granted under the plans are or will be either nonqualified or incentive stock options. One third of the options vest ratably over a five year period, while the remaining (“the Resolution Performance Options”) vest after the eighth anniversary of the grant date. The Resolution Performance Options provided for accelerated vesting upon the sale of Resolution Performance Inc. and achievement of certain financial targets. Options are granted at the fair market value on the date of the grant and expire eight years from the grant date. As a result of the Combinations, all options granted under the Resolution Performance Director Plan vested and became exercisable.
Resolution Performance Unit Plan
There is a grant for a total of 191,276 Hexion LLC restricted units outstanding under the Resolution Performance Unit Plan, which was granted to one individual on November 14, 2000. The rights under the plan are fully vested and nonforfeitable. The restricted units will be distributed to the individual upon the earliest of his termination of employment or a change of control event, or at January 1, 2009.
F-68
Table of Contents
HEXION SPECIALTY CHEMICALS, INC.
Notes to Consolidated Financial Statements—(Continued)
(In millions, except share and per share data)
Resolution Specialty Plan
In August 2004, Resolution Specialty Inc. initiated its 2004 Stock Option Plan pursuant to which options with respect to a total of 1,027,197 shares on a post-combination and reverse split basis are available for grant. The right to grant options under the option plan will expire on the tenth anniversary of the adoption date by the Board of Directors. Options granted under the plan shall be nonqualified stock options. One third of the options will vest ratably over a five year period, while the remaining (“the Resolution Specialty Performance Options”) vest after the eighth anniversary of the grant date. The Resolution Specialty Performance Options provided for accelerated vesting upon the sale of Resolution Specialty Inc. and achievement of certain financial targets. Options are granted at the fair market value on the date of the grant and expire eight years from the grant date. As a result of the Combinations, the accelerated vesting criteria for the Resolution Specialty Performance options were met and 647,229 options with an average price of $3.51 and a 6.6 year weighted average remaining term became exercisable.
Borden Chemical Plans
As a result of the Borden Transaction, all 4,968,250 of the in-the-money options to purchase Borden Chemical stock, granted under predecessor Borden Chemical option plans, were terminated, resulting in the recognition of $4 of expense.
In August 2004, BHI Acquisition (now Hexion LLC) adopted the BHI Acquisition 2004 Stock Incentive Plan, pursuant to which up to 3,670,635 options to purchase now Hexion LLC units are available for grant to employees, consultants and independent directors of Hexion. The right to grant options under this plan will expire on the tenth anniversary of the adoption of the plan. On August 12, 2004, Hexion LLC granted options to purchase 2,519,860 Hexion LLC membership units, half of which vest ratably over a five-year period, while the remaining vest (the “Performance Options”) after the eighth anniversary of the grant date. The Performance Options provide for accelerated vesting upon the sale of Borden Chemical and the achievement of certain financial targets. The options were granted at fair value, but were treated as variable because the options were liability designated awards, with the value determined by a formula. In 2004, the Company did not record any expense under APB No. 25 related to these options, as their formula value was less than the exercise price. At December 31, 2005, under the 2004 Incentive Plan there were 1,244,467 options available for future grant.
Following is a summary of the historical option activity relating to these plans, on the equivalent, post-combination and reverse split basis, for the year ended December 31, 2005:
| Hexion LLC Common Units | Weighted Average Exercise Price | ||||
Options outstanding at December 31, 2004 | 4,147,232 | $ | 6.31 | ||
Options exercised | 19,660 | 7.93 | |||
Options granted | 116,991 | 9.06 | |||
Options forfeited | 96,615 | 6.89 | |||
Options outstanding at December 31, 2005 | 4,147,948 | $ | 6.36 | ||
Exercisable at December 31, 2004 | 111,241 | 12.14 | |||
Exercisable at December 31, 2005 | 1,242,564 | 5.50 | |||
At December 31, 2005 the range of exercise prices on a post-combination and reverse split basis was $3.51 to $29.42 and the weighted average remaining contractual life was 7.3 years.
F-69
Table of Contents
HEXION SPECIALTY CHEMICALS, INC.
Notes to Consolidated Financial Statements—(Continued)
(In millions, except share and per share data)
The weighted-average grant date fair value of options granted during 2005, 2004, and 2003 was $9.06, $5.64, and $9.49, respectively. The total intrinsic value (which is the amount by which the stock price exceeded the exercise price of the options on the date of exercise) of options exercised during the year ended December 31, 2005, 2004 and 2003 was $0.
For the years ended, December 31, 2005, 2004 and 2003, the amount of cash received from the exercise of stock options was less than $1.
Stock-Based Compensation
Effective January 1, 2005, the Company elected to adopt SFAS No. 123(R) (revised 2004),Share-Based Payment. As the Company was considered a nonpublic entity, at the date of adoption, that used the minimum value method for pro forma disclosures under SFAS No. 123,Accounting for Stock-Based Compensation, the Company is required to apply the prospective transition method. As such, the Company applies the statement to any new awards and to any awards modified, repurchased or cancelled since January 1, 2005.
In connection with the filing of a registration statement, which is not yet effective, with the SEC for a proposed IPO of its common stock, the Company became subject to the measurement requirements as a public company and consequently remeasured its liability designated awards. In addition, modifications to the awards under the 2004 Incentive Plan and the stock-based deferred compensation plan were made to allow for the value of the options to be determined by fair market value instead of by formula. Also, certain directors’ options granted under the Resolution Performance Plan and Resolution Specialty Plan, which would have been forfeited upon the Combinations, were modified to allow for immediate vesting. These equity modifications were treated in accordance with the provisions of SFAS No. 123(R) and impacted the option held by 195 participants. As a result of this remeasurement and modifications associated with the Combinations to the Resolution Performance Plan, the Resolution Specialty Plan, the 2004 Incentive Plan and the deferred compensation plan, the Company recognized a compensation charge of $12 for the year ended December 31, 2005, which is included in Selling, general & administrative expense. The Company expects to realize additional compensation expense of $19, which will be recognized over the vesting period of the underlying stock based awards. The cost is expected to be recognized ratably over a weighted-average period of 4.9 years.
On May 11, 2005, Hexion LLC issued options to purchase an aggregate of 84,423 membership units to the Company’s three non-management directors. These options have a ten-year life with immediate vesting and exercise upon an IPO. Upon the consummation of an IPO, the Company will recognize expense of $1, which represents the fair value of the options at the date of grant as determined by the Black-Scholes pricing model. On October 1, 2005, Hexion LLC granted options to purchase 28,141 membership units to a new non-management director, all of which were vested at the time of grant.
The Company’s compensation expense was calculated using the Black-Scholes pricing model with risk-free weighted average interest rates ranging from 2.83% to 4.24%, expected lives of 0.22 to 8.22 years based upon the simplified method, a dividend rate of zero and expected volatility of 30%. The expected volatility measure was based upon a calculation that factored (a) the ten year historical daily volatility and (b) the implied volatility of six public companies. The Company has utilized an annual forfeiture rate of 7% to estimate future termination behavior. The fair value of the Company’s common stock was calculated using a multiple of EBITDA (earnings before interest, taxes, depreciation and amortization) approach, which is a valuation technique commonly used by the investment banking community. Under this technique, estimated enterprise values are the result of an EBITDA multiple derived from comparison to comparable company multiples applied to an appropriate EBITDA amount. The equity value is then calculated by subtracting the amount of the company’s net debt from the calculated enterprise value. This calculation yielded a fair value per share of $17.52 at the combination date.
F-70
Table of Contents
HEXION SPECIALTY CHEMICALS, INC.
Notes to Consolidated Financial Statements—(Continued)
(In millions, except share and per share data)
Stock-Based Deferred Compensation Plan
In 2004, certain key employees of the Company were granted 1,007,944 deferred common stock units under the Hexion LLC 2004 Deferred Compensation Plan (“the Deferred Compensation Plan”), which is an unfunded plan. Each unit gives the grantee the right to one share of common stock of Hexion LLC, following the completion of a forfeiture period. The forfeiture period for 686,395 of the deferred units expired on December 10, 2004. The forfeiture period for the remaining 321,549 deferred units expired on December 31, 2005. The Company recorded $0 and $4 of expense related to the Deferred Compensation Plan for the years ended December 31, 2005 and 2004, respectively; the related credit is in Paid-in capital.
16. Income Taxes
Comparative analysis of the Company’s income tax expense (benefit) related to continuing operations follows:
| 2005 | 2004 | 2003 | ||||||||||
Current | ||||||||||||
Federal | $ | — | $ | (5 | ) | $ | — | |||||
State & Local | 11 | 7 | — | |||||||||
Foreign | 40 | 1 | — | |||||||||
Total | $ | 51 | $ | 3 | $ | — | ||||||
Deferred | ||||||||||||
Federal | $ | 1 | $ | (11 | ) | $ | (22 | ) | ||||
State & Local | — | (1 | ) | (1 | ) | |||||||
Foreign | (4 | ) | 9 | (14 | ) | |||||||
Total | $ | (3 | ) | $ | (3 | ) | $ | (37 | ) | |||
Income tax expense (benefit) | $ | 48 | $ | — | $ | (37 | ) | |||||
A reconciliation of the Company’s differences between income taxes related to continuing operations computed at the federal statutory tax rate of 35% and provisions for income taxes is as follows:
| 2005 | 2004 | 2003 | ||||||||||
Income taxes computed at federal statutory tax rate | $ | (10 | ) | $ | (40 | ) | $ | (35 | ) | |||
State tax provision, net of federal benefits | 2 | (4 | ) | (2 | ) | |||||||
Foreign tax differentials | (11 | ) | 1 | (5 | ) | |||||||
Foreign source income also subject to U.S. taxation | 4 | 9 | — | |||||||||
Losses and other expenses not deductible for tax | 8 | 12 | — | |||||||||
Change in valuation allowance | 41 | (33 | ) | — | ||||||||
Additional tax on foreign unrepatriated earnings | 1 | 61 | — | |||||||||
Write-off of net operating losses | — | 17 | — | |||||||||
Long-lived asset impairment | — | — | 4 | |||||||||
Change in enacted tax rate | — | (10 | ) | — | ||||||||
Adjustment of prior estimates and other | 13 | (13 | ) | 1 | ||||||||
Income tax expense (benefit) | $ | 48 | $ | — | $ | (37 | ) | |||||
F-71
Table of Contents
HEXION SPECIALTY CHEMICALS, INC.
Notes to Consolidated Financial Statements—(Continued)
(In millions, except share and per share data)
The domestic and foreign components of the Company’s loss (income) from continuing operations before income taxes are as follows:
| 2005 | 2004 | 2003 | |||||||||
Domestic | $ | 155 | $ | 126 | $ | 72 | |||||
Foreign | (126 | ) | (13 | ) | 28 | ||||||
| $ | 29 | $ | 113 | $ | 100 | ||||||
The tax effects of the Company’s significant temporary differences, and net operating loss and credit carryforwards, which comprise the deferred tax assets and liabilities at December 31, 2005 and 2004, is as follows:
| 2005 | 2004 | |||||||
Assets | ||||||||
Non-pension postemployment benefit obligations | $ | 40 | $ | 42 | ||||
Accrued and other expenses | 100 | 65 | ||||||
Loss and credit carryforwards | 299 | 260 | ||||||
Pension liability | 38 | 26 | ||||||
Property, plant and equipment | 10 | 16 | ||||||
Other | — | 9 | ||||||
Gross deferred tax assets | 487 | 418 | ||||||
Valuation allowance | (239 | ) | (192 | ) | ||||
Net deferred tax asset | 248 | 226 | ||||||
Liabilities | ||||||||
Property, plant, equipment and intangibles | (257 | ) | (243 | ) | ||||
Unrepatriated earnings of foreign subsidiaries | (63 | ) | (66 | ) | ||||
Amortization of intangibles | (29 | ) | (30 | ) | ||||
Other | — | (4 | ) | |||||
Gross deferred tax liabilities | (349 | ) | (343 | ) | ||||
Net deferred tax liability | $ | (101 | ) | $ | (117 | ) | ||
The following table summarizes the Company’s presentation of its net deferred tax (liability) asset on the Combined Balance Sheets at December 31, 2005 and 2004:
| 2005 | 2004 | |||||||
Assets | ||||||||
Current deferred income taxes (Other current assets) | $ | 25 | $ | 14 | ||||
Long-term deferred income taxes (Other assets) | 17 | — | ||||||
Liabilities | ||||||||
Current deferred income taxes (Other current liabilities) | (4 | ) | — | |||||
Long-term deferred income taxes | (139 | ) | (131 | ) | ||||
Net deferred tax liability | $ | (101 | ) | $ | (117 | ) | ||
F-72
Table of Contents
HEXION SPECIALTY CHEMICALS, INC.
Notes to Consolidated Financial Statements—(Continued)
(In millions, except share and per share data)
The 2005 consolidated tax expense primarily reflects a federal income tax benefit recorded at the statutory rate, offset by an increase in the domestic valuation allowance related primarily to net operating losses that may, or may not, be realized. In addition, the provision reflects an $8 tax expense for nondeductible expenses primarily related to the Combinations as well as a $9 tax expense related to an increase in state tax accruals.
The foreign tax differentials reflect a release of valuation allowance in foreign jurisdictions related primarily to a wholly owned subsidiary in the Czech Republic. This subsidiary generated significantly improved earnings compared with the previous year, utilizing net operating losses for which a valuation allowance had previously been recorded. In the 4th quarter 2005, the Company completed a revised earnings estimate and determined that it was more likely than not that the deferred tax assets would be realized and the remaining valuation allowance of $16 was no longer necessary; the valuation allowance was therefore released.
In addition, the foreign tax differential includes an increase to tax contingencies for foreign locations in the Netherlands and Germany, offset by a reduction of a previously established tax contingency due to a settlement with Competent Authority in Canada. The settlement with Competent Authority in Canada resulted in a tax refund of $6, received by the Company in February 2006. Also included is an expense of $16 related to taxes on a foreign currency exchange gain from the settlement of an intercompany loan.
The 2004 consolidated tax expense primarily reflects a provision of $61 for taxes associated with the unrepatriated earnings of certain of the Company’s foreign subsidiaries. Management has determined that after the acquisition of Borden Chemical by Apollo the earnings could no longer be considered permanently invested. In addition, the provision also reflects a $12 tax expense for nondeductible expenses primarily related to the Borden Transaction and a tax benefit of $10 for the reduction in the Netherlands tax rate from 34.5% to 30.0%.
Hexion LLC and its eligible subsidiaries file a consolidated U.S. federal income tax return. As Hexion LLC is not a member of the registrant, its tax attributes are not reflected in the above tables. However, because Hexion LLC is the Company’s parent, the Company has the ability to utilize Hexion LLC’s attributes. These attributes comprise $130 of deferred interest deductions, which have significant restrictions on their use, and $25 of net operating loss carryforwards, which expire starting in 2020. Hexion LLC maintains a full valuation allowance against these attributes as it is more likely than not that some portion of these assets will not be realized.
As of December 31, 2005, the Company has a $239 valuation allowance for a portion of its net deferred tax assets that management believes, more likely than not, will not be realized. In the United States, a consolidated return will be filed and future taxable income and losses of the consolidated group may be offset. The valuation allowance was also evaluated considering the combined deferred taxes of the Company after the Combinations. At the time Borden Chemical and Resolution Specialty became part of the combined group, Resolution Performance had a $50 net deferred tax liability and Borden Chemical and Resolution Specialty had valuation allowances on a portion of their deferred tax assets. These valuation allowances were reduced by $50 based on Resolution Performance’s net deferred tax liability position. Of this amount, $2 was recorded as a component of purchase accounting and the remainder was credited to Paid-in capital.
The Company’s deferred tax assets include federal, state and foreign net operating losses carryforwards. The federal net operating loss carryforwards available are $420, which expire starting in 2020. The Company’s deferred assets also include minimum tax credits of $33, which are available indefinitely as well as capital loss carryforwards of $88, which were generated in 2003 and expire in 2008. A valuation allowance of $211 has been provided against these attributes. The Company had undistributed earnings of certain foreign subsidiaries of $59, on which deferred taxes have not been provided because such earnings are considered permanently invested outside the U.S.
F-73
Table of Contents
HEXION SPECIALTY CHEMICALS, INC.
Notes to Consolidated Financial Statements—(Continued)
(In millions, except share and per share data)
The Company currently does not have any IRS audits in progress; however, one of the Company’s U.S. subsidiaries is currently being audited by the IRS for tax year ending December 31, 2003. For Borden Chemical, the years 2002 through 2005 remain open for examination. For Resolution Performance, the years 2001 through May 31, 2005 remain open for examination. Resolution Specialty’s initial 2004 and short period 2005 through May 31, 2005 remain open for examination.
At December 31, 2005, the Company has $32 accrued for probable state tax liabilities. As the various taxing authorities continue with their audit/examination programs, the Company will adjust its reserves accordingly to reflect these settlements. The current year provision includes an increase to the state tax reserve of $9. The increase is a direct result of several state court cases being decided against taxpayers in 2005.
The Canada Revenue Agency recently concluded their audit through Competent Authority for years 1996-1999. The current year provision reflects a reduction in a previously established liability of $1. The Canadian Revenue Agency is currently auditing the Company’s Canadian subsidiary for years 2001-2002.
The Netherlands taxing authority is currently examining a Dutch subsidiary of the Company for tax years 2000-2002. Net operating losses carried back from this period of time resulted in $18 of tax refunds in the fourth quarter of 2003. The Netherlands tax authority has not issued a formal notice of deficiency and the Company will aggressively contest any proposed adjustments. The German tax authority is currently examining a German subsidiary of the Company for tax years 2000-2003. Although the final resolution of any proposed adjustments is uncertain and may involve unsettled areas, based on currently available information, the Company has provided the best estimate of the probable tax liabilities for such matters.
17. Segment Information
Our organizational structure is based on the products we offer and the markets we serve. During the fourth quarter of 2005, we changed our reportable segments to better reflect the stage of the transition from the previous organization of our pre-merger companies to the Company’s organizational structure during the latter half of 2005. The transition provides greater alignment of the respective operating divisions and reporting segments. At December 31, 2005, our organizational structure consisted of four operating divisions: Epoxy and Phenolic Resins, Formaldehyde and Forest Products Resins, Coatings and Inks, and Performance Products. A brief summary of the operating divisions, which align with the Company’s reportable segments, is as follows:
| • | Epoxy and Phenolic Resins: Includes the operations primarily from the Resolution Performance and Bakelite legacy companies and the phenolic resin operation of the Borden Chemical legacy company. Major products include epoxy resins and intermediates, molding compounds, versatics acids and derivatives, specialty phenolic resins and epoxy coating resins. |
| • | Formaldehyde and Forest Products Resins: Includes the formaldehyde and forest products operations primarily from the Borden Chemical legacy company. Major products include forest products resins and formaldehyde applications. |
| • | Coatings and Inks: Includes the operations from the Resolution Specialty legacy company. Major products include composite resins, polyester resins, acrylic resins, alkyd resins, and inks resins and additives. |
| • | Performance Products: Includes the oil field products and foundry applications from the Borden Chemical legacy company. Major products include phenolic encapsulated substrates for oil field service applications and foundry applications. |
F-74
Table of Contents
HEXION SPECIALTY CHEMICALS, INC.
Notes to Consolidated Financial Statements—(Continued)
(In millions, except share and per share data)
All historical segment information included herein has been restated to conform with our current segment reporting. The changes to previously reported segment information are simply a reclassification of activity among the Company’s segments, and they do not impact any of the Company’s previously reported consolidated results.
The Company began implementing additional refinements to its operating divisions in 2006 to more closely link similar products, minimize divisional boundaries and improve the Company’s ability to serve common customers from pre-merger legacy company relationships which may result in additional refinements to the Company’s reporting segments.
Operating Segments:
Following is a comparison of net sales, Segment EBITDA, depreciation and amortization expense, total assets and capital expenditures by reportable segment. Segment EBITDA is defined as EBITDA adjusted to exclude certain non-cash and non-recurring expenses. Segment EBITDA is the primary performance measure used by the Company in the evaluation of its operating results and in determining allocations of capital resources among our segments. Segment EBITDA is also the profitability measure used to set management and executive incentive compensation. Corporate and Other primarily represents certain corporate general and administrative expenses that are not allocated to the segments.
Net Sales to Unaffiliated Customers:(1)(2)
| 2005 | 2004 | 2003 | |||||||
Epoxy and Phenolic Resins | $ | 1,909 | $ | 1,096 | $ | 782 | |||
Formaldehyde and Forest Products Resins | 1,281 | 458 | — | ||||||
Coatings and Inks | 886 | 325 | — | ||||||
Performance Products | 394 | 140 | — | ||||||
| $ | 4,470 | $ | 2,019 | $ | 782 | ||||
| Segment EBITDA:(1) | |||||||||||
Epoxy and Phenolic Resins | $ | 245 | $ | 93 | $ | 61 | |||||
Formaldehyde and Forest Products Resins | 152 | 51 | — | ||||||||
Coatings and Inks | 63 | 26 | — | ||||||||
Performance Products | 52 | 16 | — | ||||||||
Corporate and Other | (43 | ) | (10 | ) | — | ||||||
| (1) | Intersegment sales are not significant and, as such, are eliminated within the selling segment |
| (2) | Net sales and Segment EBITDA in 2005 includes Bakelite results from the date of acquisition, April 29, 2005. Net sales and Segment EBITDA in 2004 includes Resolution Specialty results from August 2, 2004 and Borden Chemical results from August 12, 2004, their respective dates of acquisition by Apollo. |
F-75
Table of Contents
HEXION SPECIALTY CHEMICALS, INC.
Notes to Consolidated Financial Statements—(Continued)
(In millions, except share and per share data)
Depreciation and Amortization Expense:
| 2005 | 2004 | 2003 | |||||||
Epoxy and Phenolic Resins | $ | 91 | $ | 66 | $ | 58 | |||
Formaldehyde and Forest Products Resins | 29 | 11 | — | ||||||
Coatings and Inks | 14 | 4 | — | ||||||
Performance Products | 8 | 3 | — | ||||||
Corporate and Other | 6 | 2 | — | ||||||
Total | $ | 148 | $ | 86 | $ | 58 | |||
Total Assets at Year End:
| 2005 | 2004 | |||||
Epoxy and Phenolic Resins | $ | 1,931 | $ | 1,465 | ||
Formaldehyde and Forest Products Resins | 555 | 542 | ||||
Coatings and Inks | 385 | 400 | ||||
Performance Products | 177 | 171 | ||||
Corporate and Other | 161 | 118 | ||||
Total | $ | 3,209 | $ | 2,696 | ||
Capital Expenditures:
| 2005 | 2004 | 2003 | |||||||
Epoxy and Phenolic Resins | $ | 51 | $ | 28 | $ | 18 | |||
Formaldehyde and Forest Products Resins | 22 | 7 | — | ||||||
Coatings and Inks | 18 | 18 | — | ||||||
Performance Products | 10 | 2 | — | ||||||
Corporate and Other | 4 | 2 | — | ||||||
Total | $ | 105 | $ | 57 | $ | 18 | |||
F-76
Table of Contents
HEXION SPECIALTY CHEMICALS, INC.
Notes to Consolidated Financial Statements—(Continued)
(In millions, except share and per share data)
Reconciliation of Segment EBITDA to Net Loss:
| 2005 | 2004 | 2003 | ||||||||||
Segment EBITDA: | ||||||||||||
Epoxy and Phenolic Resins | $ | 245 | $ | 93 | $ | 61 | ||||||
Formaldehyde and Forest Products Resins | 152 | 51 | — | |||||||||
Coatings and Inks | 63 | 26 | — | |||||||||
Performance Products | 52 | 16 | — | |||||||||
Corporate and Other | (43 | ) | (10 | ) | — | |||||||
Reconciliation: | ||||||||||||
Items not included in Segment EBITDA | ||||||||||||
Transaction costs | (44 | ) | (56 | ) | — | |||||||
Non-cash charges | (30 | ) | (2 | ) | (13 | ) | ||||||
Unusual items: | ||||||||||||
Purchase accounting effects/inventory step-up | (16 | ) | (10 | ) | — | |||||||
Discontinued operations | (9 | ) | — | — | ||||||||
Business realignment | (9 | ) | (3 | ) | — | |||||||
Other | (31 | ) | (7 | ) | — | |||||||
Total unusual items | (65 | ) | (20 | ) | — | |||||||
Total adjustments | (139 | ) | (78 | ) | (13 | ) | ||||||
Interest expense, net | (204 | ) | (117 | ) | (77 | ) | ||||||
Write-off of deferred financing fees | (17 | ) | — | — | ||||||||
Income tax (expense) benefit | (48 | ) | — | 37 | ||||||||
Depreciation and amortization | (148 | ) | (86 | ) | (58 | ) | ||||||
Net loss | $ | (87 | ) | $ | (105 | ) | $ | (50 | ) | |||
Items not included in Segment EBITDA
Transaction costs include merger costs related to the Bakelite Acquisition and the Combinations and expenses associated with terminated acquisition activities. Non-cash charges represent impairments of fixed assets and goodwill, stock-based compensation and unrealized foreign currency exchange losses on debt instruments denominated in currencies other than the functional currency of the holder. The 2005 purchase accounting effects/inventory step-up adjustment relates to the fair value step-up of Resolution Performance’s inventory carrying value as a result of the Combinations and the fair value step-up of Bakelite’s inventory carrying value as a result of the Bakelite Acquisition. The 2004 purchase accounting effects/inventory step-up adjustment relates to the fair value step-up of Resolution Specialty’s inventory carrying value as a result of the Resolution Specialty Transaction. The results of discontinued operations are not included in our Segment EBITDA measure (see Note 4 to the Consolidated Financial Statements). The business realignment adjustment represents plant closure costs, including plant employee severance and environmental remediation costs associated with closing plants, as well as other employee severance. Other unusual items not included in Segment EBITDA represent expenses deemed by management to be non-recurring in nature. In 2005, these items principally consisted of certain non-recurring litigation expenses, a foreign currency loss on an exchange rate hedge relating to the Bakelite Acquisition, integration costs and incremental non-recurring advisor and external audit fees related to the Bakelite Acquisition and the Combinations. In 2004, other unusual items included the incremental expenses incurred as a result of a mechanical failure at a Brazilian formaldehyde plant and costs related to the integration of the Resolution Specialty Transaction.
F-77
Table of Contents
HEXION SPECIALTY CHEMICALS, INC.
Notes to Consolidated Financial Statements—(Continued)
(In millions, except share and per share data)
Geographic Information
Net Sales to Unaffiliated Customers:(1)
| 2005 | 2004 | 2003 | |||||||
United States | $ | 2,252 | $ | 1,038 | $ | 349 | |||
Netherlands | 629 | 563 | 430 | ||||||
Canada | 331 | 128 | — | ||||||
Germany | 285 | 2 | — | ||||||
Other International | 973 | 288 | 3 | ||||||
Total | $ | 4,470 | $ | 2,019 | $ | 782 | |||
| (1) | For purposes of geographic disclosures, sales are attributed to the country in which the Company’s individual business locations reside. |
Long-Lived Assets:
| 2005 | 2004 | |||||
United States | $ | 670 | $ | 655 | ||
Netherlands | 286 | 347 | ||||
Germany | 121 | 11 | ||||
Canada | 78 | 73 | ||||
Other International | 241 | 237 | ||||
Total | $ | 1,396 | $ | 1,323 | ||
Product Line Information
Net Sales to Unaffiliated Customers:
| 2005 | 2004 | 2003 | |||||||
Epoxy resins and intermediates | $ | 1,143 | $ | 797 | $ | 626 | |||
Forest products resins | 917 | 328 | — | ||||||
Coatings | 720 | 258 | — | ||||||
All other(1) | 1,690 | 636 | 156 | ||||||
Total | $ | 4,470 | $ | 2,019 | $ | 782 | |||
| (1) | Net sales of other product lines that individually account for less than 10% of consolidated Net sales. |
18. Guarantor/Non-Guarantor Subsidiary Financial Information
In conjunction with the Apollo acquisition of Borden Chemical, Borden Chemical formed two wholly owned finance subsidiaries to borrow $475 through a private debt offering. The Company and certain of its U.S. subsidiaries guarantee this debt. In addition, following the Hexion Combination, the Company, these same U.S. subsidiaries, and Hexion U.S. Finance Corporation (formerly known as Borden U.S. Finance), also guarantee the senior secured debt previously issued by Resolution Performance (“the Resolution Performance guaranteed debt”).
The following information contains the condensed consolidating financial information for the parent, Hexion, the subsidiary issuers (Hexion U.S. Finance Corporation, formerly known as Borden U.S. Finance
F-78
Table of Contents
HEXION SPECIALTY CHEMICALS, INC.
Notes to Consolidated Financial Statements—(Continued)
(In millions, except share and per share data)
Corporation, Hexion Nova Scotia Finance, ULC, formerly known as Borden Nova Scotia, ULC (“Nova Scotia, ULC”), and HSC Capital Corporation, formerly known as Resolution Performance Capital Corporation (“HSC Capital”)), the combined subsidiary guarantors (Borden Chemical Investments, Inc., Borden Chemical Foundry, Inc., Lawter International, Inc., Borden Chemical International, Inc. and Oilfield Technology Group, Inc.) and the combined non-guarantor subsidiaries, which includes all of the Company’s foreign subsidiaries and HAI. Borden Services Company was merged into the Company in the fourth quarter of 2005. Three of the subsidiary guarantors, BDS Two, Inc., Bakelite North America Holding Company and Bakelite Epoxy Polymers Corporate, were merged into the Company on February 28, 2006, and are included in the parent for all periods presented.
All of the subsidiary issuers and subsidiary guarantors are owned 100% by Hexion. All guarantees are full and unconditional and are joint and several. There are no significant restrictions on the ability of the Company to obtain funds from its domestic subsidiaries by dividend or loan. While the Company’s Australian subsidiary and HAI are restricted in the payment of dividends and intercompany loans due to the terms of their credit facilities, there are no material restrictions on the Company’s ability to obtain cash from the remaining U.S. non-guarantor subsidiaries.
This information includes allocations of corporate overhead to the combined non-guarantor subsidiaries based on net sales. Income tax expense has been provided on the combined non-guarantor subsidiaries based on actual effective tax rates. All other tax expense is reflected in the parent.
F-79
Table of Contents
HEXION SPECIALTY CHEMICALS, INC.
Notes to Consolidated Financial Statements
(Dollars in millions)
YEAR ENDED DECEMBER 31, 2005
CONDENSED CONSOLIDATING STATEMENT OF OPERATIONS
| Hexion Specialty Chemicals, Inc. | Subsidiary Issuers(1) | Combined Subsidiary Guarantors | Combined Guarantor | Eliminations | Consolidated | ||||||||||||||||||
Net sales | $ | 2,164 | $ | — | $ | 85 | $ | 2,517 | $ | (296 | ) | $ | 4,470 | ||||||||||
Cost of sales | 1,905 | — | 85 | 2,113 | (295 | ) | 3,808 | ||||||||||||||||
Gross profit | 259 | — | — | 404 | (1 | ) | 662 | ||||||||||||||||
Selling, general & administrative expense | 202 | — | 5 | 193 | — | 400 | |||||||||||||||||
Transaction costs | 33 | — | — | 11 | — | 44 | |||||||||||||||||
Intercompany royalty expense (income) | 25 | — | (25 | ) | — | — | — | ||||||||||||||||
Other operating expense (income) | (3 | ) | — | (2 | ) | 15 | — | 10 | |||||||||||||||
Operating income | 2 | — | 22 | 185 | (1 | ) | 208 | ||||||||||||||||
Interest expense, net | 133 | 56 | — | 15 | — | 204 | |||||||||||||||||
Write-off of deferred financing fees | 9 | 6 | — | 2 | — | 17 | |||||||||||||||||
Intercompany interest expense (income) | 18 | (59 | ) | (1 | ) | 42 | — | — | |||||||||||||||
Other non-operating expense (income) | (5 | ) | 4 | — | 17 | — | 16 | ||||||||||||||||
(Loss) income from continuing operations before income tax and minority interest | (153 | ) | (7 | ) | 23 | 109 | (1 | ) | (29 | ) | |||||||||||||
Income tax expense (benefit) | 15 | (2 | ) | — | 35 | — | 48 | ||||||||||||||||
(Loss) income from continuing operations before equity earnings and minority interest | (168 | ) | (5 | ) | 23 | 74 | (1 | ) | (77 | ) | |||||||||||||
Equity in earnings (losses) of subsidiaries, net | 93 | — | 7 | 2 | (100 | ) | 2 | ||||||||||||||||
Minority interest in net income of consolidated subsidiaries | (3 | ) | — | — | — | — | (3 | ) | |||||||||||||||
(Loss) income from continuing operations | (78 | ) | (5 | ) | 30 | 76 | (101 | ) | (78 | ) | |||||||||||||
Loss from discontinued operations | 9 | — | — | — | 9 | ||||||||||||||||||
Net (loss) income | $ | (87 | ) | $ | (5 | ) | $ | 30 | $ | 76 | $ | (101 | ) | $ | (87 | ) | |||||||
| (1) | Subsidiary issuers include Hexion U.S. Finance Corporation, HSC Capital and Nova Scotia, ULC. Hexion U.S. Finance Corporation is also a guarantor of the Resolution Performance guaranteed debt. HSC Capital is also a subsidiary guarantor of the debt issued by Hexion U.S. Finance Corporation and Nova Scotia, ULC. The primary asset of the Hexion U.S. Finance Corporation is an intercompany receivable from Hexion (the parent) for $197, which is essentially offset by the debt payable. HSC Capital has no significant assets. |
F-80
Table of Contents
HEXION SPECIALTY CHEMICALS, INC.
Notes to Consolidated Financial Statements—(Continued)
(Dollars in millions)
YEAR ENDED DECEMBER 31, 2004
CONDENSED CONSOLIDATING STATEMENT OF OPERATIONS
| Hexion Specialty Chemicals, Inc. | Subsidiary Issuers(1) | Combined Subsidiary Guarantors | Combined Guarantor | Eliminations | Consolidated | |||||||||||||||||||
Net sales | $ | 1,038 | $ | — | $ | 33 | $ | 1,061 | $ | (113 | ) | $ | 2,019 | |||||||||||
Cost of sales | 934 | — | 32 | 932 | (113 | ) | 1,785 | |||||||||||||||||
Gross profit | 104 | — | 1 | 129 | — | 234 | ||||||||||||||||||
Selling, general & administrative expense | 70 | — | 2 | 91 | — | 163 | ||||||||||||||||||
Transaction costs | 34 | — | — | 22 | — | 56 | ||||||||||||||||||
Intercompany royalty expense (income) | 6 | — | (6 | ) | — | — | — | |||||||||||||||||
Other operating expense (income) | 4 | — | (1 | ) | 3 | — | 6 | |||||||||||||||||
Operating income (loss) | (10 | ) | — | 6 | 13 | — | 9 | |||||||||||||||||
Interest expense, net | 99 | 16 | — | 2 | — | 117 | ||||||||||||||||||
Intercompany interest expense (income) | — | (17 | ) | — | 17 | — | — | |||||||||||||||||
Other non-operating expense | 1 | — | — | 4 | — | 5 | ||||||||||||||||||
(Loss) income before income tax and minority interests | (110 | ) | 1 | 6 | (10 | ) | — | (113 | ) | |||||||||||||||
Income tax expense (benefit) | (12 | ) | — | — | 12 | — | — | |||||||||||||||||
(Loss) income before equity earnings and minority interests | (98 | ) | 1 | 6 | (22 | ) | — | (113 | ) | |||||||||||||||
Equity in earnings (losses) of subsidiaries, net | (15 | ) | — | 2 | — | 13 | — | |||||||||||||||||
Minority interests in net loss of consolidated subsidiaries | 8 | — | — | — | — | 8 | ||||||||||||||||||
Net (loss) income | $ | (105 | ) | $ | 1 | $ | 8 | $ | (22 | ) | $ | 13 | $ | (105 | ) | |||||||||
| (1) | Subsidiary issuers include Hexion U.S. Finance Corporation, HSC Capital and Nova Scotia, ULC. Hexion U.S. Finance Corporation is also a guarantor of the Resolution Performance guaranteed debt. HSC Capital is also a subsidiary guarantor of the debt issued by Hexion U.S. Finance Corporation and Nova Scotia, ULC. The primary asset of the Hexion U.S. Finance Corporation is an intercompany receivable from Hexion (the parent) for $197, which is essentially offset by the debt payable. HSC Capital has no significant assets. |
F-81
Table of Contents
HEXION SPECIALTY CHEMICALS, INC.
Notes to Consolidated Financial Statements—(Continued)
(Dollars in millions)
YEAR ENDED DECEMBER 31, 2003
CONDENSED CONSOLIDATING STATEMENT OF OPERATIONS
| Hexion Specialty Chemicals, Inc. | Subsidiary Issuers(1) | Combined Subsidiary Guarantors | Combined Guarantor | Eliminations | Consolidated | |||||||||||||||||
Net sales | $ | 359 | $ | — | $ | — | $ | 442 | $ | (19 | ) | $ | 782 | |||||||||
Cost of sales | 311 | — | — | 422 | (19 | ) | 714 | |||||||||||||||
Gross profit | 48 | — | — | 20 | — | 68 | ||||||||||||||||
Selling, general & administrative expense | 35 | — | — | 46 | — | 81 | ||||||||||||||||
Other operating expense (income) | 13 | — | — | (3 | ) | — | 10 | |||||||||||||||
Operating loss | — | — | — | (23 | ) | — | (23 | ) | ||||||||||||||
Interest expense, net | 74 | — | — | 3 | — | 77 | ||||||||||||||||
Intercompany interest (income) expense | (6 | ) | — | — | 6 | — | — | |||||||||||||||
Loss before income tax and minority interests | (68 | ) | — | — | (32 | ) | — | (100 | ) | |||||||||||||
Income tax benefit | (23 | ) | (14 | ) | (37 | ) | ||||||||||||||||
Loss before equity earnings and minority interests | (45 | ) | — | — | (18 | ) | — | (63 | ) | |||||||||||||
Equity in losses of subsidiaries, net | (18 | ) | — | — | — | 18 | — | |||||||||||||||
Minority interest in net loss of consolidated subsidiaries | 13 | — | — | — | — | 13 | ||||||||||||||||
Net (loss) income | $ | (50 | ) | $ | — | $ | — | $ | (18 | ) | $ | 18 | $ | (50 | ) | |||||||
| (1) | Subsidiary issuers include Hexion U.S. Finance Corporation, HSC Capital and Nova Scotia, ULC. Hexion U.S. Finance Corporation is also a guarantor of the Resolution Performance guaranteed debt. HSC Capital is also a subsidiary guarantor of the debt issued by Hexion U.S. Finance Corporation and Nova Scotia, ULC. The primary asset of the Hexion U.S. Finance Corporation is an intercompany receivable from Hexion (the parent) for $197, which is essentially offset by the debt payable. HSC Capital has no significant assets. |
F-82
Table of Contents
HEXION SPECIALTY CHEMICALS, INC.
Notes to Consolidated Financial Statements—(Continued)
(Dollars in millions)
DECEMBER 31, 2005
CONDENSED CONSOLIDATING BALANCE SHEET
| Hexion Specialty Chemicals, Inc. | Subsidiary Issuers(1) | Combined Subsidiary Guarantors | Combined Guarantor | Eliminations | Consolidated | ||||||||||||||||
ASSETS | |||||||||||||||||||||
Current Assets | |||||||||||||||||||||
Cash and equivalents | $ | 8 | $ | — | $ | — | $ | 175 | $ | — | $ | 183 | |||||||||
Accounts receivable, net | 205 | — | 14 | 386 | — | 605 | |||||||||||||||
Accounts receivable from affiliates | 55 | 24 | 26 | 128 | (233 | ) | — | ||||||||||||||
Inventories: | — | ||||||||||||||||||||
Finished and in-process goods | 132 | — | 7 | 153 | — | 292 | |||||||||||||||
Raw materials and supplies | 60 | — | 5 | 88 | — | 153 | |||||||||||||||
Other current assets | 95 | — | 1 | 36 | — | 132 | |||||||||||||||
| 555 | 24 | 53 | 966 | (233 | ) | 1,365 | |||||||||||||||
Other Assets | |||||||||||||||||||||
Investment in subsidiaries | 482 | — | 17 | — | (499 | ) | — | ||||||||||||||
Intercompany loans receivable | 5 | 652 | — | 34 | (691 | ) | — | ||||||||||||||
Other assets | 4 | 21 | — | 78 | — | 103 | |||||||||||||||
| 491 | 673 | 17 | 112 | (1,190 | ) | 103 | |||||||||||||||
Property and Equipment, net | 656 | — | 9 | 731 | — | 1,396 | |||||||||||||||
Goodwill | 63 | — | — | 106 | — | 169 | |||||||||||||||
Other Intangible Assets, net | 94 | — | — | 82 | — | 176 | |||||||||||||||
Total Assets | $ | 1,859 | $ | 697 | $ | 79 | $ | 1,997 | $ | (1,423 | ) | $ | 3,209 | ||||||||
LIABILITIES, REDEEMABLE PREFERRED STOCK, COMMON STOCK AND OTHER SHAREHOLDER’S (DEFICIT) EQUITY | |||||||||||||||||||||
Current Liabilities | |||||||||||||||||||||
Accounts and drafts payable | $ | 215 | $ | — | $ | 10 | $ | 278 | $ | — | $ | 503 | |||||||||
Accounts payable to affiliates | 110 | 2 | 13 | 108 | (233 | ) | — | ||||||||||||||
Debt payable within one year | 13 | — | — | 38 | — | 51 | |||||||||||||||
Interest payable | 24 | 20 | — | 1 | — | 45 | |||||||||||||||
Income taxes payable | 45 | — | — | 46 | — | 91 | |||||||||||||||
Other current liabilities | 158 | — | 2 | 88 | — | 248 | |||||||||||||||
| 565 | 22 | 25 | 559 | (233 | ) | 938 | |||||||||||||||
Other Liabilities | |||||||||||||||||||||
Long-term debt | 1,368 | 625 | — | 310 | — | 2,303 | |||||||||||||||
Intercompany loans payable | 222 | — | — | 469 | (691 | ) | — | ||||||||||||||
Long-term pension obligations | 51 | — | — | 116 | — | 167 | |||||||||||||||
Non-pension postemployment benefit obligations | 104 | — | — | 15 | — | 119 | |||||||||||||||
Deferred tax liability | 26 | — | — | 113 | — | 139 | |||||||||||||||
Other long-term liabilities | 75 | — | — | 17 | — | 92 | |||||||||||||||
| 1,846 | 625 | — | 1,040 | (691 | ) | 2,820 | |||||||||||||||
Minority interest in consolidated subsidiaries | 8 | — | — | 3 | — | 11 | |||||||||||||||
Redeemable Preferred Stock | 364 | — | — | — | — | 364 | |||||||||||||||
Common Stock and Other Shareholder’s (Deficit) Equity | (924 | ) | 50 | 54 | 395 | (499 | ) | (924 | ) | ||||||||||||
Total Liabilities, Redeemable Preferred Stock, Common Stock and Other Shareholder’s (Deficit) Equity | $ | 1,859 | $ | 697 | $ | 79 | $ | 1,997 | $ | (1,423 | ) | $ | 3,209 | ||||||||
| (1) | Subsidiary issuers include Hexion U.S. Finance Corporation, HSC Capital and Nova Scotia, ULC. Hexion U.S. Finance Corporation is also a guarantor of the Resolution Performance guaranteed debt. HSC Capital is also a subsidiary guarantor of the debt issued by Hexion U.S. Finance Corporation and Nova Scotia, ULC. The primary asset of the Hexion U.S. Finance Corporation is an intercompany receivable from Hexion (the parent) for $197, which is essentially offset by the debt payable. HSC Capital has no significant assets. |
F-83
Table of Contents
HEXION SPECIALTY CHEMICALS, INC.
Notes to Consolidated Financial Statements—(Continued)
(Dollars in millions)
DECEMBER 31, 2004
CONDENSED CONSOLIDATING BALANCE SHEET
| Hexion Specialty Chemicals, Inc. | Subsidiary Issuers(1) | Combined Subsidiary Guarantors | Combined Guarantor | Eliminations | Consolidated | |||||||||||||||||
ASSETS | ||||||||||||||||||||||
Current Assets | ||||||||||||||||||||||
Cash and equivalents | $ | 63 | $ | — | $ | 9 | $ | 80 | $ | — | $ | 152 | ||||||||||
Accounts receivable, net | 198 | — | 15 | 305 | — | 518 | ||||||||||||||||
Accounts receivable from affiliates | 10 | — | — | — | (10 | ) | — | |||||||||||||||
Inventories: | — | |||||||||||||||||||||
Finished and in-process goods | 152 | — | 8 | 130 | — | 290 | ||||||||||||||||
Raw materials and supplies | 52 | — | 6 | 57 | — | 115 | ||||||||||||||||
Other current assets | 43 | — | 1 | 10 | 10 | 64 | ||||||||||||||||
| 518 | — | 39 | 582 | — | 1,139 | |||||||||||||||||
Other Assets | ||||||||||||||||||||||
Investment in subsidiaries | 507 | — | 16 | — | (523 | ) | — | |||||||||||||||
Intercompany loans receivable | 189 | 482 | 12 | — | (683 | ) | — | |||||||||||||||
Other assets | 29 | 19 | — | 47 | — | 95 | ||||||||||||||||
| 725 | 501 | 28 | 47 | (1,206 | ) | 95 | ||||||||||||||||
Property and Equipment, net | 636 | — | 8 | 679 | — | 1,323 | ||||||||||||||||
Goodwill | 35 | — | — | 16 | — | 51 | ||||||||||||||||
Other Intangible Assets, net | 82 | — | — | 6 | — | 88 | ||||||||||||||||
Total Assets | $ | 1,996 | $ | 501 | $ | 75 | $ | 1,330 | $ | (1,206 | ) | $ | 2,696 | |||||||||
LIABILITIES AND SHAREHOLDER’S (DEFICIT) EQUITY | ||||||||||||||||||||||
Current Liabilities | ||||||||||||||||||||||
Accounts and drafts payable | $ | 228 | $ | — | $ | 9 | $ | 251 | $ | — | $ | 488 | ||||||||||
Accounts payable to affiliates | 2 | (14 | ) | 15 | — | (3 | ) | — | ||||||||||||||
Debt payable within one year | 8 | — | — | 8 | — | 16 | ||||||||||||||||
Interest payable | 22 | 14 | — | — | — | 36 | ||||||||||||||||
Income taxes payable | 33 | — | — | — | — | 33 | ||||||||||||||||
Other current liabilities | 84 | — | 2 | 44 | 3 | 133 | ||||||||||||||||
| 377 | — | 26 | 303 | — | 706 | |||||||||||||||||
Other Liabilities | ||||||||||||||||||||||
Long-term debt | 1,348 | 475 | — | 11 | — | 1,834 | ||||||||||||||||
Intercompany loans payable | 250 | — | — | 433 | (683 | ) | — | |||||||||||||||
Long-term pension obligations | 71 | — | — | 2 | 73 | |||||||||||||||||
Non-pension postemployment benefit obligations | 120 | — | — | 22 | — | 142 | ||||||||||||||||
Deferred tax liability | 34 | — | — | 97 | — | 131 | ||||||||||||||||
Other long-term liabilities | 51 | — | 1 | 13 | — | 65 | ||||||||||||||||
| 1,874 | 475 | 1 | 578 | (683 | ) | 2,245 | ||||||||||||||||
Minority interest in consolidated subsidiaries | 54 | — | — | — | — | 54 | ||||||||||||||||
Shareholder’s (Deficit) Equity | (309 | ) | 26 | 48 | 449 | (523 | ) | (309 | ) | |||||||||||||
Total Liabilities and Shareholder’s (Deficit) Equity | $ | 1,996 | $ | 501 | $ | 75 | $ | 1,330 | $ | (1,206 | ) | $ | 2,696 | |||||||||
| (1) | Subsidiary issuers include Hexion U.S. Finance Corporation, HSC Capital and Nova Scotia, ULC. Hexion U.S. Finance Corporation is also a guarantor of the Resolution Performance guaranteed debt. HSC Capital is also a subsidiary guarantor of the debt issued by Hexion U.S. Finance Corporation and Nova Scotia, ULC. The primary asset of the Hexion U.S. Finance Corporation is an intercompany receivable from Hexion (the parent) for $197, which is essentially offset by the debt payable. HSC Capital has no significant assets. |
F-84
Table of Contents
HEXION SPECIALTY CHEMICALS, INC.
Notes to Consolidated Financial Statements—(Continued)
(Dollars in millions)
YEAR ENDED DECEMBER 31, 2005
CONDENSED CONSOLIDATING STATEMENT OF CASH FLOWS
| Hexion Specialty Chemicals, Inc. | Subsidiary Issuers(1) | Combined Subsidiary Guarantors | Combined Guarantor | Eliminations | Consolidated | |||||||||||||||||||
Cash Flows from (used in) Operating Activities | $ | (171 | ) | $ | 118 | $ | 18 | $ | 206 | $ | — | $ | 171 | |||||||||||
Cash Flows (used in) from Investing Activities | ||||||||||||||||||||||||
Capital expenditures | (57 | ) | — | (1 | ) | (47 | ) | — | (105 | ) | ||||||||||||||
Acquisition of businesses, net of cash acquired | (4 | ) | — | — | (248 | ) | — | (252 | ) | |||||||||||||||
Proceeds from sale of business | — | — | 3 | — | — | 3 | ||||||||||||||||||
Investment in subsidiary | 100 | — | — | — | (100 | ) | — | |||||||||||||||||
| 39 | — | 2 | (295 | ) | (100 | ) | (354 | ) | ||||||||||||||||
Cash flows from (used in) Financing Activities | ||||||||||||||||||||||||
Net short-term debt borrowings (repayments) | 3 | — | — | (5 | ) | — | (2 | ) | ||||||||||||||||
Borrowings of long-term debt | 452 | 398 | — | 343 | — | 1,193 | ||||||||||||||||||
Repayments of long-term debt | (435 | ) | (250 | ) | — | (65 | ) | — | (750 | ) | ||||||||||||||
Proceeds from issuance of preferred stock, net of issuance costs | 334 | — | — | — | — | 334 | ||||||||||||||||||
Affiliated loan (repayments) borrowings | 239 | (262 | ) | (8 | ) | 31 | — | — | ||||||||||||||||
Long-term debt and credit facility financing fees paid | (11 | ) | (4 | ) | — | (7 | ) | — | (22 | ) | ||||||||||||||
IPO related costs | (11 | ) | — | — | — | — | (11 | ) | ||||||||||||||||
Payment of dividends | (494 | ) | — | (21 | ) | (108 | ) | 100 | (523 | ) | ||||||||||||||
| 77 | (118 | ) | (29 | ) | 189 | 100 | 219 | |||||||||||||||||
Effect of exchange rates on cash and equivalents | — | — | — | (5 | ) | — | (5 | ) | ||||||||||||||||
Increase (decrease) in cash and equivalents | (55 | ) | — | (9 | ) | 95 | — | 31 | ||||||||||||||||
Cash & equivalents at beginning of year | 63 | — | 9 | 80 | — | 152 | ||||||||||||||||||
Cash & equivalents at end of year | $ | 8 | $ | — | $ | — | $ | 175 | $ | — | $ | 183 | ||||||||||||
| (1) | Subsidiary issuers include Hexion U.S. Finance Corporation, HSC Capital and Nova Scotia, ULC. Hexion U.S. Finance Corporation is also a guarantor of the Resolution Performance guaranteed debt. HSC Capital is also a subsidiary guarantor of the debt issued by Hexion U.S. Finance Corporation and Nova Scotia, ULC. The primary asset of the Hexion U.S. Finance Corporation is an intercompany receivable from Hexion (the parent) for $197, which is essentially offset by the debt payable. HSC Capital has no significant assets. |
F-85
Table of Contents
HEXION SPECIALTY CHEMICALS, INC.
Notes to Consolidated Financial Statements—(Continued)
(Dollars in millions)
YEAR ENDED DECEMBER 31, 2004
CONDENSED CONSOLIDATING STATEMENT OF CASH FLOWS
| Hexion Specialty Chemicals, Inc. | Subsidiary Issuers(1) | Combined Subsidiary Guarantors | Combined Guarantor | Eliminations | Consolidated | |||||||||||||||||
Cash Flows (used in) from Operating Activities | $ | (298 | ) | $ | — | $ | 41 | $ | 225 | $ | $ | (32 | ) | |||||||||
Cash Flows (used in) from Investing Activities | — | |||||||||||||||||||||
Capital expenditures | (37 | ) | — | (1 | ) | (19 | ) | — | (57 | ) | ||||||||||||
Acquisition of business, net of cash acquired | 17 | — | (24 | ) | (145 | ) | — | (152 | ) | |||||||||||||
Cash combination of Borden Chemical | 185 | — | — | — | — | 185 | ||||||||||||||||
Proceeds from sale (purchase) of business | 260 | — | — | (260 | ) | — | — | |||||||||||||||
Proceeds from the sale of assets | 2 | — | 2 | — | — | 4 | ||||||||||||||||
| 427 | — | (23 | ) | (424 | ) | — | (20 | ) | ||||||||||||||
Cash flows from (used in) Financing Activities | ||||||||||||||||||||||
Net short-term debt (repayments) borrowings | (9 | ) | — | — | 3 | — | (6 | ) | ||||||||||||||
Borrowings of long-term debt | 256 | — | — | 37 | — | 293 | ||||||||||||||||
Repayments of long-term debt | (156 | ) | — | (1 | ) | (38 | ) | — | (195 | ) | ||||||||||||
Affiliated loan (repayments) borrowings | (270 | ) | — | 14 | 256 | — | — | |||||||||||||||
Dividends received (paid) | 23 | — | (22 | ) | (1 | ) | — | — | ||||||||||||||
Proceeds related to Resolution Specialty Transaction | 60 | — | — | — | — | 60 | ||||||||||||||||
Other | (4 | ) | — | — | — | — | (4 | ) | ||||||||||||||
| (100 | ) | — | (9 | ) | 257 | — | 148 | |||||||||||||||
Effect of exchange rates on cash and cash equivalents | — | — | — | 7 | — | 7 | ||||||||||||||||
Increase in cash and equivalents | 29 | — | 9 | 65 | — | 103 | ||||||||||||||||
Cash & equivalents at beginning of year | 34 | — | — | 15 | — | 49 | ||||||||||||||||
Cash & equivalents at end of year | $ | 63 | $ | — | $ | 9 | $ | 80 | $ | — | $ | 152 | ||||||||||
| (1) | Subsidiary issuers include Hexion U.S. Finance Corporation, HSC Capital and Nova Scotia, ULC. Hexion U.S. Finance Corporation is also a guarantor of the Resolution Performance guaranteed debt. HSC Capital is also a subsidiary guarantor of the debt issued by Hexion U.S. Finance Corporation and Nova Scotia, ULC. The primary asset of the Hexion U.S. Finance Corporation is an intercompany receivable from Hexion (the parent) for $197, which is essentially offset by the debt payable. HSC Capital has no significant assets. |
F-86
Table of Contents
HEXION SPECIALTY CHEMICALS, INC.
Notes to Consolidated Financial Statements—(Continued)
(Dollars in millions)
YEAR ENDED DECEMBER 31, 2003
CONDENSED CONSOLIDATING STATEMENT OF CASH FLOWS
| Hexion Specialty Chemicals, Inc. | Subsidiary Issuers(1) | Combined Subsidiary Guarantors | Combined Guarantor | Eliminations | Consolidated | ||||||||||||||||
Cash Flows (used in) from Operating Activities | $ | (110 | ) | $ | — | $ | — | $ | 67 | $ | — | $ | (43 | ) | |||||||
Cash Flows from (used in) Investing Activities | |||||||||||||||||||||
Capital expenditures | (15 | ) | — | — | (3 | ) | — | (18 | ) | ||||||||||||
Distributions from equity affiliates | — | — | — | 2 | — | 2 | |||||||||||||||
Proceeds from the sale of assets | — | — | — | 23 | — | 23 | |||||||||||||||
| (15 | ) | — | — | 22 | — | 7 | |||||||||||||||
Cash flows from (used in) Financing Activities | |||||||||||||||||||||
Borrowings of long-term debt | 651 | — | — | 97 | — | 748 | |||||||||||||||
Repayments of long-term debt | (474 | ) | — | — | (171 | ) | — | (645 | ) | ||||||||||||
Other | (22 | ) | — | — | (1 | ) | — | (23 | ) | ||||||||||||
| 155 | — | — | (75 | ) | — | 80 | |||||||||||||||
Effect of exchange rates on cash and cash equivalents | — | — | — | 1 | — | 1 | |||||||||||||||
Increase in cash and equivalents | 30 | — | — | 15 | — | 45 | |||||||||||||||
Cash and equivalents at beginning of year | 4 | — | — | — | — | 4 | |||||||||||||||
Cash and equivalents at end of year | $ | 34 | $ | — | $ | — | $ | 15 | $ | — | $ | 49 | |||||||||
| (1) | Subsidiary issuers include Hexion U.S. Finance Corporation, HSC Capital and Nova Scotia, ULC. Hexion U.S. Finance Corporation is also a guarantor of the Resolution Performance guaranteed debt. HSC Capital is also a subsidiary guarantor of the debt issued by Hexion U.S. Finance Corporation and Nova Scotia, ULC. The primary asset of the Hexion U.S. Finance Corporation is an intercompany receivable from Hexion (the parent) for $197, which is essentially offset by the debt payable. HSC Capital has no significant assets. |
F-87
Table of Contents
HEXION SPECIALTY CHEMICALS, INC.
Notes to Consolidated Financial Statements—(Continued)
(Dollars in millions)
19. Quarterly Financial Data (Unaudited)
The following represents Quarterly Financial Data for the Company:
2005 Quarters | First(1) | Second(2)(3) | Third(4) | Fourth(5) | ||||||||||||
Net sales | $ | 1,012 | $ | 1,171 | $ | 1,134 | $ | 1,153 | ||||||||
Gross profit | 149 | 167 | 170 | 176 | ||||||||||||
Transaction related costs | 7 | 22 | 5 | 10 | ||||||||||||
Net loss available to common shareholders | (10 | ) | (62 | ) | (19 | ) | (26 | ) | ||||||||
Basic and diluted, per share of common stock: | ||||||||||||||||
Net loss applicable to common stock-basic and dilutive | $ | (0.12 | ) | $ | (0.75 | ) | $ | (0.22 | ) | $ | (0.32 | ) | ||||
Average number of common shares outstanding- basic and dilutive | 82,629,906 | 82,629,906 | 82,629,906 | 82,629,906 | ||||||||||||
| (1) | Results include $10 unrealized loss on a contingent forward contract related to the Bakelite Acquisition. |
| (2) | Includes data for Bakelite from its date of acquisition, April 30, 2005. |
| (3) | Results include (i) $17 write-off of deferred financing fee; (ii) $10 unrealized loss related to a U.S. dollar denominated $290 term loan on a Dutch subsidiary’s books; (iii) $9 of incremental cost of sales related to the purchase accounting effect from inventory step-up related to the Bakelite Acquisition and the Resolution Performance Acquisition; and (iv) $1 unrealized loss on a contingent forward contract related to the Bakelite Acquisition. Upon settlement of this contract in the second quarter, the net realized loss was $9. |
| (4) | Results include (i) $10 unfavorable impact from Hurricanes Katrina and Rita due to lost sales and incremental expenses; and (ii) $7 of incremental cost of sales related to the purchase accounting effects from inventory step-up related to the Bakelite Acquisition and the Resolution Performance Acquisition. |
| (5) | Results include (i) $17 unfavorable impact from Hurricanes Katrina and Rita due to lost sales and incremental expenses; and (ii) $9 impairment charge related to certain foreign long-lived assets. |
2004 Quarters | First | Second | Third(1)(2) | Fourth(3) | ||||||||||||
Net sales | $ | 222 | $ | 241 | $ | 618 | $ | 938 | ||||||||
Gross profit | 25 | 22 | 66 | 121 | ||||||||||||
Transaction related costs | — | — | 47 | 9 | ||||||||||||
Net loss available to common shareholders | (8 | ) | (7 | ) | (79 | ) | (11 | ) | ||||||||
Basic and diluted, per share of common stock: | ||||||||||||||||
Net loss applicable to common stock-basic and dilutive | $ | (0.09 | ) | $ | (0.09 | ) | $ | (0.96 | ) | $ | (0.13 | ) | ||||
Average number of common shares outstanding- basic and dilutive | 82,629,906 | 82,629,906 | 82,629,906 | 82,629,906 | ||||||||||||
| (1) | Includes data for Resolution Specialty from August 2, 2004 and for Borden Chemical from August 12, 2004, their respective dates of acquisition by Apollo. |
| (2) | Results include (i) $10 of incremental cost of sales related to the purchase accounting effects from inventory step-up related to the Resolution Specialty Acquisition; and (ii) $2 of costs associated with a Brazilian reactor failure. |
| (3) | Results include (i) $2 unrealized gain on a contingent forward contract related to the Bakelite Acquisition; and (ii) $1 of costs associated with a Brazilian reactor failure. |
F-88
Table of Contents
HEXION SPECIALTY CHEMICALS, INC.
Notes to Consolidated Financial Statements—(Continued)
(Dollars in millions)
20. Subsequent Events (Unaudited with respect to the Hexion Refinancings)
Acquisition of Decorative Coatings and Adhesives Business Unit of the Rhodia Group
On January 31, 2006, the Company acquired the decorative coatings and adhesives business unit of The Rhodia Group. The business generated 2004 sales of approximately $180, with 8 manufacturing facilities in Europe, Australia and Thailand. The acquisition was funded through a combination of available cash and existing credit lines.
Acquisition of Global Wax Compounds Business of Rohm and Haas
On March 1, 2006 the Company acquired the global wax compound business of Rohm and Haas. The purchase included Rohm and Haas’ wax compounds technology and product lines, manufacturing equipment and other business assets. The acquisition was funded through available cash.
Acquisition of the Global Ink and Adhesive Resins Business of Akzo Nobel
On November 25, 2005, the Company agreed to acquire the global ink and adhesive resins business of Akzo Nobel. The business produces resins used to manufacture inks for commercial printing and packaging, digital inks for laser and photocopying printing, and pressure sensitive adhesives used in tape and labeling applications. The business generated 2004 sales of approximately $200 million, and includes 10 manufacturing facilities in Europe, North America, Argentina, Asia and New Zealand. Closing should occur upon the successful completion of normal governmental reviews and consultations with employee workers’ councils, which the Company expects to occur during the second quarter of 2006. The acquisition will be funded through a combination of available cash and existing credit lines.
The Company expects the aggregate purchase price for these three acquisitions to be approximately $155 million.
The Hexion Refinancings
In May 2006, we amended and restated our senior secured credit facilities. We refer to these senior secured credit facilities as the “new senior secured credit facilities”. Upon entering into these new senior secured credit facilities, we repaid all amounts outstanding under our May 2005 term loan and synthetic letter of credit facilities. In addition, we made tender offers to repurchase all of our outstanding 8% Senior Secured Notes, 9½% Senior Second Secured Notes and 13½% Senior Subordinated Notes. On May 5, 2006, we accepted tenders from holders of 100% of the outstanding principal amount of the 8% Senior Secured Notes, 99.9% of the outstanding principal amount of the 9 1/2 Senior Second Secured Notes and 88.7% of the outstanding principal amount of the 13 1/2 Senior Subordinated Notes. In the event that all of the 9 1/2% Senior Second Secured Notes or 13 1/2% Senior Subordinated Notes tendered for are not repurchased pursuant to the tender offers, we expect to borrow under our new senior secured credit facilities to redeem any outstanding 9 1/2% Senior Second Secured Notes and 13 1/2% Senior Subordinated Notes shortly after the completion of the tender offers. In connection with the tender offers, we received the required consents with respect to each series of notes to eliminate substantially all of the restrictive covenants and certain events of default included in the indentures under which such notes were issued. On May 10, 2006, we entered into a $1 billion interest rate swap agreement. The swap is a three-year agreement designed to offset cash flow variability associated with interest rate fluctuations on our variable rate debt. The initial notional amount of the swap is $1 billion, which amortizes on a quarterly basis based on expected payments on our term loan in order to maintain a fixed to variable debt ratio of approximately 70% fixed to 30% variable. On May 12, 2006, we redeemed all of our outstanding Series A Preferred Stock with the proceeds of borrowings under our new senior secured credit facilities.
F-89
Table of Contents
HEXION SPECIALTY CHEMICALS, INC.
Schedule II – Valuation and Qualifying Accounts
| Balance December 31, 2002 | Charged to Expense | Charge to Other Acct | Write-offs | Balance December 31, 2003 | |||||||||||||||
Allowance for doubtful accounts | $ | 2 | $ | 1 | $ | 0 | $ | 0 | $ | 3 | |||||||||
| Balance December 31, 2003 | Add of Resolution 2004 | Add of Borden Chemical August 12, 2004 | Charged to Expense | Write-offs | Balance December 31, 2004 | ||||||||||||||
Allowance for doubtful accounts | $ | 3 | $ | 3 | $ | 13 | $ | 1 | $ | (5 | ) | $ | 15 | ||||||
| Balance December 31, 2004 | Add of Bakelite 2005 | Charged to Expense | Charge to Other Acct | Write-offs | Balance December 31, 2005 | ||||||||||||||
Allowance for doubtful accounts | $ | 15 | $ | 6 | $ | 4 | $ | 1 | $ | (7 | ) | $ | 19 | ||||||
F-90
Table of Contents
[PAGE INTENTIONALLY LEFT BLANK]
F-91
Table of Contents
CONDENSED CONSOLIDATED STATEMENTS OF OPERATIONS AND
COMPREHENSIVE (LOSS) INCOME (UNAUDITED)
Six Months ended June 30, | ||||||||
| 2004 | 2003 | |||||||
| (In thousands, except per share data) | ||||||||
Net sales | $ | 798,401 | $ | 720,051 | ||||
Cost of goods sold | 638,718 | 581,468 | ||||||
Gross margin | 159,683 | 138,583 | ||||||
Distribution expense | 35,992 | 33,385 | ||||||
Marketing expense | 23,397 | 21,159 | ||||||
General & administrative expense | 46,893 | 51,789 | ||||||
Transaction-related costs (see Note 1) | 7,236 | — | ||||||
Business realignment expense and impairments | 261 | 1,421 | ||||||
Other operating expense | 2,841 | 3,666 | ||||||
Operating income | 43,063 | 27,163 | ||||||
Interest expense | 23,696 | 22,839 | ||||||
Affiliated interest expense | 99 | 323 | ||||||
Other non-operating expense | 571 | 1,002 | ||||||
Income (loss) before income tax | 18,697 | 2,999 | ||||||
Income tax expense (benefit) | 145,797 | (13,746 | ) | |||||
Net (loss) income | $ | (127,100 | ) | $ | 16,745 | |||
Comprehensive (loss) income | $ | (133,033 | ) | $ | 39,758 | |||
Basic and Diluted Per Share Data | ||||||||
Net income (loss)—basic and diluted | $ | (0.64 | ) | $ | 0.08 | |||
Average number of common shares outstanding during the period—basic | 199,308 | 199,312 | ||||||
Average number of common shares outstanding during the period—diluted | 199,308 | 199,970 | ||||||
See Notes to Condensed Consolidated Financial Statements
F-92
Table of Contents
CONDENSED CONSOLIDATED BALANCE SHEET
(UNAUDITED)
June 30, 2004 | ||||
| (In thousands) | ||||
ASSETS | ||||
Current Assets | ||||
Cash and equivalents | $ | 32,190 | ||
Accounts receivable (less allowance for doubtful accounts of $12,671) | 208,986 | |||
Accounts receivable from affiliates | 301 | |||
Inventories: | ||||
Finished and in-process goods | 43,005 | |||
Raw materials and supplies | 45,562 | |||
Deferred income taxes | 23,476 | |||
Other current assets | 9,721 | |||
| 363,241 | ||||
Investments and Other Assets | ||||
Deferred income taxes | 2,320 | |||
Other assets | 23,241 | |||
| 25,561 | ||||
Property and Equipment | ||||
Land | 33,103 | |||
Buildings | 103,829 | |||
Machinery and equipment | 699,215 | |||
| 836,147 | ||||
Less accumulated depreciation | (395,501 | ) | ||
| 440,646 | ||||
Goodwill | 56,395 | |||
Other Intangible Assets | 5,064 | |||
Total Assets | $ | 890,907 | ||
See Notes to Condensed Consolidated Financial Statements
F-93
Table of Contents
BORDEN CHEMICAL, INC.
CONDENSED CONSOLIDATED BALANCE SHEET—(Continued)
(UNAUDITED)
June 30, 2004 | ||||
| (In thousands except share data) | ||||
LIABILITIES AND SHAREHOLDERS’ DEFICIT | ||||
Current Liabilities | ||||
Accounts and drafts payable | $ | 162,901 | ||
Debt payable within one year | 5,654 | |||
Loans payable to affiliates | 7,380 | |||
Income taxes payable | 32,168 | |||
Interest payable | 12,359 | |||
Other current liabilities | 66,086 | |||
| 286,548 | ||||
Other Liabilities | ||||
Long-term debt | 529,947 | |||
Non-pension post-employment benefit obligations | 121,804 | |||
Long-term pension liability | 70,915 | |||
Other long-term liabilities | 110,324 | |||
| 832,990 | ||||
Commitments and Contingencies (See Note 8) | ||||
Shareholders’ Deficit | ||||
Common stock—$0.01 par value: authorized 300,000,000 shares, Issued 201,754,598, treasury 858,970, outstanding 200,895,628 shares | 2,009 | |||
Paid-in capital | 1,248,300 | |||
Receivable from parent | (536,383 | ) | ||
Deferred compensation | (893 | ) | ||
Accumulated other comprehensive income | (134,126 | ) | ||
Accumulated deficit | (807,538 | ) | ||
| (228,631 | ) | |||
Total Liabilities and Shareholders’ Deficit | $ | 890,907 | ||
See Notes to Condensed Consolidated Financial Statements
F-94
Table of Contents
CONDENSED CONSOLIDATED STATEMENTS OF CASH FLOWS (UNAUDITED)
| Six months ended June 30, | ||||||||
| 2004 | 2003 | |||||||
| (In thousands) | ||||||||
Cash Flows from (used in) Operating Activities | ||||||||
Net income (loss) | $ | (127,100 | ) | $ | 16,745 | |||
Adjustments to reconcile net income (loss) to net cash from (used in) operating activities: | ||||||||
Tax valuation allowance | 137,110 | — | ||||||
Deferred tax benefit | (326 | ) | (23,532 | ) | ||||
Depreciation and amortization | 24,029 | 22,906 | ||||||
Business realignment expense and impairments | 261 | 1,421 | ||||||
Minority interest expense (income) | 944 | (234 | ) | |||||
Other non-cash adjustments | 1,217 | 1,796 | ||||||
Net change in assets and liabilities: | ||||||||
Accounts receivable | (26,961 | ) | (30,744 | ) | ||||
Inventories | (8,477 | ) | 2,859 | |||||
Accounts and drafts payable | 37,765 | 6,318 | ||||||
Income taxes | (1,368 | ) | 3,808 | |||||
Other assets | 6,327 | 13,637 | ||||||
Other liabilities | (16,085 | ) | (15,472 | ) | ||||
| 27,336 | (492 | ) | ||||||
Cash Flows from (used in) Investing Activities | ||||||||
Capital expenditures | (19,255 | ) | (15,621 | ) | ||||
Proceeds from the sale of assets | 9,359 | 2,231 | ||||||
| (9,896 | ) | (13,390 | ) | |||||
Cash Flows (used in) from Financing Activities | ||||||||
Net short-term debt (repayments) borrowings | (2,513 | ) | (1,456 | ) | ||||
Borrowings of long-term debt | — | 255 | ||||||
Repayment of long-term debt | (19 | ) | — | |||||
Affiliated (repayments) borrowings | (10,880 | ) | (51,382 | ) | ||||
Decrease in restricted cash | — | 65,281 | ||||||
Repurchases of common stock from management | — | (286 | ) | |||||
| (13,412 | ) | 12,412 | ||||||
Increase in cash and equivalents | 4,028 | (1,470 | ) | |||||
Cash and equivalents at beginning of year | 28,162 | 14,740 | ||||||
Cash and equivalents at end of period | $ | 32,190 | $ | 13,270 | ||||
Supplemental Disclosures of Cash Flow Information | ||||||||
Cash paid: | ||||||||
Interest, net | $ | 23,750 | $ | 22,493 | ||||
Income taxes, net | 10,381 | 6,019 | ||||||
See Notes to Condensed Consolidated Financial Statements
F-95
Table of Contents
CONDENSED CONSOLIDATED STATEMENTS OF SHAREHOLDERS’ DEFICIT (UNAUDITED)
(In thousands)
Common Stock | Paid-in Capital | Receivable From Parent | Deferred Compensation | Accumulated Other Comprehensive Income | Accumulated Deficit | Total | ||||||||||||||||||||
Balance, December 31, 2003 | $ | 2,009 | $ | 1,224,011 | $ | (512,094 | ) | $ | (1,488 | ) | $ | (128,193 | ) | $ | (680,438 | ) | $ | (96,193 | ) | |||||||
Net loss | (127,100 | ) | (127,100 | ) | ||||||||||||||||||||||
Translation adjustments and other | (5,933 | ) | (5,933 | ) | ||||||||||||||||||||||
Comprehensive loss | (133,033 | ) | ||||||||||||||||||||||||
Interest accrued on notes from parent | 24,289 | (24,289 | ) | — | ||||||||||||||||||||||
Compensation expense on restricted stock | 595 | 595 | ||||||||||||||||||||||||
Balance, June 30, 2004 | $ | 2,009 | $ | 1,248,300 | $ | (536,383 | ) | $ | (893 | ) | $ | (134,126 | ) | $ | (807,538 | ) | $ | (228,631 | ) | |||||||
See Notes to Condensed Consolidated Financial Statements
F-96
Table of Contents
Notes to Condensed Consolidated Financial Statements
(Dollars in thousands except per share amounts and as otherwise indicated)
1. Background and Nature of Operations
Borden Chemical, Inc. (the “Company”) was incorporated on April 24, 1899. The Company is engaged primarily in manufacturing, processing, purchasing and distributing forest products and industrial resins, formaldehyde, oil field products, UV coatings and other specialty and industrial chemicals worldwide. Production facilities are located throughout the U.S. and in many foreign countries. The Company has three reportable segments: Forest Products, Performance Resins and International. See Note 6.
The Company has been controlled by an affiliate of Kohlberg Kravis Roberts & Co. L.P. (“KKR”) since 1995. The Company’s immediate parent is Borden Holdings, Inc. (“BHI”), which is a wholly owned subsidiary of BW Holdings, LLC (“BWHLLC”), an entity controlled by KKR.
On July 6, 2004 an affiliate of Apollo Management LP (“Apollo”) entered into a stock purchase agreement with BWHLLC, BHI, the Company and certain members of Company’s management. Pursuant to this agreement, Apollo will acquire (the “Acquisition”) all of the outstanding capital stock of BHI, and all of the outstanding capital stock of the Company not otherwise owned by BHI will be redeemed. Completion of the Acquisition is subject to customary closing conditions. The Company and BHI will continue to operate independently until those conditions are satisfied and closing occurs.
The Acquisition, and the payment of estimated transaction fees and expenses will be financed with the net proceeds of a $475 million second-priority senior secured private debt offering and certain equity contributions from Apollo. The Company may refinance certain existing debt with a portion of this funding. The Acquisition is expected to be completed in the third quarter of 2004. During the second quarter of 2004 the Company incurred $7,236 of expenses related to the Acquisition and for a prior registration statement (subsequently withdrawn) for a proposed initial public offering of the Company’s common stock.
2. Basis of Presentation
The accompanying unaudited Consolidated Financial Statements include the accounts of Borden Chemical, Inc. and its subsidiaries, after elimination of intercompany accounts and transactions and contain all adjustments, which in the opinion of management are necessary for a fair presentation of the results for the interim periods. Results for the interim periods are not necessarily indicative of results for the full year.
Stock-Based Compensation—The Company accounts for stock-based compensation under Accounting Principles Board Opinion No. 25, “Accounting for Stock Issued to Employees,” and has adopted the disclosure-only provision of Statement of Financial Accounting Standards (“SFAS”) No. 123, “Accounting for Stock-Based Compensation,” and SFAS No. 148, “Accounting for Stock-Based Compensation—Transition and Disclosure, an amendment to SFAS No. 123.” The following table sets forth the required reconciliation of reported and pro forma net (loss) income and earnings per share (“EPS”) under SFAS No. 148:
| Six months ended June 30, | ||||||||
| 2004 | 2003 | |||||||
Net (loss) income applicable to common stock | $ | (127,100 | ) | 16,745 | ||||
Add: Stock-based employee compensation expense included in reported net income, net of related tax benefit | — | 67 | ||||||
Deduct: Total stock-based employee compensation expense determined under fair value based method for all awards granted since January 1, 1996, net of related tax effects | (97 | ) | (56 | ) | ||||
Pro forma net (loss) income | $ | (127,197 | ) | $ | 16,756 | |||
Average shares outstanding (in thousands)—basic | 199,308 | 199,312 | ||||||
Average shares outstanding (in thousands)—diluted | 199,308 | 199,970 | ||||||
Per share as reported (basic and diluted) | $ | (0.64 | ) | $ | 0.08 | |||
Per share pro forma (basic and diluted) | $ | (0.64 | ) | $ | 0.08 | |||
F-97
Table of Contents
BORDEN CHEMICAL, INC.
Notes to Condensed Consolidated Financial Statements—(Continued)
(Dollars in thousands except per share amounts and as otherwise indicated)
At June 30, 2004, options to purchase 5,578,850 common shares of the Company were outstanding, of which none are considered dilutive. At June 30, 2003, options to purchase 2,290,040 common shares of the Company were outstanding, of which 1,492,000 were considered dilutive.
Earnings Per Share
The Company’s basic and diluted earnings per share are calculated as follows:
| Six months ended June 30, | |||||||
| 2004 | 2003 | ||||||
Net income (loss) applicable to common shareholders | $ | (127,100 | ) | $ | 16,745 | ||
Effect of dilutive options | — | — | |||||
Diluted EPS—Numerator | (127,100 | ) | 16,745 | ||||
Average share outstanding (in thousands)—basic | 199,308 | 199,312 | |||||
Effect of dilutive options (in thousands) | — | 658 | |||||
Diluted EPS—Denominator (in thousands) | 199,308 | 199,970 | |||||
Diluted EPS | $ | (0.64 | ) | $ | 0.08 | ||
Reclassification—Previously, at June 30, 2004, income taxes payable of $24,374 was classified as Other long-term liabilities. This amount has been reclassified as Income taxes payable in the current presentation. In addition, for the six months ended June 30, 2004, $348 of Distribution expense and $1,109 of General & administrative expense were reclassified to Cost of goods sold as a result of standardizing the classification of corporate controlled charges across the Company.
3. Business Realignment
In June 2003, the Company initiated a realignment program (the “2003 realignment program”) designed to reduce operating expenses and increase organizational efficiency. The components of this program include reducing headcount, streamlining processes, consolidating manufacturing processes and reducing general and administrative expenses. We expect to complete this program in the first quarter of 2005 and will incur additional expenses through its completion. In addition, we have certain additional long-term realignment programs initiated prior to 2003, which primarily relate to consolidation of plant facilities.
Six Months Ended June 30, 2004
In the first half of 2004, the Company recorded business realignment expense of $261, consisting of plant closure costs (which include plant employee severance and plant asset impairments) of $794, offset by a gain of $1,025 from the sale of a former U.S. plant site. Other severance and employee costs of $492 related to continued execution of the 2003 realignment program.
Provided below is a rollforward of the business realignment reserves for the first half of 2004.
Reserves December 31, 2003 | 2004 Expense | 2004 Settlements/ Charges | Reserves June 30, 2004 | ||||||||||
Plant closure costs | |||||||||||||
2003 realignment program | $ | 3,488 | $ | 574 | $ | (3,565 | ) | $ | 497 | ||||
Other programs | 4,741 | 220 | (1,034 | ) | 3,927 | ||||||||
Other severance and employee costs | |||||||||||||
2003 realignment program | 2,784 | 492 | (1,277 | ) | 1,999 | ||||||||
Other programs | 1,151 | — | (1,151 | ) | — | ||||||||
| $ | 12,164 | $ | 1,286 | $ | (7,027 | ) | $ | 6,423 | |||||
F-98
Table of Contents
BORDEN CHEMICAL, INC.
Notes to Condensed Consolidated Financial Statements—(Continued)
(Dollars in thousands except per share amounts and as otherwise indicated)
Plant Closure Costs
Expenses for plant closure reported for the first half of 2004 of $794 relate primarily to additional costs relating to the conversion of the France manufacturing facility into a distribution center and the transition of the related production to the U.K. ($286) and other plant closure costs at various sites ($508).
Other Severance and Employee Costs
Year-to-date June 2004 realignment expense also includes additional net severance costs during the first half of 2004 totaling $492, related primarily to the 2003 realignment program.
Gain on the Sale of Assets
During the second quarter 2004, the Company sold a U.S. plant previously closed under a prior year realignment program for a gain of $1,025, which is also recorded in realignment expense.
Six Months Ended June 30, 2003
In the first half of 2003, the Company recorded business realignment expense and impairments of $1,421, consisting of plant closure expenses (which includes plant employee severance and plant asset impairments) of $1,299 less reserve reductions of $1,574, other severance and employee costs of $2,113, a gain on the sale of Melamine of $568, and non-cash asset impairment charges of $151.
Plant Closure and Other Employee Severance Costs
Provided below is a rollforward of business realignment reserve activity for the first half of 2003.
Reserves December 31, 2002 | 2003 Expense | 2003 Settlements/ Charges | Reserves June 30, 2003 | |||||||||||
Plant closure costs | ||||||||||||||
2003 realignment program | $ | — | $ | — | $ | — | $ | — | ||||||
Other programs | 9,568 | (275 | ) | (3,382 | ) | 5,911 | ||||||||
Other severance and employee costs | ||||||||||||||
2003 realignment program | — | 1,716 | — | 1,716 | ||||||||||
Other programs | 3,996 | 397 | (2,824 | ) | 1,569 | |||||||||
| $ | 13,564 | $ | 1,838 | $ | (6,206 | ) | $ | 9,196 | ||||||
Plant Closure Costs
Plant closure income of $275 in the first half of 2003 consisted of a net reduction in reserves no longer required due to the sale of Melamine of $1,574, partially offset by environmental remediation costs of $894 for closed plants in Brazil and other net costs of $405 for plant closures and consolidations.
Other Severance and Employee Costs
The Company recorded severance costs of $2,113 in the first half of 2003. Of this amount, $1,716 related to the 2003 realignment program, and $397 related to other administrative workforce reduction programs.
Gain on the Sale of Assets
During the second quarter 2003, the Company sold its melamine crystal business (“Melamine”), resulting in a gain of $568. The gain is included in realignment expense because the business was sold as part of a prior year realignment program.
F-99
Table of Contents
BORDEN CHEMICAL, INC.
Notes to Condensed Consolidated Financial Statements—(Continued)
(Dollars in thousands except per share amounts and as otherwise indicated)
Asset Impairment
The Company also recorded asset impairments of $151 related to its Colombian operations in the first six months of 2003.
4. Pension and Postretirement Expense
Following are the components of net pension and postretirement expense recognized by the Company for the periods ended June 30, 2004 and 2003:
Pension June 30, | Postretirement Six Months Ended | |||||||||||||||
| 2004 | 2003 | 2004 | 2003 | |||||||||||||
Service cost | $ | 1,490 | $ | 1,128 | $ | 36 | $ | 36 | ||||||||
Interest cost | 6,955 | 7,493 | 740 | 3,047 | ||||||||||||
Expected return on plan assets | (8,309 | ) | (7,741 | ) | — | — | ||||||||||
Amortization | ||||||||||||||||
Unrecognized transition obligation | — | 5 | — | — | ||||||||||||
Prior service cost | 219 | 198 | (5,177 | ) | (1,432 | ) | ||||||||||
Recognized net actuarial loss | 3,214 | 3,519 | — | (31 | ) | |||||||||||
| $ | 3,569 | $ | 4,602 | $ | (4,401 | ) | $ | 1,620 | ||||||||
The amortization of prior service cost in 2004 postretirement expense relates to the plan amendment made in the second quarter of 2003.
5. Comprehensive Income (Loss)
Comprehensive (loss) income is computed as follows:
| Six Months Ended June 30, | |||||||
| 2004 | 2003 | ||||||
Net income (loss) | $ | (127,100 | ) | $ | 16,745 | ||
Foreign currency translation adjustments | (5,933 | ) | 23,013 | ||||
| $ | (133,033 | ) | $ | 39,758 | |||
The currency translation adjustments in 2004 relate primarily to unfavorable changes in exchange rates in Brazil, Canada, Australia and the U.K. The favorable foreign currency translation adjustments in 2003 relate primarily due to favorable changes in exchange rates in Canada and Brazil.
6. Segment Data
The Company has three reportable segments: Forest Products, Performance Resins and International. Consolidated results also include general corporate and administrative expenses disclosed as “Corporate and Other” and activities related to Melamine, which was shut down in 2002, sold in 2003 and is disclosed as “Divested Business.” These are presented to provide a complete picture of the Company’s results.
Forest Products includes the North American forest products resins and formaldehyde product lines. The key business drivers for Forest Products are housing starts, furniture demand, panel production capacity and chemical intermediates sector operating conditions.
F-100
Table of Contents
BORDEN CHEMICAL, INC.
Notes to Condensed Consolidated Financial Statements—(Continued)
(Dollars in thousands except per share amounts and as otherwise indicated)
Performance Resins includes the North American specialty resins, foundry resins and oil field product lines. Performance Resins’ key business drivers are housing starts, auto builds, active gas drilling rigs and the general industrial sector performance.
International includes production operations in Europe, Latin America and Asia Pacific. Principal countries of operation are the U.K., Brazil, Australia and Malaysia. Product lines include formaldehyde, forest products and performance resins and consumer products. The key business drivers for International are export levels, panel production capacity, housing starts, furniture demand and the local political and general economic environments.
Corporate and Other represents general and administrative expenses and income and expenses related to liabilities retained from businesses sold in previous years.
Operating Results by Segment:
In previous documents filed with the SEC Adjusted EBITDA was the description used in our segment footnote to describe our segment performance measure. For purposes of this document we have described our segment performance measure as “Segment EBITDA”. We intend to use the term Segment EBITDA to measure segment performance in future SEC documents.
Following is a comparison of net sales and net income (loss) before depreciation and amortization, interest expense, other non-operating expense (income) income taxes and other adjustments (which may include costs associated with business realignment activities, dispositions and pension settlement charges). The Company refers to this as “Segment EBITDA.” Segment EBITDA is presented by segment and for Corporate and Other and Divested Business of the Company for the six months ended June 30, 2004 and 2003. Segment EBITDA information is presented with the Company’s segment disclosures because it is the measure used by the Company’s management in the evaluation of operating results and in determining allocations of capital resources among the business segments. It is also the metric used by the Company to set management and executive incentive compensation.
Net Sales
Six Months Ended June 30, | ||||||
| 2004 | 2003 | |||||
Forest Products | $ | 417,852 | $ | 379,735 | ||
Performance Resins | 207,718 | 188,937 | ||||
International | 172,831 | 151,373 | ||||
Divested Business | — | 6 | ||||
| $ | 798,401 | $ | 720,051 | |||
Segment EBITDA
Six Months Ended June 30, | ||||||||
| 2004 | 2003 | |||||||
Forest Products | $ | 53,103 | $ | 42,622 | ||||
Performance Resins | 24,269 | 24,295 | ||||||
International | 16,901 | 15,985 | ||||||
Corp & Other | (18,397 | ) | (28,219 | ) | ||||
Total | $ | 75,876 | $ | 54,683 | ||||
F-101
Table of Contents
BORDEN CHEMICAL, INC.
Notes to Condensed Consolidated Financial Statements—(Continued)
(Dollars in thousands except per share amounts and as otherwise indicated)
The table below reconciles Segment EBITDA to net (loss) income, which management believes to be the most directly comparable GAAP financial measure.
Reconciliation of Segment EBITDA to Net Income (Loss)
Six Months Ended June 30, | ||||||||
| Segment EBITDA: | 2004 | 2003 | ||||||
Forest Products | $ | 53,103 | $ | 42,622 | ||||
Performance Resins | 24,269 | 24,295 | ||||||
International | 16,901 | 15,985 | ||||||
Corporate and Other | (18,397 | ) | (28,219 | ) | ||||
Reconciliation: | ||||||||
Depreciation and amortization | (24,029 | ) | (22,906 | ) | ||||
Adjustments to Segment EBITDA (described below) | (8,784 | ) | (4,614 | ) | ||||
Interest expense | (23,696 | ) | (22,839 | ) | ||||
Affiliated interest expense | (99 | ) | (323 | ) | ||||
Other non-operating expense | (571 | ) | (1,002 | ) | ||||
Income tax (expense) benefit | (145,797 | ) | 13,746 | |||||
Net (loss) income | $ | (127,100 | ) | $ | 16,745 | |||
Adjustments to Segment EBITDA | ||||||||
The following items are not included in Segment EBITDA: | ||||||||
Six months ended June 30, 2004 | (1) Plant Closure | Severance | (2) Other | Total | ||||||||||||
Forest Products | $ | 189 | $ | (334 | ) | $ | (457 | ) | $ | (602 | ) | |||||
Performance Resins | 961 | — | (46 | ) | 915 | |||||||||||
International | (932 | ) | (119 | ) | (25 | ) | (1,076 | ) | ||||||||
Corporate and Other | 13 | (39 | ) | (7,995 | ) | (8,021 | ) | |||||||||
Total | $ | 231 | $ | (492 | ) | $ | (8,523 | ) | $ | (8,784 | ) | |||||
| (1) | Plant closure income for the six months ended June 30, 2004 of $231 relates primarily to a gain of $1,025 on the sale of a U.S. plant site previously closed under a realignment program, partially offset by costs relating to the shut-down of several international sites. These expenses include additional costs relating to the conversion of the France manufacturing facility into a distribution center and the transition of the related production to the U.K. ($286) and other plant closure costs at various sites ($508). |
| (2) | Other expenses of $8,523 not included in Segment EBITDA through June 30, 2004 relate primarily to Transaction-related costs of $7,236 and severance expense included in general and administrative expense for positions to be replaced as part of the 2003 realignment program. |
F-102
Table of Contents
BORDEN CHEMICAL, INC.
Notes to Condensed Consolidated Financial Statements—(Continued)
(Dollars in thousands except per share amounts and as otherwise indicated)
Six months ended June 30, 2003 | Plant Closure (1) | Severance (2) | Impairment | Other (3) | Total | |||||||||||||||
Forest Products | $ | 698 | $ | 66 | $ | — | $ | (570 | ) | $ | 194 | |||||||||
Performance Resins | (163 | ) | (310 | ) | — | — | (473 | ) | ||||||||||||
International | (1,690 | ) | (171 | ) | (151 | ) | — | (2,012 | ) | |||||||||||
Corporate and Other | (146 | ) | (1,698 | ) | — | (2,317 | ) | (4,161 | ) | |||||||||||
Divested Business | 2,144 | — | — | (306 | ) | 1,838 | ||||||||||||||
Total | $ | 843 | $ | (2,113 | ) | $ | (151 | ) | $ | (3,193 | ) | $ | (4,614 | ) | ||||||
| (1) | Plant closure income of $843 in the first half of 2003 was generated by the sale of Melamine in the second quarter and consisted of a net reduction in related reserves of $1,574 and a gain on the sale of $568. These income items were partially offset by environmental remediation costs of $894 for closed plants in Brazil and other net costs of $405 for plant closures and consolidations. |
| (2) | The Company recorded severance costs of $2,113 in the first half of 2003. Of this amount, $1,716 is related to the 2003 realignment program, and $397 related to other administrative workforce reduction programs. |
| (3) | Other expenses of $3,193 not included in Segment EBITDA for the first half of 2003 primarily represent severance expense, included in general and administrative expense, incurred by us for positions to be replaced and expenses incurred related to the closure of Melamine. |
7. Guarantees and Indemnifications
Standard Guarantees / Indemnifications
In the ordinary course of business, the Company enters into numerous agreements that contain standard guarantees and indemnities whereby the Company indemnifies another party for, among other things, breaches of representations and warranties. Such guarantees or indemnifications are granted under various agreements, including those governing (i) purchases and sales of assets or businesses, (ii) leases of real property, (iii) licenses of intellectual property and (iv) long-term supply agreements. The guarantees or indemnifications issued are for the benefit of the (i) buyers in sale agreements and sellers in purchase agreements, (ii) landlords or lessors in lease contracts, (iii) licensors or licensees in license agreements and (iv) vendors or customers in long-term supply agreements.
These parties may also be indemnified against any third party claim resulting from the transaction that is contemplated in the underlying agreement. Additionally, in connection with the sale of assets and the divestiture of businesses, the Company may agree to indemnify the buyer with respect to liabilities related to the pre-closing operations of the assets or businesses sold. Indemnities related to pre-closing operations generally include tax liabilities, environmental liabilities and employee benefit liabilities not assumed by the buyer in the transaction.
Indemnities related to the pre-closing operations of sold assets normally do not represent additional liabilities to the Company, but simply serve to protect the buyer from potential liability associated with the Company’s existing obligations at the time of sale. As with any liability, the Company has accrued for those pre-closing obligations that are considered probable and reasonably estimable. Amounts recorded are not significant at June 30, 2004.
While some of these guarantees extend only for the duration of the underlying agreement, many survive the expiration of the term of the agreement or extend into perpetuity (unless subject to a legal statute of limitations). With respect to certain of the aforementioned guarantees, the Company has limited reimbursement agreements from affiliates or maintains limited insurance coverage that mitigates potential payments to be made. There are
F-103
Table of Contents
BORDEN CHEMICAL, INC.
Notes to Condensed Consolidated Financial Statements—(Continued)
(Dollars in thousands except per share amounts and as otherwise indicated)
no specific limitations on the maximum potential amount of future payments that the Company could be required to make under these guarantees nor is the Company able to develop an estimate of the maximum potential amount of future payments to be made under these guarantees as the triggering events are not predictable.
In addition the Company has agreed to indemnify KKR for any claims resulting from its services to the Company and its affiliates. The indemnification does not expire, and the Company is not able to determine a maximum exposure under the agreement. However, the Company does have an indemnification agreement from BHI for any amounts that it must pay under the KKR indemnity relating to World Kitchen, Inc., a former affiliate of the Company.
The Company has not entered into any significant agreement subsequent to January 1, 2003 that would require it, as a guarantor, to recognize a liability for the fair value of obligations it has undertaken in issuing the guarantee.
Subsidiary Guarantees
The Company guarantees the bank debt of one of its Brazilian subsidiaries up to a maximum U.S. equivalent of $6,700.
In connection with the conversion of the $34,000 Parish of Ascension Industrial Revenue Bonds (“IRBs”) to a fixed rate, the Company’s Canadian and U.K. subsidiaries have guaranteed the Company’s IRBs.
Contingent Sale/Purchase Consideration
The Limited Liability Agreement of HA-International, LLC (“HAI”), the Company’s joint venture, provides Delta-HA, Inc. (“Delta”), the Company’s partner in HAI, the right to purchase between 3-5% of additional interest in HAI each year, beginning in 2004. Delta is limited to acquiring a maximum of 25% of additional interest in HAI under this arrangement. Pursuant to this provision, in the first quarter of 2004, Delta provided the Company with written notice of their intention to exercise their option to purchase an additional 5% interest in 2004. Delta’s purchase price of the interest is based on the enterprise value of HAI determined by applying a contractually agreed upon multiple to EBITDA, as defined in the agreement.
The Fentak Pty. Ltd. acquisition agreement includes a contingent purchase consideration provision based on achievement of certain targeted earnings before interest and taxes. Maximum annual payments are AU$600 for the period 2004-2006.
In connection with the acquisition of assets from Southeastern Adhesives Company, the Company agreed to pay a royalty fee to the seller based on sales levels to existing regular customers of the business as of the closing date. To the extent that annual sales exceed targeted levels, the Company is obligated to pay up to $300 per year, for a five-year period.
Warranties
The Company does not make express warranties on its products, other than that they comply with the Company’s specifications; therefore, the Company does not record a warranty liability. Adjustments for product quality claims are not material and are charged against sales revenues.
F-104
Table of Contents
BORDEN CHEMICAL, INC.
Notes to Condensed Consolidated Financial Statements—(Continued)
(Dollars in thousands except per share amounts and as otherwise indicated)
8. Commitments and Contingencies
Environmental Matters
Because the Company’s operations involve the use, handling, processing, storage, transportation and disposal of hazardous materials, the Company is subject to extensive environmental regulation at the Federal and state level and is exposed to the risk of claims for environmental remediation or restoration. In addition, violations of environmental laws or permits may result in restrictions being imposed on operating activities, substantial fines, penalties, damages or other costs, any of which could have a material adverse effect on the Company’s business, financial condition, results of operations or cash flows.
Accruals for environmental matters are recorded following the guidelines of Statement of Position 96-1, “Environmental Remediation Liabilities,” when it is probable that a liability has been incurred and the amount of the liability can be estimated. Environmental accruals are reviewed on an interim basis and as events and developments warrant. Based on management’s estimates, which are determined through historical experience, the Company has recorded liabilities, relating to 54 locations, of approximately $37,400 at June 30, 2004, for all probable environmental remediation, indemnification and restoration liabilities. These amounts include estimates of unasserted claims the Company believes are probable of loss and reasonably estimable. Based on the factors discussed below and currently available information and analysis, the Company believes that it is reasonably possible that costs associated with such sites may fall within a range of $22,300 to $73,500, in the aggregate, at June 30, 2004. This estimate of the range of reasonably possible costs is less certain than the estimates upon which the liabilities are based, and in order to establish the upper end of such range, assumptions less favorable to the Company among the range of reasonably possible outcomes were used. As with any estimate, if facts or circumstances change, the final outcome could differ materially from these estimates. The Company has not taken into consideration insurance coverage or any anticipated recoveries from other third parties in determining the liability or range of possible outcomes. The Company’s current insurance coverage provides very limited, if any, coverage for environmental matters.
Following is a more detailed discussion of the Company’s environmental liabilities and related assumptions:
BCP Geismar Site—The Company formerly owned a basic chemicals and polyvinyl chloride business which was taken public as Borden Chemicals and Plastics Operating Limited Partnership (“BCPOLP”) in 1987. The Company retained a 1% interest and the general partner interest, which were held by its subsidiary, BCP Management, Inc. (“BCPM”). The Company also retained the liability for certain environmental matters after BCPOLP’s formation. Under a Settlement Agreement approved by the United States Bankruptcy Court for the District of Delaware among the Company, BCPOLP, BCPM, the United States Environmental Protection Agency and the Louisiana Department of Environmental Quality, the Company agreed to perform certain of BCPOLP’s obligations with respect to environmental conditions at BCPOLP’s Geismar, Louisiana site. These obligations are related to soil and groundwater contamination at the Geismar site. The Company bears the sole responsibility for these obligations, as there are no other potentially responsible parties (“PRPs”) or third parties from which the Company can seek reimbursement, and no additional insurance recoveries are expected.
A groundwater pump and treat system for the removal of contaminants is operational, and preliminary natural attenuation studies are proceeding. The Company has performed extensive soil and groundwater testing. Regulatory agencies are reviewing the current findings and remediation efforts. If closure procedures and remediation systems prove inadequate, or if additional contamination is discovered, this could result in the costs approaching the higher end of the range of possible outcomes discussed below.
F-105
Table of Contents
BORDEN CHEMICAL, INC.
Notes to Condensed Consolidated Financial Statements—(Continued)
(Dollars in thousands except per share amounts and as otherwise indicated)
The Company has recorded a liability of approximately $21,500 at June 30, 2004 related to the BCP Geismar site. Based on currently available information and analysis, the Company believes that it is reasonably possible that costs associated with this site may fall within a range of $13,300 to $33,300, depending upon the factors discussed above. Due to the long-term nature of the project, the reliability of timing and estimability of remediation payments, this liability was recorded at its net present value, assuming a 3% discount rate and a time period of thirty years, and the range of possible outcomes is discounted similarly. The undiscounted liability is approximately $33,000 over thirty years.
Following are expected payments for each of the next five years and a reconciliation of the expected aggregate payments to the liability reflected at June 30, 2004:
2004 | $ | 2,100 | ||
2005 | 1,100 | |||
2006 | 1,700 | |||
2007 | 1,500 | |||
2008 | 700 | |||
Remaining aggregate payments | 25,900 | |||
Total undiscounted liability | 33,000 | |||
Less: discount to net present value | (11,500 | ) | ||
Liability per Consolidated Balance Sheet | $ | 21,500 | ||
Superfund Sites / Offsite Landfills—The Company is currently involved in environmental remediation activities at 26 sites where it has been notified that it is, or may be, a PRP under the United States Comprehensive Environmental Response, Compensation and Liability Act (“CERCLA”) or similar state “superfund” laws. The Company has recorded liabilities of approximately $7,400 at June 30, 2004, for environmental remediation costs related to these sites. The Company anticipates approximately 60% of this liability will be paid within the next five years, with the remaining payments occurring over the next twenty-five years. The Company generally does not bear a significant level of responsibility for these sites and has little control over the costs and timing of cash flows. At 17 of the 26 sites, the Company’s share is less than 1%. At the remaining 9 sites, the Company has a share of up to 8.8% of the total liability which accounts for approximately $6,300 of the total amount reserved for superfund / offsite landfill sites at June 30, 2004. Based on currently available information and analysis, the Company believes that it is reasonably possible that costs associated with the superfund / offsite landfill sites may be as low as $3,900 or as high as $15,700, in the aggregate. In estimating both its current reserves for environmental remediation at these sites and the possible range of additional costs, the Company has not assumed that it will bear the entire cost of remediation of every site to the exclusion of other known PRPs who may be jointly and severally liable. The Company has limited information to assess the viability of other PRPs and their probable contribution on a per site basis. The range of possible outcomes also takes into account the maturity of each project, which results in a more narrow range as the project progresses. The Company’s ultimate liability will depend on many factors including its volumetric share of waste, the financial viability of other PRPs, the remediation methods and technology used, the amount of time necessary to accomplish remediation, and the availability of insurance coverage. The Company’s insurance provides very limited, if any, coverage for these environmental matters.
Sites Under Current Ownership—The Company is conducting environmental remediation at 7 locations currently owned by the Company, of which 4 sites are no longer operating. There are no other parties responsible for remediation at these sites. Much of the remediation is being performed by the Company on a voluntary basis;
F-106
Table of Contents
BORDEN CHEMICAL, INC.
Notes to Condensed Consolidated Financial Statements—(Continued)
(Dollars in thousands except per share amounts and as otherwise indicated)
therefore, the Company has greater control over the costs to be incurred and the timing of cash flows. The Company has accrued approximately $5,000 at June 30, 2004, for remediation and restoration liabilities at these locations. The Company anticipates approximately $3,500 of these liabilities will be paid within the next three years, with the remaining amounts being paid over the next ten years. Approximately $3,300 of these reserves is included in the Company’s business realignment reserve, as the environmental clean up is being handled in conjunction with planned closure of the location (see Note 3). Based on currently available information and analysis, the Company believes that it is reasonably possible that costs associated with such sites may fall within a range of $3,100 to $13,300, in the aggregate. The factors influencing the ultimate outcome include the methods of remediation to be elected, the conclusions and assessment of site studies remaining to be completed and the time period required to complete the work.
Other Sites—The Company is conducting environmental remediation at 9 locations (10 locations as of December 31, 2003) formerly owned by the Company. The Company has accrued approximately $1,800 at June 30, 2004, for remediation and restoration liabilities at these locations. The Company anticipates cash outflows of approximately $1,500 within the next three years, with the remainder occurring over the next ten years. Based on currently available information and analysis, the Company believes that it is reasonably possible that costs associated with such sites may fall within a range of $1,300 to $9,000, in the aggregate. The primary drivers in determining the final costs to the Company on these matters are the method of remediation selected and the level of participation of third parties.
In addition, the Company is responsible for 10 sites that require monitoring where no additional remediation is expected and has also established accruals for other related costs, such as fines and penalties. The Company has accrued approximately $1,700 at June 30, 2004, related to these sites. Payment of these liabilities is anticipated to occur over the next ten years. Based on currently available information and analysis, the Company believes that it is reasonably possible that costs associated with such sites may fall within a range of $700 and $2,200, in the aggregate. The ultimate cost to the Company will be influenced by any variations in projected monitoring periods or by findings that are better or worse than anticipated findings.
The Company formerly operated the Smith Douglass fertilizer business which included a phosphate mining operation in Manatee County, Florida and an animal food processing operation in Hillsborough County, Florida. Both operations were sold in 1980. The EPA has sent the Company and another former owner of the Manatee County facility a request for $112 relating to oversight costs incurred when the site was abandoned by its current owner. The Company is disputing the charge. The Company is aware that state and Federal environmental agencies have taken measures to prevent the off-site release of water from rainfall that accumulated in the drainage ditches and lagoons surrounding the gypsum piles located on this site. The Company is aware that the current owner of the Hillsborough County site ceased operations in March of 2004 and is working with governmental agencies to effect closure of that site. At this time, the Company has not received any demands from any governmental agencies or others regarding the closure and environmental cleanup at this site, which the Company believes is the responsibility of the current owner. While it is reasonably possible some costs could be incurred related to these sites, the Company has inadequate information to enable it to estimate a potential range of liability, if any.
Non-Environmental Legal Matters
Following is a discussion of non-environmental legal proceedings that are not in the ordinary course of business:
Subsidiary Bankruptcy—The Company’s former subsidiary, BCPM, filed for protection under Chapter 11 of the United States Bankruptcy Code, in the United States Bankruptcy Court for the District of Delaware on
F-107
Table of Contents
BORDEN CHEMICAL, INC.
Notes to Condensed Consolidated Financial Statements—(Continued)
(Dollars in thousands except per share amounts and as otherwise indicated)
March 22, 2002. BCPM served as the general partner and held a 1% interest in BCPOLP, which was created in November 1987 and operated as a commodity chemicals producer. On April 3, 2001, BCPOLP filed for protection under Chapter 11 of the United States Bankruptcy Code, in the United States Bankruptcy Court for the District of Delaware. On February 5, 2003, the U.S. Bankruptcy Court approved a Joint Plan of Liquidation for BCPOLP and BCPM which provided for the transfer of the remaining assets of both entities, including preference, avoidance and other claims against third parties (including the Company) to separate liquidating entities for liquidation and distribution to their creditors. The transfer of the remaining assets of both entities to the liquidating agents was effective March 13, 2003, and the Company’s ownership interest in BCPM was extinguished.
On March 19, 2004, the Company reached a tentative agreement with BCPM Liquidating LLC, the successor in interest to BCPM, providing for the settlement of all of its claims for a payment by the Company of $6,000, and with BCP Liquidating LLC, the successor in interest to BCPOLP, providing for the settlement of all of its claims for a payment by the Company of $1,050. In June 2004, the bankruptcy court approved the settlements and the $6,000 and $1,050 payments were made shortly thereafter.
Imperial Home Décor Group—In 1998, pursuant to a merger and recapitalization transaction sponsored by The Blackstone Group (“Blackstone”) and financed by The Chase Manhattan Bank (“Chase”), Borden Decorative Products Holdings, Inc. (“BDPH”), a wholly owned subsidiary of the Company, was acquired by Blackstone and subsequently merged with Imperial Wallcoverings to create Imperial Home Décor Group (“IHDG”). Blackstone provided $84,500 in equity, a syndicate of banks funded $198,000 of senior secured financing and $125,000 of senior subordinated notes were privately placed. The Company received approximately $309,000 in cash and 11% of IHDG common stock for its interest in BDPH at the closing of the merger. On January 5, 2000, IHDG filed for reorganization under Chapter 11 of the U.S. Bankruptcy Code. The IHDG Litigation Trust (the “Trust”) was created pursuant to the plan of reorganization in the IHDG bankruptcy to pursue preference and other avoidance claims on behalf of the unsecured creditors of IHDG. In November 2001, the Trust filed a lawsuit against the Company and certain of its affiliates in U.S. Bankruptcy Court in Delaware seeking to have the IHDG recapitalization transaction voided as a fraudulent conveyance and asking for a judgment to be entered against the Company for $314,400 plus interest, costs and attorney fees. The parties have agreed to pursue non-binding mediation in September of 2004.
The Company has accrued legal expenses for scheduled depositions related to this matter and alternative dispute resolution. To the extent that additional depositions or legal work is required, legal defense costs will increase. The Company has not recorded a liability for any potential losses because a loss is not considered probable based on current information. The Company believes it has strong defenses to the Trust’s allegations and intends to defend the case vigorously. While it is reasonably possible the resolution of this matter may result in a loss due to the many variables involved, the Company is not able to estimate the range of possible outcomes at this time.
Brazil Tax Claim—In 1992, the State of Sao Paolo Administrative Tax Bureau issued an assessment against the Company’s primary Brazilian subsidiary claiming that excise taxes were owed on certain intercompany loans made for centralized cash management purposes, characterized by the Tax Bureau as intercompany sales. Since that time, management and the Tax Bureau have held discussions, and the subsidiary has filed an administrative appeal seeking cancellation of the assessment. In December 2001, the Administrative Court upheld the assessment in the amount of 52 million Brazilian Reals, or approximately US$17,000, an amount that includes tax, penalties, monetary correction and interest. In September 2002, the subsidiary filed a second appeal with the highest-level administrative court, again seeking cancellation of the assessment. The
F-108
Table of Contents
BORDEN CHEMICAL, INC.
Notes to Condensed Consolidated Financial Statements—(Continued)
(Dollars in thousands except per share amounts and as otherwise indicated)
Company believes it has a strong defense against the assessment and will pursue the appeal vigorously, including appealing to the judicial level; however, there is no assurance that the assessment will not be upheld. At this time the Company does not believe a loss is probable; therefore, only related legal fees have been accrued. Reasonably possible losses to the Company resulting from the resolution of this matter range from zero to $17,000.
HAI Grand Jury Investigation—HAI, a joint venture in which the Company has a 75% interest, received a grand jury subpoena dated November 5, 2003 from the U.S. Department of Justice Antitrust Division relating to a foundry resins Grand Jury investigation. HAI has provided documentation in response to the subpoena. As is frequently the case when such investigations are in progress, various antitrust lawsuits have been brought against the Company alleging that the Company and HAI, along with various other entities, engaged in a price fixing conspiracy. The Company has accrued legal fees for the defense of this matter but does not have sufficient information to determine a range of possible outcomes at this time.
CTA Acoustics—From the third quarter, 2003 to the first quarter, 2004 six lawsuits were filed against the Company in the 27th Judicial District, Laurel County Circuit Court, in Kentucky, arising from an explosion at a customer’s plant where seven plant workers were killed and over 40 other workers were injured. The lawsuits primarily seek recovery for wrongful death, emotional and personal injury, loss of consortium, property damage and indemnity. The Company expects that a number of these suits will be consolidated. The litigation also includes claims by its customer against its insurer and the Company. The Company is pursuing a claim for indemnity against its customer, based on language in the contract with them. The Company has accrued $5,000 relating to these actions and has insurance coverage to address any payments and legal fees in excess of this amount.
Other Legal Matters—The Company is involved in various product liability, commercial and employment litigation, personal injury, property damage and other legal proceedings which are considered to be in the ordinary course of business. There has been increased publicity about asbestos liabilities faced by manufacturing companies. In large part, as a result of the bankruptcies of many asbestos producers, plaintiff’s attorneys are increasing their focus on peripheral defendants, including the Company, and asserting that even products that contained a small amount of asbestos caused injury. Plaintiffs are also focusing on alleged harm caused by other products we have made or used, including those containing silica and vinyl chloride monomer. The Company does not believe that it has a material exposure relating to these claims and believes it has adequate reserves and insurance to cover currently pending and foreseeable future claims.
The Company has been served in a lawsuit filed in Hillsborough County, Florida Circuit Court which names the Company and several other parties, relating to an animal feed supplement processing site formerly operated by the Company and sold in 1980. The lawsuit is filed on behalf of multiple residents of Hillsborough County living near the site and alleges various injuries related to exposure to toxic chemicals. At this time, the Company has inadequate information from which to estimate a potential range of liability, if any.
The Company has reserved approximately $16,100 at June 30, 2004, relating to all non-environmental legal matters for legal defense and settlement costs that it believes are probable and estimable at this time.
9. Related Party Transactions
Financing and Investing Arrangements
The Company has a borrowing arrangement with BWHLLC, evidenced by a demand promissory note bearing interest at a variable rate. The loan is reported as Loans payable to affiliates on the Consolidated Balance
F-109
Table of Contents
BORDEN CHEMICAL, INC.
Notes to Condensed Consolidated Financial Statements—(Continued)
(Dollars in thousands except per share amounts and as otherwise indicated)
Sheet and totaled $7,380 at June 30, 2004. The interest rate on the amount outstanding at June 30, 2004 was 2.6%. Interest expense totaled $99 for the six months ended June 30, 2004.
In 2003, the Company and HAI had separate borrowing arrangements with Borden Foods Holdings Corporation (“Foods”), an affiliate, evidenced by demand promissory notes bearing interest at variable rates. The loans were reported as Loans payable to affiliates on the Consolidated Balance Sheet. Interest rates on these loans ranged from 1.0% to 4.75%. In early 2004, the Company entered into the arrangement with BWHLLC and cancelled its arrangement with Foods. In early 2004, HAI obtained a $20,000 credit facility with an external bank and terminated its affiliated borrowing arrangement with Foods. Interest expense, related to the Foods loans, totaled $323 for the six months ended June 30, 2003.
Administrative Service, Management and Consulting Arrangements
KKR provides certain management, consulting and board services to the Company for an annual fixed fee. In 2003 and through April 2004, the fixed fee was $3,000 annually. Beginning in May 2004, the fee was reduced to $1,000. For the six months ended June 30, 2004, the Company recorded $1,167 for amounts due to KKR under this arrangement. In the six months ended June 30, 2003, the management fee recorded was $1,500.
The Company provides certain administrative services to BWHLLC and other affiliates under a service agreement. Fees charged under this agreement were based on the projected cost to the Company to provide these services, primarily based on employee costs. For the six months ended June 30, 2004, the Company charged these affiliates $246 for these services. During the six months ended June 30, 2003, the Company charged these affiliates $270.
The Company has a liability to BHI of $675 at June 30, 2004 for costs incurred related to the pending sale of the Company.
Other Transactions and Arrangements
The Company utilizes Willis Group Holdings, Ltd. (“Willis”), an entity controlled by KKR, as its insurance broker. As of the six months ended June 30, 2004 and 2003, the Company had paid $411 and $237, respectively, to Willis.
10. Income Tax Expense
In connection with the expected sale of BHI, the Company has recorded a non-cash charge of $137,110 to income tax expense in the second quarter of 2004 to increase the valuation reserves related to the Company’s net domestic deferred tax asset.
As a result of the expected sale of the Company, certain limitations will be placed on the utilization of the attributes under U.S. tax law, and the new financing discussed in Note 1 will limit the Company’s flexibility with respect to prior tax planning strategies. As a result, the Company no longer believes that utilization of the net domestic deferred tax asset is more likely than not to occur.
The Company’s remaining net deferred tax liability of $32,014 is reflected in the Consolidated Balance Sheet at June 30, 2004 as a current deferred asset of $23,476 and a long-term deferred tax asset of $2,320, offset by a current deferred tax liability of $3,960 included in other current liabilities and long-term deferred tax liability of $53,850 included in Other long-term liabilities.
F-110
Table of Contents
BORDEN CHEMICAL, INC.
Notes to Condensed Consolidated Financial Statements—(Continued)
(Dollars in thousands except per share amounts and as otherwise indicated)
11. Pending Capital Market Transaction
As discussed in Note 1 the Company will be issuing $475 million of second-priority senior secured private debt in connection with the Acquisition.
The Notes will be guaranteed by the Company and certain of its existing and future domestic restricted subsidiaries (the “Guarantors”). The Notes and the related guarantees will be senior obligations secured by a second-priority lien (subject to certain exceptions and permitted liens) on certain of the Guarantors’ existing and future domestic assets.
Supplemental financial information for the Company and the combined non-guarantor subsidiaries and the combined subsidiary guarantors for the Notes are presented below:
FOR THE SIX MONTHS ENDED JUNE 30, 2004
CONDENSED CONSOLIDATING STATEMENT OF OPERATIONS
| Borden Chemical Inc. | Combined Guarantor Subsidiaries | Combined Non-Guarantor Subsidiaries | Eliminations | Consolidated | ||||||||||||||||
Net Sales | $ | 479,538 | — | $ | 385,814 | $ | (66,951 | ) | $ | 798,401 | ||||||||||
Cost of Goods Sold | 390,764 | — | 314,905 | (66,951 | ) | 638,718 | ||||||||||||||
Gross Margin | 88,774 | — | 70,909 | — | 159,683 | |||||||||||||||
Distribution expense | 21,727 | — | 14,265 | — | 35,992 | |||||||||||||||
Marketing expense | 11,736 | — | 11,661 | — | 23,397 | |||||||||||||||
General & administrative expense | 23,371 | $ | 232 | 23,290 | — | 46,893 | ||||||||||||||
Transaction—related costs | 3,920 | — | 3,316 | — | 7,236 | |||||||||||||||
Business realignment expense and impairments | (775 | ) | — | 1,036 | — | 261 | ||||||||||||||
Other operating expense | 3,120 | (25 | ) | (254 | ) | — | 2,841 | |||||||||||||
Operating income (loss) | 25,675 | (207 | ) | 17,595 | — | 43,063 | ||||||||||||||
Interest expense | 22,974 | — | 722 | — | 23,696 | |||||||||||||||
Affiliated interest expense, net | 81 | — | 18 | — | 99 | |||||||||||||||
Intracompany interest expense, net | 51,459 | (52,061 | ) | 602 | — | — | ||||||||||||||
Affiliate royalty expense (Income) | 9,769 | (9,769 | ) | — | — | — | ||||||||||||||
Other non-operating expense | 1,782 | — | (1,211 | ) | — | 571 | ||||||||||||||
Equity in (earnings) losses of investees | (69,762 | ) | (2,834 | ) | — | 72,596 | — | |||||||||||||
Income (loss) before income tax | 9,372 | 64,457 | 17,464 | (72,596 | ) | 18,697 | ||||||||||||||
Income tax (benefit) expense | 136,472 | — | 9,325 | — | 145,797 | |||||||||||||||
Net income (loss) | $ | (127,100 | ) | $ | 64,457 | $ | 8,139 | $ | (72,596 | ) | $ | (127,100 | ) | |||||||
F-111
Table of Contents
BORDEN CHEMICAL, INC.
Notes to Condensed Consolidated Financial Statements—(Continued)
(Dollars in thousands except per share amounts and as otherwise indicated)
FOR THE SIX MONTHS ENDED JUNE 30, 2003
CONDENSED CONSOLIDATING STATEMENT OF OPERATIONS
| Borden Chemical Inc. | Combined Guarantor Subsidiaries | Combined Non-Guarantor Subsidiaries | Eliminations | Consolidated | ||||||||||||||||
Net Sales | $ | 440,346 | — | $ | 340,095 | $ | (60,390 | ) | $ | 720,051 | ||||||||||
Cost of Goods Sold | 358,986 | — | 282,872 | (60,390 | ) | 581,468 | ||||||||||||||
Gross Margin | 81,360 | — | 57,223 | — | 138,583 | |||||||||||||||
Distribution expense | 20,810 | — | 12,575 | — | 33,385 | |||||||||||||||
Marketing expense | 10,433 | — | 10,726 | — | 21,159 | |||||||||||||||
General & administrative expense | 30,024 | $ | 106 | 21,659 | — | 51,789 | ||||||||||||||
Business realignment expense and impairments | (204 | ) | — | 1,625 | — | 1,421 | ||||||||||||||
Other operating expense | 4,836 | — | (1,170 | ) | — | 3,666 | ||||||||||||||
Operating Income (loss) | 15,461 | (106 | ) | 11,808 | — | 27,163 | ||||||||||||||
Interest expense | 22,137 | — | 702 | — | 22,839 | |||||||||||||||
Affiliated interest expense, net | 301 | — | 22 | — | 323 | |||||||||||||||
Intracompany interest expense, net | 56,059 | (56,648 | ) | 589 | — | — | ||||||||||||||
Affiliate royalty expense (income) | 9,116 | (9,116 | ) | — | — | — | ||||||||||||||
Other non-operating expense | 1,034 | 24 | (56 | ) | — | 1,002 | ||||||||||||||
Equity in (earnings) losses of investees | (67,325 | ) | (1,265 | ) | — | 68,590 | — | |||||||||||||
Income (loss) before income tax | (5,861 | ) | 66,899 | 10,551 | (68,590 | ) | 2,999 | |||||||||||||
Income tax (benefit) expense | (22,606 | ) | — | 8,860 | — | (13,746 | ) | |||||||||||||
Net income (loss) | $ | 16,745 | $ | 66,899 | $ | 1,691 | $ | (68,590 | ) | $ | 16,745 | |||||||||
F-112
Table of Contents
BORDEN CHEMICAL, INC.
Notes to Condensed Consolidated Financial Statements—(Continued)
(Dollars in thousands except per share amounts and as otherwise indicated)
JUNE 30, 2004
CONDENSED CONSOLIDATING BALANCE SHEET
| Borden Chemical Inc. | Combined Guarantor Subsidiaries | Combined Non-Guarantor Subsidiaries | Eliminations | Consolidated | ||||||||||||||||
ASSETS | ||||||||||||||||||||
Current Assets | ||||||||||||||||||||
Cash and equivalents | $ | 1,178 | $ | 217 | $ | 30,795 | — | $ | 32,190 | |||||||||||
Accounts receivable | 101,620 | 66 | 107,300 | — | 208,986 | |||||||||||||||
Accounts receivable from affiliates | 17,354 | 7,035 | 5,925 | $ | (30,013 | ) | 301 | |||||||||||||
Inventories: | ||||||||||||||||||||
Finished and in-process goods | 25,156 | — | 17,849 | — | 43,005 | |||||||||||||||
Raw materials and supplies | 26,542 | — | 19,020 | — | 45,562 | |||||||||||||||
Deferred income taxes | 23,132 | — | 344 | — | 23,476 | |||||||||||||||
Other current assets | 6,186 | 64 | 3,471 | — | 9,721 | |||||||||||||||
| 201,168 | 7,382 | 184,704 | (30,013 | ) | 363,241 | |||||||||||||||
Investments and Other Assets | ||||||||||||||||||||
Investment in subsidiaries | 6,366,907 | 17,045 | — | $ | (6,383,952 | ) | — | |||||||||||||
Deferred income taxes | (6,060 | ) | — | 8,380 | — | 2,320 | ||||||||||||||
Loans and interest receivable from affiliates | — | 6,084,028 | 5,047 | (6,089,075 | ) | — | ||||||||||||||
Other assets | 15,792 | — | 7,449 | — | 23,241 | |||||||||||||||
| 6,376,639 | 6,101,073 | 20,876 | (12,473,027 | ) | 25,561 | |||||||||||||||
Property and Equipment | ||||||||||||||||||||
Land | 25,119 | — | 7,984 | — | 33,103 | |||||||||||||||
Buildings | 68,333 | — | 35,496 | — | 103,829 | |||||||||||||||
Machinery and equipment | 410,575 | 531 | 288,109 | — | 699,215 | |||||||||||||||
| 504,027 | 531 | 331,589 | — | 836,147 | ||||||||||||||||
Less accumulated depreciation | (255,786 | ) | (416 | ) | (139,299 | ) | — | (395,501 | ) | |||||||||||
| 248,241 | 115 | 192,290 | — | 440,646 | ||||||||||||||||
Goodwill | 36,598 | — | 19,797 | — | 56,395 | |||||||||||||||
Other intangible assets | 4,172 | — | 892 | — | 5,064 | |||||||||||||||
Total Assets | $ | 6,866,818 | $ | 6,108,570 | $ | 418,559 | $ | (12,503,040 | ) | $ | 890,907 | |||||||||
F-113
Table of Contents
BORDEN CHEMICAL, INC.
Notes to Condensed Consolidated Financial Statements—(Continued)
(Dollars in thousands except per share amounts and as otherwise indicated)
JUNE 30, 2004
CONDENSED CONSOLIDATING BALANCE SHEET—(Continued)
| Borden Chemical Inc. | Combined Guarantor Subsidiaries | Combined Non-Guarantor Subsidiaries | Eliminations | Consolidated | ||||||||||||||
LIABILITIES AND SHAREHOLDERS’ DEFICIT | ||||||||||||||||||
Current Liabilities | ||||||||||||||||||
Accounts and drafts payable | $ | 90,521 | — | $ | 72,380 | — | $ | 162,901 | ||||||||||
Debt payable within one year | — | — | 5,654 | — | 5,654 | |||||||||||||
Loans payable to affiliates | 7,380 | — | — | — | 7,380 | |||||||||||||
Other affiliated payables (receivables) | 4,675 | $ | 60 | 25,278 | $ | (30,013 | ) | — | ||||||||||
Income taxes payable | 29,608 | — | 2,560 | — | 32,168 | |||||||||||||
Interest payable | 12,339 | — | 20 | — | 12,359 | |||||||||||||
Other current liabilities | 49,986 | 342 | 15,758 | — | 66,086 | |||||||||||||
| 194,509 | 402 | 121,650 | (30,013 | ) | 286,548 | |||||||||||||
Other Liabilities | ||||||||||||||||||
Long-term debt | 520,877 | — | 9,070 | — | 529,947 | |||||||||||||
Long-term loans payable to affiliates | 6,088,796 | — | 279 | (6,089,075 | ) | — | ||||||||||||
Non-pension postemployment benefit obligations | 120,855 | — | 949 | — | 121,804 | |||||||||||||
Long-term pension liability | 69,071 | — | 1,844 | — | 70,915 | |||||||||||||
Other long-term liabilities | 101,341 | — | 8,983 | — | 110,324 | |||||||||||||
| 6,900,940 | — | 21,125 | (6,089,075 | ) | 832,990 | |||||||||||||
Shareholders’ Equity (Deficit) | (228,631 | ) | 6,108,168 | 275,784 | (6,383,952 | ) | (228,631 | ) | ||||||||||
Total Liabilities and Shareholders’ Equity (Deficit) | $ | 6,866,818 | $ | 6,108,570 | $ | 418,559 | $ | (12,503,040 | ) | $ | 890,907 | |||||||
F-114
Table of Contents
BORDEN CHEMICAL, INC.
Notes to Condensed Consolidated Financial Statements—(Continued)
(Dollars in thousands except per share amounts and as otherwise indicated)
FOR THE SIX MONTHS ENDED JUNE 30, 2004
CONDENSED CONSOLIDATING STATEMENT OF CASH FLOWS
| Borden Chemical Inc. | Combined Guarantor Subsidiaries | Combined Non-Guarantor Subsidiaries | Eliminations | Consolidated | ||||||||||||||||
Cash Flows from (used in) Operating Activities | ||||||||||||||||||||
Net (loss) income | $ | (127,100 | ) | $ | 64,457 | $ | 8,139 | $ | (72,596 | ) | $ | (127,100 | ) | |||||||
Adjustments to reconcile net income (loss) to net cash from (used in) operating activities: | ||||||||||||||||||||
Tax valuation allowance | 137,110 | — | — | — | 137,110 | |||||||||||||||
Non-cash affiliated interest(1) | 51,804 | (51,804 | ) | — | — | — | ||||||||||||||
Equity in earnings of investee | (69,762 | ) | (2,834 | ) | — | 72,596 | — | |||||||||||||
Non-cash allocation of corporate expenses | (10,251 | ) | — | 10,251 | — | — | ||||||||||||||
Depreciation and amortization | 14,663 | 61 | 9,305 | — | 24,029 | |||||||||||||||
Deferred tax (benefit) expense | (328 | ) | — | 2 | — | (326 | ) | |||||||||||||
Minority interest expense (income) | 944 | — | — | — | 944 | |||||||||||||||
Business realignment expense and impairments | (775 | ) | — | 1,036 | — | 261 | ||||||||||||||
Other non-cash adjustments | 1,086 | — | 131 | — | 1,217 | |||||||||||||||
Net change in assets and liabilities | ||||||||||||||||||||
Accounts receivable | (17,857 | ) | 4 | (9,108 | ) | — | (26,961 | ) | ||||||||||||
Inventories | (4,130 | ) | — | (4,347 | ) | — | (8,477 | ) | ||||||||||||
Accounts and drafts payable | 24,391 | 42 | 13,332 | — | 37,765 | |||||||||||||||
Income Taxes | (1,626 | ) | — | 258 | — | (1,368 | ) | |||||||||||||
Other Assets | 6,525 | (52 | ) | (146 | ) | — | 6,327 | |||||||||||||
Other Liabilities | (13,025 | ) | (7 | ) | (3,053 | ) | — | (16,085 | ) | |||||||||||
| (8,331 | ) | 9,867 | 25,800 | — | 27,336 | |||||||||||||||
Cash Flows (used in) from Investing Activities | ||||||||||||||||||||
Capital Expenditures | (7,849 | ) | (51 | ) | (11,355 | ) | — | (19,255 | ) | |||||||||||
Proceeds from the sale of assets | 975 | — | 8,384 | — | 9,359 | |||||||||||||||
| (6,874 | ) | (51 | ) | (2,971 | ) | — | (9,896 | ) | ||||||||||||
Cash flows from (used in) Financing Activities | ||||||||||||||||||||
Net short-term debt (repayments) borrowings | (2,548 | ) | — | 35 | — | (2,513 | ) | |||||||||||||
Dividends received (paid) | 17,797 | (14,600 | ) | (3,197 | ) | — | — | |||||||||||||
Repayment of long-term debt | — | — | (19 | ) | — | (19 | ) | |||||||||||||
Affiliated (repayments/loans) borrowings/receipts | (236 | ) | 4,850 | (15,494 | ) | — | (10,880 | ) | ||||||||||||
| 15,013 | (9,750 | ) | (18,675 | ) | — | (13,412 | ) | |||||||||||||
Increase (decrease) in cash and equivalents | (192 | ) | 66 | 4,154 | — | 4,028 | ||||||||||||||
Cash and equivalents at beginning of period | 1,370 | 151 | 26,641 | — | 28,162 | |||||||||||||||
Cash and equivalents at end of period | $ | 1,178 | $ | 217 | $ | 30,795 | — | $ | 32,190 | |||||||||||
| (1) | Interest on affiliated debt to certain guarantor subsidiaries is settled by increasing the loan principal. |
F-115
Table of Contents
BORDEN CHEMICAL, INC.
Notes to Condensed Consolidated Financial Statements—(Continued)
(Dollars in thousands except per share amounts and as otherwise indicated)
FOR THE SIX MONTHS ENDED JUNE 30, 2003
CONDENSED CONSOLIDATING STATEMENT OF CASH FLOWS
| Borden Chemical Inc. | Combined Guarantor Subsidiaries | Combined Non-Guarantor Subsidiaries | Eliminations | Consolidated | ||||||||||||||||
Cash Flows from (used in) Operating Activities | ||||||||||||||||||||
Net (loss) income | $ | 16,745 | $ | 66,899 | $ | 1,691 | $ | (68,590 | ) | $ | 16,745 | |||||||||
Adjustments to reconcile net income (loss) to net cash from (used in) operating activities: | ||||||||||||||||||||
Non-cash affiliated interest(1) | 56,448 | (56,448 | ) | — | — | — | ||||||||||||||
Equity in earnings of subsidiaries | (67,325 | ) | (1,265 | ) | — | 68,590 | — | |||||||||||||
Non-cash allocations of corporate expenses | (9,261 | ) | — | 9,261 | — | — | ||||||||||||||
Depreciation and amortization | 14,512 | 75 | 8,319 | — | 22,906 | |||||||||||||||
Deferred tax (benefit) expense | (27,142 | ) | — | 3,610 | — | (23,532 | ) | |||||||||||||
Minority interest expense (income) | (234 | ) | — | — | — | (234 | ) | |||||||||||||
Business realignment expense and impairments | (204 | ) | — | 1,625 | — | 1,421 | ||||||||||||||
Other non-cash adjustments | 1,730 | — | 66 | — | 1,796 | |||||||||||||||
Net change in assets and liabilities: | ||||||||||||||||||||
Accounts receivable | (10,040 | ) | 86 | (20,790 | ) | — | (30,744 | ) | ||||||||||||
Inventories | 1,960 | — | 899 | — | 2,859 | |||||||||||||||
Accounts and drafts payable | (2,745 | ) | (119 | ) | 9,182 | — | 6,318 | |||||||||||||
Income Taxes | 3,037 | — | 771 | — | 3,808 | |||||||||||||||
Other Assets | 13,555 | 10 | 72 | — | 13,637 | |||||||||||||||
Other Liabilities | (3,568 | ) | 1,866 | (13,770 | ) | — | (15,472 | ) | ||||||||||||
| (12,532 | ) | 11,104 | 936 | — | (492 | ) | ||||||||||||||
Cash Flows (used in) from Investing Activities | ||||||||||||||||||||
Capital Expenditures | (9,931 | ) | — | (5,690 | ) | — | (15,621 | ) | ||||||||||||
Proceeds from the sale of assets | 925 | — | 1,306 | — | 2,231 | |||||||||||||||
| (9,006 | ) | — | (4,384 | ) | — | (13,390 | ) | |||||||||||||
Cash flows from (used in) Financing Activities | ||||||||||||||||||||
Net short-term debt repayments | (975 | ) | — | (481 | ) | — | (1,456 | ) | ||||||||||||
Net long-term debt borrowings | — | 255 | — | 255 | ||||||||||||||||
Affiliated (repayments/loans) borrowings/receipts | (57,463 | ) | 840 | 5,241 | — | (51,382 | ) | |||||||||||||
Decrease (increase) in restricted cash | 65,281 | — | — | 65,281 | ||||||||||||||||
Dividends received (paid) | 14,611 | (12,000 | ) | (2,611 | ) | — | — | |||||||||||||
Net repurchases of common stock from/to management | (286 | ) | — | — | — | (286 | ) | |||||||||||||
| 21,168 | (11,160 | ) | 2,404 | — | 12,412 | |||||||||||||||
Increase (decrease) in cash and equivalents | (370 | ) | (56 | ) | (1,044 | ) | — | (1,470 | ) | |||||||||||
Cash and equivalents at beginning of period | 1,838 | 116 | 12,786 | — | 14,740 | |||||||||||||||
Cash and equivalents at end of period | $ | 1,468 | $ | 60 | $ | 11,742 | — | $ | 13,270 | |||||||||||
| (1) | Interest on affiliated debt to certain guarantor subsidiaries is settled by increasing the loan principal. |
F-116
Table of Contents
BORDEN CHEMICAL, INC.
Notes to Condensed Consolidated Financial Statements—(Continued)
(Dollars in thousands except per share amounts and as otherwise indicated)
12. Reclassification
In the Company’s previously issued financial statements for the six months ended June 30, 2004, transaction-related costs of $7,236 (see Note 1) were classified as a non-operating expense. However, after discussions with the staff of the U.S. Securities and Exchange Commission, management concluded that classification of transaction-related costs as an operating expense would be a better presentation. Accordingly, the Company has reflected such reclassification in the accompanying Consolidated Statement of Operations.
F-117
Table of Contents
REPORT OF INDEPENDENT REGISTERED PUBLIC ACCOUNTING FIRM
To the Board of Directors
and Shareholder of Borden Chemical, Inc.
We have audited the accompanying consolidated balance sheets of Borden Chemical, Inc. (effective August 12, 2004, a wholly-owned subsidiary of BHI Acquisition Corp., which is a majority owned subsidiary of BHI Investment, LLC; prior to August 12, 2004, a majority-owned subsidiary of Borden Holdings, Inc.) and subsidiaries as of December 31, 2003 and 2002, and the related consolidated statements of operations and comprehensive income (loss), shareholders’ deficit and cash flows for each of the three years in the period ended December 31, 2003. These financial statements are the responsibility of the Company’s management. Our responsibility is to express an opinion on these financial statements based on our audits.
We conducted our audits in accordance with the standards of the Public Company Accounting Oversight Board (United States). Those standards require that we plan and perform the audit to obtain reasonable assurance about whether the financial statements are free of material misstatement. An audit includes examining, on a test basis, evidence supporting the amounts and disclosures in the financial statements. An audit also includes assessing the accounting principles used and significant estimates made by management, as well as evaluating the overall financial statement presentation. We believe that our audits provide a reasonable basis for our opinion.
In our opinion, such consolidated financial statements present fairly, in all material respects, the financial position of Borden Chemical, Inc. and subsidiaries at December 31, 2003 and 2002, and the results of their operations and their cash flows for each of the three years in the period ended December 31, 2003, in conformity with accounting principles generally accepted in the United States of America.
As discussed in Note 4 to the consolidated financial statements, the Company changed its method of accounting for goodwill and other intangible assets in 2002 to conform to Statement of Financial Accounting Standards No. 142.
DELOITTE & TOUCHE LLP
Columbus, Ohio
March 19, 2004, except for Note 24, as to which the date is August 5, 2004.
F-118
Table of Contents
CONSOLIDATED STATEMENTS OF OPERATIONS
AND COMPREHENSIVE INCOME (LOSS)
| Year Ended December 31, | ||||||||||||
| 2003 | 2002 | 2001 | ||||||||||
| (In thousands, except per share data) | ||||||||||||
Net sales | $ | 1,434,813 | $ | 1,247,885 | $ | 1,372,141 | ||||||
Cost of goods sold | 1,148,519 | 968,657 | 1,060,642 | |||||||||
Gross margin | 286,294 | 279,228 | 311,499 | |||||||||
Distribution expense | 66,383 | 61,927 | 63,929 | |||||||||
Marketing expense | 42,398 | 42,503 | 42,046 | |||||||||
General & administrative expense | 100,021 | 109,237 | 127,967 | |||||||||
(Gain) loss on sale of assets | (746 | ) | 282 | (3,772 | ) | |||||||
Loss on divestiture of business | — | — | 2,303 | |||||||||
Business realignment expense and impairments | 4,748 | 19,699 | 126,408 | |||||||||
Other operating expense | 6,948 | 11,872 | 28,113 | |||||||||
Operating income (loss) | 66,542 | 33,708 | (75,495 | ) | ||||||||
Interest expense | 46,138 | 47,315 | 51,613 | |||||||||
Affiliated interest expense, net | 558 | 1,402 | 11,488 | |||||||||
Other non-operating expense (income) | 1,529 | (5,989 | ) | 1,841 | ||||||||
Investment write-downs | — | — | 27,000 | |||||||||
Income (loss) from continuing operations before income tax | 18,317 | (9,020 | ) | (167,437 | ) | |||||||
Income tax benefit | (4,659 | ) | (2,262 | ) | (30,833 | ) | ||||||
Income (loss) from continuing operations | 22,976 | (6,758 | ) | (136,604 | ) | |||||||
Income from discontinued operations, net of tax | — | — | 11,804 | |||||||||
Income (loss) before cumulative effect of change in accounting principle | 22,976 | (6,758 | ) | (124,800 | ) | |||||||
Cumulative effect of change in accounting principle | — | (29,825 | ) | — | ||||||||
Net income (loss) | 22,976 | (36,583 | ) | (124,800 | ) | |||||||
Preferred stock dividends | — | — | (61,846 | ) | ||||||||
Net income (loss) applicable to common stock | $ | 22,976 | $ | (36,583 | ) | $ | (186,646 | ) | ||||
Comprehensive income | $ | 60,420 | $ | (67,784 | ) | $ | (198,959 | ) | ||||
Basic and Diluted Per Share Data | ||||||||||||
Income (loss) from continuing operations | $ | 0.11 | $ | (0.03 | ) | $ | (0.69 | ) | ||||
Income from discontinued operations, net of tax | — | — | 0.06 | |||||||||
Income (loss) before cumulative effect of change in accounting principle | 0.11 | (0.03 | ) | (0.63 | ) | |||||||
Cumulative effect of change in accounting principle | — | (0.15 | ) | — | ||||||||
Net income (loss) | 0.11 | (0.18 | ) | (0.63 | ) | |||||||
Preferred stock dividends | — | — | (0.31 | ) | ||||||||
Net income (loss) applicable to common stock—basic | $ | 0.11 | $ | (0.18 | ) | $ | (0.94 | ) | ||||
Net income (loss) applicable to common stock—dilutive | $ | 0.11 | $ | (0.18 | ) | $ | (0.94 | ) | ||||
Average number of common shares outstanding during the period—basic | 199,310 | 199,319 | 198,997 | |||||||||
Average number of common shares outstanding during the period—dilutive | 200,267 | 199,319 | 198,997 | |||||||||
See Notes to Consolidated Financial Statements
F-119
Table of Contents
CONSOLIDATED BALANCE SHEETS
December 31, 2003 | December 31, 2002 | |||||||
| (In thousands) | ||||||||
ASSETS | ||||||||
Current Assets | ||||||||
Cash and equivalents | $ | 28,162 | $ | 14,740 | ||||
Restricted cash | — | 67,049 | ||||||
Accounts receivable (less allowance for doubtful accounts of $14,459 in 2003 and $12,219 in 2002) | 196,093 | 170,822 | ||||||
Accounts receivable from affiliates | 354 | 5,840 | ||||||
Inventories: | ||||||||
Finished and in-process goods | 42,292 | 45,178 | ||||||
Raw materials and supplies | 38,819 | 41,079 | ||||||
Deferred income taxes | 27,085 | 28,869 | ||||||
Other current assets | 13,551 | 13,232 | ||||||
| 346,356 | 386,809 | |||||||
Investments and Other Assets | ||||||||
Deferred income taxes | 113,434 | 118,368 | ||||||
Other assets | 21,725 | 19,615 | ||||||
| 135,159 | 137,983 | |||||||
Property and Equipment | ||||||||
Land | 32,585 | 31,964 | ||||||
Buildings | 103,774 | 98,313 | ||||||
Machinery and equipment | 691,249 | 649,782 | ||||||
| 827,608 | 780,059 | |||||||
Less accumulated depreciation | (378,724 | ) | (340,321 | ) | ||||
| 448,884 | 439,738 | |||||||
Goodwill | 57,516 | 39,640 | ||||||
Other Intangible Assets | 5,951 | 7,610 | ||||||
Total Assets | $ | 993,866 | $ | 1,011,780 | ||||
See Notes to Consolidated Financial Statements
F-120
Table of Contents
BORDEN CHEMICAL, INC.
CONSOLIDATED BALANCE SHEETS—(Continued)
December 31, 2003 | December 31, 2002 | |||||||
(In thousands except share data) | ||||||||
LIABILITIES AND SHAREHOLDERS’ DEFICIT | ||||||||
Current Liabilities | ||||||||
Accounts and drafts payable | $ | 127,174 | $ | 113,549 | ||||
Debt payable within one year | 8,167 | 2,779 | ||||||
Loans payable to affiliates | 18,260 | 84,680 | ||||||
Income taxes payable | 34,977 | 55,964 | ||||||
Interest payable | 12,524 | 12,136 | ||||||
Other current liabilities | 71,546 | 78,957 | ||||||
| 272,648 | 348,065 | |||||||
Other Liabilities | ||||||||
Long-term debt | 529,966 | 523,287 | ||||||
Non-pension postemployment benefit obligations | 128,723 | 145,384 | ||||||
Long-term pension obligations | 66,656 | 70,216 | ||||||
Other long-term liabilities | 92,066 | 85,721 | ||||||
| 817,411 | 824,608 | |||||||
Commitments and Contingencies (See Note 22) | ||||||||
Shareholders’ Deficit | ||||||||
Common stock—$0.01 par value: authorized 300,000,000 shares, Issued 201,754,598, treasury 858,970, outstanding 200,895,628 in 2003 and Issued 201,782,598, treasury 858,970, outstanding 200,923,628 shares in 2002. | 2,009 | 2,009 | ||||||
Paid-in capital | 1,224,011 | 1,172,344 | ||||||
Receivable from parent | (512,094 | ) | (463,516 | ) | ||||
Deferred compensation | (1,488 | ) | (2,679 | ) | ||||
Accumulated other comprehensive income | (128,193 | ) | (165,637 | ) | ||||
Accumulated deficit | (680,438 | ) | (703,414 | ) | ||||
| (96,193 | ) | (160,893 | ) | |||||
Total Liabilities and Shareholders’ Deficit | $ | 993,866 | $ | 1,011,780 | ||||
See Notes to Consolidated Financial Statements
F-121
Table of Contents
CONSOLIDATED STATEMENTS OF CASH FLOWS
| Year ended December 31, | ||||||||||||
| 2003 | 2002 | 2001 | ||||||||||
| (In thousands) | ||||||||||||
Cash Flows from (used in) Operating Activities | ||||||||||||
Net income (loss) | $ | 22,976 | $ | (36,583 | ) | $ | (124,800 | ) | ||||
Adjustments to reconcile net income (loss) to net cash from (used in) operating activities: | ||||||||||||
Loss on divestiture of businesses | — | — | 2,303 | |||||||||
(Gain) loss on the sale of assets | (746 | ) | 282 | (3,772 | ) | |||||||
Deferred tax provision (benefit) | 6,223 | 16,023 | (25,883 | ) | ||||||||
Depreciation and amortization | 47,319 | 47,947 | 59,361 | |||||||||
Deferred compensation expense | 1,191 | 892 | — | |||||||||
Business realignment expense and impairments | 4,748 | 19,699 | 126,408 | |||||||||
Cumulative effect of change in accounting principle | — | 29,825 | — | |||||||||
Investment write-downs and other charges | — | — | 27,000 | |||||||||
Other non-cash adjustments | 1,070 | (822 | ) | 3,063 | ||||||||
Net change in assets and liabilities: | ||||||||||||
Accounts receivable | (3,217 | ) | (12,596 | ) | 31,698 | |||||||
Inventories | 10,731 | 2,552 | 14,679 | |||||||||
Accounts and drafts payable | 2,492 | (8,303 | ) | (20,230 | ) | |||||||
Income taxes | (30,291 | ) | (21,780 | ) | 44,130 | |||||||
Other assets | 3,581 | (2,571 | ) | (72,388 | ) | |||||||
Other liabilities | (32,051 | ) | (24,205 | ) | 33,551 | |||||||
| 34,026 | 10,360 | 95,120 | ||||||||||
Cash Flows (used in) from Investing Activities | ||||||||||||
Capital expenditures | (41,820 | ) | (38,773 | ) | (47,408 | ) | ||||||
(Purchase) proceeds from sale of businesses | (14,691 | ) | — | 96,977 | ||||||||
Proceeds from the sale of assets | 14,197 | 10,237 | 160,888 | |||||||||
Proceeds from sale of note receivable to an affiliate | — | 110,000 | — | |||||||||
Other, net | — | — | 524 | |||||||||
| (42,314 | ) | 81,464 | 210,981 | |||||||||
Cash Flows from (used in) Financing Activities | ||||||||||||
Net short-term debt borrowings (repayments) | 5,388 | 1,255 | (41,763 | ) | ||||||||
Borrowings of long-term debt | 7,925 | — | 57,400 | |||||||||
Repayments of long-term debt | (1,246 | ) | (10,764 | ) | (54,000 | ) | ||||||
Affiliated (repayments) borrowings | (66,420 | ) | 6,130 | (212,432 | ) | |||||||
Payment of note payable to unconsolidated subsidiary | — | (31,581 | ) | — | ||||||||
Decrease (increase) in restricted cash | 67,049 | (66,165 | ) | (884 | ) | |||||||
Interest received from parent | — | — | 48,578 | |||||||||
Common stock dividends paid | — | — | (48,578 | ) | ||||||||
Preferred stock dividends paid | — | — | (73,724 | ) | ||||||||
Repurchases, net of sale, of common stock from / to management | (286 | ) | (591 | ) | — | |||||||
Capital contribution from affiliates | 9,300 | — | 17,000 | |||||||||
| 21,710 | (101,716 | ) | (308,403 | ) | ||||||||
Increase (decrease) in cash and equivalents | $ | 13,422 | $ | (9,892 | ) | $ | (2,302 | ) | ||||
Cash and equivalents at beginning of year | 14,740 | 24,632 | 26,934 | |||||||||
Cash and equivalents at end of year | $ | 28,162 | $ | 14,740 | $ | 24,632 | ||||||
Supplemental Disclosures of Cash Flow Information | ||||||||||||
Cash paid (received): | ||||||||||||
Interest, net | $ | 45,466 | $ | 46,928 | $ | 70,258 | ||||||
Income taxes, net | 19,368 | 978 | (36,186 | ) | ||||||||
Non-cash activity: | ||||||||||||
Capital contribution by parent | 17,002 | 24,440 | 21,038 | |||||||||
Contribution of preferred stock and accrued dividend by parent | — | — | 620,922 | |||||||||
Reclassification of minimum pension liability adjustment from (to) shareholders’ equity | 5,830 | (17,075 | ) | (66,580 | ) | |||||||
See Notes to Consolidated Financial Statements
F-122
Table of Contents
CONSOLIDATED STATEMENTS OF SHAREHOLDERS’ DEFICIT
(In thousands)
| Preferred Stock | Common Stock | Paid-in Capital | Receivable from Parent | Deferred Compensation | Accumulated Other Comprehensive Income | Accumulated Deficit | Total | |||||||||||||||||||||||
Balance, December 31, 2000 | $ | 614,369 | $ | 1,990 | $ | 353,309 | $ | (414,937 | ) | $ | — | $ | (60,277 | ) | $ | (480,185 | ) | $ | 14,269 | |||||||||||
Net income | (124,800 | ) | (124,800 | ) | ||||||||||||||||||||||||||
Translation adjustments and other | (6,849 | ) | (6,849 | ) | ||||||||||||||||||||||||||
Cumulative effect of change in accounting principle (net of $1,900 tax) | �� | (3,300 | ) | (3,300 | ) | |||||||||||||||||||||||||
Derivative activity (net of $1,300 tax) | 2,570 | 2,570 | ||||||||||||||||||||||||||||
Minimum pension liability (net of $36,090 tax) | (66,580 | ) | (66,580 | ) | ||||||||||||||||||||||||||
Comprehensive income | (198,959 | ) | ||||||||||||||||||||||||||||
Preferred stock dividends | (61,846 | ) | (61,846 | ) | ||||||||||||||||||||||||||
Common stock dividends | (36,434 | ) | (36,434 | ) | ||||||||||||||||||||||||||
Interest accrued on notes from parent (net of $13,784 tax) | 24,674 | 10,120 | 34,794 | |||||||||||||||||||||||||||
Gain on Consumer Adhesives Sale to affiliate (net of $37,428 tax) | 94,847 | 94,847 | ||||||||||||||||||||||||||||
Gain on sale of common stock equity investment to affiliate (net of $5,600 tax) | 10,197 | 10,197 | ||||||||||||||||||||||||||||
Common stock and warrants issued to management | 1,236 | 1,236 | ||||||||||||||||||||||||||||
Capital contribution from parent of preferred stock and accrued dividend | (614,369 | ) | 620,922 | 6,553 | ||||||||||||||||||||||||||
Capital contribution from parent | 38,038 | 38,038 | ||||||||||||||||||||||||||||
Balance, December 31, 2001 | $ | — | $ | 1,990 | $ | 1,106,789 | $ | (404,817 | ) | $ | — | $ | (134,436 | ) | $ | (666,831 | ) | $ | (97,305 | ) | ||||||||||
F-123
Table of Contents
BORDEN CHEMICAL, INC.
CONSOLIDATED STATEMENTS OF SHAREHOLDERS’ DEFICIT—(Continued)
(In thousands)
| Common Stock | Paid-in Capital | Receivable from Parent | Deferred Compensation | Accumulated Other Comprehensive Income | Accumulated Deficit | Total | ||||||||||||||||||||||
Balance, December 31, 2001 | $ | 1,990 | $ | 1,106,789 | $ | (404,817 | ) | $ | — | $ | (134,436 | ) | $ | (666,831 | ) | $ | (97,305 | ) | ||||||||||
Net income | (36,583 | ) | (36,583 | ) | ||||||||||||||||||||||||
Translation adjustments | (14,856 | ) | (14,856 | ) | ||||||||||||||||||||||||
Derivative activity (net of $401 tax) | 730 | 730 | ||||||||||||||||||||||||||
Minimum pension liability (net of $9,194 tax) | (17,075 | ) | (17,075 | ) | ||||||||||||||||||||||||
Comprehensive income | (67,784 | ) | ||||||||||||||||||||||||||
Repurchases of common stock from management | (1 | ) | (1,341 | ) | (1,342 | ) | ||||||||||||||||||||||
Restricted stock issued to management | 16 | 3,555 | (3,571 | ) | — | |||||||||||||||||||||||
Interest accrued on notes from parent | 58,699 | (58,699 | ) | — | ||||||||||||||||||||||||
Compensation expense on restricted stock | 892 | 892 | ||||||||||||||||||||||||||
Common stock issued management | 4 | 747 | 751 | |||||||||||||||||||||||||
Capital contribution from parent | 3,895 | 3,895 | ||||||||||||||||||||||||||
Balance, December 31, 2002 | $ | 2,009 | $ | 1,172,344 | $ | (463,516 | ) | $ | (2,679 | ) | $ | (165,637 | ) | $ | (703,414 | ) | $ | (160,893 | ) | |||||||||
Net income | 22,976 | 22,976 | ||||||||||||||||||||||||||
Translation adjustments | 31,614 | 31,614 | ||||||||||||||||||||||||||
Minimum pension liability (net of $3,139 tax) | 5,830 | 5,830 | ||||||||||||||||||||||||||
Comprehensive income | 60,420 | |||||||||||||||||||||||||||
Repurchases of common stock from management | (286 | ) | (286 | ) | ||||||||||||||||||||||||
Income tax on sale to affiliate of Consumer Adhesives note receivable | (5,925 | ) | (5,925 | ) | ||||||||||||||||||||||||
Interest accrued on notes from parent | 48,578 | (48,578 | ) | — | ||||||||||||||||||||||||
Capital contribution from parent | 9,300 | 9,300 | ||||||||||||||||||||||||||
Compensation expense on restricted stock | 1,191 | 1,191 | ||||||||||||||||||||||||||
Balance, December 31, 2003 | $ | 2,009 | $ | 1,224,011 | $ | (512,094 | ) | $ | (1,488 | ) | $ | (128,193 | ) | $ | (680,438 | ) | $ | (96,193 | ) | |||||||||
See Notes to Consolidated Financial Statements
F-124
Table of Contents
Notes to Consolidated Financial Statements
(Dollars in thousands except per share data)
1. Background and Nature of Operations
Borden Chemical, Inc. (the “Company”) was incorporated on April 24, 1899. The Company is engaged primarily in manufacturing, processing, purchasing and distributing forest products and industrial resins, formaldehyde, oil field products and other specialty and industrial chemicals worldwide. In 2001, the Company sold its Consumer Adhesives business. The Company’s executive and administrative offices are located in Columbus, Ohio. Production facilities are located throughout the U.S. and in many foreign countries.
Domestic products are sold by the Company’s sales force throughout the U.S. to industrial users. To the extent practicable, international distribution techniques parallel those used in the U.S. and are concentrated in Canada, Western Europe, Latin America, Australia and Malaysia.
At December 31, 2003, 27 of a total 48 manufacturing and processing facilities are located in the U.S., and in 2003, approximately 63% of the Company’s sales were generated in the U.S.
The Company has three reportable segments: North American Forest Products, North American Performance Resins Group and International. See Note 19.
The Company has been controlled by affiliates of Kohlberg Kravis Roberts & Co., L.P. (“KKR”), since 1995. The Company’s immediate parent is Borden Holdings, Inc. (“BHI”), a wholly owned subsidiary of BW Holdings, LLC (“BWHLLC”), an entity controlled by KKR.
In the fourth quarter of 2001, the Company (then known as Borden, Inc.) merged with its subsidiaries Borden Chemical, Inc. (“BCI”) and Borden Chemical Holdings, Inc. (“BCHI”), executed certain financial transactions with its parent and changed its name to Borden Chemical, Inc. (the “Corporate Reorganization”). See Note 3.
In 2001, through a series of transactions with affiliates, the Company sold Consumer Adhesives (the “Consumer Adhesives Sale”) for total proceeds of $94,120. As a result of the Consumer Adhesives Sale, this segment is reflected as a discontinued operation in the Consolidated Financial Statements in 2001. The Company retained continuing investments in Consumer Adhesives in the form of preferred stock and notes receivable. The notes receivable were sold to BHI in the fourth quarter of 2001 for their carrying value of $57,691. The preferred stock, with a carrying value of $110,000, was redeemed during the first quarter of 2002 for a $110,000 note receivable from Consumer Adhesives, which was subsequently sold to BHI in 2002 for face value plus accrued interest. In 2001, a pre-tax gain of $132,275 was recognized in Paid-in capital due to the affiliated nature of the transaction. In 2003, the Company recorded an adjustment of $5,925 in Paid-in capital to reflect additional tax expense associated with the sale of the $110,000 note receivable.
2. Summary of Significant Accounting Policies
Significant accounting policies followed by the Company, as summarized below, are in conformity with generally accepted accounting principles.
Principles of Consolidation—The Consolidated Financial Statements include the accounts of the Company and its subsidiaries, after elimination of intercompany accounts and transactions.
Use of Estimates—The preparation of financial statements in conformity with generally accepted accounting principles requires management to make estimates and assumptions that affect the reported amounts
F-125
Table of Contents
BORDEN CHEMICAL, INC.
Notes to Consolidated Financial Statements—(Continued)
(Dollars in thousands except per share data)
of assets and liabilities and disclosure of contingent assets and liabilities at the date of the financial statements, as well as the reported amounts of revenues and expenses during the reporting period. The most significant estimates reflected in the financial statements include environmental remediation, legal liabilities, deferred tax assets and liabilities and related valuation allowances, income tax accruals, pension and postretirement assets and liabilities, valuation allowances for accounts receivable and inventories, general insurance liabilities, asset impairments and related party transactions. Actual results could differ from estimated amounts.
Cash and Cash Equivalents—The Company considers all highly liquid investments purchased with an original maturity of three months or less to be cash equivalents. Included in the Company’s cash equivalents and restricted cash are interest bearing time deposits of $70,133 in 2002. At December 31, 2003, the Company had no material investments in cash equivalent instruments. The effect of exchange rate changes on cash is not material.
Inventories—Inventories are stated at lower of cost or market. Cost is determined using the first-in, first-out method.
Property and Equipment—Land, buildings, and machinery and equipment are carried at cost. Depreciation is recorded on the straight-line basis by charges to expense at rates based on estimated useful lives of properties (average rates for buildings 3%; machinery and equipment 7%). Major renewals and betterments are capitalized. Maintenance, repairs and minor renewals are expensed as incurred.
Goodwill and Intangibles—The excess of purchase price over net tangible and identifiable intangible assets of businesses acquired is carried as Goodwill on the Consolidated Balance Sheet. As of January 1, 2002, the Company no longer amortizes goodwill. Prior to January 1, 2002, goodwill was amortized on a straight-line basis over not more than 40 years.
Certain trademarks, patents and other intangible assets used in the operations of the business are carried as Other Intangible Assets on the Consolidated Balance Sheet. These intangible assets are amortized on a straight-line basis over the shorter of the legal or useful life of the asset. See Note 4.
Impairment—As events warrant but at least annually, the Company evaluates the recoverability of long-lived assets by assessing whether the carrying value can be recovered over their remaining useful lives through the expected future undiscounted operating cash flows of the underlying business. Any impairment loss required is determined by comparing the carrying value of the assets to operating cash flows on a discounted basis.
The Company performs an annual impairment test for goodwill and other intangibles. See Note 4.
General Insurance—The Company is generally self-insured for losses and liabilities relating to workers’ compensation, health and welfare claims, physical damage to property, business interruption and comprehensive general, product and vehicle liability. The Company maintains insurance policies for certain items exceeding deductible limits. Losses are accrued for the estimated aggregate liability for claims using certain actuarial assumptions followed in the insurance industry and the Company’s experience.
Legal Costs—The Company accrues for legal costs in the period in which a claim is made or an event becomes known, if the amounts are probable and reasonably estimable. Each claim is assigned a range of potential liability, with the most likely amount being accrued. The amount accrued includes all costs associated with a claim, including settlements, assessments, judgments, fines and legal fees.
F-126
Table of Contents
BORDEN CHEMICAL, INC.
Notes to Consolidated Financial Statements—(Continued)
(Dollars in thousands except per share data)
Revenue Recognition—Revenue for product sales is recognized as risk and title to the product transfer to the customer, which usually occurs at the time shipment is made. Substantially all of the Company’s products are sold FOB (“free on board”) shipping point. Other terms include sales where risk and title passes upon delivery (FOB destination point). In situations where our product is delivered by pipeline, risk and title transfers when our product moves across an agreed transfer point, which is typically the customers’ property line. Product sales delivered by pipeline are measured based on daily flow meter readings. The Company’s standard terms of delivery are included in its contracts of sales and invoices.
Shipping and Handling—The Company records freight billed to customers in net sales. Shipping costs are incurred to move the Company’s products from production and storage facilities to the customers. Handling costs are incurred from the point the product is removed from inventory until it is provided to the shipper and generally include costs to store, move and prepare the products for shipment. The Company incurred shipping costs of $66,383 in 2003, $61,927 in 2002 and $63,929 in 2001. These costs are classified as Distribution expense in the Consolidated Statements of Operations. Due to the nature of the Company’s business, handling costs incurred prior to shipment are not significant.
Foreign Currency Translations—Assets and liabilities of foreign affiliates are translated at the exchange rates in effect at the balance sheet date, and income and expenses are translated at average exchange rates prevailing during the year. The effect of translation is accounted for as an adjustment to shareholders’ equity and is included in other comprehensive income.
In addition, the Company incurred realized and unrealized net foreign transaction gains (losses) aggregating $438 in 2003, $1,307 in 2002 and $(912) in 2001.
Income Taxes—The Company files a consolidated U.S. Federal Income Tax return with BHI. Income tax expense is based on reported results of operations before income taxes. Deferred income taxes represent the tax effect of temporary differences between amounts of assets and liabilities recognized for financial reporting purposes and such amounts recognized for tax purposes. Deferred tax balances are adjusted to reflect tax rates, based on current tax laws, that will be in effect in the years in which temporary differences are expected to reverse. Deferred tax assets are reduced by a valuation allowance when, in the opinion of management, it is more likely than not that some portion or all of the deferred tax assets will not be realized.
Derivative Financial Instruments—The Company primarily uses three types of derivatives: interest rate swaps to effectively convert a portion of the Company’s fixed rate obligations to variable, forward exchange contracts and options to reduce the Company’s cash flow exposure to changes in foreign exchange rates and natural gas futures to reduce the Company’s cash flow exposure to changes in natural gas prices. The Company does not hold or issue derivative financial instruments for trading purposes. The Company’s $34,000 interest rate swap agreement is accounted for as a hedge. All other derivatives are not accounted for using hedge accounting but are measured at fair value and recorded on the balance sheet as an asset or liability, depending upon the Company’s underlying rights or obligations. See Notes 16 and 17.
Stock-Based Compensation—The Company accounts for stock-based compensation under Accounting Principles Board Opinion No. 25, “Accounting for Stock Issued to Employees” (“APB No. 25”) and has adopted the disclosure-only provisions of Statement of Financial Accounting Standards (“SFAS”) No. 123, “Accounting for Stock-Based Compensation” and SFAS No. 148, “Accounting for Stock-Based Compensation—Transition and Disclosure, an amendment of SFAS No. 123.”
F-127
Table of Contents
BORDEN CHEMICAL, INC.
Notes to Consolidated Financial Statements—(Continued)
(Dollars in thousands except per share data)
The following table sets forth the required annual reconciliation of reported and pro-forma net income and earnings per share (“EPS”) under SFAS No. 148:
| 2003 | 2002 | 2001 | ||||||||||
Net income (loss) applicable to common stock | $ | 22,976 | $ | (36,583 | ) | $ | (186,646 | ) | ||||
Add: Stock-based employee compensation expense included in reported net income, net of related tax benefit | 147 | 9 | — | |||||||||
Deduct: Total stock-based employee compensation expense determined under fair value based method for all awards granted since January 1, 1996, net of related tax effects | (211 | ) | (94 | ) | (382 | ) | ||||||
Pro-forma net income | $ | 22,912 | $ | (36,668 | ) | $ | (187,028 | ) | ||||
Average shares (in thousands) outstanding—basic | 199,310 | 199,319 | 198,997 | |||||||||
Average share (in thousands) outstanding—diluted | 200,267 | 199,319 | 198,997 | |||||||||
Per share as reported (basic and diluted) | $ | 0.11 | $ | (0.18 | ) | $ | (0.94 | ) | ||||
Per share pro forma (basic and diluted) | $ | 0.11 | $ | (0.18 | ) | $ | (0.94 | ) | ||||
Earnings Per Share—Basic and diluted net income attributable to common stock is computed by dividing net income by the weighted average number of common shares outstanding during the period including the effect of dilutive options, when applicable. At December 31, 2003, options to purchase 5,532,360 common shares of the Company were outstanding, of which 4,882,000 are considered dilutive. At December 31, 2002, 198,400 warrants and options to purchase 3,426,040 common shares of the Company were outstanding and not considered dilutive. At December 31, 2001, 1,039,864 warrants and options to purchase 6,871,380 common shares of the Company were outstanding and not considered dilutive. See Note 15.
The Company’s diluted EPS is calculated as follows:
| 2003 | 2002 | 2001 | |||||||||
Net income (loss) applicable to common stock | $ | 22,976 | $ | (36,583 | ) | $ | (186,646 | ) | |||
Effect of dilutive options | — | — | — | ||||||||
Diluted EPS—Numerator | 22,976 | (36,583 | ) | (186,646 | ) | ||||||
Average share outstanding (in thousands)—basic | 199,310 | 199,319 | 198,997 | ||||||||
Effect of dilutive options (in thousands) | 957 | — | — | ||||||||
Diluted EPS—Denominator (in thousands) | 200,267 | 119,319 | 198,997 | ||||||||
Diluted EPS | $ | 0.11 | $ | (0.18 | ) | $ | (0.94 | ) | |||
Concentrations of Credit Risk—Financial instruments that potentially subject the Company to concentrations of credit risk consist principally of temporary cash investments and accounts receivable. The Company places its temporary cash investments with high quality institutions and, by policy, limits the amount of credit exposure to any one institution. Concentrations of credit risk with respect to accounts receivable are limited, due to the large number of customers comprising the Company’s customer base and their dispersion across many different industries and geographies. The Company generally does not require collateral or other security to support customer receivables.
Reclassification—Previously at December 31, 2003 and 2002, income taxes payable of $15,800 and $46,545, respectively, were classified as other long-term liabilities. These amounts were reclassified as income taxes payable in the current presentation.
F-128
Table of Contents
BORDEN CHEMICAL, INC.
Notes to Consolidated Financial Statements—(Continued)
(Dollars in thousands except per share data)
Recently Issued Accounting Standards
In November 2002, the Financial Accounting Standards Board (“FASB”) issued Interpretation No. 45, “Guarantor’s Accounting and Disclosure Requirements for Guarantees, Including Indirect Guarantees of Indebtedness of Others” (“FIN 45”). FIN 45 requires a guarantor to recognize a liability, at the inception of the guarantee, for the fair value of obligations it has undertaken in issuing the guarantee and also include more detailed disclosures with respect to guarantees. FIN 45 is effective for guarantees issued or modified after December 31, 2002. The disclosure requirements of FIN 45 are effective for financial statements for interim or annual periods ending after December 15, 2002. The Company has adopted FIN 45 and included the additional requirements with respect to guarantees in Note 21 to the Consolidated Financial Statements.
In January 2003, the FASB issued Interpretation No. 46, “Consolidation of Variable Interest Entities” (“FIN 46”) to expand upon and strengthen existing accounting guidance that addresses when a company should include in its financial statements, the assets, liabilities and activities of another entity. FIN 46 requires existing unconsolidated variable interest entities to be consolidated by their primary beneficiaries if the entities do not effectively disperse risks among parties involved. In December 2003, the FASB issued a revision of FIN 46 deferring the effective date for implementation. The Company has no variable interest entities; therefore, the implementation of FIN 46 will not have an impact on its results of operations and financial condition.
In April 2003, the FASB issued SFAS No. 149, “Amendment of Statement 133 on Derivative Instruments and Hedging Activities.” This statement amends and clarifies financial accounting and reporting for derivative instruments, including certain derivative instruments embedded in other contracts and for hedging activities under SFAS No. 133, “Accounting for Derivative Instruments and Hedging Activities.” The clarification provisions of this statement require that contracts with comparable characteristics be accounted for similarly. This statement is effective for any new derivative instruments entered into after June 30, 2003. The Company adopted SFAS No. 149 on July 1, 2003, and the adoption did not have an impact on the Company’s financial statements.
In May 2003, the FASB issued SFAS No. 150, “Accounting for Certain Financial Instruments with Characteristics of both Liabilities and Equity.” This statement addresses the accounting for certain financial instruments that, under previous guidance, could be accounted for as equity. SFAS No. 150 requires that those instruments be classified as liabilities in the statement of financial position. This statement is effective for financial instruments entered into or modified after May 31, 2003, and is otherwise effective at the beginning of the first interim period beginning after June 15, 2003. Adoption of SFAS No. 150 on July 1, 2003 did not have a material impact on the Company’s financial statements.
In December 2003, the FASB issued SFAS No. 132 (as revised 2003), “Employers’ Disclosures about Pensions and Other Postretirement Benefits, an amendment of FASB Statements No. 87, 88 and 106, and a revision of FASB Statement No. 132.” The new rules require additional disclosures about the assets, obligations, cash flows and net periodic benefit cost of defined benefit pension plans and other postretirement benefit plans. This Statement is effective for the Company for fiscal years ending after December 15, 2003, except for certain disclosures on foreign plans, which are effective for fiscal years ending after June 15, 2004. The Company has adopted SFAS No. 132 (as revised 2003) and included the additional disclosures in Notes 12 and 13 to the Consolidated Financial Statements. The Company elected to include the disclosures for its foreign plans in 2003.
3. Corporate Reorganization
In the fourth quarter of 2001, the Company merged with its subsidiaries BCHI and BCI, executed certain financial transactions with BHI and changed its name to Borden Chemical, Inc., from Borden, Inc., reflecting the fact that the only remaining segment of the Company was the chemical business. The Corporate Reorganization
F-129
Table of Contents
BORDEN CHEMICAL, INC.
Notes to Consolidated Financial Statements—(Continued)
(Dollars in thousands except per share data)
was undertaken to simplify the legal structure and strengthen the capital structure of the Company, and to reduce costs. As part of the Corporate Reorganization, certain functions were downsized, eliminated or transferred to a separate legal entity, Borden Capital, Inc. (“Capital”), also owned by BHI.
Subsequent to the Corporate Reorganization, Capital provided certain management, consulting and board services to the Company, as well as other entities owned by KKR, and charged fees to the Company and other affiliates for these services. The Company provided certain administrative services to Capital. The Company was charged a management fee of $9,000 in 2002, payable quarterly in arrears, for the net cost of Capital’s services.
The following transactions occurred as part of the Corporate Reorganization and are included in the 2001 results:
| • | BHI contributed all of the outstanding Series A Cumulative Preferred Stock plus accumulated dividends of $6,553 to the Company as a capital contribution. The significant impact of this transaction was to eliminate required annual future preferred dividend payments of $73,724. |
| • | The Company recorded severance costs of $1,501 for workforce reductions and additional costs of $2,044 related to the Corporate Reorganization. These amounts are classified as Business realignment expense and impairments in the 2001 Consolidated Statement of Operations. |
| • | The Company sold certain assets to BHI for cash. The Company sold a common stock equity investment for its estimated fair value of $55,187 resulting in a pre-tax gain of $15,797 that is recorded as an increase to Paid-in capital due to the affiliated nature of the transaction. Notes receivable from Consumer Adhesives were sold for their carrying amount of $57,691, and a loan receivable from WKI Holding Company, Inc. (“WKI”), an affiliate of the Company, of $25,056 was sold for its fair value of $18,056. Prior to the sale in 2001, the Company recorded a $7,000 charge that is included in investment write-downs and other charges to reflect the decline in fair value of the WKI loan receivable. |
| • | The Company paid Capital $8,741 to assume certain liabilities, the estimated fair value at the date of sale, net of certain assets transferred, including accounts receivable from WKI of $3,594. These liabilities were for accrued compensation, certain employee benefit obligations and accrued liabilities associated with the transferred employees and functions. |
| • | Outstanding stock options on the stock of BCHI held by its management became options of the Company (see Note 15). |
| • | In addition, the Company settled the minority interest liability related to managements’ ownership of shares in BCHI by exchanging shares of the Company’s stock and common stock warrants for the BCHI shares held by management. This resulted in an increase to Paid-in capital for 2001 of $1,236, the approximate fair value of the liability. |
In 2002, BHI decided to cease Capital’s operations during the first half of 2003. Certain management, consulting and board services previously provided to the Company by Capital were assumed by the Company, while other such services were provided to the Company by KKR for an annual fee of $3,000. The Company recorded a charge, funded by BHI, of $5,500 in 2002 related to costs allocable to the Company in connection with the cessation of Capital’s operations.
4. Goodwill and Intangible Assets
At December 31, 2003, the Company’s management performed the annual goodwill impairment test. As required by SFAS No. 142, “Goodwill and Other Intangible Assets,” the Company identified the appropriate
F-130
Table of Contents
BORDEN CHEMICAL, INC.
Notes to Consolidated Financial Statements—(Continued)
(Dollars in thousands except per share data)
reporting units and identified the assets and liabilities (including goodwill) of the reporting units. The Company determined estimated fair values of the reporting units and assessed whether the estimated fair value of each reporting unit was more or less than the carrying amount of the assets and liabilities assigned to the units.
Valuations were performed using a standard methodology based largely on comparable company analysis. Comparable company analysis ascribes a value to an entity by comparing certain operating metrics of the entity to those of a set of comparable companies in the same industry. Using this method, market multiples and ratios based on operating, financial and stock market performance are compared across different companies and to the entity being valued. The Company employed a comparable analysis technique commonly used in the investment banking and private equity industries to estimate the values of its reporting units—the EBITDA (earnings before interest, taxes, depreciation and amortization) multiple technique. Under this technique, estimated values are the result of an EBITDA multiple derived from this process applied to an appropriate historical EBITDA amount.
As a result of this test at December 31, 2003, the fair value of each reporting unit exceeded the carrying amount of assets and liabilities, except for the Company’s Malaysian reporting unit. Based on the excess of the carrying value over the estimated fair value of its Malaysian reporting unit, the Company recorded a goodwill impairment charge of $762 that represented 100% of the carrying amount. This impairment charge is reflected in the 2003 Consolidated Statement of Operations as Business realignment expense and impairments.
At December 31, 2002, the Company’s management performed the goodwill impairment test using the same methodology described above. No impairment charge was necessary as of December 31, 2002, as the fair values of all reporting units exceeded the carrying amount of the assets and liabilities assigned to the units.
Upon the adoption of SFAS No. 142, on January 1, 2002, fair values of the Company’s reporting units as of December 31, 2001 were determined employing the same methodology used by the Company, as described above. As a result of the initial test, the fair value of each reporting unit exceeded the carrying amount of assets and liabilities assigned, except for the Company’s European reporting unit. Based on the excess of the carrying value over the estimated fair value of its European reporting unit, the Company recorded a goodwill impairment charge of $29,825 that represented 100% of the December 31, 2001 carrying amount. This impairment charge is reported as Cumulative effect of change in accounting principle in the 2002 Consolidated Statement of Operations.
The following table provides a comparison of 2003, 2002 and 2001 as if the new accounting principle were applied in 2001:
| Year Ended December 31, | |||||||||||
| 2003 | 2002 | 2001 | |||||||||
Reported net income (loss) | $ | 22,976 | $ | (36,583 | ) | $ | (124,800 | ) | |||
Add back goodwill amortization | — | — | 3,712 | ||||||||
Adjusted net income (loss) | 22,976 | (36,583 | ) | (121,088 | ) | ||||||
Add back cumulative effect of change in accounting principle | — | 29,825 | — | ||||||||
Adjusted net income (loss) before cumulative effect of change in accounting principle | $ | 22,976 | $ | (6,758 | ) | $ | (121,088 | ) | |||
Basic and diluted per share data: | |||||||||||
Reported net income (loss) | $ | 0.11 | $ | (0.18 | ) | $ | (0.63 | ) | |||
Add back goodwill amortization | — | — | 0.02 | ||||||||
Adjusted net income (loss) | 0.11 | (0.18 | ) | (0.61 | ) | ||||||
Add back cumulative effect of change in accounting principle | — | 0.15 | — | ||||||||
Adjusted net income (loss) before cumulative effect of change in accounting principle | $ | 0.11 | $ | (0.03 | ) | $ | (0.61 | ) | |||
F-131
Table of Contents
BORDEN CHEMICAL, INC.
Notes to Consolidated Financial Statements—(Continued)
(Dollars in thousands except per share data)
The changes in the carrying amount of goodwill for the year ended December 31, 2003 and 2002 are as follows:
N.A. Forest Products | N.A. Performance Resins | International | Total | ||||||||||||
Goodwill balance at December 31, 2001 | $ | 20,713 | $ | 19,487 | $ | 31,199 | $ | 71,399 | |||||||
Less goodwill impairment recognized upon adoption of SFAS No. 142 | — | — | (29,825 | ) | (29,825 | ) | |||||||||
Acquisitions/divestitures | — | (1,343 | ) | — | (1,343 | ) | |||||||||
Foreign currency translation | 6 | — | (597 | ) | (591 | ) | |||||||||
Goodwill balance at December 31, 2002 | $ | 20,719 | $ | 18,144 | $ | 777 | $ | 39,640 | |||||||
Acquisitions/divestitures | 4,068 | — | 14,387 | 18,455 | |||||||||||
Impairment | — | — | (762 | ) | (762 | ) | |||||||||
Foreign currency translation | 167 | — | 16 | 183 | |||||||||||
Goodwill balance at December 31, 2003 | $ | 24,954 | $ | 18,144 | $ | 14,418 | $ | 57,516 | |||||||
Intangible assets with identifiable useful lives, which continue to be amortized, consist of the following:
| At December 31, 2003 | At December 31, 2002 | |||||||||||
Gross Amount | Accumulated Amortization | Gross Amount | Accumulated Amortization | |||||||||
Intangible assets: | ||||||||||||
Customer list and contracts | $ | 7,559 | $ | 4,619 | $ | 6,559 | $ | 3,736 | ||||
Formulas and technology | 6,524 | 4,925 | 6,524 | 4,331 | ||||||||
Unrecognized prior service cost | 2,657 | 1,309 | 2,657 | 153 | ||||||||
Other | 744 | 680 | 744 | 654 | ||||||||
| $ | 17,484 | $ | 11,533 | $ | 16,484 | $ | 8,874 | |||||
The impact of foreign currency translation adjustments is included in accumulated amortization.
Total intangible amortization expense for the year ended December 31, 2003, 2002 and 2001 was $1,508, $1,555 and $1,653, respectively.
Estimated annual intangible amortization expense for 2004 through 2008 is as follows:
2004 | $ | 1,700 | |
2005 | 970 | ||
2006 | 350 | ||
2007 | 180 | ||
2008 | 150 |
5. Business Acquisitions and Divestitures
Acquisitions
All of the Company’s acquisitions described below have been accounted for using the purchase method of accounting. Accordingly, results of operations of the acquired entities have been included from the date of acquisition, and any excess of purchase price over the sum of amounts assigned to identified assets and liabilities has been recorded as goodwill. The pro forma effects of the acquisitions are not material.
F-132
Table of Contents
BORDEN CHEMICAL, INC.
Notes to Consolidated Financial Statements—(Continued)
(Dollars in thousands except per share data)
During 2003, the Company acquired Fentak Pty. Ltd. (“Fentak”), an international manufacturer of specialty chemical products for engineered wood, laminating and paper impregnation markets, and the business and technology assets of Southeastern Adhesives Company (“SEACO”), a domestic producer of specialty adhesives, for total cash of $14,691. Fentak was acquired in November, 2003 and SEACO was acquired on December 31, 2003. The Company is required to make additional deferred payments for these acquisitions of approximately $3,050 and contingent future payments of $1,500. The Company recorded goodwill totaling $18,455 for these acquisitions.
In the second quarter of 2001, the Company and Delta-HA, Inc. (“Delta”) merged their North American foundry resins and coatings businesses forming HA-International, LLC (“HAI”). In conjunction with the merger, the Company recorded an accrual of approximately $7,000 to restructure operations of the acquired entity, a minority interest liability of $4,500 to recognize the 25% minority interest and goodwill of approximately $9,000.
The Limited Liability Agreement of HAI provides Delta the right to purchase between 3-5% of additional interest in HAI each year, beginning in 2004. Delta is limited to acquiring a maximum of 25% of additional interest in HAI under this arrangement. Pursuant to this provision, in the first quarter of 2004, Delta provided the Company with written notice of their intention to exercise their option to purchase an additional 5% interest in 2004. Delta’s purchase price of the interest is based on the enterprise value of HAI determined by applying a contractually agreed upon multiple to EBITDA, as defined in the agreement.
Divestitures
In 2003, the Company sold its idled melamine crystal business (“Melamine”). The gain from the sale was recorded as business realignment income. See Note 6.
In 2001, the Company divested its chemical operation in Ecuador. Proceeds from the sale of the Ecuador chemical business were $5,275, which resulted in a pre-tax loss of $2,303.
6. Business Realignment and Asset Impairments
In June 2003, the Company initiated a realignment program designed to reduce operating expenses and increase organizational efficiency. To achieve these goals, the Company is reducing headcount, streamlining processes, consolidating manufacturing processes and reducing general and administrative expenses. The Company is combining jobs where practical and has eliminated over 200 positions as of the end of 2003 related to this program. To further reduce future general and administrative expenses, the Company has reduced contract work, consolidated and eliminated positions and streamlined the administration of medical and other postretirement benefits. The Company anticipates this program will be completed in 2004. The Company expects to incur additional costs in 2004 related to this program.
In addition to the June 2003 realignment program, the Company has realignment activities from programs initiated in previous years, primarily related to plant consolidations and reorganization of certain administrative functions. Following is a discussion of realignment activities and impairments recognized during the past three years.
F-133
Table of Contents
BORDEN CHEMICAL, INC.
Notes to Consolidated Financial Statements—(Continued)
(Dollars in thousands except per share data)
Year Ended December 31, 2003
During 2003, the Company recorded net business realignment expense and impairments of $4,748, consisting of plant closure costs (which include plant employee severance and plant asset impairments) and other severance and employee costs of $13,825, gains on the sale of assets of $12,260 and other non-cash asset impairment charges of $3,183.
Provided below is a rollforward of the business realignment reserves for 2003:
Reserves 12/31/02 | 2003 Expense | 2003 Settlements/ Payments | Reserves 12/31/03 | ||||||||||
Plant closure costs | |||||||||||||
Prior years’ programs | $ | 9,568 | $ | 144 | $ | (4,971 | ) | $ | 4,741 | ||||
June 2003 program | — | 6,844 | (3,356 | ) | 3,488 | ||||||||
Other severance costs | |||||||||||||
Prior years’ programs | 3,996 | 3,670 | (6,515 | ) | 1,151 | ||||||||
June 2003 program | — | 3,167 | (383 | ) | 2,784 | ||||||||
Total reserve activity | $ | 13,564 | $ | 13,825 | $ | (15,225 | ) | $ | 12,164 | ||||
Plant Closure Costs
Plant closure costs in 2003 include $144 for prior years’ programs and $6,844 for 2003 programs.
Costs relating to prior years’ programs include environmental remediation of approximately $800 for closed plants in Brazil and other plant closure costs of approximately $900. Partially offsetting these costs was a reduction of reserves of approximately $1,600 for Melamine, which was sold in the second quarter of 2003.
The $6,844 of charges relating to the 2003 realignment program included costs associated with two plant consolidation programs. As a result of consolidating manufacturing processes, the Company’s facility in France has been converted into a distribution center, and the manufacturing has transitioned to the U.K., resulting in plant closure costs of $5,414, including plant employee severance of approximately $3,600, asset impairment charges of $1,427 and other costs of approximately $400. Additionally, manufacturing was transitioned from the Company’s North Bay, Ontario plant to another facility, and the North Bay site was idled as of the end of 2003, resulting in asset impairment charges of $1,430.
Other Severance Costs
Other severance costs for 2003 include $3,167 relating to the 2003 program and $3,670 relating to prior years’ programs. The 2003 severance related to the elimination of 200 positions under the June 2003 realignment program, as discussed above.
Gain on the Sale of Assets
In 2003, the Company sold Melamine and land associated with a closed plant in the U.K. for gains of $12,260. The gains related to these sales were recorded as business realignment income because the facilities were closed in conjunction with prior years’ realignment programs.
F-134
Table of Contents
BORDEN CHEMICAL, INC.
Notes to Consolidated Financial Statements—(Continued)
(Dollars in thousands except per share data)
Asset Impairment
The Company recorded other asset impairment charges of $3,183 in 2003. Of the total, $1,421 was for the write-down of assets at various international manufacturing facilities, $1,000 was for a facility held for sale and the remaining $762 related to the write-down of goodwill carried by the Company’s Malaysian operations.
Year Ended December 31, 2002
During 2002, the Company recorded net business realignment expense and impairments of $19,699, consisting of plant closure costs of $12,584, other severance and employee costs of $3,265, a gain on the sale of assets of $2,465 and non-cash impairment charges of $6,315.
Plant Closure and Other Severance and Employee Costs
Provided below is a roll forward of the business realignment reserve activity for 2002:
Reserves 12/31/01 | 2002 Expense | 2002 Settlements/ Payments | Reserves 12/31/02 | ||||||||||
Plant closure costs | $ | 14,067 | $ | 12,584 | $ | (17,083 | ) | $ | 9,568 | ||||
Other severance costs | 8,360 | 3,265 | (7,629 | ) | 3,996 | ||||||||
Total reserve activity | $ | 22,427 | $ | 15,849 | $ | (24,712 | ) | $ | 13,564 | ||||
Plant closure costs in 2002 of $12,584 consist of plant employee severance of $2,721, demolition, environmental and other costs of $8,764 and a $1,099 increase to the reserve related to revised estimates of environmental clean-up and demolition for several locations closed in previous years.
Gain on the Sale of Assets
In 2002, the Company sold land associated with a closed plant in Spain and recorded a gain of $2,465. The gain related to this sale was recorded as business realignment income because the facility was closed in conjunction with prior years’ realignment programs.
Asset Impairment
The Company recorded asset impairment charges of $6,315 in 2002. Of the total, $5,275 related to the write-down of fixed assets at various international manufacturing facilities and $1,040 was for a facility held for sale.
Year Ended December 31, 2001
During 2001, the Company recorded net business realignment expense and impairments of $126,408, consisting of plant closure costs of $23,285, other severance and employee costs of $12,582, a gain on the sale of assets of $10,507 and non-cash impairment charges of $101,048.
Plant Closure and Other Severance and Employee Costs
Plant closure costs in 2001 of $23,285 consist of fixed asset write-offs of $11,863, plant employee severance of $1,862 and demolition, environmental and other costs of $9,560.
F-135
Table of Contents
BORDEN CHEMICAL, INC.
Notes to Consolidated Financial Statements—(Continued)
(Dollars in thousands except per share data)
Gain on the Sale of Assets
In 2001, the Company sold land associated with a closed domestic plant and recorded a gain of $10,507. The gain related to this sale was recorded as business realignment income because the facility was closed in conjunction with prior years’ realignment programs.
Asset Impairment
In the fourth quarter of 2001, the Company decided to cease operations at Melamine and to offer it for sale. As of the end of 2001, no sale had been negotiated, and in January 2002, the plant was shut-down. Under SFAS No. 121, “Accounting for the Impairment of Long-Lived Assets and for Long-Lived Assets to be Disposed Of,” the Company recorded a 2001 impairment charge of $98,163 for the fixed assets ($62,527), goodwill ($32,701) and spare parts ($2,935) of Melamine.
Also, in the fourth quarter of 2001, the Company discontinued construction of a new plant facility and recorded an impairment charge of $2,885 to write-down the engineering, construction and other costs incurred to the estimated net realizable value of the land and building.
7. Discontinued Operations
The summary of discontinued operations below includes Consumer Adhesives’ results through August 2001, the date of the Consumer Adhesives Sale:
| 2001 | |||
Net sales | $ | 106,307 | |
Income before income taxes | 17,404 | ||
Income tax expense | 5,600 | ||
Income from discontinued operations | $ | 11,804 | |
Proceeds from the Consumer Adhesives sale were $94,120, net of cash sold with the business, resulting in a pre-tax gain of $132,275, which was recorded in Paid-in capital due to the affiliated nature of the transaction. See Note 1.
8. Comprehensive Income
Comprehensive income includes the following items:
| 2003 | 2002 | 2001 | |||||||||
Net income (loss) | $ | 22,976 | $ | (36,583 | ) | $ | (124,800 | ) | |||
Foreign currency translation adjustments | 31,614 | (14,856 | ) | (12,649 | ) | ||||||
Reclassification adjustments | — | — | 5,800 | ||||||||
Cumulative effect of change in accounting principle | — | — | (3,300 | ) | |||||||
Derivative activity | — | 730 | 2,570 | ||||||||
Minimum pension liability (see Note 12) | 5,830 | (17,075 | ) | (66,580 | ) | ||||||
| $ | 60,420 | $ | (67,784 | ) | $ | (198,959 | ) | ||||
F-136
Table of Contents
BORDEN CHEMICAL, INC.
Notes to Consolidated Financial Statements—(Continued)
(Dollars in thousands except per share data)
The foreign currency translation adjustments in 2003 primarily relate to favorable exchange rates in Canada, Latin America and Australia. In 2002, the foreign currency translation adjustments primarily relate to unfavorable exchange rates in Latin America. The 2001 foreign currency translation adjustments primarily relate to unfavorable exchange rates in Latin America and Canada.
The 2001 reclassification adjustment reflects the accumulated translation adjustment recognized on the sale of the Company’s operations in Ecuador.
The cumulative effect of change in accounting principle and derivative activity represents the impact of the adoption of SFAS No. 133, “Accounting for Derivative Instruments and Hedging Activities,” on January 1, 2001. The Company recorded a pre-tax initial transition adjustment to Accumulated other comprehensive income of $5,200 of which $1,330 and $3,870 was reclassified into earnings for the year ended December 31, 2002 and 2001, respectively.
The components of Accumulated other comprehensive income as of December 31, 2003 and 2002 are as follows:
| 2003 | 2002 | |||||||
Cumulative foreign currency translation adjustments | $ | (49,923 | ) | $ | (81,537 | ) | ||
Minimum pension liability, net of tax | (78,270 | ) | (84,100 | ) | ||||
| $ | (128,193 | ) | $ | (165,637 | ) | |||
9. Investments in Affiliates
The Company had no continuing investments in affiliates at December 31, 2003 and 2002.
The Company sold a common stock equity investment in 2001 for $64,141. Of the total proceeds, $55,187 was received from BHI as part of the Corporate Reorganization (see Note 3), and the related pre-tax gain of $15,797 was recorded in Paid-in capital due to the affiliated nature of the transaction. The remaining $8,954 was received from sales to third parties, and a related gain of $4,400 was reflected in the 2001 Consolidated Statement of Operations as Gain on the sale of assets.
In 2001, the Company wrote-off its $10,000 investment in WKI preferred stock, $7,000 of a loan receivable from WKI and its remaining $10,000 investment in BCP Management, Inc. (“BCPM”), a former subsidiary of the Company. The write-offs are reflected in Investment write-downs and other charges in the 2001 Consolidated Statement of Operations.
BCPM filed for protection under Chapter 11 of the United States Bankruptcy Code, in the United States Bankruptcy Court for the District of Delaware on March 22, 2002. As a result of the bankruptcy of BCPM, the Company no longer consolidated BCPM in its Consolidated Financial Statements. There was no impact on previously reported amounts of net (loss) income as a result of the deconsolidation. The Company’s investment in BCPM was written-off in 2001, as described above. In the first quarter of 2003, the assets of BCPM were transferred to a liquidating agent, and the Company’s ownership interest was extinguished.
F-137
Table of Contents
BORDEN CHEMICAL, INC.
Notes to Consolidated Financial Statements—(Continued)
(Dollars in thousands except per share data)
10. Debt and Lease Obligations
Debt outstanding at December 31, 2003 and 2002 is as follows:
| 2003 | 2002 | |||||||||||
| Long-Term | Due Within One Year | Long-Term | Due Within One Year | |||||||||
9.2% debentures due 2021 | $ | 114,800 | $ | 114,800 | ||||||||
7.875% debentures 2023 | 246,782 | 246,782 | ||||||||||
Sinking fund debentures: | ||||||||||||
8 3/8% due 2016 | 78,000 | 78,000 | ||||||||||
9 1/4% due 2019 | 47,295 | 47,295 | ||||||||||
Industrial Revenue Bonds (at an average rate of 3.1% in 2003 and 1.6% in 2002) | 34,000 | 34,885 | ||||||||||
Other (at an average rate of 8.1% in 2003 and 13.8% in 2002) | 9,089 | $ | 2,221 | 1,525 | ||||||||
Total current maturities of long-term debt | 2,221 | |||||||||||
Short-term debt (primarily foreign bank loans at an average rate of 4.8% in 2003 and 10.7% in 2002) | — | 5,946 | — | $ | 2,779 | |||||||
Total debt | $ | 529,966 | $ | 8,167 | $ | 523,287 | $ | 2,779 | ||||
The Company entered into a three-year asset based revolving credit facility dated September 23, 2002 (the “Credit Facility”) which provides for a maximum borrowing of $175,000, including letters of credit (“LOC”). The Credit Facility replaced an uncommitted LOC facility (discussed below) and the prior $250,000 credit facility that expired on July 13, 2002.
The Credit Facility is secured with inventory and accounts receivable in the United States, Canada and the U.K., a portion of property and equipment in Canada and the U.K. and the stock of certain subsidiaries. Maximum borrowing allowable under the Credit Facility is determined monthly and is based upon specified percentages of eligible accounts receivable, inventory and fixed assets. The Credit Facility contains restrictions on dividends, limitations on borrowings from affiliates ($30,000), capital expenditures ($68,000 in 2004) and payment of management fees ($5,000 per year). It also has a minimum trailing EBITDA twelve-month fixed charge coverage ratio requirement (as defined) of 1.5 to 1.0 if aggregate availability is less than $25,000, 1.25 to 1.0 if aggregate availability is between $25,000 and $50,000 and 1.1 to 1.0 if aggregate availability is between $50,000 and $75,000. There are no fixed coverage ratio requirements when aggregate availability exceeds $75,000. As of December 31, 2003, the maximum borrowing allowable under the Credit Facility was approximately $144,000, of which approximately $98,000, net of LOCs, was unused and available; therefore, the Company had no fixed charge coverage ratio requirements.
Under the terms of the Credit Facility the Company has the ability to borrow funds at either the prime rate plus an applicable margin (“the prime rate option”) or at LIBOR plus an applicable margin. The Company must designate which option it chooses at the time of the borrowing. Currently the applicable margin for any prime rate borrowing is 75 basis points and for any LIBOR borrowing is 225 basis points. As of December 31, 2003 there were borrowings of $220 outstanding under the prime rate option, equivalent to 6.0%. For LOCs issued under the Credit Facility, the Company pays a per annum fee equal to the LIBOR applicable margin, or 2.25%, plus a fronting fee of .125%. In addition, the Company pays a .50% per annum fee on the amount of the
F-138
Table of Contents
BORDEN CHEMICAL, INC.
Notes to Consolidated Financial Statements—(Continued)
(Dollars in thousands except per share data)
revolving loan commitment less any borrowings or outstanding LOCs. The Company incurred commitment fees of $557 in 2003 related to the Credit Facility.
Under an uncommitted LOC facility, the Company provided cash collateral equivalent to 101% of LOCs outstanding which was classified as Restricted cash on the Consolidated Balance Sheet as of December 31, 2002. In early July 2003, the Company completed the process of transferring all the LOCs under this facility to the Credit Facility.
The Company’s Australian subsidiary entered into a five-year asset-backed credit facility in the fourth quarter of 2003 (the “Australian facility”), which provides for a maximum borrowing of AUD$19,900, or approximately $15,000. At December 31, 2003, outstanding debt under this facility was $12,178, of which $7,670 is classified as long-term. In addition, there were approximately $400 of outstanding LOCs under the facility. The Australian facility provided the funding for the Fentak acquisition made in the fourth quarter of 2003 (see Note 5) and is secured by mortgages on the fixed assets of the Australian business and the stock of Australian subsidiaries. This facility includes a fixed rate facility used for the acquisition, as well as a revolver. The Australian facility contains restrictions relative to the Australian businesses on dividends, the sale of assets and additional borrowings. The Australian facility also contains financial covenants applying to the Australian subsidiaries including current ratio, interest coverage, debt service coverage and leverage. The fixed portion of the Australian facility requires minimum quarterly principal reductions totaling AUD$450 (approximately $330). The Australian facility requires semi-annual principal reductions based on a portion of excess cash as defined in the agreement. As of December 31, 2003, of the maximum borrowing allowable under the Australian Facility, AUD$3,178 (approximately $2,400) was unused and available.
Additional international credit facilities provide availability totaling approximately $29,900. Of this amount, approximately $15,900 (net of LOCs and other guarantees of approximately $7,700 and $2,300 of other draws) was available to fund working capital needs and capital expenditures at December 31, 2003. Of the total $2,310 of outstanding debt, $1,419 was classified as long-term. There is an additional $4,000 available for which usage is restricted to capital investments and for foreign currency hedging. While these facilities are primarily unsecured, portions of the lines are secured by equipment and with $1,442 of cash. The Company guarantees up to $6,700 of the debt of one of its Brazilian subsidiaries, included in these facilities.
The Company and HAI had affiliated borrowing arrangements with Borden Foods Holding Corporation (“Foods”) during 2003. See Note 20.
HAI entered into a three-year asset based revolving credit facility on January 28, 2004, which provides for a maximum borrowing of $20,000 (the “HAI facility”). The HAI facility replaced the affiliated loan agreement with Foods. The HAI facility is secured with inventory, accounts receivable and property and equipment of HAI. Maximum borrowing allowable under the HAI facility is based upon specific percentages of eligible accounts receivable and inventory. The HAI facility provides up to $2,000 for LOCs. The HAI facility contains restrictions relative to HAI on dividends, affiliate transactions, minimum availability ($2,000), additional debt and capital expenditures ($2,000 in 2004). In addition, HAI is required to maintain a minimum trailing twelve-month debt coverage ratio of 1.5 to 1.0.
The Company finances certain insurance premiums outside of the Credit Facility. Short-term borrowings include $2,548 and $975 related to this arrangement at December 31, 2003 and 2002, respectively.
On October 1, 2003, the Company exercised its option to redeem, at par, the remaining $885 of County of Maricopa Industrial Revenue Bonds (“IRBs”). In October 2003, the Company converted the $34,000 Parish of
F-139
Table of Contents
BORDEN CHEMICAL, INC.
Notes to Consolidated Financial Statements—(Continued)
(Dollars in thousands except per share data)
Ascension IRBs to a fixed interest rate and, by doing so, eliminated the requirement to maintain a backup letter of credit of approximately $34,500. The elimination of this LOC increased availability under the Credit Facility.
During the fourth quarter of 2002, the Company repurchased $7,368 of the outstanding publicly held bonds for $4,510 plus fees. A $2,741 gain on the extinguishment of the bonds was recognized in 2002 and is included in Other non-operating income.
Aggregate maturities of total debt and minimum annual rentals under operating leases at December 31, 2003, for the Company are as follows:
Year | Debt | Minimum Rentals Under Operating Leases | ||||
2004 | $ | 8,167 | $ | 12,120 | ||
2005 | 2,219 | 10,205 | ||||
2006 | 1,841 | 7,882 | ||||
2007 | 1,420 | 5,961 | ||||
2008 | 3,609 | 4,302 | ||||
2009 and beyond | 520,877 | 3,789 | ||||
| $ | 538,133 | $ | 44,259 | |||
Rental expense amounted to $14,595, $14,399 and $19,566 in 2003, 2002 and 2001, respectively.
11. Income Taxes
Comparative analysis of the Company’s income tax benefit related to continuing operations follows:
| Current | Deferred | |||||||||||||||||||||
| 2003 | 2002 | 2001 | 2003 | 2002 | 2001 | |||||||||||||||||
Federal | $ | (9,899 | ) | $ | (29,479 | ) | $ | (363 | ) | $ | 4,662 | $ | 12,040 | $ | (25,800 | ) | ||||||
State & Local | (737 | ) | (380 | ) | (4,365 | ) | 566 | 187 | (805 | ) | ||||||||||||
Foreign | (246 | ) | 11,574 | (222 | ) | 995 | 3,796 | 722 | ||||||||||||||
| $ | (10,882 | ) | $ | (18,285 | ) | $ | (4,950 | ) | $ | 6,223 | $ | 16,023 | $ | (25,883 | ) | |||||||
In 2001, the Company’s income tax expense related to discontinued operations was $5,600 (see Note 7). The Company’s income tax expense from the gain on disposal of discontinued operations was $37,428 in 2001, which is reflected as a reduction to shareholders’ equity due to the affiliated nature of the transaction (see Note 1).
F-140
Table of Contents
BORDEN CHEMICAL, INC.
Notes to Consolidated Financial Statements—(Continued)
(Dollars in thousands except per share data)
A reconciliation of the Company’s difference between income taxes related to continuing operations computed at Federal statutory tax rates and provisions for income taxes is as follows:
| 2003 | 2002 | 2001 | ||||||||||
Income taxes computed at Federal statutory tax rate | $ | 6,411 | $ | (3,157 | ) | $ | (58,602 | ) | ||||
State tax provision, net of Federal benefits | (111 | ) | (193 | ) | (5,842 | ) | ||||||
Foreign tax differentials | (813 | ) | 3,502 | 1,187 | ||||||||
Foreign source income also subject to U.S. taxation | 9,324 | 1,777 | 12,397 | |||||||||
Losses and other expenses not deductible for tax | 373 | (863 | ) | 2,723 | ||||||||
Impairment of non-deductible goodwill | — | — | 31,692 | |||||||||
Valuation allowance | 5,401 | 16,672 | — | |||||||||
Elimination of deferred tax liabilities of BCPM | (1,624 | ) | — | — | ||||||||
Capital loss on sale of Melamine | (19,936 | ) | — | — | ||||||||
Adjustment of prior estimates and other | (3,684 | ) | (20,000 | ) | (14,388 | ) | ||||||
Income tax benefit | $ | (4,659 | ) | $ | (2,262 | ) | $ | (30,833 | ) | |||
The 2003 consolidated rate reflects a benefit of $19,936 from the sale of the stock of Melamine in 2003. The tax basis of the stock exceeded the tax basis of the assets and this additional basis was not recognized until the stock sale was completed in 2003. This benefit is a capital loss carryforward that can only be used against capital gains; therefore, a valuation reserve was established for the full amount of this benefit. The 2003 consolidated rate also reflects a reduction of the deferred tax valuation reserve in the amount of $14,534 related to benefits which the Company now believes are more likely than not to be realized. The 2003 tax rate also reflects the elimination of $1,624 of deferred tax liabilities associated with the BCPM bankruptcy. In addition, reserves for prior years’ Canadian and U.S. tax audits were reduced by $3,997 as a result of preliminary settlements of certain matters in the fourth quarter of 2003. The effective rate also reflects additional income tax expense of $9,324 on foreign dividend income and on deemed dividend income related to loans and guarantees from foreign subsidiaries.
The 2002 consolidated tax rate reflects a valuation allowance in the amount of $16,672 recorded against the benefit of certain deferred interest expense deductions, which are subject to usage limitations by the Internal Revenue Service (“IRS”), that are no longer more likely than not to be used. This expense is offset by the reduction of a $20,000 reserve for U.S. Federal income tax audits reflecting preliminary settlement of certain matters for the years 1998 and 1999 that were resolved in 2002.
The 2001 consolidated tax rate includes a $31,692 effect of the non-deductible impairment of the fixed assets and goodwill related to the 2001 shutdown of Melamine. Additionally, tax expense of $12,397 is reflected in the tax rate for the impact of earnings related to the expected sale of foreign businesses that are no longer expected to be permanently reinvested in foreign locations, as well as the inability to use foreign tax credits associated with those earnings due to usage limitations. Offsetting this charge was a tax benefit of $14,388 relating to the settlement of U.S. Federal income tax audits for the years 1987 to 1991 that were finalized in 2001.
F-141
Table of Contents
BORDEN CHEMICAL, INC.
Notes to Consolidated Financial Statements—(Continued)
(Dollars in thousands except per share data)
The domestic and foreign components of the Company’s Income (loss) from continuing operations before income taxes are as follows:
| 2003 | 2002 | 2001 | ||||||||||
Domestic | $ | (30,706 | ) | $ | (42,929 | ) | $ | (165,478 | ) | |||
Foreign | 49,023 | 33,909 | (1,959 | ) | ||||||||
| $ | 18,317 | $ | (9,020 | ) | $ | (167,437 | ) | |||||
The tax effects of the Company’s significant temporary differences, and loss and credit carryforwards, which comprise the deferred tax assets and liabilities at December 31, 2003 and 2002, are as follows:
| 2003 | 2002 | |||||||
Assets | ||||||||
Non-pension postemployment benefit obligations | $ | 46,261 | $ | 52,411 | ||||
Accrued and other expenses | 75,493 | 91,332 | ||||||
Loss and credit carryforwards | 162,308 | 169,302 | ||||||
Pension liability | 23,448 | 23,071 | ||||||
Gross deferred tax assets | 307,510 | 336,116 | ||||||
Valuation allowance | (81,992 | ) | (89,321 | ) | ||||
| 225,518 | 246,795 | |||||||
Liabilities | ||||||||
Property, plant, equipment and intangibles | 77,558 | 76,107 | ||||||
Unrepatriated earnings of foreign subsidiaries | 30,374 | 30,374 | ||||||
Foreign property, plant, equipment and other | 9,060 | 7,275 | ||||||
Deferred gain on sale of a partnership interest | — | 17,264 | ||||||
Prepaid expenses | 2,406 | 293 | ||||||
Gross deferred tax liabilities | 119,398 | 131,313 | ||||||
Net deferred tax asset | $ | 106,120 | $ | 115,482 | ||||
The Company’s net deferred tax asset at December 31, 2003 was $106,120, which is the net of $140,518 of deferred tax assets, a $4,024 current deferred tax liability and a long-term deferred tax liability of $30,374. Of this amount, $139,336 represents net domestic deferred tax assets related to future tax benefits. The Company’s deferred tax asset related to loss and credit carryforwards, net of valuation allowance is $80,316. This $80,316 includes net operating loss carryforwards and future deductions of $43,369 for U.S. federal tax purposes, which will begin expiring in 2021. This amount also includes minimum tax credits of $33,132, which do not expire, and other available carryforwards of $3,815, with various expiration dates.
The Company regularly assesses the realizability of the deferred tax assets to determine whether it is more likely than not that some portion of the deferred tax assets will not be realized. Valuation reserves are adjusted to reflect this assessment. The Company considers projected future taxable income, the length of the period during which the deferred tax asset can be utilized and tax planning strategies in making this assessment.
In 2003 the Company reduced its deferred tax valuation reserve by $14,534. This change in our estimate was mainly based on the 2003 amendment to the Total Family Protection Plan which eliminated $88,200 of
F-142
Table of Contents
BORDEN CHEMICAL, INC.
Notes to Consolidated Financial Statements—(Continued)
(Dollars in thousands except per share data)
future obligations. Deferred tax assets of approximately $30,000 will be absorbed as the benefit associated with this decrease in future obligations is amortized over the next 9 years. In addition, $34,000 of additional taxable income will be generated by the guarantees from foreign subsidiaries discussed above. Management believes this additional future taxable income provides the capacity to reduce the deferred tax valuation reserve accordingly. In management’s judgment, the net deferred tax assets at December 31, 2003 are more likely than not to be realized.
Credit carryforwards and valuation allowances both decreased from 2002 principally due to the expiration of foreign tax credits and the valuation allowances previously established against those credits. Loss carryforwards increased from 2002 due to the generation of additional net operating loss carryforwards in 2003.
At December 31, 2003, the Company has $35,000 accrued for probable tax liabilities. This amount is recorded in income taxes payable.
The IRS has substantially completed audits of all years through 1999, and unresolved issues for the years 1994-1999 are currently under discussion with the Appeals Office of the IRS and the Competent Authority group of the U.S. Treasury Department. These unresolved issues generally include appropriateness of: expense allocations and royalty charges between U.S. and foreign jurisdictions, compensation excise tax assessments, certain carryback claims filed by the Company and the treatment of various business sale transactions undertaken by the Company during the period. The IRS has substantially completed the audit of tax years 2000-2001, and the results have been discussed and agreed upon by the Company. The years 2002 and 2003 remain open for examination.
The 2003 consolidated tax rate reflects the reversal of $3,997 of the aforementioned tax reserves. This reversal reflects the settlement of potential U.S. Federal, state and local tax matters, an adjustment of foreign tax credits available for future use, Canadian audit issues related to the divestiture of operating businesses in prior years and the settlement of other audit related tax issues offset by the utilization of available tax assets.
The Canada Revenue Agency is currently auditing the Company’s Canadian subsidiary for the period 1993-1994. The years 1995-2003 remain open for inspection and examination by various Canadian taxing authorities. Deposits have been made to offset any probable additional taxes related to the divestiture of Canadian operating businesses. Since 1995, the Company has divested its Foods, Consumer Adhesives, and wallcoverings businesses, all of which had operations in Canada.
The Company and some of its affiliates have historically operated in over forty states across the U.S. Since 1995, the Company has divested a significant number of its businesses and generated significant taxable gains from these sales and divestitures. The Company has also utilized certain affiliated legal entities for the purposes of licensing its intellectual properties to related and unrelated parties and for providing loans and other financing for operations. Reserves have been established to provide for probable additional tax liabilities related to these transactions. As the various state and city taxing jurisdictions continue with their audit/examination programs, and as the corresponding audit years are finalized at the U.S. federal audit level, the Company will adjust its reserves to reflect these settlements.
The Company has not recorded income taxes applicable to undistributed earnings of foreign subsidiaries that are permanently reinvested in foreign operations. Undistributed earnings permanently reinvested amounted to approximately $173,400 at December 31, 2003.
F-143
Table of Contents
BORDEN CHEMICAL, INC.
Notes to Consolidated Financial Statements—(Continued)
(Dollars in thousands except per share data)
12. Pension and Retirement Savings Plans
Most U.S. employees of the Company are covered under a non-contributory defined benefit plan (the “U.S. Plan”). The U.S. Plan provides benefits for salaried employees based on eligible compensation and years of credited service and for hourly employees based on years of credited service. Certain employees in other countries are covered under other contributory and non-contributory foreign defined benefit plans that, in the aggregate, are insignificant and are included in the data presented herein.
Following is a rollforward of the assets and benefit obligations of the Company’s defined benefit plans. The Company uses a September 30 measurement date for its plans.
| 2003 | 2002 | |||||||
Change in Benefit Obligation | ||||||||
Benefit obligation at beginning of year | $ | 263,364 | $ | 288,107 | ||||
Service cost | 2,316 | 3,844 | ||||||
Interest cost | 15,228 | 19,148 | ||||||
Actuarial losses | 12,038 | 4,693 | ||||||
Foreign currency exchange rate changes | 1,165 | 84 | ||||||
Benefits paid | (34,403 | ) | (28,942 | ) | ||||
Plan amendments | — | 330 | ||||||
Acquisitions/divestitures | (325 | ) | — | |||||
Settlements/curtailments | (304 | ) | (23,900 | ) | ||||
| 259,079 | 263,364 | |||||||
Change in Plan Assets | ||||||||
Fair value of plan assets at beginning of year | 190,831 | 260,540 | ||||||
Actual return on plan assets | 30,683 | (18,000 | ) | |||||
Foreign currency exchange rate changes | 805 | 34 | ||||||
Employer contribution | 1,770 | 1,099 | ||||||
Benefits paid | (34,403 | ) | (28,942 | ) | ||||
Settlements/curtailments | — | (23,900 | ) | |||||
Fair value of plan assets at end of year | 189,686 | 190,831 | ||||||
Plan assets less than benefit obligation | (69,393 | ) | (72,533 | ) | ||||
Unrecognized net actuarial loss | 122,261 | 131,658 | ||||||
Unrecognized initial transition gain | 21 | 13 | ||||||
Unrecognized prior service cost | 1,348 | 2,534 | ||||||
Net amount recognized | $ | 54,237 | $ | 61,672 | ||||
Amounts recognized in the balance sheets, after reclassification of the prepaid pension asset to reflect a minimum pension liability adjustment, consist of:
| 2003 | 2002 | |||||||
Accrued benefit liability | $ | (67,526 | ) | $ | (70,216 | ) | ||
Intangible asset | 1,348 | 2,504 | ||||||
Accumulated other comprehensive income | 120,415 | 129,384 | ||||||
Net amount recognized | $ | 54,237 | $ | 61,672 | ||||
F-144
Table of Contents
BORDEN CHEMICAL, INC.
Notes to Consolidated Financial Statements—(Continued)
(Dollars in thousands except per share data)
The weighted average rates used to determine benefit obligations for the Company were as follows:
| 2003 | 2002 | |||||
Discount rate | 5.8 | % | 6.5 | % | ||
Rate of increase in future compensation levels | 4.0 | % | 4.2 | % |
The following summarizes defined benefit pension plans with an accumulated benefit obligation in excess of plan assets:
| 2003 | 2002 | |||||
Projected benefit obligation | $ | 259,079 | $ | 263,364 | ||
Accumulated benefit obligation | 256,972 | 259,655 | ||||
Fair value of plan assets | 189,686 | 190,831 | ||||
While the Company reports the entire liability for the U.S. Plan, which is sponsored by the Company, its participants also include certain Foods’ former associates and Consumer Adhesives’ associates. Foods and Consumer Adhesives reimbursed the Company for the expense associated with their respective participants in the U.S. plan. Therefore, the tables summarizing the pension activities for the Company’s defined benefit pension plans include the liabilities and assets relating to these businesses. However, the expense table excludes the expense relating to Foods and Consumer Adhesives. Expense reimbursements received by the Company from Foods and Consumer Adhesives totaled $1,061, $1,012 and $952 for 2003, 2002 and 2001, respectively. The Company does not anticipate any future reimbursements from either Foods or Consumer Adhesives.
Following are the components of net pension expense recognized by the Company for the years ended December 31:
| 2003 | 2002 | 2001 | ||||||||||
Service cost | $ | 2,101 | $ | 3,602 | $ | 3,352 | ||||||
Interest cost on projected benefit obligation | 14,803 | 16,727 | 18,701 | |||||||||
Expected return on assets | (15,481 | ) | (19,386 | ) | (22,925 | ) | ||||||
Amortization of prior service cost | 386 | 395 | 436 | |||||||||
Amortization of initial transition asset | 10 | 12 | (122 | ) | ||||||||
Recognized actuarial loss | 7,116 | 4,102 | 3,706 | |||||||||
Settlement/curtailment loss | 411 | 13,600 | 16,300 | |||||||||
Net pension expense | $ | 9,346 | $ | 19,052 | $ | 19,448 | ||||||
The weighted average rates used to determine net pension expense for the Company were as follows:
| 2003 | 2002 | 2001 | |||||||
Discount rate | 6.5 | % | 7.2 | % | 7.7 | % | |||
Rate of increase in future compensation levels | 4.2 | % | 4.5 | % | 4.7 | % | |||
Expected long-term rate of return on plan assets | 8.2 | % | 8.3 | % | 8.7 | % |
The 2003 curtailment loss includes a $710 charge for the U.S. Plan, partially offset by a curtailment gain of $299 on an international plan. During 2002, the Company recognized a settlement charge of $13,600 related to
F-145
Table of Contents
BORDEN CHEMICAL, INC.
Notes to Consolidated Financial Statements—(Continued)
(Dollars in thousands except per share data)
lump sum payments made by the U.S. Plan. During 2001, the Company recorded settlement and curtailment charges of $10,700 relating to the partial settlement of U.S. Plan liabilities for Foods and an additional $5,600 settlement for other lump sum payments made by the U.S. Plan.
In determining the expected overall long-term rate of return on assets, the Company takes into account the rates on long-term debt investments held within the portfolio, as well as expected trends in the equity markets. Peer data and historical returns are also reviewed to confirm that the Company’s assumptions are reasonable.
The Company’s investment strategy for defined benefit pension plan assets is to maximize the long-term return on plan assets using a mix of equities and fixed income investments and accepting a prudent level of risk. Risk tolerance is established through careful consideration of plan liabilities, plan funded status and expected timing of future cash flow requirements. The investment portfolio contains a diversified blend of equity and fixed-income investments. Furthermore, equity investments are diversified across U.S. and non-U.S. stocks, as well as growth, value and small and large capital investments. Investment risk and performance is measured and monitored on an ongoing basis through quarterly investment portfolio reviews, annual liability measurements and periodic asset/liability studies.
Following is a summary of actual 2003 and 2002, at the measurement date, and target 2004 allocations of Plan assets by investment type:
| Actual | Target | ||||||||
| 2003 | 2002 | 2004 | |||||||
Fixed income securities | 49 | % | 43 | % | 40 | % | |||
Equity securities | 31 | % | 32 | % | 60 | % | |||
Cash and short-term investments | 20 | % | 25 | % | — | ||||
| 100 | % | 100 | % | 100 | % | ||||
The Company recently reviewed its target allocation of plan assets based on projections and expected timing of future benefit payments. Based on this review the Company has set a new allocation target in 2004 of 60% equities and 40% debt. The re-allocation process is expected to be completed by the end of the second quarter of 2004. The Company’s pension portfolio does not include any significant holdings in real estate.
The Company expects to make contributions totaling $870 to its defined benefit plans in 2004.
The Company has been informed by the IRS that cash balance plans may be required to be amended because of recent ERISA rulings that found some cash balance plans to be discriminatory. The IRS indicated that the U.S. Plan should continue to operate as currently designed until new guidance is available. There is insufficient information to assess any potential impact to the Company of the ERISA ruling at this time.
Most employees not covered by the Company’s U.S. and foreign defined benefit pension plans are covered by collective bargaining agreements, which are generally effective for five years. Under Federal pension law, there would be continuing liability to these pension trusts if the Company ceased all or most participation in any such trust, and under certain other specified conditions. The Consolidated Statements of Operations include charges of $472, $504 and $367 in 2003, 2002 and 2001, respectively, for payments to pension trusts on behalf of employees not covered by the Company’s plans.
F-146
Table of Contents
BORDEN CHEMICAL, INC.
Notes to Consolidated Financial Statements—(Continued)
(Dollars in thousands except per share data)
The Company also provides a defined contribution plan to its U.S. employees (the “Retirement Savings Plan”). Eligible salaried and hourly employees may contribute up to 5% of their pay (7% for certain longer service salaried employees), as basic contributions to the plan. The Company contributes monthly to the plan an amount equal to at least 50% and up to 100% of basic contributions. The Company has the option to make additional contributions based upon financial performance. Charges to operations for matching contributions under the Retirement Savings Plan in 2003, 2002 and 2001 totaled $6,560, $5,647 and $5,289 respectively.
13. Non-Pension Postretirement Benefit
The Company provides certain health and life insurance benefits for eligible domestic and Canadian retirees and their dependents. The cost of postretirement benefits is accrued during employees’ working careers. Domestic participants who are not eligible for Medicare are generally provided with the same medical benefits as active employees. Until September 2003, participants who were eligible for Medicare were provided with supplemental benefits. In September 2003, the plan was amended, as is discussed below. Canadian participants are provided with supplemental benefits to the national healthcare plan in Canada. The domestic postretirement medical benefits are contributory; the Canadian medical benefits are non-contributory. The domestic and Canadian postretirement life insurance benefits are non-contributory. Benefits are funded on a pay-as-you-go basis.
In 2003, the Company amended its Total Family Protection Plan such that, effective September 1, 2003, medical benefits are no longer provided to the Company’s retirees and their dependents who are over age 65. The Company has made an arrangement with a major benefits provider to offer affected retirees and their dependents continued access to medical and prescription drug coverage, including coverage for pre-existing conditions. The Company is subsidizing a portion of the cost of coverage for affected retirees and dependents through December 2004 to assist retirees’ transition to alternative medical coverage. The Company has reserved the right to continue, terminate or reduce the subsidy provided to affected retirees and dependents in the future. This subsidy will be reviewed for periods after December 2004. As a result of these actions, based on current actuarial estimates and assumptions, the Company’s liability related to providing post retirement medical benefits has been reduced by approximately $88,000. The Company’s unrecognized prior service cost has been adjusted for the impact of the amendment, and the adjustment is being amortized over the estimated remaining years of service of approximately nine years.
On December 8, 2003, the Medicare Prescription Drug, Improvement and Modernization Act of 2003 (the “Act”) was signed into law. The Act introduces a prescription drug benefit under Medicare (Medicare Part D) that provides several options for Medicare eligible participants and employers, including a federal subsidy to companies that elect to provide a retiree prescription drug benefit which is at least actuarially equivalent to Medicare Part D. The Act provides for a two-year transitional period to allow for, among other items, the possibility that companies may amend existing plans. There are significant uncertainties regarding the eventual regulations required to implement the Act, as well as the Act’s overall affect on plan participant’s coverage choices and the related impact on their health care costs. As such, the effects of the Act are not reflected in the accumulated postretirement benefit obligation as of December 31, 2003 or in the 2003 net periodic postretirement benefit cost. Once the regulations regarding the implementation of the Act and FASB’s authoritative guidance on the accounting for the federal subsidy is issued, the Company may be required to change its previously reported information. The Company is currently evaluating the provisions of the Act and its potential impact to the Company’s postretirement medical plans.
F-147
Table of Contents
BORDEN CHEMICAL, INC.
Notes to Consolidated Financial Statements—(Continued)
(Dollars in thousands except per share data)
Following is a rollforward of the changes in the non-pension postretirement benefit obligations of the Company for the years ended December 31. The Company uses a measurement date of September 30.
| 2003 | 2002 | |||||||
Change in Benefit Obligation | ||||||||
Benefit obligation at beginning of year | $ | 131,609 | $ | 128,499 | ||||
Service cost | 72 | 64 | ||||||
Interest cost | 3,938 | 8,822 | ||||||
Contributions by plan participants | 2,176 | 2,797 | ||||||
Actuarial (gains) losses | (4,683 | ) | 5,240 | |||||
Plan amendments | (88,168 | ) | — | |||||
Benefits paid | (12,889 | ) | (13,818 | ) | ||||
Foreign Exchange | 150 | 5 | ||||||
Benefits obligation at end of year | 32,205 | 131,609 | ||||||
Unrecognized net actuarial gain | 3,809 | 496 | ||||||
Unrecognized prior service benefit | 86,830 | 7,214 | ||||||
Accrued postretirement obligation at end of year | $ | 122,844 | $ | 139,319 | ||||
The weighted average rates used to determine benefit obligations for the Company were as follows:
| 2003 | 2002 | |||||
Discount rate | 5.8 | % | 6.5 | % |
The net postretirement (benefit) expense table excludes the expense related to Foods for 2002, as Foods reimbursed the Company $509 for the expense related to Foods’ participants in that year. Foods reimbursed the Company in 2001 to assume their remaining postretirement liability following the sale of its businesses.
Following are the components of net postretirement (benefit) expense recognized by the Company for 2003, 2002 and 2001:
| 2003 | 2002 | 2001 | ||||||||||
Service cost | $ | 72 | $ | 64 | $ | 44 | ||||||
Interest cost on projected benefit obligation | 3,938 | 8,249 | 7,884 | |||||||||
Amortization of prior service cost | (8,552 | ) | (3,294 | ) | (8,923 | ) | ||||||
Recognized actuarial gain | (122 | ) | (1 | ) | (523 | ) | ||||||
Settlement/curtailment gain | — | — | (487 | ) | ||||||||
Net postretirement (benefit) expense | $ | (4,664 | ) | $ | 5,018 | $ | (2,005 | ) | ||||
The weighted average rates used to determine net postretirement (benefit) expense for the Company were as follows:
| 2003 | 2002 | 2001 | |||||||
Discount rate | 6.5 | % | 7.3 | % | 7.7 | % |
F-148
Table of Contents
BORDEN CHEMICAL, INC.
Notes to Consolidated Financial Statements—(Continued)
(Dollars in thousands except per share data)
Following are the assumed health care cost trend rates at December 31, which are no longer significant due to the 2003 plan amendment.
| 2003 | 2002 | |||||
Health care cost trend rate assumed for next year—pre-age 65 | 5.25 | % | 5.25 | % | ||
Health care cost trend rate assumed for next year—post-age 65 | 7.75 | % | 8.25 | % | ||
Rate to which the cost trend rate is assumed to decline (the ultimate trend rate) | 5.25 | % | 5.25 | % | ||
Year that the rate reaches the ultimate trend rate | 2008 | 2008 |
A one-percentage-point change in the assumed health care cost trend rates would not have a material impact on the Company.
| 1% increase | 1% decrease | ||||||
Effect on total service cost and interest cost components | $ | 9 | $ | (10 | ) | ||
Effect on postretirement benefit obligation | 145 | (150 | ) | ||||
Also included in the Consolidated Balance Sheets at December 31, 2003 and 2002 are other postemployment benefit obligations of $5,879 and $6,065, respectively.
14. Shareholders’ Deficit
Common Stock and Warrants
The Company has 200,895,628 shares of $0.01 par value common stock issued and outstanding and 300,000,000 shares authorized. At December 31, 2003, management held a total of 1,920,634 common shares of the Company, including 1,587,301 shares of restricted stock granted during 2002, which become unrestricted on the third anniversary of the grant date. During 2002, the Company sold 333,333 shares to management at the estimated fair value of $2.25 per share. In 2002, the Company repurchased shares and retired warrants at amounts greater than fair market value and recognized compensation expense of $487.
Preferred Stock
The Company is authorized to issue up to 100,000,000 shares of Series A Preferred Stock. There were no shares outstanding in 2003 or 2002, and the Company currently has no plans to issue Preferred shares. In 2001, the Company had 24,574,751 shares of Preferred Stock issued to BHI. Each share had a liquidation preference of $25.00 and was entitled to cumulative dividends at an annual rate of 12% payable quarterly in arrears. BHI contributed all of the outstanding Preferred Stock of $620,922, including accumulated dividends of $6,553 to the Company as a capital contribution in 2001 (see Note 3). During 2001, the Company declared preferred stock cash dividends of $61,846.
Other Shareholders’ Equity
There were no common stock dividends declared in 2003 and 2002. The Company declared common stock cash dividends of $36,434 in 2001. The dividends were recorded as a charge to Paid-in capital to reflect a return of capital to BHI.
At December 31, 2003, the Company held $404,817 of notes receivable from BHI, which accrue interest at 12% per year, payable quarterly, and mature on September 29, 2005. The notes were received from affiliates as
F-149
Table of Contents
BORDEN CHEMICAL, INC.
Notes to Consolidated Financial Statements—(Continued)
(Dollars in thousands except per share data)
proceeds from the 1996 sales of businesses and options to purchase businesses formerly owned by the Company. The Receivable from parent, reflected as a reduction in the Consolidated Statements of Shareholders’ Deficit, includes accrued interest of $107,277, $58,699 and $0 related to these notes receivable at December 31, 2003, 2002 and 2001. Paid-in capital includes the related net of tax interest income of $31,576, $38,154 and $24,674 for the years ended December 31, 2003, 2002 and 2001. In the Company’s 2001 Annual Report on Form 10-K, the Company expressed its intention to cancel this note receivable; therefore; a valuation allowance was placed on the accrued interest at that date. During 2002, the Company decided to defer canceling the note, reversed this valuation allowance and resumed accruing the related interest. Historically, BHI funded the payment of the interest on the note through common dividends received from the Company. BHI has not made a payment on the accrued interest, nor has the Company paid an associated dividend, since October 15, 2001.
Deferred compensation expense of $3,571, related to the restricted shares granted in 2002, is being amortized over the three-year vesting period. At December 31, 2003, the unamortized deferred compensation was $1,488.
Capital Contributions
Following is a summary of capital contributions received by the Company during 2003, 2002 and 2001:
| 2003 | 2002 | 2001 | |||||||
Income tax benefits | $ | 17,002 | $ | 20,890 | $ | 21,038 | |||
Non-compete agreement | 5,000 | — | — | ||||||
Foods pension liability payment | 4,300 | — | — | ||||||
Capital wind-down costs | — | 3,550 | — | ||||||
Preferred stock and accumulated dividends | — | — | 620,922 | ||||||
Cash contributions | — | — | 17,000 | ||||||
| $ | 26,302 | $ | 24,440 | $ | 658,960 | ||||
BHI contributed tax benefits to the Company of $17,002, $20,890 and $21,038 during 2003, 2002 and 2001, respectively. The Company is included in BHI’s tax return, and the deductible interest expense on BHI’s notes payable reduces the Company’s tax liability.
BHI also made a $5,000 payment to the Company in 2003, relating to a non-compete agreement entered into by BHI with the third party purchaser of Consumer Adhesives, which was sold by BWHLLC in the fourth quarter of 2003. The Company does not currently market the product line disallowed under the agreement and has no plans to market such a product; therefore, there is no impact on the Company’s operations resulting from the non-compete agreement. This amount is reflected in Paid-in capital because BHI is a related party.
In the fourth quarter of 2003, Foods made a $4,300 payment to the Company related to the U.S. pension obligation retained upon the sale of Foods’ operations. This payment is reflected as a credit to Paid-in capital because it is a related party transaction.
During 2002, the Company also recorded a capital contribution from BHI of $3,550 (net of tax) related to the allocation of Capital wind-down costs to the Company, which the Company had no responsibility to fund. See Note 3.
F-150
Table of Contents
BORDEN CHEMICAL, INC.
Notes to Consolidated Financial Statements—(Continued)
(Dollars in thousands except per share data)
Other Equity Transactions
In 2001, the Company recorded a pre-tax gain on the Consumer Adhesives Sale of $132,275, which was recorded in Paid-in capital. In 2002, the Company sold its remaining investment of a $110,000 note receivable from Consumer Adhesives for face value plus accrued interest. In 2003, the Company recorded an adjustment of $5,925 in Paid-in capital to reflect additional tax expense associated with the sale of the $110,000 note receivable. See Note 1.
The Corporate Reorganization resulted in the issuance of shares of common stock of the Company and warrants to purchase common stock to certain management members, in exchange for the shares they held in BCHI. This resulted in an increase to Paid-in capital of $1,236 in 2001, the value of the minority interest liability that represented their previous interest in BCHI.
The Company recorded net of tax minimum pension liability adjustments of $5,830, $(17,075) and $(66,580) for 2003, 2002 and 2001, respectively, relating to underfunded pension plans, which is included in accumulated other comprehensive income.
15. Stock Option Plans and Other Stock Based Compensation
Stock Options
The Company accounts for stock-based compensation under APB No. 25 and has adopted the disclosure-only provisions of SFAS No. 123 “Accounting for Stock-Based Compensation.” The Company has granted options under its Amended and Restated 1996 Stock Purchase and Option Plan for Key Employees (the “Option Plan”).
Following is a summary of option activity for the three years ended December 31, 2003:
| 2003 | 2002 | 2001 | ||||||||||||||||
| Shares | Weighted Average Exercise Price | Shares | Weighted Average Exercise Price | Shares | Weighted Average Exercise Price | |||||||||||||
Options outstanding beginning of year | 3,426,040 | $ | 3.59 | 6,871,380 | $ | 4.38 | 4,382,500 | $ | 5.43 | |||||||||
Options exercised | — | — | — | — | — | — | ||||||||||||
Options granted | 3,457,500 | 2.00 | 1,492,000 | 2.25 | — | — | ||||||||||||
Option conversion | — | — | — | — | 4,451,880 | 4.38 | ||||||||||||
Options forfeited | (1,351,180 | ) | 4.30 | (4,937,340 | ) | 4.28 | (1,963,000 | ) | 5.09 | |||||||||
Options outstanding end of year | 5,532,360 | $ | 2.42 | 3,426,040 | $ | 3.59 | 6,871,380 | $ | 4.85 | |||||||||
During the fourth quarter of 2003, options to purchase 3,457,500 shares, in the aggregate, were granted to key employees. The options generally ratably vest over five years, have an exercise price of $2.00 and were granted at their estimated fair value.
During 2002, options to purchase 1,492,000 shares, in the aggregate, were granted to key employees, including performance options to purchase 1,176,000 shares. The 2002 grants have an exercise price of $2.25 per share, based on estimated fair value. The performance options vest after the fifth anniversary of the grant date; however, vesting is accelerated upon the achievement of certain financial targets. As of December 31, 2003, none of these targets were achieved. The remaining options generally vest ratably over five years.
F-151
Table of Contents
BORDEN CHEMICAL, INC.
Notes to Consolidated Financial Statements—(Continued)
(Dollars in thousands except per share data)
From 1996 through 1999, BCHI issued stock options and sold equity to key management under the Option Plan (the “BCHI option grants”). The BCHI option grants had exercise prices between $5.00 and $7.50, the estimated fair values at the grant dates, and vested over five years. The outstanding BCHI option grants became options of the Company effective with the Corporate Reorganization in 2001 (see Note 3). The conversion of the BCHI option grant provided BCHI management with equivalent intrinsic value in the Company at the new measurement date; therefore no compensation expense was recorded. The strike prices of the converted options ranged from $4.13 to $5.00, which exceeds estimated fair market value. During 2003, all of the $4.13 options were cancelled upon the repurchase of the related shares from management. There are options to purchase 650,360 shares, in the aggregate, outstanding from the converted BCHI option grant, all with a $5.00 exercise price.
In accordance with FASB Interpretation No. 44, “Accounting for Certain Transactions involving Stock Compensation,” options granted under the Option Plan after July 1, 2001 require variable accounting. The expense relating to these options for 2003 and 2002 was $230 and $14, respectively.
To determine proforma compensation cost for the Option Plan according to SFAS No. 123 (see Note 2), the fair value of each option grant is estimated on the date of grant using the Black-Scholes options pricing model with a risk-free weighted average interest rate of 2.91% for 2003 grants and 5.0% for 2002 grants and expected lives of five years for all grants. To determine compensation cost according to SFAS No. 123, the fair value of each option was estimated as of the measurement date using the Black-Scholes option-pricing model with a risk free weighted average interest rate of 4.37% and expected lives of five years.
As of December 31, 2003, there were 4,017,639 shares available for future grants.
At December 31, 2003, there were options to purchase 583,488 shares, in the aggregate, exercisable, with a range of exercise prices of $2.25 to $5.00, a weighted average exercise price of $4.70 and a weighted average remaining life of 3 years. At December 31, 2002, there were options to purchase 1,472,824 shares, in the aggregate, exercisable, with a range of exercise prices of $4.13 to $5.00, a weighted average exercise price of $4.51 and a weighted average remaining life of 4 years.
Unit Appreciation Rights
Certain current and former employees of the Company hold unit appreciation rights (“UARs”) in BWHLLC granted by the Company during the years 1996 - 2000. The UARs have a ten-year life, and all outstanding UARs are fully vested. The UARs are accounted for under the liability method as prescribed by APB No. 25, and any compensation expense incurred in conjunction with the UARs will be reflected in the Statements of Operations for the Company. In 2003, 2002 and 2001, the Company did not record any compensation expense attributable to the UARs. There were 1,157,732 UARs outstanding at December 31, 2003 and no UARs available for future grants.
16. Derivative Financial Instruments
At December 31, 2003, the Company had derivative liabilities of $1,007 classified as other current liabilities and derivative gains of $18 classified as other assets. As of December 31, 2002, the Company had derivative liabilities of $402 classified as other current liabilities and derivative gains of $16 classified as other assets. On January 1, 2001, the Company adopted SFAS No. 133 resulting in a pre-tax charge of $5,200 to accumulated other comprehensive income, as discussed in Note 8.
F-152
Table of Contents
BORDEN CHEMICAL, INC.
Notes to Consolidated Financial Statements—(Continued)
(Dollars in thousands except per share data)
Interest Rate Swaps
The Company uses interest rate swaps to alter interest rate exposures between fixed and floating rates on certain long-term debt. Under interest rate swaps, the Company agrees with other parties to exchange, at specified intervals, the difference between fixed rate and floating rate interest amounts calculated by reference to an agreed notional principal amount.
Effective December 1, 2003, the Company entered into a $34,000 interest rate swap agreement structured for the Parish of Ascension IRBs (see Note 10). Under this agreement, the Company receives a fixed rate of 10% and pays a variable rate equal to the 6-month LIBOR plus 630 basis points. This was the Company’s only outstanding interest rate swap at December 31, 2003. The $24,286 swap outstanding at December 31, 2001 matured on December 1, 2002, and the Company realized a gain on the settlement of $1,722. The net impact of interest rate swaps was a decrease in the Company’s interest expense of $62 in 2003 and an increase in interest expense of $2,566 and $2,215 in 2002 and 2001, respectively. The 2003 year-end fair value of the $34,000 interest rate swap was a loss of $483.
The following table summarizes the weighted average interest rates for the swaps used by the Company. Variable rates change with market conditions and may vary significantly in the future.
| 2003 | 2002 | 2001 | |||||||
Average rate paid | 7.6 | % | 13.7 | % | 13.7 | % | |||
Average rate received | 10.0 | % | 1.9 | % | 4.5 | % |
Foreign Exchange
International operations account for a significant portion of the Company’s revenue and operating income. It is the policy of the Company to reduce foreign currency cash flow exposure due to exchange rate fluctuations by hedging anticipated and firmly committed transactions wherever economically feasible. The Company enters into forward and option contracts to buy and sell foreign currencies only to reduce foreign exchange exposure and protect the U.S. dollar value of such transactions to the extent of the amount under contract. These contracts are designed to minimize the impact from foreign currency exchange on operating income and on certain balance sheet exposures.
Gains and losses arising from contracts are recognized on a quarterly basis through the Consolidated Statement of Operations (see Note 2). The Company does not hold or issue derivative financial instruments for trading purposes.
At December 31, 2003 and 2002, the Company had $44,300 and $60,079, respectively, of notional value of foreign currency exchange forward contracts outstanding. At December 31, 2003, the Company recorded a loss of $323 related to its foreign currency exchange forward contract outstanding. At December 31, 2002, the Company recorded a loss of $402 related to its foreign currency exchange forward contracts outstanding.
At December 31, 2003, the Company’s forward position of $44,300 was to sell British Pounds for U.S. Dollars at a rate of 1.7710. At December 31, 2002, the Company had forward positions to sell British Pounds for U.S. Dollars ($36,916) and Canadian Dollars ($23,163). The unsecured contracts mature within three months and are placed with financial institutions with investment grade credit ratings. The Company is exposed to credit loss in the event of non-performance by the other parties to the contracts. The Company evaluates the credit worthiness of the counterparties’ financial condition and does not expect default by the counterparties.
F-153
Table of Contents
BORDEN CHEMICAL, INC.
Notes to Consolidated Financial Statements—(Continued)
(Dollars in thousands except per share data)
At December 31, 2003, the Company had put options totaling $12,000 to sell Canadian Dollars to buy U.S. Dollars. The options expire within three months at varying dates and have a contract rate of 1.3600. The Company also is a party to call options held by financial institutions totaling $12,000 to buy Canadian Dollars with U.S. Dollars. The options expire within three months at varying dates and have contract rates that vary from 1.3040 to 1.3095. At December 31, 2003, the Company recorded a loss of $163 related to these options.
Option and Commodity Future Contracts
The Company is exposed to price fluctuations associated with raw materials purchases, most significantly with methanol, phenol and urea. For these commodity raw materials, the Company has purchase contracts, with periodic price adjustment provisions. The Company also adds to customer contracts selling price provisions that are indexed to publicly available indices for these commodity raw materials. The Board of Directors approves all commodity futures and commodity commitments.
Natural Gas Futures—The Company hedges a portion of natural gas purchases for North America. In March 2003, the Company entered into futures contracts with varying settlement dates through June 2004. The Company used futures contracts to hedge 69% of its 2003 North American natural gas usage. The contracts are settled for cash each month based on the closing market price on the last day the contract trades on the New York Mercantile Exchange. Obligations settled under these contracts totaled $4,866 and related losses were $224 in 2003. Remaining obligations outstanding under these contracts were $1,359 as of December 31, 2003.
The Company entered into similar futures contracts to hedge portions of its natural gas purchases in June 2001 with varying settlement dates through November 2002. Commitments settled under these contracts totaled $1,210 and $1,716 in 2002 and 2001, respectively, and related losses were $264 and $610 in 2002 and 2001, respectively. There were no remaining obligations under these contracts at December 31, 2002.
Gains and losses on commodity futures contracts are recognized each month as gas is used. Remaining obligations are marked to market on a quarterly basis. The Company recorded a loss of $20 at December 31, 2003 related to its natural gas futures contracts.
Natural Gas Commitments—In 2000, the Company entered into fixed rate, fixed quantity contracts to secure a portion of anticipated natural gas usage at certain of the Company’s facilities. The contracts were entered into to partially hedge the Company’s risk associated with natural gas price fluctuations in peak usage months through March 2003. Gas purchases under these contracts totaled $402, $671 and $853 in 2003, 2002 and 2001, respectively. These contracts covered approximately 75% of 2003 and 86% of 2002 natural gas usage during the periods of the contracts at those facilities. The Company had no natural gas commitments outstanding at December 31, 2003. The Company recorded a gain of $16 at December 31, 2002 for the difference between the fair value and carrying value of its remaining natural gas commitments.
17. Fair Value of Financial Instruments
The following table presents the carrying or notional amounts and fair values of the Company’s financial instruments at December 31, 2003 and 2002. The fair value of a financial instrument is the estimated amount at which the instrument could be exchanged in a current transaction between willing parties, other than in a forced or liquidation sale. Fair values are determined from quoted market prices where available or based on other similar financial instruments.
F-154
Table of Contents
BORDEN CHEMICAL, INC.
Notes to Consolidated Financial Statements—(Continued)
(Dollars in thousands except per share data)
The carrying amounts of cash and cash equivalents, accounts receivable, accounts payable and other accruals are considered reasonable estimates of their fair values. The carrying value of the loans payable to affiliates approximates fair values, as management believes the loans bear interest at market interest rates.
The following table includes the carrying and fair values of the Company’s financial instruments.
| 2003 | 2002 | |||||||||||||
Carrying Amount | Fair Value | Carrying Amount | Fair Value | |||||||||||
Nonderivatives | ||||||||||||||
Liabilities | ||||||||||||||
Debt | $ | 538,133 | $ | 503,630 | $ | 526,066 | $ | 345,048 | ||||||
Notional Amount | Fair Value Gain (Loss) | Notional Amount | Fair Value (Loss) Gain | |||||||||||
Derivatives relating to: | ||||||||||||||
Foreign currency contracts | �� | $ | 44,300 | $ | (323 | ) | $ | 60,079 | $ | (402 | ) | |||
Interest rate swaps | 34,000 | (483 | ) | — | — | |||||||||
Call options | 12,000 | (181 | ) | — | — | |||||||||
Put options | 12,000 | 18 | — | — | ||||||||||
Natural gas futures | 1,359 | (20 | ) | — | — | |||||||||
Natural gas commitments | — | — | 402 | 16 | ||||||||||
18. Supplemental Information
| 2003 | 2002 | 2001 | |||||||
Depreciation | $ | 45,811 | $ | 46,392 | $ | 53,996 | |||
Amortization | 1,508 | 1,555 | 5,365 | ||||||
Research and Development | 17,998 | 19,879 | 21,210 | ||||||
19. Segment and Geographic Data
In previous documents filed with the SEC Adjusted EBITDA was the description used in our segment footnote to describe our segment performance measure. For purposes of this document we have described our segment performance measure as “Segment EBITDA.” We intend to use the term Segment EBITDA to measure segment performance in future SEC documents.
The Company consists of three reportable segments: North American Forest Products, North American Performance Resins Group and International. Consolidated results also include Corporate and other and Divested business, which are reported separately. The product lines included in the North American Forest Products segment are formaldehyde and forest products resins. The key business drivers in the North American Forest Products segment are housing starts, furniture demand, panel production capacity and chemical sector operating conditions. The North American Performance Resins Group includes oil field, foundry and specialty resins. In the North American Performance Resins Group segment, the key business drivers are housing starts, auto builds, active gas drilling rigs and the general industrial sector. The International segment consists of operations in Europe, Latin America and Asia Pacific. Principal countries of operation are the U.K., Brazil, Australia and Malaysia. Product lines include formaldehyde, forest products and performance resins and consumer products. In
F-155
Table of Contents
BORDEN CHEMICAL, INC.
Notes to Consolidated Financial Statements—(Continued)
(Dollars in thousands except per share data)
the International segment, the key business drivers are export levels, panel production capacity, housing starts, furniture demand and the local political environment. Corporate and other represents general and administrative expenses and income and expenses related to liabilities retained from businesses sold in previous years. Divested business includes Melamine, which was impaired in 2001, closed in early 2002 and subsequently sold in 2003. Operating results subsequent to the closure date represent revenue from the sale of inventory.
Operating Segments:
Following is a comparison of net sales; sales by product line; depreciation and amortization; earnings before interest, taxes, depreciation and amortization adjusted for business realignment, impairments, non-operating income (expense) and certain other operating income (expense) items (“Segment EBITDA”); total assets and capital expenditures for the reportable business segments, Corporate and other and Divested business of the Company for the years ended December 31, 2003, 2002 and 2001. Segment EBITDA information is presented with the Company’s segment disclosures because it is the measure used by the Company’s chief operating decision maker to evaluate operating results and allocate capital resources:
Sales to Unaffiliated Customers:
| 2003 | 2002 | 2001 | |||||||
North American Forest Products | $ | 755,767 | $ | 634,619 | $ | 656,694 | |||
North American Performance Resins | 364,347 | 340,791 | 409,081 | ||||||
International | 314,693 | 264,541 | 282,629 | ||||||
Divested business | 6 | 7,934 | 23,737 | ||||||
Total | $ | 1,434,813 | $ | 1,247,885 | $ | 1,372,141 | |||
Sales by Product Line:
| 2003 | 2002 | 2001 | |||||||
Forest products resins | $ | 704,930 | $ | 598,835 | $ | 612,638 | |||
Formaldehyde | 242,774 | 185,102 | 189,111 | ||||||
Specialty resins | 226,161 | 211,233 | 268,087 | ||||||
Foundry resins | 137,481 | 143,419 | 140,088 | ||||||
Oil field products | 86,487 | 60,598 | 85,224 | ||||||
International consumer products | 31,050 | 34,957 | 46,252 | ||||||
Melamine | 6 | 7,934 | 23,737 | ||||||
Other | 5,924 | 5,807 | 7,004 | ||||||
Total | $ | 1,434,813 | $ | 1,247,885 | $ | 1,372,141 | |||
F-156
Table of Contents
BORDEN CHEMICAL, INC.
Notes to Consolidated Financial Statements—(Continued)
(Dollars in thousands except per share data)
Depreciation and Amortization Expense:
| 2003 | 2002 | 2001 | |||||||
North American Forest Products | $ | 19,953 | $ | 19,259 | $ | 19,950 | |||
North American Performance Resins | 10,209 | 9,929 | 11,314 | ||||||
International | 11,089 | 10,305 | 11,766 | ||||||
Corporate and other | 6,068 | 8,454 | 9,021 | ||||||
Divested business | — | — | 7,310 | ||||||
Total | $ | 47,319 | $ | 47,947 | $ | 59,361 | |||
Segment EBITDA:
| 2003 | 2002 | 2001 | ||||||||||
North American Forest Products | $ | 92,548 | $ | 92,918 | $ | 101,655 | ||||||
North American Performance Resins | 46,661 | 45,127 | 74,321 | |||||||||
International | 32,250 | 28,630 | 17,595 | |||||||||
Corporate and other | (43,713 | ) | (44,949 | ) | (54,356 | ) | ||||||
Total | $ | 127,746 | $ | 121,726 | $ | 139,215 | ||||||
Total Assets at Year End:
| 2003 | 2002 | 2001 | |||||||
North American Forest Products | $ | 400,950 | $ | 329,574 | $ | 319,846 | |||
North American Performance Resins | 202,482 | 205,385 | 211,477 | ||||||
International | 252,303 | 204,777 | 247,380 | ||||||
Corporate and other | 138,131 | 271,811 | 329,280 | ||||||
Divested business | — | 233 | 15,295 | ||||||
Total | $ | 993,866 | $ | 1,011,780 | $ | 1,123,278 | |||
Capital Expenditures:
| 2003 | 2002 | 2001 | |||||||
North American Forest Products | $ | 21,726 | $ | 17,322 | $ | 9,791 | |||
North American Performance Resins | 9,830 | 13,744 | 11,577 | ||||||
International | 8,708 | 5,691 | 15,660 | ||||||
Corporate and other | 1,556 | 2,016 | 5,016 | ||||||
Divested business | — | — | 604 | ||||||
Discontinued operations | — | — | 4,760 | ||||||
Total | $ | 41,820 | $ | 38,773 | $ | 47,408 | |||
F-157
Table of Contents
BORDEN CHEMICAL, INC.
Notes to Consolidated Financial Statements—(Continued)
(Dollars in thousands except per share data)
The Company reports and manages its business through three operating segments which do cross geographic boundaries. The following tables reflect sales and long-lived assets by major geographic area:
Sales to Unaffiliated Customers:(1)
| 2003 | 2002 | 2001 | |||||||
United States | $ | 901,018 | $ | 812,667 | $ | 908,427 | |||
Canada | 219,102 | 170,677 | 181,085 | ||||||
United Kingdom | 121,893 | 105,595 | 114,641 | ||||||
Other International | 192,800 | 158,946 | 167,988 | ||||||
Total | $ | 1,434,813 | $ | 1,247,885 | $ | 1,372,141 | |||
| (1) | For purposes of geographic disclosures, sales are attributed to the country in which individual business locations reside. |
Long-Lived Assets:(2)
| 2003 | 2002 | 2001 | |||||||
United States | $ | 265,963 | $ | 277,349 | $ | 283,423 | |||
Canada | 63,109 | 51,042 | 60,744 | ||||||
United Kingdom | 77,769 | 76,377 | 73,460 | ||||||
Other International | 42,043 | 34,970 | 39,930 | ||||||
Total | $ | 448,884 | $ | 439,738 | $ | 457,557 | |||
| (2) | Long-lived assets include property, plant and equipment, net of accumulated depreciation. |
Reconciliation of Segment EBITDA to Income (Loss) from Continuing Operations Before Income Tax:
Segment EBITDA:
| 2003 | 2002 | 2001 | ||||||||||
North American Forest Products | $ | 92,548 | $ | 92,918 | $ | 101,655 | ||||||
North American Performance Resins | 46,661 | 45,127 | 74,321 | |||||||||
International | 32,250 | 28,630 | 17,595 | |||||||||
Corporate and other | (43,713 | ) | (44,949 | ) | (54,356 | ) | ||||||
Reconciliation:
Depreciation and Amortization | (47,319 | ) | (47,947 | ) | (59,361 | ) | ||||||
Adjustments to Segment EBITDA (described below) | (13,885 | ) | (40,071 | ) | (155,349 | ) | ||||||
Interest expense | (46,138 | ) | (47,315 | ) | (51,613 | ) | ||||||
Affiliated interest expense, net | (558 | ) | (1,402 | ) | (11,488 | ) | ||||||
Other non-operating (expense) income | (1,529 | ) | 5,989 | (1,841 | ) | |||||||
Investment write-down and other charges | — | — | (27,000 | ) | ||||||||
Income (loss) from continuing operations before income tax | $ | 18,317 | $ | (9,020 | ) | $ | (167,437 | ) | ||||
F-158
Table of Contents
BORDEN CHEMICAL, INC.
Notes to Consolidated Financial Statements—(Continued)
(Dollars in thousands except per share data)
Adjustments To Segment EBITDA
The following items are not included in Segment EBITDA reviewed by the Company’s chief operating decision maker to evaluate operating results and allocate capital resources:
Year Ended December 31, 2003 | Plant Closure(1) | Severance | Impairment | Other | Total | |||||||||||||||
North American Forest Products | $ | (932 | ) | $ | (1,125 | ) | $ | — | $ | (90 | )(2) | $ | (2,147 | ) | ||||||
North American Performance Resins | 94 | (397 | ) | (1,000 | )(3) | — | (1,303 | ) | ||||||||||||
International | (7,720 | ) | (643 | ) | (2,183 | )(4) | 11,692 | (5) | 1,146 | |||||||||||
Corporate and other | (146 | ) | (4,672 | ) | — | (8,732 | )(2) | (13,550 | ) | |||||||||||
Divested business(6) | 1,716 | — | — | 253 | 1,969 | |||||||||||||||
Total | $ | (6,988 | ) | $ | (6,837 | ) | $ | (3,183 | ) | $ | 3,123 | $ | (13,885 | ) | ||||||
| (1) | Plant closure costs include fixed asset write-offs, plant employee severance and demolition, environmental and other related costs. |
| (2) | Primarily represents a charge of $5,929 related to tentative legal settlements with BCPM Liquidating and BCP Liquidating (see Note 22) and severance expense included in general and administrative expense, incurred by the Company for positions to be replaced. |
| (3) | Represents a reduction in estimated net realizable value of a facility held for sale. |
| (4) | Represents fixed asset and goodwill impairments related to various international locations. |
| (5) | Represents a gain on the sale of land associated with a closed plant in the U.K. |
| (6) | Represents gains recognized related to the closure and subsequent sale of Melamine. |
Year Ended December 31, 2002 | Plant Closure(1) | Severance | Impairment | Other | Total | |||||||||||||||
North American Forest Products | $ | (1,107 | ) | $ | (250 | ) | $ | — | $ | — | $ | (1,357 | ) | |||||||
North American Performance Resins | (1,950 | ) | (102 | ) | (1,040 | )(2) | — | (3,092 | ) | |||||||||||
International | (2,844 | ) | (795 | ) | (5,275 | )(3) | 2,465 | (4) | (6,449 | ) | ||||||||||
Corporate and other | — | (2,118 | ) | — | (19,850 | )(5) | (21,968 | ) | ||||||||||||
Divested business(6) | (6,683 | ) | — | — | (522 | ) | (7,205 | ) | ||||||||||||
Total | $ | (12,584 | ) | $ | (3,265 | ) | $ | (6,315 | ) | $ | (17,907 | ) | $ | (40,071 | ) | |||||
| (1) | Plant closure costs include fixed asset write-offs, plant employee severance and demolition, environmental and other related costs. |
| (2) | Represents a reduction in estimated net realizable value of a facility held for sale. |
| (3) | Represents fixed asset impairments at various international manufacturing facilities. |
| (4) | Represents a gain on the sale of land associated with a closed plant in Spain. |
| (5) | Primarily represents a pension settlement charge of $13,600, included in general and administrative expense, and an additional management fee of $5,500 related to the wind down of Capital, included in other operating expense. |
| (6) | Represents expenses incurred related to the closure of Melamine. |
F-159
Table of Contents
BORDEN CHEMICAL, INC.
Notes to Consolidated Financial Statements—(Continued)
(Dollars in thousands except per share data)
Year Ended December 31, 2001 | Plant Closure(1) | Severance | Impairment | Other | Total | |||||||||||||||
North American Forest Products | $ | (6,573 | ) | $ | (2,080 | ) | $ | — | $ | 10,507 | (2) | $ | 1,854 | |||||||
North American Performance Resins | 2,433 | (2,632 | ) | (2,885 | )(3) | — | (3,084 | ) | ||||||||||||
International | (20,020 | ) | (179 | ) | — | (2,303 | )(4) | (22,502 | ) | |||||||||||
Corporate and other | 875 | (7,691 | ) | — | (37,202 | )(5) | (44,018 | ) | ||||||||||||
Divested business | — | — | (98,163 | )(6) | 10,564 | (7) | (87,599 | ) | ||||||||||||
Total | $ | (23,285 | ) | $ | (12,582 | ) | $ | (101,048 | ) | $ | (18,434 | ) | $ | (155,349 | ) | |||||
| (1) | Plant closure costs include fixed asset write-offs, plant employee severance and demolition, environmental, and other related costs. |
| (2) | Represents a gain on the sale of land associated with a closed domestic plant. |
| (3) | Represents a charge related to a plant facility for which construction was discontinued in 2001. |
| (4) | Represents a loss incurred on the divestiture of the Company’s operations in Ecuador. |
| (5) | Primarily represents a charge for environmental remediation of $19,028 related to a formerly owned business and a pension settlement charge of $15,813. |
| (6) | Represents a charge related to the shut-down of Melamine including the write-down of fixed assets ($62,527), spare parts ($2,935) and goodwill ($32,701). |
| (7) | Represents earnings generated by Melamine, which was closed in 2002. |
20. Related Party Transactions
Financing and Investing Arrangements
The Company and HAI had separate borrowing arrangements with Foods, evidenced by demand promissory notes bearing interest at variable rates. These loans are reported as Loans payable to affiliates on the Consolidated Balance Sheets and totaled $18,260 and $84,680 at December 31, 2003 and 2002, respectively. Following the termination of the Company’s uncommitted LOC facility in 2003 (see Note 10), the Company (excluding HAI) is limited to borrowing up to $30,000 from affiliates. Of the total loans outstanding, $12,260 and $84,680 was owed by the Company at each respective year-end. HAI owed $6,000 at December 31, 2003 and had $4,000 available for additional borrowings. Interest rates ranged from 1.0% to 4.75%, and interest expense totaled $558, $1,857 and $9,460 for the years ended December 31, 2003, 2002 and 2001, respectively. In early 2004, the Company entered into a similar borrowing agreement with BWHLLC and cancelled its arrangement with Foods. In early 2004, HAI obtained a $20,000 credit facility with an external bank and terminated its affiliated borrowing arrangement (see Note 10).
The Company holds a $404,817 note receivable ($512,094 including accrued interest) from BHI, which is accounted for as a reduction of equity. The Company accrues interest quarterly on the note receivable in Paid-in capital. Historically, BHI funded the interest due on the note through common dividends received from the Company. However, quarterly interest has not been paid, nor an associated dividend declared, since October 15, 2001. See Note 14.
The Company had a note payable to BCPM for $34,181 that was settled in the first quarter of 2002. The Company accrued $151 and $2,502 of interest expense for the years ended December 31, 2002 and 2001, respectively, related to this note. The Company settled in full this note payable by making cash payments of $31,581 and $2,600 of certain set-offs asserted by the Company against amounts due under this note. BCPM acknowledged the validity and enforceability of the set-offs. The Company waived the right to assert other set-offs, and BCPM and the Company exchanged mutual releases with respect to this note. A committee comprised
F-160
Table of Contents
BORDEN CHEMICAL, INC.
Notes to Consolidated Financial Statements—(Continued)
(Dollars in thousands except per share data)
solely of independent directors of BCPM, represented and advised by separate and independent counsel, reviewed and agreed to the above provisions.
At December 31, 2001, the Company had a $110,000 preferred stock investment in Consumer Adhesives. The preferred stock was redeemed in 2002 for a $110,000 note receivable from Consumer Adhesives which was subsequently sold to BHI for cash proceeds of $110,000 plus accrued interest of $455. In 2003, the Company recognized an income tax charge of $5,925 related to the sale of the note receivable to BHI. Consistent with the gain on the Consumer Adhesives Sale, this income tax charge was recorded in Paid-in capital due to the affiliated nature of the transaction.
As a guarantor of the Company’s debt, Foods received an annual fee from the Company of $1,050 in 2001. Under the terms of the guarantee agreement between Foods and the Company, Foods was automatically released from its obligation to guarantee the payment of the Company’s outstanding publicly-held debt upon Foods being released from its obligation to guarantee the payment of amounts due under the Company’s $250,000 Credit Agreement that expired in 2002.
The Company also had net affiliate interest income relating to other affiliates of $474 for the year ended December 31, 2001.
Administrative Service, Management and Consulting Arrangements
Commencing in 2003, certain management, consulting and board services previously provided to the Company by Capital (see below) were assumed by the Company, while other such services were assumed by KKR. During the year ended December 31, 2003, the Company recorded $3,000 for the fixed fee due to KKR under this arrangement. During the year ended December 31, 2002, the Company recorded $9,000 for the management fee to Capital.
During 2002, Capital provided management, consulting and board services to the Company, and the Company provided certain administrative services to Capital. Capital charged the Company an annual fee of $9,000, payable quarterly in arrears, which represented the net amount of Capital’s services less the Company’s fee for providing administrative services to Capital. During 2002, BHI made a decision to cease the operations of Capital by the end of the first quarter of 2003. This decision resulted in the immediate recognition by Capital of incremental expenses and liabilities related primarily to severance and rent obligations. These incremental expenses are the legal obligation of Capital and will be funded by Capital. The Company’s share of Capital’s incremental costs was $5,500 and was recognized by the Company as an additional management fee in 2002. Since the Company was not responsible for settling these liabilities, the offset to the charge was recorded as a capital contribution of $3,550 (the liability net of tax) to the Company from BHI.
Prior to the Corporate Reorganization in 2001, KKR rendered management, consulting and board services to the Company for an annual fee of $10,000, payable quarterly in arrears. The 2001 fee through the date of the Corporate Reorganization was $9,167. Effective with the Corporate Reorganization, Capital began providing services to the Company, as described above. Charges incurred for these services in 2001, subsequent to the Corporate Reorganization, were $750.
The Company incurred certain costs on Capital’s behalf and was reimbursed by Capital for 100% of these costs. Included in accounts receivable from affiliates at December 31, 2002 was $2,298 for these expenses.
F-161
Table of Contents
BORDEN CHEMICAL, INC.
Notes to Consolidated Financial Statements—(Continued)
(Dollars in thousands except per share data)
The Company provides administrative services to Foods. Fees received for these services totaled $50, $120 and $1,000 for the years ended December 31, 2003, 2002 and 2001, respectively. In addition, the Company pays certain costs on behalf of Foods and is reimbursed by Foods for 100% of these costs. Included in accounts receivable from affiliates at December 31, 2002 was $1,375 related to these costs.
The Company provides certain administrative services to BWHLLC and other affiliates under a service agreement commencing on January 1, 2003. During the year ended December 31, 2003, the Company charged BWHLLC $540 for such services.
In 2001, the Company rendered management, consulting and financial services to WKI for an annual fee of $2,500 based on WKI reaching certain operating criteria. In addition, WKI also reimbursed the Company for certain expenses paid on its behalf. In November 2001, Capital purchased the management fee receivable of $1,667 from the Company plus receivables for expenses paid on WKI’s behalf in the amount of $1,927. Total fees received under this arrangement were $0 for 2001.
Other Transactions and Arrangements
The Company utilizes Willis Group Holdings, Ltd. (“Willis”), an entity controlled by KKR, as its insurance broker. As of December 31, 2003, and 2002, the Company had paid $429 and $241, respectively, to Willis for their services.
Capital contributions to the Company totaled $26,302, $24,440 and $658,960 for the years ended December 31, 2003, 2002 and 2001, respectively (see Note 14).
The Company and Consumer Adhesives were parties to a tax sharing agreement for periods prior to the Consumer Adhesives Sale. Under this agreement, Consumer Adhesives paid income taxes to the Company as if Consumer Adhesives filed stand-alone Federal and state income tax returns. At December 31, 2002, Consumer Adhesives had no remaining liability to the Company for any unpaid Federal or state income tax.
During 2001, the Company received payment of $11,802 from Foods for its calculated portion of the Company’s net pension liability. In the fourth quarter of 2001, the Company received $12,302 from Foods to assume the liability for payment of claims made under essentially all of Foods’ employee benefit plans.
The Corporate Reorganization included certain financial transactions between the Company and BHI (see Note 3).
21. Guarantees and Indemnifications
Standard Guarantees / Indemnifications
In the ordinary course of business, the Company enters into numerous agreements that contain standard guarantees and indemnities whereby the Company indemnifies another party for, among other things, breaches of representations and warranties. Such guarantees or indemnifications are granted under various agreements, including those governing (i) purchases and sales of assets or businesses, (ii) leases of real property, (iii) licenses of intellectual property and (iv) long-term supply agreements. The guarantees or indemnifications issued are for the benefit of the (i) buyers in sale agreements and sellers in purchase agreements, (ii) landlords or lessors in lease contracts, (iii) licensors or licensees in license agreements and (iv) vendors or customers in long-term supply agreements.
F-162
Table of Contents
BORDEN CHEMICAL, INC.
Notes to Consolidated Financial Statements—(Continued)
(Dollars in thousands except per share data)
These parties may also be indemnified against any third party claim resulting from the transaction that is contemplated in the underlying agreement. Additionally, in connection with the sale of assets and the divestiture of businesses, the Company may agree to indemnify the buyer with respect to liabilities related to the pre-closing operations of the assets or businesses sold. Indemnities related to pre-closing operations generally include tax liabilities, environmental liabilities and employee benefit liabilities not assumed by the buyer in the transaction.
Indemnities related to the pre-closing operations of sold assets normally do not represent additional liabilities to the Company, but simply serve to protect the buyer from potential liability associated with the Company’s existing obligations at the time of sale. As with any liability, the Company has accrued for those pre-closing obligations that are considered probable and reasonably estimable. Amounts recorded are not significant at December 31, 2003.
While some of these guarantees extend only for the duration of the underlying agreement, many survive the expiration of the term of the agreement or extend into perpetuity (unless subject to a legal statute of limitations). With respect to certain of the aforementioned guarantees, the Company has limited reimbursement agreements from affiliates or maintains limited insurance coverage that mitigates potential payments to be made. There are no specific limitations on the maximum potential amount of future payments that the Company could be required to make under these guarantees nor is the Company able to develop an estimate of the maximum potential amount of future payments to be made under these guarantees as the triggering events are not predictable.
In addition the Company has agreed to indemnify KKR for any claims resulting from its services to the Company and its affiliates. The indemnification does not expire and the Company is not able to determine a maximum exposure under the agreement. However, the Company does have an indemnification agreement from BHI for any amounts that it must pay under the KKR indemnity relating to WKI.
The Company has not entered into any significant agreement subsequent to January 1, 2003 that would require it, as a guarantor, to recognize a liability for the fair value of obligations it has undertaken in issuing the guarantee.
Subsidiary Guarantees
The Company guarantees the bank debt of one of its Brazilian subsidiaries at Banco Itau S.A. up to a maximum U.S. equivalent of $6,700. In addition, the Company guarantees the open payables of certain subsidiaries related to the purchase of raw materials.
In connection with the conversion of the $34,000 Parish of Ascension IRBs to a fixed rate, the Company’s Canadian and U.K. subsidiaries have guaranteed the Company’s IRBs.
Contingent Purchase Consideration
The Fentak acquisition agreement includes a contingent purchase consideration provision based on achievement of certain targeted earnings before interest and taxes. Maximum annual payments are AU$600 for the period 2004-2006.
In connection with the acquisition of assets from SEACO, the Company agreed to pay a royalty fee to the seller based on sales levels to existing regular customers of the business as of the closing date. To the extent that annual sales exceed targeted levels, the Company is obligated to pay up to $300 per year, for a five-year period.
F-163
Table of Contents
BORDEN CHEMICAL, INC.
Notes to Consolidated Financial Statements—(Continued)
(Dollars in thousands except per share data)
Warranties
The Company does not make express warranties on its products, other than that they comply with the Company’s specifications; therefore, the Company does not record a warranty liability. Adjustments for product quality claims are not material and are charged against sales revenues.
22. Commitments and Contingencies
Environmental Matters
Because the Company’s operations involve the use, handling, processing, storage, transportation and disposal of hazardous materials, the Company is subject to extensive environmental regulation at the Federal and state level and is exposed to the risk of claims for environmental remediation or restoration. In addition, violations of environmental laws or permits may result in restrictions being imposed on operating activities, substantial fines, penalties, damages or other costs, any of which could have a material adverse effect on the Company’s business, financial condition, results of operations or cash flows.
Accruals for environmental matters are recorded following the guidelines of Statement of Position 96-1, “Environmental Remediation Liabilities,” when it is probable that a liability has been incurred and the amount of the liability can be estimated. Environmental accruals are reviewed on an interim basis and as events and developments warrant. Based on management’s estimates, which are determined through historical experience, the Company has recorded liabilities, relating to 55 locations, of approximately $38,600 and $44,000 at December 31, 2003 and 2002, respectively, for all probable environmental remediation, indemnification and restoration liabilities. These amounts include estimates of unasserted claims the Company believes are probable of loss and reasonably estimable. Based on the factors discussed below and currently available information and analysis, the Company believes that it is reasonably possible that costs associated with such sites may fall within a range of $24,200 to $73,600, in the aggregate, at December 31, 2003. This estimate of the range of reasonably possible costs is less certain than the estimates upon which the liabilities are based, and in order to establish the upper end of such range, assumptions less favorable to the Company among the range of reasonably possible outcomes were used. As with any estimate, if facts or circumstances change, the final outcome could differ materially from these estimates. The Company has not taken into consideration insurance coverage or any anticipated recoveries from other third parties in determining the liability or range of possible outcomes. The Company’s current insurance coverage provides very limited, if any, coverage for environmental matters.
Following is a more detailed discussion of the Company’s environmental liabilities and related assumptions:
BCP Geismar Site—The Company formerly owned a basic chemicals and polyvinyl chloride business which was taken public as Borden Chemicals and Plastics Operating Limited Partnership (“BCPOLP”) in 1987. The Company retained a 1% interest and the general partner interest, which were held by its subsidiary, BCPM. The Company also retained the liability for certain environmental matters after BCPOLP’s formation. Under a Settlement Agreement approved by the United States Bankruptcy Court for the District of Delaware among the Company, BCPOLP, BCPM, the United States Environmental Protection Agency and the Louisiana Department of Environmental Quality, the Company agreed to perform certain of BCPOLP’s obligations with respect to environmental conditions at BCPOLP’s Geismar, Louisiana site. These obligations are related to soil and groundwater contamination at the Geismar site. The Company bears the sole responsibility for these obligations, as there are no other potentially responsible parties (“PRPs”) or third parties from which the Company can seek reimbursement, and no additional insurance recoveries are expected.
F-164
Table of Contents
BORDEN CHEMICAL, INC.
Notes to Consolidated Financial Statements—(Continued)
(Dollars in thousands except per share data)
A groundwater pump and treat system for the removal of contaminants is operational, and preliminary natural attenuation studies are proceeding. The Company has performed extensive soil and groundwater testing. Regulatory agencies are reviewing the current findings and remediation efforts. If closure procedures and remediation systems prove inadequate, or if additional contamination is discovered, this could result in the costs approaching the higher end of the range of possible outcomes discussed below.
The Company has recorded a liability of approximately $21,600 and $25,300 at December 31, 2003 and 2002, respectively, related to the BCP Geismar site. Based on currently available information and analysis, the Company believes that it is reasonably possible that costs associated with this site may fall within a range of $13,500 to $33,100, depending upon the factors discussed above. Due to the long-term nature of the project, the reliability of timing and estimability of remediation payments, this liability was recorded at its net present value, assuming a 3% discount rate and a time period of thirty years and the range of possible outcomes is discounted similarly. The undiscounted liability is approximately $33,400 over thirty years.
Following are expected payments for each of the next five years, and a reconciliation of the expected aggregate payments to the liability reflected at December 31, 2003:
2004 | $ | 2,500 | ||
2005 | 1,100 | |||
2006 | 1,700 | |||
2007 | 1,500 | |||
2008 | 700 | |||
Remaining aggregate payments | 25,900 | |||
Total undiscounted liability | 33,400 | |||
Less: discount to net present value | (11,800 | ) | ||
Liability per Consolidated Balance Sheet | $ | 21,600 | ||
Superfund Sites / Offsite Landfills—The Company is currently involved in environmental remediation activities at 25 sites in which it has been notified that it is, or may be, a PRP under the United States Comprehensive Environmental Response, Compensation and Liability Act (“CERCLA”) or similar state “superfund” laws. The Company has recorded liabilities of approximately $7,600 and $7,000 at December 31, 2003 and 2002, respectively, related to these sites. The Company anticipates approximately half of this liability will be paid within the next five years, with the remaining payments occurring over the next twenty-five years. The Company generally does not bear a significant level of responsibility for these sites, and therefore, has little control over the costs and timing of cash flows. At 16 sites, the Company’s share is less than 1%. At the remaining 9 sites, the Company has a share of up to 8.8% of the total liability which accounts for $6,400 and $5,700 of the total amount reserved for superfund / offsite landfill sites at December 31, 2003 and 2002, respectively. Based on currently available information and analysis, the Company believes that it is reasonably possible that costs associated with such sites may be as low as $4,700 or as high as $15,600, in the aggregate. In estimating both its current reserves for environmental remediation at these sites and the possible range of additional costs, the Company has not assumed that it will bear the entire cost of remediation of every site to the exclusion of other known PRPs who may be jointly and severally liable. The Company has limited information to assess the viability of other PRPs and their probable contribution on a per site basis. The range of possible outcomes also takes into account the maturity of each project, which results in a more narrow range as the project progresses. The Company’s ultimate liability will depend on many factors including its volumetric share of waste, the financial viability of other PRPs, the remediation methods and technology used and the amount of time necessary to accomplish remediation.
F-165
Table of Contents
BORDEN CHEMICAL, INC.
Notes to Consolidated Financial Statements—(Continued)
(Dollars in thousands except per share data)
Sites Under Current Ownership—The Company is conducting environmental remediation at 7 locations currently owned by the Company, of which 4 sites are no longer operating. There are no other parties responsible for remediation at these sites. Much of the remediation is being performed by the Company on a voluntary basis; therefore, the Company has greater control over the costs to be incurred and the timing of cash flows. The Company has accrued approximately $5,200 and $4,700 at December 31, 2003 and 2002, respectively, for remediation and restoration liabilities at these locations. The Company anticipates approximately $3,100 of these liabilities will be paid within the next three years, with the remaining amounts being paid over the next ten years. Approximately $3,500 of these reserves is included in the Company’s business realignment reserve, as the environmental clean up is being handled in conjunction with planned closure of the location (see Note 6). Based on currently available information and analysis, the Company believes that it is reasonably possible that costs associated with such sites may fall within a range of $3,500 to $13,500, in the aggregate. The factors influencing the ultimate outcome include the methods of remediation to be elected, the conclusions and assessment of site studies remaining to be completed and the time period required to complete the work.
Other Sites—The Company is conducting environmental remediation at 10 locations formerly owned by the Company. The Company has accrued approximately $2,400 and $5,300 at December 31, 2003 and 2002, respectively, for remediation and restoration liabilities at these locations. The Company anticipates cash outflows of approximately $2,000 within the next three years, with the remainder occurring over the next ten years. Based on currently available information and analysis, the Company believes that it is reasonably possible that costs associated with such sites may fall within a range of $1,700 to $9,100, in the aggregate. The primary drivers in determining the final costs to the Company on these matters are the method of remediation selected and the level of participation of third parties.
In addition, the Company is responsible for 11 sites that require monitoring where no additional remediation is expected and has also established accruals for other related costs, such as fines and penalties. The Company has accrued approximately $1,800 and $1,700 at December 31, 2003 and 2002, respectively, related to these sites. Payment of these liabilities is anticipated to occur over the next ten years. Based on currently available information and analysis, the Company believes that it is reasonably possible that costs associated with such sites may fall within a range of $800 and $2,300, in the aggregate. The ultimate cost to the Company will be influenced by any variations in projected monitoring periods or by findings that are better or worse than anticipated findings.
From the late 1960’s until 1980, the Company operated a phosphate processing site on leased property in Manatee County, Florida. In 1980, the Company sold these operations. The Company and another former owner have each received a demand for $112 from the U.S. Environmental Protection Agency relating to oversight costs incurred when the site was abandoned by its current owner, and the Company is disputing the charge. The Company is aware that state and Federal environmental agencies have taken measures to prevent the off-site release of water from rainfall that accumulated in the drainage ditches and lagoons surrounding the gypsum piles located on the site. At this time, although it is reasonably possible some costs could be incurred related to this site, the Company has inadequate information to enable it to estimate a potential range of liability relating to this site.
F-166
Table of Contents
BORDEN CHEMICAL, INC.
Notes to Consolidated Financial Statements—(Continued)
(Dollars in thousands except per share data)
Non-Environmental Legal Matters
Following is a discussion of non-environmental legal proceedings that are not in the ordinary course of business:
Imperial Home Décor Group—In 1998, pursuant to a merger and recapitalization transaction sponsored by The Blackstone Group (“Blackstone”) and financed by Chase Manhattan Bank (“Chase”), Borden Decorative Products Holdings, Inc. (“BDPH”), a wholly owned subsidiary of the Company, was acquired by Blackstone and subsequently merged with Imperial Wallcoverings to create Imperial Home Décor Group (“IHDG”). Blackstone provided $84,500 in equity, and Chase provided $295,000 in senior financing. The Company received approximately $309,000 in cash and 11% of IHDG common stock for its interest in BDPH at the closing of the merger. On January 5, 2000, IHDG filed for reorganization under Chapter 11 of the U. S. Bankruptcy Code. The IHDG Litigation Trust (the “Trust”) was created pursuant to the plan of reorganization in the IHDG bankruptcy to pursue preference and other avoidance claims on behalf of the unsecured creditors of IHDG. In November 2001, the Trust filed a lawsuit against the Company and certain of its affiliates seeking to have the IHDG recapitalization transaction voided as a fraudulent conveyance and asking for a judgment to be entered against the Company for $314,400 plus interest, costs and attorney fees. Discovery is proceeding in the case with a cut-off currently scheduled for November 2004. The parties are discussing alternatives to litigation.
The Company has accrued legal expenses for scheduled depositions related to this matter. To the extent that additional depositions or legal work is required, legal defense costs will increase. The Company has not recorded a liability for any potential losses because a loss is not considered probable based on current information. The Company believes it has strong defenses to the Trust’s allegations and intends to defend the case vigorously if a satisfactory alternative to litigation is not reached. While it is reasonably possible the resolution of this matter may result in a loss to the Company, due to the many variables involved, management is not able to estimate the range of possible outcomes at this time.
Subsidiary Bankruptcy—The Company’s former subsidiary, BCPM, filed for protection under Chapter 11 of the United States Bankruptcy Code, in the United States Bankruptcy Court for the District of Delaware on March 22, 2002. BCPM served as the general partner and held a 1% interest in BCPOLP, which was created in November 1987 and operated as a commodity chemicals producer. On April 3, 2001, BCPOLP filed for protection under Chapter 11 of the United States Bankruptcy Code, in the United States Bankruptcy Court for the District of Delaware. On February 5, 2003, the U.S. Bankruptcy Court approved a Joint Plan of Liquidation for BCPOLP and BCPM which provided for the transfer of the remaining assets of both entities, including preference, avoidance and other claims against third parties (including the Company) to separate liquidating entities for liquidation and distribution to their creditors. The transfer of the remaining assets of both entities to the liquidating agents was effective March 13, 2003. The Company’s ownership interest in BCPM was extinguished, and no distributions from BCPM to the Company are anticipated.
On March 19, 2004, BCPM Liquidating LLC (“BCPM Liquidating”), the successor in interest to BCPM, and the Company reached a tentative agreement providing for the settlement of all claims for a payment by the Company of $6,000. The Company has entered into an Agreement with BCPM Liquidating extending the period within which either party may file claims against the other until May 14, 2004, during which period the terms of the settlement agreement will be finalized and submitted to the bankruptcy court for approval.
In addition, on March 19, 2004, the Company and BCP Liquidating LLC (“BCP Liquidating”), the successor in interest to BCP, also reached a tentative agreement providing for the settlement of all claims for
F-167
Table of Contents
BORDEN CHEMICAL, INC.
Notes to Consolidated Financial Statements—(Continued)
(Dollars in thousands except per share data)
a payment by the Company of $1,050. The Company has entered into an Agreement with BCP Liquidating extending the period within which either party may file claims against the other until June 15, 2004, during which period the terms of the settlement agreement will be finalized and submitted to the bankruptcy court for approval.
The Company recorded expense of $5,929 in other operating expense at December 31, 2003 relating to these settlements. No assurance can be given that these settlements will be finalized and approved, and absent such approval, these and other claims could be filed against the Company.
Brazil Tax Claim—In 1992, the State of Sao Paolo Tax Bureau issued an assessment against the Company’s primary Brazilian subsidiary claiming that excise taxes were owed on certain intercompany loans made for centralized cash management purposes, characterized by the Tax Bureau as intercompany sales. Since that time, management and the Tax Bureau have held discussions, and the subsidiary has filed an administrative appeal seeking cancellation of the assessment. In December 2001, the Administrative Court upheld the assessment in the amount of R$52,000, or approximately US$18,000, including tax, penalties, monetary correction and interest. In September 2002, the subsidiary filed a second appeal with the highest level administrative court, again seeking cancellation of the assessment. The Company believes it has a strong defense against the assessment and will pursue the appeal vigorously; however, no assurance can be given that the assessment will not be upheld. At this time the Company does not believe a loss is probable; therefore, only related legal fees have been accrued. Reasonably possible losses to the Company on the resolution of this matter range from zero to $18,000.
HAI Grand Jury Investigation—HAI, a joint venture in which the Company has a 75% interest, received a grand jury subpoena dated November 5, 2003 from the U.S. Department of Justice Antitrust Division relating to a Foundry Resins Grand Jury investigation. HAI has provided documentation in response to the subpoena, is cooperating with the Department of Justice and has heard nothing further.
In addition to this discussion of specific non-environmental legal matters, the Company is involved in various product liability, commercial and employment litigation and other legal proceedings which are considered to be in the ordinary course of the Company’s business. There has been increased publicity about asbestos liabilities faced by manufacturing companies. As a result of the bankruptcies of many asbestos producers, plaintiff’s attorneys are increasing their focus on peripheral defendants, including the Company. The Company does not believe it has a material asbestos exposure and believes it has adequate reserves and insurance. The Company has reserved approximately $24,000 and $10,800 at December 31, 2003 and 2002, respectively, relating to all non-environmental legal matters for legal defense and settlement costs that it believes are probable and estimable at this time.
F-168
Table of Contents
BORDEN CHEMICAL, INC.
Notes to Consolidated Financial Statements—(Continued)
(Dollars in thousands except per share data)
23. Quarterly Financial Data (Unaudited)
The following represents Quarterly Financial Data for the Company:
2003 Quarters | First | Second | Third | Fourth | |||||||||||
Net sales | $ | 349,288 | $ | 370,763 | $ | 358,281 | $ | 356,481 | |||||||
Gross margin | 65,834 | 72,749 | 74,390 | 73,321 | |||||||||||
Business realignment expense (income) & impairments | 1,296 | 125 | (8,806 | ) | 12,133 | ||||||||||
(Loss) income from continuing operations | (3,405 | ) | 20,150 | 11,053 | (4,822 | ) | |||||||||
Net (loss) income | (3,405 | ) | 20,150 | 11,053 | (4,822 | ) | |||||||||
Net (loss) income applicable to common stock | (3,405 | ) | 20,150 | 11,053 | (4,822 | ) | |||||||||
Basic and diluted, per share of common stock: | |||||||||||||||
(Loss) income from continuing operations | $ | (0.02 | ) | $ | 0.10 | $ | 0.06 | $ | (0.02 | ) | |||||
Net (loss) income applicable to common stock—basic and dilutive | $ | (0.02 | ) | $ | 0.10 | $ | 0.06 | $ | (0.02 | ) | |||||
Average number of common shares outstanding—basic | 199,315 | 199,308 | 199,308 | 199,308 | |||||||||||
Average number of common shares outstanding—dilutive | 199,315 | 199,906 | 200,122 | 199,308 | |||||||||||
2002 Quarters | First(1) | Second | Third | Fourth | ||||||||||
Net sales | $ | 296,091 | $ | 309,567 | $ | 327,187 | $ | 315,040 | ||||||
Gross margin | 73,620 | 73,177 | 69,854 | 62,577 | ||||||||||
Business realignment expense and impairments | 4,659 | 5,401 | 2,082 | 7,557 | ||||||||||
(Loss) income from continuing operations | (1,887 | ) | 2,698 | 3,234 | (10,803 | ) | ||||||||
Net (loss) income | (31,712 | ) | 2,698 | 3,234 | (10,803 | ) | ||||||||
Net (loss) income applicable to common stock | (31,712 | ) | 2,698 | 3,234 | (10,803 | ) | ||||||||
Basic and diluted, per share of common stock: | ||||||||||||||
(Loss) income from continuing operations | $ | (0.01 | ) | $ | 0.01 | $ | 0.02 | $ | (0.05 | ) | ||||
Net (loss) income applicable to common stock—basic and dilutive | $ | (0.16 | ) | $ | 0.01 | $ | 0.02 | $ | (0.05 | ) | ||||
Average number of common shares outstanding—basic | 199,158 | 199,361 | 199,416 | 199,385 | ||||||||||
Average number of common shares outstanding—dilutive | 199,158 | 199,927 | 200,358 | 199,385 | ||||||||||
| (1) | As described in Note 6, the Company recorded an impairment charge of $29,825 in the first quarter to write-off the carrying amount of its European business unit’s goodwill as of January 1, 2002. There was no tax benefit recognized in conjunction with the impairment charge. |
24. Subsequent Events
Sale of the Business and Pending Capital Market Transaction
On July 5, 2004 an affiliate of Apollo Management LP (“Apollo”) entered into a stock purchase agreement with BWHLLC, BHI, the Company and certain members of Company’s management. Pursuant to this agreement, Apollo will acquire (the “Acquisition”) all of the outstanding capital stock of BHI, and all of the outstanding capital stock of the Company not otherwise owned by BHI will be redeemed. Completion of the Acquisition is subject to customary closing conditions. The Company and BHI will continue to operate independently until those conditions are satisfied and closing occurs.
The Acquisition, and the payment of estimated transaction fees and expenses will be financed with the net proceeds of a $475 million second-priority senior secured private debt offering by certain subsidiaries of the
F-169
Table of Contents
BORDEN CHEMICAL, INC.
Notes to Consolidated Financial Statements—(Continued)
(Dollars in thousands except per share data)
Company (the “Notes”) and certain equity contributions from Apollo. The Company may refinance certain existing debt with a portion of this funding. The Acquisition is expected to be completed in the third quarter of 2004. The closing of the Notes is conditioned upon the closing of the Acquisition.
The Notes will be guaranteed by the Company and certain of its existing and future domestic restricted subsidiaries (the “Guarantors”). The Notes and the related guarantees will be senior obligations secured by a second-priority lien (subject to certain exceptions and permitted liens) on certain of the Guarantors’ existing and future domestic assets.
Supplemental financial information for the Company and the combined non-guarantor subsidiaries and the combined subsidiary guarantors for the Notes are presented below:
YEAR ENDED DECEMBER 31, 2003
CONDENSED CONSOLIDATING STATEMENT OF OPERATIONS
| Borden Chemical, Inc. | Combined Guarantors | Combined Non-Guarantor Subsidiaries | Eliminations | Consolidated | ||||||||||||||||
Net Sales | $ | 859,411 | $ | — | $ | 688,688 | $ | (113,286 | ) | $ | 1,434,813 | |||||||||
Cost of goods sold | 696,078 | — | 565,727 | (113,286 | ) | 1,148,519 | ||||||||||||||
Gross margin | 163,333 | — | 122,961 | — | 286,294 | |||||||||||||||
Distribution expense | 40,903 | — | 25,480 | — | 66,383 | |||||||||||||||
Marketing expense | 20,845 | — | 21,553 | — | 42,398 | |||||||||||||||
General & administrative expense | 54,262 | 273 | 45,486 | — | 100,021 | |||||||||||||||
Business realignment expense (income) and impairments | 5,644 | — | (896 | ) | — | 4,748 | ||||||||||||||
Other operating expense (income) | 8,328 | (20 | ) | (2,106 | ) | — | 6,202 | |||||||||||||
Operating income (loss) | 33,351 | (253 | ) | 33,444 | — | 66,542 | ||||||||||||||
Interest expense | 44,825 | — | 1,313 | — | 46,138 | |||||||||||||||
Affiliated interest expense, net | 394 | — | 164 | — | 558 | |||||||||||||||
Intercompany interest expense (income) | 107,452 | (108,273 | ) | 821 | — | — | ||||||||||||||
Intercompany royalty expense (income) | 19,193 | (19,193 | ) | — | — | — | ||||||||||||||
Equity in (earnings) losses of subsidiaries, net | (164,062 | ) | (2,453 | ) | — | 166,515 | — | |||||||||||||
Other non-operating expense (income) | 8,038 | 105 | (6,614 | ) | — | 1,529 | ||||||||||||||
Income before income tax | 17,511 | 129,561 | 37,760 | (166,515 | ) | 18,317 | ||||||||||||||
Income tax (benefit) expense | (5,465 | ) | — | 806 | — | (4,659 | ) | |||||||||||||
Net income | $ | 22,976 | $ | 129,561 | $ | 36,954 | $ | (166,515 | ) | $ | 22,976 | |||||||||
F-170
Table of Contents
BORDEN CHEMICAL, INC.
Notes to Consolidated Financial Statements—(Continued)
(Dollars in thousands)
YEAR ENDED DECEMBER 31, 2002
CONDENSED CONSOLIDATING STATEMENT OF OPERATIONS
| Borden Chemical Inc. | Combined Guarantors | Combined Non- Guarantor Subsidiaries | Eliminations | Consolidated | ||||||||||||||||
Net Sales | $ | 740,703 | $ | — | $ | 604,214 | $ | (97,032 | ) | $ | 1,247,885 | |||||||||
Cost of goods sold | 578,907 | — | 486,782 | (97,032 | ) | 968,657 | ||||||||||||||
Gross margin | 161,796 | — | 117,432 | — | 279,228 | |||||||||||||||
Distribution expense | 38,223 | — | 23,704 | — | 61,927 | |||||||||||||||
Marketing expense | 21,535 | — | 20,968 | — | 42,503 | |||||||||||||||
General & administrative expense | 60,500 | 233 | 48,504 | — | 109,237 | |||||||||||||||
Business realignment expense and impairments | 5,316 | — | 14,383 | — | 19,699 | |||||||||||||||
Other operating expense (income) | 15,983 | (6 | ) | (3,823 | ) | — | 12,154 | |||||||||||||
Operating income (loss) | 20,239 | (227 | ) | 13,696 | — | 33,708 | ||||||||||||||
Interest expense | 46,220 | — | 1,095 | — | 47,315 | |||||||||||||||
Affiliated interest expense, net | 1,402 | — | — | — | 1,402 | |||||||||||||||
Intercompany interest expense (income) | 143,639 | (144,977 | ) | 1,338 | — | — | ||||||||||||||
Intercompany royalty expense (income) | 16,976 | (16,976 | ) | — | — | — | ||||||||||||||
Equity in (earnings) losses of subsidiaries, net | (102,441 | ) | (1,396 | ) | — | 103,837 | — | |||||||||||||
Other non-operating expense (income) | (9,871 | ) | 23 | 3,859 | — | (5,989 | ) | |||||||||||||
(Loss) income before income tax | (75,686 | ) | 163,099 | 7,404 | (103,837 | ) | (9,020 | ) | ||||||||||||
Income tax (benefit) expense | (39,103 | ) | — | 36,841 | — | (2,262 | ) | |||||||||||||
(Loss) income before cumulative effect of change in accounting principle | (36,583 | ) | 163,099 | (29,437 | ) | (103,837 | ) | (6,758 | ) | |||||||||||
Cumulative effect of change in accounting principle | — | — | (29,825 | ) | — | (29,825 | ) | |||||||||||||
Net (loss) income | $ | (36,583 | ) | $ | 163,099 | $ | (59,262 | ) | $ | (103,837 | ) | $ | (36,583 | ) | ||||||
F-171
Table of Contents
BORDEN CHEMICAL, INC.
Notes to Consolidated Financial Statements—(Continued)
(Dollars in thousands)
YEAR ENDED DECEMBER 31, 2001
CONDENSED CONSOLIDATING STATEMENT OF OPERATIONS
| Borden Chemical Inc. | Combined Subsidiary Guarantors | Combined Non-Guarantor Subsidiaries | Eliminations | Consolidated | ||||||||||||||||
Net sales | $ | 823,436 | — | $ | 609,991 | $ | (61,286 | ) | $ | 1,372,141 | ||||||||||
Cost of goods sold | 619,162 | — | 502,766 | (61,286 | ) | 1,060,642 | ||||||||||||||
Gross margin | 204,274 | — | 107,225 | — | 311,499 | |||||||||||||||
Distribution expense . | 38,617 | — | 25,312 | — | 63,929 | |||||||||||||||
Marketing expense | 22,501 | — | 19,545 | — | 42,046 | |||||||||||||||
General & administrative expense | 61,933 | $ | 213 | 65,821 | — | 127,967 | ||||||||||||||
(Gain) loss on sale of assets | (3,925 | ) | — | 153 | — | (3,772 | ) | |||||||||||||
Loss on divestiture of business | 2,303 | — | — | — | 2,303 | |||||||||||||||
Business realignment expense and impairments | 5,743 | — | 120,665 | — | 126,408 | |||||||||||||||
Other operating expense | 19,490 | 416 | 8,207 | — | 28,113 | |||||||||||||||
Operating income (loss) | 57,612 | (629 | ) | (132,478 | ) | — | (75,495 | ) | ||||||||||||
Interest expense | 50,515 | — | 1,098 | — | 51,613 | |||||||||||||||
Affiliated interest expense, net | 11,020 | (3,281 | ) | 3,749 | — | 11,488 | ||||||||||||||
Intercompany interest expense (income) | 283,398 | (278,371 | ) | (5,027 | ) | — | — | |||||||||||||
Affiliate royalty expense (income) | 22,681 | (19,557 | ) | (3,124 | ) | — | — | |||||||||||||
Other non-operating expense | 1,170 | 671 | — | — | 1,841 | |||||||||||||||
Equity in (earnings) losses of investees, net | (191,374 | ) | 787 | — | 190,587 | — | ||||||||||||||
Investment write-downs | 27,000 | — | — | — | 27,000 | |||||||||||||||
Income (loss) from continuing operations before income tax | (146,798 | ) | 299,122 | (129,174 | ) | (190,587 | ) | (167,437 | ) | |||||||||||
Income tax benefit | (21,998 | ) | — | (8,835 | ) | (30,833 | ) | |||||||||||||
Income (loss) from continuing operations | (124,800 | ) | 299,122 | (120,339 | ) | (190,587 | ) | (136,604 | ) | |||||||||||
Income from discontinued operations, net of tax | — | — | 11,804 | 11,804 | ||||||||||||||||
Net income (loss) | (124,800 | ) | 299,122 | (108,535 | ) | (190,587 | ) | (124,800 | ) | |||||||||||
Preferred stock dividends | (61,846 | ) | — | — | — | (61,846 | ) | |||||||||||||
Net income (loss) applicable to common stock | $ | (186,646 | ) | $ | 299,122 | $(108,535) | $(190,587) | $ | (186,646 | ) | ||||||||||
F-172
Table of Contents
BORDEN CHEMICAL, INC.
Notes to Consolidated Financial Statements—(Continued)
(Dollars in thousands)
DECEMBER 31, 2003
CONDENSED CONSOLIDATING BALANCE SHEET
Borden Chemical Inc. | Combined Guarantors | Combined Non-Guarantor Subsidiaries | Eliminations | Consolidated | ||||||||||||||||
ASSETS | ||||||||||||||||||||
Current Assets | ||||||||||||||||||||
Cash and equivalents | $ | 1,370 | $ | 151 | $ | 26,641 | $ | — | $ | 28,162 | ||||||||||
Accounts receivable | 85,524 | 67 | 110,502 | — | 196,093 | |||||||||||||||
Inventories: | ||||||||||||||||||||
Finished and in-process goods | 25,173 | — | 17,119 | — | 42,292 | |||||||||||||||
Raw materials and supplies | 22,395 | — | 16,424 | — | 38,819 | |||||||||||||||
Deferred income taxes | 26,744 | — | 341 | — | 27,085 | |||||||||||||||
Other current assets | 10,102 | 73 | 3,730 | — | 13,905 | |||||||||||||||
| 171,308 | 291 | 174,757 | — | 346,356 | ||||||||||||||||
Other Assets | ||||||||||||||||||||
Investment in subsidiaries | 6,315,510 | 16,610 | — | (6,332,120 | ) | — | ||||||||||||||
Loans receivable from affiliates | — | 6,037,074 | — | (6,037,074 | ) | — | ||||||||||||||
Deferred income taxes | 105,682 | — | 7,752 | — | 113,434 | |||||||||||||||
Other assets | 14,410 | — | 7,315 | — | 21,725 | |||||||||||||||
| 6,435,602 | 6,053,684 | 15,067 | (12,369,194 | ) | 135,159 | |||||||||||||||
Property and Equipment | ||||||||||||||||||||
Land | 24,389 | — | 8,196 | — | 32,585 | |||||||||||||||
Buildings | 67,365 | — | 36,409 | — | 103,774 | |||||||||||||||
Machinery and equipment | 407,587 | 480 | 283,182 | — | 691,249 | |||||||||||||||
| 499,341 | 480 | 327,787 | — | 827,608 | ||||||||||||||||
Less accumulated depreciation | (244,120 | ) | (355 | ) | (134,249 | ) | — | (378,724 | ) | |||||||||||
| 255,221 | 125 | 193,538 | — | 448,884 | ||||||||||||||||
Goodwill | 36,593 | — | 20,923 | — | 57,516 | |||||||||||||||
Other intangible assets | 4,822 | — | 1,129 | — | 5,951 | |||||||||||||||
Total Assets | $ | 6,903,546 | $ | 6,054,100 | $ | 405,414 | $ | (12,369,194 | ) | $ | 993,866 | |||||||||
F-173
Table of Contents
BORDEN CHEMICAL, INC.
Notes to Consolidated Financial Statements—(Continued)
(Dollars in thousands)
DECEMBER 31, 2003
CONDENSED CONSOLIDATING BALANCE SHEET—(Continued)
Borden Chemical Inc. | Combined Guarantors | Combined Non-Guarantor Subsidiaries | Eliminations | Consolidated | |||||||||||||||
LIABILITIES AND SHAREHOLDER’S DEFICIT | |||||||||||||||||||
Current Liabilities | |||||||||||||||||||
Accounts and drafts payable | $ | 63,707 | $ | 12 | $ | 63,455 | $ | — | $ | 127,174 | |||||||||
Accounts payable to affiliate | (8,582 | ) | (6,877 | ) | 15,459 | — | — | ||||||||||||
Debt payable within one year | 2,548 | — | 5,619 | — | 8,167 | ||||||||||||||
Loans payable to affiliates | 12,260 | — | 6,000 | — | 18,260 | ||||||||||||||
Income taxes payable | 32,533 | 2,444 | — | 34,977 | |||||||||||||||
Interest payable | 12,339 | 185 | — | 12,524 | |||||||||||||||
Other current liabilities | 55,514 | 349 | 15,683 | — | 71,546 | ||||||||||||||
| 170,319 | (6,516 | ) | 108,845 | — | 272,648 | ||||||||||||||
Other Liabilities | |||||||||||||||||||
Long-term debt | 520,877 | — | 9,089 | — | 529,966 | ||||||||||||||
Long-term loans payable to affiliates | 6,032,348 | — | 4,726 | (6,037,074 | ) | — | |||||||||||||
Non-pension postemployment benefit obligations | 127,768 | — | 955 | — | 128,723 | ||||||||||||||
Long-term pension obligations | 65,647 | — | 1,009 | — | 66,656 | ||||||||||||||
Other long-term liabilities | 82,780 | — | 9,286 | — | 92,066 | ||||||||||||||
| 6,829,420 | — | 25,065 | (6,037,074 | ) | 817,411 | ||||||||||||||
Shareholder’s (Deficit) Equity | (96,193 | ) | $ | 6,060,616 | 271,504 | (6,332,120 | ) | (96,193 | ) | ||||||||||
Total Liabilities & Shareholder’s (Deficit) Equity | $ | 6,903,546 | $ | 6,054,100 | $ | 405,414 | $ | (12,369,194 | ) | $ | 993,866 | ||||||||
F-174
Table of Contents
BORDEN CHEMICAL, INC.
Notes to Consolidated Financial Statements—(Continued)
(Dollars in thousands)
DECEMBER 31, 2002
CONDENSED CONSOLIDATING BALANCE SHEET
| Borden Chemical Inc. | Combined Guarantors | Combined Non-Guarantor | Eliminations | Consolidated | ||||||||||||||||
ASSETS | ||||||||||||||||||||
Current Assets | ||||||||||||||||||||
Cash and equivalents | $ | 1,838 | $ | 116 | $ | 12,786 | — | $ | 14,740 | |||||||||||
Restricted cash | 67,049 | — | — | — | 67,049 | |||||||||||||||
Accounts receivable | 81,120 | 121 | 89,581 | — | 170,822 | |||||||||||||||
Accounts receivable from affiliates | 5,822 | 18 | — | — | 5,840 | |||||||||||||||
Inventories: | ||||||||||||||||||||
Finished and in-process goods | 28,895 | — | 16,283 | — | 45,178 | |||||||||||||||
Raw materials and supplies | 23,002 | — | 18,077 | — | 41,079 | |||||||||||||||
Deferred income taxes | 27,074 | — | 1,795 | — | 28,869 | |||||||||||||||
Other current assets | 9,261 | 28 | 3,943 | — | 13,232 | |||||||||||||||
| 244,061 | 283 | 142,465 | — | 386,809 | ||||||||||||||||
Investments and Other Assets | ||||||||||||||||||||
Investment in subsidiaries | 6,089,381 | 16,115 | — | $ | (6,105,496 | ) | — | |||||||||||||
Deferred income taxes | 95,226 | — | 23,142 | — | 118,368 | |||||||||||||||
Loans and interest receivable from affiliates | — | 5,919,997 | 11,279 | (5,931,276 | ) | — | ||||||||||||||
Other assets | 14,844 | — | 4,771 | — | 19,615 | |||||||||||||||
| 6,199,451 | 5,936,112 | 39,192 | (12,036,772 | ) | 137,983 | |||||||||||||||
Property and Equipment | ||||||||||||||||||||
Land | 24,872 | — | 7,092 | — | 31,964 | |||||||||||||||
Buildings | 67,866 | — | 30,447 | — | 98,313 | |||||||||||||||
Machinery and equipment | 407,284 | 555 | 241,943 | — | 649,782 | |||||||||||||||
| 500,022 | 555 | 279,482 | — | 780,059 | ||||||||||||||||
Less accumulated depreciation | (234,584 | ) | (255 | ) | (105,482 | ) | — | (340,321 | ) | |||||||||||
| 265,438 | 300 | 174,000 | — | 439,738 | ||||||||||||||||
Goodwill | 32,525 | — | 7,115 | — | 39,640 | |||||||||||||||
Other intangible assets | 6,006 | — | 1,604 | — | 7,610 | |||||||||||||||
Total Assets | $ | 6,747,481 | $ | 5,936,695 | $ | 364,376 | $ | (12,036,772 | ) | $ | 1,011,780 | |||||||||
F-175
Table of Contents
BORDEN CHEMICAL, INC.
Notes to Consolidated Financial Statements—(Continued)
(Dollars in thousands)
DECEMBER 31, 2002
CONDENSED CONSOLIDATING BALANCE SHEET—(Continued)
| Borden Chemical Inc. | Combined Subsidiary Guarantors | Combined Non-Guarantor | Eliminations | Consolidated | |||||||||||||||
LIABILITIES AND SHAREHOLDERS’ DEFICIT | |||||||||||||||||||
Current Liabilities | |||||||||||||||||||
Accounts and drafts payable | $ | 64,919 | $ | 94 | $ | 48,536 | $ | — | $ | 113,549 | |||||||||
Accounts payable to affiliate | (13,225 | ) | (7,920 | ) | 21,145 | — | — | ||||||||||||
Debt payable within one year | 821 | — | 1,958 | — | 2,779 | ||||||||||||||
Loans payable to affiliates | 84,680 | — | — | — | 84,680 | ||||||||||||||
Income taxes payable | 40,054 | — | 15,910 | — | 55,964 | ||||||||||||||
Interest payable | 12,136 | — | — | — | 12,136 | ||||||||||||||
Other current liabilities | 56,157 | 1,075 | 21,725 | — | 78,957 | ||||||||||||||
| 245,542 | (6,751 | ) | 109,274 | — | 348,065 | ||||||||||||||
Other Liabilities | |||||||||||||||||||
Long-term debt | 521,916 | — | 1,371 | — | 523,287 | ||||||||||||||
Long-term loans payable to affiliates | 5,862,264 | — | 69,012 | (5,931,276 | ) | — | |||||||||||||
Non-pension postemployment benefit obligations | 144,652 | — | 732 | — | 145,384 | ||||||||||||||
Long-term pension obligation | 68,752 | — | 1,464 | — | 70,216 | ||||||||||||||
Other long-term liabilities | 65,248 | 107 | 20,366 | — | 85,721 | ||||||||||||||
| 6,662,832 | 107 | 92,945 | (5,931,276 | ) | 824,608 | ||||||||||||||
Shareholders’ Equity (Deficit) | (160,893 | ) | 5,943,339 | 162,157 | (6,105,496 | ) | (160,893 | ) | |||||||||||
Total Liabilities and Shareholders’ Equity (Deficit) | $ | 6,747,481 | $ | 5,936,695 | $ | 364,376 | $ | (12,036,772 | ) | $ | 1,011,780 | ||||||||
F-176
Table of Contents
BORDEN CHEMICAL, INC.
Notes to Consolidated Financial Statements—(Continued)
(Dollars in thousands)
FOR THE YEAR ENDED DECEMBER 31, 2003
CONDENSED CONSOLIDATING STATEMENT OF CASH FLOWS
| Borden Chemical Inc. | Combined Guarantors | Combined Guarantor | Eliminations | Consolidated | ||||||||||||||||
Cash Flows from (used in) Operating Activities | ||||||||||||||||||||
Net loss | $ | 22,976 | $ | 129,561 | $ | 36,954 | $ | (166,515 | ) | $ | 22,976 | |||||||||
Adjustments to reconcile net income to net cash from (used in) operating activities: | ||||||||||||||||||||
Non-cash affiliated interest(1) | 107,837 | (107,837 | ) | — | — | — | ||||||||||||||
Equity in earnings of subsidiaries | (166,515 | ) | — | — | 166,515 | — | ||||||||||||||
Non-cash allocation of corporate expenses | (16,150 | ) | — | 16,150 | — | — | ||||||||||||||
Depreciation and amortization | 29,789 | — | 17,530 | — | 47,319 | |||||||||||||||
Deferred tax provision | 2,588 | — | 3,635 | — | 6,223 | |||||||||||||||
Business realignment expense (income) and impairments | 5,644 | — | (896 | ) | — | 4,748 | ||||||||||||||
(Gain) loss on the sale of assets | (1,061 | ) | — | 315 | — | (746 | ) | |||||||||||||
Deferred compensation expense | 1,191 | — | — | — | 1,191 | |||||||||||||||
Other non-cash adjustments | 727 | — | 343 | — | 1,070 | |||||||||||||||
Net change in assets and liabilities: | ||||||||||||||||||||
Accounts receivable | 4,562 | — | (7,779 | ) | — | (3,217 | ) | |||||||||||||
Inventories | 4,490 | — | 6,241 | — | 10,731 | |||||||||||||||
Accounts and drafts payable | (2,886 | ) | — | 5,378 | — | 2,492 | ||||||||||||||
Income taxes | (12,993 | ) | — | (17,298 | ) | — | (30,291 | ) | ||||||||||||
Other assets | (4,207 | ) | (1,245 | ) | 9,033 | — | 3,581 | |||||||||||||
Other liabilities | 9,822 | 896 | (44,855 | ) | — | (34,137 | ) | |||||||||||||
| (14,186 | ) | 21,375 | 24,751 | — | 31,940 | |||||||||||||||
Cash Flows (used in) from Investing Activities | ||||||||||||||||||||
Capital expenditures | (24,922 | ) | — | (16,898 | ) | — | (41,820 | ) | ||||||||||||
Purchase of business | (3,140 | ) | — | (11,551 | ) | — | (14,691 | ) | ||||||||||||
Proceeds from the sale of assets | 6,613 | — | 7,584 | — | 14,197 | |||||||||||||||
| (21,449 | ) | — | (20,865 | ) | — | (42,314 | ) | |||||||||||||
Cash flows from (used in) Financing Activities | ||||||||||||||||||||
Net short-term debt borrowings | 1,727 | — | 3,661 | — | 5,388 | |||||||||||||||
Borrowings of long-term debt | 207 | — | 7,718 | — | 7,925 | |||||||||||||||
Repayments of long-term debt | (1,246 | ) | — | — | — | (1,246 | ) | |||||||||||||
Affiliated loan repayments | (53,584 | ) | (9,340 | ) | (3,496 | ) | — | (66,420 | ) | |||||||||||
Decrease in restricted cash | 67,049 | — | — | — | 67,049 | |||||||||||||||
Dividends received (paid) | 12,000 | (12,000 | ) | — | — | — | ||||||||||||||
Capital contribution from affiliates | 9,300 | — | — | — | 9,300 | |||||||||||||||
Repurchases, net of sale, of common stock (from) to management | (286 | ) | — | — | — | (286 | ) | |||||||||||||
| 35,167 | (21,340 | ) | 7,883 | — | 21,710 | |||||||||||||||
Effect of exchange rates on cash | — | — | 2,086 | — | 2,086 | |||||||||||||||
Increase (decrease) in cash and equivalents | (468 | ) | 35 | 13,855 | — | 13,422 | ||||||||||||||
Cash and equivalents at beginning of year | 1,838 | 116 | 12,786 | — | 14,740 | |||||||||||||||
Cash and equivalents at end of year | $ | 1,370 | $ | 151 | $ | 26,641 | $ | — | $ | 28,162 | ||||||||||
| (1) | Interest on affiliated debt to certain guarantor subsidiaries is settled by increasing the loan principal. |
F-177
Table of Contents
BORDEN CHEMICAL, INC.
Notes to Consolidated Financial Statements—(Continued)
(Dollars in thousands)
FOR THE YEAR ENDED DECEMBER 31, 2002
CONDENSED CONSOLIDATING STATEMENT OF CASH FLOWS
Borden Chemical, Inc. | Combined Subsidiary Guarantor | Combined Non-Guarantor Subsidiaries | Eliminations | Consolidated | ||||||||||||||||
Cash Flows from (used in) Operating Activities | ||||||||||||||||||||
Net (loss) income | $ | (36,583 | ) | $ | 163,099 | $ | (59,262 | ) | $ | (103,837 | ) | $ | (36,583 | ) | ||||||
Adjustments to reconcile net (loss) income to net cash (used in) from operating activities: | ||||||||||||||||||||
Non-cash affiliated interest (1) | 144,340 | (144,340 | ) | — | — | — | ||||||||||||||
Equity in earnings of subsidiaries | (103,837 | ) | — | — | 103,837 | — | ||||||||||||||
Non-cash allocation of corporate expenses | (16,182 | ) | — | 16,182 | — | — | ||||||||||||||
Depreciation and amortization | 31,034 | — | 16,913 | — | 47,947 | |||||||||||||||
Deferred tax provision | 15,132 | — | 891 | — | 16,023 | |||||||||||||||
Business realignment expense and impairments | 5,316 | — | 14,383 | — | 19,699 | |||||||||||||||
Loss on the sale of assets | 217 | — | 65 | — | 282 | |||||||||||||||
Deferred compensation expense | 892 | — | — | — | 892 | |||||||||||||||
Cumulative effect of change in accounting principle | — | — | 29,825 | — | 29,825 | |||||||||||||||
Other non-cash adjustments | (867 | ) | — | 45 | — | (822 | ) | |||||||||||||
Net change in assets and liabilities: | ||||||||||||||||||||
Accounts receivable | (15,812 | ) | — | 3,216 | — | (12,596 | ) | |||||||||||||
Inventories | (2,466 | ) | — | 5,018 | — | 2,552 | ||||||||||||||
Accounts and drafts payable | (30,360 | ) | — | 22,057 | — | (8,303 | ) | |||||||||||||
Income taxes | (15,220 | ) | — | (6,560 | ) | — | (21,780 | ) | ||||||||||||
Other assets | 14,239 | (2,466 | ) | (14,344 | ) | — | (2,571 | ) | ||||||||||||
Other liabilities | 1,721 | 743 | (25,733 | ) | — | (23,269 | ) | |||||||||||||
| (8,436 | ) | 17,036 | 2,696 | — | 11,296 | |||||||||||||||
Cash Flows (used in) from Investing Activities | ||||||||||||||||||||
Capital expenditures | (29,229 | ) | — | (9,544 | ) | — | (38,773 | ) | ||||||||||||
Proceeds from the sale of businesses | 7,135 | — | 3,102 | — | 10,237 | |||||||||||||||
Proceeds from the sale of assets | 110,000 | — | — | — | 110,000 | |||||||||||||||
| 87,906 | — | (6,442 | ) | — | 81,464 | |||||||||||||||
Cash Flows (used in) from Financing Activities | ||||||||||||||||||||
Net short-term debt borrowings (repayments) | (579 | ) | — | 1,834 | — | 1,255 | ||||||||||||||
Repayments of long-term debt | (8,769 | ) | — | (1,995 | ) | — | (10,764 | ) | ||||||||||||
Affiliated loans (repayments) borrowings | 23,070 | (16,940 | ) | — | — | 6,130 | ||||||||||||||
Increase in restricted cash | (66,165 | ) | — | — | — | (66,165 | ) | |||||||||||||
Payment of note payable to unconsolidated subsidiary | (31,581 | ) | — | — | — | (31,581 | ) | |||||||||||||
Repurchases, net of sale, of common stock (from) to management | (591 | ) | — | — | — | (591 | ) | |||||||||||||
| (84,615 | ) | (16,940 | ) | (161 | ) | — | (101,716 | ) | ||||||||||||
Effect of exchange rates on cash | — | — | (936 | ) | — | (936 | ) | |||||||||||||
Increase (decrease) in cash and equivalents | (5,145 | ) | 96 | (4,843 | ) | — | (9,892 | ) | ||||||||||||
Cash and equivalents at beginning of year | 6,983 | 20 | 17,629 | — | 24,632 | |||||||||||||||
Cash and equivalents at end of year | $ | 1,838 | $ | 116 | $ | 12,786 | $ | — | $ | 14,740 | ||||||||||
| (1) | Interest on affiliated debt to certain guarantor subsidiaries is settled by increasing the loan principal. |
F-178
Table of Contents
BORDEN CHEMICAL, INC.
Notes to Consolidated Financial Statements—(Continued)
(Dollars in thousands)
FOR THE YEAR ENDED DECEMBER 31, 2001
CONDENSED CONSOLIDATING STATEMENT OF CASH FLOWS
Borden Chemical | Combined Subsidiary Guarantors | Combined Non-Guarantor Subsidiaries | Eliminations | Consolidated | ||||||||||||||||
Cash Flows from (used in) Operating Activities | ||||||||||||||||||||
Net (loss) income | $ | (124,800 | ) | $ | 299,122 | $ | (108,535 | ) | $ | (190,587 | ) | $ | (124,800 | ) | ||||||
Adjustments to reconcile net income (loss) to net cash from (used in) operating activities: | ||||||||||||||||||||
Non-cash affiliated interest(1) | 278,209 | (278,209 | ) | — | — | — | ||||||||||||||
Equity in earnings of subsidiaries | (190,587 | ) | — | — | 190,587 | — | ||||||||||||||
Depreciation and amortization | 26,846 | — | 32,515 | — | 59,361 | |||||||||||||||
Deferred Tax (Benefit) Expense | (25,982 | ) | — | 99 | — | (25,883 | ) | |||||||||||||
Business Realignment Expense and Impairments | 5,743 | — | 120,665 | — | 126,408 | |||||||||||||||
(Gain) loss on the sale of assets | (3,925 | ) | — | 153 | — | (3,772 | ) | |||||||||||||
Loss on divestiture of businesses | 2,303 | — | — | — | 2,303 | |||||||||||||||
Investment write-downs and other charges | 27,000 | — | — | — | 27,000 | |||||||||||||||
Other non-cash adjustments | 2,992 | — | 71 | — | 3,063 | |||||||||||||||
Net change in assets and liabilities | ||||||||||||||||||||
Accounts receivable | 31,285 | — | 413 | — | 31,698 | |||||||||||||||
Inventories | 11,312 | — | 3,367 | — | 14,679 | |||||||||||||||
Accounts and drafts payable | (220 | ) | — | (20,010 | ) | — | (20,230 | ) | ||||||||||||
Income Taxes | 39,176 | — | 4,954 | — | 44,130 | |||||||||||||||
Other Assets | 6,207 | 2,532 | (81,127 | ) | — | (72,388 | ) | |||||||||||||
Other Liabilities | (8,705 | ) | (5,917 | ) | 48,173 | — | 33,551 | |||||||||||||
| 76,854 | 17,528 | 738 | — | 95,120 | ||||||||||||||||
Cash Flows (used in) from Investing Activities | ||||||||||||||||||||
Capital Expenditures | (22,897 | ) | — | (24,511 | ) | — | (47,408 | ) | ||||||||||||
Proceeds from the sale of businesses | 90,665 | — | 6,312 | — | 96,977 | |||||||||||||||
Proceeds from the sale of assets | 109,603 | 48,285 | 3,000 | — | 160,888 | |||||||||||||||
Other, net | 524 | — | — | — | 524 | |||||||||||||||
| 177,895 | 48,285 | (15,199 | ) | — | 210,981 | |||||||||||||||
Cash flows from (used in) Financing Activities | ||||||||||||||||||||
Net short-term debt repayments | (21,670 | ) | — | (20,093 | ) | — | (41,763 | ) | ||||||||||||
Net Borrowings of long-term debt | 2,074 | — | 1,326 | — | 3,400 | |||||||||||||||
Affiliated loans (repayments/loans) borrowings/receipts | (187,465 | ) | (52,274 | ) | 27,307 | — | (212,432 | ) | ||||||||||||
Decrease (increase) in restricted cash | (884 | ) | — | — | — | (884 | ) | |||||||||||||
Interest received from parent | 48,578 | — | — | — | 48,578 | |||||||||||||||
Common stock dividends paid | (35,019 | ) | (13,559 | ) | — | — | (48,578 | ) | ||||||||||||
Preferred stock dividends paid | (73,724 | ) | — | — | — | (73,724 | ) | |||||||||||||
Capital contribution from affiliates | 17,000 | — | — | — | 17,000 | |||||||||||||||
| (251,110 | ) | (65,833 | ) | 8,540 | — | (308,403 | ) | |||||||||||||
Increase (decrease) in cash and equivalents | $ | 3,639 | $ | (20 | ) | $ | (5,921 | ) | — | $ | (2,302 | ) | ||||||||
Cash and equivalents at beginning of year | 3,344 | 40 | 23,550 | — | 26,934 | |||||||||||||||
Cash and equivalents at end of year | $ | 6,983 | $ | 20 | $ | 17,629 | — | $ | 24,632 | |||||||||||
| (1) | Interest on affiliated debt to certain guarantor subsidiaries is settled by increasing the loan principal. |
F-179
Table of Contents
BORDEN CHEMICAL, INC.
Notes to Consolidated Financial Statements—(Continued)
(Dollars in thousands except per share data)
Deferred Tax Valuation Allowance
In connection with the expected sale of BHI, the Company has recorded a non-cash charge of $137,110 to income tax expense in the second quarter of 2004 to increase the valuation reserves related to the Company’s net domestic deferred tax asset.
As a result of the expected sale of the Company, certain limitations will be placed on the utilization of the attributes under U.S. tax law, and the new financing discussed in Note 1 will limit the Company’s flexibility with respect to prior tax planning strategies. As a result, the Company no longer believes that utilization of the net domestic deferred tax asset is more likely than not to occur.
The Company’s remaining net deferred tax liability of $32,014 is reflected in the Consolidated Balance Sheet at June 30, 2004 as a current deferred asset of $23,476 and a long-term deferred tax asset of $2,320, offset by a current deferred tax liability of $3,960 included in other current liabilities and long-term deferred tax liability of $53,850 included in Other long-term liabilities.
F-180
Table of Contents
REPORT OF INDEPENDENT REGISTERED PUBLIC ACCOUNTING FIRM
To the Board of Directors and Shareholder of
Borden Chemical, Inc.:
We have audited the consolidated balance sheet of Borden Chemical, Inc. (a wholly owned subsidiary of BHI Acquisition Corp., which is a majority owned subsidiary of BHI Investment, LLC) and subsidiaries (the “Company”) as of December 31, 2004, and the related consolidated statements of operations and comprehensive loss, shareholder’s deficit, and cash flows for the period from August 12, 2004 to December 31, 2004. Such financial statements are not presented separately herein. These financial statements are the responsibility of the Company’s management. Our responsibility is to express an opinion on these financial statements based on our audit.
We conducted our audit in accordance with the standards of the Public Company Accounting Oversight Board (United States). Those standards require that we plan and perform the audit to obtain reasonable assurance about whether the financial statements are free of material misstatement. The Company is not required to have, nor were we engaged to perform, an audit of its internal control over financial reporting. Our audit included consideration of internal control over financial reporting as a basis for designing audit procedures that are appropriate in the circumstances, but not for the purpose of expressing an opinion on the effectiveness of the Company’s internal control over financial reporting. Accordingly, we express no such opinion. An audit also includes examining, on test basis, evidence supporting the amounts and disclosure in the financial statements, assessing the accounting principles used and significant estimates made by management, as well as evaluating the overall financial statement presentation. We believe that our audit provides a reasonable basis for our opinion.
In our opinion, such consolidated financial statements present fairly, in all material respects, the financial position of Borden Chemical, Inc. and subsidiaries at December 31, 2004, and the results of their operations and their cash flows for the period from August 12, 2004 to December 31, 2004, in conformity with accounting principles generally accepted in the United States of America.
As discussed in Note 20, the accompanying balance sheet has been restated.
DELOITTE & TOUCHE LLP
Columbus, Ohio
April 24, 2005, except for the effects of
Notes 20 and 21, as to which the dates are
April 27, 2005 and August 18, 2005, respectively
F-181
Table of Contents
[THIS PAGE INTENTIONALLY LEFT BLANK]
F-182
Table of Contents
REPORT OF INDEPENDENT REGISTERED PUBLIC ACCOUNTING FIRM
To the Board of Directors and Shareholder
of Hexion Specialty Chemicals Canada, Inc.
We have audited the accompanying consolidated balance sheets of Hexion Specialty Chemicals Canada, Inc. (formerly Borden Chemical Canada, Inc.), a wholly-owned subsidiary of Hexion Specialty Chemicals, Inc., and subsidiaries (the “Company”) as of December 31, 2005 and 2004, and the related consolidated statements of operations, cash flows, and shareholder’s equity (deficit) for each of the three years in the period ended December 31, 2005. These financial statements are the responsibility of the Company’s management. Our responsibility is to express an opinion on these financial statements based on our audits. We did not audit the financial statements of National Borden Chemical Germany GmbH (a subsidiary), which statements reflect total assets constituting 59 percent of consolidated total assets as of December 31, 2005, and total revenues constituting 39 percent of consolidated total revenues for the year ended December 31, 2005. Such financial statements were audited by other auditors whose report has been furnished to us, and our opinion, insofar as it relates to the amounts included for National Borden Chemical Germany GmbH, is based solely on the report of such other auditors.
We conducted our audits in accordance with the standards of the Public Company Accounting Oversight Board (United States). Those standards require that we plan and perform the audit to obtain reasonable assurance about whether the financial statements are free of material misstatement. The Company is not required to have, nor were we engaged to perform, an audit of its internal control over financial reporting. Our audits included consideration of internal control over financial reporting as a basis for designing audit procedures that are appropriate in the circumstances, but not for the purpose of expressing an opinion on the effectiveness of the Company’s internal control over financial reporting. Accordingly, we express no such opinion. An audit also includes examining, on a test basis, evidence supporting the amounts and disclosures in the financial statements, assessing the accounting principles used and significant estimates made by management, as well as evaluating the overall financial statement presentation. We believe that our audits and the report of other auditors provide a reasonable basis for our opinion.
In our opinion, based on our audits and the report of other auditors, such consolidated financial statements present fairly, in all material respects, the financial position of Hexion Specialty Chemicals Canada, Inc. and subsidiaries as of December 31, 2005 and 2004, and the results of their operations and their cash flows for each of the three years in the period ended December 31, 2005, in conformity with accounting principles generally accepted in the United States of America.
DELOITTE & TOUCHE LLP
Columbus, Ohio
March 16, 2006
F-183
Table of Contents
HEXION SPECIALTY CHEMICALS CANADA, INC. AND SUBSIDIARIES
CONSOLIDATED STATEMENTS OF OPERATIONS
| Year ended December 31, | ||||||||||||
| 2005 | 2004 | 2003 | ||||||||||
| (In millions) | ||||||||||||
Net sales | $ | 1,234 | $ | 637 | $ | 533 | ||||||
Cost of sales | 1,047 | 550 | 459 | |||||||||
Gross profit | 187 | 87 | 74 | |||||||||
Selling, general & administrative expense | 99 | 48 | 40 | |||||||||
Transaction related costs (See Note 5) | 9 | 20 | — | |||||||||
Business realignment and impairments (See Note 4) | 11 | 3 | (4 | ) | ||||||||
Other operating expense (income) | — | (2 | ) | (2 | ) | |||||||
Operating income | 68 | 18 | 40 | |||||||||
Interest expense | 6 | 2 | 2 | |||||||||
Affiliated interest expense (See Note 9) | 40 | 12 | 3 | |||||||||
Other non-operating expense | 7 | 2 | — | |||||||||
Income before income taxes | 15 | 2 | 35 | |||||||||
Income tax expense (benefit) | 5 | 23 | (1 | ) | ||||||||
Net income (loss) | $ | 10 | $ | (21 | ) | $ | 36 | |||||
Comprehensive (loss) income | $ | (33 | ) | $ | (27 | ) | $ | 59 | ||||
See Notes to Consolidated Financial Statements
F-184
Table of Contents
HEXION SPECIALTY CHEMICALS CANADA, INC. AND SUBSIDIARIES
CONSOLIDATED BALANCE SHEETS
| December 31, 2005 | December 31, 2004 | |||||||
| (In millions) | ||||||||
ASSETS | ||||||||
Current Assets | ||||||||
Cash and equivalents | $ | 112 | $ | 58 | ||||
Accounts receivable (less allowance for doubtful accounts of $10 in 2005 and $3 in 2004) | 219 | 105 | ||||||
Inventories: | ||||||||
Finished and in-process goods | 66 | 17 | ||||||
Raw materials and supplies | 50 | 22 | ||||||
Other current assets | 16 | 4 | ||||||
| 463 | 206 | |||||||
Other Assets | 23 | 20 | ||||||
Property and Equipment | ||||||||
Land | 19 | 7 | ||||||
Buildings | 57 | 33 | ||||||
Machinery and equipment | 414 | 295 | ||||||
| 490 | 335 | |||||||
Less accumulated depreciation | (159 | ) | (138 | ) | ||||
| 331 | 197 | |||||||
Goodwill | 68 | 10 | ||||||
Other Intangibles Assets, net | 68 | 5 | ||||||
Total Assets | $ | 953 | $ | 438 | ||||
See Notes to Consolidated Financial Statements
F-185
Table of Contents
HEXION SPECIALTY CHEMICALS CANADA, INC. AND SUBSIDIARIES
CONSOLIDATED BALANCE SHEETS
| December 31, 2005 | December 31, 2004 | |||||||
| (In millions, except share data) | ||||||||
LIABILITIES AND SHAREHOLDER’S EQUITY (DEFICIT) | ||||||||
Current Liabilities | ||||||||
Accounts and drafts payable | $ | 139 | $ | 90 | ||||
Accounts payable to affiliates (See Note 5) | 10 | 5 | ||||||
Debt payable within one year | 36 | 8 | ||||||
Affiliated interest payable (See Note 9) | — | 11 | ||||||
Business realignment reserves (See Note 4) | 21 | 4 | ||||||
Other current liabilities | 52 | 20 | ||||||
| 258 | 138 | |||||||
Other Liabilities | ||||||||
Long-term debt | 21 | 7 | ||||||
Affiliated long-term debt (See Note 9) | 455 | 285 | ||||||
Affiliated royalties (See Note 5) | 7 | 8 | ||||||
Deferred income taxes | 42 | 25 | ||||||
Long-term pension obligations | 106 | 1 | ||||||
Other long-term liabilities | 15 | 6 | ||||||
| 646 | 332 | |||||||
Commitments and Contingencies (See Notes 8, 10 and 11) | ||||||||
Shareholder’s Equity (Deficit) | ||||||||
Common stock – no par value; authorized shares unlimited, issued and outstanding 489,866 shares at December 31, 2005 and 2004 | 3 | 3 | ||||||
Paid-in capital | 118 | 2 | ||||||
Accumulated other comprehensive loss | (100 | ) | (57 | ) | ||||
Retained earnings | 28 | 20 | ||||||
| 49 | (32 | ) | ||||||
Total Liabilities and Shareholder’s Equity (Deficit) | $ | 953 | $ | 438 | ||||
See Notes to Consolidated Financial Statements
F-186
Table of Contents
HEXION SPECIALTY CHEMICALS CANADA, INC. AND SUBSIDIARIES
CONSOLIDATED STATEMENTS OF CASH FLOWS
| Year ended December 31, | ||||||||||||
| 2005 | 2004 | 2003 | ||||||||||
| (In millions) | ||||||||||||
Cash Flows from (used in) Operating Activities | ||||||||||||
Net income (loss) | $ | 10 | $ | (21 | ) | $ | 36 | |||||
Adjustments to reconcile net income (loss) to net cash from (used in) operating activities | ||||||||||||
Allocations of corporate overhead, net (See Note 5) | 17 | 34 | 13 | |||||||||
Deferred tax provision | (1 | ) | 16 | 1 | ||||||||
Depreciation and amortization | 33 | 17 | 16 | |||||||||
Business realignment and impairments | 11 | 3 | (4 | ) | ||||||||
Write off of deferred financing fees | 2 | — | — | |||||||||
Other non-cash adjustments | (2 | ) | 2 | 1 | ||||||||
Net change in assets and liabilities: | ||||||||||||
Accounts receivable | 4 | (8 | ) | (6 | ) | |||||||
Inventories | 35 | (10 | ) | 5 | ||||||||
Accounts and drafts payable | (14 | ) | 31 | 4 | ||||||||
Income taxes | 1 | (9 | ) | (16 | ) | |||||||
Other assets | 11 | 1 | 2 | |||||||||
Other liabilities | (9 | ) | — | (16 | ) | |||||||
| 98 | 56 | 36 | ||||||||||
Cash Flows (used in) from Investing Activities | ||||||||||||
Capital expenditures | (25 | ) | (18 | ) | (16 | ) | ||||||
Acquisition of businesses, net of cash and debt acquired (See Note 3) | (248 | ) | — | (11 | ) | |||||||
Liquidating dividend from investment | — | — | 1 | |||||||||
Proceeds from the sale of assets | — | 8 | 7 | |||||||||
| (273 | ) | (10 | ) | (19 | ) | |||||||
Cash Flows from (used in) Financing Activities | ||||||||||||
Net short-term debt borrowings | (4 | ) | 2 | 2 | ||||||||
Borrowings of long-term debt | 5 | — | 9 | |||||||||
Repayments of long-term debt | (15 | ) | (2 | ) | (1 | ) | ||||||
Affiliated loan borrowings, net | 245 | (13 | ) | (15 | ) | |||||||
Common stock dividends paid | — | (1 | ) | (2 | ) | |||||||
| 231 | (14 | ) | (7 | ) | ||||||||
Effect of exchange rates on cash and equivalents | (2 | ) | 3 | 2 | ||||||||
Increase in cash and equivalents | $ | 54 | $ | 35 | $ | 12 | ||||||
Cash and equivalents at beginning of year | 58 | 23 | 11 | |||||||||
Cash and equivalents at end of year | $ | 112 | $ | 58 | $ | 23 | ||||||
Supplemental Disclosures of Cash Flow Information | ||||||||||||
Cash paid: | ||||||||||||
Interest, net | $ | 56 | $ | 2 | $ | 1 | ||||||
Income taxes, net | 9 | 17 | 15 | |||||||||
Non-cash activity: | ||||||||||||
Affiliate note issued to purchase businesses, net of note payable to parent acquired of $38 (See Note 1) | — | 222 | — | |||||||||
Distribution to parent – acquisition of subsidiaries previously combined (See Note 1) | — | (222 | ) | — | ||||||||
Capital contributions from parent (See Note 14) | 95 | 1 | 52 | |||||||||
See Notes to Consolidated Financial Statements
F-187
Table of Contents
HEXION SPECIALTY CHEMICALS CANADA, INC. AND SUBSIDIARIES
CONSOLIDATED STATEMENTS OF SHAREHOLDER’S (DEFICIT) EQUITY
| Common Stock | Paid-in-Capital | Accumulated Other Comprehensive Loss (a) | Retained Earnings | Total | |||||||||||||||
| (In millions) | |||||||||||||||||||
Balance, December 31, 2002 | $ | 3 | $ | 31 | $ | (74 | ) | $ | 101 | $ | 61 | ||||||||
Net income | — | — | — | 36 | 36 | ||||||||||||||
Translation adjustments | — | — | 24 | — | 24 | ||||||||||||||
Minimum pension liability adjustment, net of tax | — | — | (1 | ) | — | (1 | ) | ||||||||||||
Comprehensive income | — | — | — | — | 59 | ||||||||||||||
Capital contributions from parent (See Note 14) | — | 52 | — | — | 52 | ||||||||||||||
Common stock dividends paid | — | — | — | (2 | ) | (2 | ) | ||||||||||||
Allocations of corporate overhead | — | 13 | — | — | 13 | ||||||||||||||
Balance, December 31, 2003 | 3 | 96 | (51 | ) | 135 | 183 | |||||||||||||
Net loss | — | — | — | (21 | ) | (21 | ) | ||||||||||||
Translation adjustments | — | — | (6 | ) | — | (6 | ) | ||||||||||||
Comprehensive loss | — | — | — | — | (27 | ) | |||||||||||||
Distribution to parent – acquisition of subsidiaries previously combined (See Note 1) | — | (129 | ) | — | (93 | ) | (222 | ) | |||||||||||
Capital contributions from parent (See Note 14) | — | 1 | — | — | 1 | ||||||||||||||
Common stock dividends paid | — | — | — | (1 | ) | (1 | ) | ||||||||||||
Allocations of corporate overhead | — | 34 | — | — | 34 | ||||||||||||||
Balance, December 31, 2004 | 3 | 2 | (57 | ) | 20 | (32 | ) | ||||||||||||
Net income | — | — | — | 10 | 10 | ||||||||||||||
Translation adjustments | — | — | (42 | ) | — | (42 | ) | ||||||||||||
Minimum pension liability adjustment, net of tax | — | — | (1 | ) | — | (1 | ) | ||||||||||||
Comprehensive loss | — | — | — | — | (33 | ) | |||||||||||||
Capital contributions from parent (See Notes 9 and 14) | — | 99 | — | — | 99 | ||||||||||||||
Allocations of corporate overhead (See Note 5) | — | 17 | — | — | 17 | ||||||||||||||
Other | — | — | — | (2 | ) | (2 | ) | ||||||||||||
Balance, December 31, 2005 | $ | 3 | $ | 118 | $ | (100 | ) | $ | 28 | $ | 49 | ||||||||
| (a) | Accumulated other comprehensive loss at December 31, 2005 represents $97 of net foreign currency translation losses and a $3 minimum pension liability adjustment. Accumulated other comprehensive loss at December 31, 2004 represents $55 of net foreign currency translation losses and a $2 minimum pension liability adjustment. |
See Notes to Consolidated Financial Statements
F-188
Table of Contents
HEXION SPECIALTY CHEMICALS CANADA, INC. AND SUBSIDIARIES
Notes to Consolidated Financial Statements
(In millions)
1. Background and Basis of Presentation
Hexion Specialty Chemicals Canada, Inc. (“Hexion Canada” or “the Company”) is engaged in the manufacture and distribution of urea, phenolic, and epoxy-based resins, primarily used in forest and industrial products, molding compounds and other specialty and industrial chemicals worldwide. At December 31, 2005, the Company’s operations included 31 manufacturing facilities in Canada, Brazil, Australia, Malaysia, Korea, Germany, Italy, Spain, Finland, the Czech Republic, the Netherlands and the United Kingdom (the “U.K.”).
Hexion Canada, formerly known as Borden Chemical Canada, Inc. (“BCCI”) is owned 100% by Hexion Specialty Chemicals, Inc. (“Hexion”), formerly known as Borden Chemical, Inc. (“BCI”). Hexion was formed on May 31, 2005 upon the combination of certain Apollo Management, L.P. (“Apollo”) controlled companies (“the Combination”).
Prior to the Combination, on April 29, 2005, Hexion Canada, through its wholly owned subsidiary, National Borden Chemical Germany GmbH (“NBCG”), completed its acquisition of Bakelite Aktiengesellschaft (“Bakelite”). See Note 3.
On August 12, 2004, concurrent with the acquisition (the “Acquisition”) of BCI by an affiliate of Apollo, the Company acquired most of Hexion’s foreign subsidiaries for a note payable of CDN$343 (See Note 9). Since the reorganization was between related parties, and Hexion elected not to apply push-down accounting relating to the Acquisition, Hexion Canada’s basis in the acquired subsidiaries is Hexion’s historical cost basis. As a result, Hexion Canada’s net purchase price of the assets acquired of $222 is reflected in Shareholder’s equity (deficit) as a distribution to parent.
The Acquisition was partially financed through private debt offerings issued by two wholly owned subsidiaries of Hexion and is guaranteed by Hexion and certain of its domestic subsidiaries (the “Guarantors”). The private debt offerings and related guarantees are senior obligations secured by a second-priority lien (subject to certain exceptions and permitted liens) on certain of the Guarantors’ existing and future domestic assets, including the stock of Hexion Canada.
In accordance with Rule 3-16 of Regulation S-X under the Securities Act of 1933, Hexion is required to file the annual financial statements of Hexion Canada with the U.S. Securities and Exchange Commission as if the Company were a registrant. The financial statements for the Company, which are consolidated from the date of Acquisition, are presented on a combined basis for the periods prior to the Acquisition and the related reorganization.
Hexion incurs various costs, including corporate and administrative expenses, on behalf of the Company; the allocation of these costs is reflected in these financial statements. See Note 5.
2. Summary of Significant Accounting Policies
Significant accounting policies followed by the Company, as summarized below, are in conformity with accounting principles generally accepted in the United States of America.
Principles of Consolidation—The Consolidated financial statements include the accounts of Hexion Canada and its majority-owned subsidiaries, all of which are under the common control and management of Hexion, and for which no substantive participating rights are held by minority shareholders. Intercompany transactions and balances have been eliminated. The Company has recorded a minority interest for the equity
F-189
Table of Contents
HEXION SPECIALTY CHEMICALS CANADA, INC. AND SUBSIDIARIES
Notes to Consolidated Financial Statements—(Continued)
(In millions)
interest in subsidiaries that are not 100% owned by the Company. Due to common ownership, Hexion’s 34% interest in Hexion Specialty Chemicals SDN, BHD (“Hexion Malaysia”), is included within the consolidated financial statements presented herein.
Use of Estimates—The preparation of financial statements in conformity with generally accepted accounting principles requires management to make estimates and assumptions that affect the reported amounts of assets and liabilities and disclosure of contingent assets and liabilities at the date of the financial statements, as well as the reported amounts of revenues and expenses during the reporting period. The most significant estimates reflected in the financial statements include environmental remediation, legal liabilities, deferred tax assets and liabilities and related valuation allowances, income tax accruals, pension and postretirement assets and liabilities, valuation allowances for accounts receivable and inventories, general insurance liabilities, asset impairments, related party transactions and fair values of assets acquired and liabilities assumed in business acquisitions. Actual results could differ from estimated amounts.
Cash and Equivalents—The Company considers all highly liquid investments purchased with an original maturity of three months or less to be cash equivalents. Included in the Company’s cash and equivalents are interest-bearing time deposits of $27 and $22 at December 31, 2005 and 2004, respectively.
Inventories—Inventories are stated at lower of cost or market. Cost is determined using the first-in, first-out method.
Property and Equipment—Land, buildings and machinery and equipment are valued at cost. Depreciation is recorded on the straight-line basis by charges to expense at rates based on estimated useful lives of properties (average estimated useful life for buildings is 20 years; average useful life for machinery and equipment is 15 years). Major renewals and betterments are capitalized. Maintenance, repairs and minor renewals are expensed as incurred.
Goodwill and Intangibles—The excess of purchase price over net tangible and identifiable intangible assets of non-affiliated businesses acquired is carried as Goodwill on the Consolidated Balance Sheets. The Company does not amortize goodwill. Certain trademarks, patents and other intangible assets used in the operations of the business are carried as Other Intangibles Assets on the Consolidated Balance Sheets. Intangible assets with determinable lives are amortized on a straight-line basis over the shorter of the legal or useful life of the asset, which ranges from 8 to 30 years. Certain trademarks and patents are owned by Hexion and are used on a royalty-free basis by the Company. See Note 6.
Deferred Expenses—Deferred financing costs are classified as Other assets on the Consolidated Balance Sheets and are amortized over the lives of the related debt or credit facility using the straight-line method since no installment payments are required. Upon retirement of any of the related debt, a proportional share of debt issuance costs is expensed. At December 31, 2005 and 2004, the unamortized balance was approximately $2.
Impairment—As events warrant the Company evaluates the recoverability of long-lived assets by assessing whether the carrying value of the assets can be recovered over their remaining useful lives through the expected future undiscounted operating cash flows of the underlying business. Any impairment loss required is determined by comparing the carrying value of the assets to operating cash flows on a discounted basis.
The Company performs an annual impairment test for goodwill. See Note 6.
F-190
Table of Contents
HEXION SPECIALTY CHEMICALS CANADA, INC. AND SUBSIDIARIES
Notes to Consolidated Financial Statements—(Continued)
(In millions)
General Insurance—The Company is generally self-insured for losses and liabilities relating to workers’ compensation, physical damage to property, business interruption and comprehensive general, product and vehicle liability. The Company maintains insurance policies for certain items exceeding deductible limits. The Company is covered by certain policies, primarily excess liability coverage, maintained by Hexion and is allocated a share of these premiums (see Note 5). Losses are accrued for the estimated aggregate liability for claims using certain actuarial assumptions followed in the insurance industry and the Company’s experience.
Legal Costs—Legal costs are accrued in the period in which a claim is made or an event becomes known, if the amounts are probable and reasonably estimable. Each claim is assigned a range of potential liability, with the most likely amount being accrued. The amount accrued includes all costs associated with a claim, including settlements, assessments, judgments, fines and legal fees.
Revenue Recognition—Revenue for product sales, net of estimated allowances and returns, is recognized as risk and title to the product transfer to the customer, which usually occurs at the time shipment is made. Substantially all of the Company’s products are sold FOB (“free on board”) shipping point. Other terms include sales where risk and title passes upon delivery (FOB destination point). In situations where our product is delivered by pipeline, risk and title transfers when our product moves across an agreed transfer point, which is typically the customers’ property line. Product sales delivered by pipeline are measured based on daily flow meter readings. The Company’s standard terms of delivery are included in their contracts of sale and invoices.
Shipping and Handling—The Company records freight billed to customers in net sales. Shipping costs are incurred to move products from production and storage facilities to the customers. Handling costs are incurred from the point the product is removed from inventory until it is provided to the shipper and generally include costs to store, move and prepare the products for shipment. Shipping and handling costs are recorded in Cost of sales in the Consolidated Statements of Operations. These costs were previously reported separately as Distribution expense in the Consolidated Statements of Operations and totaled $25 and $21 in 2004 and 2003, respectively.
Research and Development Costs—Funds are committed to research and development for technical improvement of products that are expected to contribute to operating profits in future years. All costs associated with research and development are charged to expense as incurred. Research and development costs were $13, $4 and $4 in 2005, 2004 and 2003, respectively, and are included in Selling, general and administrative expense.
Foreign Currency Translations—Although the functional currency of Hexion Canada is the Canadian dollar, the accompanying financial statements are presented in the reporting currency of Hexion Canada’s parent, Hexion. Accordingly, assets and liabilities of the Company are translated into Hexion’s reporting currency, the U.S. dollar, at the exchange rates in effect at the balance sheet date, and income and expenses are translated at average exchange rates prevailing during the year. The effect of translation is accounted for as an adjustment to Shareholder’s equity (deficit) and is included in Accumulated other comprehensive loss.
The Company incurred realized and unrealized net foreign transaction gains aggregating $3, $0 and $0 in 2005, 2004 and 2003, respectively.
Income Taxes—The Company files individual tax returns in their respective countries. Income tax expense is based on reported results of operations before income taxes using the prevailing rates for each tax jurisdiction. Deferred income taxes represent the tax effect of temporary differences between amounts of assets and liabilities recognized for financial reporting purposes and such amounts recognized for tax purposes. Deferred tax balances
F-191
Table of Contents
HEXION SPECIALTY CHEMICALS CANADA, INC. AND SUBSIDIARIES
Notes to Consolidated Financial Statements—(Continued)
(In millions)
are adjusted to reflect tax rates, based on current tax laws that will be in effect in the years in which temporary differences are expected to reverse. Deferred tax assets are reduced by a valuation allowance when, in the opinion of management, it is more likely than not that some portion or all of the deferred tax assets will not be realized. For purposes of these financial statements, the international subsidiaries are treated as foreign subsidiaries of a domestic parent, Hexion Canada, for all periods presented. Reconciliations of tax rates are calculated at the statutory Canadian tax rate.
Derivative Financial Instruments—The Company does not hold or issue derivative financial instruments for trading purposes. The Company is a party to foreign currency forward contracts and options to reduce the Company’s cash flow exposure to changes in foreign exchange rates. These instruments are not accounted for using hedge accounting, but are measured at fair value and recorded on the balance sheet as an asset or liability, depending upon the Company’s underlying rights or obligations. See Note 7.
Stock-Based Compensation—Effective January 1, 2005, the Company elected to adopt SFAS No. 123(R) (revised 2004),Share-Based Payment. Under the provisions of SFAS No. 123(R), stock-based compensation cost is measured at the grant date based on the value of the award and is recognized as expense over the requisite service period. As Hexion Canada was considered a nonpublic entity, at the date of adoption, that used the minimum value method for pro forma disclosures under SFAS No. 123,Accounting for Stock-Based Compensation, the Company is required to apply the prospective transition method. As such, Hexion Canada applies the statement to any new awards and to any awards modified, repurchased or cancelled since January 1, 2005. The adoption of SFAS No. 123(R) had no initial impact on Hexion Canada’s financial condition and results of operations.
Previously, Hexion Canada accounted for stock based awards under APB No. 25 and applied the minimum value method to determine fair value for disclosure requirements under SFAS No. 123 and SFAS No. 148,Accounting for Stock-Based Compensation – Transition and Disclosure, an amendment of SFAS No. 123. Pro forma net (loss) income under SFAS No. 148 was not materially different from Net (loss) income for the years ended December 31, 2004 and 2003. As of December 31, 2005, all awards outstanding are accounted for under SFAS No. 123(R). See Note 5 for stock-based compensation expense allocated to the Company.
Concentrations of Credit Risk—Financial instruments that potentially subject the Company to concentrations of credit risk consist principally of cash and accounts receivable. The Company places cash with high quality institutions and, by policy, limits the amount of credit exposure to any one institution. At December 31, 2005, the Company’s cash is held primarily in 20 financial institutions. At December 31, 2004, approximately $18 of the Company’s cash is invested in a guaranteed investment certificate with the remaining cash being held primarily in six financial institutions. Concentrations of credit risk with respect to accounts receivable are limited, due to the large number of customers comprising the Company’s customer base and their dispersion across many different industries and geographies. The Company generally does not require collateral or other security to support customer receivables.
Recently Issued Accounting Standards
In November 2004, the FASB issued SFAS No. 151,Inventory Costs. The statement amends Accounting Research Bulletin (“ARB”) No. 43,Inventory Pricing, to clarify the accounting for abnormal amounts of idle facility expense, freight, handling costs and wasted material. ARB No. 43 previously stated that these costs must be “so abnormal as to require treatment as current-period charges.” SFAS No. 151 requires that those items be recognized as current-period charges regardless of whether they meet the criterion of “so abnormal.” In addition,
F-192
Table of Contents
HEXION SPECIALTY CHEMICALS CANADA, INC. AND SUBSIDIARIES
Notes to Consolidated Financial Statements—(Continued)
(In millions)
this statement requires that allocation of fixed production overhead to the costs of conversion be based on the normal capacity of the production facilities. The statement is effective for inventory costs incurred during fiscal years beginning after June 15, 2005. The Company believes that implementing SFAS No. 151 should not have a material impact on its consolidated financial position, results of operations or cash flows.
In September 2005, the FASB issued EITF Issue No. 04-13,Accounting for Purchases and Sales of Inventory with the Same Counterparty (“EITF 04-13”). The issue provided guidance on the circumstances under which two or more inventory transactions with the same counterparty should be viewed as a single nonmonetary transaction within the scope of APB Opinion No. 29,Accounting for Nonmonetary Transactions. The issue also provided guidance on circumstances under which nonmonetary exchanges of inventory within the same line of business should be recognized at fair value. EITF 04-13 will be effective for transactions completed in reporting periods beginning after March 15, 2006. The Company is evaluating the impact that this issue will have on its consolidated financial statements.
3. Acquisitions
On April 29, 2005, Hexion Canada, through its wholly owned subsidiary, National Borden Chemical Germany GmbH, completed its acquisition of Bakelite Aktiengesellschaft (“Bakelite”) pursuant to a share purchase agreement with RÜTGERS AG and RÜTGERS Bakelite Projekt GmbH (collectively, the “Sellers”) dated October 6, 2004 (the “Bakelite Acquisition”) for a net purchase price of approximately €206, or approximately $266. The Company incurred direct costs associated with the acquisition of $42, which have been capitalized as part of the purchase in accordance with SFAS 141 and are included in the net purchase price. Based in Iserlohn-Letmathe, Germany, Bakelite is a producer of phenolic and epoxy thermosetting resins and molding compounds with 13 manufacturing facilities and 1,700 employees, primarily in Europe. The acquisition provides the Company with additional phenolic resin technology and products and a new epoxy resin technology platform.
The Bakelite Acquisition was financed primarily through an affiliate loan (See Note 9). The Bakelite Acquisition has been accounted for under the purchase method of accounting. As such, Bakelite’s results of operations are included in the Company’s Financial Statements since the date of acquisition.
To mitigate the risk of foreign currency exposure related to the Bakelite Acquisition, Hexion and the Company entered into a foreign currency forward position of $235 to purchase Euros with U.S. Dollars, contingent upon the close of the transaction. Upon consummation of the Bakelite Acquisition, the Company realized an aggregate loss of approximately $9 on this contract, which is included in Other non-operating expense in the Consolidated Statements of Operations (See Note 7).
F-193
Table of Contents
HEXION SPECIALTY CHEMICALS CANADA, INC. AND SUBSIDIARIES
Notes to Consolidated Financial Statements—(Continued)
(In millions)
The following table summarizes the preliminary estimated fair values of the assets acquired and liabilities assumed at the date of acquisition. Fair values are based upon preliminary appraisals and internal studies and are subject to final adjustments.
Fair value at April 29, 2005 | |||
Current assets | $ | 290 | |
Property, plant and equipment | 166 | ||
Other assets | 4 | ||
Intangible assets | 72 | ||
Goodwill | 63 | ||
Total assets acquired | 595 | ||
Current liabilities | 172 | ||
Long-term debt | 21 | ||
Other liabilities | 136 | ||
Total liabilities assumed | 329 | ||
Net assets acquired | $ | 266 | |
Of the $72 of acquired intangible assets, $19 was assigned to trade names, $16 was assigned to technology and $37 was assigned to customer relationships. The acquired intangible assets with finite lives have a weighted average useful life of approximately 18 years. The trade names have a 30-year useful life, technology has a 13-year useful life and customer relationships have a 14-year weighted average useful life. The $63 of goodwill is not expected to be deductible for tax purposes.
The Company plans several actions to enhance the profitability of Bakelite, including completion of headcount reductions previously initiated by Bakelite. The actions include headcount reductions primarily in Germany, Italy and Spain; and the closure of two facilities. The headcount reductions and plant closures will be complete by 2007. Expenditures related to these actions will be substantially complete by 2009. The purchase price allocation includes a liability of $23 reflecting the estimated cost of these activities as follows:
| Business realignment rollforward | ||||
Opening balance: | ||||
Headcount reduction | $ | 20 | ||
Plant shutdown costs | 3 | |||
Total opening balance | 23 | |||
Headcount expenditures | (2 | ) | ||
Translation adjustment | (2 | ) | ||
Balance at December 31, 2005 | $ | 19 | ||
The amounts of these original estimated liabilities are subject to revision to reflect final analysis of the associated activities and costs to be completed by April 2006.
F-194
Table of Contents
HEXION SPECIALTY CHEMICALS CANADA, INC. AND SUBSIDIARIES
Notes to Consolidated Financial Statements—(Continued)
(In millions)
The following unaudited pro forma financial information combines the consolidated results of operations as if the Bakelite Acquisition had occurred as of the beginning of the periods presented. Pro forma adjustments include only the effects of events directly attributable to the acquisition. The pro forma adjustments reflected in the tables below include amortization of intangibles, depreciation adjustments due to the write-up of property, plant and equipment to estimated fair market value, interest expense on the acquisition debt and related income tax effects.
| 2005 | 2004 | ||||||
Net sales | $ | 1,495 | $ | 1,336 | |||
Net income (loss) | 5 | (30 | ) | ||||
The Net income for the year ended December 31, 2005 includes $7 of cost of sales related to inventory sold that was stepped-up at the acquisition date. The pro forma financial information does not necessarily reflect the operating results that would have occurred had the acquisition been consummated as of the beginning of the periods presented, nor is such information indicative of future operating results.
Fentak Acquisition
In November 2003, the Company acquired Fentak Pty. Ltd. (“Fentak”), an international manufacturer of specialty chemical products for engineered wood, laminating and paper impregnation markets, for cash of $11 and additional deferred payments of approximately $3. The Fentak acquisition has been accounted for using the purchase method of accounting. Accordingly, results of operations of the acquired entity have been included from the date of acquisition. The pro forma effects of the acquisition are not material.
4. Business Realignment and Impairments
In 2005 and prior years, Hexion initiated programs of plant consolidations and other business realignment initiatives, which include activities impacting the Company. These initiatives focused on improving the efficiency of both manufacturing and administrative functions and are designed to focus resources on core operational strengths. The associated business realignment charges consist primarily of employee severance, plant consolidation and environmental remediation costs and asset write-offs.
Year Ended December 31, 2005
During 2005, the Company recorded net business realignment and impairment expense of $11, consisting of $3 of plant closure and clean-up costs for facilities closed in prior years and impairment of $9 for a production line in the U.K offset by a gain of $1 on the sale of a previously impaired assets. The U.K. impairment results from the Company’s decision to close the U.K. production line in 2006 and transfer production to other facilities to improve efficiency. The impairment reduces the recorded value of the affected fixed assets to their recoverable value, which was determined from the discounted cash flows attributable to the assets.
The Company estimates that it will pay severance of $3 related to the U.K. closure in 2006, which will be recognized as expense over the period the affected employees are required to provide services.
Year Ended December 31, 2004
During 2004, the Company recorded net business realignment and impairment expense of $3, primarily related to plant closure costs (which included environmental remediation costs) for previously closed sites and other severance and employee costs of $1.
F-195
Table of Contents
HEXION SPECIALTY CHEMICALS CANADA, INC. AND SUBSIDIARIES
Notes to Consolidated Financial Statements—(Continued)
(In millions)
Year Ended December 31, 2003
During 2003, the Company recorded net business realignment and impairment income of $4, consisting of a gain on the sale of a previously closed U.K. facility of $12, offset by plant closure costs (which included environmental remediation costs) and other severance costs of $6 and other non-cash asset impairment charges of $2.
The plant closure costs relate to previously closed facilities in Brazil and the U.K., ($4) and a facility in Canada closed in 2003 ($2). As a result of the annual impairment analysis (see Note 6), the Company recorded a goodwill impairment of $1. The Company recorded asset impairments of $1 on a previously closed U.K. facility.
Following is a rollforward of the Company’s reserve for realignment activities, including the reserves on the opening balance sheet of Bakelite as of the acquisition date (see Note 3):
| Plant Closure Costs | Other Severance Costs | Total | ||||||||||
Reserve at December 31, 2002 | $ | 6 | $ | 1 | $ | 7 | ||||||
2003 Expense | 6 | — | 6 | |||||||||
2003 Payments/Settlements | (7 | ) | (1 | ) | (8 | ) | ||||||
Reserve at December 31, 2003 | 5 | — | 5 | |||||||||
2004 Expense | 2 | 1 | 3 | |||||||||
2004 Payments/Settlements | (3 | ) | (1 | ) | (4 | ) | ||||||
Reserve at December 31, 2004 | 4 | — | 4 | |||||||||
2005 Expense | 3 | — | 3 | |||||||||
2005 Payments/Settlements | (5 | ) | — | (5 | ) | |||||||
Bakelite – Reserve at Acquisition date | 3 | 20 | 23 | |||||||||
Bakelite – payments | — | (2 | ) | (2 | ) | |||||||
Bakelite – translation adjustment | — | (2 | ) | (2 | ) | |||||||
Reserve at December 31, 2005 | $ | 5 | $ | 16 | $ | 21 | ||||||
5. Related Party Transactions
Hexion incurs various administrative and operating costs on behalf of Hexion Canada that are reimbursed by the Company. These costs include engineering and technical support, purchasing, quality assurance, sales and customer service, information systems, research and development and certain administrative services. These service costs have been allocated to the Company generally based on sales or sales volumes and when determinable, based on the actual usage of resources. These costs are included within Selling, general & administrative expense and Cost of goods sold and were $7, $7 and $8 in 2005, 2004 and 2003, respectively. In addition, Hexion maintains certain insurance policies, primarily excess liability coverage, that benefit Hexion Canada. Amounts pertaining to these policies and allocated to the Company based upon sales were $1, $2 and $2 in 2005, 2004 and 2003, respectively.
The Company sells finished goods and certain raw materials to Hexion and certain of its subsidiaries. Total sales were $53, $29 and $25 in 2005, 2004 and 2003, respectively. In addition, the Company purchases raw materials and finished goods from Hexion and certain of its subsidiaries, which totaled $67, $11 and $8 in 2005, 2004 and 2003, respectively. These sales and purchases are priced similarly to prices charged to outside customers.
F-196
Table of Contents
HEXION SPECIALTY CHEMICALS CANADA, INC. AND SUBSIDIARIES
Notes to Consolidated Financial Statements—(Continued)
(In millions)
Total accounts payable, net of receivables, relating to these intercompany transactions was $10 and $5 at December 31, 2005 and 2004, respectively.
In addition to direct charges, Hexion provides certain administrative services that are not reimbursed by Hexion Canada. These costs include corporate controlled expenses such as executive management, legal, health and safety, accounting, tax and credit, and have been allocated herein to the Company on the basis of Net sales. The charge to Finance includes allocated stock-based compensation expense of $3 for the year ended December 31, 2005. Management believes that the amounts allocated in such a manner are reasonable and consistent and are necessary in order to properly depict the financial results of the Company on a stand-alone basis. However, the amounts are not necessarily indicative of the costs that would have been incurred if the Company had operated independently. This expense is included in Selling, general & administrative expense with the offsetting credit recorded in Shareholder’s equity (deficit). There is no income tax provided on these amounts as they are not deductible.
The following table summarizes these allocations for the years ended December 31:
| 2005 | 2004 | 2003 | |||||||
Executive Group | $ | 4 | $ | 4 | $ | 4 | |||
General Counsel | 1 | 3 | 3 | ||||||
Environmental, Health, and Safety Services | 1 | 1 | 1 | ||||||
Finance | 9 | 6 | 5 | ||||||
| $ | 15 | $ | 14 | $ | 13 | ||||
In addition to the Hexion administrative services costs, the Company was allocated a share of the transaction costs associated with the Combination of $8 in 2005 and a share of the transaction costs associated with the Acquisition of $20 in 2004. These costs are classified in Transaction related costs in the Consolidated Statements of Operations. The allocation of these costs was made on the basis of Net sales. The offsetting credit relating to the allocations is included in Shareholder’s equity (deficit). In 2005, the Company reimbursed Hexion $6 for amounts related to prior year allocations.
Prior to 2001, the Company incurred royalties for the use in operations of certain trademarks and patents owned by Hexion. At December 31, 2005 and 2004, the Company had amounts due to Hexion under these arrangements of $7 and $8, respectively. These amounts are included as Affiliated royalties and are classified as long-term due to restrictions on the ability to repay.
In connection with the Bakelite Acquisition, in exchange for deal structuring and negotiating provided by Apollo, the Company made payments to Apollo in the amount of $4. These amounts are considered direct costs of the acquisition and have been capitalized as part of the purchase (See Note 3). Also in conjunction with the Bakelite Acquisition, the Company sold the U.S. businesses of Bakelite to Hexion for an agreed price of $1.
Hexion Canada guarantees Hexion’s $34 Parish of Ascension Industrial Revenue Bonds, for which Hexion pays the Company a guarantor fee annually.
The Company held a 12.6% interest in a Spanish subsidiary of Hexion. The subsidiary filed for liquidation prior to 2000, and paid a liquidating dividend of $1 to the Company in 2003.
See Note 9 for a description of the Company’s affiliated financing activities.
F-197
Table of Contents
HEXION SPECIALTY CHEMICALS CANADA, INC. AND SUBSIDIARIES
Notes to Consolidated Financial Statements—(Continued)
(In millions)
6. Goodwill and Other Intangible Assets
At December 31, 2005 and 2004, management performed the annual goodwill impairment test. As required by SFAS No. 142,“Goodwill and Other Intangible Assets,” management identified the appropriate reporting units and identified the assets and liabilities (including goodwill) of the reporting units. They determined estimated fair values of the reporting units and assessed whether the estimated fair value of each reporting unit was more or less than the carrying amount of the assets and liabilities assigned to the units.
Valuations were performed using a standard methodology based largely on comparable company analysis. Comparable company analysis ascribes a value to an entity by comparing certain operating metrics of the entity to those of a set of comparable companies in the same industry. Using this method, market multiples and ratios based on operating, financial and stock market performance are compared across different companies and to the entity being valued. Management employed a comparable analysis technique commonly used in the investment banking and private equity industries to estimate the values of its reporting units—the EBITDA (earnings before interest, taxes, depreciation and amortization) multiple technique. Under this technique, estimated values are the result of an EBITDA multiple derived from this process applied to an appropriate historical EBITDA amount. At December 31, 2005 and 2004, the fair value of each reporting unit exceeded the carrying amount of assets and liabilities assigned to the units.
At December 31, 2003, the fair value of each reporting unit exceeded the carrying amount of assets and liabilities, except for Hexion Malaysia. Based on the excess of the carrying value over the estimated fair value of Hexion Malaysia, the Company recorded a goodwill impairment charge of $1 due to a decline in operating performance that represented 100% of the unit’s recorded goodwill balance. This impairment charge is reflected in the 2003 Combined Statement of Operations as Business realignment and impairments.
The changes in the carrying amount of goodwill for the years ended December 31, 2005 and 2004 are as follows:
| Total | ||||
Goodwill balance at December 31, 2003 | $ | 15 | ||
Purchase accounting adjustments from goodwill to intangible assets, related to Fentak acquisition | (5 | ) | ||
Goodwill balance at December 31, 2004 | 10 | |||
Acquisition of Bakelite | 63 | |||
Foreign currency translation | (5 | ) | ||
Goodwill balance at December 31, 2005 | $ | 68 | ||
Intangible assets consist of the following at December 31:
| 2005 | 2004 | |||||||||||
| Gross Carrying Amount | Accumulated Amortization | Gross Carrying Amount | Accumulated Amortization | |||||||||
Intangible assets: | ||||||||||||
Customer relationships | $ | 40 | $ | 5 | $ | 3 | $ | 0 | ||||
Patents and technologies | 18 | 3 | 2 | 1 | ||||||||
Tradenames | 20 | 2 | 1 | — | ||||||||
| $ | 78 | $ | 10 | $ | 6 | $ | 1 | |||||
F-198
Table of Contents
HEXION SPECIALTY CHEMICALS CANADA, INC. AND SUBSIDIARIES
Notes to Consolidated Financial Statements—(Continued)
(In millions)
The impact of foreign currency translation adjustments is included in accumulated amortization.
Total intangible amortization expense was $4 and $1 for the years ended December 31, 2005 and 2004, respectively. Estimated annual intangible amortization expense for 2006 through 2010 is $4 per year.
7. Financial Instruments
The following table presents the carrying or notional amounts and fair values of the Company’s financial instruments at December 31, 2005 and 2004. The fair value of a financial instrument is the estimated amount at which the instrument could be exchanged in a current transaction between willing parties, other than in a forced or liquidation sale. Fair values are determined from quoted market prices where available or based on other similar financial instruments.
The carrying amounts of cash and equivalents, accounts receivable, accounts payable, affiliated royalties and other liabilities are considered reasonable estimates of their fair values.
The following tables include the carrying and fair values of the Company’s financial instruments at December 31.
| 2005 | 2004 | |||||||||||
| Carrying Amount | Fair Value | Carrying Amount | Fair Value | |||||||||
Nonderivatives | ||||||||||||
Liabilities | ||||||||||||
Debt | $ | 57 | $ | 57 | $ | 15 | $ | 15 | ||||
Affiliated debt | 455 | 455 | 285 | 285 | ||||||||
| 2005 | 2004 | |||||||||||||||||
Average Days to Maturity | Average Contract Rate | Notional Amount | Fair Value Gain (Loss) | Average Days to Maturity | Average Contract Rate | Notional Amount | Fair Value Gain (Loss) | |||||||||||
Currency to sell | ||||||||||||||||||
British Pound(1) | 90 | 0.6987 | 41 | (1 | ) | — | — | — | — | |||||||||
U.S. Dollars(1) | 60 | 1.2122 | 3 | — | — | — | — | — | ||||||||||
Currency to sell | ||||||||||||||||||
Canadian Dollars(2) | — | — | — | — | 183 | 1.3200 | 36 | — | ||||||||||
Canadian Dollars(3) | — | — | — | — | 183 | 1.2300 | 36 | (2 | ) | |||||||||
Currency to sell | ||||||||||||||||||
British Pound(1) | — | — | — | — | 31 | 2.3255 | 42 | 1 | ||||||||||
| (1) | Forward contracts |
| (2) | Put options purchased |
| (3) | Call options sold |
At December 31, 2005, the Company had derivative losses of $1 classified as Other current liabilities. At December 31, 2004, the Company had derivative losses of $2 classified as Other current liabilities and derivative
F-199
Table of Contents
HEXION SPECIALTY CHEMICALS CANADA, INC. AND SUBSIDIARIES
Notes to Consolidated Financial Statements—(Continued)
(In millions)
gains of $1 classified as Other assets. Gains and losses are recognized on a quarterly basis, through the Consolidated Statement of Operations. The Company does not hold or issue derivative financial instruments for trading purposes.
Foreign Exchange
International operations account for a significant portion of the Company’s revenue and operating income. It is the policy of the Company to reduce foreign currency cash flow exposure due to exchange rate fluctuations by hedging anticipated and firmly committed transactions when economically feasible. The Company enters into forward and option contracts to buy and sell foreign currencies to reduce foreign exchange exposure and protect the U.S. dollar value of such transactions to the extent of the amount under contract. These contracts are designed to minimize the impact from foreign currency exchange on operating income and on certain balance sheet exposures. The Company is exposed to credit loss in the event of non-performance by other parties to the contract. The Company evaluates the credit worthiness of the counterparties’ financial condition and does not expect default by the counterparties.
8. Debt and Lease Obligations
Outstanding debt at December 31, 2005 and 2004 is as follows:
| 2005 | 2004 | |||||||||||
| Long Term, net of current portion | Due within one year | Long Term, net of current portion | Due within one year | |||||||||
CBA Bank, Australia, term loan, due 2008, interest at 6.4% per annum, quarterly payments, secured by assets of the business | $ | 5 | $ | 1 | $ | 7 | $ | 2 | ||||
Nordea Bank, Finland PLC, term loan, due 2008, interest at Euribor + 0.65% per annum, 2.77% per annum at December, 2005 | 12 | — | — | — | ||||||||
Korea Exchange Bank, due in 2007, variable interest, at 6.9% per annum at December 2005, payable quarterly, certain property pledged as collateral | 2 | 3 | — | — | ||||||||
Other various debt, including term loans, capital lease obligations | 2 | 2 | — | — | ||||||||
Korea Exchange Bank revolving loans, variable interest at 5.6%-6.9% per annum, payable monthly, accounts receivable of Hexion Korea pledged as collateral | — | 9 | — | — | ||||||||
Working capital revolving loans, various banks, for Taro Plast, S.p.A., variable interest, at 2.75% per annum at December 2005 | — | 12 | — | — | ||||||||
Australia, revolving facility, secured by assets of the business, variable interest, 5.97% per annum at December 2005 | — | 3 | — | 2 | ||||||||
Santander/Safra Bank, Brazil, revolving credit facilities, variable interest, 20.8% per annum at December 2005 | — | 4 | — | 4 | ||||||||
Other | — | 2 | — | — | ||||||||
Total debt, capital lease obligations and revolving loans | $ | 21 | $ | 36 | $ | 7 | $ | 8 | ||||
F-200
Table of Contents
HEXION SPECIALTY CHEMICALS CANADA, INC. AND SUBSIDIARIES
Notes to Consolidated Financial Statements—(Continued)
(In millions)
At December 31, 2005, total credit facilities available are $126. Draws against the facilities for debt and letters of credit total $73, leaving an unused balance available of $53 to fund working capital needs and capital expenditures. The credit facilities have various expiration dates ranging from 2006 through 2008. While these facilities are primarily unsecured, portions of the lines are secured by equipment at December 31, 2005. Hexion guarantees up to $7 of the debt of a Brazilian subsidiary included in these facilities.
In May 2005, Hexion entered into a new $775 senior secured credit facility (“Hexion Credit Facility”) and replaced and repaid certain other credit facilities. The Hexion Credit Facility has a $225 revolving credit facility and $500 term loan facility. The facility also provides a $50 synthetic letters of credit facility (“LOCs”). Interest on the term and revolving loan facilities is LIBOR plus 2.5% or the higher of prime rate plus 1% or the Federal Funds Rate plus 1.5%. Loans denominated in euros will carry interest at EURO LIBOR plus 2.5% or the rate quoted by JPMCB as its base rate for such loans plus 1%. Loans made in Canadian dollars will carry interest at the Canadian Bankers’ Acceptance rate plus 2.5% or the higher of prime rate plus 1% or average banker’s acceptance rate plus 1.5%. Interest rates are subject to reduction based on an improved leverage ratio.
The Hexion Credit Facility has commitment fees (other than with respect to the synthetic LOC facility) equal to 0.5% per annum of the unused line fee plus a fronting fee of 0.25% of the aggregate face amount of outstanding LOCs. The synthetic LOC facility has a commitment fee of 0.1% per annum.
The Hexion Credit Facility is secured by substantially all the assets of Hexion, subject to certain exceptions. The Hexion Credit Facility contains, among other provisions, restrictive covenants regarding indebtedness, payments and distributions, mergers and acquisitions, asset sales, affiliate transactions, capital expenditures, and the maintenance of certain financial ratios. Payment of borrowings under the Hexion Credit Facility may be accelerated in the event of a default. Events of default include the failure to pay principal and interest when due, a material breach of representation or warranty, covenant defaults, events of bankruptcy and a change of control. The Company is in compliance with all covenants of the Hexion Credit Facility and those under other borrowings as of December 31, 2005.
Certain of the Hexion Canada subsidiaries are eligible to participate in the Hexion Credit Facility. Currently, the subsidiaries located in Germany and the U.K may each borrow a maximum of $75 while the Canadian operating subsidiary may borrow a maximum of $50. At December 31, 2005, Hexion Canada’s subsidiaries have no borrowings or letters of credit outstanding against the Hexion Credit Facility. Cross collateral guarantees exist whereby Hexion Canada is a guarantor for the European borrowings under the Hexion Credit Facility; while the Company’s European subsidiaries guarantee against any default by Hexion Canada.
Aggregate maturities of total non-affiliated debt and minimum annual rentals under operating leases at December 31, 2005, for the Company are as follows:
Year | Debt | Minimum Rentals Under Operating Leases | ||||
2006 | $ | 36 | $ | 4 | ||
2007 | 7 | 4 | ||||
2008 | 13 | 3 | ||||
2009 | 1 | 3 | ||||
2010 | — | 3 | ||||
2011 and beyond | — | 4 | ||||
| $ | 57 | $ | 21 | |||
Rental expense amounted to $4, $2 and $2 in 2005, 2004 and 2003, respectively.
F-201
Table of Contents
HEXION SPECIALTY CHEMICALS CANADA, INC. AND SUBSIDIARIES
Notes to Consolidated Financial Statements—(Continued)
(In millions)
9. Loans Due To Affiliates
As discussed in Note 1, to finance the acquisition of the subsidiaries from Hexion, the Company assumed a fixed rate note of CDN$343, or approximately $294 and $285 at December 31, 2005 and 2004, respectively, payable to Hexion Nova Scotia Finance ULC (“Nova Scotia”), a subsidiary of Hexion. The note has an interest rate of 10% and becomes due July 15, 2014. Interest expense related to this note totaled $29 and $11 for 2005 and 2004, respectively. Interest payable of $0 and $11 is recorded on the Consolidated Balance Sheets at December 31, 2005 and 2004, respectively. In conjunction with the issuance of this note, Hexion entered into a common share forward subscription agreement with Hexion Canada requiring Hexion to subscribe to shares of Hexion Canada stock at CDN$845 per share at the principal repayment date for the loan.
To finance the acquisition of Bakelite in 2005, Hexion Canada also borrowed CDN$308 from Nova Scotia. Approximately CDN$119 (or $95) was effectively repaid during 2005, via a capital contribution from Hexion to the Company, which is reflected in Shareholder’s equity (deficit). The remaining outstanding loan balance at December 31, 2005 is CDN$189 or approximately $161. The loan becomes due July 15, 2010. The loan has a variable interest rate equal to the three-month US LIBOR rate plus 675 basis points, which was approximately 11.5% at December 31, 2005. Interest expense related to this loan totaled $11 for the year ended December 31, 2005.
In conjunction with the Acquisition, Hexion contributed a demand note payable by the Company to a newly formed subsidiary, which was subsequently acquired by Hexion Canada; therefore the loan and related interest is eliminated subsequent to August 12, 2004. Interest expense to Hexion was $1 and $2 for the years ended December 31, 2004 and 2003, respectively.
10. Guarantees, Indemnities and Warranties
Standard Guarantees / Indemnifications
In the ordinary course of business, the Company enters into numerous agreements that contain standard guarantees and indemnities whereby third parties are indemnified for, among other things, breaches of representations and warranties. Such guarantees or indemnifications are granted under various agreements, including those governing (i) purchases and sales of assets or businesses, (ii) leases of real property, (iii) licenses of intellectual property, (iv) long-term supply agreements, (v) employee benefits services agreements and (vi) agreements with public authorities on subsidies received for designated research and development projects. The guarantees or indemnifications issued are for the benefit of the (i) buyers in sale agreements and sellers in purchase agreements, (ii) landlords or lessors in lease contracts, (iii) licensors or licensees in license agreements, (iv) vendors or customers in long-term supply agreements, (v) service providers in employee benefits services agreements and (vi) governments or agencies subsidizing research or development. In addition, the Company guarantees certain payables of its subsidiaries for the purchase of raw materials in the ordinary course of business.
These parties may also be indemnified against any third party claim resulting from the transaction that is contemplated in the underlying agreement. Additionally, in connection with the sale of assets and the divestiture of businesses, the Company may agree to indemnify the buyer with respect to liabilities related to the pre-closing operations of the assets or businesses sold. Indemnities related to pre-closing operations generally include tax liabilities, environmental liabilities and employee benefit liabilities not assumed by the buyer in the transaction.
Indemnities related to the pre-closing operations of sold assets normally do not represent additional liabilities to the Company, but simply serve to protect the buyer from potential liability associated with its existing obligations at the time of sale. As with any liability, the Company has accrued for those pre-closing obligations that are considered probable and reasonably estimable. Such amounts are not significant.
F-202
Table of Contents
HEXION SPECIALTY CHEMICALS CANADA, INC. AND SUBSIDIARIES
Notes to Consolidated Financial Statements—(Continued)
(In millions)
While some of these guarantees extend only for the duration of the underlying agreement, many survive the expiration of the term of the agreement or extend into perpetuity (unless subject to a legal statute of limitations). With respect to certain of the aforementioned guarantees, the Company maintains limited insurance coverage that mitigates any potential payments to be made. There are no specific limitations on the maximum potential amount of future payments that the Company could be required to make under these guarantees, nor is the Company able to develop an estimate of the maximum potential amount of future payments to be made under these guarantees as the triggering events are not predictable.
The Company has not entered into any significant agreement that would require them, as guarantors, to recognize a liability for the fair value of obligations they have undertaken in issuing the guarantee.
Warranties
The Company does not make express warranties on its products, other than that they comply with their defined specifications; therefore, no warranty liability has been recorded. Adjustments for product quality claims are not material and are charged against sales revenues.
11. Commitments and Contingencies
Environmental Matters
Because the operations of the Company involve the use, handling, processing, storage, transportation and disposal of hazardous materials, it is subject to extensive environmental regulation and is exposed to the risk of claims for environmental remediation or restoration. In addition, violations of environmental laws or permits may result in restrictions being imposed on operating activities, substantial fines, penalties, damages or other costs, any of which could have a material adverse effect on the Company’s business, financial condition, results of operations or cash flows.
Accruals for environmental matters are recorded following the guidelines of Statement of Position 96-1, “Environmental Remediation Liabilities,” when it is probable that a liability has been incurred and the amount of the liability can be reasonably estimated. Environmental accruals are reviewed on an interim basis and as events and developments warrant. Based on management’s estimates, which are determined through historical experience and consultation with outside experts, the Company has recorded liabilities, relating to eight locations, of approximately $3 and $4 at December 31, 2005 and 2004, respectively, for all probable environmental remediation, indemnification and restoration liabilities. These amounts include estimates of unasserted claims management believes are probable of loss and reasonably estimable.
Based on currently available information and analysis, management believes that it is reasonably possible that costs associated with such sites may fall within a range of $2 to $5, in the aggregate, at December 31, 2005. This estimate of the range of reasonably possible costs is less certain than the estimates upon which the liabilities are based, and in order to establish the upper end of such range, assumptions less favorable to the Company among the range of reasonably possible outcomes were used. As with any estimate, if facts or circumstances change, the final outcome could differ materially from these estimates. The factors influencing the ultimate outcome include the methods of remediation to be elected, the conclusions and assessment of site studies remaining to be completed and the time period required to complete the work. The Company does not anticipate any recoveries of these costs from insurance coverage or from other third parties. There are no other potentially responsible parties for these sites.
At four of these locations, the Company is conducting environmental remediation and restoration under business realignment programs due to closure of the sites. Total reserves related to these sites included in
F-203
Table of Contents
HEXION SPECIALTY CHEMICALS CANADA, INC. AND SUBSIDIARIES
Notes to Consolidated Financial Statements—(Continued)
(In millions)
realignment were $2 and $4 at December 31, 2005 and 2004, respectively. Much of this remediation is being performed by the Company on a voluntary basis in coordination with local regulatory authorities; therefore, management has greater control over the costs to be incurred and the timing of cash flows. The Company anticipates approximately $2 of these liabilities will be paid within the next four years, with the remaining amounts being paid over the next ten years.
As a result of the Bakelite Acquisition, a site was acquired in Duisburg, Germany with significant soil and groundwater contamination beneath a facility that is shared with Rütgers Chemicals AG (“Rütgers”). Rütgers is in discussions with the local authorities concerning a proposed remediation plan; however, the scope and extent of that plan and the costs of its possible implementation are not yet reasonably estimable. Rütgers has contractually agreed to provide indemnifications to the Company with respect to this matter until 2025, subject to certain exceptions and limitations. Management believes that it is unlikely that the Company will have to take extensive actions for remediation. While it is reasonably possible some costs could be incurred related to these sites, the Company has inadequate information to enable it to estimate a potential range of liability, if any.
Legal Matters
The Company is involved in various product liability, commercial and employment litigation, personal injury, property damage and other legal proceedings that are considered to be in the ordinary course of business. The following legal claim is not in the ordinary course of business:
In 1992, the State of Sao Paulo Tax Bureau issued an assessment against Brazil Quimica, a wholly owned subsidiary of the Company, claiming that excise taxes were owed on certain intercompany loans made for centralized cash management purposes, characterized by the Tax Bureau as intercompany sales. Since that time, management and the Tax Bureau have held discussions, and Brazil Quimica has filed an administrative appeal seeking cancellation of the assessment. In December 2001, the Administrative Court upheld the assessment. In September 2002, Brazil Quimica filed a second appeal with the highest level administrative court, again seeking cancellation of the assessment. Argument was made to the court in September 2004; the Company is awaiting its ruling. At December 31, 2005, the amount of the assessment, including tax, penalties, monetary correction and interest is 54 million Brazilian Reais, or approximately $23. Management believes Brazil Quimica has a strong defense against the assessment and will pursue the appeal vigorously; including appeal to the judicial level; however, no assurance can be given that the assessment will not be upheld. At this time the Company does not believe a loss is probable, therefore, only related legal fees have been accrued.
The Company has reserved approximately $3 and $2 at December 31, 2005 and 2004, respectively, relating to all non-environmental legal matters for legal defense and settlement costs that it believes are probable and estimable at this time.
12. Pension and Retirement Savings Plans
The Company and its subsidiaries sponsor non-contributory defined-benefit pension plans that cover most Canadian employees, and foreign employees in certain countries. Depending on the plan, benefits are based on eligible compensation and / or years of credited service.
Prior to the Combination, the measurement date for the Canadian plan was September 30. Beginning in 2005, the Company has elected to make the measurement date for all pension obligations as of December 31. We are making the change to conform with the accounting policies of Hexion. This change in measurement date had an immaterial effect on the benefit obligation and expense recognized for 2005.
F-204
Table of Contents
HEXION SPECIALTY CHEMICALS CANADA, INC. AND SUBSIDIARIES
Notes to Consolidated Financial Statements—(Continued)
(In millions)
Following is a rollforward of the projected benefit obligation and assets for the Company’s defined benefit plans.
| 2005 | 2004 | |||||||
Change in Benefit Obligation | ||||||||
Benefit obligation at beginning of year | $ | 8 | $ | 7 | ||||
Service cost | 2 | — | ||||||
Interest cost | 3 | 1 | ||||||
Actuarial gains | (5 | ) | — | |||||
Foreign currency exchange rate changes | (10 | ) | 1 | |||||
Benefits paid | (2 | ) | (1 | ) | ||||
Acquisitions | 114 | — | ||||||
Benefit obligation at end of year | 110 | 8 | ||||||
Change in Plan Assets | ||||||||
Fair value of plan assets at beginning of year | 5 | 5 | ||||||
Actual return on plan assets | 1 | — | ||||||
Foreign currency exchange rate changes | — | 1 | ||||||
Employer contribution | 2 | — | ||||||
Benefits paid | (2 | ) | (1 | ) | ||||
Fair value of plan assets at end of year | 6 | 5 | ||||||
Plan assets less than benefit obligation | (104 | ) | (2 | ) | ||||
Unrecognized net actuarial loss | (1 | ) | 4 | |||||
Unrecognized prior service cost | — | |||||||
Net liability recognized | $ | (105 | ) | $ | 2 | |||
Amounts recognized in the balance sheets, after reclassification of the prepaid pension asset to reflect a minimum pension liability adjustment for certain plans, consist of:
| 2005 | 2004 | |||||||
Accrued benefit liability | $ | (110 | ) | $ | (2 | ) | ||
Accumulated other comprehensive loss | 5 | 4 | ||||||
Net amount recognized | $ | (105 | ) | $ | 2 | |||
The Company’s accrued benefit liability of $110 includes $4 recorded in Other current liabilities at December 31, 2005. At December 31, 2004, the Company’s accrued benefit liability of $2 included $1 recorded in Other current liabilities.
The Company’s acquisition of Bakelite in the second quarter of 2005 included two unfunded defined benefit plans in Germany, with a total projected benefit obligation of $114 at the date of acquisition. The foreign currency impact reflected in the rollforward relate to changes in the Euro versus the U.S. dollar.
F-205
Table of Contents
HEXION SPECIALTY CHEMICALS CANADA, INC. AND SUBSIDIARIES
Notes to Consolidated Financial Statements—(Continued)
(In millions)
The following summarizes defined benefit pension plans with an accumulated benefit obligation in excess of plan assets:
| 2005 | 2004 | |||||
Projected benefit obligation | $ | 110 | $ | 8 | ||
Accumulated benefit obligation | 102 | 7 | ||||
Fair value of plan assets | 6 | 5 | ||||
Following are the components of net pension expense recognized by the Company for the years ended December 31:
| 2005 | 2004 | 2003 | ||||||||
Service cost | $ | 2 | $ | — | $ | — | ||||
Interest cost on projected benefit obligation | 3 | 1 | — | |||||||
Expected return on assets | — | (1 | ) | — | ||||||
Net pension expense | $ | 5 | $ | — | $ | — | ||||
Determination of actuarial assumptions
The Company’s actuarial assumptions are determined separately for each plan, taking into account the demographics of the population, the target asset allocations for funded plans, the regional economic trends, statutory requirements and other factors that could impact the benefit obligation and assets of the plan.
The discount rate selected reflects the rate at which pension obligations could be effectively settled. When selecting a discount rate, the Company takes into consideration yields on government bonds and high-grade corporate bonds, as well as annuity pricing information furnished by local insurance carriers, for instruments with durations consistent with the duration of the liabilities being measured.
The rate of increase in future compensation levels is determined based on salary and wage trends in the chemical and other similar industries, as well as the Company’s specific compensation targets by country. Input is obtained from the Company’s internal Human Resources group, and outside actuaries. The rate includes components for both wage rate inflation, and merit increases.
The expected long-term rate of return on plan assets is determined based on the plan’s current and projected asset mix. In determining the expected overall long-term rate of return on assets, the Company takes into account the rates on long-term debt investments held within the portfolio, as well as expected trends in the equity markets, for plans including equity securities. Peer data and historical returns are reviewed, and the Company consults with its actuaries, as well as investment professionals, to confirm that the Company’s assumptions are reasonable.
F-206
Table of Contents
HEXION SPECIALTY CHEMICALS CANADA, INC. AND SUBSIDIARIES
Notes to Consolidated Financial Statements—(Continued)
(In millions)
The weighted average rates used to determine the benefit obligations for the Company were as follows:
| 2005 | 2004 | |||||
Discount rate | 4.3 | % | 6.0 | % | ||
Rate of increase in future compensation levels | 2.5 | % | 3.0 | % |
The weighted average rates used to determine net pension expense for the Company were as follows:
| 2005 | 2004 | 2003 | |||||||
Discount rate | 4.4 | % | 6.0 | % | 6.5 | % | |||
Rate of increase in future compensation levels | 2.5 | % | 3.0 | % | 3.5 | % | |||
Expected long-term rate of return on plan assets | 7.0 | % | 7.8 | % | 7.8 | % |
Investment Policies and Strategies
The Company’s investment strategy for the assets of its Canadian defined benefit pension plan is to maximize the long-term return on plan assets using a mix of equities and fixed income investments and accepting a prudent level of risk. Risk tolerance is established through careful consideration of plan liabilities, plan funded status and expected timing of future cash flow requirements. The investment portfolio contains a diversified blend of equity and fixed-income investments. Furthermore, equity investments are diversified across Canadian. and foreign stocks, as well as growth, value and small and large capital investments. Investment risk and performance is measured and monitored on an ongoing basis through quarterly investment portfolio reviews, annual liability measurements and periodic asset / liability studies.
The Company periodically reviews its target allocation of Canadian plan assets among various asset classes. The targeted allocations are based on anticipated asset performance, discussions with investment professionals, and on the projected timing of future benefit payments.
Following is a summary of weighted average allocations of plan assets for the Company’s Canadian plan by investment type at the 2005 and 2004 measurement dates, and weighted average target 2006 allocations:
| Actual | Target | ||||||||
North American pension assets | 2005 | 2004 | 2006 | ||||||
Equity securities | 60 | % | 58 | % | 60 | % | |||
Debt securities | 35 | % | 38 | % | 30 | % | |||
Cash, short-term investments and other | 5 | % | 4 | % | 10 | % | |||
| 100 | % | 100 | % | 100 | % | ||||
Projections of Plan Contributions and Benefit Payments
The Company expects to make contributions totaling $4 to its defined benefit plans in 2006.
Estimated future plan benefit payments as of December 31, 2005 are as follows:
2006 | $ | 3 | |
2007 | 4 | ||
2008 | 4 | ||
2009 | 5 | ||
2010 | 5 | ||
2011 to 2015 | 27 |
F-207
Table of Contents
HEXION SPECIALTY CHEMICALS CANADA, INC. AND SUBSIDIARIES
Notes to Consolidated Financial Statements—(Continued)
(In millions)
Defined Contribution Plans
The Company provides benefits under various defined benefit contribution plans to its employees in various countries . Depending upon the country and plan, eligible salaried and hourly employees may contribute up to 7% of their pay as basic contributions to the plans. The Company makes contributions to these plans in amounts up to 100% of basic contributions. Charges to operations for matching contributions under these defined contribution plans in 2005, 2004 and 2003 totaled $2, $2 and $2, respectively.
13. Non-Pension Postretirement Benefits
The Company provides other postretirement benefit plans to its Canadian employees. This plan provides retirees and their dependents certain medical and life insurance benefits. These benefits are funded on a pay-as-you-go basis.
The plan participants are provided with supplemental benefits to the respective provincial healthcare plan in Canada. The domestic postretirement medical benefits are contributory; the Canadian medical benefits are non-contributory. The domestic and Canadian postretirement life insurance benefits are non-contributory.
Prior to the Combination, the measurement date for this plan was September 30. Beginning in 2005, the Company has elected to make the measurement date for its postretirement obligations as of December 31. We are making the change to conform with the accounting policies of Hexion. This change in measurement date had an immaterial effect on the benefit obligation and expense recognized for 2005.
Following is a rollforward of the projected benefit obligation for the years ended December 31, 2005 and 2004.
| 2005 | 2004 | |||||||
Change in Benefit Obligation | ||||||||
Benefit obligation at beginning of year | $ | 3 | $ | 3 | ||||
Interest cost | 1 | — | ||||||
Actuarial losses | 1 | — | ||||||
Benefit obligation at end of year | 5 | 3 | ||||||
Unrecognized net actuarial loss | (3 | ) | (2 | ) | ||||
Accrued postretirement obligation at end of year | $ | 2 | $ | 1 | ||||
Net postretirement (benefit) expense for the Company was less than $1 million for the years ended December 31, 2005, 2004 and 2003.
The weighted average discount rates used to determine the benefit obligations for the Company were 6.5% for both periods presented.
The weighted average discount rates used to determine net postretirement (benefit) expense for the Company were 6.5%, 6.0% and 6.5% for the years ended December 31, 2005, 2004 and 2003, respectively.
F-208
Table of Contents
HEXION SPECIALTY CHEMICALS CANADA, INC. AND SUBSIDIARIES
Notes to Consolidated Financial Statements—(Continued)
(In millions)
Following are the weighted average assumed health care cost trend rates at December 31, 2005 and 2004:
| 2005 | 2004 | |||||
Health care cost trend rate assumed for next year | 7.2 | % | 7.5 | % | ||
Rate to which the cost trend rate is assumed to decline (the ultimate trend rate) | 4.4 | % | 4.4 | % | ||
Year that the rate reaches the ultimate trend rate | 2015 | 2015 |
A one-percentage-point change in the assumed health care cost trend rates would have the following impact on the Company’s postretirement benefits:
| 1% increase | 1% decrease | ||||||
Effect on total service cost and interest cost components | $ | — | $ | — | |||
Effect on postretirement benefit obligation | 1 | (1 | ) | ||||
Projected future plan benefit payments for 2006-2010 are less than $1 per year, and approximately $1 in aggregate. Projected future plan benefit payments for the years 2011-2015 are $1.
14. Shareholder’s Equity (Deficit)
Shareholder’s equity (deficit) at December 31, 2005 and 2004 reflects the common equity of Hexion Canada with all of the common equity of its subsidiaries eliminated, except for the equity of Hexion Malaysia representing Hexion’s 34% interest, totaling $1. Paid-in capital for periods prior to the reorganization of the Company on August 12, 2004 is presented on a combined basis.
Hexion Canada has 489,866 shares of no-par common stock outstanding during all periods presented with an unlimited number of shares of common preference and Preference B shares authorized.
In 2005, Hexion made a capital contribution to the Company of $95 relating to a partial repayment of Hexion Canada’s loan from Nova Scotia to finance the acquisition of Bakelite (see Note 9). In 2004, Hexion made a capital contribution to the Company for $1 relating to interest capitalized by Hexion in association with a capital project completed by Hexion Canada during 2004. In 2003, Hexion made capital contributions of $49 and $3 related to loans due to Hexion from two of the Company’s subsidiaries.
Hexion Malaysia paid common stock dividends to the Company of $1 for the year ended December 31, 2004. Borden Panama paid dividends of $2 to the Company for the year ended December 31, 2003.
F-209
Table of Contents
HEXION SPECIALTY CHEMICALS CANADA, INC. AND SUBSIDIARIES
Notes to Consolidated Financial Statements—(Continued)
(In millions)
15. Income Taxes
Comparative analysis of Hexion Canada’s income tax expense (benefit) follows:
| 2005 | 2004 | 2003 | |||||||||
Current | |||||||||||
Federal & provincial | $ | (2 | ) | $ | 5 | $ | (6 | ) | |||
Foreign | 8 | 2 | 4 | ||||||||
Total | 6 | 7 | (2 | ) | |||||||
Deferred | |||||||||||
Federal & provincial | 1 | — | 0 | ||||||||
Foreign | (2 | ) | 16 | 1 | |||||||
Total | (1 | ) | 16 | 1 | |||||||
Income tax expense (benefit) | $ | 5 | $ | 23 | $ | (1 | ) | ||||
| �� | |||||||||||
A reconciliation of the Company’s combined differences between income taxes computed at Canadian federal statutory tax rate of 22.12% and provisions for income taxes follows:
| 2005 | 2004 | 2003 | ||||||||||
Income taxes computed at federal statutory tax rate | $ | 3 | $ | — | $ | 8 | ||||||
Foreign rate differentials | 2 | 2 | 3 | |||||||||
Expenses not deductible for tax | 2 | 8 | 1 | |||||||||
Unrepatriated earnings of foreign subsidiaries | 2 | 14 | — | |||||||||
Adjustment of prior estimates and other | (4 | ) | (3 | ) | (15 | ) | ||||||
Provincial taxes and other | — | 2 | 2 | |||||||||
Income tax expense (benefit) | $ | 5 | $ | 23 | $ | (1 | ) | |||||
The 2005 consolidated tax expense reflects higher tax rates in foreign jurisdictions compared to the domestic rate of 22.12%.
Following the Acquisition in August 2004, Apollo made a determination that the unrepatriated earnings of the Company’s foreign subsidiaries are no longer considered permanently reinvested. As such, the 2004 consolidated tax expense reflects a provision of $14 for taxes associated with the unrepatriated earnings of the foreign subsidiaries.
The 2003 consolidated tax benefit reflects a release of reserves for prior years’ Canadian tax audits of $16. These reserves were released as a result of the settlement of audit issues relating to the divestiture of operating businesses by the Company in prior years.
F-210
Table of Contents
HEXION SPECIALTY CHEMICALS CANADA, INC. AND SUBSIDIARIES
Notes to Consolidated Financial Statements—(Continued)
(In millions)
The domestic and foreign components of the Company’s combined Income (loss) before income taxes are as follows:
| 2005 | 2004 | 2003 | |||||||||
Domestic | $ | (7 | ) | $ | 6 | $ | 22 | ||||
Foreign | 22 | (4 | ) | 13 | |||||||
| $ | 15 | $ | 2 | $ | 35 | ||||||
The tax effects of the Company’s significant temporary differences, and net operating loss and credit carryforwards, which comprise the deferred tax assets and liabilities at December 31, 2005 and 2004, are as follows:
| 2005 | 2004 | |||||||
Assets | ||||||||
Accrued and other expenses | $ | 10 | $ | 3 | ||||
Net operating loss and credit carryforwards | 13 | 14 | ||||||
Pension liability | 16 | 2 | ||||||
Certain intangibles | 5 | — | ||||||
Gross deferred tax assets | 44 | 19 | ||||||
Valuation allowance | (20 | ) | (10 | ) | ||||
| 24 | 9 | |||||||
Liabilities | ||||||||
Property, plant, equipment and intangibles | 43 | 13 | ||||||
Unrepatriated earnings of foreign subsidiaries | 13 | 14 | ||||||
Other long term liabilities | 5 | — | ||||||
Gross deferred tax liabilities | 61 | 27 | ||||||
Net deferred tax liability | $ | 37 | $ | 18 | ||||
The Company’s deferred tax assets include Foreign net operating loss carryforwards. As of December 31, 2005, the Foreign net operating loss carryforwards available are $43, related primarily to the UK. These net operating loss carryforwards have an unlimited carryover and do not expire. A valuation allowance of $11 has been provided against these attributes.
The Canada Revenue Agency is currently auditing the Canadian company for the period 2001-2002. Tax years 2003-2005 remain open for inspection and examination by various Canadian taxing authorities.
16. Supplemental Information
Changes in the Accounts receivable allowance for doubtful accounts are as follows for the year ended December 31, 2005:
Balance—December 31, 2004 | $ | 3 | ||
Acquisition | 6 | |||
Provision for doubtful accounts | 2 | |||
Write-offs of uncollectible accounts and other | (1 | ) | ||
Balance—December 31, 2005 | $ | 10 | ||
F-211
Table of Contents
REPORT OF INDEPENDENT REGISTERED PUBLIC ACCOUNTING FIRM
To Board of Directors and Shareholder of
National Borden Chemical GmbH:
In our opinion, the consolidated balance sheet and the related consolidated statements of operations, of shareholder’s equity and cash flows present fairly, in all material respects, the financial position of National Borden Chemical Germany GmbH, and its subsidiaries, at December 31, 2005 and the results of their operations and their cash flows for the year then ended in conformity with accounting principles generally accepted in the United States of America. These financial statements are the responsibility of the Company’s management. Our responsibility is to express an opinion on these financial statements based on our audit. We conducted our audit of these statements in accordance with the standards of the Public Company Accounting Oversight Board (United States). Those standards require that we plan and perform the audit to obtain reasonable assurance about whether the financial statements are free of material misstatement. An audit includes examining, on a test basis, evidence supporting the amounts and disclosures in the financial statements. An audit also includes assessing the accounting principles used and significant estimates made by management, as well as evaluating the overall financial statement presentation. We believe that our audit provides a reasonable basis for our opinion.
PRICEWATERHOUSECOOPERS LLP
Columbus, Ohio
March 16, 2006
F-212
Table of Contents
Report of Independent Auditors
To the Board of Directors and Shareholders of
Eastman Chemical Company
In our opinion, the accompanying combined balance sheet and the related combined statements of operations, of owner’s equity (deficit) and comprehensive income (loss) and of cash flows present fairly, in all material respects, the financial position of the Resins, Inks and Monomers Business of Eastman Chemical Company (the “Business”) at December 31, 2003, and the results of its operations and its cash flows for each of the two years in the period ended December 31, 2003 and for the seven-month period ended July 31, 2004 in conformity with accounting principles generally accepted in the United States of America. These financial statements are the responsibility of the Business’ management. Our responsibility is to express an opinion on these financial statements based on our audits. We conducted our audits of these statements in accordance with auditing standards generally accepted in the United States of America. Those standards require that we plan and perform the audit to obtain reasonable assurance about whether the financial statements are free of material misstatement. An audit includes examining, on a test basis, evidence supporting the amounts and disclosures in the financial statements, assessing the accounting principles used and significant estimates made by management, and evaluating the overall financial statement presentation. We believe that our audits provide a reasonable basis for our opinion.
As discussed in Notes 2 and 5 to the combined financial statements, on January 1, 2002, the Business adopted Statement of Financial Accounting Standards No. 142, “Goodwill and Other Intangible Assets.”
PRICEWATERHOUSECOOPERS LLP
Philadelphia, Pennsylvania
April 22, 2005
F-213
Table of Contents
RESINS, INKS AND MONOMERS BUSINESS
OF EASTMAN CHEMICAL COMPANY
COMBINED STATEMENTS OF OPERATIONS
(Dollars in thousands)
| Years ended December 31, | January 1, 2004 through July 31, 2004 | |||||||||||
| 2002 | 2003 | |||||||||||
Revenues | $ | 651,065 | $ | 678,349 | $ | 440,151 | ||||||
Cost of sales | 638,180 | 670,449 | 407,289 | |||||||||
Gross profit | 12,885 | 7,900 | 32,862 | |||||||||
Selling, general and administrative expenses | 68,110 | 60,365 | 38,450 | |||||||||
Research and development expenses | 26,215 | 29,184 | 9,103 | |||||||||
Asset impairments and restructuring charges, net | 7,743 | 412,787 | 71,107 | |||||||||
Goodwill impairments | — | 60,050 | — | |||||||||
Operating loss | (89,183 | ) | (554,486 | ) | (85,798 | ) | ||||||
Interest expense | 109 | 153 | 196 | |||||||||
Interest on advances from Eastman | 11,851 | 10,999 | 5,003 | |||||||||
Other non-operating (income) expense, net | (1,455 | ) | 678 | 515 | ||||||||
Loss before income taxes and cumulative effect of a change in accounting principle | (99,688 | ) | (566,316 | ) | (91,512 | ) | ||||||
Provision (benefit) for income taxes | (31,577 | ) | (64,470 | ) | 1,299 | |||||||
Loss before cumulative effect of change in accounting principle | (68,111 | ) | (501,846 | ) | (92,811 | ) | ||||||
Cumulative effect of change in accounting principle, net of tax | (252,969 | ) | — | — | ||||||||
Net loss | $ | (321,080 | ) | $ | (501,846 | ) | $ | (92,811 | ) | |||
The accompanying notes are an integral part of these combined financial statements
F-214
Table of Contents
RESINS, INKS AND MONOMERS BUSINESS
OF EASTMAN CHEMICAL COMPANY
COMBINED BALANCE SHEET
(Dollars in thousands)
| December 31, 2003 | ||||
ASSETS | ||||
Current assets | ||||
Cash and cash equivalents | $ | 14,455 | ||
Trade receivables, net of allowances of $4,448 | 109,673 | |||
Miscellaneous receivables | 11,077 | |||
Inventories, net | 102,318 | |||
Other current assets | 4,799 | |||
Total current assets | 242,322 | |||
Property, plant and equipment, net | 130,252 | |||
Intangible assets, net | 10,883 | |||
Other noncurrent assets | 528 | |||
Total assets | $ | 383,985 | ||
LIABILITIES AND OWNER’S EQUITY (DEFICIT) | ||||
Current liabilities | ||||
Accounts payable and accruals | $ | 72,325 | ||
Interest payable to Eastman | 94,222 | |||
Deferred income taxes | 8,152 | |||
Total current liabilities | 174,699 | |||
Deferred income taxes | 1,321 | |||
Post employment obligations | 7,551 | |||
Advances from Eastman | 624,310 | |||
Other long-term liabilities | 15,175 | |||
Total liabilities | 823,056 | |||
Commitments and contingencies | ||||
Net owner’s equity (deficit) | (458,186 | ) | ||
Accumulated other comprehensive income | 19,115 | |||
Total owner’s equity (deficit) | (439,071 | ) | ||
Total liabilities and owner’s equity (deficit) | $ | 383,985 | ||
The accompanying notes are an integral part of these combined financial statements
F-215
Table of Contents
RESINS, INKS AND MONOMERS BUSINESS
OF EASTMAN CHEMICAL COMPANY
COMBINED STATEMENTS OF CASH FLOWS
(Dollars in thousands)
| Years ended December 31, | January 1, 2004 through July 31, 2004 | |||||||||||
| 2002 | 2003 | |||||||||||
Operating activities | ||||||||||||
Net loss | $ | (321,080 | ) | $ | (501,846 | ) | $ | (92,811 | ) | |||
Adjustments to reconcile net loss to net cash used in operating activities: | ||||||||||||
Depreciation and amortization | 41,600 | 24,237 | 4,486 | |||||||||
Cumulative effect of change in accounting principle | 252,969 | — | — | |||||||||
Asset impairments | 1,700 | 462,110 | 63,878 | |||||||||
Deferred tax provision (benefit) | (35,141 | ) | (66,328 | ) | (438 | ) | ||||||
Change in assets and liabilities: | ||||||||||||
Trade receivables | (2,893 | ) | (3,832 | ) | (15,168 | ) | ||||||
Inventories | (6,254 | ) | 18,525 | 608 | ||||||||
Trade payables and accruals | 14,976 | (18,162 | ) | 6,538 | ||||||||
Interest payable to Eastman | 13,781 | 6,946 | (90,161 | ) | ||||||||
Other long-term liabilities | 2,063 | 1,033 | (1,063 | ) | ||||||||
Other items, net | (112 | ) | 3,445 | (1,009 | ) | |||||||
Net cash used in operating activities | (38,391 | ) | (73,872 | ) | (125,140 | ) | ||||||
Investing activities | ||||||||||||
Capital expenditures | (49,773 | ) | (19,715 | ) | (10,563 | ) | ||||||
Net cash used in investing activities | (49,773 | ) | (19,715 | ) | (10,563 | ) | ||||||
Financing activities | ||||||||||||
Proceeds from advances from Eastman | 64,248 | — | — | |||||||||
Repayment of advances from Eastman | — | (15,669 | ) | (98,353 | ) | |||||||
Transfers from Eastman, net | 25,944 | 107,917 | 221,869 | |||||||||
Net cash provided by financing activities | 90,192 | 92,248 | 123,516 | |||||||||
Net change in cash and equivalents | 2,028 | (1,339 | ) | (12,187 | ) | |||||||
Cash and equivalents at beginning of period | 13,766 | 15,794 | 14,455 | |||||||||
Cash and equivalents at end of period | $ | 15,794 | $ | 14,455 | $ | 2,268 | ||||||
Supplemental Cash Flow Information | ||||||||||||
Cash paid | ||||||||||||
Interest, net | $ | 1,417 | $ | 4,548 | $ | 96,869 | ||||||
Income taxes, net | 379 | 934 | 1,723 | |||||||||
Non-cash activity: | ||||||||||||
Contribution of advance from Eastman to owner’s equity | — | — | 522,576 | |||||||||
The accompanying notes are an integral part of these combined financial statements
F-216
Table of Contents
RESINS, INKS AND MONOMERS BUSINESS
OF EASTMAN CHEMICAL COMPANY
COMBINED STATEMENTS OF OWNER’S EQUITY (DEFICIT)
AND COMPREHENSIVE INCOME (LOSS)
(Dollars in thousands)
| Net Equity (Deficit) | Accumulated Other Comprehensive Income (Loss) | TOTAL | Comprehensive Income (Loss) | |||||||||||||
Balance, January 1, 2002 | $ | 230,879 | $ | 1,876 | $ | 232,755 | $ | — | ||||||||
Net loss | (321,080 | ) | — | (321,080 | ) | (321,080 | ) | |||||||||
Net transfers from Eastman | 25,944 | — | 25,944 | — | ||||||||||||
Currency translation adjustment | — | 7,591 | 7,591 | 7,591 | ||||||||||||
Comprehensive loss | — | — | — | (313,489 | ) | |||||||||||
Balance, December 31, 2002 | (64,257 | ) | 9,467 | (54,790 | ) | — | ||||||||||
Net loss | (501,846 | ) | — | (501,846 | ) | (501,846 | ) | |||||||||
Net transfers from Eastman | 107,917 | — | 107,917 | — | ||||||||||||
Currency translation adjustment | — | 9,648 | 9,648 | 9,648 | ||||||||||||
Comprehensive loss | — | — | — | (492,198 | ) | |||||||||||
Balance, December 31, 2003 | (458,186 | ) | 19,115 | (439,071 | ) | |||||||||||
Net loss | (92,811 | ) | — | (92,811 | ) | (92,811 | ) | |||||||||
Net transfers from Eastman | 221,869 | — | 221,869 | — | ||||||||||||
Contribution of advances from Eastman | 522,576 | — | 522,576 | — | ||||||||||||
Currency translation adjustment | — | (2,779 | ) | (2,779 | ) | (2,779 | ) | |||||||||
Comprehensive loss | — | — | — | $ | (95,590 | ) | ||||||||||
Balance, July 31, 2004 | $ | 193,448 | $ | 16,336 | $ | 209,784 | ||||||||||
The accompanying notes are an integral part of these combined financial statements
F-217
Table of Contents
RESINS, INKS AND MONOMERS BUSINESS
OF EASTMAN CHEMICAL COMPANY
Notes to the Combined Financial Statements
(Dollars in thousands)
1. Basis of Presentation
The accompanying combined financial statements include the Resins, Inks and Monomers business (“RIM business” or “Business”) of Eastman Chemical Company (“Eastman”), which is included in the consolidated financial statements of Eastman. On July 31, 2004, Eastman sold certain businesses and product lines of the RIM business to an investor group led by Apollo Management LP. These combined financial statements have been prepared from Eastman’s historical accounting records and are presented on a carve-out basis to include the historical financial position, results of operations and cash flows applicable to the Business. No direct relationship exists among all the operations comprising the Business. Accordingly, total equity (deficit) is presented in lieu of stockholders equity.
The accompanying combined financial statements include allocations of certain corporate services provided by Eastman’s management including finance, legal, information systems, human resources and distribution. Eastman has utilized its experience with the RIM businesses and its judgment in allocating such corporate services and other support to the periods. Costs allocated for such services for the years ended December 31, 2002 and 2003, and for the period from January 1, 2004 through July 31, 2004 were approximately:
Years ended December 31, | January 1, July 31, | ||||||||
| 2002 | 2003 | 2004 | |||||||
Cost of sales | $ | 30,000 | $ | 33,000 | $ | 14,000 | |||
Selling, general and administrative expenses | 33,000 | 33,000 | 20,000 | ||||||
Research and development | 13,000 | 14,000 | 4,000 | ||||||
Total cost and expenses allocated | $ | 76,000 | $ | 80,000 | $ | 38,000 | |||
Allocations were made primarily based on a percentage of revenues or salaries, which management believes represents a reasonable allocation methodology. Some corporate services such as information technology are charged to the business based on usage. However, these allocations and estimates are not necessarily indicative of the costs and expenses that would have resulted if the RIM business had been operating as a separate entity. It is not practicable to estimate the costs and expenses that would have resulted on a stand-alone basis.
As described in Note 7, employees working in the Business participate in various Eastman pension, health care, defined contribution and other benefit plans. The pro-rata costs related to these plans have been allocated and are included in the accompanying combined financial statements.
The Business uses a centralized approach to cash management, hedging and the financing of its operations. As a result, debt and related interest income and expense, and certain cash and cash equivalents were maintained at the corporate office and not included in the accompanying combined financial statements. The Business generally has not had borrowings except advances from Eastman. Advances from Eastman represent intercompany debt agreements between Eastman and a subsidiary that is part of the Business. See Note 14.
2. Summary of Significant Accounting Policies
Principles of Combination
The accompanying combined financial statements include the accounts of the Business after elimination of intercompany accounts and transactions.
F-218
Table of Contents
RESINS, INKS AND MONOMERS BUSINESS
OF EASTMAN CHEMICAL COMPANY
Notes to the Combined Financial Statements—(Continued)
(Dollars in thousands)
The accompanying combined statements of operations, cash flows and owner’s equity (deficit) for the years ended December 31, 2002 and 2003, and for the period from January 1, 2004 through July 31, 2004, have been prepared on a carve-out basis (see Note 1).
Use of Estimates
The preparation of financial statements in conformity with accounting principles generally accepted in the United States of America requires management to make estimates and assumptions that affect the reported amounts of assets and liabilities and disclosure of contingent assets and liabilities at the date of the financial statements, as well as the reported amounts of revenues and expenses during the reporting period. The most significant estimates reflected in the financial statements include environmental remediation, legal liabilities, deferred tax assets and liabilities and related valuation allowances, income tax accruals, pension and postretirement assets and liabilities, valuation allowances for accounts receivable and inventories, general insurance liabilities, asset impairments and related party transactions. Although management believes these estimates are reasonable, actual results could differ from those estimates.
Cash and Cash Equivalents
Cash equivalents are defined as highly liquid investments with original maturities of 90 days or less. Amounts included as cash and cash equivalents in the accompanying combined balance sheet represent cash accounts held at certain of the Business’ foreign entities.
Accounts Receivable and Allowance for Doubtful Accounts
Trade accounts receivable are recorded at the invoiced amount and do not bear interest. The Business maintains allowances for doubtful accounts (the “allowances”) for estimated losses resulting from the inability of its customers to make required payments. The allowances are based on the number of days an individual receivable is delinquent and management’s regular assessment of the financial condition of the Business’ customers. The Business considers that a receivable is delinquent if it is unpaid after the terms of the related invoice have expired. The Business evaluates the allowance based on a monthly assessment of the aged receivables. Write-offs are done at the time a customer receivable is deemed uncollectible.
The Business participates in an agreement that allows Eastman to sell certain domestic accounts receivable under a planned continuous sale program to a third party. The agreement permits the sale of undivided interests in domestic trade accounts receivable, which Eastman continues to service until collection. As the sale program is part of Eastman’s centralized approach to cash management, the Business’ $40 million participation is classified as trade accounts receivable in the accompanying combined balance sheet.
Inventories
Inventories are valued at the lower of cost or market. The Business determines the cost of inventories in the United States by the last-in, first-out (LIFO) method. The cost of all other inventories, including inventories outside the United States, is determined by the average cost method, which approximates the first-in, first-out (“FIFO”) method. The Business writes down its inventories for estimated obsolescence or unmarketable inventory equal to the difference between the cost of inventory and the estimated market value based upon assumptions about future demand and market conditions.
F-219
Table of Contents
RESINS, INKS AND MONOMERS BUSINESS
OF EASTMAN CHEMICAL COMPANY
Notes to the Combined Financial Statements—(Continued)
(Dollars in thousands)
Property, Plant and Equipment
The Business records property, plant and equipment at cost. Maintenance and repairs are charged to earnings; replacements and betterments that extend the useful life of the asset are capitalized. When the Business retires or otherwise disposes of assets, it removes the cost of such assets and related accumulated depreciation from the accounts. The Business records any profit or loss on retirement or other disposition in earnings. Depreciation expense is calculated based on historical cost and the estimated useful lives of the assets (building and building equipment 20 to 50 years, machinery and equipment 3 to 33 years), using the straight-line method.
Impaired Assets
The Business evaluates the carrying value of long-lived assets to be held and used, including definite-lived intangible assets, when events or changes in circumstances indicate that the carrying value may not be recoverable. Such events and circumstances include, but are not limited to, significant decreases in the market value of the asset, adverse change in the extent or manner in which the asset is being used, significant changes in business climate, or current or projected cash flow losses associated with the use of the assets. The carrying value of a long-lived asset is considered impaired when the total projected undiscounted cash flows from such asset is separately identifiable and is less than its carrying value. In that event, a loss is recognized based on the amount by which the carrying value exceeds the fair value of the long-lived asset. Fair value is determined primarily using the projected cash flows discounted at a rate commensurate with the risk involved or by appraisal. Losses on long-lived assets to be disposed of are determined in a similar manner, except that fair values are reduced for disposal costs.
The Business adopted the provisions of SFAS No. 142, “Goodwill and Other Intangible Assets,” effective January 1, 2002. The provisions of SFAS No. 142 require that goodwill and indefinite-lived intangible assets be tested at least annually for impairment and require reporting units to be identified for the purpose of assessing potential future impairments of goodwill. The carrying value of goodwill and indefinite lived intangibles is considered impaired when their fair value, as established by appraisal or based on undiscounted future cash flows of certain related products, is less than their carrying value. The Business conducts its annual testing of goodwill and indefinite-lived intangible assets for impairment in the third quarter of each year, unless events warrant more frequent testing.
Environmental Costs
The Business accrues environmental remediation costs when it is probable that the Business has incurred a liability and the amount can be reasonably estimated. When a single amount cannot be reasonably estimated but the cost can be estimated within a range, the Business accrues the minimum amount. This undiscounted accrued amount reflects the Business’s assumptions about remediation requirements at the contaminated site, the nature of the remedy, the outcome of discussions with regulatory agencies and other potentially responsible parties at multi-party sites, and the number and financial viability of other potentially responsible parties. Changes in the estimates on which the accruals are based, unanticipated government enforcement action, or changes in health, safety, environmental, and chemical control regulations and testing requirements could result in higher or lower costs.
The Business also establishes reserves for closure/post-closure costs associated with the environmental and other assets it maintains. Environmental assets include land fills and solid waste management units. When these types of assets are constructed, a reserve is established for the future environmental costs anticipated to be
F-220
Table of Contents
RESINS, INKS AND MONOMERS BUSINESS
OF EASTMAN CHEMICAL COMPANY
Notes to the Combined Financial Statements—(Continued)
(Dollars in thousands)
associated with the closure of the site based on an expected life of the environmental assets. These future expenses are charged into earnings over the estimated useful life of the assets. Currently, the Business estimates the useful life of each individual asset up to 50 years. If the Business changes its estimate of the asset retirement obligation costs or its estimate of the useful lives of these assets, the future expenses to be charged into earnings could increase or decrease.
Accruals for environmental liabilities are included in other long-term liabilities and exclude claims for recoveries from insurance companies or other third parties. Environmental costs are capitalized if they extend the life of the related property, increase its capacity, and/or mitigate or prevent future contamination. The cost of operating and maintaining environmental control facilities is charged to expense.
Litigation and Contingent Liabilities
The Business’ operations from time to time are parties to or targets of lawsuits, claims, investigations, and proceedings, including product liability, personal injury, asbestos, patent and intellectual property, commercial, contract, environmental, antitrust, health and safety, and employment matters, which are handled and defended in the ordinary course of business. The Business accrues a liability for such matters when it is probable that a liability has been incurred and the amount can be reasonably estimated. When a single amount cannot be reasonably estimated but the cost can be estimated within a range, the Business accrues the minimum amount. The Business expenses legal costs, including those expected to be incurred in connection with a loss contingency, as incurred.
Revenue Recognition and Customer Incentives
The Business recognizes revenue when persuasive evidence of an arrangement exists, delivery has occurred or services have been rendered, the price to the customer is fixed or determinable, and collectability is reasonably assured.
The Business records estimated obligations for customer programs and incentive offerings, which consist primarily of revenue or volume-based amounts that a customer must achieve over a specified period of time, as a reduction of revenue to each underlying revenue transaction as the customer progresses toward reaching goals specified in incentive agreements. These estimates are based on a combination of forecast of customer sales and actual sales volumes and revenues against established goals, the customer’s current level of purchases, Eastman’s knowledge of customer purchasing habits, and industry pricing practice. The incentive payment rate may be variable, based upon the customer reaching higher sales volume or revenue levels over a specified period of time in order to receive an agreed upon incentive payment.
Shipping and Handling Fees and Costs
Shipping and handling fees related to sales transactions are billed to customers and are recorded as sales revenue. Shipping and handling costs incurred are recorded in cost of sales.
Research and Development Costs
Research and development costs are expensed as incurred.
F-221
Table of Contents
RESINS, INKS AND MONOMERS BUSINESS
OF EASTMAN CHEMICAL COMPANY
Notes to the Combined Financial Statements—(Continued)
(Dollars in thousands)
Restructuring of Operations
The Business records restructuring charges incurred in connection with consolidation of operations, exited business lines, or shutdowns of specific sites. These restructuring charges generally will be substantially completed within 12 months, are based on costs associated with site closure, legal and environmental matters, demolition, contract terminations, severance or other costs directly related to the restructuring. The Business records severance charges for involuntary employee separations when the separation is probable and reasonably estimable. The Business records severance charges for voluntary employee separations ratably over the remaining service period of those employees.
Stock-Based Compensation
The employees of the Business participated in long-term compensation plans, sponsored by Eastman. As permitted by SFAS No. 123 “Accounting for Stock-Based Compensation,” the Business continues to apply intrinsic value accounting for its stock option plans. Compensation cost for stock options, if any, is measured as the excess of the quoted market price of the stock at the date of grant over the amount an employee must pay to acquire the stock. The Business has adopted disclosure-only provisions of SFAS No. 123 and SFAS No. 148, “Accounting for Stock-Based Compensation—Transition and Disclosure—an Amendment of FASB Statement No. 123.” The Business’ pro forma net loss based upon the fair value at the grant dates for awards under Eastman’s plans are disclosed below.
| Years ended December 31 | January 1, 2004 through July 31, 2004 | |||||||||||
| 2002 | 2003 | |||||||||||
Net loss as reported | $ | (321,080 | ) | $ | (501,846 | ) | $ | (92,811 | ) | |||
Deduct: Additional stock-based employee compensation cost, net of tax, that would have been included in net loss under fair value method | 435 | 465 | 184 | |||||||||
Pro forma net loss | $ | (321,515 | ) | $ | (502,311 | ) | $ | (92,995 | ) | |||
Compensated Absences
The Business accrues compensated absences and related benefits as current charges to earnings in the period earned.
Income Taxes
The provision for income taxes has been determined using the asset and liability approach of accounting for income taxes. Under this approach, deferred taxes represent the future tax consequences expected to occur when the reported amounts of assets and liabilities are recovered or paid. The provision for income taxes represents income taxes paid or payable for the current year plus the change in deferred taxes during the year. Deferred taxes result from differences between the financial and tax bases of the Business’ assets and liabilities and are adjusted for changes in tax rates and tax laws when changes are enacted. Valuation allowances are recorded to reduce deferred tax assets when it is more likely than not that a tax benefit will not be realized. Provision has been made for income taxes on unremitted earnings of subsidiaries and affiliates, except for subsidiaries in which earnings are deemed to be permanently reinvested. The Business’ taxable income is included in Eastman’s consolidated U.S. federal income tax return. The benefit for income taxes for the Business’ has been determined using the separate return method.
F-222
Table of Contents
RESINS, INKS AND MONOMERS BUSINESS
OF EASTMAN CHEMICAL COMPANY
Notes to the Combined Financial Statements—(Continued)
(Dollars in thousands)
Translation of Non-U.S. Currencies
Where cash flows are primarily denominated in the local currency, foreign combined entities of the Business use the local currency as the functional currency. The effects of those entities remeasuring transactions denominated in currencies other than the functional currency are reflected in current earnings in other (income) charges, net. The effects of translating into U.S. dollars the operations of consolidated entities that use a foreign currency as the functional currency are included in comprehensive income (loss) and accumulated other comprehensive income (loss), a component of net owner’s equity (deficit).
Other Comprehensive Income
Other comprehensive income consists of cumulative translation adjustment.Because cumulative translation adjustment is considered a component of permanently invested, unremitted earnings of subsidiaries outside the United States, no taxes are provided on such amounts.
Risks and Uncertainties
The Business had manufacturing operations in ten countries, and in each country, the business was subject to varying degrees of risks and uncertainties. Eastman insures its business and assets against insurable risks in a manner that it deems appropriate. Because of its diversity, management believes that the risk of loss from non-insurable events in any one business or country would not have a material, adverse effect on its operations as a whole. Additionally, management believes there is no material concentration of risk within any single customer or supplier, or small group of customers or suppliers, except for Eastman, whose failure or nonperformance would materially affect the Business’ results.
3. Inventories
| December 31, 2003 | ||||
At FIFO or average cost (approximates current cost) | ||||
Finished goods | $ | 71,676 | ||
Raw materials and supplies | 33,256 | |||
Total inventories at FIFO or average cost | 104,932 | |||
LIFO reserve | (2,614 | ) | ||
Total inventories | $ | 102,318 | ||
Inventories valued on the LIFO method were approximately 52% of total inventory. LIFO inventory in the Resins segment is part of Eastman’s LIFO inventory pool. Accordingly, changes in the LIFO reserve were allocated based on cost of sales. The increase (decrease) in cost of sales that resulted from the allocation of changes in the Eastman LIFO reserve to Resins was $(2,136), $974 and $2,183 for the years ended December 31, 2002 and 2003, and for the period from January 1, 2004 through July 31, 2004, respectively. The Inks segment, which had its own LIFO pool, recorded decreases in cost of sales that resulted from decrements of $2,032 and $1,579 in 2002 and for the period from January 1, 2004 through July 31, 2004, respectively.
F-223
Table of Contents
RESINS, INKS AND MONOMERS BUSINESS
OF EASTMAN CHEMICAL COMPANY
Notes to the Combined Financial Statements—(Continued)
(Dollars in thousands)
4. Property Plant and Equipment
| December 31, 2003 | ||||
Properties at cost | ||||
Balance at beginning of year | $ | 461,145 | ||
Capital expenditures | 19,715 | |||
Currency translation adjustment | 42,131 | |||
Deductions | (23,653 | ) | ||
Fixed asset impairments | (227,643 | ) | ||
Balance at end of year | $ | 271,695 | ||
Properties | ||||
Land | $ | 29,122 | ||
Buildings and equipment | 62,271 | |||
Machinery and equipment | 173,293 | |||
Construction in progress | 7,009 | |||
| 271,695 | ||||
Less: accumulated depreciation | 141,443 | |||
Properties, net | $ | 130,252 | ||
Accumulated Depreciation | ||||
Balance at beginning of year | $ | 116,678 | ||
Provision for depreciation | 17,011 | |||
Currency translation adjustment | 26,179 | |||
Deductions | (18,425 | ) | ||
Balance at end of year | $ | 141,443 | ||
Depreciation expense was $28,977, $17,011, and $4,070 for the years ended 2002 and 2003, and from January 1, 2004 to July 31, 2004, respectively. See Note 12 for additional information on asset impairments.
5. Goodwill and Intangible Assets
The Business adopted the provisions of SFAS No. 142, “Goodwill and Other Intangible Assets,” effective January 1, 2002. The provisions of SFAS No. 142 prohibit the amortization of goodwill and indefinite-lived intangible assets; require that goodwill and indefinite-lived intangible assets be tested at least annually for impairment; require reporting units to be identified for the purpose of assessing potential future impairments of goodwill; and remove the forty-year limitation on the amortization period of intangible assets that have finite lives.
In connection with the adoption of SFAS No. 142, the Business completed the impairment test for goodwill and intangible assets with indefinite useful lives. As a result of this impairment test, it was determined that the fair value of certain trademarks, as established by appraisal and based on discounted future cash flows, was less than the recorded value. Accordingly, the Business recognized goodwill impairment of $235,299 and an impairment charge for trademarks of $28,500 ($17,670 after-tax) in 2002 to reflect lower than previously expected cash flows from certain related products. This charge is reported in the Combined Statements of Operations as the cumulative effect of a change in accounting principle.
F-224
Table of Contents
RESINS, INKS AND MONOMERS BUSINESS
OF EASTMAN CHEMICAL COMPANY
Notes to the Combined Financial Statements—(Continued)
(Dollars in thousands)
The changes in the carrying amount of goodwill for the year ended December 31, 2002 and 2003 are as follows:
| Resins | Inks | Total | ||||||||||
Goodwill balance at January 1, 2002 | $ | 60,000 | $ | 235,349 | $ | 295,349 | ||||||
Less: goodwill impairment recognized upon adoption of SFAS No. 142 | (60,000 | ) | (175,299 | ) | (235,299 | ) | ||||||
Goodwill balance at December 31, 2002 | — | 60,050 | 60,050 | |||||||||
Less: goodwill impairment | — | (60,050 | ) | (60,050 | ) | |||||||
Goodwill balance at December 31, 2003 | $ | — | $ | — | $ | — | ||||||
Following are the Business’ amortizable intangible assets and indefinite-lived intangible assets. The difference between the gross carrying amount and net carrying amount for each item presented is attributable to accumulated amortization.
| At December 31, 2003 | ||||||
| Gross Carrying Amount | Net Carrying Amount | |||||
Amortizable intangible assets: | ||||||
Developed Technology | $ | 25,320 | $ | 3,588 | ||
Customer lists | 12,948 | 1,753 | ||||
| $ | 38,268 | $ | 5,341 | |||
Indefinite-lived intangible assets: | ||||||
Trademarks | 5,542 | 5,542 | ||||
| $ | 43,810 | $ | 10,883 | |||
Total intangible amortization expense was $12,623, $7,226 and $416 for the years ended December 31, 2002 and 2003 and the period from January 1, 2004 to July 31, 2004, respectively. Amortization expense for the next five years is not significant to any one year.
Additional information regarding the impairment of intangibles and goodwill is available in Note 12.
6. Accounts Payable and Accruals
| At December 31, 2003 | |||
Trade creditors | $ | 48,724 | |
Accrued payrolls, vacation, and variable-incentive compensation | 11,983 | ||
Severance | 4,566 | ||
Other | 7,052 | ||
Total | $ | 72,325 | |
F-225
Table of Contents
RESINS, INKS AND MONOMERS BUSINESS
OF EASTMAN CHEMICAL COMPANY
Notes to the Combined Financial Statements—(Continued)
(Dollars in thousands)
7. Retirement Plans
The employees of the RIM business participate in defined benefit plans sponsored by Eastman. Through Eastman, the RIM business also provided post-retirement health care and life insurance benefits for employees who meet the eligibility requirements of the plans. Retirees share in the cost of these benefits based on age and years of service. Eastman charges the RIM business for the costs of the plans through an allocation based on labor costs.
The following charges are included in the accompanying combined statements of operations:
| Years ended December 31, | January 1, 2004 through July 31, 2004 | ||||||||
| 2002 | 2003 | ||||||||
Pension plans | $ | 2,119 | $ | 2,989 | $ | 2,007 | |||
Postretirement benefits | 4,732 | 5,203 | 2,520 | ||||||
Defined Contribution Plans
The Business participates in Eastman’s defined contribution employee stock ownership plan (the “ESOP”), a qualified plan under Section 401(a) of the Internal Revenue Code, which is a component of the Eastman Investment Plan and Employee Stock Ownership Plan (“EIP/ESOP”). Eastman anticipates that it will make annual contributions for substantially all U.S. employees equal to 5% of eligible compensation to the ESOP, or for employees who have five or more prior ESOP contributions, to either the Eastman Stock Fund or other investment funds within the EIP. Employees may diversify to other investment funds within the EIP from the ESOP at anytime without restrictions. Charges for domestic contributions to the EIP/ESOP were $2,288, $2,394 and $1,379 for 2002, 2003 and for the period from January 1, 2004 through July 31, 2004, respectively.
8. Commitments
Purchase Obligations and Leases
At July 31, 2004, the Business participated in the centralized purchasing programs of Eastman for materials, supplies and energy incident to the ordinary conduct of business. Accordingly, no purchase obligations were directly related to the Business. The Business had various lease commitments for property and equipment under cancelable, non-cancelable and month-to-month operating leases totaling approximately $1,781 over a period of several years.
The obligations described above are in the following table:
| Minimum Rentals Under Operating Leases | |||
2004 Balance of Year | $ | 302 | |
2005 | 702 | ||
2006 | 472 | ||
2007 | 270 | ||
2008 | 22 | ||
Thereafter | 13 | ||
| $ | 1,781 | ||
F-226
Table of Contents
RESINS, INKS AND MONOMERS BUSINESS
OF EASTMAN CHEMICAL COMPANY
Notes to the Combined Financial Statements—(Continued)
(Dollars in thousands)
Rental expense including allocations from Eastman was $4,296, $4,430 and $1,886 for the years ended December 31, 2002 and 2003 and for the period from January 1, 2004 through July 31, 2004, respectively.
Other Guarantees
Guarantees and claims arise during the ordinary course of business from relationships with suppliers, customers and non-consolidated affiliates when the Business undertakes an obligation to guarantee the performance of others if specified triggering events occur. Non-performance under a contract could trigger an obligation of the Business. These potential claims include actions based upon alleged exposures to products, intellectual property and environmental matters, and other indemnifications. The ultimate effect on future financial results is not subject to reasonable estimation because considerable uncertainty exists as to the final outcome of these claims. However, while the ultimate liabilities resulting from such claims may be significant to results of operations in the period recognized, management does not anticipate they will have a material adverse effect on the Business’ consolidated financial position or liquidity.
Product Warranty Liability
The Business warrants to the original purchaser of its products that it will repair or replace without charge products if they fail due to a manufacturing defect. However, the Business’ historical claims experience has not been material. The estimated product warranty liability for the Business’ products as of July 31, 2004 is less than $1 million. The Business accrues for product warranties when it is probable that customers will make claims under warranties relating to products that have been sold and a reasonable estimate of the costs can be made.
9. Environmental Matters
Certain manufacturing sites generate hazardous and non-hazardous wastes, the treatment, storage, transportation, and disposal of which are regulated by various governmental agencies. In connection with the cleanup of various hazardous waste sites, the Business, along with many other entities, has been designated a potentially responsible party (“PRP”), by the U.S. Environmental Protection Agency under the Comprehensive Environmental Response, Compensation and Liability Act, which potentially subjects PRPs to joint and several liability for such cleanup costs. In addition, the Business will be required to incur costs for environmental remediation and closure and post-closure under the Federal Resource Conservation and Recovery Act. Adequate reserves for environmental contingencies have been established in accordance with the Business’ policies described in Note 2. Because of expected sharing of costs, the availability of legal defenses, and the Business’ preliminary assessment of actions that may be required, it does not believe its liability for these environmental matters, individually or in the aggregate, will be material to the Business’ consolidated financial position, results of operations or cash flows. The Business’ reserve for environmental contingencies was approximately $9,336 at December 31, 2003, representing management’s minimum or best estimate for remediation costs and other environmental cleanup issues.
10. Legal Matters
From time to time, the Business and its operations are parties to, or targets of, lawsuits, claims, investigations and proceedings, including product liability, personal injury, asbestos, patent and intellectual property, commercial, contract, environmental, antitrust, health and safety and employment matters, which are being handled and defended in the ordinary course of business. While the Business is unable to predict the outcome of these matters, it does not believe, based upon currently available facts, that the ultimate resolution of
F-227
Table of Contents
RESINS, INKS AND MONOMERS BUSINESS
OF EASTMAN CHEMICAL COMPANY
Notes to the Combined Financial Statements—(Continued)
(Dollars in thousands)
any such pending matters will have a material adverse effect on its overall financial condition, results of operations or cash flows. However, adverse developments could negatively impact earnings or cash flows in a particular future period.
11. Stock Option and Compensation Plans
The employees of the RIM business participated in various long term compensation plans, sponsored by Eastman, which provided for grants to employees of nonqualified stock options, incentive stock options, tandem and freestanding stock appreciation rights (“SAR’s”), performance shares and various other stock and stock-based awards. Certain of these awards may be based on criteria relating to Eastman performance as established by the Compensation and Management Development Committee of the Board of Directors of Eastman. The Eastman Omnibus Plan provided that options could be granted through May 2, 2007, for the purchase of Eastman common stock at an option price not less than 100% of the per share fair market value on the date of the stock option’s grant. Substantially all grants awarded under Eastman’s plans have been at option prices equal to the fair market value on the date of grant. Options typically vest in equal increments on either the first two or three anniversaries of the grant date and expire ten years after grant.
The fair value of each option is estimated by the Business on the grant date using the Black-Scholes-Merton option-pricing model, which requires input of highly subjective assumptions. Some of these assumptions used for grants in 2004, 2003, and 2002, respectively, include: average expected volatility of 28.0%, 27.90% and 27.57%; average expected dividend yield of 3.80%, 5.90% and 3.71%; and average risk-free interest rates of 3.46%, 3.50% and 5.06%. An expected option term of six years for all periods was developed based on historical experience information.
Because the Business’ employee stock options have characteristics significantly different from those of traded options, and because changes in the subjective input assumptions can materially affect the fair value estimate, in management’s opinion, the existing models do not necessarily provide a reliable single measure of the fair value of its employee stock options.
A summary of the status of the Business’ portion of Eastman’s stock option plans is presented below:
| 2002 | 2003 | January 1 to July 31, 2004 | |||||||||||||||
| Options | Weighted- Average Exercise Price | Options | Weighted- Average Exercise Price | Options | Weighted- Average Exercise Price | ||||||||||||
Outstanding at beginning of year | 159,900 | $ | 51.91 | 241,300 | $ | 50.32 | 354,700 | $ | 43.79 | ||||||||
Granted | 83,700 | 47.55 | 113,400 | 29.90 | 21,800 | 43.66 | |||||||||||
Exercised | (500 | ) | 42.75 | — | — | (26,675 | ) | 29.90 | |||||||||
Forfeited or cancelled | (1,800 | ) | 42.75 | — | — | (7,700 | ) | 59.14 | |||||||||
Outstanding at end of year | 241,300 | $ | 50.32 | 354,700 | $ | 43.79 | 342,125 | $ | 44.69 | ||||||||
Options exercisable at year-end | 121,900 | 187,800 | 249,175 | ||||||||||||||
F-228
Table of Contents
RESINS, INKS AND MONOMERS BUSINESS
OF EASTMAN CHEMICAL COMPANY
Notes to the Combined Financial Statements—(Continued)
(Dollars in thousands)
The following table summarizes information about stock options outstanding at December 31, 2003:
| Options Outstanding | Options Exercisable | |||||||||||||
Range of Exercise Prices | Number Outstanding at 12/31/03 | Weighted- Average Remaining Contractual Life | Weighted- Average Exercise Price | Number Exercisable at 12/31/03 | Weighted- Average Exercise Price | |||||||||
$30 | 113,400 | 9.2 | Years | $ | 30 | — | $ | — | ||||||
$43-46 | 32,600 | 5.3 | Years | 46 | 32,600 | 46 | ||||||||
$47-49 | 141,400 | 7.8 | Years | 48 | 87,900 | 49 | ||||||||
$50-74 | 67,300 | 3.2 | Years | 57 | 67,300 | 57 | ||||||||
| 354,700 | 7.2 | Years | $ | 44 | 187,800 | $ | 51 | |||||||
12. Impairments and Restructuring Charges, Net
The following table summarizes the impairments and restructuring charges:
| Years ended December 31, | January 1, 2004 through July 31, 2004 | ||||||||
| 2002 | 2003 | ||||||||
Resins: | |||||||||
Fixed asset impairments | $ | 1,700 | $ | 173,630 | $ | 30,304 | |||
Intangible asset impairments | — | 77,517 | — | ||||||
Restructuring charges | 3,003 | 6,838 | 4,522 | ||||||
Inks: | |||||||||
Fixed asset impairments | — | 54,013 | 27,574 | ||||||
Intangible asset impairments | — | 96,900 | 6,000 | ||||||
Goodwill impairments | — | 60,050 | — | ||||||
Restructuring charges | 3,040 | 3,889 | 2,707 | ||||||
Total | $ | 7,743 | $ | 472,837 | $ | 71,107 | |||
Total asset impairments and restructuring charges, net | $ | 7,743 | 412,787 | 71,107 | |||||
Total goodwill impairments | — | 60,050 | — | ||||||
Total | $ | 7,743 | $ | 472,837 | $ | 71,107 | |||
Asset Impairments
In the third quarter 2003, Eastman reorganized the operating structure and changed its business strategy in response to the financial performance of certain underlying product lines. Those product lines include: acrylate ester monomers; composites (unsaturated polyester resins); inks and graphic arts raw materials; liquid resins; powder resins; and textile chemicals. Prior to the third quarter, management was pursuing growth strategies aimed at significantly improving the financial performance of these product lines. However, due to the continued operating losses and deteriorating market conditions, management decided to pursue alternative strategies including restructuring, divestiture, and consolidation. This change affected both the manner in which certain assets are used and the financial outlook for these product lines, thus triggering the impairments and certain restructuring charges.
F-229
Table of Contents
RESINS, INKS AND MONOMERS BUSINESS
OF EASTMAN CHEMICAL COMPANY
Notes to the Combined Financial Statements—(Continued)
(Dollars in thousands)
The 2003 fixed asset impairments charges of $227,643 primarily relate to assets associated with the above mentioned product lines, and primarily impact manufacturing sites in the North American and European regions that were part of the Lawter International, Inc. (“Lawter”), McWhorter Technologies, Inc (“McWhorter”), and Chemicke Zavody Sokolov (“Sokolov”) acquisitions. As the undiscounted future cash flows could not support the carrying value of the assets, the fixed assets were written down to fair value, as established primarily by appraisal.
The 2003 intangible asset impairments charges relate to definite-lived intangible assets of $127,417 and indefinite-lived intangible assets of approximately $47,000. The definite-lived intangible assets relate primarily to developed technology and customer lists, and the indefinite-lived intangible assets primarily relate to trademarks. These intangible assets were primarily associated with the acquisitions of Lawter and McWhorter. As the undiscounted future cash flows could not support the carrying value of the definite-lived intangible assets, these assets were written down to fair value, as established primarily by appraisal. Indefinite-lived intangible assets were written down to fair value, as established by appraisal.
In 2004, Eastman entered into an agreement to sell certain businesses and product lines of the RIM business to an investor group led by Apollo Management LP. The estimated sales proceeds for the net assets to be sold were less than their carrying value. As a result, the Business assessed the impairment under the “held in use” model and determined that the sum of undiscounted future cash flows would not support the carrying value of the assets. As such, fixed assets and intangible assets were written down to fair value and an impairment charge was recorded in the amount of $63,878.
Restructuring Charges
Restructuring charges in 2002 and 2003 of $6,043 and $10,727, respectively, consist primarily of severance charges related to actual and probable involuntary separations resulting from decisions as part of the restructuring of Eastman discussed above and the annual budgeting process. During 2003, terminations related to actual and probable involuntary separations totaled approximately 200 employees. As of the end of 2003, approximately 150 of these terminations had been incurred, with the remaining primarily relating to previously announced consolidation and restructuring activities of certain European manufacturing sites that were completed prior to July 31, 2004.
In 2004, the Business recognized $7,229 in restructuring charges which included severance charges primarily related to separations stemming from the Eastman’s voluntary termination program announced in April 2004 and additional site closure costs of $2,616 related primarily to previously announced closures of the Waterford, Ireland and Bury, UK manufacturing facilities.
F-230
Table of Contents
RESINS, INKS AND MONOMERS BUSINESS
OF EASTMAN CHEMICAL COMPANY
Notes to the Combined Financial Statements—(Continued)
(Dollars in thousands)
The following table summarizes the charges and changes in estimates described above, other asset impairments and restructuring charges, the non-cash reductions attributable to asset impairments, and the cash reductions in shutdown reserves for severance costs and site closure costs paid:
| Balance at January 1, 2002 | Provision/ Adjustments | Non-cash Reductions | Cash Reductions | Balance at December 31, 2002 | |||||||||||||
Non-Cash Charges | $ | — | $ | 1,700 | $ | (1,700 | ) | $ | — | $ | — | ||||||
Severance costs | — | — | — | — | |||||||||||||
Site closure costs | — | 6,043 | — | (2,797 | ) | 3,246 | |||||||||||
Total | $ | — | $ | 7,743 | $ | (1,700 | ) | $ | (2,797 | ) | $ | 3,246 | |||||
Balance at January 1, 2003 | Provision/ Adjustments | Non-cash Reductions | Cash Reductions | Balance at December 31, 2003 | |||||||||||||
Non-Cash Charges | $ | — | $ | 462,110 | $ | (462,110 | ) | $ | — | $ | — | ||||||
Severance costs | — | 7,727 | — | (3,161 | ) | 4,566 | |||||||||||
Site closure costs | 3,246 | 3,000 | — | (6,246 | ) | — | |||||||||||
Total | $ | 3,246 | $ | 472,837 | $ | (462,110 | ) | $ | (9,407 | ) | $ | 4,566 | |||||
| Balance at January 1, 2004 | Provision/ Adjustments | Non-cash Reductions | Cash Reductions | Balance at July 31, 2004 | |||||||||||||
Non-Cash Charges | $ | — | $ | 63,878 | $ | (63,878 | ) | $ | — | $ | — | ||||||
Severance costs | 4,566 | 4,613 | (8,475 | ) | 704 | ||||||||||||
Site closure costs | — | 2,616 | — | (2,616 | ) | — | |||||||||||
Total | $ | 4,566 | $ | 71,107 | $ | (63,878 | ) | $ | (11,091 | ) | $ | 704 | |||||
13. Other Non-operating (Income) Expense, Net
| Years ended December 31, | January 1, 2004 through July 31, 2004 | |||||||||||
| 2002 | 2003 | |||||||||||
Other income | $ | (674 | ) | $ | (2,158 | ) | $ | (707 | ) | |||
Foreign exchange transaction (gains) losses | (1,363 | ) | (1,183 | ) | 681 | |||||||
Other expenses | 582 | 4,019 | 541 | |||||||||
Total | $ | (1,455 | ) | $ | 678 | $ | 515 | |||||
14. Transactions With Related and Certain Other Parties
Related Parties
The Business has entered into transactions with Eastman. Purchases from Eastman were approximately $43,000 for 2002, $43,000 for 2003, and $27,000 for the period from January 1, 2004 through July 31, 2004. See Note 2 regarding expenses allocated to the Business from Eastman. However, these transactions are not necessarily indicative of the costs and expenses that would have resulted if the RIM business had been operating as a separate entity.
F-231
Table of Contents
RESINS, INKS AND MONOMERS BUSINESS
OF EASTMAN CHEMICAL COMPANY
Notes to the Combined Financial Statements—(Continued)
(Dollars in thousands)
Advances from Eastman
Advances from Eastman are long-term notes payable supported by contractual agreements, primarily a $536,000 note from Lawter International, Inc., a subsidiary included in the RIM business. All principal was due on May 1, 2009. Interest was payable annually at an interest rate equal to the one-month LIBOR. On July 31, 2004, the outstanding principal and interest balances were settled by a contribution to owner’s equity (deficit) by Eastman.
15. Income Taxes
Components of loss before the provision (benefit) for U.S. and other income taxes follow:
| Years ended December 31, | January 1, 2004 through July 31, 2004 | |||||||||||
| 2002 | 2003 | |||||||||||
Loss before income taxes | ||||||||||||
United States | $ | (91,915 | ) | $ | (462,582 | ) | $ | (67,107 | ) | |||
Outside the United States | (7,773 | ) | (103,734 | ) | (24,405 | ) | ||||||
Total | $ | (99,688 | ) | $ | (566,316 | ) | $ | (91,512 | ) | |||
Provision (benefit) for income taxes | ||||||||||||
United States | ||||||||||||
Deferred | $ | (33,118 | ) | $ | (61,487 | ) | $ | — | ||||
Non-United States | ||||||||||||
Current | 3,564 | 1,858 | 1,737 | |||||||||
Deferred | 818 | 433 | (438 | ) | ||||||||
State and other | ||||||||||||
Deferred | (2,841 | ) | (5,274 | ) | — | |||||||
Total | $ | (31,577 | ) | $ | (64,470 | ) | $ | 1,299 | ||||
Differences between the provision (benefit) for income taxes and income taxes computed using the U.S. federal statutory income tax rate follow:
| Years ended December 31, | January 1, 2004 through July 31, 2004 | |||||||||||
| 2002 | 2003 | |||||||||||
Amount computed using the statutory rate | $ | (34,891 | ) | $ | (198,211 | ) | $ | (32,029 | ) | |||
State income taxes, net | (2,841 | ) | (12,020 | ) | (1,988 | ) | ||||||
Foreign rate variance | 1,462 | 10,677 | (3,585 | ) | ||||||||
Goodwill impairment | — | 21,018 | — | |||||||||
Valuation allowance | 5,641 | 113,978 | 39,029 | |||||||||
Other | (948 | ) | 88 | (128 | ) | |||||||
Provision (benefit) for income taxes | $ | (31,577 | ) | $ | (64,470 | ) | $ | 1,299 | ||||
F-232
Table of Contents
RESINS, INKS AND MONOMERS BUSINESS
OF EASTMAN CHEMICAL COMPANY
Notes to the Combined Financial Statements—(Continued)
(Dollars in thousands)
The significant components of deferred tax assets and liabilities follow:
| December 31, 2003 | ||||
Deferred tax assets | ||||
Depreciation | $ | 10,204 | ||
Purchase accounting | 7,674 | |||
Net operating loss carry forwards | 112,168 | |||
Other | 6,763 | |||
Total deferred tax assets | 136,809 | |||
Less valuation allowance | (113,846 | ) | ||
Deferred tax assets less valuation allowance | $ | 22,963 | ||
Deferred tax liabilities | ||||
Depreciation | $ | 13,072 | ||
Inventories | 5,136 | |||
Purchase accounting adjustments | 6,573 | |||
Other | 7,655 | |||
Total deferred tax liabilities | $ | 32,436 | ||
Net deferred tax liabilities | $ | 9,473 | ||
For certain consolidated foreign subsidiaries, income and losses directly flow through to taxable income in the United States. These entities are also subject to taxation in the foreign tax jurisdictions. Net operating loss carryforwards exist to offset future taxable income in foreign tax jurisdictions and valuation allowances are provided to reduce deferred related tax assets if it is more likely than not that this benefit will not be realized. Changes in the estimated realizable amount of deferred tax assets associated with net operating losses for these entities could result in changes in the deferred tax asset valuation allowance in the foreign tax jurisdiction. At the same time, because these entities are also subject to tax in the United States, a deferred tax liability for the expected future taxable income will be established concurrently. Therefore, the impact of any reversal of valuation allowances on consolidated income tax expense will only be to the extent that there are differences between the United States statutory tax rate and the tax rate in the foreign jurisdiction.
At December 31, 2003, net operating loss carryforwards totaled $330,000. Of this total, $300,000 will expire in 3 to 20 years; $30,000 will never expire.
16. Segment Information
Using guidelines set forth in SFAS No. 131, “Disclosures about Segments of an Enterprise and Related Information,” the Business has identified two reportable segments based on product line information: Resins and Inks.
Resins and Monomers (“Resins”)
The Resins segment manufactures materials for the coatings, composites, acrylics, and textile industries from 11 facilities in North America and Europe.
F-233
Table of Contents
RESINS, INKS AND MONOMERS BUSINESS
OF EASTMAN CHEMICAL COMPANY
Notes to the Combined Financial Statements—(Continued)
(Dollars in thousands)
Inks
The Inks segment produces a variety of specialty polymers and other ink products through 6 facilities in North America, Europe and Asia.
| Years ended December 31, | January 1, 2004 through July 31, 2004 | |||||||||||
| 2002 | 2003 | |||||||||||
Revenues: | ||||||||||||
Resins | $ | 454,612 | $ | 490,534 | $ | 336,059 | ||||||
Inks | 196,453 | 187,815 | 104,092 | |||||||||
Total | $ | 651,065 | $ | 678,349 | $ | 440,151 | ||||||
Operating loss: | ||||||||||||
Resins | $ | (67,341 | ) | $ | (314,323 | ) | $ | (42,768 | ) | |||
Inks | (21,842 | ) | (240,163 | ) | (43,030 | ) | ||||||
Total | $ | (89,183 | ) | $ | (554,486 | ) | $ | (85,798 | ) | |||
Depreciation expense: | ||||||||||||
Resins | $ | 21,075 | $ | 13,768 | $ | 2,428 | ||||||
Inks | 7,902 | 3,243 | 1,642 | |||||||||
Total | $ | 28,977 | $ | 17,011 | $ | 4,070 | ||||||
Capital expenditures: | ||||||||||||
Resins | $ | 34,731 | $ | 13,003 | $ | 7,409 | ||||||
Inks | 15,042 | 6,712 | 3,154 | |||||||||
Total | $ | 49,773 | $ | 19,715 | $ | 10,563 | ||||||
| At December 31, 2003 | |||
Assets: | |||
Resins | $ | 253,686 | |
Inks | 130,299 | ||
Total | $ | 383,985 | |
F-234
Table of Contents
RESINS, INKS AND MONOMERS BUSINESS
OF EASTMAN CHEMICAL COMPANY
Notes to the Combined Financial Statements—(Continued)
(Dollars in thousands)
| Years ended December 31, | January 1, 2004 through July 31, 2004 | ||||||||
| 2002 | 2003 | ||||||||
Geographic Information | |||||||||
Revenues: | |||||||||
United States | $ | 361,237 | $ | 334,502 | $ | 216,854 | |||
All foreign countries | 289,828 | 343,847 | 223,297 | ||||||
Total | $ | 651,065 | $ | 678,349 | $ | 440,151 | |||
| At December 31, 2003 | |||
Property, plant and equipment, net | |||
Unites States | $ | 36,813 | |
All foreign countries | 93,439 | ||
Total | $ | 130,252 | |
F-235
Table of Contents
Resin Business of the Bakelite Group
(Euro amounts in thousands unless otherwise stated)
UNAUDITED COMBINED INTERIM STATEMENTS OF OPERATIONS
| Three months ended March 31, | ||||||||
| 2005 | 2004 | |||||||
Net sales | € | 147,139 | € | 134,947 | ||||
Cost of goods sold | 121,553 | 110,832 | ||||||
Gross margin | 25,586 | 24,115 | ||||||
Distribution expense | 4,318 | 3,993 | ||||||
Marketing expense | 8,301 | 8,080 | ||||||
General and administrative expense | 5,332 | 4,435 | ||||||
Research and development expense | 2,832 | 2,698 | ||||||
Impairment of long-lived assets | 0 | 2,317 | ||||||
Restructuring expense | 608 | 353 | ||||||
Other operating expense, net | 216 | 203 | ||||||
Income from operations | 3,979 | 2,036 | ||||||
Other non-operating (expense) income | (38 | ) | 498 | |||||
Interest expense, net | (604 | ) | (508 | ) | ||||
Affiliated interest income (expense), net | 76 | (65 | ) | |||||
Income before income taxes, minority interest and equity in earnings of joint venture | 3,413 | 1,961 | ||||||
Income tax expense | 1,653 | 682 | ||||||
Income before minority interest and equity in earnings of joint venture | 1,760 | 1,279 | ||||||
Minority interest loss, net of tax | (65 | ) | (8 | ) | ||||
Net income | € | 1,695 | € | 1,271 | ||||
Comprehensive income | € | 1,997 | € | 2,379 | ||||
The accompanying notes are an integral part of these Unaudited Combined Interim Financial Statements.
F-236
Table of Contents
Resin Business of the Bakelite Group
(Euro amounts in thousands unless otherwise stated)
UNAUDITED COMBINED INTERIM BALANCE SHEETS
| Unaudited March 31, 2005 | Audited December 31, 2004 | |||||
ASSETS | ||||||
Current Assets: | ||||||
Cash and cash equivalents | € | 7,871 | € | 5,807 | ||
Accounts and notes receivable, net of allowance for doubtful accounts of €4,737 in 2005 and €4,194 in 2004 | 104,049 | 100,279 | ||||
Accounts receivable from affiliates | 17,422 | 17,319 | ||||
Inventories, net of reserves of €1,340 in 2005 and €988 in 2004 | ||||||
Finished goods and work-in-process goods | 53,776 | 46,363 | ||||
Raw materials | 32,602 | 32,271 | ||||
Deferred income taxes, net | 1,858 | 1,677 | ||||
Prepaid tax expense | 1,736 | 1,467 | ||||
Other current assets | 4,098 | 2,994 | ||||
Total current assets | 223,412 | 208,177 | ||||
Property, plant and equipment, net | 171,540 | 173,019 | ||||
Goodwill | 8,481 | 8,551 | ||||
Other intangible assets | 9,302 | 10,884 | ||||
Deferred income taxes, net | 1,664 | 2,098 | ||||
Investments and other long-term assets | 2,651 | 2,626 | ||||
Total assets | € | 417,050 | € | 405,355 | ||
LIABILITIES AND OWNER’S NET INVESTMENT | ||||||
Current Liabilities: | ||||||
Accounts payable | € | 45,331 | € | 52,805 | ||
Accounts payable to affiliates | 33 | 729 | ||||
Debt payable within one year | 28,400 | 25,353 | ||||
Deferred income taxes, net | 3,939 | 3,848 | ||||
Accrued income tax | 1,574 | 916 | ||||
Accrued payroll and related withholdings | 8,773 | 7,426 | ||||
Other current liabilities | 21,714 | 10,509 | ||||
Total current liabilities | 109,764 | 101,586 | ||||
Long-term debt, net of current portion | 26,329 | 28,204 | ||||
Pensions and employees’ severance indemnities | 81,580 | 80,490 | ||||
Deferred income taxes, net | 20,258 | 19,399 | ||||
Other long-term liabilities | 2,135 | 4,223 | ||||
Minority interest | 1,496 | 1,431 | ||||
Total liabilities | 241,562 | 235,333 | ||||
Owner’s net investment | € | 175,488 | € | 170,022 | ||
Total liabilities and owner’s net investment | € | 417,050 | € | 405,355 | ||
The accompanying notes are an integral part of these Unaudited Combined Interim Financial Statements.
F-237
Table of Contents
Resin Business of the Bakelite Group
(Euro amounts in thousands unless otherwise stated)
UNAUDITED COMBINED INTERIM STATEMENTS OF CHANGES IN OWNER’S
NET INVESTMENT AND COMPREHENSIVE INCOME (LOSS)
| Owner’s Net Investment | ||||
Balance, January 1, 2005 | € | 170,022 | ||
Comprehensive income | ||||
Net income | 1,695 | |||
Foreign currency translation adjustments | 355 | |||
Minimum pension liability (net of €35 tax) | (53 | ) | ||
Total comprehensive income | € | 1,997 | ||
Capital contributions | ||||
Workers council agreement contribution | 4,000 | |||
Push down of trade tax and corporation tax expenses (benefits) retained by Rütgers | (577 | ) | ||
Other equity increase | 46 | |||
Balance, March 31, 2005 | € | 175,488 | ||
The accompanying notes are an integral part of these Unaudited Combined Interim Financial Statements.
F-238
Table of Contents
Resin Business of the Bakelite Group
(Euro amounts in thousands unless otherwise stated)
UNAUDITED COMBINED INTERIM STATEMENTS OF CASH FLOWS
| Three months ended March 31, | ||||||||
| 2005 | 2004 | |||||||
Cash flows from operating activities: | ||||||||
Net income | € | 1,695 | € | 1,271 | ||||
Adjustments to reconcile net income to net cash provided by (used in) operating activities: | ||||||||
Impairment of long-lived assets | 0 | 2,317 | ||||||
Depreciation and amortization expense | 5,997 | 6,600 | ||||||
Loss (gain) on sale of assets | 180 | (14 | ) | |||||
Deferred income taxes | 1,460 | (2,359 | ) | |||||
Other non-cash adjustments | 132 | 123 | ||||||
Push down of parent company expenses (benefits) | (531 | ) | 3,175 | |||||
Changes in operating assets and liabilities, net of effects of acquisitions: | ||||||||
Accounts receivable | (4,030 | ) | (1,102 | ) | ||||
Inventories | (7,063 | ) | (2,204 | ) | ||||
Accounts payable | (8,775 | ) | (4,493 | ) | ||||
Income taxes | 388 | 844 | ||||||
Other assets | (1,083 | ) | (2,095 | ) | ||||
Other liabilities | 12,479 | 6,480 | ||||||
Other non-current assets and liabilities | (1,060 | ) | (28,647 | ) | ||||
Net cash provided by (used in) operating activities | (211 | ) | (20,104 | ) | ||||
Cash flows from investing activities: | ||||||||
Capital expenditures | (2,750 | ) | (4,080 | ) | ||||
(Purchase) Proceeds from sale of business | 0 | (134 | ) | |||||
Proceeds from the sale of assets | 64 | 321 | ||||||
Net cash (used in) provided by investing activities | (2,686 | ) | (3,893 | ) | ||||
Cash flows from financing activities: | ||||||||
Dividends paid to minorities | 0 | (134 | ) | |||||
Transactions with Rütgers | 811 | (72,806 | ) | |||||
Transactions related to Bozzetto | 0 | 101,600 | ||||||
Workers council agreement contribution | 4,000 | 0 | ||||||
Net short term borrowings | 1,345 | 3,399 | ||||||
Repayments (proceeds) from long-term borrowings | 0 | 101 | ||||||
Repayments of financing activities | (1,290 | ) | (3,785 | ) | ||||
Net cash provided by financing activities | 4,866 | 28,375 | ||||||
Effect of exchange rate fluctuations on cash and cash equivalents | 95 | 109 | ||||||
Net change in cash and cash equivalents | 2,064 | 4,487 | ||||||
Cash and cash equivalents at beginning of period | 5,807 | 5,385 | ||||||
Cash and cash equivalents at end of period | € | 7,871 | € | 9,872 | ||||
The accompanying notes are an integral part of these Unaudited Combined Interim Financial Statements.
F-239
Table of Contents
Resin Business of the Bakelite Group
(Euro amounts in thousands unless otherwise stated)
Notes to the Unaudited Combined Interim Financial Statements
Note 1—Bakelite, its Operations and Basis of Presentation
The Resin Business of the Bakelite Group (“Bakelite”), wholly owned by Rütgers and, ultimately, RAG AG, manufactures and distributes epoxy and phenolic resins as well as moulding compounds in facilities located in Europe, North America, and Asia.
The Combined Interim Financial Statements of Bakelite, prepared in accordance with accounting principles generally accepted in the United States of America (“US GAAP”), as of and for the periods presented include all assets, liabilities, revenues, expenses and cash flows directly attributable to the Resin Business of the Bakelite Group, subject to the elimination of intercompany accounts and transactions. In addition, certain expenses of Rütgers and the utilization of certain tax benefits by Rütgers are included in the unaudited Combined Interim Financial Statements in accordance with the Securities and Exchange Commission Staff Accounting Bulletin No. 54,Push Down Basis of Accounting Required in Certain Limited Circumstances (“SAB 54”). The expenses pushed down in the Combined Interim Financial Statements primarily relate to certain tax expenses, and tax benefits and cost of administrative services provided to Bakelite by Rütgers. The effects of common control transactions, to the extent appropriate, are also reflected as a component of equity.
The Combined Interim Financial Statements do not include the non-resin business of Bakelite, specifically Giovanni Bozzetto S.p.A. and its subsidiaries (“Bozzetto”). In relation to Bakelite, Bozzetto was dissimilar in its nature of business, autonomously managed and financed, and had no significant common facilities and costs. Dividends received from Bozzetto, net of related taxes, and the cash proceeds received from the sale of Bozzetto to private equity investors in February 2004 have been presented as capital contributions in the unaudited Combined Statements of Changes in Owner’s Net Investment. Cash flows associated with Bozzetto have been characterized as financing transactions with Rütgers in the unaudited Combined Statements of Cash Flows.
Transactions between Bakelite and other RAG AG companies, including Rütgers, have been identified in the Unaudited Interim Combined Financial Statements as transactions between related parties.
The remaining outstanding shares of Bakelite Ibérica S.A. were acquired for €134 in March 2004 from a third party. In May 2004, the remaining outstanding shares of Bakelite Italia S.p.A. (€159) and Bakelite Polymers UK Ltd. (for consideration of less than €1) were acquired from Rütgers. The difference between the purchase price and the minority interest carrying value was recorded as a capital contribution from Rütgers.
At the end of 2004, all appropriate corporate bodies of Bakelite approved an agreement for the sale of the shares of Bakelite AG to Borden Chemical, Inc. (Note 10).
Note 2—Significant Accounting Policies
The Combined Interim Financial Statements are unaudited but include all adjustments (consisting of normal recurring adjustments) which Bakelite’s management considers necessary for a fair presentation of the financial position as of such dates and the operating results and cash flows for those periods. Certain information and footnote disclosures normally included in financial statements prepared in accordance with accounting principles generally accepted in the US have been condensed or omitted pursuant to Securities and Exchange Commission (“SEC”) accounting rules and regulations. The result of operations for the three months ended March 31, 2005 may not necessarily be indicative of the operating results that may be incurred for the entire year. The Combined Interim Financial Statements contained herein should be read in conjunction with the Combined Financial Statements and notes thereto for the years ended December 31, 2004.
Consolidation of Variable Interest Entities (FIN 46R). FIN 46 R includes additional new scope exceptions, revised requirements on how to evaluate sufficiency of equity at risk, and quantification and allocation of an
F-240
Table of Contents
Resin Business of the Bakelite Group
(Euro amounts in thousands unless otherwise stated)
Notes to the Unaudited Combined Interim Financial Statement—(Continued)
entity’s economic risks and rewards. Bakelite, as a non-public entity (as defined under FIN 46R) was required to apply this interpretation in its entirety as of January 1, 2005 and immediately to variable interest entities created or modified on or after January 1, 2004. The adoption of FIN 46R did not have a material impact on the financial position, results of operations or cash flows.
Note 3—Impairment of long-lived assets
The impairment recorded in the first quarter at 2004 at Bakelite AG relates to the steam production plant supplied by EVO. In 2003, Bakelite decided that the steam production from a planned formaline plant would be sufficient to supply its steam needs.
In April 2004, Bakelite, Rütgers Chemicals AG (“RC”), a wholly owned subsidiary of Rütgers, and the lessor entered into a tripartite agreement to transfer Bakelite’s benefits and obligations under the lease arrangement to RC. The steam plant, as an asset to be distributed to RC, was reduced to its fair value prior to the transfer. As such, an impairment loss of €2,317 was recognized at the time management determined the steam plant would be transferred to RC, as the carrying amount of the asset exceeded its fair value.
Note 4—Pensions and employees’ severance indemnities
Bakelite maintains various defined benefit and defined contribution pension plans covering its employees worldwide. In Germany, these plans are based on fixed benefits (defined benefit pension plans), while in certain other countries, there are defined contribution pension plans. Furthermore, the Italian and Korean subsidiaries provide severance indemnity benefits to employees.
The benefit plans are unfunded. The net cost of the defined benefit pension plans and employee severance indemnities recognized for the three month periods ended March 31, 2005 and 2004 consisted of the following components:
| Three months ended March 31, | ||||||
| 2005 | 2004 | |||||
Service Cost | € | 638 | € | 654 | ||
Interest Cost | 962 | 1,048 | ||||
Amortization of transition obligation | 0 | 0 | ||||
Amortization of net (gain) loss | 32 | 3 | ||||
Total | € | 1,632 | € | 1,705 | ||
At December 31, 2003, Bakelite and Rütgers agreed to transfer certain pension obligations for retirees from Bakelite to Rütgers for a payment of €33,535, which was based on the German GAAP pension obligation. Although the agreement was made, the obligation will not be released until individual employees release Bakelite as primary obligor. The transfer and settlement of a portion of the obligation took place during 2004, when the majority of the pensioners released Bakelite as primary obligor. The remaining pensioners are not expected to release Bakelite as primary obligor.
As a result of the pension transfer Bakelite’s projected benefit obligation as of December 31, 2004, reduced by €32,339 for the year ended December 31, 2004, which consisted of €29,087 accrued pension cost, and €3,252 unrecognized loss. The difference between the €27,472 agreed payment and €29,087 of accrued pension cost for those employees was recorded as a capital contribution of €1,615 during the year ended December 31, 2004.
F-241
Table of Contents
Resin Business of the Bakelite Group
(Euro amounts in thousands unless otherwise stated)
Notes to the Unaudited Combined Interim Financial Statement—(Continued)
Note 5—Income taxes
Income tax expense 2004—Bakelite has recorded a tax expense as of March 31, 2004 of €682, resulting in an effective tax rate of 34.8%. The items causing a difference in the effective tax rate from the statutory tax rate of 39.9% are non deductible expenses, income being taxed in jurisdictions less that the statutory rate of the 39.9% and a reduction in income tax rates in several countries. Because Bakelite is in a net deferred tax liability position, the reduction in tax rates resulted in a benefit being recorded to tax expenses.
Income tax expense 2005—Bakelite has recorded a tax expense as of March 31, 2005 of €1,653 resulting in an effective tax rate of 48.45%. The items causing a difference in the effective tax rate from the statutory tax rate of 39.9% are non deductible expenses, valuation allowances and additional local and municipal taxes accrued in Italy.
Note 6—Restructuring provisions
Restructuring Project 2003.In November 2003 Bakelite initiated a restructuring program designed to improve operating efficiency of its worldwide facilities and reduce the fixed-cost base of primarily the German and Italian operations. This goal will be achieved by headcount reductions, salary adjustments and streamlining of manufacturing and general administrative functions. Total costs incurred for involuntary terminations were €353 for the three month period ended March 31, 2004, which are recorded in Restructuring expense in the Combined Statements of Operations.
Restructuring Project 2005. In 2005, Bakelite initiated additional restructuring activities designed to increase profitability through structural changes and process improvement in Italy. The restructuring plan consists of reducing headcount and streamlining processes. Bakelite Italy has scheduled a total headcount reduction of 16 employees. As of March 31, 2005 a headcount reduction was achieved through involuntary terminations of 6 employees. Total costs incurred for involuntary terminations (quantity of 16 employees) were €608.
The following table reflects the changes in the restructuring provisions for the three months ended March 31, 2005 and 2004:
| Restructuring Project 2005 | Restructuring Project 2003 | Total | ||||||||||
Three Months Ended March 31, 2004 | ||||||||||||
January 1, 2004 | € | 0 | € | 883 | € | 883 | ||||||
Additions | 0 | 353 | 353 | |||||||||
Utilization | 0 | (632 | ) | (632 | ) | |||||||
March 31, 2004 | € | 0 | € | 604 | € | 604 | ||||||
Three Months Ended March 31, 2005 | ||||||||||||
January 1, 2005 | 0 | 416 | 416 | |||||||||
Additions | 608 | 0 | 608 | |||||||||
Utilization | (188 | ) | (185 | ) | (373 | ) | ||||||
March 31, 2005 | € | 420 | € | 231 | € | 651 | ||||||
F-242
Table of Contents
Resin Business of the Bakelite Group
(Euro amounts in thousands unless otherwise stated)
Notes to the Unaudited Combined Interim Financial Statement—(Continued)
Note 7—Guarantees and Indemnifications
Standard Guarantees / Indemnifications:In the ordinary course of business, Bakelite enters into numerous agreements that contain standard guarantees and indemnities whereby Bakelite indemnifies another party for, among other things, breaches of representations and warranties. Such guarantees or indemnifications are granted under various agreements, including those governing (i) purchases and sales of assets or businesses, (ii) leases of real property, (iii) licenses of intellectual property, (iv) long-term supply agreements and (v) agreements with public authorities on subsidies received for designated research and development projects. The guarantees or indemnifications issued are for the benefit of the (i) buyers in sale agreements and sellers in purchase agreements, (ii) landlords or lessors in lease contracts, (iii) licensors or licensees in license agreements, (iv) vendors or customers in long-term supply agreements and (v) governments or agencies subsidizing research or development.
Bakelite has not entered into any significant agreements subsequent to January 1, 2003 that would require it, as a guarantor, to recognize a liability for the fair value of obligations it has undertaken in issuing the guarantee.
Subsidiary Guarantees:Bakelite AG has issued letters of comfort for €10,818 of bank debt of several non-German subsidiaries. In addition, Bakelite AG guarantees the open payables from certain vendors of Bakelite Korea and Bakelite s.r.o. related to the purchase of raw materials.
Furthermore, Rütgers has issued letters of comfort for bank and lease debt and other liabilities of Bakelite AG, Bakelite Italia, Bakelite Korea, Bakelite Oy and Bakelite UK for liabilities totalling €39,629 at March 31, 2005. These letters of comfort are intended to be terminated prior to the consummation of the sale of Bakelite to Borden Chemical, Inc. (Note 10).
The purchase agreement for the acquisition of order books from Neste-Meerbeck contained contingent consideration of €1,398 as of March, 31, 2005.
Warranties:Bakelite does not make express warranties on its products, other than that they comply with Bakelite’s specifications; therefore, Bakelite does not record a warranty liability. Adjustments for product quality claims are not material and are charged against sales revenue.
Note 8—Commitments and Contingencies
Environmental commitments and contingencies.Bakelite has responsibilities for environmental cleanup under various state, local and federal laws in the countries in which it operates as a result of Bakelite’s operations that involve the use, handling, processing, storage, transportation and disposal of hazardous materials. Based on management’s estimates, which are determined through historical experience, Bakelite has recorded liabilities of €264 and €724 at March 31, 2005 and March 31, 2004, respectively, for all probable and estimable environmental remediation activities. These accruals primarily represent two cases at the Solbiate, Italy site where remediation was performed for asbestos-containing materials identified on site and where remediation was assessed by local authorities for cumene contamination discovered. The removal of asbestos-containing materials for insulation on pipeline began in 2003 and was finalized in August 2004. This removal was not required under local law but was carried out voluntarily. The cumene contamination was discovered in 1998 and remediation began in 2000 after investigations by Bakelite and the authorities were finalized. During 2003, it was determined that the remediation procedures carried out since 1998 would be insufficient and further remediation would be required. Based on an agreement with the authorities, the current remediation measures are to be finalized by 2007 and will be performed in stages in the contaminated area. Parallel to the remediation measure, a
F-243
Table of Contents
Resin Business of the Bakelite Group
(Euro amounts in thousands unless otherwise stated)
Notes to the Unaudited Combined Interim Financial Statement—(Continued)
groundwater monitoring program has been started in 1999 and is ongoing. The accrual contains costs for both the remediation and the monitoring program. For both of these cases management believes the accruals are sufficient to meet the remediation and monitoring activities. Furthermore, management believes it is remote that further remediation or assessments will be made with regard to these contaminations.
The following table summarizes the activity in Bakelite’s accrued obligations for environmental matters for the three months ended March 31, 2005 and 2004:
| March 31 | March 31 | |||||||
| 2005 | 2004 | |||||||
Accrued obligations for environmental matters | ||||||||
Balance at January 1 | € | 288 | € | 760 | ||||
Charges against reserve | (24 | ) | (36 | ) | ||||
Total accrued obligations for environmental matters | € | 264 | € | 724 | ||||
At the Bakelite’s site in Duisburg, Germany, a significant tar contamination is located underneath Bakelite’s facilities that are shared with Rütgers Chemicals AG, a subsidiary of Rütgers. This contamination resulted from the demolition of a tar distillation facility located on that site. Although Rütgers Chemicals AG and Bakelite are in discussion with local authorities concerning a proposed remediation plan, the scope and extent of that plan and the costs of its possible implementation are not yet reasonably estimable. For the past 10 years Bakelite has taken part in investigation activities to determine the environmental impact of the tar pollution. These costs of investigation have been contractually shared by Rütgers Chemicals AG (70%) and by Bakelite (30%). Management believes it is unlikely that Bakelite will have to take extensive actions for remediation. If extensive actions were to be required by the local authorities, management estimates the range of exposure to be between €200—€500 a year and the cost will be borne by Rütgers Chemicals AG after the acquisition of Bakelite by Borden (except for a portion of up to €180 per year between 2005 and 2007, which will be borne by Bakelite).
For all other environmental risks to which Bakelite is exposed, management believes it is remote that litigation, assessments or claims will be filed against Bakelite in the future. Management believes these environmental risks cannot be estimated as there has been no indication of required remediation or possible future litigation. However, if litigation or remediation is threatened, the assessment could have a material affect on Bakelite’s results of operations or cash flows in the period of assessment.
Rütgers contractually agreed to provide indemnifications to Borden Chemicals, Inc. with respect to certain environmental liabilities. These indemnifications will be subject to exceptions and limitations.
Customer claims and other litigation.In addition to the environmental-related legal matters discussed above, Bakelite is subject to various product liability, commercial and employment litigation and other legal matters which are considered to be in the ordinary course of business. Bakelite has reserved €384 and €360 at March 31, 2005 and December 31, 2004, respectively, relating to an accident at a plant in Spain and the infringement of a patent in Finland. Furthermore the main German subsidiary faces several pending legal actions initiated by employees for protection against dismissal.
A claim has been filed against the Spanish subsidiary regarding an accident at the Salcedo Plant which caused the death of an employee of an external contractor. Management has assessed that an unfavorable outcome is probable and has recorded an accrual for the pending claim. In 2001, Ruutteri Oy filed a claim against
F-244
Table of Contents
Resin Business of the Bakelite Group
(Euro amounts in thousands unless otherwise stated)
Notes to the Unaudited Combined Interim Financial Statement—(Continued)
Bakelite Oy, for the infringement of a patent. Bakelite filed a lawsuit to nullify the patent, which was dismissed. Therefore an unfavorable outcome is probable, and an accrual has been recorded for the estimated settlement amount. Bakelite has not taken into consideration insurance coverage or any anticipated recoveries from third parties in determining the reserve for legal matters.
In Italy, there have been several civil law claims filed against Bakelite related to asbestos-containing materials that were used in production. Italian regulations provide a general fund to pay damages related to asbestos claims by employees, former employees or surviving family members. The surviving family members of two former employees have initiated legal claims against Bakelite, in addition to their claim against the general fund. It is currently unclear whether a claim against Bakelite will be accepted by the Court, or to what damages Bakelite may be exposed. Furthermore, there is another asbestos related employee claim against the Spanish subsidiary. For all of the asbestos related claims, management has assessed the outcome of the litigation to be favorable, and therefore no accrual has been recorded by Bakelite.
For all other legal matters outstanding, most of which are related to product liability, management believes it is remote the outcome will be unfavorable and thus has not recorded an accrual.
Note 9—Related Parties
In 2004, and effective in the first quarter of 2005, an agreement was reached between Rütgers, Bakelite AG, and the Company’s workers council to compensate certain Bakelite employees for economic impacts relating to the cancellation of certain old workers council agreements. Based on the new compensation agreement, Rütgers has contributed € 4,000 to Bakelite for the costs that will be paid out by Bakelite to its affected employees.
Note 10—Subsequent events
On April 12, 2005 the European Commission cleared the proposed acquisition of Bakelite AG by Borden Chemical, Inc. which is owned by affiliates of the private investment firm Apollo Management, L.P., subject to conditions. The Commission found that the proposed transaction could give rise to competition concerns in the fields of phenolic resins for refractory materials and reactive diluents for epoxy systems. However, the parties have offered remedies that alleviate the concerns identified by the Commission. Specifically, the parties agreed to license a “technology package” to their customers, who could then sub-license it to alternative suppliers. In addition, the parties offered to enter into long term supply agreements to secure supply and pricing conditions for Cardura™, a specific type of diluent, with any direct customer which uses it in epoxy formulated systems.
Borden Chemical, Inc. on April 29, 2005 announced it has completed its acquisition of Bakelite AG from its parent company, Rütgers AG. The Bakelite business will continue to be headquartered in Iserlohn-Letmathe, Germany. Upon completion of those transactions, the new combined company will be named Hexion Specialty Chemicals, Inc. “Hexion” Completion of the combination is subject to customary closing conditions including certain regulatory approvals. Borden Chemical, Resolution Performance Products LLC, Resolution Specialty Materials LLC and Bakelite AG will continue to operate independently until those conditions are satisfied.
Under sale and transfer agreements dated May 2005, Bakelite AG has sold an interest of 99.9% in Bakelite s.r.o., Czech Republic, to National Borden Chemical Germany GmbH and all shares in Bakelite North America Holding Corp. to Borden Chemical, Inc., Columbus/Ohio.
F-245
Table of Contents
Report of Independent Auditors
To the Supervisory Board and the Owners of the Resin Business of the Bakelite Group:
We have audited the accompanying Combined Balance Sheets of the Resin Business of the Bakelite Group (“Bakelite”) as of December 31, 2004 and 2003, and the related Combined Statements of Operations, Changes in Owner’s Net Investment and Comprehensive Income (Loss) and of Cash Flows for the years ended December 31, 2004, 2003 and 2002. These Combined Financial Statements are the responsibility of Bakelite’s management. Our responsibility is to express an opinion on these financial statements based on our audits.
We conducted our audits in accordance with auditing standards generally accepted in the United States of America. Those standards require that we plan and perform the audit to obtain reasonable assurance about whether the Combined Financial Statements are free of material misstatement. An audit includes examining, on a test basis, evidence supporting the amounts and disclosures in the financial statements. An audit also includes assessing the accounting principles used and significant estimates made by management, as well as evaluating the overall financial statement presentation. We believe that our audits provide a reasonable basis for our opinion.
In our opinion, the Combined Financial Statements referred to above present fairly, in all material respects, the financial position of the Resin Business of the Bakelite Group at December 31, 2004 and 2003, and the results of its operations and its cash flows for the years ended December 31, 2004, 2003 and 2002 in conformity with accounting principles generally accepted in the United States of America.
As discussed in the notes to the Combined Financial Statements, effective January 1, 2002, the Resin Business of the Bakelite Group changed its method of accounting for goodwill to conform to Statement of Financial Accounting Standards No. 142,Goodwill and Other Intangible Assets.
Düsseldorf, April 29, 2005
PwC Deutsche Revision
Aktiengesellschaft
Wirtschaftsprüfungsgesellschaft
/s/ E. Sprinkmeier | /s/ ppa. Mosko | |||
Wirtschaftsprüfer | Wirtschaftsprüfer | |||
[German Public Accountant] | [German Public Accountant] |
F-246
Table of Contents
Resin Business of the Bakelite Group
COMBINED STATEMENTS OF OPERATIONS
(Euro amounts in thousands unless otherwise stated)
| Year ended December 31, | ||||||||||||
| 2004 | 2003 | 2002 | ||||||||||
Net sales | € | 560,203 | € | 515,232 | € | 503,987 | ||||||
Cost of goods sold | 460,469 | 430,374 | 400,554 | |||||||||
Gross margin | 99,734 | 84,858 | 103,433 | |||||||||
Distribution expense | 15,154 | 15,725 | 16,197 | |||||||||
Marketing expense | 33,736 | 37,397 | 33,452 | |||||||||
General and administrative expense | 20,664 | 24,961 | 22,396 | |||||||||
Research and development expense | 11,456 | 12,258 | 11,981 | |||||||||
Impairment of long-lived assets | 10,058 | 20,701 | 4,079 | |||||||||
Goodwill impairments | 5,883 | — | 2,920 | |||||||||
Restructuring expense | 573 | 1,650 | 270 | |||||||||
Other operating expense, net | 1,702 | 4,085 | 1,834 | |||||||||
Income (loss) from operations | 508 | (31,919 | ) | 10,304 | ||||||||
Other non-operating income (expense) | 559 | (338 | ) | (176 | ) | |||||||
Interest expense, net | (3,173 | ) | (3,398 | ) | (2,924 | ) | ||||||
Affiliated interest income (expense), net | 621 | (661 | ) | (1,288 | ) | |||||||
Income (loss) before income taxes | (1,485 | ) | (36,316 | ) | 5,916 | |||||||
Income tax (expense) benefit | (661 | ) | 11,096 | (3,160 | ) | |||||||
(Loss) income before minority interest and equity in earnings of joint venture | (2,146 | ) | (25,220 | ) | 2,756 | |||||||
Minority interest (loss) net of tax | (94 | ) | (18 | ) | (5 | ) | ||||||
Equity in (loss) earnings of joint venture | (5 | ) | 326 | 1,282 | ||||||||
(Loss) income before cumulative effect of change in accounting principle | (2,245 | ) | (24,912 | ) | 4,033 | |||||||
Cumulative effect of change in accounting principle | — | — | (4,381 | ) | ||||||||
Net (loss) | € | (2,245 | ) | € | (24,912 | ) | € | (348 | ) | |||
Comprehensive income (loss) | € | (1,096 | ) | € | (28,694 | ) | € | (1,505 | ) | |||
The accompanying notes are an integral part of these Combined Financial Statements.
F-247
Table of Contents
Resin Business of the Bakelite Group
COMBINED BALANCE SHEETS
(Euro amounts in thousands unless otherwise stated)
| December 31, | ||||||
| 2004 | 2003 | |||||
ASSETS | ||||||
Current Assets: | ||||||
Cash and cash equivalents | € | 5,807 | € | 5,385 | ||
Accounts and notes receivable, net of allowance for doubtful accounts of €4,194 in 2004 and €3,161 in 2003 | 100,279 | 90,562 | ||||
Accounts receivable from affiliates | 17,319 | 1,512 | ||||
Inventories, net of reserves of €988 in 2004 and €1,596 in 2003 | ||||||
Finished and in-process goods | 46,363 | 40,929 | ||||
Raw materials | 32,271 | 25,841 | ||||
Deferred income taxes, net | 1,677 | 2,028 | ||||
Prepaid tax expense | 1,467 | 8,318 | ||||
Other current assets | 2,994 | 1,903 | ||||
Total current assets | 208,177 | 176,478 | ||||
Property, plant and equipment, net | 173,019 | 190,632 | ||||
Goodwill | 8,551 | 14,764 | ||||
Other intangible assets | 10,884 | 20,025 | ||||
Deferred income taxes | 2,098 | 1,642 | ||||
Investments and other long-term assets | 2,626 | 3,790 | ||||
Total assets | € | 405,355 | € | 407,331 | ||
LIABILITIES AND OWNER’S NET INVESTMENT | ||||||
Current Liabilities: | ||||||
Accounts payable | € | 52,805 | € | 43,067 | ||
Accounts payable to affiliates | 729 | 20,147 | ||||
Debt payable within one year | 25,353 | 21,697 | ||||
Deferred income taxes, net | 3,848 | 14,398 | ||||
Accrued income tax | 916 | 6,279 | ||||
Accrued payroll and related withholdings | 7,426 | 7,750 | ||||
Other current liabilities | 10,509 | 16,896 | ||||
Total current liabilities | 101,586 | 130,234 | ||||
Long-term debt, net of current portion | 28,204 | 43,320 | ||||
Pensions and employees’ severance indemnities | 80,490 | 106,827 | ||||
Deferred income taxes, net | 19,399 | 15,215 | ||||
Other long-term liabilities | 4,223 | 9,738 | ||||
Minority interest | 1,431 | 1,891 | ||||
Total liabilities | 235,333 | 307,225 | ||||
Commitments and contingencies (Note 13) | ||||||
Owner’s net investment | 170,022 | 100,106 | ||||
Total liabilities and owner’s net investment | € | 405,355 | € | 407,331 | ||
The accompanying notes are an integral part of these Combined Financial Statements.
F-248
Table of Contents
Resin Business of the Bakelite Group
COMBINED STATEMENTS OF CHANGES IN OWNER’S NET INVESTMENT AND
COMPREHENSIVE INCOME (LOSS)
(Euro amounts in thousands unless otherwise stated)
| Owner’s Net Investment | ||||
Balances, January 1, 2002 | € | 118,863 | ||
Comprehensive loss | ||||
Net loss | (348 | ) | ||
Foreign currency translation adjustments | (778 | ) | ||
Minimum pension liability (net of €251 tax) | (379 | ) | ||
Total comprehensive loss | € | (1,505 | ) | |
Capital contribution | ||||
Payment of dividends by Bozetto S.p.A., net of distributions to minority shareholders | 5,417 | |||
Push down of trade tax expenses retained by Rütgers | 1,042 | |||
Other equity increases | 1,026 | |||
Dividend distribution to Rütgers | (10,715 | ) | ||
Balance, December 31, 2002 | € | 114,128 | ||
Comprehensive loss | ||||
Net loss | (24,912 | ) | ||
Foreign currency translation adjustments | (1,558 | ) | ||
Minimum pension liability (net of €1,552 tax) | (2,224 | ) | ||
Total comprehensive loss | € | (28,694 | ) | |
Capital contributions | ||||
Funding under profit and loss transfer agreements with Rütgers | 16,341 | |||
Payment of dividends by Bozetto S.p.A., net of distributions to minority shareholders | 13,401 | |||
Push down of trade tax expenses and tax benefits retained by Rütgers | (5,762 | ) | ||
Purchase of remaining interest in Bozzetto | (10,397 | ) | ||
Other equity increases | 1,089 | |||
Balance, December 31, 2003 | € | 100,106 | ||
Comprehensive loss | ||||
Net loss | (2,245 | ) | ||
Foreign currency translation adjustments | 419 | |||
Minimum pension liability (net of €(486) tax) | 730 | |||
Total comprehensive loss | € | (1,096 | ) | |
Capital contributions | ||||
Proceeds from sale of Bozzetto S.p.A. | 101,685 | |||
Push down of trade tax and corporation tax expenses retained by Rütgers | 3,253 | |||
Pension transfer to Rütgers (net of €634 tax) | 981 | |||
Other equity increases | 359 | |||
Dividend distribution to Rütgers | (33,658 | ) | ||
Dividend of EVO steam capital lease to Rütgers (net of €1,039 tax) | (1,608 | ) | ||
Balance, December 31, 2004 | € | 170,022 | ||
The accompanying notes are an integral part of these Combined Financial Statements.
F-249
Table of Contents
Resin Business of the Bakelite Group
COMBINED STATEMENTS OF CASH FLOWS
(Euro amounts in thousands unless otherwise stated)
| Year ended December 31, | ||||||||||||
| 2004 | 2003 | 2002 | ||||||||||
Cash flows from operating activities: | ||||||||||||
Net (loss) | € | (2,245 | ) | € | (24,912 | ) | € | (348 | ) | |||
Adjustments to reconcile net loss to net cash provided by operating activities: | ||||||||||||
Impairment of long-lived assets | 10,058 | 20,701 | 4,079 | |||||||||
Goodwill impairments | 5,883 | — | 2,920 | |||||||||
Depreciation and amortization expense | 26,516 | 35,777 | 30,744 | |||||||||
Loss (gain) on sale of assets | (233 | ) | 1,358 | (795 | ) | |||||||
Cumulative effect of change in accounting principle | — | — | 4,381 | |||||||||
Deferred income taxes | (4,178 | ) | (6,871 | ) | 6,860 | |||||||
Dividends from joint ventures net of equity earnings | 22 | (83 | ) | 713 | ||||||||
Push down of parent company expenses | 3,437 | (5,389 | ) | 1,648 | ||||||||
Other non-cash adjustments | 134 | 18 | 5 | |||||||||
Changes in operating assets and liabilities, net of effects of acquisitions: | ||||||||||||
Accounts receivable | (6,881 | ) | 6,854 | (8,202 | ) | |||||||
Inventories | (11,766 | ) | (411 | ) | (3,284 | ) | ||||||
Accounts payable | 9,587 | (2,181 | ) | 6,002 | ||||||||
Income taxes | 1,490 | 2,279 | (6,666 | ) | ||||||||
Other assets | (496 | ) | (2,533 | ) | 1,557 | |||||||
Other liabilities | (6,764 | ) | 2,292 | 4,188 | ||||||||
Other non-current assets | (26,015 | ) | 2,349 | (1,878 | ) | |||||||
Net cash provided by operating activities | (1,451 | ) | 29,248 | 41,924 | ||||||||
Cash flows from investing activities: | ||||||||||||
Capital expenditures | (21,369 | ) | (31,410 | ) | (33,518 | ) | ||||||
Proceeds from the sale assets | 2,453 | 778 | 3,804 | |||||||||
Purchase of Bakelite Korea | — | — | (18,522 | ) | ||||||||
Purchase of minority interests | (294 | ) | — | (3,715 | ) | |||||||
Net cash (used) in investing activities | (19,210 | ) | (30,632 | ) | (51,951 | ) | ||||||
Cash flows from financing activities: | ||||||||||||
Transactions with Rütgers (Note 16) | (70,578 | ) | (5,767 | ) | (14,078 | ) | ||||||
Transactions related to Bozetto | 101,685 | 3,003 | 5,417 | |||||||||
Net short term borrowings | 5,385 | 1,188 | 11,306 | |||||||||
Proceeds from long-term borrowings | 145 | 10,510 | 13,563 | |||||||||
Repayments of financing activities | (15,120 | ) | (8,653 | ) | (12,127 | ) | ||||||
Dividends paid to minorities | (379 | ) | (390 | ) | (232 | ) | ||||||
Other cash flows from financing activities | — | — | 426 | |||||||||
Net cash (used in) provided by financing activities | 21,138 | (109 | ) | 4,275 | ||||||||
Effect of exchange rate fluctuations on cash and cash equivalents | (55 | ) | (193 | ) | (260 | ) | ||||||
Net change in cash and cash equivalents | 422 | (1,686 | ) | (6,012 | ) | |||||||
Cash and cash equivalents at beginning of period | 5,385 | 7,071 | 13,083 | |||||||||
Cash and cash equivalents at end of period | € | 5,807 | € | 5,385 | € | 7,071 | ||||||
The accompanying notes are an integral part of these Combined Financial Statements.
F-250
Table of Contents
Resin Business of the Bakelite Group
Notes to the Combined Financial Statements
(Euro amounts in thousands unless otherwise stated)
Note 1—Bakelite, its Operations and Basis of Presentation
The Resin Business of the Bakelite Group (“Bakelite”), wholly owned by Rütgers and, ultimately, RAG AG, manufactures and distributes epoxy and phenolic resins as well as moulding compounds in facilities located in Europe, North America, and Asia. Bakelite is headquartered in Iserlohn-Letmathe, Germany. The Combined Financial Statements as of and for the periods presented comprise the following subsidiaries of Bakelite and the joint venture Rütgers Plenco LLC (activities terminated in 2003) that are entirely dedicated to the resin business:
Legal entity | Percentage of Ownership* | Country of Incorporation | ||
Bakelite Aktiengesellschaft (AG) | 100% | Germany | ||
MGS Kunstharzprodukte GmbH | 100% | Germany | ||
Bakelite North America Holding Corp. | 100% | United States of America | ||
Bakelite Epoxy Polymers Corp. | 100% | United States of America | ||
Bakelite Italia S.p.A. | 100% | Italy | ||
Taro Plast S.p.A. | 100% | Italy | ||
Bakelite Ibérica S.A. | 100% | Spain | ||
Bakelite Oy | 100% | Finland | ||
Bakelite s.r.o. | 100% | Czech Republic | ||
Bakelite Polymers UK Ltd. | 100% | United Kingdom | ||
Bakelite Korea Co., Ltd. | 100% | Korea | ||
InfraTec Duisburg GmbH | 70% | Germany |
| * | as of December 31, 2004 |
The Combined Financial Statements of Bakelite, prepared in accordance with accounting principles generally accepted in the United States of America (“US GAAP”), as of and for the periods presented include all assets, liabilities, revenues, expenses and cash flows directly attributable to the legal entities above, subject to the elimination of intercompany accounts and transactions. In addition, certain expenses of Rütgers and the utilization of certain tax benefits by Rütgers are included in the Combined Financial Statements in accordance with the Securities and Exchange Commission Staff Accounting Bulletin No. 54,Push Down Basis of Accounting Required in Certain Limited Circumstances (“SAB 54”). The expenses pushed down in the Combined Financial Statements primarily relate to certain tax expenses, and tax benefits and cost of administrative services provided to Bakelite by Rütgers (Note 15). The effects of common control transactions, to the extent appropriate, are also reflected as a component of equity.
Bakelite Korea Co., Ltd (“BAK”) was acquired in May 2002 and Bakelite Epoxy Polymers Corp. began operations in January 2003. InfraTec was founded in December 2003 and began operations in January 2004. Their financial information is included in the Combined Financial Statements as of the date of acquisition or commencement of operations. In January 2002, Bakelite acquired the remaining 30% interest of Taro Plast S.p.A. for €3,715. The remaining outstanding shares of Bakelite Ibérica S.A. were acquired for €134 in March 2004 from a third party. In May 2004, the remaining outstanding shares of Bakelite Italia S.p.A. for consideration of €160 and Bakelite Polymers UK Ltd. for consideration of less than €1 were acquired from Rütgers. The Rütgers Plenco LLC joint venture agreement was terminated December 2003.
The Combined Financial Statements do not include the non-resin business of Bakelite, specifically Giovanni Bozzetto S.p.A. and its subsidiaries (“Bozzetto”). In relation to Bakelite, Bozzetto was dissimilar in its nature of business, autonomously managed and financed, and had no significant common facilities and costs. Dividends received from Bozzetto, net of related taxes, and the cash proceeds received from the sale of Bozzetto to private equity investors in February 2004 have been presented as capital contributions in the Combined Statements of
F-251
Table of Contents
Resin Business of the Bakelite Group
Notes to the Combined Financial Statements—(Continued)
(Euro amounts in thousands unless otherwise stated)
Changes in Owner’s Net Investment. Cash flows associated with Bozzetto have been characterized as financing transactions with Rütgers in the Combined Statements of Cash Flows.
Transactions between Bakelite and other RAG AG companies, including Rütgers, have been identified and disclosed in the Combined Financial Statements as transactions between related parties.
At the end of 2004, all appropriate corporate bodies of Bakelite approved an agreement for the sale of the shares of Bakelite AG to Borden Chemical, Inc. (Note 17).
Note 2—Significant Accounting Policies
A summary of the significant accounting policies followed in the preparation of the accompanying Combined Financial Statements is presented below.
Fiscal year. Bakelite’s fiscal year ends on December 31 with the exception of Bakelite Korea Co., Ltd., an entity for which the fiscal year ends on November 30.
Use of estimates. The preparation of the Combined Financial Statements in conformity with US GAAP requires management to make estimates and assumptions that affect the reported amounts of assets and liabilities, the disclosure of contingent assets and liabilities at the date of the Combined Financial Statements and the reported amount of revenues and expenses during the reporting periods. Some of the more significant estimates include pension obligations, environmental remediation, legal liabilities, doubtful accounts, inventory valuation reserves, depreciable lives of assets, amortization periods, allocation of assets and liabilities to reporting units, asset impairments, deferred tax assets and liabilities and related valuation allowance, income tax accruals, provisions and contingencies. Actual results could differ from those estimates.
Foreign currency. The functional currency of operations outside of Germany has been determined to be the local currency. Assets and liabilities of foreign subsidiaries are translated at exchange rates on the balance sheet date. Revenue and expenses are translated at the weighted average exchange rates of the period. The effects of these translation adjustments are reported within comprehensive income (loss), a component of Owner’s Net Investment.
Exchange losses arising from transactions denominated in a currency other than the functional currency of the entity involved, as well as the fair value adjustment of forward exchange contracts, are included in Other operating expense, net, in the Combined Statements of Operations. In addition, Bakelite incurred realized and unrealized net foreign transaction losses aggregating €754, €32 and €808 in 2004, 2003 and 2002, respectively.
Other comprehensive income (loss). In addition to Net loss, comprehensive income (loss) includes charges or credits to equity that are not the result of transactions with shareholders. Other comprehensive income (loss) relates to foreign currency translation adjustments from Bakelite’s foreign subsidiaries and the minimum pension liability. Components of other comprehensive income (loss) are included within the Combined Statements of Changes in Owner’s Net Investment and Comprehensive Income (Loss).
Cash and cash equivalents. Cash and cash equivalents consist of all highly liquid investments that are readily convertible into cash and have original maturities of three months or less. At December 31, 2004, Bakelite had no material investment in cash equivalent instruments. Certain non-German entities are parties to cash pooling arrangements with Bakelite AG under which these entities transfer any unused cash balances to
F-252
Table of Contents
Resin Business of the Bakelite Group
Notes to the Combined Financial Statements—(Continued)
(Euro amounts in thousands unless otherwise stated)
Bakelite AG on a monthly basis. The German entities are direct or indirect parties to cash pooling arrangements with Rütgers. Under these agreements any cash balance is ultimately cleared from Bakelite AG to Rütgers on a daily basis (Notes 15 and 16).
Accounts receivable.Collectibility of accounts receivable is regularly reviewed and is based upon management’s knowledge of customers and compliance with credit terms. In addition, Bakelite AG, MGS Kunstharzprodukte, Bakelite Korea Co., Bakelite Ibérica and Bakelite Polymers UK Ltd. have credit insurance policies which cover substantial portions of Bakelite’s trade receivables. The allowance for doubtful accounts is adjusted based on such evaluation, with a corresponding expense included in Other operating expense, net. Accounts receivable and related allowance balances are written off when management deems them uncollectible and there is no or insufficient insurance. During the periods presented, certain of Bakelite’s subsidiaries had arrangements in place that allowed for the transfer of trade receivables to the bank, on a recourse basis, in order to receive cash. Proceeds received under these arrangements have been accounted for as secured borrowings.
Inventories. Inventories are carried at the lower of cost or market value. Cost is determined using the first in, first out method. In addition to direct material and direct labour costs, certain overhead and production expenses are included in inventory. Inventory reserves are provided for slow moving, obsolete and excess items.
Property, plant and equipment. Property, plant and equipment are stated at historical cost net of impairment recognized, and less accumulated depreciation. Additions and improvements are capitalized; maintenance and repairs are expensed as incurred. When assets are retired or disposed of, the assets and related accumulated depreciation are removed from the balance sheet and the resulting gain or loss is reflected in the Statement of Operations. The cost of property, plant and equipment is depreciated using the straight-line method over the following estimated useful lives of the respective assets:
Category | Depreciation period | |
Buildings | 10-50 | |
Machinery and equipment | 3-25 | |
Leasehold improvements | 10-25 |
Interest is capitalized for assets under construction. The total amount of interest capitalized was €347, €327 and €428 for the years ended December 31, 2004, 2003 and 2002, respectively.
Bakelite elected early adoption of Financial Accounting Standards Board (“FASB”) Statement No. 143,Accounting for Asset Retirement Obligations(“FAS 143”), as of January 1, 2001, which requires entities to record the fair value of the liability for an asset retirement obligation in the period in which it is incurred. When the liability is initially recorded, the entity capitalizes the estimated cost of retiring the asset as part of the carrying amount of the related long-lived asset. Over time, the liability is adjusted to its present value each period and the capitalized cost is depreciated over the useful life of the related asset.
Intangible assets.Intangible assets, which primarily consist of customer lists, software licenses and patents, are identifiable finite-lived assets. These assets are amortized on a straight-line basis over their estimated useful lives of 3 to 10 years.
Goodwill.The excess purchase price over net tangible and identifiable intangible assets of acquired businesses is carried as goodwill on the Combined Balance Sheets. Effective January 1, 2002, Bakelite adopted FASB Statement No. FAS 142,Goodwill and Other Intangible Assets, (“FAS 142”), which requires companies
F-253
Table of Contents
Resin Business of the Bakelite Group
Notes to the Combined Financial Statements—(Continued)
(Euro amounts in thousands unless otherwise stated)
to cease amortizing goodwill. Prior to January 1, 2002, goodwill was amortized on a straight-line basis over a 20-year period.
Impairment.FAS 142 requires that goodwill and intangible assets deemed to have an indefinite useful life be reviewed for impairment upon adoption of FAS 142 and at least annually thereafter. Bakelite performed the required annual impairment tests as of December 31. Goodwill must be evaluated for impairment between these annual tests if events or changes in circumstances indicate that goodwill might be impaired (Note 6).
The testing of goodwill for impairment involves two steps:
| • | The first step is to compare each reporting unit’s fair value with its carrying amount, including goodwill. Bakelite determines the fair value of its reporting units based on a valuation model that draws on medium-term planning data used for internal reporting purposes. The model uses the discounted cash flow method and market comparables. If a reporting unit’s carrying amount exceeds its fair value, this indicates that goodwill may be impaired and the second step is required. |
| • | The second step is to compare the implied fair value of the reporting unit’s goodwill with the carrying amount of its goodwill. The implied fair value is computed by allocating the reporting unit’s fair value to all of its assets and liabilities in a manner that is similar to a purchase price allocation in a business combination in accordance with FAS 141. The remaining unallocated purchase price is the implied fair value of the reporting unit’s goodwill. If the implied fair value of goodwill is less than its carrying value, the difference is recorded as an impairment. |
Effective January 1, 2002, Bakelite adopted FASB Statement No. 144,Accounting for the Impairment or Disposal of Long-Lived Assets(“FAS 144”), which requires that long-lived assets, including property, plant and equipment and finite-lived intangible assets, be reviewed for impairment whenever events or circumstances provide evidence that suggests that the carrying amount of the asset may not be recoverable. Recoverability of assets to be held and used is measured by the comparison of the carrying amount of the assets to the undiscounted future net cash flows expected to be generated by the assets. If such assets are considered to be impaired, the impairment to be recognized is measured by the amount by which the carrying amount of the assets exceeds the fair value of the assets. Estimated fair value is generally based on either appraised value or measured by discounted estimated future cash flows. Long-lived assets to be disposed of by sale are recorded at the lower of carrying amount or fair value less costs to sell and depreciation is ceased. For these impairment reviews, Bakelite determines the fair value of its assets groups based on a valuation model that draws on medium-term planning data used for internal reporting purposes. The model uses the discounted cash flow method to determine fair value.
Environmental liabilities.Bakelite is subject to stringent laws and regulations in the various countries in which it operates. Management, on a periodic basis throughout the year, evaluates the liability for future environmental remediation costs. Bakelite accrues amounts for environmental remediation costs, which represent management’s best estimate of the probable and reasonably estimable costs relating to environmental remediation. Costs of future expenditures for environmental remediation obligations are not discounted to their present value. Estimates of the amount and timing of future costs of environmental remediation requirements are necessarily imprecise because of the continuing evolution of environmental laws and regulatory requirements, the availability and application of technology and the allocation of costs among the potentially responsible parties. Based upon information presently available, such future costs are not expected to have a material effect on Bakelite’s competitive or financial position. However, such costs could be material to results of operations in a particular future year (Note 13).
F-254
Table of Contents
Resin Business of the Bakelite Group
Notes to the Combined Financial Statements—(Continued)
(Euro amounts in thousands unless otherwise stated)
Income taxes.During the periods presented, the German entities did not file separate tax returns as they are included in the tax grouping of the ultimate parent company, RAG AG. The income tax provision in the Combined Financial Statements reflects Bakelite’s income taxes calculated as if on a stand-alone basis. Such provisions differ from the amounts currently receivable or payable because certain items of income are recognized in different time periods for financial reporting purposes than for income tax purposes. Deferred income taxes reflect the net tax effects of temporary differences between the carrying amount of assets and liabilities for financial statement and income tax purposes, as determined under enacted tax laws and rates. Bakelite records a valuation allowance to the extent that it is more likely than not that deferred tax assets will not be realized.
Revenue recognition. In accordance with US GAAP, including SAB No. 104,Revenue Recognition(“SAB 104”), Bakelite recognizes revenues from sales of products when there is evidence of a sales agreement, the delivery of goods has occurred (i.e. title and risk have been transferred), the sales price is fixed or determinable and collectibility is reasonably assured. Estimates for returns, incentive rebates and other allowances are recorded as a reduction of revenues in the period the related revenues are recorded. These estimates are based upon historical experience and information currently available to management with respect to business and economic trends. Revisions to these estimates are recorded in the period in which the facts that give rise to the revision become known. Price reduction incentives granted to customers upon the achievement of specified purchase volumes are recorded as a reduction of sales as they are earned by customers. Bakelite adopted EITF 00-21,Accounting for Revenue Arrangements with Multiple Deliverables (“EITF 00-21”) which had no material impact on reported results.
Shipping and Handling. Bakelite records freight billed to customers in net sales. Shipping costs are incurred to move Bakelite’s products from production and storage facilities to the customers. Shipping costs are classified as Distribution expense in the Combined Statements of Operations and totalled €15,154, €15,725 and €16,197 for the years ended December 31, 2004, 2003 and 2002, respectively. Handling costs are incurred from the point the product is removed from inventory until it is provided to the shipper and generally includes costs to store, move and prepare the products for shipment. Handling costs are classified as a Cost of goods sold.
Advertising. Advertising costs include advertising, promotion and trade fair costs, which are expensed as incurred. Costs incurred were €1,114, €908 and €1,059 for the years ended December 31, 2004, 2003 and 2002, respectively.
Legal costs. Bakelite expenses legal costs in the period in which the costs are incurred. Legal costs incurred for outstanding claims were €48, €37 and €20 for the years ended December 31, 2004, 2003 and 2002, respectively.
Research and development. Amounts spent by Bakelite for research and development efforts are expensed as incurred. Research and development costs amounted to €11,456 in 2004, €12,258 in 2003 and €11,981 in 2002 and related primarily to internal costs for salaries, direct overhead costs and outside vendor fees.
Derivative financial instruments. Bakelite accounts for derivative financial instruments in accordance with FASB Statement No. 133,Accounting for Derivative Instrument and Hedging Activities (“FAS 133”), which requires that all derivatives are recognized as either assets or liabilities in the Combined Balance Sheets and recorded at fair value. FAS 133 prescribes requirements for designation and documentation of hedging relationships and ongoing assessments of effectiveness in order to qualify for hedge accounting. During the years presented, Bakelite did not have derivative financial instruments designated and qualifying for hedge accounting
F-255
Table of Contents
Resin Business of the Bakelite Group
Notes to the Combined Financial Statements—(Continued)
(Euro amounts in thousands unless otherwise stated)
under FAS 133. Bakelite uses forward foreign currency contracts in order to manage currency risks arising from its forecasted and firmly committed foreign currency denominated cash flows and foreign exchange receivables. The terms of currency instruments used for hedging purposes are generally consistent with the timing of the transactions being hedged. Bakelite also uses interest rate swaps to hedge its variable cash outflows from debt instruments. All of Bakelite’s derivative financial instruments are recorded at fair value based upon quoted market prices for comparable instruments. Bakelite does not utilize financial instruments for trading or speculative purposes (Notes 10 and 11).
Concentration of credit risk.Financial instruments that potentially subject Bakelite to concentrations of credit risk include cash and cash equivalents and accounts receivable. Bakelite places its temporary cash investments with Rütgers, Bakelite’s parent. Concentrations of credit risk with respect to accounts receivable are limited, due to the large number of customers comprising Bakelite’s customer base and their dispersion across many different industries and geographies. Bakelite requires collateral or other security to support customer receivables as deemed necessary for selected customers. Bakelite is exposed to credit (or repayment) risk and market risk through the use of derivative instruments (Note 10).
General insurance. Bakelite maintains insurance policies for certain items exceeding deductible limits, including property damage, business interruption, environmental liability, product liability, credit risk and directors and officers.
Guarantees. Bakelite accounts for guarantees in accordance with FASB Interpretation No. 45,Guarantor’s Accounting and Disclosure Requirements for Guarantees, Including Indirect Guarantees of Indebtedness of Others (“FIN 45”), which clarifies the requirements of FASB Statement No. 5,Accounting for Contingencies(“FAS 5”), relating to a guarantor’s accounting for, and disclosure of, the issuance of certain types of guarantees. The recognition provisions of FIN 45 became effective for any guarantees that are issued or modified after December 31, 2002 (Note 12).
Recent accounting pronouncements.In January 2003, the FASB issued FASB Interpretation FIN 46,Consolidation of Variable Interest Entities. This interpretation of Accounting Research Bulletin No. 51,Combined Financial Statements(“ARB 51”), addresses consolidation by business enterprises of variable interest entities. FIN 46 defines the concept of a variable interest entity and requires consolidation where there is a primary beneficial interest in a variable interest entity or where the variable interest entity does not have sufficient equity at risk to finance its activities without additional subordinated financial support from other parties. The provisions of FIN 46 apply immediately to variable interest entities (VIE’s) created after January 31, 2003, and to VIE’s in which an enterprise obtains an interest after that date. In December 2003, the FASB issued a revised version of FIN 46, FASB Interpretation No. 46 (revised December 2003),Consolidation of Variable Interest Entities (FIN 46 R). FIN 46 R includes additional new scope exceptions, revised requirements on how to evaluate sufficiency of equity at risk, and quantification and allocation of an entity’s economic risks and rewards. Bakelite, as a non-public entity (as defined under FIN 46R), must apply this interpretation in its entirety no later than the first annual period beginning after December 15, 2004 and immediately to variable interest entities created or modified on or after January 1, 2004. Bakelite does not expect the adoption of FIN 46R to have a material impact on its financial position, results of operations or cash flows.
In December 2003, the FASB issued a revised FAS 132,Employers’ Disclosures about Pensions and Other Postretirement Benefits (“FAS 132R”). FAS 132R retains many of the disclosure requirements contained in FASB Statement No. 132,Employers’ Disclosures about Pensions and Other Postretirement Benefits, which it replaces, and also requires additional disclosures to be made regarding pension plans and other postretirement
F-256
Table of Contents
Resin Business of the Bakelite Group
Notes to the Combined Financial Statements—(Continued)
(Euro amounts in thousands unless otherwise stated)
benefit plans. The newly required disclosures include information describing the plan assets by major categories, target allocations for each plan asset category, investment strategy, description of basis used to determine the overall expected long-term rate of return on plan assets, plan obligations, and cash flows. In addition, the revised statement requires certain disclosures during interim periods. FAS 132R does not change the measurement of pension plans and other postretirement benefit plans and, accordingly, impact on Bakelite’s financial statements in future periods will be limited to presentation of additional required disclosures.
In November 2004, the FASB issued Statement No. 151,Inventory Costs—an amendment of ARB No. 43, Chapter 4 (“FAS 151”). This statement amends the guidance in ARB No. 43, Chapter 4,Inventory Pricing,to clarify the accounting for abnormal amounts of idle facility expense, freight, handling costs, and wasted material (spoilage). This statement requires that those items be recognized as current period charges. In addition, this statement requires that allocation of fixed production overheads to the costs of conversion be based on the normal capacity of the production facilities. The provisions of this statement must be applied prospectively and are effective for inventory costs incurred during fiscal years beginning after June 15, 2005. Bakelite does not expect the adoption of this standard to have a material impact on its financial position or results of operations.
In December 2004, the FASB issued a revision to SFAS No. 123,Share-Based Payments which now requires that stock options be expensed based on their fair value. Bakelite currently does not have any share-based compensation plan, and does not expect the adoption of this standard to have a material impact on its financial position or results of operations.
In December 2004, the FASB issued SFAS No. 153,Exchanges of Nonmonetary Assets—an amendment of APB Opinion No. 29. The statement addresses the measurement of exchanges of non-monetary assets and replaces it with an exception for exchanges that do not have commercial substance. SFAS No. 153 is effective for non-monetary asset exchanges occurring in fiscal periods beginning after June 15, 2005.
In March 2005, the FASB issued Interpretation No. 47,Accounting for Conditional Asset Retirement Obligations. The interpretation aims to clarify the requirement to record liabilities stemming from a legal obligation to clean up and retire fixed assets. Interpretation 47 is effective for fiscal years ending after December 31, 2005. Bakelite does not expect the adoption of this standard to have a material impact on its financial position or results of operations.
F-257
Table of Contents
Resin Business of the Bakelite Group
Notes to the Combined Financial Statements—(Continued)
(Euro amounts in thousands unless otherwise stated)
Note 3—Property, plant and equipment and impairment of long-lived assets
The following is a summary of Bakelite’s property, plant and equipment, net of accumulated depreciation and impairments:
| December 31, | ||||||||
| 2004 | 2003 | |||||||
Machinery and equipment | € | 375,718 | € | 390,465 | ||||
Buildings | 67,627 | 66,897 | ||||||
Construction in process | 3,941 | 12,626 | ||||||
Machinery and equipment under capital lease | 1,100 | 1,146 | ||||||
Land | 4,844 | 5,023 | ||||||
Buildings under capital lease | 600 | 600 | ||||||
Subtotal | 453,830 | 476,757 | ||||||
Less: Accumulated depreciation and impairment | (279,692 | ) | (285,314 | ) | ||||
Less: Accumulated depreciation under capital leases | (1,119 | ) | (1,024 | ) | ||||
Subtotal property, plant and equipment, net | 173,019 | 190,419 | ||||||
Assets held for sale, net | — | 213 | ||||||
Total property, plant and equipment, net | € | 173,019 | € | 190,632 | ||||
Depreciation expense for property, plant and equipment for the years ended December 31, 2004, 2003 and 2002 was €18,580, €26,245 and €21,291 respectively.
Of the land and buildings owned by Bakelite, €9,400 is subject to mortgage with a bank (Note 9). Additional land and buildings, at a cost of €13,805, is otherwise mortgaged under an agreement with an insurance company. It is anticipated that this agreement will terminate upon the sale of Bakelite.
Impairments of long-lived assets
The reviews required under FAS 144 resulted in impairment charges to long-lived assets. These charges, which are summarized in the table below, are recorded in Impairment of long-lived assets in the Combined Statements of Operations.
| Phenolic Resins | Moulding Compounds | DTC Plant | EVO Steam Plant | Sibelco | Other | Total | |||||||||||||||
2002 Bakelite Italia | € | — | € | 4,041 | € | — | € | — | € | — | € | — | € | 4,041 | |||||||
Bakelite Iberica | — | — | — | — | — | 38 | 38 | ||||||||||||||
| € | — | € | 4,041 | € | — | € | — | € | — | € | 38 | € | 4,079 | ||||||||
2003 Bakelite Italia | € | 15,434 | € | 2,536 | € | 1,513 | € | — | € | — | € | 363 | € | 19,846 | |||||||
Bakelite AG | — | — | — | — | 855 | — | 855 | ||||||||||||||
| € | 15,434 | € | 2,536 | € | 1,513 | € | — | € | 855 | € | 363 | € | 20,701 | ||||||||
2004 Bakelite Italia | € | 7,741 | € | — | € | — | € | — | € | — | € | — | € | 7,741 | |||||||
Bakelite AG | — | — | — | 2,317 | — | — | 2,317 | ||||||||||||||
| € | 7,741 | € | — | € | — | € | 2,317 | € | — | € | — | € | 10,058 | ||||||||
F-258
Table of Contents
Resin Business of the Bakelite Group
Notes to the Combined Financial Statements—(Continued)
(Euro amounts in thousands unless otherwise stated)
Phenolic Resins—In 2003, management decided to cease or sell their non-core businesses and product lines within the Bakelite Italia operations which triggered an impairment test for the phenolic resins operations. Based on management’s assessment, Bakelite recorded an impairment charge of €15,434 to reduce the carrying value of machinery, equipment and other plant assets used in the phenolic operations, as its cash flows were negatively influenced by significant increases in raw material prices which only in limited circumstances could be entirely passed on to customers under current market conditions. This trend continued in 2004. Bakelite revised its budgets for this reporting unit due to further anticipated deterioration in market conditions. This resulted in revised cash flow projections and a further impairment charge of €7,741 was necessary.
Moulding Compounds—The 2002 impairment charge of €4,041 at the Bakelite Italia moulding compounds operations was triggered by a decrease in Bakelite Italia´s customer base mainly within Italy. Market conditions further deteriorated in 2003, primarily due to (i) the market trend toward a substitution of certain moulding compounds products with less expensive products and (ii) customers relocating their facilities to Asian countries and sourcing products locally. This resulted in revised budgets and significantly reduced cash flow projections. An additional impairment charge of €2,536 was recorded in 2003. Both impairment charges primarily reduce the carrying value of machinery and equipment, tools and customer lists.
DTC Plant—In December 2002, a third party informed Bakelite of their intent to terminate an existing sub-contracting arrangement for the production of fungicides (“DTC”) effective January 1, 2004. Bakelite tested the long-lived assets for impairment at December 31, 2002 and concluded that the undiscounted cash flows exceeded the assets net carrying value; therefore no impairment was recorded. Bakelite ceased production at DTC as of June 30, 2003, since it was not economically feasible to continue production. Accordingly, Management performed another impairment analysis and determined an impairment charge of €1,513 was necessary. Management evaluated options related to the DTC assets and determined that the remaining useful lives of the assets should be adjusted.
The parties signed a memorandum of understanding in which the terms of the original sub-contracting arrangement were amended to provide for certain penalties payable to Bakelite if the third party terminates the agreement. In 2004 the third party agreed to pay Bakelite a termination penalty of €1,825 and Bakelite sold certain production lines of the DTC plant to the third party for €250, which resulted in a gain of €37.
EVO Steam Plant—The impairment recorded in 2004 at Bakelite AG relates to the steam production plant supplied by EVO. In 2003 Bakelite decided that the steam production from a planned formaline plant would be sufficient to supply its steam needs.
In April 2004, Bakelite, Rütgers Chemicals AG (“RC”), a wholly owned subsidiary of Rütgers, and the lessor entered into a tripartite agreement to transfer Bakelite’s benefits and obligations under the lease arrangement to RC. The steam plant, as an asset to be distributed to RC, was reduced to its fair value prior to the transfer. As such, an impairment loss of €2,317 was recognized at the time of transfer of the steam plant to RC, as the carrying amount of the asset exceeded its fair value.
Sibelco order book—During December 2003, management assessed a triggering event had occurred, as the projected cash flows from the order book could not justify its carrying value of €1,873. As such, management performed an impairment test and calculated an impairment of €855 based on the discounted cash flows of the order book.
Other—During 2003, Bakelite decided to dispose of the Biodiesel business (“Biodiesel”) by either sale or closure. As of December 31, 2003, an exit strategy had not been finalized; accordingly the related plant assets were not classified as held for sale. As of December 31, 2003, an impairment charge of €363 was recorded.
F-259
Table of Contents
Resin Business of the Bakelite Group
Notes to the Combined Financial Statements—(Continued)
(Euro amounts in thousands unless otherwise stated)
In April 2004, Bakelite entered into an agreement with a third party for the sale of Biodiesel. The sale included the fixed assets (carrying value of €1,503), inventory of the plant (carrying value of €2,458), as well as the transfer of debt of €119 related to the plant assets. Total proceeds received upon sale was €4,456 including €119 of assumed debt related to plant assets, resulting in a gain on sale of €495. In connection with the sale, the parties entered into a supply and services arrangement under which Bakelite will provide certain maintenance, laboratory, and other services to the buyer for a minimum period of eight years for an annual fee of €470. In the event that Bakelite fails to perform under the terms of the supply and services arrangement, Bakelite could be required to repurchase Biodiesel. The contingent repurchase price of €2,500 decreases by €400 at each anniversary in April following the year of acquisition until 2010, €200 in 2010/2011, €100 in 2011/2012 and €200 at April 2012. After April 2012 the repurchase price is one Euro.
Asset retirement obligations
Bakelite is subject to asset retirement obligations in connection with certain properties leased in Finland, Germany, and Spain. The liabilities include an obligation to dismantle and remove chemical tanks that Bakelite operates on leased land in Finland, and the obligation to dispose of installations, facilities, equipment and/or modifications erected by Bakelite on land leased in Germany. An asset retirement obligation as of December 31, 2004 was necessary for Spain, because Bakelite is required to clean up the land where the facilities are located when the factory is shut down.
Following is a reconciliation of the beginning and ending aggregate carrying amount of Bakelite’s asset retirement obligations:
| December 31, | ||||||
| 2004 | 2003 | |||||
Balance at January 1 | € | 182 | € | 120 | ||
Liability incurred during the year | 55 | 58 | ||||
Accretion expense for the year | 4 | 4 | ||||
Balance at December 31 | € | 241 | € | 182 | ||
Revisions to the liability could occur due to estimated changes in asset retirement costs, useful lives of the related assets or if federal and/or state regulators enact new legislation on the retirement of fixed assets. There were no assets legally restricted for purposes of settling the asset retirement obligations.
Note 4—Investments in Companies
Rütgers-Plenco LLC.Bakelite and an unrelated third party each held 50% of the shares in the joint venture Rütgers-Plenco LLC which was established in March 1998 for the purpose of selling technical phenolic resins and terminated in December 2003. The joint venture agreement stipulated an equal allocation of both decision making and financial results. As such, Bakelite has accounted for the joint venture using the equity method of accounting.
The joint venture was terminated under contract of December 17, 2003 with effect from December 31, 2003.
For the years ended December 31, 2003 and 2002, Bakelite sold products produced in Germany to the joint venture of €1,281 and €1,311, respectively. Profits realized by Bakelite from these sales have been eliminated proportionately.
F-260
Table of Contents
Resin Business of the Bakelite Group
Notes to the Combined Financial Statements—(Continued)
(Euro amounts in thousands unless otherwise stated)
The joint venture entered into a licensing agreement with Bakelite and the unrelated third party shareholder whereby the joint venture paid royalties on sales of products purchased from the shareholders. The royalty payments were based on formulas defined in the agreements. Total royalty income recognized by Bakelite was €100 and €88 for the years ended December 31, 2003 and 2002, respectively.
Bakelite’s 50% share of the undistributed earnings of the joint venture amounted to €22 and €768 at December 31, 2003 and 2002, respectively. In December 2003, the shareholders entered into an agreement to terminate the trading business and operations of the joint venture on December 31, 2003. The agreement stipulated that as of December 31, 2003, employees and customers of the joint venture were to be transferred to the shareholders, liabilities of the joint venture were to be settled and the remaining assets were to be distributed to the parties. As the joint venture was accounted for using the equity method, there was no gain or loss upon the transfer to Bakelite of 50% of the joint venture’s assets valued at €1,515 at December 31, 2003. As of December 31, 2003 and 2002, the investment in Rütgers—Plenco LLC was €22 and €1,610, respectively. As of December 31, 2003 and 2002, Bakelite had accounts receivable from the joint venture of €652 and €187, respectively. Dissolution of the legal entity took place on November 4, 2004.
InfraTecDuisburg GmbH.Effective in December 2003, Bakelite established a new entity, InfraTec Duisburg GmbH (“InfraTec”), to manage the infrastructure services at Bakelite’s shared site in Duisburg, Germany. The site is shared with Rütgers Chemicals AG and other related and unrelated companies. InfraTec is owned 70% by Bakelite and 30% by Rütgers Chemicals AG. On December 31, 2003, Bakelite and Rütgers Chemicals AG contributed €3,442 and €1,888 of assets, respectively, at book value. In addition, Bakelite and Rütgers Chemicals AG contributed cash of €17.5 and €7.5 as paid-in capital, as required by law.
InfraTec provides infrastructure services, technical plant services and environmental, health and safety to the parties at the Duisburg site. These services are provided under a “cost plus” arrangement. InfraTec has been combined by Bakelite and all intercompany transactions have been eliminated. Rütgers Chemicals AG’s minority interest share in InfraTec is €1,431 and €1,337 at December 31, 2004 and 2003.
Note 5—Business acquisitions
Acquisition of LG Chemicals Epoxy Resins (Bakelite Korea Co. Limited).In May 2002, Bakelite formed a new corporation, BAK, to acquire 100% of the assets of LG Chemical’s epoxy resins business. The results of operations of BAK have been included in the Combined Financial Statements since May 2002. BAK is engaged in the manufacture and sale of epoxy resins used in electrical laminates, paint, civil engineering, adhesives, electrical castings, and as fire retardant additives for thermoplastics. The aggregate purchase price was €18,522, including acquisition expenses of €187 and a purchase price adjustment of 420 million Korean won (€359 at the acquisition date). There was also variable component to the earn-out limited to a maximum of 5.3 billion Korean won. This contingent consideration was recognized as a deferred credit (€4,181) and is shown in the table below summarizing the purchase price allocation.
Bakelite acquired BAK as a platform for growth in the epoxy resins market in the Asian region. The strategic acquisition allowed Bakelite to attract new customers in Asia and enhance the existing customer base.
The purchase price was allocated to the tangible assets and identifiable intangible assets acquired. For the excess of the fair values of identified acquired net assets over the purchase price, Bakelite recognized a deferred credit of €4,181 in order to record the remaining maximum contingent consideration due from the purchase price agreement. In 2004 the contingent consideration was resolved as Bakelite Korea did not exceed the average
F-261
Table of Contents
Resin Business of the Bakelite Group
Notes to the Combined Financial Statements—(Continued)
(Euro amounts in thousands unless otherwise stated)
earnings targets for three consecutive years as stipulated in the purchase agreement. The deferred credit was recognized as a pro-rata reduction of certain non-current assets.
For US GAAP purposes, no goodwill was recognized at the acquisition date for this transaction. However, the amount of goodwill that is expected to be deductible for Korean tax purposes is 4.1 billion Korean won (€3,551).
Unaudited pro forma net revenues and income from operations of Bakelite, calculated using BAK’s financial statements, would have been as follows if the acquisition had occurred as of January 1, 2002:
| Year ended December 31, 2002 | |||
| (Unaudited) | |||
Net revenues | € | 518,846 | |
Income from operations | € | 10,469 | |
Acquisition of Taro Plast S.p.A.In January, 2002, Bakelite acquired the remaining 30% interest of Taro Plast S.p.A., an Italian corporation (“Taro Plast”). Bakelite had acquired a 70% interest in Taro Plast in 1998. Taro Plast is engaged in the engineering thermoplastic business. The business offers five main product lines which are primarily used in the automotive and electrical industries. The purchase price for the 30% interest was €3,715 in cash, including acquisition expenses of €65.
The purchase price has been allocated to the tangible assets, identifiable intangible assets acquired and liabilities assumed (the “net assets”). The excess purchase price over the net assets is goodwill.
The following is a summary of the purchase price allocations at the date of acquisition for BAK and Taro Plast:
| BAK | Taro Plast | |||||||
Inventory | € | 3,356 | € | 1,543 | ||||
Property, plant and equipment | 13,326 | 2,215 | ||||||
Identifiable intangible assets | 7,475 | 755 | ||||||
Other assets | 1,891 | 4,321 | ||||||
Goodwill | — | 1,167 | ||||||
Deferred income taxes, net | (3,345 | ) | (549 | ) | ||||
Liabilities assumed | — | (5,737 | ) | |||||
Contingent consideration | (4,181 | ) | — | |||||
Total consideration | € | 18,522 | € | 3,715 | ||||
The amortization periods for major classes of intangible assets are described in Note 6 to the Combined Financial Statements.
Acquisitions in 2004:In 2004 Bakelite acquired the remaining 0.01% of Bakelite Polymers U.K. Limited for less than €1, the remaining 1% of Bakelite Italia S.p.A. for €160 and the remaining 0.7% of Bakelite Ibérica S.A. for €134.
F-262
Table of Contents
Resin Business of the Bakelite Group
Notes to the Combined Financial Statements—(Continued)
(Euro amounts in thousands unless otherwise stated)
Note 6—Intangible assets and goodwill, net
At December 31, 2004, 2003 and 2002, Bakelite’s management performed the annual goodwill impairment test for all of its reporting units. As a result of this test at December 31, 2004, goodwill impairment of €4,603 was recognized in respect of Taro Plast S.p.A. and €1,280 in respect of Bakelite Iberica. The impairment of goodwill at Taro Plast S.p.A. relates to a reduction in the projected profitability of the moulding compounds business. At Bakelite Iberica the amount of the impairment reflects the decline in the phenolic resins business. At December 31, 2003, the fair value of each reporting unit exceeded the carrying amount of assets and liabilities assigned to the units and no impairment charge was necessary. At the end of 2002, the test resulted in an impairment charge of $2,920 with respect to Bakelite Italia. This impairment test reflects the significantly reduced expected cash flows for the phenolic resins business.
Upon the adoption of FAS 142, on January 1, 2002, Bakelite recorded a non-cash charge, net of tax, of €4,381 to reduce the carrying value of goodwill related the Bakelite Italia moulding compound business. Such charge is reflected as a cumulative effect of a change in accounting principle in the accompanying Combined Statements of Operations. The amount of the impairment reflects the decline in the customer base at the Bakelite Italia moulding compounds business.
The decline in the moulding compounds business is primarily due to (i) the market trend toward substitution of certain moulding compounds products with less expensive products, and (ii) customers relocating their facilities to Asian countries and sourcing products locally.
Prior to the adoption of FAS 142, Bakelite amortized goodwill over a 20-year period. These impairment charges were non-cash in nature and did not affect Bakelite’s liquidity.
The changes in the carrying amount of goodwill for the year ended December 31, 2004 and 2003 are as follows:
| December 31, | ||||||||
| 2004 | 2003 | |||||||
Goodwill balance at the beginning of the year | € | 14,764 | € | 15,387 | ||||
Goodwill impairment recognized | (5,883 | ) | — | |||||
Other | (330 | ) | (623 | ) | ||||
Goodwill balance at the end of the year | € | 8,551 | € | 14,764 | ||||
Intangible assets other than goodwill consist of the following as of December 31, 2004 and 2003:
| December 31, | ||||||||||||||
| 2004 | 2003 | |||||||||||||
| Gross Carrying Value | Accumulated Amortization | Gross Carrying Value | Accumulated Amortization | |||||||||||
Customer related intangibles | € | 36,867 | € | (28,249 | ) | € | 40,719 | € | (23,898 | ) | ||||
Software licenses and patents | 10,661 | (8,398 | ) | 18,926 | (15,731 | ) | ||||||||
Trademarks | 11 | (8 | ) | 16 | (7 | ) | ||||||||
Total | € | 47,539 | € | (36,655 | ) | € | 59,661 | € | (39,636 | ) | ||||
F-263
Table of Contents
Resin Business of the Bakelite Group
Notes to the Combined Financial Statements—(Continued)
(Euro amounts in thousands unless otherwise stated)
The gross carrying value and accumulated amortization include the impact of foreign currency adjustments. Total intangible amortization expense for the year ended December 31, 2004, 2003 and 2002 was €7,936, €9,531 and €9,452, respectively. Impairment charges of €855 and €349 were recorded in Impairment of long-lived assets in the years ended December 31, 2003 and 2002, respectively (Note 3).
Based on the number of intangible assets subject to amortization at the end of December 31, 2004, the expected amortization for each of the next five years is as follows:
Years ended December 31, | Amortization | ||
2005 | € | 5,823 | |
2006 | 2,504 | ||
2007 | 1,166 | ||
2008 | 758 | ||
2009 | 621 | ||
| € | 10,872 | ||
Note 7—Pensions and employees’ severance indemnities
Bakelite maintains various defined benefit and defined contribution pension plans covering its employees worldwide. In Germany, these plans are based on fixed benefits (defined benefit pension plans), while in certain other countries, there are defined contribution pension plans. Furthermore, the Italian and Korean subsidiaries provide severance indemnity benefits to employees.
Defined benefit pension plans. Under defined benefit pension plans, the benefits are based primarily on years of service and employees’ pay near retirement. Benefit obligations are determined by actuarial valuations using a method based on projected salaries to the end of employment (the projected unit credit method). The annual benefit cost comprises the estimated cost of benefits accruing in the period as determined in accordance with FASB Statement No. 87,Employers’ Accounting for Pensions(“FAS 87”), which requires re-adjustment of the significant actuarial assumptions annually to reflect current market and economic conditions. All of Bakelite’s employee benefit plans are unfunded plans. The measurement date for these plans is December 31. The need to recognize actuarial gains or losses is reviewed using the corridor approach.
Defined contribution plans. Several subsidiaries offer defined contribution plans to eligible employees, whereby employees contribute a portion of their compensation, which is partially matched by Bakelite. Once the contributions have been paid, Bakelite has no further payment obligations. The regular contributions totaled €384, €530 and €494 for the years ended December 31, 2004, 2003 and 2002, respectively, which are recognized as expense when paid.
Severance indemnity plans. The employees’ severance indemnities primarily relate to Italy and Korea. This liability, which is indexed for inflation in accordance with Italian and Korean law, is accrued at the year-end for each employee. The liability is determined in accordance with applicable national labor legislation and with the employee’s annual salary. The reserve reflects the total amount of the employees’ severance indemnities, net of any advances taken, that each employee would be entitled to receive if termination were to occur for virtually any reason, as of the balance sheet date.
F-264
Table of Contents
Resin Business of the Bakelite Group
Notes to the Combined Financial Statements—(Continued)
(Euro amounts in thousands unless otherwise stated)
The aggregate disclosures for Bakelite’s defined benefit pension plans and employee severance indemnities are presented as follows:
| Year ended December 31, | ||||||||||||
| 2004 | 2003 | 2002 | ||||||||||
Change in benefit obligation: | ||||||||||||
Benefit obligation at beginning of year | € | 113,197 | € | 104,820 | € | 95,984 | ||||||
Service cost | 2,829 | 4,039 | 2,483 | |||||||||
Interest cost | 4,193 | 5,301 | 5,320 | |||||||||
Business acquisition | — | — | 516 | |||||||||
Actuarial loss | 2,343 | 5,261 | 5,514 | |||||||||
Effects of settlements/curtailments | (81 | ) | — | — | ||||||||
Foreign currency exchange rate changes | 32 | (117 | ) | (29 | ) | |||||||
Transfer of benefit obligation (including unrecognized loss of €3,252) | (32,339 | ) | — | — | ||||||||
Benefit payments | (3,018 | ) | (6,107 | ) | (4,968 | ) | ||||||
Benefit obligation at end of year | € | 87,156 | € | 113,197 | € | 104,820 | ||||||
Funded status: | ||||||||||||
Funded Status | € | (87,156 | ) | € | (113,197 | ) | € | (104,820 | ) | |||
Unrecognized transit obligation | — | — | 1,052 | |||||||||
Unrecognized net loss | 9,856 | 10,776 | 5,514 | |||||||||
Accrued pension cost | € | (77,300 | ) | € | (102,421 | ) | € | (98,254 | ) | |||
| �� | ||||||||||||
Amounts recognized in the balance sheet consist of: | ||||||||||||
Accrued benefit cost | € | (80,490 | ) | € | (106,827 | ) | € | (99,940 | ) | |||
Intangible assets | — | — | 1,052 | |||||||||
Accumulated other comprehensive loss | 3,190 | 4,406 | 630 | |||||||||
Net amount recognized | € | (77,300 | ) | € | (102,421 | ) | € | (98,258 | ) | |||
Components of net periodic benefit costs: | ||||||||||||
Service cost | € | 2,829 | € | 4,039 | € | 2,483 | ||||||
Interest cost | 4,193 | 5,301 | 5,320 | |||||||||
Amortization of unrecognized loss | 10 | — | — | |||||||||
Amortization of transition obligation | — | 1,052 | 1,052 | |||||||||
Net periodic benefit cost | € | 7,032 | € | 10,392 | € | 8,855 | ||||||
Additional Information: | ||||||||||||
Projected benefit obligation | € | 87,156 | € | 113,197 | € | 104,820 | ||||||
Accumulated benefit obligation | € | 80,383 | € | 106,163 | € | 99,936 | ||||||
(Decrease) increase in minimum liability included in other comprehensive income | € | (1,216 | ) | € | 3,776 | € | 630 | |||||
Assumptions: | ||||||||||||
Weighted-average assumptions used to determine benefit obligations: | ||||||||||||
Discount rate | 4.75 | % | 5.25 | % | 5.50 | % | ||||||
Rate of compensation increase | 2.50 | % | 2.50 | % | 2.50 | % | ||||||
Weighted-average assumptions used to determine net periodic benefit cost: | ||||||||||||
Discount rate | 5.25 | % | 5.50 | % | 6.00 | % | ||||||
Rate of compensation increase | 2.50 | % | 2.50 | % | 3.00 | % | ||||||
F-265
Table of Contents
Resin Business of the Bakelite Group
Notes to the Combined Financial Statements—(Continued)
(Euro amounts in thousands unless otherwise stated)
At December 31, 2003, Bakelite and Rütgers agreed to transfer certain pension obligations for retirees from Bakelite to Rütgers for compensation of €33,535, which was based on the German GAAP pension obligation. Although the agreement has been made, the obligation will not be released until individual employees release Bakelite as primary obligor. The transfer of a portion of the obligation took place during the 12 month period ended December 31, 2004. The total compensation in 2004 to Rütgers amounts to €27,472.
As a result of the pension transfer Bakelite’s projected benefit obligation as of December 31, 2004 reduced by €32,339, which consisted of €29,087 accrued pension cost, and €3,252 unrecognized loss. The difference between the €27,472 agreed compensation and €29,087 of accrued pension cost was recorded as a capital contribution of €1,615.
As the benefit plans are unfunded plans, Bakelite does not expect to contribute to its pension plans in 2005.
Estimated future benefit payments, which reflect expected future service, as appropriate, are expected to be paid as follows:
2005 | € | 2,195 | |
2006 | 2,562 | ||
2007 | 2,832 | ||
2008 | 3,084 | ||
2009 | 3,329 | ||
Years 2010-2014 | 21,349 |
Note 8—Income Taxes
Profits earned by a German resident corporation are subject to a uniform corporate income tax rate of 25% (2003: 26.5%; 2002: 25%). Deferred taxes were also calculated with a solidarity surcharge of 5.5% (2003: 5.5%; 2002: 5.5%) on federal corporate taxes plus the after federal tax benefit rate for trade tax. The trade tax is levied at rates set by each municipality in which the corporation maintains a business establishment. The effective trade tax rates after federal tax benefit ranges between 12.78% to 14.01% (2003: 12.78% to 13.71%; 2002: 13.18% to 13.42%). Including the impact of the solidarity surcharge and the trade tax, the expected tax rate of Bakelite amounted to 39.90% (2003: 41.10%; 2002: 39.80%). The increase in 2003 was caused by a new tax legislation enacted by the Government in 2002 for the purpose of financing the flood disaster which, among other changes, increased Bakelite’s corporate tax rate for German companies from 25% to 26.5%, effective only for the calendar year 2003.
Comparative analysis of Bakelite’s income tax (expense) benefit related to continuing operations is as follows:
| 2004 | 2003 | 2002 | ||||||||||
Current (expense)/benefit | ||||||||||||
Germany | € | (3,380 | ) | € | 5,623 | € | (3,098 | ) | ||||
Other | (1,798 | ) | 278 | (1,125 | ) | |||||||
Total | (5,178 | ) | 5,901 | (4,223 | ) | |||||||
Deferred (expense)/benefit | ||||||||||||
Germany | 3,838 | (2,988 | ) | 1,284 | ||||||||
Other | 679 | 8,183 | (221 | ) | ||||||||
Total | 4,517 | 5,195 | 1,063 | |||||||||
Total Provision for income tax (expense) benefit | € | (661 | ) | € | 11,096 | € | (3,160 | ) | ||||
F-266
Table of Contents
Resin Business of the Bakelite Group
Notes to the Combined Financial Statements—(Continued)
(Euro amounts in thousands unless otherwise stated)
The domestic and foreign components of Bakelite’s income (loss) from before income taxes are as follows:
| 2004 | 2003 | 2002 | |||||||||
Germany | € | 1,959 | € | (6,129 | ) | € | 3,989 | ||||
Other | (3,444 | ) | (30,187 | ) | 1,927 | ||||||
Total | € | (1,485 | ) | € | (36,316 | ) | € | 5,916 | |||
The tax effects of Bakelite’s income (loss) from continuing operations before income taxes are as follows:
| 2004 | 2003 | |||||||
Assets | ||||||||
Current Assets | ||||||||
Accounts receivables | € | 0 | € | 621 | ||||
Inventory | 0 | 0 | ||||||
Liabilities and reserves | 716 | 1,036 | ||||||
Total current deferred tax assets | 716 | 1,657 | ||||||
Non current Assets | ||||||||
Intangibles assets | 882 | 0 | ||||||
Investments and other assets | 484 | 0 | ||||||
Loss and credit carryforwards | 1,269 | 991 | ||||||
Tax incentives | 97 | 76 | ||||||
Liabilities and reserves | 11,545 | 24,064 | ||||||
Total | 14,277 | 25,131 | ||||||
Valuation allowance | (3,932 | ) | (3,491 | ) | ||||
Total non current deferred assets | 10,345 | 21,640 | ||||||
Gross deferred tax assets | 11,061 | 23,297 | ||||||
Liabilities | ||||||||
Current Liabilities | ||||||||
Accounts receivables | (1,779 | ) | 0 | |||||
Investments and other current assets | 0 | (23 | ) | |||||
Accounts payable | 0 | (13,401 | ) | |||||
Other current liabilities | (1,042 | ) | (245 | ) | ||||
Inventory | (66 | ) | (358 | ) | ||||
Total | (2,887 | ) | (14,027 | ) | ||||
Non current Liabilities | ||||||||
Goodwill | (2 | ) | 0 | |||||
Property, plant and equipment | (24,727 | ) | (30,084 | ) | ||||
Additional taxes on unrepatriated earnings | (506 | ) | (353 | ) | ||||
Investments and other assets | 0 | (657 | ) | |||||
Intangibles assets | 0 | (1,708 | ) | |||||
Incentives and capital grants | (2,411 | ) | (2,410 | ) | ||||
Total | (27,646 | ) | (35,212 | ) | ||||
Gross deferred tax liabilities | (30,533 | ) | (49,239 | ) | ||||
Net deferred tax asset / (liability) | € | (19,472 | ) | € | (25,942 | ) | ||
F-267
Table of Contents
Resin Business of the Bakelite Group
Notes to the Combined Financial Statements—(Continued)
(Euro amounts in thousands unless otherwise stated)
The reconciliation of income tax benefit (expense) computed at the statutory rate applicable in Germany to Bakelite’s income tax expense is as follows:
| 2004 | 2003 | 2002 | ||||||||||
German statutory (expense) / benefit | 592 | 14,751 | (2,389 | ) | ||||||||
Effect of income tax rates of other countries | 37 | (74 | ) | 258 | ||||||||
Income not subject to tax | 232 | 106 | 279 | |||||||||
Goodwill | (1,673 | ) | 77 | (1,184 | ) | |||||||
Expenses not deductible for tax purposes | (112 | ) | (269 | ) | (303 | ) | ||||||
Additional tax payments / (refunds) from prior years | 102 | (1,291 | ) | 2 | ||||||||
Capital Investment Incentives | 1,668 | 574 | 433 | |||||||||
Change in valuation allowance | (1,634 | ) | (2,294 | ) | 0 | |||||||
Foreign, local and municipal taxes | (587 | ) | 148 | (259 | ) | |||||||
Changes in tax law and rates | 651 | (649 | ) | 1 | ||||||||
Purchase Price Adjustments and other differences | 63 | 17 | 2 | |||||||||
Total tax (expense) / benefit | € | (661 | ) | € | 11,096 | € | (3,160 | ) | ||||
Unrepatriated earnings—Bakelite has recorded all income taxes applicable to undistributed earnings of foreign and domestic subsidiaries that are not permanently reinvested. The total undistributed earnings for these subsidiaries are approximately €23,401 (2003: €17,741). From these earnings, 5 percent of the foreign dividends are non deductible expenses and are subject to both corporate and trade tax of approximately €506 (2003: €353).
Revaluation reserve—In Italy a new tax law was enacted in December 2000 which permits an entity to revalue certain assets that will require a payment of a tax on the revaluation at the rate of 19% for depreciable assets and 15% for non depreciable assets. This tax liability is paid over a 3 year period. As the revalued assets are depreciated or disposed off in the future, the tax benefit on the revaluation will be realized at the statutory tax rate of 40.25% for the years 2001 and 2002 and at 39.25% for 2003 and thereafter. For Italian financial reporting purposes, a separate equity account was credited for the revaluation of the assets and that equity account was charged for the recognition of the tax to be paid attributable to the revaluation. If the Company distribute this equity account, a tax of approximately €2,410 would be assessed. A deferred tax liability has been established for future tax on the amount included in equity.
Transfer pension liability—At December 31, 2003, Bakelite and Rütgers AG (“Rütgers”) agreed to transfer certain pension obligations to Rütgers (Note 7). The transfer for tax purposes took place in 2003, whereas under US GAAP these pensions were transferred in 2004. This resulted in temporary differences in pension obligations and accounts payables to affiliates between tax basis and US GAAP in 2003. As the transfer of the pension obligation took place in 2004 US GAAP and tax basis converged, which is the primary reason for the decrease of the deferred tax assets related to “liabilities and reserves” from €24,064 to €11,545 and the decrease in the deferred tax liabilities related to “accounts payable” from €(13,401) to €0.
This is one of the primary reason for the decrease of the deferred tax asset on the non current “Liabilities and reserves” and the corresponding decrease of the deferred tax liability on the current “Accounts payable” in 2003.
Net operating losses—At December 31, 2004, Bakelite had federal tax net operating losses (“NOLs”) amounting to approximately €3,098 (2003: €2,463) and state tax NOLs of €2,482 (2003: €2,414). The NOLs relate to losses in the USA, Korea and Italy. Approximately €783 of the total amount of these net operating losses expire in 2008 and 2009. The remaining NOLs expire in 18 to 20 years. A valuation allowance of €176 has been
F-268
Table of Contents
Resin Business of the Bakelite Group
Notes to the Combined Financial Statements—(Continued)
(Euro amounts in thousands unless otherwise stated)
recorded against net operating losses in the amount of €582 where it is more likely than not that they will expire before being utilized.
Valuation allowance—The valuation allowance increased €441 from December 31, 2003 to December 31, 2004. An increase in the valuation allowance of €1,616 went through income tax benefit (expense) while a decrease in the valuation allowance of €1,175 associated with the step down in the basis of assets at Korea was recognized in the balance sheet. A valuation allowance of €176 relates to the deferred tax asset on the NOL and a valuation allowance in the amount of €83 relates to the investment tax credit carry forward at Korea. Additionally, there is a valuation allowance of €3,482 recorded against certain deferred tax assets in Italy as a result of the impairment for those assets that will not be recovered by the reversal of deferred tax liabilities. A further valuation allowance of €191 has been placed against certain deferred tax assets in the USA as result of a related party transaction. In future periods management’s estimate of the amount of the deferred tax assets considered realizable may change, and hence the valuation allowances may increase or decrease.
Step down—In connection with the step down in the basis of the assets at Bakelite Korea described in Note 5, deferred tax assets, liabilities and related valuation allowances have been adjusted to reflect the step down of basis in the assets.
Tax audit – Bakelite has various open income tax years that have not been audited by the taxing authorities in various jurisdictions. Bakelite AG is currently under review by the tax authorities for the years 2000 until 2004. Furthermore, Bakelite received notification in March 2005 that an income tax audit in the USA will be forthcoming. The open years for other companies of Bakelite are not yet under examination. Bakelite believes it has adequately accrued for any future income taxes that may be owed for all open years and there has been no effect to the financial statements as a result of any audits.
F-269
Table of Contents
Resin Business of the Bakelite Group
Notes to the Combined Financial Statements—(Continued)
(Euro amounts in thousands unless otherwise stated)
Note 9—Debt and Lease Obligations
Debt and capital lease obligations outstanding at December 31, 2004 and 2003 are summarized as follows:
| December 31, | ||||||||||||
| 2004 | 2003 | |||||||||||
| Long- term, net of current portion | Due within one year | Long- term, net of current portion | Due within one year | |||||||||
Nordea Bank, Finland PLC, loan to Bakelite OY, line of credit €21.000, due 2008, interest Euribor +0.65% per annum | € | 10,800 | — | € | 10,800 | — | ||||||
Korea Exchange Bank, loans to Bakelite Korea original principal 4.95 bil Korean Won, due through 2007, interest 9.59% per annum, payable quarterly (certain land, building and equipment of Bakelite Korea pledged as collateral) | 3,560 | — | 5,503 | 2,201 | ||||||||
West LB, loan to Bakelite AG, original principal €8,813, due 2013, interest 4.25 % per annum, payable semi-annually | 7,951 | 509 | 8,460 | — | ||||||||
West LB, loan to MGS, original principal €4,000, due 2006, interest 5.10% per annum, payable quarterly | 1,944 | 500 | 2,450 | 500 | ||||||||
Long-term loans, various banks to Taro Plast S.p.A, due through 2007, variable interest, 2.5% to 4.0% per annum | 976 | 2,607 | 3,592 | 2,647 | ||||||||
Capital Lease Obligation of Bakelite AG, EVO steam plant, due 2020, interest 7,92% per annum, payable monthly—in 2004 transferred to Rütgers Chemicals AG | — | — | 8,428 | 252 | ||||||||
Various Capital Lease Obligations due through 2010 | 500 | 167 | 613 | 102 | ||||||||
Other, primarily bank debt, due through 2011, average interest 3.4% and 4.3% per annum | 2,473 | 789 | 3,474 | 1,343 | ||||||||
Total current maturities of debt and capital lease obligations | € | 28,204 | € | 4,572 | € | 43,320 | € | 7,045 | ||||
Korea Exchange Bank revolving loans, Bakelite Korea, 17.3 bil Korean won line of credit, interest 6.5-7.0% per annum, payable monthly, accounts receivable of Bakelite Korea pledged as collateral | 11,652 | 4,725 | ||||||||||
Working capital revolving loans, various banks, Taro Plast S.p.A, total available €16,200, variable interest rates, range of 2,3% to 7.4% per annum | 6,378 | 7,800 | ||||||||||
Other | 2,751 | 2,127 | ||||||||||
Total debt, capital lease obligations and revolving loans | € | 28,204 | € | 25,353 | € | 43,320 | € | 21,697 | ||||
Bakelite’s non-German entities have available lines of credit for an authorized total amount of €75,898. As of December 31, 2004, they had unused lines of credit amounting to €34,102. Bakelite’s German entities participate in a cash pooling arrangement with Rütgers to provide operating cash flow requirements (Note 15).
F-270
Table of Contents
Resin Business of the Bakelite Group
Notes to the Combined Financial Statements—(Continued)
(Euro amounts in thousands unless otherwise stated)
Rütgers and Bakelite AG provide letters of comfort to lenders of Bakelite’s non-German subsidiaries. Rütgers and Bakelite AG generally commit to use their influence as shareholders to assure that the subsidiaries adhere to the terms of each loan. In addition, Rütgers has provided letters of comfort to lenders of Bakelite AG and MGS. These letters generally provide that Rütgers will use its shareholder influence and maintain its profit sharing relationship to help assure that the subsidiaries adhere to the terms of each loan (Note 12). The profit sharing agreement between Rütgers and BAG and the above mentioned letters are intended to be terminated prior to the consummation of the sale of Bakelite to Borden Chemical, Inc. (Note 17).
Capital Lease—EVO steam plant.In January 2001, Bakelite entered into an arrangement with EVO, a third party utility supplier (the “lessor”), to lease certain steam generation facilities (the “steam plant”). The lease contract was classified as a capital lease due to the existence of a bargain purchase option. During 2003, Bakelite began construction of a separate manufacturing facility that would produce steam as a by-product in quantities sufficient to meet Bakelite’s prospective needs. The analysis performed by management did not indicate that an impairment existed as of the assessment date.
In April 2004, Bakelite, Rütgers Chemicals AG (“RC”), a wholly owned subsidiary of Rütgers, and the lessor entered into a tripartite agreement to transfer Bakelite’s obligations under the lease arrangement to RC. The steam plant, as an asset to be distributed to a subsidiary of Bakelite’s owners, was reduced to its fair value prior to the transfer. As such, an impairment loss of €2,317 was recognized at the time of transfer of the steam plant to RC, as the carrying amount of the asset exceeded its fair value. Upon execution of the transfer agreement, Bakelite derecognized the leased asset and the related lease obligation from its Combined Balance Sheets and made a cash payment of €700 to RC, the net impact of which has been reflected as a dividend to Rütgers in the Combined Financial Statements. Further, Bakelite paid a €400 termination penalty to the lessor, which was recorded as a General and administrative expense in the Combined Financial Statements in connection with the transfer.
Additionally, under the agreement, Bakelite will pay an annual service fee of €210 to RC allowing the continued use of the steam plant only during times when Bakelite’s plant that generates steam as a by-product undergoes maintenance. Such service fees are recognized as a component of cost of goods sold ratably in each annual period.
Aggregate maturities of debt and capital lease obligations at December 31, 2004 are as follows:
Year ending December 31, | Aggregate Maturities | ||
2005 | € | 25,353 | |
2006 | 6,867 | ||
2007 | 7,418 | ||
2008 | 8,365 | ||
2009 | 1,445 | ||
2010 and beyond | 4,108 | ||
| € | 53,556 | ||
Operating Lease Commitments. Bakelite leases certain land, buildings, cars and office equipment from unrelated parties. Rent expense was €1,553, €1,720 and €1,597 for the years ended December 31, 2004, 2003 and 2002, respectively.
F-271
Table of Contents
Resin Business of the Bakelite Group
Notes to the Combined Financial Statements—(Continued)
(Euro amounts in thousands unless otherwise stated)
Future minimum lease payments under all non-cancellable capital and operating leases as of December 31, 2004 are as follows:
Year ending December 31, | Capital leases | Operating leases | |||||
2005 | € | 214 | € | 1,486 | |||
2006 | 156 | 1,462 | |||||
2007 | 123 | 1,418 | |||||
2008 | 96 | 1,364 | |||||
2009 | 97 | 1,397 | |||||
2010 and thereafter | 140 | 2,143 | |||||
| 826 | € | 9,270 | |||||
Less: Interest (at rates ranging from 4% to 9%) | (159 | ) | |||||
Amounts reflected in debt summary | |||||||
Present value of minimum lease payments | 667 | ||||||
Less: Current portion | 167 | ||||||
Long-term portion of obligations | € | 500 | |||||
Note 10—Derivative Financial Instruments
Strategy and objectives during the normal course of business.Bakelite is exposed to foreign currency risk, commodity price risk and interest rate risk. These risks create volatility in earnings and cash flows from period to period. Bakelite has, in the past, made use of derivative instruments in various strategies to eliminate or limit a portion of its foreign currency risk. Bakelite has also hedged its interest rate risk to a limited extent. Bakelite does not hedge commodity price risk. Bakelite is not always able to immediately pass through commodity price increases to the customers. As a result, in periods of rising commodity prices, Bakelite is exposed to short term commodity price risk. Bakelite does not use derivative instruments for speculative purposes.
Foreign currency derivatives.Bakelite has forecasted transactions denominated in foreign currencies (principally United States dollars, British pounds and Czech crown). Bakelite seeks to economically hedge a portion of the foreign currency risk arising from foreign exchange receivables and foreign currency-denominated forecasted transactions. Forwards and foreign exchange swaps are used to fix or protect the exchange rate to be used for foreign currency-denominated transactions. Hedge accounting is not applied in the Combined Financial Statements of Bakelite. At December 31, 2004 and 2003, the fair market value of the foreign exchange derivatives were €135 and €(268) respectively. At December 31, 2004, these were recorded within Other current liabilities and within Other current receivables in the Combined Balance Sheets. The changes in fair value were recorded in Other operating expense, net, in the Combined Statement of Operations.
Interest rate swap.Bakelite has managed it cash flow volatility a debt instrument with variable cash outflows through the use of an interest rate swap. Hedge accounting is not applied. At December 31, 2004 and 2003, the fair market values of the interest rate swap were €(567) and €(714) respectively, which were recorded within Other long-term liabilities in the Combined Balance Sheets. The changes in fair value were recorded in Other non-operating expense, net in the Combined Statements of Operations.
Embedded Derivatives. Bakelite has no material embedded derivative instruments.
F-272
Table of Contents
Resin Business of the Bakelite Group
Notes to the Combined Financial Statements—(Continued)
(Euro amounts in thousands unless otherwise stated)
Valuation of derivative instruments. The fair value of derivative instruments is sensitive to movements in the underlying market rates and variables. Bakelite monitors the fair value of derivative instruments on a periodic basis. Foreign currency forwards and interest rate swaps are valued using forward rates observed from quoted prices in the relevant markets when possible.
Counterparty risk from the use of derivative financial instruments.Bakelite is exposed to credit (or repayment) risk and market risk through the use of derivative instruments. If the counterparty fails to fulfill its performance obligations under a derivative contract, Bakelite’s credit risk will equal the fair value gain in a derivative. Currently, when the fair value of a derivative contract is positive, this indicates that the counterparty owes Bakelite, thus creating a repayment risk for Bakelite. When the fair value of a derivative contract is negative, Bakelite owes the counterparty and, therefore, assumes no repayment risk. In order to minimize the credit risk in derivative instruments, Bakelite enters into transactions with high-quality financial institution counterparties that satisfy Bakelite’s credit approval criteria.
Note 11—Fair Value of Financial Instruments
The fair value of a financial instrument is the estimated amount at which the instrument could be exchanged in a current transaction between willing parties, other than in a forced or liquidation sale. Fair values are determined from quoted market prices where available or based on other similar financial instruments.
The carrying amounts of cash and cash equivalents, accounts receivable, accounts payable and other accruals are considered reasonable estimates of their fair values. Management estimates that the carrying amount of debt and capital lease obligations are also reasonable estimates of their fair value based on discussions with Bakelite’s lenders.
The following table includes the notional amounts and fair values of Bakelite’s derivative financial instruments.
| December 31, | ||||||||||||||
| 2004 | 2003 | |||||||||||||
Notional Amount | Fair Value | Notional Amount | Fair Value | |||||||||||
Derivatives relating to: | ||||||||||||||
Foreign currency contracts | € | 5,961 | € | 135 | € | 5,956 | € | (268 | ) | |||||
Interest rate swaps | € | 6,000 | € | (567 | ) | € | 6,250 | € | (714 | ) | ||||
Note 12—Guarantees and Indemnifications
Standard Guarantees / Indemnifications:In the ordinary course of business, Bakelite enters into numerous agreements that contain standard guarantees and indemnities whereby Bakelite indemnifies another party for, among other things, breaches of representations and warranties. Such guarantees or indemnifications are granted under various agreements, including those governing (i) purchases and sales of assets or businesses, (ii) leases of real property, (iii) licenses of intellectual property, (iv) long-term supply agreements and (v) agreements with public authorities on subsidies received for designated research and development projects. The guarantees or indemnifications issued are for the benefit of the (i) buyers in sale agreements and sellers in purchase agreements, (ii) landlords or lessors in lease contracts, (iii) licensors or licensees in license agreements, (iv) vendors or customers in long-term supply agreements and (v) governments or agencies subsidizing research or development.
F-273
Table of Contents
Resin Business of the Bakelite Group
Notes to the Combined Financial Statements—(Continued)
(Euro amounts in thousands unless otherwise stated)
Bakelite has not entered into any significant agreements subsequent to January 1, 2003 that would require it, as a guarantor, to recognize a liability for the fair value of obligations it has undertaken in issuing the guarantee.
Subsidiary Guarantees:Bakelite AG has issued letters of comfort for €8,540 of bank debt of several non-German subsidiaries. In addition, Bakelite AG guarantees the open payables from certain vendors of Bakelite Korea and Bakelite s.r.o. related to the purchase of raw materials.
Furthermore, Rütgers has issued letters of comfort for bank and lease debt and other liabilities of Bakelite AG, Bakelite Italia, Bakelite Korea, Bakelite Oy and Bakelite UK for liabilities totalling €39,629 at December 31, 2004. These letters of comfort are intended to be terminated prior to the consummation of the sale of Bakelite to Borden Chemical, Inc. (Note 17).
Contingent Purchase Consideration:In 2002 the acquisition agreement of Bakelite Korea included a contingent purchase consideration provision based on achievement of certain targeted earnings before interest and taxes. The maximum payment amount was €4,181 (Note 5). In 2004, the contingent consideration was resolved as Bakelite Korea did not exceed the average earnings targets for three consecutive years as stipulated in the purchase agreement. The deferred credit was recognized as a pro-rata reduction of certain non-current assets.
The purchase agreement for the acquisition of order books from Neste-Meerbeck contained contingent considerations of €1,398 as of December 31, 2004.
Warranties:Bakelite does not make express warranties on its products, other than that they comply with Bakelite’s specifications; therefore, Bakelite does not record a warranty liability. Adjustments for product quality claims are not material and are charged against sales revenue.
Note 13—Commitments and Contingencies
Environmental commitments and contingencies.Bakelite has responsibilities for environmental cleanup under various state, local and federal laws in the countries in which it operates as a result of Bakelite’s operations that involve the use, handling, processing, storage, transportation and disposal of hazardous materials. Based on management’s estimates, which are determined through historical experience Bakelite has recorded liabilities of €288 and €760 at December 31, 2004 and 2003, respectively, for all probable and estimable environmental remediation activities. These accruals primarily represent two cases at the Solbiate, Italy site where remediation was performed for asbestos-containing materials identified on site and where remediation was assessed by local authorities for cumene contamination discovered. The removal of asbestos-containing materials for insulation on pipelines began in 2003 and was finalized in August 2004. This removal was not required under local law but was carried out voluntarily. The cumene contamination was discovered in 1998 and remediation began in 2000 after investigations by Bakelite and the authorities were finalized. During 2003, it was determined that the remediation procedures carried out since 1998 would be insufficient and further remediation would be required. Based on an agreement with the authorities, the current remediation measures are to be finalized by 2007 and will be performed in stages in the contaminated area. Parallel to the remediation measure, a groundwater monitoring program has been started in 1999 and is ongoing. The accrual contains costs for both the remediation and the monitoring program. For both of these cases management believes the accruals are sufficient to meet the remediation and monitoring activities. Furthermore, management believes it is remote that further remediation or assessments will be made with regard to these contaminations.
F-274
Table of Contents
Resin Business of the Bakelite Group
Notes to the Combined Financial Statements—(Continued)
(Euro amounts in thousands unless otherwise stated)
The following table summarizes the activity in Bakelite’s accrued obligations for environmental matters for the years ended December 31, 2004 and 2003:
| December 31, | ||||||||||||
| 2004 | 2003 | 2002 | ||||||||||
Accrued obligations for environmental matters | ||||||||||||
Balance at January 1 | € | 760 | € | 72 | € | 253 | ||||||
Additional accruals | — | 892 | — | |||||||||
Charges against reserve | (472 | ) | (204 | ) | (153 | ) | ||||||
Adjustments to reserve | — | — | (28 | ) | ||||||||
Total accrued obligations for environmental matters | € | 288 | € | 760 | € | 72 | ||||||
At Bakelite’s site in Duisburg, Germany, a significant tar contamination is located underneath Bakelite’s facilities that are shared with Rütgers Chemicals AG, a subsidiary of Rütgers. This contamination resulted from the demolition of a tar distillation facility located on that site. Although Rütgers Chemicals AG and Bakelite are in discussion with local authorities concerning a proposed remediation plan, the scope and extent of that plan and the costs of its implementation are not yet reasonably estimable. Annually, Bakelite has incurred €45 to €60 for investigation activities. These costs have been contractually shared by Rütgers Chemicals AG (70%) and by Bakelite (30%). Pursuant to the sale of the Resin business of the Bakelite Group, Rütgers will assume all costs related to the investigation activities.
For all other environmental risks to which Bakelite is exposed, management believes it is remote that litigation, assessments or claims will be filed against Bakelite in the future. Management believes these environmental risks cannot be estimated as there has been no indication of required remediation or possible future litigation. However, if litigation or remediation is threatened, the assessment could have a material affect on Bakelite’s results of operations or cash flows in the period of assessment.
Pursuant to the sale of the Resin Business of the Bakelite Group, Rütgers intends to provide indemnifications to Borden Chemical, Inc. with respect to certain environmental liabilities. These indemnifications will be subject to exceptions and limitations. (Note 17).
Customer claims and other litigation.In addition to the environmental-related legal matters discussed above, Bakelite is subject to various product liability, commercial and employment litigation and other legal matters which are considered to be in the ordinary course of business. Bakelite has reserved €245 and €273 at December 31, 2004 and 2003, respectively, relating to an accident at a plant in Spain and the infringement of a patent in Finland.
A claim has been filed against the Spanish subsidiary regarding an accident at the Salcedo Plant which caused the death of an employee of an external contractor. Management has assessed that an unfavorable outcome is probable and has recorded an accrual for the pending claim. In 2001, Ruutteri Oy filed a claim against Bakelite Oy, for the infringement of a patent. Bakelite filed a lawsuit to nullify the patent, which was dismissed. Therefore an unfavorable outcome is probable, and an accrual has been recorded for the estimated settlement amount. Bakelite has not taken into consideration insurance coverage or any anticipated recoveries from third parties in determining the reserve for legal matters.
In Italy, there have been several civil law claims filed against Bakelite related to asbestos-containing materials that were used in production. Italian regulations provide a general fund to pay damages related to
F-275
Table of Contents
Resin Business of the Bakelite Group
Notes to the Combined Financial Statements—(Continued)
(Euro amounts in thousands unless otherwise stated)
asbestos claims by employees, former employees or surviving family members. The surviving family members of two former employees have initiated legal claims against Bakelite, in addition to their claim against the general fund. It is currently unclear whether a claim against Bakelite will be accepted by the Court, or to what damages Bakelite may be exposed. Furthermore, there is another asbestos related employee claim against the Spanish subsidiary. For all of the asbestos related claims, management has assessed the outcome of the litigation to be favorable, and therefore no accrual has been recorded by Bakelite.
For all other legal matters outstanding, most of which are related to product liability, management believes it is remote that the outcome will be unfavorable and thus has not recorded an accrual.
Non-cancellable purchase commitments. Bakelite has non-cancellable purchase agreements for raw materials on the basis of indexed price formulas to ensure market price, with a remaining period of one to three years. The non-cancellable purchase commitments as of December 31, 2004 are as follows:
Year ending December 31, | Amount | ||
2005 | € | 136,925 | |
2006 | 35,689 | ||
2007 | 0 | ||
Total purchase commitments | € | 172,614 | |
The Company has previously recorded expenses of €93,985, €56,646 and €63,588 for the year ended December 31, 2004, 2003, and 2002, respectively, in connection with these non-cancellable purchase commitment agreements. In 2004, the increase in recorded expenses mainly attributable to larger contracted volumes and increases in prices. Included in these expenses are commitments related to toll manufacturing arrangements with unconditional purchase obligations. Under these agreements, Bakelite contracts with a third party supplier to manufacture a minimum amount of raw materials into finished goods. During 2003, management terminated all tolling arrangements which included unconditional purchase obligations related to previous acquisition of orderbooks from competitors. The amount of purchases made for these tolling arrangements in 2003 and 2002 amounted to €2,591 and €4,623, respectively. The charges to terminate these contracts amounted to €800 and €300 during 2003 and 2002, respectively, and are recorded as Other operating expense. In 2004, the amount of purchases made under tolling arrangements with unconditional purchases obligations was €742 and was related to Bakelite Epoxy Polymers Corp. and Bakelite AG.
Note 14—Restructuring Provisions
Restructuring Project 2002. In 2002, Bakelite initiated restructuring activities designed to increase profitability through structural changes and process optimisations in Germany and Italy. The restructuring plan consists of 14 measures, including supplier changes, reducing headcount and streamlining processes. Bakelite achieved a total headcount reduction of 73 employees, as of December 31, 2003. The headcount reduction was achieved through involuntary terminations of 45 employees, 1 by early retirement, and the remainder by natural attrition.
The affected employees were terminated or left Bakelite throughout 2002 and 2003, with the last employee leaving in December 2003. The amount accrued at December 31, 2002 relates to severance costs for employees, who were notified in the fourth quarter of 2002 and paid in the first six months of 2003. Total costs incurred for involuntary terminations were €377 and €270 for the years ended December 31, 2003 and 2002, respectively. Only the costs incurred in Germany qualify as restructuring expenses.
F-276
Table of Contents
Resin Business of the Bakelite Group
Notes to the Combined Financial Statements—(Continued)
(Euro amounts in thousands unless otherwise stated)
Restructuring Project 2003.In November 2003, Bakelite initiated a restructuring program designed to improve operating efficiency of its worldwide facilities and reduce the fixed-cost base of primarily the German and Italian operations. This goal will be achieved by headcount reductions, salary adjustments and streamlining of manufacturing and general administrative functions. The headcount reduction measures in the plan require (i) involuntary terminations by transferring employees to a third party temporary employment agency and (ii) certain eligible employees to enter an early retirement plan, where a reduced work schedule is offered to employees who near retirement. Bakelite intends to achieve a total headcount reduction of 233 employees by the end of 2007 by involuntary terminations (134 employees), early retirement (36 employees) and leave through natural attrition (63 employees). The involuntary termination measures include 11 employees who refused the termination benefits offered by Bakelite and subsequently filed a lawsuit for reemployment. Of the measures to be used in this plan, only the expenses related to the 87 employees who accepted the involuntary termination qualify as restructuring expenses.
Management estimates the costs for the entire plan to be €7,173. The costs, to be incurred in Germany only, qualify as restructuring expenses and were estimated to be €1,846.
The estimated costs accrued for those employees who filed lawsuits as of December 31, 2004 were €40, relating to two remaining employees from the original eleven cases. This amount is recorded in other current liabilities. The comparative amount for 2003 was €420.
The following table reflects the changes in the restructuring provisions:
| Restructuring Project 2003 | Restructuring Project 2002 | Total | ||||||||||
January 1, 2002 | € | — | € | — | € | — | ||||||
Additions | — | 270 | 270 | |||||||||
Utilization | — | (125 | ) | (125 | ) | |||||||
December 31, 2002 | — | 145 | 145 | |||||||||
Additions | 1,273 | 377 | 1,650 | |||||||||
Utilization | (390 | ) | (522 | ) | (912 | ) | ||||||
December 31, 2003 | € | 883 | € | — | € | 883 | ||||||
Additions | 573 | 573 | ||||||||||
Utilization | (1,040 | ) | (1,040 | ) | ||||||||
December 31, 2004 | € | 416 | € | — | € | 416 | ||||||
Note 15—Related Parties
As discussed in Note 1, certain expenses of Rütgers have been pushed down to Bakelite. The expenses relate to tax, environmental and administrative services provided to Bakelite by Rütgers, and are based on allocations of usage deemed reasonable by management. Total expenses recognized by Bakelite were €184, €181 and €181 for each of the years ended December 31, 2004, 2003 and 2002, and are included in General and administrative expense in the Combined Statements of Operations.
The German entities of Bakelite are direct or indirect parties to cash pooling arrangements with Rütgers. Under these agreements, any cash balance is cleared and transferred to Rütgers on a daily basis. The accumulated cash transferred to or from Rütgers bears interest at 3 months EURIBOR plus 0.5% on overdrafts and 3 months
F-277
Table of Contents
Resin Business of the Bakelite Group
Notes to the Combined Financial Statements—(Continued)
(Euro amounts in thousands unless otherwise stated)
EURIBOR minus 0.5% on excess cash balances of Bakelite. Net interest income (expense) recorded related to these arrangements was €621, €(661) and €(1,288) in 2004, 2003 and 2002, respectively, and is recorded in affiliated interest expense, net, in the Combined Statements of Operations.
Under German tax law, Bakelite is subject to an arrangement (the “profit sharing arrangement”) with Rütgers whereby annual net income or net loss is transferred to or compensated by Rütgers each year, in the form of a dividend if Bakelite has net income or in the form of a capital contribution if in a net loss position. Rütgers intends to dissolve this agreement upon the consummation of the sale of Bakelite to Borden Chemicals, Inc.
Rütgers also provides letters of comfort to lenders of certain of Bakelite’s entities. As discussed further in Notes 9 and 12, these letters generally commit Rütgers to use its influence as a shareholder to assure adherence to the terms of the loans.
As discussed in Note 7, at December 31, 2003, Bakelite and Rütgers agreed to transfer certain pensioners from Bakelite to Rütgers in 2004.
Bakelite held a 50% interest in Rütgers Plenco, a joint venture. Note 4 describes the transactions between Bakelite and the former joint venture. The joint venture was terminated in December 2003, and the legal entity was dissolved in 2004.
There are service agreements in place between Bakelite and other entities of RAG AG, primarily for information technology and infrastructure services. Fees paid by Bakelite for these services are recorded in General and administrative expense in the Combined Statements of Operations of €1,389, €1,443 and €1,473 for the years ended December 31, 2004, 2003 and 2002, respectively. In addition, Bakelite purchases certain production materials from related parties, including steam from Rütgers Chemicals AG, and sells products to other entities within Rütgers.
In July 2002, one of Bakelite’s subsidiaries, Bakelite Epoxy Polymers Corp. (“BUS”), entered into an arrangement with Rütgers Organics Corporation (“ROC”), a wholly owned subsidiary of Rütgers, to lease a specialty chemical manufacturing facility in Augusta, Georgia. BUS paid rent and fees for accounting, human resources and information technology services to ROC, net of a management fee received from ROC. BUS also entered into a toll manufacturing arrangement with ROC that allowed ROC to purchase specialty chemicals produced at the facility at direct cost plus allocated overhead.
During 2002, BUS constructed equipment at the facility enabling it to manufacture epoxy resins. These improvements were completed in December 2002, at which time depreciation commenced for the costs capitalized of €2,017. Given the change in plans for the equipment during February 2003, management made the decision to cease operating the equipment by December 31, 2003 and revised the useful life accordingly.
Under the arrangement existing in 2002 and 2003 Bakelite received tolling and management fees of €1,115 and €438, offset by expenses of €440 and €653, in 2003 and 2002 respectively. These net positions are classified within expenses.
Effective January 2004, both parties agreed to terminate the 2002 leasing arrangement and entered into a new arrangement, whereby ROC (i) will resume control of the facility and manufacture epoxy resins for BUS under a toll manufacturing arrangement and (ii) will lease the improvements made by BUS. The toll manufacturing arrangement has an original term of 2 years that can be extended by an additional year unless
F-278
Table of Contents
Resin Business of the Bakelite Group
Notes to the Combined Financial Statements—(Continued)
(Euro amounts in thousands unless otherwise stated)
either party terminates the arrangement. The toll manufacturing fee is based on ROC’s direct costs, allocated overhead and a 10% margin. The tolling arrangement will be accounted for as a service contract.
As part of the new arrangement, ROC will pay BUS €4 per month for the rent of the improvements that BUS constructed at the facility and ROC has the option to purchase the improvements at a bargain purchase price at the end of the original term of the arrangement. During the initial contract periods, Bakelite is required to purchase a minimum quantity of epoxy resins amounting to €263.
During 2004, under the new arrangement, BUS paid tolling fees of €314 and €11 for rent of office space and one vehicle and received lease payments of €48 in respect of the production equipment.
As a result of these transactions, Bakelite has €225 of accounts payable at December 31, 2004, and €141 and €111 of net accounts receivable from ROC at December 31, 2003 and 2002 respectively.
All transactions with related parties as of and for the year ended December 31, 2004, 2003 and 2002 are summarized as follows:
| December 31, 2004 | December 31, 2003 | December 31, 2002 | |||||||||||||||||
| Purchases from | Revenues from | Purchases from | Revenues from | Purchases from | Revenues from | ||||||||||||||
Rütgers | € | 27 | € | 615 | € | — | € | 548 | € | 3 | € | — | |||||||
RAG Informatik | 1,389 | — | 1,443 | — | 1,473 | — | |||||||||||||
Rütgers Chemicals AG | 609 | 7,906 | 2,609 | — | 5,623 | — | |||||||||||||
Bozzetto | 148 | 86 | 93 | 295 | 75 | 771 | |||||||||||||
Rütgers Plenco LLC | — | — | — | 1,281 | — | 1,311 | |||||||||||||
Rütgers Organics Corp.* | 277 | — | (675 | ) | — | 215 | — | ||||||||||||
Other RAG AG Companies | 1 | 133 | 43 | 71 | 43 | 135 | |||||||||||||
Total related party activity | € | 2,451 | € | 8,740 | € | 3,513 | € | 2,195 | € | 7,432 | € | 2,217 | |||||||
| * | revenue and expense are presented net |
All balances with related parties as of and for the year ended December 31, 2004 and 2003 are summarized as follows:
| December 31, 2004 | December 31, 2003 | |||||||||||
| Accounts payable to | Accounts receivable from | Accounts payable to | Accounts receivable from | |||||||||
Rütgers | € | — | € | 17,260 | € | 20,026 | € | 708 | ||||
RAG Informatik | — | 14 | 85 | — | ||||||||
Rütgers Chemicals AG | 201 | 10 | — | 26 | ||||||||
Bozzetto | — | — | — | 93 | ||||||||
Rütgers Plenco LLC | — | — | — | 544 | ||||||||
Rütgers Organics Corp. | 225 | — | — | 141 | ||||||||
Other RAG AG Companies | 303 | 35 | 36 | — | ||||||||
Total related party activity | € | 729 | € | 17,319 | € | 20,147 | € | 1,512 | ||||
F-279
Table of Contents
Resin Business of the Bakelite Group
Notes to the Combined Financial Statements—(Continued)
(Euro amounts in thousands unless otherwise stated)
As also discussed in Note 1, the Combined Financial Statements do not include Bozzetto. No dividends were received in 2004. Dividends received of €13,400 and €5,417 for the years ended December 31, 2003 and 2002, respectively, have been presented as capital contributions, net of related taxes.
It is anticipated that in the event of the sale of Bakelite, various agreements between Bakelite and Rütgers will be terminated, including profit sharing and letter of comfort arrangements.
Note 16—Cash Flow Information
Financing cash flows in the Combined Financial Statements include movements under the cash pooling arrangement, cash transactions related to Bozzetto and funding (dividends) received (paid) under the Rütgers profit sharing arrangements. Following is a summary of these financing transactions:
| December 31, | ||||||||||||
| 2004 | 2003 | 2002 | ||||||||||
Transactions with Rütgers: | ||||||||||||
Cash pooling agreement | € | (36,920 | ) | € | (22,108 | ) | € | (3,363 | ) | |||
Funding under loss transfers (dividends paid) from (to) Rütgers | (33,658 | ) | 16,341 | (10,715 | ) | |||||||
| € | (70,578 | ) | € | (5,767 | ) | € | (14,078 | ) | ||||
Transactions related to Bozzetto: | ||||||||||||
Proceeds from sale of Bozzetto | 101,685 | — | — | |||||||||
Purchase of minority interest in Bozzetto | — | (10,397 | ) | — | ||||||||
Bozzetto dividends received, net of distribution to minorities | — | 13,400 | 5,417 | |||||||||
| € | 101,685 | € | 3,003 | € | 5,417 | |||||||
Following is a summary of cash paid for:
| December 31, | |||||||||
| 2004 | 2003 | 2002 | |||||||
Income taxes | € | 1,473 | € | 6,086 | € | 4,337 | |||
Interest | € | 3,735 | € | 3,841 | € | 2,889 | |||
Note 17—Subsequent Events
At the end of 2004, all appropriate corporate bodies of Bakelite approved an agreement for the sale of the shares of Bakelite AG to Borden Chemical, Inc. through its foreign subsidiary, National Borden Chemical Germany, GmbH. Subsequent to the consummation of such transaction, Bakelite does not expect to have material financial commitments, guarantees, or contingent liabilities to, or from, any RAG AG companies, including the non-resin businesses of Rütgers or Bozzetto. Concurrent with the closing, Rütgers has committed to indemnify Borden Chemical, Inc. and Bakelite against claims for certain environmental, legal and other matters, subject to terms and conditions specified in the agreement. Pursuant to the sale of Bakelite, Rütgers established a bonus arrangement with the executive management of Bakelite. The bonus arrangement is payable only upon closing by Rütgers.
With effect from January 2005 an agreement was reached between Rütgers, BAG and the Company’s workers council to cancel the old compensation agreement. Based on the new agreement, Rütgers will bear the total cost that will be paid out by Bakelite to its affected employees.
F-280
Table of Contents
Resin Business of the Bakelite Group
Notes to the Combined Financial Statements—(Continued)
(Euro amounts in thousands unless otherwise stated)
On April 12, 2005 the European Commission cleared the proposed acquisition of Bakelite AG by the investment group Apollo, subject to conditions. The commission found that the proposed transaction could give rise to competition concerns in the fields of phenolic resins for refractory materials and reactive diluents for epoxy systems. However, the parties have offered remedies that alleviate the concerns identified by the Commission.
Specifically, the parties agreed to license a “technology package” to their customers, who could then sub-license it to alternative suppliers. In addition, the parties offered to enter into long term supply agreements to secure supply and pricing conditions for Cardura™ , a specific type of diluent, with any direct customer which uses it in epoxy formulated systems.
F-281
Table of Contents
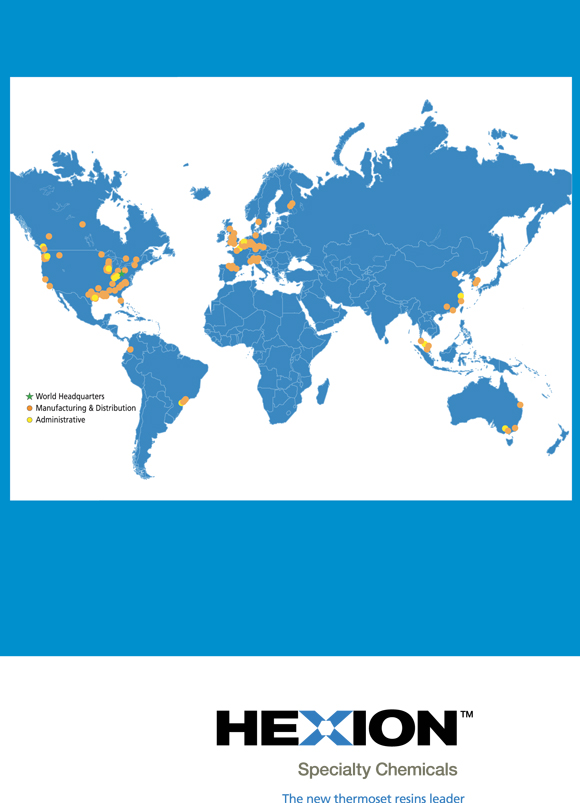
Table of Contents

Table of Contents
PART II
INFORMATION NOT REQUIRED IN PROSPECTUS
ITEM 13 OTHER EXPENSES OF ISSUANCE AND DISTRIBUTION
The following table sets forth the expenses payable by the Registrant in connection with the issuance and distribution of the ordinary shares being registered hereby. All of such expenses are estimates, other than the filing and quotation fees payable to the Securities and Exchange Commission, the National Association of Securities Dealers, Inc. and the New York Stock Exchange.
SEC Registration Fee | $ 94,160 | |
Printing and Engraving Expenses | $ 1,000,000 | |
Legal Fees and Expenses | $ 5,000,000 | |
Accounting Fees and Expenses | $ 5,000,000 | |
Transfer Agent and Registrar Fees and Expenses | $ 10,000 | |
New York Stock Exchange Listing Fees | $ 125,000 | |
NASD Filing Fee | $ 75,500 | |
Miscellaneous | $ 3,695,340 | |
Total | $15,000,000 | |
ITEM 14 INDEMNIFICATION OF DIRECTORS AND OFFICERS
The New Jersey Business Corporation Act provides that a New Jersey corporation has the power to indemnify a director or officer against his or her expenses and liabilities in connection with any proceeding involving the director or officer by reason of his or her being or having been such a director or officer, other than a proceeding by or in the right of the corporation, if such a director or officer acted in good faith and in a manner he or she reasonably believed to be in or not opposed to the best interests of the corporation; and with respect to any criminal proceeding, such director or officer had no reasonable cause to believe his or her conduct was unlawful.
The indemnification and advancement of expenses shall not exclude any other rights, including the right to be indemnified against liabilities and expenses incurred in proceedings by or in the right of the corporation, to which a director or officer may be entitled under a certificate of incorporation, by-law, agreement, vote of shareholders, or otherwise; provided that no indemnification shall be made to or on behalf of a director or officer if a judgment or other final adjudication adverse to the director or officer establishes that his or her acts or omissions (a) were in breach of his or her duty of loyalty to the corporation or its shareholders, (b) were not in good faith or involved a knowing violation of law or (c) resulted in receipt by the director or officer of an improper personal benefit.
The registrant’s Restated Certificate of Incorporation provides that every person who is or was a director or an officer of the corporation shall be indemnified by the corporation to the fullest extent allowed by law, including the indemnification permitted by New Jersey Business Corporation Act §14A:3-5(8), against all liabilities and expenses imposed upon or incurred by that person in connection with any proceeding in which that person may be made, or threatened to be made, a party, or in which that person may become involved by reason of that person being or having been a director or an officer of or of serving or having served in any capacity with any other enterprise at the request of the corporation, whether or not that person is a director or an officer or continues to serve the other enterprise at the time the liabilities or expenses are imposed or incurred. During the pendency of any such proceeding, the corporation shall, to the fullest extent permitted by law, promptly advance expenses that are incurred, from time to time, by a director or an officer in connection with the proceeding, subject to the receipt by the corporation of an undertaking as required by law.
In addition, the registrant has obtained liability insurance coverage for its directors and officers, which insures against liabilities that directors and officers may incur while acting in such capacities. These policies contain standard exclusions and endorsements.
II-1
Table of Contents
ITEM 15 RECENT SALES OF UNREGISTERED SECURITIES
During the past three years, we have issued unregistered securities to a limited number of persons, as described below. None of these transactions involved any underwriters or any public offerings and we believe that each of these transactions was exempt from registration requirements pursuant to Section 3(a)(9) or Section 4(2) of the Securities Act of 1933, as amended, Regulation D promulgated thereunder, Rule 144A of the Securities Act of 1933, as amended or Rule 701 of the Securities Act of 1933 pursuant to compensatory benefit plans and contracts related to compensation as provided under Rule 701. The recipients of the securities in these transactions represented their intention to acquire the securities for investment only and not with a view to or for sale in connection with any distribution thereof, and appropriate legends were affixed to the share certificates and instruments issued in these transactions.
On June 9, 2002 Borden Chemical sold 111,111 shares of its common stock to Executive Vice President Joseph P. Bevilaqua at a price of $2.25 per share, and granted him options to purchase 105,333 shares of common stock at $2.25 per share, and 529,100 shares of restricted common stock.
On December 18, 2002, Resolution Performance Products LLC and RPP Capital Corporation issued an aggregate of $53,000,000 of its 13 1/2% senior subordinated notes due 2010 to a group of placement agents led by Morgan Stanley & Co. Incorporated, Credit Suisse First Boston, J.P. Morgan Securities Inc. and Salomon Smith Barney Inc.
On April 9, 2003, Resolution Performance Products LLC and RPP Capital Corporation issued an aggregate of $175,000,000 of its 9 1/2% senior second secured notes due 2010. On May 22, 2003, RPP issued an additional $25,000,000 of its 9 1/2% senior second secured notes due 2010. In both cases, the senior secured notes were sold to a group of placement agents led by Morgan Stanley & Co. Incorporated, Citigroup Capital Markets Inc., Credit Suisse First Boston LLC and Salomon Smith Barney Inc.
In October 2003, Borden Chemical granted options to purchase 3,457,500 shares of its common stock to key employees. On February 1, 2004 Borden Chemical granted options to purchase a total of 330,000 shares of common stock to three key managers. The options vest ratably over five years and have an exercise price of $2.00 per share.
On December 22, 2003, Resolution Performance Products LLC and RPP Capital Corporation issued an aggregate of $140,000,000 of its 8% senior secured notes due 2009 to a group of placement agents led by Morgan Stanley & Co. Incorporated, Citigroup Capital Markets Inc., Credit Suisse First Boston LLC and Salomon Smith Barney Inc.
On August 12, 2004, Borden U.S. Finance Corp. and Borden Nova Scotia, ULC issued an aggregate of $150,000,000 of its second-priority senior secured floating rate notes due 2010 and an aggregate of $325,000,000 of its 9% second-priority senior secured notes due 2014 to a group of initial purchasers led by Credit Suisse First Boston LLC, J.P. Morgan Securities Inc. and Morgan Stanley & Co. Incorporated.
On May 20, 2005, BCI U.S. Finance Corp. and Borden 2 Nova Scotia, ULC, each of wholly-owned finance subsidiary of Hexion sold $150 million of Second-Priority Senior Secured Floating Rate Notes due 2010.
On May 20, 2005, Hexion Escrow Corp., a wholly-owned subsidiary of Hexion sold 14,000,000 shares of Series A Floating Rate Preferred Stock with an aggregate liquidiation value of $350 million.
II-2
Table of Contents
ITEM 16 EXHIBITS AND FINANCIAL STATEMENT SCHEDULES
(a) Exhibits
Exhibit Number | Description of Document | |
| 1.1 | Form of Underwriting Agreement for the Common Stock | |
| 2.1***† | Transaction Agreement dated as of April 22, 2005 among RPP Holdings LLC, Resolution Performance Products Inc., Resolution Performance Products LLC, Resolution Specialty Materials Holdings LLC, Resolution Specialty Materials LLC, Lawter International Inc., BHI Acquisition Corp., BHI Merger Sub Inc., and Borden Chemical Inc. | |
| 2.2**† | Amended and Restated Master Sale Agreement (US) dated as of November 14, 2000 among Shell Oil Company, Resin Acquisition, LLC and Resolution Performance Products Inc. (incorporated by reference to Exhibit 2.1 to Resolution Performance’s Registration Statement on Form S-4 filed on March 16, 2001 (File No. 333-57170)) | |
| 2.3**† | Amended and Restated SPNV Resins Sale Agreement dated as of November 14, 2000 between Shell Oil Company and Resolution Performance Products Inc. (incorporated by reference to Exhibit 2.2 to Resolution Performance’s Registration Statement on Form S-4 filed on March 16, 2001 (File No. 333-57170)) | |
| 2.4** | Assignment and Assumption Agreement dated November 13, 2000 between Resolution Performance Products Inc. and Resolution Performance Products LLC (incorporated by reference to Exhibit 2.3 to Resolution Performance’s Registration Statement on Form S-4 filed on March 16, 2001 (File No. 333-57170)) | |
| 2.5** | Assignment and Assumption Agreement dated November 14, 2000 between Resin Acquisition, LLC and RPP Holdings LLC (incorporated by reference to Exhibit 2.4 to Resolution Performance’s Registration Statement on Form S-4 filed on March 16, 2001 (File No. 333-57170)) | |
| 3.1 | Form of Amended and Restated Certificate of Incorporation of Hexion Specialty Chemicals, Inc. | |
| 3.2 | Form of Amended Bylaws of Hexion Specialty Chemicals, Inc. | |
| 3.3** | Amended and Restated Certificate of Incorporation of Hexion dated January 11, 2005 (incorporated by reference to Exhibit 3.5 to Hexion’s Registration Statement on Form S-4 filed on December 27, 2005 (File No. 333-122826)). | |
| 3.4** | Amended and Restated Bylaws of Borden Chemical dated December 15, 2004 (incorporated by reference to Exhibit (3)(ii) to the Form 10-K filed on March 24, 2005 (File No. 001-00071)) | |
| 4.1*** | Form of Certificate of Common Stock | |
| 4.2** | Form of Indenture between the Registrant and The First National Bank of Chicago, as Trustee, dated as of January 15, 1983, as supplemented by the First Supplemental Indenture dated as of March 31, 1986, and the Second Supplemental Indenture, dated as of June 26, 1996, relating to the $200,000,000 8 3/8% Sinking Fund Debentures due 2016, incorporated herein by reference from Exhibits (4)(a) and (b) to Amendment No. 1 to Registration Statement on Form S-3, File No. 33-4381 and Exhibit (4)(iv) to the June 30, 1996, Form 10-Q. | |
| 4.3** | Form of Indenture between Borden Chemical and The Bank of New York, as Trustee, dated as of December 15, 1987, as supplemented by the First Supplemental Indenture dated as of December 15, 1987, and the Second Supplemental Indenture dated as of February 1, 1993, and the Third Supplemental Indenture dated as of June 26, 1996, (incorporated herein by reference from Exhibits (4)(a) through (d) to Borden Chemical’s Registration Statement on Form S-3, File No. 33-45770 and Exhibit (4)(iii) to the June 30, 1996, Form 10-Q filed on August 14, 1996 (File No. 001-00071)), relating to the following Debentures and Notes: | |
| (a) The $200,000,000 9 1/5% Debentures due 2021. | ||
| (b) The $250,000,000 7 7/8% Debentures due 2023. | ||
II-3
Table of Contents
Exhibit Number | Description of Document | |
| 4.4** | Indenture dated as of August 12, 2004 among Borden U.S. Finance Corp. and Borden Nova Scotia Finance, ULC, as Issuers, Borden Chemical, and Wilmington Trust Company, as Trustee, relating to: (a) the $150,000,000 Second-Priority Senior Secured Floating Rate Notes due 2010 and (b) the $325,000,000 9% Second-Priority Senior Secured Notes due 2014 (incorporated by reference to Exhibit 4(i) to Borden Chemical’s Form 10-Q filed on November 15, 2004, File No. 001-00071) | |
| 4.5** | Indenture, dated as of November 14, 2000, among Resolution Performance Products LLC, RPP Capital Corporation and The Bank of New York, as trustee, relating to 13 1/2% Senior Subordinated Notes Due 2010 (incorporated by reference to Exhibit 4.1 to Resolution Performance’s Registration Statement on Form S-4 filed on March 16, 2001 (File No. 333-57170)) | |
| 4.6** | Form of 13 1/2% Senior Subordinated Note Due 2010 (included as Exhibit B to Exhibit 4.9) | |
| 4.7*** | Indenture dated as of May 20, 2005 among BCI US Finance Corp., Borden 2 Nova Scotia Finance, ULC, as Issuers, Hexion Specialty Chemicals, Inc. and Wilmington Trust Company, as Trustee, relating to the $150,000,000 Second-Priority Senior Secured Floating Rate Notes due 2010 | |
| 4.8*** | First Supplemental Indenture, dated as of May 31, 2005 among RPP Capital Corporation, Resolution Specialty Materials, LLC, Resolutions’ JV LLC, Lawter International, Inc., Resolution Specialty Materials Capital Corp., Borden Chemical International, Inc., Bakelite North America Holding Company, Bakelite Epoxy Polymers Corporation, Oilfield Technology Group, Inc. and Borden Services Company, as Additional Subsidiary Guarantors, Hexion Specialty Chemicals, Inc., Borden U.S. Finance Corp. and Borden Nova Scotia Finance, ULC and Wilmington Trust Company, as Trustee to the Indenture dated as of August 12, 2004 among Borden U.S. Finance Corp., Borden Nova Scotia Finance, ULC, as Issuers, Borden Chemical and Wilmington Trust Company, as Trustee relating to: (a) the $150,000,000 Second-Priority Senior Secured Floating Rate Notes due 2010 and (b) the $325,000,000 9% Second-Priority Senior Secured Notes due 2014 | |
| 4.9*** | Supplemental Indenture dated as of May 31, 2005 among Borden U.S. Finance Corp., Borden Nova Scotia Finance, ULC, the guarantors named therein and Wilmington Trust Company, as Trustee to the Indenture dated May 20, 2005 among BCI US Finance Corp. and Borden 2 Nova Scotia Finance, ULC, as Issuers, Hexion Specialty Chemicals, Inc. and Wilmington Trust Company, as Trustee relating to the $150,000,000 Second-Priority Senior Secured Floating Rate Notes due 2010 | |
| 4.10*** | First Supplemental Indenture dated as of May 31, 2005, among Resolution Performance Products Corp., RPP Capital Corporation, the guarantors named therein and The Bank of New York, as Trustee, to the Indenture dated as of November 14, 2000, among Resolution Performance Products LLC, RPP Capital Corporation and The Bank of New York, as Trustee, relating to 13 1/2% Senior Subordinated Notes Due 2010 | |
| 4.11** | Second Supplemental Indenture dated as of May 31, 2005, among Hexion Specialty Chemicals, Inc., RPP Capital Corporation, the guarantors named therein and The Bank of New York, as Trustee, to the Indenture dated as of November 14, 2000, as supplemented, among Resolution Performance Products LLC, RPP Capital Corporation and The Bank of New York, as Trustee, relating to 13 1/2% Senior Subordinated Notes Due 2010 | |
| 4.12 | Second Supplemental Indenture dated as of December 23, 2005 among Hexion U.S. Finance Corp., Hexion Nova Scotia Finance, ULC, Hexion Specialty Chemicals, Inc., Hexion CI Holding Company (China) LLC and Wilmington Trust Company, as Trustee to the Indenture dated August 12, 2004 among Borden U.S. Finance Corp., Borden Nova Scotia Finance, ULC, as Issuers, Borden Chemical, Inc. and Wilmington Trust Company, as Trustee relating to: (a) the $150,000,000 Second-Priority Senior Secured Floating Rate Notes due 2010 and (b) the $325,000,000 9% Second-Priority Senior Secured Notes due 2014 | |
II-4
Table of Contents
Exhibit Number | Description of Document | |
| 4.13 | Second Supplemental Indenture dated as of December 23, 2005 among Hexion U.S. Finance Corp., Hexion Nova Scotia Finance, ULC, Hexion Specialty Chemicals, Inc., Hexion CI Holding Company (China) LLC and Wilmington Trust Company, as Trustee to the Indenture dated May 20, 2005 among BCI US Finance Corp. and Borden 2 Nova Scotia Finance, ULC, as Issuers, Hexion Specialty Chemicals, Inc. and Wilmington Trust Company, as Trustee relating to the $150,000,000 Second-Priority Senior Secured Floating Rate Notes due 2010 | |
| 4.14 | Third Supplemental Indenture dated as of December 23, 2005, among Hexion Specialty Chemicals, Inc., HSC Capital Corporation, the guarantors named therein and The Bank of New York, as Trustee, to the Indenture dated as of November 14, 2000, as supplemented among Resolution Performance Products LLC, RPP Capital Corporation and The Bank of New York, as Trustee, relating to 13 1/2% Senior Subordinated Notes Due 2010. | |
| 4.15 | Fourth Supplemental Indenture dated as of May 5, 2006, among Hexion Specialty Chemicals, Inc., HSC Capital Corporation, the guarantors named therein and The Bank of New York, as Trustee, to the Indenture dated as of November 14, 2000, as supplemented among Resolution Performance Products LLC, RPP Capital Corporation and The Bank of New York, as Trustee, relating to 13 1/2% Senior Subordinated Notes Due 2010. | |
| 5.1 | Opinion of Connell Foley LLP | |
| 10.1** | Amended and Restated Executive Supplemental Pension Plan, dated as of January, 1996 (incorporated by reference to Exhibit (10)(xiii) to Borden Chemical’s December 31, 1998 Form 10-K filed on March 31, 1999 (File No. 001-00071)) | |
| 10.2** | Advisory Directors Plan incorporated by reference to Exhibit 10(viii) to Borden Chemical’s 1989 Form 10-K Annual Report. | |
| 10.3** | Perquisite Benefits Policy (incorporated by reference to Exhibit (10)(xviii) to Borden Chemical’s December 31, 2001 Form 10-K filed on March 29, 2002 (File No. 001-00071)) | |
| 10.4** | Master Asset Conveyance and Facility Support Agreement, dated as of December 20, 2002, between Borden Chemical and Borden Chemicals and Plastics Operating Limited Partnership (incorporated by reference to Exhibit (10)(xxvi) to Borden Chemical’s December 31, 2002 Form 10-K filed on March 28, 2003 (File No. 001-00071)) | |
| 10.5** | Environmental Servitude Agreement, dated as of December 20, 2002, between Borden Chemical and Borden Chemicals and Plastics Operating Limited Partnership (incorporated by reference to Exhibit (10)(xxvii) to Borden Chemical’s December 31, 2002 Form 10-K filed on March 28, 2003 (File No. 001-00071)) | |
| 10.6** | Stock Purchase Agreement dated as of July 5, 2004 among BHI Investment, LLC, BW Holdings LLC, Borden Holdings, Inc. Borden Chemical, Inc. Craig O. Morrison and Joseph P. Bevilaqua (incorporated by reference to Exhibit (10)(i) to Borden Chemical’s June 30, 2004 Form 10-Q filed on July 26, 2004 (File No. 001-00071)) | |
| 10.7** | Amended and Restated Employment Agreement dated as of August 12, 2004 between the Company and Craig O. Morrison (incorporated by reference to Exhibit 10(i) to Borden Chemical’s September 30, 2004 Form 10-Q filed on November 15, 2004 (File No. 001-00071)) | |
| 10.8** | Amended and Restated Employment Agreement dated as of August 12, 2004 between the Company and Joseph P. Bevilaqua (incorporated by reference to Exhibit 10(ii) to Borden Chemical’s September 30, 2004 Form 10-Q filed on November 15, 2004 (File No. 001-00071)) | |
| 10.9** | Amended and Restated Employment Agreement dated as of August 12, 2004 between the Company and William H. Carter. (incorporated by reference to Exhibit 10(iii) to Borden Chemical’s September 30, 2004 Form 10-Q filed on November 15, 2004 (File No. 001-00071)) | |
II-5
Table of Contents
Exhibit Number | Description of Document | |
| 10.10** | BHI Acquisition Corp. 2004 Deferred Compensation Plan (incorporated by reference to Exhibit 10(iv) to Borden Chemical’s September 30, 2004 Form 10-Q filed on November 15, 2004 (File No. 001-00071)) | |
| 10.11** | BHI Acquisition Corp. 2004 Stock Incentive Plan (incorporated by reference to Exhibit 10(v) to Borden Chemical’s September 30, 2004 Form 10-Q filed on November 15, 2004 (File No. 001-00071)) | |
| 10.12** | Investor Rights Agreement dated as of August 12, 2004 among BHI Acquisition Corp., and The Holders that are parties thereto (incorporated by reference to Exhibit 10(vi) to Borden Chemical’s September 30, 2004 Form 10-Q filed on November 15, 2004 (File No. 001-00071)) | |
| 10.13** | Registration Rights Agreement dated as of August 12, 2004 among BHI Acquisition Corp., BHI Investment, LC, and the Management Holders party thereto (incorporated by reference to Exhibit 10(vii) to Borden Chemical’s September 30, 2004 Form 10-Q filed on November 15, 2004 (File No. 001-00071)) | |
| 10.14** | Amendment No. 1 dated as of August 11, 2004, to the Stock Purchase Agreement dated July 5, 2004 by and among BHI Investment, LLC, Borden Holdings, Inc., Borden Chemical, Inc., Craig O. Morrison and Joseph P. Bevilaqua (incorporated by reference to Exhibit 10(viii) to the Form 10-Q filed on November 15, 2004 (File No. 001-00071)) | |
| 10.15** | Management Consulting Agreement dated as of August 12, 2004 between Borden Chemical, Inc. and Apollo Management V, L.P. (incorporated by reference to Exhibit 10(ix) to Borden Chemical’s September 30, 2004 Form 10-Q filed on November 15, 2004 (File No. 001-00071)) | |
| 10.16** | Share Purchase Agreement dated October 6, 2004 among RÜTGERS AG, RÜTGERS Bakelite Projekt GmbH, National Borden Chemical Germany GmbH, and Borden Chemical, Inc. (incorporated by reference to Exhibit 10(xi) to Borden Chemical’s September 30, 2004 Form 10-Q filed on November 15, 2004 (File No. 001-00071)) | |
| 10.17** | Secured Promissory Note dated August 10, 2001 from Jeffrey M. Nodland to Resolution Performance Product LLC (incorporated by reference to Exhibit 10.2 to Resolution Performance’s September 30, 2004 Form 10–Q filed on November 14, 2001 (File No. 333-57170)) | |
| 10.18** | Pledge Agreement dated August 10, 2001 between Jeffrey M. Nodland and Resolution Performance Products LLC (incorporated by reference to Exhibit 10.3 to Resolution Performance’s September 30, 2001 Form 10–Q filed on November 14, 2001 (File No. 333-57170)) | |
| 10.19** | Secured Promissory Note dated June 18, 2001 from Mark S. Antonvich to Resolution Performance Products LLC (incorporated by reference to Exhibit 10.4 to Resolution Performance’s September 30, 2001 Form 10–Q filed on November 14, 2001 (File No. 333-57170)) | |
| 10.20** | Pledge Agreement dated June 18, 2001 between Mark S. Antonvich to Resolution Performance Products LLC (incorporated by reference to Exhibit 10.5 to Resolution Performance’s September 30, 2001 Form 10–Q filed on November 14, 2001 (File No. 333-57170)) | |
| 10.21** | Intellectual Property Transfer and License Agreement and Contribution Agreement dated as of November 14, 2000 between Shell Oil Company and Resolution Performance Products LLC (incorporated by reference to Exhibit 10.13 to Resolution Performance’s Registration Statement on Form S-4 filed on March 16, 2001 (File No. 333-57170)) | |
| 10.22** | Intellectual Property Transfer and License Agreement and Contribution Agreement dated as of November 14, 2000 between Shell Internationale Research Maatschappij B.V. and Shell Epoxy Resins Research B.V (incorporated by reference to Exhibit 10.14 to Resolution Performance’s Registration Statement on Form S-4 filed on March 16, 2001 (File No. 333-57170)). | |
II-6
Table of Contents
Exhibit Number | Description of Document | |
| 10.23** | Management Consulting Agreement dated as of November 14, 2000 among Resolution Performance Products LLC and Apollo Management IV, L.P. (incorporated by reference to Exhibit 10.18 to Resolution Performance’s Registration Statement on Form S-4 filed on March 16, 2001 (File No. 333-57170)) | |
| 10.24** | First Amended and Restated Deer Park Site Services, Utilities, Materials and Facilities Agreement dated November 1, 2000 between Shell Chemical Company, for itself and as agent for Shell Oil Company, and Resolution Performance Products LLC (incorporated by reference to Exhibit 10.19 to Resolution Performance’s Registration Statement on Form S-4 filed on March 16, 2001 (File No. 333-57170)) | |
| 10.25** | First Amended and Restated Norco Site Services, Utilities, Materials and Facilities Agreement dated November 1, 2000 between Shell Chemical Company, for itself and as agent for Shell Oil Company, and Resolution Performance Products LLC (incorporated by reference to Exhibit 10.20 to Resolution Performance’s Registration Statement on Form S-4 filed on March 16, 2001 (File No. 333-57170)) | |
| 10.26** | First Amended and Restated Pernis Site Services, Utilities, Materials and Facilities Agreement dated November 1, 2000 between Resolution Europe B.V. (f/k/a Resolution Nederland B.V., f/k/a Shell Epoxy Resins Nederland B.V.) and Shell Nederland Raffinaderij B.V. (incorporated by reference to Exhibit 10.21 to Resolution Performance’s Registration Statement on Form S-4 filed on March 16, 2001 (File No. 333-57170)) | |
| 10.27** | First Amended and Restated Pernis Site Services, Utilities, Materials and Facilities Agreement dated November 1, 2000 between Resolution Europe B.V. (f/k/a Resolution Nederland B.V., f/k/a Shell Epoxy Resins Nederland B.V.) and Shell Nederland Chemie B.V. (incorporated by reference to Exhibit 10.22 to Resolution Performance’s Registration Statement on Form S-4 filed on March 16, 2001 (File No. 333-57170)) | |
| 10.28** | Deer Park Ground Lease and Grant of Easements dated as of November 1, 2000 between Shell Oil Company and Resolution Performance Products LLC (incorporated by reference to Exhibit 10.23 to Resolution Performance’s Registration Statement on Form S-4 filed on March 16, 2001 (File No. 333-57170)) | |
| 10.29** | Norco Ground Lease and Grant of Servitudes dated as of November 1, 2000 between Shell Oil Company and Resolution Performance Products LLC (incorporated by reference to Exhibit 10.24 to Resolution Performance’s Registration Statement on Form S-4 filed on March 16, 2001 (File No. 333-57170)) | |
| 10.30** | Amended and Restated Agreement of Sub—Lease (Pernis) dated as of November 1, 2000 between Resolution Europe B.V. (f/k/a Resolution Nederland B.V., f/k/a Shell Epoxy Resins Nederland B.V.) and Shell Nederland Raffinaderij B.V. (incorporated by reference to Exhibit 10.25 to Resolution Performance’s Registration Statement on Form S-4 filed on March 16, 2001 (File No. 333-57170)) | |
| 10.31** | Resolution Performance Products Inc. 2000 Stock Option Plan (incorporated by reference to Exhibit 10.26 to Resolution Performance’s Registration Statement on Form S-4 filed on March 16, 2001 (File No. 333-57170)) | |
| 10.32** | Resolution Performance Products Inc. 2000 Non—Employee Directors Stock Option Plan (incorporated by reference to Exhibit 10.27 to Resolution Performance’s Registration Statement on Form S-4 filed on March 16, 2001 (File No. 333-57170)) | |
| 10.33*** | Amended and Restated Resolution Performance Products, Inc. Restricted Unit Plan | |
II-7
Table of Contents
Exhibit Number | Description of Document | |
| 10.34** | Amendment No. 1 dated March 15, 2002 to the Management Consulting Agreement dated November 14, 2000 between Resolution Performance Products LLC, a Delaware corporation, and Apollo Management IV, L.P., a Delaware limited partnership (incorporated by reference to Exhibit 10.1 to Resolution Performance’s March 31, 2002 Form 10–Q filed on May 8, 2002 (File No. 333-57170)) | |
| 10.35** | Amendment No. 2 dated as of January 1, 2003 to the Management Consulting Agreement dated November 14, 2000, as amended, between Resolution Performance Products LLC, a Delaware limited liability company, and Apollo Management IV, L.P., a Delaware limited partnership (incorporated by reference to Exhibit No. 10.43 to Resolution Performance’s Amendment No. 1 to Registration Statement on Form S-4 filed on February 12, 2003 (File No. 333-57170)) | |
| 10.36** | Amendment No. 3 dated February 17, 2003 to the Management Consulting Agreement dated November 14, 2000, as amended, between Resolution Performance Products LLC and Apollo Management IV, L.P., a Delaware limited partnership (incorporated by reference to Exhibit No. 10.50 to Resolution Performance’s December 31, 2002 Form 10–K filed on March 25, 2003 (File No. 333-57170)) | |
| 10.37** | Employment Agreement dated as of May 10, 2004 by and between Resolution Performance Products LLC, and David S. Graziosi (incorporated by reference to Exhibit 10.3 to Resolution Performance’s Quarterly Report on Form 10-Q for the Quarter ended March 31, 2004 (file No. 333-571701)) | |
| 10.38** | Letter Agreement dated December 3, 2004 between Borden Chemical, Inc. and Apollo Management V, L.P. (incorporated by reference to Exhibit 10.10 to Borden Chemical’s Registration Statement on Form S-4 filed on February 14, 2005 (File No. 333-1228626)) | |
| 10.39** | Form of Non-Qualified Stock Option Agreement between BHI Acquisition Corp. and certain optionees (incorporated by reference to Exhibit 10.12 to Borden Chemical’s Registration Statement on Form S-4 filed on February 14, 2005 (File No. 333-1228626)) | |
| 10.40** | Terms of employment dated November 9, 2004 between Judy A. Sonnett and Borden Chemical, Inc. (incorporated by reference to Exhibit 10.9 to Borden Chemical’s form 10-K filed on March 24, 2005 (File No. 001-00071)) | |
| 10.41** | First Deed of Pledge of Shares in the capital of Resolution Holdings B.V. by Resolution Performance Products LLC in favor of General Electric Capital Corporation (incorporated by reference to Exhibit 10.6 to Resolution Performance’s Current Report on Form 8-K dated January 24, 2005 (File No. 333-571701)) | |
| 10.42** | Second Deed of Pledge of Shares in the capital of Resolution Holdings B.V. by Resolution Performance Products LLC in favor of General Electric Capital Corporation (incorporated by reference to Exhibit 10.7 to Resolution Performance’s Current Report on Form 8-K dated January 24, 2005 (File No. 333-571701)) | |
| 10.43** | Indemnity Agreement dated as of March 29, 2005, among Resolution Performance Products Inc., Resolution Performance Products LLC and the indemnified party, Carl S. Stutts (incorporated by reference to Exhibit 10.73 to Resolution Performance’s Annual Report on Form 10-K for the Year ended December 31, 2004 (File No. 333-571701)) | |
| 10.44*** | Resolution Specialty Materials Inc. 2004 Stock Option Plan | |
| 10.45*** | Form of Nonqualified Stock Option Agreement for Resolution Specialty Materials Inc. 2004 Stock Option Plan | |
| 10.46*** | Form of Nonqualified Stock Option Agreement for Resolution Performance Products Inc. 2000 Stock Option Plan | |
| 10.47*** | Form of Nonqualified Stock Option Agreement for Resolution Performance Products Inc. 2000 Non-Employee Director Stock Option Plan | |
II-8
Table of Contents
Exhibit Number | Description of Document | |
| 10.48** | Terms of employment dated January 21, 2005 between Sarah R. Coffin and the Company (incorporated by reference to Exhibit (10) to Borden Chemical’s Current Report on Form 8-K dated February 14, 2005 (File No. 001-00071)). | |
| 10.49*** | Employment Agreement dated December 14, 2004 between Resolution Specialty Materials LLC and Jeffrey M. Nodland. | |
| 10.50*** | Employment Agreement dated as of June 1, 2005 between Hexion Specialty Chemicals, Inc. and Marvin O. Schlanger | |
| 10.51*** | Consulting Agreement dated as of June 1, 2005 between Hexion Specialty Chemicals, Inc. and Marvin O. Schlanger | |
| 10.52*** | Employment Agreement dated as of June 1, 2005 between Hexion Specialty Chemicals, Inc. and Layle K. Smith | |
| 10.53*** | Employment Agreement dated as of June 1, 2005 between Hexion Specialty Chemicals, Inc. and Mark S. Antonvich | |
| 10.54*** | Amended and Restated Investor Rights Agreement dated as of May 31, 2005 between Hexion LLC, Hexion Specialty Chemicals, Inc. and the holders that are party thereto | |
| 10.55*** | Registration Rights Agreement dated as of May 31, 2005 between Hexion Specialty Chemicals, Inc. and Hexion LLC | |
| 10.56*** | Management Consulting Agreement dated as of May 31, 2005 between Resolution Specialty Materials LLC and Apollo Management IV, L.P. | |
| 10.57*** | Amended and Restated Consulting Agreement dated as of May 31, 2005 between Borden Chemical, Inc. and Apollo Management V, L.P. | |
| 10.58*** | Management Services Termination Agreement dated as of May 31, 2005 between Resolution Performance Products, LLC and Apollo Management IV, L.P. | |
| 10.59*** | Second Amended and Restated Intercreditor Agreement dated as of May 31, 2005 among JPMorgan Chase Bank, N.A., as Intercreditor Agent, Wilmington Trust Company, as New Trustee, Hexion LLC, Hexion Specialty Chemicals, Inc., and each subsidiary of Hexion Specialty Chemicals, Inc. party thereto | |
| 10.60*** | Second Amended and Restated Intercreditor Agreement dated as of May 31, 2005 among JPMorgan Chase Bank, N.A., as Collateral Agent, and acknowledged and agreed to by Hexion LLC, Hexion Specialty Chemicals, Inc., and each subsidiary of Hexion Specialty Chemicals, Inc. party thereto | |
| 10.61*** | Registration Rights Agreement dated as of May 20, 2005, among Hexion Specialty Chemicals, Inc. and Credit Suisse First Boston LLC, Goldman, Sachs & Co., Lehman Brothers, Inc., Lehman Commercial Paper Inc. and J.P. Morgan Securities Inc., as Initial Purchasers | |
| 10.62*** | Registration Rights Agreement dated as of May 20, 2005, among BCI US Finance Corp., Borden 2 Nova Scotia Finance ULC, as Issuers, Hexion Specialty Chemicals, Inc., and Credit Suisse First Boston LLC, J.P. Morgan Securities Inc. and Morgan Stanley & Co. Incorporated, as Initial Purchasers | |
| 10.63** | Form Offer Letter (incorporated by reference to Exhibit 10 to Borden Chemical’s March 31, 2004 10-Q filed on May 13, 2004 (File No. 001-00071)) | |
| 10.64** | Borden Chemical, Inc. 2005 Management Incentive Plan (incorporated by reference to Exhibit 10(v).1 to Borden Chemical’s December 31, 2004 10-K/A filed on August 23, 2005 (File No. 001-00071)) | |
II-9
Table of Contents
Exhibit Number | Description of Document | |
| 10.65*** | Long-Term Value Creation Reward Program | |
| 10.66*** | Hexion 2006 Long-Term Incentive Plan | |
| 10.67*** | Amendment No. 1 dated as of January 25, 2006 to the Employment Agreement dated as of June 1, 2005 between Hexion Specialty Chemicals, Inc. and Marvin O. Schlanger | |
| 10.68*** | Amendment No. 1 dated as of January 25, 2006 to the Consulting Agreement dated as of June 1, 2005 between Hexion Specialty Chemicals, Inc. and Marvin O. Schlanger | |
| 10.69*** | RPP Nonqualified Deferred Compensation Plan | |
| 10.70 | Amendment and Restatement Agreement dated as of May 5, 2006 among Hexion LLC, Hexion Specialty Chemicals, Inc., Hexion Specialty Chemicals Canada, Inc., Hexion Specialty Chemicals B.V., Hexion Specialty Chemicals UK Limited, Borden Chemical UK Limited, the lenders party thereto and JP Morgan Chase Bank, N.A., as administrative agent under the Credit Agreement dated as of May 31, 2005 among Hexion LLC, Hexion Specialty Chemicals, Inc., Hexion Specialty Chemicals Canada, Inc., Hexion Specialty Chemicals B.V., Hexion Specialty Chemicals UK Limited, Borden Chemical UK Limited, the lenders party thereto from time to time and the agents, arrangers and bookrunners party thereto | |
| 10.71 | Amended and Restated Credit Agreement dated as of May 5, 2006 among Hexion LLC, Hexion Specialty Chemicals, Inc., Hexion Specialty Chemicals Canada, Inc., Hexion Specialty Chemicals B.V., Hexion Specialty Chemicals UK Limited, Borden Chemical UK Limited, the lenders party thereto and JP Morgan Chase Bank, N.A., as Administrative Agent, Credit Suisse, as Syndication Agent, Citicorp North America, Inc., as Documentation Agent, and Credit Suisse Securities (USA) LLC, J.P. Morgan Securities Inc. and Citigroup Global Markets Inc., as Joint Lead Arrangers and Joint Bookrunners | |
| 12.1 | Statement regarding computation of ratios | |
| 21.1 | List of Subsidiaries of the registrant | |
| 23.1 | Consent of Deloitte & Touche LLP, an independent registered public accounting firm | |
| 23.2 | Consent of PricewaterhouseCoopers LLP, an independent registered public accounting firm | |
| 23.3 | Consent of PricewaterhouseCoopers LLP, an independent registered public accounting firm | |
| 23.4 | Consent of PricewaterhouseCoopers Aktiengesellschaft Wirtschaftsprüfungsgesellschaft | |
| 24.1*** | Powers of Attorney of the directors and officers of the registrant | |
| 99.1*** | Consent of Marvin O. Schlanger | |
| 99.2*** | Consent of Nigel D. T. Andrews | |
| 99.3*** | Consent of David C. House | |
| 99.4*** | Consent of Robert M. Agate | |
| 99.5 | Consent of Richard A. Lamond | |
| * | To be filed by amendment |
| ** | Incorporated by reference |
| *** | Previously filed |
| † | The schedules and exhibits to these agreements are omitted pursuant to Item 601(b)(2) of Regulation S-K. The Company agrees to furnish supplementally to the SEC, upon request, a copy of any omitted schedule or exhibit. |
II-10
Table of Contents
To the Board of Directors
and Shareholder of Borden Chemical, Inc.:
We have audited the consolidated financial statements of Borden Chemical, Inc. (effective August 12, 2004, a wholly owned subsidiary of BHI Acquisition Corp., which is a majority owned subsidiary of BHI Investment, LLC; prior to August 12, 2004, a majority-owned subsidiary of Borden Holdings, Inc.) and subsidiaries as of December 31, 2003 and 2002, and for each of the three years in the period ended December 31, 2003, and have issued our report thereon dated March 19, 2004, except for Note 24 as to which the date is August 5, 2004 (which report expresses an unqualified opinion and includes an explanatory paragraph regarding the Company’s adoption in 2002 of Statement of Financial Accounting Standards No. 142); such financial statements and report are included elsewhere in this registration statement. Our audits also included the financial statement schedule of Borden Chemical, Inc. and subsidiaries, listed in Item 16 of this registration statement. This financial statement schedule is the responsibility of the Company’s management. Our responsibility is to express an opinion on this financial statement schedule based on our audits. In our opinion, such financial statement schedule, when considered in relation to the basic financial statements taken as a whole, presents fairly in all material respects the information set forth therein.
DELOITTE & TOUCHE LLP
Columbus, Ohio
March 19, 2004
II-11
Table of Contents
BORDEN CHEMICAL, INC.
Schedule II – Valuation and Qualifying Accounts
Balance 2000 | Charged to Expense | Write-offs | Balance December 31, 2001 | |||||||||||
Allowance for doubtful accounts | $ | 13 | $ | 5 | $ | (1 | ) | $ | 17 | |||||
Balance 2001 | Charged to Expense | Write-offs | Balance December 31, 2002 | |||||||||||
Allowance for doubtful accounts | $ | 17 | $ | (1 | ) | $ | (4 | ) | $ | 12 | ||||
Balance 2002 | Charged to Expense | Write-offs | Balance December 31, 2003 | |||||||||||
Allowance for doubtful accounts | $ | 12 | $ | 2 | $ | 0 | $ | 14 | ||||||
II-12
Table of Contents
ITEM 17 UNDERTAKINGS
Insofar as indemnification for liabilities arising under the Securities Act may be permitted to directors, officers and controlling persons of the Registrant pursuant to the foregoing provisions, or otherwise, the Registrant has been advised that in the opinion of the Securities and Exchange Commission such indemnification is against public policy as expressed in the Securities Act and is, therefore, unenforceable. In the event that a claim for indemnification against such liabilities (other than the payment by the Registrant of expenses incurred or paid by a director, officer or controlling person of the Registrant in the successful defense of any action, suit or proceeding) is asserted by such director, officer or controlling person in connection with the securities being registered, the Registrant will, unless in the opinion of its counsel the matter has been settled by controlling precedent, submit to a court of appropriate jurisdiction the question whether such indemnification by it is against public policy as expressed in the Securities Act and will be governed by the final adjudication of such issue.
The undersigned Registrant hereby undertakes the following:
(1) for purposes of determining any liability under the Securities Act, the information omitted from the form of prospectus filed as part of this Registration Statement in reliance upon Rule 430A and contained in the form of prospectus filed by the Registrant pursuant to Rule 424(b)(1) or (4) or 497(h) under the Securities Act shall be deemed to be part of this Registration Statement as of the time it was declared effective;
(2) for the purpose of determining any liability under the Securities Act, each post-effective amendment that contains a form of prospectus shall be deemed to be a new registration statement relating to the securities offered therein, and the offering of such securities at that time shall be deemed to be the initial bona fide offering thereof; and
(3) to provide to the underwriters at the closing specified in the underwriting agreements, certificates in such denominations and registered in such names as required by the underwriters to permit prompt delivery to each purchaser.
II-13
Table of Contents
SIGNATURES
Pursuant to the requirements of the Securities Act of 1933, as amended, the registrant has duly caused this Amendment No. 8 to the Registration Statement to be signed on its behalf by the undersigned, thereunto duly authorized in Columbus, Ohio, on May 15, 2006.
Hexion Specialty Chemicals, Inc. | ||
By: | /S/ WILLIAM H. CARTER | |
| Name: | William H. Carter | |
| Title: | Executive Vice President and Chief Financial Officer | |
Pursuant to the requirements of the Securities Act of 1933, as amended, this Amendment No. 8 to the Registration Statement has been signed below by the following persons in the capacities and on the date indicated.
Signature | Title | Date | ||
* Craig O. Morrison | Director, Chairman, President and Chief Executive Officer (Principal Executive Officer) | May 15, 2006 | ||
* William H. Carter | Director, Executive Vice President and Chief Financial Officer (Principal Financial and Principal Accounting Officer) | May 15, 2006 | ||
* Joshua J. Harris | Director | May 15, 2006 | ||
* Robert V. Seminara | Director | May 15, 2006 | ||
* Scott M. Kleinman | Director | May 15, 2006 | ||
* Marvin O. Schlanger | Director, Vice Chairman | May 15, 2006 | ||
* Jordan C. Zaken | Director | May 15, 2006 | ||
| *By: | /S/ WILLIAM H. CARTER | May 15, 2006 | ||||
William H. Carter Attorney-in-Fact | ||||||
II-14
Table of Contents
EXHIBIT INDEX
| Exhibit Number | Description of Document | |
| 1.1 | Form of Underwriting Agreement for the Common Stock | |
| 2.1***† | Transaction Agreement dated as of April 22, 2005 among RPP Holdings LLC, Resolution Performance Products Inc., Resolution Performance Products LLC, Resolution Specialty Materials Holdings LLC, Resolution Specialty Materials LLC, Lawter International Inc., BHI Acquisition Corp., BHI Merger Sub Inc., and Borden Chemical Inc. | |
| 2.2**† | Amended and Restated Master Sale Agreement (US) dated as of November 14, 2000 among Shell Oil Company, Resin Acquisition, LLC and Resolution Performance Products Inc. (incorporated by reference to Exhibit 2.1 to Resolution Performance’s Registration Statement on Form S-4 filed on March 16, 2001 (File No. 333-57170)) | |
| 2.3**† | Amended and Restated SPNV Resins Sale Agreement dated as of November 14, 2000 between Shell Oil Company and Resolution Performance Products Inc. (incorporated by reference to Exhibit 2.2 to Resolution Performance’s Registration Statement on Form S-4 filed on March 16, 2001 (File No. 333-57170)) | |
| 2.4** | Assignment and Assumption Agreement dated November 13, 2000 between Resolution Performance Products Inc. and Resolution Performance Products LLC (incorporated by reference to Exhibit 2.3 to Resolution Performance’s Registration Statement on Form S-4 filed on March 16, 2001 (File No. 333-57170)) | |
| 2.5** | Assignment and Assumption Agreement dated November 14, 2000 between Resin Acquisition, LLC and RPP Holdings LLC (incorporated by reference to Exhibit 2.4 to Resolution Performance’s Registration Statement on Form S-4 filed on March 16, 2001 (File No. 333-57170)) | |
| 3.1 | Form of Amended and Restated Certificate of Incorporation of Hexion Specialty Chemicals, Inc. | |
| 3.2 | Form of Amended Bylaws of Hexion Specialty Chemicals, Inc. | |
| 3.3** | Amended and Restated Certificate of Incorporation of Hexion dated January 11, 2005 (incorporated by reference to Exhibit 3.5 to Hexion’s Registration Statement on Form S-4 filed on December 27, 2005 (File No. 333-122826)). | |
| 3.4** | Amended and Restated Bylaws of Borden Chemical dated December 15, 2004 (incorporated by reference to Exhibit (3)(ii) to the Form 10-K filed on March 24, 2005 (File No. 001-00071)) | |
| 4.1*** | Form of Certificate of Common Stock | |
| 4.2** | Form of Indenture between the Registrant and The First National Bank of Chicago, as Trustee, dated as of January 15, 1983, as supplemented by the First Supplemental Indenture dated as of March 31, 1986, and the Second Supplemental Indenture, dated as of June 26, 1996, relating to the $200,000,000 8 3/8% Sinking Fund Debentures due 2016, incorporated herein by reference from Exhibits (4)(a) and (b) to Amendment No. 1 to Registration Statement on Form S-3, File No. 33-4381 and Exhibit (4)(iv) to the June 30, 1996, Form 10-Q. | |
| 4.3** | Form of Indenture between Borden Chemical and The Bank of New York, as Trustee, dated as of December 15, 1987, as supplemented by the First Supplemental Indenture dated as of December 15, 1987, and the Second Supplemental Indenture dated as of February 1, 1993, and the Third Supplemental Indenture dated as of June 26, 1996, (incorporated herein by reference from Exhibits (4)(a) through (d) to Borden Chemical’s Registration Statement on Form S-3, File No. 33-45770 and Exhibit (4)(iii) to the June 30, 1996, Form 10-Q filed on August 14, 1996 (File No. 001-00071)), relating to the following Debentures and Notes: | |
| (a) The $200,000,000 9 1/5% Debentures due 2021. | ||
| (b) The $250,000,000 7 7/8% Debentures due 2023. | ||
1
Table of Contents
| Exhibit Number | Description of Document | |
| 4.4** | Indenture dated as of August 12, 2004 among Borden U.S. Finance Corp. and Borden Nova Scotia Finance, ULC, as Issuers, Borden Chemical, and Wilmington Trust Company, as Trustee, relating to: (a) the $150,000,000 Second-Priority Senior Secured Floating Rate Notes due 2010 and (b) the $325,000,000 9% Second-Priority Senior Secured Notes due 2014. (incorporated by reference to Exhibit 4(i) to Borden Chemical’s Form 10-Q filed on November 15, 2004, File No. 001-00071) | |
| 4.5** | Indenture, dated as of November 14, 2000, among Resolution Performance Products LLC, RPP Capital Corporation and The Bank of New York, as trustee, relating to 13 1/2% Senior Subordinated Notes Due 2010 (incorporated by reference to Exhibit 4.1 to Resolution Performance’s Registration Statement on Form S-4 filed on March 16, 2001 (File No. 333-57170)) | |
| 4.6** | Form of 13 1/2% Senior Subordinated Note Due 2010 (included as Exhibit B to Exhibit 4.9) | |
| 4.7** | Indenture dated as of May 20, 2005 among BCI US Finance Corp., Borden 2 Nova Scotia Finance, ULC, as Issuers, Hexion Specialty Chemicals, Inc. and Wilmington Trust Company, as Trustee, relating to the $150,000,000 Second-Priority Senior Secured Floating Rate Notes due 2010 | |
| 4.8** | First Supplemental Indenture, dated as of May 31, 2005 among RPP Capital Corporation, Resolution Specialty Materials, LLC, Resolutions’ JV LLC, Lawter International, Inc., Resolution Specialty Materials Capital Corp., Borden Chemical International, Inc., Bakelite North America Holding Company, Bakelite Epoxy Polymers Corporation, Oilfield Technology Group, Inc. and Borden Services Company, as Additional Subsidiary Guarantors, Hexion Specialty Chemicals, Inc., Borden U.S. Finance Corp. and Borden Nova Scotia Finance, ULC and Wilmington Trust Company, as Trustee to the Indenture dated as of August 12, 2004 among Borden U.S. Finance Corp., Borden Nova Scotia Finance, ULC, as Issuers, Borden Chemical and Wilmington Trust Company, as Trustee relating to: (a) the $150,000,000 Second-Priority Senior Secured Floating Rate Notes due 2010 and (b) the $325,000,000 9% Second-Priority Senior Secured Notes due 2014 | |
| 4.9*** | Supplemental Indenture dated as of May 31, 2005 among Borden U.S. Finance Corp., Borden Nova Scotia Finance, ULC, the guarantors named therein and Wilmington Trust Company, as Trustee to the Indenture dated May 20, 2005 among BCI US Finance Corp. and Borden 2 Nova Scotia Finance, ULC, as Issuers, Hexion Specialty Chemicals, Inc. and Wilmington Trust Company, as Trustee relating to the $150,000,000 Second-Priority Senior Secured Floating Rate Notes due 2010 | |
| 4.10*** | First Supplemental Indenture dated as of May 31, 2005, among Resolution Performance Products Corp., RPP Capital Corporation, the guarantors named therein and The Bank of New York, as Trustee, to the Indenture dated as of November 14, 2000, among Resolution Performance Products LLC, RPP Capital Corporation and The Bank of New York, as Trustee, relating to 13 1/2% Senior Subordinated Notes Due 2010 | |
| 4.11*** | Second Supplemental Indenture dated as of May 31, 2005, among Hexion Specialty Chemicals, Inc., RPP Capital Corporation, the guarantors named therein and The Bank of New York, as Trustee, to the Indenture dated as of November 14, 2000, as supplemented, among Resolution Performance Products LLC, RPP Capital Corporation and The Bank of New York, as Trustee, relating to 13 1/2% Senior Subordinated Notes Due 2010 | |
| 4.12 | Second Supplemental Indenture dated as of December 23, 2005 among Hexion U.S. Finance Corp., Hexion Nova Scotia Finance, ULC, Hexion Specialty Chemicals, Inc., Hexion CI Holding Company (China) LLC and Wilmington Trust Company, as Trustee to the Indenture dated August 12, 2004 among Borden U.S. Finance Corp., Borden Nova Scotia Finance, ULC, as Issuers, Borden Chemical, Inc. and Wilmington Trust Company, as Trustee relating to: (a) the $150,000,000 Second-Priority Senior Secured Floating Rate Notes due 2010 and (b) the $325,000,000 9% Second-Priority Senior Secured Notes due 2014 | |
2
Table of Contents
| Exhibit Number | Description of Document | |
| 4.13 | Second Supplemental Indenture dated as of December 23, 2005 among Hexion U.S. Finance Corp., Hexion Nova Scotia Finance, ULC, Hexion Specialty Chemicals, Inc., Hexion CI Holding Company (China) LLC and Wilmington Trust Company, as Trustee to the Indenture dated May 20, 2005 among BCI US Finance Corp. and Borden 2 Nova Scotia Finance, ULC, as Issuers, Hexion Specialty Chemicals, Inc. and Wilmington Trust Company, as Trustee relating to the $150,000,000 Second-Priority Senior Secured Floating Rate Notes due 2010 | |
| 4.14 | Third Supplemental Indenture dated as of December 23, 2005, among Hexion Specialty Chemicals, Inc., HSC Capital Corporation, the guarantors named therein and The Bank of New York, as Trustee, to the Indenture dated as of November 14, 2000, as supplemented among Resolution Performance Products LLC, RPP Capital Corporation and The Bank of New York, as Trustee, relating to 13 1/2% Senior Subordinated Notes Due 2010. | |
| 4.15 | Fourth Supplemental Indenture dated as of May 5, 2006, among Hexion Specialty Chemicals, Inc., HSC Capital Corporation, the guarantors named therein and The Bank of New York, as Trustee, to the Indenture dated as of November 14, 2000, as supplemented among Resolution Performance Products LLC, RPP Capital Corporation and The Bank of New York, as Trustee, relating to 13 1/2% Senior Subordinated Notes Due 2010. | |
| 5.1 | Opinion of Connell Foley LLP | |
| 10.1** | Amended and Restated Executive Supplemental Pension Plan, dated as of January, 1996 (incorporated by reference to Exhibit (10)(xiii) to Borden Chemical’s December 31, 1998 Form 10-K filed on March 31, 1999 (File No. 001-00071)) | |
| 10.2** | Advisory Directors Plan incorporated by reference to Exhibit 10(viii) to Borden Chemical’s 1989 Form 10-K Annual Report. | |
| 10.3** | Perquisite Benefits Policy (incorporated by reference to Exhibit (10)(xviii) to Borden Chemical’s December 31, 2001 Form 10-K filed on March 29, 2002 (File No. 001-00071)) | |
| 10.4** | Master Asset Conveyance and Facility Support Agreement, dated as of December 20, 2002, between Borden Chemical and Borden Chemicals and Plastics Operating Limited Partnership (incorporated by reference to Exhibit (10)(xxvi) to Borden Chemical’s December 31, 2002 Form 10-K filed on March 28, 2003 (File No. 001-00071)) | |
| 10.5** | Environmental Servitude Agreement, dated as of December 20, 2002, between Borden Chemical and Borden Chemicals and Plastics Operating Limited Partnership (incorporated by reference to Exhibit (10)(xxvii) to Borden Chemical’s December 31, 2002 Form 10-K filed on March 28, 2003 (File No. 001-00071)) | |
| 10.6** | Stock Purchase Agreement dated as of July 5, 2004 among BHI Investment, LLC, BW Holdings LLC, Borden Holdings, Inc. Borden Chemical, Inc. Craig O. Morrison and Joseph P. Bevilaqua. (incorporated by reference to Exhibit (10)(i) to Borden Chemical’s June 30, 2004 Form 10-Q filed on July 26, 2004 (File No. 001-00071)) | |
| 10.7** | Amended and Restated Employment Agreement dated as of August 12, 2004 between the Company and Craig O. Morrison (incorporated by reference to Exhibit 10(i) to Borden Chemical’s September 30, 2004 Form 10-Q filed on November 15, 2004 (File No. 001-00071)) | |
| 10.8** | Amended and Restated Employment Agreement dated as of August 12, 2004 between the Company and Joseph P. Bevilaqua (incorporated by reference to Exhibit 10(ii) to Borden Chemical’s September 30, 2004 Form 10-Q filed on November 15, 2004 (File No. 001-00071)) | |
| 10.9** | Amended and Restated Employment Agreement dated as of August 12, 2004 between the Company and William H. Carter. (incorporated by reference to Exhibit 10(iii) to Borden Chemical’s September 30, 2004 Form 10-Q filed on November 15, 2004 (File No. 001-00071)) | |
3
Table of Contents
| Exhibit Number | Description of Document | |
| 10.10** | BHI Acquisition Corp. 2004 Deferred Compensation Plan (incorporated by reference to Exhibit 10(iv) to Borden Chemical’s September 30, 2004 Form 10-Q filed on November 15, 2004 (File No. 001-00071)) | |
| 10.11** | BHI Acquisition Corp. 2004 Stock Incentive Plan (incorporated by reference to Exhibit 10(v) to Borden Chemical’s September 30, 2004 Form 10-Q filed on November 15, 2004 (File No. 001-00071)) | |
| 10.12** | Investor Rights Agreement dated as of August 12, 2004 among BHI Acquisition Corp., and The Holders that are parties thereto (incorporated by reference to Exhibit 10(vi) to Borden Chemical’s September 30, 2004 Form 10-Q filed on November 15, 2004 (File No. 001-00071)) | |
| 10.13** | Registration Rights Agreement dated as of August 12, 2004 among BHI Acquisition Corp., BHI Investment, LC, and the Management Holders party thereto (incorporated by reference to Exhibit 10(vii) to Borden Chemical’s September 30, 2004 Form 10-Q filed on November 15, 2004 (File No. 001-00071)) | |
| 10.14** | Amendment No. 1 dated as of August 11, 2004, to the Stock Purchase Agreement dated July 5, 2004 by and among BHI Investment, LLC, Borden Holdings, Inc., Borden Chemical, Inc., Craig O. Morrison and Joseph P. Bevilaqua (incorporated by reference to Exhibit 10(viii) to the Form 10-Q filed on November 15, 2004 (File No. 001-00071)) | |
| 10.15** | Management Consulting Agreement dated as of August 12, 2004 between Borden Chemical, Inc. and Apollo Management V, L.P. (incorporated by reference to Exhibit 10(ix) to Borden Chemical’s September 30, 2004 Form 10-Q filed on November 15, 2004 (File No. 001-00071)) | |
| 10.16** | Share Purchase Agreement dated October 6, 2004 among RÜTGERS AG, RÜTGERS Bakelite Projekt GmbH, National Borden Chemical Germany GmbH, and Borden Chemical, Inc. (incorporated by reference to Exhibit 10(xi) to Borden Chemical’s September 30, 2004 Form 10-Q filed on November 15, 2004 (File No. 001-00071)) | |
| 10.17** | Secured Promissory Note dated August 10, 2001 from Jeffrey M. Nodland to Resolution Performance Product LLC (incorporated by reference to Exhibit 10.2 to Resolution Performance’s September 30, 2004 Form 10-Q filed on November 14, 2001 (File No. 333-57170)) | |
| 10.18** | Pledge Agreement dated August 10, 2001 between Jeffrey M. Nodland and Resolution Performance Products LLC (incorporated by reference to Exhibit 10.3 to Resolution Performance’s September 30, 2001 Form 10-Q filed on November 14, 2001 (File No. 333-57170)) | |
| 10.19** | Secured Promissory Note dated June 18, 2001 from Mark S. Antonvich to Resolution Performance Products LLC (incorporated by reference to Exhibit 10.4 to Resolution Performance’s September 30, 2001 Form 10-Q filed on November 14, 2001 (File No. 333-57170)) | |
| 10.20** | Pledge Agreement dated June 18, 2001 between Mark S. Antonvich to Resolution Performance Products LLC (incorporated by reference to Exhibit 10.5 to Resolution Performance’s September 30, 2001 Form 10-Q filed on November 14, 2001 (File No. 333-57170)) | |
| 10.21** | Intellectual Property Transfer and License Agreement and Contribution Agreement dated as of November 14, 2000 between Shell Oil Company and Resolution Performance Products LLC (incorporated by reference to Exhibit 10.13 to Resolution Performance’s Registration Statement on Form S-4 filed on March 16, 2001 (File No. 333-57170)) | |
| 10.22** | Intellectual Property Transfer and License Agreement and Contribution Agreement dated as of November 14, 2000 between Shell Internationale Research Maatschappij B.V. and Shell Epoxy Resins Research B.V (incorporated by reference to Exhibit 10.14 to Resolution Performance’s Registration Statement on Form S-4 filed on March 16, 2001 (File No. 333-57170)). | |
4
Table of Contents
| Exhibit Number | Description of Document | |
| 10.23** | Management Consulting Agreement dated as of November 14, 2000 among Resolution Performance Products LLC and Apollo Management IV, L.P. (incorporated by reference to Exhibit 10.18 to Resolution Performance’s Registration Statement on Form S-4 filed on March 16, 2001 (File No. 333-57170)) | |
| 10.24** | First Amended and Restated Deer Park Site Services, Utilities, Materials and Facilities Agreement dated November 1, 2000 between Shell Chemical Company, for itself and as agent for Shell Oil Company, and Resolution Performance Products LLC (incorporated by reference to Exhibit 10.19 to Resolution Performance’s Registration Statement on Form S-4 filed on March 16, 2001 (File No. 333-57170)) | |
| 10.25** | First Amended and Restated Norco Site Services, Utilities, Materials and Facilities Agreement dated November 1, 2000 between Shell Chemical Company, for itself and as agent for Shell Oil Company, and Resolution Performance Products LLC (incorporated by reference to Exhibit 10.20 to Resolution Performance’s Registration Statement on Form S-4 filed on March 16, 2001 (File No. 333-57170)) | |
| 10.26** | First Amended and Restated Pernis Site Services, Utilities, Materials and Facilities Agreement dated November 1, 2000 between Resolution Europe B.V. (f/k/a Resolution Nederland B.V., f/k/a Shell Epoxy Resins Nederland B.V.) and Shell Nederland Raffinaderij B.V. (incorporated by reference to Exhibit 10.21 to Resolution Performance’s Registration Statement on Form S-4 filed on March 16, 2001 (File No. 333-57170)) | |
| 10.27** | First Amended and Restated Pernis Site Services, Utilities, Materials and Facilities Agreement dated November 1, 2000 between Resolution Europe B.V. (f/k/a Resolution Nederland B.V., f/k/a Shell Epoxy Resins Nederland B.V.) and Shell Nederland Chemie B.V. (incorporated by reference to Exhibit 10.22 to Resolution Performance’s Registration Statement on Form S-4 filed on March 16, 2001 (File No. 333-57170)) | |
| 10.28** | Deer Park Ground Lease and Grant of Easements dated as of November 1, 2000 between Shell Oil Company and Resolution Performance Products LLC (incorporated by reference to Exhibit 10.23 to Resolution Performance’s Registration Statement on Form S-4 filed on March 16, 2001 (File No. 333-57170)) | |
| 10.29** | Norco Ground Lease and Grant of Servitudes dated as of November 1, 2000 between Shell Oil Company and Resolution Performance Products LLC (incorporated by reference to Exhibit 10.24 to Resolution Performance’s Registration Statement on Form S-4 filed on March 16, 2001 (File No. 333-57170)) | |
| 10.30** | Amended and Restated Agreement of Sub—Lease (Pernis) dated as of November 1, 2000 between Resolution Europe B.V. (f/k/a Resolution Nederland B.V., f/k/a Shell Epoxy Resins Nederland B.V.) and Shell Nederland Raffinaderij B.V. (incorporated by reference to Exhibit 10.25 to Resolution Performance’s Registration Statement on Form S-4 filed on March 16, 2001 (File No. 333-57170)) | |
| 10.31** | Resolution Performance Products Inc. 2000 Stock Option Plan (incorporated by reference to Exhibit 10.26 to Resolution Performance’s Registration Statement on Form S-4 filed on March 16, 2001 (File No. 333-57170)) | |
| 10.32** | Resolution Performance Products Inc. 2000 Non—Employee Directors Stock Option Plan (incorporated by reference to Exhibit 10.27 to Resolution Performance’s Registration Statement on Form S-4 filed on March 16, 2001 (File No. 333-57170)) | |
| 10.33*** | Amended and Restated Resolution Performance Products, Inc. Restricted Unit Plan | |
5
Table of Contents
| Exhibit Number | Description of Document | |
| 10.34** | Amendment No. 1 dated March 15, 2002 to the Management Consulting Agreement dated November 14, 2000 between Resolution Performance Products LLC, a Delaware corporation, and Apollo Management IV, L.P., a Delaware limited partnership (incorporated by reference to Exhibit 10.1 to Resolution Performance’s March 31, 2002 Form 10-Q filed on May 8, 2002 (File No. 333-57170)) | |
| 10.35** | Amendment No. 2 dated as of January 1, 2003 to the Management Consulting Agreement dated November 14, 2000, as amended, between Resolution Performance Products LLC, a Delaware limited liability company, and Apollo Management IV, L.P., a Delaware limited partnership (incorporated by reference to Exhibit No. 10.43 to Resolution Performance’s Amendment No. 1 to Registration Statement on Form S-4 filed on February 12, 2003 (File No. 333-57170)) | |
| 10.36** | Amendment No. 3 dated February 17, 2003 to the Management Consulting Agreement dated November 14, 2000, as amended, between Resolution Performance Products LLC and Apollo Management IV, L.P., a Delaware limited partnership (incorporated by reference to Exhibit No. 10.50 to Resolution Performance’s December 31, 2002 Form 10-K filed on March 25, 2003 (File No. 333-57170)) | |
| 10.37** | Employment Agreement dated as of May 10, 2004 by and between Resolution Performance Products LLC, and David S. Graziosi (incorporated by reference to Exhibit 10.3 to Resolution Performance’s Quarterly Report on Form 10-Q for the Quarter ended March 31, 2004 (file No. 333-571701)) | |
| 10.38** | Letter Agreement dated December 3, 2004 between Borden Chemical, Inc. and Apollo Management V, L.P. (incorporated by reference to Exhibit 10.10 to Borden Chemical’s Registration Statement on Form S-4 filed on February 14, 2005 (File No. 333-1228626)) | |
| 10.39** | Form of Non-Qualified Stock Option Agreement between BHI Acquisition Corp. and certain optionees (incorporated by reference to Exhibit 10.12 to Borden Chemical’s Registration Statement on Form S-4 filed on February 14, 2005 (File No. 333-1228626)) | |
| 10.40** | Terms of employment dated November 9, 2004 between Judy A. Sonnett and Borden Chemical, Inc. (incorporated by reference to Exhibit 10.9 to Borden Chemical’s form 10-K filed on March 24, 2005 (File No. 001-00071)) | |
| 10.41** | First Deed of Pledge of Shares in the capital of Resolution Holdings B.V. by Resolution Performance Products LLC in favor of General Electric Capital Corporation (incorporated by reference to Exhibit 10.6 to Resolution Performance’s Current Report on Form 8-K dated January 24, 2005 (File No. 333-571701)) | |
| 10.42** | Second Deed of Pledge of Shares in the capital of Resolution Holdings B.V. by Resolution Performance Products LLC in favor of General Electric Capital Corporation (incorporated by reference to Exhibit 10.7 to Resolution Performance’s Current Report on Form 8-K dated January 24, 2005 (File No. 333-571701)) | |
| 10.43** | Indemnity Agreement dated as of March 29, 2005, among Resolution Performance Products Inc., Resolution Performance Products LLC and the indemnified party, Carl S. Stutts (incorporated by reference to Exhibit 10.73 to Resolution Performance’s Annual Report on Form 10-K for the Year ended December 31, 2004 (File No. 333-571701)) | |
| 10.44*** | Resolution Specialty Materials Inc. 2004 Stock Option Plan | |
| 10.45*** | Form of Nonqualified Stock Option Agreement for Resolution Specialty Materials Inc. 2004 Stock Option Plan | |
| 10.46*** | Form of Nonqualified Stock Option Agreement for Resolution Performance Products Inc. 2000 Stock Option Plan | |
| 10.47*** | Form of Nonqualified Stock Option Agreement for Resolution Performance Products Inc. 2000 Non-Employee Director Stock Option Plan | |
6
Table of Contents
| Exhibit Number | Description of Document | |
| 10.48** | Terms of employment dated January 21, 2005 between Sarah R. Coffin and the Company (incorporated by reference to Exhibit (10) to Borden Chemical’s Current Report on Form 8-K dated February 14, 2005 (File No. 001-00071)). | |
| 10.49*** | Employment Agreement dated December 14, 2004 between Resolution Specialty Materials LLC and Jeffrey M. Nodland. | |
| 10.50*** | Employment Agreement dated as of June 1, 2005 between Hexion Specialty Chemicals, Inc. and Marvin O. Schlanger | |
| 10.51*** | Consulting Agreement dated as of June 1, 2005 between Hexion Specialty Chemicals, Inc. and Marvin O. Schlanger | |
| 10.52*** | Employment Agreement dated as of June 1, 2005 between Hexion Specialty Chemicals, Inc. and Layle K. Smith | |
| 10.53*** | Employment Agreement dated as of June 1, 2005 between Hexion Specialty Chemicals, Inc. and Mark S. Antonvich | |
| 10.54*** | Amended and Restated Investor Rights Agreement dated as of May 31, 2005 between Hexion LLC, Hexion Specialty Chemicals, Inc. and the holders that are party thereto | |
| 10.55*** | Registration Rights Agreement dated as of May 31, 2005 between Hexion Specialty Chemicals, Inc. and Hexion LLC | |
| 10.56*** | Management Consulting Agreement dated as of May 31, 2005 between Resolution Specialty Materials LLC and Apollo Management IV, L.P. | |
| 10.57*** | Amended and Restated Consulting Agreement dated as of May 31, 2005 between Borden Chemical, Inc. and Apollo Management V, L.P. | |
| 10.58*** | Management Services Termination Agreement dated as of May 31, 2005 between Resolution Performance Products, LLC and Apollo Management IV, L.P. | |
| 10.59*** | Second Amended and Restated Intercreditor Agreement dated as of May 31, 2005 among JPMorgan Chase Bank, N.A., as Intercreditor Agent, Wilmington Trust Company, as New Trustee, Hexion LLC, Hexion Specialty Chemicals, Inc., and each subsidiary of Hexion Specialty Chemicals, Inc. party thereto | |
| 10.60*** | Second Amended and Restated Intercreditor Agreement dated as of May 31, 2005 among JPMorgan Chase Bank, N.A., as Collateral Agent, and acknowledged and agreed to by Hexion LLC, Hexion Specialty Chemicals, Inc., and each subsidiary of Hexion Specialty Chemicals, Inc. party thereto. | |
| 10.61*** | Registration Rights Agreement dated as of May 20, 2005, among Hexion Specialty Chemicals, Inc. and Credit Suisse First Boston LLC, Goldman, Sachs & Co., Lehman Brothers, Inc., Lehman Commercial Paper Inc. and J.P. Morgan Securities Inc., as Initial Purchasers | |
| 10.62*** | Registration Rights Agreement dated as of May 20, 2005, among BCI US Finance Corp., Borden 2 Nova Scotia Finance ULC, as Issuers, Hexion Specialty Chemicals, Inc., and Credit Suisse First Boston LLC, J.P. Morgan Securities Inc. and Morgan Stanley & Co. Incorporated, as Initial Purchasers | |
| 10.63** | Form Offer Letter (incorporated by reference to Exhibit 10 to Borden Chemical’s March 31, 2004 10-Q filed on May 13, 2004 (File No. 001-00071)) | |
| 10.64** | Borden Chemical, Inc. 2005 Management Incentive Plan (incorporated by reference to Exhibit 10(v).1 to Borden Chemical’s December 31, 2004 10-K/A filed on August 23, 2005 (File No. 001-00071)) | |
7
Table of Contents
| Exhibit Number | Description of Document | |
| 10.65*** | Long-Term Value Creation Reward Program | |
| 10.66*** | Hexion 2006 Long-Term Incentive Plan | |
| 10.67*** | Amendment No. 1 dated as of January 25, 2006 to the Employment Agreement dated as of June 1, 2005 between Hexion Specialty Chemicals, Inc. and Marvin O. Schlanger | |
| 10.68*** | Amendment No. 1 dated as of January 25, 2006 to the Consulting Agreement dated as of June 1, 2005 between Hexion Specialty Chemicals, Inc. and Marvin O. Schlanger | |
| 10.69*** | RPP Nonqualified Deferred Compensation Plan | |
| 10.70 | Amendment and Restatement Agreement dated as of May 5, 2006 among Hexion LLC, Hexion Specialty Chemicals, Inc., Hexion Specialty Chemicals Canada, Inc., Hexion Specialty Chemicals B.V., Hexion Specialty Chemicals UK Limited, Borden Chemical UK Limited, the lenders party thereto and JP Morgan Chase Bank, N.A., as administrative agent under the Credit Agreement dated as of May 31, 2005 among Hexion LLC, Hexion Specialty Chemicals, Inc., Hexion Specialty Chemicals Canada, Inc., Hexion Specialty Chemicals B.V., Hexion Specialty Chemicals UK Limited, Borden Chemical UK Limited, the lenders party thereto from time to time and the agents, arrangers and bookrunners party thereto | |
| 10.71 | Amended and Restated Credit Agreement dated as of May 5, 2006 among Hexion LLC, Hexion Specialty Chemicals, Inc., Hexion Specialty Chemicals Canada, Inc., Hexion Specialty Chemicals B.V., Hexion Specialty Chemicals UK Limited, Borden Chemical UK Limited, the lenders party thereto and JP Morgan Chase Bank, N.A., as Administrative Agent, Credit Suisse, as Syndication Agent, Citicorp North America, Inc., as Documentation Agent, and Credit Suisse Securities (USA) LLC, J.P. Morgan Securities Inc. and Citigroup Global Markets Inc., as Joint Lead Arrangers and Joint Bookrunners | |
| 12.1 | Statement regarding computation of Ratios | |
| 21.1 | List of Subsidiaries of the registrant | |
| 23.1 | Consent of Deloitte & Touche LLP, an independent registered public accounting firm | |
| 23.2 | Consent of PricewaterhouseCoopers LLP, an independent registered public accounting firm | |
| 23.3 | Consent of PricewaterhouseCoopers LLP, an independent registered public accounting firm | |
| 23.4 | Consent of PricewaterhouseCoopers Aktiengesellschaft Wirtschaftsprüfungsgesellschaft | |
| 24.1*** | Powers of Attorney of the directors and officers of the registrant | |
| 99.1*** | Consent of Marvin O. Schlanger | |
| 99.2*** | Consent of Nigel D. T. Andrews | |
| 99.3*** | Consent of David C. House | |
| 99.4*** | Consent of Robert M. Agate | |
| 99.5 | Consent of Richard A. Lamond | |
| * | To be filed by amendment |
| ** | Incorporated by reference |
| *** | Previously filed |
| † | The schedules and exhibits to these agreements are omitted pursuant to Item 601(b)(2) of Regulation S-K. The Company agrees to furnish supplementally to the SEC, upon request, a copy of any omitted schedule or exhibit. |
8