UNITED STATES
SECURITIES AND EXCHANGE COMMISSION
Washington, D.C. 20549
FORM N-CSR
CERTIFIED SHAREHOLDER REPORT OF REGISTERED MANAGEMENT INVESTMENT COMPANIES
Investment Company Act file number 811-21759
Name of Fund: BlackRock Long-Horizon Equity Fund (formerly, BlackRock Global Dynamic Equity Fund)
Fund Address: 100 Bellevue Parkway, Wilmington, DE 19809
Name and address of agent for service: John M. Perlowski, Chief Executive Officer, BlackRock Long-Horizon Equity Fund, 55 East 52nd Street, New York, NY 10055
Registrant’s telephone number, including area code: (800) 441-7762
Date of fiscal year end: 10/31/2012
Date of reporting period: 10/31/2012
Item 1 – Report to Stockholders
2
| | |
 | | October 31, 2012 |
Annual Report
BlackRock Long-Horizon Equity Fund
Not FDIC Insured · No Bank Guarantee · May Lose Value
| | | | | | |
| | | | | | | |
| 2 | | BLACKROCK LONG-HORIZON EQUITY FUND | | OCTOBER 31, 2012 | | |
In the final months of 2011, financial markets were highly volatile but were in a mode of gradual improvement. Global central bank actions and better-than-expected economic data tempered investors’ anxiety after markets had been upended in the previous quarter by sovereign debt turmoil in the United States and Europe. Improving sentiment carried over into early 2012 as investors felt some relief from the world’s financial woes. Volatility was low and risk assets (including stocks, commodities and high yield bonds) moved boldly higher through the first two months of 2012, while climbing Treasury yields pressured higher-quality fixed income assets.
Markets reversed course in the spring when Europe’s debt problems boiled over once again. High levels of volatility returned as political instability threatened Greece’s membership in the eurozone and debt problems in Spain grew increasingly severe. Sovereign debt yields in peripheral European countries continued to rise while finance leaders deliberated over the fiscal integration of the currency bloc. Alongside the drama in Europe, investors were discouraged by gloomy economic reports from various parts of the world. A slowdown in China, a key powerhouse for global growth, emerged as a particular concern. In the United States, disappointing jobs reports dealt a crushing blow to investor sentiment. Risk assets sold off in the second quarter as investors retreated to safe haven assets.
Despite ongoing concerns about the health of the global economy and the debt crisis in Europe, most asset classes enjoyed a robust summer rally powered mainly by expectations for policy stimulus from central banks in Europe and the United States. Global economic data continued to be mixed, but the spate of downside surprises seen in the second quarter had receded and, outside of some areas of Europe, the risk of recession largely subsided. Additionally, in response to mounting debt pressures, the European Central Bank allayed fears by affirming its conviction to preserve the euro bloc. Early in September, the European Central Bank announced its plan to purchase sovereign debt in the eurozone’s most troubled nations. Later that month, the US Federal Reserve announced its long-awaited — and surprisingly aggressive — stimulus program, committing to purchase $40 billion of agency mortgage-backed securities per month until the US economy exhibits enough strength to sustain real growth and the labor market shows solid improvement. These central bank actions boosted investor confidence and risk assets rallied globally.
European stocks continued their advance in the final month of the reporting period as progress toward fiscal integration created a more positive atmosphere for investors. However, as corporate earnings season got underway in the United States, lackluster results pointed to the fragility of global growth and pushed US equity markets down for the month of October. The period ended with increasing concern about how and when US politicians would resolve the nation’s looming fiscal crisis, known as the “fiscal cliff.”
All asset classes performed well for the 12-month period ended October 31, 2012, with the strongest returns coming from US stocks and high yield bonds. For the six-month period ended October 31, 2012, equities underperformed fixed income investments, where high yield was the leading sector. US and international stocks finished the six-month period with modest gains, while emerging market stocks lagged other asset classes amid ongoing uncertainty. Near-zero short term interest rates continued to keep yields on money market securities near their all-time lows.
Although the financial world remains highly uncertain, we believe there are new avenues of opportunity — new ways to invest and new markets to consider. We believe it’s our responsibility to help investors adapt to today’s new world of investing and build the portfolios these times require. We encourage you to visit www.blackrock.com/newworld for more information.
Sincerely,

Rob Kapito
President, BlackRock Advisors, LLC

“Although the financial world remains highly uncertain, we believe there are new avenues of opportunity.”
Rob Kapito
President, BlackRock Advisors, LLC
| | | | | | | | |
| Total Returns as of October 31, 2012 | |
| | | 6-month | | | 12-month | |
US large cap equities
(S&P 500® Index) | | | 2.16 | % | | | 15.21 | % |
US small cap equities (Russell 2000® Index) | | | 0.95 | | | | 12.08 | |
International equities
(MSCI Europe, Australasia, Far East Index) | | | 2.12 | | | | 4.61 | |
Emerging market equities (MSCI Emerging Markets Index) | | | (1.25 | ) | | | 2.63 | |
3-month Treasury bill
(BofA Merrill Lynch 3-Month US Treasury Bill Index) | | | 0.06 | | | | 0.08 | |
US Treasury securities
(BofA Merrill Lynch 10-Year US Treasury Index) | | | 3.49 | | | | 7.46 | |
US investment grade bonds (Barclays US Aggregate Bond Index) | | | 2.75 | | | | 5.25 | |
Tax-exempt municipal bonds (S&P Municipal Bond Index) | | | 3.65 | | | | 9.57 | |
US high yield bonds (Barclays US Corporate
High Yield 2% Issuer Capped Index) | | | 6.24 | | | | 13.58 | |
| Past performance is no guarantee of future results. Index performance is shown for illustrative purposes only. You cannot invest directly in an index. | |
| | | | | | |
| | | | | | | |
| | THIS PAGE NOT PART OF YOUR FUND REPORT | | | | 3 |
| | |
| Fund Summary as of October 31, 2012 | | |
BlackRock Long-Horizon Equity Fund’s (the “Fund”) investment objective is to provide high total investment return.
On October 15, 2012, the Fund changed its investment objective to exclude “total investment return is the combination of capital growth and investment income” and changed the name of the Fund from “BlackRock Global Dynamic Equity Fund” to “BlackRock Long-Horizon Equity Fund”. In addition, the Fund changed its performance benchmarks from the S&P 500 Index, the FTSE World Index, the FTSE World (ex US) Index and the Reference Benchmark to the Morgan Stanley Capital International (“MSCI”) All Country World Index (“ACWI”). The benchmark change reflects the Fund’s new investment guidelines.
| | |
| Portfolio Management Commentary | | |
How did the Fund perform?
| Ÿ | | For the 12-month period ended October 31, 2012, the Fund generated a positive return. For the period November 1, 2011 through October 12, 2012, under the BlackRock Global Dynamic Equity Fund strategy (“Global Dynamic Equity strategy”), the Fund underperformed both its reference benchmark, which is comprised of the S&P 500 Index® (60%) and the FTSE World (ex US) Index (40%) (the “Reference Benchmark”), and the broad-based all-equity benchmark, the FTSE World Index. For the remainder of the reporting period following the change to the BlackRock Long-Horizon Equity Fund strategy (“Long-Horizon Equity strategy”), the Fund underperformed the MSCI All Country World Index. The following discussion of relative performance regarding the Global Dynamic Equity strategy pertains to the Reference Benchmark, while the discussion of relative performance regarding the Long-Horizon Equity strategy pertains to the MSCI All Country World Index. |
What factors influenced performance?
| Ÿ | | From the beginning of the reporting period through October 12, 2012, under the Global Dynamic Equity strategy, the largest detractors from the Fund’s performance included stock selection and an underweight in the United States, as well as an overweight to India and stock selection in Australia and Canada. An overweight in Japan and Brazil also weighed on returns, although this was partially offset by good stock selection in both countries. Conversely, an underweight and stock selection in France contributed positively to performance. From a sector perspective, the Fund’s overweight to materials and stock selection in information technology (“IT”) and consumer staples detracted from performance. An underweight to consumer discretionary weighed on returns, although this was partially offset by stock selection within the sector. In financials, stock selection contributed positively to performance, although this was partially offset by an underweight to the sector. The Fund’s allocation to cash and cash equivalents also had a positive impact on performance. |
| Ÿ | | For the remainder of the period, under the Long-Horizon Equity strategy, stock selection in the health care sector had the largest negative impact on relative returns, with US-based biotechnology company Vertex Pharmaceuticals, Inc. detracting the most from performance. Contributing positively to performance was stock selection in IT, where US-based technology supplier Veeco Instruments, Inc. was the strongest-performing holding. |
Describe recent portfolio activity.
| Ÿ | | During the period November 1, 2011 through October 12, 2012, under the Global Dynamic Equity strategy, the Fund’s equity allocation decreased from 95% of net assets to 94%. Within equities, the Fund increased its exposure to Europe and the United States and reduced its weightings in Asia and Brazil. On a sector basis, the Fund increased its exposures to health care, IT, consumer discretionary and consumer staples, and decreased its exposures to materials, energy, utilities, telecommunication services and industrials. The Fund’s allocation to fixed income securities decreased from 2% of net assets to 0% and its holdings of cash and cash equivalents increased from 3% to 6% of net assets. The Fund began selling positions and increasing liquidity in October in preparation for its transition to the Long-Horizon Equity strategy. |
| Ÿ | | During the remainder of the period, pursuant to the Long-Horizon Equity strategy, the Fund initiated new positions and sector exposures consistent with an unconstrained approach to achieving a more concentrated equity portfolio across issuers and regions. |
Describe portfolio positioning at period end.
| Ÿ | | At the end of the period, the Fund was near fully invested with a cash and cash equivalents balance of 7%. The Fund’s largest sector exposures at period end were consumer discretionary, consumer staples and IT. From a regional perspective, the Fund’s largest weighting was in the United States. The Fund also held significant exposure to Europe, with a particular emphasis on Switzerland and the United Kingdom. |
The views expressed reflect the opinions of BlackRock as of the date of this report and are subject to change based on changes in market, economic or other conditions. These views are not intended to be a forecast of future events and are no guarantee of future results.
| | | | | | |
| | | | | | | |
| 4 | | BLACKROCK LONG-HORIZON EQUITY FUND | | OCTOBER 31, 2012 | | |
| | |
| Total Return Based on a $10,000 Investment | | |
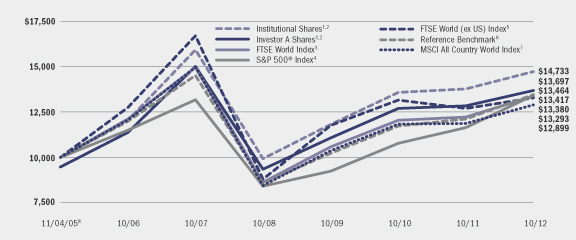
| | 1 | | Assuming maximum sales charges, if any, transaction costs and other operating expenses, including advisory fees. Institutional Shares do not have a sales charge. |
| | 2 | | The Fund invests primarily in United States and foreign equity securities. The Fund’s total returns prior to October 15, 2012 are the returns of the Fund when it followed a different investment objective and different investment strategies under the name BlackRock Global Dynamic Equity Fund. |
| | 3 | | This unmanaged capitalization-weighted index is comprised of 2,869 equities from 47 countries in 4 regions, including the United States. |
| | 4 | | This unmanaged index covers 500 industrial, utility, transportation and financial companies of the US markets (mostly New York Stock Exchange (“NYSE”) issues) representing about 75% of NYSE market capitalization and 30% of NYSE issues. |
| | 5 | | This unmanaged capitalization-weighted index is comprised of 2,257 companies in 46 countries, excluding the United States. |
| | 6 | | The Reference Benchmark is an unmanaged weighted index comprised of 60% of the S&P 500® Index and 40% of the FTSE World (ex US) Index. |
| | 7 | | This unmanaged index is a free float-adjusted, market capitalization weighted index that is designed to measure the equity market performance of developed and emerging markets. The Fund now uses this index as its benchmark rather than the S&P 500 Index, the FTSE World Index, the FTSE World (ex US) Index and the Reference Benchmark because Fund management believes it is more relevant to the Fund’s new investment strategies. |
| | 8 | | Commencement of operations. |
| | |
| Performance Summary for the Period Ended October 31, 2012 | | |
| | | | | | | | | | | | | | | | | | | | | | | | | | | | |
| | | | | | Average Annual Total Returns9 | |
| | | | | | 1 Year | | | 5 Years | | | Since Inception10 | |
| | | 6-Month
Total Returns | | | w/o sales
charge | | | w/sales
charge | | | w/o sales
charge | | | w/sales
charge | | | w/o sales
charge | | | w/sales
charge | |
Institutional | | | 1.14 | % | | | 6.93 | % | | | N/A | | | | (1.55 | )% | | | N/A | | | | 5.70 | % | | | N/A | |
Investor A | | | 0.98 | | | | 6.62 | | | | 1.02 | % | | | (1.82 | ) | | | (2.88 | )% | | | 5.41 | | | | 4.60 | % |
Investor B | | | 0.57 | | | | 5.76 | | | | 1.26 | | | | (2.60 | ) | | | (2.97 | ) | | | 4.58 | | | | 4.58 | |
Investor C | | | 0.65 | | | | 5.85 | | | | 4.85 | | | | (2.56 | ) | | | (2.56 | ) | | | 4.62 | | | | 4.62 | |
Class R | | | 0.73 | | | | 6.17 | | | | N/A | | | | (2.19 | ) | | | N/A | | | | 5.04 | | | | N/A | |
| MSCI All Country World Index | | | 1.38 | | | | 8.55 | | | | N/A | | | | (2.95 | ) | | | N/A | | | | 3.71 | | | | N/A | |
| FTSE World Index | | | 1.88 | | | | 9.48 | | | | N/A | | | | (2.21 | ) | | | N/A | | | | 4.25 | | | | N/A | |
| FTSE World (ex US) Index | | | 1.67 | | | | 4.67 | | | | N/A | | | | (4.46 | ) | | | N/A | | | | 4.16 | | | | N/A | |
| S&P 500® Index | | | 2.16 | | | | 15.21 | | | | N/A | | | | 0.36 | | | | N/A | | | | 4.29 | | | | N/A | |
Reference Benchmark | | | 2.01 | | | | 11.00 | | | | N/A | | | | (1.48 | ) | | | N/A | | | | 4.35 | | | | N/A | |
| 9 | | Assuming maximum sales charges, if any. Average annual total returns with and without sales charges reflect reductions for distribution and service fees. See “About Fund Performance” on page 6 for a detailed description of share classes, including any related sales charges and fees. |
| 10 | | The Fund commenced operations on November 4, 2005. |
| | | N/A — Not applicable as share class and index do not have a sales charge. |
Past performance not indicative of future results.
| | | | | | |
| | | | | | | |
| | BLACKROCK LONG-HORIZON EQUITY FUND | | OCTOBER 31, 2012 | | 5 |
| Ÿ | | Institutional Shares are not subject to any sales charge. These shares bear no ongoing distribution or service fees and are available only to eligible investors. |
| Ÿ | | Investor A Shares are subject to a maximum initial sales charge (front-end load) of 5.25% and a service fee of 0.25% per year (but no distribution fee). |
| Ÿ | | Investor B Shares are subject to a maximum contingent deferred sales charge (“CDSC”) of 4.50% declining to 0% after six years. In addition, these shares are subject to a distribution fee of 0.75% per year and a service fee of 0.25% per year. These shares automatically convert to Investor A Shares after approximately eight years. (There is no initial sales charge for automatic share conversions.) These shares are only available through exchanges and dividend reinvestment by existing shareholders or for purchase by certain qualified employee benefit plans. |
| Ÿ | | Investor C Shares are subject to a 1.00% CDSC if redeemed within one year of purchase. In addition, these shares are subject to a distribution fee of 0.75% per year and a service fee of 0.25% per year. |
| Ÿ | | Class R Shares are not subject to any sales charge. These shares are subject to a distribution fee of 0.25% per year and a service fee of 0.25% per year. These shares are available only to certain retirement and other similar plans. Prior to March 1, 2007, Class R Shares performance results are those of Institutional Shares (which have no distribution or service fees) restated to reflect Class R Share fees. |
Performance information reflects past performance and does not guarantee future results. Current performance may be lower or higher than the performance data quoted. Refer to www.blackrock.com/funds to obtain performance data current to the most recent month end. Performance results do not reflect the deduction of taxes that a shareholder would pay on fund distributions or the redemption of fund shares. Figures shown in the performance table on the previous page assume reinvestment of all dividends and capital gain distributions, if any, at net asset value (“NAV”) on the ex-dividend date. Investment return and principal value of shares will fluctuate so that shares, when redeemed, may be worth more or less than their original cost. Dividends paid to each class of shares will vary because of the different levels of service, distribution and transfer agency fees applicable to each class, which are deducted from the income available to be paid to shareholders. The Fund’s investment advisor waived a portion of its fees. Without such waiver, the Fund’s returns would have been lower. BlackRock Advisors, LLC is under no obligation to waive or continue waiving its fees after March 1, 2013.
| | | | |
Ten Largest Holdings (Equity Investments) | | Percent of
Long-Term
Investments | |
Imperial Tobacco Group Plc | | | 6 | % |
Nestlé SA, Registered Shares | | | 5 | |
Pfizer, Inc. | | | 5 | |
AutoZone, Inc. | | | 5 | |
Microsoft Corp. | | | 5 | |
British American Tobacco Plc | | | 5 | |
Philip Morris International, Inc. | | | 4 | |
Roche Holding AG | | | 4 | |
Assa Abloy AB, Class B | | | 4 | |
Newell Rubbermaid, Inc. | | | 4 | |
| | | | |
| Geographic Allocation | | Percent of
Long-Term
Investments | |
United States | | | 52 | % |
Switzerland | | | 15 | |
United Kingdom | | | 13 | |
Sweden | | | 4 | |
Belgium | | | 4 | |
India | | | 3 | |
Finland | | | 3 | |
China | | | 2 | |
Argentina | | | 2 | |
Netherlands | | | 2 | |
| | | | | | |
| | | | | | | |
| 6 | | BLACKROCK LONG-HORIZON EQUITY FUND | | OCTOBER 31, 2012 | | |
Shareholders of the Fund may incur the following charges: (a) expenses related to transactions, including sales charges and exchange fees; and (b) operating expenses, including advisory fees, service and distribution fees, including 12b-1 fees, and other Fund expenses. The expense example shown below (which is based on a hypothetical investment of $1,000 invested on May 1, 2012 and held through October 31, 2012) is intended to assist shareholders both in calculating expenses based on an investment in the Fund and in comparing these expenses with similar costs of investing in other mutual funds.
The expense example provides information about actual account values and actual expenses. In order to estimate the expenses a shareholder paid during the period covered by this report, shareholders can divide their account value by $1,000 and then multiply the result by the number corresponding to their share class under the heading entitled “Expenses Paid During the Period.”
The expense example also provides information about hypothetical account values and hypothetical expenses based on the Fund’s actual expense ratio and an assumed rate of return of 5% per year before expenses. In order to assist shareholders in comparing the ongoing expenses of investing in this Fund and other funds, compare the 5% hypothetical example with the 5% hypothetical examples that appear in other funds’ shareholder reports.
The expenses shown in the expense example are intended to highlight shareholders’ ongoing costs only and do not reflect any transactional expenses, such as sales charges or exchange fees, if any. Therefore, the hypothetical example is useful in comparing ongoing expenses only, and will not help shareholders determine the relative total expenses of owning different funds. If these transactional expenses were included, shareholder expenses would have been higher.
| | | | | | | | | | | | | | | | | | | | | | | | | | | | |
| | | Actual | | | Hypothetical2 | | | | |
| | | Beginning
Account Value
May 1, 2012 | | | Ending
Account Value
October 31, 2012 | | | Expenses Paid
During the Period1 | | | Beginning
Account Value
May 1, 2012 | | | Ending
Account Value
October 31, 2012 | | | Expenses Paid
During the Period1 | | | Annualized
Expense Ratio | |
Institutional | | $ | 1,000.00 | | | $ | 1,011.40 | | | $ | 4.75 | | | $ | 1,000.00 | | | $ | 1,020.44 | | | $ | 4.77 | | | | 0.94 | % |
Investor A | | $ | 1,000.00 | | | $ | 1,009.80 | | | $ | 6.47 | | | $ | 1,000.00 | | | $ | 1,018.74 | | | $ | 6.50 | | | | 1.28 | % |
Investor B | | $ | 1,000.00 | | | $ | 1,005.70 | | | $ | 10.54 | | | $ | 1,000.00 | | | $ | 1,014.64 | | | $ | 10.58 | | | | 2.09 | % |
Investor C | | $ | 1,000.00 | | | $ | 1,006.50 | | | $ | 10.29 | | | $ | 1,000.00 | | | $ | 1,014.84 | | | $ | 10.33 | | | | 2.04 | % |
Class R | | $ | 1,000.00 | | | $ | 1,007.30 | | | $ | 8.48 | | | $ | 1,000.00 | | | $ | 1,016.74 | | | $ | 8.52 | | | | 1.68 | % |
| | 1 | | For each class of the Fund, expenses are equal to the annualized expense ratio for the class multiplied by the average account value over the period, multiplied by 184/366 (to reflect the one-half year period shown). |
| | 2 | | Hypothetical 5% annual return before expenses is calculated by pro rating the number of days in the most recent fiscal half year divided by 366. |
| | |
| Derivative Financial Instruments | | |
The Fund may invest in various derivative financial instruments, including financial futures contracts, foreign currency exchange contracts, options and swaps, as specified in Note 2 of the Notes to Consolidated Financial Statements, which may constitute forms of economic leverage. Such derivative financial instruments are used to obtain exposure to a market without owning or taking physical custody of securities or to hedge market, equity, credit, foreign currency exchange rate and/or other risks. Derivative financial instruments involve risks, including the imperfect correlation between the value of a derivative financial instrument and the underlying asset, possible default of the counterparty to the transaction or illiquidity of the
derivative financial instrument. The Fund’s ability to use a derivative financial instrument successfully depends on the investment advisor’s ability to predict pertinent market movements accurately, which cannot be assured. The use of derivative financial instruments may result in losses greater than if they had not been used, may require the Fund to sell or purchase portfolio investments at inopportune times or for distressed values, may limit the amount of appreciation the Fund can realize on an investment, may result in lower dividends paid to shareholders or may cause the Fund to hold an investment that it might otherwise sell. The Fund’s investments in these instruments are discussed in detail in the Notes to Consolidated Financial Statements.
| | | | | | |
| | | | | | | |
| | BLACKROCK LONG-HORIZON EQUITY FUND | | OCTOBER 31, 2012 | | 7 |
| | |
Consolidated Schedule of Investments October 31, 2012 | | (Percentages shown are based on Net Assets) |
| | | | | | | | | | |
| Common Stocks | | | | Shares | | | Value | |
| | | | | | | | | | |
Argentina — 1.8% | |
MercadoLibre, Inc. (a) | | | | | 139,487 | | | $ | 11,712,723 | |
Belgium — 3.4% | | | | | | | | | | |
Anheuser-Busch InBev NV | | | | | 264,285 | | | | 22,102,437 | |
Canada — 0.0% | | | | | | | | | | |
Sino-Forest Corp. (b) | | | | | 60,390 | | | | 1 | |
China — 2.1% | | | | | | | | | | |
Chaoda Modern Agriculture Holdings Ltd. (b) | | | | | 3,106,585 | | | | 71,452 | |
Want Want China Holdings Ltd. | | | | | 9,783,000 | | | | 13,318,754 | |
| | | | | | | | | | |
| | | | | | | | | | 13,390,206 | |
Finland — 2.6% | | | | | | | | | | |
Kone Oyj, Class B | | | | | 231,217 | | | | 16,580,357 | |
India — 3.0% | | | | | | | | | | |
Housing Development Finance Corp. | | | | | 1,361,889 | | | | 19,225,731 | |
Netherlands — 1.6% | | | | | | | | | | |
ASML Holding NV | | | | | 185,134 | | | | 10,177,231 | |
Russia — 0.0% | | | | | | | | | | |
Novorossiysk Commercial Sea Port — GDR | | | 10,676 | | | | 71,102 | |
Sweden — 3.8% | | | | | | | | | | |
Assa Abloy AB, Class B | | | | | 725,862 | | | | 24,182,602 | |
Switzerland — 15.1% | | | | | | | | | | |
Cie Financiere Richemont SA, Class A | | | | | 236,271 | | | | 15,333,514 | |
Nestlé SA, Registered Shares | | | | | 529,795 | | | | 33,635,716 | |
Roche Holding AG | | | | | 144,456 | | | | 27,825,851 | |
The Swatch Group AG | | | | | 48,658 | | | | 20,140,858 | |
| | | | | | | | | | |
| | | | | | | | | | 96,935,939 | |
Taiwan — 0.0% | | | | | | | | | | |
Chunghwa Telecom Co. Ltd. | | | | | 1 | | | | 3 | |
United Arab Emirates — 0.0% | | | | | | | | | | |
NMC Health Plc (b) | | | | | 22,921 | | | | 66,950 | |
United Kingdom — 12.8% | | | | | | | | | | |
British American Tobacco Plc | | | | | 572,412 | | | | 28,391,385 | |
British Sky Broadcasting Group Plc | | | | | 1,366,471 | | | | 15,639,064 | |
Delta Topco Ltd. (b) | | | | | 1,559,597 | | | | 795,706 | |
Imperial Tobacco Group Plc | | | | | 984,302 | | | | 37,225,702 | |
| | | | | | | | | | |
| | | | | | | | | | 82,051,857 | |
United States — 51.1% | | | | | | | | | | |
AutoZone, Inc. (b) | | | | | 79,288 | | | | 29,733,000 | |
Coach, Inc. | | | | | 330,422 | | | | 18,520,153 | |
Cognizant Technology Solutions Corp., Class A (b) | | | | | 236,301 | | | | 15,749,462 | |
Comcast Corp., Class A | | | | | 551,114 | | | | 20,672,286 | |
DIRECTV (b) | | | | | 448,395 | | | | 22,917,469 | |
Discovery Communications, Inc., Class A (a)(b) | | | | | 357,108 | | | | 21,076,514 | |
EMC Corp. (b) | | | | | 615,253 | | | | 15,024,478 | |
JPMorgan Chase & Co. | | | | | 347,441 | | | | 14,481,341 | |
McDonald’s Corp. | | | | | 213,154 | | | | 18,501,767 | |
| | | | | | | | | | |
| Common Stocks | | | | Shares | | | Value | |
| | | | | | | | | | |
United States (concluded) | | | | | | | | | | |
Microsoft Corp. | | | | | 1,012,954 | | | $ | 28,904,642 | |
Newell Rubbermaid, Inc. | | | | | 1,164,826 | | | | 24,042,009 | |
Pfizer, Inc. | | | | | 1,229,811 | | | | 30,585,400 | |
Philip Morris International, Inc. | | | | | 315,387 | | | | 27,930,673 | |
Praxair, Inc. | | | | | 1261,561 | | | | 13,442,044 | |
Veeco Instruments, Inc. (b) | | | | | 457,249 | | | | 14,037,544 | |
Vertex Pharmaceuticals, Inc. (b) | | | | | 245,580 | | | | 11,846,779 | |
| | | | | | | | | | |
| | | | | | | | | | 327,465,561 | |
| Total Common Stocks — 97.3% | | | | | | | | | 623,962,700 | |
| | | | | | | | | | |
| | | | | | | | | | | |
| Corporate Bonds | | | | Par
(000) | | | | |
China — 0.0% | | | | | | | | | | |
China Milk Products Group Ltd.,
0.00%, 1/15/2012 (b)(c)(d) | | | | | USD 1,000 | | | | 200,000 | |
Hong Kong — 0.0% | | | | | | | | | | |
FU JI Food and Catering Services Holdings Ltd., 0.00%, 10/18/2010 (b)(c)(d)(e) | | | | | CNY 10,800 | | | | 17,315 | |
India — 0.2% | | | | | | | | | | |
REI Agro Ltd., 5.50%, 11/13/14 (e)(f) | | | | | USD 1,235 | | | | 913,900 | |
United Kingdom — 0.2% | | | | | | | | | | |
Delta Topco Ltd., 10.00%,
11/24/60 (e)(g) | | | | | 1,199 | | | | 1,286,975 | |
| Total Corporate Bonds — 0.4% | | | | | | | | | 2,418,190 | |
| | | | | | | | | | |
| | | | | | | | | | | |
| | | |
| Investment Companies | | | | Shares | | | | |
Vietnam — 0.0% | | | | | | | | | | |
Vinaland Ltd. (b) | | | | | 142,417 | | | | 63,233 | |
| | | | | | | | | | |
| | | | | | | | | | | |
| | | |
| Warrants (h) | | | | | | | | |
Canada — 0.0% | | | | | | | | | | |
Kinross Gold Corp.
(Issued/exercisable 10/29/08, 1 share for 1 warrant, Expires 9/03/13, Strike Price CAD 32.00) (a) | | | | | 36,725 | | | | 8,089 | |
United States — 0.0% | | | | | | | | | | |
Ford Motor Co.
(Issued/exercisable 3/31/10, 1 share for 1 warrant, Expires 1/01/13, Strike Price USD 9.05) | | | | | 134,367 | | | | 294,264 | |
| Total Warrants — 0.0% | | | | | | | | | 302,353 | |
Total Long-Term Investments (Cost — $630,597,595) — 97.7% | | | | | | | 626,746,476 | |
To simplify the listings of portfolio holdings in the Consolidated Schedule of Investments, the names and descriptions of many of the securities have been abbreviated according to the following list:
| | |
| AUD | | Australian Dollar |
| CAD | | Canadian Dollar |
| CHF | | Swiss Franc |
| CNY | | Chinese Yuan Renminbi |
| GBP | | British Pound |
| | |
| GDR | | Global Depositary Receipts |
| HKD | | Hong Kong Dollar |
| MYR | | Malaysian Ringgit |
| USD | | US Dollar |
See Notes to Consolidated Financial Statements.
| | | | | | |
| | | | | | | |
| 8 | | BLACKROCK LONG-HORIZON EQUITY FUND | | OCTOBER 31, 2012 | | |
| | |
Consolidated Schedule of Investments (continued) | | (Percentages shown are based on Net Assets) |
| | | | | | | | | | |
| | | |
| Short-Term Securities | | | | Shares | | | Value | |
| | | | | | | | | | |
Money Market Funds — 7.3% | | | | | | | | | | |
BlackRock Liquidity Funds,
TempFund, Institutional Class, 0.17% (i)(k) | | | | | 14,133,597 | | | $ | 14,133,597 | |
| | | |
| | | | | Beneficial
Interest
(000) | | | | |
BlackRock Liquidity Series LLC,
Money Market Series, 0.29% (i)(j)(k) | | | | | USD 32,661 | | | | 32,660,500 | |
| Total Money Market Funds — 7.3% | | | | | | | 46,794,097 | |
| | | | | | | | | | |
| Time Deposits | | | | Par
(000) | | | | |
Australia — 0.0% | | | | | | | | | | |
Brown Brothers Harriman & Co.,
0.07%, 11/01/12 | | | | | AUD 1 | | | | 1,223 | |
Canada — 0.0% | | | | | | | | | | |
Brown Brothers Harriman & Co.,
0.08%, 11/01/12 | | | | | CAD 14 | | | | 14,041 | |
Hong Kong — 0.0% | | | | | | | | | | |
Brown Brothers Harriman & Co.,
0.01%, 11/01/12 | | | | | HKD 98 | | | | 12,702 | |
Switzerland — 0.0% | | | | | | | | | | |
Brown Brothers Harriman & Co.,
0.00%, 11/01/12 | | | | | CHF 1 | | | | 1,131 | |
United States — 0.0% | | | | | | | | | | |
Brown Brothers Harriman & Co.,
0.10%, 11/01/12 | | | | | USD 28 | | | | 28,015 | |
| Total Time Deposits — 0.0% | | | | | | | | | 57,112 | |
Total Short-Term Securities (Cost — $46,851,209) — 7.3% | | | | | | | | | 46,851,209 | |
| Total Investments (Cost — $677,448,804) — 105.0% | | | | 673,597,685 | |
| Liabilities in Excess of Other Assets — (5.0)% | | | | (32,289,214 | ) |
| | | | | | | | | | |
| Net Assets — 100.0% | | | | | | $ | 641,308,471 | |
| | | | | | | | | | |
| | | | | |
| (a) | | Security, or a portion of security, is on loan. |
| (b) | | Non-income producing security. |
| (c) | | Issuer filed for bankruptcy and/or is in default of principal and/or interest payments. |
| (d) | | Represents a zero-coupon bond. Rate shown reflects the current yield as of report date. |
| (e) | | Convertible security. |
| (f) | | Security exempt from registration pursuant to Rule 144A under the Securities Act of 1933, as amended. These securities may be resold in transactions exempt from registration to qualified institutional investors. |
| (g) | | Represents a payment-in-kind security which may pay interest/dividends in additional par/shares. |
| (h) | | Warrants entitle the Fund to purchase a predetermined number of shares of common stock and are non-income producing. The purchase price and number of shares are subject to adjustment under certain conditions until the expiration date, if any. |
| (i) | | Represents the current yield as of report date. |
| (j) | | Security was purchased with the cash collateral from loaned securities. The Fund may withdraw up to 25% of its investment daily, although the manager of the Money Market Series, in its sole discretion, may permit an investor to withdraw more than 25% on any one day. |
| (k) | | Investments in issuers considered to be an affiliate of the Fund during the year, for purposes of Section 2(a)(3) of the Investment Company Act of 1940, as amended, were as follows: |
| | | | | | | | | | | | | | | | | | | | | | | | | | | | |
| Affiliate | | Shares/
Beneficial
Interest
Held at
October 31,
2011 | | | Shares/ Beneficial
Interest
Purchased | | | Shares/ Beneficial
Interest Sold | | | Shares/ Beneficial
Interest
Held at
October 31,
2012 | | | Value at
October 31,
2012 | | | Realized Gain | | | Income | |
BlackRock Liquidity Funds, TempFund, Institutional Class | | | — | | | | 14,133,597 | 1 | | | — | | | | 14,133,597 | | | $ | 14,133,597 | | | | — | | | $ | 3,497 | |
BlackRock Liquidity Series, LLC Money Market Series | | $ | 2,983,236 | | | $ | 29,677,264 | 1 | | | — | | | $ | 32,660,500 | | | $ | 32,660,500 | | | | — | | | $ | 45,521 | |
iShares Gold Trust | | | 373,094 | | | | — | | | | (373,094 | ) | | | — | | | | — | | | $ | 1,115,006 | | | | — | |
iShares Silver Trust | | | 11,200 | | | | — | | | | (11,200 | ) | | | — | | | | — | | | $ | 208,333 | | | | — | |
| 1 | | Represents net shares/beneficial interest purchased. |
See Notes to Consolidated Financial Statements.
| | | | | | |
| | | | | | | |
| | BLACKROCK LONG-HORIZON EQUITY FUND | | OCTOBER 31, 2012 | | 9 |
| | |
Consolidated Schedule of Investments (concluded) | | |
| Ÿ | | Foreign currency exchange contracts as of October 31, 2012 were as follows: |
| | | | | | | | | | | | | | |
Currency
Purchased | | Currency
Sold | | | Counterparty | | Settlement
Date | | | Unrealized
Depreciation | |
USD 32,998 | | | GBP 20,546 | | | Citigroup, Inc. | | | 11/01/12 | | | $ | (157 | ) |
USD 8,820 | | | CAD 8,820 | | | UBS AG | | | 11/02/12 | | | | (11 | ) |
USD 11,802 | | | GBP 7,322 | | | State Street Corp. | | | 11/02/12 | | | | (15 | ) |
USD 12,702 | | | HKD 98,443 | | | UBS AG | | | 11/02/12 | | | | — | |
USD 11,132 | | | MYR 33,936 | | | Brown Brothers Harriman & Co. | | | 11/02/12 | | | | (9 | ) |
| Total | | | | | | | | | | | | $ | (192 | ) |
| | | | | | | | | | | | | | |
| Ÿ | | Fair Value Measurements — Various inputs are used in determining the fair value of investments and derivative financial instruments. These inputs to valuation techniques are categorized into a disclosure hierarchy consisting of three broad levels for financial statement purposes as follows: |
| Ÿ | | Level 1 — unadjusted price quotations in active markets/exchanges for identical assets and liabilities that the Fund has the ability to access |
| Ÿ | | Level 2 — other observable inputs (including, but not limited to: quoted prices for similar assets or liabilities in markets that are active, quoted prices for identical or similar assets or liabilities in markets that are not active, inputs other than quoted prices that are observable for the assets or liabilities (such as interest rates, yield curves, volatilities, prepayment speeds, loss severities, credit risks and default rates) or other market-corroborated inputs) |
| Ÿ | | Level 3 — unobservable inputs based on the best information available in the circumstances, to the extent observable inputs are not available (including the Fund’s own assumptions used in determining the fair value of investments and derivative financial instruments) |
The hierarchy gives the highest priority to unadjusted quoted prices in active markets for identical assets or liabilities (Level 1 measurements) and the lowest priority to unobservable inputs (Level 3 measurements). Accordingly, the degree of judgment exercised in determining fair value is greatest for instruments categorized in Level 3. The inputs used to measure fair value may fall into different levels of the fair value hierarchy. In such cases, for disclosure purposes, the level in the fair value hierarchy within which the fair value measurement falls in its entirety is determined based on the lowest level input that is significant to the fair value measurement in its entirety.
Changes in valuation techniques may result in transfers into or out of an assigned level within the disclosure hierarchy. In accordance with the Fund’s policy, transfers between different levels of the fair value disclosure hierarchy are deemed to have occurred as of the beginning of the reporting period. The categorization of a value determined for investments is based on the pricing transparency of the investment and is not necessarily an indication of the risks associated with investing in those securities. For information about the Fund’s policy regarding valuation of investments and derivative financial instruments and other significant accounting policies, please refer to Note 1 of the Notes to Consolidated Financial Statements.
The following tables summarize the Fund’s investments and derivative financial instruments categorized in the disclosure hierarchy as of October 31, 2012:
| | | | | | | | |
| | | | | |
| | | Level 1 | | Level 2 | | Level 3 | | Total |
| | | | | | | | |
Assets: | | | | | | | | |
| Investments: | | | | | | | | |
Long-Term Investments: |
Common Stocks: |
Argentina | | $ 11,712,723 | | — | | — | | $11,712,723 |
Belgium | | — | | $ 22,102,437 | | — | | 22,102,437 |
Canada | | — | | — | | $ 1 | | 1 |
China | | — | | 13,390,206 | | — | | 13,390,206 |
Finland | | — | | 16,580,357 | | — | | 16,580,357 |
India | | — | | 19,225,731 | | — | | 19,225,731 |
Netherlands | | — | | 10,177,231 | | — | | 10,177,231 |
Russia | | 71,102 | | — | | — | | 71,102 |
Sweden | | — | | 24,182,602 | | — | | 24,182,602 |
Switzerland | | — | | 96,935,939 | | — | | 96,935,939 |
Taiwan | | — | | 3 | | — | | 3 |
United Arab Emirates | | 66,950 | | — | | — | | 66,950 |
United Kingdom | | — | | 81,256,151 | | 795,706 | | 82,051,857 |
United States | | 327,465,561 | | — | | — | | 327,465,561 |
Corporate Bonds | | — | | 913,900 | | 1,504,290 | | 2,418,190 |
Investment Companies | | 63,233 | | — | | — | | 63,233 |
Warrants | | 302,353 | | — | | — | | 302,353 |
Short-Term Securities: |
Money Market Funds | | 14,133,597 | | 32,660,500 | | — | | 46,794,097 |
Time Deposits | | — | | 57,112 | | — | | 57,112 |
| | |
Total | | $353,815,519 | | $317,482,169 | | $2,299,997 | | $673,597,685 |
| | |
| | | | | | | | |
| | | Level 1 | | Level 2 | | Level 3 | | Total |
| Derivative Financial Instruments1 |
Liabilities: | | | | | | | | |
Foreign currency exchange contracts | | — | | $(192) | | — | | $(192) |
| 1 | | Derivative financial instruments are foreign currency exchange contracts, which are valued at the unrealized appreciation/deprecation on the instrument. |
Certain of the Fund’s assets and liabilities are held at carrying amount, which approximates fair value for financial statement purposes. As of October 31, 2012, such assets and liabilities are categorized within the disclosure hierarchy as follows:
| | | | | | | | | | | | | | | | |
| | | Level 1 | | | Level 2 | | | Level 3 | | | Total | |
Assets: | | | | | | | | | | | | | | | | |
Foreign currency at value | | $ | 21,523 | | | | — | | | | — | | | $ | 21,523 | |
Liabilities: | | | | | | | | | | | | | | | | |
Collateral on securities loaned at value | | | — | | | $ | (32,660,500 | ) | | | — | | | | (32,660,500 | ) |
| | | | |
Total | | $ | 21,523 | | | $ | (32,660,500 | ) | | | — | | | $ | (32,638,977 | ) |
| | | | |
There were no transfers between levels during the year ended October 31, 2012.
See Notes to Consolidated Financial Statements.
| | | | | | |
| | | | | | | |
| 10 | | BLACKROCK LONG-HORIZON EQUITY FUND | | OCTOBER 31, 2012 | | |
| | |
| Consolidated Statement of Assets and Liabilities | | |
| | | | |
| October 31, 2012 | | | |
| | | | |
| Assets | | | | |
Investments at value — unaffiliated (including securities loaned at value of $32,245,961) (cost — $630,654,707) | | $ | 626,803,588 | |
Investments at value — affiliated (cost — $46,794,097) | | | 46,794,097 | |
Foreign currency at value (cost — $21,410) | | | 21,523 | |
Dividends receivable | | | 1,336,413 | |
Investments sold receivable | | | 550,475 | |
Interest receivable | | | 526,433 | |
Capital shares sold receivable | | | 215,690 | |
Securities lending income receivable — affiliated | | | 700 | |
Prepaid expenses | | | 6,187 | |
| | | | |
Total assets | | | 676,255,106 | |
| | | | |
| | | | |
| Liabilities | | | | |
Collateral on securities loaned at value | | | 32,660,500 | |
Unrealized depreciation on foreign currency exchange contracts | | | 192 | |
Capital shares redeemed payable | | | 1,248,493 | |
Investment advisory fees payable | | | 444,169 | |
Service and distribution fees payable | | | 200,266 | |
Deferred foreign capital gain tax | | | 25,896 | |
Other affiliates payable | | | 7,395 | |
Other liabilities | | | 30,000 | |
Other accrued expenses payable | | | 329,724 | |
| | | | |
Total liabilities | | | 34,946,635 | |
| | | | |
Net Assets | | $ | 641,308,471 | |
| | | | |
| | | | |
| Net Assets Consist of | | | | |
Paid-in capital | | $ | 615,313,550 | |
Undistributed net investment income | | | 16,112,593 | |
Accumulated net realized gain | | | 13,764,338 | |
Net unrealized appreciation/depreciation | | | (3,882,010 | ) |
| | | | |
Net Assets | | $ | 641,308,471 | |
| | | | |
| | | | |
| Net Asset Value | | | | |
Institutional — Based on net assets of $138,976,062 and 11,180,636 shares outstanding, unlimited shares authorized, $0.10 par value | | $ | 12.43 | |
| | | | |
Investor A — Based on net assets of $353,237,390 and 28,480,207 shares outstanding, unlimited shares authorized, $0.10 par value | | $ | 12.40 | |
| | | | |
Investor B — Based on net assets of $8,868,059 and 715,852 shares outstanding, unlimited shares authorized, $0.10 par value | | $ | 12.39 | |
| | | | |
Investor C — Based on net assets of $133,373,548 and 10,827,545 shares outstanding, unlimited shares authorized, $0.10 par value | | $ | 12.32 | |
| | | | |
Class R — Based on net assets of $6,853,412 and 554,331 shares outstanding, unlimited shares authorized, $0.10 par value | | $ | 12.36 | |
| | | | |
| | | | | | |
| See Notes to Consolidated Financial Statements. | | | | |
| | | | | | | |
| | BLACKROCK LONG-HORIZON EQUITY FUND | | OCTOBER 31, 2012 | | 11 |
| | |
| Consolidated Statement of Operations | | |
| | | | |
| Year Ended October 31, 2012 | | | |
| | | | |
| Investment Income | | | | |
Dividends — unaffiliated | | $ | 17,255,575 | |
Foreign taxes withheld | | | (840,095 | ) |
Interest | | | 621,237 | |
Securities lending — affiliated | | | 45,521 | |
Dividends — affiliated | | | 3,497 | |
| | | | |
Total income | | | 17,085,735 | |
| | | | |
| | | | |
| Expenses | | | | |
Investment advisory | | | 6,007,161 | |
Service — Investor A | | | 920,800 | |
Service and distribution — Investor B | | | 111,534 | |
Service and distribution — Investor C | | | 1,511,915 | |
Service and distribution — Class R | | | 34,584 | |
Transfer agent — Institutional | | | 194,715 | |
Transfer agent — Investor A | | | 430,051 | |
Transfer agent — Investor B | | | 22,375 | |
Transfer agent — Investor C | | | 198,146 | |
Transfer agent — Class R | | | 28,635 | |
Custodian | | | 323,617 | |
Accounting services | | | 209,277 | |
Professional | | | 152,543 | |
Printing | | | 58,183 | |
Registration | | | 36,608 | |
Officer and Trustees | | | 31,215 | |
Miscellaneous | | | 41,998 | |
| | | | |
Total expenses | | | 10,313,357 | |
Less fees waived by Manager | | | (1,454 | ) |
Less transfer agent fees waived and/or reimbursed — class specific | | | (13,041 | ) |
| | | | |
Total expenses after fees waived and/or reimbursed | | | 10,298,862 | |
| | | | |
Net investment income | | | 6,786,873 | |
| | | | |
| | | | |
| Realized and Unrealized Gain (Loss) | | | | |
| Net realized gain (loss) from: | | | | |
Investments — unaffiliated | | | 159,877,034 | |
Investments — affiliated | | | 1,323,339 | |
Financial futures contracts | | | 4,075,706 | |
Foreign currency transactions | | | (785,262 | ) |
Options written and structured options | | | (533,064 | ) |
Swaps | | | 78,358 | |
| | | | |
| | | 164,036,111 | |
| | | | |
Net change in unrealized appreciation/depreciation on: | | | | |
Investments (including $25,896 foreign capital gain tax) | | | (116,430,576 | ) |
Financial futures contracts | | | (1,052,244 | ) |
Foreign currency translations | | | (263,724 | ) |
Options written and structured options | | | 1,300,766 | |
Swaps | | | (168,530 | ) |
| | | | |
| | | (116,614,308 | ) |
| | | | |
Total realized and unrealized gain | | | 47,421,803 | |
| | | | |
Net Increase in Net Assets Resulting from Operations | | $ | 54,208,676 | |
| | | | |
| | | | | | |
| See Notes to Consolidated Financial Statements. | | | | |
| | | | | | | |
| 12 | | BLACKROCK LONG-HORIZON EQUITY FUND | | OCTOBER 31, 2012 | | |
| | |
| Consolidated Statements of Changes in Net Assets | | |
| | | | | | | | |
| | | Year Ended October 31, | |
| Increase (Decrease) in Net Assets: | | 2012 | | | 2011 | |
| | | | | | | | |
| Operations | |
Net investment income | | $ | 6,786,873 | | | $ | 7,991,264 | |
Net realized gain | | | 164,036,111 | | | | 22,277,392 | |
Net change in unrealized appreciation/depreciation | | | (116,614,308 | ) | | | (20,400,907 | ) |
| | | | |
Net increase in net assets resulting from operations | | | 54,208,676 | | | | 9,867,749 | |
| | | | |
| | | | | | | | |
| Dividends to Shareholders From1 | | | | | | | | |
| Net investment income: | | | | | | | | |
Institutional | | | (8,689,066 | ) | | | (3,254,363 | ) |
Investor A | | | (9,318,899 | ) | | | (3,013,367 | ) |
Investor B | | | (187,400 | ) | | | — | |
Investor C | | | (2,667,467 | ) | | | — | |
Class R | | | (137,233 | ) | | | (32,374 | ) |
| | | | | | | | |
Decrease in net assets resulting from dividends to shareholders | | | (21,000,065 | ) | | | (6,300,104 | ) |
| | | | | | | | |
| | | | | | | | |
| Capital Share Transactions | | | | | | | | |
Net decrease in net assets derived from capital share transactions | | | (279,610,603 | ) | | | (31,527,010 | ) |
| | | | | | | | |
| | | | | | | | |
| Redemption Fee | | | | | | | | |
Redemption fee | | | – | | | | 3,722 | |
| | | | | | | | |
| | | | | | | | |
| Net Assets | | | | | | | | |
Total decrease in net assets | | | (246,401,992 | ) | | | (27,955,643 | ) |
Beginning of year | | | 887,710,463 | | | | 915,666,106 | |
| | | | | | | | |
End of year | | $ | 641,308,471 | | | $ | 887,710,463 | |
| | | | | | | | |
Undistributed net investment income | | $ | 16,112,593 | | | $ | 17,311,373 | |
| | | | | | | | |
| | 1 | | Dividends are determined in accordance with federal income tax regulations. |
| | | | | | |
| See Notes to Consolidated Financial Statements. | | | | |
| | | | | | | |
| | BLACKROCK LONG-HORIZON EQUITY FUND | | OCTOBER 31, 2012 | | 13 |
| | | | | | | | | | | | | | | | | | | | |
| | | Institutional | |
| | | Year Ended October 31, | |
| | | 2012 (Consolidated) | | | 2011 (Consolidated) | | | 2010 (Consolidated) | | | 2009 (Consolidated) | | | 2008 | |
| | | | | | | | | | | | | | | | | | | | |
| Per Share Operating Performance | | | | | | | | | | | | | | | | | | | | |
Net asset value, beginning of year | | $ | 11.98 | | | $ | 11.93 | | | $ | 10.52 | | | $ | 8.98 | | | $ | 15.11 | |
| | | | |
Net investment income1 | | | 0.14 | | | | 0.15 | | | | 0.12 | | | | 0.15 | | | | 0.15 | |
Net realized and unrealized gain (loss) | | | 0.64 | | | | 0.02 | 2 | | | 1.44 | 2 | | | 1.52 | 2 | | | (5.60 | )2 |
| | | | |
Net increase (decrease) from investment operations | | | 0.78 | | | | 0.17 | | | | 1.56 | | | | 1.67 | | | | (5.45 | ) |
| | | | |
| Dividends and distributions from:5 | | | | | | | | | | | | | | | | | | | | |
Net investment income | | | (0.33 | ) | | | (0.12 | ) | | | (0.15 | ) | | | (0.13 | ) | | | (0.11 | ) |
Net realized gain | | | — | | | | — | | | | — | | | | — | | | | (0.57 | ) |
| | | | |
Total dividends and distributions | | | (0.33 | ) | | | (0.12 | ) | | | (0.15 | ) | | | (0.13 | ) | | | (0.68 | ) |
| | | | |
Net asset value, end of year | | $ | 12.43 | | | $ | 11.98 | | | $ | 11.93 | | | $ | 10.52 | | | $ | 8.98 | |
| | | | |
| | | | | | | | | | | | | | | | | | | | |
| Total Investment Return3 | | | | | | | | | | | | | | | | | | | | |
Based on net asset value | | | 6.93% | | | | 1.41% | | | | 14.92% | | | | 18.98% | | | | (37.62)% | |
| | | | |
| | | | | | | | | | | | | | | | | | | | |
| Ratios to Average Net Assets | | | | | | | | | | | | | | | | | | | | |
Total expenses | | | 1.01% | | | | 1.00% | | | | 1.01% | | | | 1.07% | | | | 1.12% | |
| | | | |
Total expenses after fees waived | | | 1.00% | | | | 1.00% | | | | 1.01% | | | | 1.04% | | | | 1.09% | |
| | | | |
Total expenses after fees waived, excluding reorganization expenses and dividend expense | | | 1.00% | | | | 1.00% | 4 | | | 1.01% | | | | 1.02% | | | | 0.99% | |
| | | | |
Net investment income | | | 1.17% | | | | 1.19% | | | | 1.09% | | | | 1.62% | | | | 1.13% | |
| | | | |
| | | | | | | | | | | | | | | | | | | | |
| Supplemental Data | | | | | | | | | | | | | | | | | | | | |
Net assets, end of year (000) | | $ | 138,976 | | | $ | 319,863 | | | $ | 293,944 | | | $ | 235,264 | | | $ | 233,081 | |
| | | | |
Portfolio turnover | | | 112% | | | | 37% | | | | 32% | | | | 35% | | | | 66% | |
| | | | |
| | 1 | | Based on average shares outstanding. |
| | 2 | | Includes a redemption fee, which is less than $0.01 per share. |
| | 3 | | Where applicable, total investment returns include the reinvestment of dividends and distributions. |
| | 4 | | Excludes stock loan fees, which have no impact to the ratio. |
| | 5 | | Dividends and distributions are determined in accordance with federal income tax regulations. |
| | | | | | |
| See Notes to Consolidated Financial Statements. | | | | |
| | | | | | | |
| 14 | | BLACKROCK LONG-HORIZON EQUITY FUND | | OCTOBER 31, 2012 | | |
| | |
| Financial Highlights (continued) | | |
| | | | | | | | | | | | | | | | | | | | |
| | | Investor A | |
| | | Year Ended October 31, | |
| | | 2012
(Consolidated) | | | 2011 (Consolidated) | | | 2010 (Consolidated) | | | 2009 (Consolidated) | | | 2008 | |
| | | | | | | | | | | | | | | | | | | | |
| Per Share Operating Performance | | | | | | | | | | | | | | | | | | | | |
Net asset value, beginning of year | | $ | 11.95 | | | $ | 11.90 | | | $ | 10.50 | | | $ | 8.96 | | | | $ 15.08 | |
| | | | |
Net investment income1 | | | 0.12 | | | | 0.11 | | | | 0.09 | | | | 0.12 | | | | 0.11 | |
Net realized and unrealized gain (loss) | | | 0.63 | | | | 0.03 | 2 | | | 1.43 | 2 | | | 1.52 | 2 | | | (5.57 | )2 |
| | | | |
Net increase (decrease) from investment operations | | | 0.75 | | | | 0.14 | | | | 1.52 | | | | 1.64 | | | | (5.46 | ) |
| | | | |
| Dividends and distributions from:5 | | | | | | | | | | | | | | | | | | | | |
Net investment income | | | (0.30 | ) | | | (0.09 | ) | | | (0.12 | ) | | | (0.10 | ) | | | (0.09 | ) |
Net realized gain | | | — | | | | — | | | | — | | | | — | | | | (0.57 | ) |
| | | | |
Total dividends and distributions | | | (0.30 | ) | | | (0.09 | ) | | | (0.12 | ) | | | (0.10 | ) | | | (0.66 | ) |
| | | | |
Net asset value, end of year | | $ | 12.40 | | | $ | 11.95 | | | $ | 11.90 | | | $ | 10.50 | | | | $ 8.96 | |
| | | | |
| | | | | | | | | | | | | | | | | | | | |
| Total Investment Return3 | | | | | | | | | | | | | | | | | | | | |
Based on net asset value | | | 6.62% | | | | 1.14% | | | | 14.57% | | | | 18.58% | | | | (37.74)% | |
| | | | |
| | | | | | | | | | | | | | | | | | | | |
| Ratios to Average Net Assets | | | | | | | | | | | | | | | | | | | | |
Total expenses | | | 1.28% | | | | 1.26% | | | | 1.28% | | | | 1.34% | | | | 1.38% | |
| | | | |
Total expenses after fees waived | | | 1.28% | | | | 1.26% | | | | 1.28% | | | | 1.30% | | | | 1.35% | |
| | | | |
Total expenses after fees waived, excluding reorganization expenses and dividend expense | | | 1.28% | | | | 1.26% | 4 | | | 1.27% | | | | 1.27% | | | | 1.25% | |
| | | | |
Net investment income | | | 1.04% | | | | 0.91% | | | | 0.82% | | | | 1.37% | | | | 0.88% | |
| | | | |
| | | | | | | | | | | | | | | | | | | | |
| Supplemental Data | | | | | | | | | | | | | | | | | | | | |
Net assets, end of year (000) | | $ | 353,237 | | | $ | 381,311 | | | $ | 411,573 | | | $ | 400,668 | | | $ | 372,188 | |
| | | | |
Portfolio turnover | | | 112% | | | | 37% | | | | 32% | | | | 35% | | | | 66% | |
| | | | |
| | 1 | | Based on average shares outstanding. |
| | 2 | | Includes a redemption fee, which is less than $0.01 per share. |
| | 3 | | Where applicable, total investment returns exclude the effects of any sales charges and include the reinvestment of dividends and distributions. |
| | 4 | | Excludes stock loan fees, which have no impact to the ratio. |
| | 5 | | Dividends and distributions are determined in accordance with federal income tax regulations. |
| | | | | | |
| See Notes to Consolidated Financial Statements. | | | | |
| | | | | | | |
| | BLACKROCK LONG-HORIZON EQUITY FUND | | OCTOBER 31, 2012 | | 15 |
| | |
| Financial Highlights (continued) | | |
| | | | | | | | | | | | | | | | | | | | |
| | | Investor B | |
| | | Year Ended October 31, | |
| | | 2012 (Consolidated) | | | 2011 (Consolidated) | | | 2010 (Consolidated) | | | 2009 (Consolidated) | | | 2008 | |
| | | | | | | | | | | | | | | | | | | | |
| Per Share Operating Performance | | | | | | | | | | | | | | | | | | | | |
Net asset value, beginning of year | | $ | 11.90 | | | | $ 11.86 | | | | $ 10.45 | | | | $ 8.88 | | | $ | 14.98 | |
| | | | |
Net investment income1 | | | 0.02 | | | | (0.06 | ) | | | (0.00 | )2 | | | 0.05 | | | | 0.01 | |
Net realized and unrealized gain (loss) | | | 0.64 | | | | 0.10 | 3 | | | 1.43 | 3 | | | 1.52 | 3 | | | (5.54 | )3 |
| | | | |
Net increase (decrease) from investment operations | | | 0.66 | | | | 0.04 | | | | 1.43 | | | | 1.57 | | | | (5.53 | ) |
| | | | |
Dividends and distributions from:6 | | | | | | | | | | | | | | | | | | | | |
Net investment income | | | (0.17 | ) | | | — | | | | (0.02 | ) | | | — | | | | (0.00 | )2 |
Net realized gain | | | — | | | | — | | | | — | | | | — | | | | (0.57 | ) |
| | | | |
Total dividends and distributions | | | (0.17 | ) | | | — | | | | (0.02 | ) | | | — | | | | (0.57 | ) |
| | | | |
Net asset value, end of year | | $ | 12.39 | | | | $ 11.90 | | | | $ 11.86 | | | | $ 10.45 | | | $ | 8.88 | |
| | | | |
| | | | | | | | | | | | | | | | | | | | |
| Total Investment Return4 | | | | | | | | | | | | | | | | | | | | |
Based on net asset value | | | 5.76% | | | | 0.34% | | | | 13.66% | | | | 17.68% | | | | (38.24)% | |
| | | | |
| | | | | | | | | | | | | | | | | | | | |
| Ratios to Average Net Assets | | | | | | | | | | | | | | | | | | | | |
Total expenses | | | 2.12% | | | | 2.08% | | | | 2.11% | | | | 2.22% | | | | 2.21% | |
| | | | |
Total expenses after fees waived | | | 2.12% | | | | 2.08% | | | | 2.11% | | | | 2.08% | | | | 2.15% | |
| | | | |
Total expenses after fees waived, excluding reorganization expenses and dividend expense | | | 2.12% | | | | 2.08% | 5 | | | 2.10% | | | | 2.06% | | | | 2.05% | |
| | | | |
Net investment income | | | 0.18% | | | | (0.50)% | | | | (0.01)% | | | | 0.51% | | | | 0.05% | |
| | | | |
| | | | | | | | | | | | | | | | | | | | |
| Supplemental Data | | | | | | | | | | | | | | | | | | | | |
Net assets, end of year (000) | | $ | 8,868 | | | | $13,819 | | | | $18,321 | | | | $22,889 | | | | $34,682 | |
| | | | |
Portfolio turnover | | | 112% | | | | 37% | | | | 32% | | | | 35% | | | | 66% | |
| | | | |
| | 1 | | Based on average shares outstanding. |
| | 2 | | Amount Is less than $(0.01) per share. |
| | 3 | | Includes a redemption fee, which is less than $0.01 per share. |
| | 4 | | Where applicable, total investment returns exclude the effects of any sales charges and include the reinvestment of dividends and distributions. |
| | 5 | | Excludes stock loan fees, which have no impact to the ratio. |
| | 6 | | Dividends and distributions are determined in accordance with federal income tax regulations. |
| | | | | | |
| See Notes to Consolidated Financial Statements. | | | | |
| | | | | | | |
| 16 | | BLACKROCK LONG-HORIZON EQUITY FUND | | OCTOBER 31, 2012 | | |
| | |
| Financial Highlights (continued) | | |
| | | | | | | | | | | | | | | | | | | | |
| | | Investor C | |
| | | Year Ended October 31, | |
| | | 2012 (Consolidated) | | | 2011 (Consolidated) | | | 2010 (Consolidated) | | | 2009 (Consolidated) | | | 2008 | |
| | | | | | | | | | | | | | | | | | | | |
| Per Share Operating Performance | | | | | | | | | | | | | | | | | | | | |
Net asset value, beginning of year | | $ | 11.85 | | | $ | 11.81 | | | $ | 10.42 | | | $ | 8.87 | | | $ | 14.97 | |
| | | | |
Net investment income1 | | | 0.03 | | | | 0.02 | | | | 0.01 | | | | 0.06 | | | | 0.01 | |
Net realized and unrealized gain (loss) | | | 0.64 | | | | 0.02 | 2 | | | 1.42 | 2 | | | 1.50 | 2 | | | (5.52 | )2 |
| | | | |
Net increase (decrease) from investment operations | | | 0.67 | | | | 0.04 | | | | 1.43 | | | | 1.56 | | | | (5.51 | ) |
| | | | |
Dividends and distributions from:5 | | | | | | | | | | | | | | | | | | | | |
Net investment income | | | (0.20 | ) | | | — | | | | (0.04 | ) | | | (0.01 | ) | | | (0.02 | ) |
Net realized gain | | | — | | | | — | | | | — | | | | — | | | | (0.57 | ) |
| | | | |
Total dividends and distributions | | | (0.20 | ) | | | — | | | | (0.04 | ) | | | (0.01 | ) | | | (0.59 | ) |
| | | | |
Net asset value, end of year | | $ | 12.32 | | | $ | 11.85 | | | $ | 11.81 | | | $ | 10.42 | | | $ | 8.87 | |
| | | | |
| | | | | | | | | | | | | | | | | | | | |
| Total Investment Return3 | | | | | | | | | | | | | | | | | | | | |
Based on net asset value | | | 5.85% | | | | 0.34% | | | | 13.75% | | | | 17.64% | | | | (38.20)% | |
| | | | |
| | | | | | | | | | | | | | | | | | | | |
| Ratios to Average Net Assets | | | | | | | | | | | | | | | | | | | | |
Total expenses | | | 2.05% | | | | 2.02% | | | | 2.04% | | | | 2.10% | | | | 2.14% | |
| | | | |
Total expenses after fees waived | | | 2.05% | | | | 2.02% | | | | 2.04% | | | | 2.07% | | | | 2.11% | |
| | | | |
Total expenses after fees waived, excluding reorganization expenses and dividend expense | | | 2.05% | | | | 2.02% | 4 | | | 2.04% | | | | 2.05% | | | | 2.01% | |
| | | | |
Net investment income | | | 0.26% | | | | 0.13% | | | | 0.06% | | | | 0.64% | | | | 0.12% | |
| | | | |
| | | | | | | | | | | | | | | | | | | | |
| Supplemental Data | | | | | | | | | | | | | | | | | | | | |
Net assets, end of year (000) | | $ | 133,374 | | | $ | 165,823 | | | $ | 182,756 | | | $ | 187,335 | | | | $183,125 | |
| | | | |
Portfolio turnover | | | 112% | | | | 37% | | | | 32% | | | | 35% | | | | 66% | |
| | | | |
| | 1 | | Based on average shares outstanding. |
| | 2 | | Includes a redemption fee, which is less than $0.01 per share. |
| | 3 | | Where applicable, total investment returns exclude the effects of any sales charges and include the reinvestment of dividends and distributions. |
| | 4 | | Excludes stock loan fees, which have no impact to the ratio. |
| | 5 | | Dividends and distributions are determined in accordance with federal income tax regulations. |
| | | | | | |
| See Notes to Consolidated Financial Statements. | | | | |
| | | | | | | |
| | BLACKROCK LONG-HORIZON EQUITY FUND | | OCTOBER 31, 2012 | | 17 |
| | |
| Financial Highlights (concluded) | | |
| | | | | | | | | | | | | | | | | | | | |
| | | Class R | |
| | | Year Ended October 31, | |
| | | 2012 (Consolidated) | | | 2011 (Consolidated) | | | 2010 (Consolidated) | | | 2009 (Consolidated) | | | 2008 | |
| | | | | | | | | | | | | | | | | | | | |
| Per Share Operating Performance | | | | | | | | | | | | | | | | | | | | |
Net asset value, beginning of year | | $ | 11.89 | | | $ | 11.85 | | | $ | 10.46 | | | $ | 8.92 | | | $ | 15.04 | |
| | | | |
Net investment income1 | | | 0.07 | | | | 0.06 | | | | 0.04 | | | | 0.09 | | | | 0.08 | |
Net realized and unrealized gain (loss) | | | 0.63 | | | | 0.02 | 2 | | | 1.44 | 2 | | | 1.51 | 2 | | | (5.57 | )2 |
| | | | |
Net increase (decrease) from investment operations | | | 0.70 | | | | 0.08 | | | | 1.48 | | | | 1.60 | | | | (5.49 | ) |
| | | | |
Dividends and distributions from:5 | | | | | | | | | | | | | | | | | | | | |
Net investment income | | | (0.23 | ) | | | (0.04 | ) | | | (0.09 | ) | | | (0.06 | ) | | | (0.06 | ) |
Net realized gain | | | — | | | | — | | | | — | | | | — | | | | (0.57 | ) |
| | | | |
Total dividends and distributions | | | (0.23 | ) | | | (0.04 | ) | | | (0.09 | ) | | | (0.06 | ) | | | (0.63 | ) |
| | | | |
Net asset value, end of year | | $ | 12.36 | | | $ | 11.89 | | | $ | 11.85 | | | $ | 10.46 | | | $ | 8.92 | |
| | | | |
| | | | | | | | | | | | | | | | | | | | |
| Total Investment Return3 | | | | | | | | | | | | | | | | | | | | |
Based on net asset value | | | 6.17% | | | | 0.68% | | | | 14.20% | | | | 18.16% | | | | (37.95 | )% |
| | | | |
| | | | | | | | | | | | | | | | | | | | |
| Ratios to Average Net Assets | | | | | | | | | | | | | | | | | | | | |
Total expenses | | | 1.83% | | | | 1.77% | | | | 1.78% | | | | 1.93% | | | | 1.92% | |
| | | | |
Total expenses after fees waived | | | 1.69% | | | | 1.70% | | | | 1.70% | | | | 1.62% | | | | 1.64% | |
| | | | |
Total expenses after fees waived, excluding reorganization expenses and dividend expense | | | 1.69% | | | | 1.70% | 4 | | | 1.69% | | | | 1.60% | | | | 1.54% | |
| | | | |
Net investment income | | | 0.62% | | | | 0.48% | | | | 0.40% | | | | 1.02% | | | | 0.60% | |
| | | | |
| | | | | | | | | | | | | | | | | | | | |
| Supplemental Data | | | | | | | | | | | | | | | | | | | | |
Net assets, end of year (000) | | $ | 6,853 | | | $ | 6,895 | | | $ | 9,072 | | | $ | 8,570 | | | $ | 7,183 | |
| | | | |
Portfolio turnover | | | 112% | | | | 37% | | | | 32% | | | | 35% | | | | 66% | |
| | | | |
| | 1 | | Based on average shares outstanding. |
| | 2 | | Includes a redemption fee, which is less than $0.01 per share. |
| | 3 | | Where applicable, total investment returns include the reinvestment of dividends and distributions. |
| | 4 | | Excludes stock loan fees, which have no impact to the ratio. |
| | 5 | | Dividends and distributions are determined in accordance with federal income tax regulations. |
| | | | | | |
| See Notes to Consolidated Financial Statements. | | | | |
| | | | | | | |
| 18 | | BLACKROCK LONG-HORIZON EQUITY FUND | | OCTOBER 31, 2012 | | |
| | |
| Notes to Consolidated Financial Statements | | |
1. Organization and Significant Accounting Policies:
BlackRock Long-Horizon Equity Fund (formerly known as BlackRock Global Dynamic Equity Fund) (the “Fund”) is registered under the Investment Company Act of 1940, as amended (the “1940 Act”), as a diversified, open-end management investment company. The Fund is organized as a Delaware statutory trust. The Fund’s consolidated financial statements are prepared in conformity with accounting principles generally accepted in the United States of America (“US GAAP”), which may require management to make estimates and assumptions that affect the reported amounts of assets and liabilities in the consolidated financial statements and the reported amounts of increases and decreases in net assets from operations during the reporting period. Actual results could differ from those estimates. The Fund offers multiple classes of shares. Institutional Shares are sold without a sales charge and only to certain eligible investors. Investor A Shares are generally sold with a front-end sales charge. Investor B and Investor C Shares may be subject to a CDSC. Class R Shares are sold without a sales charge and only to certain retirement and other similar plans. All classes of shares have identical voting, dividend, liquidation and other rights and the same terms and conditions, except that Investor A, Investor B, Investor C and Class R Shares bear certain expenses related to the shareholder servicing of such shares, and Investor B, Investor C and Class R Shares also bear certain expenses related to the distribution of such shares. Investor B Shares automatically convert to Investor A Shares after approximately eight years. Investor B Shares are only available through exchanges, dividend reinvestment by existing shareholders or for purchase by certain qualified employee benefit plans. Each class has exclusive voting rights with respect to matters relating to its shareholder servicing and distribution expenditures (except that Investor B shareholders may vote on material changes to the Investor A distribution and service plan).
The following is a summary of significant accounting policies followed by the Fund:
Basis of Consolidation: The accompanying consolidated financial statements include the accounts of BlackRock Cayman Global Dynamic Equity Fund I, Ltd. (the “Subsidiary”), a wholly owned subsidiary of the Fund, which primarily invests in commodity-related instruments. The Subsidiary enables the Fund to hold these commodity-related instruments and satisfy Regulated Investment Company (“RIC”) tax requirements. Intercompany accounts and transactions, if any, have been eliminated. The Subsidiary is subject to the same investment policies and restrictions that apply to the Fund. As of October 31, 2012, the Subsidiary no longer holds any assets or liabilities. The Subsidiary will be dissolved on or about December 31, 2012.
Valuation: US GAAP defines fair value as the price the Fund would receive to sell an asset or pay to transfer a liability in an orderly transaction between market participants at the measurement date. The Fund fair values its financial instruments at market value using independent
dealers or pricing services under policies approved by the Board of Trustees (the “Board”). The BlackRock Global Valuation Methodologies Committee (the “Global Valuation Committee”) is the committee formed by management to develop global pricing policies and procedures and to provide oversight of the pricing function for the Fund for all financial instruments.
Equity investments traded on a recognized securities exchange or the NASDAQ Global Market System (“NASDAQ”) are valued at the last reported sale price that day or the NASDAQ official closing price, if applicable. For equity investments traded on more than one exchange, the last reported sale price on the exchange where the stock is primarily traded is used. Equity investments traded on a recognized exchange for which there were no sales on that day are valued at the last available bid price. If no bid or ask price is available, the prior day’s price will be used, unless it is determined that such prior day’s price no longer reflects the fair value of the security.
The Fund values its bond investments on the basis of last available bid prices or current market quotations provided by dealers or pricing services. In determining the value of a particular investment, pricing services may use certain information with respect to transactions in such investments, quotations from dealers, pricing matrixes, market transactions in comparable investments, various relationships observed in the market between investments and calculated yield measures. Financial futures contracts traded on exchanges are valued at this last sale price. Swap agreements are valued utilizing quotes received daily by the Fund’s pricing service or through brokers, which are derived using daily swap curves and models that incorporate a number of market data factors, such as discounted cash flows, trades and values of the underlying reference instruments. Investments in open-end registered investment companies are valued at NAV each business day. Short-term securities with remaining maturities of 60 days or less may be valued at amortized cost, which approximates fair value.
The Fund values its investments in BlackRock Liquidity Series, LLC Money Market Series (the “Money Market Series”) at fair value, which is ordinarily based upon its pro rata ownership in the underlying Fund’s net assets. The Money Market Series seeks current income consistent with maintaining liquidity and preserving capital. Although the Money Market Series is not registered under the 1940 Act, its investments will follow the parameters of investments by a money market fund that is subject to Rule 2a-7 under the 1940 Act. The Fund may withdraw up to 25% of its investment daily, although the manager of the Money Market Series, in its sole discretion, may permit an investor in the Money Market Series to withdraw more than 25% on any one day.
Securities and other assets and liabilities denominated in foreign currencies are translated into US dollars using exchange rates determined as of the close of business on the New York Stock Exchange (“NYSE”). Foreign currency exchange contracts are valued at the mean between
| | | | | | |
| | | | | | | |
| | BLACKROCK LONG-HORIZON EQUITY FUND | | OCTOBER 31, 2012 | | 19 |
| | |
| Notes to Consolidated Financial Statements (continued) | | |
the bid and ask prices and are determined as of the close of business on the NYSE. Interpolated values are derived when the settlement date of the contract is an interim date for which quotations are not available.
Exchange-traded options are valued at the mean between the last bid and ask prices at the close of the options market in which the options trade. An exchange-traded option for which there is no mean price is valued at the last bid (long positions) or ask (short positions) price. If no bid or ask price is available, the prior day’s price will be used, unless it is determined that the prior day’s price no longer reflects the fair value of the option. Over-the-counter (“OTC”) options and swaptions are valued by an independent pricing service using a mathematical model which incorporates a number of market data factors, such as the trades and prices of the underlying instruments.
In the event that application of these methods of valuation results in a price for an investment that is deemed not to be representative of the market value of such investment, or if a price is not available, the investment will be valued by the Global Valuation Committee, or its delegate, in accordance with a policy approved by the Board as reflecting fair value (“Fair Value Assets”). When determining the price for Fair Value Assets, the Global Valuation Committee, or its delegate, seeks to determine the price that the Fund might reasonably expect to receive from the current sale of that asset in an arm’s-length transaction. Fair value determinations shall be based upon all available factors that the investment advisor and/or sub-advisor deems relevant consistent with the principals of fair value measurement
which include the market approach, income approach and/or cost approach, as appropriate. A market approach generally consists of using comparable market transactions. The income approach generally is used to discount future cash flows to present value and adjusted for liquidity as appropriate. These factors include but are not limited to (i) attributes specific to the investment or asset; (ii) the principal market for the investment or asset; (iii) the customary participants in the principal market for the investment or asset; (iv) data assumptions by market participants for the investment or asset, if reasonably available; (v) quoted prices for similar investments or assets in active markets; and (vi) other factors, such as future cash flows, interest rates, yield curves, volatilities, prepayment speeds, loss severities, credit risks, recovery rates, liquidation amounts and/or default rates. Due to the inherent uncertainty of valuations of such investments, the fair values may differ from the values that would have been used had an active market existed. The Global Valuation Committee, or its delegate, employs various methods for calibrating valuation approaches for investments where an active market does not exist, including regular due diligence of the Fund’s pricing vendors, a regular review of key inputs and assumptions, transactional back-testing or disposition analysis to compare unrealized gains and losses to realized gains and losses, reviews of missing or stale prices and large movements in market values and reviews of any market related activity. The pricing of
all Fair Value Assets is subsequently reported to the Board or a committee thereof on a quarterly basis.
Generally, trading in foreign instruments is substantially completed each day at various times prior to the close of business on the NYSE. Occasionally, events affecting the values of such instruments may occur between the foreign market close and the close of business on the NYSE that may not be reflected in the computation of the Fund’s net assets. If events (for example, a company announcement, market volatility or a natural disaster) occur during such periods that are expected to affect the value of such instruments materially , those instruments may be Fair Value Assets and valued at their fair value, as determined in good faith by the Global Valuation Committee using a pricing service and/or policies approved by the Board. Each business day, the Fund uses a pricing service to assist with the valuation of certain foreign exchange-traded equity securities and foreign exchange-traded and OTC options (the “Systematic Fair Value Price”). Using current market factors, the Systematic Fair Value Price is designed to value such foreign securities and foreign options at fair value as of the close of business on the NYSE, which follows the close of the local markets.
Foreign Currency Transactions: The Fund’s books and records are maintained in US dollars. Purchases and sales of investment securities are recorded at the rates of exchange prevailing on the respective date of such transactions. Generally, when the US dollar rises in value against a foreign currency, the Fund’s investments denominated in that currency will lose value because that currency is worth fewer US dollars; the opposite effect occurs if the US dollar falls in relative value.
The Fund does not isolate the portion of the results of operations arising as a result of changes in the foreign exchange rates from the changes in the market prices of investments held or sold for financial reporting purposes. Accordingly, the effects of changes in foreign currency exchange rates on investments are not segregated on the Consolidated Statement of Operations from the effects of changes in market prices of those investments but are included as a component of net realized and unrealized gain (loss) from investments. The Fund reports realized currency gains (losses) on foreign currency related transactions as components of net realized gain (loss) for financial reporting purposes, whereas such components are treated as ordinary income for federal income tax purposes.
Zero-Coupon Bonds: The Fund may invest in zero-coupon bonds, which are normally issued at a significant discount from face value and do not provide for periodic interest payments. Zero-coupon bonds may experience greater volatility in market value than similar maturity debt obligations which provide for regular interest payments.
Capital Trusts: The Fund may invest in capital trusts. These securities are typically issued by corporations, generally in the form of interest-bearing notes with preferred securities characteristics, or by an affiliated business trust of a corporation, generally in the form of beneficial interests in subordinated debentures or similarly structured securities. The securities
| | | | | | |
| | | | | | | |
| 20 | | BLACKROCK LONG-HORIZON EQUITY FUND | | OCTOBER 31, 2012 | | |
| | |
| Notes to Consolidated Financial Statements (continued) | | |
can be structured as either fixed or adjustable coupon securities that can have either a perpetual or stated maturity date. Dividends can be deferred without creating an event of default or acceleration, although maturity cannot take place unless all cumulative payment obligations have been met. The deferral of payments does not affect the purchase or sale of these securities in the open market. Payments on these securities are treated as interest rather than dividends for federal income tax purposes. These securities generally are rated below that of the issuing company’s senior debt securities.
Preferred Stock: The Fund may invest in preferred stocks. Preferred stock has a preference over common stock in liquidation (and generally in receiving dividends as well) but is subordinated to the liabilities of the issuer in all respects. As a general rule, the market value of preferred stock with a fixed dividend rate and no conversion element varies inversely with interest rates and perceived credit risk, while the market price of convertible preferred stock generally also reflects some element of conversion value. Because preferred stock is junior to debt securities and other obligations of the issuer, deterioration in the credit quality of the issuer will cause greater changes in the value of a preferred stock than in a more senior debt security with similar stated yield characteristics. Unlike interest payments on debt securities, preferred stock dividends are payable only if declared by the issuer’s board of directors. Preferred stock also may be subject to optional or mandatory redemption provisions.
Segregation and Collateralization: In cases in which the 1940 Act and the interpretive positions of the Securities and Exchange Commission (“SEC”) require that the Fund either deliver collateral or segregate assets in connection with certain investments (e.g., financial futures contracts, foreign currency exchange contracts, swaps, structured options and options written), the Fund will, consistent with SEC rules and/or certain interpretive letters issued by the SEC, segregate collateral or designate on its books and records cash or liquid securities having a market value at least equal to the amount that would otherwise be required to be physically segregated. Furthermore, based on requirements and agreements with certain exchanges and third party broker-dealers, a Fund engaging in such transactions may have requirements to deliver/deposit securities to/with an exchange or broker-dealer as collateral for certain investments.
Investment Transactions and Investment Income: For financial reporting purposes, investment transactions are recorded on the dates the transactions are entered into (the trade dates). Realized gains and losses on investment transactions are determined on the identified cost basis. Dividend income is recorded on the ex-dividend dates. Dividends from foreign securities where the ex-dividend date may have passed are subsequently recorded when the Fund is informed of the ex-dividend date. Under the applicable foreign tax laws, a withholding tax at various rates may be imposed on capital gains, dividends and interest. Upon notification from issuers, some of the dividend income received from a
real estate investment trust may be redesignated as a reduction of cost of the related investment and/or realized gain. Interest income, including amortization and accretion of premiums and discounts on debt securities, is recognized on the accrual basis. Income and realized and unrealized gains and losses are allocated daily to each class based on its relative net assets.
Dividends and Distributions: Dividends and distributions paid by the Fund are recorded on the ex-dividend dates. The portion of distributions that exceeds the Fund’s current and accumulated earnings and profits, which are measured on a tax basis, will constitute a nontaxable return of capital. Distributions in excess of the Fund’s taxable income and net capital gains, but not in excess of the Fund’s earnings and profits, will be taxable to shareholders as ordinary income and will not constitute a nontaxable return of capital. Capital losses carried forward from years beginning before 2011 do not reduce earnings and profits, even if such carried forward losses offset current year realized gains. The character and timing of dividends and distributions are determined in accordance with federal income tax regulations, which may differ from US GAAP.
Securities Lending: The Fund may lend securities to approved borrowers, such as banks, brokers and other financial institutions. The borrower pledges cash, securities issued or guaranteed by the US government or irrevocable letters of credit issued by a bank as collateral, which will be maintained at all times in an amount equal to at least 100% of the current market value of the loaned securities. The market value of the loaned securities is determined at the close of business of the Fund and any additional required collateral is delivered to the Fund on the next business day. Securities lending income, as disclosed in the Consolidated Statement of Operations, represents the income earned from the investment of the cash collateral, net of rebates paid to, or fees paid by, borrowers and less the fees paid to the securities lending agent. During the term of the loan, the Fund earns dividend or interest income on the securities loaned but does not receive interest income on the securities received as collateral. Loans of securities are terminable at any time and the borrower, after notice, is required to return borrowed securities within the standard time period for settlement of securities transactions. In the event that the borrower defaults on its obligation to return borrowed securities because of insolvency or for any other reason, the Fund could experience delays and costs in gaining access to the collateral. The Fund also could suffer a loss if the value of an investment purchased with cash collateral falls below the market value of loaned securities or if the value of an investment purchased with cash collateral falls below the value of the original cash collateral received. During the year ended October 31, 2012, any securities on loan were collateralized by cash.
Income Taxes: It is the Fund’s policy to comply with the requirements of the Internal Revenue Code of 1986, as amended, applicable to regulated investment companies and to distribute substantially all of its
| | | | | | |
| | | | | | | |
| | BLACKROCK LONG-HORIZON EQUITY FUND | | OCTOBER 31, 2012 | | 21 |
| | |
| Notes to Consolidated Financial Statements (continued) | | |
taxable income to its shareholders. Therefore, no federal income tax provision is required.
The Fund files US federal and various state and local tax returns. No income tax returns are currently under examination. The statute of limitations on the Fund’s US federal tax returns remains open for each of the four years ended October 31, 2012. The statutes of limitations on the Fund’s state and local tax returns may remain open for an additional year depending upon the jurisdiction. Management does not believe there are any uncertain tax positions that require recognition of a tax liability.
Recent Accounting Standard: In December 2011, the Financial Accounting Standards Board issued guidance that will expand current disclosure requirements on the offsetting of certain assets and liabilities. The new disclosures will be required for investments and derivative financial instruments subject to master netting or similar agreements which are eligible for offset in the Consolidated Statement of Assets and Liabilities and will require an entity to disclose both gross and net information about such investments and transactions in the consolidated financial statements. The guidance is effective for financial statements with fiscal years beginning on or after January 1, 2013, and interim periods within those fiscal years. Management is evaluating the impact of this guidance on the Fund’s financial statement disclosures.
Other: Expenses directly related to the Fund or its classes are charged to the Fund or class. Other operating expenses shared by several funds are pro rated among those funds on the basis of relative net assets or other appropriate methods. Expenses directly related to the Fund and other shared expenses pro rated to the Fund are allocated daily to each class based on its relative net assets or other appropriate methods.
The Fund has an arrangement with the custodian whereby fees may be reduced by credits earned on uninvested cash balances, which, if applicable, are shown as fees paid indirectly in the Consolidated Statement of Operations. The custodian imposes fees on overdrawn cash balances, which can be offset by accumulated credits earned or may result in additional custody charges.
2. Derivative Financial Instruments:
The Fund engages in various portfolio investment strategies using derivative contracts both to increase the returns of the Fund and/or to economically hedge, or protect, its exposure to certain risks such as equity risk, interest rate risk and foreign currency exchange rate risk. These contracts may be transacted on an exchange or OTC.
Losses may arise if the value of the contract decreases due to an unfavorable change in the market rates or values of the underlying instrument or if the counterparty does not perform under the contract. The Fund’s maximum risk of loss from counterparty credit risk on OTC derivatives is generally the aggregate unrealized gain netted against any collateral pledged by/posted to the counterparty. For OTC options purchased, the Fund bears the risk of loss in the amount of the premiums paid plus the positive change in market values net of any collat-
eral received on the options should the counterparty fail to perform under the contracts. Options written by the Fund do not give rise to counterparty credit risk, as options written obligate the Fund to perform and not the counterparty. Counterparty risk related to exchange-traded financial futures contracts and options and centrally cleared swaps is deemed to be minimal due to the protection against defaults provided by the exchange on which these contracts trade.
The Fund may mitigate counterparty risk by procuring collateral and through netting provisions included within an International Swaps and Derivatives Association, Inc. master agreement (“ISDA Master Agreement”) implemented between the Fund and each of its respective counterparties. An ISDA Master Agreement allows the Fund to offset with each separate counterparty certain derivative financial instrument’s payables and/or receivables with collateral held. The amount of collateral moved to/from applicable counterparties is generally based upon minimum transfer amounts of up to $500,000. To the extent amounts due to the Fund from its counterparties are not fully collateralized, contractually or otherwise, the Fund bears the risk of loss from counterparty non-performance. See Note 1 “Segregation and Collateralization” for information with respect to collateral practices. In addition, the Fund manages counterparty risk by entering into agreements only with counterparties that it believes have the financial resources to honor its obligations and by monitoring the financial stability of those counterparties.
Certain ISDA Master Agreements allow counterparties to OTC derivatives to terminate derivative contracts prior to maturity in the event the Fund’s net assets decline by a stated percentage or the Fund fails to meet the terms of its ISDA Master Agreements, which would cause the Fund to accelerate payment of any net liability owed to the counterparty.
Financial Futures Contracts: The Fund purchases or sells financial futures contracts and options on financial futures contracts to gain exposure to, or economically hedge against, changes in interest rates (interest rate risk), change in the value of equity securities (equity risk) or foreign currencies (foreign currency exchange rate risk). Financial futures contracts are agreements between the Fund and the counterparty to buy or sell a specific quantity of an underlying instrument at a specified price and at a specified date. Depending on the terms of the particular contract, financial futures contracts are settled either through physical delivery of the underlying instrument on the settlement date or by payment of a cash settlement amount on the settlement date. Pursuant to the contract, the Fund agrees to receive from or pay to the broker an amount of cash equal to the daily fluctuation in value of the contract. Such receipts or payments are known as variation margin and are recorded by the Fund as unrealized appreciation or depreciation. When the contract is closed, the Fund records a realized gain or loss equal to the difference between the value of the contract at the time it was opened and the value at the time it was closed. The use of financial futures contracts involves the risk of an imperfect correlation in the movements in the price of financial futures contracts, interest rates and the underlying assets.
| | | | | | |
| | | | | | | |
| 22 | | BLACKROCK LONG-HORIZON EQUITY FUND | | OCTOBER 31, 2012 | | |
| | |
| Notes to Consolidated Financial Statements (continued) | | |
Foreign Currency Exchange Contracts: The Fund enters into foreign currency exchange contracts as an economic hedge against either specific transactions or portfolio instruments or to obtain exposure to foreign currencies (foreign currency exchange rate risk). A foreign currency exchange contract is an agreement between two parties to buy and sell a currency at a set exchange rate on a future date. Foreign currency exchange contracts, when used by the Fund, help to manage the overall exposure to the currencies, in which some of the investments held by the Fund are denominated. The contract is marked-to-market daily and the change in market value is recorded by the Fund as an unrealized gain or loss. When the contract is closed, the Fund records a realized gain or loss equal to the difference between the value at the time it was opened and the value at the time it was closed. The use of foreign currency exchange contracts involves the risk that the value of a foreign currency exchange contract changes unfavorably due to movements in the value of the referenced foreign currencies and the risk that the counterparty to the contract does not perform its obligations under the agreement.
Options: The Fund purchases and writes call and put options to increase or decrease its exposure to underlying instruments (including equity risk, interest rate risk and/or commodity price risk) and/or, in the case of options written, to generate gains from options premiums. A call option gives the purchaser (holder) of the option the right (but not the obligation) to buy, and obligates the seller (writer) to sell (when the option is exercised), the underlying instrument at the exercise or strike price at any time or at a specified time during the option period. A put option gives the holder the right to sell and obligates the writer to buy the underlying instrument at the exercise or strike price at any time or at a specified time during the option period. When the Fund purchases (writes) an option, an amount equal to the premium paid (received) by the Fund is reflected as an asset (liability). The amount of the asset (liability) is subsequently marked-to-market to reflect the current market value of the option purchased (written). When an instrument is purchased or sold through an exercise of an option, the related premium paid (or received) is added to (or deducted from) the basis of the instrument acquired or deducted from (or added to) the proceeds of the instrument sold. When an option expires (or the Fund enters into a closing transaction), the Fund realizes a gain or loss on the option to the extent of the premiums received or paid (or gain or loss to the extent the cost of the closing transaction exceeds the premiums received or paid). When the Fund writes a call option, such option is “covered,” meaning that the Fund holds the underlying instrument subject to being called by the option counterparty. When the Fund writes a put option, such option is covered by cash in an amount sufficient to cover the obligation.
In purchasing and writing options, the Fund bears the risk of an unfavorable change in the value of the underlying instrument or the risk that the Fund may not be able to enter into a closing transaction due to an illiquid market. Exercise of a written option could result in the Fund purchasing or selling a security at a price different from the current market value.
The Fund invests in structured options to increase or decrease its exposure to an underlying index or group of securities (equity risk). These structured options are European-Style Options and may consist of single or multiple OTC options which are priced as a single security. European-Style Options may only be exercised at the expiration date, but may be transferred/sold prior to the expiration date. The value of a structured option may either increase or decrease with the underlying index or group of securities, depending on the combination of options used. Structured options are issued in units whereby each unit represents a structure based on the specific index with an initial reference strike price. One type of structure involves the combination of selling a put while buying a call on a specific index. This option would rise in value as the underlying index increases and fall in value as the underlying index decreases. Alternatively, another structure involves the sale of a call and the purchase of a put. This option structure would rise in value as the underlying index decreases and fall in value as the underlying index increases. Upon the exercise of the structured option, the Fund will receive a payment from, or be required to remit a payment to the counterparty, depending on the value of the underlying index at exercise.
Swaps: The Fund enters into swap agreements, in which the Fund and a counterparty agree to either make periodic net payments on a specified notional amount or a net payment upon termination. Swap agreements are privately negotiated in the OTC market and may be executed on a registered financial and commodities exchange (“centrally cleared swaps”). In a centrally cleared swap, the Fund typically enters into an agreement with a counterparty; however, performance is guaranteed by the central clearinghouse reducing or eliminating the Fund’s exposure to the credit risk of the counterparty. These payments received or made by the Fund are recorded in the Consolidated Statement of Operations as realized gains or losses, respectively. Any upfront fees paid are recorded as assets and any upfront fees received are recorded as liabilities and are shown as swap premiums paid and swap premiums received, respectively on the Consolidated Statement of Assets and Liabilities and amortized over the term of the swap. Swaps are marked-to-market daily and changes in value are recorded as unrealized appreciation (depreciation). The daily change in valuation of centrally cleared swaps, if any, is recorded as a receivable or payable for variation margin in the Consolidated Statement of Assets and Liabilities. When the swap is terminated, the Fund will record a realized gain or loss equal to the difference between the proceeds from (or cost of) the closing transaction and the Fund’s basis in the contract, if any. Generally, the basis of the contracts is the premium received or paid. Swap transactions involve, to varying degrees, elements of interest rate, credit and market risk in excess of the amounts recognized in the Consolidated Statement of Assets and Liabilities. Such risks involve the possibility that there will be no liquid market for these agreements, that the counterparty to the agreements may default on its obligation to perform or disagree as to
| | | | | | |
| | | | | | | |
| | BLACKROCK LONG-HORIZON EQUITY FUND | | OCTOBER 31, 2012 | | 23 |
| | |
| Notes to Consolidated Financial Statements (continued) | | |
the meaning of the contractual terms in the agreements, and that there may be unfavorable changes in interest rates and/or market values associated with these transactions.
| Ÿ | | Total return swaps — The Fund enters into total return swaps to obtain exposure to a security or market without owning such security or investing directly in that market or to transfer the risk/return of one market (e.g., fixed income) to another market (e.g., equity) (equity risk and/or interest rate risk). Total return swaps are agreements in |
| | | which there is an exchange of cash flows whereby one party commits to make payments based on the total return (coupons plus capital gains/losses) of an underlying instrument in exchange for fixed or floating rate interest payments. To the extent the total return of the instrument or index underlying the transaction exceeds or falls short of the offsetting interest rate obligation, the Fund will receive a payment from or make a payment to the counterparty. |
| | | | | | | | | | | | | | | | |
| Derivative Financial Instruments Categorized by Risk Exposure: | |
| Fair Values of Derivative Financial Instruments as of October 31, 2012 | |
| | | Asset Derivatives | | | | | Liability Derivatives | |
| | | Consolidated Statement of
Assets and Liabilities Location | | | Value | | | | | Consolidated Statement of
Assets and Liabilities Location | | Value | |
Foreign currency exchange contracts | | | — | | | | — | | | | | Unrealized depreciation on foreign
currency exchange contracts | | $ | (192 | ) |
| | | | | | | | | | | | | | | | |
The Effect of Derivative Financial Instruments in the Consolidated Statement of Operations Year Ended October 31, 2012 | |
| | | Net Realized Gain (Loss) from | |
| | | Financial Futures Contracts | | | Swaps | | | Options1 | | | Foreign Currency
Transactions | |
Foreign currency exchange contracts | | | — | | | | — | | | | — | | | $ | (1,616,243 | ) |
Equity contracts | | $ | 4,075,706 | | | $ | 78,358 | | | $ | (3,553,011 | ) | | | — | |
| | | | |
Total | | $ | 4,075,706 | | | $ | 78,358 | | | $ | (3,553,011 | ) | | $ | (1,616,243 | ) |
| | | | |
| | | Net Change in Unrealized Appreciation/Depreciation on | |
| | | Financial Futures Contracts | | | Swaps | | | Options1 | | | Foreign Currency
Translations | |
Foreign currency exchange contracts | | | — | | | | — | | | | — | | | $ | (297,819 | ) |
Equity contracts | | $ | (1,052,244 | ) | | $ | (168,530 | ) | | $ | 2,890,193 | | | | — | |
| | | | |
Total | | $ | (1,052,244 | ) | | $ | (168,530 | ) | | $ | 2,890,193 | | | $ | (297,819 | ) |
| | | | |
| 1 | | Options purchased are included in the net realized gain (loss) from investments and net change in unrealized appreciation/depreciation on investments. |
For the year ended October 31, 2012, the average quarterly balances of outstanding derivative financial instruments were as follows:
| | | | |
| Financial futures contracts: | | | | |
Average number of contracts purchased | | | 233 | |
Average notional value of contracts purchased | | $ | 17,589,005 | |
| Foreign currency exchange contracts: | | | | |
Average number of contracts-US dollars purchased | | | 15 | |
Average number of contracts-US dollars sold | | | 6 | |
Average US dollar amounts purchased | | $ | 36,769,981 | |
Average US dollar amounts sold | | $ | 10,824,463 | |
| Options: | | | | |
Average number of option contracts purchased | | | 78,233 | |
Average number of option contracts written | | | 174,395 | |
Average notional value of option contracts purchased | | $ | 22,553,531 | |
Average notional value of option contracts written | | $ | 37,103,998 | |
| Structured options: | | | | |
Average number of units | | | 5,316 | |
Average notional value | | $ | 2,514,652 | |
| Total return swaps: | | | | |
Average number of contracts | | | 1 | |
Average notional value | | $ | 440,333 | |
3. Investment Advisory Agreement and Other Transactions with Affiliates:
The PNC Financial Services Group, Inc. (“PNC”) is the largest stockholder and an affiliate, for 1940 Act purposes, of BlackRock, Inc. (“BlackRock”).
The Fund entered into an Investment Advisory Agreement with BlackRock Advisors, LLC (the “Manager”), the Fund’s investment advisor, an indirect, wholly owned subsidiary of BlackRock, to provide investment advisory and administration services. The Manager is responsible for the management of the Fund’s portfolio and provides the necessary personnel, facilities, equipment and certain other services necessary to the operations of the Fund. For such services, the Fund pays the Manager a monthly fee based on a percentage of the Fund’s average daily net assets at the following annual rates:
| | | | |
| Average Daily Net Assets | | Investment
Advisory Fee | |
First $1 Billion | | | 0.80 | % |
$1 Billion - $3 Billion | | | 0.75 | % |
$3 Billion - $5 Billion | | | 0.72 | % |
$5 Billion - $10 Billion | | | 0.70 | % |
Greater than $10 Billion | | | 0.68 | % |
| | | | | | |
| | | | | | | |
| 24 | | BLACKROCK LONG-HORIZON EQUITY FUND | | OCTOBER 31, 2012 | | |
| | |
| Notes to Consolidated Financial Statements (continued) | | |
The Manager voluntarily agreed to waive its investment advisory fees by the amount of investment advisory fees the Fund pays to the Manager indirectly through its investment in affiliated money market funds. However, the Manager does not waive its investment advisory fees by the amount of investment advisory fees paid in connection with the Fund’s investment in other affiliated investment companies, if any. This amount is shown as fees waived by Manager in the Consolidated Statement of Operations.
The Manager provides investment management and other services to the Subsidiary. The Manager does not receive separate compensation from the Subsidiary for providing investment management or administrative services. However, the Fund pays the Manager based on the Fund’s net assets, which includes the assets of the Subsidiary.
The Manager entered into a sub-advisory agreement with BlackRock Investment Management, LLC (“BIM”) and BlackRock International Limited (“BIL”), both affiliates of the Manager. The Manager pays BIM and BIL for services they provide, a monthly fee that is a percentage of the investment advisory fees paid by the Fund to the Manager. Effective October 15, 2012, BIM no longer serves as a sub-advisor to the Fund.
For the year ended October 31, 2012, the Fund reimbursed the Manager $8,552 for certain accounting services, which is included in accounting services in the Consolidated Statement of Operations.
The Fund entered into a Distribution Agreement and Distribution and Service Plan with BlackRock Investments, LLC (“BRIL”), an affiliate of the Manager. Pursuant to the Distribution and Service Plan and in accordance with Rule 12b-1 under the 1940 Act, the Fund pays BRIL ongoing service and distribution fees. The fees are accrued daily and paid monthly at annual rates based upon the average daily net assets of the shares of the Fund as follows:
| | | | | | | | |
| | | Service Fee | | | Distribution Fee | |
Investor A | | | 0.25 | % | | | — | |
Investor B | | | 0.25 | % | | | 0.75 | % |
Investor C | | | 0.25 | % | | | 0.75 | % |
Class R | | | 0.25 | % | | | 0.25 | % |
Pursuant to sub-agreements with BRIL, broker-dealers and BRIL provide shareholder servicing and distribution services to the Fund. The ongoing service and/or distribution fee compensates BRIL and each broker-dealer for providing shareholder servicing and/or distribution related services to Investor A, Investor B, Investor C and Class R shareholders.
The Manager contractually agreed to waive or reimburse fees or expenses, excluding interest expense, dividend expense, acquired fund fees and expenses and certain other fund expenses, which constitute extraordinary expenses not incurred in the ordinary course of the Fund’s business, in order to limit expenses. The Manager has agreed not to reduce or discontinue this contractual waiver or reimbursement prior to March 1, 2013 unless approved by the Board, including a majority of the Independent Trustees. These amounts are shown as transfer agent fees waived and/or reimbursed—class specific in the Consolidated Statement of Operations. This current expense limitation as a
percentage of average daily net assets are as follows: 1.15% for Institutional, 1.43% for Investor A, 2.29% for Investor B and Investor C, and 1.70% for Class R. For the year ended October 31, 2012, the Fund waived and/or reimbursed the following amounts:
| | | | |
Institutional | | $ | 3,481 | |
Class R | | $ | 9,560 | |
The Manager maintains a call center, which is responsible for providing certain shareholder services to the Fund, such as responding to shareholder inquiries and processing transactions based upon instructions from shareholders with respect to the subscription and redemption of Fund shares. For the year ended October 31, 2012, the Fund reimbursed the Manager the following amounts for costs incurred in running the call center, which are included in transfer agent — class specific in the Consolidated Statement of Operations:
| | | | |
Institutional | | $ | 1,987 | |
Class R | | $ | 118 | |
For the year ended October 31, 2012, affiliates earned underwriting discounts, direct commissions and dealer concessions on sales of the Fund’s Investor A Shares, which totaled $8,179.
For the year ended October 31, 2012, affiliates received CDSCs as follows:
| | | | |
Investor A | | $ | 2,706 | |
Investor B | | $ | 13,113 | |
Investor C | | $ | 10,346 | |
The Fund received an exemptive order from the SEC permitting it, among other things, to pay an affiliated securities lending agent a fee based on a share of the income derived from the securities lending activities and has retained BIM as the securities lending agent. BIM may, on behalf of the Fund, invest cash collateral received by the Fund for such loans, among other things, in a private investment company managed by the Manager or in registered money market funds advised by the Manager or its affiliates. As securities lending agent, BIM is responsible for all transaction fees and all other operational costs relating to securities lending activities, other than extraordinary expenses. BIM does not receive any fees for managing the cash collateral. The market value of securities on loan and the value of the related collateral, if applicable, are shown in the Consolidated Statement of Assets and Liabilities as securities loaned at value and collateral on securities loaned at value, respectively. The cash collateral invested by BIM is disclosed in the Consolidated Schedule of Investments, if any. Securities lending income is equal to the total of income earned from the reinvestment of cash collateral, net of rebates paid to, or fees paid by, borrowers of securities. The Fund retains 65% of securities lending income and pays a fee to BIM equal to 35% of such income. The share of income earned by the Fund is shown as securities lending — affiliated in the Consolidated Statement of Operations. For the year ended October 31, 2012, BIM received $24,281 in securities lending agent fees related to securities lending activities for the Fund.
| | | | | | |
| | | | | | | |
| | BLACKROCK LONG-HORIZON EQUITY FUND | | OCTOBER 31, 2012 | | 25 |
| | |
| Notes to Consolidated Financial Statements (continued) | | |
Certain officers and/or Trustees of the Fund are officers and/or directors of BlackRock or its affiliates. The Fund reimburses the Manager for compensation paid to the Fund’s Chief Compliance Officer.
4. Investments:
Purchases and sales of investments, excluding short-term securities, for the year ended October 31, 2012, were $803,529,885 and $1,057,354,870, respectively.
Transactions in options written for the year ended October 31, 2012, were as follows:
| | | | | | | | | | | | | | | | |
| | | Calls | | | Puts | |
| | | Contracts | | | Premiums Received | | | Contracts | | | Premiums Received | |
Outstanding options, beginning of year | | | 366,855 | | | $ | 2,289,371 | | | | 255,190 | | | $ | 1,787,434 | |
Options written | | | 468,958 | | | | 2,942,191 | | | | 197,395 | | | | 954,833 | |
Options exercised | | | (50,575 | ) | | | (335,181 | ) | | | (255 | ) | | | (28,639 | ) |
Options expired | | | (462,084 | ) | | | (565,197 | ) | | | (135,510 | ) | | | (413,225 | ) |
Options closed | | | (323,154 | ) | | | (4,331,184 | ) | | | (316,820 | ) | | | (2,300,403 | ) |
| | | | | | | | |
Outstanding options, end of year | | | — | | | | — | | | | — | | | | — | |
| | | | | | | | |
5. Income Tax Information:
US GAAP requires that certain components of net assets be adjusted to reflect permanent differences between financial and tax reporting. These reclassifications have no effect on net assets or net asset values per share. The following permanent differences as of October 31, 2012 attributable to foreign currency transactions, the accounting for swap agreements, income recognized from pass-through entities and the sale of stock of passive foreign investment companies were reclassified to the following accounts:
| | | | |
Undistributed net investment income | | $ | 13,014,412 | |
Accumulated net realized gain | | $ | (13,014,412 | ) |
The tax character of distributions paid during the fiscal years ended October 31, 2012 and October 31, 2011 were as follows:
| | | | | | | | |
Ordinary income | | | 10/31/12 | | | $ | 21,000,065 | |
| | | | 10/31/11 | | | $ | 6,300,104 | |
As of October 31, 2012, the tax components of accumulated net earnings were as follows:
| | | | |
Undistributed ordinary income | | $ | 16,112,411 | |
Undistributed long-term capital gains | | | 14,281,011 | |
Net unrealized losses1 | | | (4,398,501 | ) |
| | | | |
| Total | | $ | 25,994,921 | |
| | | | |
| 1 | | The difference between book-basis and tax-basis net unrealized losses was attributable primarily to the tax deferral of losses on wash sales and straddles and the realization for tax purposes of unrealized gains/losses on foreign currency exchange contracts. |
During the year ended October 31, 2012, the Fund utilized $123,723,459 of its capital loss carryforward.
As of October 31, 2012, gross unrealized appreciation and gross unrealized depreciation based on cost for federal income tax purposes were as follows:
| | | | |
Tax cost | | $ | 677,705,403 | |
| | | | |
Gross unrealized appreciation | | $ | 10,652,173 | |
Gross unrealized depreciation | | | (14,759,891 | ) |
| | | | |
Net unrealized depreciation | | $ | (4,107,718 | ) |
| | | | |
6. Borrowings:
The Fund, along with certain other funds managed by the Manager and its affiliates, is a party to a $500 million credit agreement with a group of lenders, which expires in November 2012 and was subsequently renewed until November 2013. The Fund may borrow under the credit agreement to fund shareholder redemptions. Effective November 2011 to November 2012, the credit agreement has with the following terms: a commitment fee of 0.065% per annum based on the Fund’s pro rata share of the unused portion of the credit agreement and interest at a rate equal to the higher of (a) the one-month LIBOR plus 0.80% per annum or (b) the Fed Funds rate plus 0.80% per annum on amounts borrowed. In addition, the Fund paid administration and arrangement fees which were allocated to the Fund based on its net assets as of October 31, 2011. The Fund did not borrow under the credit agreement during the year ended October 31, 2012.
7. Concentration, Market and Credit Risk:
In the normal course of business, the Fund invests in securities and enters into transactions where risks exist due to fluctuations in the market (market risk) or failure of the issuer of a security to meet all its obligations (issuer credit risk). The value of securities held by the Fund may decline in response to certain events, including those directly involving the issuers whose securities are owned by the Fund; conditions affecting the general economy; overall market changes; local, regional or global political, social or economic instability; and currency and interest rate and price fluctuations. Similar to issuer credit risk, the Fund may be exposed to counterparty credit risk, or the risk that an entity with which the Fund has unsettled or open transactions may fail to or be unable to perform on its commitments. The Fund manages counterparty credit risk by entering into transactions only with counterparties that it believes have the financial resources to honor their obligations and by monitoring the financial stability of those counterparties. Financial assets, which potentially expose the Fund to market, issuer and counterparty credit risks, consist principally of financial instruments and receivables due from counterparties. The extent of the Fund’s exposure to market, issuer and counterparty credit risks with respect to these financial assets is generally approximated by their value recorded in the
| | | | | | |
| | | | | | | |
| 26 | | BLACKROCK LONG-HORIZON EQUITY FUND | | OCTOBER 31, 2012 | | |
| | |
| Notes to Consolidated Financial Statements (continued) | | |
Consolidated Statement of Assets and Liabilities, less any collateral held by the Fund.
The Fund invests a substantial amount of its assets in issuers located in a single country or a limited number of countries. When the Fund concentrates its investments in this manner, it assumes the risk that economic, political and social conditions in those countries may have a significant impact on their investment performance. Foreign issuers may not be subject to the same uniform accounting, auditing and financial reporting standards and practices as used in the US. Foreign securities markets may also be less liquid, more volatile, and less subject to governmental supervision not typically associated with investing in US securities. Please see the Consolidated Schedule of Investments for concentrations in specific countries.
As of October 31, 2012, the Fund had the following industry classifications:
| | | | |
| Industry | | Percent of Long-Term Investments | |
Tobacco | | | 15 | % |
Media | | | 13 | |
Pharmaceuticals | | | 10 | |
Textiles, Apparel & Luxury Goods | | | 8 | |
Food Products | | | 8 | |
Specialty Retail | | | 5 | |
Software | | | 5 | |
Other1 | | | 36 | |
| 1 | | All other industries held were each less than 5% of long-term investments. |
8. Capital Share Transactions:
Transactions in capital shares for each class were as follows:
| | | | | | | | | | | | | | | | | | |
| | | Year Ended
October 31, 2012 | | | | | Year Ended
October 31, 2011 | |
| | | Shares | | | Amount | | | | | Shares | | | Amount | |
| Institutional | | | | | | | | | | | | | | |
Shares sold | | | 3,904,435 | | | $ | 47,281,824 | | | | | | 9,748,739 | | | $ | 121,874,237 | |
Shares issued to shareholders in reinvestment of dividends and distributions | | | 671,836 | | | | 7,268,276 | | | | | | 226,334 | | | | 2,774,231 | |
Shares redeemed | | | (20,103,795 | ) | | | (248,294,579 | ) | | | | | (7,914,492 | ) | | | (98,039,266 | ) |
| | | | | | | | | | | | | | |
Net increase (decrease) | | | (15,527,524 | ) | | $ | (193,744,479 | ) | | | | | 2,060,581 | | | $ | 26,609,202 | |
| | | | | | | | | | | | | | |
| | | | | | | | | | | | | | | | | | |
| Investor A | | | | | | | | | | | | | | | | | | |
Shares sold and automatic conversion of shares | | | 2,852,461 | | | $ | 34,711,475 | | | | | | 2,845,032 | | | $ | 35,466,175 | |
Shares issued to shareholders in reinvestment of dividends and distributions | | | 734,877 | | | | 7,965,395 | | | | | | 209,276 | | | | 2,565,622 | |
Shares redeemed | | | (7,010,849 | ) | | | (84,541,620 | ) | | | | | (5,733,977 | ) | | | (71,237,706 | ) |
| | | | | | | | | | | | | | |
Net decrease | | | (3,423,511 | ) | | $ | (41,864,750 | ) | | | | | (2,679,669 | ) | | $ | (33,205,909 | ) |
| | | | | | | | | | | | | | |
| | | | | | | | | | | | | | | | | | |
| Investor B | | | | | | | | | | | | | | | | | | |
Shares sold | | | 18,487 | | | $ | 218,991 | | | | | | 46,026 | | | $ | 589,749 | |
Shares issued to shareholders in reinvestment of dividends and distributions | | | 14,717 | | | | 160,406 | | | | | | — | | | | — | |
Shares redeemed and automatic conversion of shares | | | (478,609 | ) | | | (5,768,335 | ) | | | | | (429,164 | ) | | | (5,300,631 | ) |
| | | | | | | | | | | | | | |
Net decrease | | | (445,405 | ) | | $ | (5,388,938 | ) | | | | | (383,138 | ) | | $ | (4,710,882 | ) |
| | | | | | | | | | | | | | |
| | | | | | | | | | | | | | | | | | |
| Investor C | | | | | | | | | | | | | | | | | | |
Shares sold | | | 675,954 | | | $ | 8,033,621 | | | | | | 1,536,801 | | | $ | 19,268,319 | |
Shares issued to shareholders in reinvestment of dividends and distributions | | | 210,701 | | | | 2,283,776 | | | | | | — | | | | — | |
Shares redeemed | | | (4,050,066 | ) | | | (48,583,144 | ) | | | | | (3,023,776 | ) | | | (37,177,544 | ) |
| | | | | | | | | | | | | | |
Net decrease | | | (3,163,411 | ) | | $ | (38,265,747 | ) | | | | | (1,486,975 | ) | | $ | (17,909,225 | ) |
| | | | | | | | | | | | | | |
| | | | | | | | | | | | | | | | | | |
| Class R | | | | | | | | | | | | | | | | | | |
Shares sold | | | 170,584 | | | $ | 2,021,256 | | | | | | 254,714 | | | $ | 3,157,677 | |
Shares issued to shareholders in reinvestment of dividends and distributions | | | 12,412 | | | | 134,547 | | | | | | 2,616 | | | | 32,018 | |
Shares redeemed | | | (208,503 | ) | | | (2,502,492 | ) | | | | | (443,130 | ) | | | (5,499,891 | ) |
| | | | | | | | | | | | | | |
Net decrease | | | (25,507 | ) | | $ | (346,689 | ) | | | | | (185,800 | ) | | $ | (2,310,196 | ) |
| | | | | | | | | | | | | | |
Total Net Decrease | | | (22,585,358 | ) | | $ | (279,610,603 | ) | | | | | (2,675,001 | ) | | $ | (31,527,010 | ) |
| | | | | | | | | | | | | | |
| | | | | | |
| | | | | | | |
| | BLACKROCK LONG-HORIZON EQUITY FUND | | OCTOBER 31, 2012 | | 27 |
| | |
| Notes to Consolidated Financial Statements (concluded) | | |
Prior to April 1, 2011, there was a 2% redemption fee on shares redeemed or exchanged that have been held for 30 days or less. The redemption fees are collected and retained by the Fund for the benefit of the remaining shareholders. The redemption fees were recorded as a credit to paid-in-capital. Effective April 1, 2011, the redemption fee was terminated and is no longer charged by the Fund.
9. Subsequent Events:
Management has evaluated the impact of all subsequent events on the Fund through the date the consolidated financial statements were issued and has determined that there were no subsequent events requiring adjustment or additional disclosure in the consolidated financial statements.
| | | | | | |
| | | | | | | |
| 28 | | BLACKROCK LONG-HORIZON EQUITY FUND | | OCTOBER 31, 2012 | | |
| | |
| Report of Independent Registered Public Accounting Firm | | |
To the Shareholders and Board of Trustees of BlackRock Long-Horizon Equity Fund (formerly BlackRock Global Dynamic Equity Fund):
We have audited the accompanying consolidated statement of assets and liabilities of BlackRock Long-Horizon Equity Fund and Subsidiary (formerly BlackRock Global Dynamic Equity Fund) (the “Fund”), including the consolidated schedule of investments, as of October 31, 2012, and the related consolidated statement of operations for the year then ended, the consolidated statements of changes in net assets for each of the two years in the period then ended, the consolidated financial highlights for each of the four years in the period then ended, and the financial highlights for the year ended October 31, 2008. These financial statements and financial highlights are the responsibility of the Fund’s management. Our responsibility is to express an opinion on these financial statements and financial highlights based on our audits.
We conducted our audits in accordance with the standards of the Public Company Accounting Oversight Board (United States). Those standards require that we plan and perform the audit to obtain reasonable assurance about whether the financial statements and financial highlights are free of material misstatement. The Fund is not required to have, nor were we engaged to perform, an audit of its internal control over financial reporting. Our audits included consideration of internal control over financial reporting as a basis for designing audit procedures that are appropriate in the circumstances, but not for the
purpose of expressing an opinion on the effectiveness of the Fund’s internal control over financial reporting. Accordingly, we express no such opinion. An audit also includes examining, on a test basis, evidence supporting the amounts and disclosures in the financial statements, assessing the accounting principles used and significant estimates made by management, as well as evaluating the overall financial statement presentation. Our procedures included confirmation of the securities owned as of October 31, 2012, by correspondence with the custodian and brokers; where replies were not received from brokers, we performed other auditing procedures. We believe that our audits provide a reasonable basis for our opinion.
In our opinion, the consolidated financial statements and financial highlights referred to above present fairly, in all material respects, the consolidated financial position of BlackRock Long-Horizon Equity Fund and Subsidiary as of October 31, 2012, the consolidated results of their operations for the year then ended, the consolidated changes in their net assets for each of the two years in the period then ended, the consolidated financial highlights for each of the four years in the period then ended, and the financial highlights for the year ended October 31, 2008, in conformity with accounting principles generally accepted in the United States of America.
Deloitte & Touche LLP
Boston, Massachusetts
December 21, 2012
| | |
| Important Tax Information (Unaudited) | | |
The following information is provided with respect to the ordinary income distribution paid by the Fund during the fiscal year ended October 31, 2012.
| | | | | | | | |
| | | Payable
Date | | | | |
Qualified Dividend Income for Individuals1. | | | 12/20/2011 | | | | 89.91 | % |
| Dividends Qualifying for the Dividend Received Deduction for Corporations1 | | | 12/20/2011 | | | | 47.03 | % |
| | 1 | | The Fund hereby designates the percentage indicated or the maximum amount allowable by law. |
| | | | | | |
| See Notes to Financial Statements. | | | | |
| | | | | | | |
| | BLACKROCK LONG-HORIZON EQUITY FUND | | OCTOBER 31, 2012 | | 29 |
| | |
| Disclosure of Investment Advisory Agreement and Sub-Advisory Agreements | | |
The Board of Trustees (the “Board,” and the members of which are referred to as “Board Members”) of BlackRock Long-Horizon Equity Fund (the “Fund”) met on April 10, 2012 and May 8-9, 2012 to consider the approval of the Fund’s investment advisory agreement (the “Advisory Agreement”) with BlackRock Advisors, LLC (the “Manager”), the Fund’s investment advisor. The Board also considered the approval of the sub-advisory agreements (collectively, the “Sub-Advisory Agreements”) between the Manager and each of (a) BlackRock Investment Management, LLC; and (b) BlackRock International Limited (collectively, the “Sub-Advisors”), with respect to the Fund. The Manager and the Sub-Advisors are referred to herein as “BlackRock.” The Advisory Agreement and the Sub-Advisory Agreements are referred to herein as the “Agreements.”
Activities and Composition of the Board
The Board consists of thirteen individuals, ten of whom are not “interested persons” of the Fund as defined in the Investment Company Act of 1940, as amended (the “1940 Act”) (the “Independent Board Members”). The Board Members are responsible for the oversight of the operations of the Fund and perform the various duties imposed on the directors of investment companies by the 1940 Act. The Independent Board Members have retained independent legal counsel to assist them in connection with their duties. The Chairman of the Board is an Independent Board Member. The Board has established five standing committees: an Audit Committee, a Governance and Nominating Committee, a Compliance Committee, a Performance Oversight Committee and an Executive Committee, each of which is chaired by an Independent Board Member and composed of Independent Board Members (except for the Performance Oversight Committee and the Executive Committee, each of which also has one interested Board Member).
The Agreements
Pursuant to the 1940 Act, the Board is required to consider the continuation of the Agreements on an annual basis. The Board has four quarterly meetings per year, each extending over two days, and a fifth meeting to consider specific information surrounding the consideration of renewing the Agreements. In connection with this process, the Board assessed, among other things, the nature, scope and quality of the services provided to the Fund by BlackRock, its personnel and its affiliates, including investment management, administrative and shareholder services, oversight of fund accounting and custody, marketing services, risk oversight, compliance and assistance in meeting applicable legal and regulatory requirements.
The Board, acting directly and through its committees, considers at each of its meetings, and from time to time as appropriate, factors that are relevant to its annual consideration of the renewal of the Agreements, including the services and support provided by BlackRock to the Fund and its shareholders. Among the matters the Board considered
were: (a) investment performance for one-, three- and five-year periods, as applicable, against peer funds, and applicable benchmarks, if any, as well as senior management’s and portfolio managers’ analysis of the reasons for any over performance or underperformance against its peers and/or benchmark, as applicable; (b) fees, including advisory, administration, if applicable, and other amounts paid to BlackRock and its affiliates by the Fund for services, such as marketing and distribution, call center and fund accounting; (c) Fund operating expenses and how BlackRock allocates expenses to the Fund; (d) the resources devoted to, risk oversight of, and compliance reports relating to, implementation of the Fund’s investment objective, policies and restrictions; (e) the Fund’s compliance with its Code of Ethics and other compliance policies and procedures; (f) the nature, cost and character of non-investment management services provided by BlackRock and its affiliates; (g) BlackRock’s and other service providers’ internal controls and risk and compliance oversight mechanisms; (h) BlackRock’s implementation of the proxy voting policies approved by the Board; (i) the use of brokerage commissions and execution quality of portfolio transactions; (j) BlackRock’s implementation of the Fund’s valuation and liquidity procedures; (k) an analysis of management fees for products with similar investment objectives across the open-end fund, exchange traded fund (“ETF”), closed-end fund and institutional account product channels, as applicable; (l) BlackRock’s compensation methodology for its investment professionals and the incentives it creates; and (m) periodic updates on BlackRock’s business.
The Board has engaged in an ongoing strategic review with BlackRock of opportunities to consolidate funds and of BlackRock’s commitment to investment performance. In addition, the Board requested, to the extent reasonably possible, an analysis of the risk and return relative to selected funds in peer groups. BlackRock provides information to the Board in response to specific questions. These questions covered issues such as profitability, investment performance and management fee levels. The Board considered the importance of: (i) managing fixed income assets with a view toward preservation of capital; (ii) portfolio managers’ investments in the funds they manage; (iii) BlackRock’s controls surrounding the coding of quantitative investment models; and (iv) BlackRock’s oversight of relationships with third party service providers.
Board Considerations in Approving the Agreements
The Approval Process: Prior to the April 10, 2012 meeting, the Board requested and received materials specifically relating to the Agreements. The Board is engaged in a process with its independent legal counsel and BlackRock to review periodically the nature and scope of the information provided to better assist its deliberations. The materials provided in connection with the April meeting included (a) information independently compiled and prepared by Lipper, Inc. (“Lipper”) on Fund fees and expenses and the investment performance of the Fund as compared with a peer group of funds as determined by Lipper and a
| | | | | | |
| | | | | | | |
| 30 | | BLACKROCK LONG-HORIZON EQUITY FUND | | OCTOBER 31, 2012 | | |
| | |
| Disclosure of Investment Advisory Agreement and Sub-Advisory Agreements (continued) |
customized peer group selected by BlackRock (collectively, “Peers”); (b) information on the profitability of the Agreements to BlackRock and a discussion of fall-out benefits to BlackRock and its affiliates; (c) a general analysis provided by BlackRock concerning investment management fees (a combination of the advisory fee and the administration fee, if any) charged to other clients, such as institutional clients, ETFs and closed-end funds, under similar investment mandates, as well as the performance of such other clients, as applicable; (d) the existence, impact and sharing of potential economies of scale; (e) a summary of aggregate amounts paid by the Fund to BlackRock; (f) sales and redemption data regarding the Fund’s shares; and (g) if applicable, a comparison of management fees to similar BlackRock open-end funds, as classified by Lipper.
At an in-person meeting held on April 10, 2012, the Board reviewed materials relating to its consideration of the Agreements. As a result of the discussions that occurred during the April 10, 2012 meeting, and as a culmination of the Board’s year-long deliberative process, the Board presented BlackRock with questions and requests for additional information. BlackRock responded to these requests with additional written information in advance of the May 8-9, 2012 Board meeting.
At an in-person meeting held on May 8-9, 2012, the Board, including all the Independent Board Members, approved the continuation of the Advisory Agreement between the Manager and the Fund and the Sub-Advisory Agreements between the Manager and the Sub-Advisors with respect to the Fund, each for a one-year term ending June 30, 2013. In approving the continuation of the Agreements, the Board considered: (a) the nature, extent and quality of the services provided by BlackRock; (b) the investment performance of the Fund and BlackRock; (c) the advisory fee and the cost of the services and profits to be realized by BlackRock and its affiliates from their relationship with the Fund; (d) economies of scale; (e) fall-out benefits to BlackRock as a result of its relationship with the Fund; and (f) other factors deemed relevant by the Board Members.
The Board also considered other matters it deemed important to the approval process, such as payments made to BlackRock or its affiliates relating to the distribution of Fund shares and securities lending, services related to the valuation and pricing of Fund portfolio holdings, direct and indirect benefits to BlackRock and its affiliates from their relationship with the Fund and advice from independent legal counsel with respect to the review process and materials submitted for the Board’s review. The Board noted the willingness of BlackRock personnel to engage in open, candid discussions with the Board. The Board did not identify any particular information as controlling, and each Board Member may have attributed different weights to the various items considered.
A. Nature, Extent and Quality of the Services Provided by BlackRock:
The Board, including the Independent Board Members, reviewed the
nature, extent and quality of services provided by BlackRock, including the investment advisory services and the resulting performance of the Fund. Throughout the year, the Board compared Fund performance to the performance of a comparable group of mutual funds and/or the performance of a relevant benchmark, if any. The Board met with BlackRock’s senior management personnel responsible for investment operations, including the senior investment officers. The Board also reviewed the materials provided by the Fund’s portfolio management team discussing Fund performance and the Fund’s investment objective, strategies and outlook.
The Board considered, among other factors, the number, education and experience of BlackRock’s investment personnel generally and the Fund’s portfolio management team, investments by portfolio managers in the funds they manage, BlackRock’s portfolio trading capabilities, BlackRock’s use of technology, BlackRock’s commitment to compliance, BlackRock’s credit analysis capabilities, BlackRock’s risk analysis and oversight capabilities and BlackRock’s approach to training and retaining portfolio managers and other research, advisory and management personnel. The Board engaged in a review of BlackRock’s compensation structure with respect to the Fund’s portfolio management team and BlackRock’s ability to attract and retain high-quality talent and create performance incentives.
In addition to advisory services, the Board considered the quality of the administrative and non-investment advisory services provided to the Fund. BlackRock and its affiliates provide the Fund with certain administrative, shareholder and other services (in addition to any such services provided to the Fund by third parties) and officers and other personnel as are necessary for the operations of the Fund. In particular, BlackRock and its affiliates provide the Fund with the following administrative services including, among others: (i) preparing disclosure documents, such as the prospectus, the statement of additional information and periodic shareholder reports; (ii) assisting with daily accounting and pricing; (iii) overseeing and coordinating the activities of other service providers; (iv) organizing Board meetings and preparing the materials for such Board meetings; (v) providing legal and compliance support; and (vi) performing other administrative functions necessary for the operation of the Fund, such as tax reporting, fulfilling regulatory filing requirements and call center services. The Board reviewed the structure and duties of BlackRock’s fund administration, accounting, legal and compliance departments and considered BlackRock’s policies and procedures for assuring compliance with applicable laws and regulations.
B. The Investment Performance of the Fund and BlackRock: The Board, including the Independent Board Members, also reviewed and considered the performance history of the Fund. In preparation for the April 10, 2012 meeting, the Board worked with its independent legal counsel, BlackRock and Lipper to develop a template for, and was provided
| | | | | | |
| | | | | | | |
| | BLACKROCK LONG-HORIZON EQUITY FUND | | OCTOBER 31, 2012 | | 31 |
| | |
| Disclosure of Investment Advisory Agreement and Sub-Advisory Agreements (continued) |
with, reports independently prepared by Lipper, which included a comprehensive analysis of the Fund’s performance. The Board also reviewed a narrative and statistical analysis of the Lipper data that was prepared by BlackRock, which analyzed various factors that affect Lipper’s rankings. In connection with its review, the Board received and reviewed information regarding the investment performance of the Fund as compared to funds in the Fund’s applicable Lipper category and the customized peer group selected by BlackRock. The Board was provided with a description of the methodology used by Lipper to select peer funds and periodically meets with Lipper representatives to review their methodology. The Board and the Board’s Performance Oversight Committee regularly review, and meet with Fund management to discuss, the performance of the Fund throughout the year.
The Board noted that the Fund ranked in the third, third and first quartiles against its Customized Lipper Peer Group for the one-, three- and five-year periods reported, respectively. Based on its discussions with BlackRock and the Board’s review of the Fund’s investment performance compared to its Lipper Peer Group, the methodology used by Lipper to select peer funds, and other relevant information provided by BlackRock, the Board noted that the Fund’s investment performance as compared to its Customized Lipper Peer Group provided a more meaningful comparison of the Fund’s relative performance. The Board and BlackRock reviewed and discussed the reasons for the Fund’s underperformance during the one- and three-year periods compared with its Peers. The Board was informed that, among other things, the Fund’s underweight in consumer staples and consumer discretionary represented the biggest drag on performance for the one-year and three-year periods, respectively. Underperformance over the three-year period was partially a result of the Fund having on average approximately 6% of its NAV invested in instruments (mainly convertible bonds) and cash equivalents to mitigate risk in the Fund’s portfolio. The Fund’s portfolio managers believe this defensive positioning resulted in the Fund’s underperformance due to the significant appreciation of global equity markets over the period.
The Board and BlackRock discussed BlackRock’s strategy for improving the Fund’s performance and BlackRock’s commitment to providing the resources necessary to assist the Fund’s portfolio managers and to improve the Fund’s performance.
C. Consideration of the Advisory/Management Fees and the Cost of the Services and Profits to be Realized by BlackRock and its Affiliates from their Relationship with the Fund: The Board, including the Independent Board Members, reviewed the Fund’s contractual management fee rate compared with the other funds in its Lipper category. It also compared the Fund’s total expense ratio, as well as actual management fee rate, to those of other funds in its Lipper category. The Board considered the services provided and the fees
charged by BlackRock to other types of clients with similar investment mandates, including separately managed institutional accounts.
The Board received and reviewed statements relating to BlackRock’s financial condition and profitability with respect to the services it provided the Fund. The Board was also provided with a profitability analysis that detailed the revenues earned and the expenses incurred by BlackRock for services provided to the Fund. The Board reviewed BlackRock’s profitability with respect to the Fund and other funds the Board currently oversees for the year ended December 31, 2011 compared to available aggregate profitability data provided for the years ended December 31, 2010 and December 31, 2009. The Board reviewed BlackRock’s profitability with respect to other fund complexes managed by the Manager and/or its affiliates. The Board reviewed BlackRock’s assumptions and methodology of allocating expenses in the profitability analysis, noting the inherent limitations in allocating costs among various advisory products. The Board recognized that profitability may be affected by numerous factors including, among other things, fee waivers and expense reimbursements by the Manager, the types of funds managed, expense allocations and business mix, and the difficulty of comparing profitability as a result of those factors.
The Board noted that, in general, individual fund or product line profitability of other advisors is not publicly available. The Board considered BlackRock’s operating margin, in general, compared to the operating margin for leading investment management firms whose operations include advising open-end funds, among other product types. In addition, the Board considered, among other things, certain third party data comparing BlackRock’s operating margin with that of other publicly-traded asset management firms. The Board considered the differences between BlackRock and these other firms, including the contribution of technology at BlackRock, BlackRock’s expense management, and the relative product mix.
In addition, the Board considered the cost of the services provided to the Fund by BlackRock, and BlackRock’s and its affiliates’ profits relating to the management and distribution of the Fund and the other funds advised by BlackRock and its affiliates. As part of its analysis, the Board reviewed BlackRock’s methodology in allocating its costs to the management of the Fund. The Board also considered whether BlackRock has the financial resources necessary to attract and retain high quality investment management personnel to perform its obligations under the Agreements and to continue to provide the high quality of services that is expected by the Board.
The Board noted that the Fund’s contractual management fee ratio (a combination of the advisory fee and the administration fee, if any) was lower than or equal to the median contractual management fee ratio paid by the Fund’s Peers, in each case before taking into account any
| | | | | | |
| | | | | | | |
| 32 | | BLACKROCK LONG-HORIZON EQUITY FUND | | OCTOBER 31, 2012 | | |
| | |
| Disclosure of Investment Advisory Agreement and Sub-Advisory Agreements (concluded) |
expense reimbursements or fee waivers. The Board also noted that the Fund has an advisory fee arrangement that includes breakpoints that adjust the fee ratio downward as the size of the Fund increases above certain contractually specified levels. The Board further noted that BlackRock has contractually agreed to waive fees or reimburse expenses in order to limit, to a specified amount, the Fund’s total net expenses on a class-by-class basis, as applicable.
D. Economies of Scale: The Board, including the Independent Board Members, considered the extent to which economies of scale might be realized as the assets of the Fund increase, as well as the existence of expense caps. The Board also considered the extent to which the Fund benefits from such economies and whether there should be changes in the advisory fee rate or structure in order to enable the Fund to participate in these economies of scale, for example through the use of revised breakpoints in the advisory fee based upon the asset level of the Fund. In its consideration, the Board Members took into account the existence of expense caps and further considered the continuation and/or implementation, as applicable, of such caps.
E. Other Factors Deemed Relevant by the Board Members: The Board, including the Independent Board Members, also took into account other ancillary or “fall-out” benefits that BlackRock or its affiliates may derive from their respective relationships with the Fund, both tangible and intangible, such as BlackRock’s ability to leverage its investment professionals who manage other portfolios and risk management personnel, an increase in BlackRock’s profile in the investment advisory community, and the engagement of BlackRock’s affiliates as service providers to the Fund, including for administrative, distribution, securities lending and cash management services. The Board also considered BlackRock’s overall operations and its efforts to expand the scale of, and improve the quality of, its operations. The Board also noted that BlackRock may use and benefit from third party research obtained by soft dollars generated by certain registered fund transactions to assist in managing all or a number of its other client accounts. The Board further noted that it had considered the investment by BlackRock’s funds in ETFs without any offset against the management fees payable by the funds to BlackRock.
In connection with its consideration of the Agreements, the Board also received information regarding BlackRock’s brokerage and soft dollar practices. The Board received reports from BlackRock which included information on brokerage commissions and trade execution practices throughout the year.
The Board noted the competitive nature of the open-end fund marketplace, and that shareholders are able to redeem their Fund shares if they believe that the Fund’s fees and expenses are too high or if they are dissatisfied with the performance of the Fund.
Conclusion
The Board, including all the Independent Board Members, approved the continuation of the Advisory Agreement between the Manager and the Fund for a one-year term ending June 30, 2013, and the Sub-Advisory Agreements between the Manager and the Sub-Advisors with respect to the Fund for a one-year term ending June 30, 2013. Based upon its evaluation of all of the aforementioned factors in their totality, the Board, including the Independent Board Members, was satisfied that the terms of the Agreements were fair and reasonable and in the best interest of the Fund and its shareholders. In arriving at its decision to approve the Agreements, the Board did not identify any single factor or group of factors as all-important or controlling, but considered all factors together, and different Board Members may have attributed different weights to the various factors considered. The Independent Board Members were also assisted by the advice of independent legal counsel in making this determination. The contractual fee arrangements for the Fund reflect the results of several years of review by the Board Members and predecessor Board Members, and discussions between such Board Members (and predecessor Board Members) and BlackRock. As a result, the Board Members’ conclusions may be based in part on their consideration of these arrangements in prior years.
| | | | | | |
| | | | | | | |
| | BLACKROCK LONG-HORIZON EQUITY FUND | | OCTOBER 31, 2012 | | 33 |
| | | | | | | | | | |
Name, Address and Year of Birth | | Position(s) Held with Fund | | Length of Time Served as
a Trustee2 | | Principal Occupation(s) During Past Five Years | | Number of BlackRock- Advised Registered Investment Companies (“RICs”) Consisting of Investment Portfolios (“Portfolios”) Overseen | | Public Directorships |
| Independent Trustees1 |
Robert M. Hernandez 55 East 52nd Street
New York, NY 10055 1944 | | Chairman of the Board and Trustee | | Since
2007 | | Director, Vice Chairman and Chief Financial Officer of USX Corporation (energy and steel business) from 1991 to 2001; Director, TE Connectivity (electronics) from 2006 to 2012. | | 29 RICs consisting of
82 Portfolios | | ACE Limited (insurance company); Eastman Chemical Company (chemicals); RTI International Metals, Inc. (metals) |
Fred G. Weiss 55 East 52nd Street New York, NY 10055 1941 | | Vice Chairman of the Board and Trustee | | Since
2007 | | Managing Director, FGW Associates (consulting and investment company) since 1997; Director and Treasurer, Michael J. Fox Foundation for Parkinson’s Research since 2000; Director, BTG International Plc (medical technology commercialization company) from 2001 to 2007. | | 29 RICs consisting of
82 Portfolios | | Watson
Pharmaceuticals, Inc. |
James H. Bodurtha 55 East 52nd Street New York, NY 10055 1944 | | Trustee | | Since
2007 | | Director, The China Business Group, Inc. (consulting firm) since 1996 and Executive Vice President thereof from 1996 to 2003; Chairman of the Board, Berkshire Holding Corporation since 1980. | | 29 RICs consisting of
82 Portfolios | | None |
Bruce R. Bond 55 East 52nd Street New York, NY 10055 1946 | | Trustee | | Since
2007 | | Trustee and Member of the Governance Committee, State Street Research Mutual Funds from 1997 to 2005; Board Member of Governance, Audit and Finance Committee, Avaya Inc. (computer equipment) from 2003 to 2007. | | 29 RICs consisting of
82 Portfolios | | None |
Donald W. Burton 55 East 52nd Street New York, NY 10055 1944 | | Trustee | | Since
2007 | | Managing General Partner, The Burton Partnership, LP (an investment partnership) since 1979; Managing General Partner, The South Atlantic Venture Funds since 1983; Director, Lifestyle Family Fitness (fitness industry) since 2006; Director, IDology, Inc. (technology solutions) since 2006; Member of the Investment Advisory Council of the Florida State Board of Administration from 2001 to 2007. | | 29 RICs consisting of
82 Portfolios | | Knology, Inc. (tele- communications); Capital Southwest (financial) |
Honorable Stuart E. Eizenstat 55 East 52nd Street New York, NY 10055 1943 | | Trustee | | Since
2007 | | Partner and Head of International Practice, Covington and Burling LLP (law firm) since 2001; International Advisory Board Member, The Coca-Cola Company from 2002 to 2011; Advisory Board Member, Veracity Worldwide, LLC (risk management) since 2007; Member of the International Advisory Board GML (energy) since 2003; Advisory Board Member, BT Americas (telecommunications) from 2004 to 2010. | | 29 RICs consisting of
82 Portfolios | | Alcatel-Lucent (tele-communications); Global Specialty Metallurgical (metallurgical industry); UPS Corporation (delivery service) |
Kenneth A. Froot 55 East 52nd Street New York, NY 10055 1957 | | Trustee | | Since
2007 | | Professor, Harvard University since 1992. | | 29 RICs consisting of
82 Portfolios | | None |
John F. O’Brien 55 East 52nd Street New York, NY 10055 1943 | | Trustee | | Since
2007 | | Chairman and Director, Woods Hole Oceanographic Institute since 2009 and Trustee thereof from 2003 to 2009; Director, Ameresco, Inc. (energy solutions company) from 2006 to 2007. | | 29 RICs consisting of
82 Portfolios | | Cabot Corporation (chemicals); LKQ Corporation (auto parts manufacturing); TJX Companies, Inc. (retailer) |
Roberta Cooper Ramo 55 East 52nd Street New York, NY 10055 1942 | | Trustee | | Since
2007 | | Shareholder, Modrall, Sperling, Roehl, Harris & Sisk, P.A. (law firm) since 1993; Chairman of the Board, Cooper’s Inc., (retail) since 2000; Director, ECMC Group (service provider to students, schools and lenders) since 2001; President, The American Law Institute (non-profit) since 2008; President, American Bar Association from 1995 to 1996. | | 29 RICs consisting of
82 Portfolios | | None |
| | | | | | |
| | | | | | | |
| 34 | | BLACKROCK LONG-HORIZON EQUITY FUND | | OCTOBER 31, 2012 | | |
| | |
| Officers and Trustees (continued) | | |
| | | | | | | | | | |
Name, Address and Year of Birth | | Position(s) Held with Fund | | Length of Time Served as
a Trustee2 | | Principal Occupation(s) During Past Five Years | | Number of BlackRock- Advised Registered Investment Companies (“RICs”) Consisting of Investment Portfolios (“Portfolios”) Overseen | | Public Directorships |
| Independent Trustees1 (concluded) |
David H. Walsh 55 East 52nd Street New York, NY 10055 1941 | | Trustee | | Since
2007 | | Director, National Museum of Wildlife Art since 2007; Trustee, University of Wyoming Foundation since 2008; Director, Ruckelshaus Institute and Haub School of Natural Resources at the University of Wyoming from 2006 to 2008; Director, The American Museum of Fly Fishing since 1997; Director, The National Audubon Society from 1998 to 2005. | | 29 RICs consisting of
82 Portfolios | | None |
| | 1 Each Independent Trustee holds office until his or her successor is duly elected and qualifies or until his or her earlier death, resignation or removal as provided by the Fund’s by-laws or charter or statute. In no event may an Independent Trustee hold office beyond December 31 of the year in which he or she turns 74. |
| | 2 Date shown is the earliest date a person has served for the Fund covered by this annual report. Following the combination of Merrill Lynch Investment Managers, L.P. (“MLIM”) and BlackRock, Inc. (“BlackRock”) in September 2006, the various legacy MLIM and legacy BlackRock fund boards were realigned and consolidated into three new fund boards in 2007. As a result, although the chart shows Trustees as joining the Fund’s board in 2007, each Trustee first became a member of the board of other legacy MLIM or legacy BlackRock Funds as follows: James H. Bodurtha, 1995; Bruce R. Bond, 2005; Donald W. Burton, 2002; Honorable Stuart E. Eizenstat, 2001; Kenneth A. Froot, 2005; Robert M. Hernandez, 1996; John F. O’Brien, 2004; Roberta Cooper Ramo, 1999; David H. Walsh, 2003; and Fred G. Weiss, 1998. |
| Interested Trustees3 |
Paul L. Audet 55 East 52nd Street New York, NY 10055 1953 | | Trustee | | Since
2011 | | Senior Managing Director of BlackRock and Head of U.S. Mutual Funds since 2011; Chair of the U.S. Mutual Funds Committee reporting to the Global Executive Committee since 2011; Head of BlackRock’s Real Estate business from 2008 to 2011; Member of BlackRock’s Global Operating and Corporate Risk Management Committees and of the BlackRock Alternative Investors Executive Committee and Investment Committee for the Private Equity Fund of Funds business since 2008; Head of BlackRock’s Global Cash Management business from 2005 to 2010; Acting Chief Financial Officer of BlackRock from 2007 to 2008; Chief Financial Officer of BlackRock from 1998 to 2005. | | 158 RICs consisting of
277 Portfolios | | None |
Laurence D. Fink 55 East 52nd Street New York, NY 10055 1952 | | Trustee | | Since
2007 | | Chairman and Chief Executive Officer of BlackRock since its formation in 1998 and of BlackRock’s predecessor entities since 1988 and Chairman of the Executive and Management Committees; Formerly Managing Director, The First Boston Corporation, Member of its Management Committee, Co-head of its Taxable Fixed Income Division and Head of its Mortgage and Real Estate Products Group; Chairman of the Board of several of BlackRock’s alternative investment vehicles; Director of several of BlackRock’s offshore funds; Member of the Board of Trustees of New York University, Chair of the Financial Affairs Committee and a member of the Executive Committee, the Ad Hoc Committee on Board Governance, and the Committee on Trustees; Co-Chairman of the NYU Hospitals Center Board of Trustees, Chairman of the Development/Trustee Stewardship Committee and Chairman of the Finance Committee; Trustee, The Boys’ Club of New York. | | 29 RICs consisting of
82 Portfolios | | BlackRock |
Henry Gabbay 55 East 52nd Street New York, NY 10055 1947 | | Trustee | | Since
2007 | | Consultant, BlackRock from 2007 to 2008; Managing Director, BlackRock from 1989 to 2007; Chief Administrative Officer, BlackRock Advisors, LLC from 1998 to 2007; President of BlackRock Funds and BlackRock Bond Allocation Target Shares from 2005 to 2007 and Treasurer of certain closed-end funds in the BlackRock fund complex from 1989 to 2006. | | 158 RICs consisting of
277 Portfolios | | None |
| | 3 Messrs. Audet and Fink are both “interested persons,” as defined in the 1940 Act, of the Fund based on their positions with BlackRock and its affiliates. Mr. Gabbay is an “interested person” of the Fund based on his former positions with BlackRock and its affiliates as well as his ownership of BlackRock and The PNC Financial Services Group, Inc. securities. Mr. Audet and Mr. Gabbay are also Directors of the BlackRock registered closed-end funds and Directors of other BlackRock registered open-end funds. Interested Trustees serve until their resignation, removal or death, or until December 31 of the year in which they turn 72. |
| | | | | | |
| | | | | | | |
| | BLACKROCK LONG-HORIZON EQUITY FUND | | OCTOBER 31, 2012 | | 35 |
|
| Officers and Trustees (concluded) |
| | | | | | |
Name, Address and Year of Birth | | Position(s)
Held with
Fund | | Length of Time Served | | Principal Occupation(s) During Past Five Years |
| Officers1 |
John M. Perlowski 55 East 52nd Street New York, NY 10055 1964 | | President and Chief Executive Officer | | Since 2010 | | Managing Director of BlackRock since 2009; Global Head of BlackRock Fund Administration since 2009; Managing Director and Chief Operating Officer of the Global Product Group at Goldman Sachs Asset Management, L.P. from 2003 to 2009; Treasurer of Goldman Sachs Mutual Funds from 2003 to 2009 and Senior Vice President thereof from 2007 to 2009; Director of Goldman Sachs Offshore Funds from 2002 to 2009; Director of Family Resource Network (charitable foundation) since 2009. |
Brendan Kyne 55 East 52nd Street New York, NY 10055 1977 | | Vice President | | Since 2009 | | Managing Director of BlackRock since 2010; Director of BlackRock from 2008 to 2009; Head of Product Development and Management for BlackRock’s U.S. Retail Group since 2009 and Co-head thereof from 2007 to 2009; Vice President of BlackRock from 2005 to 2008. |
Neal Andrews 55 East 52nd Street New York, NY 10055 1966 | | Chief Financial
Officer | | Since
2007 | | Managing Director of BlackRock since 2006; Senior Vice President and Line of Business Head of Fund Accounting and Administration at PNC Global Investment Servicing (U.S.) Inc. from 1992 to 2006. |
Jay Fife 55 East 52nd Street New York, NY 10055 1970 | | Treasurer | | Since 2007 | | Managing Director of BlackRock since 2007; Director of BlackRock in 2006; Assistant Treasurer of the MLIM and Fund Asset Management, L.P. advised funds from 2005 to 2006; Director of MLIM Fund Services Group from 2001 to 2006. |
Brian Kindelan 55 East 52nd Street New York, NY 10055 1959 | | Chief Compliance Officer and Anti-Money Laundering Officer | | Since 2007 | | Chief Compliance Officer of the BlackRock-advised funds since 2007; Managing Director and Senior Counsel of BlackRock since 2005. |
Benjamin Archibald 55 East 52nd Street New York, NY 10055 1975 | | Secretary | | Since 2012 | | Director of BlackRock since 2010; Assistant Secretary to the Funds from 2010 to 2012; General Counsel and Chief Operating Officer of Uhuru Capital Management from 2009 to 2010; Executive Director and Counsel of Goldman Sachs Asset Management from 2005 to 2009. |
| | 1 Officers of the Fund serve at the pleasure of the Board. |
| | | Further information about the Officers and Trustees is available in the Fund’s Statement of Additional Information, which can be obtained without charge by calling (800) 441-7762. |
| | | | | | | | |
Investment Advisor BlackRock Advisors, LLC Wilmington, DE 19809 | | Custodian Brown Brothers Harriman & Co. Boston, MA 02109 | | Accounting Agent State Street Bank and Trust Company Boston, MA 02110 | | Legal Counsel Willkie Farr & Gallagher LLP New York, NY 10019 | | Address of the Fund 100 Bellevue Parkway Wilmington, DE 19809 |
Sub-Advisors BlackRock Investment Management, LLC Princeton, NJ 08540 BlackRock International Limited Edinburgh, EH3 8JB United Kingdom | | Transfer Agent BNY Mellon Investment Servicing (US) Inc. Wilmington, DE 19809 | | Distributor BlackRock Investments, LLC New York, NY 10022 | | Independent Registered Public Accounting Firm Deloitte & Touche LLP Boston, MA 02116 | | |
Effective May 8, 2012, Ira P. Shapiro resigned as Secretary of the
Fund and Benjamin Archibald became Secretary of
the Fund.
| | | | | | |
| | | | | | | |
| 36 | | BLACKROCK LONG-HORIZON EQUITY FUND | | OCTOBER 31, 2012 | | |
Electronic Delivery
Electronic copies of most financial reports and prospectuses are available on the Fund’s website or shareholders can sign up for e-mail notifications of quarterly statements, annual and semi-annual reports and prospectuses by enrolling in the Fund’s electronic delivery program.
To enroll:
Shareholders Who Hold Accounts with Investment Advisors, Banks or Brokerages:
Please contact your financial advisor. Please note that not all investment advisors, banks or brokerages may offer this service.
Shareholders Who Hold Accounts Directly with BlackRock:
| 1) | Access the BlackRock website at http://www.blackrock.com/edelivery |
| 2) | Select “eDelivery” under the “More Information” section |
Householding
The Fund will mail only one copy of shareholder documents, including prospectuses, annual and semi-annual reports and proxy statements, to shareholders with multiple accounts at the same address. This practice is commonly called “householding” and is intended to reduce expenses and eliminate duplicate mailings of shareholder documents. Mailings of your shareholder documents may be householded indefinitely unless you instruct us otherwise. If you do not want the mailing
of these documents to be combined with those for other members of your household, please call the Fund at (800) 441-7762.
Availability of Quarterly Schedule of Investments
The Fund files its complete schedule of portfolio holdings with the SEC for the first and third quarters of each fiscal year on Form N-Q. The Fund’s Forms N-Q are available on the SEC’s website at
http://www.sec.gov and may also be reviewed and copied at the SEC’s Public Reference Room in Washington, DC. Information on how to access documents on the SEC’s website without charge may be obtained by calling (800) SEC-0330. The Fund’s Forms N-Q may also be obtained upon request and without charge by calling (800) 441-7762.
Availability of Proxy Voting Policies and Procedures
A description of the policies and procedures that the Fund uses to determine how to vote proxies relating to portfolio securities is available (1) without charge, upon request by calling (800) 441-7762; (2) at http://www.blackrock.com; and (3) on the SEC’s website at http://www.sec.gov.
Availability of Proxy Voting Record
Information about how the Fund voted proxies relating to securities held in the Fund’s portfolio during the most recent 12-month period ended June 30 is available upon request and without charge (1) at http://www.blackrock.com or by calling (800) 441-7762 and (2) on the SEC’s website at http://www.sec.gov.
Account Information
Call us at (800) 441-7762 from 8:00 AM to 6:00 PM EST on any business day to get information about your account balances, recent transactions and share prices. You can also reach us on the Web at http://www.blackrock.com/funds.
Automatic Investment Plans
Investor Class shareholders who want to invest regularly can arrange to have $50 or more automatically deducted from their checking or savings account and invested in any of the BlackRock funds.
Systematic Withdrawal Plans
Investor Class shareholders can establish a systematic withdrawal plan and receive periodic payments of $50 or more from their BlackRock funds, as long as their account balance is at least $10,000.
Retirement Plans
Shareholders may make investments in conjunction with Traditional, Rollover, Roth, Coverdell, Simple IRAs, SEP IRAs and 403(b) Plans.
| | | | | | |
| | | | | | | |
| | BLACKROCK LONG-HORIZON EQUITY FUND | | OCTOBER 31, 2012 | | 37 |
| | |
| Additional Information (concluded) | | |
| | |
| BlackRock Privacy Principles | | |
BlackRock is committed to maintaining the privacy of its current and former fund investors and individual clients (collectively, “Clients”) and to safeguarding their non-public personal information. The following information is provided to help you understand what personal information BlackRock collects, how we protect that information and why in certain cases we share such information with select parties.
If you are located in a jurisdiction where specific laws, rules or regulations require BlackRock to provide you with additional or different privacy-related rights beyond what is set forth below, then BlackRock will comply with those specific laws, rules or regulations.
BlackRock obtains or verifies personal non-public information from and about you from different sources, including the following: (i) information we receive from you or, if applicable, your financial intermediary, on applications, forms or other documents; (ii) information about your transactions with us, our affiliates, or others; (iii) information we receive from a consumer reporting agency; and (iv) from visits to our websites.
BlackRock does not sell or disclose to non-affiliated third parties any non-public personal information about its Clients, except as permitted by law or as is necessary to respond to regulatory requests or to service Client accounts. These non-affiliated third parties are required to protect the confidentiality and security of this information and to use it only for its intended purpose.
We may share information with our affiliates to service your account or to provide you with information about other BlackRock products or services that may be of interest to you. In addition, BlackRock restricts access to non-public personal information about its Clients to those BlackRock employees with a legitimate business need for the information. BlackRock maintains physical, electronic and procedural safeguards that are designed to protect the non-public personal information of its Clients, including procedures relating to the proper storage and disposal of such information.
| | | | | | |
| | | | | | | |
| 38 | | BLACKROCK LONG-HORIZON EQUITY FUND | | OCTOBER 31, 2012 | | |
| | |
| A World-Class Mutual Fund Family | | |
BlackRock offers a diverse lineup of open-end mutual funds crossing all investment styles and managed by experts in equity, fixed income and tax-exempt investing.
BlackRock ACWI ex-US Index Fund
BlackRock All-Cap Energy & Resources Portfolio
BlackRock Balanced Capital Fund†
BlackRock Basic Value Fund
BlackRock Capital Appreciation Fund
BlackRock China Fund
BlackRock Commodity Strategies Fund
BlackRock Emerging Markets Fund
BlackRock Emerging Markets Long/Short Equity Fund
BlackRock Energy & Resources Portfolio
BlackRock Equity Dividend Fund
BlackRock EuroFund
BlackRock Flexible Equity Fund
BlackRock Focus Growth Fund
BlackRock Global Allocation Fund†
BlackRock Global Dividend Income Portfolio
BlackRock Global Opportunities Portfolio
BlackRock Global SmallCap Fund
BlackRock Health Sciences Opportunities Portfolio
BlackRock Index Equity Portfolio
BlackRock India Fund
BlackRock International Fund
BlackRock International Index Fund
BlackRock International Opportunities Portfolio
BlackRock Large Cap Core Fund
BlackRock Large Cap Core Plus Fund
BlackRock Large Cap Growth Fund
BlackRock Large Cap Value Fund
BlackRock Latin America Fund
BlackRock Long-Horizon Equity Fund
BlackRock Managed Volatility Portfolio†
BlackRock Mid-Cap Growth Equity Portfolio
BlackRock Mid Cap Value Opportunities Fund
BlackRock Natural Resources Trust
BlackRock Pacific Fund
BlackRock Real Estate Securities Fund
BlackRock Russell 1000 Index Fund
BlackRock Science & Technology Opportunities Portfolio
BlackRock Small Cap Growth Equity Portfolio
BlackRock Small Cap Growth Fund II
BlackRock Small Cap Index Fund
BlackRock S&P 500 Index Fund
BlackRock S&P 500 Stock Fund
BlackRock U.S. Opportunities Portfolio
BlackRock Value Opportunities Fund
BlackRock World Gold Fund
| | |
| Taxable Fixed Income Funds | | |
BlackRock Bond Index Fund
BlackRock Core Bond Portfolio
BlackRock CoreAlpha Bond Fund
BlackRock Emerging Market Local Debt Portfolio
BlackRock Floating Rate Income Portfolio
BlackRock Global Long/Short Credit Fund
BlackRock GNMA Portfolio
BlackRock High Yield Bond Portfolio
BlackRock Inflation Protected Bond Portfolio
BlackRock International Bond Portfolio
BlackRock Long Duration Bond Portfolio
BlackRock Low Duration Bond Portfolio
BlackRock Multi-Asset Income Portfolio†
BlackRock Secured Credit Portfolio
BlackRock Strategic Income Opportunities Portfolio
BlackRock Total Return Fund
BlackRock US Government Bond Portfolio
BlackRock US Mortgage Portfolio
BlackRock World Income Fund
| | |
| Municipal Fixed Income Funds | | |
BlackRock California Municipal Bond Fund
BlackRock High Yield Municipal Fund
BlackRock Intermediate Municipal Fund
BlackRock National Municipal Fund
BlackRock New Jersey Municipal Bond Fund
BlackRock New York Municipal Bond Fund
BlackRock Pennsylvania Municipal Bond Fund
BlackRock Short-Term Municipal Fund
| | |
| Target Risk & Target Date Funds† | | |
| | | | | | | | | | | | | | | | | | | | |
| BlackRock Prepared Portfolios | | LifePath Active Portfolios | | LifePath Portfolios | | LifePath Index Portfolios |
Conservative Prepared Portfolio | | | | 2015 | | 2035 | | | | | | Retirement | | 2040 | | | | Retirement | | 2040 |
Moderate Prepared Portfolio | | | | 2020 | | 2040 | | | | | | 2020 | | 2045 | | | | 2020 | | 2045 |
Growth Prepared Portfolio | | | | 2025 | | 2045 | | | | | | 2025 | | 2050 | | | | 2025 | | 2050 |
Aggressive Growth Prepared Portfolio | | | | 2030 | | 2050 | | | | | | 2030 | | 2055 | | | | 2030 | | 2055 |
| | | | | | | | | | | | 2035 | | | | | | 2035 | | |
BlackRock mutual funds are currently distributed by BlackRock Investments, LLC. You should consider the investment objectives, risks, charges and expenses of the funds under consideration carefully before investing. Each fund’s prospectus contains this and other information and is available at www.blackrock.com or by calling (800) 441-7762 or from your financial advisor. The prospectus should be read carefully before investing.
| | | | | | |
| | | | | | | |
| | BLACKROCK LONG-HORIZON EQUITY FUND | | OCTOBER 31, 2012 | | 39 |
This report is not authorized for use as an offer of sale or a solicitation of an offer to buy shares of the Fund unless accompanied or preceded by the Fund’s current prospectus. Past performance results shown in this report should not be considered a representation of future performance. Investment returns and principal value of shares will fluctuate so that shares, when redeemed, may be worth more or less than their original cost. Statements and other information herein are as dated and are subject to change. Please see the Fund’s prospectus for a description of risks associated with global investments.

| | |
| #LHE-10/12-AR | |  |
| Item 2 – | Code of Ethics – The registrant (or the “Fund”) has adopted a code of ethics, as of the end of the period covered by this report, applicable to the registrant’s principal executive officer, principal financial officer, principal accounting officer or controller, or persons performing similar functions. During the period covered by this report, there have been no amendments to or waivers granted under the code of ethics. A copy of the code of ethics is available without charge at www.blackrock.com. |
| Item 3 – | Audit Committee Financial Expert – The registrant’s board of trustees (the “board of trustees”), has determined that (i) the registrant has the following audit committee financial experts serving on its audit committee and (ii) each audit committee financial expert is independent: |
Robert M. Hernandez
Fred G. Weiss
Stuart E. Eizenstat
Under applicable securities laws, a person determined to be an audit committee financial expert will not be deemed an “expert” for any purpose, including without limitation for the purposes of Section 11 of the Securities Act of 1933, as a result of being designated or identified as an audit committee financial expert. The designation or identification of a person as an audit committee financial expert does not impose on such person any duties, obligations, or liabilities greater than the duties, obligations, and liabilities imposed on such person as a member of the audit committee and board of trustees in the absence of such designation or identification.
| Item 4 – | Principal Accountant Fees and Services |
The following table presents fees billed by Deloitte & Touche LLP (“D&T”) in each of the last two fiscal years for the services rendered to the Fund:
| | | | | | | | | | | | | | | | | | | | | | | | | | | | | | |
| | | (a) Audit Fees | | (b) Audit-Related Fees1 | | | | (c) Tax Fees2 | | | | (d) All Other Fees3 |
| Entity Name | | Current
Fiscal Year
End | | | | Previous
Fiscal Year
End | | | | Current
Fiscal Year
End | | | | Previous
Fiscal Year
End | | | | Current
Fiscal Year
End | | | | Previous
Fiscal Year
End | | | | Current
Fiscal Year
End | | | | Previous
Fiscal Year
End |
| BlackRock Long-Horizon Equity Fund | | $32,100 | | | | $32,100 | | | | $0 | | | | $0 | | | | $28,850 | | | | $28,850 | | | | $0 | | | | $0 |
The following table presents fees billed by D&T that were required to be approved by the registrant’s audit committee (the “Committee”) for services that relate directly to the operations or financial reporting of the Fund and that are rendered on behalf of BlackRock Advisors, LLC (“Investment Adviser” or “BlackRock”) and entities controlling, controlled by, or under common control with BlackRock (not including any sub-adviser whose role is primarily portfolio management and is subcontracted with or overseen by another investment adviser) that provide ongoing services to the Fund (“Fund Service Providers”):
| | | | |
| | | Current Fiscal Year End | | Previous Fiscal Year End |
(b) Audit-Related Fees1 | | $0 | | $0 |
(c) Tax Fees2 | | $0 | | $0 |
(d) All Other Fees3 | | $2,970,000 | | $3,030,000 |
1 The nature of the services includes assurance and related services reasonably related to the performance of the audit of financial statements not included in Audit Fees.
2 The nature of the services includes tax compliance, tax advice and tax planning.
3
3 Aggregate fees borne by BlackRock in connection with the review of compliance procedures and attestation thereto performed by D&T with respect to all of the registered closed-end funds and some of the registered open-end funds advised by BlackRock.
(e)(1) Audit Committee Pre-Approval Policies and Procedures:
The Committee has adopted policies and procedures with regard to the pre-approval of services. Audit, audit-related and tax compliance services provided to the registrant on an annual basis require specific pre-approval by the Committee. The Committee also must approve other non-audit services provided to the registrant and those non-audit services provided to the Investment Adviser and Fund Service Providers that relate directly to the operations and the financial reporting of the registrant. Certain of these non-audit services that the Committee believes are (a) consistent with the SEC’s auditor independence rules and (b) routine and recurring services that will not impair the independence of the independent accountants may be approved by the Committee without consideration on a specific case-by-case basis (“general pre-approval”). The term of any general pre-approval is 12 months from the date of the pre-approval, unless the Committee provides for a different period. Tax or other non-audit services provided to the registrant which have a direct impact on the operations or financial reporting of the registrant will only be deemed pre-approved provided that any individual project does not exceed $10,000 attributable to the registrant or $50,000 per project. For this purpose, multiple projects will be aggregated to determine if they exceed the previously mentioned cost levels.
Any proposed services exceeding the pre-approved cost levels will require specific pre-approval by the Committee, as will any other services not subject to general pre-approval (e.g., unanticipated but permissible services). The Committee is informed of each service approved subject to general pre-approval at the next regularly scheduled in-person board meeting. At this meeting, an analysis of such services is presented to the Committee for ratification. The Committee may delegate to the Committee Chairman the authority to approve the provision of and fees for any specific engagement of permitted non-audit services, including services exceeding pre-approved cost levels.
(e)(2) None of the services described in each of Items 4(b) through (d) were approved by the Committee pursuant to the de minimus exception in paragraph (c)(7)(i)(C) of Rule 2-01 of Regulation S-X.
(f) Not Applicable
(g) The aggregate non-audit fees paid to the accountant for services rendered by the accountant to the registrant, the Investment Adviser and the Fund Service Providers were:
| | | | | | | | | | |
| Entity Name | | Current Fiscal Year
End | | | | Previous Fiscal Year
End | | | | |
| BlackRock Long-Horizon Equity Fund | | $28,850 | | | | $28,850 | | | | |
Additionally, SSAE 16 Review (Formerly, SAS No. 70) fees for the current and previous fiscal years of $2,970,000 and $3,030,000, respectively, were billed by D&T to the Investment Adviser.
(h) The Committee has considered and determined that the provision of non-audit services that were rendered to the Investment Adviser, and the Fund Service Providers that were not pre-approved pursuant to paragraph (c)(7)(ii) of Rule 2-01 of Regulation S-X is compatible with maintaining the principal accountant’s independence.
4
| Item 5 – | Audit Committee of Listed Registrants – Not Applicable |
(a) The registrant’s Schedule of Investments is included as part of the Report to Stockholders filed under Item 1 of this Form.
(b) Not Applicable due to no such divestments during the semi-annual period covered since the previous Form N-CSR filing.
| Item 7 – | Disclosure of Proxy Voting Policies and Procedures for Closed-End Management Investment Companies – Not Applicable |
| Item 8 – | Portfolio Managers of Closed-End Management Investment Companies – Not Applicable |
| Item 9 – | Purchases of Equity Securities by Closed-End Management Investment Company and Affiliated Purchasers – Not Applicable |
| Item 10 – | Submission of Matters to a Vote of Security Holders – There have been no material changes to these procedures. |
| Item 11 – | Controls and Procedures |
| | (a) | The registrant’s principal executive and principal financial officers, or persons performing similar functions, have concluded that the registrant’s disclosure controls and procedures (as defined in Rule 30a-3(c) under the Investment Company Act of 1940, as amended (the “1940 Act”)) are effective as of a date within 90 days of the filing of this report based on the evaluation of these controls and procedures required by Rule 30a-3(b) under the 1940 Act and Rule 15d-15(b) under the Securities Exchange Act of 1934, as amended. |
| | (b) | There were no changes in the registrant’s internal control over financial reporting (as defined in Rule 30a-3(d) under the 1940 Act) that occurred during the second fiscal quarter of the period covered by this report that have materially affected, or are reasonably likely to materially affect, the registrant’s internal control over financial reporting. |
Item 12 – Exhibits attached hereto
| | |
| (a)(1) | | Code of Ethics – See Item 2 |
| |
| (a)(2) | | Certifications – Attached hereto |
| |
| (a)(3) | | Not Applicable |
| |
| (b) | | Certifications – Attached hereto |
5
Pursuant to the requirements of the Securities Exchange Act of 1934 and the Investment Company Act of 1940, the registrant has duly caused this report to be signed on its behalf by the undersigned, thereunto duly authorized.
| | | | |
| BlackRock Long-Horizon Equity Fund | | |
| | |
| By: | | /s/ John M. Perlowski | | |
| | John M. Perlowski | | |
| | Chief Executive Officer (principal executive officer) of |
| | BlackRock Long-Horizon Equity Fund | | |
Date: January 3, 2013
Pursuant to the requirements of the Securities Exchange Act of 1934 and the Investment Company Act of 1940, this report has been signed below by the following persons on behalf of the registrant and in the capacities and on the dates indicated.
| | | | |
| By: | | /s/ John M. Perlowski | | |
| | John M. Perlowski | | |
| | Chief Executive Officer (principal executive officer) of |
| | BlackRock Long-Horizon Equity Fund | | |
Date: January 3, 2013
| | | | |
| By: | | /s/ Neal J. Andrews | | |
| | Neal J. Andrews | | |
| | Chief Financial Officer (principal financial officer) of |
| | BlackRock Long-Horizon Equity Fund | | |
Date: January 3, 2013
6