Exhibit 99.1

2023 First Quarter Financial Results May 1, 2023 NYSE: CF

Safe harbor statement All statements in this presentation by CF Industries Holdings, Inc. (together with its subsidiaries, the “Company”), other th an those relating to historical facts, are forward - looking statements. Forward - looking statements can generally be identified by their use of terms such as “anticipate,” “ believe,” “could,” “estimate,” “expect,” “intend,” “may,” “plan,” “predict,” “project,” “will” or “would” and similar terms and phrases, including reference s t o assumptions. Forward - looking statements are not guarantees of future performance and are subject to a number of assumptions, risks and uncertainties, many of which are beyond the Company’s control, which could cause actual results to differ materially from such statements. These statements may include, but are not limited to, statements about the financing, synergies and other benefits, and other aspects of the proposed transactions with Incitec Pivot Limited (“IPL”), strategic plans and management’s expectations with respect to the production of green and blue (low - carbon) ammonia, the development of carbon captu re and sequestration projects, the transition to and growth of a hydrogen economy, greenhouse gas reduction targets, projected capital expenditure s, statements about future financial and operating results, and other items described in this presentation. Important factors that could cause actual results to d iff er materially from those in the forward - looking statements include, among others, the risk that regulatory approvals required for the proposed transactions with IPL are not obtained or that required approvals delay the transactions or cause the parties to abandon the transactions; the risk that other conditions to the clos ing of the proposed transactions with IPL are not satisfied; risks and uncertainties arising from the length of time necessary to consummate the proposed transacti ons with IPL and the possibility that the proposed transactions with IPL may be delayed or may not occur; the risk of obstacles to realization of the benefits of t he proposed transactions with IPL; the risk that the synergies from the proposed transactions with IPL may not be fully realized or may take longer to realize than exp ected; the risk that the pendency or completion of the proposed transactions with IPL, including integration of the Waggaman ammonia production complex into the Company’s operations, disrupt current operations or harm relationships with customers, employees and suppliers; the risk that integration of the Waggaman ammonia production complex with the Company’s current operations will be more costly or difficult than expected or may otherwise be unsuccessful; diversion o f m anagement time and attention to issues relating to the proposed transactions with IPL; unanticipated costs or liabilities associated with the IPL transaction s; the cyclical nature of the Company’s business and the impact of global supply and demand on the Company’s selling prices; the global commodity nature of the Compa ny’ s nitrogen products, the conditions in the international market for nitrogen products, and the intense global competition from other producers; condit ion s in the United States, Europe and other agricultural areas, including the influence of governmental policies and technological developments on the demand our f ert ilizer products; the volatility of natural gas prices in North America and the United Kingdom; weather conditions and the impact of adverse weather events; the sea sonality of the fertilizer business; the impact of changing market conditions on the Company’s forward sales programs; difficulties in securing the supp ly and delivery of raw materials, increases in their costs or delays or interruptions in their delivery; reliance on third party providers of transportation se rvi ces and equipment; the Company’s reliance on a limited number of key facilities; risks associated with cybersecurity; acts of terrorism and regulations to com bat terrorism; risks associated with international operations; the significant risks and hazards involved in producing and handling the Company’s products against wh ich the Company may not be fully insured; the Company’s ability to manage its indebtedness and any additional indebtedness that may be incurred; the Company’s ab ility to maintain compliance with covenants under its revolving credit agreement and the agreements governing its indebtedness; downgrades of the Company’ s c redit ratings; risks associated with changes in tax laws and disagreements with taxing authorities; risks involving derivatives and the effectiveness of the Com pany’s risk management and hedging activities; potential liabilities and expenditures related to environmental, health and safety laws and regulations a nd permitting requirements; regulatory restrictions and requirements related to greenhouse gas emissions; the development and growth of the market for green and blu e ( low - carbon) ammonia and the risks and uncertainties relating to the development and implementation of the Company’s green and blue ammonia projects; risk s a ssociated with expansions of the Company’s business, including unanticipated adverse consequences and the significant resources that could be required; an d r isks associated with the operation or management of the strategic venture with CHS (the “CHS Strategic Venture”), risks and uncertainties relating to the market prices of the fertilizer products that are the subject of the supply agreement with CHS over the life of the supply agreement, and the risk that any c hal lenges related to the CHS Strategic Venture will harm the Company’s other business relationships. More detailed information about factors that may affect the Com pan y’s performance and could cause actual results to differ materially from those in any forward - looking statements may be found in CF Industries Holdings, I nc.’s filings with the Securities and Exchange Commission, including CF Industries Holdings, Inc.’s most recent annual and quarterly reports on Form 10 - K and Form 10 - Q, which are available in the Investor Relations section of the Company’s web site. It is not possible to predict or identify all risks and uncertainties t hat might affect the accuracy of our forward - looking statements and, consequently, our descriptions of such risks and uncertainties should not be considered exhaustive. T her e is no guarantee that any of the events, plans or goals anticipated by these forward - looking statements will occur, and if any of the events do occur, there is n o guarantee what effect they will have on our business, results of operations, cash flows, financial condition and future prospects. Forward - looking statements ar e given only as of the date of this presentation and the Company disclaims any obligation to update or revise the forward - looking statements, whether as a result of new information, future events or otherwise, except as required by law.

Note regarding non - GAAP financial measures The Company reports its financial results in accordance with U.S. generally accepted accounting principles (GAAP). Managemen t believes that EBITDA, adjusted EBITDA, free cash flow, free cash flow to adjusted EBITDA conversion and free cash flow yield, which are non - GAAP financial measures, provide additional meaningful information regarding the Company's performance and financial strength. Non - GAAP financial measures should be viewed in addition to, and not as an alternative for, the Company's reported results prepared in accordance with GAAP. In addition, because not all companies use identical calculations, EBITDA , adjusted EBITDA, free cash flow, free cash flow to adjusted EBITDA conversion and free cash flow yield included in this prese nta tion may not be comparable to similarly titled measures of other companies. Reconciliations of EBITDA, adjusted EBITDA, free cash flow, and free cash flow yield to the most directly comparable GAAP measures are provided in the tables accompanying this presentation. EBITDA is defined as net earnings attributable to common stockholders plus interest expense - net, income taxes, and depreciatio n and amortization. Other adjustments include the elimination of loan fee amortization that is included in both interest and amortization, and the portion of depreciation that is included in noncontrolling interest. The Company has presented EBITDA because management uses the measure to track performance and believes that it is frequently used by securities analysts, inve sto rs and other interested parties in the evaluation of companies in the industry. Adjusted EBITDA is defined as EBITDA adjusted with the selected items as summarized in the tables accompanying this presentation. The Company has presented adjusted EBITDA because management uses adjusted EBITDA, and believes it is useful to investors, as a supplemental financial measure in the comparison of year - over - year performance. Free cash flow is defined as net cash provided by operating activities, as stated in the consolidated statements of cash flow s, reduced by capital expenditures and distributions to noncontrolling interests. Free cash flow to adjusted EBITDA conversion i s defined as free cash flow divided by adjusted EBITDA. Free cash flow yield is defined as free cash flow divided by market val ue of equity (market cap). For full year 2022 and Q1 2023 LTM, the Company has also presented cash provided by operating activities , free cash flow, free cash flow to adjusted EBITDA conversion and free cash flow yield, in each case excluding certain tax and interest payments made to Canadian tax authorities in relation to an arbitration decision covering tax years 2006 through 201 1 a nd to our transfer pricing positions between Canada and the United States for open years 2012 and after. The Company has presented these financial measures, as well as the financial measures free cash flow, free cash flow to adjusted EBITDA conversion and fre e cash flow yield, because management uses these measures and believes they are useful to investors, as an indication of the strength of the Company and its ability to generate cash and to evaluate the Company’s cash generation ability relative to it s i ndustry competitors. It should not be inferred that the entire free cash flow amount is available for discretionary expenditures.
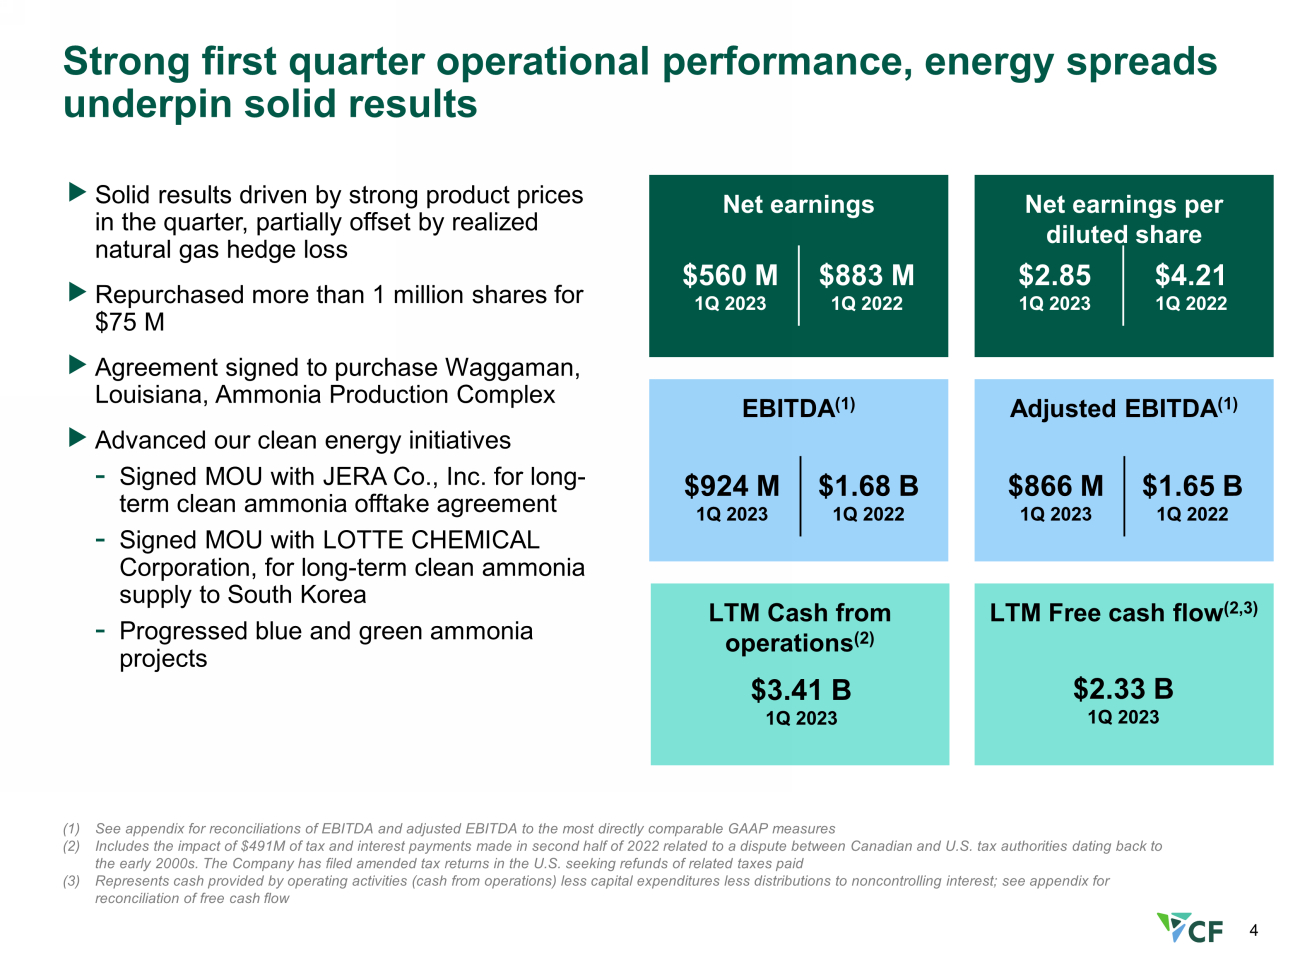
4 Strong first quarter operational performance, energy spreads underpin solid results (1) See appendix for reconciliations of EBITDA and adjusted EBITDA to the most directly comparable GAAP measures (2) Includes the impact of $491M of tax and interest payments made in second half of 2022 related to a dispute between Canadian a nd U.S. tax authorities dating back to the early 2000s. The Company has filed amended tax returns in the U.S. seeking refunds of related taxes paid (3) Represents cash provided by operating activities (cash from operations) less capital expenditures less distributions to nonco ntr olling interest; see appendix for reconciliation of free cash flow EBITDA (1) Net earnings Net earnings per diluted share Adjusted EBITDA (1) $866 M 1Q 2023 $1.65 B 1Q 2022 $2.85 1Q 2023 $4.21 1Q 2022 LTM Cash from operations (2) LTM Free cash flow (2,3) Solid results driven by strong product prices in the quarter, partially offset by realized natural gas hedge loss Repurchased more than 1 million shares for $75 M Agreement signed to purchase Waggaman, Louisiana, Ammonia Production Complex Advanced our clean energy initiatives - Signed MOU with JERA Co., Inc. for long - term clean ammonia offtake agreement - Signed MOU with LOTTE CHEMICAL Corporation, for long - term clean ammonia supply to South Korea - Progressed blue and green ammonia projects $3.41 B 1Q 2023 $924 M 1Q 2023 $1.68 B 1Q 2022 $560 M 1Q 2023 $883 M 1Q 2022 $2.33 B 1Q 2023
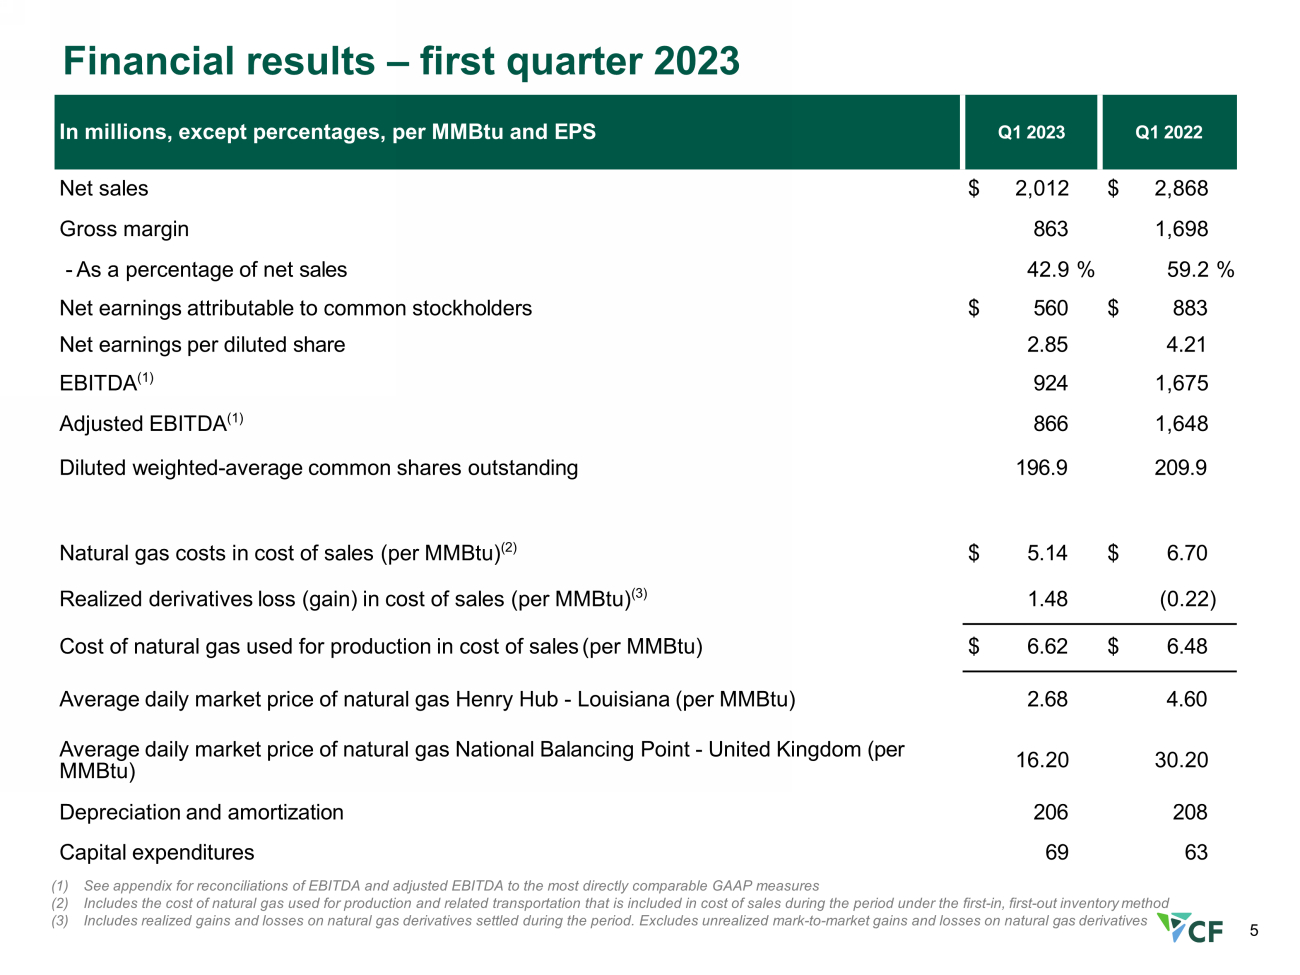
5 Financial results – first quarter 2023 In millions, except percentages, per MMBtu and EPS Q1 2023 Q1 2022 Net sales $ 2,012 $ 2,868 Gross margin 863 1,698 - As a percentage of net sales 42.9 % 59.2 % Net earnings attributable to common stockholders $ 560 $ 883 Net earnings per diluted share 2.85 4.21 EBITDA (1) 924 1,675 Adjusted EBITDA (1) 866 1,648 Diluted weighted - average common shares outstanding 196.9 209.9 Natural gas costs in cost of sales (per MMBtu) (2) $ 5.14 $ 6.70 Realized derivatives loss (gain) in cost of sales (per MMBtu) (3) 1.48 (0.22) Cost of natural gas used for production in cost of sales (per MMBtu) $ 6.62 $ 6.48 Average daily market price of natural gas Henry Hub - Louisiana (per MMBtu) 2.68 4.60 Average daily market price of natural gas National Balancing Point - United Kingdom (per MMBtu) 16.20 30.20 Depreciation and amortization 206 208 Capital expenditures 69 63 (1) See appendix for reconciliations of EBITDA and adjusted EBITDA to the most directly comparable GAAP measures (2) Includes the cost of natural gas used for production and related transportation that is included in cost of sales during the period under the first - in, first - out inventory method (3) Includes realized gains and losses on natural gas derivatives settled during the period. Excludes unrealized mark - to - market gains and losses on natural gas derivatives

6 2.6 6.0 (1) 6.0 6.1 6.6 (2) 6.6 7.0 (3) 8.1 (4) 8.1 8.2 (5) 8.2 8.2 8.2 7.9 (6) 7.9 8.6 (8) All N production numbers based on year end figures per 10 - K filings. (1) Beginning in 2010 includes capacity from Terra Industries acquisition (2) Beginning in 2013 includes incremental 34% of Medicine Hat production to reflect CF acquisition of Viterra's interests (3) Beginning in 2015 includes incremental 50% interest in CF Fertilisers UK acquired from Yara (4) Beginning in 2016 excludes nitrogen equivalent of 1.1 million tons of urea and 0.58 million tons of UAN under CHS supply agreement and includes expansion project capacity at Donaldsonville and Port Neal (5) Beginning in 2018 includes incremental 15% of Verdigris production to reflect CF’s acquisition of publicly traded TNH units (6) Decrease in production capacity due to Ince plant closure (7) Share count based on end of period common shares outstanding; share count prior to 2015 based on 5 - for - 1 split - adjusted shares (8) Includes, in addition to actual Q1 2023 production volume, the 880,000 tons of ammonia per year nameplate production capacity of the Waggaman ammonia production complex that CF has agreed to acquire, subject to regulatory approval and other closing conditions; based on March 31, 2023 outstanding share count Production Capacity (M nutrient tons) Annual Nitrogen Equivalent Tons per 1,000 Shares Outstanding CF Industries’ Nitrogen Volumes and Shares Outstanding as of March 31, 2023 Million Shares Outstanding (7) 2009 – Q1 2023 Nitrogen per share CAGR: 10.6% 11 17 18 19 24 27 30 35 35 37 38 39 40 41 41 44 0 50 100 150 200 250 300 350 400 0 5 10 15 20 25 30 35 40 45 50 (8) Capacity growth coupled with share repurchases continue to drive nitrogen participation per share…
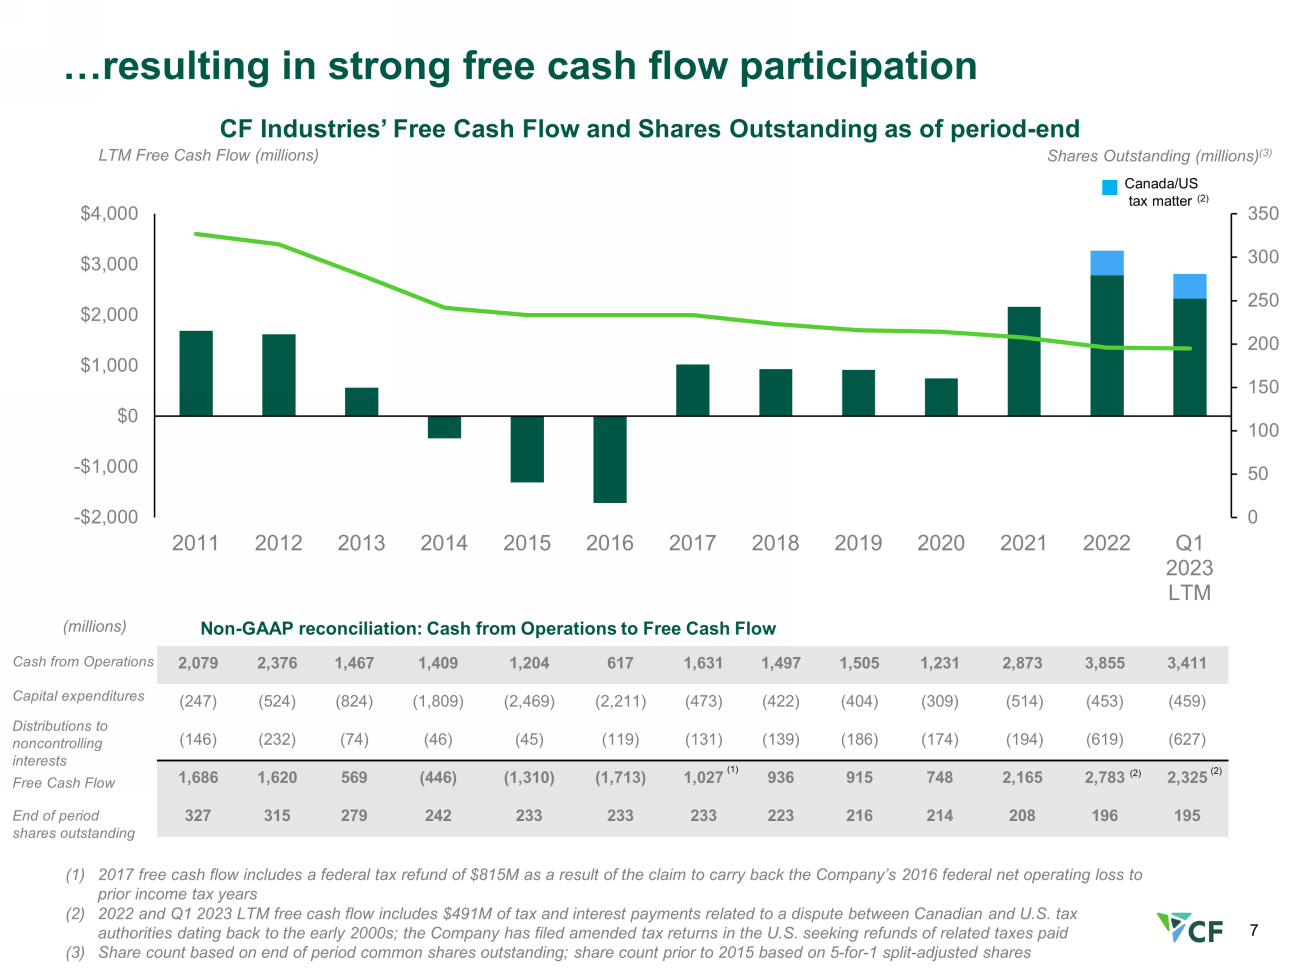
7 LTM Free Cash Flow (millions) CF Industries’ Free Cash Flow and Shares Outstanding as of period - end Shares Outstanding (millions) (3) 0 50 100 150 200 250 300 350 -$2,000 -$1,000 $0 $1,000 $2,000 $3,000 $4,000 2011 2012 2013 2014 2015 2016 2017 2018 2019 2020 2021 2022 Q1 2023 LTM …resulting in strong free cash flow participation 2,079 2,376 1,467 1,409 1,204 617 1,631 1,497 1,505 1,231 2,873 3,855 3,411 (247) (524) (824) (1,809) (2,469) (2,211) (473) (422) (404) (309) (514) (453) (459) (146) (232) (74) (46) (45) (119) (131) (139) (186) (174) (194) (619) (627) 1,686 1,620 569 (446) (1,310) (1,713) 1,027 936 915 748 2,165 2,783 2,325 327 315 279 242 233 233 233 223 216 214 208 196 195 End of period shares outstanding Cash from Operations Capital expenditures Distributions to noncontrolling interests Free Cash Flow (millions) Non - GAAP reconciliation: Cash from Operations to Free Cash Flow (2) (1) 2017 free cash flow includes a federal tax refund of $815M as a result of the claim to carry back the Company’s 2016 federal net operating loss to prior income tax years (2) 2022 and Q1 2023 LTM free cash flow includes $491M of tax and interest payments related to a dispute between Canadian and U.S . t ax authorities dating back to the early 2000s; the Company has filed amended tax returns in the U.S. seeking refunds of related taxes paid (3) Share count based on end of period common shares outstanding; share count prior to 2015 based on 5 - for - 1 split - adjusted shares (1) Canada/US tax matter (2) (2)

8 Strong free cash flow metrics show undervalued equity Attractive free cash flow yield and free cash flow to adjusted EBITDA conversion rate suggest undervalued equity, supporting robust share repurchase program 9.7% 8.9% 9.0% 14.7% 16.7% 16.5% 2018 2019 2020 2021 2022 Q1 2023 LTM 2018 - Q1 2023 LTM average yield Canada/US tax matter (3) Free Cash Flow Yield (1) FCF/Adj EBITDA conversion (2) % 67% 57% 55% 79% 47% 46% 56% 55% (3) (3) 19.6% (3) (1) Represents annual and Q1 2023 LTM free cash flow divided by market value of equity (market cap) as of December 31 st of each year for 2018 – 2022 and as of March 31 st , 2023 for Q1 2023 LTM; see appendix for reconciliation of free cash flow to the most directly comparable GAAP measure and calculati on of market cap (2) Represents annual and Q1 2023 LTM free cash flow divided by annual and Q1 2023 LTM adjusted EBITDA; see appendix for reconcil iat ions of free cash flow and adjusted EBITDA to the most directly comparable GAAP measures (3) Excluding the impact of $491M of tax and interest payments related to a dispute between Canadian and U.S. tax authorities dat ing back to the early 2000s; the Company has filed amended tax returns in the U.S. seeking refunds of related taxes paid 19.9% (3)
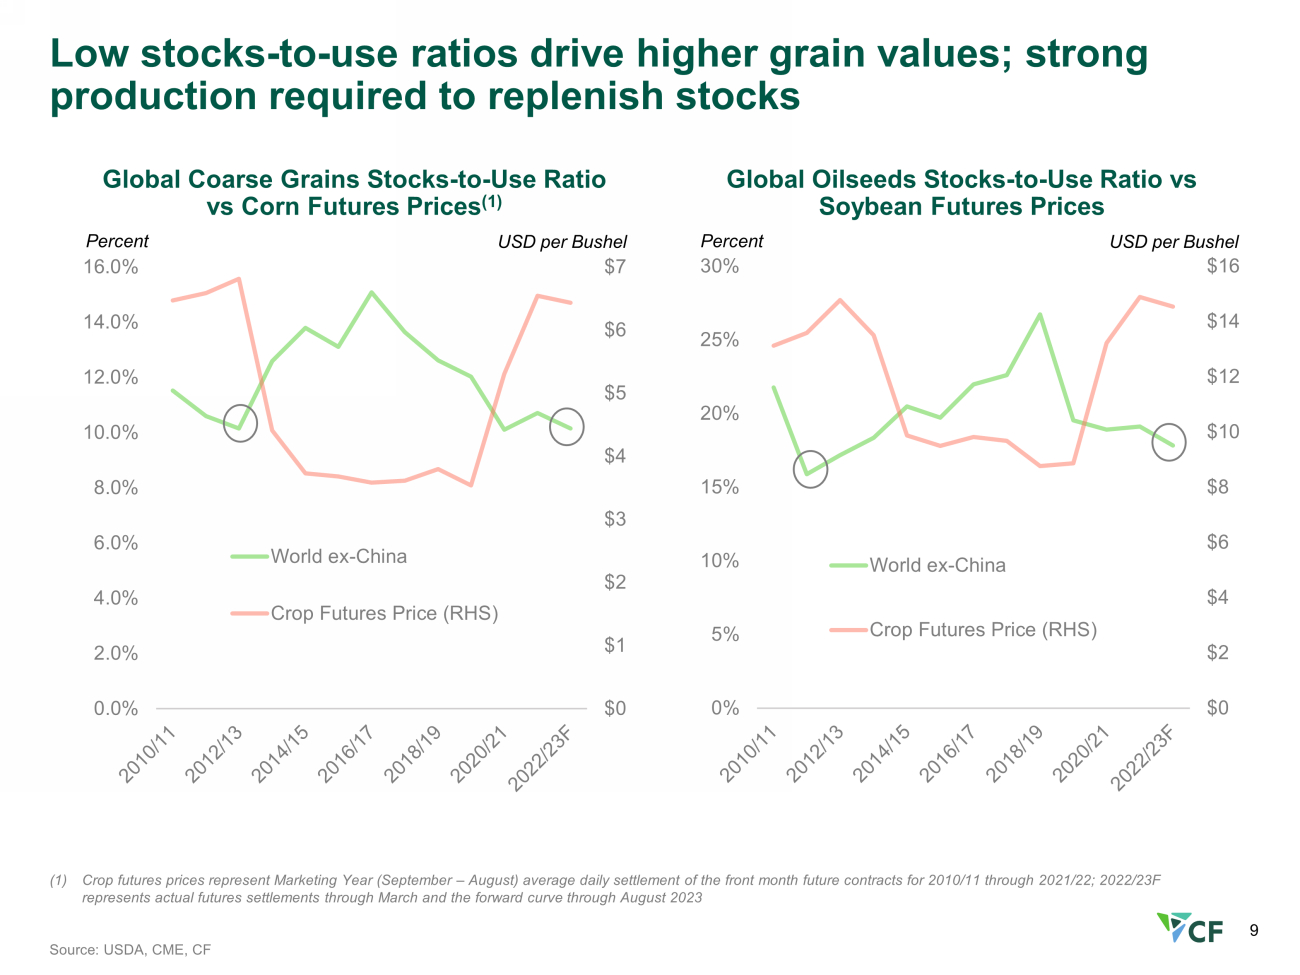
9 Low stocks - to - use ratios drive higher grain values; strong production required to replenish stocks (1) Crop futures prices represent Marketing Year (September – August) average daily settlement of the front month future contracts f or 2010/11 through 2021/22; 2022/23F represents actual futures settlements through March and the forward curve through August 2023 Source: USDA, CME, CF Global Coarse Grains Stocks - to - Use Ratio vs Corn Futures Prices (1) Percent $0 $1 $2 $3 $4 $5 $6 $7 0.0% 2.0% 4.0% 6.0% 8.0% 10.0% 12.0% 14.0% 16.0% World ex-China Crop Futures Price (RHS) USD per Bushel Global Oilseeds Stocks - to - Use Ratio vs Soybean Futures Prices Percent $0 $2 $4 $6 $8 $10 $12 $14 $16 0% 5% 10% 15% 20% 25% 30% World ex-China Crop Futures Price (RHS) USD per Bushel

10 Corn, soybean & wheat returns remain above seven - year average (1) At current cash economics and including new crop futures adjusted for basis, returns would be ~$50/acre higher for corn and ~ $25 /acre higher for soybeans than the full - year average Forecast return over variable cost includes: Annual crop price forecast utilizes marketing month - weighted crop futures adjusted for seven - year average basis Forecast fertilizer expenditure is forecast utilizing year - to - date retail fertilizer prices and forecast retail prices through J une Source: USDA Commodity Costs and Returns (October 3, 2022), CME Group, CF Analysis Estimated Returns over Variable and Land Cost, by Crop $ per acre ► Crop returns improved recently as futures remained high and input prices declined in Q1, supporting planted acreage and fertilizer applications ► Strong new crop futures have resulted in robust forecast 2023 returns over variable and land costs for major grain crops and soybeans for the third straight year ► Crop prices reflect tight global supplies, and while crop prices are forecast lower than in 2022, the profitability outlook remains historically strong ► Strong profitability for all crops is expected to result in high 2023 planted acreage and fertilization for optimal yields $0 $50 $100 $150 $200 $250 $300 $350 $400 $450 2017 2018 2019 2020 2021 2022F 2023F Corn Soybeans Wheat Range of returns (1)
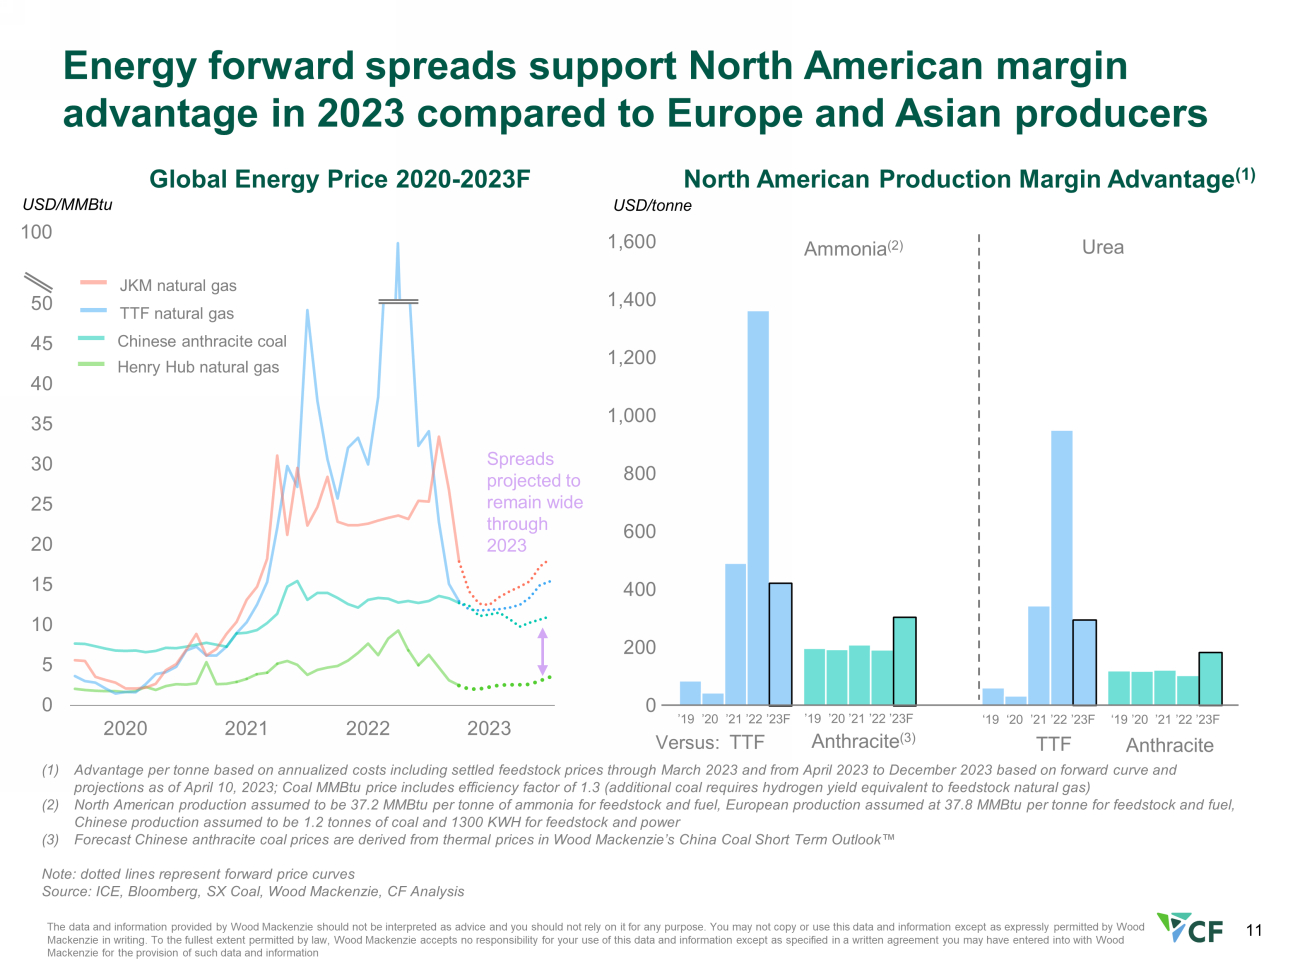
11 0 5 10 15 20 25 30 35 40 45 50 2020 2021 2022 2023 (1) Advantage per tonne based on annualized costs including settled feedstock prices through March 2023 and from April 2023 to December 2023 based on f orward curve and projections as of April 10, 2023; Coal MMBtu price includes efficiency factor of 1.3 (additional coal requires hydrogen yield eq uivalent to feedstock natural gas) (2) North American production assumed to be 37.2 MMBtu per tonne of ammonia for feedstock and fuel, European production assumed at 37.8 MMBtu per tonne for feedstock and fuel, Chinese production assumed to be 1.2 tonnes of coal and 1300 KWH for feedstock and power (3) Forecast Chinese anthracite coal prices are derived from thermal prices in Wood Mackenzie’s China Coal Short Term Outlook Œ Note: dotted lines represent forward price curves Source: ICE, Bloomberg, SX Coal, Wood Mackenzie, CF Analysis Energy forward spreads support North American margin advantage in 2023 compared to Europe and Asian producers Global Energy Price 2020 - 2023F USD/ tonne North American Production Margin Advantage (1) Henry Hub natural gas TTF natural gas Chinese anthracite coal JKM natural gas 0 200 400 600 800 1,000 1,200 1,400 1,600 Ammonia (2) Urea TTF Anthracite (3) ’19 ’20 ’21 ’22 ’23F TTF Anthracite USD/MMBtu Spreads projected to remain wide through 2023 The data and information provided by Wood Mackenzie should not be interpreted as advice and you should not rely on it for any pu rpose. You may not copy or use this data and information except as expressly permitted by Wood Mackenzie in writing. To the fullest extent permitted by law, Wood Mackenzie accepts no responsibility for your use of this d ata and information except as specified in a written agreement you may have entered into with Wood Mackenzie for the provision of such data and information Versus: ’19 ’20 ’21 ’22 ’23F ‘19 ‘20 ’21 ’22 ’23F ‘19 ’20 ’21 ’22 ’23F 100
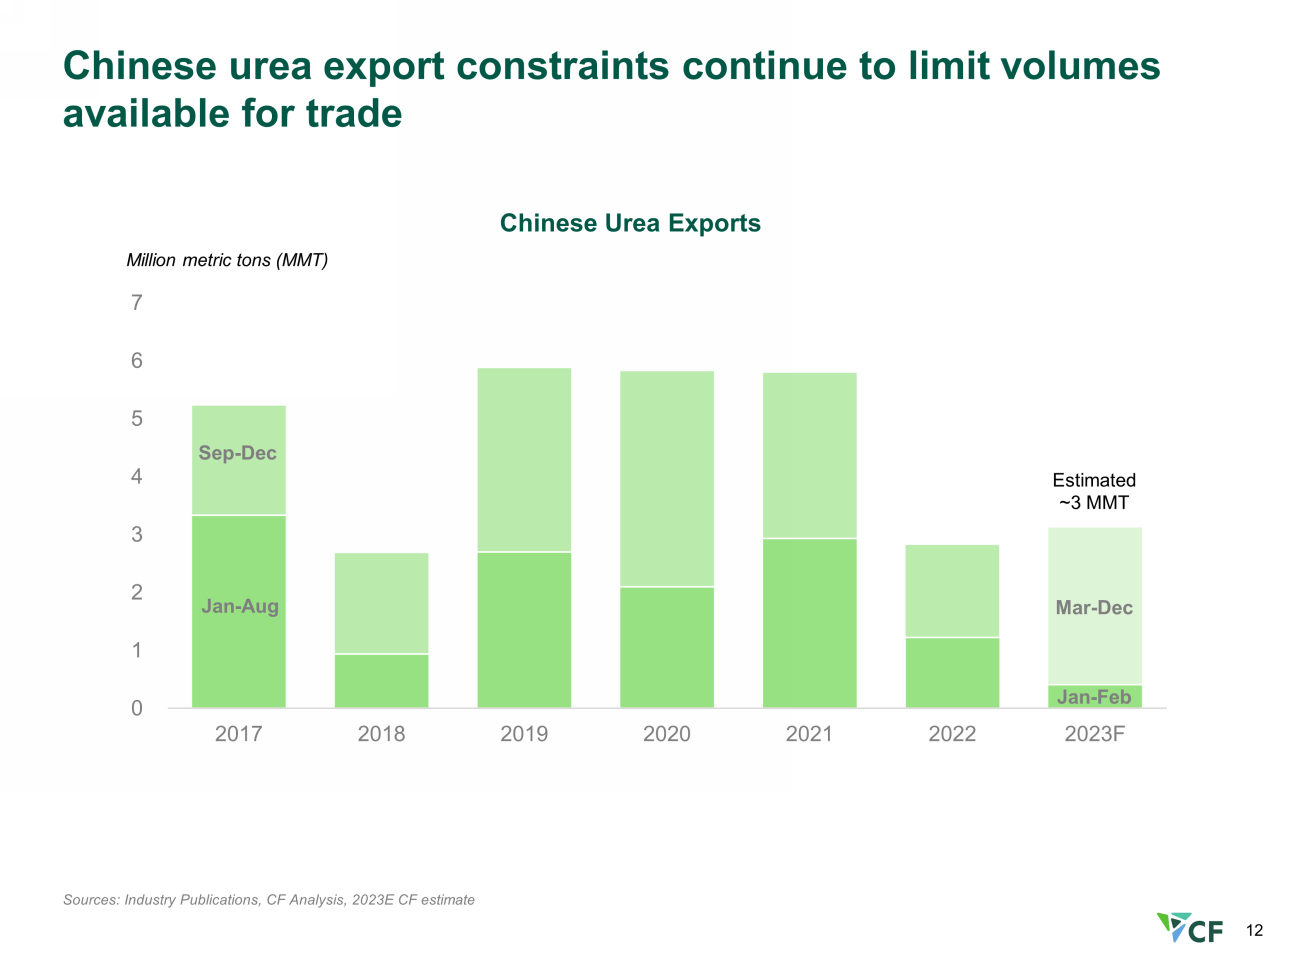
12 Chinese urea export constraints continue to limit volumes available for trade Sources: Industry Publications, CF Analysis, 2023E CF estimate 0 1 2 3 4 5 6 7 2017 2018 2019 2020 2021 2022 2023F Jan - Feb Chinese Urea Exports Jan - Aug Sep - Dec Million metric t ons (MMT) Estimated ~ 3 MMT Mar - Dec

13 Lower volumes in India in 2023, resilient import demand in Brazil and developing countries (1) Rest of Asia Includes Southeast Asia and East Asia, excludes India, Pakistan and Bangladesh (2) Rest of Latin America includes Caribbean, Central, and South America, excludes Brazil Source: CRU Urea Market Forecast as of March 17, 2023, India DOF, FAI, Trade Data Monitor, industry publications 0 2 4 6 8 10 12 2013 2015 2017 2019 2021 2023F 0 2 4 6 8 10 12 2013 2015 2017 2019 2021 2023F India Imports Million metric tons Brazil Imports Million metric tons 0 1 2 3 4 5 6 7 8 2013 2015 2017 2019 2021 2023F 0 1 2 3 4 5 6 7 8 2013 2015 2017 2019 2021 2023F Rest of Asia (1) Imports Million metric tons Rest of Latin America (2) Imports Million metric tons

14 Capital management strategy with a long - term view *Trailing twelve months of share repurchases and dividends through March 31, 2023 Emphasis on opportunistic share repurchases In Q4 2022, CF Industries’ Board of Directors authorized a new $3 billion share repurchase program through 2025 Target clean energy projects with returns above cost of capital High - quality, clean energy investments in motion with some of the world’s best companies TTM ~$1.6 B returned to shareholders* Agreement to purchase Waggaman ammonia production complex Blue & green ammonia projects Evaluating DEF production expansion Return capital to shareholders Inorganic growth opportunities Invest in high return projects within our network Disciplined growth initiatives & clean energy Focused on increasing free cash flow generation capacity and growing shareholder participation in our free cash flow
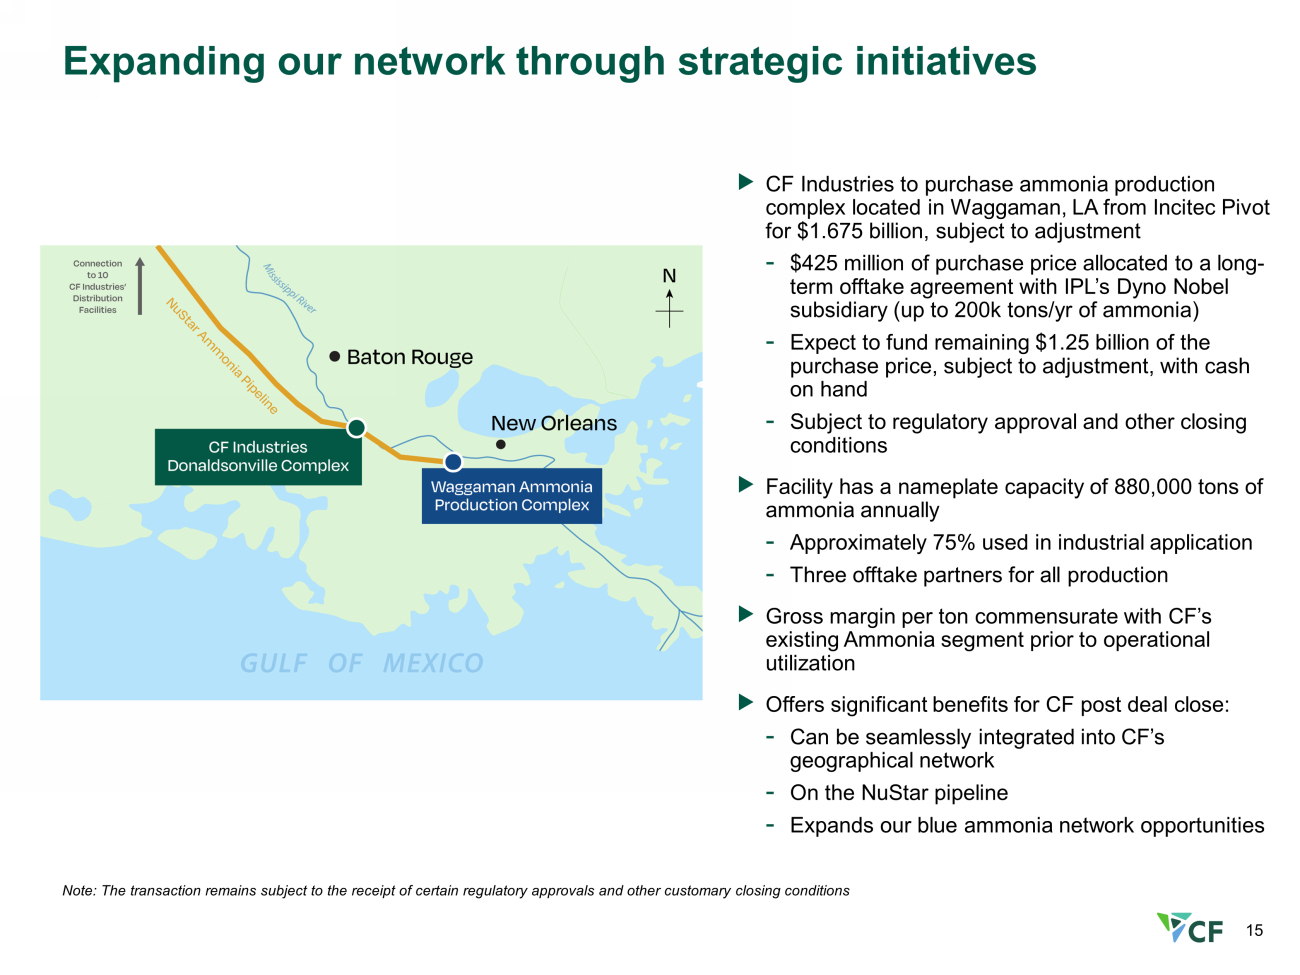
15 Expanding our network through strategic initiatives $16.38 FY 2022 $4.24 FY 2021 CF Industries to purchase ammonia production complex located in Waggaman, LA from Incitec Pivot for $1.675 billion, subject to adjustment - $425 million of purchase price allocated to a long - term offtake agreement with IPL’s Dyno Nobel subsidiary (up to 200k tons/ yr of ammonia) - Expect to fund remaining $1.25 billion of the purchase price, subject to adjustment, with cash on hand - Subject to regulatory approval and other closing conditions Facility has a nameplate capacity of 880,000 tons of ammonia annually - Approximately 75% used in industrial application - Three offtake partners for all production Gross margin per ton commensurate with CF’s existing Ammonia segment prior to operational utilization Offers significant benefits for CF post deal close: - Can be seamlessly integrated into CF’s geographical network - On the NuStar pipeline - Expands our blue ammonia network opportunities Note: The transaction remains subject to the receipt of certain regulatory approvals and other customary closing conditions

16 Pricing Supply/Demand Energy Differentials Nitrogen Market 2023 Outlook Weakened in 1Q 2023 as higher global operating rates increased supply availability and low global demand from delayed purchasing in agriculture sector, high inventory levels in Europe and lower industrial activity Recently global urea prices have risen as demand emerged for spring application season in North America Demand driven by need to replenish global grain stocks supporting high prices for corn, wheat, and canola North America – Farmer profitability continues to be strong. USDA projects 92 million acres of corn and ~50 million acres of wheat to be planted in U.S. Europe unfavorable producer economics continue to favor nitrogen imports Chinese urea exports are expected to remain lower Russian exports of other nitrogen products are at pre - war levels, with product forced to countries that have not applied sanctions on Russian fertilizer, including Brazil and the U.S. India continued to be one of world’s largest importers, with frequent urea tenders in the second half despite higher domestic production Brazil expected to have strong urea consumption and imports to continue to grow inline with increased crop planting Energy differentials between North America and marginal producers in Europe and Asia remain well above historical levels Forward energy curves continue to suggest that these wider differentials will persist for an extended period Estimated 20 - 30% of European ammonia capacity remains shut down or curtailed as production costs driven by energy costs remain higher than global ammonia spot prices Global nitrogen cost curve will remain supportive of significant margin opportunities for low - cost North American producers Longer - term, management expects the global nitrogen supply - demand balance to remain positive

17 Significant progress to support our commitment to a Clean Energy Economy Engineering activities progress Expected project completion FEED study commenced FID expected 2H 2023 Estimated completion ~4 years from FID Signed MOU Potential supply of up to ~500k metric tons/year of clean ammonia to JERA 2023 2024 2025 2027 Donaldsonville green ammonia Donaldsonville blue ammonia Blue ammonia JV w/Mitsui JERA clean ammonia supply Engineering activities progress 2025 project start - up Decarbonization Organic Growth Clean Energy Demand Purchased 2.2 billion cubic feet of natural gas certified by MiQ Initiated Signed MOU Potential supply of clean ammonia into South Korea LOTTE CHEMICAL clean ammonia supply

18 (1) Source of data: December 16, 2022 CRU Ammonia Database (2) Represents CF Industries historical North American production and CRU’s capacity estimates for CF Industries (3) Calculated by removing CF Industries’ annual reported production and capacity from the CRU data for all North American ammoni a p roduction peer group (4) ~0.9 million tons represents the difference between CF Industries’ actual trailing 5 - year average ammonia production of 9.2 mill ion tons at 96% of capacity utilization and the 8.3 million tons CF Industries would have produced if operated at the 86% CRU North American benchmark excluding CF Industries Note: CRU North American peer group includes AdvanSix , Austin Powder (US Nitrogen), Carbonair , CF Industries, Chevron, CVR Partners, Dakota Gasification Co, Dyno Nobel, Fortigen , Incitec Pivot, Koch Industries, LSB Industries, LSB Industries/Cherokee Nitrogen, Mississippi Power, Mosaic, Nutrien , OCI N.V., RenTech Nitrogen, Sherritt International Corp, Shoreline Chemical, Simplot, Yara International North American Ammonia Percent of Capacity Utilization (1) 5 - Year Rolling Avg. Percent of Capacity CF’s 10% greater capacity utilization yields an additional ~0.9 million tons of ammonia annually (4) Outstanding safety performance drives industry leading production capacity utilization 0.0 0.5 1.0 1.5 2.0 2.5 3.0 3.5 4.0 4.5 2011 2012 2014 2016 2018 2020 2022 Total injuries per 200,000 work hours Total Recordable Incident Rate BLS Fertilizer Manufacturing CF Industries CF Industries safety performance greatly exceeds industry average 97% 96% 96% 85% 84% 86% 80% 82% 84% 86% 88% 90% 92% 94% 96% 98% 100% Five Years Ending 2020 Five Years Ending 2021 Five Years Ending 2022 CF North America (2) North America Excl. CF (3)

Appendix

20 CF Industries Adjusted EBITDA sensitivity table Table illustrates the CF Industries business model across a broad range of industry conditions $50/ton urea realized movement implies ~$700M change in EBITDA on an annual basis (1) Based on 2022 sales volumes of approximately 18.3 million product tons, 2022 gas consumption of 331 million MMBtus and 2022 n itr ogen product sales price relationships for Ammonia, Urea, AN, and Other and 2021 - 2022 average nitrogen product sales relationship for UAN. Changes in product prices and gas costs are not applied to the CHS minority interest or industrial contracts where CF Industries is naturally hedged against changes in product prices and gas c ost s (2) Assumes that a $50 per ton change in urea prices is also applied proportionally to all nitrogen products and is equivalent to a $34.78 per ton change in UAN price, $36.96 per ton change in AN price, $89.14 per ton change in ammonia price, and $21.20 per ton change in the price of the Other segment EBITDA Sensitivity to Natural Gas and Urea Prices (1) $ billions CF Realized Natural Gas Cost ($/MMBtu) CF Realized Urea Price ($/ton) (2) 2.00 2.50 3.00 3.50 4.00 4.50 5.00 $300 $2.2 $2.0 $1.9 $1.8 $1.6 $1.5 $1.4 $350 $2.9 $2.7 $2.6 $2.5 $2.3 $2.2 $2.1 $400 $3.6 $3.4 $3.3 $3.2 $3.0 $2.9 $2.8 $450 $4.3 $4.1 $4.0 $3.9 $3.7 $3.6 $3.5 $500 $5.0 $4.8 $4.7 $4.6 $4.4 $4.3 $4.2 $550 $5.6 $5.5 $5.4 $5.3 $5.1 $5.0 $4.9 $600 $6.3 $6.2 $6.1 $6.0 $5.8 $5.7 $5.6
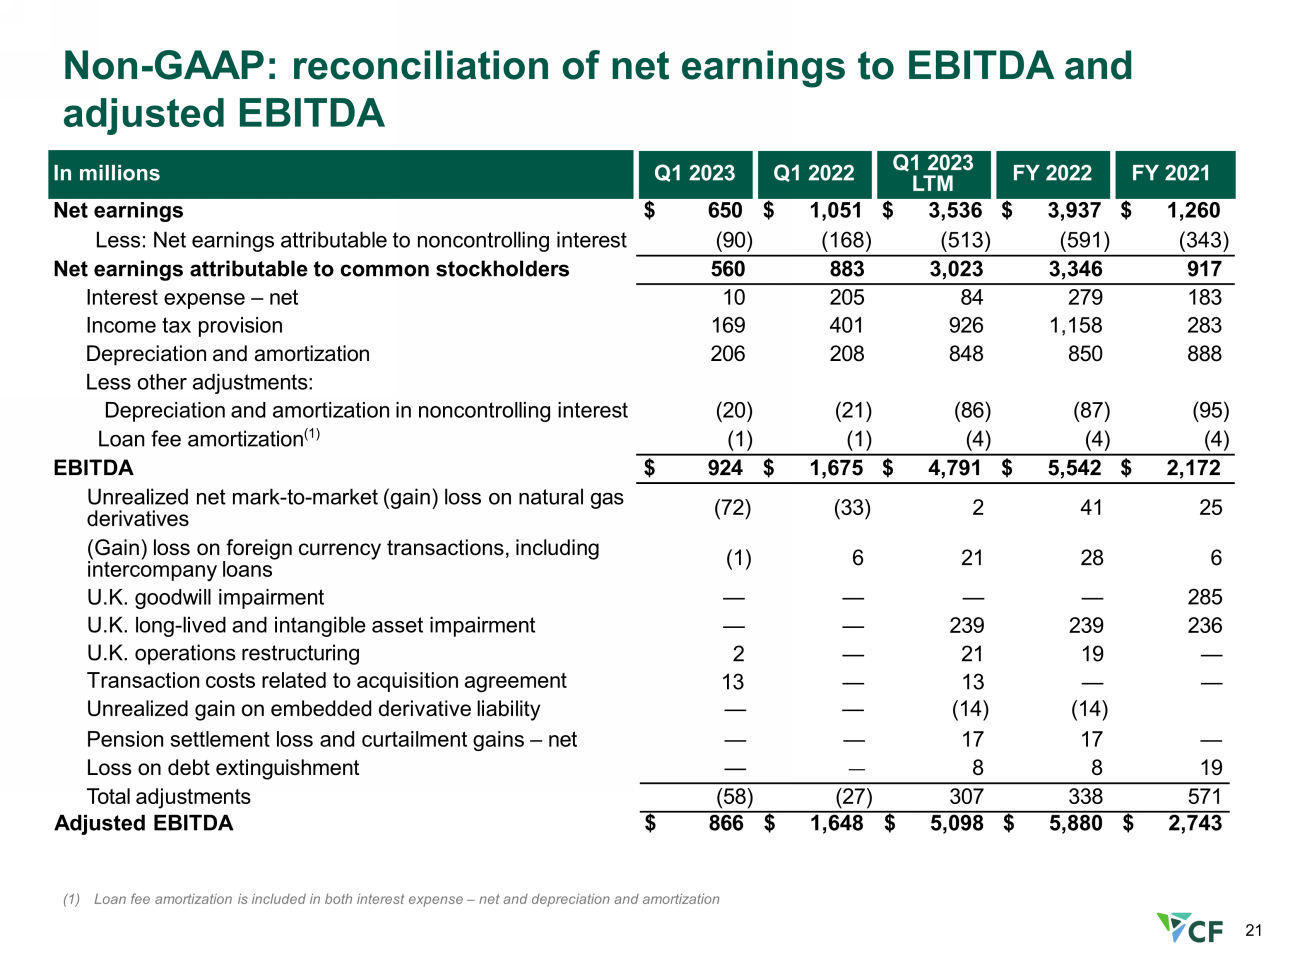
21 Non - GAAP: reconciliation of net earnings to EBITDA and adjusted EBITDA In millions Q1 2023 Q1 2022 Q1 2023 LTM FY 2022 FY 2021 Net earnings $ 650 $ 1,051 $ 3,536 $ 3,937 $ 1,260 Less: Net earnings attributable to noncontrolling interest (90) (168) (513) (591) (343) Net earnings attributable to common stockholders 560 883 3,023 3,346 917 Interest expense – net 10 205 84 279 183 Income tax provision 169 401 926 1,158 283 Depreciation and amortization 206 208 848 850 888 Less other adjustments: Depreciation and amortization in noncontrolling interest (20) (21) (86) (87) (95) Loan fee amortization (1) (1) (1) (4) (4) (4) EBITDA $ 924 $ 1,675 $ 4,791 $ 5,542 $ 2,172 Unrealized net mark - to - market (gain) loss on natural gas derivatives (Gain) loss on foreign currency transactions, including intercompany loans U.K. goodwill impairment U.K. long - lived and intangible asset impairment U.K. operations restructuring Transaction costs related to acquisition agreement (72) (33) 2 41 25 (1) 6 21 28 6 — — — — 285 — — 239 239 236 2 — 21 19 — 13 — 13 — — Unrealized gain on embedded derivative liability — — (14) (14) Pension settlement loss and curtailment gains – net — — 17 17 — Loss on debt extinguishment — — 8 8 19 Total adjustments (58) (27) 307 338 571 Adjusted EBITDA $ 866 $ 1,648 $ 5,098 $ 5,880 $ 2,743 (1) Loan fee amortization is included in both interest expense – net and depreciation and amortization
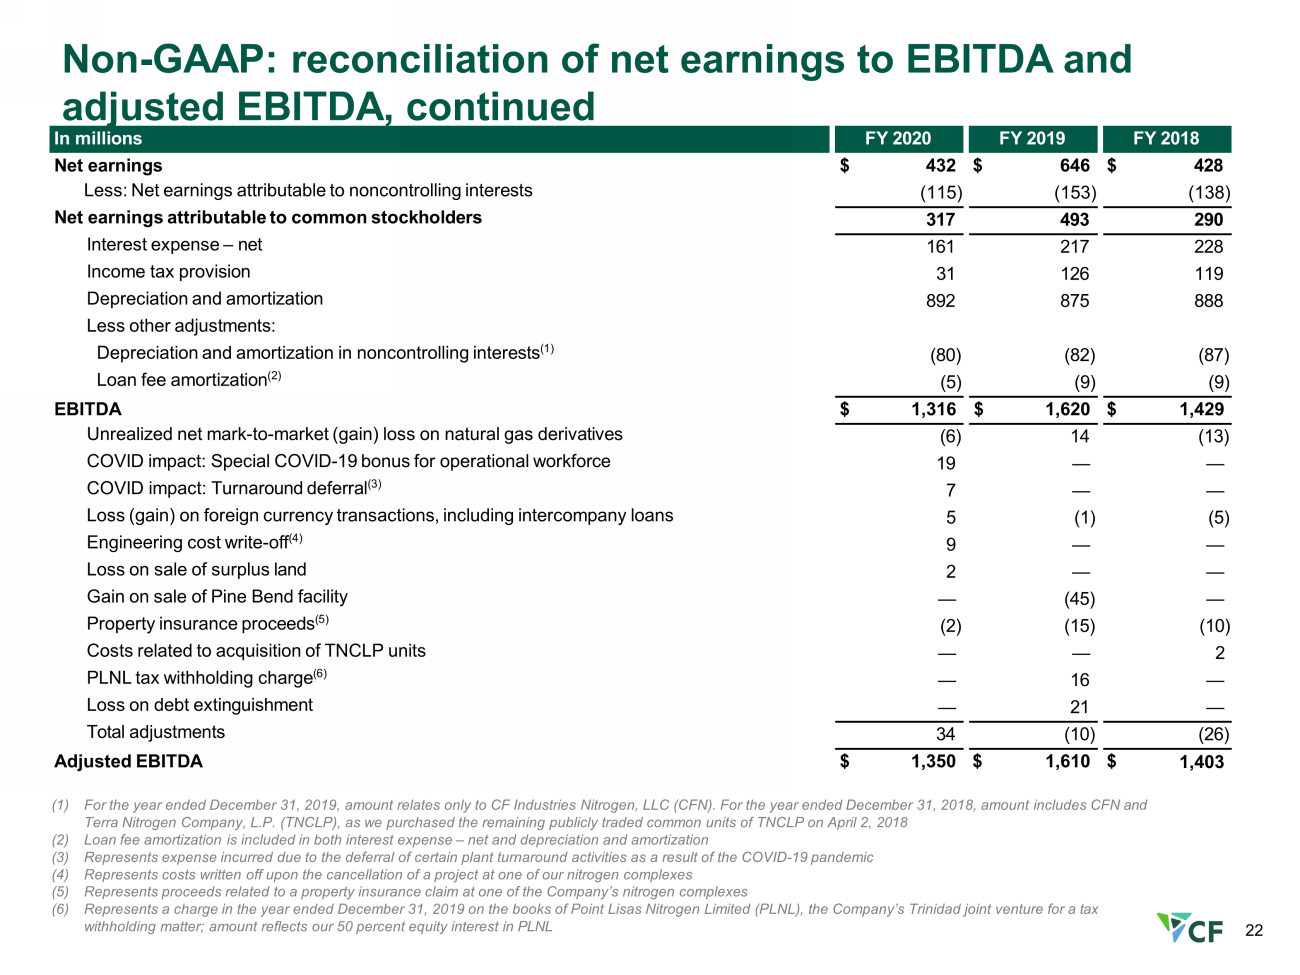
22 Non - GAAP: reconciliation of net earnings to EBITDA and adjusted EBITDA, continued In millions FY 2020 FY 2019 FY 2018 Net earnings Less: Net earnings attributable to noncontrolling interests Net earnings attributable to common stockholders Interest expense – net Income tax provision Depreciation and amortization Less other adjustments: Depreciation and amortization in noncontrolling interests (1) Loan fee amortization (2) EBITDA Unrealized net mark - to - market (gain) loss on natural gas derivatives COVID impact: Special COVID - 19 bonus for operational workforce COVID impact: Turnaround deferral (3) Loss (gain) on foreign currency transactions, including intercompany loans Engineering cost write - off (4) Loss on sale of surplus land Gain on sale of Pine Bend facility Property insurance proceeds (5) Costs related to acquisition of TNCLP units PLNL tax withholding charge (6) Loss on debt extinguishment Total adjustments Adjusted EBITDA $ 432 $ (115) 646 $ (153) 428 (138) 317 493 290 161 31 892 217 126 875 228 119 888 (80) (5) (82) (9) (87) (9) $ 1,316 $ 1,620 $ 1,429 14 (13) — — — — (6) 19 7 5 9 2 (1) (5) — — — — — — (45) (15) (2) (10) 2 — — — — 16 21 — — (26) 34 (10) $ 1,350 $ 1,610 $ 1,403 (1) For the year ended December 31, 2019, amount relates only to CF Industries Nitrogen, LLC (CFN). For the year ended December 31, 2018, amount includes CFN and Terra Nitrogen Company, L.P. (TNCLP), as we purchased the remaining publicly traded common units of TNCLP on April 2, 2018 (2) Loan fee amortization is included in both interest expense – net and depreciation and amortization (3) Represents expense incurred due to the deferral of certain plant turnaround activities as a result of the COVID - 19 pandemic (4) Represents costs written off upon the cancellation of a project at one of our nitrogen complexes (5) Represents proceeds related to a property insurance claim at one of the Company’s nitrogen complexes (6) Represents a charge in the year ended December 31, 2019 on the books of Point Lisas Nitrogen Limited (PLNL), the Company’s Trinidad joint venture for a tax withholding matter; amount reflects our 50 percent equity interest in PLNL
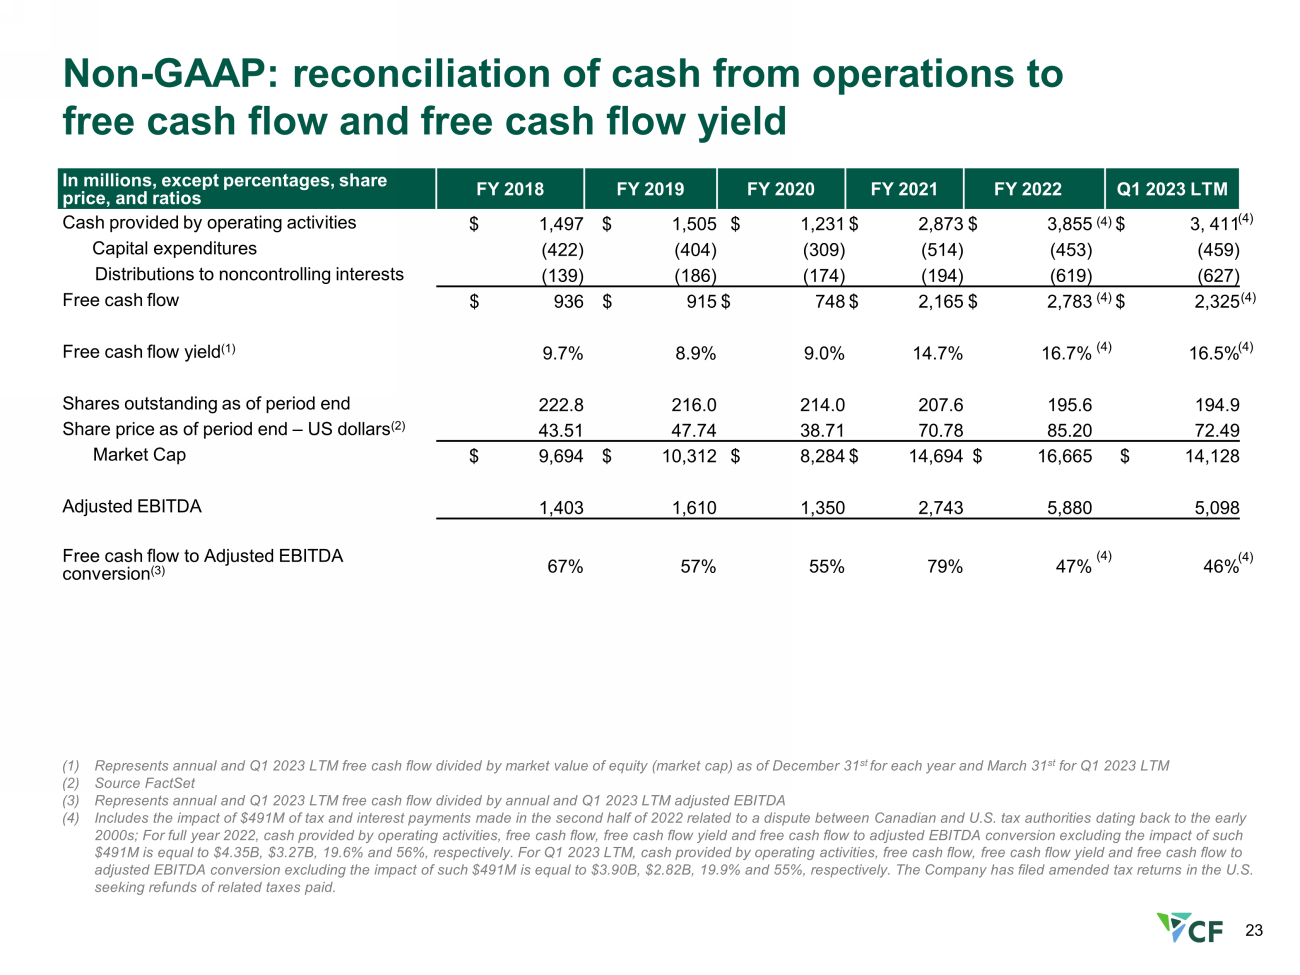
23 Non - GAAP: reconciliation of cash from operations to free cash flow and free cash flow yield In millions , except percentages , share price, and ratios FY 2018 FY 2019 FY 2020 FY 2021 FY 2022 Q1 2023 LTM Cash provided by operating activities $ 1,497 $ 1,505 $ 1,231 $ 2,873 $ 3,855 $ 3, 411 C apital expenditures (422) (404) (309) (514) (453) (459) Distributions to noncontrolling interests (139) (186) (174) (194) (619) (627) Free cash flow $ 936 $ 915 $ 748 $ 2,165 $ 2,783 $ 2,325 Free cash flow yield (1) 9.7% 8.9% 9.0% 14.7% 16.7% 16.5% Shares outstanding as of period end 222.8 216.0 214.0 207.6 195.6 194.9 Share price as of period end – US dollars (2) 43.51 47.74 38.71 70.78 85.20 72.49 Market Cap $ 9,694 $ 10,312 $ 8,284 $ 14,694 $ 16,665 $ 14,128 Adjusted EBITDA 1,403 1,610 1,350 2,743 5,880 5,098 Free cash flow to Adjusted EBITDA conversion (3) 67% 57% 55% 79% 47% 46% (1) Represents annual and Q1 2023 LTM free cash flow divided by market value of equity (market cap) as of December 31 st for each year and March 31 st for Q1 2023 LTM (2) Source FactSet (3) Represents annual and Q1 2023 LTM free cash flow divided by annual and Q1 2023 LTM adjusted EBITDA (4) Includes the impact of $491M of tax and interest payments made in the second half of 2022 related to a dispute between Canadi an and U.S. tax authorities dating back to the early 2000s; For full year 2022, cash provided by operating activities, free cash flow, free cash flow yield and free cash flow to adj usted EBITDA conversion excluding the impact of such $491M is equal to $4.35B, $3.27B, 19.6% and 56%, respectively. For Q1 2023 LTM, cash provided by operating activities, free c ash flow, free cash flow yield and free cash flow to adjusted EBITDA conversion excluding the impact of such $491M is equal to $3.90B, $2.82B, 19.9% and 55%, respectively. The Co mpa ny has filed amended tax returns in the U.S. seeking refunds of related taxes paid. (4) (4) (4) (4) (4) (4) (4) (4)