Exhibit 99.1
Investor Presentation September 2023 NYSE: CF
Safe harbor statement All statements in this presentation by CF Industries Holdings, Inc. (together with its subsidiaries, the “Company”), other th an those relating to historical facts, are forward - looking statements. Forward - looking statements can generally be identified by their use of terms such as “anticipate,” “ believe,” “could,” “estimate,” “expect,” “intend,” “may,” “plan,” “predict,” “project,” “will” or “would” and similar terms and phrases, including reference s t o assumptions. Forward - looking statements are not guarantees of future performance and are subject to a number of assumptions, risks and uncertainties, many of which are beyond the Company’s control, which could cause actual results to differ materially from such statements. These statements may include, but are not limited to, statements about the financing, synergies and other benefits, and other aspects of the proposed transactions with Incitec Pivot Limited (“I PL”), strategic plans and management’s expectations with respect to the production of green and blue (low - carbon) ammonia, the development of carbon captu re and sequestration projects, the transition to and growth of a hydrogen economy, greenhouse gas reduction targets, projected capital expenditure s, statements about future financial and operating results, and other items described in this presentation. Important factors that could cause actual results to d iff er materially from those in the forward - looking statements include, among others, the risk that regulatory approvals required for the proposed transactions with IPL are not obtained or that required approvals delay the transactions or cause the parties to abandon the transactions; the risk that other conditions to the clos ing of the proposed transactions with IPL are not satisfied; risks and uncertainties arising from the length of time necessary to consummate the proposed transacti ons with IPL and the possibility that the proposed transactions with IPL may be delayed or may not occur; the risk of obstacles to realization of the benefits of t he proposed transactions with IPL; the risk that the synergies from the proposed transactions with IPL may not be fully realized or may take longer to realize than exp ected; the risk that the pendency or completion of the proposed transactions with IPL, including integration of the Waggaman ammonia production complex into the C omp any’s operations, disrupt current operations or harm relationships with customers, employees and suppliers; the risk that integration of the Waggaman a mmo nia production complex with the Company’s current operations will be more costly or difficult than expected or may otherwise be unsuccessful; diversion o f m anagement time and attention to issues relating to the proposed transactions with IPL; unanticipated costs or liabilities associated with the IPL transaction s; the cyclical nature of the Company’s business and the impact of global supply and demand on the Company’s selling prices; the global commodity nature of the Compa ny’ s nitrogen products, the conditions in the international market for nitrogen products, and the intense global competition from other producers; condit ion s in the United States, Europe and other agricultural areas, including the influence of governmental policies and technological developments on the demand our f ert ilizer products; the volatility of natural gas prices in North America and the United Kingdom; weather conditions and the impact of adverse weather events; the sea sonality of the fertilizer business; the impact of changing market conditions on the Company’s forward sales programs; difficulties in securing the supp ly and delivery of raw materials, increases in their costs or delays or interruptions in their delivery; reliance on third party providers of transportation se rvi ces and equipment; the Company’s reliance on a limited number of key facilities; risks associated with cybersecurity; acts of terrorism and regulations to com bat terrorism; risks associated with international operations; the significant risks and hazards involved in producing and handling the Company’s products against wh ich the Company may not be fully insured; the Company’s ability to manage its indebtedness and any additional indebtedness that may be incurred; the Company’s ab ility to maintain compliance with covenants under its revolving credit agreement and the agreements governing its indebtedness; downgrades of the Company’ s c redit ratings; risks associated with changes in tax laws and disagreements with taxing authorities; risks involving derivatives and the effectiveness of the Com pany’s risk management and hedging activities; potential liabilities and expenditures related to environmental, health and safety laws and regulations a nd permitting requirements; regulatory restrictions and requirements related to greenhouse gas emissions; the development and growth of the market for green and blu e ( low - carbon) ammonia and the risks and uncertainties relating to the development and implementation of the Company’s green and blue ammonia projects; risk s a ssociated with expansions of the Company’s business, including unanticipated adverse consequences and the significant resources that could be required; an d r isks associated with the operation or management of the strategic venture with CHS (the “CHS Strategic Venture”), risks and uncertainties relating to the market prices of the fertilizer products that are the subject of the supply agreement with CHS over the life of the supply agreement, and the risk that any c hal lenges related to the CHS Strategic Venture will harm the Company’s other business relationships. More detailed information about factors that may affect the Com pan y’s performance and could cause actual results to differ materially from those in any forward - looking statements may be found in CF Industries Holdings, I nc.’s filings with the Securities and Exchange Commission, including CF Industries Holdings, Inc.’s most recent annual and quarterly reports on Form 10 - K and Form 10 - Q, which are available in the Investor Relations section of the Company’s web site. It is not possible to predict or identify all risks and uncertainties t hat might affect the accuracy of our forward - looking statements and, consequently, our descriptions of such risks and uncertainties should not be considered exhaustive. T her e is no guarantee that any of the events, plans or goals anticipated by these forward - looking statements will occur, and if any of the events do occur, there is n o guarantee what effect they will have on our business, results of operations, cash flows, financial condition and future prospects. Forward - looking statements ar e given only as of the date of this presentation and the Company disclaims any obligation to update or revise the forward - looking statements, whether as a result of new information, future events or otherwise, except as required by law.
Note regarding non - GAAP financial measures The Company reports its financial results in accordance with U.S. generally accepted accounting principles (GAAP). Managemen t believes that EBITDA, adjusted EBITDA, free cash flow, free cash flow to adjusted EBITDA conversion and free cash flow yield, which are non - GAAP financial measures, provide additional meaningful information regarding the Company's performance and financial strength. Non - GAAP financial measures should be viewed in addition to, and not as an alternative for, the Company's reported results prepared in accordance with GAAP. In addition, because not all companies use identical calculations, EBITDA , adjusted EBITDA, free cash flow, free cash flow to adjusted EBITDA conversion and free cash flow yield included in this prese nta tion may not be comparable to similarly titled measures of other companies. Reconciliations of EBITDA, adjusted EBITDA, free cash flow, and free cash flow yield to the most directly comparable GAAP measures are provided in the tables accompanying this presentation. EBITDA is defined as net earnings attributable to common stockholders plus interest expense - net, income taxes, and depreciatio n and amortization. Other adjustments include the elimination of loan fee amortization that is included in both interest and amortization, and the portion of depreciation that is included in noncontrolling interest. The Company has presented EBITDA because management uses the measure to track performance and believes that it is frequently used by securities analysts, inve sto rs and other interested parties in the evaluation of companies in the industry. Adjusted EBITDA is defined as EBITDA adjusted with the selected items as summarized in the tables accompanying this presentation. The Company has presented adjusted EBITDA because management uses adjusted EBITDA, and believes it is useful to investors, as a supplemental financial measure in the comparison of year - over - year performance. Free cash flow is defined as net cash provided by operating activities, as stated in the consolidated statements of cash flow s, reduced by capital expenditures and distributions to noncontrolling interests. Free cash flow to adjusted EBITDA conversion i s defined as free cash flow divided by adjusted EBITDA. Free cash flow yield is defined as free cash flow divided by market val ue of equity (market cap). For full year 2022 and Q2 2023 LTM, the Company has also presented cash provided by operating activities , free cash flow, free cash flow to adjusted EBITDA conversion and free cash flow yield, in each case excluding certain tax and interest payments made to Canadian tax authorities in relation to an arbitration decision covering tax years 2006 through 201 1 a nd to our transfer pricing positions between Canada and the United States for open years 2012 and after. The Company has presented these financial measures, as well as the financial measures free cash flow, free cash flow to adjusted EBITDA conversion and fre e cash flow yield, because management uses these measures and believes they are useful to investors, as an indication of the strength of the Company and its ability to generate cash and to evaluate the Company’s cash generation ability relative to it s i ndustry competitors. It should not be inferred that the entire free cash flow amount is available for discretionary expenditures.
Company Overview
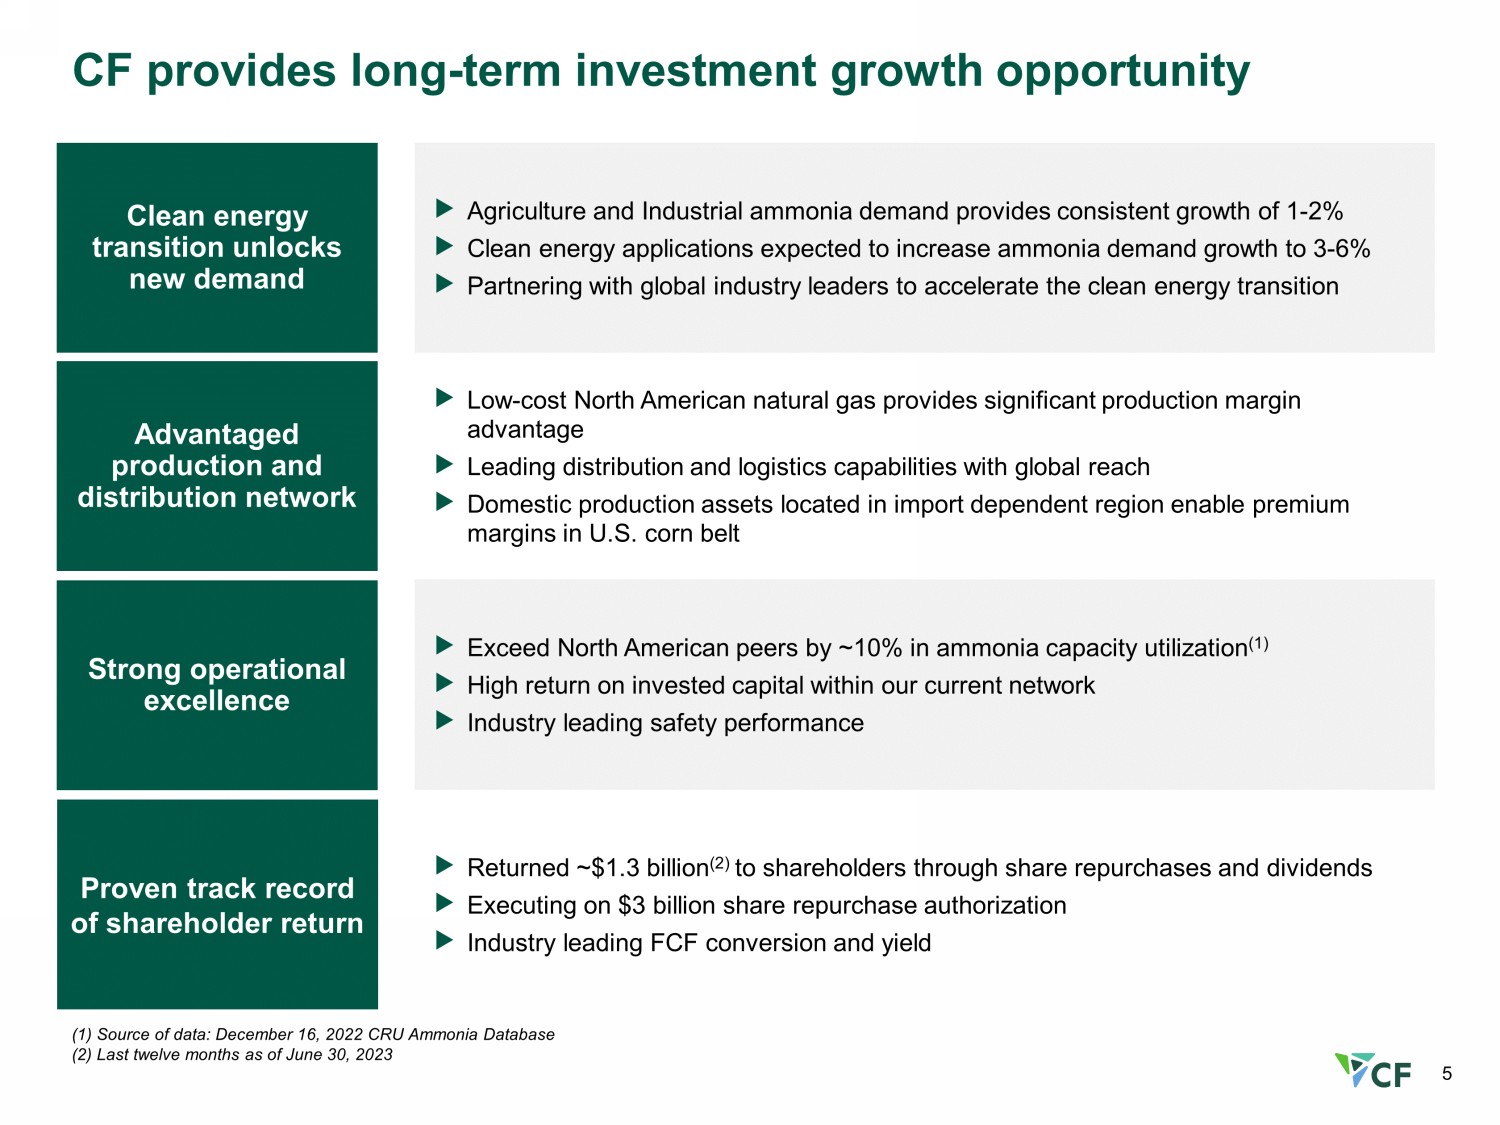
5 CF provides long - term investment growth opportunity Clean energy transition unlocks new demand Advantaged production and distribution network Strong operational excellence Proven track record of shareholder return (1) Source of data: December 16, 2022 CRU Ammonia Database (2) Last twelve months as of June 30, 2023 Agriculture and Industrial ammonia demand provides consistent growth of 1 - 2% Clean energy applications expected to increase ammonia demand growth to 3 - 6% Partnering with global industry leaders to accelerate the clean energy transition Low - cost North American natural gas provides significant production margin advantage Leading distribution and logistics capabilities with global reach Domestic production assets located in import dependent region enable premium margins in U.S. corn belt Exceed North American peers by ~10% in ammonia capacity utilization (1) High return on invested capital within our current network Industry leading safety performance Returned ~$1.3 billion (2) to shareholders through share repurchases and dividends Executing on $3 billion share repurchase authorization Industry leading FCF conversion and yield
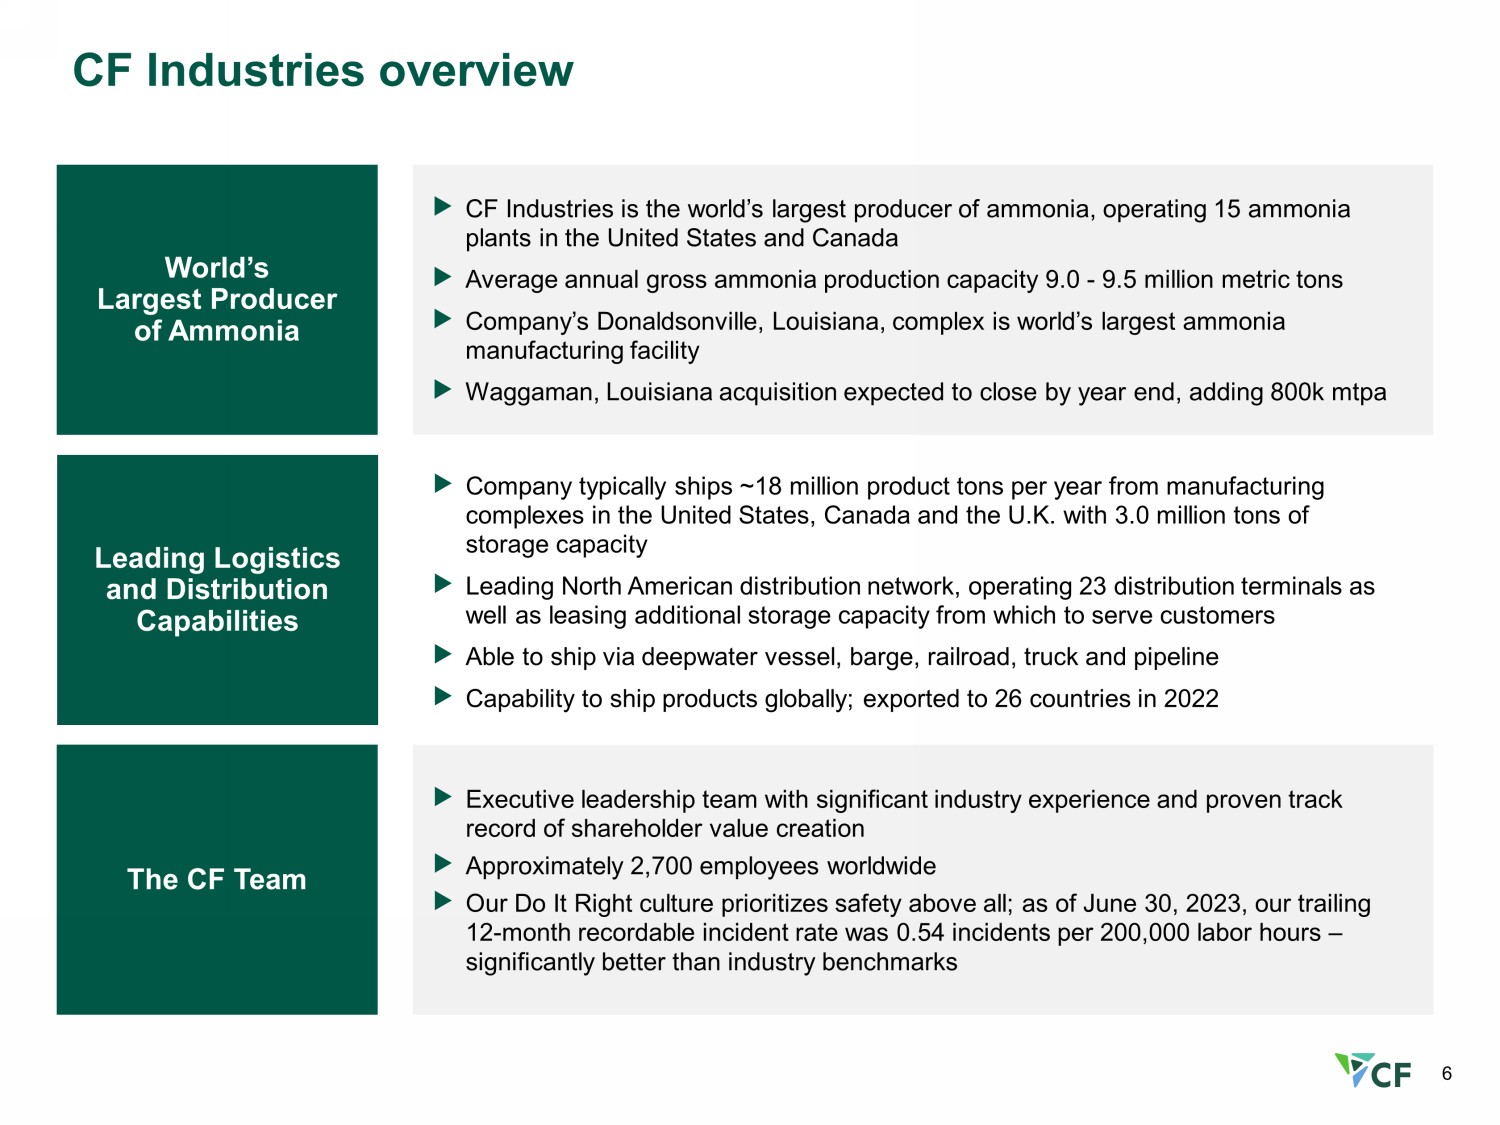
6 CF Industries overview World’s Largest Producer of Ammonia Leading Logistics and Distribution Capabilities The CF Team CF Industries is the world’s largest producer of ammonia, operating 15 ammonia plants in the United States and Canada Average annual gross ammonia production capacity 9.0 - 9.5 million metric tons Company’s Donaldsonville, Louisiana, complex is world’s largest ammonia manufacturing facility Waggaman, Louisiana acquisition expected to close by year end, adding 800k mtpa Company typically ships ~18 million product tons per year from manufacturing complexes in the United States, Canada and the U.K. with 3.0 million tons of storage capacity Leading North American distribution network, operating 23 distribution terminals as well as leasing additional storage capacity from which to serve customers Able to ship via deepwater vessel, barge, railroad, truck and pipeline Capability to ship products globally; exported to 26 countries in 2022 Executive leadership team with significant industry experience and proven track record of shareholder value creation Approximately 2,700 employees worldwide Our Do It Right culture prioritizes safety above all; as of June 30, 2023, our trailing 12 - month recordable incident rate was 0.54 incidents per 200,000 labor hours – significantly better than industry benchmarks
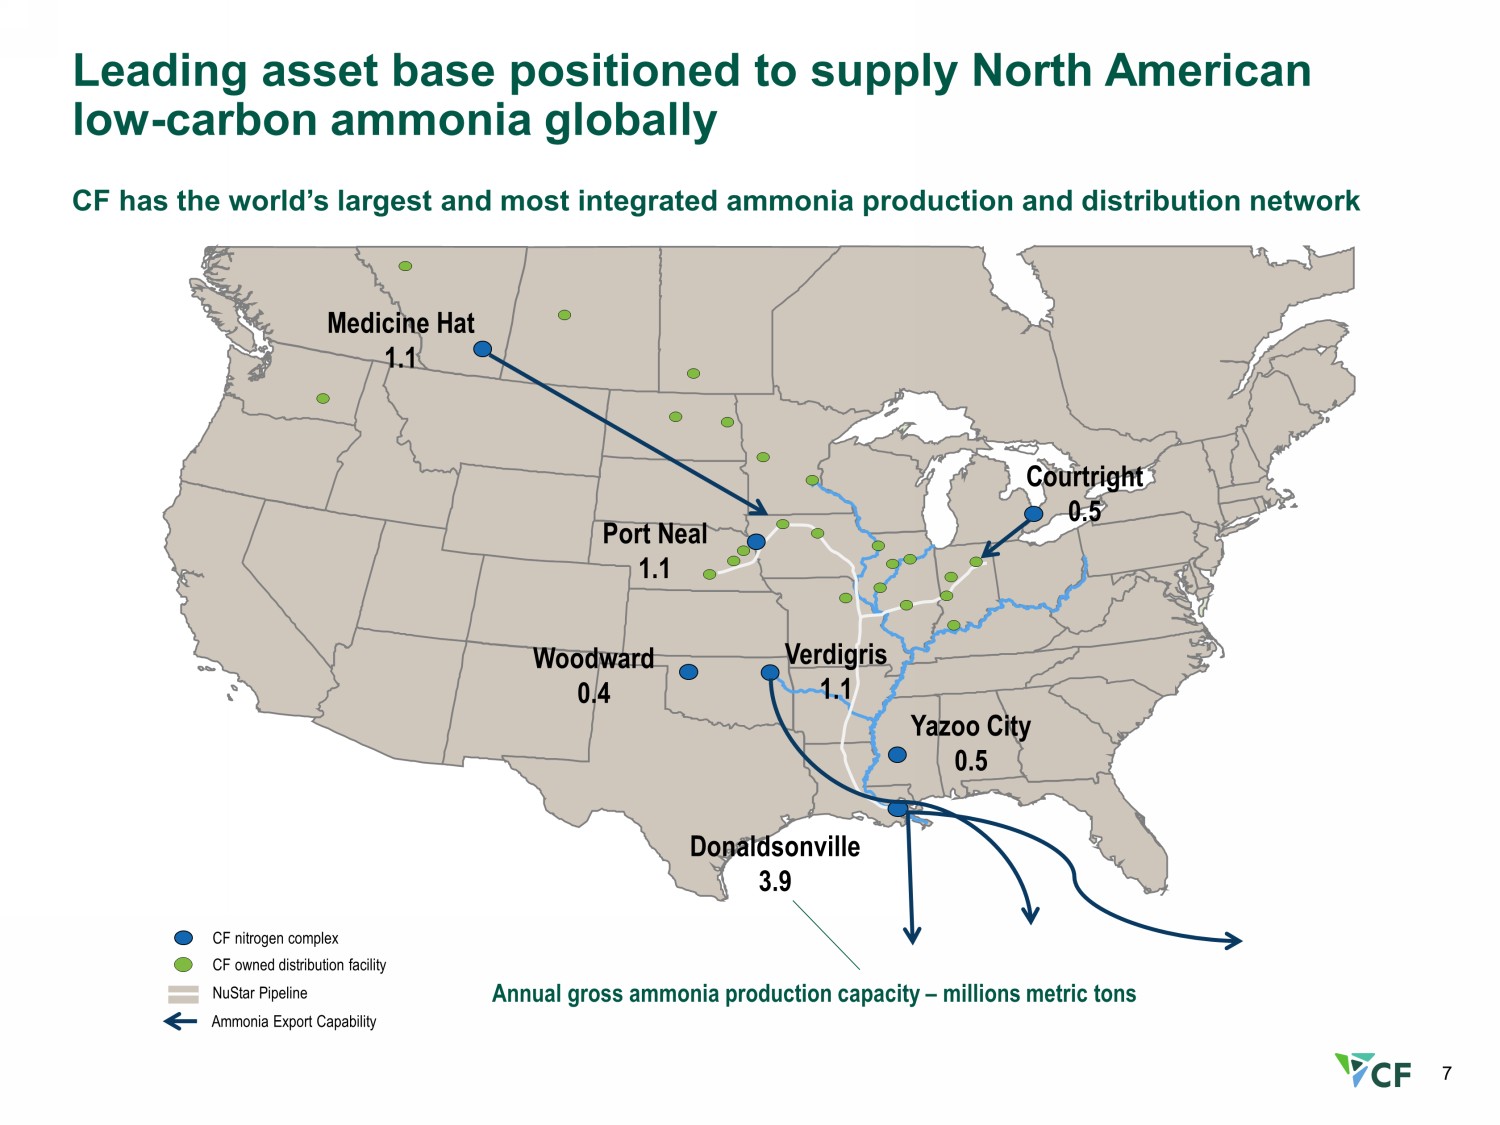
7 Leading asset base positioned to supply North American low - carbon ammonia globally CF has the world’s largest and most integrated ammonia production and distribution network CF nitrogen complex CF owned distribution facility NuStar Pipeline Ammonia Export Capability Yazoo City 0.5 Donaldsonville 3.9 Verdigris 1.1 Woodward 0.4 Port Neal 1.1 Medicine Hat 1.1 Annual gross ammonia production capacity – millions metric tons Courtright 0.5
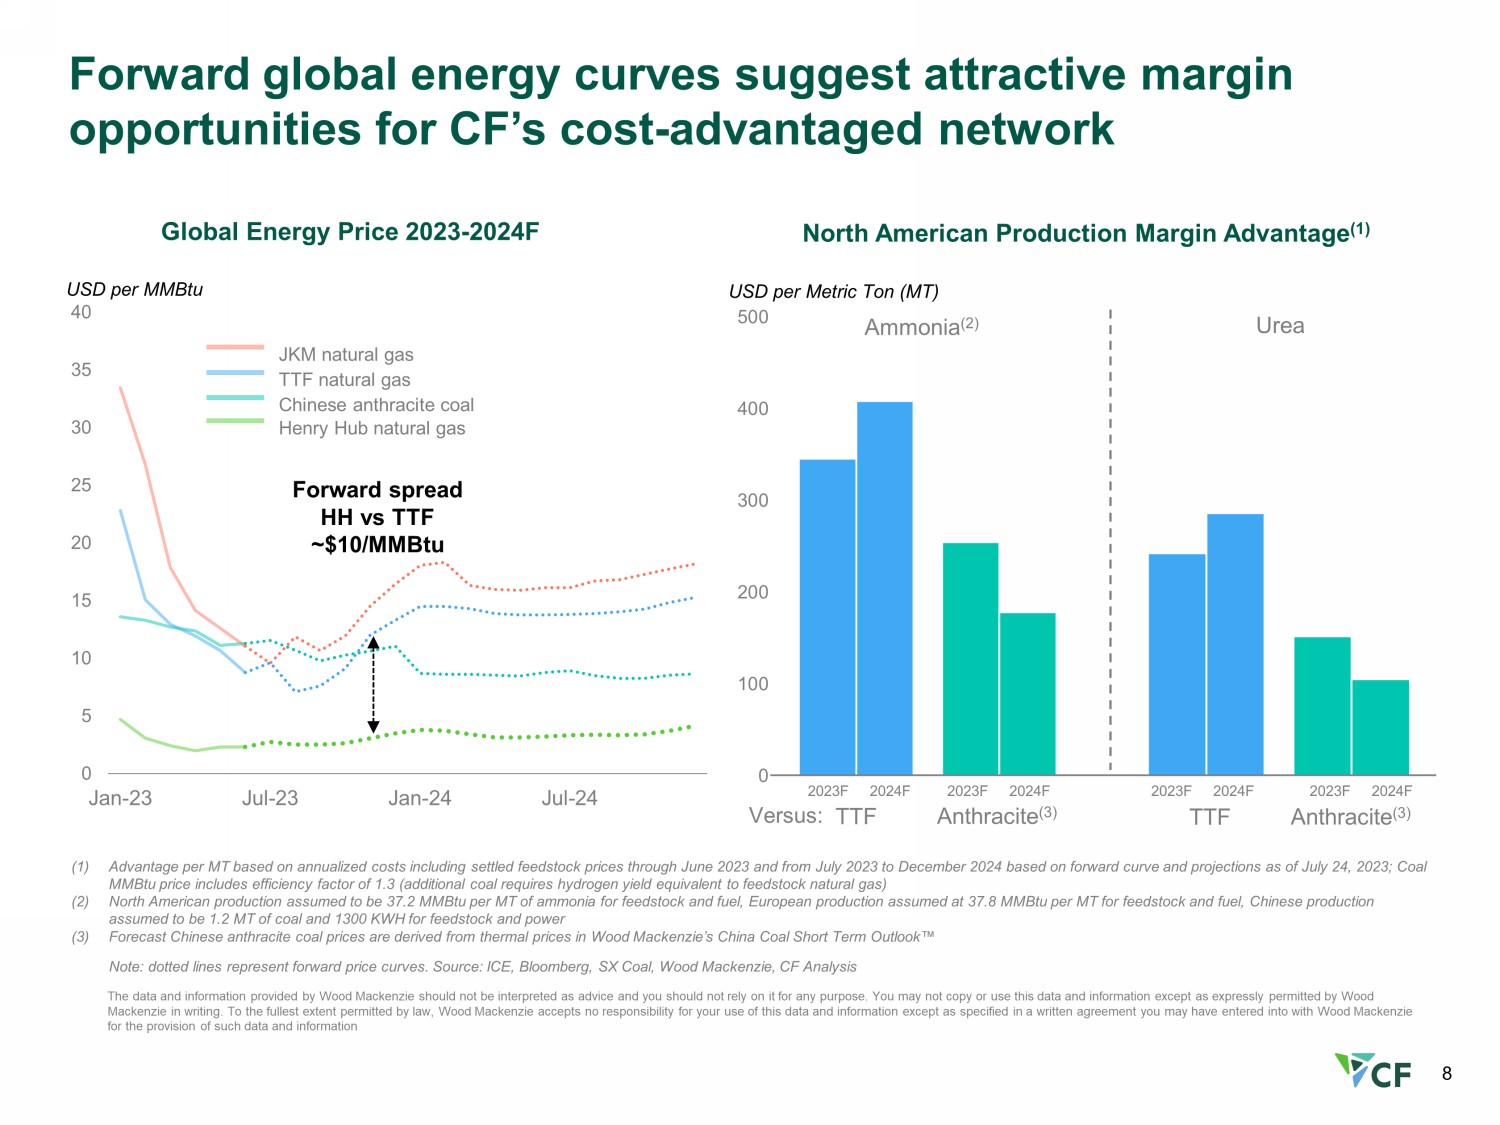
8 The data and information provided by Wood Mackenzie should not be interpreted as advice and you should not rely on it for any pu rpose. You may not copy or use this data and information except as expressly permitted by Wood Mackenzie in writing. To the fullest extent permitted by law, Wood Mackenzie accepts no responsibility for your use of this d ata and information except as specified in a written agreement you may have entered into with Wood Mackenzie for the provision of such data and information Global Energy Price 2023 - 2024F North American Production Margin Advantage (1) (1) Advantage per MT based on annualized costs including settled feedstock prices through June 2023 and from July 2023 to Decembe r 2 024 based on forward curve and projections as of July 24, 2023; Coal MMBtu price includes efficiency factor of 1.3 (additional coal requires hydrogen yield equivalent to feedstock natural gas) (2) North American production assumed to be 37.2 MMBtu per MT of ammonia for feedstock and fuel, European production assumed at 3 7.8 MMBtu per MT for feedstock and fuel, Chinese production assumed to be 1.2 MT of coal and 1300 KWH for feedstock and power (3) Forecast Chinese anthracite coal prices are derived from thermal prices in Wood Mackenzie’s China Coal Short Term Outlook Œ Note: dotted lines represent forward price curves. Source: ICE, Bloomberg, SX Coal, Wood Mackenzie, CF Analysis Forward global energy curves suggest attractive margin opportunities for CF’s cost - advantaged network 0 5 10 15 20 25 30 35 40 Jan-23 Jul-23 Jan-24 Jul-24 Henry Hub natural gas TTF natural gas Chinese anthracite coal JKM natural gas USD per MMBtu 0 100 200 300 400 500 USD per Metric Ton (MT) Ammonia (2) Urea TTF Anthracite (3) 2023F 2024F Versus: TTF Anthracite (3) 2023F 2024F 2023F 2024F 2023F 2024F Forward spread HH vs TTF ~$10/MMBtu
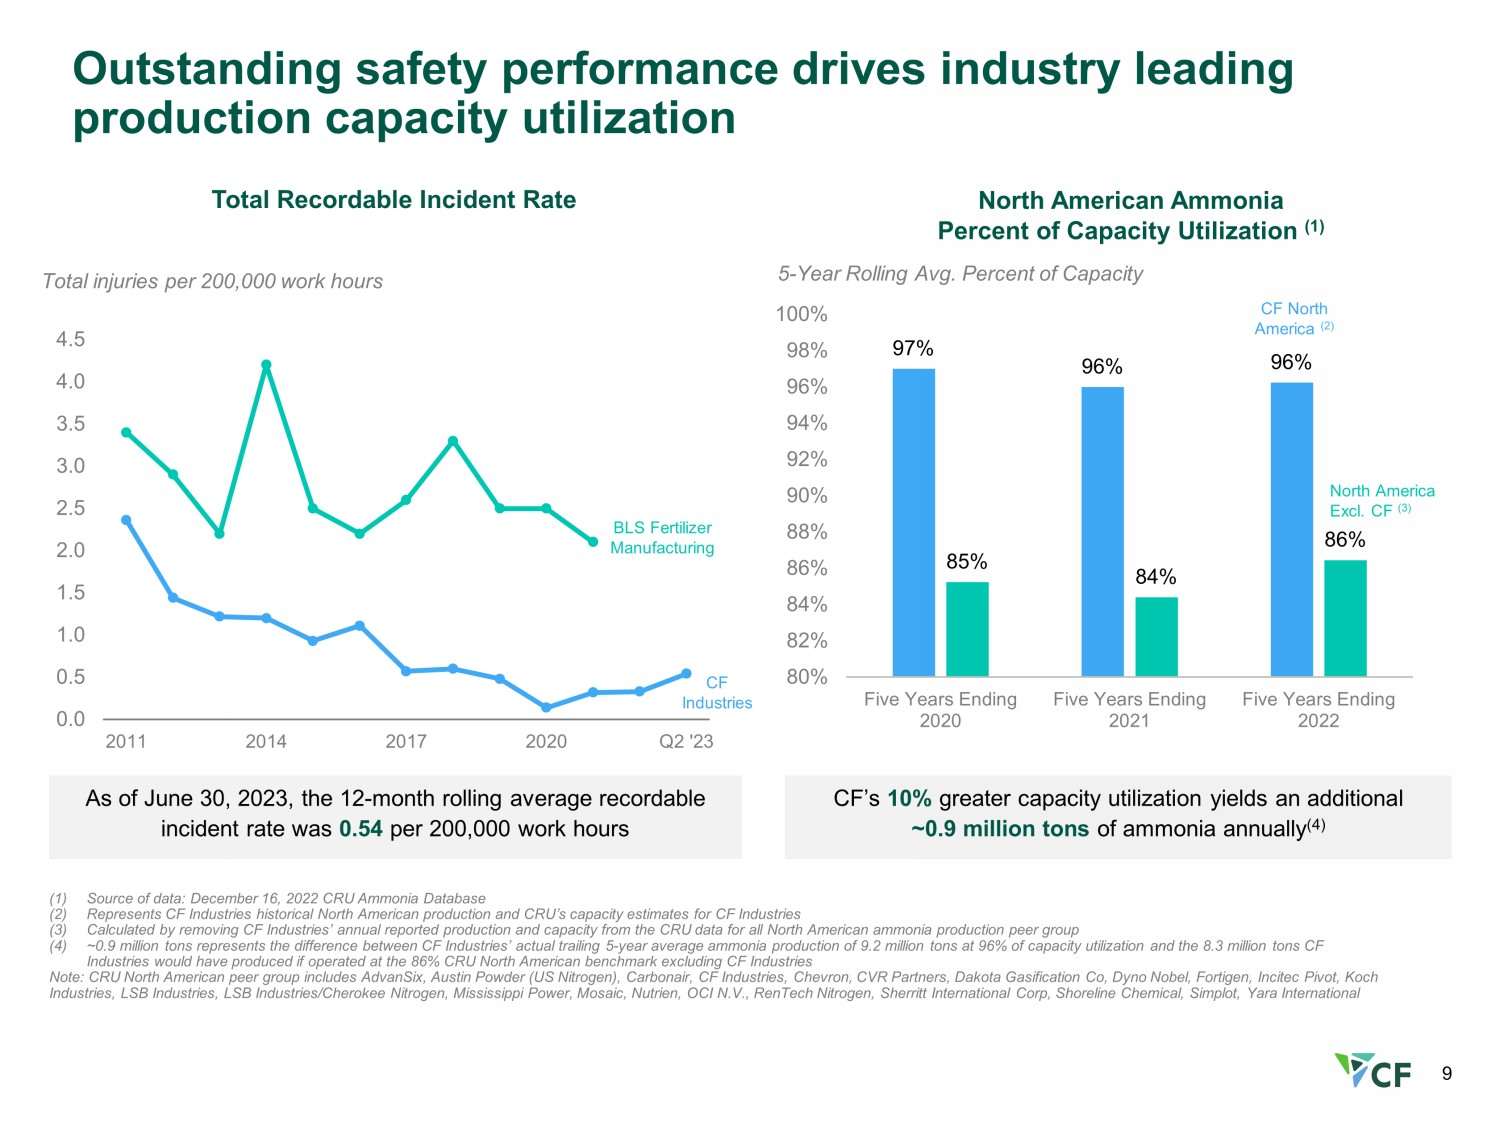
9 (1) Source of data: December 16, 2022 CRU Ammonia Database (2) Represents CF Industries historical North American production and CRU’s capacity estimates for CF Industries (3) Calculated by removing CF Industries’ annual reported production and capacity from the CRU data for all North American ammoni a p roduction peer group (4) ~0.9 million tons represents the difference between CF Industries’ actual trailing 5 - year average ammonia production of 9.2 mill ion tons at 96% of capacity utilization and the 8.3 million tons CF Industries would have produced if operated at the 86% CRU North American benchmark excluding CF Industries Note: CRU North American peer group includes AdvanSix , Austin Powder (US Nitrogen), Carbonair , CF Industries, Chevron, CVR Partners, Dakota Gasification Co, Dyno Nobel, Fortigen , Incitec Pivot, Koch Industries, LSB Industries, LSB Industries/Cherokee Nitrogen, Mississippi Power, Mosaic, Nutrien , OCI N.V., RenTech Nitrogen, Sherritt International Corp, Shoreline Chemical, Simplot, Yara International North American Ammonia Percent of Capacity Utilization (1) 5 - Year Rolling Avg. Percent of Capacity CF’s 10% greater capacity utilization yields an additional ~0.9 million tons of ammonia annually (4) Outstanding safety performance drives industry leading production capacity utilization 0.0 0.5 1.0 1.5 2.0 2.5 3.0 3.5 4.0 4.5 2011 2014 2017 2020 Q2 '23 Total injuries per 200,000 work hours Total Recordable Incident Rate BLS Fertilizer Manufacturing CF Industries As of June 30, 2023, the 12 - month rolling average recordable incident rate was 0.54 per 200,000 work hours 97% 96% 96% 85% 84% 86% 80% 82% 84% 86% 88% 90% 92% 94% 96% 98% 100% Five Years Ending 2020 Five Years Ending 2021 Five Years Ending 2022 CF North America (2) North America Excl. CF (3)
Decarbonization is central to our strategy
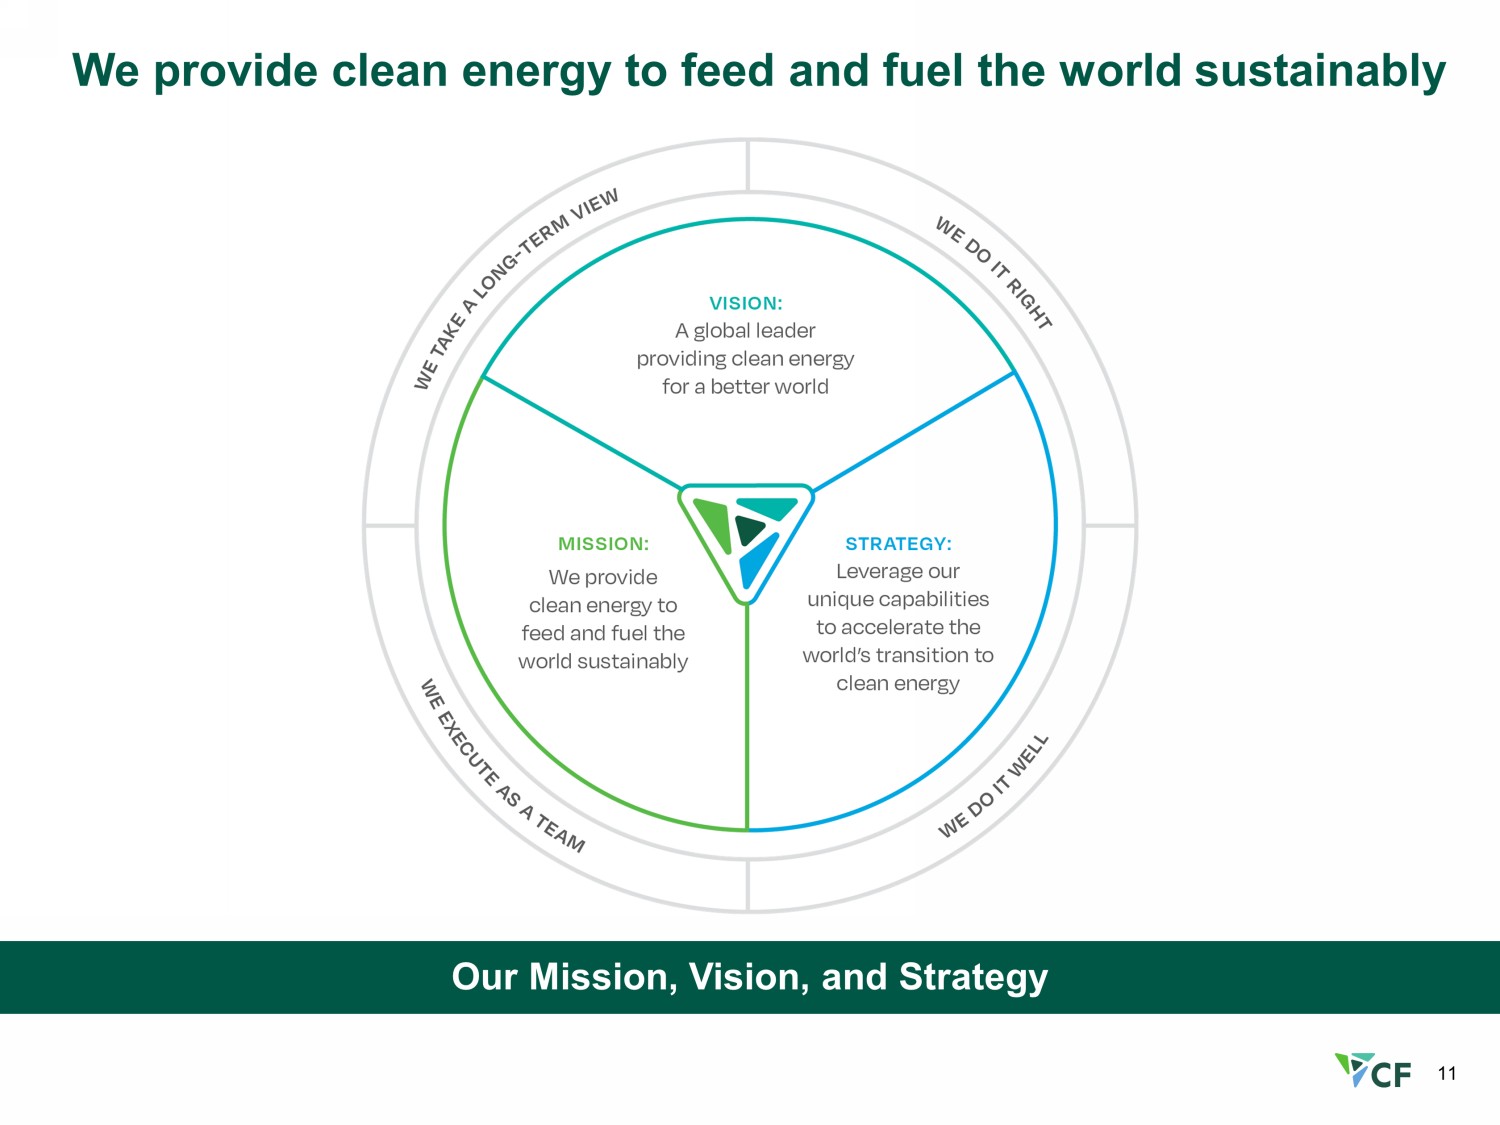
11 We provide clean energy to feed and fuel the world sustainably Our Mission, Vision, and Strategy

12 Our strategic priorities are focused on clean energy avenues of growth NH3 Production Expansion NH3 Demand Stimulation Low Carbon H2 Production Low Carbon Solutions CF Industries’ strategy is to leverage our unique capabilities to accelerate the world’s transition to clean energy while fulfilling our mission to feed and fuel the world guides organic and inorganic production expansion growth opportunities Execute CCS projects across our network to achieve our decarbonization goals and to provide solutions to decarbonize hard to abate industries Focused on supporting new demand for ammonia in clean energy applications: low - carbon solutions, power generation, ammonia as a hydrogen carrier, low - carbon solutions for Ag and CPG, SAF, Maritime fuel Identify and evaluate high value niche hydrogen markets
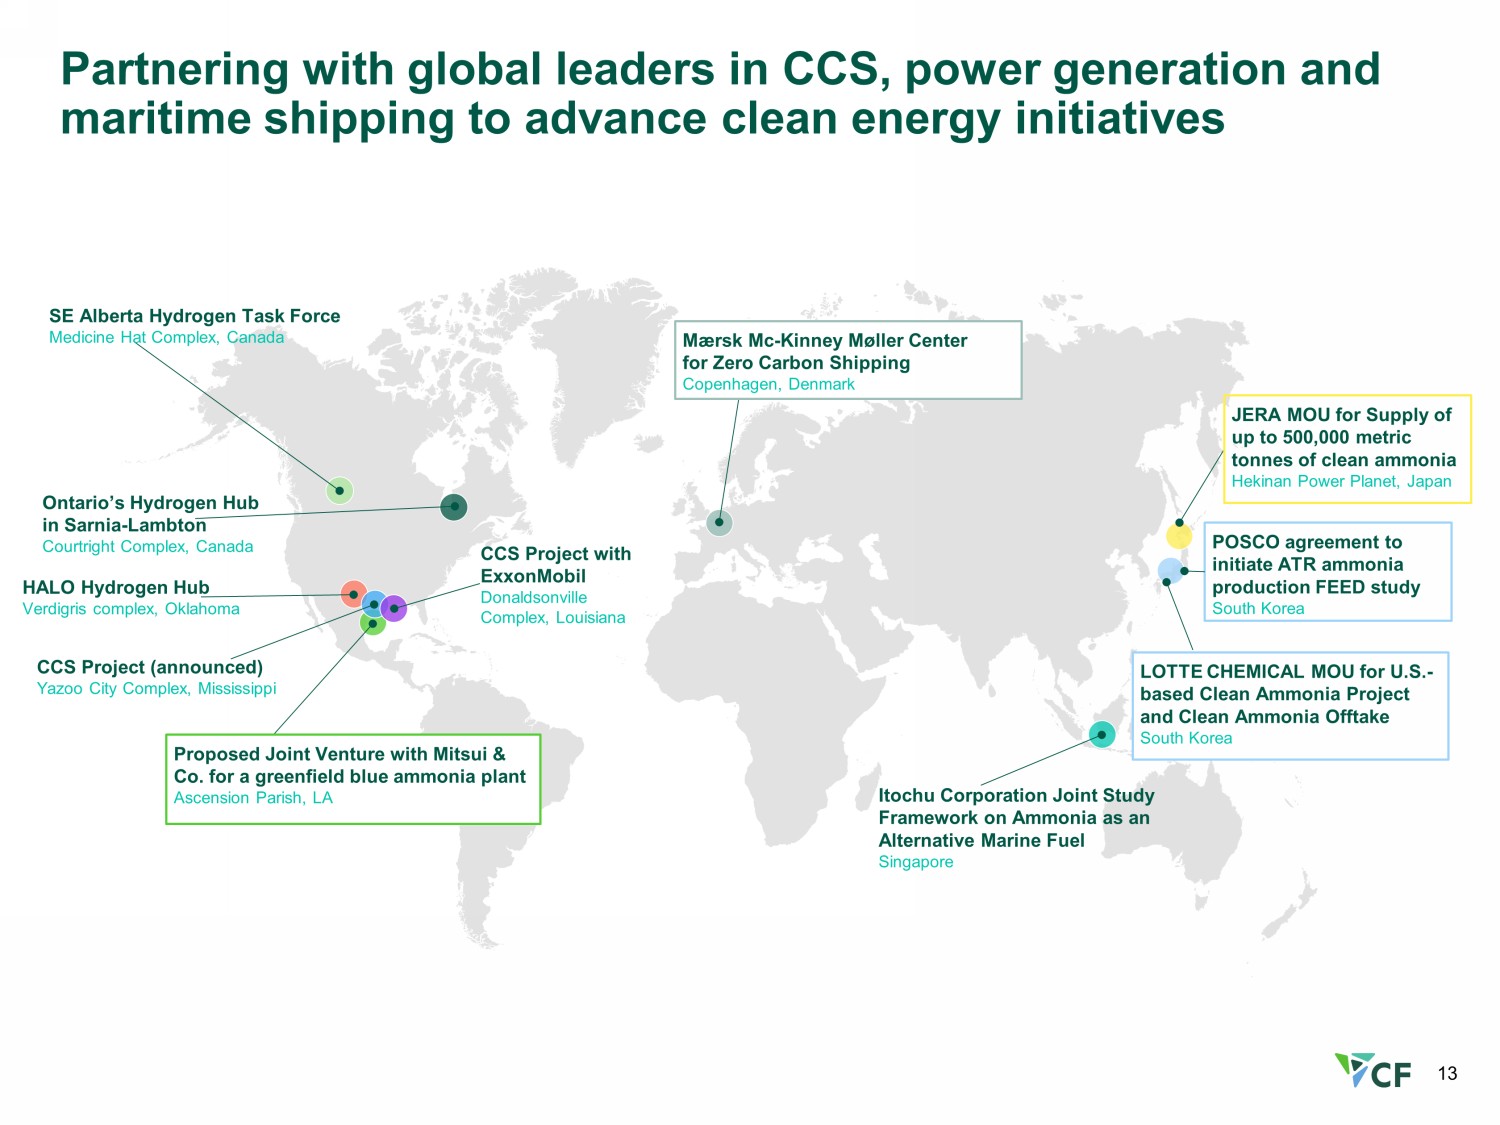
13 Proposed Joint Venture with Mitsui & Co. for a greenfield blue ammonia plant Ascension Parish, LA CCS Project with ExxonMobil Donaldsonville Complex, Louisiana CCS Project (announced) Yazoo City Complex, Mississippi HALO Hydrogen Hub Verdigris complex, Oklahoma SE Alberta Hydrogen Task Force Medicine Hat Complex, Canada Ontario’s Hydrogen Hub in Sarnia - Lambton Courtright Complex, Canada JERA MOU for Supply of up to 500,000 metric tonnes of clean ammonia Hekinan Power Planet, Japan Mærsk Mc - Kinney Møller Center for Zero Carbon Shipping Copenhagen, Denmark LOTTE CHEMICAL MOU for U.S. - based Clean Ammonia Project and Clean Ammonia Offtake South Korea Itochu Corporation Joint Study Framework on Ammonia as an Alternative Marine Fuel Singapore Partnering with global leaders in CCS, power generation and maritime shipping to advance clean energy initiatives POSCO agreement to initiate ATR ammonia production FEED study South Korea
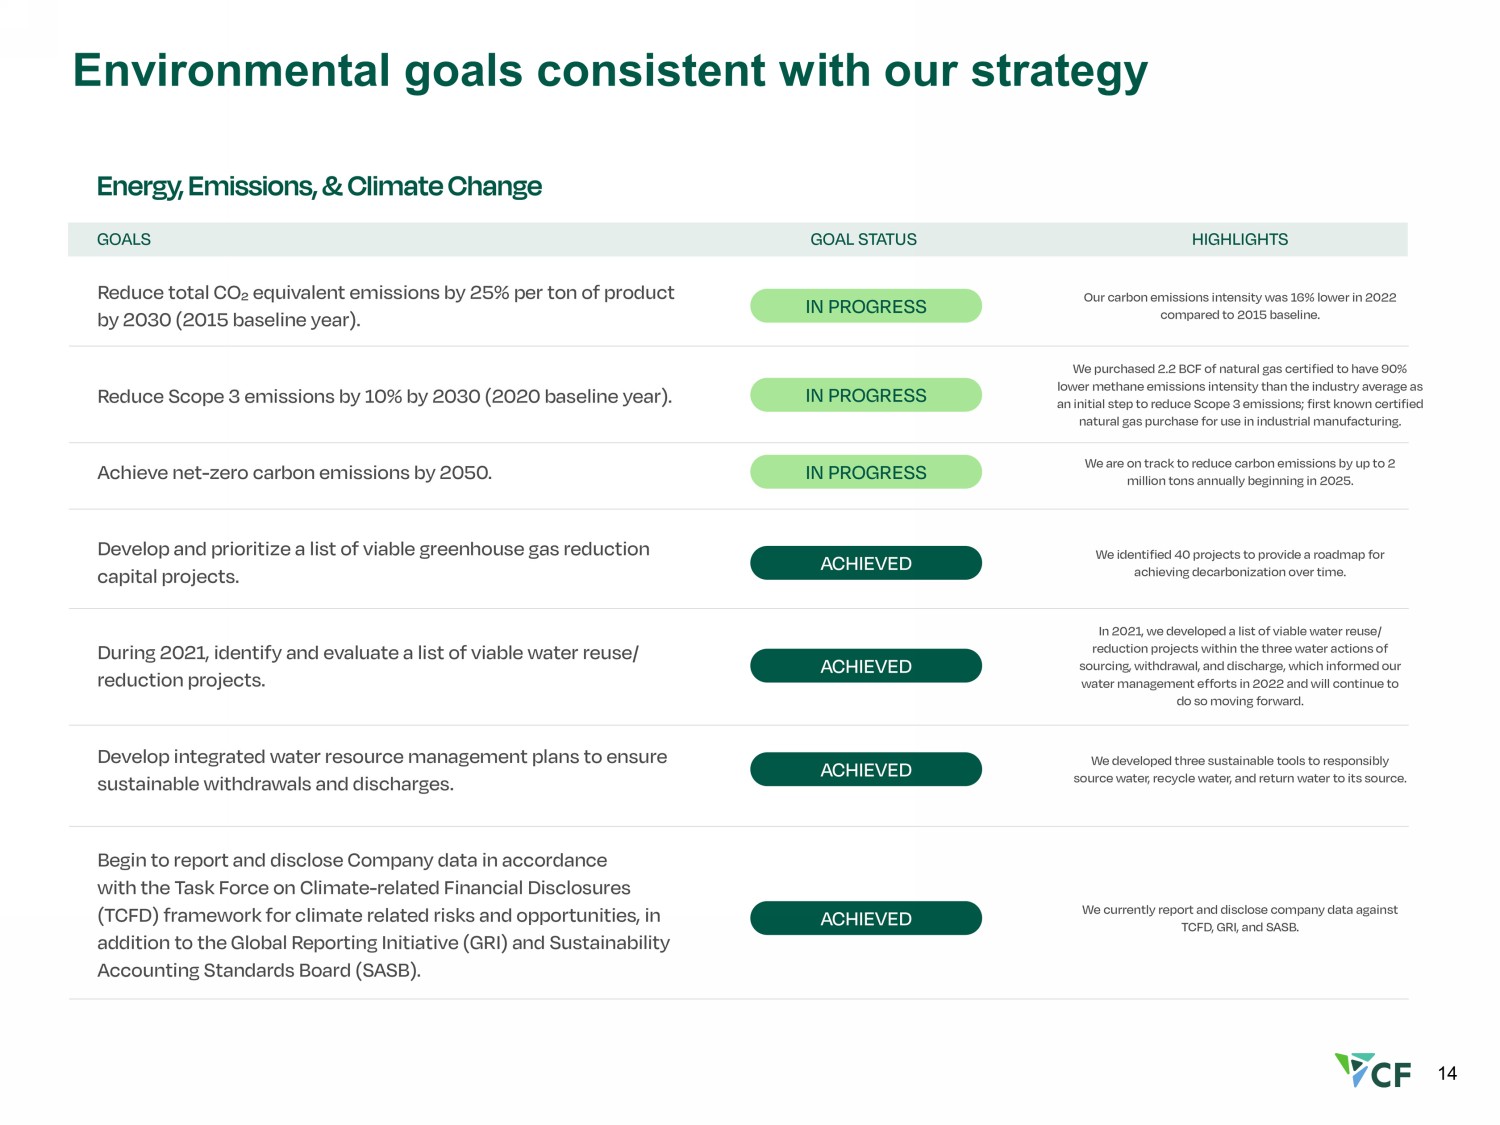
14 Environmental goals consistent with our strategy
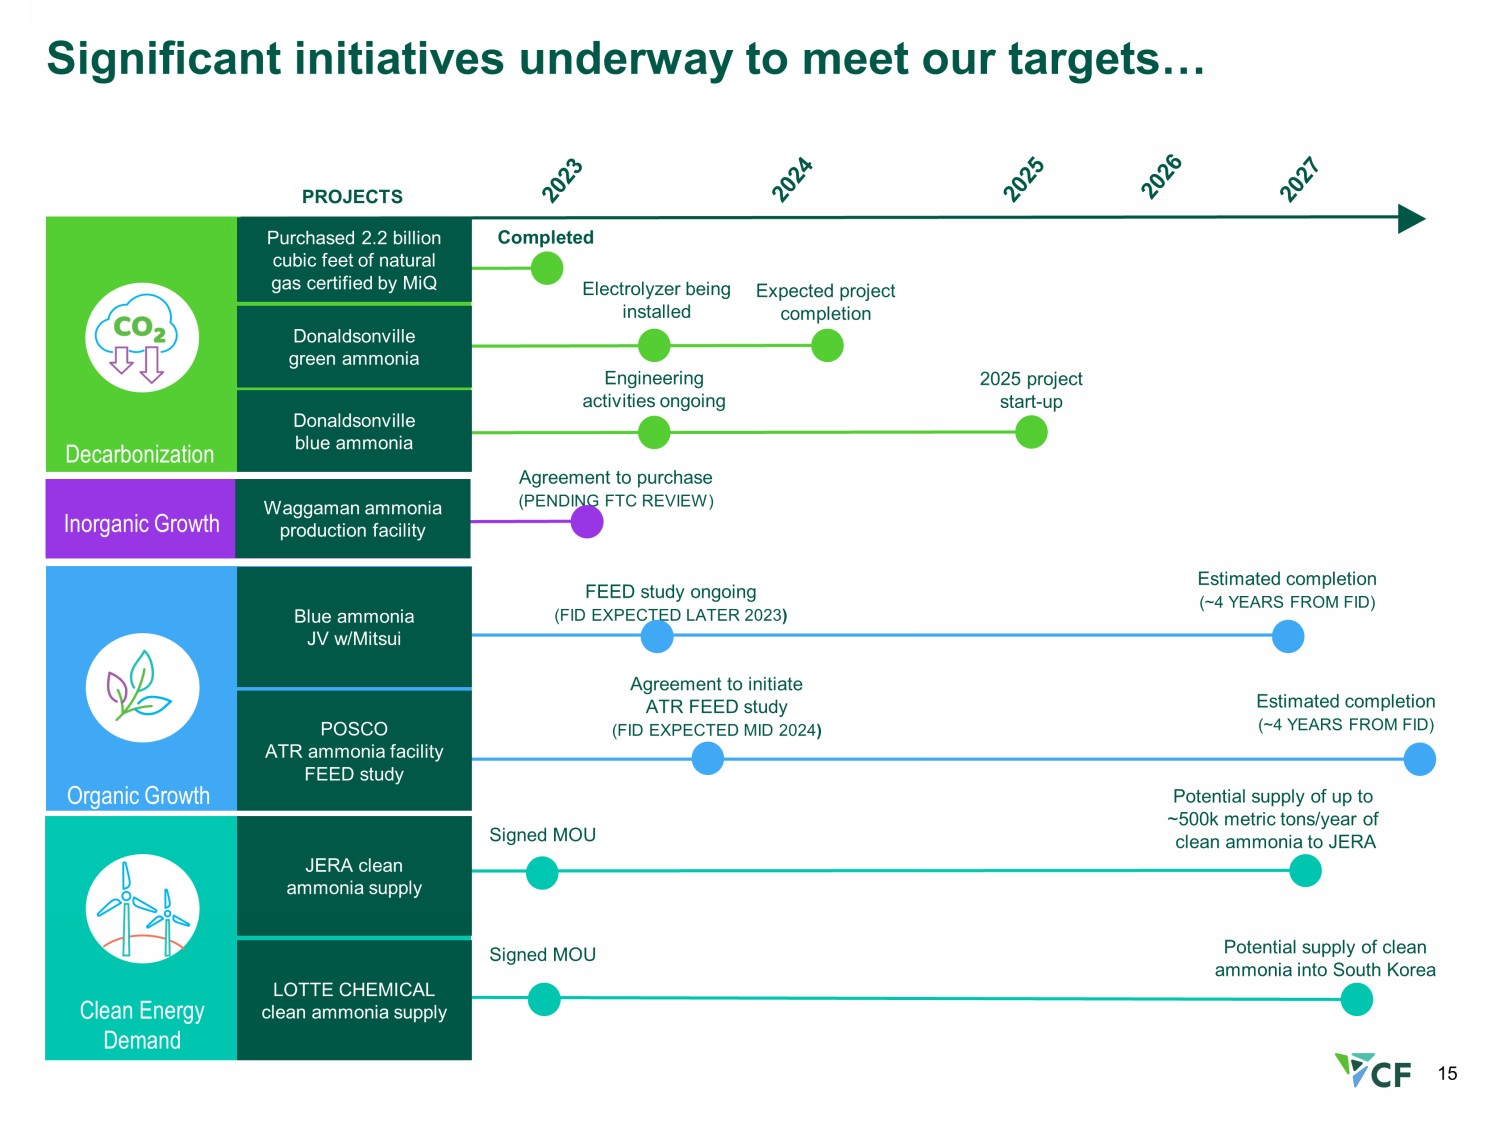
15 Significant initiatives underway to meet our targets… Organic Growth Clean Energy Demand Expected project completion Purchased 2.2 billion cubic feet of natural gas certified by MiQ Donaldsonville green ammonia Electrolyzer being installed Completed Donaldsonville blue ammonia Engineering activities ongoing Blue ammonia JV w/Mitsui FEED study ongoing (FID EXPECTED LATER 2023 ) Estimated completion (~4 YEARS FROM FID) JERA clean ammonia supply LOTTE CHEMICAL clean ammonia supply Signed MOU Potential supply of up to ~500k metric tons/year of clean ammonia to JERA Potential supply of clean ammonia into South Korea PROJECTS Signed MOU POSCO ATR ammonia facility FEED study Estimated completion (~4 YEARS FROM FID) Decarbonization Inorganic Growth Agreement to purchase (PENDING FTC REVIEW) Waggaman ammonia production facility Agreement to initiate ATR FEED study (FID EXPECTED MID 2024 ) 2025 project start - up
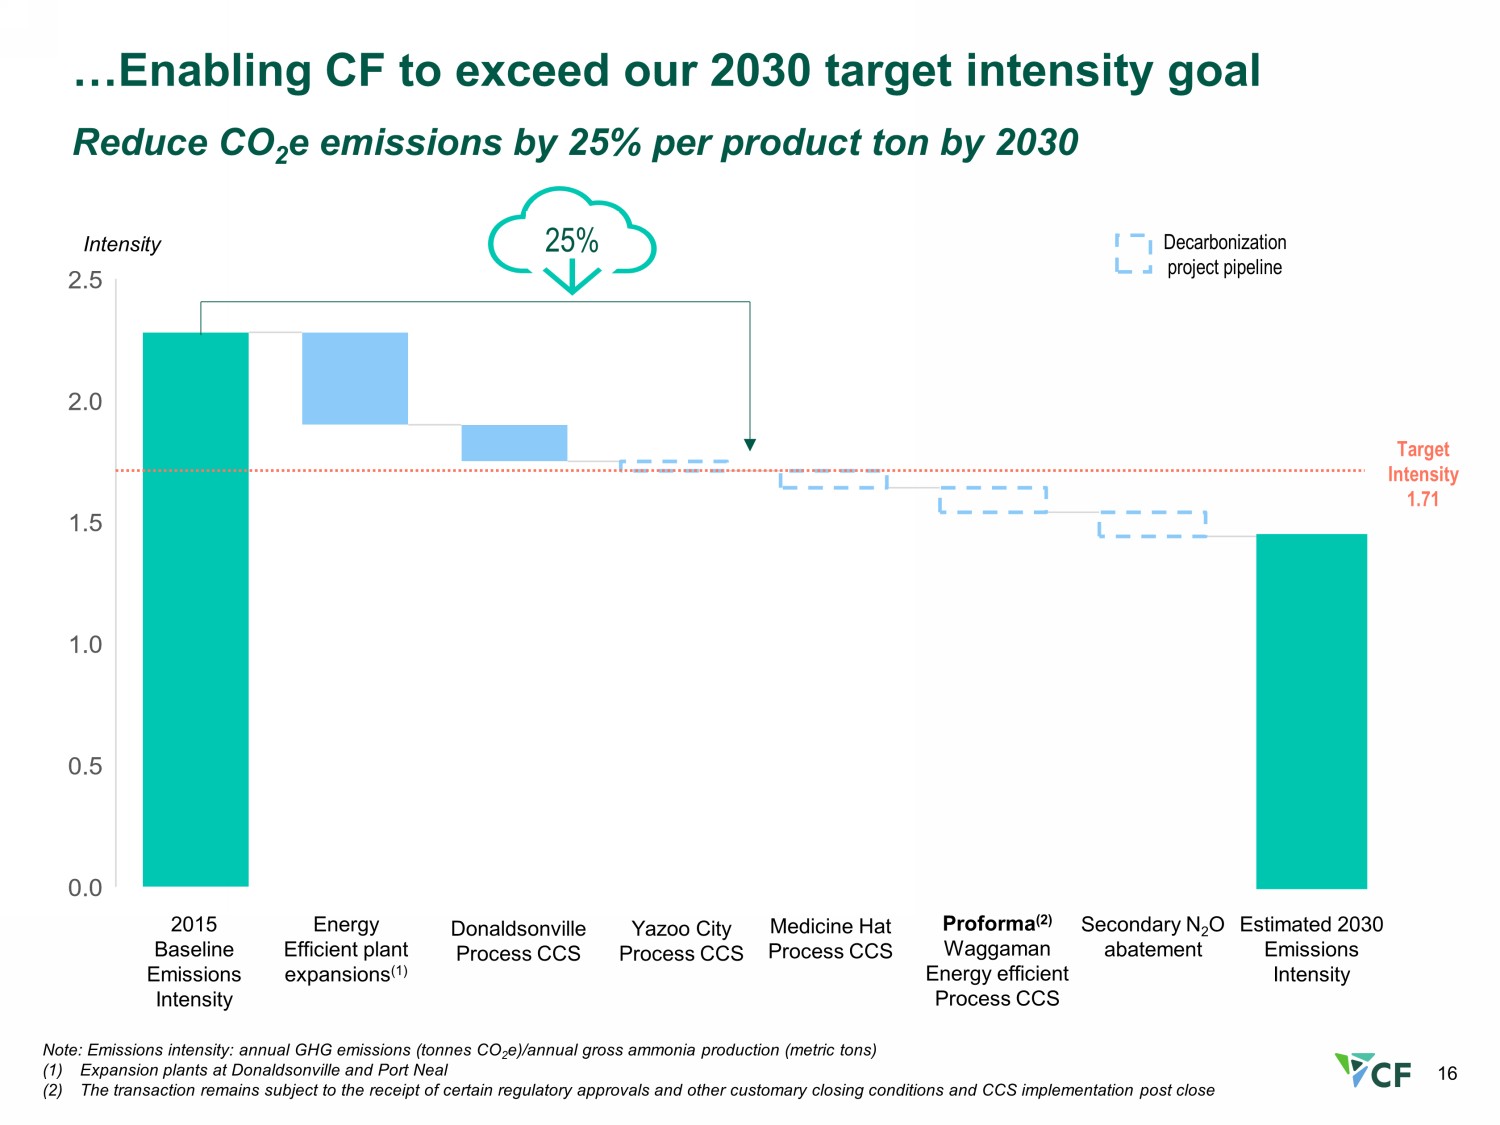
16 …Enabling CF to exceed our 2030 target intensity goal Reduce CO 2 e emissions by 25% per product ton by 2030 Note: Emissions intensity: annual GHG emissions (tonnes CO 2 e)/annual gross ammonia production (metric tons) (1) Expansion plants at Donaldsonville and Port Neal (2) The transaction remains subject to the receipt of certain regulatory approvals and other customary closing conditions and CCS im plementation post close 2015 Baseline Emissions Intensity Energy Efficient plant expansions (1) Donaldsonville Process CCS Yazoo City Process CCS Secondary N 2 O abatement Estimated 2030 Emissions Intensity 25% Medicine Hat Process CCS Target Intensity 1.71 Intensity Decarbonization project pipeline Proforma (2) Waggaman Energy efficient Process CCS
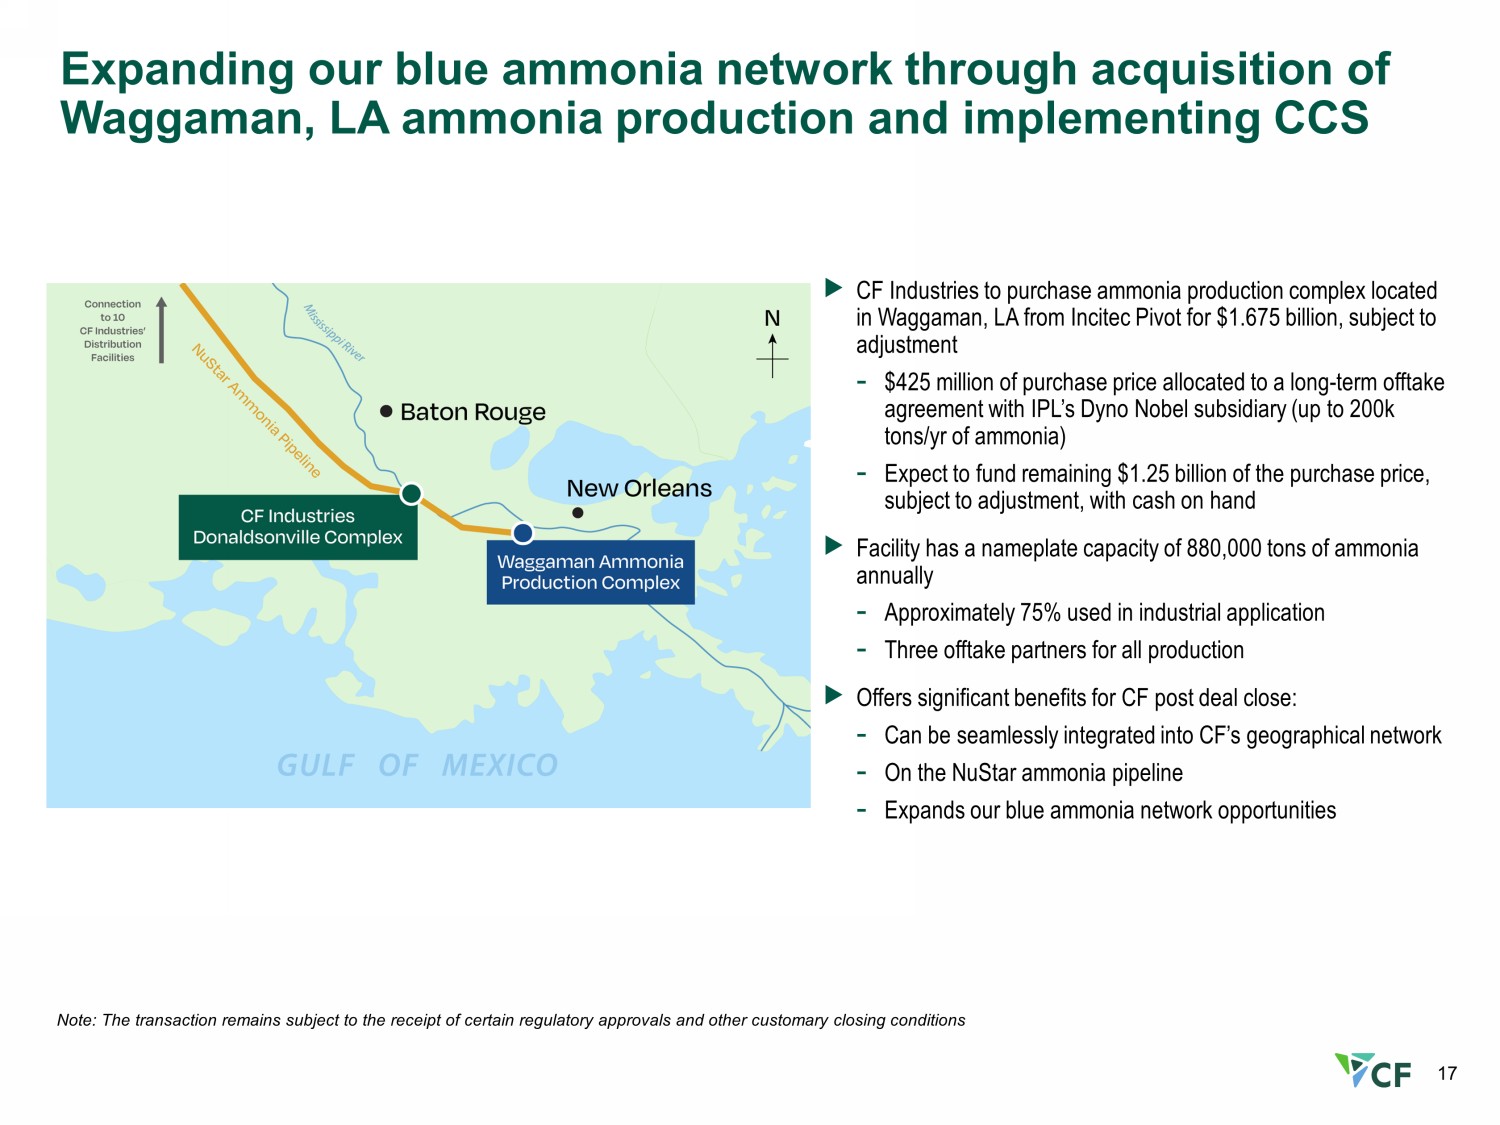
17 Expanding our blue ammonia network through acquisition of Waggaman, LA ammonia production and implementing CCS $16.38 FY 2022 $4.24 FY 2021 CF Industries to purchase ammonia production complex located in Waggaman, LA from Incitec Pivot for $1.675 billion, subject to adjustment - $425 million of purchase price allocated to a long - term offtake agreement with IPL’s Dyno Nobel subsidiary (up to 200k tons/ yr of ammonia) - Expect to fund remaining $1.25 billion of the purchase price, subject to adjustment, with cash on hand Facility has a nameplate capacity of 880,000 tons of ammonia annually - Approximately 75% used in industrial application - Three offtake partners for all production Offers significant benefits for CF post deal close: - Can be seamlessly integrated into CF’s geographical network - On the NuStar ammonia pipeline - Expands our blue ammonia network opportunities Note: The transaction remains subject to the receipt of certain regulatory approvals and other customary closing conditions
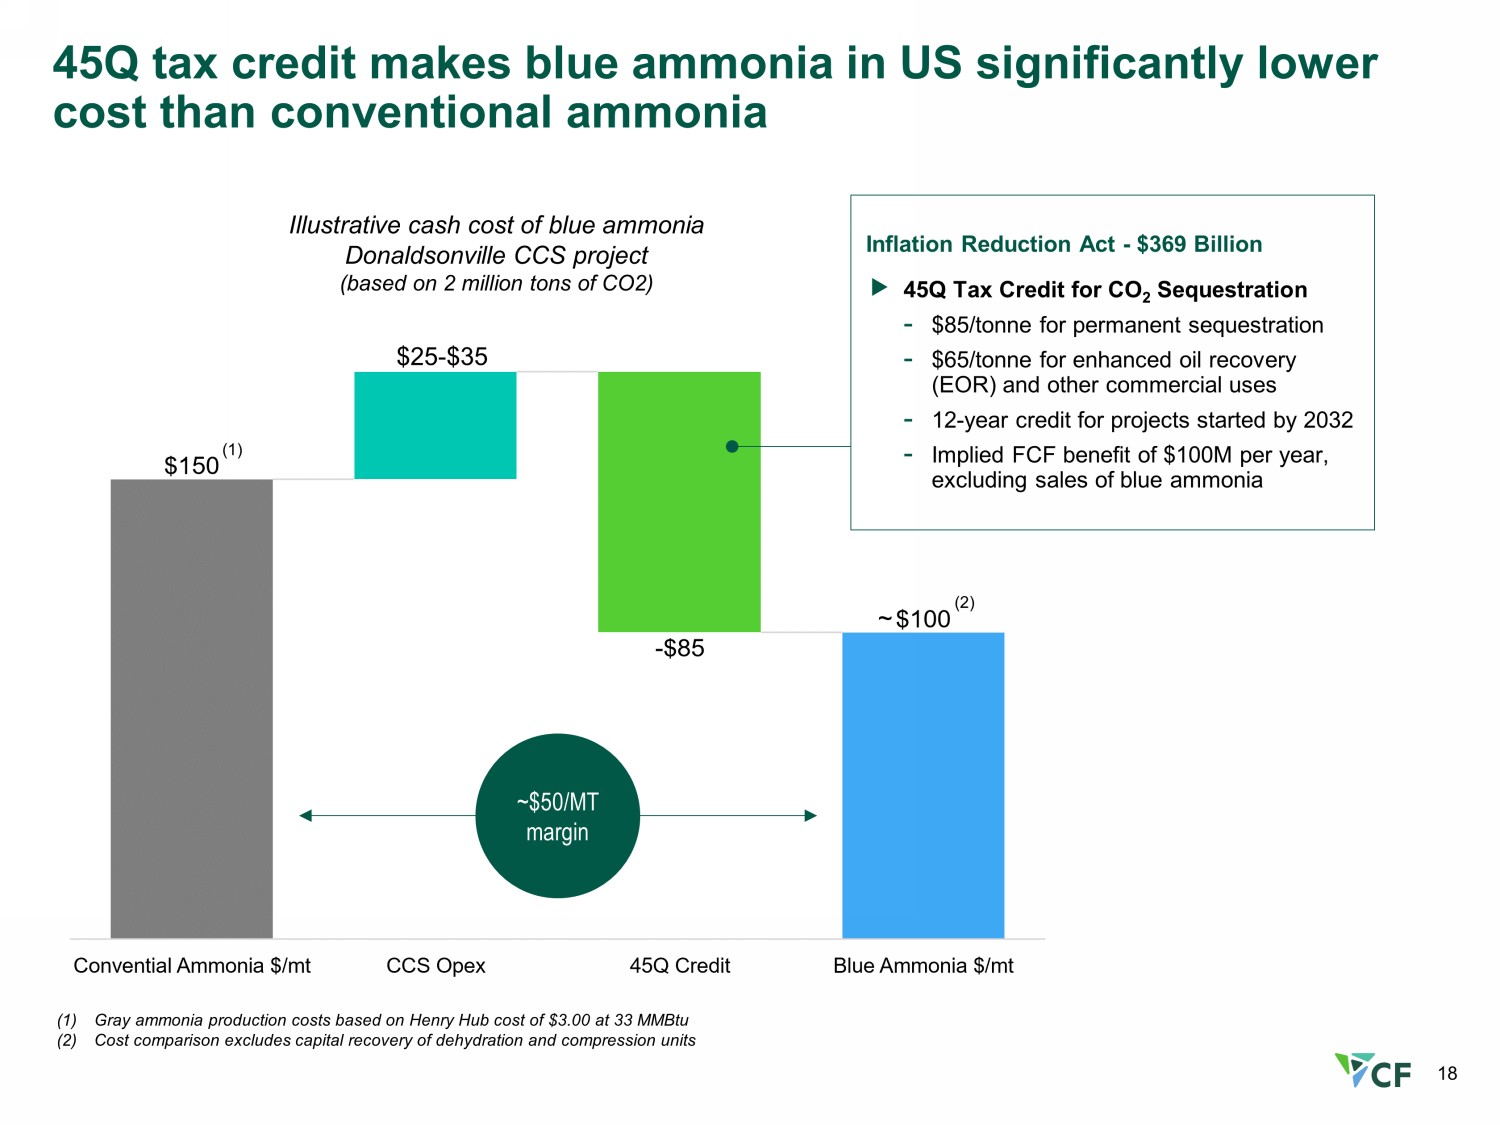
18 45Q tax credit makes blue ammonia in US significantly lower cost than conventional ammonia (1) Gray ammonia production costs based on Henry Hub cost of $3.00 at 33 MMBtu (2) Cost comparison excludes capital recovery of dehydration and compression units Illustrative cash cost of blue ammonia Donaldsonville CCS project (based on 2 million tons of CO2) ~$50/MT margin $25 - $35 Inflation Reduction Act - $369 Billion 45Q Tax Credit for CO 2 Sequestration - $85/tonne for permanent sequestration - $65/tonne for enhanced oil recovery (EOR) and other commercial uses - 12 - year credit for projects started by 2032 - Implied FCF benefit of $100M per year, excluding sales of blue ammonia ~ (1) (2)
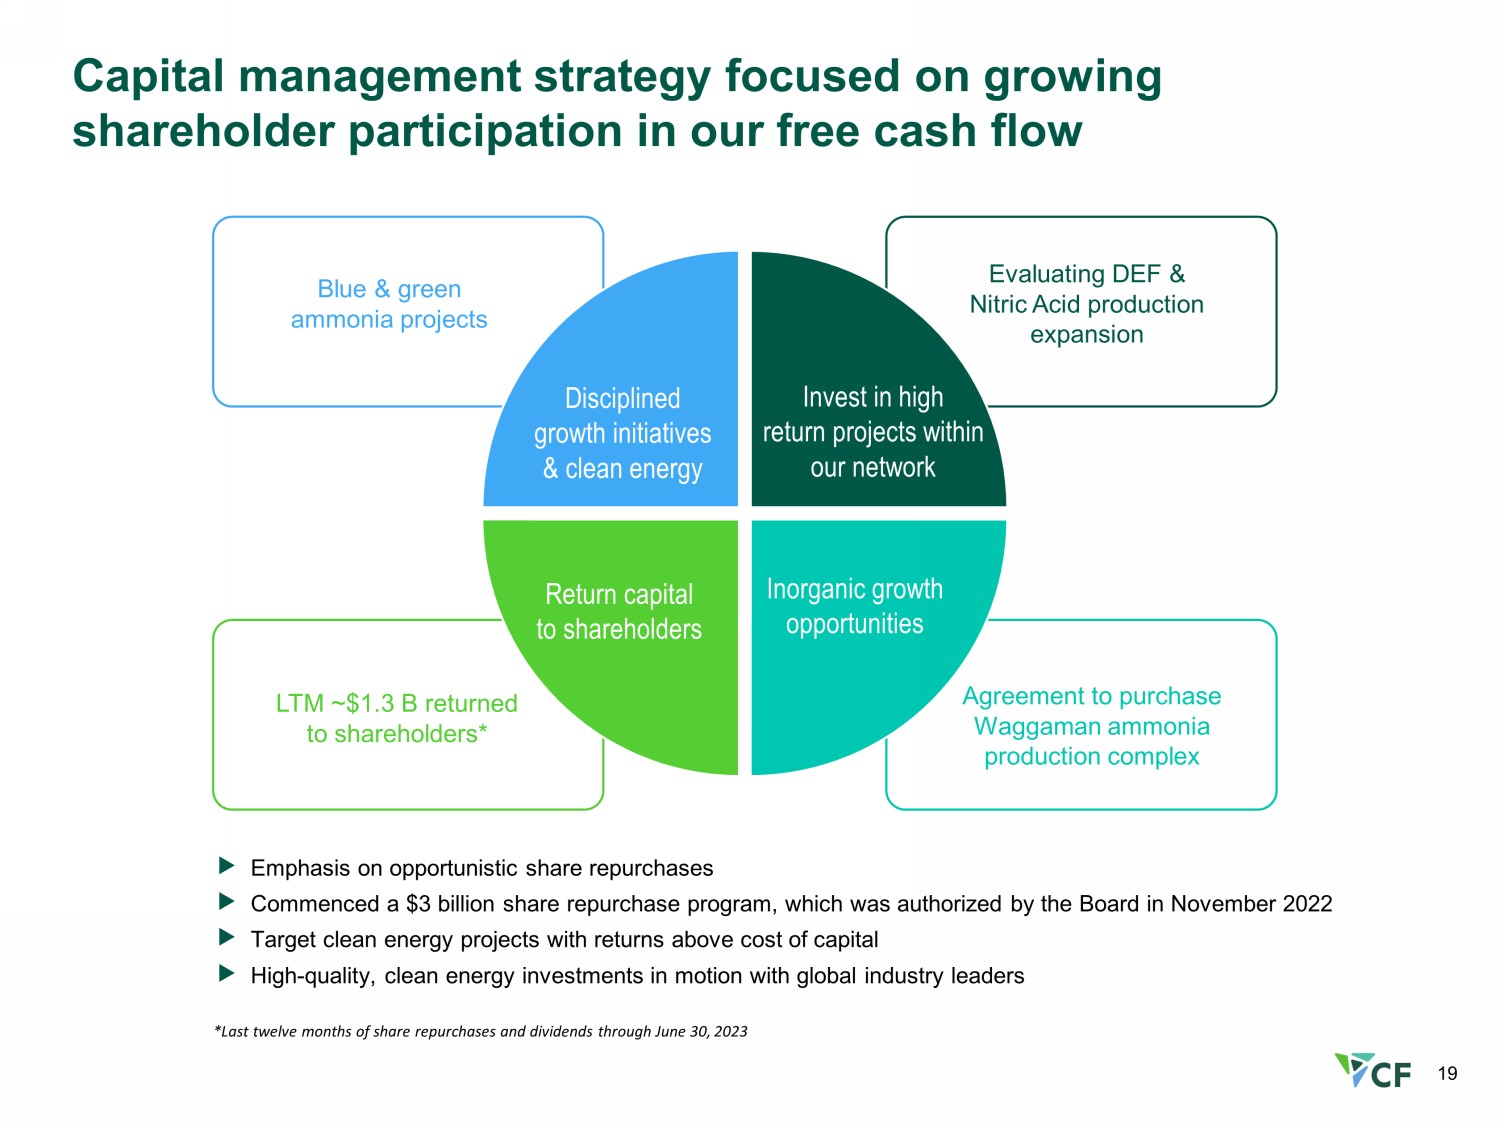
Capital management strategy focused on growing shareholder participation in our free cash flow *Last twelve months of share repurchases and dividends through June 30, 2023 Emphasis on opportunistic share repurchases Commenced a $3 billion share repurchase program, which was authorized by the Board in November 2022 Target clean energy projects with returns above cost of capital High - quality, clean energy investments in motion with global industry leaders LTM ~$1.3 B returned to shareholders* Agreement to purchase Waggaman ammonia production complex Blue & green ammonia projects Evaluating DEF & Nitric Acid production expansion Return capital to shareholders Inorganic growth opportunities Invest in high return projects within our network Disciplined growth initiatives & clean energy 19
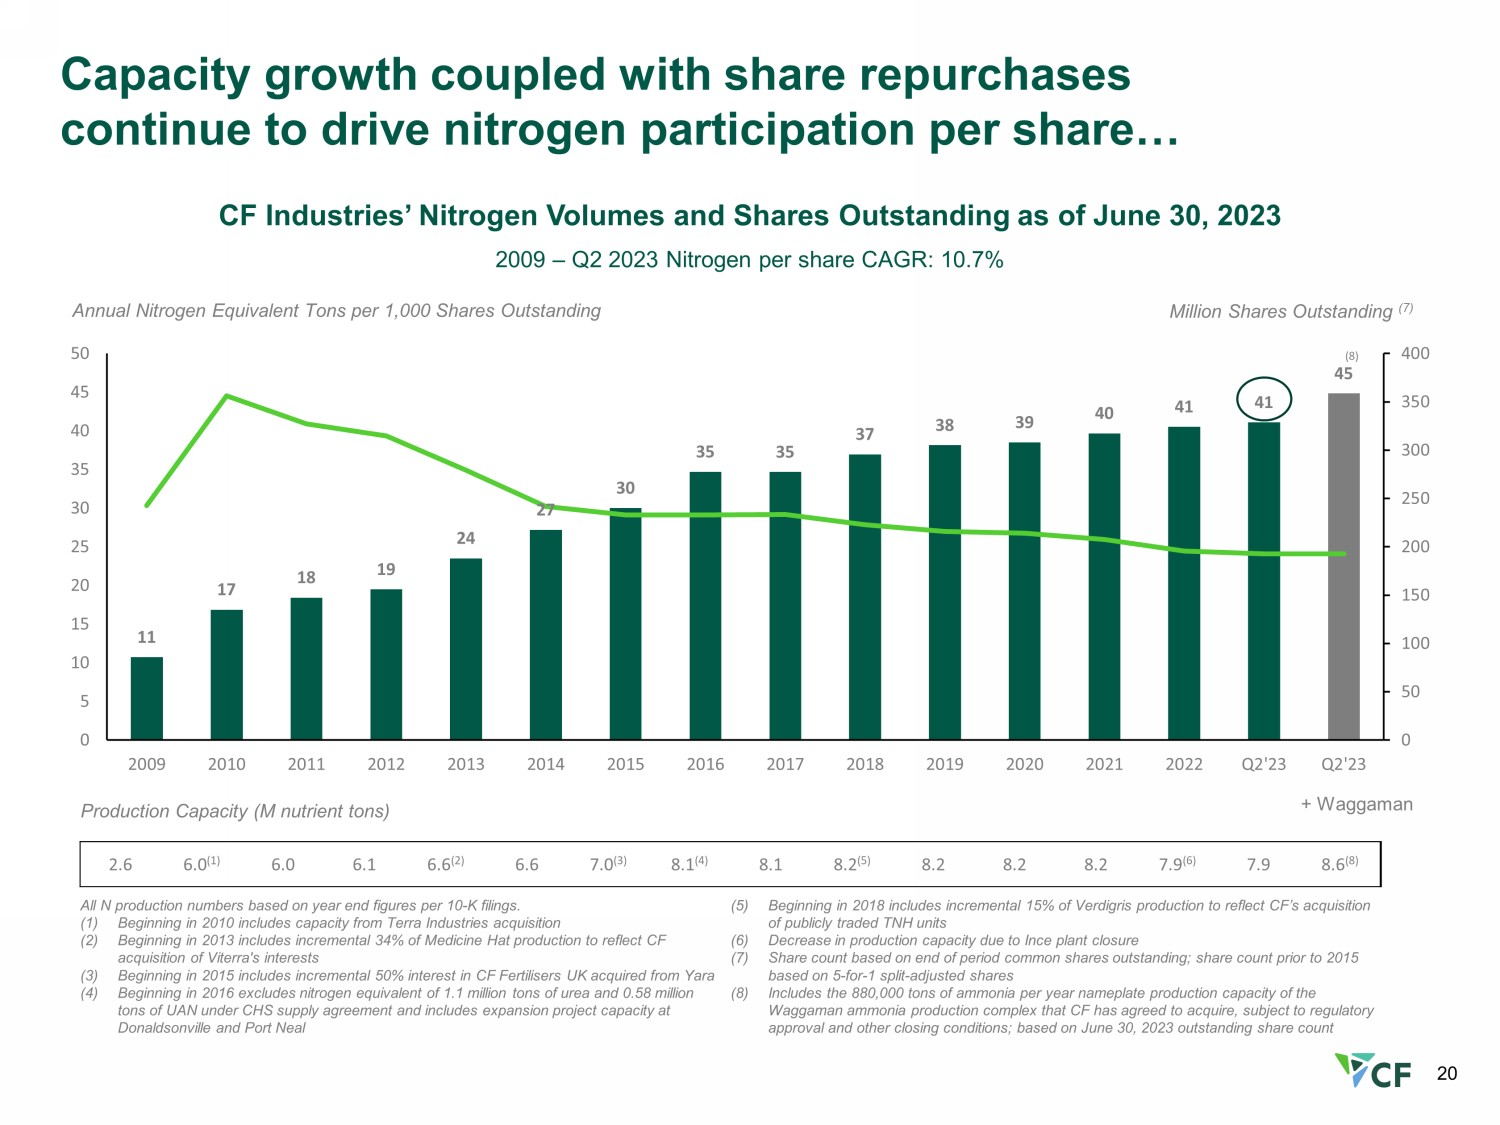
2.6 6.0 (1) 6.0 6.1 6.6 (2) 6.6 7.0 (3) 8.1 (4) 8.1 8.2 (5) 8.2 8.2 8.2 7.9 (6) 7.9 8.6 (8) All N production numbers based on year end figures per 10 - K filings. (1) Beginning in 2010 includes capacity from Terra Industries acquisition (2) Beginning in 2013 includes incremental 34% of Medicine Hat production to reflect CF acquisition of Viterra's interests (3) Beginning in 2015 includes incremental 50% interest in CF Fertilisers UK acquired from Yara (4) Beginning in 2016 excludes nitrogen equivalent of 1.1 million tons of urea and 0.58 million tons of UAN under CHS supply agreement and includes expansion project capacity at Donaldsonville and Port Neal (5) Beginning in 2018 includes incremental 15% of Verdigris production to reflect CF’s acquisition of publicly traded TNH units (6) Decrease in production capacity due to Ince plant closure (7) Share count based on end of period common shares outstanding; share count prior to 2015 based on 5 - for - 1 split - adjusted shares (8) Includes the 880,000 tons of ammonia per year nameplate production capacity of the Waggaman ammonia production complex that CF has agreed to acquire, subject to regulatory approval and other closing conditions; based on June 30, 2023 outstanding share count Production Capacity (M nutrient tons) Annual Nitrogen Equivalent Tons per 1,000 Shares Outstanding CF Industries’ Nitrogen Volumes and Shares Outstanding as of June 30, 2023 Million Shares Outstanding (7) 2009 – Q2 2023 Nitrogen per share CAGR: 10.7% 11 17 18 19 24 27 30 35 35 37 38 39 40 41 41 45 0 50 100 150 200 250 300 350 400 0 5 10 15 20 25 30 35 40 45 50 2009 2010 2011 2012 2013 2014 2015 2016 2017 2018 2019 2020 2021 2022 Q2'23 Q2'23 (8) Capacity growth coupled with share repurchases continue to drive nitrogen participation per share… + Waggaman 20

Financial Highlights
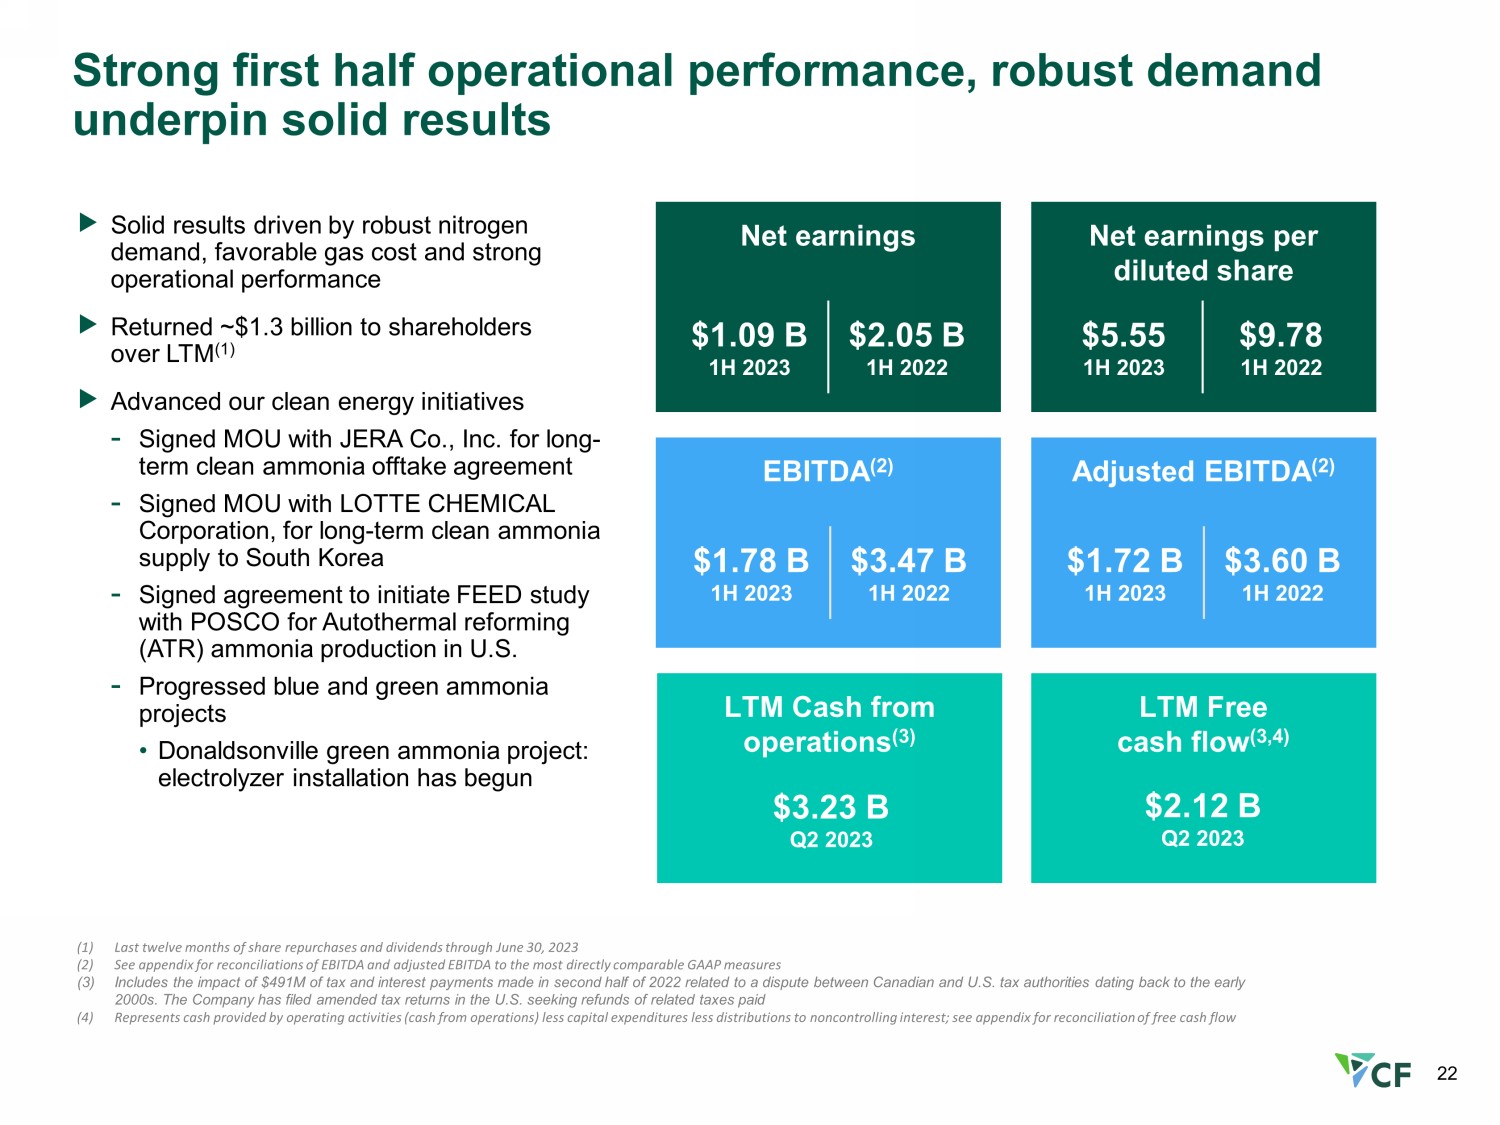
Strong first half operational performance, robust demand underpin solid results (1) Last twelve months of share repurchases and dividends through June 30, 2023 (2) See appendix for reconciliations of EBITDA and adjusted EBITDA to the most directly comparable GAAP measures (3) Includes the impact of $491M of tax and interest payments made in second half of 2022 related to a dispute between Canadian a nd U.S. tax authorities dating back to the early 2000s. The Company has filed amended tax returns in the U.S. seeking refunds of related taxes paid (4) Represents cash provided by operating activities (cash from operations) less capital expenditures less distributions to nonco ntr olling interest; see appendix for reconciliation of free cash flow EBITDA (2) Net earnings Net earnings per diluted share Adjusted EBITDA (2) $1.72 B 1H 2023 $3.60 B 1H 2022 $5.55 1H 2023 $9.78 1H 2022 LTM Cash from operations (3) LTM Free cash flow (3,4) Solid results driven by robust nitrogen demand, favorable gas cost and strong operational performance Returned ~$1.3 billion to shareholders over LTM (1) Advanced our clean energy initiatives - Signed MOU with JERA Co., Inc. for long - term clean ammonia offtake agreement - Signed MOU with LOTTE CHEMICAL Corporation, for long - term clean ammonia supply to South Korea - Signed agreement to initiate FEED study with POSCO for Autothermal reforming (ATR) ammonia production in U.S. - Progressed blue and green ammonia projects • Donaldsonville green ammonia project: electrolyzer installation has begun $3.23 B Q2 2023 $1.78 B 1H 2023 $3.47 B 1H 2022 $1.09 B 1H 2023 $2.05 B 1H 2022 $2.12 B Q2 2023 22
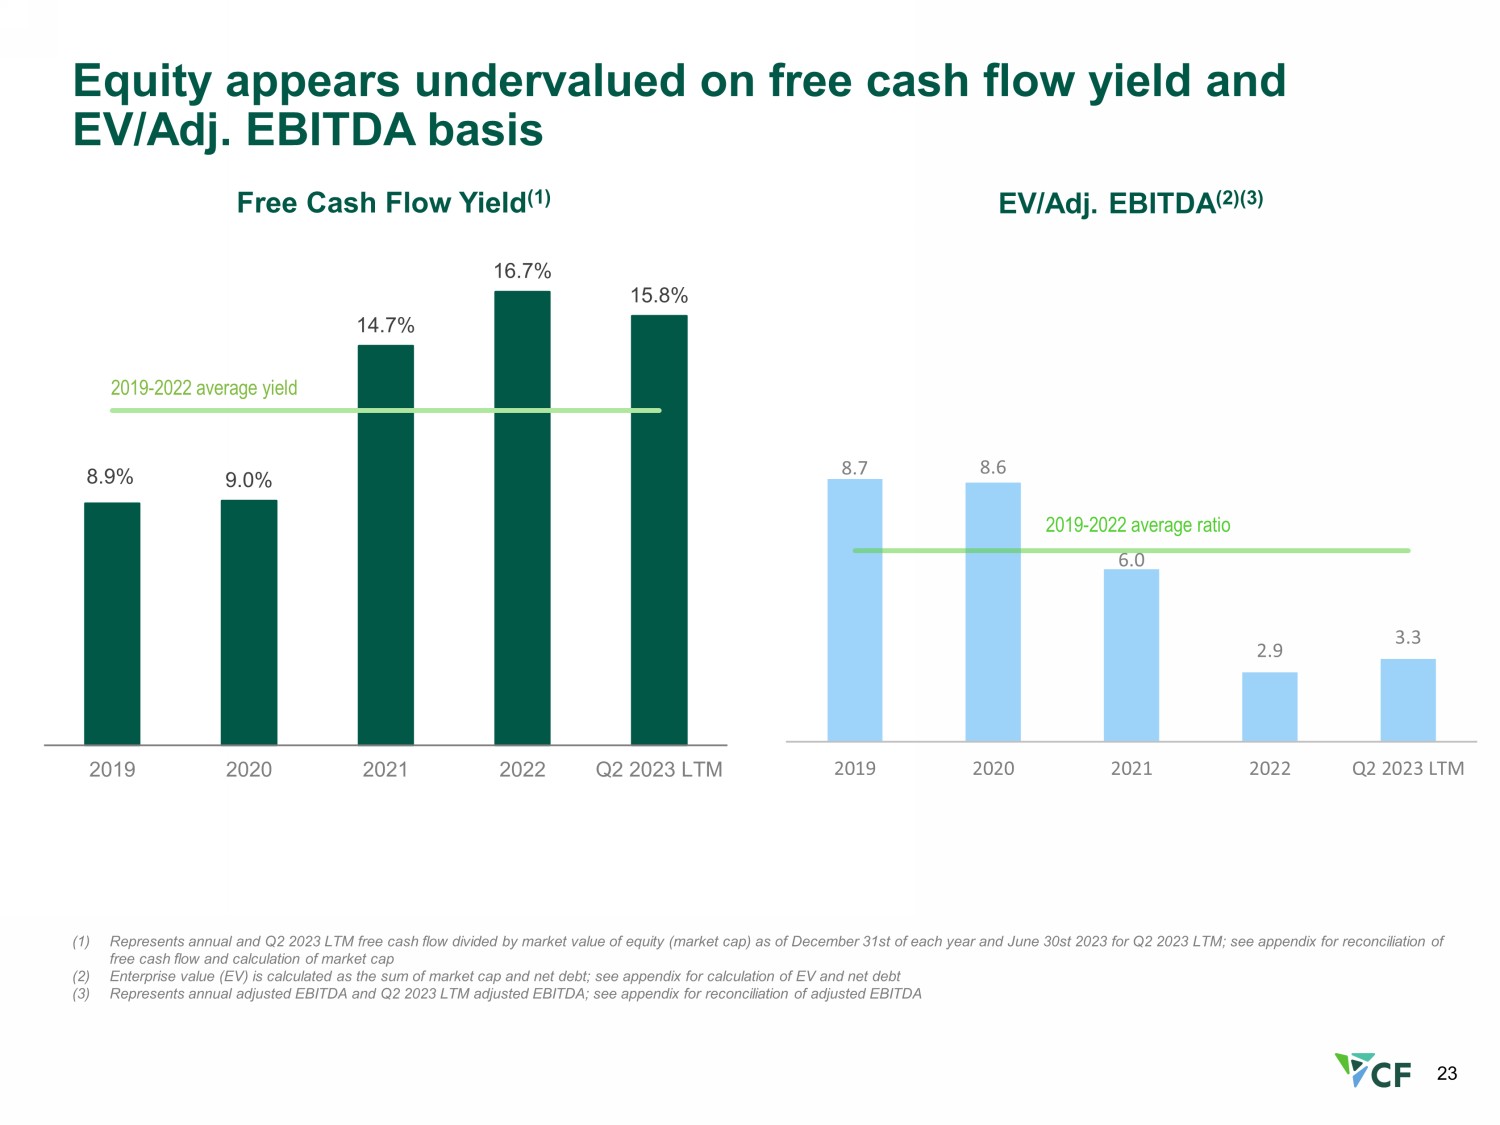
8.7 8.6 6.0 2.9 3.3 2019 2020 2021 2022 Q2 2023 LTM 2019 - 2022 average ratio EV/Adj. EBITDA (2)(3) Equity appears undervalued on free cash flow yield and EV/Adj. EBITDA basis 8.9% 9.0% 14.7% 16.7% 15.8% 2019 2020 2021 2022 Q2 2023 LTM 2019 - 2022 average yield Free Cash Flow Yield (1) (1) Represents annual and Q2 2023 LTM free cash flow divided by market value of equity (market cap) as of December 31st of each y ear and June 30st 2023 for Q2 2023 LTM; see appendix for reconciliation of free cash flow and calculation of market cap (2) Enterprise value (EV) is calculated as the sum of market cap and net debt; see appendix for calculation of EV and net debt (3) Represents annual adjusted EBITDA and Q2 2023 LTM adjusted EBITDA; see appendix for reconciliation of adjusted EBITDA 23

Appendix
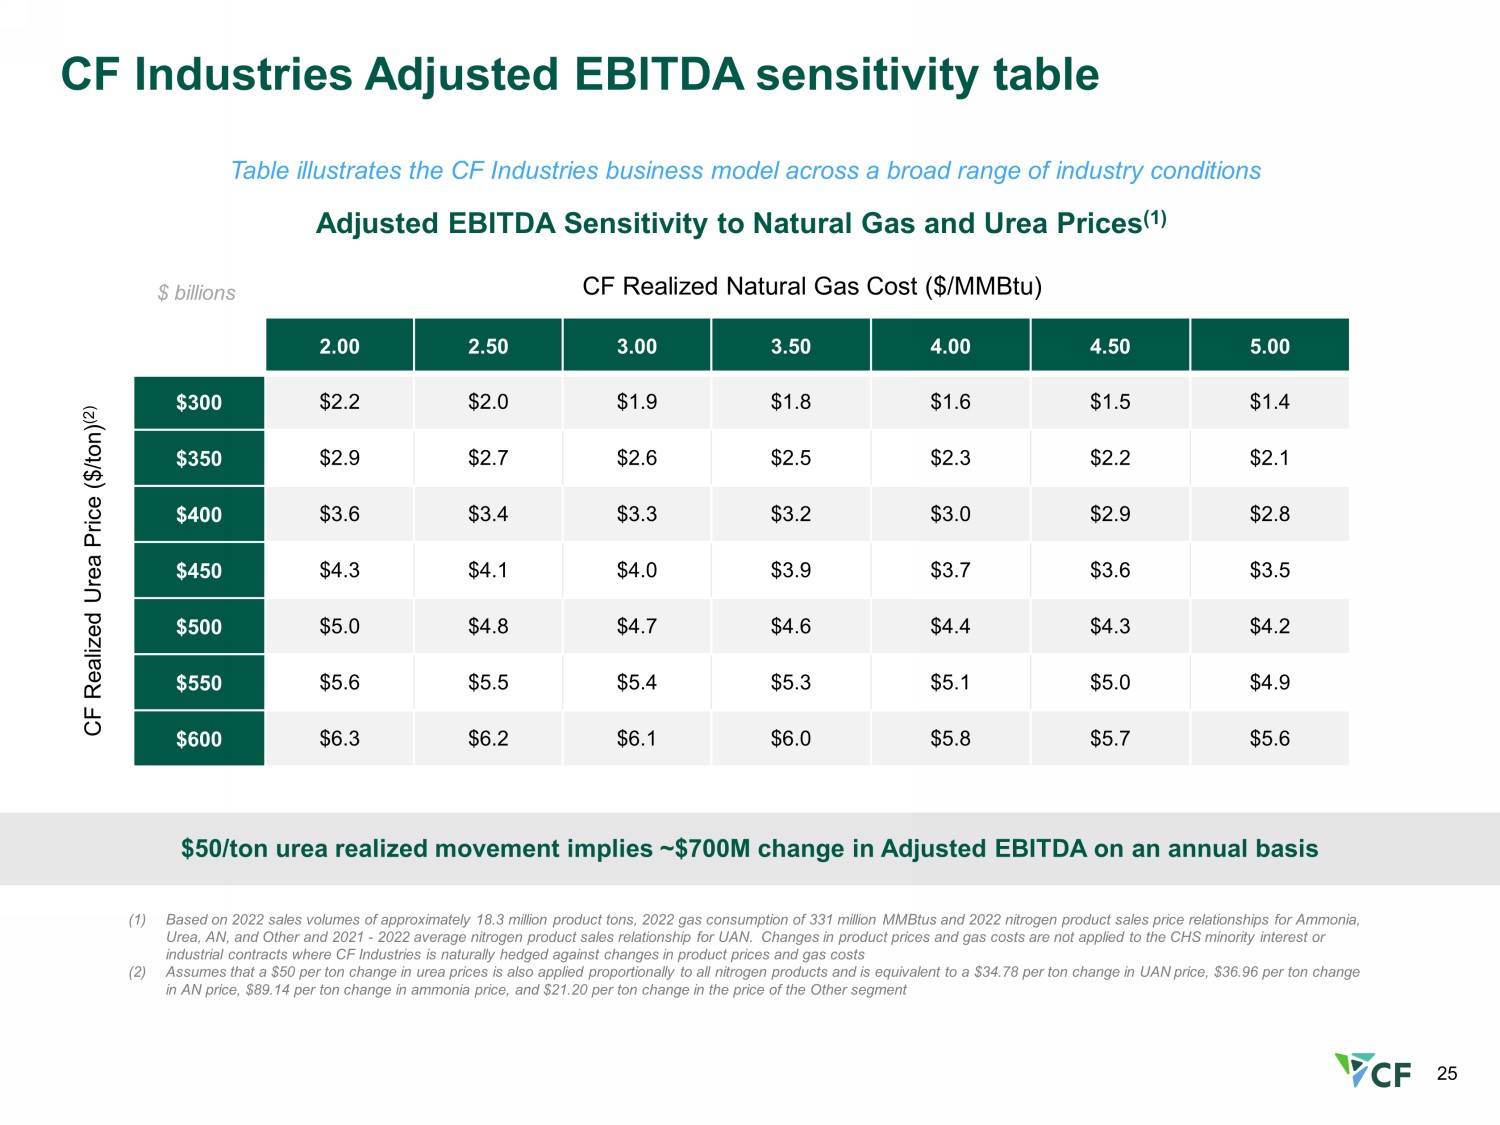
CF Industries Adjusted EBITDA sensitivity table Table illustrates the CF Industries business model across a broad range of industry conditions $50/ton urea realized movement implies ~$700M change in Adjusted EBITDA on an annual basis (1) Based on 2022 sales volumes of approximately 18.3 million product tons, 2022 gas consumption of 331 million MMBtus and 2022 n itr ogen product sales price relationships for Ammonia, Urea, AN, and Other and 2021 - 2022 average nitrogen product sales relationship for UAN. Changes in product prices and gas cost s are not applied to the CHS minority interest or industrial contracts where CF Industries is naturally hedged against changes in product prices and gas costs (2) Assumes that a $50 per ton change in urea prices is also applied proportionally to all nitrogen products and is equivalent to a $34.78 per ton change in UAN price, $36.96 per ton change in AN price, $89.14 per ton change in ammonia price, and $21.20 per ton change in the price of the Other segment Adjusted EBITDA Sensitivity to Natural Gas and Urea Prices (1) $ billions CF Realized Natural Gas Cost ($/MMBtu) CF Realized Urea Price ($/ton) (2) 2.00 2.50 3.00 3.50 4.00 4.50 5.00 $300 $2.2 $2.0 $1.9 $1.8 $1.6 $1.5 $1.4 $350 $2.9 $2.7 $2.6 $2.5 $2.3 $2.2 $2.1 $400 $3.6 $3.4 $3.3 $3.2 $3.0 $2.9 $2.8 $450 $4.3 $4.1 $4.0 $3.9 $3.7 $3.6 $3.5 $500 $5.0 $4.8 $4.7 $4.6 $4.4 $4.3 $4.2 $550 $5.6 $5.5 $5.4 $5.3 $5.1 $5.0 $4.9 $600 $6.3 $6.2 $6.1 $6.0 $5.8 $5.7 $5.6 25
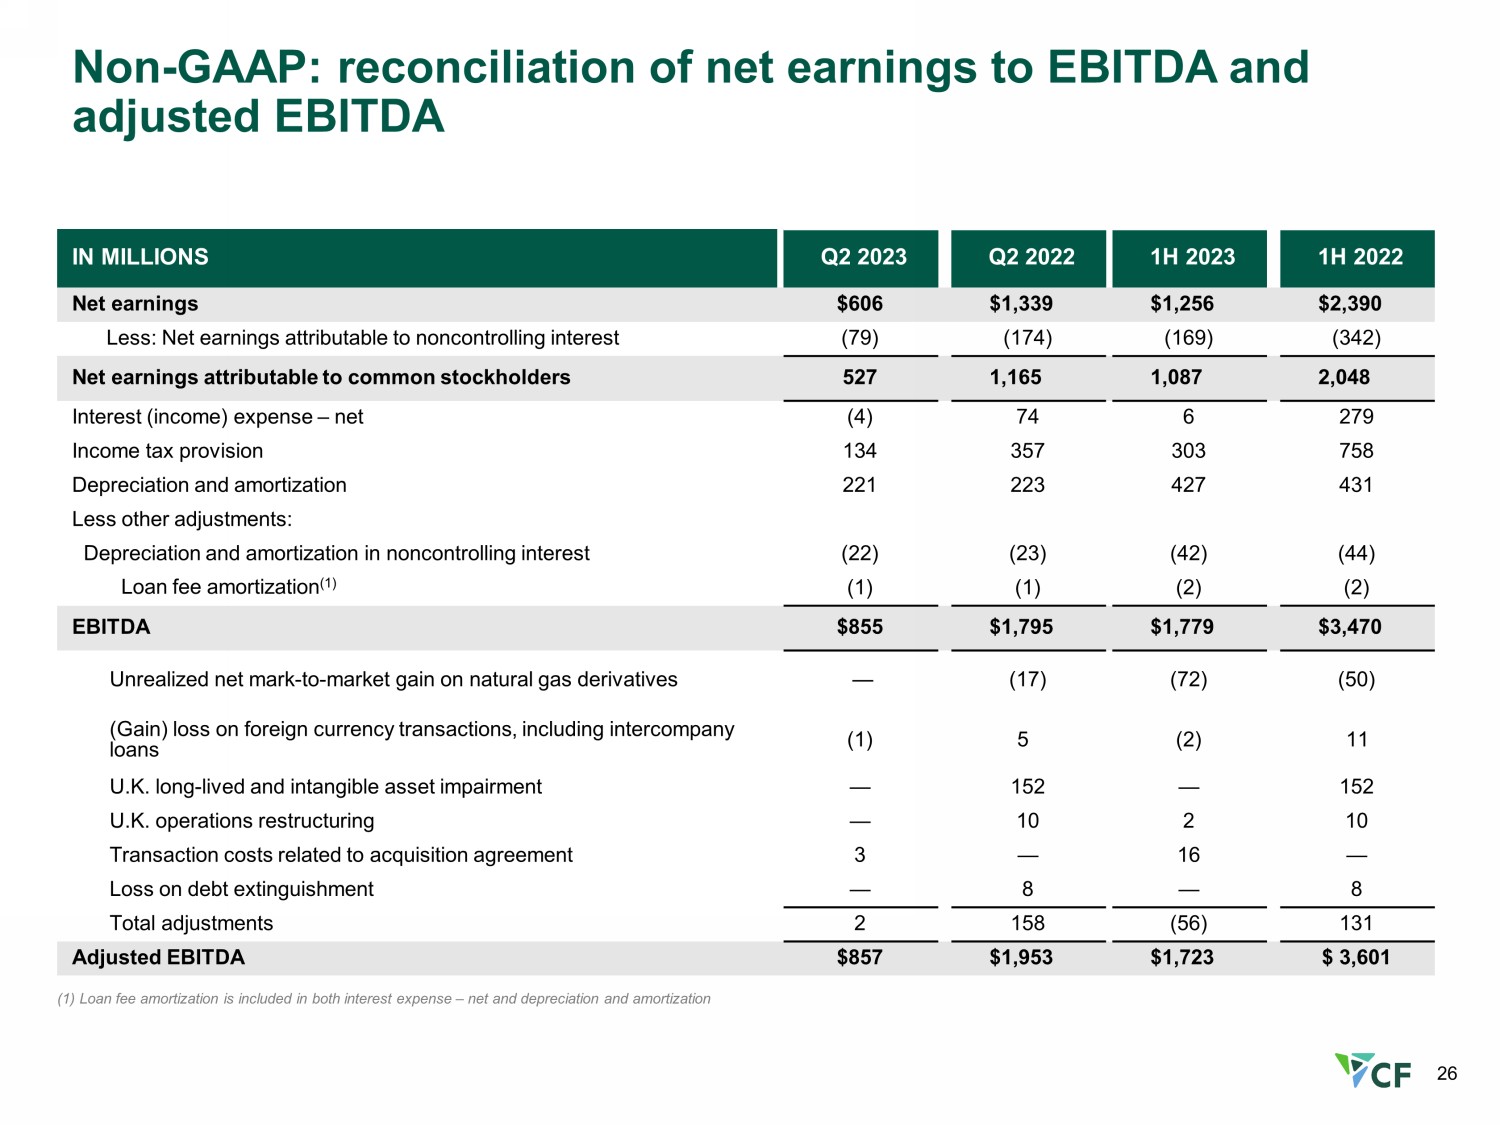
26 Non - GAAP: reconciliation of net earnings to EBITDA and adjusted EBITDA IN MILLIONS Q2 2023 Q2 2022 1H 2023 1H 2022 Net earnings $606 $1,339 $1,256 $2,390 Less: Net earnings attributable to noncontrolling interest (79) (174) (169) (342) Net earnings attributable to common stockholders 527 1,165 1,087 2,048 Interest (income) expense – net (4) 74 6 279 Income tax provision 134 357 303 758 Depreciation and amortization 221 223 427 431 Less other adjustments: Depreciation and amortization in noncontrolling interest (22) (23) (42) (44 ) Loan fee amortization (1) (1) (1) (2) (2) EBITDA $855 $1,795 $1,779 $3,470 Unrealized net mark - to - market gain on natural gas derivatives — (17) (72) (50) (Gain) loss on foreign currency transactions, including intercompany loans (1) 5 (2) 11 U.K. long - lived and intangible asset impairment — 152 — 152 U.K. operations restructuring — 10 2 10 Transaction costs related to acquisition agreement 3 — 16 — Loss on debt extinguishment — 8 — 8 Total adjustments 2 158 (56) 131 Adjusted EBITDA $857 $1,953 $1,723 $ 3,601 (1) Loan fee amortization is included in both interest expense – net and depreciation and amortization
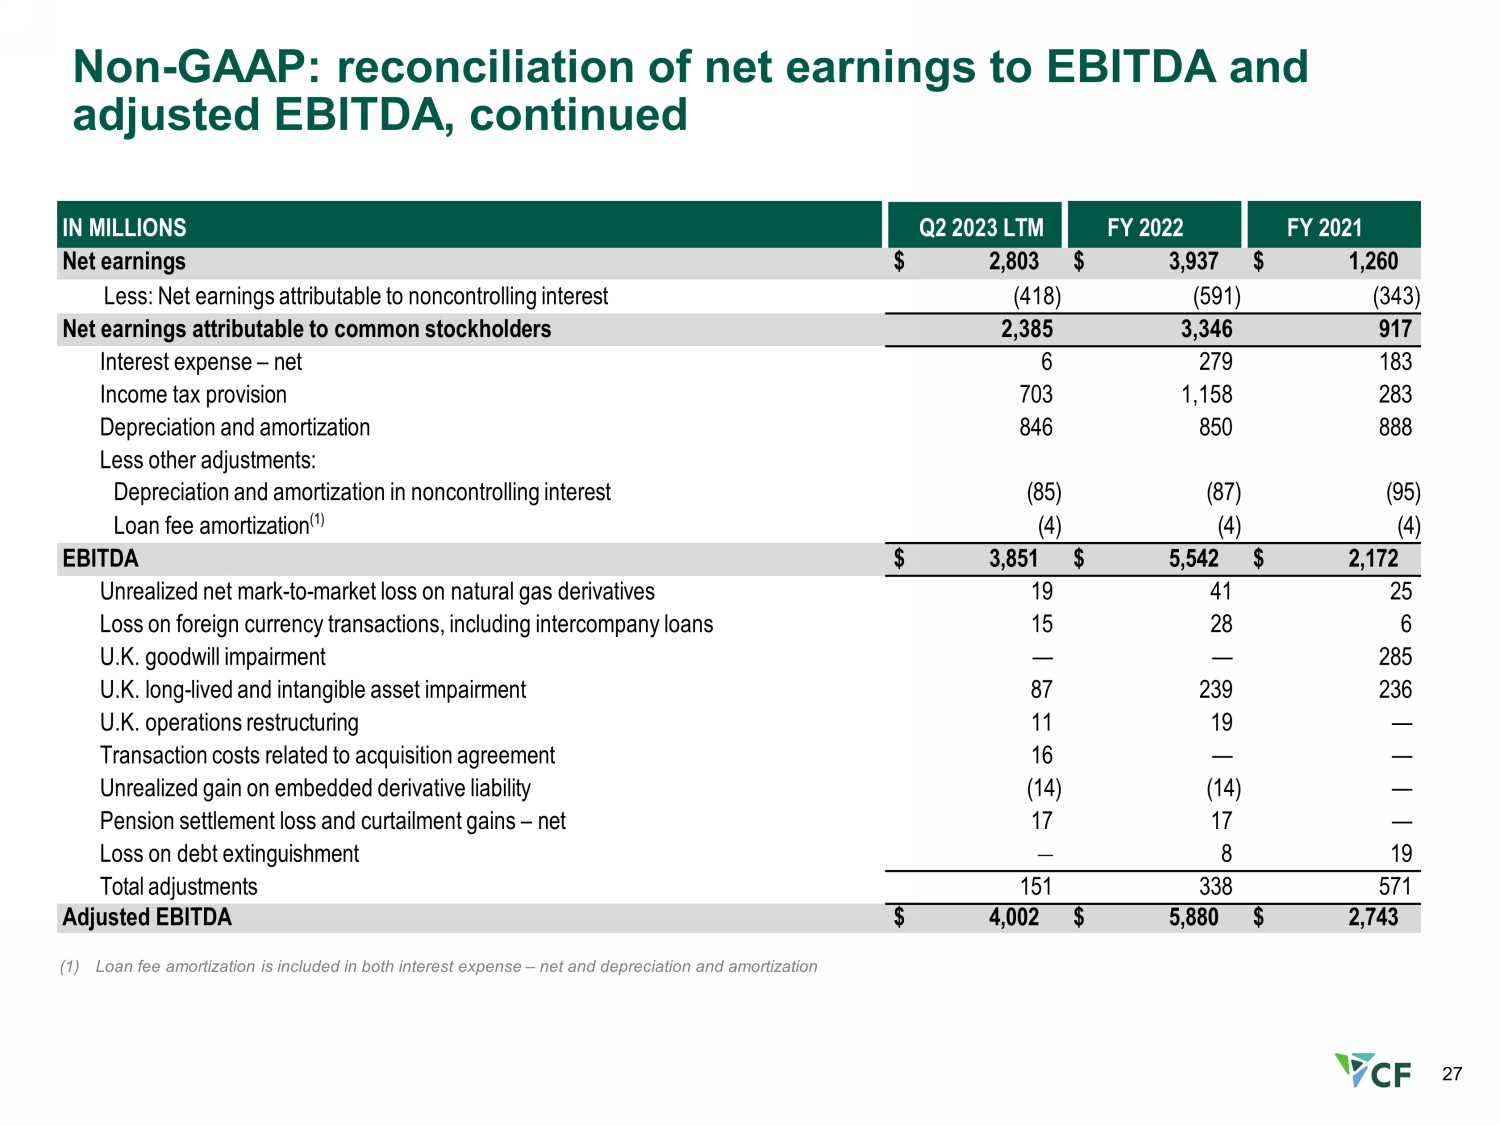
27 Non - GAAP: reconciliation of net earnings to EBITDA and adjusted EBITDA, continued IN MILLIONS Q2 2023 LTM FY 2022 FY 2021 Net earnings $ 2,803 $ 3,937 $ 1,260 Less: Net earnings attributable to noncontrolling interest (418) (591) (343) Net earnings attributable to common stockholders 2,385 3,346 917 Interest expense – net 6 279 183 Income tax provision 703 1,158 283 Depreciation and amortization 846 850 888 Less other adjustments: Depreciation and amortization in noncontrolling interest (85) (87) (95) Loan fee amortization (1) (4) (4) (4) EBITDA $ 3,851 $ 5,542 $ 2,172 Unrealized net mark - to - market loss on natural gas derivatives 19 41 25 Loss on foreign currency transactions, including intercompany loans 15 28 6 U.K. goodwill impairment — — 285 U.K. long - lived and intangible asset impairment 87 239 236 U.K. operations restructuring 11 19 — Transaction costs related to acquisition agreement 16 — — Unrealized gain on embedded derivative liability (14) (14) — Pension settlement loss and curtailment gains – net 17 17 — Loss on debt extinguishment — 8 19 Total adjustments 151 338 571 Adjusted EBITDA $ 4,002 $ 5,880 $ 2,743 (1) Loan fee amortization is included in both interest expense – net and depreciation and amortization
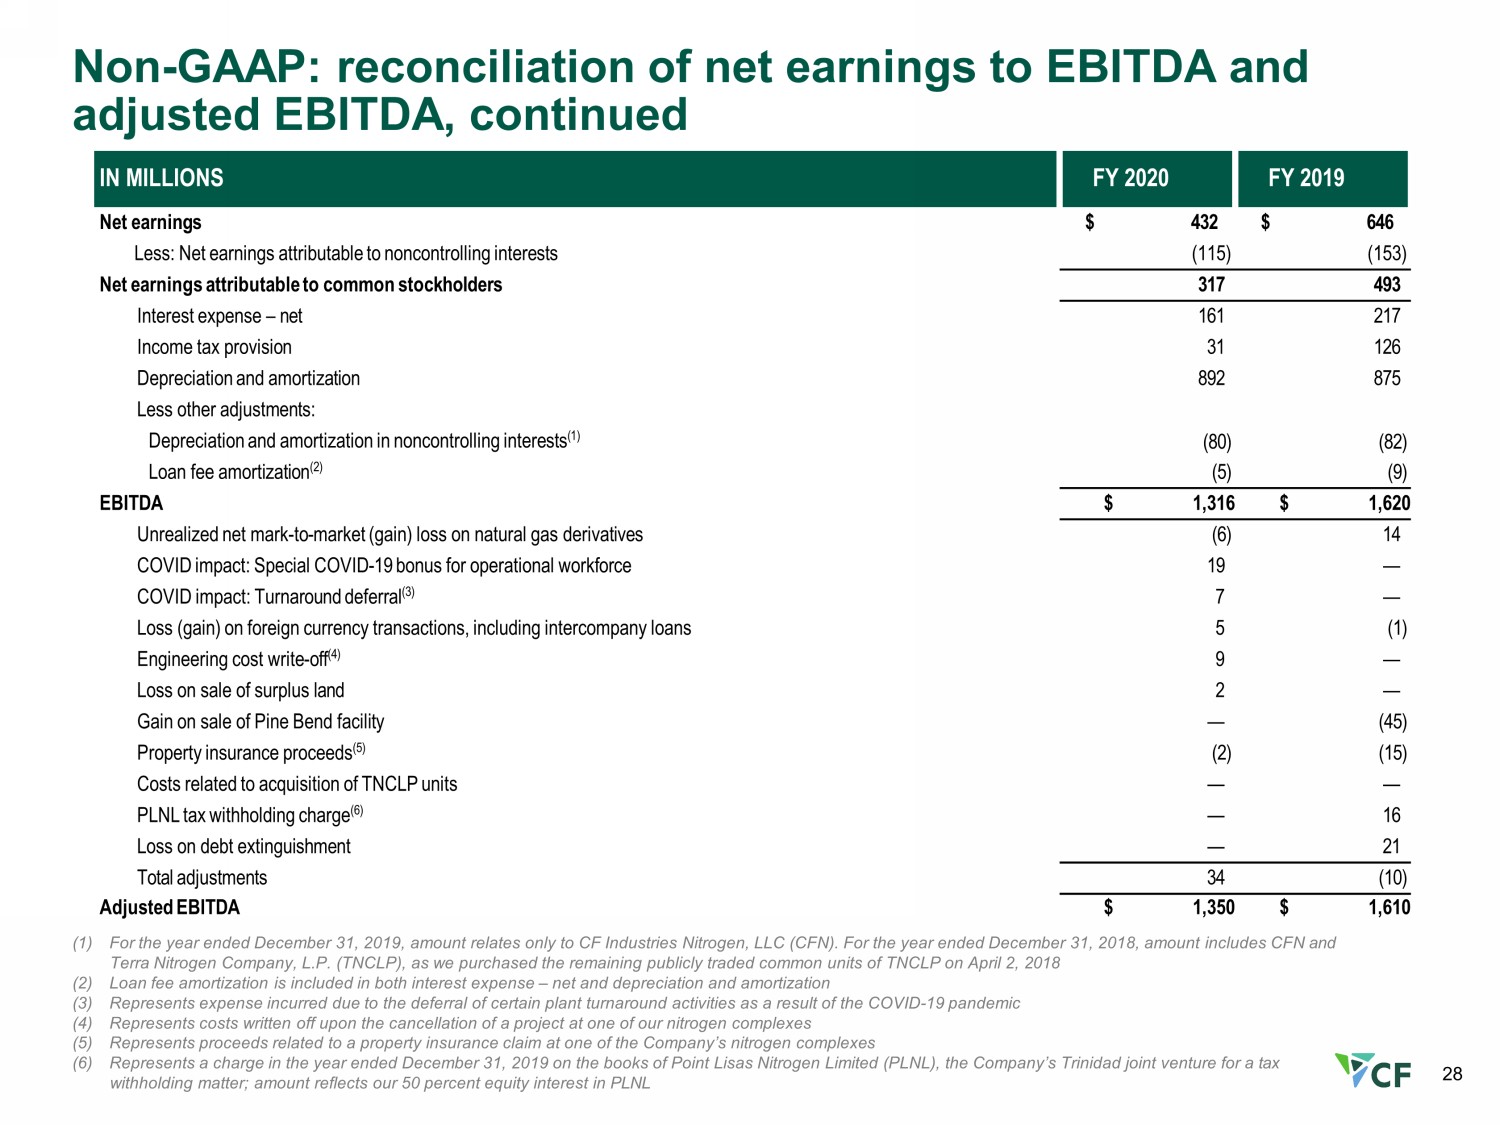
28 Non - GAAP: reconciliation of net earnings to EBITDA and adjusted EBITDA, continued I N MILLIONS FY 2020 FY 2019 Net earnings $ 432 $ 646 Less: Net earnings attributable to noncontrolling interests (115) (153) Net earnings attributable to common stockholders 317 493 Interest expense – net 161 217 Income tax provision 31 126 Depreciation and amortization 892 875 Less other adjustments: Depreciation and amortization in noncontrolling interests (1) (80) (82) Loan fee amortization (2) (5) (9) EBITDA $ 1,316 $ 1,620 Unrealized net mark - to - market (gain) loss on natural gas derivatives (6) 14 COVID impact: Special COVID - 19 bonus for operational workforce 19 — COVID impact: Turnaround deferral (3) 7 — Loss (gain) on foreign currency transactions, including intercompany loans 5 (1) Engineering cost write - off (4) 9 — Loss on sale of surplus land 2 — Gain on sale of Pine Bend facility — (45) Property insurance proceeds (5) (2) (15) Costs related to acquisition of TNCLP units — — PLNL tax withholding charge (6) — 16 Loss on debt extinguishment — 21 Total adjustments 34 (10) Adjusted EBITDA $ 1,350 $ 1,610 (1) For the year ended December 31, 2019, amount relates only to CF Industries Nitrogen, LLC (CFN). For the year ended December 31, 2018, amount includes CFN and Terra Nitrogen Company, L.P. (TNCLP), as we purchased the remaining publicly traded common units of TNCLP on April 2, 2018 (2) Loan fee amortization is included in both interest expense – net and depreciation and amortization (3) Represents expense incurred due to the deferral of certain plant turnaround activities as a result of the COVID - 19 pandemic (4) Represents costs written off upon the cancellation of a project at one of our nitrogen complexes (5) Represents proceeds related to a property insurance claim at one of the Company’s nitrogen complexes (6) Represents a charge in the year ended December 31, 2019 on the books of Point Lisas Nitrogen Limited (PLNL), the Company’s Trinidad joint venture for a tax withholding matter; amount reflects our 50 percent equity interest in PLNL
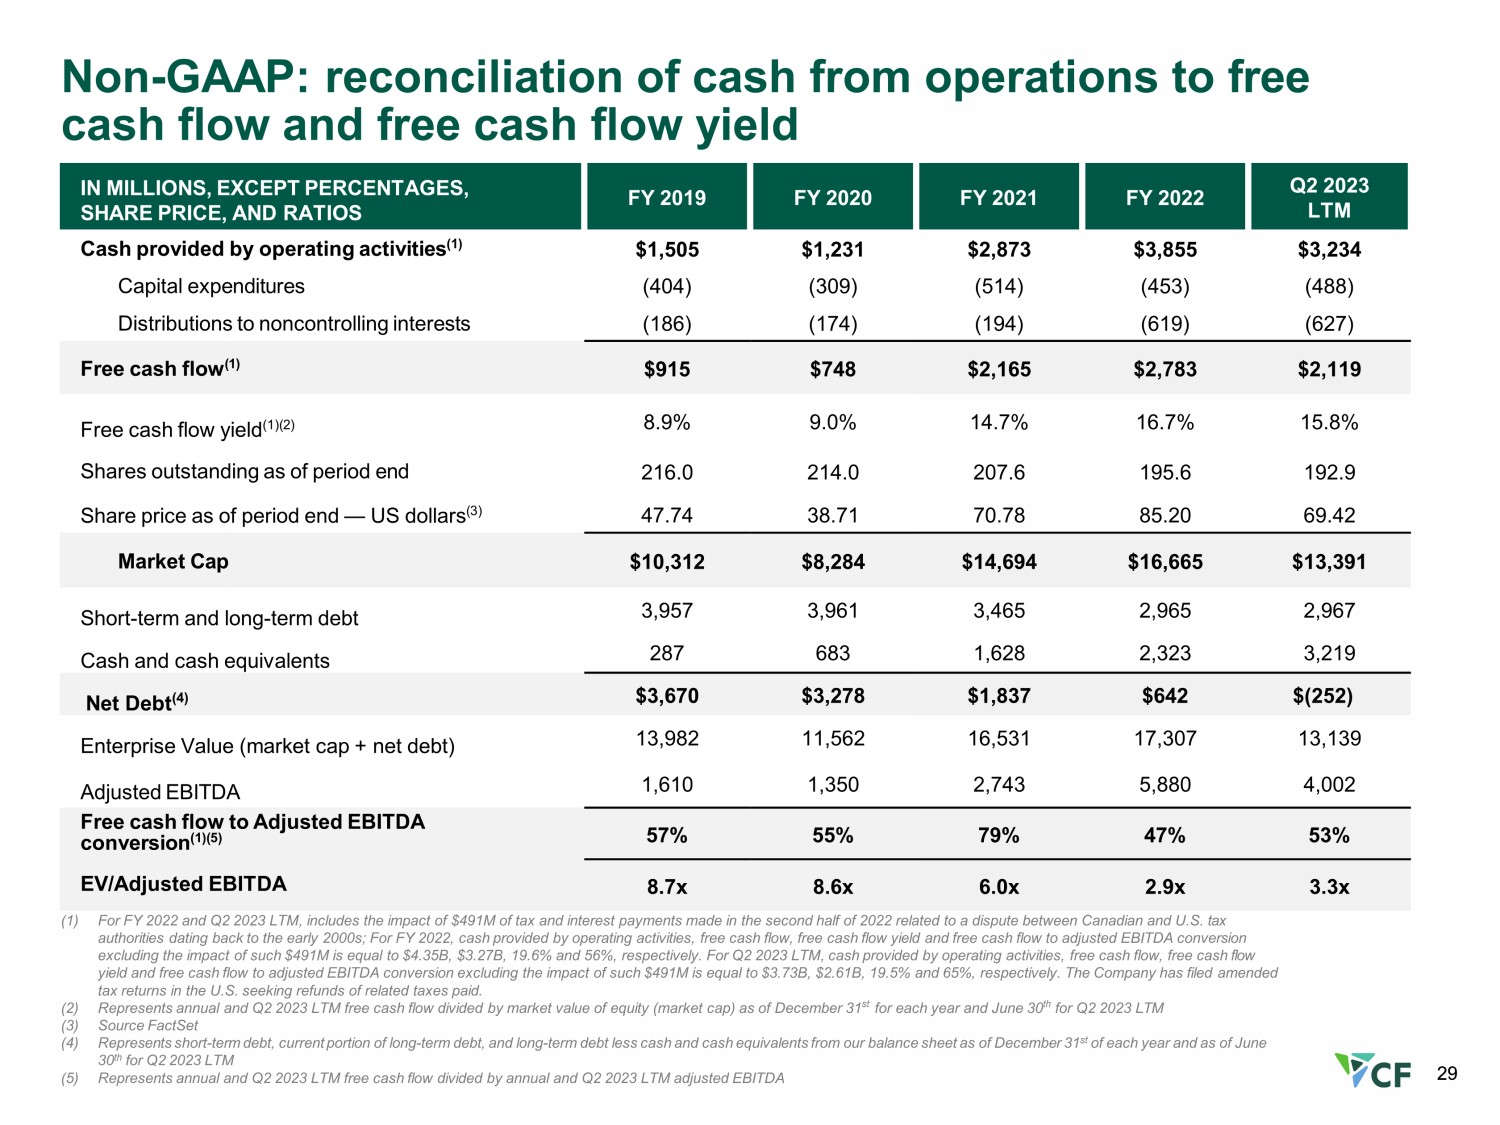
(1) For FY 2022 and Q2 2023 LTM, includes the impact of $491M of tax and interest payments made in the second half of 2022 related to a dispute between Canadian and U.S. tax authorities dating back to the early 2000s; For FY 2022, cash provided by operating activities, free cash flow, free cash flow yield and free cash flow to adjusted EBITDA conversion excluding the impact of such $491M is equal to $4.35B, $3.27B, 19.6% and 56%, respectively. For Q2 2023 LTM, cash provided by operating activities, free cash flow, free cash flow yield and free cash flow to adjusted EBITDA conversion excluding the impact of such $491M is equal to $3.73B, $2.61B, 19.5% and 65%, respectively. The Company has filed amended tax returns in the U.S. seeking refunds of related taxes paid. (2) Represents annual and Q2 2023 LTM free cash flow divided by market value of equity (market cap) as of December 31 st for each year and June 30 th for Q2 2023 LTM (3) Source FactSet (4) Represents short - term debt, current portion of long - term debt, and long - term debt less cash and cash equivalents from our balanc e sheet as of December 31 st of each year and as of June 30 th for Q2 2023 LTM (5) Represents annual and Q2 2023 LTM free cash flow divided by annual and Q2 2023 LTM adjusted EBITDA Non - GAAP: reconciliation of cash from operations to free cash flow and free cash flow yield IN MILLIONS, EXCEPT PERCENTAGES, SHARE PRICE, AND RATIOS FY 2019 FY 2020 FY 2021 FY 2022 Q2 2023 LTM Cash provided by operating activities (1) $1,505 $1,231 $2,873 $3,855 $3,234 Capital expenditures (404) (309) (514) (453) (488) Distributions to noncontrolling interests (186) (174) (194) (619) (627) Free cash flow (1) $915 $748 $2,165 $2,783 $2,119 Free cash flow yield (1)(2) 8.9% 9.0% 14.7% 16.7% 15.8% Shares outstanding as of period end 216.0 214.0 207.6 195.6 192.9 Share price as of period end — US dollars (3) 47.74 38.71 70.78 85.20 69.42 Market Cap $10,312 $8,284 $14,694 $16,665 $13,391 Short - term and long - term debt 3,957 3,961 3,465 2,965 2,967 Cash and cash equivalents 287 683 1,628 2,323 3,219 Net Debt (4) $3,670 $3,278 $1,837 $642 $(252) Enterprise Value (market cap + net debt) 13,982 11,562 16,531 17,307 13,139 Adjusted EBITDA 1,610 1,350 2,743 5,880 4,002 Free cash flow to Adjusted EBITDA conversion (1)( 5 ) 57% 55% 79% 47% 53% EV/Adjusted EBITDA 8.7x 8.6x 6.0x 2.9x 3.3x 29 29