UNITED STATES SECURITIES AND EXCHANGE COMMISSION
Washington, D.C. 20549
FORM 10-K
| | |
| | |
☒ | | ANNUAL REPORT PURSUANT TO SECTION 13 OR 15(d) OF THE SECURITIES EXCHANGE ACT OF 1934 | |
For the fiscal year ended: December 31, 2016 |
or |
☐ | | TRANSITION REPORT PURSUANT TO SECTION 13 OR 15(d) OF THE SECURITIES EXCHANGE ACT OF 1934 |
For the transition period from to |
Commission file number: 000-51556
GUARANTY BANCORP
(Exact name of registrant as specified in its charter)
| | |
Delaware | | 41-2150446 |
(State or other jurisdiction of incorporation or organization) | | (I.R.S. Employer Identification Number) |
| |
1331 Seventeenth St., Suite 200 Denver, CO | | 80202 |
(Address of principal executive offices) | | (Zip Code) |
(303) 675-1194
(Registrant’s telephone number, including area code)
Securities registered pursuant to Section 12(b) of the Act:
He | | |
| | |
Voting Common Stock, $0.001 Par Value | | The NASDAQ Stock Market LLC |
| | |
(Title of each class) | | (Name of each exchange on which registered) |
Securities registered pursuant to Section 12(g) of the Act: None
Indicate by check mark if the registrant is a well-known seasoned issuer, as defined in Rule 405 of the Securities Act. Yes ☐ No ☒
Indicate by check mark if the registrant is not required to file reports pursuant to Section 13 or Section 15(d) of the Act. Yes ☐ No ☒
Indicate by check mark whether the registrant (1) has filed all reports required to be filed by Section 13 or 15(d) of the Securities Exchange Act of 1934 during the preceding 12 months (or for such shorter period that the registrant was required to file such reports), and (2) has been subject to such filing requirements for the past 90 days. Yes ☒ No ☐
Indicate by check mark if disclosure of delinquent filers pursuant to Item 405 of Regulation S-K is not contained herein, and will not be contained, to the best of the registrant’s knowledge, in definitive proxy or information statements incorporated by reference in Part III of this Form 10-K or any amendment to this Form 10-K. ☐
Indicate by check mark whether the registrant has submitted electronically and posted on its corporate Web site, if any, every Interactive Data File required to be submitted and posted pursuant to Rule 405 of Regulation S‑T (§ 232.405 of this chapter) during the preceding 12 months (or for such shorter period that the registrant was required to submit and post such files). Yes ☒ No ☐
Indicate by check mark whether the registrant is a large accelerated filer, an accelerated filer, a non-accelerated filer, or a smaller reporting company. See the definitions of “large accelerated filer”; “accelerated filer” and “smaller reporting company” in Rule 12b-2 of the Act. (Check one):
Large accelerated filer ☐ Accelerated filer ☒ Non-accelerated filer ☐ Smaller reporting company ☐
(Do not check if a smaller
reporting company)
Indicate by check mark whether the registrant is a shell company (as defined in Rule 12b-2 of the Act.) Yes ☐ No ☒
The aggregate market value of the voting common stock held by non-affiliates of the registrant, computed by reference to the closing price per share of the registrant’s voting common stock as of the close of business on June 30, 2016, was approximately $170.8 million. For purposes of this computation, all executive officers, directors and 10% beneficial owners of the registrant’s voting and non-voting common stock are assumed to be affiliates. Such determination should not be deemed an admission that such officers, directors and beneficial owners are, in fact, affiliates of the registrant.
As of February 27, 2017 there were 28,398,385 shares of the registrant’s common stock outstanding, of which 498,394 shares were in the form of unvested stock awards.
DOCUMENTS INCORPORATED BY REFERENCE
The information required by Items 10, 11, 12, 13 and 14 of Part III of this Annual Report on Form 10-K will be found in the registrant's definitive proxy statement for its 2017 Annual Meeting of Stockholders, to be filed pursuant to Regulation 14A under the Securities Exchange Act of 1934, as amended, and such information is incorporated herein by reference.
GUARANTY BANCORP
ANNUAL REPORT ON FORM 10-K
Table of Contents
| | | | |
| | | | |
PART I | | 4 |
| |
Item 1. | | BUSINESS | | 4 |
| | |
Item 1A. | | RISK FACTORS | | 19 |
| | |
Item 1B. | | UNRESOLVED STAFF COMMENTS | | 33 |
| | |
Item 2. | | PROPERTIES | | 33 |
| | |
Item 3. | | LEGAL PROCEEDINGS | | 33 |
| | |
Item 4. | | MINE SAFETY DISCLOSURE | | 33 |
| |
PART II | | 34 |
| | |
Item 5. | | MARKET FOR REGISTRANT’S COMMON EQUITY, RELATED STOCKHOLDER MATTERS AND ISSUER PURCHASES OF EQUITY SECURITIES | | 34 |
| | |
Item 6. | | SELECTED FINANCIAL DATA | | 37 |
| | |
Item 7. | | MANAGEMENT’S DISCUSSION AND ANALYSIS OF FINANCIAL CONDITION AND RESULTS OF OPERATIONS | | 39 |
| | |
Forward-Looking Statements and Factors That Could Affect Future Results | | 39 |
| | |
Item 7A. | | QUANTITATIVE AND QUALITATIVE DISCLOSURES ABOUT MARKET RISK | | 72 |
| | | | |
Item 8. | | FINANCIAL STATEMENTS AND SUPPLEMENTARY DATA | | 75 |
| | |
Item 9. | | CHANGES IN AND DISAGREEMENTS WITH ACCOUNTANTS ON ACCOUNTING AND FINANCIAL DISCLOSURE | | 128 |
| | |
Item 9A. | | CONTROLS AND PROCEDURES | | 128 |
| | |
Item 9B. | | OTHER INFORMATION | | 128 |
| |
PART III | | 129 |
| | |
Item 10. | | DIRECTORS, EXECUTIVE OFFICERS AND CORPORATE GOVERNANCE OF THE REGISTRANT | | 129 |
| | |
Item 11. | | EXECUTIVE COMPENSATION | | 129 |
| | |
Item 12. | | SECURITY OWNERSHIP OF CERTAIN BENEFICIAL OWNERS AND MANAGEMENT AND RELATED STOCKHOLDER MATTERS | | 129 |
| | |
Item 13. | | CERTAIN RELATIONSHIPS AND RELATED TRANSACTIONS, AND DIRECTOR INDEPENDENCE | | 129 |
| | |
Item 14. | | PRINCIPAL ACCOUNTANT FEES AND SERVICES | | 129 |
| |
PART IV | | 130 |
| | |
Item 15. | | EXHIBITS AND FINANCIAL STATEMENT SCHEDULES | | 130 |
| |
SIGNATURES | | 134 |
| |
PART I
ITEM 1. BUSINESS
General
Guaranty Bancorp (the “Company”) is a bank holding company registered under the Bank Holding Company Act of 1956, as amended (the “BHC Act”) and headquartered in Colorado. The Company’s principal business is to serve as a holding company for our bank subsidiary, Guaranty Bank and Trust Company referred to as “Guaranty Bank” or “Bank”.
References to the “Company”, “us”, “we” and “our” refer to Guaranty Bancorp on a consolidated basis. References to “Guaranty Bancorp” or to the “holding company” refer to the parent company on a stand-alone basis.
At December 31, 2016, we had total assets of $3.4 billion, net loans of $2.5 billion, deposits of $2.7 billion and stockholders’ equity of $352.4 million, and we operated 32 branches and two investment management firms in Colorado through our bank subsidiary, Guaranty Bank.
Guaranty Bancorp was incorporated in 2004 in the state of Delaware under the name Centennial C Corp., and in 2004 and 2005 acquired several banking institutions and other entities, including the Bank. By 2008, all of the entities acquired were either ultimately merged into either Guaranty Bancorp or the Bank or divested.
In 2008, the Company changed its name from Centennial Bank Holdings, Inc. to its current name, Guaranty Bancorp. Since January 1, 2008, we have had a single bank subsidiary. The Bank is the sole member of several limited liability companies that hold real estate and the sole owner of two investment management firms, Private Capital Management LLC (“PCM”) and Cherry Hills Investment Advisors, Inc. (“CHIA”).
In 2012, Guaranty Bank purchased substantially all of the assets of Private Capital Management Inc., a Denver-based firm providing investment management and financial planning services to wealthy individuals since 1994.
In 2014, Guaranty Bank purchased substantially all of the assets of Cherry Hills Investment Advisors LLC, a Greenwood Village-based firm providing investment management and financial planning services to individuals and families since 2009.
On March 16, 2016, the Company entered into an Agreement and Plan of Reorganization (the “Merger Agreement”) with Home State Bancorp (“Home State”), the parent company of Home State Bank, a Colorado state chartered bank headquartered in Loveland, Colorado whereby Home State would merge into the Company. The transaction closed on September 8, 2016 with an aggregate transaction value of $152.5 million. With the acquisition, the Company increased its market share in Colorado northern Front Range markets and gained the ability to provide customers with additional conveniences, including an expanded branch and ATM network.
Business
The Bank provides comprehensive banking and other financial services including commercial and industrial, real estate, construction and consumer loans throughout its targeted Colorado markets to consumers and small to medium-sized businesses, including the owners and employees of those businesses. In addition to loans and depository services, the Bank also provides wealth management solutions, including trust and investment management services. Substantially all loans are secured by specific items of collateral, including business assets, consumer assets and commercial and residential real estate. Commercial loans are expected to be repaid from cash flow from business operations. There are no significant concentrations of loans to any one industry or borrower. The borrowers’ ability to repay their loans is generally dependent on the real estate market and general economic conditions prevailing in Colorado, among other factors.
We concentrate our lending activities in the following principal areas:
Commercial Loans: Our commercial and industrial loan portfolio is comprised of operating loans secured by business assets. The portfolio is not concentrated in any particular industry. We classify loans by the borrowers’ intended purpose for the loan rather than the underlying collateral. Therefore, we include loans
within this portfolio that are collateralized with various assets, including real estate. Repayment of secured commercial and industrial loans depends substantially on the borrower’s underlying business, financial condition and cash flows, as well as the sufficiency of the collateral. Compared to real estate, the collateral securing these loans may be more difficult to monitor, evaluate and sell. Economic conditions can significantly affect such risks.
Commercial and Residential Real Estate Loans: This portfolio is mostly comprised of loans secured by commercial and residential real estate. The commercial real estate portfolio generally consists of owner-occupied, retail and industrial, office and multi-family properties. Commercial real estate and multi-family loans typically involve one or more loans to a single sponsor or groups of related sponsors. Since payments on these loans are often dependent on the successful operation or management of the properties securing the loans, as well as the business and financial condition of the borrower, repayment of such loans may be subject to adverse conditions in the real estate market, adverse economic conditions or changes in applicable government regulations. If the borrower is unable to obtain or renew leases for the underlying premises, causing a decline in cash flow from the property, the borrower’s ability to repay the loan may be impaired. Residential real estate is comprised of residential mortgages, primarily jumbo mortgages and home equity lines of credit to customers in our markets. Home equity lines of credit are underwritten in a manner such that they result in credit risk that is substantially similar to that of residential mortgage loans. Nevertheless, home equity lines have greater credit risk than residential mortgage loans because they can be secured by mortgages that are subordinated to the existing first mortgage on the property, which we may or may not hold, and they are not covered by private mortgage insurance.
Construction Loans: Our construction loan portfolio is comprised of investor-developer and owner-occupied properties and single-family residential development properties. Investor-developer properties include loans for the construction of commercial buildings, which are primarily income-producing properties. The repayment of construction loans is dependent upon the successful and timely completion of the construction of the subject property, which may additionally include achievement of stabilized occupancy, as well as the sale of the property to a third party or the availability of permanent financing upon completion of all improvements. Construction loans expose us to the risk that improvements will not be completed on time and in accordance with specifications and projected costs. Construction delays, the financial impairment of the builder, interest rate increases or economic downturn may further impair the borrower’s ability to repay the loan. In addition, the ultimate sale or rental of the property may not occur as anticipated.
Installment Loans to Individuals and Other Consumer Loans: This category includes miscellaneous consumer loans including overdraft protection, lines of credit and other consumer loans. Consumer loans may be unsecured or secured by rapidly depreciating assets. Repossessed collateral for a defaulted consumer loan may not provide an adequate source of repayment for the outstanding loan and the remaining deficiency may not warrant further substantial collection efforts against the borrower. In addition, consumer loan collections are dependent on the borrower’s continued financial stability, which can be adversely affected by job loss, divorce, illness or personal bankruptcy. Furthermore, the application of various federal and state laws, including federal and state bankruptcy and insolvency laws, may limit the amount that we can recover on such loans.
Small Business Administration Loans: Our Small Business Administration (“SBA”) portfolio consists of SBA guaranteed and other SBA-related loans. The guaranteed loans are for qualifying business purposes with maturity dates ranging from seven to 25 years. The SBA guarantees up to 90% of the financing for these types of loans. The SBA-related loans are originated in partnership with the SBA under the SBA’s 504 loan program primarily on owner-occupied commercial real estate.
In addition, we provide traditional deposit accounts such as demand, interest-bearing demand, NOW, money market, IRA, time deposits and savings accounts. Our certificate of deposit customers primarily represent local relationships. Our branch network enables us to offer a full range of deposits, loans and personalized services to our targeted commercial and consumer customers.
Our Philosophy and Strategy
Our philosophy is to provide relationship banking; offering a broad array of personalized financial products with highly responsive and exceptional customer service. We are a community bank that serves Colorado by providing sound financial solutions to customers through experienced, engaged and empowered employees. Our vision statement expands on this by stating that we want to be recognized as a trusted financial partner where
customers experience exceptional service, employees are proud to work, stockholders value their investment and our communities prosper.
Our strategy to build a profitable, community-banking franchise along the Colorado Front Range spanning from Castle Rock to Fort Collins has not changed over the past several years. The strategy for serving our target markets is the delivery of a finely-focused set of value-added products and services that satisfy the primary needs of our customers, emphasizing superior service and relationships as opposed to transaction volume or low pricing. As a locally managed banking institution, we believe we are able to react more quickly to customers’ needs and provide a superior level of customer service compared to larger regional and super-regional banks.
Our Principal Markets
We operate 32 branches located throughout Colorado’s Front Range, including the Denver metropolitan area, and two investment management firms. The region includes the counties of Adams, Arapahoe, Boulder, Denver, Douglas, Jefferson, Larimer and Weld. Colorado’s Front Range has a regional economy that is a diverse mix of advanced technology, tourism, manufacturing, service firms, government, education, retail, small business, construction and agriculture.
Business Concentrations
Management does not consider any individual account or single group of related accounts material in relation to our total assets or in relation to the overall business of the Company. Approximately 74% of our loan portfolio held for investment at December 31, 2016 consisted of real estate-related loans, including construction loans, mini-perm loans, commercial owner-occupied real estate loans and jumbo mortgage loans. Geographically, our business activities are primarily focused in the Colorado Front Range. Consequently, our financial condition, results of operations and cash flows depend upon the general trends in the economy of the Colorado Front Range and, in particular, the commercial and residential real estate markets.
Competition
The banking business in Colorado is highly competitive. The market is characterized by a number of large financial institutions each with a large number of offices, and numerous small to medium-sized community banks and credit unions. In addition, non-bank entities in both the public and private sectors seeking to raise capital through the issuance and sale of debt or equity securities also provide competition for us in the acquisition of deposits. We also compete with brokerage firms, investment advisors, money market funds and issuers of other money market instruments. In recent years, increased competition has also developed from specialized finance and non-finance companies, some of which are not subject to the same regulatory requirements to which we are subject, that offer wholesale finance, credit card and other consumer finance services, including online banking services and personal finance software. Additionally, we expect competition to intensify among financial services companies due to mergers and acquisition of institutions within our market area by other competing, out-of-state financial institutions. Competition for deposit and loan products remains strong from both banking and non-banking firms and this competition directly affects the rates and the terms that we must offer on our products to remain competitive in the marketplace. In order to compete in our primary service area, we utilize to the fullest extent possible the flexibility that our community bank status permits, including providing an emphasis on specialized services, local promotional activity and personal contacts.
Technological innovation continues to increase competition in the financial services markets. For example, technology has made it possible for non-depository institutions to offer customers automated transfer payment services previously limited to those offered as traditional banking products. In addition, customers now expect a choice of several delivery systems and channels, including telephone, mail, online, automated teller machines (ATMs), debit cards, point-of-sale transactions, automated clearing house transactions (ACH), remote deposit, mobile banking via telephone or wireless devices and in-store branches.
Consolidation in the financial services industry and the resulting economies of scale, as well as increasing costs associated with regulatory compliance, have placed additional pressure on banks to consolidate their operations, reduce expenses and increase revenues to remain competitive. In addition, competition has intensified due to federal and state interstate banking laws, which permit banking organizations to expand geographically with fewer restrictions than in the past. These laws allow out-of-state banks to establish or expand banking operations in our market. The competitive environment is also significantly impacted by federal and state legislation that makes it easier for non-bank financial institutions to compete with us.
Economic factors, along with legislative and technological changes, continue to impact the competitive environment within the financial services industry. As the Company is an active participant in financial markets, we strive to anticipate and adapt to dynamic competitive conditions, but we cannot provide assurance as to the impact of such changes on our future business, financial condition, results of operations or cash flows nor can we provide assurances as to our ability to continue to anticipate and adapt to changing conditions.
Supervision and Regulation
General
Banking is a complex, highly regulated industry. Consequently, the performance of the Company and the Bank can be affected not only by management decisions and general and local economic conditions, but also by the statutes enacted by, and the regulations and policies of, various governmental regulatory authorities. These authorities include, but are not limited to, the Board of Governors of the Federal Reserve System, the Federal Deposit Insurance Corporation (the “FDIC”), the Colorado Division of Banking (the “CDB”), the Internal Revenue Service, the Consumer Financial Protection Bureau (the “CFPB”) and state taxing authorities. The effect of these statutes, regulations and policies and any changes to any of them can be significant and cannot be predicted.
The primary goals of the bank regulatory scheme are to maintain a safe and sound banking system and to facilitate the conduct of sound monetary policy. In furtherance of these goals, the U.S. Congress and the State of Colorado have created several largely autonomous regulatory agencies that oversee, and have enacted numerous laws that govern banks, bank holding companies and the banking industry. The system of supervision and regulation applicable to the Company and the Bank establishes a comprehensive framework for the entities’ respective operations and is intended primarily for the protection of the Bank’s depositors and the public, rather than the stockholders and creditors. The following summarizes some of the materially relevant laws, rules and regulations governing banks and bank holding companies, including the Company and the Bank, but does not purport to be a complete summary of all applicable laws, rules and regulations governing banks and bank holding companies or the Company or the Bank. The descriptions are qualified in their entirety by reference to the specific statutes, regulations and policies discussed. Any change in applicable laws, regulations or regulatory policies may have a material effect on our businesses, operations and prospects. We are unable to predict the nature or extent of the effects that economic controls or new federal or state legislation may have on our business and earnings in the future.
Regulatory Agencies
Guaranty Bancorp is a legal entity separate and distinct from its bank subsidiary, Guaranty Bank. As a bank holding company, Guaranty Bancorp is regulated under the BHC Act and is subject to inspection, examination and supervision by the Board of Governors of the Federal Reserve System, or the Federal Reserve Board. Guaranty Bancorp is also under the jurisdiction of the SEC and is subject to the disclosure and regulatory requirements of the Securities Act of 1933, as amended, and the Securities Exchange Act of 1934, as amended (the “Exchange Act”). Guaranty Bancorp is listed on The NASDAQ Global Select Market (“Nasdaq”) under the trading symbol “GBNK,” and is subject to the rules of Nasdaq for listed companies.
As a Colorado-chartered bank, the Bank is subject to supervision, periodic examination and regulation by the CDB. As a member of the Federal Reserve System, the Bank is also subject to supervision, periodic examination and regulation by the Federal Reserve Bank of Kansas City, or the Federal Reserve. In addition, the Bank is subject to certain rules and regulations of the CFPB, and PCM and CHIA are subject to the disclosure and regulatory requirements of the Investment Advisors Act of 1940, as amended. The deposits of the Bank are insured by the FDIC up to certain established limits.
The Dodd-Frank Wall Street Reform and Consumer Protection Act
On July 21, 2010, President Obama signed into law the Dodd-Frank Wall Street Reform and Consumer Protection Act (the “Dodd-Frank Act”), which implemented and continues to implement significant changes to the regulation of the financial services industry.
The effects of the Dodd-Frank Act have been far-reaching, and many aspects of the Dodd-Frank Act remain subject to rulemaking by various regulatory agencies and will take effect over several years, making it difficult to anticipate the overall financial impact on the Company, its customers or the financial industry more generally.
Provisions in the legislation that require revisions to the capital requirements of the Company and the Bank could require the Company and the Bank to seek additional sources of capital in the future.
Bank Holding Company Regulations Applicable to Guaranty Bancorp
The BHC Act and other federal laws subject bank holding companies to particular restrictions on the types of activities in which they may engage, and to a range of supervisory requirements and activities, including regulatory enforcement actions for violations of laws and regulations.
Permitted activities. Generally, bank holding companies are prohibited under the BHC Act from engaging in or acquiring direct or indirect control of more than 5% of the voting shares of any company engaged in any activity other than (i) banking or managing or controlling banks or (ii) an activity that the Federal Reserve Board determines to be so closely related to banking as to be a proper incident to the business of banking. The Federal Reserve Board has the authority to require a bank holding company to terminate an activity or terminate control of or liquidate or divest certain subsidiaries or affiliates when the Federal Reserve Board believes the activity or the control of the subsidiary or affiliate constitutes a significant risk to the financial safety, soundness or stability of any of its banking subsidiaries.
A bank holding company that qualifies and elects to become a financial holding company is permitted to engage in additional activities that are financial in nature or incidental or complementary to financial activity. We currently have no plans to make a financial holding company election.
Sound banking practices. Bank holding companies and their non-banking subsidiaries are prohibited from engaging in activities that represent unsafe and unsound banking practices. For example, under certain circumstances the Federal Reserve Board’s Regulation Y requires a holding company to give the Federal Reserve Board prior notice of any redemption or repurchase of its own equity securities if the consideration to be paid, together with the consideration paid for any repurchases in the preceding year, is equal to 10% or more of the company’s consolidated net worth. The Federal Reserve Board may oppose the transaction if it believes that the transaction would constitute an unsafe or unsound practice or would violate a regulation. As another example, a holding company is prohibited from impairing its subsidiary bank’s soundness by causing the bank to make funds available to non-banking subsidiaries or their customers if the Federal Reserve believes it not prudent to do so. The Federal Reserve Board has the power to assess civil money penalties for knowing or reckless violations, if the activities leading to a violation caused a substantial loss to a depository institution. Potential penalties are as high as $1,000,000 for each day the activity continues.
Source of Strength. In accordance with Federal Reserve Board policy, the holding company is expected to act as a source of financial and managerial strength to the Bank. Under this policy, the holding company is expected to commit resources to support its bank subsidiary, including at times when the holding company may not be in a financial position to provide it. As discussed below, the holding company could be required to guarantee the capital plan of the Bank if it becomes undercapitalized for purposes of banking regulations. Any capital loans by a bank holding company to its subsidiary bank are subordinate in right of payment to deposits and to certain other indebtedness of such subsidiary bank. The BHC Act provides that, in the event of a bank holding company’s bankruptcy, any commitment by the bank holding company to a federal bank regulatory agency to maintain the capital of a bank subsidiary will be assumed by the bankruptcy trustee and entitled to priority of payment.
Regulatory agencies have promulgated regulations to increase the capital requirements for bank holding companies to a level that matches those of banking institutions.
Anti-tying restrictions. Bank holding companies and affiliates are prohibited from tying the provision of services, such as extensions of credit, to other services offered by a holding company or its affiliates.
Acquisitions. The BHC Act, the Bank Merger Act, the Colorado Banking Code and other federal and state statutes regulate acquisitions of commercial banks and their holding companies. The BHC Act generally limits acquisitions by bank holding companies to commercial banks and companies engaged in activities that the Federal Reserve Board has determined to be so closely related to banking as to be a proper incident thereto. The BHC Act requires every bank holding company to obtain the prior approval of the Federal Reserve before (i) acquiring more than 5% of the voting stock of any bank or other bank holding company, (ii) acquiring all or substantially all of the assets of any bank or bank holding company, or (iii) merging or consolidating with any other bank holding company.
In reviewing applications seeking approval of merger and acquisition transactions, the bank regulatory authorities generally consider, among other things, the competitive effect and public benefits of the transactions, the financial and managerial resources and future prospects of the combined organization (including the capital position of the combined organization), the applicant’s performance record under the Community Reinvestment Act (see the section captioned “Community Reinvestment Act” included elsewhere in this item), fair housing laws and the effectiveness of the subject organizations in combating money laundering activities.
The Company is also subject to the Change in Bank Control Act of 1978 (the “Control Act”) and related Federal Reserve Board regulations, which provide that any person who proposes to acquire at least 10% (but less than 25%) of any class of a bank holding company’s voting securities is presumed to control the company (unless the company is not publicly held and some other shareholder owns a greater percentage of voting stock). Any person who would be presumed to acquire control or who proposes to acquire control of more than 25% of any class of a bank holding company’s voting securities, or who proposes to acquire actual control, must provide the Federal Reserve Board with at least 60 days prior written notice of the acquisition. The Federal Reserve Board may disapprove a proposed acquisition if (i) it would result in adverse competitive effects, (ii) the financial condition of the acquiring person might jeopardize the target institution’s financial stability or prejudice the interests of depositors, (iii) the competence, experience or integrity of any acquiring person indicates that the proposed acquisition would not be in the best interests of the depositors or the public, or (iv) the acquiring person fails to provide all of the information required by the Federal Reserve Board. Any proposed acquisition of the voting securities of a bank holding company that is subject to approval under the BHC Act is not subject to the Control Act notice requirements. Any company that proposes to acquire “control”, as those terms are defined in the BHC Act and Federal Reserve Board regulations, of a bank holding company or to acquire 25% or more of any class of voting securities of a bank holding company would be required to seek the Federal Reserve Board’s prior approval under the BHC Act to become a bank holding company.
Dividends. Dividends from the Bank are the holding company’s principal source of cash revenues. Our earnings and activities are affected by legislation, by regulations and by local legislative and administrative bodies and decisions of courts in the jurisdictions in which we conduct business. These include limitations on the ability of the Bank to pay dividends to the holding company and our ability to pay dividends to our stockholders. It is the policy of the Federal Reserve Board that bank holding companies should pay cash dividends on common stock only out of income available over the past year and only if prospective earnings retention is consistent with the organization’s expected future needs and financial condition. The policy provides that bank holding companies should not maintain a level of cash dividends that undermines the bank holding company’s ability to serve as a source of strength to its banking subsidiary. Consistent with such policy, a banking organization should have comprehensive policies on dividend payments that clearly articulate the organization’s objectives and approaches for maintaining a strong capital position and achieving the objectives of the policy statement.
In 2009, the Federal Reserve Board issued a supervisory letter providing greater clarity to its policy statement on the payment of dividends by bank holding companies. In this letter, the Federal Reserve Board stated that when a holding company’s board of directors is deciding on the level of dividends to declare, it should consider, among other factors: (i) overall asset quality, potential need to increase reserves and write down assets, and concentrations of credit; (ii) potential for unanticipated losses and declines in asset values; (iii) implicit and explicit liquidity and credit commitments, including off-balance sheet and contingent liabilities; (iv) quality and level of current and prospective earnings, including earnings capacity under a number of plausible economic scenarios; (v) current and prospective cash flow and liquidity; (vi) ability to serve as an ongoing source of financial and managerial strength to depository institution subsidiaries insured by the FDIC, including the extent of double leverage and the condition of subsidiary depository institutions; (vii) other risks that affect the holding company’s financial condition and are not fully captured in regulatory capital calculations; (viii) level, composition, and quality of capital; and (ix) ability to raise additional equity capital in prevailing market and economic conditions (the “Dividend Factors”). It is particularly important for a bank holding company’s board of directors to ensure that the dividend level is prudent relative to the organization’s financial position and is not based on overly optimistic earnings scenarios. In addition, a bank holding company’s board of directors should strongly consider, after careful analysis of the Dividend Factors, reducing, deferring, or eliminating dividends when the quantity and quality of the holding company's earnings have declined or the holding company is experiencing other financial problems, or when the macroeconomic outlook for the holding company's primary profit centers has deteriorated. The Federal Reserve Board further stated that, as a general matter, a bank holding company should eliminate, defer or significantly reduce its distributions if: (a) its net income is not sufficient to fully fund the dividends, (b) its prospective rate of earnings retention is not consistent with its capital needs and overall current and prospective financial condition, or (c) it will not meet, or is in danger of not meeting, its minimum regulatory capital adequacy ratios. Failure to do so could result in a supervisory finding that the bank holding company is operating in an unsafe and unsound manner.
Additionally, as discussed above, the Federal Reserve Board possesses enforcement powers over bank holding companies and their non-bank subsidiaries with which it can prevent or remedy actions that represent unsafe or unsound practices, or violations of applicable statutes and regulations. Among these powers is the ability to proscribe the payment of dividends by banks and bank holding companies.
Stock Redemptions and Repurchases. It is an essential principle of safety and soundness that a banking organization’s redemption and repurchases of regulatory capital instruments, including common stock, from investors be consistent with the organization’s current and prospective capital needs. In assessing such needs, the board of directors and management of a bank holding company should consider the Dividend Factors discussed above under “Dividends”. The risk-based capital rule directs bank holding companies to consult with the Federal Reserve before redeeming any equity or other capital instrument included in Tier 1 or Tier 2 capital prior to stated maturity, if such redemption could have a material effect on the level or composition of the organization’s capital base. Bank holding companies that are experiencing financial weaknesses, or that are at significant risk of developing financial weaknesses, must consult with the appropriate Federal Reserve supervisory staff before redeeming or repurchasing common stock or other regulatory capital instruments for cash or other valuable consideration. Similarly, any bank holding company considering expansion, whether through acquisitions or through organic growth and new activities, generally also must consult with the appropriate Federal Reserve supervisory staff before redeeming or repurchasing common stock or other regulatory capital instruments for cash or other valuable consideration. In evaluating the appropriateness of a bank holding company’s proposed redemption or repurchase of capital instruments, the Federal Reserve will consider the potential losses that the holding company may suffer from the prospective need to increase reserves and write down assets from continued asset deterioration and the holding company’s ability to raise additional common stock and other Tier 1 capital to replace capital instruments that are redeemed or repurchased. A bank holding company must inform the Federal Reserve of a redemption or repurchase of common stock or perpetual preferred stock for cash or other value resulting in a net reduction of the bank holding company’s outstanding amount of common stock or perpetual preferred stock below the amount of such capital instrument outstanding at the beginning of the quarter in which the redemption or repurchase occurs. In addition, a bank holding company must advise the Federal Reserve sufficiently in advance of such redemptions and repurchases to provide reasonable opportunity for supervisory review and possible objection should the Federal Reserve determine a transaction raises safety and soundness concerns.
Regulation Y requires that a bank holding company that is not well capitalized or well managed, or that is subject to any unresolved supervisory issues, provide prior notice to the Federal Reserve for any repurchase or redemption of its equity securities for cash or other value that would reduce by 10% or more the holding company's consolidated net worth aggregated over the preceding 12-month period.
Annual Reporting; Examinations. The holding company is required to file an annual report with the Federal Reserve Board, and such additional information as the Federal Reserve Board may require. The Federal Reserve Board may examine a bank holding company and any of its subsidiaries, and charge the company for the cost of such an examination.
Imposition of Liability for Undercapitalized Subsidiaries. The Federal Deposit Insurance Corporation Improvement Act of 1991 (“FDICIA”) requires bank regulators to take “prompt corrective action” to resolve problems associated with insured depository institutions. In the event an institution becomes “undercapitalized,” it must submit a capital restoration plan. The capital restoration plan will not be accepted by the regulators unless each company “having control of” the undercapitalized institution “guarantees” the subsidiary’s compliance with the capital restoration plan until it becomes “adequately capitalized.” For purposes of this statute, the holding company has control of the Bank. Under FDICIA, the aggregate liability of all companies controlling a particular institution is limited to the lesser of five percent of the depository institution’s total assets at the time it became undercapitalized or the amount necessary to bring the institution into compliance with applicable capital standards. FDICIA grants greater powers to bank regulators in situations where an institution becomes “significantly” or “critically” undercapitalized or fails to submit a capital restoration plan. For example, a bank holding company controlling such an institution can be required to obtain prior Federal Reserve Board approval of proposed distributions, or might be required to consent to a merger or to divest the troubled institution or other affiliates.
Transactions with Affiliates. The holding company and the Bank are considered “affiliates” of each other under the Federal Reserve Act, and transactions between such affiliates are subject to certain restrictions, including compliance with Sections 23A and 23B of the Federal Reserve Act and their implementing regulations. Generally, Sections 23A and 23B: (1) limit the extent to which a financial institution or its subsidiaries may engage in covered transactions (a) with an affiliate (as defined in such sections) to an amount equal to 10% of such institution’s capital and surplus, and (b) with all affiliates, in the aggregate to an amount equal to 20% of such capital and surplus; and
(2) require all transactions with an affiliate, whether or not covered transactions, to be on terms substantially the same, or at least as favorable to the institution or subsidiary, as the terms provided or that would be provided to a non-affiliate. The term “covered transaction” includes the making of loans, purchase of assets, issuance of a guarantee and other similar types of transactions.
State Law Restrictions. As a Delaware corporation, the holding company is subject to certain limitations and restrictions under applicable Delaware corporate law. For example, state law restrictions in Delaware include limitations and restrictions relating to indemnification of directors, distributions and dividends to stockholders, transactions involving directors, officers or interested stockholders, maintenance of books, records, and minutes, and observance of certain corporate formalities.
Capital Adequacy and Prompt Corrective Action – Guaranty Bancorp and Guaranty Bank
The federal bank regulatory authorities’ risk-based capital guidelines were previously based upon the 1988 capital accord of the Basel Committee on Banking Supervision, or Basel I. The Basel Committee on Banking Supervision is a committee of central banks and bank supervisors and regulators from the major industrialized countries that develops broad policy guidelines for use by each country’s supervisors in determining the supervisory policies they apply. In 2004, the Basel Committee on Banking Supervision published a new capital accord to replace Basel I, with an update in November 2005 (“Basel II”). Basel II provided two approaches for setting capital standards for credit risk — an internal ratings-based approach tailored to individual institutions’ circumstances (which for many asset classes is itself broken into a “foundation” approach and an “advanced or A-IRB” approach, the availability of which is subject to additional restrictions) and a standardized approach that based risk weightings on external credit assessments to a much greater extent than permitted in previous risk-based capital guidelines. Basel II also set capital requirements for operational risk and refined the existing capital requirements for market risk exposures.
In July 2007, the U.S. banking and thrift agencies reached an agreement on the implementation of the capital adequacy regulations and standards based on Basel II. In November 2007, the agencies approved final rules to implement the new risk-based capital requirements in the United States for large, internationally active banking organizations, or “core banks” - defined as those with consolidated total assets of $250 billion or more or consolidated on-balance sheet foreign exposures of $10 billion or more. The final rule was effective as of April 1, 2008. We are not a core bank and do not apply the Basel II approach to computing risk-weighted assets.
In response to the economic and financial industry crisis that began in 2008, the Basel Committee on Banking Supervision and their oversight body - the Group of Central Bank Governors and Heads of Supervision (GHOS) – set out in late 2009 to work on global initiatives to strengthen the financial regulatory system. In July 2010, the GHOS agreed on key design elements and in September 2010 agreed to transition and implementation measures. This work is known as Basel III, and it is designed to strengthen the regulation, supervision and risk management of the banking sector. In particular, Basel III strengthens existing capital requirements and introduces a global liquidity standard. In June 2012, the Federal Reserve Board, the FDIC and the Office of the Comptroller of the Currency (the “OCC”) jointly issued three notices of proposed rulemaking (“NPRs”) to, among other things implement the Basel III minimum capital requirements. Following the receipt of comment letters from multiple U.S. financial institutions, on November 9, 2012, the Federal Reserve Board, the FDIC, and the OCC indefinitely delayed the start date for the Basel III capital requirements and stated that they did not expect the final rules to implement the Basel III capital requirements to be in effect on January 1, 2013, the initial deadline. In July 2013, the Federal Reserve Board, the FDIC and OCC issued two final interim rules to implement the Basel III capital reforms and the rules began phasing-in in 2015, depending on the size of the financial institution. For more on Basel III and its potential effect on us, see item 1A “Risk Factors”.
The Federal Deposit Insurance Act, as amended (“FDIA”), requires, among other things, that federal banking agencies take “prompt corrective action” with respect to depository institutions that do not meet minimum capital requirements. The FDIA sets forth the following five capital tiers: “well capitalized,” “adequately capitalized,” “undercapitalized,” “significantly undercapitalized” and “critically undercapitalized.” A depository institution’s capital tier will depend upon how its capital levels compare with various relevant capital measures and certain other factors, as established by regulation. The relevant capital measures are the total capital ratio, the Tier 1 capital ratio, the leverage ratio and a new ratio requirement under Basel III, the common equity Tier I capital ratio.
Under the regulations adopted by the federal regulatory authorities, a bank is: (i) “well capitalized” if the institution has a total risk-based capital ratio of 10.0% or greater, a common equity Tier 1 capital ratio of 6.5% or greater, a Tier 1 risk-based capital ratio of 8.0% or greater, and a leverage ratio of 5.0% or greater, and is not subject
to any order or written directive by any such regulatory authority to meet and maintain a specific capital level for any capital measure; (ii) “adequately capitalized” if the institution has a total risk-based capital ratio of 8.0% or greater, a common equity Tier 1 capital ratio of 4.5% or greater, a Tier 1 risk-based capital ratio of 6.0% or greater and a leverage ratio of 4.0% or greater and is not “well capitalized”; (iii) “undercapitalized” if the institution has a total risk-based capital ratio that is less than 8.0%, a common equity Tier 1 capital ratio of less than 4.5%, a Tier 1 risk-based capital ratio of less than 6.0% or a leverage ratio of less than 4.0%; (iv) “significantly undercapitalized” if the institution has a total risk-based capital ratio of less than 6.0%, a common equity Tier 1 capital ratio of less than 3.0%, a Tier 1 risk-based capital ratio of less than 4.0% or a leverage ratio of less than 3.0%; and (v) “critically undercapitalized” if the institution’s tangible equity is equal to or less than 2.0% of average quarterly tangible assets. An institution may be downgraded to, or deemed to be in, a capital category that is lower than indicated by its capital ratios if it is determined to be in an unsafe or unsound condition or if it receives an unsatisfactory examination rating with respect to certain matters. A bank’s capital category is determined solely for the purpose of applying prompt corrective action regulations, and the capital category may not constitute an accurate representation of the bank’s overall financial condition or prospects for other purposes.
The final rules also established a “capital conservation buffer” of 2.5% above the regulatory minimum capital ratios, and when fully effective in 2019, will result in the following minimum ratios: (i) a common equity Tier 1 capital ratio of 7.0%; (ii) a Tier 1 risk-based capital ratio of 8.5%; and (iii) a total capital ratio of 10.5%. The new capital conservation buffer requirement began phasing in January 2016 at 0.625% of risk-weighted assets and will increase each year until fully implemented in January 2019. An institution is subject to limitations on paying dividends, engaging in share repurchases, and paying discretionary bonuses if its buffer level falls below the required buffer amount. These limitations will establish a maximum percentage of eligible retained income that can be utilized for such activities.
The FDIA generally prohibits a depository institution from making any capital distributions (including payment of a dividend) or paying any management fee to its parent holding company if the depository institution would thereafter be undercapitalized. Undercapitalized institutions are subject to growth limitations and are required to submit a capital restoration plan to the FDIC. The agencies may not accept such a plan without determining, among other things, that the plan is based on realistic assumptions and is likely to succeed in restoring the depository institution’s capital. In addition, for a capital restoration plan to be acceptable, the depository institution’s parent holding company must guarantee that the institution will comply with such capital restoration plan. The aggregate liability of the parent holding company is limited to the lesser of (i) an amount equal to 5.0% of the depository institution’s total assets at the time it became undercapitalized and (ii) the amount which is necessary (or would have been necessary) to bring the institution into compliance with all capital standards applicable with respect to such institution as of the time it fails to comply with the plan. If a depository institution fails to submit an acceptable plan, it is treated as if it is “significantly undercapitalized.”
“Significantly undercapitalized” depository institutions may be subject to a number of requirements and restrictions, including orders to sell sufficient voting stock to become “adequately capitalized,” requirements to reduce total assets, and cessation of receipt of deposits from correspondent banks. “Critically undercapitalized” institutions are subject to the appointment of a receiver or conservator.
Both Guaranty Bank and Guaranty Bancorp have always maintained the capital ratios and leverage ratio above the levels to be considered quantitatively well-capitalized. For information regarding the capital ratios and leverage ratio of the Company and the Bank as of December 31, 2016 and December 31, 2015, see the discussion under the section captioned “Capital Resources” included in Item 7, “Management’s Discussion and Analysis of Financial Condition and Results of Operations” and Note 21 —Regulatory Capital Matters in “Notes to Consolidated Financial Statements” included in Item 8, “Financial Statements and Supplementary Data”, elsewhere in this report.
Banking Regulations Applicable to Guaranty Bank
Branching. Colorado state law provides that a Colorado-chartered bank can establish a branch anywhere in Colorado provided that the branch is approved in advance by the CDB. The branch must also be approved by the Federal Reserve. The approval process takes into account a number of factors, including financial history, capital adequacy, earnings prospects, character of management, needs of the community and consistency with corporate powers. The Dodd-Frank Act also reduced any significant barriers to interstate branching.
Dividends. As a member of the Federal Reserve System, the Bank is subject to Regulation H, which, among other things, provides that a member bank may not declare or pay a dividend if the total of all dividends declared during the calendar year, including the proposed dividend, exceeds the sum of the bank’s net income (as reportable
in its Reports of Condition and Income) during the current calendar year and its retained net income for the prior two calendar years, unless the Federal Reserve has approved the dividend. Regulation H also provides that a member bank may not declare or pay a dividend if the dividend would exceed the bank’s undivided profits as reportable on its Reports of Condition and Income, unless the Federal Reserve and holders of at least two-thirds of the outstanding shares of each class of the bank’s outstanding stock have approved the dividend. Additionally, there are potential additional restrictions and prohibitions if a bank were to be less than well-capitalized.
As a Colorado state-chartered bank, the Bank is subject to limitations under Colorado law on the payment of dividends. The Colorado Banking Code provides that a bank may declare dividends from retained earnings and other components of capital specifically approved by the Banking Board so long as the declaration is made in compliance with rules established by the Banking Board.
Deposit Insurance. The deposits of the Bank are insured up to applicable limits by the Deposit Insurance Fund (the “DIF”) of the FDIC and are subject to deposit insurance assessments to maintain the DIF. The FDIC utilizes a risk-based assessment system that imposes insurance premiums based upon a risk matrix that takes into account a bank’s capital level and supervisory rating. Risk Category I is the lowest risk category while Risk Category IV is the highest risk category.
In 2010, the Dodd-Frank Act revised certain statutes governing the FDIC’s management of the DIF. Among other things, the revisions raised the minimum fund reserve ratio from 1.15% to 1.35% and required the fund reserve ratio to reach 1.35% by September 30, 2020. In August 2016, the FDIC announced that the fund reserve ratio had surpassed 1.15% as of June 30, 2016. As a result, beginning in the third quarter of 2016, the range of initial assessment rates for all institutions was adjusted downward and institutions with $10 billion or more in assets were assessed a quarterly surcharge. The quarterly surcharge will continue to be assessed until such time as the reserve ratio reaches the statutory minimum of 1.35% required by the Dodd-Frank Act. The Company had $3.4 billion in total assets as of December 31, 2016 and therefore was not subject to the quarterly surcharge. At December 31, 2016, the Bank’s total assessment rate was approximately three basis points.
The FDIC may further increase or decrease the assessment rate schedule in order to manage the DIF to prescribed statutory target levels. An increase in the risk category for the Bank or in the assessment rates could have an adverse effect on the Bank’s and consequently the Company’s earnings. The FDIC may terminate deposit insurance if it determines the institution involved has engaged in or is engaging in unsafe or unsound banking practices, is in an unsafe or unsound condition, or has violated applicable laws, regulations or orders. In the case of a Colorado-chartered bank, the termination of deposit insurance would result in the revocation of its charter.
In addition, all institutions with deposits insured by the FDIC are required to pay assessments to fund interest payments on bonds issued by the Financing Corporation (FICO), a mixed-ownership government corporation established to recapitalize a predecessor to the DIF. The current annualized assessment rate is six basis points and the rate is adjusted quarterly. These assessments will continue until the FICO bonds mature in 2019.
The enactment of the Emergency Economic Stabilization Act of 2008 then-temporarily raised the basic limit on federal deposit insurance coverage from $100,000 to $250,000 per depositor and in July of 2010, the Dodd-Frank Act made the increased coverage amount permanent.
The Volcker Rule. Through the Volker Rule, the Dodd-Frank Act prohibits banks and their affiliates from engaging in proprietary trading and investing in and sponsoring certain unregistered investments companies (defined as hedge funds and private equity funds). The Volcker Rule, which became effective in July 2015, does not significantly affect our operations, as we generally do not engage in the businesses prohibited by the Volcker Rule.
Depositor Preference. The FDIA provides that, in the event of the “liquidation or other resolution” of an insured depository institution, the claims of depositors of the institution, including the claims of the FDIC as subrogee of insured depositors, and certain claims for administrative expenses of the FDIC as a receiver, will have priority over other general unsecured claims against the institution. If an insured depository institution fails, insured and uninsured depositors, along with the FDIC, will have priority in payment ahead of unsecured, non-deposit creditors, including the parent bank holding company, with respect to any extensions of credit they have made to such insured depository institution.
Consumer Financial Protection. The Company is subject to a number of federal and state consumer protection laws that extensively govern its relationship with its customers. These laws include the Equal Credit Opportunity Act, the Fair Credit Reporting Act, the Truth in Lending Act, the Truth in Savings Act, the Electronic Fund Transfer
Act, the Expedited Funds Availability Act, the Home Mortgage Disclosure Act, the Fair Housing Act, the Real Estate Settlement Procedures Act, the Fair Debt Collection Practices Act, the Right to Financial Privacy Act, the Service Members Civil Relief Act and these laws’ respective state-law counterparts, as well as state usury laws and laws regarding unfair and deceptive acts and practices. These and other federal laws, among other things, require disclosures of the cost of credit and terms of deposit accounts, provide substantive consumer rights, prohibit discrimination in credit transactions, regulate the use of credit report information, provide financial privacy protections, prohibit unfair, deceptive and abusive practices, restrict the Company’s ability to raise interest rates and subject the Company to substantial regulatory oversight. Violations of applicable consumer protection laws can result in significant potential liability from litigation brought by customers, including actual damages, restitution and attorneys’ fees. Federal bank regulators, state attorneys general and state and local consumer protection agencies may also seek to enforce consumer protection requirements and obtain these and other remedies, including regulatory sanctions, customer rescission rights, action by the state and local attorneys general in each jurisdiction in which we operate and civil money penalties. Failure to comply with consumer protection requirements may also result in our failure to obtain any required bank regulatory approval for merger or acquisition transactions the Company may want to pursue or our prohibition from engaging in such transactions even if approval is not required.
Further, the CFPB has broad rulemaking authority for a wide range of consumer financial laws that apply to all banks, including, among other things, the authority to prohibit “unfair, deceptive or abusive” acts and practices. Abusive acts or practices are defined as those that materially interfere with a consumer’s ability to understand a term or condition of a consumer financial product or service or take unreasonable advantage of a consumer’s: (i) lack of financial savvy, (ii) inability to protect himself in the selection or use of consumer financial products or services, or (iii) reasonable reliance on a covered entity to act in the consumer’s interests.
Brokered Deposit Restrictions. Well-capitalized institutions are not subject to limitations on brokered deposits, while an adequately capitalized institution is able to accept, renew or roll over brokered deposits only with a waiver from the FDIC and subject to certain restrictions on the yield paid on such deposits. Undercapitalized institutions are generally not permitted to accept, renew, or roll over brokered deposits.
Community Reinvestment Act. The Community Reinvestment Act of 1977 (“the CRA”), requires depository institutions to assist in meeting the credit needs of their market areas consistent with safe and sound banking practice. Under the CRA, each depository institution is required to help meet the credit needs of its market areas by, among other things, providing credit to low- and moderate-income individuals and communities. These factors are also considered in evaluating mergers, acquisitions and applications to open a branch or facility. The applicable federal regulators regularly conduct CRA examinations to assess the performance of financial institutions and assign one of four ratings to the institution’s records of meeting the credit needs of its community. During its last examination, a rating of “satisfactory” was received by the Bank.
Insider Credit Transactions. Banks are subject to certain restrictions imposed by the Federal Reserve Act on extensions of credit to certain executive officers, directors, principal stockholders and any related interests of such persons. Extensions of credit to such persons must: (i) be made on substantially the same terms, including interest rates and collateral, and follow credit underwriting procedures that are not less stringent than those prevailing at the time for comparable transactions with persons not covered by such restrictions and (ii) not involve more than the normal risk of repayment or present other unfavorable features. Banks are also subject to certain lending limits and restrictions on overdrafts to such persons. A violation of these restrictions may result in the assessment of substantial civil monetary penalties on the affected bank or any officer, director, employee, agent or other person participating in the conduct of the affairs of that bank, the imposition of a cease and desist order, and other regulatory sanctions.
Concentration in Commercial Real Estate Lending. As a part of their regulatory oversight, the federal regulators have issued guidelines on sound risk management practices with respect to a financial institution’s concentrations in commercial real estate (“CRE”) lending activities. The guidelines identify certain concentration levels that, if exceeded, will expose the institution to additional supervisory analysis surrounding the institution’s CRE concentration risk. The guidelines are designed to promote appropriate levels of capital and sound loan and risk management practices for institutions with a concentration of CRE loans. In general, the guidelines establish two concentration levels. First, a concentration is deemed to exist if the institution’s total construction, land development and other land loans represent 100 percent or more of total risk-based capital (“CRE 1 Concentration”). Second, a concentration will be deemed to exist if total loans for construction, land development and other land and loans secured by multifamily and non-owner occupied non-farm residential properties (excluding loans secured by owner-occupied properties) represent 300 percent or more of total risk-based capital (“CRE 2 Concentration”) and the institution’s commercial real estate loan portfolio has increased by 50 percent or more during the prior 36 month period. As of December 31, 2016, the Bank’s CRE 1 Concentration level was 40 percent and the Bank’s CRE 2
Concentration level was 319 percent. The Bank’s commercial real estate loan portfolio increased by 78 percent during the prior 36 months. Excluding loans acquired in the transaction with Home State, the balance of commercial real estate loans increased by 52 percent during the preceding 36 months. Management employs heightened risk management practices with respect to commercial real estate lending, including board and management oversight and strategic planning, development and underwriting standards, risk assessment and monitoring through market analysis and stress testing. At December 31, 2016 we have concluded that we have an acceptable and well-managed concentration in commercial real estate lending under the foregoing standards.
FDICIA. Under FDICIA, each federal banking agency has prescribed, by regulation, non-capital safety and soundness standards for institutions under its authority. These standards cover internal controls, information and internal audit systems, loan documentation, credit underwriting, interest rate exposure, asset growth, compensation, fees and benefits, such other operational and managerial standards as the agency determines to be appropriate, and standards for asset quality, earnings and stock valuation. An institution which fails to meet these standards must develop a plan acceptable to the agency, specifying the steps that the institution will take to meet the standards. Failure to submit or implement such a plan may subject the institution to regulatory sanctions.
Examinations. The Bank is examined from time to time by its primary federal banking regulator, the Federal Reserve, and the CDB and is charged for the cost of such an examination. Depending on the results of a given examination, the Federal Reserve and the CDB may revalue the Bank’s assets and require that the Bank establish specific reserves to compensate for the difference between the value determined by the regulator and the book value of the assets.
Financial Privacy. In accordance with the Gramm-Leach-Bliley Financial Modernization Act of 1999 (the “GLB Act”), federal banking regulators adopted rules that limit the ability of banks and other financial institutions to disclose nonpublic information about consumers to nonaffiliated third parties. These limitations require disclosure of privacy policies to consumers and, in some circumstances, allow consumers to prevent disclosure of certain personal information to a nonaffiliated third party. The privacy provisions of the GLB Act affect how consumer information is transmitted through diversified financial companies and conveyed to outside vendors.
Anti-Money Laundering Initiatives and the USA Patriot Act. A major focus of governmental policy on financial institutions over the last decade has been combating money laundering and terrorist financing. The USA PATRIOT Act of 2001 (the “USA Patriot Act”), substantially broadened the scope of United States anti-money laundering laws and regulations by imposing significant new compliance and due diligence obligations, creating new crimes and penalties and expanding the extra-territorial jurisdiction of the United States. The U.S. Treasury Department has issued a number of regulations that apply various requirements of the USA Patriot Act to financial institutions such as the Bank. These regulations impose obligations on financial institutions to maintain appropriate policies, procedures and controls to detect, prevent and report money laundering and terrorist financing and to verify the identities of their customers. Financial institutions are also prohibited from entering into specified financial transactions and account relationships and must use enhanced due diligence procedures in their dealings with certain types of high-risk customers and implement a written customer identification program. Financial institutions must take certain steps to assist government agencies in detecting and preventing money laundering and reporting certain types of suspicious transactions. Regulatory authorities routinely examine financial institutions for compliance with these obligations, and failure of a financial institution to maintain and implement adequate programs to combat money laundering and terrorist financing, or to comply with all of the relevant laws or regulations, can have serious legal and reputational consequences for the institution.
Office of Foreign Assets Control Regulation. The United States has imposed economic sanctions that affect transactions with designated foreign countries, nationals and others. These are typically known as the “OFAC” rules based on their administration by the U.S. Treasury Department Office of Foreign Assets Control (“OFAC”). The OFAC-administered sanctions targeting countries take many different forms. Generally, however, they contain one or more of the following elements: (i) restrictions on trade with or investment in a sanctioned country, including prohibitions against direct or indirect imports from and exports to a sanctioned country and prohibitions on “U.S. persons” engaging in financial transactions relating to making investments in, or providing investment-related advice or assistance to, a sanctioned country; and (ii) a blocking of assets in which the government or specially designated nationals of the sanctioned country have an interest, by prohibiting transfers of property subject to U.S. jurisdiction (including property in the possession or control of U.S. persons). Blocked assets (e.g., property and bank deposits) cannot be paid out, withdrawn, set off or transferred in any manner without a license from OFAC. The Company is responsible for, among other things, blocking accounts of, and transactions with, such targets and countries, prohibiting unlicensed trade and financial transactions with them and reporting blocked transactions after their occurrence. Failure to comply with these sanctions could have serious legal and reputational consequences.
Other Laws and Regulations. The Company is not only subject to federal laws applicable to it, it is also subject to the rules and regulations of the various federal agencies charged with the responsibility of implementing these federal laws.
Guidance on Sound Incentive Compensation Policies
In 2010, the federal bank regulators jointly issued final guidance on sound incentive compensation policies (“SICP”) intended to ensure that the incentive compensation policies of banking organizations do not undermine the safety and soundness of such organizations by encouraging excessive risk-taking. The SICP guidance, which covers all employees that have the ability to materially affect the risk profile of an organization, either individually or as part of a group, is based upon the key principles that a banking organization’s incentive compensation arrangements should: (i) provide incentives that do not encourage risk-taking beyond the organization’s ability to effectively identify and manage risks, (ii) be compatible with effective internal controls and risk management, and (iii) be supported by strong corporate governance, including active and effective oversight by the organization’s board of directors. Any deficiencies in compensation practices that are identified may be incorporated into the organization’s supervisory ratings, which can affect its ability to make acquisitions or perform other actions. The SICP guidance provides that enforcement actions may be taken against a banking organization if its incentive compensation arrangements or related risk-management control or governance processes pose a risk to the organization’s safety and soundness and the organization is not taking prompt and effective measures to correct the deficiencies.
During the second quarter of 2016, the U.S. financial regulators proposed revised rules on incentive-based payment arrangements at specified regulated entities having at least $1 billion in total assets, including the Company and the Bank. The proposed revised rules would establish general requirements applicable to all covered entities, which would include: (i) prohibiting incentive arrangements that encourage inappropriate risks by providing excessive compensation; (ii) prohibiting incentive arrangements that encourage inappropriate risks that could lead to a material financial loss; (iii) establishing requirements for performance measures to appropriately balance risk and reward; (iv) requiring board of director oversight of incentive arrangements; and (v) mandating appropriate record-keeping. Under the proposed rule, larger financial institutions with total average consolidated assets of at least $50 billion would also be subject to additional requirements applicable to such institutions’ “senior executive officers” and “significant risk-takers”. These additional requirements would not be applicable to the Company which currently has less than $50 billion in total average consolidated assets.
Cybersecurity
In March 2015, the Federal Financial Institutions Examination Council issued two related statements regarding cybersecurity. One statement indicates that financial institutions should design multiple layers of security controls to establish lines of defense and to ensure that their risk management processes also address the risk posed by compromised customer credentials, including security measures to reliably authenticate customers accessing internet-based services of the financial institution. The other statement indicates that a financial institution’s management is expected to maintain sufficient business continuity planning processes to ensure the rapid recovery, resumption and maintenance of the institution’s operations after a cyber-attack involving destructive malware. A financial institution is also expected to develop appropriate processes to enable recovery of data and business operations and address rebuilding network capabilities and restoring data if the institution or its critical service providers fall victim to this type of cyber-attack. If we fail to observe the regulatory guidance, we could be subject to various regulatory sanctions, including financial penalties.
In the ordinary course of business, we rely on electronic communications and information systems to conduct our operations and to store sensitive data. We employ an in-depth, layered, defensive approach that leverages people, processes and technology to manage and maintain cybersecurity controls. We employ a variety of preventative and detective tools to monitor, block, and provide alerts regarding suspicious activity, as well as to report on any suspected advanced persistent threats. Notwithstanding the strength of our defensive measures, the threat from cyber-attacks is severe, attacks are sophisticated and increasing in volume, and attackers respond rapidly to changes in defensive measures. While to date, we have not experienced a significant compromise, significant data loss or any material financial losses related to cybersecurity attacks, our systems and those of our customers and third-party service providers are under constant threat and it is possible that we could experience a significant event in the future. Risks and exposures related to cybersecurity attacks are expected to remain high for the foreseeable future due to the rapidly evolving nature and sophistication of these threats, as well as due to the expanding use of Internet banking, mobile banking and other technology-based products and services by us and our customers. See “Risk Factors” for a further discussion of risks related to cybersecurity.
Changing Regulatory Structure and Future Legislation and Regulation
Congress may enact further legislation that affects the regulation of the financial services industry, and state legislatures may enact further legislation affecting the regulation of financial institutions chartered by or operating in these states. Federal and state regulatory agencies also periodically propose and adopt changes to their regulations or change the manner in which existing regulations are applied. We cannot predict the substance or impact of pending or future legislation or regulations, or the application thereof, although enactment of the proposed legislation could impact the regulatory structure under which the Company operates and may significantly increase costs, impede the efficiency of internal business processes, require an increase in regulatory capital, require modifications to the Company’s business strategy, and limit the Company’s ability to pursue business opportunities in an efficient manner. A change in statutes, regulations or regulatory policies applicable to the Company or any of its subsidiaries could have a material effect on our business.
Monetary Policy and Economic Environment
The policies of regulatory authorities, including the monetary policy of the Federal Reserve Board, can have a significant effect on the operating results of bank holding companies and their subsidiaries. Among the means available to the Federal Reserve Board to affect the money supply are open market operations in United States Government securities, changes in the discount rate on member bank borrowings, and changes in reserve requirements against member bank deposits. These means are used in varying combinations to influence overall growth and distribution of bank loans, investments and deposits, and their use may affect interest rates charged on loans or paid on deposits. The Federal Reserve Board’s monetary policies have materially affected the operating results of commercial banks in the past and are expected to continue to do so in the future. The nature of future monetary policies and the effect of these policies on the Bank’s business and earnings cannot be predicted.
Employees
At December 31, 2016, we employed 521 employees, including 475 full-time employees and 46 part-time employees. None of our employees are represented by collective bargaining agreements. We believe our employee relations to be good.
Available Information
Guaranty Bancorp maintains an Internet website at www.gbnk.com. At this website, our Annual Report on Form 10-K, Quarterly Reports on Form 10-Q, Current Reports on Form 8-K and proxy statements on Schedule 14A and amendments to such reports filed or furnished pursuant to Section 13(a) or 15(d) of the Exchange Act are available, free of charge, as soon as reasonably practicable after such forms are electronically filed with, or furnished to, the SEC. The public may read and copy any materials we file with the SEC at the SEC’s Public Reference Room, located at 100 F Street, NE, Washington, D.C. 20549. The public may obtain information on the operation of the Public Reference Room by calling the SEC at 1-800-SEC-0330. The SEC also maintains an Internet website at www.sec.gov that contains reports, proxy and information statements, and other information regarding issuers that file electronically with the SEC. You may obtain copies of the Company’s filings on the SEC website. These documents may also be obtained in print upon request by our stockholders to our Investor Relations Department.
We have adopted a written code of ethics that applies to all directors, officers and employees of the Company, including our principal executive officer and senior financial officers, in accordance with Section 406 of the Sarbanes-Oxley Act of 2002 and the rules of the SEC promulgated thereunder. The code of ethics, which we call our “Code of Business Conduct and Ethics”, is available on our corporate website, www.gbnk.com, in the section entitled “Corporate Governance.” In the event that we make changes in, or provide waivers from, the provisions of this code of ethics that the SEC requires us to disclose, we intend to disclose these events on our corporate website in such section. In the Corporate Governance section of our corporate website, we have also posted the charters for our Audit Committee, Corporate Risk Committee and Compensation, Nominating and Governance Committee, as well as our Corporate Governance Guidelines. In addition, information concerning purchases and sales of our equity securities by our executive officers and directors is available on our corporate website.
Our Investor Relations Department can be contacted at Guaranty Bancorp, 1331 Seventeenth Street, Suite 200, Denver, CO 80202, Attention: Investor Relations, telephone 303-675-1194, or via e-mail to investor.relations@gbnk.com.
Except for the documents specifically incorporated by reference into this document, information contained on our website or information that can be accessed through our website is not incorporated by reference into this document.
ITEM 1A. RISK FACTORS
An investment in our common stock involves risks. The following is a description of the material risks and uncertainties that management believes affect our business and an investment in our common stock. You should carefully consider the risks and uncertainties described below together with all of the other information included or incorporated by reference in this report. The risks and uncertainties described below are not the only ones we face. Additional risks and uncertainties that management is not aware of or focused on or that management currently deems immaterial also may become important factors that affect us and our business operations. This report is qualified in its entirety by these risk factors. Therefore, the risk factors below should not be considered a complete list of potential risks that we may face.
If any of the following risks actually occurs, our financial condition, results of operations or cash flows could be materially and adversely affected. If this were to happen, the value of our common stock could decline significantly, and you could lose all or part of your investment.
Risks Related to Our Business
Our loan portfolio exposes us to credit risk.
There are inherent risks associated with our lending activities and we seek to mitigate these risks by adhering to conservative underwriting practices. Although we believe that our underwriting practices are appropriate for the various kinds of loans we make, we may nevertheless incur losses on loans that meet our underwriting criteria, and these losses may exceed the amounts set aside as reserves in our allowance for loan losses. Although conditions have improved, difficult economic conditions in the past and the resulting effects on the real estate market caused many lending institutions, including us, to experience a decline in the performance of their loans. This decline was widespread and encompassed a wide variety of loans. Likewise, the value of collateral supporting many of these loans declined over that timeframe, and despite market improvement, there can be no assurance that these values will continue to improve or that they will not decline in the future. Accordingly, the deterioration of one or several of these loans could cause a significant increase in nonperforming loans, which could result in a loss of earnings from these loans and an increase in the provision for credit losses and net charge-offs.
We make both secured and unsecured commercial loans. Unsecured loans generally involve a higher degree of risk of loss than do secured loans because, without collateral, repayment is wholly dependent upon the success of the borrowers’ respective businesses. Secured commercial loans are generally collateralized by real estate, accounts receivable, inventory, equipment or other assets owned by the borrower and may include a personal guaranty of the business owner. Compared to real estate, other types of collateral securing commercial loans are more difficult to monitor, their values are harder to ascertain, their values may depreciate more rapidly and they may not be as readily saleable if repossessed. Commercial loans secured by collateral other than real estate are generally serviced from the operations of the business, which may not be successful, while commercial real estate loans generally will be serviced from the income on the properties securing the loans. If the Bank’s commercial loan portfolio increases, the corresponding risks and potential for losses from these loans will also increase.
We are subject to interest rate risk, and fluctuations in interest rates may adversely affect our financial condition and results of operations.
The majority of our assets are monetary in nature. As a result, our earnings and cash flows are largely dependent upon our net interest income which is the difference between interest income earned on interest-earning assets such as loans and securities and interest expense paid on interest-bearing liabilities such as deposits and borrowed funds.
Interest rates are highly sensitive to many factors that are beyond our control, including general economic conditions, demand for loans, securities and deposits, and policies of various governmental and regulatory agencies and, in particular, the policies and actions of the Board of Governors of the Federal Reserve System. On December 14, 2016, the Federal Reserve raised short-term interest rates for the second time in a decade. Further, the Federal Reserve indicated that they intend to continue to raise interest rates. Changes in monetary policy, including changes in interest rates, could influence not only the interest we receive on loans and securities and the amount of interest we pay on deposits and borrowings, but such changes could also affect: (i) our ability to originate loans and obtain deposits, (ii) the fair value of our financial assets and liabilities, and (iii) the average duration of our loans and securities that are collateralized by mortgages. If the interest rates paid on deposits and other borrowings increase at a faster rate than the interest rates received on loans and other investments, our net interest income, and therefore
earnings, could be adversely affected. Earnings could also be adversely affected if the interest rates received on loans and other investments fall more quickly than the interest rates paid on deposits and other borrowings. In addition, our assets and liabilities may react differently to changes in overall market rates or conditions because there may be mismatches between the repricing or maturity characteristics of the assets and liabilities. If interest rates increase, our interest rates on deposits may increase more significantly than we model in our asset-liability model causing a greater increase in interest expense than modeled. Additionally, if interest rates increase, our interest rates on loans may not increase as significantly as we model in our asset-liability model causing a smaller increase in interest income than modeled. If interest rates decline, our higher-rate loans and investments may be subject to prepayment risk, which could negatively impact our net interest margin. Conversely, if interest rates increase, our loans and investments may be subject to extension risk, which could negatively impact our net interest margin as well.
Any substantial, unexpected, prolonged change in market interest rates could have a material adverse effect on our financial condition, results of operations and cash flows. See Item 7A. “Quantitative and Qualitative Disclosures about Market Risk” located elsewhere in this report for further discussion related to our management of interest rate risk.
Our business has been and in the future may be adversely affected by conditions in the financial markets and economic conditions generally.
Negative developments in the financial services industry from 2008 through 2011 resulted in uncertainty in the financial markets in general and an economic recession. As a consequence of the recession, businesses across a wide range of industries faced numerous challenges, including decreases in consumer spending, consumer confidence and credit market liquidity. While conditions have gradually improved many of these circumstances continue to represent challenges and continue to create a degree of economic uncertainty. In addition, volatile oil prices, the implementation of the employer mandate under the Patient Protection and Affordable Care Act and the level of U.S. debt may have a destabilizing effect on financial markets.
As a result of these financial and economic conditions, many lending institutions, including us, experienced declines in the performance of their loans. In addition, the values of real estate collateral supporting many commercial loans and home mortgages declined and may decline again in the future. Bank and bank holding company stock prices were negatively affected, and the ability of banks and bank holding companies to raise capital or borrow in the debt markets became more difficult compared to previous periods. As a result, bank regulatory agencies have been and are expected to continue to be very aggressive in responding to concerns and trends identified in examinations. The impact of legislation enacted in response to these developments may negatively impact our operations by restricting our business operations, including our ability to originate or sell loans, and adversely impact our financial performance or our stock price.
Negative economic developments, including another recession, may affect consumer confidence levels and may cause adverse changes in payment patterns, causing increases in delinquencies and default rates, which may impact our charge-offs and provision for credit losses. Although economic conditions in Colorado and in the U.S. in general have improved, there can be no assurances that the economic environment will continue to improve or that they will not decline in the future. Declines in real estate values, home sales volumes and financial stress on borrowers as a result of the uncertain economic environment could have an adverse effect on our borrowers or their customers, which could adversely affect our business, financial condition, results of operations and cash flows.
The concentration of our commercial real estate loan portfolio may subject us to heightened regulatory scrutiny.
The FDIC, the Federal Reserve and the OCC have promulgated joint guidance on sound risk management practices for financial institutions with concentrations in commercial real estate lending. Under the guidance, a financial institution that, like us, is actively involved in commercial real estate lending should perform a risk assessment to identify concentrations. A financial institution may have a concentration in commercial real estate lending if, among other factors: (i) total reported loans for construction, land development, and other land represent 100% or more of total risk-based capital or (ii) total reported loans for construction, land development and other land and loans secured by multifamily and non-owner occupied non-farm residential properties (excluding loans secured by owner-occupied properties) represent 300% or more of total risk-based capital and the institution’s commercial real estate loan portfolio has increased by 50 percent or more during the prior 36 month period. In such event, management should employ heightened risk management practices, including board and management oversight and strategic planning, development of underwriting standards, risk assessment and monitoring through market analysis and stress testing.
The Bank’s total reported loans for construction, land development and other land represented 40% of capital at December 31, 2016 as compared to 47% of capital at December 31, 2015. This ratio is below the regulatory commercial real estate concentration guideline level of 100% for land and construction loans. The Bank’s total reported commercial real estate loans to total capital was 319% at December 31, 2016, as compared to 356% of capital at December 31, 2015. This ratio is above the regulatory commercial real estate concentration guideline level of 300% for all investor real estate loans. The Bank’s commercial real estate portfolio has increased by 78% over the preceding 36 months. Excluding loans acquired in the transaction with Home State, the balance of commercial real estate loans increased by 52% over the preceding 36 months.
There is no assurance that in the future we will not continue to exceed the levels set forth in these guidelines and we may be required to take additional steps to mitigate our potential concentration risk or be required to raise additional capital in order to further reduce our risk. In addition, if we are considered to have a concentration in commercial real estate lending under the foregoing standards in the future and our risk management practices are found to be deficient, it could result in increased reserves and capital costs as well as potential regulatory enforcement action.
Commercial real estate loans are generally viewed as having more inherent risk of default than residential mortgage loans or other consumer loans. Also, the commercial real estate loan balance per borrower is typically larger than that for residential mortgage loans and other consumer loans, inferring higher potential losses on an individual loan basis. The deterioration of one or more of the Bank’s significant commercial real estate loans could cause a significant increase in nonaccrual loans. An increase in nonaccrual loans could result in a loss of interest income from these loans, an increase in the provision for loan losses, and an increase in loan charge-offs, all of which could have a material adverse effect on our financial condition and results of operations.
The short-term and long-term impact of the changing regulatory capital requirements and capital rules is unknown.
In 2013, the FDIC, the OCC and the Federal Reserve Board approved a new rule that substantially amends the regulatory risk-based capital rules applicable to us. The final rule implements the “Basel III” regulatory capital reforms and changes required by the Dodd-Frank Act.
The final rule includes minimum risk-based capital and leverage ratios which became effective for us on January 1, 2015, and refines the definition of what constitutes “capital” for purposes of calculating these ratios. The minimum capital requirements to be considered “adequately capitalized” are: (i) a common equity Tier 1 capital ratio of 4.5%; (ii) a Tier 1 to risk-based assets capital ratio of 6.0%, which was increased from 4.0%; (iii) a total capital ratio of 8.0%, which was unchanged from the previous rules; and (iv) a Tier 1 leverage ratio of 4.0%. The final rule also established a “capital conservation buffer” of 2.5% above the regulatory minimum capital ratios, and when fully effective in 2019, will result in the following minimum capital ratios: (a) a common equity Tier 1 capital ratio of 7.0%; (b) a Tier 1 to risk-based assets capital ratio of 8.5%; and (c) a total capital ratio of 10.5%. The capital conservation buffer requirement began phasing in January 2016 at 0.625% of risk-weighted assets and will increase each year until fully implemented in January 2019. If an institution does not meet or exceed these minimum capital ratios it will be subject to limitations on paying dividends, engaging in share repurchases, and paying discretionary bonuses if its buffer level falls below the required buffer amount. These limitations will establish a maximum percentage of eligible retained income that can be utilized for such activities.
The application of more stringent capital requirements for us could, among other things, result in lower returns on equity, require the raising of additional capital, and result in regulatory actions such as a prohibition on the payment of dividends, the payment of bonuses to employees or the repurchase of shares if we were unable to comply with such requirements. Furthermore, the imposition of liquidity requirements in connection with the implementation of Basel III could result in our having to restructure our business models or increase our holdings of liquid assets. Implementation of changes in asset risk weightings for risk-based capital calculations, items included or deducted in calculating regulatory capital or additional capital conservation buffers could result in management modifying our business strategy.
Our allowance for loan losses may not be sufficient to cover actual credit losses, which could adversely affect our earnings and results of operations.
As a lender, we are exposed to the risk that our borrowers may not repay their loans according to the terms of these loans and that the collateral securing the payment of a particular loan may be insufficient to fully compensate for the outstanding balance of the loan and the costs to dispose of the underlying collateral. We maintain an allowance for loan losses, which is a reserve established through a provision for loan losses charged to expense, that
represents management’s best estimate of probable incurred losses within our existing portfolio of loans. Additional credit losses will likely occur in the future and may occur at a rate greater than the Company has experienced to date. The level of the allowance reflects management’s ongoing evaluation of specific credit risks, loan loss experience, loan portfolio quality, economic conditions, loan industry concentrations, and other potential but unidentifiable losses inherent in the current loan portfolio. The determination of the appropriate level of the allowance for loan losses inherently involves a high degree of subjectivity and judgment and requires us to make significant estimates of current credit risks, future trends, and general economic conditions, all of which may undergo material changes. Further, the measure of our allowance for loan losses is also dependent on the adoption of new accounting standards. On June 16, 2016, the Financial Accounting Standards Board issued the Current Expected Credit Loss (“CECL”) standard, which will require financial institutions to estimate and develop a provision for credit losses at origination for the lifetime of the loan, as opposed to reserving for incurred or probable losses up to the balance sheet date. Under the CECL model, credit deterioration would be reflected in the income statement in the period of origination or acquisition of the loan, with changes in expected credit losses due to further credit deterioration or improvement reflected in the periods in which the expectation changes. Accordingly, the CECL model could require financial institutions, such as the Bank, to increase their allowance for loan losses. Moreover, the CECL model could create more volatility in the Bank’s level of allowance for loan losses.
Changes in economic conditions affecting borrowers, new information regarding existing loans, identification of additional problem loans and other factors, both within and outside of our control, may require an increase in the allowance for loan losses. Likewise, increases in nonperforming loans have a significant impact on our allowance for loan losses. If real estate values decline, we could experience increased delinquencies and credit losses, particularly with respect to commercial real estate loans. Likewise, if management’s assumptions prove to be incorrect or if we experience significant loan losses in future periods, our current level of allowance may not be sufficient to cover actual loan losses and adjustments may be necessary to allow for different economic conditions or adverse developments in our loan portfolio. A material change to the allowance could cause net income and possibly capital to decrease.
In addition, federal and state regulators periodically review our allowance for loan losses and may require management to increase its provision for loan losses or recognize further charge-offs, based on judgments different than those of the Bank’s management. An increase in our allowance for loan losses or charge-offs as required by these regulatory agencies could have a material adverse effect on the Bank’s operating results and financial condition.
Liquidity risk could impair our ability to fund operations and jeopardize our financial condition.
An inability to raise funds through deposits, borrowings, the sale of securities or loans or other sources could have a substantial negative effect on our liquidity. Our access to funding sources in amounts adequate to finance our activities or on terms which are acceptable to us could be impaired by factors that affect us specifically or the financial services industry or economy in general. Factors that could detrimentally impact our access to liquidity sources include a decrease in the level of our business activity as a result of a downturn in the markets in which our loans are concentrated or adverse regulatory action against us. Our ability to borrow could also be impaired by factors that are not specific to us, such as a disruption in the financial markets or negative views and expectations about the prospects for the financial services industry in light of the turmoil faced by banking organizations and the deterioration in credit markets from 2008 through 2011.
We rely primarily on commercial and retail deposits and to a lesser extent, brokered deposit renewals and rollovers, advances from the Federal Home Loan Bank (“FHLB”) and other secured and unsecured borrowings to fund our operations. Although we have historically been able to replace maturing deposits and advances as necessary, we might not be able to replace such funds in the future if, among other things, our results of operations or financial condition or the results of operations or financial condition of the FHLB or market conditions were to change. In addition, if we fall below the FDIC’s thresholds to be considered “well capitalized”, we will be unable to continue to rollover or renew brokered funds, and the interest rate paid on deposits would be restricted.
Our deposit insurance premiums could increase in the future, which could have a material adverse effect on our future earnings.
The FDIC insures deposits at certain financial institutions, including the Bank and charges insured financial institutions a premium to maintain the DIF at a certain level. In the event that deteriorating economic conditions increase bank failures, the FDIC ensures payments of deposits up to insured limits from the DIF.
In August 2016, the FDIC announced that the DIF reserve ratio had surpassed 1.15% as of June 30, 2016. As a result, beginning in the third quarter of 2016, the range of initial assessment rates for all institutions was adjusted downward and institutions with $10 billion or more in assets were assessed a quarterly surcharge. The quarterly surcharge will continue to be assessed until such time as the reserve ratio reaches the statutory minimum of 1.35% required by the Dodd-Frank Act. The Company had $3.4 billion in total assets as of December 31, 2016 and therefore was not subject to the quarterly surcharge. At December 31, 2016, the Bank’s total assessment rate was approximately three basis points. Although the Bank's FDIC insurance assessments have not increased as a result of these changes, there can be no assurance that the FDIC will not increase assessment rates in the future or that the Bank will not be subject to higher assessment rates as a result of a change in its risk category, either of which could have an adverse effect on the Bank’s earnings.
In addition, the FDIC may terminate an institution’s deposit insurance if it determines that the institution involved has engaged in or is engaging in unsafe or unsound banking practices, is in an unsafe or unsound condition, or has violated applicable laws, regulations or orders. In the case of a Colorado-chartered bank, the termination of deposit insurance would result in the revocation of its charter.
We may need to raise additional capital or debt in the future and such capital or debt may not be available when needed or at all.
We may need to raise additional capital or debt in the future to provide us with sufficient capital resources and liquidity to meet our commitments and business needs. In addition, we may elect to raise additional capital or debt to support our business or to finance acquisitions.
Our ability to raise additional capital, if needed, will depend on, among other things, conditions in the capital markets at that time, which are outside of our control, and our financial performance.
We cannot assure you that such capital will be available to us on acceptable terms or at all. Any occurrence that may limit our access to the capital markets, such as a decline in the confidence of investors, the Bank’s depositors or counterparties participating in the capital markets may adversely affect our capital costs and our ability to raise capital and, in turn, our liquidity. Moreover, if we need to raise capital in the future, we may have to do so when many other financial institutions are also seeking to raise capital and would have to compete with those institutions for investors. An inability to raise additional capital on acceptable terms when needed could have a material adverse effect on our business, financial condition and results of operations.
The value of securities in our investment securities portfolio may be negatively affected by disruptions in securities markets.
The market for some of the investment securities held in our portfolio has been volatile over the past several years. Volatile market conditions may quickly and detrimentally affect the value of these securities due to the perception of heightened credit and liquidity risks associated with their ownership. There can be no assurance that declines in market value will not result in other than temporary impairments of these assets, which would lead to accounting charges that could have a material adverse effect on our net income and capital levels.
Our accounting estimates and risk management processes rely on analytical and forecasting models.
Processes that management uses to estimate our probable credit losses and to measure the fair value of financial instruments, as well as the processes used to estimate the effects of changing interest rates and other market measures on our financial condition and results of operations, depend upon the use of analytical and forecasting models. These models reflect assumptions that may not be accurate, particularly in times of market stress or other unforeseen circumstances. Even if these assumptions are accurate, the models may prove to be inadequate or inaccurate because of other flaws in their design or their implementation.
If the models that management uses for interest rate risk and asset-liability management are inadequate, we may incur increased or unexpected losses upon changes in market interest rates or other market measures. If the models that management uses for determining our probable incurred credit losses are inadequate, the allowance for loan losses may not be sufficient to support future charge-offs. If the models that management uses to measure the fair value of financial instruments are inadequate, the fair value of such financial instruments may fluctuate unexpectedly or may not accurately reflect what we could realize upon sale or settlement of such financial instruments. Any such failure in management’s analytical or forecasting models could have a material adverse effect on our business, financial condition and results of operations.
The lack of soundness of other financial institutions could adversely affect us.
Our ability to engage in routine funding transactions could be adversely affected by the actions and lack of commercial soundness of other financial institutions. The businesses of many financial services companies are interrelated as a result of trading, clearing, counterparty, or other relationships. We have exposure to many different industries and counterparties, and we routinely execute transactions with counterparties in the financial services industry, including brokers and dealers, commercial banks, investment banks, mutual and hedge funds, and other institutional clients. Many of these transactions expose us to credit risk in the event of a default by our counterparty or client. In addition, our credit risk may be exacerbated when the collateral held by us cannot be sold or is liquidated at prices not sufficient to recover the full amount of the loan or derivative exposure due to us. Any such losses could have a material adverse effect on our business, financial condition or results of operations.
We operate in a highly regulated environment and, as a result, are subject to extensive regulation and supervision.
The Company and the Bank are subject to extensive federal and state regulation, supervision and examination. Any change in the laws or regulations applicable to us, or in banking regulators’ supervisory policies, examination procedures or enforcement actions, whether by the CDB, the FDIC, the Federal Reserve Board, other state or federal regulators, the U.S. Congress or the Colorado legislature could have a material adverse effect on our business, financial condition, results of operations and cash flows. Further, compliance with these regulations and laws may increase our costs and limit our ability to pursue business opportunities.
Supervision and the regulations to which we are subject limit the activities in which we may permissibly engage along with our lending practices, capital structure, investment practices, dividend policy and growth. The purpose of supervision and regulation is primarily to protect depositors’ funds, federal deposit insurance funds and the banking system as a whole, rather than our stockholders.
The Dodd-Frank Act instituted major changes to the banking and financial institutions regulatory regimes in light of the recent performance of and government intervention in the financial services sector. Additional legislation and regulations or regulatory policies, including changes in interpretation or implementation of statutes, regulations or policies, could significantly affect the Company’s and the Bank’s powers, authority and operations in substantial and unpredictable ways. Further, regulatory authorities have extensive discretion in the exercise of their supervisory and enforcement powers under banking regulations, as well as under various consumer protection and civil rights laws. Regulators may, among other things, impose restrictions on the operation of a banking institution, the classification of assets by such institution and such institution’s allowance for loan losses. The exercise of this regulatory discretion and power could have a negative impact on the Company. Failure to comply with laws, regulations or policies could result in sanctions by regulatory agencies, civil money penalties and/or reputation damage, which could have a material adverse effect on the Company’s business, financial condition and results of operations.
Regulations could restrict our ability to originate loans.
The CFPB has issued a rule designed to clarify how lenders can avoid legal liability under the Dodd-Frank Act, which would hold lenders accountable for ensuring a borrower’s ability to repay a mortgage. Loans that meet this definition of “qualified mortgage” will be presumed to have complied with the new ability-to-repay standard. Under the CFPB’s rule, a “qualified mortgage” loan must not contain certain specified features, including:
| · | | excessive upfront points and fees (those exceeding 3% of the total loan amount, less “bona fide discount points” for prime loans); |
| · interest-only payments; |
| · negative-amortization; and |
| · terms longer than 30 years. |
Also, to qualify as a “qualified mortgage,” a borrower’s total monthly debt-to-income ratio may not exceed 43%. Lenders must also verify and document the income and financial resources relied upon to qualify the borrower for the loan and underwrite the loan based on a fully amortizing payment schedule and maximum interest rate during the first five years, taking into account all applicable taxes, insurance and assessments. The CFPB’s rule on qualified mortgages and similar rules could limit our ability to make certain types of loans or loans to certain borrowers, or could make it more expensive and time-consuming to make these loans, which could limit our growth or profitability.
We are subject to losses resulting from fraudulent and negligent acts on the part of loan applicants, correspondents or other third parties.
We rely heavily upon information supplied to us by third parties, including the information contained in credit applications, property appraisals, title information, equipment pricing and valuation and employment and income documentation, in deciding which loans we will originate, as well as the terms of those loans. If any of the information upon which we rely is misrepresented, either fraudulently or inadvertently, and the misrepresentation is not detected prior to asset funding, the value of the asset may be significantly lower than expected, we may fund a loan that we would not have otherwise funded or we may fund a loan on terms that we would not have otherwise extended. Whether a misrepresentation is made by the applicant or by another third party, we generally bear the risk of loss associated with the misrepresentation. A loan subject to a material misrepresentation is typically unsellable or subject to repurchase if it is sold prior to detection of the misrepresentation. The sources of the misrepresentation are often difficult to locate, and it is often difficult to recover any of the monetary losses we may suffer.
Our profitability depends significantly on economic conditions in the Colorado Front Range.
Our success depends significantly on the general economic conditions in the counties in which we conduct business and where our loans are concentrated. Unlike larger banks that are more geographically diversified, we provide banking and financial services to customers primarily in the Front Range of Colorado, which includes the Denver metropolitan area. The local economic conditions in our market area have a significant impact on our loans, the ability of our borrowers to repay those loans and the value of the collateral securing these loans. Accordingly, if the population or income growth along the Colorado Front Range is slower than projected, income levels, deposits and housing starts could be adversely affected and could result in a reduction of our expansion, growth and profitability. The oil and gas industry has a significant economic impact on some of the counties in which we conduct business and a prolonged downturn in this industry may negatively impact our borrowers and their ability to repay their loans. If our market area experiences a downturn or a recession for a prolonged period of time, we could experience significant increases in nonperforming loans, which could lead to operating losses, impaired liquidity and eroding capital.
In view of the concentration of our operations and the collateral securing our loan portfolio in the Front Range, of Colorado we may be particularly susceptible to the effects not only of national-level events such as recession and war but also more local calamities such as natural disasters and fluctuations in the local economy. Any of these events could have a material adverse effect on our business, financial condition, results of operations and cash flows.
A downturn in our real estate markets along the Colorado Front Range could hurt our business.
Our business activities and credit exposure are primarily concentrated along the Front Range of Colorado. As of December 31, 2016, approximately 74% of the book value of our loan portfolio consisted of real estate loans, the majority of which are secured by properties located in Colorado. A weakening of the real estate market in our primary market areas could have an adverse effect on the demand for new loans, the ability of borrowers to repay outstanding loans, the value of real estate and other collateral securing the loans and the value of real estate owned by us. As a result of decreased collateral values, our ability to recover on defaulted loans by selling the underlying real estate would be diminished, and we would be more likely to suffer losses on defaulted loans and a corresponding material adverse effect on our business, results of operations and financial condition. If real estate values decline, it is also more likely that we would be required to increase our allowance for loan losses, which could also adversely affect our business, results of operation and financial condition.
We may be adversely affected by declining crude oil prices.
Decisions by certain members of the Organization of Petroleum Exporting Countries to maintain higher crude oil production levels, as well as other market and economic conditions, have led to increased global oil supplies, which in turn has resulted in significant declines in oil prices. While oil prices have recently stabilized, decreased market oil prices have resulted in compressed margins for many U.S. and Colorado-based oil producers, particularly those that utilize higher-cost production technologies such as hydraulic fracking and horizontal drilling, as well as oilfield service providers, energy equipment manufacturers and transportation suppliers, among others. While the Bank has very limited direct exposure to the energy industry, energy production and related industries represent a relatively significant portion of the Colorado economy and can affect us indirectly through our borrowers in other industries that depend on or benefit from energy production and related industries. A prolonged period of low oil prices could also have a negative impact on the U.S. economy and, in particular, the economies of states such as
Colorado. Accordingly, we are unable to predict when or if oil prices will rise, and a prolonged period of low oil prices could have a material adverse effect on our results of operations and financial condition.
The small to medium-sized businesses to which we lend may have fewer financial resources to weather a downturn in the economy, which could materially harm our operating results.
We serve the banking and financial services needs of small and medium-sized businesses. Small to medium-sized businesses frequently have smaller market shares than their competition, may be more vulnerable to economic downturns, often need substantial additional capital to expand and compete and may experience significant volatility in operating results. Any one or more of these factors may impair a borrower’s ability to repay a loan. In addition, the success of a small to medium-sized business often depends on the management talents and efforts of one or two persons or a small group of persons, and the death, disability or resignation of one or more of these persons could have a material adverse impact on the business and its ability to repay a loan. Economic downturns and other events that negatively impact our market areas could cause us to incur substantial credit losses that could negatively affect our results of operations and financial condition.
New lines of business or new products and services may subject us to additional risks.
From time to time, we may implement or may acquire new lines of business or offer new products and services within existing lines of business. There are substantial risks and uncertainties associated with these efforts, particularly in instances where the markets are not fully developed. In developing and marketing new lines of business and new products and services, we may invest significant time and resources. We may not achieve target timetables for the introduction and development of new lines of business and new products or services and price and profitability targets may not prove feasible. External factors, such as regulatory compliance obligations, competitive alternatives, and shifting market preferences, may also impact the successful implementation of a new line of business or a new product or service. Furthermore, any new line of business and/or new product or service could have a significant impact on the effectiveness of our system of internal controls. Failure to successfully manage these risks in the development and implementation of new lines of business or new products or services could have a material adverse effect on our business, results of operations and financial condition.
We operate in a highly competitive industry and market area.
We face substantial competition in all areas of our operations from a variety of different competitors, both within and beyond our principal markets, many of which are larger than us and may have more financial resources available to them. Such competitors primarily include national, regional and community banks within the various markets we serve. We also face competition from many other types of financial institutions, including, without limitation, savings and loans, credit unions, finance companies, brokerage firms, investment advisors, insurance companies, factoring companies and other financial intermediaries. The financial services industry could become even more competitive as a result of legislative, regulatory and technological changes and continued consolidation. Additionally, we expect competition to intensify among financial services companies due to the merger and acquisition activity in our market area by competing, out-of-state financial institutions. Also, technology and other changes have lowered barriers to entry and made it possible for non-banks to offer products and services traditionally provided by banks, such as automatic funds transfer and automatic payment systems. The process of eliminating banks as intermediaries, or “disintermediation”, could result in the loss of fee income, as well as the loss of customer deposits and the related income generated from those deposits. Further, many of our competitors have fewer regulatory constraints than we do and may have lower cost structures than ours. Additionally, due to their size, many competitors may be able to achieve economies of scale and, as a result, may be able to offer a broader range of products and services as well as better pricing for those products and services than we can.
Our ability to compete successfully depends on a number of factors, including, among other things:
| | | |
| • | | The ability to develop, maintain and build upon long-term customer relationships based on quality service, high ethical standards and safe, sound assets. |
| • | | The ability to expand our market position. |
| • | | The ability to attract and retain qualified staff, including those with key customer relationships. |
| • | | The scope, relevance and pricing of products and services offered to meet customer needs and demands. |
| • | | The rate at which we introduce new products and services relative to our competitors. |
| • | | Customer satisfaction with our level of service. |
| • | | Industry and general economic trends. |
Failure to perform in any of these areas could significantly weaken our competitive position, adversely affect our growth and profitability, and, in turn, could have a material adverse effect on our financial condition, results of operations and cash flows.
We rely on dividends from the Bank to pay our expenses and fund our dividends.
Because we are a holding company with no significant assets other than the Bank, we currently depend upon dividends from the Bank for a substantial portion of our revenues and to fund our expenses. Our ability to pay dividends to our stockholders therefore depends in large part upon our receipt of dividends or other capital distributions from the Bank.
Various federal and state regulations limit the Bank’s payment of dividends, management fees and other distributions to the Company, and may therefore limit our ability to pay dividends on our common stock. Under these laws, the Bank is currently required to request permission from the Federal Reserve and the CDB prior to payment of a dividend to the Company.
Further, we may from time to time enter into financing agreements or other contractual arrangements that have the effect of limiting or prohibiting us or the Bank from declaring or paying dividends. See “Item 5. Market for Registrant’s Common Equity, Related Stockholder Matters and Issuer Purchases of Equity Securities—Dividends” for more information on these restrictions.
We are dependent on key personnel and the loss of one or more of those key personnel could harm our business.
Competition for qualified employees and personnel in the banking industry is intense and there are a limited number of qualified persons with knowledge of and experience in the Colorado community banking industry. The process of recruiting personnel with the combination of skills and attributes required to carry out our strategies is often lengthy. Our success depends on our ability to attract and retain qualified management and loan origination, administrative, marketing and technical personnel and upon the continued contributions of customer relationships developed by our management and personnel. In particular, our success is highly dependent upon the capabilities of our senior executive management. We believe that our management team, comprised of individuals who have worked in the banking industry for many years, is integral to implementing our business plan. The loss of the services of one or more of them could harm our business. In addition, the scope and content of U.S. banking regulators’ policies on incentive compensation, as well as changes to these policies, could adversely affect our ability to hire, retain and motivate our key employees. To mitigate the potential impact of a loss of key personnel, the Company has a management succession plan to ensure that it has a process in place to replace any lost personnel.
Our controls and procedures may fail or be circumvented.
Management regularly reviews and updates our internal controls, disclosure controls and procedures and corporate governance policies and procedures are based in part on certain assumptions and can provide only reasonable, not absolute, assurances that the objectives of the system will be met. Any failure or circumvention of our controls and procedures or failure to comply with regulations related to controls and procedures could have a material adverse effect on our business, results of operations, cash flows and financial condition.
We are subject to a variety of operational risks, the manifestation of any one of which may adversely affect our business and results of operations.
We are exposed to many types of operational risks, including reputational risk, legal and compliance risk, the risk of fraud or theft by employees or outsiders and the risk of unauthorized transactions or operational errors by employees, including clerical or record-keeping errors or errors resulting from faulty or disabled computer or telecommunications systems.
Because the nature of the financial services business involves a high volume of transactions, certain errors may be repeated or compounded before they are discovered and successfully rectified. Our necessary dependence upon automated systems to record and process transactions and our large transaction volume may further increase the risk that technical flaws or tampering or manipulation of those systems will result in losses that are difficult to detect. We also may be subject to disruptions of our operating systems arising from events that are wholly or partially beyond our control (for example, computer viruses or electrical or telecommunications outages, natural disasters, disease pandemics affecting large numbers of employees or other damage to property or physical assets), which may give rise to disruption of service to customers and to financial loss or liability. The occurrence of any of these risks
could diminish our ability to operate our business (for example, by requiring us to expend significant resources to correct the defect), as well as potential liability to clients, reputational damage and regulatory intervention, which in turn could materially and adversely affect our business, financial condition and results of operations.
Our operations rely on external vendors.
We rely on external vendors to provide certain products and services necessary to maintain our day-to-day operations. Accordingly, our operations are exposed to risk that these vendors will not perform in accordance with the contracted arrangements under service agreements. The failure of external vendors to perform in accordance with the contractual terms of a service agreement because of changes in a vendor’s organization structure, financial condition, support for existing products and services or strategic focus or for any other reason could be disruptive to our operations, which could have a material adverse impact on our business and, in turn, our financial condition and results of operations.
Additionally, we outsource our data processing to an external vendor. If this vendor encounters difficulties or if we have difficulty in communicating with the vendor, it could significantly affect our ability to adequately process and account for customer transactions, which would in turn significantly affect our ability to conduct our business operations. Furthermore, a breach of the vendor’s technology may also cause reimbursable loss to our consumer and business customers, through no fault of our own. Fraud attacks targeting customer-controlled devices, plastic payment card devices such as cash advance machines and ATMs and merchant data collection points provide another source of potential loss, again through no fault of our own. Liability arising from such a security breach or fraud attack could have a material adverse impact on our business and, in turn, our financial condition and results of operations.
An interruption in or breach in security of our information systems may result in a loss of customer business and have an adverse effect on our results of operations, financial condition and cash flows.
We rely heavily on communications and information systems to conduct our business serving both internal and customer constituencies. Any failure, interruption or breach in security of these systems, or the failure of those used by our suppliers and counterparties, could result in failures or disruptions in our customer relationship management, general ledger, deposit, loan and other systems. Moreover, any such failures, interruptions or security breaches of our information systems used to process customer transactions could damage our reputation, result in a loss of customer business, subject us to additional regulatory scrutiny or expose us to civil litigation and possible financial liability, any of which could have a material adverse effect on our financial condition, results of operations and cash flows.
Unauthorized disclosure of sensitive or confidential customer information, whether through a cyber-attack, other breach of our computer systems or otherwise, could severely harm our business.
In the ordinary course of business, we rely on electronic communications and information systems to conduct our operations and to store sensitive data. Any failure, interruption or breach in security of these systems could result in significant disruption to our operations. Information security breaches and cybersecurity-related incidents may include attempts to access information, including customer and company information, capture of systems access information, malicious code, computer viruses and denial of service attacks that could result in unauthorized access, misuse, loss or destruction of data (including confidential customer information), account takeovers, unavailability of service or other events. These types of threats may derive from human error, fraud or malice on the part of external or internal parties, or may result from accidental technological failure. Further, to access our products and services our customers may use computers and mobile devices that are outside the protection of our security control systems. Our technologies, systems, networks and software, and those of other financial institutions have been, and are likely to continue to be, the target of cybersecurity threats and attacks, which may range from uncoordinated individual attempts to sophisticated and targeted measures directed at us. The risk of a security breach or disruption, particularly through cyber-attack or cyber intrusion, has increased as the number, intensity and sophistication of attempted attacks and intrusions from around the world have increased.
Our business requires the collection and retention of large volumes of customer data, including personally identifiable information in various information systems that we maintain and in those maintained by third parties with whom we contract to provide data services. We also maintain important internal company data such as personally identifiable information about our employees and information relating to our operations. The integrity and protection of that customer and Company data is important to us.
Our customers and employees have been, and will continue to be, targeted by parties using fraudulent e-mails and other communications in attempts to misappropriate passwords, bank account information or other personal information or to introduce viruses or other malware through Trojan horse programs to our information systems or our customers’ computers. Though we endeavor to mitigate these threats through product improvements, use of encryption and authentication technology and customer and employee education, such cyber-attacks against us or our merchants and our third party service providers remain a serious issue. The pervasiveness of cybersecurity incidents in general and the risks of cyber-crime are complex and continue to evolve. More generally, publicized information concerning security and cyber-related problems could inhibit the use or growth of electronic or web-based applications or solutions as a means of conducting commercial transactions.
Although we make significant efforts to maintain the security and integrity of our information systems and have implemented various measures to manage the risk of a security breach or disruption, there can be no assurance that our security efforts and measures will be effective or that attempted security breaches or disruptions would not be successful or damaging. Even the most well protected information, networks, systems and facilities remain potentially vulnerable because attempted security breaches, particularly cyber-attacks and intrusions, or disruptions will occur in the future, and because the techniques used in such attempts are constantly evolving and generally are not recognized until launched against a target, and in some cases are designed not to be detected and, in fact, may not be detected. Accordingly, we may be unable to anticipate these techniques or to implement adequate security barriers or other preventative measures, and thus it is virtually impossible for us to entirely mitigate this risk. While we maintain specific cyber insurance coverage, the amount of coverage may not be adequate in any particular case. Furthermore, because cyber threat scenarios are inherently difficult to predict and can take many forms, some breaches may not be covered under our cyber insurance coverage. A security breach or other significant disruption of our information systems or those related to our customers, merchants and our third party vendors, including as a result of cyber-attacks, could (i) disrupt the proper functioning of our networks and systems and therefore our operations or those of certain of our customers; (ii) result in the unauthorized access to, and destruction, loss, theft, misappropriation or release of confidential, sensitive or otherwise valuable information of ours or our customers; (iii) result in a violation of applicable privacy, data breach and other laws, subjecting us to additional regulatory scrutiny and expose us to civil litigation, governmental fines and possible financial liability; (iv) require significant management attention and resources to remedy the damages that result; or (v) harm our reputation or cause a decrease in the number of customers that choose to do business with us. The occurrence of any of the foregoing could have a material adverse effect on our business, financial condition, cash flows and results of operations.
We continually encounter technological change.
The financial services industry is continually undergoing rapid technological change with frequent introductions of new technology-driven products and services. The effective use of technology increases efficiency and enables financial institutions to better serve customers and reduce costs. Our future success depends, in part, upon our ability to address the needs of our customers by using technology to provide products and services that will satisfy customer demands, as well as create additional efficiencies in our operations. Many of our competitors have substantially greater resources to invest in technological improvements. We may not be able to effectively implement new technology-driven products and services or be successful in marketing these products and services to our customers. Failure to successfully keep pace with technological change affecting the financial services industry could have a material adverse impact on our business and, in turn, our financial condition, results of operations and cash flows.
We are subject to claims and litigation.
From time to time, customers and other stakeholders make claims and take legal action pertaining to the performance of our professional, fiduciary and lender responsibilities. At any given time, these claims are in various stages of the legal process from initial complaints to legal cases currently in appeals. Whether or not these claims and legal actions are founded, if such claims and legal actions are not resolved in a manner favorable to us, they may result in significant financial liability and adversely affect the market perception of us and our products and services as well as impact customer demand for our products and services. Any financial liability or reputation damage could have a material adverse effect on our business, which, in turn, could have a material adverse effect on our financial condition, results of operations and cash flows.
If we are unable to identify and acquire other financial institutions and successfully integrate our acquired businesses, our business and earnings may be negatively affected.
The market for acquisitions remains highly competitive and we may be unable to find acquisition candidates in the future that fit our acquisition and growth strategy. To the extent that we are unable to find suitable acquisition candidates, an important component of our growth strategy may be lost.
Acquisitions of financial institutions involve operational risks and uncertainties and acquired companies may have unforeseen liabilities, exposure to asset quality problems, key employee and customer retention problems and other problems that could negatively affect the Company. We may not be able to complete future acquisitions and, if we do complete such acquisitions, we may not be able to sell certain pieces acquired or successfully integrate the operations, management, products and services of the entities that we acquire and eliminate redundancies. The integration process could result in the loss of key employees or disruption of the combined entity’s ongoing business or inconsistencies in standards, controls, procedures and policies that adversely affect our ability to maintain relationships with customers and employees or achieve the anticipated benefits of the transaction. The integration process may also require significant time and attention from our management that they would otherwise direct at servicing existing business and developing new business. Our inability to find suitable acquisition candidates and failure to successfully integrate the entities we acquire into our existing operations may increase our operating costs significantly and adversely affect our business and earnings.
Acquisitions may be delayed, impeded, or prohibited due to regulatory issues.
Acquisitions by us, particularly those of financial institutions, are subject to approval by a variety of federal and state regulatory agencies. The process for obtaining these required regulatory approvals has become more difficult in recent years. Regulatory approvals could be delayed, impeded, restrictively conditioned or denied due to existing or new regulatory issues that we have, or may have, with regulatory agencies, including, without limitation, issues related to fair lending laws, fair housing laws, consumer protection laws, unfair, deceptive, or abusive acts or practices regulations, Community Reinvestment Act issues and other similar laws and regulations. We may fail to pursue, evaluate or complete strategic and competitively significant acquisition opportunities as a result of our inability, or perceived or anticipated inability, to obtain regulatory approvals in a timely manner, under reasonable conditions or at all. Difficulties associated with potential acquisitions that may result from these factors could have a material adverse impact on our business, and, in turn, our financial condition and results of operations.
We may realize impairment of goodwill.
During 2016, we recorded $56.4 million in goodwill. We evaluate this goodwill at least annually for possible impairment. If the goodwill became impaired and not recoverable, it could result in a material non-cash charge to earnings, which could have a material adverse effect on our financial condition. See Note 8, “Goodwill and Other Intangible Assets” under Item 8, “Financial Statements and Supplementary Data – Notes to Consolidated Financial Statements” for more information on goodwill impairment.
We are exposed to risk of environmental liabilities with respect to properties to which we take title.
A significant portion of our loan portfolio is secured by real property. In the course of our business, we may own or foreclose on and take title to properties securing certain loans and could be subject to environmental liabilities with respect to these properties. In doing so, there is a risk that hazardous or toxic substances could be found on these properties. If hazardous or toxic substances are found, we may be held liable to a governmental entity or to third parties for property damage, personal injury, investigation costs and clean-up costs incurred by these parties in connection with the environmental contamination, or we may be required to investigate or clean up the hazardous or toxic substances. The costs associated with investigation or remediation activities could be substantial. Further, the discovery or presence of hazardous or toxic substances may materially reduce the affected property’s value or limit the Company’s ability to use or sell the affected property. In addition, as the owner or former owner of a contaminated site, we may be subject to common law claims by third parties based on damages and costs resulting from environmental contamination emanating from the property. If we ever become subject to significant environmental liabilities, our business, financial condition, cash flows and results of operations could be materially and adversely affected.
Consumers may decide not to use banks to complete their financial transactions.
Technology and other changes are allowing parties to complete financial transactions through alternative methods that historically have involved banks. For example, consumers can now maintain funds that would have historically been held as bank deposits in brokerage accounts, mutual funds or general-purpose reloadable prepaid cards. Consumers can also complete transactions such as paying bills, obtaining a loan or transferring funds directly without the assistance of a bank. The process of eliminating banks as intermediaries, or “disintermediation,” could result in the loss of fee income, as well as the loss of customer deposits and the related income generated from those deposits. The loss of these revenue streams and the lower cost of deposits as a source of funds could have a material adverse effect on our financial condition, cash flows and results of operations.
Risks Related to Our Common Stock
An investment in our common stock is not an insured deposit.
Our common stock is not a bank deposit and, therefore, is not insured against loss by the FDIC, any other deposit insurance fund or by any other public or private entity. Investment in our common stock is inherently risky for the reasons described in this “Risk Factors” section and elsewhere in this report and is subject to the same market forces that affect the price of common stock in any company. As a result, if you acquire our common stock, you could lose some or all of your investment.
Concentrated ownership of our stock may discourage a change in control and have an adverse effect on the share price of our voting common stock and also can influence stockholder decisions.
As of February 17, 2017, executive officers, directors and stockholders of more than 5% of our common stock beneficially owned or controlled approximately 42.1% of our common stock. Investors who purchase our common stock may be subject to certain risks due to the concentrated ownership of our common stock. Such a concentration of ownership may have the effect of discouraging, delaying or preventing a change in control and may also have an adverse effect on the market price of our voting common stock. In addition, as a result of their ownership, executive officers, directors and stockholders of more than 5% of our common stock may have the ability to influence the outcome of any matter submitted to our stockholders for approval, including the election of directors.
Our stock price can be volatile.
Stock price volatility may make it more difficult for investors to resell our common stock when desired and at attractive prices. Our stock price can fluctuate significantly in response to a variety of factors including, among other things: actual or anticipated variations in quarterly results of operations; recommendations by securities analysts; operating and stock price performance of other companies that investors deem comparable to us; news reports relating to trends, concerns and other issues in the financial services industry; perceptions in the marketplace regarding us and/or our competitors; new technology used, or services offered, by competitors; significant acquisitions or business combinations, strategic partnerships, joint ventures or capital commitments by or involving us or our competitors; failure to integrate acquisitions or realize anticipated benefits from acquisitions; changes in government regulations; and geopolitical conditions such as acts or threats of terrorism or military conflicts.
The trading volume in our voting common stock is less than that of larger financial services companies.
Although our voting common stock is listed for trading on the Nasdaq, its trading volume is generally less than that of other, larger financial services companies, and investors are not assured that a liquid market will exist at any given time for our voting common stock. A public trading market having the desired characteristics of depth, liquidity and orderliness depends on the presence in the marketplace at any given time of willing buyers and sellers of our voting common stock. This presence depends on the individual decisions of investors and general economic and market conditions over which we have no control. Given the lower trading volume of our voting common stock, significant sales of our voting common stock, or the expectation of these sales, could cause our stock price to fall.
The holders of our junior subordinated debentures have rights that are senior to those of our stockholders.
We currently have outstanding an aggregate of $65.0 million in junior subordinated debentures. We conditionally guarantee payments of the principal and interest on the junior subordinated debentures. Our junior subordinated debentures are senior to our shares of common stock. As a result, we must make payments on the junior subordinated debentures before any dividends can be paid on our common stock and, in the event of the
Company’s bankruptcy, dissolution or liquidation, the holders of the debentures must be satisfied before any distributions can be made to the holders of the common stock. With respect to two of the three junior subordinated debenture issuances, the Company has the right to defer periodic distributions for up to 60 months, during which time the Company would be prohibited from paying dividends on its common stock. The Company’s ability to pay the future distributions depends upon the earnings of the Bank and the dividends from the Bank to the Company, which may be inadequate to service the obligations.
ITEM 1B. UNRESOLVED STAFF COMMENTS
None.
ITEM 2. PROPERTIES
As of December 31, 2016, we had a total of 32 branch office properties, including our headquarters, 26 of which we owned and six of which we leased. In addition we have two leased offices, housing our investment management firms. All of our properties are located in the Colorado Front Range. Each of Guaranty Bancorp’s and Guaranty Bank’s principal office is located at 1331 Seventeenth Street, Suite 200, Denver, Colorado 80202.
We consider our properties to be suitable and adequate for our needs.
ITEM 3. LEGAL PROCEEDINGS
The Company and the Bank are defendants, from time to time, in legal actions at various points of the legal process, including appeals, arising from transactions conducted in the ordinary course of business. Management believes, after consultations with legal counsel that it is not probable that the outcome of current legal actions will result in a liability that has a material adverse effect on the Company’s consolidated financial position, results of operations, comprehensive income or cash flows. In the event that such legal action results in an unfavorable outcome, the resulting liability could have a material adverse effect on the Company’s consolidated financial position, results of operations, comprehensive income or cash flows.
ITEM 4. MINE SAFETY DISCLOSURE
Not applicable.
PART II
ITEM 5. MARKET FOR REGISTRANT’S COMMON EQUITY, RELATED STOCKHOLDER MATTERS AND ISSUER PURCHASES OF EQUITY SECURITIES
Common Stock Market Prices
Our voting common stock is traded on the Nasdaq under the symbol “GBNK”. The table below sets forth the high and low sales prices per share of our voting common stock as reported by Nasdaq for each quarter in the preceding two fiscal years.
| | | | | | | |
| | | | | | | |
| | | Sales Prices |
| | | High | | Low | | Close |
Year/Quarter: | | | | | | | |
2016 | | | | | | | |
Fourth quarter | $ | 24.95 | $ | 17.00 | $ | 24.20 |
Third quarter | | 18.88 | | 16.30 | | 17.85 |
Second quarter | | 17.17 | | 15.01 | | 16.70 |
First quarter | | 16.95 | | 13.92 | | 15.46 |
2015 | | | | | | | |
Fourth quarter | $ | 17.91 | $ | 15.43 | $ | 16.54 |
Third quarter | | 17.42 | | 12.78 | | 16.47 |
Second quarter | | 17.53 | | 15.22 | | 16.51 |
First quarter | | 17.78 | | 13.33 | | 16.96 |
On February 17, 2017, the closing price of our voting common stock on Nasdaq was $24.70 per share. As of that date, we believe, based on the records of our transfer agent, that there were approximately 240 record holders of our voting common stock.
Dividends
Our Board of Directors reviews the appropriateness of declaring or paying cash dividends on an ongoing basis. Any determination to declare or pay dividends in the future is at the discretion of our Board of Directors. Our Board of Directors takes into account such matters as general business conditions, our financial results, future prospects, capital requirements, contractual, legal and regulatory restrictions on the payment of dividends by us to our stockholders or by the Bank to the holding company, and such other factors as our Board of Directors may deem relevant. On February 7, 2017 the Company’s Board of Directors declared a quarterly stock dividend of 12 and ½ cents per share, payable on February 28, 2017 to stockholders of record on February 21, 2017. During 2016 the Company paid stockholder dividends aggregating to 46 cents per share. These dividends were paid at the level of 11 and ½ cents per share, per quarter, in February, May, August and November 2016. During 2015 the Company paid stockholder dividends aggregating to 40 cents per share. These dividends were paid at the level of ten cents per share, per quarter, in February, May, August and November 2015.
Our ability to pay dividends is subject to the restrictions of the Delaware General Corporation Law. Because we are a bank holding company with no significant assets other than our bank subsidiary, we currently depend upon dividends from the Bank for a substantial portion of our revenues. For further information on dividend restrictions affecting the Company and the Bank, refer to the discussion in the sub-sections titled “Bank Holding Company Regulations Applicable to Guaranty Bancorp-Dividends” and “Banking Regulations Applicable to Guaranty Bank-Dividends” in Item 1, Business-Supervision and Regulation, and under Note 2(w) included in the “Notes to Consolidated Financial Statements” contained in Part II, Item 8, “Financial Statements and Supplementary Data”.
Under the terms of our trust preferred securities, including our related subordinated debentures, issued on June 30, 2003 and April 8, 2004, we cannot declare or pay any dividends or distributions (other than stock dividends) on, or redeem, purchase, acquire or make a liquidation payment with respect to, any shares of our capital stock if (i) an event of default under any of the subordinated debenture agreements has occurred and is continuing, or (ii) we defer payment of interest on the trust preferred securities (for a period of up to 60 consecutive months as long as we are in compliance with all covenants of the agreement).
Securities Authorized for Issuance under Equity Compensation Plans
The following table provides information as of December 31, 2016 regarding securities issued and to be issued under our equity compensation plans that were in effect during the year ended December 31, 2016:
| | | | | | |
| | | | | | |
| Plan Category | Number of Securities
to be Issued
Upon Exercise of
Outstanding Options,
Warrants and Rights | | Weighted-Average
Exercise Price of
Outstanding Options,
Warrants and Rights | Number of Securities
Remaining Available
for Future Issuance
Under Equity
Compensation Plans
(Excluding Securities
Reflected in Column (a)) | |
| | (a) | | (b) | (c) | |
Equity compensation plans | Guaranty Bancorp
2015 Long-Term | | | | | |
approved by security holders | Incentive Plan (1) | - | (2) | - | 728,305 | (3)(4) |
____________________ | | - | | - | 728,305 | |
| | | | | | |
| | | | | | |
| | | | |
(1) The Guaranty Bancorp Long-Term Incentive Plan (the “2015 Plan”) was approved by the stockholders of the Company at the Company’s 2015 Annual Meeting of Stockholders. |
(2) Does not include the 513,187 voting shares of unvested stock grants outstanding as of December 31, 2016. |
(3) The total number of shares of common stock that have been approved for issuance pursuant to awards granted or which may be granted in the future under the 2015 Plan is 935,000 shares. The number of shares remaining available for future issuance has been reduced by 206,695 shares, which represents the number of vested shares and the number of unvested shares of time-based and performance stock awards outstanding at December 31, 2016 under the 2015 Plan. Forfeited shares are included in the amount which may be granted in the future. |
(4) All of the 728,305 shares remaining available for issuance under the 2015 Plan may be issued not only for future grants of options, warrants and rights, but also for future stock awards. The Company’s current practice is to grant only awards of stock. While the Company has not issued any stock options, warrants or rights, it may do so in the future. |
Repurchases of Common Stock
See “Supervision and Regulation” in Item 1 of this report for a discussion of potential regulatory limitations for stock repurchases and on the holding company’s receipt of dividends from its bank subsidiary, which may be used to repurchase our common stock. On February 7, 2017, the Company’s Board of Directors authorized the extension of the expiration date of the Company’s share repurchase program originally announced in April 2014. The repurchase program had been scheduled to expire 12 months from the date of its announcement, and as extended, the program is scheduled to expire on April 2, 2018. Pursuant to the program, the Company may repurchase up to 1,000,000 shares of voting common stock, par value $0.001 per share. As of December 31, 2016, no shares had been repurchased under this plan.
The following table provides information with respect to purchases made by or on behalf of the Company or any “affiliated purchaser” (as defined in Rule 10b-18(a)(3) under the Exchange Act) of our voting common stock during the fourth quarter of 2016.
| | | | | |
| | | | | |
| | | | Shares Purchased | Remaining |
| | | | under | Repurchase |
| Total Shares | | Average Price | Publicly Announced | Authority |
| Purchased (1) | | Paid per Share | Repurchase Plan | in Shares |
October 1 to October 31, 2016 | - | $ | - | - | 1,000,000 |
November 1 to November 30, 2016 | 165 | | 20.27 | - | 1,000,000 |
December 1 to December 31, 2016 | 16,808 | | 24.18 | - | 1,000,000 |
____________________ | 16,973 | $ | 24.14 | - | 1,000,000 |
|
(1) These shares relate to the net settlement by employees related to vested, restricted stock awards and do not impact the 1,000,000 shares available for repurchase under the repurchase plan originally announced on April 3, 2014, which is scheduled to expire April 2, 2018. Net settlements represent instances where employees elect to satisfy their income tax liability related to the vesting of restricted stock through the surrender of a proportionate number of the vested shares to the Company. |
Performance Graph
Our voting common stock trades on the Nasdaq under the symbol “GBNK”. The following graph shows a comparison from December 31, 2011 through December 31, 2016 of the cumulative total return for the Company’s voting common stock, the Nasdaq Composite Index and Nasdaq Bank Stocks Index. Such returns are based on historical results and are not intended to suggest future performance. Data for GBNK voting common stock, the Nasdaq Composite Index and the Nasdaq Bank Stocks Index assumes reinvestment of dividends. The total return on the Company’s voting common stock and on each of the comparison indices is determined based on the total return on investment under the assumption that a $100 investment was made on December 31, 2011.
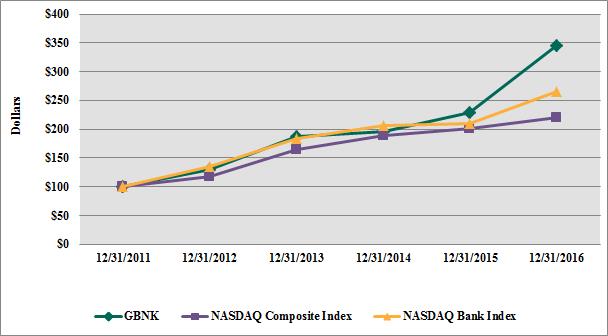
| | | | | | | | | | | | | | | | | |
Index | | 12/31/2011 | | | 12/31/2012 | | | 12/31/2013 | | | 12/31/2014 | | | 12/31/2015 | | | 12/31/2016 |
GBNK . . . . . . . . . . . . . . . . . . . . . . . . . . . . . . | $ | 100 | | $ | 129 | | $ | 187 | | $ | 195 | | $ | 229 | | $ | 345 |
NASDAQ Composite Index . . . . . . . . . . . . . . . . . | | 100 | | | 117 | | | 165 | | | 189 | | | 202 | | | 220 |
NASDAQ Bank Index . . . . . . . . . . . . | | 100 | | | 135 | | | 184 | | | 206 | | | 210 | | | 266 |
ITEM 6. SELECTED FINANCIAL DATA
The following table sets forth certain financial and statistical information for each of the years in the five-year period ended December 31, 2016. This data should be read in conjunction with our audited consolidated financial statements and related “Notes to Consolidated Financial Statements” contained in “Item 8. Financial Statements and Supplementary Data.”
| | | | | | | | | | | | | | |
| | | | | | | | | | | | | | |
| | Year Ended December 31, |
| | 2016 | | | 2015 | | | 2014 | | | 2013 | | | 2012 |
| | | | | | | | | | | | | | |
| | (In thousands, except share data and ratios) |
Consolidated Statement of Income (Loss) Data: | | | | | | | | | |
Interest income | $ | 99,853 | | $ | 82,330 | | $ | 75,520 | | $ | 70,638 | | $ | 69,565 |
Interest expense | | 9,465 | | | 5,351 | | | 6,707 | | | 7,068 | | | 9,154 |
Net interest income | | 90,388 | | | 76,979 | | | 68,813 | | | 63,570 | | | 60,411 |
Provision (credit) for loan losses | | 143 | | | 96 | | | 14 | | | 296 | | | (2,000) |
Net interest income after | | | | | | | | | | | | | | |
provision for loan losses | | 90,245 | | | 76,883 | | | 68,799 | | | 63,274 | | | 62,411 |
Noninterest income | | 19,257 | | | 17,180 | | | 16,695 | | | 13,799 | | | 13,591 |
Noninterest expense | | 72,787 | | | 60,339 | | | 65,746 | | | 56,688 | | | 64,114 |
Income before income taxes | | 36,715 | | | 33,724 | | | 19,748 | | | 20,385 | | | 11,888 |
Income tax expense (benefit) | | 11,988 | | | 11,270 | | | 6,236 | | | 6,356 | | | (3,171) |
Net income | $ | 24,727 | | $ | 22,454 | | $ | 13,512 | | $ | 14,029 | | $ | 15,059 |
____________________ | | | | | | | | | | | | | | |
Common Share Data: | | | | | | | | | | | | | | |
Basic earnings per common | | | | | | | | | | | | | | |
share (1) | $ | 1.06 | | $ | 1.07 | | $ | 0.64 | | $ | 0.67 | | $ | 0.72 |
Diluted earnings per common | | | | | | | | | | | | | | |
share (1) | $ | 1.05 | | $ | 1.06 | | $ | 0.64 | | $ | 0.67 | | $ | 0.72 |
Dividends declared per common share | $ | 0.46 | | $ | 0.40 | | $ | 0.20 | | $ | 0.08 | | $ | - |
Book value per common share (1) | $ | 12.44 | | $ | 10.21 | | $ | 9.57 | | $ | 8.89 | | $ | 8.89 |
Weighted average common shares | | | | | | | | | | | | | | |
outstanding-basic (1) | | 23,267,108 | | | 21,065,590 | | | 20,957,702 | | | 20,867,064 | | | 20,786,806 |
Weighted average common shares | | | | | | | | | | | | | | |
outstanding-diluted (1) | | 23,559,947 | | | 21,272,336 | | | 21,086,543 | | | 20,951,237 | | | 20,878,251 |
Common shares outstanding | | | | | | | | | | | | | | |
at end of period (1) | | 28,334,004 | | | 21,704,852 | | | 21,628,873 | | | 21,303,707 | | | 21,169,521 |
____________________ | | | | | | | | | | | | | | |
(1) Share and per share amounts have been adjusted to reflect the Company's 1-for-5 reverse stock split on May 20, 2013. |
| | | | | | | | | | | | | | | |
| | | | | | | | | | | | | | | |
| | For the Year Ended December 31, | |
| | 2016 | | | 2015 | | | 2014 | | | 2013 | | | 2012 | |
| | | | | | | | | | | | | | | |
| | (In thousands, except share data and ratios) | |
Consolidated Balance Sheet Data: | | | | | | | | | | | | | | | |
Cash and cash equivalents | $ | 50,111 | | $ | 26,711 | | $ | 32,441 | | $ | 28,077 | | $ | 163,217 | |
Time deposits with banks | | 254 | | | - | | | - | | | - | | | 8,000 | |
Total investments | | 590,856 | | | 424,692 | | | 449,482 | | | 442,300 | | | 458,923 | |
Net loans (including loans held for sale) | | 2,495,888 | | | 1,791,536 | | | 1,518,944 | | | 1,299,419 | | | 1,133,607 | |
Total assets | | 3,366,427 | | | 2,368,525 | | | 2,124,778 | | | 1,911,032 | | | 1,886,938 | |
Deposits | | 2,699,084 | | | 1,801,845 | | | 1,685,324 | | | 1,528,457 | | | 1,454,756 | |
Debt | | 299,097 | | | 333,098 | | | 219,582 | | | 180,058 | | | 218,442 | |
Stockholders' equity | | 352,378 | | | 221,639 | | | 206,939 | | | 189,394 | | | 188,200 | |
| | | | | | | | | | | | | | | |
Selected Other Balance Sheet Data: | | | | | | | | | | | | | | | |
Average assets | | 2,668,035 | | | 2,226,794 | | | 2,001,552 | | | 1,863,578 | | | 1,749,115 | |
Average earning assets | | 2,510,332 | | | 2,098,995 | | | 1,882,194 | | | 1,755,693 | | | 1,644,898 | |
Average stockholders' equity | | 264,474 | | | 215,513 | | | 201,082 | | | 189,534 | | | 179,300 | |
| | | | | | | | | | | | | | | |
Selected Financial Ratios: | | | | | | | | | | | | | | | |
Return on average assets (a) | | 0.93 | % | | 1.01 | % | | 0.68 | % | | 0.75 | % | | 0.86 | % |
Return on average equity (b) | | 9.35 | % | | 10.42 | % | | 6.72 | % | | 7.40 | % | | 8.40 | % |
Net interest margin (c) | | 3.60 | % | | 3.67 | % | | 3.66 | % | | 3.62 | % | | 3.67 | % |
Efficiency ratio (tax equivalent) (d) | | 57.46 | % | | 60.20 | % | | 65.56 | % | | 66.79 | % | | 77.05 | % |
| | | | | | | | | | | | | | | |
Selected Asset Quality Ratios: | | | | | | | | | | | | | | | |
Nonperforming assets to total assets | | 0.17 | % | | 0.64 | % | | 0.70 | % | | 1.04 | % | | 1.78 | % |
Nonperforming loans to loans, net | | | | | | | | | | | | | | | |
of deferred costs and fees | | 0.21 | % | | 0.80 | % | | 0.82 | % | | 1.17 | % | | 1.20 | % |
Allowance for loan losses to total loans, | | | | | | | | | | | | | | | |
net of deferred costs and fees, held | | | | | | | | | | | | | | | |
for investment | | 0.92 | % | | 1.27 | % | | 1.46 | % | | 1.59 | % | | 2.17 | % |
Allowance for loan losses plus unaccreted | | | | | | | | | | | | | | | |
discount to loans, net of deferred | | | | | | | | | | | | | | | |
costs and fees, held for investment | | 1.50 | % | | 1.27 | % | | 1.46 | % | | 1.59 | % | | 2.17 | % |
Allowance for loan losses plus unaccreted | | | | | | | | | | | | | | | |
discount to nonperforming loans, held | | | | | | | | | | | | | | | |
for investment | | 722.93 | % | | 158.91 | % | | 178.25 | % | | 135.73 | % | | 180.67 | % |
Net charge-offs (recoveries) to average | | | | | | | | | | | | | | | |
loans, held for investment | | (0.01) | % | | (0.03) | % | | (0.10) | % | | 0.36 | % | | 0.68 | % |
____________________ | | | | | | | | | | | | | | | |
| (a) | | Return on average assets is determined by dividing net income (loss) by average assets. |
| (b) | | Return on average stockholders’ equity is determined by dividing net income (loss) by average stockholders’ equity. |
| (c) | | Net interest margin is determined by dividing net interest income by average interest-earning assets. |
| (d) | | Efficiency ratio is determined by dividing total noninterest expense less intangible amortization expense, less select nonrecurring charges, by an amount equal to net interest income plus noninterest income, plus incremental tax benefit from tax exempt bonds and bank-owned life insurance. |
ITEM 7. MANAGEMENT’S DISCUSSION AND ANALYSIS OF FINANCIAL CONDITION AND RESULTS OF OPERATIONS
Forward-Looking Statements and Factors that Could Affect Future Results
Certain statements contained in this Annual Report on Form 10-K that are not statements of historical fact constitute forward-looking statements within the meaning of the Private Securities Litigation Reform Act of 1995 (the “Act”), notwithstanding that such statements are not specifically identified as such. Examples of forward-looking statements include, but are not limited to: (i) projections of revenues, expenses, income or loss, earnings or loss per share, the payment or nonpayment of dividends, capital structure and other financial items; (ii) statements of plans, objectives and expectations of the Company or its management or Board of Directors, including those relating to products or services; (iii) statements of future economic performance; and (iv) statements of assumptions underlying such statements. Words such as “believes”, “anticipates”, “expects”, “intends”, “targeted”, “projected”, “continue”, “remain”, “will”, “should”, “could”, “may” and other similar expressions are intended to identify forward-looking statements but are not the exclusive means of identifying such statements and the lack of such an identifying word does not necessarily indicate the absence of a forward-looking statement.
Forward-looking statements are based on assumptions and involve risks and uncertainties, many of which are beyond our control, which may cause actual results to differ materially from those discussed in such statements. Factors that could cause actual results to differ from those discussed in the forward-looking statements include, but are not limited to:
| · | | Local, regional, national and international economic conditions and the impact they may have on us and our customers, and our assessment of that impact on our estimates including, but not limited to, the allowance for loan losses. |
| · | | The effects of and changes in trade, monetary and fiscal policies and laws, including the interest rate policies of the Federal Open Market Committee of the Federal Reserve Board. |
| · | | Requirements imposed by regulatory agencies to increase our capital to a level greater than the current level required for well-capitalized financial institutions (including the impact of the joint rule by the Federal Reserve Board, the OCC, and the FDIC to revise the regulatory capital rules, including the implementation of the Basel III standards), the failure to maintain capital above the level required to be well-capitalized under the regulatory capital adequacy guidelines, the availability of capital from private or government sources, or the failure to raise additional capital as needed. |
| · | | Changes in the level of nonperforming assets and charge-offs and the deterioration of other credit quality measures, and their impact on the adequacy of the allowance for loan losses and provision for loan losses. |
| · | | Changes in sources and uses of funds, including loans, deposits and borrowings, including the ability of the Bank to retain and grow core deposits, to purchase brokered deposits and to maintain unsecured federal funds lines and secured lines of credit with correspondent banks. |
| · | | Failure, interruption or breach in security of our electronic communications, information systems and computer systems. |
| · | | The effects of inflation and interest rate, securities market and monetary supply fluctuations. |
| · | | Political instability, acts of war or terrorism and natural disasters. |
| · | | Our ability to develop and promote customer acceptance of new products and services in a timely manner and customers’ perceived overall value of these products and services. |
| · | | Changes in consumer spending, borrowings and savings habits. |
| · | | Competition for loans and deposits and failure to attract or retain loans and deposits. |
| · | | Changes in the financial performance or condition of the Bank’s borrowers and the ability of the Bank’s borrowers to perform under the terms of their loans and the terms of other credit agreements. |
| · | | Our ability to receive regulatory approval for the Bank to declare and pay dividends to the holding company. |
| · | | Our ability to acquire, operate and maintain cost effective and efficient systems. |
| · | | The timing, impact and other uncertainties of any future acquisitions, including our ability to identify suitable future acquisition candidates, success or failure in the integration of their operations, the ability to raise capital or debt to fund acquisitions and the ability to enter new markets successfully and capitalize on growth opportunities. |
| · | | Our ability to successfully implement changes in accounting policies and practices, adopted by regulatory agencies, the Public Company Accounting Oversight Board, the Financial Accounting Standards Board and other accounting standard setters. |
| · | | The loss of senior management or operating personnel and the potential inability to hire qualified personnel at reasonable compensation levels. |
| · | | The costs and other effects resulting from changes in laws and regulations and of other legal and regulatory developments, including, but not limited to, increases in FDIC insurance premiums, the commencement of legal proceedings or regulatory or other governmental inquiries, and our ability to successfully undergo regulatory examinations, reviews and other inquiries. |
| · | | Other risks and uncertainties listed from time to time in the Company’s reports and documents filed with the SEC. |
Forward-looking statements speak only as of the date on which such statements are made. We do not undertake any obligation to update any forward-looking statement to reflect events or circumstances after the date on which such statement is made, or to reflect the occurrence of unanticipated events.
Overview
Guaranty Bancorp is a bank holding company with its principal business to serve as the holding company for its Colorado-based bank subsidiary, Guaranty Bank and Trust Company (the “Bank”). The Bank is the sole member of several limited liability companies that hold real estate as well as the sole owner of two investment management firms, Private Capital Management LLC (“PCM”) and Cherry Hills Investment Advisors Inc. (“CHIA”).
On March 16, 2016, the Company entered into the Merger Agreement with Home State, the parent company of Home State Bank, a Colorado state chartered bank headquartered in Loveland, Colorado whereby Home State would merge into the Bank. The transaction closed on September 8, 2016 and substantially all integration activities were completed on November 7, 2016.
Through the Bank, we provide banking and other financial services throughout our targeted Colorado markets to small to medium-sized businesses, including the owners and employees of those businesses and consumers. Our banking products and services include accepting demand and time deposits and originating real estate loans (including construction loans), commercial loans, SBA guaranteed loans and consumer loans. The Bank, PCM and CHIA also provide wealth management solutions, including trust and investment management services. We derive our income primarily from interest (including loan origination fees) received on loans and, to a lesser extent, interest on investment securities and other fees received in connection with servicing loan and deposit accounts, trust and investment management services. Our major operating expenses include the interest we pay on deposits and borrowings and general operating expenses. We rely primarily on locally generated deposits to provide us with funds for making loans.
In addition to building growth organically through our existing branches, we seek opportunities to acquire small to medium-sized banks or specialty finance companies that will allow us to expand our franchise in a manner consistent with our community-banking focus. Ideally, the financial institutions we seek to acquire will be in or contiguous to our existing footprint, which would allow us to use the acquisition to consolidate duplicative costs and administrative functions and to rationalize operating expenses. We believe that by streamlining the administrative and operational functions of an acquired financial institution, we are able to substantially lower operating costs, operate more efficiently and integrate the acquired financial institution while maintaining the stability of our existing business. In certain circumstances we may seek to acquire financial institutions that may be located outside of our existing footprint. We also seek opportunities which will allow us to further diversify our noninterest income base, including adding to our wealth management platform.
We are subject to competition from other financial institutions and our operating results, like those of other financial institutions operating exclusively or primarily in Colorado, are significantly influenced by economic conditions in Colorado, including the strength of the Colorado real estate market. In addition, the fiscal, monetary
and regulatory policies of the federal government and regulatory authorities that govern financial institutions and market interest rates impact our financial condition, results of operations and cash flows.
Application of Critical Accounting Policies and Accounting Estimates
Our accounting policies are integral to understanding our reported financial results. Our most complex accounting policies require management’s judgment to ascertain the valuation of assets, liabilities, commitments and contingencies. We have established detailed policies and procedures that are intended to ensure valuation methods are well controlled and consistently applied from period to period. In addition, the policies and procedures are intended to ensure that the process for changing methodologies occurs in an appropriate manner. The following is a brief description of our current accounting policies that we believe are critical or involve significant management judgment.
Allowance for Loan Losses
Our loan portfolio represents the largest category of assets on our balance sheet. We estimate probable incurred losses in our loan portfolio and establish an allowance for those losses by considering factors including historical loss rates, expected cash flows and estimated collateral values. In assessing these factors, we use organizational history and experience with credit decisions and related outcomes. The allowance for loan losses represents our best estimate of losses inherent in the existing loan portfolio and is increased by the provision for loan losses charged to expense and reduced by credit provisions and loans charged off, net of recoveries. We evaluate our allowance for loan losses quarterly. If our underlying assumptions later prove to be inaccurate based on subsequent loss evaluations, we adjust the allowance for loan losses accordingly.
We estimate the appropriate level of allowance for loan losses by separately evaluating impaired and non-impaired loans. A specific allowance is assigned to an impaired loan when the present value of expected cash flows or value of underlying collateral does not support the carrying amount of the loan. The methodology used to assign an allowance to a non-impaired loan is more subjective. Generally, the allowance assigned to non-impaired loans is determined by applying historical loss rates by portfolio segment to existing loans with similar risk characteristics, adjusted for qualitative factors including the volume and types of loans we make, volume and severity of identified classified loans, economic conditions, changes in credit policies or underwriting standards, and changes in the level of credit risk associated with specific industries and markets. Because the economic and business climate in any given industry or market, and its impact on any given borrower, can change rapidly, management continually assesses the risk profile of our loan portfolio and adjusts it when appropriate. Despite the fact that we have these preventative procedures in place, there still exists the possibility that our assessment could prove to be incorrect and thus require an immediate adjustment to the allowance for loan losses.
We estimate the appropriate level of loan loss allowance by conducting a detailed review of the three portfolio segments which comprise our loan portfolio. Loans in the same portfolio segment would normally have similar characteristics, such as risk classification, past due status, type of loan, industry or collateral. The risk profile of certain segments of the loan portfolio may be improving, while the risk profile of others may be deteriorating. As a result, an increase in the appropriate level of the allowance for one segment may offset a decrease for another. Adjustments to the allowance represent the aggregate impact from the analysis of each of our portfolio segments.
Investment in Securities
We classify our investments in debt and equity securities as either held to maturity or available for sale. Securities classified as held to maturity are recorded at cost or amortized cost. Available for sale securities are carried at fair value. Fair value calculations are based on quoted market prices when such prices are available. If quoted market prices are not available, estimates of fair value are computed using a variety of techniques, including extrapolation from the quoted prices of similar instruments or recent trades for thinly traded securities, fundamental analysis, discounted cash flow analysis or through obtaining purchase quotes. Due to the subjective nature of the valuation process, it is possible that the actual fair values of these investments could differ from the estimated amounts, thereby affecting our financial position, results of operations and cash flows. If the estimated value of investments is less than the cost or amortized cost, we evaluate whether an event or change in circumstances has occurred that may have a significant adverse effect on the fair value of the investment. If such an event or change has occurred and we determine that the impairment is other-than-temporary, we expense the impairment of the investment in the period in which the event or change occurred.
Business Combinations
The Company accounts for acquisitions of businesses using the acquisition method of accounting. Under the acquisition method, assets acquired and liabilities assumed are recorded at their estimated fair value upon the date of acquisition. Management utilizes third party valuation, such as appraisals which incorporate various valuation techniques including discounted cash flow analyses to determine the fair values of assets acquired and liabilities assumed. Any excess of purchase price over amounts allocated to the acquired assets, including identifiable intangible assets, and liabilities assumed is recorded as goodwill.
RESULTS OF OPERATIONS
The following table summarizes certain key financial results for the periods indicated:
Table 1
| | | | | | | | | | | | | | | | |
| | | | | | | | | | | | | | | | |
| | | | | | | | | | | | Change | |
| | Year Ended December 31, | | | | Favorable (Unfavorable) | |
| | 2016 | | | 2015 | | | 2014 | | | | 2016 v 2015 | | | 2015 v 2014 | |
| | | | | | | | | | | | | | | | |
| | (In thousands, except for share data and ratios) | |
Results of Operations: | | | | | | | | | | | | | | | | |
Interest income | $ | 99,853 | | $ | 82,330 | | $ | 75,520 | | | $ | 17,523 | | $ | 6,810 | |
Interest expense | | 9,465 | | | 5,351 | | | 6,707 | | | | (4,114) | | | 1,356 | |
Net interest income | | 90,388 | | | 76,979 | | | 68,813 | | | | 13,409 | | | 8,166 | |
Provision for loan losses | | 143 | | | 96 | | | 14 | | | | (47) | | | (82) | |
Net interest income after | | | | | | | | | | | | | | | | |
provision for loan losses | | 90,245 | | | 76,883 | | | 68,799 | | | | 13,362 | | | 8,084 | |
Noninterest income | | 19,257 | | | 17,180 | | | 16,695 | | | | 2,077 | | | 485 | |
Noninterest expense | | 72,787 | | | 60,339 | | | 65,746 | | | | (12,448) | | | 5,407 | |
Income before income taxes | | 36,715 | | | 33,724 | | | 19,748 | | | | 2,991 | | | 13,976 | |
Income tax expense | | 11,988 | | | 11,270 | | | 6,236 | | | | (718) | | | (5,034) | |
Net income | $ | 24,727 | | $ | 22,454 | | $ | 13,512 | | | $ | 2,273 | | $ | 8,942 | |
| | | | | | | | | | | | | | | | |
Common Share Data: | | | | | | | | | | | | | | | | |
Basic earnings per common share | $ | 1.06 | | $ | 1.07 | | $ | 0.64 | | | $ | (0.01) | | $ | 0.43 | |
Diluted earnings per common | | | | | | | | | | | | | | | | |
share | $ | 1.05 | | $ | 1.06 | | $ | 0.64 | | | $ | (0.01) | | $ | 0.42 | |
Average common shares | | | | | | | | | | | | | | | | |
outstanding | | 23,267,108 | | | 21,065,590 | | | 20,957,702 | | | | 2,201,518 | | | 107,888 | |
Diluted average common shares | | | | | | | | | | | | | | | | |
outstanding | | 23,559,947 | | | 21,272,336 | | | 21,086,543 | | | | 2,287,611 | | | 185,793 | |
Average equity to average assets | | 9.91 | % | | 9.68 | % | | 10.05 | % | | | 0.23 | % | | (0.37) | % |
Return on average equity | | 9.35 | % | | 10.42 | % | | 6.72 | % | | | (1.07) | % | | 3.70 | % |
Return on average assets | | 0.93 | % | | 1.01 | % | | 0.68 | % | | | (0.08) | % | | 0.33 | % |
Dividend payout ratio | | 42.56 | % | | 37.54 | % | | 31.01 | % | | | 5.02 | % | | 6.53 | % |
| | | | | | | | | | | | | | | | |
| | | | | | | | | | | | | | | | |
| | Year Ended December 31, | | | | Change | |
| | 2016 | | | 2015 | | | 2014 | | | | 2016 v 2015 | | | 2015 v 2014 | |
Selected Balance Sheet Ratios: | | | | | | | | | | | | | | | | |
Total risk-based capital to | | | | | | | | | | | | | | | | |
risk-weighted assets | | 13.58 | % | | 13.24 | % | | 13.85 | % | | | 0.34 | % | | (0.61) | % |
Leverage ratio | | 9.81 | % | | 10.68 | % | | 11.10 | % | | | (0.87) | % | | (0.42) | % |
Loans(1), net of deferred fees and costs | | | | | | | | | | | | | | | | |
to deposits | | 93.18 | % | | 100.70 | % | | 91.46 | % | | | (7.52) | % | | 9.24 | % |
Allowance for loan losses to loans (1), | | | | | | | | | | | | | | | | |
net of deferred fees and costs | | 0.92 | % | | 1.27 | % | | 1.46 | % | | | (0.35) | % | | (0.19) | % |
Allowance for loan losses + unaccreted | | | | | | | | | | | | | | | | |
discount to loans (1), | | | | | | | | | | | | | | | | |
net of deferred fees and costs | | 1.50 | % | | 1.27 | % | | 1.46 | % | | | 0.23 | % | | (0.19) | % |
Allowance for loan losses + unaccreted | | | | | | | | | | | | | | | | |
discount to nonperforming loans | | 722.93 | % | | 158.91 | % | | 178.25 | % | | | 564.02 | % | | (19.34) | % |
Classified assets to allowance | | | | | | | | | | | | | | | | |
and Tier 1 capital (2) | | 9.79 | % | | 11.66 | % | | 11.08 | % | | | (1.87) | % | | 0.58 | % |
Noninterest bearing deposits to | | | | | | | | | | | | | | | | |
total deposits | | 33.96 | % | | 33.99 | % | | 38.81 | % | | | (0.03) | % | | (4.82) | % |
Time deposits to total deposits | | 13.55 | % | | 14.38 | % | | 11.38 | % | | | (0.83) | % | | 3.00 | % |
______________________ | | | | | | | | | | | | | | | | |
(1) Loans held for investment | | | | | | | | | | | | | | | | |
(2) Based on Bank only Tier 1 capital | | | | | | | | | | | | | | | | |
2016 Compared to 2015
The Company’s net income for 2016 increased by $2.3 million to $24.7 million compared to $22.5 million for the year ended December 31, 2015. Earnings per basic common share decreased to $1.06 and earnings per diluted common share decreased to $1.05 for the year ended December 31, 2016 compared to $1.07 per basic common share and $1.06 per diluted common share for the year ended December 31, 2015.
The increase in net income for 2016, compared to 2015, was due to a $13.4 million increase in net interest income and a $2.1 million increase in noninterest income, partially offset by a $12.4 million increase in noninterest expense and an increase in income taxes due to higher pretax income. The $13.4 million increase in net interest income for the year ended December 31, 2016, compared to 2015, was comprised of a $17.5 million increase in interest income, primarily due to a $411.3 million, or a 19.6% increase in average earnings assets, partially offset by a $4.1 million increase in interest expense mostly due to a $299.9 million, or 26.8% increase in average interest bearing deposits. The $2.1 million increase in noninterest income for the year ended December 31, 2016, compared to 2015, was mostly related to a $1.5 million increase in deposit services and other fees and a $0.3 million increase in investment management and trust fees. Noninterest expense increased $12.4 million for the year ended December 31, 2016, compared to the same period in 2015, mostly due to $6.3 million in merger-related expenses incurred in 2016. The $6.3 million in merger-related expenses included $1.9 million in severance, retention bonuses and related taxes and $4.4 million in other general and administrative expense, consisting of professional fees and system conversion costs. Excluding the $1.9 million in severance, retention bonuses and related taxes, described above, salaries and employee benefits expense increased $5.5 million during 2016 as compared to 2015, primarily due to the addition of 143 full-time equivalent employees, mostly due to employees added pursuant to the Home State transaction.
The Company’s total risk-based capital ratio was 13.58% at December 31, 2016 as compared to 13.24% at December 31, 2015. The increase in the Company’s total risk-based capital ratio was primarily due to an increase in capital related to the Home State transaction, in addition to growth in retained earnings.
2015 Compared to 2014
The Company’s net income for 2015 increased by $8.9 million to $22.5 million compared to $13.5 million for the year ended December 31, 2014. Earnings per basic common share increased to $1.07 and earnings per diluted common share increased to $1.06 for the year ended December 31, 2015 compared to $0.64 per basic and diluted common share for the year ended December 31, 2014.
The increase in net income in 2015, compared to 2014, was attributable to a $6.8 million increase in interest income, a $1.4 million decrease in interest expense, a $0.5 million increase in noninterest income and a $5.4 million decrease in noninterest expense. These improvements were partially offset by a $5.0 million increase in income taxes as a result of the Company’s increased pretax income. The $6.8 million increase in interest income was the result of a $236.4 million increase in average loans for the year ended December 31, 2015 compared to the year ended December 31, 2014. The decline in interest expense during 2015, compared to the prior year, was primarily due to the prepayment of $90.0 million in Federal Home Loan Bank (“FHLB”) term advances in the fourth quarter 2014. The $0.5 million increase in noninterest income was mostly due to a $0.8 million increase in investment management and trust income for the year ended December 31, 2015 compared to the same period in 2014. The $5.4 million decrease in noninterest expense for the year ended December 31, 2015 compared to the year ended December 31, 2014 was primarily due to the $5.5 million penalty incurred in the fourth quarter 2014 as a result of the prepayment of $90.0 million in FHLB term advances.
The Company’s total risk-based capital ratio was 13.24% at December 31, 2015 compared to 13.85% at December 31, 2014. The decrease in the Company’s total risk-based capital ratio was primarily due to an increase in risk-weighted assets attributable to loan growth during 2015.
Net Interest Income and Net Interest Margin
Net interest income, which is our primary source of income, represents the difference between interest earned on assets and interest paid on liabilities. The interest rate spread is the difference between the yield on our interest-bearing assets and liabilities. Net interest margin is net interest income expressed as a percentage of average interest-earning assets.
The following table summarizes the Company’s net interest income and related spread and margin for the periods indicated:
Table 2
| | | | | | | | | |
| | | | | | | | | |
| | Year Ended December 31, | |
| | 2016 | | | 2015 | | | 2014 | |
| | (Dollars in thousands) | | | | |
Net interest income | $ | 90,388 | | $ | 76,979 | | | 68,813 | |
Interest rate spread | | 3.42 | % | | 3.53 | % | | 3.45 | % |
Net interest margin | | 3.60 | % | | 3.67 | % | | 3.66 | % |
Net interest margin, fully tax | | | | | | | | | |
equivalent | | 3.69 | % | | 3.75 | % | | 3.74 | % |
Loan yield | | 4.31 | % | | 4.24 | % | | 4.43 | % |
Average cost of interest-bearing | | | | | | | | | |
liabilities (including noninterest- | | | | | | | | | |
bearing deposits) | | 0.40 | % | | 0.27 | % | | 0.37 | % |
Average cost of deposits | | | | | | | | | |
(including noninterest-bearing | | | | | | | | | |
deposits) | | 0.23 | % | | 0.18 | % | | 0.16 | % |
The following table presents, for the years indicated, average assets, liabilities and stockholders’ equity, as well as interest income from average interest-earning assets, interest expense from average interest-bearing liabilities and the resultant yields and costs expressed in percentages. Nonaccrual loans are included in the calculation of average loans and leases, while nonaccrued interest thereon, is excluded from the computation of yield earned.
Table 3
| | | | | | | | | | | | | |
| | | | | | | | | | | | | |
| | Year Ended December 31, | |
| | 2016 | | | | 2015 | |
| | Average Balance | | Interest Income or Expense | Average Yield or Cost | | | | Average Balance | | Interest Income or Expense | Average Yield or Cost | |
| | | | | | | | | | | | | |
| | (Dollars in thousands) | |
ASSETS: | | | | | | | | | | | | | |
Interest-earning assets: | | | | | | | | | | | | | |
Gross loans, net of deferred costs | | | | | | | | | | | | | |
and fees (1)(2)(3) | $ | 2,024,804 | $ | 87,249 | 4.31 | % | | $ | 1,655,857 | $ | 70,188 | 4.24 | % |
Investment securities (1) | | | | | | | | | | | | | |
Taxable | | 300,568 | | 7,625 | 2.54 | % | | | 335,363 | | 8,325 | 2.48 | % |
Tax-exempt | | 130,242 | | 3,683 | 2.83 | % | | | 88,727 | | 2,852 | 3.21 | % |
Bank Stocks (4) | | 18,897 | | 1,063 | 5.63 | % | | | 16,956 | | 959 | 5.66 | % |
Other earning assets | | 35,821 | | 233 | 0.65 | % | | | 2,092 | | 6 | 0.29 | % |
Total interest-earning assets | | 2,510,332 | | 99,853 | 3.98 | % | | | 2,098,995 | | 82,330 | 3.92 | % |
Non-earning assets: | | | | | | | | | | | | | |
Cash and due from banks | | 28,896 | | | | | | | 25,461 | | | | |
Other assets | | 128,807 | | | | | | | 102,338 | | | | |
Total assets | $ | 2,668,035 | | | | | | $ | 2,226,794 | | | | |
| | �� | | | | | | | | | | | |
LIABILITIES AND STOCKHOLDERS' EQUITY: | | | | | | | | | | | |
Interest-bearing liabilities: | | | | | | | | | | | | | |
Deposits: | | | | | | | | | | | | | |
Interest-bearing demand and NOW | $ | 514,877 | $ | 702 | 0.14 | % | | $ | 377,036 | $ | 390 | 0.10 | % |
Money market | | 438,100 | | 1,181 | 0.27 | % | | | 376,061 | | 888 | 0.24 | % |
Savings | | 155,236 | | 173 | 0.11 | % | | | 143,222 | | 158 | 0.11 | % |
Time certificates of deposit | | 310,961 | | 2,803 | 0.90 | % | | | 222,990 | | 1,771 | 0.79 | % |
Total interest-bearing deposits | | 1,419,174 | | 4,859 | 0.34 | % | | | 1,119,309 | | 3,207 | 0.29 | % |
Borrowings: | | | | | | | | | | | | | |
Repurchase agreements | | 25,221 | | 52 | 0.21 | % | | | 24,531 | | 45 | 0.18 | % |
Federal funds purchased (5) | | 2 | | - | 0.94 | % | | | 15 | | - | 0.80 | % |
Subordinated debentures | | 43,691 | | 2,005 | 4.59 | % | | | 25,774 | | 814 | 3.16 | % |
Borrowings | | 188,380 | | 2,549 | 1.35 | % | | | 186,248 | | 1,285 | 0.69 | % |
Total interest-bearing liabilities | | 1,676,468 | | 9,465 | 0.56 | % | | | 1,355,877 | | 5,351 | 0.39 | % |
Noninterest bearing liabilities: | | | | | | | | | | | | | |
Demand deposits | | 711,678 | | | | | | | 642,015 | | | | |
Other liabilities | | 15,415 | | | | | | | 13,389 | | | | |
Total liabilities | | 2,403,561 | | | | | | | 2,011,281 | | | | |
Stockholders' Equity | | 264,474 | | | | | | | 215,513 | | | | |
Total liabilities and stockholders' equity | $ | 2,668,035 | | | | | | $ | 2,226,794 | | | | |
| | | | | | | | | | | | | |
Net interest income | | | $ | 90,388 | | | | | | $ | 76,979 | | |
Net interest margin | | | | | 3.60 | % | | | | | | 3.67 | % |
| | | | | | | | | | | | | |
|
(1) Yields on loans and securities have not been adjusted to a tax-equivalent basis. Net interest margin on a fully tax-equivalent basis would have been 3.69% and 3.75% for the years ended December 31, 2016 and December 31, 2015, respectively. The tax-equivalent basis was computed by calculating the deemed interest on municipal bonds and tax-exempt loans that would have been earned on a fully taxable basis to yield the same after-tax income, net of the interest expense disallowance under Internal Revenue Code Sections 265 and 291, using a combined federal and state marginal tax rate of 38.01%. |
|
(2) The loan average balances and yields include nonaccrual loans. |
(3) Net loan fees of $0.7 million and $1.4 million for the years ended December 31, 2016 and December 31, 2015, respectively, are included in the yield computation. |
|
(4) Includes Bankers’ Bank of the West stock, Federal Agricultural Mortgage Corporation (Farmer Mac) stock, Federal Reserve Bank stock, Federal Home Loan Bank stock and Pacific Coast Bankers’ Bank stock. |
|
(5) The interest expense related to federal funds purchased for the years ended December 31, 2016 and December 31, 2015 rounded to zero. |
The net interest margin and loan yield are impacted by volatility in accretion of acquired loan discounts. The effects of the accretion on net interest margin and loan yield are outlined in the following table for the periods indicated:
Table 4
| | | | | |
| | | | | |
| | Year Ended December 31, 2016 | |
| | Net Interest
Margin | | Loan
Yield | |
Reported | | 3.60 | % | 4.31 | % |
Less: Accelerated accretion of acquired loan discount from early payoffs | | (0.03) | % | (0.04) | % |
Subtotal | | 3.57 | % | 4.27 | % |
Less: Accretion of acquired loan discount not attributable to early payoffs | | (0.02) | % | (0.03) | % |
Excluding total accretion of loan acquisition discounts | | 3.55 | % | 4.24 | % |
| | | | | |
Total accretion of loan acquisition discounts | | (0.05) | % | (0.07) | % |
During 2016, interest income on loans included $1.3 million related to accretion of the discount applied to loans acquired in the Home State transaction.
The following table presents the dollar amount of changes in interest income and interest expense for the major categories of our interest-earning assets and interest-bearing liabilities. Information is provided for each category of interest-earning assets and interest-bearing liabilities with respect to (i) changes attributable to volume (i.e., changes in average balances multiplied by the prior-period average rate) and (ii) changes attributable to rate (i.e., changes in average rate multiplied by prior-period average balances). For purposes of this table, changes attributable to both rate and volume, which cannot be segregated, have been allocated proportionately to the change due to volume and the change due to rate.
Table 5
| | | | | | |
| | | | | | |
| | Year Ended December 31, 2016 Compared to
Year Ended December 31, 2015 |
| | Net Change | | Rate | | Volume |
| | | | | | |
| | | | | | |
Interest income: | | | | | | |
Gross Loans, net of deferred | | | | | | |
fees and costs | $ | 17,061 | $ | 1,181 | $ | 15,880 |
Investment Securities | | | | | | |
Taxable | | (700) | | 188 | | (888) |
Tax-exempt | | 831 | | (287) | | 1,118 |
Bank Stocks | | 104 | | (5) | | 109 |
Other earning assets | | 227 | | 17 | | 210 |
Total interest income | | 17,523 | | 1,094 | | 16,429 |
| | | | | | |
Interest expense: | | | | | | |
Deposits: | | | | | | |
Interest-bearing demand | | | | | | |
and NOW | | 312 | | 145 | | 167 |
Money market | | 293 | | 135 | | 158 |
Savings | | 15 | | 2 | | 13 |
Time certificates of deposit | | 1,032 | | 263 | | 769 |
Repurchase agreements | | 7 | | 6 | | 1 |
Subordinated debentures | | 1,191 | | 470 | | 721 |
Borrowings | | 1,264 | | 1,249 | | 15 |
Total interest expense | | 4,114 | | 2,270 | | 1,844 |
Net interest income | $ | 13,409 | $ | (1,176) | $ | 14,585 |
2016 Compared to 2015
For the year ended December 31, 2016, the Company’s net interest income increased by $13.4 million to $90.4 million compared to $77.0 million for the year ended December 31, 2015. This increase in net interest income during 2016 was attributable to a $14.6 million favorable volume variance partially offset by a $1.2 million unfavorable rate variance.
The favorable volume variance of $14.6 million in 2016, compared to 2015, was primarily the result of a $16.4 million favorable volume variance related to average earning assets partially offset by a $1.8 million unfavorable volume variance on average interest-bearing liabilities. The favorable volume variance in average interest-earning assets was mostly attributable to a $368.9 million increase in average loans. The unfavorable volume variance in average interest-bearing liabilities was attributable to a $299.9 million increase in average interest-bearing deposits and a $20.7 million increase in average borrowings.
The $1.2 million unfavorable rate variance in 2016, compared to 2015, was the result of an unfavorable rate variance of $2.3 million related to average interest-bearing liabilities, partially offset by a favorable rate variance of $1.1 million related to average interest earning assets. The unfavorable rate variance in average interest-bearing liabilities was primarily due to a 66 basis point increase in average yield on borrowings, a 143 basis point increase in the average yield on subordinated debentures and a five basis point increase in yield on interest-bearing deposits. The $1.1 million favorable rate variance on interest earning assets was primarily attributable to $1.3 million in accretion of the discount on loans acquired in the Home State transaction.
The following table presents, for the years indicated, average assets, liabilities and stockholders’ equity, as well as interest income from average interest-earning assets, interest expense from average interest-bearing liabilities and the resultant yields and costs expressed in percentages. Nonaccrual loans are included in the calculation of average loans and leases, while nonaccrued interest thereon, is excluded from the computation of yield earned.
Table 6
| | | | | | | | | | | | | |
| | | | | | | | | | | | | |
| | Year Ended December 31, | |
| | 2015 | | | | 2014 | |
| | Average Balance | | Interest Income or Expense | Average Yield or Cost | | | | Average Balance | | Interest Income or Expense | Average Yield or Cost | |
| | | | | | | | | | | | | |
| | (Dollars in thousands) | |
ASSETS: | | | | | | | | | | | | | |
Interest-earning assets: | | | | | | | | | | | | | |
Gross loans, net of deferred costs | | | | | | | | | | | | | |
and fees (1)(2)(3) | $ | 1,655,857 | $ | 70,188 | 4.24 | % | | $ | 1,419,483 | $ | 62,819 | 4.43 | % |
Investment securities (1) | | | | | | | | | | | | | |
Taxable | | 335,363 | | 8,325 | 2.48 | % | | | 363,768 | | 9,178 | 2.52 | % |
Tax-exempt | | 88,727 | | 2,852 | 3.21 | % | | | 79,803 | | 2,708 | 3.39 | % |
Bank Stocks (4) | | 16,956 | | 959 | 5.66 | % | | | 15,880 | | 807 | 5.08 | % |
Other earning assets | | 2,092 | | 6 | 0.29 | % | | | 3,260 | | 8 | 0.25 | % |
Total interest-earning assets | | 2,098,995 | | 82,330 | 3.92 | % | | | 1,882,194 | | 75,520 | 4.01 | % |
Non-earning assets: | | | | | | | | | | | | | |
Cash and due from banks | | 25,461 | | | | | | | 25,005 | | | | |
Other assets | | 102,338 | | | | | | | 94,353 | | | | |
Total assets | $ | 2,226,794 | | | | | | $ | 2,001,552 | | | | |
| | | | | | | | | | | | | |
LIABILITIES AND STOCKHOLDERS' EQUITY: | | | | | | | | | | | |
Interest-bearing liabilities: | | | | | | | | | | | | | |
Deposits: | | | | | | | | | | | | | |
Interest-bearing demand and NOW | $ | 377,036 | $ | 390 | 0.10 | % | | $ | 342,696 | $ | 341 | 0.10 | % |
Money market | | 376,061 | | 888 | 0.24 | % | | | 344,165 | | 802 | 0.23 | % |
Savings | | 143,222 | | 158 | 0.11 | % | | | 123,201 | | 135 | 0.11 | % |
Time certificates of deposit | | 222,990 | | 1,771 | 0.79 | % | | | 187,121 | | 1,186 | 0.63 | % |
Total interest-bearing deposits | | 1,119,309 | | 3,207 | 0.29 | % | | | 997,183 | | 2,464 | 0.25 | % |
Borrowings: | | | | | | | | | | | | | |
Repurchase agreements | | 24,531 | | 45 | 0.18 | % | | | 24,399 | | 40 | 0.16 | % |
Federal funds purchased (5) | | 15 | | - | 0.80 | % | | | 2 | | - | 0.77 | % |
Subordinated debentures | | 25,774 | | 814 | 3.16 | % | | | 25,774 | | 800 | 3.10 | % |
Borrowings | | 186,248 | | 1,285 | 0.69 | % | | | 157,587 | | 3,403 | 2.16 | % |
Total interest-bearing liabilities | | 1,355,877 | | 5,351 | 0.39 | % | | | 1,204,945 | | 6,707 | 0.56 | % |
Noninterest bearing liabilities: | | | | | | | | | | | | | |
Demand deposits | | 642,015 | | | | | | | 585,671 | | | | |
Other liabilities | | 13,389 | | | | | | | 9,854 | | | | |
Total liabilities | | 2,011,281 | | | | | | | 1,800,470 | | | | |
Stockholders' Equity | | 215,513 | | | | | | | 201,082 | | | | |
Total liabilities and stockholders' equity | $ | 2,226,794 | | | | | | $ | 2,001,552 | | | | |
| | | | | | | | | | | | | |
Net interest income | | | $ | 76,979 | | | | | | $ | 68,813 | | |
Net interest margin | | | | | 3.67 | % | | | | | | 3.66 | % |
| | | | | | | | | | | | | |
|
(1) Yields on loans and securities have not been adjusted to a tax-equivalent basis. Net interest margin on a fully tax-equivalent basis would have been 3.75% and 3.74% for the years ended December 31, 2015 and December 31, 2014, respectively. The tax-equivalent basis was computed by calculating the deemed interest on municipal bonds and tax-exempt loans that would have been earned on a fully taxable basis to yield the same after-tax income, net of the interest expense disallowance under Internal Revenue Code Sections 265 and 291, using a combined federal and state marginal tax rate of 38.01%. |
|
(2) The loan average balances and yields include nonaccrual loans. |
(3) Net loan costs and fees of $1.4 million and $1.2 million for the years ended December 31, 2015 and December 31, 2014, respectively, are included in the yield computation. |
|
(4) Includes Bankers’ Bank of the West stock, Federal Agricultural Mortgage Corporation (Farmer Mac) stock, Federal Reserve Bank stock and Federal Home Loan Bank stock. |
|
(5) The interest expense related to federal funds purchased for the years ended December 31, 2015 and December 31, 2014 rounded to zero. |
The following table presents the dollar amount of changes in interest income and interest expense for the major categories of our interest-earning assets and interest-bearing liabilities. Information is provided for each category of interest-earning assets and interest-bearing liabilities with respect to (i) changes attributable to volume (i.e., changes in average balances multiplied by the prior-period average rate) and (ii) changes attributable to rate (i.e., changes in average rate multiplied by prior-period average balances). For purposes of this table, changes attributable to both rate and volume, which cannot be segregated, have been allocated proportionately to the change due to volume and the change due to rate.
Table 7
| | | | | | |
| | | | | | |
| | Year Ended December 31, 2015 Compared to
Year Ended December 31, 2014 |
| | Net Change | | Rate | | Volume |
| | | | | | |
| | (In thousands) |
Interest income: | | | | | | |
Gross Loans, net of deferred | | | | | | |
costs and fees | $ | 7,369 | $ | (2,501) | $ | 9,870 |
Investment Securities | | | | | | |
Taxable | | (853) | | (136) | | (717) |
Tax-exempt | | 144 | | (129) | | 273 |
Bank Stocks | | 152 | | 95 | | 57 |
Other earning assets | | (2) | | 2 | | (4) |
Total interest income | | 6,810 | | (2,669) | | 9,479 |
| | | | | | |
Interest expense: | | | | | | |
Deposits: | | | | | | |
Interest-bearing demand | | | | | | |
and NOW | | 49 | | 14 | | 35 |
Money market | | 86 | | 11 | | 75 |
Savings | | 23 | | 1 | | 22 |
Time certificates of deposit | | 585 | | 333 | | 252 |
Repurchase agreements | | 5 | | 5 | | - |
Subordinated debentures | | 14 | | 14 | | - |
Borrowings | | (2,118) | | (2,891) | | 773 |
Total interest expense | | (1,356) | | (2,513) | | 1,157 |
Net interest income | $ | 8,166 | $ | (156) | $ | 8,322 |
2015 Compared to 2014
For the year ended December 31, 2015, the Company’s net interest income increased by $8.2 million to $77.0 million compared to $68.8 million for the year ended December 31, 2014. This increase in net interest income during 2015 was attributable to an $8.3 million favorable volume variance partially offset by a $0.2 million unfavorable rate variance.
The favorable volume variance of $8.3 million in 2015 compared to 2014 was primarily the result of a $9.5 million favorable volume variance related to average earning assets partially offset by a $1.2 million unfavorable volume variance on average interest-bearing liabilities. The favorable volume variance in average interest-earning assets was mostly attributable to a $236.4 million increase in average loan balances, partially offset by an $18.4 million decrease in average investments. The unfavorable volume variance in average interest-bearing liabilities was attributable to a $122.1 million increase in average interest-bearing deposits and a $28.7 million increase in average borrowings.
The $0.2 million unfavorable rate variance in 2015, compared to 2014 was the result of an unfavorable rate variance of $2.7 million related to average earning assets, partially offset by a favorable rate variance of $2.5 million related to average interest-bearing liabilities. The unfavorable rate variance in average earning assets was primarily due to a 19 basis point decline in average loan yield. The decline in loan yield was primarily due to lower rates on new and renewing loans, which had a more pronounced impact due to the 17.7% loan growth recognized during 2015, and reflected the extremely competitive interest rate environment. The unfavorable rate variance in average earning assets was partially offset by a 17 basis point decline in the average cost of funds during the year, from 0.56% in 2014 to 0.39% in 2015. This decline was mostly due to the December 2014 prepayment of $90.0 million in FHLB term advances as discussed above.
Provision for Loan Losses
The provision for loan losses is a charge against earnings and represents management’s estimate of the amount required to maintain the allowance for loan losses at a level that, in our judgment, is adequate to absorb probable incurred loan losses in the loan portfolio. The provision for loan losses is based on our allowance methodology and reflects our judgments about the adequacy of the allowance for loan losses. In determining the amount of the provision, we consider certain quantitative and qualitative factors, including our historical loan loss experience, the volume and type of lending we conduct, the results of our credit review process, the amounts and severity of classified, criticized and nonperforming assets, regulatory policies, general economic conditions, underlying collateral values and other factors regarding collectability and impairment. The estimated amount of expected loss in our loan portfolio is influenced by the collateral value associated with our loans. Loans with greater collateral values, as a percentage of the outstanding loan balance, reduce our exposure to loan loss provision.
For further discussion of the methodology and factors impacting management’s estimate of the allowance for loan losses, see “Financial Condition – Allowance for Loan Losses” below. For a discussion of impaired loans and associated collateral values, see “Financial Condition—Nonperforming Assets and Other Impaired Loans” below.
2016 Compared to 2015
The provision for loan losses was $0.1 million in both 2016 and 2015. The $0.1 million provision recognized in 2016 was impacted by an increase of $0.3 million in the general component of our allowance for loan losses, a $0.1 million decline in the specific component of our allowance for loan losses and by $0.1 million in net recoveries. The increase in the general component of the allowance for loan losses was primarily attributable to the growth in loans during 2016. During 2016, net recoveries were $0.1 million, compared to $0.4 million in net recoveries during 2015. The Company determined that the provision for loan losses recorded during 2016 was necessary to maintain the allowance for loan losses at an adequate level for the probable incurred losses in the loan portfolio as of December 31, 2016.
As a percentage of loans, the allowance for loan losses decreased to 0.92% at December 31, 2016, compared to 1.27% at December 31, 2015. The decrease in the allowance as a percentage of total loans during 2016 compared to the prior year was primarily the result of the acquisition of $445.5 million in loans in the Home State transaction, for which no allowance was established as of the date of acquisition in accordance with GAAP. When the unaccreted purchase discount is added to the allowance for loan losses, the combined allowance and purchase discount was 1.50% of loans held for investment as of December 31, 2016. The ratio of allowance for loan losses to nonperforming loans and purchased discount increased to 722.93% at December 31, 2016 from 158.91% at December 31, 2015, primarily as a result of a $9.4 million out-of-state loan syndication returning to performing status during the third quarter 2016.
2015 Compared to 2014
The provision for loan losses was $0.1 million in 2015 compared to an immaterial provision for loan losses in 2014. The $0.1 million provision recognized in 2015 was impacted by increases of $0.4 million and $0.1 million to the general and specific components of our allowance for loan losses, offset by $0.4 million in net recoveries. The increase in the general component of the allowance for loan losses was primarily attributable to the growth in loans during 2015. During 2015, net recoveries were $0.4 million, as compared to $1.5 million in net recoveries during 2014. The Company determined that the provision for loan losses recorded during 2015 was necessary to maintain the allowance for loan losses at an adequate level for the probable incurred losses in the loan portfolio as of December 31, 2015.
As a percentage of loans, the allowance for loan losses decreased to 1.27% at December 31, 2015, as compared to 1.46% at December 31, 2014. The decrease in the allowance as a percentage of total loans during 2015 as compared to the prior year was the result of a reduction in the historical loss rate utilized to estimate current incurred losses in the loan portfolio. The ratio of allowance for loan losses to nonperforming loans decreased to 158.91% at December 31, 2015 from 178.25% at December 31, 2014, primarily as a result of a net $1.9 million increase in nonperforming loans, attributable to three loans with an aggregate principal balance of $2.7 million, which were moved to nonaccrual status during 2015.
Noninterest Income
The following table presents the major categories of noninterest income for 2016 and the preceding two years:
Table 8
| | | | | | | | | | | |
| | | | | | | | | | | |
| | Year Ended December 31, | | | Change - Increase /
(Decrease) |
| | 2016 | | 2015 | | 2014 | | | 2016 v 2015 | | 2015 v 2014 |
| | | | | | | | | | | |
| | (In thousands) |
Noninterest income: | | | | | | | | | | | |
Deposit service and other fees | $ | 10,447 | $ | 8,941 | $ | 9,066 | | $ | 1,506 | $ | (125) |
Investment management and trust | | 5,452 | | 5,189 | | 4,380 | | | 263 | | 809 |
Increase in cash surrender value of | | | | | | | | | | | |
life insurance | | 2,005 | | 1,758 | | 1,295 | | | 247 | | 463 |
Gain (loss) on sale of securities | | (73) | | 132 | | 28 | | | (205) | | 104 |
Gain on sale of SBA loans | | 873 | | 824 | | 798 | | | 49 | | 26 |
Other | | 553 | | 336 | | 1,128 | | | 217 | | (792) |
Total noninterest income | $ | 19,257 | $ | 17,180 | $ | 16,695 | | $ | 2,077 | $ | 485 |
2016 Compared to 2015
Noninterest income increased by $2.1 million in 2016 compared to 2015. The increase in noninterest income during 2016 was primarily the result of a $1.5 million increase in deposit service and other fees, a $0.3 million increase in investment management and trust income and a $0.2 million increase in bank owned life insurance (“BOLI”) earnings. The increases in deposit service and other fees and investment management and trust income were primarily a result of fees generated by deposits and assets under management (“AUM”) acquired in the Home State transaction. Total AUM at December 31, 2016 was $852.4 million, comprised of $375.1 million attributable to PCM, $192.6 million attributable to CHIA and $284.7 million attributable to our trust department. The increase in BOLI income was primarily the result of an additional $15.0 million in BOLI insurance purchased during the third quarter 2016.
2015 Compared to 2014
Noninterest income increased by $0.5 million in 2015 compared to 2014. The increase in noninterest income during 2014 was primarily the result of a $0.8 million increase in investment management and trust income and a $0.5 million increase in BOLI earnings, partially offset by a $0.8 million decline in other noninterest income. The increase in investment management and trust income during 2015, compared to 2014, was mostly due to the Company’s July 2014 acquisition of an investment management firm and the growth in AUM. Total AUM at December 31, 2015 was $698.2 million, comprised of $341.4 million attributable to PCM, $182.0 million attributable to CHIA and $174.8 million attributable to our trust department. The increase in BOLI income was primarily the result of an additional $10.0 million in BOLI insurance purchased during the fourth quarter of 2014 and an additional $5.0 million in BOLI insurance purchased during the first quarter of 2015. The decrease in other noninterest income during 2015, compared to 2014, was comprised of a $0.3 million decrease in customer interest rate swap income and a $0.3 million decrease related to non-recurring income received in 2014.
Noninterest Expense
The following table presents the major categories of noninterest expense for 2016 and the preceding two years:
Table 9
| | | | | | | | | | | |
| | | | | | | | | | | |
| | Year Ended December 31, | | | Change - Increase /
(Decrease) |
| | 2016 | | 2015 | | 2014 | | | 2016 v 2015 | | 2015 v 2014 |
| | | | | | | | | | | |
| | (In thousands) |
Noninterest expense: | | | | | | | | | | | |
Salaries and employee benefits | $ | 40,946 | $ | 33,564 | $ | 32,766 | | $ | 7,382 | $ | 798 |
Occupancy expense | | 5,887 | | 6,312 | | 6,308 | | | (425) | | 4 |
Furniture and equipment | | 3,070 | | 3,007 | | 2,759 | | | 63 | | 248 |
Amortization of intangible assets | | 1,557 | | 1,981 | | 2,506 | | | (424) | | (525) |
Other real estate owned, net | | 31 | | 80 | | 367 | | | (49) | | (287) |
Insurance and assessment | | 2,314 | | 2,398 | | 2,355 | | | (84) | | 43 |
Professional fees | | 3,639 | | 3,220 | | 3,520 | | | 419 | | (300) |
Prepayment penalty on debt extinguishment | | - | | - | | 5,459 | | | - | | (5,459) |
Impairment of long-lived assets | | 185 | | 122 | | 186 | | | 63 | | (64) |
Other general and administrative | | 15,158 | | 9,655 | | 9,520 | | | 5,503 | | 135 |
Total noninterest expense | $ | 72,787 | $ | 60,339 | $ | 65,746 | | $ | 12,448 | $ | (5,407) |
2016 Compared to 2015
Noninterest expense was $72.8 million for the year ended December 31, 2016 compared to $60.3 million for the year ended December 31, 2015. The $12.4 million increase in noninterest expense was primarily due to $6.3 million in merger-related expenses incurred during 2016. These merger-related expenses consisted of $1.9 million in salaries and employee benefits related to severance and retention payments and $4.4 million in other general and administrative expense, mostly due to system conversion costs and professional fees. Excluding the merger-related expenses, noninterest expense increased $6.2 million for the year ended December 31, 2016, compared to the year ended December 31, 2015, due to a $5.5 million increase in salaries and employee benefits, a $1.2 million increase in general and administrative expense and a $0.4 million increase in professional fees. These increases were partially offset by a $0.4 million decline in occupancy expense and a $0.4 million decline in amortization of intangible assets.
The $5.5 million increase in salaries and employee benefits in 2016, compared to 2015, was mostly due to a $3.5 million increase in base salaries and a $1.4 million increase in employee benefits, mostly due to the addition of 143 full-time equivalent employees since December 31, 2015. The $1.2 million increase in general and administrative expense during the year, compared to the prior year, was due to a $0.5 million increase in advertising and business development expense and smaller increases in several other categories.
Amortization expense decreased in 2016, compared to 2015, by $0.4 million as a result of an accelerated amortization schedule. Amortization expense is projected to increase by $1.1 million in 2017 compared to 2016 as presented in Note 8, Goodwill and Other Intangible Assets, to “Item 8. Financial Statements and Supplementary Data – Notes to Consolidated Financial Statements”, primarily as a result of the intangible assets acquired in the Home State transaction.
2015 Compared to 2014
Noninterest expense was $60.3 million for the year ended December 31, 2015 compared to $65.7 million for the year ended December 31, 2014. The $5.4 million decrease in noninterest expense was primarily due to the $5.5 million FHLB prepayment penalty incurred in 2014. Other offsetting variances in noninterest expense for the year ended December 31, 2015 compared to the year ended December 31, 2014 included a $0.8 million increase in salaries and employee benefits expense and a $0.2 million increase in furniture and equipment expense, offset by a $0.5 million decline in amortization of intangible assets, a $0.3 million decline in OREO expense and a $0.3 million decline in professional fees expense.
Salaries and employee benefits increased during 2015, compared to 2014, primarily due to a $0.7 million increase in incentive and bonus expense, a $0.3 million increase in salaries and a $0.2 million increase in equity compensation expense, partially offset by a $0.6 million decrease in employee benefit expense. The $0.7 million
increase in incentive and bonus expense was the result of continued financial performance of the Company. The $0.3 million increase in salary expense was primarily due to the creation of new positions within the Company’s wealth management, healthcare lending, equipment finance lending and compliance groups. The $0.2 million increase in equity compensation expense was the result of higher restricted stock grants in 2015 compared to 2014. The $0.6 million decline in employee benefit expense was mostly due to lower claims incurred in 2015, compared to 2014, under the Company’s self-funded medical plan. The $0.2 million increase in furniture and equipment expense was mostly due to an increase in equipment leasing and maintenance expense.
Amortization expense decreased in 2015 by $0.5 million as a result of accelerated amortization methods. OREO expense decreased to $0.1 million in 2015 compared to $0.4 million during 2014 mostly due to the reduced number of OREO properties in 2015, compared to 2014. Professional fees expense declined $0.3 million during 2015 as compared to 2014 primarily due to a decline in legal expense.
Income Taxes
2016 Compared to 2015
During the year ended December 31, 2016 income tax expense of $12.0 million was recognized compared to $11.3 million recognized in the year ending December 31, 2015.
The effective tax rate in 2016 was 32.7% compared to 33.4% in 2015. In 2016, the primary differences between the statutory rate of approximately 38.0% and the effective tax rate were tax-exempt income and state taxes. The decrease in the effective tax rate during 2016, compared to 2015 was the result of tax-exempt income in 2016 representing a slightly greater proportion of pretax income compared to 2015, due in part to the Home State transaction. The Company adopted the provisions of the accounting standards update 2016-09 Compensation-Stock Compensation in the fourth quarter of 2016 with the most significant impact being $0.5 million of excess tax benefit in restricted stock vestings directly benefiting 2016 income tax expense. For further information regarding differences between the effective tax rate and the actual tax rate, see Note 12, Income Taxes under Item 8. “Financial Statements and Supplementary Data – Notes to Consolidated Financial Statements”.
Income tax expense is the total of the current year income tax due or refundable and the change in deferred tax assets and liabilities. Deferred tax assets and liabilities are recognized for the future tax consequences attributable to differences between the financial statement carrying amounts of existing assets and liabilities and their respective tax bases and operating loss and tax credit carryforwards. Deferred tax assets and liabilities are measured using enacted tax rates expected to apply to taxable income in the years in which those temporary differences are expected to be recovered or settled. The effect on deferred tax assets and liabilities of a change in tax rates is recognized in income in the period that includes the enactment date. Deferred tax assets are reduced by a valuation allowance when, in the opinion of management, it is more likely than not that some portion, or all, of the deferred tax asset will not be realized. In assessing the realizability of deferred tax assets, management evaluates both positive and negative evidence, including the existence of any cumulative losses in the current year and the prior two years, the amount of taxes paid in available carry-back years, forecasts of future income, applicable tax planning strategies, and assessments of current and future economic and business conditions. This analysis is updated quarterly and adjusted as necessary.
2015 Compared to 2014
During the year ended December 31, 2015 income tax expense of $11.3 million was recognized compared to $6.2 million recognized in the year ending December 31, 2014.
The effective tax rate in 2015 was 33.4% compared to 31.6% in 2014. In 2015, the primary differences between the statutory rate of approximately 38.0% and the effective tax rate were tax-exempt income and state taxes. The increase in the effective tax rate during 2015 compared to 2014 was the result of tax-exempt income in 2015 representing a slightly smaller proportion of pretax income compared to 2014.
Financial Condition
At December 31, 2016, the Company had total assets of $3.4 billion, compared to $2.4 billion at December 31, 2015, representing a year-over-year increase of $997.9 million. The increase in total assets year-over-year was comprised of a $704.6 million increase in loans, a $166.2 million increase in investments and a $66.5 million increase in goodwill and intangible assets. The increase in total assets was primarily funded by an
$897.2 million increase in total deposits and a $130.7 million increase in equity. The 2016 acquisition of Home State included the acquisition of $445.5 million in loans, and $769.9 million in deposits.
The following table sets forth certain key consolidated balance sheet data:
Table 10
| | | | | | |
| | | | | | |
| | December 31, |
| | 2016 | | 2015 | | 2014 |
| | (In thousands) |
Cash and cash equivalents | $ | 50,111 | $ | 26,711 | $ | 32,441 |
Time deposits with banks | | 254 | | - | | - |
Total investments | | 590,856 | | 424,692 | | 449,482 |
Total loans | | 2,519,138 | | 1,814,536 | | 1,541,434 |
Total assets | | 3,366,427 | | 2,368,525 | | 2,124,778 |
Earning assets | | 3,115,613 | | 2,241,058 | | 1,992,199 |
Deposits | | 2,699,084 | | 1,801,845 | | 1,685,324 |
FHLB Borrowings | | 197,168 | | 280,847 | | 160,300 |
Loans
The following table sets forth the amount of our loans held for investment outstanding at the dates indicated:
Table 11
| | | | | | | | | | | | | | | | | | | | | | | | | | | | | |
| | | | | | | | | | | | | | | | | | | | | | | | | | | | | |
| | December 31, | |
| | 2016 | | | | 2015 | | | | 2014 | | | | 2013 | | | | 2012 | |
| | Amount | | % of
Loans | | | | Amount | | % of
Loans | | | | Amount | | % of
Loans | | | | Amount | | % of
Loans | | | | Amount | | % of
Loans | |
| | | | | | | | | | | | | | | | | | | | | | | | | | | | | |
| | (Dollars in thousands) | |
Commercial and | | | | | | | | | | | | | | | | | | | | | | | | | | | | | |
residential | | | | | | | | | | | | | | | | | | | | | | | | | | | | | |
real estate | $ | 1,768,424 | | 70.3 | % | | $ | 1,281,701 | | 70.6 | % | | $ | 1,049,315 | | 68.1 | % | | $ | 866,507 | | 65.6 | % | | $ | 737,537 | | 63.6 | % |
Construction | | 88,451 | | 3.5 | % | | | 107,170 | | 5.9 | % | | | 66,634 | | 4.3 | % | | | 77,657 | | 5.9 | % | | | 72,842 | | 6.3 | % |
Commercial | | 432,083 | | 17.2 | % | | | 323,552 | | 17.8 | % | | | 324,057 | | 21.0 | % | | | 271,843 | | 20.6 | % | | | 237,199 | | 20.4 | % |
Consumer | | 125,264 | | 5.0 | % | | | 66,288 | | 3.7 | % | | | 60,155 | | 3.9 | % | | | 60,932 | | 4.6 | % | | | 63,095 | | 5.4 | % |
Other | | 100,848 | | 4.0 | % | | | 35,570 | | 2.0 | % | | | 41,652 | | 2.7 | % | | | 43,821 | | 3.3 | % | | | 49,667 | | 4.3 | % |
Total gross loans | | 2,515,070 | | 100.0 | % | | | 1,814,281 | | 100.0 | % | | | 1,541,813 | | 100.0 | % | | | 1,320,760 | | 100.0 | % | | | 1,160,340 | | 100.0 | % |
Less allowance for | | | | | | | | | | | | | | | | | | | | | | | | | | | | | |
loan losses | | (23,250) | | | | | | (23,000) | | | | | | (22,490) | | | | | | (21,005) | | | | | | (25,142) | | | |
Deferred (fees) | | | | | | | | | | | | | | | | | | | | | | | | | | | | | |
and costs | | (61) | | | | | | 255 | | | | | | (379) | | | | | | (843) | | | | | | (1,591) | | | |
Net loans, held | | | | | | | | | | | | | | | | | | | | | | | | | | | | | |
for investment | $ | 2,491,759 | | | | | $ | 1,791,536 | | | | | $ | 1,518,944 | | | | | $ | 1,298,912 | | | | | $ | 1,133,607 | | | |
For the year ended December 31, 2016, net loans held for investment increased by $700.2 million, including $445.5 million in loans acquired in the Home State transaction. The 2016 net loan growth was primarily comprised of a $486.7 million increase in commercial and residential real estate loans, a $108.5 million increase in commercial loans and a $59.0 million increase in consumer loans. The growth in loans was primarily the result of loans acquired in the Home State transaction, new customer relationships, utilization of existing lines of credit and commitments.
At December 31, 2016, the overall loan portfolio included 33.6% owner-occupied properties, including commercial and residential real estate; 15.2% retail and industrial properties, 10.0% office properties, 9.1% other commercial real estate properties; and 4.4% multi-family properties. We continue to have capacity to extend additional credit on commercial real estate loans and closely monitor the regulatory concentration ratios relative to the regulatory guidance discussed below.
The FDIC, the Federal Reserve and the OCC have promulgated joint guidance on sound risk management practices for financial institutions with concentrations in commercial real estate lending. Under the guidance, a financial institution that, like us, is actively involved in commercial real estate lending should perform a risk assessment to identify concentrations. A financial institution may have a concentration in commercial real estate lending if, among other factors, (i) total reported loans for construction, land development, and other land represent
100% or more of total risk-based capital or (ii) total reported loans for construction, land development and other land and loans secured by multifamily and non-owner occupied non-farm residential properties (excluding loans secured by owner-occupied properties) represent 300% or more of total risk-based capital and the institution’s commercial real estate loan portfolio has increased by 50 percent or more during the prior 36 month period. In such event, management should employ heightened risk management practices, including board and management oversight and strategic planning, development of underwriting standards, risk assessment and monitoring through market analysis and stress testing.
The Bank’s total reported loans for construction, land development and other land represented 40% of capital at December 31, 2016 compared to 47% of capital at December 31, 2015. This ratio is below the regulatory commercial real estate concentration guideline level of 100% for land and construction loans. The Bank’s total reported commercial real estate loans to total capital was 319% at December 31, 2016, compared to 356% of capital at December 31, 2015. This ratio is above the regulatory commercial real estate concentration guideline level of 300% for all investor real estate loans; however, the amount by which the ratio exceeds the guideline consists of loans with a better quality risk rating, supported by significantly better credit metrics in comparison to the Bank’s underwriting guidelines. The Bank’s commercial real estate portfolio increased by 78 percent in the preceding 36 months. Excluding loans acquired in the Home State transaction, the Bank’s commercial real estate loans increased by 52 percent during the preceding 36 months. Management employs heightened risk management practices with respect to commercial real estate lending, including board and management oversight and strategic planning and development of underwriting standards, risk assessment and monitoring through market analysis and stress testing. Loans secured by commercial real estate are recorded on the balance sheet as either a commercial real estate loan or commercial loan depending on the purpose of the loan, regardless of the underlying collateral. We have concluded that we have an acceptable and well-managed concentration in commercial real estate lending under the foregoing standards.
With respect to geographic concentrations, most of our business activity is with customers in the state of Colorado. At December 31, 2016, we did not have any significant concentrations in any particular industry. During 2016, the Company’s energy loan portfolio decreased from $11.4 million at December 31, 2015 to $0.3 million as of December 31, 2016, primarily as a result of management’s efforts to proactively reduce our direct exposure to the energy industry.
The following table presents the changes in our loan balances (including loans held for sale) at the dates indicated:
Table 12
| | | | | | |
| | | | | | |
| December 31, |
| | 2016 | | 2015 | | 2014 |
| | | | | | |
| | (In thousands) |
Beginning balance | $ | 1,814,281 | $ | 1,541,813 | $ | 1,321,267 |
New credit extended | | 589,159 | | 570,672 | | 404,416 |
Acquisition of Home State Bank | | 445,529 | | - | | - |
Net existing credit advanced | | 433,844 | | 263,641 | | 241,305 |
Net pay-downs and maturities | | (768,845) | | (562,221) | | (424,193) |
Other | | 5,231 | | 376 | | (982) |
Gross loans | | 2,519,199 | | 1,814,281 | | 1,541,813 |
Deferred (fees) and costs | | (61) | | 255 | | (379) |
Loans, net | $ | 2,519,138 | $ | 1,814,536 | $ | 1,541,434 |
| | | | | | |
Net change - loans outstanding | $ | 704,602 | $ | 273,102 | $ | 221,010 |
Loan maturities
The following table shows the amounts of loans held for investment at December 31, 2016 which, based on remaining scheduled repayments of principal, were due in one year or less, more than one year through five years, and more than five years. Borrowers have the right to prepay their loans with or without penalty, based on their specific loan agreement provisions. Demand notes or other loans having no stated maturity and no stated schedule of repayments are reported as due in one year or less. The table also presents, for loans with maturities over one year, an analysis with respect to fixed interest rate loans and floating interest rate loans. The table excludes deferred costs and fees and loans held for sale.
Table 13
| | | | | | | | | | | | | |
| | | | | | | | | | | | | |
| | Maturity | | | Rate Structure for Loans
with Maturities
over One Year |
| | One Year
or Less | | One through
Five Years | | Over Five
Years | | Total | | | Fixed
Rate | | Floating
Rate |
| | | | | | | | | | | | | |
| | (In thousands) |
Commercial and residential | | | | | | | | | | | | | |
real estate | $ | 174,532 | $ | 510,601 | $ | 1,083,291 | $ | 1,768,424 | | $ | 1,031,394 | $ | 562,498 |
Construction | | 51,684 | | 32,590 | | 4,177 | | 88,451 | | | 6,459 | | 30,308 |
Commercial | | 103,784 | | 207,352 | | 120,947 | | 432,083 | | | 218,248 | | 110,051 |
Consumer | | 6,146 | | 25,569 | | 93,549 | | 125,264 | | | 58,193 | | 60,925 |
Other | | 14,999 | | 12,583 | | 73,266 | | 100,848 | | | 38,934 | | 46,915 |
Total gross loans | $ | 351,145 | $ | 788,695 | $ | 1,375,230 | $ | 2,515,070 | | $ | 1,353,228 | $ | 810,697 |
Nonperforming Assets and Other Impaired Loans
Credit risk related to nonperforming assets is inherent in lending activities. To manage this risk, we utilize routine monitoring procedures and take prompt corrective action when necessary. We employ a risk rating system that identifies the potential risk associated with loans in our loan portfolio. This monitoring and rating system is designed to help management identify current and potential problems so that corrective actions can be taken promptly.
Generally, loans are placed on nonaccrual status when they become 90 days or more past due or at such earlier time as management determines timely recognition of interest to be in doubt. Accrual of interest is discontinued on a loan when we believe, after considering economic and business conditions and analysis of the borrower’s financial condition and the underlying collateral value, that the collection of interest is doubtful.
A loan is impaired when, based on current information and events, it is probable that we will be unable to collect the scheduled payments when due according to the contractual terms of the underlying loan agreement. Impaired loans consist of our nonaccrual loans, loans that are 90 days or more past due, and other loans for which we determine that noncompliance with contractual terms of the loan agreement is probable. Losses on individually identified impaired loans that are not collateral dependent are measured based on the present value of expected future cash flows discounted at the original effective interest rate of each loan. For loans that are collateral dependent, impairment is measured based on the fair value of the collateral less estimated selling costs.
The following table sets forth the amount of our nonperforming assets and impaired loans outstanding at the dates indicated:
Table 14
| | | | | | | |
| | | | | | | |
| | December 31, | |
| | 2016 | | | | 2015 | |
| | | | | | | |
| | (Dollars in thousands) | |
Nonperforming Assets: | | | | | | | |
Originated nonaccrual loans and leases | $ | 3,254 | | | $ | 3,762 | |
Purchased nonaccrual loans and leases | | 1,902 | | | | - | |
Nonperforming troubled debt restructurings | | 91 | | | | 10,712 | |
Accruing loans past due 90 days or more | | - | | | | - | |
Total nonperforming loans | $ | 5,247 | | | $ | 14,474 | |
Other real estate owned and foreclosed assets | | 569 | | | | 674 | |
Total nonperforming assets | $ | 5,816 | | | $ | 15,148 | |
| | | | | | | |
Impaired Loans: | | | | | | | |
Nonperforming loans | $ | 5,247 | | | $ | 14,474 | |
Performing troubled debt restructurings | | 25,128 | | | | 11,679 | |
Allocated allowance for loan losses | | (222) | | | | (293) | |
Net carrying amount of impaired loans | $ | 30,153 | | | $ | 25,860 | |
| | | | | | | |
Impaired loans with a valuation allowance | $ | 9,067 | | | $ | 11,890 | |
Impaired loans without a valuation allowance | | 21,308 | | | | 14,263 | |
Total impaired loans | $ | 30,375 | | | $ | 26,153 | |
Valuation allowance related to impaired loans | $ | 222 | | | $ | 293 | |
Valuation allowance as a percent of impaired loans | | 0.73 | % | | | 1.12 | % |
| | | | | | | |
Nonperforming loans to loans, net of deferred fees and costs (1) | | 0.21 | % | | | 0.80 | % |
Nonperforming assets to total assets | | 0.17 | % | | | 0.64 | % |
Allowance for loan losses plus unaccreted discount to nonperforming loans | | 722.93 | % | | | 158.91 | % |
________________________ | | | | | | | |
(1) Loans, net of deferred fees and costs, exclude loans held for sale. | | | | | | | |
At December 31, 2016, nonperforming assets had decreased $9.3 million to $5.8 million from $15.1 million at December 31, 2015. The $9.3 million decrease in nonperforming assets as of December 31, 2016, compared to December 31, 2015, was primarily the result of a single out-of-state syndication of $9.4 million returning to performing status in the third quarter 2016.
At December 31, 2016, nonperforming loans included approximately $0.9 million in commercial real estate loans. At December 31, 2015, nonperforming loans were primarily comprised of approximately $11.9 million in commercial real estate loans.
Our loss exposure on nonperforming loans is mitigated by collateral positions on these loans. The allocated allowance for loan losses associated with impaired loans is computed based upon the related collateral value of the loans if the loan is collateral-dependent or based on the present value of expected cash flows if the loan does not qualify as collateral-dependent. The collateral values are determined by recent appraisals, but are generally discounted by management based on historical collateral dispositions, changes in market conditions since the last valuation, and management’s expertise and knowledge of the client and the client’s business. Management reviews all real estate loan relationships in excess of $500,000 annually, or more frequently where risk categories or property conditions suggest a potentially significant decline in the property’s value. If management determines that such a decline exists, we obtain an updated appraisal. Similarly, upon the renewal, extension or refinancing of a real estate loan, we obtain an appraisal when management determines that there has been a significant decline in value. Appraisals are required in compliance with bank policy and applicable regulations. Generally speaking, appraisals are required for all new commercial real estate loans or loans secured by residential property in excess of $250,000; new business loans secured by real estate in excess of $1.0 million; renewals, extensions or refinancing with the advance of new monies if there is evidence of market or property deterioration; and any foreclosure of other real estate in excess of $250,000. If an appraisal is not required, an internal evaluation is completed or other alternative re-valuation approach is used.
At December 31, 2016, approximately $2.2 million in additional funds was committed to be advanced in connection with four performing impaired loans.
Additionally, at December 31, 2016, the book value of loans modified in troubled debt restructurings was $25 million compared to $22.4 million at December 31, 2015.
OREO was $0.6 million at December 31, 2016, compared to $0.7 million at December 31, 2015. The balances at December 31, 2016 and December 31, 2015 were comprised of two separate properties, both of which were land.
The following table presents our nonperforming assets (including classified loans held for sale) at the dates indicated:
Table 15
| | | | | | | | | | | | | | | | | | | |
| | | | | | | | | | | | | | | | | | | |
| | At December 31, | |
| | 2016 | | | | 2015 | | | | 2014 | | | | 2013 | | | | 2012 | |
| | | | | | | | | | | | | | | | | | | |
| | (Dollars in thousands) | |
Originated nonaccrual loans and leases | $ | 3,254 | | | $ | 3,762 | | | $ | 941 | | | $ | 12,371 | | | $ | 9,033 | |
Purchased nonaccrual loans and leases | | 1,902 | | | | - | | | | - | | | | - | | | | - | |
Nonperforming troubled debt restructurings | | 91 | | | | 10,712 | | | | 11,676 | | | | 3,105 | | | | 4,659 | |
Accruing loans past due 90 days or more | | - | | | | - | | | | - | | | | - | | | | 224 | |
Total nonperforming loans (NPLs) | | 5,247 | | | | 14,474 | | | | 12,617 | | | | 15,476 | | | | 13,916 | |
Other real estate owned and foreclosed assets | | 569 | | | | 674 | | | | 2,175 | | | | 4,493 | | | | 19,580 | |
Total nonperforming assets (NPAs) | $ | 5,816 | | | $ | 15,148 | | | $ | 14,792 | | | $ | 19,969 | | | $ | 33,496 | |
| | | | | | | | | | | | | | | | | | | |
Performing troubled debt restructurings | $ | 25,128 | | | $ | 11,679 | | | $ | 14,227 | | | $ | 6,227 | | | $ | 3,838 | |
| | | | | | | | | | | | | | | | | | | |
Selected ratios: | | | | | | | | | | | | | | | | | | | |
NPLs to loans, held for investment, net | | | | | | | | | | | | | | | | | | | |
of deferred costs and fees | | 0.21 | % | | | 0.80 | % | | | 0.82 | % | | | 1.17 | % | | | 1.20 | % |
NPAs to total assets | | 0.17 | % | | | 0.64 | % | | | 0.70 | % | | | 1.04 | % | | | 1.78 | % |
As further described below under “Allowance for Loan Losses” we categorize loans into risk categories based on relevant information obtained regarding the ability of borrowers to service their debt, such as current financial information, historical payment experience, credit documentation, public information, and current economic trends, among other factors. These risk categories are based on the definitions in the Uniform Agreement on the Classification of Assets and Appraisal of Securities Held by Banks and Thrifts issued by the OCC, the FDIC and the Board of Governors of the Federal Reserve System. Each internal risk classification is judgmental, but based on objective and subjective factors/criteria. As described below under “Allowance for Loan Losses”, the Company adjusts the general component of its allowance for loan losses for the trends in the volume and severity of adversely classified loans.
At December 31, 2016, the amount of loans that the Company has internally considered to be adversely classified, other than impaired loans, increased to $6.2 million compared to $1.5 million at December 31, 2015; $2.5 million at December 31, 2014; $5.7 million at December 31, 2013 and $24.3 million at December 31, 2012.
All acquired loans are initially recorded at their estimated fair value which encompasses an estimate of credit losses. The table below presents two alternative views of credit risk coverage ratios for loans, reflecting adjustments for acquired loans and the associated purchase accounting discount:
Table 16
| | | | | | | | |
| | | | | | | | |
| | Loans | | | Allowance /
Discount | | Allowance over
Loans Ratio | |
| | (Dollars in thousands) | |
December 31, 2016 Reported Balance | $ | 2,515,009 | | | 23,250 | | 0.92 | % |
Unaccreted net discount | | 14,682 | | | 14,682 | 1 | | |
Adjusted December 31, 2016 Balance | $ | 2,529,691 | | $ | 37,932 | | 1.50 | % |
1 Unaccreted net discount relates to $445.5 million of acquired loans and is assigned specifically to those loans only. The discount represents the remaining acquisition date fair value adjustment based on market, liquidity, interest rate risk and credit risk and is being accreted into interest income over the remaining life of the respective loans. Credit deterioration on acquired loans subsequent to purchase will result in recognition of additional allowance for loan losses to the extent the recorded investment exceeds net realizable value.
The following table provides the allowance for loan losses allocated to troubled debt restructurings at the dates indicated:
Table 17
| | | | | |
| | | | | |
| | December 31, |
| | 2016 | | | 2015 |
| | | | | |
| | (In thousands) |
Troubled Debt Restructurings (TDRs): | | | | | |
Performing TDRs | $ | 25,128 | | $ | 11,679 |
Allocated allowance for loan losses | | | | | |
on performing TDRs | | (72) | | | (270) |
Net investment in performing TDRs | $ | 25,056 | | $ | 11,409 |
| | | | | |
Nonperforming TDRs | $ | 91 | | $ | 10,712 |
Allocated allowance for loan losses | | | | | |
on nonperforming TDRs | | (2) | | | (6) |
Net investment in nonperforming TDRs | $ | 89 | | $ | 10,706 |
The following table provides a rollforward of troubled debt restructurings for the years ended December 31, 2016 and December 31, 2015:
Table 18
| | | | | | |
| | | | | | |
Troubled Debt Restructuring Rollforward: | | Performing
TDRs | | Nonperforming
TDRs | | Total |
| | (In thousands) |
Balance at January 1, 2015 | $ | 14,227 | $ | 11,676 | $ | 25,903 |
Principal repayments / advances | | (3,565) | | (956) | | (4,521) |
Charge-offs, net | | - | | (8) | | (8) |
New modifications | | 1,017 | | - | | 1,017 |
Loans removed from TDR Status | | - | | - | | - |
Transfers | | - | | - | | - |
Balance at December 31, 2015 | $ | 11,679 | $ | 10,712 | $ | 22,391 |
Principal repayments / advances | | (3,538) | | (1,135) | | (4,673) |
Charge-offs, net | | - | | - | | - |
New modifications | | 7,765 | | - | | 7,765 |
Loans removed from TDR Status | | (164) | | (100) | | (264) |
Transfers | | 9,386 | | (9,386) | | - |
Balance at December 31, 2016 | $ | 25,128 | $ | 91 | $ | 25,219 |
Allowance for Loan Losses
The allowance for loan losses is maintained at a level that, in our judgment, is adequate to absorb probable incurred loan losses in the loan portfolio. The amount of the allowance is based on management’s evaluation of the collectability of the loan portfolio, historical loss experience and other significant factors affecting loan portfolio collectability, including the level and trends in delinquent, nonaccrual and adversely classified loans, trends in volume and terms of loans, levels and trends in credit concentrations, effects of changes in underwriting standards, policies, procedures and practices, national and local economic trends and conditions, changes in capabilities and experience of lending management and staff and other external factors including industry conditions, competition and regulatory requirements.
Our methodology for evaluating the adequacy of the allowance for loan losses has two basic elements: first, the specific identification of impaired loans and the measurement of an estimated loss for each individual loan identified; and second, estimating a nonspecific allowance for probable losses on all other loans.
The specific allowance for impaired loans and the allowance calculated for probable incurred losses on other loans are combined to determine the required allowance for loan losses. The amount calculated is compared to the recorded allowance balance at each quarter end and any shortfall is charged against income as an additional provision for loan losses. If the amount calculated exceeds the recorded allowance for loan losses, the excess would be credited to income as a credit provision for loan losses. For further discussion of the provision for loan losses, see “Provision for Loan Losses” above.
In estimating the allowance for probable incurred losses on other loans, we group the balance of the loan portfolio into portfolio segments that have common characteristics, such as loan type or risk rating. For each nonspecific allowance portfolio segment, we apply loss factors to calculate the required allowance based upon actual historical loss rates over a time period that we have determined represents the current credit cycle, adjusted for qualitative factors affecting loan portfolio collectability as described above. We also look at risk ratings of loans and compute a qualitative adjustment based on our credit quality in consideration of credit quality during the historical loss period. We also consider other qualitative factors that may warrant adjustment of the computed historical loss rate, including loan growth, loan concentrations, economic considerations and organizational factors.
We monitor the allowance for loan losses closely and adjust the allowance when necessary, based on our analysis, which includes an ongoing evaluation of impaired loans and their collateral positions.
The following table provides a summary of the activity within the allowance for loan losses account for the periods presented:
Table 19
| | | | | | | | | | | | | | | |
| | | | | | | | | | | | | | | |
| | Year Ended December 31, |
| | 2016 | | | 2015 | | | 2014 | | | 2013 | | | 2012 | |
| | | | | | | | | | | | | | | |
| | (In thousands) |
Balance, beginning of period | $ | 23,000 | | $ | 22,490 | | $ | 21,005 | | $ | 25,142 | | $ | 34,661 | |
Loan charge-offs: | | | | | | | | | | | | | | | |
Commercial and residential real estate | | (14) | | | (14) | | | (21) | | | (5,455) | | | (3,504) | |
Construction | | (203) | | | (7) | | | (2) | | | (325) | | | (1,283) | |
Commercial | | (196) | | | (4) | | | (360) | | | (960) | | | (5,432) | |
Consumer | | (51) | | | (12) | | | (38) | | | (35) | | | (79) | |
Other | | (257) | | | (201) | | | (202) | | | (498) | | | (401) | |
Total loan charge-offs | | (721) | | | (238) | | | (623) | | | (7,273) | | | (10,699) | |
| | | | | | | | | | | | | | | |
Loan recoveries: | | | | | | | | | | | | | | | |
Commercial and residential real estate | | 206 | | | 258 | | | 1,385 | | | 1,558 | | | 838 | |
Construction | | 134 | | | 26 | | | 349 | | | 734 | | | 2,184 | |
Commercial | | 203 | | | 160 | | | 75 | | | 30 | | | 83 | |
Consumer | | 14 | | | 29 | | | 27 | | | 33 | | | 51 | |
Other | | 271 | | | 179 | | | 258 | | | 485 | | | 24 | |
Total loan recoveries | | 828 | | | 652 | | | 2,094 | | | 2,840 | | | 3,180 | |
Net loan recoveries (charge-offs) | | 107 | | | 414 | | | 1,471 | | | (4,433) | | | (7,519) | |
Provision (credit) for loan losses | | 143 | | | 96 | | | 14 | | | 296 | | | (2,000) | |
Balance, end of period | $ | 23,250 | | $ | 23,000 | | $ | 22,490 | | $ | 21,005 | | $ | 25,142 | |
| | | | | | | | | | | | | | | |
| | | | | | | | | | | | | | | |
Loans held for investment | $ | 2,515,009 | | $ | 1,814,536 | | $ | 1,541,434 | | $ | 1,319,917 | | $ | 1,158,749 | |
Average loans, held for investment | | 2,024,554 | | | 1,655,679 | | | 1,419,077 | | | 1,237,696 | | | 1,110,267 | |
Nonperforming loans, held for investment | | 5,247 | | | 14,474 | | | 12,617 | | | 15,476 | | | 13,916 | |
| | | | | | | | | | | | | | | |
Selected ratios: | | | | | | | | | | | | | | | |
Annualized net charge-offs (recoveries) to | | | | | | | | | | | | | | | |
average loans, held for investment | | (0.01) | % | | (0.03) | % | | (0.10) | % | | 0.36 | % | | 0.68 | % |
Provision for the allowance for | | | | | | | | | | | | | | | |
loan losses to average loans, | | | | | | | | | | | | | | | |
held for investment | | 0.01 | % | | 0.01 | % | | 0.00 | % | | 0.02 | % | | (0.18) | % |
Allowance for loan losses to | | | | | | | | | | | | | | | |
loans, held for investment | | 0.92 | % | | 1.27 | % | | 1.46 | % | | 1.59 | % | | 2.17 | % |
Allowance for loan losses plus unaccreted | | | | | | | | | | | | | | | |
discount to loans, held for investment | | 1.50 | % | | 1.27 | % | | 1.46 | % | | 1.59 | % | | 2.17 | % |
Allowance for loan losses plus unaccreted | | | | | | | | | | | | | | | |
discount to nonperforming loans, | | | | | | | | | | | | | | | |
held for investment | | 722.93 | % | | 158.91 | % | | 178.25 | % | | 135.73 | % | | 180.67 | % |
At December 31, 2016, the allowance for loan losses was $23.3 million, or 0.92% of total loans held for investment. This compares to an allowance for loan losses of $23.0 million, or 1.27% of total loans held for investment at December 31, 2015.
The $0.3 million increase in the allowance for loan losses during 2016 was primarily a result of the additional reserves needed on the net increase in loans of $700.5 million. The additional reserves attributed to growth in loans were partially offset by a decline in reserves tied to historical losses given the net recoveries recognized in 2016. Charge-offs are taken on loans when management determines, after review of all possible sources of repayment including future cash flows, collateral values and the financial strength of guarantors or co-makers, that there is no longer a reasonable probability that the principal can be collected.
Net charge-offs have an impact on the historical loss component of our allowance for loan losses computation. We utilize a history of net charge-offs, incurred during the current credit cycle, to calculate our historical loss rate, which is adjusted as necessary by management in consideration of various qualitative factors.
Approximately $0.2 million, or 1.0%, of the $23.3 million allowance for loan losses at December 31, 2016, relates to specific reserve allocations. This compares to a specific reserve of $0.3 million, or 1.3%, of the total
allowance for loan losses at December 31, 2015. In addition to the specific reserve against impaired loans, the balance of impaired loans at December 31, 2016 and 2015 reflects a reduction of approximately $0.4 million and $0.3 million, respectively, related to previous partial charge-offs.
The general component of the allowance as a percentage of overall loans, net of unearned loan fees, was 0.91% at December 31, 2016 compared to 1.25% at December 31, 2015. The general component of the allowance as a percentage of loans that were not impaired was 0.9% at December 31, 2016 compared to 1.27% at December 31, 2015. The decrease in the general component as a percent of loans, net of deferred costs and fees, was due primarily to the impact of purchase accounting related to the Home State transaction.
The following table allocates the allowance for loan losses based on our judgment of inherent losses to the listed classes of loans which correspond closely to how we classify loans for internal management reporting purposes. This differs from the portfolio segment breakout of the allowance for loan losses as illustrated in Note 6, Loans, under Item 8. “Financial Statements and Supplementary Data – Notes to the Consolidated Financial Statements.”
Table 20
| | | | | | | | | | | | | | | | | | | | | | | | | | | | | |
| | | | | | | | | | | | | | | | | | | | | | | | | | | | | |
| | At December 31, |
| | 2016 | | | | 2015 | | | | 2014 | | | | 2013 | | | | 2012 | |
| | Allocation
of the
Allowance | | % of
Allocation
to Total | | | | Allocation
of the
Allowance | | % of
Allocation
to Total | | | | Allocation
of the
Allowance | | % of
Allocation
to Total | | | | Allocation
of the
Allowance | | % of
Allocation
to Total | | | | Allocation
of the
Allowance | | % of
Allocation
to Total | |
| | | | | | | | | | | | | | | | | | | | | | | | | | | | | |
| | (Dollars in thousands) | |
Commercial | | | | | | | | | | | | | | | | | | | | | | | | | | | | | |
and | | | | | | | | | | | | | | | | | | | | | | | | | | | | | |
residential | | | | | | | | | | | | | | | | | | | | | | | | | | | | | |
real estate | $ | 11,954 | | 51.4 | % | | $ | 11,824 | | 51.4 | % | | $ | 11,323 | | 50.4 | % | | $ | 10,214 | | 48.6 | % | | $ | 12,586 | | 50.1 | % |
Construction | | 2,979 | | 12.8 | % | | | 3,236 | | 14.1 | % | | | 3,424 | | 15.2 | % | | | 3,382 | | 16.1 | % | | | 2,760 | | 11.0 | % |
Commercial | | 3,951 | | 17.0 | % | | | 3,824 | | 16.6 | % | | | 3,813 | | 17.0 | % | | | 3,757 | | 17.9 | % | | | 5,612 | | 22.3 | % |
Consumer | | 3,323 | | 14.3 | % | | | 3,073 | | 13.4 | % | | | 2,844 | | 12.6 | % | | | 2,532 | | 12.1 | % | | | 2,839 | | 11.3 | % |
Other | | 1,043 | | 4.5 | % | | | 1,043 | | 4.5 | % | | | 1,086 | | 4.8 | % | | | 1,120 | | 5.3 | % | | | 1,345 | | 5.3 | % |
Total | $ | 23,250 | | 100.0 | % | | $ | 23,000 | | 100.0 | % | | $ | 22,490 | | 100.0 | % | | $ | 21,005 | | 100.0 | % | | $ | 25,142 | | 100.0 | % |
During 2016 and 2015, the majority of the allowance for loan losses remained allocable to real estate loans. This allocation was attributable to the level of risk in the real estate loan portfolio in consideration of historical losses impacting the classification.
Securities
We manage our investment portfolio principally to provide liquidity, to balance our overall interest rate risk and to provide collateral for public deposits and customer repurchase agreements.
The carrying value of our portfolio of investment securities at the dates indicated were as follows:
Table 21
| | | | | | |
| | | | | | |
| | December 31, |
| | 2016 | | 2015 | | 2014 |
| | (In thousands) |
Securities available for sale: | | | | | | |
State and municipal | $ | 81,608 | $ | 34,713 | $ | 49,399 |
Mortgage-backed - agency / residential | | 129,832 | | 129,017 | | 201,902 |
Mortgage-backed - private / residential | | 265 | | 274 | | 412 |
Asset-backed | | - | | - | | 8,708 |
Trust preferred | | - | | 17,806 | | 18,075 |
Corporate | | 86,246 | | 65,291 | | 64,717 |
Collateralized loan obligations | | 26,277 | | 8,330 | | 2,933 |
Total securities available for sale | $ | 324,228 | $ | 255,431 | $ | 346,146 |
| | | | | | |
Securities held to maturity: | | | | | | |
State and municipal | | 121,109 | | 54,853 | | 35,223 |
Mortgage-backed - agency / residential | | 102,648 | | 74,536 | | 40,531 |
Asset-backed | | 19,022 | | 19,372 | | 12,760 |
Other | | 1,200 | | - | | - |
Total securities held to maturity | $ | 243,979 | $ | 148,761 | $ | 88,514 |
| | | | | | |
Bank stocks, at cost | $ | 22,649 | $ | 20,500 | $ | 14,822 |
Securities available for sale are carried at fair value, while securities held to maturity and bank stocks are carried at historical cost.
The carrying value of our available for sale investment securities at December 31, 2016 was $324.2 million, compared to the December 31, 2015 carrying value of $255.4 million. At December 31, 2016, the effective duration of the investment securities portfolio was approximately 5.3 years compared to 5.1 years as of December 31, 2015. Purchase activity during 2016 in our available for sale portfolio included purchases of mortgage-backed securities, corporate bonds, collateralized loan obligations and municipal bonds. In addition to these purchases the Company acquired $396.5 million in securities in the Home State transaction, consisting of mortgage-backed securities and municipal bonds. Subsequent to the Home State transaction, the Company sold $106.1 million in acquired municipal bonds, $180.2 million in acquired mortgage-backed securities and $5.0 million in U.S. Treasury securities to redistribute these funds to higher yielding assets. Excluding the sales of securities acquired in the Home State transaction, the Company sold corporate bonds, trust preferred securities, mortgage-backed securities and municipal bonds during 2016. The 2016 purchases in our held to maturity investment portfolio included U.S. government sponsored agency mortgage-backed securities and rated municipal bonds. During the fourth quarter 2016, the Company reclassified, at fair value, approximately $63.4 million in available for sale municipal bonds, asset-backed securities and mortgage backed securities to the held to maturity category, primarily to limit future volatility in equity due to potential increases in interest rates.
The fair values of our securities are determined through the utilization of evaluated pricing models that vary by asset class and incorporate available market information. The evaluated pricing models apply available information as applicable through processes such as benchmark curves, benchmarking of like securities, sector groupings and matrix pricing. These models assess interest rate impact, develop prepayment scenarios and take into account market conventions. Standard inputs into these models include benchmark yields, reported trades, broker/dealer quotes, issuer spreads, two-sided markets, benchmark securities, bids, offers and reference data including market research publications.
At December 31, 2016, there were 271 individual securities in an unrealized loss position, including 10 individual securities that had been in a continuous unrealized loss position for 12 months or longer. We evaluated these securities in addition to the remaining 261 securities in an unrealized loss position and determined that the decline in value since their purchase dates was primarily attributable to fluctuations in market interest rates. At
December 31, 2016, we did not intend to sell, and did not consider it likely that we would be required to sell, any of these securities prior to recovery of their fair value, which may be upon maturity.
At December 31, 2016 and December 31, 2015, we held $22.6 million and $20.5 million, respectively, of other equity securities consisting primarily of bank stocks with no maturity date, which are not reflected in Table 22 below. Bank stocks are comprised of stock of the Federal Reserve Bank of Kansas City, the Federal Home Loan Bank of Topeka, Bankers’ Bank of the West and Pacific Coast Bankers’ Bank. These stocks have restrictions placed on their transferability as only members of the entities can own the stock. We review the equity securities quarterly for potential impairment. No impairment has been recognized on these equity securities.
The following table shows the maturities of investment securities at December 31, 2016, and the weighted average yields of such securities, including the benefit of tax-exempt securities:
Table 22
| | | | | | | | | | | | | | | | | | | |
| | | | | | | | | | | | | | | | | | | |
| | At December 31, 2016 |
| | | | | | After One Year | | | | After Five Years | | | | | | |
| | Within | | | | but Within | | | | but Within | | | | After | |
| | One Year | | | | Five Years | | | | Ten Years | | | | Ten Years | |
| | Amount | Yield (1) | | | Amount | Yield (1) | | | Amount | Yield (1) | | | Amount | Yield (1) |
| | | | | | | | | | | | | | | | | | | |
| | (Dollars in thousands) | |
Securities available for sale: | | | | | | | | | | | | | | | | | | | |
State and municipal | $ | 677 | 1.30 | % | | $ | 829 | 1.87 | % | | $ | 24,350 | 2.11 | % | | $ | 55,752 | 5.25 | % |
Mortgage-backed - agency / residential | | - | 0.00 | % | | | - | 0.00 | % | | | 7,738 | 3.15 | % | | | 122,094 | 2.25 | % |
Mortgage-backed - private / residential | | - | 0.00 | % | | | - | 0.00 | % | | | - | 0.00 | % | | | 265 | 3.27 | % |
Corporate | | 4,067 | 2.42 | % | | | 19,767 | 2.74 | % | | | 53,431 | 3.74 | % | | | 8,981 | 3.24 | % |
Collateralized loan obligations | | - | 0.00 | % | | | - | 0.00 | % | | | 18,702 | 2.95 | % | | | 7,575 | 2.92 | % |
Total securities available for sale | $ | 4,744 | 2.26 | % | | $ | 20,596 | 2.70 | % | | $ | 104,221 | 3.17 | % | | $ | 194,667 | 3.18 | % |
| | | | | | | | | | | | | | | | | | | |
Securities held to maturity: | | | | | | | | | | | | | | | | | | | |
State and municipal | $ | 190 | 1.74 | % | | $ | 7,375 | 2.43 | % | | $ | 74,206 | 1.95 | % | | $ | 39,338 | 2.62 | % |
Mortgage-backed - agency / residential | | - | 0.00 | % | | | 13,173 | 2.21 | % | | | 60,115 | 2.31 | % | | | 29,360 | 1.85 | % |
Asset-backed | | - | 0.00 | % | | | - | 0.00 | % | | | 2,132 | 2.09 | % | | | 16,890 | 2.09 | % |
Other | | 150 | 2.33 | % | | | - | 0.00 | % | | | 1,050 | 2.19 | % | | | - | 0.00 | % |
Total securities held to maturity | $ | 340 | 2.00 | % | | $ | 20,548 | 2.29 | % | | $ | 137,503 | 2.11 | % | | $ | 85,588 | 2.25 | % |
______________________ | | | | | | | | | | | | | | | | | | | |
(1) Yield is computed on a fully-tax equivalent basis for municipal bonds based on a marginal tax rate of 38.01% | |
Deposits
Total deposits were $2.7 billion at December 31, 2016, compared to $1.8 billion at December 31, 2015.
At December 31, 2016 and December 31, 2015, noninterest-bearing deposits constituted 34.0% of total deposits. Noninterest-bearing deposits help reduce overall deposit funding costs, but due to the extremely low rate environment, the impact of noninterest-bearing deposits on the overall cost of funds is currently less significant than in a higher rate environment. Interest-bearing, non-maturing deposits, including NOW, money market and savings accounts, increased by $486.3 million to $1.4 billion at December 31, 2016, as compared to $930.3 million at December 31, 2015. Time deposits as a percentage of total deposits were 13.6% at December 31, 2016 compared to 14.4% at December 31, 2015. The overall cost of time deposits increased from 0.79% in 2015 to 0.90% in 2016, mostly due to higher rates on time deposits offered to our local customer base and the purchase of $22.4 million in broker certificates of deposit at a weighted average rate of 1.05% during 2016.
The following table shows the average amount and average rate paid on the categories of deposits for each of the periods indicated:
Table 23
| | | | | | | | | | | | | | |
| | | | | | | | | | | | | | |
| | At December 31, | |
| | 2016 | | | | 2015 | | | | 2014 | |
| | Average
Balance | Average
Rate | | | | Average
Balance | Average
Rate | | | | Average
Balance | Average
Rate | |
| | | | | | | | | | | | | | |
| | (Dollars in thousands) | |
Noninterest-bearing: | | | | | | | | | | | | | | |
Noninterest-bearing demand | $ | 711,678 | 0.00 | % | | $ | 642,015 | 0.00 | % | | $ | 585,671 | 0.00 | % |
Interest-bearing: | | | | | | | | | | | | | | |
Interest-bearing demand and NOW | | 514,877 | 0.14 | % | | | 377,036 | 0.10 | % | | | 342,696 | 0.10 | % |
Money market | | 438,100 | 0.27 | % | | | 376,061 | 0.24 | % | | | 344,165 | 0.23 | % |
Savings | | 155,236 | 0.11 | % | | | 143,222 | 0.11 | % | | | 123,201 | 0.11 | % |
Time | | 310,961 | 0.90 | % | | | 222,990 | 0.79 | % | | | 187,121 | 0.63 | % |
Total interest-bearing deposits | | 1,419,174 | 0.34 | % | | | 1,119,309 | 0.29 | % | | | 997,183 | 0.25 | % |
Total deposits | $ | 2,130,852 | 0.23 | % | | $ | 1,761,324 | 0.18 | % | | $ | 1,582,854 | 0.16 | % |
Additionally, the following table shows the maturities of time certificates of deposit and other time deposits of $100,000 or more at the dates indicated:
Table 24
| | | | | |
| | | | | |
| | At December 31, |
| | 2016 | | | 2015 |
| | | | | |
| | (In thousands) |
Due in three months or less | $ | 37,444 | | $ | 13,320 |
Due in three months through six months | | 46,267 | | | 15,431 |
Due in over six months through twelve months | | 79,612 | | | 42,822 |
Due in over twelve months | | 95,859 | | | 112,244 |
Total | $ | 259,182 | | $ | 183,817 |
The following table presents the mix of our deposits by type based on average balances for each of the periods indicated:
Table 25
| | | | | | | | | | | | | | |
| | | | | | | | | | | | | | |
| | At December 31, |
| | 2016 | | | | 2015 | | | | 2014 | |
| | Average
Balance | %
of Total | | | | Average
Balance | %
of Total | | | | Average
Balance | %
of Total | |
| | (Dollars in thousands) |
Noninterest-bearing demand | $ | 711,678 | 33.40 | % | | $ | 642,015 | 36.45 | % | | $ | 585,671 | 37.00 | % |
Interest-bearing demand | | | | | | | | | | | | | | |
and NOW | | 514,877 | 24.16 | % | | | 377,036 | 21.41 | % | | | 342,696 | 21.66 | % |
Money market | | 438,100 | 20.56 | % | | | 376,061 | 21.35 | % | | | 344,165 | 21.74 | % |
Savings | | 155,236 | 7.29 | % | | | 143,222 | 8.13 | % | | | 123,201 | 7.78 | % |
Time | | 310,961 | 14.59 | % | | | 222,990 | 12.66 | % | | | 187,121 | 11.82 | % |
Total deposits | $ | 2,130,852 | 100.00 | % | | $ | 1,761,324 | 100.00 | % | | $ | 1,582,854 | 100.00 | % |
Overall, average time deposits increased by $88.0 million, or 39.5%, to $311.0 million in 2016 compared to $223.0 million in 2015. At December 31, 2016 time deposits increased by $106.6 million to $365.8 million compared to $259.1 million at December 31, 2015, primarily due to the $84.1 million in time deposits acquired in the Home State transaction.
At December 31, 2016, time deposits included approximately $94.3 million of brokered deposits. These brokered deposits have maturity dates ranging from the second quarter 2017 through the first quarter 2020. At December 31, 2015, time deposits included approximately $78.4 million in brokered deposits, with maturities
ranging from 2016 to 2018. Brokered time deposits comprised 4.1% of total deposits at December 31, 2016 compared to 4.4% at December 31, 2015.
At December 31, 2016, our average noninterest-bearing deposits increased $69.7 million, or 10.9% to $711.7 million, from $642.0 million as of December 31, 2015. Our noninterest-bearing deposits grew during 2016 as a result of building existing and new customer relationships in addition to the $181.5 million in noninterest bearing demand accounts acquired in the Home State transaction.
Borrowings
Subordinated Debentures and Trust Preferred Securities
In April 2004, a predecessor to the Company formed CenBank Statutory Trust III and the trust completed an offering of $15.0 million, LIBOR plus 2.65% Cumulative Trust Preferred Securities (“TruPS”), which are guaranteed by the Company. The trust also issued common securities to the predecessor of the Company and used the net proceeds from the offering to purchase $15.5 million in principal amount of floating rate Junior Subordinated Debentures (“Debentures”) issued by the predecessor. The Company assumed the predecessor’s obligations relating to such securities upon the acquisition of the predecessor. Interest paid on the Debentures was distributed to the holders of the TruPS. Distributions payable on the TruPS were recorded as interest expense in the consolidated statements of income. These Debentures were unsecured, ranked junior and were subordinate in right of payment to all senior debt of the Company. The TruPS were subject to mandatory redemption upon repayment of the Debentures. The Company had the right, subject to events of default, to defer payments of interest on the Debentures at any time by extending the interest payment period for a period not exceeding 10 consecutive semi-annual periods with respect to each deferral period, provided that no extension period could extend beyond the redemption or maturity date of the Debentures. The Debentures mature on April 15, 2034 and are callable on each quarterly payment date.
In June 2003, a predecessor to the Company formed Guaranty Capital Trust III and the trust completed an offering of $10.0 million, LIBOR plus 3.10% Cumulative TruPS which are guaranteed by the Company. The trust also issued common securities to the predecessor of the Company and used the net proceeds from the offering to purchase $10.3 million in principal amount of junior subordinated debentures issued by the predecessor. The Company assumed the predecessor’s obligations relating to such securities upon the acquisition of the predecessor. Interest is paid quarterly and is distributed to the holders of the TruPS. The other terms and conditions of these Debentures are substantially similar to those as described under the CenBank Statutory Trust III. The Debentures mature on July 7, 2033 and are callable on each quarterly interest payment date.
Under the terms of each indenture, we have the ability to defer interest on the debentures for a period of up to 60 months as long as we are in compliance with all covenants of the agreement. At December 31, 2016, the interest payments with respect to our two subordinated debentures were current.
The Company is not considered the primary beneficiary of these trusts (variable interest entities), therefore the trusts are not consolidated in the Company’s financial statements, but rather the subordinated debentures are shown as a liability. The Company’s investment in the common stock of each trust is included in other assets on the consolidated balance sheets.
Under the Dodd-Frank Act and the joint rule from the Federal Reserve Board, the OCC and the FDIC, certain TruPS are no longer eligible to be included as Tier 1 capital for regulatory purposes. However, an exception to this statutory prohibition applies to securities issued prior to May 19, 2010 by bank holding companies with less than $15 billion of total assets. As we have less than $15 billion in total assets and issued all of our TruPS prior to May 19, 2010, we expect our TruPS will continue to be eligible to be treated as Tier 1 capital, subject to other rules and limitations.
In July 2016, the Company issued $40.0 million in fixed-floating rate subordinated debentures primarily to fund the cash consideration paid to Home State shareholders in the Home State transaction. The subordinated debentures bear a fixed interest rate of 5.75% per annum, payable semi-annually in arrears. On July 20, 2021 and thereafter the interest on the subordinated debentures will be payable quarterly in arrears, at an annual floating rate equal to three-month LIBOR as determined by the applicable quarterly period, plus 4.73%. The subordinated debentures mature on July 20, 2026.
Although the subordinated debt is not included as a component of stockholders’ equity on the consolidated balance sheets, it is treated as capital for regulatory purposes. Specifically, under applicable regulatory guidelines, the Company is allowed to include in Tier 1 capital an amount of subordinated debt equal to no more than 25% of the sum of all core capital elements, which is generally defined as stockholders’ equity less certain intangibles, including core deposit intangibles and customer relationship intangibles, net of any related deferred income tax liability. Any amount that exceeds 25% qualifies as Tier 2 capital. At December 31, 2016, $25.0 million of subordinated debt qualified as Tier 1 capital and $40.0 million of subordinated debt qualified as Tier 2 capital.
Other Borrowings
At December 31, 2016, our outstanding borrowings were $197.2 million as compared to $280.8 million at December 31, 2015.
The borrowings at December 31, 2016 consisted of $124.7 million in FHLB line of credit advances and $72.5 million in term notes with the FHLB at the Bank level. In the fourth quarter 2014, as part of a strategic decision to reduce interest expense, management prepaid certain fixed rate FHLB advances bearing an average rate of interest of 3.07% with original maturities between November 2017 and January 2018. As a result of the prepayment, the Company incurred a prepayment penalty of approximately $5.5 million.
The FHLB term borrowings at December 31, 2016 consisted of three fixed-rate term notes and two variable-rate term notes. The fixed-rate term notes that were acquired in the Home State transaction consisted of a $1.6 million note maturing on April 10, 2017 with an interest rate of 6.38% and a $1.7 million note maturing August 30, 2017 with an interest rate of 5.63%. The third fixed-rate term note is a $20.0 million note maturing on January 23, 2018 with an interest rate of 2.52% and is convertible on a quarterly basis by the FHLB to a variable rate note. If the note is converted by the FHLB, we have the option to prepay the note without penalty. The two variable-rate term notes of $25.0 million each bore interest rates of 0.96% and 1.15% at December 31, 2016. These notes mature on March 7, 2017 and August 4, 2017 and will be renewed annually for the next four years under our five year forward starting balance sheet swaps initiated in June 2013 and March 2014.
The total FHLB commitment, including balances outstanding, December 31, 2016 and December 31, 2015 was $597.2 million and $454.7 million, respectively. The increase in the total commitment was primarily due to the additional collateral pledged to the FHLB during 2016, including loans acquired in the Home State transaction. The Bank had additional borrowing capacity with FHLB of $400.1 million at December 31, 2016, which can be utilized with term advances, line of credit advances or a combination of both.
In April 2016, we entered into a credit agreement for a $10.0 million holding company line of credit with Wells Fargo Bank, National Association. This line of credit is secured by the holding company’s stock in the Bank. The line of credit matures on March 17, 2017. Under the credit agreement, we can elect a fixed or floating interest rate on each advance. As of December 31, 2016 no amounts had been borrowed on this line of credit.
Capital Resources
Current risk-based regulatory capital standards generally require banks and bank holding companies to maintain a ratio of Common Equity Tier 1 capital to risk-weighted assets of at least 4.50%, a ratio of Tier 1 capital to risk-weighted assets of at least 6.00%, a ratio of Tier 1 capital to average total assets (leverage ratio) of at least 4.00% and a ratio of total capital (which includes Tier 1 capital plus certain forms of subordinated debt, a portion of the allowance for loan and lease losses, and preferred stock) to risk-weighted assets of at least 8.00%. However, under the final rule on Enhanced Regulatory Capital Standards, commonly referred to as Basel III, which became effective in the first quarter 2015, a capital conservation buffer of 2.5%, comprised of Common Equity Tier 1, was established above the regulatory minimum capital requirement. The capital conservation buffer phase-in period began January 1, 2016 and will become fully effective on January 1, 2019. A fully phased-in capital conservation buffer is included in the table below.
The Bank made the one-time accumulated other comprehensive income (loss) (“AOCI”) opt-out election on its March 31, 2015 Call Report, which allowed community banks under $250 billion, in total assets, which made the one-time opt-out election, to remove the impact of certain unrealized gains and losses from the calculation of regulatory capital. There is no opportunity to change methodology in future periods.
Risk-weighted assets are calculated by multiplying the balance in each category of assets by a risk factor, which ranges from zero for cash assets and certain government obligations to 150% for some loans, and adding the products together.
The following table provides the capital ratios of the Company and Bank as of the dates indicated, along with the applicable regulatory capital requirements:
Table 26
| | | | | | | | | |
| | | | | | | | | |
| Ratio at
December 31,
2016 | | Ratio at
December 31,
2015 | | | Minimum Requirement
for “Adequately Capitalized”
Institution plus fully
phased in Capital
Conservation Buffer | | Minimum
Requirement for
"Well-Capitalized"
Institution | |
Common Equity Tier 1 Risk-Based | | | | | | | | | |
Capital Ratio | | | | | | | | | |
Consolidated | 10.46 | % | 10.94 | % | | 7.00 | % | N/A | |
Guaranty Bank | 12.43 | % | 11.96 | % | | 7.00 | % | 6.50 | % |
| | | | | | | | | |
Tier 1 Risk-Based Capital Ratio | | | | | | | | | |
Consolidated | 11.34 | % | 12.11 | % | | 8.50 | % | N/A | |
Guaranty Bank | 12.43 | % | 11.96 | % | | 8.50 | % | 8.00 | % |
| | | | | | | | | |
Total Risk-Based Capital Ratio | | | | | | | | | |
Consolidated | 13.58 | % | 13.24 | % | | 10.50 | % | N/A | |
Guaranty Bank | 13.26 | % | 13.09 | % | | 10.50 | % | 10.00 | % |
| | | | | | | | | |
Leverage Ratio | | | | | | | | | |
Consolidated | 9.81 | % | 10.68 | % | | 4.00 | % | N/A | |
Guaranty Bank | 10.76 | % | 10.55 | % | | 4.00 | % | 5.00 | % |
At December 31, 2016, all of our regulatory capital ratios remain well above minimum requirements for a “well-capitalized” institution. Our consolidated Common Equity Tier 1 risk-based capital ratio, our Tier 1 risk-based capital ratio and our leverage ratio declined compared to December 31, 2015, while our consolidated total risk-based capital ratio increased during the same period. Our consolidated capital ratios were impacted by the Home State transaction in the third quarter 2016. The Home State transaction was funded through the issuance of $40.0 million in fixed-to-floating rate subordinated notes, which qualified for treatment as Tier 2 capital, and by the issuance of common stock valued at $117.5 million, which qualified as Common Equity Tier 1 capital.
Liquidity
The Bank relies on deposits as its principal source of funds, and therefore must be in a position to service depositors’ needs as they arise. Fluctuations in the account balances of a few large depositors may cause temporary increases and decreases in liquidity from time to time. We deal with such fluctuations by using other sources of liquidity, as discussed below.
The Bank’s initial sources of liquidity are its liquid assets. At December 31, 2016, the Company had $328.9 million in unencumbered securities, $50.1 million in cash and cash equivalents and $24.9 million of excess pledging related to customer accounts that required collateral. When the level of our liquid assets does not meet our liquidity needs, other available sources of liquid assets, including the purchase of federal funds, sales of loans, including jumbo mortgage loans, brokered and internet certificates of deposit, one-way purchases of certificates of deposit through the Certificates of Deposit Account Registry Service, discount window borrowings from the Federal Reserve and our lines of credit with the FHLB and other correspondent banks are employed to meet current and presently anticipated funding needs. At December 31, 2016, the Bank had approximately $400.1 million of availability on its FHLB line, $50.8 million of availability on its unsecured federal funds lines with correspondent banks and $3.3 million of availability with the Federal Reserve discount window.
At December 31, 2016, the Bank had $109.3 million of brokered deposits, of which $13.3 million will mature in the second quarter 2017, $15.8 million will mature in the third quarter 2017, $5.0 million will mature in the fourth quarter 2017, $42.1 million will mature during 2018, $18.2 million will mature during 2019 and 2020 and $15.0 million is non-maturing. We continue to evaluate new brokered deposits as a source of low-cost, longer-term
funding.
The holding company relies primarily on cash flow from the Bank as its source of liquidity. The holding company requires liquidity for the payment of interest on the subordinated debentures, for operating expenses, principally salaries and benefits, for repurchases of our common stock and, if declared by our Board of Directors, for the payment of dividends to our stockholders. The Bank pays a management fee for its share of expenses paid by the holding company, as well as for services provided by the holding company. As discussed in the “Capital Resources” section above, various banking laws applicable to the Bank limit the payment of dividends by the Bank to the holding company, and may therefore limit our ability to pay dividends on our common stock. Under these laws, the Bank is currently required to request permission from the Federal Reserve prior to payment of a dividend to the Company. Under the terms of our TruPS financings, we may defer payment of interest on the subordinated debentures and related TruPS for a period of up to 60 consecutive months as long as we are in compliance with all covenants of the agreement.
As of December 31, 2016, the holding company had approximately $9.5 million of cash on hand. Based on current cash flow projections for the holding company, we estimate that cash balances maintained by the holding company are sufficient to meet the operating needs of the holding company through 2019.
Dividends
Holders of voting common stock are entitled to dividends out of funds legally available for such dividends, when, and if, declared by the Board of Directors. Beginning in May 2013, we paid cash dividends of 2.5 cents per share to stockholders on a quarterly basis through November of 2013. In February 2014, we increased the quarterly cash dividend to 5 cents per share and paid quarterly cash dividends at this level through the fourth quarter 2014. Beginning in February 2015, we increased the quarterly cash dividend to 10 cents per share and paid quarterly cash dividends at this level through the fourth quarter 2015. Beginning in February 2016, we increased the quarterly cash dividend to 11.5 cents per share and paid quarterly cash dividends through the fourth quarter 2016.
On February 7, 2017 the Company’s Board of Directors declared a quarterly cash dividend of 12.5 cents per share, payable on February 28, 2017 to stockholders of record on February 21, 2017.
Our ability to pay dividends is subject to the restrictions of the Delaware General Corporation Law. Because we are a bank holding company with no significant assets other than our bank subsidiary, we currently depend upon dividends from our bank subsidiary for the majority of our revenues. Various banking laws applicable to the Bank limit the payment of dividends, management fees and other distributions by the Bank to the holding company, and may therefore limit our ability to pay dividends on our common stock.
Under the terms of each of our two outstanding trust preferred financings, including our related subordinated debentures, which occurred on June 30, 2003 and April 8, 2004, respectively, we cannot declare or pay any dividends or distributions (other than stock dividends) on, or redeem, purchase, acquire or make a liquidation payment with respect to, any shares of our capital stock if (1) an event of default under any of the subordinated debenture agreements has occurred and is continuing, or (2) we defer payment of interest on the TruPS for a period of up to 60 consecutive months as long as we are in compliance with all covenants of the agreement. At December 31, 2016, interest payments on our two trust preferred financings were current.
Any future determination relating to dividend policy will be made at the discretion of our Board of Directors and will depend on a number of factors, including general business conditions, our financial results, our future business prospects, capital requirements, contractual, legal and regulatory restrictions on the payment of dividends by us to our stockholders or by the Bank to the holding company, and such other factors as our Board of Directors may deem relevant.
Contractual Obligations and Off-Balance Sheet Arrangements
The Bank is a party to credit-related financial instruments with off-balance sheet risk entered into in the normal course of business to meet the financing needs of the Bank’s customers. These financial instruments include commitments to extend credit, standby letters of credit and commercial letters of credit. Such commitments involve, to varying degrees, elements of credit and interest rate risk in excess of the amount recognized in the consolidated balance sheets.
Our exposure to credit loss is represented by the contractual amount of these commitments. We follow the same credit policies in making commitments as we do for on-balance sheet instruments.
The following table sets forth our significant contractual obligations and off-balance sheet commitments at December 31, 2016:
Table 27
| | | | | | | | | | |
| | | | | | | | | | |
| | Payments Due by Period |
| | Totals | | Less Than
1 Year | | 1 - 3
Years | | 3 - 5
Years | | Over 5
Years |
| | | | | | | | | | |
| | (In thousands) |
Contractual Obligations | | | | | | | | | | |
Subordinated debentures | $ | 65,774 | $ | - | $ | - | $ | - | $ | 65,774 |
Federal home loan bank obligations | | 197,100 | | 177,100 | | 20,000 | | - | | - |
Operating lease obligations | | 9,685 | | 1,296 | | 2,306 | | 2,280 | | 3,803 |
Total contractual obligations | $ | 272,559 | $ | 178,396 | $ | 22,306 | $ | 2,280 | $ | 69,577 |
| | | | | | | | | | |
Off Balance Sheet Commitments | | | | | | | | | | |
Commitments to extend credit: | | | | | | | | | | |
Variable | $ | 436,546 | $ | 225,526 | $ | 87,005 | $ | 23,974 | $ | 100,041 |
Fixed | | 95,607 | | 20,723 | | 26,146 | | 6,848 | | 41,890 |
Total commitments to extend credit | | 532,153 | | 246,249 | | 113,151 | | 30,822 | | 141,931 |
| | | | | | | | | | |
Standby letters of credit | | 10,292 | | 9,493 | | 799 | | - | | - |
Total off balance sheet commitments | $ | 542,445 | $ | 255,742 | $ | 113,950 | $ | 30,822 | $ | 141,931 |
Recently Issued Accounting Pronouncements
See Note 2 of the “Notes to Consolidated Financial Statements” contained in Item 8. “Financial Statements and Supplementary Data” for information on recent accounting pronouncements and their anticipated impact, on our consolidated financial statements.
ITEM 7A. QUANTITATIVE AND QUALITATIVE DISCLOSURES ABOUT MARKET RISK
Market risk is the risk of loss in a financial instrument arising from adverse changes in market prices and rates, foreign currency exchange rates, commodity prices and equity prices. Our market risk arises primarily from interest rate risk inherent in our lending, investing and deposit taking activities. To that end, management actively monitors and manages our interest rate risk exposure. We have not entered into any market risk sensitive instruments for trading purposes. We manage our interest rate sensitivity by matching the repricing opportunities on our earning assets to those on our funding liabilities. In order to manage the repricing characteristics of our assets and liabilities, we use various strategies designed to ensure that our exposure to interest rate fluctuations is limited in accordance with our guidelines of acceptable levels of risk-taking. Balance sheet hedging strategies, including monitoring the terms and pricing of loans and deposits and managing the deployment of our securities, are used to reduce mismatches in interest rate repricing between our portfolio of assets and their funding sources.
Credit Risk-Related Contingent Features
The Company enters into interest rate swap contracts with certain commercial banking customers to facilitate the customer’s respective risk management strategies and for the purpose of securing long-term borrowing rates. Customer interest rate swaps are simultaneously hedged by offsetting interest rate swaps that the Company executes with a third party, such that the Company minimizes its net risk exposure resulting from such transactions. Thus, these existing interest rate derivatives result from a service provided to certain qualifying customers and, therefore, are not used to manage interest rate risk in the Company’s assets or liabilities.
The Company has entered into interest rate swap contracts to mitigate interest rate risk attributed to its current mix of assets and liabilities. These interest rate swaps are accounted for as cash flow hedges and are marked to market through Other Comprehensive Income (“OCI”). The fluctuations in market value related to these interest rate swaps are generally in the opposite direction of fluctuations in market value related to our available for sale investment portfolio allowing us to mitigate the impact of market value fluctuations on OCI.
Management evaluates the Company’s credit risk associated with its interest rate swaps by evaluating the maximum potential credit exposure prior to the execution of the interest rate swap. This maximum potential credit exposure is evaluated by executive management in relation to the Company’s Derivatives and Hedging Policy. On a quarterly basis, the actual credit risk for all swaps is reported to the Company’s asset-liability management committee and compared to the maximum exposure approved in the Company’s Derivatives and Hedging Policy.
The Company has agreements with its derivative counterparties that contain a provision where if the Company defaults on any of its indebtedness, including default where repayment of the indebtedness has not been accelerated by the lender, then the Company could also be declared in default on its derivative obligations.
The Company also has agreements with certain of its derivative counterparties that contain a provision where if the Company fails to maintain its status as a well-capitalized institution, then the counterparty could terminate the derivative positions and the Company would be required to settle its obligations under the agreements.
As of December 31, 2016, the fair value of derivatives in a net liability position, which excludes any adjustment for nonperformance risk related to these agreements, was $1.9 million. The Company has minimum collateral posting thresholds with certain of its derivative counterparties, and had posted $4.2 million in collateral as of December 31, 2016 in relation to these thresholds. If the Company had breached any of these provisions at December 31, 2016, it would have been required to settle its obligations under the agreements at the termination value.
Net Interest Income Modeling
Our Asset Liability Management Committee, or ALCO, oversees our exposure to and mitigation of interest rate risk and, along with our Board of Directors, reviews our exposure to interest rate risk at least quarterly. The committee is composed of members of our senior management. The ALCO monitors interest rate risk by analyzing the potential impact on the net portfolio value and net interest income from potential changes in interest rates, and considers the impact of alternative strategies or changes in balance sheet structure. The ALCO manages our balance sheet in part to minimize the potential impact of changes in interest rates on net portfolio value and net interest income.
Interest rate risk exposure is measured using interest rate sensitivity analysis to evaluate fluctuations in net portfolio value and net interest income in the event of hypothetical changes in interest rates. If potential changes to net portfolio value and net interest income from hypothetical interest rate changes are not within the limits approved by the Board of Directors, the Board may direct management to adjust the Bank’s mix of assets and liabilities to bring interest rate risk within these limits.
We monitor and evaluate our interest rate risk position on at least a quarterly basis using net interest income simulation analysis under 100, 200 and 300 basis point change scenarios (see below). Each of these analyses measures different interest rate risk factors inherent in the financial statements.
Our primary interest rate risk measurement tool, the “Net Interest Income Simulation Analysis”, measures interest rate risk and the effect of hypothetical interest rate changes on net interest income. This analysis incorporates all of our assets and liabilities together with forecasted changes in the balance sheet and assumptions that reflect the current interest rate environment. Through these simulations, we estimate the impact on net interest income of an immediate change in market rates of 100, 200 and 300 basis points upward or downward, over a one year period. Assumptions are made to project rates for new loans and deposits based on historical analysis, our outlook and repricing strategies. Asset prepayments and other market risks are developed from industry estimates of prepayment speeds and other market changes. Since the results of these simulations can be significantly influenced by the assumptions on which the simulations rely, we also evaluate the sensitivity of simulation results to changes in underlying assumptions.
The following table shows the projected net interest income increase or decrease over the next 12 months as of December 31, 2016 and December 31, 2015:
Table 28
| | | | | |
| | | | | |
Market Risk: | | | | | |
| | | | | |
| | Annualized Net Interest Income |
| | December 31, 2016 | | | December 31, 2015 |
| | Amount of Change | | | Amount of Change |
| | (In thousands) |
Rates in Basis Points | | | | | |
300 | $ | 3,168 | | $ | 49 |
200 | | 1,827 | | | 207 |
100 | | 908 | | | (22) |
Static | | - | | | - |
(100) | | (4,152) | | | (1,531) |
(200) | | (4,149) | | | (1,304) |
(300) | | N/M | | | N/M |
N/M = not meaningful | | | | | |
At December 31, 2016, we had moved toward a more asset sensitive balance sheet as compared to December 31, 2015 primarily due to variable rate loans acquired in the Home State transaction and a lower overnight funding position. At December 31, 2016, we are positioned to have a short-term favorable interest income impact in the event of an immediate 300, 200 or 100 basis point increase in market interest rates. Our asset sensitivity is mostly due to the amount of variable rate loans on the books and is partially mitigated by interest rate floors, or minimum rates: as rates rise, the loan rate may continue to be at the minimum rate. We also anticipate that deposit rates, other than time deposit rates, would increase immediately in a rising rate environment, but at a reduced magnitude. In our market risk table above, we model that interest rates on our NOW and savings accounts will increase 11 percent of any increase in market interest rates For interest-bearing demand and money market accounts, we model that interest rates would increase 65 percent of any increase in market interest rates. Additionally, the interest rates paid on our FHLB line of credit advances would increase immediately as well. In addition to performing net interest income modeling, we also monitor the impact an instantaneous change in interest rates would have on our economic value of equity. We anticipate a reduction in the economic value of equity in a rising rate environment as the reduction in the value of our fixed rate earning assets would outweigh the corresponding increase in value of our low cost deposits.
We estimate that our net interest income would decline in a 100, 200 or 300 basis point falling rate environment. This is consistent with our belief that our balance sheet is asset sensitive. At December 31, 2016, it is not possible for the majority of our deposit rates to fall 100 to 300 basis points since most deposit rates were already
below 100 basis points. At December 31, 2016, the loss of gross interest income in a falling interest rate environment is expected to exceed the corresponding reduction in interest expense in a falling rate environment. We believe that this scenario is currently very unlikely. The target federal funds rate is currently set by the Federal Open Market Committee of the Federal Reserve Board at a rate of between 50 and 75 basis points and the prime rate has historically been set at a rate of 300 basis points over the target federal funds rate. Our interest rate risk modeling assumes that the prime rate would continue to be set at a rate of 300 basis points over the target federal funds rate; therefore, a 200 basis point decline in overall rates would only result in a 50 to 75 basis point decline in both target federal funds rate and the prime rate. Further, other rates that are currently below 1% or 2% (e.g. short-term U.S. Treasuries and LIBOR) are modeled to not fall below 0% with an overall 100 or 200 basis point decrease in rates. Many of our variable rate loans are set to an index tied to the prime rate, the target federal funds rate or LIBOR, therefore, a further decrease in rates would likely not have a substantial impact on loan yields.
ITEM 8. FINANCIAL STATEMENTS AND SUPPLEMENTARY DATA
Index to Financial Statements
| |
Guaranty Bancorp and Subsidiaries | |
Management’s Report on Internal Control over Financial Reporting | 76 |
Report of Independent Registered Public Accounting Firm | 77 |
Consolidated Balance Sheets at December 31, 2016 and 2015 | 78 |
Consolidated Statements of Income, Years Ended December 31, 2016, 2015 and 2014 | 79 |
Consolidated Statements of Comprehensive Income, Years Ended December 31, 2016, 2015 and 2014 | 80 |
Consolidated Statements of Changes in Stockholders’ Equity, Years Ended December 31, 2016, 2015 and 2014 | 81 |
Consolidated Statements of Cash Flows, Years Ended December 31, 2016, 2015 and 2014 | 82 |
Notes to Consolidated Financial Statements | 83 |
Management’s Report on Internal Control over Financial Reporting
The management of Guaranty Bancorp, including its consolidated subsidiary, is responsible for establishing and maintaining adequate internal control over financial reporting. The Company’s internal control system was designed to provide reasonable assurance to the Company’s management and Board of Directors regarding the preparation and fair presentation of published financial statements in accordance with U.S. generally accepted accounting principles. All internal control systems, no matter how well designed, have inherent limitations. Therefore, even those systems determined to be effective can provide only reasonable assurance with respect to financial statement preparation and presentation.
Management maintains a comprehensive system of controls intended to ensure that transactions are executed in accordance with management’s authorization, assets are safeguarded, and financial records are reliable. Management also takes steps to see that information and communication flows are effective and to monitor performance, including performance of internal control procedures.
As of December 31, 2016, Guaranty Bancorp management assessed the effectiveness of the Company’s internal control over financial reporting based on the framework established in Internal Control-Integrated Framework issued by the Committee of Sponsoring Organizations of the Treadway Commission – 2013 (COSO). Based on this assessment, management has determined that the Company’s internal control over financial reporting as of December 31, 2016 was effective.
Because of its inherent limitations, internal control over financial reporting may not prevent or detect misstatements should they occur. Also, projections of any evaluation of effectiveness to future periods are subject to the risk that controls may become inadequate because of changes in conditions, or that the degree or compliance with the control procedures may deteriorate.
As permitted, the Company has excluded the operations of Home State Bancorp acquired during 2016, which is described in Note 3 of the consolidated financial statements, from the scope of this report. The assets acquired in this acquisition and excluded from management's assessment on internal control over financial reporting comprised approximately 28% of total consolidated assets as of December 31, 2016.
Crowe Horwath LLP, the independent registered public accounting firm that audited the Company’s consolidated financial statements for the years ended December 31, 2016 and 2015, included in the Annual Report on Form 10-K filed February 28, 2017, has issued an audit report on the Company’s internal control over financial reporting as of December 31, 2016. The report, which expresses an unqualified opinion on the effectiveness of the Company’s internal control over financial reporting as of December 31, 2016, is included in this Item under the heading “Report of Independent Registered Public Accounting Firm.”
/s/ Paul W. Taylor /s/ Christopher G. Treece
Paul W. Taylor Christopher G. Treece
President, Chief Executive Officer Executive Vice President, Chief
and Director Financial Officer and Secretary
February 28, 2017
REPORT OF INDEPENDENT REGISTERED PUBLIC ACCOUNTING FIRM
Board of Directors and Stockholders
Guaranty Bancorp
Denver, Colorado
We have audited the accompanying consolidated balance sheets of Guaranty Bancorp and Subsidiaries (“the Company”) as of December 31, 2016 and 2015, and the related consolidated statements of income, comprehensive income, changes in stockholders' equity, and cash flows for each of the years in the three-year period ended December 31, 2016. We also have audited the Company’s internal control over financial reporting as of December 31, 2016, based on criteria established in the Internal Control – Integrated Framework (2013), issued by the Committee of Sponsoring Organizations of the Treadway Commission (COSO). The Company’s management is responsible for these consolidated financial statements, for maintaining effective internal control over financial reporting, and for its assessment of the effectiveness of internal control over financial reporting, included in the accompanying Management’s Report on Internal Control over Financial Reporting. Our responsibility is to express an opinion on these consolidated financial statements and an opinion on the Company's internal control over financial reporting based on our audits.
We conducted our audits in accordance with the standards of the Public Company Accounting Oversight Board (United States). Those standards require that we plan and perform the audits to obtain reasonable assurance about whether the consolidated financial statements are free of material misstatement and whether effective internal control over financial reporting was maintained in all material respects. Our audits of the consolidated financial statements included examining, on a test basis, evidence supporting the amounts and disclosures in the consolidated financial statements, assessing the accounting principles used and significant estimates made by management, and evaluating the overall financial statement presentation. Our audit of internal control over financial reporting included obtaining an understanding of internal control over financial reporting, assessing the risk that a material weakness exists, and testing and evaluating the design and operating effectiveness of internal control based on the assessed risk. Our audits also included performing such other procedures as we considered necessary in the circumstances. We believe that our audits provide a reasonable basis for our opinions.
A company's internal control over financial reporting is a process designed to provide reasonable assurance regarding the reliability of financial reporting and the preparation of consolidated financial statements for external purposes in accordance with generally accepted accounting principles. A company's internal control over financial reporting includes those policies and procedures that (1) pertain to the maintenance of records that, in reasonable detail, accurately and fairly reflect the transactions and dispositions of the assets of the company; (2) provide reasonable assurance that transactions are recorded as necessary to permit preparation of consolidated financial statements in accordance with generally accepted accounting principles, and that receipts and expenditures of the company are being made only in accordance with authorizations of management and directors of the company; and (3) provide reasonable assurance regarding prevention or timely detection of unauthorized acquisition, use, or disposition of the company's assets that could have a material effect on the consolidated financial statements.
Because of its inherent limitations, internal control over financial reporting may not prevent or detect misstatements. Also, projections of any evaluation of effectiveness to future periods are subject to the risk that controls may become inadequate because of changes in conditions, or that the degree of compliance with the policies or procedures may deteriorate.
As permitted, the Company has excluded the operations of Home State Bancorp acquired during 2016, which is described in Note 3 of the consolidated financial statements, from the scope of management’s report on internal control over financial reporting. As such, it has also been excluded from the scope of our audit of internal control over financial reporting.
In our opinion, the consolidated financial statements referred to above present fairly, in all material respects, the financial position of Guaranty Bancorp as of December 31, 2016 and 2015, and the results of its operations and its cash flows for each of the years in the three-year period ended December 31, 2016 in conformity with accounting principles generally accepted in the United States of America. Also in our opinion, the Company maintained, in all material respects, effective internal control over financial reporting as of December 31, 2016, based on criteria established in the Internal Control – Integrated Framework (2013), issued by the Committee of Sponsoring Organizations of the Treadway Commission (COSO).
/s/ Crowe Horwath LLP
Oak Brook, Illinois
February 28, 2017
GUARANTY BANCORP AND SUBSIDIARIES
Consolidated Balance Sheets
| | | | |
| | | | |
| | December 31, | | December 31, |
| | 2016 | | 2015 |
| | (In thousands, except share and per share data) |
Assets | | | | |
Cash and due from banks | $ | 50,111 | $ | 26,711 |
| | | | |
Time deposits with banks | | 254 | | - |
| | | | |
Securities available for sale, at fair value | | 324,228 | | 255,431 |
Securities held to maturity (fair value of $239,404 and $150,122 at | | | | |
December 31, 2016 and December 31, 2015) | | 243,979 | | 148,761 |
Bank stocks, at cost | | 22,649 | | 20,500 |
Total investments | | 590,856 | | 424,692 |
| | | | |
Loans held for sale | | 4,129 | | - |
| | | | |
Loans, held for investment, net of deferred fees and costs | | 2,515,009 | | 1,814,536 |
Less allowance for loan losses | | (23,250) | | (23,000) |
Net loans, held for investment | | 2,491,759 | | 1,791,536 |
| | | | |
Premises and equipment, net | | 67,390 | | 48,308 |
Other real estate owned and foreclosed assets | | 569 | | 674 |
Goodwill | | 56,404 | | - |
Other intangible assets, net | | 15,317 | | 5,173 |
Bank-owned life insurance | | 65,538 | | 48,909 |
Other assets | | 24,100 | | 22,522 |
Total assets | $ | 3,366,427 | $ | 2,368,525 |
| | | | |
Liabilities and Stockholders’ Equity | | | | |
Liabilities: | | | | |
Deposits: | | | | |
Noninterest-bearing demand | $ | 916,632 | $ | 612,371 |
Interest-bearing demand and NOW | | 767,523 | | 381,834 |
Money market | | 484,664 | | 397,371 |
Savings | | 164,478 | | 151,130 |
Time | | 365,787 | | 259,139 |
Total deposits | | 2,699,084 | | 1,801,845 |
| | | | |
Securities sold under agreement to repurchase and federal funds purchased | | 36,948 | | 26,477 |
Federal Home Loan Bank line of credit borrowing | | 124,691 | | 185,847 |
Federal Home Loan Bank term notes | | 72,477 | | 95,000 |
Subordinated debentures, net | | 64,981 | | 25,774 |
Interest payable and other liabilities | | 15,868 | | 11,943 |
Total liabilities | | 3,014,049 | | 2,146,886 |
| | | | |
Stockholders’ equity: | | | | |
Common stock (1) | | 31 | | 24 |
Additional paid-in capital - common stock | | 832,067 | | 712,310 |
Accumulated deficit | | (367,944) | | (382,147) |
Accumulated other comprehensive loss | | (6,726) | | (4,805) |
Treasury stock, at cost, 2,361,882 and 2,287,744 shares, respectively | | (105,050) | | (103,743) |
Total stockholders’ equity | | 352,378 | | 221,639 |
Total liabilities and stockholders’ equity | $ | 3,366,427 | $ | 2,368,525 |
____________________ | | | | |
| (1) | | Common stock—$0.001 par value; 40,000,000 shares authorized; 30,695,886 shares issued and 28,334,004 shares outstanding at December 31, 2016 (including 513,187 shares of unvested restricted stock); 30,000,000 shares authorized; 23,992,596 shares issued and 21,704,852 shares outstanding at December 31, 2015 (including 590,755 shares of unvested restricted stock). |
See “Notes to Consolidated Financial Statements.”
GUARANTY BANCORP AND SUBSIDIARIES
Consolidated Statements of Income
| | | | | | |
| | | | | | |
| | Year Ended December 31, |
| | 2016 | | 2015 | | 2014 |
| | | | | | |
| | (In thousands, except share and per share data) |
Interest income: | | | | | | |
Loans, including costs and fees | $ | 87,249 | $ | 70,188 | $ | 62,819 |
Investment securities: | | | | | | |
Taxable | | 7,625 | | 8,325 | | 9,178 |
Tax-exempt | | 3,683 | | 2,852 | | 2,708 |
Dividends | | 1,063 | | 959 | | 807 |
Federal funds sold and other | | 233 | | 6 | | 8 |
Total interest income | | 99,853 | | 82,330 | | 75,520 |
Interest expense: | | | | | | |
Deposits | | 4,859 | | 3,207 | | 2,464 |
Securities sold under agreement to repurchase and | | | | | | |
federal funds purchased | | 52 | | 45 | | 40 |
Borrowings | | 2,549 | | 1,285 | | 3,403 |
Subordinated debentures | | 2,005 | | 814 | | 800 |
Total interest expense | | 9,465 | | 5,351 | | 6,707 |
Net interest income | | 90,388 | | 76,979 | | 68,813 |
Provision for loan losses | | 143 | | 96 | | 14 |
Net interest income, after provision for loan losses | | 90,245 | | 76,883 | | 68,799 |
Noninterest income: | | | | | | |
Deposit service and other fees | | 10,447 | | 8,941 | | 9,066 |
Investment management and trust | | 5,452 | | 5,189 | | 4,380 |
Increase in cash surrender value of life insurance | | 2,005 | | 1,758 | | 1,295 |
Gain (loss) on sale of securities | | (73) | | 132 | | 28 |
Gain on sale of SBA loans | | 873 | | 824 | | 798 |
Other | | 553 | | 336 | | 1,128 |
Total noninterest income | | 19,257 | | 17,180 | | 16,695 |
Noninterest expense: | | | | | | |
Salaries and employee benefits | | 40,946 | | 33,564 | | 32,766 |
Occupancy expense | | 5,887 | | 6,312 | | 6,308 |
Furniture and equipment | | 3,070 | | 3,007 | | 2,759 |
Amortization of intangible assets | | 1,557 | | 1,981 | | 2,506 |
Other real estate owned, net | | 31 | | 80 | | 367 |
Insurance and assessments | | 2,314 | | 2,398 | | 2,355 |
Professional fees | | 3,639 | | 3,220 | | 3,520 |
Prepayment penalty on debt extinguishment | | - | | - | | 5,459 |
Impairment of long-lived assets | | 185 | | 122 | | 186 |
Other general and administrative | | 15,158 | | 9,655 | | 9,520 |
Total noninterest expense | | 72,787 | | 60,339 | | 65,746 |
Income before income taxes | | 36,715 | | 33,724 | | 19,748 |
Income tax expense | | 11,988 | | 11,270 | | 6,236 |
Net income | $ | 24,727 | $ | 22,454 | $ | 13,512 |
| | | | | | |
Earnings per common share–basic: | $ | 1.06 | $ | 1.07 | $ | 0.64 |
Earnings per common share–diluted: | | 1.05 | | 1.06 | | 0.64 |
Dividends declared per common share: | | 0.46 | | 0.40 | | 0.20 |
| | | | | | |
Weighted average common shares outstanding-basic: | | 23,267,108 | | 21,065,590 | | 20,957,702 |
Weighted average common shares outstanding-diluted: | | 23,559,947 | | 21,272,336 | | 21,086,543 |
See “Notes to Consolidated Financial Statements.”
GUARANTY BANCORP AND SUBSIDIARIES
Notes to Consolidated Financial Statements
Table of Contents
(1)Organization
Guaranty Bancorp is a bank holding company registered under the Bank Holding Company Act of 1956, as amended, and headquartered in Colorado.
The Company’s principal business is to serve as a holding company for its wholly owned bank subsidiary, Guaranty Bank and Trust Company, referred to as the “Bank”.
References to the “Company,” “us,” “we,” and “our” refer to Guaranty Bancorp on a consolidated basis. References to “Guaranty Bancorp” or to the “holding company” refer to the parent company on a stand-alone basis.
(2)Summary of Significant Accounting Policies
(a)Nature of Operations and Principles of Consolidation
The Bank is a full-service community bank offering an array of banking products and services to the communities it serves along the Front Range of Colorado including accepting time and demand deposits and originating commercial loans, commercial and residential real estate loans, Small Business Administration (“SBA”) guaranteed loans and consumer loans. The Bank together with its wholly owned subsidiaries, Private Capital Management, LLC (“PCM”) and Cherry Hills Investment Advisors, Inc. (“CHIA”), provide wealth management services, including private banking, investment management and trust services. Substantially all of the Bank’s loans are secured by specific items of collateral, including business assets, commercial and residential real estate, which include land or improved land and consumer assets. Commercial loans are expected to be repaid from cash flow from the operations of businesses that have taken out the loans. There are no significant concentrations of loans to any one industry or customer. On September 8, 2016, the Company completed the acquisition of Home State Bancorp (“Home State”), based in Loveland, Colorado, in exchange for a combination of Company stock and cash. The transaction enhanced the Company’s balance sheet liquidity and supports the Company’s objective of serving the banking needs of northern Colorado business and consumer customers.
The accounting and reporting policies of the Company conform to generally accepted accounting principles in the United States of America. All material intercompany balances and transactions have been eliminated in consolidation. The Company’s financial statements reflect all adjustments that are, in the opinion of management, necessary for a fair presentation of its financial position and results of operations for the periods presented.
(b)Business Combinations
The Company accounts for acquisitions of businesses using the acquisition method of accounting. Under the acquisition method, assets acquired and liabilities assumed are recorded at their estimated fair value upon the date of acquisition. Management utilizes various valuation techniques including discounted cash flow analyses to determine the fair values of assets acquired and liabilities assumed. Any excess of purchase price over amounts allocated to the acquired assets, including identifiable intangible assets, and liabilities assumed is recorded as goodwill.
(c)Use of Estimates
The preparation of the consolidated financial statements in conformity with U.S. generally accepted accounting principles requires management to make estimates and assumptions that affect the reported amounts of assets and liabilities as of the dates of the consolidated balance sheets and income and expense for the periods presented. Actual results could differ significantly from those estimates.
(d)Cash Flows
Cash and cash equivalents on the Company’s consolidated balance sheets include cash-on-hand, balances due from banks and interest-bearing deposits in other financial institutions that have an original maturity of three months or less and are carried at cost. Net cash flows are reported for customer loan and deposit transactions, interest-bearing deposits in other financial institutions, short-term borrowings, federal funds purchased and repurchase agreements.
GUARANTY BANCORP AND SUBSIDIARIES
Notes to Consolidated Financial Statements
Table of Contents
(e)Time Deposits with Banks
The Company may invest in short term, fully insured time deposits with other banks.
(f)Securities
Securities are classified as held to maturity and carried at amortized cost when management has the positive intent and ability to hold them to maturity. Securities not classified as held to maturity are classified as available for sale. Securities available for sale are carried at fair value, with unrealized gains and losses reported in other comprehensive income, net of tax.
Interest income includes amortization of purchase premium or discount. Premiums and discounts on securities are amortized according to the effective interest method without anticipating prepayments, except for mortgage-backed securities where prepayments are anticipated. Gains and losses on sales are recorded on the trade date and determined using the specific identification method.
Management evaluates securities for other-than-temporary impairment (“OTTI”) on a quarterly basis, and more frequently when economic or market conditions warrant such an evaluation. For securities in an unrealized loss position, management considers the extent and duration of the unrealized loss and the financial condition and near-term prospects of the issuer. Management also assesses whether it intends to sell, or it is more likely than not that it will be required to sell, a security in an unrealized loss position before recovery of its amortized cost basis. If either of the criteria regarding intent or requirement to sell is met, the entire difference between amortized cost and fair value is recognized as an impairment to earnings.
The investments in bank stocks are reviewed by management quarterly for potential OTTI. This quarterly review considers the credit quality of the institution, the institution’s ability to repurchase shares and the Company’s carrying value in the shares relative to book value. Based on these reviews, management concluded that there was no impairment during 2016, 2015 and 2014.
(g)Loans and Loan Commitments
The Company extends commercial, real estate and consumer loans to customers. A substantial portion of the loan portfolio consists of commercial and real estate loans throughout the Front Range of Colorado. The ability of the Company’s borrowers to honor their contracts is generally dependent upon the real estate and general economic conditions prevailing in Colorado, among other factors.
Purchased loans for which there was no evidence of credit deterioration upon acquisition and for which collection of all contractually required payments upon acquisition was considered probable are referred to collectively as non-purchased credit impaired loans, or “Non-PCI” loans. Purchased loans for which there was at the acquisition date evidence of credit deterioration since origination and for which collection of all contractually required payments was not probable were designated as and referred to as purchased credit impaired or “PCI” loans. In the September 8, 2016 Home State transaction, the Company designated $2,108,000 of loans as PCI. As of December 31, 2016 $1,902,000 in PCI loans remained in the Company’s loan portfolio.
Loans that management has the intent and ability to hold for the foreseeable future or until maturity or payoff are reported at their outstanding unpaid principal balances, adjusted for charge-offs, the allowance for loan losses and any deferred fees or costs. Acquired loans are recorded upon acquisition at fair value, with no associated allowance for loan loss. However, if subsequent to acquisition the credit quality of an acquired loan deteriorates, an allowance may be required. Accounting for loans is performed consistently across all portfolio segments and classes.
A portfolio segment is defined in accounting guidance as the level at which an entity develops and documents a systematic methodology to determine its allowance for loan losses. A class is defined in accounting guidance as a group of loans having similar initial measurement attributes, risk characteristics and methods for monitoring and assessing risk.
Interest income is accrued on the unpaid principal balance of the Company’s loans. Loan origination fees, net of direct origination costs, are deferred and recognized as an adjustment to the related loan yield
GUARANTY BANCORP AND SUBSIDIARIES
Notes to Consolidated Financial Statements
Table of Contents
using the effective interest method without anticipating prepayments. Purchase discount or premium on acquired, Non-PCI loans is recognized as an adjustment to interest income over the contractual life of such loans using the effective interest method, or taken into income when the related loans are paid off or sold. With respect to PCI loans, the “accretable yield”, calculated as the excess of undiscounted expected cash flows over the present value of expected cash flows, is accreted into income over the term of the loan assuming the amount and timing of cash flows are reasonably estimable.
The accrual of interest on loans is discontinued (and the loan is put on nonaccrual status) at the time the loan is 90 days past due unless the loan is well secured and in process of collection. The time at which a loan enters past due status is based on the contractual terms of the loan. In all cases, loans are placed on nonaccrual or charged-off prior to the date on which they would otherwise enter past due status if collection of principal or interest is considered doubtful. The interest on a nonaccrual loan is accounted for using the cost-recovery or cash-basis method, until the loan qualifies for a return to the accrual-basis method. Under the cost-recovery method, interest income is not recognized until the loan balance is reduced to zero, with payments received being applied first to the principal balance of the loan. Under the cash-basis method, interest income is recognized when the payment is received in cash. A loan is returned to accrual status after the delinquent borrower’s financial condition has improved, when all the principal and interest amounts contractually due are brought current and when the likelihood of the borrower making future timely payments is reasonably assured.
Financial instruments include off‑balance sheet credit instruments, such as commitments to make loans and commercial letters of credit issued to meet customer financing needs. The face amount of each item represents the Company’s total exposure to loss with respect to the item before considering customer collateral or ability to repay. Such financial instruments are recorded when they are funded.
(h)Allowance for Loan Losses and Allowance for Unfunded Commitments
The allowance for loan losses or “the allowance” is a valuation allowance for probable incurred loan losses and is reported as a reduction of outstanding loan balances.
Management evaluates the amount of the allowance on a regular basis based upon its periodic review of the collectability of the Company’s loans. Factors affecting the collectability of the loans include historical loss experience, the nature and volume of the loan portfolio, adverse situations that may affect the borrowers’ ability to repay, the estimated value of any underlying collateral and prevailing economic conditions. This evaluation is inherently subjective as it requires estimates that are susceptible to significant revision as more information becomes available. Management maintains the allowance at a level that it deems appropriate to adequately provide for probable incurred losses in the loan portfolio and other extensions of credit. The Company’s methodology for estimating the allowance is consistent across all portfolio segments and classes of loans.
Loans deemed to be uncollectible are charged-off and deducted from the allowance. The Company’s loan portfolio primarily consists of non-homogeneous commercial and real estate loans where charge-offs are considered on a loan-by-loan basis based on the facts and circumstances, including management’s evaluation of collateral values in comparison to book values on collateral-dependent loans. Charge-offs on smaller balance unsecured homogenous type loans such as overdrafts and ready reserves are recognized by the time the loan in question is 90 days past due. The provision for loan losses and recoveries on loans previously charged-off are added to the allowance.
The allowance consists of both specific and general components. The specific component relates to loans that are individually classified as impaired. All loans are subject to individual impairment evaluation should the pertinent facts and circumstances suggest that such evaluation is necessary. Factors considered by management in determining impairment include the loan’s payment status and the probability of collecting scheduled principal and interest payments when they become due. Loans that experience insignificant payment delays and payment shortfalls generally are not classified as impaired. A loan is considered impaired when, based on current information and events, it is probable that the Company will be unable to collect the scheduled payments of principal or interest when due according to the contractual terms of the original underlying loan agreement. Management determines the significance of payment delays and payment shortfalls on a case-by-case basis, taking into consideration all of the circumstances surrounding the loan and the borrower, including the length of the delay, the reasons for the delay, the borrower’s prior payment record, and the amount of the shortfall in relation to the principal and interest owed. If a loan is impaired, a portion, if
GUARANTY BANCORP AND SUBSIDIARIES
Notes to Consolidated Financial Statements
Table of Contents
any, of the allowance is allocated so that the loan is reported at the present value of estimated future cash flows using the loan’s original contractual rate or at the fair value of collateral, less estimated selling costs, if repayment is expected solely from collateral. Troubled debt restructurings (“TDRs”) are separately identified for impairment disclosures. If a TDR is considered to be a collateral-dependent loan, impairment of the loan is measured using the fair value of the collateral, less estimated selling costs. Likewise, if a TDR is not collateral-dependent, impairment is measured by the present value of estimated future cash flows using the loan’s effective rate at inception. For TDRs that subsequently default, the Company determines the amount of reserve in accordance with its accounting policy for the allowance.
The general component of the allowance covers all other loans not specifically identified as impaired and is determined by calculating losses recognized by portfolio segment during the current credit cycle and adjusted based on management’s evaluation of various qualitative factors. In performing this calculation, loans are aggregated into one of three portfolio segments: Real Estate, Consumer and Commercial & Other. An assessment of risks impacting loans in each of these portfolio segments is performed, and qualitative adjustment factors, which will adjust the historical loss rate, are estimated. These qualitative adjustment factors consider current conditions relative to conditions present throughout the current credit cycle in the following areas: credit quality, loan class concentration levels, economic conditions, loan growth dynamics and organizational conditions. The historical loss experience is adjusted for management’s estimate of the impact of these factors based on the risks present for each portfolio segment.
The Company recognizes a liability in relation to unfunded commitments that is intended to represent the estimated future losses on commitments. In calculating the amount of this liability, management considers the amount of the Company’s off-balance sheet commitments, estimated utilization factors and loan specific risk factors. The Company’s liability for unfunded commitments is calculated quarterly and the liability is included under “other liabilities” in the consolidated balance sheet.
(i)Loans Held for Sale
Particular loans may be considered “held for sale” as of the Company’s balance sheet date. The Company routinely sells SBA guaranteed loans, and historically has designated select classified or nonaccrual loans as held-for-sale as part of its strategy to dispose of these non-earning assets. Once the decision is made to sell a loan, the loan is designated as held for sale and carried at the lower of cost or fair value, with any required write-down being taken at the time of the reclassification.
| (j) | | Transfers of Financial Assets |
Transfers of financial assets are accounted for as sales when control over the assets has been relinquished. Control over transferred assets is deemed to be surrendered when the assets have been isolated from the Company, the transferee obtains the right (free of conditions that constrain it from taking advantage of that right) to pledge or exchange the transferred assets, and the Company does not maintain effective control over the transferred assets through an agreement to repurchase them before their maturity.
(k)Other Real Estate Owned and Foreclosed Assets
Assets acquired through, or in lieu of, loan foreclosure are initially recorded at fair value less costs to sell when acquired, establishing a new cost basis. If the asset’s fair value declines subsequent to the asset’s acquisition, a valuation allowance is recorded through expense. Operating revenues and expenses of these assets and reductions in the fair value of the assets are included in noninterest expense. Gains and losses on their disposition are also included in noninterest expense.
(l)Premises and Equipment
Land is carried at cost. Buildings, equipment and software are carried at cost, less accumulated depreciation and amortization computed on the straight-line method over the useful life of the asset. Leasehold improvements are depreciated over the shorter of their estimated useful life or the lease term. Buildings and leasehold improvements carry an estimated useful life of five to 40 years and equipment and software carry an estimated useful life of one to 15 years. Repairs and maintenance are charged to noninterest expense as incurred.
GUARANTY BANCORP AND SUBSIDIARIES
Notes to Consolidated Financial Statements
Table of Contents
(m)Bank Stocks
The Bank is a member of the Federal Home Loan Bank (FHLB) system. Members are required to own a certain amount of stock based on the level of borrowings and other factors, and may invest in additional amounts. The Bank also owns Federal Reserve Bank (FRB) stock, Bankers’ Bank of the West (BBW) stock and Pacific Coast Bankers’ Bank (PCBB) stock. FHLB, FRB, BBW and PCBB stock is carried at cost, classified as a restricted security, and periodically reviewed for impairment based on the likelihood of ultimate recovery of par value. Both cash and stock dividends are reported as income.
(n)Goodwill and Other Intangible Assets
Goodwill was recorded in the Home State transaction and represents the excess of the purchase price over the fair value of acquired tangible assets, identifiable intangible assets and liabilities. Goodwill is assessed at least annually for impairment and any such impairment is recognized in the period identified.
Intangible assets acquired in a business combination are amortized over their estimated useful lives to their estimated residual values and evaluated for impairment whenever changes in circumstances indicate that such an evaluation is necessary.
Core deposit intangible assets (“CDI assets”) are recognized at the time of their acquisition based on valuations prepared by independent third parties or other estimates of fair value. In preparing such valuations, management considers variables such as deposit servicing costs, attrition rates and market discount rates. CDI assets are amortized to expense over their useful lives, ranging from 10 years to 15 years.
Customer relationship intangible assets are recognized at the time of their acquisition based upon management’s estimate of their fair value. In preparing their valuation, management considers variables such as growth in existing customer base, attrition rates and market discount rates. The customer relationship intangible assets are amortized to expense over their estimated useful life, which has been estimated to be 10 years. The Company has recognized three customer relationship intangible assets as a result of the acquisitions of PCM on July 31, 2012, CHIA on July 16, 2014 and Home State on September 8, 2016.
(o)Impairment of Long-Lived Assets
Long-lived assets, such as premises and equipment, and finite-lived intangible assets subject to amortization, are reviewed for impairment whenever events or changes in circumstances indicate that the carrying value of an asset may not be recoverable. The recoverability of assets to be held and used is measured by a comparison of the carrying value of the asset to the estimated undiscounted future cash flows expected to be generated by the asset. If the carrying value of an asset exceeds its estimated undiscounted future cash flows, an impairment charge is recognized by the amount by which the carrying value of the asset exceeds the fair value of the asset, less costs to sell.
Assets to be disposed of are reported at the lower of their carrying value or fair value less costs to sell, and are no longer depreciated. During 2016, the Company recognized an $185,000 impairment charge on a long-lived asset; the asset was designated as held for sale and included in “other assets” in the December 31, 2016 consolidated balance sheet. During 2015 the Company recognized $122,000 in impairment charges on the sale of a former branch facility. An impairment charge of $186,000 on the same former branch facility was recognized in 2014.
(p)Derivative Instruments
The Company records all derivatives on its consolidated balance sheet at fair value. At the inception of a derivative contract, the Company designates the derivative as one of three types based on the Company’s intentions and belief as to the derivative’s likely effectiveness as a hedge. These three types are (1) a hedge of the fair value of a recognized asset or liability or of an unrecognized firm commitment (“fair value hedge”), (2) a hedge of a forecasted transaction or the variability of cash flows to be received or paid related to a recognized asset or liability (“cash flow hedge”), or (3) an instrument with no hedging designation (“stand-alone derivative”). To date, the Company has entered into cash flow hedges and stand-alone derivative agreements but has not entered into any fair value hedges. For a cash flow hedge, the gain or loss on the derivative is reported in other comprehensive income and is reclassified into earnings in the same periods
GUARANTY BANCORP AND SUBSIDIARIES
Notes to Consolidated Financial Statements
Table of Contents
during which the hedged transaction impacts earnings. Any portion of the cash flow hedge not deemed highly effective in hedging the changes in expected cash flows of the hedged item is recognized immediately in current earnings. Changes in the fair value of derivatives that do not qualify for hedge accounting are reported currently in earnings, as noninterest income.
The Company formally documents the relationship between derivatives and hedged items, as well as the risk-management objective and the strategy for undertaking hedge transactions, at the inception of the derivative contract. This documentation includes linking cash flow hedges to specific assets and liabilities on the balance sheet or to specific firm commitments or forecasted transactions. The Company also formally assesses, both at the hedge’s inception and on an ongoing basis, whether the hedge is highly effective in offsetting changes in cash flows of the hedged items.
(q)Stock Incentive Plan
The Company’s Amended and Restated 2005 Stock Incentive Plan (the “Incentive Plan”) provided for the grant of equity-based awards representing up to a total of 1,700,000 shares of voting common stock to key employees, nonemployee directors, consultants and prospective employees. The Incentive Plan expired by its terms on April 4, 2015. At the Company’s annual meeting of stockholders on May 5, 2015, the Company’s stockholders approved the Guaranty Bancorp 2015 Long-Term Incentive Plan (the “2015 Plan”), which had been previously approved by the Company’s Board of Directors. The 2015 Plan provides for the grant of stock options, stock awards, stock unit awards, performance stock awards, stock appreciation rights, and other equity-based awards representing up to a total of 935,000 shares of voting common stock to key employees, nonemployee directors, consultants and prospective employees. All awards issued under the Incentive Plan will remain outstanding in accordance with their terms despite the expiration of the Incentive Plan; however, any awards granted subsequent to the expiration of the Incentive Plan have been, and will continue to be, issued under the 2015 Plan.
As of December 31, 2016, the Company had granted stock awards under both the Incentive Plan and the 2015 plan. The Company recognizes stock compensation expense for services received in a share-based payment transaction over the requisite service period, generally defined as the vesting period. For awards with graded vesting, compensation cost is recognized on a straight-line basis over the requisite service period for the entire award. The compensation cost of employee and director services received in exchange for stock awards is based on the grant date fair value of the award, as determined by quoted market prices. Stock compensation expense is recognized using an estimated forfeiture rate, adjusted as necessary to reflect actual forfeitures. The Company has issued stock awards that vest based on the passage of time over service periods of one to five years (in some cases vesting in annual installments, in other cases cliff vesting at the end of the service period), and other stock awards that vest contingent upon the satisfaction of certain performance conditions. The last date on which outstanding performance stock awards may vest is February 14, 2019. At December 31, 2016, certain performance stock awards were expected to vest prior to their expiration. Should expectations of future financial performance change, expense to be recognized in future periods could be impacted.
(r)Stock Repurchase Plan
On February 7, 2017, the Company’s Board of Directors authorized the extension of the expiration date of the Company’s share repurchase program originally announced in April 2014. Due to previous extensions the program was scheduled to expire on April 2, 2017, however, this most recent extension extends the expiration date of the repurchase program through April 2, 2018. Pursuant to the program, the Company may repurchase up to 1,000,000 shares of its voting common stock, par value $0.001 per share. As of the date of this filing, the Company had not repurchased any shares under the program.
(s)Bank-Owned Life Insurance
The Bank has life insurance policies on certain key executives and former key executives. Bank-owned life insurance (“BOLI”) is recorded at the amount that can be realized under the insurance contract at the balance sheet date, which is the cash surrender value adjusted for other charges or other amounts likely due at settlement.
GUARANTY BANCORP AND SUBSIDIARIES
Notes to Consolidated Financial Statements
Table of Contents
(t)Income Taxes
Income tax expense is the total of the current year’s income tax payable or refundable and the increase or decrease in deferred tax assets and liabilities. Deferred tax assets and liabilities are recognized for the future tax consequences attributable to differences between the financial statement carrying amounts of existing assets and liabilities and their respective tax bases and operating loss and tax credit carry forwards. Deferred tax assets and liabilities are measured using enacted tax rates expected to apply to taxable income in the years in which those temporary differences are expected to be recovered or settled. The effect on deferred tax assets and liabilities of a change in tax rates is recognized in income in the period of the enactment date.
Deferred tax assets are reduced by a valuation allowance when, in the opinion of management, it is more likely than not that the Company will not realize some portion of, or the entire deferred tax asset. In assessing the Company’s likelihood of realizing deferred tax assets, management evaluates both positive and negative evidence, including the existence of any cumulative losses in the current year and the prior two years, the amount of taxes paid in available carry-back years, forecasts of future income, taking into account applicable tax planning strategies, and assessments of current and future economic and business conditions. Management performs this analysis quarterly and adjusts as necessary. At December 31, 2016 and December 31, 2015, the Company had a net deferred tax asset of $4,846,000 and $7,912,000, respectively, which includes the deferred tax asset associated with the net unrealized gain (loss) on securities. After analyzing the composition of and changes in the deferred tax assets and liabilities and considering the Company’s forecasted future taxable income and various tax planning strategies, including the intent to hold the securities available for sale that were in a loss position until maturity, management determined that as of December 31, 2016 it was more likely than not that the net deferred tax asset would be fully realized. As a result, there was no valuation allowance with respect to the Company’s deferred tax asset as of December 31, 2016 or December 31, 2015.
The Company and the Bank are subject to U.S. federal income tax, State of Colorado income tax and income tax in other states. Generally, the Company is no longer subject to examination by Federal taxing authorities for years before 2013 and is no longer subject to examination by the State of Colorado for years before 2012. The Company recognizes interest related to income tax matters as interest expense and penalties related to income tax matters as other noninterest expense. At December 31, 2016 and December 31, 2015, the Company did not have any amounts accrued for interest or penalties.
(u)Segments of an Enterprise and Related Information
The Company operates as a single segment. The operating information used by the Company’s Chief Executive Officer for purposes of assessing performance and making operating decisions impacting the Company is the consolidated financial data presented in this report. For the years ended 2016 and 2015, the Company had one active operating subsidiary, Guaranty Bank and Trust Company. The Company has determined that banking is its one reportable business segment.
(v)Earnings per Common Share
Basic earnings per common share represents the earnings allocable to common stockholders divided by the weighted average number of common shares outstanding during the period. Dilutive common shares that may be issued by the Company represent unvested stock awards subject to a service or performance condition.
GUARANTY BANCORP AND SUBSIDIARIES
Notes to Consolidated Financial Statements
Table of Contents
Earnings per common share have been computed based on the following calculation of weighted average shares outstanding:
| | | | | |
| | | | | |
| Year Ended December 31, |
| 2016 | | 2015 | | 2014 |
| | | | | |
Average common shares outstanding | 23,267,108 | | 21,065,590 | | 20,957,702 |
Effect of dilutive unvested stock grants (1) | 292,839 | | 206,746 | | 128,841 |
Average shares outstanding for calculated | | | | | |
diluted earnings per common share | 23,559,947 | | 21,272,336 | | 21,086,543 |
_____________ | | | | | |
(1) Unvested stock grants representing 513,187 shares at December 31, 2016 had a dilutive impact of 292,839 shares in the diluted earnings per share calculation. Unvested stock grants representing 590,755 shares at December 31, 2015 had a dilutive impact of 206,746 shares in the diluted earnings per share calculation. Unvested stock grants representing 620,075 shares at December 31, 2014 had a dilutive impact of 128,841 shares in the diluted earnings per share calculation.
(w)Dividend Restrictions
Holders of voting common stock are entitled to dividends out of funds legally available for such dividends, when, and if, declared by the Board of Directors.
Various banking laws applicable to the Bank limit the payment of dividends, management fees and other distributions by the Bank to the Company, and may therefore limit our ability to pay dividends on our common stock. Under these laws, the Bank is currently required to request permission from the Federal Reserve and the Colorado Division of Banking prior to payment of a dividend to the Company.
Any future determination relating to dividend policy will be made at the discretion of our Board of Directors and will depend on a number of factors, including general business conditions, our financial results, our future prospects, capital requirements, contractual, legal, and regulatory restrictions on the payment of dividends by us to our stockholders or by the Bank to the holding company, and such other factors as our Board of Directors may deem relevant.
On February 7, 2017 the Company announced that its Board of Directors declared a quarterly cash dividend of 12.5 cents per share, payable on February 28, 2017 to stockholders of record on February 21, 2017.
(x)Fair Values of Financial Instruments
Fair values of financial instruments are estimated using relevant market information and other assumptions, as more fully disclosed in Note 18 “Fair Value Measurements and Fair Value of Financial Instruments”. Fair value estimates involve uncertainties and matters of significant judgment regarding interest rates, credit risk, prepayments, and other factors, especially in the absence of broad markets for particular items. Changes in assumptions or in market conditions could significantly affect the estimates.
(y)Loss Contingencies
Loss contingencies, including claims and legal actions arising in the ordinary course of business, are recorded as liabilities when the likelihood of a loss is probable and an amount or range of loss can be reasonably estimated. Loss contingencies are more fully disclosed in Note 15 “Legal Contingencies”.
(z)Recently Issued Accounting Standards
Adoption of New Accounting Standards:
In April 2015, the Financial Accounting Standards Board (the “FASB”) issued accounting standards update 2015-03 modifying the presentation of debt issuance costs. The update requires that debt issuance costs be presented as a direct reduction of debt balances on the balance sheet. For public business entities, the amendments of this update are effective for interim and annual periods beginning after December 15, 2015.
GUARANTY BANCORP AND SUBSIDIARIES
Notes to Consolidated Financial Statements
Table of Contents
As a result of this update the Company has presented debt issuance costs as a reduction of the related debt balance on the Company’s balance sheet.
In September 2015, the FASB issued accounting standards update 2015-16 Simplifying the Accounting for Measurement-Period Adjustments. The update requires acquirers to adjust provisional amounts identified during the measurement period in the reporting period in which the adjustments are determined, rather than retrospectively adjusting previously reported information. Additional disclosure of the impact of measurement period adjustments on current year earnings will also be required. For public business entities, the amendments of this update are effective for interim and annual periods beginning after December 15, 2015. This update did not have a material impact on the Company’s financial position, results of operations or cash flows.
In March 2016, the FASB issued accounting standards update 2016-09 Compensation-Stock Compensation. The purpose of the update was to simplify the accounting for share-based payment transactions, including the income tax consequences of such transactions. Under the provisions of the update the income tax consequences of excess tax benefits and deficiencies should be recognized in income tax expense in the reporting period in which the awards vest. Currently, excess tax benefits or deficiencies impact stockholders’ equity directly to the extent there is a cumulative excess tax benefit. In the event that a tax deficiency has occurred during the reporting period and a cumulative excess tax benefit does not exist, the tax deficiency is recognized in income tax expense under current GAAP. The update also provides that entities may continue to estimate forfeitures in accounting for stock based compensation or recognize them as they occur. The provisions of this update become effective for interim and annual periods beginning after December 15, 2016, however early adoption was permitted beginning in 2016. The Company adopted the provisions of the update in the fourth quarter of 2016 with the most significant impact being $528,000 of excess tax benefit in restricted stock vestings directly benefiting 2016 income tax expense.
Recently Issued but not yet Effective Accounting Standards:
In May 2014, the FASB issued accounting standards update 2014-09 Revenue from Contracts with Customers. The main provisions of the update require the identification of performance obligations within a contract and require the recognition of revenue based on a stand-alone allocation of contract revenue to each performance obligation. Performance obligations may be satisfied and revenue recognized over a period of time if: (i) the customer simultaneously receives and consumes the benefits provided by the entity’s performance as the entity performs, or (ii) the entity’s performance creates or enhances an asset that the customer controls as the asset is created or enhanced, or (iii) the entity’s performance does not create an asset with an alternative use to the entity and the entity has an enforceable right to payment for performance completed to date. The amendments of the update are to be effective for public entities beginning with interim and annual reporting periods beginning after December 15, 2017. Management does not expect the requirements of this update to have a material impact on the Company’s financial position, results of operations or cash flows.
In January 2016, the FASB released accounting standards update 2016-01 Recognition and Measurement of Financial Assets and Liabilities. The main provisions of the update are to eliminate the available for sale classification of accounting for equity securities and to adjust the fair value disclosures for financial instruments carried at amortized costs such that the disclosed fair values represent an exit price as opposed to an entry price. The provisions of this update will require that equity securities be carried at fair market value on the balance sheet and any periodic changes in value will be adjustments to the income statement. A practical expedient is provided for equity securities without a readily determinable fair value, such that these securities can be carried at cost less any impairment. The provisions of this update become effective for interim and annual periods beginning after December 15, 2017. Management does not expect the requirements of this update to have a material impact on the Company’s financial position, results of operations or cash flows.
In February 2016, the FASB issued accounting standards update 2016-02 Leases. The update requires all leases, with the exception of short-term leases that have contractual terms of no greater than one year, to be recorded on the balance sheet. Under the provisions of the update, leases classified as operating will be reflected on the balance sheet with the recognition of both a right-of-use asset and a lease liability. Under the update, a distinction will exist between finance and operating type leases and the rules for determining which classification a lease will fall into are similar to existing rules. For public business entities, the amendments of
GUARANTY BANCORP AND SUBSIDIARIES
Notes to Consolidated Financial Statements
Table of Contents
this update are effective for interim and annual periods beginning after December 15, 2018. The update requires a modified retrospective transition under which comparative balance sheets from the earliest historical period presented will be revised to reflect what the financials would have looked like were the provisions of the update applied consistently in all prior periods. Management is in the process of evaluating the impacts of the update on the Company’s financial position and does not expect the requirements of the update to have a material impact on the Company’s financial position, results of operations or cash flows. Based on leases outstanding at December 31, 2016, we anticipate total assets and total liabilities will increase between $8,200,000 and $9,800,000 as the result of additional leases being recognized on our balance sheet. Decisions to repurchase, modify, or renew leases prior to the implementation date will impact the results of the Company’s final analysis.
In June 2016, the FASB issued accounting standards update 2016-13 Financial Instruments - Credit Losses, commonly referred to as “CECL”. The provisions of the update eliminate the probable initial recognition threshold under current GAAP which requires reserves to be based on an incurred loss methodology. Under CECL reserves required for financial assets measured at amortized cost will reflect an organization’s estimate of all expected credit losses over the contractual term of the financial asset and thereby require the use of reasonable and supportable forecasts to estimate future credit losses. Because CECL encompasses all financial assets carried at amortized cost, the requirement that reserves be established based on an organization’s reasonable and supportable estimate of expected credit losses extends to held to maturity (“HTM”) debt securities. Under the provisions of the update credit losses recognized on available for sale (“AFS”) debt securities will be presented as an allowance as opposed to a write-down. In addition, CECL will modify the accounting for purchased loans, with credit deterioration since origination, so that reserves are established at the date of acquisition for purchased loans. Under current GAAP a purchased loan’s contractual balance is adjusted to fair value through a credit discount and no reserve is recorded on the purchased loan upon acquisition. Since under CECL reserves will be established for purchased loans at the time of acquisition the accounting for purchased loans is made more comparable to the accounting for originated loans. Finally, increased disclosure requirements under CECL require organizations to present the currently required credit quality disclosures disaggregated by the year of origination or vintage. The FASB expects that the evaluation of underwriting standards and credit quality trends by financial statement users will be enhanced with the additional vintage disclosures. For public business entities that are SEC filers the amendments of the update will become effective beginning January 1, 2020. The Company has formed a cross-functional committee that is assessing our data and system needs. Management expects to recognize a one-time cumulative effect adjustment to the allowance for loan losses as of the first reporting period in which the new standard is effective, but cannot yet estimate the magnitude of the one-time adjustment or the overall impact of the new guidance on the Company’s financial position, results of operations or cash flows.
In August 2016, the FASB issued accounting standards update 2016-15, Statement of Cash Flows. This update addresses eight specific cash flow issues with the objective of reducing the existing diversity in practice of how certain cash receipts and cash payments are presented and classified in the statement of cash flows. The amendments in this update are effective for fiscal years and interim periods beginning after December 15, 2017; however early adoption is permitted. Management is currently in the process of evaluating the impact of the update on the Company’s statement of cash flows.
In January 2017, the FASB issued accounting standards update 2017-04, Simplifying the Test for Goodwill Impairment. The provisions of the update eliminate the existing second step of the goodwill impairment test which provides for the allocation of reporting unit fair value amongst existing assets and liabilities, with the net leftover amount representing the implied fair value of goodwill. In replacement of the existing goodwill impairment rule, the update will provide that impairment should be recognized as the excess if any of the reporting unit’s goodwill over the fair value of the reporting unit. Under the provisions of this update the amount of the impairment is limited to the carrying value of the reporting unit’s goodwill. For public business entities that are SEC filers the amendments of the update will become effective in fiscal years beginning after December 15, 2020.
(z)Reclassifications
Certain reclassifications of prior year balances have been made to conform to the current year presentation. These reclassifications had no impact on the Company’s consolidated financial position, results of operations or cash flows.
GUARANTY BANCORP AND SUBSIDIARIES
Notes to Consolidated Financial Statements
Table of Contents
(3)Business Combination
On March 16, 2016, the Company entered into an Agreement and Plan of Reorganization (the “Merger Agreement”) with Home State, parent company of Home State Bank, a Colorado state chartered bank headquartered in Loveland, Colorado whereby Home State would merge into the Company. The transaction closed on September 8, 2016 with an aggregate transaction value of $152,478,000. The Merger Agreement provided that, subject to certain conditions, Home State shareholders would receive 6,533,756 shares of Company voting common stock valued at $117,477,000 based on the Company’s closing stock price on September 8, 2016 of $17.98, in addition to $35,001,000 in cash.
The transaction enhances the Company’s balance sheet liquidity and supported the Company’s objective of serving the banking needs of northern Colorado business and consumer customers.
Home State’s results of operations have been included in the Company’s results of operations beginning September 9, 2016; however, it is impractical to provide separate information on Home State’s revenues and income subsequent to September 8, 2016 due to changes in the consolidated balance sheet. Pre-tax merger expenses of $6,259,000 were included in the Company’s results of operations for the year ended December 31, 2016. The pre-tax merger expenses incurred during 2016 consisted of $1,915,000 in salaries and employee benefits expense and $4,344,000 in other general and administrative expense. In addition to merger-related costs recognized as expense, the Company incurred debt-issuance and stock-issuance costs of $830,000 and $834,000, respectively, during the year ended December 31, 2016. Debt-issuance costs were recorded as a reduction to subordinated debentures and stock-issuance costs were recorded as a reduction to additional paid in capital on the Company’s balance sheet.
Goodwill of $56,404,000 was recognized in the transaction and represents expected synergies and cost savings resulting from combining the operations of Home State with those of the Company. Due to the tax-free structure of the transaction, the recognized goodwill was not deductible for tax purposes. The fair values of assets acquired and liabilities assumed at acquisition were subjected to limited measurement period adjustments in the fourth quarter 2016 as a result of receipt of final valuations, with the net impact of these changes offset by a $256,000 increase in goodwill. These adjustments included changes in the acquired fair value of investments, premises and equipment, other assets and liabilities, and the related impact to deferred income taxes. Impacts to income and expense recognized in the fourth quarter 2016 related to adjustments to the fair value of acquired assets and liabilities were not material.
The following table summarizes the estimated fair values of the assets acquired and liabilities assumed in the September 8, 2016 transaction with Home State, and reflects all adjustments made to the fair value of the opening balance sheet through December 31, 2016:
| | |
| | |
Assets acquired: | | |
| | (In thousands) |
Cash and cash equivalents | $ | 11,849 |
Time deposits with banks | | 504 |
Securities available-for-sale | | 396,450 |
Securities held-to-maturity | | 850 |
Bank stocks | | 1,477 |
Net Loans | | 445,529 |
Premises and equipment, net | | 22,950 |
Other real estate owned | | 45 |
Goodwill | | 56,404 |
Other intangible assets, net | | 11,701 |
Other assets | | 8,118 |
Total assets acquired | | 955,877 |
| | |
Liabilities assumed: | | |
Deposits | | 769,709 |
Securities sold under agreement to repurchase and federal funds purchased | | 19,985 |
Federal Home Loan Bank term notes | | 2,525 |
Federal Home Loan Bank line of credit borrowing | | 2,052 |
Other liabilities | | 9,128 |
Total liabilities assumed | | 803,399 |
Net Assets Acquired | $ | 152,478 |
GUARANTY BANCORP AND SUBSIDIARIES
Notes to Consolidated Financial Statements
Table of Contents
The fair value of net assets acquired includes fair value adjustments to certain loans that were considered impaired as of the acquisition date. The fair value adjustments were determined using discounted expected cash flows. Acquired loans that evidence credit deterioration since origination, for which the acquirer does not expect to collect all contractual cash flows are designated as PCI upon acquisition. The gross contractual amount of loans identified as PCI as of the acquisition date totaled $2,834,000, contractual cash flows not expected to be collected as of acquisition date on these PCI loans totaled $531,000, representing 18.7% of their contractual balance. Additionally, PCI loans had an interest rate fair value adjustment of $195,000 bringing the net fair value to $2,108,000 as of September 8, 2016. Cash flows on PCI loans cannot be reliably estimated and as a result these loans have been designated as nonaccrual. Loans that were not designated PCI at acquisition had a fair value of $443,421,000 and a contractual balance of $458,014,000 as of September 8, 2016. The credit component of the fair value adjustment on non-PCI loans as of acquisition totaled $8,358,000, representing 1.8% of their contractual balances. No allowance for loan losses related to acquired loans was brought over as a result of the Home State transaction.
The composition of Home State’s portfolio as of September 8, 2016 is detailed in the table below:
| | |
| | September 8, |
| | 2016 |
| | (In thousands) |
Commercial and residential real estate | $ | 294,069 |
Construction | | 39,947 |
Commercial | | 45,996 |
Agricultural | | 7,906 |
Consumer | | 16,460 |
SBA | | 25,227 |
Other | | 15,924 |
Total gross loans | | 445,529 |
The following tables present unaudited pro-forma financial information as if the transaction occurred as of January 1, 2015. The unaudited pro-forma information includes adjustments for interest income on loans and securities acquired, amortization of intangibles arising from the transaction and the related tax effects. The unaudited pro forma financial information has been adjusted to exclude one-time expenses related to the transaction. The pro forma financial information is not necessarily indicative of the results of operations that would have occurred had the transactions been effected on January 1, 2015.
| | | | | |
| | | | | |
| | Year Ended December 31, |
UNAUDITED | | 2016 | | | 2015 |
| | (Dollars in thousands, except per share data) |
| | | | | |
Net interest income | $ | 111,642 | | $ | 107,911 |
Noninterest income | | 25,558 | | | 24,132 |
Net income | | 35,106 | | | 31,330 |
| | | | | |
Earnings per common share-basic: | $ | 1.26 | | $ | 1.14 |
Earnings per common share-diluted: | $ | 1.25 | | $ | 1.13 |
Unaudited pro forma net income for 2016 excludes $6,259,000 in merger-related expenses incurred by the Company and $3,353,000 in merger-related expenses incurred by Home State during the year ended December 31, 2016. These expenses were excluded since they were nonrecurring in nature and directly attributable to the transaction. For the year ended December 31, 2015, no merger-related expense adjustments were made to pro forma income. Adjustment of net interest income and noninterest income for nonrecurring income or expense directly related to the acquisition was not necessary for the years ending December 31, 2016 and December 31, 2015.
GUARANTY BANCORP AND SUBSIDIARIES
Notes to Consolidated Financial Statements
Table of Contents
(4)Securities
The fair value of available for sale debt securities and the related gross unrealized gains and losses recognized in accumulated other comprehensive income (loss)(“AOCI”) were as follows as of the dates presented:
| | | | | | | | |
| | | | | | | | |
| December 31, 2016 |
| | Fair
Value | | Gross
Unrealized
Gains | | Gross
Unrealized
Losses | | Amortized
Cost |
| | (In thousands) |
Securities available for sale: | | | | | | | | |
State and municipal | $ | 81,608 | $ | 91 | $ | (2,542) | $ | 84,059 |
Mortgage-backed - agency / residential | | 129,832 | | 347 | | (3,117) | | 132,602 |
Mortgage-backed - private / residential | | 265 | | - | | (6) | | 271 |
Corporate | | 86,246 | | 288 | | (1,357) | | 87,315 |
Collateralized loan obligations | | 26,277 | | 50 | | (66) | | 26,293 |
Total securities available for sale | $ | 324,228 | $ | 776 | $ | (7,088) | $ | 330,540 |
| | | | | | | | |
| | | | | | | | |
| December 31, 2015 |
| | Fair
Value | | Gross
Unrealized
Gains | | Gross
Unrealized
Losses | | Amortized
Cost |
| | (In thousands) |
Securities available for sale: | | | | | | | | |
State and municipal | $ | 34,713 | $ | 20 | $ | - | $ | 34,693 |
Mortgage-backed - agency / residential | | 129,017 | | 1,081 | | (1,929) | | 129,865 |
Mortgage-backed - private / residential | | 274 | | - | | (10) | | 284 |
Trust preferred | | 17,806 | | 100 | | (2,294) | | 20,000 |
Corporate | | 65,291 | | 660 | | (389) | | 65,020 |
Collateralized loan obligations | | 8,330 | | - | | (148) | | 8,478 |
Total securities available for sale | $ | 255,431 | $ | 1,861 | $ | (4,770) | $ | 258,340 |
During the fourth quarter 2016, the Company reclassified, at fair value, approximately $63,432,000 in available for sale municipal bonds, asset-backed securities and mortgage backed securities to the held to maturity category, primarily to limit future volatility in equity due to potential increases in interest rates. The related unrealized pre-tax losses of approximately $828,000 remained in accumulated other comprehensive income (loss) and will be accreted over the remaining life of the securities, offsetting the related accretion of discount on the transferred securities. No gains or losses were recognized at the time of reclassification.
During the first quarter 2015, the Company reclassified, at fair value, approximately $49,084,000 in available for sale mortgage-backed, asset-backed and municipal securities to the held to maturity category, primarily to limit future volatility in equity due to potential increases in interest rates. The related unrealized pre-tax losses of approximately $750,000 remained in accumulated other comprehensive income (loss) and will continue to be accreted over the remaining life of the securities. No gains or losses were recognized at the time of reclassification.
GUARANTY BANCORP AND SUBSIDIARIES
Notes to Consolidated Financial Statements
Table of Contents
The carrying amount, unrecognized gains/losses and fair value of securities held to maturity were as follows as of the dates presented:
| | | | | | | | |
| | | | | | | | |
|
| | Fair
Value | | Gross
Unrecognized
Gains | | Gross
Unrecognized
Losses | | Amortized
Cost |
| | (In thousands) |
December 31, 2016: | | | | | | | | |
State and municipal | $ | 118,734 | $ | 745 | $ | (3,120) | $ | 121,109 |
Mortgage-backed - agency / residential | | 100,565 | | 507 | | (2,590) | | 102,648 |
Asset-backed | | 18,905 | | 9 | | (126) | | 19,022 |
Other | | 1,200 | | - | | - | | 1,200 |
| $ | 239,404 | $ | 1,261 | $ | (5,836) | $ | 243,979 |
| | | | | | | | |
December 31, 2015: | | | | | | | | |
State and municipal | $ | 55,812 | $ | 1,349 | $ | (390) | $ | 54,853 |
Mortgage-backed - agency / residential | | 74,692 | | 767 | | (611) | | 74,536 |
Asset-backed | | 19,618 | | 273 | | (27) | | 19,372 |
| $ | 150,122 | $ | 2,389 | $ | (1,028) | $ | 148,761 |
The proceeds from sales and calls of securities and the associated gains are listed below:
| | | | | | |
| | | | | | |
| | Year Ended December 31, |
| | 2016 | | 2015 | | 2014 |
| | | | | | |
| | (In thousands) | | |
Proceeds | $ | 370,111 | $ | 27,985 | $ | 11,570 |
Gross gains | | 2,486 | | 217 | | 45 |
Gross losses | | (2,608) | | (85) | | (17) |
Net tax (benefit) expense related to | | | | | | |
gains (losses) on sale | | (46) | | 50 | | 11 |
GUARANTY BANCORP AND SUBSIDIARIES
Notes to Consolidated Financial Statements
Table of Contents
The amortized cost and estimated fair value of available for sale and held to maturity debt securities by contractual maturity at December 31, 2016 are shown below. Expected maturities will differ from contractual maturities because borrowers may have the right to prepay obligations with or without prepayment penalties. Securities not due at a single maturity date are presented separately.
| | | | |
| | | | |
| | Available for Sale |
December 31, 2016 | | Fair Value | | Amortized Cost |
| | (In thousands) |
Securities available for sale: | | | | |
Due in one year or less | $ | 4,744 | $ | 4,728 |
Due after one year through five years | | 20,596 | | 20,500 |
Due after five years through ten years | | 77,781 | | 80,158 |
Due after ten years | | 64,733 | | 65,988 |
Total AFS, excluding mortgage-backed (MBS) | | | | |
and collateralized loan obligations | | 167,854 | | 171,374 |
Mortgage-backed and collateralized | | | | |
loan obligations | | 156,374 | | 159,166 |
Total securities available for sale | $ | 324,228 | $ | 330,540 |
| | | | |
| | | | |
| | Held to Maturity |
December 31, 2016 | | Fair Value | | Amortized Cost |
| | (In thousands) |
Securities held to maturity: | | | | |
Due in one year or less | $ | 340 | $ | 340 |
Due after one year through five years | | 7,386 | | 7,375 |
Due after five years through ten years | | 73,152 | | 75,256 |
Due after ten years | | 39,056 | | 39,338 |
Total HTM, excluding MBS and asset-backed | | 119,934 | | 122,309 |
Mortgage-backed and asset-backed | | 119,470 | | 121,670 |
Total securities held to maturity | $ | 239,404 | $ | 243,979 |
Securities with carrying values of $237,036,000 and $168,723,000 were pledged at December 31, 2016 and 2015, respectively, as collateral for various lines of credit, public deposits and for other purposes as required or permitted by law. Fluctuations in the fair value of these securities, and/or the fluctuation in public deposits or customer repurchase agreement balances, may result in the need to pledge additional securities against these borrowings. Management monitors the Bank’s collateral position with respect to public deposits and repurchase agreement borrowings on a daily basis. At December 31, 2016, approximately $328,946,000 of securities were unpledged. At December 31, 2015, approximately $227,749,000 of securities were unpledged.
GUARANTY BANCORP AND SUBSIDIARIES
Notes to Consolidated Financial Statements
Table of Contents
The following table presents the fair value and the unrealized loss on securities that were temporarily impaired as of December 31, 2016, aggregated by major security type and length of time in a continuous unrealized loss position:
| | | | | | | | | | | | | | | | | |
| | | | | | | | | | | | | | | | | |
December 31, 2016 | | Less than 12 Months | | | 12 Months or More | | | Total |
| | Fair
Value | | | Unrealized
Losses | | | Fair
Value | | | Unrealized
Losses | | | Fair
Value | | | Unrealized
Losses |
| | | | | | | | | | | | | | | | | |
| | (In thousands) |
Description of securities: | | | | | | | | | | | | | | | | | |
Available for sale: | | | | | | | | | | | | | | | | | |
State and municipal | $ | 47,434 | | $ | (2,542) | | $ | - | | $ | - | | $ | 47,434 | | $ | (2,542) |
Mortgage-backed - agency / | | | | | | | | | | | | | | | | | |
residential | | 93,909 | | | (2,782) | | | 9,526 | | | (335) | | | 103,435 | | | (3,117) |
Mortgage-backed - private / | | | | | | | | | | | | | | | | | |
residential | | 265 | | | (6) | | | - | | | - | | | 265 | | | (6) |
Corporate | | 49,964 | | | (1,042) | | | 5,685 | | | (315) | | | 55,649 | | | (1,357) |
Collateralized loan obligations | | 9,077 | | | (17) | | | 5,488 | | | (49) | | | 14,565 | | | (66) |
| | | | | | | | | | | | | | | | | |
Held to maturity: | | | | | | | | | | | | | | | | | |
State and municipal | | 90,959 | | | (3,804) | | | 596 | | | (259) | | | 91,555 | | | (4,063) |
Mortgage-backed - agency / | | | | | | | | | | | | | | | | | |
residential | | 99,920 | | | (3,442) | | | - | | | - | | | 99,920 | | | (3,442) |
Asset-backed | | 15,690 | | | (542) | | | 3,216 | | | (98) | | | 18,906 | | | (640) |
Total temporarily impaired | $ | 407,218 | | $ | (14,177) | | $ | 24,511 | | $ | (1,056) | | $ | 431,729 | | $ | (15,233) |
The table above presents unrealized losses on held to maturity securities since the date of the securities purchase, independent of the impact associated with changes in cost basis upon transfer from available for sale to held to maturity.
In determining whether or not there is an OTTI for a security, management considers many factors, including: (i) the length of time for which and the extent to which the security’s fair value has been less than cost, (ii) the financial condition and near-term prospects of the security’s issuer, (iii) whether the decline in the security’s value was affected by macroeconomic conditions, and (iv) whether the Company intends to sell the security and whether it is more likely than not that the Company will be required to sell the security before a recovery in its fair value. The assessment of whether an OTTI exists involves a high degree of subjectivity and judgment and is based on the information available to management at a particular point in time. There were no accumulated credit losses on any of the Company’s securities as of December 31, 2016.
At December 31, 2016, there were 271 individual securities in an unrealized loss position, including 10 individual securities that had been in a continuous unrealized loss position for 12 months or longer. Management has evaluated these securities in addition to the remaining 261 securities in an unrealized loss position and has determined that the decline in value since their purchase dates was primarily attributable to fluctuations in market interest rates and does not reflect a decline in the underlying issuers’ ability to repay. Management determined that the decrease in the number of securities in an unrealized loss position in excess of 12 months from 43 securities at December 31, 2015 to 10 securities at December 31, 2016 was primarily attributable to the repositioning of the Company’s investment portfolio following the Home State transaction in addition to the timing of interest rate fluctuations. The total number of securities in an unrealized loss position increased from 88 individual securities at December 31, 2015 to 271 securities at December 31, 2016. At December 31, 2016 the Company did not intend to sell, and did not consider it likely that it would be required to sell, any of these securities prior to recovery in their fair value.
The Company’s unrated and rated municipal bond securities, along with the Company’s other rated investment securities, are subject to an annual internal review process that management has historically performed in the fourth quarter. The review process includes a review of the securities’ issuers’ most recent financial statements, including an evaluation of the expected sufficiency of the issuers’ cash flows relative to their debt service requirements. In addition, management considers any interim information reasonably made available to it that would prompt the need for more frequent review. At December 31, 2016 and December 31, 2015, the Company’s unrated municipal bonds comprised approximately 5.0% and 13.8%, respectively, of the carrying value of the Company’s entire municipal bond portfolio.
GUARANTY BANCORP AND SUBSIDIARIES
Notes to Consolidated Financial Statements
Table of Contents
The following table presents the fair value and the unrealized loss on securities that were temporarily impaired as of December 31, 2015, aggregated by major security type and length of time in a continuous unrealized loss position:
| | | | | | | | | | | | | | | | | |
| | | | | | | | | | | | | | | | | |
December 31, 2015 | | Less than 12 Months | | | 12 Months or More | | | Total |
| | Fair
Value | | | Unrealized
Losses | | | Fair
Value | | | Unrealized
Losses | | | Fair
Value | | | Unrealized
Losses |
| | | | | | | | | | | | | | | | | |
| | (In thousands) |
Description of securities: | | | | | | | | | | | | | | | | | |
Available for sale: | | | | | | | | | | | | | | | | | |
Mortgage-backed - agency / | | | | | | | | | | | | | | | | | |
residential | $ | 56,204 | | $ | (800) | | $ | 31,755 | | $ | (1,129) | | $ | 87,959 | | $ | (1,929) |
Mortgage-backed - private / | | | | | | | | | | | | | | | | | |
residential | | 274 | | | (10) | | | - | | | - | | | 274 | | | (10) |
Trust preferred | | - | | | - | | | 7,706 | | | (2,294) | | | 7,706 | | | (2,294) |
Corporate | | 27,176 | | | (389) | | | - | | | - | | | 27,176 | | | (389) |
Collateralized loan obligations | | 8,330 | | | (148) | | | - | | | - | | | 8,330 | | | (148) |
| | | | | | | | | | | | | | | | | |
Held to maturity: | | | | | | | | | | | | | | | | | |
State and municipal | | 6,726 | | | (351) | | | 10,056 | | | (102) | | | 16,782 | | | (453) |
Mortgage-backed - agency / | | | | | | | | | | | | | | | | | |
residential | | 39,280 | | | (781) | | | 25,838 | | | (820) | | | 65,118 | | | (1,601) |
Asset-backed | | - | | | - | | | 19,618 | | | (438) | | | 19,618 | | | (438) |
Total temporarily impaired | $ | 137,990 | | $ | (2,479) | | $ | 94,973 | | $ | (4,783) | | $ | 232,963 | | $ | (7,262) |
At December 31, 2015, there were 88 individual securities in an unrealized loss position, including 43 individual securities that had been in a continuous unrealized loss position for 12 months or longer. Management evaluated these securities in addition to the remaining 45 securities in an unrealized loss position and determined that the decline in value since their purchase dates was primarily attributable to fluctuations in market interest rates and did not reflect a decline in the underlying issuers’ ability to repay. At December 31, 2015 the Company did not intend to sell, and did not consider it likely that it would be required to sell, any of these securities prior to recovery in their fair value.
(5)Bank Stocks
The Bank is a member of both the Federal Reserve Bank of Kansas City and the Federal Home Loan Bank of Topeka and is required to maintain an investment in the capital stock of each. The Federal Reserve, Federal Home Loan Bank and other bank stock are restricted in that they can only be redeemed by the issuer at par value. The Company’s investments in these instruments at December 31, 2016 and December 31, 2015 were as follows:
| | | | | |
| | | | | |
| | 2016 | | | 2015 |
| | | | | |
| | (In thousands) |
Federal Reserve Bank of Kansas City | $ | 12,104 | | $ | 7,104 |
Federal Home Loan Bank of Topeka | | 8,895 | | | 12,638 |
Other bank stocks securities | | 1,650 | | | 758 |
Totals | $ | 22,649 | | $ | 20,500 |
GUARANTY BANCORP AND SUBSIDIARIES
Notes to Consolidated Financial Statements
Table of Contents
(6)Loans
A summary of loans held for investment by loan type is included in the following table:
| | | | | |
| | | | | |
| | December 31, | | | December 31, |
| | 2016 | | | 2015 |
| | | | | |
| | (In thousands) |
Commercial and residential real estate | $ | 1,768,424 | | $ | 1,281,701 |
Construction | | 88,451 | | | 107,170 |
Commercial | | 432,083 | | | 323,552 |
Agricultural | | 16,690 | | | 9,294 |
Consumer | | 125,264 | | | 66,288 |
SBA | | 52,380 | | | 25,645 |
Other | | 31,778 | | | 631 |
Total gross loans | | 2,515,070 | | | 1,814,281 |
Deferred (fees) and costs | | (61) | | | 255 |
Loans, held for investment, net | | 2,515,009 | | | 1,814,536 |
Less allowance for loan losses | | (23,250) | | | (23,000) |
Net loans, held for investment | $ | 2,491,759 | | $ | 1,791,536 |
During 2016, excluding the Home State transaction, the Company purchased $109,519,000 in performing loans, included in our Real Estate and Consumer portfolios. In comparison, during 2015 the Company purchased $50,111,000 in performing loans included in our Real Estate portfolio segment.
Activity in the allowance for loan losses for the periods indicated is as follows:
| | | | | | | | |
| | | | | | | | |
| | Year Ended December 31, |
| | 2016 | | | 2015 | | | 2014 |
| | | | | | | | |
| | | | | | | | |
Balance, beginning of period | $ | 23,000 | | $ | 22,490 | | $ | 21,005 |
Provision for loan losses | | 143 | | | 96 | | | 14 |
Loans charged-off | | (721) | | | (238) | | | (623) |
Recoveries on loans previously | | | | | | | | |
charged-off | | 828 | | | 652 | | | 2,094 |
Balance, end of period | $ | 23,250 | | $ | 23,000 | | $ | 22,490 |
The Company’s additional disclosures relating to loans and the allowance for loan losses are broken out into two subsets, portfolio segment and class. The portfolio segment level is defined as the level where financing receivables are aggregated in developing the Company’s systematic method for calculating its allowance for loan losses. The class level is the second level at which credit information is presented and represents the categorization of financing related receivables at a slightly less aggregated level than the portfolio segment level. Because data presented according to class is dependent upon the underlying purpose of the loan, whereas loan data organized by portfolio segment is determined by the loan’s underlying collateral, disclosures broken out by portfolio segment versus class may not be in agreement. The disclosures in this footnote include both Non-PCI and PCI loans. As of December 31, 2016 PCI loans acquired in the Home State transaction are not considered material and as a result separate PCI disclosures are not included.
GUARANTY BANCORP AND SUBSIDIARIES
Notes to Consolidated Financial Statements
Table of Contents
The following tables provide detail for the ending balances in the Company’s allowance for loan losses and loans held for investment, broken down by portfolio segment as of December 31, 2016 and December 31, 2015. In addition, the table also provides a rollforward by portfolio segment of the allowance for loan losses for the years ended December 31, 2016, December 31, 2015 and December 31, 2014. The detail provided for the amount of the allowance for loan losses and loans individually versus collectively evaluated for impairment (i.e., the specific component versus the general component of the allowance for loan losses) corresponds to the Company’s systematic methodology for estimating its allowance for loan losses.
| | | | | | | | | | | |
| | | | | | | | | | | |
| | Real Estate | | | Consumer and
Installment | | | Commercial
and Other | | | Total |
| | (In thousands) |
Allowance for Loan Losses | | | | | | | | | | | |
Balance as of January 1, 2014 | $ | 18,475 | | $ | 52 | | $ | 2,478 | | $ | 21,005 |
Charge-offs | | (23) | | | (38) | | | (562) | | | (623) |
Recoveries | | 1,734 | | | 27 | | | 333 | | | 2,094 |
Provision (credit) | | (579) | | | (2) | | | 595 | | | 14 |
Balance as of December 31, 2014 | $ | 19,607 | | $ | 39 | | $ | 2,844 | | $ | 22,490 |
| | | | | | | | | | | |
Balance as of December 31, 2014 | $ | 19,607 | | $ | 39 | | $ | 2,844 | | $ | 22,490 |
Charge-offs | | (21) | | | (12) | | | (205) | | | (238) |
Recoveries | | 284 | | | 29 | | | 339 | | | 652 |
Provision (credit) | | 436 | | | 15 | | | (355) | | | 96 |
Balance as of December 31, 2015 | $ | 20,306 | | $ | 71 | | $ | 2,623 | | $ | 23,000 |
| | | | | | | | | | | |
Balance as of December 31, 2015 | $ | 20,306 | | $ | 71 | | $ | 2,623 | | $ | 23,000 |
Charge-offs | | (217) | | | (51) | | | (453) | | | (721) |
Recoveries | | 340 | | | 14 | | | 474 | | | 828 |
Provision (credit) | | (347) | | | 71 | | | 419 | | | 143 |
Balance as of December 31, 2016 | $ | 20,082 | | $ | 105 | | $ | 3,063 | | $ | 23,250 |
| | | | | | | | | | | |
| | | | | | | | | | | |
| | | | | | | | | | | |
| | | | | | | | | | | |
Balances at December 31, 2016: | | | | | | | | | |
| | | | | | | | | | | |
Allowance for Loan Losses | | | | | | | | | | | |
Individually evaluated | $ | 29 | | $ | - | | $ | 193 | | $ | 222 |
Collectively evaluated | | 20,053 | | | 105 | | | 2,870 | | | 23,028 |
Total | $ | 20,082 | | $ | 105 | | $ | 3,063 | | $ | 23,250 |
| | | | | | | | | | | |
Loans | | | | | | | | | | | |
Individually evaluated | $ | 22,728 | | $ | 2 | | $ | 7,645 | | $ | 30,375 |
Collectively evaluated | | 2,024,524 | | | 55,182 | | | 404,928 | | | 2,484,634 |
Total | $ | 2,047,252 | | $ | 55,184 | | $ | 412,573 | | $ | 2,515,009 |
| | | | | | | | | | | |
| | | | | | | | | | | |
Balances at December 31, 2015: | | | | | | | | | |
| | | | | | | | | | | |
Allowance for Loan Losses | | | | | | | | | | | |
Individually evaluated | $ | 282 | | $ | - | | $ | 11 | | $ | 293 |
Collectively evaluated | | 20,024 | | | 71 | | | 2,612 | | | 22,707 |
Total | $ | 20,306 | | $ | 71 | | $ | 2,623 | | $ | 23,000 |
| | | | | | | | | | | |
Loans | | | | | | | | | | | |
Individually evaluated | $ | 23,846 | | $ | 2 | | $ | 2,305 | | $ | 26,153 |
Collectively evaluated | | 1,489,211 | | | 5,716 | | | 293,456 | | | 1,788,383 |
Total | $ | 1,513,057 | | $ | 5,718 | | $ | 295,761 | | $ | 1,814,536 |
GUARANTY BANCORP AND SUBSIDIARIES
Notes to Consolidated Financial Statements
Table of Contents
The following tables provide additional detail with respect to impaired loans broken out according to class as of the dates indicated. The recorded investment included in the following table represents customer balances net of any partial charge-offs recognized on the loans, net of any deferred fees and costs. The unpaid balance represents the recorded balance prior to any partial charge-offs. Interest income recognized may exclude an immaterial amount of interest income on matured loans that are 90 days or more past due, but that are in the process of being renewed and thus are still accruing.
| | | | | | | | | | | | | | |
| | | | | | | | | | | | | | |
December 31, 2016 | | Recorded
Investment | | | Unpaid
Balance | | | Related
Allowance | | | Average
Recorded
Investment
YTD | | | Interest
Income
Recognized
YTD |
| | (In thousands) |
Impaired loans with no related allowance: | | | | | | | | | | | | | | |
Commercial and residential real estate | $ | 20,477 | | $ | 21,140 | | $ | - | | $ | 13,875 | | $ | 1,911 |
Construction | | - | | | - | | | - | | | 592 | | | - |
Commercial | | 222 | | | 229 | | | - | | | 243 | | | 16 |
Consumer | | 18 | | | 19 | | | - | | | 117 | | | 2 |
Other | | 817 | | | 1,625 | | | - | | | 493 | | | - |
Total | $ | 21,534 | | $ | 23,013 | | $ | - | | $ | 15,320 | | $ | 1,929 |
| | | | | | | | | | | | | | |
Impaired loans with a related allowance: | | | | | | | | | | | | | | |
Commercial and residential real estate | $ | 1,767 | | $ | 1,890 | | $ | 19 | | $ | 8,590 | | $ | 44 |
Construction | | - | | | - | | | - | | | - | | | - |
Commercial | | 6,371 | | | 6,423 | | | 155 | | | 2,937 | | | 309 |
Consumer | | 306 | | | 383 | | | 9 | | | 389 | | | 9 |
Other | | 397 | | | 444 | | | 39 | | | 348 | | | - |
Total | $ | 8,841 | | $ | 9,140 | | $ | 222 | | $ | 12,264 | | $ | 362 |
| | | | | | | | | | | | | | |
Total impaired loans: | | | | | | | | | | | | | | |
Commercial and residential real estate | $ | 22,244 | | $ | 23,030 | | $ | 19 | | $ | 22,465 | | $ | 1,955 |
Construction | | - | | | - | | | - | | | 592 | | | - |
Commercial | | 6,593 | | | 6,652 | | | 155 | | | 3,180 | | | 325 |
Consumer | | 324 | | | 402 | | | 9 | | | 506 | | | 11 |
Other | | 1,214 | | | 2,069 | | | 39 | | | 841 | | | - |
Total impaired loans | $ | 30,375 | | $ | 32,153 | | $ | 222 | | $ | 27,584 | | $ | 2,291 |
GUARANTY BANCORP AND SUBSIDIARIES
Notes to Consolidated Financial Statements
Table of Contents
| | | | | | | | | | | | | | |
| | | | | | | | | | | | | | |
December 31, 2015 | | Recorded
Investment | | | Unpaid
Balance | | | Related
Allowance | | | Average
Recorded
Investment
YTD | | | Interest
Income
Recognized
YTD |
| | (In thousands) |
Impaired loans with no related allowance: | | | | | | | | | | | | | | |
Commercial and residential real estate | $ | 12,756 | | $ | 14,472 | | $ | - | | $ | 14,194 | | $ | 242 |
Construction | | 986 | | | 986 | | | - | | | 789 | | | - |
Commercial | | - | | | - | | | - | | | 19 | | | - |
Consumer | | 271 | | | 310 | | | - | | | 307 | | | 5 |
Other | | 250 | | | 588 | | | - | | | 171 | | | - |
Total | $ | 14,263 | | $ | 16,356 | | $ | - | | $ | 15,480 | | $ | 247 |
| | | | | | | | | | | | | | |
Impaired loans with a related allowance: | | | | | | | | | | | | | | |
Commercial and residential real estate | $ | 10,232 | | $ | 10,472 | | $ | 268 | | $ | 9,989 | | $ | 388 |
Construction | | - | | | - | | | - | | | - | | | - |
Commercial | | 1,204 | | | 1,220 | | | 11 | | | 492 | | | 18 |
Consumer | | 454 | | | 529 | | | 14 | | | 493 | | | 13 |
Other | | - | | | - | | | - | | | - | | | - |
Total | $ | 11,890 | | $ | 12,221 | | $ | 293 | | $ | 10,974 | | $ | 419 |
| | | | | | | | | | | | | | |
Total impaired loans: | | | | | | | | | | | | | | |
Commercial and residential real estate | $ | 22,988 | | $ | 24,944 | | $ | 268 | | $ | 24,183 | | $ | 630 |
Construction | | 986 | | | 986 | | | - | | | 789 | | | - |
Commercial | | 1,204 | | | 1,220 | | | 11 | | | 511 | | | 18 |
Consumer | | 725 | | | 839 | | | 14 | | | 800 | | | 18 |
Other | | 250 | | | 588 | | | - | | | 171 | | | - |
Total impaired loans | $ | 26,153 | | $ | 28,577 | | $ | 293 | | $ | 26,454 | | $ | 666 |
The following tables summarize by class loans classified as past due in excess of 30 days or more in addition to those loans classified as nonaccrual:
| | | | | | | | | | |
| | | | | | | | | | |
December 31, 2016 | | 30-89
Days Past
Due | | 90 Days +
Past Due
and Still
Accruing | | Nonaccrual | | Total Nonaccrual and
Past Due | | Total Loans,
Held for
Investment |
| | (In thousands) |
Commercial and residential | | | | | | | | | | |
real estate | $ | 1,258 | $ | - | $ | 2,835 | $ | 4,093 | $ | 1,768,381 |
Construction | | - | | - | | - | | - | | 88,449 |
Commercial | | 37 | | - | | 1,094 | | 1,131 | | 432,072 |
Consumer | | 42 | | - | | 201 | | 243 | | 125,261 |
Other | | - | | - | | 1,117 | | 1,117 | | 100,846 |
Total | $ | 1,337 | $ | - | $ | 5,247 | $ | 6,584 | $ | 2,515,009 |
| | | | | | | | | | |
| | | | | | | | | | |
December 31, 2015 | | 30-89
Days Past
Due | | 90 Days +
Past Due
and Still
Accruing | | Nonaccrual | | Total Nonaccrual and
Past Due | | Total Loans,
Held for
Investment |
| | (In thousands) |
Commercial and residential | | | | | | | | | | |
real estate | $ | 653 | $ | - | $ | 11,905 | $ | 12,558 | $ | 1,281,881 |
Construction | | - | | - | | 986 | | 986 | | 107,185 |
Commercial | | 1,147 | | - | | 874 | | 2,021 | | 323,598 |
Consumer | | 291 | | - | | 459 | | 750 | | 66,297 |
Other | | - | | - | | 250 | | 250 | | 35,575 |
Total | $ | 2,091 | $ | - | $ | 14,474 | $ | 16,565 | $ | 1,814,536 |
If nonaccrual loans outstanding during 2016, 2015 and 2014 had been current in accordance with their original terms, $257,000, $586,000 and $657,000 would have been recorded in incremental gross interest income during
GUARANTY BANCORP AND SUBSIDIARIES
Notes to Consolidated Financial Statements
Table of Contents
2016, 2015 and 2014, respectively. The income recognized on nonaccrual loans prior to impairment during 2016, 2015 and 2014 was $163,000, $90,000 and $5,000 respectively. During 2016 and 2015 $332,000 and $118,000 of cash basis interest income was recognized on a nonaccrual loan that was moved to accruing status in the third quarter of 2016. With the exception of cash-basis interest income, the $2,291,000 and $666,000 in interest income recognized on impaired loans during 2016 and 2015 is primarily comprised of interest income recognized on performing TDRs.
The Company categorizes loans into risk categories based on relevant information about the ability of a particular borrower to service its debt, such as: current financial information, historical payment experience, credit documentation, public information, and current economic trends, among other factors. The Company uses the following definitions for risk ratings, which are consistent with the definitions used in supervisory guidance:
Substandard. Loans classified as substandard are inadequately protected by the current net worth and paying capacity of the obligor or of the collateral, if any, pledged to secure the loan. Loans so classified have a well-defined weakness or weaknesses that jeopardize the collection of the debt. They are characterized by the distinct possibility that the Company will sustain some loss if the deficiencies are not corrected.
Doubtful. Loans classified as doubtful have all the weaknesses inherent in those classified as substandard, with the added characteristic that the weaknesses make collection or liquidation in full, on the basis of currently existing facts, conditions, and values, highly questionable and improbable.
Loans not meeting the criteria above are considered to be non-classified loans.
The following tables provide detail for the risk categories of loans by class of loans based on the most recent credit analysis performed as of the dates indicated:
| | | | | | | | | | | | |
| | | | | | | | | | | | |
December 31, 2016 | | Commercial
& Residential
Real Estate | | Construction | | Commercial | | Consumer | | Other | | Total |
| | (In thousands) |
Non-classified | $ | 1,742,974 | $ | 88,451 | $ | 427,278 | $ | 124,932 | $ | 98,561 | $ | 2,482,196 |
Substandard | | 25,450 | | - | | 4,805 | | 332 | | 2,287 | | 32,874 |
Doubtful | | - | | - | | - | | - | | - | | - |
Subtotal | | 1,768,424 | | 88,451 | | 432,083 | | 125,264 | | 100,848 | | 2,515,070 |
Deferred fees and costs | | (43) | | (2) | | (11) | | (3) | | (2) | | (61) |
Loans, held for investment, net | $ | 1,768,381 | $ | 88,449 | $ | 432,072 | $ | 125,261 | $ | 100,846 | $ | 2,515,009 |
| | | | | | | | | | | | |
| | | | | | | | | | | | |
December 31, 2015 | | Commercial
& Residential
Real Estate | | Construction | | Commercial | | Consumer | | Other | | Total |
| | (In thousands) |
Non-classified | $ | 1,260,134 | $ | 106,184 | $ | 322,650 | $ | 65,365 | $ | 34,194 | $ | 1,788,527 |
Substandard | | 21,567 | | 986 | | 902 | | 923 | | 1,376 | | 25,754 |
Doubtful | | - | | - | | - | | - | | - | | - |
Subtotal | | 1,281,701 | | 107,170 | | 323,552 | | 66,288 | | 35,570 | | 1,814,281 |
Deferred costs, net | | 180 | | 15 | | 46 | | 9 | | 5 | | 255 |
Loans, held for investment, net | $ | 1,281,881 | $ | 107,185 | $ | 323,598 | $ | 66,297 | $ | 35,575 | $ | 1,814,536 |
The book balance of TDRs at December 31, 2016 and December 31, 2015 was $25,219,000 and $22,391,000, respectively. Management established approximately $74,000 and $276,000 in specific reserves with respect to these loans as of December 31, 2016 and December 31, 2015. At December 31, 2016 the Company had an additional $2,238,000 committed on loans classified as troubled debt restructurings. At December 31, 2015, the Company had additional $953,000 committed on loans classified as troubled debt restructurings.
During the year ended December 31, 2016, the terms of 19 loans were modified in troubled debt restructurings. The modification of the terms of such loans included one or a combination of the following: the renewal of a loan with a stated interest rate below market, an extension of maturity or a restructure of payment terms. As a result of these modifications, the Company did not recognize any additional charge-offs during 2016.
GUARANTY BANCORP AND SUBSIDIARIES
Notes to Consolidated Financial Statements
Table of Contents
During the year ended December 31, 2015, the terms of five loans were modified in troubled debt restructurings. The modification of the terms of such loans included one or a combination of the following: the renewal of a loan with a stated interest rate below market, an extension of maturity or a restructure of payment terms. As a result of these modifications, the Company did not recognize any additional charge-offs during 2015.
The following tables present loans by class modified as troubled debt restructurings that occurred during the years indicated:
| | | | | | | |
| | | | | | | |
Year Ended December 31, 2016: | | | | | | |
Troubled Debt Restructurings | Number of
Loans | | | Pre-Modification
Outstanding Recorded
Investment | | | Post-Modification
Outstanding Recorded
Investment |
| | | | | | | |
| | | | (In thousands) |
Commercial and residential | | | | | | | |
real estate | 2 | | $ | 1,018 | | $ | 1,018 |
Construction | - | | | - | | | - |
Commercial | 16 | | | 6,650 | | | 6,650 |
Consumer | - | | | - | | | - |
Other | 1 | | | 97 | | | 97 |
Total | 19 | | $ | 7,765 | | $ | 7,765 |
| | | | | | | |
| | | | | | | |
Year Ended December 31, 2015: | | | | | | |
Troubled Debt Restructurings | Number of
Loans | | | Pre-Modification
Outstanding Recorded
Investment | | | Post-Modification
Outstanding Recorded
Investment |
| | | | | | | |
| | | | (In thousands) |
Commercial and residential | | | | | | | |
real estate | 1 | | $ | 715 | | $ | 715 |
Construction | - | | | - | | | - |
Commercial | 3 | | | 300 | | | 300 |
Consumer | 1 | | | 2 | | | 2 |
Other | - | | | - | | | - |
Total | 5 | | $ | 1,017 | | $ | 1,017 |
A TDR loan is considered to be in payment default once it is 90 days contractually past due under the modified terms. No TDRs defaulted during the year ended December 31, 2016. A single default occurred on a loan designated as a TDR during 2015 and no charge-offs were recognized as a result of the default.
(7)Premises and Equipment
A summary of the cost and accumulated depreciation and amortization of premises and equipment at December 31 is as follows:
| | | | | |
| | | | | |
| | 2016 | | | 2015 |
| | | | | |
| | (In thousands) |
Land | $ | 16,826 | | $ | 11,789 |
Buildings | | 58,637 | | | 45,568 |
Leasehold improvements | | 3,691 | | | 5,461 |
Equipment and Software | | 16,553 | | | 15,009 |
Leasehold interest in land | | 684 | | | 684 |
Subtotal | $ | 96,391 | | $ | 78,511 |
Accumulated depreciation and amortization | | (29,001) | | | (30,203) |
Total premises and equipment | $ | 67,390 | | $ | 48,308 |
GUARANTY BANCORP AND SUBSIDIARIES
Notes to Consolidated Financial Statements
Table of Contents
Depreciation expense for the years ended December 31, 2016, 2015 and 2014 was approximately $2,713,000, $2,747,000 and $2,563,000, respectively. Such amounts are classified in occupancy and furniture and equipment expense.
Operating Leases: Pursuant to the terms of non-cancelable lease agreements in effect at December 31, 2016 pertaining to banking premises, future minimum rent commitments under various operating leases are as follows (in thousands):
| | |
| | |
| | |
2017 | $ | 1,296 |
2018 | | 1,153 |
2019 | | 1,153 |
2020 | | 1,183 |
2021 | | 1,097 |
Thereafter | | 3,803 |
| $ | 9,685 |
Certain leases contain options to extend the lease terms for five to twenty-one years. The cost of such extensions is not included in the above rental commitments. Rent expense for the years ended December 31, 2016, 2015 and 2014 was $1,849,000, $2,213,000 and $2,345,000, respectively.
(8)Goodwill and Other Intangible Assets
The Company recognized $56,404,000 in goodwill as a result of the Home State transaction on September 8, 2016. Current estimates of the fair value of acquired assets and liabilities assumed remain subject to change, up to twelve months following the transaction if additional information becomes available impacting acquisition date fair values. Subsequent changes to estimates of acquisition date fair value will impact the amount recognized as goodwill.
Other intangible assets with finite lives are amortized over their respective estimated useful lives to their estimated residual values. As of December 31, 2016, the Company had intangible assets comprised of its core deposit intangible assets and customer relationship intangible assets.
The following table presents the gross amounts of core deposit intangible assets and customer relationship intangible assets and the related accumulated amortization at the dates indicated:
| | | | | | | |
| | | | | | | |
| | | | December 31, |
| Useful Life | | | 2016 | | | 2015 |
| | | | | | | |
| | | | (In thousands) |
Core deposit intangible assets | 10 - 15 years | | $ | 74,087 | | $ | 62,975 |
Core deposit intangible assets accumulated amortization | | | | (63,112) | | | (62,124) |
Core deposit intangible assets, net | | | $ | 10,975 | | $ | 851 |
| | | | | | | |
Customer relationship intangible assets | 10 years | | | 6,243 | | | 5,654 |
Customer relationship intangible assets accumulated amortization | | | | (1,901) | | | (1,332) |
Customer relationship intangible assets, net | | | $ | 4,342 | | $ | 4,322 |
| | | | | | | |
Total other intangible assets, net | | | $ | 15,317 | | $ | 5,173 |
GUARANTY BANCORP AND SUBSIDIARIES
Notes to Consolidated Financial Statements
Table of Contents
Amortization expense for the years ended December 31, 2016, 2015 and 2014 was $1,557,000, $1,981,000 and $2,506,000 respectively. Estimated amortization expense for the next five years, and thereafter, is as follows (in thousands):
| | |
| | |
| | Total |
Fiscal year ending: | | |
2017 | $ | 2,687 |
2018 | | 2,395 |
2019 | | 1,942 |
2020 | | 1,720 |
2021 | | 1,605 |
Thereafter | | 4,968 |
| $ | 15,317 |
(9)Deposits
The aggregate amount of time deposits in denominations of $250,000 or more at December 31, 2016 and December 31, 2015 was $56,018,000 and $30,194,000, respectively.
At December 31, 2016 and December 31, 2015, the Bank had $94,338,000 and $78,403,000, respectively, in brokered time deposits. Reciprocal time deposits at December 31, 2016 and December 31, 2015 were $1,206,000 and $1,202,000, respectively.
At December 31, 2016 the scheduled maturities of time deposits are as follows (amounts in thousands):
| | |
| | |
2017 | $ | 243,239 |
2018 | | 71,678 |
2019 | | 31,747 |
2020 | | 12,384 |
2021 | | 6,739 |
| $ | 365,787 |
(10)Securities Sold Under Agreements to Repurchase
The following is a summary of information pertaining to securities sold under agreement to repurchase at December 31:
| | | | | | | |
| | | | | | | |
| | 2016 | | | | 2015 | |
| | | | | | | |
| | (Dollars in thousands) | |
Ending Balance | $ | 36,948 | | | $ | 26,477 | |
Weighted-average interest rate at year-end | | 0.19 | % | | | 0.19 | % |
Securities sold under agreements to repurchase, which are classified as secured borrowings, generally mature within one to four days from the transaction date. Securities sold under agreements to repurchase are reflected at the amount of cash received in connection with the transaction. The Company may be required to provide additional collateral based on the fair value of the underlying security. The securities sold under agreements to repurchase are collateralized by government agency and mortgage-backed securities held by the Company, which had carrying values of $42,825,000 and $29,059,000 at December 31, 2016 and 2015, respectively.
GUARANTY BANCORP AND SUBSIDIARIES
Notes to Consolidated Financial Statements
Table of Contents
Information concerning securities sold under agreements to repurchase is summarized below:
| | | | | | | | | | | |
| | | | | | | | | | | |
| | Year Ended December 31, | |
| | 2016 | | | | 2015 | | | | 2014 | |
| | | | | | | | | | | |
| | (Dollars in thousands) | |
Average daily balance during the year | $ | 25,221 | | | $ | 24,531 | | | $ | 24,399 | |
Average interest rate during the year | | 0.21 | % | | | 0.18 | % | | | 0.16 | % |
Maximum month-end balance during the year | $ | 38,089 | | | $ | 31,977 | | | $ | 33,508 | |
(11)Federal Home Loan Bank Borrowings
A summary of borrowings is as follows:
| | | | | | |
| | | | | | |
| | Principal | Interest Rate | Maturity
Date | | Total
Committed |
| | (Dollars in thousands) |
December 31, 2016 | | | | | | |
Short-term borrowings: | | | | | | |
FHLB line of credit | $ | 124,691 | 0.72% | overnight | $ | 597,202 |
Total short-term borrowings | $ | 124,691 | | | | |
| | | | | | |
Long-term borrowings: | | | | | | |
FHLB term notes (fixed rate) | | 22,477 | Range: 2.52% - 6.38% | 2017 - 2018 | | See below |
FHLB term notes (variable rate) | | 25,000 | 1.15% | March 7, 2017 | | See below |
FHLB term notes (variable rate) | | 25,000 | 0.96% | August 4, 2017 | | See below |
Total long-term borrowings | $ | 72,477 | | | | |
| | | | | | |
Total borrowings | $ | 197,168 | | | | |
| | | | | | |
December 31, 2015 | | | | | | |
Short-term borrowings: | | | | | | |
FHLB line of credit | $ | 185,847 | 0.48% | overnight | $ | 454,748 |
Total short-term borrowings | $ | 185,847 | | | | |
| | | | | | |
Long-term borrowings: | | | | | | |
FHLB term notes (fixed rate) | | 70,000 | Range: 0.58% - 2.52% | 2016 - 2018 | | See below |
FHLB term notes (variable rate) | | 25,000 | 0.45% | August 5, 2016 | | See below |
Total long-term borrowings | $ | 95,000 | | | | |
| | | | | | |
Total borrowings | $ | 280,847 | | | | |
At December 31, 2016, the Company’s outstanding borrowings were $197,168,000 compared to $280,847,000 at December 31, 2015. These borrowings at December 31, 2016 consisted of $72,477,000 of term notes and $124,691,000 of advances on our line of credit, both with the Federal Home Loan Bank (the “FHLB”). At December 31, 2015, outstanding borrowings consisted of $95,000,000 of term notes and $185,847,000 of advances on our line of credit, both with the FHLB.
The interest rate on the line of credit varies with the federal funds rate, and was 0.72% at December 31, 2016. The Company has five term notes with the FHLB. Three of the term notes have fixed interest rates, the first a $20,000,000 term note at 2.52% that is payable at its maturity date of January 23, 2018, with a prepayment penalty if paid prior to maturity and is convertible to floating rate on predetermined conversion dates at the discretion of the FHLB. If the note is converted by the FHLB, the Bank has the option to prepay the note without penalty. If the note is not converted by the FHLB, the note continues to be convertible quarterly thereafter, with the option to convert to floating rate continuing to be at the discretion of the FHLB. The second fixed rate term note of $1,740,000 carries an interest rate of 5.63% and matures August 30, 2017. The third fixed rate term note of $669,000 carries an interest rate of 6.38% and matures April 10, 2017. As a result of the Home State transaction the Company recognized a premium on Home State borrowings at acquisition of $90,000; the premium had a balance of $68,000 as of December 31, 2016. Additionally, the Company also has two $25,000,000 variable rate term notes that mature on March 7, 2017 and August 4, 2017 and carry an interest rate that resets quarterly. As of December 31, 2016 the rates on our variable rate term notes were set at 1.15% and 0.96%.
GUARANTY BANCORP AND SUBSIDIARIES
Notes to Consolidated Financial Statements
Table of Contents
The Company has an advance, pledge and security agreement with the FHLB and had pledged qualifying loans and securities in the amount of $597,202,000 at December 31, 2016 and $454,748,000 at December 31, 2015. The maximum credit allowance for future borrowings, including term notes and advances on the line of credit, was $400,102,000 at December 31, 2016 and $173,901,000 at December 31, 2015.
Information concerning borrowings on the FHLB line of credit is summarized below:
| | | | | | | | | | | |
| | | | | | | | | | | |
| | Year Ended December 31, | |
| | 2016 | | | | 2015 | | | | 2014 | |
| | | | | | | | | | | |
| | (Dollars in thousands) | |
Average daily balance during the year | $ | 81,539 | | | $ | 130,152 | | | $ | 48,327 | |
Average interest rate during the year | | 0.55 | % | | | 0.28 | % | | | 0.23 | % |
Maximum month-end balance during the year | $ | 185,700 | | | $ | 212,065 | | | $ | 140,300 | |
(12)Income Taxes
The components of the income tax expense (benefit) are as follows:
| | | | | | |
| | | | | | |
| | Year Ended December 31, |
| | 2016 | | 2015 | | 2014 |
| | | | | | |
| | (In thousands) |
Current tax expense: | | | | | | |
Federal | $ | 11,921 | $ | 7,165 | $ | 4,116 |
State | | 427 | | - | | - |
Total current tax expense | | 12,348 | | 7,165 | | 4,116 |
Deferred tax expense | | | | | | |
Federal | | (1,026) | | 3,132 | | 1,678 |
State | | 666 | | 973 | | 442 |
Total deferred tax expense (benefit) | | (360) | | 4,105 | | 2,120 |
| | | | | | |
Total tax expense | $ | 11,988 | $ | 11,270 | $ | 6,236 |
Income tax expense attributable to the income from continuing operations differed from the amounts computed by applying the U.S. federal statutory tax rate to pretax income from operations as a result of the following:
| | | | | | | |
| | | | | | | |
| | Year Ended December 31, | |
| | 2016 | | 2015 | | 2014 | |
| | | | | | | |
Tax expense at statutory federal rate | | 35.0 | % | 35.0 | % | 35.0 | % |
State tax, net of federal benefit | | 2.7 | % | 2.8 | % | 2.6 | % |
Tax exempt income | | (5.1) | % | (4.4) | % | (6.6) | % |
Other | | 0.1 | % | - | % | 0.6 | % |
Effective tax rate | | 32.7 | % | 33.4 | % | 31.6 | % |
As of December 31, 2016 the Company maintained a current tax receivable of approximately $2,090,000 compared to current taxes receivable at December 31, 2015 of $1,770,000. The Company’s net deferred tax asset is included in other assets at December 31, 2016 and December 31, 2015.
GUARANTY BANCORP AND SUBSIDIARIES
Notes to Consolidated Financial Statements
Table of Contents
Deferred tax assets and liabilities result from the tax effects of temporary differences between the carrying amount of assets and liabilities for financial reporting purposes and the amounts used for income tax purposes at December 31, 2016 and December 31, 2015 are as follows:
| | | | |
| | | | |
| | 2016 | | 2015 |
| | | | |
| | (In thousands) |
Deferred tax assets: | | | | |
Allowance for loan losses | $ | 8,837 | $ | 8,742 |
Other real estate owned | | 93 | | 54 |
Other assets and accruals | | 1,522 | | 1,209 |
Unrealized loss on available for sale securities | | 2,399 | | 1,106 |
Unrealized loss on securities transferred to held to maturity | | 1,029 | | 906 |
Unrealized loss on cash flow hedges | | 696 | | 935 |
Net operating loss, AMT and other tax | | | | |
attribute carryforwards | | - | | 808 |
Intangible assets | | 848 | | 806 |
Fair value adjustments on loans and other assets | | 5,816 | | - |
Stock compensation and other | | 1,281 | | 1,237 |
Total deferred tax assets: | | 22,521 | | 15,803 |
| | | | |
Deferred tax liabilities: | | | | |
Premises and equipment | | 8,321 | | 4,451 |
Unrealized gain on acquired securities | | 1,726 | | - |
Core deposit intangibles | | 4,394 | | 323 |
Deferred loan costs | | 1,724 | | 1,527 |
FHLB stock, prepaid assets, equity | | | | |
investments and other liabilities | | 1,510 | | 1,590 |
Total deferred tax liabilities | | 17,675 | | 7,891 |
Deferred tax asset, net | $ | 4,846 | $ | 7,912 |
Realization of deferred tax assets is dependent upon the generation of sufficient future taxable income during the periods in which existing deferred tax assets are expected to become deductible for income tax purposes. Based on projections of future taxable income in periods in which existing deferred tax assets are expected to become deductible, in addition to the support provided by available tax planning strategies, management determined that the realization of the Company’s net deferred tax asset was more likely than not. As a result the Company did not recognize a valuation allowance on its net deferred tax asset as of December 31, 2016 or December 31, 2015.
As of December 31, 2016 the Company had utilized its Federal NOL loss carryforward, Alternative Minimum Tax (“AMT”) Credit carryforward and State of Colorado net operating loss carryforward.
As of both December 31, 2016 and December 31, 2015 the Company maintained an immaterial unrecognized tax benefit. If this benefit were to be recognized tax expense and our effective tax rate would be reduced in future periods. The Company does not expect the total amount of unrecognized tax benefits to significantly increase or decrease in the next 12 months.
(13)Subordinated Debentures and Trust Preferred Securities
At December 31, 2016, the Company’s outstanding subordinated debentures (the “Debentures”) consisted of $65,774,000 in debt, partially offset by $793,000 in debt issuance costs. As of December 31, 2016 the Debentures carried a weighted average cost of funds of 4.95% compared to 3.15% at December 31, 2015. The Company’s Debentures were issued in three separate series.
The first two issuances have a maturity of 30 years from its date of issuance. These Debentures were issued to trusts established by the Company, which in turn issued $25,000,000 of trust preferred securities (“TruPS”). Generally, and with certain limitations, the Company is permitted to call the Debentures subsequent to the first five or ten years, as applicable, after issuance, if certain conditions are met, or at any time upon the occurrence and continuation of certain changes in either the tax treatment or the capital treatment of the trusts, the Debentures or the TruPS. The Guaranty Capital Trust III TruPS became callable at each quarterly interest payment date starting on July 7, 2008. The CenBank Statutory Trust III TruPS became callable at each quarterly interest payment date starting on April 15, 2009.
GUARANTY BANCORP AND SUBSIDIARIES
Notes to Consolidated Financial Statements
Table of Contents
In April 2004, a predecessor to the Company formed CenBank Statutory Trust III and the trust completed an offering of $15,000,000, LIBOR plus 2.65% Cumulative TruPS, which are guaranteed by the Company. The trust also issued common securities to the predecessor of the Company and used the net proceeds from the offering to purchase $15,464,000 in principal amount of floating rate Debentures issued by the predecessor. The Company assumed the predecessor’s obligations relating to such securities upon the acquisition of the predecessor. Interest is paid quarterly and is distributed to the holders of the TruPS. These Debentures were unsecured, ranked junior and were subordinate in right of payment to all senior debt of the Company. The TruPS were subject to mandatory redemption upon repayment of the Debentures. The Company had the right, subject to events of default, to defer payments of interest on the Debentures at any time by extending the interest payment period for a period not exceeding 60 consecutive months with respect to each deferral period, provided that no extension period could extend beyond the redemption or maturity date of the Debentures. The Debentures mature on April 15, 2034 and are callable on each quarterly payment date.
In June 2003, a predecessor to the Company formed Guaranty Capital Trust III and the trust completed an offering of $10,000,000, LIBOR plus 3.10% Cumulative TruPS, which are guaranteed by the Company. The trust also issued common securities to the predecessor of the Company and used the net proceeds from the offering to purchase $10,310,000 in principal amount of Debentures issued by the predecessor. The Company assumed the predecessor’s obligations relating to such securities upon the acquisition of the predecessor. Interest is paid quarterly and is distributed to the holders of the TruPS. The other terms and condition of these Debentures are substantially similar to those described under the CenBank Statutory Trust III. The Debentures mature on July 7, 2033 and are callable on each quarterly interest payment date.
Under the terms of each indenture pursuant to which the two respective Debentures were issued, the Company has the ability to defer interest on the Debentures for a period not exceeding 60 consecutive months as long as it is in compliance with all covenants of the respective indenture. Such a deferral is not an event of default under each indenture and interest on the Debentures continues to accrue during the deferral period. No interest is being deferred as of December 31, 2016.
The Company is not considered the primary beneficiary of the trusts that issued the TruPS (variable interest entities); therefore, the trusts are not consolidated in the Company’s financial statements and these two Debentures are shown as liabilities. The Company’s investment in the common stock of each trust is included in other assets in the Company’s consolidated balance sheets.
In July 2016, the Company issued its third set of Debentures in anticipation of closing on the Home State transaction. This third issuance of $40,000,000 fixed-to-floating rate subordinated Debentures yield 5.75% and are due July 20, 2026. These Debentures initially bear a fixed interest rate of 5.75% per annum, payable semi-annually in arrears. The carrying balance of these Debentures at December 31, 2016 was comprised of the $40,000,000 face amount net of unamortized debt-issuance costs $793,000. On July 20, 2021, and, thereafter, the interest on the Debentures will be payable quarterly in arrears, at an annual floating rate equal to three-month LIBOR as determined by the applicable quarterly period, plus 4.73%.
As of December 31, 2016, the Company was in compliance with all financial covenants of all three Debentures.
At December 31, 2016 the Company had accrued, unpaid interest on all three Debentures of approximately $1,286,000 compared to $208,000 at December 31, 2015. Interest payable on Debentures is included in interest payable and other liabilities, on the consolidated balance sheets.
Although the securities issued by each of the trusts are not included as a component of stockholders’ equity in the consolidated balance sheets, they are treated as capital for regulatory purposes. Specifically, under applicable regulatory guidelines, the $25,000,000 of TruPS issued by the trusts qualify as Tier 1 capital, up to a maximum of 25% of capital on an aggregate basis. Any amount that exceeds 25% qualifies as Tier 2 capital. At both December 31, 2016, and December 31, 2015, the full $25,000,000 of the TruPS qualified as Tier 1 capital. The $40,000,000 from July 2016 issuance qualifies for inclusion in Tier 2 capital.
Under the Dodd-Frank Act and the joint rule from the Federal Reserve Board, the OCC, and the FDIC, certain TruPS are no longer eligible to be included as Tier 1 capital for regulatory purposes. However, an exception to this statutory prohibition applies to securities issued prior to May 19, 2010 by bank holding companies with less than
GUARANTY BANCORP AND SUBSIDIARIES
Notes to Consolidated Financial Statements
Table of Contents
$15 billion in total assets. As we have less than $15 billion in total assets and issued all of our TruPS prior to May 19, 2010, our TruPS continue to be eligible to be treated as Tier 1 capital, subject to other rules and limitations.
The following table summarizes the terms of each outstanding subordinated debenture issuance at December 31, 2016 (dollars in thousands):
| | | | | | | | | | | |
| | | | | | | | | | | |
| Date Issued | | Amount | Maturity Date | Call
Date * | Fixed or
Variable | Rate
Adjuster | | Current
Rate | | Next Rate
Reset
Date** |
| | | | | | | | | | | |
CenBank Trust III | 4/8/2004 | | 15,464 | 4/15/2034 | 4/15/2017 | Variable | LIBOR + 2.65 | % | 3.53 | % | 4/15/2017 |
Guaranty Capital Trust III | 6/30/2003 | | 10,310 | 7/7/2033 | 4/7/2017 | Variable | LIBOR + 3.10 | % | 3.98 | % | 4/7/2017 |
Subordinated Notes | 7/18/2016 | | 40,000 | 7/20/2026 | 7/20/2021 | Fixed | LIBOR + 4.73 | % | 5.75 | % | 7/20/2021 |
* Call date represents the earliest or next date the Company can call the debentures.
** On January 7, 2017, the rate on the Guaranty Capital Trust III subordinated debentures reset to 4.12%. On January 15, 2017, the rate on the CenBank Trust III subordinated debentures reset to 3.67%. The subordinated notes issued July 18, 2016 are fixed at 5.75% until July 20, 2021 at which point the notes turn to floating rate at three-month LIBOR plus 4.73%.
(14)Commitments
The Bank enters into credit-related financial instruments with off-balance sheet risk in the normal course of business to meet the financing needs of its customers. These financial instruments include commitments to extend credit, standby letters of credit and commercial letters of credit. Such commitments involve, to varying degrees, elements of credit and interest rate risk in excess of the amount recognized in the consolidated balance sheets.
The Bank’s exposure to credit loss is represented by the contractual amount of these commitments. The Bank follows the same credit policies in making commitments, including obtaining collateral, if necessary, as it does for on-balance sheet instruments.
At December 31 of the year indicated the following financial instruments were outstanding whose contract amounts represented credit risk:
| | | | | |
| | | | | |
| | 2016 | | | 2015 |
| | | | | |
| | (In thousands) |
Commitments to extend credit: | | | | | |
Variable | $ | 436,546 | | $ | 307,463 |
Fixed | | 95,607 | | | 61,184 |
Total commitments to extend credit | $ | 532,153 | | $ | 368,647 |
| | | | | |
Standby letters of credit | $ | 10,292 | | $ | 8,857 |
At December 31, 2016, the rates on the fixed rate commitments to extend credit ranged from 1.95% to 6.75%
A commitment to extend credit is an agreement to lend to a customer as long as there is no violation of any condition established in the underlying contract. Commitments generally have fixed expiration dates or other termination clauses and may require payment of a fee. Several of the commitments may expire without being drawn upon. Therefore, the total commitment amounts do not necessarily represent future cash requirements. Off-balance sheet risk to credit loss exists up to the face amount of these instruments, although material losses are not anticipated.
A commitment to extend credit under an overdraft protection agreement is a commitment for a possible future extension of credit to an existing deposit customer. These lines of credit are uncollateralized and usually do not contain a specified maturity date and may not be drawn upon to the total extent to which the Bank is committed.
Standby letters of credit are conditional commitments issued by the Bank to guarantee the performance of a customer to a third party. These letters of credit are primarily issued to support public and private borrowing arrangements. A majority of letters of credit issued have expiration dates within one year. The credit risk involved in issuing letters of credit is essentially the same as that involved in extending loan facilities to customers. The Bank holds collateral supporting these commitments if deemed necessary.
GUARANTY BANCORP AND SUBSIDIARIES
Notes to Consolidated Financial Statements
Table of Contents
(15)Legal Contingencies
The Company and the Bank are defendants, from time to time, in legal actions at various points of the legal process, including appeals, arising from transactions conducted in the ordinary course of business. Management believes, after consultations with legal counsel that it is not probable that the outcome of current legal actions will result in a liability that has a material adverse effect on the Company’s consolidated financial position, results of operations, comprehensive income or cash flows. In the event that such legal action results in an unfavorable outcome, the resulting liability could have a material adverse effect on the Company’s consolidated financial position, results of operations, comprehensive income or cash flows.
(16)Employee Benefit Plans
Substantially all employees are eligible to participate in the Company’s 401(k) plan. Employees may contribute up to 100% of their compensation subject to certain limits based on federal tax laws. The Company makes matching contributions equal to a specified percentage of the employee’s compensation as defined by the plan. For years ended December 31, 2016, 2015 and 2014, matching contributions to the 401(k) plan were $615,000, $503,000 and $471,000, respectively.
Stock-Based Compensation
Under the Company’s Incentive Plan, which expired by its terms on April 4, 2015, the Company’s Board of Directors had authority to grant stock-based compensation awards prior to the plan’s expiration. Under the 2015 Plan, which was approved by the Company’s stockholders at the May 5, 2015 annual meeting, the Company’s Board of Directors maintains the authority to grant stock-based compensation awards to nonemployee directors, key employees, consultants and prospective employees.
Stock-based compensation awards issuable under the Incentive Plan include the grant of stock-based compensation awards in the form of options, restricted stock awards, restricted stock unit awards, performance stock awards, stock appreciation rights and other equity based awards. Likewise, the Incentive Plan provided for, and the 2015 Plan provides, that eligible participants may be granted shares of Company common stock that are subject to forfeiture until the grantee vests in the stock award based on the established conditions, which may include service conditions, established performance measures or both.
Prior to the vesting of stock awards that are subject to a service vesting condition, each grantee has the rights of a stockholder with respect to voting the shares of stock represented by the award. The grantee is not entitled to dividend rights with respect to the shares of stock until vesting occurs. Prior to vesting of the stock awards with performance vesting conditions, each grantee has the rights of a stockholder with respect to voting of the shares of stock represented by the award. The recipient is generally not entitled to dividend rights with respect to unvested shares. Other than the stock awards with service and performance-based vesting conditions, no other grants have been made under the Incentive Plan or 2015 Plan.
Under the provisions of the 2015 Plan and the Incentive Plan grants of stock-based compensation awards of 935,000 and 1,700,000 shares, respectively, were authorized, subject to adjustments upon the occurrence of certain events. As of December 31, 2016 there were 178,513 and 334,674 outstanding awards under the 2015 Plan and the Incentive Plan, respectively. As of December 31, 2016 there were 728,305 shares remaining available for grant under the 2015 Plan. As of December 31, 2015 there were 21,846 and 568,909 outstanding awards under the 2015 Plan and the Incentive Plan, respectively and 913,154 shares remaining available for grant under the 2015 Plan.
Of the 513,187 shares represented by unvested awards at December 31, 2016, approximately 494,000 shares are expected to vest. At December 31, 2016, there were 315,966 shares of restricted stock outstanding that were subject to a performance condition. As of December 31, 2016 management expects that approximately 307,000 of these shares will vest and that the remaining shares will expire unvested. The performance shares that are expected to vest relate to awards granted to various key employees from February 2014 through November 2016. The vesting of these performance shares is contingent upon meeting certain return on average asset performance measures. The performance-based shares awarded in 2014, 2015 and 2016 each include a “threshold” and “target” performance level, with vesting determined based on where actual performance falls in relation to the numeric range represented by these performance criteria. As of December 31, 2016 management expected that all of the performance awards made in 2014, 2015 and 2016 not forfeited from a failure by the grantee to provide the requisite service will vest,
GUARANTY BANCORP AND SUBSIDIARIES
Notes to Consolidated Financial Statements
Table of Contents
which is consistent with the level of expense currently being recognized over the vesting period. Should this expectation change, the accrual of compensation expense in future periods could be impacted.
A summary of the status of unearned stock awards and the change during the period is presented in the table below:
| | | |
| | | |
| Shares | | Weighted Average Fair
Value on Award Date |
Unearned at January 1, 2016 | 590,755 | $ | 12.88 |
Awarded | 191,034 | | 15.69 |
Forfeited | (21,500) | | 12.76 |
Vested | (247,102) | | 11.91 |
Unearned at December 31, 2016 | 513,187 | $ | 14.39 |
The Company recognized $3,121,000, $2,739,000 and $2,454,000 in stock-based compensation expense for services rendered for the years ended December 31, 2016, 2015 and 2014, respectively. The total income tax benefit recognized for share-based compensation arrangements was $1,186,000, $1,041,000 and $933,000 for the years ending December 31, 2016, 2015 and 2014, respectively. The grant date fair value of restricted stock awards granted in 2016, 2015 and 2014 was $2,998,000, $2,427,000 and $5,761,000, respectively. The fair value of vested shares as of the date of vesting were $4,334,000, $2,250,000 and $1,704,000 in 2016, 2015 and 2014 respectively. At December 31, 2016, compensation cost of $3,739,000 related to unvested awards not yet recognized is expected to be recognized over a weighted-average period of 1.5 years.
(17)Related-Party Transactions
Deposits from related parties held by the Company at December 31, 2016 and 2015 amounted to $3,330,000 and $2,543,000, respectively. At December 31, 2016 the Company had no loans to related parties. At December 31, 2015 the Company had one loan to a related party with a balance of $60,000.
On December 2, 2016, the Company entered into an Exchange Agreement with Castle Creek Capital Partners IV, LP providing for the exchange of 1,019,000 shares of the Company’s non-voting common stock, which represented 100% of the outstanding shares of non-voting common stock, for 1,019,000 shares of the Company’s voting common stock.
(18)Fair Value Measurements and Fair Value of Financial Instruments
Fair value is the exchange price that would be received for an asset or paid to transfer a liability (exit price) in the principal or most advantageous market for the asset or liability in an orderly transaction between market participants on the measurement date. There are three levels of inputs that may be used to measure fair values:
Level 1 - Unadjusted quoted prices in active markets that are accessible at the measurement date for identical, unrestricted assets.
Level 2 - Significant other observable inputs other than Level 1 prices such as quoted prices in markets that are not active, quoted prices for similar assets, or other inputs that are observable, either directly or indirectly, for substantially the full term of the asset.
Level 3 - Significant unobservable inputs that reflect a reporting entity’s own assumptions about the assumptions that market participants would use in pricing an asset or liability.
A financial instrument’s level within the fair value hierarchy is based on the lowest level of input that is significant to the fair value measurement. Transfers of financial instruments between levels within the fair value hierarchy are recognized on the date management determines that the underlying circumstances or assumptions have changed.
Fair values of our securities are determined through the utilization of evaluated pricing models that vary by asset class and incorporate available market information (Level 2). The evaluated pricing models apply available information, as applicable, through processes such as benchmark curves, benchmarking of like securities, sector groupings, and matrix pricing to prepare evaluations. These models assess interest rate impact, develop prepayment
GUARANTY BANCORP AND SUBSIDIARIES
Notes to Consolidated Financial Statements
Table of Contents
scenarios and take into account market conventions. For securities where routine valuation techniques are not used, management utilizes a discounted cash flow model with market-adjusted discount rates or other unobservable inputs to estimate fair value. Due to the lack of ratings available on these securities, management determined that a relationship to other benchmark quoted securities was unobservable and as a result these securities should be classified as Level 3 (Level 3 inputs). The valuation of the Company’s Level 3 bonds is highly sensitive to changes in unobservable inputs.
Currently, the Company uses interest rate swaps to manage interest rate risk. The fair value of interest rate swaps are determined using the market standard methodology of netting the discounted future fixed cash payments (or receipts) and the discounted expected variable cash receipts (or payments). The variable cash receipts (or payments) are based on the expectation of future interest rates (forward curves) derived from observed market interest rate curves (Level 2 inputs). The Company considers the value of the swaps to be sensitive to fluctuations in interest rates.
Financial Assets and Liabilities Measured on a Recurring Basis
Assets and liabilities measured at fair value on a recurring basis are summarized below:
| | | | | | | | |
| | | | | | | | |
| | Quoted Prices in
Active Markets
for Identical
Assets (Level 1) | | Significant
Other Observable
Inputs (Level 2) | | Significant
Unobservable
Inputs (Level 3) | | Balance |
| | (In thousands) |
Assets/(Liabilities) at December 31, 2016 | | | | | | | | |
State and municipal securities | $ | - | $ | 49,856 | $ | 31,752 | $ | 81,608 |
Mortgage-backed securities – agency / | | | | | | | | |
residential | | - | | 129,832 | | - | | 129,832 |
Mortgage-backed securities – private / | | | | | | | | |
residential | | - | | 265 | | - | | 265 |
Corporate securities | | - | | 86,246 | | - | | 86,246 |
Collateralized loan obligations | | - | | 26,277 | | | | 26,277 |
Interest rate swaps - cash flow hedge | | - | | (1,929) | | - | | (1,929) |
| | | | | | | | |
Assets/(Liabilities) at December 31, 2015 | | | | | | | | |
State and municipal securities | $ | - | $ | 2,673 | $ | 32,040 | $ | 34,713 |
Mortgage-backed securities – agency / | | | | | | | | |
residential | | - | | 129,017 | | - | | 129,017 |
Mortgage-backed securities – private / | | | | | | | | |
residential | | - | | 274 | | - | | 274 |
Trust preferred securities | | - | | 17,806 | | - | | 17,806 |
Corporate securities | | - | | 65,291 | | - | | 65,291 |
Collateralized loan obligations | | - | | 8,330 | | | | 8,330 |
Interest rate swaps - cash flow hedge | | - | | (2,558) | | - | | (2,558) |
There were no transfers of financial assets and liabilities among Level 1, Level 2 and Level 3 during 2016 or 2015.
GUARANTY BANCORP AND SUBSIDIARIES
Notes to Consolidated Financial Statements
Table of Contents
The table below presents a reconciliation and income statement classification of gains and losses for all assets measured at fair value on a recurring basis using significant unobservable inputs (Level 3) for the year ended December 31, 2016:
| | |
| | |
| | State and Municipal
Securities |
| | (In thousands) |
Beginning balance December 31, 2015 | $ | 32,040 |
Total unrealized gains (losses) included in: | | |
Net income | | 6 |
Other comprehensive income (loss) | | - |
Sales, calls and prepayments | | (425) |
Acquisition of Level 3 security | | 131 |
Transfers in and (out) of Level 3 | | - |
Balance December 31, 2016 | $ | 31,752 |
For the year ended December 31, 2016, there was no comprehensive income or loss for assets measured at fair value on a recurring basis using significant unobservable inputs (Level 3) as a result of consistent mark-to-market valuations at December 31, 2016 and December 31, 2015. For the years ended December 31, 2016 and December 31, 2015, the amounts included in net income include accretion of any discount on these Level 3 bonds.
The table below presents a reconciliation and income statement classification of gains and losses for all assets measured at fair value on a recurring basis using significant unobservable inputs (Level 3) for the year ended December 31, 2015:
| | |
| | |
| | State and Municipal
Securities |
| | (In thousands) |
Beginning balance December 31, 2014 | $ | 32,317 |
Total unrealized gains (losses) included in: | | |
Net income | | 3 |
Other comprehensive income (loss) | | - |
Sales, calls and prepayments | | - |
Transfer to held to maturity | | (280) |
Transfers in and (out) of Level 3 | | - |
Balance December 31, 2015 | $ | 32,040 |
For the year ended December 31, 2015, there was no comprehensive income or loss for assets measured at fair value on a recurring basis using significant unobservable inputs (Level 3) as a result of consistent mark-to-market valuations at December 31, 2015 and December 31, 2014.
The following tables present quantitative information about Level 3 fair value measurements on the Company’s state and municipal securities at December 31, 2016 and December 31, 2015:
| | | | | |
| | | | | |
December 31, 2016 | | Fair Value | Valuation Technique | Unobservable Inputs | Range |
| | (In thousands) |
State and municipal securities | $ | 31,752 | discounted cash flow | discount rate | 2.29%-4.75% |
Total | $ | 31,752 | | | |
| | | | | |
| | | | | |
December 31, 2015 | | Fair Value | Valuation Technique | Unobservable Inputs | Range |
| | (In thousands) |
State and municipal securities | $ | 32,040 | discounted cash flow | discount rate | 2.05%-4.75% |
Total | $ | 32,040 | | | |
GUARANTY BANCORP AND SUBSIDIARIES
Notes to Consolidated Financial Statements
Table of Contents
Financial Assets and Liabilities Measured on a Nonrecurring Basis
Financial assets and liabilities measured at fair value on a nonrecurring basis were not material as of December 31, 2016 and December 31, 2015.
Nonfinancial Assets and Liabilities Measured on a Nonrecurring Basis
Nonfinancial assets and liabilities measured at fair value on a nonrecurring basis were not material as of December 31, 2016 and December 31, 2015.
GUARANTY BANCORP AND SUBSIDIARIES
Notes to Consolidated Financial Statements
Table of Contents
Fair Value of Financial Instruments
The estimated fair values, and related carrying amounts, of the Company’s financial instruments are as follows:
| | | | | | | | | | |
| | | | | | | | | | |
| | | | Fair Value Measurements at December 31, 2016: |
| | Carrying Amount | | Level 1 | | Level 2 | | Level 3 | | Total |
| | (In thousands) |
Financial assets: | | | | | | | | | | |
Cash and cash equivalents | $ | 50,111 | $ | 50,111 | $ | - | $ | - | $ | 50,111 |
Time deposits with banks | | 254 | | 254 | | - | | - | | 254 |
Securities available for sale | | 324,228 | | - | | 292,476 | | 31,752 | | 324,228 |
Securities held to maturity | | 243,979 | | - | | 236,857 | | 2,547 | | 239,404 |
Bank stocks | | 22,649 | | n/a | | n/a | | n/a | | n/a |
Loans held for sale | | 4,129 | | 4,542 | | - | | - | | 4,542 |
Loans held for investment, net | | 2,491,759 | | - | | - | | 2,504,144 | | 2,504,144 |
Accrued interest receivable | | 9,825 | | - | | 9,825 | | - | | 9,825 |
| | | | | | | | | | |
Financial liabilities: | | | | | | | | | | |
Deposits | $ | 2,699,084 | $ | - | $ | 2,696,766 | $ | - | $ | 2,696,766 |
Federal funds purchased and sold under | | | | | | | | | | |
agreements to repurchase | | 36,948 | | - | | 36,948 | | - | | 36,948 |
Short-term borrowings | | 124,691 | | - | | 124,691 | | - | | 124,691 |
Subordinated debentures | | 64,981 | | - | | - | | 60,048 | | 60,048 |
Long-term borrowings | | 72,477 | | - | | 72,769 | | - | | 72,769 |
Accrued interest payable | | 1,661 | | - | | 1,661 | | - | | 1,661 |
Interest rate swap - cash flow hedge | | 1,929 | | - | | 1,929 | | - | | 1,929 |
| | | | | | | | | | |
| | | | | | | | | | |
| | | | | | | | | | |
| | | | Fair Value Measurements at December 31, 2015: |
| | Carrying Amount | | Level 1 | | Level 2 | | Level 3 | | Total |
| | (In thousands) |
Financial assets: | | | | | | | | | | |
Cash and cash equivalents | $ | 26,711 | $ | 26,711 | $ | - | $ | - | $ | 26,711 |
Securities available for sale | | 255,431 | | - | | 223,391 | | 32,040 | | 255,431 |
Securities held to maturity | | 148,761 | | - | | 145,698 | | 4,424 | | 150,122 |
Bank stocks | | 20,500 | | n/a | | n/a | | n/a | | n/a |
Loans held for investment, net | | 1,791,536 | | - | | - | | 1,791,128 | | 1,791,128 |
Accrued interest receivable | | 6,554 | | - | | 6,554 | | - | | 6,554 |
| | | | | | | | | | |
Financial liabilities: | | | | | | | | | | |
Deposits | $ | 1,801,845 | $ | - | $ | 1,800,112 | $ | - | $ | 1,800,112 |
Federal funds purchased and sold under | | | | | | | | | | |
agreements to repurchase | | 26,477 | | - | | 26,477 | | - | | 26,477 |
Short-term borrowings | | 185,847 | | - | | 185,847 | | - | | 185,847 |
Subordinated debentures | | 25,774 | | - | | - | | 18,640 | | 18,640 |
Long-term borrowings | | 95,000 | | - | | 95,353 | | - | | 95,353 |
Accrued interest payable | | 508 | | - | | 508 | | - | | 508 |
Interest rate swap - cash flow hedge | | 2,558 | | - | | 2,558 | | - | | 2,558 |
The fair value of a financial instrument is the current amount that would be exchanged between willing parties, other than in a forced liquidation. Fair value is best determined based upon quoted market prices. However, in many instances, there are no quoted market prices for the Company’s various financial instruments. In cases where quoted market prices are not available, fair values are based on estimates using present value or other valuation techniques. Those techniques are significantly affected by the assumptions used, including the discount rate and estimates of future cash flows. Accordingly, the fair value estimates may not be realized in an immediate settlement of the instrument.
GUARANTY BANCORP AND SUBSIDIARIES
Notes to Consolidated Financial Statements
Table of Contents
Certain financial instruments and all nonfinancial instruments are excluded from the disclosure requirements. Therefore, the aggregate fair value amounts presented may not necessarily represent the underlying fair value of the Company.
The following methods and assumptions are used by the Company in estimating fair value disclosures for financial instruments:
| (a) | | Cash and Cash Equivalents |
The carrying amounts of cash and short-term instruments approximate fair values (Level 1).
| (b) | | Securities and Bank Stocks |
Fair values for securities available for sale and held to maturity are generally determined through the utilization of evaluated pricing models that vary by asset class and incorporate available market information (Level 2). The evaluated pricing models apply available information, as applicable, through processes such as benchmark curves, benchmarking of like securities, sector groupings, and matrix pricing to prepare evaluations. These models assess interest rate impact, develop prepayment scenarios and take into account market conventions. For positions that are not traded in active markets or are subject to transfer restrictions (i.e., bonds valued with Level 3 inputs), management uses a combination of reviews of the underlying financial statements, appraisals and management’s judgment regarding credit quality and intent to sell in order to determine the value of the bond.
It is not practical to determine the fair value of bank stocks due to restrictions placed on the transferability of FHLB stock, Federal Reserve Bank stock and Bankers’ Bank of the West stock. These three stocks comprise the majority of the balance of the Company’s bank stocks.
(c)Loans Held for Investment
For variable rate loans that reprice frequently and with no significant change in credit risk, fair values are based on carrying values (Level 3). Fair values for other loans (e.g., commercial real estate and investment property mortgage loans, commercial loans) are estimated using discounted cash flow analyses, using interest rates currently being offered for loans with similar terms to borrowers of similar credit quality (Level 3). Impaired loans are valued at the lower of cost or fair value when specific reserves are attributed to these loans because the present value of expected cash flows or the net realizable value of collateral is less than the impaired loan’s recorded investment. The methods utilized to estimate the fair value of loans do not necessarily represent an exit price.
(d)Loans Held for Sale
Loans held for sale are carried at the lower of cost or fair value, with fair value determined by the sales price agreed upon in negotiations with the purchaser (Level 1).
(e)Deposits
The fair values of demand deposits (e.g., interest and non-interest checking, passbook savings, and certain types of money market accounts) are, by definition, equal to the amount payable on demand at the reporting date (i.e., their carrying amount) (Level 2). The carrying amounts of variable rate, fixed-term money market accounts and certificates of deposit approximate their fair values at the reporting date (Level 2). Fair values for fixed rate certificates of deposit are estimated using a discounted cash flow calculation that applies interest rates currently being offered on certificates to a schedule of aggregated expected monthly maturities on time deposits (Level 2).
(f)Short-term Borrowings
The carrying amounts of federal funds purchased, borrowings under repurchase agreements, and other short-term borrowings maturing within ninety days approximate their fair values (Level 2).
GUARANTY BANCORP AND SUBSIDIARIES
Notes to Consolidated Financial Statements
Table of Contents
(g)Long-term Borrowings
The fair values of the Company’s long-term borrowings are estimated using discounted cash flow analyses based on the Company’s current incremental borrowing rates for similar types of borrowing arrangements (Level 2).
(h)Subordinated Debentures
The fair values of the Company’s Subordinated Debentures are estimated using discounted cash flow analyses based on the Company’s current incremental borrowing rates for similar types of borrowing arrangements (Level 3).
(i)Accrued Interest Receivable/Payable
The carrying amounts of accrued interest approximate fair value (Level 2).
(j)Interest Rate Swaps, net
The fair value of interest rate swaps are determined using the market standard methodology of netting the discounted future fixed cash payments (or receipts) and the discounted expected variable cash receipts (or payments). The variable cash receipts (or payments) are based on the expectation of future interest rates (forward curves) derived from observed market interest rate curves (Level 2).
(k)Off-balance Sheet Instruments
Fair values for off-balance sheet, credit-related financial instruments are based on fees currently charged to enter into similar agreements, taking into account the remaining terms of the agreements and the counterparties’ credit standing. The fair value of commitments is not material.
(19)Derivatives and Hedging Activities
The Company is exposed to certain risks arising from both its business operations and economic conditions. The Company principally manages its exposures to a wide variety of business and operational risks through management of its core business activities. The Company utilizes derivative financial instruments to assist in the management of interest rate risk, primarily helping to secure long-term borrowing rates. Specifically, the Company enters into derivative financial instruments to manage exposures that arise from business activities that result in the payment or receipt of future known and uncertain cash amounts, the value of which are determined by interest rates. The Company’s derivative financial instruments are used to manage differences in the amount, timing and duration of the Company’s known or expected cash payments or receipts principally related to certain variable-rate borrowings. The Company does not use derivatives for trading or speculative purposes.
The table below presents the fair value of the Company’s derivative financial instruments as well as their classification on the consolidated balance sheet as of December 31, 2016 and December 31, 2015:
| | | | | | | |
| | | | | | | |
| Balance | | | |
| Sheet | | | Fair Value December 31, |
| Location | | | 2016 | | | 2015 |
| | | | | | | |
| | | | (In thousands) |
Derivatives designated as hedging instruments | | | | | | | |
Assets: | | | | | | | |
Interest rate swaps | Other assets | | $ | - | | $ | - |
Liabilities: | | | | | | | |
Interest rate swaps | Other liabilities | | $ | 1,929 | | $ | 2,558 |
The Company’s objectives in using interest rate derivatives are to add stability and predictability to interest expense and to manage the Company’s exposure to interest rate movements. To accomplish this objective, the Company primarily uses interest rate swaps as part of its interest rate risk management strategy. For hedges of the Company’s variable-rate borrowings, interest rate swaps designated as cash flow hedges involve the receipt of variable amounts from a counterparty in exchange for the Company making fixed payments. As of
GUARANTY BANCORP AND SUBSIDIARIES
Notes to Consolidated Financial Statements
Table of Contents
December 31, 2016 and December 31, 2015 the Company had two interest rate swaps with an aggregate notional amount of $50,000,000 that were each designated as a cash flow hedge associated with the Company’s forecasted variable-rate borrowings. The first $25,000,000 swap became effective in June 2015 at a fixed rate of 2.46% and matures in June 2020. The second $25,000,000 swap became effective in March 2016 at a fixed rate of 3.00% with a maturity date of March 2021.
Summary information about the interest-rate swaps designated as cash flow hedges as of December 31, 2016 and December 31, 2015 is included in the table below:
| | | | | | | |
| | | | | | | |
| | 2016 | | | | 2015 | |
| | | | | | | |
| | (Dollars in thousands) | |
Notional amounts | $ | 50,000 | | | $ | 50,000 | |
Weighted average pay rates | | 2.73 | % | | | 2.73 | % |
Weighted average receive rates | | 3 month LIBOR | | | | 3 month LIBOR | |
Weighted average maturity | | 3.9 years | | | | 4.9 years | |
Unrealized gains (losses) | $ | (1,929) | | | $ | (2,558) | |
The effective portion of changes in the fair value of derivatives designated and that qualify as cash flow hedges is recorded in AOCI and is subsequently reclassified into earnings in the period that the hedged forecasted transaction affects earnings. The ineffective portion of the change in fair value of the derivatives is recognized directly in earnings. The Company’s cash flow hedges are used to hedge the forecasted variable cash outflows associated with forecasted issuances of FHLB advances. During 2016, 2015, and 2014, the income statement effect of hedge ineffectiveness was not material.
Amounts reported in AOCI related to derivatives will be reclassified to interest expense as interest payments are made on the Company’s variable-rate liabilities. Management expects that, during the next 12 months approximately $790,000 will be reclassified from AOCI into interest expense.
The Company executes interest rate swaps with commercial banking customers to facilitate their respective risk management strategies. Those interest rate swaps are simultaneously hedged by offsetting interest rate swaps that the Company executes with another third party, such that the Company minimizes its net risk exposure resulting from such transactions. As the interest rate swaps associated with this program do not meet the strict hedge accounting requirements, changes in the fair value of both the customer swaps and the offsetting swaps are recognized directly in earnings. The impact of these customer interest rate swaps on the Company’s financial statements was not material for any periods covered by this report.
The table below presents the effect of the Company’s derivative financial instruments on both comprehensive income and net income for the years ended December 31, 2016 and December 31, 2015:
| | | | | | | |
| | | | | | | |
| | Income | | | |
Interest Rate Swaps with | | Statement | | | December 31, |
Hedge Designation | | Location | | | 2016 | | 2015 |
| | | | | | | |
| | | | | | | |
Gain or (loss) recognized in OCI on | | | | | | | |
derivative - net of tax | | Not applicable | | $ | (183) | $ | (775) |
(Gain) or loss reclassified from | | | | | | | |
accumulated OCI into income | | | | | | | |
(effective portion) - net of tax | | Interest expense | | | 573 | | 135 |
The Company has agreements with its derivative counterparties that contain a cross-default provision whereby if the Company defaults on any of its indebtedness, including default where repayment of the indebtedness has not been accelerated by the lender, then the Company could also be declared in default on its derivative obligations.
The Company has minimum collateral posting thresholds with certain of its derivative counterparties, and has posted $4,188,000 against its obligations under these agreements. If the Company had breached any of these provisions at December 31, 2016, it could have been required to settle its obligations under the agreements at the termination value.
GUARANTY BANCORP AND SUBSIDIARIES
Notes to Consolidated Financial Statements
Table of Contents
(20)Accumulated Other Comprehensive Income
The following table summarizes the changes within each classification of accumulated other comprehensive income (loss) (“AOCI”) net of tax for the years ended December 31, 2016, 2015 and 2014:
| | | | | | | | |
| | Unrealized
Gains and Losses on Available for Sale Securities | | Unrealized
Gains and Losses on Held to Maturity Securities | | Unrealized
Gains and Losses on Cash Flow Hedges | | Total |
| | (in thousands) |
Balance, January 1, 2014 | $ | (9,303) | $ | - | $ | 349 | $ | (8,954) |
Other comprehensive income (loss) | | | | | | | | |
before reclassifications, net of tax | | 6,951 | | - | | (1,234) | | 5,717 |
Net unrealized losses on securities transferred | | | | | | | | |
from available for sale, to held to maturity | | | | | | | | |
net of tax | | 1,404 | | (1,404) | | - | | - |
Amounts reclassified from accumulated | | | | | | | | |
other comprehensive income (loss), net of tax | | (17) | | 127 | | - | | 110 |
Net other comprehensive income (loss) | | 8,338 | | (1,277) | | (1,234) | | 5,827 |
Balance, December 31, 2014 | $ | (965) | $ | (1,277) | $ | (885) | $ | (3,127) |
| | | | | | | | |
Other comprehensive income (loss) | | | | | | | | |
before reclassifications, net of tax | $ | (1,221) | $ | - | $ | (775) | $ | (1,996) |
Net unrealized losses on securities transferred | | | | | | | | |
from available for sale, to held to maturity | | | | | | | | |
net of tax | | 465 | | (465) | | - | | - |
Amounts reclassified from accumulated | | | | | | | | |
other comprehensive income (loss), net of tax | | (82) | | 265 | | 135 | | 318 |
Net other comprehensive income (loss) | | (838) | | (200) | | (640) | | (1,678) |
Balance, December 31, 2015 | $ | (1,803) | $ | (1,477) | $ | (1,525) | $ | (4,805) |
| | | | | | | | |
Other comprehensive income (loss) | | | | | | | | |
before reclassifications, net of tax | $ | (2,668) | $ | - | $ | (183) | $ | (2,851) |
Net unrealized losses on securities transferred | | | | | | | | |
from available for sale, to held to maturity | | | | | | | | |
net of tax | | 513 | | (513) | | - | | - |
Amounts reclassified from accumulated | | | | | | | | |
other comprehensive income (loss), net of tax | | 45 | | 312 | | 573 | | 930 |
Net other comprehensive income (loss) | | (2,110) | | (201) | | 390 | | (1,921) |
Balance, December 31, 2016 | $ | (3,913) | $ | (1,678) | $ | (1,135) | $ | (6,726) |
GUARANTY BANCORP AND SUBSIDIARIES
Notes to Consolidated Financial Statements
Table of Contents
The following table summarizes the significant amounts reclassified out of each component of AOCI for the years ended December 31, 2016, 2015 and 2014:
| | | | | | | | | |
Details about AOCI Components | | | Amount Reclassified from AOCI | | Affected Income Statement Line Item |
| | | Year Ended December 31, | | |
(in thousands) | | | 2016 | | 2015 | | 2014 | | |
Unrealized gains and losses on | | | | | | | | | |
available for sale securities | | $ | 73 | $ | (132) | $ | (28) | | (Gain) loss on the sale of securities |
| | | (28) | | 50 | | 11 | | Income tax effect |
| | $ | 45 | $ | (82) | $ | (17) | | Net Income |
Unrealized gains and losses on | | | | | | | | | |
held to maturity securities | | $ | 504 | $ | 427 | $ | 205 | | Interest Income |
| | | (192) | | (162) | | (78) | | Income tax effect |
| | $ | 312 | $ | 265 | $ | 127 | | Net Income |
Unrealized gains and losses on | | | | | | | | | |
cash flow hedges | | $ | 925 | $ | 218 | $ | - | | Interest Expense |
| | | (352) | | (83) | | - | | Income tax effect |
| | $ | 573 | $ | 135 | $ | - | | Net Income |
| | | | | | | | | |
Total reclassifications for the period | | $ | 930 | $ | 318 | $ | 110 | | Net Income |
(21)Regulatory Capital Matters
The Holding Company and the Bank are subject to various regulatory capital requirements administered by the federal banking agencies. Failure to meet minimum capital requirements can initiate certain mandatory and possibly additional discretionary actions by regulators that, if undertaken, could have a direct material effect on the Company’s consolidated financial statements. Under capital adequacy guidelines and the regulatory framework for prompt corrective action, the Company must meet specific capital guidelines that involve quantitative measures of their assets, liabilities, and certain off-balance sheet items as calculated under regulatory accounting practices. The Company’s capital amounts and classification are also subject to qualitative judgments by the regulators about components, risk weighting, and other factors.
Current risk-based regulatory capital standards generally require banks and bank holding companies to maintain a ratio of Common Equity Tier 1 capital to risk-weighted assets of at least 4.50%, a ratio of Tier 1 capital to risk-weighted assets of at least 6.00%, a ratio of Tier 1 capital to average total assets (leverage ratio) of at least 4.00% and a ratio of total capital (which includes Tier 1 capital plus certain forms of subordinated debt, a portion of the allowance for loan and lease losses, and preferred stock) to risk-weighted assets of at least 8.00%. However, under the final rule on Enhanced Regulatory Capital Standards, commonly referred to as Basel III, which became effective in the first quarter 2015, a capital conservation buffer of 2.5%, comprised of Common Equity Tier 1 was established above the regulatory minimum capital requirement. The capital conservation buffer phase-in period began January 1, 2016 and will become fully effective on January 1, 2019. A fully phased-in capital conservation buffer is included in the table below. Management believes that the Holding Company and the Bank met all capital adequacy requirements to which they are subject.
GUARANTY BANCORP AND SUBSIDIARIES
Notes to Consolidated Financial Statements
Table of Contents
The Company’s and the Bank’s actual capital amounts and ratios as of both December 31, 2016 and December 31, 2015 are presented in the table below:
| | | | | | | | | | | | | | |
| | | | | | | | | | | | | | |
| | Actual | | | | Minimum Requirement
for “Adequately Capitalized”
Institution plus fully
phased in Capital
Conservation Buffer | | | | Minimum
Requirement for
"Well-Capitalized"
Institution | |
| | Amount | Ratio | | | | Amount | Ratio | | | | Amount | Ratio | |
| | | | | | | | | | | | | | |
| | Dollars in thousands | |
As of December 31, 2016: | | | | | | | | | | | | | | |
Common Equity Tier 1 Risk-Based | | | | | | | | | | | | | | |
Capital Ratio | | | | | | | | | | | | | | |
Consolidated | $ | 296,146 | 10.46 | % | | $ | 198,249 | 7.00 | % | | $ | N/A | N/A | |
Guaranty Bank and Trust Company | | 351,806 | 12.43 | % | | | 198,111 | 7.00 | % | | | 183,960 | 6.50 | |
Tier 1 Risk-Based Capital Ratio | | | | | | | | | | | | | | |
Consolidated | | 321,146 | 11.34 | % | | | 240,731 | 8.50 | % | | | N/A | N/A | |
Guaranty Bank and Trust Company | | 351,806 | 12.43 | % | | | 240,564 | 8.50 | % | | | 226,413 | 8.00 | % |
Total Risk-Based Capital Ratio | | | | | | | | | | | | | | |
Consolidated | | 384,552 | 13.58 | % | | | 297,373 | 10.50 | % | | | N/A | N/A | |
Guaranty Bank and Trust Company | | 375,213 | 13.26 | % | | | 297,167 | 10.50 | % | | | 283,016 | 10.00 | % |
Leverage Ratio | | | | | | | | | | | | | | |
Consolidated | | 321,146 | 9.81 | % | | | 130,927 | 4.00 | % | | | N/A | N/A | |
Guaranty Bank and Trust Company | | 351,806 | 10.76 | % | | | 130,841 | 4.00 | % | | | 163,552 | 5.00 | % |
| | | | | | | | | | | | | | |
As of December 31, 2015: | | | | | | | | | | | | | | |
Common Equity Tier 1 Risk-Based | | | | | | | | | | | | | | |
Capital Ratio | | | | | | | | | | | | | | |
Consolidated | $ | 224,305 | 10.94 | % | | $ | 143,480 | 7.00 | % | | $ | N/A | N/A | |
Guaranty Bank and Trust Company | | 245,054 | 11.96 | % | | | 143,412 | 7.00 | % | | | 133,169 | 6.50 | |
Tier 1 Risk-Based Capital Ratio | | | | | | | | | | | | | | |
Consolidated | | 248,283 | 12.11 | % | | | 174,225 | 8.50 | % | | | N/A | N/A | |
Guaranty Bank and Trust Company | | 245,054 | 11.96 | % | | | 174,144 | 8.50 | % | | | 163,900 | 8.00 | % |
Total Risk-Based Capital Ratio | | | | | | | | | | | | | | |
Consolidated | | 271,404 | 13.24 | % | | | 215,220 | 10.50 | % | | | N/A | N/A | |
Guaranty Bank and Trust Company | | 268,176 | 13.09 | % | | | 215,119 | 10.50 | % | | | 204,875 | 10.00 | % |
Leverage Ratio | | | | | | | | | | | | | | |
Consolidated | | 248,283 | 10.68 | % | | | 92,962 | 4.00 | % | | | N/A | N/A | |
Guaranty Bank and Trust Company | | 245,054 | 10.55 | % | | | 92,916 | 4.00 | % | | | 116,145 | 5.00 | % |
GUARANTY BANCORP AND SUBSIDIARIES
Notes to Consolidated Financial Statements
Table of Contents
(22)Parent Company Only Condensed Financial Information
The following is condensed financial information of Guaranty Bancorp (parent company only):
| | | | | |
| | | | | |
Balance Sheets |
(Parent Company Only) |
December 31, 2016 and 2015 |
| | | | | |
| | 2016 | | | 2015 |
| | | | | |
| | (In thousands) |
Assets | | | | | |
Cash | $ | 9,469 | | $ | 3,739 |
Investments in subsidiaries | | 408,039 | | | 242,320 |
Other assets | | 2,742 | | | 2,827 |
Total assets | $ | 420,250 | | $ | 248,886 |
| | | | | |
Liabilities and Stockholders' Equity | | | | | |
Liabilities: | | | | | |
Subordinated debentures | $ | 64,981 | | $ | 25,774 |
Other liabilities | | 2,891 | | | 1,473 |
Total liabilities | | 67,872 | | | 27,247 |
Stockholders' equity: | | | | | |
Common stock | | 31 | | | 24 |
Common stock - additional paid-in capital | | 832,067 | | | 712,310 |
Accumulated deficit | | (367,944) | | | (382,147) |
Accumulated other comprehensive loss | | (6,726) | | | (4,805) |
Treasury stock | | (105,050) | | | (103,743) |
Total stockholders' equity | | 352,378 | | | 221,639 |
Total liabilities and stockholders' equity | $ | 420,250 | | $ | 248,886 |
| | | | | |
| | | | | | | | |
| | | | | | | | |
Statements of Income and Comprehensive Income |
(Parent Company Only) |
Years Ended December 31, 2016, 2015 and 2014 |
| | | | | | | | |
| | 2016 | | | 2015 | | | 2014 |
| | | | | | | | |
| | (In thousands) |
Income: | | | | | | | | |
Management fee - subsidiary bank | $ | 8,127 | | $ | 5,129 | | $ | 4,466 |
Dividends from subsidiary bank | | 9,800 | | | 8,400 | | | - |
Other | | - | | | 28 | | | 41 |
Total income | | 17,927 | | | 13,557 | | | 4,507 |
Expenses: | | | | | | | | |
Interest expense | | 2,005 | | | 814 | | | 800 |
Salaries and benefits | | 3,838 | | | 3,325 | | | 3,155 |
Professional services | | 1,774 | | | 1,779 | | | 1,917 |
Other | | 3,759 | | | 953 | | | 813 |
Total expenses | | 11,376 | | | 6,871 | | | 6,685 |
Income (loss) before federal income taxes and equity | | | | | | | | |
in undistributed net income of subsidiaries | | 6,551 | | | 6,686 | | | (2,178) |
Income tax benefit | | 1,024 | | | 495 | | | 822 |
Income (loss) before equity in undistributed | | | | | | | | |
net income of subsidiaries | | 7,575 | | | 7,181 | | | (1,356) |
Equity in undistributed income of subsidiaries | | 17,152 | | | 15,273 | | | 14,868 |
Net income | $ | 24,727 | | $ | 22,454 | | $ | 13,512 |
| | | | | | | | |
Other Comprehensive Income (Loss) | | (1,921) | | | (1,678) | | | 5,827 |
Total Comprehensive Income | $ | 22,806 | | $ | 20,776 | | $ | 19,339 |
GUARANTY BANCORP AND SUBSIDIARIES
Notes to Consolidated Financial Statements
Table of Contents
| | | | | | | | |
| | | | | | | | |
Statements of Cash Flow |
(Parent Company Only) |
Years Ended December 31, 2016, 2015 and 2014 |
| | | | | | | | |
| | 2016 | | | 2015 | | | 2014 |
| | | | | | | | |
| | (In thousands) |
Cash flows from operating activities: | | | | | | | | |
Net income | $ | 24,727 | | $ | 22,454 | | $ | 13,512 |
Reconciliation of net income to net cash from | | | | | | | | |
operating activities: | | | | | | | | |
Equity based compensation | | 1,168 | | | 990 | | | 817 |
Net change in: | | | | | | | | |
Other assets | | 1,474 | | | (168) | | | 4,165 |
Other liabilities | | 1,454 | | | 111 | | | 156 |
Equity in undistributed income | | | | | | | | |
of consolidated subsidiaries | | (17,152) | | | (15,273) | | | (14,868) |
Net cash from operating activities | | 11,671 | | | 8,114 | | | 3,782 |
Cash flows from investing activities: | | | | | | | | |
Cash paid in acquisition, net of cash acquired | | (32,446) | | | | | | |
Net cash used by investing activities | | (32,446) | | | - | | | - |
Cash flows from financing activities: | | | | | | | | |
Repurchase of common stock | | (1,307) | | | (616) | | | (455) |
Tax effect of restricted stock vesting | | - | | | - | | | - |
Proceeds from issuance of subordinated debt, net | | | | | | | | |
of issuance costs | | 39,170 | | | - | | | - |
Dividends paid | | (10,524) | | | (8,429) | | | (4,190) |
Payment of stock issuance costs related to acquisition | | (834) | | | - | | | - |
Net cash used by financing activities | | 26,505 | | | (9,045) | | | (4,645) |
Net change in cash and cash equivalents | | 5,730 | | | (931) | | | (863) |
Cash and cash equivalents, beginning of year | | 3,739 | | | 4,670 | | | 5,533 |
Cash and cash equivalents, end of year | $ | 9,469 | | $ | 3,739 | | $ | 4,670 |
(23)Quarterly Results of Operations (Unaudited)
2016 Quarterly Results of Operations
| | | | | | | | |
| | | | | | | | |
| | Quarter Ended |
| | December 31, | | September 30, | | June 30, | | March 31, |
| | 2016 | | 2016 | | 2016 | | 2016 |
| | (In thousands, except share data) |
| | | | | | | | |
Interest income | $ | 30,800 | $ | 25,342 | $ | 21,851 | $ | 21,860 |
Interest expense | | 2,978 | | 2,592 | | 2,030 | | 1,865 |
Net interest income | | 27,822 | | 22,750 | | 19,821 | | 19,995 |
Provision for loan losses | | 90 | | 27 | | 10 | | 16 |
Net interest income after | | | | | | | | |
provision for loan losses | | 27,732 | | 22,723 | | 19,811 | | 19,979 |
Noninterest income | | 6,232 | | 4,705 | | 4,142 | | 4,178 |
Noninterest expense | | 23,237 | | 18,624 | | 15,134 | | 15,792 |
Income before income taxes | | 10,727 | | 8,804 | | 8,819 | | 8,365 |
Income tax expense | | 3,306 | | 3,039 | | 3,133 | | 2,510 |
Net income | $ | 7,421 | $ | 5,765 | $ | 5,686 | $ | 5,855 |
| | | | | | | | |
Basic earnings per common | | | | | | | | |
share | $ | 0.27 | $ | 0.25 | $ | 0.27 | $ | 0.28 |
Diluted earnings per common | | | | | | | | |
share | $ | 0.26 | $ | 0.25 | $ | 0.27 | $ | 0.27 |
The acquisition of Home State on September 8, 2016 in addition to loan growth resulted in increased income in the fourth quarter or 2016. Likewise, increases in deposits from the transaction in addition to organic growth resulted in increased interest expense during 2016. Noninterest expense during 2016 was impacted by merger-
GUARANTY BANCORP AND SUBSIDIARIES
Notes to Consolidated Financial Statements
Table of Contents
related expenses and grew in the fourth quarter 2016 as a result of additional employee and occupancy related expenses driven by the increased size of the organization following the acquisition.
2015 Quarterly Results of Operations
| | | | | | | | |
| | | | | | | | |
| | Quarter Ended |
| | December 31, | | September 30, | | June 30, | | March 31, |
| | 2015 | | 2015 | | 2015 | | 2015 |
| | (In thousands, except share data) |
| | | | | | | | |
Interest income | $ | 21,454 | $ | 20,863 | $ | 20,159 | $ | 19,854 |
Interest expense | | 1,598 | | 1,457 | | 1,219 | | 1,077 |
Net interest income | | 19,856 | | 19,406 | | 18,940 | | 18,777 |
Provision (credit) for loan losses | | (8) | | 14 | | 113 | | (23) |
Net interest income after | | | | | | | | |
provision for loan losses | | 19,864 | | 19,392 | | 18,827 | | 18,800 |
Noninterest income | | 4,262 | | 4,399 | | 4,404 | | 4,115 |
Noninterest expense | | 15,247 | | 14,866 | | 14,956 | | 15,270 |
Income before income taxes | | 8,879 | | 8,925 | | 8,275 | | 7,645 |
Income tax expense | | 2,988 | | 2,923 | | 2,798 | | 2,561 |
Net income | $ | 5,891 | $ | 6,002 | $ | 5,477 | $ | 5,084 |
| | | | | | | | |
Basic earnings per common | | | | | | | | |
share | $ | 0.28 | $ | 0.28 | $ | 0.26 | $ | 0.24 |
Diluted earnings per common | | | | | | | | |
share | $ | 0.28 | $ | 0.28 | $ | 0.26 | $ | 0.24 |
Loan growth, increases in deposits and increases in borrowings during 2015 contributed to increased interest income and increased interest expense.