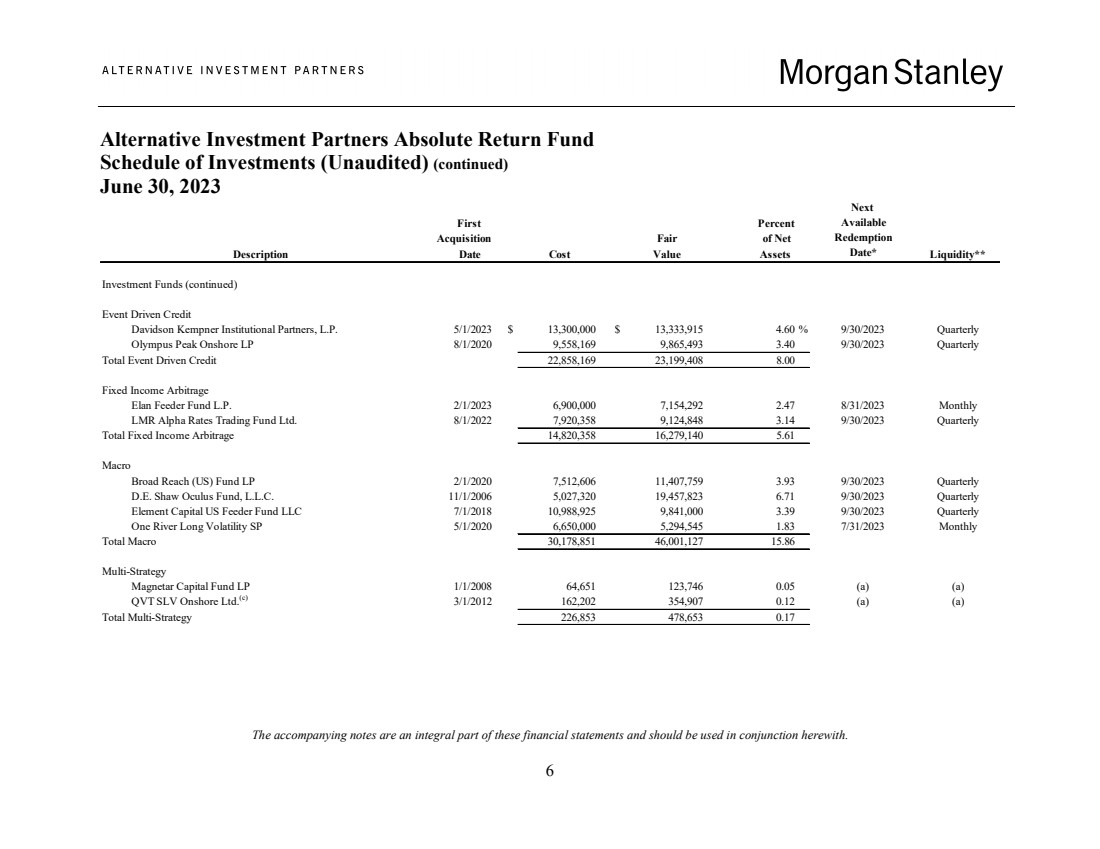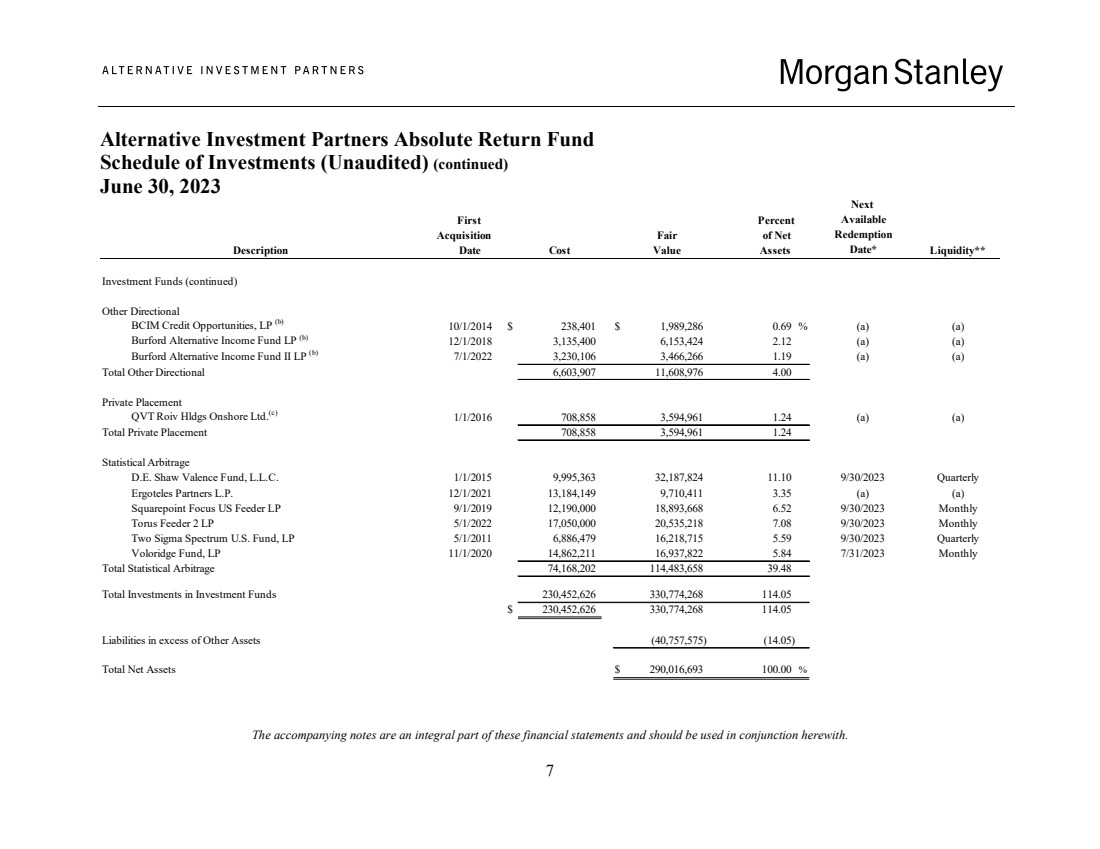
| The accompanying notes are an integral part of these financial statements and should be used in conjunction herewith. 7 Alternative Investment Partners Absolute Return Fund Schedule of Investments (Unaudited) (continued) June 30, 2023 Next First Percent Available Acquisition Fair of Net Redemption Description Date Cost Value Assets Date* Liquidity** Investment Funds (continued) Other Directional BCIM Credit Opportunities, LP (b) 10/1/2014 $ 238,401 $ 1,989,286 0.69 % (a) (a) Burford Alternative Income Fund LP (b) 12/1/2018 3,135,400 6,153,424 2.12 (a) (a) Burford Alternative Income Fund II LP (b) 7/1/2022 3,230,106 3,466,266 1.19 (a) (a) Total Other Directional 6,603,907 11,608,976 4.00 Private Placement QVT Roiv Hldgs Onshore Ltd.(c) 1/1/2016 708,858 3,594,961 1.24 (a) (a) Total Private Placement 708,858 3,594,961 1.24 Statistical Arbitrage D.E. Shaw Valence Fund, L.L.C. 1/1/2015 9,995,363 32,187,824 11.10 9/30/2023 Quarterly Ergoteles Partners L.P. 12/1/2021 13,184,149 9,710,411 3.35 (a) (a) Squarepoint Focus US Feeder LP 9/1/2019 12,190,000 18,893,668 6.52 9/30/2023 Monthly Torus Feeder 2 LP 5/1/2022 17,050,000 20,535,218 7.08 9/30/2023 Monthly Two Sigma Spectrum U.S. Fund, LP 5/1/2011 6,886,479 16,218,715 5.59 9/30/2023 Quarterly Voloridge Fund, LP 11/1/2020 14,862,211 16,937,822 5.84 7/31/2023 Monthly Total Statistical Arbitrage 74,168,202 114,483,658 39.48 Total Investments in Investment Funds 230,452,626 330,774,268 114.05 $ 230,452,626 330,774,268 114.05 Liabilities in excess of Other Assets (40,757,575) (14.05) Total Net Assets $ 290,016,693 100.00 % |