Our extensive product offering fits nearly every car and light truck vehicle make and model on the road, allowing us to serve as a full line supplier to our customers for our product categories. These customers primarily include large aftermarket distributors and retailers selling to professional installers. Our customer base also includes certain original equipment service (‘‘OES’’) market participants. Many of our customers are leading aftermarket companies, including NAPA, CARQUEST, Aftermarket Auto Parts Alliance (the ‘‘Alliance’’), Uni-Select, CSK Auto, Inc. (‘‘CSK’’) and Federated. As an active participant in the aftermarket for more than 60 years, we have developed many long-standing customer relationships. Consequently, our top ten customers in 2005 have been doing business with us for an average of 27 years.
We derived approximately 95% of our 2005 net sales from the aftermarket. The growth of the aftermarket has been, and we believe will continue to be, affected by the size, age and use of the population of vehicles in operation. We believe that the aftermarket will continue to grow steadily as a result of increases in (1) the light vehicle population, (2) the average age of light vehicles, (3) the total number of vehicle miles driven per year, and (4) the popularity of SUVs and light trucks and the emergence of cross-over vehicles, which generally have greater service requirements than other passenger vehicles. According to Automotive Aftermarket Industry Association, the U.S. aftermarket grew by 4.9% during 2005.
Table of ContentsBased on 2005 net sales, we believe we had the #1 market position in North America in brake and filtration components and the #2 market position in North America in chassis components. We believe we have achieved our #1 and #2 market positions due to the quality and reputation of our brands and products among professional automotive technicians, who are the primary installers of the types of components we supply to the aftermarket. These professionals prefer to order reliable, well known brands because it is industry practice to replace, free of any labor or service charge, malfunctioning parts. We believe that the quality and reputation of our brands for form, fit, and functional quality creates and maintains significant demand for our products from these technicians and throughout the aftermarket supply chain.
We continue to face factors affecting our competitive position, including significant price increases during 2004 in raw steel and steel-related components (the prices remained at high levels in 2005) and increases in freight and energy costs during 2005. In addition, the aftermarket in which the Company operates continues to experience increased price competition from various manufacturers in countries with lower production costs.
In 2005, we announced two restructuring plans: (i) a restructuring plan that we announced at the beginning of 2005 as part of the Acquisition, also referred to as the acquisition restructuring and (ii) a restructuring plan that we announced at the end of 2005, also referred to as the comprehensive restructuring.
The comprehensive restructuring will affect several facilities over the next two years. In December 2005, we announced the closure of our Southampton facility. Additionally, in March 2006 we announced the closure of the Erie, North East and McHenry plants and the intent to sell our Waupauca, Sudbury and St. Catharines facilities. Additional facility closures will be announced periodically over 2006 and 2007. In 2005, we recorded a charge of $23 million primarily comprised of severance costs, and fixed asset impairment. The write-down of fixed assets was accounted for in accordance with SFAS No. 144, Accounting for the Impairment or Disposal of Long-Lived Assets. Severance costs are being accounted for in accordance with SFAS No. 146, Accounting for Costs Associated with Exit or Disposal Activities. We currently estimate that we will incur in the aggregate approximately $152 million of cash and non-cash restructuring costs for the comprehensive restructuring.
In the first quarter of 2005, as part of the Acquisition, we announced the acquisition restructuring. The acquisition restructuring plan was initiated to take advantage of opportunities we identified prior to the Acquisition but were, due to resource constraints, limited in our ability to actively pursue as part of Dana. Acquisition restructuring costs of $21 million associated with the acquisition restructuring were recorded to goodwill as an adjustment to the opening balance sheet, comprised of severance costs, fixed asset impairments, and other exit costs. Additionally, we charged directly to operations $2 million relating to current period exit costs. We do not expect any material costs subsequent to December 31, 2005, relating to the acquisition restructuring.
Industry
The statements regarding industry outlook, trends, the future development of certain aftermarket products and other non-historical information contained in this section are forward-looking statements.
Aftermarket products can be classified into three primary groups: (1) routine service parts, such as oil, fuel, air and other filters, lubricants, fluids and tune up parts; (2) wear parts, such as brake and chassis system components (e.g., pads, rotors, shoes, drums, shock absorbers, steering and other suspension components); and (3) components that commonly fail, such as batteries, starters, alternators and rubber products. We primarily compete in the routine service parts and wear parts product categories.
We believe the overall U.S. motor vehicle aftermarket was approximately $132 billion in aggregate wholesale sales in 2005. We estimate that the demand for our primary aftermarket products, which consists of brake system parts, steering and suspension parts and general service parts industry
5
Table of Contentscategories (which mainly includes filtration and battery products), in the U.S. was approximately $9 billion in aggregate wholesale sales. We have significant presence in filtration products and no presence in the battery market. The suppliers to this market consist of a few large participants and many smaller ones. We are one of the largest participants, offering a full line of quality products within these product categories. To facilitate efficient inventory management, many of our customers rely on larger suppliers like us to have full product line offerings, consistent service and timely delivery. There are important advantages to having meaningful size and scale in the aftermarket, including the ability to support significant distribution operations, offer sophisticated supply chain management capabilities and provide broad product line offerings.
In general, aftermarket industry participants can be categorized into three major groups: (1) manufacturers of parts, (2) distributors of replacement parts (without manufacturing capabilities) and (3) installers, both professional and Do-It-Yourself (‘‘DIY’’). Distributors purchase products from manufacturers and sell them to wholesale or retail operations, which in turn sell them to those who install the parts.
The distribution segment is comprised of the (1) traditional, (2) retail and (3) original equipment manufacturers (‘‘OEM’’) and OES channels. Typically, professional installers purchase their products through the traditional channel, and DIY mechanics purchase products through both traditional and retail stores. The traditional channel includes such well-known distributors as NAPA, CARQUEST, Federated, the Alliance, Uni-Select and Automotive Distribution Network (‘‘ADN’’; formerly known as Parts Plus and IAPA). Through a network of distribution centers, these distributors sell primarily to owned or affiliated stores, which in turn supply professional installers. The retail sector includes merchants such as Advance Auto Parts, CSK and Pep Boys. OEM and OES channels consist primarily of new vehicle manufacturers’ service departments at new vehicle dealerships.
We believe that the growth in aftermarket product sales has been driven by the following key factors:
Increasing Light Vehicle Population. U.S. light vehicle population has been increasing steadily in recent years, driven principally by population growth and the increase in average vehicles in service per person. As of 2004, there were over 233 million vehicles in operation in the United States. This figure has risen steadily each year, increasing by a total of 12% from approximately 208 million vehicles in use in 1999.
Increasing Average Age of Vehicles. As of 2004, the average light vehicle age in the United States was approximately 9.4 years, compared to an average of approximately 8.5 years in 1995. As average vehicle age continues to rise, the use of aftermarket parts is expected to continue to increase.
Increasing Total and Average Miles Driven. In the United States, total light vehicle miles driven rose from 2.4 trillion in 1994 to 2.9 trillion in 2004. We believe according to industry sources that average annual miles driven increased by 2% in 2005.
Increasing Prevalence of SUVs, Cross-Over Vehicles and Light Trucks. The Automotive Aftermarket Industry Association estimates that the number of SUVs, light trucks and crossover vehicles currently in operation in the United States has increased 50% from 1995 to 2004. Since larger and heavier vehicles place more wear on brake systems and chassis components, increases in the number of these vehicles are expected to result in corresponding growth in the sale of aftermarket brake and chassis components. Additionally, we expect the increasing prevalence of light trucks to increase the demand for filtration products due to increased use of diesel engines in trucks, which require more complex filtration and more frequent maintenance. Also, the percentage of light vehicles in operation that use disc brakes, rather than drum brakes, continues to grow and is eventually expected to include all light vehicles. Smaller and lighter weight disc brake systems have shorter operational lives than drum brakes, and therefore require more frequent replacement.
6
Table of ContentsProducts
Our principal product areas are described below:

| | | | | | | | | | | | | | | | | | |
| Product | | 2005 Net
Sales
(Dollars in
Millions) | | Percent
of 2005
Net Sales | | Representative Brands | | Product Description |
| Brake products | | $ | 1,052 | | | | 50 | % | | Raybestos, NAPA, CARQUEST, AIMCO and ACDelco | | Drums, rotors, calipers, pads and shoes and hydraulic components |
| Filtration products | | | 661 | | | | 31 | % | | WIX, NAPA and CARQUEST | | Oil, fuel, air and other filters for light-, medium- and heavy-duty vehicle applications |
| Chassis products | | | 156 | | | | 7 | % | | Spicer Chassis, NAPA Chassis, McQuay-Norris, ACDelco and Nakata | | Steering, suspension and driveline components |
| European products and other | | | 260 | | | | 12 | % | | Quinton Hazell and other | | Various European and other foreign nameplate aftermarket products |
| Corporate and other | | | 3 | | | | | | | | | |
| Total net sales | | $ | 2,132 | | | | | | | | | |
|
We offer primarily three types of products: brake products, which include brake drums and rotors, pads and shoes and hydraulic brake system components; filtration products, which include oil, fuel, air and other filters; and chassis products, which include steering, suspension and driveline components.
Brake Products. We are a leading designer, manufacturer, marketer and distributor of a broad range of brake products for the aftermarket. Based on 2005 net sales, we believe we hold the #1 market position in North America for brake components. Our products include master cylinders, wheel cylinders, hardware and hydraulics, drums, shoes, linings, bonded/riveted segments, rotors, brake pads, calipers and castings. We sell our brake products into the three primary distribution channels — traditional, retail and OEM/OES.
We have an extensive offering of high quality, premium brake products. The brake products are sold under our leading premium brand name, Raybestos, as well as the AIMCO brand name. We believe the Raybestos brand name is the most recognized brake product brand in the aftermarket. In addition to our own brands, we also provide private label offerings for NAPA and CARQUEST.
Our aftermarket and OEM brake customers have differing needs and requirements. Aftermarket customers rely on our expertise for product design and engineering. These customers are highly focused on delivery time for their unpredictable and changing volume requirements, as they prefer to carry lower inventory levels while demanding full product coverage of different makes and models. In contrast, OEM customers provide more predictable sales volumes. However, they require individualized engineering as they are subject to self-imposed quality standards.
This product category has and is expected to continue to have one of the highest growth rates in the aftermarket due to the proliferation of SUVs, cross-over vehicles and other heavy vehicles which tend to generate greater wear of brake system products.
7
Table of ContentsFiltration Products. We are a leading designer, manufacturer, marketer and distributor of a broad range of filtration products for the aftermarket. Based on 2005 net sales, we believe we hold the #1 market position in North America for filtration components. We are one of the few aftermarket suppliers of heavy-duty and light-duty filters, which helps secure our leading market position. Our filtration product lines include oil, fuel, air and other filters for automobiles, trucks and off-road equipment. We sell our filtration products primarily into the traditional channel and, to a lesser extent, into the OES/OEM channel.
Under our well-known WIX brand, we offer automotive, diesel, agricultural, industrial and specialty filter applications. WIX is the #1 filter for cars on the NASCAR circuit and an exclusive NASCAR Performance Product. We also provide a comprehensive private label product offering to our two largest customers, NAPA and CARQUEST. We also sell our filters under the Kralinator brand in Canada and the Filtron brand in Europe.
The heavy-duty filtration segment is expected to continue to grow at a stable rate as demand for heavy-duty oil filters is expected to increase due to newer diesel engines with exhaust gas recirculation technology, which generates more soot particulates compared to older engine designs, thereby increasing engine filtration demands. Overall heavy-duty filter demand is expected to experience stable growth, as there are more filters per engine in newer vehicles. Proprietary filtration designs and increasingly complicated filtration systems are also expected to create additional demand.
Chassis Products. We are a leading designer, manufacturer, marketer and distributor of a broad range of chassis components in the aftermarket. Based on 2005 net sales, we believe we hold the #2 market position in North America for chassis components. Our chassis parts include steering, suspension and driveline components such as ball joints, tie rods, pittman arms, idler arms, drag links, control arms, center links, stabilizers and other related parts. In addition to our own brands, including Nakata and McQuay-Norris, we provide private label products for NAPA and other customers. We also sell our Chassis products under the Spicer brand name, which is a brand we use pursuant to a license agreement with Dana. We sell our chassis products into the three primary distribution channels — traditional, retail and OEM/OES.
Chassis products by their nature wear out and need to be replaced periodically. Frequency of replacement depends on the use of the vehicle. As a result, fleet construction and off-road vehicles typically need to have chassis parts replaced more frequently than other types of vehicles. We believe growth in the replacement of chassis components will be driven by an increase in the proliferation of replaceable chassis components and in the average age of vehicles.
European Products and Other. Our European products and other businesses include our Quinton Hazell European parts supplier. Quinton Hazell designs, manufactures and distributes a wide range of aftermarket replacement motor vehicle components for customers throughout the United Kingdom and Continental Europe, primarily under the Quinton Hazell brand name. It is focused on supplying Europe’s independent aftermarkets as a ‘‘one-stop shop’’ for regional aftermarket suppliers. Its products include cooling, transmission, steering and suspension, brakes, shock absorbers, electrical and filter products. In addition to the Quinton Hazell brand, Quinton Hazell supplies components under nine other subordinate brands targeting specific industry segments and/or geographies.
Corporate and other. Consists of sales of our subsidiary Beck/Arnley World Parts Corp. ("Beck Arnley") and inter company sales eliminations between product grouping. On March 31, 2005, we completed the sale of Beck Arnley to Heritage Equity Group (‘‘Heritage’’). Beck Arnley was our foreign nameplate for light vehicle parts into North America. Its products included brake system components, chassis parts, electrical products, clutch and driveline products, engine and filter parts and cooling systems.
Sales Channels and Customers
We distribute our products across several sales channels, including traditional, retail and OEM and OES channels. Our ten largest customers accounted for approximately 52% of our net sales in 2005, with approximately 21% and 8% derived from our two largest customers, NAPA and
8
Table of ContentsCARQUEST, respectively. During 2005, we derived 59% of our net sales from United States and 41% of our net sales from other countries.
We have maintained long-standing relationships with our customers and, consequently, our top ten customers in 2005 have been doing business with us for an average of 27 years. Some of our most significant customers include NAPA, CARQUEST, ADN, Federated, the Alliance, and CSK each of which is a key player in the aftermarket.
The following table provides a description of the primary sales channels to which we supply our products:
| | | | | | | | | | |
| Primary Sales Channels | | Description | | Customers |
| Traditional | | Warehouses and distribution centers that supply local distribution outlets, which sell to professional installers. | | NAPA, CARQUEST, Federated and Uni-Select |
| OEM and OES | | New vehicle manufacturers and service departments at new vehicle dealerships. | | GM/GMSPO, Delphi, Robert Bosch, TRW Automotive and DaimlerChrysler |
| Retail and Mass Merchant | | Retail stores, including national chains that sell replacement parts directly to consumers (the DIY market) and to some professional installers. | | CSK |
|
The traditional channel is important to us because it is the primary source of products for professional installers. We believe that the quality and reputation of our brands for form, fit, and functional quality promotes significant demand for our products from these installers and throughout the aftermarket supply chain. We have many long-standing relationships with leading distributors in the traditional channel such as NAPA and CARQUEST, for whom we have manufactured products for 38 and 16 years, respectively.
The retail channel has historically provided us with steadily increasing revenue streams. As retailers become increasingly focused on consolidating their supplier base, we believe that our broad product offering, product quality, sales and marketing support and customer service capabilities make us more valuable to these customers.
Recently, many vehicle dealerships have begun providing ‘‘all-makes’’ service whereby dealers will service a vehicle even if they do not sell the make or model being serviced. In these circumstances, OEMs cannot require their dealerships to purchase components exclusively from their suppliers, and therefore dealerships can choose to purchase less expensive components from aftermarket suppliers. We believe the volumes generated by OES customers, especially in brakes, may provide an opportunity for significant increases in our sales and profitability.
Customer Support
We believe that our emphasis on customer support has been a key factor in maintaining our leading market positions. We continuously seek to improve service, order turnaround time, product coverage and order accuracy. As a result of our efforts, we have achieved typical order fill rates of approximately 95%. Our ability to replenish inventory quickly is extremely important to customers as it enables them to maximize their sales while carrying reduced inventory levels. For these reasons, we ship the majority of orders within 24 to 48 hours of receipt.
In order to maintain the competitiveness of our existing customers and maximize new sales opportunities, we have extensive product coverage. In turn, this has allowed our customers to develop
9
Table of Contentsa reputation for carrying the parts their customers need, especially for newer vehicles for which OEM warranties may not have expired and aftermarket parts are not generally available.
In addition, as the aftermarket has become more electronically integrated, customers more often prefer to receive their application information electronically as well as in print form. We provide both printed and electronic catalog media. We also provide products which are problem solvers for professional installers, such as alignment products that allow installers to properly align a vehicle, even though the vehicle was not equipped with adjustment features by the OEM. We provide many other support features, such as technical support hot lines and training and electronic systems which interface with customers and conform to aftermarket industry standards.
Intellectual Property
We own significant intellectual property, including a large number of patents, trademarks, copyrights and trade secrets and are involved in numerous licensing arrangements. Although our intellectual property plays an important role in maintaining our competitive position in a number of the markets that we serve, no single patent, copyright, trade secret or license, or group of related patents, copyrights, trade secrets or licenses is, in our opinion, of such value to us that our business would be materially affected by its expiration or termination. Our general policy is to apply for patents on an ongoing basis in the United States, the United Kingdom and certain other countries to protect our patentable technology developments.
Our patent portfolio of nearly 200 patents and pending patent applications reflects our commitment to invest in technology and covers many aspects of our products and the processes for making those products. In addition, we have developed a substantial body of manufacturing know-how that we believe provides a significant competitive advantage in the marketplace. We have entered into numerous technology license agreements that either strategically exploit our intellectual property rights or provide a conduit for us into third party intellectual property rights useful in our businesses. In many of these agreements, we license technology to our suppliers, joint venture companies and other local manufacturers to support outsourced product manufacturing. In other agreements, we license the technology to other companies to obtain royalty income. Also, as part of the Acquisition, we entered into intellectual property license agreements with Dana.
We also own a number of secondary trade names and marks applicable to certain of our businesses and products that we view as important to such businesses and products.
Raw Materials and Manufactured Components
We use a broad range of manufactured components and raw materials in our products, including raw steel, steel-related components, filtration media, aluminum, brass, iron, rubber, resins, plastics, paper and packaging materials. We purchase raw materials from a wide variety of domestic and international suppliers, and we have not, in recent years, experienced any significant shortages of these items and normally do not carry inventories of these items in excess of those reasonably required to meet our production and shipping schedule. Raw materials comprise the largest component of our costs. We experienced significant price increases in our raw steel and steel-related component purchases in 2004 and the prices have remained at higher levels than historical prices. We were successful in passing through price increases on some products in 2005 in order to partially offset these costs. Additional increases could further materially increase our operating costs and materially adversely affect our profit margins. In addition, there has typically been a delay of up to several months or longer in our ability to increase prices to our customers, which has temporarily impacted profitability. Furthermore, we are subject to freight and energy costs in obtaining the supply of components and products that our customers require and thus are sensitive to increases in those prices as well. Moreover, we have experienced longer than typical lead times in sourcing some of our steel-related components and certain finished products, which caused us to buy from non-preferred vendors at higher costs. In the future, if costs continue to rise rapidly, it may be difficult to pass these costs on to our customers in a timely fashion. We also purchase component parts or finished goods from competitors or other suppliers, a common practice in the aftermarket industry.
10
Table of ContentsCompetition
The brake aftermarket is comprised of several large manufacturers: our Company, Federal Mogul Corp. under the brand name Wagner, Genuine Parts Co. under the brand name Rayloc, Honeywell International Inc. under the brand name Bendix, and Cardone Industries, Inc. under the brand name Cardone. The light-duty filter aftermarket is comprised of several large U.S. manufacturers: our Company, United Components, Inc. under the brand name Champ, Honeywell International Inc. under the FRAM brand and ArvinMeritor Inc. under the Purolator brand, along with several international light-duty filter suppliers. The heavy-duty filter aftermarket is comprised of several manufacturers, including our Company, Cummins, Inc. under the brand name Fleetguard, CLARCOR Inc. under the brand name Baldwin, and Donaldson Company Inc. under the brand name Donaldson. The chassis aftermarket is comprised primarily of two large U.S. manufacturers: Federal Mogul Corp. under the brand name Moog, and our Company, along with some international chassis suppliers. We compete on, among other things, the basis of quality, price, service, brand reputation, delivery, technology and product offerings.
Employees
As of December 31, 2005, we had 11,678 employees, of whom 7,978 were employed in North America, 2,180 were employed in Europe and 1,520 were employed in South America. Approximately 24% of our employees are salaried and the remaining 76% of our employees are paid hourly. As of December 31, 2005, approximately 120 of our U.S. employees and approximately 812 Canadian employees were represented by unions. We consider relations with our employees to be good.
Environmental Matters
We are subject to a variety of federal, state, local and foreign environmental laws and regulations, including those governing the discharge of pollutants into the air or water, the emission of noise and odors, the management and disposal of hazardous substances or wastes, the clean-up of contaminated sites and human health and safety. Some of our operations require environmental permits and controls to prevent and reduce air and water pollution, and these permits are subject to modification, renewal and revocation by issuing authorities. Contamination has been discovered at certain of our owned properties, which is currently being monitored and/or remediated. Although we are not aware of any contaminated sites which we believe will result in material liabilities, the discovery of additional remedial obligations at these sites could result in significant liabilities. In addition, many of our current and former facilities are located on properties with long histories of industrial or commercial operations. Because some environmental laws can impose liability for the entire cost of clean-up upon any of the current or former owners or operators, regardless of fault, we could become liable for investigating or remediating contamination at these properties if contamination requiring such activities is discovered in the future. We anticipate incurring environmental remediation costs and retirement obligations associated with the comprehensive restructuring and the acquisition restructuring plans that were announced in 2005 (Refer to Item 8. Note 18. Restructuring of Operations).
We are also subject to the U.S. Occupational Safety and Health Act and similar state and foreign laws. We believe that we are in substantial compliance with all applicable environmental laws and regulations. Historically, our costs of achieving and maintaining compliance with environmental and health and safety requirements have not been material to our operations.
Internet Availability
Available free of charge through our internet website is a link to our reports on forms 10-K, 10-Q, 8-K and amendments to those reports filed with the Securities and Exchange Commission. These reports can be found through a link on our internet website www.affiniagroup.com as soon as reasonably practicable after they are electronically filed with, or furnished to, the Securities and Exchange Commission.
11
Table of Contents | |
| Item 1A. | Risk Factors |
If any of the following events discussed in the following risks were to occur, our results of operations, financial conditions, or cash flows could be materially affected. Additional risks and uncertainties not presently known or currently deemed material by us may also constrain our business operations.
We are subject to increasing pricing pressure from import activity, particularly from China.
Price competition from aftermarket manufacturers particularly based in China and other locations with lower production costs have historically played a role and may play an increasing role in the aftermarket sectors in which we compete. Pricing pressures have historically been more prevalent with respect to our brake and chassis products than our other products. While aftermarket manufacturers in these locations have historically competed primarily in markets for less technologically advanced products and manufactured a limited number of products, they are expanding their manufacturing capabilities to produce a broad range of lower cost, higher quality products and provide an expanded product offering. In the future, competitors in Asia may be able to effectively compete in our premium markets and produce a wider range of products which may force us to move additional manufacturing capacity offshore and/or lower our prices, reducing our margins and/or decreasing our net sales.
The shift in demand from premium to economy brands may force us to produce value products at the expense of premium products, forcing us to lower our prices, thereby reducing our margins and decreasing our net sales.
We estimate that a majority of our net sales are currently derived from products we consider to be premium products and this number has been declining. There has been, and may continue to be, a shift in demand from premium products, on which we can generally command premium pricing and generate enhanced margins, to value products. If such a trend continues, we may be forced to expand our production and/or purchases of value products at competitive prices. In addition, we could be forced to further reduce our prices to remain competitive, in which case our margins will decrease unless we make corresponding reductions in our cost structure.
Our substantial leverage could harm our business by limiting our available cash and our access to additional capital and, to the extent of our variable rate indebtedness, exposing us to interest rate risk.
As a result of the Acquisition, we are highly leveraged. This leverage may limit our ability to obtain additional financing for working capital, capital expenditures, product development, debt service requirements, acquisitions, restructuring and general corporate or other purposes, limit our ability to adjust to changing market conditions and place us at a competitive disadvantage compared to our less leveraged competitors. In addition, a substantial portion of our cash flows from operations must be dedicated to the payment of principal and interest on our indebtedness and is not available for other purposes, including our operations, capital expenditures and future business opportunities. Certain of our borrowings, including borrowings under our senior credit facilities, are at variable rates of interest, exposing us to the risk of increased interest rates. We may be more vulnerable than a less leveraged company to a downturn in general economic conditions or in our business, or we may be unable to carry out capital spending that is important to our growth.
Our business would be materially and adversely affected if we lost any of our largest customers.
For the year ended December 31, 2005, approximately 21% and 8% of our gross sales were to NAPA and CARQUEST, respectively. To compete effectively, we must continue to satisfy these and other customers' pricing, service, technology and increasingly stringent quality and reliability requirements. Additionally, our revenues may be affected by decreases in NAPA's or CARQUEST's business or market share. Consolidation among our customers may also negatively impact our
12
Table of Contentsbusiness. We cannot provide any assurance as to the amount of future business with these or any other customers. While we intend to continue to focus on retaining and winning these and other customers' business, we may not succeed in doing so. Although business with any given customer is typically split among numerous contracts, the loss of, or significant reduction in purchases by, one of those major customers could materially and adversely affect our business, results of operations and financial condition.
During June 2004, AutoZone terminated its relationship with us. We believe the termination was primarily due to our decision not to participate in its consignment inventory program known as pay-on-scan. We have replaced some of this business in 2005 with business from new and existing customers. We have not been able to, and we cannot assure you that we will be able to, replace the balance of the AutoZone business with business from new or existing customers.
Increasing costs for manufactured components, raw materials, crude oil and energy prices may adversely affect our profitability.
We use a broad range of manufactured components and raw materials in our products, including raw steel, steel-related components, filtration media, aluminum, brass, iron, rubber, resins, plastics, paper and packaging materials. Materials comprise the largest component of our costs. We have recently experienced significant price increases in our crude oil, raw steel and steel-related component purchases. Further increases in the price of these items could further materially increase our operating costs and materially adversely affect our profit margins. In addition, in connection with passing through steel and other raw material price increases to our customers, there has typically been a delay of up to several months in our ability to increase prices, which has temporarily impacted profitability. For example, although we began implementing price increases with customers in June 2004 to pass through the increases in steel costs that we began experiencing in the beginning of 2004, delays in implementing these increases resulted in a deterioration of our margins and profitability. In the future, it may be difficult to pass further price increases on to our customers, especially if we experience additional cost increases soon after implementing price increases. In addition, we have experienced longer than typical lead times in sourcing some of our steel-related components and certain finished products, which caused us to buy from non-preferred vendors at higher costs.
We may not be able to achieve the cost savings that we expect from the restructuring of our operations.
Although we expect to realize cost savings as a result of our comprehensive restructuring plan, we may not be able to achieve the level of benefits that we expect to realize or we may not be able to realize these benefits within the timeframes we currently expect. We are currently rationalizing certain manufacturing operations in order to alleviate redundant capacity and reduce our cost basis. This restructuring will involve the movement of U.S. and Canada production to Mexico, South America and Asia. Our ability to achieve these cost savings could be affected by a number of factors. Since our restructuring efforts will focus on increasing our international presence, they will exacerbate the risks described below relating to our non-U.S. operations. Changes in the amount, timing and character of charges related to the restructuring, failure to complete or a substantial delay in completing the restructuring and planned divestitures or the receipt of lower proceeds from such divestitures than currently is anticipated could have a material adverse effect on us.
As a result of the consolidation driven by improved logistics and data management, distributors have reduced their inventory levels, which has reduced and could continue to reduce our sales.
Warehouse distributors have consolidated through acquisition and drained off inventories, while streamlining their own distribution systems through more timely deliveries and better data management. The corresponding reduction in purchases by distributors negatively impacted our sales. Further consolidation could have a similar adverse impact on our sales.
If the aftermarket adopts practices such as pay-on-scan programs and expansion of return policies, our cash flow and results of operations could be harmed.
Some customers in the aftermarket are pursuing ways to shift their costs of working capital. For example, our fourth largest customer in 2003, AutoZone, publicly stated that it is pursuing a
13
Table of Contentsconsignment inventory program known as pay-on-scan whereby suppliers retain title to inventory until the inventory is eventually sold. Under such a program, we would not record a sale until our customer sells our product and our receipt of payment for such sales would typically be delayed for a specified period until after the sale was made. We have declined to participate in this program, even though some of our competitors do so. We believe AutoZone's termination of its relationship with us in 2004 was primarily based on our decision not to participate in this pay-on-scan program. If the pay-on-scan program or a similar program is pursued by other customers, we may be asked to participate in such programs with our customers or extend more favorable terms to them. If this were to occur, we may lose these customers and our net sales and cash flow may be adversely affected.
We are also subject to returns from customers, some of which may manage their excess inventory through returns. Arrangements with customers typically include provisions that permit them to return specified levels of their purchases. Returns have historically represented approximately 2% of our sales. If returns from our customers significantly increase, our profitability may be adversely affected.
We are subject to other risks associated with our non-U.S. operations.
We have significant manufacturing operations outside the United States, including joint ventures and other alliances. We operate 44 manufacturing facilities with 17 locations in the United States, 6 in Canada, 4 in Mexico, 10 in Europe and 7 in South America. In 2005, approximately 41% of our net sales originated outside the United States. Risks are inherent in international operations, including:
| | |
| • | exchange controls and currency restrictions; |
| | |
| • | currency fluctuations and devaluations; |
| | |
| • | changes in local economic conditions; |
| | |
| • | changes in laws and regulations; |
| | |
| • | exposure to possible expropriation or other government actions; and |
| | |
| • | unsettled political conditions and possible terrorist attacks against American interests. |
These and other factors may have a material adverse effect on our international operations or on our business, results of operations and financial condition. We may experience net foreign exchange losses of gains due to currency fluctuations.
We may incur material losses and costs as a result of product liability and warranty and recall claims that may be brought against us.
We may be exposed to product liability and warranty claims in the event that our products actually or allegedly fail to perform as expected or the use of our products results, or is alleged to result, in bodily injury and/or property damage. Accordingly, we could experience material warranty or product liability losses in the future and incur significant costs to defend these claims.
In addition, if any of our products are, or are alleged to be, defective, we may be required to participate in a recall of that product if the defect or the alleged defect relates to automotive safety. Our costs associated with providing product warranties could be material. Product liability, warranty and recall costs may have a material adverse effect on our business, results of operations and financial condition. Our insurance may not be sufficient to cover such costs.
Recently, the U.S. automotive industry has been experiencing financial difficulties, which has led to some companies filing for protection under Chapter 11 of the United States Bankruptcy Code (the "Bankruptcy Code"). Specifically, Dana and Delphi Corporation have filed Chapter 11 cases, with Delphi Corporation filing on October 8, 2005 and Dana filing on March 3, 2006. We do not do sell a significant amount of parts to Delphi and currently the amount recorded in account receivables is insignificant. We have more significant relationships with Dana as discussed in the next paragraph (Refer to Item 8. Note 22. Subsequent Event for details on the Dana Chapter 11 cases).
On March 3, 2006, Dana and forty of its domestic subsidiaries (the "Debtors") filed voluntary petitions for reorganization under the Bankruptcy Code in the United States Bankruptcy Court,
14
Table of ContentsSouthern District of New York (the "Court") (Case No. 06-10354). The Debtors will continue to operate their businesses as ‘‘debtors-in-possession’’ under the jurisdiction of the Court and in accordance with applicable provisions of the Bankruptcy Code and orders of the Court. Dana is, pursuant to the Purchase Agreement, contractually obligated to indemnify us for specified liabilities, including, among others, (1) liabilities arising out of legal proceedings that commenced prior to the Acquisition and (2) liabilities for death, personal injury or other injury to persons (including, but not limited to, such liabilities that result from human exposure to asbestos) or property damage occurring prior to the Acquisition relating to the use or exposure to any of Dana's products designed, manufactured, served or sold by Dana. However, in the context of Dana's bankruptcy, Dana may be discharged entirely from its obligations to indemnify us for future defense, settlements or payments in respect of any claim subject to its indemnity obligations and we may recover less than 100% of any indemnification obligations of Dana existing as of March 3, 2006. Further, we do not know whether any insurance that may have been maintained by Dana will cover the costs for which Dana is contractually obligated to indemnify us. In addition, if Dana is unable or unwilling to pay settlements or judgments, claims may be brought against us that historically have been asserted only against Dana and other current or former manufacturers of automotive products, not including us. The failure of Dana to honor its indemnification obligations could adversely affect our financial condition and results of operations. Our accounts receivable from Dana at April 13, 2006 were insignificant.
We are subject to costly regulation, particularly in relation to environmental, health and safety matters, which could adversely affect our business and results of operations.
We are subject to a substantial number of costly regulations. In particular, we are required to comply with frequently changing and increasingly stringent requirements of federal, state and local environmental and occupational safety and health laws and regulations in the United States and other countries, including those governing emissions to air, discharges to air and water, and the creation and emission of noise and odor; the generation, handling, storage, transportation, treatment and disposal of waste materials; and the cleanup of contaminated properties and occupational health and safety. We could incur substantial costs, including cleanup costs, fines and civil or criminal sanctions, third party property damage or personal injury claims, or costs to upgrade or replace existing equipment, as a result of violations of or liabilities under environmental, health and safety laws or non-compliance with environmental permits required at our facilities. In addition, many of our current and former facilities are located on properties with long histories of industrial or commercial operations. Because some environmental laws can impose joint and several liability for the entire cost of cleanup upon any of the current or former owners or operators, regardless of fault, we could become liable for investigating and/or remediating contamination at these properties if contamination requiring such activities is discovered in the future. We cannot assure you that we have been, or will at all times be, in complete compliance with all environmental requirements, or that we will not incur material costs or liabilities in connection with these requirements in excess of amounts we have reserved. In addition, environmental requirements are complex, change frequently and have tended to become more stringent over time. These requirements may change in the future in a manner that could have a material adverse effect on our business, results of operations and financial condition. We have made and will continue to make expenditures to comply with environmental requirements. These requirements, responsibilities and associated expenses and expenditures, if they continue to increase, could have a material adverse effect on our business and results of operations. While our costs to defend and settle claims arising under environmental laws in the past have not been material, we cannot assure you that this will remain so in the future. For more information about our environmental compliance and potential environmental liabilities, see ‘‘Item 1. Business — Environmental Matters’’ and ‘‘Item 3. Legal Proceedings.’’
Increased crude oil and energy prices could reduce global demand for and use of automobiles and increase our costs, which could have an adverse effect on our profitability.
Material increases in the price of crude oil have, historically, been a contributing factor to the periodic reduction in the global demand for and use of automobiles. A continued increase in the price of crude oil could reduce global demand for and use of automobiles and continue to shift customer
15
Table of Contentsdemand away from larger cars and light trucks (including SUVs), which we believe have more frequent replacement intervals for our products, which could have an adverse effect on our profitability. Further, as higher gasoline prices result in a reduction in discretionary spending for auto repair by the end users of our products, our results of operations have been, and could continue to be, impacted.
Our operations would be adversely affected if we are unable to purchase raw materials, manufactured components or equipment from our suppliers.
Because we purchase from suppliers various types of raw materials, finished goods, equipment and component parts, we may be materially and adversely affected by the failure of those suppliers to perform as expected. This non-performance may consist of delivery delays or failures caused by production issues or delivery of non-conforming products. The risk of non-performance may also result from the insolvency or bankruptcy of one or more of our suppliers. Our suppliers' ability to supply products to us is also subject to a number of risks, including availability of raw materials, such as steel, destruction of their facilities or work stoppages. In addition, our failure to promptly pay, or order sufficient quantities of inventory from, our suppliers may increase the cost of products we purchase or may lead to suppliers refusing to sell products to us at all. Our efforts to protect against and to minimize these risks may not always be effective.
Work stoppages or similar difficulties could significantly disrupt our operations.
As of December 31, 2005, approximately 120 of our U.S. employees and approximately 812 of our Canadian employees were represented by unions. It is possible that our workforce will become more unionized in the future. We may be subject to work stoppages and may be affected by other labor disputes. A work stoppage at one or more of our plants may have a material adverse effect on our business. Unionization activities could also increase our costs, which could have an adverse effect on our profitability.
Additionally, a work stoppage at one of our suppliers could adversely affect our operations if an alternative source of supply were not readily available. Stoppages by employees of our customers also could result in reduced demand for our products.
Our intellectual property portfolio is subject to legal challenges.
We have developed and actively pursue developing a considerable amount of proprietary technology in the automotive industry and rely on intellectual property laws and a number of patents to protect such technology. In doing so, we incur ongoing costs to enforce and defend our intellectual property. We also face increasing exposure to the claims of others for infringement of intellectual property rights. We cannot assure you that we will not incur material intellectual property claims in the future or that we will not incur significant costs or losses related to such claims. We also cannot assure you that our proprietary rights will not be invalidated or circumvented.
We may not be able to successfully respond to changing distribution channels for aftermarket products.
Major aftermarket retailers, such as AutoZone and Advance Auto Parts, are attempting to increase their commercial sales by selling directly to automotive parts installers in addition to individual consumers. These installers have historically purchased from local warehouse distributors and jobbers, who are our more traditional customers. We cannot assure you that we will be able to maintain or increase aftermarket sales through increasing our sales to retailers.
Our success depends in part on our development of improved products, and our efforts may fail to meet the needs of customers on a timely or cost-effective basis.
Our continued success depends on our ability to maintain advanced technological capabilities, machinery and knowledge necessary to adapt to changing market demands as well as to develop and commercialize innovative products. We cannot assure you that we will be able to develop new
16
Table of Contentsproducts as successfully as in the past or that we will be able to keep pace with technological developments by our competitors and the industry generally. In addition, we may develop specific technologies and capabilities in anticipation of customers' demands for new innovations and technologies. If such demand does not materialize, we may be unable to recover the costs incurred in such programs. If we are unable to recover these costs or if any such programs do not progress as expected, our business, financial condition or results of operations could be materially adversely affected.
The introduction of new and improved products and services may reduce our future sales.
Improvements in technology and product quality may extend the longevity of automotive parts and delay aftermarket sales. In particular, in our oil filter business the introduction of oil change indicators and the use of synthetic motor oils may extend oil filter replacement cycles. The introduction of electric, fuel cell and hybrid automobiles may pose a long-term risk to our business because these vehicles may alter demand for our primary product lines. In addition, the introduction by OEMs of increased warranty and maintenance service initiatives, which are gaining popularity, have the potential to decrease the demand for our products in the traditional and retail sales channels.
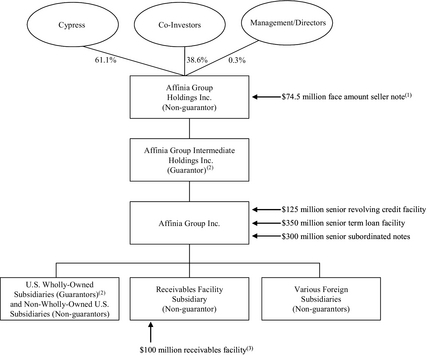
Cypress controls us and may have conflicts of interest with us or the holders of our senior subordinated notes in the future.
Cypress beneficially owns 61.1% of the outstanding shares of our common stock. As a result, Cypress has control over our decisions to enter into any corporate transaction and has the ability to prevent any transaction that requires the approval of stockholders regardless of whether or not other stockholders or noteholders believe that any such transactions are in their own best interests. For example, Cypress could cause us to make acquisitions that increase the amount of indebtedness that is secured or senior to the senior subordinated notes or sell revenue-generating assets, impairing our ability to make payments under the senior subordinated notes.
Additionally, Cypress is in the business of making investments in companies and may from time to time acquire and hold interests in businesses that compete directly or indirectly with us. So long as Cypress continues to own a significant amount of the outstanding shares of our common stock, even if such amount is less than 50%, it will continue to be able to strongly influence or effectively control our decisions.
| |
| Item 1B. | Unresolved Staff Comments. |
None.
| |
| Item 2. | Properties |
Our principal executive offices are located in Ann Arbor, Michigan; our operations include numerous manufacturing, research and development and warehousing facilities as well as offices. We operate 44 principal manufacturing facilities with 17 locations in the United States, 6 in Canada, 4 in Mexico, 10 in Europe and 7 in South America. In addition, we own or lease 49 principal distribution facilities located throughout the world, including 11 in the United States, 3 in Canada, 3 in Mexico, 10 in Europe and 22 in South America. Approximately 60% of our principal manufacturing domestic facilities are brake production facilities, 30% are filtration production facilities and 10% are chassis production facilities. Of the total number of principal manufacturing facilities operated by us, approximately 64% of such facilities are owned and 36% are leased.
| |
| Item 3. | Legal Proceedings |
Various claims, lawsuits and administrative proceedings are pending or threatened against us and our subsidiaries, arising from the ordinary course of business with respect to commercial, intellectual property, product liability and environmental matters. We believe that the ultimate resolution of the foregoing matters will not have a material effect on our financial condition or results of operations.
17
Table of ContentsOn March 3, 2006, Dana and forty of its domestic subsidiaries (the "Debtors") filed voluntary petitions for reorganization under the Bankruptcy Code in the United States Bankruptcy Court, Southern District of New York (the "Court") (Case No. 06-10354). The Debtors will continue to operate their businesses as ‘‘debtors-in-possession’’ under the jurisdiction of the Court and in accordance with applicable provisions of the Bankruptcy Code and orders of the Court. Dana is, pursuant to the Purchase Agreement, contractually obligated to indemnify us for specified liabilities, including, among others, (1) liabilities arising out of legal proceedings that commenced prior to the Acquisition and (2) liabilities for death, personal injury or other injury to persons (including, but not limited to, such liabilities that result from human exposure to asbestos) or property damage occurring prior to the Acquisition relating to the use or exposure to any of Dana's products designed, manufactured, served or sold by Dana. However, in the context of Dana's bankruptcy, Dana may be discharged entirely from its obligations to indemnify us for future defense settlements or payments in respect of any claim subject to its indemnity obligations and we may recover less than 100% of any indemnification obligations of Dana existing as of March 3, 2006. Further, we do not know whether any insurance that may have been maintained by Dana will cover the costs for which Dana is contractually obligated to indemnify us. In addition, if Dana is unable or unwilling to pay settlements or judgments, claims may be brought against us that historically have been asserted only against Dana and other current or former manufacturers of automotive products, not including us. The failure of Dana to honor its indemnification obligations could adversely affect our financial condition and results of operations.
| |
| Item 4. | Submission of Matters to a Vote of Security Holders |
During the fourth quarter of the year covered by this report, no matters were submitted to a vote of security holders.
18
Table of ContentsPART II.
| |
| Item 5. | Market for Registrant’s Common Equity, Related Stockholder Matters and Issuer Purchases of Equity Shares |
No trading market for our common stock currently exists. As of April 13, 2006, our parent, Affinia Group Holdings Inc., was the sole holder of our common stock. The Company has not declared or paid any cash dividends on its common stock in its two most recent years. We intend to retain all current and foreseeable future earnings to support operations. Our senior credit facilities and our senior subordinated notes indenture restrict our ability to pay cash dividends on our common stock. For information in respect of securities authorized under our equity compensation plan, see Item 11. Executive Compensation.
The following table provides information about Affinia Group Holdings Inc.'s shares of common stock that may be issued upon the exercise of options under its existing equity compensation plans as of December 31, 2005:
| | | | | | | | | | | | | | |
| Plan Category | | Number of securities to
be issued upon exercise
of outstanding options,
warrants and rights | | Weighted average
exercise price of
outstanding options,
warrants and rights | | Number of securities
remaining available for
future issuance |
| Equity compensation plans approved by security holders(1): | | | 227,000 | | | $ | 100.00 | | | | 86,300 | |
| Equity compensation plans not approved by security holders | | | N/A | | | | N/A | | | | N/A | |
| Total | | | 227,000 | | | $ | 100.00 | | | | 86,300 | |
|
| |
| (1) | This plan consists of the Affinia Group Holdings Inc. 2005 Stock Incentive Plan. See Item 11. Executive Compensation for a description of the plan. |
| |
| Item 6. | Selected Historical Consolidated and Combined Financial Data |
Affinia Group Intermediate Holdings Inc. was formed in connection with the Acquisition. The financial statements included in this report are the combined financial statements of the aftermarket business of Dana before the Acquisition and the consolidated financial statements of Affinia Group Intermediate Holdings Inc. after the Acquisition. The financial data presented below for periods prior to the Acquisition are referred to as ‘‘Predecessor’’ and the financial data for periods after the Acquisition are referred to as ‘‘Successor.’’ The selected financial data have been derived from our financial statements. The financial data as of December 31, 2004 and 2005 and for the years ended December 31, 2003 and 2005 and for the period from January 1, 2004 through November 30, 2004 and for the period from December 1, 2004 through December 31, 2004 have been derived from the audited financial statements contained under ‘‘Item 8. Financial Statements and Supplementary Data.’’ The selected financial data as of December 31, 2002 and 2003 and for the year ended December 31, 2002 and 2001 have been derived from the audited financial statements of the Predecessor. The selected financial data as of December 31, 2001 have been derived from the internal unaudited accounting records of Predecessor. In the opinion of management, such unaudited financial data reflect all adjustments, consisting only of normal and recurring adjustments, necessary for a fair presentation of the results for those periods.
The statement of cash flows for the period December 1, 2004 through December 31, 2004 has been restated (Refer to Note 2. Restatement of Financial Statement).
The data for the periods after the Acquisition are therefore based on an allocation of the Acquisition purchase price, which is based on fair values of the assets acquired and liabilities assumed.
19
Table of ContentsYou should read the following data in conjunction with ‘‘Item 7. Management's Discussion and Analysis of Financial Condition and Results of Operations’’ and ‘‘Item 8. Financial Statements and Supplementary Data (Dollars in Millions).’’
| | | | | | | | | | | | | | | | | | | | | | | | | | |
| | | Predecessor | | Successor |
| | | Year Ended December 31, | | January 1 to
November 30, | | December 1 to
December 31, | | Year Ended
December 31, |
| | | 2001 | | 2002 | | 2003 | | 2004 | | 2004 | | 2005 |
| Statement of income data: | | | | | | | | | | | | | | | | | | | | | | | | |
| Net sales | | $ | 2,038 | | | $ | 2,035 | | | $ | 2,025 | | | $ | 1,934 | | | $ | 155 | | | $ | 2,132 | |
| Cost of sales | | | 1,760 | | | | 1,634 | | | | 1,656 | | | | 1,657 | | | | 137 | | | | 1,837 | |
| Gross profit | | | 278 | | | | 401 | | | | 369 | | | | 277 | | | | 18 | | | | 295 | |
| Selling, general and administrative expenses | | | 276 | | | | 281 | | | | 254 | | | | 234 | | | | 21 | | | | 261 | |
| Loss on disposition of Beck Arnley | | | — | | | | — | | | | — | | | | — | | | | — | | | | 21 | |
| Operating profit (loss) | | | 2 | | | | 120 | | | | 115 | | | | 43 | | | | (3 | ) | | | 13 | |
| Other income, net | | | 4 | | | | 4 | | | | 5 | | | | 4 | | | | 2 | | | | 8 | |
| Income (loss) before interest expense, taxes and minority interest | | | 6 | | | | 124 | | | | 120 | | | | 47 | | | | (1 | ) | | | 21 | |
| Interest expense | | | (8 | ) | | | (5 | ) | | | (3 | ) | | | (2 | ) | | | (5 | ) | | | (55 | ) |
| (Loss) income before taxes and minority interest | | | (2 | ) | | | 119 | | | | 117 | | | | 45 | | | | (6 | ) | | | (34 | ) |
| Income tax provision (benefit) | | | 13 | | | | 56 | | | | 49 | | | | 18 | | | | (2 | ) | | | (4 | ) |
| Minority interest, net of tax | | | — | | | | (1 | ) | | | (2 | ) | | | — | | | | — | | | | — | |
| (Loss) income before effect of change in accounting | | | (15 | ) | | | 62 | | | | 66 | | | | 27 | | | | (4 | ) | | | (30 | ) |
Effect of change of accounting, net
of tax | | | — | | | | (20 | ) | | | — | | | | — | | | | — | | | | — | |
(Loss) income from continuing
operations | | | (15 | ) | | | 42 | | | | 66 | | | | 27 | | | | (4 | ) | | | (30 | ) |
| (Loss) income from discontinued operations net of tax | | | (4 | ) | | | (2 | ) | | | 1 | | | | 1 | | | | — | | | | — | |
| Net (loss) income | | $ | (19 | ) | | $ | 40 | | | $ | 67 | | | $ | 28 | | | $ | (4 | ) | | $ | (30 | ) |
| Statement of cash flows data: | | | | | | | | | | | | | | | | | | | | | | | | |
| Net cash from continuing operations: | | | | | | | | | | | | | | | | | | | | | | | | |
| Operating activities, restated | | $ | 183 | | | $ | 155 | | | $ | 115 | | | $ | (7 | ) | | $ | 58 | | | $ | 103 | |
| Investment activities | | | (24 | ) | | | (22 | ) | | | (37 | ) | | | (37 | ) | | | (1,018 | ) | | | (52 | ) |
| Financing activities, restated | | | (153 | ) | | | (120 | ) | | | (70 | ) | | | 42 | | | | 996 | | | | (49 | ) |
| Other financial data: | | | | | | | | | | | | | | | | | | | | | | | | |
| Capital expenditures | | $ | 28 | | | $ | 26 | | | $ | 44 | | | $ | 44 | | | $ | 3 | | | $ | 35 | |
| Depreciation | | | 50 | | | | 46 | | | | 46 | | | | 41 | | | | 4 | | | | 46 | |
| Amortization of goodwill (pre-tax)(2) | | | 5 | | | | — | | | | — | | | | — | | | | — | | | | — | |
| Balance sheet data (end of period):(3) | | (Unaudited) | | | | | | | | | | | | | | | | | | | | |
| Cash and cash equivalents | | $ | 21 | | | $ | 38 | | | $ | 46 | | | $ | 44 | | | $ | 80 | | | $ | 82 | |
| Total current assets | | | 970 | | | | 961 | | | | 985 | | | | 1,091 | | | | 988 | | | | 907 | |
| Total assets | | | 1,323 | | | | 1,281 | | | | 1,313 | | | | 1,435 | | | | 1,469 | | | | 1,440 | |
| Total current liabilities | | | 346 | | | | 381 | | | | 385 | | | | 366 | | | | 397 | | | | 408 | |
| Total non-current liabilities and minority interest in consolidated subsidiaries | | | 66 | | | | 104 | | | | 106 | | | | 144 | | | | 668 | | | | 658 | |
| Shareholders equity | | | 911 | | | | 796 | | | | 822 | | | | 925 | | | | 404 | | | | 374 | |
|
| |
| (1) | We initiated in 2001 a restructuring plan that we completed in 2003, including a reduction of our workforce, the closure of 13 facilities, the sale of two non-core businesses, a reduction in real estate and improvements in working capital management. The restructuring charges relating to this plan were $38, $35 and $4 million for 2001 through 2003, respectively. Additionally, for the period January 1 to November 30, 2004, we had $2 million in restructuring charges. Restructuring charges related to these efforts included severance, asset writedowns and related exit costs. In 2005, we |
20
Table of Contents | |
| substantially completed the acquisition restructuring plan and announced the comprehensive restructuring plan that will be completed over the next two years. The comprehensive and acquisition restructuring charges combined were $25 million in 2005. |
| |
| (2) | SFAS No. 142, ‘‘Goodwill and Other Intangible Assets,’’ which the Predecessor adopted effective January 1, 2002, did not provide for restatement of prior periods. The amounts below present the amount of goodwill amortization, net of the related income tax benefits, included in reported net loss as if SFAS No. 142 had been adopted prior to the earliest year presented. |
| | | | | | |
| | | Year Ended
December 31, 2001 |
| | | (Dollars in Millions) |
| Reported net loss | | $ | (19 | ) |
| Effect of goodwill amortization, net of tax | | | 4 | |
| Adjusted net loss | | $ | (15 | ) |
|
| |
| (3) | For presentation purposes, the various balance sheet line items as of December 31, 2001, 2002, 2003, and November 30, 2004 within the table have not been modified to reflect the 2005 disposition of Candados Universales de Mexico, S.A. de C.V. (‘‘Cumsa’’) as such a presentation would not be materially different. The presentation of the various balance sheet line items as of December 31, 2005 and 2004 within the table does reflect the impact of the 2005 disposition of Cumsa. |
| |
| Item 7. | Management’s Discussion and Analysis of Financial Condition and Results of Operations |
The following discussion and analysis of our financial condition and results of operations covers periods prior and subsequent to the Acquisition. Accordingly, the discussion and analysis of historical operations of the Predecessor during the periods prior to the consummation of the Acquisition do not reflect the impact that the Acquisition has had on us. In addition, the statements in the discussion and analysis regarding industry outlook, our expectations regarding the performance of our business and other non-historical statements in the discussion and analysis are forward-looking statements. These forward-looking statements are subject to numerous risks and uncertainties, including, but not limited to, the risks and uncertainties described under ‘‘Forward-Looking Statements.’’ Our actual results may differ materially from those contained in or implied by any forward-looking statements. You should read the following discussion together with ‘‘Forward-Looking Statements,’’ ‘‘Item 6. Selected Historical Consolidated and Combined Financial Data’’ and ‘‘Item 8. Financial Statements and Supplementary Data.’’
The consolidated statement of cash flows for the period December 1, 2004 to December 31, 2004 has been restated to correct the presentation of funds received from the receivables facility and used to partially fund the Acquisition. There was no income statement or balance sheet impact as a result of this restatement. Amounts within this Management's Discussion and Analysis of Financial Condition and Results of Operations have been adjusted accordingly.
Company Overview
We are a leading designer, manufacturer and distributor of motor vehicle components for passenger cars, sports utility vehicles, light, medium and heavy trucks and off-highway vehicles in North America, Europe and South America. Our broad range of brake, filtration and chassis products are sold in North America, Europe and South America sold primarily to the aftermarket. In 2005, brake and filtration products which, by their nature, sustain significant wear and must routinely be replaced, represented 50% and 31% of our net sales, respectively. Chassis products, which include steering, suspension and driveline components, represented 7% of our net sales in 2005. The remaining 12% of our 2005 net sales were derived from our European products and other business, which includes our Quinton Hazell European distribution group and our North American Beck Arnley foreign nameplate business, which was sold on March 31, 2005.
The acquisition of Dana’s aftermarket business, which consisted of several operating units, was completed on November 30, 2004. In 2005, the first full year of operations, we sold three of our acquired operating units, Beck Arnley, Candados Universales de Mexico, S.A. de C.V. (‘‘Cumsa’’) and Auto Parts Acquisition LLC (which is part of Cumsa). These companies were not compatible with our strategic plan. Due to Affinia’s $3 million working capital loan to Beck Arnley and the contingent consideration used to pay for the sale, the transaction, under accounting rules, could not be presented as a discontinued operation. The Cumsa disposition qualified for discontinued operations treatment and we accordingly reclassified the amounts presented for prior years as discontinued operations.
21
Table of ContentsWe typically conduct business with our customers pursuant to short-term contracts and purchase orders. However, our business is not characterized by frequent customer turnover due to the critical nature of long-term relationships in our industry. The expectation of quick turnaround times for car repairs and the broad proliferation of available part numbers require a large investment in inventory and strong fulfillment capabilities in order to deliver high fill rates and quick cycle times. Large aftermarket distributors typically source their product lines at a particular price point and product category with one "full-line" supplier, such as our company, which covers substantially all of their product requirements. Switching to a new supplier typically requires that a distributor make a substantial investment to purchase, or "changeover," to the new supplier's products.
In addition, the end user of our products, who is most frequently a professional installer, requires consistently high quality products because it is industry practice to replace, free of any labor or service charge, malfunctioning parts. Despite these factors, our business is becoming more competitive as "value line" and offshore suppliers have tried to penetrate our customer base by targeting the highest volume part numbers in the value category, without offering full product line coverage. In many cases, the presence of these lower priced parts has caused full-line suppliers either to reduce prices in their premium categories or introduce new, intermediate-priced product offerings. In many instances, full-line suppliers have also been required to move more of their sourcing and production of value products to offshore, lower cost locations to offset this trend. We currently estimate that a majority of our net sales are currently derived from products we consider to be premium products and this number has been declining.
We frequently provide various rebates or allowances as a component of our product pricing. Rebates have steadily increased each year as a percentage of net sales due to the creation of new programs intended to maintain and grow our business. Our traditional channel and national retail customers have demanded increasingly competitive, as well as increasingly complex, pricing programs.
Business Environment
Our Markets. We believe that the aftermarket will continue to grow steadily as a result of continuing increases in (1) the light vehicle population, (2) the average age of vehicles, (3) the total number of miles driven, and (4) the prevalence of SUVs and lighter trucks in the fleet mix, since larger vehicles place greater wear on components such as brake systems and chassis components. Growth in sales in the aftermarket does not always have a direct correlation to sales growth for aftermarket suppliers like our company. For example, as automotive parts distributors have consolidated during the past several years, they have reduced purchases from manufacturers as they focused on reducing their combined inventories.
Raw Materials and Manufactured Components. Our variable costs are proportional to sales volume and mix and are comprised primarily of raw materials and labor and certain overhead costs. Our fixed costs are not significantly influenced by volume in the short term and consist principally of selling, general and administrative expenses, depreciation and other facility-related costs.
We use a broad range of manufactured components and raw materials in our products, including raw steel, steel-related components, filtration media, aluminum, brass, iron, rubber, resins, plastics, paper and packaging materials. We purchase raw materials from a wide variety of domestic and international suppliers, and we have not, in recent years, experienced any significant shortages of these items and normally do not carry inventories of these items in excess of those reasonably required to meet our production and shipping schedule.
We experienced significant price increases in our raw steel and steel-related component purchases last year. We have historically been successful in passing through price increases in order to offset these types of cost increases. Further increases in the price of these items could increase our operating costs and materially adversely affect our profit margins. In addition, there has typically been a delay of up to several months or longer in our ability to increase prices to our customers which has impacted profitability. We are also subject to freight and energy costs in obtaining the supply of components and products that our customers require and thus are sensitive to increases in those costs as well. In addition, we have experienced longer than typical lead times in sourcing some of our steel-related
22
Table of Contentscomponents and certain finished products, which caused us to buy from non-preferred vendors at higher costs. In the future, if costs continue to rise rapidly, it may be difficult to pass all of these costs on to our customers in a timely fashion.
We also purchase component parts or finished goods from competitors or other suppliers, a common practice in the automotive aftermarket industry.
Seasonality. Our working capital requirements are significantly impacted by the seasonality of the automotive aftermarket. In a typical year, we build inventory during the first and second quarters to accommodate our peak sales during the second and third quarters. Our working capital requirements therefore tend to be highest from March through August. In periods of weak sales, inventory can increase beyond typical seasonal levels, as our product delivery lead times are less than two days while certain components we purchase from overseas require lead times of up to 90 days.
Global Developments. The aftermarket has also experienced increased price competition from manufacturers based in China and other countries with lower production costs. These manufacturers may continue to play an increasing role in the areas of the aftermarket in which we compete by increasing their product offerings and expanding their manufacturing capabilities to produce lower cost, higher quality products. We are responding to this challenge through restructuring and outsourcing initiatives, as well as through ongoing cost reduction programs.
Restructuring
In 2005, we announced two restructuring plans: (i) a restructuring plan that we announced at the beginning of 2005 as part of the Acquisition, also referred to as the acquisition restructuring and (ii) a restructuring plan that we announced at the end of 2005, also referred to as the comprehensive restructuring.
The comprehensive restructuring will affect several facilities over the next two years. In December 2005, we announced the closure of one facility, our Southampton facility. Additionally, in March 2006 we announced the closure of the Erie, North East and McHenry plants and the intent to sell our Waupauca, Sudbury and St. Catherines facilities. Additional facility closures will be announced periodically over 2006 and 2007. In 2005, we recorded a charge of $23 million primarily comprised of severance costs and fixed asset impairment. The write-down of fixed assets was accounted for in accordance with Statement of Financial Account Standard (‘‘SFAS’’) No. 144, Accounting for the Impairment or Disposal of Long-Lived Assets. Severance costs are being accounted for in accordance with SFAS No. 146, Accounting for Costs Associated with Exit or Disposal Activities. We currently estimate that we will incur in the aggregate approximately $152 million of cash and non cash restructuring costs for the comprehensive restructuring. We anticipate that, upon completion of the restructuring program over the next two years, we will be strategically realigned to better take advantage of our well known brand names. We expect after the restructuring program is complete our modified cost structure should result in a better margins.
In the first quarter of 2005, as part of the Acquisition, we announced the acquisition restructuring. The acquisition restructuring plan was initiated to take advantage of opportunities we identified prior to the Acquisition but were, due to resource constraints, limited in our ability to actively pursue as part of Dana. Acquisition restructuring costs of $21 million associated with the acquisition restructuring were recorded to goodwill as an adjustment to the opening balance sheet, comprised of severance costs, fixed asset impairments, and other exit costs. Additionally, we charged directly to operations $2 million relating to current period exit costs. We do not expect any material costs subsequent to December 31, 2005, relating to the acquisition restructuring.
The restructuring plans are focused on lowering costs and improving profitability by rationalizing manufacturing operations and focusing on low-cost sourcing opportunities. Such initiatives include the movement of manufacturing to lower cost facilities. In addition to the shift of manufacturing to lower cost facilities relating to our restructuring plan, we are also focusing on the following:
| | |
| • | We have increased our foreign sourcing through direct manufacturing, purchasing of finished goods from third parties and strategic partnerships to better position ourselves relative to |
23
Table of Contents | | |
| | lower cost competitors for certain products. We have increased our production capacity in South America to capitalize on the lower cost environment for the manufacturing of many of our value line products. We have also significantly increased our sourcing of products from low labor cost countries as our suppliers in that market have increased their production quality and lowered their costs. |
| | |
| • | We are focused on expanding our product lines and solidifying our position as a leading provider of aftermarket brake, filtration and chassis parts in order to capitalize on several trends that are likely to affect growth and profitability positively in the aftermarket. The aftermarket has historically experienced stable growth rates. |
Basis of Presentation
The Predecessor did not historically operate as a stand-alone business, but as a reportable business segment of Dana. The audited and unaudited financial information of the Predecessor represents our business as it historically operated within Dana. Also, due to the Acquisition, and the resultant application of purchase accounting, the historical financial statements of the Predecessor and the Successor included in this report have been prepared on different bases for the periods presented and are not comparable.
The following provides a description of the basis of presentation during all periods presented:
Successor: Represents our consolidated financial position as of December 31, 2004 and December 31, 2005 and our consolidated results of operations and cash flows for the year ended December 31, 2005 and for the period from December 1, 2004 to December 31, 2004 following the Acquisition. The financial position as of December 31, 2004 and results of operations and cash flows for the period from December 1, 2004 to December 31, 2004 reflect the preliminary application of purchase accounting, described above, relating to the Acquisition. The financial position as of December 31, 2005 and results of operations and cash flows for the period ending December 31, 2005 reflect the final adjustments for purchase accounting.
Predecessor: Represents the combined financial position of the Predecessor for all periods prior to the Acquisition on November 30, 2004. The combined financial statements of the Predecessor for the year ended December 31, 2003 and the period from January 1, 2004 to November 30, 2004 are based on the historical assets, liabilities, sales and expenses of the Predecessor for the periods prior to the Acquisition.
As a result of the foregoing, the historical financial information for periods prior to December 1, 2004 included in this report may not reflect what our results of operations, financial position and cash flows would have been had we operated as a separate, stand-alone company for such periods.
The Company operates in a single business segment, which is the manufacturing and distribution of aftermarket parts. We have identified in tabular format in the Results of Operations tables below the revenue by product. At the end of 2005, we realigned the classification of our South American brake products from distribution and other into brake products. Additionally, we reclassified our hydraulic products from chassis products to brake products because hydraulic products relate more closely to the way brake products are managed operationally. We have also renamed our distribution and other products to European products and other. The European products and other classification consists mainly of our Quinton Hazell operations.
24
Table of ContentsResults of Operations
Year Ended December 31, 2005 Compared to the twelve months ended December 31, 2004
To enable meaningful comparisons, the consolidated results of the Successor after the November 30, 2004 Acquisition, and the combined 2004 results of the Predecessor before the Acquisition have been combined (referred to hereafter as the "twelve months ended December 31, 2004’’) in the following table for comparison to our operating results for the year ended December 31, 2005 (Dollars in Millions):
| | | | | | | | | | | | | | | | | | |
| | | Non-GAAP(1)
Combined
Twelve Months
Ended
December 31,
2004 | | Consolidated
Year Ended
December 31,
2005 | | Dollar
Change | | Percent
Change |
| Net sales | | | | | | | | | | | | | | | | |
| Brake products | | $ | 1,046 | | | $ | 1,052 | | | $ | 6 | | | | 1 | % |
| Chassis products | | | 163 | | | | 156 | | | | (7 | ) | | | −4 | % |
| Filtration products | | | 608 | | | | 661 | | | | 53 | | | | 9 | % |
| European products and other | | | 260 | | | | 260 | | | | — | | | | 0 | % |
| Corporate and eliminations | | | 12 | | | | 3 | | | | (9 | ) | | | −75 | % |
| Total net sales | | | 2,089 | | | | 2,132 | | | | 43 | | | | 2 | % |
| Cost of sales(2) | | | (1,794 | ) | | | (1,837 | ) | | | (43 | ) | | | 2 | % |
| Gross profit | | | 295 | | | | 295 | | | | — | | | | 0 | % |
| Gross margin | | | 14 | % | | | 14 | % | | | | | | | | |
| Selling, general and administrative expenses(3) | | | (255 | ) | | | (261 | ) | | | (6 | ) | | | 2 | % |
| Selling, general and administrative expenses as a percent of sales | | | 12 | % | | | 12 | % | | | | | | | | |
| Loss on disposition of Beck Arnley | | | — | | | | (21 | ) | | | (21 | ) | | | N/A | |
| Operating profit | | | 40 | | | | 13 | | | | (27 | ) | | | −68 | % |
| Operating margin | | | 2 | % | | | 1 | % | | | | | | | | |
| Other income, net | | | 6 | | | | 8 | | | | 2 | | | | 33 | % |
| Interest expense | | | (7 | ) | | | (55 | ) | | | (48 | ) | | | 686 | % |
| Income (loss) before taxes and minority interest and discontinued operations | | | 39 | | | | (34 | ) | | | (73 | ) | | | −187 | % |
| Income tax (benefit) provision | | | 16 | | | | (4 | ) | | | 20 | | | | −125 | % |
| Income (loss) from continuing operations | | | 23 | | | | (30 | ) | | | (53 | ) | | | 230 | % |
| Income (loss) from discontinued operations, net of tax | | | 1 | | | | — | | | | (1 | ) | | | −100 | % |
| Net income (loss) | | $ | 24 | | | $ | (30 | ) | | $ | (54 | ) | | | −225 | % |
|
| |
| (1) | The combined financial data for the twelve months ended December 31, 2004 represents the combined historical results of the Predecessor and Successor for the twelve months ended December 31, 2004. The presentation of both periods, in accordance with GAAP, is set forth under Item 6. Selected Historical Consolidated and Combined Financial Data. |
| |
| (2) | During 2005 we had $23 million in restructuring charges recorded in cost of sales, which was mainly due to asset writedowns. |
| |
| (3) | During the combined twelve months of 2004 and the year ended 2005, we recorded $2 million of restructuring costs in selling, general and administrative expenses for each year. |
Net sales. Our net sales increased in 2005 in comparison to 2004 due to (i) economic effects (principally rebates, pricing, cash discounts and returns and allowances) increases of $47 million which were implemented in late 2004 to partially offset higher materials costs and (ii) foreign currency
25
Table of Contentstranslation gains of $53 million primarily due to the strong Brazilian Real. Offsetting the economic effect increases and the translation gains were the following: (i) $32 million reduction due to our discontinued relationship with AutoZone (which ceased in 2004) and (ii) $25 million reduction in our Beck Arnley foreign nameplate distribution business that was sold in March of 2005.
Brake product sales were up slightly in 2005 in comparison to the combined results of 2004, primarily due to foreign currency translation gains of $40 million and economic effects of $5 million. These increases were somewhat offset by a $22 million decrease in sales volume (other than AutoZone) and the loss of AutoZone as a customer in 2004, which accounted for a $17 million decrease. Sales volume was down as a result of weaker retail markets in the first half of 2005.
Chassis product sales were down due to our loss of AutoZone as a customer in June 2004, which accounted for $15 million of sales during the combined twelve months of 2004. We were able to offset the decrease in volume with an $8 million increase in economic effects. Without the effect of the loss of AutoZone, chassis sales grew by $8 million or 5% compared to the 2004 combined year.
Filtration sales increased in 2005 primarily due to (i) economic effects of $34 million instituted in the latter half of 2004 in response to higher material costs related to significant steel cost increases incurred in 2004; (ii) $9 million increase in sales volume and (iii) $10 million in foreign currency translation gains.
European products and other operations sales for 2005 were comparable with the combined twelve months of 2004.
Corporate and eliminations consists of Beck Arnley sales and intercompany sales eliminations between product groupings. The sales were lower in the current year due to the divestiture of Beck Arnley in the first quarter of 2005. Beck Arnley sales decreased $24 million in 2005 in comparison to the 2004 twelve months.
Cost of sales. Our cost of sales increased in 2005 mainly due to restructuring charges associated with our recently announced comprehensive restructuring plan. Also contributing to the increase in cost of sales were foreign currency translation adjustments and lower absorption of manufacturing costs as a result of our facility closures and our aggressive inventory reduction program.
Selling, general and administrative expenses. Our selling, general and administrative expenses increased in 2005 over the combined twelve months of 2004 due to costs of approximately $8 million associated with the procurement of new business in the brake and chassis product lines. While our selling, general and administrative expenses increased, our selling, general and administrative expenses as a percent of sales was the same for both 2004 and 2005.
Operating profit. Our operating profit decreased in the current year due mainly to a $21 million loss on the disposition of Beck Arnley and restructuring charges of $25 million. We disposed of our subsidiary, Beck Arnley, on March 31, 2005 because its operations did not match with our strategic objectives. Also contributing to the decrease in operating profit were foreign currency translation adjustments and lower absorption of manufacturing costs as a result of our facility closures and our aggressive inventory reduction program.
Interest expense. The interest expense increase in 2005 was due to interest and finance charges in respect of the Company's senior subordinated notes and senior credit facilities, entered into during the fourth quarter of 2004 to fund the Acquisition.
Income tax (benefit) provision. The tax benefit rate of 12% for 2005 was lower than the 35% U.S. federal statutory tax rate on account of higher effective tax rates on non-U.S. income. We had tax benefit in 2005 due to the net loss incurred in the current year. The effective tax rate of 41% for the combined twelve months of 2004 was higher than the 35% effective U.S. federal statutory tax rate due principally to higher effective non-U.S. tax rates and, to a lesser extent, inclusion of state and local taxes net of the state and federal tax benefit.
Net income (loss). Net income decreased in comparison to last year due mainly, as discussed above, to significant restructuring charges and the loss on the sale of Beck Arnley.
26
Table of ContentsTwelve months ended December 31, 2004 Compared to Year Ended December 31, 2003
To enable meaningful comparisons, the consolidated results of the Successor after the November 30, 2004 Acquisition and the combined 2004 results of the Predecessor before the Acquisition have been combined (referred to hereafter as the ‘‘twelve months ended December 31, 2004’’) in the following table for the comparison to the Predecessor’s operating results for the year ended December 31, 2003 (Dollars in Millions):
| | | | | | | | | | | | | | | | | | |
| | | Twelve Months
Ended
December 31,
2003 | | Non-GAAP(1)
Twelve Months
Ended
December 31,
2004 | | Dollar
Change | | Percent
Change |
| Net sales | | | | | | | | | | | | | | | | |
| Brake products | | $ | 1,042 | | | $ | 1,046 | | | $ | 4 | | | | 0 | % |
| Chassis products | | | 166 | | | | 163 | | | | (3 | ) | | | −2 | % |
| Filtration products | | | 562 | | | | 608 | | | | 46 | | | | 8 | % |
| European products and other | | | 234 | | | | 260 | | | | 26 | | | | 11 | % |
| Corporate and eliminations | | | 21 | | | | 12 | | | | (9 | ) | | | −43 | % |
| Total net sales | | | 2,025 | | | | 2,089 | | | | 64 | | | | 3 | % |
| Cost of sales | | | (1,656 | ) | | | (1,794 | ) | | | (138 | ) | | | 8 | % |
| Gross profit | | | 369 | | | | 295 | | | | (74 | ) | | | −20 | % |
| Gross margin | | | 18 | % | | | 14 | % | | | | | | | | |
| Selling, general and administrative expenses(2) | | | (254 | ) | | | (255 | ) | | | (1 | ) | | | 0 | % |
| Selling, general and administrative expenses as a percent of sales | | | 13 | % | | | 12 | % | | | | | | | | |
| Operating profit | | | 115 | | | | 40 | | | | (75 | ) | | | −65 | % |
| Operating margin | | | 6 | % | | | 2 | % | | | | | | | | |
| Other income, net | | | 5 | | | | 6 | | | | 1 | | | | 20 | % |
| Interest expense | | | (3 | ) | | | (7 | ) | | | (4 | ) | | | 133 | % |
| Income before taxes and minority interest and discontinued operations | | | 117 | | | | 39 | | | | (78 | ) | | | −67 | % |
| Income tax provision | | | (49 | ) | | | (16 | ) | | | 33 | | | | −67 | % |
| Minority interest | | | 2 | | | | — | | | | (2 | ) | | | −100 | % |
| Income from continuing operations | | | 66 | | | | 23 | | | | (43 | ) | | | −65 | % |
| Income from discontinued operations, net of tax | | | 1 | | | | 1 | | | | — | | | | 0 | % |
| Net income | | $ | 67 | | | $ | 24 | | | $ | (43 | ) | | | −64 | % |
|
| |
| (1) | The combined financial data for the twelve months ended December 31, 2004 represents the combined historical results of the Predecessor and Successor for the twelve months ended December 31, 2004. The presentation of both periods, in accordance with GAAP, is set forth under Item 6. Selected Historical Consolidated and Combined Financial Data. |
| |
| (2) | During the year ended 2003 and the combined twelve months of 2004 we recorded $4 and $2 million of restructuring costs, respectively, in selling and general and administrative expenses. |
Net sales. Our net sales increased in the 2004 combined twelve months from the year ending December 31, 2003 by $105 million, or 5% excluding the impact of the loss of AutoZone sales on both brake and chassis products, which represented an approximately $41 million decline in sales during the comparable period. This increase resulted primarily from increased unit volume across substantially all our product lines, principally during the first six months of 2004. Additionally, our net sales increased $32 million due to the impact of foreign currency translation of non U.S. dollar denominated sales, primarily driven by the appreciation of the euro, Canadian dollar and British pound sterling against the U.S. dollar.
27
Table of ContentsBrake product sales increased due in part to growth in unit volume of brake rotors and rotor castings to OEM and OES customers, as well as the favorable impact of foreign currency translation.
Chassis product sales decreased primarily due to the loss of AutoZone sales.
Filtration product sales increased due primarily to unit volume increases to existing customers in the United States as well as strong sales growth in Poland and Venezuela and, to a lesser extent, the favorable impact of foreign currency translation.
Our European products and other products sales increased due to the favorable impact of foreign currency translation on net sales. More specifically, due to the favorable impact of foreign currency translation of non-U.S. dollar denominated sales, primarily driven by the appreciation of the euro and British pound sterling against the U.S. dollar.
Corporate and eliminations decreased due to the decrease in Beck Arnley sales in 2004 in comparison to 2003. Beck Arnley sales were $12 million lower in the combined twelve months of 2004 in comparison to 2003. As previously mentioned, the Beck Arnley business was sold in 2005 because its operations did not match with our strategic objectives. Beck Arnley continued to experience declines due to lower unit volume, the exit of several product lines in late 2003 and higher levels of returns and selling price reductions.
Cost of sales. Our cost of sales increased for the combined twelve months of 2004 from the year ended December 31, 2003, related to the unit volume growth discussed above, foreign currency exchange rate movements and raw material price increases. As a percentage of net sales, cost of sales increased in the combined twelve months of 2004 compared to 2003. The increase in cost of sales as a percentage of net sales is primarily due to raw material price increases, particularly relating to raw steel and steel-related components. During 2004, our steel and steel-related components costs increased and have remained at high levels. These costs primarily affected our brake and chassis product lines, which have a larger steel content than our other product lines. We began implementing price increases with customers in June 2004 to pass through some of these increases in steel costs; however, timing of implementing those increases resulted in a deterioration of our margins and profitability. Further, the end markets in our brake and chassis products experienced weakness in demand beginning in the third quarter. We also experienced unfavorable product mix and pricing pressure from Asian competitors in certain of our brake product lines throughout the combined year of 2004. These factors, when coupled with the loss of AutoZone sales, resulted in the deterioration of margins in the combined year of 2004. Also, the Canadian dollar's appreciation against the U.S. dollar adversely impacted margins for our Canadian operations. Our products manufactured in Canada maintain a cost base denominated in Canadian dollars, while a majority of their sales to U.S. customers are denominated in U.S. dollars. In addition, cost of sales as a percentage of net sales increased for our Beck Arnley foreign nameplate products due to the sales erosion discussed above and the resulting reduction of absorption of fixed costs.
Selling, general and administrative expenses. Our selling, general and administrative expenses were comparable for the twelve months ended December 31, 2004 and for the year ended December 31, 2003.
Operating profit. As a result of the foregoing, our operating profit decreased to $40 million for the twelve months ended December 31, 2004 from $115 million for the year ended December 31, 2003. The main contributing factor for the decrease in operating profit was the decrease in our gross margin from 18% to 14% in 2004, which was due to raw material price increases.
Interest expense. Interest expense increased in the 2004 combined year from the year ended December 31, 2003. The increase was due to the Company obtaining $650 million of financing during the fourth quarter of 2004 to fund the Acquisition.
Income tax provision. Our provision for income taxes decreased due to the reduction in pre-tax income. Our effective tax rate for the combined twelve months of 2004 was 41% compared to 42% for the year ended December 31, 2003. The effective tax rate for both periods was higher than the 35% effective U.S. federal statutory tax rate due principally to higher effective non-U.S. tax rates and, to a lesser extent, inclusion of state and local taxes net of the state and federal tax benefit.
28
Table of ContentsNet income. Net income decreased in the combined twelve months of 2004 compared to 2003 due primarily to the decline in gross profit percentage as discussed above.
Liquidity and Capital Resources
The Company's primary source of liquidity is cash flow from operations. We also have availability under our revolving credit facility and receivables facility, subject to certain requirements. Our primary liquidity requirements are expected to be for debt servicing, working capital, restructuring obligations and capital spending. Our liquidity requirements are significant, primarily due to debt service requirements, restructuring and expected capital expenditures.
We are significantly leveraged as a result of the Acquisition. Affinia Group Inc. issued senior subordinated notes, entered into senior credit facilities, consisting of a revolving credit facility and a term loan facility, and initiated a trade accounts receivable securitization program (the ‘‘Receivables Facility’’). As of December 31, 2005, we had $612 million in aggregate indebtedness, with an additional $113 million of borrowing capacity available under our revolving credit facility, after giving effect to $12 million in outstanding letters of credit, which reduced the amount available thereunder. The aggregate indebtedness decreased $50 million since December 31, 2004. We had no amounts outstanding under our Receivables Facility as of December 31, 2005. The Receivables Facility provides for a maximum capacity of $100 million subject to certain adjustments. In addition, we had a cash and cash equivalents balance of $80 million as of December 31, 2004 and $82 million as of December 31, 2005.
Pursuant to a registration rights agreement, additional interest on the senior subordinated notes began to accrue as of August 27, 2005 at a rate of 0.25% per annum. On November 2, 2005, additional interest ceased to accrue as we completed the exchange offer pursuant to which the senior subordinated notes were exchanged for freely tradable senior subordinated notes registered under the Securities Act.
We spent $47 million and $35 million on capital expenditures during 2004 and 2005, respectively. Most of the capital expenditures in 2005 were in connection with capital improvement programs for lean manufacturing implementation throughout the Company. Based on the current level of operations, the Company believes that cash flow from operations and available cash, together with available borrowings under its revolving credit facility and Receivables Facility, will be adequate to meet liquidity needs and restructuring plans and to fund planned capital expenditures. The Company may, however, need to refinance all or a portion of the principal amount of the senior subordinated notes and/or senior credit facility borrowings, on or prior to maturity, to meet liquidity needs. If it is determined that refinancing is necessary, and the Company is unable to secure such financing on acceptable terms, then the Company may have insufficient liquidity to carry on its operations and meet its obligations at such time.
The Company can give no assurance that its business will generate sufficient cash flow from operations, that revenue growth or operating improvements will be realized, or that future borrowings will be available under its revolving credit facility in an amount sufficient to enable it to service its indebtedness or to fund other liquidity needs. In addition, the Company can give no assurance that it will be able to refinance any of its indebtedness, including its senior credit facilities and the senior subordinated notes, on commercially reasonable terms or at all.
Debt and Commitments. Prior to the Acquisition, the principal source of liquidity for the Predecessor was cash flow generated from operations, and the principal liquidity requirements were for working capital and capital expenditures. Following the Acquisition, our primary source of liquidity continues to be cash flow generated from operations. We also have availability under our revolving credit facility and Receivables Facility, subject to certain conditions, described below. Our primary liquidity requirements are expected to be for debt service, working capital, restructuring obligations and capital spending.
Senior credit facilities. Our senior credit facilities consist of a revolving credit facility and a term loan facility. Our revolving credit facility provides for loans in a total principal amount of up to
29
Table of Contents$125 million and matures in 2010. Our term loan facility provides for up to $350 million of which $312 million is outstanding and matures in 2011. Proceeds from the term loan were used to fund the Acquisition.
The senior credit facilities bear interest at a rate equal to an applicable margin plus, at our option, either (a) a base rate determined by reference to the higher of (1) the bank's prime rate and (2) the federal funds rate plus one-half of 1% or (b) LIBOR rate determined by reference to the costs of funds for deposits in U.S. dollars for the interest period relevant to such borrowing adjusted for certain additional costs. The applicable margins for borrowings under the revolving credit facility are 2.00% with respect to base rate borrowings and 3.00% with respect to LIBOR borrowings. The initial applicable margin for borrowings under the term loan facility was 1.50% with respect to base rate borrowings and 2.50% with respect to LIBOR borrowings. However, in connection with an amendment to our senior credit facilities in December 2005, in connection with our restructuring program, the applicable margin for borrowings under the term loan facility was increased to 2.00% with respect to base rate borrowings and 3.00% with respect to LIBOR borrowings. Following the amendment to our senior credit facilities the applicable margin for borrowings under the revolving credit facility and the term loan facility may be reduced subject to our attaining certain leverage ratios or increased based on certain credit ratings as determined by Moody’s and Standard & Poor's.
In addition to paying interest on the outstanding principal under the senior credit facilities, we are required to pay a commitment fee to the lenders under the revolving credit facility in respect of the unutilized commitments there under at a rate equal to 0.50% per annum. We also paid customary letter of credit fees.
Principal amounts outstanding under the revolving credit facility are due and payable in full at maturity on November 30, 2010.
The senior credit facilities contain a number of covenants that, among other things, restrict, subject to certain exceptions, our ability, and the ability of our subsidiaries, to sell assets, incur additional indebtedness or issue preferred stock, repay other indebtedness (including our senior subordinated notes), pay certain dividends and distributions or repurchase our capital stock, create liens on assets, make investments, loans or advances, make certain acquisitions, engage in mergers or consolidations, enter into sale and leaseback transactions, engage in certain transactions with affiliates, amend certain material agreements governing our indebtedness (including our senior subordinated notes), and change the business conducted by us and our subsidiaries. In addition, the senior credit facilities contain the following financial covenants: a maximum total leverage ratio; a minimum interest coverage ratio; and a maximum capital expenditures limitation. As of December 31, 2004 and December 31, 2005, we were in compliance with all of these covenants.
Indenture. The indenture governing the senior subordinated notes limits our (and most or all of our subsidiaries') ability to incur additional indebtedness, pay dividends on or make other distributions or repurchase our capital stock, make certain investments, enter into certain types of transactions with affiliates, use assets as security in other transactions and sell certain assets or merge with or into other companies. Subject to certain exceptions, Affinia and its restricted subsidiaries are permitted to incur additional indebtedness, including secured indebtedness, under the terms of the senior subordinated notes.
Adjusted EBITDA is used to determine our compliance with many of the covenants contained in our senior credit facilities and in the indenture governing the senior subordinated notes. Adjusted EBITDA is defined as EBITDA further adjusted to exclude unusual items and other adjustments permitted in calculating covenant compliance under the indenture and our senior credit facility.
We believe that the inclusion of supplementary adjustments to EBITDA applied in presenting Adjusted EBITDA is appropriate to provide additional information to investors to demonstrate compliance with our financing covenants.
The breach of covenants in our senior credit facilities that are tied to ratios based on Adjusted EBITDA could result in a default under those facilities and the lenders could elect to declare all amounts borrowed due and payable. Any such acceleration would also result in a default under our
30
Table of Contentsindenture and trade accounts receivable securitization program. Additionally, under the indenture, our ability to engage in activities such as incurring additional indebtedness, making investments and paying dividends is also tied to ratios based on Adjusted EBITDA. However, EBITDA and Adjusted EBITDA are not recognized terms under U.S. GAAP (Accounting Principles Generally Accepted in the United States) and do not purport to be alternatives to net income as a measure of operating performance. Additionally, EBITDA and Adjusted EBITDA are not intended to be measures of free cash flow for management's discretionary use, as they do not consider certain cash requirements such as interest payments, tax payments and debt service requirements.
The following table reconciles net income to EBITDA and Adjusted EBITDA (Dollars in Millions):
| | | | | | | | | | | | | | | | | | |
| | | Predecessor | | Successor |
| | | Year
Ended
December 31, | | January 1 to
November 30, | | December 1
to December 31, | | Year
Ended
December 31, |
| | | 2003 | | 2004 | | 2004 | | 2005 |
| Net income (loss) | | $ | 67 | | | $ | 28 | | | $ | (4 | ) | | $ | (30 | ) |
| Interest expense | | | 3 | | | | 2 | | | | 5 | | | | 55 | |
| Depreciation and amortization | | | 46 | | | | 41 | | | | 4 | | | | 46 | |
| Income tax (benefit) | | | 49 | | | | 18 | | | | (2 | ) | | | (4 | ) |
| EBITDA | | | 165 | | | | 89 | | | | 3 | | | | 67 | |
| Restructuring charges(a) | | | 5 | | | | 2 | | | | — | | | | 25 | |
| Change in accounting(b) | | | — | | | | 25 | | | | — | | | | — | |
| Transaction costs retained by Dana(c) | | | — | | | | 15 | | | | — | | | | — | |
| Liabilities retained by Dana(d) | | | — | | | | 9 | | | | — | | | | — | |
| Minority interest(e) | | | 2 | | | | — | | | | — | | | | — | |
| Non-operating foreign exchange losses(f) | | | 9 | | | | — | | | | — | | | | — | |
| Other non-operating income(g) | | | (5 | ) | | | — | | | | — | | | | — | |
| Other negotiated costs(h) | | | 4 | | | | — | | | | — | | | | — | |
| Substitution of stand-alone costs for allocated costs(i) | | | 2 | | | | — | | | | — | | | | — | |
| Beck Arnley(j) | | | — | | | | 14 | | | | 1 | | | | 24 | |
| Certain joint ventures(k) | | | — | | | | — | | | | — | | | | (1 | ) |
| Other adjustments(l) | | | (3 | ) | | | 5 | | | | — | | | | 8 | |
| Adjusted EBITDA | | $ | 179 | | | $ | 159 | | | $ | 4 | | | $ | 123 | |
|
| |
| (a) | Our previous restructuring plan, which we initiated in 2001 and completed in 2003, included a reduction of our workforce, the closure of 13 facilities, the sale of two non-core businesses, a reduction in real estate and improvements in working capital management. EBITDA has been adjusted to exclude costs associated with this restructuring, which are principally related to severance, asset write-downs and related exit costs. In 2005, we substantially completed the acquisition restructuring plan and at the end of 2005, we commenced our comprehensive restructuring plan that will mainly occur in 2006 and 2007. Related to the comprehensive restructuring plan we took an impairment charge on fixed assets and we accrued for severance costs. |
| |
| (b) | We incurred charges related to changes in accounting for inventories and other accounts that can be added back to EBITDA in accordance with the terms our senior credit facilities. |
| |
| (c) | We incurred other severance and transaction related costs that are added back to EBITDA in accordance with the terms of our senior credit facilities. |
| |
| (d) | We incurred costs related to pensions and other post-employment benefits and other Dana retained liabilities that are allowed to be added back to EBITDA per our senior credit facilities. |
| |
| (e) | We incurred charges for the minority interest for a number of non-wholly owned subsidiaries, most significantly our Polish subsidiary. EBITDA is adjusted to eliminate the minority interest charge. Dana purchased the minority interest in our Polish subsidiary in July 2004 in anticipation of the Acquisition. |
| |
| (f) | As part of Dana, we had a financing arrangement requirement that we maintained certain U.S. dollar denominated cash and intercompany balances in Canada, which resulted in significant foreign exchange losses until December 2003 when this financing arrangement was terminated and the balances were settled. Since these losses resulted from Dana's arrangements that have been discontinued and were not reinstituted after the Acquisition, they have been added back to EBITDA. |
31
Table of Contents | |
| (g) | EBITDA includes non-operating income and expense related to the sale of assets, including a $4 million gain on the sale of a closed facility in the United Kingdom in the fourth quarter of 2003. We have excluded profit and loss on the sale of fixed assets recorded in non-operating income and expense from our calculation of Adjusted EBITDA |
| |
| (h) | We incurred certain other non-recurring costs that have been excluded from Adjusted EBITDA. These include non-recurring charges and write-offs as well as the cost associated with previously closed facilities that Dana retained after the Acquisition. |
| |
| (i) | Dana historically allocated a portion of its costs related to general corporate services to us. Adjusted EBITDA eliminates these allocated costs and adds the expenses we believe we would have incurred to perform these functions on a stand-alone basis. |
| |
| (j) | Adjustments for net loss of Beck Arnley in accordance with the terms of our senior credit facilities. The pretax loss on the disposition of Beck Arnley was $21 million and Beck Arnley had a $3 million loss on operations. |
| |
| (k) | Adjustment for net income of certain joint ventures is excluded in accordance with the terms of our senior credit facilities. |
| |
| (l) | Certain costs such as other non-recurring charges are allowed to be added back to EBITDA in accordance with the terms of our senior credit facilities. |
Our covenant compliance levels and ratios for the year ended December 31, 2005 are as follows:
| | | | | | | | | | |
| | | Covenant
Compliance
Level for the Year
Ended
December 31,
2005 | | Actual
Ratios |
| Senior Credit Facilities | | | | | | | | |
| Minimum Adjusted EBITDA to cash interest ratio | | | 2.00x | | | | 2.60x | |
| Maximum net debt to Adjusted EBITDA ratio | | | 5.50x | | | | 4.64x | |
|
Receivables facility. Our off-balance sheet receivables facility provides up to $100 million in funding, based on availability of eligible receivables and satisfaction of other customary conditions. Under the receivables facility, receivables are sold by certain subsidiaries of our company to a wholly-owned bankruptcy remote finance subsidiary of the company, which transfers an undivided interest in the purchased receivables to a commercial paper conduit or its bank sponsor in exchange for cash.
Affinia Group Inc., as the receivables collection agent, services, administers and collects the receivables under the receivables purchase agreement for which it receives a monthly servicing fee at a rate of 1.00% per annum of the average daily outstanding balance of receivables. The receivables facility fees include a usage fee paid by the finance subsidiary, that varies based upon the company's leverage ratio as calculated under the senior credit facilities. Funded amounts under the receivables facility bear interest at a rate equal to the conduit's pooled commercial paper rate plus the usage fee. At December 31, 2005, the usage fee margin for the receivables facility was 1.25% per annum of the amount funded. In addition, the finance subsidiary is required to pay a fee on the unused portion of the receivables facility that varies based upon the same ratio. At December 31, 2005 the unused fee was 0.50% per annum of the unused portion of the receivables facility.
Availability of funding under the receivables facility depends primarily upon the outstanding trade accounts receivable balance from time to time. Aggregate availability is determined by using a formula that reduces the gross receivables balance by factors that take into account historical default and dilution rates, obligor concentrations, average days outstanding and the costs of the facility. As of December 31, 2005, $248 million of our accounts receivable balance was considered eligible for financing under the program, of which approximately $69 million was available for funding. At December 31, 2005, we had no amounts outstanding under this facility.
The receivables facility contains conditions, representations, warranties and covenants similar to those in the senior credit facilities. It also contains amortization events similar to the events of default under the senior credit facilities, plus amortization events relating to the quality and performance of the trade receivables. If an amortization event occurs, all of the cash flow from the receivables sold to the finance subsidiary will be allocated to the receivables facility until it is paid in full.
Net cash provided by or used in operating activities
In 2005, the cash flow from operating activities was a source of cash of $103 million in comparison to a $51 million use of cash during the 2004 combined twelve months. The increase in
32
Table of Contentsyear 2005 operating cash flows over 2004 was due primarily to reductions in inventory. In 2005, inventories were a $77 million source of cash and in the 2004 combined twelve months inventories were a $41 million use of cash. The Company is in the process of implementing a program designed to increase efficiencies in our manufacturing processes. As a result of this lean manufacturing program, we are beginning to see the benefits of reduced inventories.
Net cash used in investing activities
In 2005, the cash flow from investing activities was a use of cash of $52 million in comparison to a $1,055 million use of cash during 2004. During the 2004 combined twelve months, we used $1 billion for the Acquisition. In addition, we reduced capital expenditures by $12 million in 2005 in comparison to the 2004 combined twelve months.
Net cash provided by or used in financing activities
In 2005 the cash flow from financing activities was a use of cash of $49 million in comparison to a $1,038 million source of cash during the 2004 combined twelve months. During the 2004 combined twelve months, we received $650 million in proceeds from borrowings to finance the Acquisition and the capital contribution accounted for $355 million increase in financing activities.
Impact of the Acquisition and Related Financing Transaction
As a result of the Acquisition, our assets and liabilities were adjusted to their preliminary estimated fair value as of November 30, 2004, the closing date of the Acquisition. Purchase price adjustments were finalized for the year ended December 31, 2005. As discussed above, we incurred significant indebtedness in connection with the Acquisition. Accordingly, our interest expense is higher than it was prior to the Acquisition. The excess of the total purchase price over the value of our net assets at December 31, 2005, the date of the finalization of the purchasing accounting adjustments, was allocated to goodwill, trade names and other intangible assets.
Seller Note. As part of the financing in connection with the Acquisition, Affinia Group Holdings Inc. issued subordinated notes due 2019 with a face amount of $74.5 million (collectively, the ‘‘Seller Note’’) to Dana. The Seller Note had an estimated fair value of $50 million, which was recorded on the books of Affinia Group Holdings Inc. upon issuance. We and the guarantors of the Notes have no obligations with respect to the Seller Note and therefore the Seller Note is not reflected in our consolidated balance sheet.
The Seller Note will mature on November 30, 2019. The interest rate on the Seller Note is 8% per annum initially, with an increase to 10% per annum effective November 30, 2009. Upon a change of control, the holder shall have the right to require Affinia Group Holdings Inc. to repurchase the Seller Note at specified prepayment prices. Under specified circumstances, Affinia Group Holdings Inc. will be required to offer to redeem a portion of the Seller Note at specified prepayment prices using 17.5% of dividends proposed to be made. Notwithstanding Affinia Group Holdings Inc.’s option to make cash interest payments, our senior credit facilities and the indenture governing the senior subordinated notes limit our ability to pay dividends to Affinia Group Holdings Inc. for the purpose of making any payments in respect of, or otherwise servicing, the obligations represented by the Seller Note.
Payment under the Seller Note is structurally and contractually subordinated to the prior payment in full of the Notes and all our other senior debt and any senior debt of Affinia Group Holdings Inc. Any holder may sell or otherwise transfer all or part of the Seller Note (in no less than increments of $10 million of the principal amount) with the prior written consent of Affinia Group Holdings Inc. which consent shall not be unreasonably withheld if such transfer would not adversely affect Affinia Group Holdings Inc., and its affiliates.
Contractual Obligations and Commitments
Cash obligations. Under various agreements, we are obligated to make future cash payments in fixed amounts. These include payments under debt obligations at maturity, under operating lease
33
Table of Contentsagreements, and under purchase commitments for property, plant, and equipment. The following table summarizes our fixed cash obligations over various future periods as of December 31, 2005:
| | | | | | | | | | | | | | | | | | | | | | |
| | | Payments Due By Period |
| Contractual Cash Obligations | | Total | | Less than
1 year | | 1 – 3 Years | | 4 – 5 years | | After
5 Years |
| | | (Dollars in Millions) |
| Debt obligations | | $ | 612 | | | $ | — | | | $ | — | | | $ | — | | | $ | 612 | |
| Interest on senior subordinated notes | | | 243 | | | | 27 | | | | 54 | | | | 54 | | | | 108 | |
| Interest on term debt* | | | 129 | | | | 22 | | | | 44 | | | | 44 | | | | 19 | |
| Operating leases | | | 87 | | | | 17 | | | | 20 | | | | 15 | | | | 35 | |
| Post employment obligations | | | 10 | | | | 1 | | | | 2 | | | | 2 | | | | 5 | |
| Purchase commitments for property, plant, and equipment | | | 4 | | | | 4 | | | | — | | | | — | | | | — | |
| Total contractual obligations | | $ | 1,085 | | | $ | 71 | | | $ | 120 | | | $ | 115 | | | $ | 779 | |
|
| |
| * | The term debt consists of a 3% fixed margin on LIBOR borrowings. |
Commitments and Contingencies
The Company is party to various pending judicial and administrative proceedings arising in the ordinary course of business. These include, among others, proceedings based on product liability claims and alleged violations of environmental laws. As part of the Acquisition, Dana retained responsibility for the defense of, and any liabilities associated with, all legal proceedings commenced prior to November 30, 2004, relating to, arising out of or resulting from the operations acquired by the Company from Dana. In addition, Dana retained responsibility for certain other liabilities related to the period prior to November 30, 2004. As of December 31, 2005, the Company is not party to any judicial proceedings for which Dana has not retained responsibility that if adversely determined would have a material adverse affect on the Company’s financial performance. On March 3, 2006 Dana and forty of its domestic subsidiaries filed voluntary petitions for reorganization under Chapter 11 of the Bankruptcy Code.
The Company, including subsidiaries acquired from Dana in the Acquisition, had 54 pending asbestos-related product liability claims at December 31, 2004 and 34 as of December 31, 2005. As part of the Acquisition, Dana retained responsibility for the defense of, and all liabilities associated with, these claims, in addition to responsibility for all asbestos-related liabilities arising from products manufactured or sold or services performed prior to November 30, 2004. The Predecessor had accrued $1 million for defense costs for such claims. The Predecessor has not produced any products containing asbestos in several years and the Successor has never produced any products containing asbestos.
The Company has various accruals for contingent non-asbestos product liability costs. At December 31, 2003, 2004 and 2005, the Company had $4 million, less than $1 million and $1 million accrued, respectively. There are no recoveries expected from third parties. There was no difference between our minimum and maximum estimates for these liabilities at any date. If there is a range of equally probable outcomes, we accrue the lower end of the range.
The Company estimates contingent environmental liabilities based on the most probable method of remediation, current laws and regulations and existing technology. Estimates are made on an undiscounted basis and exclude the effects of inflation. If there is a range of equally probable remediation methods or outcomes, we accrue the lower end of the range. At December 31, 2003 and 2004 the Company had $1 million and less than $1 million accrued as part our restructuring program, respectively. There are no recoveries expected from third parties. There was no difference between our minimum and maximum estimates for these liabilities at either date.
The Company was required to adopt FIN 47, "Accounting for Conditional Asset Retirement Obligations’’ ("FIN 47’’) for the year ending December 31, 2005. FIN 47 provides an interpretation
34
Table of Contentswhich clarifies that the term ‘‘conditional asset retirement obligation’’ as used in FASB Statement No. 143, "Accounting for Asset Retirement Obligations’’, refers to a legal obligation to perform an asset retirement activity in which the timing and (or) method of settlement are conditional on a future event that may or may not be within the control of the entity. The adoption of FIN 47 resulted in an asset retirement obligation of $2.6 million.
Critical Accounting Estimates
The critical accounting estimates that affect our financial statements and that use judgments and assumptions are listed below. These estimates are subject to a range of amounts because of inherent imprecision that may result from applying judgment to the estimation process. The expenses and accrued liabilities or allowances related to certain of these policies are initially based on our best estimate at the time of original entry in our accounting records. Adjustments are recorded when actual results differ from the expected forecasts underlying the estimates. These adjustments could be material if our results were to change significantly in a short period of time. We make frequent comparisons of actual results and expected forecasts in order to mitigate the likelihood of material adjustments.
Asset impairment. We perform periodic impairment analyses, which are based on the guidance found in SFAS No. 142 and SFAS No. 144, on long-lived assets such as property, plant and equipment, identifiable intangible assets and goodwill. Management also evaluates the carrying amount of our inventories on a recurring basis for impairment due to lower of cost or market issues, and for excess or obsolete quantities. On January 1, 2002, we adopted SFAS No. 142 and, in connection with the adoption, discontinued the amortization of goodwill and intangibles with indefinite lives. In lieu of amortization of goodwill in 2002, goodwill was tested for impairment as of the date of adoption and in the fourth quarter of subsequent years. The factors that would cause a more frequent test for impairment include, among other things, a significant negative change in the estimated future cash flows of the reporting unit that has goodwill because of an event or a combination of events.
We perform impairment analyses of our recorded long-lived assets whenever events and circumstances indicate that they may be impaired. In the case of goodwill and intangibles with indefinite lives (trade names), these reviews are performed at least once a year, during the fourth quarter.
Inventories. Predecessor inventories are valued at the lower of cost or market. Cost is determined on the last-in, first-out (‘‘LIFO’’) basis for U.S. inventories and on the first-in, first-out (‘‘FIFO’’) or average cost basis for non-U.S. inventories.
Successor inventories are valued at the lower of cost or market. Cost is determined on the FIFO basis for all inventories. Where appropriate, standard cost systems are utilized for purposes of determining cost; the standards are adjusted as necessary to ensure they approximate actual costs. Estimates of inventory value are determined on a product line basis. These estimates are based upon current economic conditions, historical sales quantities and patterns and, in some cases, the specific risk of loss on specifically identified inventories.
We also evaluate inventories on a regular basis to identify inventory on hand that may be obsolete or in excess of current and future projected market demand principally based on historical market demand. For inventory deemed to be obsolete, we provide a reserve on the full value of the inventory. Inventory that is in excess of current and projected use, which is generally defined by us as inventory quantities in excess of 24 months historical sales, is adjusted for certain allowances such as new part number introductions and product repacking opportunities.
Revenue recognition. Sales are recognized when products are shipped and risk of loss has transferred to the customer. The Company estimates and records provisions for warranty costs, sales returns and other allowances based on experience and other relevant factors, when sales are recognized. The Company assesses the adequacy of its recorded warranty, sales returns and allowances liabilities on a regular basis and adjusts the recorded amounts as necessary. While management believes that these estimates are reasonable, actual returns and allowances and warranty costs may differ from estimates. Inter-company sales have been eliminated. Sales to other Dana businesses are included in net sales.
35
Table of ContentsSales returns and rebates. The amount of sales returns accrued at the time of sale is estimated on the basis of the history of the customer and the history of products returned. Other factors considered in establishing the accrual include consideration of current economic conditions and changes in trends in returns, as well as adjusting for the impact of extraordinary returns that may result from individual negotiations with a customer in an unusual situation. The level of sales returns are recorded as a reduction of gross sales in our financial statements at the time of sale. In addition, we periodically perform studies to determine a scrap factor to be applied to the returns on a product-by-product basis, since a portion of the goods historically returned by customers have not been in saleable condition. Estimates of returned goods that are not in saleable condition are included in cost of sales.
We customize rebate programs with individual customers. Under certain rebate programs, a customer may earn a rebate that will increase as a percentage of the sale amount based on the achievement of specified sales levels. In order to estimate the amount of a rebate under this type of arrangement, we project the amount of sales that the customer will make over the specified rebate period in order to calculate an overall rebate to be accrued at the time that each sale is made. Gross sales are reduced at the time of sale. These estimates may need to be adjusted based on actual customer purchases compared to the projected purchases. Adjustments to the accrual are made as new information becomes available. In other cases a customer may earn a specific rebate for a specific period of time, based upon the sales of certain product types within the specified timeframe. Rebates are recorded as a reduction of gross sales in our financial statements.
Warranty. Estimated costs related to product warranty are accrued at the time of sale and included in cost of sales. Estimated costs are based upon past warranty claims and sales history. In certain situations the estimated cost of the warranty includes a salvage factor where a portion of the inventory returned proves to be saleable. These costs are then adjusted, as required, to reflect subsequent experience.
Pension and post-retirement benefits other than pensions. Dana retained a majority of the assets and liabilities of our pension plans that were in place prior to the Acquisition. As a result, we estimate that our annual pension expense will be less than $1 million as we are not assuming the under-funded position of these plans and are not retaining all of the plans. However, we have retained plans related to Canadian employees with assets of approximately $21 million and liabilities of approximately $23 million as of December 31, 2005.
Historically, we have maintained defined benefit plans which cover only certain employees in the United States, Canada, Mexico and/or Europe, among other plans. The tables in Note 13 to the audited financial statements presented under Item 8 of this report reflect a reconciliation of the changes in the defined benefit pension plans and other post-retirement plans’ benefit obligations and the fair value of assets relate only to those plans that cover solely our employees.
Under the defined benefit plans, annual net periodic expense and benefit liabilities are determined on an actuarial basis. Each year, actual experience is compared to the more significant assumptions used and, if warranted, we make adjustments to the assumptions. The healthcare trend rates are reviewed with actuaries based upon the results of their review of claims experience. Discount rates are based upon an expected benefit payments duration analysis and the equivalent average yield rate for high-quality fixed-income investments. Pension benefits are funded through deposits with trustees and the expected long-term rates of return on fund assets are based upon actual historical returns modified for known changes in the market and any expected changes in investment policy.
Income taxes. Accounting for income taxes involves matters that require estimates and the application of judgment. These include an evaluation of the realizability of recorded deferred tax benefits and assessment of potential tax liability relating to areas of potential dispute with various tax regulatory agencies. We have operations in a number of jurisdictions around the world, each with its own unique tax laws and regulations. This further complicates the process of accounting for income taxes. Our income tax estimates are adjusted in light of changing circumstances, such as the progress of tax audits and our evaluation of the realizability of our tax assets.
Contingency reserves. Dana retained specified liabilities relating to the operation of our business prior to November 30, 2004, including: liabilities for injury or damages occurring prior to
36
Table of ContentsNovember 30, 2004, relating to or arising from use or exposure to any products designed, manufactured, sold or serviced, or services performed, by Dana; liabilities arising from or relating to actual or alleged human exposure to asbestos or asbestos-containing materials; liabilities arising out of legal proceedings commenced prior to November 30, 2004; liabilities with respect to the real property currently or formerly owned, leased or used by Dana other than the owned or leased real property acquired in the Acquisition; and liabilities relating to the disposal, prior to November 30, 2004, of hazardous materials generated or otherwise originating at the owned or leased real property acquired in the transaction at or to a location other than such owned or leased real property. The Predecessor has not produced any products containing asbestos in several years and the Successor has never produced any products containing asbestos (Refer to Note 22. Subsequent Event or Item 1A. Risk Factors for further discussion on the Dana reorganization under chapter 11 of the Bankruptcy Code).
However, we have historically been subject to a number of loss exposures, such as environmental claims, product liability and litigation. Establishing loss reserves for these matters requires the use of estimates and judgment with regard to risk exposure and ultimate liability. We expect to estimate losses relating to such contingent liabilities using consistent and appropriate methods. Changes to assumptions we use could materially affect the recorded liabilities for loss.
Restructuring. In 2005, we announced two restructuring plans: (i) a restructuring plan that we announced at the beginning of 2005 as part of the Acquisition, also referred to as the acquisition restructuring and (ii) a restructuring plan that we announced at the end of 2005, also referred to as the comprehensive restructuring.
The comprehensive restructuring will affect several facilities over the next two years. In December 2005, we announced the closure of one facility, our Southampton facility. Additionally, in March 2006 we announced the closure of the Erie, North East and McHenry plants and the intent to sell our Waupauca, Sudbury and St. Catharines facilities. Additional facility closures will be announced periodically over 2006 and 2007. In 2005, we recorded a charge of $23 million primarily comprised of severance costs and fixed asset impairment. The write-down of fixed assets was accounted for in accordance with SFAS No. 144. Severance costs are being accounted for in accordance with SFAS No. 146, Accounting for Costs Associated with Exit or Disposal Activities. We currently estimate that we will incur in the aggregate approximately $152 million of cash and non cash restructuring costs for the comprehensive restructuring.
In the first quarter of 2005, as part of the Acquisition, we announced the acquisition restructuring. The acquisition restructuring plan was initiated to take advantage of opportunities we identified prior to the Acquisition but were, due to resource constraints, limited in our ability to actively pursue as part of Dana. Acquisition restructuring costs of $21 million associated with the acquisition restructuring were recorded to goodwill as an adjustment to the opening balance sheet, comprised of severance costs, fixed asset impairments, and other exit costs. Additionally, we charged directly to operations $2 million relating to current period exit costs. We do not expect any material costs subsequent to December 31, 2005, relating to the acquisition restructuring.
During 2003, the Company made substantial progress toward the completion of its then-current restructuring program, including the reduction of employees and relocation of equipment. In connection with these efforts, the Company recorded an additional $4 million for employee termination benefits and exit costs, including the cost of relocating employees, transferring equipment and maintaining buildings held for sale. Restructuring provisions resulted in a pre-tax charge of $4 million in 2003. During 2004, the Company recorded $2 million of restructuring costs, which consisted primarily of employee termination benefits.
Recent Accounting Pronouncements
In February 2006, the FASB issued statement SFAS No. 155 ‘‘Accounting for Certain Hybrid Financial Instruments — an amendment of FASB Statements No. 133 and 140.’’ This Statement amends FASB Statements No. 133, Accounting for Derivative Instruments and Hedging Activities, and No. 140, Accounting for Transfers and Servicing of Financial Assets and Extinguishments of Liabilities. This Statement eliminates the exemption from applying Statement 133 to interests in securitized
37
Table of Contentsfinancial assets so that similar instruments are accounted for similarly regardless of the form of the instruments. Additionally, the statement allows a preparer to elect fair value measurement at acquisition, at issuance, or when a previously recognized financial instrument is subject to a remeasurement (new basis) event, on an instrument-by-instrument basis, in cases in which a derivative would otherwise have to be bifurcated. Providing a fair value measurement election also results in more financial instruments being measured at what the Board regards as the most relevant attribute for financial instruments, fair value. This Statement is effective for all financial instruments acquired or issued after the beginning of an entity’s first fiscal year that begins after September 15, 2006. The Company has not yet evaluated the potential impact of this statement but anticipate that the adoption of this statement will not have a material impact on our financial position or results of operations.
In December 2004, the FASB issued SFAS No. 151, ‘‘Inventory Costs, an amendment of ARB No. 43, Chapter 4.’’ SFAS No. 151 clarifies the treatment of certain costs, such as idle facility expense, freight and handling, as period expenses and requires that allocation of fixed overhead be based on normal capacity. The Company is required to adopt this guidance beginning January 1, 2006 and has not yet evaluated the potential impact on its financial position or results of operations.
In December 2004, the FASB issued SFAS No. 153, ‘‘Exchange of Nonmonetary Assets, an amendment of APB No. 29, Accounting for Nonmonetary Transactions.’’ SFAS 153 amends APB No. 29 to eliminate the exception for nonmonetary exchanges of similar productive assets and replaces it with a general exception for exchanges of nonmonetary assets that do not have commercial substance. A nonmonetary exchange has commercial substance if the future cash flows of the entity are expected to change significantly as a result of the exchange. We have adopted this standard and it did not have any impact on the Company's results of operations or financial position.
In December 2004, the FASB issued SFAS No. 123(R), ‘‘Share-Based Payment,’’ which requires compensation costs related to share-based payment transactions to be recognized in the financial statements. This statement also establishes fair value as the measurement objective for share-based payment transactions with employees. The Company began expensing the fair value of stock options in 2005. The Company adopted the provisions of SFAS No. 123(R) in the fourth quarter of 2005. The adoption of SFAS No. 123(R) did not have a material impact on the Company’s results of operations or financial position.
In March 2005, the FASB issued Financial Interpretation (FIN) 47 ‘‘Accounting for Conditional Asset Retirement Obligations’’. We adopted FIN 47 effective December 31, 2005. FIN 47 requires that a liability for the fair value of an Asset Retirement Obligation (‘‘ARO’’) be recognized in the period in which it is incurred if it can be reasonably estimated, with the offsetting associated asset retirement costs capitalized as part of the carrying amount of the long-lived assets. The ARO is subsequently allocated to expense using a systematic and rational method over its useful life. Changes in the ARO liability resulting from the passage of time are recognized as an increase in the carrying amount of the liability and as accretion expense. Changes resulting from revisions to the timing or amount of the original estimate of cash flows are recognized as an increase or a decrease in both the asset and liability. The ARO recorded at December 31, 2005 was $2.6 million. The cumulative effect of a change in accounting principle and of adopting FIN 47 was not material to our net income in the period of adoption.
In April 2005, the FASB issued SFAS No. 154, ‘‘Accounting Changes and Error Corrections,’’ requiring retrospective application as the required method for reporting a change in accounting principle, unless impracticable or a pronouncement includes specific transition provisions. This statement also requires that a change in depreciation, amortization, or depletion method for long-lived, nonfinancial assets be accounted for as a change in accounting estimate effected by a change in accounting principle. This statement carries forward the guidance in APB Opinion No. 20, ‘‘Accounting Changes,’’ for the reporting of the correction of an error and a change in accounting estimate. This statement is effective for accounting changes and correction of errors made in fiscal years beginning after December 15, 2005.
In November 2005, the FASB issued FSP 123(R)-3, Transition Election Related to Accounting for the Tax Effects of Share-Based Award Payments (‘‘FSP 123(R)-3’’). The provisions of FSP 123(R)-3 set
38
Table of Contentsforth an alternative method of calculating the excess tax benefits available to absorb tax deficiencies recognized subsequent to the adoption of FAS No. 123(R). The Company, which is currently evaluating its available transition alternatives, has until November 2006 to make its one-time election.
| |
| Item 7A. | Quantitative and Qualitative Disclosures About Market Risk |
We are exposed to various market risks, which are potential losses arising from adverse changes in market rates and prices, such as currency and interest rate fluctuation. Where necessary to minimize such risks we will enter into derivatives transactions, however we do not enter into derivatives or other financial instruments for trading or speculative purposes.
Currency risk
Outside of the United States, we maintain assets and operations in Canada, Europe, Mexico, South America and Asia. The results of operations and financial position of our foreign operations are principally measured in their respective currency and translated into U.S. dollars. As a result, exposure to foreign currency gains and losses exists. The reported income of these subsidiaries will be higher or lower depending on an appreciation or depreciation of the U.S. dollar against the respective foreign currency. Our subsidiaries and affiliates also purchase and sell products and services in various currencies. As a result, we may be exposed to cost increases relative to the local currencies in the markets in which we sell. Because a different percentage of our revenues is in foreign currency than our costs, a change in the relative value of the U.S. dollar could have a disproportionate impact on our revenues as compared to our costs.
A portion of our assets is based in our foreign locations and is translated into U.S. dollars at foreign currency exchange rates in effect as of the end of each period, with the effect of such translation reflected in other comprehensive income (loss). Accordingly, our shareholders' equity will fluctuate depending upon the appreciation or depreciation of the U.S. dollar against the respective foreign currency. Similarly, the revenues and expenses of our foreign operations are transacted at average rates during the period such that exchange rate movements can have a significant impact on our sales trend, and to a lesser extent on our profits.
Our strategy for management of currency risk relies primarily on conducting our operations in a country's respective currency and may, from time to time, involve currency derivatives.
Interest rate risk
As of December 31, 2005, we had $312 million of variable rate debt outstanding. A 1% increase in the average interest rate would increase future interest expense by approximately $3 million per year. We are required by our senior credit facilities, for a period of not less than two years from November 30, 2004, to maintain in effect appropriate interest protection and other hedging arrangements so that at least 40% of our aggregate obligations under the term loan facility, our senior subordinated notes and any additional senior subordinated notes we might issue will bear interest at a fixed rate. At December 31, 2005, the percentage of fixed rate to total debt of our aggregate obligations under the term loan facility and senior subordinated notes was approximately 49%.
39
Table of Contents | |
| Item 8. | Financial Statements and Supplementary Data |
Report of Independent Registered Public Accounting Firm
To the Board of Directors and Shareholders of
Affinia Group Intermediate Holdings Inc.:
We have audited the accompanying consolidated balance sheet of Affinia Group Intermediate Holdings Inc. (the ‘‘Company’’) as of December 31, 2005, and the related consolidated statements of operations, shareholders’ equity, and cash flows for the year then ended. Our audit also included the 2005 financial statement schedule listed in the Index at Item 15. These financial statements and financial statement schedule are the responsibility of the Company's management. Our responsibility is to express an opinion on the financial statements and financial statement schedule based on our audit.
We conducted our audit in accordance with the standards of the Public Company Accounting Oversight Board (United States). Those standards require that we plan and perform the audit to obtain reasonable assurance about whether the financial statements are free of material misstatement. The Company is not required to have, nor were we engaged to perform, an audit of its internal control over financial reporting. Our audit included consideration of internal control over financial reporting as a basis for designing audit procedures that are appropriate in the circumstances, but not for the purpose of expressing an opinion on the effectiveness of the Company's internal control over financial reporting. Accordingly, we express no such opinion. An audit also includes examining, on a test basis, evidence supporting the amounts and disclosures in the financial statements, assessing the accounting principles used and significant estimates made by management, as well as evaluating the overall financial statement presentation. We believe that our audit provides a reasonable basis for our opinion.
In our opinion, such consolidated financial statements present fairly, in all material respects, the financial position of the Company as of December 31, 2005, and the results of its operations and its cash flows for the year then ended in conformity with accounting principles generally accepted in the United States of America. Also, in our opinion, such 2005 financial statement schedule, when considered in relation to the basic consolidated financial statements taken as a whole, presents fairly in all material respects the information set forth therein.
Deloitte & Touche LLP
Detroit, Michigan
March 22, 2006
40
Table of ContentsReport of Independent Registered Public Accounting Firm
To the Board of Directors and Shareholders of
Affinia Group Intermediate Holdings Inc.:
In our opinion, the accompanying consolidated balance sheet and the related consolidated statements of operations, of shareholders' equity and of cash flows present fairly, in all material respects, the financial position of Affinia Group Intermediate Holdings Inc. and subsidiaries (the "Company") at December 31, 2004, and the results of its operations and its cash flows for the period December 1, 2004 to December 31, 2004, in conformity with accounting principles generally accepted in the United States of America. These financial statements are the responsibility of the Company's management. Our responsibility is to express an opinion on these financial statements based on our audit. We conducted our audit of these statements in accordance with the standards of the Public Company Accounting Oversight Board (United States). Those standards require that we plan and perform the audit to obtain reasonable assurance about whether the financial statements are free of material misstatement. An audit includes examining, on a test basis, evidence supporting the amounts and disclosures in the financial statements, assessing the accounting principles used and significant estimates made by management, and evaluating the overall financial statement presentation. We believe that our audit provides a reasonable basis for our opinion.
As described in Note 2, the Company has restated its consolidated financial statements for the period December 1, 2004 to December 31, 2004.
PRICEWATERHOUSECOOPERS LLP
Detroit, Michigan
April 15, 2005, except for Notes 2 (not presented herein), 5 (not presented herein) and 22 (not presented herein) to the consolidated financial statements appearing in the Registration Statement on Form S-4 (No. 333-128166-10), as to which the date is September 6, 2005 and the effect of the restatement of cash flows for the one month period ended December 31, 2004 discussed in Note 2 and the effects of the discontinued operations on the consolidated financial statements as of December 31, 2004 and for the one month period ended December 31, 2004 discussed in Note 23, as to which the date is April 11, 2006
41
Table of ContentsReport of Independent Registered Public Accounting Firm
To the Board of Directors of Dana Corporation
In our opinion, the accompanying combined statements of income, of shareholders equity and of cashflows for the eleven months ended November 30, 2004 and the year ended December 31, 2003 present fairly, in all material respects, the results of operations of and cash flows of substantially all of the automotive aftermarket business of Dana Corporation (AAG) for the eleven months ended November 30, 2004 and the year ended December 31, 2003 in conformity with accounting principles generally accepted in the United States of America. These financial statements are the responsibility of the company's management. Our responsibility is to express an opinion on these financial statements based on our audits. We conducted our audits of these statements in accordance with the standards of the Public Company Accounting Oversight Board (United States). Those standards require that we plan and perform the audit to obtain reasonable assurance about whether the financial statements are free of material misstatement. An audit includes examining, on a test basis, evidence supporting the amounts and disclosures in the financial statements, assessing the accounting principles used and significant estimates made by management, and evaluating the overall financial statement presentation. We believe that our audits provide a reasonable basis for our opinion.
PRICEWATERHOUSECOOPERS LLP
Toledo, Ohio
April 15, 2005, except for Notes 2 (not presented herein) and 22 (not presented herein) to the consolidated financial statements appearing in the Registration Statement on Form S-4 (No. 333-128166-10), as to which the date is September 6, 2005 and the effects of the discontinued operations on the combined financial statements for the eleven months ended November 30, 2004 and the year ended December 31, 2003 discussed in Note 23, as to which the date is April 11, 2006
42
Table of ContentsAffinia Group Intermediate Holdings Inc.
Combined (Predecessor) and Consolidated (Successor)
Statements of Operations
(Dollars in Millions)
| | | | | | | | | | | | | | | | | | |
| | | Predecessor | | Successor |
| | | Year
Ended
December 31,
2003 | | January 1,
2004
through
November 30,
2004 | | December 1,
2004
through
December 31,
2004 | | Year
Ended
December 31,
2005 |
| Net sales | | $ | 2,025 | | | $ | 1,934 | | | $ | 155 | | | $ | 2,132 | |
| Cost of sales | | | (1,656 | ) | | | (1,657 | ) | | | (137 | ) | | | (1,837 | ) |
| Gross profit | | | 369 | | | | 277 | | | | 18 | | | | 295 | |
| Selling, general and administrative expenses | | | (254 | ) | | | (234 | ) | | | (21 | ) | | | (261 | ) |
| Loss on disposition of Beck Arnley | | | — | | | | — | | | | — | | | | (21 | ) |
| Operating profit (loss) | | | 115 | | | | 43 | | | | (3 | ) | | | 13 | |
| Other income, net | | | 5 | | | | 4 | | | | 2 | | | | 8 | |
| Interest expense | | | (3 | ) | | | (2 | ) | | | (5 | ) | | | (55 | ) |
| Income (loss) before income tax provision and minority interest | | | 117 | | | | 45 | | | | (6 | ) | | | (34 | ) |
| Income tax provision (benefit) | | | 49 | | | | 18 | | | | (2 | ) | | | (4 | ) |
| Minority interest, net of tax | | | (2 | ) | | | — | | | | — | | | | — | |
| Income (loss) from continuing operations | | | 66 | | | | 27 | | | | (4 | ) | | | (30 | ) |
| Income from discontinued operations, net of tax | | | 1 | | | | 1 | | | | — | | | | — | |
| Net income (loss) | | $ | 67 | | | $ | 28 | | | $ | (4 | ) | | $ | (30 | ) |
|
The accompanying notes are an integral part of the combined and consolidated financial statements.
43
Table of ContentsAffinia Group Intermediate Holdings Inc.
Consolidated Balance Sheets
(Dollars in Millions)
| | | | | | | | | | |
| | | December 31,
2004 | | December 31,
2005 |
| Assets |
| Current assets: |
| Cash and cash equivalents | | $ | 80 | | | $ | 82 | |
| Trade accounts receivable, less allowances of $4 million and $2 million, respectively, in 2004 and 2005 | | | 358 | | | | 350 | |
| Inventories | | | 494 | | | | 417 | |
| Other current assets | | | 44 | | | | 58 | |
| Assets of discontinued operations | | | 12 | | | | — | |
| Total current assets | | | 988 | | | | 907 | |
| Property, plant, and equipment, net | | | 233 | | | | 198 | |
| Goodwill | | | — | | | | 57 | |
| Other intangible assets, net | | | 187 | | | | 178 | |
| Deferred financing costs | | | 23 | | | | 22 | |
| Investments and other assets | | | 38 | | | | 78 | |
| Total assets | | $ | 1,469 | | | $ | 1,440 | |
| Liabilities and shareholders' equity | | | | |
| Current liabilities: | | | | |
| Accounts payable | | $ | 206 | | | $ | 232 | |
| Other accrued expenses | | | 151 | | | | 142 | |
| Accrued payroll and employee benefits | | | 22 | | | | 34 | |
| Notes payable and current portion of long term debt | | | 15 | | | | — | |
| Liabilities of discontinued operations | | | 3 | | | | — | |
| Total current liabilities | | | 397 | | | | 408 | |
| Long-term debt | | | 647 | | | | 612 | |
| Deferred employee benefits and other noncurrent liabilities | | | 20 | | | | 45 | |
| Total liabilities | | | 1,064 | | | | 1,065 | |
| Minority interest in consolidated subsidiaries | | | 1 | | | | 1 | |
| Contingencies and commitments | | | | | | | | |
| Common stock, $.01 par value, 1,000 shares authorized, issued and outstanding | | | — | | | | — | |
| Additional paid-in capital | | | 405 | | | | 406 | |
| Accumulated deficit | | | (4 | ) | | | (34 | ) |
| Foreign currency translation adjustment | | | 3 | | | | 2 | |
| Shareholders’ equity | | | 404 | | | | 374 | |
| Total liabilities and shareholders' equity | | $ | 1,469 | | | $ | 1,440 | |
|
The accompanying notes are an integral part of the combined and consolidated financial statements.
44
Table of ContentsAffinia Group Intermediate Holdings Inc.
Combined (Predecessor) and Consolidated (Successor) Statements of Shareholders' Equity
(Dollars in Millions)
| | | | | | | | | | | | | | | | | | | | | | | | | | | | | | |
| | | Common
Stock | | Additional
Paid-In
Capital | | Retained
Earnings
Accumulated
(Deficit) | | Minimum
Pension
Liability
Adjustment | | Foreign Currency
Translation
Adjustment | | Comprehensive
Income
(Loss) | | Total
Shareholders'
Equity |
| Predecessor Company | | | | | | | | | | | | | | | | | | | | | | | | | | | | |
| Balance at January 1, 2003 | | $ | — | | | $ | 409 | | | $ | 470 | | | $ | (22 | ) | | $ | (61 | ) | | | | | | $ | 796 | |
| Net income | | | — | | | | — | | | | 67 | | | | — | | | | — | | | $ | 67 | | | | 67 | |
| Other comprehensive income: | | | | | | | | | | | | | | | | | | | | | | | | | | | | |
| Minimum pension liability adjustment | | | — | | | | — | | | | — | | | | 1 | | | | — | | | | 1 | | | | 1 | |
Currency translation
adjustments | | | — | | | | — | | | | — | | | | — | | | | 37 | | | | 37 | | | | 37 | |
| Comprehensive income | | | — | | | | — | | | | — | | | | — | | | | — | | | $ | 105 | | | | | |
| Transactions with Dana | | | — | | | | (79 | ) | | | | | | | | | | | | | | | | | | | (79 | ) |
| Balance at December 31, 2003 | | | — | | | | 330 | | | | 537 | | | | (21 | ) | | | (24 | ) | | | | | | | 822 | |
| Net income | | | — | | | | — | | | | 28 | | | | — | | | | — | | | $ | 28 | | | | 28 | |
| Other comprehensive income: | | | | | | | | | | | | | | | | | | | | | | | | | | | | |
| Minimum pension liability adjustment – net of tax benefit of $3 million | | | — | | | | — | | | | — | | | | (6 | ) | | | — | | | | (6 | ) | | | (6 | ) |
Currency translation
adjustments | | | — | | | | — | | | | — | | | | — | | | | 28 | | | | 28 | | | | 28 | |
| Comprehensive income | | | — | | | | | | | | | | | | | | | | | | | $ | 50 | | | | | |
| Transactions with Dana | | | — | | | | 53 | | | | — | | | | — | | | | — | | | | | | | | 53 | |
| Balance at November 30, 2004 | | $ | — | | | $ | 383 | | | $ | 565 | | | $ | (27 | ) | | $ | 4 | | | | | | | $ | 925 | |
| Successor Company | | | | | | | | | | | | | | | | | | | | | | | | | | | | |
| Capital contribution | | $ | — | | | $ | 405 | | | $ | — | | | $ | — | | | $ | — | | | | | | | $ | 405 | |
| Net loss | | | — | | | | — | | | | (4 | ) | | | — | | | | — | | | $ | (4 | ) | | | (4 | ) |
| Other comprehensive income: | | | | | | | | | | | | | | | | | | | | | | | | | | | | |
| Currency translation | | | — | | | | — | | | | — | | | | — | | | | 3 | | | | 3 | | | | 3 | |
| Comprehensive loss | | | — | | | | — | | | | — | | | | — | | | | — | | | | (1 | ) | | | — | |
| Balance at December 31, 2004 | | | — | | | | 405 | | | | (4 | ) | | | — | | | | 3 | | | | | | | | 404 | |
| Capital contribution | | | — | | | | 1 | | | | — | | | | — | | | | — | | | | | | | | 1 | |
| Net loss | | | — | | | | — | | | | (30 | ) | | | — | | | | — | | | | (30 | ) | | | (30 | ) |
| Other comprehensive loss: | | | | | | | | | | | | | | | | | | | | | | | | | | | | |
| Currency translation – net of tax of $1 million | | | — | | | | — | | | | — | | | | — | | | | (1 | ) | | | (1 | ) | | | (1 | ) |
| Comprehensive loss | | | — | | | | — | | | | — | | | | — | | | | — | | | $ | (31 | ) | | | — | |
| Balance at December 31, 2005 | | $ | — | | | $ | 406 | | | $ | (34 | ) | | $ | — | | | $ | 2 | | | | | | | $ | 374 | |
|
The accompanying notes are an integral part of the combined and consolidated financial statements.
45
Table of ContentsAffinia Group Intermediate Holdings Inc.
Combined (Predecessor) and Consolidated (Successor) Statements of Cash Flows
(Dollars in Millions)
| | | | | | | | | | | | | | | | | | |
| | | Predecessor | | Successor |
| | | Year
Ended
December 31,
2003 | | January 1,
2004 through
November 30,
2004 | | December 1,
2004 through
December 31,
2004 | | Year
Ended
December 31,
2005 |
| | | | | | | [Restated] | | |
| Operating activities | | | | | | | | | | | | | | | | |
| Net income (loss) | | $ | 67 | | | $ | 28 | | | $ | (4 | ) | | $ | (30 | ) |
| Adjustments to reconcile net income (loss) from continuing operations to net cash provided by (used in) operating activities: | | | | | | | | | | | | | | | | |
| Depreciation and amortization | | | 46 | | | | 41 | | | | 4 | | | | 46 | |
| Impairment of assets | | | — | | | | 1 | | | | — | | | | 22 | |
| Provision for deferred income taxes | | | (9 | ) | | | (28 | ) | | | (8 | ) | | | (44 | ) |
| Gains on asset sales | | | (3 | ) | | | (2 | ) | | | — | | | | — | |
| Changes in current assets and liabilities: | | | | | | | | | | | | | | | | |
| Trade accounts receivable | | | 12 | | | | 8 | | | | 47 | | | | 8 | |
| Inventories | | | 8 | | | | (37 | ) | | | (4 | ) | | | 77 | |
| Other operating assets | | | (1 | ) | | | (30 | ) | | | 3 | | | | (14 | ) |
| Other operating liabilities | | | (16 | ) | | | (2 | ) | | | 14 | | | | 58 | |
| Other | | | 11 | | | | 13 | | | | 6 | | | | (22 | ) |
| Net cash provided by (used in) operating activities of continuing operations | | | 115 | | | | (8 | ) | | | 58 | | | | 101 | |
| Net cash provided by operating activities of discontinued operations | | | — | | | | 1 | | | | — | | | | 2 | |
| Net cash provided by (used in) operating activities | | | 115 | | | | (7 | ) | | | 58 | | | | 103 | |
| Investing activities | | | | | | | | | | | | | | | | |
| Acquisition of Dana Aftermarket Group | | | — | | | | — | | | | (1,016 | ) | | | — | |
| Proceeds from sales of assets | | | 7 | | | | 6 | | | | 1 | | | | 4 | |
| Working capital settlement with Dana | | | — | | | | — | | | | — | | | | (28 | ) |
| Proceeds from disposition of discontinued operations | | | — | | | | — | | | | — | | | | 7 | |
| Additions to property, plant, and equipment, net | | | (44 | ) | | | (44 | ) | | | (3 | ) | | | (35 | ) |
| Other investing activities | | | — | | | | 1 | | | | — | | | | — | |
| Net cash used in investing activities of continuing operations | | | (37 | ) | | | (37 | ) | | | (1,018 | ) | | | (52 | ) |
| Net cash used in investing activities of discontinued operations | | | — | | | | — | | | | — | | | | — | |
| Net cash used investing activities | | | (37 | ) | | | (37 | ) | | | (1,018 | ) | | | (52 | ) |
| Financing activities | | | | | | | | | | | | | | | | |
| Short-term debt, net | | | (1 | ) | | | (19 | ) | | | 10 | | | | (15 | ) |
| Proceeds from (payment of) long-term debt | | | | | | | | | | | 650 | | | | (35 | ) |
| Net transactions with Dana Corporation | | | (68 | ) | | | 63 | | | | — | | | | — | |
| Deferred financing costs | | | | | | | | | | | (19 | ) | | | — | |
| Capital contribution | | | — | | | | — | | | | 355 | | | | 1 | |
| Other financing activities | | | — | | | | — | | | | — | | | | — | |
| Net cash (used in) provided by financing activities of continuing operations | | | (69 | ) | | | 44 | | | | 996 | | | | (49 | ) |
| Net cash (used in) financing activities of discontinued operations | | | (1 | ) | | | (2 | ) | | | — | | | | — | |
| Net cash (used in) provided by financing activities | | | (70 | ) | | | 42 | | | | 996 | | | | (49 | ) |
| Increase (decrease) in cash and cash equivalents | | | 8 | | | | (2 | ) | | | 36 | | | | 2 | |
| Cash and cash equivalents at beginning of the period | | | 38 | | | | 46 | | | | 44 | | | | 80 | |
| Cash and cash equivalents at end of the period | | $ | 46 | | | $ | 44 | | | $ | 80 | | | $ | 82 | |
| Supplemental cash flows information | | | | | | | | | | | | | | | | |
| Cash paid during the period for: | | | | | | | | | | | | | | | | |
| Interest | | | — | | | | — | | | $ | 2 | | | $ | 49 | |
| Income taxes | | | — | | | | — | | | | — | | | $ | 18 | |
| Non-cash contribution of capital | | | — | | | | — | | | $ | 50 | | | | — | |
|
The accompanying notes are an integral part of the combined and consolidated financial statements.
46
Table of Contents | |
| Note 1. | Organization and Description of Business |
On July 8, 2004, Affinia Group Inc. (‘‘Affinia’’), a newly-formed company, wholly owned by Affinia Group Intermediate Holdings Inc. and controlled by affiliates of The Cypress Group L.L.C. (‘‘Cypress’’), entered into a stock and asset purchase agreement (the ‘‘Stock and Asset Purchase Agreement’’), as amended, with Dana Corporation (‘‘Dana’’). Affinia Group Intermediate Holdings Inc. is wholly owned by Affinia Group Holdings Inc. The Stock and Asset Purchase Agreement provided for the acquisition by Affinia of the outstanding shares of capital stock of certain subsidiaries and certain assets consisting primarily of Dana’s aftermarket business operations, which was completed on November 30, 2004 (the ‘‘Acquisition’’).
The accompanying combined financial statements prior to the Acquisition include the combined financial statements of Dana’s Aftermarket Group (the ‘‘Predecessor’’ financial statements). The accompanying consolidated financial statements subsequent to the Acquisition include the accounts of Affinia Group Intermediate Holdings Inc. and its consolidated subsidiaries (the ‘‘Successor’’ financial statements). In these notes to the financial statements, the terms the ‘‘Company’’ and ‘‘we’’ refer to either or both the Predecessor or Successor company.
Affinia is a leading designer, manufacturer and distributor of aftermarket components for passenger cars, sport utility vehicles, light, medium and heavy trucks and off-highway vehicles.
| |
| Note 2. | Restatement of Financial Statement |
Subsequent to the issuance of the consolidated financial statements as of December 31, 2004 the Company identified an error related to its initial recording in the Statement of Cash Flows of the funds received from the receivable financing facility that were used to partially fund the Acquisition. The Company originally increased financing activities by $55 million for the cash received from the sale of trade accounts receivable. In addition, the Company originally reduced short term debt by $20 million, which reflected the collection of trade accounts receivable during the period. Subsequently, we determined that cash received from the sale of trade accounts receivable should be accounted for in operating activities and cash received on trade account receivables previously sold should not be reflected in the Statement of Cash Flows. There was no income statement impact or balance sheet impact as a result of this restatement.
The following table sets forth the impact of the adjustment discussed above on the consolidated statement of cash flows (Dollars in Millions):
| | | | | | | | | | |
| | | December 1, 2004 through
December 31, 2004 |
| | | As
Originally
Reported | | As
Restated |
| Cash and cash equivalents at December 1, 2004 | | $ | 44 | | | $ | 44 | |
| Change in trade accounts receivable | | | (8 | ) | | | 47 | |
| Net cash provided by operating activities | | | 3 | | | | 58 | |
| Net cash used in investing activities | | | (1,018 | ) | | | (1,018 | ) |
| Financing activities: | | | | | | | | |
| Short-term debt, net | | | (10 | ) | | | 10 | |
| Proceeds from long-term debt | | | 725 | | | | 650 | |
| Deferred financing costs | | | (19 | ) | | | (19 | ) |
| Capital contribution | | | 355 | | | | 355 | |
| Net cash provided by financing activities | | | 1,051 | | | | 996 | |
| Net increase in cash and cash equivalents | | | 36 | | | | 36 | |
| Cash and cash equivalents at December 31, 2004 | | $ | 80 | | | $ | 80 | |
|
| |
| Note 3. | Acquisition and Basis of Presentation |
The Acquisition was completed on November 30, 2004, for a purchase price of approximately $1.0 billion, consisting of $967 million in cash, a working capital loan for $13 million and a seller note
47
Table of Contentsthat was issued by Affinia's indirect parent, Affinia Group Holdings Inc., with an estimated fair value, upon issuance, of $50 million. Pursuant to the Stock and Asset Purchase Agreement, the cash portion of the purchase price was increased by $3 million as a purchase price adjustment for working capital and $13 million as a purchase price adjustment for closing cash.
The consolidated financial statements of the Successor reflect the Acquisition under the purchase method of accounting, in accordance with Statement of Financial Accounting Standards (SFAS) No. 141, Business Combinations.
The Company engaged independent appraisers to assist in determining the fair values of property, plant and equipment and intangible assets acquired; including trade names, trademarks, developed technology and customer relationships. A preliminary allocation was made as of the acquisition date based on the report of the appraiser. The Company finalized the allocation of the purchase price during 2005 to reflect the fair value of the underlying assets acquired and liabilities assumed at December 1, 2004.
The following table summarizes the estimated fair values of the assets acquired and liabilities assumed at the date of the Acquisition (Dollars in Millions):
| | | | | | | | | | | | | | |
| | | Preliminary
Allocation | | Adjustments | | Final
Allocation |
| Current assets | | $ | 939 | | | | (10 | ) | | $ | 929 | |
| Property, plant and equipment | | | 235 | | | | (8 | ) | | | 227 | |
| Customer relationships | | | 118 | | | | — | | | | 118 | |
| Other intangible assets | | | 70 | | | | (1 | ) | | | 69 | |
| Goodwill | | | — | | | | 57 | | | | 57 | |
| Other assets | | | 80 | | | | 18 | | | | 98 | |
| Total acquired assets | | | 1,442 | | | | 56 | | | | 1,498 | |
| Current liabilities | | | 386 | | | | 36 | | | | 422 | |
| Other liabilities | | | 26 | | | | 20 | | | | 46 | |
| Total liabilities assumed | | | 412 | | | | 56 | | | | 468 | |
| Net assets acquired | | $ | 1,030 | | | $ | — | | | $ | 1,030 | |
|
Funding for the purchase price of the Acquisition included the equity investment of $405 million by Affinia Group Holdings Inc., a term loan and revolving credit facility, a receivable securitization facility and the issuance of senior subordinated notes in a private offering.
Cash and cash equivalents, trade accounts receivable, other current assets, accounts payable, accrued expenses and other current liabilities were recorded at historical carrying values, given the short-term nature of these assets and liabilities. Inventory, other non-current assets, long-term debt, and other non-current liabilities outstanding as of the effective date of the Acquisition have been allocated based on management's estimate of fair market value which approximates book value. Deferred income taxes have been provided in the consolidated balance sheet based on the Company's preliminary estimates of the tax versus book basis of the assets acquired and liabilities assumed, as adjusted to estimated fair values. Trademarks and trade names have been valued based on the royalty savings approach. This method allocates value based on what the Company would be willing to pay as a royalty to a third-party owner of the trademark or trade name in order to exploit the economic benefits. The trademarks and trade names that have been valued under this approach are the Company's name and other product-related trademarks that have a value of $48 million at December 1, 2004 with an estimated indefinite life. Patents and developed technology of $22 million at December 1, 2004 have also been valued based on the royalty savings approach with an estimated useful life of 6 to 20 years. Customer relationships have been valued using an income approach after considering a fair return on fixed assets, working capital, patents, tradenames, trademarks, technology, and assembled workforce. A value of $118 million at December 1, 2004 has been assigned to customer relationships with estimated useful lives ranging from 15 to 20 years. During 2005 we recorded goodwill adjustments related to the purchase price.
48
Table of Contents | |
| Note 4. | Summary of Significant Accounting Policies |
Principles of Consolidation
The consolidated financial statements include the accounts of Affinia and its majority-owned subsidiaries (‘‘the Company’’). All significant intercompany transactions have been eliminated. Equity investments in which we exercise significant influence but do not control are accounted for using the equity method. Investments in which we are not able to exercise significant influence over the investee are accounted for under the cost method.
Use of Estimates
The preparation of these combined and consolidated financial statements requires estimates and assumptions that affect the amounts reported in these combined and consolidated financial statements and accompanying notes. Some of the more significant estimates include valuation of deferred tax assets and inventories; workers compensation; sales return, rebate and warranty accruals; restructuring, environmental and product liability accruals; valuation of postemployment and postretirement benefits, as applicable; depreciation and amortization of long-lived assets and allowances for doubtful accounts. Actual results may differ from these estimates and assumptions.
Allocation of Corporate Costs
Certain expenses incurred by Dana on behalf of the Predecessor have been included in these financial statements in the Predecessor periods presented. These expenses include accounting, audit, legal, tax, treasury and certain other administrative services. These expenses have been allocated to the Company generally based upon its sales relative to the consolidated sales of Dana. Management believes that this methodology yields a reasonable allocation. See Note 19 for details of amounts allocated to the Company.
Concentration of Credit Risk
The primary type of financial instruments that potentially subject the Company to concentrations of credit risk are trade accounts receivable. The Company limits its credit risk by performing ongoing credit evaluations of its customers and, when deemed necessary, requires letters of credit, guarantees or collateral. The majority of the Company's accounts receivable is due from replacement parts wholesalers and retailers serving the aftermarket.
For the year ended December 31, 2005, the Company's net sales to its three largest customers were 21%, 8% and 5%, respectively. Net sales represent the amounts invoiced to customers after adjustments related to rebates, returns and discounts. The Company provides reserves for rebates, returns and discounts at the time of sale which are subsequently applied to the account of specific customers based upon actual activity including the attainment of targeted volumes.
Foreign Currency Translation
Assets and liabilities recorded in foreign currencies are translated at the exchange rate on the balance sheet date. Revenue and expenses are translated at average rates of exchange prevailing during the year. Translation adjustments resulting from this process are charged or credited to Other Comprehensive Income (OCI).
Cash and Cash Equivalents
Cash and cash equivalents include all cash balances and highly liquid investments with original maturities of three months or less.
Inventories
Predecessor inventories are valued at the lower of cost or market. Cost was determined on the last-in, first-out (‘‘LIFO’’) basis for U.S. inventories and on the first-in, first out (‘‘FIFO’’) or average cost basis for non-U.S. inventories.
49
Table of ContentsSuccessor inventories are valued at the lower of cost or market. Cost is determined on the FIFO basis for all inventories. The FIFO basis more closely represents the physical flow of goods and will better represent the current cost and value of the inventory on hand.
Goodwill
On January 1, 2002, the Predecessor adopted SFAS No. 142, Goodwill and Other Intangible Assets. In accordance with this standard, goodwill is no longer amortized, but instead the Predecessor and the Successor evaluate goodwill for impairment, during the fourth quarter of each year, unless conditions arise that would require a more frequent evaluation. In assessing the recoverability of goodwill, projections regarding estimated future cash flows and other factors are made to determine the fair value of the respective assets. If these estimates or related projections change in the future, we may be required to record impairment charges for goodwill at that time.
Intangibles
We have trade names with indefinite lives and other intangibles with definite lives. As discussed above, we adopted SFAS No. 142 as of January 1, 2002, which eliminated the amortization of trade names. In lieu of amortization, the Predecessor and Successor test trade names for impairment on an annual basis, during the fourth quarter, unless conditions arise that would require a more frequent evaluation. Trade names were tested for impairment by comparing the fair value to their carrying values.
Our intangibles with definite lives consist of customer relationships, patents and developed technology. These assets are amortized on a straight-line basis over estimated useful lives ranging from 6 to 20 years.
Deferred Financing Costs
Deferred financing costs are incurred to obtain long-term financing and are amortized using the effective interest method over the term of the related debt. The amortization of deferred financing costs is classified in interest expense in the statement of operations.
Properties and Depreciation
As noted in Note 3, in conjunction with the Acquisition, the Company used independent appraisers' valuations as a basis for determining the fair values of property, plant and equipment acquired. As of December 1, 2004, and thereafter, the Company has reflected in the financial statements of the Successor the appraised fair value of the property, plant and equipment acquired. These assets are being depreciated over their estimated remaining lives using primarily the straight-line method for financial reporting purposes and accelerated depreciation methods for federal income tax purposes. Major additions and improvements are capitalized and depreciated over their estimated useful lives and repairs and maintenance are charged to expense in the period incurred. We review long-lived assets for impairment as required by SFAS 144 ‘‘Accounting for the Impairment or Disposal of Long-Lived Assets.’’ SFAS 144 requires recognition of an impairment loss only if the carrying amount of a long-lived asset is not recoverable from its undiscounted cash flows. If the long-lived asset is not recoverable we measure an impairment loss as the difference between the carrying amount and fair value of the asset.
Useful lives for buildings and building improvements, machinery and equipment, tooling and office equipment, furniture and fixtures principally range from 20 to 30 years, five to ten years, three to five years and three to ten years, respectively. Upon retirement or other disposal of fixed assets, the cost and related accumulated depreciation are eliminated from the asset and accumulated depreciation accounts, respectively. The difference, if any, between the net asset value and the proceeds is recorded as a gain or loss on disposition.
Revenue Recognition
Sales are recognized when products are shipped and risk of loss has transferred to the customer. The Company estimates and records provisions for warranty costs, sales returns and other allowances
50
Table of Contentsbased on experience and other relevant factors, when sales are recognized. The Company assesses the adequacy of its recorded warranty, sales returns and allowances liabilities on a regular basis and adjusts the recorded amounts as necessary. While management believes that these estimates are reasonable, actual returns and allowances and warranty costs may differ from estimates. Shipping and handling fees billed to customers are included in sales and the costs of shipping and handling are included in cost of sales. Inter-company sales have been eliminated. Sales to other Dana businesses are included in net sales.
Income Taxes
Income taxes are recognized during the period in which transactions enter into the determination of financial statement income, with deferred income taxes being provided for the tax effect of temporary differences between the carrying amount of assets and liabilities and their tax bases. Deferred income taxes are provided on the undistributed earnings of foreign subsidiaries and affiliated companies except to the extent such earnings are considered to be permanently reinvested in the subsidiary or affiliate. In cases where foreign tax credits will not offset U.S. income taxes, appropriate provisions are included in the combined or consolidated statement of operations.
Financial Instruments
The reported fair values of financial instruments, consisting of cash and cash equivalents, trade accounts receivable and long-term debt, are based on a variety of factors. Where available, fair values represent quoted market prices for identical or comparable instruments. Where quoted market prices are not available, fair values are estimated based on assumptions concerning the amount and timing of estimated future cash flows and assumed discount rates reflecting varying degrees of credit risk. Fair values may not represent actual values of the financial instruments that could be realized as of the balance sheet date or that will be realized in the future. As of December 31, 2004, the book values of all financial instruments approximated their fair values. As of December 31, 2005, the book value of some of our financial instruments, consisting of cash and cash equivalents and trade accounts receivable, approximated their fair values. The fair value of long-term debt is disclosed in Note 8. Debt.
Environmental Compliance and Remediation
Environmental expenditures that relate to current operations are expensed or capitalized as appropriate. Expenditures that relate to existing conditions caused by past operations which do not contribute to current or future revenue generation are expensed. Liabilities are recorded when environmental assessments and/or remedial efforts are probable and the costs can be reasonably estimated. Estimated costs are based upon current laws and regulations, existing technology and the most probable method of remediation. The costs are not discounted and exclude the effects of inflation. If the cost estimates result in a range of equally probable amounts, the lower end of the range is accrued.
Pension Plans
Annual net periodic pension costs of the Predecessor under defined benefit pension plans were determined on an actuarial basis. The Company’s policy had been to fund these costs through deposits with trustees in accordance with applicable funding regulations. Benefits were determined based upon employees' length of service, wages or a combination of length of service and wages. With the exception of six defined benefit pension plans continuing in Canada as of December 31, 2005, the remaining defined benefit pension plans of the Predecessor, covering substantially all U.S. employees, were terminated effective November 30, 2004 and replaced by defined contribution arrangements.
Postretirement Benefits Other Than Pensions
The annual net postretirement benefits expense under defined benefit plans and the related liabilities are determined on an actuarial basis. The Company’s policy is to fund these benefits as they
51
Table of Contentsbecome due. Benefits are determined primarily based upon employees' length of service and include applicable employee cost sharing. These postretirement benefits have been replaced by the Successor with defined contribution arrangements.
Postemployment Benefits
Annual net postemployment benefits expense under Successor benefit plans and the related liabilities were accrued as service was rendered for those obligations that accumulated or vested and could be reasonably estimated. Obligations that did not accumulate or vest were recorded when payment of the benefits were probable and the amounts could be reasonably estimated.
Promotional Programs
Advertising costs are recognized as selling expenses at the time advertising is aired or published. Cooperative advertising programs conducted with customers that promote the Company’s products are accrued as a rebate based on anticipated total amounts to be rebated to customers over the period of the agreement with the customer. Changeover costs incurred in connection with obtaining new business are recognized as selling expense in the period in which the changeover from a competitor's product to the Company’s product occurs.
Insurance
We use a combination of insurance and self-insurance for a number of risks, including workers’ compensation, general liability, vehicle liability and the company-funded portion of employee-related health care benefits. Liabilities associated with these risks are estimated in part by considering historical claims experience, demographic factors, severity factors and other actuarial assumptions.
Research and Development Costs
Research and development expenses are charged to operations as incurred. The Company incurred $3 million, $4 million and less than $1 million for the full year of 2003 and the period January 1, 2004 through November 30, 2004 and for the period December 1, 2004 through December 31, 2004, respectively. During 2005, the Company incurred $4 million for such costs.
Stock-Based Compensation
Predecessor Plan: Certain Affinia employees participated in Dana's stock-based compensation plans. Stock-based compensation was accounted for using the intrinsic value method prescribed in Accounting Principles Board Opinion No. 25, Accounting for Stock Issued to Employees, and related interpretations. Stock compensation expense recorded by the Company was limited to the cost of the Dana restricted stock programs, which totaled less than $1 million in 2003 and for the period January 1, 2004 through November 30, 2004. No compensation expense was recorded for stock options when granted, as option prices have historically been set at the market value of the underlying Dana stock. If the Company had included the fair value of stock options in these financial statements in accordance with SFAS No. 123, the pro forma after-tax expense would have been $2 million in 2003 and $1 million for the period January 1, 2004 through November 30, 2004 and the pro forma net income would have been $65 million in 2003 and $27 million for the period January 1, 2004 through November 30, 2004.
Successor Plan: On July 20, 2005, we adopted the Affinia Group Holdings Inc. 2005 Stock Incentive Plan, which we refer to as our stock incentive plan. The stock incentive plan permits the grant of non-qualified stock options, incentive stock options, stock appreciation rights, restricted stock and other stock-based awards to employees, directors or consultants of Affinia Group Holdings Inc. and its affiliates. A maximum of 227,000 shares of common stock may be subject to awards under the stock incentive plan. The number of shares issued or reserved pursuant to the stock incentive plan (or pursuant to outstanding awards) is subject to adjustment on account of mergers, consolidations, reorganizations, stock splits, stock dividends and other dilutive changes in the common stock. Shares
52
Table of Contentsof common stock covered by awards that terminate or lapse and shares delivered by a participant or withheld to pay the minimum statutory withholding rate, in each case, will again be available for grant under the stock incentive plan. We adopted SFAS 123R in 2005 and account for the Successor stock incentive plan employee stock options under the fair value method of accounting using a Black-Scholes model to measure stock-based compensation expense at the date of grant. The compensation expense for the year ended December 31, 2005 was $0.2 million.
Refer to note 10 for further information on and discussion of our stock incentive plan.
New Accounting Pronouncements
In February 2006, the FASB issued statement SFAS No. 155 ‘‘Accounting for Certain Hybrid Financial Instruments — an amendment of FASB Statements No. 133 and 140.’’ This Statement amends FASB Statements No. 133, Accounting for Derivative Instruments and Hedging Activities, and No. 140, Accounting for Transfers and Servicing of Financial Assets and Extinguishments of Liabilities. This statement eliminates the exemption from applying Statement 133 to interests in securitized financial assets so that similar instruments are accounted for similarly regardless of the form of the instruments. Additionally, the statement allows a preparer to elect fair value measurement at acquisition, at issuance, or when a previously recognized financial instrument is subject to a remeasurement (new basis) event, on an instrument-by-instrument basis, in cases in which a derivative would otherwise have to be bifurcated. Providing a fair value measurement election also results in more financial instruments being measured at what the board of directors regards as the most relevant attribute for financial instruments, fair value. This statement is effective for all financial instruments acquired or issued after the beginning of an entity’s first fiscal year that begins after September 15, 2006. The Company has not yet evaluated the potential impact of this statement but anticipate that the adoption of this statement will not have a material impact on our financial position or results of operations.
In December 2004, the FASB issued SFAS No. 151, ‘‘Inventory Costs, an amendment of ARB No. 43, Chapter 4.’’ SFAS No. 151 clarifies the treatment of certain costs, such as idle facility expense, freight and handling, as period expenses and requires that allocation of fixed overhead be based on normal capacity. The Company is required to adopt this guidance beginning January 1, 2006 and has not yet evaluated the potential impact on its financial position or results of operations.
In December 2004, the FASB issued SFAS No. 153, ‘‘Exchange of Nonmonetary Assets, an amendment of APB No. 29, Accounting for Nonmonetary Transactions.’’ SFAS 153 amends APB No. 29 to eliminate the exception for nonmonetary exchanges of similar productive assets and replaces it with a general exception for exchanges of nonmonetary assets that do not have commercial substance. A nonmonetary exchange has commercial substance if the future cash flows of the entity are expected to change significantly as a result of the exchange. We have adopted this standard and it did not have any impact on the Company's results of operations or financial position.
In December 2004, the FASB issued SFAS No. 123(R), ‘‘Share-Based Payment,’’ which requires compensation costs related to share-based payment transactions to be recognized in the financial statements. This statement also establishes fair value as the measurement objective for share-based payment transactions with employees. The Company began expensing the fair value of stock options in 2005. The Company adopted the provisions of SFAS No. 123(R) in the fourth quarter of 2005. The adoption of SFAS No. 123(R) did not have a material impact on the Company’s results of operations or financial position.
In March 2005, the FASB issued Financial Interpretation (FIN) 47 ‘‘Accounting for Conditional Asset Retirement Obligations’’. We adopted FIN 47 effective December 31, 2005. FIN 47 requires that a liability for the fair value of an Asset Retirement Obligation (‘‘ARO’’) be recognized in the period in which it is incurred if it can be reasonably estimated, with the offsetting associated asset retirement costs capitalized as part of the carrying amount of the long-lived assets. The ARO is subsequently allocated to expense using a systematic and rational method over its useful life. Changes in the ARO liability resulting from the passage of time are recognized as an increase in the carrying amount of the liability and as accretion expense. Changes resulting from revisions to the timing or amount of the
53
Table of Contentsoriginal estimate of cash flows are recognized as an increase or a decrease in both the asset and liability. The ARO recorded at December 31, 2005 was $2.6 million. The cumulative effect of a change in accounting principle of adopting and FIN 47 was not material to our net income in the period of adoption.
In April 2005, the FASB issued SFAS No. 154, ‘‘Accounting Changes and Error Corrections,’’ requiring retrospective application as the required method for reporting a change in accounting principle, unless impracticable or a pronouncement includes specific transition provisions. This statement also requires that a change in depreciation, amortization, or depletion method for long-lived, nonfinancial assets be accounted for as a change in accounting estimate effected by a change in accounting principle. This statement carries forward the guidance in APB Opinion No. 20, ‘‘Accounting Changes,’’ for the reporting of the correction of an error and a change in accounting estimate. This statement is effective for accounting changes and correction of errors made in fiscal years beginning after December 15, 2005.
In November 2005, the FASB issued FSP 123(R)-3, Transition Election Related to Accounting for the Tax Effects of Share-Based Award Payments (‘‘FSP 123(R)-3’’). The provisions of FSP 123(R)-3 set forth an alternative method of calculating the excess tax benefits available to absorb tax deficiencies recognized subsequent to the adoption of FAS No. 123(R). The Company, which is currently evaluating its available transition alternatives, has until November 2006 to make its one-time election.
| |
| Note 5. | Inventories |
Inventories consist of the following (Dollars in Millions):
| | | | | | | | | | |
| | | Successor
At December 31,
2004 | | Successor
At December 31,
2005 |
| Raw materials | | $ | 109 | | | $ | 107 | |
| Work-in-process | | | 25 | | | | 21 | |
| Finished goods | | | 360 | | | | 289 | |
| | | $ | 494 | | | $ | 417 | |
|
| |
| Note 6. | Goodwill |
The Predecessor adopted SFAS No. 142, ‘‘Goodwill and Other Intangible Assets,’’ as of January 1, 2002. In lieu of amortization, we test goodwill for impairment on an annual basis, during the fourth quarter, unless conditions arise that would require a more frequent evaluation. In assessing the recoverability of goodwill, projections regarding estimated future cash flows and other factors are made to determine the fair value of the respective assets. If these estimates or related projections change in the future, we may be required to record impairment charges for goodwill at that time. In connection with the adoption of SFAS No. 142, ‘‘Goodwill and Other Intangible Assets,’’ the Predecessor discontinued its amortization of goodwill as of January 1, 2002. In lieu of amortization, goodwill was tested for impairment as of the date of adoption and again during the fourth quarter of 2003.
In conjunction with the Acquisition we determined the fair value of intangibles, property, plant and equipment, other assets and liabilities. Based on our valuations and purchase accounting adjustments we had no amounts recorded as goodwill as of December 31, 2004. During 2005, we made purchase price adjustments primarily to reflect revised fair value adjustments, the acquisition restructuring during the year and tax valuation adjustments. We have tested the goodwill for impairment during the fourth quarter of 2005 and concluded no adjustment was necessary. The following table summarizes the Successor’s goodwill activity during 2005 (Dollars in Millions):
54
Table of Contents
| | | | | | |
| | | Successor
Consolidated
Year
Ended
December 31, 2005 |
| Balance at December 31, 2004 | | $ | — | |
| Tax valuation | | | 14 | |
| Termination benefits and other | | | 21 | |
| Account receivable valuation | | | 5 | |
| Final valuation of fixed assets | | | 7 | |
| Pension | | | 5 | |
| Other | | | 5 | |
| Balance at December 31, 2005 | | $ | 57 | |
|
| |
| Note 7. | Other Intangible Assets |
Effective as of November 30, 2004, the Acquisition date, an outside appraisal company performed an appraisal of all the acquired assets. Based on this valuation, it was determined that we had trade names and other intangibles with a value of $188 million. Subsequently, during the allocation period intangible assets were ultimately reduced by $1 million.
In accordance with SFAS 142, trade names and other intangibles were tested for impairment in the fourth quarter of 2005 by comparing their fair value to their carrying values. The fair value for each trade name was established based upon a royalty savings approach. We determined that the value of trade names were not impaired as of December 31, 2005.
As of December 31, 2004 and December 31, 2005, the Company’s other intangible assets consisted of customer relationships, patents, and developed technology. The Company recorded approximately $8 million of amortization on customer relationships, patents, and developed technology for the period January 1, 2005 to December 31, 2005. Amortization expense is calculated on a straight line basis over 6 to 20 years. We estimate that the amortization expense will be approximately $8 million for the years ending December 31, 2006 through December 31, 2010. The other intangibles amortization for the period of December 1, 2004 to December 31, 2004 was less than $1 million.
A rollfoward of the other intangibles and trade names for 2005 is shown below (Dollars in Millions):
| | | | | | | | | | | | | | | | | | | | | | | | | | |
| | | 12/1/2004 | | Amortization | | 12/31/2004 | | Amortization | | Purchase
Accounting
Adjustments | | 12/31/2005 |
| Trade names | | $ | 48 | | | | | | | $ | 48 | | | $ | — | | | $ | — | | | $ | 48 | |
| Other intangibles | | | 140 | | | | (1 | ) | | | 139 | | | | (8 | ) | | | (1 | ) | | | 130 | |
| Total | | $ | 188 | | | $ | (1 | ) | | $ | 187 | | | $ | (8 | ) | | $ | (1 | ) | | $ | 178 | |
|
55
Table of Contents | |
| Note 8. | Debt |
Debt consists of the following (Dollars in Millions):
| | | | | | | | | | |
| | | At December 31, |
| | | 2004 | | 2005 |
| Short-term: | | | | | | | | |
| Current portion of long-term debt | | $ | 3 | | | $ | — | |
| Receivable financing facility | | | 10 | | | | — | |
| Short-term note payable | | | 2 | | | | — | |
| | | $ | 15 | | | $ | — | |
| Long-term: | | | | | | | | |
| Term loan, due November 2011 | | $ | 350 | | | $ | 312 | |
| Senior subordinated notes, due November 2014 | | | 300 | | | | 300 | |
| Revolving credit facility, due November 2010 | | | — | | | | — | |
| | | | 650 | | | | 612 | |
| Less: Current portion | | | 3 | | | | — | |
| | | $ | 647 | | | $ | 612 | |
|
The fair value of debt is as follows (Dollars in Millions):
Fair Value of Debt at December 31, 2005
| | | | | | | | | | | | | | |
| | | Book
Value of
Debt | | Trading
Price
Factor | | Fair
Value of
Debt |
| Term loan, due November 2011 | | $ | 312 | | | | 100 | % | | $ | 312 | |
| Senior subordinated notes, due November 2014 | | | 300 | | | | 80 | % | | | 240 | |
| Total fair value of debt at December 31, 2005 | | | | | | | | | | $ | 552 | |
|
On November 30, 2004, in connection with the Acquisition, the Company issued 9.0% senior subordinated notes due 2014 in the principal amount of $300 million. The senior subordinated notes were offered only to qualified institutional buyers and certain persons in offshore transactions. The senior subordinated notes were subsequently registered under the Securities Act of 1933 pursuant to an exchange offer completed on November 2, 2005. Interest is payable semiannually in arrears on May 30 and November 30. The senior subordinated notes do not require principal payments prior to maturity. Affinia Group Intermediate Holdings Inc. and certain of the Company’s current and future subsidiaries guarantee the senior subordinated notes. At its option, Affinia may redeem some or all of the senior subordinated notes prior to November 30, 2009 at a redemption price equal to 100% of the principal amount thereof plus a specified ‘‘make-whole’’ premium plus accrued and unpaid interest, if any. On and after November 30, 2009, the Company may, at its option, redeem all or a portion of the senior subordinated notes the redemption prices set forth below (expressed as percentages of principal amount), plus accrued interest, if any, if redeemed during the twelve-month period commencing on November 30 of the years set forth below:
56
Table of Contents
| | | | | | |
| Senior Subordinated Notes |
| Period | | Redemption Price |
| 2009 | | 104.500% |
| 2010 | | 103.000% |
| 2011 | | 101.500% |
| 2012 and thereafter | | 100.000% |
|
In addition, prior to November 30, 2007, the Company may, at its option, redeem up to 35% of the senior subordinated notes with the proceeds of certain equity offerings at a redemption price of 109% (expressed as a percentage of principal amount), plus accrued and unpaid interest, if any.
On November 30, 2004, in connection with the Acquisition, Affinia established financing arrangements with third-party lenders (the ‘‘banks’’) that provide senior credit facilities consisting of a revolving credit facility and a term loan facility that are unconditionally guaranteed by the Company, and certain domestic subsidiaries of Affinia (collectively, the ‘‘Guarantors’’). The repayment of these facilities is secured by substantially all the assets of the Guarantors, including, but not limited to, a pledge of their capital stock and 65 percent of the capital stock of non-U.S. subsidiaries owned directly by the Guarantors. The revolving credit facility, which expires on November 30, 2010, provides for borrowings of up to $125 million through a syndicate of lenders. The revolving credit facility also includes borrowing capacity available for letters of credit. As of December 31, 2005, the Company had $12 million in outstanding letters of credit, none of which had been drawn against. There were no other amounts outstanding under the revolving credit facility at December 31, 2005. The term loan facility provides for a $350 million term loan with a maturity of seven years, of which $312 million was outstanding at December 31, 2005. On December 12, 2005, in connection with the comprehensive restructuring, certain provisions applicable to the senior credit facilities were amended as described below.
The senior credit facilities bear interest at a rate equal to an applicable margin plus, at our option, either (a) a base rate determined by reference to the higher of (1) the bank's prime rate and (2) the federal funds rate plus one-half of 1% or (b) LIBOR rate determined by reference to the costs of funds for deposits in U.S. dollars for the interest period relevant to such borrowing adjusted for certain additional costs. The initial applicable margin for borrowings under the term loan facility was 1.50% with respect to base rate borrowings and 2.50% with respect to LIBOR borrowings. However, in connection with an amendment to our senior credit facilities in December 2005, in connection with our comprehensive restructuring program, the applicable margin for borrowings under the term loan facility was increased to 2.00% with respect to base rate borrowings and 3.00% with respect to LIBOR borrowings. Following the amendment to our senior credit facilities, the applicable margin for borrowings under the revolving credit facility and the term loan facility may be reduced subject to our attaining certain leverage ratios or increased based on certain credit ratings as determined by Moody’s and Standard & Poors.
In addition to paying interest on outstanding principal under the senior credit facilities, Affinia is required to pay a commitment fee to the lenders under the revolving credit facility in respect of the unutilized commitments thereunder at a rate equal to 0.50% per annum. The Company also paid customary letter of credit fees.
Principal amounts outstanding under the revolving credit facility are due and payable in full at maturity on November 30, 2010.
At December 31, 2005 the Company had $312 million outstanding under the term loan facility with a weighted-average interest rate of 6.9%. The amounts outstanding, as well as the base rates and margins, at December 31, 2005, were as follows:
| | | | | | | | | | | | | | |
| | | Amount | | Base Rate | | Margin |
| Term loan facility | | $312 million | | | 3.9 | % | | | 3.00 | % |
|
The senior credit facilities contain a number of covenants that, among other things, restrict, subject to certain exceptions, the Company’s ability, and the ability of the Company’s subsidiaries, to
57
Table of Contentssell assets, incur additional indebtedness or issue preferred stock, repay other indebtedness (including the senior subordinated notes), pay certain dividends and distributions or repurchase its capital stock, create liens on assets, make investments, loans or advances, make certain acquisitions, engage in mergers or consolidations, enter into sale and leaseback transactions, engage in certain transactions with affiliates, amend certain material agreements governing Affinia’s indebtedness (including the senior subordinated notes), and change the business conducted by Affinia and its subsidiaries. In addition, the senior credit facilities contain the following financial covenants: a maximum total leverage ratio; a minimum interest coverage ratio; and a maximum capital expenditures limitation. As of December 31, 2005 and 2004 the Company was in compliance with all of these covenants.
In December 2005 the senior credit facilities were amended to allow for the implementation of the comprehensive restructuring. The amendment modified a number of terms and conditions providing for, among others, an increase to the maximum total leverage ratio in certain periods, the ability to add back certain restructuring expenses associated with the comprehensive restructuring in calculating adjusted EBITDA, an increase to the applicable margin for borrowings under the term loan facility with the ability of such margin to be decreased subject to our attaining certain leverage ratios or increased subject to a deterioration in certain credit ratings as determined by Moody’s and Standard & Poor’s and a prepayment premium of 1% payable if the senior credit facilities are refinanced for the purpose of obtaining more favorable interest rates within 2 years of the amendment.
The senior subordinated notes limit Affinia’s (and most or all of its subsidiaries’) ability to incur additional indebtedness, pay dividends on or make other distributions or repurchase our capital stock, make certain investments, enter into certain types of transactions with affiliates, use assets as security in other transactions, and sell certain assets or merge with or into other companies. Subject to the aforementioned exceptions, Affinia and its restricted subsidiaries are permitted to incur additional indebtedness, including secured indebtedness, under the terms of the senior subordinated notes. All of the long-term debt matures after 2010.
| |
| Note 9. | Securitization of Accounts Receivable |
On November 30, 2004, in connection with the Acquisition, Affinia established a receivables facility that provides up to $100 million in funding, based on availability of eligible receivables and satisfaction of other customary conditions. Under the receivables facility, receivables are sold by certain subsidiaries of Affinia to a wholly-owned bankruptcy-remote finance subsidiary of Affinia, which transfers an undivided interest in the purchased receivables to a commercial paper conduit or bank sponsor in exchange for cash.
Affinia, as the receivables collection agent, services, administers and collects the receivables under the receivables purchase agreement for which it receives a monthly servicing fee at a rate of 1.00% per annum of the average daily outstanding balance of receivables. The fees in respect of the receivables facility include a usage fee paid by the finance subsidiaries that varies based upon the Company's leverage ratio as calculated under the senior credit facilities. Funded amounts under the receivables facility bear interest at a rate equal to the conduit's pooled commercial paper rate plus the usage fee.
At December 31, 2004 and December 31, 2005, the usage fee margin for the receivables facility was 1.25% per annum of the amount funded. In addition, the finance subsidiary is required to pay a fee on the unused portion of the receivables facility that varies based upon the same ratio. At December 31, 2004 and December 31, 2005, the unused fee was 0.50% per annum of the unused portion of the receivables facility.
Availability of funding under the receivables facility depends primarily upon the outstanding trade accounts receivable balance from time to time. Aggregate availability is determined by using a formula that reduces the gross receivables balance by factors that take into account historical default and dilution rates, obligor concentrations and average days outstanding and the costs of the facility. As of December 31, 2004 and December 31, 2005, approximately $79 million and $69 million, respectively, were available for funding. At December 31, 2004, we had $55 million of receivables outstanding under this facility, of which $45 million qualified for sale accounting. At December 31, 2005, there were no receivables outstanding under this facility.
58
Table of ContentsThe receivables facility contains conditions, representations, warranties and covenants similar to those in the senior credit facilities. We were in compliance with all covenants in both 2005 and 2004. It also contains amortization events similar to the events of default under the senior credit facilities, plus amortization events relating to the quality and performance of the trade receivables. If an amortization event occurs, all of the cash flow from the receivables sold to the finance subsidiary will be allocated to the receivables facility until it is paid in full.
| |
| Note 10. | Stock Option Plans |
Successor Plan
On July 20, 2005, we adopted the Affinia Group Holdings Inc. 2005 Stock Incentive Plan, which we refer to as our stock incentive plan. The stock incentive plan permits the grant of non-qualified stock options, incentive stock options, stock appreciation rights, restricted stock and other stock-based awards to employees, directors or consultants of Affinia Group Holdings Inc. and its affiliates. A maximum of 227,000 shares of common stock may be subject to awards under the stock incentive plan. The number of shares issued or reserved pursuant to the stock incentive plan (or pursuant to outstanding awards) is subject to adjustment on account of mergers, consolidations, reorganizations, stock splits, stock dividends and other dilutive changes in the common stock. Shares of common stock covered by awards that terminate or lapse and shares delivered by a participant or withheld to pay the minimum statutory withholding rate, in each case, will again be available for grant under the stock incentive plan.
Administration. The stock incentive plan is administered by a committee of our Board of Directors. The committee has full power and authority to make, and establish the terms and conditions of any award, and to waive any such terms and conditions at any time (including, without limitation, accelerating or waiving any vesting conditions or payment dates). The committee is authorized to interpret the plan, to establish, amend and rescind any rules and regulations relating to the plan and to make any other determinations that it, in good faith, deems necessary or desirable for the administration of the plan and may delegate such authority as it deems appropriate. The committee may correct any defect or supply an omission or reconcile any inconsistency in the plan in the manner and to the extent the committee deems necessary or desirable and any decision of the committee in the interpretation and administration of the plan shall lie within its sole and absolute good faith discretion and shall be final, conclusive and binding on all parties concerned.
Options. The committee determines the option price for each option, however, the incentive stock options must have an exercise price that is at least equal to the fair market value of the common stock on the date the option is granted. An option holder may exercise an option by written notice and payment of the option price (i) in cash or its equivalent, (ii) by the surrender of a number of shares of common stock already owned by the option holder for at least six months (or such other period established by the committee) with a fair market value equal to the exercise price, (iii) if there is a public market for the shares, subject to rules established by the committee, through the delivery of irrevocable instructions to a broker to sell shares obtained upon the exercise of the option and to deliver to Affinia Group Holdings Inc. an amount out of the proceeds of the sale equal to the aggregate option price for the shares being purchased or (iv) by another method approved by the committee.
Stock Appreciation Rights. The committee may grant stock appreciation rights independent of or in connection with an option. The exercise price per share of a stock appreciation right shall be an amount determined by the committee. Generally, each stock appreciation right shall entitle a participant upon exercise to an amount equal to (i) the excess of (1) the fair market value on the exercise date of one share of common stock over (2) the exercise price, multiplied by (ii) the number of shares of common stock covered by the stock appreciation right. Payment shall be made in common stock or in cash, or partly in common stock and partly in cash, all as shall be determined by the committee.
Other Stock-Based Awards. The committee may grant awards of restricted stock units, rights to purchase stock, restricted stock and other awards that are valued in whole or in part by reference to,
59
Table of Contentsor are otherwise based on the fair market value of, shares of common stock. The other stock-based awards will be subject to the terms and conditions established by the committee.
Transferability. Unless otherwise determined by the committee, awards granted under the stock incentive plan are not transferable other than by will or by the laws of descent and distribution.
Change of Control. In the event of a change of control (as defined in the stock incentive plan), the committee may provide for (i) the termination of an award upon the consummation of the change of control, but only if the award has vested and been paid out or the participant has been permitted to exercise an option in full for a period of not less than 30 days prior to the change of control, (ii) the acceleration of all or any portion of an award, (iii) payment in exchange for the cancellation of an award and/or (iv) the issuance of substitute awards that would substantially preserve the terms of any awards.
Amendment and Termination. Our Board of Directors may amend, alter or discontinue the stock incentive plan in any respect at any time, but no amendment may diminish any of the rights of a participant under any awards previously granted, without his or her consent.
Management Stockholders Agreement. All shares issued under the plan will be subject to a management stockholders agreement or a director stockholders agreement, as applicable.
Restrictive Covenant Agreement. Unless otherwise determined by our Board of Directors, all award recipients will be obligated to sign the standard Confidentiality, Non-Competition and Proprietary Information Agreement which includes restrictive covenants regarding confidentiality, proprietary information and a one year period restricting competition and solicitation of our clients, customers or employees. In the event a participant breaches these restrictive covenants, any exercise of, or payment or delivery pursuant to, an award may be rescinded by the committee in its discretion in which event the participant may be required to pay to us the amount of any gain realized in connection with, or as a result of, the rescinded exercise, payment or delivery.
Method of Accounting and Our Assumptions
We adopted SFAS 123R, Share-Based Payment, during our fourth quarter in 2005 and account for our employee stock options under the fair value method of accounting using a Black-Scholes model to measure stock-based compensation expense at the date of grant. Our weighted-average Black-Scholes fair value assumptions include:
| | | | | | |
| | | 2005 |
| Effective term | | 6 years |
| Risk free interest rate | | 4.2% |
| Expected volatility | | 40.0% |
| Expected dividend yield | | 0.0% |
|
Our Stock Option Activity
In August of 2005, we granted 140,700 options and during the year no options were exercised or forfeited/expired. Consequently, we had 140,700 options outstanding at the end of 2005. The exercise price during 2005 was $100. The options contractual term is ten years with vesting of 20% each year for the first five years. The weighted fair value of the options granted was approximately $2 million as of December 31, 2005 and we recognized $0.2 million in selling, general and administrative expenses during 2005.
Predecessor Plan
Under the Predecessor’s Stock Incentive Plan, which was approved by shareholders in 2003 and amended and restated the 1997 Stock Option Plan of the Predecessor, the Compensation Committee of the board of directors could grant stock options to employees, including selected employees of the Company. Options outstanding, including options granted under a 1992 Stock Option Plan, were
60
Table of Contentsgranted at option prices not less than the market price of the stock at the date of grant. Generally, one-fourth of the options granted become exercisable at each of the first four anniversary dates of the grant and all options expire ten years from the date of grant. Stock appreciation rights could be granted separately or in conjunction with the options.
Stock options are cancelled upon an optionee’s termination of employment. Retirees have up to five years after retirement to exercise their stock options, so long as the options are at least six months old at the date of retirement and remain outstanding under their original ten-year term. In connection with the divestiture of the Company, the Predecessor agreed to pay optionees the excess of market value over the option value for any ‘‘in the money’’ stock options that had not vested when the divestiture closed. The Predecessor paid approximately $1 million in connection with this agreement, which has been included in the results of operations for the eleven months ended November 30, 2004. These stock options, along with the stock options with option prices exceeding the market price at closing, are reported as expired in the table below.
The following table is a summary of transactions under these plans related to the Company’s employees in the period January 1, 2003 through November 30, 2004:
| | | | | | | | | | |
| | | Number of
Shares | | Weighted
Average
Exercise
Price |
| Outstanding at | | | | | | | | |
| January 1, 2003 | | | 1,840,998 | | | $ | 27.79 | |
| Granted – 2003 | | | 395,250 | | | | 8.34 | |
| Exercised – 2003 | | | — | | | | — | |
| Cancelled – 2003 | | | (238,309 | ) | | | 29.59 | |
| Outstanding at | | | | | | | | |
| December 31, 2003 | | | 1,997,939 | | | $ | 23.97 | |
| Exercised – 2004 | | | (137,771 | ) | | | 13.22 | |
| Cancelled – 2004 | | | (1,860,168 | ) | | | 24.77 | |
| Outstanding at | | | | | | | | |
| November 30, 2004 | | | — | | | | — | |
|
The fair value of each option grant was estimated on the date of grant using the Black-Scholes model. The Black-Scholes model is heavily influenced by the assumptions used, especially the stock price volatility assumption. The assumptions used in 2003 and 2002 are as follows:
| | | | | | | | | | |
| | | 2003 | | 2002 |
| Risk free interest rate | | | 2.97 | % | | | 3.53 | % |
| Dividend yield of Dana | | | 0.48 | % | | | 0.26 | % |
| Expected life | | 5.4 years | | 5.4 years |
| Dana stock price volatility | | | 43.46 | % | | | 53.24 | % |
|
Based on the above assumptions, the weighted average fair value per share of options granted under these plans was $3.47 in 2003 and $7.67 in 2002. Black-Scholes is one of several models that are used by companies to estimate the value of option grants. Different estimates of the fair values of the Dana stock options would likely result if one of the alternative methods were used.
In accordance with our accounting policy for stock-based compensation, the Predecessor has not recognized any expense relating to stock options.
| |
| Note 11. | Predecessor Employees’ Stock Purchase Plan |
Full-time employees of the Company and some part-time employees of the Company’s non-U.S. business units were eligible to participate in the Predecessor’s Employees’ Stock Purchase Plan. Plan participants could authorize payroll deductions up to 15% of their earnings; these deductions were deposited with the independent plan custodian. The Predecessor matched up to 50% of the
61
Table of Contentsparticipants’ contributions in cash over a five-year period beginning with the year the amounts are withheld. If a participant withdrew any shares before the end of five years, the amount of the match would depend on how long the shares were in the account. The charge to expense allocated to the Company for matching contributions was less than $1 million for the eleven months ended November 30, 2004 and $1 million in 2003.
The custodian used the payroll deductions and matching contributions to purchase Predecessor common stock at current market prices. The custodian purchased the following number of shares in the open market on behalf of the Predecessor’s participants: 128,461 for the eleven months ended November 30, 2004 and 259,342 in 2003.
| |
| Note 12. | Additional Predecessor Equity Compensation Plans |
The Predecessor had several additional compensation plans under which it paid employees for increased productivity and improved performance. One such plan was the Predecessor Additional Compensation Plan for certain officers and other key employees. Under this plan, a percentage of the participants’ compensation was accrued for additional compensation if certain annual corporate performance goals were attained. Expense related to the plan for the Predecessor participants was less than $1 million for the eleven months ended November 30, 2004 and $1 million for the year ended December 31, 2003.
The Predecessor also had two successive Restricted Stock Plans under which the Compensation Committee could grant restricted common shares to key employees, including those of the Company. Charges to expense for these plans relating to the Company were $1 million in the eleven months ended November 30, 2004 and less than $1 million for the year ended December 31, 2003. These have been replaced by the Successor with defined contribution arrangements and the Successor stock option plan discussed in Note. 10.
| |
| Note 13. | Pension and Other Postretirement Benefits |
The Company provides defined contribution and defined benefit, qualified and nonqualified, pension plans for certain employees.
Under the terms of the defined contribution retirement plans, employee and employer contributions may be directed into a number of diverse investments. None of these defined contribution plans allow direct investment of contributions in Predecessor stock. Expenses related to these defined contribution plans were $2 million in 2003 and $2 million for the period January 1, 2004 through November 30, 2004. Additionally, the Successor has established defined contribution plans, under which it incurred under $1 million of expenses for the period December 1, 2004 through December 31, 2004 and $10 million for the year ended December 31, 2005.
The following tables provide a reconciliation of the changes in the Predecessor's and Successor’s defined benefit pension plans' and other postretirement plans' benefit obligations and the fair value of assets for the period January 1, 2004 through November 30, 2004 and for the year ended December 31, 2005, as well as the statements of the funded status and schedules of the net amounts recognized in the balance sheet at December 31, 2004 and 2005. The measurement date for the amounts in these tables was December 31, of each year presented (Dollars in Millions):
62
Table of Contents
| | | | | | | | | | | | | | |
| | | Pension Benefits |
| | | Predecessor | | Successor |
| | | January 1, 2004
through
November 30, 2004 | | December 1, 2004
through
December 31, 2004 | | Year
Ended
December 31, 2005 |
| Reconciliation of benefit obligation | | | | | | | | | | | | |
| Obligation at beginning of period | | $ | 221 | | | $ | 18 | | | $ | 18 | |
| Service cost | | | 6 | | | | — | | | | 1 | |
| Interest cost | | | 12 | | | | — | | | | 1 | |
| Employee contributions | | | 1 | | | | — | | | | — | |
| Plan amendments | | | 1 | | | | — | | | | — | |
| Actuarial (gain) loss | | | 9 | | | | — | | | | 3 | |
| Benefit payments | | | (9 | ) | | | — | | | | (1 | ) |
| Acquisitions and divestitures | | | — | | | | — | | | | — | |
| Translation adjustments | | | 9 | | | | — | | | | 1 | |
| Obligation at end of period | | $ | 250 | | | $ | 18 | | | $ | 23 | |
| Accumulated benefit obligation | | $ | 237 | | | $ | 18 | | | $ | 23 | |
|
| | | | | | | | | | | | | | |
| | | Pension Benefits |
| | | Predecessor | | Successor |
| | | January 1, 2004
through
November 30, 2004 | | December 1, 2004
through
December 31, 2004 | | Year
Ended
December 31, 2005 |
| Reconciliation of fair value of plan assets | | | | | | | | | | | | |
| Fair value, beginning of period | | $ | 156 | | | $ | 17 | | | $ | 17 | |
| Actual return on plan assets | | | 17 | | | | — | | | | 2 | |
| Acquisitions and divestitures | | | — | | | | — | | | | — | |
| Employer contributions | | | 39 | | | | — | | | | 2 | |
| Employee contributions | | | 1 | | | | — | | | | — | |
| Benefit payments | | | (9 | ) | | | — | | | | (1 | ) |
| Translation adjustments | | | 7 | | | | — | | | | 1 | |
| Fair value, end of period | | $ | 211 | | | $ | 17 | | | $ | 21 | |
| Fair value of plan assets | | | | | | | | | | | | |
| U.S. plans | | | 67 | | | | — | | | | — | |
| Non U.S. plans | | | 144 | | | | 17 | | | | 21 | |
| | | $ | 211 | | | $ | 17 | | | $ | 21 | |
|
| | | | | | | | | | | | | | |
| | | Other Benefits |
| | | Predecessor | | Successor |
| | | January 1, 2004
through
November 30, 2004 | | December 1, 2004
through
December 31, 2004 | | Year
Ended
December 31, 2005 |
| Reconciliation of benefit obligation | | | | | | | | | | | | |
| Obligation at beginning of period | | $ | 52 | | | $ | — | | | $ | — | |
| Service cost | | | 1 | | | | — | | | | — | |
| Interest cost | | | 3 | | | | — | | | | — | |
| Actuarial (gain) loss | | | (1 | ) | | | — | | | | — | |
| Benefit payments | | | (3 | ) | | | — | | | | — | |
| Translation adjustments | | | 2 | | | | — | | | | — | |
| Obligation at end of period | | $ | 54 | | | $ | — | | | $ | — | |
|
63
Table of ContentsThe weighted average asset allocations of the pension plans at December 31, 2004 and December 31, 2005 were as follows:
| | | | | | | | | | |
| | | Successor |
| | | December 31,
2004 | | December 31,
2005 |
| Asset Category | | | | | | | | |
| Equity securities | | | 68 | % | | | 72 | % |
| Controlled-risk debt securities | | | 30 | % | | | 26 | % |
| Absolute return strategies investments | | | — | | | | — | |
| Cash and short-term obligations | | | 2 | % | | | 2 | % |
| Total | | | 100 | % | | | 100 | % |
|
The target asset allocations of the pension plans for equity securities, controlled-risk debt securities, absolute return strategies investments and cash and other assets at December 31, 2004 were 40%, 45%, 10% and 5%, respectively, and at December 31, 2005 were 70%, 0%, 30%, and 0%, respectively.
The Predecessor U.S. pension plan target asset allocations are established through an investment policy, which is updated periodically and reviewed by the Finance Committee of the Board of Directors of Dana. The policy recognizes that the link between assets and liabilities is the level of long-term interest rates, and that properly managing the relationship between assets of the pension plans and pension liabilities serves to mitigate the impact of market volatility on the funding levels. Given the U.S. plans' demographics, an important component of the asset/liability modeling approach is the use of what we refer to as ‘‘controlled-risk assets;’’ for the U.S. fund these assets are long duration U.S. government fixed-income securities. Such securities are a positively correlated asset class to pension liabilities and their use mitigates interest rate risk and provides the opportunity to allocate additional plan assets to other asset categories with low correlation to equity market indices. This investment policy permits plan assets to be invested in a number of diverse investment categories, including ‘‘absolute return strategies’’ investments such as hedge funds. Absolute return strategies investments are currently limited to not more than 15% of total assets, although this limitation may be increased if appropriate.
The Successor has retained the Canadian pension plans (the assets of which are referred to as the Fund). The Successor plans are managed in accordance with all applicable legal requirements and legislation relating to the investment of registered pension plans. The responsibility for the investment of the Fund lies with the Investment Committee of ITT Industries of Canada Ltd. (the "Committee"). The Committee is composed of representatives of ITT and of the participating companies, which includes our Company. The investments objectives of the plans is to maximize long-term total investment returns while assuming a prudent level of risk deemed appropriate by the Committee. The risk to capital will be minimized through the prudent diversification of the Fund's investments across asset classes. We maintain the responsibility of each of our plans to determine that the objectives meet the investment objectives for each plan, and to determine the amount of plan assets to invest in the Fund taking into account the provisions of their respective statement of investment policies and procedures and the provisions of the statement. The Fund may not engage in certain investments that are not permitted for a pension plan pursuant to applicable provincial pension benefits legislation and the Income Tax Act of Canada. Additionally, the Fund may not invest more than 10% of the assets in any single public issue of securities except where the security is issued by or guaranteed by the government of Canada or a Canadian province. This investment policy permits plan assets to be invested in a number of diverse investment categories such as demand or term deposits, short term notes, treasury bills, bankers acceptances, commercial paper, investment certificates issued by banks, insurance companies or trust companies, bonds and non-convertible debentures, mortgages and other asset-backed securities, convertible debentures, real estate, preferred and common stocks that are traded publicly, including both Canadian and foreign stocks, resource properties, venture capital, insured contracts, pooled funds, segregated funds, trusts, closed-end investment companies, limited partnerships and other structured vehicles invested directly or indirectly in, or in interests.
64
Table of ContentsThe following table presents the funded status of the Successor pension plans and the amounts recognized in the balance sheet as of December 31, 2004 and 2005 (Dollars in Millions):
| | | | | | | | | | |
| | | Successor |
| | | December 31,
2004 | | December 31,
2005 |
| Accumulated benefit obligation at beginning of period | | $ | 18 | | | $ | 23 | |
| Projected benefit obligation | | | 18 | | | | 23 | |
| Fair value of assets | | | 17 | | | | 21 | |
| Prepaid expense (accrued cost) | | $ | (1 | ) | | $ | (2 | ) |
| Amounts recognized in balance sheet: | | | | | | | | |
| Prepaid benefit cost (accrued benefit liability) | | $ | (2 | ) | | $ | (1 | ) |
| Intangible asset | | | — | | | | 1 | |
| Accumulated other income | | | — | | | | — | |
| Net amount recognized | | $ | (2 | ) | | $ | — | |
|
Expected benefit payments by the pension plans retained by the Successor for periods subsequent to December 31, 2005 are expected to be less than $1 million.
Projected contributions to be made to the Company’s defined benefit pension plans in 2006 are less than $1 million and for the next ten years.
Components of net periodic benefit costs for the Predecessor’s and the Successor’s defined benefit plans for the year ended December 31, 2003, the period January 1, 2004 through November 30, 2004, the period December 1, 2004 through December 31, 2004 and for the year ended December 31, 2005 are as follows (Dollars in Millions):
| | | | | | | | | | | | | | | | | | |
| | | Pension Benefits |
| | | Predecessor | | Successor |
| | | Year
Ended
December 31,
2003 | | January 1,
2004
through
November 31,
2004 | | December 1,
2004
through
December 31,
2004 | | Year
Ended
December 31,
2005 |
| Service cost | | $ | 5 | | | $ | 6 | | | $ | — | | | $ | 1 | |
| Interest cost | | | 12 | | | | 12 | | | | — | | | | 1 | |
| Expected return on plan assets | | | (12 | ) | | | (12 | ) | | | — | | | | (1 | ) |
| Amortization of transition obligation | | | (1 | ) | | | — | | | | — | | | | — | |
| Amortization of prior service cost | | | 1 | | | | 1 | | | | — | | | | — | |
| Recognized net actuarial loss (gain) | | | 1 | | | | 2 | | | | — | | | | — | |
| Net periodic benefit cost | | $ | 6 | | | $ | 9 | | | $ | — | | | $ | 1 | |
|
| | | | | | | | | | | | | | | | | | |
| | | Other Benefits |
| | | Predecessor | | Successor |
| | | Year
Ended
December 31,
2003 | | January 1,
2004
through
November 30,
2004 | | December 1,
2004
through
December 31,
2004 | | Year
Ended
December 31,
2005 |
| Service cost | | $ | 1 | | | $ | 1 | | | $ | — | | | $ | — | |
| Interest cost | | | 3 | | | | 3 | | | | — | | | | — | |
| Net periodic benefit cost | | $ | 4 | | | $ | 4 | | | $ | — | | | $ | — | |
|
The Predecessor plans included U.S and Non-U.S. plans. The Successor plans only include Canadian plans.
65
Table of Contents
| | | | | | |
| | | U.S. Plans |
| | | November 30,
2004 |
| Discount rate | | | 6.00 | % |
| Expected return on plan assets | | | 8.75 | % |
| Rate of compensation increase | | | 5.00 | % |
|
| | | | | | | | | | | | | | |
| | | Non-U.S. Plans |
| | | Predecessor | | Successor |
| | | November 30,
2004 | | December 31,
2004 | | December 31,
2005 |
| Discount rate | | | 5.48 | % | | | 6.25 | % | | | 6.0 | % |
| Expected return on plan assets | | | 6.59 | % | | | 7.00 | % | | | 7.0 | % |
| Rate of compensation increase | | | 3.15 | % | | | | | | | | |
|
The discount rate and expected return on plan assets for the Company plans presented in the tables above are used to determine pension expense for the succeeding year.
The Company selects the expected rate of return on plan assets on the basis of a long-term view of asset portfolio performance of the pension plans. Since the 1981 adoption of the asset/liability management investment policy, the compounded rate of return was 12.7%. However, the two-year, five-year and ten-year compounded rates of return through November 30, 2004 were 16.9%, 4.3% and 11.4%, respectively. The Company assesses the appropriateness of the expected rate of return on an annual basis and when necessary revises the assumption. The rate of return assumption for U.S. plans was last revised in 2002 when it was lowered from 9.5% to 8.75%, based in part on the expectation of lower future rates of return.
The weighted average assumptions used in the measurement of other postretirement benefit obligations for the Predecessor plans are as follows:
| | | | | | | | | | |
| | | December 31,
2003 | | November 30,
2004 |
| Discount rate | | | 6.25 | % | | | 6.09 | % |
| Initial weighted health care costs trend rate | | | 10.61 | % | | | 9.55 | % |
| Ultimate health care costs trend rate | | | 5.00 | % | | | 5.00 | % |
| Years to ultimate | | | 6.6 | | | | 5.9 | |
|
| |
| Note 14. | Income Tax |
The Predecessor’s domestic operations were included in Dana’s consolidated U.S. tax return. The domestic income tax provision had been calculated for each period on a method that is generally consistent with a separate return basis as if the Predecessor was a separate entity. The income tax provision of the Company in other countries is generally based on separate returns of the operating units, as adjusted for the effects of applying accounting principles generally accepted in the United States. The components of the income tax provision (benefit) are as follows (Dollars in Millions):
66
Table of Contents
| | | | | | | | | | | | | | | | | | |
| | | Predecessor | | Successor |
| | | Year Ended
December 31,
2003 | | January 1,
2004 through
November 30,
2004 | | December 1,
2004 through
December 31,
2004 | | Year Ended
December 31,
2005 |
| Current: | | | | | | | | | | | | | | | | |
| U.S federal | | $ | 29 | | | $ | 25 | | | $ | — | | | $ | — | |
| U.S. state and local | | | 4 | | | | 1 | | | | — | | | | 1 | |
| Non-United States | | | 18 | | | | 20 | | | | 3 | | | | 13 | |
| Total current | | | 51 | | | | 46 | | | | 3 | | | | 14 | |
| Deferred: | | | | | | | | | | | | | | | | |
| U.S. federal & state | | | 2 | | | | (22 | ) | | | (1 | ) | | | (21 | ) |
| Non-United States | | | (4 | ) | | | (6 | ) | | | (4 | ) | | | 3 | |
| Total deferred | | | (2 | ) | | | (28 | ) | | | (5 | ) | | | (18 | ) |
| Income tax provision (benefit) | | $ | 49 | | | $ | 18 | | | $ | (2 | ) | | $ | (4 | ) |
|
The provision (benefit) for income taxes was calculated based upon the following components of earnings (loss) before income taxes and minority interest (Dollars in Millions):
| | | | | | | | | | | | | | | | | | |
| | | Predecessor | | Successor |
| | | Year Ended
December 31,
2003 | | January 1,
2004 through
November 30,
2004 | | December 1,
2004 through
December 31,
2004 | | Year Ended
December 31,
2005 |
| United States | | $ | 90 | | | $ | 9 | | | $ | (3 | ) | | $ | (80 | ) |
| Non-United States | | | 27 | | | | 36 | | | | (3 | ) | | | 46 | |
| Earnings (loss) before income taxes | | $ | 117 | | | $ | 45 | | | $ | (6 | ) | | $ | (34 | ) |
|
Deferred tax assets (liabilities) consisted of the following (Dollars in Millions):
| | | | | | | | | | |
| | | Successor
At December 31,
2004 | | Successor
At December 31,
2005 |
| Post-retirement benefits other than pensions | | $ | 4 | | | $ | — | |
| Pension accruals | | | — | | | | — | |
| Net operating loss carryforwards | | | 17 | | | | 27 | |
| Inventory reserves | | | — | | | | 1 | |
| Fixed Assets | | | 7 | | | | 6 | |
| Expense accruals | | | 12 | | | | 32 | |
| Intangible Assets | | | 5 | | | | — | |
| Other | | | 17 | | | | 8 | |
| Subtotal | | | 62 | | | | 74 | |
| Valuation allowance | | | (10 | ) | | | (11 | ) |
| Deferred tax assets | | | 52 | | | | 63 | |
| Depreciation | | | — | | | | 18 | |
| Foreign Earnings | | | 30 | | | | 5 | |
| Other | | | 8 | | | | 7 | |
| Deferred tax liabilities | | | 38 | | | | 30 | |
| Net deferred tax assets | | $ | 14 | | | $ | 33 | |
|
Valuation allowances are provided for deferred tax assets whenever the realization of the assets is not deemed to meet a ‘‘more likely than not’’ standard. Accordingly, valuation allowances have been
67
Table of Contentsprovided for net operating losses in certain non-U.S. countries. To reflect judgments in applying this standard, the Company increased the valuation allowance against deferred tax assets by $1 million in 2005.
The effective income tax rate differs from the U.S. federal income tax rate for the following reasons:
| | | | | | | | | | | | | | | | | | |
| | | Predecessor | | Successor |
| | | Year
Ended
December 31,
2003 | | January 1,
2004 through
November 30,
2004 | | December 1,
2004 through
December 31,
2004 | | Year
Ended
December 31,
2005 |
| U.S. federal income tax rate | | | 35.0 | % | | | 35.0 | % | | | 35.0 | % | | | 35.0 | % |
| Increases (reductions) resulting from: | | | | | | | | | | | | | | | | |
| State and local income taxes, net of federal income tax benefit | | | 2.3 | | | | 0.7 | | | | 1.1 | | | | (2.9 | ) |
| Non-U.S. income | | | 3.8 | | | | 4.3 | | | | (11.3 | ) | | | (20.6 | ) |
| Miscellaneous items | | | 0.6 | | | | 0.7 | | | | 2.3 | | | | 0.3 | |
| Effective income tax rate | | | 41.7 | % | | | 40.7 | % | | | 27.1 | % | | | 11.8 | % |
|
At the end of 2005, federal domestic net operating loss carryforwards were $39 million. Of these, $8 million expire in 2024 and $31 million expire in 2025. At the end of 2005, foreign net operating loss carryforwards were $33 million and expire as follows: $3 million in 2006, $1 million in 2007, $1 million in 2008, $1 million in 2010, $6 million in 2011, $1 million in 2012, $2 million in 2013, $4 million in 2014 and $14 million may be carried forward indefinitely.
| |
| Note 15. | Property, Plant and Equipment |
The following table breaks out the property, plant and equipment in further detail (Dollars in Millions):
| | | | | | | | | | |
| | | December 31, |
| | | 2004 | | 2005 |
| Property, plant and equipment | | | | | | | | |
| Land and improvements to land | | $ | 31 | | | $ | 26 | |
| Buildings and building fixtures | | | 61 | | | | 66 | |
| Machinery and equipment | | | 117 | | | | 119 | |
| Software | | | 8 | | | | 13 | |
| Construction in progress | | | 19 | | | | 17 | |
| | | | 236 | | | | 241 | |
| Less: Accumulated depreciation | | | (3 | ) | | | (43 | ) |
| | | $ | 233 | | | $ | 198 | |
|
68
Table of Contents | |
| Note 16. | Other Accrued Liabilities |
The following table breaks out the other accrued liabilities in further detail (Dollars in Millions):
| | | | | | | | | | |
| | | December 31, |
| | | 2004 | | 2005 |
| Other accrued liabilities | | | | | | | | |
| Return reserve | | $ | 18 | | | $ | 19 | |
| Accrued rebates and promotions | | | 19 | | | | 15 | |
| Core deposit liability | | | 7 | | | | 9 | |
| Taxes other than income taxes | | | 7 | | | | 9 | |
| Accrued property and casualty | | | 3 | | | | 7 | |
| Accrued restructuring | | | 3 | | | | 8 | |
| Tax deposit payable | | | 27 | | | | 30 | |
| Accrued marketing expense | | | 10 | | | | 10 | |
| Accrued freight | | | 4 | | | | 6 | |
| Other | | | 53 | | | | 29 | |
| | | $ | 151 | | | $ | 142 | |
|
| |
| Note 17. | Commitments and Contingencies |
At December 31, 2005, the Company had purchase commitments for property, plant and equipment of approximately $4 million.
The Company had future minimum rental commitments under non-cancelable operating leases of $87 million at December 31, 2005, with rental payments during the next five years of: $17 million in 2006; $11 million in 2007; $9 million in 2008; $8 million in 2009; $7 million in 2010; and $35 million thereafter. The leases do not contain restrictions on future borrowings. There are no significant lease escalation clauses or purchase options.
Rent expense was $32 million in 2003, $26 million for the period January 1, 2004 through November 30, 2004, $3 million for the period December 1, 2004 through December 31, 2004 and $27 million in 2005.
A reconciliation of the changes in our return reserves is as follows beginning with December 1, 2004 (Dollars in Millions):
| | | | | | | | | | |
| | | December 31, |
| | | 2004 | | 2005 |
| Beginning balance | | $ | 18 | | | $ | 18 | |
| Amounts charged to income | | | 1 | | | | 62 | |
| Returns processed | | | (1 | ) | | | (61 | ) |
| | | $ | 18 | | | $ | 19 | |
|
The Company is party to various pending judicial and administrative proceedings arising in the ordinary course of business. These include, among others, proceedings based on product liability claims and alleged violations of environmental laws. As part of the Acquisition, Dana retained responsibility for the defense of, and any liabilities associated with, all legal proceedings commenced prior to November 30, 2004, relating to, arising out of or resulting from the operations acquired by the Company from Dana. In addition, Dana retained certain other liabilities related to the period prior to November 30, 2004. The Company, including subsidiaries acquired from Dana in the Acquisition, had 54 pending asbestos-related product liability claims at December 31, 2004 and 34 as of December 31, 2005. As part of the Acquisition, Dana retained responsibility for the defense of, and all liabilities associated with, these claims (Refer to Note 21. Subsequent Event). In addition, Dana retained responsibility for all asbestos-related liabilities arising from products manufactured or sold, or services performed, prior to November 30, 2004. The Company had approximately 270 pending asbestos-related product liability claims at December 31, 2003. At both dates, the Predecessor had accrued $1 million for defense costs for such claims. On March 3, 2006, Dana and forty of its domestic subsidiaries (the Debtors) filed voluntary petitions for reorganization under chapter 11 of the United States Bankruptcy Code (the Bankruptcy Code) in the United States Bankruptcy Court, Southern District of New York (the Court) (Case No. 06-10354).
69
Table of ContentsThe Company has various accruals for contingent non-asbestos product liability costs. At December 31, 2004 and 2005, the Company had less than $1 million, and $1 million accrued, respectively. There are no recoveries expected from third parties. There was no difference between our minimum and maximum estimates for these liabilities at any date. If there is a range of equally probable outcomes, we accrue the lower end of the range.
The Company estimates contingent environmental liabilities based on the most probable method of remediation, current laws and regulations and existing technology. Estimates are made on an undiscounted basis and exclude the effects of inflation. If there is a range of equally probable remediation methods or outcomes, we accrue the lower end of the range. At December 31, 2004 and 2005 the Company had less than $1 million accrued. There are no recoveries expected from third parties. There was no difference between our minimum and maximum estimates for these liabilities at either date.
| |
| Note 18. | Restructuring of Operations |
In 2005, we announced two restructuring plans: (i) a restructuring plan that we announced at the beginning of 2005 as part of the Acquisition, also referred to as the acquisition restructuring and (ii) a restructuring plan that we announced at the end of 2005, also referred to as the comprehensive restructuring.
The comprehensive restructuring will affect several facilities over the next two years. In December 2005, we announced the closure of one facility, our Southampton facility. Additionally, in March 2006 we announced the closure of the Erie, North East and McHenry plants and the intent to sell our Waupauca, Sudbury and St. Catharines facilities. Additional facility closures will be announced periodically over 2006 and 2007. In 2005, we recorded a charge of $21 million to cost of sales and $2 million to selling, general and administrative expenses, primarily comprised of severance costs and fixed asset impairment. In 2004 and 2003, we recorded all restructuring charges to selling, general and administrative expenses. The write-down of fixed assets was accounted for in accordance with SFAS No. 144, Accounting for the Impairment or Disposal of Long-Lived Assets. Severance costs are being accounted for in accordance with SFAS No. 146, Accounting for Costs Associated with Exit or Disposal Activities. We currently estimate that we will incur in the aggregate approximately $152 million of cash and non cash restructuring costs for the comprehensive restructuring.
In the first quarter of 2005, as part of the Acquisition, we announced the acquisition restructuring. The acquisition restructuring plan was initiated to take advantage of opportunities we identified prior to the Acquisition but were, due to resource constraints, limited in our ability to actively pursue as part of Dana. Acquisition restructuring costs of $21 million associated with the acquisition restructuring were recorded to goodwill as an adjustment to the opening balance sheet, comprised of severance costs, fixed asset impairments and other exit costs. Additionally, we charged directly to operations $2 million relating to current period exit costs. We do not expect any material costs subsequent to December 31, 2005, relating to the acquisition restructuring.
During December 2004, in connection with the Acquisition the Company recorded $1 million of liabilities for facility closures, which consisted primarily of employee termination benefits.
During 2003, the Company made substantial progress toward the completion of its then-current restructuring program, including the reduction of employees and relocation of equipment. In connection with these efforts, the Company recorded an additional $3 million for employee termination benefits and $1 million for exit costs, including the cost of relocating employees, transferring equipment and maintaining buildings held for sale. Restructuring provisions resulted in a pre-tax charge of $4 million in 2003 and reduced net income by $3 million.
The following summarizes the restructuring charges and activity for all the Company’s restructuring programs recorded in the last three years (Dollars in Millions):
70
Table of Contents
| | | | | | | | | | | | | | | | | | |
| | | Employee
Termination
Benefits | | Long-Lived
Asset
Impairment | | Exit
Costs | | Total |
| Predecessor | | | | | | | | | | | | | | | | |
| Balance at January 1, 2003 | | $ | 11 | | | $ | — | | | $ | 8 | | | $ | 19 | |
| Activity from January 1, 2003 through December 31, 2003 | | | | | | | | | | | | | | | | |
| Charges to expense | | | 3 | | | | — | | | | 1 | | | | 4 | |
| Cash payments | | | (12 | ) | | | — | | | | (7 | ) | | | (19 | ) |
| Balance at December 31, 2003 | | $ | 2 | | | $ | — | | | $ | 2 | | | $ | 4 | |
| Activity from January 1, 2004 through November 30, 2004 | | | | | | | | | | | | | | | | |
| Charges to expense | | | 2 | | | | — | | | | — | | | | 2 | |
| Cash payments | | | (2 | ) | | | — | | | | (2 | ) | | | (4 | ) |
| Write-off of assets | | | — | | | | — | | | | — | | | | — | |
| Balance at November 30, 2004 | | $ | 2 | | | $ | — | | | $ | — | | | $ | 2 | |
| Successor | | | | | | | | | | | | | | | | |
| Balance at December 1, 2004 | | $ | 2 | | | $ | — | | | $ | — | | | $ | 2 | |
| Activity from December 1, 2004 through December 31, 2004 | | | | | | | | | | | | | | | | |
| Charges to expense | | | — | | | | — | | | | — | | | | — | |
| Cash payments income: | | | | | | | | | | | | | | | | |
| Other | | | 1 | | | | | | | | | | | | 1 | |
| Balance at December 31, 2004 | | $ | 3 | | | $ | — | | | $ | — | | | $ | 3 | |
| Activity from January 1, 2005 through December 31, 2005 | | | | | | | | | | | | | | | | |
| Charges to expense | | $ | 2 | | | $ | 20 | | | $ | 3 | | | $ | 25 | |
| Write-off of assets | | | — | | | | (20 | ) | | | — | | | | (20 | ) |
| Balance at December 31, 2005 | | $ | 5 | | | $ | — | | | $ | 3 | | | $ | 8 | |
|
At December 31, 2005, $8 million of restructuring charges remained in accrued liabilities. These remaining benefits are expected to be paid during 2006.
| |
| Note 19. | Related Party Transactions |
For purposes of these financial statements, Predecessor sales between the Company and other Dana units have not been eliminated. These transactions between Predecessor and other Dana units were on a cost-plus basis with a mark-up on most transactions of approximately 10%. The Company’s sales to other Dana units totaled $19 million in 2003, $16 million for the period January 1, 2004, through November 30, 2004, and $1 million for the period December 1, 2004 through December 31, 2004. The Predecessor distributed parts produced by Dana for aftermarket customers. The purchases by the Company from Dana were $79 million for the year ended December 31, 2003, $77 million for the period from January 1, 2004, through November 30, 2004, $9 million for the period December 1, 2004 through December 31, 2004, and $93 million for the year ended December 31, 2005. We had approximately $15 million and $14 million in payables to Dana at December 31, 2004 and December 31, 2005, respectively. Additionally, we had approximately $3 million and $2 million in receivables at December 31, 2004 and December 31, 2005, respectively.
The following table presents the components of administrative services provided at the Dana corporate level that have been allocated to the Predecessor, plus expenses charged to the aftermarket department within the Dana corporate office, including wages, fringe benefits, travel, employee relocation, charges for internal services such as information technology support and charges for certain external services. These items have been allocated to the Predecessor and included in the selling, general and administrative expenses in the combined statement of income but historically not included in the Predecessor's accounts (Dollars in Millions):
71
Table of Contents
| | | | | | | | | | |
| | | Predecessor |
| | | Year
Ended
December 31,
2003 | | January 1,
2004 through
November 30,
2004 |
| Administrative staff wages and fringe benefits | | $ | 3 | | | $ | 2 | |
| Treasury services | | | 2 | | | | 2 | |
| Accounting, tax and audit services | | | 2 | | | | 2 | |
| Legal services | | | 1 | | | | 1 | |
| Environmental services | | | 1 | | | | 1 | |
| Other services | | | 1 | | | | 2 | |
| Allocated corporate expenses | | | 10 | | | | 10 | |
| Aftermarket department expenses | | | 3 | | | | (1 | ) |
| Total corporate expenses | | $ | 13 | | | $ | 9 | |
|
In addition to the above amounts, Dana incurred certain expenditures on behalf of the Predecessor that have been charged to the Predecessor periodically based on estimated or actual cost. Such services include transportation services, insurance risk management (including participation in and administration of insurance programs), employee benefits and payroll administration, information technology and third party legal services paid by Dana. Accordingly, these items are reflected in Predecessor's historical accounts.
No allocation of interest expense has been included in these combined financial statements as no debt was allocated by Dana.
Affinia and Dana entered into a Transition Services Agreement (‘‘the TSA’’) effective with the closing of the Acquisition on November 30, 2004. The TSA provides for certain administrative and other services and support to be provided by Dana to the Company, and to be provided by the Company to Dana, in each case after the Acquisition. The Company also will continue to lease certain properties, warehouses and office space from Dana after the Acquisition for periods of several months to five years. Some of these lease terms may be renewed indefinitely by the parties. Dana agreed in the Purchase Agreement to provide the Company with a $16 million credit for payments otherwise due for services under the TSA.
On April 29, 2005, Dana paid the Company $12 million in settlement of the TSA agreement noted above, as well as $11 million for uncollectible receivables covered by the Purchase Agreement, offset by $13 million of original purchase price consideration and $3 million of working capital adjustments, which resulted in a net payment of $7 million.
The Company purchased approximately $6 million and $13 million of products from Carquest Canada during 2004 and 2005, respectively. Mr. John M. Reiss, an Affinia Group Board member, is related to the President of Carquest Canada.
| |
| Note 20. | Segment Information |
The Company operates in a single business segment, which is the manufacturing and distribution of vehicle aftermarket parts. The products and services, customer base, distribution channel, manufacturing process, procurement, and economic characteristics are similar throughout all of the Company��s operations.
72
Table of ContentsNet sales by geographic region were as follows (Dollars in Millions):
| | | | | | | | | | | | | | | | | | |
| | | Predecessor | | Successor |
| | | Year
Ended
December 31,
2003 | | January 1,
2004
through
November 30,
2004 | | December 1,
2004
through
December 31,
2004 | | January 1,
2005
through
December 31,
2005 |
| North America | | $ | 1,572 | | | $ | 1,448 | | | $ | 111 | | | $ | 1,547 | |
| Other Continents | | | 453 | | | | 486 | | | | 44 | | | | 585 | |
| | | $ | 2,025 | | | $ | 1,934 | | | $ | 155 | | | $ | 2,132 | |
|
Long-lived assets by geographic region were as follows (Dollars in Millions):
| | | | | | | | | | |
| | | Successor
December 31,
2004 | | Successor
December 31,
2005 |
| North America | | $ | 176 | | | $ | 142 | |
| Other Continents | | | 57 | | | | 56 | |
| | | $ | 233 | | | $ | 198 | |
|
Net sales by geographic area were determined based on origin of sale. Geographic data on long-lived assets is based on physical location of those assets.
| |
| Note 21. | Asset Retirement Obligations |
We adopted FAS 143, ‘‘Accounting for Asset Retirement Obligations’’ and FIN 47, ‘‘Accounting for Conditional Asset Retirement Obligations’’ effective January 1, 2003 and December 31, 2005, respectively. FAS 143 and FIN 47 require that a liability for the fair value of an ARO be recognized in the period in which it is incurred if it can be reasonably estimated, with the offsetting associated asset retirement costs capitalized as part of the carrying amount of the long-lived assets. The asset retirement cost is subsequently allocated to expense using a systematic and rational method over its useful life. Changes in the ARO resulting from the passage of time are recognized as an increase in the carrying amount of the liability and as accretion expense, which is included in depreciation and amortization expense in the consolidated statements of income. Changes resulting from revisions to the timing or amount of the original estimate of cash flows are recognized as an increase or a decrease in the asset retirement cost and ARO. The ARO recorded at December 31, 2005 was $2.6 million. If the provisions of FIN 47 had been in effect on December 31, 2004, the aggregate carrying amount of asset retirement obligations on that date would have been $2.5 million. If the amortization of asset retirement cost and accretion of asset retirement obligation provisions of FAS 143, as interpreted by FIN 47, had been in effect during 2004, the impact on the increase in unrestricted net assets would have been immaterial.
The cumulative effect of a change in accounting principle of adopting FIN 47 was not material to our net income in the period of adoption and had no effect on net income due to the regulatory treatment.
| |
| Note 22. | Subsequent Event |
On March 3, 2006, Dana and forty of its domestic subsidiaries (the Debtors) filed voluntary petitions for reorganization under chapter 11 of the United States Bankruptcy Code in the United States Bankruptcy Court, Southern District of New York (the Court) (Case No. 06-10354). The Debtors will continue to operate their businesses as ‘‘debtors-in-possession’’ under the jurisdiction of the Court and in accordance with applicable provisions of the Bankruptcy Code and orders of the Court. Dana is, pursuant to the Purchase Agreement, contractually obligated to indemnify us for specified liabilities, including, among others, (1) liabilities arising out of legal proceedings commenced prior to the Acquisition and (2) liabilities for death, personal injury or other injury to persons
73
Table of Contents(including, but not limited to, such liabilities that result from human exposure to asbestos) or property damage occurring prior to the Acquisition relating to the use or exposure to any of Dana's products designed, manufactured, served or sold by Dana. However, in the context of Dana's bankruptcy, Dana may be discharged entirely from its obligations to indemnify us for future defense settlements or payments in respect of any claim subject to its indemnification obligations and we may recover less than 100% of any indemnification obligations of Dana existing as of March 3, 2006. Further, we do not know whether any insurance that may have been maintained by Dana will cover the costs for which Dana is contractually obligated to indemnify us. In addition, if Dana is unable or unwilling to pay settlements or judgments, claims may be brought against us that historically have been asserted only against Dana and other current or former manufacturers of automotive products, not including us. The failure of Dana to honor its indemnification obligations could adversely affect our financial condition and results of operations. Our receivables from Dana at the date of filing of this report were insignificant and we had no reserve recorded.
| |
| Note 23. | Divestiture of Affiliate and Discontinued Operation |
On March 31, 2005, the Company completed the legal sale of its subsidiary, Beck Arnley Worldparts Corporation (‘‘Beck Arnley’’) to Heritage Equity Group (‘‘Heritage’’), pursuant to a stock purchase agreement. The contingent purchase price for the stock of Beck Arnley was $5 million to be paid starting in the first quarter of 2006. Affinia also made a $3 million five year term loan to Beck Arnley, bearing interest at nine percent per annum. In addition, the stock purchase agreement provided that all of the cash at Beck Arnley, with the exception of $2 million, be retained by the Company. As a result, the Company retained $17 million of cash that was held on the books of Beck Arnley. In connection with the transaction, Affinia recognized a pre-tax loss on the sale of $21 million, in addition to the $3 million loss from normal operations in the first quarter of 2005. Due to Affinia's $3 million working capital loan to Beck Arnley and the contingent consideration, the sale of Beck Arnley did not qualify as a sale under accounting rules and could not be presented as a discontinued operation.
During the third quarter of 2005, we completed the sale of Candados Universales de Mexico, S.A. de C.V. (‘‘Cumsa’’), one of our Mexican operations, and the distribution company for Cumsa (Auto Parts Acquisition LLC) for $7 million in cash. Under the provisions of SFAS No. 144, ‘‘Accounting for the Impairment or Disposal of Long-Lived Assets,’’ we classify a business component that has been disposed of as a discontinued operation if the cash flow of the component has been eliminated from our ongoing operations and we will no longer have any significant continuing involvement in the component. The results of operations of our discontinued operations through the date of sale, including any gains or losses on disposition, are aggregated and presented on one line in the Statement of Operations. SFAS No. 144 requires the reclassification of amounts presented for prior years as discontinued operations. The amounts presented in the Statement of Operations and Consolidated Balance Sheet for years prior to fiscal 2005 were reclassified to comply with SFAS No. 144. The after-tax loss recognized on the sale during the third quarter of fiscal 2005 was $0.4 million. This disposition qualified for discontinued operations treatment. Accordingly, the Statement of Operations for all prior years has been reclassified to reflect the results of operations of this divested business as a discontinued operation.
| |
| Note 24. | Financial Information for Guarantors and Non-Guarantors |
Affinia Group Inc. issued $300 million of senior subordinated notes to qualified institutional buyers and certain persons in offshore transactions. The senior subordinated notes were subsequently registered under the Securities Act of 1933 pursuant to an exchange offer completed on November 2, 2005. The senior subordinated notes are general obligations of Affinia Group Inc. and guaranteed by Affinia Group Intermediate Holdings Inc. ("Parent") and all of the wholly-owned domestic subsidiaries. These guarantors jointly and severally guarantee the Company’s obligations under the senior subordinated notes and the guarantees represent full and unconditional general obligations.
The following information presents combining and consolidating Statements of Operations and Statements of Cash Flows for the year ended December 31, 2003, for the period from January 1, 2004
74
Table of Contentsthrough November 30, 2004, for the period from December 1, 2004, through December 31, 2004, and for the year ended December 31, 2005 and Condensed Consolidated Balance Sheets as of December 31, 2004 and 2005. The statement of cash flows for the period December 1, 2004 through December 31, 2004 has been restated. See Note 2.
75
Table of ContentsAffinia Group Intermediate Holdings Inc.
Notes to combined and consolidated financial statements (continued)
Supplemental Guarantor
Combining Statement of Operations
For the Year Ended December 31, 2003
(Dollars in Millions)
| | | | | | | | | | | | | | | | | | | | | | | | | | |
| | | Parent | | Issuer | | Guarantor | | Non-Guarantor | | Eliminations | | Combined
Total |
| Net sales | | $ | — | | | $ | — | | | $ | 1,364 | | | $ | 739 | | | $ | (78 | ) | | $ | 2,025 | |
| Cost of sales | | | — | | | | — | | | | (1,116 | ) | | | (618 | ) | | | 78 | | | | (1,656 | ) |
| Gross profit | | | — | | | | — | | | | 248 | | | | 121 | | | | — | | | | 369 | |
| Selling, general and administrative expenses | | | — | | | | — | | | | (146 | ) | | | (108 | ) | | | — | | | | (254 | ) |
| Operating profit | | | | | | | | | | | 102 | | | | 13 | | | | — | | | | 115 | |
| Other income, net | | | — | | | | — | | | | 2 | | | | 3 | | | | — | | | | 5 | |
| Interest expense | | | — | | | | — | | | | — | | | | (3 | ) | | | — | | | | (3 | ) |
| Income before income provision and minority interest | | | — | | | | — | | | | 104 | | | | 13 | | | | — | | | | 117 | |
| Income tax provision | | | — | | | | — | | | | 40 | | | | 9 | | | | — | | | | 49 | |
| Minority interest, net of taxes | | | — | | | | — | | | | — | | | | (2 | ) | | | — | | | | (2 | ) |
| Income from continuing operations | | | — | | | | — | | | | 64 | | | | 2 | | | | — | | | | 66 | |
| Income from discontinued operations, net of taxes | | | — | | | | — | | | | 1 | | | | — | | | | — | | | | 1 | |
| Equity in income | | | — | | | | — | | | | 36 | | | | — | | | | (36 | ) | | | — | |
| Net income (loss) | | $ | — | | | $ | — | | | $ | 101 | | | $ | 2 | | | $ | (36 | ) | | $ | 67 | |
|
76
Table of ContentsAffinia Group Intermediate Holdings Inc.
Notes to combined and consolidated financial statements (continued)
Supplemental Guarantor
Combining Statement of Operations
For the Eleven Months Ended November 30, 2004
(Dollars in Millions)
| | | | | | | | | | | | | | | | | | | | | | | | | | |
| | | Parent | | Issuer | | Guarantor | | Non-Guarantor | | Eliminations | | Combined
Total |
| Net sales | | $ | — | | | $ | — | | | $ | 1,251 | | | $ | 739 | | | $ | (56 | ) | | $ | 1,934 | |
| Cost of sales | | | — | | | | — | | | | (1,102 | ) | | | (611 | ) | | | 56 | | | | (1,657 | ) |
| Gross profit | | | — | | | | — | | | | 149 | | | | 128 | | | | — | | | | 277 | |
| Selling, general and administrative expenses | | | — | | | | — | | | | (133 | ) | | | (101 | ) | | | — | | | | (234 | ) |
| Operating profit | | | | | | | | | | | 16 | | | | 27 | | | | — | | | | 43 | |
| Other income, net | | | — | | | | — | | | | 1 | | | | 3 | | | | — | | | | 4 | |
| Interest expense | | | — | | | | — | | | | — | | | | (2 | ) | | | — | | | | (2 | ) |
| Income before taxes and minority interest | | | — | | | | — | | | | 17 | | | | 28 | | | | — | | | | 45 | |
| Income tax provision | | | — | | | | — | | | | 3 | | | | 15 | | | | — | | | | 18 | |
| Minority interest, net | | | — | | | | — | | | | — | | | | — | | | | — | | | | — | |
| Income from continuing operations | | | — | | | | — | | | | 14 | | | | 13 | | | | — | | | | 27 | |
| Income from discontinued operations | | | — | | | | — | | | | 1 | | | | — | | | | — | | | | 1 | |
| Equity in income | | | — | | | | — | | | | (26 | ) | | | 5 | | | | 21 | | | | — | |
| Net (loss) income | | $ | — | | | $ | — | | | $ | (11 | ) | | $ | 18 | | | $ | 21 | | | $ | 28 | |
|
77
Table of ContentsAffinia Group Intermediate Holdings Inc.
Notes to combined and consolidated financial statements (continued)
Supplemental Guarantor
Consolidating Statement of Operations
For the One Month Ended December 31, 2004
(Dollars in Millions)
| | | | | | | | | | | | | | | | | | | | | | | | | | |
| | | Parent | | Issuer | | Guarantor | | Non-Guarantor | | Eliminations | | Consolidated
Total |
| Net sales | | $ | — | | | $ | — | | | $ | 100 | | | $ | 59 | | | $ | (4 | ) | | $ | 155 | |
| Cost of sales | | | — | | | | — | | | | (88 | ) | | | (53 | ) | | | 4 | | | | (137 | ) |
| Gross profit | | | — | | | | — | | | | 12 | | | | 6 | | | | — | | | | 18 | |
| Selling, general and administrative expenses | | | — | | | | (1 | ) | | | (10 | ) | | | (10 | ) | | | — | | | | (21 | ) |
| Operating profit | | | | | | | (1 | ) | | | 2 | | | | (4 | ) | | | — | | | | (3 | ) |
| Other income, net | | | — | | | | — | | | | — | | | | 2 | | | | — | | | | 2 | |
| Interest expense | | | — | | | | (5 | ) | | | — | | | | — | | | | — | | | | (5 | ) |
| Income before taxes and minority interest | | | — | | | | (6 | ) | | | 2 | | | | (2 | ) | | | — | | | | (6 | ) |
| Income tax (benefit) provision | | | — | | | | (2 | ) | | | 1 | | | | (1 | ) | | | — | | | | (2 | ) |
| Minority interest, net | | | — | | | | — | | | | — | | | | — | | | | — | | | | — | |
| Income from continuing operations | | | — | | | | (4 | ) | | | 1 | | | | (1 | ) | | | — | | | | (4 | ) |
| Income from discontinued operations | | | — | | | | — | | | | — | | | | — | | | | — | | | | — | |
| Equity in income | | | (4 | ) | | | — | | | | (1 | ) | | | — | | | | 5 | | | | — | |
| Net (loss) income | | $ | (4 | ) | | $ | (4 | ) | | $ | — | | | $ | (1 | ) | | $ | 5 | | | $ | (4 | ) |
|
78
Table of ContentsAffinia Group Intermediate Holdings Inc.
Notes to combined and consolidated financial statements (continued)
Supplemental Guarantor
Consolidating Statement of Operations
For the Year Ended December 31, 2005
(Dollars in Millions)
| | | | | | | | | | | | | | | | | | | | | | | | | | |
| | | Parent | | Issuer | | Guarantor | | Non-Guarantor | | Eliminations | | Consolidated
Total |
| Net sales | | $ | | | | $ | — | | | $ | 1,266 | | | $ | 1,157 | | | $ | (291 | ) | | $ | 2,132 | |
| Cost of sales | | | — | | | | — | | | | (1,065 | ) | | | (1,063 | ) | | | 291 | | | | (1,837 | ) |
| Gross profit | | | — | | | | — | | | | 201 | | | | 94 | | | | — | | | | 295 | |
| Selling, general and administrative expenses | | | | | | | (46 | ) | | | (117 | ) | | | (98 | ) | | | — | | | | (261 | ) |
| Loss on disposition of Beck Arnley | | | — | | | | — | | | | — | | | | (21 | ) | | | — | | | | (21 | ) |
| Operating profit | | | — | | | | (46 | ) | | | 84 | | | | (25 | ) | | | — | | | | 13 | |
| Other income, net | | | — | | | | 1 | | | | 1 | | | | 6 | | | | — | | | | 8 | |
| Interest expense | | | — | | | | (55 | ) | | | — | | | | — | | | | — | | | | (55 | ) |
| Income before taxes and minority interest | | | — | | | | (100 | ) | | | 85 | | | | (19 | ) | | | — | | | | (34 | ) |
| Income tax (benefit) provision | | | — | | | | (44 | ) | | | 22 | | | | 18 | | | | — | | | | (4 | ) |
| Minority interest, net | | | — | | | | — | | | | — | | | | — | | | | — | | | | — | |
| Income from continuing operations | | | — | | | | (56 | ) | | | 63 | | | | (37 | ) | | | — | | | | (30 | ) |
| Income from discontinued operations | | | — | | | | — | | | | — | | | | — | | | | — | | | | — | |
| Equity interest in income | | | (30 | ) | | | 56 | | | | 11 | | | | 50 | | | | (87 | ) | | | — | |
| Net (loss) income | | $ | (30 | ) | | $ | — | | | $ | 74 | | | $ | 13 | | | $ | (87 | ) | | $ | (30 | ) |
|
79
Table of ContentsAffinia Group Intermediate Holdings Inc.
Notes to combined and consolidated financial statements (continued)
Supplemental Guarantor
Combining Statement of Cash Flows
For the Year Ended December 31, 2003
(Dollars in Millions)
| | | | | | | | | | | | | | | | | | | | | | | | | | |
| | | Parent | | Issuer | | Guarantor | | Non-Guarantor | | Elimination | | Combined
Total |
| Operating activities |
| Net income (loss) | | $ | — | | | $ | — | | | $ | 101 | | | $ | 2 | | | $ | (36 | ) | | $ | 67 | |
| Adjustments to reconcile net income (loss) from continuing operations to net cash provided by (used in) operating activities: | | | | | | | | | | | | | | | | | | | | | | | | |
| Depreciation and amortization | | | — | | | | — | | | | 21 | | | | 25 | | | | — | | | | 46 | |
| Deferred income taxes | | | — | | | | — | | | | — | | | | (9 | ) | | | — | | | | (9 | ) |
| Gain on asset sales | | | — | | | | — | | | | (1 | ) | | | (2 | ) | | | — | | | | (3 | ) |
| Change in current assets & liabilities: | | | | | | | | | | | | | | | | | | | | | | | | |
| Equity in subsidiaries | | | — | | | | — | | | | (36 | ) | | | — | | | | 36 | | | | — | |
| Trade accounts receivable | | | — | | | | — | | | | 9 | | | | 3 | | | | — | | | | 12 | |
| Inventories | | | — | | | | — | | | | 16 | | | | (8 | ) | | | — | | | | 8 | |
| Other operating assets | | | — | | | | — | | | | 7 | | | | (8 | ) | | | — | | | | (1 | ) |
| Other operating liabilities | | | — | | | | — | | | | (1 | ) | | | (15 | ) | | | — | | | | (16 | ) |
| Other | | | — | | | | — | | | | 6 | | | | 5 | | | | — | | | | 11 | |
| Net cash provided by (used in) operating activities of continuing operations | | | — | | | | — | | | | 122 | | | | (7 | ) | | | — | | | | 115 | |
| Net cash provided by operating activities of discontinued operations | | | — | | | | — | | | | — | | | | — | | | | — | | | | — | |
| Net cash provided by (used in) operating activities | | | — | | | | — | | | | 122 | | | | (7 | ) | | | — | | | | 115 | |
| Investing activities |
| Proceeds from sale of assets | | | — | | | | — | | | | 1 | | | | 6 | | | | — | | | | 7 | |
Additions to property, plant and
equipment, net | | | — | | | | — | | | | (25 | ) | | | (19 | ) | | | — | | | | (44 | ) |
| Other investing activities | | | — | | | | — | | | | (1 | ) | | | 1 | | | | — | | | | — | |
| Net cash used in investing activities of continuing operations | | | — | | | | — | | | | (25 | ) | | | (12 | ) | | | — | | | | (37 | ) |
| Net cash used in investing activities of discontinued operations | | | — | | | | — | | | | — | | | | — | | | | — | | | | — | |
| Net cash used in investing activities | | | — | | | | — | | | | (25 | ) | | | (12 | ) | | | — | | | | (37 | ) |
| Financing activities | | | | | | | | | | | | | | | | | | | | | | | | |
| Short-term debt, net | | | — | | | | — | | | | — | | | | (1 | ) | | | — | | | | (1 | ) |
| Net transactions with Dana Corporation | | | — | | | | — | | | | (96 | ) | | | 28 | | | | — | | | | (68 | ) |
| Net cash used in financing activities of continuing operations | | | — | | | | — | | | | (96 | ) | | | 27 | | | | — | | | | (69 | ) |
| Net cash used in financing activities of discontinued operations | | | — | | | | — | | | | (1 | ) | | | — | | | | — | | | | (1 | ) |
| Net cash (used in) provided by financing activities | | | — | | | | — | | | | (97 | ) | | | 27 | | | | — | | | | (70 | ) |
| Change in cash and cash equivalents | | | — | | | | — | | | | — | | | | 8 | | | | | | | | 8 | |
| Cash and cash equivalents at beginning of period | | | — | | | | — | | | | — | | | | 38 | | | | — | | | | 38 | |
| Cash and cash equivalents at end of period | | $ | — | | | $ | — | | | $ | — | | | $ | 46 | | | $ | — | | | $ | 46 | |
|
80
Table of ContentsAffinia Group Intermediate Holdings Inc.
Notes to combined and consolidated financial statements (continued)
Supplemental Guarantor
Combining Statement of Cash Flows
For the Eleven Months Ended November 30, 2004
(Dollars in Millions)
| | | | | | | | | | | | | | | | | | | | | | | | | | |
| | | Parent | | Issuer | | Guarantor | | Non-Guarantor | | Elimination | | Combined
Total |
| Operating activities | | | | | | | | | | | | | | | | | | | | | | | | |
| Net (loss) income | | $ | — | | | $ | — | | | $ | (11 | ) | | $ | 18 | | | $ | 21 | | | $ | 28 | |
| Adjustments to reconcile net (loss) income from continuing operations to net cash provided by (used in) operating activities: | | | | | | | | | | | | | | | | | | | | | | | | |
| Depreciation and amortization | | | — | | | | — | | | | 21 | | | | 20 | | | | — | | | | 41 | |
| Impairment of assets | | | — | | | | — | | | | 1 | | | | — | | | | — | | | | 1 | |
| Deferred income taxes | | | — | | | | — | | | | 3 | | | | (31 | ) | | | — | | | | (28 | ) |
| Losses (gains) on asset sales | | | — | | | | — | | | | 1 | | | | (3 | ) | | | — | | | | (2 | ) |
| Equity in subsidiaries | | | — | | | | — | | | | 26 | | | | (5 | ) | | | (21 | ) | | | — | |
| Change in current assets & liabilities: | | | | | | | | | | | | | | | | | | | | | | | | |
| Trade accounts receivable | | | — | | | | — | | | | 22 | | | | (14 | ) | | | — | | | | 8 | |
| Inventories | | | — | | | | — | | | | (20 | ) | | | (17 | ) | | | — | | | | (37 | ) |
| Other operating assets | | | — | | | | — | | | | (32 | ) | | | 2 | | | | — | | | | (30 | ) |
| Other operating liabilities | | | — | | | | — | | | | 10 | | | | (12 | ) | | | — | | | | (2 | ) |
| Other | | | — | | | | — | | | | 16 | | | | (3 | ) | | | — | | | | 13 | |
| Net cash provided by (used in) operating activities of continuing operations | | | — | | | | — | | | | 37 | | | | (45 | ) | | | — | | | | (8 | ) |
| Net cash provided by operating activities of discontinued operations | | | — | | | | — | | | | — | | | | 1 | | | | — | | | | 1 | |
Net cash provided by (used in) operating
activities | | | — | | | | — | | | | 37 | | | | (44 | ) | | | — | | | | (7 | ) |
| Investing activities | | | | | | | | | | | | | | | | | | | | | | | | |
| Proceeds from sale of assets | | | — | | | | — | | | | 1 | | | | 5 | | | | — | | | | 6 | |
| Additions to property, plant and equipment, net | | | — | | | | — | | | | (20 | ) | | | (24 | ) | | | — | | | | (44 | ) |
| Other investing activities | | | — | | | | — | | | | — | | | | 1 | | | | — | | | | 1 | |
Net cash used in investing activities of continuing
operations | | | — | | | | — | | | | (19 | ) | | | (18 | ) | | | — | | | | (37 | ) |
| Net cash used in investing activities of discontinued operations | | | — | | | | — | | | | — | | | | — | | | | — | | | | — | |
| Net cash used in investing activities | | | — | | | | — | | | | (19 | ) | | | (18 | ) | | | — | | | | (37 | ) |
| Financing activities | | | | | | | | | | | | | | | | | | | | | | | | |
| Short-term debt, net | | | — | | | | — | | | | — | | | | (19 | ) | | | — | | | | (19 | ) |
| Net transactions with Dana Corporation | | | — | | | | — | | | | (12 | ) | | | 75 | | | | — | | | | 63 | |
| Net cash (used in) provided by financing activities of continuing operations | | | — | | | | — | | | | (12 | ) | | | 56 | | | | — | | | | 44 | |
| Net cash used in financing activities of discontinued operations | | | — | | | | — | | | | (2 | ) | | | — | | | | — | | | | (2 | ) |
| Net cash (used in) provided by financing activities | | | — | | | | — | | | | (14 | ) | | | 56 | | | | — | | | | 42 | |
| Change in cash and cash equivalents | | | — | | | | — | | | | 4 | | | | (6 | ) | | | | | | | (2 | ) |
| Cash and cash equivalents at beginning of period | | | — | | | | — | | | | — | | | | 46 | | | | — | | | | 46 | |
| Cash and cash equivalents at end of period | | $ | — | | | $ | — | | | $ | 4 | | | $ | 40 | | | $ | — | | | $ | 44 | |
|
81
Table of ContentsAffinia Group Intermediate Holdings Inc.
Notes to combined and consolidated financial statements (continued)
Supplemental Guarantor
Consolidating Statement of Cash Flows
For the One Month Ended December 31, 2004
(Dollars in Millions)
| | | | | | | | | | | | | | | | | | | | | | | | | | |
| | | Parent | | Issuer | | Guarantor | | Non-Guarantor | | Elimination | | Consolidated
Total |
| | | | | [Restated] | | | | | | | | |
| Operating activities | | | | | | | | | | | | | | | | | | | | | | | | |
| Net (loss) income | | $ | (4 | ) | | $ | (4 | ) | | $ | — | | | $ | (1 | ) | | $ | 5 | | | $ | (4 | ) |
| Adjustments to reconcile net (loss) income from continuing operations to net cash provided by (used in) operating activities: | | | | | | | | | | | | | | | | | | | | | | | | |
| Depreciation and amortization | | | — | | | | — | | | | 3 | | | | 1 | | | | — | | | | 4 | |
| Deferred income taxes | | | — | | | | — | | | | — | | | | (8 | ) | | | | | | | (8 | ) |
| Change in current assets & liabilities: | | | | | | | | | | | | | | | | | | | | | | | | |
| Equity in income | | | 4 | | | | — | | | | 1 | | | | — | | | | (5 | ) | | | — | |
| Trade accounts receivable | | | — | | | | 55 | | | | 10 | | | | (18 | ) | | | — | | | | 47 | |
| Inventories | | | — | | | | — | | | | (6 | ) | | | 2 | | | | — | | | | (4 | ) |
| Other operating assets | | | — | | | | — | | | | (42 | ) | | | 45 | | | | — | | | | 3 | |
| Other operating liabilities | | | — | | | | 17 | | | | 35 | | | | (38 | ) | | | — | | | | 14 | |
| Other | | | — | | | | — | | | | — | | | | 6 | | | | — | | | | 6 | |
| Net cash provided by (used in) operating activities of continuing operations | | | — | | | | 68 | | | | 1 | | | | (11 | ) | | | — | | | | 58 | |
| Net cash provided by operating activities of discontinued operations | | | — | | | | — | | | | — | | | | — | | | | — | | | | — | |
Net cash provided by (used in) operating
activities | | | — | | | | 68 | | | | 1 | | | | (11 | ) | | | — | | | | 58 | |
| Investing activities | | | | | | | | | | | | | | | | | | | | | | | | |
| Acquisition of Dana Aftermarket Group | | | — | | | | (1,016 | ) | | | — | | | | — | | | | — | | | | (1,016 | ) |
| Proceeds from sale of assets | | | — | | | | — | | | | 1 | | | | — | | | | — | | | | 1 | |
| Additions to property, plant and equipment, net | | | — | | | | — | | | | (2 | ) | | | (1 | ) | | | — | | | | (3 | ) |
| Other investing activities | | | — | | | | — | | | | — | | | | — | | | | — | | | | — | |
| Net cash used in investing activities of continuing operations | | | — | | | | (1,016 | ) | | | (1 | ) | | | (1 | ) | | | — | | | | (1,018 | ) |
| Net cash used in investing activities of discontinued operations | | | — | | | | — | | | | — | | | | — | | | | — | | | | — | |
| Net cash used in investing activities | | | — | | | | (1,016 | ) | | | (1 | ) | | | (1 | ) | | | — | | | | (1,018 | ) |
| Financing activities | | | | | | | | | | | | | | | | | | | | | | | | |
| Short-term debt, net | | | — | | | | 10 | | | | — | | | | — | | | | — | | | | 10 | |
| Proceeds from long term debt | | | — | | | | 650 | | | | — | | | | — | | | | — | | | | 650 | |
| Deferred financing costs | | | — | | | | (19 | ) | | | — | | | | — | | | | — | | | | (19 | ) |
| Capital contribution | | | — | | | | 355 | | | | — | | | | — | | | | — | | | | 355 | |
| Net cash used in financing activities of continuing operations | | | — | | | | 996 | | | | — | | | | — | | | | — | | | | 996 | |
| Net cash used in financing activities of discontinued operations | | | — | | | | — | | | | — | | | | — | | | | — | | | | — | |
| Net cash provided by financing activities | | | — | | | | 996 | | | | — | | | | — | | | | — | | | | 996 | |
| Change in cash and cash equivalents | | | — | | | | 48 | | | | — | | | | (12 | ) | | | | | | | 36 | |
| Cash and cash equivalents at beginning of period | | | — | | | | — | | | | — | | | | 44 | | | | — | | | | 44 | |
| Cash and cash equivalents at end of period | | $ | — | | | $ | 48 | | | $ | — | | | $ | 32 | | | $ | — | | | $ | 80 | |
|
82
Table of ContentsAffinia Group Intermediate Holdings Inc.
Notes to combined and consolidated financial statements (continued)
Supplemental Guarantor
Consolidating Statement of Cash Flows
For the Year Ended December 31, 2005
(Dollars in Millions)
| | | | | | | | | | | | | | | | | | | | | | | | | | |
| | | Parent | | Issuer | | Guarantor | | Non-Guarantor | | Elimination | | Consolidated
Total |
| Operating activities | | | | | | | | | | | | | | | | | | | | | | | | |
| Net (loss) income | | $ | (30 | ) | | $ | — | | | $ | 74 | | | $ | 13 | | | $ | (87 | ) | | $ | (30 | ) |
| Adjustments to reconcile net (loss) income from continuing operations to net cash provided by (used in) operating activities: | | | | | | | | | | | | | | | | | | | | | | | | |
| Depreciation and amortization | | | — | | | | 9 | | | | 21 | | | | 16 | | | | — | | | | 46 | |
| Impairment of assets | | | — | | | | — | | | | 22 | | | | — | | | | — | | | | 22 | |
| Deferred income taxes | | | — | | | | (32 | ) | | | — | | | | (12 | ) | | | | | | | (44 | ) |
| Change in current assets & liabilities: | | | | | | | | | | | | | | | | | | | | | | | | |
| Equity in income | | | 30 | | | | (56 | ) | | | (11 | ) | | | (50 | ) | | | 87 | | | | — | |
| Trade accounts receivable | | | — | | | | (16 | ) | | | 2 | | | | 22 | | | | — | | | | 8 | |
| Inventories | | | — | | | | — | | | | 47 | | | | 30 | | | | — | | | | 77 | |
| Other operating assets | | | — | | | | (29 | ) | | | (1 | ) | | | 16 | | | | — | | | | (14 | ) |
| Other operating liabilities | | | — | | | | 97 | | | | (2 | ) | | | (37 | ) | | | — | | | | 58 | |
| Other | | | — | | | | (225 | ) | | | 188 | | | | 15 | | | | — | | | | (22 | ) |
| Net cash (used in) provided by operating activities of continuing operations | | | — | | | | (252 | ) | | | 340 | | | | 13 | | | | — | | | | 101 | |
| Net cash provided by operating activities of discontinued operations | | | — | | | | — | | | | 1 | | | | 1 | | | | — | | | | 2 | |
Net cash (used in) provided by operating
activities | | | — | | | | (252 | ) | | | 341 | | | | 14 | | | | — | | | | 103 | |
| Investing activities | | | | | | | | | | | | | | | | | | | | | | | | |
| Proceeds from sale of assets | | | — | | | | — | | | | 1 | | | | 3 | | | | — | | | | 4 | |
| Working capital settlement with Dana | | | — | | | | (28 | ) | | | — | | | | — | | | | — | | | | (28 | ) |
| Proceeds from disposition of discontinued operations | | | — | | | | — | | | | 7 | | | | — | | | | — | | | | 7 | |
| Additions to property, plant and equipment, net | | | — | | | | (7 | ) | | | (12 | ) | | | (16 | ) | | | — | | | | (35 | ) |
| Other investing activities | | | — | | | | — | | | | — | | | | — | | | | — | | | | — | |
| Net cash used in investing activities of continuing operations | | | — | | | | (35 | ) | | | (4 | ) | | | (13 | ) | | | — | | | | (52 | ) |
| Net cash used in investing activities of discontinued operations | | | — | | | | — | | | | — | | | | — | | | | — | | | | — | |
| Net cash used in investing activities | | | — | | | | (35 | ) | | | (4 | ) | | | (13 | ) | | | — | | | | (52 | ) |
| Financing activities | | | | | | | | | | | | | | | | | | | | | | | | |
| Short-term debt, net | | | — | | | | (3 | ) | | | — | | | | (12 | ) | | | — | | | | (15 | ) |
| Payment of long-term debt | | | — | | | | (35 | ) | | | — | | | | — | | | | — | | | | (35 | ) |
| Capital contribution | | | — | | | | 1 | | | | — | | | | — | | | | — | | | | 1 | |
| Net transactions with Parent | | | — | | | | 320 | | | | (336 | ) | | | 16 | | | | — | | | | — | |
| Net cash provided by (used in) financing activities of continuing operations | | | — | | | | 283 | | | | (336 | ) | | | 4 | | | | — | | | | (49 | ) |
| Net cash used in financing activities of discontinued operations | | | — | | | | — | | | | — | | | | — | | | | — | | | | — | |
| Net cash provided by (used in) financing activities | | | — | | | | 283 | | | | (336 | ) | | | 4 | | | | — | | | | (49 | ) |
| Change in cash and cash equivalents | | | — | | | | (4 | ) | | | 1 | | | | 5 | | | | | | | | 2 | |
| Cash and cash equivalents at beginning of period | | | — | | | | 48 | | | | — | | | | 32 | | | | — | | | | 80 | |
| Cash and cash equivalents at end of period | | $ | — | | | $ | 44 | | | $ | 1 | | | $ | 37 | | | $ | — | | | $ | 82 | |
|
83
Table of ContentsAffinia Group Intermediate Holdings Inc.
Notes to combined and consolidated financial statements (continued)
Supplemental Guarantor
Consolidating Balance Sheet
December 31, 2004
(Dollars in Millions)
| | | | | | | | | | | | | | | | | | | | | | | | | | |
| | | Parent | | Issuer | | Guarantor | | Non-Guarantor | | Eliminations | | Consolidated
Total |
| Assets | | | | | | | | | | | | | | | | | | | | | | | | |
| Current assets: | | | | | | | | | | | | | | | | | | | | | | | | |
| Cash and cash equivalents | | $ | — | | | $ | 48 | | | $ | — | | | $ | 32 | | | $ | — | | | $ | 80 | |
| Accounts receivable | | | — | | | | 16 | | | | 192 | | | | 150 | | | | — | | | | 358 | |
| Inventories | | | — | | | | — | | | | 292 | | | | 202 | | | | — | | | | 494 | |
| Other current assets | | | — | | | | 2 | | | | 1 | | | | 41 | | | | — | | | | 44 | |
| Assets of discontinued operations | | | — | | | | — | | | | 11 | | | | 1 | | | | — | | | | 12 | |
| Total current assets | | | — | | | | 66 | | | | 496 | | | | 426 | | | | — | | | | 988 | |
| Investments and other assets | | | — | | | | 23 | | | | 189 | | | | 36 | | | | — | | | | 248 | |
| Intercompany investments | | | 404 | | | | 936 | | | | 393 | | | | 156 | | | | (1,889 | ) | | | — | |
| Intercompany receivables | | | — | | | | — | | | | — | | | | — | | | | — | | | | — | |
| Property, plant and equipment, net | | | — | | | | — | | | | 120 | | | | 113 | | | | — | | | | 233 | |
| Total assets | | $ | 404 | | | $ | 1,025 | | | $ | 1,198 | | | $ | 731 | | | $ | (1,889 | ) | | $ | 1,469 | |
| Liabilities and Equity | | | | | | | | | | | | | | | | | | | | | | | | |
| Current liabilities: | | | | | | | | | | | | | | | | | | | | | | | | |
| Notes payable and current portion of long term debt | | $ | — | | | $ | 3 | | | $ | — | | | $ | 12 | | | $ | — | | | $ | 15 | |
| Accounts payable | | | — | | | | — | | | | 85 | | | | 121 | | | | — | | | | 206 | |
| Accrued payroll and employee benefits | | | — | | | | 2 | | | | 6 | | | | 14 | | | | — | | | | 22 | |
| Liabilities of discontinued operations | | | — | | | | — | | | | 3 | | | | — | | | | — | | | | 3 | |
| Other accrued liabilities | | | — | | | | 21 | | | | 76 | | | | 54 | | | | — | | | | 151 | |
| Total current liabilities | | | — | | | | 26 | | | | 170 | | | | 201 | | | | — | | | | 397 | |
| Deferred employee benefits and noncurrent liabilities | | | — | | | | — | | | | — | | | | 20 | | | | — | | | | 20 | |
| Long-term debt | | | — | | | | 647 | | | | — | | | | — | | | | — | | | | 647 | |
| Total liabilities | | | — | | | | 673 | | | | 170 | | | | 221 | | | | — | | | | 1,064 | |
| Minority interest in consolidated subsidiaries | | | — | | | | — | | | | — | | | | 1 | | | | — | | | | 1 | |
| Shareholders’ equity | | | 404 | | | | 352 | | | | 1,028 | | | | 509 | | | | (1,889 | ) | | | 404 | |
| Total liabilities and equity | | $ | 404 | | | $ | 1,025 | | | $ | 1,198 | | | $ | 731 | | | $ | (1,889 | ) | | $ | 1,469 | |
|
84
Table of ContentsAffinia Group Intermediate Holdings Inc.
Notes to combined and consolidated financial statements (continued)
Supplemental Guarantor
Consolidating Balance Sheet
December 31, 2005
(Dollars in Millions)
| | | | | | | | | | | | | | | | | | | | | | | | | | |
| | | Parent | | Issuer | | Guarantor | | Non-Guarantor | | Eliminations | | Consolidated
Total |
| Assets | | | | | | | | | | | | | | | | | | | | | | | | |
| Current assets: | | | | | | | | | | | | | | | | | | | | | | | | |
| Cash and cash equivalents | | $ | — | | | $ | 44 | | | $ | 1 | | | $ | 37 | | | $ | — | | | $ | 82 | |
| Accounts receivable | | | — | | | | 32 | | | | 190 | | | | 128 | | | | — | | | | 350 | |
| Inventories | | | — | | | | — | | | | 245 | | | | 172 | | | | — | | | | 417 | |
| Other current assets | | | — | | | | 31 | | | | 2 | | | | 25 | | | | — | | | | 58 | |
| Total current assets | | | — | | | | 107 | | | | 438 | | | | 362 | | | | — | | | | 907 | |
| Investments and other assets | | | — | | | | 319 | | | | 2 | | | | 14 | | | | — | | | | 335 | |
| Intercompany investments | | | 366 | | | | 979 | | | | 404 | | | | 206 | | | | (1,955 | ) | | | — | |
| Intercompany receivables | | | — | | | | (247 | ) | | | 228 | | | | 19 | | | | — | | | | — | |
| Property, plant and equipment, net | | | — | | | | 5 | | | | 94 | | | | 99 | | | | — | | | | 198 | |
| Total assets | | $ | 366 | | | $ | 1,163 | | | $ | 1,166 | | | $ | 700 | | | $ | (1,955 | ) | | $ | 1,440 | |
| Liabilities and Equity | | | | | | | | | | | | | | | | | | | | | | | | |
| Current liabilities: | | | | | | | | | | | | | | | | | | | | | | | | |
| Notes payable and current portion of long term debt | | $ | — | | | $ | — | | | $ | — | | | $ | — | | | $ | — | | | $ | — | |
| Accounts payable | | | — | | | | 13 | | | | 111 | | | | 108 | | | | — | | | | 232 | |
| Accrued payroll and employee benefits | | | — | | | | 14 | | | | 8 | | | | 12 | | | | — | | | | 34 | |
| Other accrued liabilities | | | — | | | | 64 | | | | 46 | | | | 32 | | | | — | | | | 142 | |
| Total current liabilities | | | — | | | | 91 | | | | 165 | | | | 152 | | | | — | | | | 408 | |
| Deferred employee benefits and noncurrent liabilities | | | — | | | | 39 | | | | — | | | | 6 | | | | — | | | | 45 | |
| Long-term debt | | | — | | | | 612 | | | | — | | | | — | | | | — | | | | 612 | |
| Total liabilities | | | — | | | | 742 | | | | 165 | | | | 158 | | | | — | | | | 1,065 | |
| Minority interest in consolidated subsidiaries | | | — | | | | — | | | | 1 | | | | — | | | | — | | | | 1 | |
| Shareholders’ equity | | | 366 | | | | 421 | | | | 1,000 | | | | 542 | | | | (1,955 | ) | | | 374 | |
| Total liabilities and equity | | $ | 366 | | | $ | 1,163 | | | $ | 1,166 | | | $ | 700 | | | $ | (1,955 | ) | | $ | 1,440 | |
|
85
Table of Contents | |
| Item 9. | Changes in and Disagreements with Accountants on Accounting and Financial Disclosure |
On September 29, 2005, PricewaterhouseCoopers LLP (‘‘PricewaterhouseCoopers’’) was dismissed as the independent registered public accounting firm for the Company.
The decision to change independent registered public accounting firms was approved by the Audit Committee of the Board of Directors of the Company. The reports of PricewaterhouseCoopers on the financial statements of the Company as of and for the one month period ended December 31, 2004, and its report on the Predecessor’s financial statements for the eleven months ended November 30, 2004 and for the year ended December 31, 2003 contained no adverse opinion or disclaimer of opinion and were not qualified or modified as to uncertainty, audit scope or accounting principle. During the one month period ended December 31, 2004 for the Company and the eleven-month period ended November 30, 2004 and the year ended December 31, 2003 for the Predecessor, there were no disagreements with PricewaterhouseCoopers on any matter of accounting principles or practices, financial statement disclosure, or auditing scope or procedure, which disagreements, if not resolved to PricewaterhouseCoopers' satisfaction, would have caused PricewaterhouseCoopers to make reference thereto in its reports on the Company's financial statements for such years. We requested PricewaterhouseCoopers to furnish us with a letter addressed to the Securities and Exchange Commission stating whether it agreed with the above statements. A copy of the letter was filed in a Form 8-K on September 29, 2005.
On October 14, 2005, the Company engaged Deloitte & Touche LLP (‘‘Deloitte & Touche’’) as the Company's new independent registered public accounting firm for the fiscal year ending December 31, 2005. The engagement of Deloitte & Touche was approved by the Audit Committee of the Company's Board of Directors.
Item 9A. Controls and Procedures
Disclosure Controls and Procedures.
As of the end of the period covered by this Report we carried out an evaluation, under the supervision and with the participation of our Disclosure Committee and our management, including our Chief Executive Officer and our Chief Financial Officer, of the effectiveness of the design and operation of our disclosure controls and procedures as such term is defined in Exchange Act Rules 13a-15(e) and 15d-15(e). Based on that evaluation, the Chief Executive Officer and Chief Financial Officer concluded that as of December 31, 2005, our disclosure controls and procedures were not effective for the reasons described below to ensure that information we are required to disclose in reports that we file or submit under the Exchange Act are recorded, processed, summarized and reported within the time periods specified in the SEC's rules and forms, and that such information is accumulated and communicated to our management, including our Chief Executive Officer and Chief Financial Officer, as appropriate, to allow timely decisions regarding required disclosure, due to our Chief Executive Officer and Chief Financial Officer identifying a material weakness (as defined in PCAOB Auditing Standard No. 2) in our controls over the recording and reporting of non-routine, complex transactions as of December 31, 2005. A material weakness is a control deficiency or combination of control deficiencies that results in more than a remote likelihood that a material misstatement of the annual or interim financial statements will not be prevented or detected. Specifically, we did not have adequate resources to allow sufficient time for review and supervision over reporting of non-routine, complex transactions in accordance with generally accepted accounting principles, specifically with respect to the impairment of fixed assets in accordance with Statement of Financial Standard No. 144, Accounting for the Impairment or Disposal of Long-Lived Assets and the recording of the cash flow effects of purchase accounting. With respect to the control deficiency with respect to the impairment of fixed assets, we have adopted a further detailed work plan to ensure that proper training and supervision is provided to field personnel for recording charges in connection with our comprehensive restructuring program on a timely basis. With respect to the control deficiency regarding recording of the cash flow effects of purchase accounting, we have significantly increased our finance and accounting staff with individuals who have experience in complex accounting
86
Table of Contentstransactions. This control deficiency resulted in a misstatement to our consolidated statement of cash flows for the one month period ended December 31, 2004. This adjustment, which did not have any income statement impact, is more fully described in Note 2 to the consolidated financial statements as of December 31, 2005. Notwithstanding the material weaknesses described above, management has concluded that the consolidated financial statements included in this report on Form 10-K fairly present, in all material respects, the Company's financial position, results of operations and cash flows for the period presented.
Changes in Internal Control over Financial Reporting.
Any system of internal controls, no matter how well designed or implemented, can provide only reasonable, not absolute, assurance that the objectives of the control system are met. The design of a control system must reflect the fact that the benefits of controls must be considered relative to their costs. The design of any system of controls also is based in part upon certain assumptions about the likelihood of future events, and there can be no assurance that any design will succeed in achieving its stated goals under all potential future conditions. Also, projections of any evaluation of effectiveness to future periods are subject to the risk that controls may become inadequate because of changes to conditions, or that the degree of compliance with the policies or procedures may deteriorate.
During the third quarter of 2005, we identified four material weaknesses in our internal control over financial reporting which resulted in the restatement of the Company's audited financial statements as of December 31, 2004, the Company's unaudited financial statements as of March 31, 2005 and adjustments to the unaudited interim consolidated financial statements as of June 30, 2005. None of the restatements or adjustments had a material income statement impact. These material weaknesses are described in our Registration Statement filed on Form S-4 on September 8, 2005 (No.353-128166-10).
Specifically, as of December 31, 2004, March 31, 2005, and June 30, 2005, we did not have effective controls over (i) the recording and review of our disclosures in our subsidiary guarantors and non-guarantors footnote and (ii) the recording of purchase accounting and we did not have adequate resources to allow sufficient time for review and supervision over the application of generally accepted accounting principles in connection with the initial recording of purchase accounting entries, which failed to identify adjustments needed to record the purchase accounting entries related to the Acquisition. As of the end of the period covered by this report, we had remediated the foregoing material weaknesses by making certain changes in our internal controls during our fourth fiscal quarter. We have completed the process to verify the adequacy of the measures taken and ensure that these measures have completely addressed these previously identified concerns. We believe that our remediation efforts with regard to these material weaknesses have been successful.
In addition, as of December 31, 2004, March 31, 2005, June 30, 2005, September 30, 2005 and December 31, 2005, we did not have effective controls over the recording and reporting of non-routine, complex transactions. With regard to our remediation of our recording and reporting of non-routine, complex transactions, we made certain changes to our internal controls, including implementing internal controls and processes and hiring additional financial personnel with experience in complex transactions during the last fiscal quarter. As described above, we further adopted a detailed work plan to remedy this material weakness.
Item 9B. Other Information
None.
87
Table of ContentsPART III
| |
| Item 10. | Directors and Executive Officers of the Registrant |
Set forth below is certain information concerning the individuals serving as our executive officers and members of the Board of Directors, including their ages as of March 27, 2006.
| | | | | | | | | | |
| Name | | Age | | Position |
| Terry R. McCormack | | | 55 | | | Chief Executive Officer, President, and Director |
| Thomas H. Madden | | | 56 | | | Chief Financial Officer |
| John R. Washbish | | | 52 | | | President, Customer Relationship Management, Vice President and General Manager, Under Vehicle Group, and Director |
| Keith A. Wilson | | | 44 | | | Vice President and General Manager, Under Hood Group |
| Steven E. Keller | | | 47 | | | General Counsel and Secretary |
| Jerry A. McCabe | | | 58 | | | Vice President, Communications & Marketing Services |
| Timothy J. Zorn | | | 53 | | | Vice President, Human Resources |
| Larry W. McCurdy | | | 70 | | | Chairman of the Board of Directors |
| Joseph A. Onorato | | | 57 | | | Director |
| John M. Riess | | | 64 | | | Director |
| Michael F. Finley | | | 44 | | | Director |
| Donald J. Morrison | | | 45 | | | Director |
| James A. Stern | | | 55 | | | Director |
|
Terry R. McCormack has served as our Chief Executive Officer, President, and a Director since the Acquisition on November 30, 2004. Mr. McCormack began his career at Dana in 1973 as a sales trainee. He held a variety of positions at Dana from 1974 through July 2000, when he was named President of Dana’s Aftermarket Group, a position he held until the Acquisition. Mr. McCormack holds a B.S. degree in Psychology from Ball State University. He has completed the Harvard Advanced Management Program. Mr. McCormack serves on the Board of Directors of MEMA and the University of North Carolina at Charlotte’s Belk College School of Business. He is also a member of the Automotive Presidents’ Group.
Thomas H. Madden has served as our Chief Financial Officer since the Acquisition on November 30, 2004. Mr. Madden formerly served as Vice President and Group Controller for the Aftermarket Group of Dana since 1998. He joined Dana in 1974 as an accountant with the Transmission Division and served in a variety of positions, including as Division Controller, Spicer Drivetrain Europe. While in Europe, he also held the position of General Manager of the Transmission Assembly and Components Group. In 1992, he returned to the United States as Division Controller for the Wix Filtration Division, and in 1996 became Division Controller of the Spicer Driveshaft Division. He earned a B.B.A. in Accounting from the University of Toledo. He also attended the University of Michigan Executive Business School.
John R. Washbish has served as our Vice President and General Manager, Under Vehicle Group since the Acquisition on November 30, 2004. Mr. Washbish served as the President of Customer Relationship Management for the Aftermarket Group of Dana from May 2003 and has continued to serve in this capacity for Affinia Group Inc. since the Acquisition. Prior to this, he served as the President of the Under Hood Group and Global Filtration and Clevite Engine Products divisions of Dana. From 1987 to 2000, he served as President of Clevite Engine Parts, a division of Dana Engine Controls, which joined Dana through its 1998 acquisition of Glacier Engine Bearings and AE Clevite Engine Parts. Mr. Washbish earned his Bachelor’s degree in Business Administration and an Associate’s degree in Automotive Aftermarket Management from Northwood University and an Automotive Aftermarket Professional Degree from the University of the Aftermarket. A past President of the National Engine Parts Manufacturers Association, Mr. Washbish has also served a four-year term on the Board of Directors for MEMA, and he currently serves on the Boards of Directors of the AASA, Heavy Duty Manufacturers Association and AWDA. He attended the University of Michigan Executive Business School and INSEAD University in France.
88
Table of ContentsKeith A. Wilson has served as Vice President and General Manager of Under Hood Group of Affinia Group Inc. since the Acquisition on November 30, 2004. Mr. Wilson had served as Vice President and division manager of Wix Filtration Products Division since September 2000 and was given additional responsibility for Engine Operations in 2003. Mr. Wilson joined Dana in 1984 as a sales and marketing specialist with the Spicer Axle Division. Following a series of positions in Indiana and Missouri, Mr. Wilson became the production control manager at the Spicer Driveshaft Division plant in Lima, Ohio in 1990, and he was named plant manager at the Spicer Heavy Axle and Brake Division in Hilliard, Ohio in 1991. Mr. Wilson became the resident manager of the Spicer Trailer Products Division in 1994, General Manager of the division in 1996 and Vice President and General Manager in September 1997. In 1998, he was named Vice President and General Manager of the Victor Reinz Division. Mr. Wilson earned a Bachelor’s degree in Marketing and Management from Ball State University and he is a graduate of Dana’s M.B.A. Program. He also served as Chairman of Dana’s Global Environmental Health & Safety Advisory Council.
Steven E. Keller has served as General Counsel and Secretary since the Acquisition on November 30, 2004. Mr. Keller held various positions in Dana’s Law Department, most recently as Managing Attorney and a member of the Law Department’s Operating Committee. His responsibilities included serving as Strategic Business Unit counsel to the Aftermarket Group of Dana, division counsel to several Dana divisions, regional counsel to Dana’s Asia-Pacific operations, and providing legal advice on acquisition and divestiture transactions. Prior to joining Dana in 1993, Mr. Keller was a partner in the law firm of Hogan & Hartson. Mr. Keller earned a B.A. in Financial Administration from Michigan State University and his J.D. from the Marshall-Wythe School of Law at the College of William and Mary. He also attended the University of Michigan Executive Business School. He is a member of the Virginia Bar.
Timothy J. Zorn has served as Vice President, Human Resources since the Acquisition on November 30, 2004. Mr. Zorn held the same position with the Aftermarket Group of Dana from May 2003 until the Acquisition and was previously the Human Resources Manager of Dana’s Wix division from May 1999 until May 2003.
Jerry A. McCabe has served as Vice President, Communications and Marketing Services, since the Acquisition on November 30, 2004. Prior to the Acquisition, Mr. McCabe had served as Vice President, Marketing for the Aftermarket Group of Dana’s Under Hood Group from September 2000, and Vice President, Marketing for Clevite Engine Parts from the time Dana purchased Clevite in December 1998. He had been hired as Vice President, Marketing at Clevite in May 1994 and was appointed to its Board of Directors in 1996. For the previous 20 years, Mr. McCabe had held positions in sales, product management, marketing, and general management with aftermarket companies including McCord Gaskets, TRW and Camshaft Machine. He earned his B.B.A. in Marketing from Eastern Michigan University in 1975. After two tours of duty in Vietnam, Mr. McCabe was granted an Honorable Discharge from the U.S. Army in 1970.
Larry W. McCurdy has served as Chairman of the Board of Directors since the Acquisition on November 30, 2004. He was President of the Aftermarket Group at Dana from 1998 until his retirement in 2000. He served as Chairman of the Board, President and Chief Executive Officer of Echlin, Inc. from March 1997 until its merger with Dana in 1998. He has also held senior executive positions at Cooper Industries, Inc. and Moog Automotive, Inc., where he served as President and Chief Executive Officer, and Tenneco Inc., where he served as President of its subsidiary Walker Manufacturing and Executive Vice President of its North American Operations. Mr. McCurdy also serves on the Boards of Directors of Lear Corporation, Mohawk Industries Inc. and General Parts, Inc.
Michael F. Finley has served as a Director since the Acquisition on November 30, 2004. Mr. Finley also serves as Chair of the Nominating Committee of our Board of Directors. Mr. Finley has been a Managing Director of Cypress since 1998 and has been a member of Cypress since its formation in April 1994. Prior to joining Cypress, he was a Vice President in the Merchant Banking Group at Lehman Brothers Inc. Mr. Finley received a B.A. from St. Thomas University and an
89
Table of ContentsM.B.A. from the University of Chicago’s Graduate School of Business. Mr. Finley currently serves on the Boards of Directors of CPI International, Inc., Williams Scotsman International, Inc. and Cooper-Standard Automotive Inc.
Donald J. Morrison has served as a Director since the Acquisition on November 30, 2004. Mr. Morrison is a Senior Vice President with OMERS Capital Partners, which makes private equity investments on behalf of OMERS, one of Canada's largest pension funds. Before joining OMERS, Mr. Morrison spent ten years with PricewaterhouseCoopers LLP in Corporate Finance focusing on restructurings and turnarounds and eight years as Senior Vice President and member of the Senior Management Investment Committee with one of Canada's largest venture capital funds originating and structuring expansion and buyout investments. Mr. Morrison has served on the Boards of Directors of over 20 public and private companies. Mr. Morrison has a B.S. Commerce degree from the University of Toronto, is a Chartered Accountant and a Chartered Insolvency and Restructuring Practitioner. He currently serves on the Boards of Directors of CRC Health Corporation and OMERS Energy.
Joseph A. Onorato has served as a Director since the Acquisition on November 30, 2004. Mr. Onorato also serves as Chair of the Audit Committee of our Board of Directors. Mr. Onorato was Chief Financial Officer of Echlin. Inc., where he spent nineteen years. He served as Treasurer from 1990 to 1994, as Vice President and Treasurer from 1994 to 1997 and as Vice President and Chief Financial Officer from 1997 until the company was acquired by Dana in July 1998. Mr. Onorato served as Senior Vice President and Chief Financial Officer for the Aftermarket Group from July 1998 until his retirement in September 2000. Mr. Onorato previously worked for PricewaterhouseCoopers LLP.
John M. Riess has served as a Director since the Acquisition on November 30, 2004. He formerly served as Chairman and Chief Executive Officer of Breed Technologies, Inc. from 2000 to 2003. Prior to this, Mr. Riess held various management and executive positions within the Gates Rubber Company, serving as Chairman of the Board and Chief Executive Officer from 1997 to 1999. Mr. Riess also serves on the Board of Form Fiber Technology.
James A. Stern has served as a Director since the Acquisition on November 30, 2004. Mr. Stern also serves as Chair of the Compensation Committee of our Board of Directors. Mr. Stern is Chairman and CEO of Cypress, a position he has held since 1994. Mr. Stern headed Lehman Brothers’ Merchant Banking Group before leaving that firm to help found Cypress. During his 20-year tenure with Lehman, he held senior management positions where he was responsible for the high yield and primary capital markets groups. He also served as co-head of investment banking and was a member of Lehman’s operating committee. Before graduating from Harvard Business School, Mr. Stern earned a B.S. from Tufts University, where he is Chairman of the Board of Trustees. He also serves on the Boards of Directors of Lear Corporation, Clubcorp, Inc., AMTROL, Inc., Med Pointe Inc. and WESCO International, Inc.
Stockholders Agreement
Pursuant to the Stockholders Agreement dated as of November 30, 2004, among Affinia Group Holdings Inc., various Cypress funds, Ontario Municipal Employees Retirement Board (‘‘OMERS’’), The Northwestern Mutual Life Insurance Company, California State Teachers' Retirement System and Stockwell Fund, L.P., the number of directors serving on the Board of Directors will be no less than seven and no more than eleven. The Stockholders Agreement entitles Cypress to designate three directors. Mr. Stern and Mr. Finley are both Cypress designees. As long as OMERS members own at least 50 percent in the aggregate of the number of shares owned by them on November 30, 2004, OMERS is entitled to designate one director, who initially is Mr. Morrision. Cypress is entitled to designate three independent directors, as defined by SEC rules, who currently are Mr. McCurdy, Mr. Onorato and Mr. Riess. Additionally, the Stockholders Agreement entitles the individual serving as CEO, currently Mr. McCormack, and another individual serving as one of our senior officers, currently Mr. Washbish, to seats on the Board of Directors. The Stockholders Agreement also provides that the nominating committee of the Board of Directors may from time to time select two additional individuals who must be independent to serve as directors.
90
Table of ContentsCode of Ethics
We have adopted a Code of Business Conduct, which applies to all of our officers, directors, and employees. A current copy of the code is posted at our website ‘‘http://www.affiniagroup.com’’.
Committees of the Board of Directors
Our board of directors currently has audit, compensation and nominating committees. Our audit committee currently consists of Mr. Onorato, Mr. Finley, Mr. Morrison and Mr. Riess, with Mr. McCurdy serving as an ex-officio, non-voting member. Mr. Onorato, the chair of our audit committee, is independent and is our audit committee ‘‘financial expert’’ as such term is defined in Item 401(h) of Regulation S-K. Our current compensation committee consists of Mr. Stern (chair), Mr. Riess, Mr. Onorato and Mr. Finley, with Mr. McCurdy serving as an ex-officio, non-voting member. Our current nominating committee consists of Mr. Finley (chair), Mr. McCurdy and Mr. Morrison.
| |
| Item 11. | Executive Compensation |
As a stand-alone company, we have established executive compensation plans that link compensation with the performance of our Company. We will continually review our executive compensation programs to ensure that they are competitive.
The following table shows all compensation awarded to, earned by, or paid to our Chief Executive Officer (‘‘CEO’’) and our four other most highly compensated executive officers serving at the end of 2005 based on salary and bonus, whom we refer to as the ‘‘named executive officers.’’
SUMMARY COMPENSATION TABLE
| | | | | | | | | | | | | | | | | | | | | | | | | | |
| | | | | | | | | | | Long-Term
Compensation | | |
| | | | | | | | | | | Awards | | |
| Name and Principal Position | | Year | | Salary(1)
($) | | Bonus(2)
($) | | Other Annual
Compensation(3)
($) | | Securities
Underlying
Options | | All Other
Compensation
($)(4) (5) |
| Terry R. McCormack | | 2005 | | 600,000 | | | 420,000 | | | | 94,657 | | | | 17,500 | | | | 15,501 | |
| President and Chief Executive Officer | | 2004 | | 405,000 | | | 27,594 | | | | 0 | | | | 0 | | | | 811,013 | |
| Thomas H. Madden | | 2005 | | 275,000 | | | 154,000 | | | | 42,185 | | | | 8,500 | | | | 12,073 | |
| Chief Financial Officer | | 2004 | | 200,000 | | | 15,826 | | | | 0 | | | | 0 | | | | 300,500 | |
| John R. Washbish | | 2005 | | 420,000 | | | 294,000 | | | | 10,574 | | | | 14,500 | | | | 12,287 | |
| President, Customer Relationship Management, Vice President and General Manager, Under Vehicle Group | | 2004 | | 360,000 | | | 21,863 | | | | 0 | | | | 0 | | | | 489,900 | |
| Keith A. Wilson | | 2005 | | 300,000 | | | 210,000 | | | | 21,865 | | | | 9,000 | | | | 12,315 | |
| Vice President and General Manager, Under Hood Group | | 2004 | | 235,000 | | | 16,194 | | | | 0 | | | | 0 | | | | 235,588 | |
| Steven E. Keller | | 2005 | | 275,000 | | | 154,000 | | | | 14,031 | | | | 6,500 | | | | 12,036 | |
| General Counsel and Secretary of the Board of Directors | | 2004 | | 220,000 | | | 12,865 | | | | 0 | | | | 0 | | | | 220,550 | |
|
| |
| (1) | 2004 was the first year in which, we, as a newly-established company following the Acquisition, paid compensation to our named executive officers. Amounts shown are based on the amount of full-year compensation; actual payments were prorated based on the date of hire for all executive officers as of the date of the Acquisition, November 30, 2004. Actual amounts paid were as follows: Mr. McCormack: $33,750; Mr. Madden: $16,667; Mr. Washbish: $30,000; Mr. Wilson: $19,583; and Mr. Keller: $18,333. |
91
Table of Contents | |
| (2) | Amounts for 2005 include amounts received under our annual performance based bonus plan. Amounts for 2004 include a pro-rated bonus for December 2004 based on our annual performance based bonus plan plus a bonus awarded in connection with the completion of the Acquisition. |
| |
| (3) | Amounts for 2005 include vehicle leases and allowances as follows: Mr. McCormack: $12,850; Mr. Madden: $7,780; Mr. Washbish: $7,862; Mr. Wilson: $11,045; and Mr. Keller: $11,459. Amounts also include $55,487 for Mr. McCormack, which represents our payment to Mr. McCormack to reimburse him for certain relocation expenses in his move to from Ohio to Michigan in connection with the Acquisition and $31,892 to Mr. Madden, which represents our payment to Mr. Madden to reimburse him for certain relocation expenses in his move from Ohio to Michigan in connection with the Acquisition. |
| |
| (4) | Amounts for 2004 and 2005 include contributions made by Affinia Group Inc. under the Affinia Group Partners in Wealth Savings Plan, a defined contribution plan. Amounts for 2004 also include contributions made by Affinia under the Affinia Group Partners in Wealth Savings Plan, a defined contribution plan. The amounts of the contributions in 2004 were: for Mr. McCormack, $1,013; for Mr. Washbish, $900; for Mr. Madden, $500; for Mr. Wilson, $588; and for Mr. Keller, $550. Amount for 2005 also includes supplemental life insurance premium paid for Mr. McCormack in the amount of $1,136. |
| |
| (5) | Amounts for 2004 represent payments made by Dana to each of the named executive officers pursuant to Retention Agreements (except for Mr. Keller, who was paid by Affinia Group Inc. pursuant to a separate letter agreement) in connection with the Acquisition. The first installment was paid within 60 days after the closing of the Acquisition, except for Mr. Washbish who received his payment in March 2005. The second installment was paid within 60 days after six months following the closing of the Acquisition. These retention and letter agreements have been superseded by the employment agreements with Affinia Group Inc. described below. |
OPTION GRANTS IN LAST FISCAL YEAR
| | | | | | | | | | | | | | | | | | | | | | | | | | |
| | | Individual Grants | | Potential Realizable
Value at Assumed
Annual Rates of Stock
Price Appreciation for
Option Term |
Name and
Principal Position | | Number of
Securities
Underlying
Options
Granted | | Percentage
of Total
Options
Granted to
Employees in
Fiscal Year | | Exercise of
Base Price | | Expiration
Date | | 5%
(000's) | | 10%
(000's) |
| Terry R. McCormack | | | 17,500 | | | | 12.71 | % | | $ | 100 | | | | 8/1/ 2015 | | | $ | 2,850 | | | $ | 4,539 | |
| Thomas H. Madden | | | 8,500 | | | | 6.17 | % | | $ | 100 | | | | 8/1/ 2015 | | | $ | 1,385 | | | $ | 2,205 | |
| John R. Washbish | | | 14,500 | | | | 10.53 | % | | $ | 100 | | | | 8/1/ 2015 | | | $ | 2,362 | | | $ | 3,761 | |
| Keith A. Wilson | | | 9,000 | | | | 6.54 | % | | $ | 100 | | | | 8/1/ 2015 | | | $ | 1,466 | | | $ | 2,334 | |
| Steven E. Keller | | | 6,500 | | | | 4.72 | % | | $ | 100 | | | | 8/1/ 2015 | | | $ | 1,059 | | | $ | 1,686 | |
|
Employment and Severance Agreements
On July 21, 2005 we entered into employment agreements with each of Messrs. McCormack (Chief Executive Officer and President), Washbish (President, Customer Relationship Management and Vice President and General Manger, Under Vehicle Group), Wilson (Vice President and General Manager, Under Hood Group), Madden (Chief Financial Officer) and Keller (General Counsel and Secretary), with substantially identical terms, except as noted below.
Each such employment agreement has an employment term which commenced as of May 1, 2005 and, unless earlier terminated, will continue until December 31, 2007 and on each December 31 thereafter, will be automatically extended for successive additional one year periods thereafter unless either party provides the other 90 days prior written notice that the employment term will not be so extended. Under the employment agreements, Messrs. McCormack, Washbish, Wilson, Madden and Keller will be entitled to base salaries of $600,000, $426,000, $300,000, $275,000 and $275,000, respectively, subject to such increases, if any, as may be determined by the Board and are eligible to earn a target annual bonus as a percentage of base salary (100% for Messrs. McCormack, Washbish and Wilson and 80% for Messrs. Madden and Keller) upon the achievement of performance goals established by the Board and are entitled to a greater annual bonus for performance in excess of targeted performance goals or a lesser annual bonus for performance which does not meet targeted performance goals, in each case, in the discretion of the Board. Each executive is restricted, for a period following termination of employment with us (24 months for Messrs. McCormack, Washbish and Wilson; 18 months for Messrs. Madden and Keller (or 12 months for Messrs. Madden and Keller if their employment agreement expires due to their election not to extend the term)), from (i) soliciting in competition certain of our clients, (ii) competing with us or entering the employment or providing services to entities who compete with us or (iii) soliciting or hiring our employees.
92
Table of ContentsUnder the employment agreements, each executive is entitled to the following payments and benefits in the event of a termination by us without cause (as defined in the agreement) or by the executive for good reason (as defined in the agreement) during the employment term: (i) subject to the executive's compliance with the restrictive covenants described above, an amount equal to the ‘‘severance multiple’’ (2.0 for each of Messrs. McCormack, Washbish and Wilson; 1.5 times for each of Messrs. Madden and Keller) times the sum of base salary and the ‘‘average annual bonus’’ paid under the agreement for the preceding two years (or if terminated after the first fiscal year but prior to the completion of second fiscal year of the employment term, the average of the annual bonus hereunder for the completed fiscal year and the annual bonus paid by Dana Corporation and us, in the aggregate, for 2004 (the ‘‘2004 Bonus’’) or if terminated during the first fiscal year, the 2004 Bonus) (the ‘‘Multiplier’’), payable as follows: an amount equal to 1 times the Multiplier to be paid in equal monthly installments for 12 months following termination of employment and the balance to be paid in a lump sum on the first anniversary of the termination of the executive's employment; (ii) a pro-rata annual bonus for the year of termination; and (iii) continued medical and dental coverage at our cost, on the same basis made available for active employees for a period of years corresponding with the severance multiple; provided that if such coverage is not available for any portion of such period under our medical plans, we may pay the executive an amount equal to the premium cost otherwise payable by executives (without giving effect to any employer subsidies) under our plans for such coverage. In addition, if the executive is terminated by us without cause or the executive resigns for good reason within two years following a change of control, the executive shall be entitled to a supplemental payment equal to the excess, if any, of (A) the product of the severance multiple times the executive's target annual bonus, over (B) the product of the severance multiple times the average annual bonus described above.
In addition, in the event the employment term ends due to election by either party not to extend the employment term, then the executive shall be entitled, subject to the executive's compliance with the restrictive covenants described above to, (x) if we elect not to extend the employment term, an amount equal to the ‘‘severance multiple’’ times the base salary, payable as follows: an amount equal to 1 times the base salary to be paid in 12 equal monthly installments following termination of employment and the balance to be paid in a lump sum on the first anniversary of the termination of the executive's employment and (y) if the executive elects not to extend the employment term, an amount equal to 2 times (in the case of Messrs. McCormack, Washbish and Wilson) or 1 times (in the case of Messrs. Madden and Keller) the base salary paid in equal monthly installments over 24 months (in the case of Messrs. McCormack, Washbish and Wilson) or 12 months (in the case of Messrs. Madden and Keller).
The employment agreements described above supersede all prior employment agreements or understandings between these executives and us and our affiliates regarding their employment.
Affinia Group Holdings Inc. 2005 Stock Incentive Plan
On July 20, 2005, we adopted the Affinia Group Holdings Inc. 2005 Stock Incentive Plan, which we refer to as our stock incentive plan. The stock incentive plan permits the grant of non-qualified stock options, incentive stock options, stock appreciation rights, restricted stock and other stock-based awards to employees, directors or consultants of Affinia Group Holdings Inc. and its affiliates. A maximum of 227,000 shares of common stock may be subject to awards under the stock incentive plan. The number of shares issued or reserved pursuant to the stock incentive plan (or pursuant to outstanding awards) is subject to adjustment on account of mergers, consolidations, reorganizations, stock splits, stock dividends and other dilutive changes in the common stock. Shares of common stock covered by awards that terminate or lapse and shares delivered by a participant or withheld to pay the minimum statutory withholding rate, in each case, will again be available for grant under the stock incentive plan.
Administration. The stock incentive plan is administered by a committee of our Board of Directors; provided, that our Board of Directors may take any action designated to the committee. The committee has full power and authority to make, and establish the terms and conditions of any award, and to waive any such terms and conditions at any time (including, without limitation,
93
Table of Contentsaccelerating or waiving any vesting conditions or payment dates). The committee is authorized to interpret the plan, to establish, amend and rescind any rules and regulations relating to the plan and to make any other determinations that it, in good faith, deems necessary or desirable for the administration of the plan and may delegate such authority as it deems appropriate. The committee may correct any defect or supply an omission or reconcile any inconsistency in the plan in the manner and to the extent the committee deems necessary or desirable and any decision of the committee in the interpretation and administration of the plan shall lie within its sole and absolute good faith discretion and shall be final, conclusive and binding on all parties concerned.
Options. The committee determines the option price for each option; provided, however, that incentive stock options must have an exercise price that is at least equal to the fair market value of the common stock on the date the option is granted. An option holder may exercise an option by written notice and payment of the option price (i) in cash or its equivalent, (ii) by the surrender of a number of shares of common stock already owned by the option holder for at least six months (or such other period established by the committee) with a fair market value equal to the exercise price, (iii) if there is a public market for the shares, subject to rules established by the committee, through the delivery of irrevocable instructions to a broker to sell shares obtained upon the exercise of the option and to deliver to Affinia Group Holdings Inc. an amount out of the proceeds of the sale equal to the aggregate option price for the shares being purchased or (iv) by another method approved by the committee.
Stock Appreciation Rights. The committee may grant stock appreciation rights independent of or in connection with an option. The exercise price per share of a stock appreciation right shall be an amount determined by the committee. Generally, each stock appreciation right shall entitle a participant upon exercise to an amount equal to (i) the excess of (1) the fair market value on the exercise date of one share of common stock over (2) the exercise price, multiplied by (ii) the number of shares of common stock covered by the stock appreciation right. Payment shall be made in common stock or in cash, or partly in common stock and partly in cash, all as shall be determined by the committee.
Other Stock-Based Awards. The committee may grant awards of restricted stock units, rights to purchase stock, restricted stock and other awards that are valued in whole or in part by reference to, or are otherwise based on the fair market value of, shares of common stock. The other stock-based awards will be subject to the terms and conditions established by the committee.
Transferability. Unless otherwise determined by the committee, awards granted under the stock incentive plan are not transferable other than by will or by the laws of descent and distribution.
Change of Control. In the event of a change of control (as defined in the stock incentive plan), the committee may provide for (i) the termination of an award upon the consummation of the change of control, but only if the award has vested and been paid out or the participant has been permitted to exercise an option in full for a period of not less than 30 days prior to the change of control, (ii) the acceleration of all or any portion of an award, (iii) payment in exchange for the cancellation of an award and/or (iv) the issuance of substitute awards that would substantially preserve the terms of any awards.
Amendment and Termination. Our Board of Directors may amend, alter or discontinue the stock incentive plan in any respect at any time, but no amendment may diminish any of the rights of a participant under any awards previously granted, without his or her consent.
Management or Director Stockholders Agreement. All shares issued under the plan will be subject to the management stockholders agreement or directors stockholders agreement, as applicable.
Restrictive Covenant Agreement. Unless otherwise determined by our Board of Directors, all award recipients will be obligated to sign the standard Confidentiality, Non-Competition and Proprietary Information Agreement which includes restrictive covenants regarding confidentiality, proprietary information and a one year period restricting competition and solicitation of our clients, customers or employees. In the event a participant breaches these restrictive covenants, any exercise of, or payment or delivery pursuant to, an award may be rescinded by the committee in its discretion
94
Table of Contentsin which event the participant may be required to pay to us the amount of any gain realized in connection with, or as a result of, the rescinded exercise, payment or delivery.
On December 15, 2005, Affinia Group Holdings, Inc. (the ‘‘Affinia Group’’), the parent company of Affinia Group Intermediate Holdings Inc., entered into stockholder's and other agreements with certain officers, directors and key employees (collectively, the ‘‘Executives’’) of the Company and the Registrant, pursuant to which those Executives purchased an aggregate of 9,520 shares (the ‘‘Shares’’) of the Affinia Group's common stock for $100.00 per Share in cash. The Affinia Group received aggregate proceeds of $952,000 as a result of the offering, which was made pursuant to the Affinia Group's 2005 Stock Incentive Plan. The offers and sales of the Shares were exempt from the registration requirements of the Securities Act of 1933 in reliance on Rule 701 issued thereunder as transactions pursuant to compensatory benefit plans and contracts relating to compensation as provided under Rule 701. None of the foregoing transactions involved any underwriters, underwriting discounts or commissions, or any public offering
The stockholder's agreements impose restrictions on transfers of the Shares by the Executives and also provide for various put and call rights with respect to the Shares. These put and call rights include the Executive's right to require Affinia Group to purchase the Shares on death or disability at the then-fair market value of the Shares and Affinia Group's option to repurchase the Shares upon specified events, including termination of service or employment at a price equal to the then-fair market value or, in certain circumstances, at a price equal to the lesser of $100.00 and the then-fair market value. The Executives have also been granted limited ‘‘piggyback’’ registration rights with respect to the Shares. Certain Executives also entered into confidentiality and non-competition agreements in connection with their purchase. The forms of the various agreements are referenced under Item 15. Exhibits and Financial Statement Schedules, and the forms of the agreements relating to the directions are substantially similar to the forms relating to management.
Director Compensation
The Board of Directors has approved compensation for independent directors comprised of a $40,000 annual retainer. The Chairman of the Board of Directors is paid an additional $15,000 annually. The chair of our Audit Committee is paid an additional $10,000 annually. Also, each non-management director is paid an additional $1,500 for each meeting of the Board of Directors attended and an additional $1,500 for each committee meeting attended.
Mr. Onorato and Mr. McCurdy were each paid a consulting fee of $95,000 for their services in connection with the Acquisition. Mr. Onorato’s fee was paid in 2004 and Mr. McCurdy’s fee was paid in 2005.
| |
| Item 12. | Security Ownership of Certain Beneficial Owners and Management |
Affinia Group Holdings Inc. owns 100% of the issued and outstanding common stock of Affinia Group Intermediate Holdings Inc. Affinia Group Intermediate Holdings Inc. owns 100% of the issued and outstanding common stock of Affinia Group Inc.
The following table and accompanying footnotes show information regarding the beneficial ownership of the common stock of Affinia Group Holdings Inc. as of March 15, 2006 by each person known by us to beneficially own more than 5% of the issued and outstanding common stock of Affinia Group Holdings Inc., (ii) each of our directors, (iii) each named executive officer and (iv) all directors and executive officers as a group.
95
Table of Contents
| | | | | | | | | | |
| Names and addresses of beneficial owner | | Nature and
Amount of
Beneficial
Ownership(1) | | Percentage of Class |
| The Cypress Group L.L.C. | | | 2,175,000 | (2) | | | 61.1 | % |
| The address of each of the Cypress Funds and Cypress Side-By-Side L.L.C. is c/o The Cypress Group L.L.C., 65 East 55th Street, 28th Floor, New York, NY 10022. | | | | | | | | |
| Ontario Municipal Employees Retirement Board | | | 700,000 | | | | 19.7 | % |
| The address of Ontario Municipal Employees Retirement Board is c/o Omers Capital, 50 Golf Valley Lane, Etobicoke, Ontario, Canada, M9C 2K3. | | | | | | | | |
| California State Teachers' Retirement System | | | 200,000 | | | | 5.6 | % |
| The address of California State Teachers' Retirement System is 7667 Folsom Blvd., Sacramento, CA 95826. | | | | | | | | |
| The Northwestern Mutual Life Insurance Company | | | 400,000 | | | | 11.3 | % |
| The address of The Northwestern Mutual Life Insurance Company is 720 East Wisconsin Avenue, Milwaukee, WI 53202. | | | | | | | | |
| Executive officers or member of board of directors of Affinia Group Intermediate Holdings Inc. and Affinia Group Inc. | | | | | | | | |
| Terry R. McCormack | | | 1,500 | | | | | * |
| Thomas H. Madden | | | 750 | | | | | * |
| John R. Washbish | | | 1,250 | | | | | * |
| Keith A. Wilson | | | 550 | | | | | * |
| Steven E. Keller | | | 500 | | | | | * |
| Larry W. McCurdy | | | 3,000 | | | | 0.1 | % |
| John M. Riess | | | 250 | | | | | * |
|
| |
| * | The executive officers or members of the Board of Directors of Affinia Group Inc. currently hold 0.3% of shares of the outstanding common stock of Affinia Group Holdings Inc. The amount of ownership for each executive officer or member of the board own is shown above and all of the executive officers or members of the Board own less than 0.1% of outstanding shares except for Mr. Larry W. McCurdy. |
| |
| (1) | Applicable percentage of ownership includes 3,559,520 shares of common stock outstanding as of December 31, 2005. |
| |
| (2) | Includes 2,063,038 shares of common stock owned by Cypress Merchant Banking Partners II L.P., 87,703 shares of common stock owned by Cypress Merchant Banking II C.V., 19,908 shares of common stock owned by 55th Street Partners II L.P. (collectively, the ‘‘Cypress Funds’’) and 4,350 shares of common stock owned by Cypress Side-by-Side LLC. Cypress Associates II L.L.C. is the managing general partner of Cypress Merchant Banking II C.V. and the general partner of Cypress Merchant Banking Partners II L.P. and 55th Street Partners II L.P., and has voting and investment power over the shares held or controlled by each of these funds. Certain executives of The Cypress Group L.L.C., including Messrs. Jeffrey Hughes and James Stern, may be deemed to share beneficial ownership of the shares shown as beneficially owned by the Cypress Funds. Each of such individuals disclaims beneficial ownership of such shares. Cypress Side-By-Side L.L.C. is a sole member-L.L.C. of which Mr. James A. Stern is the sole member. |
| |
| Item 13. | Certain Relationships and Related Party Transactions |
Investor Stockholders Agreement
Pursuant to the Stockholders Agreement dated as of November 30, 2004, among Affinia Group Holdings Inc., various Cypress funds, Ontario Municipal Employees Retirement Board (‘‘OMERS’’), The Northwestern Mutual Life Insurance Company, California State Teachers' Retirement System and Stockwell Fund, L.P., the number of directors serving on the Board of Directors will be no less than seven and no more than eleven. The Stockholders Agreement entitles Cypress to designate three directors. Cypress has currently appointed Mr. Stern and Mr. Finley. As long as OMERS members own at least 50 percent in the aggregate of the number of shares owned by them on November 30, 2004, OMERS is entitled to designate one director, who initially is Mr. Morrison. Cypress is entitled to designate three independent directors, as defined by SEC rules, who initially are Mr. McCurdy, Mr. Onorato and Mr. Riess. Additionally, the Stockholders Agreement entitles the individual serving
96
Table of Contentsas CEO, currently Mr. McCormack, and another individual serving as one of our senior officers, currently Mr. Washbish, to seats on the Board of Directors. The Stockholders Agreement also provides that the nominating committee of the Board of Directors may from time to time select two additional individuals who must be independent to serve as Directors.
Agreements Related to the Acquisition
On or prior to the closing of the Acquisition, the parties entered into agreements governing certain relationships between and among the parties after the closing. These agreements include bills of sale, special warranty deeds, real property lease assignments, intellectual property assignment agreements, assignment and assumption agreements, transition intellectual property agreements and transition services agreements, including the following agreements. Upon consummation of the Acquisition, we paid aggregate transaction and advisory fees of $10 million to Cypress relating to certain structuring and advisory services that Cypress provided to us.
Transition services agreements. The transition services agreements provide for certain administrative and other services and support (1) to be provided by Dana to us, and (2) to be provided by us to Dana, in each case after the Acquisition. We also will continue to lease certain properties, warehouses and office space from Dana after the Acquisition for periods of several months to five years. Some of these lease terms may be renewed indefinitely by the parties.
On April 29, 2005, Dana paid the Company $12 million in settlement of the TSA agreement noted above, as well as $11 million for uncollectible receivables covered by the Purchase Agreement, offset by $13 million of original purchase price consideration and $3 million of working capital adjustments, which resulted in a net payment of $7 million.
Ancillary agreements. Pursuant to the ancillary agreements, we will, among other things, sell various Dana products in the United States and in foreign markets. We generally will receive commissions on these sales. Many of these agreements can be terminated by either party upon notice. In addition to the various ancillary agreements, we entered into a distribution agreement with Dana, whereby Dana Brazil appointed us its exclusive distributor of specified products in Brazil for a period of six years.
Credit. Dana agreed in the Purchase Agreement to provide us with a $16 million credit for payments otherwise due for services under the transition services agreements and ancillary agreements. Up to $11 million may be credited against payments arising in the fourth fiscal quarter of 2004 and up to $5 million may be credited in the first fiscal quarter of 2005. In the event that the full $16 million credit was not used by us by the end of the first quarter of 2005, Dana agreed to make a cash payment to us by April 29, 2005 for the unused balance, which was $12 million and has been received.
Trademark license agreements. Dana and we also have agreed to license trademarks to one another to facilitate the performance of each party's obligations under the transition services and ancillary agreements.
Affinia Group Holdings Inc. Seller Note
As part of the financing in connection with the Acquisition, Affinia Group Holdings Inc., our ultimate parent company, issued subordinated pay-in-kind notes due 2019 with a face amount of $74.5 million (collectively, the ‘‘Seller Note’’) to an affiliate of Dana. The Seller Note had an estimated fair value of $50 million upon issuance. We and the guarantors of our senior subordinated notes have no obligations with respect to the Seller Note.
The Seller Note will mature on November 30, 2019. The interest rate on the Seller Note is 8% per annum initially, with an increase to 10% per annum from November 30, 2009, payable at the option of Affinia Group Holdings Inc. Affinia Group Holdings Inc. may prepay at its option all or part of the Seller Note at specified prepayment prices. Upon a change of control, the holder shall have the right to require Affinia Group Holdings Inc. to repurchase the Seller Note at specified
97
Table of Contentsprepayment prices. Under specified circumstances, Affinia Group Holdings Inc. will be required to offer to redeem a portion of the Seller Note at specified prepayment prices using 17.5% of dividends proposed to be made. Notwithstanding Affinia Group Holdings Inc.'s option to make cash interest payments, our senior credit facilities and the indenture governing the senior subordinated notes limit our ability to make dividends to Affinia Group Holdings Inc. for the purpose of making any payments in respect of, or otherwise servicing, the obligations represented by the Seller Note.
Payment under the Seller Note is structurally and contractually subordinated to the prior payment in full of our senior subordinated notes and all our other senior debt and any senior debt of Affinia Group Holdings Inc. Any holder may sell or otherwise transfer all or part of the Seller Note (in no less than increments of $10 million of the principal amount) with the prior written consent of Affinia Group Holdings Inc. which consent shall not be unreasonably withheld if such transfer would not adversely affect Affinia Group Holdings Inc. and its affiliates.
Other Related Party Transactions
Mr. Washbish’s brother is the owner of Moog Automotive Warehouse, Louisville, Kentucky, an automotive warehouse distributor that purchased approximately $0.3 million of products from Affinia Group Inc. in 2004.
Mr. Riess’ son is the President of Carquest Canada which purchased approximately $13.3 million of products from Affinia Group Inc. in 2005.
| |
| Item 14. | Principal Accountant Fees and Services |
Audit Fees and Tax Fees
The Company was established and became operational with the Acquisition and, therefore, had no services from a principal accountant during 2004. There were no bills rendered or fees paid to PricewaterhouseCoopers LLP for audit fees, audit-related fees, tax fees or any other fees for the year ended December 31, 2004.
The Audit Committee approved the selection of PricewaterhouseCoopers LLP as the Company’s principal accountants in January 2005. The Audit Committee then adopted procedures for pre-approving all audit and non-audit services provided by PricewaterhouseCooper LLP. We paid PricewaterhouseCoopers LLP $4.5 million in audit fees and less than $1 million for global tax compliance services. On October 14, 2005, the Company engaged Deloitte & Touche LLP (‘‘Deloitte & Touche’’) as the Company's new independent registered public accounting firm for the fiscal year ending December 31, 2005. The engagement of Deloitte & Touche was approved by the Audit Committee of the Company's Board of Directors. The Audit Committee then adopted procedures for pre-approving all audit and non-audit services provided by Deloitte & Touche. The Audit Committee, as required by its Charter, approves in advance any audit or permitted non-audit engagement or relationship between the Company and the Company’s independent auditors. The Audit Committee has adopted an Audit and Non-Audit Services Pre-Approval Policy which provides that the Company's independent auditors are only permitted to provide services to the Company that have been specifically approved by the Audit Committee or entered into pursuant to the pre-approval provisions of the Policy. All tax services to be performed by the independent auditors that fall within certain categories and certain designated dollar thresholds have been pre-approved under the Policy. All tax services that exceed the dollar thresholds and any other services must be approved in advance by the Audit Committee. The Audit Committee also has delegated approval authority, subject to certain dollar limitations, to the Chairman of the Audit Committee, who is an independent director. Pursuant to this delegation, the Chairman is required to present, and as of the date of this report has presented, all approval decisions to the full Audit Committee. During 2005 we paid Deloitte & Touche $0.6 million in audit fees and $0.4 million in U.S. tax compliance and consulting services.
98
Table of ContentsPART IV.
| |
| Item 15. | Exhibits and Financial Statement Schedules |
| |
| (a) | The following documents are filed as part of this report: |
| |
| 1. | Financial Statements: |
See Item 8 above.
| |
| 2. | Financial Statement Schedules: |
Report of Independent Registered Public Accounting Firm
on
Financial Statement Schedule
To the Board of Directors and Shareholders of
Affinia Group Intermediate Holdings Inc.:
Our audit of the consolidated financial statements as of December 31, 2004 and for the period from December 1, 2004 to December 31, 2004 referred to in our report dated April 15, 2005, except for Notes 2 (not presented herein), 5 (not presented herein) and 22 (not presented herein) to the consolidated financial statements appearing in the Registration Statement on Form S-4 (No. 333-128166-10), as to which the date is September 6, 2005, and the effect of the restatement of cash flows for the one month period ended December 31, 2004 discussed in Note 2 and the effects of the discontinued operations on the consolidated financial statements as of December 31, 2004 and for the one month period ended December 31, 2004 discussed in Note 23, as to which the date is April 11, 2006, also included an audit of the financial statement schedule listed in Item 15(a)(2) of this Form 10-K. In our opinion, the financial statement schedule presents fairly, in all material respects, the information set forth therein when read in conjunction with the related consolidated financial statements.
PricewaterhouseCoopers LLP
Detroit, Michigan
September 6, 2005
Report of Independent Registered Public Accounting Firm
on
Financial Statement Schedule
To the Board of Directors of Dana Corporation:
Our audit of the combined statements of income, of shareholders equity and of cashflows of substantially all of the automotive aftermarket business of Dana Corporation for the eleven months ended November 30, 2004 and the year ended December 31, 2003 referred to in our report dated April 15, 2005, except for Notes 2 (not presented herein) and 22 (not presented herein) to the combined financial statements appearing in the Registration Statement on Form S-4 (No. 333-128166), as to which the date is September 6, 2005, and the effects of the discontinued operations on the combined financial statements for the eleven months ended November 30, 2004 and the year ended December 31, 2003 discussed in Note 23, as to which the date is April 11, 2006, also included an audit of the financial statement schedule listed in Item 15 (a)(2) of this Form 10-K. In our opinion, the financial statement schedule presents fairly, in all material respects, the information set forth therein when read in conjunction with the related consolidated financial statements.
PricewaterhouseCoopers LLP
Toledo, Ohio
September 6, 2005
Schedule II – Valuation and Qualifying Accounts
The allowance for doubtful accounts is summarized below for the Successor for the period ending December 31, 2005 and for period from December 1, 2004 through
99
Table of ContentsDecember 31, 2004. Additionally, the predecessor period from January 1, 2004 through November 30, 2004 and for the period ending December 31, 2003 (Dollars in Millions):
| | | | | | | | | | | | | | | | | | | | | | |
| | | Balance
at
beginning
of period | | Amounts
charged to
income | | Trade
accounts
receivable
‘‘written off’’
net of
recoveries | | Adjustments
arising from
change in
currency
exchange
rates and
other items | | Balance at
end of period |
| Year ended December 31, 2003 | | $ | 3 | | | $ | 6 | | | $ | (8 | ) | | $ | 3 | | | $ | 4 | |
| Eleven month period ended November 30, 2004 | | | 4 | | | | 1 | | | | (1 | ) | | | — | | | | 4 | |
One month period ended
December 31, 2004 | | | 4 | | | | — | | | | — | | | | — | | | | 4 | |
| Year ended December 31, 2005 | | $ | 4 | | | $ | 1 | | | $ | (6 | ) | | $ | 3 | | | $ | 2 | |
|
All other financial statement schedules are not required under the relevant instructions or are inapplicable and therefore have been omitted.
| |
| 3. | Exhibits: |
| | | | | | |
Exhibit
Number | | Description of Exhibit |
| 2.1 | | Stock and Asset Purchase Agreement by and between Affinia Group Inc. (formerly known as AAG Opco Corp.) and Dana Corporation, dated as of July 8, 2004, which is incorporated herein by reference from Exhibit 2.1 of the Registration Statement on Form S-4 of Affinia Group Intermediate Holdings Inc. filed on September 8, 2005 (File No. 333-128166-10). |
| 2.2 | | Amendment No. 1, dated as of November 1, 2004, to the Stock and Asset Purchase Agreement by and between Affinia Group Inc. (formerly known as AAG Opco Corp.) and Dana Corporation, dated as of July 8, 2004, which is incorporated herein by reference from Exhibit 2.2 of the Registration Statement on Form S-4 of Affinia Group Intermediate Holdings Inc. filed on September 8, 2005 (File No. 333-128166-10). |
| 2.3 | | Amendment No. 2, dated as of November 30, 2004, to the Stock and Asset Purchase Agreement by and between Affinia Group Inc. (formerly known as AAG Opco Corp.) and Dana Corporation, dated as of July 8, 2004, which is incorporated herein by reference from Exhibit 2.3 of the Registration Statement on Form S-4 of Affinia Group Intermediate Holdings Inc. filed on September 8, 2005 (File No. 333-128166-10). |
| 3.5 | | Certificate of Incorporation of Affinia Group Intermediate Holdings Inc., which is incorporated herein by reference from Exhibit 3.5 of the Registration Statement on Form S-4 of Affinia Group Intermediate Holdings Inc. filed on September 8, 2005 (File No. 333-128166-10). |
| 3.6 | | By-laws of Affinia Group Intermediate Holdings Inc., which is incorporated herein by reference from Exhibit 3.6 of the Registration Statement on Form S-4 of Affinia Group Intermediate Holdings Inc. filed on September 8, 2005 (File No. 333-128166-10). |
| 4.1 | | Indenture, dated as of November 30, 2004, among Affinia Group Inc., the Guarantors named therein and Wilmington Trust Company, as Trustee, which is incorporated herein by reference from Exhibit 4.1 of the Registration Statement on Form S-4 of Affinia Group Intermediate Holdings Inc. filed on September 8, 2005 (File No. 333-128166-10). |
| 4.4 | | 9% Senior Subordinated Notes due 2014, Rule 144A Global Note, which is incorporated herein by reference from Exhibit 4.4 of the Registration Statement on Form S-4 of Affinia Group Intermediate Holdings Inc. filed on September 8, 2005 (File No. 333-128166-10). |
|
100
Table of Contents
| | | | | | |
Exhibit
Number | | Description of Exhibit |
| 4.5 | | 9% Senior Subordinated Notes due 2014, Regulation S Global Note, which is incorporated herein by reference from Exhibit 4.5 of the Registration Statement on Form S-4 of Affinia Group Intermediate Holdings Inc. filed on September 8, 2005 (File No. 333-128166-10). |
| 10.1 | | Credit Agreement, dated as of November 30, 2004, among Affinia Group Intermediate Holdings Inc., Affinia Group Inc., the Lenders party thereto, JPMorgan Chase Bank, N.A., as Administrative Agent and Collateral Agent, Goldman Sachs Credit Partners, L.P. and Credit Suisse First Boston, as Co-Syndication Agents, and Deutsche Bank AG, Cayman Islands Branch and UBS Securities LLC, as Co-Documentation Agents, which is incorporated herein by reference from Exhibit 10.1 of the Registration Statement on Form S-4 of Affinia Group Intermediate Holdings Inc. filed on September 8, 2005 (File No. 333-128166-10). |
| 10.2 | | Amendment No. 1 and Waiver, dated as of December 12, 2005 to Credit Agreement, dated as of November 30, 2004, among Affinia Group Intermediate Holdings Inc., Affinia Group Inc., the Lenders party thereto, JPMorgan Chase Bank, N.A., as Administrative Agent, Goldman Sachs Credit Partners, L.P. and Credit Suisse, Cayman Islands Branch (formerly known as Credit Suisse First Boston, acting through its Cayman Islands Branch), as Co-Syndication Agents, and Deutsche Bank AG, Cayman Islands Branch and UBS Securities LLC, as Co-Documentation Agents, which is incorporated herein by reference from Exhibit 10.1 on the Form 8-K of Affinia Group Intermediate Holdings Inc. filed on December 15, 2005 (File No. 333-128166-10). |
| 10.3 | | Guarantee and Collateral Agreement, dated as of November 30, 2004, among Affinia Group Intermediate Holdings Inc., Affinia Group Inc., each other Subsidiary Loan Party identified therein and JPMorgan Chase Bank, N.A. as Collateral Agent, which is incorporated herein by reference from Exhibit 10.2 of the Registration Statement on Form S-4 of Affinia Group Intermediate Holdings Inc. filed on September 8, 2005 (File No. 333-128166-10). |
| 10.4 | | Receivables Sale Agreement, dated as of November 30, 2004, among Affinia Group Inc., as Seller Agent, certain subsidiaries thereof, as Sellers, and Affinia Receivables LLC, as Finance Subsidiary, which is incorporated herein by reference from Exhibit 10.3 of the Registration Statement on Form S-4 of Affinia Group Intermediate Holdings Inc. filed on September 8, 2005 (File No. 333-128166-10). |
| 10.5 | | Amendment, dated as of April 1, 2005, to the Receivables Sale Agreement, dated as of November 30, 2004, among Affinia Group Inc., as Seller Agent, certain subsidiaries thereof, as Sellers, and Affinia Receivables LLC, as Finance Subsidiary, which is incorporated herein by reference from Exhibit 10.4 of the Registration Statement on Form S-4 of Affinia Group Intermediate Holdings Inc. filed on September 8, 2005 (File No. 333-128166-10). |
| 10.6 | | Receivables Purchase Agreement, dated as of November 30, 2004, among Affinia Receivables LLC, as Finance Subsidiary, Affinia Group Inc., as Servicer, Park Avenue Receivables Company LLC, and JPMorgan Chase Bank, N.A., as Agent, which is incorporated herein by reference from Exhibit 10.5 of the Registration Statement on Form S-4 of Affinia Group Intermediate Holdings Inc. filed on September 8, 2005 (File No. 333-128166-10). |
| 10.7 | | Amendment Number 1, dated as of April 1, 2005, to the Receivables Purchase Agreement, dated as of November 30, 2004, among Affinia Receivables LLC, as Finance Subsidiary, Affinia Group Inc., as Servicer, Park Avenue Receivables Company LLC, and JPMorgan Chase Bank, N.A., as Agent, which is incorporated herein by reference from Exhibit 10.6 of the Registration Statement on Form S-4 of Affinia Group Intermediate Holdings Inc. filed on September 8, 2005 (File No. 333-128166-10). |
|
101
Table of Contents
| | | | | | |
Exhibit
Number | | Description of Exhibit |
| 10.8 | | Amendment Number 2, dated as of June 30, 2005, to the Receivables Purchase Agreement, dated as of November 30, 2004, among Affinia Receivables LLC, as Finance Subsidiary, Affinia Group Inc., as Servicer, Park Avenue Receivables Company LLC, and JPMorgan Chase Bank, N.A., as Agent, which is incorporated herein by reference from Exhibit 10.7 of the Registration Statement on Form S-4 of Affinia Group Intermediate Holdings Inc. filed on September 8, 2005 (File No. 333-128166-10). |
| 10.9 | | Trademark License Agreement by and between Raymark Industries, Inc. and Brake Systems, Inc., dated March 18, 1985, which is incorporated herein by reference from Exhibit 10.8 of the Registration Statement on Form S-4 of Affinia Group Intermediate Holdings Inc. filed on September 8, 2005 (File No. 333-128166-10). |
| 10.10 | | Transition Services Agreement by and between Affinia Group Inc. and Dana Corporation, dated November 30, 2004, which is incorporated herein by reference from Exhibit 10.9 of the Registration Statement on Form S-4 of Affinia Group Intermediate Holdings Inc. filed on September 8, 2005 (File No. 333-128166-10). |
| 10.11 | | Stockholders Agreement, dated as of November 30, 2004, among Affinia Group Holdings Inc., various Cypress funds, Ontario Municipal Employees Retirement Board (‘‘OMERS’’), The Northwestern Mutual Life Insurance Company, California State Teachers' Retirement System and Stockwell Fund, L.P., which is incorporated herein by reference from Exhibit 10.10 of the Registration Statement on Form S-4 of Affinia Group Intermediate Holdings Inc. filed on September 8, 2005 (File No. 333-128166-10). |
| 10.12 | | Employment Agreement, dated July 21, 2005, by and between Affinia Group Inc. and Terry R. McCormack, which is incorporated herein by reference from Exhibit 10.11 of the Registration Statement on Form S-4 of Affinia Group Intermediate Holdings Inc. filed on September 8, 2005 (File No. 333-128166-10). |
| 10.13 | | Employment Agreement, dated July 21, 2005, by and between Affinia Group Inc. and Keith A. Wilson, which is incorporated herein by reference from Exhibit 10.12 of the Registration Statement on Form S-4 of Affinia Group Intermediate Holdings Inc. filed on September 8, 2005 (File No. 333-128166-10). |
| 10.14 | | Employment Agreement, dated July 21, 2005, by and between Affinia Group Inc. and John R. Washbish, which is incorporated herein by reference from Exhibit 10.13 of the Registration Statement on Form S-4 of Affinia Group Intermediate Holdings Inc. filed on September 8, 2005 (File No. 333-128166-10). |
| 10.15 | | Employment Agreement, dated July 21, 2005, by and between Affinia Group Inc. and Thomas H. Madden, which is incorporated herein by reference from Exhibit 10.14 of the Registration Statement on Form S-4 of Affinia Group Intermediate Holdings Inc. filed on September 8, 2005 (File No. 333-128166-10). |
| 10.16 | | Employment Agreement, dated July 21, 2005, by and between Affinia Group Inc. and Steven E. Keller which is incorporated herein by reference from Exhibit 10.15 of the Registration Statement on Form S-4 of Affinia Group Intermediate Holdings Inc. filed on September 8, 2005 (File No. 333-128166-10). |
| 10.17 | | Affinia Group Holdings Inc. 2005 Stock Incentive Plan, which is incorporated herein by reference from Exhibit 10.16 of the Registration Statement on Form S-4 of Affinia Group Intermediate Holdings Inc. filed on September 8, 2005 (File No. 333-128166-10). |
|
102
Table of Contents
| | | | | | |
Exhibit
Number | | Description of Exhibit |
| 10.18 | | Form of Nonqualified Stock Option Agreement, which is incorporated herein by reference from Exhibit 10.17 of the Registration Statement on Form S-4 of Affinia Group Intermediate Holdings Inc. filed on September 8, 2005 (File No. 333-128166-10). |
| 10.19 | | Form of Management Stockholder's Agreement, which is incorporated herein by reference from Exhibit 10.18 of the Registration Statement on Form S-4 of Affinia Group Intermediate Holdings Inc. filed on September 8, 2005 (File No. 333-128166-10). |
| 10.20* | | Form of Sale Participation Agreement. |
| 16.1 | | Letter from PricewaterhouseCoopers LLP dated October 5, 2005, which is incorporated herein by reference from Exhibit 10.1 on the Form 8-K of Affinia Group Intermediate Holdings Inc. filed on October 5, 2005 (File No. 333-128166-10). |
| 21.1* | | List of Subsidiaries. |
| 31.1* | | Certification of the Chief Executive Officer pursuant to Rule 13a-14(a) of Securities Exchange Act of 1934, as adopted pursuant to Section 302 of the Sarbanes-Oxley Act of 2002. |
| 31.2* | | Certification of the Chief Financial Officer pursuant to Rule 13a-14(a) of Securities Exchange Act of 1934, as adopted pursuant to Section 302 of the Sarbanes-Oxley Act of 2002. |
| 32.1* | | Certification of Terry R. McCormack, our Chief Executive Officer, and Thomas H. Madden, our Chief Financial Officer, pursuant to 18 U.S.C. Section 1350, as adopted pursuant to Section 906 of the Sarbanes-Oxley Act of 2002. |
|
| |
| * | filed herewith |
103
Table of ContentsSIGNATURES
Pursuant to the requirements of section 13 or 15(d) of the Securities Exchange Act of 1934, the registrant has duly caused this report to be signed on its behalf by the undersigned, thereunto duly authorized.
| | | | | | |
| AFFINIA GROUP INTERMEDIATE HOLDINGS INC. |
| By: | | /s/ Terry R. McCormack |
| | | Terry R. McCormack |
| | | Chief Executive Officer, President, and Director |
|
Date: April 13, 2006
Pursuant to the requirements of the Securities Exchange Act of 1934, this report has been signed below by the following persons on behalf of the registrant and in the capacities indicated on April 13, 2006
| | |
| Signature | | Title |
|
| By: /s/ Terry R. McCormack | | Chief Executive Officer, President, and Director
(Principal Executive Officer) |
|
| Terry R. McCormack |
|
| By: /s/ Thomas H. Madden | | Chief Financial Officer
(Principal Financial Officer) |
|
| Thomas H. Madden |
|
| By: /s/ Patrick W. Flanagan | | Corporate Controller
(Principal Accounting Officer) |
|
| Patrick W. Flanagan |
|
| By: /s/ Larry W. McCurdy | | Chairman of the Board of Directors |
|
| Larry W. McCurdy |
|
| By: /s/ Michael F. Finley | | Director |
|
| Michael F. Finley |
|
| By: /s/ Donald J. Morrison | | Director |
|
| Donald J. Morrison |
|
| By: /s/ Joseph A. Onorato | | Director |
|
| Joseph A. Onorato |
|
| By: /s/ John M. Riess | | Director |
|
| John M. Riess |
|
| By: /s/ James A. Stern | | Director |
|
| James A. Stern |
|
| By: /s/ John R. Washbish | | Director |
|
| John R. Washbish |
|
104