A rollfoward of the other intangibles and trade names for 2005 and 2006 is shown below (Dollars in Millions):
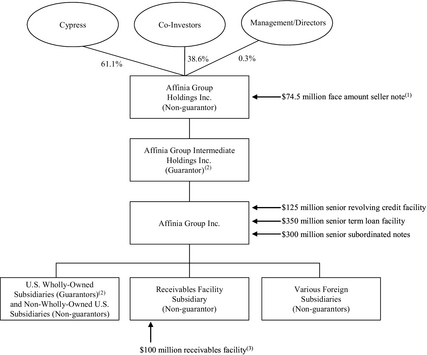
On November 30, 2004, in connection with the Acquisition, the Company issued 9.0% senior subordinated notes due 2014 in the principal amount of $300 million. The senior subordinated notes were offered only to qualified institutional buyers and certain persons in offshore transactions. The senior subordinated notes were subsequently registered under the Securities Act of 1933 pursuant to an exchange offer completed on November 2, 2005. Interest is payable semiannually in arrears on May 30 and November 30. The senior subordinated notes do not require principal payments prior to maturity. Affinia Group Intermediate Holdings Inc. and certain of the Company’s current and future subsidiaries guarantee the senior subordinated notes. At its option, Affinia may redeem some or all of the senior subordinated notes prior to November 30, 2009 at a redemption price equal to 100% of the principal amount thereof plus a specified ‘‘make-whole’’ premium plus accrued and unpaid interest, if any. On and after November 30, 2009, the Company may, at its option, redeem all or a portion of the
Table of Contentssenior subordinated notes the redemption prices set forth below (expressed as percentages of principal amount), plus accrued interest, if any, if redeemed during the twelve-month period commencing on November 30 of the years set forth below:
Senior Subordinated Notes

| | | |
| Period | | | Redemption Price |
| 2009 | | | 104.500% |
| 2010 | | | 103.000% |
| 2011 | | | 101.500% |
| 2012 and thereafter | | | 100.000% |
|
In addition, prior to November 30, 2007, the Company may, at its option, redeem up to 35% of the senior subordinated notes with the proceeds of certain equity offerings at a redemption price of 109% (expressed as a percentage of principal amount), plus accrued and unpaid interest, if any.
On November 30, 2004, in connection with the Acquisition, Affinia established financing arrangements with third-party lenders (the ‘‘banks’’) that provide senior credit facilities consisting of a revolving credit facility and a term loan facility that are unconditionally guaranteed by the Company, and certain domestic subsidiaries of Affinia (collectively, the ‘‘Guarantors’’). The repayment of these facilities is secured by substantially all the assets of the Guarantors, including, but not limited to, a pledge of their capital stock and 65 percent of the capital stock of non-U.S. subsidiaries owned directly by the Guarantors. The revolving credit facility, which expires on November 30, 2010, provides for borrowings of up to $125 million through a syndicate of lenders. The revolving credit facility also includes borrowing capacity available for letters of credit. As of December 31, 2006, the Company had $14 million in outstanding letters of credit, none of which had been drawn against. There were no other amounts outstanding under the revolving credit facility at December 31, 2006. The term loan facility provided for a $350 million term loan with a maturity of seven years, of which $297 million was outstanding at December 31, 2006. On December 12, 2005, in connection with the comprehensive restructuring, certain provisions applicable to the senior credit facilities were amended.
The senior credit facilities, as amended, bear interest at a rate equal to an applicable margin plus, at our option, either (a) a base rate determined by reference to the higher of (1) the bank’s prime rate and (2) the federal funds rate plus one-half of 1% or (b) LIBOR rate determined by reference to the costs of funds for deposits in U.S. dollars for the interest period relevant to such borrowing adjusted for certain additional costs. The applicable margin for borrowings under the term loan facility is 2.00% with respect to base rate borrowings and 3.00% with respect to LIBOR borrowings. The applicable margin for borrowings under the revolving credit facility and the term loan facility may be reduced subject to our attaini ng certain leverage ratios or increased based on certain credit ratings as determined by Moody’s and Standard & Poor’s.
In addition to paying interest on outstanding principal under the senior credit facilities, Affinia is required to pay a commitment fee to the lenders under the revolving credit facility in respect of the unutilized commitments thereunder at a rate equal to 0.50% per annum. The Company also paid customary letter of credit fees.
Principal amounts outstanding under the revolving credit facility are due and payable in full at maturity on November 30, 2010.
At December 31, 2006 the Company had $297 million outstanding under the term loan facility with a weighted-average interest rate during the year of 8.1%. The amounts outstanding, as well as the base rates and margins, at December 31, 2006, were as follows:
| | | | | | | | | | | | | | | |
| | | | Amount | | | Base Rate | | | Margin |
| Term loan facility | | | $297 million | | | | | 5.36 | | | | | | 3.00 | |
|
The senior credit facilities contain a number of covenants that, among other things, restrict, subject to certain exceptions, the Company’s ability, and the ability of the Company’s subsidiaries, to
57
Table of Contentssell assets, incur additional indebtedness or issue preferred stock, repay other indebtedness (including the senior subordinated notes), pay certain dividends and distributions or repurchase its capital stock, create liens on assets, make investments, loans or advances, make certain acquisitions, engage in mergers or consolidations, enter into sale and leaseback transactions, engage in certain transactions with affiliates, amend certain material agreements governing Affinia’s indebtedness (including the senior subordinated notes), and change the business conducted by Affinia and its subsidiaries. In addition, the senior credit facilities contain the following financial covenants: a maximum total leverage ratio; a minimum interest coverage ratio; and a maximum capital expenditures limitation. As of December 31, 2006 and 2005 the Company was in compliance with all of these covenants.
The senior subordinated notes limit Affinia’s (and most or all of its subsidiaries’) ability to incur additional indebtedness, pay dividends on or make other distributions or repurchase our capital stock, make certain investments, enter into certain types of transactions with affiliates, use assets as security in other transactions, and sell certain assets or merge with or into other companies. Subject to the aforementioned exceptions, Affinia and its restricted subsidiaries are permitted to incur additional indebtedness, including secured indebtedness, under the terms of the senior subordinated notes. The long term debt matures in 2011 (Term loan) and 2014 (Senior subordinated notes).
| |
| Note 8. | Securitization of Accounts Receivable |
On November 30, 2004, in connection with the Acquisition, Affinia established a receivables facility that provides up to $100 million in funding, based on availability of eligible receivables and satisfaction of other customary conditions. Under the receivables facility, receivables are sold by certain subsidiaries of Affinia to a wholly owned bankruptcy-remote finance subsidiary of Affinia, which transfers an undivided interest in the purchased receivables to a commercial paper conduit or bank sponsor in exchange for cash.
Affinia, as the receivables collection agent, services, administers and collects the receivables under the receivables purchase agreement for which it receives a monthly servicing fee at a rate of 1.00% per annum of the average daily outstanding balance of receivables. The fees in respect of the receivables facility include a usage fee paid by the finance subsidiaries that varies based upon the Company’s leverage ratio as calculated under the senior credit facilities. Funded amounts under the receivables facility bear interest at a rate equal to the conduit’s pooled commercial paper rate plus the usage fee.
At December 31, 2005 and December 31, 2006, the usage fee margin for the receivables facility was 1.25% per annum of the amount funded. In addition, the finance subsidiary is required to pay a fee on the unused portion of the receivables facility that varies based upon the same ratio. At December 31, 2005 and December 31, 2006, the unused fee was 0.50% per annum of the unused portion of the receivables facility.
Availability of funding under the receivables facility depends primarily upon the outstanding trade accounts receivable balance from time to time. Aggregate availability is determined by using a formula that reduces the gross receivables balance by factors that take into account historical default and dilution rates, obligor concentrations and average days outstanding and the costs of the facility. As of December 31, 2005 and December 31, 2006, approximately $69 million and $71 million, respectively, were available for funding. At December 31, 2005 and December 31, 2006, there were no receivables outstanding under this facility.
The receivables facility contains conditions, representations, warranties and covenants similar to those in the senior credit facilities. We were in compliance with all covenants in both 2006 and 2005. It also contains amortization events similar to the events of default under the senior credit facilities, plus amortization events relating to the quality and performance of the trade receivables. If an amortization event occurs, all of the cash flow from the receivables sold to the finance subsidiary will be allocated to the receivables facility until it is paid in full.
58
Table of Contents | |
| Note 9. | Stock Option Plans |
Successor Plan
On July 20, 2005, we adopted the Affinia Group Holdings Inc. 2005 Stock Incentive Plan, which we refer to as our stock incentive plan. The stock incentive plan permits the grant of non-qualified stock options, incentive stock options, stock appreciation rights, restricted stock and other stock-based awards to employees, directors or consultants of Affinia Group Holdings Inc. and its affiliates. A maximum of 227,000 shares of common stock may be subject to awards under the stock incentive plan. The number of shares issued or reserved pursuant to the stock incentive plan (or pursuant to outstanding awards) is subject to adjustment on account of mergers, consolidations, reorganizations, stock splits, stock dividends and other diluti ve changes in the common stock. Shares of common stock covered by awards that terminate or lapse and shares delivered by a participant or withheld to pay the minimum statutory withholding rate, in each case, will again be available for grant under the stock incentive plan.
Administration. The stock incentive plan is administered by the compensation committee of our Board of Directors. The committee has full power and authority to make, and establish the terms and conditions of any award, and to waive any such terms and conditions at any time (including, without limitation, accelerating or waiving any vesting conditions or payment dates). The committee is authorized to interpret the plan, to establish, amend and rescind any rules and regulations relating to the plan and to make any other determinations that it, in good faith, deems necessary or desirable for the administration of the plan and may delegate such authority as it deems appropriate. The committee may correct any defect or supply an omission or reconcile any inconsistency in the plan in the manner and to the extent the committee deems necessary or desirable and any decision of the committee in the interpretation and administration of the plan shall lie within its sole and absolute good faith discretion and shall be final, conclusive and binding on all parties concerned.
Options. The committee determines the option price for each option; however, the stock options must have an exercise price that is at least equal to the fair market value of the common stock on the date the option is granted. An option holder may exercise an option by written notice and payment of the option price (i) in cash or its equivalent, (ii) by the surrender of a number of shares of common stock already owned by the option holder for at least six months (or such other period established by the committee) with a fair market value equal to the exercise price, (iii) if there is a public market for the shares, subject to rules established by the committee, through the delivery of irrevocable instructions to a broker to sell shares obtained upon the exercise of the option and to deliver to Affinia Group Holdings Inc. an amount out of the proceeds of the sale equal to the aggregate option price for the shares being purchase d or (iv) by another method approved by the committee.
Stock Appreciation Rights. The committee may grant stock appreciation rights independent of or in connection with an option. The exercise price per share of a stock appreciation right shall be an amount determined by the committee. Generally, each stock appreciation right shall entitle a participant upon exercise to an amount equal to (i) the excess of (1) the fair market value on the exercise date of one share of common stock over (2) the exercise price, multiplied by (ii) the number of shares of common stock covered by the stock appreciation right. Payment shall be made in common stock or in cash, or partly in common stock and partly in cash, all as shall be determined by the committee.
Other Stock-Based Awards. The committee may grant awards of restricted stock units, rights to purchase stock, restricted stock and other awards that are valued in whole or in part by reference to, or are otherwise based on the fair market value of, shares of common stock. The other stock-based awards will be subject to the terms and conditions established by the committee.
Transferability. Unless otherwise determined by the committee, awards granted under the stock incentive plan are not transferable other than by will or by the laws of descent and distribution.
Change of Control. In the event of a change of control (as defined in the stock incentive plan), the committee may provide for (i) the termination of an award upon the consummation of the change
59
Table of Contentsof control, but only if the award has vested and been paid out or the participant has been permitted to exercise an option in full for a period of not less than 30 days prior to the change of control, (ii) the acceleration of all or any portion of an award, (iii) payment in exchange for the cancellation of an award and/or (iv) the issuance of substitute awards that would substantially preserve the terms of any awards.
Amendment and Termination. Our Board of Directors may amend, alter or discontinue the stock incentive plan in any respect at any time, but no amendment may diminish any of the rights of a participant under any awards previously granted, without his or her consent.
Management Stockholders Agreement. All shares issued under the plan will be subject to a management stockholders agreement or a director stockholders agreement, as applicable.
Restrictive Covenant Agreement. Unless otherwise determined by our Board of Directors, all award recipients will be obligated to sign the standard Confidentiality, Non-Competition and Proprietary Information Agreement which includes restrictive covenants regarding confidentiality, proprietary information and a one year period restricting competition and solicitation of our clients, customers or employees. In the event a participant breaches these restrictive covenants, any exercise of, or payment or delivery pursuant to, an award may be rescinded by the committee in its discretion in which event the participant may be required to pay to us the amount of any gain realized in connection with, or as a result of, the rescinded exercise, payment or delivery.
Amendment. On November 14, 2006, the Compensation Committee of Affinia Group Holdings Inc. revised the vesting terms applicable to options previously awarded by the Committee to its named executive officers, as well as all other employees, under the Plan. One-half of these options vest in equal portions at the end of each year beginning with the year of the grant and ending December 31, 2009 (the ‘‘Vesting Period’’), 40% are eligible for vesting in equal portions upon the Company’s achievement of certain specified annual EBITDA performance targets over the Vesting Period and 10% are eligible for vesting in equal portions upon the Company’s achievement of certain net working capital performance targets over the Vesting Period. The Committee has not modified the time-vesting options or the working capital performance options. The Committee has elected to modify the vesting terms for the EBI TDA performance options so that these options will be eligible for vesting in equal portions at the end of each of the years 2007, 2008 and 2009. The Committee also modified the performance targets for those years. The fair value of the modified award was slightly higher than the grant date fair value. As a result the incremental compensation cost for the modification of the options was less than $0.1 million for 2006.
Method of Accounting and Our Assumptions
On July 20, 2005, we adopted the stock incentive plan with a maximum of 227 thousand shares of common stock subject to awards. As of December 31, 2006 there were 32 thousand vested shares and 117 thousand unvested shares. Additionally, at year-end 78 thousand shares were available for future stock option grants. Each option expires August 1, 2015. One-half of the options vest based on the performance of the Company and the remaining portion vests at the end of each year ratably over the period from the year of the grant until December 31, 2009. The exercise price is $100 per option.
We adopted SFAS 123(R), Share-Based Payment, during the fourth quarter of 2005 and account for our employee stock options under the fair value method of accounting using a Black-Scholes model to measure stock-based compensation expense at the date of grant. Our weighted-average Black-Scholes fair value assumptions for 2005 and 2006 include the following: effective term of six years, risk free interest rate of 4% and expected volatility of 40%. Dividend yields were not a factor because there were no cash dividends issued during 2005 and 2006.
The weighted fair value of the options granted was approximately $2 million as of December 31, 2006. The fair value of the stock option grants is amortized to expense over the vesting period. The Company reduces the overall compensation expense by a turnover rate consistent with historical trends. Stock-based compensation expense, which was recorded in selling, general and administrative expenses, and tax related income tax benefits were less than $1 million for 2005 and 2006.
60
Table of Contents
| | | | | | |
| | | | Options |
| Outstanding at January 1, 2005 | | | | | — | |
| Granted | | | | | 140,700 | |
| Forfeited/expired | | | | | — | |
| Outstanding at January 1, 2006 | | | | | 140,700 | |
| Granted | | | | | 14,060 | |
| Forfeited/expired | | | | | (5,500 | |
| Outstanding at December 31, 2006 | | | | | 149,260 | |
|
Predecessor Plan
Under the Predecessor’s Stock Incentive Plan, which was approved by shareholders in 2003 and amended and restated the 1997 Stock Option Plan of the Predecessor, the Compensation Committee of the board of directors could grant stock options to employees, including selected employees of the Company. Options outstanding, including options granted under a 1992 Stock Option Plan, were granted at option prices not less than the market price of the stock at the date of grant. Generally, one-fourth of the options granted become exercisable at each of the first four anniversary dates of the grant and all options expire ten years from the date of grant. Stock appreciation rights could be granted separately or in conjunction with the o ptions.
Stock options are cancelled upon an optionee’s termination of employment. Retirees have up to five years after retirement to exercise their stock options, so long as the options are at least six months old at the date of retirement and remain outstanding under their original ten-year term. In connection with the divestiture of the Company, the Predecessor agreed to pay optionees the excess of market value over the option value for any ‘‘in the money’’ stock options that had not vested when the divestiture closed. The Predecessor paid approximately $1 million in connection with this agreement, which has been included in the results of operations for the eleven months ended November 30, 2004. These s tock options, along with the stock options with option prices exceeding the market price at closing, are reported as expired in the table below.
The following table is a summary of transactions under these plans related to the Company’s employees in the period January 1, 2004 through November 30, 2004:
| | | | | | | | | | | | |
| | | | Number of
Shares | | | Weighted
Average
Exercise
Price |
| Outstanding at | | | | | | | | | | | | |
| December 31, 2003 | | | | | 1,997,939 | | | | | $ | 23.97 | |
| Exercised – 2004 | | | | | (137,771 | | | | | | 13.22 | |
| Cancelled – 2004 | | | | | (1,860,168 | | | | | | 24.77 | |
| Outstanding at | | | | | | | | | | | | |
| November 30, 2004 | | | | | — | | | | | | — | |
|
| |
| Note 10. | Pension and Other Postretirement Benefits |
The Company provides defined contribution and defined benefit, qualified and nonqualified, pension plans for certain employees.
Under the terms of the defined contribution retirement plans, employee and employer contributions may be directed into a number of diverse investments. None of these defined contribution plans allow direct investment of contributions in Predecessor stock. Expenses related to these defined contribution plans were $2 million for the period January 1, 2004 through November 30, 2004. Additionally, the Successor has established defined contribution plans, under which it incurred under $1 million of expenses for the period December 1, 2004 through December 31, 2004 , $10 million for the year ended December 31, 2005 and $10 million for the year ended December 31, 2006.
61
Table of ContentsThe Successor has retained the Canadian pension plans (the assets of which are referred to as the Fund). The Successor plans are managed in accordance with applicable legal requirements relating to the investment of registered pension plans. The responsibility for the investment of the Fund lies with the Investment Committee of ITT Industries of Canada Ltd. (the ‘‘Committee’’). The Committee is composed of representatives of ITT and of the participating companies, which includes our Company. The investments objectives of the plans are to maximize long-term total investment returns while assuming a prudent level of risk deemed appropriate by the Committee. The Fund may not engage in certain investments that are not permitted for a pension plan pursuant to applicable provincial pension benefits legislation and the Income Tax Act of Canada. Additionally, the Fund may not invest more than 10% of the assets in any single public issue of securities except where the security is issued by or guaranteed by the government of Canada or a Canadian province. This investment policy permits plan assets to be invested in a number of diverse investment categories such as demand or term deposits, short term notes, treasury bills, bankers acceptances, commercial paper, investment certificates issued by banks, insurance companies or trust companies, bonds and non-convertible debentures, mortgages and other asset-backed securities, convertible debentures, real estate, preferred and common stocks that are traded publicly, including both Canadian and foreign stocks, resource properties, venture capital, insured contracts, pooled funds, segregated funds, trusts, closed-end investment companies, limited partnerships and other structur ed vehicles invested directly or indirectly in, or in interests.
The following tables provide a reconciliation of the changes in the Successor’s defined benefit pension plans’ and other postretirement plans’ benefit obligations and the fair value of assets for the years ended December 31, 2005 and December 31, 2006, as well as the statements of the funded status and schedules of the net amounts recognized in the balance sheet at December 31, 2005 and 2006. The measurement date for the amounts in these tables was December 31, of each year presented (Dollars in Millions):
| | | | | | | | | | | | |
| | | | Pension Benefits |
| | | | Year Ended
December 31, 2005 | | | Year Ended
December 31, 2006 |
| Reconciliation of benefit obligation | | | | | | | | | | | | |
| Obligation at beginning of period | | | | $ | 18 | | | | | $ | 23 | |
| Service cost | | | | | 1 | | | | | | 1 | |
| Interest cost | | | | | 1 | | | | | | 1 | |
| Actuarial (gain) loss | | | | | 3 | | | | | | 3 | |
| Benefit payments | | | | | (1 | | | | | | (1 | |
| Translation adjustments | | | | | 1 | | | | | | — | |
| Obligation at end of period | | | | $ | 23 | | | | | $ | 27 | |
| Accumulated benefit obligation | | | | $ | 23 | | | | | $ | 27 | |
|
| | | | | | | | | | | | |
| | | | Pension Benefits |
| | | | Year Ended
December 31, 2005 | | | Year Ended
December 31, 2006 |
| Reconciliation of fair value of plan assets | | | | | | | | | | | | |
| Fair value, beginning of period | | | | $ | 17 | | | | | $ | 21 | |
| Actual return on plan assets | | | | | 2 | | | | | | 3 | |
| Employer contributions | | | | | 2 | | | | | | 3 | |
| Benefit payments | | | | | (1 | | | | | | (1 | |
| Translation adjustments | | | | | 1 | | | | | | — | |
| Fair value, end of period | | | | $ | 21 | | | | | $ | 26 | |
|
The weighted average asset allocations of the pension plans at December 31, 2005 and December 31, 2006 were as follows:
62
Table of Contents
| | | | | | | | | | | | |
| | | | December 31,
2005 | | | December 31,
2006 |
| Asset Category | | | | | | | | | | | | |
| Equity securities | | | | | 72 | | | | | | 66 | |
| Controlled-risk debt securities | | | | | 26 | | | | | | 33 | |
| Absolute return strategies investments | | | | | — | | | | | | — | |
| Cash and short-term obligations | | | | | 2 | | | | | | 1 | |
| Total | | | | | 100 | | | | | | 100 | |
|
The target asset allocations of the pension plans for equity securities, controlled-risk debt securities, absolute return strategies investments and cash and other assets at December 31, 2005 and December 31, 2006 were 70%, 30%, 0% and 0%.
The following table presents the funded status of the Successor pension plans and the amounts recognized in the balance sheet as of December 31, 2005 and 2006 (Dollars in Millions):
| | | | | | | | | | | | |
| | | | December 31,
2005 | | | December 31,
2006 |
| Accumulated benefit obligation at beginning of period | | | | $ | 23 | | | | | $ | 23 | |
| Projected benefit obligation | | | | | 23 | | | | | | 27 | |
| Fair value of assets | | | | | 21 | | | | | | 26 | |
| Accrued cost | | | | $ | (2 | | | | | $ | (1 | |
| Amounts recognized in balance sheet: | | | | | | | | | | | | |
| Accrued benefit liability | | | | $ | (1 | | | | | $ | (1 | |
| Intangible asset | | | | | 1 | | | | | | — | |
| Accumulated other income | | | | | — | | | | | | 2 | |
| Net amount recognized | | | | $ | — | | | | | $ | 1 | |
|
Expected benefit payments by the pension plans retained by the Successor for periods subsequent to December 31, 2006 are expected to be less than $1 million.
Projected contributions to be made to the Company’s defined benefit pension plans are expected to be $1 million and for the next ten years.
63
Table of ContentsComponents of net periodic benefit costs for the Predecessor’s and the Successor’s defined benefit plans for the period January 1, 2004 through November 30, 2004, the period December 1, 2004 through December 31, 2004, the year ended December 31, 2005, and the year ended December 31, 2006 are as follows (Dollars in Millions):
| | | | | | | | | | | | | | | | | | | | | | | | |
| | | | Pension Benefits |
| | | | Predecessor | | | Successor |
| | | | January 1,
2004 through
November 31,
2004 | | | December 1,
2004 through
December 31,
2004 | | | Year Ended
December 31,
2005 | | | Year Ended
December 31,
2006 |
| Service cost | | | | $ | 6 | | | | | $ | — | | | | | $ | 1 | | | | | $ | 1 | |
| Interest cost | | | | | 12 | | | | | | — | | | | | | 1 | | | | | | 1 | |
| Expected return on plan assets | | | | | (12 | | | | | | — | | | | | | (1 | | | | | | (1 | |
| Amortization of transition obligation | | | | | — | | | | | | — | | | | | | — | | | | | | — | |
| Amortization of prior service cost | | | | | 1 | | | | | | — | | | | | | — | | | | | | — | |
| Recognized net actuarial loss (gain) | | | | | 2 | | | | | | — | | | | | | — | | | | | | — | |
| Net periodic benefit cost | | | | $ | 9 | | | | | $ | — | | | | | $ | 1 | | | | | $ | 1 | |
|
| | | | | | | | | | | | | | | | | | | | | | | | |
| | | | Other Benefits |
| | | | Predecessor | | | Successor |
| | | | January 1,
2004 through
November 30,
2004 | | | December 1,
2004 through
December 31,
2004 | | | Year Ended
December 31,
2005 | | | Year Ended
December 31,
2006 |
| Service cost | | | | $ | 1 | | | | | $ | — | | | | | $ | — | | | | | $ | — | |
| Interest cost | | | | | 3 | | | | | | — | | | | | | — | | | | | | — | |
| Net periodic benefit cost | | | | $ | 4 | | | | | $ | — | | | | | $ | — | | | | | $ | — | |
|
The Predecessor plans included U.S and Non-U.S. plans. The Successor plans only include Canadian plans.
| | | | | | |
| | | | U.S. Plans |
| | | | November 30,
2004 |
| Discount rate | | | | | 6.00 | |
| Expected return on plan assets | | | | | 8.75 | |
| Rate of compensation increase | | | | | 5.00 | |
|
| | | | | | | | | | | | | | | | | | | | | | | | |
| | | | Non-U.S. Plans |
| | | | Predecessor | | | Successor |
| | | | November 30,
2004 | | | December 31,
2004 | | | December 31,
2005 | | | December 31,
2006 |
| Discount rate | | | | | 5.48 | | | | | | 6.25 | | | | | | 6.0 | | | | | | 5.0 | |
| Expected return on plan assets | | | | | 6.59 | | | | | | 7.00 | | | | | | 7.0 | | | | | | 6.7 | |
| Rate of compensation increase | | | | | 3.15 | | | | | | | | | | | | | | | | | | | |
|
The discount rate and expected return on plan assets for the Company plans presented in the tables above are used to determine pension expense for the succeeding year.
The Company selects the expected rate of return on plan assets on the basis of a long-term view of asset portfolio performance of the pension plans. Since the 1981 adoption of the asset/liability management investment policy, the compounded rate of return was 12.7%. However, the two-year, five-year and ten-year compounded rates of return through November 30, 2004 were 16.9%, 4.3% and 11.4%, respectively. The Company assesses the appropriateness of the expected rate of return on an
64
Table of Contentsannual basis and when necessary revises the assumption. The weighted average assumptions used in the measurement of other postretirement benefit obligations for the Predecessor plans are as follows:
| | | | | | |
| | | | November 30,
2004 |
| Discount rate | | | | | 6.09 | |
| Initial weighted health care costs trend rate | | | | | 9.55 | |
| Ultimate health care costs trend rate | | | | | 5.00 | |
| Years to ultimate | | | | | 5.9 | |
|
| |
| Note 11. | Income Tax |
The Predecessor’s domestic operations were included in Dana’s consolidated U.S. tax return. The domestic income tax provision had been calculated for each period on a method that is generally consistent with a separate return basis as if the Predecessor was a separate entity. The income tax provision of the Company in other countries is generally based on separate returns of the operating units, as adjusted for the effects of applying accounting principles generally accepted in the United States. The components of the income tax provision (benefit) are as follows (Dollars in Millions):
| | | | | | | | | | | | | | | | | | | | | | | | |
| | | | Predecessor | | | Successor |
| | | | January 1,
2004 through
November 30,
2004 | | | December 1,
2004 through
December 31,
2004 | | | Year Ended
December 31,
2005 | | | Year Ended
December 31,
2006 |
| Current: | | | | | | | | | | | | | | | | | | | | | | | | |
| U.S federal | | | | $ | 25 | | | | | $ | — | | | | | $ | — | | | | | $ | — | |
| U.S. state and local | | | | | 1 | | | | | | — | | | | | | 1 | | | | | | — | |
| Non-United States | | | | | 20 | | | | | | 3 | | | | | | 13 | | | | | | 9 | |
| Total current | | | | | 46 | | | | | | 3 | | | | | | 14 | | | | | | 9 | |
| Deferred: | | | | | | | | | | | | | | | | | | | | | | | | |
| U.S. federal & state | | | | | (22 | | | | | | (1 | | | | | | (21 | | | | | | (7 | |
| Non-United States | | | | | (6 | | | | | | (4 | | | | | | 3 | | | | | | (5 | |
| Total deferred | | | | | (28 | | | | | | (5 | | | | | | (18 | | | | | | (12 | |
| Income tax provision (benefit) | | | | $ | 18 | | | | | $ | (2 | | | | | $ | (4 | | | | | | (3 | |
|
The income tax provision (benefit) was calculated based upon the following components of earnings (loss) before income taxes and minority interest (Dollars in Millions):
| | | | | | | | | | | | | | | | | | | | | | | | |
| | | | Predecessor | | | Successor |
| | | | January 1,
2004 through
November 30,
2004 | | | December 1,
2004 through
December 31,
2004 | | | Year Ended
December 31,
2005 | | | Year Ended
December 31,
2006 |
| United States | | | | $ | 9 | | | | | $ | (3 | | | | | $ | (80 | | | | | $ | (27 | |
| Non-United States | | | | | 36 | | | | | | (3 | | | | | | 46 | | | | | | 19 | |
| Earnings (loss) before income taxes | | | | $ | 45 | | | | | $ | (6 | | | | | $ | (34 | | | | | | (8 | |
|
65
Table of ContentsDeferred tax assets (liabilities) consisted of the following and are presented in investments and other assets and other current assets (Dollars in Millions):
| | | | | | | | | | | | |
| | | | Successor
At December 31,
2005 | | | Successor
At December 31,
2006 |
| Deferred tax assets: | | | | | | | | | | | | |
| Net operating loss carryforwards | | | | $ | 27 | | | | | $ | 45 | |
| Inventory reserves | | | | | 1 | | | | | | 7 | |
| Fixed assets | | | | | 6 | | | | | | — | |
| Expense accruals | | | | | 32 | | | | | | 42 | |
| Other | | | | | 8 | | | | | | 7 | |
| Subtotal | | | | | 74 | | | | | | 101 | |
| Valuation allowance | | | | | (11 | | | | | | (15 | |
| Net deferred tax assets | | | | | 63 | | | | | | 86 | |
| Current portion | | | | | 36 | | | | | | 53 | |
| Long term portion | | | | | 27 | | | | | | 33 | |
| Deferred tax liabilities: | | | | | | | | | | | | |
| Depreciation & amortization | | | | | 18 | | | | | | 24 | |
| Foreign earnings | | | | | 5 | | | | | | 14 | |
| Other | | | | | 7 | | | | | | — | |
| Deferred tax liabilities (long-term) | | | | | 30 | | | | | | 38 | |
| Net deferred tax assets | | | | $ | 33 | | | | | $ | 48 | |
|
Valuation allowances are provided for deferred tax assets whenever the realization of the assets is not deemed to meet a ‘‘more likely than not’’ standard. Accordingly, valuation allowances have been provided for net operating losses in certain non-U.S. countries. To reflect judgments in applying this standard, the Company increased the valuation allowance against deferred tax assets by $4 million in 2006.
The effective income tax rate differs from the U.S. federal income tax rate for the following reasons:
| | | | | | | | | | | | | | | | | | | | | | | | |
| | | | Predecessor | | | Successor |
| | | | January 1, 2004
through
November 30,
2004 | | | December 1,
2004 through
December 31,
2004 | | | Year Ended
December 31,
2005 | | | Year Ended
December 31,
2006 |
| U.S. federal income tax rate | | | | | 35.0 | | | | | | 35.0 | | | | | | 35.0 | | | | | | 35.0 | |
| Increases (reductions) resulting from: | | | | | | | | | | | | | | | | | | | | | | | | |
| State and local income taxes, net of federal income tax benefit | | | | | 0.7 | | | | | | 1.1 | | | | | | (2.9 | | | | | | 25.6 | |
| Non-U.S. income | | | | | 4.3 | | | | | | (11.3 | | | | | | (20.6 | | | | | | (9.7 | |
| Miscellaneous items | | | | | 0.7 | | | | | | 2.3 | | | | | | 0.3 | | | | | | (8.6 | |
| Effective income tax rate | | | | | 40.7 | | | | | | 27.1 | | | | | | 11.8 | | | | | | 42.3 | |
|
At the end of 2006, federal domestic net operating loss carryforwards were $70 million. Of these, $8 million expire in 2024, $25 million expire in 2025, and $37 million expire in 2026. At the end of 2006, state domestic net operating loss carryforwards were estimated to be $37 million, the majority of which expire between 2024 and 2026. At the end of 2006, foreign net operating loss carryforwards were $42 million and expire as follows: $1 million in 2007, $1 million in 2008, $1 million in 2009, $1 million in 2010, $2 million in 2011, $1 million in 2012, $2 million in 2013, $3 million in 2014, $1 million in 2015 and $29 million may be carried forward indefinitely.
66
Table of Contents | |
| Note 12. | Property, Plant and Equipment |
The following table breaks out the property, plant and equipment in further detail (Dollars in Millions):
| | | | | | | | | | | | |
| | | | December 31, |
| | | | 2005 | | | 2006 |
| Property, plant and equipment | | | | | | | | | | | | |
| Land and improvements to land | | | | $ | 26 | | | | | $ | 25 | |
| Buildings and building fixtures | | | | | 66 | | | | | | 74 | |
| Machinery and equipment | | | | | 119 | | | | | | 125 | |
| Software | | | | | 13 | | | | | | 14 | |
| Other | | | | | — | | | | | | 1 | |
| Construction in progress | | | | | 17 | | | | | | 17 | |
| | | | | | 241 | | | | | | 256 | |
| Less: Accumulated depreciation | | | | | (43 | | | | | | (69 | |
| | | | | $ | 198 | | | | | $ | 187 | |
|
| |
| Note 13. | Other Accrued Expenses |
The following table breaks out the other accrued expenses in further detail (Dollars in Millions):
| | | | | | | | | | | | |
| | | | December 31, |
| | | | 2005 | | | 2006 |
| Other accrued expenses | | | | | | | | | | | | |
| Return reserve | | | | $ | 19 | | | | | $ | 18 | |
| Accrued rebates and promotions | | | | | 15 | | | | | | 15 | |
| Core deposit liability | | | | | 9 | | | | | | 10 | |
| Taxes other than income taxes | | | | | 9 | | | | | | 8 | |
| Accrued property and casualty | | | | | 7 | | | | | | 8 | |
| Accrued restructuring | | | | | 8 | | | | | | 13 | |
| Tax deposit payable | | | | | 30 | | | | | | 30 | |
| Accrued marketing expense | | | | | 10 | | | | | | 9 | |
| Accrued freight | | | | | 6 | | | | | | 4 | |
| Other | | | | | 29 | | | | | | 28 | |
| | | | | $ | 142 | | | | | $ | 143 | |
|
At December 31, 2005 and December 31, 2006 the Company had other accrued liabilities of $29 million and $28 million, respectively. The other accrued expenses primarily consist of accrued utilities, accrued professional fees and other miscellaneous accruals.
| |
| Note 14. | Commitments and Contingencies |
At December 31, 2006, the Company had purchase commitments for property, plant and equipment of approximately $4 million.
67
Table of ContentsThe Company had future minimum rental commitments under non-cancelable operating leases of $88 million at December 31, 2006, with future rental payments of:
| | | | | | |
| 2007 | | | | | 15 | |
| 2008 | | | | | 12 | |
| 2009 | | | | | 12 | |
| 2010 | | | | | 9 | |
| 2011 | | | | | 8 | |
| Thereafter | | | | | 32 | |
| Total | | | | | 88 | |
|
The leases do not contain restrictions on future borrowings. There are no significant lease escalation clauses or purchase options. Rent expense was $26 million for the period January 1, 2004 through November 30, 2004, $3 million for the period December 1, 2004 through December 31, 2004, $27 million in 2005 and $24 million in 2006. We recently entered into a logistics service agreement to provide logistic services for an international location. The logistic contractual fees for the ten year agreement are $64 million.
A reconciliation of the changes in our return reserves is as follows beginning with January 1, 2005 (Dollars in Millions):
| | | | | | | | | | | | |
| | | | December 31, |
| | | | 2005 | | | 2006 |
| Beginning balance | | | | $ | 18 | | | | | $ | 19 | |
| Amounts charged to income | | | | | 49 | | | | | | 49 | |
| Returns processed | | | | | (48 | | | | | | (50 | |
| | | | | $ | 19 | | | | | $ | 18 | |
|
The Company is party to various pending judicial and administrative proceedings arising in the ordinary course of business. These include, among others, proceedings based on product liability claims and alleged violations of environmental laws.
On March 3, 2006, Dana and forty of its domestic subsidiaries (the ‘‘Debtors’’) filed voluntary petitions for reorganization under Chapter 11 of the United States Bankruptcy Code in the United States Bankruptcy Court, Southern District of New York (the ‘‘Court’’) (Case No. 06-10354). The Debtors will continue to operate their businesses as ‘‘debtors-in-possession’’ under the jurisdiction of the Court and in accordance with applicable provisions of the Bankruptcy Code and orders of the Court. Dana is, pursuant to the Purchase Agreement, contractually obligated to indemnify us for specified liabilities, including, among others, (1) liabilities arising out of le gal proceedings commenced prior to the Acquisition and (2) liabilities for death, personal injury or other injury to persons (including, but not limited to, such liabilities that result from human exposure to asbestos) or property damage occurring prior to the Acquisition relating to the use or exposure to any of Dana’s products designed, manufactured, served or sold by Dana. However, in the context of Dana’s bankruptcy, Dana may be discharged entirely from its obligations to indemnify us for future defense settlements or payments in respect of any claim subject to its indemnification obligations and we may recover less than 100% of any indemnification obligations of Dana existing as of March 3, 2006. Further, we do not know whether any insurance that may have been maintained by Dana will cover the costs for which Dana is contractually obligated to indemnify us. We cannot estimate the impact of Dana failing to honor its indemnification obligations but such a failure could adversely affect our fi nancial condition and results of operations.
On January 30, 2006, Parker-Hannifin Corporation (‘‘Parker’’) filed a complaint and request for preliminary injunction against Wix Filtration Corp. (‘‘Wix’’), which is a wholly owned subsidiary of Affinia, alleging patent infringement of four U.S. patents held by Parker. These patents cover an oil filter and fuel filter, designed for the Ford F-150 pickup truck, which Parker was selling to Wix for sale
68
Table of Contentsinto the automotive aftermarket prior to the complaint date. Wix’s response to Parker’s preliminary injunction brief was filed on May 10, 2006 and the preliminary injunction hearing was held on August 23, 2006 in the U.S. District Court for the Eastern District of California. On October 24, 2006, the court denied Parker’s preliminary injunction motion. Wix intends to continue to defend itself vigorously in this suit.
On April 20, 2006, Heritage and Beck Arnley filed suit against Affinia in the Rutherford County Chancery Court for the State of Tennessee. The suit arises out of Affinia’s sale of Beck Arnley to Heritage and damages allegedly arising from a tax election which Affinia was required to make under the Purchase Agreement with Dana. Affinia intends to vigorously defend this matter and does not believe it has any liability. Affinia has moved to dismiss the suit in Tennessee and filed a declaratory judgment action in Illinois. On November 2, 2006, the court dismissed the declaratory judgment action. The parties have begun the discovery process.
The Company has various accruals for contingent product liability costs. At December 31, 2005 and 2006, the Company had $1 million and $3 million accrued, respectively. There are no recoveries expected from third parties. If there is a range of equally probable outcomes, we accrue the lower end of the range.
The Company estimates contingent environmental liabilities based on the most probable method of remediation, current laws and regulations and existing technology. Estimates are made on an undiscounted basis and exclude the effects of inflation. If there is a range of equally probable remediation methods or outcomes, we accrue the lower end of the range. At December 31, 2005 and 2006 the Company had less than $1 million accrued. There are no recoveries expected from third parties.
| |
| Note 15. | Restructuring of Operations |
In 2005, we announced two restructuring plans: (i) a restructuring plan that we announced at the beginning of 2005 as part of the Acquisition, also referred to herein as the acquisition restructuring and (ii) a restructuring plan that we announced at the end of 2005, also referred to herein as the comprehensive restructuring.
In December 2005, we announced the closure of our Southampton (UK) facility. Additionally, in March 2006 we announced the closure of the Erie (PA), North East (PA) and the McHenry (IL) plants and our intent to sell the Waupaca (WI), Sudbury (Ontario, Canada) and St. Catharines (Ontario, Canada) facilities. In June 2006, we announced our decision to close the St. Catharines foundry, which was closed by the end of 2006. In the third quarter of 2006 we announced the closure of our Cambridge (Ontario, Canada) facility, which is anticipated to close during the first quarter of 2007. In October 2006, we announced the closure of our Cuba (MO) facility, which is anticipated to close during the first quarter of 2007. In November 2006, w e announced and closed our Mississauga (Ontario, Canada) facility.
In connection with the comprehensive restructuring, during 2006, we recorded a charge of $1 million to cost of sales and $39 million to selling, general and administrative expense consisting of employee termination benefits and other exit costs. During 2005, also in connection with the comprehensive restructuring, we recorded a charge of $21 million to cost of sales and $2 million to selling, general and administrative expense, comprised primarily of severance costs and fixed asset impairment. The write-down of fixed assets was accounted for in accordance with SFAS 144, Accounting for the Impairment or Disposal of Long-Lived Assets. Severance costs are being accounte d for in accordance with SFAS 146, Accounting for Costs Associated with Exit or Disposal Activities and SFAS 112, Employers’ Accounting for Postemployment Benefits — an amendment of FASB Statements No. 5 and 43. We currently estimate that we will incur approximately $152 million of cash and non cash restructuring costs.
In the first quarter of 2005, as part of the Acquisition, we announced the acquisition restructuring. The acquisition restructuring was initiated to take advantage of opportunities we identified prior to the Acquisition but were limited in our ability to pursue as part of Dana due to resource constraints.
69
Table of ContentsDuring 2005, acquisition restructuring costs of $21 million were recorded to goodwill as an adjustment to the opening balance sheet, comprised of severance costs, fixed asset impairments and other exit costs. Additionally in 2005, we charged directly to selling, general and administrative expense $2 million relating to current period exit costs.
The following summarizes the restructuring charges and activity for all the Company’s restructuring programs. (Dollars in Millions):
| | | | | | | | | | | | | | | | | | | | | | | | |
| | | | Employee
Termination
Benefits | | | Long-Lived
Asset
Impairment | | | Exit
Costs | | | Total |
| Predecessor | | | | | | | | | | | | | | | | | | | | | | | | |
| Balance at December 31, 2003 | | | | $ | 2 | | | | | $ | — | | | | | $ | 2 | | | | | $ | 4 | |
| Activity from January 1, 2004 through November 30, 2004 | | | | | | | | | | | | | | | | | | | | | | | | |
| Charges to expense | | | | | 2 | | | | | | — | | | | | | — | | | | | | 2 | |
| Cash payments | | | | | (2 | | | | | | — | | | | | | (2 | | | | | | (4 | |
| Write-off of assets | | | | | — | | | | | | — | | | | | | — | | | | | | — | |
| Balance at November 30, 2004 | | | | $ | 2 | | | | | $ | — | | | | | $ | — | | | | | $ | 2 | |
| Successor | | | | | | | | | | | | | | | | | | | | | | | | |
| Balance at December 1, 2004 | | | | $ | 2 | | | | | $ | — | | | | | $ | — | | | | | $ | 2 | |
| Activity from December 1, 2004 through December 31, 2004 | | | | | | | | | | | | | | | | | | | | | | | | |
| Charges to expense | | | | | — | | | | | | — | | | | | | — | | | | | | — | |
| Other | | | | | 1 | | | | | | | | | | | | | | | | | | 1 | |
| Balance at December 31, 2004 | | | | $ | 3 | | | | | $ | — | | | | | $ | — | | | | | $ | 3 | |
| Activity from January 1, 2005 through December 31, 2005 | | | | | | | | | | | | | | | | | | | | | | | | |
| Charges to expense | | | | $ | 2 | | | | | $ | 20 | | | | | $ | 3 | | | | | $ | 25 | |
| Write-off of assets | | | | | — | | | | | | (20 | | | | | | — | | | | | | (20 | |
| Balance at December 31, 2005 | | | | $ | 5 | | | | | $ | — | | | | | $ | 3 | | | | | $ | 8 | |
| Activity from January 1, 2006 through December 31, 2006 | | | | | | | | | | | | | | | | | | | | | | | | |
| Charges to expense | | | | $ | 19 | | | | | $ | 1 | | | | | $ | 20 | | | | | $ | 40 | |
| Write-off of assets and other | | | | | | | | | | | (1 | | | | | | (2 | | | | | | (3 | |
| Cash payments | | | | | (12 | | | | | | — | | | | | | (20 | | | | | | (32 | |
| Balance at December 31, 2006 | | | | $ | 12 | | | | | $ | — | | | | | $ | 1 | | | | | $ | 13 | |
|
At December 31, 2006, $13 million of restructuring charges remained in accrued liabilities, relating to wage and healthcare continuation for severed employees and other termination costs. These remaining benefits are expected to be paid during 2007.
| |
| Note 16. | Related Party Transactions |
For purposes of these financial statements, Predecessor sales between the Company and other Dana units have not been eliminated. These transactions between Predecessor and other Dana units were on a cost-plus basis with a mark-up on most transactions of approximately 10%. The Company’s sales to other Dana units totaled $16 million for the period January 1, 2004, through November 30, 2004, and $1 million for the period December 1, 2004 through December 31, 2004. The Predecessor distributed parts produced by Dana for aftermarket customers. The purchases by the Company from Dana were $77 million for the period from January 1, 2004 through November 30, 2004, and $9 million for the period December 1, 2004 through Dece mber 31, 2004.
The following table presents the components of administrative services provided at the Dana corporate level that have been allocated to the Predecessor, plus expenses charged to the aftermarket department within the Dana corporate office, including wages, fringe benefits, travel, employee relocation, charges for internal services such as information technology support and charges for certain
70
Table of Contentsexternal services. These items have been allocated to the Predecessor and included in the selling, general and administrative expenses in the combined statement of income (Dollars in Millions):
| | | | | | |
| | | | Predecessor |
| | | | January 1,
2004 through
November 30,
2004 |
| Administrative staff wages and fringe benefits | | | | $ | 2 | |
| Treasury services | | | | | 2 | |
| Accounting, tax and audit services | | | | | 2 | |
| Legal services | | | | | 1 | |
| Environmental services | | | | | 1 | |
| Other services | | | | | 2 | |
| Allocated corporate expenses | | | | | 10 | |
| Aftermarket department expenses | | | | | (1 | |
| Total corporate expenses | | | | $ | 9 | |
|
Affinia and Dana entered into a transition services agreement (the ‘‘TSA’’) effective with the closing of the Acquisition on November 30, 2004. The TSA provided for certain administrative and other services and support to be provided by Dana to the Company, and to be provided by the Company to Dana, in each case after the Acquisition. The Company also leases certain properties, warehouses and office space from Dana for periods up to five years after the Acquisition. Some of these lease terms may be renewed indefinitely by the parties. Dana agreed in the Purchase Agreement to provide the Company with a $16 million credit for payments otherwise due for services under the TSA.
On April 29, 2005, Dana paid the Company $12 million in settlement of the TSA noted above, as well as $11 million for uncollectible receivables covered by the Purchase Agreement, offset by $13 million of original purchase price consideration and $3 million of working capital adjustments, which resulted in a net payment of $7 million to the Company.
Mr. John M. Riess, an Affinia Group Board member, is related to an executive at CARQUEST. In 2006, CARQUEST purchased 7% of our total sales. The related party was the president of CARQUEST Canada in 2005. In 2005, CARQUEST Canada purchased less than 1% of our total sales.
| |
| Note 17. | Segment Information |
The Company’s operating segments have been aggregated into one reportable business segment, which is the manufacturing and distribution of vehicle aftermarket parts. The products, customer base, distribution channel, manufacturing process, procurement, and economic characteristics are similar throughout all of the Company’s operations.
Net sales by geographic region were as follows (Dollars in Millions):
| | | | | | | | | | | | | | | | | | | | | | | | |
| | | | Predecessor | | | Successor |
| | | | January 1,
2004 through
November 30,
2004 | | | December 1,
2004 through
December 31,
2004 | | | January 1,
2005 through
December 31,
2005 | | | January 1,
2006 through
December 31,
2006 |
| United States | | | | $ | 1,065 | | | | | $ | 88 | | | | | $ | 1,188 | | | | | $ | 1,198 | |
| Canada | | | | | 302 | | | | | | 19 | | | | | | 282 | | | | | | 255 | |
| Brazil | | | | | 163 | | | | | | 18 | | | | | | 217 | | | | | | 242 | |
| Other Countries | | | | | 404 | | | | | | 30 | | | | | | 445 | | | | | | 465 | |
| | | | | $ | 1,934 | | | | | $ | 155 | | | | | $ | 2,132 | | | | | $ | 2,160 | |
|
71
Table of ContentsLong-lived assets by geographic region were as follows (Dollars in Millions):
| | | | | | | | | | | | |
| | | | Successor
December 31,
2005 | | | Successor
December 31,
2006 |
| United States | | | | $ | 314 | | | | | $ | 310 | |
| Canada | | | | | 65 | | | | | | 31 | |
| Brazil | | | | | 6 | | | | | | 6 | |
| Other Countries | | | | | 70 | | | | | | 73 | |
| | | | | $ | 455 | | | | | $ | 420 | |
|
Net sales by geographic area were determined based on origin of sale. Geographic data on long-lived long-lived assets are comprised of property, plant and equipment, goodwill, other intangible assets and deferred financing costs.
We offer primarily three types of products: brake products, which include brake drums, rotors, pads and shoes and hydraulic brake system components; filtration products, which include oil, fuel, air and other filters; and chassis products, which include steering, suspension and driveline components. Additionally, we have European products and other businesses, which includes our Quinton Hazell European parts operations. Quinton Hazell designs, manufactures, purchases and distributes a wide range of aftermarket replacement motor vehicle components for customers throughout the United Kingdom and Continental Europe, primarily under the Quinton Hazell brand name. The Company’s sales by group of similar products are as follows:
| | | | | | | | | | | | | | | | | | | | | | | | |
| | | | Predecessor | | | Successor |
| | | | January 1,
2004 through
November 30,
2004 | | | December 1,
2004 through
December 31,
2004 | | | January 1,
2005 through
December 31,
2005 | | | January 1,
2006 through
December 31,
2006 |
| Brake | | | | $ | 969 | | | | | $ | 77 | | | | | $ | 1,052 | | | | | $ | 1,053 | |
| Chassis | | | | | 153 | | | | | | 10 | | | | | | 156 | | | | | | 156 | |
| Filtration | | | | | 562 | | | | | | 46 | | | | | | 661 | | | | | | 689 | |
| Europe | | | | | 241 | | | | | | 19 | | | | | | 260 | | | | | | 268 | |
| Eliminations and other | | | | | 9 | | | | | | 3 | | | | | | 3 | | | | | | (6 | |
| | | | | $ | 1,934 | | | | | $ | 155 | | | | | $ | 2,132 | | | | | $ | 2,160 | |
|
| |
| Note 18. | Asset Retirement Obligations |
We adopted FAS 143, ‘‘Accounting for Asset Retirement Obligations’’ and FIN 47, ‘‘Accounting for Conditional Asset Retirement Obligations’’ effective January 1, 2003 and December 31, 2005, respectively. FAS 143 and FIN 47 require that a liability for the fair value of an ARO be recognized in the period in which it is incurred if it can be reasonably estimated, with the offsetting associated asset retirement costs capitalized as part of the carrying amount of the long-lived assets. The asset retirement cost is subsequently allocated to exp ense using a systematic and rational method over its useful life. Changes in the ARO resulting from the passage of time are recognized as an increase in the carrying amount of the liability and as accretion expense, which is included in depreciation and amortization expense in the consolidated statements of income. Changes resulting from revisions to the timing or amount of the original estimate of cash flows are recognized as an increase or a decrease in the asset retirement cost and ARO. The ARO recorded at December 31, 2005 and December 31, 2006 was $3 million. If the provisions of FIN 47 had been in effect on December 31, 2004, the aggregate carrying amount of asset retirement obligations on that date would have been $3 million. If the amortization of asset retirement cost and accretion of asset retirement obligation provisions of FAS 143, as interpreted by FIN 47, had been in effect during 2004, the impact would have been immaterial.
The cumulative effect of a change in accounting principle of adopting FIN 47 was not material to our net income in the period of adoption and had no effect on net income.
72
Table of Contents | |
| Note 19. | Divestiture of Affiliate and Discontinued Operation |
On March 31, 2005, Affinia completed the legal sale of its subsidiary, Beck Arnley Worldparts Corporation (‘‘Beck Arnley’’), to Heritage Equity Group (‘‘Heritage’’), pursuant to a stock purchase agreement. The contingent purchase price, which was based on future sales of Beck Arnley, for the stock of Beck Arnley was $5 million to be paid starting in 2006. Affinia also made a $3 million five year term loan to Beck Arnley, bearing interest at nine percent per annum. In addition, the stock purchase agreement provided that all of the cash at Beck Arnley, with the exception of $2 million, be retained by the Company. As a result, Affinia retained $17 million of cash that was held on the books of Beck Arnley. In connection with the transaction, Affinia recognized a pre-tax loss on the sale of $21 million, in addition to the $3 million loss from normal operations in the first quarter of 2005.
On April 20, 2006, Heritage and Beck Arnley filed suit against Affinia in the Rutherford County Chancery Court for the State of Tennessee. The suit arises out of Affinia’s sale of Beck Arnley to Heritage and damages allegedly arising from a tax election which Affinia was required to make under the Purchase Agreement with Dana. Affinia intends to vigorously defend this matter and does not believe it has any liability. Affinia has moved to dismiss the suit in Tennessee and filed a declaratory judgment action in Illinois. On November 2, 2006, the court dismissed the declaratory judgment action. The parties have begun the discovery process.
During the third quarter of 2005, we completed the sale of Candados Universales de Mexico, S.A. de C.V. (‘‘Cumsa’’), one of our Mexican operations, and the distribution company for Cumsa (Auto Parts Acquisition LLC) for $7 million in cash. Under the provisions of SFAS 144, Accounting for the Impairment or Disposal of Long-Lived Assets, we classify a business component that has been disposed of as a discontinued operation if the cash flow of the component has been eliminated from our ongoing operations and we will no longer have any significant continuing involvement in the component. The results of operations of our discontinued operations throug h the date of sale, including any gains or losses on disposition, are aggregated and presented on one line in the Consolidated Statement of Operations. The amounts presented in the Consolidated Statement of Operations for 2005 were reclassified to comply with SFAS 144. The after-tax loss recognized on the sale during the third quarter of fiscal 2005 was less than $1 million.
| |
| Note 20. | Financial Information for Guarantors and Non-Guarantors |
Affinia Group Inc. issued $300 million of senior subordinated notes to qualified institutional buyers and certain persons in offshore transactions. The senior subordinated notes were subsequently registered under the Securities Act of 1933 pursuant to an exchange offer completed on November 2, 2005. The senior subordinated notes are general obligations of Affinia Group Inc. and guaranteed by Affinia Group Intermediate Holdings Inc. (‘‘Parent’’) and all of the wholly owned domestic subsidiaries. These guarantors jointly and severally guarantee the Company’s obligations under the senior subordinated notes and the guarantees represent full and unconditional general obligations.
The following information presents combining and consolidating Statements of Operations and Statements of Cash Flows for the period from January 1, 2004 through November 30, 2004, for the period from December 1, 2004, through December 31, 2004, for the year ended December 31, 2005 and for the year ended December 31, 2006 and Consolidated Balance Sheets as of December 31, 2005 and 2006.
73
Table of ContentsAffinia Group Intermediate Holdings Inc.
Notes to combined and consolidated financial statements (continued)
Supplemental Guarantor
Combining Statement of Operations
For the Eleven Months Ended November 30, 2004
(Dollars in Millions)
| | | | | | | | | | | | | | | | | | | | | | | | | | | | | | | | | | | | |
| | | | Parent | | | Issuer | | | Guarantor | | | Non-Guarantor | | | Eliminations | | | Combined
Total |
| Net sales | | | | $ | — | | | | | $ | — | | | | | $ | 1,251 | | | | | $ | 739 | | | | | $ | (56 | | | | | $ | 1,934 | |
| Cost of sales | | | | | — | | | | | | — | | | | | | (1,102 | | | | | | (611 | | | | | | 56 | | | | | | (1,657 | |
| Gross profit | | | | | — | | | | | | — | | | | | | 149 | | | | | | 128 | | | | | | — | | | | | | 277 | |
| Selling, general and administrative expenses | | | | | — | | | | | | — | | | | | | (133 | | | | | | (101 | | | | | | — | | | | | | (234 | |
| Operating profit | | | | | | | | | | | | | | | | | 16 | | | | | | 27 | | | | | | — | | | | | | 43 | |
| Other income, net | | | | | — | | | | | | — | | | | | | 1 | | | | | | 3 | | | | | | — | | | | | | 4 | |
| Interest expense | | | | | — | | | | | | — | | | | | | — | | | | | | (2 | | | | | | — | | | | | | (2 | |
| Income before taxes and minority interest | | | | | — | | | | | | — | | | | | | 17 | | | | | | 28 | | | | | | — | | | | | | 45 | |
| Income tax provision | | | | | — | | | | | | — | | | | | | 3 | | | | | | 15 | | | | | | — | | | | | | 18 | |
| Minority interest, net | | | | | — | | | | | | — | | | | | | — | | | | | | — | | | | | | — | | | | | | — | |
| Income from continuing operations | | | | | — | | | | | | — | | | | | | 14 | | | | | | 13 | | | | | | — | | | | | | 27 | |
| Income from discontinued operations | | | | | — | | | | | | — | | | | | | 1 | | | | | | — | | | | | | — | | | | | | 1 | |
| Equity in income | | | | | — | | | | | | — | | | | | | (26 | | | | | | 5 | | | | | | 21 | | | | | | — | |
| Net (loss) income | | | | $ | — | | | | | $ | — | | | | | $ | (11 | | | | | $ | 18 | | | | | $ | 21 | | | | | $ | 28 | |
|
74
Table of ContentsAffinia Group Intermediate Holdings Inc.
Notes to combined and consolidated financial statements (continued)
Supplemental Guarantor
Consolidating Statement of Operations
For the One Month Ended December 31, 2004
(Dollars in Millions)
| | | | | | | | | | | | | | | | | | | | | | | | | | | | | | | | | | | | |
| | | | Parent | | | Issuer | | | Guarantor | | | Non-Guarantor | | | Eliminations | | | Consolidated
Total |
| Net sales | | | | $ | — | | | | | $ | — | | | | | $ | 100 | | | | | $ | 59 | | | | | $ | (4 | | | | | $ | 155 | |
| Cost of sales | | | | | — | | | | | | — | | | | | | (88 | | | | | | (53 | | | | | | 4 | | | | | | (137 | |
| Gross profit | | | | | — | | | | | | — | | | | | | 12 | | | | | | 6 | | | | | | — | | | | | | 18 | |
| Selling, general and administrative expenses | | | | | — | | | | | | (1 | | | | | | (10 | | | | | | (10 | | | | | | — | | | | | | (21 | |
| Operating profit | | | | | | | | | | | (1 | | | | | | 2 | | | | | | (4 | | | | | | — | | | | | | (3 | |
| Other income, net | | | | | — | | | | | | — | | | | | | — | | | | | | 2 | | | | | | — | | | | | | 2 | |
| Interest expense | | | | | — | | | | | | (5 | | | | | | — | | | | | | — | | | | | | — | | | | | | (5 | |
| Income before taxes and minority interest | | | | | — | | | | | | (6 | | | | | | 2 | | | | | | (2 | | | | | | — | | | | | | (6 | |
| Income tax (benefit) provision | | | | | — | | | | | | (2 | | | | | | 1 | | | | | | (1 | | | | | | — | | | | | | (2 | |
| Minority interest, net | | | | | — | | | | | | — | | | | | | — | | | | | | — | | | | | | — | | | | | | — | |
| Income from continuing operations | | | | | — | | | | | | (4 | | | | | | 1 | | | | | | (1 | | | | | | — | | | | | | (4 | |
| Income from discontinued operations | | | | | — | | | | | | — | | | | | | — | | | | | | — | | | | | | — | | | | | | — | |
| Equity in income | | | | | (4 | | | | | | — | | | | | | (1 | | | | | | — | | | | | | 5 | | | | | | — | |
| Net (loss) income | | | | $ | (4 | | | | | $ | (4 | | | | | $ | — | | | | | $ | (1 | | | | | $ | 5 | | | | | $ | (4 | |
|
75
Table of ContentsAffinia Group Intermediate Holdings Inc.
Notes to combined and consolidated financial statements (continued)
Supplemental Guarantor
Consolidating Statement of Operations
For the Year Ended December 31, 2005
(Dollars in Millions)
| | | | | | | | | | | | | | | | | | | | | | | | | | | | | | | | | | | | |
| | | | Parent | | | Issuer | | | Guarantor | | | Non-Guarantor | | | Eliminations | | | Consolidated
Total |
| Net sales | | | | $ | | | | | | $ | — | | | | | $ | 1,266 | | | | | $ | 1,157 | | | | | $ | (291 | | | | | $ | 2,132 | |
| Cost of sales | | | | | — | | | | | | — | | | | | | (1,065 | | | | | | (1,063 | | | | | | 291 | | | | | | (1,837 | |
| Gross profit | | | | | — | | | | | | — | | | | | | 201 | | | | | | 94 | | | | | | — | | | | | | 295 | |
| Selling, general and administrative expenses | | | | | | | | | | | (46 | | | | | | (117 | | | | | | (98 | | | | | | — | | | | | | (261 | |
| Loss on disposition of Beck Arnley | | | | | — | | | | | | — | | | | | | — | | | | | | (21 | | | | | | — | | | | | | (21 | |
| Operating profit | | | | | — | | | | | | (46 | | | | | | 84 | | | | | | (25 | | | | | | — | | | | | | 13 | |
| Other income, net | | | | | — | | | | | | 1 | | | | | | 1 | | | | | | 6 | | | | | | — | | | | | | 8 | |
| Interest expense | | | | | — | | | | | | (55 | | | | | | — | | | | | | — | | | | | | — | | | | | | (55 | |
| Income before taxes and minority interest | | | | | — | | | | | | (100 | | | | | | 85 | | | | | | (19 | | | | | | — | | | | | | (34 | |
| Income tax (benefit) provision | | | | | — | | | | | | (44 | | | | | | 22 | | | | | | 18 | | | | | | — | | | | | | (4 | |
| Minority interest, net | | | | | — | | | | | | — | | | | | | — | | | | | | — | | | | | | — | | | | | | — | |
| Income from continuing operations | | | | | — | | | | | | (56 | | | | | | 63 | | | | | | (37 | | | | | | — | | | | | | (30 | |
| Income from discontinued operations | | | | | — | | | | | | — | | | | | | — | | | | | | — | | | | | | — | | | | | | — | |
| Equity interest in income | | | | | (30 | | | | | | 56 | | | | | | 11 | | | | | | 50 | | | | | | (87 | | | | | | — | |
| Net (loss) income | | | | $ | (30 | | | | | $ | — | | | | | $ | 74 | | | | | $ | 13 | | | | | $ | (87 | | | | | $ | (30 | |
|
76
Table of ContentsAffinia Group Intermediate Holdings Inc.
Notes to combined and consolidated financial statements (continued)
Supplemental Guarantor
Consolidating Statement of Operations
For the Year Ended December 31, 2006
(Dollars in Millions)
| | | | | | | | | | | | | | | | | | | | | | | | | | | | | | | | | | | | |
| | | | Parent | | | Issuer | | | Guarantor | | | Non-Guarantor | | | Eliminations | | | Consolidated
Total |
| Net sales | | | | $ | — | | | | | $ | — | | | | | $ | 1,266 | | | | | $ | 1,235 | | | | | $ | (341 | | | | | $ | 2,160 | |
| Cost of sales | | | | | — | | | | | | — | | | | | | (992 | | | | | | (1,133 | | | | | | 341 | | | | | | (1,784 | |
| Gross profit | | | | | — | | | | | | — | | | | | | 274 | | | | | | 102 | | | | | | — | | | | | | 376 | |
| Selling, general, and administrative expenses | | | | | — | | | | | | (63 | | | | | | (144 | | | | | | (125 | | | | | | — | | | | | | (332 | |
| Operating profit | | | | | — | | | | | | (63 | | | | | | 130 | | | | | | (23 | | | | | | — | | | | | | 44 | |
| Other income, net | | | | | — | | | | | | 73 | | | | | | (70 | | | | | | 4 | | | | | | — | | | | | | 7 | |
| Interest expense | | | | | — | | | | | | (59 | | | | | | — | | | | | | — | | | | | | — | | | | | | (59 | |
| Income before taxes and minority interest | | | | | — | | | | | | (49 | | | | | | 60 | | | | | | (19 | | | | | | — | | | | | | (8 | |
| Income tax (benefit) provision | | | | | — | | | | | | (9 | | | | | | — | | | | | | 6 | | | | | | — | | | | | | (3 | |
| Income from continuing operations | | | | | — | | | | | | (40 | | | | | | 60 | | | | | | (25 | | | | | | — | | | | | | (5 | |
| Income from discontinued operations | | | | | — | | | | | | — | | | | | | — | | | | | | — | | | | | | — | | | | | | — | |
| Equity interest in income | | | | | (5 | | | | | | 40 | | | | | | 17 | | | | | | 35 | | | | | | (87 | | | | | | — | |
| Net (loss) income | | | | $ | (5 | | | | | | — | | | | | $ | 77 | | | | | $ | 10 | | | | | $ | (87 | | | | | $ | (5 | |
|
77
Table of ContentsAffinia Group Intermediate Holdings Inc.
Notes to combined and consolidated financial statements (continued)
Supplemental Guarantor
Combining Statement of Cash Flows
For the Eleven Months Ended November 30, 2004
(Dollars in Millions)
| | | | | | | | | | | | | | | | | | | | | | | | | | | | | | | | | | | | |
| | | | Parent | | | Issuer | | | Guarantor | | | Non-Guarantor | | | Elimination | | | Combined
Total |
| Operating activities | | | | | | | | | | | | | | | | | | | | | | | | | | | | | | | | | | | | |
| Net (loss) income | | | $ — | | | $ — | | | | $ | (11 | | | | | $ | 18 | | | | | $ | 21 | | | | | $ | 28 | |
| Adjustments to reconcile net (loss) income from continuing operations to net cash provided by (used in) operating activities: | | | | | | | | | | | | | | | | | | | | | | | | | | | | | | | | | | | | |
| Depreciation and amortization | | | | | — | | | | | | — | | | | | | 21 | | | | | | 20 | | | | | | — | | | | | | 41 | |
| Impairment of assets | | | | | — | | | | | | — | | | | | | 1 | | | | | | — | | | | | | — | | | | | | 1 | |
| Deferred income taxes | | | | | — | | | | | | — | | | | | | 3 | | | | | | (31 | | | | | | — | | | | | | (28 | |
| Losses (gains) on asset sales | | | | | — | | | | | | — | | | | | | 1 | | | | | | (3 | | | | | | — | | | | | | (2 | |
| Equity in subsidiaries | | | | | — | | | | | | — | | | | | | 26 | | | | | | (5 | | | | | | (21 | | | | | | — | |
| Change in trade accounts receivable | | | | | — | | | | | | — | | | | | | 22 | | | | | | (14 | | | | | | — | | | | | | 8 | |
| Change in inventories | | | | | — | | | | | | — | | | | | | (20 | | | | | | (17 | | | | | | — | | | | | | (37 | |
| Change in other operating assets | | | | | — | | | | | | — | | | | | | (32 | | | | | | 2 | | | | | | — | | | | | | (30 | |
| Change in other operating liabilities | | | | | — | | | | | | — | | | | | | 10 | | | | | | (12 | | | | | | — | | | | | | (2 | |
| Change in other | | | | | — | | | | | | — | | | | | | 16 | | | | | | (3 | | | | | | — | | | | | | 13 | |
| Net cash provided by (used in) operating activities of continuing operations | | | | | — | | | | | | — | | | | | | 37 | | | | | | (45 | | | | | | — | | | | | | (8 | |
| Net cash provided by operating activities of discontinued operations | | | | | — | | | | | | — | | | | | | — | | | | | | 1 | | | | | | — | | | | | | 1 | |
Net cash provided by (used in) operating
activities | | | | | — | | | | | | — | | | | | | 37 | | | | | | (44 | | | | | | — | | | | | | (7 | |
| Investing activities | | | | | | | | | | | | | | | | | | | | | | | | | | | | | | | | | | | | |
| Proceeds from sale of assets | | | | | — | | | | | | — | | | | | | 1 | | | | | | 5 | | | | | | — | | | | | | 6 | |
| Additions to property, plant and equipment, net | | | | | — | | | | | | — | | | | | | (20 | | | | | | (24 | | | | | | — | | | | | | (44 | |
| Other investing activities | | | | | — | | | | | | — | | | | | | — | | | | | | 1 | | | | | | — | | | | | | 1 | |
Net cash used in investing activities of continuing
operations | | | | | — | | | | | | — | | | | | | (19 | | | | | | (18 | | | | | | — | | | | | | (37 | |
| Net cash used in investing activities of discontinued operations | | | | | — | | | | | | — | | | | | | — | | | | | | — | | | | | | — | | | | | | — | |
| Net cash used in investing activities | | | | | — | | | | | | — | | | | | | (19 | | | | | | (18 | | | | | | — | | | | | | (37 | |
| Financing activities | | | | | | | | | | | | | | | | | | | | | | | | | | | | | | | | | | | | |
| Short-term debt, net | | | | | — | | | | | | — | | | | | | — | | | | | | (19 | | | | | | — | | | | | | (19 | |
| Net transactions with Dana Corporation | | | | | — | | | | | | — | | | | | | (12 | | | | | | 75 | | | | | | — | | | | | | 63 | |
| Net cash (used in) provided by financing activities of continuing operations | | | | | — | | | | | | — | | | | | | (12 | | | | | | 56 | | | | | | — | | | | | | 44 | |
| Net cash used in financing activities of discontinued operations | | | | | — | | | | | | — | | | | | | (2 | | | | | | — | | | | | | — | | | | | | (2 | |
| Net cash (used in) provided by financing activities | | | | | — | | | | | | — | | | | | | (14 | | | | | | 56 | | | | | | — | | | | | | 42 | |
| Change in cash and cash equivalents | | | | | — | | | | | | — | | | | | | 4 | | | | | | (6 | | | | | | | | | | | | (2 | |
| Cash and cash equivalents at beginning of period | | | | | — | | | | | | — | | | | | | — | | | | | | 46 | | | | | | — | | | | | | 46 | |
| Cash and cash equivalents at end of period | | | | $ | — | | | | | $ | — | | | | | $ | 4 | | | | | $ | 40 | | | | | $ | — | | | | | $ | 44 | |
|
78
Table of ContentsAffinia Group Intermediate Holdings Inc.
Notes to combined and consolidated financial statements (continued)
Supplemental Guarantor
Consolidating Statement of Cash Flows
For the One Month Ended December 31, 2004
(Dollars in Millions)
| | | | | | | | | | | | | | | | | | | | | | | | | | | | | | | | | | | | |
| | | | Parent | | | Issuer | | | Guarantor | | | Non-Guarantor | | | Elimination | | | Consolidated
Total |
| Operating activities | | | | | | | | | | | | | | | | | | | | | | | | | | | | | | | | | | | | |
| Net (loss) income | | | | $ | (4 | | | | | $ | (4 | | | | | $ | — | | | | | $ | (1 | | | | | $ | 5 | | | | | $ | (4 | |
| Adjustments to reconcile net (loss) income from continuing operations to net cash provided by (used in) operating activities: | | | | | | | | | | | | | | | | | | | | | | | | | | | | | | | | | | | | |
| Depreciation and amortization | | | | | — | | | | | | — | | | | | | 3 | | | | | | 1 | | | | | | — | | | | | | 4 | |
| Deferred income taxes | | | | | — | | | | | | — | | | | | | — | | | | | | (8 | | | | | | | | | | | | (8 | |
| Equity in income | | | | | 4 | | | | | | — | | | | | | 1 | | | | | | — | | | | | | (5 | | | | | | — | |
| Change in trade accounts receivable | | | | | — | | | | | | 55 | | | | | | 10 | | | | | | (18 | | | | | | — | | | | | | 47 | |
| Change in inventories | | | | | — | | | | | | — | | | | | | (6 | | | | | | 2 | | | | | | — | | | | | | (4 | |
| Change in other current assets | | | | | — | | | | | | — | | | | | | (42 | | | | | | 45 | | | | | | — | | | | | | 3 | |
| Change in other current liabilities | | | | | — | | | | | | 17 | | | | | | 35 | | | | | | (38 | | | | | | — | | | | | | 14 | |
| Change in other | | | | | — | | | | | | — | | | | | | — | | | | | | 6 | | | | | | — | | | | | | 6 | |
| Net cash provided by (used in) operating activities of continuing operations | | | | | — | | | | | | 68 | | | | | | 1 | | | | | | (11 | | | | | | — | | | | | | 58 | |
| Net cash provided by operating activities of discontinued operations | | | | | — | | | | | | — | | | | | | — | | | | | | — | | | | | | — | | | | | | — | |
Net cash provided by (used in) operating
activities | | | | | — | | | | | | 68 | | | | | | 1 | | | | | | (11 | | | | | | — | | | | | | 58 | |
| Investing activities | | | | | | | | | | | | | | | | | | | | | | | | | | | | | | | | | | | | |
| Acquisition of Dana Aftermarket Group | | | | | — | | | | | | (1,016 | | | | | | — | | | | | | — | | | | | | — | | | | | | (1,016 | |
| Proceeds from sale of assets | | | | | — | | | | | | — | | | | | | 1 | | | | | | — | | | | | | — | | | | | | 1 | |
| Additions to property, plant and equipment, net | | | | | — | | | | | | — | | | | | | (2 | | | | | | (1 | | | | | | — | | | | | | (3 | |
| Other investing activities | | | | | — | | | | | | — | | | | | | — | | | | | | — | | | | | | — | | | | | | — | |
| Net cash used in investing activities of continuing operations | | | | | — | | | | | | (1,016 | | | | | | (1 | | | | | | (1 | | | | | | — | | | | | | (1,018 | |
| Net cash used in investing activities of discontinued operations | | | | | — | | | | | | — | | | | | | — | | | | | | — | | | | | | — | | | | | | — | |
| Net cash used in investing activities | | | | | — | | | | | | (1,016 | | | | | | (1 | | | | | | (1 | | | | | | — | | | | | | (1,018 | |
| Financing activities | | | | | | | | | | | | | | | | | | | | | | | | | | | | | | | | | | | | |
| Short-term debt, net | | | | | — | | | | | | 10 | | | | | | — | | | | | | — | | | | | | — | | | | | | 10 | |
| Proceeds from long term debt | | | | | — | | | | | | 650 | | | | | | — | | | | | | — | | | | | | — | | | | | | 650 | |
| Deferred financing costs | | | | | — | | | | | | (19 | | | | | | — | | | | | | — | | | | | | — | | | | | | (19 | |
| Capital contribution | | | | | — | | | | | | 355 | | | | | | — | | | | | | — | | | | | | — | | | | | | 355 | |
| Net cash used in financing activities of continuing operations | | | | | — | | | | | | 996 | | | | | | — | | | | | | — | | | | | | — | | | | | | 996 | |
| Net cash used in financing activities of discontinued operations | | | | | — | | | | | | — | | | | | | — | | | | | | — | | | | | | — | | | | | | — | |
| Net cash provided by financing activities | | | | | — | | | | | | 996 | | | | | | — | | | | | | — | | | | | | — | | | | | | 996 | |
| Change in cash and cash equivalents | | | | | — | | | | | | 48 | | | | | | — | | | | | | (12 | | | | | | — | | | | | | 36 | |
| Cash and cash equivalents at beginning of period | | | | | — | | | | | | — | | | | | | — | | | | | | 44 | | | | | | — | | | | | | 44 | |
| Cash and cash equivalents at end of period | | | | $ | — | | | | | $ | 48 | | | | | $ | — | | | | | $ | 32 | | | | | $ | — | | | | | $ | 80 | |
|
79
Table of ContentsAffinia Group Intermediate Holdings Inc.
Notes to combined and consolidated financial statements (continued)
Supplemental Guarantor
Consolidating Statement of Cash Flows
For the Year Ended December 31, 2005
(Dollars in Millions)
| | | | | | | | | | | | | | | | | | | | | | | | | | | | | | | | | | | | |
| | | | Parent | | | Issuer | | | Guarantor | | | Non-Guarantor | | | Elimination | | | Consolidated
Total |
| Operating activities | | | | | | | | | | | | | | | | | | | | | | | | | | | | | | | | | | | | |
| Net (loss) income | | | | $ | (30 | | | | | $ | — | | | | | $ | 74 | | | | | $ | 13 | | | | | $ | (87 | | | | | $ | (30 | |
| Adjustments to reconcile net (loss) income from continuing operations to net cash provided by (used in) operating activities: | | | | | | | | | | | | | | | | | | | | | | | | | | | | | | | | | | | | |
| Depreciation and amortization | | | | | — | | | | | | 9 | | | | | | 21 | | | | | | 16 | | | | | | — | | | | | | 46 | |
| Impairment of assets | | | | | — | | | | | | — | | | | | | 22 | | | | | | — | | | | | | — | | | | | | 22 | |
| Deferred income taxes | | | | | — | | | | | | (32 | | | | | | — | | | | | | (12 | | | | | | | | | | | | (44 | |
| Equity in income | | | | | 30 | | | | | | (56 | | | | | | (11 | | | | | | (50 | | | | | | 87 | | | | | | — | |
| Change in trade accounts receivable | | | | | — | | | | | | (16 | | | | | | 2 | | | | | | 22 | | | | | | — | | | | | | 8 | |
| Change in inventories | | | | | — | | | | | | — | | | | | | 47 | | | | | | 30 | | | | | | — | | | | | | 77 | |
| Change in other current assets | | | | | — | | | | | | (29 | | | | | | (1 | | | | | | 16 | | | | | | — | | | | | | (14 | |
| Change in other current liabilities | | | | | — | | | | | | 97 | | | | | | (2 | | | | | | (37 | | | | | | — | | | | | | 58 | |
| Change in other | | | | | — | | | | | | (225 | | | | | | 188 | | | | | | 15 | | | | | | — | | | | | | (22 | |
| Net cash (used in) provided by operating activities of continuing operations | | | | | — | | | | | | (252 | | | | | | 340 | | | | | | 13 | | | | | | — | | | | | | 101 | |
| Net cash provided by operating activities of discontinued operations | | | | | — | | | | | | — | | | | | | 1 | | | | | | 1 | | | | | | — | | | | | | 2 | |
Net cash (used in) provided by operating
activities | | | | | — | | | | | | (252 | | | | | | 341 | | | | | | 14 | | | | | | — | | | | | | 103 | |
| Investing activities | | | | | | | | | | | | | | | | | | | | | | | | | | | | | | | | | | | | |
| Proceeds from sale of assets | | | | | — | | | | | | — | | | | | | 1 | | | | | | 3 | | | | | | — | | | | | | 4 | |
| Working capital settlement with Dana | | | | | — | | | | | | (28 | | | | | | — | | | | | | — | | | | | | — | | | | | | (28 | |
| Proceeds from disposition of discontinued operations | | | | | — | | | | | | — | | | | | | 7 | | | | | | — | | | | | | — | | | | | | 7 | |
| Additions to property, plant and equipment, net | | | | | — | | | | | | (7 | | | | | | (12 | | | | | | (16 | | | | | | — | | | | | | (35 | |
| Other investing activities | | | | | — | | | | | | — | | | | | | — | | | | | | — | | | | | | — | | | | | | — | |
| Net cash used in investing activities of continuing operations | | | | | — | | | | | | (35 | | | | | | (4 | | | | | | (13 | | | | | | — | | | | | | (52 | |
| Net cash used in investing activities of discontinued operations | | | | | — | | | | | | — | | | | | | — | | | | | | — | | | | | | — | | | | | | — | |
| Net cash used in investing activities | | | | | — | | | | | | (35 | | | | | | (4 | | | | | | (13 | | | | | | — | | | | | | (52 | |
| Financing activities | | | | | | | | | | | | | | | | | | | | | | | | | | | | | | | | | | | | |
| Short-term debt, net | | | | | — | | | | | | (3 | | | | | | — | | | | | | (12 | | | | | | — | | | | | | (15 | |
| Payment of long-term debt | | | | | — | | | | | | (35 | | | | | | — | | | | | | — | | | | | | — | | | | | | (35 | |
| Capital contribution | | | | | — | | | | | | 1 | | | | | | — | | | | | | — | | | | | | — | | | | | | 1 | |
| Net transactions with Parent | | | | | — | | | | | | 320 | | | | | | (336 | | | | | | 16 | | | | | | — | | | | | | — | |
| Net cash provided by (used in) financing activities of continuing operations | | | | | — | | | | | | 283 | | | | | | (336 | | | | | | 4 | | | | | | — | | | | | | (49 | |
| Net cash used in financing activities of discontinued operations | | | | | — | | | | | | — | | | | | | — | | | | | | — | | | | | | — | | | | | | — | |
| Net cash provided by (used in) financing activities | | | | | — | | | | | | 283 | | | | | | (336 | | | | | | 4 | | | | | | — | | | | | | (49 | |
| Change in cash and cash equivalents | | | | | — | | | | | | (4 | | | | | | 1 | | | | | | 5 | | | | | | — | | | | | | 2 | |
| Cash and cash equivalents at beginning of period | | | | | — | | | | | | 48 | | | | | | — | | | | | | 32 | | | | | | — | | | | | | 80 | |
| Cash and cash equivalents at end of period | | | | $ | — | | | | | $ | 44 | | | | | $ | 1 | | | | | $ | 37 | | | | | $ | — | | | | | $ | 82 | |
|
80
Table of ContentsAffinia Group Intermediate Holdings Inc.
Notes to combined and consolidated financial statements (continued)
Supplemental Guarantor
Consolidating Statement of Cash Flows
For the Year Ended December 31, 2006
(Dollars in Millions)
| | | | | | | | | | | | | | | | | | | | | | | | | | | | | | | | | | | | |
| | | | Parent | | | Issuer | | | Guarantor | | | Non-Guarantor | | | Elimination | | | Consolidated
Total |
| Operating activities | | | | | | | | | | | | | | | | | | | | | | | | | | | | | | | | | | | | |
| Net (loss) income | | | | $ | (5 | | | | | $ | — | | | | | $ | 77 | | | | | $ | 10 | | | | | $ | (87 | | | | | $ | (5 | |
| Adjustments to reconcile net (loss) income from continuing operations to net cash provided by (used in) operating activities: | | | | | | | | | | | | | | | | | | | | | | | | | | | | | | | | | | | | |
| Depreciation and amortization | | | | | — | | | | | | 9 | | | | | | 22 | | | | | | 15 | | | | | | — | | | | | | 46 | |
| Impairment of assets | | | | | — | | | | | | — | | | | | | — | | | | | | — | | | | | | — | | | | | | — | |
| Stock-based compensation | | | | | — | | | | | | 1 | | | | | | — | | | | | | — | | | | | | — | | | | | | 1 | |
| Deferred income taxes | | | | | — | | | | | | 13 | | | | | | — | | | | | | (3 | | | | | | | | | | | | 10 | |
| Equity in income | | | | | 5 | | | | | | (40 | | | | | | (17 | | | | | | (35 | | | | | | 87 | | | | | | — | |
| Change in trade accounts receivable | | | | | — | | | | | | 5 | | | | | | — | | | | | | (6 | | | | | | — | | | | | | (1 | |
| Change in inventories | | | | | — | | | | | | — | | | | | | (10 | | | | | | (3 | | | | | | — | | | | | | (13 | |
| Change in other current assets | | | | | — | | | | | | — | | | | | | — | | | | | | 13 | | | | | | — | | | | | | 13 | |
| Change in other current liabilities | | | | | — | | | | | | 15 | | | | | | (17 | | | | | | (17 | | | | | | — | | | | | | (19 | |
| Change in other | | | | | — | | | | | | (10 | | | | | | (47 | | | | | | 47 | | | | | | — | | | | | | (10 | |
| Net cash (used in) provided by operating activities of continuing operations | | | | | — | | | | | | (7 | | | | | | 8 | | | | | | 21 | | | | | | — | | | | | | 22 | |
| Net cash provided by operating activities of discontinued operations | | | | | — | | | | | | — | | | | | | — | | | | | | — | | | | | | — | | | | | | — | |
Net cash (used in) provided by operating
activities | | | | | — | | | | | | (7 | | | | | | 8 | | | | | | 21 | | | | | | — | | | | | | 22 | |
| Investing activities | | | | | | | | | | | | | | | | | | | | | | | | | | | | | | | | | | | | |
| Proceeds from sale of assets | | | | | — | | | | | | — | | | | | | — | | | | | | 3 | | | | | | — | | | | | | 3 | |
| Additions to property, plant and equipment, net | | | | | — | | | | | | (3 | | | | | | (9 | | | | | | (12 | | | | | | — | | | | | | (24 | |
| Other investing activities | | | | | — | | | | | | — | | | | | | — | | | | | | — | | | | | | — | | | | | | — | |
| Net cash used in investing activities of continuing operations | | | | | — | | | | | | (3 | | | | | | (9 | | | | | | (9 | | | | | | — | | | | | | (21 | |
| Net cash used in investing activities of discontinued operations | | | | | — | | | | | | — | | | | | | — | | | | | | — | | | | | | — | | | | | | — | |
| Net cash used in investing activities | | | | | — | | | | | | (3 | | | | | | (9 | | | | | | (9 | | | | | | — | | | | | | (21 | |
| Financing activities | | | | | | | | | | | | | | | | | | | | | | | | | | | | | | | | | | | | |
| Short-term debt, net | | | | | — | | | | | | — | | | | | | — | | | | | | — | | | | | | — | | | | | | — | |
| Payment of long-term debt | | | | | — | | | | | | (15 | | | | | | — | | | | | | — | | | | | | — | | | | | | (15 | |
| Capital contribution | | | | | — | | | | | | — | | | | | | — | | | | | | — | | | | | | — | | | | | | — | |
| Net transactions with Parent | | | | | — | | | | | | — | | | | | | — | | | | | | — | | | | | | — | | | | | | — | |
| Net cash provided by (used in) financing activities of continuing operations | | | | | — | | | | | | (15 | | | | | | — | | | | | | — | | | | | | — | | | | | | (15 | |
| Net cash used in financing activities of discontinued operations | | | | | — | | | | | | — | | | | | | — | | | | | | — | | | | | | — | | | | | | — | |
| Net cash provided by (used in) financing activities | | | | | — | | | | | | (15 | | | | | | — | | | | | | — | | | | | | — | | | | | | (15 | |
| Effect of exchange rates on cash | | | | | — | | | | | | — | | | | | | — | | | | | | 2 | | | | | | — | | | | | | 2 | |
| Change in cash and cash equivalents | | | | | — | | | | | | (25 | | | | | | (1 | | | | | | 14 | | | | | | — | | | | | | (12 | |
| Cash and cash equivalents at beginning of period | | | | | — | | | | | | 44 | | | | | | 1 | | | | | | 37 | | | | | | — | | | | | | 82 | |
| Cash and cash equivalents at end of period | | | | $ | — | | | | | $ | 19 | | | | | $ | — | | | | | $ | 51 | | | | | $ | — | | | | | $ | 70 | |
|
81
Table of ContentsAffinia Group Intermediate Holdings Inc.
Notes to combined and consolidated financial statements (continued)
Supplemental Guarantor
Consolidating Balance Sheet
December 31, 2005
(Dollars in Millions)
| | | | | | | | | | | | | | | | | | | | | | | | | | | | | | | | | | | | |
| | | | Parent | | | Issuer | | | Guarantor | | | Non-Guarantor | | | Eliminations | | | Consolidated
Total |
| Assets | | | | | | | | | | | | | | | | | | | | | | | | | | | | | | | | | | | | |
| Current assets: | | | | | | | | | | | | | | | | | | | | | | | | | | | | | | | | | | | | |
| Cash and cash equivalents | | | | $ | — | | | | | $ | 44 | | | | | $ | 1 | | | | | $ | 37 | | | | | $ | — | | | | | $ | 82 | |
| Accounts receivable | | | | | — | | | | | | 32 | | | | | | 190 | | | | | | 128 | | | | | | — | | | | | | 350 | |
| Inventories | | | | | — | | | | | | — | | | | | | 245 | | | | | | 172 | | | | | | — | | | | | | 417 | |
| Other current assets | | | | | — | | | | | | 31 | | | | | | 2 | | | | | | 25 | | | | | | — | | | | | | 58 | |
| Total current assets | | | | | — | | | | | | 107 | | | | | | 438 | | | | | | 362 | | | | | | — | | | | | | 907 | |
| Investments and other assets | | | | | — | | | | | | 319 | | | | | | 2 | | | | | | 14 | | | | | | — | | | | | | 335 | |
| Intercompany investments | | | | | 374 | | | | | | 979 | | | | | | 404 | | | | | | 206 | | | | | | (1,963 | | | | | | — | |
| Intercompany receivables | | | | | — | | | | | | (247 | | | | | | 228 | | | | | | 19 | | | | | | — | | | | | | — | |
| Property, plant and equipment, net | | | | | — | | | | | | 5 | | | | | | 94 | | | | | | 99 | | | | | | — | | | | | | 198 | |
| Total assets | | | | $ | 374 | | | | | $ | 1,163 | | | | | $ | 1,166 | | | | | $ | 700 | | | | | $ | (1,963 | | | | | $ | 1,440 | |
| Liabilities and Equity | | | | | | | | | | | | | | | | | | | | | | | | | | | | | | | | | | | | |
| Current liabilities: | | | | | | | | | | | | | | | | | | | | | | | | | | | | | | | | | | | | |
| Notes payable and current portion of long term debt | | | | $ | — | | | | | $ | — | | | | | $ | — | | | | | $ | — | | | | | $ | — | | | | | $ | — | |
| Accounts payable | | | | | — | | | | | | 13 | | | | | | 111 | | | | | | 108 | | | | | | — | | | | | | 232 | |
| Accrued payroll and employee benefits | | | | | — | | | | | | 14 | | | | | | 8 | | | | | | 12 | | | | | | — | | | | | | 34 | |
| Other accrued liabilities | | | | | — | | | | | | 64 | | | | | | 46 | | | | | | 32 | | | | | | — | | | | | | 142 | |
| Total current liabilities | | | | | — | | | | | | 91 | | | | | | 165 | | | | | | 152 | | | | | | — | | | | | | 408 | |
| Deferred employee benefits and noncurrent liabilities | | | | | — | | | | | | 39 | | | | | | — | | | | | | 6 | | | | | | — | | | | | | 45 | |
| Long-term debt | | | | | — | | | | | | 612 | | | | | | — | | | | | | — | | | | | | — | | | | | | 612 | |
| Total liabilities | | | | | — | | | | | | 742 | | | | | | 165 | | | | | | 158 | | | | | | — | | | | | | 1,065 | |
| Minority interest in consolidated subsidiaries | | | | | — | | | | | | — | | | | | | 1 | | | | | | — | | | | | | — | | | | | | 1 | |
| Shareholders’ equity | | | | | 374 | | | | | | 421 | | | | | | 1,000 | | | | | | 542 | | | | | | (1,963 | | | | | | 374 | |
| Total liabilities and equity | | | | $ | 374 | | | | | $ | 1,163 | | | | | $ | 1,166 | | | | | $ | 700 | | | | | $ | (1,963 | | | | | $ | 1,440 | |
|
82
Table of ContentsAffinia Group Intermediate Holdings Inc.
Notes to combined and consolidated financial statements (continued)
Supplemental Guarantor
Consolidating Balance Sheet
December 31, 2006
(Dollars in Millions)
| | | | | | | | | | | | | | | | | | | | | | | | | | | | | | | | | | | | |
| | | | Parent | | | Issuer | | | Guarantor | | | Non-Guarantor | | | Eliminations | | | Consolidated
Total |
| Assets | | | | | | | | | | | | | | | | | | | | | | | | | | | | | | | | | | | | |
| Current assets: | | | | | | | | | | | | | | | | | | | | | | | | | | | | | | | | | | | | |
| Cash and cash equivalents | | | | $ | — | | | | | $ | 19 | | | | | $ | — | | | | | $ | 51 | | | | | $ | — | | | | | $ | 70 | |
| Accounts receivable | | | | | — | | | | | | 27 | | | | | | 190 | | | | | | 134 | | | | | | — | | | | | | 351 | |
| Inventories | | | | | — | | | | | | — | | | | | | 255 | | | | | | 175 | | | | | | — | | | | | | 430 | |
| Other current assets | | | | | — | | | | | | 31 | | | | | | 2 | | | | | | 12 | | | | | | — | | | | | | 45 | |
| Total current assets | | | | | — | | | | | | 77 | | | | | | 447 | | | | | | 372 | | | | | | — | | | | | | 896 | |
| Investments and other assets | | | | | — | | | | | | 283 | | | | | | 1 | | | | | | 14 | | | | | | — | | | | | | 298 | |
| Intercompany investments | | | | | 381 | | | | | | 1,019 | | | | | | 421 | | | | | | 241 | | | | | | (2,062 | | | | | | — | |
| Intercompany receivables | | | | | — | | | | | | (265 | | | | | | 231 | | | | | | 34 | | | | | | — | | | | | | — | |
| Property, plant and equipment, net | | | | | — | | | | | | 10 | | | | | | 89 | | | | | | 88 | | | | | | — | | | | | | 187 | |
| Total assets | | | | $ | 381 | | | | | $ | 1,124 | | | | | $ | 1,189 | | | | | $ | 749 | | | | | $ | (2,062 | | | | | $ | 1,381 | |
| Liabilities and Equity | | | | | | | | | | | | | | | | | | | | | | | | | | | | | | | | | | | | |
| Current liabilities: | | | | | | | | | | | | | | | | | | | | | | | | | | | | | | | | | | | | |
| Notes payable and current portion of long term debt | | | | $ | — | | | | | $ | — | | | | | $ | — | | | | | $ | — | | | | | $ | — | | | | | $ | — | |
| Accounts payable | | | | | — | | | | | | 11 | | | | | | 104 | | | | | | 95 | | | | | | — | | | | | | 210 | |
| Accrued payroll and employee benefits | | | | | — | | | | | | 19 | | | | | | 5 | | | | | | 12 | | | | | | — | | | | | | 36 | |
| Other accrued liabilities | | | | | — | | | | | | 76 | | | | | | 39 | | | | | | 28 | | | | | | — | | | | | | 143 | |
| Total current liabilities | | | | | — | | | | | | 106 | | | | | | 148 | | | | | | 135 | | | | | | — | | | | | | 389 | |
| Deferred employee benefits and noncurrent liabilities | | | | | — | | | | | | 4 | | | | | | — | | | | | | 8 | | | | | | — | | | | | | 12 | |
| Long-term debt | | | | | — | | | | | | 597 | | | | | | — | | | | | | — | | | | | | — | | | | | | 597 | |
| Total liabilities | | | | | — | | | | | | 707 | | | | | | 148 | | | | | | 143 | | | | | | — | | | | | | 998 | |
| Minority interest in consolidated subsidiaries | | | | | — | | | | | | — | | | | | | 2 | | | | | | — | | | | | | — | | | | | | 2 | |
| Shareholders’ equity | | | | | 381 | | | | | | 417 | | | | | | 1,039 | | | | | | 606 | | | | | | (2,062 | | | | | | 381 | |
| Total liabilities and equity | | | | $ | 381 | | | | | $ | 1,124 | | | | | $ | 1,189 | | | | | $ | 749 | | | | | $ | (2,062 | | | | | $ | 1,381 | |
|
83
Table of Contents | |
| Item 9A. | Controls and Procedures |
Disclosure Controls and Procedures.
Disclosure Controls and Procedures. The Company maintains controls and procedures designed to ensure that it is able to collect the information it is required to disclose in the reports it files with the SEC, and to record, process, summarize and disclose this information within the time periods specified in the rules of the SEC. Based on an evaluation of the Company’s disclosure controls and procedures as of the end of the period covered by this report conducted by the Company’s management, with the participation of the Chief Executive Officer, Chief Financial Officer and the Company’s disclosure committee, the Chief Executive Officer and the Chief Financial Officer believe that these controls and procedures are effective to ensure that the Company is able to collect, process and disclose the information it is required to disclose in the reports it files with the SEC within the required time periods.
The certifications of the Company’s Chief Executive Officer and Chief Financial Officer required under Section 302 of the Sarbanes-Oxley Act have been filed as Exhibits 31.1 and 31.2 to this report.
Change in Internal Control Over Financial Reporting — There were no changes in our internal control over financial reporting that occurred during our last fiscal quarter that have materially affected, or are reasonably likely to materially affect, our internal control over financial reporting.
| |
| Item 9B. | Other Information |
None.
84
Table of ContentsPART III
Item 10. Directors, Executive Officers and Corporate Governance
Set forth below is certain information concerning the individuals serving as the executive officers and members of the Board of Directors of Affinia Group Inc., including their ages as of March 20, 2007.
| | | | | | |
| Name | | | Age | | | Position |
| Terry R. McCormack | | | 56 | | | President, Chief Executive Officer and Director |
| Thomas H. Madden | | | 57 | | | Senior Vice President and Chief Financial Officer |
| John R. Washbish | | | 53 | | | President, Under Vehicle Group and Customer Relationship Management, and Director |
| Keith A. Wilson | | | 45 | | | President, Under Hood Group |
| Steven E. Keller | | | 48 | | | Senior Vice President, General Counsel and Secretary |
| Jerry A. McCabe | | | 59 | | | Vice President, Business Architecture |
| Timothy J. Zorn | | | 54 | | | Vice President, Human Resources |
| Larry W. McCurdy | | | 71 | | | Chairman of the Board of Directors |
| Joseph A. Onorato | | | 58 | | | Director |
| John M. Riess | | | 65 | | | Director |
| Michael F. Finley | | | 45 | | | Director |
| Donald J. Morrison | | | 46 | | | Director |
| James A. Stern | | | 56 | | | Director |
|
Terry R. McCormack has served as our President, Chief Executive Officer and a Director since the Acquisition on November 30, 2004. Mr. McCormack began his career at Dana in 1973 as a sales trainee. He held a variety of positions at Dana from 1974 through July 2000, when he was named President of Dana’s Aftermarket Group, a position he held until the Acquisition. Mr. McCormack holds a B.S. degree in Psychology from Ball State University. He has completed the Harvard Advanced Management Program. Mr. McCormack serves on the Board of Directors of MEMA and the University of North Carolina at Charlotte’s Belk College School of Business. He is also a member of the Automotive Presidents’ Group.
Thomas H. Madden was recently announced as our Senior Vice President and Chief Financial Officer. Mr. Madden previously served as our Vice President and Chief Financial Officer from the Acquisition on November 30, 2004 until the end of 2006. Mr. Madden formerly served as Vice President and Group Controller for the Aftermarket Group of Dana since 1998. He joined Dana in 1974 as an accountant with the Transmission Division and served in a variety of positions, including as Division Controller, Spicer Drivetrain Europe. While in Europe, he also held the position of General Manager of the Transmission Assembly and Components Group. In 1992, he returned to the United States as Division Controller for the Wix Filtration Division, and in 1996 became Division Controller of the Spicer Driveshaft Division. He earned a B.B.A. in Accounting from the University of Toledo. He also attended the University of Michigan Executive Business School.
John R. Washbish was recently announced as our President, Under Vehicle Group and Customer Relationship Management. Mr. Washbish previously served as our Vice President and General Manager, Under Vehicle Group from the Acquisition on November 30, 2004 until the end of 2006. Mr. Washbish served as the President of Customer Relationship Management for the Aftermarket Group of Dana from May 2003 and has continued to serve in this capacity for Affinia Group Inc. since the Acquisition. Prior to this, he served as the President of the Under Hood Group and Global Filtration and Clevite Engine Products divisions of Dana. From 1987 to 2000, he served as President of Clevite Engine Parts, a division of Dana Engine Controls, which joined Dana through its 1998 acquisition of Glacier Engine Bearings and AE Clevite Engine Parts. Mr. Washbish earned his Bachelor’s degree in Business Administration and an Associate&r squo;s degree in Automotive Aftermarket Management from Northwood University and an Automotive Aftermarket Professional Degree from the University of the Aftermarket. A past President of the National Engine Parts Manufacturers
85
Table of ContentsAssociation, Mr. Washbish has also served a four-year term on the Board of Directors for MEMA, and he currently serves on the Boards of Directors of the AASA, Heavy Duty Manufacturers Association and AWDA. He attended the University of Michigan Executive Business School and INSEAD University in France.
Keith A. Wilson was recently announced as the President, Under Hood Group. Mr. Wilson served as Vice President and General Manager of Under Hood Group of Affinia Group Inc. from the Acquisition on November 30, 2004 until the end of 2006. Mr. Wilson had served as Vice President and division manager of Wix Filtration Products Division since September 2000 and was given additional responsibility for Engine Operations in 2003. Mr. Wilson joined Dana in 1984 as a sales and marketing specialist with the Spicer Axle Division. Following a series of positions in Indiana and Missouri, Mr. Wilson became the production control manager at the Spicer Driveshaft Division plant in Lima, Ohio in 1990, and he was named plant manager at the Spicer Heavy Axle and Brake Division in Hilliard, Ohio in 1991. Mr. Wilson became the resident manager of the Spicer Trailer Products Division in 1994, General Manager of the division in 1 996 and Vice President and General Manager in September 1997. In 1998, he was named Vice President and General Manager of the Victor Reinz Division. Mr. Wilson earned a Bachelor’s degree in Marketing and Management from Ball State University and he is a graduate of Dana’s M.B.A. Program. He also served as Chairman of Dana’s Global Environmental Health & Safety Advisory Council.
Steven E. Keller was recently announced as the Senior Vice President, General Counsel and Secretary. Mr. Keller served as General Counsel and Secretary from the Acquisition on November 30, 2004 until the end of 2006. Mr. Keller held various positions in Dana’s Law Department, most recently as Managing Attorney and a member of the Law Department’s Operating Committee. His responsibilities included serving as Strategic Business Unit counsel to the Aftermarket Group of Dana, division counsel to several Dana divisions, regional counsel to Dana’s Asia-Pacific operations, and providing legal advice on acquisition and divestiture transactions. Prior to joining Dana in 1993, Mr. Keller was a partner in the law firm of Hogan & Hartson. Mr. Keller earned a B.A. in Financial Administration from Michigan State University and his J.D. from the Marshall-Wythe School of Law at the College of William and Mary. He also attended the University of Michigan Executive Business School. He is a member of the Virginia Bar.
Timothy J. Zorn has served as Vice President, Human Resources since the Acquisition on November 30, 2004. Mr. Zorn held the same position with the Aftermarket Group of Dana from May 2003 until the Acquisition and was previously the Human Resources Manager of Dana’s Wix division from May 1999 until May 2003. Mr. Zorn joined Dana in 1974 as Sales Coordinator for the Automotive Aftermarket Division. After serving in several assignments in field sales and marketing positions, Mr. Zorn was part of the plant start up team in Foglesville, Pennsylvania. In 1984, he became the plant Superintendent at the Fort Wayne Distribution Center in Fort Wayne, Indiana. Mr. Zorn held several assignments in Human Resources as Plant and Division Human Resource Manager prior to his assignment of Director of Human Resources for the Wix Division. Mr. Zorn earned his Bachelor’s degree in Economics from Ohio Wesleyan Unive rsity. He is a certified SPHR and has served terms on the board of directors of several charitable and educational organizations.
Jerry A. McCabe was recently announced as Vice President, Business Architecture. Mr. McCabe served as Vice President, Communications and Marketing Services, from the Acquisition on November 30, 2004 until the end of 2006. Prior to the Acquisition, Mr. McCabe had served as Vice President, Marketing for the Aftermarket Group of Dana’s Under Hood Group from September 2000, and Vice President, Marketing for Clevite Engine Parts from the time Dana purchased Clevite in December 1998. He had been hired as Vice President, Marketing at Clevite in May 1994 and was appointed to its Board of Directors in 1996. For the previous 20 years, Mr. McCabe had held positions in sales, product management, marketing, and general management with aftermarket companies including McCord Gaskets, TRW and Camshaft Machine. He earned his B.B.A. in Marketing from Eastern Michigan University in 1975. After two tours of duty in Vietnam, Mr. McCabe was granted an Honorable Di scharge from the U.S. Army in 1970.
Larry W. McCurdy has served as Chairman of the Board of Directors since the Acquisition on November 30, 2004. He was President of the Aftermarket Group at Dana from 1998 until his
86
Table of Contentsretirement in 2000. He served as Chairman of the Board, President and Chief Executive Officer of Echlin, Inc. from March 1997 until its merger with Dana in 1998. He has also held senior executive positions at Cooper Industries, Inc. and Moog Automotive, Inc., where he served as President and Chief Executive Officer, and Tenneco Inc., where he served as President of its subsidiary Walker Manufacturing and Executive Vice President of its North American Operations. Mr. McCurdy also serves on the Boards of Directors of Lear Corporation, Mohawk Industries Inc. and General Parts, Inc.
Michael F. Finley has served as a Director since the Acquisition on November 30, 2004. Mr. Finley also serves as Chair of the Nominating Committee of our Board of Directors. Mr. Finley has been a Managing Director of Cypress since 1998 and has been a member of Cypress since its formation in April 1994. Prior to joining Cypress, he was a Vice President in the Merchant Banking Group at Lehman Brothers Inc. Mr. Finley received a B.A. from St. Thomas University and an M.B.A. from the University of Chicago’s Graduate School of Business. Mr. Finley currently serves on the Boards of Directors of CPI International, Inc., Williams Scotsman International, Inc. and Cooper-Standard Automotive Inc.
Donald J. Morrison has served as a Director since the Acquisition on November 30, 2004. Mr. Morrison is a Senior Vice President with OMERS Capital Partners, which makes private equity investments on behalf of OMERS, one of Canada’s largest pension funds. Before joining OMERS, Mr. Morrison spent ten years with PricewaterhouseCoopers LLP in Corporate Finance focusing on restructurings and turnarounds and eight years as Senior Vice President and member of the Senior Management Investment Committee with one of Canada’s largest venture capital funds originating and structuring expansion and buyout investments. Mr. Morrison has served on the Boards of Directors of over 20 public and private companies. Mr. Morrison has a B. Commerce degree from the University of Toronto, is a Chartered Accountant and a Chartered Insolvency and Restructuring Practitioner.
Joseph A. Onorato has served as a Director since the Acquisition on November 30, 2004. Mr. Onorato also serves as Chair of the Audit Committee of our Board of Directors. Mr. Onorato was Chief Financial Officer of Echlin, Inc., where he spent nineteen years. He served as Treasurer from 1990 to 1994, as Vice President and Treasurer from 1994 to 1997 and as Vice President and Chief Financial Officer from 1997 until the company was acquired by Dana in July 1998. Mr. Onorato served as Senior Vice President and Chief Financial Officer for the Aftermarket Group from July 1998 until his retirement in September 2000. Mr. Onorato previously worked for PricewaterhouseCoopers LLP.
John M. Riess has served as a Director since the Acquisition on November 30, 2004. He formerly served as Chairman and Chief Executive Officer of Breed Technologies, Inc. from 2000 to 2003. Prior to this, Mr. Riess held various management and executive positions within the Gates Rubber Company, serving as Chairman of the Board and Chief Executive Officer from 1997 to 1999. Mr. Riess also serves on the Board of Form Fiber Technology.
James A. Stern has served as a Director since the Acquisition on November 30, 2004. Mr. Stern also serves as Chair of the Compensation Committee of our Board of Directors. Mr. Stern is Chairman and CEO of Cypress, a position he has held since 1994. Mr. Stern headed Lehman Brothers’ Merchant Banking Group before leaving that firm to help found Cypress. During his 20-year tenure with Lehman, he held senior management positions where he was responsible for the high yield and primary capital markets groups. He also served as co-head of investment banking and was a member of Lehman’s operating committee. Before graduating from Harvard Business School, Mr. Stern earned a B.S. from Tufts University, where he is Chairman of the Board of Trustees. He also serves on the Boards of Directors of Lear Corporation, AMTROL, Inc., Med Pointe Inc. and Cooper-Standard Automotive Inc.
Code of Ethics
We have adopted a Code of Conduct, which applies to all of our officers, directors, and employees. A current copy of the code is posted at our website http://www.affiniagroup.com, and we will post at our website any changes to or waivers of our Code.
87
Table of ContentsBoard of Directors
Our board of directors currently consists of one class of eight directors who serve until resignation or removal.
Stockholders Agreement
Pursuant to the Stockholders Agreement dated as of November 30, 2004, among Affinia Group Holdings Inc., various Cypress funds, Ontario Municipal Employees Retirement Board (‘‘OMERS’’), The Northwestern Mutual Life Insurance Company, California State Teachers’ Retirement System and Stockwell Fund, L.P., the number of directors serving on the Board of Directors will be no less than seven and no more than eleven. The Stockholders Agreement entitles Cypress to designate three directors. Mr. Stern and Mr. Finley are both Cypress designees. As long as OMERS members own at least 50 percent in the aggregate of the number of shares owned by them on November 30, 2004, OMERS is entitled to designate one directo r, who currently is Mr. Morrison. Cypress is entitled to designate three independent directors, as defined by SEC rules, who currently are Mr. McCurdy, Mr. Onorato and Mr. Riess. Additionally, the Stockholders Agreement entitles the individual serving as CEO, currently Mr. McCormack, and another individual serving as one of our senior officers, currently Mr. Washbish, to seats on the Board of Directors. The Stockholders Agreement also provides that the nominating committee of the Board of Directors may from time to time select two additional individuals who must be independent to serve as directors.
Committees
Our board of directors currently has audit, compensation and nominating committees. Our audit committee currently consists of Mr. Onorato, Mr. Finley, Mr. Morrison and Mr. Riess, with Mr. McCurdy serving as an ex-officio, non-voting member. Mr. Onorato, the chair of our audit committee, is independent and is our ‘‘audit committee financial expert’’ as such term is defined in Item 401(h) of Regulation S-K. Our current compensation committee consists of Mr. Stern (chair), Mr. Riess, Mr. Onorato and Mr. Finley, with Mr. McCurdy serving as an ex-officio, non-voting member. Our curre nt nominating committee consists of Mr. Finley (chair), Mr. McCurdy and Mr. Morrison.
88
Table of Contents | |
| Item 11. | Executive Compensation |
Compensation Discussion and Analysis
Compensation Committee Role
The Compensation Committee, composed entirely of independent directors, administers our executive compensation program. The role of the Compensation Committee is to oversee our compensation and benefit plans and policies, administer our parent company’s equity incentive plans (including reviewing and approving equity grants to executive officers), establish annual goals and objectives for our Chief Executive Officer, and review and approve annually all compensation decisions relating to executive officers, including those for the Chief Executive Officer, Chief Financial Officer, and our next three most highly compensated executive officers, each of whom is named in the Summary Compensation Table (the ‘‘Named Exec utive Officers’’). The Compensation Committee recognizes the importance of maintaining sound principles for the development and administration of compensation and benefit programs, as well as ensuring that we maintain strong links between executive pay and performance. The Compensation Committee’s Charter details the Compensation Committee’s specific responsibilities and functions. The Compensation Committee annually reviews and revises its Charter, with the most recent review occurring at the Compensation Committee’s March 12, 2007 meeting. The full text of the Compensation Committee’s Charter is available on our website at www.affiniagroup.com. The Compensation Committee’s membership is determined by our board of directors and its meeting agendas are established by the Committee Chair. The Chief Executive Officer, Chief Financial Officer, General Counsel and Vice President of Human Resources generally attend meetings of the Compensation Committee, but do not attend executive sessions. There were six formal meetings of the Compensation Committee in 2006, including three executive sessions with the Compensation Committee members only. The Compensation Committee holds meetings in person, by telephone and also considers and takes action by written consent.
General Compensation Philosophy
The Compensation Committee believes that compensation paid to executive officers should be closely aligned with our performance on both a short-term and long-term basis, and that such compensation should enable us to attract, motivate and retain key executives critical to our long-term success. Total compensation should be structured to ensure that a significant portion of compensation opportunity will be directly related to factors that drive future financial and operating performance and align our executive officers’ long-term interests with those of our investors. To that end, the Compensation Committee has determined that the total compensation program for executive officers should consist of the following:
We pay each executive officer a base salary in recognition of his ongoing performance throughout the year. While a significant portion of each executive officer’s compensation is ‘‘at risk’’ in the form of equity incentive awards (stock options) and non-equity incentive awards (annual cash performance bonuses), the Compensation Committee believes it prudent that periodic base salary payments constitute an element of an executive officer’s compensation. We have entered into an employment agreement with each of our Named Executive Officers which, among other things, provides for periodic base salary payments. The employment agreements are described in more detail under the heading ‘‘Em ployment, Severance and Change in Control Agreements.’’
| | |
| (B) | Non-Equity Incentive Awards |
We provide for the opportunity to earn annual non-equity incentive awards (cash performance bonuses) to encourage and reward exceptional performance for the year. Annual non-equity incentive awards recognize the contribution of our executive officers to our overall financial, operational and strategic success. Amounts payable under the cash
89
Table of Contentsincentive award program depend on our EBITDA performance, our management of net working capital measured in relation to sales and to EBITDA. Because EBITDA is not a recognized term under United States Generally Accepted Accounting Principles, a reconciliation of EBITDA to net income is contained in the ‘‘Liquidity and Capital Resources’’ section of ‘‘Item 7. Management’s Discussion and Analysis of Financial Condition and Results of Operations’’. The range for 2006 of potential non-equity incentive award cash payments as a percentage of base salary is described in the ‘‘Grants of Plan Based Awards’’ table. We established the performance targets for our 2006 non-equity incentive compensation plan such that the threshold performance level was reasonably likely to be achieved while the target performance level required significant improvement over actual 2005 performance making it more difficult to achieve.
| | |
| (C) | Long-term Equity Incentive Awards |
We provide long-term equity incentive awards in the form of stock options to each of our executive officers. The Compensation Committee believes that these awards align our executive officer’s interests with those of our investors, as well as providing an effective incentive for our executive officers to remain with us. The principal terms of the stock option grants are described in the narrative following the ‘‘Outstanding Equity Awards at Fiscal Year End’’ table. The Compensation Committee is evaluating whether to establish minimum equity ownership targets for executive officers.
| | |
| (D) | Certain Other Benefits |
We provide our executive officers with benefits and perquisites we believe assist us in retaining their services. Some of these benefits are available to our employees generally (e.g., contributions to a defined contribution (401(k)) plan, health care coverage and paid vacation days) and some are available to a more limited number of key employees (e.g., car allowances and tax preparation services). The specific benefits provided to each Named Executive Officer are described in the ‘‘All Other Compensation’’ column of the Summary Compensation Table and in the Incremental Cost of Perquisite and Other Compensation table.
Our decisions on executive officer compensation are based primarily upon our assessment of each executive’s leadership and operational performance and potential to enhance long-term shareholder value. We rely upon our judgment about each individual (and not on rigid formulas or short-term changes in business performance) in determining the amount and mix of compensation elements and whether each particular payment or award provides an appropriate incentive and reward for performance that sustains and enhances long-term shareholder value. Key factors affecting our judgment include the executive officer’s: performance compared to the financial, operational and strategic goals established for the executive at the beginnin g of the year; nature, scope and level of responsibilities; contribution to our financial results, particularly with respect to key metrics such as EBITDA, net working capital and cash flow; effectiveness in leading our restructuring initiatives; and contribution to our commitment to corporate responsibility, including success in creating a culture of integrity and compliance with applicable laws and our ethics policies. The importance of each factor varies by individual. We also consider each executive’s current salary and prior-year bonus, the recommendations of the Chief Executive Officer regarding compensation for the executives he directly supervises, the appropriate balance between incentives for long-term and short-term performance, the compensation paid to the executive’s peers within the company and the compensation paid to executives at peer group companies. In addition, we review the total compensation potentially payable to, and the benefits accruing to, the executive, including (1) c urrent value of outstanding equity incentive awards and (2) potential payments under each executive’s employment agreement upon termination of employment or a change in control.
Our human resources department supports the Compensation Committee in its responsibilities. At the Compensation Committee’s request, our Vice President of Human Resources retained an independent external compensation consultant to provide the Compensation Committee with an executive salary survey that considered the compensation levels and performances of the following
90
Table of Contentspeer groups companies, as these companies are most likely to compete with us for the services of our executives: American Axle & Manufacturing Inc., Applied Industrial Technologies Inc., Borg Warner Automotive Inc., Cooper Tire & Rubber Co., Cummins Inc., Dura Automotive Systems Inc., Exide Technologies, Flowserve Corp., Gencorp Inc., General Cable Corp., Gentek Inc., Hayes Lemmerz International Inc., Modine Manufacturing Co., Tenneco Inc., Timken Co., and Tower Automotive Inc. However, we do not tie our compensation decisions to any particular range or level of total compensation paid to executives at these companies.
Employment, Severance, and Change in Control Agreements
On July 21, 2005 we entered into employment agreements with each of Messrs. McCormack (Chief Executive Officer and President), Washbish (President, Under Vehicle Group, and Customer Relationship Management), Wilson (President, Under Hood Group), Madden (Senior Vice President and Chief Financial Officer) and Keller (Senior Vice President, General Counsel and Secretary), with substantially identical terms, except as noted below.
Each such employment agreement has an employment term which commenced as of May 1, 2005 and, unless earlier terminated, will continue until December 31, 2007 and on each December 31 thereafter, will be automatically extended for successive additional one year periods thereafter unless either party provides the other 90 days prior written notice that the employment term will not be so extended. Under the employment agreements, Messrs. McCormack, Washbish, Wilson, Madden and Keller will be entitled to base salaries of $600,000, $426,000, $300,000, $275,000 and $275,000, respectively, subject to such increases, if any, as may be determined by the Board. Effective April 16, 2006, the Compensation Committee increased Mr. Wilson’s salary to $315,000. The Compensation Committee, pursuant to a unanimous consent resolution dated as of January 1, 2007, approved a salary increase for each Named Executive Officer, effective January 1, 2007, which increase will result in base salaries for Messrs. McCormack, Washbish, Wilson, Madden and Keller of $630,000, $448,000, $360,000, $290,000, and $290,000, respectively. In addition, the employment agreements provide that our Named Executive Officers are eligible to earn an annual cash incentive award as a percentage of base salary (100% for Messrs. McCormack, Washbish and Wilson and 80% for Messrs. Madden and Keller) upon the achievement of performance goals established by the Board and are entitled to a greater cash incentive award for performance in excess of targeted performance goals or a lesser cash incentive award for performance which does not meet targeted performance goals, in each case, in the discretion of the Board.
Upon termination, each executive has agreed to certain post-termination restrictions and each executive is entitled to certain payments and benefits depending on the reason for termination. A description of these provisions, together with a table detailing amounts payable to our Named Executive Officers upon the occurrence of certain termination events, begins under the heading ‘‘Termination Provisions of Employment Agreements.’’
The employment agreements described above supersede all prior employment agreements or understandings between these executives and us and our affiliates regarding their employment.
Financial Restatement
It is the Board of Directors’ Policy that the Compensation Committee will, to the extent permitted by governing law, have the sole and absolute authority to make retroactive adjustments to any cash or equity based incentive compensation paid to executive officers and certain other employees where the payment was predicated upon the achievement of certain financial results that were subsequently the subject of a restatement. Where applicable, we will seek to recover any amount determined to have been inappropriately received by the individual executive.
Executive Compensation
The following table summarizes all compensation awarded to, earned by, or paid to our Named Executive Officers, for the last fiscal year for service to Affinia Group Intermediate Holdings Inc., Affinia Group Inc. and their subsidiaries. Mr. McCormack and Mr. Washbish each also served as a director but received no separate remuneration in that capacity.
91
Table of ContentsSUMMARY COMPENSATION TABLE
| | | | | | | | | | | | | | | | | | | | | | | | | | | | | | | | | | | | | | | | | | | | | | | | | | | | | | |
| Name and Principal Position | | | Year | | | Salary1
($) | | | Bonus
($) | | | Stock
Awards
($) | | | Option
Awards2
($) | | | Non-Equity
Incentive Plan
Compensation
($) | | | Change in
Pension
Value and
Nonqualified
Deferred
Compensation
Earnings
($) | | | All Other
Compensation3
($) | | | Total
($) |
Terry R. McCormack
President and Chief Executive Officer
| | | | | 2006 | | | | | | 600,000 | | | | | | -0- | | | | | | -0- | | | | | | 73,971 | | | | | | 531,600 | | | | | | -0- | | | | | | 87,260 | | | | | | 1,292,831 | |
Thomas H. Madden
Senior Vice President and Chief Financial Officer
| | | | | 2006 | | | | | | 275,000 | | | | | | -0- | | | | | | -0- | | | | | | 35,929 | | | | | | 194,920 | | | | | | -0- | | | | | | 28,410 | | | | | | 534,259 | |
John R. Washbish
President, Under Vehicle Group and Customer Relationship Management
| | | | | 2006 | | | | | | 426,000 | | | | | | -0- | | | | | | -0- | | | | | | 61,290 | | | | | | 372,120 | | | | | | -0- | | | | | | 81,888 | | | | | | 941,298 | |
Keith A. Wilson
President, Under Hood Group
| | | | | 2006 | | | | | | 310,625 | | | | | | -0- | | | | | | -0- | | | | | | 38,042 | | | | | | 265,800 | | | | | | -0- | | | | | | 43,918 | | | | | | 658,385 | |
Steven E. Keller
Senior Vice President, General Counsel and Secretary | | | | | 2006 | | | | | | 275,000 | | | | | | -0- | | | | | | -0- | | | | | | 27,475 | | | | | | 194,920 | | | | | | -0- | | | | | | 29,389 | | | | | | 526,784 | |
|
| |
| 1 | Effective April 16, 2006, Mr. Wilson’s salary was increased from $300,000 to $315,000. |
| |
| 2 | Reflects the amounts recognized for 2006 financial statement reporting purposes in connection with the vesting of a portion of the options awarded August 1, 2005 to certain key employees, including the Named Executive Officers. See Note 9. Stock Option Plans – Method Of Accounting And Our Assumptions – for a discussion of the valuation assumptions used in determining the amounts contained in this column. No option awards were made to the Named Executive Officers in 2006. |
| |
| 3 | Mr. Washbish’s salary and bonus were computed incorrectly for 2005 and corrected in 2006 in the amount of $8,200. The other components of the amounts in this column are described in the ‘‘Incremental Cost of Perquisites and Other Compensation’’ table. |
92
Table of ContentsINCREMENTAL COST OF PERQUISITES AND OTHER COMPENSATION
| | | | | | | | | | | | | | | | | | | | | | | | | | | | | | | | | | | | | | | | | | | | | | | | | | | | | | |
| Name and Principal Position | | | Tax
Preparation
and
Financial
Planning1 | | | Vehicle
Allowance/
Leases2 | | | Relocation
Costs3 | | | Annual
Physical4 | | | Supplemental
Life
Insurance | | | 401(k)
Basic
Contribution | | | 401(k)
Matching
Contribution | | | Tax
Gross-Up5 | | | Total |
Terry R. McCormack
President and Chief Executive Officer
| | | | | 8,000 | | | | | | 14,949 | | | | | | 31,379 | | | | | | ____ | | | | | | 5,519 | | | | | | 6,600 | | | | | | 5,500 | | | | | | 15,313 | | | | | | 87,260 | |
Thomas H. Madden
Senior Vice President and Chief Financial Officer
| | | | | 643 | | | | | | 15,269 | | | | | | ____ | | | | | | ____ | | | | | | ____ | | | | | | 6,600 | | | | | | 5,500 | | | | | | 398 | | | | | | 28,410 | |
John R. Washbish
President, Under Vehicle Group and Customer Relationship Management
| | | | | 1,618 | | | | | | 5,689 | | | | | | 47,754 | | | | | | ____ | | | | | | ____ | | | | | | 6,600 | | | | | | 4,199 | | | | | | 7,828 | | | | | | 73,688 | |
Keith A. Wilson
President, Under Hood Group
| | | | | 9,000 | | | | | | 17,554 | | | | | | ____ | | | | | | 541 | | | | | | ____ | | | | | | 6,600 | | | | | | 5,500 | | | | | | 4,723 | | | | | | 43,918 | |
Steven E. Keller
Senior Vice President, General Counsel and Secretary | | | | | 1,143 | | | | | | 16,592 | | | | | | ____ | | | | | | ____ | | | | | | ____ | | | | | | 6,600 | | | | | | 3,299 | | | | | | 1,755 | | | | | | 29,389 | |
|
| |
| 1 | Amounts for Messrs. Madden and Keller reflect reimbursement only for tax preparation costs. |
| |
| 2 | We have adopted a vehicle allowance program to replace our vehicle lease program. The vehicle lease program is being phased out for most employees, including the Named Executive Officers, over a three year period depending on the age and mileage of each leased vehicle. For participants in the vehicle lease program, we pay all costs of vehicle operation, including maintenance, fuel, and insurance. These operating costs (McCormack, $3,456; Washbish, $2,071; Wilson, $222; Keller, $801) are included in this column. |
| |
| 3 | Mr. Washbish’s relocation costs in connection with his move from Michigan to the McHenry, Illinois area (which is the location of the headquarters for the Under Vehicle Group) include a housing allowance ($9,000) paid in repayment of his living expenses prior to his purchase of a home in the McHenry, Illinois area, and relocation costs ($38,754) paid to Mr. Washbish in accordance with our relocation policy upon the purchase of his home in the McHenry, Illinois area. Mr. McCormack’s relocation costs were incurred in connection with his move from Ohio to Michigan following the Acquisition and our establishment of our corporate headquarters in Ann Arbor, Michigan. |
| |
| 4 | The amount in this column represents the cost of Mr. Wilson’s annual physical which exceeded the amount provided for in our health plan. |
| |
| 5 | The amounts in this column constitute the tax gross-up expense incurred in respect of tax preparation and financial planning costs, vehicle lease costs, a portion of the relocation costs, and supplemental life insurance costs shown in the table. |
93
Table of Contents2006 GRANTS OF PLAN-BASED AWARDS
| | | | | | | | | | | | | | | | | | | | | | | | | | | | | | | | | | | | | | | | | | | | | | | | | | | | | | | | | | | | | | | |
| | | | | | | Estimated Future Payouts
Under Non-Equity
Incentive Plan Awards | | | Estimated Future Payouts
Under Equity
Incentive Plan Awards | | | | | | | | | | | | |
| Name | | | Grant
Date | | | Threshold
($) | | | Target
($) | | | Maximum
($) | | | Threshold
(#) | | | Target
(#) | | | Maximum
(#) | | | All
Other
Stock
Awards:
Number
of
Shares
of
Stock
Units
($) | | | All
Other
Option
Awards:
Number
of
Securities
Underlying
Options
($) | | | Exercise
or
Base
Price
of
Option
Awards
($/Sh) | | | Grant
Date
Fair
Value
of
Stock
and
Option
Awards
($) |
| Terry R. McCormack | | | June 16,
2006 | | | | | -0- | | | | | | 600,000 | | | | | | 1,050,000 | | | | | | — | | | | | | — | | | | | | — | | | | | | — | | | | | | — | | | | | | — | | | | | | — | |
| President and Chief Executive Officer | | | November 14,
2006 | | | | | — | | | | | | — | | | | | | — | | | | | | 7,000 | | | | | | — | | | | | | — | | | | | | — | | | | | | — | | | | | | 100 | | | | | | 1,514 | |
| Thomas H. Madden | | | June 16,
2006 | | | | | -0- | | | | | | 220,000 | | | | | | 385,000 | | | | | | — | | | | | | — | | | | | | — | | | | | | — | | | | | | — | | | | | | — | | | | | | — | |
| Senior Vice President and Chief Financial Officer | | | November 14,
2006 | | | | | — | | | | | | — | | | | | | — | | | | | | 3,400 | | | | | | — | | | | | | — | | | | | | — | | | | | | — | | | | | | 100 | | | | | | 736 | |
| John R. Washbish | | | June 16,
2006 | | | | | -0- | | | | | | 426,000 | | | | | | 745,500 | | | | | | — | | | | | | — | | | | | | — | | | | | | — | | | | | | — | | | | | | — | | | | | | — | |
| President, Under Vehicle Group and Customer Relationship Management | | | November 14,
2006 | | | — | | | — | | | — | | | 5,850 | | | — | | | — | | | — | | | — | | | 100 | | | 1,255 |
| Keith A. Wilson | | | June 16,
2006 | | | -0- | | | 300,000 | | | 525,000 | | | — | | | — | | | — | | | — | | | — | | | — | | | — |
| President, Under Hood Group | | | November 14,
2006 | | | — | | | — | | | — | | | 3,600 | | | — | | | — | | | — | | | — | | | 100 | | | 779 |
| Steven E. Keller | | | June 16,
2006 | | | -0- | | | 220,000 | | | 385,000 | | | — | | | — | | | — | | | — | | | — | | | — | | | — |
| Senior Vice President, General Counsel and Secretary | | | November 14,
2006 | | | — | | | — | | | — | | | 2,600 | | | — | | | — | | | — | | | — | | | 100 | | | 563 |
|
94
Table of ContentsNon-Equity Incentive Plan Awards
The Compensation Committee provides for non-equity incentive plan awards in the form of an annual cash incentive award plan. Amounts payable under the cash incentive plan are a function of our full year EBITDA performance, working capital measured in relation to sales, and to EBITDA. Under the terms of the incentive plan, regardless of our EBITDA performance or working capital as a percentage of sales, no cash awards are payable if the ratio of working capital to EBITDA exceeds the specified maximum performance level. If the ratio of working capital to EBITDA is below the specified maximum performance level, then participants in the cash incentive plan have the opportunity to earn cash incentive awards based on our (or a particula r business unit’s) achievement of specified EBITDA performance levels and performance levels for working capital as a percentage of sales. The incentive plan establishes certain minimum performance levels, below which no cash incentive award is payable. At the minimum performance levels, a participant is entitled to a payout equal to 50% of their target cash incentive award opportunity (which is a specified percentage of base salary ranging from 10% to 100% and, in the case of our Named Executive Officers, is 100% for Messrs. McCormack, Washbish and Wilson, and 80% for Messrs. Madden and Keller). As an example, a participant whose target cash incentive award opportunity is 25% of base salary would be entitled to a cash incentive award of 12.5% (50% times 25%) of base salary upon achievement of the minimum performance levels. At the established target performance level, a participant is entitled to a payment equal to 100% of their target cash incentive award opportunity. Performance above the establishe d target performance levels entitles participants to a greater percentage of their target cash incentive award opportunity, up to a maximum of 175%. Actual awards for 2006 are described in the ‘‘Non-Equity Incentive Plan Compensation’’ column of the Summary Compensation Table.
Equity Incentive Plan Awards
The Compensation Committee grants equity incentive awards (stock options) periodically, as and when appropriate in the Compensation Committee’s judgment. On July 20, 2005, we adopted the Affinia Group Holdings Inc. 2005 Stock Incentive Plan, which we refer to as our stock incentive plan. The stock incentive plan permits the grant of non-qualified stock options, incentive stock options, stock appreciation rights, restricted stock and other stock-based awards to employees, directors or consultants of Affinia Group Holdings Inc. and its affiliates. The Compensation Committee has granted only stock options pursuant to the stock incentive plan and has not granted any other stock-based awards. A maximum of 227,000 shares of common stock may be subject to awards under the stock incentive plan. The number of shares issued or reserved pursuant to the stock incentive plan (or pursuant to outstanding awards) is subject to adjustment on account of mergers, consolidations, reorganizations, stock splits, stock dividends and other dilutive changes in the common stock. Shares of common stock covered by awards that terminate or lapse and shares delivered by a participant or withheld to pay the minimum statutory withholding rate, in each case, will again be available for grant under the stock incentive plan.
Administration. The stock incentive plan is administered by the compensation committee of our Board of Directors; provided, that our Board of Directors may take any action designated to the Compensation Committee. The Compensation Committee has full power and authority to make, and establish the terms and conditions of any award, and to waive any such terms and conditions at any time (including, without limitation, accelerating or waiving any vesting conditions or payment dates). The Compensation Committee is authorized to interpret the plan, to establish, amend and rescind any rules and regulations relating to the plan and to make any other determinations that it, in good faith, deems necessary or desirable for the administration of the plan and may delegate such authority as it deems appropriate. The Compensation Committee may correct any defect or supply any omission or reconcile any inconsistency in the plan in the manner and to the extent the Compensation Committee deems necessary or desirable and any decision of the Compensation Committee in the interpretation and administration of the plan shall lie within its sole and absolute good faith discretion and shall be final, conclusive and binding on all parties concerned.
Options. The Compensation Committee determines the option price for each option; provided, however, that incentive stock options must have an exercise price that is at least equal to the fair
95
Table of Contentsmarket value of the common stock on the date the option is granted. An option holder may exercise an option by written notice and payment of the option price (i) in cash or its equivalent, (ii) by the surrender of a number of shares of common stock already owned by the option holder for at least six months (or such other period established by the Compensation Committee) with a fair market value equal to the exercise price, (iii) if there is a public market for the shares, subject to rules established by the Compensation Committee, through the delivery of irrevocable instructions to a broker to sell shares obtained upon the exercise of the option and to deliver to Affinia Group Holdings Inc. an amount out of the proceeds of the sale equal to the aggregate option price for the shares being purchased or (iv) by another method approved by the Compensation Committee.
Stock Appreciation Rights. The Compensation Committee may grant stock appreciation rights independent of or in connection with an option. The exercise price per share of a stock appreciation right shall be an amount determined by the Compensation Committee. Generally, each stock appreciation right shall entitle a participant upon exercise to an amount equal to (i) the excess of (1) the fair market value on the exercise date of one share of common stock over (2) the exercise price, multiplied by (ii) the number of shares of common stock covered by the stock appreciation right. Payment shall be made in common stock or in cash, or partly in common stock and partly in cash, all as shall be determined by the Compensation Committee.
Other Stock-Based Awards. The Compensation Committee may grant awards of restricted stock units, rights to purchase stock, restricted stock and other awards that are valued in whole or in part by reference to, or are otherwise based on the fair market value of, shares of common stock. The other stock-based awards will be subject to the terms and conditions established by the Compensation Committee.
Transferability. Unless otherwise determined by the Compensation Committee, awards granted under the stock incentive plan are not transferable other than by will or by the laws of descent and distribution.
Change of Control. In the event of a change of control (as defined in the stock incentive plan), the Compensation Committee may provide for (i) the termination of an award upon the consummation of the change of control, but only if the award has vested and been paid out or the participant has been permitted to exercise an option in full for a period of not less than 30 days prior to the change of control, (ii) the acceleration of all or any portion of an award, (iii) payment in exchange for the cancellation of an award and/or (iv) the issuance of substitute awards that would substantially preserve the terms of any awards.
Amendment and Termination. Our Board of Directors may amend, alter or discontinue the stock incentive plan in any respect at any time, but no amendment may diminish any of the rights of a participant under any awards previously granted, without his or her consent.
Management or Director Stockholders Agreement. All shares issued under the plan will be subject to the management stockholders agreement or directors stockholders agreement, as applicable. The stockholder’s agreements impose restrictions on transfers of the shares by the individuals and also provide for various put and call rights with respect to the shares. These put and call rights include the individual’s right to require Affinia Group Holdings Inc. to purchase the shares on death or disability at the then-fair market value of the shares and Affinia Group Holdings Inc.’s option to repurchase the shares upon specified events, including termination of service or employment at a price equal to the then-fair market value or, in certain circumstances, at a price equal to the lesser of $100.00 and the then-fair market value. The individuals have also been granted limited ‘‘piggyback’’ re gistration rights with respect to the shares. Certain individuals also entered into confidentiality and non-competition agreements in connection with the shares they purchased. The forms of the various agreements are referenced under Item 15. Exhibits and Financial Statement Schedules, and the forms of the agreements relating to the directors are substantially similar to the forms relating to management.
Restrictive Covenant Agreement. Unless otherwise determined by our Board of Directors, all award recipients will be obligated to sign the standard Confidentiality, Non-Competition and Proprietary Information Agreement which includes restrictive covenants regarding confidentiality,
96
Table of Contentsproprietary information and a one year period restricting competition and solicitation of our clients, customers or employees. In the event a participant breaches these restrictive covenants, any exercise of, or payment or delivery pursuant to, an award may be rescinded by the Compensation Committee in its discretion in which event the participant may be required to pay to us the amount of any gain realized in connection with, or as a result of, the rescinded exercise, payment or delivery.
Modification of Stock Options. On November 14, 2006, the Compensation Committee revised the vesting terms applicable to stock options previously awarded by the Compensation Committee to our Named Executive Officers, as well as all other employees, under the stock incentive plan. One-half of these options vest in equal portions at the end of each year beginning with the year of the grant and ending December 31, 2009, 40% are eligible for vesting in equal portions upon our achievement of certain specified annual EBITDA performance targets over the vesting period and 10% are eligible for vesting in equal portions upon our achievement of certain specified annual net working capital performance targets over the Vesting Period. The Compensation Committee has elected to modify the vesting terms for the EBITDA performance options so that these options will be eligible for vesting in equal portions at the end of each of the years 2007 , 2008 and 2009. The Compensation Committee also reduced the performance targets for those years. The Compensation Committee has not modified the time-vesting options or the working capital performance options.
None of our Named Executive Officers was granted any equity incentive awards for 2006. However, the Compensation Committee, pursuant to a unanimous consent resolution dated as of January 1, 2007, approved grants of the following equity incentive awards with an effective grant date of January 1, 2007:
| | | | | | |
| Name | | | Number of
Stock Options |
| Mr. McCormack | | | | | 5,000 | |
| Mr. Washbish | | | | | 3,500 | |
| Mr. Wilson | | | | | 3,300 | |
| Mr. Madden | | | | | 2,000 | |
| Mr. Keller | | | | | 2,000 | |
|
The Compensation Committee grants equity incentive awards to new employees at the same time as the Compensation Committee grants equity incentive awards to existing employees. The Compensation Committee has not made any grants of equity incentive awards where the grant date has been determined by reference to any fact or circumstance particular to a new employee’s hiring date. However, the Compensation Committee has delegated to Mr. Finley the authority to grant up to 10,000 stock options in the aggregate (and not more than 5,000 stock options to any one grantee) in connection with the hiring of key employees between meetings of the Compensation Committee. As of December 31, 2006, Mr. Finley had not exercised his delegated a uthority.
97
Table of ContentsOUTSTANDING EQUITY AWARDS AT 2006 FISCAL-YEAR END
| | | | | | | | | | | | | | | | | | | | | | | | | | | | | | |
| | | | Option Awards |
| Name | | | Number of
Securities
Underlying
Unexercised
Options
(#)
Exercisable | | | Number of
Securities
Underlying
Unexercised
Options
(#)
Unexercisable | | | Equity Incentive
Plan Awards:
Number of
Securities
Underlying
Unexercised
Unearned
Options
(#) | | | Option
Exercise
Price
($) | | | Option
Expiration
Date |
Terry R. McCormack
President and Chief Executive Officer
| | | | | 3,850 | | | | | | 5,250 | | | | | | 8,400 | | | | | | 100 | | | | | | 8/1/2015 | |
Thomas H. Madden
Senior Vice President and Chief Financial Officer
| | | | | 1,870 | | | | | | 2,550 | | | | | | 4,080 | | | | | | 100 | | | | | | 8/1/2015 | |
John R. Washbish
President, Under Vehicle Group and Customer Relationship Management
| | | | | 3,170 | | | | | | 4,350 | | | | | | 6,980 | | | | | | 100 | | | | | | 8/1/2015 | |
Keith A. Wilson
President, Under Hood Group
| | | | | 1,980 | | | | | | 2,700 | | | | | | 4,320 | | | | | | 100 | | | | | | 8/1/2015 | |
Steven E. Keller
Senior Vice President, General Counsel and Secretary | | | | | 1,430 | | | | | | 1,950 | | | | | | 3,120 | | | | | | 100 | | | | | | 8/1/2015 | |
|
As of December 31, 2006, all outstanding equity awards granted to our Named Executive Officers were in the form of stock option awards granted pursuant to our stock incentive plan which is described in more detail under the heading ‘‘Equity Incentive Plan Awards.’’ The equity awards described in this table have the following terms:
| | |
| • | An exercise price at least equal to the fair market value of Affinia Group Holdings Inc.’s common stock on the date of grant. |
| | |
| • | For stock options granted to key employees, a vesting schedule pursuant to which (i) one-half of the stock options vest in equal portions at the end of each year beginning with the year of the grant and ending December 31, 2009, (ii) 40% are eligible for vesting in equal portions at the end of each year beginning December 31, 2007 and ending December 31, 2009 based on the achievement of certain specified annual EBITDA performance objectives, and (iii) 10% are eligible for vesting in equal portions at the end of each year beginning with the year of the grant and ending December 31, 2009 based on the achievement of certain specified annual net working capital performance objectives. |
Because our parent company’s equity securities are not publicly traded, the Compensation Committee obtained an independent third party appraisal of the fair market value of our parent company’s securities prior to the grant of these stock options, which valuation confirmed that the exercise price was not less than the fair market value of our parent company’s equity securities on each grant date.
Option Exercises and Stock Vested
None of our Named Executive Officers exercised any stock options in 2006, nor have any of them received any restricted stock, phantom stock units or other awards of shares of stock with vesting provisions.
98
Table of ContentsPension Benefits
We do not sponsor a defined benefit plan for our U.S. employees. None of the Named Executive Officers participate in or are entitled to receive benefits pursuant to any defined benefit plan sponsored by us. We do offer a defined contribution (401(k)) plan for our U.S. employees pursuant to which we contribute three percent of an employee’s earnings and also match fifty percent of the first five percent of an employee’s pre-tax contributions, all subject to applicable Internal Revenue Service limitations.
Nonqualified Deferred Compensation
We do not offer our employees, including our Named Executive Officers, the opportunity to defer any portion of their salary, bonus, non-equity incentive awards, equity incentive awards or any other component of total compensation.
Termination Provisions of Employment Agreements
Each of our Named Executive Officers entered into an employment agreement with us, the terms of which are described under the heading ‘‘Employment, Severance, and Change in Control Agreements.’’ Specifically with respect to termination under the employment agreements, each executive is entitled to the following payments and benefits in the event of a termination by us without cause (as defined in the agreement) or by the executive for good reason (as defined in the agreement) during the employment term: (i) subject to the executive’s compliance with the restrictive covenants described below, an amount equal to the ‘‘severance multiple’’ (2.0 times for each of Messrs. McCormack, Washbish and Wilson; 1.5 times for each of Messrs. Madden and Keller) times the sum of base salary and the ‘‘average annual bonus’’ paid under the agreement for the preceding two years (the ‘‘Multiplier’’), payable as follows: an amount equal to 1 times the Multiplier to be paid in equal monthly installments for 12 months following termination of employment and the balance to be paid in a lump sum on the first anniversary of the termination of the executive’s employment; (ii) a pro-rata annual bonus for the year of termination; and (iii) continued medical and dental coverage at our cost, on the same basis made available for active employees for a period of years corresponding with the severance multiple; provided that if such coverage is not available for any portion of such period under our medical plans, we may pay the executive an amount equal to the premium cost otherwise payable by executives (without giving effect to any employer subsidies) under o ur plans for such coverage. In addition, if the executive is terminated by us without cause or the executive resigns for good reason within two years following a change of control, the executive shall be entitled to a supplemental payment equal to the excess, if any, of (A) the product of the severance multiple times the executive’s target annual bonus, over (B) the product of the severance multiple times the average annual bonus described above.
In addition, in the event the employment term ends due to election by either party not to extend the employment term, then the executive shall be entitled, subject to the executive’s compliance with the restrictive covenants described below, to (x) if we elect not to extend the employment term, an amount equal to the ‘‘severance multiple’’ times the base salary, payable as follows: an amount equal to 1 times the base salary to be paid in 12 equal monthly installments following termination of employment and the balance to be paid in a lump sum on the first anniversary of the termination of the executive’s employment and (y) if the executive elects not to extend the employment term, an amount equa l to 2 times (in the case of Messrs. McCormack, Washbish and Wilson) or 1 times (in the case of Messrs. Madden and Keller) the base salary paid in equal monthly installments over 24 months (in the case of Messrs. McCormack, Washbish and Wilson) or 12 months (in the case of Messrs. Madden and Keller).
Each executive is restricted, for a period following termination of employment (24 months for Messrs. McCormack, Washbish and Wilson; 18 months for Messrs. Madden and Keller (or 12 months for Messrs. Madden and Keller if their employment agreement expires due to their election not to extend the term)), from (i) soliciting in competition certain of our customers, (ii) competing with us or entering the employment or providing services to entities who compete with us or (iii) soliciting or hiring our employees.
99
Table of ContentsTOTAL POTENTIAL PAYOUT PURSUANT TO EMPLOYMENT AGREEMENT
ASSUMING TERMINATION EVENT OCCURS ON DECEMBER 31, 2006
| | | | | | | | | | | | | | | | | | | | | | | | | | | | | | | | | | | | | | | | | | | | | |
| | | | | | | Termination by
Company w/o
Cause or by
Executive for
Good Reason2 | | | | | | Termination Due to
Non-Renewal of
Employment
Agreement2 | | | | | | |
| Name | | | Benefit1 | | | Normally | | | After
Change
in
Control | | | Termination
by
Company
for Cause2 | | | By
Company | | | By
Executive | | | Voluntary
Resignation
by
Executive2 | | | Death or
Disability3 |
| Terry R. McCormack | | | •Severance | | | | | 2,151,600 | | | | | | 2,400,000 | | | | | | N/A | | | | | | 1,200,000 | | | | | | 1,200,000 | | | | | | N/A | | | | | | N/A | |
| President and Chief Executive Officer | | | •Continued
medical
coverage | | | | | 17,496 | | | | | | 17,496 | | | | | | N/A | | | | | | N/A | | | | | | N/A | | | | | | N/A | | | | | | N/A | |
| Thomas H. Madden | | | •Severance | | | | | 674,190 | | | | | | 742,500 | | | | | | N/A | | | | | | 412,500 | | | | | | 275,000 | | | | | | N/A | | | | | | N/A | |
| Senior Vice President and Chief Financial Officer | | | •Continued
medical
coverage | | | | | 13,122 | | | | | | 13,122 | | | | | | N/A | | | | | | N/A | | | | | | N/A | | | | | | N/A | | | | | | N/A | |
| John R. Washbish | | | •Severance | | | | | 1,518,120 | | | | | | 1,704,000 | | | | | | N/A | | | | | | 852,000 | | | | | | 852,000 | | | | | | N/A | | | | | | N/A | |
| President, Under Vehicle Group and Customer Relationship Management | | | •Continued
medical
coverage | | | | | 17,496 | | | | | | 17,496 | | | | | | N/A | | | | | | N/A | | | | | | N/A | | | | | | N/A | | | | | | N/A | |
| Keith A. Wilson | | | •Severance | | | | | 1,130,800 | | | | | | 1,260,000 | | | | | | N/A | | | | | | 630,000 | | | | | | 630,000 | | | | | | N/A | | | | | | N/A | |
President, Under
Hood Group | | | •Continued
medical
coverage | | | | | 17,496 | | | | | | 17,496 | | | | | | N/A | | | | | | N/A | | | | | | N/A | | | | | | N/A | | | | | | N/A | |
| Steven E. Keller | | | •Severance | | | | | 674,190 | | | | | | 742,500 | | | | | | N/A | | | | | | 412,500 | | | | | | 275,000 | | | | | | N/A | | | | | | N/A | |
Senior Vice President,
General Counsel and Secretary | | | •Continued
medical
coverage | | | | | 13,122 | | | | | | 13,122 | | | | | | N/A | | | | | | N/A | | | | | | N/A | | | | | | N/A | | | | | | N/A | |
|
| |
| 1 | The Named Executive Officers are entitled to continued medical and dental coverage for 2 years in the case of Messrs. McCormack, Washbish and Wilson, and 18 months in the case of Messrs. Madden and Keller. |
| |
| 2 | Amounts payable under our non-equity incentive plan (annual cash incentive plan) are earned on the last day of the applicable calendar year. Because this table assumes that the termination event occurred on December 31, 2006, each Named Executive Officer (as well as any other employee participating in the cash incentive plan) would be entitled to payment of the cash incentive award earned pursuant to the 2006 non-equity cash incentive plan. |
| |
| 3 | Upon death or disability, the Named Executive Officer (or his estate) is entitled to receive any earned but unpaid cash incentive award plus a pro-rata portion of any annual cash incentive award that the Named Executive Officer would have earned had his employment not terminated. Because this table assumes that the termination event occurred on December 31, 2006, each Named Executive Officer (as well as any other employee participating in the cash incentive plan) would be entitled to payment of the cash incentive award earned pursuant to the 2006 non-equity incentive plan. |
100
Table of ContentsDirector Compensation
The following table summarizes all compensation for our non-employee directors for 2006.
| | | | | | | | | | | | | | | | | | | | | | | | | | | | | | | | | | | | | | | | | | |
| Name | | | Fees Earned
or Paid
in Cash1
($) | | | Stock
Awards
($) | | | Option
Awards2
($) | | | Non-Equity
Incentive
Plan Compensation
($) | | | Change in
Pension Value
and
Nonqualified
Deferred
Compensation
Earnings | | | All Other
Compensation
($) | | | Total
($) |
| Michael F. Finley | | | | | -0- | | | | | | -0- | | | | | | -0- | | | | | | -0- | | | | | | -0- | | | | | | -0- | | | | | | -0- | |
| Larry W. McCurdy | | | | | 67,500 | | | | | | -0- | | | | | | 4,227 | | | | | | -0- | | | | | | -0- | | | | | | -0- | | | | | | 71,727 | |
| Donald J. Morrison | | | | | -0- | | | | | | -0- | | | | | | -0- | | | | | | -0- | | | | | | -0- | | | | | | -0- | | | | | | -0- | |
| Joseph A. Onorato | | | | | 105,000 | | | | | | -0- | | | | | | 4,227 | | | | | | -0- | | | | | | -0- | | | | | | -0- | | | | | | 109,227 | |
| John M. Riess | | | | | 75,000 | | | | | | -0- | | | | | | 4,227 | | | | | | -0- | | | | | | -0- | | | | | | -0- | | | | | | 79,227 | |
| James A. Stern | | | | | -0- | | | | | | -0- | | | | | | -0- | | | | | | -0- | | | | | | -0- | | | | | | -0- | | | | | | -0- | |
|
| |
| 1 | Mr. McCurdy, Mr. Riess and Mr. Onorato each earned $45,000 in annual retainer fees. Mr. McCurdy also earned $15,000 for serving as Board Chairman and $7,500 in meeting fees. Mr. Onorato also earned $30,000 for serving as Audit Committee Chair and $30,000 in meeting fees. Mr. Riess also earned $30,000 in meeting fees. |
| |
| 2 | Reflects the amounts recognized for 2006 financial statement reporting purposes in connection with the vesting of a portion of the options awarded August 1, 2005. See Note 9. Stock Option Plans – Method Of Accounting And Our Assumptions – for a discussion of the valuation assumptions used in determining the amounts contained in this column. For stock options granted to directors, the equity awards have a vesting schedule pursuant to which the stock options vest in equal portions at the end of each year, beginning with the year of the grant and ending December 31, 2009. None of our non-management directors were granted any equity incentive awards for 2006. However, the Compensation Committee, pursuant to a unanimous consent resolution dated as of January 1, 2007, approved a grant of 1,000 stock options to each non-management director with an effective grant date of January 1, 2007. |
At its meeting on July 24, 2006, the Compensation Committee approved an increase in the annual retainer for independent directors from $40,000 to $50,000, effective July 1, 2006. The Chairman of the Board of Directors is paid an additional $15,000 annually. The chair of our Audit Committee was paid an additional $10,000 annually until July 1, 2006, at which time this fee was increased to $50,000 annually in recognition of the Audit Committee chair’s expanded responsibilities as we implement our Sarbanes-Oxley compliance efforts. Also, each independent director is paid an additional $1,500 for each meeting of the Board of Directors attended and an additional $1,500 for each committee meeting attended. The Compensation Committ ee, pursuant to a unanimous consent resolution, has determined that, effective January 1, 2007, all non-management directors shall be entitled to compensation for their service as members of the Board of Directors and any committee thereof, consistent with our compensation practices for independent directors.
Compensation Committee Interlocks and Insider Participation
No member of the Compensation Committee was at any time during 2006, or at any other time, one of our officers or employees or had any relationship requiring disclosure by us under any paragraph of Item 404. None of our Executive Officers served on the compensation committee or board of directors of another entity whose executive officer(s) served on our Compensation Committee or Board of Directors.
Report of the Compensation Committee
The Compensation Committee has reviewed and discussed the foregoing Compensation Discussion and Analysis with management and based on that review and discussion, the Compensation Committee recommended to the board of directors that the Compensation Discussion and Analysis be included in our annual report on Form 10-K.
| The Compensation Committee
James A. Stern, Chairman
Michael F. Finley
Joseph A. Onorato
John M. Riess
Larry W. McCurdy, ex officio |
101
Table of ContentsItem 12. Security Ownership of Certain Beneficial Owners and Management
Equity Compensation Plan Information
The following table sets forth information about our common stock that may be issued under all of our existing equity compensation plans as of March 20, 2007, including the 2005 Stock Incentive Plan.
| | | | | | | | | | | | | | | | | | |
| Plan category | | | Number of securities to
be issued upon exercise of
outstanding options, warrants
and rights(1) | | | Weighted average
exercise price of
outstanding options,
warrants and rights | | | Number of securities
remaining available
for future issuance
(excluding securities
reflected in column(a)) |
| | | | (a) | | | (b) | | | (c) |
| Equity compensation plans approved by security holders: | | | | | N/A | | | | | $ | N/A | | | | | | N/A | |
| Equity compensation plans not approved by security holders: | | | | | 222,810 | | | | | $ | 100 | | | | | | 4,190 | |
| Total | | | | | 222,810 | | | | | $ | 100 | | | | | | 4,190 | |
|
As of December 31, 2006, there were 149,260 outstanding stock options granted pursuant to our Stock Incentive Plan. The Compensation Committee, pursuant to a unanimous consent resolution dated as of January 1, 2007, approved grants of an additional 75,650 stock options, having a grant date of January 1, 2007, and which are included in the totals reflected in the table.
Security Ownership
Affinia Group Holdings Inc. owns 100% of the issued and outstanding common stock of Affinia Group Intermediate Holdings Inc. Affinia Group Intermediate Holdings Inc. owns 100% of the issued and outstanding common stock of Affinia Group Inc.
The following table and accompanying footnotes show information regarding the beneficial ownership of the common stock of Affinia Group Holdings Inc. as of March 20, 2007 by (i) each person known by us to beneficially own more than 5% of the issued and outstanding common stock of Affinia Group Holdings Inc., (ii) each of our directors and nominees, (iii) each named executive officer and (iv) all directors and executive officers as a group.
| | | | | | | | | | | | |
| Names and addresses of beneficial owner | | | Nature and
Amount of
Beneficial
Ownership(1) | | | Percentage of
Class |
| The Cypress Group L.L.C. | | | | | 2,175,000(2 | | | | | | 61.1 | |
| The address of each of the Cypress Funds and Cypress Side-By-Side L.L.C. is c/o The Cypress Group L.L.C., 65 East 55th Street, 28th Floor, New York, NY 10022. | | | | | | | | | | | | |
| Ontario Municipal Employees Retirement Board | | | | | 700,000 | | | | | | 19.7 | |
| The address of Ontario Municipal Employees Retirement Board is c/o Omers Capital, 50 Golf Valley Lane, Etobicoke, Ontario, Canada, M9C 2K3. | | | | | | | | | | | | |
| California State Teachers’ Retirement System | | | | | 200,000 | | | | | | 5.6 | |
| The address of California State Teachers’ Retirement System is 7667 Folsom Blvd., Sacramento, CA 95826. | | | | | | | | | | | | |
| The Northwestern Mutual Life Insurance Company | | | | | 400,000 | | | | | | 11.3 | |
| The address of The Northwestern Mutual Life Insurance Company is 720 East Wisconsin Avenue, Milwaukee, WI 53202. | | | | | | | | | | | | |
| Name of Individual or Identity of Group | | | | | | | | | | | | |
| Terry R. McCormack | | | | | 1,500 | | | | | | | |
| Thomas H. Madden | | | | | 750 | | | | | | | |
| John R. Washbish | | | | | 1,250 | | | | | | | |
|
102
Table of Contents
| | | | | | | | | | | | |
| Names and addresses of beneficial owner | | | Nature and
Amount of
Beneficial
Ownership(1) | | | Percentage of
Class |
| Keith A. Wilson | | | | | 550 | | | | | | | |
| Steven E. Keller | | | | | 500 | | | | | | | |
| Larry W. McCurdy | | | | | 3,000 | | | | | | 0.1 | |
| John M. Riess | | | | | 250 | | | | | | | |
| All executive officers and directors as a group | | | | | 8,420 | | | | | | 0.3 | |
|
| |
| * | The executive officers or members of the Board of Directors of Affinia Group Inc. currently hold 0.3% of shares of the outstanding common stock of Affinia Group Holdings Inc. The amount of ownership for each executive officer or member of the Board is shown above and each of the executive officers or members of the Board own less than 0.1% of outstanding shares except for Mr. Larry W. McCurdy. |
| |
| (1) | Applicable percentage of ownership is based on 3,559,520 shares of common stock outstanding as of December 31, 2006. |
| |
| (2) | Includes 2,063,038 shares of common stock owned by Cypress Merchant Banking Partners II L.P., 87,703 shares of common stock owned by Cypress Merchant Banking II C.V., 19,908 shares of common stock owned by 55th Street Partners II L.P. (collectively, the ‘‘Cypress Funds’’) and 4,350 shares of common stock owned by Cypress Side-by-Side LLC. Cypress Associates II L.L.C. is the managing general partner of Cypress Merchant Banking II C.V. and the general partner of Cypress Merchant Banking Partners II L.P. and 55th Street Partners II L.P., and has voting and investment power over the shares held or controlled by each of these funds. Certain executives of The Cypress Group L.L.C., including Messrs. Jeffrey Hughes and James Stern, may be deemed to share beneficial ownership of t he shares shown as beneficially owned by the Cypress Funds. Each of such individuals disclaims beneficial ownership of such shares. Cypress Side-By-Side L.L.C. is a sole member-L.L.C. of which Mr. James A. Stern is the sole member. |
Item 13. Certain Relationships and Related Transactions and Director Independence
Investor Stockholders Agreement
Pursuant to the Stockholders Agreement dated as of November 30, 2004, among Affinia Group Holdings Inc., various Cypress funds, Ontario Municipal Employees Retirement Board (‘‘OMERS’’), The Northwestern Mutual Life Insurance Company, California State Teachers’ Retirement System and Stockwell Fund, L.P., the number of directors serving on the Board of Directors will be no less than seven and no more than eleven. The Stockholders Agreement entitles Cypress to designate three directors. Cypress has currently appointed Mr. Stern and Mr. Finley. As long as OMERS members own at least 50 percent in the aggregate of the number of shares owned by them on November 30, 2004, OMERS is entitled to designate one di rector, who currently is Mr. Morrison. Cypress is entitled to designate three independent directors, as defined by SEC rules, who currently are Mr. McCurdy, Mr. Onorato and Mr. Riess. Additionally, the Stockholders Agreement entitles the individual serving as CEO, currently Mr. McCormack, and another individual serving as one of our senior officers, currently Mr. Washbish, to seats on the Board of Directors. The Stockholders Agreement also provides that the nominating committee of the Board of Directors may from time to time select two additional individuals who must be independent to serve as Directors.
Other Related Party Transactions
Mr. Washbish’s brother is the owner of Moog Automotive Warehouse, Louisville, Kentucky, an automotive warehouse distributor that purchased approximately $0.2 million of products from Affinia Group Inc. in 2006.
Mr. John M. Riess, an Affinia Group Board member, is related to an executive at Carquest. In 2006, Carquest purchased 7% of our total sales.
Item 14. Principal Accountant Fees and Services
Audit Fees and Tax Fees
The Audit Committee approved the selection of PricewaterhouseCoopers LLP as the Company’s principal accountants in January 2005. The Audit Committee then adopted procedures for pre-approving all audit and non-audit services provided by PricewaterhouseCooper LLP. We paid
103
Table of ContentsPricewaterhouseCoopers LLP $4.5 million in audit fees and less than $1 million for global tax compliance services. On October 14, 2005, the Company engaged Deloitte & Touche LLP (Deloitte & Touche’’) as the Company’s new independent registered public accounting firm for the fiscal year ending December 31, 2005. The engagement of Deloitte & Touche was approved by the Audit Committee of the Company’s Board of Directors. The Audit Committee then adopted procedures for pre-approving all audit and non-audit services provided by Deloitte & Touche. The Audit Committee, as required by its Charter, approves in advance any audit or permitted non-audit engagement or relationship between the Company and the Company’s independent auditors. The Audit Committee has adopted an Audit and Non-Audit Services Pre-Approval Policy which provides that the Company’s independent auditors are only permitted to provide services to the Company that have been specifically approved by t he Audit Committee or entered into pursuant to the pre-approval provisions of the Policy. All tax services to be performed by the independent auditors that fall within certain categories and certain designated dollar thresholds have been pre-approved under the Policy. All tax services that exceed the dollar thresholds and any other services must be approved in advance by the Audit Committee. The Audit Committee also has delegated approval authority, subject to certain dollar limitations, to the Chairman of the Audit Committee, who is an independent director. Pursuant to this delegation, the Chairman is required to present, and as of the date of this report has presented, all approval decisions to the full Audit Committee. During 2005 we paid Deloitte & Touche $0.6 million in audit fees and $0.4 million in U.S. tax compliance and consulting services. During 2006 we paid Deloitte & Touche $2.8 million in audit fees and $0.8 million in U.S. tax compliance and consulting services.
104
Table of ContentsPART IV.
| |
| Item 15. | Exhibits and Financial Statement Schedules |
| |
| (a) | The following documents are filed as part of this report: |
| |
| 1. | Financial Statements: |
See Item 8 above.
| |
| 2. | Financial Statement Schedules: |
Report of Independent Registered Public Accounting Firm
on
Financial Statement Schedule
To the Board of Directors and Shareholders of
Affinia Group Intermediate Holdings Inc.:
Our audit of the consolidated financial statements for the period from December 1, 2004 to December 31, 2004 referred to in our report dated April 15, 2005, except for Notes 2 (not presented herein), 5 (not presented herein) and 22 (not presented herein) to the consolidated financial statements appearing in the Registration Statement on Form S-4 (No. 333-128166), as to which the date is September 6, 2005, and Notes 2 (not presented herein) and 23 (not presented herein) appearing in the Company’s 2005 Annual Report on Form 10-K, as to which the date is April 11, 2006, also included an audit of the financial statement schedule listed in Item 15(a)(2) of this Form 10-K. In our opinion, the financial statement schedule presents fairly, in all material respects, the information set forth therein when read in conjunction with the related consolidated financial statements.
PricewaterhouseCoopers LLP
Detroit, Michigan
September 6, 2005
Report of Independent Registered Public Accounting Firm
on
Financial Statement Schedule
To the Board of Directors and Shareholders of Dana Corporation:
Our audit of the combined statement of income, of shareholders equity and of cashflows of substantially all of the automotive aftermarket business of Dana Corporation for the eleven months ended November 30, 2004 referred to in our report dated April 15, 2005, except for Notes 22 (not presented herein) to the consolidated financial statements appearing in the Registration Statement on Form S-4 (No. 333-128166), as to which the date is September 6, 2005, and 23 (not presented herein) to the consolidated financial statements appearing in the Affinia Group Intermediate Holdings Inc. 2005 Annual Report on Form 10-K, as to which the date is April 11, 2006, also included an audit of the financial statement schedule listed in Item 15 (a)(2) of this Form 10-K. In our opinion, the financial statement schedule presents fairly, in all material respects, the information set forth therein when read in conjunction with the related consolidated financial statements.
PricewaterhouseCoopers LLP
Toledo, Ohio
September 6, 2005
Schedule II – Valuation and Qualifying Accounts
The allowance for doubtful accounts is summarized below for the Successor for the period ending December 31, 2006, December 31, 2005 and for period from December 1, 2004
105
Table of Contentsthrough December 31, 2004. Additionally, the predecessor period from January 1, 2004 through November 30, 2004 and for the period ending December 31, 2003 (Dollars in Millions):
| | | | | | | | | | | | | | | | | | | | | | | | | | | | | | |
| | | | Balance
at
beginning of
period | | | Amounts
charged to
income | | | Trade
accounts
receivable
‘‘written off’’
net of
recoveries | | | Adjustments
arising from
change in
currency
exchange
rates and
other items | | | Balance at
end of period |
| Eleven month period ended November 30, 2004 | | | | $ | 4 | | | | | $ | 1 | | | | | $ | | | | | | $ | — | | | | | $ | 4 | |
One month period ended
December 31, 2004 | | | | | 4 | | | | | | — | | | | | | — | | | | | | — | | | | | | 4 | |
| Year ended December 31, 2005 | | | | | 4 | | | | | | 1 | | | | | | | | | | | | 3 | | | | | | 2 | |
| Year ended December 31, 2006 | | | | $ | 2 | | | | | $ | 5 | | | | | $ | | | | | | $ | — | | | | | $ | 5 | |
|
All other financial statement schedules are not required under the relevant instructions or are inapplicable and therefore have been omitted.
| |
| 3. | Exhibits: |
| | | | | | |
| Exhibit Number | | | Description of Exhibit |
| 2 | .1 | | | | Stock and Asset Purchase Agreement by and between Affinia Group Inc. (formerly known as AAG Opco Corp.) and Dana Corporation, dated as of July 8, 2004, which is incorporated herein by reference from Exhibit 2.1 of the Registration Statement on Form S-4 of Affinia Group Intermediate Holdings Inc. filed on September 8, 2005 (File No. 333-128166-10). |
| 2 | .2 | | | | Amendment No. 1, dated as of November 1, 2004, to the Stock and Asset Purchase Agreement by and between Affinia Group Inc. (formerly known as AAG Opco Corp.) and Dana Corporation, dated as of July 8, 2004, which is incorporated herein by reference from Exhibit 2.2 of the Registration Statement on Form S-4 of Affinia Group Intermediate Holdings Inc. filed on September 8, 2005 (File No. 333-128166-10). |
| 2 | .3 | | | | Amendment No. 2, dated as of November 30, 2004, to the Stock and Asset Purchase Agreement by and between Affinia Group Inc. (formerly known as AAG Opco Corp.) and Dana Corporation, dated as of July 8, 2004, which is incorporated herein by reference from Exhibit 2.3 of the Registration Statement on Form S-4 of Affinia Group Intermediate Holdings Inc. filed on September 8, 2005 (File No. 333-128166-10). |
| 3 | .5 | | | | Certificate of Incorporation of Affinia Group Intermediate Holdings Inc., which is incorporated herein by reference from Exhibit 3.5 of the Registration Statement on Form S-4 of Affinia Group Intermediate Holdings Inc. filed on September 8, 2005 (File No. 333-128166-10). |
| 3 | .6 | | | | By-laws of Affinia Group Intermediate Holdings Inc., which is incorporated herein by reference from Exhibit 3.6 of the Registration Statement on Form S-4 of Affinia Group Intermediate Holdings Inc. filed on September 8, 2005 (File No. 333-128166-10). |
| 4 | .1 | | | | Indenture, dated as of November 30, 2004, among Affinia Group Inc., the Guarantors named therein and Wilmington Trust Company, as Trustee, which is incorporated herein by reference from Exhibit 4.1 of the Registration Statement on Form S-4 of Affinia Group Intermediate Holdings Inc. filed on September 8, 2005 (File No. 333-128166-10). |
|
106
Table of Contents
| | | | | | |
| Exhibit Number | | | Description of Exhibit |
| 4 | .4 | | | | 9% Senior Subordinated Notes due 2014, Rule 144A Global Note, which is incorporated herein by reference from Exhibit 4.4 of the Registration Statement on Form S-4 of Affinia Group Intermediate Holdings Inc. filed on September 8, 2005 (File No. 333-128166-10). |
| 4 | .5 | | | | 9% Senior Subordinated Notes due 2014, Regulation S Global Note, which is incorporated herein by reference from Exhibit 4.5 of the Registration Statement on Form S-4 of Affinia Group Intermediate Holdings Inc. filed on September 8, 2005 (File No. 333-128166-10). |
| 10 | .1 | | | | Credit Agreement, dated as of November 30, 2004, among Affinia Group Intermediate Holdings Inc., Affinia Group Inc., the Lenders party thereto, JPMorgan Chase Bank, N.A., as Administrative Agent and Collateral Agent, Goldman Sachs Credit Partners, L.P. and Credit Suisse First Boston, as Co-Syndication Agents, and Deutsche Bank AG, Cayman Islands Branch and UBS Securities LLC, as Co-Documentation Agents, which is incorporated herein by reference from Exhibit 10.1 of the Registration Statement on Form S-4 of Affinia Group Intermediate Holdings Inc. filed on September 8, 2005 (File No. 333-128166-10). |
| 10 | .2 | | | | Amendment No. 1 and Waiver, dated as of December 12, 2005 to Credit Agreement, dated as of November 30, 2004, among Affinia Group Intermediate Holdings Inc., Affinia Group Inc., the Lenders party thereto, JPMorgan Chase Bank, N.A., as Administrative Agent, Goldman Sachs Credit Partners, L.P. and Credit Suisse, Cayman Islands Branch (formerly known as Credit Suisse First Boston, acting through its Cayman Islands Branch), as Co-Syndication Agents, and Deutsche Bank AG, Cayman Islands Branch and UBS Securities LLC, as Co-Documentation Agents, which is incorporated herein by reference from Exhibit 10.1 on the Form 8-K of Affinia Group Intermediate Holdings Inc. filed on December 15, 2005 (File No. 333-128166-10). |
| 10 | .3 | | | | Guarantee and Collateral Agreement, dated as of November 30, 2004, among Affinia Group Intermediate Holdings Inc., Affinia Group Inc., each other Subsidiary Loan Party identified therein and JPMorgan Chase Bank, N.A. as Collateral Agent, which is incorporated herein by reference from Exhibit 10.2 of the Registration Statement on Form S-4 of Affinia Group Intermediate Holdings Inc. filed on September 8, 2005 (File No. 333-128166-10). |
| 10 | .4 | | | | Receivables Sale Agreement, dated as of November 30, 2004, among Affinia Group Inc., as Seller Agent, certain subsidiaries thereof, as Sellers, and Affinia Receivables LLC, as Finance Subsidiary, which is incorporated herein by reference from Exhibit 10.3 of the Registration Statement on Form S-4 of Affinia Group Intermediate Holdings Inc. filed on September 8, 2005 (File No. 333-128166-10). |
| 10 | .5 | | | | Amendment, dated as of April 1, 2005, to the Receivables Sale Agreement, dated as of November 30, 2004, among Affinia Group Inc., as Seller Agent, certain subsidiaries thereof, as Sellers, and Affinia Receivables LLC, as Finance Subsidiary, which is incorporated herein by reference from Exhibit 10.4 of the Registration Statement on Form S-4 of Affinia Group Intermediate Holdings Inc. filed on September 8, 2005 (File No. 333-128166-10). |
|
107
Table of Contents
| | | | | | |
| Exhibit Number | | | Description of Exhibit |
| 10 | .6 | | | | Receivables Purchase Agreement, dated as of November 30, 2004, among Affinia Receivables LLC, as Finance Subsidiary, Affinia Group Inc., as Servicer, Park Avenue Receivables Company LLC, and JPMorgan Chase Bank, N.A., as Agent, which is incorporated herein by reference from Exhibit 10.5 of the Registration Statement on Form S-4 of Affinia Group Intermediate Holdings Inc. filed on September 8, 2005 (File No. 333-128166-10). |
| 10 | .7 | | | | Amendment Number 1, dated as of April 1, 2005, to the Receivables Purchase Agreement, dated as of November 30, 2004, among Affinia Receivables LLC, as Finance Subsidiary, Affinia Group Inc., as Servicer, Park Avenue Receivables Company LLC, and JPMorgan Chase Bank, N.A., as Agent, which is incorporated herein by reference from Exhibit 10.6 of the Registration Statement on Form S-4 of Affinia Group Intermediate Holdings Inc. filed on September 8, 2005 (File No. 333-128166-10). |
| 10 | .8 | | | | Amendment Number 2, dated as of June 30, 2005, to the Receivables Purchase Agreement, dated as of November 30, 2004, among Affinia Receivables LLC, as Finance Subsidiary, Affinia Group Inc., as Servicer, Park Avenue Receivables Company LLC, and JPMorgan Chase Bank, N.A., as Agent, which is incorporated herein by reference from Exhibit 10.7 of the Registration Statement on Form S-4 of Affinia Group Intermediate Holdings Inc. filed on September 8, 2005 (File No. 333-128166-10). |
| 10 | .9 | | | | Trademark License Agreement by and between Raymark Industries, Inc. and Brake Systems, Inc., dated March 18, 1985, which is incorporated herein by reference from Exhibit 10.8 of the Registration Statement on Form S-4 of Affinia Group Intermediate Holdings Inc. filed on September 8, 2005 (File No. 333-128166-10). |
| 10 | .10 | | | | Transition Services Agreement by and between Affinia Group Inc. and Dana Corporation, dated November 30, 2004, which is incorporated herein by reference from Exhibit 10.9 of the Registration Statement on Form S-4 of Affinia Group Intermediate Holdings Inc. filed on September 8, 2005 (File No. 333-128166-10). |
| 10 | .11 | | | | Stockholders Agreement, dated as of November 30, 2004, among Affinia Group Holdings Inc., various Cypress funds, Ontario Municipal Employees Retirement Board (‘‘OMERS’’), The Northwestern Mutual Life Insurance Company, California State Teachers’ Retirement System and Stockwell Fund, L.P., which is incorporated herein by reference from Exhibit 10.10 of the Registration Statement on Form S-4 of Affinia Group Intermediate Holdings Inc. filed on September 8, 2005 (File No. 333-128166-10). |
| 10 | .12 | | | | Employment Agreement, dated July 21, 2005, by and between Affinia Group Inc. and Terry R. McCormack, which is incorporated herein by reference from Exhibit 10.11 of the Registration Statement on Form S-4 of Affinia Group Intermediate Holdings Inc. filed on September 8, 2005 (File No. 333-128166-10). |
| 10 | .13 | | | | Employment Agreement, dated July 21, 2005, by and between Affinia Group Inc. and Keith A. Wilson, which is incorporated herein by reference from Exhibit 10.12 of the Registration Statement on Form S-4 of Affinia Group Intermediate Holdings Inc. filed on September 8, 2005 (File No. 333-128166-10). |
| 10 | .14 | | | | Employment Agreement, dated July 21, 2005, by and between Affinia Group Inc. and John R. Washbish, which is incorporated herein by reference from Exhibit 10.13 of the Registration Statement on Form S-4 of Affinia Group Intermediate Holdings Inc. filed on September 8, 2005 (File No. 333-128166-10). |
|
108
Table of Contents
| | | | | | |
| Exhibit Number | | | Description of Exhibit |
| 10 | .15 | | | | Employment Agreement, dated July 21, 2005, by and between Affinia Group Inc. and Thomas H. Madden, which is incorporated herein by reference from Exhibit 10.14 of the Registration Statement on Form S-4 of Affinia Group Intermediate Holdings Inc. filed on September 8, 2005 (File No. 333-128166-10). |
| 10 | .16 | | | | Employment Agreement, dated July 21, 2005, by and between Affinia Group Inc. and Steven E. Keller which is incorporated herein by reference from Exhibit 10.15 of the Registration Statement on Form S-4 of Affinia Group Intermediate Holdings Inc. filed on September 8, 2005 (File No. 333-128166-10). |
| 10 | .17 | | | | Affinia Group Holdings Inc. 2005 Stock Incentive Plan, which is incorporated herein by reference from Exhibit 10.16 of the Registration Statement on Form S-4 of Affinia Group Intermediate Holdings Inc. filed on September 8, 2005 (File No. 333-128166-10). |
| 10 | .18 | | | | Form of Nonqualified Stock Option Agreement, which is incorporated herein by reference from Exhibit 10.17 of the Registration Statement on Form S-4 of Affinia Group Intermediate Holdings Inc. filed on September 8, 2005 (File No. 333-128166-10). |
| 10 | .19 | | | | Form of Management Stockholder’s Agreement, which is incorporated herein by reference from Exhibit 10.18 of the Registration Statement on Form S-4 of Affinia Group Intermediate Holdings Inc. filed on September 8, 2005 (File No. 333-128166-10). |
| 10 | .20 | | | | Form of Sale Participation Agreement. |
| 16 | .1 | | | | Letter from PricewaterhouseCoopers LLP dated October 5, 2005, which is incorporated herein by reference from Exhibit 10.1 on the Form 8-K of Affinia Group Intermediate Holdings Inc. filed on October 5, 2005 (File No. 333-128166-10). |
| 21 | .1* | | | | List of Subsidiaries. |
| 31 | .1* | | | | Certification of the Chief Executive Officer pursuant to Rule 13a-14(a) of Securities Exchange Act of 1934, as adopted pursuant to Section 302 of the Sarbanes-Oxley Act of 2002. |
| 31 | .2* | | | | Certification of the Chief Financial Officer pursuant to Rule 13a-14(a) of Securities Exchange Act of 1934, as adopted pursuant to Section 302 of the Sarbanes-Oxley Act of 2002. |
| 32 | .1* | | | | Certification of Terry R. McCormack, our Chief Executive Officer, President and Director, and Thomas H. Madden, our Senior Vice President and Chief Financial Officer, pursuant to 18 U.S.C. Section 1350, as adopted pursuant to Section 906 of the Sarbanes-Oxley Act of 2002. |
|
| |
| * | filed herewith |
109
Table of ContentsSIGNATURES
Pursuant to the requirements of section 13 or 15(d) of the Securities Exchange Act of 1934, the registrant has duly caused this report to be signed on its behalf by the undersigned, thereunto duly authorized.
| | | |
| AFFINIA GROUP INTERMEDIATE HOLDINGS INC. |
| By: | | | /s/ Terry R. McCormack |
| | | | Terry R. McCormack |
| | | | Chief Executive Officer, President, and Director |
|
Date: March 20, 2007
Pursuant to the requirements of the Securities Exchange Act of 1934, this report has been signed below by the following persons on behalf of the registrant and in the capacities indicated on March 20, 2007
| | |
| Signature | | Title |
|
| By: /s/ Terry R. McCormack | | Chief Executive Officer, President, and Director
(Principal Executive Officer) |
|
| Terry R. McCormack |
|
| By: /s/ Thomas H. Madden | | Senior Vice President and Chief Financial Officer
(Principal Financial Officer) |
|
| Thomas H. Madden |
|
| By: /s/ Patrick W. Flanagan | | Chief Accounting and Financial Compliance Officer
(Principal Accounting Officer) |
|
| Patrick W. Flanagan |
|
| By: /s/ Larry W. McCurdy | | Chairman of the Board of Directors |
|
| Larry W. McCurdy |
|
| By: /s/ Michael F. Finley | | Director |
|
| Michael F. Finley |
|
| By: /s/ Donald J. Morrison | | Director |
|
| Donald J. Morrison |
|
| By: /s/ Joseph A. Onorato | | Director |
|
| Joseph A. Onorato |
|
| By: /s/ John M. Riess | | Director |
|
| John M. Riess |
|
| By: /s/ James A. Stern | | Director |
|
| James A. Stern |
|
| By: /s/ John R. Washbish | | Director |
|
| John R. Washbish |
|
110