UNITED STATES
SECURITIES AND EXCHANGE COMMISSION
Washington, D.C. 20549
FORM 10-Q
(Mark One)
| x | Quarterly Report Pursuant to Section 13 or 15(d) of the Securities Exchange Act of 1934 |
For the Quarterly Period Ended June 30, 2009.
| ¨ | Transition Report Pursuant to Section 13 or 15(d) of the Securities Exchange Act of 1934 |
For the Transition Period From to .
Commission File No. 333-128166-10

Affinia Group Intermediate Holdings Inc.
(Exact name of registrant as specified in its charter)
| | |
| Delaware | | 34-2022081 |
(State or Other Jurisdiction of Incorporation or Organization) | | (I.R.S. Employer Identification No.) |
| | |
| 1101 Technology Drive, Ann Arbor, Michigan | | 48108 |
| (Address of Principal Executive Offices) | | (Zip Code) |
(734) 827-5400
(Registrant’s Telephone Number, Including Area Code)
N/A
(Former Name, Former Address and Former Fiscal Year, if Changed Since Last Report)
Indicate by check mark whether the registrant (1) has filed all reports required to be filed by Section 13 or 15(d) of the Securities Exchange Act of 1934 during the preceding 12 months (or for such shorter period that the registrant was required to file such reports), and (2) has been subject to such filing requirements for the past 90 days. Yes ¨ No x
(Note: As a voluntary filer not subject to the filing requirements of Section 13 or 15(d) of the Exchange Act, the registrant has filed all reports required to be filed by Section 13 or 15(d) of the Exchange Act during the preceding 12 months (or for such shorter period that the registrant would have been required to file such reports) as if it were subject to such filing requirements).
Indicate by check mark whether the registrant has submitted electronically and posted on its corporate Web site, if any, every Interactive Data File required to be submitted pursuant to Rule 405 of Regulation S-T (§232.405 of this chapter) during the preceding 12 months (or for such shorter period that the registrant was required to submit and post such files). Yes ¨ No ¨
Indicate by check mark whether the registrant is a large accelerated filer, an accelerated filer, a non-accelerated filer, or a smaller reporting company. See the definitions of “large accelerated filer,” “accelerated filer” and “smaller reporting company” in Rule 12b-2 of the Exchange Act.
| | | | | | |
| Large accelerated filer | | ¨ | | Accelerated filer | | ¨ |
| Non-accelerated filer | | x (Do not check if a smaller reporting company) | | Smaller reporting company | | ¨ |
Indicate by check mark whether the registrant is a shell company (as defined in Rule 12b-2 of the Exchange Act). Yes ¨ No x
There were 1,000 shares outstanding of the registrant’s common stock as of August 13, 2009 (all of which are privately owned and not traded on a public market).
Index
Affinia Group Intermediate Holdings Inc.
2
CAUTIONARY NOTE REGARDING FORWARD-LOOKING STATEMENTS
This report includes “forward-looking statements” within the meaning of Section 27A of the Securities Act of 1933, as amended (the “Securities Act”) and Section 21E of the Securities Exchange Act of 1934, as amended (the “Exchange Act”). These forward-looking statements may include comments concerning our plans, objectives, goals, strategies, future events, future revenue or performance, capital expenditures, financing needs, plans or intentions relating to acquisitions, business trends and other information that is not historical. When used in this report, the words “estimates,” “expects,” “anticipates,” “projects,” “plans,” “intends,” “believes,” “forecasts,” or future or conditional verbs, such as “will,” “should,” “could” or “may,” and variations of such words or similar expressions are intended to identify forward-looking statements. All forward-looking statements, including, without limitation, management’s examination of historical operating trends and data are based upon our current expectations and various assumptions. Our expectations, beliefs and projections are expressed in good faith and we believe there is a reasonable basis for them. However, there is no assurance that these expectations, beliefs and projections will be achieved. With respect to all forward-looking statements, we claim the protection of the safe harbor for forward-looking statements contained in the Private Securities Litigation Reform Act of 1995.
There are a number of risks and uncertainties that could cause our actual results to differ materially from the forward-looking statements contained in this report. Such risks, uncertainties and other important factors include, among others: the impact of the recent turmoil in the financial markets on the availability and cost of credit; financial viability of key customers and key suppliers; our substantial leverage; limitations on flexibility in operating our business contained in our debt agreements; pricing and import pressures; the shift in demand from premium to economy products; our dependence on our largest customers; changing distribution channels; increasing costs for manufactured components, raw materials, crude oil and energy; our ability to achieve cost savings from our restructuring; increased costs in imported products from low cost sources; the consolidation of distributors; risks associated with our non-U.S. operations; product liability and customer warranty and recall claims; changes to environmental and automotive safety regulations; risk of impairment to intangibles and goodwill; risk of successful refinancing if required; non-performance by, or insolvency of, our suppliers or our customers; work stoppages or similar difficulties that could significantly disrupt our operations, and other labor disputes; challenges to our intellectual property portfolio; changes in accounting standards that impact our financial statements; difficulties in developing, maintaining or upgrading information technology systems; the adequacy of our capital resources for future acquisitions; our ability to successfully combine our operations with any businesses we have acquired or may acquire; effective tax rates and timing and amounts of tax payments; and our exposure to a recession. Additionally, there may be other factors that could cause our actual results to differ materially from the forward-looking statements.
3
PART I
FINANCIAL INFORMATION
| Item 1. | Financial Statements |
Affinia Group Intermediate Holdings Inc.
Unaudited Condensed Consolidated Balance Sheets
(Dollars in Millions)
| | | | | | | | |
| | | December 31,
2008 | | | June 30,
2009 | |
Assets | | | | | | | | |
Current assets: | | | | | | | | |
Cash and cash equivalents | | $ | 77 | | | $ | 43 | |
Restricted cash | | | 4 | | | | 14 | |
Trade accounts receivable, less allowances of $4 million for 2008 and $3 million for 2009 | | | 312 | | | | 375 | |
Inventories, net | | | 512 | | | | 501 | |
Other current assets | | | 89 | | | | 104 | |
| | | | | | | | |
Total current assets | | | 994 | | | | 1,037 | |
Property, plant, and equipment, net | | | 208 | | | | 211 | |
Goodwill | | | 58 | | | | 56 | |
Other intangible assets, net | | | 163 | | | | 158 | |
Deferred financing costs | | | 11 | | | | 9 | |
Deferred income taxes | | | 59 | | | | 63 | |
Investments and other assets | | | 22 | | | | 24 | |
| | | | | | | | |
Total assets | | $ | 1,515 | | | $ | 1,558 | |
| | | | | | | | |
| | |
Liabilities and equity | | | | | | | | |
Current liabilities: | | | | | | | | |
Accounts payable | | $ | 274 | | | $ | 280 | |
Short-term debt | | | 14 | | | | 40 | |
Other accrued expenses | | | 148 | | | | 156 | |
Accrued payroll and employee benefits | | | 31 | | | | 38 | |
| | | | | | | | |
Total current liabilities | | | 467 | | | | 514 | |
Long-term debt | | | 608 | | | | 554 | |
Deferred employee benefits and other noncurrent liabilities | | | 24 | | | | 35 | |
| | | | | | | | |
Total liabilities | | | 1,099 | | | | 1,103 | |
| | | | | | | | |
Contingencies and commitments | | | | | | | | |
Common stock, $.01 par value, 1,000 shares authorized, issued and outstanding | | | — | | | | — | |
Additional paid-in capital | | | 411 | | | | 433 | |
Accumulated income (deficit) | | | (37 | ) | | | (24 | ) |
Accumulated other comprehensive income (loss) | | | (18 | ) | | | 4 | |
| | | | | | | | |
Total shareholder’s equity of the Company | | | 356 | | | | 413 | |
Noncontrolling interest | | | 60 | | | | 42 | |
| | | | | | | | |
Total equity | | | 416 | | | | 455 | |
| | | | | | | | |
Total liabilities and equity | | $ | 1,515 | | | $ | 1,558 | |
| | | | | | | | |
The accompanying notes are an integral part of the unaudited condensed consolidated financial statements.
4
Affinia Group Intermediate Holdings Inc.
Unaudited Condensed Consolidated Statements of Operations
(Dollars in Millions)
| | | | | | | | | | | | | | | | |
| | | Three Months
Ended
June 30,
2008 | | | Three Months
Ended
June 30,
2009 | | | Six Months
Ended
June 30,
2008 | | | Six Months
Ended
June 30,
2009 | |
Net sales | | $ | 603 | | | $ | 519 | | | $ | 1,132 | | | $ | 976 | |
Cost of sales | | | (503 | ) | | | (423 | ) | | | (937 | ) | | | (795 | ) |
| | | | | | | | | | | | | | | | |
Gross profit | | | 100 | | | | 96 | | | | 195 | | | | 181 | |
Selling, general and administrative expenses | | | (98 | ) | | | (71 | ) | | | (175 | ) | | | (135 | ) |
Loss on disposition of affiliate | | | (1 | ) | | | — | | | | (1 | ) | | | — | |
| | | | | | | | | | | | | | | | |
Operating profit | | | 1 | | | | 25 | | | | 19 | | | | 46 | |
Gain on extinguishment of debt | | | — | | | | 8 | | | | — | | | | 8 | |
Other income, net | | | 1 | | | | 1 | | | | 1 | | | | 1 | |
Interest expense | | | (14 | ) | | | (14 | ) | | | (28 | ) | | | (28 | ) |
| | | | | | | | | | | | | | | | |
Income before income tax provision and equity income | | | (12 | ) | | | 20 | | | | (8 | ) | | | 27 | |
Income tax provision | | | 6 | | | | 7 | | | | 7 | | | | 11 | |
Equity in income, net of tax | | | — | | | | — | | | | — | | | | — | |
| | | | | | | | | | | | | | | | |
Net income | | | (18 | ) | | | 13 | | | | (15 | ) | | | 16 | |
Less: Net income attributable to noncontrolling interest, net of tax | | | — | | | | (4 | ) | | | — | | | | (3 | ) |
| | | | | | | | | | | | | | | | |
Net income (loss) attributable to the Company | | $ | (18 | ) | | $ | 9 | | | $ | (15 | ) | | $ | 13 | |
| | | | | | | | | | | | | | | | |
The accompanying notes are an integral part of the unaudited condensed consolidated financial statements.
5
Affinia Group Intermediate Holdings Inc.
Unaudited Condensed Consolidated Statements of Cash Flows
(Dollars in Millions)
| | | | | | | | |
| | | Six Months Ended
June 30, 2008 | | | Six Months Ended
June 30, 2009 | |
Operating activities | | | | | | | | |
Net income | | $ | (15 | ) | | $ | 16 | |
Adjustments to reconcile net income to net cash provided by (used in) operating activities: | | | | | | | | |
Depreciation and amortization | | | 17 | | | | 18 | |
Stock-based compensation | | | — | | | | 1 | |
Loss on disposition of affiliate | | | 1 | | | | — | |
Provision for deferred income taxes | | | (4 | ) | | | (3 | ) |
Gain on extinguishment of debt | | | — | | | | (8 | ) |
Change in trade accounts receivable | | | (74 | ) | | | (68 | ) |
Change in inventories | | | 19 | | | | 26 | |
Change in other current operating assets | | | (28 | ) | | | (13 | ) |
Change in other current operating liabilities | | | 95 | | | | 9 | |
Change in other | | | — | | | | 15 | |
| | | | | | | | |
Net cash provided by (used in) operating activities | | | 11 | | | | (7 | ) |
| | |
Investing activities | | | | | | | | |
Proceeds from sales of assets | | | 1 | | | | — | |
Proceeds from sales of affiliates | | | 6 | | | | — | |
Investment in affiliate | | | (3 | ) | | | (25 | ) |
Change in restricted cash | | | — | | | | (10 | ) |
Additions to property, plant and equipment | | | (12 | ) | | | (13 | ) |
| | | | | | | | |
Net cash used in investing activities | | | (8 | ) | | | (48 | ) |
| | |
Financing activities | | | | | | | | |
Net increase in debt of noncontrolling interest | | | — | | | | 5 | |
Payment of long-term debt | | | — | | | | (10 | ) |
Proceeds from accounts receivable facility | | | — | | | | 25 | |
| | | | | | | | |
Net cash provided by financing activities | | | — | | | | 20 | |
Effect of exchange rate changes on cash | | | 1 | | | | 1 | |
Change in cash and cash equivalents | | | 4 | | | | (34 | ) |
Cash and cash equivalents at beginning of the period | | | 59 | | | | 77 | |
| | | | | | | | |
Cash and cash equivalents at end of the period | | $ | 63 | | | $ | 43 | |
| | | | | | | | |
| | |
Supplemental cash flows information | | | | | | | | |
Cash paid during the period for: | | | | | | | | |
Interest | | $ | 26 | | | $ | 27 | |
Income taxes | | $ | 17 | | | $ | 7 | |
The accompanying notes are an integral part of the unaudited condensed consolidated financial statements.
6
NOTES TO UNAUDITED CONDENSED CONSOLIDATED FINANCIAL STATEMENTS
Note 1. Description of Business
Affinia Group Inc. (“Affinia”) is a global leader in the on and off-highway replacement products and services industry. We derive approximately 98% of our sales from this industry and, as a result, are not directly affected by the market cyclicality of the automotive original equipment manufacturers. Our broad range of brake, filtration, chassis and other products are sold globally. Our brands include WIX®, Raybestos®, McQuay-Norris®, Nakata®, Filtron®, BrakePro® and Quinton Hazell®. Additionally, we provide private label offerings for NAPA®, CARQUEST®, ACDelco®, and other customers; together with co-branded offerings for Federated Auto Parts and Automotive Distribution Network. Affinia is wholly-owned by Affinia Group Intermediate Holdings Inc., which, in turn, is wholly-owned by Affinia Group Holdings Inc., a company controlled by affiliates of The Cypress Group L.L.C. (“Cypress”).
Affinia, a Delaware corporation formed on June 28, 2004, entered into a stock and asset purchase agreement, as amended (the “Purchase Agreement”), with Dana Corporation (“Dana”). The Purchase Agreement provided for the acquisition by Affinia of substantially all of Dana’s aftermarket business operations (the “Acquisition”).
Note 2. Basis of Presentation
The accompanying unaudited condensed consolidated financial statements include the accounts of Affinia Group Intermediate Holdings Inc. and its subsidiaries. In these notes to the condensed consolidated financial statements, the terms “the Company,” “we,” “our” and “us” refer to Affinia Group Intermediate Holdings Inc. and its subsidiaries on a consolidated basis.
The interim financial information is prepared in conformity with accounting principles generally accepted in the United States of America and such principles are applied on a basis consistent with information reflected in our Form 10-K for the year ended December 31, 2008 filed with the Securities and Exchange Commission (“SEC”). Certain information and footnote disclosures normally included in financial statements prepared in accordance with accounting principles generally accepted in the United States of America have been condensed or omitted pursuant to the rules and regulations promulgated by the SEC. In the opinion of management, the interim financial information includes all adjustments and accruals, consisting only of normal recurring adjustments, which are necessary for a fair presentation of results for the respective interim period. We have evaluated all subsequent events through August 13, 2009, the date the financial statements were issued.
Effective January 1, 2009, we implemented Statement of Financial Accounting Standards (“SFAS”) No. 160, “Noncontrolling Interests in Consolidated Financial Statements, an amendment of ARB No. 51”, (“SFAS No. 160”). This standard changed the accounting for and reporting of minority interest (now called noncontrolling interest) in our consolidated financial statements. Upon adoption, certain prior period amounts have been retrospectively changed to conform to the current period financial statement presentation.
Note 3. Variable Interest Entity
Effective October 31, 2008, Affinia Acquisition LLC completed the purchase of 85% of the equity interests (the “Acquired Shares”) in HBM Investment Limited (“HBM”). HBM is the sole owner of Longkou Haimeng Machinery Company Limited (“Haimeng”), a drum and rotor manufacturing company located in Longkou City, China.
HBM subsequently changed its name to Affinia Hong Kong Limited. Affinia Group Holdings Inc. owned 95% of Affinia Acquisition LLC and Affinia Group Inc. owned the remaining 5% interest. Effective June 1, 2009, Affinia Group Inc. acquired an additional 35% ownership interest in Affinia Acquisition LLC for a purchase price of $25 million, which increased its ownership to 40%. Financial Accounting Standards Board Interpretation No. (“FIN”) 46R, “Consolidation of Variable Interest Entities an Interpretation of ARB No. 51”(“FIN 46”), requires the “primary beneficiary” of a variable interest entities (“VIE”) to include the VIE’s assets, liabilities and operating results in its consolidated financial statements. Based on the criteria for consolidation of VIEs, we determined that Affinia Group Inc. is deemed the primary beneficiary of Affinia Acquisition LLC. Therefore, the consolidated financial statements of the Company include Affinia Acquisition LLC and its subsidiaries. The net income attributable to the noncontrolling interest owned in Affinia Acquisition LLC was $4 million and $3 million for the second quarter of 2009 and the first six months of 2009, respectively.
The aforementioned acquisition has been accounted for in accordance with SFAS No. 141,Business Combinations. There were no significant adjustments recorded to the preliminary allocations during the first six months of 2009. During the remainder of 2009, the Company may make further adjustments to these preliminary allocations, but these such adjustments if any, are not expected to be material. Purchase price allocations are subject to adjustment until all pertinent information regarding the Acquisition is obtained and fully evaluated.
7
Affinia Hong Kong Limited is reporting its financial results on a one-month reporting lag. There are no arrangements between the primary beneficiary, Affinia Group Inc., and the VIE, Affinia Acquisition LLC, that would require financial support be provided to the VIE. Additionally, the primary beneficiary has not imposed any restrictions on the VIE and there are no recourse provisions in the acquisition agreement.
Noncontrolling interest decreased to $42 million as of June 30, 2009 from $60 million as of December 31, 2008. The noncontrolling interest decreased $21 million due to acquiring an additional 35% ownership interest in Affinia Acquisition LLC offset by a $3 million increase related to the net income attributable to noncontrolling interest.
Note 4. New Accounting Pronouncements
Effective January 1, 2009, we implemented SFAS No. 161, “Disclosures About Derivative Instruments and Hedging Activities”(“SFAS No. 161”). As a result of adopting this standard we enhanced our disclosures for derivative instruments and hedging activities by providing additional information about our objectives for using derivative instruments, the level of derivative activity we engage in, as well as how derivative instruments and related hedged items affect our financial position and performance. Since SFAS No. 161 requires only additional disclosures concerning derivatives and hedging activities, the adoption of SFAS No. 161 did not affect the presentation of our financial position or results of operations.
In May 2009, the FASB issued SFAS No. 165,“Subsequent Events” (“SFAS 165”), which provides guidance to establish general standards of accounting for, and disclosures of, events that occur after the balance sheet date but before financial statements are issued or are available to be issued. It requires the disclosure of the date through which an entity has evaluated subsequent events and the basis for that date, that is, whether that date represents the date the financial statements were issued or were available to be issued. See Footnote No. 2, “Basis of Presentation” for the related disclosures. The adoption of FAS No. 165 did not have a material impact on our financial statements. We adopted FAS No. 165 in the second quarter of 2009.
In June 2009, the FASB issued SFAS No. 166,“Accounting for Transfers of Financial Assets — an amendment of FASB Statement No. 140” (“SFAS No. 166”), which requires additional information regarding transfers of financial assets, including securitization transactions, and where companies have continuing exposure to the risks related to transferred financial assets. SFAS No. 166 eliminates the concept of a “qualifying special-purpose entity,” changes the requirements for derecognizing financial assets, and requires additional disclosures. SFAS No. 166 is effective for fiscal years beginning after November 15, 2009. SFAS No. 166 is effective for us on January 1, 2010. We are currently evaluating the impact that the adoption of SFAS No. 166 may have on our financial condition, results of operations, and disclosures.
In June 2009, the FASB issued SFAS No. 167, “Amendments to FASB Interpretation No. 46(R)” (“SFAS No. 167”), which modifies how a company determines when an entity that is insufficiently capitalized or is not controlled through voting (or similar rights) should be consolidated. SFAS No. 167 clarifies that the determination of whether a company is required to consolidate an entity is based on, among other things, an entity’s purpose and design and a company’s ability to direct the activities of the entity that most significantly impact the entity’s economic performance. SFAS No. 167 requires an ongoing reassessment of whether a company is the primary beneficiary of a variable interest entity. SFAS No. 167 also requires additional disclosures about a company’s involvement in variable interest entities and any significant changes in risk exposure due to that involvement. SFAS No. 167 is effective for fiscal years beginning after November 15, 2009 and is effective for us on January 1, 2010. We are currently evaluating the impact that the adoption of SFAS No. 167 may have on our financial condition, results of operations, and disclosures.
In June 2009, the FASB approved the “FASB Accounting Standards Codification” (“Codification”) as the single source of authoritative nongovernmental U.S. GAAP to be launched on July 1, 2009. The Codification does not change current U.S. GAAP, but is intended to simplify user access to all authoritative U.S. GAAP by providing all the authoritative literature related to a particular topic in one place. All existing accounting standard documents will be superseded and all other accounting literature not included in the Codification will be considered nonauthoritative. The Codification is effective for interim and annual periods ending after September 15, 2009. The Codification is effective for us during our interim period ending September 30, 2009 and will not have an impact on our financial condition or results of operations, but will result in a revision to our references to generally accepted accounting principles in our future public filings.
Note 5. Inventories, net
Inventories are valued at the lower of cost or market. Cost is determined on the FIFO basis for all domestic inventories or average cost basis for non-U.S. inventories. Inventories are reduced by an allowance for slow-moving and obsolete inventories based on management’s review of on-hand inventories compared to historical and estimated future sales and usage. A summary of inventories, net is provided in the table below (Dollars in Millions):
8
| | | | | | |
| | | At December 31,
2008 | | At June 30,
2009 |
Raw materials | | $ | 115 | | $ | 116 |
Work-in-process | | | 42 | | | 30 |
Finished goods | | | 355 | | | 355 |
| | | | | | |
| | $ | 512 | | $ | 501 |
| | | | | | |
During the first three months of 2009, we had a change in estimate that adjusted the carrying amount of finished goods inventory. The change results from new information as defined in SFAS No. 154 “Accounting Changes and Error Corrections a replacement of APB Opinion No. 20 and FASB Statement No. 3.“ Due to the recent addition of new controls and reporting processes related to certain remanufactured inventory components we were able to more closely determine the cost of these components. The financial impact of this change in estimate increased inventory and decreased cost of sales by $3 million in the first three months of 2009.
Note 6. Comprehensive Income
The elements of comprehensive income are presented in the following table (Dollars in Millions):
| | | | | | | | | | | | | | | | |
| | | Three Months
Ended
June 30, 2008 | | | Three Months
Ended
June 30, 2009 | | | Six Months
Ended
June 30,
2008 | | | Six Months
Ended
June 30,
2009 | |
Net (loss) income | | $ | (18 | ) | | $ | 13 | | | $ | (15 | ) | | $ | 16 | |
Interest rate swap, net of tax | | | 2 | | | | — | | | | — | | | | 1 | |
Change in foreign currency translation adjustments, net of tax | | | 12 | | | | 35 | | | | 25 | | | | 21 | |
| | | | | | | | | | | | | | | | |
Comprehensive income (loss) | | | (4 | ) | | | 48 | | | | 10 | | | | 38 | |
Less: Comprehensive income attributable to noncontrolling interest | | | — | | | | (4 | ) | | | — | | | | (3 | ) |
| | | | | | | | | | | | | | | | |
Comprehensive income (loss) attributable to the Company | | $ | (4 | ) | | $ | 44 | | | $ | 10 | | | $ | 35 | |
| | | | | | | | | | | | | | | | |
Note 7. Goodwill
The goodwill relates to the initial acquisition in 2004, as described in Note 1, the acquisition of Affinia Hong Kong Limited (as described in Note 3) in 2008 and a minor acquisition in the second quarter of 2008. For the 2004 acquisition, the tax benefit for the excess of tax-deductible goodwill over the reported amount of goodwill is applied to first reduce the goodwill related to the Acquisition, in accordance with SFAS No. 109, “Accounting for Income Taxes“. The tax benefit for the excess of tax deductible goodwill reduced reported goodwill by approximately $9 million during 2008 to $26 million at the end of 2008 and $4 million during the first six months of 2009. We anticipate goodwill being reduced by another $5 million during the second half of 2009. Once the reported amount of goodwill for the 2004 acquisition is reduced to zero, the remaining tax benefit reduces the basis of intangible assets purchased in the 2004 acquisition. Any remaining tax benefit reduces the income tax provision.
In conjunction with the acquisition of Affinia Hong Kong Limited, we determined the fair value of intangibles, property, plant and equipment, other assets and liabilities. Based on our valuations and purchase accounting adjustments, we recorded $30 million as goodwill at the end of 2008 and we have increased goodwill by $2 million in the first six months of 2009.
During the second quarter of 2008, we purchased the remaining 40% interest in Wix Helsa Company. The purchase price exceeded the fair value of the assets and the liabilities acquired by approximately $2 million, which was recorded to goodwill.
The following table summarizes goodwill activity, which is related to the On and Off-Highway segment for the first six months of 2009 (Dollars in Millions):
| | | | |
| | | Six Months
Ended
June 30,
2009 | |
Balance at December 31, 2008 | | $ | 58 | |
Tax benefit reduction | | | (4 | ) |
Other | | | 2 | |
| | | | |
Balance at June 30, 2009 | | $ | 56 | |
| | | | |
9
Note 8. Commitments and Contingencies
At June 30, 2009, the Company had purchase commitments for property, plant and equipment of approximately $3 million.
A reconciliation of the changes in our return reserves is as follows (Dollars in Millions):
| | | | | | | | |
| | | Six Months
Ended
June 30,
2008 | | | Six Months
Ended
June 30,
2009 | |
Beginning balance | | $ | 20 | | | $ | 18 | |
Amounts charged to expense | | | 31 | | | | 28 | |
Returns processed | | | (29 | ) | | | (27 | ) |
| | | | | | | | |
| | $ | 22 | | | $ | 19 | |
| | | | | | | | |
Note 9. Income Taxes
The total amount of unrecognized tax benefits as of December 31, 2008 and June 30, 2009 was $2 million, and if recognized, would affect the effective tax rate. The Company recognizes interest related to unrecognized tax benefits in interest expense and penalties as part of the income tax provision. As of June 30, 2009 the Company’s accrual for interest and penalties was less than $1 million. The Company is subject to taxation in the U.S. and various state and foreign jurisdictions. For jurisdictions in which the Company transacts significant business, tax years ended December 31, 2004 and later remain subject to examination by tax authorities. We do not anticipate any material change in the total amount of unrecognized tax benefits to occur within the next twelve months. The income tax provision was $11 million and $7 million for the first six months of 2009 and 2008, respectively. The effective tax rate on ordinary income, which excludes the valuation entity losses and restructuring activities, was comparable for both 2009 and 2008.
Note 10. Legal Proceedings
On March 31, 2008, a class action lawsuit was filed by S&E Quick Lube Distributors, Inc. of Utah against several auto parts manufacturers for allegedly conspiring to fix prices for replacement oil, air, fuel and transmission filters. Several auto parts companies are named as defendants, including Champion Laboratories, Inc., Purolator Filters NA LLC, Honeywell International Inc., Cummins Filtration Inc., Donaldson Company, Baldwin Filters Inc., Bosch USA., Mann + Hummel USA Inc., Arvinmeritor Inc., United Components Inc. and WIX Filtration Corp LLC (“Wix”), a subsidiary of Affinia. The lawsuit was filed in US District Court for the District of Connecticut and seeks damages and injunctive relief on behalf of a nationwide class of direct purchasers of filters. Since this initial complaint was filed, over 56 “tag-along” suits in multiple jurisdictions have been filed on behalf of both direct and indirect purchasers of automotive filtration products. Two suits have also been filed in the Canadian provinces of Ontario and Quebec. As a result, all U.S. lawsuits have been consolidated in a Multi-District Litigation Proceeding in Chicago, IL. Wix along with other named defendants filed various motions to dismiss Plaintiffs’ complaints. Those motions are scheduled to be decided in August 2009. Affinia believes that Wix did not have significant sales in this particular market at the relevant time periods so we currently expect any potential exposure to be immaterial. Additionally, as of April 2009, the Florida Attorney General’s office had filed a tag along suit also naming Wix as a defendant.
The Company has various accruals for civil product liability and other costs. If there is a range of equally probable outcomes, we accrue the lower end of the range. The Company had $1 million accrued as of December 31, 2008 and June 30, 2009. There are no recoveries expected from third parties.
10
Note 11. Restructuring of Operations
In 2005, we announced two restructuring plans: (i) a restructuring plan that we announced at the beginning of 2005 as part of the Acquisition, also referred to herein as the acquisition restructuring and (ii) a restructuring plan that we announced at the end of 2005, also referred to herein as the comprehensive restructuring. We have completed the acquisition restructuring and we are continuing the comprehensive restructuring program. We have closed 44 facilities in the last four years. The following chart summarizes the timing of the significant comprehensive restructuring activity to date:
| | | | |
Facility | | Closure
Announcement Date | | Date Closed |
Southampton (UK) | | December 2005 | | 2nd Qtr. 2006 |
Erie (PA) | | March 2006 | | 4th Qtr. 2006 |
North East (PA) | | March 2006 | | 4th Qtr. 2006 |
McHenry (IL) | | March 2006 | | 4th Qtr. 2006 |
Nuneaton (UK) | | May 2006 | | 3rd Qtr. 2007 |
St. Catharines (ON, Canada) | | June 2006 | | 4th Qtr. 2006 |
Cambridge (ON, Canada) | | September 2006 | | 1st Qtr. 2007 |
Cuba (MO) | | October 2006 | | 2nd Qtr. 2007 |
Mississauga (ON, Canada) | | November 2006 | | 4th Qtr. 2006 |
Sudbury (ON, Canada) | | March 2007 | | 2nd Qtr. 2007 |
Mishawaka (IN) | | October 2007 | | 2nd Qtr. 2008 |
El Talar (Argentina) | | April 2008 | | 2nd Qtr. 2008 |
Barcelona (Spain) | | May 2008 | | 4th Qtr. 2008 |
Litchfield (IL) | | June 2008 | | Open |
Dallas (TX) | | June 2008 | | 2nd Qtr. 2009 |
Milton (ON, Canada) | | June 2008 | | Open |
Brownhills (UK) | | May 2008 | | 3rd Qtr. 2008 |
Balatas Plant in Mexico City (Mexico) | | December 2008 | | 2nd Qtr. 2009 |
In connection with the comprehensive restructuring, we have recorded $144 million in restructuring costs to date. The restructuring costs were recorded in selling, general and administrative expense and cost of sales and are disclosed by year in the chart below (Dollars in Millions).
| | | | | | | | | |
| | | Selling, General
and
Administrative
Expenses | | Cost of Sales | | Total |
2005 | | $ | 2 | | $ | 21 | | $ | 23 |
2006 | | | 39 | | | 1 | | | 40 |
2007 | | | 35 | | | 3 | | | 38 |
2008 | | | 39 | | | 1 | | | 40 |
First six months of 2009 | | | 2 | | | 1 | | | 3 |
| | | | | | | | | |
Total | | $ | 117 | | $ | 27 | | $ | 144 |
| | | | | | | | | |
These charges consist of employee termination costs, other exit costs and impairment costs. Severance costs are being accounted for in accordance with SFAS No. 146, “Accounting for Costs Associated with Exit or Disposal Activities“ and SFAS No. 112, “Employers’ Accounting for Postemployment Benefits —an amendment of FASB Statements No. 5 and 43.” As of the end of 2008, we have announced all the expected comprehensive restructuring activity.
We forecast that the comprehensive restructuring program will result in approximately $162 million in restructuring costs, which exceeds preliminary expectations of $152 million. We anticipate that we will incur approximately $18 million more in restructuring costs during 2009 and 2010 completing the closure of the previously announced facilities.
The Company also continues to expect that the major components of such costs will be employee severance costs, asset impairment charges, and other costs (i.e. moving costs, environmental remediation, site clearance and repair costs) each of which we expect to represent approximately 42%, 18% and 40% respectively, of the total cost of the comprehensive restructuring program.
11
The following summarizes the restructuring charges and activity for all the Company’s restructuring programs (Dollars in Millions):
| | | | | | | |
Balance at December 31, 2008 | | | | | $ | 11 | |
Charges to expense: | | | | | | | |
Asset write-offs expense | | — | | | | | |
Other expenses | | 3 | | | | | |
| | | | | | | |
Total restructuring expenses | | 3 | | | | | |
Cash payments | | (6 | ) | | | | |
| | | | | | | |
Total activity for the first six months of 2009 | | | | | | (3 | ) |
| | | | | | | |
Balance at June 30, 2009 | | | | | $ | 8 | |
| | | | | | | |
At June 30, 2009, $8 million of restructuring charges remained in other accrued liabilities, relating to wage and healthcare continuation for severed employees and other termination costs. These remaining benefits are expected to be paid during 2009 and 2010. The following table shows the restructuring expenses by segment (Dollars in Millions):
| | | | | | | | | | | | |
| | | Three Months
Ended
June 30,
2008 | | Three Months
Ended
June 30,
2009 | | Six Months
Ended
June 30,
2008 | | Six Months
Ended
June 30,
2009 |
On and Off-highway segment | | $ | 9 | | $ | — | | $ | 12 | | $ | 1 |
Commercial Distribution European segment | | | 10 | | | — | | | 11 | | | 1 |
Brake South America segment | | | 5 | | | — | | | 5 | | | — |
Corporate, eliminations and other | | | 1 | | | 1 | | | 1 | | | 1 |
| | | | | | | | | | | | |
| | $ | 25 | | $ | 1 | | $ | 29 | | $ | 3 |
| | | | | | | | | | | | |
Note 12. Segment and Geographic Information
The products, customer base, distribution channel, manufacturing process, and procurement are similar throughout all of the Company’s operations. However, due to different economic characteristics in the Company’s operations we have a Commercial Distribution European Segment, a Brake South America Segment and a third segment that includes multiple operating segments aggregated into one reportable business segment. All three segments are in the On and Off-highway industry but for segment reporting purposes we refer to the third segment as the On and Off-highway Segment. Segment net sales, operating profit, total assets, depreciation and capital expenditures were as follows (Dollars in Millions):
12
| | | | | | | | | | | | | | | | |
| | | Net Sales | |
| | | Three Months
Ended
June 30,
2008 | | | Three Months
Ended
June 30,
2009 | | | Six Months
Ended
June 30,
2008 | | | Six Months
Ended
June 30,
2009 | |
On and Off-Highway segment | | $ | 526 | | | $ | 459 | | | $ | 982 | | | $ | 861 | |
Commercial Distribution European segment | | | 74 | | | | 59 | | | | 146 | | | | 113 | |
Brake South America segment | | | 9 | | | | 6 | | | | 16 | | | | 11 | |
Corporate, eliminations and other | | | (6 | ) | | | (5 | ) | | | (12 | ) | | | (9 | ) |
| | | | | | | | | | | | | | | | |
| | $ | 603 | | | $ | 519 | | | $ | 1,132 | | | $ | 976 | |
| | | | | | | | | | | | | | | | |
| |
| | | Operating Profit | |
| | | Three Months
Ended
June
30, 2008 | | | Three Months
Ended
June 30,
2009 | | | Six Months
Ended
June 30,
2008 | | | Six Months
Ended
June 30,
2009 | |
On and Off-Highway segment | | $ | 27 | | | $ | 35 | | | $ | 54 | | | $ | 64 | |
Commercial Distribution European segment | | | (12 | ) | | | (1 | ) | | | (13 | ) | | | (1 | ) |
Brake South America segment | | | (6 | ) | | | (1 | ) | | | (7 | ) | | | (1 | ) |
Corporate, eliminations and other | | | (8 | ) | | | (8 | ) | | | (15 | ) | | | (16 | ) |
| | | | | | | | | | | | | | | | |
| | $ | 1 | | | $ | 25 | | | $ | 19 | | | $ | 46 | |
| | | | | | | | | | | | | | | | |
| | | | | | |
| | | Total Assets |
| | | December 31,
2008 | | June 30,
2009 |
On and Off-Highway segment | | $ | 1,327 | | $ | 1,436 |
Commercial Distribution European segment | | | 120 | | | 110 |
Brake South America segment | | | 6 | | | 4 |
Corporate, eliminations and other | | | 62 | | | 8 |
| | | | | | |
| | $ | 1,515 | | $ | 1,558 |
| | | | | | |
| | | | | | | | | | | | |
| | | Depreciation and Amortization |
| | | Three Months
Ended
June 30,
2008 | | Three Months
Ended
June 30,
2009 | | Six Months
Ended
June 30,
2008 | | Six Months
Ended
June 30,
2009 |
On and Off-Highway segment | | $ | 5 | | $ | 6 | | $ | 10 | | $ | 11 |
Commercial Distribution European segment | | | — | | | — | | | 1 | | | 1 |
Brake South America segment | | | — | | | — | | | — | | | — |
Corporate, eliminations and other | | | 3 | | | 3 | | | 6 | | | 6 |
| | | | | | | | | | | | |
| | $ | 8 | | $ | 9 | | $ | 17 | | $ | 18 |
| | | | | | | | | | | | |
| |
| | | Capital Expenditures |
| | | Three Months
Ended
June 30,
2008 | | Three Months
Ended
June 30,
2009 | | Six Months
Ended
June 30,
2008 | | Six Months
Ended
June 30,
2009 |
On and Off-Highway segment | | $ | 4 | | $ | 7 | | $ | 9 | | $ | 10 |
Commercial Distribution European segment | | | 1 | | | 1 | | | 1 | | | 2 |
Brake South America segment | | | — | | | — | | | 1 | | | 1 |
Corporate, eliminations and other | | | 1 | | | — | | | 1 | | | — |
| | | | | | | | | | | | |
| | $ | 6 | | $ | 8 | | $ | 12 | | $ | 13 |
| | | | | | | | | | | | |
13
Net sales by geographic region were as follows (Dollars in Millions):
| | | | | | | | | | | | |
| | | Three Months
Ended
June 30,
2008 | | Three Months
Ended
June 30,
2009 | | Six Months
Ended
June 30,
2008 | | Six Months
Ended
June 30,
2009 |
United States | | $ | 316 | | $ | 265 | | $ | 592 | | $ | 504 |
Canada | | | 42 | | | 26 | | | 76 | | | 52 |
Brazil | | | 94 | | | 74 | | | 179 | | | 133 |
Other Countries | | | 151 | | | 154 | | | 285 | | | 287 |
| | | | | | | | | | | | |
| | $ | 603 | | $ | 519 | | $ | 1,132 | | $ | 976 |
| | | | | | | | | | | | |
Long-lived assets by geographic region were as follows (Dollars in Millions):
| | | | | | |
| | | December 31,
2008 | | June 30,
2009 |
United States | | $ | 284 | | $ | 275 |
Canada | | | 14 | | | 12 |
Brazil | | | 6 | | | 6 |
China | | | 78 | | | 81 |
Other Countries | | | 58 | | | 60 |
| | | | | | |
| | $ | 440 | | $ | 434 |
| | | | | | |
Net sales by geographic region were determined based on origin of sale. Geographic data on long-lived assets are comprised of property, plant and equipment, goodwill, other intangible assets and deferred financing costs.
We offer primarily three types of products: brake products, which include brake drums, rotors, pads and shoes and hydraulic brake system components; filtration products, which include oil, fuel, air and other filters; and chassis products, which include steering, suspension and driveline components. Additionally, we have our Commercial Distribution South America products and Commercial Distribution European products which offer brake, chassis, filtration and other products. The Commercial Distribution European products include our Quinton Hazell European parts operation. Quinton Hazell designs, manufactures, purchases and distributes a wide range of aftermarket replacement motor vehicle components for customers throughout Europe, primarily under the Quinton Hazell brand name. Brake products are segregated below into Brake North America and Asia products and Brake South America products. The Company’s sales by group of similar products are as follows:
| | | | | | | | | | | | | | | | |
| | | Three Months
Ended
June 30,
2008 | | | Three Months
Ended
June 30,
2009 | | | Six Months
Ended
June 30,
2008 | | | Six Months
Ended
June 30,
2009 | |
Filtration products | | $ | 197 | | | $ | 183 | | | $ | 380 | | | $ | 355 | |
Brake North America and Asia products | | | 191 | | | | 159 | | | | 340 | | | | 291 | |
Commercial Distribution South America products | | | 97 | | | | 76 | | | | 184 | | | | 138 | |
Commercial Distribution European products | | | 74 | | | | 59 | | | | 146 | | | | 113 | |
Chassis products | | | 41 | | | | 41 | | | | 78 | | | | 77 | |
Brake South America products | | | 9 | | | | 6 | | | | 16 | | | | 11 | |
Corporate, eliminations and other | | | (6 | ) | | | (5 | ) | | | (12 | ) | | | (9 | ) |
| | | | | | | | | | | | | | | | |
| | $ | 603 | | | $ | 519 | | | $ | 1,132 | | | $ | 976 | |
| | | | | | | | | | | | | | | | |
14
Note 13. Stock Option Plans
On July 20, 2005, we adopted a stock incentive plan with a maximum of 227,000 shares of common stock subject to awards. As of June 30, 2009, 179,533 shares had been awarded, which included vested shares of 79,196 and 100,337 unvested shares. Additionally, at June 30, 2009 there were 47,467 shares available for future stock option grants. Each option expires August 1, 2015. One-half of the options vest based on the performance of the Company and the remaining portion vests at the end of each year ratably over the period from the year of the grant until December 31, 2009. The exercise price is $100 per option.
We account for our employee stock options under the fair value method of accounting using a Black-Scholes model to measure stock-based compensation expense at the date of grant. Dividend yields were not a factor because there were no cash dividends declared during 2008 and the first six months of 2009. Our weighted-average Black-Scholes fair value assumptions include:
| | | | | | | | |
| | | 2008 | | | 2009 | |
Weighted-average effective term | | | 5.2 years | | | | 5.2 years | |
Weighted-average risk free interest rate | | | 4.35 | % | | | 4.35 | % |
Weighted-average expected volatility | | | 40.1 | % | | | 40.2 | % |
Weighted-average fair value of options (Dollars in millions) | | $ | 7 | | | $ | 7 | |
The fair value of the stock option grants is amortized to expense over the vesting period. The Company reduces the overall compensation expense by a turnover rate consistent with historical trends. Stock-based compensation expense, which was recorded in selling, general and administrative expenses, and related income tax benefits were less than $1 million for each of the six month periods ending June 30, 2008 and 2009. A summary of our stock-based compensation activity for the year ended December 31, 2008 and the quarter ended June 30, 2009 is presented below:
| | | |
Outstanding at December 31, 2007 | | 217,510 | |
Granted | | 9,500 | |
Forfeited/expired | | (45,225 | ) |
| | | |
Outstanding at December 31, 2008 | | 181,785 | |
Granted | | 1,500 | |
Forfeited/expired | | (3,752 | ) |
| | | |
Balance at June 30, 2009 | | 179,533 | |
| | | |
Note 14. Derivatives
The Company’s financial derivative assets and liabilities consist of standard currency forward contracts and “plain-vanilla” interest rate swaps. The fair value framework requires the categorization of assets and liabilities into three levels based upon the assumptions (inputs) used to price the assets or liabilities. Level 1 provides the most reliable measure of fair value, whereas Level 3 generally requires significant management judgment. The three levels are defined as follows:
| | • | | Level 1: Unadjusted quoted prices in active markets for identical assets and liabilities. |
| | • | | Level 2: Observable inputs other than those included in Level 1. For example, quoted prices for similar assets or liabilities in active markets or quoted prices for identical assets or liabilities in inactive markets. |
| | • | | Level 3: Unobservable inputs reflecting management’s own assumptions about the inputs used in pricing the asset or liability. |
The fair value measurements of the Company’s interest rate and the currency derivatives are based upon Level 2 inputs consisting of observable current market data pertaining to relevant interest and currency exchange rates, as reported by a recognized independent third-party financial information provider. Based upon the Company’s periodic assessment of the creditworthiness of its derivative transactions counterparties, neither the currency nor the interest rate derivative instruments’ fair value measurements are adjusted for incremental counterparty credit risk.
As a result of adopting SFAS No. 161 we have provided the following enhanced disclosures regarding our derivative and hedging activities.
Currency Rate Derivatives
The Company transacts business in multiple currencies in various international markets. Therefore, our reported results from operations and financial position are vulnerable to several forms of risk related to currency exchange rate volatility. The Company’s use of currency rate derivatives (currency forward contracts) is limited to transactions intended to mitigate reported currency gains
15
and losses arising from the periodic re-measurement of monetary assets and liabilities denominated in a non-local currency. Our policy does not require hedging each individual exposure that may give rise to currency gain or loss. However, our practice has been to execute hedge transactions in notional amounts that would be reasonably expected to result in gains and losses that approximately offset expected gains and losses arising from specific underlying net currency exposures. Our policy strictly prohibits the use of currency rate derivatives to generate trading profits or to otherwise speculate on currency rate movements.
Our currency forward transactions are undesignated hedges and are, therefore, not eligible for hedge accounting treatment as described in SFAS No. 133, “Accounting for Derivative Instruments and Hedging Activities,” as amended and interpreted (“SFAS No. 133”). The Company’s outstanding currency forward contracts are recorded in the Consolidated Balance Sheets as “Other current assets” or “Other accrued expenses”, accordingly. Currency derivative gains and losses are recognized in “Other Income, net” in the Consolidated Statements of Operations in the reporting period of occurrence. The Company has not recorded currency derivative gains (losses) to other comprehensive income (loss) nor has it reclassified prior period currency derivative results from other comprehensive income to earning during the last twelve months. The Company does not anticipate that it will record any currency derivative gains or losses to other comprehensive income (loss) or that it will reclassify prior period currency derivative results from other comprehensive income to earning in the next twelve months.
The notional amount and fair value of our outstanding currency forward contracts were as follows (Dollars in millions):
| | | | | | | | | |
| | | Notional Amount | | Asset Derivative | | Liability Derivative |
As of June 30, 2009 | | $ | 139 | | $ | 1 | | $ | 3 |
As of December 31, 2008 | | $ | 146 | | $ | 3 | | $ | 2 |
Interest Rate Derivatives
The Company funds its business operations with a combination of fixed- and floating-rate debt. Therefore, our reported results from operations may be adversely impacted by rising interest rates. The Company’s interest rate risk policy seeks to minimize the long-term cost of debt, subject to a limitation of the maximum percentage of net floating-rate debt versus total debt outstanding.
Our use of interest rate derivative instruments (interest rate swaps), is confined to transactions intended to manage the ratio of net floating-rate debt versus total debt outstanding within a specified target range. Under agreements with its credit line banks, the Company is required to maintain at least 40% of its total debt outstanding as fixed- or effectively fixed-rate in nature. At quarter-end, about half of the Company’s total debt obligations were inherently fixed-rate in nature. In addition, pursuant to the Company’s risk management strategy, an additional $150 million of debt was effectively fixed-rate via pay-fixed interest rate swaps. At June 30, 2009 the combined percentage of fixed-rate and swapped-to-fixed-rate debt versus total debt outstanding was 72%.
While our policy does not require that we maintain a specific ratio of net floating-rate debt as a proportion of total debt outstanding, we use interest rate swaps to manage the ratio of net floating-rate debt to total debt outstanding to within our policy target range, thereby reducing the potential impact that interest rate variability may have on our consolidated financial results. Our policy strictly prohibits the use of interest rate derivatives to generate trading profits or to otherwise speculate on interest rate movements.
We have designated our interest rate swaps as “cash flow” hedges as described in SFAS No. 133. At inception of the hedge, the Company formally documents its hedge relationships and risk management objective and strategy for undertaking the hedge. In addition, the documentation identifies the interest rate swaps as a hedge of specific interest payments on variable rate debt, with the objective to perfectly offset the variability of interest expense as related to specific floating-rate debt. We also specify that the effectiveness of the interest rate swaps in mitigating interest expense variability shall be assessed using the “Hypothetical Derivative Method” as described in SFAS No. 133 Implementation Issue No. G7.
The interest rate swaps are recorded in the Consolidated Balance Sheets as “Other current assets” or “Other accrued expenses”, accordingly. In compliance with SFAS No. 133, the Company formally assesses the effectiveness of its interest rate swaps at inception and on a quarterly basis thereafter. These assessments have established that swaps have been, and are expected to continue to be, highly effective at offsetting the interest expense variability of the underlying floating rate debt and are therefore eligible for cash flow hedge accounting treatment, pursuant to SFAS No. 133.
Changes in the fair value of derivatives designated as cash flow hedges are recorded to other comprehensive income (loss), to the extent such cash flow hedges are effective. Amounts are reclassified from other comprehensive income (loss) when the underlying hedged items are recognized, during the period that a hedge transaction is terminated, or whenever a portion of the hedge transaction results are deemed ineffective. We reclassified from other comprehensive income (loss) into interest expense $1 million and $2 million in the first six months of 2008 and the first six months of 2009, respectively. There have been no gains or losses reclassified from other comprehensive income (loss) into earnings due to hedge ineffectiveness related to any of the Company’s interest rate swap transactions, nor were there gains or losses reclassified to income due to early termination of designated cash-flow hedge transactions.
16
The notional amount and fair value of interest rate swaps outstanding are as follows (Dollars in millions):
| | | | | | |
| | | Notional Amount | | Fair Value |
As of June 30, 2009 | | $ | 150 | | $ | 5 Liability |
As of December 31, 2008 | | $ | 150 | | $ | 7 Liability |
Note 15. Debt
The following table summarizes the debt activity from December 31, 2008 to June 30, 2009.
| | | | | | | | | | | |
| | | Short-term debt | | Long-term debt | | | Total debt | |
As of December 31, 2008 | | $ | 14 | | $ | 608 | | | $ | 622 | |
Long-term debt payment | | | — | | | (10 | ) | | | (10 | ) |
Extinguishment of debt(1) | | | — | | | (33 | ) | | | (33 | ) |
Accounts receivable facility(2) | | | 10 | | | — | | | | 10 | |
Increase (decrease) in Haimeng debt(3) | | | 16 | | | (11 | ) | | | 5 | |
| | | | | | | | | | | |
As of June 30, 2009 | | $ | 40 | | $ | 554 | | | $ | 594 | |
| | | | | | | | | | | |
(1)In June of 2009, Affinia Group Holdings Inc. purchased in the open market approximately $33 million principal amount of the nine percent senior subordinated notes due 2014 and thereafter contributed such notes to Affinia Group Intermediate Holdings Inc., who contributed such notes to Affinia Group Inc. Affinia Group Inc. promptly surrendered such purchased notes for cancellation which resulted in a pre-tax gain on the extinguishment of debt of $8 million in the second quarter of 2009.
(2) On November 30, 2004, Affinia established a receivables facility that provides up to $100 million in funding, based on availability of eligible receivables and satisfaction of other customary conditions. We had $25 million outstanding as of June 30, 2009 under this program of which $15 million qualified for off balance sheet financing and $10 million was included in short-term debt.
(3) During the second quarter Haimeng restructured its debt facilities and as a result short-term debt increased while long-term debt decreased.
Note 16. Subsequent Refinancing
On August 13, 2009 we refinanced our existing term loan facility and accounts receivable facility. The refinancing consists of a new four-year $315 million asset-based revolving credit facility (the “ABL Revolver”) and $225 million of new senior secured notes, the proceeds of which were used to repay outstanding borrowings under our existing term loan and our existing accounts receivable facility, as well as to settle interest rate derivatives and to pay fees and expenses related to the refinancing.
Note 17. Financial Information for Guarantors and Non-Guarantors
On November 30, 2004, the Company issued 9.0% senior subordinated notes due 2014 in the principal amount of $300 million. As of June 30, 2009 there were $267 million of senior subordinated notes outstanding. The senior subordinated notes were offered only to qualified institutional buyers and certain persons in offshore transactions. The senior subordinated notes were subsequently registered under the Securities Act of 1933 pursuant to an exchange offer completed on November 2, 2005. The senior subordinated notes are general obligations of Affinia Group Inc. and guaranteed by Affinia Group Intermediate Holdings Inc. (“Parent”) and all of the wholly owned current and future domestic subsidiaries. These guarantors jointly and severally guarantee Affinia’s obligations under the senior subordinated notes and the guarantees represent full and unconditional obligations.
The following unaudited information presents Condensed Consolidating Statements of Operations for the three and six months ended June 30, 2008 and 2009, Condensed Consolidating Statements of Cash Flows for the six months ended June 30, 2008 and 2009 and Condensed Consolidating Balance Sheets as of December 31, 2008 and June 30, 2009 to arrive at the information for the Company on a consolidated basis. Other separate financial statements and other disclosures concerning the Parent and the Guarantors are not presented because management does not believe that such information is material to investors.
17
Affinia Group Intermediate Holdings Inc.
Supplemental Guarantor
Condensed Consolidating Balance Sheet
December 31, 2008
(Dollars in Millions)
| | | | | | | | | | | | | | | | | | | | |
| | | Parent | | Issuer | | | Guarantor | | Non-Guarantor | | Eliminations | | | Consolidated
Total |
Assets | | | | | | | | | | | | | | | | | | | | |
Current assets: | | | | | | | | | | | | | | | | | | | | |
Cash and cash equivalents | | $ | — | | $ | 59 | | | $ | — | | $ | 18 | | $ | — | | | $ | 77 |
Restricted cash | | | — | | | — | | | | — | | | 4 | | | — | | | | 4 |
Trade accounts receivable | | | — | | | 31 | | | | 155 | | | 126 | | | — | | | | 312 |
Inventories, net | | | — | | | — | | | | 314 | | | 198 | | | — | | | | 512 |
Other current assets | | | — | | | 47 | | | | 1 | | | 41 | | | — | | | | 89 |
| | | | | | | | | | | | | | | | | | | | |
Total current assets | | | — | | | 137 | | | | 470 | | | 387 | | | — | | | | 994 |
Investments and other assets | | | — | | | 218 | | | | 76 | | | 19 | | | — | | | | 313 |
Intercompany investments | | | 356 | | | 1,068 | | | | 347 | | | — | | | (1,771 | ) | | | — |
Intercompany receivables | | | — | | | (332 | ) | | | 275 | | | 57 | | | — | | | | — |
Property, plant and equipment, net | | | — | | | 9 | | | | 95 | | | 104 | | | — | | | | 208 |
| | | | | | | | | | | | | | | | | | | | |
Total assets | | $ | 356 | | $ | 1,100 | | | $ | 1,263 | | $ | 567 | | $ | (1,771 | ) | | $ | 1,515 |
| | | | | | | | | | | | | | | | | | | | |
| | | | | | |
Liabilities and Equity | | | | | | | | | | | | | | | | | | | | |
Current liabilities: | | | | | | | | | | | | | | | | | | | | |
Accounts payable | | $ | — | | $ | 13 | | | $ | 156 | | $ | 105 | | $ | — | | | $ | 274 |
Short-term debt | | | — | | | — | | | | — | | | 14 | | | — | | | | 14 |
Accrued payroll and employee benefits | | | — | | | 6 | | | | 4 | | | 21 | | | — | | | | 31 |
Other accrued expenses | | | — | | | 59 | | | | 31 | | | 58 | | | — | | | | 148 |
| | | | | | | | | | | | | | | | | | | | |
Total current liabilities | | | — | | | 78 | | | | 191 | | | 198 | | | — | | | | 467 |
Deferred employee benefits and noncurrent liabilities | | | — | | | 14 | | | | — | | | 10 | | | — | | | | 24 |
Long-term debt | | | — | | | 597 | | | | — | | | 11 | | | — | | | | 608 |
| | | | | | | | | | | | | | | | | | | | |
Total liabilities | | | — | | | 689 | | | | 191 | | | 219 | | | — | | | | 1,099 |
Total shareholder’s equity of the company | | | 356 | | | 356 | | | | 1,067 | | | 348 | | | (1,771 | ) | | | 356 |
Noncontrolling interest | | | — | | | 55 | | | | 5 | | | — | | | — | | | | 60 |
| | | | | | | | | | | | | | | | | | | | |
Total equity | | | 356 | | | 411 | | | | 1,072 | | | 348 | | | (1,771 | ) | | | 416 |
| | | | | | | | | | | | | | | | | | | | |
Total liabilities and equity | | $ | 356 | | $ | 1,100 | | | $ | 1,263 | | $ | 567 | | $ | (1,771 | ) | | $ | 1,515 |
| | | | | | | | | | | | | | | | | | | | |
18
Affinia Group Intermediate Holdings Inc.
Supplemental Guarantor
Condensed Consolidating Balance Sheet
June 30, 2009
(Dollars in Millions)
| | | | | | | | | | | | | | | | | | | | |
| | | Parent | | Issuer | | | Guarantor | | Non-Guarantor | | Eliminations | | | Consolidated
Total |
Assets | | | | | | | | | | | | | | | | | | | | |
Current assets: | | | | | | | | | | | | | | | | | | | | |
Cash and cash equivalents | | $ | — | | $ | 23 | | | $ | — | | $ | 20 | | $ | — | | | $ | 43 |
Restricted cash | | | — | | | — | | | | — | | | 14 | | | — | | | | 14 |
Trade accounts receivable | | | — | | | 13 | | | | 190 | | | 172 | | | — | | | | 375 |
Inventories, net | | | — | | | — | | | | 286 | | | 215 | | | — | | | | 501 |
Other current assets | | | — | | | 47 | | | | 1 | | | 56 | | | — | | | | 104 |
| | | | | | | | | | | | | | | | | | | | |
Total current assets | | | — | | | 83 | | | | 477 | | | 477 | | | — | | | | 1,037 |
Investments and other assets | | | — | | | 216 | | | | 16 | | | 78 | | | — | | | | 310 |
Intercompany investments | | | 413 | | | 1,129 | | | | 447 | | | — | | | (1,989 | ) | | | — |
Intercompany receivables | | | — | | | (322 | ) | | | 281 | | | 41 | | | — | | | | — |
Property, plant and equipment, net | | | — | | | 6 | | | | 98 | | | 107 | | | — | | | | 211 |
| | | | | | | | | | | | | | | | | | | | |
Total assets | | $ | 413 | | $ | 1,112 | | | $ | 1,319 | | $ | 703 | | $ | (1,989 | ) | | $ | 1,558 |
| | | | | | | | | | | | | | | | | | | | |
| | | | | | |
Liabilities and Equity | | | | | | | | | | | | | | | | | | | | |
Current liabilities: | | | | | | | | | | | | | | | | | | | | |
Accounts payable | | $ | — | | $ | 15 | | | $ | 145 | | $ | 120 | | $ | — | | | $ | 280 |
Short-term debt | | | — | | | 10 | | | | — | | | 30 | | | — | | | | 40 |
Accrued payroll and employee benefits | | | — | | | 15 | | | | 8 | | | 15 | | | — | | | | 38 |
Other accrued expenses | | | — | | | 49 | | | | 36 | | | 71 | | | — | | | | 156 |
| | | | | | | | | | | | | | | | | | | | |
Total current liabilities | | | — | | | 89 | | | | 189 | | | 236 | | | — | | | | 514 |
Deferred employee benefits and noncurrent liabilities | | | — | | | 14 | | | | — | | | 21 | | | — | | | | 35 |
Long-term debt | | | — | | | 554 | | | | — | | | — | | | — | | | | 554 |
| | | | | | | | | | | | | | | | | | | | |
Total liabilities | | | — | | | 657 | | | | 189 | | | 257 | | | — | | | | 1,103 |
Total shareholder’s equity of the company | | | 413 | | | 419 | | | | 1,124 | | | 446 | | | (1,989 | ) | | | 413 |
Noncontrolling interest | | | — | | | 36 | | | | 6 | | | — | | | — | | | | 42 |
| | | | | | | | | | | | | | | | | | | | |
Total equity | | | 413 | | | 455 | | | | 1,130 | | | 446 | | | (1,989 | ) | | | 455 |
| | | | | | | | | | | | | | | | | | | | |
Total liabilities and equity | | $ | 413 | | $ | 1,112 | | | $ | 1,319 | | $ | 703 | | $ | (1,989 | ) | | $ | 1,558 |
| | | | | | | | | | | | | | | | | | | | |
19
Affinia Group Intermediate Holdings Inc.
Supplemental Guarantor
Condensed Consolidating Statement of Operations
For the Three Months Ended June 30, 2008
(Dollars in Millions)
| | | | | | | | | | | | | | | | | | | | | | | | |
| | | Parent | | | Issuer | | | Guarantor | | | Non-Guarantor | | | Eliminations | | | Consolidated
Total | |
Net sales | | $ | — | | | $ | — | | | $ | 314 | | | $ | 376 | | | $ | (87 | ) | | $ | 603 | |
Cost of sales | | | — | | | | — | | | | (249 | ) | | | (341 | ) | | | 87 | | | | (503 | ) |
| | | | | | | | | | | | | | | | | | | | | | | | |
Gross profit | | | — | | | | — | | | | 65 | | | | 35 | | | | — | | | | 100 | |
Selling, general and administrative expenses | | | — | | | | (6 | ) | | | (42 | ) | | | (50 | ) | | | — | | | | (98 | ) |
Loss on disposition of affiliate | | | — | | | | — | | | | — | | | | (1 | ) | | | — | | | | (1 | ) |
| | | | | | | | | | | | | | | | | | | | | | | | |
Operating (loss) profit | | | — | | | | (6 | ) | | | 23 | | | | (16 | ) | | | — | | | | 1 | |
Other income (loss), net | | | — | | | | 7 | | | | (7 | ) | | | 1 | | | | — | | | | 1 | |
Interest expense | | | — | | | | (14 | ) | | | — | | | | — | | | | — | | | | (14 | ) |
| | | | | | | | | | | | | | | | | | | | | | | | |
(Loss) income before taxes and equity income | | | — | | | | (13 | ) | | | 16 | | | | (15 | ) | | | — | | | | (12 | ) |
Income tax (benefit) provision | | | — | | | | (2 | ) | | | — | | | | 8 | | | | — | | | | 6 | |
Equity interest in income, net of tax | | | (18 | ) | | | 2 | | | | (17 | ) | | | 11 | | | | 22 | | | | — | |
| | | | | | | | | | | | | | | | | | | | | | | | |
(Loss) income | | | (18 | ) | | | (9 | ) | | | (1 | ) | | | (12 | ) | | | 22 | | | | (18 | ) |
Less: Net income attributable to noncontrolling interest, net of tax | | | — | | | | — | | | | — | | | | — | | | | — | | | | — | |
| | | | | | | | | | | | | | | | | | | | | | | | |
Net (loss) income attributable to the company | | $ | (18 | ) | | $ | (9 | ) | | $ | (1 | ) | | $ | (12 | ) | | $ | 22 | | | $ | (18 | ) |
| | | | | | | | | | | | | | | | | | | | | | | | |
20
Affinia Group Intermediate Holdings Inc.
Supplemental Guarantor
Condensed Consolidating Statement of Operations
For the Six Months Ended June 30, 2008
(Dollars in Millions)
| | | | | | | | | | | | | | | | | | | | | | | | |
| | | Parent | | | Issuer | | | Guarantor | | | Non-Guarantor | | | Eliminations | | | Consolidated
Total | |
Net sales | | $ | — | | | $ | — | | | $ | 591 | | | $ | 695 | | | $ | (154 | ) | | $ | 1,132 | |
Cost of sales | | | — | | | | — | | | | (469 | ) | | | (622 | ) | | | 154 | | | | (937 | ) |
| | | | | | | | | | | | | | | | | | | | | | | | |
Gross profit | | | — | | | | — | | | | 122 | | | | 73 | | | | — | | | | 195 | |
Selling, general and administrative expenses | | | — | | | | (11 | ) | | | (83 | ) | | | (81 | ) | | | — | | | | (175 | ) |
Loss on disposition of affiliate | | | — | | | | — | | | | — | | | | (1 | ) | | | — | | | | (1 | ) |
| | | | | | | | | | | | | | | | | | | | | | | | |
Operating (loss) profit | | | — | | | | (11 | ) | | | 39 | | | | (9 | ) | | | — | | | | 19 | |
Other income (loss), net | | | — | | | | 14 | | | | (14 | ) | | | 1 | | | | — | | | | 1 | |
Interest expense | | | — | | | | (28 | ) | | | — | | | | — | | | | — | | | | (28 | ) |
| | | | | | | | | | | | | | | | | | | | | | | | |
(Loss) income before taxes and equity income | | | — | | | | (25 | ) | | | 25 | | | | (8 | ) | | | — | | | | (8 | ) |
Income tax (benefit) provision | | | — | | | | (5 | ) | | | — | | | | 12 | | | | — | | | | 7 | |
Equity interest in income, net of tax | | | (15 | ) | | | 18 | | | | (1 | ) | | | 35 | | | | (37 | ) | | | — | |
| | | | | | | | | | | | | | | | | | | | | | | | |
(Loss) income | | | (15 | ) | | | (2 | ) | | | 24 | | | | 15 | | | | (37 | ) | | | (15 | ) |
Less: Net income attributable to noncontrolling interest, net of tax | | | — | | | | — | | | | — | | | | — | | | | — | | | | — | |
| | | | | | | | | | | | | | | | | | | | | | | | |
Net (loss) income attributable to the company | | $ | (15 | ) | | $ | (2 | ) | | $ | 24 | | | $ | 15 | | | $ | (37 | ) | | $ | (15 | ) |
| | | | | | | | | | | | | | | | | | | | | | | | |
21
Affinia Group Intermediate Holdings Inc.
Supplemental Guarantor
Condensed Consolidating Statement of Operations
For the Three Months Ended June 30, 2009
(Dollars in Millions)
| | | | | | | | | | | | | | | | | | | | | | | |
| | | Parent | | Issuer | | | Guarantor | | | Non-Guarantor | | | Eliminations | | | Consolidated
Total | |
Net sales | | $ | — | | $ | — | | | $ | 309 | | | $ | 291 | | | $ | (81 | ) | | $ | 519 | |
Cost of sales | | | — | | | — | | | | (262 | ) | | | (242 | ) | | | 81 | | | | (423 | ) |
| | | | | | | | | | | | | | | | | | | | | | | |
Gross profit | | | — | | | — | | | | 47 | | | | 49 | | | | — | | | | 96 | |
Selling, general and administrative expenses | | | — | | | (7 | ) | | | (35 | ) | | | (29 | ) | | | — | | | | (71 | ) |
Income from settlement | | | — | | | — | | | | — | | | | — | | | | — | | | | — | |
| | | | | | | | | | | | | | | | | | | | | | | |
Operating (loss) profit | | | — | | | (7 | ) | | | 12 | | | | 20 | | | | — | | | | 25 | |
Gain on extinguishment of debt | | | — | | | 8 | | | | — | | | | — | | | | — | | | | 8 | |
Other income (loss), net | | | — | | | 4 | | | | (5 | ) | | | 2 | | | | — | | | | 1 | |
Interest expense | | | — | | | (13 | ) | | | — | | | | (1 | ) | | | — | | | | (14 | ) |
| | | | | | | | | | | | | | | | | | | | | | | |
(Loss) income before income tax provision and equity income | | | — | | | (8 | ) | | | 7 | | | | 21 | | | | — | | | | 20 | |
Income tax (benefit) provision | | | — | | | 3 | | | | — | | | | 4 | | | | — | | | | 7 | |
Equity interest in income, net of tax | | | 9 | | | 23 | | | | 17 | | | | — | | | | (49 | ) | | | — | |
| | | | | | | | | | | | | | | | | | | | | | | |
(Loss) income | | | 9 | | | 12 | | | | 24 | | | | 17 | | | | (49 | ) | | | 13 | |
Less: Net income attributable to noncontrolling interest, net of tax | | | — | | | (3 | ) | | | (1 | ) | | | — | | | | — | | | | (4 | ) |
| | | | | | | | | | | | | | | | | | | | | | | |
Net (loss) income attributable to the company | | $ | 9 | | $ | 9 | | | $ | 23 | | | $ | 17 | | | $ | (49 | ) | | $ | 9 | |
| | | | | | | | | | | | | | | | | | | | | | | |
22
Affinia Group Intermediate Holdings Inc.
Supplemental Guarantor
Condensed Consolidating Statement of Operations
For the Six Months Ended June 30, 2009
(Dollars in Millions)
| | | | | | | | | | | | | | | | | | | | | | | |
| | | Parent | | Issuer | | | Guarantor | | | Non-Guarantor | | | Eliminations | | | Consolidated
Total | |
Net sales | | $ | — | | $ | — | | | $ | 594 | | | $ | 543 | | | $ | (161 | ) | | $ | 976 | |
Cost of sales | | | — | | | — | | | | (506 | ) | | | (450 | ) | | | 161 | | | | (795 | ) |
| | | | | | | | | | | | | | | | | | | | | | | |
Gross profit | | | — | | | — | | | | 88 | | | | 93 | | | | — | | | | 181 | |
Selling, general and administrative expenses | | | — | | | (12 | ) | | | (68 | ) | | | (55 | ) | | | — | | | | (135 | ) |
Income from settlement | | | — | | | — | | | | — | | | | — | | | | — | | | | — | |
| | | | | | | | | | | | | | | | | | | | | | | |
Operating (loss) profit | | | — | | | (12 | ) | | | 20 | | | | 38 | | | | — | | | | 46 | |
Gain on extinguishment of debt of debt | | | — | | | 8 | | | | — | | | | — | | | | — | | | | 8 | |
Other income (loss), net | | | — | | | 8 | | | | (8 | ) | | | 1 | | | | — | | | | 1 | |
Interest expense | | | — | | | (27 | ) | | | — | | | | (1 | ) | | | — | | | | (28 | ) |
| | | | | | | | | | | | | | | | | | | | | | | |
(Loss) income before income tax provision and equity income | | | — | | | (23 | ) | | | 12 | | | | 38 | | | | — | | | | 27 | |
Income tax (benefit) provision | | | — | | | 1 | | | | — | | | | 10 | | | | — | | | | 11 | |
Equity interest in income, net of tax | | | 13 | | | 39 | | | | 28 | | | | — | | | | (80 | ) | | | — | |
| | | | | | | | | | | | | | | | | | | | | | | |
(Loss) income | | | 13 | | | 15 | | | | 40 | | | | 28 | | | | (80 | ) | | | 16 | |
Less: Net income attributable to noncontrolling interest, net of tax | | | — | | | (2 | ) | | | (1 | ) | | | — | | | | — | | | | (3 | ) |
| | | | | | | | | | | | | | | | | | | | | | | |
Net (loss) income attributable to the company | | $ | 13 | | $ | 13 | | | $ | 39 | | | $ | 28 | | | $ | (80 | ) | | $ | 13 | |
| | | | | | | | | | | | | | | | | | | | | | | |
23
Affinia Group Intermediate Holdings Inc.
Supplemental Guarantor
Condensed Consolidating Statement of Cash Flows
For the Six Months Ended June 30, 2008
(Dollars in Millions)
| | | | | | | | | | | | | | | | | | | | | | |
| | | Parent | | Issuer | | | Guarantor | | | Non-Guarantor | | | Elimination | | Consolidated
Total | |
Operating activities | | | | | | | | | | | | | | | | | | | | | | |
Net cash (used in) provided by operating activities | | $ | — | | $ | 18 | | | $ | 8 | | | $ | (15 | ) | | $ | — | | $ | 11 | |
Investing activities | | | | | | | | | | | | | | | | | | | | | | |
Proceeds from sale of assets | | | — | | | — | | | | — | | | | 1 | | | | — | | | 1 | |
Proceeds from sale of affiliates | | | — | | | 3 | | | | — | | | | 3 | | | | — | | | 6 | |
Investment in affiliate | | | — | | | — | | | | (3 | ) | | | — | | | | — | | | (3 | ) |
Additions to property, plant, and equipment, net | | | — | | | (1 | ) | | | (6 | ) | | | (5 | ) | | | — | | | (12 | ) |
| | | | | | | | | | | | | | | | | | | | | | |
Net cash used in investing activities | | | — | | | 2 | | | | (9 | ) | | | (1 | ) | | | — | | | (8 | ) |
Financing activities | | | | | | | | | | | | | | | | | | | | | | |
Short-term debt, net | | | — | | | — | | | | — | | | | — | | | | — | | | — | |
equipment transactions with Parent | | | — | | | — | | | | — | | | | — | | | | — | | | — | |
| | | | | | | | | | | | | | | | | | | | | | |
Net cash provided by (used in) financing activities | | | — | | | — | | | | — | | | | — | | | | — | | | — | |
Effect of exchange rates on cash | | | — | | | — | | | | — | | | | 1 | | | | — | | | 1 | |
Change in cash and cash equivalents | | | — | | | 20 | | | | (1 | ) | | | (15 | ) | | | — | | | 4 | |
Cash and cash equivalents at beginning of period | | | — | | | 20 | | | | 1 | | | | 38 | | | | — | | | 59 | |
| | | | | | | | | | | | | | | | | | | | | | |
Cash and cash equivalents at end of period | | $ | — | | $ | 40 | | | $ | — | | | $ | 23 | | | $ | — | | $ | 63 | |
| | | | | | | | | | | | | | | | | | | | | | |
24
Affinia Group Intermediate Holdings Inc.
Supplemental Guarantor
Condensed Consolidating Statement of Cash Flows
For the Six Months Ended June 30, 2009
(Dollars in Millions)
| | | | | | | | | | | | | | | | | | | | | | |
| | | Parent | | Issuer | | | Guarantor | | | Non-Guarantor | | | Elimination | | Consolidated
Total | |
Operating activities | | | | | | | | | | | | | | | | | | | | | | |
Net cash (used in) provided by operating activities | | $ | — | | $ | (25 | ) | | $ | 6 | | | $ | 12 | | | $ | — | | $ | (7 | ) |
Investing activities | | | | | | | | | | | | | | | | | | | | | | |
Proceeds from sale of assets | | | — | | | — | | | | — | | | | — | | | | — | | | — | |
Investments in companies, net of cash acquired | | | — | | | — | | | | — | | | | — | | | | — | | | — | |
Proceeds from sale of affiliates | | | — | | | — | | | | — | | | | — | | | | — | | | — | |
Investments in affiliates | | | — | | | (25 | ) | | | — | | | | — | | | | — | | | (25 | ) |
Change in restricted cash | | | — | | | — | | | | — | | | | (10 | ) | | | — | | | (10 | ) |
Additions to property, plant and equipment, net | | | — | | | (1 | ) | | | (6 | ) | | | (6 | ) | | | — | | | (13 | ) |
Other investing activities | | | — | | | — | | | | — | | | | — | | | | — | | | — | |
| | | | | | | | | | | | | | | | | | | | | | |
Net cash used in investing activities | | | — | | | (26 | ) | | | (6 | ) | | | (16 | ) | | | — | | | (48 | ) |
Financing activities | | | | | | | | | | | | | | | | | | | | | | |
Increase in debt of noncontrolling interest | | | — | | | — | | | | — | | | | 5 | | | | — | | | 5 | |
Proceeds from (payment of) long-term debt | | | — | | | (10 | ) | | | — | | | | — | | | | — | | | (10 | ) |
Proceeds from (payment of) accounts receivable facility | | | — | | | 25 | | | | — | | | | — | | | | — | | | 25 | |
Capital contribution | | | — | | | — | | | | — | | | | — | | | | — | | | — | |
Net transactions with Parent | | | — | | | — | | | | — | | | | — | | | | — | | | — | |
| | | | | | | | | | | | | | | | | | | | | | |
Net cash provided by (used in) financing activities | | | — | | | 15 | | | | — | | | | 5 | | | | — | | | 20 | |
Effect of exchange rates on cash | | | — | | | — | | | | — | | | | 1 | | | | — | | | 1 | |
Change in cash and cash equivalents | | | — | | | (36 | ) | | | — | | | | 2 | | | | — | | | (34 | ) |
Cash and cash equivalents at beginning of period | | | — | | | 59 | | | | — | | | | 18 | | | | — | | | 77 | |
| | | | | | | | | | | | | | | | | | | | | | |
Cash and cash equivalents at end of period | | $ | — | | $ | 23 | | | $ | — | | | $ | 20 | | | $ | — | | $ | 43 | |
| | | | | | | | | | | | | | | | | | | | | | |
25
| Item 2. | Management’s Discussion and Analysis of Financial Condition and Results of Operations |
Company Overview
Affinia is a global leader in the on and off-highway replacement products and services industry, also commonly known as the aftermarket. Our extensive aftermarket product offering, which consists principally of brake, steering, suspension and filtration products, fits nearly every car, truck, off-highway and agricultural make and model, allowing us to serve as a full line supplier in our product categories to our customers.We derive approximately 98% of our sales from this industry and, as a result, are not directly affected by the market cyclicality of the automotive original equipment manufacturers (“OEM”). The following charts illustrate the aggregation of net sales by product grouping together with a representative brand for the first six months of 2009 and the concentration of On and Off-Highway replacement product sales and OEM sales as of December 31, 2008.
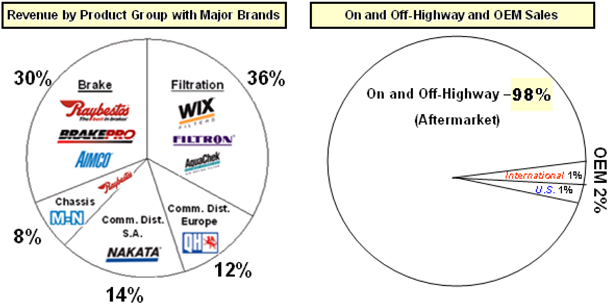
We sell our broad range of aftermarket products in North America, Europe, South America and Asia under a variety of brands including: WIX®, Raybestos®, McQuay-Norris®, Nakata®, Quinton Hazell™, Filtron™ and Brake-Pro®. Additionally, we provide private label offerings for NAPA®, CARQUEST® and ACDelco® and co-branded offerings for Federated Auto Parts (“Federated”) and Automotive Distribution Network (“ADN”), as well as filtration products for industrial applications. We believe we have achieved our leading market positions due to the quality and reputation of our brands, the broad product offering, quality products, brand recognition (e.g., Wix and Raybestos), value-added services, and distribution and global sourcing capabilities. Due to these key advantages, we believe we hold the number one market position in North America in filtration products and in brake product sales and the number two market position in North America in chassis product sales.
Additionally, we hold a significant presence in South America and Europe, which we believe is demonstrated by our number three position as a distributor of aftermarket products in Brazil, our number one position in filtration products in Poland and our position as a leader in various other countries.
Among the value-added services we bring to our customers are our customer focused sales force, professional tech support, and e-cataloguing services to name a few. The value we bring to our customers has been recognized with numerous awards over the last several years. We believe that these key advantages strategically position us for growth in North America and globally.
Recent Developments
Consumer confidence dropped significantly in 2008 due to the unprecedented disruption in the credit markets. A lack of consumer confidence and a decrease in miles driven coupled with recessionary pressures and the strengthening of the U.S. dollar has led to a decline in sales volume in the fourth quarter of 2008 and the first six months of 2009. In direct response to the deepening global recession, we made operational changes in the fourth quarter of 2008 including implementing layoffs and wage freezes, along with postponing, for all U.S. employees, 401(k) basic and matching contributions. Despite the economic climate and credit markets uncertainty, we have continued to transform our Company into a world class global manufacturer and distributor. Our successes in
26
2008 included the acquisition by Affinia Acquisition LLC of HBM Investment Limited which owns Haimeng, one of the world’s largest manufacturers of brake drums and rotors. Additionally, the launch of our joint venture in India will continue to keep us competitive in brake friction products. We believe that these actions, along with operational changes and the numerous restructuring
initiatives we have taken since we launched our comprehensive restructuring program in December 2005 have enabled us to remain competitive through this difficult economic environment.
Strategic Focus
We are focusing on expanding our manufacturing capabilities globally to position us to take advantage of global growth opportunities. Currently, we have manufacturing and distribution operations in North America, South America, Asia and Europe. We have recently completed or are in the process of completing the following transformation projects:
| | • | | Effective October 31, 2008, an Affinia affiliated company purchased a controlling interest in HBM Investment Limited (“HBM”), a Hong Kong company. HBM owns one of the world’s largest drum and rotor manufacturing companies, Haimeng, which is located in China. HBM has over 1 million square feet of modern manufacturing and machining capacity. |
| | • | | During the fourth quarter of 2008, we started production of brake products at a new facility in northern Mexico. We are still in the process of ramping up to full capacity at this new facility. |
| | • | | We recently completed our 50% owned manufacturing site in India. The initial testing and manufacturing of brake friction products began during the fourth quarter of 2008, and initial shipments began in the first quarter of 2009. |
| | • | | Our first filter manufacturing operation in Mexico opened in the third quarter of 2007. During 2008, the manufacturing operation was brought up to its full capabilities. This operation serves markets in both North America and Central America. We are currently expanding our distribution capabilities at this operation to increase our Mexican sales. |
These new business ventures reinforce our commitment to expanding our position as a global manufacturer. The chart below illustrates our global position based on manufacturing square feet as of December 31, 2008.
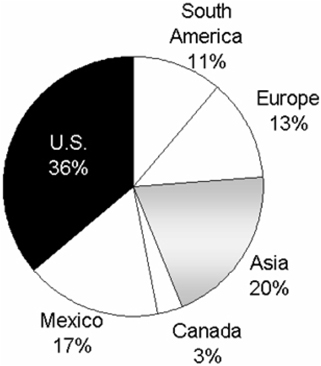
As the chart shows, our manufacturing capabilities are spread throughout North America, Asia, Europe and South America. In the last four years the diversification of our manufacturing locations has transformed us from a domestic manufacturer to a global manufacturer with a significant portion of our manufacturing base in low cost countries. We are also focusing on growing our business in emerging markets as we continue to diversify our global manufacturing and distribution capabilities. We will continue to expand our global capabilities as we pursue our objective of becoming a world class on and off-highway replacement products and services company.
27
We categorize our customers into three channels (1) traditional distributors, (2) retail and (3) Original Equipment Service (“OES”). OES consists primarily of new vehicle manufacturers’ service departments at new vehicle dealerships. As the majority of our sales are to traditional distributors and retailers rather than to OEM; the closure of a large number of automotive dealerships in connection with the bankruptcies of General Motors and Chrysler may benefit our business if vehicle owners who previously relied on dealership service centers turn to traditional aftermarket distributors and retailers. We generate a majority of our sales from the traditional and retail channels and less sales from our OES channel.
Restructuring Activity
In 2005, we announced two restructuring plans: (i) a restructuring plan that we announced at the beginning of 2005 as part of the Acquisition, also referred to herein as the acquisition restructuring and (ii) a restructuring plan that we announced at the end of 2005, also referred to herein as the comprehensive restructuring. We have completed the acquisition restructuring and we are in the process of completing the comprehensive restructuring program. We have closed 44 facilities during the last four years and have shifted some of our manufacturing base to countries such as China, India, Ukraine and Mexico. In connection with the comprehensive restructuring, we have recorded $144 million in restructuring costs to date. We recorded $23 million in 2005, $40 million in 2006, $38 million in 2007, $40 million in 2008, and $3 million during the first six months of 2009. We anticipate that we will incur approximately $18 million more in restructuring costs during 2009 and 2010 completing the closure of the previously announced facilities. The restructuring plans have had a favorable impact on our gross margin over the last four years as shown in the chart below:
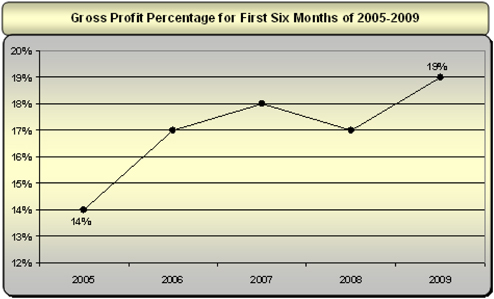
Critical Accounting Policies
The Company’s critical accounting policies are those related to asset impairment, inventories, revenue recognition, sales returns and rebates, estimated costs related to product warranties, pensions, income taxes, contingency reserves and restructuring expenses. These policies are more fully described in the notes to the consolidated financial statements in the Company’s Annual Report on Form 10-K for the year ended December 31, 2008.
The preparation of interim financial statements involves the use of certain estimates that are consistent with those used in the preparation of the annual financial statements.
Basis of Presentation
The On and Off-Highway segment is comprised of the following operations: Filtration, Brake North America and Asia, Commercial Distribution South America, and Chassis. The Company also has two other reportable segments, which are Commercial Distribution European and Brake South America. In the Results of Operations tables below, we have identified in tabular format the revenue by product.
28
Results of Operations
Three months ended June 30, 2008 compared to the three months ended June 30, 2009
Net sales.Consolidated sales decreased by $84 million in the second quarter of 2009 in comparison to the second quarter of 2008 due mainly to currency translation losses of $55 million. Additionally, sales were negatively impacted by the recessionary pressures in the global economy. The following table summarizes the consolidated net sales results for the three months ended June 30, 2008 and the consolidated results for the three months ended June 30, 2009 (Dollars in Millions):
| | | | | | | | | | | | | | | | | | | |
| | | Consolidated
Three Months
Ended
June 30,
2008 | | | Consolidated
Three Months
Ended
June 30,
2009 | | | Dollar
Change | | | Percent
Change | | | Currency
Effect | |
Net sales | | | | | | | | | | | | | | | | | | | |
Filtration products | | $ | 197 | | | $ | 183 | | | $ | (14 | ) | | -7 | % | | $ | (19 | ) |
Brake North America and Asia products | | | 191 | | | | 159 | | | | (32 | ) | | -17 | % | | | (6 | ) |
Commercial Distribution South America products | | | 97 | | | | 76 | | | | (21 | ) | | -22 | % | | | (19 | ) |
Chassis products | | | 41 | | | | 41 | | | | — | | | — | % | | | (1 | ) |
| | | | | | | | | | | | | | | | | | | |
On and Off-highway segment | | | 526 | | | | 459 | | | | (67 | ) | | -13 | % | | | (45 | ) |
Commercial Distribution European segment | | | 74 | | | | 59 | | | | (15 | ) | | -20 | % | | | (11 | ) |
Brake South America segment | | | 9 | | | | 6 | | | | (3 | ) | | -33 | % | | | — | |
Eliminations and other | | | (6 | ) | | | (5 | ) | | | 1 | | | 17 | % | | | 1 | |
| | | | | | | | | | | | | | | | | | | |
Total net sales | | | 603 | | | | 519 | | | | (84 | ) | | -14 | % | | | (55 | ) |
On and Off-highway segment product sales decreased due to the following:
Filtration productssales decreased in the second quarter of 2009 in comparison to the second quarter of 2008 due to currency translation losses of $19 million, which were related to the weakening of the Polish Zloty, the Canadian Dollar and the Mexican Peso against the U.S. Dollar. Offsetting the translation losses were increased sales in our Polish operations. Recently, one of our customers increased orders for our filtration products and ceased orders for certain of our brake products. On a consolidated basis, we do not anticipate the impact of these changes to be significant.
Brake North America and Asia products sales decreased in the second quarter of 2009 in comparison to the second quarter of 2008 partially due to $6 million in currency translation losses, which were related to the weakening of the Canadian Dollar and the Mexican Peso against the U.S. Dollar. The remaining decrease was primarily attributable to a decline in volume, due to the general softness of the aftermarket business, and a decrease in sales related to a customer ceasing orders on certain of our brake products during the second quarter as described above. Additionally, OES channels, which consist primarily of new vehicle manufacturers’ service departments at new vehicle dealerships, have also decreased orders due to the recessionary pressures and the changing landscape in the industry.
Commercial Distribution South America productssales decreased in the second quarter of 2009 in comparison to the second quarter of 2008 mainly due to currency translation losses of $19 million. The general softness of the South American economies led to a decline in sales in most of our South American operations. However, our Brazilian distribution company continued to grow its market share even in the unfavorable market conditions.
Commercial Distribution European segmentsales for the second quarter of 2009 decreased in comparison to the second quarter of 2008 due partially to currency translation losses of $11 million, which were related to the weakening of the Euro and the British Pound against the U.S. Dollar. The remaining decrease in sales was mainly due to the decrease in sales in Spain and the United Kingdom, which was partially due to unfavorable market conditions. Offsetting the decrease in sales in Spain and the United Kingdom was an increase in sales in France.
Brake South America segmentsales for the second quarter of 2009 decreased in comparison to the second quarter of 2008 due to the closure of a facility in Argentina in the middle of 2008. The closed facility mainly manufactured product for our Brake North America operations and Commercial Distribution South America operations. On a consolidated basis the closure did not result in a significant loss of sales.
29
The following table summarizes the consolidated results for the three months ended June 30, 2008 and the consolidated results for the three months ended June 30, 2009 (Dollars in Millions):
| | | | | | | | | | | | | | | |
| | | Consolidated
Three Months
Ended
June 30,
2008 | | | Consolidated
Three Months
Ended
June 30,
2009 | | | Dollar
Change | | | Percent
Change | |
Net Sales | | | 603 | | | | 519 | | | | (84 | ) | | -14 | % |
Cost of sales(1) | | | (503 | ) | | | (423 | ) | | | 80 | | | -16 | % |
| | | | | | | | | | | | | | | |
Gross profit | | | 100 | | | | 96 | | | | (4 | ) | | -4 | % |
Gross margin | | | 17 | % | | | 18 | % | | | | | | | |
Selling, general and administrative expenses(2) | | | (98 | ) | | | (71 | ) | | | 27 | | | 28 | % |
Loss on disposition of affiliate | | | (1 | ) | | | — | | | | 1 | | | NM | |
Selling, general and administrative expenses as a percent of sales | | | 16 | % | | | 14 | % | | | | | | | |
| | | | | | | | | | | | | | | |
Operating profit (loss) | | | | | | | | | | | | | | | |
On and Off-highway segment | | | 27 | | | | 35 | | | | 8 | | | 30 | % |
Commercial Distribution European segment | | | (12 | ) | | | (1 | ) | | | 11 | | | 92 | % |
Brake South America segment | | | (6 | ) | | | (1 | ) | | | 5 | | | 83 | % |
Corporate and other | | | (8 | ) | | | (8 | ) | | | — | | | — | % |
| | | | | | | | | | | | | | | |
Operating profit | | | 1 | | | | 25 | | | | 24 | | | 2400 | % |
Operating margin | | | 0 | % | | | 5 | % | | | | | | | |
Gain on extinguishment of debt | | | — | | | | 8 | | | | 8 | | | NM | |
Other income, net | | | 1 | | | | 1 | | | | — | | | — | % |
Interest expense | | | (14 | ) | | | (14 | ) | | | — | | | — | % |
| | | | | | | | | | | | | | | |
Income (loss) before taxes | | | (12 | ) | | | 20 | | | | 32 | | | -267 | % |
Income tax provision | | | 6 | | | | 7 | | | | 1 | | | 17 | % |
| | | | | | | | | | | | | | | |
Net income | | | (18 | ) | | | 13 | | | | 31 | | | NM | |
Less: Net income attributable to noncontrolling interest, net of tax | | | — | | | | (4 | ) | | | (4 | ) | | NM | |
| | | | | | | | | | | | | | | |
Net (loss) income attributable to the Company | | $ | (18 | ) | | $ | 9 | | | $ | 27 | | | NM | |
| | | | | | | | | | | | | | | |
| (1) | We recorded $1 million of restructuring costs in cost of sales in the second quarter of 2008. |
| (2) | We recorded $24 million and $1 million of restructuring costs in selling, general and administrative expenses for the second quarter of 2008 and 2009, respectively. |
Cost of sales/Gross margin. Gross margin increased in the second quarter of 2009 to 18% from 17% in the second quarter of 2008. The improvement in gross margin was due primarily to cost savings from the comprehensive restructuring program.
Selling, general and administrative expenses. Our selling, general and administrative expenses for the second quarter of 2009 decreased from the second quarter of 2008 due mainly to a reduction in restructuring costs of $23 million. The increase in restructuring expenses in 2008 was related to announcing the closure of six facilities in the second quarter of 2008 and in contrast we announced no closures in the second quarter of 2009. We also reduced advertising costs by $2 million and payroll related costs by $1 million. The reduction in payroll related costs was due mainly to layoffs, wage freezes, and a suspension of 401(k) contributions for all U.S. employees beginning at the end of the fourth quarter of 2008.
Operating profit. Our operating profit increased in the second quarter of 2009 in comparison to the second quarter of 2008. The decrease in sales was more than offset by an improvement in gross margin percentage and a reduction in restructuring costs. TheOn and Off-Highway segment operating profit increased in the second quarter of 2009 in comparison to the second quarter of 2008 due to the improved gross margin percentage and a reduction in restructuring costs and other selling, general and administrative costs. TheCommercial Distribution European segment operating loss decreased in the second quarter of 2009 in comparison to the second quarter of 2008 due to a reduction in restructuring costs of $10 million, which mainly related to the consolidation of our Spain facilities. The Brake South America segment operating loss decreased in the second quarter of 2009 due to the reduction in operating costs from the closure of an Argentina facility in the middle of 2008.
30
Gain on extinguishment of debt. In June of 2009, Affinia Group Holdings Inc. purchased in the open market approximately $33 million principal amount of the nine percent senior subordinated notes due 2014 and thereafter contributed such notes to Affinia Group Intermediate Holdings Inc., who contributed such notes to Affinia Group Inc. Affinia Group Inc. promptly surrendered such purchased notes for cancellation which resulted in a pre-tax gain on the extinguishment of debt of $8 million in the second quarter of 2009.
Income tax provision. The income tax provision was $7 million and $6 million for the second quarter of 2009 and 2008, respectively. The effective tax rate on ordinary income, which excludes the valuation entity losses and restructuring activities, was comparable for both 2009 and 2008.
Noncontrolling interest, net of tax.As further described in Note 3 to the condensed financial statements, Affinia started consolidating Affinia Acquisition LLC, a VIE, during the fourth quarter of 2008. Affinia Group Inc. increased its ownership in Affinia Acquisition LLC from 5% to 40% effective on June 1, 2009. Therefore our noncontrolling interest, net of tax, eliminates 95% of the VIE’s consolidated income for April and May and 60% for June, resulting in net income attributable to noncontrolling interest of $4 million in the second quarter of 2009.
Net income attributable to the Company.Net income increased by $27 million in the second quarter of 2009 in comparison to the second quarter of 2008 due mainly to the decrease in restructuring expenses.
31
Results of Operations
Six months ended June 30, 2008 compared to the six months ended June 30, 2009
Net sales.Consolidated sales decreased $156 million in the first six months of 2009 in comparison to the first six months of 2008 due in part to currency translation losses of $109 million. Additionally, sales were negatively impacted by the recessionary pressures in the global economy. The following table summarizes the consolidated net sales results for the six months ended June 30, 2008 and the consolidated results for the six months ended June 30, 2009 (Dollars in Millions):
| | | | | | | | | | | | | | | | | | | |
| | | Consolidated
Six Months
Ended
June 30,
2008 | | | Consolidated
Six Months
Ended
June 30,
2009 | | | Dollar
Change | | | Percent
Change | | | Currency
Effect | |
Net sales | | | | | | | | | | | | | | | | | | | |
Filtration products | | $ | 380 | | | $ | 355 | | | $ | (25 | ) | | -7 | % | | $ | (33 | ) |
Brake North America and Asia products | | | 340 | | | | 291 | | | | (49 | ) | | -14 | % | | | (13 | ) |
Commercial Distribution South America products | | | 184 | | | | 138 | | | | (46 | ) | | -25 | % | | | (40 | ) |
Chassis products | | | 78 | | | | 77 | | | | (1 | ) | | -1 | % | | | (3 | ) |
| | | | | | | | | | | | | | | | | | | |
On and Off-highway segment | | | 982 | | | | 861 | | | | (121 | ) | | -12 | % | | | (89 | ) |
Commercial Distribution European segment | | | 146 | | | | 113 | | | | (33 | ) | | –23 | % | | | (22 | ) |
Brake South America segment | | | 16 | | | | 11 | | | | (5 | ) | | –31 | % | | | — | |
Eliminations and other | | | (12 | ) | | | (9 | ) | | | 3 | | | 25 | % | | | 2 | |
| | | | | | | | | | | | | | | | | | | |
Total net sales | | | 1,132 | | | | 976 | | | | (156 | ) | | -14 | % | | | (109 | ) |
On and Off-highway segment product sales decreased due to the following:
Filtration productssales decreased in the first six months of 2009 in comparison to the first six months of 2008 due to currency translation losses of $33 million, which were related to the weakening of the Polish Zloty, the Canadian Dollar and the Mexican Peso against the U.S. Dollar. Offsetting the translation losses were increased sales in our Polish operations. Recently, one of our customers increased orders for our filtration products and ceased orders for certain of our brake products. On a consolidated basis, we do not anticipate the impact of these changes to be significant.
Brake North America and Asia products sales decreased in the first six months of 2009 in comparison to the first six months of 2008 partially due to $13 million in currency translation losses. The remaining decrease is mainly attributable to a decline in volume, which is related to the general softness of the aftermarket business relating to our branded products and a decrease in sales related to a customer that ceased orders for certain of our brake products during the second quarter as discussed above. Additionally, OES channels, which consist primarily of new vehicle manufacturers’ service departments at new vehicle dealerships, have also decreased orders due to the recessionary pressures and the changing landscape in the industry.
Commercial Distribution South America productssales decreased in the first six months of 2009 in comparison to the first six months of 2008 mainly due to currency translation losses of $40 million. The general softness of the South American economies led to a decline in sales in most of our South American operations. However, our Brazilian distribution company continued to grow its market share even in the unfavorable market conditions.
Chassis products sales decreased in the first six months of 2009 in comparison to the first six months of 2008 due to currency translation losses of $3 million, which were related to the weakening of the Canadian Dollar against the U.S. Dollar.
Commercial Distribution European segmentsales decreased in the first six months of 2009 in comparison to the first six months of 2008 due partially to currency translation losses of $22 million, which were related to the weakening of the Euro and the British Pound against the U.S. Dollar. The remaining decrease in sales was mainly due to the decrease in sales in Spain and the United Kingdom, which was partially due to unfavorable market conditions.
Brake South America segmentsales for the second quarter of 2009 decreased in comparison to the second quarter of 2008 due to the closure of a facility in Argentina in the middle of 2008. The closed facility mainly manufactured product for our Brake North America operations and Commercial Distribution South America operations. On a consolidated basis the closure did not result in a significant loss of sales.
32
The following table summarizes the consolidated results for the six months ended June 30, 2008 and the consolidated results for the six months ended June 30, 2009 (Dollars in Millions):
| | | | | | | | | | | | | | | |
| | | Consolidated
Six Months
Ended
June 30,
2008 | | | Consolidated
Six Months
Ended
June 30,
2009 | | | Dollar
Change | | | Percent
Change | |
Net Sales | | | 1,132 | | | | 976 | | | | (156 | ) | | -14 | % |
Cost of sales(1) | | | (937 | ) | | | (795 | ) | | | 142 | | | -15 | % |
| | | | | | | | | | | | | | | |
Gross profit | | | 195 | | | | 181 | | | | (14 | ) | | -7 | % |
Gross margin | | | 17 | % | | | 19 | % | | | | | | | |
Selling, general and administrative expenses(2) | | | (175 | ) | | | (135 | ) | | | 40 | | | -23 | % |
Loss on disposition of affiliate | | | (1 | ) | | | — | | | | 1 | | | NM | |
Selling, general and administrative expenses as a percent of sales | | | 15 | % | | | 14 | % | | | | | | | |
| | | | | | | | | | | | | | | |
Operating profit (loss) | | | | | | | | | | | | | | | |
On and Off-highway segment | | | 54 | | | | 64 | | | | 10 | | | 19 | % |
Commercial Distribution European segment | | | (13 | ) | | | (1 | ) | | | 12 | | | 92 | % |
Brake South America segment | | | (7 | ) | | | (1 | ) | | | 6 | | | 86 | % |
Corporate and other | | | (15 | ) | | | (16 | ) | | | (1 | ) | | -7 | % |
| | | | | | | | | | | | | | | |
Operating profit | | | 19 | | | | 46 | | | | 27 | | | 142 | % |
Operating margin | | | 2 | % | | | 5 | % | | | | | | | |
Gain on extinguishment of debt | | | — | | | | 8 | | | | 8 | | | NM | |
Other income, net | | | 1 | | | | 1 | | | | — | | | — | % |
Interest expense | | | (28 | ) | | | (28 | ) | | | — | | | — | % |
| | | | | | | | | | | | | | | |
Income before taxes | | | (8 | ) | | | 27 | | �� | | 35 | | | NM | |
Income tax provision | | | 7 | | | | 11 | | | | 4 | | | 57 | % |
| | | | | | | | | | | | | | | |
Net income | | | (15 | ) | | | 16 | | | | 31 | | | NM | |
Less: Net income attributable to noncontrolling interest, net of tax | | | — | | | | (3 | ) | | | (3 | ) | | NM | |
| | | | | | | | | | | | | | | |
Net income attributable to the Company | | $ | (15 | ) | | $ | 13 | | | $ | 28 | | | NM | |
| | | | | | | | | | | | | | | |
| (1) | We recorded $1 million of restructuring costs in cost of sales in the first six months of 2009. |
| (2) | We recorded $29 million and $2 million of restructuring costs in selling, general and administrative expenses for the first six months of 2008 and 2009, respectively. |
Cost of sales/Gross margin. Gross margin increased in the first six months of 2009 to 19% from 17% in the first six months of 2008. The improvement in gross margin was due primarily to cost savings from the comprehensive restructuring program.
Selling, general and administrative expenses. Our selling, general and administrative expenses for the first six months of 2009 decreased from the first six months of 2008 due mainly to a reduction in restructuring costs of $27 million. The increase in restructuring expenses in 2008 was related to announcing the closure of six facilities in the first six months of 2008 and, in contrast, we announced no closures in the first six months of 2009. In addition, our selling, general and administrative expenses for the first six months of 2009 decreased from the first six months of 2008 due to reductions in payroll related costs, legal and professional fees, travel costs, advertising costs, workers compensation and general liability expenses. The reduction in payroll related costs was $3 million due mainly to layoffs, wage freezes, and a suspension of 401(k) contributions for all U.S. employees beginning at the end of the fourth quarter of 2008. Legal and professional fees decreased by $2 million due to a reduction in legal claims from the prior year. Advertising and other marketing related expenses were reduced by $3 million. Workers compensation and general liability reserves are determined by actuarial studies and assumptions and these reserves decreased by approximately $3 million in the first six months due to the improved historical experience and the reduction in our domestic manufacturing base. The remaining $3 million decrease was attributable to a reduction in travel costs and other miscellaneous expenses.
33
Operating profit. Our operating profit increased in the first six months of 2009 in comparison to the first six months of 2008. The decrease in sales was more than offset by an improvement in gross margin percentage and a reduction in selling, general and administrative costs. TheOn and Off-Highway segment operating profit increased in the first six months of 2009 in comparison to the first six months of 2008 due to the improved gross margin percentage and a reduction in restructuring costs. TheCommercial Distribution European segmentoperating loss decreased in the first six months of 2009 in comparison to the first six months of 2008 due to a reduction in restructuring costs related to the consolidation of our facilities in Spain. The Brake South America segment operating loss decreased in the first six months of 2009 due to the reduction in operating costs from the closure of an Argentina facility in the middle of 2008.
Gain on extinguishment of debt. In June of 2009 Affinia Group Holdings Inc. purchased in the open market approximately $33 million principal amount of the nine percent senior subordinated notes due 2014 and thereafter contributed such notes to Affinia Group Intermediate Holdings Inc., who contributed such notes to Affinia Group Inc. Affinia Group Inc. promptly surrendered such purchased notes for cancellation which resulted in a pre-tax gain on the extinguishment of debt of $8 million in the second quarter of 2009.
Income tax provision. The income tax provision was $11 million and $7 million for the first six months of 2009 and 2008, respectively. The effective tax rate on ordinary income, which excludes the valuation entity losses and restructuring activities, was comparable for both 2009 and 2008.
Noncontrolling interest, net of tax.As further described in Note 3 to the condensed financial statements, Affinia started consolidating Affinia Acquisition LLC, a VIE, during the fourth quarter of 2008. Affinia increased its ownership from 5% to 40% effective on June 1, 2009. Therefore our noncontrolling interest, net of tax, eliminates 95% of the VIE’s consolidated income for January through May and 60% for June, resulting in net income attributable to noncontrolling interest of $3 million in the first six months of 2009.
Net income attributable to the Company.Net income increased by $28 million in the first six months of 2009 in comparison to the first six months of 2008 due mainly to the decrease in restructuring expenses.
Liquidity and Capital Resources
The Company’s primary source of liquidity is cash flow from operations. We also had availability under our revolving credit facility and receivables facility, subject to certain requirements. On August 13, 2009 we refinanced our existing term loan facility. The refinancing consisted of a new four-year $315 million asset-based revolving credit facility (the “ABL Revolver”) and $225 million of new senior secured notes, the proceeds of which were used to repay outstanding borrowings under our existing term loan facility and our existing accounts receivable facility, as well as to settle interest rate derivatives and to pay fees and expenses related to the refinancing. Our primary liquidity requirements are expected to be for debt servicing, working capital, restructuring obligations and capital spending. Our liquidity requirements are significant, primarily due to debt service requirements and restructuring.
Based on the current level of operations, the Company believes that cash flow from operations and available cash, together with available borrowings under its ABL Revolver, will be adequate to meet liquidity needs and restructuring plans and to fund planned capital expenditures. If we were to be in default under the ABL Revolver, the lenders could elect to declare all amounts borrowed due and payable. Any such acceleration would also result in a default under our indenture securing the senior secured notes and the indenture governing our senior subordinated notes. Additionally, under the indenture, our ability to engage in activities such as incurring additional indebtedness, making investments and paying dividends is also tied to ratios based on financial performance. If a default were to occur we would need to obtain a waiver or amend our financing or obtain new financings.
As of June 30, 2009, we had $594 million in aggregate indebtedness, with an additional $107 million of borrowing capacity available under our revolving credit facility, after giving effect to $18 million in outstanding letters of credit, which reduced the amount available. We had no amounts outstanding under our trade accounts receivable securitization program (the “Receivables Facility”) as of December 31, 2008 and $25 million outstanding as of June 30, 2009 of which $10 million was included in short-term debt and $15 million qualified for off balance sheet financing. The Receivables Facility provided for a maximum capacity of $100 million subject to certain adjustments. In addition, we had cash and cash equivalents of $77 million and $43 million as of December 31, 2008 and June 30, 2009, respectively.
34
We spent $12 and $13 million on capital expenditures during the first six months of 2008 and 2009, respectively. Based on the current level of operations, the Company believes that cash flow from operations and available cash, together with the new ABL Revolver and the new senior secured notes, will be adequate to meet liquidity needs and restructuring plans and to fund planned capital expenditures.
Net cash provided by or used in operating activities
Net cash provided by or used in operating activities for the six months ended June 30, 2008 and 2009 was a $11 million source of cash and a $7 million use of cash, respectively. There were significant changes in the following operating activities (Dollars in Millions):
| | | | | | | | |
| | | Six Months
Ended
June 30,
2008 | | | Six Months
Ended
June 30,
2009 | |
Summary of significant changes in operating activities: | | | | | | | | |
Net income | | $ | (15 | ) | | $ | 16 | |
Gain on extinguishment of debt | | | — | | | | (8 | ) |
Change in trade accounts receivable | | | (74 | ) | | | (68 | ) |
Change in inventories | | | 19 | | | | 26 | |
Change in other current operating liabilities | | | 95 | | | | 9 | |
Change in other current operating assets | | | (28 | ) | | | (13 | ) |
| | | | | | | | |
Subtotal | | | (3 | ) | | | (38 | ) |
Other less significant changes in operating activities | | | 14 | | | | 31 | |
| | | | | | | | |
Net cash provided by (used in) operating activities from cash flow statement | | $ | 11 | | | $ | (7 | ) |
Gain on extinguishment of debt - The retirement of $33 million of notes during the second quarter of 2009 resulted in a pre-tax gain on the extinguishment of debt of $8 million.
Trade accounts receivable – The change in receivables was a $68 million use of cash in the first six months of 2009 and a $74 million use of cash in the first six months of 2008. The change in accounts receivable was a higher use of cash during the first six months of 2008 as compared to the first six months of 2009 partially due to higher sales during the first six months of 2008.
Inventories – The change in inventories was a $26 million source of cash in the first six months of 2009 and a $19 million source of cash in the first six months of 2008. The higher reduction in inventory in 2009 was due to a concerted effort to reduce inventories due to the economic downturn.
Other current operating liabilities – The change in other operating liabilities was a $9 million source of cash in the first six months of 2009 as compared to a $95 million source of cash during the first six months of 2008. Accounts payable was a use of cash of $1 million in the first six months of 2009 compared with a source of cash of $58 million in the first six months of 2008. We changed payment and distribution terms in the first six months of 2008 and as a result the source of cash for that period increased. Additionally, accounts payable fluctuated in the first six months of 2008 due to the timing of payments. In addition, accrued liabilities were a larger source of cash during the first six months of 2008 in comparison to the first six months of 2009. The increase was in part due to a reduction in the workers compensation, general liability and warranty reserve.
35
Net cash used in investing activities
The following table summarizes investing activities (Dollars in Millions):
| | | | | | |
| | | Six Months Ended
June 30, 2008 | | | Six Months Ended
June 30, 2009 | |
Investing activities | | | | | | |
Proceeds from sales of assets | | 1 | | | — | |
Proceeds from sales of affiliates | | 6 | | | — | |
Investment in affiliate | | (3 | ) | | (25 | ) |
Change in restricted cash | | — | | | (10 | ) |
Additions to property, plant and equipment | | (12 | ) | | (13 | ) |
| | | | | | |
Net cash used in investing activities | | (8 | ) | | (48 | ) |
Net cash used in investing activities for the six months ended June 30, 2008 and 2009 was $8 million and $48 million, respectively. The $40 million change in investing activities was mainly comprised of the following:
(1) Proceeds from sale of assets and affiliates were a source of cash of $7 million in 2008 and nil in 2009;
(2) A $25 million investment in Affinia Acquisition LLC, an affiliate, in 2009 compared to a $3 million investment in an affiliate in 2008;
(3) An additional use of cash was a change in restricted cash of $10 million during the six months ended June 30, 2009. The change in restricted cash related to Haimeng, which we commenced consolidating during the fourth quarter of 2008; and
(4) We spent $12 million and $13 million on capital expenditures during the six months ended June 30, 2008, and 2009, respectively.
Net cash provided by financing activities
The following table summarizes financing activities (Dollars in Millions):
| | | | | |
| | | Six Months Ended
June 30, 2008 | | Six Months Ended
June 30, 2009 | |
Financing activities | | | | | |
Increase in debt of noncontrolling interest | | — | | 5 | |
Payment of long-term debt | | — | | (10 | ) |
Proceeds from accounts receivable facility | | — | | 25 | |
| | | | | |
Net cash provided by financing activities | | — | | 20 | |
Net cash provided by financing activities for the six months ended June 30, 2009 and 2008 was a $20 million source and nil, respectively. Haimeng increased its debt by $5 million during the first six months of 2009. We also borrowed $25 million during the first six months of 2009 on our accounts receivable facility of which, $15 million qualified for off balance sheet financing. Offsetting the $30 million source of cash was a $10 million payment of long-term debt during the first six months of 2009.
Asset based credit facilities.The ABL revolver provides for loans up to $315 million and is scheduled to mature in 2013. The ABL revolver and the new senior secured notes, scheduled to mature in 2016, replace the receivables facility and the senior credit facilities. The ABL revolver does not have the same restrictive performance covenant ratios as the term loan facility and the receivables facility. The ABL Collateral consists of all accounts receivable, inventory, cash (other than certain cash proceeds of the Notes Collateral) and proceeds of the foregoing and certain assets related thereto, in each case held by the Company, Parent and the Subsidiary Guarantors.
36
New Senior Notes. The Company issued $225 million of Notes as part of the refinancing. Subject to our compliance with the covenants described in the indentures securing the senior secured notes we are permitted to issue more Notes from time to time under the Indenture. The Notes and the Additional Notes, if any, will be treated as a single class for all purposes of the Indenture, including waivers, amendments, redemptions and offers to purchase. The Notes will mature in 2016 and will accrue interest at rate of 11% per annum and will be payable semiannually. The Notes are senior obligations of the Company.
Senior credit facilities. Through August 13, 2009, our senior credit facilities consisted of a revolving credit facility and a term loan facility. Our revolving credit facility provided for loans in a total principal amount of up to $125 million and was scheduled to mature in 2010. Our term loan facility provided for up to $350 million in loans of which $287 million was outstanding at June 30, 2009. The term loan was scheduled to mature in 2011. Proceeds from the term loan were used to fund the Acquisition. As discussed above, these facilities were replaced with the ABL Revolver and the new senior notes.
On November 30, 2004, in connection with the Acquisition, Affinia established financing arrangements with third-party lenders (the “lenders”) that provide senior credit facilities consisting of a revolving credit facility and a term loan facility that are unconditionally guaranteed by the parent, and certain domestic subsidiaries of Affinia (collectively, the “Guarantors”). The repayment of these facilities was secured by substantially all the assets of the Guarantors, including, but not limited to, a pledge of their capital stock and 65 percent of the capital stock of non-U.S. subsidiaries owned directly by the Guarantors. The revolving credit facility, which was scheduled to expire on November 30, 2010, provided for borrowings of up to $125 million through a syndicate of lenders. The revolving credit facility also included borrowing capacity available for letters of credit. As of June 30, 2009, the Company had $18 million in outstanding letters of credit, none of which had been drawn against. There were no other amounts outstanding under the revolving credit facility at June 30, 2009. The term loan facility provided for a $350 million term loan with a maturity of seven years, of which $287 million was outstanding at June 30, 2009. On December 12, 2005, in connection with the comprehensive restructuring, certain provisions applicable to the senior credit facilities were amended.
The senior credit facilities, as amended, bear interest at a rate equal to an applicable margin plus, at our option, either (a) a base rate determined by reference to the higher of (1) the lender’s prime rate and (2) the federal funds rate plus one-half of 1% or (b) LIBOR rate determined by reference to the costs of funds for deposits in U.S. dollars for the interest period relevant to such borrowing adjusted for certain additional costs. The applicable margin for borrowings under the term loan facility is 2.00% with respect to base rate borrowings and 3.00% with respect to LIBOR borrowings. The applicable margin for borrowings under the revolving credit facility and the term loan facility may be reduced subject to our attaining certain leverage ratios or increased based on certain credit ratings as determined by Moody’s and Standard & Poor’s.
In addition to paying interest on the outstanding principal under the senior credit facilities, we were required to pay a commitment fee, which was less than $1 million in the first six months of 2009, to the lenders under the revolving credit facility in respect of the unutilized commitments at a rate equal to 0.50% per annum. We also paid customary letter of credit fees.
The senior credit facilities contained a number of covenants that, among other things and subject to certain exceptions, restrict our ability, and the ability of our subsidiaries, to sell assets, incur additional indebtedness or issue preferred stock, repay other indebtedness (including our senior subordinated notes), pay certain dividends and distributions or repurchase our capital stock, create liens on assets, make investments, loans or advances, make certain acquisitions, engage in mergers or consolidations, enter into sale and leaseback transactions, engage in certain transactions with affiliates, amend certain material agreements governing our indebtedness (including our senior subordinated notes), and change the business conducted by us and our subsidiaries. In addition, the senior credit facilities contain the following financial covenants: a maximum total leverage ratio; a minimum interest coverage ratio; and a maximum capital expenditures limitation. As of June 30, 2009, we were in compliance with all of these covenants.
Our covenant compliance levels and ratios for the six months ended June 30, 2009 were as follows:
| | | | |
| | | Covenant
Compliance
Level for the
Quarter Ended
June 30,
2009 | | Actual
Ratios |
Minimum Adjusted EBITDA to cash interest ratio | | 2.50x | | 3.05x |
Maximum net debt to Adjusted EBITDA ratio | | 3.75x | | 3.63x |
Adjusted EBITDA is used to determine our compliance with many of the covenants contained in our senior credit facilities. Adjusted EBITDA is defined as EBITDA further adjusted to exclude unusual items and other adjustments permitted by our lenders in calculating covenant compliance under our senior credit facility.
37
We believe that the inclusion of debt covenant related adjustments to EBITDA applied in presenting Adjusted EBITDA is appropriate to provide additional information to investors to demonstrate compliance with our financing covenants. However, EBITDA and Adjusted EBITDA are not recognized terms under U.S. GAAP (Accounting Principles Generally Accepted in the United States) and do not purport to be alternatives to net income as a measure of operating performance. Additionally, EBITDA and Adjusted EBITDA are not intended to be measures of free cash flow for management’s discretionary use, as they do not consider certain cash requirements such as interest payments, tax payments and debt service requirements.
The breach of covenants in our senior credit facilities that were tied to ratios based on Adjusted EBITDA would have resulted in a default under those facilities and the lenders could elect to declare all amounts borrowed due and payable. Any such acceleration would also result in a default under our indenture and trade accounts receivable securitization program. Additionally, under the indenture governing our senior subordinated notes, our ability to engage in activities such as incurring additional indebtedness, making investments and paying dividends is also tied to ratios based on Adjusted EBITDA.
The following table reconciles net income to EBITDA and Adjusted EBITDA (Dollars in Millions):
| | | | | | | | | | | | | | | | |
| | | Three Months
Ended
June 30,
2008 | | | Three Months
Ended
June 30,
2009 | | | Six Months
Ended
June 30,
2008 | | | Six Months
Ended
June 30,
2009 | |
Net income (loss) attributable to the Company | | $ | (18 | ) | | $ | 9 | | | $ | (15 | ) | | $ | 13 | |
Interest expense | | | 14 | | | | 14 | | | | 28 | | | | 28 | |
Depreciation and amortization | | | 8 | | | | 9 | | | | 17 | | | | 18 | |
Income tax provision | | | 6 | | | | 7 | | | | 7 | | | | 11 | |
| | | | | | | | | | | | | | | | |
EBITDA | | | 10 | | | | 39 | | | | 37 | | | | 70 | |
Restructuring charges(a) | | | 25 | | | | 1 | | | | 29 | | | | 3 | |
Other adjustments(b) | | | 2 | | | | (2 | ) | | | 4 | | | | (5 | ) |
| | | | | | | | | | | | | | | | |
Adjusted EBITDA | | $ | 37 | | | $ | 38 | | | $ | 70 | | | $ | 68 | |
| | | | | | | | | | | | | | | | |
| (a) | In accordance with the terms of our senior credit facilities, EBITDA has been adjusted to exclude costs associated with restructuring, which are principally related to severance, asset write-downs and related exit costs. In 2005, we commenced our comprehensive restructuring plan that will mainly occur between 2006 and 2009. |
| (b) | Certain adjustments are required to be made to EBITDA in accordance with the terms of our senior credit facilities. |
Indenture.The indenture governing the senior subordinated notes limits Affinia’s (and most or all of our subsidiaries’) ability to incur additional indebtedness, pay dividends on or make other distributions or repurchase our capital stock, make certain investments, enter into certain types of transactions with affiliates, use assets as security in other transactions and sell certain assets or merge with or into other companies. Subject to certain exceptions, Affinia and its restricted subsidiaries are permitted to incur additional indebtedness, including secured indebtedness, under the terms of the senior subordinated notes.
The indenture also uses EBITDA adjusted as permitted under the indenture to determine compliance with various covenants under the indenture.
Receivables facility. Through August 13, 2009 our off-balance sheet receivables facility provided up to $100 million in funding based on availability of eligible receivables and satisfaction of other customary conditions. Under the receivables facility, receivables are sold by certain subsidiaries of our Company to a wholly-owned bankruptcy remote finance subsidiary of the Company, which transfers an undivided interest in the purchased receivables to a commercial paper conduit or its bank sponsor in exchange for cash.
Affinia as the receivables collection agent, services, administers and collects the receivables under the receivables purchase agreement for which it receives a monthly servicing fee at a rate of 1.00% per annum of the average daily outstanding balance of receivables. The receivables facility fees include a usage fee paid by the finance subsidiary, that varies based upon the Company’s leverage ratio as calculated under the senior credit facilities. Funded amounts under the receivables facility bear interest at a rate equal to the conduit’s pooled commercial paper rate plus the usage fee. At June 30, 2009, the usage fee margin for the receivables facility was 1.75% per annum of the amount funded. In addition, the finance subsidiary is required to pay a fee on the unused portion of the receivables facility that varies based upon the same ratio. At June 30, 2009, the fee was 0.80% per annum of the unused portion of the receivables facility.
Availability of funding under the receivables facility depends primarily upon the outstanding trade accounts receivable balance from time to time. Aggregate availability is determined by using a formula that reduces the gross receivables balance by factors that take into account historical default and dilution rates, obligor concentrations, average days outstanding and the costs of the facility. As of June 30, 2009, $185 million of our accounts receivable balance was considered eligible for financing under the program, of which
38
approximately $28 million was available for funding. We had $25 million outstanding as of June 30, 2009 under this program of which $15 million qualified for off balance sheet financing.
The receivables facility contains conditions, representations, warranties and covenants similar to those in the senior credit facilities. It also contains amortization events similar to the events of default under the senior credit facilities, plus amortization events relating to the quality and performance of the trade receivables. If an amortization event occurs, all of the cash flow from the receivables sold to the finance subsidiary will be allocated to the receivables facility until it is paid in full.
| Item 3. | Quantitative and Qualitative Disclosures About Market Risk |
We are exposed to various market risks, such as currency exchange and interest rate fluctuation. Where necessary to minimize such risks we may enter into financial derivative transactions, however we do not enter into derivatives or other financial instruments for trading or speculative purposes.
Currency risk
We conduct business throughout the world. Although we manage our businesses in such a way as to reduce a portion of the risks associated with operating internationally, changes in currency exchange rates may adversely impact our results of operations and financial position.
The results of operations and financial position of each of our operations are measured in their respective local (functional) currency. Business transactions denominated in currencies other than an operation’s functional currency produce foreign exchange gains and losses, as a result of the re-measurement process, as described in SFAS No. 52,“Foreign Currency Translation.” To the extent that our business activities create monetary assets or liabilities denominated in a non-local currency, changes in an entity’s functional currency exchange rate versus each currency in which an entity transacts business have a varying impact on an entity’s results of operations and financial position, as reported in functional currency terms. Therefore, for entities that transact business in multiple currencies, we seek to minimize the net amount of cash flows and balances denominated in non-local currencies. However, in the normal course of conducting international business, some amount of non-local currency exposure will exist. Therefore, management monitors these exposures and may engage in business activities or execute financial hedge transactions intended to mitigate the potential financial impact due to changes in the respective exchange rates.
The Company’s consolidated results of operations and financial position, as reported in U.S. dollars, are also affected by changes in currency exchange rates. The results of operations of our non-U.S. dollar functional entities are translated into U.S. dollars for consolidated reporting purposes each period at the average currency exchange rate experienced during the period. To the extent that the U.S. dollar may appreciate or depreciate over time, the contribution of non-U.S. dollar denominated results of operations to the Company’s U.S. dollar reported consolidated earnings will vary accordingly. Therefore, changes in the various local currency exchange rates, as applied to the revenue and expenses of our non-U.S. dollar operations may have a significant impact on the Company’s sales and, to a lesser extent, consolidated net income trends. In addition, a significant portion of the Company’s consolidated financial position is maintained at foreign locations and is denominated in functional currencies other than the U.S. dollar. The non-U.S. dollar denominated monetary assets and liabilities are translated into U.S. dollars at each respective currency’s exchange rate then in effect at the end of each reporting period. The financial impact of the translation process is reflected within the other comprehensive income component of shareholder’s equity. Accordingly, the amounts shown in our consolidated shareholder’s equity account will fluctuate depending upon the cumulative appreciation or depreciation of the U.S. dollar versus each of the respective functional currencies in which the Company conducts business. Management seeks to mitigate the potential financial impact upon the Company’s consolidated results of operations due to exchange rate changes by engaging in business activities or may execute financial derivative transactions intended to mitigate specific transactional underlying currency exposures. We do not engage in activities solely intended to counteract the impact that changes in currency exchange rates may have upon the Company’s U.S. dollar reported statement of financial condition.
Our foreign currency exchange rate risk management efforts primarily focus upon operationally managing the net amount of non-functional currency denominated monetary assets and liabilities. In addition, we routinely execute short-term currency exchange rate forward contracts with the intention to mitigate the earnings impact related to the re-measurement process. At June 30, 2009, we had currency exchange rate derivatives with an aggregate notional value of $139 million having fair values of $1 million in assets and $3 million in liabilities.
Interest rate risk
The Company is exposed to the risk of rising interest rates to the extent that it funds its operations with short-term or variable-rate borrowings. At June 30, 2009, the Company’s $594 million of aggregate debt outstanding consisted of $317 million of floating-rate debt and $277 million of fixed-rate debt.
39
Under agreements with its credit line banks, the Company is required to maintain at least 40% of its total debt outstanding as fixed- or effectively fixed-rate in nature. At quarter-end, about half of the Company’s total debt obligations were inherently fixed-rate in nature. In addition, pursuant to the Company’s risk management strategy, an additional $150 million of debt was effectively fixed-
rate via pay-fixed interest rate swaps. At June 30, 2009 the combined percentage of fixed-rate and swapped-to-fixed-rate debt versus total debt outstanding was 72%.
As of quarter-end, the amount of total un-hedged floating-rate debt was $167 million. Based on this amount, an immediate one-time interest rate increase of 1.00% would result in approximately $2 million in incremental annual interest expense.
At June 30, 2009, the aggregate fair value of the interest rate swaps was a liability of $5 million. The potential loss in fair value of these swaps arising from a hypothetical immediate decrease in interest rates of 50 basis points is less than $1 million.
| Item 4T. | Controls and Procedures |
The Company maintains disclosure controls and procedures (as that term is defined in Rules 13a-15(e) and 15d-15(e) under the Securities Exchange Act of 1934, as amended (Exchange Act)) that are designed to ensure that information required to be disclosed in the Company’s reports under the Exchange Act is recorded, processed, summarized and reported within the time periods specified in the Securities and Exchange Commission’s rules and forms, and that such information is accumulated and communicated to the Company’s management, including its Chief Executive Officer and Chief Financial Officer, as appropriate, to allow timely decisions regarding required disclosures. Any controls and procedures, no matter how well designed and operated, can provide only reasonable assurance of achieving the desired control objectives. The Company’s management, with the participation of the Company’s Chief Executive Officer and Chief Financial Officer, has evaluated the effectiveness of the design and operation of the Company’s disclosure controls and procedures as of June 30, 2009. Based upon that evaluation and subject to the foregoing, the Company’s Chief Executive Officer and Chief Financial Officer concluded that, as of June 30, 2009, the design and operation of the Company’s disclosure controls and procedures provided reasonable assurance that the disclosure controls are effective to accomplish their objectives.
During the quarter ended June 30 2009, there were no changes in our internal control over financial reporting (as such term is defined in Rules 13a-15(f) and 15d-15(f) under the Securities Exchange Act of 1934, as amended) that have materially affected, or are reasonably likely to materially affect, our internal control over financial reporting.
40
PART II
OTHER INFORMATION
On March 31, 2008, a class action lawsuit was filed by S&E Quick Lube Distributors, Inc. of Utah against several auto parts manufacturers for allegedly conspiring to fix prices for replacement oil, air, fuel and transmission filters. Several auto parts companies are named as defendants, including Champion Laboratories, Inc., Purolator Filters NA LLC, Honeywell International Inc., Cummins Filtration Inc., Donaldson Company, Baldwin Filters Inc., Bosch USA., Mann + Hummel USA Inc., Arvinmeritor Inc., United Components Inc and Wix Filtration Corp LLC (“Wix”), a subsidiary of Affinia. The lawsuit was filed in US District Court for the District of Connecticut and seeks damages and injunctive relief on behalf of a nationwide class of direct purchasers of filters. Since this initial complaint was filed, over 56 “tag-along” suits in multiple jurisdictions have been filed on behalf of both direct and indirect purchasers of automotive filtration products. Two suits have also been filed in the Canadian provinces of Ontario and Quebec. As a result, all U.S. lawsuits have been consolidated in a Multi-District Litigation (“MDL”) Proceeding in Chicago, IL. Wix along with other named defendants filed various motions to dismiss Plaintiffs’ complaints. Those motions are scheduled to be decided in August 2009. Affinia believes that Wix did not have significant sales in this particular market at the relevant time periods so we currently expect any potential exposure to be immaterial. Additionally, as of April 2009, the Florida Attorney General’s office had filed a tag along suit also naming Wix as a defendant.
In addition to the other information set forth in this report, you should carefully consider the factors discussed in Part I, “Item 1A. Risk Factors” in our Annual Report on Form 10-K for the year ended December 31, 2008, which could materially affect our business, financial condition or future results. The risks described in our Annual Report on Form 10-K are not the only risks facing our Company. Additional risks and uncertainties not currently known to us or that we currently deem to be immaterial also may materially adversely affect our business, financial condition and/or operating results.
| | |
| (31.1) | | Certification of President and Chief Executive Officer pursuant to Rule 13a-14(a) of the Securities and Exchange Act, as amended. |
| |
| (31.2) | | Certification of Senior Vice President and Chief Financial Officer pursuant to Rule 13a-14(a) of the Securities and Exchange Act, as amended. |
| |
| (32) | | Certifications of Executive Officers pursuant to 18 U.S.C. Section 1350(b) |
41
SIGNATURES
Pursuant to the requirements of the Securities and Exchange Act of 1934, the registrant has duly caused this report to be signed on its behalf by the undersigned thereunto duly authorized.
| | |
| AFFINIA GROUP INTERMEDIATE HOLDINGS INC. |
| |
By: | | /s/ Terry R. McCormack |
| | Terry R. McCormack |
| | Chief Executive Officer, President, and Director (Principal Executive Officer) |
| |
By: | | /s/ Thomas H. Madden |
| | Thomas H. Madden Senior Vice President and Chief Financial Officer (Principal Financial Officer) |
Date: August 13, 2009
42