Financial Condition — March 31, 2022 compared to December 31, 2021
Our financial condition is characterized by a solid balance sheet and ample liquidity readily available for our member institutions.
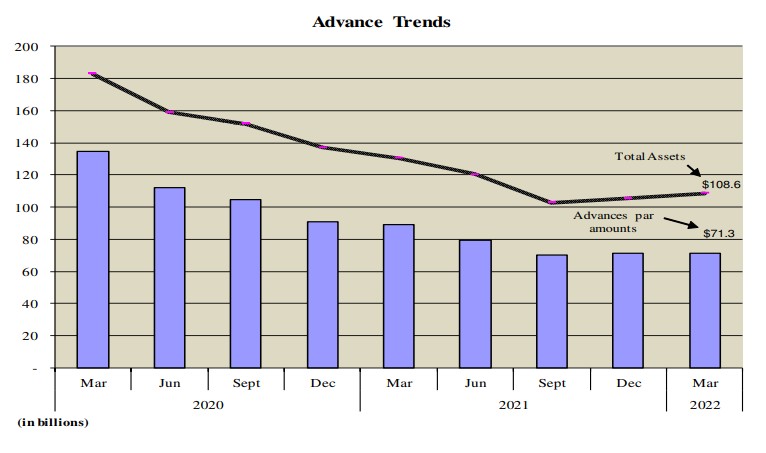
Total assets increased to $108.6 billion at March 31, 2022 from $105.4 billion at December 31, 2021, an increase of $3.2 billion, or 3.1%.
Cash at banks was $20.2 million at March 31, 2022, compared to $21.7 million at December 31, 2021.
Liquidity investments — Money market investments at March 31, 2021 were $9.4 billion in federal funds sold and $0.8 billion in overnight resale agreements. At December 31, 2021, money market investments were $7.2 billion in federal funds sold and $1.2 billion in overnight resale agreements. Money market investments also included interest-bearing deposits at highly rated financial institutions. Balances were $675.0 million at March 31, 2022 and December 31, 2021.
For liquidity, we maintain a portfolio of U.S. Treasury securities designated as trading to meet short-term contingency liquidity needs. Balances were $8.1 billion and $5.8 billion at March 31, 2022 and December 31, 2021, respectively.
Our liquidity position remains strong, and in compliance with all regulatory requirements, and we do not foresee any changes to that position. In addition to the liquidity trading portfolio and assets discussed above, liquid assets at March 31, 2022 and December 31, 2021 included $5.8 billion and $5.5 billion, respectively, of high credit quality GSE-issued available-for-sale securities that are investment quality and readily marketable. The Finance Agency issued a Liquidity Advisory Bulletin in 2018 that defined liquidity levels to be maintained within certain ranges. We also have other liquidity measures in place, deposit liquidity and operational liquidity, and other liquidity buffers. We remain in compliance with the Advisory Bulletin and all liquidity regulations.
For more information about the Advisory Bulletin and our liquidity measures, see section Liquidity, Cash Flows, Short-Term Borrowings and Short-Term Debt, and Table 8.1 through Table 8.3 in this MD&A.
Advances — Par balances were relatively flat at March 31, 2022 at $71.3 billion, compared to $71.2 billion at December 31, 2021. Short-term fixed-rate advances decreased by 13.0% to $10.0 billion at March 31, 2022, down from $11.5 billion at December 31, 2021. ARC advances, which are adjustable-rate borrowings, decreased by 24.7% to $5.6 billion at March 31, 2022, compared to $7.5 billion at December 31, 2021. Given that advances are always well collateralized, a provision for credit loss was not necessary. We have no history of credit losses on advances.
Long-term investment debt securities — Long-term investment debt securities are designated as available-for-sale (AFS) or held-to-maturity (HTM). Our investment profile consists almost exclusively of GSE and Agency issued (GSE-issued) securities.
In the AFS portfolio, long-term investments of floating-rate GSE-issued mortgage-backed securities were carried on the balance sheet at fair values of $552.3 million and $589.5 million at March 31, 2022 and December 31, 2021, respectively. Fixed-rate long-term investments in the AFS portfolio, comprising of fixed-rate GSE-issued mortgage-backed securities, were carried on the balance sheet at fair values of $5.2 billion and $5.0 billion at March 31, 2022 and December 31, 2021, respectively.
In the AFS portfolio, long-term investments of floating rate State and local housing finance agency obligations were carried on the balance sheet at fair value of $998.6 million at March 31, 2022 of which the majority were transferred from the HTM portfolio in the second quarter of 2021.
State and local housing finance agency obligations, primarily New York and New Jersey, were carried as AFS securities at $1.0 billion at March 31, 2022 and December 31, 2021.
In the HTM portfolio, long-term investments were predominantly GSE-issued fixed- and floating-rate mortgage-backed securities and a portfolio of housing finance agency bonds. Securities in the HTM portfolio are recorded at amortized cost, adjusted for credit and non-credit losses from the application of pre-ASU 2016-13 credit loss standards (formerly referred to as OTTI), and, beginning January 1, 2020, adjusted for allowances for credit losses under the new framework. Fixed- and floating-rate mortgage-backed securities in the HTM portfolio were $9.0 billion and $9.1 billion at March 31, 2022 and December 31, 2021, respectively. No