UNITED STATES
SECURITIES AND EXCHANGE COMMISSION
Washington, D.C. 20549
FORM N-CSR
CERTIFIED SHAREHOLDER REPORT OF REGISTERED
MANAGEMENT INVESTMENT COMPANIES
Investment Company Act file number 811-21777
John Hancock Funds III
(Exact name of registrant as specified in charter)
601 Congress Street, Boston, Massachusetts 02210
(Address of principal executive offices) (Zip code)
Salvatore Schiavone
Treasurer
601 Congress Street
Boston, Massachusetts 02210
(Name and address of agent for service)
Registrant's telephone number, including area code: 617-663-4497
| Date of fiscal year end: | February 28 | |
| Date of reporting period: | August 31, 2017 |
ITEM 1. REPORTS TO STOCKHOLDERS.
John Hancock
International Growth Fund
Semiannual report 8/31/17


A message to shareholders
Dear shareholder,
Global equity markets generally delivered solid gains, supported by rising economic activity, stronger corporate earnings, and low levels of inflation. Monetary policy remains accommodative in many parts of the world as central banks strive to help nurture the economic growth that has begun to materialize. Non-U.S. markets recently reversed a multi-year bout of underperformance and have begun to outpace those in the United States as growth strengthens around the world, particularly during the last six months.
Advancing the interests of fund shareholders
One of our primary goals is to advance the interests of our fund shareholders wherever possible. To that end, we recently announced our third round of expense reductions this year, targeting six mutual funds and two closed-end funds that together represent more than $6.9 billion in assets under management. Details can be found at jhinvestments.com.
In addition, we recently learned that fund researcher Morningstar, Inc. formally recognized our shareholder friendly initiatives by upgrading our parent pillar rating—a key component of the Morningstar Analyst Rating system—to positive, the highest possible rating. Morningstar evaluates select funds and their parent firms based on intensive research, including on-site due diligence. They focused on such factors as whether our portfolio managers invest meaningfully in the funds they manage, the quality of our risk management, our corporate culture, and our commitment to recognizing shareholder interests—in other words, how effective we are as stewards of investor capital. We're proud to have been recognized by Morningstar for our efforts and we're committed to continue our work of furthering the interests of our shareholders.
On behalf of everyone at John Hancock Investments, I'd like to take this opportunity to welcome new shareholders and to thank existing shareholders for the continued trust you've placed in us.
Sincerely,

Andrew G. Arnott
President and Chief Executive Officer
John Hancock Investments
This commentary reflects the CEO's views, which are subject to change at any time. Investing involves risks, including the potential loss of principal. Diversification does not guarantee investment returns and does not eliminate risk of loss. For more up-to-date information, please visit our website at jhinvestments.com.
John Hancock
International Growth Fund
INVESTMENT OBJECTIVE
The fund seeks high total return primarily through capital appreciation.
AVERAGE ANNUAL TOTAL RETURNS AS OF 8/31/17 (%)
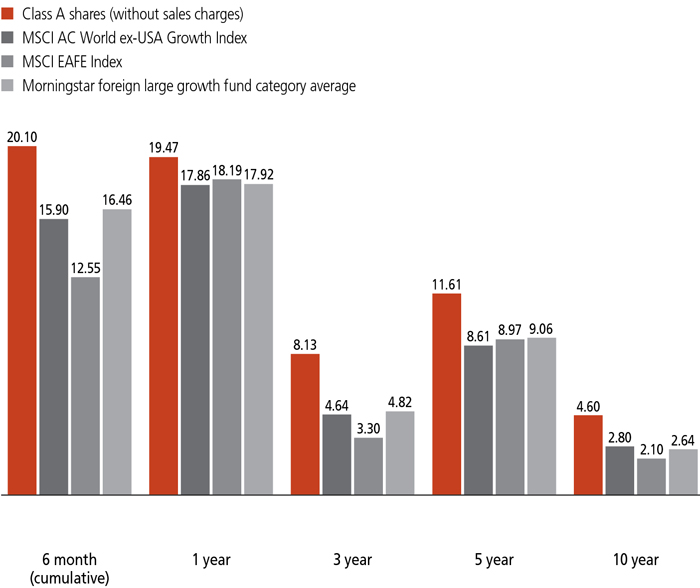
The MSCI AC World ex-USA Growth Index (gross of foreign withholding tax on dividends) is a free float-adjusted market capitalization index that is designed to measure the equity performance of growth-oriented stocks in developed (excluding the U.S.) and emerging markets.
The MSCI EAFE Index (gross of foreign withholding tax on dividends) is a free float-adjusted market capitalization index that is designed to measure the equity market performance of developed markets, excluding the U.S. and Canada.
It is not possible to invest directly in an index. Index figures do not reflect expenses or sales charges, which would result in lower returns.
Figures from Morningstar, Inc. include reinvested distributions and do not take into account sales charges. Actual load-adjusted performance is lower.
The past performance shown here reflects reinvested distributions and the beneficial effect of any expense reductions, and does not guarantee future results. Returns for periods shorter than one year are cumulative. Performance of the other share classes will vary based on the difference in the fees and expenses of those classes. Shares will fluctuate in value and, when redeemed, may be worth more or less than their original cost. Current month-end performance may be lower or higher than the performance cited, and can be found at jhinvestments.com or by calling 800-225-5291. For further information on the fund's objectives, risks, and strategy, see the fund's prospectus.
PERFORMANCE HIGHLIGHTS OVER THE LAST SIX MONTHS
Economic improvement continued to support equities
Most developed-market stocks outside the United States posted strong gains as economic conditions improved in key markets.
The fund outperformed on a relative basis
The fund posted a positive return and outperformed its benchmark, the MSCI AC World ex-USA Growth Index, largely as a result of stock selection in the information technology, industrials, and telecommunication services sectors.
Allocations in certain sectors added value
The fund's overweight in information technology and underweights in the energy and healthcare sectors contributed to relative performance.
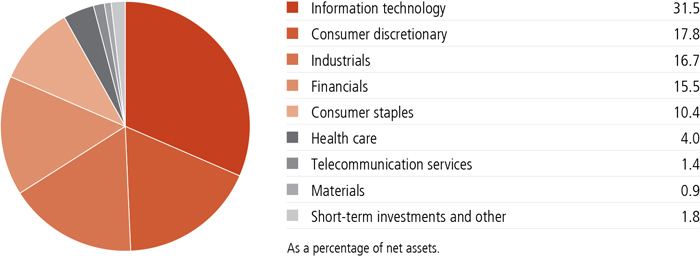
SECTOR COMPOSITION AS OF 8/31/17 (%)
A note about risks
Foreign investing, especially in emerging markets, has additional risks, such as currency and market volatility and political and social instability. Growth stocks may be subject to greater price fluctuations because their prices tend to place greater emphasis on earnings expectations. The value of a company's equity securities is subject to changes in the company's financial condition and overall market and economic conditions. Derivatives transactions, including hedging and other strategic transactions, may increase a fund's volatility and could produce disproportionate losses, potentially more than the fund's principal investment. A fund concentrated in one sector or that holds a limited number of securities may fluctuate more than a fund that invests in a wider variety of sectors. A higher portfolio turnover rate may indicate higher transaction costs and may result in higher taxes when fund shares are held in a taxable account. Please see the fund's prospectus for additional risks.

John A. Boselli, CFA
Portfolio Manager
Wellington Management Company LLP
Can you describe the market environment during the six months ended August 31, 2017, and the factors that drove the significant return for the fund's benchmark, the MSCI AC World ex-USA Growth Index?
Global equities posted positive results as diminishing concerns about China, encouraging economic data, and significant easing measures from the European Central Bank jolted the market back into risk-on mode. While issues surrounding the Trump administration's ambitious U.S. legislative agenda and European elections were top of mind, economic data releases across most major economies pointed to strong growth, helping the rally to roll on. Market risks appeared to diminish in May after independent centrist Emmanuel Macron won the French presidential election by a large margin, a victory widely seen as supportive for the stability of the European Union.
Continued evidence of an upswing in global growth helped to maintain bullish sentiment, although events such as terrorist attacks in Spain diverted attention somewhat from the generally positive economic data. Japanese second-quarter GDP growth came in at 4.0%, far exceeding expectations and the Bank of Japan's 2.5% growth target for the year. Tensions in Asia resurfaced after North Korea ignored warnings from the United States and its allies by firing a midrange ballistic missile, capable of carrying a nuclear payload, over northern Japan.
The eurozone's economy continued to accelerate, with GDP expected to reach the highest level in a decade driven by stronger internal demand and lower unemployment, while consumer and investor confidence remained high. Brexit continued to present challenges for the United Kingdom, as inflation induced by a weak currency dampened consumer real wages in an environment with high debt levels and uncertainty weighing on U.K. investments. The emerging markets continued to benefit from cyclical recoveries supported by the positive global economic cycle and developed-market quantitative easing leading to low interest rates and increased credit lending.
How did this environment affect your security selection during the period?
The macroeconomic indicators that we follow continued to highlight a positive global economic cycle with strong fundamentals across all regions globally. In this environment, we continued to put
The fund outperformed relative to its benchmark. What key factors had the most significant impact on this result?
Overall, stock selection and sector allocations both contributed to relative performance. Stock selection was particularly strong among holdings in information technology; this was partially offset by weaker selection in consumer staples and healthcare. Sector allocation also contributed due to the fund's overweight in information technology and underweights in energy and healthcare. Regionally, holdings in many emerging markets and Japan outperformed.
Which equity positions had the biggest positive impact on the fund's relative results?
The top relative contributor was a position in China-based Alibaba Group Holding, Ltd., an internet and e-commerce company. Alibaba's shares outperformed after the company posted strong earnings ahead of analysts' consensus expectations across multiple metrics. In addition, the company began to see the results of its powerful network of online properties, and this progress led the company to increase earnings guidance. Alibaba continued to rank near the top of the global
TOP 10 HOLDINGS AS OF 8/31/17 (%)
| Tencent Holdings, Ltd. | 3.9 |
| Alibaba Group Holding, Ltd., ADR | 3.6 |
| Unilever NV | 3.2 |
| Taiwan Semiconductor Manufacturing Company, Ltd. | 2.9 |
| Samsung Electronics Company, Ltd. | 2.6 |
| British American Tobacco PLC | 2.4 |
| ASML Holding NV | 1.9 |
| Airbus SE | 1.8 |
| Ping An Insurance Group Company of China, Ltd., H Shares | 1.8 |
| Keyence Corp. | 1.8 |
| TOTAL | 25.9 |
| As a percentage of net assets. | |
| Cash and cash equivalents are not included. | |
AAC Technologies Holdings, Inc., a China-based micro-components supplier, also contributed significantly to relative performance. Its shares outperformed after the company reported strong quarterly results and raised guidance, driven by expectations of higher capital spending. AAC ranked well in our process for high organic growth and solid free cash flow margins, and the stock traded at a discount to our estimate of fair value.
Which positions had the biggest negative impact on the fund's performance?
Denmark-based bracelet and charms maker Pandora A/S was our largest detractor from performance as shares trended down on concerns about competitive threats to the company's business from online retailers, such as Amazon.com. We eliminated the position, as earnings estimate revisions turned sharply negative.
The fund's position in multinational pharmaceutical company Allergan PLC, which is headquartered in Ireland and produces branded and generic drugs, also had a negative impact on performance. The company reported strong earnings, but the stock declined due to concerns over competitive pressure for key products. While we monitored competitive dynamics, we were not concerned as, in our view, Allergan has many strengths. The company offers a broad and diverse range of innovative
TOP 10 COUNTRIES AS OF 8/31/17 (%)
| China | 16.0 |
| United Kingdom | 15.2 |
| France | 10.5 |
| Japan | 8.2 |
| Switzerland | 8.0 |
| India | 5.9 |
| Taiwan | 5.5 |
| Australia | 4.1 |
| Netherlands | 4.1 |
| United States | 2.7 |
| TOTAL | 80.2 |
| As a percentage of net assets. | |
| Cash and cash equivalents are not included. |
products and possesses strong research and development capabilities with a healthy pipeline of branded drugs in development. In addition, Allergan recently implemented a share buyback program. The company ranked in the top of our universe based on quality, capital return to shareholders, and valuation upside to our estimate of fair value.
How was the fund positioned at the end of the period?
From a sector standpoint, our bottom-up stock selection process resulted in the fund remaining overweight in information technology and financials, while the most significant underweights were in consumer staples, materials, and healthcare.
From a geographic perspective, the fund ended the period most overweight in emerging markets, particularly China, India, and Taiwan—countries where we see the potential for strong economic growth. The fund remained underweight in Japan, where regulatory and demographic issues continue to constrain growth. In Europe, the fund was most overweight in the Netherlands, France, and Norway, and underweight in Germany, Sweden, and Italy, as well as the United Kingdom.
MANAGED BY
| | John A. Boselli, CFA On the fund since 2014 Investing since 1996 |
![]()
TOTAL RETURNS FOR THE PERIOD ENDED AUGUST 31, 2017
| Average annual total returns (%) with maximum sales charge | Cumulative total returns (%) with maximum sales charge | ||||||
| 1-year | 5-year | 10-year | 6-month | 5-year | 10-year | ||
| Class A | 13.52 | 10.48 | 4.07 | 14.10 | 64.58 | 48.97 | |
| Class B | 13.67 | 10.53 | 3.83 | 14.72 | 64.94 | 45.56 | |
| Class C | 17.67 | 10.81 | 3.82 | 18.72 | 67.09 | 45.47 | |
| Class I1 | 19.84 | 11.99 | 5.00 | 20.30 | 76.14 | 62.82 | |
| Class R21,2 | 19.38 | 11.55 | 4.57 | 20.08 | 72.74 | 56.38 | |
| Class R41,2 | 19.69 | 11.69 | 4.63 | 20.21 | 73.77 | 57.31 | |
| Class R61,2 | 20.01 | 11.86 | 4.72 | 20.39 | 75.11 | 58.52 | |
| Class 11 | 19.92 | 12.07 | 5.06 | 20.36 | 76.82 | 63.76 | |
| Class NAV1,2 | 19.99 | 11.82 | 4.70 | 20.36 | 74.83 | 58.27 | |
| Index 1† | 17.86 | 8.61 | 2.80 | 15.90 | 51.14 | 31.77 | |
| Index 2† | 18.19 | 8.97 | 2.10 | 12.55 | 53.62 | 23.08 | |
Performance figures assume all distributions have been reinvested. Figures reflect maximum sales charges on Class A shares of 5%, and the applicable contingent deferred sales charge (CDSC) on Class B and Class C shares. The Class B shares' CDSC declines annually between years 1 to 6 according to the following schedule: 5%, 4%, 3%, 3%, 2%, and 1%. No sales charge will be assessed after the sixth year. Class C shares sold within one year of purchase are subject to a 1% CDSC. Sales charges are not applicable to Class I, Class R2, Class R4, Class R6, Class 1, and Class NAV shares.
The expense ratios of the fund, both net (including any fee waivers and/or expense limitations) and gross (excluding any fee waivers and/or expense limitations), are set forth according to the most recent publicly available prospectuses for the fund and may differ from those disclosed in the Financial highlights tables in this report. Had the contractual fee waivers and expense limitations not been in place, gross expenses would apply. The expense ratios are as follows:
| Class A | Class B | Class C | Class I | Class R2 | Class R4 | Class R6 | Class 1 | Class NAV | |
| Gross (%) | 1.33 | 2.03 | 2.03 | 1.02 | 1.43 | 1.28 | 0.93 | 0.96 | 0.91 |
| Net (%) | 1.33 | 2.03 | 2.03 | 1.02 | 1.43 | 1.18 | 0.93 | 0.96 | 0.91 |
Please refer to the most recent prospectus and annual or semiannual report for more information on expenses and any expense limitation arrangements for each class.
The returns reflect past results and should not be considered indicative of future performance. The return and principal value of an investment will fluctuate so that shares, when redeemed, may be worth more or less than their original cost. Due to market volatility and other factors, the fund's current performance may be higher or lower than the performance shown. For current to the most recent month-end performance data, please call 800-225-5291 or visit the fund's website at jhinvestments.com.
The performance table above and the chart on the next page do not reflect the deduction of taxes that a shareholder would pay on fund distributions or the redemption of fund shares. The fund's performance results reflect any applicable fee waivers or expense reductions, without which the expenses would increase and results would have been less favorable.
| † | Index 1 is the MSCI AC World ex-USA Growth Index; Index 2 is the MSCI EAFE Index. |
See the following page for footnotes.
This chart and table show what happened to a hypothetical $10,000 investment in John Hancock International Growth Fund for the share classes and periods indicated, assuming all distributions were reinvested. For comparison, we've shown the same investment in two separate indexes.
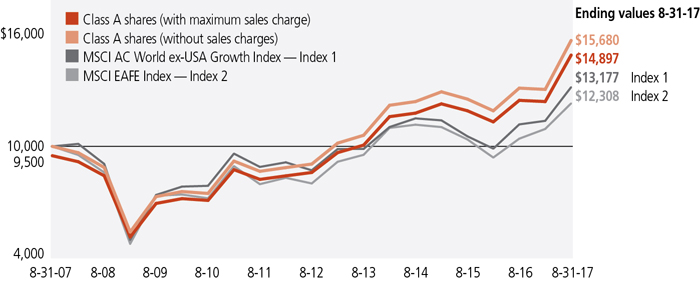
| Start date | With maximum sales charge ($) | Without sales charge ($) | Index 1 ($) | Index 2 ($) | |
| Class B3 | 8-31-07 | 14,556 | 14,556 | 13,177 | 12,308 |
| Class C3 | 8-31-07 | 14,547 | 14,547 | 13,177 | 12,308 |
| Class I1 | 8-31-07 | 16,282 | 16,282 | 13,177 | 12,308 |
| Class R21,2 | 8-31-07 | 15,638 | 15,638 | 13,177 | 12,308 |
| Class R41,2 | 8-31-07 | 15,731 | 15,731 | 13,177 | 12,308 |
| Class R61,2 | 8-31-07 | 15,852 | 15,852 | 13,177 | 12,308 |
| Class 11 | 8-31-07 | 16,376 | 16,376 | 13,177 | 12,308 |
| Class NAV1,2 | 8-31-07 | 15,827 | 15,827 | 13,177 | 12,308 |
The MSCI AC World ex-USA Growth Index (gross of foreign withholding tax on dividends) is a free float-adjusted market capitalization index that is designed to measure the equity performance of growth-oriented stocks in developed (excluding the U.S.) and emerging markets.
The MSCI EAFE Index (gross of foreign withholding tax on dividends) is a free float-adjusted market capitalization index that is designed to measure the equity market performance of developed markets, excluding the U.S. and Canada.
It is not possible to invest directly in an index. Index figures do not reflect expenses or sales charges, which would result in lower returns.
Footnotes related to performance pages
| 1 | For certain types of investors, as described in the fund's prospectuses. |
| 2 | Class R2, Class R4, and Class R6 shares were first offered on 3-27-15. Class NAV shares were first offered on 6-2-15. The returns prior to these dates are those of Class A shares and have not been adjusted for expenses; otherwise, returns would vary. |
| 3 | The contingent deferred sales charge is not applicable. |
These examples are intended to help you understand your ongoing operating expenses of investing in the fund so you can compare these costs with the ongoing costs of investing in other mutual funds.
Understanding fund expenses
As a shareholder of the fund, you incur two types of costs:
| • | Transaction costs, which include sales charges (loads) on purchases or redemptions (varies by share class), minimum account fee charge, etc. |
| • | Ongoing operating expenses, including management fees, distribution and service fees (if applicable), and other fund expenses. |
We are presenting only your ongoing operating expenses here.
Actual expenses/actual returns
The first line of each share class in the table on the following page is intended to provide information about the fund's actual ongoing operating expenses, and is based on the fund's actual return. It assumes an account value of $1,000.00 on March 1, 2017, with the same investment held until August 31, 2017.
Together with the value of your account, you may use this information to estimate the operating expenses that you paid over the period. Simply divide your account value at August 31, 2017, by $1,000.00, then multiply it by the "expenses paid" for your share class from the table. For example, for an account value of $8,600.00, the operating expenses should be calculated as follows:
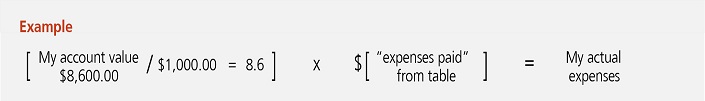
Hypothetical example for comparison purposes
The second line of each share class in the table on the following page allows you to compare the fund's ongoing operating expenses with those of any other fund. It provides an example of the fund's hypothetical account values and hypothetical expenses based on each class's actual expense ratio and an assumed 5% annualized return before expenses (which is not the fund's actual return). It assumes an account value of $1,000.00 on March 1, 2017, with the same investment held until August 31, 2017. Look in any other fund shareholder report to find its hypothetical example and you will be able to compare these expenses. Please remember that these hypothetical account values and expenses may not be used to estimate the actual ending account balance or expenses you paid for the period.
Remember, these examples do not include any transaction costs, therefore, these examples will not help you to determine the relative total costs of owning different funds. If transaction costs were included, your expenses would have been higher. See the prospectuses for details regarding transaction costs.
SHAREHOLDER EXPENSE EXAMPLE CHART
| Account value on 3-1-2017 | Ending value on 8-31-2017 | Expenses paid during period ended 8-31-20171 | Annualized expense ratio | ||
| Class A | Actual expenses/actual returns | $1,000.00 | $1,201.00 | $7.10 | 1.28% |
| Hypothetical example for comparison purposes | 1,000.00 | 1,018.80 | 6.51 | 1.28% | |
| Class B | Actual expenses/actual returns | 1,000.00 | 1,197.20 | 10.97 | 1.98% |
| Hypothetical example for comparison purposes | 1,000.00 | 1,015.20 | 10.06 | 1.98% | |
| Class C | Actual expenses/actual returns | 1,000.00 | 1,197.20 | 10.97 | 1.98% |
| Hypothetical example for comparison purposes | 1,000.00 | 1,015.20 | 10.06 | 1.98% | |
| Class I | Actual expenses/actual returns | 1,000.00 | 1,203.00 | 5.39 | 0.97% |
| Hypothetical example for comparison purposes | 1,000.00 | 1,020.30 | 4.94 | 0.97% | |
| Class R2 | Actual expenses/actual returns | 1,000.00 | 1,200.80 | 7.60 | 1.37% |
| Hypothetical example for comparison purposes | 1,000.00 | 1,018.30 | 6.97 | 1.37% | |
| Class R4 | Actual expenses/actual returns | 1,000.00 | 1,202.10 | 6.22 | 1.12% |
| Hypothetical example for comparison purposes | 1,000.00 | 1,019.60 | 5.70 | 1.12% | |
| Class R6 | Actual expenses/actual returns | 1,000.00 | 1,203.90 | 4.83 | 0.87% |
| Hypothetical example for comparison purposes | 1,000.00 | 1,020.80 | 4.43 | 0.87% | |
| Class 1 | Actual expenses/actual returns | 1,000.00 | 1,203.60 | 5.05 | 0.91% |
| Hypothetical example for comparison purposes | 1,000.00 | 1,020.60 | 4.63 | 0.91% | |
| Class NAV | Actual expenses/actual returns | 1,000.00 | 1,203.60 | 4.78 | 0.86% |
| Hypothetical example for comparison purposes | 1,000.00 | 1,020.90 | 4.38 | 0.86% | |
| 1 | Expenses are equal to the fund's annualized expense ratio, multiplied by the average account value over the period, multiplied by184/365 (to reflect the one-half year period). |
| Fund’s investments |
| AS OF 8-31-17 (unaudited) | ||||
| Shares | Value | |||
| Common stocks 98.2% | $6,556,189,516 | |||
| (Cost $5,526,440,482) | ||||
| Australia 4.1% | 276,728,667 | |||
| Aristocrat Leisure, Ltd. | 5,096,078 | 85,811,547 | ||
| Qantas Airways, Ltd. | 16,636,237 | 75,723,731 | ||
| Treasury Wine Estates, Ltd. | 10,002,098 | 115,193,389 | ||
| Austria 1.1% | 71,437,688 | |||
| ams AG (A)(B) | 990,634 | 71,437,688 | ||
| Canada 1.9% | 128,897,554 | |||
| Magna International, Inc. (B) | 1,339,113 | 64,438,278 | ||
| The Bank of Nova Scotia | 1,036,086 | 64,459,276 | ||
| China 16.0% | 1,071,674,762 | |||
| AAC Technologies Holdings, Inc. | 4,891,587 | 89,518,164 | ||
| Alibaba Group Holding, Ltd., ADR (A) | 1,391,604 | 238,994,068 | ||
| NetEase, Inc., ADR | 355,340 | 98,016,986 | ||
| New Oriental Education & Technology Group, Inc., ADR (A) | 1,234,166 | 100,893,071 | ||
| Ping An Insurance Group Company of China, Ltd., H Shares | 15,189,500 | 120,981,836 | ||
| TAL Education Group, ADR | 2,512,589 | 76,458,083 | ||
| Tencent Holdings, Ltd. | 6,266,214 | 263,680,248 | ||
| Weibo Corp., ADR (A)(B) | 822,278 | 83,132,306 | ||
| Denmark 2.4% | 160,352,496 | |||
| DSV A/S | 1,124,381 | 79,814,205 | ||
| Genmab A/S (A) | 343,963 | 80,538,291 | ||
| France 10.5% | 699,844,276 | |||
| Airbus SE | 1,463,072 | 123,218,247 | ||
| Alstom SA | 2,263,922 | 80,526,070 | ||
| Edenred | 3,101,168 | 83,911,125 | ||
| Kering | 221,615 | 83,133,565 | ||
| Legrand SA | 1,404,231 | 98,481,511 | ||
| LVMH Moet Hennessy Louis Vuitton SE | 432,225 | 113,532,203 | ||
| Safran SA | 1,205,371 | 117,041,555 | ||
| Germany 1.2% | 83,332,461 | |||
| United Internet AG | 1,402,250 | 83,332,461 | ||
| Hong Kong 1.1% | 70,214,714 | |||
| Melco Resorts & Entertainment, Ltd., ADR | 3,198,848 | 70,214,714 | ||
| India 5.9% | 392,713,900 | |||
| HDFC Bank, Ltd. | 2,879,683 | 80,030,046 | ||
| IndusInd Bank, Ltd. | 2,624,143 | 68,144,582 | ||
| ITC, Ltd. | 19,287,462 | 85,305,325 | ||
| Maruti Suzuki India, Ltd. | 847,614 | 102,503,421 |
| SEE NOTES TO FINANCIAL STATEMENTS | SEMIANNUAL REPORT | JOHN HANCOCK INTERNATIONAL GROWTH FUND 12 |
| Shares | Value | |||
| India (continued) | ||||
| UPL, Ltd. | 4,351,180 | $56,730,526 | ||
| Indonesia 2.5% | 167,778,526 | |||
| Bank Central Asia Tbk PT | 52,639,767 | 74,776,729 | ||
| Telekomunikasi Indonesia Persero Tbk PT | 263,641,851 | 93,001,797 | ||
| Ireland 1.5% | 99,376,130 | |||
| ICON PLC (A) | 876,410 | 99,376,130 | ||
| Japan 8.2% | 546,300,807 | |||
| Bandai Namco Holdings, Inc. | 2,425,540 | 81,407,897 | ||
| Keyence Corp. | 230,408 | 120,124,980 | ||
| Nexon Company, Ltd. (A) | 4,320,000 | 107,940,810 | ||
| SMC Corp. | 285,470 | 97,991,586 | ||
| Tokyo Electron, Ltd. (B) | 520,177 | 73,260,933 | ||
| Yamaha Corp. | 1,881,000 | 65,574,601 | ||
| Netherlands 4.1% | 271,118,920 | |||
| ASML Holding NV | 792,273 | 123,693,295 | ||
| ING Groep NV | 3,388,498 | 60,148,420 | ||
| Wolters Kluwer NV | 1,997,728 | 87,277,205 | ||
| Norway 1.0% | 65,246,262 | |||
| DNB ASA | 3,340,374 | 65,246,262 | ||
| Singapore 1.2% | 76,950,983 | |||
| DBS Group Holdings, Ltd. (B) | 5,050,700 | 76,950,983 | ||
| South Korea 2.6% | 170,965,545 | |||
| Samsung Electronics Company, Ltd. | 83,053 | 170,965,545 | ||
| Spain 1.5% | 100,199,918 | |||
| Industria de Diseno Textil SA | 2,634,188 | 100,199,918 | ||
| Switzerland 8.0% | 535,929,135 | |||
| ABB, Ltd. | 3,963,784 | 91,715,640 | ||
| Cie Financiere Richemont SA | 1,134,903 | 101,453,561 | ||
| Julius Baer Group, Ltd. (A) | 1,796,159 | 100,438,361 | ||
| Partners Group Holding AG | 147,047 | 95,391,789 | ||
| Temenos Group AG (A) | 841,145 | 83,062,687 | ||
| UBS Group AG (A) | 3,876,161 | 63,867,097 | ||
| Taiwan 5.5% | 368,373,657 | |||
| Catcher Technology Company, Ltd. | 5,613,000 | 71,794,066 | ||
| Largan Precision Company, Ltd. | 524,712 | 101,772,004 | ||
| Taiwan Semiconductor Manufacturing Company, Ltd. | 27,066,008 | 194,807,587 | ||
| United Kingdom 15.2% | 1,015,249,901 | |||
| Aon PLC | 481,237 | 66,968,941 | ||
| BAE Systems PLC | 11,626,276 | 91,363,980 | ||
| British American Tobacco PLC | 2,611,435 | 162,913,751 |
| SEE NOTES TO FINANCIAL STATEMENTS | SEMIANNUAL REPORT | JOHN HANCOCK INTERNATIONAL GROWTH FUND 13 |
| Shares | Value | ||||
| United Kingdom (continued) | |||||
| Compass Group PLC | 5,449,068 | $116,521,338 | |||
| IHS Markit, Ltd. (A) | 1,939,591 | 90,850,442 | |||
| Prudential PLC | 4,197,491 | 98,532,520 | |||
| Reckitt Benckiser Group PLC | 1,207,454 | 114,500,421 | |||
| Spectris PLC | 1,123,156 | 33,654,040 | |||
| UBM PLC | 2,928,758 | 25,133,717 | |||
| Unilever NV | 3,608,195 | 214,810,751 | |||
| United States 2.7% | 183,503,214 | ||||
| Allergan PLC | 373,455 | 85,700,453 | |||
| Amdocs, Ltd. | 436,080 | 28,253,623 | |||
| Broadcom, Ltd. | 275,912 | 69,549,138 | |||
| Yield (%) | Shares | Value | |||
| Securities lending collateral 0.3% | $16,754,635 | ||||
| (Cost $16,754,161) | |||||
| John Hancock Collateral Trust (C) | 1.2169(D) | 1,674,459 | 16,754,635 | ||
| Par value^ | Value | ||||
| Short-term investments 1.4% | $96,800,000 | ||||
| (Cost $96,800,000) | |||||
| Repurchase agreement 1.4% | 96,800,000 | ||||
| Repurchase Agreement with Bank of America dated 8-31-17 at | |||||
| 1.060% to be repurchased at $57,301,687 on 9-1-17, | |||||
| collateralized by $21,661,361 Federal Home Loan Mortgage | |||||
| Corp., 2.927% due 7-1-47 (valued at $22,289,273, including | |||||
| interest) and $34,962,171 Federal National Mortgage | |||||
| Association, 2.995% due 8-1-47 (valued at $36,156,728, | |||||
| including interest) | 57,300,000 | 57,300,000 | |||
| Repurchase Agreement with Societe Generale dated 8-31-17 at | |||||
| 1.080% to be repurchased at $39,501,185 on 9-1-17, | |||||
| collateralized by $3,242,144 Federal Home Loan Mortgage | |||||
| Corp., 3.297%-5.968% due 1-1-20 to 1-1-35 (valued at | |||||
| $3,384,948, including interest), $129 Federal National | |||||
| Mortgage Association, 2.483%-4.818% due 11-1-17 to | |||||
| 5-1-18 (valued at $130, including interest), $500 U.S. Treasury | |||||
| Bills, 0.000% due 11-9-17 (valued at $499, including | |||||
| interest), $9,220,900 U.S. Treasury Bonds, 3.000%-3.625% | |||||
| due 2-15-44 to 2-15-47 (valued at $9,704,088, including | |||||
| interest) and $26,982,800 U.S. Treasury Notes, | |||||
| 1.375%-1.500% due 10-31-19 to 12-15-19 (valued at | |||||
| $27,200,369, including interest) | 39,500,000 | 39,500,000 | |||
| Total investments (Cost $5,639,994,643) 99.9% | $6,669,744,151 | ||||
| Other assets and liabilities, net 0.1% | 9,168,713 | ||||
| Total net assets 100.0% | $6,678,912,864 |
The percentage shown for each investment category is the total value of the category as a percentage of the net assets of the fund.
^All par values are denominated in U.S. dollars unless otherwise indicated.
Security Abbreviations and Legend
| ADR | American Depositary Receipt |
| SEE NOTES TO FINANCIAL STATEMENTS | SEMIANNUAL REPORT | JOHN HANCOCK INTERNATIONAL GROWTH FUND 14 |
(A) | Non-income producing security. | |
| (B) | A portion of this security is on loan as of 8-31-17. | |
| (C) | Investment is an affiliate of the fund, the advisor and/or subadvisor. This security represents the investment of cash collateral received for securities lending. | |
| (D) | The rate shown is the annualized seven-day yield as of 8-31-17. |
At 8-31-17, the aggregate cost of investments for federal income tax purposes was $5,648,959,920. Net unrealized appreciation aggregated to $1,020,784,231, of which $1,043,291,784 related to gross unrealized appreciation and $22,507,553 related to gross unrealized depreciation.
| SEE NOTES TO FINANCIAL STATEMENTS | SEMIANNUAL REPORT | JOHN HANCOCK INTERNATIONAL GROWTH FUND 15 |
Financial statements
STATEMENT OF ASSETS AND LIABILITIES 8-31-17 (unaudited)
| Assets | |||||||||||||||||||||||||||||||||
| Unaffiliated investments, at value (Cost $5,623,240,482) including $16,043,056 of securities loaned | $6,652,989,516 | ||||||||||||||||||||||||||||||||
| Affiliated investments, at value (Cost $16,754,161) | 16,754,635 | ||||||||||||||||||||||||||||||||
| Cash | 12,348 | ||||||||||||||||||||||||||||||||
| Foreign currency, at value (Cost $7,672,102) | 7,675,364 | ||||||||||||||||||||||||||||||||
| Receivable for investments sold | 37,217,406 | ||||||||||||||||||||||||||||||||
| Receivable for fund shares sold | 99,275,330 | ||||||||||||||||||||||||||||||||
| Dividends and interest receivable | 11,978,315 | ||||||||||||||||||||||||||||||||
| Receivable for securities lending income | 19,289 | ||||||||||||||||||||||||||||||||
| Other receivables and prepaid expenses | 270,574 | ||||||||||||||||||||||||||||||||
| Total assets | 6,826,192,777 | ||||||||||||||||||||||||||||||||
| Liabilities | |||||||||||||||||||||||||||||||||
| Payable for investments purchased | 123,736,325 | ||||||||||||||||||||||||||||||||
| Payable for fund shares repurchased | 5,677,309 | ||||||||||||||||||||||||||||||||
| Payable upon return of securities loaned | 16,754,181 | ||||||||||||||||||||||||||||||||
| Payable to affiliates | |||||||||||||||||||||||||||||||||
| Accounting and legal services fees | 161,121 | ||||||||||||||||||||||||||||||||
| Transfer agent fees | 467,879 | ||||||||||||||||||||||||||||||||
| Distribution and service fees | 4,262 | ||||||||||||||||||||||||||||||||
| Trustees' fees | 1,730 | ||||||||||||||||||||||||||||||||
| Other liabilities and accrued expenses | 477,106 | ||||||||||||||||||||||||||||||||
| Total liabilities | 147,279,913 | ||||||||||||||||||||||||||||||||
| Net assets | $6,678,912,864 | ||||||||||||||||||||||||||||||||
| Net assets consist of | |||||||||||||||||||||||||||||||||
| Paid-in capital | $5,710,427,742 | ||||||||||||||||||||||||||||||||
| Undistributed net investment income | 40,446,289 | ||||||||||||||||||||||||||||||||
| Accumulated net realized gain (loss) on investments and foreign currency transactions | (101,857,201 | ) | |||||||||||||||||||||||||||||||
| Net unrealized appreciation (depreciation) on investments and translation of assets and liabilities in foreign currencies | 1,029,896,034 | ||||||||||||||||||||||||||||||||
| Net assets | $6,678,912,864 | ||||||||||||||||||||||||||||||||
STATEMENT OF ASSETS AND LIABILITIES (continued)
| Net asset value per share | |||||||||||||||||||||
| Based on net asset values and shares outstanding - The fund has an unlimited number of shares authorized with no par value | |||||||||||||||||||||
| Class A ($635,849,550 ÷ 24,406,194 shares)1 | $26.05 | ||||||||||||||||||||
| Class B ($1,632,404 ÷ 63,572 shares)1 | $25.68 | ||||||||||||||||||||
| Class C ($225,045,461 ÷ 8,783,010 shares)1 | $25.62 | ||||||||||||||||||||
| Class I ($4,502,891,708 ÷ 172,302,275 shares) | $26.13 | ||||||||||||||||||||
| Class R2 ($15,638,676 ÷ 599,979 shares) | $26.07 | ||||||||||||||||||||
| Class R4 ($6,351,046 ÷ 243,232 shares) | $26.11 | ||||||||||||||||||||
| Class R6 ($57,437,196 ÷ 2,195,629 shares) | $26.16 | ||||||||||||||||||||
| Class 1 ($70,083,839 ÷ 2,682,235 shares) | $26.13 | ||||||||||||||||||||
| Class NAV ($1,163,982,984 ÷ 44,543,098 shares) | $26.13 | ||||||||||||||||||||
| Maximum offering price per share | |||||||||||||||||||||
| Class A (net assets value per share ÷ 95%)2 | $27.42 | ||||||||||||||||||||
| 1 | Redemption price per share is equal to net asset value less any applicable contingent deferred sales charge. | |||||||||||||||||||
| 2 | On single retail sales of less than $50,000. On sales of $50,000 or more and on group sales the offering price is reduced. | |||||||||||||||||||
STATEMENT OF OPERATIONS For the six months ended 8-31-17 (unaudited)
| Investment income | ||||||||||||||||||||||||
| Dividends | $73,752,727 | |||||||||||||||||||||||
| Interest | 635,049 | |||||||||||||||||||||||
| Securities lending | 556,590 | |||||||||||||||||||||||
| Less foreign taxes withheld | (6,629,958 | ) | ||||||||||||||||||||||
| Total investment income | 68,314,408 | |||||||||||||||||||||||
| Expenses | ||||||||||||||||||||||||
| Investment management fees | 21,101,569 | |||||||||||||||||||||||
| Distribution and service fees | 1,779,424 | |||||||||||||||||||||||
| Accounting and legal services fees | 416,590 | |||||||||||||||||||||||
| Transfer agent fees | 2,201,011 | |||||||||||||||||||||||
| Trustees' fees | 27,221 | |||||||||||||||||||||||
| State registration fees | 135,357 | |||||||||||||||||||||||
| Printing and postage | 116,719 | |||||||||||||||||||||||
| Professional fees | 79,180 | |||||||||||||||||||||||
| Custodian fees | 732,358 | |||||||||||||||||||||||
| Other | 29,179 | |||||||||||||||||||||||
| Total expenses | 26,618,608 | |||||||||||||||||||||||
| Less expense reductions | (212,370 | ) | ||||||||||||||||||||||
| Net expenses | 26,406,238 | |||||||||||||||||||||||
| Net investment income | 41,908,170 | |||||||||||||||||||||||
| Realized and unrealized gain (loss) | ||||||||||||||||||||||||
| Net realized gain (loss) on | ||||||||||||||||||||||||
| Unaffiliated investments and foreign currency transactions | 136,691,583 | |||||||||||||||||||||||
| Affiliated investments | (3,502 | ) | ||||||||||||||||||||||
| 136,688,081 | ||||||||||||||||||||||||
| Change in net unrealized appreciation (depreciation) of | ||||||||||||||||||||||||
| Unaffiliated investments and translation of assets and liabilities in foreign currencies | 741,373,437 | |||||||||||||||||||||||
| Affiliated investments | (1,899 | ) | ||||||||||||||||||||||
| 741,371,538 | ||||||||||||||||||||||||
| Net realized and unrealized gain | 878,059,619 | |||||||||||||||||||||||
| Increase in net assets from operations | $919,967,789 | |||||||||||||||||||||||
STATEMENTS OF CHANGES IN NET ASSETS
| Six months ended 8-31-17 | Year ended 2-28-17 | |||||||||||||||||||||||||||||||||||||||||||||||
| (unaudited) | ||||||||||||||||||||||||||||||||||||||||||||||||
| Increase (decrease) in net assets | ||||||||||||||||||||||||||||||||||||||||||||||||
| From operations | ||||||||||||||||||||||||||||||||||||||||||||||||
| Net investment income | $41,908,170 | $23,250,804 | ||||||||||||||||||||||||||||||||||||||||||||||
| Net realized gain (loss) | 136,688,081 | (148,412,441 | ) | |||||||||||||||||||||||||||||||||||||||||||||
| Change in net unrealized appreciation (depreciation) | 741,371,538 | 353,314,086 | ||||||||||||||||||||||||||||||||||||||||||||||
| Increase in net assets resulting from operations | 919,967,789 | 228,152,449 | ||||||||||||||||||||||||||||||||||||||||||||||
| Distributions to shareholders | ||||||||||||||||||||||||||||||||||||||||||||||||
| From net investment income | ||||||||||||||||||||||||||||||||||||||||||||||||
| Class A | — | (4,015,960 | ) | |||||||||||||||||||||||||||||||||||||||||||||
| Class I | — | (16,927,587 | ) | |||||||||||||||||||||||||||||||||||||||||||||
| Class R2 | — | (51,219 | ) | |||||||||||||||||||||||||||||||||||||||||||||
| Class R4 | — | (21,812 | ) | |||||||||||||||||||||||||||||||||||||||||||||
| Class R6 | — | (402,651 | ) | |||||||||||||||||||||||||||||||||||||||||||||
| Class 1 | — | (457,163 | ) | |||||||||||||||||||||||||||||||||||||||||||||
| Class NAV | — | (2,999,617 | ) | |||||||||||||||||||||||||||||||||||||||||||||
| Total distributions | — | (24,876,009 | ) | |||||||||||||||||||||||||||||||||||||||||||||
| From fund share transactions | 1,857,204,686 | 1,668,056,731 | ||||||||||||||||||||||||||||||||||||||||||||||
| Total increase | 2,777,172,475 | 1,871,333,171 | ||||||||||||||||||||||||||||||||||||||||||||||
| Net assets | ||||||||||||||||||||||||||||||||||||||||||||||||
| Beginning of period | 3,901,740,389 | 2,030,407,218 | ||||||||||||||||||||||||||||||||||||||||||||||
| End of period | $6,678,912,864 | $3,901,740,389 | ||||||||||||||||||||||||||||||||||||||||||||||
| Undistributed (accumulated distributions in excess of) net investment income | $40,446,289 | ($1,461,881 | ) | |||||||||||||||||||||||||||||||||||||||||||||
Financial highlights
| Class A Shares Period ended | 8-31-171 | 2-28-17 | 2-29-16 | 2-28-15 | 2-28-14 | 2-28-13 | ||||||||||||||||||||||||||||||||||||||||||||||||||||||||||||||||||||||||||||||||||||||||||||||||||||||||||||||||
| Per share operating performance | ||||||||||||||||||||||||||||||||||||||||||||||||||||||||||||||||||||||||||||||||||||||||||||||||||||||||||||||||||||||
| Net asset value, beginning of period | $21.69 | $19.90 | $21.64 | $24.60 | $21.28 | $19.98 | ||||||||||||||||||||||||||||||||||||||||||||||||||||||||||||||||||||||||||||||||||||||||||||||||||||||||||||||||
| Net investment income2 | 0.17 | 0.17 | 0.10 | 0.24 | 0.25 | 0.23 | ||||||||||||||||||||||||||||||||||||||||||||||||||||||||||||||||||||||||||||||||||||||||||||||||||||||||||||||||
| Net realized and unrealized gain (loss) on investments | 4.19 | 1.75 | (1.81 | ) | 0.83 | 3.94 | 2.65 | |||||||||||||||||||||||||||||||||||||||||||||||||||||||||||||||||||||||||||||||||||||||||||||||||||||||||||||||
| Total from investment operations | 4.36 | 1.92 | (1.71 | ) | 1.07 | 4.19 | 2.88 | |||||||||||||||||||||||||||||||||||||||||||||||||||||||||||||||||||||||||||||||||||||||||||||||||||||||||||||||
| Less distributions | ||||||||||||||||||||||||||||||||||||||||||||||||||||||||||||||||||||||||||||||||||||||||||||||||||||||||||||||||||||||
| From net investment income | — | (0.13 | ) | (0.03 | ) | (0.47 | ) | (0.15 | ) | (0.42 | ) | |||||||||||||||||||||||||||||||||||||||||||||||||||||||||||||||||||||||||||||||||||||||||||||||||||||||||||
| From net realized gain | — | — | — | (3.56 | ) | (0.72 | ) | (1.16 | ) | |||||||||||||||||||||||||||||||||||||||||||||||||||||||||||||||||||||||||||||||||||||||||||||||||||||||||||||
| Total distributions | — | (0.13 | ) | (0.03 | ) | (4.03 | ) | (0.87 | ) | (1.58 | ) | |||||||||||||||||||||||||||||||||||||||||||||||||||||||||||||||||||||||||||||||||||||||||||||||||||||||||||
| Net asset value, end of period | $26.05 | $21.69 | $19.90 | $21.64 | $24.60 | $21.28 | ||||||||||||||||||||||||||||||||||||||||||||||||||||||||||||||||||||||||||||||||||||||||||||||||||||||||||||||||
| Total return (%)3,4 | 20.10 | 5 | 9.62 | (7.86 | ) | 5.91 | 19.95 | 14.82 | ||||||||||||||||||||||||||||||||||||||||||||||||||||||||||||||||||||||||||||||||||||||||||||||||||||||||||||||
| Ratios and supplemental data | ||||||||||||||||||||||||||||||||||||||||||||||||||||||||||||||||||||||||||||||||||||||||||||||||||||||||||||||||||||||
| Net assets, end of period (in millions) | $636 | $427 | $615 | $140 | $130 | $73 | ||||||||||||||||||||||||||||||||||||||||||||||||||||||||||||||||||||||||||||||||||||||||||||||||||||||||||||||||
| Ratios (as a percentage of average net assets): | ||||||||||||||||||||||||||||||||||||||||||||||||||||||||||||||||||||||||||||||||||||||||||||||||||||||||||||||||||||||
| Expenses before reductions | 1.29 | 6 | 1.32 | 1.38 | 1.53 | 1.56 | 1.68 | |||||||||||||||||||||||||||||||||||||||||||||||||||||||||||||||||||||||||||||||||||||||||||||||||||||||||||||||
| Expenses including reductions | 1.28 | 6 | 1.32 | 1.37 | 1.52 | 1.55 | 1.60 | |||||||||||||||||||||||||||||||||||||||||||||||||||||||||||||||||||||||||||||||||||||||||||||||||||||||||||||||
| Net investment income | 1.36 | 6,7 | 0.79 | 0.48 | 1.02 | 1.09 | 1.13 | |||||||||||||||||||||||||||||||||||||||||||||||||||||||||||||||||||||||||||||||||||||||||||||||||||||||||||||||
| Portfolio turnover (%) | 42 | 94 | 82 | 204 | 42 | 61 | ||||||||||||||||||||||||||||||||||||||||||||||||||||||||||||||||||||||||||||||||||||||||||||||||||||||||||||||||
| �� | |||||||||||||||||||||||||||||||||||||||||||||||||||||||||||||||||||||||||||||||||||
| 1 | Six months ended 8-31-17. Unaudited. | ||||||||||||||||||||||||||||||||||||||||||||||||||||||||||||||||||||||||||||||||||
| 2 | Based on average daily shares outstanding. | ||||||||||||||||||||||||||||||||||||||||||||||||||||||||||||||||||||||||||||||||||
| 3 | Does not reflect the effect of sales charges, if any. | ||||||||||||||||||||||||||||||||||||||||||||||||||||||||||||||||||||||||||||||||||
| 4 | Total returns would have been lower had certain expenses not been reduced during the applicable periods. | ||||||||||||||||||||||||||||||||||||||||||||||||||||||||||||||||||||||||||||||||||
| 5 | Not annualized. | ||||||||||||||||||||||||||||||||||||||||||||||||||||||||||||||||||||||||||||||||||
| 6 | Annualized. | ||||||||||||||||||||||||||||||||||||||||||||||||||||||||||||||||||||||||||||||||||
| 7 | Net investment income is affected by the timing and frequency of the declaration of dividends by the securities held in the portfolio. | ||||||||||||||||||||||||||||||||||||||||||||||||||||||||||||||||||||||||||||||||||
| Class B Shares Period ended | 8-31-171 | 2-28-17 | 2-29-16 | 2-28-15 | 2-28-14 | 2-28-13 | ||||||||||||||||||||||||||||||||||||||||||||||||||||||||||||||||||||||||||||||||||||||||||||||||||||||||||||||||
| Per share operating performance | ||||||||||||||||||||||||||||||||||||||||||||||||||||||||||||||||||||||||||||||||||||||||||||||||||||||||||||||||||||||
| Net asset value, beginning of period | $21.45 | $19.70 | $21.55 | $24.50 | $21.22 | $19.94 | ||||||||||||||||||||||||||||||||||||||||||||||||||||||||||||||||||||||||||||||||||||||||||||||||||||||||||||||||
| Net investment income2 | 0.09 | 0.04 | 0.02 | — | 3 | 0.10 | 0.10 | |||||||||||||||||||||||||||||||||||||||||||||||||||||||||||||||||||||||||||||||||||||||||||||||||||||||||||||||
| Net realized and unrealized gain (loss) on investments | 4.14 | 1.71 | (1.87 | ) | 0.88 | 3.90 | 2.62 | |||||||||||||||||||||||||||||||||||||||||||||||||||||||||||||||||||||||||||||||||||||||||||||||||||||||||||||||
| Total from investment operations | 4.23 | 1.75 | (1.85 | ) | 0.88 | 4.00 | 2.72 | |||||||||||||||||||||||||||||||||||||||||||||||||||||||||||||||||||||||||||||||||||||||||||||||||||||||||||||||
| Less distributions | ||||||||||||||||||||||||||||||||||||||||||||||||||||||||||||||||||||||||||||||||||||||||||||||||||||||||||||||||||||||
| From net investment income | — | — | — | (0.27 | ) | — | (0.28 | ) | ||||||||||||||||||||||||||||||||||||||||||||||||||||||||||||||||||||||||||||||||||||||||||||||||||||||||||||||
| From net realized gain | — | — | — | (3.56 | ) | (0.72 | ) | (1.16 | ) | |||||||||||||||||||||||||||||||||||||||||||||||||||||||||||||||||||||||||||||||||||||||||||||||||||||||||||||
| Total distributions | — | — | — | (3.83 | ) | (0.72 | ) | (1.44 | ) | |||||||||||||||||||||||||||||||||||||||||||||||||||||||||||||||||||||||||||||||||||||||||||||||||||||||||||||
| Net asset value, end of period | $25.68 | $21.45 | $19.70 | $21.55 | $24.50 | $21.22 | ||||||||||||||||||||||||||||||||||||||||||||||||||||||||||||||||||||||||||||||||||||||||||||||||||||||||||||||||
| Total return (%)4,5 | 19.72 | 6 | 8.88 | (8.58 | ) | 5.07 | 19.07 | 14.00 | ||||||||||||||||||||||||||||||||||||||||||||||||||||||||||||||||||||||||||||||||||||||||||||||||||||||||||||||
| Ratios and supplemental data | ||||||||||||||||||||||||||||||||||||||||||||||||||||||||||||||||||||||||||||||||||||||||||||||||||||||||||||||||||||||
| Net assets, end of period (in millions) | $2 | $2 | $2 | $2 | $2 | $1 | ||||||||||||||||||||||||||||||||||||||||||||||||||||||||||||||||||||||||||||||||||||||||||||||||||||||||||||||||
| Ratios (as a percentage of average net assets): | ||||||||||||||||||||||||||||||||||||||||||||||||||||||||||||||||||||||||||||||||||||||||||||||||||||||||||||||||||||||
| Expenses before reductions | 1.99 | 7 | 2.03 | 2.32 | 3.18 | 3.29 | 3.92 | |||||||||||||||||||||||||||||||||||||||||||||||||||||||||||||||||||||||||||||||||||||||||||||||||||||||||||||||
| Expenses including reductions | 1.98 | 7 | 2.02 | 2.12 | 2.34 | 2.30 | 2.30 | |||||||||||||||||||||||||||||||||||||||||||||||||||||||||||||||||||||||||||||||||||||||||||||||||||||||||||||||
| Net investment income | 0.77 | 7,8 | 0.19 | 0.07 | — | 9 | 0.46 | 0.47 | ||||||||||||||||||||||||||||||||||||||||||||||||||||||||||||||||||||||||||||||||||||||||||||||||||||||||||||||
| Portfolio turnover (%) | 42 | 94 | 82 | 204 | 42 | 61 | ||||||||||||||||||||||||||||||||||||||||||||||||||||||||||||||||||||||||||||||||||||||||||||||||||||||||||||||||
| 1 | Six months ended 8-31-17. Unaudited. | ||||||||||||||||||||||||||||||||||||||||||||||||||||||||||||||||||||||||||||||||||
| 2 | Based on average daily shares outstanding. | ||||||||||||||||||||||||||||||||||||||||||||||||||||||||||||||||||||||||||||||||||
| 3 | Less than $0.005 per share. | ||||||||||||||||||||||||||||||||||||||||||||||||||||||||||||||||||||||||||||||||||
| 4 | Does not reflect the effect of sales charges, if any. | ||||||||||||||||||||||||||||||||||||||||||||||||||||||||||||||||||||||||||||||||||
| 5 | Total returns would have been lower had certain expenses not been reduced during the applicable periods. | ||||||||||||||||||||||||||||||||||||||||||||||||||||||||||||||||||||||||||||||||||
| 6 | Not annualized. | ||||||||||||||||||||||||||||||||||||||||||||||||||||||||||||||||||||||||||||||||||
| 7 | Annualized. | ||||||||||||||||||||||||||||||||||||||||||||||||||||||||||||||||||||||||||||||||||
| 8 | Net investment income is affected by the timing and frequency of the declaration of dividends by the securities held in the portfolio. | ||||||||||||||||||||||||||||||||||||||||||||||||||||||||||||||||||||||||||||||||||
| 9 | Less than 0.005%. | ||||||||||||||||||||||||||||||||||||||||||||||||||||||||||||||||||||||||||||||||||
| Class C Shares Period ended | 8-31-171 | 2-28-17 | 2-29-16 | 2-28-15 | 2-28-14 | 2-28-13 | ||||||||||||||||||||||||||||||||||||||||||||||||||||||||||||||||||||||||||||||||||||||||||||||||||||||||||||||||
| Per share operating performance | ||||||||||||||||||||||||||||||||||||||||||||||||||||||||||||||||||||||||||||||||||||||||||||||||||||||||||||||||||||||
| Net asset value, beginning of period | $21.40 | $19.66 | $21.49 | $24.45 | $21.18 | $19.91 | ||||||||||||||||||||||||||||||||||||||||||||||||||||||||||||||||||||||||||||||||||||||||||||||||||||||||||||||||
| Net investment income (loss)2 | 0.08 | 0.01 | (0.07 | ) | (0.03 | ) | 0.07 | 0.10 | ||||||||||||||||||||||||||||||||||||||||||||||||||||||||||||||||||||||||||||||||||||||||||||||||||||||||||||||
| Net realized and unrealized gain (loss) on investments | 4.14 | 1.73 | (1.76 | ) | 0.92 | 3.92 | 2.61 | |||||||||||||||||||||||||||||||||||||||||||||||||||||||||||||||||||||||||||||||||||||||||||||||||||||||||||||||
| Total from investment operations | 4.22 | 1.74 | (1.83 | ) | 0.89 | 3.99 | 2.71 | |||||||||||||||||||||||||||||||||||||||||||||||||||||||||||||||||||||||||||||||||||||||||||||||||||||||||||||||
| Less distributions | ||||||||||||||||||||||||||||||||||||||||||||||||||||||||||||||||||||||||||||||||||||||||||||||||||||||||||||||||||||||
| From net investment income | — | — | — | (0.29 | ) | — | (0.28 | ) | ||||||||||||||||||||||||||||||||||||||||||||||||||||||||||||||||||||||||||||||||||||||||||||||||||||||||||||||
| From net realized gain | — | — | — | (3.56 | ) | (0.72 | ) | (1.16 | ) | |||||||||||||||||||||||||||||||||||||||||||||||||||||||||||||||||||||||||||||||||||||||||||||||||||||||||||||
| Total distributions | — | — | — | (3.85 | ) | (0.72 | ) | (1.44 | ) | |||||||||||||||||||||||||||||||||||||||||||||||||||||||||||||||||||||||||||||||||||||||||||||||||||||||||||||
| Net asset value, end of period | $25.62 | $21.40 | $19.66 | $21.49 | $24.45 | $21.18 | ||||||||||||||||||||||||||||||||||||||||||||||||||||||||||||||||||||||||||||||||||||||||||||||||||||||||||||||||
| Total return (%)3,4 | 19.72 | 5 | 8.85 | (8.52 | ) | 5.11 | 19.05 | 13.97 | ||||||||||||||||||||||||||||||||||||||||||||||||||||||||||||||||||||||||||||||||||||||||||||||||||||||||||||||
| Ratios and supplemental data | ||||||||||||||||||||||||||||||||||||||||||||||||||||||||||||||||||||||||||||||||||||||||||||||||||||||||||||||||||||||
| Net assets, end of period (in millions) | $225 | $145 | $113 | $13 | $7 | $2 | ||||||||||||||||||||||||||||||||||||||||||||||||||||||||||||||||||||||||||||||||||||||||||||||||||||||||||||||||
| Ratios (as a percentage of average net assets): | ||||||||||||||||||||||||||||||||||||||||||||||||||||||||||||||||||||||||||||||||||||||||||||||||||||||||||||||||||||||
| Expenses before reductions | 1.99 | 6 | 2.03 | 2.08 | 2.40 | 2.62 | 3.32 | |||||||||||||||||||||||||||||||||||||||||||||||||||||||||||||||||||||||||||||||||||||||||||||||||||||||||||||||
| Expenses including reductions | 1.98 | 6 | 2.02 | 2.07 | 2.30 | 2.30 | 2.30 | |||||||||||||||||||||||||||||||||||||||||||||||||||||||||||||||||||||||||||||||||||||||||||||||||||||||||||||||
| Net investment income (loss) | 0.66 | 6,7 | 0.03 | (0.33 | ) | (0.11 | ) | 0.32 | 0.48 | |||||||||||||||||||||||||||||||||||||||||||||||||||||||||||||||||||||||||||||||||||||||||||||||||||||||||||||
| Portfolio turnover (%) | 42 | 94 | 82 | 204 | 42 | 61 | ||||||||||||||||||||||||||||||||||||||||||||||||||||||||||||||||||||||||||||||||||||||||||||||||||||||||||||||||
| 1 | Six months ended 8-31-17. Unaudited. | ||||||||||||||||||||||||||||||||||||||||||||||||||||||||||||||||||||||||||||||||||
| 2 | Based on average daily shares outstanding. | ||||||||||||||||||||||||||||||||||||||||||||||||||||||||||||||||||||||||||||||||||
| 3 | Does not reflect the effect of sales charges, if any. | ||||||||||||||||||||||||||||||||||||||||||||||||||||||||||||||||||||||||||||||||||
| 4 | Total returns would have been lower had certain expenses not been reduced during the applicable periods. | ||||||||||||||||||||||||||||||||||||||||||||||||||||||||||||||||||||||||||||||||||
| 5 | Not annualized. | ||||||||||||||||||||||||||||||||||||||||||||||||||||||||||||||||||||||||||||||||||
| 6 | Annualized. | ||||||||||||||||||||||||||||||||||||||||||||||||||||||||||||||||||||||||||||||||||
| 7 | Net investment income is affected by the timing and frequency of the declaration of dividends by the securities held in the portfolio. | ||||||||||||||||||||||||||||||||||||||||||||||||||||||||||||||||||||||||||||||||||
| Class I Shares Period ended | 8-31-171 | 2-28-17 | 2-29-16 | 2-28-15 | 2-28-14 | 2-28-13 | ||||||||||||||||||||||||||||||||||||||||||||||||||||||||||||||||||||||||||||||||||||||||||||||||||||||||||||||||
| Per share operating performance | ||||||||||||||||||||||||||||||||||||||||||||||||||||||||||||||||||||||||||||||||||||||||||||||||||||||||||||||||||||||
| Net asset value, beginning of period | $21.72 | $19.94 | $21.67 | $24.62 | $21.31 | $20.01 | ||||||||||||||||||||||||||||||||||||||||||||||||||||||||||||||||||||||||||||||||||||||||||||||||||||||||||||||||
| Net investment income2 | 0.20 | 0.20 | 0.16 | 0.35 | 0.31 | 0.43 | ||||||||||||||||||||||||||||||||||||||||||||||||||||||||||||||||||||||||||||||||||||||||||||||||||||||||||||||||
| Net realized and unrealized gain (loss) on investments | 4.21 | 1.77 | (1.80 | ) | 0.81 | 3.95 | 2.53 | |||||||||||||||||||||||||||||||||||||||||||||||||||||||||||||||||||||||||||||||||||||||||||||||||||||||||||||||
| Total from investment operations | 4.41 | 1.97 | (1.64 | ) | 1.16 | 4.26 | 2.96 | |||||||||||||||||||||||||||||||||||||||||||||||||||||||||||||||||||||||||||||||||||||||||||||||||||||||||||||||
| Less distributions | ||||||||||||||||||||||||||||||||||||||||||||||||||||||||||||||||||||||||||||||||||||||||||||||||||||||||||||||||||||||
| From net investment income | — | (0.19 | ) | (0.09 | ) | (0.55 | ) | (0.23 | ) | (0.50 | ) | |||||||||||||||||||||||||||||||||||||||||||||||||||||||||||||||||||||||||||||||||||||||||||||||||||||||||||
| From net realized gain | — | — | — | (3.56 | ) | (0.72 | ) | (1.16 | ) | |||||||||||||||||||||||||||||||||||||||||||||||||||||||||||||||||||||||||||||||||||||||||||||||||||||||||||||
| Total distributions | — | (0.19 | ) | (0.09 | ) | (4.11 | ) | (0.95 | ) | (1.66 | ) | |||||||||||||||||||||||||||||||||||||||||||||||||||||||||||||||||||||||||||||||||||||||||||||||||||||||||||
| Net asset value, end of period | $26.13 | $21.72 | $19.94 | $21.67 | $24.62 | $21.31 | ||||||||||||||||||||||||||||||||||||||||||||||||||||||||||||||||||||||||||||||||||||||||||||||||||||||||||||||||
| Total return (%)3 | 20.30 | 4 | 9.96 | (7.59 | ) | 6.33 | 20.31 | 15.23 | ||||||||||||||||||||||||||||||||||||||||||||||||||||||||||||||||||||||||||||||||||||||||||||||||||||||||||||||
| Ratios and supplemental data | ||||||||||||||||||||||||||||||||||||||||||||||||||||||||||||||||||||||||||||||||||||||||||||||||||||||||||||||||||||||
| Net assets, end of period (in millions) | $4,503 | $2,380 | $1,168 | $152 | $290 | $79 | ||||||||||||||||||||||||||||||||||||||||||||||||||||||||||||||||||||||||||||||||||||||||||||||||||||||||||||||||
| Ratios (as a percentage of average net assets): | ||||||||||||||||||||||||||||||||||||||||||||||||||||||||||||||||||||||||||||||||||||||||||||||||||||||||||||||||||||||
| Expenses before reductions | 0.98 | 5 | 1.02 | 1.06 | 1.19 | 1.21 | 1.27 | |||||||||||||||||||||||||||||||||||||||||||||||||||||||||||||||||||||||||||||||||||||||||||||||||||||||||||||||
| Expenses including reductions | 0.97 | 5 | 1.01 | 1.06 | 1.18 | 1.21 | 1.25 | |||||||||||||||||||||||||||||||||||||||||||||||||||||||||||||||||||||||||||||||||||||||||||||||||||||||||||||||
| Net investment income | 1.64 | 5,6 | 0.94 | 0.73 | 1.46 | 1.33 | 2.09 | |||||||||||||||||||||||||||||||||||||||||||||||||||||||||||||||||||||||||||||||||||||||||||||||||||||||||||||||
| Portfolio turnover (%) | 42 | 94 | 82 | 204 | 42 | 61 | ||||||||||||||||||||||||||||||||||||||||||||||||||||||||||||||||||||||||||||||||||||||||||||||||||||||||||||||||
| 1 | Six months ended 8-31-17. Unaudited. | ||||||||||||||||||||||||||||||||||||||||||||||||||||||||||||||||||||||||||||||||||
| 2 | Based on average daily shares outstanding. | ||||||||||||||||||||||||||||||||||||||||||||||||||||||||||||||||||||||||||||||||||
| 3 | Total returns would have been lower had certain expenses not been reduced during the applicable periods. | ||||||||||||||||||||||||||||||||||||||||||||||||||||||||||||||||||||||||||||||||||
| 4 | Not annualized. | ||||||||||||||||||||||||||||||||||||||||||||||||||||||||||||||||||||||||||||||||||
| 5 | Annualized. | ||||||||||||||||||||||||||||||||||||||||||||||||||||||||||||||||||||||||||||||||||
| 6 | Net investment income is affected by the timing and frequency of the declaration of dividends by the securities held in the portfolio. | ||||||||||||||||||||||||||||||||||||||||||||||||||||||||||||||||||||||||||||||||||
| Class R2 Shares Period ended | 8-31-171 | 2-28-17 | 2-29-162 | ||||||||||||||||||||||||||||||||||||||||||||||||||||||||||||||||||||
| Per share operating performance | |||||||||||||||||||||||||||||||||||||||||||||||||||||||||||||||||||||||
| Net asset value, beginning of period | $21.71 | $19.92 | $21.46 | ||||||||||||||||||||||||||||||||||||||||||||||||||||||||||||||||||||
| Net investment income (loss)3 | 0.16 | (0.02 | ) | 0.02 | |||||||||||||||||||||||||||||||||||||||||||||||||||||||||||||||||||
| Net realized and unrealized gain (loss) on investments | 4.20 | 1.91 | (1.56 | ) | |||||||||||||||||||||||||||||||||||||||||||||||||||||||||||||||||||
| Total from investment operations | 4.36 | 1.89 | (1.54 | ) | |||||||||||||||||||||||||||||||||||||||||||||||||||||||||||||||||||
| Less distributions | |||||||||||||||||||||||||||||||||||||||||||||||||||||||||||||||||||||||
| From net investment income | — | (0.10 | ) | — | |||||||||||||||||||||||||||||||||||||||||||||||||||||||||||||||||||
| Total distributions | — | (0.10 | ) | — | |||||||||||||||||||||||||||||||||||||||||||||||||||||||||||||||||||
| Net asset value, end of period | $26.07 | $21.71 | $19.92 | ||||||||||||||||||||||||||||||||||||||||||||||||||||||||||||||||||||
| Total return (%)4 | 20.08 | 5 | 9.54 | (7.18 | ) 5 | ||||||||||||||||||||||||||||||||||||||||||||||||||||||||||||||||||
| Ratios and supplemental data | |||||||||||||||||||||||||||||||||||||||||||||||||||||||||||||||||||||||
| Net assets, end of period (in millions) | $16 | $12 | $1 | ||||||||||||||||||||||||||||||||||||||||||||||||||||||||||||||||||||
| Ratios (as a percentage of average net assets): | |||||||||||||||||||||||||||||||||||||||||||||||||||||||||||||||||||||||
| Expenses before reductions | 1.38 | 6 | 1.42 | 1.90 | 6 | ||||||||||||||||||||||||||||||||||||||||||||||||||||||||||||||||||
| Expenses including reductions | 1.37 | 6 | 1.42 | 1.52 | 6 | ||||||||||||||||||||||||||||||||||||||||||||||||||||||||||||||||||
| Net investment income (loss) | 1.34 | 6,7 | (0.08 | ) | 0.11 | 6 | |||||||||||||||||||||||||||||||||||||||||||||||||||||||||||||||||
| Portfolio turnover (%) | 42 | 94 | 82 | 8 | |||||||||||||||||||||||||||||||||||||||||||||||||||||||||||||||||||
| 1 | Six months ended 8-31-17. Unaudited. | |||||||||||||||||||||||||||||||||||||||||||||||||||||||||||||||||||||||||||||||
| 2 | The inception date for Class R2 shares is 3-27-15. | |||||||||||||||||||||||||||||||||||||||||||||||||||||||||||||||||||||||||||||||
| 3 | Based on average daily shares outstanding. | |||||||||||||||||||||||||||||||||||||||||||||||||||||||||||||||||||||||||||||||
| 4 | Total returns would have been lower had certain expenses not been reduced during the applicable periods. | |||||||||||||||||||||||||||||||||||||||||||||||||||||||||||||||||||||||||||||||
| 5 | Not annualized. | |||||||||||||||||||||||||||||||||||||||||||||||||||||||||||||||||||||||||||||||
| 6 | Annualized. | |||||||||||||||||||||||||||||||||||||||||||||||||||||||||||||||||||||||||||||||
| 7 | Net investment income is affected by the timing and frequency of the declaration of dividends by the securities held in the portfolio. | |||||||||||||||||||||||||||||||||||||||||||||||||||||||||||||||||||||||||||||||
| 8 | The portfolio turnover is shown for the period from 3-1-15 to 2-29-16. | �� | ||||||||||||||||||||||||||||||||||||||||||||||||||||||||||||||||||||||||||||||
| Class R4 Shares Period ended | 8-31-171 | 2-28-17 | 2-29-162 | ||||||||||||||||||||||||||||||||||||||||||||||||||||||||||||||||||||
| Per share operating performance | |||||||||||||||||||||||||||||||||||||||||||||||||||||||||||||||||||||||
| Net asset value, beginning of period | $21.72 | $19.94 | $21.46 | ||||||||||||||||||||||||||||||||||||||||||||||||||||||||||||||||||||
| Net investment income3 | 0.20 | 0.19 | 0.05 | ||||||||||||||||||||||||||||||||||||||||||||||||||||||||||||||||||||
| Net realized and unrealized gain (loss) on investments | 4.19 | 1.75 | (1.54 | ) | |||||||||||||||||||||||||||||||||||||||||||||||||||||||||||||||||||
| Total from investment operations | 4.39 | 1.94 | (1.49 | ) | |||||||||||||||||||||||||||||||||||||||||||||||||||||||||||||||||||
| Less distributions | |||||||||||||||||||||||||||||||||||||||||||||||||||||||||||||||||||||||
| From net investment income | — | (0.16 | ) | (0.03 | ) | ||||||||||||||||||||||||||||||||||||||||||||||||||||||||||||||||||
| Total distributions | — | (0.16 | ) | (0.03 | ) | ||||||||||||||||||||||||||||||||||||||||||||||||||||||||||||||||||
| Net asset value, end of period | $26.11 | $21.72 | $19.94 | ||||||||||||||||||||||||||||||||||||||||||||||||||||||||||||||||||||
| Total return (%)4 | 20.21 | 5 | 9.81 | (6.95 | ) 5 | ||||||||||||||||||||||||||||||||||||||||||||||||||||||||||||||||||
| Ratios and supplemental data | |||||||||||||||||||||||||||||||||||||||||||||||||||||||||||||||||||||||
| Net assets, end of period (in millions) | $6 | $5 | $3 | ||||||||||||||||||||||||||||||||||||||||||||||||||||||||||||||||||||
| Ratios (as a percentage of average net assets): | |||||||||||||||||||||||||||||||||||||||||||||||||||||||||||||||||||||||
| Expenses before reductions | 1.22 | 6 | 1.25 | 1.66 | 6 | ||||||||||||||||||||||||||||||||||||||||||||||||||||||||||||||||||
| Expenses including reductions | 1.12 | 6 | 1.14 | 1.24 | 6 | ||||||||||||||||||||||||||||||||||||||||||||||||||||||||||||||||||
| Net investment income | 1.64 | 6,7 | 0.88 | 0.24 | 6 | ||||||||||||||||||||||||||||||||||||||||||||||||||||||||||||||||||
| Portfolio turnover (%) | 42 | 94 | 82 | 8 | |||||||||||||||||||||||||||||||||||||||||||||||||||||||||||||||||||
| 1 | Six months ended 8-31-17. Unaudited. | |||||||||||||||||||||||||||||||||||||||||||||||||||||||||||||||||||||||||||||||
| 2 | The inception date for Class R4 shares is 3-27-15. | |||||||||||||||||||||||||||||||||||||||||||||||||||||||||||||||||||||||||||||||
| 3 | Based on average daily shares outstanding. | |||||||||||||||||||||||||||||||||||||||||||||||||||||||||||||||||||||||||||||||
| 4 | Total returns would have been lower had certain expenses not been reduced during the applicable periods. | |||||||||||||||||||||||||||||||||||||||||||||||||||||||||||||||||||||||||||||||
| 5 | Not annualized. | |||||||||||||||||||||||||||||||||||||||||||||||||||||||||||||||||||||||||||||||
| 6 | Annualized. | |||||||||||||||||||||||||||||||||||||||||||||||||||||||||||||||||||||||||||||||
| 7 | Net investment income is affected by the timing and frequency of the declaration of dividends by the securities held in the portfolio. | |||||||||||||||||||||||||||||||||||||||||||||||||||||||||||||||||||||||||||||||
| 8 | The portfolio turnover is shown for the period from 3-1-15 to 2-29-16. | |||||||||||||||||||||||||||||||||||||||||||||||||||||||||||||||||||||||||||||||
| Class R6 Shares Period ended | 8-31-171 | 2-28-17 | 2-29-162 | ||||||||||||||||||||||||||||||||||||||||||||||||||||||||||||||||||||
| Per share operating performance | |||||||||||||||||||||||||||||||||||||||||||||||||||||||||||||||||||||||
| Net asset value, beginning of period | $21.73 | $19.95 | $21.46 | ||||||||||||||||||||||||||||||||||||||||||||||||||||||||||||||||||||
| Net investment income3 | 0.22 | 0.20 | 0.12 | ||||||||||||||||||||||||||||||||||||||||||||||||||||||||||||||||||||
| Net realized and unrealized gain (loss) on investments | 4.21 | 1.79 | (1.53 | ) | |||||||||||||||||||||||||||||||||||||||||||||||||||||||||||||||||||
| Total from investment operations | 4.43 | 1.99 | (1.41 | ) | |||||||||||||||||||||||||||||||||||||||||||||||||||||||||||||||||||
| Less distributions | |||||||||||||||||||||||||||||||||||||||||||||||||||||||||||||||||||||||
| From net investment income | — | (0.21 | ) | (0.10 | ) | ||||||||||||||||||||||||||||||||||||||||||||||||||||||||||||||||||
| Total distributions | — | (0.21 | ) | (0.10 | ) | ||||||||||||||||||||||||||||||||||||||||||||||||||||||||||||||||||
| Net asset value, end of period | $26.16 | $21.73 | $19.95 | ||||||||||||||||||||||||||||||||||||||||||||||||||||||||||||||||||||
| Total return (%)4 | 20.39 | 5 | 10.08 | (6.59 | ) 5 | ||||||||||||||||||||||||||||||||||||||||||||||||||||||||||||||||||
| Ratios and supplemental data | |||||||||||||||||||||||||||||||||||||||||||||||||||||||||||||||||||||||
| Net assets, end of period (in millions) | $57 | $18 | $2 | ||||||||||||||||||||||||||||||||||||||||||||||||||||||||||||||||||||
| Ratios (as a percentage of average net assets): | |||||||||||||||||||||||||||||||||||||||||||||||||||||||||||||||||||||||
| Expenses before reductions | 0.89 | 6 | 0.93 | 1.37 | 6 | ||||||||||||||||||||||||||||||||||||||||||||||||||||||||||||||||||
| Expenses including reductions | 0.87 | 6 | 0.90 | 0.95 | 6 | ||||||||||||||||||||||||||||||||||||||||||||||||||||||||||||||||||
| Net investment income | 1.75 | 6,7 | 0.95 | 0.60 | 6 | ||||||||||||||||||||||||||||||||||||||||||||||||||||||||||||||||||
| Portfolio turnover (%) | 42 | 94 | 82 | 8 | |||||||||||||||||||||||||||||||||||||||||||||||||||||||||||||||||||
| 1 | Six months ended 8-31-17. Unaudited. | |||||||||||||||||||||||||||||||||||||||||||||||||||||||||||||||||||||||||||||||
| 2 | The inception date for Class R6 shares is 3-27-15. | |||||||||||||||||||||||||||||||||||||||||||||||||||||||||||||||||||||||||||||||
| 3 | Based on average daily shares outstanding. | |||||||||||||||||||||||||||||||||||||||||||||||||||||||||||||||||||||||||||||||
| 4 | Total returns would have been lower had certain expenses not been reduced during the applicable periods. | |||||||||||||||||||||||||||||||||||||||||||||||||||||||||||||||||||||||||||||||
| 5 | Not annualized. | |||||||||||||||||||||||||||||||||||||||||||||||||||||||||||||||||||||||||||||||
| 6 | Annualized. | |||||||||||||||||||||||||||||||||||||||||||||||||||||||||||||||||||||||||||||||
| 7 | Net investment income is affected by the timing and frequency of the declaration of dividends by the securities held in the portfolio. | |||||||||||||||||||||||||||||||||||||||||||||||||||||||||||||||||||||||||||||||
| 8 | The portfolio turnover is shown for the period from 3-1-15 to 2-29-16. | |||||||||||||||||||||||||||||||||||||||||||||||||||||||||||||||||||||||||||||||
| Class 1 Shares Period ended | 8-31-171 | 2-28-17 | 2-29-16 | 2-28-15 | 2-28-14 | 2-28-13 | ||||||||||||||||||||||||||||||||||||||||||||||||||||||||||||||||||||||||||||||||||||||||||||||||||||||||||||||||
| Per share operating performance | ||||||||||||||||||||||||||||||||||||||||||||||||||||||||||||||||||||||||||||||||||||||||||||||||||||||||||||||||||||||
| Net asset value, beginning of period | $21.71 | $19.93 | $21.65 | $24.61 | $21.30 | $20.00 | ||||||||||||||||||||||||||||||||||||||||||||||||||||||||||||||||||||||||||||||||||||||||||||||||||||||||||||||||
| Net investment income2 | 0.21 | 0.23 | 0.23 | 0.28 | 0.37 | 0.34 | ||||||||||||||||||||||||||||||||||||||||||||||||||||||||||||||||||||||||||||||||||||||||||||||||||||||||||||||||
| Net realized and unrealized gain (loss) on investments | 4.21 | 1.76 | (1.84 | ) | 0.90 | 3.92 | 2.63 | |||||||||||||||||||||||||||||||||||||||||||||||||||||||||||||||||||||||||||||||||||||||||||||||||||||||||||||||
| Total from investment operations | 4.42 | 1.99 | (1.61 | ) | 1.18 | 4.29 | 2.97 | |||||||||||||||||||||||||||||||||||||||||||||||||||||||||||||||||||||||||||||||||||||||||||||||||||||||||||||||
| Less distributions | ||||||||||||||||||||||||||||||||||||||||||||||||||||||||||||||||||||||||||||||||||||||||||||||||||||||||||||||||||||||
| From net investment income | — | (0.21 | ) | (0.11 | ) | (0.58 | ) | (0.26 | ) | (0.51 | ) | |||||||||||||||||||||||||||||||||||||||||||||||||||||||||||||||||||||||||||||||||||||||||||||||||||||||||||
| From net realized gain | — | — | — | (3.56 | ) | (0.72 | ) | (1.16 | ) | |||||||||||||||||||||||||||||||||||||||||||||||||||||||||||||||||||||||||||||||||||||||||||||||||||||||||||||
| Total distributions | — | (0.21 | ) | (0.11 | ) | (4.14 | ) | (0.98 | ) | (1.67 | ) | |||||||||||||||||||||||||||||||||||||||||||||||||||||||||||||||||||||||||||||||||||||||||||||||||||||||||||
| Net asset value, end of period | $26.13 | $21.71 | $19.93 | $21.65 | $24.61 | $21.30 | ||||||||||||||||||||||||||||||||||||||||||||||||||||||||||||||||||||||||||||||||||||||||||||||||||||||||||||||||
| Total return (%)3 | 20.36 | 4 | 10.04 | (7.49 | ) | 6.39 | 20.43 | 15.29 | ||||||||||||||||||||||||||||||||||||||||||||||||||||||||||||||||||||||||||||||||||||||||||||||||||||||||||||||
| Ratios and supplemental data | ||||||||||||||||||||||||||||||||||||||||||||||||||||||||||||||||||||||||||||||||||||||||||||||||||||||||||||||||||||||
| Net assets, end of period (in millions) | $70 | $50 | $39 | $20 | $16 | $11 | ||||||||||||||||||||||||||||||||||||||||||||||||||||||||||||||||||||||||||||||||||||||||||||||||||||||||||||||||
| Ratios (as a percentage of average net assets): | ||||||||||||||||||||||||||||||||||||||||||||||||||||||||||||||||||||||||||||||||||||||||||||||||||||||||||||||||||||||
| Expenses before reductions | 0.92 | 5 | 0.95 | 1.00 | 1.10 | 1.12 | 1.19 | |||||||||||||||||||||||||||||||||||||||||||||||||||||||||||||||||||||||||||||||||||||||||||||||||||||||||||||||
| Expenses including reductions | 0.91 | 5 | 0.94 | 0.99 | 1.09 | 1.12 | 1.15 | |||||||||||||||||||||||||||||||||||||||||||||||||||||||||||||||||||||||||||||||||||||||||||||||||||||||||||||||
| Net investment income | 1.75 | 5,6 | 1.09 | 1.06 | 1.18 | 1.59 | 1.68 | |||||||||||||||||||||||||||||||||||||||||||||||||||||||||||||||||||||||||||||||||||||||||||||||||||||||||||||||
| Portfolio turnover (%) | 42 | 94 | 82 | 204 | 42 | 61 | ||||||||||||||||||||||||||||||||||||||||||||||||||||||||||||||||||||||||||||||||||||||||||||||||||||||||||||||||
| 1 | Six months ended 8-31-17. Unaudited. | ||||||||||||||||||||||||||||||||||||||||||||||||||||||||||||||||||||||||||||||||||
| 2 | Based on average daily shares outstanding. | ||||||||||||||||||||||||||||||||||||||||||||||||||||||||||||||||||||||||||||||||||
| 3 | Total returns would have been lower had certain expenses not been reduced during the applicable periods. | ||||||||||||||||||||||||||||||||||||||||||||||||||||||||||||||||||||||||||||||||||
| 4 | Not annualized. | ||||||||||||||||||||||||||||||||||||||||||||||||||||||||||||||||||||||||||||||||||
| 5 | Annualized. | ||||||||||||||||||||||||||||||||||||||||||||||||||||||||||||||||||||||||||||||||||
| 6 | Net investment income is affected by the timing and frequency of the declaration of dividends by the securities held in the portfolio. | ||||||||||||||||||||||||||||||||||||||||||||||||||||||||||||||||||||||||||||||||||
| Class NAV Shares Period ended | 8-31-171 | 2-28-17 | 2-29-162 | ||||||||||||||||||||||||||||||||||||||||||||||||||||||||||||||||||||
| Per share operating performance | |||||||||||||||||||||||||||||||||||||||||||||||||||||||||||||||||||||||
| Net asset value, beginning of period | $21.71 | $19.93 | $22.66 | ||||||||||||||||||||||||||||||||||||||||||||||||||||||||||||||||||||
| Net investment income3 | 0.23 | 0.19 | 0.11 | ||||||||||||||||||||||||||||||||||||||||||||||||||||||||||||||||||||
| Net realized and unrealized gain (loss) on investments | 4.19 | 1.81 | (2.72 | ) | |||||||||||||||||||||||||||||||||||||||||||||||||||||||||||||||||||
| Total from investment operations | 4.42 | 2.00 | (2.61 | ) | |||||||||||||||||||||||||||||||||||||||||||||||||||||||||||||||||||
| Less distributions | |||||||||||||||||||||||||||||||||||||||||||||||||||||||||||||||||||||||
| From net investment income | — | (0.22 | ) | (0.12 | ) | ||||||||||||||||||||||||||||||||||||||||||||||||||||||||||||||||||
| Total distributions | — | (0.22 | ) | (0.12 | ) | ||||||||||||||||||||||||||||||||||||||||||||||||||||||||||||||||||
| Net asset value, end of period | $26.13 | $21.71 | $19.93 | ||||||||||||||||||||||||||||||||||||||||||||||||||||||||||||||||||||
| Total return (%)4 | 20.36 | 5 | 10.10 | (11.57 | ) 5 | ||||||||||||||||||||||||||||||||||||||||||||||||||||||||||||||||||
| Ratios and supplemental data | |||||||||||||||||||||||||||||||||||||||||||||||||||||||||||||||||||||||
| Net assets, end of period (in millions) | $1,164 | $864 | $86 | ||||||||||||||||||||||||||||||||||||||||||||||||||||||||||||||||||||
| Ratios (as a percentage of average net assets): | |||||||||||||||||||||||||||||||||||||||||||||||||||||||||||||||||||||||
| Expenses before reductions | 0.87 | 6 | 0.91 | 0.94 | 6 | ||||||||||||||||||||||||||||||||||||||||||||||||||||||||||||||||||
| Expenses including reductions | 0.86 | 6 | 0.90 | 0.93 | 6 | ||||||||||||||||||||||||||||||||||||||||||||||||||||||||||||||||||
| Net investment income | 1.88 | 6,7 | 0.91 | 0.69 | 6 | ||||||||||||||||||||||||||||||||||||||||||||||||||||||||||||||||||
| Portfolio turnover (%) | 42 | 94 | 82 | 8 | |||||||||||||||||||||||||||||||||||||||||||||||||||||||||||||||||||
| 1 | Six months ended 8-31-17. Unaudited. | |||||||||||||||||||||||||||||||||||||||||||||||||||||||||||||||||||||||||||||||
| 2 | The inception date for Class NAV shares is 6-2-15. | |||||||||||||||||||||||||||||||||||||||||||||||||||||||||||||||||||||||||||||||
| 3 | Based on average daily shares outstanding. | |||||||||||||||||||||||||||||||||||||||||||||||||||||||||||||||||||||||||||||||
| 4 | Total returns would have been lower had certain expenses not been reduced during the applicable periods. | |||||||||||||||||||||||||||||||||||||||||||||||||||||||||||||||||||||||||||||||
| 5 | Not annualized. | |||||||||||||||||||||||||||||||||||||||||||||||||||||||||||||||||||||||||||||||
| 6 | Annualized. | |||||||||||||||||||||||||||||||||||||||||||||||||||||||||||||||||||||||||||||||
| 7 | Net investment income is affected by the timing and frequency of the declaration of dividends by the securities held in the portfolio. | |||||||||||||||||||||||||||||||||||||||||||||||||||||||||||||||||||||||||||||||
| 8 | The portfolio turnover is shown for the period from 3-1-15 to 2-29-16. | |||||||||||||||||||||||||||||||||||||||||||||||||||||||||||||||||||||||||||||||
Note 1 — Organization
John Hancock International Growth Fund (the fund) is a series of John Hancock Funds III (the Trust), an open-end management investment company organized as a Massachusetts business trust and registered under the Investment Company Act of 1940, as amended (the 1940 Act). The investment objective of the fund is to seek high total return primarily through capital appreciation.
The fund may offer multiple classes of shares. The shares currently offered are detailed in the Statement of assets and liabilities. Class A and Class C shares are offered to all investors. Class B shares are closed to new investors. Class I shares are offered to institutions and certain investors. Class R2 and Class R4 shares are available only to certain retirement plans. Class R6 shares are available only to certain retirement plans, institutions and other investors. Class 1 shares are offered only to certain affiliates of Manulife Financial Corporation (MFC). Class NAV shares are offered to John Hancock affiliated funds and certain 529 plans. Shareholders of each class have exclusive voting rights to matters that affect that class. The distribution and service fees, if any, and transfer agent fees for each class may differ. Class B shares convert to Class A shares eight years after purchase.
Note 2 — Significant accounting policies
The financial statements have been prepared in conformity with accounting principles generally accepted in the United States of America (US GAAP), which require management to make certain estimates and assumptions as of the date of the financial statements. Actual results could differ from those estimates and those differences could be significant. The fund qualifies as an investment company under Topic 946 of Accounting Standards Codification of US GAAP.
Events or transactions occurring after the end of the fiscal period through the date that the financial statements were issued have been evaluated in the preparation of the financial statements. The following summarizes the significant accounting policies of the fund:
Security valuation. Investments are stated at value as of the scheduled close of regular trading on the New York Stock Exchange (NYSE), normally at 4:00 P.M., Eastern Time. In case of emergency or other disruption resulting in the NYSE not opening for trading or the NYSE closing at a time other than the regularly scheduled close, the net asset value (NAV) may be determined as of the regularly scheduled close of the NYSE pursuant to the fund's Valuation Policies and Procedures.
In order to value the securities, the fund uses the following valuation techniques: Equity securities held by the fund are typically valued at the last sale price or official closing price on the exchange or principal market where the security trades. In the event there were no sales during the day or closing prices are not available, the securities are valued using the last available bid price. Investments by the fund in open-end mutual funds, including John Hancock Collateral Trust (JHCT), are valued at their respective NAVs each business day. Foreign securities and currencies are valued in U.S. dollars, based on foreign currency exchange rates supplied by an independent pricing vendor.
In certain instances, the Pricing Committee may determine to value equity securities using prices obtained from another exchange or market if trading on the exchange or market on which prices are typically obtained did not open for trading as scheduled, or if trading closed earlier than scheduled, and trading occurred as normal on another exchange or market.
Other portfolio securities and assets, for which reliable market quotations are not readily available, are valued at fair value as determined in good faith by the fund's Pricing Committee following procedures established by the Board of Trustees. The frequency with which these fair valuation procedures are used cannot be predicted and fair value of securities may differ significantly from the value that would have been used had a ready market for such securities existed. Trading in foreign securities may be completed before the scheduled daily close of trading on the NYSE. Significant events at the issuer or market level may affect the values of securities between the time when the valuation of the securities is generally determined and the close of the NYSE. If a significant event occurs, these securities may be fair valued, as determined in good faith by the fund's Pricing Committee, following procedures established by the Board of Trustees. The fund uses fair value adjustment factors provided by an independent pricing vendor to value certain foreign securities in order to adjust for events that may occur between the close of foreign exchanges or markets and the close of the NYSE.
The fund uses a three-tier hierarchy to prioritize the pricing assumptions, referred to as inputs, used in valuation techniques to measure fair value. Level 1 includes securities valued using quoted prices in active markets for identical securities. Level 2
includes securities valued using other significant observable inputs. Observable inputs may include quoted prices for similar securities, interest rates, prepayment speeds and credit risk. Prices for securities valued using these inputs are received from independent pricing vendors and brokers and are based on an evaluation of the inputs described. Level 3 includes securities valued using significant unobservable inputs when market prices are not readily available or reliable, including the fund's own assumptions in determining the fair value of investments. Factors used in determining value may include market or issuer specific events or trends, changes in interest rates and credit quality. The inputs or methodology used for valuing securities are not necessarily an indication of the risks associated with investing in those securities. Changes in valuation techniques and related inputs may result in transfers into or out of an assigned level within the disclosure hierarchy.
The following is a summary of the values by input classification of the fund's investments as of August 31, 2017, by major security category or type:
| Total value at 8-31-17 | Level 1 quoted price | Level 2 significant observable inputs | Level 3 significant unobservable inputs | ||
| Common stocks | |||||
| Australia | $276,728,667 | — | $276,728,667 | — | |
| Austria | 71,437,688 | — | 71,437,688 | — | |
| Canada | 128,897,554 | $128,897,554 | — | — | |
| China | 1,071,674,762 | 597,494,514 | 474,180,248 | — | |
| Denmark | 160,352,496 | — | 160,352,496 | — | |
| France | 699,844,276 | — | 699,844,276 | — | |
| Germany | 83,332,461 | — | 83,332,461 | — | |
| Hong Kong | 70,214,714 | 70,214,714 | — | — | |
| India | 392,713,900 | — | 392,713,900 | — | |
| Indonesia | 167,778,526 | — | 167,778,526 | — | |
| Ireland | 99,376,130 | 99,376,130 | — | — | |
| Japan | 546,300,807 | — | 546,300,807 | — | |
| Netherlands | 271,118,920 | — | 271,118,920 | — | |
| Norway | 65,246,262 | — | 65,246,262 | — | |
| Singapore | 76,950,983 | — | 76,950,983 | — | |
| South Korea | 170,965,545 | — | 170,965,545 | — | |
| Spain | 100,199,918 | — | 100,199,918 | — | |
| Switzerland | 535,929,135 | — | 535,929,135 | — | |
| Taiwan | 368,373,657 | — | 368,373,657 | — | |
| United Kingdom | 1,015,249,901 | 157,819,383 | 857,430,518 | — | |
| United States | 183,503,214 | 183,503,214 | — | — | |
| Securities lending collateral | 16,754,635 | 16,754,635 | — | — | |
| Short-term investments | 96,800,000 | — | 96,800,000 | — | |
| Total investments in securities | $6,669,744,151 | $1,254,060,144 | $5,415,684,007 | — | |
Repurchase agreements. The fund may enter into repurchase agreements. When the fund enters into a repurchase agreement, it receives collateral that is held in a segregated account by the fund's custodian, or for tri-party repurchase agreements, collateral is held at a third-party custodian bank in a segregated account for the benefit of the fund. The collateral amount is marked-to-market and monitored on a daily basis to ensure that the collateral held is in an amount not less than the principal amount of the repurchase agreement plus any accrued interest. Collateral received by the fund for repurchase agreements is disclosed in the Fund's investments as part of the caption related to the repurchase agreement.
Repurchase agreements are typically governed by the terms and conditions of the Master Repurchase Agreement and/or Global Master Repurchase Agreement (collectively, MRA). Upon an event of default, the non-defaulting party may close out
all transactions traded under the MRA and net amounts owed. Absent an event of default, assets and liabilities resulting from repurchase agreements are not offset in the Statement of assets and liabilities. In the event of a default by the counterparty, realization of the collateral proceeds could be delayed, during which time the collateral value may decline or the counterparty may have insufficient assets to pay back claims resulting from close-out of the transactions.
Security transactions and related investment income. Investment security transactions are accounted for on a trade date plus one basis for daily NAV calculations. However, for financial reporting purposes, investment transactions are reported on trade date. Interest income is accrued as earned. Dividend income is recorded on the ex-date, except for dividends of foreign securities where the dividend may not be known until after the ex-date. In those cases, dividend income, net of withholding taxes, is recorded when the fund becomes aware of the dividends. Foreign taxes are provided for based on the fund's understanding of the tax rules and rates that exist in the foreign markets in which it invests. Gains and losses on securities sold are determined on the basis of identified cost and may include proceeds from litigation.
Securities lending. The fund may lend its securities to earn additional income. The fund receives cash collateral from the borrower in an amount not less than the market value of the loaned securities. The fund will invest its collateral in JHCT, an affiliate of the fund which has a floating NAV and is registered with the Securities and Exchange Commission (SEC) as an investment company. JHCT invests cash received as collateral as part of the securities lending program in short-term money market investments. The fund will receive the benefit of any gains and bear any losses generated by JHCT with respect to the cash collateral.
The fund has the right to recall loaned securities on demand. If a borrower fails to return loaned securities when due, then the lending agent is responsible and indemnifies the fund for the lent securities. The lending agent uses the collateral received from the borrower to purchase replacement securities of the same issue, type, class and series of the loaned securities. If the value of the collateral is less than the purchase cost of replacement securities, the lending agent is responsible for satisfying the shortfall but only to the extent that the shortfall is not due to any decrease in the value of JHCT.
Although the risk of the loss of the securities lent is mitigated by receiving collateral from the borrower and through lending agent indemnification, the fund could experience a delay in recovering securities or could experience a lower than expected return if the borrower fails to return the securities on a timely basis. The fund receives compensation for lending its securities by retaining a portion of the return on the investment of the collateral and compensation from fees earned from borrowers of the securities. Securities lending income received by the fund is net of fees retained by the securities lending agent. Net income received from JHCT is a component of securities lending income as recorded on the Statement of operations.
Obligations to repay collateral received by the fund are shown on the Statement of assets and liabilities as Payable upon return of securities loaned and are secured by the loaned securities. As of August 31, 2017, the fund loaned common stocks valued at $16,043,056 and received $16,754,181 of cash collateral.
Foreign currency translation. Assets, including investments and liabilities denominated in foreign currencies, are translated into U.S. dollar values each day at the prevailing exchange rate. Purchases and sales of securities, income and expenses are translated into U.S. dollars at the prevailing exchange rate on the date of the transaction. The effect of changes in foreign currency exchange rates on the value of securities is reflected as a component of the realized and unrealized gains (losses) on investments.
Funds that invest internationally generally carry more risk than funds that invest strictly in U.S. securities. These risks are heightened for investments in emerging markets. Risks can result from differences in economic and political conditions, regulations, market practices (including higher transaction costs), accounting standards and other factors. Foreign investments are also subject to a decline in the value of a foreign currency versus the U.S. dollar, which reduces the dollar value of securities denominated in that currency.
Foreign taxes. The fund may be subject to withholding tax on income and/or capital gains or repatriation taxes imposed by certain countries in which the fund invests. Taxes are accrued based upon investment income, realized gains or unrealized appreciation.
Line of credit. The fund may have the ability to borrow from banks for temporary or emergency purposes, including meeting redemption requests that otherwise might require the untimely sale of securities. Pursuant to the fund's custodian
agreement, the custodian may loan money to the fund to make properly authorized payments. The fund is obligated to repay the custodian for any overdraft, including any related costs or expenses. The custodian may have a lien, security interest or security entitlement in any fund property that is not otherwise segregated or pledged, to the extent of any overdraft, and to the maximum extent permitted by law.
Effective June 29, 2017, the fund and other affiliated funds have entered into a syndicated line of credit agreement with Citibank, N.A. as the administrative agent that enables them to participate in a $750 million unsecured committed line of credit. Excluding commitments designated for a certain fund and subject to the need of all other affiliated funds, the fund can borrow up to an aggregate commitment amount of $500 million, subject to asset coverage and other limitations as specified in the agreement. A commitment fee payable at the end of each calendar quarter, based on the average daily unused portion of the line of credit, is charged to each participating fund based on a combination of fixed and asset based allocations and is reflected in Other expenses on the Statement of operations. Prior to June 29, 2017, the fund had a similar agreement that enabled it to participate in a $1 billion unsecured committed line of credit. For the six months ended August 31, 2017, the fund had no borrowings under either line of credit. Commitment fees for the six months ended August 31, 2017, were $7,517.
Expenses. Within the John Hancock group of funds complex, expenses that are directly attributable to an individual fund are allocated to such fund. Expenses that are not readily attributable to a specific fund are allocated among all funds in an equitable manner, taking into consideration, among other things, the nature and type of expense and the fund's relative net assets. Expense estimates are accrued in the period to which they relate and adjustments are made when actual amounts are known.
Class allocations. Income, common expenses and realized and unrealized gains (losses) are determined at the fund level and allocated daily to each class of shares based on the net assets of the class. Class-specific expenses, such as distribution and service fees, if any, and transfer agent fees, for all classes, are charged daily at the class level based on the net assets of each class and the specific expense rates applicable to each class.
Federal income taxes. The fund intends to continue to qualify as a regulated investment company by complying with the applicable provisions of the Internal Revenue Code and will not be subject to federal income tax on taxable income that is distributed to shareholders. Therefore, no federal income tax provision is required.
For federal income tax purposes, as of February 28, 2017, the fund has a short-term capital loss carryforward of $205,495,812 and a long-term capital loss carryforward of $24,084,193 available to offset future net realized capital gains. These carryforwards do not expire.
As of February 28, 2017, the fund had no uncertain tax positions that would require financial statement recognition, derecognition or disclosure. The fund's federal tax returns are subject to examination by the Internal Revenue Service for a period of three years.
Distribution of income and gains. Distributions to shareholders from net investment income and net realized gains, if any, are recorded on the ex-date. The fund typically declares and pays dividends and capital gain distributions, if any, at least annually.
Distributions paid by the fund with respect to each class of shares are calculated in the same manner, at the same time and in the same amount, except for the effect of class level expenses that may be applied differently to each class.
Such distributions, on a tax basis, are determined in conformity with income tax regulations, which may differ from US GAAP.
Capital accounts within the financial statements are adjusted for permanent book-tax differences. These adjustments have no impact on net assets or the results of operations. Temporary book-tax differences, if any, will reverse in a subsequent period. Book-tax differences are primarily attributable to wash sale loss deferrals.
Note 3 — Guarantees and indemnifications
Under the Trust's organizational documents, its Officers and Trustees are indemnified against certain liabilities arising out of the performance of their duties to the Trust, including the fund. Additionally, in the normal course of business, the fund enters into contracts with service providers that contain general indemnification clauses. The fund's maximum exposure under
these arrangements is unknown, as this would involve future claims that may be made against the fund that have not yet occurred. The risk of material loss from such claims is considered remote.
Note 4 — Fees and transactions with affiliates
John Hancock Advisers, LLC (the Advisor) serves as investment advisor for the fund. John Hancock Funds, LLC (the Distributor), an affiliate of the Advisor, serves as principal underwriter of the fund. The Advisor and the Distributor are indirect, wholly owned subsidiaries of Manulife Financial Corporation.
Management fee. The fund has an investment management agreement with the Advisor under which the fund pays a daily management fee to the Advisor, equivalent on an annual basis to the sum of (a) 0.900% of the first $500 million of the fund's aggregate average daily net assets (together with the assets of any other applicable fund identified in the advisory agreement); (b) 0.850% of the next $500 million of the fund's aggregate average daily net assets, and (c) 0.800% of the fund's aggregate average daily net assets in excess of $1 billion. The Advisor has a subadvisory agreement with Wellington Management Company LLP. The fund is not responsible for payment of the subadvisory fees.
The Advisor has contractually agreed to waive a portion of its management fee and/or reimburse expenses for certain funds of the John Hancock group of funds complex, including the fund (the participating portfolios). This waiver is based upon aggregate net assets of all the participating portfolios. The amount of the reimbursement is calculated daily and allocated among all the participating portfolios in proportion to the daily net assets of each fund. During the six months ended August 31, 2017, this waiver amounted to 0.01% of the fund's average net assets (on an annualized basis). This arrangement may be amended or terminated at any time by the Advisor upon notice to the fund and with the approval of the Board of Trustees.
The Advisor has contractually agreed to waive fees and/or reimburse certain expenses for each share class of the fund. This agreement excludes taxes, brokerage commissions, interest expense, litigation and indemnification expenses and other extraordinary expenses not incurred in the ordinary course of the fund's business, acquired fees and expenses paid indirectly and short dividend expense. The fee waivers and/or reimbursements are such that these expenses will not exceed 1.35%, 2.05%, 2.05%, 1.05%, 1.45%, and 1.20% of average net assets for Class A, Class B, Class C, Class I, Class R2, and Class R4, respectively. The current expense limitation agreement will remain in effect through June 30, 2018, unless renewed by mutual agreement of the fund and the Advisor based upon a determination that this is appropriate under the circumstances at the time.
Prior to July 1, 2017, the Advisor had contractually agreed to waive and/or reimburse all class specific expenses for Class R6 shares of the fund to the extent they exceed 0.00% of average annual net assets, on an annualized basis.
The expense reductions described above amounted to the following for the six months ended August 31, 2017:
| Class | Expense reduction | Class | Expense reduction | |
| Class A | $21,412 | Class R4 | $234 | |
| Class B | 65 | Class R6 | 3,823 | |
| Class C | 7,267 | Class 1 | 2,413 | |
| Class I | 137,029 | Class NAV | 36,647 | |
| Class R2 | 552 | Total | $209,442 |
Expenses waived or reimbursed in the current fiscal period are not subject to recapture in future fiscal periods.
The investment management fees, including the impact of the waivers and reimbursements as described above, incurred for the six months ended August 31, 2017, were equivalent to a net annual effective rate of 0.81% of the fund's average daily net assets.
Accounting and legal services. Pursuant to a service agreement, the fund reimburses the Advisor for all expenses associated with providing the administrative, financial, legal, accounting and recordkeeping services to the fund, including the preparation of all tax returns, periodic reports to shareholders and regulatory reports, among other services. These expenses are allocated to each share class based on its relative net assets at the time the expense was incurred. These accounting and legal services fees incurred for the six months ended August 31, 2017 amounted to an annual rate of 0.02% of the fund's average daily net assets.
Distribution and service plans. The fund has a distribution agreement with the Distributor. The fund has adopted distribution and service plans with respect to Class A, Class B, Class C, Class R2, Class R4 and Class 1 shares pursuant to Rule 12b-1 under the 1940 Act, to pay the Distributor for services provided as the distributor of shares of the fund. In addition, under a service plan for Class R2 and Class R4 shares, the fund pays for certain other services. The fund may pay up to the following contractual rates of distribution and service fees under these arrangements, expressed as an annual percentage of average daily net assets for each class of the fund's shares:
| Class | Rule 12b-1 fee | Service fee | Class | Rule 12b-1 fee | Service fee | |
| Class A | 0.30% | — | Class R2 | 0.25% | 0.25% | |
| Class B | 1.00% | — | Class R4 | 0.25% | 0.10% | |
| Class C | 1.00% | — | Class 1 | 0.05% | — |
The fund's Distributor has contractually agreed to waive 0.10% of Rule 12b-1 fees for Class R4 shares. The current waiver agreement expires on June 30, 2018, unless renewed by mutual agreement of the fund and the Distributor based upon a determination that this is appropriate under the circumstances at the time. This contractual waiver amounted to $2,928 for Class R4 shares for the six months ended August 31, 2017.
Sales charges. Class A shares are assessed up-front sales charges, which resulted in payments to the Distributor amounting to $1,842,275 for the six months ended August 31, 2017. Of this amount, $308,253 was retained and used for printing prospectuses, advertising, sales literature and other purposes, $1,532,216 was paid as sales commissions to broker-dealers and $1,806 was paid as sales commissions to sales personnel of Signator Investors, Inc., a broker-dealer affiliate of the Advisor.
Class A, Class B and Class C shares may be subject to contingent deferred sales charges (CDSCs). Certain Class A shares that are acquired through purchases of $1 million or more and are redeemed within one year of purchase are subject to a 1.00% sales charge. Class B shares that are redeemed within six years of purchase are subject to CDSCs, at declining rates, beginning at 5.00%. Class C shares that are redeemed within one year of purchase are subject to a 1.00% CDSC. CDSCs are applied to the lesser of the current market value at the time of redemption or the original purchase cost of the shares being redeemed. Proceeds from CDSCs are used to compensate the Distributor for providing distribution-related services in connection with the sale of these shares. During the six months ended August 31, 2017, CDSCs received by the Distributor amounted to $4,372, $332 and $15,696 for Class A, Class B and Class C shares, respectively.
Transfer agent fees. The John Hancock Group of Funds has a complex-wide transfer agent agreement with John Hancock Signature Services, Inc. (Signature Services), an affiliate of the Advisor. The transfer agent fees paid to Signature Services are determined based on the cost to Signature Services (Signature Services Cost) of providing recordkeeping services. It also includes out-of-pocket expenses, including payments made to third-parties for recordkeeping services provided to their clients who invest in one or more John Hancock funds. In addition, Signature Services Cost may be reduced by certain fees that Signature Services receives in connection with retirement and small accounts. Signature Services Cost is calculated monthly and allocated, as applicable, to five categories of share classes: Retail Share and Institutional Share Classes of Non-Municipal Bond Funds, Class R6 Shares, Retirement Share Classes and Municipal Bond Share Classes. Within each of these categories, the applicable costs are allocated to the affected John Hancock affiliated funds and/or classes, based on the relative average daily net assets.
Class level expenses. Class level expenses for the six months ended August 31, 2017 were:
| Class | Distribution and service fees | Transfer agent fees | ||||||
| Class A | $803,471 | $310,481 | ||||||
| Class B | 8,149 | 945 | ||||||
| Class C | 908,311 | 105,220 | ||||||
| Class I | — | 1,780,051 | ||||||
| Class R2 | 34,428 | 945 | ||||||
| Class R4 | 9,961 | 400 | ||||||
| Class R6 | — | 2,969 |
| Class | Distribution and service fees | Transfer agent fees | ||||||
| Class 1 | $15,104 | — | ||||||
| Total | $1,779,424 | $2,201,011 |
Trustee expenses. The Trust compensates each Trustee who is not an employee of the Advisor or its affiliates. The costs of paying Trustee compensation and expenses are allocated to each fund based on its net assets relative to other funds within the John Hancock group of funds complex.
Note 5 — Fund share transactions
Transactions in fund shares for the six months ended August 31, 2017 and for the year ended February 28, 2017 were as follows:
| Six months ended 8-31-17 | Year ended 2-28-17 | |||||||||||||||||||||||||
| Shares | Amount | Shares | Amount | |||||||||||||||||||||||
| Class A shares | ||||||||||||||||||||||||||
| Sold | 8,717,643 | $210,557,752 | 16,001,157 | $339,897,058 | ||||||||||||||||||||||
| Distributions reinvested | — | — | 196,175 | 3,966,659 | ||||||||||||||||||||||
| Repurchased | (3,986,766 | ) | (95,734,661 | ) | (27,443,668 | ) | (587,270,568 | ) | ||||||||||||||||||
| Net increase (decrease) | 4,730,877 | $114,823,091 | (11,246,336 | ) | ($243,406,851 | ) | ||||||||||||||||||||
| Class B shares | ||||||||||||||||||||||||||
| Sold | 7,750 | $175,846 | 6,462 | $132,615 | ||||||||||||||||||||||
| Repurchased | (14,503 | ) | (343,002 | ) | (37,113 | ) | (782,533 | ) | ||||||||||||||||||
| Net decrease | (6,753 | ) | ($167,156 | ) | (30,651 | ) | ($649,918 | ) | ||||||||||||||||||
| Class C shares | ||||||||||||||||||||||||||
| Sold | 2,927,663 | $70,394,621 | 3,157,986 | $66,136,615 | ||||||||||||||||||||||
| Repurchased | (923,545 | ) | (21,848,657 | ) | (2,147,869 | ) | (44,798,519 | ) | ||||||||||||||||||
| Net increase | 2,004,118 | $48,545,964 | 1,010,117 | $21,338,096 | ||||||||||||||||||||||
| Class I shares | ||||||||||||||||||||||||||
| Sold | 74,789,549 | $1,813,165,931 | 90,657,790 | $1,938,510,713 | ||||||||||||||||||||||
| Distributions reinvested | — | — | 704,235 | 14,253,717 | ||||||||||||||||||||||
| Repurchased | (12,059,133 | ) | (291,591,937 | ) | (40,391,991 | ) | (855,244,453 | ) | ||||||||||||||||||
| Net increase | 62,730,416 | $1,521,573,994 | 50,970,034 | $1,097,519,977 | ||||||||||||||||||||||
| Class R2 shares | ||||||||||||||||||||||||||
| Sold | 123,794 | $3,010,509 | 562,895 | $12,363,392 | ||||||||||||||||||||||
| Distributions reinvested | — | — | 2,087 | 42,253 | ||||||||||||||||||||||
| Repurchased | (76,493 | ) | (1,875,265 | ) | (76,255 | ) | (1,618,262 | ) | ||||||||||||||||||
| Net increase | 47,301 | $1,135,244 | 488,727 | $10,787,383 | ||||||||||||||||||||||
| Class R4 shares | ||||||||||||||||||||||||||
| Sold | 110,127 | $2,573,704 | 121,641 | $2,513,391 | ||||||||||||||||||||||
| Distributions reinvested | — | — | 1,077 | 21,812 | ||||||||||||||||||||||
| Repurchased | (88,085 | ) | (2,108,637 | ) | (39,004 | ) | (826,106 | ) | ||||||||||||||||||
| Net increase | 22,042 | $465,067 | 83,714 | $1,709,097 | ||||||||||||||||||||||
| Class R6 shares | ||||||||||||||||||||||||||
| Sold | 1,506,614 | $34,953,552 | 2,241,015 | $47,393,271 | ||||||||||||||||||||||
| Distributions reinvested | — | — | 19,894 | 402,651 | ||||||||||||||||||||||
| Repurchased | (141,283 | ) | (3,441,925 | ) | (1,553,248 | ) | (33,698,306 | ) | ||||||||||||||||||
| Net increase | 1,365,331 | $31,511,627 | 707,661 | $14,097,616 | ||||||||||||||||||||||
| Six months ended 8-31-17 | Year ended 2-28-17 | |||||||||||||||||||||||||
| Shares | Amount | Shares | Amount | |||||||||||||||||||||||
| Class 1 shares | ||||||||||||||||||||||||||
| Sold | 521,879 | $12,616,211 | 677,086 | $14,407,914 | ||||||||||||||||||||||
| Distributions reinvested | — | — | 22,598 | 457,163 | ||||||||||||||||||||||
| Repurchased | (138,941 | ) | (3,323,363 | ) | (345,698 | ) | (7,385,847 | ) | ||||||||||||||||||
| Net increase | 382,938 | $9,292,848 | 353,986 | $7,479,230 | ||||||||||||||||||||||
| Class NAV shares | ||||||||||||||||||||||||||
| Sold | 9,924,726 | $254,429,436 | 36,007,828 | $770,657,902 | ||||||||||||||||||||||
| Distributions reinvested | — | — | 148,349 | 2,999,617 | ||||||||||||||||||||||
| Repurchased | (5,177,127 | ) | (124,405,429 | ) | (672,404 | ) | (14,475,418 | ) | ||||||||||||||||||
| Net increase | 4,747,599 | $130,024,007 | 35,483,773 | $759,182,101 | ||||||||||||||||||||||
| Total net increase | 76,023,869 | $1,857,204,686 | 77,821,025 | $1,668,056,731 | ||||||||||||||||||||||
Affiliates of the fund owned 100% of shares of Class 1 and Class NAV on August 31, 2017. Such concentration of shareholders' capital could have a material effect on the fund if such shareholders redeem from the fund.
Note 6 — Purchase and sale of securities
Purchases and sales of securities, other than short-term investments, amounted to $3,984,349,894 and $2,115,828,434, respectively, for the six months ended August 31, 2017.
Note 7 — Industry or sector risk
The fund may invest a large percentage of its assets in one or more particular industries or sectors of the economy. If a large percentage of the fund's assets are economically tied to a single or small number of industries or sectors of the economy, the fund will be less diversified than a more broadly diversified fund, and it may cause the fund to underperform if that industry or sector underperforms. In addition, focusing on a particular industry or sector may make the fund's NAV more volatile. Further, a fund that invests in particular industries or sectors is particularly susceptible to the impact of market, economic, regulatory and other factors affecting those industries or sectors.
Note 8 — Investment by affiliated funds
Certain investors in the fund are affiliated funds that are managed by the Advisor and its affiliates. The affiliated funds do not invest in the fund for the purpose of exercising management or control; however, this investment may represent a significant portion of the fund's net assets. At August 31, 2017, funds within the John Hancock group of funds complex held 15.9% of the fund's net assets. At August 31, 2017, there were no affiliated funds with an ownership of 5% or more of the fund's net assets.
CONTINUATION OF INVESTMENT ADVISORY AND SUBADVISORY AGREEMENTS
Evaluation of Advisory and Subadvisory Agreements by the Board of Trustees
This section describes the evaluation by the Board of Trustees (the Board) of John Hancock Funds III (the Trust) of the Advisory Agreement (the Advisory Agreement) with John Hancock Advisers, LLC (the Advisor) and the Subadvisory Agreement (the Subadvisory Agreement) with Wellington Management Company LLP (the Subadvisor), for John Hancock International Growth Fund (the fund). The Advisory Agreement and Subadvisory Agreement are collectively referred to as the Agreements. Prior to the June 19-22, 2017 in-person meeting, at which the Agreements were approved, the Board also discussed and considered information regarding the proposed continuation of the Agreements at an in-person meeting held on May 22-24, 2017.
Approval of Advisory and Subadvisory Agreements
At in-person meetings held on June 19-22, 2017, the Board, including the Trustees who are not parties to any Agreement or considered to be interested persons of the Trust under the Investment Company Act of 1940, as amended (the 1940 Act) (the Independent Trustees), reapproved for an annual period the continuation of the Advisory Agreement between the Trust and the Advisor and the Subadvisory Agreement between the Advisor and the Subadvisor with respect to the fund.
In considering the Advisory Agreement and the Subadvisory Agreement, the Board received in advance of the meetings a variety of materials relating to the fund, the Advisor and the Subadvisor, including comparative performance, fee and expense information for a peer group of similar funds prepared by an independent third-party provider of mutual fund data, performance information for an applicable benchmark index; and, with respect to the Subadvisor, comparative performance information for comparably managed accounts, as applicable, and other information provided by the Advisor and the Subadvisor regarding the nature, extent and quality of services provided by the Advisor and the Subadvisor under their respective Agreements, as well as information regarding the Advisor's revenues and costs of providing services to the fund and any compensation paid to affiliates of the Advisor. At the meetings at which the renewal of the Advisory Agreement and Subadvisory Agreement are considered, particular focus is given to information concerning fund performance, comparability of fees and total expenses, and profitability. However, the Board notes that the evaluation process with respect to the Advisor and the Subadvisor is an ongoing one. In this regard, the Board also took into account discussions with management and information provided to the Board (including its various committees) at prior meetings with respect to the services provided by the Advisor and the Subadvisor to the fund, including quarterly performance reports prepared by management containing reviews of investment results and prior presentations from the Subadvisor with respect to the fund. The information received and considered by the Board in connection with the May and June meetings and throughout the year was both written and oral. The Board also considered the nature, quality, and extent of non-advisory services, if any, to be provided to the fund by the Advisor's affiliates, including distribution services. The Board considered the Advisory Agreement and the Subadvisory Agreement separately in the course of its review. In doing so, the Board noted the respective roles of the Advisor and Subadvisor in providing services to the fund.
Throughout the process, the Board asked questions of and requested additional information from management. The Board is assisted by counsel for the Trust and the Independent Trustees are also separately assisted by independent legal counsel throughout the process. The Independent Trustees also received a memorandum from their independent legal counsel discussing the legal standards for their consideration of the proposed continuation of the Agreements and discussed the proposed continuation of the Agreements in private sessions with their independent legal counsel at which no representatives of management were present.
Approval of Advisory Agreement
In approving the Advisory Agreement with respect to the fund, the Board, including the Independent Trustees, considered a variety of factors, including those discussed below. The Board also considered other factors (including conditions and trends prevailing generally in the economy, the securities markets, and the industry) and did not treat any single factor as determinative, and each Trustee may have attributed different weights to different factors. The Board's conclusions may be
based in part on its consideration of the advisory and subadvisory arrangements in prior years and on the Board's ongoing regular review of fund performance and operations throughout the year.
Nature, extent, and quality of services. Among the information received by the Board from the Advisor relating to the nature, extent, and quality of services provided to the fund, the Board reviewed information provided by the Advisor relating to its operations and personnel, descriptions of its organizational and management structure, and information regarding the Advisor's compliance and regulatory history, including its Form ADV. The Board also noted that on a regular basis it receives and reviews information from the Trust's Chief Compliance Officer (CCO) regarding the fund's compliance policies and procedures established pursuant to Rule 38a-1 under the 1940 Act. The Board observed that the scope of services provided by the Advisor, and of the undertakings required of the Advisor in connection with those services, including maintaining and monitoring its own and the fund's compliance programs, risk management programs, liquidity management programs and cybersecurity programs, had expanded over time as a result of regulatory, market and other developments. The Board considered that the Advisor is responsible for the management of the day-to-day operations of the fund, including, but not limited to, general supervision of and coordination of the services provided by the Subadvisor, and is also responsible for monitoring and reviewing the activities of the Subadvisor and other third-party service providers. The Board also considered the significant risks assumed by the Advisor in connection with the services provided to the fund including entrepreneurial risk in sponsoring new funds and ongoing risks including investment, operational, enterprise, litigation, regulatory and compliance risks with respect to all funds.
In considering the nature, extent, and quality of the services provided by the Advisor, the Trustees also took into account their knowledge of the Advisor's management and the quality of the performance of the Advisor's duties, through Board meetings, discussions and reports during the preceding year and through each Trustee's experience as a Trustee of the Trust and of the other trusts in the John Hancock group of funds complex (the John Hancock Fund Complex).
In the course of their deliberations regarding the Advisory Agreement, the Board considered, among other things:
| (a) | the skills and competency with which the Advisor has in the past managed the Trust's affairs and its subadvisory relationship, the Advisor's oversight and monitoring of the Subadvisor's investment performance and compliance programs, such as the Subadvisor's compliance with fund policies and objectives, review of brokerage matters, including with respect to trade allocation and best execution and the Advisor's timeliness in responding to performance issues; |
| (b) | the background, qualifications and skills of the Advisor's personnel; |
| (c) | the Advisor's compliance policies and procedures and its responsiveness to regulatory changes and mutual fund industry developments; |
| (d) | the Advisor's administrative capabilities, including its ability to supervise the other service providers for the fund; |
| (e) | the financial condition of the Advisor and whether it has the financial wherewithal to provide a high level and quality of services to the fund; |
| (f) | the Advisor's initiatives intended to improve various aspects of the Trust's operations and investor experience with the fund; and |
| (g) | the Advisor's reputation and experience in serving as an investment advisor to the Trust and the benefit to shareholders of investing in funds that are part of a family of funds offering a variety of investments. |
The Board concluded that the Advisor may reasonably be expected to continue to provide a high quality of services under the Advisory Agreement with respect to the fund.
Investment performance. In considering the fund's performance, the Board noted that it reviews at its regularly scheduled meetings information about the fund's performance results. In connection with the consideration of the Advisory Agreement, the Board:
| (a) | reviewed information prepared by management regarding the fund's performance; |
| (b) | considered the comparative performance of an applicable benchmark index; |
| (c) | considered the performance of comparable funds, if any, as included in the report prepared by an independent third-party provider of fund data; and |
| (d) | took into account the Advisor's analysis of the fund's performance and its plans and recommendations regarding the Trust's subadvisory arrangements generally. |
The Board noted that while it found the data provided by the independent third-party generally useful it recognized its limitations, including in particular that the data may vary depending on the end date selected and that the results of the performance comparisons may vary depending on the selection of the peer group. The Board noted that the fund underperformed its benchmark for the one-year period, and outperformed its benchmark for the three- and five-year periods ended December 31, 2016. The Board also noted that the fund underperformed the peer group average for the one-year period, and outperformed the peer group average for the three- and five-year periods ended December 31, 2016. The Board took into account management's discussion of the fund's performance, including favorable performance relative to the benchmark and peer group for the three- and five-year periods. The Board concluded that the fund's performance has generally been in line with or outperformed the historical performance of comparable funds and the fund's benchmark index over the longer-term.
Fees and expenses. The Board reviewed comparative information prepared by an independent third-party provider of mutual fund data, including, among other data, the fund's contractual and net management fees (and subadvisory fees, to the extent available) and total expenses as compared to similarly situated investment companies deemed to be comparable to the fund in light of the nature, extent and quality of the management and advisory and subadvisory services provided by the Advisor and the Subadvisor. The Board considered the fund's ranking within a smaller group of peer funds chosen by the independent third-party provider, as well as the fund's ranking within a broader group of funds. In comparing the fund's contractual and net management fees to those of comparable funds, the Board noted that such fees include both advisory and administrative costs. The Board noted that net management fees and total expenses for the fund are higher than the peer group median.
The Board took into account management's discussion of the fund's expenses. The Board also took into account management's discussion with respect to the overall management fee, the fees of the Subadvisor, including the amount of the advisory fee retained by the Advisor after payment of the subadvisory fee, in each case in light of the services rendered for those amounts and the risks undertaken by the Advisor. The Board also noted that the Advisor pays the subadvisory fee, and that such fees are negotiated at arm's length with respect to the Subadvisor. The Board also took into account that management had agreed to implement an overall fee waiver across the complex, which is discussed further below. The Board also noted actions taken over the past several years to reduce the fund's operating expenses. The Board also noted that, in addition, the Advisor is currently waiving fees and/or reimbursing expenses with respect to the fund and that the fund has breakpoints in its contractual management fee schedule that reduces management fees as assets increase. The Board reviewed information provided by the Advisor concerning investment advisory fees charged by the Advisor or one of its advisory affiliates to other clients (including other funds in the complex) having similar investment mandates, if any. The Board considered any differences between the Advisor's and a Subadvisor's services to a fund and the services they provide to other comparable clients or funds. The Board concluded that the advisory fee paid with respect to the fund is reasonable in light of the nature, extent and quality of the services provided to the fund under the Advisory Agreement.
Profitability/Fall out benefits. In considering the costs of the services to be provided and the profits to be realized by the Advisor and its affiliates from the Advisor's relationship with the Trust, the Board:
| (a) | reviewed financial information of the Advisor; |
| (b) | reviewed and considered information presented by the Advisor regarding the net profitability to the Advisor and its affiliates with respect to the fund; |
| (c) | received and reviewed profitability information with respect to the John Hancock Fund Complex as a whole and with respect to the fund; |
| (d) | received information with respect to the Advisor's allocation methodologies used in preparing the profitability data and considered that the Advisor hired an independent third-party consultant to provide an analysis of the Advisor's allocation methodologies; |
| (e) | considered that the John Hancock insurance companies that are affiliates of the Advisor, as shareholders of the Trust directly or through their separate accounts, receive certain tax credits or deductions relating to foreign taxes paid and dividends received by certain funds of the Trust and noted that these tax benefits, which are not available to participants in qualified retirement plans under applicable income tax law, are reflected in the profitability information reviewed by the Board; |
| (f) | considered that the Advisor also provides administrative services to the fund on a cost basis pursuant to an administrative services agreement; |
| (g) | noted that affiliates of the Advisor provide transfer agency services and distribution services to the fund, and that the fund's distributor also receives Rule 12b-1 payments to support distribution of the fund; |
| (h) | noted that the Advisor also derives reputational and other indirect benefits from providing advisory services to the fund; |
| (i) | noted that the subadvisory fee for the fund is paid by the Advisor and is negotiated at arm's length; |
| (j) | considered the Advisor's ongoing costs and expenditures necessary to improve services, meet new regulatory and compliance requirements, and adapt to other challenges impacting the mutual fund industry; and |
| (k) | considered that the Advisor should be entitled to earn a reasonable level of profits in exchange for the level of services it provides to the fund and the risks that it assumes as Advisor, including entrepreneurial, operational, reputational, litigation and regulatory risk. |
Based upon its review, the Board concluded that the level of profitability, if any, of the Advisor and its affiliates from their relationship with the fund was reasonable and not excessive.
Economies of scale. In considering the extent to which economies of scale would be realized as the fund grows and whether fee levels reflect these economies of scale for the benefit of fund shareholders, the Board:
| (a) | considered that the Advisor has contractually agreed to waive a portion of its management fee for certain funds of the John Hancock Fund Complex, including the fund (the participating portfolios) or otherwise reimburse the expenses of the participating portfolios (the reimbursement). This waiver is based upon aggregate net assets of all the participating portfolios. The amount of the reimbursement is calculated daily and allocated among all the participating portfolios in proportion to the daily net assets of each fund; |
| (b) | reviewed the fund's advisory fee structure and concluded that: (i) the fund's fee structure contains breakpoints at the subadvisory fee level and that such breakpoints are reflected as breakpoints in the advisory fees for the fund; and (ii) although economies of scale cannot be measured with precision, these arrangements permit shareholders of the fund to benefit from economies of scale if the fund grows. The Board also took into account management's discussion of the fund's advisory fee structure; and |
| (c) | the Board also considered the effect of the fund's growth in size on its performance and fees. The Board also noted that if the fund's assets increase over time, the fund may realize other economies of scale. |
Approval of Subadvisory Agreement
In making its determination with respect to approval of the Subadvisory Agreement, the Board reviewed:
| (1) | information relating to the Subadvisor's business, including current subadvisory services to the Trust (and other funds in the John Hancock Fund Complex); |
| (2) | the historical and current performance of the fund and comparative performance information relating to an applicable benchmark index and comparable funds; |
| (3) | the subadvisory fee for the fund, including any breakpoints, and to the extent available, comparable fee information prepared by an independent third party provider of fund data; and |
| (4) | information relating to the nature and scope of any material relationships and their significance to the Trust's Advisor and Subadvisor. |
Nature, extent, and quality of services. With respect to the services provided by the Subadvisor, the Board received information provided to the Board by the Subadvisor, including the Subadvisor's Form ADV, as well as took into account information presented throughout the past year. The Board considered the Subadvisor's current level of staffing and its overall resources, as well as received information relating to the Subadvisor's compensation program. The Board reviewed the Subadvisor's history and investment experience, as well as information regarding the qualifications, background, and responsibilities of the Subadvisor's investment and compliance personnel who provide services to the fund. The Board also considered, among other things, the Subadvisor's compliance program and any disciplinary history. The Board also considered the Subadvisor's risk assessment and monitoring process. The Board reviewed the Subadvisor's regulatory history, including whether it was involved in any regulatory actions or investigations as well as material litigation, and any settlements and amelioratory actions undertaken, as appropriate. The Board noted that the Advisor conducts regular, periodic reviews of the Subadvisor and its operations, including regarding investment processes and organizational and staffing matters. The Board also noted that the Trust's CCO and his staff conduct regular, periodic compliance reviews with the Subadvisor and present reports to the Independent Trustees regarding the same, which includes evaluating the regulatory compliance systems of the Subadvisor and procedures reasonably designed to assure compliance with the federal securities laws. The Board also took into account the financial condition of the Subadvisor.
The Board considered the Subadvisor's investment process and philosophy. The Board took into account that the Subadvisor's responsibilities include the development and maintenance of an investment program for the fund that is consistent with the fund's investment objective, the selection of investment securities and the placement of orders for the purchase and sale of such securities, as well as the implementation of compliance controls related to performance of these services. The Board also received information with respect to the Subadvisor's brokerage policies and practices, including with respect to best execution and soft dollars.
Subadvisor compensation. In considering the cost of services to be provided by the Subadvisor and the profitability to the Subadvisor of its relationship with the fund, the Board noted that the fees under the Subadvisory Agreement are paid by the Advisor and not the fund.
The Board also relied on the ability of the Advisor to negotiate the Subadvisory Agreement with the Subadvisor, which is not affiliated with the Advisor, and the fees thereunder at arm's length. As a result, the costs of the services to be provided and the profits to be realized by the Subadvisor from its relationship with the Trust were not a material factor in the Board's consideration of the Subadvisory Agreement.
The Board also received information regarding the nature and scope (including their significance to the Advisor and its affiliates and to the Subadvisor) of any material relationships with respect to the Subadvisor, which include arrangements in which the Subadvisor or its affiliates provide advisory, distribution, or management services in connection with financial products sponsored by the Advisor or its affiliates, and may include other registered investment companies, a 529 education savings plan, managed separate accounts and exempt group annuity contracts sold to qualified plans. The Board also received information and took into account any other potential conflicts of interest the Advisor might have in connection with the Subadvisory Agreement.
In addition, the Board considered other potential indirect benefits that the Subadvisor and its affiliates may receive from the Subadvisor's relationship with the fund, such as the opportunity to provide advisory services to additional funds in the John Hancock Fund Complex and reputational benefits.
Subadvisory fees. The Board considered that the fund pays an advisory fee to the Advisor and that, in turn, the Advisor pays a subadvisory fee to the Subadvisor. As noted above, the Board also considered the fund's subadvisory fees as compared to similarly situated investment companies deemed to be comparable to the fund as included in the report prepared by the independent third party provider of fund data, to the extent available. The Board noted that the limited size of the Broadridge peer group was not sufficient for comparative purposes. The Board also took into account the subadvisory fees paid by the Advisor to the Subadvisor with respect to the fund and compared them to fees charged by the Subadvisor to manage other subadvised portfolios and portfolios not subject to regulation under the 1940 Act, as applicable.
Subadvisor performance. As noted above, the Board considered the fund's performance as compared to the fund's peer group and the benchmark index and noted that the Board reviews information about the fund's performance results at its regularly scheduled meetings. The Board noted the Advisor's expertise and resources in monitoring the performance, investment style and risk-adjusted performance of the Subadvisor. The Board was mindful of the Advisor's focus on the Subadvisor's performance. The Board also noted the Subadvisor's long-term performance record for similar accounts, as applicable.
The Board's decision to approve the Subadvisory Agreement was based on a number of determinations, including the following:
* * *
Based on the Board's evaluation of all factors that the Board deemed to be material, including those factors described above, the Board, including the Independent Trustees, concluded that renewal of the Advisory Agreement and the Subadvisory Agreement would be in the best interest of the fund and its shareholders. Accordingly, the Board, and the Independent Trustees voting separately, approved the Advisory Agreement and Subadvisory Agreement for an additional one-year period.
Trustees Hassell H. McClellan, Chairperson Officers Andrew G. Arnott John J. Danello Francis V. Knox, Jr. Charles A. Rizzo Salvatore Schiavone | Investment advisor John Hancock Advisers, LLC Subadvisor Wellington Management Company LLP Principal distributor John Hancock Funds, LLC Custodian Citibank. N.A. Transfer agent John Hancock Signature Services, Inc. Legal counsel K&L Gates LLP |
*Member of the Audit Committee
†Non-Independent Trustee
#Effective 6-20-17
The fund's proxy voting policies and procedures, as well as the fund proxy voting record for the most recent twelve-month period ended June 30, are available free of charge on the Securities and Exchange Commission (SEC) website at sec.gov or on our website.
The fund's complete list of portfolio holdings, for the first and third fiscal quarters, is filed with the SEC on Form N-Q. The fund's Form N-Q is available on our website and the SEC's website, sec.gov, and can be reviewed and copied (for a fee) at the SEC's Public Reference Room in Washington, DC. Call 800-SEC-0330 to receive information on the operation of the SEC's Public Reference Room.
We make this information on your fund, as well as monthly portfolio holdings, and other fund details available on our website at jhinvestments.com or by calling 800-225-5291.
| You can also contact us: | |||
| 800-225-5291 jhinvestments.com | Regular mail: John Hancock Signature Services, Inc. | Express mail: John Hancock Signature Services, Inc. | |
John Hancock family of funds
DOMESTIC EQUITY FUNDS Balanced Blue Chip Growth Classic Value Disciplined Value Disciplined Value Mid Cap Equity Income Fundamental All Cap Core Fundamental Large Cap Core Fundamental Large Cap Value New Opportunities Small Cap Value Small Company Strategic Growth U.S. Global Leaders Growth U.S. Growth Value Equity GLOBAL AND INTERNATIONAL EQUITY FUNDS Disciplined Value International Emerging Markets Emerging Markets Equity Fundamental Global Franchise Global Equity Global Shareholder Yield Greater China Opportunities International Growth International Small Company International Value Equity | INCOME FUNDS Bond California Tax-Free Income Emerging Markets Debt Floating Rate Income Global Income Government Income High Yield High Yield Municipal Bond Income Investment Grade Bond Money Market Short Duration Credit Opportunities Spectrum Income Strategic Income Opportunities Tax-Free Bond ALTERNATIVE AND SPECIALTY FUNDS Absolute Return Currency Alternative Asset Allocation Enduring Assets Financial Industries Global Absolute Return Strategies Global Conservative Absolute Return Global Focused Strategies Natural Resources Redwood Regional Bank Seaport Technical Opportunities |
A fund's investment objectives, risks, charges, and expenses should be considered carefully before investing. The prospectus contains this and other important information about the fund. To obtain a prospectus, contact your financial professional, call John Hancock Investments at 800-225-5291, or visit our website at jhinvestments.com. Please read the prospectus carefully before investing or sending money.
ASSET ALLOCATION Income Allocation Fund Multi-Index Lifetime Portfolios Multi-Index Preservation Portfolios Multimanager Lifestyle Portfolios Multimanager Lifetime Portfolios EXCHANGE-TRADED FUNDS John Hancock Multifactor Consumer Discretionary ETF John Hancock Multifactor Consumer Staples ETF John Hancock Multifactor Developed International ETF John Hancock Multifactor Energy ETF John Hancock Multifactor Financials ETF John Hancock Multifactor Healthcare ETF John Hancock Multifactor Industrials ETF John Hancock Multifactor Large Cap ETF John Hancock Multifactor Materials ETF John Hancock Multifactor Mid Cap ETF John Hancock Multifactor Technology ETF John Hancock Multifactor Utilities ETF | ENVIRONMENTAL, SOCIAL, AND GOVERNANCE FUNDS ESG All Cap Core ESG Core Bond ESG International Equity ESG Large Cap Core CLOSED-END FUNDS Financial Opportunities Hedged Equity & Income Income Securities Trust Investors Trust Preferred Income Preferred Income II Preferred Income III Premium Dividend Tax-Advantaged Dividend Income Tax-Advantaged Global Shareholder Yield |
John Hancock Multifactor ETF shares are bought and sold at market price (not NAV), and are not individually redeemed
from the fund. Brokerage commissions will reduce returns.
John Hancock ETFs are distributed by Foreside Fund Services, LLC, and are subadvised by Dimensional Fund Advisors LP.
Foreside is not affiliated with John Hancock Funds, LLC or Dimensional Fund Advisors LP.
Dimensional Fund Advisors LP receives compensation from John Hancock in connection with licensing rights to the
John Hancock Dimensional indexes. Dimensional Fund Advisors LP does not sponsor, endorse, or sell, and makes no
representation as to the advisability of investing in, John Hancock Multifactor ETFs.
John Hancock Investments
A trusted brand
John Hancock Investments is a premier asset manager representing one of
America's most trusted brands, with a heritage of financial stewardship dating
back to 1862. Helping our shareholders pursue their financial goals is at the
core of everything we do. It's why we support the role of professional financial
advice and operate with the highest standards of conduct and integrity.
A better way to invest
We serve investors globally through a unique multimanager approach:
We search the world to find proven portfolio teams with specialized
expertise for every strategy we offer, then we apply robust investment
oversight to ensure they continue to meet our uncompromising standards
and serve the best interests of our shareholders.
Results for investors
Our unique approach to asset management enables us to provide a diverse set
of investments backed by some of the world's best managers, along with strong
risk-adjusted returns across asset classes.

 | John Hancock Funds, LLC n Member FINRA, SIPC 601 Congress Street n Boston, MA 02210-2805 800-225-5291 n jhinvestments.com | |
| This report is for the information of the shareholders of John Hancock International Growth Fund. It is not authorized for distribution to prospective investors unless preceded or accompanied by a prospectus. | ||
| MF399098 | 87SA 8/17 10/17 | |
John Hancock
Global Shareholder Yield Fund
Semiannual report 8/31/17
A message to shareholders
Dear shareholder,
Global equity markets generally delivered solid gains, supported by rising economic activity, stronger corporate earnings, and low levels of inflation. Monetary policy remains accommodative in many parts of the world as central banks strive to help nurture the economic growth that has begun to materialize. Non-U.S. markets recently reversed a multi-year bout of underperformance and have begun to outpace those in the United States as growth strengthens around the world, particularly during the last six months.
Advancing the interests of fund shareholders
One of our primary goals is to advance the interests of our fund shareholders wherever possible. To that end, we recently announced our third round of expense reductions this year, targeting six mutual funds and two closed-end funds that together represent more than $6.9 billion in assets under management. Details can be found at jhinvestments.com.
In addition, we recently learned that fund researcher Morningstar, Inc. formally recognized our shareholder friendly initiatives by upgrading our parent pillar rating—a key component of the Morningstar Analyst Rating system—to positive, the highest possible rating. Morningstar evaluates select funds and their parent firms based on intensive research, including on-site due diligence. They focused on such factors as whether our portfolio managers invest meaningfully in the funds they manage, the quality of our risk management, our corporate culture, and our commitment to recognizing shareholder interests—in other words, how effective we are as stewards of investor capital. We're proud to have been recognized by Morningstar for our efforts and we're committed to continue our work of furthering the interests of our shareholders.
On behalf of everyone at John Hancock Investments, I'd like to take this opportunity to welcome new shareholders and to thank existing shareholders for the continued trust you've placed in us.
Sincerely,
Andrew G. Arnott
President and Chief Executive Officer
John Hancock Investments
This commentary reflects the CEO's views, which are subject to change at any time. Investing involves risks, including the potential loss of principal. Diversification does not guarantee investment returns and does not eliminate risk of loss. For more up-to-date information, please visit our website at jhinvestments.com.
John Hancock
Global Shareholder Yield Fund
INVESTMENT OBJECTIVE
The fund seeks to provide a high level of income as its primary objective. Capital appreciation is a secondary investment objective.
AVERAGE ANNUAL TOTAL RETURNS AS OF 8/31/17 (%)
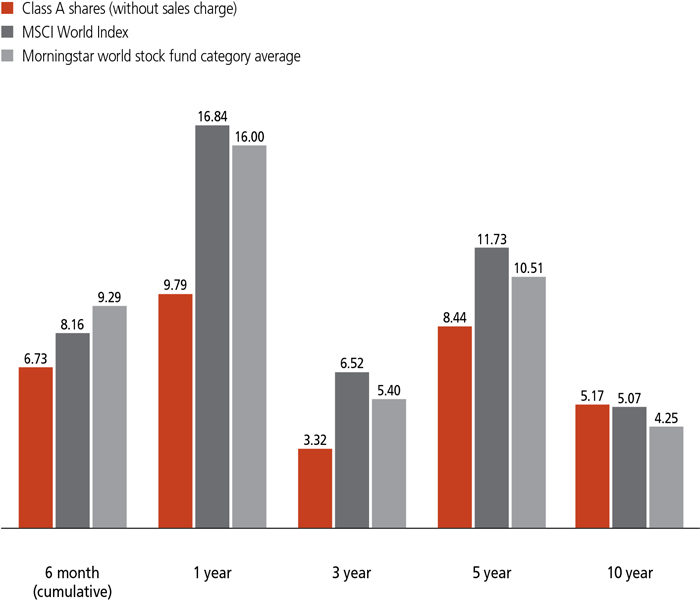
The MSCI World Index (gross of foreign withholding tax on dividends) is a free float-adjusted market capitalization weighted index that is designed to measure the equity market performance of developed markets.
It is not possible to invest directly in an index. Index figures do not reflect expenses or sales charges, which would result in lower returns.
Figures from Morningstar, Inc. include reinvested distributions and do not take into account sales charges. Actual load-adjusted performance is lower.
The past performance shown here reflects reinvested distributions and the beneficial effect of any expense reductions, and does not guarantee future results. Returns for periods shorter than one year are cumulative. Performance of the other share classes will vary based on the difference in the fees and expenses of those classes. Shares will fluctuate in value and, when redeemed, may be worth more or less than their original cost. Current month-end performance may be lower or higher than the performance cited, and can be found at jhinvestments.com or by calling 800-225-5291. For further information on the fund's objectives, risks, and strategy, see the fund's prospectus.
PERFORMANCE HIGHLIGHTS OVER THE LAST SIX MONTHS
Global equity markets moved higher
Improving global economic conditions provided a favorable backdrop for global stock markets to advance during the six-month period.
The fund trailed its benchmark index
The fund generated a positive return, but underperformed its benchmark, the MSCI World Index.
Sector allocation detracted
An underweight position in the information technology sector weighed on fund performance.
SECTOR COMPOSITION AS OF 8/31/17 (%)
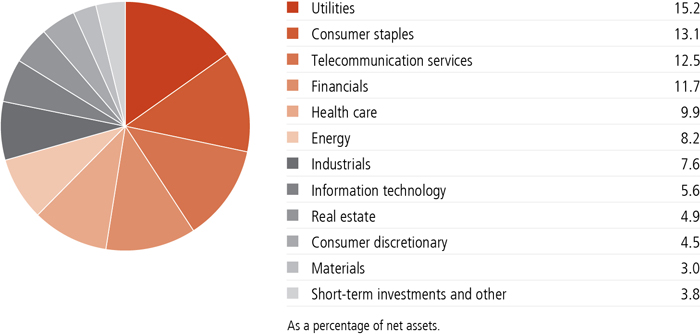
A note about risks
Foreign investing, especially in emerging markets, has additional risks, such as currency and market volatility and political and social instability. Liquidity—the extent to which a security may be sold or a derivative position closed without negatively affecting its market value—may be impaired by reduced trading volume, heightened volatility, rising interest rates, and other market conditions. Investments in higher-yielding, lower-rated securities include a higher risk of default. The value of a company's equity securities is subject to changes in the company's financial condition and overall market and economic conditions. Actively trading securities can increase transaction costs (thus lowering performance) and taxable distributions. Derivatives transactions, including hedging and other strategic transactions, may increase a fund's volatility and could produce disproportionate losses, potentially more than the fund's principal investment. Fund distributions generally depend on income from underlying investments and may vary or cease altogether in the future. Please see the fund's prospectus for additional risks.

Eric L. Sappenfield
Portfolio Manager
Epoch Investment Partners, Inc.
Can you discuss the global equity market environment during the six months ended August 31, 2017?
Global stock markets rallied, thanks to improving economic growth in many regions of the world. In Europe, signs of an emerging economic recovery led the European Central Bank to consider scaling back some of its economic stimulus measures. In addition, presidential elections in the Netherlands and France, in which centrist candidates won over antiestablishment populists, eased investor concerns about nationalist sentiment and its potential impact on the European Union.
Elsewhere, the Chinese economy stabilized after several years of decelerating growth, providing a catalyst for improving economic growth across Asia. In the United States, corporate earnings strengthened despite mixed economic data and two interest-rate increases by the U.S. Federal Reserve (Fed). The Fed also announced a plan to reduce the amount of U.S. Treasury and mortgage-backed securities on its balance sheet.
For the six-month period, the fund's benchmark, the MSCI World Index, returned 8.16%. On a regional basis, Europe generated the best returns among developed markets, while equity markets in the U.S. posted more modest gains. Emerging markets outperformed as improving global economic growth led to increased exports, the engine driving many emerging economies.
In this environment, how did the fund perform?
The fund trailed the performance of its benchmark. Sector allocation, which is driven by our fundamental bottom-up investment process, was the primary reason for the underperformance. Despite trailing, the fund posted a gain, capturing returns from cash dividends generated by a diversified portfolio of high-quality companies, while also benefiting from share buybacks and debt reduction efforts.
As global economic conditions improved, investors favored more cyclical segments of the market, but stocks in these sectors tend to lack the shareholder yield characteristics that we seek in our investments. The fund held underweight positions in cyclical sectors that outperformed during the period, including information technology and materials. Overweight positions in more defensive sectors of the market, such as telecommunication services, also detracted from relative results.
On the positive side, security selection aided fund performance compared with the benchmark, particularly among energy, financials, and telecommunication services stocks.
What holdings detracted from fund performance?
The fund's holdings in the tobacco industry weighed on relative results, particularly Altria Group, Inc. and Imperial Brands PLC. During the period, the U.S. Food and Drug Administration announced a proposal to reduce nicotine levels in cigarettes, which put downward pressure on the shares of many tobacco companies. Altria continues to return cash to shareholders in the form of dividends and share buybacks, while Imperial Brands is focused on strengthening its brands and reducing debt. Both stocks remain in the portfolio.
Regal Entertainment Group, the largest theater chain in the U.S. with over 7,000 screens, was another notable detractor during the period. A weak summer at the box office weighed on the stock, as well as the possibility of a shorter theatrical window before movies are released for home viewing. The company continues to return cash through its steady, attractive dividend and recently announced a share repurchase program.
Australian telecom company Telstra Corp., Ltd. was also a meaningful detractor from relative performance. Shares fell after a competitor purchased wireless spectrum and announced its intention to invest in building out a fourth wireless network in the country. In our view, this development would create increased competitive challenges and put Telstra's dividend at risk, so
TOP 10 HOLDINGS AS OF 8/31/17 (%)
| BCE, Inc. | 1.9 |
| Vodafone Group PLC | 1.8 |
| PPL Corp. | 1.8 |
| Welltower, Inc. | 1.8 |
| Duke Energy Corp. | 1.7 |
| Verizon Communications, Inc. | 1.7 |
| Terna Rete Elettrica Nazionale SpA | 1.6 |
| Muenchener Rueckversicherungs-Gesellschaft AG | 1.6 |
| Imperial Brands PLC | 1.6 |
| TOTAL SA | 1.6 |
| TOTAL | 17.1 |
| As a percentage of net assets. | |
| Cash and cash equivalents are not included. | |
TOP 10 COUNTRIES AS OF 8/31/17 (%)
| United States | 43.8 |
| United Kingdom | 14.0 |
| Germany | 8.2 |
| France | 7.6 |
| Canada | 5.3 |
| Switzerland | 4.3 |
| Italy | 2.7 |
| Australia | 2.3 |
| Norway | 2.0 |
| Spain | 1.8 |
| TOTAL | 92.0 |
| As a percentage of net assets. | |
| Cash and cash equivalents are not included. |
What holdings aided fund performance?
The fund's top contributor during the period was Terna Rete Elettrica Nazionale SpA, a utility company in Italy that owns and operates the country's electricity transmission network. The company reported better-than-expected results for the first half of 2017 as Terna continued to generate strong cash flow from its regulated utility operations. The stock offers an attractive and growing dividend, supported by the rate growth resulting from transmission network upgrades in Italy.
German financial services provider Allianz SE was also among the leading performance contributors. Allianz benefited from favorable reported earnings and signs of a strengthening economic backdrop in Europe. The company has a transparent capital allocation policy and is executing on its share repurchase program. Furthermore, Allianz pays an attractive and growing dividend that is well supported by earnings and a strong regulatory capital position.
Top contributors included two companies in the telecommunication services sector, Canadian telecom provider Rogers Communications, Inc. and British multinational telecom provider Vodafone Group PLC. Rogers outperformed based on strong earnings and a new CEO, who is emphasizing customer service and incremental adjustments that should support free cash flow growth.
Vodafone reported healthy earnings across many of its markets in Europe, Asia, and Africa, and the company recently raised its dividend.
The best contributor to relative performance among the fund's U.S. holdings was fast-food restaurant chain McDonald's Corp. The company has been investing in a series of initiatives to improve the customer experience, including digital engagement, delivery, and changes to food sourcing and preparation. These initiatives have begun to pay off for the company. In addition, McDonald's continues to return cash to shareholders through dividends and share buybacks.
What changes did you make to the portfolio during the reporting period?
In addition to Telstra, we also sold semiconductor producer Microchip Technology, Inc. Tobacco producer Reynolds American, Inc. was also removed from the portfolio when the company's merger with British American Tobacco PLC was finalized. We added four new holdings to the portfolio during the period—Spanish electric utility Red Electrica Corp. SA, U.S. self-storage real estate investment trust Public Storage, U.S. semiconductor manufacturer Intel Corp., and U.S. electric utility American Electric Power Company, Inc.
These changes reflect our effort to improve the fund's shareholder yield while remaining invested in companies that deliver proven free cash flow growth and have a disciplined approach to allocating cash for the benefit of shareholders.
Can you tell us about an upcoming change to the fund's management?
Effective October 31, 2017, I will no longer manage the fund. The fund will continue to be managed by the rest of the team.
MANAGED BY
| | Eric L. Sappenfield On the fund since inception Investing since 1986 |
 | William W. Priest, CFA On the fund since inception Investing since 1965 |
 | John Tobin, Ph.D., CFA On the fund since 2014 Investing since 1981 |
 | Kera Van Valen, CFA On the fund since 2014 Investing since 2001 |
 | Michael A. Welhoelter, CFA On the fund since inception Investing since 1986 |
![]()
TOTAL RETURNS FOR THE PERIOD ENDED AUGUST 31, 2017
| Average annual total returns (%) with maximum sales charge | Cumulative total returns (%) with maximum sales charge | SEC 30-day yield (%) subsidized | SEC 30-day yield (%) unsubsidized1 | ||||||||||||||||||||||||||||||||||||||
| 1-year | 5-year | 10-year | Since inception | 6-month | 5-year | 10-year | Since inception | as of 8-31-17 | as of 8-31-17 | ||||||||||||||||||||||||||||||||
| Class A | 4.27 | 7.34 | 4.63 | — | 1.37 | 42.51 | 57.27 | — | 2.48 | 2.30 | |||||||||||||||||||||||||||||||
| Class B | 4.00 | 7.34 | 4.42 | — | 1.34 | 42.48 | 54.04 | — | 1.87 | 1.73 | |||||||||||||||||||||||||||||||
| Class C | 7.99 | 7.69 | 4.44 | — | 5.34 | 44.82 | 54.40 | — | 1.87 | 1.73 | |||||||||||||||||||||||||||||||
| Class I2 | 10.16 | 8.80 | 5.58 | — | 6.93 | 52.43 | 72.18 | — | 2.86 | 2.73 | |||||||||||||||||||||||||||||||
| Class R22,3 | 9.72 | 8.32 | 5.11 | — | 6.72 | 49.15 | 64.57 | — | 2.47 | 2.46 | |||||||||||||||||||||||||||||||
| Class R62,3 | 10.19 | 8.88 | 5.44 | — | 6.89 | 53.04 | 69.83 | — | 2.96 | 2.83 | |||||||||||||||||||||||||||||||
| Class NAV2 | 10.18 | 8.92 | — | 6.64 | 4 | 6.89 | 53.29 | — | 82.28 | 4 | 2.96 | 2.83 | |||||||||||||||||||||||||||||
| Index† | 16.84 | 11.73 | 5.07 | — | 8.16 | 74.10 | 63.92 | — | — | — | |||||||||||||||||||||||||||||||
Performance figures assume all distributions have been reinvested. Figures reflect maximum sales charges on Class A shares of 5%, and the applicable contingent deferred sales charge (CDSC) on Class B and Class C shares. The Class B shares' CDSC declines annually between years 1 to 6 according to the following schedule: 5%, 4%, 3%, 3%, 2%, and 1%. No sales charge will be assessed after the sixth year. Class C shares sold within one year of purchase are subject to a 1% CDSC. Sales charges are not applicable to Class I, Class R2, Class R6, and Class NAV shares.
The expense ratios of the fund, both net (including any fee waivers and/or expense limitations) and gross (excluding any fee waivers and/or expense limitations), are set forth according to the most recent publicly available prospectuses for the fund and may differ from those disclosed in the Financial highlights tables in this report. Had the contractual fee waivers and expense limitations not been in place, gross expenses would apply. The expense ratios are as follows:
| Class A | Class B | Class C | Class I | Class R2 | Class R6 | Class NAV | |
| Gross (%) | 1.29 | 1.99 | 1.99 | 0.97 | 1.38 | 0.88 | 0.86 |
| Net (%) | 1.09 | 1.84 | 1.84 | 0.84 | 1.24 | 0.74 | 0.86 |
Please refer to the most recent prospectus and annual or semiannual report for more information on expenses and any expense limitation arrangements for each class.
The returns reflect past results and should not be considered indicative of future performance. The return and principal value of an investment will fluctuate so that shares, when redeemed, may be worth more or less than their original cost. Due to market volatility and other factors, the fund's current performance may be higher or lower than the performance shown. For current to the most recent month-end performance data, please call 800-225-5291 or visit the fund's website at jhinvestments.com.
The performance table above and the chart on the next page do not reflect the deduction of taxes that a shareholder would pay on fund distributions or the redemption of fund shares. The fund's performance results reflect any applicable fee waivers or expense reductions, without which the expenses would increase and results would have been less favorable.
| † | Index is the MSCI World Index. |
See the following page for footnotes.
This chart and table show what happened to a hypothetical $10,000 investment in John Hancock Global Shareholder Yield Fund for the share classes and periods indicated, assuming all distributions were reinvested. For comparison, we've shown the same investment in the MSCI World Index.
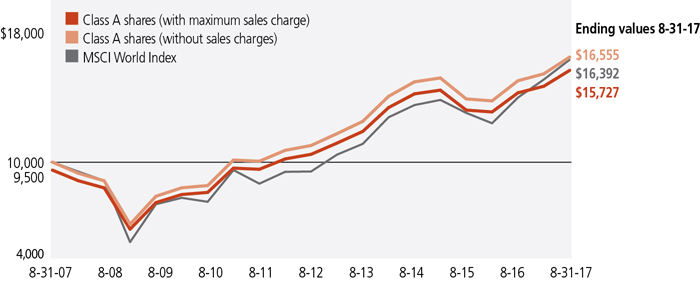
| Start date | With maximum sales charge ($) | Without sales charge ($) | Index ($) | |
| Class B5 | 9-1-07 | 15,404 | 15,404 | 16,392 |
| Class C5 | 9-1-07 | 15,440 | 15,440 | 16,392 |
| Class I2 | 9-1-07 | 17,218 | 17,218 | 16,392 |
| Class R22,3 | 9-1-07 | 16,457 | 16,457 | 16,392 |
| Class R62,3 | 9-1-07 | 16,983 | 16,983 | 16,392 |
| Class NAV2 | 4-28-08 | 18,228 | 18,228 | 16,644 |
The MSCI World Index (gross of foreign withholding tax on dividends) is a free float-adjusted market capitalization weighted index that is designed to measure the equity market performance of developed markets.
It is not possible to invest directly in an index. Index figures do not reflect expenses or sales charges, which would result in lower returns.
Footnotes related to performance pages
| 1 | Unsubsidized yield reflects what the yield would have been without the effect of reimbursements and waivers. |
| 2 | For certain types of investors, as described in the fund's prospectuses. |
| 3 | Class R2 and Class R6 shares were first offered 3-1-12 and 9-1-11, respectively. The returns prior to these dates are those of Class A shares that have not been adjusted for expenses; otherwise, returns would vary. |
| 4 | From 4-28-08. |
| 5 | The contingent deferred sales charge is not applicable. |
These examples are intended to help you understand your ongoing operating expenses of investing in the fund so you can compare these costs with the ongoing costs of investing in other mutual funds.
Understanding fund expenses
As a shareholder of the fund, you incur two types of costs:
| • | Transaction costs, which include sales charges (loads) on purchases or redemptions (varies by share class), minimum account fee charge, etc. |
| • | Ongoing operating expenses, including management fees, distribution and service fees (if applicable), and other fund expenses. |
We are presenting only your ongoing operating expenses here.
Actual expenses/actual returns
The first line of each share class in the table on the following page is intended to provide information about the fund's actual ongoing operating expenses, and is based on the fund's actual return. It assumes an account value of $1,000.00 on March 1, 2017, with the same investment held until August 31, 2017.
Together with the value of your account, you may use this information to estimate the operating expenses that you paid over the period. Simply divide your account value at August 31, 2017, by $1,000.00, then multiply it by the "expenses paid" for your share class from the table. For example, for an account value of $8,600.00, the operating expenses should be calculated as follows:
Hypothetical example for comparison purposes
The second line of each share class in the table on the following page allows you to compare the fund's ongoing operating expenses with those of any other fund. It provides an example of the fund's hypothetical account values and hypothetical expenses based on each class's actual expense ratio and an assumed 5% annualized return before expenses (which is not the fund's actual return). It assumes an account value of $1,000.00 on March 1, 2017, with the same investment held until August 31, 2017. Look in any other fund shareholder report to find its hypothetical example and you will be able to compare these expenses. Please remember that these hypothetical account values and expenses may not be used to estimate the actual ending account balance or expenses you paid for the period.
Remember, these examples do not include any transaction costs, therefore, these examples will not help you to determine the relative total costs of owning different funds. If transaction costs were included, your expenses would have been higher. See the prospectuses for details regarding transaction costs.
SHAREHOLDER EXPENSE EXAMPLE CHART
| Account value on 3-1-2017 | Ending value on 8-31-2017 | Expenses paid during period ended 8-31-20171 | Annualized expense ratio | ||
| Class A | Actual expenses/actual returns | $1,000.00 | $1,067.30 | $5.68 | 1.09% |
| Hypothetical example for comparison purposes | 1,000.00 | 1,019.70 | 5.55 | 1.09% | |
| Class B | Actual expenses/actual returns | 1,000.00 | 1,063.40 | 9.57 | 1.84% |
| Hypothetical example for comparison purposes | 1,000.00 | 1,015.90 | 9.35 | 1.84% | |
| Class C | Actual expenses/actual returns | 1,000.00 | 1,063.40 | 9.57 | 1.84% |
| Hypothetical example for comparison purposes | 1,000.00 | 1,015.90 | 9.35 | 1.84% | |
| Class I | Actual expenses/actual returns | 1,000.00 | 1,069.30 | 4.38 | 0.84% |
| Hypothetical example for comparison purposes | 1,000.00 | 1,021.00 | 4.28 | 0.84% | |
| Class R2 | Actual expenses/actual returns | 1,000.00 | 1,067.20 | 6.46 | 1.24% |
| Hypothetical example for comparison purposes | 1,000.00 | 1,019.00 | 6.31 | 1.24% | |
| Class R6 | Actual expenses/actual returns | 1,000.00 | 1,068.90 | 3.86 | 0.74% |
| Hypothetical example for comparison purposes | 1,000.00 | 1,021.50 | 3.77 | 0.74% | |
| Class NAV | Actual expenses/actual returns | 1,000.00 | 1,068.90 | 3.86 | 0.74% |
| Hypothetical example for comparison purposes | 1,000.00 | 1,021.50 | 3.77 | 0.74% | |
| 1 | Expenses are equal to the fund's annualized expense ratio, multiplied by the average account value over the period, multiplied by 184/365 (to reflect the one-half year period). |
| Fund’s investments |
| AS OF 8-31-17 (unaudited) | ||||
| Shares | Value | |||
| Common stocks 96.2% | $2,318,583,453 | |||
| (Cost $1,936,692,079) | ||||
| Australia 2.3% | 55,154,965 | |||
| Commonwealth Bank of Australia (A) | 287,154 | 17,348,205 | ||
| Sonic Healthcare, Ltd. | 807,990 | 14,071,762 | ||
| Westpac Banking Corp. (A) | 953,689 | 23,734,998 | ||
| Canada 5.3% | 126,533,230 | |||
| Agrium, Inc. | 140,950 | 13,818,738 | ||
| BCE, Inc. | 976,101 | 46,462,017 | ||
| Rogers Communications, Inc., Class B | 611,085 | 31,901,206 | ||
| Royal Bank of Canada (A) | 234,570 | 17,409,367 | ||
| TELUS Corp. (A) | 467,954 | 16,941,902 | ||
| France 7.6% | 183,421,300 | |||
| AXA SA | 1,010,823 | 29,308,317 | ||
| Cie Generale des Etablissements Michelin | 162,005 | 22,098,854 | ||
| Sanofi | 214,485 | 20,912,323 | ||
| SCOR SE | 444,720 | 18,617,448 | ||
| TOTAL SA | 722,279 | 37,477,074 | ||
| Unibail-Rodamco SE (Amsterdam Stock Exchange) | 138,341 | 35,191,249 | ||
| Vinci SA | 215,370 | 19,816,035 | ||
| Germany 8.2% | 197,027,331 | |||
| Allianz SE | 140,967 | 30,212,883 | ||
| BASF SE | 273,983 | 26,575,590 | ||
| Daimler AG | 357,175 | 26,063,702 | ||
| Deutsche Post AG | 682,021 | 28,321,172 | ||
| Deutsche Telekom AG | 1,698,379 | 30,715,031 | ||
| Muenchener Rueckversicherungs-Gesellschaft AG | 186,510 | 38,521,390 | ||
| Siemens AG | 126,940 | 16,617,563 | ||
| Italy 2.7% | 65,287,331 | |||
| Snam SpA | 5,448,699 | 26,547,094 | ||
| Terna Rete Elettrica Nazionale SpA | 6,556,110 | 38,740,237 | ||
| Netherlands 1.5% | 36,664,406 | |||
| Royal Dutch Shell PLC, ADR, Class A | 664,451 | 36,664,406 | ||
| Norway 2.0% | 47,406,742 | |||
| Orkla ASA | 2,119,430 | 21,761,381 | ||
| Statoil ASA | 1,355,185 | 25,645,361 | ||
| Singapore 1.1% | 27,109,163 | |||
| Singapore Exchange, Ltd. | 2,304,151 | 12,754,774 | ||
| Singapore Telecommunications, Ltd. | 5,252,583 | 14,354,389 |
| SEE NOTES TO FINANCIAL STATEMENTS | SEMIANNUAL REPORT | JOHN HANCOCK GLOBAL SHAREHOLDER YIELD FUND 12 |
| Shares | Value | |||
| Spain 1.8% | $43,102,648 | |||
| Gas Natural SDG SA | 745,170 | 18,130,442 | ||
| Red Electrica Corp. SA | 1,110,857 | 24,972,206 | ||
| Sweden 0.8% | 20,454,381 | |||
| Svenska Handelsbanken AB, A Shares | 1,366,420 | 20,454,381 | ||
| Switzerland 4.3% | 104,810,103 | |||
| Nestle SA | 293,253 | 24,860,801 | ||
| Novartis AG | 296,449 | 24,992,772 | ||
| Roche Holding AG | 99,806 | 25,357,789 | ||
| Swisscom AG (A) | 58,643 | 29,598,741 | ||
| Taiwan 0.8% | 19,191,940 | |||
| Taiwan Semiconductor Manufacturing Company, Ltd., ADR | 519,122 | 19,191,940 | ||
| United Kingdom 14.0% | 336,882,866 | |||
| AstraZeneca PLC, ADR | 917,480 | 27,368,428 | ||
| BAE Systems PLC | 3,648,770 | 28,673,511 | ||
| British American Tobacco PLC | 505,966 | 31,564,568 | ||
| British American Tobacco PLC, ADR | 242,862 | 15,086,587 | ||
| Diageo PLC | 576,900 | 19,296,038 | ||
| GlaxoSmithKline PLC | 1,510,110 | 29,960,048 | ||
| Imperial Brands PLC | 923,627 | 38,208,831 | ||
| National Grid PLC | 2,669,172 | 33,641,712 | ||
| Sky PLC | 1,947,856 | 24,090,064 | ||
| SSE PLC | 1,016,335 | 18,731,569 | ||
| Unilever PLC | 456,995 | 26,663,052 | ||
| Vodafone Group PLC | 15,235,205 | 43,598,458 | ||
| United States 43.8% | 1,055,537,047 | |||
| AbbVie, Inc. | 377,330 | 28,412,949 | ||
| Altria Group, Inc. | 531,425 | 33,692,345 | ||
| Ameren Corp. | 539,285 | 32,351,707 | ||
| American Electric Power Company, Inc. | 182,985 | 13,473,186 | ||
| Arthur J. Gallagher & Company | 249,480 | 14,444,892 | ||
| AT&T, Inc. | 983,975 | 36,859,700 | ||
| Automatic Data Processing, Inc. | 130,429 | 13,886,776 | ||
| BlackRock, Inc. | 39,405 | 16,511,089 | ||
| CenturyLink, Inc. (A) | 519,975 | 10,253,907 | ||
| Cisco Systems, Inc. | 757,293 | 24,392,408 | ||
| CME Group, Inc. | 103,290 | 12,993,882 | ||
| Dominion Energy, Inc. | 295,932 | 23,310,564 | ||
| Duke Energy Corp. | 468,355 | 40,887,392 | ||
| Eaton Corp. PLC | 261,800 | 18,786,768 | ||
| Emerson Electric Company | 295,920 | 17,471,117 | ||
| Entergy Corp. | 342,330 | 27,102,266 | ||
| Enterprise Products Partners LP (A) | 900,812 | 23,484,169 | ||
| Exxon Mobil Corp. | 318,680 | 24,324,844 |
| SEE NOTES TO FINANCIAL STATEMENTS | SEMIANNUAL REPORT | JOHN HANCOCK GLOBAL SHAREHOLDER YIELD FUND 13 |
| Shares | Value | ||||
| United States (continued) | |||||
| Intel Corp. | 397,494 | $13,940,115 | |||
| Iron Mountain, Inc. | 674,115 | 26,573,613 | |||
| Johnson & Johnson | 129,585 | 17,153,166 | |||
| Kimberly-Clark Corp. | 178,590 | 22,018,361 | |||
| Lockheed Martin Corp. | 54,264 | 16,571,683 | |||
| McDonald’s Corp. | 156,693 | 25,066,179 | |||
| Merck & Company, Inc. | 288,060 | 18,395,512 | |||
| Microsoft Corp. | 185,577 | 13,875,592 | |||
| Occidental Petroleum Corp. | 404,405 | 24,142,979 | |||
| People’s United Financial, Inc. | 841,287 | 14,049,493 | |||
| PepsiCo, Inc. | 133,980 | 15,505,505 | |||
| Pfizer, Inc. | 901,731 | 30,586,716 | |||
| Philip Morris International, Inc. | 298,519 | 34,905,827 | |||
| PPL Corp. | 1,082,920 | 42,493,781 | |||
| Public Storage | 68,240 | 14,012,402 | |||
| QUALCOMM, Inc. | 562,020 | 29,376,785 | |||
| Regal Entertainment Group, Class A (A) | 794,930 | 11,741,116 | |||
| Texas Instruments, Inc. | 253,342 | 20,981,784 | |||
| The Coca-Cola Company | 297,620 | 13,556,591 | |||
| The Dow Chemical Company | 483,250 | 32,208,613 | |||
| The Procter & Gamble Company | 201,395 | 18,582,717 | |||
| The Southern Company | 360,650 | 17,404,969 | |||
| United Parcel Service, Inc., Class B | 210,071 | 24,023,720 | |||
| Verizon Communications, Inc. | 836,905 | 40,146,333 | |||
| Waste Management, Inc. | 177,724 | 13,704,298 | |||
| WEC Energy Group, Inc. | 529,650 | 34,543,773 | |||
| Wells Fargo & Company | 296,819 | 15,158,546 | |||
| Welltower, Inc. | 576,030 | 42,176,917 | |||
| Yield (%) | Shares | Value | |||
| Securities lending collateral 2.0% | $48,533,594 | ||||
| (Cost $48,532,463) | |||||
| John Hancock Collateral Trust (B) | 1.2169(C) | 4,850,449 | 48,533,594 | ||
| Total investments (Cost $1,985,224,542) 98.2% | $2,367,117,047 | ||||
| Other assets and liabilities, net 1.8% | 42,661,220 | ||||
| Total net assets 100.0% | $2,409,778,267 |
The percentage shown for each investment category is the total value of the category as a percentage of the net assets of the fund.
Security Abbreviations and Legend
| ADR | American Depositary Receipt | |
| (A) | A portion of this security is on loan as of 8-31-17. | |
| (B) | Investment is an affiliate of the fund, the advisor and/or subadvisor. This security represents the investment of cash collateral received for securities lending. | |
| (C) | The rate shown is the annualized seven-day yield as of 8-31-17. |
| SEE NOTES TO FINANCIAL STATEMENTS | SEMIANNUAL REPORT | JOHN HANCOCK GLOBAL SHAREHOLDER YIELD FUND 14 |
At 8-31-17, the aggregate cost of investments for federal income tax purposes was $1,983,037,844. Net unrealized appreciation aggregated to $384,079,203, of which $431,701,574 related to gross unrealized appreciation and $47,622,371 related to gross unrealized depreciation.
| SEE NOTES TO FINANCIAL STATEMENTS | SEMIANNUAL REPORT | JOHN HANCOCK GLOBAL SHAREHOLDER YIELD FUND 15 |
Financial statements
STATEMENT OF ASSETS AND LIABILITIES 8-31-17 (unaudited)
| Assets | |||||||||||||||||||||||||||||||||
| Unaffiliated investments, at value (Cost $1,936,692,079) including $46,607,966 of securities loaned | $2,318,583,453 | ||||||||||||||||||||||||||||||||
| Affiliated investments, at value (Cost $48,532,463) | 48,533,594 | ||||||||||||||||||||||||||||||||
| Cash | 79,436,879 | ||||||||||||||||||||||||||||||||
| Foreign currency, at value (Cost $97,797) | 97,878 | ||||||||||||||||||||||||||||||||
| Receivable for fund shares sold | 4,109,010 | ||||||||||||||||||||||||||||||||
| Dividends and interest receivable | 11,893,615 | ||||||||||||||||||||||||||||||||
| Receivable for securities lending income | 75,153 | ||||||||||||||||||||||||||||||||
| Receivable due from advisor | 8,242 | ||||||||||||||||||||||||||||||||
| Other receivables and prepaid expenses | 122,819 | ||||||||||||||||||||||||||||||||
| Total assets | 2,462,860,643 | ||||||||||||||||||||||||||||||||
| Liabilities | |||||||||||||||||||||||||||||||||
| Payable for fund shares repurchased | 4,048,422 | ||||||||||||||||||||||||||||||||
| Payable upon return of securities loaned | 48,553,410 | ||||||||||||||||||||||||||||||||
| Payable to affiliates | |||||||||||||||||||||||||||||||||
| Accounting and legal services fees | 64,099 | ||||||||||||||||||||||||||||||||
| Transfer agent fees | 173,467 | ||||||||||||||||||||||||||||||||
| Distribution and service fees | 165 | ||||||||||||||||||||||||||||||||
| Trustees' fees | 869 | ||||||||||||||||||||||||||||||||
| Other liabilities and accrued expenses | 241,944 | ||||||||||||||||||||||||||||||||
| Total liabilities | 53,082,376 | ||||||||||||||||||||||||||||||||
| Net assets | $2,409,778,267 | ||||||||||||||||||||||||||||||||
| Net assets consist of | |||||||||||||||||||||||||||||||||
| Paid-in capital | $2,062,192,208 | ||||||||||||||||||||||||||||||||
| Undistributed net investment income | 11,180,012 | ||||||||||||||||||||||||||||||||
| Accumulated net realized gain (loss) on investments and foreign currency transactions | (45,622,109 | ) | |||||||||||||||||||||||||||||||
| Net unrealized appreciation (depreciation) on investments and translation of assets and liabilities in foreign currencies | 382,028,156 | ||||||||||||||||||||||||||||||||
| Net assets | $2,409,778,267 | ||||||||||||||||||||||||||||||||
STATEMENT OF ASSETS AND LIABILITIES (continued)
| Net asset value per share | |||||||||||||||||||||
| Based on net asset values and shares outstanding - The fund has an unlimited number of shares authorized with no par value | |||||||||||||||||||||
| Class A ($379,870,178 ÷ 33,579,703 shares)1 | $11.31 | ||||||||||||||||||||
| Class B ($9,340,965 ÷ 825,879 shares)1 | $11.31 | ||||||||||||||||||||
| Class C ($119,792,464 ÷ 10,586,717 shares)1 | $11.32 | ||||||||||||||||||||
| Class I ($1,367,305,740 ÷ 120,397,027 shares) | $11.36 | ||||||||||||||||||||
| Class R2 ($1,210,712 ÷ 106,612 shares) | $11.36 | ||||||||||||||||||||
| Class R6 ($1,130,810 ÷ 99,694 shares) | $11.34 | ||||||||||||||||||||
| Class NAV ($531,127,398 ÷ 46,794,017 shares) | $11.35 | ||||||||||||||||||||
| Maximum offering price per share | |||||||||||||||||||||
| Class A (net assets value per share ÷ 95%)2 | $11.91 | ||||||||||||||||||||
| 1 | Redemption price per share is equal to net asset value less any applicable contingent deferred sales charge. | |||||||||||||||||||
| 2 | On single retail sales of less than $50,000. On sales of $50,000 or more and on group sales the offering price is reduced. | |||||||||||||||||||
STATEMENT OF OPERATIONS For the six months ended 8-31-17 (unaudited)
| Investment income | ||||||||||||||||||||||||
| Dividends | $61,598,326 | |||||||||||||||||||||||
| Securities lending | 671,981 | |||||||||||||||||||||||
| Interest | 198,549 | |||||||||||||||||||||||
| Less foreign taxes withheld | (3,580,436 | ) | ||||||||||||||||||||||
| Total investment income | 58,888,420 | |||||||||||||||||||||||
| Expenses | ||||||||||||||||||||||||
| Investment management fees | 9,557,419 | |||||||||||||||||||||||
| Distribution and service fees | 1,256,570 | |||||||||||||||||||||||
| Accounting and legal services fees | 194,175 | |||||||||||||||||||||||
| Transfer agent fees | 991,399 | |||||||||||||||||||||||
| Trustees' fees | 19,712 | |||||||||||||||||||||||
| State registration fees | 115,862 | |||||||||||||||||||||||
| Printing and postage | 99,101 | |||||||||||||||||||||||
| Professional fees | 82,938 | |||||||||||||||||||||||
| Custodian fees | 217,976 | |||||||||||||||||||||||
| Other | 20,104 | |||||||||||||||||||||||
| Total expenses | 12,555,256 | |||||||||||||||||||||||
| Less expense reductions | (1,630,938 | ) | ||||||||||||||||||||||
| Net expenses | 10,924,318 | |||||||||||||||||||||||
| Net investment income | 47,964,102 | |||||||||||||||||||||||
| Realized and unrealized gain (loss) | ||||||||||||||||||||||||
| Net realized gain (loss) on | ||||||||||||||||||||||||
| Unaffiliated investments and foreign currency transactions | 56,977,916 | |||||||||||||||||||||||
| Affiliated investments | (14,276 | ) | ||||||||||||||||||||||
| 56,963,640 | ||||||||||||||||||||||||
| Change in net unrealized appreciation (depreciation) of | ||||||||||||||||||||||||
| Unaffiliated investments and translation of assets and liabilities in foreign currencies | 51,240,813 | |||||||||||||||||||||||
| Affiliated investments | (4,970 | ) | ||||||||||||||||||||||
| 51,235,843 | ||||||||||||||||||||||||
| Net realized and unrealized gain | 108,199,483 | |||||||||||||||||||||||
| Increase in net assets from operations | $156,163,585 | |||||||||||||||||||||||
STATEMENTS OF CHANGES IN NET ASSETS
| Six months ended 8-31-17 | Year ended 2-28-17 | |||||||||||||||||||||||||||||||||||||||||||||||
| (unaudited) | ||||||||||||||||||||||||||||||||||||||||||||||||
| Increase (decrease) in net assets | ||||||||||||||||||||||||||||||||||||||||||||||||
| From operations | ||||||||||||||||||||||||||||||||||||||||||||||||
| Net investment income | $47,964,102 | $61,460,505 | ||||||||||||||||||||||||||||||||||||||||||||||
| Net realized gain | 56,963,640 | 11,490,466 | ||||||||||||||||||||||||||||||||||||||||||||||
| Change in net unrealized appreciation (depreciation) | 51,235,843 | 186,838,768 | ||||||||||||||||||||||||||||||||||||||||||||||
| Increase in net assets resulting from operations | 156,163,585 | 259,789,739 | ||||||||||||||||||||||||||||||||||||||||||||||
| Distributions to shareholders | ||||||||||||||||||||||||||||||||||||||||||||||||
| From net investment income | ||||||||||||||||||||||||||||||||||||||||||||||||
| Class A | (6,609,417 | ) | (14,191,542 | ) | ||||||||||||||||||||||||||||||||||||||||||||
| Class B | (134,403 | ) | (261,696 | ) | ||||||||||||||||||||||||||||||||||||||||||||
| Class C | (1,669,842 | ) | (2,974,793 | ) | ||||||||||||||||||||||||||||||||||||||||||||
| Class I | (24,027,346 | ) | (29,470,689 | ) | ||||||||||||||||||||||||||||||||||||||||||||
| Class R2 | (18,629 | ) | (27,249 | ) | ||||||||||||||||||||||||||||||||||||||||||||
| Class R6 | (24,660 | ) | (34,696 | ) | ||||||||||||||||||||||||||||||||||||||||||||
| Class NAV | (10,049,032 | ) | (18,198,344 | ) | ||||||||||||||||||||||||||||||||||||||||||||
| Total distributions | (42,533,329 | ) | (65,159,009 | ) | ||||||||||||||||||||||||||||||||||||||||||||
| From fund share transactions | (3,217,113 | ) | (22,649,680 | ) | ||||||||||||||||||||||||||||||||||||||||||||
| Total increase | 110,413,143 | 171,981,050 | ||||||||||||||||||||||||||||||||||||||||||||||
| Net assets | ||||||||||||||||||||||||||||||||||||||||||||||||
| Beginning of period | 2,299,365,124 | 2,127,384,074 | ||||||||||||||||||||||||||||||||||||||||||||||
| End of period | $2,409,778,267 | $2,299,365,124 | ||||||||||||||||||||||||||||||||||||||||||||||
| Undistributed net investment income | $11,180,012 | $5,749,239 | ||||||||||||||||||||||||||||||||||||||||||||||
Financial highlights
| Class A Shares Period ended | 8-31-171 | 2-28-17 | 2-29-16 | 2-28-15 | 2-28-14 | 2-28-13 | ||||||||||||||||||||||||||||||||||||||||||||||||||||||||||||||||||||||||||||||||||||||||||||||||||||||||||||||||
| Per share operating performance | ||||||||||||||||||||||||||||||||||||||||||||||||||||||||||||||||||||||||||||||||||||||||||||||||||||||||||||||||||||||
| Net asset value, beginning of period | $10.78 | $9.89 | $11.78 | $11.74 | $10.46 | $9.81 | ||||||||||||||||||||||||||||||||||||||||||||||||||||||||||||||||||||||||||||||||||||||||||||||||||||||||||||||||
| Net investment income2 | 0.22 | 0.27 | 0.33 | 0.36 | 0.45 | 3 | 0.29 | |||||||||||||||||||||||||||||||||||||||||||||||||||||||||||||||||||||||||||||||||||||||||||||||||||||||||||||||
| Net realized and unrealized gain (loss) on investments | 0.50 | 0.92 | (1.42 | ) | 0.55 | 1.57 | 0.63 | |||||||||||||||||||||||||||||||||||||||||||||||||||||||||||||||||||||||||||||||||||||||||||||||||||||||||||||||
| Total from investment operations | 0.72 | 1.19 | (1.09 | ) | 0.91 | 2.02 | 0.92 | |||||||||||||||||||||||||||||||||||||||||||||||||||||||||||||||||||||||||||||||||||||||||||||||||||||||||||||||
| Less distributions | �� | |||||||||||||||||||||||||||||||||||||||||||||||||||||||||||||||||||||||||||||||||||||||||||||||||||||||||||||||||||||
| From net investment income | (0.19 | ) | (0.30 | ) | (0.32 | ) | (0.44 | ) | (0.31 | ) | (0.27 | ) | ||||||||||||||||||||||||||||||||||||||||||||||||||||||||||||||||||||||||||||||||||||||||||||||||||||||||||
| From net realized gain | — | — | (0.48 | ) | (0.43 | ) | (0.43 | ) | — | |||||||||||||||||||||||||||||||||||||||||||||||||||||||||||||||||||||||||||||||||||||||||||||||||||||||||||||
| Total distributions | (0.19 | ) | (0.30 | ) | (0.80 | ) | (0.87 | ) | (0.74 | ) | (0.27 | ) | ||||||||||||||||||||||||||||||||||||||||||||||||||||||||||||||||||||||||||||||||||||||||||||||||||||||||||
| Net asset value, end of period | $11.31 | $10.78 | $9.89 | $11.78 | $11.74 | $10.46 | ||||||||||||||||||||||||||||||||||||||||||||||||||||||||||||||||||||||||||||||||||||||||||||||||||||||||||||||||
| Total return (%)4,5 | 6.73 | 6 | 12.21 | (9.38 | ) | 8.10 | 19.85 | 9.66 | ||||||||||||||||||||||||||||||||||||||||||||||||||||||||||||||||||||||||||||||||||||||||||||||||||||||||||||||
| Ratios and supplemental data | ||||||||||||||||||||||||||||||||||||||||||||||||||||||||||||||||||||||||||||||||||||||||||||||||||||||||||||||||||||||
| Net assets, end of period (in millions) | $380 | $381 | $470 | $580 | $553 | $276 | ||||||||||||||||||||||||||||||||||||||||||||||||||||||||||||||||||||||||||||||||||||||||||||||||||||||||||||||||
| Ratios (as a percentage of average net assets): | ||||||||||||||||||||||||||||||||||||||||||||||||||||||||||||||||||||||||||||||||||||||||||||||||||||||||||||||||||||||
| Expenses before reductions | 1.28 | 7 | 1.29 | 1.29 | 1.33 | 1.34 | 1.43 | |||||||||||||||||||||||||||||||||||||||||||||||||||||||||||||||||||||||||||||||||||||||||||||||||||||||||||||||
| Expenses including reductions | 1.09 | 7 | 1.26 | 1.28 | 1.32 | 1.34 | 1.42 | |||||||||||||||||||||||||||||||||||||||||||||||||||||||||||||||||||||||||||||||||||||||||||||||||||||||||||||||
| Net investment income | 3.85 | 7 | 2.62 | 3.03 | 2.99 | 4.01 | 3 | 2.92 | ||||||||||||||||||||||||||||||||||||||||||||||||||||||||||||||||||||||||||||||||||||||||||||||||||||||||||||||
| Portfolio turnover (%) | 9 | 25 | 33 | 23 | 40 | 21 | ||||||||||||||||||||||||||||||||||||||||||||||||||||||||||||||||||||||||||||||||||||||||||||||||||||||||||||||||
| 1 | Six months ended 8-31-17. Unaudited. | ||||||||||||||||||||||||||||||||||||||||||||||||||||||||||||||||||||||||||||||||||
| 2 | Based on average daily shares outstanding. | ||||||||||||||||||||||||||||||||||||||||||||||||||||||||||||||||||||||||||||||||||
| 3 | Net investment income per share and the percentage of average net assets reflect special dividends received by the fund, which amounted to $0.08 and 0.72%. | ||||||||||||||||||||||||||||||||||||||||||||||||||||||||||||||||||||||||||||||||||
| 4 | Does not reflect the effect of sales charges, if any. | ||||||||||||||||||||||||||||||||||||||||||||||||||||||||||||||||||||||||||||||||||
| 5 | Total returns would have been lower had certain expenses not been reduced during the applicable periods. | ||||||||||||||||||||||||||||||||||||||||||||||||||||||||||||||||||||||||||||||||||
| 6 | Not annualized. | ||||||||||||||||||||||||||||||||||||||||||||||||||||||||||||||||||||||||||||||||||
| 7 | Annualized. | ||||||||||||||||||||||||||||||||||||||||||||||||||||||||||||||||||||||||||||||||||
| Class B Shares Period ended | 8-31-171 | 2-28-17 | 2-29-16 | 2-28-15 | 2-28-14 | 2-28-13 | ||||||||||||||||||||||||||||||||||||||||||||||||||||||||||||||||||||||||||||||||||||||||||||||||||||||||||||||||
| Per share operating performance | ||||||||||||||||||||||||||||||||||||||||||||||||||||||||||||||||||||||||||||||||||||||||||||||||||||||||||||||||||||||
| Net asset value, beginning of period | $10.78 | $9.89 | $11.78 | $11.74 | $10.46 | $9.81 | ||||||||||||||||||||||||||||||||||||||||||||||||||||||||||||||||||||||||||||||||||||||||||||||||||||||||||||||||
| Net investment income2 | 0.18 | 0.20 | 0.25 | 0.27 | 0.35 | 3 | 0.22 | |||||||||||||||||||||||||||||||||||||||||||||||||||||||||||||||||||||||||||||||||||||||||||||||||||||||||||||||
| Net realized and unrealized gain (loss) on investments | 0.50 | 0.92 | (1.42 | ) | 0.55 | 1.58 | 0.64 | |||||||||||||||||||||||||||||||||||||||||||||||||||||||||||||||||||||||||||||||||||||||||||||||||||||||||||||||
| Total from investment operations | 0.68 | 1.12 | (1.17 | ) | 0.82 | 1.93 | 0.86 | |||||||||||||||||||||||||||||||||||||||||||||||||||||||||||||||||||||||||||||||||||||||||||||||||||||||||||||||
| Less distributions | ||||||||||||||||||||||||||||||||||||||||||||||||||||||||||||||||||||||||||||||||||||||||||||||||||||||||||||||||||||||
| From net investment income | (0.15 | ) | (0.23 | ) | (0.24 | ) | (0.35 | ) | (0.22 | ) | (0.21 | ) | ||||||||||||||||||||||||||||||||||||||||||||||||||||||||||||||||||||||||||||||||||||||||||||||||||||||||||
| From net realized gain | — | — | (0.48 | ) | (0.43 | ) | (0.43 | ) | — | |||||||||||||||||||||||||||||||||||||||||||||||||||||||||||||||||||||||||||||||||||||||||||||||||||||||||||||
| Total distributions | (0.15 | ) | (0.23 | ) | (0.72 | ) | (0.78 | ) | (0.65 | ) | (0.21 | ) | ||||||||||||||||||||||||||||||||||||||||||||||||||||||||||||||||||||||||||||||||||||||||||||||||||||||||||
| Net asset value, end of period | $11.31 | $10.78 | $9.89 | $11.78 | $11.74 | $10.46 | ||||||||||||||||||||||||||||||||||||||||||||||||||||||||||||||||||||||||||||||||||||||||||||||||||||||||||||||||
| Total return (%)4,5 | 6.34 | 6 | 11.42 | (10.10 | ) | 7.26 | 18.95 | 8.90 | ||||||||||||||||||||||||||||||||||||||||||||||||||||||||||||||||||||||||||||||||||||||||||||||||||||||||||||||
| Ratios and supplemental data | ||||||||||||||||||||||||||||||||||||||||||||||||||||||||||||||||||||||||||||||||||||||||||||||||||||||||||||||||||||||
| Net assets, end of period (in millions) | $9 | $11 | $12 | $17 | $17 | $11 | ||||||||||||||||||||||||||||||||||||||||||||||||||||||||||||||||||||||||||||||||||||||||||||||||||||||||||||||||
| Ratios (as a percentage of average net assets): | ||||||||||||||||||||||||||||||||||||||||||||||||||||||||||||||||||||||||||||||||||||||||||||||||||||||||||||||||||||||
| Expenses before reductions | 1.98 | 7 | 1.99 | 2.02 | 2.10 | 2.15 | 2.29 | |||||||||||||||||||||||||||||||||||||||||||||||||||||||||||||||||||||||||||||||||||||||||||||||||||||||||||||||
| Expenses including reductions | 1.84 | 7 | 1.97 | 2.02 | 2.10 | 2.12 | 2.12 | |||||||||||||||||||||||||||||||||||||||||||||||||||||||||||||||||||||||||||||||||||||||||||||||||||||||||||||||
| Net investment income | 3.16 | 7 | 1.94 | 2.31 | 2.24 | 3.11 | 3 | 2.21 | ||||||||||||||||||||||||||||||||||||||||||||||||||||||||||||||||||||||||||||||||||||||||||||||||||||||||||||||
| Portfolio turnover (%) | 9 | 25 | 33 | 23 | 40 | 21 | ||||||||||||||||||||||||||||||||||||||||||||||||||||||||||||||||||||||||||||||||||||||||||||||||||||||||||||||||
| 1 | Six months ended 8-31-17. Unaudited. | ||||||||||||||||||||||||||||||||||||||||||||||||||||||||||||||||||||||||||||||||||
| 2 | Based on average daily shares outstanding. | ||||||||||||||||||||||||||||||||||||||||||||||||||||||||||||||||||||||||||||||||||
| 3 | Net investment income per share and the percentage of average net assets reflect special dividends received by the fund, which amounted to $0.08 and 0.72%. | ||||||||||||||||||||||||||||||||||||||||||||||||||||||||||||||||||||||||||||||||||
| 4 | Does not reflect the effect of sales charges, if any. | ||||||||||||||||||||||||||||||||||||||||||||||||||||||||||||||||||||||||||||||||||
| 5 | Total returns would have been lower had certain expenses not been reduced during the applicable periods. | ||||||||||||||||||||||||||||||||||||||||||||||||||||||||||||||||||||||||||||||||||
| 6 | Not annualized. | ||||||||||||||||||||||||||||||||||||||||||||||||||||||||||||||||||||||||||||||||||
| 7 | Annualized. | ||||||||||||||||||||||||||||||||||||||||||||||||||||||||||||||||||||||||||||||||||
| Class C Shares Period ended | 8-31-171 | 2-28-17 | 2-29-16 | 2-28-15 | 2-28-14 | 2-28-13 | ||||||||||||||||||||||||||||||||||||||||||||||||||||||||||||||||||||||||||||||||||||||||||||||||||||||||||||||||
| Per share operating performance | ||||||||||||||||||||||||||||||||||||||||||||||||||||||||||||||||||||||||||||||||||||||||||||||||||||||||||||||||||||||
| Net asset value, beginning of period | $10.78 | $9.90 | $11.79 | $11.74 | $10.46 | $9.81 | ||||||||||||||||||||||||||||||||||||||||||||||||||||||||||||||||||||||||||||||||||||||||||||||||||||||||||||||||
| Net investment income2 | 0.17 | 0.20 | 0.25 | 0.27 | 0.36 | 3 | 0.22 | |||||||||||||||||||||||||||||||||||||||||||||||||||||||||||||||||||||||||||||||||||||||||||||||||||||||||||||||
| Net realized and unrealized gain (loss) on investments | 0.52 | 0.91 | (1.41 | ) | 0.56 | 1.58 | 0.64 | |||||||||||||||||||||||||||||||||||||||||||||||||||||||||||||||||||||||||||||||||||||||||||||||||||||||||||||||
| Total from investment operations | 0.69 | 1.11 | (1.16 | ) | 0.83 | 1.94 | 0.86 | |||||||||||||||||||||||||||||||||||||||||||||||||||||||||||||||||||||||||||||||||||||||||||||||||||||||||||||||
| Less distributions | ||||||||||||||||||||||||||||||||||||||||||||||||||||||||||||||||||||||||||||||||||||||||||||||||||||||||||||||||||||||
| From net investment income | (0.15 | ) | (0.23 | ) | (0.25 | ) | (0.35 | ) | (0.23 | ) | (0.21 | ) | ||||||||||||||||||||||||||||||||||||||||||||||||||||||||||||||||||||||||||||||||||||||||||||||||||||||||||
| From net realized gain | — | — | (0.48 | ) | (0.43 | ) | (0.43 | ) | — | |||||||||||||||||||||||||||||||||||||||||||||||||||||||||||||||||||||||||||||||||||||||||||||||||||||||||||||
| Total distributions | (0.15 | ) | (0.23 | ) | (0.73 | ) | (0.78 | ) | (0.66 | ) | (0.21 | ) | ||||||||||||||||||||||||||||||||||||||||||||||||||||||||||||||||||||||||||||||||||||||||||||||||||||||||||
| Net asset value, end of period | $11.32 | $10.78 | $9.90 | $11.79 | $11.74 | $10.46 | ||||||||||||||||||||||||||||||||||||||||||||||||||||||||||||||||||||||||||||||||||||||||||||||||||||||||||||||||
| Total return (%)4,5 | 6.34 | 6 | 11.41 | (10.02 | ) | 7.42 | 18.97 | 8.90 | ||||||||||||||||||||||||||||||||||||||||||||||||||||||||||||||||||||||||||||||||||||||||||||||||||||||||||||||
| Ratios and supplemental data | ||||||||||||||||||||||||||||||||||||||||||||||||||||||||||||||||||||||||||||||||||||||||||||||||||||||||||||||||||||||
| Net assets, end of period (in millions) | $120 | $126 | $133 | $168 | $127 | $65 | ||||||||||||||||||||||||||||||||||||||||||||||||||||||||||||||||||||||||||||||||||||||||||||||||||||||||||||||||
| Ratios (as a percentage of average net assets): | ||||||||||||||||||||||||||||||||||||||||||||||||||||||||||||||||||||||||||||||||||||||||||||||||||||||||||||||||||||||
| Expenses before reductions | 1.98 | 7 | 1.99 | 1.99 | 2.03 | 2.05 | 2.15 | |||||||||||||||||||||||||||||||||||||||||||||||||||||||||||||||||||||||||||||||||||||||||||||||||||||||||||||||
| Expenses including reductions | 1.84 | 7 | 1.97 | 1.98 | 2.02 | 2.05 | 2.12 | |||||||||||||||||||||||||||||||||||||||||||||||||||||||||||||||||||||||||||||||||||||||||||||||||||||||||||||||
| Net investment income | 3.11 | 7 | 1.92 | 2.33 | 2.24 | 3.22 | 3 | 2.22 | ||||||||||||||||||||||||||||||||||||||||||||||||||||||||||||||||||||||||||||||||||||||||||||||||||||||||||||||
| Portfolio turnover (%) | 9 | 25 | 33 | 23 | 40 | 21 | ||||||||||||||||||||||||||||||||||||||||||||||||||||||||||||||||||||||||||||||||||||||||||||||||||||||||||||||||
| 1 | Six months ended 8-31-17. Unaudited. | ||||||||||||||||||||||||||||||||||||||||||||||||||||||||||||||||||||||||||||||||||
| 2 | Based on average daily shares outstanding. | ||||||||||||||||||||||||||||||||||||||||||||||||||||||||||||||||||||||||||||||||||
| 3 | Net investment income per share and the percentage of average net assets reflect special dividends received by the fund, which amounted to $0.08 and 0.72%. | ||||||||||||||||||||||||||||||||||||||||||||||||||||||||||||||||||||||||||||||||||
| 4 | Does not reflect the effect of sales charges, if any. | ||||||||||||||||||||||||||||||||||||||||||||||||||||||||||||||||||||||||||||||||||
| 5 | Total returns would have been lower had certain expenses not been reduced during the applicable periods. | ||||||||||||||||||||||||||||||||||||||||||||||||||||||||||||||||||||||||||||||||||
| 6 | Not annualized. | ||||||||||||||||||||||||||||||||||||||||||||||||||||||||||||||||||||||||||||||||||
| 7 | Annualized. | ||||||||||||||||||||||||||||||||||||||||||||||||||||||||||||||||||||||||||||||||||
| Class I Shares Period ended | 8-31-171 | 2-28-17 | 2-29-16 | 2-28-15 | 2-28-14 | 2-28-13 | ||||||||||||||||||||||||||||||||||||||||||||||||||||||||||||||||||||||||||||||||||||||||||||||||||||||||||||||||
| Per share operating performance | ||||||||||||||||||||||||||||||||||||||||||||||||||||||||||||||||||||||||||||||||||||||||||||||||||||||||||||||||||||||
| Net asset value, beginning of period | $10.82 | $9.93 | $11.83 | $11.78 | $10.49 | $9.84 | ||||||||||||||||||||||||||||||||||||||||||||||||||||||||||||||||||||||||||||||||||||||||||||||||||||||||||||||||
| Net investment income2 | 0.23 | 0.31 | 0.37 | 0.39 | 0.47 | 3 | 0.31 | |||||||||||||||||||||||||||||||||||||||||||||||||||||||||||||||||||||||||||||||||||||||||||||||||||||||||||||||
| Net realized and unrealized gain (loss) on investments | 0.52 | 0.91 | (1.43 | ) | 0.56 | 1.59 | 0.65 | |||||||||||||||||||||||||||||||||||||||||||||||||||||||||||||||||||||||||||||||||||||||||||||||||||||||||||||||
| Total from investment operations | 0.75 | 1.22 | (1.06 | ) | 0.95 | 2.06 | 0.96 | |||||||||||||||||||||||||||||||||||||||||||||||||||||||||||||||||||||||||||||||||||||||||||||||||||||||||||||||
| Less distributions | ||||||||||||||||||||||||||||||||||||||||||||||||||||||||||||||||||||||||||||||||||||||||||||||||||||||||||||||||||||||
| From net investment income | (0.21 | ) | (0.33 | ) | (0.36 | ) | (0.47 | ) | (0.34 | ) | (0.31 | ) | ||||||||||||||||||||||||||||||||||||||||||||||||||||||||||||||||||||||||||||||||||||||||||||||||||||||||||
| From net realized gain | — | — | (0.48 | ) | (0.43 | ) | (0.43 | ) | — | |||||||||||||||||||||||||||||||||||||||||||||||||||||||||||||||||||||||||||||||||||||||||||||||||||||||||||||
| Total distributions | (0.21 | ) | (0.33 | ) | (0.84 | ) | (0.90 | ) | (0.77 | ) | (0.31 | ) | ||||||||||||||||||||||||||||||||||||||||||||||||||||||||||||||||||||||||||||||||||||||||||||||||||||||||||
| Net asset value, end of period | $11.36 | $10.82 | $9.93 | $11.83 | $11.78 | $10.49 | ||||||||||||||||||||||||||||||||||||||||||||||||||||||||||||||||||||||||||||||||||||||||||||||||||||||||||||||||
| Total return (%)4 | 6.93 | 5 | 12.51 | (9.13 | ) | 8.50 | 20.28 | 10.07 | ||||||||||||||||||||||||||||||||||||||||||||||||||||||||||||||||||||||||||||||||||||||||||||||||||||||||||||||
| Ratios and supplemental data | ||||||||||||||||||||||||||||||||||||||||||||||||||||||||||||||||||||||||||||||||||||||||||||||||||||||||||||||||||||||
| Net assets, end of period (in millions) | $1,367 | $1,245 | $957 | $1,242 | $893 | $641 | ||||||||||||||||||||||||||||||||||||||||||||||||||||||||||||||||||||||||||||||||||||||||||||||||||||||||||||||||
| Ratios (as a percentage of average net assets): | ||||||||||||||||||||||||||||||||||||||||||||||||||||||||||||||||||||||||||||||||||||||||||||||||||||||||||||||||||||||
| Expenses before reductions | 0.97 | 6 | 0.97 | 0.97 | 1.01 | 1.01 | 1.05 | |||||||||||||||||||||||||||||||||||||||||||||||||||||||||||||||||||||||||||||||||||||||||||||||||||||||||||||||
| Expenses including reductions | 0.84 | 6 | 0.95 | 0.97 | 1.00 | 1.01 | 1.03 | |||||||||||||||||||||||||||||||||||||||||||||||||||||||||||||||||||||||||||||||||||||||||||||||||||||||||||||||
| Net investment income | 4.08 | 6 | 2.91 | 3.37 | 3.24 | 4.19 | 3 | 3.10 | ||||||||||||||||||||||||||||||||||||||||||||||||||||||||||||||||||||||||||||||||||||||||||||||||||||||||||||||
| Portfolio turnover (%) | 9 | 25 | 33 | 23 | 40 | 21 | ||||||||||||||||||||||||||||||||||||||||||||||||||||||||||||||||||||||||||||||||||||||||||||||||||||||||||||||||
| 1 | Six months ended 8-31-17. Unaudited. | ||||||||||||||||||||||||||||||||||||||||||||||||||||||||||||||||||||||||||||||||||
| 2 | Based on average daily shares outstanding. | ||||||||||||||||||||||||||||||||||||||||||||||||||||||||||||||||||||||||||||||||||
| 3 | Net investment income per share and the percentage of average net assets reflect special dividends received by the fund, which amounted to $0.08 and 0.72%. | ||||||||||||||||||||||||||||||||||||||||||||||||||||||||||||||||||||||||||||||||||
| 4 | Total returns would have been lower had certain expenses not been reduced during the applicable periods. | ||||||||||||||||||||||||||||||||||||||||||||||||||||||||||||||||||||||||||||||||||
| 5 | Not annualized. | ||||||||||||||||||||||||||||||||||||||||||||||||||||||||||||||||||||||||||||||||||
| 6 | Annualized. | ||||||||||||||||||||||||||||||||||||||||||||||||||||||||||||||||||||||||||||||||||
| Class R2 Shares Period ended | 8-31-171 | 2-28-17 | 2-29-16 | 2-28-15 | 2-28-14 | 2-28-132 | ||||||||||||||||||||||||||||||||||||||||||||||||||||||||||||||||||||||||||||||||||||||||||||||||||||||||||||||||
| Per share operating performance | ||||||||||||||||||||||||||||||||||||||||||||||||||||||||||||||||||||||||||||||||||||||||||||||||||||||||||||||||||||||
| Net asset value, beginning of period | $10.82 | $9.93 | $11.82 | $11.78 | $10.49 | $9.84 | ||||||||||||||||||||||||||||||||||||||||||||||||||||||||||||||||||||||||||||||||||||||||||||||||||||||||||||||||
| Net investment income3 | 0.21 | 0.26 | 0.32 | 0.31 | 0.50 | 4 | 0.29 | |||||||||||||||||||||||||||||||||||||||||||||||||||||||||||||||||||||||||||||||||||||||||||||||||||||||||||||||
| Net realized and unrealized gain (loss) on investments | 0.51 | 0.92 | (1.43 | ) | 0.58 | 1.52 | 0.63 | |||||||||||||||||||||||||||||||||||||||||||||||||||||||||||||||||||||||||||||||||||||||||||||||||||||||||||||||
| Total from investment operations | 0.72 | 1.18 | (1.11 | ) | 0.89 | 2.02 | 0.92 | |||||||||||||||||||||||||||||||||||||||||||||||||||||||||||||||||||||||||||||||||||||||||||||||||||||||||||||||
| Less distributions | ||||||||||||||||||||||||||||||||||||||||||||||||||||||||||||||||||||||||||||||||||||||||||||||||||||||||||||||||||||||
| From net investment income | (0.18 | ) | (0.29 | ) | (0.30 | ) | (0.42 | ) | (0.30 | ) | (0.27 | ) | ||||||||||||||||||||||||||||||||||||||||||||||||||||||||||||||||||||||||||||||||||||||||||||||||||||||||||
| From net realized gain | — | — | (0.48 | ) | (0.43 | ) | (0.43 | ) | — | |||||||||||||||||||||||||||||||||||||||||||||||||||||||||||||||||||||||||||||||||||||||||||||||||||||||||||||
| Total distributions | (0.18 | ) | (0.29 | ) | (0.78 | ) | (0.85 | ) | (0.73 | ) | (0.27 | ) | ||||||||||||||||||||||||||||||||||||||||||||||||||||||||||||||||||||||||||||||||||||||||||||||||||||||||||
| Net asset value, end of period | $11.36 | $10.82 | $9.93 | $11.82 | $11.78 | $10.49 | ||||||||||||||||||||||||||||||||||||||||||||||||||||||||||||||||||||||||||||||||||||||||||||||||||||||||||||||||
| Total return (%)5 | 6.72 | 6 | 12.04 | (9.51 | ) | 7.93 | 19.78 | 9.58 | ||||||||||||||||||||||||||||||||||||||||||||||||||||||||||||||||||||||||||||||||||||||||||||||||||||||||||||||
| Ratios and supplemental data | ||||||||||||||||||||||||||||||||||||||||||||||||||||||||||||||||||||||||||||||||||||||||||||||||||||||||||||||||||||||
| Net assets, end of period (in millions) | $1 | $1 | $1 | $1 | $1 | — | 7 | |||||||||||||||||||||||||||||||||||||||||||||||||||||||||||||||||||||||||||||||||||||||||||||||||||||||||||||||
| Ratios (as a percentage of average net assets): | ||||||||||||||||||||||||||||||||||||||||||||||||||||||||||||||||||||||||||||||||||||||||||||||||||||||||||||||||||||||
| Expenses before reductions | 1.36 | 8 | 1.36 | 1.86 | 3.22 | 8.52 | 19.42 | |||||||||||||||||||||||||||||||||||||||||||||||||||||||||||||||||||||||||||||||||||||||||||||||||||||||||||||||
| Expenses including reductions | 1.24 | 8 | 1.34 | 1.43 | 1.47 | 1.47 | 1.47 | |||||||||||||||||||||||||||||||||||||||||||||||||||||||||||||||||||||||||||||||||||||||||||||||||||||||||||||||
| Net investment income | 3.67 | 8 | 2.50 | 2.92 | 2.66 | 4.38 | 4 | 2.91 | ||||||||||||||||||||||||||||||||||||||||||||||||||||||||||||||||||||||||||||||||||||||||||||||||||||||||||||||
| Portfolio turnover (%) | 9 | 25 | 33 | 23 | 40 | 21 | ||||||||||||||||||||||||||||||||||||||||||||||||||||||||||||||||||||||||||||||||||||||||||||||||||||||||||||||||
| 1 | Six months ended 8-31-17. Unaudited. | ||||||||||||||||||||||||||||||||||||||||||||||||||||||||||||||||||||||||||||||||||
| 2 | The inception date for Class R2 shares is 3-1-12. | ||||||||||||||||||||||||||||||||||||||||||||||||||||||||||||||||||||||||||||||||||
| 3 | Based on average daily shares outstanding. | ||||||||||||||||||||||||||||||||||||||||||||||||||||||||||||||||||||||||||||||||||
| 4 | Net investment income per share and the percentage of average net assets reflect special dividends received by the fund, which amounted to $0.08 and 0.72%. | ||||||||||||||||||||||||||||||||||||||||||||||||||||||||||||||||||||||||||||||||||
| 5 | Total returns would have been lower had certain expenses not been reduced during the applicable periods. | ||||||||||||||||||||||||||||||||||||||||||||||||||||||||||||||||||||||||||||||||||
| 6 | Not annualized. | ||||||||||||||||||||||||||||||||||||||||||||||||||||||||||||||||||||||||||||||||||
| 7 | Less than $500,000. | ||||||||||||||||||||||||||||||||||||||||||||||||||||||||||||||||||||||||||||||||||
| 8 | Annualized. | ||||||||||||||||||||||||||||||||||||||||||||||||||||||||||||||||||||||||||||||||||
| Class R6 Shares Period ended | 8-31-171 | 2-28-17 | 2-29-16 | 2-28-15 | 2-28-14 | 2-28-13 | ||||||||||||||||||||||||||||||||||||||||||||||||||||||||||||||||||||||||||||||||||||||||||||||||||||||||||||||||
| Per share operating performance | ||||||||||||||||||||||||||||||||||||||||||||||||||||||||||||||||||||||||||||||||||||||||||||||||||||||||||||||||||||||
| Net asset value, beginning of period | $10.81 | $9.92 | $11.81 | $11.77 | $10.49 | $9.84 | ||||||||||||||||||||||||||||||||||||||||||||||||||||||||||||||||||||||||||||||||||||||||||||||||||||||||||||||||
| Net investment income2 | 0.23 | 0.30 | 0.38 | 0.39 | 0.48 | 3 | 0.33 | |||||||||||||||||||||||||||||||||||||||||||||||||||||||||||||||||||||||||||||||||||||||||||||||||||||||||||||||
| Net realized and unrealized gain (loss) on investments | 0.51 | 0.93 | (1.42 | ) | 0.57 | 1.58 | 0.64 | |||||||||||||||||||||||||||||||||||||||||||||||||||||||||||||||||||||||||||||||||||||||||||||||||||||||||||||||
| Total from investment operations | 0.74 | 1.23 | (1.04 | ) | 0.96 | 2.06 | 0.97 | |||||||||||||||||||||||||||||||||||||||||||||||||||||||||||||||||||||||||||||||||||||||||||||||||||||||||||||||
| Less distributions | ||||||||||||||||||||||||||||||||||||||||||||||||||||||||||||||||||||||||||||||||||||||||||||||||||||||||||||||||||||||
| From net investment income | (0.21 | ) | (0.34 | ) | (0.37 | ) | (0.49 | ) | (0.35 | ) | (0.32 | ) | ||||||||||||||||||||||||||||||||||||||||||||||||||||||||||||||||||||||||||||||||||||||||||||||||||||||||||
| From net realized gain | — | — | (0.48 | ) | (0.43 | ) | (0.43 | ) | — | |||||||||||||||||||||||||||||||||||||||||||||||||||||||||||||||||||||||||||||||||||||||||||||||||||||||||||||
| Total distributions | (0.21 | ) | (0.34 | ) | (0.85 | ) | (0.92 | ) | (0.78 | ) | (0.32 | ) | ||||||||||||||||||||||||||||||||||||||||||||||||||||||||||||||||||||||||||||||||||||||||||||||||||||||||||
| Net asset value, end of period | $11.34 | $10.81 | $9.92 | $11.81 | $11.77 | $10.49 | ||||||||||||||||||||||||||||||||||||||||||||||||||||||||||||||||||||||||||||||||||||||||||||||||||||||||||||||||
| Total return (%)4 | 6.89 | 5 | 12.66 | (8.94 | ) | 8.56 | 20.29 | 10.12 | ||||||||||||||||||||||||||||||||||||||||||||||||||||||||||||||||||||||||||||||||||||||||||||||||||||||||||||||
| Ratios and supplemental data | ||||||||||||||||||||||||||||||||||||||||||||||||||||||||||||||||||||||||||||||||||||||||||||||||||||||||||||||||||||||
| Net assets, end of period (in millions) | $1 | $2 | $1 | — | 6 | — | 6 | — | 6 | |||||||||||||||||||||||||||||||||||||||||||||||||||||||||||||||||||||||||||||||||||||||||||||||||||||||||||||
| Ratios (as a percentage of average net assets): | ||||||||||||||||||||||||||||||||||||||||||||||||||||||||||||||||||||||||||||||||||||||||||||||||||||||||||||||||||||||
| Expenses before reductions | 0.88 | 7 | 0.87 | 1.45 | 6.51 | 10.30 | 10.38 | |||||||||||||||||||||||||||||||||||||||||||||||||||||||||||||||||||||||||||||||||||||||||||||||||||||||||||||||
| Expenses including reductions | 0.74 | 7 | 0.85 | 0.85 | 0.87 | 0.97 | 0.97 | |||||||||||||||||||||||||||||||||||||||||||||||||||||||||||||||||||||||||||||||||||||||||||||||||||||||||||||||
| Net investment income | 4.17 | 7 | 2.85 | 3.48 | 3.32 | 4.26 | 3 | 3.29 | ||||||||||||||||||||||||||||||||||||||||||||||||||||||||||||||||||||||||||||||||||||||||||||||||||||||||||||||
| Portfolio turnover (%) | 9 | 25 | 33 | 23 | 40 | 21 | ||||||||||||||||||||||||||||||||||||||||||||||||||||||||||||||||||||||||||||||||||||||||||||||||||||||||||||||||
| 1 | Six months ended 8-31-17. Unaudited. | ||||||||||||||||||||||||||||||||||||||||||||||||||||||||||||||||||||||||||||||||||
| 2 | Based on average daily shares outstanding. | ||||||||||||||||||||||||||||||||||||||||||||||||||||||||||||||||||||||||||||||||||
| 3 | Net investment income per share and the percentage of average net assets reflect special dividends received by the fund, which amounted to $0.08 and 0.72%. | ||||||||||||||||||||||||||||||||||||||||||||||||||||||||||||||||||||||||||||||||||
| 4 | Total returns would have been lower had certain expenses not been reduced during the applicable periods. | ||||||||||||||||||||||||||||||||||||||||||||||||||||||||||||||||||||||||||||||||||
| 5 | Not annualized. | ||||||||||||||||||||||||||||||||||||||||||||||||||||||||||||||||||||||||||||||||||
| 6 | Less than $500,000. | ||||||||||||||||||||||||||||||||||||||||||||||||||||||||||||||||||||||||||||||||||
| 7 | Annualized. | ||||||||||||||||||||||||||||||||||||||||||||||||||||||||||||||||||||||||||||||||||
| Class NAV Shares Period ended | 8-31-171 | 2-28-17 | 2-29-16 | 2-28-15 | 2-28-14 | 2-28-13 | ||||||||||||||||||||||||||||||||||||||||||||||||||||||||||||||||||||||||||||||||||||||||||||||||||||||||||||||||
| Per share operating performance | ||||||||||||||||||||||||||||||||||||||||||||||||||||||||||||||||||||||||||||||||||||||||||||||||||||||||||||||||||||||
| Net asset value, beginning of period | $10.81 | $9.92 | $11.82 | $11.78 | $10.49 | $9.84 | ||||||||||||||||||||||||||||||||||||||||||||||||||||||||||||||||||||||||||||||||||||||||||||||||||||||||||||||||
| Net investment income2 | 0.24 | 0.32 | 0.37 | 0.41 | 0.49 | 3 | 0.35 | |||||||||||||||||||||||||||||||||||||||||||||||||||||||||||||||||||||||||||||||||||||||||||||||||||||||||||||||
| Net realized and unrealized gain (loss) on investments | 0.51 | 0.91 | (1.42 | ) | 0.55 | 1.59 | 0.62 | |||||||||||||||||||||||||||||||||||||||||||||||||||||||||||||||||||||||||||||||||||||||||||||||||||||||||||||||
| Total from investment operations | 0.75 | 1.23 | (1.05 | ) | 0.96 | 2.08 | 0.97 | |||||||||||||||||||||||||||||||||||||||||||||||||||||||||||||||||||||||||||||||||||||||||||||||||||||||||||||||
| Less distributions | ||||||||||||||||||||||||||||||||||||||||||||||||||||||||||||||||||||||||||||||||||||||||||||||||||||||||||||||||||||||
| From net investment income | (0.21 | ) | (0.34 | ) | (0.37 | ) | (0.49 | ) | (0.36 | ) | (0.32 | ) | ||||||||||||||||||||||||||||||||||||||||||||||||||||||||||||||||||||||||||||||||||||||||||||||||||||||||||
| From net realized gain | — | — | (0.48 | ) | (0.43 | ) | (0.43 | ) | — | |||||||||||||||||||||||||||||||||||||||||||||||||||||||||||||||||||||||||||||||||||||||||||||||||||||||||||||
| Total distributions | (0.21 | ) | (0.34 | ) | (0.85 | ) | (0.92 | ) | (0.79 | ) | (0.32 | ) | ||||||||||||||||||||||||||||||||||||||||||||||||||||||||||||||||||||||||||||||||||||||||||||||||||||||||||
| Net asset value, end of period | $11.35 | $10.81 | $9.92 | $11.82 | $11.78 | $10.49 | ||||||||||||||||||||||||||||||||||||||||||||||||||||||||||||||||||||||||||||||||||||||||||||||||||||||||||||||||
| Total return (%)4 | 6.89 | 5 | 12.76 | (9.03 | ) | 8.57 | 20.47 | 10.17 | ||||||||||||||||||||||||||||||||||||||||||||||||||||||||||||||||||||||||||||||||||||||||||||||||||||||||||||||
| Ratios and supplemental data | ||||||||||||||||||||||||||||||||||||||||||||||||||||||||||||||||||||||||||||||||||||||||||||||||||||||||||||||||||||||
| Net assets, end of period (in millions) | $531 | $535 | $554 | $696 | $653 | $944 | ||||||||||||||||||||||||||||||||||||||||||||||||||||||||||||||||||||||||||||||||||||||||||||||||||||||||||||||||
| Ratios (as a percentage of average net assets): | ||||||||||||||||||||||||||||||||||||||||||||||||||||||||||||||||||||||||||||||||||||||||||||||||||||||||||||||||||||||
| Expenses before reductions | 0.86 | 6 | 0.86 | 0.86 | 0.88 | 0.88 | 0.90 | |||||||||||||||||||||||||||||||||||||||||||||||||||||||||||||||||||||||||||||||||||||||||||||||||||||||||||||||
| Expenses including reductions | 0.74 | 6 | 0.85 | 0.85 | 0.87 | 0.87 | 0.89 | |||||||||||||||||||||||||||||||||||||||||||||||||||||||||||||||||||||||||||||||||||||||||||||||||||||||||||||||
| Net investment income | 4.20 | 6 | 3.03 | 3.45 | 3.42 | 4.35 | 3 | 3.56 | ||||||||||||||||||||||||||||||||||||||||||||||||||||||||||||||||||||||||||||||||||||||||||||||||||||||||||||||
| Portfolio turnover (%) | 9 | 25 | 33 | 23 | 40 | 21 | ||||||||||||||||||||||||||||||||||||||||||||||||||||||||||||||||||||||||||||||||||||||||||||||||||||||||||||||||
| 1 | Six months ended 8-31-17. Unaudited. | ||||||||||||||||||||||||||||||||||||||||||||||||||||||||||||||||||||||||||||||||||
| 2 | Based on average daily shares outstanding. | ||||||||||||||||||||||||||||||||||||||||||||||||||||||||||||||||||||||||||||||||||
| 3 | Net investment income per share and the percentage of average net assets reflect special dividends received by the fund, which amounted to $0.08 and 0.72%. | ||||||||||||||||||||||||||||||||||||||||||||||||||||||||||||||||||||||||||||||||||
| 4 | Total returns would have been lower had certain expenses not been reduced during the applicable periods. | ||||||||||||||||||||||||||||||||||||||||||||||||||||||||||||||||||||||||||||||||||
| 5 | Not annualized. | ||||||||||||||||||||||||||||||||||||||||||||||||||||||||||||||||||||||||||||||||||
| 6 | Annualized. | ||||||||||||||||||||||||||||||||||||||||||||||||||||||||||||||||||||||||||||||||||
Note 1 — Organization
John Hancock Global Shareholder Yield Fund (the fund) is a series of John Hancock Funds III (the Trust), an open-end management investment company organized as a Massachusetts business trust and registered under the Investment Company Act of 1940, as amended (the 1940 Act). The primary investment objective of the fund is to seek to provide a high level of income. Capital appreciation is a secondary investment objective.
The fund may offer multiple classes of shares. The shares currently offered are detailed in the Statement of assets and liabilities. Class A and Class C shares are offered to all investors. Class B shares are closed to new investors. Class I shares are offered to institutions and certain investors. Class R2 shares are available only to certain retirement plans. Class R6 shares are available only to certain retirement plans, institutions and other investors. Class NAV shares are offered to John Hancock affiliated funds of funds and certain 529 plans. Shareholders of each class have exclusive voting rights to matters that affect that class. The distribution and service fees, if any, and transfer agent fees for each class may differ. Class B shares convert to Class A shares eight years after purchase.
Note 2 — Significant accounting policies
The financial statements have been prepared in conformity with accounting principles generally accepted in the United States of America (US GAAP), which require management to make certain estimates and assumptions as of the date of the financial statements. Actual results could differ from those estimates and those differences could be significant. The fund qualifies as an investment company under Topic 946 of Accounting Standards Codification of US GAAP.
Events or transactions occurring after the end of the fiscal period through the date that the financial statements were issued have been evaluated in the preparation of the financial statements. The following summarizes the significant accounting policies of the fund:
Security valuation. Investments are stated at value as of the scheduled close of regular trading on the New York Stock Exchange (NYSE), normally at 4:00 p.m., Eastern Time. In case of emergency or other disruption resulting in the NYSE not opening for trading or the NYSE closing at a time other than the regularly scheduled close, the net asset value (NAV) may be determined as of the regularly scheduled close of the NYSE pursuant to the fund's Valuation Policies and Procedures.
In order to value the securities, the fund uses the following valuation techniques: Equity securities held by the fund are typically valued at the last sale price or official closing price on the exchange or principal market where the security trades. In the event there were no sales during the day or closing prices are not available, the securities are valued using the last available bid price. Investments by the fund in open-end mutual funds, including John Hancock Collateral Trust (JHCT), are valued at their respective NAVs each business day. Foreign securities and currencies are valued in U.S. dollars based on foreign currency exchange rates supplied by an independent pricing vendor.
In certain instances, the Pricing Committee may determine to value equity securities using prices obtained from another exchange or market if trading on the exchange or market on which prices are typically obtained did not open for trading as scheduled, or if trading closed earlier than scheduled, and trading occurred as normal on another exchange or market.
Other portfolio securities and assets, for which reliable market quotations are not readily available, are valued at fair value as determined in good faith by the fund's Pricing Committee following procedures established by the Board of Trustees. The frequency with which these fair valuation procedures are used cannot be predicted and fair value of securities may differ significantly from the value that would have been used had a ready market for such securities existed. Trading in foreign securities may be completed before the scheduled daily close of trading on the NYSE. Significant events at the issuer or market level may affect the values of securities between the time when the valuation of the securities is generally determined and the close of the NYSE. If a significant event occurs, these securities may be fair valued, as determined in good faith by the fund's Pricing Committee, following procedures established by the Board of Trustees. The fund uses fair value adjustment factors provided by an independent pricing vendor to value certain foreign securities in order to adjust for events that may occur between the close of foreign exchanges or markets and the close of the NYSE.
The fund uses a three-tier hierarchy to prioritize the pricing assumptions, referred to as inputs, used in valuation techniques to measure fair value. Level 1 includes securities valued using quoted prices in active markets for identical securities. Level 2 includes securities valued using other significant observable inputs. Observable inputs may include quoted prices for similar securities, interest rates, prepayment speeds and credit risk. Prices for securities valued using these inputs are received from independent pricing vendors and brokers and are based on an evaluation of the inputs described. Level 3 includes securities valued using significant unobservable inputs when market prices are not readily available or reliable, including the fund's own assumptions in determining the fair value of investments. Factors used in determining value may include market or issuer specific events or trends, changes in interest rates and credit quality. The inputs or methodology used for valuing securities are not necessarily an indication of the risks associated with investing in those securities. Changes in valuation techniques and related inputs may result in transfers into or out of an assigned level within the disclosure hierarchy.
The following is a summary of the values by input classification of the fund's investments as of August 31, 2017, by major security category or type:
| Total value at 8-31-17 | Level 1 quoted price | Level 2 significant observable inputs | Level 3 significant unobservable inputs | ||
| Common stocks | |||||
| Australia | $55,154,965 | — | $55,154,965 | — | |
| Canada | 126,533,230 | $126,533,230 | — | — | |
| France | 183,421,300 | — | 183,421,300 | — | |
| Germany | 197,027,331 | — | 197,027,331 | — | |
| Italy | 65,287,331 | — | 65,287,331 | — | |
| Netherlands | 36,664,406 | 36,664,406 | — | — | |
| Norway | 47,406,742 | — | 47,406,742 | — | |
| Singapore | 27,109,163 | — | 27,109,163 | — | |
| Spain | 43,102,648 | — | 43,102,648 | — | |
| Sweden | 20,454,381 | — | 20,454,381 | — | |
| Switzerland | 104,810,103 | — | 104,810,103 | — | |
| Taiwan | 19,191,940 | 19,191,940 | — | — | |
| United Kingdom | 336,882,866 | 42,455,015 | 294,427,851 | — | |
| United States | 1,055,537,047 | 1,055,537,047 | — | — | |
| Securities lending collateral | 48,533,594 | 48,533,594 | — | — | |
| Total investments in securities | $2,367,117,047 | $1,328,915,232 | $1,038,201,815 | — | |
Security transactions and related investment income. Investment security transactions are accounted for on a trade date plus one basis for daily NAV calculations. However, for financial reporting purposes, investment transactions are reported on trade date. Interest income is accrued as earned. Dividend income is recorded on the ex-date, except for dividends of foreign securities where the dividend may not be known until after the ex-date. In those cases, dividend income, net of withholding taxes, is recorded when the fund becomes aware of the dividends. Foreign taxes are provided for based on the fund's understanding of the tax rules and rates that exist in the foreign markets in which it invests. Gains and losses on securities sold are determined on the basis of identified cost and may include proceeds from litigation.
Securities lending. The fund may lend its securities to earn additional income. The fund receives cash collateral from the borrower in an amount not less than the market value of the loaned securities. The fund will invest its collateral in JHCT, an affiliate of the fund, which has a floating NAV and is registered with the Securities and Exchange Commission as an investment company. JHCT invests cash received as collateral as part of the securities lending program in short-term money market investments. The fund will receive the benefit of any gains and bear any losses generated by JHCT with respect to the cash collateral.
The fund has the right to recall loaned securities on demand. If a borrower fails to return loaned securities when due, then the lending agent is responsible and indemnifies the fund for the lent securities. The lending agent uses the collateral received from the borrower to purchase replacement securities of the same issue, type, class and series of the loaned securities. If the value of the collateral is less than the purchase cost of replacement securities, the lending agent is responsible for satisfying the shortfall but only to the extent that the shortfall is not due to any decrease in the value of JHCT.
Although the risk of the loss of the securities lent is mitigated by receiving collateral from the borrower and through lending agent indemnification, the fund could experience a delay in recovering securities or could experience a lower than expected return if the borrower fails to return the securities on a timely basis. The fund receives compensation for lending its securities by retaining a portion of the return on the investment of the collateral and compensation from fees earned from borrowers of the securities. Securities lending income received by the fund is net of fees retained by the securities lending agent. Net income received from JHCT is a component of securities lending income as recorded on the Statement of operations.
Obligations to repay collateral received by the fund are shown on the Statement of assets and liabilities as Payable upon return of securities loaned and are secured by the loaned securities. As of August 31, 2017, the fund loaned common stocks valued at $46,607,966 and received $48,553,410 of cash collateral.
Foreign currency translation. Assets, including investments and liabilities denominated in foreign currencies, are translated into U.S. dollar values each day at the prevailing exchange rate. Purchases and sales of securities, income and expenses are translated into U.S. dollars at the prevailing exchange rate on the date of the transaction. The effect of changes in foreign currency exchange rates on the value of securities is reflected as a component of the realized and unrealized gains (losses) on investments.
Funds that invest internationally generally carry more risk than funds that invest strictly in U.S. securities. These risks are heightened for investments in emerging markets. Risks can result from differences in economic and political conditions, regulations, market practices (including higher transaction costs), accounting standards and other factors. Foreign investments are also subject to a decline in the value of a foreign currency versus the U.S. dollar, which reduces the dollar value of securities denominated in that currency.
Foreign taxes. The fund may be subject to withholding tax on income and/or capital gains or repatriation taxes imposed by certain countries in which the fund invests. Taxes are accrued based upon investment income, realized gains or unrealized appreciation.
Line of credit. The fund may have the ability to borrow from banks for temporary or emergency purposes, including meeting redemption requests that otherwise might require the untimely sale of securities. Pursuant to the fund's custodian agreement, the custodian may loan money to the fund to make properly authorized payments. The fund is obligated to repay the custodian for any overdraft, including any related costs or expenses. The custodian may have a lien, security interest or security entitlement in any fund property that is not otherwise segregated or pledged, to the extent of any overdraft, and to the maximum extent permitted by law.
Effective June 29, 2017, the fund and other affiliated funds have entered into a syndicated line of credit agreement with Citibank, N.A. as the administrative agent that enables them to participate in a $750 million unsecured committed line of credit. Excluding commitments designated for a certain fund and subject to the need of all other affiliated funds, the fund can borrow up to an aggregate commitment amount of $500 million, subject to asset coverage and other limitations as specified in the agreement. A commitment fee payable at the end of each calendar quarter, based on the average daily unused portion of the line of credit, is charged to each participating fund based on a combination of fixed and asset based allocations and is reflected in Other expenses on the Statement of operations. Prior to June 29, 2017, the fund had a similar agreement that enabled it to participate in a $1 billion unsecured committed line of credit. For the six months ended August 31, 2017, the fund had no borrowings under either line of credit. Commitment fees for the six months ended August 31, 2017, were $5,178.
Expenses. Within the John Hancock group of funds complex, expenses that are directly attributable to an individual fund are allocated to such fund. Expenses that are not readily attributable to a specific fund are allocated among all funds in an
equitable manner, taking into consideration, among other things, the nature and type of expense and the fund's relative net assets. Expense estimates are accrued in the period to which they relate and adjustments are made when actual amounts are known.
Class allocations. Income, common expenses and realized and unrealized gains (losses) are determined at the fund level and allocated daily to each class of shares based on the net assets of the class. Class-specific expenses, such as distribution and service fees, if any, and transfer agent fees, for all classes, are charged daily at the class level based on the net assets of each class and the specific expense rates applicable to each class.
Federal income taxes. The fund intends to continue to qualify as a regulated investment company by complying with the applicable provisions of the Internal Revenue Code and will not be subject to federal income tax on taxable income that is distributed to shareholders. Therefore, no federal income tax provision is required.
For federal income tax purposes, as of February 28, 2017, the fund has a short-term capital loss carryfoward of $42,185,848 and a long-term capital loss carryforward of $54,587,482 available to offset future net realized capital gains. These carryforwards do not expire.
As of February 28, 2017, the fund had no uncertain tax positions that would require financial statement recognition, derecognition or disclosure. The fund's federal tax returns are subject to examination by the Internal Revenue Service for a period of three years.
Distribution of income and gains. Distributions to shareholders from net investment income and net realized gains, if any, are recorded on the ex-date. The fund typically declares and pays dividends quarterly. Capital gain distributions, if any, at least annually.
Distributions paid by the fund with respect to each class of shares are calculated in the same manner, at the same time and in the same amount, except for the effect of class level expenses that may be applied differently to each class.
Such distributions, on a tax basis, are determined in conformity with income tax regulations, which may differ from US GAAP.
Capital accounts within the financial statements are adjusted for permanent book-tax differences. These adjustments have no impact on net assets or the results of operations. Temporary book-tax differences, if any, will reverse in a subsequent period. Book-tax differences are primarily attributable to wash sale loss deferrals and partnerships.
Note 3 — Guarantees and indemnifications
Under the Trust's organizational documents, its Officers and Trustees are indemnified against certain liabilities arising out of the performance of their duties to the Trust, including the fund. Additionally, in the normal course of business, the fund enters into contracts with service providers that contain general indemnification clauses. The fund's maximum exposure under these arrangements is unknown, as this would involve future claims that may be made against the fund that have not yet occurred. The risk of material loss from such claims is considered remote.
Note 4 — Fees and transactions with affiliates
John Hancock Advisers, LLC (the Advisor) serves as investment advisor for the fund. John Hancock Distributors, LLC (the Distributor), an affiliate of the Advisor, serves as principal underwriter of the fund. The Advisor and the Distributor are indirect, wholly owned subsidiaries of Manulife Financial Corporation (MFC).
Management fee. The fund has an investment management agreement with the Advisor under which the fund pays a daily management fee to the Advisor, equivalent on an annual basis to the sum of 0.800% of average daily net assets. The Advisor has a subadvisory agreement with Epoch Investment Partners, Inc.. The fund is not responsible for payment of the subadvisory fees.
The Advisor has contractually agreed to waive a portion of its management fee and/or reimburse expenses for certain funds of the John Hancock group of funds complex, including the fund (the participating portfolios). This waiver is based upon aggregate net assets of all the participating portfolios. The amount of the reimbursement is calculated daily and allocated
among all the participating portfolios in proportion to the daily net assets of each fund. During the six months ended August 31, 2017, this waiver amounted to 0.01% of the fund's average net assets (on an annualized basis). This arrangement may be amended or terminated at any time by the Advisor upon notice to the fund and with the approval of the Board of Trustees.
The Advisor contractually agrees to reduce its management fee or, if necessary, make payment to the applicable class in an amount equal to the amount by which expenses of Class A, Class B, Class C, Class I, Class R2, and Class R6 shares, as applicable, exceed 1.09%, 1.84%, 1.84%, 0.84%, 1.24%, and 0.74%, respectively, of average net assets attributable to the applicable class. For purposes of this agreement, "expenses of Class A, Class B, Class C, Class I, Class R2, and Class R6 shares" means all class expenses (including fund expenses attributable to the class), excluding taxes, brokerage commissions, interest expense, litigation and indemnification expenses and other extraordinary expenses not incurred in the ordinary course of the fund's business, acquired fund fees and expenses paid indirectly, and short dividend expense. This agreement expires on June 30, 2018, unless renewed by mutual agreement of the fund and the Advisor based on upon a determination that this is appropriate under the circumstances at that time.
Prior to July 1, 2017, the Advisor had contractually agreed to waive and/or reimburse all class-specific expenses for Class R6 shares of the fund to the extent they exceed 0.00% of average net assets.
The Advisor has voluntarily agreed to reduce its management fee, or if necessary make payment to the applicable class in an amount equal to the amount by which the expenses of Class NAV shares exceed 0.74% of average net assets attributable to the class. "Expenses" means all the expenses of Class NAV shares, excluding taxes, brokerage commissions, interest expense, litigation and indemnification expenses and other extraordinary expenses not incurred in the ordinary course of the fund's business, acquired fund fees and expenses paid indirectly, and short dividend expense. This voluntary expense reduction will continue in effect until terminated at any time by the Advisor on notice to the fund.
For the six months ended August 31, 2017, the expense reductions described above amounted to the following:
| Class | Expense reductions | Class | Expense reductions | |
| Class A | $364,821 | Class R2 | $692 | |
| Class B | 7,018 | Class R6 | 908 | |
| Class C | 85,926 | Class NAV | 330,589 | |
| Class I | 840,984 | Total | $1,630,938 |
Expenses waived or reimbursed in the current fiscal period are not subject to recapture in future fiscal periods.
The investment management fees, including the impact of the waivers and reimbursements as described above, incurred for the six months ended August 31, 2017 were equivalent to a net annual effective rate of 0.66% of the fund's average daily net assets.
Accounting and legal services. Pursuant to a service agreement, the fund reimburses the Advisor for all expenses associated with providing the administrative, financial, legal, accounting and recordkeeping services to the fund, including the preparation of all tax returns, periodic reports to shareholders and regulatory reports, among other services. These expenses are allocated to each share class based on its relative net assets at the time the expense was incurred. These accounting and legal services fees incurred for the six months ended August 31, 2017 amounted to an annual rate of 0.02% of the fund's average daily net assets.
Distribution and service plans. The fund has a distribution agreement with the Distributor. The fund has adopted distribution and service plans with respect to Class A, Class B, Class C and Class R2 shares pursuant to Rule 12b-1 under the 1940 Act, to pay the Distributor for services provided as the distributor of shares of the fund. In addition, under a service plan for Class R2 shares, the fund pays for certain other services. The fund may pay up to the following contractual rates of
distribution and service fees under these arrangements, expressed as an annual percentage of average daily net assets for each class of the fund's shares:
| Class | Rule 12b-1 fee | Service fee | Class | Rule 12b-1 fee | Service fee | |
| Class A | 0.30% | — | Class C | 1.00% | — | |
| Class B | 1.00% | — | Class R2 | 0.25% | 0.25% |
Sales charges. Class A shares are assessed up-front sales charges, which resulted in payments to the Distributor amounting to $652,658 for the six months ended August 31, 2017. Of this amount, $112,701 was retained and used for printing prospectuses, advertising, sales literature and other purposes, $538,855 was paid as sales commissions to broker-dealers and $1,102 was paid as sales commissions to sales personnel of Signator Investors, Inc., a broker-dealer affiliate of the Advisor.
Class A, Class B and Class C shares may be subject to contingent deferred sales charges (CDSCs). Certain Class A shares that are acquired through purchases of $1 million or more and are redeemed within one year of purchase are subject to a 1.00% sales charge. Class B shares that are redeemed within six years of purchase are subject to CDSCs, at declining rates, beginning at 5.00%. Class C shares that are redeemed within one year of purchase are subject to a 1.00% CDSC. CDSCs are applied to the lesser of the current market value at the time of redemption or the original purchase cost of the shares being redeemed. Proceeds from CDSCs are used to compensate the Distributor for providing distribution-related services in connection with the sale of these shares. During the six months ended August 31, 2017, CDSCs received by the Distributor amounted to $734, $4,181 and $6,505 for Class A, Class B and Class C shares, respectively.
Transfer agent fees. The John Hancock Group of Funds has a complex-wide transfer agent agreement with John Hancock Signature Services, Inc. (Signature Services), an affiliate of the Advisor. The transfer agent fees paid to Signature Services are determined based on the cost to Signature Services (Signature Services Cost) of providing recordkeeping services. It also includes out-of-pocket expenses, including payments made to third-parties for recordkeeping services provided to their clients who invest in one or more John Hancock funds. In addition, Signature Services Cost may be reduced by certain fees that Signature Services receives in connection with retirement and small accounts. Signature Services Cost is calculated monthly and allocated, as applicable, to five categories of share classes: Retail Share and Institutional Share Classes of Non-Municipal Bond Funds, Class R6 Shares, Retirement Share Classes and Municipal Bond Share Classes. Within each of these categories, the applicable costs are allocated to the affected John Hancock affiliated funds and/or classes, based on the relative average daily net assets.
Class level expenses. Class level expenses for the six months ended August 31, 2017 were:
| Class | Distribution and service fees | Transfer agent fees |
| Class A | $580,759 | $224,603 |
| Class B | 50,942 | 5,911 |
| Class C | 622,088 | 72,165 |
| Class I | — | 688,547 |
| Class R2 | 2,781 | 79 |
| Class R6 | — | 94 |
| Total | $1,256,570 | $991,399 |
Trustee expenses. The Trust compensates each Trustee who is not an employee of the Advisor or its affiliates. The costs of paying Trustee compensation and expenses are allocated to each fund based on its net assets relative to other funds within the John Hancock group of funds complex.
Note 5 — Fund share transactions
Transactions in fund shares for the six months ended August 31, 2017 and for the year ended February 28, 2017 were as follows:
| Six months ended 8-31-17 | Year ended 2-28-17 | |||||||||||||||||||||||||
| Shares | Amount | Shares | Amount | |||||||||||||||||||||||
| Class A shares | ||||||||||||||||||||||||||
| Sold | 2,888,937 | $32,081,013 | 10,495,512 | $110,012,405 | ||||||||||||||||||||||
| Distributions reinvested | 582,435 | 6,494,758 | 1,364,405 | 13,995,516 | ||||||||||||||||||||||
| Repurchased | (5,246,597 | ) | (58,273,484 | ) | (23,980,304 | ) | (251,777,384 | ) | ||||||||||||||||||
| Net decrease | (1,775,225 | ) | ($19,697,713 | ) | (12,120,387 | ) | ($127,769,463 | ) | ||||||||||||||||||
| Class B shares | ||||||||||||||||||||||||||
| Sold | 4,082 | $44,922 | 46,334 | $483,148 | ||||||||||||||||||||||
| Distributions reinvested | 9,164 | 102,468 | 18,961 | 194,376 | ||||||||||||||||||||||
| Repurchased | (166,767 | ) | (1,870,306 | ) | (296,555 | ) | (3,105,472 | ) | ||||||||||||||||||
| Net decrease | (153,521 | ) | ($1,722,916 | ) | (231,260 | ) | ($2,427,948 | ) | ||||||||||||||||||
| Class C shares | ||||||||||||||||||||||||||
| Sold | 453,834 | $5,050,021 | 2,017,179 | $21,196,030 | ||||||||||||||||||||||
| Distributions reinvested | 143,504 | 1,604,813 | 274,676 | 2,817,422 | ||||||||||||||||||||||
| Repurchased | (1,668,048 | ) | (18,552,005 | ) | (4,093,360 | ) | (42,785,906 | ) | ||||||||||||||||||
| Net decrease | (1,070,710 | ) | ($11,897,171 | ) | (1,801,505 | ) | ($18,772,454 | ) | ||||||||||||||||||
| Class I shares | ||||||||||||||||||||||||||
| Sold | 17,929,062 | $200,017,209 | 71,471,059 | $752,004,989 | ||||||||||||||||||||||
| Distributions reinvested | 2,126,021 | 23,783,479 | 2,811,312 | 29,001,772 | ||||||||||||||||||||||
| Repurchased | (14,690,652 | ) | (163,862,792 | ) | (55,588,014 | ) | (587,635,516 | ) | ||||||||||||||||||
| Net increase | 5,364,431 | $59,937,896 | 18,694,357 | $193,371,245 | ||||||||||||||||||||||
| Class R2 shares | ||||||||||||||||||||||||||
| Sold | 12,805 | $144,132 | 36,435 | $380,649 | ||||||||||||||||||||||
| Distributions reinvested | 1,646 | 18,443 | 2,631 | 27,105 | ||||||||||||||||||||||
| Repurchased | (7,733 | ) | (86,285 | ) | (29,789 | ) | (312,790 | ) | ||||||||||||||||||
| Net increase | 6,718 | $76,290 | 9,277 | $94,964 | ||||||||||||||||||||||
| Class R6 shares | ||||||||||||||||||||||||||
| Sold | 16,410 | $183,158 | 67,568 | $711,304 | ||||||||||||||||||||||
| Distributions reinvested | 2,211 | 24,660 | 3,370 | 34,696 | ||||||||||||||||||||||
| Repurchased | (58,060 | ) | (643,915 | ) | (21,368 | ) | (223,952 | ) | ||||||||||||||||||
| Net increase (decrease) | (39,439 | ) | ($436,097 | ) | 49,570 | $522,048 | ||||||||||||||||||||
| Class NAV shares | ||||||||||||||||||||||||||
| Sold | 273,476 | $3,077,357 | 2,603,181 | $27,412,499 | ||||||||||||||||||||||
| Distributions reinvested | 899,276 | 10,049,032 | 1,767,262 | 18,198,344 | ||||||||||||||||||||||
| Repurchased | (3,809,926 | ) | (42,603,791 | ) | (10,780,446 | ) | (113,278,915 | ) | ||||||||||||||||||
| Net decrease | (2,637,174 | ) | ($29,477,402 | ) | (6,410,003 | ) | ($67,668,072 | ) | ||||||||||||||||||
| Total net decrease | (304,920 | ) | ($3,217,113 | ) | (1,809,951 | ) | ($22,649,680 | ) | ||||||||||||||||||
Affiliates of the fund owned 100% of shares of Class NAV, on August 31, 2017. Such concentration of shareholders' capital could have a material effect on the fund if such shareholders redeem from the fund.
Note 6 — Purchase and sale of securities
Purchases and sales of securities, other than short-term investments, amounted to $197,302,810 and $229,482,796, respectively, for the six months ended August 31, 2017.
Note 7 — Investment by affiliated funds
Certain investors in the fund are affiliated funds that are managed by the Advisor and its affiliates. The affiliated funds do not invest in the fund for the purpose of exercising management or control; however, this investment may represent a significant portion of the fund's net assets. At August 31, 2017, funds within the John Hancock group of funds complex held 21.9% of the fund's net assets. The following funds had an affiliate ownership of 5% or more of the fund's net assets:
| Fund | Affiliated concentration |
| John Hancock Funds II Multimanager Lifestyle Growth Portfolio | 6.9% |
| John Hancock Funds II Multimanager Lifestyle Balanced Portfolio | 6.8% |
CONTINUATION OF INVESTMENT ADVISORY AND SUBADVISORY AGREEMENTS
Evaluation of Advisory and Subadvisory Agreements by the Board of Trustees
This section describes the evaluation by the Board of Trustees (the Board) of John Hancock Funds III (the Trust) of the Advisory Agreement (the Advisory Agreement) with John Hancock Advisers, LLC (the Advisor) and the Subadvisory Agreement (the Subadvisory Agreement) with Epoch Investment Partners, Inc. (the Subadvisor), for John Hancock Global Shareholder Yield Fund (the fund). The Advisory Agreement and Subadvisory Agreement are collectively referred to as the Agreements. Prior to the June 19-22, 2017 in-person meeting at which the Agreements were approved, the Board also discussed and considered information regarding the proposed continuation of the Agreements at an in-person meeting held on May 22-24, 2017.
Approval of Advisory and Subadvisory Agreements
At in-person meetings held on June 19-22, 2017, the Board, including the Trustees who are not parties to any Agreement or considered to be interested persons of the Trust under the Investment Company Act of 1940, as amended (the 1940 Act) (the Independent Trustees), reapproved for an annual period the continuation of the Advisory Agreement between the Trust and the Advisor and the Subadvisory Agreement between the Advisor and the Subadvisor with respect to the fund.
In considering the Advisory Agreement and the Subadvisory Agreement, the Board received in advance of the meetings a variety of materials relating to the fund, the Advisor and the Subadvisor, including comparative performance, fee and expense information for a peer group of similar funds prepared by an independent third-party provider of mutual fund data, performance information for an applicable benchmark index; and, with respect to the Subadvisor, comparative performance information for comparably managed accounts, as applicable, and other information provided by the Advisor and the Subadvisor regarding the nature, extent and quality of services provided by the Advisor and the Subadvisor under their respective Agreements, as well as information regarding the Advisor's revenues and costs of providing services to the fund and any compensation paid to affiliates of the Advisor. At the meetings at which the renewal of the Advisory Agreement and Subadvisory Agreement are considered, particular focus is given to information concerning fund performance, comparability of fees and total expenses, and profitability. However, the Board notes that the evaluation process with respect to the Advisor and the Subadvisor is an ongoing one. In this regard, the Board also took into account discussions with management and information provided to the Board (including its various committees) at prior meetings with respect to the services provided by the Advisor and the Subadvisor to the fund, including quarterly performance reports prepared by management containing reviews of investment results and prior presentations from the Subadvisor with respect to the fund. The information received and considered by the Board in connection with the May and June meetings and throughout the year was both written and oral. The Board also considered the nature, quality, and extent of non-advisory services, if any, to be provided to the fund by the Advisor's affiliates, including distribution services. The Board considered the Advisory Agreement and the Subadvisory Agreement separately in the course of its review. In doing so, the Board noted the respective roles of the Advisor and Subadvisor in providing services to the fund.
Throughout the process, the Board asked questions of and requested additional information from management. The Board is assisted by counsel for the Trust and the Independent Trustees are also separately assisted by independent legal counsel throughout the process. The Independent Trustees also received a memorandum from their independent legal counsel discussing the legal standards for their consideration of the proposed continuation of the Agreements and discussed the proposed continuation of the Agreements in private sessions with their independent legal counsel at which no representatives of management were present.
Approval of Advisory Agreement
In approving the Advisory Agreement with respect to the fund, the Board, including the Independent Trustees, considered a variety of factors, including those discussed below. The Board also considered other factors (including conditions and trends prevailing generally in the economy, the securities markets, and the industry) and did not treat any single factor as determinative, and each Trustee may have attributed different weights to different factors. The Board's conclusions may be
based in part on its consideration of the advisory and subadvisory arrangements in prior years and on the Board's ongoing regular review of fund performance and operations throughout the year.
Nature, extent, and quality of services. Among the information received by the Board from the Advisor relating to the nature, extent, and quality of services provided to the fund, the Board reviewed information provided by the Advisor relating to its operations and personnel, descriptions of its organizational and management structure, and information regarding the Advisor's compliance and regulatory history, including its Form ADV. The Board also noted that on a regular basis it receives and reviews information from the Trust's Chief Compliance Officer (CCO) regarding the fund's compliance policies and procedures established pursuant to Rule 38a-1 under the 1940 Act. The Board observed that the scope of services provided by the Advisor, and of the undertakings required of the Advisor in connection with those services, including maintaining and monitoring its own and the fund's compliance programs, risk management programs, liquidity management programs and cybersecurity programs, had expanded over time as a result of regulatory, market and other developments. The Board considered that the Advisor is responsible for the management of the day-to-day operations of the fund, including, but not limited to, general supervision of and coordination of the services provided by the Subadvisor, and is also responsible for monitoring and reviewing the activities of the Subadvisor and other third-party service providers. The Board also considered the significant risks assumed by the Advisor in connection with the services provided to the fund including entrepreneurial risk in sponsoring new funds and ongoing risks including investment, operational, enterprise, litigation, regulatory and compliance risks with respect to all funds.
In considering the nature, extent, and quality of the services provided by the Advisor, the Trustees also took into account their knowledge of the Advisor's management and the quality of the performance of the Advisor's duties, through Board meetings, discussions and reports during the preceding year and through each Trustee's experience as a Trustee of the Trust and of the other trusts in the John Hancock group of funds complex (the John Hancock Fund Complex).
In the course of their deliberations regarding the Advisory Agreement, the Board considered, among other things:
| (a) | the skills and competency with which the Advisor has in the past managed the Trust's affairs and its subadvisory relationship, the Advisor's oversight and monitoring of the Subadvisor's investment performance and compliance programs, such as the Subadvisor's compliance with fund policies and objectives, review of brokerage matters, including with respect to trade allocation and best execution and the Advisor's timeliness in responding to performance issues; |
| (b) | the background, qualifications and skills of the Advisor's personnel; |
| (c) | the Advisor's compliance policies and procedures and its responsiveness to regulatory changes and mutual fund industry developments; |
| (d) | the Advisor's administrative capabilities, including its ability to supervise the other service providers for the fund; |
| (e) | the financial condition of the Advisor and whether it has the financial wherewithal to provide a high level and quality of services to the fund; |
| (f) | the Advisor's initiatives intended to improve various aspects of the Trust's operations and investor experience with the fund; and |
| (g) | the Advisor's reputation and experience in serving as an investment advisor to the Trust and the benefit to shareholders of investing in funds that are part of a family of funds offering a variety of investments. |
The Board concluded that the Advisor may reasonably be expected to continue to provide a high quality of services under the Advisory Agreement with respect to the fund.
Investment performance. In considering the fund's performance, the Board noted that it reviews at its regularly scheduled meetings information about the fund's performance results. In connection with the consideration of the Advisory Agreement, the Board:
| (a) | reviewed information prepared by management regarding the fund's performance; |
| (b) | considered the comparative performance of an applicable benchmark index; |
| (c) | considered the performance of comparable funds, if any, as included in the report prepared by an independent third-party provider of fund data; and |
| (d) | took into account the Advisor's analysis of the fund's performance and its plans and recommendations regarding the Trust's subadvisory arrangements generally. |
The Board noted that while it found the data provided by the independent third-party generally useful it recognized its limitations, including in particular that the data may vary depending on the end date selected and that the results of the performance comparisons may vary depending on the selection of the peer group. The Board noted that the fund underperformed its benchmark index for the one-, three-, and five-year periods ended December 31, 2016. The Board also noted that the fund underperformed its peer group average for the one-year period and outperformed the peer group average for the three- and five-year periods ended December 31, 2016. The Board took into account management's discussion of the fund's performance, including favorable performance relative to the peer group for the three- and five-year periods. The Board concluded that the fund's performance has generally been in line with or generally outperformed the historical performance of comparable funds over the longer-term.
Fees and expenses. The Board reviewed comparative information prepared by an independent third-party provider of mutual fund data, including, among other data, the fund's contractual and net management fees (and subadvisory fees, to the extent available) and total expenses as compared to similarly situated investment companies deemed to be comparable to the fund in light of the nature, extent and quality of the management and advisory and subadvisory services provided by the Advisor and the Subadvisor. The Board considered the fund's ranking within a smaller group of peer funds chosen by the independent third-party provider, as well as the fund's ranking within a broader group of funds. In comparing the fund's contractual and net management fees to those of comparable funds, the Board noted that such fees include both advisory and administrative costs. The Board noted that net management fees and total expenses for the fund are lower than the peer group median.
The Board took into account management's discussion with respect to the overall management fee, the fees of the Subadvisor, including the amount of the advisory fee retained by the Advisor after payment of the subadvisory fee, in each case in light of the services rendered for those amounts and the risks undertaken by the Advisor. The Board also noted that the Advisor pays the subadvisory fee, and that such fees are negotiated at arm's length with respect to the Subadvisor. The Board also took into account that management had agreed to implement an overall fee waiver across the complex, which is discussed further below. The Board also noted that, in addition, the Advisor is currently waiving fees and/or reimbursing expenses with respect to the fund. The Board reviewed information provided by the Advisor concerning investment advisory fees charged by the Advisor or one of its advisory affiliates to other clients (including other funds in the complex) having similar investment mandates, if any. The Board considered any differences between the Advisor's and a Subadvisor's services to the fund and the services they provide to other comparable clients or funds. The Board concluded that the advisory fee paid with respect to the fund is reasonable in light of the nature, extent and quality of the services provided to the fund under the Advisory Agreement.
Profitability/Fall out benefits. In considering the costs of the services to be provided and the profits to be realized by the Advisor and its affiliates from the Advisor's relationship with the Trust, the Board:
| (a) | reviewed financial information of the Advisor; |
| (b) | reviewed and considered information presented by the Advisor regarding the net profitability to the Advisor and its affiliates with respect to the fund; |
| (c) | received and reviewed profitability information with respect to the John Hancock Fund Complex as a whole and with respect to the fund; |
| (d) | received information with respect to the Advisor's allocation methodologies used in preparing the profitability data and considered that the Advisor hired an independent third-party consultant to provide an analysis of the Advisor's allocation methodologies; |
| (e) | considered that the John Hancock insurance companies that are affiliates of the Advisor, as shareholders of the Trust directly or through their separate accounts, receive certain tax credits or deductions relating to foreign taxes paid and dividends received by certain funds of the Trust and noted that these tax benefits, which are not available to participants in qualified retirement plans under applicable income tax law, are reflected in the profitability information reviewed by the Board; |
| (f) | considered that the Advisor also provides administrative services to the fund on a cost basis pursuant to an administrative services agreement; |
| (g) | noted that affiliates of the Advisor provide transfer agency services and distribution services to the fund, and that the fund's distributor also receives Rule 12b-1 payments to support distribution of the fund; |
| (h) | noted that the Advisor also derives reputational and other indirect benefits from providing advisory services to the fund; |
| (i) | noted that the subadvisory fee for the fund is paid by the Advisor and is negotiated at arm's length; |
| (j) | considered the Advisor's ongoing costs and expenditures necessary to improve services, meet new regulatory and compliance requirements, and adapt to other challenges impacting the mutual fund industry; and |
| (k) | considered that the Advisor should be entitled to earn a reasonable level of profits in exchange for the level of services it provides to the fund and the risks that it assumes as Advisor, including entrepreneurial, operational, reputational, litigation and regulatory risk. |
Based upon its review, the Board concluded that the level of profitability, if any, of the Advisor and its affiliates from their relationship with the fund was reasonable and not excessive.
Economies of scale. In considering the extent to which economies of scale would be realized as the fund grows and whether fee levels reflect these economies of scale for the benefit of fund shareholders, the Board:
| (a) | considered that the Advisor has contractually agreed to waive a portion of its management fee for certain funds of the John Hancock Fund Complex, including the fund (the participating portfolios) or otherwise reimburse the expenses of the participating portfolios (the reimbursement). This waiver is based upon aggregate net assets of all the participating portfolios. The amount of the reimbursement is calculated daily and allocated among all the participating portfolios in proportion to the daily net assets of each fund; |
| (b) | the Board also took into account management's discussion of the fund's advisory fee structure; and |
| (c) | the Board also considered the effect of the fund's growth in size on its performance and fees. The Board also noted that if the fund's assets increase over time, the fund may realize other economies of scale. |
Approval of Subadvisory Agreement
In making its determination with respect to approval of the Subadvisory Agreement, the Board reviewed:
| (1) | information relating to the Subadvisor's business, including current subadvisory services to the Trust (and other funds in the John Hancock Fund Complex); |
| (2) | the historical and current performance of the fund and comparative performance information relating to an applicable benchmark index and comparable funds; |
| (3) | the subadvisory fee for the fund, including any breakpoints, and to the extent available, comparable fee information prepared by an independent third party provider of fund data; and |
| (4) | information relating to the nature and scope of any material relationships and their significance to the Trust's Advisor and Subadvisor. |
Nature, extent, and quality of services. With respect to the services provided by the Subadvisor, the Board received information provided to the Board by the Subadvisor, including the Subadvisor's Form ADV, as well as took into account information presented throughout the past year. The Board considered the Subadvisor's current level of staffing and its overall resources, as well as received information relating to the Subadvisor's compensation program. The Board reviewed the Subadvisor's history and investment experience, as well as information regarding the qualifications, background, and responsibilities of the Subadvisor's investment and compliance personnel who provide services to the fund. The Board also considered, among other things, the Subadvisor's compliance program and any disciplinary history. The Board also considered the Subadvisor's risk assessment and monitoring process. The Board reviewed the Subadvisor's regulatory history, including whether it was involved in any regulatory actions or investigations as well as material litigation, and any settlements and amelioratory actions undertaken, as appropriate. The Board noted that the Advisor conducts regular, periodic reviews of the Subadvisor and its operations, including regarding investment processes and organizational and staffing matters. The Board also noted that the Trust's CCO and his staff conduct regular, periodic compliance reviews with the Subadvisor and present reports to the Independent Trustees regarding the same, which includes evaluating the regulatory compliance systems of the Subadvisor and procedures reasonably designed to assure compliance with the federal securities laws. The Board also took into account the financial condition of the Subadvisor.
The Board considered the Subadvisor's investment process and philosophy. The Board took into account that the Subadvisor's responsibilities include the development and maintenance of an investment program for the fund that is consistent with the fund's investment objective, the selection of investment securities and the placement of orders for the purchase and sale of such securities, as well as the implementation of compliance controls related to performance of these services. The Board also received information with respect to the Subadvisor's brokerage policies and practices, including with respect to best execution and soft dollars.
Subadvisor compensation. In considering the cost of services to be provided by the Subadvisor and the profitability to the Subadvisor of its relationship with the fund, the Board noted that the fees under the Subadvisory Agreement are paid by the Advisor and not the fund.
The Board also relied on the ability of the Advisor to negotiate the Subadvisory Agreement with the Subadvisor, which is not affiliated with the Advisor, and the fees thereunder at arm's length. As a result, the costs of the services to be provided and the profits to be realized by the Subadvisor from its relationship with the Trust were not a material factor in the Board's consideration of the Subadvisory Agreement.
The Board also received information regarding the nature and scope (including their significance to the Advisor and its affiliates and to the Subadvisor) of any material relationships with respect to the Subadvisor, which include arrangements in which the Subadvisor or its affiliates provide advisory, distribution, or management services in connection with financial products sponsored by the Advisor or its affiliates, and may include other registered investment companies, a 529 education savings plan, managed separate accounts and exempt group annuity contracts sold to qualified plans. The Board also received information and took into account any other potential conflicts of interest the Advisor might have in connection with the Subadvisory Agreement.
In addition, the Board considered other potential indirect benefits that the Subadvisor and its affiliates may receive from the Subadvisor's relationship with the fund, such as the opportunity to provide advisory services to additional funds in the John Hancock Fund Complex and reputational benefits.
Subadvisory fees. The Board considered that the fund pays an advisory fee to the Advisor and that, in turn, the Advisor pays a subadvisory fee to the Subadvisor. As noted above, the Board also considered the fund's subadvisory fees as compared to similarly situated investment companies deemed to be comparable to the fund as included in the report prepared by the independent third party provider of fund data, to the extent available. The Board noted that the limited size of the Broadridge peer group was not sufficient for comparative purposes. The Board also took into account the subadvisory fees paid by the
Advisor to the Subadvisor with respect to the fund and compared them to fees charged by the Subadvisor to manage other subadvised portfolios and portfolios not subject to regulation under the 1940 Act, as applicable.
Subadvisor performance. As noted above, the Board considered the fund's performance as compared to the fund's peer group and the benchmark index and noted that the Board reviews information about the fund's performance results at its regularly scheduled meetings. The Board noted the Advisor's expertise and resources in monitoring the performance, investment style and risk-adjusted performance of the Subadvisor. The Board was mindful of the Advisor's focus on the Subadvisor's performance. The Board also noted the Subadvisor's long-term performance record for similar accounts, as applicable.
The Board's decision to approve the Subadvisory Agreement was based on a number of determinations, including the following:
* * *
Based on the Board's evaluation of all factors that the Board deemed to be material, including those factors described above, the Board, including the Independent Trustees, concluded that renewal of the Advisory Agreement and the Subadvisory Agreement would be in the best interest of the fund and its shareholders. Accordingly, the Board, and the Independent Trustees voting separately, approved the Advisory Agreement and Subadvisory Agreement for an additional one-year period.
Trustees Hassell H. McClellan, Chairperson Officers Andrew G. Arnott John J. Danello Francis V. Knox, Jr. Charles A. Rizzo Salvatore Schiavone | Investment advisor John Hancock Advisers, LLC Subadvisor Epoch Investment Partners, Inc. Principal distributor John Hancock Funds, LLC Custodian Citibank, N.A. Transfer agent John Hancock Signature Services, Inc. Legal counsel K&L Gates LLP |
*Member of the Audit Committee
†Non-Independent Trustee
#Effective 6-20-17
The fund's proxy voting policies and procedures, as well as the fund proxy voting record for the most recent twelve-month period ended June 30, are available free of charge on the Securities and Exchange Commission (SEC) website at sec.gov or on our website.
The fund's complete list of portfolio holdings, for the first and third fiscal quarters, is filed with the SEC on Form N-Q. The fund's Form N-Q is available on our website and the SEC's website, sec.gov, and can be reviewed and copied (for a fee) at the SEC's Public Reference Room in Washington, DC. Call 800-SEC-0330 to receive information on the operation of the SEC's Public Reference Room.
We make this information on your fund, as well as monthly portfolio holdings, and other fund details available on our website at jhinvestments.com or by calling 800-225-5291.
| You can also contact us: | |||
| 800-225-5291 jhinvestments.com | Regular mail: John Hancock Signature Services, Inc. | Express mail: John Hancock Signature Services, Inc. | |
John Hancock family of funds
DOMESTIC EQUITY FUNDS Balanced Blue Chip Growth Classic Value Disciplined Value Disciplined Value Mid Cap Equity Income Fundamental All Cap Core Fundamental Large Cap Core Fundamental Large Cap Value New Opportunities Small Cap Value Small Company Strategic Growth U.S. Global Leaders Growth U.S. Growth Value Equity GLOBAL AND INTERNATIONAL EQUITY FUNDS Disciplined Value International Emerging Markets Emerging Markets Equity Fundamental Global Franchise Global Equity Global Shareholder Yield Greater China Opportunities International Growth International Small Company International Value Equity | INCOME FUNDS Bond California Tax-Free Income Emerging Markets Debt Floating Rate Income Global Income Government Income High Yield High Yield Municipal Bond Income Investment Grade Bond Money Market Short Duration Credit Opportunities Spectrum Income Strategic Income Opportunities Tax-Free Bond ALTERNATIVE AND SPECIALTY FUNDS Absolute Return Currency Alternative Asset Allocation Enduring Assets Financial Industries Global Absolute Return Strategies Global Conservative Absolute Return Global Focused Strategies Natural Resources Redwood Regional Bank Seaport Technical Opportunities |
A fund's investment objectives, risks, charges, and expenses should be considered carefully before investing. The prospectus contains this and other important information about the fund. To obtain a prospectus, contact your financial professional, call John Hancock Investments at 800-225-5291, or visit our website at jhinvestments.com. Please read the prospectus carefully before investing or sending money.
ASSET ALLOCATION Income Allocation Fund Multi-Index Lifetime Portfolios Multi-Index Preservation Portfolios Multimanager Lifestyle Portfolios Multimanager Lifetime Portfolios EXCHANGE-TRADED FUNDS John Hancock Multifactor Consumer Discretionary ETF John Hancock Multifactor Consumer Staples ETF John Hancock Multifactor Developed International ETF John Hancock Multifactor Energy ETF John Hancock Multifactor Financials ETF John Hancock Multifactor Healthcare ETF John Hancock Multifactor Industrials ETF John Hancock Multifactor Large Cap ETF John Hancock Multifactor Materials ETF John Hancock Multifactor Mid Cap ETF John Hancock Multifactor Technology ETF John Hancock Multifactor Utilities ETF | ENVIRONMENTAL, SOCIAL, AND GOVERNANCE FUNDS ESG All Cap Core ESG Core Bond ESG International Equity ESG Large Cap Core CLOSED-END FUNDS Financial Opportunities Hedged Equity & Income Income Securities Trust Investors Trust Preferred Income Preferred Income II Preferred Income III Premium Dividend Tax-Advantaged Dividend Income Tax-Advantaged Global Shareholder Yield |
John Hancock Multifactor ETF shares are bought and sold at market price (not NAV), and are not individually redeemed
from the fund. Brokerage commissions will reduce returns.
John Hancock ETFs are distributed by Foreside Fund Services, LLC, and are subadvised by Dimensional Fund Advisors LP.
Foreside is not affiliated with John Hancock Funds, LLC or Dimensional Fund Advisors LP.
Dimensional Fund Advisors LP receives compensation from John Hancock in connection with licensing rights to the
John Hancock Dimensional indexes. Dimensional Fund Advisors LP does not sponsor, endorse, or sell, and makes no
representation as to the advisability of investing in, John Hancock Multifactor ETFs.
John Hancock Investments
A trusted brand
John Hancock Investments is a premier asset manager representing one of
America's most trusted brands, with a heritage of financial stewardship dating
back to 1862. Helping our shareholders pursue their financial goals is at the
core of everything we do. It's why we support the role of professional financial
advice and operate with the highest standards of conduct and integrity.
A better way to invest
We serve investors globally through a unique multimanager approach:
We search the world to find proven portfolio teams with specialized
expertise for every strategy we offer, then we apply robust investment
oversight to ensure they continue to meet our uncompromising standards
and serve the best interests of our shareholders.
Results for investors
Our unique approach to asset management enables us to provide a diverse set
of investments backed by some of the world's best managers, along with strong
risk-adjusted returns across asset classes.
| | John Hancock Funds, LLC n Member FINRA, SIPC 601 Congress Street n Boston, MA 02210-2805 800-225-5291 n jhinvestments.com | |
| This report is for the information of the shareholders of John Hancock Global Shareholder Yield Fund. It is not authorized for distribution to prospective investors unless preceded or accompanied by a prospectus. | ||
| MF399096 | 320SA 8/17 10/17 | |
ITEM 2. CODE OF ETHICS.
Not applicable at this time.
ITEM 3. AUDIT COMMITTEE FINANCIAL EXPERT.
Not applicable at this time.
ITEM 4. PRINCIPAL ACCOUNTANT FEES AND SERVICES.
Not applicable at this time.
ITEM 5. AUDIT COMMITTEE OF LISTED REGISTRANTS.
Not applicable at this time.
ITEM 6. SCHEDULE OF INVESTMENTS.
(a) This schedule is included as part of the Report to shareholders filed under Item 1 of this form.
(b) Not applicable.
ITEM 7. DISCLOSURE OF PROXY VOTING POLICIES AND PROCEDURES FOR CLOSED-END MANAGEMENT INVESTMENT COMPANIES.
Not applicable.
ITEM 8. PORTFOLIO MANAGERS OF CLOSED-END MANAGEMENT INVESTMENT COMPANIES.
Not applicable.
ITEM 9. PURCHASES OF EQUITY SECURITIES BY CLOSED-END MANAGEMENT INVESTMENT COMPANY AND AFFILIATED PURCHASERS.
Not applicable.
ITEM 10. SUBMISSION OF MATTERS TO A VOTE OF SECURITY HOLDERS.
Not applicable.
ITEM 11. CONTROLS AND PROCEDURES.
| (a) | EVALUATION OF DISCLOSURE CONTROLS AND PROCEDURES. The registrant maintains disclosure controls and procedures that are designed to ensure that information required to be disclosed in this Form N-CSR is recorded, processed, summarized and reported within the time periods specified in the rules and forms of the Securities and Exchange Commission. Such disclosure and procedures include controls and procedures designed to ensure that such information is accumulated and communicated to the registrant’s management, including its principal executive officer and principal financial officer, as appropriate, to allow timely decisions regarding required disclosure. |
Within 90 days prior to the filing date of this Form N-CSR, the registrant had carried out an evaluation, under the supervision and with the participation of the registrant’s management, including the registrant’s principal executive officer and the registrant’s principal financial officer, of the effectiveness of the design and operation of the registrant’s disclosure controls and procedures relating to information required to be disclosed on Form N-CSR. Based on such evaluation, the registrant’s principal executive officer and principal financial officer concluded that the registrant’s disclosure controls and procedures are operating effectively to ensure that: | |||
(i) information required to be disclosed in this Form N-CSR is recorded, processed, summarized and reported within the periods specified in the rules and forms of the Securities and Exchange Commission, and (ii) information is accumulated and communicated to the registrant’s management, including its principal executive officer and principal financial officer, as appropriate, to allow timely decisions regarding required disclosure. | |||
| (b) | CHANGE IN REGISTRANT’S INTERNAL CONTROL: Not applicable. |
ITEM 12. DISCLOSURE OF SECURITIES LENDING ACTIVITIES FOR CLOSED-END MANAGEMENT INVESTMENT COMPANIES.
Not applicable.
ITEM 13. EXHIBITS.
(a) The certification required by Rule 30a-2(a) under the 1940 Act.
(b) The certification required by Rule 30a-2(b) under the 1940 Act.
(c)(1) Submission of Matters to a Vote of Security Holders is attached. See attached “John Hancock Funds – Nominating and Governance Committee Charter”.
(c)(2) Contact person at the registrant.
SIGNATURES
Pursuant to the requirements of the Securities Exchange Act of 1934 and the Investment Company Act of 1940, the registrant has duly caused this report to be signed on its behalf by the undersigned, thereunto duly authorized.
| John Hancock Funds III | |||
| By: | /s/ Andrew Arnott | ||
| Andrew Arnott | |||
| President | |||
| Date: | October 30, 2017 | ||
Pursuant to the requirements of the Securities Exchange Act of 1934 and the Investment Company Act of 1940, this report has been signed below by the following persons on behalf of the registrant and in the capacities and on the dates indicated.
| By: | /s/ Andrew Arnott | ||
| Andrew Arnott | |||
| President | |||
| Date: | October 30, 2017 | ||
| By: | /s/ Charles A. Rizzo | ||
| Charles A. Rizzo | |||
| Chief Financial Officer | |||
| Date: | October 30, 2017 | ||