UNITED STATES
SECURITIES AND EXCHANGE COMMISSION
Washington, D.C. 20549
FORM N-CSR
CERTIFIED SHAREHOLDER REPORT OF REGISTERED
MANAGEMENT INVESTMENT COMPANIES
Investment Company Act file number 811-21777
John Hancock Funds III
(Exact name of registrant as specified in charter)
200 Berkeley Street, Boston, Massachusetts 02116
(Address of principal executive offices) (Zip code)
Salvatore Schiavone
Treasurer
200 Berkeley Street
Boston, Massachusetts 02116
(Name and address of agent for service)
Registrant’s telephone number, including area code: 617-663-4497
Date of fiscal year end: March 31
Date of reporting period: September 30, 2020
ITEM 1. REPORTS TO STOCKHOLDERS

Dear shareholder,
Despite heightened fears over the coronavirus (COVID-19), which sent markets tumbling just prior to the beginning of the reporting period, global financial markets delivered positive returns for the 6 months ended September 30, 2020. In response to the pandemic-led shock, the U.S. Federal Reserve and the government worked quickly to shore up the economy and equity markets began to rise, particularly large-cap U.S. growth stocks, during the period.
Of course, it would be a mistake to consider this market turnaround a trustworthy signal of assured or swift economic recovery. The ongoing spread of COVID-19 continues to create uncertainty among businesses and investors. While there has been economic growth in most of the United States, the pace has slowed in many areas as interest rates remain low and consumer spending remains far below prepandemic levels.
From an investment perspective, we continue to think that maintaining a focus on long-term objectives while pursuing a risk-aware strategy is a prudent way forward. Above all, we believe the counsel of a trusted financial professional matters now more than ever. Periods of heightened uncertainty are precisely the time to review your financial goals and follow a plan that helps you make the most of what continues to be a challenging situation.
On behalf of everyone at John Hancock Investment Management, I’d like to take this opportunity to welcome new shareholders and thank existing shareholders for the continued trust you’ve placed in us.
Sincerely,
Andrew G. Arnott
President and CEO,
John Hancock Investment Management
Head of Wealth and Asset Management,
United States and Europe
This commentary reflects the CEO’s views as of this report’s period end and are subject to change at any time. Diversification does not guarantee investment returns and does not eliminate risk of loss. All investments entail risks, including the possible loss of principal. For more up-to-date information, you can visit our website at jhinvestments.com.
John Hancock
Disciplined Value Fund
| | |
| SEMIANNUAL REPORT | JOHN HANCOCK DISCIPLINED VALUE FUND | | 1 |
INVESTMENT OBJECTIVE
The fund seeks to provide long-term growth of capital primarily through investment in equity securities. Current income is a secondary objective.
AVERAGE ANNUAL TOTAL RETURNS AS OF 9/30/2020 (%)
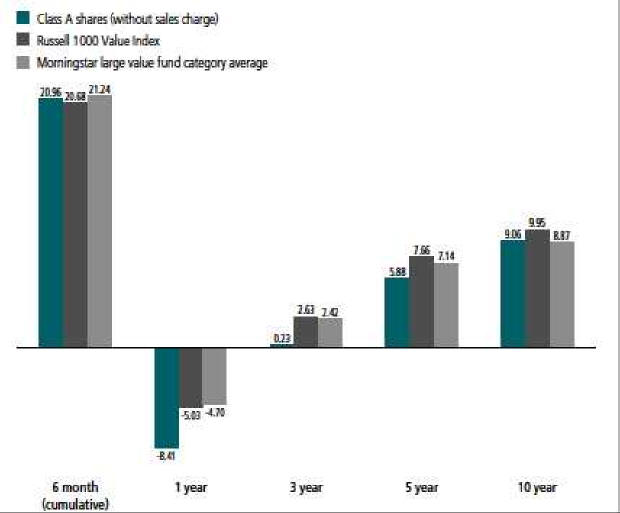
The Russell 1000 Value Index is an unmanaged index containing those securities in the Russell 1000 Index with a lower price-to-book ratio and less-than-average growth orientation.
It is not possible to invest directly in an index. Index figures do not reflect expenses or sales charges, which would result in lower returns.
The fund’s Morningstar category average is a group of funds with similar investment objectives and strategies and is the equal-weighted return of all funds per category. Morningstar places funds in certain categories based on their historical portfolio holdings. Figures from Morningstar, Inc. include reinvested distributions and do not take into account sales charges. Actual load-adjusted performance is lower.
The past performance shown here reflects reinvested distributions and the beneficial effect of any expense reductions, and does not guarantee future results. Performance of the other share classes will vary based on the difference in the fees and expenses of those classes. Shares will fluctuate in value and, when redeemed, may be worth more or less than their original cost. Current month-end performance may be lower or higher than the performance cited, and can be found at jhinvestments.com or by calling 800-225-5291. For further information on the fund’s objectives, risks, and strategy, see the fund’s prospectus.
| | |
| 2 | | JOHN HANCOCK DISCIPLINED VALUE FUND | SEMIANNUAL REPORT |
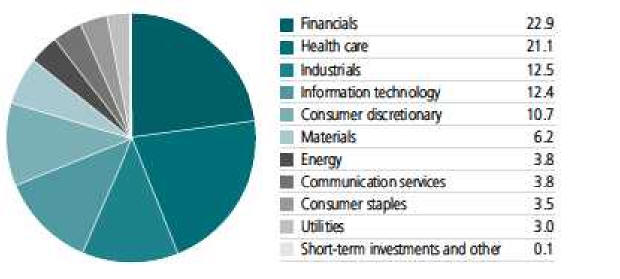
SECTOR COMPOSITION AS OF 9/30/2020 (% of net assets)
| | | | |
| TOP 10 HOLDINGS AS OF 9/30/2020 (% of net assets) | | | |
| |
JPMorgan Chase & Co. | | | 3.9 | |
| |
Johnson & Johnson | | | 3.8 | |
| |
Berkshire Hathaway, Inc., Class B | | | 3.7 | |
| |
Bank of America Corp. | | | 2.6 | |
| |
Cisco Systems, Inc. | | | 2.5 | |
| |
Pfizer, Inc. | | | 2.4 | |
| |
Cigna Corp. | | | 2.3 | |
| |
AutoZone, Inc. | | | 2.1 | |
| |
Eaton Corp. PLC | | | 2.0 | |
| |
Anthem, Inc. | | | 2.0 | |
| |
TOTAL | | | 27.3 | |
Cash and cash equivalents are not included. | | | | |
A note about risks
The fund may be subject to various risks as described in the fund’s prospectus. A widespread health crisis such as a global pandemic could cause substantial market volatility, exchange trading suspensions and closures, impact the ability to complete redemptions, and affect fund performance. For example, the novel coronavirus disease (COVID-19) has resulted in significant disruptions to global business activity. The impact of a health crisis and other epidemics and pandemics that may arise in the future, could affect the global economy in ways that cannot necessarily be foreseen at the present time. A health crisis may exacerbate other pre-existing political, social, and economic risks. Any such impact could adversely affect the fund’s performance, resulting in losses to your investment. For more information, please refer to the “Principal risks” section of the prospectus.
| | |
| SEMIANNUAL REPORT | JOHN HANCOCK DISCIPLINED VALUE FUND | | 3 |
| | | | |
| COUNTRY COMPOSITION AS OF 9/30/2020 (% of net assets) | | | |
| |
United States | | | 87.4 | |
| |
Switzerland | | | 3.6 | |
| |
Canada | | | 2.3 | |
| |
Ireland | | | 2.2 | |
| |
United Kingdom | | | 1.8 | |
| |
Bermuda | | | 1.5 | |
| |
Netherlands | | | 1.2 | |
| |
TOTAL | | | 100.0 | |
| | |
| 4 | | JOHN HANCOCK DISCIPLINED VALUE FUND | SEMIANNUAL REPORT |
| | | | | | | | | | | | | | | | | | | | | | | | | | | | |
TOTAL RETURNS FOR THE PERIOD ENDED SEPTEMBER 30, 2020 | | | | | | | | | | | | | |
| | |
| | | Average annual total returns (%) | | | | | | Cumulative total returns (%) | |
| | | with maximum sales charge | | | | | | with maximum sales charge | |
| | | 1-year | | | 5-year | | | 10-year | | | | | | 6-month | | | 5-year | | | 10-year | |
Class A | | | -12.98 | | | | 4.80 | | | | 8.51 | | | | | | | | 14.90 | | | | 26.39 | | | | 126.26 | |
Class B | | | -13.43 | | | | 4.75 | | | | 8.20 | | | | | | | | 15.47 | | | | 26.14 | | | | 119.98 | |
Class C | | | -9.95 | | | | 5.08 | | | | 8.23 | | | | | | | | 19.47 | | | | 28.12 | | | | 120.62 | |
Class I1 | | | -8.22 | | | | 6.14 | | | | 9.37 | | | | | | | | 21.11 | | | | 34.72 | | | | 144.91 | |
Class I21 | | | -8.22 | | | | 6.14 | | | | 9.37 | | | | | | | | 21.11 | | | | 34.72 | | | | 144.89 | |
Class R11 | | | -8.73 | | | | 5.47 | | | | 8.62 | | | | | | | | 20.79 | | | | 30.52 | | | | 128.67 | |
Class R21,2 | | | -8.55 | | | | 5.71 | | | | 8.92 | | | | | | | | 20.85 | | | | 32.03 | | | | 135.05 | |
Class R31 | | | -8.69 | | | | 5.56 | | | | 8.72 | | | | | | | | 20.73 | | | | 31.10 | | | | 130.82 | |
Class R41 | | | -8.30 | | | | 5.99 | | | | 9.15 | | | | | | | | 21.02 | | | | 33.77 | | | | 140.10 | |
Class R51 | | | -8.16 | | | | 6.19 | | | | 9.42 | | | | | | | | 21.13 | | | | 35.03 | | | | 146.01 | |
Class R61,2 | | | -8.11 | | | | 6.25 | | | | 9.43 | | | | | | | | 21.13 | | | | 35.43 | | | | 146.26 | |
Class NAV1 | | | -8.10 | | | | 6.27 | | | | 9.49 | | | | | | | | 21.12 | | | | 35.54 | | | | 147.62 | |
Index 1† | | | -5.03 | | | | 7.66 | | | | 9.95 | | | | | | | | 20.68 | | | | 44.61 | | | | 158.14 | |
Index 2† | | | 15.15 | | | | 14.15 | | | | 13.74 | | | | | | | | 31.31 | | | | 93.80 | | | | 262.44 | |
Performance figures assume all distributions have been reinvested. Figures reflect maximum sales charge on Class A shares of 5%, and the applicable contingent deferred sales charge (CDSC) on Class B and Class C shares. The Class B shares’ CDSC declines annually between years 1 to 6 according to the following schedule: 5%, 4%, 3%, 3%, 2%, and 1%. No sales charge will be assessed after the sixth year. Class C shares sold within one year of purchase are subject to a 1% CDSC. Sales charges are not applicable to Class I, Class I2, Class R1, Class R2, Class R3, Class R4, Class R5, Class R6, and Class NAV shares.
The expense ratios of the fund, both net (including any fee waivers and/or expense limitations) and gross (excluding any fee waivers and/or expense limitations), are set forth according to the most recent publicly available prospectuses for the fund and may differ from those disclosed in the Financial highlights tables in this report. Net expenses reflect contractual expense limitations in effect until July 31, 2021 and are subject to change. Had the contractual fee waivers and expense limitations not been in place, gross expenses would apply. The expense ratios are as follows:
| | | | | | | | | | | | | | | | | | | | | | | | |
| | | Class A | | Class B | | Class C | | Class I | | Class I2 | | Class R1 | | Class R2 | | Class R3 | | Class R4 | | Class R5 | | Class R6 | | Class NAV |
Gross (%) | | 1.07 | | 1.82 | | 1.82 | | 0.82 | | 0.82 | | 1.46 | | 1.21 | | 1.36 | | 1.06 | | 0.76 | | 0.71 | | 0.70 |
Net (%) | | 1.06 | | 1.81 | | 1.81 | | 0.81 | | 0.81 | | 1.45 | | 1.20 | | 1.35 | | 0.95 | | 0.75 | | 0.70 | | 0.69 |
Please refer to the most recent prospectus and annual or semiannual report for more information on expenses and any expense limitation arrangements for each class.
The returns reflect past results and should not be considered indicative of future performance. The return and principal value of an investment will fluctuate so that shares, when redeemed, may be worth more or less than their original cost. Due to market volatility and other factors, the fund’s current performance may be higher or lower than the performance shown. For current to the most recent month-end performance data, please call 800–225–5291 or visit the fund’s website at jhinvestments.com.
The performance table above and the chart on the next page do not reflect the deduction of taxes that a shareholder would pay on fund distributions or the redemption of fund shares. The fund’s performance results reflect any applicable fee waivers or expense reductions, without which the expenses would increase and results would have been less favorable.
| | † | Index 1 is the Russell 1000 Value Index; Index 2 is the S&P 500 Index. |
See the following page for footnotes.
| | |
| SEMIANNUAL REPORT | JOHN HANCOCK DISCIPLINED VALUE FUND | | 5 |
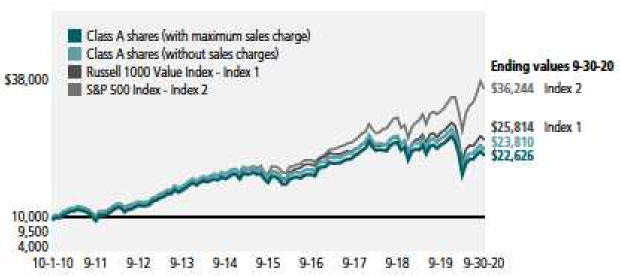
This chart and table show what happened to a hypothetical $10,000 investment in John Hancock Disciplined Value Fund for the share classes and periods indicated, assuming all distributions were reinvested. For comparison, we’ve shown the same investment in two separate indexes.
| | | | | | | | | | | | | | | | | | | | |
| | | | | | With maximum | | | Without | | | | | | | |
| | | Start date | | | sales charge ($) | | | sales charge ($) | | | Index 1 ($) | | | Index 2 ($) | |
Class B3 | | | 9-30-10 | | | | 21,998 | | | | 21,998 | | | | 25,814 | | | | 36,244 | |
Class C3 | | | 9-30-10 | | | | 22,062 | | | | 22,062 | | | | 25,814 | | | | 36,244 | |
Class I1 | | | 9-30-10 | | | | 24,491 | | | | 24,491 | | | | 25,814 | | | | 36,244 | |
Class I21 | | | 9-30-10 | | | | 24,489 | | | | 24,489 | | | | 25,814 | | | | 36,244 | |
Class R11 | | | 9-30-10 | | | | 22,867 | | | | 22,867 | | | | 25,814 | | | | 36,244 | |
Class R21,2 | | | 9-30-10 | | | | 23,505 | | | | 23,505 | | | | 25,814 | | | | 36,244 | |
Class R31 | | | 9-30-10 | | | | 23,082 | | | | 23,082 | | | | 25,814 | | | | 36,244 | |
Class R41 | | | 9-30-10 | | | | 24,010 | | | | 24,010 | | | | 25,814 | | | | 36,244 | |
Class R51 | | | 9-30-10 | | | | 24,601 | | | | 24,601 | | | | 25,814 | | | | 36,244 | |
Class R61,2 | | | 9-30-10 | | | | 24,626 | | | | 24,626 | | | | 25,814 | | | | 36,244 | |
Class NAV1 | | | 9-30-10 | | | | 24,762 | | | | 24,762 | | | | 25,814 | | | | 36,244 | |
The Russell 1000 Value Index is an unmanaged index containing those securities in the Russell 1000 Index with a lower price-to-book ratio and less-than-average growth orientation.
The S&P 500 Index is an unmanaged index that includes 500 widely traded common stocks. It is not possible to invest directly in an index. Index figures do not reflect expenses or sales charges, which would result in lower returns.
Footnotes related to performance pages
| | 1 | For certain types of investors, as described in the fund’s prospectuses. | |
| | 2 | Class R6, and Class R2 shares were first offered on 9-1-11, and 3-1-12, respectively. Returns shown prior to Class R2 and Class R6 shares’ commencement dates are those of Class A shares that have not been adjusted for class-specific expenses; otherwise, returns would vary. | |
| | 3 | The contingent deferred sales charge is not applicable. | |
| | |
| 6 | | JOHN HANCOCK DISCIPLINED VALUE FUND | SEMIANNUAL REPORT |
These examples are intended to help you understand your ongoing operating expenses of investing in the fund so you can compare these costs with the ongoing costs of investing in other mutual funds.
Understanding fund expenses
As a shareholder of the fund, you incur two types of costs:
| | ∎ | | Transaction costs, which include sales charges (loads) on purchases or redemptions (varies by share class), minimum account fee charge, etc. | |
| | ∎ | | Ongoing operating expenses, including management fees, distribution and service fees (if applicable), and other fund expenses. | |
We are presenting only your ongoing operating expenses here.
Actual expenses/actual returns
The first line of each share class in the table on the following page is intended to provide information about the fund’s actual ongoing operating expenses, and is based on the fund’s actual return. It assumes an account value of $1,000.00 on April 1, 2020, with the same investment held until September 30, 2020.
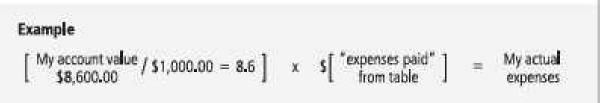
Together with the value of your account, you may use this information to estimate the operating expenses that you paid over the period. Simply divide your account value at September 30, 2020, by $1,000.00, then multiply it by the “expenses paid” for your share class from the table. For example, for an account value of $8,600.00, the operating expenses should be calculated as follows:
Hypothetical example for comparison purposes
The second line of each share class in the table on the following page allows you to compare the fund’s ongoing operating expenses with those of any other fund. It provides an example of the fund’s hypothetical account values and hypothetical expenses based on each class’s actual expense ratio and an assumed 5% annualized return before expenses (which is not the class’s actual return). It assumes an account value of $1,000.00 on April 1, 2020, with the same investment held until September 30, 2020. Look in any other fund shareholder report to find its hypothetical example and you will be able to compare these expenses. Please remember that these hypothetical account values and expenses may not be used to estimate the actual ending account balance or expenses you paid for the period.
| | |
| SEMIANNUAL REPORT | JOHN HANCOCK DISCIPLINED VALUE FUND | | 7 |
Remember, these examples do not include any transaction costs, therefore, these examples will not help you to determine the relative total costs of owning different funds. If transaction costs were included, your expenses would have been higher. See the prospectuses for details regarding transaction costs.
| | | | | | | | | | | | | | | | | | |
SHAREHOLDER EXPENSE EXAMPLE CHART | |
| | | | | | | | | | | Expenses | | | | |
| | | | | Account | | | Ending | | | paid during | | | Annualized | |
| | | | | value on | | | value on | | | period ended | | | expense | |
| | | | | 4-1-2020 | | | 9-30-2020 | | | 9-30-20201 | | | ratio | |
Class A | | Actual expenses/actual returns | | $ | 1,000.00 | | | $ | 1,209.60 | | | $ | 5.93 | | | | 1.07 | % |
| | | Hypothetical example | | | 1,000.00 | | | | 1,019.70 | | | | 5.42 | | | | 1.07 | % |
Class B | | Actual expenses/actual returns | | | 1,000.00 | | | | 1,204.70 | | | | 10.06 | | | | 1.82 | % |
| | | Hypothetical example | | | 1,000.00 | | | | 1,015.90 | | | | 9.20 | | | | 1.82 | % |
Class C | | Actual expenses/actual returns | | | 1,000.00 | | | | 1,204.70 | | | | 10.06 | | | | 1.82 | % |
| | | Hypothetical example | | | 1,000.00 | | | | 1,015.90 | | | | 9.20 | | | | 1.82 | % |
Class I | | Actual expenses/actual returns | | | 1,000.00 | | | | 1,211.10 | | | | 4.55 | | | | 0.82 | % |
| | | Hypothetical example | | | 1,000.00 | | | | 1,021.00 | | | | 4.15 | | | | 0.82 | % |
Class I2 | | Actual expenses/actual returns | | | 1,000.00 | | | | 1,211.10 | | | | 4.55 | | | | 0.82 | % |
| | | Hypothetical example | | | 1,000.00 | | | | 1,021.00 | | | | 4.15 | | | | 0.82 | % |
Class R1 | | Actual expenses/actual returns | | | 1,000.00 | | | | 1,207.90 | | | | 7.86 | | | | 1.42 | % |
| | | Hypothetical example | | | 1,000.00 | | | | 1,017.90 | | | | 7.18 | | | | 1.42 | % |
Class R2 | | Actual expenses/actual returns | | | 1,000.00 | | | | 1,208.50 | | | | 6.59 | | | | 1.19 | % |
| | | Hypothetical example | | | 1,000.00 | | | | 1,019.10 | | | | 6.02 | | | | 1.19 | % |
Class R3 | | Actual expenses/actual returns | | | 1,000.00 | | | | 1,207.30 | | | | 7.47 | | | | 1.35 | % |
| | | Hypothetical example | | | 1,000.00 | | | | 1,018.30 | | | | 6.83 | | | | 1.35 | % |
Class R4 | | Actual expenses/actual returns | | | 1,000.00 | | | | 1,210.20 | | | | 5.32 | | | | 0.96 | % |
| | | Hypothetical example | | | 1,000.00 | | | | 1,020.30 | | | | 4.86 | | | | 0.96 | % |
Class R5 | | Actual expenses/actual returns | | | 1,000.00 | | | | 1,211.30 | | | | 4.21 | | | | 0.76 | % |
| | | Hypothetical example | | | 1,000.00 | | | | 1,021.30 | | | | 3.85 | | | | 0.76 | % |
Class R6 | | Actual expenses/actual returns | | | 1,000.00 | | | | 1,211.30 | | | | 3.94 | | | | 0.71 | % |
| | | Hypothetical example | | | 1,000.00 | | | | 1,021.50 | | | | 3.60 | | | | 0.71 | % |
Class NAV | | Actual expenses/actual returns | | | 1,000.00 | | | | 1,211.20 | | | | 3.88 | | | | 0.70 | % |
| | | Hypothetical example | | | 1,000.00 | | | | 1,021.60 | | | | 3.55 | | | | 0.70 | % |
| | 1 | Expenses are equal to the annualized expense ratio, multiplied by the average account value over the period, multiplied by 183/365 (to reflect the one-half year period). |
| | |
| 8 | | JOHN HANCOCK DISCIPLINED VALUE FUND | SEMIANNUAL REPORT |
| | | | | | | | |
AS OF 9-30-20 (unaudited) | | | | | | | | |
| | | Shares | | | Value | |
| | |
Common stocks 99.9% | | | | | | | $11,425,520,863 | |
(Cost $10,410,493,450) | | | | | | | | |
| | |
Communication services 3.8% | | | | | | | 431,554,437 | |
| | |
Interactive media and services 2.3% | | | | | | | | |
Alphabet, Inc., Class A (A) | | | 133,682 | | | | 195,924,339 | |
Facebook, Inc., Class A (A) | | | 259,685 | | | | 68,011,502 | |
| | |
Wireless telecommunication services 1.5% | | | | | | | | |
T-Mobile US, Inc. (A) | | | 1,465,710 | | | | 167,618,596 | |
| | |
Consumer discretionary 10.7% | | | | | | | 1,229,876,198 | |
| | |
Auto components 0.3% | | | | | | | | |
Lear Corp. | | | 337,638 | | | | 36,819,424 | |
| | |
Automobiles 0.5% | | | | | | | | |
Harley-Davidson, Inc. | | | 2,158,243 | | | | 52,963,283 | |
| | |
Distributors 0.5% | | | | | | | | |
LKQ Corp. (A) | | | 2,080,900 | | | | 57,703,357 | |
| | |
Hotels, restaurants and leisure 0.9% | | | | | | | | |
Las Vegas Sands Corp. | | | 1,076,935 | | | | 50,249,787 | |
Wyndham Hotels & Resorts, Inc. | | | 1,156,580 | | | | 58,407,290 | |
| | |
Household durables 1.7% | | | | | | | | |
Lennar Corp., A Shares | | | 1,372,387 | | | | 112,096,570 | |
Mohawk Industries, Inc. (A) | | | 901,149 | | | | 87,943,131 | |
| | |
Specialty retail 6.2% | | | | | | | | |
AutoZone, Inc. (A) | | | 204,268 | | | | 240,554,168 | |
Best Buy Company, Inc. | | | 1,885,380 | | | | 209,823,940 | |
Lowe’s Companies, Inc. | | | 684,292 | | | | 113,496,671 | |
The TJX Companies, Inc. | | | 1,710,987 | | | | 95,216,427 | |
Williams-Sonoma, Inc. | | | 541,082 | | | | 48,935,456 | |
| | |
Textiles, apparel and luxury goods 0.6% | | | | | | | | |
Tapestry, Inc. | | | 4,201,324 | | | | 65,666,694 | |
| | |
Consumer staples 3.5% | | | | | | | 395,347,752 | |
| | |
Beverages 1.0% | | | | | | | | |
Coca-Cola European Partners PLC | | | 2,833,993 | | | | 109,987,268 | |
| | |
Food and staples retailing 1.5% | | | | | | | | |
The Kroger Company | | | 5,096,173 | | | | 172,811,226 | |
| | |
Household products 1.0% | | | | | | | | |
Kimberly-Clark Corp. | | | 762,219 | | | | 112,549,258 | |
| | |
Energy 3.8% | | | | | | | 432,867,367 | |
| | |
Energy equipment and services 0.4% | | | | | | | | |
Schlumberger NV | | | 3,225,425 | | | | 50,187,613 | |
| | | | |
| SEE NOTES TO FINANCIAL STATEMENTS | | SEMIANNUAL REPORT | JOHN HANCOCK DISCIPLINED VALUE FUND | | 9 |
| | | | | | | | |
| | | Shares | | | Value | |
| | |
Energy (continued) | | | | | | | | |
| | |
Oil, gas and consumable fuels 3.4% | | | | | | | | |
ConocoPhillips | | | 4,598,962 | | | | $151,029,912 | |
Marathon Petroleum Corp. | | | 4,156,665 | | | | 121,956,551 | |
Parsley Energy, Inc., Class A | | | 5,516,463 | | | | 51,634,094 | |
Valero Energy Corp. | | | 1,340,240 | | | | 58,059,197 | |
| | |
Financials 22.9% | | | | | | | 2,613,984,299 | |
| | |
Banks 10.3% | | | | | | | | |
Bank of America Corp. | | | 12,086,137 | | | | 291,155,040 | |
Citigroup, Inc. | | | 2,493,763 | | | | 107,506,123 | |
Fifth Third Bancorp | | | 3,070,924 | | | | 65,472,100 | |
Huntington Bancshares, Inc. | | | 9,999,095 | | | | 91,691,701 | |
JPMorgan Chase & Co. | | | 4,612,276 | | | | 444,023,810 | |
Truist Financial Corp. | | | 4,580,364 | | | | 174,282,850 | |
| | |
Capital markets 0.9% | | | | | | | | |
The Charles Schwab Corp. | | | 2,720,271 | | | | 98,555,418 | |
| | |
Diversified financial services 3.7% | | | | | | | | |
Berkshire Hathaway, Inc., Class B (A) | | | 1,981,094 | | | | 421,854,156 | |
| | |
Insurance 8.0% | | | | | | | | |
Aflac, Inc. | | | 2,200,620 | | | | 79,992,537 | |
American International Group, Inc. | | | 5,444,423 | | | | 149,884,965 | |
Chubb, Ltd. | | | 1,783,083 | | | | 207,051,598 | |
Everest Re Group, Ltd. | | | 564,836 | | | | 111,577,703 | |
Marsh & McLennan Companies, Inc. | | | 870,587 | | | | 99,856,329 | |
RenaissanceRe Holdings, Ltd. | | | 318,328 | | | | 54,032,995 | |
The Progressive Corp. | | | 2,292,669 | | | | 217,046,974 | |
| | |
Health care 21.1% | | | | | | | 2,415,523,179 | |
| | |
Health care equipment and supplies 2.1% | | | | | | | | |
Medtronic PLC | | | 1,730,519 | | | | 179,835,534 | |
Zimmer Biomet Holdings, Inc. | | | 459,406 | | | | 62,543,533 | |
| | |
Health care providers and services 8.2% | | | | | | | | |
AmerisourceBergen Corp. | | | 1,402,643 | | | | 135,944,160 | |
Anthem, Inc. | | | 831,885 | | | | 223,435,992 | |
Cigna Corp. | | | 1,579,568 | | | | 267,594,615 | |
McKesson Corp. | | | 953,115 | | | | 141,947,417 | |
UnitedHealth Group, Inc. | | | 536,907 | | | | 167,391,495 | |
| | |
Life sciences tools and services 0.8% | | | | | | | | |
Avantor, Inc. (A) | | | 4,078,967 | | | | 91,735,968 | |
Pharmaceuticals 10.0% | | | | | | | | |
GlaxoSmithKline PLC, ADR | | | 2,426,025 | | | | 91,315,581 | |
Johnson & Johnson | | | 2,905,318 | | | | 432,543,744 | |
Merck & Company, Inc. | | | 1,596,631 | | | | 132,440,541 | |
| | | | |
| 10 | | JOHN HANCOCK DISCIPLINED VALUE FUND | SEMIANNUAL REPORT | | SEE NOTES TO FINANCIAL STATEMENTS |
| | | | | | | | |
| | | Shares | | | Value | |
| | |
Health care (continued) | | | | | | | | |
| | |
Pharmaceuticals (continued) | | | | | | | | |
Novartis AG, ADR | | | 2,399,468 | | | | $208,657,737 | |
Pfizer, Inc. | | | 7,633,157 | | | | 280,136,862 | |
| | |
Industrials 12.5% | | | | | | | 1,432,907,238 | |
| | |
Aerospace and defense 1.3% | | | | | | | | |
Howmet Aerospace, Inc. | | | 3,213,621 | | | | 53,731,743 | |
Huntington Ingalls Industries, Inc. | | | 276,758 | | | | 38,953,689 | |
Northrop Grumman Corp. | | | 201,941 | | | | 63,710,366 | |
| | |
Building products 1.2% | | | | | | | | |
Owens Corning | | | 1,970,998 | | | | 135,624,372 | |
| | |
Electrical equipment 2.4% | | | | | | | | |
AMETEK, Inc. | | | 495,761 | | | | 49,278,643 | |
Eaton Corp. PLC | | | 2,208,051 | | | | 225,287,444 | |
| | |
Machinery 5.5% | | | | | | | | |
Caterpillar, Inc. | | | 1,023,129 | | | | 152,599,690 | |
Cummins, Inc. | | | 483,607 | | | | 102,118,454 | |
Deere & Company | | | 899,301 | | | | 199,312,081 | |
Dover Corp. | | | 1,010,989 | | | | 109,530,548 | |
Otis Worldwide Corp. | | | 996,885 | | | | 62,225,562 | |
| | |
Road and rail 1.4% | | | | | | | | |
Kansas City Southern | | | 355,301 | | | | 64,249,080 | |
Union Pacific Corp. | | | 487,847 | | | | 96,042,439 | |
| | |
Trading companies and distributors 0.7% | | | | | | | | |
United Rentals, Inc. (A) | | | 459,846 | | | | 80,243,127 | |
| | |
Information technology 12.4% | | | | | | | 1,415,565,749 | |
| | |
Communications equipment 2.5% | | | | | | | | |
Cisco Systems, Inc. | | | 7,145,598 | | | | 281,465,105 | |
| | |
Semiconductors and semiconductor equipment 7.1% | | | | | | | | |
Applied Materials, Inc. | | | 2,359,329 | | | | 140,262,109 | |
KLA Corp. | | | 555,338 | | | | 107,591,184 | |
Lam Research Corp. | | | 538,971 | | | | 178,803,629 | |
Micron Technology, Inc. (A) | | | 3,286,737 | | | | 154,345,170 | |
NXP Semiconductors NV | | | 1,123,424 | | | | 140,214,549 | |
ON Semiconductor Corp. (A) | | | 809,151 | | | | 17,550,485 | |
Qorvo, Inc. (A) | | | 613,299 | | | | 79,121,704 | |
| | |
Software 2.8% | | | | | | | | |
Microsoft Corp. | | | 351,191 | | | | 73,866,003 | |
Oracle Corp. | | | 2,405,883 | | | | 143,631,215 | |
SS&C Technologies Holdings, Inc. | | | 1,631,107 | | | | 98,714,596 | |
| | | | |
| SEE NOTES TO FINANCIAL STATEMENTS | | SEMIANNUAL REPORT | JOHN HANCOCK DISCIPLINED VALUE FUND | | 11 |
| | | | | | | | | | | | |
| | | | | | Shares | | | Value | |
| | | |
Materials 6.2% | | | | | | | | | | | $712,216,811 | |
| | | |
Chemicals 2.6% | | | | | | | | | | | | |
DuPont de Nemours, Inc. | | | | | | | 2,953,018 | | | | 163,833,439 | |
FMC Corp. | | | | | | | 731,973 | | | | 77,523,260 | |
PPG Industries, Inc. | | | | | | | 450,882 | | | | 55,043,675 | |
| | | |
Construction materials 0.6% | | | | | | | | | | | | |
CRH PLC, ADR | | | | | | | 1,935,647 | | | | 69,857,500 | |
| | | |
Metals and mining 3.0% | | | | | | | | | | | | |
Barrick Gold Corp. | | | | | | | 4,318,916 | | | | 121,404,729 | |
Kinross Gold Corp. (A)(B) | | | | | | | 5,932,033 | | | | 52,320,531 | |
Newmont Corp. | | | | | | | 1,242,593 | | | | 78,842,526 | |
Yamana Gold, Inc. | | | | | | | 16,442,104 | | | | 93,391,151 | |
| | | |
Utilities 3.0% | | | | | | | | | | | 345,677,833 | |
| | | |
Electric utilities 1.5% | | | | | | | | | | | | |
Edison International | | | | | | | 2,253,820 | | | | 114,584,209 | |
FirstEnergy Corp. | | | | | | | 2,093,847 | | | | 60,114,347 | |
| | | |
Independent power and renewable electricity producers 0.7% | | | | | | | | | | | | |
Vistra Corp. | | | | | | | 4,430,742 | | | | 83,563,794 | |
| | | |
Multi-utilities 0.8% | | | | | | | | | | | | |
CenterPoint Energy, Inc. | | | | | | | 4,517,596 | | | | 87,415,483 | |
| | | |
| | | Yield (%) | | | Shares | | | Value | |
| | | |
Short-term investments 0.5% | | | | | | | | | | | $51,239,720 | |
(Cost $51,239,803) | | | | | | | | | | | | |
| | | |
Short-term funds 0.5% | | | | | | | | | | | 51,239,720 | |
John Hancock Collateral Trust (C) | | | 0.2185 | (D) | | | 416,413 | | | | 4,168,255 | |
State Street Institutional U.S. Government Money Market Fund, Premier Class | | | 0.0266 | (D) | | | 47,071,465 | | | | 47,071,465 | |
| | | |
Total investments (Cost $10,461,733,253) 100.4% | | | | | | | | | | | $11,476,760,583 | |
| | | |
Other assets and liabilities, net (0.4%) | | | | | | | | | | | (42,532,536 | ) |
| | | |
Total net assets 100.0% | | | | | | | | | | | $11,434,228,047 | |
The percentage shown for each investment category is the total value of the category as a percentage of the net assets of the fund.
Security Abbreviations and Legend
| | |
ADR | | American Depositary Receipt |
| | |
(A) | | Non-income producing security. |
| |
(B) | | All or a portion of this security is on loan as of 9-30-20. |
| |
(C) | | Investment is an affiliate of the fund, the advisor and/or subadvisor. This security represents the investment of cash collateral received for securities lending. |
| |
(D) | | The rate shown is the annualized seven-day yield as of 9-30-20. |
At 9-30-20, the aggregate cost of investments for federal income tax purposes was $10,502,718,814. Net unrealized appreciation aggregated to $974,041,769, of which $1,636,106,055 related to gross unrealized appreciation and $662,064,286 related to gross unrealized depreciation.
| | | | |
| 12 | | JOHN HANCOCK DISCIPLINED VALUE FUND | SEMIANNUAL REPORT | | SEE NOTES TO FINANCIAL STATEMENTS |
| | | | |
| STATEMENT OF ASSETS AND LIABILITIES 9-30-20 (unaudited) | |
| |
Assets | | | | |
Unaffiliated investments, at value (Cost $10,457,564,915) including $4,073,064 of securities loaned | | | $11,472,592,328 | |
Affiliated investments, at value (Cost $4,168,338) | | | 4,168,255 | |
Total investments, at value (Cost $10,461,733,253) | | | 11,476,760,583 | |
Dividends and interest receivable | | | 14,130,012 | |
Receivable for fund shares sold | | | 14,694,904 | |
Receivable for investments sold | | | 48,044,751 | |
Receivable for securities lending income | | | 5,682 | |
Other assets | | | 329,233 | |
Total assets | | | 11,553,965,165 | |
Liabilities | | | | |
Payable for investments purchased | | | 65,962,688 | |
Payable for fund shares repurchased | | | 47,306,027 | |
Payable upon return of securities loaned | | | 4,168,740 | |
Payable to affiliates | | | | |
Accounting and legal services fees | | | 664,927 | |
Transfer agent fees | | | 696,800 | |
Distribution and service fees | | | 21,083 | |
Trustees’ fees | | | 7,029 | |
Other liabilities and accrued expenses | | | 909,824 | |
Total liabilities | | | 119,737,118 | |
Net assets | | | $11,434,228,047 | |
Net assets consist of | | | | |
Paid-in capital | | | $10,533,521,314 | |
Total distributable earnings (loss) | | | 900,706,733 | |
Net assets | | | $11,434,228,047 | |
| | | | |
| SEE NOTES TO FINANCIAL STATEMENTS | | SEMIANNUAL REPORT | JOHN HANCOCK DISCIPLINED VALUE FUND | | 13 |
| | | | |
| STATEMENT OF ASSETS AND LIABILITIES (continued) | |
| |
Net asset value per share | | | | |
Based on net asset value and shares outstanding - the fund has an unlimited number of shares authorized with no par value | | | | |
Class A ($780,193,788 ÷ 42,514,130 shares)1 | | $ | 18.35 | |
Class B ($1,150,220 ÷ 67,611 shares)1 | | $ | 17.01 | |
Class C ($129,632,475 ÷ 7,594,510 shares)1 | | $ | 17.07 | |
Class I ($5,783,366,223 ÷ 326,149,052 shares) | | $ | 17.73 | |
Class I2 ($40,877,373 ÷ 2,305,120 shares) | | $ | 17.73 | |
Class R1 ($10,720,839 ÷ 607,231 shares) | | $ | 17.66 | |
Class R2 ($45,407,967 ÷ 2,567,789 shares) | | $ | 17.68 | |
Class R3 ($9,398,711 ÷ 532,352 shares) | | $ | 17.66 | |
Class R4 ($69,914,674 ÷ 3,943,045 shares) | | $ | 17.73 | |
Class R5 ($57,764,954 ÷ 3,250,168 shares) | | $ | 17.77 | |
Class R6 ($3,327,202,462 ÷ 187,194,075 shares) | | $ | 17.77 | |
Class NAV ($1,178,598,361 ÷ 66,280,478 shares) | | $ | 17.78 | |
Maximum offering price per share | | | | |
Class A (net asset value per share ÷ 95%)2 | | $ | 19.32 | |
| 1 | Redemption price per share is equal to net asset value less any applicable contingent deferred sales charge. |
| 2 | On single retail sales of less than $50,000. On sales of $50,000 or more and on group sales the offering price is reduced. |
| | | | |
| 14 | | JOHN HANCOCK DISCIPLINED VALUE FUND | SEMIANNUAL REPORT | | SEE NOTES TO FINANCIAL STATEMENTS |
| | | | |
| STATEMENT OF OPERATIONS For the six months ended 9-30-20 (unaudited) | |
| |
Investment income | | | | |
Dividends | | | $120,665,224 | |
Interest | | | 124,554 | |
Securities lending | | | 52,988 | |
Less foreign taxes withheld | | | (758,682 | ) |
Total investment income | | | 120,084,084 | |
Expenses | | | | |
Investment management fees | | | 39,125,479 | |
Distribution and service fees | | | 2,063,800 | |
Accounting and legal services fees | | | 1,059,319 | |
Transfer agent fees | | | 4,498,840 | |
Trustees’ fees | | | 111,940 | |
Custodian fees | | | 678,594 | |
State registration fees | | | 146,533 | |
Printing and postage | | | 301,038 | |
Professional fees | | | 96,358 | |
Other | | | 230,932 | |
Total expenses | | | 48,312,833 | |
Less expense reductions | | | (441,493 | ) |
Net expenses | | | 47,871,340 | |
Net investment income | | | 72,212,744 | |
Realized and unrealized gain (loss) | | | | |
Net realized gain (loss) on | | | | |
Unaffiliated investments | | | (17,442,684 | ) |
Affiliated investments | | | 16,852 | |
| | | | (17,425,832 | ) |
Change in net unrealized appreciation (depreciation) of | | | | |
Unaffiliated investments | | | 2,145,375,240 | |
Affiliated investments | | | (3,018 | ) |
| | | | 2,145,372,222 | |
Net realized and unrealized gain | | | 2,127,946,390 | |
Increase in net assets from operations | | | $2,200,159,134 | |
| | | | |
| SEE NOTES TO FINANCIAL STATEMENTS | | SEMIANNUAL REPORT | JOHN HANCOCK DISCIPLINED VALUE FUND | | 15 |
| | | | | | | | |
| STATEMENTS OF CHANGES IN NET ASSETS | |
| | |
| | | Six months ended 9-30-20 (unaudited) | | | Year ended 3-31-20 | |
Increase (decrease) in net assets | | | | | | | | |
From operations | | | | | | | | |
Net investment income | | $ | 72,212,744 | | | $ | 248,099,684 | |
Net realized loss | | | (17,425,832 | ) | | | (42,322,615 | ) |
Change in net unrealized appreciation (depreciation) | | | 2,145,372,222 | | | | (2,856,600,816 | ) |
Increase (decrease) in net assets resulting from operations | | | 2,200,159,134 | | | | (2,650,823,747 | ) |
Distributions to shareholders | | | | | | | | |
From earnings | | | | | | | | |
Class A | | | — | | | | (56,946,059 | ) |
Class B | | | — | | | | (182,380 | ) |
Class C | | | — | | | | (10,620,453 | ) |
Class I | | | — | | | | (435,736,847 | ) |
Class I2 | | | — | | | | (2,535,381 | ) |
Class R1 | | | — | | | | (827,170 | ) |
Class R2 | | | — | | | | (4,693,632 | ) |
Class R3 | | | — | | | | (726,592 | ) |
Class R4 | | | — | | | | (6,169,593 | ) |
Class R5 | | | — | | | | (8,353,442 | ) |
Class R6 | | | — | | | | (268,564,030 | ) |
Class NAV | | | — | | | | (64,632,066 | ) |
Total distributions | | | — | | | | (859,987,645 | ) |
From fund share transactions | | | (1,372,403,955 | ) | | | (791,429,067 | ) |
Total increase (decrease) | | | 827,755,179 | | | | (4,302,240,459 | ) |
Net assets | | | | | | | | |
Beginning of period | | | 10,606,472,868 | | | | 14,908,713,327 | |
End of period | | $ | 11,434,228,047 | | | $ | 10,606,472,868 | |
| | | | |
| 16 | | JOHN HANCOCK DISCIPLINED VALUE FUND | SEMIANNUAL REPORT | | SEE NOTES TO FINANCIAL STATEMENTS |
| | | | | | | | | | | | | | | | | | | | | | | | |
| | | | | | |
| CLASS A SHARES Period ended | | 9-30-201 | | | 3-31-20 | | | 3-31-19 | | | 3-31-18 | | | 3-31-17 | | | 3-31-16 | |
Per share operating performance | | | | | | | | | | | | | | | | | | | | | | | | |
Net asset value, beginning of period | | | $15.18 | | | | $20.25 | | | | $22.11 | | | | $20.71 | | | | $17.64 | | | | $19.44 | |
Net investment income2 | | | 0.09 | | | | 0.30 | | | | 0.26 | | | | 0.20 | | | | 0.18 | | | | 0.16 | |
Net realized and unrealized gain (loss) on investments | | | 3.08 | | | | (4.20 | ) | | | (0.28 | ) | | | 2.39 | | | | 3.08 | | | | (1.18 | ) |
Total from investment operations | | | 3.17 | | | | (3.90 | ) | | | (0.02 | ) | | | 2.59 | | | | 3.26 | | | | (1.02 | ) |
Less distributions | | | | | | | | | | | | | | | | | | | | | | | | |
From net investment income | | | — | | | | (0.25 | ) | | | (0.23 | ) | | | (0.18 | ) | | | (0.19 | ) | | | (0.19 | ) |
From net realized gain | | | — | | | | (0.92 | ) | | | (1.61 | ) | | | (1.01 | ) | | | — | | | | (0.59 | ) |
Total distributions | | | — | | | | (1.17 | ) | | | (1.84 | ) | | | (1.19 | ) | | | (0.19 | ) | | | (0.78 | ) |
Net asset value, end of period | | | $18.35 | | | | $15.18 | | | | $20.25 | | | | $22.11 | | | | $20.71 | | | | $17.64 | |
Total return (%)3,4 | | | 20.96 | 5 | | | (20.99 | ) | | | 0.45 | | | | 12.42 | | | | 18.50 | | | | (5.29 | ) |
Ratios and supplemental data | | | | | | | | | | | | | | | | | | | | | | | | |
Net assets, end of period (in millions) | | | $780 | | | | $731 | | | | $1,092 | | | | $1,289 | | | | $1,449 | | | | $2,375 | |
Ratios (as a percentage of average net assets): | | | | | | | | | | | | | | | | | | | | | | | | |
Expenses before reductions | | | 1.08 | 6 | | | 1.07 | | | | 1.06 | | | | 1.06 | | | | 1.07 | | | | 1.08 | |
Expenses including reductions | | | 1.07 | 6 | | | 1.06 | | | | 1.05 | | | | 1.05 | | | | 1.06 | | | | 1.07 | |
Net investment income | | | 0.96 | 6 | | | 1.44 | | | | 1.18 | | | | 0.92 | | | | 0.96 | | | | 0.87 | |
Portfolio turnover (%) | | | 31 | | | | 88 | | | | 69 | | | | 45 | | | | 65 | | | | 61 | |
| 1 | Six months ended 9-30-20. Unaudited. |
| 2 | Based on average daily shares outstanding. |
| 3 | Total returns would have been lower had certain expenses not been reduced during the applicable periods. |
| 4 | Does not reflect the effect of sales charges, if any. |
| | | | |
| SEE NOTES TO FINANCIAL STATEMENTS | | SEMIANNUAL REPORT | JOHN HANCOCK DISCIPLINED VALUE FUND | | 17 |
| | | | | | | | | | | | | | | | | | | | | | | | |
| | | | | | |
| CLASS B SHARES Period ended | | 9-30-201 | | | 3-31-20 | | | 3-31-19 | | | 3-31-18 | | | 3-31-17 | | | 3-31-16 | |
Per share operating performance | | | | | | | | | | | | | | | | | | | | | | | | |
Net asset value, beginning of period | | | $14.12 | | | | $18.92 | | | | $20.76 | | | | $19.52 | | | | $16.64 | | | | $18.38 | |
Net investment income2 | | | 0.02 | | | | 0.11 | | | | 0.09 | | | | 0.03 | | | | 0.03 | | | | 0.02 | |
Net realized and unrealized gain (loss) on investments | | | 2.87 | | | | (3.89 | ) | | | (0.26 | ) | | | 2.24 | | | | 2.91 | | | | (1.12 | ) |
Total from investment operations | | | 2.89 | | | | (3.78 | ) | | | (0.17 | ) | | | 2.27 | | | | 2.94 | | | | (1.10 | ) |
Less distributions | | | | | | | | | | | | | | | | | | | | | | | | |
From net investment income | | | — | | | | (0.10 | ) | | | (0.06 | ) | | | (0.02 | ) | | | (0.06 | ) | | | (0.05 | ) |
From net realized gain | | | — | | | | (0.92 | ) | | | (1.61 | ) | | | (1.01 | ) | | | — | | | | (0.59 | ) |
Total distributions | | | — | | | | (1.02 | ) | | | (1.67 | ) | | | (1.03 | ) | | | (0.06 | ) | | | (0.64 | ) |
Net asset value, end of period | | | $17.01 | | | | $14.12 | | | | $18.92 | | | | $20.76 | | | | $19.52 | | | | $16.64 | |
Total return (%)3,4 | | | 20.47 | 5 | | | (21.56 | ) | | | (0.34 | ) | | | 11.61 | | | | 17.66 | | | | (6.02 | ) |
Ratios and supplemental data | | | | | | | | | | | | | | | | | | | | | | | | |
Net assets, end of period (in millions) | | | $1 | | | | $2 | | | | $6 | | | | $9 | | | | $13 | | | | $14 | |
Ratios (as a percentage of average net assets): | | | | | | | | | | | | | | | | | | | | | | | | |
Expenses before reductions | | | 1.83 | 6 | | | 1.82 | | | | 1.81 | | | | 1.81 | | | | 1.82 | | | | 1.85 | |
Expenses including reductions | | | 1.82 | 6 | | | 1.81 | | | | 1.80 | | | | 1.80 | | | | 1.81 | | | | 1.84 | |
Net investment income | | | 0.21 | 6 | | | 0.59 | | | | 0.42 | | | | 0.16 | | | | 0.18 | | | | 0.09 | |
Portfolio turnover (%) | | | 31 | | | | 88 | | | | 69 | | | | 45 | | | | 65 | | | | 61 | |
| 1 | Six months ended 9-30-20. Unaudited. |
| 2 | Based on average daily shares outstanding. |
| 3 | Total returns would have been lower had certain expenses not been reduced during the applicable periods. |
| 4 | Does not reflect the effect of sales charges, if any. |
| | | | |
| 18 | | JOHN HANCOCK DISCIPLINED VALUE FUND | SEMIANNUAL REPORT | | SEE NOTES TO FINANCIAL STATEMENTS |
| | | | | | | | | | | | | | | | | | | | | | | | |
| CLASS C SHARES Period ended | | 9-30-201 | | | 3-31-20 | | | 3-31-19 | | | 3-31-18 | | | 3-31-17 | | | 3-31-16 | |
Per share operating performance | | | | | | | | | | | | | | | | | | | | | | | | |
Net asset value, beginning of period | | | $14.17 | | | | $18.98 | | | | $20.82 | | | | $19.57 | | | | $16.69 | | | | $18.43 | |
Net investment income2 | | | 0.02 | | | | 0.13 | | | | 0.09 | | | | 0.03 | | | | 0.03 | | | | 0.02 | |
Net realized and unrealized gain (loss) on investments | | | 2.88 | | | | (3.92 | ) | | | (0.26 | ) | | | 2.25 | | | | 2.91 | | | | (1.12 | ) |
Total from investment operations | | | 2.90 | | | | (3.79 | ) | | | (0.17 | ) | | | 2.28 | | | | 2.94 | | | | (1.10 | ) |
Less distributions | | | | | | | | | | | | | | | | | | | | | | | | |
From net investment income | | | — | | | | (0.10 | ) | | | (0.06 | ) | | | (0.02 | ) | | | (0.06 | ) | | | (0.05 | ) |
From net realized gain | | | — | | | | (0.92 | ) | | | (1.61 | ) | | | (1.01 | ) | | | — | | | | (0.59 | ) |
Total distributions | | | — | | | | (1.02 | ) | | | (1.67 | ) | | | (1.03 | ) | | | (0.06 | ) | | | (0.64 | ) |
Net asset value, end of period | | | $17.07 | | | | $14.17 | | | | $18.98 | | | | $20.82 | | | | $19.57 | | | | $16.69 | |
Total return (%)3,4 | | | 20.47 | 5 | | | (21.51 | ) | | | (0.35 | ) | | | 11.58 | | | | 17.61 | | | | (6.00 | ) |
Ratios and supplemental data | | | | | | | | | | | | | | | | | | | | | | | | |
Net assets, end of period (in millions) | | | $130 | | | | $140 | | | | $235 | | | | $275 | | | | $293 | | | | $309 | |
Ratios (as a percentage of average net assets): | | | | | | | | | | | | | | | | | | | | | | | | |
Expenses before reductions | | | 1.83 | 6 | | | 1.82 | | | | 1.81 | | | | 1.81 | | | | 1.82 | | | | 1.83 | |
Expenses including reductions | | | 1.82 | 6 | | | 1.81 | | | | 1.80 | | | | 1.80 | | | | 1.81 | | | | 1.82 | |
Net investment income | | | 0.21 | 6 | | | 0.67 | | | | 0.43 | | | | 0.16 | | | | 0.18 | | | | 0.12 | |
Portfolio turnover (%) | | | 31 | | | | 88 | | | | 69 | | | | 45 | | | | 65 | | | | 61 | |
| 1 | Six months ended 9-30-20. Unaudited. |
| 2 | Based on average daily shares outstanding. |
| 3 | Total returns would have been lower had certain expenses not been reduced during the applicable periods. |
| 4 | Does not reflect the effect of sales charges, if any. |
| | | | |
| SEE NOTES TO FINANCIAL STATEMENTS | | SEMIANNUAL REPORT | JOHN HANCOCK DISCIPLINED VALUE FUND | | 19 |
| | | | | | | | | | | | | | | | | | | | | | | | |
| CLASS I SHARES Period ended | | 9-30-201 | | | 3-31-20 | | | 3-31-19 | | | 3-31-18 | | | 3-31-17 | | | 3-31-16 | |
Per share operating performance | | | | | | | | | | | | | | | | | | | | | | | | |
Net asset value, beginning of period | | | $14.65 | | | | $19.58 | | | | $21.45 | | | | $20.12 | | | | $17.14 | | | | $18.91 | |
Net investment income2 | | | 0.10 | | | | 0.34 | | | | 0.30 | | | | 0.25 | | | | 0.22 | | | | 0.20 | |
Net realized and unrealized gain (loss) on investments | | | 2.98 | | | | (4.05 | ) | | | (0.27 | ) | | | 2.32 | | | | 3.00 | | | | (1.14 | ) |
Total from investment operations | | | 3.08 | | | | (3.71 | ) | | | 0.03 | | | | 2.57 | | | | 3.22 | | | | (0.94 | ) |
Less distributions | | | | | | | | | | | | | | | | | | | | | | | | |
From net investment income | | | — | | | | (0.30 | ) | | | (0.29 | ) | | | (0.23 | ) | | | (0.24 | ) | | | (0.24 | ) |
From net realized gain | | | — | | | | (0.92 | ) | | | (1.61 | ) | | | (1.01 | ) | | | — | | | | (0.59 | ) |
Total distributions | | | — | | | | (1.22 | ) | | | (1.90 | ) | | | (1.24 | ) | | | (0.24 | ) | | | (0.83 | ) |
Net asset value, end of period | | | $17.73 | | | | $14.65 | | | | $19.58 | | | | $21.45 | | | | $20.12 | | | | $17.14 | |
Total return (%)3 | | | 21.11 | 4 | | | (20.77 | ) | | | 0.64 | | | | 12.71 | | | | 18.80 | | | | (5.02 | ) |
Ratios and supplemental data | | | | | | | | | | | | | | | | | | | | | | | | |
Net assets, end of period (in millions) | | | $5,783 | | | | $5,250 | | | | $7,399 | | | | $6,988 | | | | $7,540 | | | | $6,730 | |
Ratios (as a percentage of average net assets): | | | | | | | | | | | | | | | | | | | | | | | | |
Expenses before reductions | | | 0.83 | 5 | | | 0.82 | | | | 0.82 | | | | 0.81 | | | | 0.81 | | | | 0.81 | |
Expenses including reductions | | | 0.82 | 5 | | | 0.81 | | | | 0.81 | | | | 0.80 | | | | 0.80 | | | | 0.80 | |
Net investment income | | | 1.21 | 5 | | | 1.69 | | | | 1.43 | | | | 1.17 | | | | 1.18 | | | | 1.13 | |
Portfolio turnover (%) | | | 31 | | | | 88 | | | | 69 | | | | 45 | | | | 65 | | | | 61 | |
| 1 | Six months ended 9-30-20. Unaudited. |
| 2 | Based on average daily shares outstanding. |
| 3 | Total returns would have been lower had certain expenses not been reduced during the applicable periods. |
| | | | |
| 20 | | JOHN HANCOCK DISCIPLINED VALUE FUND | SEMIANNUAL REPORT | | SEE NOTES TO FINANCIAL STATEMENTS |
| | | | | | | | | | | | | | | | | | | | | | | | |
| CLASS I2 SHARES Period ended | | 9-30-201 | | | 3-31-20 | | | 3-31-19 | | | 3-31-18 | | | 3-31-17 | | | 3-31-16 | |
Per share operating performance | | | | | | | | | | | | | | | | | | | | | | | | |
Net asset value, beginning of period | | | $14.65 | | | | $19.58 | | | | $21.45 | | | | $20.12 | | | | $17.14 | | | | $18.92 | |
Net investment income2 | | | 0.10 | | | | 0.34 | | | | 0.30 | | | | 0.25 | | | | 0.22 | | | | 0.20 | |
Net realized and unrealized gain (loss) on investments | | | 2.98 | | | | (4.05 | ) | | | (0.27 | ) | | | 2.32 | | | | 3.00 | | | | (1.15 | ) |
Total from investment operations | | | 3.08 | | | | (3.71 | ) | | | 0.03 | | | | 2.57 | | | | 3.22 | | | | (0.95 | ) |
Less distributions | | | | | | | | | | | | | | | | | | | | | | | | |
From net investment income | | | — | | | | (0.30 | ) | | | (0.29 | ) | | | (0.23 | ) | | | (0.24 | ) | | | (0.24 | ) |
From net realized gain | | | — | | | | (0.92 | ) | | | (1.61 | ) | | | (1.01 | ) | | | — | | | | (0.59 | ) |
Total distributions | | | — | | | | (1.22 | ) | | | (1.90 | ) | | | (1.24 | ) | | | (0.24 | ) | | | (0.83 | ) |
Net asset value, end of period | | | $17.73 | | | | $14.65 | | | | $19.58 | | | | $21.45 | | | | $20.12 | | | | $17.14 | |
Total return (%)3 | | | 21.11 | 4 | | | (20.77 | ) | | | 0.64 | | | | 12.71 | | | | 18.80 | | | | (5.07 | ) |
Ratios and supplemental data | | | | | | | | | | | | | | | | | | | | | | | | |
Net assets, end of period (in millions) | | | $41 | | | | $32 | | | | $50 | | | | $54 | | | | $54 | | | | $49 | |
Ratios (as a percentage of average net assets): | | | | | | | | | | | | | | | | | | | | | | | | |
Expenses before reductions | | | 0.83 | 5 | | | 0.82 | | | | 0.82 | | | | 0.81 | | | | 0.81 | | | | 0.82 | |
Expenses including reductions | | | 0.82 | 5 | | | 0.81 | | | | 0.81 | | | | 0.80 | | | | 0.80 | | | | 0.81 | |
Net investment income | | | 1.21 | 5 | | | 1.69 | | | | 1.43 | | | | 1.16 | | | | 1.18 | | | | 1.11 | |
Portfolio turnover (%) | | | 31 | | | | 88 | | | | 69 | | | | 45 | | | | 65 | | | | 61 | |
| 1 | Six months ended 9-30-20. Unaudited. |
| 2 | Based on average daily shares outstanding. |
| 3 | Total returns would have been lower had certain expenses not been reduced during the applicable periods. |
| | | | |
| SEE NOTES TO FINANCIAL STATEMENTS | | SEMIANNUAL REPORT | JOHN HANCOCK DISCIPLINED VALUE FUND | | 21 |
| | | | | | | | | | | | | | | | | | | | | | | | |
| CLASS R1 SHARES Period ended | | 9-30-201 | | | 3-31-20 | | | 3-31-19 | | | 3-31-18 | | | 3-31-17 | | | 3-31-16 | |
Per share operating performance | | | | | | | | | | | | | | | | | | | | | | | | |
Net asset value, beginning of period | | | $14.63 | | | | $19.56 | | | | $21.41 | | | | $20.09 | | | | $17.13 | | | | $18.90 | |
Net investment income2 | | | 0.05 | | | | 0.21 | | | | 0.16 | | | | 0.11 | | | | 0.10 | | | | 0.09 | |
Net realized and unrealized gain (loss) on investments | | | 2.98 | | | | (4.05 | ) | | | (0.26 | ) | | | 2.32 | | | | 2.98 | | | | (1.15 | ) |
Total from investment operations | | | 3.03 | | | | (3.84 | ) | | | (0.10 | ) | | | 2.43 | | | | 3.08 | | | | (1.06 | ) |
Less distributions | | | | | | | | | | | | | | | | | | | | | | | | |
From net investment income | | | — | | | | (0.17 | ) | | | (0.14 | ) | | | (0.10 | ) | | | (0.12 | ) | | | (0.12 | ) |
From net realized gain | | | — | | | | (0.92 | ) | | | (1.61 | ) | | | (1.01 | ) | | | — | | | | (0.59 | ) |
Total distributions | | | — | | | | (1.09 | ) | | | (1.75 | ) | | | (1.11 | ) | | | (0.12 | ) | | | (0.71 | ) |
Net asset value, end of period | | | $17.66 | | | | $14.63 | | | | $19.56 | | | | $21.41 | | | | $20.09 | | | | $17.13 | |
Total return (%)3 | | | 20.79 | 4 | | | (21.27 | ) | | | 0.01 | | | | 11.99 | | | | 18.00 | | | | (5.66 | ) |
Ratios and supplemental data | | | | | | | | | | | | | | | | | | | | | | | | |
Net assets, end of period (in millions) | | | $11 | | | | $10 | | | | $16 | | | | $21 | | | | $27 | | | | $26 | |
Ratios (as a percentage of average net assets): | | | | | | | | | | | | | | | | | | | | | | | | |
Expenses before reductions | | | 1.42 | 5 | | | 1.45 | | | | 1.46 | | | | 1.46 | | | | 1.47 | | | | 1.48 | |
Expenses including reductions | | | 1.42 | 5 | | | 1.44 | | | | 1.45 | | | | 1.45 | | | | 1.46 | | | | 1.47 | |
Net investment income | | | 0.61 | 5 | | | 1.03 | | | | 0.77 | | | | 0.52 | | | | 0.53 | | | | 0.48 | |
Portfolio turnover (%) | | | 31 | | | | 88 | | | | 69 | | | | 45 | | | | 65 | | | | 61 | |
| 1 | Six months ended 9-30-20. Unaudited. |
| 2 | Based on average daily shares outstanding. |
| 3 | Total returns would have been lower had certain expenses not been reduced during the applicable periods. |
| | | | |
| 22 | | JOHN HANCOCK DISCIPLINED VALUE FUND | SEMIANNUAL REPORT | | SEE NOTES TO FINANCIAL STATEMENTS |
| | | | | | | | | | | | | | | | | | | | | | | | |
| CLASS R2 SHARES Period ended | | 9-30-201 | | | 3-31-20 | | | 3-31-19 | | | 3-31-18 | | | 3-31-17 | | | 3-31-16 | |
Per share operating performance | | | | | | | | | | | | | | | | | | | | | | | | |
Net asset value, beginning of period | | | $14.63 | | | | $19.57 | | | | $21.43 | | | | $20.10 | | | | $17.13 | | | | $18.90 | |
Net investment income2 | | | 0.07 | | | | 0.23 | | | | 0.22 | | | | 0.16 | | | | 0.14 | | | | 0.13 | |
Net realized and unrealized gain (loss) on investments | | | 2.98 | | | | (4.03 | ) | | | (0.27 | ) | | | 2.33 | | | | 2.99 | | | | (1.14 | ) |
Total from investment operations | | | 3.05 | | | | (3.80 | ) | | | (0.05 | ) | | | 2.49 | | | | 3.13 | | | | (1.01 | ) |
Less distributions | | | | | | | | | | | | | | | | | | | | | | | | |
From net investment income | | | — | | | | (0.22 | ) | | | (0.20 | ) | | | (0.15 | ) | | | (0.16 | ) | | | (0.17 | ) |
From net realized gain | | | — | | | | (0.92 | ) | | | (1.61 | ) | | | (1.01 | ) | | | — | | | | (0.59 | ) |
Total distributions | | | — | | | | (1.14 | ) | | | (1.81 | ) | | | (1.16 | ) | | | (0.16 | ) | | | (0.76 | ) |
Net asset value, end of period | | | $17.68 | | | | $14.63 | | | | $19.57 | | | | $21.43 | | | | $20.10 | | | | $17.13 | |
Total return (%)3 | | | 20.85 | 4 | | | (21.08 | ) | | | 0.24 | | | | 12.30 | | | | 18.32 | | | | (5.42 | ) |
Ratios and supplemental data | | | | | | | | | | | | | | | | | | | | | | | | |
Net assets, end of period (in millions) | | | $45 | | | | $42 | | | | $102 | | | | $135 | | | | $135 | | | | $136 | |
Ratios (as a percentage of average net assets): | | | | | | | | | | | | | | | | | | | | | | | | |
Expenses before reductions | | | 1.20 | 5 | | | 1.21 | | | | 1.21 | | | | 1.21 | | | | 1.21 | | | | 1.22 | |
Expenses including reductions | | | 1.19 | 5 | | | 1.20 | | | | 1.20 | | | | 1.20 | | | | 1.21 | | | | 1.21 | |
Net investment income | | | 0.84 | 5 | | | 1.17 | | | | 1.02 | | | | 0.76 | | | | 0.78 | | | | 0.74 | |
Portfolio turnover (%) | | | 31 | | | | 88 | | | | 69 | | | | 45 | | | | 65 | | | | 61 | |
| 1 | Six months ended 9-30-20. Unaudited. |
| 2 | Based on average daily shares outstanding. |
| 3 | Total returns would have been lower had certain expenses not been reduced during the applicable periods. |
| | | | |
| SEE NOTES TO FINANCIAL STATEMENTS | | SEMIANNUAL REPORT | JOHN HANCOCK DISCIPLINED VALUE FUND | | 23 |
| | | | | | | | | | | | | | | | | | | | | | | | |
| CLASS R3 SHARES Period ended | | 9-30-201 | | | 3-31-20 | | | 3-31-19 | | | 3-31-18 | | | 3-31-17 | | | 3-31-16 | |
Per share operating performance | | | | | | | | | | | | | | | | | | | | | | | | |
Net asset value, beginning of period | | | $14.62 | | | | $19.55 | | | | $21.41 | | | | $20.09 | | | | $17.12 | | | | $18.89 | |
Net investment income2 | | | 0.06 | | | | 0.23 | | | | 0.18 | | | | 0.13 | | | | 0.12 | | | | 0.10 | |
Net realized and unrealized gain (loss) on investments | | | 2.98 | | | | (4.05 | ) | | | (0.27 | ) | | | 2.32 | | | | 2.99 | | | | (1.14 | ) |
Total from investment operations | | | 3.04 | | | | (3.82 | ) | | | (0.09 | ) | | | 2.45 | | | | 3.11 | | | | (1.04 | ) |
Less distributions | | | | | | | | | | | | | | | | | | | | | | | | |
From net investment income | | | — | | | | (0.19 | ) | | | (0.16 | ) | | | (0.12 | ) | | | (0.14 | ) | | | (0.14 | ) |
From net realized gain | | | — | | | | (0.92 | ) | | | (1.61 | ) | | | (1.01 | ) | | | — | | | | (0.59 | ) |
Total distributions | | | — | | | | (1.11 | ) | | | (1.77 | ) | | | (1.13 | ) | | | (0.14 | ) | | | (0.73 | ) |
Net asset value, end of period | | | $17.66 | | | | $14.62 | | | | $19.55 | | | | $21.41 | | | | $20.09 | | | | $17.12 | |
Total return (%)3 | | | 20.73 | 4 | | | (21.16 | ) | | | 0.08 | | | | 12.10 | | | | 18.17 | | | | (5.57 | ) |
Ratios and supplemental data | | | | | | | | | | | | | | | | | | | | | | | | |
Net assets, end of period (in millions) | | | $9 | | | | $9 | | | | $12 | | | | $16 | | | | $22 | | | | $30 | |
Ratios (as a percentage of average net assets): | | | | | | | | | | | | | | | | | | | | | | | | |
Expenses before reductions | | | 1.36 | 5 | | | 1.35 | | | | 1.36 | | | | 1.35 | | | | 1.36 | | | | 1.37 | |
Expenses including reductions | | | 1.35 | 5 | | | 1.34 | | | | 1.35 | | | | 1.34 | | | | 1.35 | | | | 1.37 | |
Net investment income | | | 0.68 | 5 | | | 1.15 | | | | 0.86 | | | | 0.63 | | | | 0.66 | | | | 0.57 | |
Portfolio turnover (%) | | | 31 | | | | 88 | | | | 69 | | | | 45 | | | | 65 | | | | 61 | |
| 1 | Six months ended 9-30-20. Unaudited. |
| 2 | Based on average daily shares outstanding. |
| 3 | Total returns would have been lower had certain expenses not been reduced during the applicable periods. |
| | | | |
| 24 | | JOHN HANCOCK DISCIPLINED VALUE FUND | SEMIANNUAL REPORT | | SEE NOTES TO FINANCIAL STATEMENTS |
| | | | | | | | | | | | | | | | | | | | | | | | |
| CLASS R4 SHARES Period ended | | 9-30-201 | | | 3-31-20 | | | 3-31-19 | | | 3-31-18 | | | 3-31-17 | | | 3-31-16 | |
Per share operating performance | | | | | | | | | | | | | | | | | | | | | | | | |
Net asset value, beginning of period | | | $14.65 | | | | $19.59 | | | | $21.45 | | | | $20.12 | | | | $17.14 | | | | $18.92 | |
Net investment income2 | | | 0.09 | | | | 0.30 | | | | 0.27 | | | | 0.22 | | | | 0.19 | | | | 0.18 | |
Net realized and unrealized gain (loss) on investments | | | 2.99 | | | | (4.05 | ) | | | (0.27 | ) | | | 2.32 | | | | 3.00 | | | | (1.16 | ) |
Total from investment operations | | | 3.08 | | | | (3.75 | ) | | | — | | | | 2.54 | | | | 3.19 | | | | (0.98 | ) |
Less distributions | | | | | | | | | | | | | | | | | | | | | | | | |
From net investment income | | | — | | | | (0.27 | ) | | | (0.25 | ) | | | (0.20 | ) | | | (0.21 | ) | | | (0.21 | ) |
From net realized gain | | | — | | | | (0.92 | ) | | | (1.61 | ) | | | (1.01 | ) | | | — | | | | (0.59 | ) |
Total distributions | | | — | | | | (1.19 | ) | | | (1.86 | ) | | | (1.21 | ) | | | (0.21 | ) | | | (0.80 | ) |
Net asset value, end of period | | | $17.73 | | | | $14.65 | | | | $19.59 | | | | $21.45 | | | | $20.12 | | | | $17.14 | |
Total return (%)3 | | | 21.02 | 4 | | | (20.87 | ) | | | 0.52 | | | | 12.54 | | | | 18.63 | | | | (5.22 | ) |
Ratios and supplemental data | | | | | | | | | | | | | | | | | | | | | | | | |
Net assets, end of period (in millions) | | | $70 | | | | $74 | | | | $143 | | | | $231 | | | | $286 | | | | $268 | |
Ratios (as a percentage of average net assets): | | | | | | | | | | | | | | | | | | | | | | | | |
Expenses before reductions | | | 1.06 | 5 | | | 1.06 | | | | 1.06 | | | | 1.06 | | | | 1.07 | | | | 1.06 | |
Expenses including reductions | | | 0.96 | 5 | | | 0.95 | | | | 0.95 | | | | 0.95 | | | | 0.96 | | | | 0.96 | |
Net investment income | | | 1.07 | 5 | | | 1.50 | | | | 1.26 | | | | 1.02 | | | | 1.03 | | | | 1.00 | |
Portfolio turnover (%) | | | 31 | | | | 88 | | | | 69 | | | | 45 | | | | 65 | | | | 61 | |
| 1 | Six months ended 9-30-20. Unaudited. |
| 2 | Based on average daily shares outstanding. |
| 3 | Total returns would have been lower had certain expenses not been reduced during the applicable periods. |
| | | | |
| SEE NOTES TO FINANCIAL STATEMENTS | | SEMIANNUAL REPORT | JOHN HANCOCK DISCIPLINED VALUE FUND | | 25 |
| | | | | | | | | | | | | | | | | | | | | | | | |
| CLASS R5 SHARES Period ended | | 9-30-201 | | | 3-31-20 | | | 3-31-19 | | | 3-31-18 | | | 3-31-17 | | | 3-31-16 | |
Per share operating performance | | | | | | | | | | | | | | | | | | | | | | | | |
Net asset value, beginning of period | | | $14.67 | | | | $19.62 | | | | $21.48 | | | | $20.15 | | | | $17.16 | | | | $18.94 | |
Net investment income2 | | | 0.11 | | | | 0.34 | | | | 0.31 | | | | 0.26 | | | | 0.23 | | | | 0.21 | |
Net realized and unrealized gain (loss) on investments | | | 2.99 | | | | (4.06 | ) | | | (0.26 | ) | | | 2.32 | | | | 3.00 | | | | (1.15 | ) |
Total from investment operations | | | 3.10 | | | | (3.72 | ) | | | 0.05 | | | | 2.58 | | | | 3.23 | | | | (0.94 | ) |
Less distributions | | | | | | | | | | | | | | | | | | | | | | | | |
From net investment income | | | — | | | | (0.31 | ) | | | (0.30 | ) | | | (0.24 | ) | | | (0.24 | ) | | | (0.25 | ) |
From net realized gain | | | — | | | | (0.92 | ) | | | (1.61 | ) | | | (1.01 | ) | | | — | | | | (0.59 | ) |
Total distributions | | | — | | | | (1.23 | ) | | | (1.91 | ) | | | (1.25 | ) | | | (0.24 | ) | | | (0.84 | ) |
Net asset value, end of period | | | $17.77 | | | | $14.67 | | | | $19.62 | | | | $21.48 | | | | $20.15 | | | | $17.16 | |
Total return (%)3 | | | 21.13 | 4 | | | (20.74 | ) | | | 0.75 | | | | 12.73 | | | | 18.88 | | | | (5.02 | ) |
Ratios and supplemental data | | | | | | | | | | | | | | | | | | | | | | | | |
Net assets, end of period (in millions) | | | $58 | | | | $61 | | | | $166 | | | | $198 | | | | $200 | | | | $275 | |
Ratios (as a percentage of average net assets): | | | | | | | | | | | | | | | | | | | | | | | | |
Expenses before reductions | | | 0.76 | 5 | | | 0.76 | | | | 0.76 | | | | 0.76 | | | | 0.76 | | | | 0.77 | |
Expenses including reductions | | | 0.76 | 5 | | | 0.75 | | | | 0.75 | | | | 0.75 | | | | 0.75 | | | | 0.76 | |
Net investment income | | | 1.27 | 5 | | | 1.70 | | | | 1.48 | | | | 1.22 | | | | 1.27 | | | | 1.16 | |
Portfolio turnover (%) | | | 31 | | | | 88 | | | | 69 | | | | 45 | | | | 65 | | | | 61 | |
| 1 | Six months ended 9-30-20. Unaudited. |
| 2 | Based on average daily shares outstanding. |
| 3 | Total returns would have been lower had certain expenses not been reduced during the applicable periods. |
| | | | |
| 26 | | JOHN HANCOCK DISCIPLINED VALUE FUND | SEMIANNUAL REPORT | | SEE NOTES TO FINANCIAL STATEMENTS |
| | | | | | | | | | | | | | | | | | | | | | | | |
| CLASS R6 SHARES Period ended | | 9-30-201 | | | 3-31-20 | | | 3-31-19 | | | 3-31-18 | | | 3-31-17 | | | 3-31-16 | |
Per share operating performance | | | | | | | | | | | | | | | | | | | | | | | | |
Net asset value, beginning of period | | | $14.67 | | | | $19.61 | | | | $21.48 | | | | $20.14 | | | | $17.16 | | | | $18.94 | |
Net investment income2 | | | 0.11 | | | | 0.36 | | | | 0.32 | | | | 0.27 | | | | 0.24 | | | | 0.23 | |
Net realized and unrealized gain (loss) on investments | | | 2.99 | | | | (4.06 | ) | | | (0.27 | ) | | | 2.33 | | | | 3.00 | | | | (1.15 | ) |
Total from investment operations | | | 3.10 | | | | (3.70 | ) | | | 0.05 | | | | 2.60 | | | | 3.24 | | | | (0.92 | ) |
Less distributions | | | | | | | | | | | | | | | | | | | | | | | | |
From net investment income | | | — | | | | (0.32 | ) | | | (0.31 | ) | | | (0.25 | ) | | | (0.26 | ) | | | (0.27 | ) |
From net realized gain | | | — | | | | (0.92 | ) | | | (1.61 | ) | | | (1.01 | ) | | | — | | | | (0.59 | ) |
Total distributions | | | — | | | | (1.24 | ) | | | (1.92 | ) | | | (1.26 | ) | | | (0.26 | ) | | | (0.86 | ) |
Net asset value, end of period | | | $17.77 | | | | $14.67 | | | | $19.61 | | | | $21.48 | | | | $20.14 | | | | $17.16 | |
Total return (%)3 | | | 21.13 | 4 | | | (20.66 | ) | | | 0.76 | | | | 12.84 | | | | 18.97 | | | | (5.00 | ) |
Ratios and supplemental data | | | | | | | | | | | | | | | | | | | | | | | | |
Net assets, end of period (in millions) | | | $3,327 | | | | $3,369 | | | | $4,584 | | | | $4,564 | | | | $3,077 | | | | $2,024 | |
Ratios (as a percentage of average net assets): | | | | | | | | | | | | | | | | | | | | | | | | |
Expenses before reductions | | | 0.72 | 5 | | | 0.71 | | | | 0.71 | | | | 0.71 | | | | 0.72 | | | | 0.72 | |
Expenses including reductions | | | 0.71 | 5 | | | 0.70 | | | | 0.70 | | | | 0.70 | | | | 0.69 | | | | 0.69 | |
Net investment income | | | 1.32 | 5 | | | 1.81 | | | | 1.54 | | | | 1.25 | | | | 1.27 | | | | 1.26 | |
Portfolio turnover (%) | | | 31 | | | | 88 | | | | 69 | | | | 45 | | | | 65 | | | | 61 | |
| 1 | Six months ended 9-30-20. Unaudited. |
| 2 | Based on average daily shares outstanding. |
| 3 | Total returns would have been lower had certain expenses not been reduced during the applicable periods. |
| | | | |
| SEE NOTES TO FINANCIAL STATEMENTS | | SEMIANNUAL REPORT | JOHN HANCOCK DISCIPLINED VALUE FUND | | 27 |
| | | | | | | | | | | | | | | | | | | | | | | | |
| CLASS NAV SHARES Period ended | | 9-30-201 | | | 3-31-20 | | | 3-31-19 | | | 3-31-18 | | | 3-31-17 | | | 3-31-16 | |
Per share operating performance | | | | | | | | | | | | | | | | | | | | | | | | |
Net asset value, beginning of period | | | $14.68 | | | | $19.62 | | | | $21.49 | | | | $20.15 | | | | $17.16 | | | | $18.94 | |
Net investment income2 | | | 0.11 | | | | 0.36 | | | | 0.33 | | | | 0.27 | | | | 0.24 | | | | 0.23 | |
Net realized and unrealized gain (loss) on investments | | | 2.99 | | | | (4.06 | ) | | | (0.28 | ) | | | 2.34 | | | | 3.01 | | | | (1.15 | ) |
Total from investment operations | | | 3.10 | | | | (3.70 | ) | | | 0.05 | | | | 2.61 | | | | 3.25 | | | | (0.92 | ) |
Less distributions | | | | | | | | | | | | | | | | | | | | | | | | |
From net investment income | | | — | | | | (0.32 | ) | | | (0.31 | ) | | | (0.26 | ) | | | (0.26 | ) | | | (0.27 | ) |
From net realized gain | | | — | | | | (0.92 | ) | | | (1.61 | ) | | | (1.01 | ) | | | — | | | | (0.59 | ) |
Total distributions | | | — | | | | (1.24 | ) | | | (1.92 | ) | | | (1.27 | ) | | | (0.26 | ) | | | (0.86 | ) |
Net asset value, end of period | | | $17.78 | | | | $14.68 | | | | $19.62 | | | | $21.49 | | | | $20.15 | | | | $17.16 | |
Total return (%)3 | | | 21.12 | 4 | | | (20.64 | ) | | | 0.77 | | | | 12.85 | | | | 18.95 | | | | (4.95 | ) |
Ratios and supplemental data | | | | | | | | | | | | | | | | | | | | | | | | |
Net assets, end of period (in millions) | | | $1,179 | | | | $887 | | | | $1,105 | | | | $1,219 | | | | $1,245 | | | | $750 | |
Ratios (as a percentage of average net assets): | | | | | | | | | | | | | | | | | | | | | | | | |
Expenses before reductions | | | 0.71 | 5 | | | 0.70 | | | | 0.70 | | | | 0.70 | | | | 0.70 | | | | 0.70 | |
Expenses including reductions | | | 0.70 | 5 | | | 0.69 | | | | 0.69 | | | | 0.69 | | | | 0.69 | | | | 0.69 | |
Net investment income | | | 1.33 | 5 | | | 1.83 | | | | 1.54 | | | | 1.28 | | | | 1.27 | | | | 1.25 | |
Portfolio turnover (%) | | | 31 | | | | 88 | | | | 69 | | | | 45 | | | | 65 | | | | 61 | |
| 1 | Six months ended 9-30-20. Unaudited. |
| 2 | Based on average daily shares outstanding. |
| 3 | Total returns would have been lower had certain expenses not been reduced during the applicable periods. |
| | | | |
| 28 | | JOHN HANCOCK DISCIPLINED VALUE FUND | SEMIANNUAL REPORT | | SEE NOTES TO FINANCIAL STATEMENTS |
|
Notes to financial statements (unaudited) |
Note 1 — Organization
John Hancock Disciplined Value Fund (the fund) is a series of John Hancock Funds III (the Trust), an open-end management investment company organized as a Massachusetts business trust and registered under the Investment Company Act of 1940, as amended (the 1940 Act). The investment objective of the fund is to seek to provide long-term growth of capital primarily through investment in equity securities. Current income is a secondary objective.
The fund may offer multiple classes of shares. The shares currently outstanding are detailed in the Statement of assets and liabilities. Class A and Class C shares are offered to all investors. Class B and Class I2 shares are closed to new investors. Class I shares are offered to institutions and certain investors. Class R1, Class R2, Class R3, Class R4 and Class R5 shares are available only to certain retirement and 529 plans. Class R6 shares are only available to certain retirement plans, institutions and other investors. Class NAV shares are offered to John Hancock affiliated funds of funds, retirement plans for employees of John Hancock and/or Manulife Financial Corporation, and certain 529 plans. Class B shares convert to Class A shares eight years after purchase. Class C shares convert to Class A shares ten years after purchase (certain exclusions may apply). Shareholders of each class have exclusive voting rights to matters that affect that class. The distribution and service fees, if any, and transfer agent fees for each class may differ.
Effective after the close of business on August 31, 2020, Class R1 and Class R3 were closed to new investors.
Effective November 1, 2020, Class C shares convert to Class A shares after 8 years (certain exclusions apply).
Note 2 — Significant accounting policies
The financial statements have been prepared in conformity with accounting principles generally accepted in the United States of America (US GAAP), which require management to make certain estimates and assumptions as of the date of the financial statements. Actual results could differ from those estimates and those differences could be significant. The fund qualifies as an investment company under Topic 946 of Accounting Standards Codification of US GAAP.
Events or transactions occurring after the end of the fiscal period through the date that the financial statements were issued have been evaluated in the preparation of the financial statements. The following summarizes the significant accounting policies of the fund:
Security valuation. Investments are stated at value as of the scheduled close of regular trading on the New York Stock Exchange (NYSE), normally at 4:00 P.M., Eastern Time. In case of emergency or other disruption resulting in the NYSE not opening for trading or the NYSE closing at a time other than the regularly scheduled close, the net asset value (NAV) may be determined as of the regularly scheduled close of the NYSE pursuant to the fund’s Valuation Policies and Procedures.
In order to value the securities, the fund uses the following valuation techniques: Equity securities, including exchange-traded or closed-end funds, are typically valued at the last sale price or official closing price on the exchange or principal market where the security trades. In the event there were no sales during the day or closing prices are not available, the securities are valued using the last available bid price. Investments by the fund in open-end mutual funds, including John Hancock Collateral Trust (JHCT), are valued at their respective NAVs each business day.
In certain instances, the Pricing Committee may determine to value equity securities using prices obtained from another exchange or market if trading on the exchange or market on which prices are typically obtained did not open for trading as scheduled, or if trading closed earlier than scheduled, and trading occurred as normal on another exchange or market.
| | | | |
| | SEMIANNUAL REPORT | JOHN HANCOCK DISCIPLINED VALUE FUND | | 29 |
Other portfolio securities and assets, for which reliable market quotations are not readily available, are valued at fair value as determined in good faith by the fund’s Pricing Committee following procedures established by the Board of Trustees. The frequency with which these fair valuation procedures are used cannot be predicted and fair value of securities may differ significantly from the value that would have been used had a ready market for such securities existed.
The fund uses a three-tier hierarchy to prioritize the pricing assumptions, referred to as inputs, used in valuation techniques to measure fair value. Level 1 includes securities valued using quoted prices in active markets for identical securities, including registered investment companies. Level 2 includes securities valued using other significant observable inputs. Observable inputs may include quoted prices for similar securities, interest rates, prepayment speeds and credit risk. Prices for securities valued using these inputs are received from independent pricing vendors and brokers and are based on an evaluation of the inputs described. Level 3 includes securities valued using significant unobservable inputs when market prices are not readily available or reliable, including the fund’s own assumptions in determining the fair value of investments. Factors used in determining value may include market or issuer specific events or trends, changes in interest rates and credit quality. The inputs or methodology used for valuing securities are not necessarily an indication of the risks associated with investing in those securities. Changes in valuation techniques and related inputs may result in transfers into or out of an assigned level within the disclosure hierarchy.
As of September 30, 2020, all investments are categorized as Level 1 under the hierarchy described above.
Real estate investment trusts. The fund may invest in real estate investment trusts (REITs). Distributions from REITs may be recorded as income and subsequently characterized by the REIT at the end of the fiscal year as a reduction of cost of investments and/or as a realized gain. As a result, the fund will estimate the components of distributions from these securities. Such estimates are revised when the actual components of the distributions are known.
Security transactions and related investment income. Investment security transactions are accounted for on a trade date plus one basis for daily NAV calculations. However, for financial reporting purposes, investment transactions are reported on trade date. Interest income is accrued as earned. Dividend income is recorded on the ex-date, except for dividends of certain foreign securities where the dividend may not be known until after the ex-date. In those cases, dividend income, net of withholding taxes, is recorded when the fund becomes aware of the dividends. Non-cash dividends, if any, are recorded at the fair market value of the securities received. Gains and losses on securities sold are determined on the basis of identified cost and may include proceeds from litigation.
Securities lending. The fund may lend its securities to earn additional income. The fund receives collateral from the borrower in an amount not less than the market value of the loaned securities. The fund will invest its cash collateral in JHCT, an affiliate of the fund, which has a floating NAV and is registered with the Securities and Exchange Commission (SEC) as an investment company. JHCT invests in short-term money market investments. The fund will receive the benefit of any gains and bear any losses generated by JHCT with respect to the cash collateral.
The fund has the right to recall loaned securities on demand. If a borrower fails to return loaned securities when due, then the lending agent is responsible and indemnifies the fund for the lent securities. The lending agent uses the collateral received from the borrower to purchase replacement securities of the same issue, type, class and series of the loaned securities. If the value of the collateral is less than the purchase cost of replacement securities, the lending agent is responsible for satisfying the shortfall but only to the extent that the shortfall is not due to any decrease in the value of JHCT.
Although the risk of loss on securities lent is mitigated by receiving collateral from the borrower and through lending agent indemnification, the fund could experience a delay in recovering securities or could experience a lower than expected return if the borrower fails to return the securities on a timely basis. The fund receives
| | | | |
| 30 | | JOHN HANCOCK DISCIPLINED VALUE FUND | SEMIANNUAL REPORT | | |
compensation for lending its securities by retaining a portion of the return on the investment of the collateral and compensation from fees earned from borrowers of the securities. Securities lending income received by the fund is net of fees retained by the securities lending agent. Net income received from JHCT is a component of securities lending income as recorded on the Statement of operations.
Obligations to repay collateral received by the fund are shown on the Statement of assets and liabilities as Payable upon return of securities loaned and are secured by the loaned securities. As of September 30, 2020, the fund loaned securities valued at $4,073,064 and received $4,168,740 of cash collateral.
Foreign taxes. The fund may be subject to withholding tax on income, capital gains or repatriations imposed by certain countries, a portion of which may be recoverable. Foreign taxes are accrued based upon the fund’s understanding of the tax rules and rates that exist in the foreign markets in which it invests. Taxes are accrued based on gains realized by the fund as a result of certain foreign security sales. In certain circumstances, estimated taxes are accrued based on unrealized appreciation of such securities. Investment income is recorded net of foreign withholding taxes.
Overdraft. The fund may have the ability to borrow from banks for temporary or emergency purposes, including meeting redemption requests that otherwise might require the untimely sale of securities. Pursuant to the fund’s custodian agreement, the custodian may loan money to the fund to make properly authorized payments. The fund is obligated to repay the custodian for any overdraft, including any related costs or expenses. The custodian may have a lien, security interest or security entitlement in any fund property that is not otherwise segregated or pledged, to the extent of any overdraft, and to the maximum extent permitted by law.
Line of credit. Effective June 25, 2020, the fund and other affiliated funds have entered into a syndicated line of credit agreement with Citibank, N.A. as the administrative agent that enables them to participate in a $1 billion unsecured committed line of credit. Excluding commitments designated for a certain fund and subject to the needs of all other affiliated funds, the fund can borrow up to an aggregate commitment amount of $850 million, subject to asset coverage and other limitations as specified in the agreement. Each participating fund paid an upfront fee in connection with this line of credit agreement, which is charged based on a combination of fixed and asset-based allocations and amortized over 365 days. Prior to June 25, 2020, the fund and other affiliated funds had a similar agreement that enabled them to participate in a $750 million unsecured committed line of credit. A commitment fee payable at the end of each calendar quarter, based on the average daily unused portion of the line of credit, is charged to each participating fund based on a combination of fixed and asset-based allocations and is reflected in Other expenses on the Statement of operations. Commitment fees for the six months ended September 30, 2020 were $24,773.
Expenses. Within the John Hancock group of funds complex, expenses that are directly attributable to an individual fund are allocated to such fund. Expenses that are not readily attributable to a specific fund are allocated among all funds in an equitable manner, taking into consideration, among other things, the nature and type of expense and the fund’s relative net assets. Expense estimates are accrued in the period to which they relate and adjustments are made when actual amounts are known.
Class allocations. Income, common expenses and realized and unrealized gains (losses) are determined at the fund level and allocated daily to each class of shares based on the net assets of the class. Class-specific expenses, such as distribution and service fees, if any, and transfer agent fees, for all classes, are charged daily at the class level based on the net assets of each class and the specific expense rates applicable to each class.
Federal income taxes. The fund intends to continue to qualify as a regulated investment company by complying with the applicable provisions of the Internal Revenue Code and will not be subject to federal income tax on taxable income that is distributed to shareholders. Therefore, no federal income tax provision is required.
As of March 31, 2020, the fund had no uncertain tax positions that would require financial statement recognition, derecognition or disclosure. The fund’s federal tax returns are subject to examination by the Internal Revenue Service for a period of three years.
| | | | |
| | SEMIANNUAL REPORT | JOHN HANCOCK DISCIPLINED VALUE FUND | | 31 |
Distribution of income and gains. Distributions to shareholders from net investment income and net realized gains, if any, are recorded on the ex-date. The fund generally declares and pays dividends annually. Capital gain distributions, if any, are typically distributed annually.
Distributions paid by the fund with respect to each class of shares are calculated in the same manner, at the same time and in the same amount, except for the effect of class level expenses that may be applied differently to each class.
Such distributions, on a tax basis, are determined in conformity with income tax regulations, which may differ from US GAAP. Distributions in excess of tax basis earnings and profits, if any, are reported in the fund’s financial statements as a return of capital. The final determination of tax characteristics of the fund’s distribution will occur at the end of the year and will subsequently be reported to shareholders.
Capital accounts within the financial statements are adjusted for permanent book-tax differences. These adjustments have no impact on net assets or the results of operations. Temporary book-tax differences, if any, will reverse in a subsequent period. Book-tax differences are primarily attributable to wash sale loss deferrals and treatment of a portion of the proceeds from redemptions as distributions for tax purposes.
Note 3 — Guarantees and indemnifications
Under the Trust’s organizational documents, its Officers and Trustees are indemnified against certain liabilities arising out of the performance of their duties to the Trust, including the fund. Additionally, in the normal course of business, the fund enters into contracts with service providers that contain general indemnification clauses. The fund’s maximum exposure under these arrangements is unknown, as this would involve future claims that may be made against the fund that have not yet occurred. The risk of material loss from such claims is considered remote.
Note 4 — Fees and transactions with affiliates
John Hancock Investment Management LLC (the Advisor) serves as investment advisor for the fund. John Hancock Investment Management Distributors LLC (the Distributor), an affiliate of the Advisor, serves as principal underwriter of the fund. The Advisor and the Distributor are indirect, principally owned subsidiaries of Manulife Financial Corporation.
Management fee. The fund has an investment management agreement with the Advisor under which the fund pays a daily management fee to the Advisor equivalent on an annual basis to the sum of: (a) 0.750% of the first $500 million of the fund’s average daily net assets; (b) 0.725% of the next $500 million of the fund’s average daily net assets; (c) 0.700% of the next $500 million of the fund’s average daily net assets; (d) 0.675% of the next $1 billion of the fund’s average daily net assets; (e) 0.650% of the next $10 billion of the fund’s average daily net assets; and (f) 0.625% of the fund’s average daily net assets in excess of $12.5 billion. The Advisor has a subadvisory agreement with Boston Partners Global Investors, Inc., an indirect, wholly owned subsidiary of ORIX Corporation of Japan. The fund is not responsible for payment of the subadvisory fees.
The Advisor has contractually agreed to waive a portion of its management fee and/or reimburse expenses for certain funds of the John Hancock group of funds complex, including the fund (the participating portfolios). This waiver is based upon aggregate net assets of all the participating portfolios. The amount of the reimbursement is calculated daily and allocated among all the participating portfolios in proportion to the daily net assets of each fund. During the six months ended September 30, 2020, this waiver amounted to 0.01% of the fund’s average daily net assets on an annualized basis. This arrangement expires on July 31, 2022, unless renewed by mutual agreement of the fund and the Advisor based upon a determination that this is appropriate under the circumstances at that time.
| | | | |
| 32 | | JOHN HANCOCK DISCIPLINED VALUE FUND | SEMIANNUAL REPORT | | |
For the six months ended September 30, 2020, the expense reductions described above amounted to the following:
| | | | |
| Class | | Expense reduction | |
Class A | | | $27,035 | |
Class B | | | 56 | |
Class C | | | 4,922 | |
Class I | | | 200,870 | |
Class I2 | | | 1,298 | |
Class R1 | | | 377 | |
Class R2 | | | 1,611 | |
| | | | |
| Class | | Expense reduction | |
Class R3 | | | $317 | |
Class R4 | | | 2,672 | |
Class R5 | | | 2,188 | |
Class R6 | | | 122,801 | |
Class NAV | | | 37,863 | |
Total | | | $402,010 | |
Expenses waived or reimbursed in the current fiscal period are not subject to recapture in future fiscal periods.
The investment management fees, including the impact of the waivers and reimbursements as described above, incurred for the six months ended September 30, 2020, were equivalent to a net annual effective rate of 0.65% of the fund’s average daily net assets.
Accounting and legal services. Pursuant to a service agreement, the fund reimburses the Advisor for all expenses associated with providing the administrative, financial, legal, compliance, accounting and recordkeeping services to the fund, including the preparation of all tax returns, periodic reports to shareholders and regulatory reports, among other services. These expenses are allocated to each share class based on its relative net assets at the time the expense was incurred. These accounting and legal services fees incurred, for the six months ended September 30, 2020, amounted to an annual rate of 0.02% of the fund’s average daily net assets.
Distribution and service plans. The fund has a distribution agreement with the Distributor. The fund has adopted distribution and service plans for certain classes as detailed below pursuant to Rule 12b-1 under the 1940 Act, to pay the Distributor for services provided as the distributor of shares of the fund. In addition, under a service plan for certain classes as detailed below, the fund pays for certain other services. The fund may pay up to the following contractual rates of distribution and service fees under these arrangements, expressed as an annual percentage of average daily net assets for each class of the fund’s shares:
| | | | | | | | |
| Class | | Rule 12b-1 Fee | | | Service fee | |
Class A | | | 0.30 | % | | | — | |
Class B | | | 1.00 | % | | | — | |
Class C | | | 1.00 | % | | | — | |
Class R1 | | | 0.50 | % | | | 0.25 | % |
Class R2 | | | 0.25 | % | | | 0.25 | % |
Class R3 | | | 0.50 | % | | | 0.15 | % |
Class R4 | | | 0.25 | % | | | 0.10 | % |
Class R5 | | | — | | | | 0.05 | % |
Currently only 0.25% is charged to Class A shares for Rule 12b-1 fees.
The fund’s Distributor has contractually agreed to waive 0.10% of Rule12b-1 fees for Class R4 shares. The current waiver agreement expires on July 31, 2021, unless renewed by mutual agreement of the fund and the Distributor based upon a determination that this is appropriate under the circumstances at the time. This contractual waiver amounted to $39,483 for Class R4 shares for the six months ended September 30, 2020.
| | | | |
| | SEMIANNUAL REPORT | JOHN HANCOCK DISCIPLINED VALUE FUND | | 33 |
Sales charges. Class A shares are assessed up-front sales charges, which resulted in payments to the Distributor amounting to $252,906 for the six months ended September 30, 2020. Of this amount, $37,598 was retained and used for printing prospectuses, advertising, sales literature and other purposes and $215,308 was paid as sales commissions to broker-dealers.
Class A, Class B and Class C shares may be subject to contingent deferred sales charges (CDSCs). Certain Class A shares that are acquired through purchases of $1 million or more and are redeemed within one year of purchase are subject to a 1.00% sales charge. Class B shares that are redeemed within six years of purchase are subject to CDSCs, at declining rates, beginning at 5.00%. Class C shares that are redeemed within one year of purchase are subject to a 1.00% CDSC. CDSCs are applied to the lesser of the current market value at the time of redemption or the original purchase cost of the shares being redeemed. Proceeds from CDSCs are used to compensate the Distributor for providing distribution-related services in connection with the sale of these shares. During the six months ended September 30, 2020, CDSCs received by the Distributor amounted to $3,521 and $4,676 for Class A and Class C shares, respectively. During the six months ended September 30, 2020, there were no CDSCs received by the Distributor for Class B shares.
Transfer agent fees. The John Hancock group of funds has a complex-wide transfer agent agreement with John Hancock Signature Services, Inc. (Signature Services), an affiliate of the Advisor. The transfer agent fees paid to Signature Services are determined based on the cost to Signature Services (Signature Services Cost) of providing recordkeeping services. It also includes out-of-pocket expenses, including payments made to third-parties for recordkeeping services provided to their clients who invest in one or more John Hancock funds. In addition, Signature Services Cost may be reduced by certain fees that Signature Services receives in connection with retirement and small accounts. Signature Services Cost is calculated monthly and allocated, as applicable, to five categories of share classes: Retail Share and Institutional Share Classes of Non-Municipal Bond Funds, Class R6 Shares, Retirement Share Classes and Municipal Bond Share Classes. Within each of these categories, the applicable costs are allocated to the affected John Hancock affiliated funds and/or classes, based on the relative average daily net assets.
Class level expenses. Class level expenses for the six months ended September 30, 2020 were as follows:
| | | | | | | | |
| Class | | Distribution and service fees | | | Transfer agent fees | |
Class A | | | $994,682 | | | | $491,769 | |
Class B | | | 8,350 | | | | 1,045 | |
Class C | | | 727,426 | | | | 90,194 | |
Class I | | | — | | | | 3,643,411 | |
Class I2 | | | — | | | | 23,390 | |
Class R1 | | | 39,145 | | | | 722 | |
Class R2 | | | 114,205 | | | | 3,070 | |
Class R3 | | | 29,696 | | | | 606 | |
Class R4 | | | 136,053 | | | | 5,140 | |
Class R5 | | | 14,243 | | | | 4,284 | |
Class R6 | | | — | | | | 235,209 | |
Total | | | $2,063,800 | | | | $4,498,840 | |
Trustee expenses. The fund compensates each Trustee who is not an employee of the Advisor or its affiliates. The costs of paying Trustee compensation and expenses are allocated to the fund based on its net assets relative to other funds within the John Hancock group of funds complex.
Interfund lending program. Pursuant to an Exemptive Order issued by the SEC, the fund, along with certain other funds advised by the Advisor or its affiliates, may participate in an interfund lending program. This program provides an alternative credit facility allowing the fund to borrow from, or lend money to, other participating
| | | | |
| 34 | | JOHN HANCOCK DISCIPLINED VALUE FUND | SEMIANNUAL REPORT | | |
affiliated funds. At period end, no interfund loans were outstanding. Interest expense is included in Other expenses on the Statement of operations. The fund’s activity in this program during the period for which loans were outstanding was as follows:
| | | | | | | | | | | | | | | | |
Borrower or Lender | | Weighted Average Loan Balance | | | Days Outstanding | | | Weighted Average Interest Rate | | | Interest Income (Expense) | |
Borrower | | | $19,600,000 | | | | 3 | | | | 0.540% | | | | $(882) | |
Lender | | | 10,460,000 | | | | 5 | | | | 0.563% | | | | 818 | |
Note 5 — Fund share transactions
Transactions in fund shares for the six months ended September 30, 2020 and for the year ended March 31, 2020 were as follows:
| | | | | | | | | | | | | | | | |
| | | Six Months Ended 9-30-20 | | | Year Ended 3-31-20 | |
| | | Shares | | | Amount | | | Shares | | | Amount | |
| | | | |
Class A shares | | | | | | | | | | | | | | | | |
Sold | | | 4,016,527 | | | | $71,116,425 | | | | 8,099,695 | | | | $161,568,240 | |
Distributions reinvested | | | — | | | | — | | | | 2,637,777 | | | | 55,762,596 | |
Repurchased | | | (9,669,442) | | | | (170,147,647) | | | | (16,480,693) | | | | (325,837,430) | |
Net decrease | | | (5,652,915) | | | | $(99,031,222) | | | | (5,743,221) | | | | $(108,506,594) | |
| | | | |
Class B shares | | | | | | | | | | | | | | | | |
Sold | | | 1,216 | | | | $19,172 | | | | 1,192 | | | | $22,584 | |
Distributions reinvested | | | — | | | | — | | | | 8,442 | | | | 166,393 | |
Repurchased | | | (69,697) | | | | (1,141,855) | | | | (164,821) | | | | (3,165,681) | |
Net decrease | | | (68,481) | | | | $(1,122,683) | | | | (155,187) | | | | $(2,976,704) | |
| | | | |
Class C shares | | | | | | | | | | | | | | | | |
Sold | | | 176,425 | | | | $2,873,581 | | | | 644,136 | | | | $12,311,289 | |
Distributions reinvested | | | — | | | | — | | | | 489,485 | | | | 9,682,020 | |
Repurchased | | | (2,459,909) | | | | (40,944,338) | | | | (3,633,809) | | | | (68,564,142) | |
Net decrease | | | (2,283,484) | | | | $(38,070,757) | | | | (2,500,188) | | | | $(46,570,833) | |
| | | | |
Class I shares | | | | | | | | | | | | | | | | |
Sold | | | 51,156,811 | | | | $869,255,600 | | | | 102,018,395 | | | | $1,907,812,951 | |
Distributions reinvested | | | — | | | | — | | | | 17,973,096 | | | | 366,291,706 | |
Repurchased | | | (83,450,644) | | | | (1,418,013,392) | | | | (139,397,179) | | | | (2,680,658,813) | |
Net decrease | | | (32,293,833) | | | | $(548,757,792) | | | | (19,405,688) | | | | $(406,554,156) | |
| | | | |
Class I2 shares | | | | | | | | | | | | | | | | |
Sold | | | 181,930 | | | | $3,209,025 | | | | 72,243 | | | | $1,448,534 | |
Distributions reinvested | | | — | | | | — | | | | 124,145 | | | | 2,530,085 | |
Repurchased | | | (57,220) | | | | (1,012,057) | | | | (575,124) | | | | (11,394,741) | |
Net increase (decrease) | | | 124,710 | | | | $2,196,968 | | | | (378,736) | | | | $(7,416,122) | |
| | | | |
| | SEMIANNUAL REPORT | JOHN HANCOCK DISCIPLINED VALUE FUND | | 35 |
| | | | | | | | | | | | | | | | |
| | | Six Months Ended 9-30-20 | | | Year Ended 3-31-20 | |
| | | Shares | | | Amount | | | Shares | | | Amount | |
| | | | |
Class R1 shares | | | | | | | | | | | | | | | | |
Sold | | | 66,263 | | | | $1,084,448 | | | | 197,405 | | | | $3,877,157 | |
Distributions reinvested | | | — | | | | — | | | | 30,916 | | | | 630,377 | |
Repurchased | | | (161,625 | ) | | | (2,634,182) | | | | (350,335 | ) | | | (6,893,030) | |
Net decrease | | | (95,362 | ) | | | $(1,549,734) | | | | (122,014 | ) | | | $(2,385,496) | |
| | | | |
Class R2 shares | | | | | | | | | | | | | | | | |
Sold | | | 211,319 | | | | $3,567,160 | | | | 733,520 | | | | $14,089,125 | |
Distributions reinvested | | | — | | | | — | | | | 189,843 | | | | 3,870,898 | |
Repurchased | | | (536,785 | ) | | | (9,337,678) | | | | (3,237,649 | ) | | | (65,014,511) | |
Net decrease | | | (325,466 | ) | | | $(5,770,518) | | | | (2,314,286 | ) | | | $(47,054,488) | |
| | | | |
Class R3 shares | | | | | | | | | | | | | | | | |
Sold | | | 45,614 | | | | $786,598 | | | | 270,206 | | | | $5,400,467 | |
Distributions reinvested | | | — | | | | — | | | | 35,261 | | | | 718,612 | |
Repurchased | | | (154,678 | ) | | | (2,396,713) | | | | (292,433 | ) | | | (5,770,953) | |
Net increase (decrease) | | | (109,064 | ) | | | $(1,610,115) | | | | 13,034 | | | | $348,126 | |
| | | | |
Class R4 shares | | | | | | | | | | | | | | | | |
Sold | | | 345,194 | | | | $5,727,612 | | | | 942,602 | | | | $18,482,411 | |
Distributions reinvested | | | — | | | | — | | | | 302,431 | | | | 6,169,593 | |
Repurchased | | | (1,421,924 | ) | | | (24,530,678) | | | | (3,500,335 | ) | | | (70,587,011) | |
Net decrease | | | (1,076,730 | ) | | | $(18,803,066) | | | | (2,255,302 | ) | | | $(45,935,007) | |
| | | | |
Class R5 shares | | | | | | | | | | | | | | | | |
Sold | | | 370,479 | | | | $6,277,671 | | | | 728,176 | | | | $14,187,537 | |
Distributions reinvested | | | — | | | | — | | | | 409,081 | | | | 8,353,442 | |
Repurchased | | | (1,297,955 | ) | | | (22,484,337) | | | | (5,399,053 | ) | | | (108,668,647) | |
Net decrease | | | (927,476 | ) | | | $(16,206,666) | | | | (4,261,796 | ) | | | $(86,127,668) | |
| | | | |
Class R6 shares | | | | | | | | | | | | | | | | |
Sold | | | 14,932,961 | | | | $251,759,784 | | | | 43,133,272 | | | | $824,215,152 | |
Distributions reinvested | | | — | | | | — | | | | 12,963,310 | | | | 264,581,161 | |
Repurchased | | | (57,343,030 | ) | | | (991,817,171) | | | | (60,250,923 | ) | | | (1,189,814,359) | |
Net decrease | | | (42,410,069 | ) | | | $(740,057,387) | | | | (4,154,341 | ) | | | $(101,018,046) | |
| | | | |
Class NAV shares | | | | | | | | | | | | | | | | |
Sold | | | 6,832,874 | | | | $113,243,544 | | | | 10,253,020 | | | | $187,949,281 | |
Distributions reinvested | | | — | | | | — | | | | 3,165,135 | | | | 64,632,066 | |
Repurchased | | | (954,793 | ) | | | (16,864,527) | | | | (9,328,190 | ) | | | (189,813,426) | |
Net increase | | | 5,878,081 | | | | $96,379,017 | | | | 4,089,965 | | | | $62,767,921 | |
| | | | |
Total net decrease | | | (79,240,089 | ) | | | $(1,372,403,955) | | | | (37,187,760 | ) | | | $(791,429,067) | |
| | | | |
| 36 | | JOHN HANCOCK DISCIPLINED VALUE FUND | SEMIANNUAL REPORT | | |
Affiliates of the fund owned 86% of shares of Class NAV on September 30, 2020. Such concentration of shareholders’ capital could have a material effect on the fund if such shareholders redeem from the fund.
Note 6 — Purchase and sale of securities
Purchases and sales of securities, other than short-term investments, amounted to $3,566,816,652 and $4,581,541,807, respectively, for the six months ended September 30, 2020.
Note 7 — Industry or sector risk
The fund may invest a large percentage of its assets in one or more particular industries or sectors of the economy. If a large percentage of the fund’s assets are economically tied to a single or small number of industries or sectors of the economy, the fund will be less diversified than a more broadly diversified fund, and it may cause the fund to underperform if that industry or sector underperforms. In addition, focusing on a particular industry or sector may make the fund’s NAV more volatile. Further, a fund that invests in particular industries or sectors is particularly susceptible to the impact of market, economic, regulatory and other factors affecting those industries or sectors.
Note 8 — Investment by affiliated funds
Certain investors in the fund are affiliated funds that are managed by the Advisor and its affiliates. The affiliated funds do not invest in the fund for the purpose of exercising management or control; however, this investment may represent a significant portion of the fund’s net assets. At September 30, 2020, funds within the John Hancock group of funds complex held 8.7% of the fund’s net assets. There were no affiliated funds with an ownership of 5% or more of the fund’s net assets.
Note 9 — Investment in affiliated underlying funds
The fund may invest in affiliated underlying funds that are managed by the Advisor and its affiliates. Information regarding the fund’s fiscal year to date purchases and sales of the affiliated underlying funds as well as income and capital gains earned by the fund, if any, is as follows:
| | | | | | | | | | | | | | | | | | | | | | | | | | | | | | | | | | | | |
| | | | | | | | | | | | | | | | | | | | | Dividends and distributions | | | | |
Affiliate | | Ending share amount | | | Beginning value | | | Cost of purchases | | | Proceeds from shares sold | | | Realized gain (loss) | | | Change in unrealized appreciation (depreciation) | | | Income distributions received | | | Capital gain distributions received | | | Ending value | |
John Hancock Collateral Trust* | | | 416,413 | | | | $6,063,564 | | | | $488,175,555 | | | | $(490,084,698) | | | | $16,852 | | | | $(3,018) | | | | $52,988 | | | | — | | | | $4,168,255 | |
|
| * | Refer to the Securities lending note within Note 2 for details regarding this investment. |
Note 10 — Coronavirus (COVID-19) pandemic
The novel COVID-19 disease has resulted in significant disruptions to global business activity. A widespread health crisis such as a global pandemic could cause substantial market volatility, exchange trading suspensions and closures, impact the ability to complete redemptions, and affect fund performance.
Note 11 — Subsequent events
On June 25, 2020, the Board of Trustees approved redesignations of the following share classes:
| | |
| Redesignation | | Effective date |
Class B shares as Class A shares | | October 14, 2020 |
Class I2 shares as Class I shares | | October 9, 2020 |
Class R1 shares as Class R2 shares | | October 23, 2020 |
Class R3 shares as Class R2 shares | | October 9, 2020 |
| | | | |
| | SEMIANNUAL REPORT | JOHN HANCOCK DISCIPLINED VALUE FUND | | 37 |
As a result of the Redesignations, Class B, Class I2, Class R1, and Class R3 shares were terminated, and shareholders in these classes became shareholders of the respective classes identified above, in each case with the same or lower total net expenses.
| | | | |
| 38 | | JOHN HANCOCK DISCIPLINED VALUE FUND | SEMIANNUAL REPORT | | |
Continuation of Investment Advisory and Subadvisory Agreements
Evaluation of Advisory and Subadvisory Agreements by the Board of Trustees
This section describes the evaluation by the Board of Trustees (the Board) of John Hancock Funds III (the Trust) of the Advisory Agreement (the Advisory Agreement) with John Hancock Investment Management, LLC (the Advisor) and the Subadvisory Agreement (the Subadvisory Agreement) with Boston Partners Global Investors, Inc. (the Subadvisor), for John Hancock Disciplined Value Fund (the fund). The Advisory Agreement and Subadvisory Agreement are collectively referred to as the Agreements. Prior to the June 23-25, 2020 telephonic1 meeting at which the Agreements were approved, the Board also discussed and considered information regarding the proposed continuation of the Agreements at the telephonic meeting held on May 26-27, 2020.
Approval of Advisory and Subadvisory Agreements
At telephonic meetings held on June 23-25, 2020, the Board, including the Trustees who are not parties to any Agreement or considered to be interested persons of the Trust under the Investment Company Act of 1940, as amended (the 1940 Act) (the Independent Trustees), reapproved for an annual period the continuation of the Advisory Agreement between the Trust and the Advisor and the Subadvisory Agreement between the Advisor and the Subadvisor with respect to the fund.
In considering the Advisory Agreement and the Subadvisory Agreement, the Board received in advance of the meetings a variety of materials relating to the fund, the Advisor and the Subadvisor, including comparative performance, fee and expense information for a peer group of similar funds prepared by an independent third-party provider of fund data, performance information for an applicable benchmark index; and, with respect to the Subadvisor, comparative performance information for comparably managed accounts, as applicable, and other information provided by the Advisor and the Subadvisor regarding the nature, extent and quality of services provided by the Advisor and the Subadvisor under their respective Agreements, as well as information regarding the Advisor’s revenues and costs of providing services to the fund and any compensation paid to affiliates of the Advisor. At the meetings at which the renewal of the Advisory Agreement and Subadvisory Agreement are considered, particular focus is given to information concerning fund performance, comparability of fees and total expenses, and profitability. However, the Board notes that the evaluation process with respect to the Advisor and the Subadvisor is an ongoing one. In this regard, the Board also took into account discussions with management and information provided to the Board (including its various committees) at prior meetings with respect to the services provided by the Advisor and the Subadvisor to the fund, including quarterly performance reports prepared by management containing reviews of investment results and prior presentations from the Subadvisor with respect to the fund. The information received and considered by the Board in connection with the May and June meetings and throughout the year was both written and oral. The Board also considered the nature, quality, and extent of non-advisory services, if any, to be provided to the fund by the Advisor’s affiliates, including distribution services. The Board considered the Advisory Agreement and the Subadvisory Agreement separately in the course of its review. In doing so, the Board noted the respective roles of the Advisor and Subadvisor in providing services to the fund.
Throughout the process, the Board asked questions of and requested additional information from management. The Board is assisted by counsel for the Trust and the Independent Trustees are also separately assisted by independent legal counsel throughout the process. The Independent Trustees also received a memorandum from
1 On March 25, 2020, as a result of health and safety measures put in place to combat the global COVID-19 pandemic, the Securities and Exchange Commission issued an exemptive order (the “Order”) pursuant to Sections 6(c) and 38(a) of the Investment Company Act of 1940, as amended (the “1940 Act”), that temporarily exempts registered investment management companies from the in-person voting requirements under the 1940 Act, subject to certain requirements, including that votes taken pursuant to the Order are ratified at the next in-person meeting. The Board determined that reliance on the Order was necessary or appropriate due to the circumstances related to current or potential effects of COVID-19 and therefore, the Board’s May and June meetings were held telephonically in reliance on the Order.
| | | | |
| | SEMIANNUAL REPORT | JOHN HANCOCK DISCIPLINED VALUE FUND | | 39 |
their independent legal counsel discussing the legal standards for their consideration of the proposed continuation of the Agreements and discussed the proposed continuation of the Agreements in private sessions with their independent legal counsel at which no representatives of management were present.
Approval of Advisory Agreement
In approving the Advisory Agreement with respect to the fund, the Board, including the Independent Trustees, considered a variety of factors, including those discussed below. The Board also considered other factors (including conditions and trends prevailing generally in the economy, the securities markets, and the industry) and did not treat any single factor as determinative, and each Trustee may have attributed different weights to different factors. The Board’s conclusions may be based in part on its consideration of the advisory and subadvisory arrangements in prior years and on the Board’s ongoing regular review of fund performance and operations throughout the year.
Nature, extent, and quality of services. Among the information received by the Board from the Advisor relating to the nature, extent, and quality of services provided to the fund, the Board reviewed information provided by the Advisor relating to its operations and personnel, descriptions of its organizational and management structure, and information regarding the Advisor’s compliance and regulatory history, including its Form ADV. The Board also noted that on a regular basis it receives and reviews information from the Trust’s Chief Compliance Officer (CCO) regarding the fund’s compliance policies and procedures established pursuant to Rule 38a-1 under the 1940 Act. The Board observed that the scope of services provided by the Advisor, and of the undertakings required of the Advisor in connection with those services, including maintaining and monitoring its own and the fund’s compliance programs, risk management programs, liquidity management programs and cybersecurity programs, had expanded over time as a result of regulatory, market and other developments. The Board considered that the Advisor is responsible for the management of the day-to-day operations of the fund, including, but not limited to, general supervision of and coordination of the services provided by the Subadvisor, and is also responsible for monitoring and reviewing the activities of the Subadvisor and other third-party service providers. The Board considered the significant risks assumed by the Advisor in connection with the services provided to the fund including entrepreneurial risk in sponsoring new funds and ongoing risks including investment, operational, enterprise, litigation, regulatory and compliance risks with respect to all funds.
In considering the nature, extent, and quality of the services provided by the Advisor, the Trustees also took into account their knowledge of the Advisor’s management and the quality of the performance of the Advisor’s duties, through Board meetings, discussions and reports during the preceding year and through each Trustee’s experience as a Trustee of the Trust and of the other trusts in the John Hancock group of funds complex (the John Hancock Fund Complex).
In the course of their deliberations regarding the Advisory Agreement, the Board considered, among other things:
| | (a) | the skills and competency with which the Advisor has in the past managed the Trust’s affairs and its subadvisory relationship, the Advisor’s oversight and monitoring of the Subadvisor’s investment performance and compliance programs, such as the Subadvisor’s compliance with fund policies and objectives, review of brokerage matters, including with respect to trade allocation and best execution and the Advisor’s timeliness in responding to performance issues; |
| | (b) | the background, qualifications and skills of the Advisor’s personnel; |
| | (c) | the Advisor’s compliance policies and procedures and its responsiveness to regulatory changes and fund industry developments; |
| | (d) | the Advisor’s administrative capabilities, including its ability to supervise the other service providers for the fund, as well as the Advisor’s oversight of any securities lending activity, its monitoring of class action litigation and collection of class action settlements on behalf of the fund, and bringing loss recovery actions on behalf of the fund; |
| | | | |
| 40 | | JOHN HANCOCK DISCIPLINED VALUE FUND | SEMIANNUAL REPORT | | |
| | (e) | the financial condition of the Advisor and whether it has the financial wherewithal to provide a high level and quality of services to the fund; |
| | (f) | the Advisor’s initiatives intended to improve various aspects of the Trust’s operations and investor experience with the fund; and |
| | (g) | the Advisor’s reputation and experience in serving as an investment advisor to the Trust and the benefit to shareholders of investing in funds that are part of a family of funds offering a variety of investments. |
The Board concluded that the Advisor may reasonably be expected to continue to provide a high quality of services under the Advisory Agreement with respect to the fund.
Investment performance.In considering the fund’s performance, the Board noted that it reviews at its regularly scheduled meetings information about the fund’s performance results. In connection with the consideration of the Advisory Agreement, the Board:
| | (a) | reviewed information prepared by management regarding the fund’s performance; |
| | (b) | considered the comparative performance of an applicable benchmark index; |
| | (c) | considered the performance of comparable funds, if any, as included in the report prepared by an independent third-party provider of fund data; and |
| | (d) | took into account the Advisor’s analysis of the fund’s performance and its plans and recommendations regarding the Trust’s subadvisory arrangements generally. |
The Board noted that while it found the data provided by the independent third-party generally useful it recognized its limitations, including in particular that data may vary depending on the end date selected and the results of the performance comparisons may vary depending on the selection of the peer group. The Board noted that the fund outperformed its benchmark index for the three-year period and underperformed its benchmark index for the one-,five- and ten-year periods ended December 31, 2019. The Board also noted that the fund underperformed its peer group median for the one- and five-year periods and outperformed its peer group median for the three- and ten-year periods ended December 31, 2019. The Board took into account management’s discussion of the factors that contributed to the fund’s performance for the benchmark index for the one-, five-and ten-year periods and to the peer group median for the one- and five-year periods, including the impact of past and current market conditions on the fund’s strategy and management’s plans for the fund. The Board concluded that the fund’s performance is being monitored and reasonably addressed, where appropriate.
Fees and expenses. The Board reviewed comparative information prepared by an independent third-party provider of fund data, including, among other data, the fund’s contractual and net management fees (and subadvisory fees, to the extent available) and total expenses as compared to similarly situated investment companies deemed to be comparable to the fund in light of the nature, extent and quality of the management and advisory and subadvisory services provided by the Advisor and the Subadvisor. The Board considered the fund’s ranking within a smaller group of peer funds chosen by the independent third-party provider, as well as the fund’s ranking within a broader group of funds. In comparing the fund’s contractual and net management fees to those of comparable funds, the Board noted that such fees include both advisory and administrative costs. The Board noted that net management fees and net total expenses for the fund are higher than the peer group median.
The Board took into account management’s discussion of the fund’s expenses. The Board took into account management’s discussion with respect to the overall management fee and the fees of the Subadvisor, including the amount of the advisory fee retained by the Advisor after payment of the subadvisory fee, in each case in light of the services rendered for those amounts and the risks undertaken by the Advisor. The Board also noted that the Advisor pays the subadvisory fee, and that such fees are negotiated at arm’s length with respect to the Subadvisor. In addition, the Board took into account that management had agreed to implement an overall fee waiver across
| | | | |
| | SEMIANNUAL REPORT | JOHN HANCOCK DISCIPLINED VALUE FUND | | 41 |
the complex, including the fund, which is discussed further below. The Board also noted actions taken over the past several years to reduce the fund’s operating expenses. The Board also noted that, in addition, the fund has breakpoints in its contractual management fee schedule that reduces management fees as assets increase. The Board also noted that the fund’s distributor, an affiliate of the Advisor, has agreed to waive a portion of its Rule 12b-1 fee for a share class of the fund. The Board reviewed information provided by the Advisor concerning the investment advisory fee charged by the Advisor or one of its advisory affiliates to other clients (including other funds in the John Hancock Fund Complex) having similar investment mandates, if any. The Board considered any differences between the Advisor’s and Subadvisor’s services to the fund and the services they provide to other comparable clients or funds. The Board concluded that the advisory fee paid with respect to the fund is reasonable in light of the nature, extent and quality of the services provided to the fund under the Advisory Agreement.
Profitability/Fall out benefits. In considering the costs of the services to be provided and the profits to be realized by the Advisor and its affiliates from the Advisor’s relationship with the Trust, the Board:
| | (a) | reviewed financial information of the Advisor; |
| | (b) | reviewed and considered information presented by the Advisor regarding the net profitability to the Advisor and its affiliates with respect to the fund; |
| | (c) | received and reviewed profitability information with respect to the John Hancock Fund Complex as a whole and with respect to the fund; |
| | (d) | received information with respect to the Advisor’s allocation methodologies used in preparing the profitability data and considered that the Advisor hired an independent third-party consultant to provide an analysis of the Advisor’s allocation methodologies; |
| | (e) | considered that the John Hancock insurance companies that are affiliates of the Advisor, as shareholders of the Trust directly or through their separate accounts, receive certain tax credits or deductions relating to foreign taxes paid and dividends received by certain funds of the Trust and noted that these tax benefits, which are not available to participants in qualified retirement plans under applicable income tax law, are reflected in the profitability information reviewed by the Board; |
| | (f) | considered that the Advisor also provides administrative services to the fund on a cost basis pursuant to an administrative services agreement; |
| | (g) | noted that affiliates of the Advisor provide transfer agency services and distribution services to the fund, and that the fund’s distributor also receives Rule 12b-1 payments to support distribution of the fund; |
| | (h) | noted that the Advisor also derives reputational and other indirect benefits from providing advisory services to the fund; |
| | (i) | noted that the subadvisory fee for the fund is paid by the Advisor and is negotiated at arm’s length; |
| | (j) | considered the Advisor’s ongoing costs and expenditures necessary to improve services, meet new regulatory and compliance requirements, and adapt to other challenges impacting the fund industry; and |
| | (k) | considered that the Advisor should be entitled to earn a reasonable level of profits in exchange for the level of services it provides to the fund and the risks that it assumes as Advisor, including entrepreneurial, operational, reputational, litigation and regulatory risk. |
Based upon its review, the Board concluded that the level of profitability, if any, of the Advisor and its affiliates from their relationship with the fund was reasonable and not excessive.
| | | | |
| 42 | | JOHN HANCOCK DISCIPLINED VALUE FUND | SEMIANNUAL REPORT | | |
Economies of scale. In considering the extent to which economies of scale would be realized as the fund grows and whether fee levels reflect these economies of scale for the benefit of fund shareholders, the Board:
| | (a) | considered that the Advisor has contractually agreed to waive a portion of its management fee for certain funds of the John Hancock Fund Complex, including the fund (the participating portfolios) or otherwise reimburse the expenses of the participating portfolios (the reimbursement). This waiver is based upon aggregate net assets of all the participating portfolios. The amount of the reimbursement is calculated daily and allocated among all the participating portfolios in proportion to the daily net assets of each fund; |
| | (b) | reviewed the fund’s advisory fee structure and concluded that: (i) the fund’s fee structure contains breakpoints at the subadvisory fee level and that such breakpoints are reflected as breakpoints in the advisory fees for the fund; and (ii) although economies of scale cannot be measured with precision, these arrangements permit shareholders of the fund to benefit from economies of scale if the fund grows. The Board also took into account management’s discussion of the fund’s advisory fee structure; and |
| | (c) | the Board also considered the effect of the fund’s growth in size on its performance and fees. The Board also noted that if the fund’s assets increase over time, the fund may realize other economies of scale. |
Approval of Subadvisory Agreement
In making its determination with respect to approval of the Subadvisory Agreement, the Board reviewed:
| | (1) | information relating to the Subadvisor’s business, including current subadvisory services to the Trust (and other funds in the John Hancock Fund Complex); |
| | (2) | the historical and current performance of the fund and comparative performance information relating to an applicable benchmark index and comparable funds; |
| | (3) | the subadvisory fee for the fund, including any breakpoints, and to the extent available, comparable fee information prepared by an independent third party provider of fund data; and |
| | (4) | information relating to the nature and scope of any material relationships and their significance to the Trust’s Advisor and Subadvisor. |
Nature, extent, and quality of services. With respect to the services provided by the Subadvisor, the Board received information provided to the Board by the Subadvisor, including the Subadvisor’s Form ADV, as well as took into account information presented throughout the past year. The Board considered the Subadvisor’s current level of staffing and its overall resources, as well as received information relating to the Subadvisor’s compensation program. The Board reviewed the Subadvisor’s history and investment experience, as well as information regarding the qualifications, background, and responsibilities of the Subadvisor’s investment and compliance personnel who provide services to the fund. The Board also considered, among other things, the Subadvisor’s compliance program and any disciplinary history. The Board also considered the Subadvisor’s risk assessment and monitoring process. The Board reviewed the Subadvisor’s regulatory history, including whether it was involved in any regulatory actions or investigations as well as material litigation, and any settlements and amelioratory actions undertaken, as appropriate. The Board noted that the Advisor conducts regular, periodic reviews of the Subadvisor and its operations, including regarding investment processes and organizational and staffing matters. The Board also noted that the Trust’s CCO and his staff conduct regular, periodic compliance reviews with the Subadvisor and present reports to the Independent Trustees regarding the same, which includes evaluating the regulatory compliance systems of the Subadvisor and procedures reasonably designed to assure compliance with the federal securities laws. The Board also took into account the financial condition of the Subadvisor.
| | | | |
| | SEMIANNUAL REPORT | JOHN HANCOCK DISCIPLINED VALUE FUND | | 43 |
The Board considered the Subadvisor’s investment process and philosophy. The Board took into account that the Subadvisor’s responsibilities include the development and maintenance of an investment program for the fund that is consistent with the fund’s investment objective, the selection of investment securities and the placement of orders for the purchase and sale of such securities, as well as the implementation of compliance controls related to performance of these services. The Board also received information with respect to the Subadvisor’s brokerage policies and practices, including with respect to best execution and soft dollars.
Subadvisor compensation. In considering the cost of services to be provided by the Subadvisor and the profitability to the Subadvisor of its relationship with the fund, the Board noted that the fees under the Subadvisory Agreement are paid by the Advisor and not the fund.
The Board also relied on the ability of the Advisor to negotiate the Subadvisory Agreement with the Subadvisor, which is not affiliated with the Advisor, and the fees thereunder at arm’s length. As a result, the costs of the services to be provided and the profits to be realized by the Subadvisor from its relationship with the Trust were not a material factor in the Board’s consideration of the Subadvisory Agreement.
The Board also received information regarding the nature and scope (including their significance to the Advisor and its affiliates and to the Subadvisor) of any material relationships with respect to the Subadvisor, which include arrangements in which the Subadvisor or its affiliates provide advisory, distribution, or management services in connection with financial products sponsored by the Advisor or its affiliates, and may include other registered investment companies, a 529 education savings plan, managed separate accounts and exempt group annuity contracts sold to qualified plans. The Board also received information and took into account any other potential conflicts of interest the Advisor might have in connection with the Subadvisory Agreement.
In addition, the Board considered other potential indirect benefits that the Subadvisor and its affiliates may receive from the Subadvisor’s relationship with the fund, such as the opportunity to provide advisory services to additional funds in the John Hancock Fund Complex and reputational benefits.
Subadvisory fees. The Board considered that the fund pays an advisory fee to the Advisor and that, in turn, the Advisor pays a subadvisory fee to the Subadvisor. As noted above, the Board also considered the fund’s subadvisory fees as compared to similarly situated investment companies deemed to be comparable to the fund as included in the report prepared by the independent third party provider of fund data, to the extent available. The Board noted that the limited size of the Lipper peer group was not sufficient for comparative purposes. The Board also took into account the subadvisory fees paid by the Advisor to the Subadvisor with respect to the fund and compared them to fees charged by the Subadvisor to manage other subadvised portfolios and portfolios not subject to regulation under the 1940 Act, as applicable.
Subadvisor performance. As noted above, the Board considered the fund’s performance as compared to the fund’s peer group median and the benchmark index and noted that the Board reviews information about the fund’s performance results at its regularly scheduled meetings. The Board noted the Advisor’s expertise and resources in monitoring the performance, investment style and risk-adjusted performance of the Subadvisor. The Board was mindful of the Advisor’s focus on the Subadvisor’s performance. The Board also noted the Subadvisor’s long-term performance record for similar accounts, as applicable.
The Board’s decision to approve the Subadvisory Agreement was based on a number of determinations, including the following:
| | (1) | the Subadvisor has extensive experience and demonstrated skills as a manager; |
| | (2) | the performance of the fund is being monitored and reasonably addressed, where appropriate; |
��
| | (3) | the subadvisory fee is reasonable in relation to the level and quality of services being provided under the Subadvisory Agreement; and |
| | | | |
| 44 | | JOHN HANCOCK DISCIPLINED VALUE FUND | SEMIANNUAL REPORT | | |
| | (4) | noted that the subadvisory fees are paid by the Advisor not the fund and that the subadvisory fee breakpoints are reflected as breakpoints in the advisory fees for the fund in order to permit shareholders to benefit from economies of scale if the fund grows. |
* * *
Based on the Board’s evaluation of all factors that the Board deemed to be material, including those factors described above, the Board, including the Independent Trustees, concluded that renewal of the Advisory Agreement and the Subadvisory Agreement would be in the best interest of the fund and its shareholders. Accordingly, the Board, and the Independent Trustees voting separately, approved the Advisory Agreement and Subadvisory Agreement for an additional one-year period.
| | | | |
| | SEMIANNUAL REPORT | JOHN HANCOCK DISCIPLINED VALUE FUND | | 45 |
Trustees
Hassell H. McClellan, Chairperson
Steven R. Pruchansky, Vice Chairperson
Andrew G. Arnott†
Charles L. Bardelis*
James R. Boyle
Peter S. Burgess*
William H. Cunningham
Grace K. Fey
Marianne Harrison†
Deborah C. Jackson
James M. Oates*
Frances G. Rathke*,1
Gregory A. Russo
Officers
Andrew G. Arnott
President
Charles A. Rizzo
Chief Financial Officer
Salvatore Schiavone
Treasurer
Christopher (Kit) Sechler
Secretary and Chief Legal Officer
Trevor Swanberg2
Chief Compliance Officer
Investment advisor
John Hancock Investment Management LLC
Subadvisor
Boston Partners Global Investors, Inc.
Portfolio Managers
David T. Cohen, CFA
Mark E. Donovan, CFA
Stephanie T. McGirr
David J. Pyle, CFA
Principal distributor
John Hancock Investment Management
Distributors LLC
Custodian
State Street Bank and Trust Company
Transfer agent
John Hancock Signature Services, Inc.
Legal counsel
K&L Gates LLP
* Member of the Audit Committee
† Non-Independent Trustee
1 Appointed as Independent Trustee effective as of September 15, 2020
2 Effective July 31, 2020
The fund’s proxy voting policies and procedures, as well as the fund proxy voting record for the most recent twelve-month period ended June 30, are available free of charge on the Securities and Exchange Commission (SEC) website at sec.gov or on our website.
All of the fund’s holdings as of the end of the third month of every fiscal quarter are filed with the SEC on Form N-PORT within 60 days of the end of the fiscal quarter. The fund’s Form N-PORT filings are available on our website and the SEC’s website, sec.gov.
We make this information on your fund, as well as monthly portfolio holdings, and other fund details available on our website at jhinvestments.com or by calling 800-225-5291.
| | | | |
| You can also contact us: | | | | |
| | |
| 800-225-5291 | | Regular mail: | | Express mail: |
| | |
| jhinvestments.com | | John Hancock Signature Services, Inc. | | John Hancock Signature Services, Inc. |
| | P.O. Box 219909 | | 430 W 7th Street |
| | Kansas City, MO 64121-9909 | | Suite 219909 |
| | | | Kansas City, MO 64105-1407 |
| | | | |
| 46 | | JOHN HANCOCK DISCIPLINED VALUE FUND | SEMIANNUAL REPORT | | |
|
John Hancock family of funds |
DOMESTIC EQUITY FUNDS
Blue Chip Growth
Classic Value
Disciplined Value
Disciplined Value Mid Cap
Equity Income
Financial Industries
Fundamental All Cap Core
Fundamental Large Cap Core
New Opportunities
Regional Bank
Small Cap Core
Small Cap Growth
Small Cap Value
U.S. Global Leaders Growth
U.S. Growth
GLOBAL AND INTERNATIONAL EQUITY FUNDS
Disciplined Value International
Emerging Markets
Emerging Markets Equity
Fundamental Global Franchise
Global Equity
Global Shareholder Yield
Global Thematic Opportunities
International Dynamic Growth
International Growth
International Small Company
INCOME FUNDS
Bond
California Tax-Free Income
Emerging Markets Debt
Floating Rate Income
Government Income
High Yield
High Yield Municipal Bond
Income
Investment Grade Bond
Money Market
Short Duration Bond
Short Duration Credit Opportunities
Strategic Income Opportunities
Tax-Free Bond
ALTERNATIVE AND SPECIALTY FUNDS
Absolute Return Currency
Alternative Asset Allocation
Alternative Risk Premia
Diversified Macro
Infrastructure
Multi-Asset Absolute Return
Seaport Long/Short
A fund’s investment objectives, risks, charges, and expenses should be considered carefully before investing. The prospectus contains this and other important information about the fund. To obtain a prospectus, contact your financial professional, call John Hancock Investment Management at 800-225-5291, or visit our website at jhinvestments.com. Please read the prospectus carefully before investing or sending money.
ASSET ALLOCATION
Balanced
Multi-Asset High Income
Multi-Index Lifetime Portfolios
Multi-Index Preservation Portfolios
Multimanager Lifestyle Portfolios
Multimanager Lifetime Portfolios
Retirement Income 2040
EXCHANGE-TRADED FUNDS
John Hancock Multifactor Consumer Discretionary ETF
John Hancock Multifactor Consumer Staples ETF
John Hancock Multifactor Developed International ETF
John Hancock Multifactor Emerging Markets ETF
John Hancock Multifactor Energy ETF
John Hancock Multifactor Financials ETF
John Hancock Multifactor Healthcare ETF
John Hancock Multifactor Industrials ETF
John Hancock Multifactor Large Cap ETF
John Hancock Multifactor Materials ETF
John Hancock Multifactor Media and Communications ETF
John Hancock Multifactor Mid Cap ETF
John Hancock Multifactor Small Cap ETF
John Hancock Multifactor Technology ETF
John Hancock Multifactor Utilities ETF
ENVIRONMENTAL, SOCIAL, AND
GOVERNANCE FUNDS
ESG All Cap Core
ESG Core Bond
ESG International Equity
ESG Large Cap Core
CLOSED-END FUNDS
Financial Opportunities
Hedged Equity & Income
Income Securities Trust
Investors Trust
Preferred Income
Preferred Income II
Preferred Income III
Premium Dividend
Tax-Advantaged Dividend Income
Tax-Advantaged Global Shareholder Yield
John Hancock Multifactor ETF shares are bought and sold at market price (not NAV), and are not individually redeemed from the fund. Brokerage commissions will reduce returns.
John Hancock ETFs are distributed by Foreside Fund Services, LLC, and are subadvised by Dimensional Fund Advisors LP. Foreside is not affiliated with John Hancock Investment Management Distributors LLC or Dimensional Fund Advisors LP.
Dimensional Fund Advisors LP receives compensation from John Hancock in connection with licensing rights to the John Hancock Dimensional indexes. Dimensional Fund Advisors LP does not sponsor, endorse, or sell, and makes no representation as to the advisability of investing in, John Hancock Multifactor ETFs.
|
John Hancock Investment Management A trusted brand John Hancock Investment Management is a premier asset manager with a heritage of financial stewardship dating back to 1862. Helping our shareholders pursue their financial goals is at the core of everything we do. It’s why we support the role of professional financial advice and operate with the highest standards of conduct and integrity. A better way to invest We serve investors globally through a unique multimanager approach: We search the world to find proven portfolio teams with specialized expertise for every strategy we offer, then we apply robust investment oversight to ensure they continue to meet our uncompromising standards and serve the best interests of our shareholders. Results for investors Our unique approach to asset management enables us to provide a diverse set of investments backed by some of the world’s best managers, along with strong risk-adjusted returns across asset classes. |
| | |
 | | Investment Management |
John Hancock Investment Management Distributors LLC ◾ Member FINRA, SIPC 200 Berkeley Street ◾ Boston, MA 02116-5010 ◾ 800-225-5291 ◾ jhinvestments.com
This report is for the information of the shareholders of John Hancock Disciplined Value Fund. It is not authorized for distribution to prospective investors unless preceded or accompanied by a prospectus.
| | |
A company of  Manulife Investment Management Manulife Investment Management | | |
| | 340SA 9/20 |
| MF1355794 | | 11/2020 |
Dear shareholder,
Despite heightened fears over the coronavirus (COVID-19), which sent markets tumbling just prior to the beginning of the reporting period, global financial markets delivered positive returns for the 6 months ended September 30, 2020. In response to the pandemic-led shock, the U.S. Federal Reserve and the government worked quickly to shore up the economy and equity markets began to rise, particularly large-cap U.S. growth stocks, during the period.
Of course, it would be a mistake to consider this market turnaround a trustworthy signal of assured or swift economic recovery. The ongoing spread of COVID-19 continues to create uncertainty among businesses and investors. While there has been economic growth in most of the United States, the pace has slowed in many areas as interest rates remain low and consumer spending remains far below prepandemic levels.
From an investment perspective, we continue to think that maintaining a focus on long-term objectives while pursuing a risk-aware strategy is a prudent way forward. Above all, we believe the counsel of a trusted financial professional matters now more than ever. Periods of heightened uncertainty are precisely the time to review your financial goals and follow a plan that helps you make the most of what continues to be a challenging situation.
On behalf of everyone at John Hancock Investment Management, I’d like to take this opportunity to welcome new shareholders and thank existing shareholders for the continued trust you’ve placed in us.
Sincerely,
Andrew G. Arnott
President and CEO,
John Hancock Investment Management
Head of Wealth and Asset Management,
United States and Europe
This commentary reflects the CEO’s views as of this report’s period end and are subject to change at any time. Diversification does not guarantee investment returns and does not eliminate risk of loss. All investments entail risks, including the possible loss of principal. For more up-to-date information, you can visit our website at jhinvestments.com.
|
John Hancock Disciplined Value Mid Cap Fund |
| | |
| SEMIANNUAL REPORT | JOHN HANCOCK DISCIPLINED VALUE MID CAP FUND | | 1 |
| | |
| |
| | INVESTMENT OBJECTIVE |
| |
| | The fund seeks long-term growth of capital with current income as a secondary objective. |
| |
| | AVERAGE ANNUAL TOTAL RETURNS AS OF 9/30/2020 (%) |

The Russell Midcap Value Index is an unmanaged index that measures the performance of those Russell Midcap Index companies with lower price-to-book ratios and lower forecasted growth values.
It is not possible to invest directly in an index. Index figures do not reflect expenses or sales charges, which would result in lower returns.
The fund’s Morningstar category average is a group of funds with similar investment objectives and strategies and is the equal-weighted return of all funds per category. Morningstar places funds in certain categories based on their historical portfolio holdings. Figures from Morningstar, Inc. include reinvested distributions and do not take into account sales charges. Actual load-adjusted performance is lower.
The past performance shown here reflects reinvested distributions and the beneficial effect of any expense reductions, and does not guarantee future results. Performance of the other share classes will vary based on the difference in the fees and expenses of those classes. Shares will fluctuate in value and, when redeemed, may be worth more or less than their original cost. Current month-end performance may be lower or higher than the performance cited, and can be found at jhinvestments.com or by calling 800-225-5291. For further information on the fund’s objectives, risks, and strategy, see the fund’s prospectus.
| | |
| 2 | | JOHN HANCOCK DISCIPLINED VALUE MID CAP FUND | SEMIANNUAL REPORT |
| | |
| |
| | SECTOR COMPOSITION AS OF 9/30/2020 (% of net assests) |
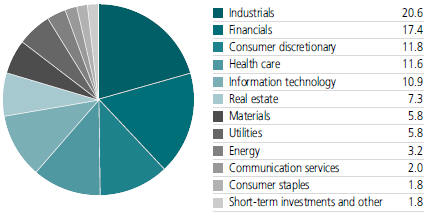
| | | | |
| TOP 10 HOLDINGS AS OF 9/30/2020 (% of net assets) | | | |
| |
Ameriprise Financial, Inc. | | | 1.7 | |
| |
AMETEK, Inc. | | | 1.6 | |
| |
Dover Corp. | | | 1.5 | |
| |
TE Connectivity, Ltd. | | | 1.5 | |
| |
Huntington Bancshares, Inc. | | | 1.5 | |
| |
Fifth Third Bancorp | | | 1.5 | |
| |
Qorvo, Inc. | | | 1.4 | |
| |
FMC Corp. | | | 1.4 | |
| |
Eaton Corp. PLC | | | 1.3 | |
| |
Humana, Inc. | | | 1.2 | |
| |
TOTAL | | | 14.6 | |
Cash and cash equivalents are not included.
A note about risks
The fund may be subject to various risks as described in the fund’s prospectus. A widespread health crisis such as a global pandemic could cause substantial market volatility, exchange trading suspensions and closures, impact the ability to complete redemptions, and affect fund performance. For example, the novel coronavirus disease (COVID-19) has resulted in significant disruptions to global business activity. The impact of a health crisis and other epidemics and pandemics that may arise in the future, could affect the global economy in ways that cannot necessarily be foreseen at the present time. A health crisis may exacerbate other pre-existing political, social, and economic risks. Any such impact could adversely affect the fund’s performance, resulting in losses to your investment. For more information, please refer to the “Principal risks” section of the prospectus.
| | |
| SEMIANNUAL REPORT | JOHN HANCOCK DISCIPLINED VALUE MID CAP FUND | | 3 |
| | | | | | | | | | | | | | | | | | | | | | | | |
TOTAL RETURNS FOR THE PERIOD ENDED SEPTEMBER 30, 2020 | |
| | Average annual total returns (%) with maximum sales charge | | | | | | |
| Cumulative total returns (%)
with maximum sales charge |
|
| | | 1-year | | | 5-year | | | | 10-year | | | | | | | | 6-month | | | 5-year | | | 10-year | |
Class A | | -12.41 | | | 4.85 | | | | 10.13 | | | | | | | | 18.04 | | | 26.70 | | | 162.52 | |
Class C1 | | -9.38 | | | 5.13 | | | | 9.93 | | | | | | | | 22.69 | | | 28.40 | | | 157.64 | |
Class I2 | | -7.58 | | | 6.18 | | | | 10.99 | | | | | | | | 24.33 | | | 34.98 | | | 183.65 | |
Class R21,2 | | -7.92 | | | 5.78 | | | | 10.56 | | | | | | | | 24.08 | | | 32.42 | | | 173.00 | |
Class R41,2 | | -7.72 | | | 6.03 | | | | 10.76 | | | | | | | | 24.21 | | | 34.02 | | | 177.94 | |
Class R61,2 | | -7.45 | | | 6.30 | | | | 11.05 | | | | | | | | 24.39 | | | 35.73 | | | 185.22 | |
Class ADV2 | | -7.78 | | | 5.92 | | | | 10.67 | | | | | | | | 24.21 | | | 33.33 | | | 175.71 | |
Index† | | -7.30 | | | 6.38 | | | | 9.71 | | | | | | | | 27.63 | | | 36.24 | | | 152.71 | |
Performance figures assume all distributions are reinvested. Figures reflect maximum sales charges on Class A shares of 5% and the applicable contingent deferred sales charge (CDSC) on Class C shares. Class C shares sold within one year of purchase are subject to a 1% CDSC. Sales charges are not applicable to Class I, Class R2, Class R4, Class R6, and Class ADV shares.
The expense ratios of the fund, both net (including any fee waivers and/or expense limitations) and gross (excluding any fee waivers and/or expense limitations), are set forth according to the most recent publicly available prospectuses for the fund and may differ from those disclosed in the Financial highlights tables in this report. Net expenses reflect contractual expense limitations in effect until July 31, 2021 and are subject to change. Had the contractual fee waivers and expense limitations not been in place, gross expenses would apply. The expense ratios are as follows:
| | | | | | | | | | | | | | | | |
| | | Class A | | Class C | | Class I | | Class R2 | | Class R4 | | Class R6 | | Class ADV | | |
Gross (%) | | 1.12 | | 1.87 | | 0.87 | | 1.26 | | 1.11 | | 0.76 | | 1.12 |
Net (%) | | 1.11 | | 1.86 | | 0.86 | | 1.25 | | 1.00 | | 0.75 | | 1.11 |
Please refer to the most recent prospectus and annual or semiannual report for more information on expenses and any expense limitation arrangements for each class.
The returns reflect past results and should not be considered indicative of future performance. The return and principal value of an investment will fluctuate so that shares, when redeemed, may be worth more or less than their original cost. Due to market volatility and other factors, the fund’s current performance may be higher or lower than the performance shown. For current to the most recent month-end performance data, please call 800–225–5291 or visit the fund’s website at jhinvestments.com.
The performance table above and the chart on the next page do not reflect the deduction of taxes that a shareholder would pay on fund distributions or the redemption of fund shares. The fund’s performance results reflect any applicable fee waivers or expense reductions, without which the expenses would increase and results would have been less favorable.
† Index is the Russell Midcap Value Index.
See the following page for footnotes.
| | |
| 4 | | JOHN HANCOCK DISCIPLINED VALUE MID CAP FUND | SEMIANNUAL REPORT |
This chart and table show what happened to a hypothetical $10,000 investment in John Hancock Disciplined Value Mid Cap Fund for the share classes and periods indicated, assuming all distributions were reinvested. For comparison, we’ve shown the same investment in the Russell Midcap Value Index.
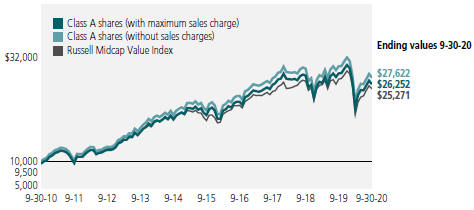
| | | | | | | | | | | | | | | | |
| | | Start date | | | With maximum
sales charge ($) | | | Without
sales charge ($) | | | Index ($) | |
Class C1,3 | | | 9-30-10 | | | | 25,764 | | | | 25,764 | | | | 25,271 | |
Class I | | | 9-30-10 | | | | 28,365 | | | | 28,365 | | | | 25,271 | |
Class R21,2 | | | 9-30-10 | | | | 27,300 | | | | 27,300 | | | | 25,271 | |
Class R41,2 | | | 9-30-10 | | | | 27,794 | | | | 27,794 | | | | 25,271 | |
Class R61,2 | | | 9-30-10 | | | | 28,522 | | | | 28,522 | | | | 25,271 | |
Class ADV2 | | | 9-30-10 | | | | 27,571 | | | | 27,571 | | | | 25,271 | |
The Russell Midcap Value Index is an unmanaged index that measures the performance of those Russell Midcap companies with lower price-to-book ratios and lower forecasted growth values. It is not possible to invest directly in an index. Index figures do not reflect expenses or sales charges, which would result in lower returns.
Footnotes related to performance pages
| | 1 | Class C, Class R2, Class R4, and Class R6 shares were first offered on 8-15-11, 3-1-12, 7-2-13, and 9-1-11, respectively. Returns shown prior to these dates are those of Class A shares, that have not been adjusted for class-specific expenses; otherwise, returns would vary. | |
| | 2 | For certain types of investors, as described in the Fund’s prospectus. | |
| | 3 | The contingent deferred sales charge is not applicable. | |
| | |
| SEMIANNUAL REPORT | JOHN HANCOCK DISCIPLINED VALUE MID CAP FUND | | 5 |
These examples are intended to help you understand your ongoing operating expenses of investing in the fund so you can compare these costs with the ongoing costs of investing in other mutual funds.
Understanding fund expenses
As a shareholder of the fund, you incur two types of costs:
| | ∎ | | Transaction costs, which include sales charges (loads) on purchases or redemptions (varies by share class), minimum account fee charge, etc. | |
| | ∎ | | Ongoing operating expenses, including management fees, distribution and service fees (if applicable), and other fund expenses. | |
We are presenting only your ongoing operating expenses here.
Actual expenses/actual returns
The first line of each share class in the table on the following page is intended to provide information about the fund’s actual ongoing operating expenses, and is based on the fund’s actual return. It assumes an account value of $1,000.00 on April 1, 2020, with the same investment held until September 30, 2020.
Together with the value of your account, you may use this information to estimate the operating expenses that you paid over the period. Simply divide your account value at September 30, 2020, by $1,000.00, then multiply it by the “expenses paid” for your share class from the table. For example, for an account value of $8,600.00, the operating expenses should be calculated as follows:
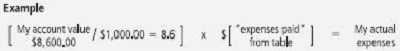
Hypothetical example for comparison purposes
The second line of each share class in the table on the following page allows you to compare the fund’s ongoing operating expenses with those of any other fund. It provides an example of the fund’s hypothetical account values and hypothetical expenses based on each class’s actual expense ratio and an assumed 5% annualized return before expenses (which is not the class’s actual return). It assumes an account value of $1,000.00 on April 1, 2020, with the same investment held until September 30, 2020. Look in any other fund shareholder report to find its hypothetical example and you will be able to compare these expenses. Please remember that these hypothetical account values and expenses may not be used to estimate the actual ending account balance or expenses you paid for the period.
| | |
| 6 | | JOHN HANCOCK DISCIPLINED VALUE MID CAP FUND | SEMIANNUAL REPORT |
Remember, these examples do not include any transaction costs, therefore, these examples will not help you to determine the relative total costs of owning different funds. If transaction costs were included, your expenses would have been higher. See the prospectuses for details regarding transaction costs.
|
| SHAREHOLDER EXPENSE EXAMPLE CHART |
| | | | | | | | | | | | | | | | | | |
| |
| | | | | Account value on 4-1-2020 | | | Ending value on 9-30-2020 | | | Expenses paid during period ended 9-30-20201 | | | Annualized expense ratio | |
Class A | | Actual expenses/actual returns | | | $1,000.00 | | | | $1,242.10 | | | | $ 6.30 | | | | 1.12% | |
| | | Hypothetical example | | | 1,000.00 | | | | 1,019.50 | | | | 5.67 | | | | 1.12% | |
Class C | | Actual expenses/actual returns | | | 1,000.00 | | | | 1,236.90 | | | | 10.49 | | | | 1.87% | |
| | | Hypothetical example | | | 1,000.00 | | | | 1,015.70 | | | | 9.45 | | | | 1.87% | |
Class I | | Actual expenses/actual returns | | | 1,000.00 | | | | 1,243.30 | | | | 4.89 | | | | 0.87% | |
| | | Hypothetical example | | | 1,000.00 | | | | 1,020.70 | | | | 4.41 | | | | 0.87% | |
Class R2 | | Actual expenses/actual returns | | | 1,000.00 | | | | 1,240.80 | | | | 6.97 | | | | 1.24% | |
| | | Hypothetical example | | | 1,000.00 | | | | 1,018.90 | | | | 6.28 | | | | 1.24% | |
Class R4 | | Actual expenses/actual returns | | | 1,000.00 | | | | 1,242.10 | | | | 5.68 | | | | 1.01% | |
| | | Hypothetical example | | | 1,000.00 | | | | 1,020.00 | | | | 5.11 | | | | 1.01% | |
Class R6 | | Actual expenses/actual returns | | | 1,000.00 | | | | 1,243.90 | | | | 4.28 | | | | 0.76% | |
| | | Hypothetical example | | | 1,000.00 | | | | 1,021.30 | | | | 3.85 | | | | 0.76% | |
Class ADV | | Actual expenses/actual returns | | | 1,000.00 | | | | 1,242.10 | | | | 6.30 | | | | 1.12% | |
| | | Hypothetical example | | | 1,000.00 | | | | 1,019.50 | | | | 5.67 | | | | 1.12% | |
| | 1 | Expenses are equal to the annualized expense ratio, multiplied by the average account value over the period, multiplied by 183/365 (to reflect the one-half year period). |
| | | | |
| | SEMIANNUAL REPORT | JOHN HANCOCK DISCIPLINED VALUE MID CAP FUND | | 7 |
AS OF 9-30-20 (unaudited)
| | | | | | | | |
| | | Shares | | | Value | |
Common stocks 98.2% | | | | | | | $11,510,013,340 | |
(Cost $9,957,813,729) | | | | | | | | |
| | |
Communication services 2.0% | | | | | | | 233,456,296 | |
| | |
Entertainment 1.0% | | | | | | | | |
Activision Blizzard, Inc. | | | 358,656 | | | | 29,033,203 | |
Electronic Arts, Inc. (A) | | | 254,582 | | | | 33,200,039 | |
Live Nation Entertainment, Inc. (A) | | | 1,048,084 | | | | 56,470,766 | |
| | |
Interactive media and services 0.3% | | | | | | | | |
Yelp, Inc. (A)(B) | | | 1,457,247 | | | | 29,276,092 | |
| | |
Media 0.7% | | | | | | | | |
Altice USA, Inc., Class A (A) | | | 3,287,546 | | | | 85,476,196 | |
| | |
Consumer discretionary 11.8% | | | | | | | 1,382,128,341 | |
| | |
Auto components 1.0% | | | | | | | | |
Gentex Corp. | | | 2,338,008 | | | | 60,203,706 | |
Lear Corp. | | | 523,261 | | | | 57,061,612 | |
| | |
Automobiles 0.7% | | | | | | | | |
Harley-Davidson, Inc. (B) | | | 3,273,518 | | | | 80,332,132 | |
| | |
Distributors 0.4% | | | | | | | | |
LKQ Corp. (A) | | | 1,755,587 | | | | 48,682,428 | |
| | |
Hotels, restaurants and leisure 3.3% | | | | | | | | |
Darden Restaurants, Inc. | | | 518,821 | | | | 52,266,028 | |
International Game Technology PLC (B) | | | 2,392,395 | | | | 26,627,356 | |
Las Vegas Sands Corp. | | | 1,280,621 | | | | 59,753,776 | |
Marriott International, Inc., Class A | | | 616,615 | | | | 57,086,217 | |
Norwegian Cruise Line Holdings, Ltd. (A)(B) | | | 2,373,315 | | | | 40,607,420 | |
Wyndham Destinations, Inc. | | | 1,332,680 | | | | 40,993,237 | |
Wyndham Hotels & Resorts, Inc. | | | 1,382,305 | | | | 69,806,403 | |
Wynn Resorts, Ltd. | | | 612,058 | | | | 43,951,885 | |
| | |
Household durables 1.9% | | | | | | | | |
Mohawk Industries, Inc. (A) | | | 963,161 | | | | 93,994,882 | |
Whirlpool Corp. | | | 679,086 | | | | 124,877,125 | |
| | |
Internet and direct marketing retail 0.9% | | | | | | | | |
eBay, Inc. | | | 685,183 | | | | 35,698,034 | |
Expedia Group, Inc. | | | 771,683 | | | | 70,755,614 | |
| | |
Multiline retail 0.4% | | | | | | | | |
Dollar Tree, Inc. (A) | | | 437,451 | | | | 39,956,774 | |
| | |
Specialty retail 3.2% | | | | | | | | |
AutoZone, Inc. (A) | | | 122,327 | | | | 144,057,168 | |
Best Buy Company, Inc. | | | 779,630 | | | | 86,765,023 | |
Foot Locker, Inc. | | | 1,670,568 | | | | 55,178,861 | |
| | | | |
| 8 | | JOHN HANCOCK DISCIPLINED VALUE MID CAP FUND | SEMIANNUAL REPORT | | SEE NOTES TO FINANCIAL STATEMENTS |
| | | | | | | | |
| | | Shares | | | Value | |
| | |
Consumer discretionary (continued) | | | | | | | | |
| | |
Specialty retail (continued) | | | | | | | | |
Ross Stores, Inc. | | | 638,122 | | | | $59,549,545 | |
Ulta Beauty, Inc. (A) | | | 151,456 | | | | 33,923,115 | |
| | |
Consumer staples 1.8% | | | | | | | 212,031,622 | |
| | |
Beverages 0.5% | | | | | | | | |
Coca-Cola European Partners PLC | | | 1,406,756 | | | | 54,596,200 | |
| | |
Food products 1.3% | | | | | | | | |
Nomad Foods, Ltd. (A) | | | 3,639,266 | | | | 92,728,498 | |
Tyson Foods, Inc., Class A | | | 1,087,877 | | | | 64,706,924 | |
| | |
Energy 3.2% | | | | | | | 372,844,240 | |
| | |
Energy equipment and services 1.0% | | | | | | | | |
ChampionX Corp. (A) | | | 5,341,540 | | | | 42,678,905 | |
Schlumberger NV | | | 4,890,281 | | | | 76,092,772 | |
| | |
Oil, gas and consumable fuels 2.2% | | | | | | | | |
ConocoPhillips | | | 2,378,036 | | | | 78,094,702 | |
Marathon Petroleum Corp. | | | 2,099,382 | | | | 61,595,868 | |
Parsley Energy, Inc., Class A | | | 6,138,499 | | | | 57,456,351 | |
Valero Energy Corp. | | | 1,314,073 | | | | 56,925,642 | |
| | |
Financials 17.4% | | | | | | | 2,043,518,608 | |
| | |
Banks 5.7% | | | | | | | | |
East West Bancorp, Inc. | | | 1,871,439 | | | | 61,270,913 | |
Fifth Third Bancorp | | | 8,096,361 | | | | 172,614,417 | |
Huntington Bancshares, Inc. | | | 18,872,860 | | | | 173,064,126 | |
KeyCorp | | | 10,309,024 | | | | 122,986,656 | |
Truist Financial Corp. (B) | | | 3,528,375 | | | | 134,254,669 | |
| | |
Capital markets 2.7% | | | | | | | | |
Ameriprise Financial, Inc. | | | 1,272,144 | | | | 196,050,113 | |
State Street Corp. | | | 774,627 | | | | 45,958,620 | |
TD Ameritrade Holding Corp. | | | 2,008,313 | | | | 78,625,454 | |
| | |
Consumer finance 1.2% | | | | | | | | |
Discover Financial Services | | | 1,763,483 | | | | 101,894,048 | |
SLM Corp. | | | 4,635,872 | | | | 37,504,204 | |
| | |
Insurance 7.5% | | | | | | | | |
Aflac, Inc. | | | 1,614,636 | | | | 58,692,019 | |
Alleghany Corp. | | | 213,704 | | | | 111,222,247 | |
American International Group, Inc. | | | 2,146,469 | | | | 59,092,292 | |
Aon PLC, Class A | | | 588,080 | | | | 121,320,904 | |
Everest Re Group, Ltd. | | | 454,049 | | | | 89,692,839 | |
Globe Life, Inc. | | | 913,631 | | | | 72,999,117 | |
Reinsurance Group of America, Inc. | | | 1,423,056 | | | | 135,460,701 | |
RenaissanceRe Holdings, Ltd. | | | 262,617 | | | | 44,576,610 | |
| | | | |
| SEE NOTES TO FINANCIAL STATEMENTS | | SEMIANNUAL REPORT | JOHN HANCOCK DISCIPLINED VALUE MID CAP FUND | | 9 |
| | | | | | | | |
| | | Shares | | | Value | |
| | |
Financials (continued) | | | | | | | | |
| | |
Insurance (continued) | | | | | | | | |
The Allstate Corp. | | | 1,023,737 | | | | $96,374,601 | |
The Travelers Companies, Inc. | | | 419,015 | | | | 45,333,233 | |
Willis Towers Watson PLC | | | 198,997 | | | | 41,554,554 | |
| | |
Thrifts and mortgage finance 0.3% | | | | | | | | |
Essent Group, Ltd. | | | 1,161,207 | | | | 42,976,271 | |
| | |
Health care 11.6% | | | | | | | 1,357,635,967 | |
| | |
Health care equipment and supplies 1.5% | | | | | | | | |
Boston Scientific Corp. (A) | | | 1,378,510 | | | | 52,672,867 | |
Zimmer Biomet Holdings, Inc. | | | 934,525 | | | | 127,226,234 | |
| | |
Health care providers and services 6.0% | | | | | | | | |
AmerisourceBergen Corp. | | | 945,520 | | | | 91,639,798 | |
Centene Corp. (A) | | | 1,636,087 | | | | 95,432,955 | |
HCA Healthcare, Inc. | | | 477,691 | | | | 59,558,514 | |
Humana, Inc. | | | 348,349 | | | | 144,178,168 | |
Laboratory Corp. of America Holdings (A) | | | 570,053 | | | | 107,323,878 | |
McKesson Corp. | | | 346,998 | | | | 51,678,412 | |
Molina Healthcare, Inc. (A) | | | 330,629 | | | | 60,518,332 | |
Universal Health Services, Inc., Class B | | | 912,522 | | | | 97,658,104 | |
| | |
Health care technology 0.6% | | | | | | | | |
Change Healthcare, Inc. (A) | | | 4,749,332 | | | | 68,912,807 | |
| | |
Life sciences tools and services 3.0% | | | | | | | | |
Avantor, Inc. (A) | | | 4,558,621 | | | | 102,523,386 | |
ICON PLC (A) | | | 532,578 | | | | 101,770,330 | |
IQVIA Holdings, Inc. (A) | | | 494,879 | | | | 78,007,777 | |
PPD, Inc. (A) | | | 1,686,052 | | | | 62,367,063 | |
| | |
Pharmaceuticals 0.5% | | | | | | | | |
Jazz Pharmaceuticals PLC (A) | | | 393,908 | | | | 56,167,342 | |
| | |
Industrials 20.6% | | | | | | | 2,419,734,725 | |
| | |
Aerospace and defense 4.2% | | | | | | | | |
BWX Technologies, Inc. | | | 767,082 | | | | 43,194,387 | |
Curtiss-Wright Corp. | | | 596,994 | | | | 55,675,660 | |
Hexcel Corp. | | | 1,163,098 | | | | 39,021,938 | |
Howmet Aerospace, Inc. | | | 4,237,990 | | | | 70,859,193 | |
Huntington Ingalls Industries, Inc. | | | 321,613 | | | | 45,267,030 | |
L3Harris Technologies, Inc. | | | 766,276 | | | | 130,144,316 | |
Textron, Inc. | | | 2,853,078 | | | | 102,967,585 | |
| | |
Air freight and logistics 0.5% | | | | | | | | |
Expeditors International of Washington, Inc. | | | 625,984 | | | | 56,664,072 | |
| | |
Airlines 1.0% | | | | | | | | |
Southwest Airlines Company | | | 3,130,174 | | | | 117,381,525 | |
| | | | |
| 10 | | JOHN HANCOCK DISCIPLINED VALUE MID CAP FUND | SEMIANNUAL REPORT | | SEE NOTES TO FINANCIAL STATEMENTS |
| | | | | | | | |
| | | Shares | | | Value | |
| | |
Industrials (continued) | | | | | | | | |
| | |
Building products 2.2% | | | | | | | | |
Masco Corp. | | | 1,703,970 | | | | $93,939,866 | |
Owens Corning | | | 1,491,707 | | | | 102,644,359 | |
Trane Technologies PLC | | | 501,216 | | | | 60,772,440 | |
| | |
Construction and engineering 0.4% | | | | | | | | |
MasTec, Inc. (A)(B) | | | 1,171,907 | | | | 49,454,475 | |
| | |
Electrical equipment 3.7% | | | | | | | | |
AMETEK, Inc. | | | 1,913,943 | | | | 190,245,934 | |
Eaton Corp. PLC | | | 1,519,446 | | | | 155,029,075 | |
EnerSys | | | 545,305 | | | | 36,600,872 | |
Hubbell, Inc. | | | 374,220 | | | | 51,208,265 | |
| | |
Machinery 5.8% | | | | | | | | |
Altra Industrial Motion Corp. | | | 850,001 | | | | 31,424,537 | |
Cummins, Inc. | | | 391,765 | | | | 82,725,097 | |
Dover Corp. | | | 1,611,280 | | | | 174,566,075 | |
Ingersoll Rand, Inc. (A) | | | 1,317,707 | | | | 46,910,369 | |
ITT, Inc. | | | 1,559,418 | | | | 92,083,633 | |
Oshkosh Corp. | | | 979,177 | | | | 71,969,510 | |
PACCAR, Inc. | | | 853,536 | | | | 72,789,550 | |
Parker-Hannifin Corp. | | | 527,904 | | | | 106,816,095 | |
| | |
Professional services 1.1% | | | | | | | | |
ASGN, Inc. (A) | | | 951,341 | | | | 60,467,234 | |
Robert Half International, Inc. (B) | | | 1,401,747 | | | | 74,208,486 | |
| | |
Road and rail 0.9% | | | | | | | | |
Kansas City Southern | | | 589,451 | | | | 106,590,424 | |
| | |
Trading companies and distributors 0.8% | | | | | | | | |
HD Supply Holdings, Inc. (A) | | | 2,379,067 | | | | 98,112,723 | |
| | |
Information technology 10.9% | | | | | | | 1,272,658,937 | |
| | |
Electronic equipment, instruments and components 1.9% | | | | | | | | |
Flex, Ltd. (A) | | | 4,684,551 | | | | 52,185,898 | |
TE Connectivity, Ltd. | | | 1,774,094 | | | | 173,399,948 | |
| | |
IT services 3.0% | | | | | | | | |
Amdocs, Ltd. | | | 764,116 | | | | 43,867,900 | |
EVERTEC, Inc. | | | 1,927,844 | | | | 66,915,465 | |
Leidos Holdings, Inc. | | | 1,083,375 | | | | 96,582,881 | |
Rackspace Technology, Inc. (A)(B) | | | 2,576,417 | | | | 49,699,084 | |
Science Applications International Corp. | | | 1,151,085 | | | | 90,268,086 | |
| | |
Semiconductors and semiconductor equipment 4.2% | | | | | | | | |
KLA Corp. | | | 370,114 | | | | 71,705,886 | |
Lam Research Corp. | | | 154,199 | | | | 51,155,518 | |
NXP Semiconductors NV | | | 1,009,288 | | | | 125,969,235 | |
ON Semiconductor Corp. (A) | | | 3,613,873 | | | | 78,384,905 | |
| | | | |
| SEE NOTES TO FINANCIAL STATEMENTS | | SEMIANNUAL REPORT | JOHN HANCOCK DISCIPLINED VALUE MID CAP FUND | | 11 |
| | | | | | | | |
| | | Shares | | | Value | |
| | |
Information technology (continued) | | | | | | | | |
| | |
Semiconductors and semiconductor equipment (continued) | | | | | | | | |
Qorvo, Inc. (A) | | | 1,292,020 | | | $ | 166,683,500 | |
| | |
Software 0.5% | | | | | | | | |
SS&C Technologies Holdings, Inc. | | | 922,437 | | | | 55,825,887 | |
| | |
Technology hardware, storage and peripherals 1.3% | | | | | | | | |
Western Digital Corp. | | | 2,510,037 | | | | 91,741,852 | |
Xerox Holdings Corp. | | | 3,104,576 | | | | 58,272,892 | |
| | |
Materials 5.8% | | | | | | | 682,968,159 | |
| | |
Chemicals 4.3% | | | | | | | | |
Corteva, Inc. (B) | | | 2,716,166 | | | | 78,252,742 | |
DuPont de Nemours, Inc. | | | 1,407,246 | | | | 78,074,008 | |
FMC Corp. | | | 1,565,620 | | | | 165,814,814 | |
Ingevity Corp. (A) | | | 839,880 | | | | 41,523,667 | |
PPG Industries, Inc. | | | 508,952 | | | | 62,132,860 | |
The Mosaic Company | | | 4,134,022 | | | | 75,528,582 | |
| | |
Construction materials 0.5% | | | | | | | | |
Eagle Materials, Inc. | | | 649,370 | | | | 56,053,618 | |
| | |
Containers and packaging 0.4% | | | | | | | | |
Avery Dennison Corp. | | | 380,768 | | | | 48,677,381 | |
| | |
Metals and mining 0.6% | | | | | | | | |
Steel Dynamics, Inc. | | | 2,686,360 | | | | 76,910,487 | |
| | |
Real estate 7.3% | | | | | | | 857,895,478 | |
| | |
Equity real estate investment trusts 7.3% | | | | | | | | |
American Homes 4 Rent, Class A | | | 3,042,682 | | | | 86,655,583 | |
Boston Properties, Inc. | | | 910,091 | | | | 73,080,307 | |
Cousins Properties, Inc. | | | 2,424,104 | | | | 69,305,133 | |
Duke Realty Corp. | | | 2,965,899 | | | | 109,441,673 | |
Equity Residential | | | 1,559,485 | | | | 80,048,365 | |
Essex Property Trust, Inc. | | | 227,173 | | | | 45,614,067 | |
Healthpeak Properties, Inc. | | | 2,457,379 | | | | 66,717,840 | |
Invitation Homes, Inc. | | | 1,345,896 | | | | 37,671,629 | |
Kilroy Realty Corp. | | | 1,197,086 | | | | 62,200,589 | |
Lamar Advertising Company, Class A | | | 686,414 | | | | 45,420,014 | |
Regency Centers Corp. | | | 2,064,925 | | | | 78,508,449 | |
Welltower, Inc. | | | 1,873,876 | | | | 103,231,829 | |
| | |
Utilities 5.8% | | | | | | | 675,140,967 | |
| | |
Electric utilities 3.1% | | | | | | | | |
Edison International | | | 2,187,161 | | | | 111,195,265 | |
Entergy Corp. | | | 1,439,496 | | | | 141,833,541 | |
Evergy, Inc. | | | 928,728 | | | | 47,197,957 | |
FirstEnergy Corp. | | | 2,071,138 | | | | 59,462,372 | |
| | | | |
| 12 | | JOHN HANCOCK DISCIPLINED VALUE MID CAP FUND | SEMIANNUAL REPORT | | SEE NOTES TO FINANCIAL STATEMENTS |
| | | | | | | | | | | | |
| | | | | | Shares | | | Value | |
Utilities (continued) | | | | | | | | | | | | |
| | | |
Independent power and renewable electricity producers 0.7% | | | | | | | | | | | | |
Vistra Corp. | | | | | | | 4,188,944 | | | | $79,003,484 | |
| | | |
Multi-utilities 2.0% | | | | | | | | | | | | |
Ameren Corp. | | | | | | | 947,566 | | | | 74,933,519 | |
CenterPoint Energy, Inc. | | | | | | | 5,783,863 | | | | 111,917,749 | |
DTE Energy Company | | | | | | | 431,129 | | | | 49,597,080 | |
| | | |
| | | Yield (%) | | | Shares | | | Value | |
Short-term investments 2.4% | | | | | | | | | | | $276,954,646 | |
(Cost $276,876,285) | | | | | | | | | | | | |
| | | |
Short-term funds 2.4% | | | | | | | | | | | 276,954,646 | |
John Hancock Collateral Trust (C) | | | 0.2185(D) | | | | 9,439,145 | | | | 94,484,897 | |
State Street Institutional U.S. Government Money Market Fund, Premier Class | | | 0.0266(D) | | | | 182,469,749 | | | | 182,469,749 | |
| | | | | | | | | | | | |
Total investments (Cost $10,234,690,014) 100.6% | | | | | | | | | | $ | 11,786,967,986 | |
| | | | | | | | | | | | |
Other assets and liabilities, net (0.6%) | | | | | | | | | | | (66,972,530 | ) |
| | | | | | | | | | | | |
Total net assets 100.0% | | | | | | | | | | $ | 11,719,995,456 | |
The percentage shown for each investment category is the total value of the category as a percentage of the net assets of the fund.
Security Abbreviations and Legend
| | |
| |
(A) | | Non-income producing security. |
| |
(B) | | All or a portion of this security is on loan as of 9-30-20. |
| |
(C) | | Investment is an affiliate of the fund, the advisor and/or subadvisor. This security represents the investment of cash collateral received for securities lending. |
| |
(D) | | The rate shown is the annualized seven-day yield as of 9-30-20. |
At 9-30-20,the aggregate cost of investments for federal income tax purposes was $10,431,381,050.Net unrealized appreciation aggregated to $1,355,586,936,of which $1,994,878,073 related to gross unrealized appreciation and $639,291,137 related to gross unrealized depreciation.
| | | | |
| SEE NOTES TO FINANCIAL STATEMENTS | | SEMIANNUAL REPORT | JOHN HANCOCK DISCIPLINED VALUE MID CAP FUND | | 13 |
STATEMENT OF ASSETS AND LIABILITIES 9-30-20 (unaudited)
| | |
Assets | | |
Unaffiliated investments, at value (Cost $10,140,283,478) including $92,050,679 of securities loaned | | $11,692,483,089 |
Affiliated investments, at value (Cost $94,406,536) | | 94,484,897 |
Total investments, at value (Cost $10,234,690,014) | | 11,786,967,986 |
Cash | | 338,095 |
Dividends and interest receivable | | 13,551,526 |
Receivable for fund shares sold | | 18,887,530 |
Receivable for investments sold | | 16,201,335 |
Receivable for securities lending income | | 75,116 |
Other assets | | 351,394 |
Total assets | | 11,836,372,982 |
Liabilities | | |
Payable for investments purchased | | 2,018,804 |
Payable for fund shares repurchased | | 17,498,844 |
Payable upon return of securities loaned | | 94,465,331 |
Payable to affiliates | | |
Accounting and legal services fees | | 656,042 |
Transfer agent fees | | 861,466 |
Distribution and service fees | | 26,120 |
Trustees’ fees | | 8,073 |
Other liabilities and accrued expenses | | 842,846 |
Total liabilities | | 116,377,526 |
Net assets | | $11,719,995,456 |
Net assets consist of | | |
Paid-in capital | | $9,929,187,368 |
Total distributable earnings (loss) | | 1,790,808,088 |
Net assets | | $11,719,995,456 |
| | | | |
| 14 | | JOHN HANCOCK DISCIPLINED VALUE MID CAP FUND | SEMIANNUAL REPORT | | SEE NOTES TO FINANCIAL STATEMENTS |
STATEMENT OF ASSETS AND LIABILITIES (continued)
| | |
Net asset value per share | | |
Based on net asset value and shares outstanding - the fund has an unlimited number of shares authorized with no par value | | |
Class A ($856,614,651 ÷ 46,260,770 shares)1 | | $18.52 |
Class C ($99,448,919 ÷ 5,381,188 shares)1 | | $18.48 |
Class I ($7,670,994,181 ÷ 395,932,101 shares) | | $19.37 |
Class R2 ($87,378,297 ÷ 4,534,629 shares) | | $19.27 |
Class R4 ($102,299,759 ÷ 5,288,423 shares) | | $19.34 |
Class R6 ($2,902,684,861 ÷ 149,792,927 shares) | | $19.38 |
Class ADV ($574,788 ÷ 31,120 shares) | | $18.47 |
Maximum offering price per share | | |
Class A (net asset value per share ÷ 95%)2 | | $19.49 |
| 1 | Redemption price per share is equal to net asset value less any applicable contingent deferred sales charge. |
| 2 | On single retail sales of less than $50,000. On sales of $50,000 or more and on group sales the offering price is reduced. |
| | | | |
| SEE NOTES TO FINANCIAL STATEMENTS | | SEMIANNUAL REPORT | JOHN HANCOCK DISCIPLINED VALUE MID CAP FUND | | 15 |
STATEMENT OF OPERATIONS For the six months ended 9-30-20 (unaudited)
| | | | |
Investment income | | | | |
Dividends | | | $110,115,944 | |
Securities lending | | | 330,588 | |
Interest | | | 108,377 | |
Less foreign taxes withheld | | | (172,001 | ) |
Total investment income | | | 110,382,908 | |
Expenses | | | | |
Investment management fees | | | 40,676,906 | |
Distribution and service fees | | | 1,990,563 | |
Accounting and legal services fees | | | 1,021,070 | |
Transfer agent fees | | | 5,350,671 | |
Trustees’ fees | | | 107,676 | |
Custodian fees | | | 648,062 | |
State registration fees | | | 138,644 | |
Printing and postage | | | 304,259 | |
Professional fees | | | 99,184 | |
Other | | | 209,334 | |
Total expenses | | | 50,546,369 | |
Less expense reductions | | | (436,446 | ) |
Net expenses | | | 50,109,923 | |
Net investment income | | | 60,272,985 | |
Realized and unrealized gain (loss) | | | | |
Net realized gain (loss) on | | | | |
Unaffiliated investments | | | 376,045,387 | |
Affiliated investments | | | 70,294 | |
| | | | 376,115,681 | |
Change in net unrealized appreciation (depreciation) of | | | | |
Unaffiliated investments | | | 1,957,336,521 | |
Affiliated investments | | | 53,252 | |
| | | | 1,957,389,773 | |
Net realized and unrealized gain | | | 2,333,505,454 | |
Increase in net assets from operations | | | $2,393,778,439 | |
| | | | |
| 16 | | JOHN HANCOCK DISCIPLINED VALUE MID CAP FUND | SEMIANNUAL REPORT | | SEE NOTES TO FINANCIAL STATEMENTS |
STATEMENTS OF CHANGES IN NET ASSETS
| | | | |
| | | Six months ended 9-30-20 (unaudited) | | Year ended 3-31-20 |
Increase (decrease) in net assets | | | | |
From operations | | | | |
Net investment income | | $60,272,985 | | $124,207,131 |
Net realized gain | | 376,115,681 | | 113,183,884 |
Change in net unrealized appreciation (depreciation) | | 1,957,389,773 | | (2,735,655,599) |
Increase (decrease) in net assets resulting from operations | | 2,393,778,439 | | (2,498,264,584) |
Distributions to shareholders | | | | |
From earnings | | | | |
Class A | | — | | (25,996,912) |
Class C | | — | | (2,622,914) |
Class I | | — | | (214,061,726) |
Class R2 | | — | | (2,428,506) |
Class R4 | | — | | (2,021,537) |
Class R6 | | — | | (83,982,247) |
Class ADV | | — | | (17,729) |
Total distributions | | — | | (331,131,571) |
From fund share transactions | | (590,151,376) | | 396,141,647 |
Total increase (decrease) | | 1,803,627,063 | | (2,433,254,508) |
Net assets | | | | |
Beginning of period | | 9,916,368,393 | | 12,349,622,901 |
End of period | | $11,719,995,456 | | $9,916,368,393 |
| | | | |
| SEE NOTES TO FINANCIAL STATEMENTS | | SEMIANNUAL REPORT | JOHN HANCOCK DISCIPLINED VALUE MID CAP FUND | | 17 |
| | | | | | | | | | | | | | | | | | | | |
| CLASS A SHARES Period ended | | 9-30-201 | | 3-31-20 | | | | 3-31-19 | | | | 3-31-18 | | | | 3-31-17 | | | | 3-31-16 |
Per share operating performance | | | | | | | | | | | | | | | | | | | | |
Net asset value, beginning of period | | $14.91 | | $19.08 | | | | $22.35 | | | | $21.61 | | | | $18.49 | | | | $20.19 |
Net investment income2 | | 0.07 | | 0.14 | | | | 0.12 | | | | 0.07 | | | | 0.10 | | | | 0.13 |
Net realized and unrealized gain (loss) on investments | | 3.54 | | (3.83) | | | | (1.01) | | | | 2.11 | | | | 3.57 | | | | (0.63) |
Total from investment operations | | 3.61 | | (3.69) | | | | (0.89) | | | | 2.18 | | | | 3.67 | | | | (0.50) |
Less distributions | | | | | | | | | | | | | | | | | | | | |
From net investment income | | — | | (0.14) | | | | (0.13) | | | | (0.06) | | | | (0.14) | | | | (0.07) |
From net realized gain | | — | | (0.34) | | | | (2.25) | | | | (1.38) | | | | (0.41) | | | | (1.13) |
Total distributions | | — | | (0.48) | | | | (2.38) | | | | (1.44) | | | | (0.55) | | | | (1.20) |
Net asset value, end of period | | $18.52 | | $14.91 | | | | $19.08 | | | | $22.35 | | | | $21.61 | | | | $18.49 |
Total return (%)3,4 | | 24.215 | | (20.06) | | | | (2.98) | | | | 10.15 | | | | 19.96 | | | | (2.59) |
Ratios and supplemental data | | | | | | | | | | | | | | | | | | | | |
Net assets, end of period (in millions) | | $857 | | $782 | | | | $1,184 | | | | $1,547 | | | | $2,088 | | | | $1,971 |
Ratios (as a percentage of average net assets): | | | | | | | | | | | | | | | | | | | | |
Expenses before reductions | | 1.136 | | 1.12 | | | | 1.11 | | | | 1.11 | | | | 1.12 | | | | 1.13 |
Expenses including reductions | | 1.126 | | 1.12 | | | | 1.10 | | | | 1.10 | | | | 1.12 | | | | 1.12 |
Net investment income | | 0.816 | | 0.70 | | | | 0.58 | | | | 0.30 | | | | 0.48 | | | | 0.70 |
Portfolio turnover (%) | | 24 | | 54 | | | | 53 | | | | 53 | | | | 50 | | | | 47 |
| 1 | Six months ended 9-30-20. Unaudited. |
| 2 | Based on average daily shares outstanding. |
| 3 | Total returns would have been lower had certain expenses not been reduced during the applicable periods. |
| 4 | Does not reflect the effect of sales charges, if any. |
| | | | |
| 18 | | JOHN HANCOCK DISCIPLINED VALUE MID CAP FUND | SEMIANNUAL REPORT | | SEE NOTES TO FINANCIAL STATEMENTS |
| | | | | | | | | | | | | | | | | | | | | | | | |
| CLASS C SHARES Period ended | | 9-30-201 | | | 3-31-20 | | | 3-31-19 | | | 3-31-18 | | | 3-31-17 | | | 3-31-16 | |
Per share operating performance | | | | | | | | | | | | | | | | | | | | | | | | |
Net asset value, beginning of period | | | $14.94 | | | $ | 19.13 | | | $ | 22.42 | | | $ | 21.77 | | | $ | 18.65 | | | $ | 20.43 | |
Net investment loss2 | | | —3 | | | | (0.01) | | | | (0.04) | | | | (0.10) | | | | (0.05) | | | | (0.01) | |
Net realized and unrealized gain (loss) on investments | | | 3.54 | | | | (3.84) | | | | (1.00) | | | | 2.13 | | | | 3.58 | | | | (0.64) | |
Total from investment operations | | | 3.54 | | | | (3.85) | | | | (1.04) | | | | 2.03 | | | | 3.53 | | | | (0.65) | |
Less distributions | | | | | | | | | | | | | | | | | | | | | | | | |
From net investment income | | | — | | | | — | | | | — | | | | — | | | | — | | | | — | |
From net realized gain | | | — | | | | (0.34) | | | | (2.25) | | | | (1.38) | | | | (0.41) | | | | (1.13) | |
Total distributions | | | — | | | | (0.34) | | | | (2.25) | | | | — | | | | — | | | | — | |
Net asset value, end of period | | | $18.48 | | | $ | 14.94 | | | $ | 19.13 | | | $ | 22.42 | | | $ | 21.77 | | | $ | 18.65 | |
Total return (%)4,5 | | | 23.696 | | | | (20.63) | | | | (3.72) | | | | 9.35 | | | | 18.99 | | | | (3.27) | |
Ratios and supplemental data | | | | | | | | | | | | | | | | | | | | | | | | |
Net assets, end of period (in millions) | | | $99 | | | $ | 107 | | | $ | 182 | | | $ | 278 | | | $ | 319 | | | $ | 329 | |
Ratios (as a percentage of average net assets): | | | | | | | | | | | | | | | | | | | | | | | | |
Expenses before reductions | | | 1.887 | | | | 1.87 | | | | 1.86 | | | | 1.86 | | | | 1.87 | | | | 1.88 | |
Expenses including reductions | | | 1.877 | | | | 1.87 | | | | 1.85 | | | | 1.85 | | | | 1.87 | | | | 1.87 | |
Net investment income (loss) | | | 0.047 | | | | (0.07) | | | | (0.19) | | | | (0.43) | | | | (0.27) | | �� | | (0.06) | |
Portfolio turnover (%) | | | 24 | | | | 54 | | | | 53 | | | | 53 | | | | 50 | | | | 47 | |
| 1 | Six months ended 9-30-20. Unaudited. |
| 2 | Based on average daily shares outstanding. |
| 3 | Less than $0.005 per share. |
| 4 | Total returns would have been lower had certain expenses not been reduced during the applicable periods. |
| 5 | Does not reflect the effect of sales charges, if any. |
| | | | |
| SEE NOTES TO FINANCIAL STATEMENTS | | SEMIANNUAL REPORT | JOHN HANCOCK DISCIPLINED VALUE MID CAP FUND | | 19 |
| | | | | | | | | | | | | | | | | | | | | | | | |
| CLASS I SHARES Period ended | | 9-30-201 | | | 3-31-20 | | | 3-31-19 | | | 3-31-18 | | | 3-31-17 | | | 3-31-16 | |
Per share operating performance | | | | | | | | | | | | | | | | | | | | | | | | |
Net asset value, beginning of period | | $ | 15.58 | | | $ | 19.91 | | | $ | 23.22 | | | $ | 22.39 | | | $ | 19.14 | | | $ | 20.86 | |
Net investment income2 | | | 0.10 | | | | 0.20 | | | | 0.18 | | | | 0.14 | | | | 0.16 | | | | 0.20 | |
Net realized and unrealized gain (loss) on investments | | | 3.69 | | | | (4.00) | | | | (1.06) | | | | 2.19 | | | | 3.69 | | | | (0.67) | |
Total from investment operations | | | 3.79 | | | | (3.80) | | | | (0.88) | | | | 2.33 | | | | 3.85 | | | | (0.47) | |
Less distributions | | | | | | | | | | | | | | | | | | | | | | | | |
From net investment income | | | — | | | | (0.19) | | | | (0.18) | | | | (0.12) | | | | (0.19) | | | | (0.12) | |
From net realized gain | | | — | | | | (0.34) | | | | (2.25) | | | | (1.38) | | | | (0.41) | | | | (1.13) | |
Total distributions | | | — | | | | (0.53) | | | | (2.43) | | | | (1.50) | | | | (0.60) | | | | (1.25) | |
Net asset value, end of period | | $ | 19.37 | | | $ | 15.58 | | | $ | 19.91 | | | $ | 23.22 | | | $ | 22.39 | | | $ | 19.14 | |
Total return (%)3 | | | 24.334 | | | | (19.84) | | | | (2.79) | | | | 10.46 | | | | 20.25 | | | | (2.35) | |
Ratios and supplemental data | | | | | | | | | | | | | | | | | | | | | | | | |
Net assets, end of period (in millions) | | $ | 7,671 | | | $ | 6,349 | | | $ | 7,784 | | | $ | 9,799 | | | $ | 9,512 | | | $ | 7,802 | |
Ratios (as a percentage of average net assets): | | | | | | | | | | | | | | | | | | | | | | | | |
Expenses before reductions | | | 0.885 | | | | 0.87 | | | | 0.88 | | | | 0.86 | | | | 0.86 | | | | 0.87 | |
Expenses including reductions | | | 0.875 | | | | 0.87 | | | | 0.87 | | | | 0.85 | | | | 0.86 | | | | 0.86 | |
Net investment income | | | 1.065 | | | | 0.97 | | | | 0.82 | | | | 0.58 | | | | 0.75 | | | | 0.99 | |
Portfolio turnover (%) | | | 24 | | | | 54 | | | | 53 | | | | 53 | | | | 50 | | | | 47 | |
| 1 | Six months ended 9-30-20. Unaudited. |
| 2 | Based on average daily shares outstanding. |
| 3 | Total returns would have been lower had certain expenses not been reduced during the applicable periods. |
| | | | |
| 20 | | JOHN HANCOCK DISCIPLINED VALUE MID CAP FUND | SEMIANNUAL REPORT | | SEE NOTES TO FINANCIAL STATEMENTS |
| | | | | | | | | | | | | | | | | | | | | | | | |
| | | | | | |
| CLASS R2 SHARES Period ended | | 9-30-201 | | | 3-31-20 | | | 3-31-19 | | | 3-31-18 | | | 3-31-17 | | | 3-31-16 | |
Per share operating performance | | | | | | | | | | | | | | | | | | | | | | | | |
Net asset value, beginning of period | | | $15.53 | | | | $19.85 | | | | $23.14 | | | | $22.32 | | | | $19.09 | | | | $20.81 | |
Net investment income2 | | | 0.06 | | | | 0.11 | | | | 0.09 | | | | 0.04 | | | | 0.07 | | | | 0.11 | |
Net realized and unrealized gain (loss) on investments | | | 3.68 | | | | (3.98 | ) | | | (1.04 | ) | | | 2.19 | | | | 3.68 | | | | (0.66 | ) |
Total from investment operations | | | 3.74 | | | | (3.87 | ) | | | (0.95 | ) | | | 2.23 | | | | 3.75 | | | | (0.55 | ) |
Less distributions | | | | | | | | | | | | | | | | | | | | | | | | |
From net investment income | | | — | | | | (0.11 | ) | | | (0.09 | ) | | | (0.03 | ) | | | (0.11 | ) | | | (0.04 | ) |
From net realized gain | | | — | | | | (0.34 | ) | | | (2.25 | ) | | | (1.38 | ) | | | (0.41 | ) | | | (1.13 | ) |
Total distributions | | | — | | | | (0.45 | ) | | | (2.34 | ) | | | (1.41 | ) | | | (0.52 | ) | | | (1.17 | ) |
Net asset value, end of period | | | $19.27 | | | | $15.53 | | | | $19.85 | | | | $23.14 | | | | $22.32 | | | | $19.09 | |
Total return (%)3 | | | 24.08 | 4 | | | (20.14 | ) | | | (3.14 | ) | | | 10.03 | | | | 19.76 | | | | (2.74 | ) |
Ratios and supplemental data | | | | | | | | | | | | | | | | | | | | | | | | |
Net assets, end of period (in millions) | | | $87 | | | | $77 | | | | $131 | | | | $188 | | | | $216 | | | | $234 | |
Ratios (as a percentage of average net assets): | | | | | | | | | | | | | | | | | | | | | | | | |
Expenses before reductions | | | 1.25 | 5 | | | 1.26 | | | | 1.27 | | | | 1.26 | | | | 1.27 | | | | 1.27 | |
Expenses including reductions | | | 1.24 | 5 | | | 1.25 | | | | 1.26 | | | | 1.25 | | | | 1.26 | | | | 1.27 | |
Net investment income | | | 0.69 | 5 | | | 0.54 | | | | 0.41 | | | | 0.17 | | | | 0.35 | | | | 0.56 | |
Portfolio turnover (%) | | | 24 | | | | 54 | | | | 53 | | | | 53 | | | | 50 | | | | 47 | |
| 1 | Six months ended 9-30-20. Unaudited. |
| 2 | Based on average daily shares outstanding. |
| 3 | Total returns would have been lower had certain expenses not been reduced during the applicable periods. |
| | | | |
| SEE NOTES TO FINANCIAL STATEMENTS | | SEMIANNUAL REPORT | JOHN HANCOCK DISCIPLINED VALUE MID CAP FUND | | 21 |
| | | | | | | | | | | | | | | | | | | | | | | | |
| | | | | | |
| CLASS R4 SHARES Period ended | | 9-30-201 | | | 3-31-20 | | | 3-31-19 | | | 3-31-18 | | | 3-31-17 | | | 3-31-16 | |
Per share operating performance | | | | | | | | | | | | | | | | | | | | | | | | |
Net asset value, beginning of period | | | $15.57 | | | | $19.90 | | | | $23.20 | | | | $22.38 | | | | $19.13 | | | | $20.85 | |
Net investment income2 | | | 0.09 | | | | 0.17 | | | | 0.15 | | | | 0.09 | | | | 0.12 | | | | 0.16 | |
Net realized and unrealized gain (loss) on investments | | | 3.68 | | | | (4.00 | ) | | | (1.05 | ) | | | 2.20 | | | | 3.70 | | | | (0.66 | ) |
Total from investment operations | | | 3.77 | | | | (3.83 | ) | | | (0.90 | ) | | | 2.29 | | | | 3.82 | | | | (0.50 | ) |
Less distributions | | | | | | | | | | | | | | | | | | | | | | | | |
From net investment income | | | — | | | | (0.16 | ) | | | (0.15 | ) | | | (0.09 | ) | | | (0.16 | ) | | | (0.09 | ) |
From net realized gain | | | — | | | | (0.34 | ) | | | (2.25 | ) | | | (1.38 | ) | | | (0.41 | ) | | | (1.13 | ) |
Total distributions | | | — | | | | (0.50 | ) | | | (2.40 | ) | | | (1.47 | ) | | | (0.57 | ) | | | (1.22 | ) |
Net asset value, end of period | | | $19.34 | | | | $15.57 | | | | $19.90 | | | | $23.20 | | | | $22.38 | | | | $19.13 | |
Total return (%)3 | | | 24.21 | 4 | | | (19.96 | ) | | | (2.90 | ) | | | 10.26 | | | | 20.09 | | | | (2.50 | ) |
Ratios and supplemental data | | | | | | | | | | | | | | | | | | | | | | | | |
Net assets, end of period (in millions) | | | $102 | | | | $55 | | | | $74 | | | | $97 | | | | $95 | | | | $104 | |
Ratios (as a percentage of average net assets): | | | | | | | | | | | | | | | | | | �� | | | | | | |
Expenses before reductions | | | 1.12 | 5 | | | 1.11 | | | | 1.12 | | | | 1.12 | | | | 1.11 | | | | 1.12 | |
Expenses including reductions | | | 1.01 | 5 | | | 1.00 | | | | 1.01 | | | | 1.01 | | | | 1.00 | | | | 1.02 | |
Net investment income | | | 0.98 | 5 | | | 0.81 | | | | 0.68 | | | | 0.42 | | | | 0.60 | | | | 0.81 | |
Portfolio turnover (%) | | | 24 | | | | 54 | | | | 53 | | | | 53 | | | | 50 | | | | 47 | |
| 1 | Six months ended 9-30-20. Unaudited. |
| 2 | Based on average daily shares outstanding. |
| 3 | Total returns would have been lower had certain expenses not been reduced during the applicable periods. |
| | | | |
| 22 | | JOHN HANCOCK DISCIPLINED VALUE MID CAP FUND | SEMIANNUAL REPORT | | SEE NOTES TO FINANCIAL STATEMENTS |
| | | | | | | | | | | | | | | | | | | | | | | | |
| | | | | | |
| CLASS R6 SHARES Period ended | | 9-30-201 | | | 3-31-20 | | | 3-31-19 | | | 3-31-18 | | | 3-31-17 | | | 3-31-16 | |
Per share operating performance | | | | | | | | | | | | | | | | | | | | | | | | |
Net asset value, beginning of period | | | $15.58 | | | | $19.90 | | | | $23.21 | | | | $22.38 | | | | $19.13 | | | | $20.85 | |
Net investment income2 | | | 0.11 | | | | 0.23 | | | | 0.21 | | | | 0.17 | | | | 0.18 | | | | 0.22 | |
Net realized and unrealized gain (loss) on investments | | | 3.69 | | | | (4.00 | ) | | | (1.07 | ) | | | 2.18 | | | | 3.69 | | | | (0.67 | ) |
Total from investment operations | | | 3.80 | | | | (3.77 | ) | | | (0.86 | ) | | | 2.35 | | | | 3.87 | | | | (0.45 | ) |
Less distributions | | | | | | | | | | | | | | | | | | | | | | | | |
From net investment income | | | — | | | | (0.21 | ) | | | (0.20 | ) | | | (0.14 | ) | | | (0.21 | ) | | | (0.14 | ) |
From net realized gain | | | — | | | | (0.34 | ) | | | (2.25 | ) | | | (1.38 | ) | | | (0.41 | ) | | | (1.13 | ) |
Total distributions | | | — | | | | (0.55 | ) | | | (2.45 | ) | | | (1.52 | ) | | | (0.62 | ) | | | (1.27 | ) |
Net asset value, end of period | | | $19.38 | | | | $15.58 | | | | $19.90 | | | | $23.21 | | | | $22.38 | | | | $19.13 | |
Total return (%)3 | | | 24.39 | 4 | | | (19.72 | ) | | | (2.66 | ) | | | 10.56 | | | | 20.35 | | | | (2.25 | ) |
Ratios and supplemental data | | | | | | | | | | | | | | | | | | | | | | | | |
Net assets, end of period (in millions) | | | $2,903 | | | | $2,546 | | | | $2,994 | | | | $2,748 | | | | $1,774 | | | | $1,053 | |
Ratios (as a percentage of average net assets): | | | | | | | | | | | | | | | | | | | | | | | | |
Expenses before reductions | | | 0.77 | 5 | | | 0.76 | | | | 0.77 | | | | 0.77 | | | | 0.77 | | | | 0.77 | |
Expenses including reductions | | | 0.76 | 5 | | | 0.76 | | | | 0.76 | | | | 0.76 | | | | 0.76 | | | | 0.76 | |
Net investment income | | | 1.17 | 5 | | | 1.08 | | | | 0.96 | | | | 0.71 | | | | 0.86 | | | | 1.13 | |
Portfolio turnover (%) | | | 24 | | | | 54 | | | | 53 | | | | 53 | | | | 50 | | | | 47 | |
| 1 | Six months ended 9-30-20. Unaudited. |
| 2 | Based on average daily shares outstanding. |
| 3 | Total returns would have been lower had certain expenses not been reduced during the applicable periods. |
| | | | |
| SEE NOTES TO FINANCIAL STATEMENTS | | SEMIANNUAL REPORT | JOHN HANCOCK DISCIPLINED VALUE MID CAP FUND | | 23 |
| | | | | | | | | | | | | | | | | | | | | | | | |
| CLASS ADV SHARES Period ended | | 9-30-201 | | | 3-31-20 | | | 3-31-19 | | | 3-31-18 | | | 3-31-17 | | | 3-31-16 | |
Per share operating performance | | | | | | | | | | | | | | | | | | | | | | | | |
Net asset value, beginning of period | | | $14.87 | | | | $19.03 | | | | $22.30 | | | | $21.56 | | | | $18.46 | | | | $20.15 | |
Net investment income2 | | | 0.07 | | | | 0.14 | | | | 0.11 | | | | 0.07 | | | | 0.11 | | | | 0.12 | |
Net realized and unrealized gain (loss) on investments | | | 3.53 | | | | (3.82 | ) | | | (1.00 | ) | | | 2.11 | | | | 3.54 | | | | (0.63 | ) |
Total from investment operations | | | 3.60 | | | | (3.68 | ) | | | (0.89 | ) | | | 2.18 | | | | 3.65 | | | | (0.51 | ) |
Less distributions | | | | | | | | | | | | | | | | | | | | | | | | |
From net investment income | | | — | | | | (0.14 | ) | | | (0.13 | ) | | | (0.06 | ) | | | (0.14 | ) | | | (0.05 | ) |
From net realized gain | | | — | | | | (0.34 | ) | | | (2.25 | ) | | | (1.38 | ) | | | (0.41 | ) | | | (1.13 | ) |
Total distributions | | | — | | | | (0.48 | ) | | | (2.38 | ) | | | (1.44 | ) | | | (0.55 | ) | | | (1.18 | ) |
Net asset value, end of period | | | $18.47 | | | | $14.87 | | | | $19.03 | | | | $22.30 | | | | $21.56 | | | | $18.46 | |
Total return (%)3 | | | 24.21 | 4 | | | (20.06 | ) | | | (2.98 | ) | | | 10.17 | | | | 19.88 | | | | (2.59 | ) |
Ratios and supplemental data | | | | | | | | | | | | | | | | | | | | | | | | |
Net assets, end of period (in millions) | | | $1 | | | | $— | 5 | | | $1 | | | | $2 | | | | $2 | | | | $1 | |
Ratios (as a percentage of average net assets): | | | | | | | | | | | | | | | | | | | | | | | | |
Expenses before reductions | | | 1.13 | 6 | | | 1.12 | | | | 1.11 | | | | 1.11 | | | | 1.13 | | | | 1.42 | |
Expenses including reductions | | | 1.12 | 6 | | | 1.12 | | | | 1.10 | | | | 1.10 | | | | 1.12 | | | | 1.16 | |
Net investment income | | | 0.81 | 6 | | | 0.71 | | | | 0.49 | | | | 0.32 | | | | 0.55 | | | | 0.63 | |
Portfolio turnover (%) | | | 24 | | | | 54 | | | | 53 | | | | 53 | | | | 50 | | | | 47 | |
| 1 | Six months ended 9-30-20. Unaudited. |
| 2 | Based on average daily shares outstanding. |
| 3 | Total returns would have been lower had certain expenses not been reduced during the applicable periods. |
| | | | |
| 24 | | JOHN HANCOCK DISCIPLINED VALUE MID CAP FUND | SEMIANNUAL REPORT | | SEE NOTES TO FINANCIAL STATEMENTS |
|
Notes to financial statements (unaudited) |
Note 1 — Organization
John Hancock Disciplined Value Mid Cap Fund (the fund) is a series of John Hancock Funds III (the Trust), an open-end management investment company organized as a Massachusetts business trust and registered under the Investment Company Act of 1940, as amended (the 1940 Act). The investment objective of the fund is to seek long-term growth of capital with current income as a secondary objective.
The fund may offer multiple classes of shares. The shares currently outstanding are detailed in the Statement of assets and liabilities. Class A and Class C shares are offered to all investors. Class I shares are offered to institutions and certain investors. Class R2 and Class R4 shares are available only to certain retirement and 529 plans. Class R6 shares are only available to certain retirement plans, institutions and other investors. Class ADV shares are available only to investors who acquired Class A shares as a result of the reorganization of the Robeco Boston Partners Mid Cap Value Fund into the fund. Class C shares convert to Class A shares ten years after purchase (certain exclusions may apply). Shareholders of each class have exclusive voting rights to matters that affect that class. The distribution and service fees, if any, and transfer agent fees for each class may differ.
Effective November 1, 2020, Class C shares convert to Class A shares after 8 years (certain exclusions apply).
Note 2 — Significant accounting policies
The financial statements have been prepared in conformity with accounting principles generally accepted in the United States of America (US GAAP), which require management to make certain estimates and assumptions as of the date of the financial statements. Actual results could differ from those estimates and those differences could be significant. The fund qualifies as an investment company under Topic 946 of Accounting Standards Codification of US GAAP.
Events or transactions occurring after the end of the fiscal period through the date that the financial statements were issued have been evaluated in the preparation of the financial statements. The following summarizes the significant accounting policies of the fund:
Security valuation. Investments are stated at value as of the scheduled close of regular trading on the New York Stock Exchange (NYSE), normally at 4:00 P.M., Eastern Time. In case of emergency or other disruption resulting in the NYSE not opening for trading or the NYSE closing at a time other than the regularly scheduled close, the net asset value (NAV) may be determined as of the regularly scheduled close of the NYSE pursuant to the fund’s Valuation Policies and Procedures.
In order to value the securities, the fund uses the following valuation techniques: Equity securities, including exchange-traded or closed-end funds, are typically valued at the last sale price or official closing price on the exchange or principal market where the security trades. In the event there were no sales during the day or closing prices are not available, the securities are valued using the last available bid price. Investments by the fund in open-end mutual funds, including John Hancock Collateral Trust (JHCT), are valued at their respective NAVs each business day.
In certain instances, the Pricing Committee may determine to value equity securities using prices obtained from another exchange or market if trading on the exchange or market on which prices are typically obtained did not open for trading as scheduled, or if trading closed earlier than scheduled, and trading occurred as normal on another exchange or market.
Other portfolio securities and assets, for which reliable market quotations are not readily available, are valued at fair value as determined in good faith by the fund’s Pricing Committee following procedures established by the Board of Trustees. The frequency with which these fair valuation procedures are used cannot be predicted and fair value of securities may differ significantly from the value that would have been used had a ready market for such securities existed.
| | | | |
| | SEMIANNUAL REPORT | JOHN HANCOCK DISCIPLINED VALUE MID CAP FUND | | 25 |
The fund uses a three-tier hierarchy to prioritize the pricing assumptions, referred to as inputs, used in valuation techniques to measure fair value. Level 1 includes securities valued using quoted prices in active markets for identical securities, including registered investment companies. Level 2 includes securities valued using other significant observable inputs. Observable inputs may include quoted prices for similar securities, interest rates, prepayment speeds and credit risk. Prices for securities valued using these inputs are received from independent pricing vendors and brokers and are based on an evaluation of the inputs described. Level 3 includes securities valued using significant unobservable inputs when market prices are not readily available or reliable, including the fund’s own assumptions in determining the fair value of investments. Factors used in determining value may include market or issuer specific events or trends, changes in interest rates and credit quality. The inputs or methodology used for valuing securities are not necessarily an indication of the risks associated with investing in those securities. Changes in valuation techniques and related inputs may result in transfers into or out of an assigned level within the disclosure hierarchy.
As of September 30, 2020, all investments are categorized as Level 1 under the hierarchy described above.
Real estate investment trusts. The fund may invest in real estate investment trusts (REITs). Distributions from REITs may be recorded as income and subsequently characterized by the REIT at the end of the fiscal year as a reduction of cost of investments and/or as a realized gain. As a result, the fund will estimate the components of distributions from these securities. Such estimates are revised when the actual components of the distributions are known.
Security transactions and related investment income. Investment security transactions are accounted for on a trade date plus one basis for daily NAV calculations. However, for financial reporting purposes, investment transactions are reported on trade date. Interest income is accrued as earned. Dividend income is recorded on the ex-date, except for dividends of certain foreign securities where the dividend may not be known until after the ex-date. In those cases, dividend income, net of withholding taxes, is recorded when the fund becomes aware of the dividends. Non-cash dividends, if any, are recorded at the fair market value of the securities received. Gains and losses on securities sold are determined on the basis of identified cost and may include proceeds from litigation.
Securities lending. The fund may lend its securities to earn additional income. The fund receives collateral from the borrower in an amount not less than the market value of the loaned securities. The fund will invest its cash collateral in JHCT, an affiliate of the fund, which has a floating NAV and is registered with the Securities and Exchange Commission (SEC) as an investment company. JHCT invests in short-term money market investments. The fund will receive the benefit of any gains and bear any losses generated by JHCT with respect to the cash collateral.
The fund has the right to recall loaned securities on demand. If a borrower fails to return loaned securities when due, then the lending agent is responsible and indemnifies the fund for the lent securities. The lending agent uses the collateral received from the borrower to purchase replacement securities of the same issue, type, class and series of the loaned securities. If the value of the collateral is less than the purchase cost of replacement securities, the lending agent is responsible for satisfying the shortfall but only to the extent that the shortfall is not due to any decrease in the value of JHCT.
Although the risk of loss on securities lent is mitigated by receiving collateral from the borrower and through lending agent indemnification, the fund could experience a delay in recovering securities or could experience a lower than expected return if the borrower fails to return the securities on a timely basis. The fund receives compensation for lending its securities by retaining a portion of the return on the investment of the collateral and compensation from fees earned from borrowers of the securities. Securities lending income received by the fund is net of fees retained by the securities lending agent. Net income received from JHCT is a component of securities lending income as recorded on the Statement of operations.
| | | | |
| 26 | | JOHN HANCOCK DISCIPLINED VALUE MID CAP FUND | SEMIANNUAL REPORT | | |
Obligations to repay collateral received by the fund are shown on the Statement of assets and liabilities as Payable upon return of securities loaned and are secured by the loaned securities. As of September 30, 2020, the fund loaned securities valued at $92,050,679 and received $94,465,331 of cash collateral.
Foreign taxes. The fund may be subject to withholding tax on income, capital gains or repatriations imposed by certain countries, a portion of which may be recoverable. Foreign taxes are accrued based upon the fund’s understanding of the tax rules and rates that exist in the foreign markets in which it invests. Taxes are accrued based on gains realized by the fund as a result of certain foreign security sales. In certain circumstances, estimated taxes are accrued based on unrealized appreciation of such securities. Investment income is recorded net of foreign withholding taxes.
Overdraft. The fund may have the ability to borrow from banks for temporary or emergency purposes, including meeting redemption requests that otherwise might require the untimely sale of securities. Pursuant to the fund’s custodian agreement, the custodian may loan money to the fund to make properly authorized payments. The fund is obligated to repay the custodian for any overdraft, including any related costs or expenses. The custodian may have a lien, security interest or security entitlement in any fund property that is not otherwise segregated or pledged, to the extent of any overdraft, and to the maximum extent permitted by law.
Line of credit. Effective June 25, 2020, the fund and other affiliated funds have entered into a syndicated line of credit agreement with Citibank, N.A. as the administrative agent that enables them to participate in a $1 billion unsecured committed line of credit. Excluding commitments designated for a certain fund and subject to the needs of all other affiliated funds, the fund can borrow up to an aggregate commitment amount of $850 million, subject to asset coverage and other limitations as specified in the agreement. Each participating fund paid an upfront fee in connection with this line of credit agreement, which is charged based on a combination of fixed and asset-based allocations and amortized over 365 days. Prior to June 25, 2020, the fund and other affiliated funds had a similar agreement that enabled them to participate in a $750 million unsecured committed line of credit. A commitment fee payable at the end of each calendar quarter, based on the average daily unused portion of the line of credit, is charged to each participating fund based on a combination of fixed and asset-based allocations and is reflected in Other expenses on the Statement of operations. For the six months ended September 30, 2020, the fund had no borrowings under the line of credit. Commitment fees for the six months ended September 30, 2020 were $23,318.
Expenses. Within the John Hancock group of funds complex, expenses that are directly attributable to an individual fund are allocated to such fund. Expenses that are not readily attributable to a specific fund are allocated among all funds in an equitable manner, taking into consideration, among other things, the nature and type of expense and the fund’s relative net assets. Expense estimates are accrued in the period to which they relate and adjustments are made when actual amounts are known.
Class allocations. Income, common expenses and realized and unrealized gains (losses) are determined at the fund level and allocated daily to each class of shares based on the net assets of the class. Class-specific expenses, such as distribution and service fees, if any, and transfer agent fees, for all classes, are charged daily at the class level based on the net assets of each class and the specific expense rates applicable to each class.
Federal income taxes. The fund intends to continue to qualify as a regulated investment company by complying with the applicable provisions of the Internal Revenue Code and will not be subject to federal income tax on taxable income that is distributed to shareholders. Therefore, no federal income tax provision is required.
As of March 31, 2020, the fund had no uncertain tax positions that would require financial statement recognition, derecognition or disclosure. The fund’s federal tax returns are subject to examination by the Internal Revenue Service for a period of three years.
Distribution of income and gains. Distributions to shareholders from net investment income and net realized gains, if any, are recorded on the ex-date. The fund generally declares and pays dividends annually. Capital gain distributions, if any, are typically distributed annually.
| | | | |
| | SEMIANNUAL REPORT | JOHN HANCOCK DISCIPLINED VALUE MID CAP FUND | | 27 |
Distributions paid by the fund with respect to each class of shares are calculated in the same manner, at the same time and in the same amount, except for the effect of class level expenses that may be applied differently to each class.
Such distributions, on a tax basis, are determined in conformity with income tax regulations, which may differ from US GAAP. Distributions in excess of tax basis earnings and profits, if any, are reported in the fund’s financial statements as a return of capital. The final determination of tax characteristics of the fund’s distribution will occur at the end of the year and will subsequently be reported to shareholders.
Capital accounts within the financial statements are adjusted for permanent book-tax differences. These adjustments have no impact on net assets or the results of operations. Temporary book-tax differences, if any, will reverse in a subsequent period. Book-tax differences are primarily attributable to wash sale loss deferrals and treatment of a portion of the proceeds from redemptions as distributions for tax purposes.
Note 3 — Guarantees and indemnifications
Under the Trust’s organizational documents, its Officers and Trustees are indemnified against certain liabilities arising out of the performance of their duties to the Trust, including the fund. Additionally, in the normal course of business, the fund enters into contracts with service providers that contain general indemnification clauses. The fund’s maximum exposure under these arrangements is unknown, as this would involve future claims that may be made against the fund that have not yet occurred. The risk of material loss from such claims is considered remote.
Note 4 — Fees and transactions with affiliates
John Hancock Investment Management LLC (the Advisor) serves as investment advisor for the fund. John Hancock Investment Management Distributors LLC (the Distributor), an affiliate of the Advisor, serves as principal underwriter of the fund. The Advisor and the Distributor are indirect, principally owned subsidiaries of Manulife Financial Corporation.
Management fee. The fund has an investment management agreement with the Advisor under which the fund pays a daily management fee to the Advisor equivalent on an annual basis to the sum of: (a) 0.800% of the first $500 million of the fund’s average daily net assets; (b) 0.775% of the next $500 million of the fund’s average daily net assets; (c) 0.750% of the next $500 million of the fund’s average daily net assets; (d) 0.725% of the next $1 billion of the fund’s average daily net assets; and (e) 0.700% of the fund’s average daily net assets in excess of $2.5 billion. The Advisor has a subadvisory agreement with Boston Partners Global Investors, Inc., an indirect, wholly owned subsidiary of ORIX Corporation of Japan. The fund is not responsible for payment of the subadvisory fees.
The Advisor has contractually agreed to waive a portion of its management fee and/or reimburse expenses for certain funds of the John Hancock group of funds complex, including the fund (the participating portfolios). This waiver is based upon aggregate net assets of all the participating portfolios. The amount of the reimbursement is calculated daily and allocated among all the participating portfolios in proportion to the daily net assets of each fund. During the six months ended September 30, 2020, this waiver amounted to 0.01% of the fund’s average daily net assets on an annualized basis. This arrangement expires on July 31, 2022, unless renewed by mutual agreement of the fund and the Advisor based upon a determination that this is appropriate under the circumstances at that time.
| | | | |
| 28 | | JOHN HANCOCK DISCIPLINED VALUE MID CAP FUND | SEMIANNUAL REPORT | | |
For the six months ended September 30, 2020, the expense reductions described above amounted to the following:
| | | | |
Class | | | Expense reduction | |
Class A | | | $28,865 | |
Class C | | | 3,752 | |
Class I | | | 252,091 | |
Class R2 | | | 2,972 | |
| | | | |
Class | | | Expense reduction | |
Class R4 | | | $3,264 | |
Class R6 | | | 98,021 | |
Class ADV | | | 19 | |
Total | | | $388,984 | |
Expenses waived or reimbursed in the current fiscal period are not subject to recapture in future fiscal periods.
The investment management fees, including the impact of the waivers and reimbursements as described above, incurred for the six months ended September 30, 2020, were equivalent to a net annual effective rate of 0.71% of the fund’s average daily net assets.
Accounting and legal services. Pursuant to a service agreement, the fund reimburses the Advisor for all expenses associated with providing the administrative, financial, legal, compliance, accounting and recordkeeping services to the fund, including the preparation of all tax returns, periodic reports to shareholders and regulatory reports, among other services. These expenses are allocated to each share class based on its relative net assets at the time the expense was incurred. These accounting and legal services fees incurred, for the six months ended September 30, 2020, amounted to an annual rate of 0.02% of the fund’s average daily net assets.
Distribution and service plans. The fund has a distribution agreement with the Distributor. The fund has adopted distribution and service plans for certain classes as detailed below pursuant to Rule 12b-1 under the 1940 Act, to pay the Distributor for services provided as the distributor of shares of the fund. In addition, under a service plan for certain classes as detailed below, the fund pays for certain other services. The fund may pay up to the following contractual rates of distribution and service fees under these arrangements, expressed as an annual percentage of average daily net assets for each class of the fund’s shares:
| | | | | | | | |
Class | | | Rule 12b-1 Fee | | | | Service fee | |
Class A | | | 0.30% | | | | — | |
Class C | | | 1.00% | | | | — | |
Class R2 | | | 0.25% | | | | 0.25% | |
Class R4 | | | 0.25% | | | | 0.10% | |
Class ADV | | | 0.25% | | | | — | |
Currently only 0.25% is charged to Class A shares for Rule 12b-1 fees.
The fund’s Distributor has contractually agreed to waive 0.10% of Rule12b-1 fees for Class R4 shares. The current waiver agreement expires on July 31, 2021, unless renewed by mutual agreement of the fund and the Distributor based upon a determination that this is appropriate under the circumstances at the time. This contractual waiver amounted to $47,462 for Class R4 shares for the six months ended September 30, 2020.
Sales charges. Class A shares are assessed up-front sales charges, which resulted in payments to the Distributor amounting to $326,964 for the six months ended September 30, 2020. Of this amount, $50,503 was retained and used for printing prospectuses, advertising, sales literature and other purposes and $276,461 was paid as sales commissions to broker-dealers.
Class A and Class C shares may be subject to contingent deferred sales charges (CDSCs). Certain Class A shares that are acquired through purchases of $1 million or more and are redeemed within one year of purchase are subject to a 1.00% sales charge. Class C shares that are redeemed within one year of purchase are subject to a 1.00% CDSC. CDSCs are applied to the lesser of the current market value at the time of redemption or the original purchase cost of the shares being redeemed. Proceeds from CDSCs are used to compensate the Distributor for
| | | | |
| | SEMIANNUAL REPORT | JOHN HANCOCK DISCIPLINED VALUE MID CAP FUND | | 29 |
providing distribution-related services in connection with the sale of these shares. During the six months ended September 30, 2020, CDSCs received by the Distributor amounted to $6,908 and $6,976 for Class A and Class C shares, respectively.
Transfer agent fees. The John Hancock group of funds has a complex-wide transfer agent agreement with John Hancock Signature Services, Inc. (Signature Services), an affiliate of the Advisor. The transfer agent fees paid to Signature Services are determined based on the cost to Signature Services (Signature Services Cost) of providing recordkeeping services. It also includes out-of-pocket expenses, including payments made to third-parties for recordkeeping services provided to their clients who invest in one or more John Hancock funds. In addition, Signature Services Cost may be reduced by certain fees that Signature Services receives in connection with retirement and small accounts. Signature Services Cost is calculated monthly and allocated, as applicable, to five categories of share classes: Retail Share and Institutional Share Classes of Non-Municipal Bond Funds, Class R6 Shares, Retirement Share Classes and Municipal Bond Share Classes. Within each of these categories, the applicable costs are allocated to the affected John Hancock affiliated funds and/or classes, based on the relative average daily net assets.
Class level expenses. Class level expenses for the six months ended September 30, 2020 were as follows:
| | | | | | | | |
Class | | | Distribution and service fees | | | | Transfer agent fees | |
Class A | | | $1,061,806 | | | | $525,014 | |
Class C | | | 554,655 | | | | 68,798 | |
Class I | | | — | | | | 4,558,482 | |
Class R2 | | | 209,648 | | | | 5,665 | |
Class R4 | | | 163,751 | | | | 5,987 | |
Class R6 | | | — | | | | 186,378 | |
Class ADV | | | 703 | | | | 347 | |
Total | | | $1,990,563 | | | | $5,350,671 | |
Trustee expenses. The fund compensates each Trustee who is not an employee of the Advisor or its affiliates. The costs of paying Trustee compensation and expenses are allocated to the fund based on its net assets relative to other funds within the John Hancock group of funds complex.
Interfund lending program. Pursuant to an Exemptive Order issued by the SEC, the fund, along with certain other funds advised by the Advisor or its affiliates, may participate in an interfund lending program. This program provides an alternative credit facility allowing the fund to borrow from, or lend money to, other participating affiliated funds. At period end, no interfund loans were outstanding. Interest expense is included in Other expenses on the Statement of operations. The fund’s activity in this program during the period for which loans were outstanding was as follows:
| | | | | | | | | | | | | | | | |
Borrower or Lender | |
| Weighted Average
Loan Balance |
| |
| Days
Outstanding |
| |
| Weighted Average
Interest Rate |
| |
| Interest Income
(Expense) |
|
Borrower | | | $29,500,000 | | | | 3 | | | | 0.530% | | | | $(1,303) | |
Lender | | | 26,692,218 | | | | 5 | | | | 0.596% | | | | 2,209 | |
| | | | |
| 30 | | JOHN HANCOCK DISCIPLINED VALUE MID CAP FUND | SEMIANNUAL REPORT | | |
Note 5 — Fund share transactions
Transactions in fund shares for the six months ended September 30, 2020 and for the year ended March 31, 2020 were as follows:
| | | | | | | | | | | | | | | | |
| | |
| | | Six Months Ended 9-30-20 | | | Year Ended 3-31-20 | |
| | | | |
| | | Shares | | | Amount | | | Shares | | | Amount | |
Class A shares | | | | | | | | | | | | | | | | |
Sold | | | 5,940,050 | | | | $104,119,176 | | | | 13,654,022 | | | | $265,293,757 | |
Distributions reinvested | | | — | | | | — | | | | 1,080,962 | | | | 22,667,783 | |
Repurchased | | | (12,106,882 | ) | | | (208,477,674 | ) | | | (24,370,445 | ) | | | (471,965,836 | ) |
Net decrease | | | (6,166,832 | ) | | | $(104,358,498 | ) | | | (9,635,461 | ) | | | $(184,004,296 | ) |
Class C shares | | | | | | | | | | | | | | | | |
Sold | | | 245,920 | | | | $4,341,811 | | | | 646,233 | | | | $12,714,167 | |
Distributions reinvested | | | — | | | | — | | | | 110,510 | | | | 2,326,246 | |
Repurchased | | | (2,043,699 | ) | | | (35,980,778 | ) | | | (3,069,943 | ) | | | (60,355,776 | ) |
Net decrease | | | (1,797,779 | ) | | | $(31,638,967 | ) | | | (2,313,200 | ) | | | $(45,315,363 | ) |
Class I shares | | | | | | | | | | | | | | | | |
Sold | | | 61,430,315 | | | | $1,111,961,076 | | | | 132,026,217 | | | | $2,651,759,012 | |
Distributions reinvested | | | — | | | | — | | | | 8,328,620 | | | | 182,396,777 | |
Repurchased | | | (72,939,504 | ) | | | (1,321,841,442 | ) | | | (123,797,738 | ) | | | (2,419,758,033 | ) |
Net increase (decrease) | | | (11,509,189 | ) | | | $(209,880,366 | ) | | | 16,557,099 | | | | $414,397,756 | |
Class R2 shares | | | | | | | | | | | | | | | | |
Sold | | | 466,786 | | | | $8,559,745 | | | | 1,106,934 | | | | $21,770,845 | |
Distributions reinvested | | | — | | | | — | | | | 97,034 | | | | 2,119,217 | |
Repurchased | | | (881,141 | ) | | | (16,153,147 | ) | | | (2,850,860 | ) | | | (59,144,063 | ) |
Net decrease | | | (414,355 | ) | | | $(7,593,402 | ) | | | (1,646,892 | ) | | | $(35,254,001 | ) |
Class R4 shares | | | | | | | | | | | | | | | | |
Sold | | | 3,109,336 | | | | $52,437,534 | | | | 1,516,265 | | | | $31,772,255 | |
Distributions reinvested | | | — | | | | — | | | | 92,350 | | | | 2,021,537 | |
Repurchased | | | (1,360,310 | ) | | | (24,881,653 | ) | | | (1,809,529 | ) | | | (38,067,820 | ) |
Net increase (decrease) | | | 1,749,026 | | | | $27,555,881 | | | | (200,914 | ) | | | $(4,274,028 | ) |
Class R6 shares | | | | | | | | | | | | | | | | |
Sold | | | 20,985,419 | | | | $376,747,040 | | | | 42,572,165 | | | | $851,126,502 | |
Distributions reinvested | | | — | | | | — | | | | 3,643,329 | | | | 79,716,046 | |
Repurchased | | | (34,648,773 | ) | | | (640,978,558 | ) | | | (33,199,308 | ) | | | (680,251,869 | ) |
Net increase (decrease) | | | (13,663,354 | ) | | | $(264,231,518 | ) | | | 13,016,186 | | | | $250,590,679 | |
| | | | |
| | SEMIANNUAL REPORT | JOHN HANCOCK DISCIPLINED VALUE MID CAP FUND | | 31 |
| | | | | | | | | | | | | | | | |
| | |
| | | Six Months Ended 9-30-20 | | | Year Ended 3-31-20 | |
| | | | |
| | | Shares | | | Amount | | | Shares | | | Amount | |
Class ADV shares | | | | | | | | | | | | | | | | |
Sold | | | 2,365 | | | | $40,000 | | | | 6,498 | | | | $131,200 | |
Distributions reinvested | | | — | | | | — | | | | 844 | | | | 17,640 | |
Repurchased | | | (2,512 | ) | | | (44,506 | ) | | | (6,990 | ) | | | (147,940 | ) |
Net increase (decrease) | | | (147 | ) | | | $(4,506 | ) | | | 352 | | | | $900 | |
Total net increase (decrease) | | | (31,802,630 | ) | | | $(590,151,376 | ) | | | 15,777,170 | | | | $396,141,647 | |
Note 6 — Purchase and sale of securities
Purchases and sales of securities, other than short-term investments, amounted to $2,680,368,431 and $3,159,863,377, respectively, for the six months ended September 30, 2020.
Note 7 — Investment in affiliated underlying funds
The fund may invest in affiliated underlying funds that are managed by the Advisor and its affiliates. Information regarding the fund’s fiscal year to date purchases and sales of the affiliated underlying funds as well as income and capital gains earned by the fund, if any, is as follows:
| | | | | | | | | | | | | | | | | | | | | | | | | | | | | | | | | | | | |
| | | | | | | | | | | | | | | | | | | | | Dividends and distributions | | | | |
Affiliate | |
| Ending
share amount |
| |
| Beginning
value |
| |
| Cost of
purchases |
| |
| Proceeds
from shares sold |
| |
| Realized
gain
(loss) |
| |
| Change in
unrealized
appreciation
(depreciation) |
| |
| Income
distributions
received |
| |
| Capital gain
distributions
received |
| |
| Ending
value |
|
John Hancock Collateral Trust* | | | 9,439,145 | | | $ | 57,755,072 | | | $ | 615,591,414 | | | $ | (578,985,135 | ) | | $ | 70,294 | | | $ | 53,252 | | | $ | 330,588 | | | | — | | | $ | 94,484,897 | |
| * | Refer to the Securities lending note within Note 2 for details regarding this investment. |
Note 8 — Coronavirus (COVID-19) pandemic
The novel COVID-19 disease has resulted in significant disruptions to global business activity. A widespread health crisis such as a global pandemic could cause substantial market volatility, exchange trading suspensions and closures, impact the ability to complete redemptions, and affect fund performance.
Note 9 — Subsequent events
On June 25, 2020, the Board of Trustees approved redesignations of the following share class:
| | | | | | |
Redesignation | | | Effective date | | | |
Class ADV shares as Class A shares | | | October 9, 2020 | | | |
As a result of the redesignation, the existing Class ADV shares were terminated, and shareholders currently in this class became shareholders of Class A with the same or lower total net expenses.
| | | | |
| 32 | | JOHN HANCOCK DISCIPLINED VALUE MID CAP FUND | SEMIANNUAL REPORT | | |
Continuation of Investment Advisory and Subadvisory Agreements
Evaluation of Advisory and Subadvisory Agreements by the Board of Trustees
This section describes the evaluation by the Board of Trustees (the Board) of John Hancock Funds III (the Trust) of the Advisory Agreement (the Advisory Agreement) with John Hancock Investment Management, LLC (the Advisor) and the Subadvisory Agreement (the Subadvisory Agreement) with Boston Partners Global Investors, Inc. (the Subadvisor), for John Hancock Disciplined Value Mid Cap Fund (the fund). The Advisory Agreement and Subadvisory Agreement are collectively referred to as the Agreements. Prior to the June 23-25, 2020 telephonic1 meeting at which the Agreements were approved, the Board also discussed and considered information regarding the proposed continuation of the Agreements at the telephonic meeting held on May 26-27, 2020.
Approval of Advisory and Subadvisory Agreements
At telephonic meetings held on June 23-25, 2020, the Board, including the Trustees who are not parties to any Agreement or considered to be interested persons of the Trust under the Investment Company Act of 1940, as amended (the 1940 Act) (the Independent Trustees), reapproved for an annual period the continuation of the Advisory Agreement between the Trust and the Advisor and the Subadvisory Agreement between the Advisor and the Subadvisor with respect to the fund.
In considering the Advisory Agreement and the Subadvisory Agreement, the Board received in advance of the meetings a variety of materials relating to the fund, the Advisor and the Subadvisor, including comparative performance, fee and expense information for a peer group of similar funds prepared by an independent third-party provider of fund data, performance information for an applicable benchmark index; and, with respect to the Subadvisor, comparative performance information for comparably managed accounts, as applicable, and other information provided by the Advisor and the Subadvisor regarding the nature, extent and quality of services provided by the Advisor and the Subadvisor under their respective Agreements, as well as information regarding the Advisor’s revenues and costs of providing services to the fund and any compensation paid to affiliates of the Advisor. At the meetings at which the renewal of the Advisory Agreement and Subadvisory Agreement are considered, particular focus is given to information concerning fund performance, comparability of fees and total expenses, and profitability. However, the Board notes that the evaluation process with respect to the Advisor and the Subadvisor is an ongoing one. In this regard, the Board also took into account discussions with management and information provided to the Board (including its various committees) at prior meetings with respect to the services provided by the Advisor and the Subadvisor to the fund, including quarterly performance reports prepared by management containing reviews of investment results and prior presentations from the Subadvisor with respect to the fund. The information received and considered by the Board in connection with the May and June meetings and throughout the year was both written and oral. The Board also considered the nature, quality, and extent of non-advisory services, if any, to be provided to the fund by the Advisor’s affiliates, including distribution services. The Board considered the Advisory Agreement and the Subadvisory Agreement separately in the course of its review. In doing so, the Board noted the respective roles of the Advisor and Subadvisor in providing services to the fund.
Throughout the process, the Board asked questions of and requested additional information from management. The Board is assisted by counsel for the Trust and the Independent Trustees are also separately assisted by independent legal counsel throughout the process. The Independent Trustees also received a memorandum from
1 On March 25, 2020, as a result of health and safety measures put in place to combat the global COVID-19 pandemic, the Securities and Exchange Commission issued an exemptive order (the “Order”) pursuant to Sections 6(c) and 38(a) of the Investment Company Act of 1940, as amended (the “1940 Act”), that temporarily exempts registered investment management companies from the in-person voting requirements under the 1940 Act, subject to certain requirements, including that votes taken pursuant to the Order are ratified at the next in-person meeting. The Board determined that reliance on the Order was necessary or appropriate due to the circumstances related to current or potential effects of COVID-19 and therefore, the Board’s May and June meetings were held telephonically in reliance on the Order.
| | | | |
| | SEMIANNUAL REPORT | JOHN HANCOCK DISCIPLINED VALUE MID CAP FUND | | 33 |
their independent legal counsel discussing the legal standards for their consideration of the proposed continuation of the Agreements and discussed the proposed continuation of the Agreements in private sessions with their independent legal counsel at which no representatives of management were present.
Approval of Advisory Agreement
In approving the Advisory Agreement with respect to the fund, the Board, including the Independent Trustees, considered a variety of factors, including those discussed below. The Board also considered other factors (including conditions and trends prevailing generally in the economy, the securities markets, and the industry) and did not treat any single factor as determinative, and each Trustee may have attributed different weights to different factors. The Board’s conclusions may be based in part on its consideration of the advisory and subadvisory arrangements in prior years and on the Board’s ongoing regular review of fund performance and operations throughout the year.
Nature, extent, and quality of services. Among the information received by the Board from the Advisor relating to the nature, extent, and quality of services provided to the fund, the Board reviewed information provided by the Advisor relating to its operations and personnel, descriptions of its organizational and management structure, and information regarding the Advisor’s compliance and regulatory history, including its Form ADV. The Board also noted that on a regular basis it receives and reviews information from the Trust’s Chief Compliance Officer (CCO) regarding the fund’s compliance policies and procedures established pursuant to Rule 38a-1 under the 1940 Act. The Board observed that the scope of services provided by the Advisor, and of the undertakings required of the Advisor in connection with those services, including maintaining and monitoring its own and the fund’s compliance programs, risk management programs, liquidity management programs and cybersecurity programs, had expanded over time as a result of regulatory, market and other developments. The Board considered that the Advisor is responsible for the management of the day-to-day operations of the fund, including, but not limited to, general supervision of and coordination of the services provided by the Subadvisor, and is also responsible for monitoring and reviewing the activities of the Subadvisor and other third-party service providers. The Board considered the significant risks assumed by the Advisor in connection with the services provided to the fund including entrepreneurial risk in sponsoring new funds and ongoing risks including investment, operational, enterprise, litigation, regulatory and compliance risks with respect to all funds.
In considering the nature, extent, and quality of the services provided by the Advisor, the Trustees also took into account their knowledge of the Advisor’s management and the quality of the performance of the Advisor’s duties, through Board meetings, discussions and reports during the preceding year and through each Trustee’s experience as a Trustee of the Trust and of the other trusts in the John Hancock group of funds complex (the John Hancock Fund Complex).
In the course of their deliberations regarding the Advisory Agreement, the Board considered, among other things:
| | (a) | the skills and competency with which the Advisor has in the past managed the Trust’s affairs and its subadvisory relationship, the Advisor’s oversight and monitoring of the Subadvisor’s investment performance and compliance programs, such as the Subadvisor’s compliance with fund policies and objectives, review of brokerage matters, including with respect to trade allocation and best execution and the Advisor’s timeliness in responding to performance issues; |
| | (b) | the background, qualifications and skills of the Advisor’s personnel; |
| | (c) | the Advisor’s compliance policies and procedures and its responsiveness to regulatory changes and fund industry developments; |
| | (d) | the Advisor’s administrative capabilities, including its ability to supervise the other service providers for the fund, as well as the Advisor’s oversight of any securities lending activity, its monitoring of class action litigation and collection of class action settlements on behalf of the fund, and bringing loss recovery actions on behalf of the fund; |
| | | | |
| 34 | | JOHN HANCOCK DISCIPLINED VALUE MID CAP FUND | SEMIANNUAL REPORT | | |
| | (e) | the financial condition of the Advisor and whether it has the financial wherewithal to provide a high level and quality of services to the fund; |
| | (f) | the Advisor’s initiatives intended to improve various aspects of the Trust’s operations and investor experience with the fund; and |
| | (g) | the Advisor’s reputation and experience in serving as an investment advisor to the Trust and the benefit to shareholders of investing in funds that are part of a family of funds offering a variety of investments. |
The Board concluded that the Advisor may reasonably be expected to continue to provide a high quality of services under the Advisory Agreement with respect to the fund.
Investment performance.In considering the fund’s performance, the Board noted that it reviews at its regularly scheduled meetings information about the fund’s performance results. In connection with the consideration of the Advisory Agreement, the Board:
| | (a) | reviewed information prepared by management regarding the fund’s performance; |
| | (b) | considered the comparative performance of an applicable benchmark index; |
| | (c) | considered the performance of comparable funds, if any, as included in the report prepared by an independent third-party provider of fund data; and |
| | (d) | took into account the Advisor’s analysis of the fund’s performance and its plans and recommendations regarding the Trust’s subadvisory arrangements generally. |
The Board noted that while it found the data provided by the independent third-party generally useful it recognized its limitations, including in particular that data may vary depending on the end date selected and the results of the performance comparisons may vary depending on the selection of the peer group. The Board noted that the fund outperformed its benchmark index and peer group median for the one-, three-, five- and ten-year periods ended December 31, 2019. The Board took into account management’s discussion of the fund’s performance, including the favorable performance relative to the benchmark index and peer group median for the one-, three-, five- and ten-year periods. The Board concluded that the fund’s performance has generally been in line with or outperformed the historical performance of comparable funds and the fund’s benchmark index.
Fees and expenses. The Board reviewed comparative information prepared by an independent third-party provider of fund data, including, among other data, the fund’s contractual and net management fees (and subadvisory fees, to the extent available) and total expenses as compared to similarly situated investment companies deemed to be comparable to the fund in light of the nature, extent and quality of the management and advisory and subadvisory services provided by the Advisor and the Subadvisor. The Board considered the fund’s ranking within a smaller group of peer funds chosen by the independent third-party provider, as well as the fund’s ranking within a broader group of funds. In comparing the fund’s contractual and net management fees to those of comparable funds, the Board noted that such fees include both advisory and administrative costs. The Board noted that net management fees and net total expenses for the fund are higher than the peer group median.
The Board took into account management’s discussion of the fund’s expenses. The Board took into account management’s discussion with respect to the overall management fee and the fees of the Subadvisor, including the amount of the advisory fee retained by the Advisor after payment of the subadvisory fee, in each case in light of the services rendered for those amounts and the risks undertaken by the Advisor. The Board also noted that the Advisor pays the subadvisory fee, and that such fees are negotiated at arm’s length with respect to the Subadvisor. In addition, the Board took into account that management had agreed to implement an overall fee waiver across the complex, including the fund, which is discussed further below. The Board also noted actions taken over the past several years to reduce the fund’s operating expenses. The Board also noted that, in addition, the fund has breakpoints in its contractual management fee schedule that reduces management fees as assets increase. The
| | | | |
| | SEMIANNUAL REPORT | JOHN HANCOCK DISCIPLINED VALUE MID CAP FUND | | 35 |
Board also noted that the fund’s distributor, an affiliate of the Advisor, has agreed to waive a portion of its Rule 12b-1 fee for a share class of the fund. The Board reviewed information provided by the Advisor concerning the investment advisory fee charged by the Advisor or one of its advisory affiliates to other clients (including other funds in the John Hancock Fund Complex) having similar investment mandates, if any. The Board considered any differences between the Advisor’s and Subadvisor’s services to the fund and the services they provide to other comparable clients or funds. The Board concluded that the advisory fee paid with respect to the fund is reasonable in light of the nature, extent and quality of the services provided to the fund under the Advisory Agreement.
Profitability/Fall out benefits. In considering the costs of the services to be provided and the profits to be realized by the Advisor and its affiliates from the Advisor’s relationship with the Trust, the Board:
| | (a) | reviewed financial information of the Advisor; |
| | (b) | reviewed and considered information presented by the Advisor regarding the net profitability to the Advisor and its affiliates with respect to the fund; |
| | (c) | received and reviewed profitability information with respect to the John Hancock Fund Complex as a whole and with respect to the fund; |
| | (d) | received information with respect to the Advisor’s allocation methodologies used in preparing the profitability data and considered that the Advisor hired an independent third-party consultant to provide an analysis of the Advisor’s allocation methodologies; |
| | (e) | considered that the John Hancock insurance companies that are affiliates of the Advisor, as shareholders of the Trust directly or through their separate accounts, receive certain tax credits or deductions relating to foreign taxes paid and dividends received by certain funds of the Trust and noted that these tax benefits, which are not available to participants in qualified retirement plans under applicable income tax law, are reflected in the profitability information reviewed by the Board; |
| | (f) | considered that the Advisor also provides administrative services to the fund on a cost basis pursuant to an administrative services agreement; |
| | (g) | noted that affiliates of the Advisor provide transfer agency services and distribution services to the fund, and that the fund’s distributor also receives Rule 12b-1 payments to support distribution of the fund; |
| | (h) | noted that the Advisor also derives reputational and other indirect benefits from providing advisory services to the fund; |
| | (i) | noted that the subadvisory fee for the fund is paid by the Advisor and is negotiated at arm’s length; |
| | (j) | considered the Advisor’s ongoing costs and expenditures necessary to improve services, meet new regulatory and compliance requirements, and adapt to other challenges impacting the fund industry; and |
| | (k) | considered that the Advisor should be entitled to earn a reasonable level of profits in exchange for the level of services it provides to the fund and the risks that it assumes as Advisor, including entrepreneurial, operational, reputational, litigation and regulatory risk. |
Based upon its review, the Board concluded that the level of profitability, if any, of the Advisor and its affiliates from their relationship with the fund was reasonable and not excessive.
Economies of scale. In considering the extent to which economies of scale would be realized as the fund grows and whether fee levels reflect these economies of scale for the benefit of fund shareholders, the Board:
| | (a) | considered that the Advisor has contractually agreed to waive a portion of its management fee for certain funds of the John Hancock Fund Complex, including the fund (the participating portfolios) or |
| | | | |
| 36 | | JOHN HANCOCK DISCIPLINED VALUE MID CAP FUND | SEMIANNUAL REPORT | | |
| | otherwise reimburse the expenses of the participating portfolios (the reimbursement). This waiver is based upon aggregate net assets of all the participating portfolios. The amount of the reimbursement is calculated daily and allocated among all the participating portfolios in proportion to the daily net assets of each fund; |
| | (b) | reviewed the fund’s advisory fee structure and concluded that: (i) the fund’s fee structure contains breakpoints at the subadvisory fee level and that such breakpoints are reflected as breakpoints in the advisory fees for the fund; and (ii) although economies of scale cannot be measured with precision, these arrangements permit shareholders of the fund to benefit from economies of scale if the fund grows. The Board also took into account management’s discussion of the fund’s advisory fee structure; and |
| | (c) | the Board also considered the effect of the fund’s growth in size on its performance and fees. The Board also noted that if the fund’s assets increase over time, the fund may realize other economies of scale. |
Approval of Subadvisory Agreement
In making its determination with respect to approval of the Subadvisory Agreement, the Board reviewed:
| | (1) | information relating to the Subadvisor’s business, including current subadvisory services to the Trust (and other funds in the John Hancock Fund Complex); |
| | (2) | the historical and current performance of the fund and comparative performance information relating to an applicable benchmark index and comparable funds; |
| | (3) | the subadvisory fee for the fund, including any breakpoints, and to the extent available, comparable fee information prepared by an independent third party provider of fund data; and |
| | (4) | information relating to the nature and scope of any material relationships and their significance to the Trust’s Advisor and Subadvisor. |
Nature, extent, and quality of services. With respect to the services provided by the Subadvisor, the Board received information provided to the Board by the Subadvisor, including the Subadvisor’s Form ADV, as well as took into account information presented throughout the past year. The Board considered the Subadvisor’s current level of staffing and its overall resources, as well as received information relating to the Subadvisor’s compensation program. The Board reviewed the Subadvisor’s history and investment experience, as well as information regarding the qualifications, background, and responsibilities of the Subadvisor’s investment and compliance personnel who provide services to the fund. The Board also considered, among other things, the Subadvisor’s compliance program and any disciplinary history. The Board also considered the Subadvisor’s risk assessment and monitoring process. The Board reviewed the Subadvisor’s regulatory history, including whether it was involved in any regulatory actions or investigations as well as material litigation, and any settlements and amelioratory actions undertaken, as appropriate. The Board noted that the Advisor conducts regular, periodic reviews of the Subadvisor and its operations, including regarding investment processes and organizational and staffing matters. The Board also noted that the Trust’s CCO and his staff conduct regular, periodic compliance reviews with the Subadvisor and present reports to the Independent Trustees regarding the same, which includes evaluating the regulatory compliance systems of the Subadvisor and procedures reasonably designed to assure compliance with the federal securities laws. The Board also took into account the financial condition of the Subadvisor.
The Board considered the Subadvisor’s investment process and philosophy. The Board took into account that the Subadvisor’s responsibilities include the development and maintenance of an investment program for the fund that is consistent with the fund’s investment objective, the selection of investment securities and the placement of
| | | | |
| | SEMIANNUAL REPORT | JOHN HANCOCK DISCIPLINED VALUE MID CAP FUND | | 37 |
orders for the purchase and sale of such securities, as well as the implementation of compliance controls related to performance of these services. The Board also received information with respect to the Subadvisor’s brokerage policies and practices, including with respect to best execution and soft dollars.
Subadvisor compensation. In considering the cost of services to be provided by the Subadvisor and the profitability to the Subadvisor of its relationship with the fund, the Board noted that the fees under the Subadvisory Agreement are paid by the Advisor and not the fund.
The Board also relied on the ability of the Advisor to negotiate the Subadvisory Agreement with the Subadvisor, which is not affiliated with the Advisor, and the fees thereunder at arm’s length. As a result, the costs of the services to be provided and the profits to be realized by the Subadvisor from its relationship with the Trust were not a material factor in the Board’s consideration of the Subadvisory Agreement.
The Board also received information regarding the nature and scope (including their significance to the Advisor and its affiliates and to the Subadvisor) of any material relationships with respect to the Subadvisor, which include arrangements in which the Subadvisor or its affiliates provide advisory, distribution, or management services in connection with financial products sponsored by the Advisor or its affiliates, and may include other registered investment companies, a 529 education savings plan, managed separate accounts and exempt group annuity contracts sold to qualified plans. The Board also received information and took into account any other potential conflicts of interest the Advisor might have in connection with the Subadvisory Agreement.
In addition, the Board considered other potential indirect benefits that the Subadvisor and its affiliates may receive from the Subadvisor’s relationship with the fund, such as the opportunity to provide advisory services to additional funds in the John Hancock Fund Complex and reputational benefits.
Subadvisory fees. The Board considered that the fund pays an advisory fee to the Advisor and that, in turn, the Advisor pays a subadvisory fee to the Subadvisor. As noted above, the Board also considered the fund’s subadvisory fees as compared to similarly situated investment companies deemed to be comparable to the fund as included in the report prepared by the independent third party provider of fund data, to the extent available. The Board noted that the limited size of the Lipper peer group was not sufficient for comparative purposes. The Board also took into account the subadvisory fees paid by the Advisor to the Subadvisor with respect to the fund and compared them to fees charged by the Subadvisor to manage other subadvised portfolios and portfolios not subject to regulation under the 1940 Act, as applicable.
Subadvisor performance. As noted above, the Board considered the fund’s performance as compared to the fund’s peer group median and the benchmark index and noted that the Board reviews information about the fund’s performance results at its regularly scheduled meetings. The Board noted the Advisor’s expertise and resources in monitoring the performance, investment style and risk-adjusted performance of the Subadvisor. The Board was mindful of the Advisor’s focus on the Subadvisor’s performance. The Board also noted the Subadvisor’s long-term performance record for similar accounts, as applicable.
The Board’s decision to approve the Subadvisory Agreement was based on a number of determinations, including the following:
| | (1) | the Subadvisor has extensive experience and demonstrated skills as a manager; |
| | (2) | the performance of the fund has generally been in line with or outperformed the historical performance of comparable funds and the fund’s benchmark index; |
| | (3) | subadvisory fee is reasonable in relation to the level and quality of services being provided under the Subadvisory Agreement; and |
| | | | |
| 38 | | JOHN HANCOCK DISCIPLINED VALUE MID CAP FUND | SEMIANNUAL REPORT | | |
| | (4) | noted that the subadvisory fees are paid by the Advisor not the fund and that the subadvisory fee breakpoints are reflected as breakpoints in the advisory fees for the fund in order to permit shareholders to benefit from economies of scale if the fund grows. |
* * *
Based on the Board’s evaluation of all factors that the Board deemed to be material, including those factors described above, the Board, including the Independent Trustees, concluded that renewal of the Advisory Agreement and the Subadvisory Agreement would be in the best interest of the fund and its shareholders. Accordingly, the Board, and the Independent Trustees voting separately, approved the Advisory Agreement and Subadvisory Agreement for an additional one-year period.
| | | | |
| | SEMIANNUAL REPORT | JOHN HANCOCK DISCIPLINED VALUE MID CAP FUND | | 39 |
Trustees
Hassell H. McClellan, Chairperson
Steven R. Pruchansky, Vice Chairperson
Andrew G. Arnott†
Charles L. Bardelis*
James R. Boyle
Peter S. Burgess*
William H. Cunningham
Grace K. Fey
Marianne Harrison†
Deborah C. Jackson
James M. Oates*
Frances G. Rathke*,1
Gregory A. Russo
Officers
Andrew G. Arnott
President
Charles A. Rizzo
Chief Financial Officer
Salvatore Schiavone
Treasurer
Christopher (Kit) Sechler
Secretary and Chief Legal Officer
Trevor Swanberg2
Chief Compliance Officer
Investment advisor
John Hancock Investment Management LLC
Subadvisor
Boston Partners Global Investors, Inc.
Portfolio Managers
Joseph F. Feeney, Jr., CFA
Steven L. Pollack, CFA
Principal distributor
John Hancock Investment Management
Distributors LLC
Custodian
State Street Bank and Trust Company
Transfer agent
John Hancock Signature Services, Inc.
Legal counsel
K&L Gates LLP
* Member of the Audit Committee
† Non-Independent Trustee
1 Appointed as Independent Trustee effective as of September 15, 2020
2 Effective July 31, 2020
The fund’s proxy voting policies and procedures, as well as the fund proxy voting record for the most recent twelve-month period ended June 30, are available free of charge on the Securities and Exchange Commission (SEC) website at sec.gov or on our website.
All of the fund’s holdings as of the end of the third month of every fiscal quarter are filed with the SEC on Form N-PORT within 60 days of the end of the fiscal quarter. The fund’s Form N-PORT filings are available on our website and the SEC’s website, sec.gov.
We make this information on your fund, as well as monthly portfolio holdings, and other fund details available on our website at jhinvestments.com or by calling 800-225-5291.
| | | | |
You can also contact us: | | | | |
| | |
| 800-225-5291 | | Regular mail: | | Express mail: |
| | |
| jhinvestments.com | | John Hancock Signature Services, Inc. | | John Hancock Signature Services, Inc. |
| | P.O. Box 219909 | | 430 W 7th Street |
| | Kansas City, MO 64121-9909 | | Suite 219909 |
| | | | Kansas City, MO 64105-1407 |
| | | | |
| 40 | | JOHN HANCOCK DISCIPLINED VALUE MID CAP FUND | SEMIANNUAL REPORT | | |
|
John Hancock family of funds |
DOMESTIC EQUITY FUNDS
Blue Chip Growth
Classic Value
Disciplined Value
Disciplined Value Mid Cap
Equity Income
Financial Industries
Fundamental All Cap Core
Fundamental Large Cap Core
New Opportunities
Regional Bank
Small Cap Core
Small Cap Growth
Small Cap Value
U.S. Global Leaders Growth
U.S. Growth
GLOBAL AND INTERNATIONAL EQUITY FUNDS
Disciplined Value International
Emerging Markets
Emerging Markets Equity
Fundamental Global Franchise
Global Equity
Global Shareholder Yield
Global Thematic Opportunities
International Dynamic Growth
International Growth
International Small Company
INCOME FUNDS
Bond
California Tax-Free Income
Emerging Markets Debt
Floating Rate Income
Government Income
High Yield
High Yield Municipal Bond
Income
Investment Grade Bond
Money Market
Short Duration Bond
Short Duration Credit Opportunities
Strategic Income Opportunities
Tax-Free Bond
ALTERNATIVE AND SPECIALTY FUNDS
Absolute Return Currency
Alternative Asset Allocation
Alternative Risk Premia
Diversified Macro
Infrastructure
Multi-Asset Absolute Return
Seaport Long/Short
A fund’s investment objectives, risks, charges, and expenses should be considered carefully before investing. The prospectus contains this and other important information about the fund. To obtain a prospectus, contact your financial professional, call John Hancock Investment Management at 800-225-5291, or visit our website at jhinvestments.com. Please read the prospectus carefully before investing or sending money.
ASSET ALLOCATION
Balanced
Multi-Asset High Income
Multi-Index Lifetime Portfolios
Multi-Index Preservation Portfolios
Multimanager Lifestyle Portfolios
Multimanager Lifetime Portfolios
Retirement Income 2040
EXCHANGE-TRADED FUNDS
John Hancock Multifactor Consumer Discretionary ETF
John Hancock Multifactor Consumer Staples ETF
John Hancock Multifactor Developed International ETF
John Hancock Multifactor Emerging Markets ETF
John Hancock Multifactor Energy ETF
John Hancock Multifactor Financials ETF
John Hancock Multifactor Healthcare ETF
John Hancock Multifactor Industrials ETF
John Hancock Multifactor Large Cap ETF
John Hancock Multifactor Materials ETF
John Hancock Multifactor Media and Communications ETF
John Hancock Multifactor Mid Cap ETF
John Hancock Multifactor Small Cap ETF
John Hancock Multifactor Technology ETF
John Hancock Multifactor Utilities ETF
ENVIRONMENTAL, SOCIAL, AND
GOVERNANCE FUNDS
ESG All Cap Core
ESG Core Bond
ESG International Equity
ESG Large Cap Core
CLOSED-END FUNDS
Financial Opportunities
Hedged Equity & Income
Income Securities Trust
Investors Trust
Preferred Income
Preferred Income II
Preferred Income III
Premium Dividend
Tax-Advantaged Dividend Income
Tax-Advantaged Global Shareholder Yield
John Hancock Multifactor ETF shares are bought and sold at market price (not NAV), and are not individually redeemed from the fund. Brokerage commissions will reduce returns.
John Hancock ETFs are distributed by Foreside Fund Services, LLC, and are subadvised by Dimensional Fund Advisors LP. Foreside is not affiliated with John Hancock Investment Management Distributors LLC or Dimensional Fund Advisors LP.
Dimensional Fund Advisors LP receives compensation from John Hancock in connection with licensing rights to the John Hancock Dimensional indexes. Dimensional Fund Advisors LP does not sponsor, endorse, or sell, and makes no representation as to the advisability of investing in, John Hancock Multifactor ETFs.
|
John Hancock Investment Management A trusted brand John Hancock Investment Management is a premier asset manager with a heritage of financial stewardship dating back to 1862. Helping our shareholders pursue their financial goals is at the core of everything we do. It’s why we support the role of professional financial advice and operate with the highest standards of conduct and integrity. A better way to invest We serve investors globally through a unique multimanager approach: We search the world to find proven portfolio teams with specialized expertise for every strategy we offer, then we apply robust investment oversight to ensure they continue to meet our uncompromising standards and serve the best interests of our shareholders. Results for investors Our unique approach to asset management enables us to provide a diverse set of investments backed by some of the world’s best managers, along with strong risk-adjusted returns across asset classes. |
| | |
 | | Investment Management |
John Hancock Investment Management Distributors LLC ∎ Member FINRA, SIPC
200 Berkeley Street ∎ Boston, MA 02116-5010 ∎ 800-225-5291 ∎ jhinvestments.com
This report is for the information of the shareholders of John Hancock Disciplined Value Mid Cap Fund. It is not authorized for distribution to prospective investors unless preceded or accompanied by a prospectus.
| | |
 | | |
| | 363SA 9/20 |
| MF1355799 | | 11/2020 |


Dear shareholder,
Despite heightened fears over the coronavirus (COVID-19), which sent markets tumbling just prior to the beginning of the reporting period, global financial markets delivered positive returns for the 6 months ended September 30, 2020. The governments of many nations worked to shore up their economies, and equity markets began to rise from their first-quarter sell-off; this comeback gathered momentum for the remainder of the period.
Of course, it would be a mistake to consider this market turnaround a trustworthy signal of assured or swift economic recovery. The ongoing spread of COVID-19 continues to create uncertainty among businesses and investors. While there has been economic growth in much of the developed world, the pace has slowed in many areas as interest rates remain low and consumer spending remains far below prepandemic levels.
From an investment perspective, we continue to think that maintaining a focus on long-term objectives while pursuing a risk-aware strategy is a prudent way forward. Above all, we believe the counsel of a trusted financial professional continues to matter now more than ever. Periods of heightened uncertainty are precisely the time to review your financial goals and follow a plan that helps you make the most of what continues to be a challenging situation.
On behalf of everyone at John Hancock Investment Management, I’d like to take this opportunity to welcome new shareholders and thank existing shareholders for the continued trust you’ve placed in us.
Sincerely,
Andrew G. Arnott
President and CEO,
John Hancock Investment Management
Head of Wealth and Asset Management,
United States and Europe
This commentary reflects the CEO’s views as of this report’s period end and are subject to change at any time. Diversification does not guarantee investment returns and does not eliminate risk of loss. All investments entail risks, including the possible loss of principal. For more up-to-date information, you can visit our website at jhinvestments.com.
|
John Hancock Global Shareholder Yield Fund |
| | |
| SEMIANNUAL REPORT | JOHN HANCOCK GLOBAL SHAREHOLDER YIELD FUND | | 1 |
| | | | |
| | |
| | | | INVESTMENT OBJECTIVE |
| | |
| | | | The fund seeks to provide a high level of income as its primary objective. Capital appreciation is a secondary investment objective. |
| | |
| | | | AVERAGE ANNUAL TOTAL RETURNS AS OF 9/30/2020 (%) |
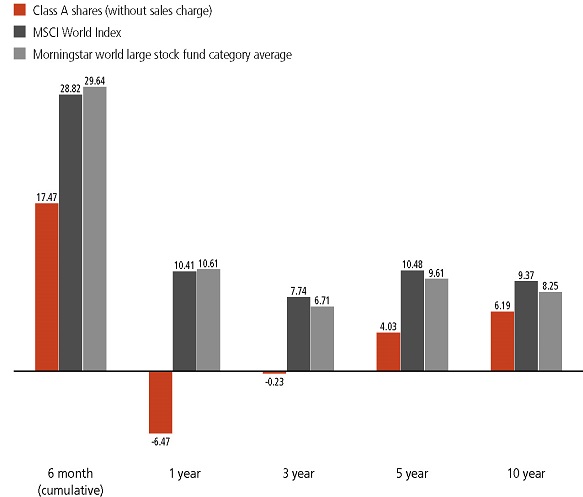
The MSCI World Index is a free float-adjusted market capitalization weighted index that is designed to measure the equity market performance of developed markets.
It is not possible to invest directly in an index. Index figures do not reflect expenses or sales charges, which would result in lower returns.
The fund’s Morningstar category average is a group of funds with similar investment objectives and strategies and is the equal-weighted return of all funds per category. Morningstar places funds in certain categories based on their historical portfolio holdings. Figures from Morningstar, Inc. include reinvested distributions and do not take into account sales charges. Actual load-adjusted performance is lower.
The past performance shown here reflects reinvested distributions and the beneficial effect of any expense reductions, and does not guarantee future results. Performance of the other share classes will vary based on the difference in the fees and expenses of those classes. Shares will fluctuate in value and, when redeemed, may be worth more or less than their original cost. Current month-end performance may be lower or higher than the performance cited, and can be found at jhinvestments.com or by calling 800-225-5291. For further information on the fund’s objectives, risks, and strategy, see the fund’s prospectus.
| | |
| 2 | | JOHN HANCOCK GLOBAL SHAREHOLDER YIELD FUND | SEMIANNUAL REPORT |
| | | | |
| | SECTOR COMPOSITION AS OF 9/30/2020 (% of net assets) |
| | |
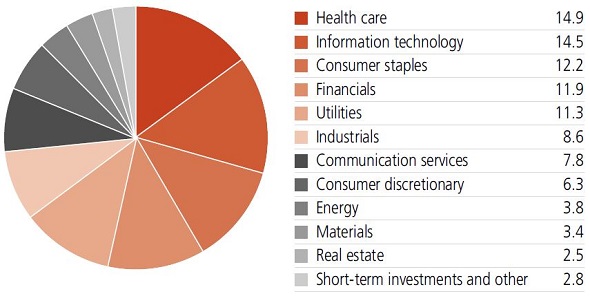
| | | | | | |
| | TOP 10 HOLDINGS AS OF 9/30/2020 (% of net assets) | |
| | Microsoft Corp. | | | 2.2 | |
| | | |
| | Verizon Communications, Inc. | | | 1.9 | |
| | | |
| | Taiwan Semiconductor Manufacturing Company, Ltd., ADR | | | 1.7 | |
| | | |
| | KLA Corp. | | | 1.7 | |
| | | |
| | Takeda Pharmaceutical Company, Ltd. | | | 1.6 | |
| | | |
| | Unilever PLC | | | 1.5 | |
| | | |
| | Snam SpA | | | 1.5 | |
| | | |
| | AbbVie, Inc. | | | 1.4 | |
| | | |
| | Allianz SE | | | 1.4 | |
| | | |
| | AT&T, Inc. | | | 1.4 | |
| | | |
| | TOTAL | | | 16.3 | |
Cash and cash equivalents are not included.
A note about risks
The fund may be subject to various risks as described in the fund’s prospectus. A widespread health crisis such as a global pandemic could cause substantial market volatility, exchange trading suspensions and closures, impact the ability to complete redemptions, and affect fund performance. For example, the novel coronavirus disease (COVID-19) has resulted in significant disruptions to global business activity. The impact of a health crisis and other epidemics and pandemics that may arise in the future, could affect the global economy in ways that cannot necessarily be foreseen at the present time. A health crisis may exacerbate other pre-existing political, social, and economic risks. Any such impact could adversely affect the fund’s performance, resulting in losses to your investment. For more information, please refer to the ‘‘Principal risks” section of the prospectus.
| | |
| SEMIANNUAL REPORT | JOHN HANCOCK GLOBAL SHAREHOLDER YIELD FUND | | 3 |
| | | | |
TOP 10 COUNTRIES AS OF 9/30/2020 (% of net assets) | | | | |
United States | | | 56.7 | |
| United Kingdom | | | 7.2 | |
| Germany | | | 6.7 | |
| Canada | | | 6.0 | |
| France | | | 5.7 | |
| Italy | | | 3.2 | |
| Switzerland | | | 2.9 | |
| Japan | | | 2.3 | |
| South Korea | | | 1.7 | |
| Taiwan | | | 1.7 | |
| TOTAL | | | 94.1 | |
Cash and cash equivalents are not included.
| | |
| 4 | | JOHN HANCOCK GLOBAL SHAREHOLDER YIELD FUND | SEMIANNUAL REPORT |
TOTAL RETURNS FOR THE PERIOD ENDED SEPTEMBER 30, 2020
| | | | | | | | | | | | | | | | | | | | | | | | | | | | | | | | | | | | | | | | | | | | | | |
| | | | | | | | | | | | | | | | | | | | | | | | | | | | | | | | | | | | |
| | | | | | | | | | | | | | | | | SEC 30-day | | | | | | SEC 30-day | |
| | | | | Average annual total returns (%) | | | | | | Cumulative total returns (%) | | | | | | yield (%) | | | | | | yield (%) | |
| | | | | with maximum sales charge | | | | | | with maximum sales charge | | | | | | subsidized | | | | | | unsubsidized† | |
| | | | | | | | | | | | | | | | | | | | | | | | | | | | | as of | | | | | | as of | |
| | | | | 1-year | | | 5-year | | | 10-year | | | | | | 6-month | | | 5-year | | | 10-year | | | | | | 9-30-20 | | | | | | 9-30-20 | |
| | | | | | | | | | | | |
Class A | | | | | -11.17 | | | | 2.96 | | | | 5.65 | | | | | | | | 11.64 | | | | 15.70 | | | | 73.33 | | | | | | | | 2.46 | | | | | | | | 2.28 | |
| | | | | | | | | | | | |
Class B | | | | | -11.52 | | | | 2.95 | | | | 5.56 | | | | | | | | 12.11 | | | | 15.63 | | | | 71.83 | | | | | | | | 1.80 | | | | | | | | 1.66 | |
| | | | | | | | | | | | |
Class C | | | | | -7.94 | | | | 3.29 | | | | 5.43 | | | | | | | | 16.11 | | | | 17.56 | | | | 69.74 | | | | | | | | 1.82 | | | | | | | | 1.68 | |
| | | | | | | | | | | | |
Class I1 | | | | | -6.19 | | | | 4.32 | | | | 6.53 | | | | | | | | 17.67 | | | | 23.53 | | | | 88.32 | | | | | | | | 2.85 | | | | | | | | 2.71 | |
| | | | | | | | | | | | |
Class R21,2 | | | | | -6.50 | | | | 3.92 | | | | 6.09 | | | | | | | | 17.53 | | | | 21.22 | | | | 80.56 | | | | | | | | 2.50 | | | | | | | | 2.37 | |
| | | | | | | | | | | | |
Class R61,2 | | | | | -6.10 | | | | 4.41 | | | | 6.58 | | | | | | | | 17.63 | | | | 24.10 | | | | 89.10 | | | | | | | | 2.94 | | | | | | | | 2.80 | |
| | | | | | | | | | | | |
Class NAV1 | | | | | -6.10 | | | | 4.43 | | | | 6.64 | | | | | | | | 17.75 | | | | 24.20 | | | | 90.26 | | | | | | | | 2.95 | | | | | | | | 2.82 | |
| | | | | | | | | | | | |
Index†† | | | | | 10.41 | | | | 10.48 | | | | 9.37 | | | | | | | | 28.82 | | | | 64.56 | | | | 145.01 | | | | | | | | — | | | | | | | | — | |
Performance figures assume all distributions have been reinvested. Figures reflect maximum sales charges on Class A shares of 5%, and the applicable contingent deferred sales charge (CDSC) on Class B and Class C shares. The Class B shares’ CDSC declines annually between years 1 to 6 according to the following schedule: 5%, 4%, 3%, 3%, 2%, and 1%. No sales charge will be assessed after the sixth year. Class C shares sold within one year of purchase are subject to a 1% CDSC. Sales charges are not applicable to Class I, Class R2, Class R6, and Class NAV shares.
The expense ratios of the fund, both net (including any fee waivers and/or expense limitations) and gross (excluding any fee waivers and/or expense limitations), are set forth according to the most recent publicly available prospectuses for the fund and may differ from those disclosed in the Financial highlights tables in this report. Net expenses reflect contractual expense limitations in effect until July 31, 2021 and are subject to change. Had the contractual fee waivers and expense limitations not been in place, gross expenses would apply. The expense ratios are as follows:
| | | | | | | | | | | | | | | | | | |
| | | | Class A | | Class B | | Class C | | Class I | | Class R2 | | Class R6 | | Class NAV | | |
| | Gross (%) | | 1.29 | | 1.99 | | 1.99 | | 0.99 | | 1.38 | | 0.88 | | 0.87 | | |
| | Net (%) | | 1.09 | | 1.84 | | 1.84 | | 0.84 | | 1.24 | | 0.74 | | 0.86 | | |
Please refer to the most recent prospectus and annual or semiannual report for more information on expenses and any expense limitation arrangements for each class.
The returns reflect past results and should not be considered indicative of future performance. The return and principal value of an investment will fluctuate so that shares, when redeemed, may be worth more or less than their original cost. Due to market volatility and other factors, the fund’s current performance may be higher or lower than the performance shown. For current to the most recent month-end performance data, please call 800–225–5291 or visit the fund’s website at jhinvestments.com.
The performance table above and the chart on the next page do not reflect the deduction of taxes that a shareholder would pay on fund distributions or the redemption of fund shares. The fund’s performance results reflect any applicable fee waivers or expense reductions, without which the expenses would increase and results would have been less favorable.
† Unsubsidized yield reflects what the yield would have been without the effect of reimbursements and waivers.
| | †† | Index is the MSCI World Index. |
See the following page for footnotes.
| | |
| SEMIANNUAL REPORT | JOHN HANCOCK GLOBAL SHAREHOLDER YIELD FUND | | 5 |
This chart and table show what happened to a hypothetical $10,000 investment in John Hancock Global Shareholder Yield Fund for the share classes and periods indicated, assuming all distributions were reinvested. For comparison, we’ve shown the same investment in the MSCI World Index.
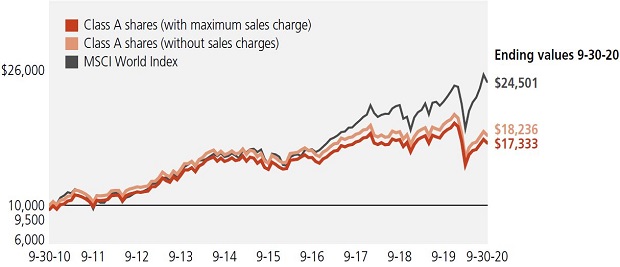
| | | | | | | | | | | | | | | | |
| | | | | | | With maximum | | | | Without | | | | | |
| | | | Start date | | | | sales charge ($) | | | | sales charge ($) | | | | Index ($) | |
Class B3 | | | 9-30-10 | | | | 17,183 | | | | 17,183 | | | | 24,501 | |
Class C3 | | | 9-30-10 | | | | 16,974 | | | | 16,974 | | | | 24,501 | |
Class I1 | | | 9-30-10 | | | | 18,832 | | | | 18,832 | | | | 24,501 | |
Class R21,2 | | | 9-30-10 | | | | 18,056 | | | | 18,056 | | | | 24,501 | |
Class R61,2 | | | 9-30-10 | | | | 18,910 | | | | 18,910 | | | | 24,501 | |
Class NAV1 | | | 9-30-10 | | | | 19,026 | | | | 19,026 | | | | 24,501 | |
The MSCI World Index is a free float-adjusted market capitalization weighted index that is designed to measure the equity market performance of developed markets.
It is not possible to invest directly in an index. Index figures do not reflect expenses or sales charges, which would result in lower returns.
Footnotes related to performance pages
| | 1 | For certain types of investors, as described in the fund’s prospectuses. |
| | 2 | Class R2 and Class R6 shares were first offered 3-1-12 and 9-1-11, respectively. The returns prior to these dates are those of Class A shares that have not been adjusted for class-specific expenses; otherwise, returns would vary. |
| | 3 | The contingent deferred sales charge is not applicable. |
| | |
| 6 | | JOHN HANCOCK GLOBAL SHAREHOLDER YIELD FUND | SEMIANNUAL REPORT |
These examples are intended to help you understand your ongoing operating expenses of investing in the fund so you can compare these costs with the ongoing costs of investing in other mutual funds.
Understanding fund expenses
As a shareholder of the fund, you incur two types of costs:
| | ∎ | | Transaction costs, which include sales charges (loads) on purchases or redemptions (varies by share class), minimum account fee charge, etc. | |
| | ∎ | | Ongoing operating expenses, including management fees, distribution and service fees (if applicable), and other fund expenses. | |
We are presenting only your ongoing operating expenses here.
Actual expenses/actual returns
The first line of each share class in the table on the following page is intended to provide information about the fund’s actual ongoing operating expenses, and is based on the fund’s actual return. It assumes an account value of $1,000.00 on April 1, 2020, with the same investment held until September 30, 2020.
Together with the value of your account, you may use this information to estimate the operating expenses that you paid over the period. Simply divide your account value at September 30, 2020, by $1,000.00, then multiply it by the “expenses paid” for your share class from the table. For example, for an account value of $8,600.00, the operating expenses should be calculated as follows:
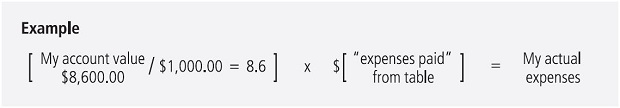
Hypothetical example for comparison purposes
The second line of each share class in the table on the following page allows you to compare the fund’s ongoing operating expenses with those of any other fund. It provides an example of the fund’s hypothetical account values and hypothetical expenses based on each class’s actual expense ratio and an assumed 5% annualized return before expenses (which is not the class’s actual return). It assumes an account value of $1,000.00 on April 1, 2020, with the same investment held until September 30, 2020. Look in any other fund shareholder report to find its hypothetical example and you will be able to compare these expenses. Please remember that these hypothetical account values and expenses may not be used to estimate the actual ending account balance or expenses you paid for the period.
| | |
| SEMIANNUAL REPORT | JOHN HANCOCK GLOBAL SHAREHOLDER YIELD FUND | | 7 |
Remember, these examples do not include any transaction costs, therefore, these examples will not help you to determine the relative total costs of owning different funds. If transaction costs were included, your expenses would have been higher. See the prospectuses for details regarding transaction costs.
SHAREHOLDER EXPENSE EXAMPLE CHART
| | | | | | | | | | | | | | | | | | |
| | | | | | | | | | | | | | | | | | | |
| | | |
| Account
value on 4-1-2020 |
| |
| Ending
value on 9-30-2020 |
| |
| Expenses
paid during period ended 9-30-20201 |
| |
| Annualized
expense ratio |
|
Class A | | Actual expenses/actual returns | | | $1,000.00 | | | | $1,174.70 | | | | $ 5.94 | | | | 1.09% | |
| | | Hypothetical example | | | 1,000.00 | | | | 1,019.60 | | | | 5.52 | | | | 1.09% | |
Class B | | Actual expenses/actual returns | | | 1,000.00 | | | | 1,171.10 | | | | 10.01 | | | | 1.84% | |
| | | Hypothetical example | | | 1,000.00 | | | | 1,015.80 | | | | 9.30 | | | | 1.84% | |
Class C | | Actual expenses/actual returns | | | 1,000.00 | | | | 1,171.10 | | | | 10.01 | | | | 1.84% | |
| | | Hypothetical example | | | 1,000.00 | | | | 1,015.80 | | | | 9.30 | | | | 1.84% | |
Class I | | Actual expenses/actual returns | | | 1,000.00 | | | | 1,176.70 | | | | 4.58 | | | | 0.84% | |
| | | Hypothetical example | | | 1,000.00 | | | | 1,020.90 | | | | 4.26 | | | | 0.84% | |
Class R2 | | Actual expenses/actual returns | | | 1,000.00 | | | | 1,175.30 | | | | 6.71 | | | | 1.23% | |
| | | Hypothetical example | | | 1,000.00 | | | | 1,018.90 | | | | 6.23 | | | | 1.23% | |
Class R6 | | Actual expenses/actual returns | | | 1,000.00 | | | | 1,176.30 | | | | 4.04 | | | | 0.74% | |
| | | Hypothetical example | | | 1,000.00 | | | | 1,021.40 | | | | 3.75 | | | | 0.74% | |
Class NAV | | Actual expenses/actual returns | | | 1,000.00 | | | | 1,177.50 | | | | 4.04 | | | | 0.74% | |
| | | Hypothetical example | | | 1,000.00 | | | | 1,021.40 | | | | 3.75 | | | | 0.74% | |
| | 1 | Expenses are equal to the annualized expense ratio, multiplied by the average account value over the period, multiplied by 183/365 (to reflect the one-half year period). |
| | |
| 8 | | JOHN HANCOCK GLOBAL SHAREHOLDER YIELD FUND | SEMIANNUAL REPORT |
AS OF 9-30-20 (unaudited)
| | | | | | | | |
| | | Shares | | | | Value | |
Common stocks 97.2% | | | | | | | $1,556,149,228 | |
(Cost $1,320,929,334) | | | | | | | | |
| | |
Australia 0.5% | | | | | | | 8,548,202 | |
Macquarie Group, Ltd. | | | 98,613 | | | | 8,548,202 | |
| | |
Canada 6.0% | | | | | | | 96,661,624 | |
BCE, Inc. (A) | | | 479,477 | | | | 19,884,135 | |
Fortis, Inc. (A) | | | 299,352 | | | | 12,238,912 | |
Nutrien, Ltd. | | | 438,283 | | | | 17,193,842 | |
Restaurant Brands International, Inc. | | | 149,404 | | | | 8,592,224 | |
Rogers Communications, Inc., Class B | | | 213,745 | | | | 8,478,849 | |
Royal Bank of Canada | | | 205,565 | | | | 14,433,008 | |
TELUS Corp. (A) | | | 900,240 | | | | 15,840,654 | |
| | |
Denmark 0.6% | | | | | | | 9,650,304 | |
Novo Nordisk A/S, B Shares | | | 139,285 | | | | 9,650,304 | |
| | |
France 5.7% | | | | | | | 91,399,578 | |
AXA SA | | | 625,969 | | | | 11,585,485 | |
Cie Generale des Etablissements Michelin SCA | | | 125,956 | | | | 13,521,148 | |
Danone SA | | | 173,396 | | | | 11,231,799 | |
Orange SA | | | 832,440 | | | | 8,670,377 | |
Sanofi | | | 218,654 | | | | 21,911,845 | |
SCOR SE (B) | | | 316,256 | | | | 8,805,234 | |
TOTAL SE | | | 456,390 | | | | 15,673,690 | |
| | |
Germany 6.7% | | | | | | | 106,581,823 | |
Allianz SE | | | 115,597 | | | | 22,186,638 | |
BASF SE | | | 260,093 | | | | 15,838,732 | |
Bayer AG | | | 145,329 | | | | 8,965,940 | |
Deutsche Post AG | | | 411,132 | | | | 18,655,455 | |
Deutsche Telekom AG | | | 547,451 | | | | 9,115,136 | |
Muenchener Rueckversicherungs-Gesellschaft AG | | | 74,156 | | | | 18,851,854 | |
Siemens AG | | | 101,399 | | | | 12,805,662 | |
Siemens Energy AG (B) | | | 6,023 | | | | 162,406 | |
| | |
Italy 3.2% | | | | | | | 50,597,633 | |
Assicurazioni Generali SpA | | | 781,377 | | | | 11,013,119 | |
Snam SpA | | | 4,692,593 | | | | 24,133,082 | |
Terna Rete Elettrica Nazionale SpA | | | 2,208,343 | | | | 15,451,432 | |
| | |
Japan 2.3% | | | | | | | 36,662,712 | |
Takeda Pharmaceutical Company, Ltd. | | | 714,800 | | | | 25,549,051 | |
Tokio Marine Holdings, Inc. | | | 254,000 | | | | 11,113,661 | |
| | | | |
| SEE NOTES TO FINANCIAL STATEMENTS | | SEMIANNUAL REPORT | JOHN HANCOCK GLOBAL SHAREHOLDER YIELD FUND | | 9 |
| | | | | | | | |
| | | Shares | | | | Value | |
| | |
Norway 0.7% | | | | | | | $10,700,438 | |
Orkla ASA | | | 1,060,239 | | | | 10,700,438 | |
| | |
Singapore 0.6% | | | | | | | 10,145,329 | |
Singapore Exchange, Ltd. | | | 1,504,200 | | | | 10,145,329 | |
| | |
South Korea 1.7% | | | | | | | 27,964,152 | |
Hyundai Glovis Company, Ltd. | | | 67,957 | | | | 8,355,709 | |
Samsung Electronics Company, Ltd., GDR (C) | | | 15,465 | | | | 19,608,443 | |
| | |
Sweden 0.7% | | | | | | | 10,503,067 | |
Atlas Copco AB, A Shares | | | 220,288 | | | | 10,503,067 | |
| | |
Switzerland 2.9% | | | | | | | 46,123,958 | |
Nestle SA | | | 130,864 | | | | 15,574,392 | |
Novartis AG | | | 166,852 | | | | 14,486,812 | |
Roche Holding AG | | | 46,893 | | | | 16,062,754 | |
| | |
Taiwan 1.7% | | | | | | | 27,141,750 | |
Taiwan Semiconductor Manufacturing Company, Ltd., ADR | | | 334,794 | | | | 27,141,750 | |
| | |
United Kingdom 7.2% | | | | | | | 114,806,376 | |
AstraZeneca PLC, ADR (A) | | | 221,378 | | | | 12,131,514 | |
BAE Systems PLC | | | 2,665,279 | | | | 16,552,828 | |
British American Tobacco PLC | | | 479,292 | | | | 17,192,914 | |
British American Tobacco PLC, ADR (A) | | | 160,855 | | | | 5,814,908 | |
Coca-Cola European Partners PLC | | | 220,289 | | | | 8,549,416 | |
GlaxoSmithKline PLC | | | 932,346 | | | | 17,479,242 | |
National Grid PLC | | | 1,124,346 | | | | 12,914,476 | |
Unilever PLC | | | 392,047 | | | | 24,171,078 | |
| | |
United States 56.7% | | | | | | | 908,662,282 | |
AbbVie, Inc. | | | 258,180 | | | | 22,613,986 | |
Altria Group, Inc. | | | 507,686 | | | | 19,616,987 | |
Ameren Corp. | | | 197,387 | | | | 15,609,364 | |
American Electric Power Company, Inc. | | | 170,670 | | | | 13,948,859 | |
American Tower Corp. | | | 41,440 | | | | 10,017,291 | |
Amgen, Inc. | | | 59,979 | | | | 15,244,263 | |
Analog Devices, Inc. | | | 137,407 | | | | 16,040,893 | |
Apple, Inc. | | | 170,124 | | | | 19,702,060 | |
AT&T, Inc. | | | 774,828 | | | | 22,090,346 | |
BlackRock, Inc. | | | 19,630 | | | | 11,062,487 | |
Broadcom, Inc. | | | 35,988 | | | | 13,111,148 | |
Chevron Corp. | | | 111,779 | | | | 8,048,088 | |
Cisco Systems, Inc. | | | 442,758 | | | | 17,440,238 | |
CME Group, Inc. | | | 41,440 | | | | 6,933,326 | |
Comcast Corp., Class A | | | 225,195 | | | | 10,417,521 | |
Dominion Energy, Inc. | | | 248,096 | | | | 19,582,217 | |
| | | | |
| 10 | | JOHN HANCOCK GLOBAL SHAREHOLDER YIELD FUND | SEMIANNUAL REPORT | | SEE NOTES TO FINANCIAL STATEMENTS |
| | | | | | | | |
| | | Shares | | | | Value | |
| | |
United States (continued) | | | | | | | | |
Dow, Inc. | | | 201,205 | | | | $9,466,695 | |
Duke Energy Corp. | | | 171,215 | | | | 15,162,800 | |
Eaton Corp. PLC | | | 206,656 | | | | 21,085,112 | |
Emerson Electric Company | | | 169,033 | | | | 11,083,494 | |
Entergy Corp. | | | 165,761 | | | | 16,332,431 | |
Enterprise Products Partners LP | | | 705,579 | | | | 11,141,092 | |
Evergy, Inc. | | | 162,491 | | | | 8,257,793 | |
Exxon Mobil Corp. | | | 209,382 | | | | 7,188,084 | |
FirstEnergy Corp. | | | 346,791 | | | | 9,956,370 | |
Hanesbrands, Inc. | | | 632,513 | | | | 9,962,080 | |
Hasbro, Inc. (A) | | | 121,595 | | | | 10,058,338 | |
IBM Corp. | | | 170,124 | | | | 20,698,987 | |
Intel Corp. | | | 226,831 | | | | 11,745,309 | |
Iron Mountain, Inc. | | | 682,677 | | | | 18,288,917 | |
Johnson & Johnson | | | 127,047 | | | | 18,914,757 | |
JPMorgan Chase & Co. | | | 107,418 | | | | 10,341,131 | |
Kimberly-Clark Corp. | | | 134,681 | | | | 19,886,996 | |
KLA Corp. | | | 136,863 | | | | 26,515,838 | |
Las Vegas Sands Corp. | | | 202,296 | | | | 9,439,131 | |
Lazard, Ltd., Class A | | | 289,537 | | | | 9,569,198 | |
Leggett & Platt, Inc. (A) | | | 216,472 | | | | 8,912,152 | |
Lockheed Martin Corp. | | | 33,807 | | | | 12,957,547 | |
LyondellBasell Industries NV, Class A | | | 148,858 | | | | 10,493,000 | |
Magellan Midstream Partners LP | | | 263,909 | | | | 9,025,688 | |
Maxim Integrated Products, Inc. | | | 64,342 | | | | 4,350,163 | |
McDonald’s Corp. | | | 39,259 | | | | 8,616,958 | |
Merck & Company, Inc. | | | 261,183 | | | | 21,665,130 | |
MetLife, Inc. | | | 357,151 | | | | 13,275,303 | |
Microsoft Corp. | | | 166,852 | | | | 35,093,983 | |
PepsiCo, Inc. | | | 100,329 | | | | 13,905,599 | |
Pfizer, Inc. | | | 547,995 | | | | 20,111,417 | |
Philip Morris International, Inc. | | | 291,869 | | | | 21,887,256 | |
Phillips 66 | | | 147,222 | | | | 7,631,988 | |
T. Rowe Price Group, Inc. | | | 64,887 | | | | 8,319,811 | |
Target Corp. | | | 86,697 | | | | 13,647,842 | |
Texas Instruments, Inc. | | | 147,222 | | | | 21,021,829 | |
The Coca-Cola Company | | | 259,550 | | | | 12,813,984 | |
The Home Depot, Inc. | | | 35,988 | | | | 9,994,227 | |
The PNC Financial Services Group, Inc. | | | 61,070 | | | | 6,712,204 | |
The Procter & Gamble Company | | | 92,150 | | | | 12,807,929 | |
Truist Financial Corp. | | | 270,453 | | | | 10,290,737 | |
United Parcel Service, Inc., Class B | | | 71,430 | | | | 11,902,381 | |
UnitedHealth Group, Inc. | | | 36,533 | | | | 11,389,893 | |
Vail Resorts, Inc. (A) | | | 47,438 | | | | 10,150,309 | |
| | | | |
| SEE NOTES TO FINANCIAL STATEMENTS | | SEMIANNUAL REPORT | JOHN HANCOCK GLOBAL SHAREHOLDER YIELD FUND | | 11 |
| | | | | | | | | | | | |
| | | | | | | Shares | | | | Value | |
| | | |
United States (continued) | | | | | | | | | | | | |
Verizon Communications, Inc. | | | | | | | 512,552 | | | | $30,491,718 | |
Watsco, Inc. | | | | | | | 62,706 | | | | 14,603,600 | |
WEC Energy Group, Inc. | | | | | | | 182,664 | | | | 17,700,142 | |
Welltower, Inc. | | | | | | | 223,559 | | | | 12,315,865 | |
| | | |
| | | Yield (%) | | | | Shares | | | | Value | |
Short-term investments 1.5% | | | | | | | | | | | $23,849,367 | |
(Cost $23,826,454) | | | | | | | | | | | | |
| | | |
Short-term funds 1.5% | | | | | | | | | | | 23,849,367 | |
John Hancock Collateral Trust (D) | | | 0.2185(E) | | | | 2,382,578 | | | | 23,849,367 | |
| | | | | | | | | | | | |
Total investments (Cost $1,344,755,788) 98.7% | | | | | | | | | | | $1,579,998,595 | |
| | | | | | | | | | | | |
Other assets and liabilities, net 1.3% | | | | | | | | | | | 21,039,682 | |
| | | | | | | | | | | | |
Total net assets 100.0% | | | | | | | | | | | $1,601,038,277 | |
The percentage shown for each investment category is the total value of the category as a percentage of the net assets of the fund.
Security Abbreviations and Legend
| ADR | American Depositary Receipt |
| GDR | Global Depositary Receipt |
| (A) | All or a portion of this security is on loan as of 9-30-20. |
| (B) | Non-income producing security. |
| (C) | These securities are exempt from registration under Rule 144A of the Securities Act of 1933. Such securities may be resold, normally to qualified institutional buyers, in transactions exempt from registration. |
| (D) | Investment is an affiliate of the fund, the advisor and/or subadvisor. This security represents the investment of cash collateral received for securities lending. |
| (E) | The rate shown is the annualized seven-day yield as of 9-30-20. |
At 9-30-20, the aggregate cost of investments for federal income tax purposes was $1,349,234,386. Net unrealized appreciation aggregated to $230,764,209, of which $326,833,285 related to gross unrealized appreciation and $96,069,076 related to gross unrealized depreciation.
| | | | |
| 12 | | JOHN HANCOCK GLOBAL SHAREHOLDER YIELD FUND | SEMIANNUAL REPORT | | SEE NOTES TO FINANCIAL STATEMENTS |
STATEMENT OF ASSETS AND LIABILITIES 9-30-20 (unaudited)
| | | | |
Assets | | | | |
Unaffiliated investments, at value (Cost $1,320,929,334) including $22,239,046 of securities loaned | | $ | 1,556,149,228 | |
Affiliated investments, at value (Cost $23,826,454) | | | 23,849,367 | |
Total investments, at value (Cost $1,344,755,788) | | | 1,579,998,595 | |
Cash | | | 8,633,715 | |
Foreign currency, at value (Cost $123,171) | | | 123,564 | |
Dividends and interest receivable | | | 6,995,829 | |
Receivable for fund shares sold | | | 1,518,098 | |
Receivable for investments sold | | | 30,263,627 | |
Receivable for securities lending income | | | 14,155 | |
Receivable from affiliates | | | 6,325 | |
Other assets | | | 95,371 | |
Total assets | | | 1,627,649,279 | |
Liabilities | | | | |
Payable for investments purchased | | | 1,927 | |
Payable for fund shares repurchased | | | 2,239,188 | |
Payable upon return of securities loaned | | | 23,961,247 | |
Payable to affiliates | | | | |
Accounting and legal services fees | | | 96,556 | |
Transfer agent fees | | | 95,965 | |
Distribution and service fees | | | 100 | |
Trustees’ fees | | | 1,584 | |
Other liabilities and accrued expenses | | | 214,435 | |
Total liabilities | | | 26,611,002 | |
Net assets | | $ | 1,601,038,277 | |
Net assets consist of | | | | |
Paid-in capital | | $ | 1,491,653,951 | |
Total distributable earnings (loss) | | | 109,384,326 | |
Net assets | | $ | 1,601,038,277 | |
| | |
| SEMIANNUAL REPORT | JOHN HANCOCK GLOBAL SHAREHOLDER YIELD FUND | | 13 |
STATEMENT OF ASSETS AND LIABILITIES (continued)
| | | | |
| |
Net asset value per share | | | | |
Based on net asset value and shares outstanding - the fund has an unlimited number of shares authorized with no par value | | | | |
Class A ($281,754,034 ÷ 28,223,172 shares)1 | | | $9.98 | |
Class B ($457,785 ÷ 45,748 shares)1 | | | $10.01 | |
Class C ($38,340,417 ÷ 3,831,830 shares)1 | | | $10.01 | |
Class I ($645,617,777 ÷ 64,426,884 shares) | | | $10.02 | |
Class R2 ($532,327 ÷ 53,046 shares) | | | $10.04 | |
Class R6 ($258,913,872 ÷ 25,881,685 shares) | | | $10.00 | |
Class NAV ($375,422,065 ÷ 37,496,629 shares) | | | $10.01 | |
| |
Maximum offering price per share | | | | |
Class A (net asset value per share ÷ 95%)2 | | | $10.51 | |
| 1 | Redemption price per share is equal to net asset value less any applicable contingent deferred sales charge. |
| 2 | On single retail sales of less than $50,000. On sales of $50,000 or more and on group sales the offering price is reduced. |
| | |
| 14 | | JOHN HANCOCK GLOBAL SHAREHOLDER YIELD FUND | SEMIANNUAL REPORT |
STATEMENT OF OPERATIONS For the six months ended 9-30-20 (unaudited)
| | |
Investment income | | |
Dividends | | $35,835,999 |
Securities lending | | 264,251 |
Interest | | 5,032 |
Less foreign taxes withheld | | (1,686,308) |
Total investment income | | 34,418,974 |
| | |
Expenses | | |
Investment management fees | | 6,417,716 |
Distribution and service fees | | 643,761 |
Accounting and legal services fees | | 146,733 |
Transfer agent fees | | 617,953 |
Trustees’ fees | | 15,147 |
Custodian fees | | 205,793 |
State registration fees | | 73,576 |
Printing and postage | | 66,369 |
Professional fees | | 32,364 |
Other | | 47,866 |
Total expenses | | 8,267,278 |
Less expense reductions | | (1,270,316) |
Net expenses | | 6,996,962 |
Net investment income | | 27,422,012 |
| | |
Realized and unrealized gain (loss) | | |
Net realized gain (loss) on | | |
Unaffiliated investments and foreign currency transactions | | (37,368,955) |
Affiliated investments | | 23,645 |
| | | (37,345,310) |
Change in net unrealized appreciation (depreciation) of | | |
Unaffiliated investments and translation of assets and liabilities in foreign currencies | | 266,122,511 |
Affiliated investments | | 30,808 |
| | | 266,153,319 |
Net realized and unrealized gain | | 228,808,009 |
Increase in net assets from operations | | $256,230,021 |
| | |
| SEMIANNUAL REPORT | JOHN HANCOCK GLOBAL SHAREHOLDER YIELD FUND | | 15 |
STATEMENTS OF CHANGES IN NET ASSETS
| | | | | | | | |
| | |
| | | Six months ended | | | |
| | | 9-30-20 | | Year ended | |
| | | (unaudited) | | 3-31-20 | |
| | |
Increase (decrease) in net assets | | | | | | | | |
From operations | | | | | | | | |
Net investment income | | | $27,422,012 | | | | $62,259,045 | |
Net realized loss | | | (37,345,310 | ) | | | (66,219,485 | ) |
Change in net unrealized appreciation (depreciation) | | | 266,153,319 | | | | (311,882,012 | ) |
Increase (decrease) in net assets resulting from operations | | | 256,230,021 | | | | (315,842,452 | ) |
Distributions to shareholders | | | | | | | | |
From earnings | | | | | | | | |
Class A | | | (3,999,109 | ) | | | (15,750,740 | ) |
Class B | | | (5,944 | ) | | | (84,788 | ) |
Class C | | | (437,316 | ) | | | (2,561,797 | ) |
Class I | | | (9,867,599 | ) | | | (39,251,704 | ) |
Class R2 | | | (7,535 | ) | | | (33,638 | ) |
Class R6 | | | (4,188,517 | ) | | | (16,610,095 | ) |
Class NAV | | | (5,831,149 | ) | | | (22,256,224 | ) |
Total distributions | | | (24,337,169 | ) | | | (96,548,986 | ) |
From fund share transactions | | | (108,405,598 | ) | | | (147,804,453 | ) |
Total increase (decrease) | | | 123,487,254 | | | | (560,195,891 | ) |
| | | | | | | | |
| | |
Net assets | | | | | | | | |
Beginning of period | | | 1,477,551,023 | | | | 2,037,746,914 | |
End of period | | | $1,601,038,277 | | | | $1,477,551,023 | |
| | |
| 16 | | JOHN HANCOCK GLOBAL SHAREHOLDER YIELD FUND | SEMIANNUAL REPORT |
| | | | | | | | | | | | | | | | | | | | | | | | | | | | |
| | | | | | | |
| CLASS A SHARES Period ended | | | 9-30-201 | | | | 3-31-20 | | | | 3-31-19 | | | | 3-31-182 | | | | 2-28-18 | | | | 2-28-17 | | | | 2-29-16 | |
Per share operating performance | | | | | | | | | | | | | | | | | | | | | | | | | | | | |
Net asset value, beginning of period | | | $8.62 | | | | $11.03 | | | | $11.14 | | | | $11.31 | | | | $10.78 | | | | $9.89 | | | | $11.78 | |
Net investment income3 | | | 0.16 | | | | 0.33 | | | | 0.35 | | | | 0.04 | | | | 0.32 | | | | 0.27 | | | | 0.33 | |
Net realized and unrealized gain (loss) on investments | | | 1.34 | | | | (2.21 | ) | | | 0.16 | | | | (0.16 | ) | | | 0.53 | | | | 0.92 | | | | (1.42 | ) |
Total from investment operations | | | 1.50 | | | | (1.88 | ) | | | 0.51 | | | | (0.12 | ) | | | 0.85 | | | | 1.19 | | | | (1.09 | ) |
Less distributions | | | | | | | | | | | | | | | | | | | | | | | | | | | | |
From net investment income | | | (0.14 | ) | | | (0.33 | ) | | | (0.35 | ) | | | (0.05 | ) | | | (0.32 | ) | | | (0.30 | ) | | | (0.32 | ) |
From net realized gain | | | — | | | | (0.20 | ) | | | (0.27 | ) | | | — | | | | — | | | | — | | | | (0.48 | ) |
Total distributions | | | (0.14 | ) | | | (0.53 | ) | | | (0.62 | ) | | | (0.05 | ) | | | (0.32 | ) | | | (0.30 | ) | | | (0.80 | ) |
Net asset value, end of period | | | $9.98 | | | | $8.62 | | | | $11.03 | | | | $11.14 | | | | $11.31 | | | | $10.78 | | | | $9.89 | |
Total return (%)4,5 | | | 17.47 | 6 | | | (17.96 | ) | | | 4.86 | | | | (1.03 | )6 | | | 7.87 | | | | 12.21 | | | | (9.38 | ) |
Ratios and supplemental data | | | | | | | | | | | | | | | | | | | | | | | | | | | | |
Net assets, end of period (in millions) | | | $282 | | | | $257 | | | | $334 | | | | $348 | | | | $355 | | | | $381 | | | | $470 | |
Ratios (as a percentage of average net assets): | | | | | | | | | | | | | | | | | | | | | | | | | | | | |
Expenses before reductions | | | 1.30 | 7 | | | 1.29 | | | | 1.28 | | | | 1.30 | 7 | | | 1.27 | | | | 1.29 | | | | 1.29 | |
Expenses including reductions | | | 1.09 | 7 | | | 1.09 | | | | 1.09 | | | | 1.09 | 7 | | | 1.09 | | | | 1.26 | | | | 1.28 | |
Net investment income | | | 3.20 | 7 | | | 2.96 | | | | 3.18 | | | | 3.78 | 7 | | | 2.85 | | | | 2.62 | | | | 3.03 | |
Portfolio turnover (%) | | | 15 | | | | 33 | | | | 16 | | | | 2 | | | | 19 | | | | 25 | | | | 33 | |
| 1 | Six months ended 9-30-20. Unaudited. |
| 2 | For the one-month period ended 3-31-18. The fund changed its fiscal year end from February 28 to March 31. |
| 3 | Based on average daily shares outstanding. |
| 4 | Total returns would have been lower had certain expenses not been reduced during the applicable periods. |
| 5 | Does not reflect the effect of sales charges, if any. |
| | | | |
| SEE NOTES TO FINANCIAL STATEMENTS | | SEMIANNUAL REPORT | JOHN HANCOCK GLOBAL SHAREHOLDER YIELD FUND | | 17 |
| | | | | | | | | | | | | | | | | | | | | | | | | | | | |
| | | | | | | |
| CLASS B SHARES Period ended | | | 9-30-201 | | | | 3-31-20 | | | | 3-31-19 | | | | 3-31-182 | | | | 2-28-18 | | | | 2-28-17 | | | | 2-29-16 | |
Per share operating performance | | | | | | | | | | | | | | | | | | | | | | | | | | | | |
Net asset value, beginning of period | | | $8.64 | | | | $11.05 | | | | $11.15 | | | | $11.30 | | | | $10.78 | | | | $9.89 | | | | $11.78 | |
Net investment income3 | | | 0.12 | | | | 0.27 | | | | 0.27 | | | | 0.03 | | | | 0.25 | | | | 0.20 | | | | 0.25 | |
Net realized and unrealized gain (loss) on investments | | | 1.35 | | | | (2.23 | ) | | | 0.17 | | | | (0.15 | ) | | | 0.50 | | | | 0.92 | | | | (1.42 | ) |
Total from investment operations | | | 1.47 | | | | (1.96 | ) | | | 0.44 | | | | (0.12 | ) | | | 0.75 | | | | 1.12 | | | | (1.17 | ) |
Less distributions | | | | | | | | | | | | | | | | | | | | | | | | | | | | |
From net investment income | | | (0.10 | ) | | | (0.25 | ) | | | (0.27 | ) | | | (0.03 | ) | | | (0.23 | ) | | | (0.23 | ) | | | (0.24 | ) |
From net realized gain | | | — | | | | (0.20 | ) | | | (0.27 | ) | | | — | | | | — | | | | — | | | | (0.48 | ) |
Total distributions | | | (0.10 | ) | | | (0.45 | ) | | | (0.54 | ) | | | (0.03 | ) | | | (0.23 | ) | | | (0.23 | ) | | | (0.72 | ) |
Net asset value, end of period | | | $10.01 | | | | $8.64 | | | | $11.05 | | | | $11.15 | | | | $11.30 | | | | $10.78 | | | | $9.89 | |
Total return (%)4,5 | | | 17.11 | 6 | | | (18.59 | ) | | | 4.16 | | | | (1.05 | )6 | | | 6.98 | | | | 11.42 | | | | (10.10 | ) |
Ratios and supplemental data | | | | | | | | | | | | | | | | | | | | | | | | | | | | |
Net assets, end of period (in millions) | | | $— | 7 | | | $1 | | | | $4 | | | | $7 | | | | $7 | | | | $11 | | | | $12 | |
Ratios (as a percentage of average net assets): | | | | | | | | | | | | | | | | | | | | | | | | | | | | |
Expenses before reductions | | | 2.00 | 8 | | | 1.99 | | | | 1.97 | | | | 2.00 | 8 | | | 1.97 | | | | 1.99 | | | | 2.02 | |
Expenses including reductions | | | 1.84 | 8 | | | 1.84 | | | | 1.84 | | | | 1.84 | 8 | | | 1.84 | | | | 1.97 | | | | 2.02 | |
Net investment income | | | 2.45 | 8 | | | 2.41 | | | | 2.49 | | | | 3.03 | 8 | | | 2.19 | | | | 1.94 | | | | 2.31 | |
Portfolio turnover (%) | | | 15 | | | | 33 | | | | 16 | | | | 2 | | | | 19 | | | | 25 | | | | 33 | |
| 1 | Six months ended 9-30-20. Unaudited. |
| 2 | For the one-month period ended 3-31-18. The fund changed its fiscal year end from February 28 to March 31. |
| 3 | Based on average daily shares outstanding. |
| 4 | Total returns would have been lower had certain expenses not been reduced during the applicable periods. |
| 5 | Does not reflect the effect of sales charges, if any. |
| | | | |
| 18 | | JOHN HANCOCK GLOBAL SHAREHOLDER YIELD FUND | SEMIANNUAL REPORT | | SEE NOTES TO FINANCIAL STATEMENTS |
| | | | | | | | | | | | | | | | | | | | | | | | | | | | |
| | | | | | | |
CLASS C SHARES Period ended | | | 9-30-201 | | | | 3-31-20 | | | | 3-31-19 | | | | 3-31-182 | | | | 2-28-18 | | | | 2-28-17 | | | | 2-29-16 | |
Per share operating performance | | | | | | | | | | | | | | | | | | | | | | | | | | | | |
Net asset value, beginning of period | | | $8.64 | | | | $11.05 | | | | $11.16 | | | | $11.31 | | | | $10.78 | | | | $9.90 | | | | $11.79 | |
Net investment income3 | | | 0.12 | | | | 0.25 | | | | 0.27 | | | | 0.03 | | | | 0.24 | | | | 0.20 | | | | 0.25 | |
Net realized and unrealized gain (loss) on investments | | | 1.35 | | | | (2.21 | ) | | | 0.16 | | | | (0.15 | ) | | | 0.52 | | | | 0.91 | | | | (1.41 | ) |
Total from investment operations | | | 1.47 | | | | (1.96 | ) | | | 0.43 | | | | (0.12 | ) | | | 0.76 | | | | 1.11 | | | | (1.16 | ) |
Less distributions | | | | | | | | | | | | | | | | | | | | | | | | | | | | |
From net investment income | | | (0.10 | ) | | | (0.25 | ) | | | (0.27 | ) | | | (0.03 | ) | | | (0.23 | ) | | | (0.23 | ) | | | (0.25 | ) |
From net realized gain | | | — | | | | (0.20 | ) | | | (0.27 | ) | | | — | | | | — | | | | — | | | | (0.48 | ) |
Total distributions | | | (0.10 | ) | | | (0.45 | ) | | | (0.54 | ) | | | (0.03 | ) | | | (0.23 | ) | | | (0.23 | ) | | | (0.73 | ) |
Net asset value, end of period | | | $10.01 | | | | $8.64 | | | | $11.05 | | | | $11.16 | | | | $11.31 | | | | $10.78 | | | | $9.90 | |
Total return (%)4,5 | | | 17.11 | 6 | | | (18.59 | ) | | | 4.06 | | | | (1.05 | )6 | | | 6.98 | | | | 11.41 | | | | (10.02 | ) |
Ratios and supplemental data | | | | | | | | | | | | | | | | | | | | | | | | | | | | |
Net assets, end of period (in millions) | | | $38 | | | | $44 | | | | $75 | | | | $107 | | | | $110 | | | | $126 | | | | $133 | |
Ratios (as a percentage of average net assets): | | | | | | | | | | | | | | | | | | | | | | | | | | | | |
Expenses before reductions | | | 2.00 | 7 | | | 1.99 | | | | 1.97 | | | | 2.00 | 7 | | | 1.97 | | | | 1.99 | | | | 1.99 | |
Expenses including reductions | | | 1.84 | 7 | | | 1.84 | | | | 1.84 | | | | 1.84 | 7 | | | 1.84 | | | | 1.97 | | | | 1.98 | |
Net investment income | | | 2.45 | 7 | | | 2.27 | | | | 2.49 | | | | 3.03 | 7 | | | 2.11 | | | | 1.92 | | | | 2.33 | |
Portfolio turnover (%) | | | 15 | | | | 33 | | | | 16 | | | | 2 | | | | 19 | | | | 25 | | | | 33 | |
| 1 | Six months ended 9-30-20. Unaudited. |
| 2 | For the one-month period ended 3-31-18. The fund changed its fiscal year end from February 28 to March 31. |
| 3 | Based on average daily shares outstanding. |
| 4 | Total returns would have been lower had certain expenses not been reduced during the applicable periods. |
| 5 | Does not reflect the effect of sales charges, if any. |
| | | | |
| SEE NOTES TO FINANCIAL STATEMENTS | | SEMIANNUAL REPORT | JOHN HANCOCK GLOBAL SHAREHOLDER YIELD FUND | | 19 |
| | | | | | | | | | | | | | | | | | | | | | | | | | | | |
| | | | | | | |
CLASS I SHARES Period ended | | | 9-30-201 | | | | 3-31-20 | | | | 3-31-19 | | | | 3-31-182 | | | | 2-28-18 | | | | 2-28-17 | | | | 2-29-16 | |
Per share operating performance | | | | | | | | | | | | | | | | | | | | | | | | | | | | |
Net asset value, beginning of period | | | $8.65 | | | | $11.07 | | | | $11.18 | | | | $11.35 | | | | $10.82 | | | | $9.93 | | | | $11.83 | |
Net investment income3 | | | 0.17 | | | | 0.36 | | | | 0.38 | | | | 0.04 | | | | 0.36 | | | | 0.31 | | | | 0.37 | |
Net realized and unrealized gain (loss) on investments | | | 1.35 | | | | (2.22 | ) | | | 0.16 | | | | (0.15 | ) | | | 0.51 | | | | 0.91 | | | | (1.43 | ) |
Total from investment operations | | | 1.52 | | | | (1.86 | ) | | | 0.54 | | | | (0.11 | ) | | | 0.87 | | | | 1.22 | | | | (1.06 | ) |
Less distributions | | | | | | | | | | | | | | | | | | | | | | | | | | | | |
From net investment income | | | (0.15 | ) | | | (0.36 | ) | | | (0.38 | ) | | | (0.06 | ) | | | (0.34 | ) | | | (0.33 | ) | | | (0.36 | ) |
From net realized gain | | | — | | | | (0.20 | ) | | | (0.27 | ) | | | — | | | | — | | | | — | | | | (0.48 | ) |
Total distributions | | | (0.15 | ) | | | (0.56 | ) | | | (0.65 | ) | | | (0.06 | ) | | | (0.34 | ) | | | (0.33 | ) | | | (0.84 | ) |
Net asset value, end of period | | | $10.02 | | | | $8.65 | | | | $11.07 | | | | $11.18 | | | | $11.35 | | | | $10.82 | | | | $9.93 | |
Total return (%)4 | | | 17.67 | 5 | | | (17.77 | ) | | | 5.10 | | | | (0.96 | )5 | | | 8.10 | | | | 12.51 | | | | (9.13 | ) |
Ratios and supplemental data | | | | | | | | | | | | | | | | | | | | | | | | | | | | |
Net assets, end of period (in millions) | | | $646 | | | | $605 | | | | $815 | | | | $881 | | | | $894 | | | | $1,245 | | | | $957 | |
Ratios (as a percentage of average net assets): | | | | | | | | | | | | | | | | | | | | | | | | | | | | |
Expenses before reductions | | | 1.00 | 6 | | | 0.99 | | | | 0.99 | | | | 1.00 | 6 | | | 0.97 | | | | 0.97 | | | | 0.97 | |
Expenses including reductions | | | 0.84 | 6 | | | 0.84 | | | | 0.84 | | | | 0.84 | 6 | | | 0.84 | | | | 0.95 | | | | 0.97 | |
Net investment income | | | 3.45 | 6 | | | 3.22 | | | | 3.44 | | | | 4.03 | 6 | | | 3.12 | | | | 2.91 | | | | 3.37 | |
Portfolio turnover (%) | | | 15 | | | | 33 | | | | 16 | | | | 2 | | | | 19 | | | | 25 | | | | 33 | |
| 1 | Six months ended 9-30-20. Unaudited. |
| 2 | For the one-month period ended 3-31-18. The fund changed its fiscal year end from February 28 to March 31. |
| 3 | Based on average daily shares outstanding. |
| 4 | Total returns would have been lower had certain expenses not been reduced during the applicable periods. |
| | | | |
| 20 | | JOHN HANCOCK GLOBAL SHAREHOLDER YIELD FUND | SEMIANNUAL REPORT | | SEE NOTES TO FINANCIAL STATEMENTS |
| | | | | | | | | | | | | | | | | | | | | | | | | | | | |
| | | | | | | |
| CLASS R2 SHARES Period ended | | 9-30-201 | | | 3-31-20 | | | 3-31-19 | | | 3-31-182 | | | 2-28-18 | | | 2-28-17 | | | 2-29-16 | |
Per share operating performance | | | | | | | | | | | | | | | | | | | | | | | | | | | | |
Net asset value, beginning of period | | | $8.66 | | | | $11.08 | | | | $11.19 | | | | $11.35 | | | | $10.82 | | | | $9.93 | | | | $11.82 | |
Net investment income3 | | | 0.15 | | | | 0.32 | | | | 0.33 | | | | 0.03 | | | | 0.30 | | | | 0.26 | | | | 0.32 | |
Net realized and unrealized gain (loss) on investments | | | 1.36 | | | | (2.22 | ) | | | 0.16 | | | | (0.14 | ) | | | 0.53 | | | | 0.92 | | | | (1.43 | ) |
Total from investment operations | | | 1.51 | | | | (1.90 | ) | | | 0.49 | | | | (0.11 | ) | | | 0.83 | | | | 1.18 | | | | (1.11 | ) |
Less distributions | | | | | | | | | | | | | | | | | | | | | | | | | | | | |
From net investment income | | | (0.13 | ) | | | (0.32 | ) | | | (0.33 | ) | | | (0.05 | ) | | | (0.30 | ) | | | (0.29 | ) | | | (0.30 | ) |
From net realized gain | | | — | | | | (0.20 | ) | | | (0.27 | ) | | | — | | | | — | | | | — | | | | (0.48 | ) |
Total distributions | | | (0.13 | ) | | | (0.52 | ) | | | (0.60 | ) | | | (0.05 | ) | | | (0.30 | ) | | | (0.29 | ) | | | (0.78 | ) |
Net asset value, end of period | | | $10.04 | | | | $8.66 | | | | $11.08 | | | | $11.19 | | | | $11.35 | | | | $10.82 | | | | $9.93 | |
Total return (%)4 | | | 17.53 | 5 | | | (18.10 | ) | | | 4.68 | | | | (0.98 | )5 | | | 7.68 | | | | 12.04 | | | | (9.51 | ) |
Ratios and supplemental data | | | | | | | | | | | | | | | | | | | | | | | | | | | | |
Net assets, end of period (in millions) | | | $1 | | | | $1 | | | | $1 | | | | $1 | | | | $1 | | | | $1 | | | | $1 | |
Ratios (as a percentage of average net assets): | | | | | | | | | | | | | | | | | | | | | | | | | | | | |
Expenses before reductions | | | 1.36 | 6 | | | 1.34 | | | | 1.36 | | | | 1.38 | 6 | | | 1.37 | | | | 1.36 | | | | 1.86 | |
Expenses including reductions | | | 1.23 | 6 | | | 1.22 | | | | 1.22 | | | | 1.24 | 6 | | | 1.24 | | | | 1.34 | | | | 1.43 | |
Net investment income | | | 3.06 | 6 | | | 2.86 | | | | 3.02 | | | | 3.62 | 6 | | | 2.62 | | | | 2.50 | | | | 2.92 | |
Portfolio turnover (%) | | | 15 | | | | 33 | | | | 16 | | | | 2 | | | | 19 | | | | 25 | | | | 33 | |
| 1 | Six months ended 9-30-20. Unaudited. |
| 2 | For the one-month period ended 3-31-18. The fund changed its fiscal year end from February 28 to March 31. |
| 3 | Based on average daily shares outstanding. |
| 4 | Total returns would have been lower had certain expenses not been reduced during the applicable periods. |
| | | | |
| SEE NOTES TO FINANCIAL STATEMENTS | | SEMIANNUAL REPORT | JOHN HANCOCK GLOBAL SHAREHOLDER YIELD FUND | | 21 |
| | | | | | | | | | | | | | | | | | | | | | | | | | | | |
| | | | | | | |
| CLASS R6 SHARES Period ended | | 9-30-201 | | | 3-31-20 | | | 3-31-19 | | | 3-31-182 | | | 2-28-18 | | | 2-28-17 | | | 2-29-16 | |
Per share operating performance | | | | | | | | | | | | | | | | | | | | | | | | | | | | |
Net asset value, beginning of period | | | $8.64 | | | | $11.06 | | | | $11.16 | | | | $11.34 | | | | $10.81 | | | | $9.92 | | | | $11.81 | |
Net investment income3 | | | 0.17 | | | | 0.37 | | | | 0.39 | | | | 0.04 | | | | 0.31 | | | | 0.30 | | | | 0.38 | |
Net realized and unrealized gain (loss) on investments | | | 1.35 | | | | (2.22 | ) | | | 0.17 | | | | (0.16 | ) | | | 0.57 | | | | 0.93 | | | | (1.42 | ) |
Total from investment operations | | | 1.52 | | | | (1.85 | ) | | | 0.56 | | | | (0.12 | ) | | | 0.88 | | | | 1.23 | | | | (1.04 | ) |
Less distributions | | | | | | | | | | | | | | | | | | | | | | | | | | | | |
From net investment income | | | (0.16 | ) | | | (0.37 | ) | | | (0.39 | ) | | | (0.06 | ) | | | (0.35 | ) | | | (0.34 | ) | | | (0.37 | ) |
From net realized gain | | | — | | | | (0.20 | ) | | | (0.27 | ) | | | — | | | | — | | | | — | | | | (0.48 | ) |
Total distributions | | | (0.16 | ) | | | (0.57 | ) | | | (0.66 | ) | | | (0.06 | ) | | | (0.35 | ) | | | (0.34 | ) | | | (0.85 | ) |
Net asset value, end of period | | | $10.00 | | | | $8.64 | | | | $11.06 | | | | $11.16 | | | | $11.34 | | | | $10.81 | | | | $9.92 | |
Total return (%)4 | | | 17.63 | 5 | | | (17.69 | ) | | | 5.31 | | | | (1.03 | )5 | | | 8.22 | | | | 12.66 | | | | (8.94 | ) |
Ratios and supplemental data | | | | | | | | | | | | | | | | | | | | | | | | | | | | |
Net assets, end of period (in millions) | | | $259 | | | | $245 | | | | $351 | | | | $477 | | | | $483 | | | | $2 | | | | $1 | |
Ratios (as a percentage of average net assets): | | | | | | | | | | | | | | | | | | | | | | | | | | | | |
Expenses before reductions | | | 0.89 | 6 | | | 0.88 | | | | 0.88 | | | | 0.89 | 6 | | | 0.87 | | | | 0.87 | | | | 1.45 | |
Expenses including reductions | | | 0.74 | 6 | | | 0.74 | | | | 0.74 | | | | 0.74 | 6 | | | 0.74 | | | | 0.85 | | | | 0.85 | |
Net investment income | | | 3.55 | 6 | | | 3.34 | | | | 3.57 | | | | 4.13 | 6 | | | 2.61 | | | | 2.85 | | | | 3.48 | |
Portfolio turnover (%) | | | 15 | | | | 33 | | | | 16 | | | | 2 | | | | 19 | | | | 25 | | | | 33 | |
| 1 | Six months ended 9-30-20. Unaudited. |
| 2 | For the one-month period ended 3-31-18. The fund changed its fiscal year end from February 28 to March 31. |
| 3 | Based on average daily shares outstanding. |
| 4 | Total returns would have been lower had certain expenses not been reduced during the applicable periods. |
| | | | |
| 22 | | JOHN HANCOCK GLOBAL SHAREHOLDER YIELD FUND | SEMIANNUAL REPORT | | SEE NOTES TO FINANCIAL STATEMENTS |
| | | | | | | | | | | | | | | | | | | | | | | | | | | | |
| | | | | | | |
| CLASS NAV SHARES Period ended | | 9-30-201 | | | 3-31-20 | | | 3-31-19 | | | 3-31-182 | | | 2-28-18 | | | 2-28-17 | | | 2-29-16 | |
Per share operating performance | | | | | | | | | | | | | | | | | | | | | | | | | | | | |
Net asset value, beginning of period | | | $8.64 | | | | $11.06 | | | | $11.17 | | | | $11.34 | | | | $10.81 | | | | $9.92 | | | | $11.82 | |
Net investment income3 | | | 0.17 | | | | 0.37 | | | | 0.39 | | | | 0.04 | | | | 0.36 | | | | 0.32 | | | | 0.37 | |
Net realized and unrealized gain (loss) on investments | | | 1.36 | | | | (2.22 | ) | | | 0.16 | | | | (0.15 | ) | | | 0.52 | | | | 0.91 | | | | (1.42 | ) |
Total from investment operations | | | 1.53 | | | | (1.85 | ) | | | 0.55 | | | | (0.11 | ) | | | 0.88 | | | | 1.23 | | | | (1.05 | ) |
Less distributions | | | | | | | | | | | | | | | | | | | | | | | | | | | | |
From net investment income | | | (0.16 | ) | | | (0.37 | ) | | | (0.39 | ) | | | (0.06 | ) | | | (0.35 | ) | | | (0.34 | ) | | | (0.37 | ) |
From net realized gain | | | — | | | | (0.20 | ) | | | (0.27 | ) | | | — | | | | — | | | | — | | | | (0.48 | ) |
Total distributions | | | (0.16 | ) | | | (0.57 | ) | | | (0.66 | ) | | | (0.06 | ) | | | (0.35 | ) | | | (0.34 | ) | | | (0.85 | ) |
Net asset value, end of period | | | $10.01 | | | | $8.64 | | | | $11.06 | | | | $11.17 | | | | $11.34 | | | | $10.81 | | | | $9.92 | |
Total return (%)4 | | | 17.75 | 5 | | | (17.77 | ) | | | 5.30 | | | | (0.94 | )5 | | | 8.11 | | | | 12.76 | | | | (9.03 | ) |
Ratios and supplemental data | | | | | | | | | | | | | | | | | | | | | | | | | | | | |
Net assets, end of period (in millions) | | | $375 | | | | $325 | | | | $458 | | | | $511 | | | | $514 | | | | $535 | | | | $554 | |
Ratios (as a percentage of average net assets): | | | | | | | | | | | | | | | | | | | | | | | | | | | | |
Expenses before reductions | | | 0.87 | 6 | | | 0.87 | | | | 0.87 | | | | 0.88 | 6 | | | 0.86 | | | | 0.86 | | | | 0.86 | |
Expenses including reductions | | | 0.74 | 6 | | | 0.74 | | | | 0.74 | | | | 0.74 | 6 | | | 0.74 | | | | 0.85 | | | | 0.85 | |
Net investment income | | | 3.55 | 6 | | | 3.32 | | | | 3.54 | | | | 4.13 | 6 | | | 3.19 | | | | 3.03 | | | | 3.45 | |
Portfolio turnover (%) | | | 15 | | | | 33 | | | | 16 | | | | 2 | | | | 19 | | | | 25 | | | | 33 | |
| 1 | Six months ended 9-30-20. Unaudited. |
| 2 | For the one-month period ended 3-31-18. The fund changed its fiscal year end from February 28 to March 31. |
| 3 | Based on average daily shares outstanding. |
| 4 | Total returns would have been lower had certain expenses not been reduced during the applicable periods. |
| | | | |
| SEE NOTES TO FINANCIAL STATEMENTS | | SEMIANNUAL REPORT | JOHN HANCOCK GLOBAL SHAREHOLDER YIELD FUND | | 23 |
|
Notes to financial statements (unaudited) |
Note 1 — Organization
John Hancock Global Shareholder Yield Fund (the fund) is a series of John Hancock Funds III (the Trust), an open-end management investment company organized as a Massachusetts business trust and registered under the Investment Company Act of 1940, as amended (the 1940 Act). The investment objective of the fund is to seek to provide a high level of income as its primary objective. Capital appreciation is a secondary investment objective.
The fund may offer multiple classes of shares. The shares currently outstanding are detailed in the Statement of assets and liabilities. Class A and Class C shares are offered to all investors. Class B shares are closed to new investors. Class I shares are offered to institutions and certain investors. Class R2 shares are available only to certain retirement and 529 plans. Class R6 shares are only available to certain retirement plans, institutions and other investors. Class NAV shares are offered to John Hancock affiliated funds of funds, retirement plans for employees of John Hancock and/or Manulife Financial Corporation, and certain 529 plans. Class B shares convert to Class A shares eight years after purchase. Class C shares convert to Class A shares ten years after purchase (certain exclusions may apply). Shareholders of each class have exclusive voting rights to matters that affect that class. The distribution and service fees, if any, and transfer agent fees for each class may differ.
Effective November 1, 2020, Class C shares convert to Class A shares after 8 years (certain exclusions apply).
Note 2 — Significant accounting policies
The financial statements have been prepared in conformity with accounting principles generally accepted in the United States of America (US GAAP), which require management to make certain estimates and assumptions as of the date of the financial statements. Actual results could differ from those estimates and those differences could be significant. The fund qualifies as an investment company under Topic 946 of Accounting Standards Codification of US GAAP.
Events or transactions occurring after the end of the fiscal period through the date that the financial statements were issued have been evaluated in the preparation of the financial statements. The following summarizes the significant accounting policies of the fund:
Security valuation. Investments are stated at value as of the scheduled close of regular trading on the New York Stock Exchange (NYSE), normally at 4:00 P.M., Eastern Time. In case of emergency or other disruption resulting in the NYSE not opening for trading or the NYSE closing at a time other than the regularly scheduled close, the net asset value (NAV) may be determined as of the regularly scheduled close of the NYSE pursuant to the fund’s Valuation Policies and Procedures.
In order to value the securities, the fund uses the following valuation techniques: Equity securities, including exchange-traded or closed-end funds, are typically valued at the last sale price or official closing price on the exchange or principal market where the security trades. In the event there were no sales during the day or closing prices are not available, the securities are valued using the last available bid price. Investments by the fund in open-end mutual funds, including John Hancock Collateral Trust (JHCT), are valued at their respective NAVs each business day. Foreign securities and currencies are valued in U.S. dollars based on foreign currency exchange rates supplied by an independent pricing vendor.
In certain instances, the Pricing Committee may determine to value equity securities using prices obtained from another exchange or market if trading on the exchange or market on which prices are typically obtained did not open for trading as scheduled, or if trading closed earlier than scheduled, and trading occurred as normal on another exchange or market.
Other portfolio securities and assets, for which reliable market quotations are not readily available, are valued at fair value as determined in good faith by the fund’s Pricing Committee following procedures established by the Board of Trustees. The frequency with which these fair valuation procedures are used cannot be predicted and fair value of securities may differ significantly from the value that would have been used had a ready market for such securities existed. Trading in foreign securities may be completed before the scheduled daily close of trading on the
| | |
| 24 | | JOHN HANCOCK GLOBAL SHAREHOLDER YIELD FUND | SEMIANNUAL REPORT |
NYSE. Significant events at the issuer or market level may affect the values of securities between the time when the valuation of the securities is generally determined and the close of the NYSE. If a significant event occurs, these securities may be fair valued, as determined in good faith by the fund’s Pricing Committee, following procedures established by the Board of Trustees. The fund uses fair value adjustment factors provided by an independent pricing vendor to value certain foreign securities in order to adjust for events that may occur between the close of foreign exchanges or markets and the close of the NYSE.
The fund uses a three-tier hierarchy to prioritize the pricing assumptions, referred to as inputs, used in valuation techniques to measure fair value. Level 1 includes securities valued using quoted prices in active markets for identical securities, including registered investment companies. Level 2 includes securities valued using other significant observable inputs. Observable inputs may include quoted prices for similar securities, interest rates, prepayment speeds and credit risk. Prices for securities valued using these inputs are received from independent pricing vendors and brokers and are based on an evaluation of the inputs described. Level 3 includes securities valued using significant unobservable inputs when market prices are not readily available or reliable, including the fund’s own assumptions in determining the fair value of investments. Factors used in determining value may include market or issuer specific events or trends, changes in interest rates and credit quality. The inputs or methodology used for valuing securities are not necessarily an indication of the risks associated with investing in those securities. Changes in valuation techniques and related inputs may result in transfers into or out of an assigned level within the disclosure hierarchy.
The following is a summary of the values by input classification of the fund’s investments as of September 30, 2020, by major security category or type:
| | | | | | | | | | | | | | | | |
| | | | | | | | | Level 2 | | | Level 3 | |
| | | Total | | | Level 1 | | | significant | | | significant | |
| | | value at | | | quoted | | | observable | | | unobservable | |
| | | 9-30-20 | | | price | | | inputs | | | inputs | |
Investments in securities: | | | | | | | | | | | | | | | | |
Assets | | | | | | | | | | | | | | | | |
Common stocks | | | | | | | | | | | | | | | | |
Australia | | | $8,548,202 | | | | — | | | | $8,548,202 | | | | — | |
Canada | | | 96,661,624 | | | | $96,661,624 | | | | — | | | | — | |
Denmark | | | 9,650,304 | | | | — | | | | 9,650,304 | | | | — | |
France | | | 91,399,578 | | | | — | | | | 91,399,578 | | | | — | |
Germany | | | 106,581,823 | | | | — | | | | 106,581,823 | | | | — | |
Italy | | | 50,597,633 | | | | — | | | | 50,597,633 | | | | — | |
Japan | | | 36,662,712 | | | | — | | | | 36,662,712 | | | | — | |
Norway | | | 10,700,438 | | | | — | | | | 10,700,438 | | | | — | |
Singapore | | | 10,145,329 | | | | — | | | | 10,145,329 | | | | — | |
South Korea | | | 27,964,152 | | | | — | | | | 27,964,152 | | | | — | |
Sweden | | | 10,503,067 | | | | — | | | | 10,503,067 | | | | — | |
Switzerland | | | 46,123,958 | | | | — | | | | 46,123,958 | | | | — | |
Taiwan | | | 27,141,750 | | | | 27,141,750 | | | | — | | | | — | |
United Kingdom | | | 114,806,376 | | | | 26,495,838 | | | | 88,310,538 | | | | — | |
United States | | | 908,662,282 | | | | 908,662,282 | | | | — | | | | — | |
Short-term investments | | | 23,849,367 | | | | 23,849,367 | | | | — | | | | — | |
Total investments in securities | | | $1,579,998,595 | | | | $1,082,810,861 | | | | $497,187,734 | | | | — | |
| | |
| SEMIANNUAL REPORT | JOHN HANCOCK GLOBAL SHAREHOLDER YIELD FUND | | 25 |
Real estate investment trusts. The fund may invest in real estate investment trusts (REITs). Distributions from REITs may be recorded as income and subsequently characterized by the REIT at the end of the fiscal year as a reduction of cost of investments and/or as a realized gain. As a result, the fund will estimate the components of distributions from these securities. Such estimates are revised when the actual components of the distributions are known.
Security transactions and related investment income. Investment security transactions are accounted for on a trade date plus one basis for daily NAV calculations. However, for financial reporting purposes, investment transactions are reported on trade date. Interest income is accrued as earned. Dividend income is recorded on the ex-date, except for dividends of certain foreign securities where the dividend may not be known until after the ex-date. In those cases, dividend income, net of withholding taxes, is recorded when the fund becomes aware of the dividends. Non-cash dividends, if any, are recorded at the fair market value of the securities received. Gains and losses on securities sold are determined on the basis of identified cost and may include proceeds from litigation.
Securities lending. The fund may lend its securities to earn additional income. The fund receives collateral from the borrower in an amount not less than the market value of the loaned securities. The fund will invest its cash collateral in JHCT, an affiliate of the fund, which has a floating NAV and is registered with the Securities and Exchange Commission (SEC) as an investment company. JHCT invests in short-term money market investments. The fund will receive the benefit of any gains and bear any losses generated by JHCT with respect to the cash collateral.
The fund has the right to recall loaned securities on demand. If a borrower fails to return loaned securities when due, then the lending agent is responsible and indemnifies the fund for the lent securities. The lending agent uses the collateral received from the borrower to purchase replacement securities of the same issue, type, class and series of the loaned securities. If the value of the collateral is less than the purchase cost of replacement securities, the lending agent is responsible for satisfying the shortfall but only to the extent that the shortfall is not due to any decrease in the value of JHCT.
Although the risk of loss on securities lent is mitigated by receiving collateral from the borrower and through lending agent indemnification, the fund could experience a delay in recovering securities or could experience a lower than expected return if the borrower fails to return the securities on a timely basis. The fund receives compensation for lending its securities by retaining a portion of the return on the investment of the collateral and compensation from fees earned from borrowers of the securities. Securities lending income received by the fund is net of fees retained by the securities lending agent. Net income received from JHCT is a component of securities lending income as recorded on the Statement of operations.
Obligations to repay collateral received by the fund are shown on the Statement of assets and liabilities as Payable upon return of securities loaned and are secured by the loaned securities. As of September 30, 2020, the fund loaned securities valued at $22,239,046 and received $23,961,247 of cash collateral.
Foreign investing. Assets, including investments, and liabilities denominated in foreign currencies are translated into U.S. dollar values each day at the prevailing exchange rate. Purchases and sales of securities, income and expenses are translated into U.S. dollars at the prevailing exchange rate on the date of the transaction. The effect of changes in foreign currency exchange rates on the value of securities is reflected as a component of the realized and unrealized gains (losses) on investments. Foreign investments are subject to a decline in the value of a foreign currency versus the U.S. dollar, which reduces the dollar value of securities denominated in that currency.
Funds that invest internationally generally carry more risk than funds that invest strictly in U.S. securities. Risks can result from differences in economic and political conditions, regulations, market practices (including higher transaction costs), accounting standards and other factors.
| | |
| 26 | | JOHN HANCOCK GLOBAL SHAREHOLDER YIELD FUND | SEMIANNUAL REPORT |
Foreign taxes. The fund may be subject to withholding tax on income, capital gains or repatriations imposed by certain countries, a portion of which may be recoverable. Foreign taxes are accrued based upon the fund’s understanding of the tax rules and rates that exist in the foreign markets in which it invests. Taxes are accrued based on gains realized by the fund as a result of certain foreign security sales. In certain circumstances, estimated taxes are accrued based on unrealized appreciation of such securities. Investment income is recorded net of foreign withholding taxes.
Overdraft. The fund may have the ability to borrow from banks for temporary or emergency purposes, including meeting redemption requests that otherwise might require the untimely sale of securities. Pursuant to the fund’s custodian agreement, the custodian may loan money to the fund to make properly authorized payments. The fund is obligated to repay the custodian for any overdraft, including any related costs or expenses. The custodian may have a lien, security interest or security entitlement in any fund property that is not otherwise segregated or pledged, to the extent of any overdraft, and to the maximum extent permitted by law.
Line of credit. Effective June 25, 2020, the fund and other affiliated funds have entered into a syndicated line of credit agreement with Citibank, N.A. as the administrative agent that enables them to participate in a $1 billion unsecured committed line of credit. Excluding commitments designated for a certain fund and subject to the needs of all other affiliated funds, the fund can borrow up to an aggregate commitment amount of $850 million, subject to asset coverage and other limitations as specified in the agreement. Each participating fund paid an upfront fee in connection with this line of credit agreement, which is charged based on a combination of fixed and asset-based allocations and amortized over 365 days. Prior to June 25, 2020, the fund and other affiliated funds had a similar agreement that enabled them to participate in a $750 million unsecured committed line of credit. A commitment fee payable at the end of each calendar quarter, based on the average daily unused portion of the line of credit, is charged to each participating fund based on a combination of fixed and asset-based allocations and is reflected in Other expenses on the Statement of operations. For the six months ended September 30, 2020, the fund had no borrowings under the line of credit. Commitment fees for the six months ended September 30, 2020 were $4,915.
Expenses. Within the John Hancock group of funds complex, expenses that are directly attributable to an individual fund are allocated to such fund. Expenses that are not readily attributable to a specific fund are allocated among all funds in an equitable manner, taking into consideration, among other things, the nature and type of expense and the fund’s relative net assets. Expense estimates are accrued in the period to which they relate and adjustments are made when actual amounts are known.
Class allocations. Income, common expenses and realized and unrealized gains (losses) are determined at the fund level and allocated daily to each class of shares based on the net assets of the class. Class-specific expenses, such as distribution and service fees, if any, and transfer agent fees, for all classes, are charged daily at the class level based on the net assets of each class and the specific expense rates applicable to each class.
Federal income taxes. The fund intends to continue to qualify as a regulated investment company by complying with the applicable provisions of the Internal Revenue Code and will not be subject to federal income tax on taxable income that is distributed to shareholders. Therefore, no federal income tax provision is required.
As of March 31, 2020, the fund had no uncertain tax positions that would require financial statement recognition, derecognition or disclosure. The fund’s federal tax returns are subject to examination by the Internal Revenue Service for a period of three years.
Distribution of income and gains. Distributions to shareholders from net investment income and net realized gains, if any, are recorded on the ex-date. The fund generally declares and pays dividends quarterly. Capital gain distributions, if any, are typically distributed annually.
Distributions paid by the fund with respect to each class of shares are calculated in the same manner, at the same time and in the same amount, except for the effect of class level expenses that may be applied differently to each class.
| | |
| SEMIANNUAL REPORT | JOHN HANCOCK GLOBAL SHAREHOLDER YIELD FUND | | 27 |
Such distributions, on a tax basis, are determined in conformity with income tax regulations, which may differ from US GAAP. Distributions in excess of tax basis earnings and profits, if any, are reported in the fund’s financial statements as a return of capital. The final determination of tax characteristics of the fund’s distribution will occur at the end of the year and will subsequently be reported to shareholders.
Capital accounts within the financial statements are adjusted for permanent book-tax differences. These adjustments have no impact on net assets or the results of operations. Temporary book-tax differences, if any, will reverse in a subsequent period. Book-tax differences are primarily attributable to partnerships and wash sale loss deferrals.
Note 3 — Guarantees and indemnifications
Under the Trust’s organizational documents, its Officers and Trustees are indemnified against certain liabilities arising out of the performance of their duties to the Trust, including the fund. Additionally, in the normal course of business, the fund enters into contracts with service providers that contain general indemnification clauses. The fund’s maximum exposure under these arrangements is unknown, as this would involve future claims that may be made against the fund that have not yet occurred. The risk of material loss from such claims is considered remote.
Note 4 — Fees and transactions with affiliates
John Hancock Investment Management LLC (the Advisor) serves as investment advisor for the fund. John Hancock Investment Management Distributors LLC (the Distributor), an affiliate of the Advisor, serves as principal underwriter of the fund. The Advisor and the Distributor are indirect, principally owned subsidiaries of Manulife Financial Corporation.
Management fee. The fund has an investment management agreement with the Advisor under which the fund pays a daily management fee to the Advisor, equivalent on an annual basis to the sum of 0.800% of average daily net assets. The Advisor has a subadvisory agreement with Epoch Investment Partners, Inc. The fund is not responsible for payment of the subadvisory fees.
The Advisor has contractually agreed to waive a portion of its management fee and/or reimburse expenses for certain funds of the John Hancock group of funds complex, including the fund (the participating portfolios). This waiver is based upon aggregate net assets of all the participating portfolios. The amount of the reimbursement is calculated daily and allocated among all the participating portfolios in proportion to the daily net assets of each fund. During the six months ended September 30, 2020, this waiver amounted to 0.01% of the fund’s average daily net assets on an annualized basis. This arrangement expires on July 31, 2022, unless renewed by mutual agreement of the fund and the Advisor based upon a determination that this is appropriate under the circumstances at that time.
The Advisor contractually agrees to reduce its management fee or, if necessary, make payment to the applicable class in an amount equal to the amount by which expenses of Class A, Class B, Class C, Class I, Class R2, and Class R6 shares, as applicable, exceed 1.09%, 1.84%, 1.84%, 0.84%, 1.24%, and 0.74%, respectively, of average net assets attributable to the applicable class. For purposes of this agreement, “expenses of Class A, Class B, Class C, Class I, Class R2, and Class R6 shares” means all class expenses (including fund expenses attributable to the class), excluding taxes, brokerage commissions, interest expense, litigation and indemnification expenses and other extraordinary expenses not incurred in the ordinary course of the fund’s business, acquired fund fees and expenses paid indirectly, and short dividend expense. This agreement expires on July 31, 2021, unless renewed by mutual agreement of the fund and the Advisor based on upon a determination that this is appropriate under the circumstances at that time.
The Advisor has voluntarily agreed to reduce its management fee for the fund, or if necessary, make payment to the fund, in an amount equal to the amount by which the fund’s expenses exceed 0.74% of average net assets, on an annualized basis. Expenses means all the expenses of the fund, excluding taxes, brokerage commissions, interest expense, litigation and indemnification expenses and other extraordinary expenses not incurred in the
| | |
| 28 | | JOHN HANCOCK GLOBAL SHAREHOLDER YIELD FUND | SEMIANNUAL REPORT |
ordinary course of the fund’s business, advisory fees, class-specific expenses, borrowing costs, prime brokerage fees, acquired fund fees and expenses paid indirectly, and short dividend expense. This voluntary expense reduction will continue in effect until terminated at any time by the Advisor on notice to the fund.
For the six months ended September 30, 2020, the expense reductions described above amounted to the following:
| | | | |
| Class | | Expense reduction | |
Class A | | | $291,123 | |
Class B | | | 530 | |
Class C | | | 33,762 | |
Class I | | | 506,719 | |
| | | | |
| Class | | Expense reduction | |
Class R2 | | | $377 | |
Class R6 | | | 193,795 | |
Class NAV | | | 244,010 | |
Total | | | $1,270,316 | |
Expenses waived or reimbursed in the current fiscal period are not subject to recapture in future fiscal periods.
The investment management fees, including the impact of the waivers and reimbursements as described above, incurred for the six months ended September 30, 2020, were equivalent to a net annual effective rate of 0.64% of the fund’s average daily net assets.
Accounting and legal services. Pursuant to a service agreement, the fund reimburses the Advisor for all expenses associated with providing the administrative, financial, legal, compliance, accounting and recordkeeping services to the fund, including the preparation of all tax returns, periodic reports to shareholders and regulatory reports, among other services. These expenses are allocated to each share class based on its relative net assets at the time the expense was incurred. These accounting and legal services fees incurred, for the six months ended September 30, 2020, amounted to an annual rate of 0.02% of the fund’s average daily net assets.
Distribution and service plans. The fund has a distribution agreement with the Distributor. The fund has adopted distribution and service plans for certain classes as detailed below pursuant to Rule 12b-1 under the 1940 Act, to pay the Distributor for services provided as the distributor of shares of the fund. In addition, under a service plan for certain classes as detailed below, the fund pays for certain other services. The fund may pay up to the following contractual rates of distribution and service fees under these arrangements, expressed as an annual percentage of average daily net assets for each class of the fund’s shares:
| | | | | | | | |
| Class | | Rule 12b-1 Fee | | | Service fee | |
Class A | | | 0.30% | | | | — | |
Class B | | | 1.00% | | | | — | |
Class C | | | 1.00% | | | | — | |
Class R2 | | | 0.25% | | | | 0.25% | |
Sales charges. Class A shares are assessed up-front sales charges, which resulted in payments to the Distributor amounting to $110,283 for the six months ended September 30, 2020. Of this amount, $18,947 was retained and used for printing prospectuses, advertising, sales literature and other purposes and $91,336 was paid as sales commissions to broker-dealers.
Class A, Class B and Class C shares may be subject to contingent deferred sales charges (CDSCs). Certain Class A shares that are acquired through purchases of $1 million or more and are redeemed within one year of purchase are subject to a 1.00% sales charge. Class B shares that are redeemed within six years of purchase are subject to CDSCs, at declining rates, beginning at 5.00%. Class C shares that are redeemed within one year of purchase are subject to a 1.00% CDSC. CDSCs are applied to the lesser of the current market value at the time of redemption or the original purchase cost of the shares being redeemed. Proceeds from CDSCs are used to compensate the Distributor for providing distribution-related services in connection with the sale of these shares. During the six
| | |
| SEMIANNUAL REPORT | JOHN HANCOCK GLOBAL SHAREHOLDER YIELD FUND | | 29 |
months ended September 30, 2020, CDSCs received by the Distributor amounted to $3,603 and $1,792 for Class A and Class C shares, respectively. During the six months ended September 30, 2020, there were no CDSCs received by the Distributor for Class B shares.
Transfer agent fees. The John Hancock group of funds has a complex-wide transfer agent agreement with John Hancock Signature Services, Inc. (Signature Services), an affiliate of the Advisor. The transfer agent fees paid to Signature Services are determined based on the cost to Signature Services (Signature Services Cost) of providing recordkeeping services. It also includes out-of-pocket expenses, including payments made to third-parties for recordkeeping services provided to their clients who invest in one or more John Hancock funds. In addition, Signature Services Cost may be reduced by certain fees that Signature Services receives in connection with retirement and small accounts. Signature Services Cost is calculated monthly and allocated, as applicable, to five categories of share classes: Retail Share and Institutional Share Classes of Non-Municipal Bond Funds, Class R6 Shares, Retirement Share Classes and Municipal Bond Share Classes. Within each of these categories, the applicable costs are allocated to the affected John Hancock affiliated funds and/or classes, based on the relative average daily net assets.
Class level expenses. Class level expenses for the six months ended September 30, 2020 were as follows:
| | | | | | | | |
| Class | | Distribution and service fees | | | Transfer agent fees | |
Class A | | | $422,627 | | | | $173,836 | |
Class B | | | 3,419 | | | | 430 | |
Class C | | | 216,362 | | | | 26,850 | |
Class I | | | — | | | | 399,588 | |
Class R2 | | | 1,353 | | | | 37 | |
Class R6 | | | — | | | | 17,212 | |
Total | | | $643,761 | | | | $617,953 | |
Trustee expenses. The fund compensates each Trustee who is not an employee of the Advisor or its affiliates. The costs of paying Trustee compensation and expenses are allocated to the fund based on its net assets relative to other funds within the John Hancock group of funds complex.
Interfund lending program. Pursuant to an Exemptive Order issued by the SEC, the fund, along with certain other funds advised by the Advisor or its affiliates, may participate in an interfund lending program. This program provides an alternative credit facility allowing the fund to borrow from, or lend money to, other participating affiliated funds. At period end, no interfund loans were outstanding. Interest expense is included in Other expenses on the Statement of operations. The fund’s activity in this program during the period for which loans were outstanding was as follows:
| | | | | | | | | | | | | | | | |
Borrower or Lender | | Weighted Average Loan Balance | | | Days Outstanding | | | Weighted Average Interest Rate | | | Interest Income (Expense) | |
Borrower | | | $7,625,000 | | | | 4 | | | | 0.540% | | | | ($458) | |
| | |
| 30 | | JOHN HANCOCK GLOBAL SHAREHOLDER YIELD FUND | SEMIANNUAL REPORT |
Note 5 — Fund share transactions
Transactions in fund shares for the six months ended September 30, 2020 and for the year ended March 31, 2020 were as follows:
| | | | | | | | | | | | | | |
| | | Six Months Ended 9-30-20 | | | Year Ended 3-31-20 |
| | | | |
| | | Shares | | | Amount | | | Shares | | | Amount |
| | | | |
Class A shares | | | | | | | | | | | | | | |
Sold | | | 2,168,527 | | | | $20,937,492 | | | | 5,060,895 | | | $55,505,983 |
Distributions reinvested | | | 406,181 | | | | 3,907,407 | | | | 1,426,626 | | | 15,435,830 |
Repurchased | | | (4,185,601 | ) | | | (40,599,654 | ) | | | (6,920,446 | ) | | (74,350,835) |
Net decrease | | | (1,610,893 | ) | | | $(15,754,755 | ) | | | (432,925 | ) | | $(3,409,022) |
| | | | |
Class B shares | | | | | | | | | | | | | | |
Sold | | | 10 | | | | $85 | | | | 1,022 | | | $13,714 |
Distributions reinvested | | | 587 | | | | 5,649 | | | | 6,585 | | | 73,013 |
Repurchased | | | (51,709 | ) | | | (503,236 | ) | | | (245,982 | ) | | (2,647,333) |
Net decrease | | | (51,112 | ) | | | $(497,502 | ) | | | (238,375 | ) | | $(2,560,606) |
| | | | |
Class C shares | | | | | | | | | | | | | | |
Sold | | | 36,175 | | | | $342,135 | | | | 177,891 | | | $1,935,032 |
Distributions reinvested | | | 44,580 | | | | 429,360 | | | | 224,189 | | | 2,461,371 |
Repurchased | | | (1,346,152 | ) | | | (13,049,664 | ) | | | (2,136,687 | ) | | (23,207,373) |
Net decrease | | | (1,265,397 | ) | | | $(12,278,169 | ) | | | (1,734,607 | ) | | $(18,810,970) |
| | | | |
Class I shares | | | | | | | | | | | | | | |
Sold | | | 5,528,999 | | | | $53,814,083 | | | | 13,847,419 | | | $151,299,218 |
Distributions reinvested | | | 1,015,056 | | | | 9,807,112 | | | | 3,591,473 | | | 38,902,359 |
Repurchased | | | (12,033,347 | ) | | | (116,924,849 | ) | | | (21,095,735 | ) | | (226,991,285) |
Net decrease | | | (5,489,292 | ) | | | $(53,303,654 | ) | | | (3,656,843 | ) | | $(36,789,708) |
| | | | |
Class R2 shares | | | | | | | | | | | | | | |
Sold | | | 4,063 | | | | $39,645 | | | | 10,495 | | | $115,586 |
Distributions reinvested | | | 772 | | | | 7,458 | | | | 3,059 | | | 33,350 |
Repurchased | | | (15,339 | ) | | | (150,439 | ) | | | (21,581 | ) | | (243,938) |
Net decrease | | | (10,504 | ) | | | $(103,336 | ) | | | (8,027 | ) | | $(95,002) |
| | | | |
Class R6 shares | | | | | | | | | | | | | | |
Sold | | | 2,514,801 | | | | $24,310,761 | | | | 5,075,379 | | | $54,966,937 |
Distributions reinvested | | | 434,450 | | | | 4,187,681 | | | | 1,535,978 | | | 16,606,455 |
Repurchased | | | (5,452,398 | ) | | | (53,250,506 | ) | | | (9,996,795 | ) | | (108,749,059) |
Net decrease | | | (2,503,147 | ) | | | $(24,752,064 | ) | | | (3,385,438 | ) | | $(37,175,667) |
| | |
| SEMIANNUAL REPORT | JOHN HANCOCK GLOBAL SHAREHOLDER YIELD FUND | | 31 |
| | | | | | | | | | | | | | |
| | | Six Months Ended 9-30-20 | | | Year Ended 3-31-20 |
| | | | |
| | | Shares | | | Amount | | | Shares | | | Amount |
| | | | |
Class NAV shares | | | | | | | | | | | | | | |
Sold | | | 715,814 | | | | $6,632,264 | | | | 1,794,177 | | | $16,247,432 |
Distributions reinvested | | | 604,025 | | | | 5,831,149 | | | | 2,054,726 | | | 22,256,224 |
Repurchased | | | (1,410,162 | ) | | | (14,179,531 | ) | | | (7,644,056 | ) | | (87,467,134) |
Net decrease | | | (90,323 | ) | | | $(1,716,118 | ) | | | (3,795,153 | ) | | $(48,963,478) |
| | | | | |
Total net decrease | | | (11,020,668 | ) | | | $(108,405,598 | ) | | | (13,251,368 | ) | | $(147,804,453) |
Affiliates of the fund owned 100% of shares of Class NAV on September 30, 2020. Such concentration of shareholders’ capital could have a material effect on the fund if such shareholders redeem from the fund.
Note 6 — Purchase and sale of securities
Purchases and sales of securities, other than short-term investments, amounted to $230,753,257 and $335,766,614, respectively, for the six months ended September 30, 2020.
Note 7 — Investment by affiliated funds
Certain investors in the fund are affiliated funds that are managed by the Advisor and its affiliates. The affiliated funds do not invest in the fund for the purpose of exercising management or control; however, this investment may represent a significant portion of the fund’s net assets. At September 30, 2020, funds within the John Hancock group of funds complex held 23.4% of the fund’s net assets. The following fund(s) had an affiliate ownership of 5% or more of the fund’s net assets:
| | |
| Fund | | Affiliated Concentration |
John Hancock Funds II Multimanager Lifestyle Growth Portfolio | | 8.1% |
John Hancock Funds II Multimanager Lifestyle Balanced Portfolio | | 7.7% |
Note 8 — Investment in affiliated underlying funds
The fund may invest in affiliated underlying funds that are managed by the Advisor and its affiliates. Information regarding the fund’s fiscal year to date purchases and sales of the affiliated underlying funds as well as income and capital gains earned by the fund, if any, is as follows:
| | | | | | | | | | | | | | | | | | | | | | | | | | | | | | | | | | | | |
| | | | | | | | | | | | | | | | | | | | | Dividends and distributions | | | | |
| | | | | | | | | | | | | | | | | | Change in | | | | | | | | | | |
| | | Ending | | | | | | | | | Proceeds | | | Realized | | | unrealized | | | Income | | | Capital gain | | | | |
| | | share | | | Beginning | | | Cost of | | | from shares | | | gain | | | appreciation | | | distributions | | | distributions | | | Ending | |
| Affiliate | | amount | | | value | | | purchases | | | sold | | | (loss) | | | (depreciation) | | | received | | | received | | | value | |
| John Hancock Collateral Trust* | | | 2,382,578 | | | | $31,461,673 | | | | $427,532,267 | | | | $(435,199,026 | ) | | | $23,645 | | | | $30,808 | | | | $264,251 | | | | — | | | | $23,849,367 | |
| * | Refer to the Securities lending note within Note 2 for details regarding this investment. |
Note 9 — Coronavirus (COVID-19) pandemic
The novel COVID-19 disease has resulted in significant disruptions to global business activity. A widespread health crisis such as a global pandemic could cause substantial market volatility, exchange trading suspensions and closures, impact the ability to complete redemptions, and affect fund performance.
| | |
| 32 | | JOHN HANCOCK GLOBAL SHAREHOLDER YIELD FUND | SEMIANNUAL REPORT |
Note 10 — Subsequent events
On June 25, 2020, the Board of Trustees approved redesignation of the following share class:
| | |
| Redesignation | | Effective date |
Class B shares as Class A shares | | October 14, 2020 |
As a result of the Redesignation, Class B shares were terminated, and shareholders in the class became shareholders of the respective class identified above, in each case with the same or lower total net expenses.
| | |
| SEMIANNUAL REPORT | JOHN HANCOCK GLOBAL SHAREHOLDER YIELD FUND | | 33 |
CONTINUATION OF INVESTMENT ADVISORY AND SUBADVISORY AGREEMENTS
Evaluation of Advisory and Subadvisory Agreements by the Board of Trustees
This section describes the evaluation by the Board of Trustees (the Board) of John Hancock Funds III (the Trust) of the Advisory Agreement (the Advisory Agreement) with John Hancock Investment Management, LLC (the Advisor) and the Subadvisory Agreement (the Subadvisory Agreement) with Epoch Investment Partners, Inc. (the Subadvisor), for John Hancock Global Shareholder Yield Fund (the fund). The Advisory Agreement and Subadvisory Agreement are collectively referred to as the Agreements. Prior to the June 23-25, 2020 telephonic1 meeting at which the Agreements were approved, the Board also discussed and considered information regarding the proposed continuation of the Agreements at the telephonic meeting held on May 26-27, 2020.
Approval of Advisory and Subadvisory Agreements
At telephonic meetings held on June 23-25, 2020, the Board, including the Trustees who are not parties to any Agreement or considered to be interested persons of the Trust under the Investment Company Act of 1940, as amended (the 1940 Act) (the Independent Trustees), reapproved for an annual period the continuation of the Advisory Agreement between the Trust and the Advisor and the Subadvisory Agreement between the Advisor and the Subadvisor with respect to the fund.
In considering the Advisory Agreement and the Subadvisory Agreement, the Board received in advance of the meetings a variety of materials relating to the fund, the Advisor and the Subadvisor, including comparative performance, fee and expense information for a peer group of similar funds prepared by an independent third-party provider of fund data, performance information for an applicable benchmark index; and, with respect to the Subadvisor, comparative performance information for comparably managed accounts, as applicable, and other information provided by the Advisor and the Subadvisor regarding the nature, extent and quality of services provided by the Advisor and the Subadvisor under their respective Agreements, as well as information regarding the Advisor’s revenues and costs of providing services to the fund and any compensation paid to affiliates of the Advisor. At the meetings at which the renewal of the Advisory Agreement and Subadvisory Agreement are considered, particular focus is given to information concerning fund performance, comparability of fees and total expenses, and profitability. However, the Board notes that the evaluation process with respect to the Advisor and the Subadvisor is an ongoing one. In this regard, the Board also took into account discussions with management and information provided to the Board (including its various committees) at prior meetings with respect to the services provided by the Advisor and the Subadvisor to the fund, including quarterly performance reports prepared by management containing reviews of investment results and prior presentations from the Subadvisor with respect to the fund. The information received and considered by the Board in connection with the May and June meetings and throughout the year was both written and oral. The Board also considered the nature, quality, and extent of non-advisory services, if any, to be provided to the fund by the Advisor’s affiliates, including distribution services. The Board considered the Advisory Agreement and the Subadvisory Agreement separately in the course of its review. In doing so, the Board noted the respective roles of the Advisor and Subadvisor in providing services to the fund.
Throughout the process, the Board asked questions of and requested additional information from management. The Board is assisted by counsel for the Trust and the Independent Trustees are also separately assisted by independent legal counsel throughout the process. The Independent Trustees also received a memorandum from
1 On March 25, 2020, as a result of health and safety measures put in place to combat the global COVID-19 pandemic, the Securities and Exchange Commission issued an exemptive order (the “Order”) pursuant to Sections 6(c) and 38(a) of the Investment Company Act of 1940, as amended (the “1940 Act”), that temporarily exempts registered investment management companies from the in-person voting requirements under the 1940 Act, subject to certain requirements, including that votes taken pursuant to the Order are ratified at the next in-person meeting. The Board determined that reliance on the Order was necessary or appropriate due to the circumstances related to current or potential effects of COVID-19 and therefore, the Board’s May and June meetings were held telephonically in reliance on the Order.
| | |
| 34 | | JOHN HANCOCK GLOBAL SHAREHOLDER YIELD FUND | SEMIANNUAL REPORT |
their independent legal counsel discussing the legal standards for their consideration of the proposed continuation of the Agreements and discussed the proposed continuation of the Agreements in private sessions with their independent legal counsel at which no representatives of management were present.
Approval of Advisory Agreement
In approving the Advisory Agreement with respect to the fund, the Board, including the Independent Trustees, considered a variety of factors, including those discussed below. The Board also considered other factors (including conditions and trends prevailing generally in the economy, the securities markets, and the industry) and did not treat any single factor as determinative, and each Trustee may have attributed different weights to different factors. The Board’s conclusions may be based in part on its consideration of the advisory and subadvisory arrangements in prior years and on the Board’s ongoing regular review of fund performance and operations throughout the year.
Nature, extent, and quality of services. Among the information received by the Board from the Advisor relating to the nature, extent, and quality of services provided to the fund, the Board reviewed information provided by the Advisor relating to its operations and personnel, descriptions of its organizational and management structure, and information regarding the Advisor’s compliance and regulatory history, including its Form ADV. The Board also noted that on a regular basis it receives and reviews information from the Trust’s Chief Compliance Officer (CCO) regarding the fund’s compliance policies and procedures established pursuant to Rule 38a-1 under the 1940 Act. The Board observed that the scope of services provided by the Advisor, and of the undertakings required of the Advisor in connection with those services, including maintaining and monitoring its own and the fund’s compliance programs, risk management programs, liquidity management programs and cybersecurity programs, had expanded over time as a result of regulatory, market and other developments. The Board considered that the Advisor is responsible for the management of the day-to-day operations of the fund, including, but not limited to, general supervision of and coordination of the services provided by the Subadvisor, and is also responsible for monitoring and reviewing the activities of the Subadvisor and other third-party service providers. The Board also considered the significant risks assumed by the Advisor in connection with the services provided to the fund including entrepreneurial risk in sponsoring new funds and ongoing risks including investment, operational, enterprise, litigation, regulatory and compliance risks with respect to all funds.
In considering the nature, extent, and quality of the services provided by the Advisor, the Trustees also took into account their knowledge of the Advisor’s management and the quality of the performance of the Advisor’s duties, through Board meetings, discussions and reports during the preceding year and through each Trustee’s experience as a Trustee of the Trust and of the other trusts in the John Hancock group of funds complex (the John Hancock Fund Complex).
In the course of their deliberations regarding the Advisory Agreement, the Board considered, among other things:
| | (a) | the skills and competency with which the Advisor has in the past managed the Trust’s affairs and its subadvisory relationship, the Advisor’s oversight and monitoring of the Subadvisor’s investment performance and compliance programs, such as the Subadvisor’s compliance with fund policies and objectives, review of brokerage matters, including with respect to trade allocation and best execution and the Advisor’s timeliness in responding to performance issues; |
| | (b) | the background, qualifications and skills of the Advisor’s personnel; |
| | (c) | the Advisor’s compliance policies and procedures and its responsiveness to regulatory changes and fund industry developments; |
| | (d) | the Advisor’s administrative capabilities, including its ability to supervise the other service providers for the fund, as well as the Advisor’s oversight of any securities lending activity, its monitoring of class action litigation and collection of class action settlements on behalf of the fund, and bringing loss recovery actions on behalf of the fund; |
| | |
| SEMIANNUAL REPORT | JOHN HANCOCK GLOBAL SHAREHOLDER YIELD FUND | | 35 |
| | (e) | the financial condition of the Advisor and whether it has the financial wherewithal to provide a high level and quality of services to the fund; |
| | (f) | the Advisor’s initiatives intended to improve various aspects of the Trust’s operations and investor experience with the fund; and |
| | (g) | the Advisor’s reputation and experience in serving as an investment advisor to the Trust and the benefit to shareholders of investing in funds that are part of a family of funds offering a variety of investments. |
The Board concluded that the Advisor may reasonably be expected to continue to provide a high quality of services under the Advisory Agreement with respect to the fund.
Investment performance. In considering the fund’s performance, the Board noted that it reviews at its regularly scheduled meetings information about the fund’s performance results. In connection with the consideration of the Advisory Agreement, the Board:
| | (a) | reviewed information prepared by management regarding the fund’s performance; |
| | (b) | considered the comparative performance of an applicable benchmark index; |
| | (c) | considered the performance of comparable funds, if any, as included in the report prepared by an independent third-party provider of fund data; and |
| | (d) | took into account the Advisor’s analysis of the fund’s performance and its plans and recommendations regarding the Trust’s subadvisory arrangements generally. |
The Board noted that while it found the data provided by the independent third-party generally useful it recognized its limitations, including in particular that the data may vary depending on the end date selected and that the results of the performance comparisons may vary depending on the selection of the peer group. The Board noted that the fund underperformed its benchmark index and peer group median for the one-, three-,five- and ten-year periods ended December 31, 2019. The Board took into account management’s discussion of the factors that contributed to the fund’s performance for the benchmark index and peer group median for the one-, three-, five- and ten-year periods including the impact of past and current market conditions on the fund’s strategy and management’s outlook for the fund. The Board concluded that the fund’s performance is being monitored and reasonably addressed, where appropriate.
Fees and expenses. The Board reviewed comparative information prepared by an independent third-party provider of fund data, including, among other data, the fund’s contractual and net management fees (and subadvisory fees, to the extent available) and total expenses as compared to similarly situated investment companies deemed to be comparable to the fund in light of the nature, extent and quality of the management and advisory and subadvisory services provided by the Advisor and the Subadvisor. The Board considered the fund’s ranking within a smaller group of peer funds chosen by the independent third-party provider, as well as the fund’s ranking within a broader group of funds. In comparing the fund’s contractual and net management fees to those of comparable funds, the Board noted that such fees include both advisory and administrative costs. The Board noted that net management fees for the fund are lower than the peer group median and total expenses for the fund are equal to the peer group median.
The Board took into account management’s discussion with respect to the overall management fee and the fees of the Subadvisor, including the amount of the advisory fee retained by the Advisor after payment of the subadvisory fee, in each case in light of the services rendered for those amounts and the risks undertaken by the Advisor. The Board also noted that the Advisor pays the subadvisory fee, and that such fees are negotiated at arm’s length with respect to the Subadvisor. The Board also took into account that management had agreed to implement an overall fee waiver across the complex, including the fund, which is discussed further below. The Board also noted that, in addition, the Advisor is currently waiving fees and/or reimbursing expenses with respect to the fund. The Board
| | |
| 36 | | JOHN HANCOCK GLOBAL SHAREHOLDER YIELD FUND | SEMIANNUAL REPORT |
reviewed information provided by the Advisor concerning investment advisory fees charged by the Advisor or one of its advisory affiliates to other clients (including other funds in the complex) having similar investment mandates, if any. The Board considered any differences between the Advisor’s and a Subadvisor’s services to the fund and the services they provide to other comparable clients or funds. The Board concluded that the advisory fee paid with respect to the fund is reasonable in light of the nature, extent and quality of the services provided to the fund under the Advisory Agreement.
Profitability/Fall out benefits. In considering the costs of the services to be provided and the profits to be realized by the Advisor and its affiliates from the Advisor’s relationship with the Trust, the Board:
| | (a) | reviewed financial information of the Advisor; |
| | (b) | reviewed and considered information presented by the Advisor regarding the net profitability to the Advisor and its affiliates with respect to the fund; |
| | (c) | received and reviewed profitability information with respect to the John Hancock Fund Complex as a whole and with respect to the fund; |
| | (d) | received information with respect to the Advisor’s allocation methodologies used in preparing the profitability data and considered that the Advisor hired an independent third-party consultant to provide an analysis of the Advisor’s allocation methodologies; |
| | (e) | considered that the John Hancock insurance companies that are affiliates of the Advisor, as shareholders of the Trust directly or through their separate accounts, receive certain tax credits or deductions relating to foreign taxes paid and dividends received by certain funds of the Trust and noted that these tax benefits, which are not available to participants in qualified retirement plans under applicable income tax law, are reflected in the profitability information reviewed by the Board; |
| | (f) | considered that the Advisor also provides administrative services to the fund on a cost basis pursuant to an administrative services agreement; |
| | (g) | noted that affiliates of the Advisor provide transfer agency services and distribution services to the fund, and that the fund’s distributor also receives Rule 12b-1 payments to support distribution of the fund; |
| | (h) | noted that the Advisor also derives reputational and other indirect benefits from providing advisory services to the fund; |
| | (i) | noted that the subadvisory fee for the fund is paid by the Advisor and is negotiated at arm’s length; |
| | (j) | considered the Advisor’s ongoing costs and expenditures necessary to improve services, meet new regulatory and compliance requirements, and adapt to other challenges impacting the fund industry; and |
| | (k) | considered that the Advisor should be entitled to earn a reasonable level of profits in exchange for the level of services it provides to the fund and the risks that it assumes as Advisor, including entrepreneurial, operational, reputational, litigation and regulatory risk. |
Based upon its review, the Board concluded that the level of profitability, if any, of the Advisor and its affiliates from their relationship with the fund was reasonable and not excessive.
Economies of scale. In considering the extent to which economies of scale would be realized as the fund grows and whether fee levels reflect these economies of scale for the benefit of fund shareholders, the Board:
| | (a) | considered that the Advisor has contractually agreed to waive a portion of its management fee for certain funds of the John Hancock Fund Complex, including the fund (the participating portfolios) or otherwise reimburse the expenses of the participating portfolios (the reimbursement). This waiver is |
| | |
| SEMIANNUAL REPORT | JOHN HANCOCK GLOBAL SHAREHOLDER YIELD FUND | | 37 |
| | based upon aggregate net assets of all the participating portfolios. The amount of the reimbursement is calculated daily and allocated among all the participating portfolios in proportion to the daily net assets of each fund; |
| | (b) | the Board also took into account management’s discussion of the fund’s advisory fee structure; and |
| | (c) | the Board also considered the effect of the fund’s growth in size on its performance and fees. The Board also noted that if the fund’s assets increase over time, the fund may realize other economies of scale. |
Approval of Subadvisory Agreement
In making its determination with respect to approval of the Subadvisory Agreement, the Board reviewed:
| | (1) | information relating to the Subadvisor’s business, including current subadvisory services to the Trust (and other funds in the John Hancock Fund Complex); |
| | (2) | the historical and current performance of the fund and comparative performance information relating to an applicable benchmark index and comparable funds; |
| | (3) | the subadvisory fee for the fund, including any breakpoints, and to the extent available, comparable fee information prepared by an independent third party provider of fund data; and |
| | (4) | information relating to the nature and scope of any material relationships and their significance to the Trust’s Advisor and Subadvisor. |
Nature, extent, and quality of services. With respect to the services provided by the Subadvisor, the Board received information provided to the Board by the Subadvisor, including the Subadvisor’s Form ADV, as well as took into account information presented throughout the past year. The Board considered the Subadvisor’s current level of staffing and its overall resources, as well as received information relating to the Subadvisor’s compensation program. The Board reviewed the Subadvisor’s history and investment experience, as well as information regarding the qualifications, background, and responsibilities of the Subadvisor’s investment and compliance personnel who provide services to the fund. The Board also considered, among other things, the Subadvisor’s compliance program and any disciplinary history. The Board also considered the Subadvisor’s risk assessment and monitoring process. The Board reviewed the Subadvisor’s regulatory history, including whether it was involved in any regulatory actions or investigations as well as material litigation, and any settlements and amelioratory actions undertaken, as appropriate. The Board noted that the Advisor conducts regular, periodic reviews of the Subadvisor and its operations, including regarding investment processes and organizational and staffing matters. The Board also noted that the Trust’s CCO and his staff conduct regular, periodic compliance reviews with the Subadvisor and present reports to the Independent Trustees regarding the same, which includes evaluating the regulatory compliance systems of the Subadvisor and procedures reasonably designed to assure compliance with the federal securities laws. The Board also took into account the financial condition of the Subadvisor.
The Board considered the Subadvisor’s investment process and philosophy. The Board took into account that the Subadvisor’s responsibilities include the development and maintenance of an investment program for the fund that is consistent with the fund’s investment objective, the selection of investment securities and the placement of orders for the purchase and sale of such securities, as well as the implementation of compliance controls related to performance of these services. The Board also received information with respect to the Subadvisor’s brokerage policies and practices, including with respect to best execution and soft dollars.
Subadvisor compensation. In considering the cost of services to be provided by the Subadvisor and the profitability to the Subadvisor of its relationship with the fund, the Board noted that the fees under the Subadvisory Agreement are paid by the Advisor and not the fund.
| | |
| 38 | | JOHN HANCOCK GLOBAL SHAREHOLDER YIELD FUND | SEMIANNUAL REPORT |
The Board also relied on the ability of the Advisor to negotiate the Subadvisory Agreement with the Subadvisor, which is not affiliated with the Advisor, and the fees thereunder at arm’s length. As a result, the costs of the services to be provided and the profits to be realized by the Subadvisor from its relationship with the Trust were not a material factor in the Board’s consideration of the Subadvisory Agreement.
The Board also received information regarding the nature and scope (including their significance to the Advisor and its affiliates and to the Subadvisor) of any material relationships with respect to the Subadvisor, which include arrangements in which the Subadvisor or its affiliates provide advisory, distribution, or management services in connection with financial products sponsored by the Advisor or its affiliates, and may include other registered investment companies, a 529 education savings plan, managed separate accounts and exempt group annuity contracts sold to qualified plans. The Board also received information and took into account any other potential conflicts of interest the Advisor might have in connection with the Subadvisory Agreement.
In addition, the Board considered other potential indirect benefits that the Subadvisor and its affiliates may receive from the Subadvisor’s relationship with the fund, such as the opportunity to provide advisory services to additional funds in the John Hancock Fund Complex and reputational benefits.
Subadvisory fees. The Board considered that the fund pays an advisory fee to the Advisor and that, in turn, the Advisor pays a subadvisory fee to the Subadvisor. As noted above, the Board also considered the fund’s subadvisory fees as compared to similarly situated investment companies deemed to be comparable to the fund as included in the report prepared by the independent third party provider of fund data, to the extent available. The Board noted that the limited size of the Lipper peer group was not sufficient for comparative purposes. The Board also took into account the subadvisory fees paid by the Advisor to the Subadvisor with respect to the fund and compared them to fees charged by the Subadvisor to manage other subadvised portfolios and portfolios not subject to regulation under the 1940 Act, as applicable.
Subadvisor performance. As noted above, the Board considered the fund’s performance as compared to the fund’s peer group median and the benchmark index and noted that the Board reviews information about the fund’s performance results at its regularly scheduled meetings. The Board noted the Advisor’s expertise and resources in monitoring the performance, investment style and risk-adjusted performance of the Subadvisor. The Board was mindful of the Advisor’s focus on the Subadvisor’s performance. The Board also noted the Subadvisor’s long-term performance record for similar accounts, as applicable.
The Board’s decision to approve the Subadvisory Agreement was based on a number of determinations, including the following:
| | (1) | the Subadvisor has extensive experience and demonstrated skills as a manager; |
| | (2) | the performance of the fund is being monitored and reasonably addressed, where appropriate; |
| | (3) | the subadvisory fee is reasonable in relation to the level and quality of services being provided under the Subadvisory Agreement; and |
| | (4) | noted that the subadvisory fees are paid by the Advisor not the fund. |
* * *
Based on the Board’s evaluation of all factors that the Board deemed to be material, including those factors described above, the Board, including the Independent Trustees, concluded that renewal of the Advisory Agreement and the Subadvisory Agreement would be in the best interest of the fund and its shareholders. Accordingly, the Board, and the Independent Trustees voting separately, approved the Advisory Agreement and Subadvisory Agreement for an additional one-year period.
| | |
| SEMIANNUAL REPORT | JOHN HANCOCK GLOBAL SHAREHOLDER YIELD FUND | | 39 |
Trustees
Hassell H. McClellan, Chairperson
Steven R. Pruchansky, Vice Chairperson
Andrew G. Arnott†
Charles L. Bardelis*
James R. Boyle
Peter S. Burgess*
William H. Cunningham
Grace K. Fey
Marianne Harrison†
Deborah C. Jackson
James M. Oates*
Frances G. Rathke*,1
Gregory A. Russo
Officers
Andrew G. Arnott
President
Charles A. Rizzo
Chief Financial Officer
Salvatore Schiavone
Treasurer
Christopher (Kit) Sechler
Secretary and Chief Legal Officer
Trevor Swanberg2
Chief Compliance Officer
Investment advisor
John Hancock Investment Management LLC
Subadvisor
Epoch Investment Partners, Inc.
Portfolio Managers
William W. Priest, CFA
John M. Tobin, Ph.D., CFA
Kera Van Valen, CFA
Michael A.Welhoelter, CFA
Principal distributor
John Hancock Investment Management
Distributors LLC
Custodian
Citibank, N.A.
Transfer agent
John Hancock Signature Services, Inc.
Legal counsel
K&L Gates LLP
| * | Member of the Audit Committee |
| † | Non-Independent Trustee |
| 1 | Appointed as Independent Trustee effective as of September 15, 2020 |
| 2 | Effective July 31, 2020 |
The fund’s proxy voting policies and procedures, as well as the fund proxy voting record for the most recent twelve-month period ended June 30, are available free of charge on the Securities and Exchange Commission (SEC) website at sec.gov or on our website.
All of the fund’s holdings as of the end of the third month of every fiscal quarter are filed with the SEC on Form N-PORT within 60 days of the end of the fiscal quarter. The fund’s Form N-PORT filings are available on our website and the SEC’s website, sec.gov.
We make this information on your fund, as well as monthly portfolio holdings, and other fund details available on our website at jhinvestments.com or by calling 800-225-5291.
| | | | |
You can also contact us: 800-225-5291 | | Regular mail: | | Express mail: |
| jhinvestments.com | | John Hancock Signature Services, Inc. | | John Hancock Signature Services, Inc. |
| | P.O. Box 219909 | | 430 W 7th Street |
| | Kansas City, MO 64121-9909 | | Suite 219909 |
| | | | Kansas City, MO 64105-1407 |
| | |
| 40 | | JOHN HANCOCK GLOBAL SHAREHOLDER YIELD FUND | SEMIANNUAL REPORT |
|
John Hancock family of funds |
| | | | |
| | |
DOMESTIC EQUITY FUNDS | | | | INCOME FUNDS |
| | |
Blue Chip Growth | | | | Bond |
| | |
Classic Value | | | | California Tax-Free Income |
| | |
Disciplined Value | | | | Emerging Markets Debt |
| | |
Disciplined Value Mid Cap | | | | Floating Rate Income |
| | |
Equity Income | | | | Government Income |
| | |
Financial Industries | | | | High Yield |
| | |
Fundamental All Cap Core | | | | High Yield Municipal Bond |
| | |
Fundamental Large Cap Core | | | | Income |
| | |
New Opportunities | | | | Investment Grade Bond |
| | |
Regional Bank | | | | Money Market |
| | |
Small Cap Core | | | | Short Duration Bond |
| | |
Small Cap Growth | | | | Short Duration Credit Opportunities |
| | |
Small Cap Value | | | | Strategic Income Opportunities |
| | |
U.S. Global Leaders Growth | | | | Tax-Free Bond |
| | |
U.S. Growth | | | | ALTERNATIVE AND SPECIALTY FUNDS |
| | |
GLOBAL AND INTERNATIONAL EQUITY FUNDS | | | | Absolute Return Currency |
| | |
Disciplined Value International | | | | Alternative Asset Allocation |
| | |
Emerging Markets | | | | Alternative Risk Premia |
| | |
Emerging Markets Equity | | | | Diversified Macro |
| | |
Fundamental Global Franchise | | | | Infrastructure |
| | |
Global Equity | | | | Multi-Asset Absolute Return |
| | |
Global Shareholder Yield | | | | Seaport Long/Short |
| | |
Global Thematic Opportunities | | | | |
| | |
International Dynamic Growth | | | | |
| | |
International Growth | | | | |
| | |
International Small Company | | | | |
A fund’s investment objectives, risks, charges, and expenses should be considered carefully before investing. The prospectus contains this and other important information about the fund. To obtain a prospectus, contact your financial professional, call John Hancock Investment Management at 800-225-5291, or visit our website at jhinvestments.com. Please read the prospectus carefully before investing or sending money.
| | | | |
| | |
ASSET ALLOCATION | | | | ENVIRONMENTAL, SOCIAL, AND |
| | |
Balanced | | | | GOVERNANCE FUNDS |
| | |
Multi-Asset High Income | | | | ESG All Cap Core |
| | |
Multi-Index Lifetime Portfolios | | | | ESG Core Bond |
| | |
Multi-Index Preservation Portfolios | | | | ESG International Equity |
| | |
Multimanager Lifestyle Portfolios | | | | ESG Large Cap Core |
| | |
Multimanager Lifetime Portfolios | | | | CLOSED-END FUNDS |
| | |
Retirement Income 2040 | | | | Financial Opportunities |
| | |
EXCHANGE-TRADED FUNDS | | | | Hedged Equity & Income |
| | |
John Hancock Multifactor Consumer Discretionary ETF | | | | Income Securities Trust |
| | |
John Hancock Multifactor Consumer Staples ETF | | | | Investors Trust |
| | |
John Hancock Multifactor Developed International ETF | | | | Preferred Income |
| | |
John Hancock Multifactor Emerging Markets ETF | | | | Preferred Income II |
| | |
John Hancock Multifactor Energy ETF | | | | Preferred Income III |
| | |
John Hancock Multifactor Financials ETF | | | | Premium Dividend |
| | |
John Hancock Multifactor Healthcare ETF | | | | Tax-Advantaged Dividend Income |
| | |
John Hancock Multifactor Industrials ETF | | | | Tax-Advantaged Global Shareholder Yield |
| | |
John Hancock Multifactor Large Cap ETF | | | | |
| | |
John Hancock Multifactor Materials ETF | | | | |
| | |
John Hancock Multifactor Media and Communications ETF | | | | |
| | |
John Hancock Multifactor Mid Cap ETF | | | | |
| | |
John Hancock Multifactor Small Cap ETF | | | | |
| | |
John Hancock Multifactor Technology ETF | | | | |
| | |
John Hancock Multifactor Utilities ETF | | | | |
John Hancock Multifactor ETF shares are bought and sold at market price (not NAV), and are not individually redeemed from the fund. Brokerage commissions will reduce returns.
John Hancock ETFs are distributed by Foreside Fund Services, LLC, and are subadvised by Dimensional Fund Advisors LP. Foreside is not affiliated with John Hancock Investment Management Distributors LLC or Dimensional Fund Advisors LP.
Dimensional Fund Advisors LP receives compensation from John Hancock in connection with licensing rights to the John Hancock Dimensional indexes. Dimensional Fund Advisors LP does not sponsor, endorse, or sell, and makes no representation as to the advisability of investing in, John Hancock Multifactor ETFs.
|
John Hancock Investment Management A trusted brand John Hancock Investment Management is a premier asset manager with a heritage of financial stewardship dating back to 1862. Helping our shareholders pursue their financial goals is at the core of everything we do. It’s why we support the role of professional financial advice and operate with the highest standards of conduct and integrity. A better way to invest We serve investors globally through a unique multimanager approach: We search the world to find proven portfolio teams with specialized expertise for every strategy we offer, then we apply robust investment oversight to ensure they continue to meet our uncompromising standards and serve the best interests of our shareholders. Results for investors Our unique approach to asset management enables us to provide a diverse set of investments backed by some of the world’s best managers, along with strong risk-adjusted returns across asset classes. |
| | |
 | | Investment Management |
John Hancock Investment Management Distributors LLC ∎ Member FINRA, SIPC
200 Berkeley Street ∎ Boston, MA 02116-5010 ∎ 800-225-5291 ∎ jhinvestments.com
This report is for the information of the shareholders of John Hancock Global Shareholder Yield Fund. It is not authorized for distribution to prospective investors unless preceded or accompanied by a prospectus.
| | |
| A company of Manulife Investment Management | | |
| | 320SA 9/20 |
| MF1355816 | | 11/2020 |


Dear shareholder,
Despite heightened fears over the coronavirus (COVID-19), which sent markets tumbling just prior to the beginning of the reporting period, global financial markets delivered positive returns for the 6 months ended September 30, 2020. The governments of many nations worked to shore up their economies, and equity markets began to rise from their first-quarter sell-off; this comeback gathered momentum for the remainder of the period.
Of course, it would be a mistake to consider this market turnaround a trustworthy signal of assured or swift economic recovery. The ongoing spread of COVID-19 continues to create uncertainty among businesses and investors. While there has been economic growth in much of the developed world, the pace has slowed in many areas as interest rates remain low and consumer spending remains far below prepandemic levels.
From an investment perspective, we continue to think that maintaining a focus on long-term objectives while pursuing a risk-aware strategy is a prudent way forward. Above all, we believe the counsel of a trusted financial professional continues to matter now more than ever. Periods of heightened uncertainty are precisely the time to review your financial goals and follow a plan that helps you make the most of what continues to be a challenging situation.
On behalf of everyone at John Hancock Investment Management, I’d like to take this opportunity to welcome new shareholders and thank existing shareholders for the continued trust you’ve placed in us.
Sincerely,
Andrew G. Arnott
President and CEO,
John Hancock Investment Management
Head of Wealth and Asset Management,
United States and Europe
This commentary reflects the CEO’s views as of this report’s period end and are subject to change at any time. Diversification does not guarantee investment returns and does not eliminate risk of loss. All investments entail risks, including the possible loss of principal. For more up-to-date information, you can visit our website at jhinvestments.com.
|
John Hancock International Growth Fund |
| | |
| SEMIANNUAL REPORT | JOHN HANCOCK INTERNATIONAL GROWTH FUND | | 1 |
| | | | |
| |
| | INVESTMENT OBJECTIVE |
| |
| | The fund seeks a high total return primarily through capital appreciation. |
| |
| | AVERAGE ANNUAL TOTAL RETURNS AS OF 9/30/2020 (%) |
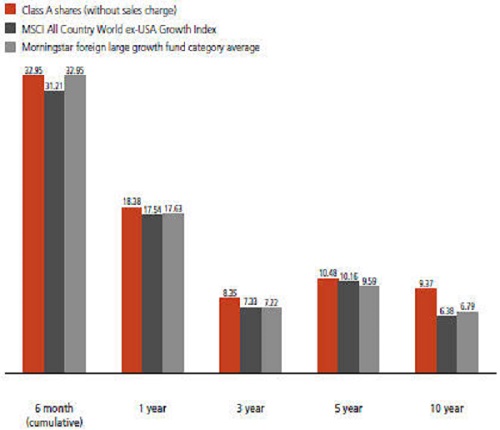
The MSCI All Country World ex-USA Growth Index is a free float-adjusted market capitalization index that is designed to measure the equity performance of growth-oriented stocks in developed (excluding the U.S.) and emerging markets.
It is not possible to invest directly in an index. Index figures do not reflect expenses or sales charges, which would result in lower returns.
The fund’s Morningstar category average is a group of funds with similar investment objectives and strategies and is the equal-weighted return of all funds per category. Morningstar places funds in certain categories based on their historical portfolio holdings. Figures from Morningstar, Inc. include reinvested distributions and do not take into account sales charges. Actual load-adjusted performance is lower.
The past performance shown here reflects reinvested distributions and the beneficial effect of any expense reductions, and does not guarantee future results. Performance of the other share classes will vary based on the difference in the fees and expenses of those classes. Shares will fluctuate in value and, when redeemed, may be worth more or less than their original cost. Current month-end performance may be lower or higher than the performance cited, and can be found at jhinvestments.com or by calling 800-225-5291. For further information on the fund’s objectives, risks, and strategy, see the fund’s prospectus.
| | |
| 2 | | JOHN HANCOCK INTERNATIONAL GROWTH FUND | SEMIANNUAL REPORT |
| | | | |
| | SECTOR COMPOSITION AS OF 9/30/2020 (% of net assets) | | |
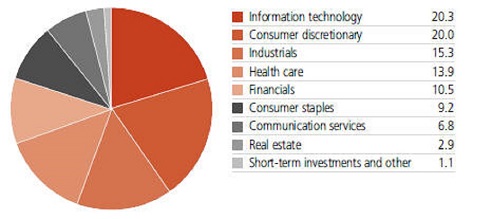
| | | | |
TOP 10 HOLDINGS AS OF 9/30/2020 (% of net assets) | |
Alibaba Group Holding, Ltd., ADR | | | 6.8 | |
Taiwan Semiconductor Manufacturing Company, Ltd. | | | 4.9 | |
Tencent Holdings, Ltd. | | | 4.8 | |
Nestle SA | | | 4.4 | |
Roche Holding AG | | | 3.1 | |
AstraZeneca PLC | | | 2.7 | |
ASML Holding NV | | | 2.5 | |
Hoya Corp. | | | 2.2 | |
Novo Nordisk A/S, B Shares | | | 2.2 | |
LVMH Moet Hennessy Louis Vuitton SE | | | 2.1 | |
TOTAL | | | 35.7 | |
Cash and cash equivalents are not included.
A note about risks
The fund may be subject to various risks as described in the fund’s prospectus. A widespread health crisis such as a global pandemic could cause substantial market volatility, exchange trading suspensions and closures, impact the ability to complete redemptions, and affect fund performance. For example, the novel coronavirus disease (COVID-19) has resulted in significant disruptions to global business activity. The impact of a health crisis and other epidemics and pandemics that may arise in the future, could affect the global economy in ways that cannot necessarily be foreseen at the present time. A health crisis may exacerbate other pre-existing political, social, and economic risks. Any such impact could adversely affect the fund’s performance, resulting in losses to your investment. For more information, please refer to the “Principal risks” section of the prospectus.
| | |
| SEMIANNUAL REPORT | JOHN HANCOCK INTERNATIONAL GROWTH FUND | | 3 |
| | | | |
TOP 10 COUNTRIES AS OF 9/30/2020 (% of net assets) | |
China | | | 23.4 | |
Switzerland | | | 12.6 | |
France | | | 9.4 | |
Japan | | | 8.7 | |
Taiwan | | | 8.1 | |
Netherlands | | | 4.7 | |
Germany | | | 4.5 | |
United Kingdom | | | 4.4 | |
Sweden | | | 4.2 | |
Denmark | | | 4.0 | |
TOTAL | | | 84.0 | |
Cash and cash equivalents are not included.
| | |
| 4 | | JOHN HANCOCK INTERNATIONAL GROWTH FUND | SEMIANNUAL REPORT |
| | | | | | | | | | | | | | | | | | | | | | | | | | | | |
TOTAL RETURNS FOR THE PERIOD ENDED SEPTEMBER 30, 2020 | |
| | | | | | | | | | | | | | | | | | | | | | |
| | | Average annual total returns (%) with maximum sales charge | | | | | | | | | Cumulative total returns (%) with maximum sales charge | |
| | | 1-year | | | 5-year | | | 10-year | | | | | | 6-month | | | 5-year | | | 10-year | |
Class A | | | 12.46 | | | | 9.34 | | | | 8.81 | | | | | | | | 26.32 | | | | 56.31 | | | | 132.67 | |
Class B | | | 12.53 | | | | 9.42 | | | | 8.73 | | | | | | | | 27.46 | | | | 56.88 | | | | 130.98 | |
Class C | | | 16.53 | | | | 9.70 | | | | 8.58 | | | | | | | | 31.50 | | | | 58.85 | | | | 127.75 | |
Class I1 | | | 18.71 | | | | 10.80 | | | | 9.73 | | | | | | | | 33.17 | | | | 67.00 | | | | 153.08 | |
Class R21,2 | | | 18.26 | | | | 10.36 | | | | 9.31 | | | | | | | | 32.93 | | | | 63.74 | | | | 143.47 | |
Class R41,2 | | | 18.57 | | | | 10.64 | | | | 9.46 | | | | | | | | 33.10 | | | | 65.78 | | | | 146.86 | |
Class R61,2 | | | 18.83 | | | | 10.92 | | | | 9.62 | | | | | | | | 33.23 | | | | 67.90 | | | | 150.62 | |
Class 11 | | | 18.79 | | | | 10.87 | | | | 9.80 | | | | | | | | 33.18 | | | | 67.54 | | | | 154.80 | |
Class NAV1,2 | | | 18.88 | | | | 10.92 | | | | 9.61 | | | | | | | | 33.23 | | | | 67.93 | | | | 150.35 | |
Index 1† | | | 17.54 | | | | 10.16 | | | | 6.38 | | | | | | | | 31.21 | | | | 62.22 | | | | 85.69 | |
Index 2† | | | 0.49 | | | | 5.26 | | | | 4.62 | | | | | | | | 20.39 | | | | 29.23 | | | | 57.06 | |
Performance figures assume all distributions have been reinvested. Figures reflect maximum sales charges on Class A shares of 5%, and the applicable contingent deferred sales charge (CDSC) on Class B and Class C shares. The Class B shares’ CDSC declines annually between years 1 to 6 according to the following schedule: 5%, 4%, 3%, 3%, 2%, and 1%. No sales charge will be assessed after the sixth year. Class C shares sold within one year of purchase are subject to a 1% CDSC. Sales charges are not applicable to Class I, Class R2, Class R4, Class R6, Class 1, and Class NAV shares.
The expense ratios of the fund, both net (including any fee waivers and/or expense limitations) and gross (excluding any fee waivers and/or expense limitations), are set forth according to the most recent publicly available prospectuses for the fund and may differ from those disclosed in the Financial highlights tables in this report. Net expenses reflect contractual fee waivers and expense limitations in effect until July 31, 2021 and are subject to change. Had the contractual fee waivers and expense limitations not been in place, gross expenses would apply. The expense ratios are as follows:
| | | | | | | | | | | | | | | | | | | | | | |
| | | Class A | | Class B | | Class C | | Class I | | Class R2 | | Class R4 | | Class R6 | | Class 1 | | Class NAV | | | |
Gross (%) | | 1.30 | | 2.00 | | 2.00 | | 1.00 | | 1.39 | | 1.24 | | 0.89 | | 0.93 | | 0.88 | | | | |
Net (%) | | 1.29 | | 1.99 | | 1.99 | | 0.99 | | 1.38 | | 1.13 | | 0.88 | | 0.92 | | 0.87 | | | | |
Please refer to the most recent prospectuses and annual or semiannual report for more information on expenses and any expense limitation arrangements for each class.
The returns reflect past results and should not be considered indicative of future performance. The return and principal value of an investment will fluctuate so that shares, when redeemed, may be worth more or less than their original cost. Due to market volatility and other factors, the fund’s current performance may be higher or lower than the performance shown. For current to the most recent month-end performance data, please call 800–225–5291 or visit the fund’s website at jhinvestments.com.
The performance table above and the chart on the next page do not reflect the deduction of taxes that a shareholder would pay on fund distributions or the redemption of fund shares. The fund’s performance results reflect any applicable fee waivers or expense reductions, without which the expenses would increase and results would have been less favorable.
| | † | Index 1 is the MSCI All Country World ex-USA Growth Index; Index 2 is the MSCI EAFE Index. |
See the following page for footnotes.
| | |
| SEMIANNUAL REPORT | JOHN HANCOCK INTERNATIONAL GROWTH FUND | | 5 |
This chart and table show what happened to a hypothetical $10,000 investment in John Hancock International Growth Fund for the share classes and periods indicated, assuming all distributions were reinvested. For comparison, we’ve shown the same investment in two separate indexes.
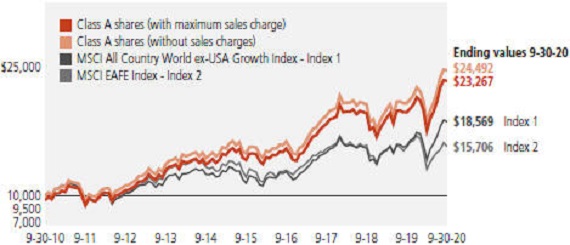
| | | | | | | | | | | | | | | | | | | | |
| | | Start date | | | With maximum
sales charge ($) | | | Without
sales charge ($) | | | Index 1 ($) | | | Index 2 ($) | |
Class B3 | | | 9-30-10 | | | | 23,098 | | | | 23,098 | | | | 18,569 | | | | 15,706 | |
Class C3 | | | 9-30-10 | | | | 22,775 | | | | 22,775 | | | | 18,569 | | | | 15,706 | |
Class I1 | | | 9-30-10 | | | | 25,308 | | | | 25,308 | | | | 18,569 | | | | 15,706 | |
Class R21,2 | | | 9-30-10 | | | | 24,347 | | | | 24,347 | | | | 18,569 | | | | 15,706 | |
Class R41,2 | | | 9-30-10 | | | | 24,686 | | | | 24,686 | | | | 18,569 | | | | 15,706 | |
Class R61,2 | | | 9-30-10 | | | | 25,062 | | | | 25,062 | | | | 18,569 | | | | 15,706 | |
Class 11 | | | 9-30-10 | | | | 25,480 | | | | 25,480 | | | | 18,569 | | | | 15,706 | |
Class NAV1,2 | | | 9-30-10 | | | | 25,035 | | | | 25,035 | | | | 18,569 | | | | 15,706 | |
The MSCI All Country World ex-USA Growth Index is a free float-adjusted market capitalization index that is designed to measure the equity performance of growth-oriented stocks in developed (excluding the U.S.) and emerging markets.
The MSCI EAFE Index is a free float-adjusted market capitalization index that is designed to measure the equity market performance of developed markets, excluding the U.S. and Canada.
It is not possible to invest directly in an index. Index figures do not reflect expenses or sales charges, which would result in lower returns.
Footnotes related to performance pages
| | 1 | For certain types of investors, as described in the fund’s prospectuses. | |
| | 2 | Class R2, Class R4, and Class R6 shares were first offered on 3-27-15. Class NAV shares were first offered on 6-2-15. The returns prior to these dates are those of Class A shares that have not been adjusted for class-specific expenses; otherwise, returns would vary. | |
| | 3 | The contingent deferred sales charge is not applicable. | |
| | |
| 6 | | JOHN HANCOCK INTERNATIONAL GROWTH FUND�� | SEMIANNUAL REPORT |
These examples are intended to help you understand your ongoing operating expenses of investing in the fund so you can compare these costs with the ongoing costs of investing in other mutual funds.
Understanding fund expenses
As a shareholder of the fund, you incur two types of costs:
| | ∎ | | Transaction costs, which include sales charges (loads) on purchases or redemptions (varies by share class), minimum account fee charge, etc. |
| | ∎ | | Ongoing operating expenses, including management fees, distribution and service fees (if applicable), and other fund expenses. |
We are presenting only your ongoing operating expenses here.
Actual expenses/actual returns
The first line of each share class in the table on the following page is intended to provide information about the fund’s actual ongoing operating expenses, and is based on the fund’s actual return. It assumes an account value of $1,000.00 on April 1, 2020, with the same investment held until September 30, 2020.
Together with the value of your account, you may use this information to estimate the operating expenses that you paid over the period. Simply divide your account value at September 30, 2020, by $1,000.00, then multiply it by the “expenses paid” for your share class from the table. For example, for an account value of $8,600.00, the operating expenses should be calculated as follows:
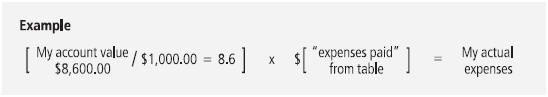
Hypothetical example for comparison purposes
The second line of each share class in the table on the following page allows you to compare the fund’s ongoing operating expenses with those of any other fund. It provides an example of the fund’s hypothetical account values and hypothetical expenses based on each class’s actual expense ratio and an assumed 5% annualized return before expenses (which is not the class’s actual return). It assumes an account value of $1,000.00 on April 1, 2020, with the same investment held until September 30, 2020. Look in any other fund shareholder report to find its hypothetical example and you will be able to compare these expenses. Please remember that these hypothetical account values and expenses may not be used to estimate the actual ending account balance or expenses you paid for the period.
| | |
| SEMIANNUAL REPORT | JOHN HANCOCK INTERNATIONAL GROWTH FUND | | 7 |
Remember, these examples do not include any transaction costs, therefore, these examples will not help you to determine the relative total costs of owning different funds. If transaction costs were included, your expenses would have been higher. See the prospectuses for details regarding transaction costs.
| | | | |
| | SHAREHOLDER EXPENSE EXAMPLE CHART | | |
| | | | | | | | | | | | | | | | | | |
| | | | | Account
value on
4-1-2020 | | | Ending
value on
9-30-2020 | | | Expenses
paid during
period ended
9-30-20201 | | | Annualized
expense
ratio | |
Class A | | Actual expenses/actual returns | | $ | 1,000.00 | | | $ | 1,329.50 | | | | $ 7.53 | | | | 1.29% | |
| | | Hypothetical example | | | 1,000.00 | | | | 1,018.60 | | | | 6.53 | | | | 1.29% | |
Class B | | Actual expenses/actual returns | | | 1,000.00 | | | | 1,324.60 | | | | 11.60 | | | | 1.99% | |
| | | Hypothetical example | | | 1,000.00 | | | | 1,015.10 | | | | 10.05 | | | | 1.99% | |
Class C | | Actual expenses/actual returns | | | 1,000.00 | | | | 1,325.00 | | | | 11.60 | | | | 1.99% | |
| | | Hypothetical example | | | 1,000.00 | | | | 1,015.10 | | | | 10.05 | | | | 1.99% | |
Class I | | Actual expenses/actual returns | | | 1,000.00 | | | | 1,331.70 | | | | 5.79 | | | | 0.99% | |
| | | Hypothetical example | | | 1,000.00 | | | | 1,020.10 | | | | 5.01 | | | | 0.99% | |
Class R2 | | Actual expenses/actual returns | | | 1,000.00 | | | | 1,329.30 | | | | 8.06 | | | | 1.38% | |
| | | Hypothetical example | | | 1,000.00 | | | | 1,018.10 | | | | 6.98 | | | | 1.38% | |
Class R4 | | Actual expenses/actual returns | | | 1,000.00 | | | | 1,331.00 | | | | 6.49 | | | | 1.11% | |
| | | Hypothetical example | | | 1,000.00 | | | | 1,019.50 | | | | 5.62 | | | | 1.11% | |
Class R6 | | Actual expenses/actual returns | | | 1,000.00 | | | | 1,332.30 | | | | 5.15 | | | | 0.88% | |
| | | Hypothetical example | | | 1,000.00 | | | | 1,020.70 | | | | 4.46 | | | | 0.88% | |
Class 1 | | Actual expenses/actual returns | | | 1,000.00 | | | | 1,331.80 | | | | 5.38 | | | | 0.92% | |
| | | Hypothetical example | | | 1,000.00 | | | | 1,020.50 | | | | 4.66 | | | | 0.92% | |
Class NAV | | Actual expenses/actual returns | | | 1,000.00 | | | | 1,332.30 | | | | 5.09 | | | | 0.87% | |
| | | Hypothetical example | | | 1,000.00 | | | | 1,020.70 | | | | 4.41 | | | | 0.87% | |
| | 1 | Expenses are equal to the annualized expense ratio, multiplied by the average account value over the period, multiplied by 183/365 (to reflect the one-half year period). | |
| | |
| 8 | | JOHN HANCOCK INTERNATIONAL GROWTH FUND | SEMIANNUAL REPORT |
AS OF 9-30-20 (unaudited)
| | | | | | | | |
| | | Shares | | | Value | |
Common stocks 98.9% | | | | | | $ | 10,440,012,719 | |
(Cost $7,299,809,393) | | | | | | | | |
| | |
Australia 2.0% | | | | | | | 209,448,549 | |
Goodman Group | | | 16,176,833 | | | | 209,448,549 | |
| | |
Canada 3.3% | | | | | | | 349,909,566 | |
Dollarama, Inc. | | | 4,739,098 | | | | 181,655,636 | |
Intact Financial Corp. | | | 1,571,318 | | | | 168,253,930 | |
| | |
China 23.4% | | | | | | | 2,466,118,521 | |
Alibaba Group Holding, Ltd., ADR (A) | | | 2,431,190 | | | | 714,721,234 | |
ANTA Sports Products, Ltd. | | | 15,121,759 | | | | 157,817,060 | |
CSPC Pharmaceutical Group, Ltd. | | | 80,099,214 | | | | 156,357,504 | |
Huazhu Group, Ltd., ADR (B) | | | 3,265,605 | | | | 141,204,760 | |
Kweichow Moutai Company, Ltd., Class A | | | 465,930 | | | | 114,593,713 | |
Li Ning Company, Ltd. | | | 27,125,427 | | | | 127,633,251 | |
Longfor Group Holdings, Ltd. (C) | | | 16,446,000 | | | | 93,186,019 | |
Shanghai International Airport Company, Ltd., Class A | | | 14,180,831 | | | | 143,982,845 | |
Shenzhou International Group Holdings, Ltd. | | | 7,220,609 | | | | 122,958,961 | |
Smoore International Holdings, Ltd. (A)(B)(C) | | | 11,000,000 | | | | 49,606,132 | |
TAL Education Group, ADR (A) | | | 1,720,168 | | | | 130,801,575 | |
Tencent Holdings, Ltd. | | | 7,598,900 | | | | 513,255,467 | |
| | |
Denmark 4.0% | | | | | | | 420,291,552 | |
DSV Panalpina A/S | | | 1,189,949 | | | | 193,013,512 | |
Novo Nordisk A/S, B Shares | | | 3,280,355 | | | | 227,278,040 | |
| | |
France 9.4% | | | | | | | 992,207,517 | |
Edenred (B) | | | 3,453,093 | | | | 155,031,658 | |
Kering SA | | | 269,702 | | | | 178,905,884 | |
L’Oreal SA | | | 529,030 | | | | 172,162,746 | |
LVMH Moet Hennessy Louis Vuitton SE | | | 476,392 | | | | 222,905,432 | |
Schneider Electric SE | | | 848,559 | | | | 105,475,576 | |
Worldline SA (A)(B)(C) | | | 1,926,222 | | | | 157,726,221 | |
| | |
Germany 4.5% | | | | | | | 472,320,479 | |
Brenntag AG | | | 2,053,937 | | | | 130,593,896 | |
Deutsche Boerse AG | | | 912,780 | | | | 160,029,815 | |
Infineon Technologies AG (B) | | | 6,446,358 | | | | 181,696,768 | |
| | |
Hong Kong 2.0% | | | | | | | 217,041,739 | |
Hong Kong Exchanges & Clearing, Ltd. | | | 4,610,700 | | | | 217,041,739 | |
| | |
Ireland 3.5% | | | | | | | 371,565,551 | |
Accenture PLC, Class A | | | 447,024 | | | | 101,022,954 | |
Experian PLC | | | 3,572,855 | | | | 134,248,419 | |
| | | | |
| SEE NOTES TO FINANCIAL STATEMENTS | | SEMIANNUAL REPORT | JOHN HANCOCK INTERNATIONAL GROWTH FUND | | 9 |
| | | | | | | | |
| | | Shares | | | Value | |
| | |
Ireland (continued) | | | | | | | | |
ICON PLC (A) | | | 713,246 | | | | $136,294,178 | |
| | |
Italy 1.1% | | | | | | | 115,485,925 | |
Nexi SpA (A)(C) | | | 5,762,097 | | | | 115,485,925 | |
| | |
Japan 8.7% | | | | | | | 919,333,640 | |
Bandai Namco Holdings, Inc. | | | 1,872,300 | | | | 137,183,555 | |
Hoya Corp. | | | 2,077,400 | | | | 234,572,387 | |
Keyence Corp. | | | 458,000 | | | | 214,105,521 | |
Recruit Holdings Company, Ltd. | | | 5,011,500 | | | | 199,033,527 | |
SMC Corp. | | | 241,000 | | | | 134,438,650 | |
| | |
Netherlands 4.7% | | | | | | | 491,987,167 | |
ASM International NV | | | 709,646 | | | | 101,723,306 | |
ASML Holding NV | | | 713,479 | | | | 263,541,455 | |
Wolters Kluwer NV | | | 1,485,557 | | | | 126,722,406 | |
| | |
Spain 2.0% | | | | | | | 211,324,505 | |
Cellnex Telecom SA (A)(C) | | | 3,481,285 | | | | 211,324,505 | |
| | |
Sweden 4.2% | | | | | | | 446,824,745 | |
Alfa Laval AB (A) | | | 5,790,591 | | | | 127,824,474 | |
EQT AB (B) | | | 7,585,563 | | | | 147,194,538 | |
Swedish Match AB | | | 2,101,169 | | | | 171,805,733 | |
| | |
Switzerland 12.6% | | | | | | | 1,328,345,352 | |
Julius Baer Group, Ltd. | | | 2,815,493 | | | | 119,580,730 | |
Kuehne + Nagel International AG (B) | | | 665,000 | | | | 129,125,339 | |
Nestle SA | | | 3,872,817 | | | | 460,911,853 | |
Novartis AG | | | 1,121,501 | | | | 97,373,563 | |
Partners Group Holding AG | | | 217,259 | | | | 199,835,709 | |
Roche Holding AG | | | 938,628 | | | | 321,518,158 | |
| | |
Taiwan 8.1% | | | | | | | 851,555,679 | |
Accton Technology Corp. | | | 22,527,000 | | | | 174,284,286 | |
MediaTek, Inc. | | | 7,580,364 | | | | 160,620,118 | |
Taiwan Semiconductor Manufacturing Company, Ltd. | | | 34,342,501 | | | | 516,651,275 | |
| | |
United Kingdom 4.4% | | | | | | | 467,991,975 | |
AstraZeneca PLC | | | 2,671,565 | | | | 291,908,465 | |
BAE Systems PLC | | | 4,603,158 | | | | 28,588,108 | |
IHS Markit, Ltd. | | | 1,878,683 | | | | 147,495,402 | |
| | |
United States 1.0% | | | | | | | 108,260,257 | |
Aon PLC, Class A | | | 524,771 | | | | 108,260,257 | |
| | | | |
| 10 | | JOHN HANCOCK INTERNATIONAL GROWTH FUND | SEMIANNUAL REPORT | | SEE NOTES TO FINANCIAL STATEMENTS |
| | | | | | | | | | | | |
| | | Yield (%) | | | Shares | | | Value | |
Short-term investments 1.5% | | | | | | | | | | | $154,948,684 | |
(Cost $154,931,667) | | | | | | | | | | | | |
| | | |
Short-term funds 0.7% | | | | | | | | | | | 75,048,684 | |
John Hancock Collateral Trust (D) | | | 0.2185(E) | | | | 7,497,446 | | | | 75,048,684 | |
| | | |
| | | | | | Par value^ | | | Value | |
| | | |
Repurchase agreement 0.8% | | | | | | | | | | | 79,900,000 | |
Bank of America Corp. Tri-Party Repurchase Agreement dated 9-30-20 at 0.080% to be repurchased at $31,100,069 on 10-1-20, collateralized by $30,241,190 Government National Mortgage Association, 3.000% due 7-20-49 (valued at $31,722,000) | | | | | | | 31,100,000 | | | | 31,100,000 | |
Societe Generale Tri-Party Repurchase Agreement dated 9-30-20 at 0.060% to be repurchased at $48,800,081 on 10-1-20, collateralized by $4,598,182 Federal Home Loan Mortgage Corp., 4.000% due 5-1-49 (valued at $4,966,544), $37,862,015 Federal National Mortgage Association, 2.500% - 4.500% due 3-1-48 to 7-1-50 (valued at $40,637,860), and $4,003,486 Government National Mortgage Association, 2.000% - 3.125% due 6-20-26 to 8-20-50 (valued at $4,171,596) | | | | | | | 48,800,000 | | | | 48,800,000 | |
| | | | | | | | | | | | |
Total investments (Cost $7,454,741,060) 100.4% | | | | | | | | | | $ | 10,594,961,403 | |
| | | | | | | | | | | | |
Other assets and liabilities, net (0.4%) | | | | | | | | | | | (41,697,629 | ) |
| | | | | | | | | | | | |
Total net assets 100.0% | | | | | | | | | | $ | 10,553,263,774 | |
The percentage shown for each investment category is the total value of the category as a percentage of the net assets of the fund.
^All par values are denominated in U.S. dollars unless otherwise indicated.
Security Abbreviations and Legend
| | |
| ADR | | American Depositary Receipt |
| |
| (A) | | Non-income producing security. |
| |
| (B) | | All or a portion of this security is on loan as of 9-30-20. |
| |
| (C) | | These securities are exempt from registration under Rule 144A of the Securities Act of 1933. Such securities may be resold, normally to qualified institutional buyers, in transactions exempt from registration. |
| |
| (D) | | Investment is an affiliate of the fund, the advisor and/or subadvisor. This security represents the investment of cash collateral received for securities lending. |
| |
| (E) | | The rate shown is the annualized seven-day yield as of 9-30-20. |
At 9-30-20, the aggregate cost of investments for federal income tax purposes was $7,506,243,883. Net unrealized appreciation aggregated to $3,088,717,520, of which $3,110,225,330 related to gross unrealized appreciation and $21,507,810 related to gross unrealized depreciation.
| | | | |
| SEE NOTES TO FINANCIAL STATEMENTS | | SEMIANNUAL REPORT | JOHN HANCOCK INTERNATIONAL GROWTH FUND | | 11 |
STATEMENT OF ASSETS AND LIABILITIES 9-30-20 (unaudited)
| | | | |
Assets | | | | |
Unaffiliated investments, at value (Cost $7,379,709,393) including $72,862,845 of securities loaned | | $ | 10,519,912,719 | |
Affiliated investments, at value (Cost $75,031,667) | | | 75,048,684 | |
Total investments, at value (Cost $7,454,741,060) | | | 10,594,961,403 | |
Foreign currency, at value (Cost $1,442,225) | | | 1,442,731 | |
Dividends and interest receivable | | | 20,780,485 | |
Receivable for fund shares sold | | | 27,120,724 | |
Receivable for investments sold | | | 94,032,005 | |
Receivable for securities lending income | | | 21,944 | |
Other assets | | | 228,506 | |
Total assets | | | 10,738,587,798 | |
Liabilities | | | | |
Due to custodian | | | 7,852,146 | |
Foreign capital gains tax payable | | | 2,632,516 | |
Payable for investments purchased | | | 66,605,054 | |
Payable for fund shares repurchased | | | 30,575,327 | |
Payable upon return of securities loaned | | | 75,018,498 | |
Payable to affiliates | | | | |
Accounting and legal services fees | | | 563,020 | |
Transfer agent fees | | | 723,736 | |
Distribution and service fees | | | 7,113 | |
Trustees’ fees | | | 7,904 | |
Other liabilities and accrued expenses | | | 1,338,710 | |
Total liabilities | | | 185,324,024 | |
Net assets | | $ | 10,553,263,774 | |
Net assets consist of | | | | |
Paid-in capital | | | $7,729,697,204 | |
Total distributable earnings (loss) | | | 2,823,566,570 | |
Net assets | | $ | 10,553,263,774 | |
| | |
| 12 | | JOHN HANCOCK INTERNATIONAL GROWTH FUND | SEMIANNUAL REPORT |
STATEMENT OF ASSETS AND LIABILITIES (continued)
| | | | |
Net asset value per share | | | | |
Based on net asset value and shares outstanding - the fund has an unlimited number of shares authorized with no par value | | | | |
Class A ($562,655,475 ÷ 17,219,178 shares)1 | | $ | 32.68 | |
Class B ($188,595 ÷ 5,913 shares)1 | | $ | 31.89 | |
Class C ($209,751,983 ÷ 6,587,406 shares)1 | | $ | 31.84 | |
Class I ($6,680,278,201 ÷ 203,662,659 shares) | | $ | 32.80 | |
Class R2 ($31,750,294 ÷ 970,979 shares) | | $ | 32.70 | |
Class R4 ($9,366,141 ÷ 285,814 shares) | | $ | 32.77 | |
Class R6 ($1,937,045,923 ÷ 58,977,590 shares) | | $ | 32.84 | |
Class 1 ($76,031,835 ÷ 2,318,450 shares) | | $ | 32.79 | |
Class NAV ($1,046,195,327 ÷ 31,895,551 shares) | | $ | 32.80 | |
Maximum offering price per share | | | | |
Class A (net asset value per share ÷ 95%)2 | | $ | 34.40 | |
| 1 | Redemption price per share is equal to net asset value less any applicable contingent deferred sales charge. |
| 2 | On single retail sales of less than $50,000. On sales of $50,000 or more and on group sales the offering price is reduced. |
| | |
| SEMIANNUAL REPORT | JOHN HANCOCK INTERNATIONAL GROWTH FUND | | 13 |
STATEMENT OF OPERATIONS For the six months ended 9-30-20 (unaudited)
| | | | |
Investment income | | | | |
Dividends | | | $88,650,283 | |
Securities lending | | | 608,332 | |
Interest | | | 34,059 | |
Less foreign taxes withheld | | | (10,234,813 | ) |
Total investment income | | | 79,057,861 | |
Expenses | | | | |
Investment management fees | | | 37,919,755 | |
Distribution and service fees | | | 1,897,309 | |
Accounting and legal services fees | | | 888,161 | |
Transfer agent fees | | | 4,144,835 | |
Trustees’ fees | | | 81,728 | |
Custodian fees | | | 1,665,738 | |
State registration fees | | | 85,777 | |
Printing and postage | | | 219,446 | |
Professional fees | | | 81,682 | |
Other | | | 187,995 | |
Total expenses | | | 47,172,426 | |
Less expense reductions | | | (325,133 | ) |
Net expenses | | | 46,847,293 | |
Net investment income | | | 32,210,568 | |
Realized and unrealized gain (loss) | | | | |
Net realized gain (loss) on | | | | |
Unaffiliated investments and foreign currency transactions | | | 90,271,655 | |
Affiliated investments | | | 54,823 | |
| | | 90,326,478 | |
Change in net unrealized appreciation (depreciation) of | | | | |
Unaffiliated investments and translation of assets and liabilities in foreign currencies | | | 2,443,042,916 | |
Affiliated investments | | | 16,415 | |
| | | 2,443,059,331 | |
Net realized and unrealized gain | | | 2,533,385,809 | |
Increase in net assets from operations | | | $2,565,596,377 | |
| | |
| 14 | | JOHN HANCOCK INTERNATIONAL GROWTH FUND | SEMIANNUAL REPORT |
STATEMENTS OF CHANGES IN NET ASSETS
| | | | | | | | |
| | |
| | | Six months ended 9-30-20 (unaudited) | | Year ended 3-31-20 | |
| | |
Increase (decrease) in net assets | | | | | | | | |
From operations | | | | | | | | |
Net investment income | | | $32,210,568 | | | | $68,354,617 | |
Net realized gain (loss) | | | 90,326,478 | | | | (55,580,903 | ) |
Change in net unrealized appreciation (depreciation) | | | 2,443,059,331 | | | | (639,220,464 | ) |
Increase (decrease) in net assets resulting from operations | | | 2,565,596,377 | | | | (626,446,750 | ) |
Distributions to shareholders | | | | | | | | |
From earnings | | | | | | | | |
Class A | | | — | | | | (2,418,886 | ) |
Class I | | | — | | | | (39,918,280 | ) |
Class R2 | | | — | | | | (119,573 | ) |
Class R4 | | | — | | | | (54,100 | ) |
Class R6 | | | — | | | | (14,116,540 | ) |
Class 1 | | | — | | | | (571,277 | ) |
Class NAV | | | — | | | | (8,104,635 | ) |
Total distributions | | | — | | | | (65,303,291 | ) |
From fund share transactions | | | 289,225,953 | | | | (1,050,898,927 | ) |
Total increase (decrease) | | | 2,854,822,330 | | | | (1,742,648,968 | ) |
Net assets | | | | | | | | |
Beginning of period | | | 7,698,441,444 | | | | 9,441,090,412 | |
End of period | | | $10,553,263,774 | | | | $7,698,441,444 | |
| | |
| SEMIANNUAL REPORT | JOHN HANCOCK INTERNATIONAL GROWTH FUND | | 15 |
| | | | | | | | | | | | | | | | | | | | | | | | | | | | |
| | | | | | | |
| CLASS A SHARES Period ended | | 9-30-201 | | | 3-31-20 | | | 3-31-19 | | | 3-31-182 | | | 2-28-18 | | | 2-28-17 | | | 2-29-16 | |
Per share operating performance | | | | | | | | | | | | | | | | | | | | | | | | | | | | |
Net asset value, beginning of period | | | $24.58 | | | | $26.79 | | | | $28.52 | | | | $28.43 | | | | $21.69 | | | | $19.90 | | | | $21.64 | |
Net investment income3 | | | 0.06 | | | | 0.13 | | | | 0.19 | | | | 0.02 | | | | 0.11 | | | | 0.17 | | | | 0.10 | |
Net realized and unrealized gain (loss) on investments | | | 8.04 | | | | (2.22 | ) | | | (1.31 | ) | | | 0.07 | | | | 6.69 | | | | 1.75 | | | | (1.81 | ) |
Total from investment operations | | | 8.10 | | | | (2.09 | ) | | | (1.12 | ) | | | 0.09 | | | | 6.80 | | | | 1.92 | | | | (1.71 | ) |
Less distributions | | | | | | | | | | | | | | | | | | | | | | | | | | | | |
From net investment income | | | — | | | | (0.12 | ) | | | (0.15 | ) | | | — | | | | (0.06 | ) | | | (0.13 | ) | | | (0.03 | ) |
From net realized gain | | | — | | | | — | | | | (0.46 | ) | | | — | | | | — | | | | — | | | | — | |
Total distributions | | | — | | | | (0.12 | ) | | | (0.61 | ) | | | — | | | | (0.06 | ) | | | (0.13 | ) | | | (0.03 | ) |
Net asset value, end of period | | | $32.68 | | | | $24.58 | | | | $26.79 | | | | $28.52 | | | | $28.43 | | | | $21.69 | | | | $19.90 | |
Total return (%)4,5 | | | 32.95 | 6 | | | (7.87 | ) | | | (3.69 | ) | | | 0.32 | 6 | | | 31.38 | | | | 9.62 | | | | (7.86 | ) |
Ratios and supplemental data | | | | | | | | | | | | | | | | | | | | | | | | | | | | |
Net assets, end of period (in millions) | | | $563 | | | | $456 | | | | $609 | | | | $827 | | | | $803 | | | | $427 | | | | $615 | |
Ratios (as a percentage of average net assets): | | | | | | | | | | | | | | | | | | | | | | | | | | | | |
Expenses before reductions | | | 1.30 | 7 | | | 1.30 | | | | 1.28 | | | | 1.29 | 7 | | | 1.29 | | | | 1.32 | | | | 1.38 | |
Expenses including reductions | | | 1.29 | 7 | | | 1.29 | | | | 1.28 | | | | 1.28 | 7 | | | 1.28 | | | | 1.32 | | | | 1.37 | |
Net investment income | | | 0.41 | 7 | | | 0.45 | | | | 0.72 | | | | 0.69 | 7 | | | 0.41 | | | | 0.79 | | | | 0.48 | |
Portfolio turnover (%) | | | 37 | | | | 80 | | | | 98 | | | | 4 | | | | 65 | | | | 94 | | | | 82 | |
| 1 | Six months ended 9-30-20. Unaudited. |
| 2 | For the one-month period ended 3-31-18. The fund changed its fiscal year end from February 28 to March 31. |
| 3 | Based on average daily shares outstanding. |
| 4 | Total returns would have been lower had certain expenses not been reduced during the applicable periods. |
| 5 | Does not reflect the effect of sales charges, if any. |
| | | | |
| 16 | | JOHN HANCOCK INTERNATIONAL GROWTH FUND | SEMIANNUAL REPORT | | SEE NOTES TO FINANCIAL STATEMENTS |
| | | | | | | | | | | | | | | | | | | | | | | | | | | | |
| | | | | | | |
| CLASS B SHARES Period ended | | 9-30-201 | | | 3-31-20 | | | 3-31-19 | | | 3-31-182 | | | 2-28-18 | | | 2-28-17 | | | 2-29-16 | |
Per share operating performance | | | | | | | | | | | | | | | | | | | | | | | | | | | | |
Net asset value, beginning of period | | | $24.08 | | | | $26.33 | | | | $28.06 | | | | $27.99 | | | | $21.45 | | | | $19.70 | | | | $21.55 | |
Net investment income (loss)3 | | | (0.03 | ) | | | (0.06 | ) | | | 0.02 | | | | — | 4 | | | (0.04 | ) | | | 0.04 | | | | 0.02 | |
Net realized and unrealized gain (loss) on investments | | | 7.84 | | | | (2.19 | ) | | | (1.29 | ) | | | 0.07 | | | | 6.58 | | | | 1.71 | | | | (1.87 | ) |
Total from investment operations | | | 7.81 | | | | (2.25 | ) | | | (1.27 | ) | | | 0.07 | | | | 6.54 | | | | 1.75 | | | | (1.85 | ) |
Less distributions | | | | | | | | | | | | | | | | | | | | | | | | | | | | |
From net investment income | | | — | | | | — | | | | — | | | | — | | | | — | | | | — | | | | — | |
From net realized gain | | | — | | | | — | | | | (0.46 | ) | | | — | | | | — | | | | — | | | | — | |
Total distributions | | | — | | | | — | | | | (0.46 | ) | | | — | | | | — | | | | — | | | | — | |
Net asset value, end of period | | | $31.89 | | | | $24.08 | | | | $26.33 | | | | $28.06 | | | | $27.99 | | | | $21.45 | | | | $19.70 | |
Total return (%)5,6 | | | 32.46 | 7 | | | (8.51 | ) | | | (4.36 | ) | | | 0.25 | 7 | | | 30.49 | | | | 8.88 | | | | (8.58 | ) |
Ratios and supplemental data | | | | | | | | | | | | | | | | | | | | | | | | | | | | |
Net assets, end of period (in millions) | | | $— | 8 | | | $— | 8 | | | $1 | | | | $2 | | | | $2 | | | | $2 | | | | $2 | |
Ratios (as a percentage of average net assets): | | | | | | | | | | | | | | | | | | | | | | | | | | | | |
Expenses before reductions | | | 2.00 | 9 | | | 2.00 | | | | 1.98 | | | | 1.99 | 9 | | | 1.99 | | | | 2.03 | | | | 2.32 | |
Expenses including reductions | | | 1.99 | 9 | | | 1.99 | | | | 1.98 | | | | 1.98 | 9 | | | 1.98 | | | | 2.02 | | | | 2.12 | |
Net investment income (loss) | | | (0.22 | )9 | | | (0.21 | ) | | | 0.08 | | | | (0.01 | )9 | | | (0.15 | ) | | | 0.19 | | | | 0.07 | |
Portfolio turnover (%) | | | 37 | | | | 80 | | | | 98 | | | | 4 | | | | 65 | | | | 94 | | | | 82 | |
| 1 | Six months ended 9-30-20. Unaudited. |
| 2 | For the one-month period ended 3-31-18. The fund changed its fiscal year end from February 28 to March 31. |
| 3 | Based on average daily shares outstanding. |
| 4 | Less than $0.005 per share. |
| 5 | Total returns would have been lower had certain expenses not been reduced during the applicable periods. |
| 6 | Does not reflect the effect of sales charges, if any. |
| | | | |
| SEE NOTES TO FINANCIAL STATEMENTS | | SEMIANNUAL REPORT | JOHN HANCOCK INTERNATIONAL GROWTH FUND | | 17 |
| | | | | | | | | | | | | | | | | | | | | | | | | | | | |
| | | | | | | |
| CLASS C SHARES Period ended | | 9-30-201 | | | 3-31-20 | | | 3-31-19 | | | 3-31-182 | | | 2-28-18 | | | 2-28-17 | | | 2-29-16 | |
Per share operating performance | | | | | | | | | | | | | | | | | | | | | | | | | | | | |
Net asset value, beginning of period | | | $24.03 | | | | $26.27 | | | | $28.00 | | | | $27.93 | | | | $21.40 | | | | $19.66 | | | | $21.49 | |
Net investment income (loss)3 | | | (0.04 | ) | | | (0.06 | ) | | | — | 4 | | | — | 4 | | | (0.09 | ) | | | 0.01 | | | | (0.07 | ) |
Net realized and unrealized gain (loss) on investments | | | 7.85 | | | | (2.18 | ) | | | (1.27 | ) | | | 0.07 | | | | 6.62 | | | | 1.73 | | | | (1.76 | ) |
Total from investment operations | | | 7.81 | | | | (2.24 | ) | | | (1.27 | ) | | | 0.07 | | | | 6.53 | | | | 1.74 | | | | (1.83 | ) |
Less distributions | | | | | | | | | | | | | | | | | | | | | | | | | | | | |
From net investment income | | | — | | | | — | | | | — | | | | — | | | | — | | | | — | | | | — | |
From net realized gain | | | — | | | | — | | | | (0.46 | ) | | | — | | | | — | | | | — | | | | — | |
Total distributions | | | — | | | | — | | | | (0.46 | ) | | | — | | | | — | | | | — | | | | — | |
Net asset value, end of period | | | $31.84 | | | | $24.03 | | | | $26.27 | | | | $28.00 | | | | $27.93 | | | | $21.40 | | | | $19.66 | |
Total return (%)5,6 | | | 32.50 | 7 | | | (8.53 | ) | | | (4.37 | ) | | | 0.25 | 7 | | | 30.51 | | | | 8.85 | | | | (8.52 | ) |
Ratios and supplemental data | | | | | | | | | | | | | | | | | | | | | | | | | | | | |
Net assets, end of period (in millions) | | | $210 | | | | $181 | | | | $263 | | | | $349 | | | | $333 | | | | $145 | | | | $113 | |
Ratios (as a percentage of average net assets): | | | | | | | | | | | | | | | | | | | | | | | | | | | | |
Expenses before reductions | | | 2.00 | 8 | | | 2.00 | | | | 1.98 | | | | 1.99 | 8 | | | 1.99 | | | | 2.03 | | | | 2.08 | |
Expenses including reductions | | | 1.99 | 8 | | | 1.99 | | | | 1.98 | | | | 1.98 | 8 | | | 1.98 | | | | 2.02 | | | | 2.07 | |
Net investment income (loss) | | | (0.28 | )8 | | | (0.24 | ) | | | (0.01 | ) | | | (0.01 | )8 | | | (0.33 | ) | | | 0.03 | | | | (0.33 | ) |
Portfolio turnover (%) | | | 37 | | | | 80 | | | | 98 | | | | 4 | | | | 65 | | | | 94 | | | | 82 | |
| 1 | Six months ended 9-30-20. Unaudited. |
| 2 | For the one-month period ended 3-31-18. The fund changed its fiscal year end from February 28 to March 31. |
| 3 | Based on average daily shares outstanding. |
| 4 | Less than $0.005 per share. |
| 5 | Total returns would have been lower had certain expenses not been reduced during the applicable periods. |
| 6 | Does not reflect the effect of sales charges, if any. |
| | | | |
| 18 | | JOHN HANCOCK INTERNATIONAL GROWTH FUND | SEMIANNUAL REPORT | | SEE NOTES TO FINANCIAL STATEMENTS |
| | | | | | | | | | | | | | | | | | | | | | | | | | | | |
CLASS I SHARES Period ended | | 9-30-201 | | | 3-31-20 | | | 3-31-19 | | | 3-31-182 | | | 2-28-18 | | | 2-28-17 | | | 2-29-16 | |
Per share operating performance | | | | | | | | | | | | | | | | | | | | | | | | | | | | |
Net asset value, beginning of period | | | $24.63 | | | | $26.84 | | | | $28.59 | | | | $28.49 | | | | $21.72 | | | | $19.94 | | | | $21.67 | |
Net investment income3 | | | 0.10 | | | | 0.21 | | | | 0.24 | | | | 0.02 | | | | 0.18 | | | | 0.20 | | | | 0.16 | |
Net realized and unrealized gain (loss) on investments | | | 8.07 | | | | (2.22 | ) | | | (1.30 | ) | | | 0.08 | | | | 6.72 | | | | 1.77 | | | | (1.80 | ) |
Total from investment operations | | | 8.17 | | | | (2.01 | ) | | | (1.06 | ) | | | 0.10 | | | | 6.90 | | | | 1.97 | | | | (1.64 | ) |
Less distributions | | | | | | | | | | | | | | | | | | | | | | | | | | | | |
From net investment income | | | — | | | | (0.20 | ) | | | (0.23 | ) | | | — | | | | (0.13 | ) | | | (0.19 | ) | | | (0.09 | ) |
From net realized gain | | | — | | | | — | | | | (0.46 | ) | | | — | | | | — | | | | — | | | | — | |
Total distributions | | | — | | | | (0.20 | ) | | | (0.69 | ) | | | — | | | | (0.13 | ) | | | (0.19 | ) | | | (0.09 | ) |
Net asset value, end of period | | | $32.80 | | | | $24.63 | | | | $26.84 | | | | $28.59 | | | | $28.49 | | | | $21.72 | | | | $19.94 | |
Total return (%)4 | | | 33.17 | 5 | | | (7.61 | ) | | | (3.45 | ) | | | 0.35 | 5 | | | 31.82 | | | | 9.96 | | | | (7.59 | ) |
Ratios and supplemental data | | | | | | | | | | | | | | | | | | | | | | | | | | | | |
Net assets, end of period (in millions) | | | $6,680 | | | | $4,677 | | | | $5,576 | | | | $5,631 | | | | $5,424 | | | | $2,380 | | | | $1,168 | |
Ratios (as a percentage of average net assets): | | | | | | | | | | | | | | | | | | | | | | | | | | | | |
Expenses before reductions | | | 1.00 | 6 | | | 1.00 | | | | 1.00 | | | | 1.00 | 6 | | | 0.99 | | | | 1.02 | | | | 1.06 | |
Expenses including reductions | | | 0.99 | 6 | | | 0.99 | | | | 0.99 | | | | 0.99 | 6 | | | 0.98 | | | | 1.01 | | | | 1.06 | |
Net investment income | | | 0.68 | 6 | | | 0.74 | | | | 0.89 | | | | 0.98 | 6 | | | 0.70 | | | | 0.94 | | | | 0.73 | |
Portfolio turnover (%) | | | 37 | | | | 80 | | | | 98 | | | | 4 | | | | 65 | | | | 94 | | | | 82 | |
| 1 | Six months ended 9-30-20. Unaudited. |
| 2 | For the one-month period ended 3-31-18. The fund changed its fiscal year end from February 28 to March 31. |
| 3 | Based on average daily shares outstanding. |
| 4 | Total returns would have been lower had certain expenses not been reduced during the applicable periods. |
| | | | |
| SEE NOTES TO FINANCIAL STATEMENTS | | SEMIANNUAL REPORT | JOHN HANCOCK INTERNATIONAL GROWTH FUND | | 19 |
| | | | | | | | | | | | | | | | | | | | | | | | | | | | |
| | | | | | | |
| CLASS R2 SHARES Period ended | | 9-30-201 | | | 3-31-20 | | | 3-31-19 | | | 3-31-182
| | | 2-28-18 | | | 2-28-17 | | | 2-29-163
| |
Per share operating performance | | | | | | | | | | | | | | | | | | | | | | | | | | | | |
Net asset value, beginning of period | | | $24.60 | | | | $26.82 | | | | $28.55 | | | | $28.45 | | | | $21.71 | | | | $19.92 | | | | $21.46 | |
Net investment income (loss)4 | | | 0.05 | | | | 0.12 | | | | 0.15 | | | | 0.02 | | | | 0.13 | | | | (0.02 | ) | | | 0.02 | |
Net realized and unrealized gain (loss) on investments | | | 8.05 | | | | (2.25 | ) | | | (1.30 | ) | | | 0.08 | | | | 6.65 | | | | 1.91 | | | | (1.56 | ) |
Total from investment operations | | | 8.10 | | | | (2.13 | ) | | | (1.15 | ) | | | 0.10 | | | | 6.78 | | | | 1.89 | | | | (1.54 | ) |
Less distributions | | | | | | | | | | | | | | | | | | | | | | | | | | | | |
From net investment income | | | — | | | | (0.09 | ) | | | (0.12 | ) | | | — | | | | (0.04 | ) | | | (0.10 | ) | | | — | |
From net realized gain | | | — | | | | — | | | | (0.46 | ) | | | — | | | | — | | | | — | | | | — | |
Total distributions | | | — | | | | (0.09 | ) | | | (0.58 | ) | | | — | | | | (0.04 | ) | | | (0.10 | ) | | | — | |
Net asset value, end of period | | | $32.70 | | | | $24.60 | | | | $26.82 | | | | $28.55 | | | | $28.45 | | | | $21.71 | | | | $19.92 | |
Total return (%)5 | | | 32.93 | 6 | | | (7.98 | ) | | | (3.81 | ) | | | 0.35 | 6 | | | 31.23 | | | | 9.54 | | | | (7.18 | )6 |
Ratios and supplemental data | | | | | | | | | | | | | | | | | | | | | | | | | | | | |
Net assets, end of period (in millions) | | | $32 | | | | $30 | | | | $43 | | | | $43 | | | | $37 | | | | $12 | | | | $1 | |
Ratios (as a percentage of average net assets): | | | | | | | | | | | | | | | | | | | | | | | | | | | | |
Expenses before reductions | | | 1.39 | 7 | | | 1.39 | | | | 1.38 | | | | 1.32 | 7 | | | 1.40 | | | | 1.42 | | | | 1.90 | 7 |
Expenses including reductions | | | 1.38 | 7 | | | 1.38 | | | | 1.37 | | | | 1.31 | 7 | | | 1.39 | | | | 1.42 | | | | 1.52 | 7 |
Net investment income (loss) | | | 0.34 | 7 | | | 0.41 | | | | 0.54 | | | | 0.71 | 7 | | | 0.49 | | | | (0.08 | ) | | | 0.11 | 7 |
Portfolio turnover (%) | | | 37 | | | | 80 | | | | 98 | | | | 4 | | | | 65 | | | | 94 | | | | 82 | 8 |
| 1 | Six months ended 9-30-20. Unaudited. |
| 2 | For the one-month period ended 3-31-18. The fund changed its fiscal year end from February 28 to March 31. |
| 3 | The inception date for Class R2 shares is 3-27-15. |
| 4 | Based on average daily shares outstanding. |
| 5 | Total returns would have been lower had certain expenses not been reduced during the applicable periods. |
| 8 | Portfolio turnover is shown for the period from 3-1-15 to 2-29-16. |
| | | | |
| 20 | | JOHN HANCOCK INTERNATIONAL GROWTH FUND | SEMIANNUAL REPORT | | SEE NOTES TO FINANCIAL STATEMENTS |
| | | | | | | | | | | | | | | | | | | | | | | | | | | | |
| | | | | | | |
| CLASS R4 SHARES Period ended | | 9-30-201 | | | 3-31-20 | | | 3-31-19 | | | 3-31-182 | | | 2-28-18 | | | 2-28-17 | | | 2-29-163
| |
Per share operating performance | | | | | | | | | | | | | | | | | | | | | | | | | | | | |
Net asset value, beginning of period | | | $24.62 | | | | $26.84 | | | | $28.57 | | | | $28.48 | | | | $21.72 | | | | $19.94 | | | | $21.46 | |
Net investment income4 | | | 0.09 | | | | 0.16 | | | | 0.22 | | | | 0.02 | | | | 0.17 | | | | 0.19 | | | | 0.05 | |
Net realized and unrealized gain (loss) on investments | | | 8.06 | | | | (2.22 | ) | | | (1.30 | ) | | | 0.07 | | | | 6.69 | | | | 1.75 | | | | (1.54 | ) |
Total from investment operations | | | 8.15 | | | | (2.06 | ) | | | (1.08 | ) | | | 0.09 | | | | 6.86 | | | | 1.94 | | | | (1.49 | ) |
Less distributions | | | | | | | | | | | | | | | | | | | | | | | | | | | | |
From net investment income | | | — | | | | (0.16 | ) | | | (0.19 | ) | | | — | | | | (0.10 | ) | | | (0.16 | ) | | | (0.03 | ) |
From net realized gain | | | — | | | | — | | | | (0.46 | ) | | | — | | | | — | | | | — | | | | — | |
Total distributions | | | — | | | | (0.16 | ) | | | (0.65 | ) | | | — | | | | (0.10 | ) | | | (0.16 | ) | | | (0.03 | ) |
Net asset value, end of period | | | $32.77 | | | | $24.62 | | | | $26.84 | | | | $28.57 | | | | $28.48 | | | | $21.72 | | | | $19.94 | |
Total return (%)5 | | | 33.10 | 6 | | | (7.77 | ) | | | (3.53 | ) | | | 0.32 | 6 | | | 31.60 | | | | 9.81 | | | | (6.95 | )6 |
Ratios and supplemental data | | | | | | | | | | | | | | | | | | | | | | | | | | | | |
Net assets, end of period (in millions) | | | $9 | | | | $7 | | | | $8 | | | | $8 | | | | $9 | | | | $5 | | | | $3 | |
Ratios (as a percentage of average net assets): | | | | | | | | | | | | | | | | | | | | | | | | | | | | |
Expenses before reductions | | | 1.22 | 7 | | | 1.24 | | | | 1.24 | | | | 1.25 | 7 | | | 1.24 | | | | 1.25 | | | | 1.66 | 7 |
Expenses including reductions | | | 1.11 | 7 | | | 1.13 | | | | 1.13 | | | | 1.14 | 7 | | | 1.13 | | | | 1.14 | | | | 1.24 | 7 |
Net investment income | | | 0.58 | 7 | | | 0.58 | | | | 0.80 | | | | 0.83 | 7 | | | 0.64 | | | | 0.88 | | | | 0.24 | 7 |
Portfolio turnover (%) | | | 37 | | | | 80 | | | | 98 | | | | 4 | | | | 65 | | | | 94 | | | | 82 | 8 |
| 1 | Six months ended 9-30-20. Unaudited. |
| 2 | For the one-month period ended 3-31-18. The fund changed its fiscal year end from February 28 to March 31. |
| 3 | The inception date for Class R4 shares is 3-27-15. |
| 4 | Based on average daily shares outstanding. |
| 5 | Total returns would have been lower had certain expenses not been reduced during the applicable periods. |
| 8 | Portfolio turnover is shown for the period from 3-1-15 to 2-29-16. |
| | | | |
| SEE NOTES TO FINANCIAL STATEMENTS | | SEMIANNUAL REPORT | JOHN HANCOCK INTERNATIONAL GROWTH FUND | | 21 |
| | | | | | | | | | | | | | | | | | | | | | | | | | | | |
| | | | | | | |
| CLASS R6 SHARES Period ended | | 9-30-201 | | | 3-31-20 | | | 3-31-19 | | | 3-31-182
| | | 2-28-18 | | | 2-28-17 | | | 2-29-163
| |
Per share operating performance | | | | | | | | | | | | | | | | | | | | | | | | | | | | |
Net asset value, beginning of period | | | $24.65 | | | | $26.86 | | | | $28.61 | | | | $28.50 | | | | $21.73 | | | | $19.95 | | | | $21.46 | |
Net investment income4 | | | 0.12 | | | | 0.24 | | | | 0.27 | | | | 0.03 | | | | 0.05 | | | | 0.20 | | | | 0.12 | |
Net realized and unrealized gain (loss) on investments | | | 8.07 | | | | (2.22 | ) | | | (1.30 | ) | | | 0.08 | | | | 6.88 | | | | 1.79 | | | | (1.53 | ) |
Total from investment operations | | | 8.19 | | | | (1.98 | ) | | | (1.03 | ) | | | 0.11 | | | | 6.93 | | | | 1.99 | | | | (1.41 | ) |
Less distributions | | | | | | | | | | | | | | | | | | | | | | | | | | | | |
From net investment income | | | — | | | | (0.23 | ) | | | (0.26 | ) | | | — | | | | (0.16 | ) | | | (0.21 | ) | | | (0.10 | ) |
From net realized gain | | | — | | | | — | | | | (0.46 | ) | | | — | | | | — | | | | — | | | | — | |
Total distributions | | | — | | | | (0.23 | ) | | | (0.72 | ) | | | — | | | | (0.16 | ) | | | (0.21 | ) | | | (0.10 | ) |
Net asset value, end of period | | | $32.84 | | | | $24.65 | | | | $26.86 | | | | $28.61 | | | | $28.50 | | | | $21.73 | | | | $19.95 | |
Total return (%)5 | | | 33.23 | 6 | | | (7.52 | ) | | | (3.32 | ) | | | 0.39 | 6 | | | 31.91 | | | | 10.08 | | | | (6.59 | )6 |
Ratios and supplemental data | | | | | | | | | | | | | | | | | | | | | | | | | | | | |
Net assets, end of period (in millions) | | | $1,937 | | | | $1,434 | | | | $1,836 | | | | $1,795 | | | | $1,702 | | | | $18 | | | | $2 | |
Ratios (as a percentage of average net assets): | | | | | | | | | | | | | | | | | | | | | | | | | | | | |
Expenses before reductions | | | 0.89 | 7 | | | 0.89 | | | | 0.89 | | | | 0.89 | 7 | | | 0.90 | | | | 0.93 | | | | 1.37 | 7 |
Expenses including reductions | | | 0.88 | 7 | | | 0.88 | | | | 0.88 | | | | 0.88 | 7 | | | 0.89 | | | | 0.90 | | | | 0.95 | 7 |
Net investment income | | | 0.81 | 7 | | | 0.85 | | | | 1.01 | | | | 1.09 | 7 | | | 0.16 | | | | 0.95 | | | | 0.60 | 7 |
Portfolio turnover (%) | | | 37 | | | | 80 | | | | 98 | | | | 4 | | | | 65 | | | | 94 | | | | 82 | 8 |
| 1 | Six months ended 9-30-20. Unaudited. |
| 2 | For the one-month period ended 3-31-18. The fund changed its fiscal year end from February 28 to March 31. |
| 3 | The inception date for Class R6 shares is 3-27-15. |
| 4 | Based on average daily shares outstanding. |
| 5 | Total returns would have been lower had certain expenses not been reduced during the applicable periods. |
| 8 | Portfolio turnover is shown for the period from 3-1-15 to 2-29-16. |
| | | | |
| 22 | | JOHN HANCOCK INTERNATIONAL GROWTH FUND | SEMIANNUAL REPORT | | SEE NOTES TO FINANCIAL STATEMENTS |
| | | | | | | | | | | | | | | | | | | | | | | | | | | | |
| | | | | | | |
CLASS 1 SHARES Period ended | | 9-30-201 | | | 3-31-20 | | | 3-31-19 | | | 3-31-182
| | | 2-28-18 | | | 2-28-17 | | | 2-29-16 | |
Per share operating performance | | | | | | | | | | | | | | | | | | | | | | | | | | | | |
Net asset value, beginning of period | | | $24.62 | | | | $26.83 | | | | $28.57 | | | | $28.47 | | | | $21.71 | | | | $19.93 | | | | $21.65 | |
Net investment income3 | | | 0.11 | | | | 0.23 | | | | 0.28 | | | | 0.03 | | | | 0.21 | | | | 0.23 | | | | 0.23 | |
Net realized and unrealized gain (loss) on investments | | | 8.06 | | | | (2.22 | ) | | | (1.30 | ) | | | 0.07 | | | | 6.70 | | | | 1.76 | | | | (1.84 | ) |
Total from investment operations | | | 8.17 | | | | (1.99 | ) | | | (1.02 | ) | | | 0.10 | | | | 6.91 | | | | 1.99 | | | | (1.61 | ) |
Less distributions | | | | | | | | | | | | | | | | | | | | | | | | | | | | |
From net investment income | | | — | | | | (0.22 | ) | | | (0.26 | ) | | | — | | | | (0.15 | ) | | | (0.21 | ) | | | (0.11 | ) |
From net realized gain | | | — | | | | — | | | | (0.46 | ) | | | — | | | | — | | | | — | | | | — | |
Total distributions | | | — | | | | (0.22 | ) | | | (0.72 | ) | | | — | | | | (0.15 | ) | | | (0.21 | ) | | | (0.11 | ) |
Net asset value, end of period | | | $32.79 | | | | $24.62 | | | | $26.83 | | | | $28.57 | | | | $28.47 | | | | $21.71 | | | | $19.93 | |
Total return (%)4 | | | 33.18 | 5 | | | (7.55 | ) | | | (3.32 | ) | | | 0.35 | 5 | | | 31.86 | | | | 10.04 | | | | (7.49 | ) |
Ratios and supplemental data | | | | | | | | | | | | | | | | | | | | | | | | | | | | |
Net assets, end of period (in millions) | | | $76 | | | | $59 | | | | $78 | | | | $93 | | | | $91 | | | | $50 | | | | $39 | |
Ratios (as a percentage of average net assets): | | | | | | | | | | | | | | | | | | | | | | | | | | | | |
Expenses before reductions | | | 0.93 | 6 | | | 0.93 | | | | 0.92 | | | | 0.92 | 6 | | | 0.93 | | | | 0.95 | | | | 1.00 | |
Expenses including reductions | | | 0.92 | 6 | | | 0.92 | | | | 0.92 | | | | 0.92 | 6 | | | 0.92 | | | | 0.94 | | | | 0.99 | |
Net investment income | | | 0.77 | 6 | | | 0.82 | | | | 1.05 | | | | 1.06 | 6 | | | 0.79 | | | | 1.09 | | | | 1.06 | |
Portfolio turnover (%) | | | 37 | | | | 80 | | | | 98 | | | | 4 | | | | 65 | | | | 94 | | | | 82 | |
| 1 | Six months ended 9-30-20. Unaudited. |
| 2 | For the one-month period ended 3-31-18. The fund changed its fiscal year end from February 28 to March 31. |
| 3 | Based on average daily shares outstanding. |
| 4 | Total returns would have been lower had certain expenses not been reduced during the applicable periods. |
| | | | |
| SEE NOTES TO FINANCIAL STATEMENTS | | SEMIANNUAL REPORT | JOHN HANCOCK INTERNATIONAL GROWTH FUND | | 23 |
| | | | | | | | | | | | | | | | | | | | | | | | | | | | |
| | | | | | | |
| CLASS NAV SHARES Period ended | | 9-30-201 | | | 3-31-20 | | | 3-31-19 | | | 3-31-182 | | | 2-28-18 | | | 2-28-17 | | | 2-29-163 | |
Per share operating performance | | | | | | | | | | | | | | | | | | | | | | | | | | | | |
Net asset value, beginning of period | | | $24.62 | | | | $26.82 | | | | $28.57 | | | | $28.47 | | | | $21.71 | | | | $19.93 | | | | $22.66 | |
Net investment income4 | | | 0.12 | | | | 0.24 | | | | 0.29 | | | | 0.03 | | | | 0.23 | | | | 0.19 | | | | 0.11 | |
Net realized and unrealized gain (loss) on investments | | | 8.06 | | | | (2.21 | ) | | | (1.31 | ) | | | 0.07 | | | | 6.69 | | | | 1.81 | | | | (2.72 | ) |
Total from investment operations | | | 8.18 | | | | (1.97 | ) | | | (1.02 | ) | | | 0.10 | | | | 6.92 | | | | 2.00 | | | | (2.61 | ) |
Less distributions | | | | | | | | | | | | | | | | | | | | | | | | | | | | |
From net investment income | | | — | | | | (0.23 | ) | | | (0.27 | ) | | | — | | | | (0.16 | ) | | | (0.22 | ) | | | (0.12 | ) |
From net realized gain | | | — | | | | — | | | | (0.46 | ) | | | — | | | | — | | | | — | | | | — | |
Total distributions | | | — | | | | (0.23 | ) | | | (0.73 | ) | | | — | | | | (0.16 | ) | | | (0.22 | ) | | | (0.12 | ) |
Net asset value, end of period | | | $32.80 | | | | $24.62 | | | | $26.82 | | | | $28.57 | | | | $28.47 | | | | $21.71 | | | | $19.93 | |
Total return (%)5 | | | 33.23 | 6 | | | (7.51 | ) | | | (3.27 | ) | | | 0.35 | 6 | | | 31.91 | | | | 10.10 | | | | (11.57 | )6 |
Ratios and supplemental data | | | | | | | | | | | | | | | | | | | | | | | | | | | | |
Net assets, end of period (in millions) | | | $1,046 | | | | $854 | | | | $1,028 | | | | $1,136 | | | | $1,151 | | | | $864 | | | | $86 | |
Ratios (as a percentage of average net assets): | | | | | | | | | | | | | | | | | | | | | | | | | | | | |
Expenses before reductions | | | 0.88 | 7 | | | 0.88 | | | | 0.87 | | | | 0.87 | 7 | | | 0.88 | | | | 0.91 | | | | 0.94 | 7 |
Expenses including reductions | | | 0.87 | 7 | | | 0.87 | | | | 0.87 | | | | 0.87 | 7 | | | 0.87 | | | | 0.90 | | | | 0.93 | 7 |
Net investment income | | | 0.83 | 7 | | | 0.87 | | | | 1.06 | | | | 1.10 | 7 | | | 0.89 | | | | 0.91 | | | | 0.69 | 7 |
Portfolio turnover (%) | | | 37 | | | | 80 | | | | 98 | | | | 4 | | | | 65 | | | | 94 | | | | 82 | 8 |
| 1 | Six months ended 9-30-20. Unaudited. |
| 2 | For the one-month period ended 3-31-18. The fund changed its fiscal year end from February 28 to March 31. |
| 3 | The inception date for Class NAV shares is 6-2-15. |
| 4 | Based on average daily shares outstanding. |
| 5 | Total returns would have been lower had certain expenses not been reduced during the applicable periods. |
| 8 | The portfolio turnover is shown for the period from 3-1-15 to 2-29-16. |
| | | | |
| 24 | | JOHN HANCOCK INTERNATIONAL GROWTH FUND | SEMIANNUAL REPORT | | SEE NOTES TO FINANCIAL STATEMENTS |
|
Notes to financial statements (unaudited) |
Note 1 — Organization
John Hancock International Growth Fund (the fund) is a series of John Hancock Funds III (the Trust), an open-end management investment company organized as a Massachusetts business trust and registered under the Investment Company Act of 1940, as amended (the 1940 Act). The investment objective of the fund is to seek a high total return primarily through capital appreciation.
The fund may offer multiple classes of shares. The shares currently outstanding are detailed in the Statement of assets and liabilities. Class A and Class C shares are offered to all investors. Class B shares are closed to new investors. Class I shares are offered to institutions and certain investors. Class R2 and Class R4 shares are available only to certain retirement and 529 plans. Class R6 shares are only available to certain retirement plans, institutions and other investors. Class 1 shares are offered only to certain affiliates of Manulife Financial Corporation. Class NAV shares are offered to John Hancock affiliated funds of funds, retirement plans for employees of John Hancock and/or Manulife Financial Corporation, and certain 529 plans. Class B shares convert to Class A shares eight years after purchase. Class C shares convert to Class A shares ten years after purchase (certain exclusions may apply). Shareholders of each class have exclusive voting rights to matters that affect that class. The distribution and service fees, if any, and transfer agent fees for each class may differ.
Effective November 1, 2020, Class C shares convert to Class A shares after 8 years (certain exclusions apply).
The fund is closed to new investors, except as provided in the fund’s prospectus.
Note 2 — Significant accounting policies
The financial statements have been prepared in conformity with accounting principles generally accepted in the United States of America (US GAAP), which require management to make certain estimates and assumptions as of the date of the financial statements. Actual results could differ from those estimates and those differences could be significant. The fund qualifies as an investment company under Topic 946 of Accounting Standards Codification of US GAAP.
Events or transactions occurring after the end of the fiscal period through the date that the financial statements were issued have been evaluated in the preparation of the financial statements. The following summarizes the significant accounting policies of the fund:
Security valuation. Investments are stated at value as of the scheduled close of regular trading on the New York Stock Exchange (NYSE), normally at 4:00 P.M., Eastern Time. In case of emergency or other disruption resulting in the NYSE not opening for trading or the NYSE closing at a time other than the regularly scheduled close, the net asset value (NAV) may be determined as of the regularly scheduled close of the NYSE pursuant to the fund’s Valuation Policies and Procedures.
In order to value the securities, the fund uses the following valuation techniques: Equity securities, including exchange-traded or closed-end funds, are typically valued at the last sale price or official closing price on the exchange or principal market where the security trades. In the event there were no sales during the day or closing prices are not available, the securities are valued using the last available bid price. Investments by the fund in open-end mutual funds, including John Hancock Collateral Trust (JHCT), are valued at their respective NAVs each business day. Debt obligations are typically valued based on evaluated prices provided by an independent pricing vendor. Independent pricing vendors utilize matrix pricing, which takes into account factors such as institutional-size trading in similar groups of securities, yield, quality, coupon rate, maturity, type of issue, trading characteristics and other market data, as well as broker supplied prices. Foreign securities and currencies are valued in U.S. dollars based on foreign currency exchange rates supplied by an independent pricing vendor.
In certain instances, the Pricing Committee may determine to value equity securities using prices obtained from another exchange or market if trading on the exchange or market on which prices are typically obtained did not open for trading as scheduled, or if trading closed earlier than scheduled, and trading occurred as normal on another exchange or market.
| | |
| SEMIANNUAL REPORT | JOHN HANCOCK INTERNATIONAL GROWTH FUND | | 25 |
Other portfolio securities and assets, for which reliable market quotations are not readily available, are valued at fair value as determined in good faith by the fund’s Pricing Committee following procedures established by the Board of Trustees. The frequency with which these fair valuation procedures are used cannot be predicted and fair value of securities may differ significantly from the value that would have been used had a ready market for such securities existed. Trading in foreign securities may be completed before the scheduled daily close of trading on the NYSE. Significant events at the issuer or market level may affect the values of securities between the time when the valuation of the securities is generally determined and the close of the NYSE. If a significant event occurs, these securities may be fair valued, as determined in good faith by the fund’s Pricing Committee, following procedures established by the Board of Trustees. The fund uses fair value adjustment factors provided by an independent pricing vendor to value certain foreign securities in order to adjust for events that may occur between the close of foreign exchanges or markets and the close of the NYSE.
The fund uses a three-tier hierarchy to prioritize the pricing assumptions, referred to as inputs, used in valuation techniques to measure fair value. Level 1 includes securities valued using quoted prices in active markets for identical securities, including registered investment companies. Level 2 includes securities valued using other significant observable inputs. Observable inputs may include quoted prices for similar securities, interest rates, prepayment speeds and credit risk. Prices for securities valued using these inputs are received from independent pricing vendors and brokers and are based on an evaluation of the inputs described. Level 3 includes securities valued using significant unobservable inputs when market prices are not readily available or reliable, including the fund’s own assumptions in determining the fair value of investments. Factors used in determining value may include market or issuer specific events or trends, changes in interest rates and credit quality. The inputs or methodology used for valuing securities are not necessarily an indication of the risks associated with investing in those securities. Changes in valuation techniques and related inputs may result in transfers into or out of an assigned level within the disclosure hierarchy.
The following is a summary of the values by input classification of the fund’s investments as of September 30, 2020, by major security category or type:
| | | | | | | | | | | | | | | | |
| | | Total value at 9-30-20 | | | Level 1 quoted price | | | Level 2 significant observable inputs | | | Level 3 significant unobservable inputs | |
Investments in securities: | | | | | | | | | | | | | | | | |
Assets | | | | | | | | | | | | | | | | |
Common stocks | | | | | | | | | | | | | | | | |
Australia | | | $209,448,549 | | | | — | | | | $209,448,549 | | | | — | |
Canada | | | 349,909,566 | | | | $349,909,566 | | | | — | | | | — | |
China | | | 2,466,118,521 | | | | 986,727,569 | | | | 1,479,390,952 | | | | — | |
Denmark | | | 420,291,552 | | | | — | | | | 420,291,552 | | | | — | |
France | | | 992,207,517 | | | | — | | | | 992,207,517 | | | | — | |
Germany | | | 472,320,479 | | | | — | | | | 472,320,479 | | | | — | |
Hong Kong | | | 217,041,739 | | | | — | | | | 217,041,739 | | | | — | |
Ireland | | | 371,565,551 | | | | 237,317,132 | | | | 134,248,419 | | | | — | |
Italy | | | 115,485,925 | | | | — | | | | 115,485,925 | | | | — | |
Japan | | | 919,333,640 | | | | — | | | | 919,333,640 | | | | — | |
Netherlands | | | 491,987,167 | | | | — | | | | 491,987,167 | | | | — | |
Spain | | | 211,324,505 | | | | — | | | | 211,324,505 | | | | — | |
Sweden | | | 446,824,745 | | | | — | | | | 446,824,745 | | | | — | |
Switzerland | | | 1,328,345,352 | | | | — | | | | 1,328,345,352 | | | | — | |
Taiwan | | | 851,555,679 | | | | — | | | | 851,555,679 | | | | — | |
| | |
| 26 | | JOHN HANCOCK INTERNATIONAL GROWTH FUND | SEMIANNUAL REPORT |
| | | | | | | | | | | | | | | | |
| | | Total value at 9-30-20 | | | Level 1 quoted price | | | Level 2 significant observable inputs | | | Level 3 significant unobservable inputs | |
United Kingdom | | | $467,991,975 | | | | $147,495,402 | | | | $320,496,573 | | | | — | |
United States | | | 108,260,257 | | | | 108,260,257 | | | | — | | | | — | |
Short-term investments | | | 154,948,684 | | | | 75,048,684 | | | | 79,900,000 | | | | — | |
Total investments in securities | | | $10,594,961,403 | | | | $1,904,758,610 | | | | $8,690,202,793 | | | | — | |
Repurchase agreements. The fund may enter into repurchase agreements. When the fund enters into a repurchase agreement, it receives collateral that is held in a segregated account by the fund’s custodian, or for tri-party repurchase agreements, collateral is held at a third-party custodian bank in a segregated account for the benefit of the fund. The collateral amount is marked-to-market and monitored on a daily basis to ensure that the collateral held is in an amount not less than the principal amount of the repurchase agreement plus any accrued interest. Collateral received by the fund for repurchase agreements is disclosed in the Fund’s investments as part of the caption related to the repurchase agreement.
Repurchase agreements are typically governed by the terms and conditions of the Master Repurchase Agreement and/or Global Master Repurchase Agreement (collectively, MRA). Upon an event of default, the non-defaulting party may close out all transactions traded under the MRA and net amounts owed. Absent an event of default, assets and liabilities resulting from repurchase agreements are not offset in the Statement of assets and liabilities. In the event of a default by the counterparty, realization of the collateral proceeds could be delayed, during which time the collateral value may decline or the counterparty may have insufficient assets to pay claims resulting from close-out of the transactions.
Security transactions and related investment income. Investment security transactions are accounted for on a trade date plus one basis for daily NAV calculations. However, for financial reporting purposes, investment transactions are reported on trade date. Interest income is accrued as earned. Dividend income is recorded on the ex-date, except for dividends of certain foreign securities where the dividend may not be known until after the ex-date. In those cases, dividend income, net of withholding taxes, is recorded when the fund becomes aware of the dividends. Non-cash dividends, if any, are recorded at the fair market value of the securities received. Gains and losses on securities sold are determined on the basis of identified cost and may include proceeds from litigation.
Securities lending. The fund may lend its securities to earn additional income. The fund receives collateral from the borrower in an amount not less than the market value of the loaned securities. The fund will invest its cash collateral in JHCT, an affiliate of the fund, which has a floating NAV and is registered with the Securities and Exchange Commission (SEC) as an investment company. JHCT invests in short-term money market investments. The fund will receive the benefit of any gains and bear any losses generated by JHCT with respect to the cash collateral.
The fund has the right to recall loaned securities on demand. If a borrower fails to return loaned securities when due, then the lending agent is responsible and indemnifies the fund for the lent securities. The lending agent uses the collateral received from the borrower to purchase replacement securities of the same issue, type, class and series of the loaned securities. If the value of the collateral is less than the purchase cost of replacement securities, the lending agent is responsible for satisfying the shortfall but only to the extent that the shortfall is not due to any decrease in the value of JHCT.
Although the risk of loss on securities lent is mitigated by receiving collateral from the borrower and through lending agent indemnification, the fund could experience a delay in recovering securities or could experience a lower than expected return if the borrower fails to return the securities on a timely basis. The fund receives compensation for lending its securities by retaining a portion of the return on the investment of the collateral and
| | |
| SEMIANNUAL REPORT | JOHN HANCOCK INTERNATIONAL GROWTH FUND | | 27 |
compensation from fees earned from borrowers of the securities. Securities lending income received by the fund is net of fees retained by the securities lending agent. Net income received from JHCT is a component of securities lending income as recorded on the Statement of operations.
Obligations to repay collateral received by the fund are shown on the Statement of assets and liabilities as Payable upon return of securities loaned and are secured by the loaned securities. As of September 30, 2020, the fund loaned securities valued at $72,862,845 and received $75,018,498 of cash collateral.
Foreign investing. Assets, including investments, and liabilities denominated in foreign currencies are translated into U.S. dollar values each day at the prevailing exchange rate. Purchases and sales of securities, income and expenses are translated into U.S. dollars at the prevailing exchange rate on the date of the transaction. The effect of changes in foreign currency exchange rates on the value of securities is reflected as a component of the realized and unrealized gains (losses) on investments. Foreign investments are subject to a decline in the value of a foreign currency versus the U.S. dollar, which reduces the dollar value of securities denominated in that currency.
Funds that invest internationally generally carry more risk than funds that invest strictly in U.S. securities. Risks can result from differences in economic and political conditions, regulations, market practices (including higher transaction costs), accounting standards and other factors.
Foreign taxes. The fund may be subject to withholding tax on income, capital gains or repatriations imposed by certain countries, a portion of which may be recoverable. Foreign taxes are accrued based upon the fund’s understanding of the tax rules and rates that exist in the foreign markets in which it invests. Taxes are accrued based on gains realized by the fund as a result of certain foreign security sales. In certain circumstances, estimated taxes are accrued based on unrealized appreciation of such securities. Investment income is recorded net of foreign withholding taxes.
Overdraft. The fund may have the ability to borrow from banks for temporary or emergency purposes, including meeting redemption requests that otherwise might require the untimely sale of securities. Pursuant to the fund’s custodian agreement, the custodian may loan money to the fund to make properly authorized payments. The fund is obligated to repay the custodian for any overdraft, including any related costs or expenses. The custodian may have a lien, security interest or security entitlement in any fund property that is not otherwise segregated or pledged, to the extent of any overdraft, and to the maximum extent permitted by law. Overdrafts at period end are presented under the caption Due to custodian in the Statement of assets and liabilities.
Line of credit. Effective June 25, 2020, the fund and other affiliated funds have entered into a syndicated line of credit agreement with Citibank, N.A. as the administrative agent that enables them to participate in a $1 billion unsecured committed line of credit. Excluding commitments designated for a certain fund and subject to the needs of all other affiliated funds, the fund can borrow up to an aggregate commitment amount of $850 million, subject to asset coverage and other limitations as specified in the agreement. Each participating fund paid an upfront fee in connection with this line of credit agreement, which is charged based on a combination of fixed and asset-based allocations and amortized over 365 days. Prior to June 25, 2020, the fund and other affiliated funds had a similar agreement that enabled them to participate in a $750 million unsecured committed line of credit. A commitment fee payable at the end of each calendar quarter, based on the average daily unused portion of the line of credit, is charged to each participating fund based on a combination of fixed and asset-based allocations and is reflected in Other expenses on the Statement of operations. Commitment fees for the six months ended September 30, 2020 were $17,916.
Expenses. Within the John Hancock group of funds complex, expenses that are directly attributable to an individual fund are allocated to such fund. Expenses that are not readily attributable to a specific fund are allocated among all funds in an equitable manner, taking into consideration, among other things, the nature and type of expense and the fund’s relative net assets. Expense estimates are accrued in the period to which they relate and adjustments are made when actual amounts are known.
| | |
| 28 | | JOHN HANCOCK INTERNATIONAL GROWTH FUND | SEMIANNUAL REPORT |
Class allocations. Income, common expenses and realized and unrealized gains (losses) are determined at the fund level and allocated daily to each class of shares based on the net assets of the class. Class-specific expenses, such as distribution and service fees, if any, and transfer agent fees, for all classes, are charged daily at the class level based on the net assets of each class and the specific expense rates applicable to each class.
Federal income taxes. The fund intends to continue to qualify as a regulated investment company by complying with the applicable provisions of the Internal Revenue Code and will not be subject to federal income tax on taxable income that is distributed to shareholders. Therefore, no federal income tax provision is required.
For federal income tax purposes, as of March 31, 2020, the fund has a short-term capital loss carryforward of $391,104,401 available to offset future net realized capital gains. This carryforward does not expire.
As of March 31, 2020, the fund had no uncertain tax positions that would require financial statement recognition, derecognition or disclosure. The fund’s federal tax returns are subject to examination by the Internal Revenue Service for a period of three years.
Distribution of income and gains. Distributions to shareholders from net investment income and net realized gains, if any, are recorded on the ex-date. The fund generally declares and pays dividends annually. Capital gain distributions, if any, are typically distributed annually.
Distributions paid by the fund with respect to each class of shares are calculated in the same manner, at the same time and in the same amount, except for the effect of class level expenses that may be applied differently to each class.
Such distributions, on a tax basis, are determined in conformity with income tax regulations, which may differ from US GAAP. Distributions in excess of tax basis earnings and profits, if any, are reported in the fund’s financial statements as a return of capital. The final determination of tax characteristics of the fund’s distribution will occur at the end of the year and will subsequently be reported to shareholders.
Capital accounts within the financial statements are adjusted for permanent book-tax differences. These adjustments have no impact on net assets or the results of operations. Temporary book-tax differences, if any, will reverse in a subsequent period. Book-tax differences are primarily attributable to foreign currency transactions, investments in passive foreign investment companies, wash sale loss deferrals and foreign capital gains tax.
Note 3 — Guarantees and indemnifications
Under the Trust’s organizational documents, its Officers and Trustees are indemnified against certain liabilities arising out of the performance of their duties to the Trust, including the fund. Additionally, in the normal course of business, the fund enters into contracts with service providers that contain general indemnification clauses. The fund’s maximum exposure under these arrangements is unknown, as this would involve future claims that may be made against the fund that have not yet occurred. The risk of material loss from such claims is considered remote.
Note 4 — Fees and transactions with affiliates
John Hancock Investment Management LLC (the Advisor) serves as investment advisor for the fund. John Hancock Investment Management Distributors LLC (the Distributor), an affiliate of the Advisor, serves as principal underwriter of the fund. The Advisor and the Distributor are indirect, principally owned subsidiaries of Manulife Financial Corporation.
Management fee. The fund has an investment management agreement with the Advisor under which the fund pays a daily management fee to the Advisor, equivalent on an annual basis to the sum of (a) 0.900% of the first $500 million of the fund’s average daily net assets; (b) 0.850% of the next $500 million of the fund’s average daily net assets, and (c) 0.800% of the fund’s average daily net assets in excess of $1 billion. The Advisor has a subadvisory agreement with Wellington Management Company LLP. The fund is not responsible for payment of the subadvisory fees.
| | |
| SEMIANNUAL REPORT | JOHN HANCOCK INTERNATIONAL GROWTH FUND | | 29 |
The Advisor has contractually agreed to waive a portion of its management fee and/or reimburse expenses for certain funds of the John Hancock group of funds complex, including the fund (the participating portfolios). This waiver is based upon aggregate net assets of all the participating portfolios. The amount of the reimbursement is calculated daily and allocated among all the participating portfolios in proportion to the daily net assets of each fund. During the six months ended September 30, 2020, this waiver amounted to 0.01% of the fund’s average daily net assets on an annualized basis. This arrangement expires on July 31, 2022, unless renewed by mutual agreement of the fund and the Advisor based upon a determination that this is appropriate under the circumstances at that time.
For the six months ended September 30, 2020, the expense reductions described above amounted to the following:
| | | | |
| Class | | Expense reduction | |
Class A | | | $17,654 | |
Class B | | | 11 | |
Class C | | | 6,860 | |
Class I | | | 200,496 | |
Class R2 | | | 1,048 | |
| | | | |
| Class | | Expense reduction | |
Class R4 | | | $298 | |
Class R6 | | | 58,374 | |
Class 1 | | | 2,353 | |
Class NAV | | | 33,682 | |
Total | | | $320,776 | |
Expenses waived or reimbursed in the current fiscal period are not subject to recapture in future fiscal periods.
The investment management fees, including the impact of the waivers and reimbursements as described above, incurred for the six months ended September 30, 2020, were equivalent to a net annual effective rate of 0.80% of the fund’s average daily net assets.
Accounting and legal services. Pursuant to a service agreement, the fund reimburses the Advisor for all expenses associated with providing the administrative, financial, legal, compliance, accounting and recordkeeping services to the fund, including the preparation of all tax returns, periodic reports to shareholders and regulatory reports, among other services. These expenses are allocated to each share class based on its relative net assets at the time the expense was incurred. These accounting and legal services fees incurred, for the six months ended September 30, 2020, amounted to an annual rate of 0.02% of the fund’s average daily net assets.
Distribution and service plans. The fund has a distribution agreement with the Distributor. The fund has adopted distribution and service plans for certain classes as detailed below pursuant to Rule 12b-1 under the 1940 Act, to pay the Distributor for services provided as the distributor of shares of the fund. In addition, under a service plan for certain classes as detailed below, the fund pays for certain other services. The fund may pay up to the following contractual rates of distribution and service fees under these arrangements, expressed as an annual percentage of average daily net assets for each class of the fund’s shares:
| | | | | | | | |
| Class | | Rule 12b-1 Fee | | | Service fee | |
Class A | | | 0.30% | | | | — | |
Class B | | | 1.00% | | | | — | |
Class C | | | 1.00% | | | | — | |
Class R2 | | | 0.25% | | | | 0.25% | |
Class R4 | | | 0.25% | | | | 0.10% | |
Class 1 | | | 0.05% | | | | — | |
The fund’s Distributor has contractually agreed to waive 0.10% of Rule12b-1 fees for Class R4 shares. The current waiver agreement expires on July 31, 2021, unless renewed by mutual agreement of the fund and the Distributor based upon a determination that this is appropriate under the circumstances at the time. This contractual waiver amounted to $4,357 for Class R4 shares for the six months ended September 30, 2020.
| | |
| 30 | | JOHN HANCOCK INTERNATIONAL GROWTH FUND | SEMIANNUAL REPORT |
Sales charges. Class A shares are assessed up-front sales charges, which resulted in payments to the Distributor amounting to $113,616 for the six months ended September 30, 2020. Of this amount, $19,156 was retained and used for printing prospectuses, advertising, sales literature and other purposes and $94,460 was paid as sales commissions to broker-dealers.
Class A, Class B and Class C shares may be subject to contingent deferred sales charges (CDSCs). Certain Class A shares that are acquired through purchases of $1 million or more and are redeemed within one year of purchase are subject to a 1.00% sales charge. Class B shares that are redeemed within six years of purchase are subject to CDSCs, at declining rates, beginning at 5.00%. Class C shares that are redeemed within one year of purchase are subject to a 1.00% CDSC. CDSCs are applied to the lesser of the current market value at the time of redemption or the original purchase cost of the shares being redeemed. Proceeds from CDSCs are used to compensate the Distributor for providing distribution-related services in connection with the sale of these shares. During the six months ended September 30, 2020, CDSCs received by the Distributor amounted to $6,486 and $967 for Class A and Class C shares, respectively. During the six months ended September 30, 2020, there were no CDSCs received by the Distributor for Class B shares.
Transfer agent fees. The John Hancock group of funds has a complex-wide transfer agent agreement with John Hancock Signature Services, Inc. (Signature Services), an affiliate of the Advisor. The transfer agent fees paid to Signature Services are determined based on the cost to Signature Services (Signature Services Cost) of providing recordkeeping services. It also includes out-of-pocket expenses, including payments made to third-parties for recordkeeping services provided to their clients who invest in one or more John Hancock funds. In addition, Signature Services Cost may be reduced by certain fees that Signature Services receives in connection with retirement and small accounts. Signature Services Cost is calculated monthly and allocated, as applicable, to five categories of share classes: Retail Share and Institutional Share Classes of Non-Municipal Bond Funds, Class R6 Shares, Retirement Share Classes and Municipal Bond Share Classes. Within each of these categories, the applicable costs are allocated to the affected John Hancock affiliated funds and/or classes, based on the relative average daily net assets.
Class level expenses. Class level expenses for the six months ended September 30, 2020 were as follows:
| | | | | | | | |
| Class | | Distribution and service fees | | | Transfer agent fees | |
Class A | | | $777,758 | | | | $318,982 | |
Class B | | | 1,639 | | | | 205 | |
Class C | | | 1,008,850 | | | | 124,265 | |
Class I | | | — | | | | 3,589,469 | |
Class R2 | | | 77,381 | | | | 2,006 | |
Class R4 | | | 14,436 | | | | 559 | |
Class R6 | | | — | | | | 109,349 | |
Class 1 | | | 17,245 | | | | — | |
Total | | | $1,897,309 | | | | $4,144,835 | |
Trustee expenses. The fund compensates each Trustee who is not an employee of the Advisor or its affiliates. The costs of paying Trustee compensation and expenses are allocated to the fund based on its net assets relative to other funds within the John Hancock group of funds complex.
Interfund lending program. Pursuant to an Exemptive Order issued by the SEC, the fund, along with certain other funds advised by the Advisor or its affiliates, may participate in an interfund lending program. This program provides an alternative credit facility allowing the fund to borrow from, or lend money to, other participating
| | |
| SEMIANNUAL REPORT | JOHN HANCOCK INTERNATIONAL GROWTH FUND | | 31 |
affiliated funds. At period end, no interfund loans were outstanding. Interest expense is included in Other expenses on the Statement of operations. The fund’s activity in this program during the period for which loans were outstanding was as follows:
| | | | | | | | | | | | | | | | |
Borrower or Lender | | Weighted Average Loan Balance | | | Days Outstanding | | | Weighted Average Interest Rate | | | Interest Income (Expense) | |
Borrower | | | $17,727,143 | | | | 7 | | | | 0.646% | | | | $(2,226) | |
Lender | | | 94,150,000 | | | | 2 | | | | 0.544% | | | | 2,845 | |
Note 5 — Fund share transactions
Transactions in fund shares for the six months ended September 30, 2020 and for the year ended March 31, 2020 were as follows:
| | | | | | | | | | | | | | | | |
| | |
| | | Six Months Ended 9-30-20 | | | Year Ended 3-31-20 | |
| | | | |
| | | Shares | | | Amount | | | Shares | | | Amount | |
Class A shares | | | | | | | | | | | | | | | | |
Sold | | | 1,480,068 | | | | $44,641,586 | | | | 2,446,594 | | | | $68,358,288 | |
Distributions reinvested | | | — | | | | — | | | | 80,353 | | | | 2,361,574 | |
Repurchased | | | (2,819,635 | ) | | | (81,444,214 | ) | | | (6,692,046 | ) | | | (183,226,522 | ) |
Net decrease | | | (1,339,567 | ) | | | $(36,802,628 | ) | | | (4,165,099 | ) | | | $(112,506,660 | ) |
| | | | |
Class B shares | | | | | | | | | | | | | | | | |
Sold | | | — | | | | — | | | | 734 | | | | $20,222 | |
Repurchased | | | (9,392 | ) | | | $(278,727 | ) | | | (22,043 | ) | | | (603,733 | ) |
Net decrease | | | (9,392 | ) | | | $(278,727 | ) | | | (21,309 | ) | | | $(583,511 | ) |
| | | | |
Class C shares | | | | | | | | | | | | | | | | |
Sold | | | 93,978 | | | | $2,718,001 | | | | 254,037 | | | | $6,963,940 | |
Repurchased | | | (1,023,336 | ) | | | (29,179,818 | ) | | | (2,740,410 | ) | | | (73,029,343 | ) |
Net decrease | | | (929,358 | ) | | | $(26,461,817 | ) | | | (2,486,373 | ) | | | $(66,065,403 | ) |
| | | | |
Class I shares | | | | | | | | | | | | | | | | |
Sold | | | 43,516,982 | | | | $1,269,870,371 | | | | 49,477,777 | | | | $1,366,902,827 | |
Distributions reinvested | | | — | | | | — | | | | 1,167,622 | | | | 34,363,108 | |
Repurchased | | | (29,742,019 | ) | | | (861,119,198 | ) | | | (68,467,588 | ) | | | (1,865,250,138 | ) |
Net increase (decrease) | | | 13,774,963 | | | | $408,751,173 | | | | (17,822,189 | ) | | | $(463,984,203) | |
| | | | |
Class R2 shares | | | | | | | | | | | | | | | | |
Sold | | | 59,841 | | | | $1,787,460 | | | | 202,705 | | | | $5,575,034 | |
Distributions reinvested | | | — | | | | — | | | | 3,673 | | | | 108,135 | |
Repurchased | | | (294,149 | ) | | | (8,441,191 | ) | | | (598,767 | ) | | | (16,480,184 | ) |
Net decrease | | | (234,308 | ) | | | $(6,653,731 | ) | | | (392,389 | ) | | | $(10,797,015 | ) |
| | |
| 32 | | JOHN HANCOCK INTERNATIONAL GROWTH FUND | SEMIANNUAL REPORT |
| | | | | | | | | | | | | | | | |
| | |
| | | Six Months Ended 9-30-20 | | | Year Ended 3-31-20 | |
| | | | |
| | | Shares | | | Amount | | | Shares | | | Amount | |
| | | | |
Class R4 shares | | | | | | | | | | | | | | | | |
Sold | | | 36,949 | | | | $1,081,901 | | | | 140,115 | | | | $3,952,475 | |
Distributions reinvested | | | — | | | | — | | | | 1,838 | | | | 54,100 | |
Repurchased | | | (43,858 | ) | | | (1,320,793 | ) | | | (145,979 | ) | | | (4,067,537 | ) |
Net decrease | | | (6,909 | ) | | | $(238,892 | ) | | | (4,026 | ) | | | $(60,962 | ) |
| | | | |
Class R6 shares | | | | | | | | | | | | | | | | |
Sold | | | 7,398,837 | | | | $231,717,673 | | | | 8,691,254 | | | | $245,579,858 | |
Distributions reinvested | | | — | | | | — | | | | 475,842 | | | | 14,013,544 | |
Repurchased | | | (6,593,990 | ) | | | (196,553,139 | ) | | | (19,333,160 | ) | | | (539,601,756 | ) |
Net increase (decrease) | | | 804,847 | | | | $35,164,534 | | | | (10,166,064 | ) | | | $(280,008,354 | ) |
| | | | |
Class 1 shares | | | | | | | | | | | | | | | | |
Sold | | | 130,647 | | | | $3,941,265 | | | | 153,496 | | | | $4,299,780 | |
Distributions reinvested | | | — | | | | — | | | | 19,424 | | | | 571,277 | |
Repurchased | | | (203,536 | ) | | | (5,866,776 | ) | | | (702,781 | ) | | | (19,373,039 | ) |
Net decrease | | | (72,889 | ) | | | $(1,925,511 | ) | | | (529,861 | ) | | | $(14,501,982 | ) |
| | | | |
Class NAV shares | | | | | | | | | | | | | | | | |
Sold | | | 3,684,801 | | | | $106,978,694 | | | | 2,253,310 | | | | $63,614,641 | |
Distributions reinvested | | | — | | | | — | | | | 275,574 | | | | 8,104,635 | |
Repurchased | | | (6,489,050 | ) | | | (189,307,142 | ) | | | (6,147,081 | ) | | | (174,110,113 | ) |
Net decrease | | | (2,804,249 | ) | | | $(82,328,448 | ) | | | (3,618,197 | ) | | | $(102,390,837 | ) |
| | | | |
Total net increase (decrease) | | | 9,183,138 | | | | $289,225,953 | | | | (39,205,507 | ) | | | $(1,050,898,927 | ) |
Affiliates of the fund owned 100% and 80% of shares of Class 1 and Class NAV, respectively, on September 30, 2020. Such concentration of shareholders’ capital could have a material effect on the fund if such shareholders redeem from the fund.
Note 6 — Purchase and sale of securities
Purchases and sales of securities, other than short-term investments, amounted to $3,660,094,949 and $3,408,457,050, respectively, for the six months ended September 30, 2020.
Note 7 — Investment by affiliated funds
Certain investors in the fund are affiliated funds that are managed by the Advisor and its affiliates. The affiliated funds do not invest in the fund for the purpose of exercising management or control; however, this investment may represent a significant portion of the fund’s net assets. At September 30, 2020, funds within the John Hancock group of funds complex held 8.0% of the fund’s net assets. There were no affiliated funds with an ownership of 5% or more of the fund’s net assets.
| | |
| SEMIANNUAL REPORT | JOHN HANCOCK INTERNATIONAL GROWTH FUND | | 33 |
Note 8 — Investment in affiliated underlying funds
The fund may invest in affiliated underlying funds that are managed by the Advisor and its affiliates. Information regarding the fund’s fiscal year to date purchases and sales of the affiliated underlying funds as well as income and capital gains earned by the fund, if any, is as follows:
| | | | | | | | | | | | | | | | | | | | | | | | | | | | | | | | | | | | |
| | | | | | | | | | | | | | | | | | | | | Dividends and distributions | | | |
| Affiliate | | Ending share amount | | | Beginning value | | | Cost of purchases | | | Proceeds from shares sold | | | Realized gain (loss) | | | Change in unrealized appreciation
(depreciation) | | | Income
distributions
received | | | Capital gain distributions received | | | Ending value |
John Hancock Collateral Trust* | | | 7,497,446 | | | | $3,802,480 | | | | $1,412,126,354 | | | | (1,340,951,388 | ) | | | $54,823 | | | | $16,415 | | | | $608,332 | | | | — | | | | $75,048,684 | |
| * | Refer to the Securities lending note within Note 2 for details regarding this investment. |
Note 9 — Coronavirus (COVID-19) pandemic
The novel COVID-19 disease has resulted in significant disruptions to global business activity. A widespread health crisis such as a global pandemic could cause substantial market volatility, exchange trading suspensions and closures, impact the ability to complete redemptions, and affect fund performance.
Note 10 — Subsequent events
On June 25, 2020, the Board of Trustees approved redesignation of the following share class:
| | |
| Redesignation | | Effective date |
Class B shares as Class A shares | | October 14, 2020 |
As a result of the Redesignation, Class B shares were terminated, and shareholders in the class became shareholders of the respective class identified above, in each case with the same or lower total net expenses.
| | |
| 34 | | JOHN HANCOCK INTERNATIONAL GROWTH FUND | SEMIANNUAL REPORT |
CONTINUATION OF INVESTMENT ADVISORY AND SUBADVISORY AGREEMENTS
Evaluation of Advisory and Subadvisory Agreements by the Board of Trustees
This section describes the evaluation by the Board of Trustees (the Board) of John Hancock Funds III (the Trust) of the Advisory Agreement (the Advisory Agreement) with John Hancock Investment Management, LLC (the Advisor) and the Subadvisory Agreement (the Subadvisory Agreement) with Wellington Management Company LLP (the Subadvisor), for John Hancock International Growth Fund (the fund). The Advisory Agreement and Subadvisory Agreement are collectively referred to as the Agreements. Prior to the June 23-25, 2020 telephonic1 meeting, at which the Agreements were approved, the Board also discussed and considered information regarding the proposed continuation of the Agreements at the telephonic meeting held on May 26-27, 2020.
Approval of Advisory and Subadvisory Agreements
At telephonic meetings held on June 23-25, 2020, the Board, including the Trustees who are not parties to any Agreement or considered to be interested persons of the Trust under the Investment Company Act of 1940, as amended (the 1940 Act) (the Independent Trustees), reapproved for an annual period the continuation of the Advisory Agreement between the Trust and the Advisor and the Subadvisory Agreement between the Advisor and the Subadvisor with respect to the fund.
In considering the Advisory Agreement and the Subadvisory Agreement, the Board received in advance of the meetings a variety of materials relating to the fund, the Advisor and the Subadvisor, including comparative performance, fee and expense information for a peer group of similar funds prepared by an independent third-party provider of fund data, performance information for an applicable benchmark index; and, with respect to the Subadvisor, comparative performance information for comparably managed accounts, as applicable, and other information provided by the Advisor and the Subadvisor regarding the nature, extent and quality of services provided by the Advisor and the Subadvisor under their respective Agreements, as well as information regarding the Advisor’s revenues and costs of providing services to the fund and any compensation paid to affiliates of the Advisor. At the meetings at which the renewal of the Advisory Agreement and Subadvisory Agreement are considered, particular focus is given to information concerning fund performance, comparability of fees and total expenses, and profitability. However, the Board notes that the evaluation process with respect to the Advisor and the Subadvisor is an ongoing one. In this regard, the Board also took into account discussions with management and information provided to the Board (including its various committees) at prior meetings with respect to the services provided by the Advisor and the Subadvisor to the fund, including quarterly performance reports prepared by management containing reviews of investment results and prior presentations from the Subadvisor with respect to the fund. The information received and considered by the Board in connection with the May and June meetings and throughout the year was both written and oral. The Board also considered the nature, quality, and extent of non-advisory services, if any, to be provided to the fund by the Advisor’s affiliates, including distribution services. The Board considered the Advisory Agreement and the Subadvisory Agreement separately in the course of its review. In doing so, the Board noted the respective roles of the Advisor and Subadvisor in providing services to the fund.
Throughout the process, the Board asked questions of and requested additional information from management. The Board is assisted by counsel for the Trust and the Independent Trustees are also separately assisted by independent legal counsel throughout the process. The Independent Trustees also received a memorandum from
1 On March 25, 2020, as a result of health and safety measures put in place to combat the global COVID-19 pandemic, the Securities and Exchange Commission issued an exemptive order (the “Order”) pursuant to Sections 6(c) and 38(a) of the Investment Company Act of 1940, as amended (the “1940 Act”), that temporarily exempts registered investment management companies from the in-person voting requirements under the 1940 Act, subject to certain requirements, including that votes taken pursuant to the Order are ratified at the next in-person meeting. The Board determined that reliance on the Order was necessary or appropriate due to the circumstances related to current or potential effects of COVID-19 and therefore, the Board’s May and June meetings were held telephonically in reliance on the Order.
| | |
| SEMIANNUAL REPORT | JOHN HANCOCK INTERNATIONAL GROWTH FUND | | 35 |
their independent legal counsel discussing the legal standards for their consideration of the proposed continuation of the Agreements and discussed the proposed continuation of the Agreements in private sessions with their independent legal counsel at which no representatives of management were present.
Approval of Advisory Agreement
In approving the Advisory Agreement with respect to the fund, the Board, including the Independent Trustees, considered a variety of factors, including those discussed below. The Board also considered other factors (including conditions and trends prevailing generally in the economy, the securities markets, and the industry) and did not treat any single factor as determinative, and each Trustee may have attributed different weights to different factors. The Board’s conclusions may be based in part on its consideration of the advisory and subadvisory arrangements in prior years and on the Board’s ongoing regular review of fund performance and operations throughout the year.
Nature, extent, and quality of services. Among the information received by the Board from the Advisor relating to the nature, extent, and quality of services provided to the fund, the Board reviewed information provided by the Advisor relating to its operations and personnel, descriptions of its organizational and management structure, and information regarding the Advisor’s compliance and regulatory history, including its Form ADV. The Board also noted that on a regular basis it receives and reviews information from the Trust’s Chief Compliance Officer (CCO) regarding the fund’s compliance policies and procedures established pursuant to Rule 38a-1 under the 1940 Act. The Board observed that the scope of services provided by the Advisor, and of the undertakings required of the Advisor in connection with those services, including maintaining and monitoring its own and the fund’s compliance programs, risk management programs, liquidity management programs and cybersecurity programs, had expanded over time as a result of regulatory, market and other developments. The Board considered that the Advisor is responsible for the management of the day-to-day operations of the fund, including, but not limited to, general supervision of and coordination of the services provided by the Subadvisor, and is also responsible for monitoring and reviewing the activities of the Subadvisor and other third-party service providers. The Board also considered the significant risks assumed by the Advisor in connection with the services provided to the fund including entrepreneurial risk in sponsoring new funds and ongoing risks including investment, operational, enterprise, litigation, regulatory and compliance risks with respect to all funds.
In considering the nature, extent, and quality of the services provided by the Advisor, the Trustees also took into account their knowledge of the Advisor’s management and the quality of the performance of the Advisor’s duties, through Board meetings, discussions and reports during the preceding year and through each Trustee’s experience as a Trustee of the Trust and of the other trusts in the John Hancock group of funds complex (the John Hancock Fund Complex).
In the course of their deliberations regarding the Advisory Agreement, the Board considered, among other things:
| | (a) | the skills and competency with which the Advisor has in the past managed the Trust’s affairs and its subadvisory relationship, the Advisor’s oversight and monitoring of the Subadvisor’s investment performance and compliance programs, such as the Subadvisor’s compliance with fund policies and objectives, review of brokerage matters, including with respect to trade allocation and best execution and the Advisor’s timeliness in responding to performance issues; |
| | (b) | the background, qualifications and skills of the Advisor’s personnel; |
| | (c) | the Advisor’s compliance policies and procedures and its responsiveness to regulatory changes and fund industry developments; |
| | (d) | the Advisor’s administrative capabilities, including its ability to supervise the other service providers for the fund, as well as the Advisor’s oversight of any securities lending activity, its monitoring of class action litigation and collection of class action settlements on behalf of the fund, and bringing loss recovery actions on behalf of the fund; |
| | |
| 36 | | JOHN HANCOCK INTERNATIONAL GROWTH FUND | SEMIANNUAL REPORT |
| | (e) | the financial condition of the Advisor and whether it has the financial wherewithal to provide a high level and quality of services to the fund; |
| | (f) | the Advisor’s initiatives intended to improve various aspects of the Trust’s operations and investor experience with the fund; and |
| | (g) | the Advisor’s reputation and experience in serving as an investment advisor to the Trust and the benefit to shareholders of investing in funds that are part of a family of funds offering a variety of investments. |
The Board concluded that the Advisor may reasonably be expected to continue to provide a high quality of services under the Advisory Agreement with respect to the fund.
Investment performance. In considering the fund’s performance, the Board noted that it reviews at its regularly scheduled meetings information about the fund’s performance results. In connection with the consideration of the Advisory Agreement, the Board:
| | (a) | reviewed information prepared by management regarding the fund’s performance; |
| | (b) | considered the comparative performance of an applicable benchmark index; |
| | (c) | considered the performance of comparable funds, if any, as included in the report prepared by an independent third-party provider of fund data; and |
| | (d) | took into account the Advisor’s analysis of the fund’s performance and its plans and recommendations regarding the Trust’s subadvisory arrangements generally. |
The Board noted that while it found the data provided by the independent third-party generally useful it recognized its limitations, including in particular that the data may vary depending on the end date selected and that the results of the performance comparisons may vary depending on the selection of the peer group. The Board noted that the fund outperformed its benchmark index for the one, three-, five- and ten-year periods ended December 31, 2019. The Board also noted that the fund outperformed the peer group median for the three-, five-and ten-year periods and was in-line with the peer group median for the one-year period ended December 31, 2019. The Board took into account management’s discussion of the fund’s performance, including favorable performance relative to the benchmark index and peer group for the one-, three-, five- and ten-year periods and to the peer group median for the three-, five- and ten-year periods. The Board concluded that the fund’s performance has generally been in line with or outperformed the historical performance of comparable funds and the fund’s benchmark index.
Fees and expenses. The Board reviewed comparative information prepared by an independent third-party provider of fund data, including, among other data, the fund’s contractual and net management fees (and subadvisory fees, to the extent available) and total expenses as compared to similarly situated investment companies deemed to be comparable to the fund in light of the nature, extent and quality of the management and advisory and subadvisory services provided by the Advisor and the Subadvisor. The Board considered the fund’s ranking within a smaller group of peer funds chosen by the independent third-party provider, as well as the fund’s ranking within a broader group of funds. In comparing the fund’s contractual and net management fees to those of comparable funds, the Board noted that such fees include both advisory and administrative costs. The Board noted that net management fees for the fund are lower than the peer group median and total expenses for the fund are equal to the peer group median.
The Board took into account management’s discussion with respect to the overall management fee and the fees of the Subadvisor, including the amount of the advisory fee retained by the Advisor after payment of the subadvisory fee, in each case in light of the services rendered for those amounts and the risks undertaken by the Advisor. The Board also noted that the Advisor pays the subadvisory fee, and that such fees are negotiated at arm’s length with respect to the Subadvisor. The Board also took into account that management had agreed to implement an overall
| | |
| SEMIANNUAL REPORT | JOHN HANCOCK INTERNATIONAL GROWTH FUND | | 37 |
fee waiver across the complex, including the fund, which is discussed further below. The Board also noted actions taken over the past several years to reduce the fund’s operating expenses. The Board also noted that, in addition, the Advisor is currently waiving fees and/or reimbursing expenses with respect to the fund and that the fund has breakpoints in its contractual management fee schedule that reduces management fees as assets increase. The Board reviewed information provided by the Advisor concerning investment advisory fees charged by the Advisor or one of its advisory affiliates to other clients (including other funds in the complex) having similar investment mandates, if any. The Board considered any differences between the Advisor’s and a Subadvisor’s services to a fund and the services they provide to other comparable clients or funds. The Board concluded that the advisory fee paid with respect to the fund is reasonable in light of the nature, extent and quality of the services provided to the fund under the Advisory Agreement.
Profitability/Fall out benefits. In considering the costs of the services to be provided and the profits to be realized by the Advisor and its affiliates from the Advisor’s relationship with the Trust, the Board:
| | (a) | reviewed financial information of the Advisor; |
| | (b) | reviewed and considered information presented by the Advisor regarding the net profitability to the Advisor and its affiliates with respect to the fund; |
| | (c) | received and reviewed profitability information with respect to the John Hancock Fund Complex as a whole and with respect to the fund; |
| | (d) | received information with respect to the Advisor’s allocation methodologies used in preparing the profitability data and considered that the Advisor hired an independent third-party consultant to provide an analysis of the Advisor’s allocation methodologies; |
| | (e) | considered that the John Hancock insurance companies that are affiliates of the Advisor, as shareholders of the Trust directly or through their separate accounts, receive certain tax credits or deductions relating to foreign taxes paid and dividends received by certain funds of the Trust and noted that these tax benefits, which are not available to participants in qualified retirement plans under applicable income tax law, are reflected in the profitability information reviewed by the Board; |
| | (f) | considered that the Advisor also provides administrative services to the fund on a cost basis pursuant to an administrative services agreement; |
| | (g) | noted that affiliates of the Advisor provide transfer agency services and distribution services to the fund, and that the fund’s distributor also receives Rule 12b-1 payments to support distribution of the fund; |
| | (h) | noted that the Advisor also derives reputational and other indirect benefits from providing advisory services to the fund; |
| | (i) | noted that the subadvisory fee for the fund is paid by the Advisor and is negotiated at arm’s length; |
| | (j) | considered the Advisor’s ongoing costs and expenditures necessary to improve services, meet new regulatory and compliance requirements, and adapt to other challenges impacting the fund industry; and |
| | (k) | considered that the Advisor should be entitled to earn a reasonable level of profits in exchange for the level of services it provides to the fund and the risks that it assumes as Advisor, including entrepreneurial, operational, reputational, litigation and regulatory risk. |
Based upon its review, the Board concluded that the level of profitability, if any, of the Advisor and its affiliates from their relationship with the fund was reasonable and not excessive.
| | |
| 38 | | JOHN HANCOCK INTERNATIONAL GROWTH FUND | SEMIANNUAL REPORT |
Economies of scale. In considering the extent to which economies of scale would be realized as the fund grows and whether fee levels reflect these economies of scale for the benefit of fund shareholders, the Board:
| | (a) | considered that the Advisor has contractually agreed to waive a portion of its management fee for certain funds of the John Hancock Fund Complex, including the fund (the participating portfolios) or otherwise reimburse the expenses of the participating portfolios (the reimbursement). This waiver is based upon aggregate net assets of all the participating portfolios. The amount of the reimbursement is calculated daily and allocated among all the participating portfolios in proportion to the daily net assets of each fund; |
| | (b) | reviewed the fund’s advisory fee structure and concluded that: (i) the fund’s fee structure contains breakpoints at the subadvisory fee level and that such breakpoints are reflected as breakpoints in the advisory fees for the fund; and (ii) although economies of scale cannot be measured with precision, these arrangements permit shareholders of the fund to benefit from economies of scale if the fund grows. The Board also took into account management’s discussion of the fund’s advisory fee structure; and |
| | (c) | the Board also considered the effect of the fund’s growth in size on its performance and fees. The Board also noted that if the fund’s assets increase over time, the fund may realize other economies of scale. |
Approval of Subadvisory Agreement
In making its determination with respect to approval of the Subadvisory Agreement, the Board reviewed:
| | (1) | information relating to the Subadvisor’s business, including current subadvisory services to the Trust (and other funds in the John Hancock Fund Complex); |
| | (2) | the historical and current performance of the fund and comparative performance information relating to an applicable benchmark index and comparable funds; |
| | (3) | the subadvisory fee for the fund, including any breakpoints, and to the extent available, comparable fee information prepared by an independent third party provider of fund data; and |
| | (4) | information relating to the nature and scope of any material relationships and their significance to the Trust’s Advisor and Subadvisor. |
Nature, extent, and quality of services. With respect to the services provided by the Subadvisor, the Board received information provided to the Board by the Subadvisor, including the Subadvisor’s Form ADV, as well as took into account information presented throughout the past year. The Board considered the Subadvisor’s current level of staffing and its overall resources, as well as received information relating to the Subadvisor’s compensation program. The Board reviewed the Subadvisor’s history and investment experience, as well as information regarding the qualifications, background, and responsibilities of the Subadvisor’s investment and compliance personnel who provide services to the fund. The Board also considered, among other things, the Subadvisor’s compliance program and any disciplinary history. The Board also considered the Subadvisor’s risk assessment and monitoring process. The Board reviewed the Subadvisor’s regulatory history, including whether it was involved in any regulatory actions or investigations as well as material litigation, and any settlements and amelioratory actions undertaken, as appropriate. The Board noted that the Advisor conducts regular, periodic reviews of the Subadvisor and its operations, including regarding investment processes and organizational and staffing matters. The Board also noted that the Trust’s CCO and his staff conduct regular, periodic compliance reviews with the Subadvisor and present reports to the Independent Trustees regarding the same, which includes evaluating the regulatory compliance systems of the Subadvisor and procedures reasonably designed to assure compliance with the federal securities laws. The Board also took into account the financial condition of the Subadvisor.
| | |
| SEMIANNUAL REPORT | JOHN HANCOCK INTERNATIONAL GROWTH FUND | | 39 |
The Board considered the Subadvisor’s investment process and philosophy. The Board took into account that the Subadvisor’s responsibilities include the development and maintenance of an investment program for the fund that is consistent with the fund’s investment objective, the selection of investment securities and the placement of orders for the purchase and sale of such securities, as well as the implementation of compliance controls related to performance of these services. The Board also received information with respect to the Subadvisor’s brokerage policies and practices, including with respect to best execution and soft dollars.
Subadvisor compensation. In considering the cost of services to be provided by the Subadvisor and the profitability to the Subadvisor of its relationship with the fund, the Board noted that the fees under the Subadvisory Agreement are paid by the Advisor and not the fund.
The Board also relied on the ability of the Advisor to negotiate the Subadvisory Agreement with the Subadvisor, which is not affiliated with the Advisor, and the fees thereunder at arm’s length. As a result, the costs of the services to be provided and the profits to be realized by the Subadvisor from its relationship with the Trust were not a material factor in the Board’s consideration of the Subadvisory Agreement.
The Board also received information regarding the nature and scope (including their significance to the Advisor and its affiliates and to the Subadvisor) of any material relationships with respect to the Subadvisor, which include arrangements in which the Subadvisor or its affiliates provide advisory, distribution, or management services in connection with financial products sponsored by the Advisor or its affiliates, and may include other registered investment companies, a 529 education savings plan, managed separate accounts and exempt group annuity contracts sold to qualified plans. The Board also received information and took into account any other potential conflicts of interest the Advisor might have in connection with the Subadvisory Agreement.
In addition, the Board considered other potential indirect benefits that the Subadvisor and its affiliates may receive from the Subadvisor’s relationship with the fund, such as the opportunity to provide advisory services to additional funds in the John Hancock Fund Complex and reputational benefits.
Subadvisory fees. The Board considered that the fund pays an advisory fee to the Advisor and that, in turn, the Advisor pays a subadvisory fee to the Subadvisor. As noted above, the Board also considered the fund’s subadvisory fees as compared to similarly situated investment companies deemed to be comparable to the fund as included in the report prepared by the independent third party provider of fund data, to the extent available. The Board noted that the limited size of the Lipper peer group was not sufficient for comparative purposes. The Board also took into account the subadvisory fees paid by the Advisor to the Subadvisor with respect to the fund and compared them to fees charged by the Subadvisor to manage other subadvised portfolios and portfolios not subject to regulation under the 1940 Act, as applicable.
Subadvisor performance. As noted above, the Board considered the fund’s performance as compared to the fund’s peer group median and the benchmark index and noted that the Board reviews information about the fund’s performance results at its regularly scheduled meetings. The Board noted the Advisor’s expertise and resources in monitoring the performance, investment style and risk-adjusted performance of the Subadvisor. The Board was mindful of the Advisor’s focus on the Subadvisor’s performance. The Board also noted the Subadvisor’s long-term performance record for similar accounts, as applicable.
The Board’s decision to approve the Subadvisory Agreement was based on a number of determinations, including the following:
| | (1) | the Subadvisor has extensive experience and demonstrated skills as a manager; |
| | (2) | the performance of the fund has generally been in line with or outperformed the historical performance of comparable funds and the fund’s benchmark index; |
| | (3) | the subadvisory fee is reasonable in relation to the level and quality of services being provided under the Subadvisory Agreement; and |
| | |
| 40 | | JOHN HANCOCK INTERNATIONAL GROWTH FUND | SEMIANNUAL REPORT |
| | (4) | noted that the subadvisory fees are paid by the Advisor not the fund and that the subadvisory fee breakpoints are reflected as breakpoints in the advisory fees for the fund in order to permit shareholders to benefit from economies of scale if the fund grows. |
* * *
Based on the Board’s evaluation of all factors that the Board deemed to be material, including those factors described above, the Board, including the Independent Trustees, concluded that renewal of the Advisory Agreement and the Subadvisory Agreement would be in the best interest of the fund and its shareholders. Accordingly, the Board, and the Independent Trustees voting separately, approved the Advisory Agreement and Subadvisory Agreement for an additional one-year period.
| | |
| SEMIANNUAL REPORT | JOHN HANCOCK INTERNATIONAL GROWTH FUND | | 41 |
Trustees
Hassell H. McClellan, Chairperson
Steven R. Pruchansky, Vice Chairperson
Andrew G. Arnott†
Charles L. Bardelis*
James R. Boyle
Peter S. Burgess*
William H. Cunningham
Grace K. Fey
Marianne Harrison†
Deborah C. Jackson
James M. Oates*
Frances G. Rathke*,1
Gregory A. Russo
Officers
Andrew G. Arnott
President
Charles A. Rizzo
Chief Financial Officer
Salvatore Schiavone
Treasurer
Christopher (Kit) Sechler
Secretary and Chief Legal Officer
Trevor Swanberg2
Chief Compliance Officer
Investment advisor
John Hancock Investment Management LLC
Subadvisor
Wellington Management Company LLP
Portfolio Manager
John A. Boselli, CFA
Principal distributor
John Hancock Investment Management Distributors LLC
Custodian
Citibank, N.A.
Transfer agent
John Hancock Signature Services, Inc.
Legal counsel
K&L Gates LLP
* Member of the Audit Committee
† Non-Independent Trustee
1 Appointed as Independent Trustee effective as of September 15, 2020
2 Effective July 31, 2020
The fund’s proxy voting policies and procedures, as well as the fund proxy voting record for the most recent twelve-month period ended June 30, are available free of charge on the Securities and Exchange Commission (SEC) website at sec.gov or on our website.
All of the fund’s holdings as of the end of the third month of every fiscal quarter are filed with the SEC on Form N-PORT within 60 days of the end of the fiscal quarter. The fund’s Form N-PORT filings are available on our website and the SEC’s website, sec.gov.
We make this information on your fund, as well as monthly portfolio holdings, and other fund details available on our website at jhinvestments.com or by calling 800-225-5291.
| | | | |
| | |
| You can also contact us: | | | | |
| | |
| 800-225-5291 | | Regular mail: | | Express mail: |
| | |
| jhinvestments.com | | John Hancock Signature Services, Inc. | | John Hancock Signature Services, Inc. |
| | P.O. Box 219909 | | 430 W 7th Street |
| | Kansas City, MO 64121-9909 | | Suite 219909 |
| | | | Kansas City, MO 64105-1407 |
| | |
| 42 | | JOHN HANCOCK INTERNATIONAL GROWTH FUND | SEMIANNUAL REPORT |
|
John Hancock family of funds |
DOMESTIC EQUITY FUNDS
Blue Chip Growth
Classic Value
Disciplined Value
Disciplined Value Mid Cap
Equity Income
Financial Industries
Fundamental All Cap Core
Fundamental Large Cap Core
New Opportunities
Regional Bank
Small Cap Core
Small Cap Growth
Small Cap Value
U.S. Global Leaders Growth
U.S. Growth
GLOBAL AND INTERNATIONAL EQUITY FUNDS
Disciplined Value International
Emerging Markets
Emerging Markets Equity
Fundamental Global Franchise
Global Equity
Global Shareholder Yield
Global Thematic Opportunities
International Dynamic Growth
International Growth
International Small Company
INCOME FUNDS
Bond
California Tax-Free Income
Emerging Markets Debt
Floating Rate Income
Government Income
High Yield
High Yield Municipal Bond
Income
Investment Grade Bond
Money Market
Short Duration Bond
Short Duration Credit Opportunities
Strategic Income Opportunities
Tax-Free Bond
ALTERNATIVE AND SPECIALTY FUNDS
Absolute Return Currency
Alternative Asset Allocation
Alternative Risk Premia
Diversified Macro
Infrastructure
Multi-Asset Absolute Return
Seaport Long/Short
A fund’s investment objectives, risks, charges, and expenses should be considered carefully before investing. The prospectus contains this and other important information about the fund. To obtain a prospectus, contact your financial professional, call John Hancock Investment Management at 800-225-5291, or visit our website at jhinvestments.com. Please read the prospectus carefully before investing or sending money.
ASSET ALLOCATION
Balanced
Multi-Asset High Income
Multi-Index Lifetime Portfolios
Multi-Index Preservation Portfolios
Multimanager Lifestyle Portfolios
Multimanager Lifetime Portfolios
Retirement Income 2040
EXCHANGE-TRADED FUNDS
John Hancock Multifactor Consumer Discretionary ETF
John Hancock Multifactor Consumer Staples ETF
John Hancock Multifactor Developed International ETF
John Hancock Multifactor Emerging Markets ETF
John Hancock Multifactor Energy ETF
John Hancock Multifactor Financials ETF
John Hancock Multifactor Healthcare ETF
John Hancock Multifactor Industrials ETF
John Hancock Multifactor Large Cap ETF
John Hancock Multifactor Materials ETF
John Hancock Multifactor Media and Communications ETF
John Hancock Multifactor Mid Cap ETF
John Hancock Multifactor Small Cap ETF
John Hancock Multifactor Technology ETF
John Hancock Multifactor Utilities ETF
ENVIRONMENTAL, SOCIAL, AND GOVERNANCE FUNDS
ESG All Cap Core
ESG Core Bond
ESG International Equity
ESG Large Cap Core
CLOSED-END FUNDS
Financial Opportunities
Hedged Equity & Income
Income Securities Trust
Investors Trust
Preferred Income
Preferred Income II
Preferred Income III
Premium Dividend
Tax-Advantaged Dividend Income
Tax-Advantaged Global Shareholder Yield
John Hancock Multifactor ETF shares are bought and sold at market price (not NAV), and are not individually redeemed from the fund. Brokerage commissions will reduce returns.
John Hancock ETFs are distributed by Foreside Fund Services, LLC, and are subadvised by Dimensional Fund Advisors LP. Foreside is not affiliated with John Hancock Investment Management Distributors LLC or Dimensional Fund Advisors LP.
Dimensional Fund Advisors LP receives compensation from John Hancock in connection with licensing rights to the John Hancock Dimensional indexes. Dimensional Fund Advisors LP does not sponsor, endorse, or sell, and makes no representation as to the advisability of investing in, John Hancock Multifactor ETFs.
|
|
John Hancock Investment Management |
|
A trusted brand |
|
John Hancock Investment Management is a premier asset manager with a heritage of financial stewardship dating back to 1862. Helping our shareholders pursue their financial goals is at the core of everything we do. It’s why we support the role of professional financial advice and operate with the highest standards of conduct and integrity. |
|
A better way to invest |
|
We serve investors globally through a unique multimanager approach: We search the world to find proven portfolio teams with specialized expertise for every strategy we offer, then we apply robust investment oversight to ensure they continue to meet our uncompromising standards and serve the best interests of our shareholders. |
|
Results for investors |
|
Our unique approach to asset management enables us to provide a diverse set of investments backed by some of the world’s best managers, along with strong risk-adjusted returns across asset classes. |
| | |
| | Investment Management |
John Hancock Investment Management Distributors LLC ∎ Member FINRA, SIPC 200 Berkeley Street ∎ Boston, MA 02116-5010 ∎ 800-225-5291 ∎ jhinvestments.com
This report is for the information of the shareholders of John Hancock International Growth Fund. It is not authorized for distribution to prospective investors unless preceded or accompanied by a prospectus.
| | |
A company of  Manulife Investment Management Manulife Investment Management | | |
| | 87SA 9/20 |
| MF1355828 | | 11/2020 |

Dear shareholder,
Despite heightened fears over the coronavirus (COVID-19), which sent markets tumbling just prior to the beginning of the reporting period, global financial markets delivered positive returns for the 6 months ended September 30, 2020. In response to the pandemic-led shock, the U.S. Federal Reserve and the government worked quickly to shore up the economy and equity markets began to rise, particularly large-cap U.S. growth stocks, during the period.
Of course, it would be a mistake to consider this market turnaround a trustworthy signal of assured or swift economic recovery. The ongoing spread of COVID-19 continues to create uncertainty among businesses and investors. While there has been economic growth in most of the United States, the pace has slowed in many areas as interest rates remain low and consumer spending remains far below prepandemic levels.
From an investment perspective, we continue to think that maintaining a focus on long-term objectives while pursuing a risk-aware strategy is a prudent way forward. Above all, we believe the counsel of a trusted financial professional matters now more than ever. Periods of heightened uncertainty are precisely the time to review your financial goals and follow a plan that helps you make the most of what continues to be a challenging situation.
On behalf of everyone at John Hancock Investment Management, I’d like to take this opportunity to welcome new shareholders and thank existing shareholders for the continued trust you’ve placed in us.
|
Sincerely, |
|
| Andrew G. Arnott |
| President and CEO, |
| John Hancock Investment Management |
| Head of Wealth and Asset Management, |
| United States and Europe |
This commentary reflects the CEO’s views as of this report’s period end and are subject to change at any time. Diversification does not guarantee investment returns and does not eliminate risk of loss. All investments entail risks, including the possible loss of principal. For more up-to-date information, you can visit our website at jhinvestments.com.
John Hancock
U.S. Quality Growth Fund
| | |
| SEMIANNUAL REPORT | JOHN HANCOCK U.S. QUALITY GROWTH FUND | | 1 |
INVESTMENT OBJECTIVE
The fund seeks long-term capital appreciation.
AVERAGE ANNUAL TOTAL RETURNS AS OF 9/30/2020 (%)
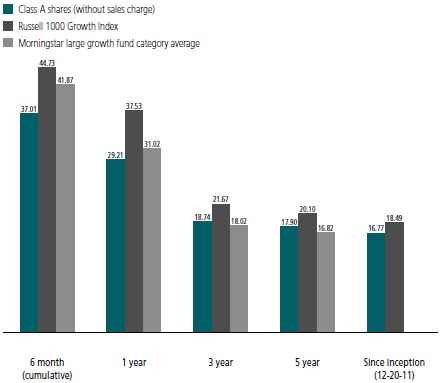
The Russell 1000 Growth Index is an unmanaged index that measures the performance of the small-cap growth segment of the U.S. equity universe. It includes those Russell 1000 Index companies with higher price-to-book ratios and higher forecasted growth values.
It is not possible to invest directly in an index. Index figures do not reflect expenses or sales charges, which would result in lower returns.
The fund’s Morningstar category average is a group of funds with similar investment objectives and strategies and is the equal-weighted return of all funds per category. Morningstar places funds in certain categories based on their historical portfolio holdings. Figures from Morningstar, Inc. include reinvested distributions and do not take into account sales charges. Actual load-adjusted performance is lower. Since-inception returns for the Morningstar fund category average are not available.
The past performance shown here reflects reinvested distributions and the beneficial effect of any expense reductions, and does not guarantee future results. Performance of the other share classes will vary based on the difference in the fees and expenses of those classes. Shares will fluctuate in value and, when redeemed, may be worth more or less than their original cost. Current month-end performance may be lower or higher than the performance cited, and can be found at jhinvestments.com or by calling 800-225-5291. For further information on the fund’s objectives, risks, and strategy, see the fund’s prospectus.
| | |
| 2 | | JOHN HANCOCK U.S. QUALITY GROWTH FUND | SEMIANNUAL REPORT |
| | | | |
| | | SECTOR COMPOSITION AS OF 9/30/2020 (% of total investments) | | |
| | | | |
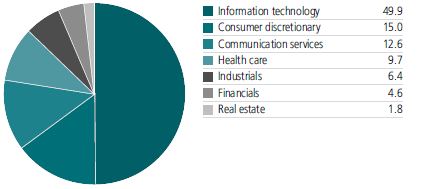
| | | | |
| TOP 10 HOLDINGS AS OF 9/30/2020 (% of total investments) | | | | |
| |
Apple, Inc. | | | 9.8 | |
| |
Microsoft Corp. | | | 9.2 | |
| |
Amazon.com, Inc. | | | 7.1 | |
| |
Facebook, Inc., Class A | | | 4.9 | |
| |
Alphabet, Inc., Class A | | | 4.7 | |
| |
Visa, Inc., Class A | | | 3.3 | |
| |
Mastercard, Inc., Class A | | | 3.1 | |
| |
UnitedHealth Group, Inc. | | | 2.7 | |
| |
salesforce.com, Inc. | | | 2.7 | |
| |
Adobe, Inc. | | | 2.7 | |
| |
TOTAL | | | 50.2 | |
Cash and cash equivalents are not included.
A note about risks
The fund may be subject to various risks as described in the fund’s prospectus. A widespread health crisis such as a global pandemic could cause substantial market volatility, exchange trading suspensions and closures, impact the ability to complete redemptions, and affect fund performance. For example, the novel coronavirus disease (COVID-19) has resulted in significant disruptions to global business activity. The impact of a health crisis and other epidemics and pandemics that may arise in the future, could affect the global economy in ways that cannot necessarily be foreseen at the present time. A health crisis may exacerbate other pre-existing political, social, and economic risks. Any such impact could adversely affect the fund’s performance, resulting in losses to your investment. For more information, please refer to the “Principal risks” section of the prospectus.
| | |
| SEMIANNUAL REPORT | JOHN HANCOCK U.S. QUALITY GROWTH FUND | | 3 |
| | | | | | | | | | | | | | | | | | | | | | | | |
TOTAL RETURNS FOR THE PERIOD ENDED SEPTEMBER 30, 2020 | |
| |
Average annual total returns (%) with maximum sales charge | | | | |
| Cumulative total returns (%)
with maximum sales charge |
|
| | | | | | | | Since
inception | | | | | | | | | | | Since
inception | |
| | | 1-year | | | 5-year | | | | (12-20-11 | ) | | | | | 6-month | | | | 5-year | | | | (12-20-11 | ) |
Class A | | 22.72 | | | 16.70 | | | | 16.09 | | | | | | 30.19 | | | | 116.46 | | | | 270.71 | |
Class C1 | | 27.25 | | | 17.01 | | | | 16.16 | | | | | | 35.46 | | | | 119.32 | | | | 272.90 | |
Class I2 | | 29.59 | | | 18.20 | | | | 17.12 | | | | | | 37.24 | | | | 130.70 | | | | 300.79 | |
Class R21,2 | | 29.06 | | | 17.76 | | | | 16.68 | | | | | | 36.94 | | | | 126.50 | | | | 287.78 | |
Class R41,2 | | 29.31 | | | 18.04 | | | | 16.86 | | | | | | 37.05 | | | | 129.20 | | | | 292.90 | |
Class R61,2 | | 29.73 | | | 18.33 | | | | 17.05 | | | | | | 37.27 | | | | 131.95 | | | | 298.66 | |
Class NAV2 | | 29.75 | | | 18.33 | | | | 17.29 | | | | | | 37.29 | | | | 131.96 | | | | 305.87 | |
Index† | | 37.53 | | | 20.10 | | | | 18.49 | | | | | | 44.73 | | | | 149.89 | | | | 343.85 | |
Performance figures assume all distributions are reinvested. Figures reflect the maximum sales charge on Class A shares of 5% and the applicable contingent deferred sales charge (CDSC) on Class C shares. Class C shares sold within one year of purchase are subject to a 1% CDSC. Sales charges are not applicable to Class I, Class R2, Class R4, Class R6, and Class NAV shares.
The expense ratios of the fund, both net (including any fee waivers and/or expense limitations) and gross (excluding any fee waivers and/or expense limitations), are set forth according to the most recent publicly available prospectuses for the fund and may differ from those disclosed in the Financial highlights tables in this report. Net expenses reflect contractual expense limitations in effect until July 31, 2021 and are subject to change. Had the contractual fee waivers and expense limitations not been in place, gross expenses would apply. The expense ratios are as follows:
| | | | | | | | | | | | | | | | | | |
| | | | Class A | | Class C | | Class I | | Class R2 | | Class R4 | | Class R6 | | Class NAV | | |
| | Gross (%) | | 1.01 | | 1.76 | | 0.76 | | 1.15 | | 1.00 | | 0.65 | | 0.64 | | |
| | Net (%) | | 1.00 | | 1.75 | | 0.75 | | 1.14 | | 0.89 | | 0.64 | | 0.63 | | |
Please refer to the most recent prospectus and annual or semiannual report for more information on expenses and any expense limitation arrangements for each class.
The returns reflect past results and should not be considered indicative of future performance. The return and principal value of an investment will fluctuate so that shares, when redeemed, may be worth more or less than their original cost. Due to market volatility and other factors, the fund’s current performance may be higher or lower than the performance shown. For current to the most recent month-end performance data, please call 800–225–5291 or visit the fund’s website at jhinvestments.com.
The performance table above and the chart on the next page do not reflect the deduction of taxes that a shareholder would pay on fund distributions or the redemption of fund shares. The fund’s performance results reflect any applicable fee waivers or expense reductions, without which the expenses would increase and results would have been less favorable.
| | † | Index is the Russell 1000 Growth Index. |
See the following page for footnotes.
| | |
| 4 | | JOHN HANCOCK U.S. QUALITY GROWTH FUND | SEMIANNUAL REPORT |
This chart and table show what happened to a hypothetical $10,000 investment in John Hancock U.S. Quality Growth Fund for the share classes and periods indicated, assuming all distributions were reinvested. For comparison, we’ve shown the same investment in the Russell 1000 Growth Index.

| | | | | | | | | | | | | | | | |
| | | Start date | | | With maximum
sales charge ($) | | | Without
sales charge ($) | | | Index ($) | |
Class C1,3 | | | 12-20-11 | | | | 37,290 | | | | 37,290 | | | | 44,385 | |
Class I2 | | | 12-20-11 | | | | 40,079 | | | | 40,079 | | | | 44,385 | |
Class R21,2 | | | 12-20-11 | | | | 38,778 | | | | 38,778 | | | | 44,385 | |
Class R41,2 | | | 12-20-11 | | | | 39,290 | | | | 39,290 | | | | 44,385 | |
Class R61,2 | | | 12-20-11 | | | | 39,866 | | | | 39,866 | | | | 44,385 | |
Class NAV2 | | | 12-20-11 | | | | 40,587 | | | | 40,587 | | | | 44,385 | |
The Russell 1000 Growth Index is an unmanaged index that measures the performance of the large-cap growth segment of the U.S. equity universe. It includes those Russell 1000 companies with higher price-to-book ratios and higher forecasted growth values.
It is not possible to invest directly in an index. Index figures do not reflect expenses or sales charges, which would result in lower returns.
Footnotes related to performance pages
| | 1 | Class C shares were first offered on 8-28-14; Class R2, Class R4, and Class R6 shares were first offered on 3-27-15. Returns prior to these dates are those of Class A shares that have not been adjusted for class-specific expenses; otherwise, returns would vary. |
| | 2 | For certain types of investors, as described in the fund’s prospectuses. |
| | 3 | The contingent deferred sales charge is not applicable. |
| | |
| SEMIANNUAL REPORT | JOHN HANCOCK U.S. QUALITY GROWTH FUND | | 5 |
These examples are intended to help you understand your ongoing operating expenses of investing in the fund so you can compare these costs with the ongoing costs of investing in other mutual funds.
Understanding fund expenses
As a shareholder of the fund, you incur two types of costs:
| | ∎ | | Transaction costs, which include sales charges (loads) on purchases or redemptions (varies by share class), minimum account fee charge, etc. | |
| | ∎ | | Ongoing operating expenses, including management fees, distribution and service fees (if applicable), and other fund expenses. | |
We are presenting only your ongoing operating expenses here.
Actual expenses/actual returns
The first line of each share class in the table on the following page is intended to provide information about the fund’s actual ongoing operating expenses, and is based on the fund’s actual return. It assumes an account value of $1,000.00 on April 1, 2020, with the same investment held until September 30, 2020.
Together with the value of your account, you may use this information to estimate the operating expenses that you paid over the period. Simply divide your account value at September 30, 2020, by $1,000.00, then multiply it by the “expenses paid” for your share class from the table. For example, for an account value of $8,600.00, the operating expenses should be calculated as follows:
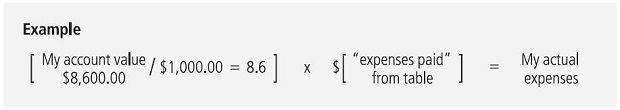
Hypothetical example for comparison purposes
The second line of each share class in the table on the following page allows you to compare the fund’s ongoing operating expenses with those of any other fund. It provides an example of the fund’s hypothetical account values and hypothetical expenses based on each class’s actual expense ratio and an assumed 5% annualized return before expenses (which is not the class’s actual return). It assumes an account value of $1,000.00 on April 1, 2020, with the same investment held until September 30, 2020. Look in any other fund shareholder report to find its hypothetical example and you will be able to compare these expenses. Please remember that these hypothetical account values and expenses may not be used to estimate the actual ending account balance or expenses you paid for the period.
| | |
| 6 | | JOHN HANCOCK U.S. QUALITY GROWTH FUND | SEMIANNUAL REPORT |
Remember, these examples do not include any transaction costs, therefore, these examples will not help you to determine the relative total costs of owning different funds. If transaction costs were included, your expenses would have been higher. See the prospectuses for details regarding transaction costs.
| | | | | | | | | | | | | | | | | | |
SHAREHOLDER EXPENSE EXAMPLE CHART | |
| | | | | | | | | | | | | | | | | | |
| | | | |
| Account
value on
4-1-2020 |
| |
| Ending
value on
9-30-2020 |
| |
| Expenses
paid during
period ended
9-30-2020 |
1 | |
| Annualized
expense
ratio |
|
Class A | | Actual expenses/actual returns | | | $1,000.00 | | | | $1,370.10 | | | | $ 5.88 | | | | 0.99% | |
| | | Hypothetical example | | | 1,000.00 | | | | 1,020.10 | | | | 5.01 | | | | 0.99% | |
Class C | | Actual expenses/actual returns | | | 1,000.00 | | | | 1,364.60 | | | | 10.31 | | | | 1.74% | |
| | | Hypothetical example | | | 1,000.00 | | | | 1,016.30 | | | | 8.79 | | | | 1.74% | |
Class I | | Actual expenses/actual returns | | | 1,000.00 | | | | 1,372.40 | | | | 4.40 | | | | 0.74% | |
| | | Hypothetical example | | | 1,000.00 | | | | 1,021.40 | | | | 3.75 | | | | 0.74% | |
Class R2 | | Actual expenses/actual returns | | | 1,000.00 | | | | 1,369.40 | | | | 6.59 | | | | 1.11% | |
| | | Hypothetical example | | | 1,000.00 | | | | 1,019.50 | | | | 5.62 | | | | 1.11% | |
Class R4 | | Actual expenses/actual returns | | | 1,000.00 | | | | 1,370.50 | | | | 5.23 | | | | 0.88% | |
| | | Hypothetical example | | | 1,000.00 | | | | 1,020.70 | | | | 4.46 | | | | 0.88% | |
Class R6 | | Actual expenses/actual returns | | | 1,000.00 | | | | 1,372.70 | | | | 3.75 | | | | 0.63% | |
| | | Hypothetical example | | | 1,000.00 | | | | 1,021.90 | | | | 3.19 | | | | 0.63% | |
Class NAV | | Actual expenses/actual returns | | | 1,000.00 | | | | 1,372.90 | | | | 3.63 | | | | 0.61% | |
| | | Hypothetical example | | | 1,000.00 | | | | 1,022.00 | | | | 3.09 | | | | 0.61% | |
| | 1 | Expenses are equal to the annualized expense ratio, multiplied by the average account value over the period, multiplied by 183/365 (to reflect the one-half year period). |
| | |
| SEMIANNUAL REPORT | JOHN HANCOCK U.S. QUALITY GROWTH FUND | | 7 |
AS OF 9-30-20 (unaudited)
| | | | | | | | |
| | | Shares | | | | Value | |
Common stocks 100.7% | | | | | | $ | 1,328,905,461 | |
(Cost $876,546,227) | | | | | | | | |
| | |
Communication services 12.7% | | | | | | | 167,981,695 | |
Interactive media and services 11.0% | | | | | | | | |
Alphabet, Inc., Class A (A) | | | 42,851 | | | | 62,802,426 | |
Facebook, Inc., Class A (A) | | | 249,534 | | | | 65,352,955 | |
Match Group, Inc. (A) | | | 159,459 | | | | 17,644,138 | |
Media 1.7% | | | | | | | | |
Charter Communications, Inc., Class A (A) | | | 35,529 | | | | 22,182,176 | |
| | |
Consumer discretionary 15.1% | | | | | | | 199,528,844 | |
Household durables 1.2% | | | | | | | | |
NVR, Inc. (A) | | | 3,785 | | | | 15,454,609 | |
Internet and direct marketing retail 7.1% | | | | | | | | |
Amazon.com, Inc. (A) | | | 29,807 | | | | 93,854,195 | |
Multiline retail 1.5% | | | | | | | | |
Dollar General Corp. | | | 97,873 | | | | 20,516,138 | |
Specialty retail 5.3% | | | | | | | | |
AutoZone, Inc. (A) | | | 13,445 | | | | 15,833,370 | |
Lowe’s Companies, Inc. | | | 158,489 | | | | 26,286,986 | |
The Home Depot, Inc. | | | 99,325 | | | | 27,583,546 | |
| | |
Financials 4.6% | | | | | | | 60,948,470 | |
Capital markets 3.2% | | | | | | | | |
Ares Management Corp., Class A | | | 372,286 | | | | 15,047,800 | |
LPL Financial Holdings, Inc. | | | 176,287 | | | | 13,515,924 | |
The Blackstone Group, Inc., Class A | | | 276,408 | | | | 14,428,498 | |
Insurance 1.4% | | | | | | | | |
The Progressive Corp. | | | 189,672 | | | | 17,956,248 | |
| | |
Health care 9.8% | | | | | | | 129,050,525 | |
Biotechnology 1.6% | | | | | | | | |
Vertex Pharmaceuticals, Inc. (A) | | | 78,393 | | | | 21,332,303 | |
Health care equipment and supplies 1.2% | | | | | | | | |
Danaher Corp. | | | 70,839 | | | | 15,253,762 | |
Health care providers and services 4.0% | | | | | | | | |
Humana, Inc. | | | 39,660 | | | | 16,414,877 | |
UnitedHealth Group, Inc. | | | 115,086 | | | | 35,880,362 | |
Life sciences tools and services 1.1% | | | | | | | | |
Agilent Technologies, Inc. | | | 147,080 | | | | 14,846,255 | |
Pharmaceuticals 1.9% | | | | | | | | |
Eli Lilly & Company | | | 171,078 | | | | 25,322,966 | |
| | | | |
| 8 | | JOHN HANCOCK U.S. QUALITY GROWTH FUND | SEMIANNUAL REPORT | | SEE NOTES TO FINANCIAL STATEMENTS |
| | | | | | | | |
| | | Shares | | | | Value | |
| | |
Industrials 6.4% | | | | | | | $84,352,322 | |
| | |
Aerospace and defense 1.7% | | | | | | | | |
Lockheed Martin Corp. | | | 59,348 | | | | 22,746,901 | |
| | |
Building products 2.3% | | | | | | | | |
Fortune Brands Home & Security, Inc. | | | 171,977 | | | | 14,879,450 | |
Trane Technologies PLC | | | 125,147 | | | | 15,174,074 | |
| | |
Professional services 2.4% | | | | | | | | |
IHS Markit, Ltd. | | | 205,783 | | | | 16,156,023 | |
TransUnion | | | 183,001 | | | | 15,395,874 | |
| | |
Information technology 50.3% | | | | | | | 663,725,604 | |
| | |
Electronic equipment, instruments and components 1.3% | | | | | | | | |
CDW Corp. | | | 141,211 | | | | 16,878,951 | |
| | |
IT services 15.8% | | | | | | | | |
Accenture PLC, Class A | | | 116,881 | | | | 26,413,937 | |
Fidelity National Information Services, Inc. | | | 109,933 | | | | 16,183,237 | |
FleetCor Technologies, Inc. (A) | | | 67,620 | | | | 16,100,322 | |
Global Payments, Inc. | | | 85,146 | | | | 15,120,227 | |
GoDaddy, Inc., Class A (A) | | | 197,543 | | | | 15,007,342 | |
Mastercard, Inc., Class A | | | 120,995 | | | | 40,916,879 | |
PayPal Holdings, Inc. (A) | | | 178,917 | | | | 35,252,017 | |
Visa, Inc., Class A | | | 217,591 | | | | 43,511,672 | |
| | |
Semiconductors and semiconductor equipment 5.7% | | | | | | | | |
Advanced Micro Devices, Inc. (A) | | | 267,878 | | | | 21,963,317 | |
Marvell Technology Group, Ltd. | | | 411,830 | | | | 16,349,651 | |
Teradyne, Inc. | | | 196,399 | | | | 15,605,865 | |
Texas Instruments, Inc. | | | 147,048 | | | | 20,996,984 | |
| | |
Software 17.6% | | | | | | | | |
Adobe, Inc. (A) | | | 72,809 | | | | 35,707,718 | |
Autodesk, Inc. (A) | | | 73,544 | | | | 16,989,399 | |
Intuit, Inc. | | | 67,361 | | | | 21,973,832 | |
Microsoft Corp. | | | 581,405 | | | | 122,286,914 | |
salesforce.com, Inc. (A) | | | 142,462 | | | | 35,803,550 | |
| | |
Technology hardware, storage and peripherals 9.9% | | | | | | | | |
Apple, Inc. | | | 1,128,260 | | | | 130,663,790 | |
| | |
Real estate 1.8% | | | | | | | 23,318,001 | |
| | |
Equity real estate investment trusts 1.8% | | | | | | | | |
American Tower Corp. | | | 96,463 | | | | 23,318,001 | |
| | | | |
| SEE NOTES TO FINANCIAL STATEMENTS | | SEMIANNUAL REPORT | JOHN HANCOCK U.S. QUALITY GROWTH FUND | | 9 |
| | | | | | | | | | | | |
| | | Yield | (%) | | | Shares | | | | Value | |
Short-term investments 0.0% | | | | | | | | | | | $83 | |
(Cost $83) | | | | | | | | | | | | |
| | | |
Short-term funds 0.0% | | | | | | | | | | | 83 | |
State Street Institutional U.S. Government Money Market Fund, Premier Class | | | 0.0266 | (B) | | | 83 | | | | 83 | |
| | | | | | | | | | | | |
Total investments (Cost $876,546,310) 100.7% | | | | | | | | | | | $1,328,905,544 | |
| | | | | | | | | | | | |
Other assets and liabilities, net (0.7%) | | | | | | | | | | | (8,887,589 | ) |
| | | | | | | | | | | | |
Total net assets 100.0% | | | | | | | | | | | $1,320,017,955 | |
The percentage shown for each investment category is the total value of the category as a percentage of the net assets of the fund.
Security Abbreviations and Legend
(A) Non-income producing security.
(B) The rate shown is the annualized seven-day yield as of 9-30-20.
At 9-30-20, the aggregate cost of investments for federal income tax purposes was $882,150,194. Net unrealized appreciation aggregated to $446,755,350, of which $448,811,685 related to gross unrealized appreciation and $2,056,335 related to gross unrealized depreciation.
| | | | |
| 10 | | JOHN HANCOCK U.S. QUALITY GROWTH FUND | SEMIANNUAL REPORT | | SEE NOTES TO FINANCIAL STATEMENTS |
| | | | |
| STATEMENT OF ASSETS AND LIABILITIES 9-30-20 (unaudited) | | | | |
| | | | |
Assets | | | | |
| |
Unaffiliated investments, at value (Cost $876,546,310) | | | $1,328,905,544 | |
| |
Dividends and interest receivable | | | 149,375 | |
| |
Receivable for fund shares sold | | | 1,486,061 | |
| |
Receivable for investments sold | | | 1,355,213 | |
| |
Receivable for securities lending income | | | 301 | |
| |
Other assets | | | 85,868 | |
| |
Total assets | | | 1,331,982,362 | |
Liabilities | | | | |
| |
Due to custodian | | | 254,786 | |
| |
Payable for investments purchased | | | 83 | |
| |
Payable for fund shares repurchased | | | 11,406,422 | |
| |
Payable to affiliates | | | | |
| |
Accounting and legal services fees | | | 79,088 | |
| |
Transfer agent fees | | | 108,880 | |
| |
Distribution and service fees | | | 313 | |
| |
Trustees’ fees | | | 1,242 | |
| |
Other liabilities and accrued expenses | | | 113,593 | |
| |
Total liabilities | | | 11,964,407 | |
| |
Net assets | | | $1,320,017,955 | |
Net assets consist of | | | | |
| |
Paid-in capital | | | $851,390,632 | |
| |
Total distributable earnings (loss) | | | 468,627,323 | |
| |
Net assets | | | $1,320,017,955 | |
| | | | |
Net asset value per share | | | | |
| |
Based on net asset value and shares outstanding - the fund has an unlimited number of shares authorized with no par value | | | | |
| |
Class A ($614,492,166 ÷ 27,620,412 shares)1 | | | $22.25 | |
| |
Class C ($34,552,475 ÷ 1,605,217 shares)1 | | | $21.53 | |
| |
Class I ($471,284,904 ÷ 20,967,865 shares) | | | $22.48 | |
| |
Class R2 ($1,108,320 ÷ 49,420 shares) | | | $22.43 | |
| |
Class R4 ($1,198,033 ÷ 53,259 shares) | | | $22.49 | |
| |
Class R6 ($143,040,134 ÷ 6,346,814 shares) | | | $22.54 | |
| |
Class NAV ($54,341,923 ÷ 2,412,035 shares) | | | $22.53 | |
Maximum offering price per share | | | | |
| |
Class A (net asset value per share ÷ 95%)2 | | | $23.42 | |
| 1 | Redemption price per share is equal to net asset value less any applicable contingent deferred sales charge. |
| 2 | On single retail sales of less than $50,000. On sales of $50,000 or more and on group sales the offering price is reduced. |
| | | | |
| SEE NOTES TO FINANCIAL STATEMENTS | | SEMIANNUAL REPORT | JOHN HANCOCK U.S. QUALITY GROWTH FUND | | 11 |
| | | | |
| STATEMENT OF OPERATIONS For the six months ended 9-30-20 (unaudited) | | | | |
| | | | |
Investment income | | | | |
| |
Dividends | | | $4,961,814 | |
| |
Securities lending | | | 5,975 | |
| |
Interest | | | 4,644 | |
| |
Total investment income | | | 4,972,433 | |
Expenses | | | | |
| |
Investment management fees | | | 3,382,122 | |
| |
Distribution and service fees | | | 868,558 | |
| |
Accounting and legal services fees | | | 108,621 | |
| |
Transfer agent fees | | | 640,979 | |
| |
Trustees’ fees | | | 9,720 | |
| |
Custodian fees | | | 68,241 | |
| |
State registration fees | | | 67,530 | |
| |
Printing and postage | | | 49,835 | |
| |
Professional fees | | | 49,965 | |
| |
Other | | | 30,712 | |
| |
Total expenses | | | 5,276,283 | |
| |
Less expense reductions | | | (42,002 | ) |
| |
Net expenses | | | 5,234,281 | |
| |
Net investment loss | | | (261,848 | ) |
Realized and unrealized gain (loss) | | | | |
| |
Net realized gain (loss) on | | | | |
| |
Unaffiliated investments | | | 24,763,193 | |
| |
Affiliated investments | | | (679 | ) |
| |
| | | | 24,762,514 | |
| |
Change in net unrealized appreciation (depreciation) of | | | | |
| |
Unaffiliated investments | | | 331,944,056 | |
| |
| | | | 331,944,056 | |
| |
Net realized and unrealized gain | | | 356,706,570 | |
| |
Increase in net assets from operations | | | $356,444,722 | |
| | | | |
| 12 | | JOHN HANCOCK U.S. QUALITY GROWTH FUND | SEMIANNUAL REPORT | | SEE NOTES TO FINANCIAL STATEMENTS |
| | | | | | | | |
| STATEMENTS OF CHANGES IN NET ASSETS | | | | | | | | |
| | | | | | | | |
| | | Six months ended 9-30-20 (unaudited) | | |
| Year ended
3-31-20 |
|
Increase (decrease) in net assets | | | | | | | | |
| | |
From operations | | | | | | | | |
| | |
Net investment income (loss) | | | $(261,848 | ) | | | $1,250,280 | |
| | |
Net realized gain (loss) | | | 24,762,514 | | | | (1,513,541 | ) |
| | |
Change in net unrealized appreciation (depreciation) | | | 331,944,056 | | | | (21,077,986 | ) |
| | |
Increase (decrease) in net assets resulting from operations | | | 356,444,722 | | | | (21,341,247 | ) |
| | |
Distributions to shareholders | | | | | | | | |
| | |
From earnings | | | | | | | | |
| | |
Class I | | | — | | | | (416,220 | ) |
| | |
Class R4 | | | — | | | | (414 | ) |
| | |
Class R6 | | | — | | | | (216,751 | ) |
| | |
Class NAV | | | — | | | | (89,547 | ) |
| | |
Total distributions | | | — | | | | (722,932 | ) |
| | |
From fund share transactions | | | | | | | | |
| | |
Fund share transactions | | | 20,745,640 | | | | 186,865,267 | |
| | |
Issued in reorganization | | | — | | | | 229,828,003 | |
| | |
From fund share transactions | | | 20,745,640 | | | | 416,693,270 | |
Total increase | | | 377,190,362 | | | | 394,629,091 | |
Net assets | | | | | | | | |
| | |
Beginning of period | | | 942,827,593 | | | | 548,198,502 | |
| | |
End of period | | | $1,320,017,955 | | | | $942,827,593 | |
| | | | |
| SEE NOTES TO FINANCIAL STATEMENTS | | SEMIANNUAL REPORT | JOHN HANCOCK U.S. QUALITY GROWTH FUND | | 13 |
| | | | | | | | | | | | | | | | | | | | | | | | |
| | | | | | |
CLASS A SHARES Period ended | | | 9-30-20 | 1 | | | 3-31-20 | | | | 3-31-19 | | | | 3-31-18 | | | | 3-31-17 | | | | 3-31-16 | |
Per share operating performance | | | | | | | | | | | | | | | | | | | | | | | | |
Net asset value, beginning of period | | | $16.24 | | | | $16.23 | | | | $17.94 | | | | $16.89 | | | | $15.33 | | | | $16.44 | |
Net investment income (loss)2 | | | (0.02 | ) | | | 0.01 | | | | (0.01 | ) | | | 0.01 | | | | 0.04 | | | | 0.03 | |
Net realized and unrealized gain (loss) on investments | | | 6.03 | | | | — | 3 | | | 2.22 | | | | 3.62 | | | | 2.12 | | | | (0.24 | ) |
Total from investment operations | | | 6.01 | | | | 0.01 | | | | 2.21 | | | | 3.63 | | | | 2.16 | | | | (0.21 | ) |
Less distributions | | | | | | | | | | | | | | | | | | | | | | | | |
From net investment income | | | — | | | | — | | | | (0.03 | ) | | | (0.03 | ) | | | (0.04 | ) | | | (0.05 | ) |
From net realized gain | | | — | | | | — | | | | (3.89 | ) | | | (2.55 | ) | | | (0.56 | ) | | | (0.85 | ) |
Total distributions | | | — | | | | — | | | | (3.92 | ) | | | (2.58 | ) | | | (0.60 | ) | | | (0.90 | ) |
Net asset value, end of period | | | $22.25 | | | | $16.24 | | | | $16.23 | | | | $17.94 | | | | $16.89 | | | | $15.33 | |
Total return (%)4,5 | | | 37.01 | 6 | | | 0.06 | | | | 12.22 | | | | 21.91 | | | | 14.34 | | | | (1.45 | ) |
Ratios and supplemental data | | | | | | | | | | | | | | | | | | | | | | | | |
Net assets, end of period (in millions) | | | $614 | | | | $458 | | | | $404 | | | | $379 | | | | $343 | | | | $18 | |
Ratios (as a percentage of average net assets): | | | | | | | | | | | | | | | | | | | | | | | | |
Expenses before reductions | | | 0.99 | 7 | | | 1.01 | | | | 1.10 | | | | 1.10 | | | | 1.11 | | | | 1.19 | |
Expenses including reductions | | | 0.99 | 7 | | | 1.00 | | | | 1.09 | | | | 1.09 | | | | 1.10 | | | | 1.18 | |
Net investment income (loss) | | | (0.17 | )7 | | | 0.03 | | | | (0.07 | ) | | | 0.03 | | | | 0.27 | | | | 0.20 | |
Portfolio turnover (%) | | | 33 | | | | 91 | 8 | | | 88 | 9 | | | 83 | | | | 94 | | | | 90 | |
| 1 | Six months ended 9-30-20. Unaudited. |
| 2 | Based on average daily shares outstanding. |
| 3 | Less than $0.005 per share. |
| 4 | Total returns would have been lower had certain expenses not been reduced during the applicable periods. |
| 5 | Does not reflect the effect of sales charges, if any. |
| 8 | Excludes in-kind transactions and merger activity. |
| 9 | Excludes in-kind transactions. |
| | | | |
| 14 | | JOHN HANCOCK U.S. QUALITY GROWTH FUND | SEMIANNUAL REPORT | | SEE NOTES TO FINANCIAL STATEMENTS |
| | | | | | | | | | | | | | | | | | | | | | | | |
| | | | | | |
CLASS C SHARES Period ended | | | 9-30-20 | 1 | | | 3-31-20 | | | | 3-31-19 | | | | 3-31-18 | | | | 3-31-17 | | | | 3-31-16 | |
Per share operating performance | | | | | | | | | | | | | | | | | | | | | | | | |
Net asset value, beginning of period | | | $15.77 | | | | $15.88 | | | | $17.71 | | | | $16.80 | | | | $15.32 | | | | $16.51 | |
Net investment loss2 | | | (0.09 | ) | | | (0.12 | ) | | | (0.14 | ) | | | (0.13 | ) | | | (0.08 | ) | | | (0.09 | ) |
Net realized and unrealized gain (loss) on investments | | | 5.85 | | | | 0.01 | 3 | | | 2.20 | | | | 3.59 | | | | 2.12 | | | | (0.25 | ) |
Total from investment operations | | | 5.76 | | | | (0.11 | ) | | | 2.06 | | | | 3.46 | | | | 2.04 | | | | (0.34 | ) |
Less distributions | | | | | | | | | | | | | | | | | | | | | | | | |
From net realized gain | | | — | | | | — | | | | (3.89 | ) | | | (2.55 | ) | | | (0.56 | ) | | | (0.85 | ) |
Net asset value, end of period | | | $21.53 | | | | $15.77 | | | | $15.88 | | | | $17.71 | | | | $16.80 | | | | $15.32 | |
Total return (%)4,5 | | | 36.46 | 6 | | | (0.69 | ) | | | 11.44 | | | | 20.95 | | | | 13.53 | | | | (2.24 | ) |
Ratios and supplemental data | | | | | | | | | | | | | | | | | | | | | | | | |
Net assets, end of period (in millions) | | | $35 | | | | $23 | | | | $12 | | | | $18 | | | | $17 | | | | $1 | |
Ratios (as a percentage of average net assets): | | | | | | | | | | | | | | | | | | | | | | | | |
Expenses before reductions | | | 1.74 | 7 | | | 1.76 | | | | 1.85 | | | | 1.85 | | | | 1.86 | | | | 2.50 | |
Expenses including reductions | | | 1.74 | 7 | | | 1.75 | | | | 1.84 | | | | 1.84 | | | | 1.85 | | | | 1.94 | |
Net investment loss | | | (0.92 | )7 | | | (0.72 | ) | | | (0.85 | ) | | | (0.72 | ) | | | (0.48 | ) | | | (0.54 | ) |
Portfolio turnover (%) | | | 33 | | | | 91 | 8 | | | 88 | 9 | | | 83 | | | | 94 | | | | 90 | |
| 1 | Six months ended 9-30-20. Unaudited. |
| 2 | Based on average daily shares outstanding. |
| 3 | The amount shown for a share outstanding does not correspond with the aggregate net gain (loss) on investments for the period due to the timing of the sales and repurchases of shares in relation to fluctuating market values of the investments of the fund. |
| 4 | Total returns would have been lower had certain expenses not been reduced during the applicable periods. |
| 5 | Does not reflect the effect of sales charges, if any. |
| 8 | Excludes in-kind transactions and merger activity. |
| 9 | Excludes in-kind transactions. |
| | | | |
| SEE NOTES TO FINANCIAL STATEMENTS | | SEMIANNUAL REPORT | JOHN HANCOCK U.S. QUALITY GROWTH FUND | | 15 |
| | | | | | | | | | | | | | | | | | | | | | | | |
| | | | | | |
CLASS I SHARES Period ended | | | 9-30-20 | 1 | | | 3-31-20 | | | | 3-31-19 | | | | 3-31-18 | | | | 3-31-17 | | | | 3-31-16 | |
Per share operating performance | | | | | | | | | | | | | | | | | | | | | | | | |
Net asset value, beginning of period | | | $16.38 | | | | $16.36 | | | | $18.05 | | | | $16.98 | | | | $15.41 | | | | $16.53 | |
Net investment income2 | | | 0.01 | | | | 0.05 | | | | 0.04 | | | | 0.06 | | | | 0.08 | | | | 0.08 | |
Net realized and unrealized gain (loss) on investments | | | 6.09 | | | | (0.01 | ) | | | 2.23 | | | | 3.64 | | | | 2.13 | | | | (0.24 | ) |
Total from investment operations | | | 6.10 | | | | 0.04 | | | | 2.27 | | | | 3.70 | | | | 2.21 | | | | (0.16 | ) |
Less distributions | | | | | | | | | | | | | | | | | | | | | | | | |
From net investment income | | | — | | | | (0.02 | ) | | | (0.07 | ) | | | (0.08 | ) | | | (0.08 | ) | | | (0.11 | ) |
From net realized gain | | | — | | | | — | | | | (3.89 | ) | | | (2.55 | ) | | | (0.56 | ) | | | (0.85 | ) |
Total distributions | | | — | | | | (0.02 | ) | | | (3.96 | ) | | | (2.63 | ) | | | (0.64 | ) | | | (0.96 | ) |
Net asset value, end of period | | | $22.48 | | | | $16.38 | | | | $16.36 | | | | $18.05 | | | | $16.98 | | | | $15.41 | |
Total return (%)3 | | | 37.24 | 4 | | | 0.26 | | | | 12.55 | | | | 22.12 | | | | 14.70 | | | | (1.17 | ) |
Ratios and supplemental data | | | | | | | | | | | | | | | | | | | | | | | | |
Net assets, end of period (in millions) | | | $471 | | | | $321 | | | | $115 | | | | $20 | | | | $17 | | | | $10 | |
Ratios (as a percentage of average net assets): | | | | | | | | | | | | | | | | | | | | | | | | |
Expenses before reductions | | | 0.74 | 5 | | | 0.76 | | | | 0.87 | | | | 0.84 | | | | 0.85 | | | | 0.90 | |
Expenses including reductions | | | 0.74 | 5 | | | 0.75 | | | | 0.86 | | | | 0.83 | | | | 0.84 | | | | 0.88 | |
Net investment income | | | 0.08 | 5 | | | 0.28 | | | | 0.25 | | | | 0.31 | | | | 0.47 | | | | 0.50 | |
Portfolio turnover (%) | | | 33 | | | | 91 | 6 | | | 88 | 7 | | | 83 | | | | 94 | | | | 90 | |
| 1 | Six months ended 9-30-20. Unaudited. |
| 2 | Based on average daily shares outstanding. |
| 3 | Total returns would have been lower had certain expenses not been reduced during the applicable periods. |
| 6 | Excludes in-kind transactions and merger activity. |
| 7 | Excludes in-kind transactions. |
| | | | |
| 16 | | JOHN HANCOCK U.S. QUALITY GROWTH FUND | SEMIANNUAL REPORT | | SEE NOTES TO FINANCIAL STATEMENTS |
| | | | | | | | | | | | | | | | | | | | | | | | |
| | | | | | |
CLASS R2 SHARES Period ended | | | 9-30-20 | 1 | | | 3-31-20 | | | | 3-31-19 | | | | 3-31-18 | | | | 3-31-17 | | | | 3-31-16 | |
Per share operating performance | | | | | | | | | | | | | | | | | | | | | | | | |
Net asset value, beginning of period | | | $16.38 | | | | $16.40 | | | | $18.08 | | | | $17.02 | | | | $15.44 | | | | $16.55 | |
Net investment income (loss)2 | | | (0.03 | ) | | | (0.02 | ) | | | (0.04 | ) | | | (0.02 | ) | | | 0.03 | | | | 0.01 | |
Net realized and unrealized gain (loss) on investments | | | 6.08 | | | | — | 3 | | | 2.25 | | | | 3.64 | | | | 2.14 | | | | (0.25 | ) |
Total from investment operations | | | 6.05 | | | | (0.02 | ) | | | 2.21 | | | | 3.62 | | | | 2.17 | | | | (0.24 | ) |
Less distributions | | | | | | | | | | | | | | | | | | | | | | | | |
From net investment income | | | — | | | | — | | | | — | 3 | | | (0.01 | ) | | | (0.03 | ) | | | (0.02 | ) |
From net realized gain | | | — | | | | — | | | | (3.89 | ) | | | (2.55 | ) | | | (0.56 | ) | | | (0.85 | ) |
Total distributions | | | — | | | | — | | | | (3.89 | ) | | | (2.56 | ) | | | (0.59 | ) | | | (0.87 | ) |
Net asset value, end of period | | | $22.43 | | | | $16.38 | | | | $16.40 | | | | $18.08 | | | | $17.02 | | | | $15.44 | |
Total return (%)4 | | | 36.94 | 5 | | | (0.12 | ) | | | 12.13 | | | | 21.68 | | | | 14.30 | | | | (1.63 | ) |
Ratios and supplemental data | | | | | | | | | | | | | | | | | | | | | | | | |
Net assets, end of period (in millions) | | | $1 | | | | $1 | | | | $1 | | | | $1 | | | | $1 | | | | $— | 6 |
Ratios (as a percentage of average net assets): | | | | | | | | | | | | | | | | | | | | | | | | |
Expenses before reductions | | | 1.11 | 7 | | | 1.15 | | | | 1.25 | | | | 1.22 | | | | 1.18 | | | | 4.73 | |
Expenses including reductions | | | 1.11 | 7 | | | 1.14 | | | | 1.25 | | | | 1.21 | | | | 1.17 | | | | 1.32 | |
Net investment income (loss) | | | (0.29 | )7 | | | (0.11 | ) | | | (0.22 | ) | | | (0.11 | ) | | | 0.19 | | | | 0.06 | |
Portfolio turnover (%) | | | 33 | | | | 91 | 8 | | | 88 | 9 | | | 83 | | | | 94 | | | | 90 | |
| 1 | Six months ended 9-30-20. Unaudited. |
| 2 | Based on average daily shares outstanding. |
| 3 | Less than $0.005 per share. |
| 4 | Total returns would have been lower had certain expenses not been reduced during the applicable periods. |
| 8 | Excludes in-kind transactions and merger activity. |
| 9 | Excludes in-kind transactions. |
| | | | |
| SEE NOTES TO FINANCIAL STATEMENTS | | SEMIANNUAL REPORT | JOHN HANCOCK U.S. QUALITY GROWTH FUND | | 17 |
| | | | | | | | | | | | | | | | | | | | | | | | |
| | | | | | |
CLASS R4 SHARES Period ended | | | 9-30-20 | 1 | | | 3-31-20 | | | | 3-31-19 | | | | 3-31-18 | | | | 3-31-17 | | | | 3-31-16 | |
Per share operating performance | | | | | | | | | | | | | | | | | | | | | | | | |
Net asset value, beginning of period | | | $16.41 | | | | $16.39 | | | | $18.08 | | | | $17.01 | | | | $15.43 | | | | $16.55 | |
Net investment income (loss)2 | | | (0.01 | ) | | | 0.03 | | | | 0.01 | | | | 0.03 | | | | 0.07 | | | | 0.04 | |
Net realized and unrealized gain (loss) on investments | | | 6.09 | | | | — | 3 | | | 2.24 | | | | 3.65 | | | | 2.14 | | | | (0.25 | ) |
Total from investment operations | | | 6.08 | | | | 0.03 | | | | 2.25 | | | | 3.68 | | | | 2.21 | | | | (0.21 | ) |
Less distributions | | | | | | | | | | | | | | | | | | | | | | | | |
From net investment income | | | — | | | | (0.01 | ) | | | (0.05 | ) | | | (0.06 | ) | | | (0.07 | ) | | | (0.06 | ) |
From net realized gain | | | — | | | | — | | | | (3.89 | ) | | | (2.55 | ) | | | (0.56 | ) | | | (0.85 | ) |
Total distributions | | | — | | | | (0.01 | ) | | | (3.94 | ) | | | (2.61 | ) | | | (0.63 | ) | | | (0.91 | ) |
Net asset value, end of period | | | $22.49 | | | | $16.41 | | | | $16.39 | | | | $18.08 | | | | $17.01 | | | | $15.43 | |
Total return (%)4 | | | 37.05 | 5 | | | 0.17 | | | | 12.36 | | | | 22.05 | | | | 14.60 | | | | (1.47 | ) |
Ratios and supplemental data | | | | | | | | | | | | | | | | | | | | | | | | |
Net assets, end of period (in millions) | | | $1 | | | | $1 | | | | $1 | | | | $1 | | | | $— | 6 | | | $— | 6 |
Ratios (as a percentage of average net assets): | | | | | | | | | | | | | | | | | | | | | | | | |
Expenses before reductions | | | 0.98 | 7 | | | 1.00 | | | | 1.10 | | | | 1.06 | | | | 1.02 | | | | 4.73 | |
Expenses including reductions | | | 0.88 | 7 | | | 0.89 | | | | 1.00 | | | | 0.95 | | | | 0.91 | | | | 1.13 | |
Net investment income (loss) | | | (0.06 | )7 | | | 0.15 | | | | 0.03 | | | | 0.18 | | | | 0.44 | | | | 0.25 | |
Portfolio turnover (%) | | | 33 | | | | 91 | 8 | | | 88 | 9 | | | 83 | | | | 94 | | | | 90 | |
| 1 | Six months ended 9-30-20. Unaudited. |
| 2 | Based on average daily shares outstanding. |
| 3 | Less than $0.005 per share. |
| 4 | Total returns would have been lower had certain expenses not been reduced during the applicable periods. |
| 8 | Excludes in-kind transactions and merger activity. |
| 9 | Excludes in-kind transactions. |
| | | | |
| 18 | | JOHN HANCOCK U.S. QUALITY GROWTH FUND | SEMIANNUAL REPORT | | SEE NOTES TO FINANCIAL STATEMENTS |
| | | | | | | | | | | | | | | | | | | | | | | | |
| | | | | | |
CLASS R6 SHARES Period ended | | | 9-30-20 | 1 | | | 3-31-20 | | | | 3-31-19 | | | | 3-31-18 | | | | 3-31-17 | | | | 3-31-16 | |
Per share operating performance | | | | | | | | | | | | | | | | | | | | | | | | |
Net asset value, beginning of period | | | $16.42 | | | | $16.39 | | | | $18.08 | | | | $17.01 | | | | $15.42 | | | | $16.55 | |
Net investment income2 | | | 0.02 | | | | 0.07 | | | | 0.05 | | | | 0.05 | | | | 0.09 | | | | 0.10 | |
Net realized and unrealized gain (loss) on investments | | | 6.10 | | | | — | 3 | | | 2.24 | | | | 3.67 | | | | 2.16 | | | | (0.25 | ) |
Total from investment operations | | | 6.12 | | | | 0.07 | | | | 2.29 | | | | 3.72 | | | | 2.25 | | | | (0.15 | ) |
Less distributions | | | | | | | | | | | | | | | | | | | | | | | | |
From net investment income | | | — | | | | (0.04 | ) | | | (0.09 | ) | | | (0.10 | ) | | | (0.10 | ) | | | (0.13 | ) |
From net realized gain | | | — | | | | — | | | | (3.89 | ) | | | (2.55 | ) | | | (0.56 | ) | | | (0.85 | ) |
Total distributions | | | — | | | | (0.04 | ) | | | (3.98 | ) | | | (2.65 | ) | | | (0.66 | ) | | | (0.98 | ) |
Net asset value, end of period | | | $22.54 | | | | $16.42 | | | | $16.39 | | | | $18.08 | | | | $17.01 | | | | $15.42 | |
Total return (%)4 | | | 37.27 | 5 | | | 0.38 | | | | 12.68 | | | | 22.26 | | | | 14.87 | | | | (1.09 | ) |
Ratios and supplemental data | | | | | | | | | | | | | | | | | | | | | | | | |
Net assets, end of period (in millions) | | | $143 | | | | $99 | | | | $15 | | | | $9 | | | | $1 | | | | $— | 6 |
Ratios (as a percentage of average net assets): | | | | | | | | | | | | | | | | | | | | | | | | |
Expenses before reductions | | | 0.63 | 7 | | | 0.65 | | | | 0.75 | | | | 0.75 | | | | 0.75 | | | | 4.75 | |
Expenses including reductions | | | 0.63 | 7 | | | 0.64 | | | | 0.74 | | | | 0.74 | | | | 0.73 | | | | 0.73 | |
Net investment income | | | 0.19 | 7 | | | 0.37 | | | | 0.29 | | | | 0.25 | | | | 0.50 | | | | 0.65 | |
Portfolio turnover (%) | | | 33 | | | | 91 | 8 | | | 88 | 9 | | | 83 | | | | 94 | | | | 90 | |
| 1 | Six months ended 9-30-20. Unaudited. |
| 2 | Based on average daily shares outstanding. |
| 3 | Less than $0.005 per share. |
| 4 | Total returns would have been lower had certain expenses not been reduced during the applicable periods. |
| 8 | Excludes in-kind transactions and merger activity. |
| 9 | Excludes in-kind transactions. |
| | | | |
| SEE NOTES TO FINANCIAL STATEMENTS | | SEMIANNUAL REPORT | JOHN HANCOCK U.S. QUALITY GROWTH FUND | | 19 |
| | | | | | | | | | | | | | | | | | | | | | | | |
| | | | | | |
CLASS NAV SHARES Period ended | | | 9-30-20 | 1 | | | 3-31-20 | | | | 3-31-19 | | | | 3-31-18 | | | | 3-31-17 | | | | 3-31-16 | |
Per share operating performance | | | | | | | | | | | | | | | | | | | | | | | | |
Net asset value, beginning of period | | | $16.41 | | | | $16.38 | | | | $18.07 | | | | $17.00 | | | | $15.42 | | | | $16.55 | |
Net investment income2 | | | 0.02 | | | | 0.07 | | | | 0.03 | | | | 0.07 | | | | 0.10 | | | | 0.10 | |
Net realized and unrealized gain (loss) on investments | | | 6.10 | | | | — | 3 | | | 2.26 | | | | 3.65 | | | | 2.14 | | | | (0.25 | ) |
Total from investment operations | | | 6.12 | | | | 0.07 | | | | 2.29 | | | | 3.72 | | | | 2.24 | | | | (0.15 | ) |
Less distributions | | | | | | | | | | | | | | | | | | | | | | | | |
From net investment income | | | — | | | | (0.04 | ) | | | (0.09 | ) | | | (0.10 | ) | | | (0.10 | ) | | | (0.13 | ) |
From net realized gain | | | — | | | | — | | | | (3.89 | ) | | | (2.55 | ) | | | (0.56 | ) | | | (0.85 | ) |
Total distributions | | | — | | | | (0.04 | ) | | | (3.98 | ) | | | (2.65 | ) | | | (0.66 | ) | | | (0.98 | ) |
Net asset value, end of period | | | $22.53 | | | | $16.41 | | | | $16.38 | | | | $18.07 | | | | $17.00 | | | | $15.42 | |
Total return (%)4 | | | 37.29 | 5 | | | 0.39 | | | | 12.69 | | | | 22.30 | | | | 14.81 | | | | (1.09 | ) |
Ratios and supplemental data | | | | | | | | | | | | | | | | | | | | | | | | |
Net assets, end of period (in millions) | | | $54 | | | | $40 | | | | $— | 6 | | | $1,410 | | | | $1,592 | | | | $1,666 | |
Ratios (as a percentage of average net assets): | | | | | | | | | | | | | | | | | | | | | | | | |
Expenses before reductions | | | 0.62 | 7 | | | 0.64 | | | | 0.74 | | | | 0.73 | | | | 0.73 | | | | 0.74 | |
Expenses including reductions | | | 0.61 | 7 | | | 0.63 | | | | 0.73 | | | | 0.73 | | | | 0.73 | | | | 0.74 | |
Net investment income | | | 0.20 | 7 | | | 0.41 | | | | 0.18 | | | | 0.40 | | | | 0.61 | | | | 0.64 | |
Portfolio turnover (%) | | | 33 | | | | 91 | 8 | | | 88 | 9 | | | 83 | | | | 94 | | | | 90 | |
| 1 | Six months ended 9-30-20. Unaudited. |
| 2 | Based on average daily shares outstanding. |
| 3 | Less than $0.005 per share. |
| 4 | Total returns would have been lower had certain expenses not been reduced during the applicable periods. |
| 8 | Excludes in-kind transactions and merger activity. |
| 9 | Excludes in-kind transactions. |
| | | | |
| 20 | | JOHN HANCOCK U.S. QUALITY GROWTH FUND | SEMIANNUAL REPORT | | SEE NOTES TO FINANCIAL STATEMENTS |
|
Notes to financial statements (unaudited) |
Note 1 — Organization
John Hancock U.S. Quality Growth Fund (the fund) is a series of John Hancock Funds III (the Trust), an open-end management investment company organized as a Massachusetts business trust and registered under the Investment Company Act of 1940, as amended (the 1940 Act). The investment objective of the fund is to seek long-term capital appreciation.
The fund may offer multiple classes of shares. The shares currently outstanding are detailed in the Statement of assets and liabilities. Class A and Class C shares are offered to all investors. Class I shares are offered to institutions and certain investors. Class R2 and Class R4 shares are available only to certain retirement and 529 plans. Class R6 shares are only available to certain retirement plans, institutions and other investors. Class NAV shares are offered to John Hancock affiliated funds of funds, retirement plans for employees of John Hancock and/or Manulife Financial Corporation, and certain 529 plans. Class C shares convert to Class A shares ten years after purchase (certain exclusions may apply). Shareholders of each class have exclusive voting rights to matters that affect that class. The distribution and service fees, if any, and transfer agent fees for each class may differ.
Effective November 1, 2020, Class C shares convert to Class A shares after 8 years (certain exclusions apply).
On September 17, 2020, the Board of Trustees approved that the name of the fund will change to U.S. Growth Fund. This name change was effective on October 19, 2020.
Note 2 — Significant accounting policies
The financial statements have been prepared in conformity with accounting principles generally accepted in the United States of America (US GAAP), which require management to make certain estimates and assumptions as of the date of the financial statements. Actual results could differ from those estimates and those differences could be significant. The fund qualifies as an investment company under Topic 946 of Accounting Standards Codification of US GAAP.
Events or transactions occurring after the end of the fiscal period through the date that the financial statements were issued have been evaluated in the preparation of the financial statements. The following summarizes the significant accounting policies of the fund:
Security valuation. Investments are stated at value as of the scheduled close of regular trading on the New York Stock Exchange (NYSE), normally at 4:00 P.M., Eastern Time. In case of emergency or other disruption resulting in the NYSE not opening for trading or the NYSE closing at a time other than the regularly scheduled close, the net asset value (NAV) may be determined as of the regularly scheduled close of the NYSE pursuant to the fund’s Valuation Policies and Procedures.
In order to value the securities, the fund uses the following valuation techniques: Equity securities, including exchange-traded or closed-end funds, are typically valued at the last sale price or official closing price on the exchange or principal market where the security trades. In the event there were no sales during the day or closing prices are not available, the securities are valued using the last available bid price. Investments by the fund in open-end mutual funds are valued at their respective NAVs each business day.
In certain instances, the Pricing Committee may determine to value equity securities using prices obtained from another exchange or market if trading on the exchange or market on which prices are typically obtained did not open for trading as scheduled, or if trading closed earlier than scheduled, and trading occurred as normal on another exchange or market.
Other portfolio securities and assets, for which reliable market quotations are not readily available, are valued at fair value as determined in good faith by the fund’s Pricing Committee following procedures established by the Board of Trustees. The frequency with which these fair valuation procedures are used cannot be predicted and fair value of securities may differ significantly from the value that would have been used had a ready market for such securities existed.
| | | | |
| | SEMIANNUAL REPORT | JOHN HANCOCK U.S. QUALITY GROWTH FUND | | 21 |
The fund uses a three-tier hierarchy to prioritize the pricing assumptions, referred to as inputs, used in valuation techniques to measure fair value. Level 1 includes securities valued using quoted prices in active markets for identical securities, including registered investment companies. Level 2 includes securities valued using other significant observable inputs. Observable inputs may include quoted prices for similar securities, interest rates, prepayment speeds and credit risk. Prices for securities valued using these inputs are received from independent pricing vendors and brokers and are based on an evaluation of the inputs described. Level 3 includes securities valued using significant unobservable inputs when market prices are not readily available or reliable, including the fund’s own assumptions in determining the fair value of investments. Factors used in determining value may include market or issuer specific events or trends, changes in interest rates and credit quality. The inputs or methodology used for valuing securities are not necessarily an indication of the risks associated with investing in those securities. Changes in valuation techniques and related inputs may result in transfers into or out of an assigned level within the disclosure hierarchy.
As of September 30, 2020, all investments are categorized as Level 1 under the hierarchy described above.
Real estate investment trusts. The fund may invest in real estate investment trusts (REITs). Distributions from REITs may be recorded as income and subsequently characterized by the REIT at the end of the fiscal year as a reduction of cost of investments and/or as a realized gain. As a result, the fund will estimate the components of distributions from these securities. Such estimates are revised when the actual components of the distributions are known.
Security transactions and related investment income. Investment security transactions are accounted for on a trade date plus one basis for daily NAV calculations. However, for financial reporting purposes, investment transactions are reported on trade date. Interest income is accrued as earned. Dividend income is recorded on the ex-date, except for dividends of certain foreign securities where the dividend may not be known until after the ex-date. In those cases, dividend income, net of withholding taxes, is recorded when the fund becomes aware of the dividends. Non-cash dividends, if any, are recorded at the fair market value of the securities received. Gains and losses on securities sold are determined on the basis of identified cost and may include proceeds from litigation.
Securities lending. The fund may lend its securities to earn additional income. The fund receives collateral from the borrower in an amount not less than the market value of the loaned securities. The fund will invest its cash collateral in John Hancock Collateral Trust (JHCT), an affiliate of the fund, which has a floating NAV and is registered with the Securities and Exchange Commission (SEC) as an investment company. JHCT invests in short-term money market investments. The fund will receive the benefit of any gains and bear any losses generated by JHCT with respect to the cash collateral.
The fund has the right to recall loaned securities on demand. If a borrower fails to return loaned securities when due, then the lending agent is responsible and indemnifies the fund for the lent securities. The lending agent uses the collateral received from the borrower to purchase replacement securities of the same issue, type, class and series of the loaned securities. If the value of the collateral is less than the purchase cost of replacement securities, the lending agent is responsible for satisfying the shortfall but only to the extent that the shortfall is not due to any decrease in the value of JHCT.
Although the risk of loss on securities lent is mitigated by receiving collateral from the borrower and through lending agent indemnification, the fund could experience a delay in recovering securities or could experience a lower than expected return if the borrower fails to return the securities on a timely basis. The fund receives compensation for lending its securities by retaining a portion of the return on the investment of the collateral and compensation from fees earned from borrowers of the securities. Securities lending income received by the fund is net of fees retained by the securities lending agent. Net income received from JHCT is a component of securities lending income as recorded on the Statement of operations. As of September 30, 2020, there were no securities on loan.
| | | | |
| 22 | | JOHN HANCOCK U.S. QUALITY GROWTH FUND | SEMIANNUAL REPORT | | |
Overdraft. The fund may have the ability to borrow from banks for temporary or emergency purposes, including meeting redemption requests that otherwise might require the untimely sale of securities. Pursuant to the fund’s custodian agreement, the custodian may loan money to the fund to make properly authorized payments. The fund is obligated to repay the custodian for any overdraft, including any related costs or expenses. The custodian may have a lien, security interest or security entitlement in any fund property that is not otherwise segregated or pledged, to the extent of any overdraft, and to the maximum extent permitted by law. Overdrafts at period end are presented under the caption Due to custodian in the Statement of assets and liabilities.
Line of credit. Effective June 25, 2020, the fund and other affiliated funds have entered into a syndicated line of credit agreement with Citibank, N.A. as the administrative agent that enables them to participate in a $1 billion unsecured committed line of credit. Excluding commitments designated for a certain fund and subject to the needs of all other affiliated funds, the fund can borrow up to an aggregate commitment amount of $850 million, subject to asset coverage and other limitations as specified in the agreement. Each participating fund paid an upfront fee in connection with this line of credit agreement, which is charged based on a combination of fixed and asset-based allocations and amortized over 365 days. Prior to June 25, 2020, the fund and other affiliated funds had a similar agreement that enabled them to participate in a $750 million unsecured committed line of credit. A commitment fee payable at the end of each calendar quarter, based on the average daily unused portion of the line of credit, is charged to each participating fund based on a combination of fixed and asset-based allocations and is reflected in Other expenses on the Statement of operations. For the six months ended September 30, 2020, the fund had no borrowings under the line of credit. Commitment fees for the six months ended September 30, 2020 were $3,880.
Expenses. Within the John Hancock group of funds complex, expenses that are directly attributable to an individual fund are allocated to such fund. Expenses that are not readily attributable to a specific fund are allocated among all funds in an equitable manner, taking into consideration, among other things, the nature and type of expense and the fund’s relative net assets. Expense estimates are accrued in the period to which they relate and adjustments are made when actual amounts are known.
Class allocations. Income, common expenses and realized and unrealized gains (losses) are determined at the fund level and allocated daily to each class of shares based on the net assets of the class. Class-specific expenses, such as distribution and service fees, if any, and transfer agent fees, for all classes, are charged daily at the class level based on the net assets of each class and the specific expense rates applicable to each class.
Federal income taxes. The fund intends to continue to qualify as a regulated investment company by complying with the applicable provisions of the Internal Revenue Code and will not be subject to federal income tax on taxable income that is distributed to shareholders. Therefore, no federal income tax provision is required.
For federal income tax purposes, as of March 31, 2020, the fund has a short-term capital loss carryforward of $3,294,396 available to offset future net realized capital gains. This carryforward does not expire.
Availability of a certain amount of the loss carryforwards, which were acquired on April 12, 2019, in a merger with John Hancock Funds II U.S. Growth Fund, may be limited in a given year.
As of March 31, 2020, the fund had no uncertain tax positions that would require financial statement recognition, derecognition or disclosure. The fund’s federal tax returns are subject to examination by the Internal Revenue Service for a period of three years.
Distribution of income and gains. Distributions to shareholders from net investment income and net realized gains, if any, are recorded on the ex-date. The fund generally declares and pays dividends annually. Capital gain distributions, if any, are typically distributed annually.
Distributions paid by the fund with respect to each class of shares are calculated in the same manner, at the same time and in the same amount, except for the effect of class level expenses that may be applied differently to each class.
| | | | |
| | SEMIANNUAL REPORT | JOHN HANCOCK U.S. QUALITY GROWTH FUND | | 23 |
Such distributions, on a tax basis, are determined in conformity with income tax regulations, which may differ from US GAAP. Distributions in excess of tax basis earnings and profits, if any, are reported in the fund’s financial statements as a return of capital. The final determination of tax characteristics of the fund’s distribution will occur at the end of the year and will subsequently be reported to shareholders.
Capital accounts within the financial statements are adjusted for permanent book-tax differences. These adjustments have no impact on net assets or the results of operations. Temporary book-tax differences, if any, will reverse in a subsequent period. Book-tax differences are primarily attributable to wash sale loss deferrals and merger related adjustments.
Note 3 — Guarantees and indemnifications
Under the Trust’s organizational documents, its Officers and Trustees are indemnified against certain liabilities arising out of the performance of their duties to the Trust, including the fund. Additionally, in the normal course of business, the fund enters into contracts with service providers that contain general indemnification clauses. The fund’s maximum exposure under these arrangements is unknown, as this would involve future claims that may be made against the fund that have not yet occurred. The risk of material loss from such claims is considered remote.
Note 4 — Fees and transactions with affiliates
John Hancock Investment Management LLC (the Advisor) serves as investment advisor for the fund. John Hancock Investment Management Distributors LLC (the Distributor), an affiliate of the Advisor, serves as principal underwriter of the fund. The Advisor and the Distributor are indirect, principally owned subsidiaries of Manulife Financial Corporation.
Management fee. The fund has an investment management agreement with the Advisor under which the fund pays a daily management fee to the Advisor equivalent on an annual basis to the sum of: (a) 0.600% of the first $500 million of the fund’s aggregate net assets; (b) 0.550% of the next $1.0 billion of the fund’s aggregate net assets; and (c) 0.530% of the fund’s aggregate net assets in excess of $1.5 billion. Aggregate net assets include the net assets of the fund and Manulife U.S. Diversified Growth Equity Fund, a series trust of The Manufacturers Life Insurance Company. The advisor has a subadvisory agreement with Wellington Management Company LLP. The fund is not responsible for payment of the subadvisory fees.
The Advisor has contractually agreed to waive a portion of its management fee and/or reimburse expenses for certain funds of the John Hancock group of funds complex, including the fund (the participating portfolios). This waiver is based upon aggregate net assets of all the participating portfolios. The amount of the reimbursement is calculated daily and allocated among all the participating portfolios in proportion to the daily net assets of each fund. During the six months ended September 30, 2020, this waiver amounted to 0.01% of the fund’s average daily net assets on an annualized basis. This arrangement expires on July 31, 2022, unless renewed by mutual agreement of the fund and the Advisor based upon a determination that this is appropriate under the circumstances at that time.
For the six months ended September 30, 2020, the expense reductions described above amounted to the following:
| | | | |
| Class | | Expense reduction | |
Class A | | | $19,421 | |
Class C | | | 1,044 | |
Class I | | | 14,789 | |
Class R2 | | | 35 | |
| | | | |
| Class | | Expense reduction | |
Class R4 | | | $38 | |
Class R6 | | | 4,428 | |
Class NAV | | | 1,697 | |
Total | | | $41,452 | |
Expenses waived or reimbursed in the current fiscal period are not subject to recapture in future fiscal periods.
| | | | |
| 24 | | JOHN HANCOCK U.S. QUALITY GROWTH FUND | SEMIANNUAL REPORT | | |
The investment management fees, including the impact of the waivers and reimbursements as described above, incurred for the six months ended September 30, 2020, were equivalent to a net annual effective rate of 0.55% of the fund’s average daily net assets.
Accounting and legal services. Pursuant to a service agreement, the fund reimburses the Advisor for all expenses associated with providing the administrative, financial, legal, compliance, accounting and recordkeeping services to the fund, including the preparation of all tax returns, periodic reports to shareholders and regulatory reports, among other services. These expenses are allocated to each share class based on its relative net assets at the time the expense was incurred. These accounting and legal services fees incurred, for the six months ended September 30, 2020, amounted to an annual rate of 0.02% of the fund’s average daily net assets.
Distribution and service plans. The fund has a distribution agreement with the Distributor. The fund has adopted distribution and service plans for certain classes as detailed below pursuant to Rule 12b-1 under the 1940 Act, to pay the Distributor for services provided as the distributor of shares of the fund. In addition, under a service plan for certain classes as detailed below, the fund pays for certain other services. The fund may pay up to the following contractual rates of distribution and service fees under these arrangements, expressed as an annual percentage of average daily net assets for each class of the fund’s shares:
| | | | | | | | |
| Class | | Rule 12b-1 Fee | | | Service fee | |
Class A | | | 0.25% | | | | — | |
Class C | | | 1.00% | | | | — | |
Class R2 | | | 0.25% | | | | 0.25% | |
Class R4 | | | 0.25% | | | | 0.10% | |
The fund’s Distributor has contractually agreed to waive 0.10% of Rule12b-1 fees for Class R4 shares. The current waiver agreement expires on July 31, 2021, unless renewed by mutual agreement of the fund and the Distributor based upon a determination that this is appropriate under the circumstances at the time. This contractual waiver amounted to $550 for Class R4 shares for the six months ended September 30, 2020.
Sales charges. Class A shares are assessed up-front sales charges, which resulted in payments to the Distributor amounting to $168,744 for the six months ended September 30, 2020. Of this amount, $27,401 was retained and used for printing prospectuses, advertising, sales literature and other purposes and $141,343 was paid as sales commissions to broker-dealers.
Class A and Class C shares may be subject to contingent deferred sales charges (CDSCs). Certain Class A shares that are acquired through purchases of $1 million or more and are redeemed within one year of purchase are subject to a 1.00% sales charge. Class C shares that are redeemed within one year of purchase are subject to a 1.00% CDSC. CDSCs are applied to the lesser of the current market value at the time of redemption or the original purchase cost of the shares being redeemed. Proceeds from CDSCs are used to compensate the Distributor for providing distribution-related services in connection with the sale of these shares. During the six months ended September 30, 2020, CDSCs received by the Distributor amounted to $2,918 and $2,766 for Class A and Class C shares, respectively.
Transfer agent fees. The John Hancock group of funds has a complex-wide transfer agent agreement with John Hancock Signature Services, Inc. (Signature Services), an affiliate of the Advisor. The transfer agent fees paid to Signature Services are determined based on the cost to Signature Services (Signature Services Cost) of providing recordkeeping services. It also includes out-of-pocket expenses, including payments made to third-parties for recordkeeping services provided to their clients who invest in one or more John Hancock funds. In addition, Signature Services Cost may be reduced by certain fees that Signature Services receives in connection with retirement and small accounts. Signature Services Cost is calculated monthly and allocated, as applicable, to five categories of share classes: Retail Share and Institutional Share Classes of Non-Municipal Bond Funds, Class R6
| | | | |
| | SEMIANNUAL REPORT | JOHN HANCOCK U.S. QUALITY GROWTH FUND | | 25 |
Shares, Retirement Share Classes and Municipal Bond Share Classes. Within each of these categories, the applicable costs are allocated to the affected John Hancock affiliated funds and/or classes, based on the relative average daily net assets.
Class level expenses. Class level expenses for the six months ended September 30, 2020 were as follows:
| | | | | | | | |
| Class | | Distribution and service fees | | | Transfer agent fees | |
Class A | | | $711,736 | | | | $349,413 | |
Class C | | | 152,460 | | | | 18,650 | |
Class I | | | — | | | | 264,529 | |
Class R2 | | | 2,443 | | | | 65 | |
Class R4 | | | 1,919 | | | | 70 | |
Class R6 | | | — | | | | 8,252 | |
Total | | | $868,558 | | | | $640,979 | |
Trustee expenses. The fund compensates each Trustee who is not an employee of the Advisor or its affiliates. The costs of paying Trustee compensation and expenses are allocated to the fund based on its net assets relative to other funds within the John Hancock group of funds complex.
Interfund lending program. Pursuant to an Exemptive Order issued by the SEC, the fund, along with certain other funds advised by the Advisor or its affiliates, may participate in an interfund lending program. This program provides an alternative credit facility allowing the fund to borrow from, or lend money to, other participating affiliated funds. At period end, no interfund loans were outstanding. The fund’s activity in this program during the period for which loans were outstanding was as follows:
| | | | | | | | | | | | | | | | |
Borrower or Lender | | Weighted Average Loan Balance | | | Days Outstanding | | | Weighted Average Interest Rate | | | Interest Income (Expense) | |
Lender | | | $6,677,903 | | | | 4 | | | | 0.536% | | | | $398 | |
Note 5 — Fund share transactions
Transactions in fund shares for the six months ended September 30, 2020 and for the year ended March 31, 2020 were as follows:
| | | | | | | | | | | | | | | | |
| | |
| | | Six Months Ended 9-30-20 | | | Year Ended 3-31-20 | |
| | | | |
| | | Shares | | | Amount | | | Shares | | | Amount | |
Class A shares | | | | | | | | | | | | | | | | |
Sold | | | 1,254,584 | | | | $25,091,354 | | | | 3,023,155 | | | | $53,258,748 | |
Issued in reorganization (Note 9) | | | — | | | | — | | | | 4,540,944 | | | | 75,293,391 | |
Repurchased | | | (1,863,638 | ) | | | (37,762,256 | ) | | | (4,242,450 | ) | | | (74,258,441 | ) |
Net increase (decrease) | | | (609,054 | ) | | | $(12,670,902 | ) | | | 3,321,649 | | | | $54,293,698 | |
Class C shares | | | | | | | | | | | | | | | | |
Sold | | | 292,766 | | | | $5,676,098 | | | | 711,141 | | | | $11,948,771 | |
Issued in reorganization (Note 9) | | | — | | | | — | | | | 374,818 | | | | 6,079,328 | |
Repurchased | | | (120,578 | ) | | | (2,391,446 | ) | | | (387,791 | ) | | | (6,566,893 | ) |
Net increase | | | 172,188 | | | | $3,284,652 | | | | 698,168 | | | | $11,461,206 | |
| | | | |
| 26 | | JOHN HANCOCK U.S. QUALITY GROWTH FUND | SEMIANNUAL REPORT | | |
| | | | | | | | | | | | | | | | |
| | |
| | | Six Months Ended 9-30-20 | | | Year Ended 3-31-20 | |
| | | | |
| | | Shares | | | Amount | | | Shares | | | Amount | |
Class I shares | | | | | | | | | | | | | | | | |
Sold | | | 5,404,593 | | | | $108,818,254 | | | | 13,078,856 | | | | $233,950,325 | |
Issued in reorganization (Note 9) | | | — | | | | — | | | | 4,260,837 | | | | 71,208,808 | |
Distributions reinvested | | | — | | | | — | | | | 22,425 | | | | 414,859 | |
Repurchased | | | (4,019,681 | ) | | | (83,844,254 | ) | | | (4,828,389 | ) | | | (83,891,080 | ) |
Net increase | | | 1,384,912 | | | | $24,974,000 | | | | 12,533,729 | | | | $221,682,912 | |
Class R2 shares | | | | | | | | | | | | | | | | |
Sold | | | 3,498 | | | | $73,406 | | | | 25,337 | | | | $455,795 | |
Repurchased | | | (3,694 | ) | | | (77,234 | ) | | | (32,442 | ) | | | (616,700 | ) |
Net decrease | | | (196 | ) | | | $(3,828 | ) | | | (7,105 | ) | | | $(160,905 | ) |
Class R4 shares | | | | | | | | | | | | | | | | |
Sold | | | 1,885 | | | | $37,179 | | | | 7,348 | | | | $126,515 | |
Distributions reinvested | | | — | | | | — | | | | 22 | | | | 414 | |
Repurchased | | | (1,636 | ) | | | (34,682 | ) | | | (4,602 | ) | | | (79,440 | ) |
Net increase | | | 249 | | | | $2,497 | | | | 2,768 | | | | $47,489 | |
Class R6 shares | | | | | | | | | | | | | | | | |
Sold | | | 926,460 | | | | $18,761,263 | | | | 2,190,777 | | | | $39,155,732 | |
Issued in reorganization (Note 9) | | | — | | | | — | | | | 4,614,044 | | | | 77,246,476 | |
Distributions reinvested | | | — | | | | — | | | | 11,697 | | | | 216,751 | |
Repurchased | | | (622,933 | ) | | | (12,986,455 | ) | | | (1,692,994 | ) | | | (29,940,487 | ) |
Net increase | | | 303,527 | | | | $5,774,808 | | | | 5,123,524 | | | | $86,678,472 | |
Class NAV shares | | | | | | | | | | | | | | | | |
Sold | | | 440,193 | | | | $8,834,461 | | | | 3,029,075 | | | | $52,879,370 | 1 |
Distributions reinvested | | | — | | | | — | | | | 4,835 | | | | 89,547 | |
Repurchased | | | (473,546 | ) | | | (9,450,048 | ) | | | (591,550 | ) | | | (10,278,519 | ) |
Net increase (decrease) | | | (33,353 | ) | | | $(615,587 | ) | | | 2,442,360 | | | | $42,690,398 | |
Total net increase | | | 1,218,273 | | | | $20,745,640 | | | | 24,115,093 | | | | $416,693,270 | |
| 1 | Includes in-kind subscriptions of approximately $18.4 million by affiliates of the fund. The cost basis of the contributed securities is equal to the market value of the securities on the date of the subscription. |
Affiliates of the fund owned 100% of shares of Class NAV on September 30, 2020. Such concentration of shareholders’ capital could have a material effect on the fund if such shareholders redeem from the fund.
Note 6 — Purchase and sale of securities
Purchases and sales of securities, other than short-term investments, amounted to $429,119,587 and $395,648,174, respectively, for the six months ended September 30, 2020.
| | | | |
| | SEMIANNUAL REPORT | JOHN HANCOCK U.S. QUALITY GROWTH FUND | | 27 |
Note 7 — Industry or sector risk
The fund may invest a large percentage of its assets in one or more particular industries or sectors of the economy. If a large percentage of the fund’s assets are economically tied to a single or small number of industries or sectors of the economy, the fund will be less diversified than a more broadly diversified fund, and it may cause the fund to underperform if that industry or sector underperforms. In addition, focusing on a particular industry or sector may make the fund’s NAV more volatile. Further, a fund that invests in particular industries or sectors is particularly susceptible to the impact of market, economic, regulatory and other factors affecting those industries or sectors.
Note 8 — Investment in affiliated underlying funds
The fund may invest in affiliated underlying funds that are managed by the Advisor and its affiliates. Information regarding the fund’s fiscal year to date purchases and sales of the affiliated underlying funds as well as income and capital gains earned by the fund, if any, is as follows:
| | | | | | | | | | | | | | | | | | | | | | | | | | | | | | | | | | | | |
| | | | | | | | | | | | | | | | | | | | | Dividends and distributions | | | | |
| Affiliate | | Ending share amount | | | Beginning value | | | Cost of purchases | | | Proceeds from shares sold | | | Realized gain (loss) | | | Change in unrealized appreciation (depreciation) | | | Income distributions received | | | Capital gain distributions received | | | Ending
value | |
| John Hancock Collateral Trust* | | | — | | | | — | | | | $178,793,387 | | | | $(178,792,708 | ) | | | $(679 | ) | | | — | | | | $5,975 | | | | — | | | | — | |
| * | Refer to the Securities lending note within Note 2 for details regarding this investment. |
Note 9 — Reorganization
On March 15, 2019, the shareholders of John Hancock Funds II U.S. Growth Fund (the Acquired Fund) voted to approve an Agreement and Plan of Reorganization (the Agreement) which provided for an exchange of shares of U.S. Quality Growth Fund (the Acquiring Fund) with a value equal to the net assets transferred. The Agreement provided for (a) the acquisition of all the assets, subject to all of the liabilities, of the Acquired Fund in exchange for shares of the Acquiring Fund with a value equal to the net assets transferred; (b) the liquidation of the Acquired Fund; and (c) the distribution to the Acquired Fund’s shareholders of such Acquiring Fund’s shares. The reorganization was intended to achieve a more consistent long-term performance record and stronger prospects for growth and achieve potential opportunities for economies of scale. As a result of the reorganization, the Acquiring Fund is the legal and accounting survivor.
The reorganization qualified as a tax-free reorganization for federal income tax purposes with no gain or loss recognized by the Acquired Fund or their shareholders. Thus, the investments were transferred to the Acquiring Fund at the Acquired Fund’s identified cost. All distributable amounts of net income and realized gains from the Acquired Fund were distributed prior to the reorganization. In addition, the Acquired Fund and Acquiring Fund will bear a pro-rata portion of the costs that are incurred in connection with the reorganization. The effective time of the reorganization occurred immediately after the close of regularly scheduled trading on the New York Stock Exchange (NYSE) on April 12, 2019. The following outlines the reorganization:
| | | | | | | | | | | | | | | | | | | | | | | | | | |
Acquiring Fund | | Acquired Fund | | Net Asset Value of the Acquired Fund | | | Appreciation of the Acquired Fund’s Investment | | | Shares
Redeemed by the Acquired Fund | | | Shares
Issued by the Acquiring
Fund | | | Acquiring Fund Net Assets Prior to Combination | | | Acquiring Fund Total Net Assets After Combination | |
U.S. Quality Growth Fund | | John Hancock Funds II U.S. Growth Fund | | | $229,828,003 | | | | $51,116,210 | | | | 18,999,208 | | | | 13,790,643 | | | | $582,981,914 | | | | $812,809,917 | |
See Note 5 for capital shares issued in connection with the above referenced reorganization.
| | | | |
| 28 | | JOHN HANCOCK U.S. QUALITY GROWTH FUND | SEMIANNUAL REPORT | | |
Note 10 — Coronavirus (COVID-19) pandemic
The novel COVID-19 disease has resulted in significant disruptions to global business activity. A widespread health crisis such as a global pandemic could cause substantial market volatility, exchange trading suspensions and closures, impact the ability to complete redemptions, and affect fund performance.
| | | | |
| | SEMIANNUAL REPORT | JOHN HANCOCK U.S. QUALITY GROWTH FUND | | 29 |
Continuation of Investment Advisory and Subadvisory Agreements
Evaluation of Advisory and Subadvisory Agreements by the Board of Trustees
This section describes the evaluation by the Board of Trustees (the Board) of John Hancock Funds III (the Trust) of the Advisory Agreement (the Advisory Agreement) with John Hancock Investment Management, LLC (the Advisor) and the Subadvisory Agreement (the Subadvisory Agreement) with Wellington Management Company LLP (the Subadvisor), for John Hancock U.S. Quality Growth Fund (the fund). The Advisory Agreement and Subadvisory Agreement are collectively referred to as the Agreements. Prior to the June 23-25, 2020 telephonic1 meeting at which the Agreements were approved, the Board also discussed and considered information regarding the proposed continuation of the Agreements at the telephonic meeting held on May 26-27, 2020.
Approval of Advisory and Subadvisory Agreements
At telephonic meetings held on June 23-25, 2020, the Board, including the Trustees who are not parties to any Agreement or considered to be interested persons of the Trust under the Investment Company Act of 1940, as amended (the 1940 Act) (the Independent Trustees), reapproved for an annual period the continuation of the Advisory Agreement between the Trust and the Advisor and the Subadvisory Agreement between the Advisor and the Subadvisor with respect to the fund.
In considering the Advisory Agreement and the Subadvisory Agreement, the Board received in advance of the meetings a variety of materials relating to the fund, the Advisor and the Subadvisor, including comparative performance, fee and expense information for a peer group of similar funds prepared by an independent third-party provider of fund data, performance information for an applicable benchmark index; and, with respect to the Subadvisor, comparative performance information for comparably managed accounts, as applicable, and other information provided by the Advisor and the Subadvisor regarding the nature, extent and quality of services provided by the Advisor and the Subadvisor under their respective Agreements, as well as information regarding the Advisor’s revenues and costs of providing services to the fund and any compensation paid to affiliates of the Advisor. At the meetings at which the renewal of the Advisory Agreement and Subadvisory Agreement are considered, particular focus is given to information concerning fund performance, comparability of fees and total expenses, and profitability. However, the Board notes that the evaluation process with respect to the Advisor and the Subadvisor is an ongoing one. In this regard, the Board also took into account discussions with management and information provided to the Board (including its various committees) at prior meetings with respect to the services provided by the Advisor and the Subadvisor to the fund, including quarterly performance reports prepared by management containing reviews of investment results and prior presentations from the Subadvisor with respect to the fund. The information received and considered by the Board in connection with the May and June meetings and throughout the year was both written and oral. The Board also considered the nature, quality, and extent of non-advisory services, if any, to be provided to the fund by the Advisor’s affiliates, including distribution services. The Board considered the Advisory Agreement and the Subadvisory Agreements separately in the course of its review. In doing so, the Board noted the respective roles of the Advisor and Subadvisor in providing services to the fund.
Throughout the process, the Board asked questions of and requested additional information from management. The Board is assisted by counsel for the Trust and the Independent Trustees are also separately assisted by independent legal counsel throughout the process. The Independent Trustees also received a memorandum from
1 On March 25, 2020, as a result of health and safety measures put in place to combat the global COVID-19 pandemic, the Securities and Exchange Commission issued an exemptive order (the “Order”) pursuant to Sections 6(c) and 38(a) of the Investment Company Act of 1940, as amended (the “1940 Act”), that temporarily exempts registered investment management companies from the in-person voting requirements under the 1940 Act, subject to certain requirements, including that votes taken pursuant to the Order are ratified at the next in-person meeting. The Board determined that reliance on the Order was necessary or appropriate due to the circumstances related to current or potential effects of COVID-19 and therefore, the Board’s May and June meetings were held telephonically in reliance on the Order.
| | | | |
| 30 | | JOHN HANCOCK U.S. QUALITY GROWTH FUND | SEMIANNUAL REPORT | | |
their independent legal counsel discussing the legal standards for their consideration of the proposed continuation of the Agreements and discussed the proposed continuation of the Agreements in private sessions with their independent legal counsel at which no representatives of management were present.
Approval of Advisory Agreement
In approving the Advisory Agreement with respect to the fund, the Board, including the Independent Trustees, considered a variety of factors, including those discussed below. The Board also considered other factors (including conditions and trends prevailing generally in the economy, the securities markets, and the industry) and did not treat any single factor as determinative, and each Trustee may have attributed different weights to different factors. The Board’s conclusions may be based in part on its consideration of the advisory and subadvisory arrangements in prior years and on the Board’s ongoing regular review of fund performance and operations throughout the year.
Nature, extent, and quality of services. Among the information received by the Board from the Advisor relating to the nature, extent, and quality of services provided to the fund, the Board reviewed information provided by the Advisor relating to its operations and personnel, descriptions of its organizational and management structure, and information regarding the Advisor’s compliance and regulatory history, including its Form ADV. The Board also noted that on a regular basis it receives and reviews information from the Trust’s Chief Compliance Officer (CCO) regarding the fund’s compliance policies and procedures established pursuant to Rule 38a-1 under the 1940 Act. The Board observed that the scope of services provided by the Advisor, and of the undertakings required of the Advisor in connection with those services, including maintaining and monitoring its own and the fund’s compliance programs, risk management programs, liquidity management programs and cybersecurity programs, had expanded over time as a result of regulatory, market and other developments. The Board considered that the Advisor is responsible for the management of the day-to-day operations of the fund, including, but not limited to, general supervision of and coordination of the services provided by the Subadvisor, and is also responsible for monitoring and reviewing the activities of the Subadvisor and third-party service providers. The Board also considered the significant risks assumed by the Advisor in connection with the services provided to the fund including entrepreneurial risk in sponsoring new funds and ongoing risks including investment, operational, enterprise, litigation, regulatory and compliance risk with respect to all funds.
In considering the nature, extent, and quality of the services provided by the Advisor, the Trustees also took into account their knowledge of the Advisor’s management and the quality of the performance of the Advisor’s duties, through Board meetings, discussions and reports during the preceding year and through each Trustee’s experience as a Trustee of the Trust and of the other trusts in the John Hancock group of funds complex (the John Hancock Fund Complex).
In the course of their deliberations regarding the Advisory Agreement, the Board considered, among other things:
| | (a) | the skills and competency with which the Advisor has in the past managed the Trust’s affairs and its subadvisory relationship, the Advisor’s oversight and monitoring of the Subadvisor’s investment performance and compliance programs, such as the Subadvisor’s compliance with fund policies and objectives, review of brokerage matters, including with respect to trade allocation and best execution and the Advisor’s timeliness in responding to performance issues; |
| | (b) | the background, qualifications and skills of the Advisor’s personnel; |
| | (c) | the Advisor’s compliance policies and procedures and its responsiveness to regulatory changes and fund industry developments; |
| | (d) | the Advisor’s administrative capabilities, including its ability to supervise the other service providers for the fund, as well as the Advisor’s oversight of any securities lending activity, its monitoring of class action litigation and collection of class action settlements on behalf of the fund, and bringing loss recovery actions on behalf of the fund; |
| | | | |
| | SEMIANNUAL REPORT | JOHN HANCOCK U.S. QUALITY GROWTH FUND | | 31 |
| | (e) | the financial condition of the Advisor and whether it has the financial wherewithal to provide a high level and quality of services to the fund; |
| | (f) | the Advisor’s initiatives intended to improve various aspects of the Trust’s operations and investor experience with the fund; and |
| | (g) | the Advisor’s reputation and experience in serving as an investment advisor to the Trust and the benefit to shareholders of investing in funds that are part of a family of funds offering a variety of investments. |
The Board concluded that the Advisor may reasonably be expected to continue to provide a high quality of services under the Advisory Agreement with respect to the fund.
Investment performance.In considering the fund’s performance, the Board noted that it reviews at its regularly scheduled meetings information about the fund’s performance results. In connection with the consideration of the Advisory Agreement, the Board:
| | (a) | reviewed information prepared by management regarding the fund’s performance; |
| | (b) | considered the comparative performance of an applicable benchmark index; |
| | (c) | considered the performance of comparable funds, if any, as included in the report prepared by an independent third-party provider of fund data; and |
| | (d) | took into account the Advisor’s analysis of the fund’s performance and its plans and recommendations regarding the Trust’s subadvisory arrangements generally. |
The Board noted that while it found the data provided by independent third-party generally useful it recognized its limitations, including in particular that the data may vary depending on the end date selected and the results of the performance comparisons may vary depending on the selection of the peer group. The Board noted that the fund underperformed its benchmark index for the one-, three- and five year periods ended December 31, 2019. The Board also noted that the fund outperformed its peer group median for the one-, three- and five-year periods ended December 31, 2019. The Board took into account management’s discussion of the fund’s performance, including the favorable performance relative to the peer group median for the one-, three- and five-year periods. The Board concluded that the fund’s performance has generally been in line with or outperformed the historical performance of comparable funds.
Fees and expenses. The Board reviewed comparative information prepared by an independent third-party provider of fund data, including, among other data, the fund’s contractual and net management fees (and subadvisory fees, to the extent available) and total expenses as compared to similarly situated investment companies deemed to be comparable to the fund in light of the nature, extent and quality of the management and advisory and subadvisory services provided by the Advisor and the Subadvisor. The Board considered the fund’s ranking within a smaller group of peer funds chosen by the independent third-party provider, as well as the fund’s ranking within a broader group of funds. In comparing the fund’s contractual and net management fees to those of comparable funds, the Board noted that such fees include both advisory and administrative costs. The Board noted that net management fees and net total expenses for the fund are lower than the peer group median.
The Board also took into account management’s discussion with respect to the overall management fee and the fees of the Subadvisor, including the amount of the advisory fee retained by the Advisor after payment of the subadvisory fee, in each case in light of the services rendered for those amounts and the risks undertaken by the Advisor. The Board also noted that the Advisor pays the subadvisory fee, and that such fees are negotiated at arm’s length with respect to the Subadvisor. In addition, the Board took into account that management had agreed to implement an overall fee waiver across the complex, including the fund, which is discussed further below. The Board also noted actions taken over the past several years to reduce the fund’s operating expenses. The Board also noted that, in addition, the Advisor is currently waiving fees and/or reimbursing expenses with respect to the fund
| | | | |
| 32 | | JOHN HANCOCK U.S. QUALITY GROWTH FUND | SEMIANNUAL REPORT | | |
and that the fund has breakpoints in its contractual management fee schedule that reduces management fees as assets increase. The Board also noted that the fund’s distributor, an affiliate of the Advisor, has agreed to waive a portion of its Rule 12b-1 fee for a share class of the fund. The Board noted that the fund has a voluntary fee waiver and/or expense reimbursement, which reduces certain expenses of the fund. The Board reviewed information provided by the Advisor concerning the investment advisory fee charged by the Advisor or one of its advisory affiliates to other clients (including other funds in the John Hancock Fund Complex) having similar investment mandates, if any. The Board considered any differences between the Advisor’s and Subadvisor’s services to the fund and the services they provide to other comparable clients or funds. The Board concluded that the advisory fee paid with respect to the fund is reasonable in light of the nature, extent and quality of the services provided to the fund under the Advisory Agreement.
Profitability/Fall out benefits. In considering the costs of the services to be provided and the profits to be realized by the Advisor and its affiliates from the Advisor’s relationship with the Trust, the Board:
| | (a) | reviewed financial information of the Advisor; |
| | (b) | reviewed and considered information presented by the Advisor regarding the net profitability to the Advisor and its affiliates with respect to the fund; |
| | (c) | received and reviewed profitability information with respect to the John Hancock Fund Complex as a whole and with respect to the fund; |
| | (d) | received information with respect to the Advisor’s allocation methodologies used in preparing the profitability data and considered that the Advisor hired an independent third-party consultant to provide an analysis of the Advisor’s allocation methodologies; |
| | (e) | considered that the John Hancock insurance companies that are affiliates of the Advisor, as shareholders of the Trust directly or through their separate accounts, receive certain tax credits or deductions relating to foreign taxes paid and dividends received by certain funds of the Trust and noted that these tax benefits, which are not available to participants in qualified retirement plans under applicable income tax law, are reflected in the profitability information reviewed by the Board; |
| | (f) | considered that the Advisor also provides administrative services to the fund on a cost basis pursuant to an administrative services agreement; |
| | (g) | noted that affiliates of the Advisor provide transfer agency services and distribution services to the fund, and that the fund’s distributor also receives Rule 12b-1 payments to support distribution of the fund; |
| | (h) | noted that the Advisor also derives reputational and other indirect benefits from providing advisory services to the fund; |
| | (i) | noted that the subadvisory fee for the fund is paid by the Advisor and is negotiated at arm’s length; |
| | (j) | considered the Advisor’s ongoing costs and expenditures necessary to improve services, meet new regulatory and compliance requirements, and adapt to other challenges impacting the fund industry; and |
| | (k) | considered that the Advisor should be entitled to earn a reasonable level of profits in exchange for the level of services it provides to the fund and the risks it assumes as Advisor, including entrepreneurial, operational, reputational, litigation and regulatory risk. |
Based upon its review, the Board concluded that the level of profitability, if any, of the Advisor and its affiliates from their relationship with the fund was reasonable and not excessive.
| | | | |
| | SEMIANNUAL REPORT | JOHN HANCOCK U.S. QUALITY GROWTH FUND | | 33 |
Economies of scale. In considering the extent to which economies of scale would be realized as the fund grows and whether fee levels reflect these economies of scale for the benefit of fund shareholders, the Board:
| | (a) | considered that the Advisor has contractually agreed to waive a portion of its management fee for certain funds of the John Hancock Fund Complex, including the fund (the participating portfolios) or otherwise reimburse the expenses of the participating portfolios (the reimbursement). This waiver is based upon aggregate net assets of all the participating portfolios. The amount of the reimbursement is calculated daily and allocated among all the participating portfolios in proportion to the daily net assets of each fund; |
| | (b) | reviewed the fund’s advisory fee structure and concluded that: (i) the fund’s fee structure contains breakpoints at the subadvisory fee level and that such breakpoints are reflected as breakpoints in the advisory fees for the fund; and (ii) although economies of scale cannot be measured with precision, these arrangements permit shareholders of the fund to benefit from economies of scale if the fund grows. The Board also took into account management’s discussion of the fund’s advisory fee structure; and |
| | (c) | the Board also considered the effect of the fund’s growth in size on its performance and fees. The Board also noted that if the fund’s assets increase over time, the fund may realize other economies of scale. |
Approval of Subadvisory Agreement
In making its determination with respect to approval of the Subadvisory Agreement, the Board reviewed:
| | (1) | information relating to the Subadvisor’s business, including current subadvisory services to the Trust (and other funds in the John Hancock Fund Complex); |
| | (2) | the historical and current performance of the fund and comparative performance information relating to an applicable benchmark index and comparable funds; and |
| | (3) | the subadvisory fee for the fund, including any breakpoints, and to the extent available, comparable fee information prepared by an independent third party provider of fund data. |
Nature, extent, and quality of services. With respect to the services provided by the Subadvisor, the Board received information provided to the Board by the Subadvisor, including the Subadvisor’s Form ADV, as well as took into account information presented throughout the past year. The Board considered the Subadvisor’s current level of staffing and its overall resources, as well as received information relating to the Subadvisor’s compensation program. The Board reviewed the Subadvisor’s history and investment experience, as well as information regarding the qualifications, background, and responsibilities of the Subadvisor’s investment and compliance personnel who provide services to the fund. The Board also considered, among other things, the Subadvisor’s compliance program and any disciplinary history. The Board also considered the Subadvisor’s risk assessment and monitoring process. The Board reviewed the Subadvisor’s regulatory history, including whether it was involved in any regulatory actions or investigations as well as material litigation, and any settlements and amelioratory actions undertaken, as appropriate. The Board noted that the Advisor conducts regular, periodic reviews of the Subadvisor and its operations, including regarding investment processes and organizational and staffing matters. The Board also noted that the Trust’s CCO and his staff conduct regular, periodic compliance reviews with the Subadvisor and present reports to the Independent Trustees regarding the same, which includes evaluating the regulatory compliance systems of the Subadvisor and procedures reasonably designed to assure compliance with the federal securities laws. The Board also took into account the financial condition of the Subadvisor.
The Board considered the Subadvisor’s investment process and philosophy. The Board took into account that the Subadvisor’s responsibilities include the development and maintenance of an investment program for the fund that is consistent with the fund’s investment objective, the selection of investment securities and the placement of
| | | | |
| 34 | | JOHN HANCOCK U.S. QUALITY GROWTH FUND | SEMIANNUAL REPORT | | |
orders for the purchase and sale of such securities, as well as the implementation of compliance controls related to performance of these services. The Board also received information with respect to the Subadvisor’s brokerage policies and practices, including with respect to best execution and soft dollars.
Subadvisor compensation. In considering the cost of services to be provided by the Subadvisor and the profitability to the Subadvisor of its relationship with the fund, the Board noted that the fees under the Subadvisory Agreement are paid by the Advisor and not the fund. The Board also received information and took into account any other potential conflicts of interest the Advisor might have in connection with the Subadvisory Agreement.
The Board also relied on the ability of the Advisor to negotiate the Subadvisory Agreement with the Subadvisor, which is not affiliated with the Advisor, and the fees thereunder at arm’s length. As a result, the costs of the services to be provided and the profits to be realized by the Subadvisor from its relationship with the Trust were not a material factor in the Board’s consideration of the Subadvisory Agreement.
The Board also received information regarding the nature and scope (including their significance to the Advisor and its affiliates and to the Subadvisor) of any material relationships with respect to the Subadvisor, which include arrangements in which the Subadvisor or its affiliates provide advisory, distribution, or management services in connection with financial products sponsored by the Advisor or its affiliates, and may include other registered investment companies, a 529 education savings plan, managed separate accounts and exempt group annuity contracts sold to qualified plans. The Board also received information and took into account any other potential conflicts of interest the Advisor might have in connection with the Subadvisory Agreement.
In addition, the Board considered other potential indirect benefits that the Subadvisor and its affiliates may receive from the Subadvisor’s relationship with the fund, such as the opportunity to provide advisory services to additional funds in the John Hancock Fund Complex and reputational benefits.
Subadvisory fees. The Board considered that the fund pays an advisory fee to the Advisor and that, in turn, the Advisor pays a subadvisory fee to the Subadvisor. As noted above, the Board also considered the fund’s subadvisory fees as compared to similarly situated investment companies deemed to be comparable to the fund as included in the report prepared by the independent third party provider of fund data, to the extent available. The Board noted that the fund’s subadvisory fees are below the peer group median. The Board also took into account the subadvisory fees paid by the Advisor to the Subadvisor with respect to the fund and compared them to fees charged by the Subadvisor to manage other subadvised portfolios and portfolios not subject to regulation under the 1940 Act, as applicable.
Subadvisor performance. As noted above, the Board considered the fund’s performance as compared to the fund’s peer group median and the benchmark index and noted that the Board reviews information about the fund’s performance results at its regularly scheduled meetings. The Board noted the Advisor’s expertise and resources in monitoring the performance, investment style and risk-adjusted performance of the Subadvisor. The Board was mindful of the Advisor’s focus on the Subadvisor’s performance. The Board also noted the Subadvisor’s long-term performance record for similar accounts, as applicable.
The Board’s decision to approve the Subadvisory Agreement was based on a number of determinations, including the following:
| | (1) | the Subadvisor has extensive experience and demonstrated skills as a manager; |
| | (2) | the performance of the fund has generally been in line with or outperformed the historical performance of comparable funds; |
| | (3) | the subadvisory fee is reasonable in relation to the level and quality of services being provided under the Subadvisory Agreement; and |
| | | | |
| | SEMIANNUAL REPORT | JOHN HANCOCK U.S. QUALITY GROWTH FUND | | 35 |
| | (4) | noted that the subadvisory fees are paid by the Advisor not the fund and that the subadvisory fee breakpoints are reflected as breakpoints in the advisory fees for the fund in order to permit shareholders to benefit from economies of scale if the fund grows. |
* * *
Based on the Board’s evaluation of all factors that the Board deemed to be material, including those factors described above, the Board, including the Independent Trustees, concluded that renewal of the Advisory Agreement and the Subadvisory Agreement would be in the best interest of the fund and its shareholders. Accordingly, the Board, and the Independent Trustees voting separately, approved the Advisory Agreement and Subadvisory Agreement for an additional one-year period.
| | | | |
| 36 | | JOHN HANCOCK U.S. QUALITY GROWTH FUND | SEMIANNUAL REPORT | | |
Trustees
Hassell H. McClellan, Chairperson
Steven R. Pruchansky, Vice Chairperson
Andrew G. Arnott†
Charles L. Bardelis*
James R. Boyle
Peter S. Burgess*
William H. Cunningham
Grace K. Fey
Marianne Harrison†
Deborah C. Jackson
James M. Oates*
Frances G. Rathke*,1
Gregory A. Russo
Officers
Andrew G. Arnott
President
Charles A. Rizzo
Chief Financial Officer
Salvatore Schiavone
Treasurer
Christopher (Kit) Sechler
Secretary and Chief Legal Officer
Trevor Swanberg2
Chief Compliance Officer
| * | Member of the Audit Committee |
| † | Non-Independent Trustee |
| 1 | Appointed as Independent Trustee effective as of September 15, 2020 |
| 2 | Effective July 31, 2020 |
Investment advisor
John Hancock Investment Management LLC
Subadvisor
Wellington Management Company LLP
Portfolio Managers
John A. Boselli, CFA
Principal distributor
John Hancock Investment Management Distributors LLC
Custodian
State Street Bank and Trust Company
Transfer agent
John Hancock Signature Services, Inc.
Legal counsel
K&L Gates LLP
The fund’s proxy voting policies and procedures, as well as the fund proxy voting record for the most recent twelve-month period ended June 30, are available free of charge on the Securities and Exchange Commission (SEC) website at sec.gov or on our website.
All of the fund’s holdings as of the end of the third month of every fiscal quarter are filed with the SEC on Form N-PORT within 60 days of the end of the fiscal quarter. The fund’s Form N-PORT filings are available on our website and the SEC’s website, sec.gov.
We make this information on your fund, as well as monthly portfolio holdings, and other fund details available on our website at jhinvestments.com or by calling 800-225-5291.
| | | | |
| | |
| You can also contact us: | | | | |
| | |
800-225-5291 | | Regular mail: | | Express mail: |
| | |
| jhinvestments.com | | John Hancock Signature Services, Inc. P.O. Box 219909 Kansas City, MO 64121-9909 | | John Hancock Signature Services, Inc. 430 W 7th Street Suite 219909 Kansas City, MO 64105-1407 |
| | | | |
| | SEMIANNUAL REPORT | JOHN HANCOCK U.S. QUALITY GROWTH FUND | | 37 |
|
John Hancock family of funds |
DOMESTIC EQUITY FUNDS
Blue Chip Growth
Classic Value
Disciplined Value
Disciplined Value Mid Cap
Equity Income
Financial Industries
Fundamental All Cap Core
Fundamental Large Cap Core
New Opportunities
Regional Bank
Small Cap Core
Small Cap Growth
Small Cap Value
U.S. Global Leaders Growth
U.S. Growth
GLOBAL AND INTERNATIONAL EQUITY FUNDS
Disciplined Value International
Emerging Markets
Emerging Markets Equity
Fundamental Global Franchise
Global Equity
Global Shareholder Yield
Global Thematic Opportunities
International Dynamic Growth
International Growth
International Small Company
INCOME FUNDS
Bond
California Tax-Free Income
Emerging Markets Debt
Floating Rate Income
Government Income
High Yield
High Yield Municipal Bond
Income
Investment Grade Bond
Money Market
Short Duration Bond
Short Duration Credit Opportunities
Strategic Income Opportunities
Tax-Free Bond
ALTERNATIVE AND SPECIALTY FUNDS
Absolute Return Currency
Alternative Asset Allocation
Alternative Risk Premia
Diversified Macro
Infrastructure
Multi-Asset Absolute Return
Seaport Long/Short
A fund’s investment objectives, risks, charges, and expenses should be considered carefully before investing. The prospectus contains this and other important information about the fund. To obtain a prospectus, contact your financial professional, call John Hancock Investment Management at 800-225-5291, or visit our website at jhinvestments.com. Please read the prospectus carefully before investing or sending money.
ASSET ALLOCATION
Balanced
Multi-Asset High Income
Multi-Index Lifetime Portfolios
Multi-Index Preservation Portfolios
Multimanager Lifestyle Portfolios
Multimanager Lifetime Portfolios
Retirement Income 2040
EXCHANGE-TRADED FUNDS
John Hancock Multifactor Consumer Discretionary ETF
John Hancock Multifactor Consumer Staples ETF
John Hancock Multifactor Developed International ETF
John Hancock Multifactor Emerging Markets ETF
John Hancock Multifactor Energy ETF
John Hancock Multifactor Financials ETF
John Hancock Multifactor Healthcare ETF
John Hancock Multifactor Industrials ETF
John Hancock Multifactor Large Cap ETF
John Hancock Multifactor Materials ETF
John Hancock Multifactor Media and Communications ETF
John Hancock Multifactor Mid Cap ETF
John Hancock Multifactor Small Cap ETF
John Hancock Multifactor Technology ETF
John Hancock Multifactor Utilities ETF
ENVIRONMENTAL, SOCIAL, AND GOVERNANCE FUNDS
ESG All Cap Core
ESG Core Bond
ESG International Equity
ESG Large Cap Core
CLOSED-END FUNDS
Financial Opportunities
Hedged Equity & Income
Income Securities Trust
Investors Trust
Preferred Income
Preferred Income II
Preferred Income III
Premium Dividend
Tax-Advantaged Dividend Income
Tax-Advantaged Global Shareholder Yield
John Hancock Multifactor ETF shares are bought and sold at market price (not NAV), and are not individually redeemed from the fund. Brokerage commissions will reduce returns.
John Hancock ETFs are distributed by Foreside Fund Services, LLC, and are subadvised by Dimensional Fund Advisors LP. Foreside is not affiliated with John Hancock Investment Management Distributors LLC or Dimensional Fund Advisors LP.
Dimensional Fund Advisors LP receives compensation from John Hancock in connection with licensing rights to the John Hancock Dimensional indexes. Dimensional Fund Advisors LP does not sponsor, endorse, or sell, and makes no representation as to the advisability of investing in, John Hancock Multifactor ETFs.
|
John Hancock Investment Management A trusted brand John Hancock Investment Management is a premier asset manager with a heritage of financial stewardship dating back to 1862. Helping our shareholders pursue their financial goals is at the core of everything we do. It’s why we support the role of professional financial advice and operate with the highest standards of conduct and integrity. A better way to invest We serve investors globally through a unique multimanager approach: We search the world to find proven portfolio teams with specialized expertise for every strategy we offer, then we apply robust investment oversight to ensure they continue to meet our uncompromising standards and serve the best interests of our shareholders. Results for investors Our unique approach to asset management enables us to provide a diverse set of investments backed by some of the world’s best managers, along with strong risk-adjusted returns across asset classes. |

John Hancock Investment Management Distributors LLC ∎ Member FINRA, SIPC 200 Berkeley Street ∎ Boston, MA 02116-5010 ∎ 800-225-5291 ∎ jhinvestments.com
This report is for the information of the shareholders of John Hancock U.S. Quality Growth Fund. It is not authorized for distribution to prospective investors unless preceded or accompanied by a prospectus.

| | |
MF1355837 | | 393SA 9/20 |
| | 11/2020 |
ITEM 2. CODE OF ETHICS.
Not applicable at this time.
ITEM 3. AUDIT COMMITTEE FINANCIAL EXPERT.
Not applicable at this time.
ITEM 4. PRINCIPAL ACCOUNTANT FEES AND SERVICES.
Not applicable at this time.
ITEM 5. AUDIT COMMITTEE OF LISTED REGISTRANTS.
Not applicable at this time.
ITEM 6. SCHEDULE OF INVESTMENTS.
Not applicable.
ITEM 7. DISCLOSURE OF PROXY VOTING POLICIES AND PROCEDURES FOR CLOSED-END MANAGEMENT INVESTMENT COMPANIES.
Not applicable.
ITEM 8. PORTFOLIO MANAGERS OF CLOSED-END MANAGEMENT INVESTMENT COMPANIES.
Not applicable.
ITEM 9. PURCHASES OF EQUITY SECURITIES BY CLOSED-END MANAGEMENT INVESTMENT COMPANY AND AFFILIATED PURCHASERS.
Not applicable.
ITEM 10. SUBMISSION OF MATTERS TO A VOTE OF SECURITY HOLDERS.
(a) The registrant has adopted procedures by which shareholders may recommend nominees to the registrant’s Board of Trustees. A copy of the procedures is filed as an exhibit to this Form N-CSR. See attached “John Hancock Funds – Nominating and Governance Committee Charter”.
ITEM 11. CONTROLS AND PROCEDURES.
(a) Based upon their evaluation of the registrant’s disclosure controls and procedures as conducted within 90 days of the filing date of this Form N-CSR, the registrant’s principal executive officer and principal financial officer have concluded that those disclosure controls and procedures provide reasonable assurance that the material information required to be disclosed by the registrant on this report is recorded, processed, summarized and reported within the time periods specified in the Securities and Exchange Commission’s rules and forms.
(b) There were no changes in the registrant’s internal control over financial reporting that occurred during the period covered by this report that have materially affected, or are reasonably likely to materially affect, the registrant’s internal control over financial reporting.
ITEM 12. DISCLOSURE OF SECURITIES LENDING ACTIVITIES FOR CLOSED-END MANGEMENT INVESTMENT COMPANIES.
Not applicable.
ITEM 13. EXHIBITS.
(a)(1) Separate certifications for the registrant’s principal executive officer and principal financial officer, as required by Section 302 of the Sarbanes-Oxley Act of 2002 and Rule 30a-2(a) under the Investment Company Act of 1940, are attached.
(b)(1) Separate certifications for the registrant’s principal executive officer and principal financial officer, as required by 18 U.S.C. Section 1350, as adopted pursuant to Section 906 of the Sarbanes-Oxley Act of 2002, and Rule 30a-2(b) under the Investment Company Act of 1940, are attached. The certifications furnished pursuant to this paragraph are not deemed to be “filed” for purposes of Section 18 of the Securities Exchange Act of 1934, or otherwise subject to the liability of that section. Such certifications are not deemed to be incorporated by reference into any filing under the Securities Act of 1933 or the Securities Exchange Act of 1934, except to the extent that the Registrant specifically incorporates them by reference.
(c)(1) Submission of Matters to a Vote of Security Holders is attached. See attached “John Hancock Funds – Nominating and Governance Committee Charter”.
2
SIGNATURES
Pursuant to the requirements of the Securities Exchange Act of 1934 and the Investment Company Act of 1940, the registrant has duly caused this report to be signed on its behalf by the undersigned, thereunto duly authorized.
| | |
| John Hancock Funds III |
| |
| By: | | /s/ Andrew Arnott |
| | Andrew Arnott President |
Date: November 6, 2020
Pursuant to the requirements of the Securities Exchange Act of 1934 and the Investment Company Act of 1940, this report has been signed below by the following persons on behalf of the registrant and in the capacities and on the dates indicated.
| | |
| |
| By: | | /s/ Andrew Arnott |
| | Andrew Arnott President |
| | |
| Date: November 6, 2020 |
| |
| By: | | /s/ Charles A. Rizzo |
| | Charles A. Rizzo Chief Financial Officer |
Date: November 6, 2020