UNITED STATES
SECURITIES AND EXCHANGE COMMISSION
Washington, D.C. 20549
FORM 10-K
(Mark One)
|
| |
| x | ANNUAL REPORT PURSUANT TO SECTION 13 OR 15(d) OF THE SECURITIES EXCHANGE ACT OF 1934 |
For the fiscal year ended December 31, 2011
OR
|
| |
| o | TRANSITION REPORT PURSUANT TO SECTION 13 OR 15(d) OF THE SECURITIES EXCHANGE ACT OF 1934 |
For the transition period from to
Commission file number 000-52606
KBS REAL ESTATE INVESTMENT TRUST, INC.
(Exact Name of Registrant as Specified in Its Charter)
|
| | |
| Maryland | | 20-2985918 |
(State or Other Jurisdiction of Incorporation or Organization) | | (I.R.S. Employer Identification No.) |
| | |
620 Newport Center Drive, Suite 1300 Newport Beach, California | | 92660 |
| (Address of Principal Executive Offices) | | (Zip Code) |
(949) 417-6500
(Registrant’s Telephone Number, Including Area Code)
______________________________________________________________________
Securities registered pursuant to Section 12(b) of the Act:
|
| |
| Title of Each Class | Name of Each Exchange on Which Registered |
| None | None |
Securities registered pursuant to Section 12(g) of the Act:
Common Stock, $0.01 par value per share
______________________________________________________________________
Indicate by check mark if the Registrant is a well-known seasoned issuer, as defined in Rule 405 of the Securities Act. Yes o No x
Indicate by check mark if the Registrant is not required to file reports pursuant to Section 13 or Section 15(d) of the Act. Yes o No x
Indicate by check mark whether the registrant: (1) has filed all reports required to be filed by Section 13 or 15(d) of the Securities Exchange Act of 1934 during the preceding 12 months (or for such shorter period that the registrant was required to file such reports), and (2) has been subject to such filing requirements for the past 90 days. Yes x No o
Indicate by check mark whether the registrant has submitted electronically and posted on its corporate website, if any, every Interactive Data File required to be submitted and posted pursuant to Rule 405 of Regulation S-T (§232.405 of this chapter) during the preceding 12 months (or for such shorter period that the registrant was required to submit and post such files). Yes x No o
Indicate by check mark if disclosure of delinquent filers pursuant to Item 405 of Regulation S-K is not contained herein, and will not be contained, to the best of Registrant’s knowledge, in definitive proxy or information statements incorporated by reference in Part III of the Form 10-K or any amendment of this Form 10-K. x
Indicate by check mark whether the registrant is a large accelerated filer, an accelerated filer, a non-accelerated filer or a smaller reporting company. See the definitions of “large accelerated filer,” “accelerated filer” and “smaller reporting company” in Rule 12b-2 of the Exchange Act. (Check one):
|
| | | | | |
| Large Accelerated Filer | o | | | Accelerated Filer | ¨ |
| | | | | | |
| Non-Accelerated Filer | x | (Do not check if a smaller reporting company) | | Smaller reporting company | ¨ |
Indicate by check mark whether the registrant is a shell company (as defined in Rule 12b-2 of the Exchange Act). Yes o No x
On December 2, 2010, the board of directors of the Registrant approved an estimated value per share of the Registrant’s common stock of $7.32 derived from the estimated value of the Registrant’s assets less the estimated value of the Registrant’s liabilities divided by the number of shares outstanding, all as of September 30, 2010. On March 22, 2012, the board of directors of the Registrant approved an estimated value per share of the Registrant’s common stock of $5.16 derived from the estimated value of the Registrant’s assets less the estimated value of the Registrant’s liabilities divided by the number of shares outstanding, all as of December 31, 2011. For a full description of the methodologies used to value the Registrant’s assets and liabilities in connection with the calculation of the estimated value per share, see Part II, Item 5, “Market for Registrant’s Common Equity, Related Stockholder Matters and Issuer Purchases of Equity Securities — Market Information.”
There were approximately 188,082,165 shares of common stock held by non-affiliates as of June 30, 2011, the last business day of the Registrant’s most recently completed second fiscal quarter.
As of March 22, 2012, there were 191,520,009 outstanding shares of common stock of KBS Real Estate Investment Trust, Inc.
Documents Incorporated by Reference:
Registrant incorporates by reference in Part III (Items 10, 11, 12, 13 and 14) of this Form 10‑K portions of its Definitive Proxy Statement for the 2012 Annual Meeting of Stockholders.
TABLE OF CONTENTS
|
| | |
| PART I | | |
| ITEM 1. | | |
| ITEM 1A. | | |
| ITEM 1B. | | |
| ITEM 2. | | |
| ITEM 3. | | |
| ITEM 4. | | |
| | | |
| PART II | | |
| ITEM 5. | | |
| ITEM 6. | | |
| ITEM 7. | | |
| ITEM 7A. | | |
| ITEM 8. | | |
| ITEM 9. | | |
| ITEM 9A. | | |
| ITEM 9B. | | |
| | | |
| PART III | | |
| ITEM 10. | | |
| ITEM 11. | | |
| ITEM 12. | | |
| ITEM 13. | | |
| ITEM 14. | | |
| | | |
| PART IV | | |
| ITEM 15. | | |
| | | |
| INDEX TO FINANCIAL STATEMENTS | |
FORWARD-LOOKING STATEMENTS
Certain statements included in this annual report on Form 10-K are forward-looking statements. Those statements include statements regarding the intent, belief or current expectations of KBS Real Estate Investment Trust, Inc. and members of our management team, as well as the assumptions on which such statements are based, and generally are identified by the use of words such as “may,” “will,” “seeks,” “anticipates,” “believes,” “estimates,” “expects,” “plans,” “intends,” “should” or similar expressions. Actual results may differ materially from those contemplated by such forward-looking statements. Further, forward-looking statements speak only as of the date they are made, and we undertake no obligation to update or revise forward-looking statements to reflect changed assumptions, the occurrence of unanticipated events or changes to future operating results over time, unless required by law.
The following are some of the risks and uncertainties, although not all of the risks and uncertainties, that could cause our actual results to differ materially from those presented in our forward-looking statements:
| |
| • | We are the first publicly offered investment program sponsored by the affiliates of our advisor, KBS Capital Advisors LLC, which makes our future performance difficult to predict. Our stockholders should not assume that our performance will be similar to the past performance of other real estate investment programs sponsored by affiliates of our advisor. |
| |
| • | All of our executive officers and some of our directors and other key real estate and debt finance professionals are also officers, directors, managers, key professionals and/or holders of a direct or indirect controlling interest in our advisor, the entity that acted as our dealer manager and other KBS-affiliated entities. As a result, they face conflicts of interest, including significant conflicts created by our advisor’s compensation arrangements with us and other KBS-advised programs and investors and conflicts in allocating time among us and these other programs and investors. These conflicts could result in unanticipated actions. |
| |
| • | We depend on tenants for our revenue and, accordingly, our revenue is dependent upon the success and economic viability of our tenants. Revenues from our properties could decrease due to a reduction in tenants (caused by factors including, but not limited to, tenant defaults, tenant insolvency, early termination of tenant leases and non-renewal of existing tenant leases) and/or lower rental rates, making it more difficult for us to meet our debt service obligations and limiting our ability to pay distributions to our stockholders. |
| |
| • | Our projected cash flow from operations will not be sufficient to cover our capital expenditures, amortization payment requirements on our debt obligations and principal pay-down requirements for our debt obligations at maturity or to allow us to meet the conditions for extension of our loans, therefore, requiring us to sell assets in order to meet our capital requirements. If our cash flow from operations continues to deteriorate, we will be more dependent on asset sales to fund our operations and for our liquidity needs. Moreover, we may be unable to meet financial and operating covenants in our debt obligations, and our lenders may take action against us. These factors could also have a material adverse effect on us and our stockholders’ return. |
| |
| • | We may not be able to refinance our existing indebtedness or to obtain additional debt financing on attractive terms. If we are not able to refinance existing indebtedness on attractive terms at its maturity, we may be forced to dispose of our assets sooner than we otherwise would. We may not have sufficient liquidity from our operations to fund our future capital needs and, as a result of the debt we assumed in relation to the GKK Properties (defined in Part I, Item 1, “Business — Investment Portfolio — GKK Properties”), we presently have extremely limited additional borrowing capacity. Additionally, the Amended Repurchase Agreements (defined in Part I, Item 1, “Business — Investment Portfolio — GKK Properties”) and/ or some of our other debt, including debt we assumed in relation to the GKK Properties that were transferred under the Settlement Agreement (defined in Part I, Item 1, “Business — Investment Portfolio — GKK Properties”), contain restrictive covenants relating to our operations, our ability to incur additional debt and our ability to declare distributions. |
| |
| • | Our investments in real estate and mortgage, mezzanine, B-Notes and other loans as well as our investments in real estate securities may be affected by unfavorable real estate market and general economic conditions, which could decrease the value of those assets and reduce the investment return to our stockholders. Revenues from our real property investments could decrease, making it more difficult for us to meet our debt service obligations. Revenues from the properties and other assets directly securing our loan investments and underlying our investments in real estate securities could decrease, making it more difficult for the borrower to meet its payment obligations to us. In addition, decreases in revenues from the properties directly securing our loan investments and underlying our investments in real estate securities could result in decreased valuations for those properties, which could make it difficult for our borrowers to repay or refinance their obligations to us. These factors could make it more difficult for us to meet our debt service obligations and reduce our stockholders’ return. |
| |
| • | Continued disruptions in the financial markets and deteriorating economic conditions could adversely affect the value of our investments. |
| |
| • | Certain of our debt obligations have variable interest rates with interest and related payments that vary with the movement of LIBOR or other indexes. Increases in the indexes could increase the amount of our debt payments and reduce our stockholders’ return. |
| |
| • | Without the availability of funds from our dividend reinvestment plan offering (which will terminate effective April 10, 2012), we may have to use a greater proportion of our cash flow from operations and asset sales to meet our general cash requirements, which would reduce the return to our stockholders. |
| |
| • | We have amended and restated our share redemption program to provide only for redemptions sought upon a stockholder’s death, “qualifying disability” or “determination of incompetence” (each as defined in the share redemption program). The dollar amounts available for such redemptions are determined by the board of directors and may be reviewed and adjusted from time to time. Additionally, redemptions are further subject to limitations described in the share redemption program. We currently do not expect to have funds available for ordinary redemptions in the future. |
| |
| • | We may not be able to successfully operate and sell the GKK Properties transferred under the Settlement Agreement given current economic conditions and the concentration of the GKK Properties in the financial services sector, the significant debt obligations we have assumed with respect to such GKK Properties, and our advisor’s limited experience operating, managing and selling bank branch properties. Moreover, we depend upon GKK Stars to manage and conduct the operations of the GKK Properties and any adverse changes in or termination of our relationship with GKK Stars could hinder the performance of the GKK Properties and the return on our stockholders’ investment. |
| |
| • | As a result of the GKK Properties transferred under the Settlement Agreement, a significant portion of our properties will be leased to financial institutions, making us more economically vulnerable in the event of a downturn in the banking industry. |
All forward-looking statements should be read in light of the risks identified in Part I, Item 1A of this annual report on Form 10-K.
PART I
Overview
KBS Real Estate Investment Trust, Inc. (the “Company”) is a Maryland corporation that was formed on June 13, 2005 to invest in a diverse portfolio of real estate properties and real estate‑related investments. The Company elected to be taxed as a real estate investment trust (“REIT”) beginning with the taxable year ended December 31, 2006 and it intends to operate in such a manner. As used herein, the terms “we,” “our” and “us” refer to the Company and as required by context, KBS Limited Partnership, a Delaware limited partnership, which we refer to as our “Operating Partnership,” and to their subsidiaries. We own substantially all of our assets and conduct our operations through our Operating Partnership, of which we are the sole general partner. Subject to certain restrictions and limitations, our business is managed by KBS Capital Advisors LLC (“KBS Capital Advisors”), our external advisor, pursuant to an advisory agreement. Our advisor owns 20,000 shares of our common stock. We have no paid employees.
On January 27, 2006, we launched our initial public offering of up to 200,000,000 shares of common stock in our primary offering and 80,000,000 shares of common stock under our dividend reinvestment plan. We ceased offering shares of common stock in our primary offering on May 30, 2008. We sold 171,109,494 shares in our primary offering for gross offering proceeds of $1.7 billion and, as of December 31, 2011, we had sold 26,592,090 shares under our dividend reinvestment plan (which will terminate effective April 10, 2012) for gross offering proceeds of $222.6 million.
As of December 31, 2011, we owned 892 real estate properties (of which 250 properties were held for sale), including the GKK Properties (defined below). In addition, as of December 31, 2011, we owned seven real estate loans receivable, two investments in securities directly or indirectly backed by commercial mortgage loans, a preferred membership interest in a real estate joint venture, a participation interest with respect to another real estate joint venture and a 10-story condominium building with 62 units acquired through foreclosure, of which four condominium units, two retail spaces and parking spaces were owned by us and held for sale.
On September 1, 2011 (the “Effective Date”), we, through indirect wholly owned subsidiaries (collectively, “KBS”), entered into a Collateral Transfer and Settlement Agreement (the “Settlement Agreement”) with, among other parties, GKK Stars Acquisition LLC (“GKK Stars”), the wholly owned subsidiary of Gramercy Capital Corp. (“Gramercy”) that indirectly owned the Gramercy real estate portfolio, to effect the orderly transfer of certain assets and liabilities of the Gramercy real estate portfolio to KBS in satisfaction of certain debt obligations owed by wholly owned subsidiaries of Gramercy to KBS. The Settlement Agreement resulted in the transfer of the equity interests in certain subsidiaries of Gramercy (the “Equity Interests”) that indirectly own or, with respect to a limited number of properties, hold a leasehold interest in, approximately 867 properties (the “GKK Properties”), including 576 bank branch properties and 291 office buildings, operations centers and other properties. As of December 15, 2011, GKK Stars had transferred all of the Equity Interests to us, giving us title to or, with respect to a limited number of GKK Properties, a leasehold interest in, 867 GKK Properties.
Our focus in 2012 is to manage our existing investment portfolio and our debt service obligations. To the extent we receive proceeds from the repayment of real estate-related investments or the sale of properties in 2012, we are required under existing financing agreements to use a majority of these funds to pay down debt and maintain a liquidity reserve.
Objectives and Strategies
Our primary investment objectives were:
| |
| • | to preserve and return our stockholders’ capital contributions; and |
| |
| • | to manage our investments to allow our stockholders to realize a return on their investment. |
We have sought and will seek to achieve these objectives by investing in and managing a diverse portfolio of real estate and real estate-related investments, which we acquired using a combination of equity raised in our initial public offering, debt financing and joint ventures. We have diversified our portfolio by investment type, geographic region, and tenant/borrower base.
Our primary business objectives are: (i) to maintain and, if possible, improve the quality and income-producing ability of our investments; (ii) to position our investments to improve their value; and (iii) to manage our portfolio to remain compliant with REIT requirements under the Internal Revenue Code of 1986, as amended (the “Internal Revenue Code”). We intend to meet these objectives by utilizing the expertise of our advisor to diligently increase the occupancy of our real estate properties while structuring leases that enhance property operating performance. We will also, through our advisor, seek to improve the cash flows from our real estate-related investments, through continuing debt service, restructuring of terms and, if necessary, foreclosure on collateral. All of our business activities are conducted with the intention of remaining compliant with REIT requirements; if we qualify for taxation as a REIT, we will generally not be subject to federal corporate income taxes on our taxable income that is currently distributed to stockholders. This treatment substantially eliminates the “double taxation” at the corporate and stockholder levels that usually results from investment in the stock of a corporation.
Investment Portfolio
Real Estate Properties
We have made investments in core properties, which are generally lower risk, existing properties with at least 80% occupancy and minimal near-term lease rollover. To date we have invested in:
| |
| • | office properties — including low-rise, mid-rise and high-rise office buildings and office parks in urban and suburban locations, especially those that are in or near central business districts or have access to transportation; and |
| |
| • | industrial properties — including warehouse and distribution facilities, office/warehouse flex properties, research and development properties and light industrial properties. |
We also own other types of properties, including bank branches, transferred to us pursuant to the Settlement Agreement and properties transferred to us through foreclosures or deeds-in-lieu of foreclosures. These properties had originally secured certain of our investments in real estate loans receivable.
All of our properties are located in the United States.
We originally intended to hold our core properties for four to seven years. With respect to the GKK Properties, our management is in the process of determining which properties to hold and which properties to sell. We expect the average hold period to be significantly shorter than that of our core properties. However, economic and market conditions may influence us to hold our investments for different periods of time, and we currently expect our hold period may last for several more years.
As of December 31, 2011, we owned 642 real estate properties held for investment. We also owned 250 real estate properties that were held for sale. The 642 real estate properties held for investment total 24.4 million rentable square feet and include the following:
| |
| • | 16 office buildings, three corporate research buildings, one industrial portfolio consisting of four distribution and office/warehouse properties, one office/flex portfolio consisting of four properties; and |
| |
| • | GKK Properties consisting of 388 bank branch properties and 227 office buildings, operations centers and other properties. |
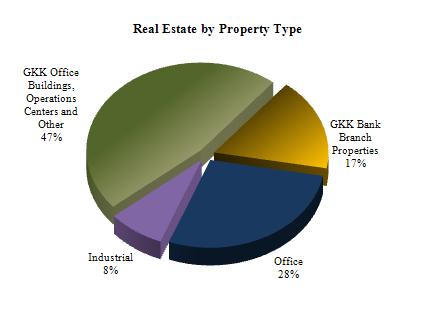
The following chart illustrates the composition of our real estate portfolio (excluding three office properties and 247 GKK Properties that are held for sale) as of December 31, 2011 based on the carrying value of the investments:
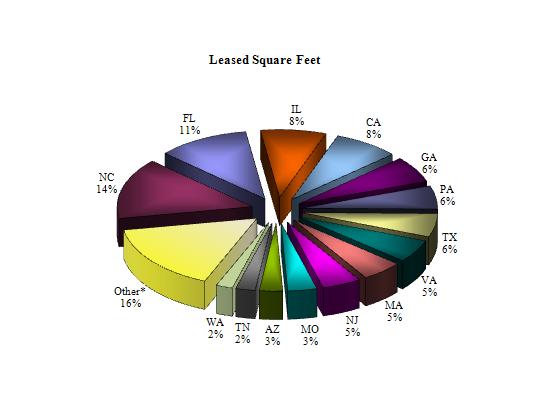
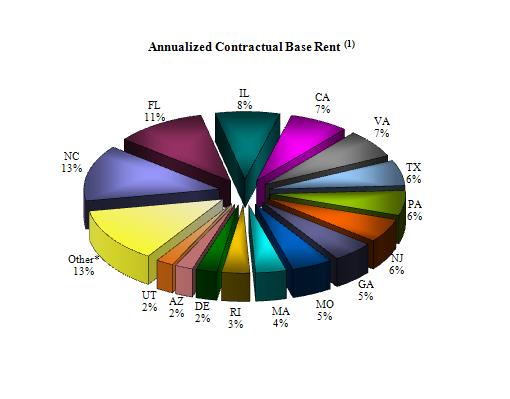
As noted above, our real estate property investments (excluding three office properties and 247 GKK Properties that are held for sale) are diversified by geographic location with properties in 34 states as shown in the charts below:
_____________________
*Other includes any state less than 2% of the total.
(1) Annualized base rent represents annualized contractual base rental income as of December 31, 2011, adjusted for any contractual tenant concessions (including free rent).
We have historically had a stable and diversified tenant base and have had long-term relationships with our tenants in order to limit our exposure to any one tenant or industry. However, as a result of the Transfers (defined below) under the Settlement Agreement, as of December 31, 2011, we had a concentration of credit risk related to Bank of America, N.A., which represented approximately 29.2% of our annualized base rent and reduced the diversity of our tenant base. Annualized base rent represents annualized contractual base rental income as of December 31, 2011, adjusted for any contractual tenant concessions (including free rent). Also, as of December 31, 2011, we had a concentration of credit risk related to the finance industry, which represented approximately 57.3% of our annualized base rent. The increase in the finance industry concentration from the prior period is due to the concentration in the GKK Properties. The chart below illustrates the diversity of tenant industries in our portfolio (excluding three office properties and 247 GKK Properties that are held for sale) based on total annualized base rent:
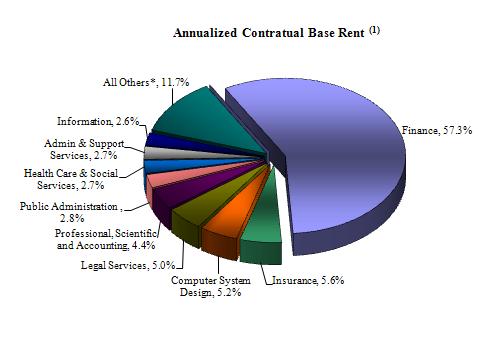
_____________________
* All others includes any industry less than 2% of the total.
(1) Annualized base rent represents annualized contractual base rental income as of December 31, 2011, adjusted for any contractual tenant concessions (including free rent).
The carrying value of our real estate portfolio as of December 31, 2011 was $3.0 billion.
GKK Properties
Background
On August 22, 2008, we, through an indirect wholly owned subsidiary, acquired a senior mezzanine loan with a face amount of $500 million (the “GKK Mezzanine Loan”). The GKK Mezzanine Loan was used to finance a portion of Gramercy’s acquisition of American Financial Realty Trust (“AFR”) and its real estate portfolio that closed on April 1, 2008. Also in connection with its acquisition of AFR, Gramercy, through wholly owned subsidiaries, secured senior mortgage financing (the “Goldman/Citi Mortgage Loan”) and junior mezzanine financing (the “Junior Mezzanine Loan”) from Goldman Sachs Mortgage Company (“Goldman”), Citicorp North America, Inc. (“Citi”) and SL Green Realty Corp. Commencing on March 11, 2011, we, through indirect wholly owned subsidiaries, entered into a series of extension agreements to extend the maturity date of the GKK Mezzanine Loan to May 6, 2011. The extension agreements related to the GKK Mezzanine Loan also extended the maturity dates of the Goldman/Citi Mortgage Loan and the Junior Mezzanine Loan to May 6, 2011. On May 6, 2011, the Goldman/Citi Mortgage Loan, the GKK Mezzanine Loan and the Junior Mezzanine Loan (collectively, the “GKK Loans”) matured and all amounts outstanding under these loans became due and payable by the wholly owned subsidiaries of Gramercy that were the borrowers under the respective loan agreements (collectively, the “GKK Borrower”). As such, as of May 6, 2011, the GKK Loans were in default.
Repurchase Agreements
The GKK Mezzanine Loan served as security for two repurchase agreements: one with Goldman and one originally with Citigroup Financial Products Inc. (“Citigroup” and, together with Goldman, the “GKK Lenders”). On April 28, 2011, our subsidiaries that are the borrowers under the repurchase agreements (individually and collectively, “KBS GKK”) and the GKK Lenders amended and restated the repurchase agreements, which agreements were further amended on May 10, 2011 and on September 1, 2011 (the “Amended Repurchase Agreements”). The purposes of the Amended Repurchase Agreements were, among others, to (i) extend the maturity dates of the existing repurchase agreements between KBS GKK, and Goldman and Citigroup, respectively, dated August 22, 2008, as amended, (ii) provide for additional security for the GKK Lenders under the Amended Repurchase Agreements, and (iii) set certain conditions that, on the date met (the “Conversion Date”), would automatically convert the Amended Repurchase Agreements into a mezzanine loan. On December 30, 2011, Citigroup sold its interest in its Amended Repurchase Agreement to Midtown Acquisitions L.P. (“Midtown”), who replaced Citigroup as one of the “GKK Lenders.”
The Amended Repurchase Agreements will terminate on the earliest to occur of (i) April 28, 2013, (ii) the Conversion Date, (iii) the full payment of all obligations under the Amended Repurchase Agreements, or (iv) upon an event causing the Amended Repurchase Agreements to otherwise terminate.
As part of the closing of the Amended Repurchase Agreements, we paid $120 million in the aggregate to the GKK Lenders, of which approximately $115 million was used for the reduction of the principal balance under the Amended Repurchase Agreements (the “Principal Payment”), with the remaining $5 million used for accrued interest, and costs and expenses incurred by the GKK Lenders in connection with the closing of the Amended Repurchase Agreements. On May 10, 2011, the GKK Lenders advanced an additional $34.4 million under the Amended Repurchase Agreements to fund our acquisition, through KBS GKK, of a subordinated portion of the Goldman/Citi Mortgage Loan (the “GKK Subordinated Mortgage Loan”). Additionally, in connection with the acquisition of the GKK Subordinated Mortgage Loan, on May 10, 2011, the GKK Lenders provided financing of $8.5 million to fund our acquisition, through KBS GKK, of a subordinated portion of the Junior Mezzanine Loan (the “GKK Junior Mezzanine Tranche”).
The Amended Repurchase Agreements are secured by, among other things, the Equity Interests. The Amended Repurchase Agreements bear interest at an annual rate of 350 basis points over one-month LIBOR. In addition to monthly interest payments under the terms of the Amended Repurchase Agreements, we, through KBS GKK, were and are required to make certain mandatory payments to the GKK Lenders as follows:
| |
| (i) | on October 15, 2011, we made an amortization payment of $35 million; |
| |
| (ii) | every three months from January 15, 2012 through April 2013, we are required to make additional amortization payments of approximately $24.3 million, which payments may be decreased by KBS GKK making any prepayments of principal, including any mandatory or voluntary prepayments of principal; |
| |
| (iii) | on October 15, 2011, we made payments relating to the acquisition of the GKK Subordinated Mortgage Loan and the GKK Junior Mezzanine Tranche in the amount of $1.6 million, and we must make payments in the amount of $1.1 million every three months thereafter through April 2013; and |
| |
| (iv) | we are required to pay 75% to 100% of excess cash flows or net cash proceeds from: (a) the operations of the GKK Properties, net of debt service and capital reserves; (b) the sale of the GKK Properties; (c) the sale of certain real estate-related debt investments owned by us; (d) the sale of substantially all other properties owned by us, in excess of $75 million in the aggregate in any calendar year; and (e) certain indebtedness incurred or equity issued (excluding proceeds from our dividend reinvestment plan, which will terminate effective April 10, 2012), by us. |
As of December 31, 2011, the Amended Repurchase Agreements had an aggregate outstanding principal balance of $143.0 million. KBS GKK may voluntarily prepay amounts outstanding under the Amended Repurchase Agreements without prepayment penalties.
The Amended Repurchase Agreements require KBS GKK and its subsidiaries, and us and certain of our subsidiaries that indirectly own most of our assets (collectively, the “Guarantors”), to meet certain financial and other covenants, which include, among other covenants, the requirement for the Guarantors to maintain minimum liquidity of $19.0 million. The Guarantors have guaranteed, and other of our subsidiaries as may be added in the future will guarantee, all amounts owed by KBS GKK to the GKK Lenders under the Amended Repurchase Agreements. We also agreed that, unless permitted by or pursuant to the terms of the Amended Repurchase Agreements, during the term of the Amended Repurchase Agreements we would not create or incur additional liens or indebtedness on our assets, make additional investments, or make certain dispositions except pursuant to the mandatory payment provisions discussed above. During the term of the Amended Repurchase Agreements, we also agreed (i) except for distributions to stockholders necessary to maintain our REIT status, to limit distributions to stockholders to an amount not to exceed $6.0 million per month, excluding any distributions to stockholders reinvested in us pursuant to our dividend reinvestment plan (which will terminate effective April 10, 2012), and (ii) to continue to limit redemptions under the share redemption program to those redemptions sought upon a stockholder’s death, “qualifying disability” or “determination of incompetence” (each as defined in the share redemption program).
In connection with its execution of the Settlement Agreement (discussed below), KBS GKK agreed that a default by KBS on any of the five loans specified in the Amended Repurchase Agreements (a “Mortgage Default”), including the Goldman/Citi Mortgage Loan, may, in certain circumstances, constitute a default under the Amended Repurchase Agreements. Under certain conditions, a Mortgage Default would not trigger a default under the Amended Repurchase Agreements if KBS were to transfer the Equity Interests in the owner of the property subject to the Mortgage Default to the GKK Lenders.
Settlement Agreement
On the Effective Date, we, through KBS, entered into (a) the Settlement Agreement with, among other parties, GKK Stars, to effect the orderly transfer of certain assets and liabilities of the Gramercy real estate portfolio to KBS in satisfaction of certain debt obligations owed by the GKK Borrower to KBS, and (b) an Acknowledgment and Consent Agreement with, among other parties, Goldman and Citi.
Under the Settlement Agreement, GKK Stars agreed to cause the Transfers (defined below) to KBS of the Equity Interests in the indirect owners of or, with respect to a limited number of GKK Properties, the holders of a leasehold interest in, the GKK Properties, with transfers to commence on the Effective Date. The Settlement Agreement contemplated the transfer of Equity Interests in entities that own or hold leasehold interests in approximately 815 GKK Properties, including approximately 524 bank branch properties and approximately 291 office buildings, operations centers and other properties, as well as a 99% interest in the Citizens Bank Joint Venture, which owned 52 bank branch properties. Pursuant to the Settlement Agreement, on September 1, 2011, KBS indirectly took title to or, with respect to a limited number of GKK Properties, took a leasehold interest in, 317 of the GKK Properties. On October 24, 2011, the minority interest members of the Citizens Bank Joint Venture assigned their entire interest in the joint venture to the 99% interest holder. On December 1, 2011, KBS, through the transfer of certain Equity Interests, indirectly took title to 116 GKK Properties, all of which are office buildings or operations centers. On December 14, 2011 and December 15, 2011, KBS, through the transfer of certain Equity Interests, indirectly took title to or, with respect to a limited number of GKK Properties, indirectly took a leasehold interest in, the remaining 382 GKK Properties, consisting of 287 bank branch properties and 95 office buildings, operations centers and other properties. Such transfers of the Equity Interests in the owners of, or in the holders of leasehold interests in, the GKK Properties are referred to herein as the “Transfers.” Our estimated fair values of the underlying GKK Properties and related current assets and liabilities support the approximately $1.9 billion total of the combined outstanding mortgage loan balance encumbering the GKK Properties (including the GKK Subordinated Mortgage Loan) plus our carrying value of the GKK Mezzanine Loan and GKK Junior Mezzanine Tranche prior to our entry into the Settlement Agreement. As a result, we did not record a gain or loss upon the signing of the Settlement Agreement and the consolidation of the underlying GKK Properties and related assets and liabilities into our consolidated financial statements. The fair value of the individual GKK Properties was determined using either a direct capitalization approach (generally for stabilized properties with long-term leases) or a discounted cash flow analysis. With respect to the GKK Properties marketed for sale or that have been sold subsequent to December 31, 2011, the estimated fair values were based on actual offers received or brokers estimated selling prices, net of expected selling costs. The GKK Properties, as of September 1, 2011, contained a total of approximately 20.7 million rentable square feet and were located in 36 different states.
Below is a summary of the GKK Properties as of the Effective Date:
|
| | | | | | | | | | | | |
| Property Type | | Number of Properties | | Number of States (1) | | Rentable Square Feet | | Average Remaining Lease Term in Years | | Occupancy |
Bank branch properties (2) | | 524 | | 28 | | 3,397,659 |
| | 6.6 | | 89 | % |
| Office buildings/ Operations centers | | 288 | | 36 | | 17,275,203 |
| | 9.4 | | 83 | % |
| Land & parking | | 3 | | 3 | | 4,587 |
| | 8.0 | | N/A |
|
| | | 815 | | | | 20,677,449 |
| | 9.2 | | 84 | % |
_____________________
(1) In total, the GKK Properties are located in 36 different states throughout the United States.
(2) Does not include 52 bank branch properties previously owned by the Citizens Bank Joint Venture. These properties are 100% occupied, primarily by RBA Citizens, N.A., and were consolidated as of October 24, 2011.
Because the Settlement Agreement provided that KBS accept the Transfer of all of the remaining Equity Interests that had not been transferred as of December 15, 2011, with the only requirement being the passage of time, and because for accounting purposes (although not for legal purposes), we were deemed to control the decisions that affect the economic outcome of all of the Equity Interests and all of the GKK Properties as of the Effective Date, we consolidated in our financial statements as of the Effective Date all assets transferred to and liabilities assumed by us in connection with the Transfers of the Equity Interests and the wholly owned GKK Properties or the GKK Properties in which we hold long-term leasehold interests, including the related assumption of the Mortgage Pools and other liabilities related to the GKK Properties, with the exception of the assets and liabilities owned by the Citizens Bank Joint Venture, which was consolidated as of October 24, 2011. The Citizens Bank Joint Venture owned 52 bank branch properties that are 100% occupied and encompass 237,172 rentable square feet. These Citizens Bank Joint Venture properties are located in 10 different states with an average remaining lease term of 5.7 years. Additionally, the outstanding indebtedness under the GKK Mezzanine Loan, the GKK Subordinated Mortgage Loan and the GKK Junior Mezzanine Tranche have been eliminated in consolidation in our consolidated financial statements.
As of the Effective Date, GKK Stars had agreed to provide: standard asset management services relating to the GKK Properties transferred pursuant to the Settlement Agreement (the “Services”) through December 31, 2013, which Services may be terminated by either GKK Stars or KBS at any time on 90 days prior written notice, subject to certain additional termination rights and restrictions; and to provide us with financial information for the GKK Properties for fiscal year 2011. As compensation for the Services, KBS agreed to pay to GKK Stars: (i) an annual fee of $10 million (prorated for incomplete years) plus all property-related expenses incurred by GKK Stars, (ii) subject to certain terms and conditions in the Settlement Agreement, participation interests in the amounts by which the net sales proceeds from the sale of the GKK Properties plus the remaining net value of KBS’ remaining assets exceed certain threshold amounts, and (iii) subject to certain conditions in the Settlement Agreement, a minimum of $3.5 million. Accordingly, we have recorded a contingent liability of $12.0 million based on the expected consideration to be paid as a result of GKK Stars’ participation interests. GKK Stars and KBS have agreed to negotiate a separate management services agreement to further outline the terms and conditions under which GKK Stars or one of its affiliates would continue to provide the Services for KBS. The terms of such an agreement have not yet been finalized, however, and there can be no assurance that GKK Stars or one of its affiliates and KBS will ever consummate such an agreement. In the event KBS and GKK Stars or one of its affiliates are unable to consummate such an agreement by March 31, 2012, the terms for the provision of the Services under the Settlement Agreement may be terminated on June 30, 2012, though, in certain circumstances, GKK Stars will retain its right to the participation interests and minimum threshold described above.
So long as KBS is still obligated under certain Mortgage Pools, the Guarantor and our indirect wholly owned subsidiaries created to receive the Equity Interests may not incur debt for borrowed money in excess of $180 million (which may be increased to $200 million under certain circumstances), other than mortgage financing secured by, among other things, interests in real property.
With the exception of 52 unencumbered properties, including 38 properties in which we have received leasehold interests, the GKK Properties subject to the Transfers are divided into 25 separate property pools with each property pool being encumbered by a mortgage loan in favor of a third-party lender (collectively, the “Mortgage Pools” and individually, a “Mortgage Pool”), except for the $34.3 million GKK Subordinated Mortgage Loan that we own and is therefore eliminated in consolidation. As of December 31, 2011, the aggregate outstanding principal balance of the Mortgage Pools was $1.5 billion, including the GKK Subordinated Mortgage Loan. The GKK Subordinated Mortgage Loan is a subordinated portion of the Goldman/Citi Mortgage Loan, which had an outstanding principal balance of $238.8 million as of December 31, 2011. As of December 31, 2011, the Mortgage Pools had a total of $1.0 billion of fixed rate notes payable with a weighted-average annual effective interest rate of 5.8% and a total of $0.5 billion of variable rate notes payable with a weighted-average annual effective interest rate of 3.7%.
Real Estate-Related Investments
We have also invested in real estate-related investments including: (i) mortgage loans; (ii) mezzanine loans; (iii) participations in mortgage and mezzanine loans; (iv) B-Notes; and (v) real estate-related debt securities, such as commercial mortgage-backed securities (“CMBS”). We generally intend to hold our real estate-related investments until maturity. However, economic and market conditions may influence the length of time that we hold these investments.
As of December 31, 2011, we owned one mezzanine real estate loan, two B-Notes, two loans representing senior subordinated debt of a private REIT and two mortgage loans. We also owned two investments in securities directly or indirectly backed by commercial mortgage loans and a preferred membership in a real estate joint venture. The following chart illustrates the composition of our real estate-related investments based on carrying value as of December 31, 2011:
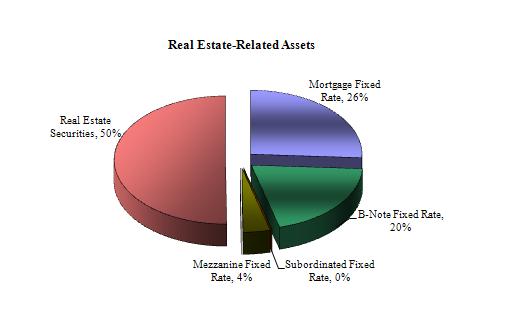
The total cost and book value of our real estate-related investments as of December 31, 2011 were $179.2 million and $91.3 million, respectively, excluding investments that were subject to the Settlement Agreement, that we have foreclosed on or that were transferred to us pursuant to a deed-in-lieu of foreclosure and an investment for which we received preferred equity interests in the property owner. As of December 31, 2011, we had invested in fixed rate loans receivable with book values (net of asset-specific reserves) of $45.0 million and the weighted average annualized effective interest rate on the fixed rate loans receivable was 2.5%.
Financing Objectives
We financed the majority of our real estate acquisitions with a combination of the proceeds we received from our initial public offering and debt. In addition, we purchased certain real estate-related investments with a combination of the proceeds we received from our initial public offering and repurchase financing. We used debt financing to increase the amount available for investment and to increase overall investment yields to us and our stockholders. As of December 31, 2011, the weighted-average interest rate on our debt was 4.9%.
We borrow funds at a combination of fixed and variable rates. As of December 31, 2011, we had approximately $1.4 billion and $916.6 million of fixed and variable rate debt outstanding, respectively. Of the variable rate debt outstanding, approximately $85.4 million was effectively fixed through the use of interest rate swap agreements. The weighted-average interest rates of our fixed rate debt and variable rate debt at December 31, 2011 were 5.8% and 3.5%, respectively.
Some of our debt allows us to extend the maturity dates, subject to certain conditions. Although we believe we will be permitted to extend the maturity of our current loan agreements, we can give no assurance in this regard. The following table shows the contractual maturity of our debt as of December 31, 2011:
|
| | | | | | | | | | | |
| | Notes Payable | | Repurchase Agreements | | Total |
| 2012 | $ | 519,398 |
| | $ | 94,352 |
| | $ | 613,750 |
|
| 2013 | 692,100 |
| | 55,305 |
| | 747,405 |
|
| 2014 | 163,921 |
| | — |
| | 163,921 |
|
| 2015 | 220,136 |
| | — |
| | 220,136 |
|
| 2016 | 137,611 |
| | — |
| | 137,611 |
|
| Thereafter | 425,369 |
| | — |
| | 425,369 |
|
| | $ | 2,158,535 |
| | $ | 149,657 |
| | $ | 2,308,192 |
|
Our charter limits our total liabilities to 75% of the cost (before deducting depreciation or other noncash reserves) of all of our tangible assets; however, we may exceed that limit if the majority of the conflicts committee approves each borrowing in excess of our charter limitation and we disclose such borrowings to our stockholders in our next quarterly report with an explanation from the conflicts committee of the justification for the excess borrowing. Due to the amount of debt that we have assumed related to the Transfers under the Settlement Agreement, we exceeded our charter limitation on total liabilities as of September 30, 2011. The conflicts committee had approved all such borrowings in excess of our charter limitation on total liabilities. The conflicts committee determined that the excess leverage was justified for the following reasons:
| |
| • | the assumption of debt was necessary as part of the Transfers of the GKK Properties; |
| |
| • | the Transfers will allow us to operate the GKK Properties and generate ongoing income for our investors; and |
| |
| • | the Transfers will allow us to develop an exit strategy for the GKK Properties, thus optimizing the return on investor capital. |
As of December 31, 2011, we no longer exceeded our charter limitation on total liabilities and our borrowings and other liabilities were approximately 71% and 72% of the cost (before depreciation or other noncash reserves) and book value (before depreciation) of our tangible assets, respectively.
Market Outlook – Real Estate and Real Estate Finance Markets
During the past four years, there have been significant and widespread concerns about credit risk, both corporate and sovereign, and access to capital in the U.S. and global capital markets. Economies throughout the world have experienced lingering levels of high unemployment and low levels of consumer and business confidence due to a global downturn in economic activity. While some markets have shown some signs of recovery, concerns remain regarding job growth, income growth and the overall health of consumers and businesses. Recent global economic events remain centered on the potential for the default of European sovereign debt and the impact that such an event would have on the rest of the world’s financial markets. During 2011, Standard and Poor’s downgraded the credit rating of the United States to AA+ from AAA. Moody’s recently downgraded Italy, Spain, Portugal and Greece and placed the UK and France on negative watch. These events have led to increased volatility in the capital markets.
In this environment, the health of the global capital markets remains a concern. The banking industry has been experiencing improved earnings, but the relatively low growth economic environment has caused the markets to question whether financial institutions are adequately capitalized. The credit downgrade of the United States has increased these concerns, especially for the larger, money center banks. Smaller financial institutions have continued to work with borrowers to amend and extend existing loans; however, as these loans reach maturity, there is the potential for future credit losses.
In Europe, the unresolved sovereign debt crisis remains a concern. Some European banks hold material quantities of sovereign debt on their balance sheets. The possible default or restructuring of the sovereign debt obligations of certain European Union countries and the resulting negative impact on the global banking system is a significant concern. The uncertainty surrounding the size of the problem and how regulators and governments intend to deal with the situation has caused many investors to reassess their pricing of risks. In response to the growing crisis the global credit markets have tightened, and the cost of capital, in general, has begun to increase.
Throughout the financial crisis and economic downturn, U.S. commercial real estate transactions experienced a sharp decline in volume. Very little market activity (buying or selling) took place in 2009 and the first half of 2010. In the second half of 2010 and the first half of 2011, the markets experienced a rebound in transaction activity. High-quality assets in primary (top-tier) markets experienced the largest increase in transaction volume. The second half of 2011, however, witnessed a significant slowdown in the level of market activity. Uncertainty in areas such as the cost of capital, and the ability to hedge asset risks, produced enough friction to bring transaction volumes down. However, toward the end of December and the beginning of the first quarter of 2012, the U.S. commercial real estate markets showed signs of recovery and increased transaction volumes.
While there are signs of improvement for commercial real estate, the outstanding economic, credit and regulatory issues remain. Certain markets will continue to benefit from employment gains specific to the location and regionally based growth industries such as technology, energy and health care. The capital markets also have an impact on these trends. Lending activity increased in 2011, but market volatility has increased caution among lenders and can affect capital supply. CMBS lending, which was shut down in the second half of 2011, began again during the first quarter of 2012.
Despite improved access to capital for some companies, the aforementioned economic conditions have continued to impact the capital markets. Global government interventions in the banking system and the persistence of a highly expansionary monetary policy by the U.S. Treasury have introduced additional complexity and uncertainty to the markets. The U.S. government’s recent introduction of additional regulation to the financial markets, including the banking, insurance and brokerage sectors, has resulted in general uncertainty as to the long-term impact on these markets and on the economy as a whole. Adding to this uncertainty are increased disclosure requirements and changes to accounting principles involving the valuation of investments. These conditions are expected to continue, and combined with a challenging macro-economic environment, may interfere with the implementation of our business strategy and/or force us to modify it.
Impact on Our Real Estate Investments
These market conditions have had and will likely continue to have a significant impact on our real estate investments. In addition, these market conditions have impacted our tenants’ businesses, which makes it more difficult for them to meet their current lease obligations and places pressure on them to negotiate favorable lease terms upon renewal in order for their businesses to remain viable. Increases in rental concessions given to retain tenants and maintain our occupancy level, which is vital to the continued success of our portfolio, has resulted in lower current cash flow. Projected future declines in rental rates, slower or potentially negative net absorption of leased space and expectations of future rental concessions, including free rent to renew tenants early, to retain tenants who are up for renewal or to sign new tenants, are expected to result in additional decreases in cash flows. Historically low interest rates have helped offset some of the impact of these decreases in operating cash flow for properties financed with variable rate mortgages; however, interest rates likely will not remain at these historically low levels for the remaining life of many of our investments.
Impact on Our Real Estate-Related Investments
Nearly all of our real estate-related investments are either directly secured by commercial real estate (e.g., first deeds of trust or mortgages) or secured by ownership interests in entities that directly or indirectly own and operate real estate (e.g., mezzanine loans). As a result, our real estate-related investments in general have been impacted by the same factors impacting our real estate investments. In particular, our investments in mezzanine loans and B-Notes have been impacted to a greater degree as current valuations for buildings directly or indirectly securing our investment positions have likely decreased from the date of our acquisition or origination of these investments. In such instances, the borrowers may not be able to refinance their debt to us or sell the collateral at a price sufficient to repay our note balances in full when they become due. In addition, current economic conditions have impacted the performance of collateral directly or indirectly securing our loan investments, and therefore have impacted the ability of some borrowers under our loans to make contractual interest payments to us. For the year ended December 31, 2011, we recorded a loan loss reserve of $12.0 million, which was comprised of a $30.1 million increase of loan loss reserve calculated on an asset-specific basis, offset by a reduction of $18.1 million to our portfolio-based reserve.
Assuming our real estate-related loans are fully extended under the terms of the respective loan agreements and excluding our loan investments with asset-specific loan loss reserves, we do not have any investments maturing within a year from December 31, 2011. We have fixed rate real estate-related loans with book values (excluding asset-specific loan loss reserves) of $119.2 million.
Impact on Our Financing Activities
In light of the risks associated with declining operating cash flows from our real estate properties and the properties directly or indirectly serving as the collateral for our repurchase agreements, and the current underwriting environment for commercial real estate mortgages, we may have difficulty refinancing some of our mortgage notes, credit facilities and repurchase agreements at maturity or we may not be able to refinance our obligations at terms as favorable as the terms of our existing indebtedness. Although we believe we will be permitted to extend the maturity of our current loan agreements and other loan documents, we can give no assurance in this regard. We have $613.8 million of debt obligations maturing during the 12 months ending December 31, 2012. Assuming our notes payable are fully extended under the terms of the respective loan agreements or other loan documents, we have $443.4 million of debt obligations maturing during the 12 months ending December 31, 2012.
As of December 31, 2011, we had a total of $1.4 billion of fixed rate notes payable and $916.6 million of variable rate notes payable and repurchase agreements. Of the $916.6 million of variable rate notes payable and repurchase agreements, $85.4 million is effectively fixed through interest rate swaps. In addition to the debt obligations maturing during the 12 months ending December 31, 2012, we are required to make a minimum of $97.4 million in amortization payments of principal related to the Amended Repurchase Agreements prior to December 31, 2012 and to pay $4.6 million in fees relating to the amendment of these repurchase agreements by December 31, 2012.
Economic Dependency
We are dependent on our advisor for certain services that are essential to us, including the management of our real estate and real estate-related investment portfolio; the disposition of real estate and real estate-related investments; and other general and administrative responsibilities. In the event that KBS Capital Advisors is unable to provide these services, we will be required to obtain such services from other sources. We are also dependent on GKK Stars for asset management services including the operations, leasing and eventual dispositions of the GKK Properties.
Competitive Market Factors
The United States commercial real estate leasing markets remain competitive. We face competition from various entities for prospective tenants and to retain our current tenants, including other REITs, pension funds, insurance companies, investment funds and companies, partnerships, and developers. Many of these entities have substantially greater financial resources than we do and may be able to accept more risk than we can prudently manage, including risks with respect to the creditworthiness of a tenant or the geographic location of its investments. As a result of their greater resources, those entities may have more flexibility than we do in their ability to offer rental concessions to attract tenants. This could put pressure on our ability to maintain or raise rents and could adversely affect our ability to attract or retain tenants. As a result, our financial condition, results of operations, cash flow, ability to satisfy our debt service obligations and ability to pay distributions to our stockholders has been adversely affected.
Compliance with Federal, State and Local Environmental Law
Under various federal, state and local environmental laws, ordinances and regulations, a current or previous real property owner or operator may be liable for the cost of removing or remediating hazardous or toxic substances on, under or in such property. These costs could be substantial. Such laws often impose liability whether or not the owner or operator knew of, or was responsible for, the presence of such hazardous or toxic substances. Environmental laws also may impose restrictions on the manner in which a property may be used or businesses may be operated, and these restrictions may require substantial expenditures or prevent us from entering into leases with prospective tenants that may be impacted by such laws. Environmental laws provide for sanctions for noncompliance and may be enforced by governmental agencies or, in certain circumstances, by private parties. Certain environmental laws and common law principles could be used to impose liability for the release of and exposure to hazardous substances, including asbestos-containing materials. Third parties may seek recovery from real property owners or operators for personal injury or property damage associated with exposure to released hazardous substances. The cost of defending against claims of liability, of complying with environmental regulatory requirements, of remediating any contaminated property, or of paying personal injury claims could reduce the amounts available for distribution to our stockholders.
Except for certain GKK Properties and other properties to which we took title to through foreclosure or deed-in-lieu of foreclosure, all of our direct real estate investments were subject to Phase I environmental assessments at the time they were acquired. Some of our properties are subject to potential environmental liabilities arising primarily from historic activities at or in the vicinity of the properties. Based on our environmental diligence and assessments of our properties and our purchase of pollution and remediation legal liability insurance with respect to some of our properties, we do not believe that environmental conditions at our properties are likely to have a material adverse effect on our operations.
We own one property that is subject to activity use limitations (“AULs”) whereby the government has placed limitations on redevelopment of the property for certain uses, particularly residential uses. AULs are typically imposed on a property that has environmental contamination in exchange for less stringent environmental clean‑up standards. In view of the locations of the affected properties, the environmental characteristics of the contaminants and the characteristics of the neighborhoods, we do not believe that these AULs have a material impact on our portfolio valuation, but they could in individual cases result in a depression of the value of a property, should we resell the property for uses different from its existing uses. The property subject to AULs is ADP Plaza, located in Portland, Oregon.
Some of the properties in our portfolio, particularly the warehouse and light industrial properties, had or have underground storage tanks either for space heating of the buildings, fueling motor vehicles, or industrial processes. Many of the underground storage tanks at the premises have been replaced over time. Given changing standards regarding closure of underground storage tanks and associated contamination, many of the tanks may not have been closed in compliance with current standards. Some of these properties likely have some residual petroleum or chemical contamination. Properties exhibiting these risks include 129 Concord Road, Billerica, Massachusetts (Rivertech) and ADP Plaza, Portland, Oregon.
Since under the Settlement Agreement, we indirectly took title to or, with respect to a limited number of the GKK Properties, indirectly took a leasehold interest in, the GKK Properties through the Transfers of Equity Interests, the GKK Properties were transferred to us on an “as is” basis. As such, we were not able to inspect the GKK Properties or conduct standard due diligence on certain of the GKK Properties before the Transfers. Additionally, we did not receive representations, warranties and indemnities relating to the GKK Properties from Gramercy and/or its affiliates. Thus, the value of the GKK Properties may decline if we subsequently discover environmental problems with the GKK Properties.
Industry Segments
Our segments are based on our method of internal reporting which classifies our operations by investment type: (i) real estate, (ii) real estate-related and (iii) commercial properties primarily leased to financial institutions transferred to us pursuant to the Settlement Agreement. For financial data by segment, see Note 16, “Segment Information” in the notes to our consolidated financial statements filed herewith.
Employees
We have no paid employees. The employees of our advisor and its affiliates provide management, disposition, advisory and certain administrative services to us.
Principal Executive Office
Our principal executive offices are located at 620 Newport Center Drive, Suite 1300, Newport Beach, California 92660. Our telephone number, general facsimile number and web address are (949) 417-6500, (949) 417-6520 and http://www.kbsreit.com, respectively.
Available Information
Access to copies of our annual reports on Form 10-K, quarterly reports on Form 10-Q, current reports on Form 8-K, proxy statements and other filings with the SEC, including amendments to such filings, may be obtained free of charge from the following Web site, http://www.kbsreit.com, through a link to the SEC’s Web site, http://www.sec.gov. These filings are available promptly after we file them with, or furnish them to, the SEC.
The following are some of the risks and uncertainties that could cause our actual results to differ materially from those presented in our forward‑looking statements. The risks and uncertainties described below are not the only ones we face but do represent those risks and uncertainties that we believe are material to us. Additional risks and uncertainties not presently known to us or that we currently deem immaterial may also harm our business.
Risks Related to an Investment in Us
Because no public trading market for our shares currently exists and because it is increasingly likely that we will delay the liquidation or the listing of our shares of common stock on a national securities exchange beyond 2012, our stockholders will not realize the cash value of their investment for an extended period.
There is no public market for our shares and we currently have no plans to list our shares on a national securities exchange. Until our shares are listed, if ever, stockholders may not sell their shares unless the buyer meets the applicable suitability and minimum purchase standards. In addition, our charter prohibits the ownership of more than 9.8% of our stock, unless exempted by our board of directors, which may inhibit large investors from purchasing our shares. We have amended and restated our share redemption program to provide only for redemptions sought upon a stockholder’s death, “qualifying disability” or “determination of incompetence” (each as defined in the share redemption program). Such redemptions are subject to an annual dollar limitation, which shall be $10.0 million in the aggregate for the calendar year 2012 (subject to review and adjustment during the year by the board of directors), and further subject to the limitations described in the share redemption program plan document. Based on historical redemption activity, we believe the $10.0 million redemption limitation for the calendar year 2012 will be sufficient for these special redemptions. During each calendar year, the annual dollar limitation for the share redemption program will be reviewed and adjusted from time to time. We currently do not expect to have funds available to resume ordinary redemptions in the future. Therefore, until further notice, and except with respect to redemptions sought upon a stockholder’s death, “qualifying disability” or “determination of incompetence,” stockholders will not be able to sell any of their shares back to us pursuant to our share redemption program. In addition, even if resumed, our share redemption program includes numerous restrictions that would limit a stockholder’s ability to sell his or her shares. In its sole discretion, our board of directors may amend, suspend or terminate our share redemption program upon 30 days’ notice. Therefore, it will be difficult for our stockholders to sell their shares promptly or at all. If a stockholder is able to sell his or her shares, it would likely be at a substantial discount to the price at which we sold the shares in our public offering. It is also likely that our shares would not be accepted as the primary collateral for a loan.
If our shares of common stock are not listed on a national securities exchange by November 2012, our charter requires that we seek stockholder approval of our liquidation unless a majority of our independent directors determines that liquidation is not then in the best interest of our stockholders and postpones the decision of whether to liquidate. Due to the continuing impact of the disruptions in the financial markets on the values of our investments and our entry into the Settlement Agreement that required the transfer of certain assets and liabilities of the Gramercy real estate portfolio to us in satisfaction of certain debt obligations owed to us by wholly owned subsidiaries of Gramercy, it is increasingly likely that we will postpone such a liquidity event in order to improve the prospects for our stockholders to have their capital returned and to realize a profit on their investment, likely through sales of individual or pooled assets. Therefore, our stockholders should be prepared to hold our shares for an extended period before realizing the cash value of their investment.
Continued disruptions in the financial markets and uncertain economic conditions could adversely affect our ability to service our existing indebtedness, our ability to refinance or secure additional debt financing on attractive terms and the values of our investments.
Despite improved access to capital for some companies, the aforementioned economic conditions have continued to impact the capital markets. Global government interventions in the banking system and the persistence of a highly expansionary monetary policy by the U.S. Treasury have introduced additional complexity and uncertainty to the markets. The U.S. government’s recent introduction of additional regulation to the financial markets, including the banking, insurance and brokerage sectors, has resulted in general uncertainty as to the long-term impact on these markets and on the economy as a whole. Adding to this uncertainty are increased disclosure requirements and changes to accounting principles involving the valuation of investments. These conditions are expected to continue, and combined with a challenging macro-economic environment, may interfere with the implementation of our business strategy and/or force us to modify it.
Looking forward, it is widely assumed that mortgage delinquencies have not yet peaked. Liquidity in the global credit market has been severely contracted by market disruptions, and new lending is expected to remain subdued in the near term. We have relied on debt financing to finance our properties and real estate-related assets. As a result of the uncertainties in the credit market, we may not be able to refinance our existing indebtedness or to obtain additional debt financing on attractive terms or at all. If we are not able to refinance existing indebtedness on attractive terms at the various maturity dates, we may be forced to dispose of some of our assets.
Further disruptions in the financial markets and uncertain economic conditions could adversely affect the values of our investments. Turmoil in the capital markets has constrained equity and debt capital available for investment in commercial real estate, resulting in fewer buyers seeking to acquire commercial properties and possible increases in capitalization rates and lower property values. Furthermore, declining economic conditions could negatively impact commercial real estate fundamentals and result in lower occupancy, lower rental rates and declining values in our real estate portfolio and in the collateral securing our loan investments, which could have the following negative effects on us:
| |
| • | the values of our investments in commercial properties could decrease below the amounts we paid for such investments; |
| |
| • | the value of collateral securing our loan investments could decrease below the outstanding principal amounts of such loans; |
| |
| • | revenues from our properties could decrease due to fewer tenants and/or lower rental rates, making it more difficult for us to pay dividends or meet our debt service obligations on debt financing; and/or |
| |
| • | revenues on the properties and other assets underlying our loan investments could decrease, making it more difficult for the borrowers to meet their payment obligations to us, which could in turn make it more difficult for us to pay dividends or meet our debt service obligations on debt financing. |
All of these factors could reduce our stockholders’ return and decrease the value of an investment in us.
Our stockholders should not assume that our performance will be similar to the performance of other real estate programs sponsored by affiliates of our advisor, which makes our future performance difficult to predict.
We are the first publicly offered investment program sponsored by the affiliates of our advisor, KBS Capital Advisors. Our stockholders should not assume that our performance will be similar to the past performance of other real estate investment programs sponsored by affiliates of our advisor. The private KBS-sponsored programs were not subject to the up-front commissions, fees and expenses associated with our initial public offering nor all of the laws and regulations that apply to us. For all of these reasons, our stockholders should be especially cautious when drawing conclusions about our future performance and our stockholders should not assume that it will be similar to the prior performance of other KBS-sponsored programs. The differences between us and the private KBS-sponsored programs significantly increase the risk and uncertainty our stockholders face.
Because we depend upon our advisor and its affiliates to conduct our operations, any adverse changes in the financial health of our advisor or its affiliates or our relationship with them could hinder our operating performance and the return on our stockholders’ investment.
We depend on our advisor to manage our operations and our portfolio of real estate and real estate-related assets. Our advisor depends upon the fees and other compensation that it receives from us and the other public KBS-sponsored programs in connection with the purchase, management and sale of assets to conduct its operations. Any adverse changes in the financial condition of KBS Capital Advisors or our relationship with KBS Capital Advisors could hinder its ability to successfully manage our operations and our portfolio of investments.
KBS Capital Advisors has limited experience operating, overseeing and selling bank branch properties, which could cause inefficiencies in the operation and sale of these properties, thereby reducing distributions to our stockholders.
Our advisor has limited experience operating, overseeing and selling bank branch properties, which properties make up the majority of the GKK Properties. As such, and while we believe we have retained appropriate asset management by hiring GKK Stars or one of its affiliates to manage the GKK Properties, we may not be able to operate, lease and/or sell these GKK Properties efficiently and effectively, which could prevent us from improving the value of our overall portfolio. Additionally, some of these bank branches are located outside of our target markets and our advisor has limited experience in these markets. For these reasons, there may be inefficiencies in the operation and sale of these GKK Properties, which may prevent us from recognizing the full potential value of these GKK Properties and may cause reduced distributions to our stockholders.
Because of GKK Stars’ experience with managing the bank branch and bank-related properties that make up the majority of the GKK Properties, we depend upon GKK Stars to manage and conduct the operations of the GKK Properties and any adverse changes in or termination of our relationship with GKK Stars could hinder the performance of the GKK Properties and reduce the return on our stockholders’ investment.
Prior to the Transfers, GKK Stars and its affiliates indirectly owned and managed the GKK Properties and thus have developed experience and expertise in the management and operations of bank branch and bank-related properties. As of the Effective Date, GKK Stars agreed to provide standard asset management services relating to the GKK Properties transferred pursuant to the Settlement Agreement (the “Services”) through December 31, 2013, which Services may be terminated by either GKK Stars or KBS at any time on 90 days prior written notice, subject to certain additional termination rights and restrictions. GKK Stars and KBS agreed to negotiate a separate management services agreement to further outline the terms and conditions under which GKK Stars or one of its affiliates would continue to provide the Services for KBS. As of March 26, 2012, the terms of such an agreement had not yet been finalized, and there can be no assurance that GKK Stars or one of its affiliates and KBS will ever consummate such an agreement. In the event KBS and GKK Stars or one of its affiliates are unable to consummate such an agreement by March 31, 2012, the terms for the provision of the Services under the Settlement Agreement may be terminated on June 30, 2012.
We depend on GKK Stars to efficiently conduct the management and operations of the GKK Properties. If the current agreement relating to the Services is terminated, or a new management services agreement between KBS and GKK Stars or one of its affiliates is not consummated, we would be required to obtain such management services for the GKK Properties from other sources, which sources may not have the experience or capabilities of GKK Stars or its affiliates. Additionally, as our advisor has limited experience operating bank branch properties, should GKK Stars or an affiliate cease managing the GKK Properties, our ability to efficiently and effectively manage the GKK Properties would be affected, and as a result, the value of our stockholders’ investment could decline.
To the extent distributions exceed current and accumulated earnings and profits, a stockholder’s basis in our stock will be reduced and, to the extent distributions exceed a stockholder’s basis, the stockholder may recognize capital gain.
Our organizational documents permit us, to the extent permitted by Maryland law, to pay distributions from any source. If we fund distributions from financings or sources other than cash flow from operations, the overall return to our stockholders may be reduced. Our board of directors approved the suspension of monthly distribution payments in order to manage our reduced cash flows from operations and to redirect available funds to reduce our debt. Our primary concern is the repayment of our Amended Repurchase Agreements, but we expect to use available funds to repay other debt obligations as well. Reducing our debt will allow us to hold certain assets in our portfolio to improve their value and the returns to our stockholders. After repaying our Amended Repurchase Agreements and some of our other debt obligations through the suspension of monthly distribution payments and the sale of certain assets, we plan to make certain strategic asset sales and, from time to time, may declare special distributions to our stockholders that would be funded with the net proceeds from those asset sales or from cash flow from other sources. To the extent distributions in excess of current and accumulated earnings and profits (i) do not exceed a stockholder’s adjusted basis in our stock, such distributions will not be taxable to a stockholder, but rather a stockholder’s adjusted basis in our stock will be reduced; and, (ii) exceed a stockholder’s adjusted basis in our stock, such distributions will be included in income as long-term capital gain if the stockholder has held its shares for more than one year and otherwise as short-term capital gain.
Pursuant to the Amended Repurchase Agreements, we agreed to restrict monthly cash distributions.
In connection with the Amended Repurchase Agreements, and except for distributions to stockholders necessary to maintain our REIT status, we agreed to limit distributions to stockholders to an amount not to exceed $6.0 million per month, excluding any distributions to stockholders reinvested in us pursuant to our dividend reinvestment plan. Because we have terminated our dividend reinvestment plan effective April 10, 2012, we are more restricted in the amount of distributions we may pay and still remain in compliance with the covenants in the Amended Repurchase Agreements. Further, we have modified our distribution strategy as described in the preceding risk factor. These restrictions of the Amended Repurchase Agreements will likely be in place until April 28, 2013.
Without the availability of funds from our dividend reinvestment plan offering, we will have to use a greater proportion of our cash flow from operations and asset sales to meet our general cash requirements.
We have terminated our dividend reinvestment plan effective April 10, 2012. The termination of dividend reinvestment plan was related to a modification to our distribution strategy. In an effort to manage our reduced cash flows from operations and to redirect available funds to reduce debt, we have suspended monthly distribution payments and amended and restated our share redemption program to provide only for redemptions sought upon a stockholder’s death, “qualifying disability” or “determination of incompetence” (each as defined in the share redemption program). We depended on the proceeds from our dividend reinvestment plan to provide funds for general corporate purposes, including our share redemption program; funds for capital expenditures on our real estate investments, tenant improvement costs and leasing costs related to our real estate investments; reserves required by financings of our real estate investments; and the repayment of debt. Without the availability of funds from our dividend reinvestment plan offering, we will have to use a greater proportion of our cash flow from operations and proceeds from asset sales to meet our general cash requirements.
We may not have sufficient liquidity to fund our future capital needs. If we are unable to repay indebtedness or to fund future contractual commitments or required capital expenditures on our real estate investments, lenders or tenants may take legal action against us, which could have a material adverse effect on us and our stockholders’ return.
We cannot be certain that our business will generate sufficient cash flow from operations or from the sales of some of our real estate assets, that we will be able to raise funds in the capital markets or that future financing or refinancing will be available to us in an amount sufficient, if at all, to enable to us to fund our liquidity needs. Our inability to repay indebtedness or to fund future contractual commitments or necessary capital expenditures on our real estate investments may cause lenders or tenants to take legal action against us, which could have a material adverse effect on us and our stockholders’ return.
Declining economic conditions have had and will likely continue to have a significant impact on our real estate and real estate-related investments. In addition, these conditions have impacted the businesses of our tenants as well as the tenants in buildings securing our real estate-related investments. As a result of a decline in cash flows and projected future declines, on March 20, 2012, our board of directors approved the suspension of monthly distribution payments in order to manage our reduced cash flows from operations and to redirect available funds to reduce our debt. Our primary concern is the repayment of our Amended Repurchase Agreements, but we expect to use available funds to repay other debt obligations as well. After repaying our Amended Repurchase Agreements and some of our other debt obligations through the suspension of monthly distribution payments and the sale of certain assets, we plan to make certain strategic asset sales and, from time to time, may declare special distributions to our stockholders that would be funded with the net proceeds from those asset sales or from cash flow from other sources.
Projected future declines in rental rates, slower or potentially negative net absorption of leasable space and expectations of future rental concessions, including free rent to renew tenants early, to retain tenants who are up for renewal or to sign new tenants, are expected to result in additional decreases in cash flows from our properties. As a result of these same factors, the borrowers under our real estate-related investments have experienced a reduction in cash flows that has made it difficult for them to pay us debt service in some instances. Additionally, these reduced and potentially decreasing cash flows have had a negative impact on the valuation of the collateral directly or indirectly securing our real estate-related investments and as a result the borrowers may not be able to refinance their debt to us or sell the collateral at a price sufficient to repay our note balances in full when they come due. Moreover, the terms of the Amended Repurchase Agreements provide that certain excess cash flows generated by our portfolio must be used for the repayment of the Amended Repurchase Agreements. Further, we depend on the cash flow from our real estate and real estate-related investments to meet the debt service obligations under our financing arrangements, and we will depend on the proceeds from the sale of real estate and proceeds from the repayment of our real estate-related investments in order to repay our outstanding debt obligations.
All of these factors could limit our liquidity and impact our ability to properly maintain or make improvements to our real estate investments. If we are unable to meet future funding commitments or fund required capital expenditures, our borrowers or tenants may take legal action against us. This, in turn, could result in reductions in the value of our investments and therefore a reduction in the value of an investment in us.
We may not generate sufficient operating cash flow on a quarterly basis to fund our operations, which would reduce the value of an investment in us.
As a result of general economic conditions over the last several years, our portfolio has experienced increasing pressure from declines in cash flow from a number of our investments. The most significant factor has been a decline in cash flow from our real estate-related investments. In particular, our investments in mezzanine and mortgage loans have been impacted as the operating performance and values of buildings directly or indirectly securing our investment positions have decreased from the date of our acquisition or origination of these investments. In such instances, the borrowers have not been able to refinance their debt to us or sell the collateral at a price sufficient to repay our note balances in full when they become due. In addition, current economic conditions have impacted the ability of some borrowers under our loans to make contractual interest payments to us. Economic conditions have also impacted our real estate investments, resulting in a decline in the occupancy of our portfolio, an important element to the continued growth of our portfolio, that has resulted in lower current cash flow. Tenant-specific issues, including bankruptcy and down-sizing, have placed downward pressure on our operating cash flow because these tenants have terminated their leases early, not renewed their leases or have not paid their contractual rent to us. Projected future declines in rental rates, slower or potentially negative net absorption of leased space and expectations of increases in future rental concessions, including three or more months of free rent to retain tenants who are up for renewal or to sign new tenants, are expected to result in additional decreases in cash flow. Moreover, asset sales in 2011 and expected future asset sales to meet our liquidity needs will result in further decreases in operating cash flow.
Due to these factors, we may not generate sufficient operating cash flow on a quarterly basis to cover our operations. Our projected cash flow from operations will not be sufficient to cover our capital expenditures, amortization payment requirements on our debt obligations and principal pay-down requirements for our debt obligations at maturity or to allow us to meet the conditions for extension of our loans, requiring us to sell assets in order to meet our capital requirements. If our cash flow from operations continues to deteriorate, we will be more dependent on asset sales to fund our operations and for our liquidity needs. Moreover, we may be unable to meet financial and operating covenants in our debt obligations, and our lenders may take action against us, including commencing foreclosure actions. If we are unable to meet future funding commitments or fund required capital expenditures, our borrowers or tenants may take legal action against us. This, in turn, could result in reductions in the value of our investments and therefore a reduction in the value of an investment in us. These factors could also have a material adverse effect on us and our stockholders’ return.
We presently have extremely limited additional borrowing capacity.
We currently do not have a corporate credit facility to draw against for liquidity purposes and substantially all of our assets are pledged as collateral for our secured borrowings. As a result, we must fund future contractual funding commitments and capital expenditures with existing liquidity, including unrestricted cash, or future liquidity resulting from asset sales. See also “—Risks Associated with Debt Financing — Lenders have required and may continue to require us to enter into restrictive covenants relating to our operations, which could limit our ability to make distributions to our stockholders.”
If we are unable to obtain funding for future capital needs, the value of our investments and our stockholders’ return could decline.
When tenants do not renew their leases or otherwise vacate their space, we will often need to expend substantial funds for improvements to the vacated space in order to attract replacement tenants. Even when tenants do renew their leases we may agree to make improvements to their space as part of our negotiations. If we need additional capital in the future to improve or maintain our properties or for any other reason, we may have to obtain funding from sources other than our cash flow from operations, such as borrowings, asset sales or future equity offerings. These sources of funding may not be available on attractive terms or at all. If we cannot procure additional funding for capital improvements, our investments may generate lower cash flows or decline in value, or both, which would reduce the value of our stockholders’ investment.
The loss of or the inability to obtain key real estate and debt finance professionals at our advisor could delay or hinder implementation of our investment management and disposition strategies, which could decrease the value of an investment in our shares.
Our success depends to a significant degree upon the contributions of Peter M. Bren, Keith D. Hall, Peter McMillan III, and Charles J. Schreiber, Jr., each of whom would be difficult to replace. Neither we nor our affiliates have employment agreements with Messrs. Bren, Hall, McMillan, or Schreiber. Messrs. Bren, Hall, McMillan, and Schreiber may not remain associated with us. If any of these persons were to cease their association with us, our operating results could suffer. We do not intend to maintain key person life insurance on any person. We believe that our future success depends, in large part, upon our advisor’s and its affiliates’ ability to attract and retain highly skilled managerial, operational and marketing professionals. Competition for such professionals is intense, and our advisor and its affiliates may be unsuccessful in attracting and retaining such skilled individuals. Further, we have established strategic relationships with firms that have special expertise in certain services or detailed knowledge regarding real properties in certain geographic regions. Maintaining such relationships will be important for us to effectively compete with other investors for tenants in such regions. We may be unsuccessful in establishing and retaining such relationships. If we lose or are unable to obtain the services of highly skilled professionals or do not establish or maintain appropriate strategic relationships, our ability to implement our investment management and disposition strategies could be delayed or hindered, and the value of our stockholders’ investments may decline.
Our rights and the rights of our stockholders to recover claims against our independent directors are limited, which could reduce our stockholders’ and our recovery against our independent directors if they negligently cause us to incur losses.
Maryland law provides that a director has no liability in that capacity if he performs his duties in good faith, in a manner he reasonably believes to be in our best interests and with the care that an ordinarily prudent person in a like position would use under similar circumstances. Our charter provides that no independent director shall be liable to us or our stockholders for monetary damages and that we will generally indemnify them for losses unless they are grossly negligent or engage in willful misconduct. As a result, our stockholders and we may have more limited rights against our independent directors than might otherwise exist under common law, which could reduce our stockholders’ and our recovery from these persons if they act in a negligent manner. In addition, we may be obligated to fund the defense costs incurred by our independent directors (as well as by our other directors, officers, employees (if we ever have employees) and agents) in some cases, which would decrease the return to our stockholders.
Risks Related to Conflicts of Interest
KBS Capital Advisors and its affiliates, including all of our executive officers and some of our directors and other key real estate and debt finance professionals, face conflicts of interest caused by their compensation arrangements with us and with other KBS-sponsored programs, which could result in actions that are not in the long-term best interests of our stockholders.
All of our executive officers and some of our directors and other key real estate and debt finance professionals are also officers, directors, managers, key professionals and/or holders of a direct or indirect controlling interest in our advisor, KBS Capital Markets Group LLC, our dealer manager, and other affiliated KBS entities. KBS Capital Advisors and its affiliates receive substantial fees from us. These fees could influence our advisor’s advice to us as well as the judgment of affiliates of KBS Capital Advisors. Among other matters, these compensation arrangements could affect their judgment with respect to:
| |
| • | the continuation, renewal or enforcement of our agreements with KBS Capital Advisors and its affiliates, including the advisory agreement; |
| |
| • | public offerings of equity by us, which would entitle our dealer manager to dealer-manager fees and would likely entitle KBS Capital Advisors to increased acquisition and asset-management fees; |
| |
| • | sales of properties and other investments, which entitle KBS Capital Advisors to disposition fees and possible subordinated incentive fees; |
| |
| • | whether and when we seek to list our common stock on a national securities exchange, which listing (i) may make it more likely for us to become self-managed or internalize our management or (ii) could entitle our advisor to a subordinated incentive listing fee, and which could also adversely affect the sales efforts for other KBS-sponsored programs, depending on the price at which our shares trade; |
| |
| • | whether we seek stockholder approval to become self-managed or internalize our management, which may entail (i) acquiring entities from our sponsors or advisor at a price resulting in substantial compensation to them and/or (ii) acquiring assets (such as office space, furnishings and technology costs) and negotiating compensation for real estate, debt finance, management and accounting professionals at our advisor and its affiliates that may result in these individuals receiving more compensation from us than they currently receive from our advisor and its affiliates; and |
| |
| • | whether and when we seek to sell the company or its assets, which sale could entitle KBS Capital Advisors to a subordinated incentive fee. |
The fees our advisor receives in connection with the management of our assets are based on the cost of the investment, and not based on the quality of the investment or the quality of the services rendered to us. This may influence our advisor to recommend riskier transactions to us.
KBS Capital Advisors faces conflicts of interest relating to the leasing of properties and such conflicts may not be resolved in our favor, meaning that we may obtain less creditworthy or desirable tenants, which could reduce our stockholders’ overall investment return.
We and other KBS-sponsored programs and KBS-advised investors rely on the same group of key real estate professionals at our advisor, including Messrs. Bren, Hall, McMillan, Schreiber, to supervise the property management and leasing of properties. If the KBS team of real estate professionals directs creditworthy prospective tenants to properties owned by another KBS-sponsored program or KBS-advised investor when they could direct such tenants to our properties, our tenant base may have more inherent risk and our properties’ occupancy may be lower than might otherwise be the case.
Our sponsors, our officers, our advisor and the real estate, debt finance, management and accounting professionals assembled by our advisor face competing demands on their time and this may cause our operations and our stockholders’ investment to suffer.
We rely on our sponsors, our officers, our advisor and the real estate, debt finance, management and accounting professionals our advisor retains, including Messrs. Bren, Hall, McMillan, Schreiber and David E. Snyder and Ms. Stacie K. Yamane, to provide services to us for the day-to-day operation of our business. KBS Real Estate Investment Trust II, Inc. (“KBS REIT II”), KBS Strategic Opportunity REIT, Inc. (“KBS Strategic Opportunity REIT”), KBS Legacy Partners Apartment REIT, Inc. (“KBS Legacy Partners Apartment REIT”) and KBS Real Estate Investment Trust III, Inc. (“KBS REIT III”) are also advised by KBS Capital Advisors and rely on our sponsors and many of the same real estate, debt finance, management and accounting professionals, as will future public KBS-sponsored programs. Further, our officers and directors are also officers and/or directors of some or all of the other public KBS-sponsored programs. Messrs. Bren, Hall, McMillan, Schreiber and Snyder and Ms. Yamane are also executive officers of KBS REIT II and KBS REIT III. Messrs. Hall, McMillan and Snyder and Ms. Yamane are executive officers of KBS Strategic Opportunity REIT, and Messrs. Bren, McMillan and Snyder and Ms. Yamane are executive officers of KBS Legacy Partners Apartment REIT. In addition, Messrs. Bren and Schreiber and Ms. Yamane are executive officers of KBS Realty Advisors and its affiliates, the advisors of the private KBS-sponsored programs and the investment advisors to institutional investors in real estate and real estate-related assets. As a result of their interests in other KBS programs, their obligations to other investors and the fact that they engage in and will continue to engage in other business activities, on behalf of themselves and others, Messrs. Bren, Hall, McMillan, Schreiber and Snyder and Ms. Yamane face conflicts of interest in allocating their time among us, KBS REIT II, KBS Strategic Opportunity REIT, KBS Legacy Partners Apartment REIT, KBS REIT III, KBS Capital Advisors and other KBS-sponsored programs, as well as other business activities in which they are involved. In addition, our advisor and KBS Realty Advisors and their affiliates share many of the key same real estate, management and accounting professionals. During times of intense activity in other programs and ventures, these individuals may devote less time and fewer resources to our business than are necessary or appropriate to manage our business. Furthermore, some or all of these individuals may become employees of another KBS-sponsored program in an internalization transaction or, if we internalize our advisor, may not become our employees as a result of their relationship with other KBS-sponsored programs. If these events occur, the returns on our investments and the value of our stockholders’ investment may decline.
All of our executive officers and some of our directors and the key real estate and debt finance professionals assembled by our advisor face conflicts of interest related to their positions and/or interests in KBS Capital Advisors and its affiliates, which could hinder our ability to implement our business strategy and to generate returns to our stockholders.
All of our executive officers and some of our directors and the key real estate and debt finance professionals assembled by our advisor are also executive officers, directors, managers, key professionals and/or holders of a direct or indirect controlling interest in our advisor and other affiliated KBS entities. Through KBS-affiliated entities, some of these persons also serve as the investment advisors to institutional investors in real estate and real estate-related assets and through KBS Capital Advisors and KBS Realty Advisors these persons serve as the advisor to other KBS programs, including KBS REIT II, KBS Strategic Opportunity REIT, KBS Legacy Partners Apartment REIT and KBS REIT III. As a result, they owe fiduciary duties to each of these entities, their members and limited partners and their investors, which fiduciary duties may from time to time conflict with the fiduciary duties that they owe to us and our stockholders. Their loyalties to these other entities and investors could result in action or inaction that is detrimental to our business, which could harm the implementation of our business strategy and our leasing opportunities. Further, Messrs. Bren, Hall, McMillan and Schreiber and existing and future KBS-sponsored programs and KBS-advised investors are not prohibited from engaging, directly or indirectly, in any business or from possessing interests in any other business venture or ventures, including businesses and ventures involved in the acquisition, development, ownership, leasing or sale of real estate investments. Messrs. Bren, Hall, McMillan and Schreiber have agreed to restrictions with respect to sponsoring another multi-family REIT while the KBS Legacy Partners Apartment REIT offering is ongoing. If we do not successfully implement our business strategy, we may be unable to maintain or increase the value of our assets, which would reduce the returns to our stockholders.
Our board of directors’ loyalties to KBS REIT II, KBS REIT III, KBS Strategic Opportunity REIT and possibly to future KBS-sponsored programs could influence its judgment, resulting in actions that may not be in our stockholders’ best interest or that result in a disproportionate benefit to another KBS-sponsored program at our expense.
All of our directors are also directors of KBS REIT II and KBS REIT III. One of our directors is also a director of KBS Strategic Opportunity REIT. The loyalties of our directors serving on the boards of KBS REIT II, KBS REIT III and KBS Strategic Opportunity REIT, or possibly on the boards of future KBS-sponsored programs, may influence the judgment of our board of directors when considering issues for us that also may affect other KBS-sponsored programs, such as the following:
| |
| • | We could enter into transactions with other KBS-sponsored programs, such as property sales or financing arrangements. Such transactions might entitle our advisor or its affiliates to fees and other compensation from both parties to the transaction. For example, property sales to other KBS-sponsored programs might entitle our advisor or its affiliates to acquisition fees in connection with its services to the purchaser in addition to disposition and other fees that we might pay to our advisor in connection with such transaction. Decisions of our board or the conflicts committee regarding the terms of those transactions may be influenced by our board’s or committee’s loyalties to such other KBS-sponsored programs. |
| |
| • | A decision of our board or the conflicts committee regarding the timing of a debt or equity offering could be influenced by concerns that the offering would compete with an offering of other KBS-sponsored programs. |
| |
| • | A decision of our board or the conflicts committee regarding the timing of property sales could be influenced by concerns that the sales would compete with those of other KBS-sponsored programs. |
| |
| • | A decision of our board or the conflicts committee regarding whether or when we seek to list our common stock on a national securities exchange could be influenced by concerns that such listing could adversely affect the sales efforts of other KBS-sponsored programs, depending on the price at which our shares trade. |
Because our independent directors are also independent directors of KBS REIT II and KBS REIT III, they receive compensation for service on the board of directors of KBS REIT II and KBS REIT III. Like us, KBS REIT II and KBS REIT III pay each independent director an annual retainer of $40,000 as well as compensation for attending meetings as follows: (i) $2,500 for each board meeting attended, (ii) $2,500 for each committee meeting attended (except that the committee chairman is paid $3,000 for each meeting attended), (iii) $2,000 for each teleconference board meeting attended, and (iv) $2,000 for each teleconference committee meeting attended (except that the committee chairman is paid $3,000 for each teleconference committee meeting attended). In addition, KBS REIT II and KBS REIT III reimburse directors for reasonable out-of-pocket expenses incurred in connection with attendance at meetings of the board of directors.
Risks Related to Our Corporate Structure
Our charter limits the number of shares a person may own, which may discourage a takeover that could otherwise result in a premium price to our stockholders.
Our charter, with certain exceptions, authorizes our directors to take such actions as are necessary and desirable to preserve our qualification as a REIT. To help us comply with the REIT ownership requirements of the Internal Revenue Code, our charter prohibits a person from directly or constructively owning more than 9.8% of our outstanding shares, unless exempted by our board of directors. This restriction may have the effect of delaying, deferring or preventing a change in control of us, including an extraordinary transaction (such as a merger, tender offer or sale of all or substantially all of our assets) that might provide a premium price for holders of our common stock.
Our charter permits our board of directors to issue stock with terms that may subordinate the rights of our common stockholders or discourage a third party from acquiring us in a manner that could result in a premium price to our stockholders.
Our board of directors may classify or reclassify any unissued common stock or preferred stock and establish the preferences, conversion or other rights, voting powers, restrictions, limitations as to dividends and other distributions, qualifications and terms or conditions of redemption of any such stock. Thus, our board of directors could authorize the issuance of preferred stock with priority as to distributions and amounts payable upon liquidation over the rights of the holders of our common stock. Such preferred stock could also have the effect of delaying, deferring or preventing a change in control of us, including an extraordinary transaction (such as a merger, tender offer or sale of all or substantially all of our assets) that might provide a premium price to holders of our common stock.
Our stockholders’ investment return may be reduced if we are required to register as an investment company under the Investment Company Act; if we or our subsidiaries become an unregistered investment company, we could not continue our business.
Neither we nor any of our subsidiaries intend to register as investment companies under the Investment Company Act. If we or our subsidiaries were obligated to register as investment companies, we would have to comply with a variety of substantive requirements under the Investment Company Act that impose, among other things:
| |
| • | limitations on capital structure; |
| |
| • | restrictions on specified investments; |
| |
| • | prohibitions on transactions with affiliates; and |
| |
| • | compliance with reporting, record keeping, voting, proxy disclosure and other rules and regulations that would significantly increase our operating expenses. |
Under the relevant provisions of Section 3(a)(1) of the Investment Company Act, an investment company is any issuer that:
| |
| • | is or holds itself out as being engaged primarily, or proposes to engage primarily, in the business of investing, reinvesting or trading in securities (the “primarily engaged test”); or |
| |
| • | is engaged or proposes to engage in the business of investing, reinvesting, owning, holding or trading in securities and owns or proposes to acquire “investment securities” having a value exceeding 40% of the value of such issuer’s total assets (exclusive of U.S. government securities and cash items) on an unconsolidated basis (the “40% test”). “Investment securities” excludes U.S. government securities and securities of majority-owned subsidiaries that are not themselves investment companies and are not relying on the exception from the definition of investment company under Section 3(c)(1) or Section 3(c)(7) (relating to private investment companies). |
We believe that we and our Operating Partnership satisfy both tests above. With respect to the 40% test, most of the entities through which we and our Operating Partnership own our assets are majority-owned subsidiaries that are not themselves investment companies and are not relying on the exceptions from the definition of investment company under Section 3(c)(1) or Section 3(c)(7).
With respect to the primarily engaged test, we and our Operating Partnership are holding companies. Through the majority-owned subsidiaries of our Operating Partnership, we and our Operating Partnership are primarily engaged in the non-investment company businesses of these subsidiaries.
We believe that most of the subsidiaries of our Operating Partnership may rely on Section 3(c)(5)(C) of the Investment Company Act for an exception from the definition of an investment company. (Any other subsidiaries of our Operating Partnership should be able to rely on the exceptions for private investment companies pursuant to Section 3(c)(1) and Section 3(c)(7) of the Investment Company Act.) As reflected in no-action letters, the SEC staff’s position on Section 3(c)(5)(C) generally requires that an issuer maintain at least 55% of its assets in “mortgages and other liens on and interests in real estate,” or qualifying assets; at least 80% of its assets in qualifying assets plus real estate-related assets; and no more than 20% of the value of its assets in other than qualifying assets and real estate-related assets, which we refer to as miscellaneous assets. To constitute a qualifying asset under this 55% requirement, a real estate interest must meet various criteria based on no-action letters.
If, however, the value of the subsidiaries of our Operating Partnership that must rely on Section 3(c)(1) or Section 3(c)(7) is greater than 40% of the value of the assets of our Operating Partnership, then we and our Operating Partnership may seek to rely on the exception from registration under Section 3(c)(6) if we and our Operating Partnership are “primarily engaged,” through majority-owned subsidiaries, in the business of purchasing or otherwise acquiring mortgages and other interests in real estate. The SEC staff has issued little interpretive guidance with respect to Section 3(c)(6); however, it is our view that we and our Operating Partnership may rely on Section 3(c)(6) if 55% of the assets of our Operating Partnership consist of, and at least 55% of the income of our Operating Partnership is derived from, majority-owned subsidiaries that rely on Section 3(c)(5)(C).
To maintain compliance with the Investment Company Act, our subsidiaries may be unable to sell assets we would otherwise want them to sell and may need to sell assets we would otherwise wish them to retain. In addition, our subsidiaries may have to acquire additional assets that they might not otherwise have acquired or may have to forego opportunities to make investments that we would otherwise want them to make and would be important to our investment strategy. Moreover, the SEC may issue interpretations with respect to various types of assets that are contrary to our views and current SEC staff interpretations are subject to change, which increases the risk of non-compliance and the risk that we may be forced to make adverse changes to our portfolio. If we were required to register as an investment company but failed to do so, we would be prohibited from engaging in our business and criminal and civil actions could be brought against us. In addition, our contracts would be unenforceable unless a court required enforcement and a court could appoint a receiver to take control of us and liquidate our business.
Rapid changes in the values of our assets may make it more difficult for us to maintain our qualification as a REIT or our exception from the definition of an investment company under the Investment Company Act.
If the market value or income potential of our qualifying real estate assets changes as compared to the market value or income potential of our non-qualifying assets, or if the market value or income potential of our assets that are considered “real estate-related assets” under the Investment Company Act or REIT qualification tests changes as compared to the market value or income potential of our assets that are not considered “real estate-related assets” under the Investment Company Act or REIT qualification tests, whether as a result of increased interest rates, prepayment rates or other factors, we may need to modify our investment portfolio in order to maintain our REIT qualification or exception from the definition of an investment company. If the decline in asset values or income occurs quickly, this may be especially difficult, if not impossible, to accomplish. This difficulty may be exacerbated by the illiquid nature of many of the assets that we may own. We may have to make investment decisions that we otherwise would not make absent REIT and Investment Company Act considerations.
Our stockholders will have limited control over changes in our policies and operations, which increases the uncertainty and risks our stockholders face.
Our board of directors determines our major policies, including our policies regarding financing, growth, debt capitalization, REIT qualification and distributions. Our board of directors may amend or revise these and other policies without a vote of the stockholders. Under Maryland General Corporation Law and our charter, our stockholders have a right to vote only on limited matters. Our board’s broad discretion in setting policies and our stockholders’ inability to exert control over those policies increases the uncertainty and risks our stockholders face.
We have not had funds available for ordinary redemptions under our share redemption program since the April 2009 redemption date, and we have amended and restated our share redemption program to provide only for redemptions sought upon a stockholder’s death, “qualifying disability” or “determination of incompetence.” We currently do not expect to have funds available to resume ordinary redemptions in the future.
We have not had funds available for ordinary redemptions since the April 2009 redemption date, and we have amended and restated our share redemption program to provide only for redemptions sought upon a stockholder’s death, “qualifying disability” or “determination of incompetence” (each as defined in the share redemption program). Such redemptions are subject to an annual dollar limitation, which shall be $10.0 million in the aggregate for the calendar year 2012 (subject to review and adjustment during the year by the board of directors), and further subject to the limitations described in the share redemption program plan document. Based on historical redemption activity, we believe the $10.0 million redemption limitation for the calendar year 2012 will be sufficient for these special redemptions. During each calendar year, the annual dollar limitation for the share redemption program will be reviewed and adjusted from time to time. We currently do not expect to have funds available to resume ordinary redemptions in the future. Therefore, until further notice, and except with respect to redemptions sought upon a stockholder’s death, “qualifying disability” or “determination of incompetence,” stockholders will not be able to sell any of their shares back to us pursuant to our share redemption program. Even if resumed, our share redemption program includes numerous restrictions that would limit a stockholder’s ability to sell his or her shares. Further, we have no obligation to redeem shares if the redemption would violate the restrictions on distributions under Maryland law, which prohibits distributions that would cause a corporation to fail to meet statutory tests of solvency. Our board may amend, suspend or terminate our share redemption program upon 30 days’ notice.
Further, pursuant to the terms of the Amended Repurchase Agreements and during the terms thereof, we must continue to limit redemptions under our share redemption program to those sought upon a stockholder’s death, “qualifying disability” or “determination of incompetence.” The Amended Repurchase Agreements will terminate on the earliest to occur of (i) April 28, 2013; (ii) the date that the Amended Repurchase Agreements convert into mezzanine loans (which would likely contain substantially similar terms as the Amended Repurchase Agreements, including with respect to our share redemption program restrictions); (iii) the date that all obligations under the Amended Repurchase Agreements are fully paid; or (iv) upon an event causing the Amended Repurchase Agreements to otherwise terminate.
Pursuant to our share redemption program, once we have established an estimated value per share of our common stock, the redemption price per share for eligible redemptions is equal to the estimated value per share. On March 22, 2012, our board of directors approved an estimated value per share of our common stock of $5.16 based on the estimated value of our assets less the estimated value of our liabilities divided by the number of shares outstanding, all as of December 31, 2011. Therefore, effective commencing with the March 30, 2012 redemption date, the redemption price for all shares eligible for redemption is $5.16 per share. For a full description of the methodologies used to value our assets and liabilities in connection with the calculation of the estimated value per share, see Part II, Item 5, “Market for Registrant’s Common Equity, Related Stockholder Matters and Issuer Purchases of Equity Securities — Market Information.” The value of our shares will fluctuate over time in response to developments related to individual assets in the portfolio and in response to fluctuations in the real estate and finance markets. We currently expect to update our estimated value per share in December 2012, at which time the redemption price per share would also change. If stockholders are able to sell their shares under the share redemption program, they may not recover the amount of their investment in us.
The estimated value per share of our common stock may not reflect the value that stockholders will receive for their investment.
On March 22, 2012, our board of directors approved an estimated value per share of our common stock of $5.16 based on the estimated value of our assets less the estimated value of our liabilities divided by the number of shares outstanding, all as of December 31, 2011. We provided this estimated value per share to assist broker-dealers that participated in our initial public offering in meeting their customer account statement reporting obligations under National Association of Securities Dealers Rule 2340. The estimated value per share was based upon the recommendation and valuation provided by our advisor.
The Financial Industry Regulatory Authority (“FINRA”) rules provide no guidance on the methodology an issuer must use to determine its estimated value per share. As with any valuation methodology, our advisor’s methodology is based upon a number of estimates and assumptions that may not be accurate or complete. Different parties with different assumptions and estimates could derive a different estimated value per share, and these differences could be significant. The estimated value per share is not audited and does not represent the fair value of our assets or liabilities according to GAAP.
Accordingly, with respect to the estimated value per share, we can give no assurance that:
| |
| • | a stockholder would be able to resell his or her shares at this estimated value; |
| |
| • | a stockholder would ultimately realize distributions per share equal to our estimated value per share upon liquidation of our assets and settlement of our liabilities or a sale of the company; |
| |
| • | our shares of common stock would trade at the estimated value per share on a national securities exchange; |
| |
| • | an independent third-party appraiser or other third-party valuation firm would agree with our estimated value per share; or |
| |
| • | the methodology used to estimate our value per share would or would not be acceptable to FINRA or for compliance with ERISA reporting requirements. |
Further, the value of our shares will fluctuate over time in response to developments related to individual assets in our portfolio and the management of those assets and in response to fluctuations in the real estate and finance markets. For a full description of the methodologies used to value our assets and liabilities in connection with the calculation of the estimated value per share, see Part II, Item 5, “Market for Registrant’s Common Equity, Related Stockholder Matters and Issuer Purchases of Equity Securities — Market Information.”
We currently expect to engage our advisor and/or an independent valuation firm to update the estimated value per share in December 2012, but we are not required to update the estimated value per share more frequently than every 18 months.
Our stockholders’ interest in us will be diluted if we issue additional shares, which could reduce the overall value of their investment.
Our common stockholders do not have preemptive rights to any shares we issue in the future. Our charter authorizes us to issue 1,010,000,000 shares of capital stock, of which 1,000,000,000 shares are designated as common stock and 10,000,000 shares are designated as preferred stock. Our board of directors may increase the number of authorized shares of capital stock without stockholder approval. Our board may elect to (i) sell additional shares in future public offerings, (ii) issue equity interests in private offerings, or (iii) issue shares to our advisor, or its successors or assigns, in payment of an outstanding obligation. To the extent we issue additional equity interests, our stockholders’ percentage ownership interest in us will be diluted. In addition, depending upon the terms, the use of proceeds and pricing of any additional offerings and the value of our real estate investments, our stockholders may also experience dilution in the book value and fair value of their shares.
Payment of fees to KBS Capital Advisors and its affiliates increases the risk that our stockholders will not be able to recover the amount of their investment in our shares.
KBS Capital Advisors and its affiliates performed services for us in connection with the selection and acquisition or origination of our investments and continue to perform services for us in connection with the management, leasing and disposition of our properties and the management, structuring and administration of our other investments. We pay them substantial fees for these services, which results in immediate dilution to the value of our stockholders’ investment and reduces the amount of cash available for our stockholders’ return.
We may also pay significant fees during our listing/liquidation stage. Although some of the fees expected to be paid during our listing/liquidation stage are contingent on our stockholders first receiving agreed-upon investment returns, affiliates of KBS Capital Advisors could also receive significant payments even without our reaching the investment-return thresholds should we ever seek to become self-managed. Due to the apparent preference of the public markets for self-managed companies, a decision to list our shares on a national securities exchange might be preceded by a decision to become self-managed. Given our advisor’s familiarity with our assets and operations, if our board of directors ever did decide that we should become self-managed, then we may prefer to become self-managed by acquiring entities affiliated with our advisor. Such an internalization transaction could result in significant payments to affiliates of our advisor irrespective of whether our stockholders enjoyed the returns on which we have conditioned other incentive compensation.
Therefore, these fees increase the risk that the amount available for distribution to common stockholders upon a liquidation of our portfolio would be less than stockholders paid for our shares. These substantial fees and other payments also increase the risk that our stockholders will not be able to resell their shares at a profit, even if our shares are listed on a national securities exchange.
Our stockholders may be more likely to sustain a loss on their investment because our sponsors do not have as strong an economic incentive to avoid losses as do sponsors who have made significant equity investments in their companies.
Our sponsors have only invested $200,000 in us through the purchase of 20,000 shares of our common stock at $10 per share. Our sponsors will have little exposure to loss in the value of our shares. Without this exposure, our stockholders may be at a greater risk of loss because our sponsors do not have as much to lose from a decrease in the value of our shares as do those sponsors who make more significant equity investments in their companies.
General Risks Related to Investments in Real Estate
Economic and regulatory changes that impact the real estate market generally may decrease the value of our investments and weaken our operating results.
Our operating results and the performance of our properties are subject to the risks typically associated with real estate, any of which could decrease the value of our investments and could weaken our operating results, including:
| |
| • | downturns in national, regional and local economic conditions; |
| |
| • | competition from other office and industrial buildings; |
| |
| • | adverse local conditions, such as oversupply or reduction in demand for office and industrial buildings and changes in real estate zoning laws that may reduce the desirability of real estate in an area; |
| |
| • | vacancies, changes in market rental rates and the need to periodically repair, renovate and re‑let space; |
| |
| • | changes in the supply of or the demand for similar or competing properties in an area; |
| |
| • | changes in interest rates and the availability of permanent mortgage financing, which may render the sale of a property or loan difficult or unattractive; |
| |
| • | changes in tax laws (including real property and personal tax laws), real estate, environmental and zoning laws; |
| |
| • | natural disasters such as hurricanes, earthquakes and floods; |
| |
| • | acts of war or terrorism, including the consequences of terrorist attacks, such as those that occurred on September 11, 2001; |
| |
| • | the potential for uninsured or underinsured property losses; and |
| |
| • | periods of high interest rates and tight money supply. |
Any of the above factors, or a combination thereof, could result in a decrease in our cash flows from operations and a decrease in the value of our investments, which would have an adverse effect on our operations and on the value of our stockholders’ investment.
Since the acquisition of our real estate and real estate-related investments, downturns in national and regional and local economic conditions have impacted our properties’ operating performance and the operating performance of properties securing our real estate-related investments, which will reduce the overall return to our stockholders.
Since breaking escrow in July 2006, we have made acquisitions of real estate and real estate-related assets based on an underwriting analysis with respect to each asset and how the asset fits into our portfolio. In particular, our investments in mezzanine and mortgage loans have been impacted as the operating performance and values of buildings directly or indirectly securing our investment positions have decreased from the date of our acquisition or origination of these investments. In such instances, some of the borrowers have not been able to refinance their debt to us or sell the collateral at a price sufficient to repay our note balances in full when they become due. In addition, current economic conditions have impacted the ability of some borrowers under our loans to make contractual interest payments to us. Economic conditions have also impacted our real estate investments resulting in a decline in the occupancy of our portfolio, an important element to the continued growth of our portfolio, that has resulted in lower current cash flow. Tenant-specific issues, including bankruptcy and down-sizing, have placed downward pressure on our operating cash flow because these tenants have terminated their leases early, not renewed their leases or have not paid their contractual rent to us. Projected future declines in rental rates, slower or potentially negative net absorption of leased space and expectations of increases in future rental concessions, including three or more months of free rent to retain tenants who are up for renewal or to sign new tenants, are expected to result in additional decreases in cash flow. Our stockholders’ overall return will be reduced as a result of these factors.
Because of the concentration of a significant portion of our assets in North Carolina, any adverse economic, real estate or business conditions in North Carolina could affect our operating results and our ability to make distributions to our stockholders.
As of December 31, 2011, our net investments in real estate in North Carolina represented 10.9% of our total assets. As a result, the geographic concentration of our portfolio makes it particularly susceptible to adverse economic developments in North Carolina’s real estate market. Any adverse economic or real estate developments in this market, such as business layoffs or downsizing, industry slowdowns, relocations of businesses, changing demographics and other factors, or any decrease in demand for office space or resulting from the local business climate, could adversely affect our operating results.
Properties that have significant vacancies could be difficult to sell, which could diminish the return on these properties and adversely affect our cash flow and our stockholders’ overall return.
A property may incur vacancies either by the expiration and non-renewal of tenant leases or the continued default of tenants under their leases. If vacancies continue for a long period of time, we may suffer reduced revenues resulting in less cash available to distribute to stockholders. In addition, the resale value of the property could be diminished because the market value of a particular property depends principally upon the value of the cash flow generated by the leases associated with that property. Such a reduction in the resale value of a property could also reduce the value of our stockholders’ investment. As of December 31, 2011, our portfolio, consisted of approximately 24.4 million rentable square feet, was 85% occupied and our bad debt reserve for our properties was approximately 2% of annualized base rent. Included among these properties are 107 properties containing 4.0 million rentable square feet that were less than 70% occupied. As of December 31, 2011, and excluding real estate held for sale, 23 of our properties were 100% vacant.
As a result of the recent decline in general economic conditions, the U.S. commercial real estate industry has been experiencing deteriorating fundamentals across all major property types and in most geographic markets, including most major metropolitan markets. In general, tenant defaults are on the rise, rental rates are falling and demand for commercial real estate space in most markets is still contracting. These trends have created a highly competitive leasing environment that has resulted in downward pressure on both occupancy and rental rates, resulting in leasing incentives becoming more common. These trends may result in reduced revenue and lower resale value of properties, which may reduce our stockholders’ return.
We depend on tenants for our revenue and, accordingly, our revenue and our ability to make distributions to our stockholders is dependent upon the success and economic viability of our tenants and our ability to retain and attract tenants. Non-renewals, terminations or lease defaults could reduce our net income and reduce our stockholders’ overall return.
The success of our investments materially depends upon the financial stability of the tenants leasing the properties we own. The inability of a single major tenant or a significant number of smaller tenants to meet their rental obligations would lower our net income. A non-renewal after the expiration of a lease term, a termination, or default by a tenant on its lease payments to us would cause us to lose the revenue associated with such lease and require us to find an alternative source of revenue to meet mortgage payments and prevent a foreclosure if the property is subject to a mortgage. In the event of a tenant default or bankruptcy, we may experience delays in enforcing our rights as landlord of a property and may incur substantial costs in protecting our investment and re-letting the property. Tenants may have the right to terminate their leases upon the occurrence of certain customary events of default and, in other circumstances, may not renew their leases or, because of market conditions, may only be able to renew their leases on terms that are less favorable to us than the terms of their initial leases. When tenants exercise early termination rights, our cash flow and earnings will be adversely affected to the extent that we are unable to generate an equivalent amount of net rental income by leasing the vacated space to new third party tenants. Certain leases to tenants of the GKK Properties permit such tenants to terminate their leases, in whole or in part, prior to their stated lease expiration dates, frequently with little or no termination fee being paid to us.
Further, some of our properties may be outfitted to suit the particular needs of the tenants. We may have difficulty replacing the tenants of these properties if the outfitted space limits the types of businesses that could lease that space without major renovation. If a tenant does not renew, terminates or defaults on a lease, we may be unable to lease the property for the rent previously received or sell the property without incurring a loss as described above. See also “ — General Risks Related to Investments in Real Estate — Bank branches are specialty-use properties and therefore may be more difficult to lease or sell to non-banks.”
The bankruptcy or insolvency of our tenants or delays by our tenants in making rental payments could seriously harm our operating results and financial condition.
Any bankruptcy filings by or relating to any of our tenants could bar us from collecting pre-bankruptcy debts from that tenant, unless we receive an order permitting us to do so from the bankruptcy court. A tenant bankruptcy could delay our efforts to collect past due balances under the relevant leases, and could ultimately preclude full collection of these sums. If a lease is rejected by a tenant in bankruptcy, we would have only a general unsecured claim for damages. Any unsecured claim we hold against a bankrupt entity may be paid only to the extent that funds are available and only in the same percentage as is paid to all other holders of unsecured claims. We may recover substantially less than the full value of any unsecured claims, which would harm our financial condition.
Many tenants in the GKK Properties are banks that are not eligible to be debtors under the federal bankruptcy code, but would be subject to the liquidation and insolvency provisions of applicable banking laws and regulations. If the FDIC were appointed as receiver of a banking tenant because of that tenant’s insolvency, we would become an unsecured creditor of the tenant and only be entitled to share with the other unsecured non-depositor creditors in the tenant’s assets on an equal basis after payment to the depositors of their claims. The FDIC has broad powers to reject any contract (including a lease) of a failed depository institution that the FDIC deems burdensome if the FDIC determines that such rejection is necessary to promise the orderly administration of the institution’s affairs. By federal statute, a landlord under a lease rejected by the FDIC is not entitled to claim any damages with respect to the disaffirmation, other than rent through the effective date of the disaffirmation. The amount paid on claims in respect of the lease would depend on, among other factors, the amount of assets of the insolvent tenant available for unsecured claims. We may recover substantially less than the full value of any unsecured claims, which could have a material adverse effect on our operating results and financial condition, as well as the returns to our stockholders.
The GKK Properties were transferred to us on an “as is” basis and, therefore, the value of the GKK Properties may decline if we subsequently discover problems with them.
Since, under the Settlement Agreement, we indirectly took title to or, with respect to a limited number of GKK Properties, indirectly took a leasehold interest in, the GKK Properties, the GKK Properties were transferred to us on an “as is” basis. We were not able to inspect the GKK Properties or conduct standard due diligence on certain of the GKK Properties before the Transfers. We did not receive representations, warranties and indemnities relating to the GKK Properties from Gramercy and/or its affiliates and, in certain cases, pursuant to the terms of the Settlement Agreement, certain of our indirect wholly-owned subsidiaries are required to indemnify Gramercy and/or its affiliates for certain matters, including environmental matters, in connection with the Transfer of such GKK Properties. If we discover issues or problems related to the physical condition of a GKK Property, zoning, compliance with ordinances and regulations or other significant problems with a GKK Property, we will have no recourse against Gramercy and its affiliates and the value of the GKK Property may be less than our estimated value of the GKK Property. We may incur substantial costs in remediating or repairing a GKK Property or in ensuring its compliance with governmental regulations. If we choose to and are able to make such capital expenditures, they would reduce returns to our stockholders. In addition, we may be unable to rent these GKK Properties on terms favorable to us, or at all, which could also reduce the returns to our stockholders.
Bank branches are specialty-use properties and therefore may be more difficult to lease or sell to non-banks.
Some of the GKK Properties are vacant and some of the bank branch tenants in these GKK Properties may not renew their leases or may terminate them before their expiration. Bank branches are specialty-use properties that are outfitted with vaults, teller counters and other customary installations and equipment specific to bank branches that require significant capital expenditures. Our revenue from and the value of these bank branches may be affected by a number of factors, including:
| |
| • | demand from financial institutions to lease or purchase properties that are configured to operate as bank branches; |
| |
| • | the requirements by non-banking institutions for us to make significant capital expenditures to modify these specialty-use GKK Properties to suit their needs before these institutions will lease or purchase such GKK Properties; |
| |
| • | a downturn in the banking industry generally and, in particular, among smaller community banks; |
| |
| • | tenants exercising shedding rights; |
| |
| • | bank branches with unfavorable lease terms; and |
| |
| • | mergers among financial institutions resulting in the consolidation of properties and a reduction in the number of bank branches or other facilities needed by such institutions. |
Further, if financial institutions do not increase the number of bank branches they operate, do not find the locations of our bank branches desirable, do not renew or extend their leases of our bank branches, or if they elect to make capital expenditures to materially modify other, non-bank branch properties rather than pay higher lease or acquisition prices for those of our GKK Properties that already are configured as bank branches, then our operating results and financial condition, as well as the returns to our stockholders, may suffer. Additionally, the sale or lease of these GKK Properties to entities other than financial institutions may be difficult due to the added cost and time of refitting the GKK Properties, which we do not expect to undertake.
Certain of the GKK Properties, including some bank branches, are located in unattractive locations and are properties that we otherwise would not have elected to add to our portfolio, which could have an adverse effect on our operating results and financial condition, as well as the returns to our stockholders.
Certain of the GKK Properties are surplus bank branches that certain financial institutions owned before they were sold to Gramercy or were subsequently vacated by the financial institution. Were we not required to accept these properties as part of the Settlement Agreement, we otherwise likely would not have elected to add these GKK Properties to our portfolio. The characteristics of these bank branches, including the following, may make it difficult for us to lease or sell these GKK Properties and could have an adverse effect on our operating results and financial condition, as well as the returns to our stockholders. Some of these bank branches:
| |
| • | are in locations that overlap with other bank branches of the same financial institution, accumulated in connection with mergers and acquisitions with other financial institutions; |
| |
| • | have low deposit levels as compared to other bank branches of the same financial institution; |
| |
| • | are located in unattractive areas. |
The terms of the Settlement Agreement required us to take ownership of certain leasehold interests in various GKK Properties under which the rent expense we pay to the property owner may exceed the rental income we receive from tenants.
Under the Settlement Agreement, we were required to assume leasehold interests that we otherwise likely would not have elected to assume. Such leasehold interests relate to properties we do not own, but under which we lease space from the property owner and then sub-lease this space to various tenants. In certain cases the rent that we are required to pay to the owner of the property exceeds the rental income that we receive from the various tenants. Such negative cash flow may continue throughout the life of the lease and may also have an adverse effect on our operating results and financial condition, as well as the returns to our stockholders.
Our inability to sell a property when we want could limit the returns to our stockholders.
Many factors that are beyond our control affect the real estate market and could affect our ability to sell properties for the price, on the terms or within the time frame that we desire. These factors include general economic conditions, the availability of financing, interest rates and other factors, including supply and demand. Because real estate investments are relatively illiquid, we have a limited ability to vary our portfolio in response to changes in economic or other conditions. Further, before we can sell a property on the terms we want, it may be necessary to expend funds to correct defects or to make improvements. However, we can give no assurance that we will have the funds available to correct such defects or to make such improvements. We may be unable to sell our properties at a profit. Our inability to sell properties at the time and on the terms we want could reduce our cash flow and could reduce the value of our stockholders’ investment.
As a result of the Transfers of the GKK Properties, a significant portion of our properties are leased to financial institutions, making us more economically vulnerable in the event of a downturn in the banking industry.
Because of the Transfers of the GKK Properties, a significant portion of our revenue is derived from leases to financial institutions and as such, our portfolio has become less diversified. As of December 31, 2011, 57% of our annualized base rent was generated by leases to financial institutions. Individual banks, as well as the banking industry in general, may be adversely affected by negative economic and market conditions throughout the United States or in the local economies in which regional or community banks operate, including negative conditions caused by the recent disruptions in the financial markets. Acquisitions of regional or community banks by larger financial institutions could lead to the closure of some of the bank branches formerly occupied by these regional or community banks. In addition, changes in trade, monetary and fiscal policies and laws, including interest rate policies of the Board of Governors of the Federal Reserve System, may have an adverse impact on banks’ loan portfolios and allowances for loan losses. As a result, we may experience higher rates of lease default or terminations in the event of a downturn in the banking industry than we would if our tenant base were more diversified.
Because of the Transfers, certain tenants represent a significant portion of the revenue generated by our real estate portfolio and failure of these tenants to perform their obligations to us or to renew their leases upon expiration may adversely affect our cash flow and the returns to our stockholders.
Because of the Transfers, as of December 31, 2011, Bank of America, N.A. represented approximately 29.2% of our real estate portfolio’s base rental income and occupied approximately 33.9% of our total rentable square feet. The default, financial distress or insolvency of Bank of America, N.A., or the failure of this party to renew its leases with us upon expiration, could cause interruptions in the receipt of lease revenue from this tenant and the properties that it occupies and/or result in vacancies, which would reduce our revenue and increase operating costs until the affected properties are leased, and could decrease the ultimate value of the affected properties upon sale. We may be unable to lease the vacant properties at a comparable lease rate or at all, which could affect our operating results and financial condition as well as the returns to our stockholders. See Note 4, “Real Estate Held for Investment — Operating Leases” in the notes to our consolidated financial statements filed herewith.
Should GKK Stars or any of its affiliates declare bankruptcy or otherwise become the subject of an involuntary bankruptcy proceeding, our ability to indirectly retain title to or, with respect to a limited number of GKK Properties, indirectly retain a leasehold interest in, the GKK Properties would be threatened.
Any voluntary or involuntary bankruptcy filing by GKK Stars or any of its affiliates could have an adverse effect on our ability to indirectly retain title to or, with respect to a limited number of GKK Properties, indirectly retain a leasehold interest in, the GKK Properties, including the following:
| |
| • | Any transfers to us of equity interests in the entities owning the GKK Properties made within two years prior to a bankruptcy filing potentially could be voided by a bankruptcy court as fraudulent transfers. If any such transfers are voided, it is possible that our liens on the GKK Properties subject to those transfers may not reattach with their existing priority. |
| |
| • | A bankruptcy court could reject the Settlement Agreement, which could release GKK Stars from having to satisfy any of its remaining obligations under the Settlement Agreement. |
| |
| • | The automatic stay imposed in certain bankruptcy actions would limit our, among other parties to the Settlement Agreement, ability to enforce the terms of the Settlement Agreement against parties with respect to whom there has been a bankruptcy filing, including preventing the exercise of remedies under the Settlement Agreement without prior bankruptcy court approval following notice and a hearing. |
If we sell a property and provide some of the financing to the purchaser, we will bear the risk of default by the purchaser, which could delay or reduce the returns to our stockholders.
If we decide to sell any of our properties, we intend to use our best efforts to sell them for cash; however, in some instances, we may sell our properties and provide some of the financing to the purchasers. When we provide financing to a purchaser, we will bear the risk that the purchaser may default, which could reduce the returns to our stockholders. Even in the absence of a purchaser default, the use of the proceeds of the sale to reduce our debt, or the possible distribution of excess proceeds of the sale to our stockholders would be delayed until the promissory note or other property we may accept upon a sale is actually paid, sold, refinanced or otherwise disposed.
Costs imposed pursuant to laws and governmental regulations may reduce our net income and the overall return to our stockholders.
Real property and the operations conducted on real property are subject to federal, state and local laws and regulations relating to protection of the environment and human health. We could be subject to liability in the form of fines, penalties or damages for noncompliance with these laws and regulations. These laws and regulations generally govern wastewater discharges, air emissions, the operation and removal of underground and above-ground storage tanks, the use, storage, treatment, transportation and disposal of solid and hazardous materials, the remediation of contamination associated with the release or disposal of solid and hazardous materials, the presence of toxic building materials, and other health and safety-related concerns.
Some of these laws and regulations may impose joint and several liability on the tenants, owners or operators of real property for the costs to investigate or remediate contaminated properties, regardless of fault, whether the contamination occurred prior to purchase, or whether the acts causing the contamination were legal. Our tenants’ operations, the condition of properties at the time we buy them, operations in the vicinity of our properties, such as the presence of underground storage tanks, or activities of unrelated third parties may affect our properties.
The presence of hazardous substances, or the failure to properly manage or remediate these substances, may hinder our ability to sell, rent or pledge such property as collateral for future borrowings. Any material expenditures, fines, penalties, or damages we must pay will reduce the value of our stockholders’ investment.
The costs of defending against claims of environmental liability, of complying with environmental regulatory requirements, of remediating any contaminated property, or of paying personal injury claims could reduce the amounts available for distribution to our stockholders.
Under various federal, state and local environmental laws, ordinances and regulations, a current or previous real property owner or operator may be liable for the cost of removing or remediating hazardous or toxic substances on, under or in such property. These costs could be substantial. Such laws often impose liability whether or not the owner or operator knew of, or was responsible for, the presence of such hazardous or toxic substances. Environmental laws also may impose liens on property or restrictions on the manner in which property may be used or businesses may be operated, and these restrictions may require substantial expenditures or prevent us from entering into leases with prospective tenants that may be impacted by such laws. Environmental laws provide for sanctions for noncompliance and may be enforced by governmental agencies or, in certain circumstances, by private parties. Certain environmental laws and common law principles could be used to impose liability for the release of and exposure to hazardous substances, including asbestos-containing materials and lead-based paint. Third parties may seek recovery from real property owners or operators for personal injury or property damage associated with exposure to released hazardous substances and governments may seek recovery for natural resource damage. The costs of defending against claims of environmental liability, of complying with environmental regulatory requirements, of remediating any contaminated property, or of paying personal injury claims could reduce the amounts available for distribution to our stockholders.
Except for certain GKK Properties and other properties to which we took title to through foreclosure or deed-in-lieu of foreclosure, all of our direct real estate investments were subject to Phase I environmental assessments at the time they were acquired. Some of the properties we have acquired are subject to potential environmental liabilities arising primarily from historic activities at or in the vicinity of the properties.
We own one property that is subject to activity use limitations (“AULs”) whereby the government has placed limitations on redevelopment of the property for certain uses, particularly residential uses. AULs are typically imposed on a property that has environmental contamination in exchange for less stringent environmental clean-up standards. In view of the locations of the affected properties, the environmental characteristics of the contaminants and the characteristics of the neighborhoods, we do not believe that these AULs have a material impact on our portfolio valuation, but they could in individual cases result in a depression of the value of a property, should we resell the property for uses different from its existing uses. The Property subject to AULs is ADP Plaza, located in Portland, Oregon.
Some of the properties in our portfolio, particularly the warehouse and light industrial properties, had or have underground storage tanks either for space heating of the buildings, fueling motor vehicles, or industrial processes. Many of the underground storage tanks at the premises have been replaced over time. Given changing standards regarding closure of underground storage tanks and associated contamination, many of the tanks may not have been closed in compliance with current standards. Some of these properties likely have some residual petroleum or chemical contamination. Properties exhibiting these risks include 129 Concord Road, Billerica, Massachusetts (Rivertech) and ADP Plaza, Portland, Oregon.
Costs associated with complying with the Americans with Disabilities Act may decrease the returns to our stockholders.
Our properties may be subject to the Americans with Disabilities Act of 1990, as amended (the “Disabilities Act”). Under the Disabilities Act, all places of public accommodation are required to comply with federal requirements related to access and use by disabled persons. The Disabilities Act has separate compliance requirements for “public accommodations” and “commercial facilities” that generally require that buildings and services be made accessible and available to people with disabilities. The Disabilities Act’s requirements could require removal of access barriers and could result in the imposition of injunctive relief, monetary penalties or, in some cases, an award of damages. Any funds used for Disabilities Act compliance will reduce our net income and the returns to our stockholders.
Uninsured losses relating to real property or excessively expensive premiums for insurance coverage could reduce our cash flows and the return on our stockholders’ investment.
There are types of losses, generally catastrophic in nature, such as losses due to wars, acts of terrorism, earthquakes, floods, hurricanes, pollution or environmental matters, that are uninsurable or not economically insurable, or may be insured subject to limitations, such as large deductibles or co-payments. Insurance risks associated with potential acts of terrorism could sharply increase the premiums we pay for coverage against property and casualty claims. Additionally, mortgage lenders in some cases have begun to insist that commercial property owners purchase coverage against terrorism as a condition to providing mortgage loans. Such insurance policies may not be available at reasonable costs, if at all, which could inhibit our ability to finance or refinance our properties. In such instances, we may be required to provide other financial support, either through financial assurances or self-insurance, to cover potential losses. We may not have adequate coverage for such losses. If any of our properties incurs a casualty loss that is not fully insured, the value of our assets will be reduced by any such uninsured loss, which may reduce the value of our stockholders’ investment. In addition, other than any working capital reserve or other reserves we may establish, we have extremely limited sources of funding to repair or reconstruct any uninsured property. Also, to the extent we must pay unexpectedly large amounts for insurance, we could suffer reduced earnings that would result in lower returns to stockholders.
Terrorist attacks and other acts of violence or war may affect the markets in which we plan to operate, which could delay or hinder our ability to meet our investment objectives and reduce our stockholders’ overall return.
Terrorist attacks or armed conflicts may directly impact the value of our properties through damage, destruction, loss or increased security costs. Many of our investments are in major metropolitan areas. Insurance risks associated with potential acts of terrorism against office and other properties in major metropolitan areas could sharply increase the premiums we pay for coverage against property and casualty claims. Additionally, mortgage lenders in some cases have begun to insist that specific coverage against terrorism be purchased by commercial owners as a condition for providing loans. We may not be able to obtain insurance against the risk of terrorism because it may not be available or may not be available on terms that are economically feasible. The terrorism insurance that we obtain may not be sufficient to cover loss for damages to our properties as a result of terrorist attacks. In addition, certain losses resulting from these types of events are uninsurable and others may not be covered by our terrorism insurance. The costs of obtaining terrorism insurance and any uninsured losses we may suffer as a result of terrorist attacks could reduce the returns on our investments and the returns to our stockholders.
Risks Related to Real Estate-Related Investments
Our real estate-related investments are subject to the risks typically associated with real estate.
Our investments in mortgage and mezzanine loans, B-Notes and other real estate loans are generally directly or indirectly secured by a lien on real property (or the equity interests in an entity that owns real property) that, upon the occurrence of a default on the loan, could result in our taking ownership of the property. The values of the properties ultimately securing our loans may change after we acquire or originate those loans. If the values of the underlying properties drop, our risk will increase because of the lower value of the security associated with such loans. In this manner, real estate values could impact the values of our loan investments. Our investments in mortgage-backed securities, collateralized debt obligations and other real estate-related investments are similarly affected by real estate property values. Therefore, our real estate-related investments are subject to the risks typically associated with real estate, which are described above under the heading “— General Risks Related to Investments in Real Estate.”
Our investments in mortgage and mezzanine loans, B-Notes and and other real estate loans are subject to interest rate fluctuations that affect our returns as compared to market interest rates; accordingly, the value of our stockholders’ investment in us is subject to fluctuations in interest rates.
With respect to our fixed rate, long-term loans, if interest rates rise, the loans could yield a return that is lower than then-current market rates. If interest rates decrease, we will be adversely affected to the extent that loans are prepaid because we may not be able to make new loans at the higher interest rate. With respect to our variable rate loans, if interest rates decrease, our revenues will also decrease. For these reasons, our returns on these loans and the value of our stockholders’ investment in us are subject to fluctuations in interest rates.
Our mortgage and mezzanine loan and B-Note investments and the mortgage loans underlying the mortgage securities we invest in are subject to delinquency, foreclosure and loss, which could result in losses to us.
Commercial real estate loans are secured by multifamily or commercial property and are subject to risks of delinquency and foreclosure. The ability of a borrower to repay a loan secured by an income-producing property typically is dependent primarily upon the successful operation of such property rather than upon the existence of independent income or assets of the borrower. If the net operating income of the property is reduced, the borrower’s ability to repay the loan may be impaired. Net operating income of an income-producing property can be affected by, among other things: tenant mix, success of tenant businesses, property management decisions, property location and condition, competition from comparable types of properties, changes in laws that increase operating expenses or limit rents that may be charged, any need to address environmental contamination at the property, the occurrence of any uninsured casualty at the property, changes in national, regional or local economic conditions and/or specific industry segments, declines in regional or local real estate values, declines in regional or local rental or occupancy rates, increases in interest rates, real estate tax rates and other operating expenses, changes in governmental rules, regulations and fiscal policies, including environmental legislation, natural disasters, terrorism, social unrest and civil disturbances.
In the event of any default under a mortgage loan held directly by us, we will bear a risk of loss of principal to the extent of any deficiency between the value of the collateral and the principal and accrued interest of the mortgage loan, which could have a material adverse effect on our cash flow from operations. Foreclosure of a property securing a mortgage loan can be an expensive and lengthy process that could have a substantial negative effect on our anticipated return on our investment. In the event of the bankruptcy of a mortgage loan borrower, the mortgage loan to such borrower will be deemed to be secured only to the extent of the value of the underlying collateral at the time of bankruptcy (as determined by the bankruptcy court), and the lien securing the mortgage loan will be subject to the avoidance powers of the bankruptcy trustee or debtor-in-possession to the extent the lien is unenforceable under state law.
Delays in liquidating defaulted mortgage loans could reduce our investment returns.
If there are defaults under our mortgage loan investments, we may not be able to repossess and sell the underlying properties quickly. The resulting time delay could reduce the value of our investment in the defaulted mortgage loans. An action to foreclose on a property securing a mortgage loan is regulated by state statutes and regulations and is subject to many of the delays and expenses of other lawsuits if the borrower raises defenses or counterclaims. In the event of default by a borrower, these restrictions, among other things, may impede our ability to foreclose on or sell the mortgaged property or to obtain proceeds sufficient to repay all amounts due to us on the mortgage loan.
Our investments in mezzanine loans involve greater risks of loss than senior loans secured by the same properties.
Our investments in mezzanine loans take the form of subordinated loans secured by a pledge of the ownership interests of the entity owning (directly or indirectly) the real property. These types of investments may involve a higher degree of risk than long-term senior mortgage lending secured by income-producing real property because the investment may become unsecured as a result of foreclosure by the senior lender. In the event of a bankruptcy of the entity providing the pledge of its ownership interests as security, we may not have full recourse to the assets of such entity, or the assets of the entity may not be sufficient to satisfy our mezzanine loan. If a borrower defaults on our mezzanine loan or debt senior to our loan, or in the event of a borrower bankruptcy, our mezzanine loan will be satisfied only after the senior debt. As a result, we may not recover some or all of our investment. In addition, mezzanine loans may have higher loan-to-value ratios than conventional mortgage loans, resulting in less equity in the real property and increasing the risk of loss of principal.
Our investments in B-Notes may be subject to additional risks relating to the privately negotiated structure and terms of the transaction, which may result in losses to us.
We invest in B-Notes. A B‑Note is a mortgage loan typically (i) secured by a first mortgage on a single large commercial property or group of related properties and (ii) subordinated to an A-Note secured by the same first mortgage on the same collateral. As a result, if a borrower defaults, there may not be sufficient funds remaining for B-Note holders after payment to the A-Note holders. Since each transaction is privately negotiated, B-Notes can vary in their structural characteristics and risks. For example, the rights of holders of B-Notes to control the process following a borrower default may be limited.
Our investments in subordinated loans and subordinated mortgage-backed securities may be subject to losses.
We have invested in subordinated loans and subordinated mortgage-backed securities. In the event a borrower defaults on a subordinated loan and lacks sufficient assets to satisfy our loan, we may suffer a loss of principal or interest. In the event a borrower declares bankruptcy, we may not have full recourse to the assets of the borrower, or the assets of the borrower may not be sufficient to satisfy the loan. If a borrower defaults on our loan or on debt senior to our loan, or in the event of a borrower bankruptcy, our loan will be satisfied only after the senior debt is paid in full. Where debt senior to our loan exists, the presence of intercreditor arrangements may limit our ability to amend our loan documents, assign our loans, accept prepayments, exercise our remedies (through “standstill periods”), and control decisions made in bankruptcy proceedings relating to borrowers.
In general, losses on a mortgage loan included in a securitization will be borne first by the equity holder of the property, then by a cash reserve fund or letter of credit, if any, and then by the “first loss” subordinated security holder. In the event of default and the exhaustion of any equity support, reserve fund, letter of credit and any classes of securities junior to those in which we invest, we may not be able to recover all of our investment in the securities we purchase. In addition, if the underlying mortgage portfolio has been overvalued by the originator, or if the values subsequently decline and, as a result, less collateral is available to satisfy interest and principal payments due on the related mortgage-backed securities, the securities in which we invest may effectively become the “first loss” position behind the more senior securities, which may result in significant losses to us.
Risks of cost overruns and non-completion of the renovation of the properties underlying loans we make or acquire may materially adversely affect our investment.
The renovation, refurbishment or expansion by a borrower under a mortgaged or leveraged property involves risks of cost overruns and non-completion. Costs of improvements to bring a property up to standards established for the market position intended for that property may exceed original estimates, possibly making a project uneconomical. Other risks may include: environmental risks and the possibility that the rehabilitation and subsequent leasing of the property may not be completed on schedule. If such renovation is not completed in a timely manner, or if it costs more than expected, the borrower may experience a prolonged impairment of net operating income and may not be able to make payments on our investment and we may not recover some or all of our investment.
Our CMBS investments are subject to all of the risks of the underlying mortgage loans and the risks of the securitization process.
CMBS are securities that evidence interests in, or are secured by, a single commercial mortgage loan or a pool of commercial mortgage loans. Accordingly, these securities are subject to all of the risks of the underlying mortgage loans.
In a rising interest rate environment, the value of CMBS may be adversely affected when payments on underlying mortgages do not occur as anticipated, resulting in the extension of the security’s effective maturity and the related increase in interest rate sensitivity of a longer-term instrument. The value of CMBS may also change due to shifts in the market’s perception of issuers and regulatory or tax changes adversely affecting the mortgage securities market as a whole. In addition, CMBS are subject to the credit risk associated with the performance of the underlying mortgage properties. In certain instances, third-party guarantees or other forms of credit support can reduce the credit risk.
CMBS are also subject to several risks created through the securitization process. Subordinate CMBS are paid interest only to the extent that there are funds available to make payments. To the extent the collateral pool includes delinquent loans, there is a risk that interest payments on subordinate CMBS will not be fully paid. Subordinate CMBS are also subject to greater credit risk than senior CMBS that are more highly rated. Thus, any particular class of CMBS may be riskier and more volatile than the rating may suggest, which may cause the returns on any CMBS investment to be less than anticipated.
We will not have the right to foreclose on commercial mortgage loans underlying our CMBS investments since we do not directly own such underlying loans. Accordingly, we must rely on third parties to initiate and execute any foreclosure proceedings upon a default of such mortgage loans.
A portion of our investments in loans and real estate-related securities may be illiquid and we may not be able to adjust our portfolio in response to changes in economic and other conditions.
Certain of the real estate-related securities that we own are not registered under the relevant securities laws, resulting in a prohibition against their transfer, sale, pledge or other disposition except in a transaction that is exempt from the registration requirements of, or is otherwise in accordance with, those laws. As a result, our ability to vary our portfolio in response to changes in economic and other conditions may be relatively limited. The mezzanine loans we own are particularly illiquid investments due to their short life, their unsuitability for securitization and the greater difficulty of recoupment in the event of a borrower’s default.
Delays in restructuring or liquidating non-performing real estate securities could reduce the return on our stockholders’ investment.
Real estate securities may become non-performing after acquisition for a wide variety of reasons. Such non-performing real estate investments may require a substantial amount of workout negotiations and/or restructuring, which may entail, among other things, a substantial reduction in the interest rate and a substantial write-down of such loan or asset. However, even if a restructuring is successfully accomplished, upon maturity of such real estate security, replacement “takeout” financing may not be available. We may find it necessary or desirable to foreclose on some of the collateral securing one or more of our real estate securities investments. Intercreditor provisions may significantly interfere with our ability to do so. Even if foreclosure is an option, the foreclosure process can be lengthy and expensive. Borrowers often resist foreclosure actions by asserting numerous claims, counterclaims and defenses, including, without limitation, lender liability claims and defenses, in an effort to prolong the foreclosure action. In some states, foreclosure actions can take up to several years or more to litigate. At any time during the foreclosure proceedings, the borrower may file for bankruptcy, which would have the effect of staying the foreclosure action and further delaying the foreclosure process. Foreclosure litigation tends to create a negative public image of the collateral property and may result in disrupting ongoing leasing and management of the property. Foreclosure actions by senior lenders may substantially affect the amount that we may earn or recover from an investment.
We depend on debtors for the revenue generated by our real estate-related investments and, accordingly, such revenue and the returns to our stockholders is dependent upon the success and economic viability of such debtors.
The success of our real estate-related investments, such as loans and debt and derivative securities, will materially depend on the financial stability of the debtors underlying such investments. The inability of a single major debtor or a number of smaller debtors to meet their payment obligations could result in reduced revenue or losses. In the event of a debtor default or bankruptcy, we may experience delays in enforcing our rights as a creditor, and such rights may be subordinated to the rights of other creditors. These events could negatively affect the returns to our stockholders and the value of our stockholders’ investment.
Prepayments can adversely affect the yields on our debt investments.
The yields on our debt investments may be affected by the rate of prepayments differing from our projections. Prepayments on debt instruments, where permitted under the debt documents, are influenced by changes in current interest rates and a variety of economic, geographic and other factors beyond our control, and consequently, such prepayment rates cannot be predicted with certainty. If such prepayments occur, the yield on our portfolio may decline. In addition, we may acquire debt assets at a discount or premium and if the debt asset does not repay when expected, our anticipated yield may be impacted. Under certain interest rate and prepayment scenarios we may fail to recoup fully our cost of acquisition of certain debt investments.
Hedging against interest rate exposure may adversely affect our earnings, limit our gains or result in losses, which could adversely affect our stockholders’ returns.
We have entered and in the future may enter into interest rate swap agreements or pursue other interest rate hedging strategies. Our hedging activity will vary in scope based on the level of interest rates, the type of investments we hold at the relevant time and other changing market conditions. Interest rate hedging may fail to protect or could adversely affect us because, among other things:
| |
| • | interest rate hedging can be expensive, particularly during periods of rising and volatile interest rates; |
| |
| • | available interest rate hedging may not correspond directly with the interest rate risk for which protection is sought; |
| |
| • | the duration of the hedge may not match the duration of the related liability or asset; |
| |
| • | the amount of income that we may earn from hedging transactions to offset interest rate losses is limited by federal tax provisions governing REITs; |
| |
| • | the credit quality of the party owing money on the hedge may be downgraded to such an extent that it impairs our ability to sell or assign our side of the hedging transaction; |
| |
| • | the party owing money in the hedging transaction may default on its obligation to pay; and |
| |
| • | we may purchase a hedge that turns out not to be necessary, i.e., a hedge that is out of the money. |
Any hedging activity we engage in may adversely affect our earnings, which could adversely affect the returns to our stockholders. Therefore, while we may enter into such transactions to seek to reduce interest rate risks, unanticipated changes in interest rates may result in poorer overall investment performance than if we had not engaged in any such hedging transactions. In addition, the degree of correlation between price movements of the instruments used in a hedging strategy and price movements in the portfolio positions being hedged or liabilities being hedged may vary materially. Moreover, for a variety of reasons, we may not seek to establish a perfect correlation between such hedging instruments and the portfolio holdings being hedged. Any such imperfect correlation may prevent us from achieving the intended accounting treatment and may expose us to risk of loss.
We assume the credit risk of our counterparties with respect to derivative transactions.
We enter into derivative contracts for risk management purposes to hedge our exposure to cash flow variability caused by changing interest rates on our variable rate notes payable. These derivative contracts generally are entered into with bank counterparties and are not traded on an organized exchange or guaranteed by a central clearing organization. We therefore assume the credit risk that our counterparties will fail to make periodic payments when due under these contracts. If a counterparty fails to make a required payment, becomes the subject of a bankruptcy case, or otherwise defaults under the applicable contract, we would have the right to terminate all outstanding derivative transactions with that counterparty and settle them based on their net market value or replacement cost. In such an event, we may be required to make a termination payment to the counterparty, or we may have the right to collect a termination payment from such counterparty. We assume the credit risk that the counterparty will not be able to make any termination payment owing to us. We may not receive any collateral from a counterparty, or we may receive collateral that is insufficient to satisfy the counterparty’s obligation to make a termination payment. If a counterparty is the subject of a bankruptcy case, we will be an unsecured creditor in such case unless the counterparty has pledged sufficient collateral to us to satisfy the counterparty’s obligations to us.
We assume the risk that our derivative counterparty may terminate transactions early.
If we fail to make a required payment or otherwise default under the terms of a derivative contract, the counterparty would have the right to terminate all outstanding derivative transactions between us and that counterparty and settle them based on their net market value or replacement cost. In certain circumstances, the counterparty may have the right to terminate derivative transactions early even if we are not defaulting. If our derivative transactions are terminated early, it may not be possible for us to replace those transactions with another counterparty, on as favorable terms or at all.
We may be required to collateralize our derivative transactions.
We may be required to secure our obligations to our counterparties under our derivative contracts by pledging collateral to our counterparties. That collateral may be in the form of cash, securities or other assets. If we default under a derivative contract with a counterparty, or if a counterparty otherwise terminates one or more derivative contracts early, that counterparty may apply such collateral toward our obligation to make a termination payment to the counterparty. If we have pledged securities or other assets, the counterparty may liquidate those assets in order to satisfy our obligations. If we are required to post cash or securities as collateral, such cash or securities will not be available for use in our business. Cash or securities pledged to counterparties may be repledged by counterparties and may not be held in segregated accounts. Therefore, in the event of a counterparty insolvency, we may not be entitled to recover some or all of the collateral pledged to that counterparty, which could result in losses and have an adverse effect on our operations.
There can be no assurance that the direct or indirect effects of the Dodd-Frank Wall Street Reform and Consumer Protection Act, enacted in July 2010 for the purpose of stabilizing or reforming the financial markets, will not have an adverse effect on our interest rate hedging activities.
On July 21, 2010, the Dodd-Frank Wall Street Reform and Consumer Protection Act (the “Dodd-Frank Act”) became law in the United States. Title VII of the Dodd-Frank Act contains a sweeping overhaul of the regulation of privately negotiated derivatives. Some of the provisions of Title VII became effective on July 16, 2011 or, with respect to particular provisions, became or will become effective on such other date specified in the Dodd-Frank Act or by subsequent rulemaking. While the full impact of the Dodd‑Frank Act on our interest rate hedging activities cannot be assessed until implementing rules and regulations are promulgated, the requirements of Title VII may affect our ability to enter into hedging or other risk management transactions, may increase our costs related to entering into such transactions, and may result in us entering into such transactions on less favorable terms than prior to effectiveness of the Dodd-Frank Act. The occurrence of any of the foregoing events may have an adverse effect on our business.
Declines in the market values of our investments may adversely affect periodic reported results of operations and credit availability, which may reduce earnings and, in turn, the returns to our stockholders.
A portion of our assets may be classified for accounting purposes as “available-for-sale.” These investments are carried at estimated fair value and temporary changes in the market values of those assets will be directly charged or credited to stockholders’ equity without impacting net income on our income statement. Moreover, if we determine that a decline in the estimated fair value of an available-for-sale security below its amortized value is other-than-temporary, we will recognize a loss on that security on our income statement, which will reduce our earnings in the period recognized.
A decline in the market value of our assets may adversely affect us, particularly in instances where we have borrowed money based on the market value of those assets. If the market value of those assets declines, the lender may require us to post additional collateral to support the loan. If we were unable to post the additional collateral, we may have to sell assets at a time when we might not otherwise choose to do so. A reduction in credit available may reduce our earnings and, in turn, the returns to our stockholders.
Further, credit facility providers have required and in the future may require us to maintain a certain amount of cash reserves or to set aside unlevered assets sufficient to maintain a specified liquidity position, which would allow us to satisfy our collateral obligations. As a result, we may not be able to leverage our assets as fully as we would choose, which could reduce our return on equity. In the event that we are unable to meet these contractual obligations, our financial condition could deteriorate rapidly.
Market values of our investments may decline for a number of reasons, such as changes in prevailing market rates, increases in defaults, increases in voluntary prepayments for our investments that are subject to prepayment risk, widening of credit spreads and downgrades of ratings of the securities by ratings agencies.
Some of our investments are carried at estimated fair value as determined by us and, as a result, there may be uncertainty as to the value of these investments.
Some of our investments are in the form of securities that are recorded at fair value but that have limited liquidity or are not publicly traded. The fair value of securities and other investments that have limited liquidity or are not publicly traded may not be readily determinable. We estimate the fair value of any such investments on a quarterly basis. Because such valuations are inherently uncertain, may fluctuate over short periods of time and may be based on numerous estimates, our determinations of fair value may differ materially from the values that would have been used if a ready market for these securities existed. The value of our common stock could be adversely affected if our determinations regarding the fair value of these investments are materially higher than the values that we ultimately realize upon their disposal.
Our asset-specific loan loss reserve may not be sufficient to cover losses on loans we consider to be impaired.
Our asset-specific loan loss reserve relates to reserves for losses on loans considered impaired. We consider a loan to be impaired when, based upon current information and events, we believe that it is probable that we will be unable to collect all amounts due under the contractual terms of the loan agreement or other documents relating to the loan. We also consider a loan to be impaired if we grant the borrower a concession through a modification of the loan terms or if we expect to receive assets (including equity interests in the borrower) in partial satisfaction of the loan. A reserve is established when the present value of payments expected to be received, observable market prices, the estimated fair value of the collateral (for loans that are dependent on the collateral for repayment) or amounts expected to be received in partial satisfaction of an impaired loan are lower than the carrying value of that loan. Our portfolio-based loan loss reserve is a reserve against all of the loans in our portfolio that are not specifically reserved. It is based on estimated probabilities of both term and maturity default and estimated loss severities for the portfolio. Our provision for loan losses of $74.1 million, all of which related to asset-specific loan loss reserves as of December 31, 2011, may not be sufficient to cover losses on these loans.
Risks Associated with Debt Financing
We incur and assume mortgage indebtedness and other borrowings, which increases our risk of loss due to potential foreclosure.
We may obtain lines of credit and obtain or assume long-term financing that may be secured by our properties and other assets. We have acquired many of our real properties by financing a portion of the price of the properties and mortgaging or pledging some or all of the properties purchased as security for that debt, or by taking title to properties that already had been pledged as security for debt we assumed in connection with taking title to such properties. In addition, we may be forced to try to borrow as necessary or advisable to ensure that we maintain our qualification as a REIT for federal income tax purposes, including borrowings to satisfy the REIT requirement that we distribute at least 90% of our annual REIT taxable income to our stockholders (computed without regard to the dividends-paid deduction and excluding net capital gain). However, we can give our stockholders no assurance that we will be able to obtain such borrowings on satisfactory terms or at all.
Mortgage debt or the assumption of mortgage debt as part of taking title to a property increases the risk of loss of a property since defaults on indebtedness secured by a property may result in lenders initiating foreclosure actions. In that case, we could lose the property securing the loan that is in default, reducing the value of our stockholders’ investment. For tax purposes, a foreclosure of any of our properties would be treated as a sale of the property for a purchase price equal to the outstanding balance of the debt secured by the mortgage. If the outstanding balance of the debt secured by the mortgage exceeds our tax basis in the property, we would recognize taxable income on foreclosure even though we would not necessarily receive any cash proceeds. We have given and may give full or partial guarantees to lenders of mortgage or other debt on behalf of the entities that own our properties. When we give a guarantee on behalf of an entity that owns one of our properties, we will be responsible to the lender for satisfaction of all or a part of the debt or other amounts related to the debt if it is not paid by such entity. If any mortgages contain cross-collateralization or cross-default provisions, a default on a mortgage secured by a single property could affect mortgages secured by other properties.
We utilize repurchase agreements as a component of our financing strategy. Repurchase agreements economically resemble short-term, variable rate financing and usually require the maintenance of specific loan-to-collateral value ratios. If the market value of the assets subject to certain repurchase agreements declines, we may be required to provide additional collateral or make cash payments to maintain the loan-to-collateral value ratios.
Certain of our loan agreements, including the Amended Repurchase Agreements, contain cross-default provisions whereby a default under one agreement could result in a default and acceleration of indebtedness under other agreements. The Amended Repurchase Agreements provide that a default by us on any of the five loans specified in the Amended Repurchase Agreements, including the Goldman/Citi Mortgage Loan, may, in certain circumstances, constitute a default under the Amended Repurchase Agreements. Under certain conditions, such a default would not trigger a default under the Amended Repurchase Agreements if we were to transfer the equity interests in the entities owning the GKK Properties subject to the default to the GKK Lenders. If a cross-default were to occur, we may not be able to pay our debts or access capital from external sources in order to refinance our debts. If some or all of our debt obligations default, causing a default under other indebtedness, our business, financial condition and results of operations would be adversely affected.
We may also obtain recourse debt to meet our REIT distribution requirements. If we have insufficient income to service our recourse debt obligations, our lenders could institute proceedings against us to foreclose on our assets. If a lender successfully forecloses on any of our assets, our stockholders could lose all or part of their investment.
Certain pledges of Equity Interests may have triggered certain provisions in the mortgage loan documents that encumber the GKK Properties owned directly or indirectly by such Equity Interests, which could allow the third party lenders to exercise certain rights or remedies under their mortgage loan documents.
The loan agreements and security documents relating to the FSI 6000A, FSI 6000B, FSI 6000C, FSI 6000D and 801 Market Street loans contain provisions that prohibit the pledge of certain Equity Interests in the mortgage borrowers or their direct or indirect owners. As a result of the Transfers under the Settlement Agreement and our subsequent pledge of certain Equity Interests as security for certain of our repurchase agreements, the lenders under these mortgage loans may view certain pledges as being prohibited. If they do, they may attempt to exercise certain remedies detailed in the respective loan and security documents, including without limitation, accelerating the outstanding amount under each mortgage loan or foreclosing on the underlying properties securing the mortgage loans. As of December 31, 2011, the total outstanding debt on these five loans was $147.8 million.
High mortgage rates or changes in underwriting standards may make it difficult for us to refinance properties, which could reduce our cash flows from operations and reduce the returns to our stockholders.
If mortgage debt is unavailable at reasonable rates, we run the risk of being unable to refinance part or all of our property subject to such mortgage debt when the debt becomes due or of being unable to refinance on favorable terms. If interest rates are higher when we refinance properties, our income could be reduced. We may be unable to refinance or may only be able to partly refinance properties if underwriting standards, including loan to value ratios and yield requirements, among other requirements, are more strict than when we originally financed the properties. If any of these events occurs, our cash flow could be reduced and/or we might have to pay down existing mortgages. This, in turn, could cause us to require additional capital and may hinder our ability to raise capital by issuing more stock or by borrowing more money, reducing our stockholders’ overall returns.
Lenders have required and may continue to require us to enter into restrictive covenants relating to our operations, which could reduce the returns to our stockholders.
When providing financing, lenders have imposed, and in connection with future financings, may impose, restrictions on us that may reduce the returns to our stockholders and may affect our operating policies and our ability to incur additional debt. Loan agreements into which we enter may contain covenants that limit our ability to further mortgage a property or otherwise incur additional debt, or that prohibit us from discontinuing insurance coverage or replacing KBS Capital Advisors as our advisor. These or other limitations would decrease our operating flexibility and our ability to achieve our operating objectives.
The Amended Repurchase Agreements and/or some of our other debt, including debt we assumed related to the GKK Properties transferred under the Settlement Agreement, contain restrictive covenants relating to our operations, our ability to incur additional debt and our ability to declare distributions. The Amended Repurchase Agreements will terminate on the earliest to occur of (i) April 28, 2013; (ii) the date that the Amended Repurchase Agreements convert into mezzanine loans (which would likely contain substantially similar terms as the Amended Repurchase Agreements, including with respect to certain restrictive covenants); (iii) the date that all obligations under the Amended Repurchase Agreements are fully paid; or (iv) upon an event causing the Amended Repurchase Agreements to otherwise terminate. The Amended Repurchase Agreements require us to meet certain financial and other covenants, which include, among other covenants, the requirement for us to maintain minimum liquidity of $19 million beginning on August 28, 2011.
We also agreed that, unless permitted by or pursuant to the terms of the Amended Repurchase Agreements, during the term of the Amended Repurchase Agreements we would not create or incur additional liens or indebtedness on our assets, make additional investments, or make certain dispositions except pursuant to certain mandatory payment provisions contained in the Amended Repurchase Agreements. During the term of the Amended Repurchase Agreements, we also agreed (i) except for distributions to stockholders necessary to maintain our REIT status, to limit distributions to stockholders to an amount not to exceed $6 million per month, excluding any distributions to stockholders reinvested in us pursuant to our dividend reinvestment plan (which will terminate effective April 10, 2012) and (ii) to continue to limit redemptions under our share redemption program to those redemptions sought upon a stockholder’s death, “qualifying disability” or “determination of incompetence” (each as defined in our share redemption program).
In addition to monthly interest payments under the terms of the Amended Repurchase Agreements, the Amended Repurchase Agreements required and require us to make certain mandatory payments as follows:
| |
| (i) | on October 15, 2011, we made an amortization payment of $35 million; |
| |
| (ii) | every three months from January 15, 2012 through April 2013, we are required to make additional amortization payments of approximately $24.3 million, which payments may be decreased by any prepayments of principal, including any mandatory or voluntary prepayments of principal; |
| |
| (iii) | on October 15, 2011, we made payments relating to the acquisition of the GKK Subordinated Mortgage Loan and the GKK Junior Mezzanine Tranche in the amount of $1.6 million, and we must make payments in the amount of $1.1 million every three months thereafter through April 2013; and |
| |
| (iv) | we are required to pay 75% to 100% of excess cash flows or net cash proceeds from: (a) the operations of the GKK Properties, net of debt service and capital reserves; (b) the sale of the GKK Properties; (c) the sale of certain real estate-related debt investments owned by us; (d) the sale of substantially all other properties owned by us, in excess of $75 million in the aggregate in any calendar year; and (e) certain indebtedness incurred or equity issued (excluding proceeds from our dividend reinvestment plan, which will terminate effective April 10, 2012), by us. |
Further, pursuant to the terms of the Settlement Agreement, so long as certain of our subsidiaries are still obligated under the Mortgage Pools secured by certain GKK Properties, then our subsidiaries providing indemnities under the Settlement Agreement and our subsidiaries created to take title to the equity interests in the entities owning the GKK Properties may not incur debt for borrowed money in excess of $180 million (which may be increased to $200 million under certain circumstances), other than mortgage financing secured by, among other things, interests in real property.
Certain of the mortgage loans that we have assumed in connection with the Transfers of the GKK Properties under the Settlement Agreement impose “cash traps”, which could adversely affect our financial condition and operating results.
Certain mortgage loans that we have assumed in connection with the Transfers of the GKK Properties impose “cash traps” as a condition to transfer the loan or when the financial performance of the GKK Properties securing such loans fails to meet certain financial metrics. If enforced, these “cash traps” could adversely affect our financial condition and operating results. If the provisions relating to “cash traps” in these mortgage loan documents are triggered, we may be required to fund excess cash flow into reserve accounts with our mortgage lenders until compliance with the required metrics is achieved. In such event, our liquidity will be negatively impacted, which could have an adverse effect on our results of operations and financial condition. As of December 31, 2011, seven of the lenders under the loans we have assumed (the BBD2 Loan, Jenkins Loan, One Citizens Loan, Goldman/Citi Mortgage Loan, FSI Loan, Wachovia 8 Loan and Wachovia 9 Loan) have imposed a “cash trap” on the properties securing these loans.
Increases in interest rates could increase the amount of our debt payments and reduce the returns to our stockholders.
If we are able to incur additional debt in the future, increases in interest rates will increase the cost of that debt, which could reduce the returns to our stockholders. If we incur variable rate debt, increases in interest rates would increase our interest costs, which would reduce our cash flows and the returns to our stockholders. In addition, if we need to repay existing debt during periods of rising interest rates, we could be required to liquidate one or more of our investments at times that may not permit realization of the maximum return on such investments.
We have broad authority to incur debt and high debt levels could decrease the value of our stockholders’ investment.
Our policies do not limit us from incurring debt until our total liabilities would exceed 75% of the cost (before deducting depreciation or other noncash reserves) of our tangible assets (although restrictive covenants contained in certain loan documents related to debt we have incurred may not allow us to borrow up to this amount), and we may exceed this limit with the approval of the conflicts committee of our board of directors. As of December 31, 2011, our total liabilities were approximately 71% and 72% of the cost (before depreciation or other noncash reserves) and book value (before depreciation) of our tangible assets, respectively.
Due to the amount of debt that we have assumed as a result of the Transfers under the Settlement Agreement, we exceeded our charter limitation on total liabilities as of September 30, 2011. The conflicts committee had approved all such borrowings in excess of our charter limitation on total liabilities. In such case, the conflicts committee determined that the excess leverage was justified for the following reasons:
| |
| • | the assumption of debt was necessary as part of the Transfers of the GKK Properties; |
| |
| • | the Transfers will allow us to operate the GKK Properties and generate ongoing income for our investors; and |
| |
| • | the Transfers will allow us to develop an exit strategy for the GKK Properties, thus optimizing return on investor capital. |
High debt levels would cause us to incur higher interest charges and higher debt service payments and may also be accompanied by additional restrictive covenants. These factors could result in a decline in the value of our stockholders’ investment.
Non-compliance with the financial covenants included in the documents evidencing our outstanding debt obligations may result in the lender imposing additional restrictions on our operations or constitute an event of default under such documents. Such events would harm our financial condition, results of operations and the return on our stockholders’ investment in us.
The documents evidencing our outstanding debt obligations typically include restrictive financial covenants, including that specified loan-to-value and debt service coverage ratios be maintained with respect to our financed properties before we can exercise certain rights under the documents relating to such properties. A breach of the financial covenants in these documents may result in the lender imposing additional restrictions on our operations, such as our ability to incur additional debt, or may allow the lender to impose cash traps with respect to cash flow from the property securing the loan. In addition, such a breach may constitute an event of default and the lender could require us to repay the debt immediately. If we fail to make such repayment in a timely manner, the lender may be entitled to take possession of any property securing the loan.
As of December 31, 2011, we and/or our subsidiaries that are the borrowers under our loan and security documents were in compliance with the financial covenants in such documents included in our consolidated financial statements, except that, as of December 31, 2011, the borrowers under two mortgage loans that we assumed pursuant to the Settlement Agreement, the BBD2 Loan and the Jenkins Loan, were out of debt service coverage compliance. The BBD2 Loan had an outstanding principal balance of $206.2 million and the Jenkins Loan had an outstanding principal balance of $13.6 million as of December 31, 2011. Such non-compliance does not constitute an event of default under the applicable loan and security documents. However, as a result of such non-compliance, under the BBD2 Loan, the lender has imposed a “cash trap” to restrict distributions to us to the budgeted property operating expenses and requires lender consent regarding the release of properties securing the loan, and under the Jenkins Loan, the lender has also imposed a “cash trap” and has the right to replace the property manager of the property. These events may have a material adverse affect on our financial condition, results of operations and the return on our stockholders’ investment in us.
Federal Income Tax Risks
Failure to qualify as a REIT would reduce our net earnings available for investment or distribution.
Our qualification as a REIT will depend upon our ability to meet requirements regarding our organization and ownership, distributions of our income, the nature and diversification of our income and assets and other tests imposed by the Internal Revenue Code. If we fail to qualify as a REIT for any taxable year after electing REIT status, we will be subject to federal income tax on our taxable income at corporate rates. In addition, we would generally be disqualified from treatment as a REIT for the four taxable years following the year in which we lost our REIT status. Losing our REIT status would reduce our net earnings available for distribution to stockholders because of the additional tax liability. In addition, distributions would no longer qualify for the dividends-paid deduction and we would no longer be required to make distributions. If this occurs, we might be required to borrow funds or liquidate some investments in order to pay the applicable tax.
Failure to qualify as a REIT would subject us to federal income tax, which would reduce the cash available for distribution to our stockholders.
We expect to operate in a manner that will allow us to continue to qualify as a REIT for federal income tax purposes. However, the federal income tax laws governing REITs are extremely complex, and interpretations of the federal income tax laws governing qualification as a REIT are limited. Qualifying as a REIT requires us to meet various tests regarding the nature of our assets and our income, the ownership of our outstanding stock, and the amount of our distributions on an ongoing basis. While we intend to operate so that we will qualify as a REIT, given the highly complex nature of the rules governing REITs, the ongoing importance of factual determinations, including the tax treatment of certain investments we may make, and the possibility of future changes in our circumstances, no assurance can be given that we will so qualify for any particular year. If we fail to qualify as a REIT in any calendar year and we do not qualify for certain statutory relief provisions, we would be required to pay federal income tax on our taxable income. We might need to borrow money or sell assets to pay that tax. Our payment of income tax would decrease the amount of our income available for distribution to our stockholders. Furthermore, if we fail to maintain our qualification as a REIT and we do not qualify for certain statutory relief provisions, we no longer would be required to distribute substantially all of our REIT taxable income to our stockholders. Unless our failure to qualify as a REIT were excused under federal tax laws, we would be disqualified from taxation as a REIT for the four taxable years following the year during which qualification was lost.
Our stockholders may have current tax liability on distributions they elected to reinvest in our common stock.
If our stockholders participated in our dividend reinvestment plan (which will terminate effective April 10, 2012), they will be deemed to have received, and for income tax purposes will be taxed on, the amount reinvested in shares of our common stock to the extent the amount reinvested was not a tax-free return of capital. In addition, our stockholders will be treated for tax purposes as having received an additional distribution to the extent the shares were purchased at a discount to fair market value, if any. As a result, unless our stockholders are tax-exempt entities, they may have to use funds from other sources to pay their tax liability on the value of the shares of common stock received.
Even if we qualify as a REIT for federal income tax purposes, we may be subject to other tax liabilities that reduce our cash flow and our ability to make distributions to our stockholders.
Even if we qualify as a REIT for federal income tax purposes, we may be subject to some federal, state and local taxes on our income or property. For example:
| |
| • | In order to qualify as a REIT, we must distribute annually at least 90% of our REIT taxable income to our stockholders (which is determined without regard to the dividends-paid deduction or net capital gain). To the extent that we satisfy the distribution requirement but distribute less than 100% of our REIT taxable income, we will be subject to federal corporate income tax on the undistributed income. |
| |
| • | We will be subject to a 4% nondeductible excise tax on the amount, if any, by which distributions we pay in any calendar year are less than the sum of 85% of our ordinary income, 95% of our capital gain net income and 100% of our undistributed income from prior years. |
| |
| • | If we have net income from the sale of foreclosure property that we hold primarily for sale to customers in the ordinary course of business or other non-qualifying income from foreclosure property, we must pay a tax on that income at the highest corporate income tax rate. We will elect foreclosure property status for the GKK Properties but do not believe such GKK Properties will be disposed of in a manner that results in this tax. |
| |
| • | If we sell an asset, other than foreclosure property, that we hold primarily for sale to customers in the ordinary course of business, our gain would be subject to the 100% “prohibited transaction” tax unless such sale were made by one of our taxable REIT subsidiaries. |
We intend to make distributions to our stockholders to comply with the REIT requirements of the Internal Revenue Code.
REIT distribution requirements could adversely affect our ability to execute our business plan.
We generally must distribute annually at least 90% of our REIT taxable income, subject to certain adjustments and excluding any net capital gain, in order for federal corporate income tax not to apply to earnings that we distribute. To the extent that we satisfy this distribution requirement, but distribute less than 100% of our REIT taxable income, we will be subject to federal corporate income tax on our undistributed REIT taxable income. In addition, we will be subject to a 4% nondeductible excise tax if the actual amount that we pay out to our stockholders in a calendar year is less than a minimum amount specified under federal tax laws. We intend to make distributions to our stockholders to comply with the REIT requirements of the Internal Revenue Code.
To qualify as a REIT, we must distribute to our stockholders each year 90% of our REIT taxable income (which is determined without regard to the dividends paid deduction or net capital gain). From time to time, we may generate taxable income greater than our income for financial reporting purposes, or our taxable income may be greater than our cash flow available for distribution to stockholders (for example, where a borrower defers the payment of interest in cash pursuant to a contractual right or otherwise). If we do not have other funds available in these situations we could be required to borrow funds, sell investments at disadvantageous prices or find another alternative source of funds to make distributions sufficient to enable us to pay out enough of our taxable income to satisfy the REIT distribution requirements and to avoid corporate income tax and the 4% excise tax in a particular year. These alternatives could increase our costs or reduce our equity. Thus, compliance with the REIT requirements may hinder our ability to operate solely on the basis of maximizing profits.
To maintain our REIT status, we may be forced to forego otherwise attractive opportunities, which may delay or hinder our ability to meet our investment objectives and reduce our stockholders’ overall return.
To qualify as a REIT, we must satisfy certain tests on an ongoing basis concerning, among other things, the sources of our income, nature of our assets and the amounts we distribute to our stockholders. We may be required to make distributions to stockholders at times when it would be more advantageous to reinvest cash in our business or when we do not have funds readily available for distribution. Compliance with the REIT requirements may hinder our ability to operate solely on the basis of maximizing profits and the value of our stockholders’ investment.
The tax on prohibited transactions will limit our ability to engage in transactions that would be treated as sales for federal income tax purposes.
A REIT’s net income from prohibited transactions is subject to a 100% tax. In general, prohibited transactions are sales or other dispositions of assets, other than foreclosure property, deemed held primarily for sale to customers in the ordinary course of business. We might be subject to this tax if we were to dispose of loans in a manner that was treated as a sale of the loans for federal income tax purposes. Therefore, in order to avoid the prohibited transactions tax, we may choose not to engage in certain sales of loans at the REIT level even though the sales might otherwise be beneficial to us.
It may be possible to reduce the impact of the prohibited transaction tax by conducting certain activities through taxable REIT subsidiaries. However, to the extent that we engage in such activities through taxable REIT subsidiaries, the income associated with such activities may be subject to full corporate income tax.
We may be subject to adverse legislative or regulatory tax changes.
At any time, the federal income tax laws or regulations governing REITs or the administrative interpretations of those laws or regulations may be amended. We cannot predict when or if any new federal income tax law, regulation or administrative interpretation, or any amendment to any existing federal income tax law, regulation or administrative interpretation, will be adopted, promulgated or become effective and any such law, regulation or interpretation may take effect retroactively. We and our stockholders could be adversely affected by any such change in, or any new, federal income tax law, regulation or administrative interpretation.
Dividends payable by REITs do not qualify for the reduced tax rates.
Legislation enacted in 2003 and modified in 2005 and 2010 generally reduces the maximum tax rate for dividends payable to domestic stockholders that are individuals, trusts and estates to 15% (through 2012). Dividends payable by REITs, however, are generally not eligible for the reduced rates. Although this legislation does not adversely affect the taxation of REITs or dividends paid by REITs, the more favorable rates applicable to regular corporate dividends could cause investors who are individuals, trusts and estates to perceive investments in REITs to be relatively less attractive than investments in stock of non-REIT corporations that pay dividends, which could adversely affect the value of the stock of REITs, including our common stock.
The failure of a mezzanine loan to qualify as a real estate asset could adversely affect our ability to qualify as a REIT.
The IRS has issued Revenue Procedure 2003-65, which provides a safe harbor pursuant to which a mezzanine loan that is secured by interests in a pass-through entity will be treated by the IRS as a real estate asset for purposes of the REIT tests, and interest derived from such loan will be treated as qualifying mortgage interest for purposes of the REIT 75% income test. Although the Revenue Procedure provides a safe harbor on which taxpayers may rely, it does not prescribe rules of substantive tax law. We made investments in loans secured by interests in pass-through entities in a manner than complies with the various requirements applicable to our qualification as a REIT. To the extent, however, that any such loans do not satisfy all of the requirements for reliance on the safe harbor set forth in Revenue Procedure, there can be no assurance that the IRS will not challenge the tax treatment of such loans, which could jeopardize our ability to qualify as a REIT.
Retirement Plan Risks
If the fiduciary of an employee benefit plan subject to ERISA (such as a profit sharing, Section 401(k) or pension plan) or an owner of a retirement arrangement subject to Section 4975 of the Internal Revenue Code (such as an individual retirement account (“IRA”)) fails to meet the fiduciary and other standards under ERISA or the Internal Revenue Code as a result of an investment in our stock, the fiduciary could be subject to penalties and other sanctions.
There are special considerations that apply to employee benefit plans subject to the Employee Retirement Income Security Act (“ERISA”) (such as profit sharing, Section 401(k) or pension plans) and other retirement plans or accounts subject to Section 4975 of the Internal Revenue Code (such as an IRA) that are investing in our shares. Fiduciaries and IRA owners investing the assets of such a plan or account in our common stock should satisfy themselves that:
| |
| • | the investment is consistent with their fiduciary and other obligations under ERISA and the Internal Revenue Code; |
| |
| • | the investment is made in accordance with the documents and instruments governing the plan or IRA, including the plan’s or account’s investment policy; |
| |
| • | the investment satisfies the prudence and diversification requirements of Sections 404(a)(1)(B) and 404(a)(1)(C) of ERISA and other applicable provisions of ERISA and the Internal Revenue Code; |
| |
| • | the investment in our shares, for which no public market currently exists, is consistent with the liquidity needs of the plan or IRA; |
| |
| • | the investment will not produce an unacceptable amount of “unrelated business taxable income” for the plan or IRA; |
| |
| • | our stockholders will be able to comply with the requirements under ERISA and the Internal Revenue Code to value the assets of the plan or IRA annually; and |
| |
| • | the investment will not constitute a prohibited transaction under Section 406 of ERISA or Section 4975 of the Internal Revenue Code. |
With respect to the annual valuation requirements described above, we will provide an estimated value for our shares annually. See “—Risks Related to Our Corporate Structure — The estimated value per share of our common stock may not reflect the value that stockholders will receive for their investment.” We can make no claim whether such estimated value will or will not satisfy the applicable annual valuation requirements under ERISA and the Internal Revenue Code. The Department of Labor or the Internal Revenue Service may determine that a plan fiduciary or an IRA custodian is required to take further steps to determine the value of our common shares. In the absence of an appropriate determination of value, a plan fiduciary or an IRA custodian may be subject to damages, penalties or other sanctions.
Failure to satisfy the fiduciary standards of conduct and other applicable requirements of ERISA and the Internal Revenue Code may result in the imposition of civil and criminal penalties and could subject the fiduciary to claims for damages or for equitable remedies, including liability for investment losses. In addition, if an investment in our shares constitutes a prohibited transaction under ERISA or the Internal Revenue Code, the fiduciary or IRA owner who authorized or directed the investment may be subject to the imposition of excise taxes with respect to the amount invested and the investment transaction must be undone. In the case of a prohibited transaction involving an IRA owner, the IRA may be disqualified as a tax-exempt account and all of the assets of the IRA may be deemed distributed and subjected to tax. ERISA plan fiduciaries and IRA owners should consult with counsel before making an investment in our common shares.
| |
| ITEM 1B. | UNRESOLVED STAFF COMMENTS |
We have no unresolved staff comments.
Real Estate Investments
As of December 31, 2011, our portfolio consisted of 642 properties encompassing 24.4 million rentable square feet, excluding 250 properties that were held for sale. The properties are located in 34 states and include office, industrial and bank branch properties. As of December 31, 2011, our portfolio was 85% occupied and the average annualized base rent per square foot of our real estate portfolio was $11.96 per square foot. The weighted-average remaining lease term of our real estate portfolio was 8.1 years as of December 31, 2011. Included in our real estate portfolio was 18.0 million rentable square feet related to 615 GKK Properties, excluding 247 GKK Properties held for sale. For a discussion of our real estate portfolio, see Part I, Item 1, “Business” of this annual report on Form 10-K.
Portfolio Lease Expirations
The following table reflects lease expirations of our properties, including the GKK Properties, but excluding 250 properties that were held for sale, as of December 31, 2011:
|
| | | | | | | | | | | | | | | | |
| Year of Expiration | | Number of Leases Expiring | | Annualized Base Rent (in thousands) (1) | | % of Portfolio Annualized Base Rent Expiring | | Leased Rentable Square Feet Expiring | | % of Portfolio Leased Rentable Square Feet Expiring |
| Month-to-Month | | 55 |
| | $ | 2,042 |
| | 1 | % | | 233,718 |
| | 1 | % |
| 2012 | | 161 |
| | 17,751 |
| | 7 | % | | 1,259,018 |
| | 6 | % |
| 2013 | | 128 |
| | 20,071 |
| | 8 | % | | 927,709 |
| | 4 | % |
| 2014 | | 107 |
| | 25,792 |
| | 10 | % | | 1,560,405 |
| | 8 | % |
| 2015 | | 81 |
| | 19,728 |
| | 8 | % | | 995,856 |
| | 5 | % |
| 2016 | | 93 |
| | 16,630 |
| | 7 | % | | 1,159,861 |
| | 6 | % |
| 2017 | | 65 |
| | 15,419 |
| | 7 | % | | 824,509 |
| | 4 | % |
| 2018 | | 32 |
| | 5,086 |
| | 2 | % | | 266,022 |
| | 1 | % |
| 2019 | | 161 |
| | 28,307 |
| | 11 | % | | 3,611,908 |
| | 17 | % |
| 2020 | | 26 |
| | 4,447 |
| | 2 | % | | 169,800 |
| | 1 | % |
| 2021 | | 18 |
| | 10,563 |
| | 4 | % | | 693,761 |
| | 3 | % |
Thereafter (2) | | 327 |
| | 83,495 |
| | 33 | % | | 9,173,084 |
| | 44 | % |
| Total | | 1,254 |
| | 249,331 |
| | 100 | % | | 20,875,651 |
| | 100 | % |
_____________________
(1) Annualized base rent represents annualized contractual base rental income as of December 31, 2011, adjusted for any contractual tenant concessions (including free rent).
(2) Represents leases expiring at various dates from 2022 through 2027.
We have assumed several leases related to the GKK Properties which contain shedding right provisions. As of December 31, 2011, these shedding rights totaled approximately 1.1 million square feet and can be exercised at various dates during 2012-2017. We have already been notified that 344,886 square feet will be shed in 2012 pursuant to these provisions, and this amount is not included in the table above.
Concentration of Credit Risks
As of December 31, 2011, our highest tenant industry concentration (greater than 10% of annualized base rent) was as follows:
|
| | | | | | | | | |
| Industry | | Number of Tenants | | Annualized
Base Rent (1) (in thousands) | | Percentage of Annualized Base Rent |
| Finance | | 110 | | $ | 143,943 |
| | 57.3 | % |
_____________________
(1) Annualized base rent represents annualized contractual base rental income as of December 31, 2011, adjusted for any contractual tenant concessions (including free rent).
The increase in the finance industry concentration from the prior period is due to the concentration in the GKK Properties. No other tenant industries accounted for more than 10% of our annualized base rent.
As of December 31, 2011, we had a concentration of credit risk related to leases with the following tenant that represented more than 10% of our annualized base rent:
|
| | | | | | | | | | | | | | | | | | | | | | |
| | | | | | | | | Annualized Base Rent Statistics | | |
| Tenant | | Property | | Tenant Industry | | Rentable Square Feet | | % of Portfolio Net Rentable Sq. Ft. | | Annualized Base Rent(1) (in thousands) | | % of Portfolio Annualized Base Rent | | Annualized Base Rent per Square Foot | | Lease Expirations |
| Bank of America, N.A. | | Various | | Finance | | 8,273,999 | | 33.9 | % | | $ | 72,800 |
| | 29.2 | % | | $ | 8.80 |
| | (2) |
_____________________
(1) Annualized base rent represents annualized contractual base rental income as of December 31, 2011, adjusted for any contractual tenant concessions (including free rent).
(2) As of December 31, 2011, lease expiration dates ranged from 2012 to 2026 with a weighted-average remaining term of 10.0 years. Some of the Bank of America leases contain shedding right provisions. These shedding rights totaled approximately 627,000 square feet and can be exercised at various dates from 2012 to 2017.
From time to time, we are party to legal proceedings that arise in the ordinary course of our business. Management is not aware of any legal proceedings of which the outcome is reasonably likely to have a material adverse effect on our results of operations or financial condition. Nor are we aware of any such legal proceedings contemplated by government authorities.
| |
| ITEM 4. | MINE SAFETY DISCLOSURES |
Not applicable.
PART II
| |
| ITEM 5. | MARKET FOR REGISTRANT’S COMMON EQUITY, RELATED STOCKHOLDER MATTERS AND ISSUER PURCHASES OF EQUITY SECURITIES |
Stockholder Information
As of March 22, 2012, we had approximately 191.5 million shares of common stock outstanding held by a total of approximately 42,000 stockholders. The number of stockholders is based on the records of DST Systems, Inc., who serves as our transfer agent.
Market Information
No public market currently exists for our shares of common stock, and we currently have no plans to list our shares on a national securities exchange. Until our shares are listed, if ever, our stockholders may not sell their shares unless the buyer meets the applicable suitability and minimum purchase requirements. In addition, our charter prohibits the ownership of more than 9.8% of our stock, unless exempted by our board of directors. Consequently, there is the risk that our stockholders may not be able to sell their shares at a time or price acceptable to them.
We are providing this estimated value per share to assist broker dealers that participated in our initial public offering in meeting their customer account statement reporting obligations under the National Association of Securities Dealers Rule 2340. For this purpose, we estimated the value of the shares of our common stock as $5.16 per share as of December 31, 2011. This estimated value per share is based on our board of directors’ approval on March 22, 2012 of an estimated value per share of our common stock of $5.16 based on the estimated value of our assets less the estimated value of our liabilities, divided by the number of shares outstanding, all as of December 31, 2011.
The estimated value per share was based upon the recommendation and valuation of our advisor based on the methodologies and assumptions described further below. With regard to the valuation of our real estate properties, we engaged Duff & Phelps, LLC (“Duff & Phelps”), a third-party real estate valuation firm, to review the assumptions and methodologies applied by our advisor in accordance with a set of limited procedures. Duff & Phelps reviewed our advisor’s real estate valuations, and the methodologies and assumptions used in determining our advisor’s valuation conclusions (including capitalization rates, discount rates and estimated cash flows), and shared with our board of directors its views regarding the reasonableness of such methodologies and valuation conclusions. Nothing in the Duff & Phelps report caused our board of directors to question the reasonableness of our advisor’s valuation of our real estate. After considering all information provided in light of our board of directors’ extensive knowledge of our assets, our board of directors unanimously agreed upon the estimated value per share of $5.16, which determination is ultimately and solely the responsibility of our board of directors.
The table below sets forth the calculation of our unaudited estimated value per share as of March 22, 2012 as well as the calculation of our prior estimated value per share as of December 2, 2010:
|
| | | | | | | | |
| | | March 22, 2012 Estimated Value per Share | | December 2, 2010 Estimated Value per Share |
| Real estate properties - historical | | $ | 5.14 |
| | $ | 7.53 |
|
| Real estate held for sale | | 0.64 |
| | 0.17 |
|
Real estate - GKK Properties (including properties held for sale) (1) | | 9.47 |
| | — |
|
| Foreclosed real estate held for sale | | 0.15 |
| | 0.36 |
|
Real estate loans receivable (1) | | 0.22 |
| | 3.19 |
|
| Real estate securities | | 0.24 |
| | 0.36 |
|
Pledged government securities (1) | | 0.48 |
| | — |
|
| Investments in joint ventures | | 0.16 |
| | 0.68 |
|
| Cash and restricted cash | | 0.93 |
| | 0.74 |
|
| Other assets | | 0.22 |
| | 0.04 |
|
Mortgage debt and repurchase agreements (1) | | (11.84 | ) | | (5.48 | ) |
| Other liabilities | | (0.65 | ) | | (0.27 | ) |
| Estimated value per share | | $ | 5.16 |
| | $ | 7.32 |
|
| Estimated enterprise value premium | | None assumed |
| | None assumed |
|
| Total estimated value per share | | $ | 5.16 |
| | $ | 7.32 |
|
(1) During the year ended December 31, 2011, we entered into the Settlement Agreement to effect the orderly transfer of certain assets and liabilities to us in satisfaction of the debt owed to us by the borrower under the GKK Mezzanine Loan. The estimated value of the real estate transferred was $1,806.1 million, of which $285.6 million was held for sale as of December 31, 2011. In addition, we assumed $1,544.0 million of mortgage debt and approximately $203.0 million of other net assets. Our investment in the GKK Mezzanine Loan was fully secured by the collateral and no impairment charge was recorded as the fair value of the assets and liabilities transferred approximated the carrying value of the GKK Mezzanine Loan as of September 1, 2011.
The decrease in our unaudited estimated value per share from the previous estimate was primarily due to the items noted below, which reflect the major contributors to the decrease in the estimated value per share from $7.32 to $5.16. The changes are not equal to the change in values of each asset and liability group presented above due to asset sales, loan paydowns, the transfers resulting from the Settlement Agreement and other factors, which caused the value of certain asset or liability groups to change without necessarily impacting the overall estimated value per share. The decrease in our estimated value per share was due to the following: |
| | | | | | | | | | |
| | | Change in Unaudited Estimated Value (in thousands) | | Change in Unaudited Estimated Value per Share | | % Change in Estimated Value per Share |
| Historical real estate investments (including the National Industrial Portfolio Joint Venture) | | $ | (136,222 | ) | | $ | (0.71 | ) | | (33.1)% |
| Arden/HSC Partners Joint Venture | | (75,308 | ) | | (0.39 | ) | | (18.3)% |
| Dividends declared in excess of operating cash flows | | (68,780 | ) | | (0.36 | ) | | (16.7)% |
| Real estate loans receivable | | (60,278 | ) | | (0.32 | ) | | (14.5)% |
| Notes payable and repurchase agreements | | (42,045 | ) | | (0.22 | ) | | (10.2)% |
| Real estate investments sold | | (28,539 | ) | | (0.15 | ) | | (7.0)% |
| Real estate securities | | (20,426 | ) | | (0.11 | ) | | (5.0)% |
| Other changes, net | | 19,016 |
| | 0.10 |
| | 4.6% |
| | | $ | (412,582 | ) | | $ | (2.16 | ) | | |
FINRA rules provide no guidance on the methodology an issuer must use to determine its estimated value per share. As with any valuation methodology, our advisor’s methodology is based upon a number of estimates and assumptions that may not be accurate or complete. Different parties with different assumptions and estimates could derive a different estimated value per share, and these differences could be significant. The estimated value per share is not audited and does not represent the fair value of our assets less our liabilities according to GAAP, nor does it represent a liquidation value of our assets and liabilities or the amount our shares of common stock would trade at on a national securities exchange. As of March 26, 2012, we had no potentially dilutive securities outstanding that would impact the estimated value per share of our common stock.
Methodology
Our goal in calculating an estimated value per share is to arrive at a value that is reasonable and supportable using what we and our advisor deem to be appropriate valuation methodologies and assumptions. The following is a summary of the valuation methodologies used by our advisor to value our assets and liabilities:
Investments in Real Estate: For purposes of calculating an estimated value per share, our advisor estimated the value of our historical investments in real estate by using a 10-year discounted cash flow analysis. Our advisor calculated the value of our investments in real estate using internally prepared cash flow estimates, terminal capitalization rates and discount rates that fall within ranges our advisor believes would be used by similar investors to value the properties we own. The capitalization rates and discount rates were calculated utilizing methodologies that adjust for various property specific and market specific information. The resulting capitalization rates were compared to historical average capitalization rate ranges that were obtained from third-party service providers for specific metro areas and applied on a property-by-property basis. The calculated discount rates were compared to a number of data points including third‑party estimates, a variety of weighted-average cost of capital calculations and yields and changes in yields on benchmark securities over the last year. The cash flow estimates were developed for each property by the real estate professionals at our advisor based on their expertise in managing commercial real estate and preparing real estate valuations for pension funds and institutional investors that have invested in other KBS-sponsored funds. While our advisor believes a 10-year discounted cash flow analysis is a valuation method that would be used by a willing market participant to value real estate and is a concept in accordance with GAAP, the estimated values for our investments in real estate may or may not represent current market values and do not equal the book value of our real estate investments in accordance with GAAP. Real estate is currently carried in our financial statements at its amortized cost basis, adjusted for any impairments recognized to date.
As of December 31, 2011, we owned 27 real estate properties (which excludes the GKK Properties and three properties that were held for sale) consisting of office and industrial properties. The cost of these properties, including acquisition fees and expenses and capital improvements, was $1,169.7 million. As of December 31, 2011, the estimated value of our investments in real estate using the valuation method described above was $980.8 million. The following summarizes the key assumptions that were used in the discounted cash flow models to estimate the value of our real estate assets:
|
| | | |
| | Range in Values | | Weighted-Average Basis |
| Terminal capitalization rate | 6.75% to 8.50% | | 7.43% |
| Discount rate | 7.25% to 9.50% | | 8.13% |
Annual market rent growth rate (1) | 0% to 6.13% | | 3.91% |
Annual net operating income growth rate (2) | (1.3)% to 22.3% | | 4.96% |
| Holding period | 10 to 11 years | | 10.1 years |
_____________________
(1) Rates reflect estimated compounded annual growth rates (CAGRs) for market rents over the holding period. The range of CAGRs shown is the constant annual rate at which the market rent is projected to grow to reach the market rent in the final year of the hold period for each of the properties.
(2) The net operating income CAGRs reflects both the contractual and market rents (in cases where the contractual lease period is less than the hold period) net of expenses over the holding period. The range of CAGRs shown is the constant annual rate at which the net operating income is projected to grow to reach the net operating income in the final year of the hold period for each of the properties.
While we believe that our assumptions and inputs are reasonable, a change in these assumptions and inputs would change the estimated value of our real estate. Assuming all other factors remain unchanged, a decrease to the terminal capitalization rates of 25 basis points would increase our real estate value to $1,002.1 million and an increase in the terminal capitalization rates of 25 basis points would decrease our real estate value to $961.0 million. Similarly, a decrease to the discount rates of 25 basis points would increase our real estate value to $999.5 million and an increase in the discount rates of 25 basis points would decrease our real estate value to $962.6 million.
Real Estate Held‑for‑Sale: As of December 31, 2011, we owned 3 properties held for sale. These properties all sold subsequent to December 31, 2011. Our advisor estimated the value of our investment in real estate held for sale based on the net proceeds from the sale. The cost of our properties held for sale, including acquisition fees and expenses and capital improvements, was $151.1 million and the estimated value was $121.7 million.
GKK Properties: As of December 31, 2011, the GKK Properties (including 247 properties that were held for sale) consisted of 862 bank branch properties, office buildings, operations centers and other properties. Our advisor obtained estimated property values for the GKK Properties from various sources such as third-party valuations, broker’s opinions of value and other broker estimates of value. Our advisor also obtained property specific information from the previous owners of the GKK Properties. With respect to the GKK Properties marketed for sale or that have been sold subsequent to December 31, 2011, the estimated fair values were based on actual offers received or brokers estimated selling prices, net of expected selling costs. Based on all of the information obtained from these various sources and the expertise of the professionals at our advisor in managing commercial real estate and preparing real estate valuations for private funds and institutional investors, our advisor calculated the estimated value of the GKK Properties to be $1,806.1 million as of December 31, 2011. This value is equal to the GAAP fair value at which we recorded these properties upon consolidation in conjunction with the execution of the Settlement Agreement as reflected in this annual report on Form 10-K.
Foreclosed Real Estate Held‑for‑Sale: The estimated value for foreclosed condos held-for-sale is equal to their book value which our advisor believes equals net realizable value based on recent comparable sales in the marketplace. Our advisor believes the book value of the foreclosed condos held-for-sale is fully recoverable upon the sales of the condos.
Real Estate Loans Receivable: The estimated values for the real estate loans receivable are equal to the GAAP fair values disclosed in the notes to our financial statements in this annual report on Form 10-K. The values of the real estate loans receivable were estimated by applying a discounted cash flow analysis over the remaining expected lives of the investments, excluding any potential transaction costs. The cash flow estimates used in the analysis during the term of the investments were based on the investments’ contractual cash flows, which we anticipate to receive. The expected cash flows for the loans were discounted at rates that we expect a market participant would require for instruments with similar characteristics, including remaining loan term, loan-to-value ratios, type of collateral, current performance, credit enhancements and other factors.
As of December 31, 2011, we owned seven real estate loans receivable, consisting of mortgage loans, mezzanine loans, B-notes and subordinated debt. The cost of our real estate loans receivable, including origination fees and costs and net of principal repayments, was $66.8 million. As of December 31, 2011, the estimated value of our investments in real estate loans receivable was $42.6 million. The weighted-average discount rate applied to the cash flows from the real estate loans receivable, which have a weighted-average remaining term of 2.8 years, was approximately 12.7%. Similar to the valuation for real estate, a change in the assumptions and inputs would change the estimated value of our real estate loans receivable. Assuming all factors remain unchanged, a decrease to the discount rates of 25 basis points would increase our real estate loans receivable value to $42.8 million and an increase of 25 basis points would decrease our real estate loans receivable value to $42.3 million.
Real Estate Securities: The estimated value of the fixed rate securities is equal to the GAAP fair value disclosed in this annual report on Form 10-K. The cost and estimated value of our fixed rate real estate securities were $44.2 million and $46.2 million, respectively.
Our advisor estimated the value of our floating rate real estate securities at zero, which is consistent with the GAAP fair value of the floating rate securities. We do not expect to receive future interest or principal repayment on our floating rate real estate securities. The cost of the floating rate real estate securities was $17.7 million.
Pledged government securities: The estimated value of the government securities of $91.5 million is equal to the GAAP fair value disclosed in this annual report on Form 10-K.
Investments in Unconsolidated Joint Ventures
Participation Interest in Unconsolidated Joint Venture: As of December 31, 2011, we held an interest in an unconsolidated joint venture whereby we have been granted a participation interest in certain future profits generated by the joint venture. Our advisor estimated the value of our participation interest in this unconsolidated joint venture using a discounted cash flow analysis of the expected distributions to us. The cash flow estimates used in the analysis were based on our participation interest in the estimated cash flows available after paying debt service and making distributions to the other joint venture members until such members have received distributions sufficient to recover the entire amount of their invested capital plus a stipulated return. The cash flow estimates of the joint venture were reviewed by our advisor. As of December 31, 2011, the carrying value and estimated fair value of our investment in this unconsolidated joint venture were $0 and $30.8 million, respectively. The estimated value of our unconsolidated joint venture for purposes of our estimated value per share was calculated by applying a 12% discount rate to the estimated cash flows for a total value of $0.16 per share. Assuming all factors remain unchanged, a decrease to the discount rate of 100 basis points would increase the estimated value of our participation interest in this unconsolidated joint venture to $32.1 million and an increase of 100 basis points would decrease the estimated value of our participation interest in this unconsolidated joint venture to $29.6 million.
Arden/HSC Partners Joint Venture: As of December 31, 2011, we held a preferred membership interest in another unconsolidated joint venture. We do not expect to receive any future income or capital return from this joint venture and determined that the estimated value of our preferred membership interest was $0 at December 31, 2011, which was equal to the GAAP fair value. See further discussion of the Arden/HSC Partners Joint Venture in this annual report on Form 10-K.
Notes Payable and Repurchase Agreements: The estimated values of our notes payable and repurchase agreements are equal to the GAAP fair values as disclosed in the notes to the financial statements in this annual report on Form 10-K. The values of our notes payable and repurchase agreements were determined using a discounted cash flow analysis. The cash flows were based on the remaining loan terms, including extensions expected to be exercised, and the discount rates were based on management’s estimates of current market interest rates for instruments with similar characteristics, including remaining loan term, loan‑to‑value ratio and type of collateral.
As of December 31, 2011, the fair value and carrying value of our notes payable and repurchase agreements were $2,257.7 million and $2,299.2 million, respectively. The weighted-average discount rate applied to the future estimated debt payments, which have a weighted-average remaining term of 3.0 years, was approximately 5.3%. Assuming all factors remained unchanged, a decrease to the discount rates of 25 basis points would result in an increase in our notes payable to $2,270.9 million and an increase to the discount rates of 25 basis points would result in a decrease in our notes payable to $2,244.6 million.
Other Assets and Liabilities: The carrying values of a majority of our other assets and liabilities are considered to equal their fair value due to their short maturities or liquid nature. Certain balances, including interest receivable on real estate‑related assets, above/below market leases related to real estate investments and interest payable on notes payable have been eliminated for the purpose of the valuation due to the fact that the value of those balances were already considered in the valuation of the respective investments. Our advisor has also excluded redeemable common stock as temporary equity does not represent a true liability to us and the shares that this amount represents are included in our total outstanding shares of common stock for purposes of calculating the estimated value per share of our common stock.
Other Considerations: In addition to the estimated values for our assets and liabilities, our advisor also adjusted the estimated value per share due to distributions declared for record dates subsequent to December 31, 2011. During 2012, we declared distributions based on daily record dates for each day during the period commencing January 1, 2012 through February 28, 2012. The net cash distributions (dividends declared less dividends reinvested) paid or to be paid were $9.0 million. As a result, our advisor reduced the estimated value per share by $0.05 to reflect the amount of net cash distributions for record dates commencing January 1, 2012 through February 28, 2012 with no adjustment for cash flows from operations for the period as such cash flows have not been finalized.
Different parties using different assumptions and estimates could derive a different estimated value per share, and these differences could be significant. Markets for real estate and real estate-related investments can fluctuate and values are expected to change in the future.
Limitations of Estimated Value Per Share
As mentioned above, we are providing this estimated value per share to assist broker dealers that participated in our initial public offering in meeting their customer account statement reporting obligations. The estimated value per share set forth above will first appear on the March 2012 customer account statements that will be mailed in April 2012. As with any valuation methodology, our advisor’s methodology is based upon a number of estimates and assumptions that may not be accurate or complete. Different parties with different assumptions and estimates could derive a different estimated value per share. Accordingly, with respect to the estimated value per share, we can give no assurance that:
| |
| • | a stockholder would be able to resell his or her shares at this estimated value; |
| |
| • | a stockholder would ultimately realize distributions per share equal to our estimated value per share upon liquidation of our assets and settlement of our liabilities or a sale of our company; |
| |
| • | our shares of common stock would trade at the estimated value per share on a national securities exchange; |
| |
| • | an independent third-party appraiser or other third-party valuation firm would agree with our estimated value per share; or |
| |
| • | the methodology used to estimate our value per share would be acceptable to FINRA or for compliance with ERISA reporting requirements. |
Further, the estimated value per share as of March 22, 2012 is based on the estimated value of our assets less the estimated value of our liabilities divided by the number of shares outstanding, all as of December 31, 2011. The value of our shares will fluctuate over time in response to developments related to individual assets in the portfolio and the management of those assets and in response to the real estate and finance markets. We currently expect to engage our advisor and/or an independent valuation firm to update the estimated value per share in December 2012, but are not required to update the estimated value per share more frequently than every 18 months.
Distribution Information
We elected to be taxed as a REIT under the Internal Revenue Code and have operated as such beginning with our taxable year ended December 31, 2006. To qualify and maintain our qualification as a REIT, we must meet certain organizational and operational requirements, including a requirement to distribute at least 90% of our REIT taxable income (computed without regard to the dividends-paid deduction or net capital gain and which does not necessarily equal net income as calculated in accordance with GAAP). Our board of directors may authorize distributions in excess of those required for us to maintain REIT status depending on our financial condition and such other factors as our board of directors deems relevant.
During 2010 and 2011, we declared distributions based on daily record dates for each day during the period commencing January 1, 2010 through December 31, 2011. Distributions for all record dates of a given month are paid approximately 15 days after month-end. Distributions declared during 2010 and 2011, aggregated by quarter, are as follows (dollars in thousands, except per share amounts):
|
| | | | | | | | | | | | | | | | | | | | |
| | | 2011 |
| | | 1st Quarter | | 2nd Quarter | | 3rd Quarter | | 4th Quarter | | Total |
| Total Distributions Declared | | $ | 24,090 |
| | $ | 24,538 |
| | $ | 24,987 |
| | $ | 25,161 |
| | $ | 98,776 |
|
| Total Per Share Distribution | | $ | 0.129 |
| | $ | 0.131 |
| | $ | 0.132 |
| | $ | 0.133 |
| | $ | 0.525 |
|
Annualized Rate Based on Purchase Price of $10.00 Per Share | | 5.25 | % | | 5.25 | % | | 5.25 | % | | 5.25 | % | | 5.25 | % |
|
| | | | | | | | | | | | | | | | | | | | |
| | | 2010 |
| | | 1st Quarter | | 2nd Quarter | | 3rd Quarter | | 4th Quarter | | Total |
| Total Distributions Declared | | $ | 23,324 |
| | $ | 23,777 |
| | $ | 24,231 |
| | $ | 24,429 |
| | $ | 95,761 |
|
| Total Per Share Distribution | | $ | 0.129 |
| | $ | 0.131 |
| | $ | 0.132 |
| | $ | 0.133 |
| | $ | 0.525 |
|
Annualized Rate Based on Purchase Price of $10.00 Per Share | | 5.25 | % | | 5.25 | % | | 5.25 | % | | 5.25 | % | | 5.25 | % |
The tax composition of our distributions declared for the years ended December 31, 2011 and 2010 was as follows:
|
| | | | | | |
| | | 2011 | | 2010 |
| Ordinary Income | | — | % | | — | % |
| Capital Gain | | — | % | | 4 | % |
| Return of Capital | | 100 | % | | 96 | % |
| Total | | 100 | % | | 100 | % |
For more information with respect to our distributions paid, see Part II, Item 7, “Management’s Discussion and Analysis of Financial Condition and Results of Operations — Distributions.”
On March 20, 2012, our board of directors approved the suspension of monthly distribution payments in order to manage our reduced cash flows from operations and to redirect available funds to reduce our debt. Our primary concern is the repayment of our Amended Repurchase Agreements, but we expect to use available funds to repay other debt obligations as well. Reducing our debt will allow us to hold certain assets in our portfolio to improve their value and the returns to our stockholders. After repaying our Amended Repurchase Agreements and some of our other debt obligations through the suspension of monthly distribution payments and the sale of certain assets, we plan to make certain strategic asset sales and, from time to time, may declare special distributions to our stockholders that would be funded with the net proceeds from those asset sales or from cash flow from other sources. We will continue our existing strategy to sell assets when we believe the assets have reached the stage that disposition will assist in improving returns to our investors.
As a result of general economic conditions over the last several years, our portfolio has experienced increasing pressure from declines in cash flow from a number of our investments. The most significant factor has been a decline in cash flow from our real estate-related investments. In particular, our investments in mezzanine and mortgage loans have been impacted as the operating performance and values of buildings directly or indirectly securing our investment positions have decreased from the date of our acquisition or origination of these investments. In such instances, some of the borrowers have not been able to refinance their debt to us or sell the collateral at a price sufficient to repay our note balances in full when they become due. In addition, current economic conditions have impacted the ability of some borrowers under our loans to make contractual interest payments to us. Economic conditions have also impacted our real estate investments resulting in a decline in the occupancy of our portfolio, an important element to the continued growth of our portfolio, that has resulted in lower current cash flow. Tenant-specific issues, including bankruptcy and down-sizing, have placed downward pressure on our operating cash flow because these tenants have terminated their leases early, not renewed their leases or have not paid their contractual rent to us. Projected future declines in rental rates, slower or potentially negative net absorption of leased space and expectations of increases in future rental concessions, including three or more months of free rent to retain tenants who are up for renewal or to sign new tenants, are expected to result in additional decreases in cash flow. Moreover, asset sales in 2011 and expected future asset sales to meet our liquidity needs will result in further decreases in operating cash flow.
Due to these factors, we may not generate sufficient operating cash flow on a quarterly basis to cover our operations. If our cash flow from operations continues to deteriorate, we will be more dependent on asset sales to fund our operations and for our liquidity needs. These factors could also reduce our stockholders’ overall investment return.
In connection with the change to our distribution policy, our board of directors has terminated our dividend reinvestment plan effective April 10, 2012. In addition, our board of directors has amended and restated our share redemption program to provide only for redemptions sought upon a stockholder’s death, “qualifying disability” or “determination of incompetence” (each as defined in the share redemption program). Such redemptions are subject to an annual dollar limitation, which shall be $10.0 million in the aggregate for the calendar year 2012 (subject to review and adjustment during the year by the board of directors), and further subject to the limitations described in the share redemption program plan document. Based on historical redemption activity, we believe the $10.0 million redemption limitation for the calendar year 2012 will be sufficient for these special redemptions. During each calendar year, the annual dollar limitation for the share redemption program will be reviewed and adjusted from time to time.
On April 28, 2011, in connection with the execution of the Amended Repurchase Agreements, we agreed that during the term of the Amended Repurchase Agreements and except for distributions to stockholders necessary to maintain our REIT status, we would limit distributions to stockholders to an amount not to exceed $6.0 million per month, excluding any distributions to stockholders reinvested in our dividend reinvestment plan (which will terminate effective April 10, 2012).
In order that our stockholders could begin earning cash distributions, KBS Capital Advisors agreed to advance funds to us equal to the amount by which the cumulative amount of distributions declared by our board of directors from January 1, 2006 through the period ending August 31, 2010 exceeded the amount of our Funds from Operations (as defined in the advisory agreement) for the same period. From inception, our advisor had advanced an aggregate unreimbursed amount of $1.6 million to us and no amount had been advanced since January 2007. We were only obligated to reimburse our advisor for these expenses if and to the extent that our cumulative Funds from Operations for the period commencing January 1, 2006 through the date of any such reimbursement exceeded the lesser of (i) the cumulative amount of any distributions declared and payable to our stockholders as of the date of such reimbursement or (ii) an amount that is equal to a 7.0% cumulative, non-compounded, annual return on invested capital for our stockholders for the period from July 18, 2006 through the date of such reimbursement. No interest accrued on the advances made by our advisor. On March 20, 2012, we entered into an amendment to the advisory agreement with our advisor pursuant to which our advisor agreed to forgive the debt related to the $1.6 million of advances.
Our operating performance cannot be accurately predicted and may deteriorate in the future due to numerous factors, including those discussed under “Forward-Looking Statements,” Part I, Item 1, “Business — Market Outlook — Real Estate and Real Estate Finance Markets,” Part I, Item 1A, “Risk Factors” and Part II, Item 7, “Management’s Discussion and Analysis of Financial Condition and Results of Operations.” Those factors include: the future operating performance of our investments in the existing real estate and financial environment; the success and economic viability of our tenants; the ability of our borrowers and their sponsors to continue to make their debt service payments and/or to repay their loans upon maturity; our ability to refinance existing indebtedness at comparable terms; changes in interest rates on our variable rate debt obligations; our ability to sell assets to cover our liquidity needs; our ability to successfully operate and sell the GKK Properties transferred to us under the Settlement Agreement given current economic conditions and the concentration of the GKK Properties in the financial services sector; the significant debt obligations we assumed with respect to the GKK Properties; and our advisor’s limited experience operating and selling bank branch properties.
On November 23, 2011, our board of directors declared distributions based on daily record dates for the period from December 1, 2011 through December 31, 2011, which we paid on January 13, 2012. On December 19, 2011, our board of directors declared distributions based on daily record dates for the period from January 1, 2012 through January 31, 2012, which we paid on February 15, 2012. On January 30, 2012, our board of directors declared distributions based on daily record dates for the period from February 1, 2012 through February 28, 2012, which we expect to pay on March 30, 2012. Investors may choose to receive cash distributions or purchase additional shares through our dividend reinvestment plan (which will terminate effective April 10, 2012).
Distributions for these periods are calculated based on stockholders of record each day during these periods at a rate of $0.00143836 per share per day and equal a daily amount that, if paid each day for a 365-day period, would equal a 5.25% annualized rate based on a purchase price of $10.00 per share.
Equity Compensation Plan
We have adopted an Employee and Independent Director Incentive Stock Plan to (i) furnish incentives to individuals chosen to receive share-based awards because we consider them capable of improving our operations and increasing our profits; (ii) encourage selected persons to accept or continue employment with our advisor; and (iii) increase the interest of our independent directors in our welfare through their participation in the growth in the value of our shares of common stock. The total number of shares of common stock we have reserved for issuance under the Employee and Independent Director Incentive Stock Plan is equal to 5% of our outstanding shares at any time, but not to exceed 10,000,000 shares. No awards have been granted under the plan as of March 26, 2012. We have no timetable for the grant of any awards under the Employee and Independent Director Incentive Stock Plan, and our board of directors has adopted a policy that prohibits grants of any awards of shares of common stock to any person under the Employee and Independent Director Stock Plan. Our Employee and Independent Director Incentive Stock Plan was approved prior to the commencement of our public offering by our board of directors and initial stockholder, KBS Capital Advisors, our advisor.
Unregistered Sales of Equity Securities
During the year ended December 31, 2011, we did not sell any equity securities that were not registered under the Securities Act of 1933.
Share Redemption Program
We have a share redemption program that may enable stockholders to sell their shares to us in connection with a stockholder’s death, “qualifying disability” or “determination of incompetence” (each as defined in the share redemption program). On December 10, 2010, we announced that based on our 2011 budgeted expenditures, and except with respect to redemptions sought upon a stockholder’s death, “qualifying disability” and “determination of incompetence,” we did not expect to have funds available for redemption under the share redemption program in 2011. On April 28, 2011, in connection with the amendment and restatement of the repurchase agreements related to our investment in the GKK Mezzanine Loan, we agreed that during the term of the Amended Repurchase Agreements we would continue to limit redemptions under our share redemption program to those sought upon a stockholder’s death, “qualifying disability” or “determination of incompetence.” The Amended Repurchase Agreements will terminate on the earliest to occur of (i) April 28, 2013; (ii) the date that the Amended Repurchase Agreements convert into a mezzanine loan (which would likely contain substantially similar terms as the Amended Repurchase Agreements, including with respect to our share redemption program restrictions); (iii) the date that all obligations under the Amended Repurchase Agreements are fully paid; or (iv) upon an event causing the Amended Repurchase Agreements to otherwise terminate. See Part I, Item 1, “Business — Investment Portfolio — GKK Properties.”
On March 20, 2012, our board of directors amended and restated our share redemption program to provide only for redemptions sought upon a stockholder’s death, “qualifying disability” or “determination of incompetence” (each as defined in the share redemption program). Such redemptions are subject to an annual dollar limitation and further subject to the other limitations described in the share redemption program plan document, including:
| |
| • | During each calendar year, redemptions sought in connection with a stockholder’s death, “qualifying disability” or “determination of incompetence” (each as defined under the share redemption program) will be limited to an annual amount determined by the board of directors. The annual dollar limitation for the share redemption program may be reviewed and adjusted from time to time during the year. The dollar limitation for calendar year 2012 is $10.0 million in the aggregate, subject to review and adjustment during the year by the board of directors. |
| |
| • | During any calendar year, we may redeem no more than 5% of the weighted-average number of shares outstanding during the prior calendar year. |
| |
| • | We have no obligation to redeem shares if the redemption would violate the restrictions on distributions under Maryland law, which prohibits distributions that would cause a corporation to fail to meet statutory tests of solvency. |
We do not expect to have funds available for ordinary redemptions in the future.
The amended and restated share redemption program will be effective on April 25, 2012, 30 days after we file this annual report on Form 10-K. The complete plan document is filed as an exhibit to this annual report on Form 10-K and is available at the SEC’s website at http://www.sec.gov.
Prior to the recent amendments to the share redemption program, the limitations on our ability to redeem shares were as follows:
| |
| • | Unless the shares were being redeemed in connection with a stockholder’s death, “qualifying disability” or “determination of incompetence” (each as defined under the share redemption program), we could not redeem shares until the stockholder had held the shares for one year. |
| |
| • | During each calendar year, redemptions were limited to the amount of net proceeds from the issuance of shares under the dividend reinvestment plan during the prior calendar year less amounts we deemed necessary from such proceeds to fund current and future: capital expenditures, tenant improvement costs and leasing costs related to our investments in real estate properties; reserves required by financings of our investments in real estate properties; and funding obligations under our real estate loans receivable, as each may be adjusted from time to time by management, provided that if the shares were submitted for redemption in connection with a stockholder’s death, “qualifying disability” or “determination of incompetence”, we would honor such redemptions to the extent that all redemptions for the calendar year were less than the amount of the net proceeds from the issuance of shares under the dividend reinvestment plan during the prior calendar year. |
| |
| • | During any calendar year, we redeemed no more than 5% of the weighted-average number of shares outstanding during the prior calendar year. |
| |
| • | We had no obligation to redeem shares if the redemption would have violated the restrictions on distributions under Maryland law, which prohibits distributions that would cause a corporation to fail to meet statutory tests of solvency. |
The only redemptions we made under the share redemption program in 2011 were those that qualified as, and met the requirements for, special redemptions under our share redemption program, i.e., all redemptions under the plan were made in connection with a stockholder’s death, “qualifying disability” or “determination of incompetence.” In 2011, we fulfilled all redemption requests that qualified as special redemptions under the share redemption program.
In accordance with our share redemption program, once we establish an estimated value per share, the redemption price for all stockholders whose share are eligible for redemption is equal to the estimated value per share. On December 2, 2010, our board of directors approved an estimated value per share of our common stock of $7.32 based on the estimated value of our assets less the estimated value of our liabilities divided by the number of shares outstanding, all as of September 30, 2010. As such, the redemption price for all stockholders whose shares were eligible for redemption was $7.32 per share for redemption dates from January 2011 through December 2011.
On March 22, 2012, our board of directors approved an estimated value per share of our shares of common stock of $5.16 per share, based on the estimated value of our assets less the estimated value of our liabilities divided by the number of shares outstanding, all as of December 31, 2011. Commencing with the March 2012 redemption date, the redemption price for all shares eligible for redemption is $5.16 per share. For a full description of the methodologies used to value our assets and liabilities in connection with the calculation of the estimated value per share, see Part II, Item 5, “Market for Registrant’s Common Equity, Related Stockholder Matters and Issuer Purchases of Equity Securities — Market Information.” We currently expect to engage our advisor and/or an independent valuation firm to update the estimated value per share in December 2012, but are not required to update the estimated value per share more frequently than every 18 months.
During the year ended December 31, 2011, we redeemed shares pursuant to our share redemption program as follows:
|
| | | | | | | | | |
| Month | | Total Number of Shares Redeemed (1) | | Average Price Paid Per Share (2) | | Approximate Dollar Value of Shares Available That May Yet Be Redeemed Under the Program |
| January 2011 | | 62,143 |
| | $ | 7.32 |
| | (3) |
| February 2011 | | 66,590 |
| | $ | 7.32 |
| | (3) |
| March 2011 | | 77,692 |
| | $ | 7.32 |
| | (3) |
| April 2011 | | 34,869 |
| | $ | 7.32 |
| | (3) |
| May 2011 | | 88,229 |
| | $ | 7.32 |
| | (3) |
| June 2011 | | 63,150 |
| | $ | 7.32 |
| | (3) |
| July 2011 | | 48,349 |
| | $ | 7.32 |
| | (3) |
| August 2011 | | 170,070 |
| | $ | 7.32 |
| | (3) |
| September 2011 | | 91,612 |
| | $ | 7.32 |
| | (3) |
| October 2011 | | 62,312 |
| | $ | 7.32 |
| | (3) |
| November 2011 | | 99,644 |
| | $ | 7.32 |
| | (3) |
| December 2011 | | 75,340 |
| | $ | 7.32 |
| | (3) |
| Total | | 940,000 |
| | | | |
(1) We announced commencement of the program on April 6, 2006 and amendments to the program on August 16, 2006 (which amendment became effective on December 14, 2006), August 1, 2007 (which amendment became effective on September 13, 2007), August 14, 2008 (which amendment became effective on September 13, 2008), March 26, 2009 (which amendment became effective on April 26, 2009), May 13, 2009 (which amendment became effective on June 12, 2009) and March 26, 2012 (which amendment will become effective on April 25, 2012).
(2) In accordance with our share redemption program, the redemption price for all stockholders is equal to the estimated value per share. During 2011, all shares redeemed under the share redemption program were redeemed at $7.32. On March 22, 2012, our board of directors approved an estimated value per share of our common stock of $5.16 based on the estimated value of our assets less the estimated value of our liabilities divided by the number of shares outstanding, all as of December 31, 2011. Effective for the March 2012 redemption date and until the estimated value per share is updated, the redemption price for all stockholders whose shares are eligible for redemption is $5.16 per share. We currently expect to engage our advisor and/or an independent valuation firm to update the estimated value per share in December 2012, but are not required to update the estimated value per share more frequently than every 18 months.
(3) We limit the dollar value of shares that may be redeemed under the share redemption program as described above.
We may amend, suspend or terminate the program upon 30 days’ notice to our stockholders. We may provide this notice by including such information in a Current Report on Form 8-K or in our annual or quarterly reports, all publicly filed with the SEC, or by a separate mailing to our stockholders.
| |
| ITEM 6. | SELECTED FINANCIAL DATA |
The following selected financial data as of and for the years ended December 31, 2011, 2010, 2009, 2008 and 2007 should be read in conjunction with the accompanying consolidated financial statements and related notes thereto and Part II, Item 7, “Management’s Discussion and Analysis of Financial Condition and Results of Operations” below (in thousands, except share and per share amounts):
|
| | | | | | | | | | | | | | | | | | | | |
| | | As of December 31, |
| | | 2011 | | 2010 | | 2009 | | 2008 | | 2007 |
| Balance sheet data | | | | | | | | | | |
| Total real estate and real estate-related investments, net | | $ | 3,084,354 |
| | $ | 2,204,198 |
| | $ | 2,507,327 |
| | $ | 2,807,768 |
| | $ | 1,680,777 |
|
| Total assets | | 3,504,788 |
| | 2,433,390 |
| | 2,640,011 |
| | 2,928,550 |
| | 1,816,494 |
|
| Total notes payable and repurchase agreements | | 2,299,208 |
| | 1,479,015 |
| | 1,504,720 |
| | 1,499,806 |
| | 1,008,564 |
|
| Total liabilities | | 2,644,531 |
| | 1,548,506 |
| | 1,590,650 |
| | 1,605,451 |
| | 1,077,179 |
|
| Redeemable common stock | | 45,376 |
| | 45,382 |
| | 56,741 |
| | 55,907 |
| | 14,645 |
|
| Total KBS Real Estate Investment Trust, Inc. stockholders’ equity | | 814,881 |
| | 861,838 |
| | 987,833 |
| | 1,255,141 |
| | 706,440 |
|
| | | For the Years Ended December 31, |
| | | 2011 | | 2010 | | 2009 | | 2008 | | 2007 |
| Operating data | | | | | | | | | | |
| Total revenues | | $ | 228,538 |
| | $ | 163,693 |
| | $ | 184,587 |
| | $ | 183,918 |
| | $ | 50,131 |
|
| Net loss attributable to common stockholders | | (19,338 | ) | | (90,352 | ) | | (182,966 | ) | | (120,627 | ) | | (7,198 | ) |
| Net loss per common share - basic and diluted | | $ | (0.10 | ) | | $ | (0.50 | ) | | $ | (1.03 | ) | | $ | (0.81 | ) | | $ | (0.15 | ) |
| Other data | | | | | | | | | | |
| Cash flows provided by operating activities | | $ | 39,059 |
| | $ | 53,388 |
| | $ | 99,738 |
| | $ | 115,178 |
| | $ | 43,982 |
|
| Cash flows provided by (used in) investing activities | | 189,322 |
| | 166,931 |
| | 1,358 |
| | (1,340,848 | ) | | (1,498,999 | ) |
| Cash flows (used in) provided by financing activities | | (326,298 | ) | | (123,840 | ) | | (91,306 | ) | | 1,203,972 |
| | 1,473,600 |
|
| Distributions declared | | $ | 98,776 |
| | $ | 95,761 |
| | $ | 108,811 |
| | $ | 104,264 |
| | $ | 32,862 |
|
Distributions declared per common share (1) | | 0.525 |
| | 0.525 |
| | 0.612 |
| | 0.702 |
| | 0.700 |
|
Weighted-average number of common shares outstanding, basic and diluted | | 188,134,294 |
| | 182,437,352 |
| | 177,959,297 |
| | 148,539,558 |
| | 46,973,602 |
|
Reconciliation of funds from operations (2) | | | | | | | | | | |
| Net loss attributable to common stockholders | | $ | (19,338 | ) | | $ | (90,352 | ) | | $ | (182,966 | ) | | $ | (120,627 | ) | | $ | (7,198 | ) |
| Depreciation of real estate assets | | 42,954 |
| | 25,275 |
| | 23,257 |
| | 17,377 |
| | 6,149 |
|
| Depreciation of real estate assets - discontinued operations | | 17,948 |
| | 17,861 |
| | 18,448 |
| | 16,228 |
| | 7,877 |
|
| Amortization of lease-related costs | | 39,356 |
| | 24,846 |
| | 36,777 |
| | 31,282 |
| | 10,672 |
|
| Amortization of lease-related costs - discontinued operations | | 9,780 |
| | 12,691 |
| | 41,829 |
| | 32,134 |
| | 18,218 |
|
| Impairment charges on real estate | | 15,823 |
| | — |
| | — |
| | — |
| | — |
|
| Impairment charges on real estate - discontinued operations | | 36,754 |
| | 123,453 |
| | — |
| | — |
| | — |
|
| Gain on sales of foreclosed real estate held for sale | | (134 | ) | | (2,011 | ) | | — |
| | — |
| | — |
|
| Gain on sales of real estate, net | | (5,141 | ) | | (5,646 | ) | | — |
| | — |
| | — |
|
Adjustments for noncontrolling interest - consolidated entity (3) | | (2,053 | ) | | (27,699 | ) | | (8,183 | ) | | (6,711 | ) | | (3,231 | ) |
| FFO | | $ | 135,949 |
| | $ | 78,418 |
| | $ | (70,838 | ) | | $ | (30,317 | ) | | $ | 32,487 |
|
_____________________
(1) Distributions declared per common share assumes each share was issued and outstanding each day from January 1, 2007 through the last day of the period presented. Distributions for the period from January 1, 2007 through June 30, 2009 are based on daily record dates and calculated at a rate of $0.0019178 per share per day. Distributions for the period from July 1, 2009 through December 31, 2011 were based on daily record dates and calculated at a rate of $0.00143836 per share per day.
(2) We believe that funds from operations (“FFO”) is a beneficial indicator of the performance of an equity REIT. We compute FFO in accordance with the current National Association of Real Estate Investment Trusts (“NAREIT”) definition. FFO represents net income, excluding gains and losses from sales of operating real estate assets (which can vary among owners of identical assets in similar conditions based on historical cost accounting and useful-life estimates), impairment losses on real estate assets, depreciation and amortization of real estate assets, and adjustments for unconsolidated partnerships and joint ventures. In connection with NAREIT’s recent Accounting and Financial Standards Hot Topics, we are excluding impairment charges on real estate assets in our calculation of FFO as of December 31, 2011. We have also restated FFO from prior periods to exclude these impairment charges. NAREIT believes that impairment charges on real estate assets are often early recognition of losses on prospective sales of properties, and therefore, the exclusion of these impairments is consistent with the exclusion of gains and losses recognized from the sales of real estate. Although these losses are included in the calculation of net income (loss), we have excluded these impairment charges in our calculation of FFO because impairments do not impact the current operating performance of our investments, and may or may not provide an indication of future operating performance. We believe FFO facilitates comparisons of operating performance between periods and among other REITs. However, our computation of FFO may not be comparable to other REITs that do not define FFO in accordance with the current NAREIT definition or that interpret the current NAREIT definition differently than we do. Our management believes that historical cost accounting for real estate assets in accordance with GAAP implicitly assumes that the value of real estate assets diminishes predictably over time. Since real estate values have historically risen or fallen with market conditions, many industry investors and analysts have considered the presentation of operating results for real estate companies that use historical cost accounting to be insufficient by themselves. As a result, we believe that the use of FFO, together with the required GAAP presentations, provides a more complete understanding of our performance relative to our competitors and a more informed and appropriate basis on which to make decisions involving operating, financing, and investing activities.
FFO is a non-GAAP financial measure and does not represent net income as defined by GAAP. Net income as defined by GAAP is the most relevant measure in determining our operating performance because FFO includes adjustments that investors may deem subjective, such as adding back expenses such as depreciation and amortization. Accordingly, FFO should not be considered as an alternative to net income as an indicator of our operating performance.
(3) The noncontrolling interest holder’s share of our consolidated venture’s real estate depreciation was $1.7 million, $1.8 million, $2.0 million, $2.0 million and $0.7 million, respectively, in 2011, 2010, 2009, 2008 and 2007. Its share of amortization of lease-related costs was $0.3 million, $1.2 million, $6.2 million, $4.7 million and $2.5 million, respectively, in 2011, 2010, 2009, 2008 and 2007.
| |
| ITEM 7. | MANAGEMENT’S DISCUSSION AND ANALYSIS OF FINANCIAL CONDITION AND RESULTS OF OPERATIONS |
The following discussion and analysis should be read in conjunction with the “Selected Financial Data” above and our accompanying consolidated financial statements and the notes thereto. Also see “Forward-Looking Statements” preceding Part I and Part I, Item 1, “Business” and Part I, Item 1A, “Risk Factors.”
Overview
We are a Maryland corporation that was formed on June 13, 2005 to invest in a diverse portfolio of real estate properties and real estate-related investments. We have elected to be taxed as a REIT beginning with the taxable year ended December 31, 2006 and we intend to operate in such a manner. We own substantially all of our assets and conduct our operations through our Operating Partnership, of which we are the sole general partner. Subject to certain restrictions and limitations, our business is managed by KBS Capital Advisors, our external advisor, pursuant to an advisory agreement. Our advisor owns 20,000 shares of our common stock. We have no paid employees.
On January 27, 2006, we launched our initial public offering of up to 200,000,000 shares of common stock in our primary offering and 80,000,000 shares of common stock under our dividend reinvestment plan. We ceased offering shares of common stock in our primary offering on May 30, 2008. We sold 171,109,494 shares in our primary offering for gross offering proceeds of $1.7 billion and, as of December 31, 2011, we had sold 26,592,090 shares under our now terminated dividend reinvestment plan for gross offering proceeds of $222.6 million. Our dividend reinvestment plan will terminate effective April 10, 2012.
As of December 31, 2011, we owned 892 real estate properties (of which 250 properties were held for sale), including the GKK Properties. In addition, as of December 31, 2011, we owned seven real estate loans receivable, two investments in securities directly or indirectly backed by commercial mortgage loans, a preferred membership interest in a real estate joint venture, a participation interest with respect to another real estate joint venture and a 10-story condominium building with 62 units acquired through foreclosure, of which four condominium units, two retail spaces and parking spaces were owned by us and were held for sale.
On September 1, 2011, we, through KBS, entered into the Settlement Agreement with, among other parties, GKK Stars, the wholly owned subsidiary of Gramercy that indirectly owned the Gramercy real estate portfolio, to effect the orderly transfer of certain assets and liabilities of the Gramercy real estate portfolio to KBS in satisfaction of certain debt obligations owed by wholly owned subsidiaries of Gramercy to KBS. The Settlement Agreement contemplated the transfer of the Equity Interests in certain subsidiaries of Gramercy that indirectly own or, with respect to a limited number of properties, hold a leasehold interest in, 867 properties (the “GKK Properties”), including 576 bank branch properties and 291 office buildings, operations centers and other properties. As of December 15, 2011, GKK Stars had transferred all of the Equity Interests to us, giving us title to or, with respect to a limited number of GKK Properties, a leasehold interest in, 867 GKK Properties. See Part I, Item 1, “Business — Investment Portfolio — GKK Properties.”
Our focus in 2012 is to manage our existing investment portfolio and our debt service obligations. To the extent we receive proceeds from the repayment of real estate-related investments or the sale of properties in 2012, we are required under existing financing agreements to use a majority of these funds to pay down debt.
Market Outlook – Real Estate and Real Estate Finance Markets
During the past three years, significant and widespread concerns about credit risk, both corporate and sovereign, and access to capital have been present in the U.S. and global financial markets. Economies throughout the world have experienced lingering levels of high unemployment and low levels of consumer and business confidence due to a global downturn in economic activity. Amid signs of recovery in the economic and financial markets, concerns remain regarding job growth, wage stagnation, credit restrictions and increased taxation. These conditions are expected to continue, and combined with a challenging macro-economic environment, may interfere with the implementation of our business strategy and/or force us to modify it. For further discussion of current market conditions, see Part I, Item 1, “Business — Market Outlook — Real Estate and Real Estate Finance Markets.”
Impact on Our Real Estate Investments
These market conditions have had and will likely continue to have a significant impact on our real estate investments. In addition, these market conditions have impacted our tenants’ businesses, which makes it more difficult for them to meet their current lease obligations and places pressure on them to negotiate favorable lease terms upon renewal in order for their businesses to remain viable. Increases in rental concessions given to retain tenants and maintain our occupancy level, which is vital to the continued success of our portfolio, has resulted in lower current cash flow. Projected future declines in rental rates, slower or potentially negative net absorption of leased space and expectations of future rental concessions, including free rent to renew tenants early, to retain tenants who are up for renewal or to sign new tenants, are expected to result in additional decreases in cash flows. Historically low interest rates have helped offset some of the impact of these decreases in operating cash flow for properties financed with variable rate mortgages; however, interest rates likely will not remain at these historically low levels for the remaining life of many of our investments.
Impact on Our Real Estate-Related Investments
Nearly all of our real estate-related investments are either directly secured by commercial real estate (e.g., first deeds of trust or mortgages) or secured by ownership interests in entities that directly or indirectly own and operate real estate (e.g., mezzanine loans). As a result, our real estate-related investments in general have been impacted by the same factors impacting our real estate investments. In particular, our investments in mezzanine loans and B-Notes have been impacted to a greater degree as current valuations for buildings directly or indirectly securing our investment positions have likely decreased from the date of our acquisition or origination of these investments. In such instances, the borrowers may not be able to refinance their debt to us or sell the collateral at a price sufficient to repay our note balances in full when they become due. In addition, current economic conditions have impacted the performance of collateral directly or indirectly securing our loan investments, and therefore have impacted the ability of some borrowers under our loans to make contractual interest payments to us. For the year ended December 31, 2011, we recorded a loan loss reserve of $12.0 million, which was comprised of a $30.1 million increase of loan loss reserve calculated on an asset-specific basis, offset by a reduction of $18.1 million to our portfolio-based reserve.
Assuming our real estate-related loans are fully extended under the terms of the respective loan agreements and excluding our loan investments with asset-specific loan loss reserves, we do not have any investments maturing within a year from December 31, 2011. We have fixed rate real estate-related loans with book values (excluding asset-specific loan loss reserves) of $119.2 million.
Impact on Our Financing Activities
In light of the risks associated with declining operating cash flows from our real estate properties and the properties directly or indirectly serving as the collateral for our repurchase agreements, and the current underwriting environment for commercial real estate mortgages, we may have difficulty refinancing some of our mortgage notes, credit facilities and repurchase agreements at maturity or we may not be able to refinance our obligations at terms as favorable as the terms of our existing indebtedness. Although we believe we will be permitted to extend the maturity of our current loan agreements and other loan documents, we can give no assurance in this regard. We have $492.2 million of debt obligations maturing during the 12 months ending December 31, 2012. Assuming our notes payable, credit facilities and repurchase agreements are fully extended under the terms of the respective loan agreements and other loan documents, we have $321.9 million of debt obligations maturing during the 12 months ending December 31, 2012.
As of December 31, 2011, we had a total of $1.4 billion of fixed rate notes payable and $916.6 million of variable rate notes payable and repurchase agreements. Of the $916.6 million of variable rate notes payable and repurchase agreements, $85.4 million is effectively fixed through interest rate swaps. In addition to the debt obligations maturing during the 12 months ending December 31, 2012, we are required to make a minimum of $97.4 million in amortization payments of principal related to the Amended Repurchase Agreements prior to December 31, 2012 and to pay $4.6 million in fees relating to the amendment of these repurchase agreements by December 31, 2012.
Liquidity and Capital Resources
Our principal demands for funds during the short- and long-term are for the payment of operating expenses, capital expenditures, general and administrative expenses and, substantial pay down of debt obligations in order to refinance loans with near term maturities. To date, we have had six primary sources of capital for meeting our cash requirements:
| |
| • | Proceeds from our primary offering, which closed in 2008; |
| |
| • | Debt financings, including mortgage loans, repurchase agreements and credit facilities; |
| |
| • | Proceeds from common stock issued under our dividend reinvestment plan (which will terminate effective April 10, 2012); |
| |
| • | Cash flow generated by our real estate operations and real estate-related investments; |
| |
| • | Proceeds from the sales of real estate; and |
| |
| • | Principal repayments on our real estate loans receivable. |
We ceased offering shares of common stock in our primary offering on May 30, 2008. We do not currently plan to acquire or originate additional real estate or real estate-related assets. We intend to use proceeds from asset sales and principal repayments on our real estate loans receivable as our primary sources of immediate and long-term liquidity. To the extent available, we also intend to use our cash on hand, cash flow generated by our real estate operations and real estate-related investments and funds available under our credit facilities. However, we have and/or expect to suffer declines in cash flows from these sources.
On March 20, 2012, our board of directors approved the suspension of monthly distribution payments in order to manage our reduced cash flows from operations and to redirect available funds to reduce our debt. Our primary concern is the repayment of our Amended Repurchase Agreements, but we expect to use available funds to repay other debt obligations as well. Reducing our debt will allow us to hold certain assets in our portfolio to improve their value and the returns to our stockholders. After repaying our Amended Repurchase Agreements and some of our other debt obligations through the suspension of monthly distribution payments and the sale of certain assets, we plan to make certain strategic asset sales and, from time to time, may declare special distributions to our stockholders that would be funded with the net proceeds from those asset sales or from cash flow from other sources. We will continue our existing strategy to sell assets when we believe the assets have reached the stage that disposition will assist in improving returns to our investors.
In connection with the change to our distribution policy, our board of directors terminated our dividend reinvestment plan effective April 10, 2012. In addition, our board of directors amended and restated our share redemption program to provide only for redemptions sought upon a stockholder’s death, “qualifying disability” or “determination of incompetence” (each as defined in the share redemption program). Such redemptions are subject to an annual dollar limitation, which shall be $10.0 million in the aggregate for the calendar year 2012 (subject to review and adjustment during the year by the board of directors), and further subject to the limitations described in the share redemption program plan document. Based on historical redemption activity, we believe the $10.0 million redemption limitation for the calendar year 2012 will be sufficient for these special redemptions. During each calendar year, the annual dollar limitation for the share redemption program will be reviewed and adjusted from time to time.
On April 28, 2011, in connection with the amendment and restatement of the repurchase agreements related to our investment in the GKK Mezzanine Loan, we had agreed that during the term of the Amended Repurchase Agreements and except for distributions to stockholders necessary to maintain our REIT status, we would limit distributions to stockholders to an amount not to exceed $6.0 million per month, excluding any distributions to stockholders reinvested in our dividend reinvestment plan. In addition, we agreed that during the term of the Amended Repurchase Agreements, we would continue to limit redemptions under the share redemption program to those sought upon a stockholder’s death, “qualifying disability” or “determination of incompetence.” Additionally, any net cash flows from operations generated by the GKK Properties are restricted for the repayment of principal outstanding under the Amended Repurchase Agreements and expenditures related to the GKK Properties. See Part I, Item 1, “Business — Investment Portfolio — GKK Properties.”
Our investments in real estate generate cash flow in the form of rental revenues and tenant reimbursements, which are reduced by operating expenditures, debt service payments and corporate general and administrative expenses. Cash flows from operations from real estate investments is primarily dependent upon the occupancy level of our portfolio, the net effective rental rates on our leases, the collectibility of rent and operating recoveries from our tenants and how well we manage our expenditures. As of December 31, 2011, our real estate portfolio was 85% occupied and our bad debt reserve was approximately 2% of annualized base rent. Our real estate-related investments generate cash flow in the form of interest income, which is reduced by loan servicing fees and debt service payments. Cash flows from operations from our real estate‑related investments is primarily dependent on the operating performance of the underlying collateral and the borrowers’ ability to make their debt service payments. As of December 31, 2011, two of the six borrowers under our real estate loans receivable were delinquent and these loans have an amortized cost basis of $88.8 million. As a result of these factors, we may experience declines in future cash flows from our real estate and real estate-related investments and we expect an increased need for capital to cover leasing costs and capital improvements needed to improve the performance of our assets.
We depended on the proceeds from our dividend reinvestment plan (which will terminate effective April 10, 2012) to provide funds for general corporate purposes, including our share redemption program; funds for capital expenditures on our real estate investments, tenant improvement costs and leasing costs related to our investments in real estate properties; reserves required by financings of our investments in real estate properties; and the repayment of debt. Without the availability of funds from our dividend reinvestment plan offering, we will have to use a greater proportion of our cash flow from operations to meet our general cash requirements. However, we will depend on proceeds from asset sales and principal repayments on our real estate loans receivable as our primary sources of liquidity to meet our capital needs.
For the year ended December 31, 2011, we met our operating cash needs with cash flow generated by proceeds from the sale of real estate, cash flow from operations, proceeds from the sale of real estate loans receivable and cash on hand. We believe that our potential proceeds from the sale of real estate, cash flow from operations, potential proceeds from the sale or payoff of real estate loans receivable, cash on hand and availability under our revolving credit facilities will be sufficient to meet our liquidity needs for the upcoming year. For additional information regarding our cash needs during 2012, see the discussion of our Amended Repurchase Agreements under Part I, Item 1, “Business — Investment Portfolio — GKK Properties” and “ — Contractual Commitments and Contingencies” below.
Cash Flows from Operating Activities
As of December 31, 2011, we owned 892 real estate properties (of which 250 properties were held for sale), including the GKK Properties. In addition, as of December 31, 2011, we owned seven real estate loans receivable, two investments in securities directly or indirectly backed by commercial mortgage loans, a preferred membership interest in a real estate joint venture and a participation interest with respect to another real estate joint venture.
During the year ended December 31, 2011, net cash provided by operating activities was $39.1 million, compared to $53.4 million of net cash provided by operating activities during the year ended December 31, 2010. Net cash from operations decreased in 2011 primarily due to a $28.9 million decrease in interest income from real estate loans receivable. The decrease in 2011 was also due to an increase in general and administrative expenses. The decrease in net cash from operations was partially offset by cash provided by operating activities, which included $15.9 million of cash flows generated by the GKK Properties transferred to us pursuant to the Settlement Agreement. Any net cash flows from operations generated by the GKK Properties are restricted for the repayment of principal outstanding under the Amended Repurchase Agreements and expenditures related to the GKK Properties. See Part I, Item 1, “Business — Investment Portfolio — GKK Properties.”
Cash Flows from Investing Activities
Net cash provided by investing activities was $189.3 million for the year ended December 31, 2011. The significant sources and uses of cash from investing activities were as follows:
| |
| • | $176.9 million of cash provided from the sale of real estate; |
| |
| • | $41.2 million of cash used to acquire two real estate loans receivable, partially offset by $0.4 million of cash provided by principal repayments on real estate loans receivable; |
| |
| • | $34.7 million of cash used for improvements to real estate; |
| |
| • | $32.4 million of cash received from the sale of a real estate loan receivable; |
| |
| • | $32.1 million of cash received from the Transfer of the GKK Properties; |
| |
| • | $20.4 million of cash provided from the sale of foreclosed real estate held for sale; and |
| |
| • | a $3.0 million decrease in restricted cash for capital expenditures relating to the payment of leasing commissions, tenant improvements and capital improvements for the releasing of one of our joint venture properties. |
Cash Flows from Financing Activities
Net cash used in financing activities was $326.3 million for the year ended December 31, 2011. The significant uses of cash for financing activities were as follows:
| |
| • | $262.2 million of net cash used for the repayment of debt and other financings as a result of $422.7 million of principal payments on notes payable and repurchase agreements and $12.3 million of payments for related financing costs, partially offset by proceeds from notes payable of $172.8 million; |
| |
| • | $52.0 million of net cash used for distributions, after giving effect to dividends reinvested by stockholders of $46.5 million; |
| |
| • | $6.9 million of cash used for redemptions of common stock and $1.1 million of cash used for payments of commissions on stock sales; |
| |
| • | $2.3 million of cash surrendered from deed in lieu of foreclosure of the National Industrial Portfolio (defined below); and |
| |
| • | $1.7 million of distributions paid to the noncontrolling interest holder of our joint venture investment in the National Industrial Portfolio. |
Contractual Commitments and Contingencies
In order to execute our investment strategy, we utilized mortgage, mezzanine and repurchase financings to finance a portion of our investment portfolio. Management remains vigilant in monitoring the risks inherent with the use of debt in our portfolio and is taking actions to ensure that these risks, including refinancing and interest rate risk, are properly balanced with the benefits of maintaining such leverage. Assuming our notes payable and repurchase agreements are fully extended under the terms of the respective loan agreements, as of December 31, 2011, we had $321.9 million of debt maturing during the 12 months ending December 31, 2012. In addition to the debt obligations maturing during the 12 months ending December 31, 2012, we are required to pay a minimum of $97.4 million in principal amortization payments and $4.6 million in fees under the Amended Repurchase Agreements prior to December 31, 2012. See the discussion regarding the amendment and restatement of the Amended Repurchase Agreements and the GKK Loans above under Part I, Item 1, “Business — Investment Portfolio — GKK Properties.”
As of December 31, 2011, we had a total of $1.4 billion of fixed rate notes payable and $916.6 million of variable rate notes payable and repurchase agreements; of the $916.6 million of variable rate notes payable and repurchase agreements, interest rates on $85.4 million of these notes were effectively fixed through interest rate swaps. As discussed above, during the last four years, the global capital markets have experienced significant dislocations and liquidity disruptions that have caused the credit spreads of debt to fluctuate considerably and caused significant volatility in interest rates, including LIBOR. As of December 31, 2011, we had a total of $831.2 million of variable rate notes payable and repurchase agreements not subject to interest rate swaps that are impacted by fluctuations in interest rates. While LIBOR currently stands at historically low levels, future increases in LIBOR may result in the use of increased capital resources to meet our debt obligations.
As discussed under Part I, Item 1, “Business — Investment Portfolio — GKK Properties,” we have consolidated in our financial statements as of the Effective Date all assets and liabilities assumed by us in connection with the Transfers of the Equity Interests and the wholly owned GKK Properties, or the GKK Properties held through leasehold interests, including the related assumption of the Mortgage Pools and other liabilities related to the GKK Properties, with the exception of the assets and liabilities owned by the Citizens Bank Joint Venture, which was consolidated on October 24, 2011.
In addition to using our capital resources to meet our debt service obligations, for capital expenditures and for operating costs, we use our capital resources to make certain payments to our advisor and the dealer manager. We pay our advisor fees in connection with the management and disposition of our assets and for certain costs incurred by our advisor in providing services to us. We also paid the dealer manager selling commissions of up to 3% of gross offering proceeds in connection with eligible sales under our dividend reinvestment plan (which will terminate effective April 10, 2012) to the extent permitted under state securities laws. We also have reimbursed our advisor and the dealer manager for certain offering costs related to our dividend reinvestment plan.
As of December 31, 2011, we had $54.0 million of cash and cash equivalents. As of December 31, 2011, our borrowings and other liabilities were approximately 71% and 72% of the cost (before depreciation or other noncash reserves) and book value (before depreciation) of our tangible assets, respectively. Our charter limits our total liabilities to 75% of the cost (before deducting depreciation or other non-cash reserves) of our tangible assets; however, we may exceed that limit if a majority of the conflicts committee approves each borrowing in excess of our charter limitation and we disclose such borrowing to our stockholders in our next quarterly report with an explanation from the conflicts committee of the justification for exceeding the total liabilities limitation. Due to the amount of debt that we assumed in connection with the Transfers of the GKK Properties (which debt is consolidated in our financial statements as of December 31, 2011), as described under Part I, Item 1, “Business — Investment Portfolio — GKK Properties,” we exceeded our charter limitation on total liabilities as of September 30, 2011. The conflicts committee had approved all such borrowings in excess of our charter limitation on total liabilities and determined that the excess leverage was justified for the following reasons:
| |
| • | the assumption of debt was necessary as part of the Transfers of the GKK Properties; |
| |
| • | the Transfers will allow us to operate the GKK Properties and generate ongoing income for our investors; and |
| |
| • | the Transfers will allow us to develop an exit strategy for the GKK Properties, thus optimizing the return on investor capital. |
The following is a summary of our contractual obligations as of December 31, 2011 (in thousands):
|
| | | | | | | | | | | | | | | | | | | |
| | Payments Due During the Years Ending December 31, |
| Contractual Obligations | Total | | 2012 | | 2013-2014 | | 2015-2016 | | Thereafter |
Outstanding debt obligations related to historical portfolio(1) | $ | 796,261 |
| | $ | 266,010 |
| | $ | 295,551 |
| | $ | 234,700 |
| | $ | — |
|
Outstanding debt obligations related to the GKK Properties(1)(2) | $ | 1,511,931 |
| | $ | 347,740 |
| | $ | 615,775 |
| | $ | 123,047 |
| | $ | 425,369 |
|
Interest payments on outstanding debt obligations related to historical portfolio(3) | $ | 74,245 |
| | $ | 30,885 |
| | $ | 34,188 |
| | $ | 9,172 |
| | $ | — |
|
Interest payments on outstanding debt obligations related to the GKK Properties(3) | $ | 334,630 |
| | $ | 71,726 |
| | $ | 93,507 |
| | $ | 60,263 |
| | $ | 109,134 |
|
| Outstanding funding obligations under real estate loans receivable | $ | 1,358 |
| | $ | 1,358 |
| | $ | — |
| | $ | — |
| | $ | — |
|
| Operating leases | $ | 238,730 |
| | $ | 20,695 |
| | $ | 40,270 |
| | $ | 37,628 |
| | $ | 140,137 |
|
(1) Amounts include principal payments under notes payable and repurchase agreements based on maturity dates of debt obligations as of December 31, 2011.
(2) As of December 31, 2011, $84.0 of the debt was defeased by $91.5 of pledged government securities, net of unamortized discounts and premiums.
(3) Projected interest payments are based on the outstanding principal amounts and weighted-average interest rates as of December 31, 2011, adjusted for the impact of interest rate caps and swap agreements. We incurred interest expense of $63.7 million, excluding amortization of deferred financing costs totaling $7.3 million, during the year ended December 31, 2011.
Subsequent to December 31, 2011, the One Citizens Loan, with an outstanding principal balance of $43.5 million, matured without repayment. We are in negotiations with the One Citizens Loan lender to restructure or extend this loan; however, there is no guarantee that the lender would extend or refinance the balance due under this loan and it may choose to attempt to exercise certain of its rights under the loan and security documents, including without limitation, requiring the repayment of principal outstanding or foreclosing on the underlying properties securing the loan. In addition, the lender has imposed a "cash trap" on the properties securing the One Citizens Loan.
Debt Covenants
The documents evidencing our outstanding debt obligations typically require that specified loan-to-value and debt service coverage ratios be maintained with respect to our financed properties before we can exercise certain rights under the documents relating to such properties. A breach of the financial covenants in these documents may result in the lender imposing additional restrictions on our operations, such as our ability to incur additional debt, or may allow the lender to impose “cash traps” with respect to cash flow from the property securing the loan. In addition, such a breach may constitute an event of default and the lender could require us to repay the debt immediately if we fail to make such repayment in a timely manner, or the lender may be entitled to take possession of any property securing the loan.
As of December 31, 2011, we and/or our subsidiaries that are the borrowers under our loan and security documents were in compliance with the financial covenants in such documents included in our consolidated financial statements, except that, as of December 31, 2011, the borrowers under two mortgage loans that we assumed pursuant to the Settlement Agreement, the BBD2 Loan and the Jenkins Loan, were out of debt service coverage compliance. The BBD2 Loan had an outstanding principal balance of $206.2 million and the Jenkins Loan had an outstanding principal balance of $13.6 million as of December 31, 2011. Such non-compliance does not constitute an event of default under the applicable loan and security documents. However, as a result of such non-compliance, under the BBD2 Loan, the lender has imposed a “cash trap” to restrict distributions to us to the budgeted property operating expenses and requires lender consent regarding the release of properties securing the loan, and under the Jenkins Loan, the lender has also imposed a “cash trap” and has the right to replace the property manager of the property. These events may have a material adverse affect on our financial condition, results of operations and the return on our stockholders’ investment in us.
The loan agreements and security documents relating to the FSI 6000A, FSI 6000B, FSI 6000C, FSI 6000D and 801 Market Street loans contain provisions that prohibit the pledge of certain Equity Interests in the mortgage borrowers or their direct or indirect owners. As a result of the Transfers under the Settlement Agreement and our subsequent pledge of certain Equity Interests as security for certain of our repurchase agreements, the lenders under these mortgage loans may view certain pledges as being prohibited. If they do, they may attempt to exercise certain remedies detailed in the respective loan and security documents, including without limitation, accelerating the outstanding amount under each mortgage loan or foreclosing on the underlying properties securing the mortgage loans. As of December 31, 2011, the total outstanding debt on these five loans was $147.8 million.
Extinguishment of National Industrial Portfolio Mortgage and Mezzanine Loans
In August 2007, we entered a joint venture (the “KBS-New Leaf Joint Venture”) with New Leaf Industrial Partners Fund, L.P. (“New Leaf”) to acquire a portfolio of industrial properties (the “National Industrial Portfolio”) for approximately $515.9 million plus closing costs. The National Industrial Portfolio consisted of 23 industrial properties and a master lease with respect to another industrial property. We owned an 80% membership interest in the KBS-New Leaf Joint Venture and consolidated the joint venture in our financial statements.
The KBS-New Leaf Joint Venture financed the National Industrial Portfolio properties with a mortgage loan in the amount of $300 million (the “Mortgage Loan”). In addition, there were five outstanding mezzanine loans on the National Industrial Portfolio totaling $143.6 million (the “Mezzanine Loans” and, together with the Mortgage Loans, the “Loans”), which were secured by a pledge of 100% of the ownership interest in the wholly owned subsidiaries of the KBS-New Leaf Joint Venture that directly or indirectly owned the National Industrial Portfolio properties. As of December 28, 2011, an affiliate of Oaktree Capital Management, L.P. (“Oaktree”) owned each of the Loans.
The Loans were to mature on December 31, 2011. However, due to a decline in the operating performance of the National Industrial Portfolio resulting from increased vacancies, lower rental rates and tenant bankruptcies, in addition to declines in market value across all real estate types in the period following the initial investment, it became unlikely that the KBS-New Leaf Joint Venture would be able to refinance or extend the Loans upon their maturities. As a result, on December 28, 2011, we entered into an agreement in lieu of foreclosure and related documents (collectively, the “Agreement”) to transfer the National Industrial Portfolio properties to certain indirect wholly owned subsidiaries of the NIP JV (defined below) in full satisfaction of the debt outstanding under, and other obligations related to, the Loans. As a result, we recorded, in discontinued operations, a gain on extinguishment of debt of $115.5 million (including amounts for noncontrolling interest of approximately $24.2 million), which represents the difference between the carrying amount of the outstanding debt and other liabilities of $446.1 million and the carrying value of the real estate properties and other assets of $328.3 million, net of closing costs of $2.3 million, upon transfer of the properties.
In addition, on December 28, 2011, we, through an indirect wholly-owned subsidiary (the “KBS Member”), entered into a joint venture (the “HC KBS JV”) with an affiliate of New Leaf (the “HC Member”), and on the date of the Agreement, the HC KBS JV entered into a joint venture (the “NIP JV”, which now indirectly owns the National Industrial Portfolio) with an affiliate of Oaktree (the “Oaktree Member”). The HC KBS JV indirectly manages the day-to-day affairs of the NIP JV; however, its authority is limited, as major decisions involving the NIP JV must receive approval from an Oaktree Member-controlled board of representatives. Pursuant to the terms of the NIP JV agreement, as subsequently amended, the HC KBS JV, or either the KBS Member or the HC Member, through the HC KBS JV, has an option, but is under no obligation, to contribute up to $20.0 million in equity to the NIP JV by April 16, 2012, or a maximum of 15% of the pre-leveraged equity of the NIP JV. The KBS Member does not intend to exercise its right to make any portion of the $20.0 million contribution. Additionally, the HC KBS JV may be subject to future optional capital calls as determined by the Oaktree Member; however, should the HC KBS JV not make a capital contribution pursuant to such a capital call, the Oaktree Member may make the capital contribution, which capital contribution would be treated as an equity loan by the Oaktree Member to the NIP JV. The KBS Member has no intention of contributing funds in response to future capital calls. Under the NIP JV agreement, the HC KBS JV was also granted a participation interest in certain future profits generated by the NIP JV. This participation interest is separate from any equity interest that the HC KBS JV would receive if it chose to make an equity contribution to the NIP JV.
Asset Management Services Related to the GKK Properties
As of the Effective Date, GKK Stars had agreed to provide: the Services through December 31, 2013, which Services may be terminated by either GKK Stars or KBS at any time on 90 days prior written notice, subject to certain additional termination rights and restrictions; and to provide us with financial information for the GKK Properties for fiscal year 2011. As compensation for the Services, KBS agreed to pay to GKK Stars: (i) an annual fee of $10 million (prorated for incomplete years) plus all property-related expenses incurred by GKK Stars, (ii) subject to certain terms and conditions in the Settlement Agreement, participation interests in the amounts by which the net sales proceeds from the sale of the GKK Properties plus the remaining net value of KBS’ remaining assets exceed certain threshold amounts, and (iii) subject to certain conditions in the Settlement Agreement, a minimum of $3.5 million. Accordingly, we have recorded a contingent liability of $12.0 million based on the expected consideration to be paid as a result of GKK Stars’ participation interests. GKK Stars and KBS have agreed to negotiate a separate management services agreement to further outline the terms and conditions under which GKK Stars or one of its affiliates would continue to provide the Services for KBS. The terms of such an agreement have not yet been finalized, however, and there can be no assurance that GKK Stars or one of its affiliates and KBS will ever consummate such an agreement. In the event KBS and GKK Stars or one of its affiliates are unable to consummate such an agreement by March 31, 2012, the terms for the provision of the Services under the Settlement Agreement may be terminated on June 30, 2012, though, in certain circumstances, GKK Stars will retain its right to the participation interests and minimum threshold described above.
Other Obligations
We had a contingent liability with respect to advances to us from our advisor in the amount of $1.6 million for the payment of distributions and to cover expenses, excluding depreciation and amortization, in excess of our revenues. Pursuant to the advisory agreement, we would have been obligated to reimburse our advisor for these advances only if and to the extent that our cumulative Funds from Operations (as defined in the advisory agreement) for the period commencing January 1, 2006 through the date of any such reimbursement exceeded the lesser of (i) the cumulative amount of any distributions declared and payable to our stockholders as of the date of such reimbursement or (ii) an amount that is equal to a 7.0% cumulative, non-compounded, annual return on invested capital for our stockholders for the period from July 18, 2006 through the date of such reimbursement. No interest accrued on the advance made by our advisor.
In addition to the advances to us from our advisor in the amount of $1.6 million, as of December 31, 2011, we had incurred but unpaid performance fees totaling approximately $5.4 million related to our joint venture investment in the National Industrial Portfolio. The performance fee was earned by our advisor upon our meeting certain Funds from Operations (as defined in the advisory agreement) thresholds and made our advisor’s cumulative asset management fees related to our former investment in the National Industrial Portfolio joint venture equal to 0.75% of the cost of the joint venture investment on an annualized basis from the date of our investment in the joint venture through the date of calculation. Our operations from the date of our investment through March 31, 2010 were sufficient to meet the Funds from Operations condition as defined in the advisory agreement. Beginning in April 2010, our operations did not meet the Funds from Operations condition as defined in the advisory agreement. Although performance fees of approximately $5.4 million had been incurred as of December 31, 2011, the advisory agreement further provided that the payment of the performance fees would be made only after the repayment of the advances from our advisor discussed above.
As of December 31, 2011, we determined that it was unlikely that we would meet the requirements at any future date to be obligated to reimburse our advisor for the advances and performances fees discussed above and wrote-off, as an increase to other income and a decrease to asset management fees related to discontinued operations, amounts due to affiliates of $1.6 million related to advances and $5.4 million related to previously accrued performance fees, respectively. On March 20, 2012, we entered into an amendment to the advisory agreement with our advisor pursuant to which our advisor agreed to forgive the debt related to the $1.6 million of advances discussed above and to waive the approximately $5.4 million of performance fees discussed above.
Results of Operations
Overview
As of December 31, 2010, we owned 63 real estate properties, one master lease, 12 real estate loans receivable (five of which were impaired), two investments in securities directly or indirectly backed by commercial mortgage loans, and a preferred membership interest in a real estate joint venture. Also as of December 31, 2010, we owned a 10-story condominium building with 62 units acquired through foreclosure, of which 11 condominium units, two retail spaces and parking spaces were owned by us and were held for sale. Subsequent to December 31, 2010, we entered into the Settlement Agreement to effect the orderly transfer of certain assets and liabilities of the Gramercy real estate portfolio to us, sold one real estate loan receivable, wrote-off three real estate loans receivable and recorded an impairment charge against one additional real estate loan receivable. In addition, subsequent to December 31, 2010, we sold seven industrial properties and three office properties, transferred the National Industrial Portfolio, consisting of 23 industrial properties and a master lease, to the lender in full satisfaction of the debt secured by the properties, and designated three office properties as held for sale. Accordingly, we classified these properties as discontinued operations for all periods presented in our consolidated financial statements. As a result, as of December 31, 2011, we owned 892 real estate properties, including the GKK Properties and 250 properties that were held for sale. In addition, as of December 31, 2011, we owned seven real estate loans receivable, two investments in securities directly or indirectly backed by commercial mortgage loans, a preferred membership interest in a real estate joint venture, a participation interest with respect to another real estate joint venture and a 10-story condominium building with 62 units acquired through foreclosure, of which four condominium units, two retail spaces and parking spaces were held for sale. See the discussion of the Settlement Agreement under Part I, Item 1, “Business — Investment Portfolio — GKK Properties.”
Comparison of the year ended December 31, 2011 versus the year ended December 31, 2010
The following table provides summary information about our results of operations for the years ended December 31, 2011 and 2010 (dollar amounts in thousands):
|
| | | | | | | | | | | | | | | | | | | | | | |
| | For the Years Ended December 31, | | Increase (Decrease) | | Percentage Change | | $ Change Due to GKK Properties | | $ Change Due to Properties Held Throughout Both Periods |
| | 2011 | | 2010 |
| Rental income | $ | 156,060 |
| | $ | 98,008 |
| | $ | 58,052 |
| | 59 | % | | $ | 62,827 |
| | $ | (4,775 | ) |
| Tenant reimbursements | 53,708 |
| | 17,935 |
| | 35,773 |
| | 199 | % | | 36,019 |
| | (246 | ) |
| Interest income from real estate loans receivable | 13,383 |
| | 42,321 |
| | (28,938 | ) | | (68 | )% | | — |
| | (28,938 | ) |
| Interest income from real estate securities | 2,857 |
| | 3,090 |
| | (233 | ) | | (8 | )% | | — |
| | (233 | ) |
| Parking revenues and other operating income | 2,530 |
| | 2,339 |
| | 191 |
| | 8 | % | | 870 |
| | (679 | ) |
| Operating, maintenance, and management costs | 73,185 |
| | 27,954 |
| | 45,231 |
| | 162 | % | | 43,806 |
| | 1,425 |
|
| Real estate taxes, property-related taxes, and insurance | 29,822 |
| | 17,422 |
| | 12,400 |
| | 71 | % | | 13,086 |
| | (686 | ) |
| Asset management fees to affiliate | 14,546 |
| | 15,228 |
| | (682 | ) | | (4 | )% | | 1,139 |
| | (1,821 | ) |
| General and administrative expenses | 20,232 |
| | 7,045 |
| | 13,187 |
| | 187 | % | | 11,435 |
| | 1,752 |
|
| Depreciation and amortization expense | 82,310 |
| | 50,121 |
| | 32,189 |
| | 64 | % | | 35,260 |
| | (3,071 | ) |
| Interest expense | 70,970 |
| | 39,553 |
| | 31,417 |
| | 79 | % | | 30,420 |
| | 997 |
|
| Impairment charge on real estate | 15,823 |
| | — |
| | 15,823 |
| | 100 | % | | — |
| | 15,823 |
|
| Provision for loan losses | 11,999 |
| | 11,046 |
| | 953 |
| | 9 | % | | — |
| | 953 |
|
| Gain on sales of foreclosed real estate held for sale | 134 |
| | 2,011 |
| | (1,877 | ) | | (93 | )% | | — |
| | (1,877 | ) |
| Income from unconsolidated joint venture | 5,029 |
| | 7,701 |
| | (2,672 | ) | | (35 | )% | | — |
| | (2,672 | ) |
| Other income | 1,600 |
| | — |
| | 1,600 |
| | 100 | % | | — |
| | 1,600 |
|
| Gain on sales of real estate, net | 5,141 |
| | 5,646 |
| | (505 | ) | | (9 | )% | | — |
| | (505 | ) |
| Income (loss) from discontinued operations | 4,122 |
| | (1,720 | ) | | 5,842 |
| | (340 | )% | | (2,609 | ) | | 8,451 |
|
| Impairment charges on discontinued operations | (36,754 | ) | | (123,453 | ) | | 86,699 |
| | (70 | )% | | — |
| | 86,699 |
|
| Gain from extinguishment of debt | 115,531 |
| | — |
| | 115,531 |
| | 100 | % | | — |
| | 115,531 |
|
Rental income from our real estate properties increased by $58.0 million primarily due to an increase of $62.8 million related to the Transfer of the GKK Properties. Excluding the GKK Properties, rental income decreased by $4.8 million primarily due to a net decrease in amortization of below-market in-place leases, a decrease in lease termination fees, lower occupancy (as a result of tenants vacating or tenants reducing leased space) and lower rental rates for the year ended December 31, 2011. Overall, we expect rental income to increase in future periods as a result of owning the GKK Properties for an entire period, partially offset by rental loss due to anticipated asset sales. Our rental income in future periods will also vary in large part based on the occupancy rates and rental rates of the properties in our portfolio. The current economic conditions could result in lower occupancy and/or rental rates and a corresponding decrease in rental income.
Tenant reimbursements from our real estate properties increased by $35.8 million primarily due to an increase of $36.0 million related to the Transfer of the GKK Properties. Excluding the GKK Properties, tenant reimbursements decreased by $0.2 million primarily due to lower occupancy (as a result of tenants vacating or tenants reducing leased space), lower recovery of operating expenses during 2011 caused by the reset of tenant base years (as a result of new tenants and lease renewals) and lower reimbursable utility expenses and property taxes for certain properties. Overall, we expect tenant reimbursements to increase in future periods as a result of owning the GKK Properties for an entire period, partially offset by decreases due to anticipated asset sales. Our tenant reimbursements in future periods will also vary based on several factors, including the occupancy rate of the buildings, changes in base year terms, and changes in reimbursable operating expenses. The current economic conditions could result in lower occupancy rates and increased tenant turnover and lease renewals resulting in lower tenant reimbursements. Generally, as new leases are negotiated, the base year resets to operating expenses incurred in the year the lease is signed and the tenant generally only reimburses operating expenses to the extent and by the amount that its allocable share of the building’s operating expenses in future years increases from its base year. As a result, as new leases are executed, tenant reimbursements would generally decrease. Rental income may or may not change by amounts corresponding to changes in tenant reimbursements due to new leases.
The $28.9 million decrease in interest income from loans receivable was primarily due to the following:
| |
| • | A net decrease of $20.9 million related to the GKK Mezzanine Loan due to the failure of the GKK Borrower to meet its contractual interest payment obligation beginning in April 2011. On May 6, 2011, the GKK Mezzanine Loan matured without repayment by the GKK Borrower and on September 1, 2011, we, through KBS, entered into the Settlement Agreement. As of December 15, 2011, GKK Stars had transferred all of the Equity Interests to us, giving us title to or, with respect to a limited number of GKK Properties, a leasehold interest in, 867 GKK Properties that had indirectly secured the GKK Mezzanine Loan. See the discussion of the Settlement Agreement under Part I, Item 1, “Business — Investment Portfolio — GKK Properties.” |
| |
| • | A decrease of $4.6 million related to the pay-off of the 55 East Monroe Mezzanine Loan Origination on September 9, 2010. |
| |
| • | A decrease of $0.8 million related to the foreclosure on the properties secured by the Artisan Multifamily Portfolio Mezzanine Loan by the first mortgage lender on January 21, 2011 and our write-off of this investment. |
| |
| • | A decrease of $2.5 million related to the maturity and default of the 11 South LaSalle Loan on September 1, 2010. |
Interest income from real estate loans receivable will decrease in future periods due to the maturity and default of the GKK Mezzanine Loan, the subsequent entry into the Settlement Agreement and the consummation of the related Transfers. Thus, we will not receive any future interest payments related to the GKK Mezzanine Loan. Interest income may also be affected by potential loan impairments in the future as a result of current or future market conditions. Assuming our real estate-related loans receivable are fully extended under the terms of the respective loan agreements, and excluding our loan investments with asset-specific loan loss reserves, we do not have any investments maturing within a year from December 31, 2011.
If any of the borrowers under our loans receivable are unable to repay a loan at maturity or default on their loan, the impact to future interest income and loan recoveries may be significant and will depend on several factors unique to each individual loan. In general, if we have a first priority lien on the collateral securing a loan, we may agree to extend the loan at similar terms, modify the terms of the loan, or foreclose on the collateral. If we foreclose on the collateral, we may either operate the property, resulting in our receipt of any cash flows generated by the property or our payment of any cash shortfalls related to the property, or sell the property for whatever amount we are able to obtain, which may or may not be equal to the loan balance prior to foreclosure. In general, if we own a mezzanine loan or a B-Note and the borrower is unable to repay its loan at maturity, we may have more restrictions and fewer options regarding the resolution of our investment. In certain circumstances, the senior lenders, in conjunction with us, may be willing to grant the borrower extensions or may grant extensions in exchange for more favorable terms (such as higher interest rates, a partial payoff, or the entitlement to a portion of a junior lender’s interest income, etc.). If the senior lenders will not grant the borrower an extension, we, as the mezzanine lender, may foreclose on the ownership interests of the borrower and take legal title to the property subject to the existing senior loans or we may negotiate a discounted repayment. We could attempt to negotiate an extension or modification with the senior lenders as the new borrower; however, if the senior lenders were not willing to extend or modify the loans and we were not able to repay the senior loans, we would most likely relinquish our interests or rights in the investment to the holders of the senior loans. Actual outcomes may differ significantly from the above based on factors specific to individual loans and situations.
Property operating, maintenance, and management costs from our real estate properties increased by $45.2 million primarily due to an increase of $43.8 million related to the Transfer of the GKK Properties. Excluding the GKK Properties, property operating, maintenance, and management costs increased by $1.4 million due to an increase of $0.4 million in bad debt expense related to rental revenues and $0.8 million of bad debt expense related to an interest receivable write-off related to the 11 South LaSalle Loan and as well as an increase of $0.2 million in utilities and other operating expenses related to our real estate portfolio. Overall, we expect property operating, maintenance, and management costs to increase in future periods as a result of owning the GKK Properties for an entire period, partially offset by decreases due to anticipated asset sales.
Real estate taxes, property-related taxes, and insurance from our real estate properties increased by $12.4 million primarily due to an increase of $13.1 million related to the Transfer of the GKK Properties. Excluding the GKK Properties, real estate taxes, property-related taxes, and insurance decreased by $0.7 million primarily due to an adjustment in the property tax estimate for a property. Overall, we expect real estate taxes, property-related taxes, and insurance to increase in future periods as a result of owning the GKK Properties for an entire period, partially offset by decreases due to anticipated asset sales.
The $0.7 million decrease in asset management fees was due to the exclusion of certain impaired real estate loans receivable from our asset management fee calculation.
General and administrative expenses increased by $13.2 million primarily due to an increase of $11.4 million related to the Transfer of the GKK Properties. Excluding the GKK Properties, general and administrative expenses increased by $1.8 million primarily related to higher legal fees, professional fees and expenses related to the Transfer of the GKK Properties, partially offset by a decrease in fees and expenses related to the Tribeca Building. General and administrative expenses consist primarily of legal fees, audit fees, transfer agent fees, state and local income taxes and other professional fees.
Depreciation and amortization expense from our real estate properties increased by $32.2 million primarily due to an increase of $35.3 million related to the Transfer of the GKK Properties. Excluding the GKK Properties, depreciation and amortization expense decreased by $3.1 million primarily due to decreased amortization of tenant origination and absorption costs resulting from lease expirations, partially offset by an increase of accelerated depreciation and amortization for early lease terminations or renewals during the year ended December 31, 2011. Overall, we expect depreciation and amortization expense to increase in future periods as a result of owning the GKK Properties for an entire period, partially offset by decreases due to anticipated asset sales.
Interest expense from the financing of our portfolio increased by $31.4 million primarily due to an increase of $30.4 million related to debt secured by the GKK Properties. Excluding debt secured by the GKK Properties, interest expense increased by $1.0 million primarily due to a $2.7 million increase related to the amortization of loan fee extension costs of $8.5 million under the Amended Repurchase Agreements, partially offset by a $1.0 million decrease due to a repayment in full of all mortgage debt on the Tribeca Building, a $0.3 million decrease due to a lower interest rate as a result of refinancing of a portion of our debt and a $0.2 million decrease due to pay-off of our debt related to real estate sold in 2011. Included in interest expense is the amortization of deferred financing costs of $1.5 million and $7.3 million for the years ended December 31, 2010 and December 31, 2011, respectively. Interest expense in future periods will vary based on fluctuations in one-month LIBOR, our level of future borrowings and our ability to refinance existing indebtedness at similar rates. We do not currently plan to acquire or originate more real estate or real estate‑related assets, and therefore, do not plan to enter into any purchase financing in the future. However, we will need to refinance our existing indebtedness in the future. Overall, we expect interest expense to increase in future periods as a result of our assumption of the debt secured by the GKK Properties.
During the year ended December 31, 2011, we recognized an impairment charge on real estate of $15.8 million with respect to eight real estate properties held for investment. We did not recognize any impairment charge on real estate held for investment during the year ended December 31, 2010.
The provision for loan losses for the year ended December 31, 2011 increased by $1.0 million compared to the year ended December 31, 2010. During the year ended December 31, 2011, we recorded provision for loan losses of $12.0 million, which consisted of $30.1 million calculated on an asset-specific basis and partially offset by a decrease of $18.1 million calculated on a portfolio-basis. The provision for loan losses calculated on an asset-specific basis related to the 11 South LaSalle Loan Origination, the Park Central Mezzanine Loan and the San Antonio Business Park Mortgage Loan. During the year ended December 31, 2010, we recorded a provision for loan losses of $11.0 million, which consisted of an increase of a $16.9 million calculated on an asset-specific basis and partially offset by a reduction of $5.9 million calculated on a portfolio-basis. The asset-specific reserves related to the Artisan Multifamily Portfolio Mezzanine Loan.
We recognized a gain of $0.1 million and $2.0 million on the sales of foreclosed real estate held for sale during the years ended December 31, 2011 and 2010, respectively. During the year ended December 31, 2011, we sold seven condominium units of the Tribeca Building and during the year ended December 31, 2010, we sold 16 condominium units of the Tribeca Building.
We recognized $5.0 million and $7.7 million in income from an unconsolidated joint venture related to the Arden Portfolio during the years ended December 31, 2011 and 2010, respectively. On July 8, 2011, the members of the HSC Partners Joint Venture entered into an amendment to its joint venture operating agreement to convert another lender’s $30.0 million of outstanding mezzanine debt to preferred membership interests. The HSC Partners Joint Venture also agreed that any cash flows from the joint venture after monthly debt service payments to existing mortgage and mezzanine lenders would be used to pay down principal. Accordingly, we do not expect to receive future income from our investment in the HSC Partners Joint Venture.
We recognized $1.6 million in other income due to the write-off of the liability related to the $1.6 million of advances provided by our advisor as we determined that it was unlikely that we would meet the requirements at any future date to be obligated to reimburse our advisor for these amounts. See “— Contractual Commitments and Contingencies — Other Obligations.”
We recognized a gain on sale of real estate of $5.1 million related to the disposition of seven industrial properties and three office properties during the year ended December 31, 2011. During the year ended December 31, 2010, we recognized a gain on sale of real estate of $5.6 million related to the disposition of the 18301 Von Karman Building and Southpark Commerce Center II Buildings.
Income (loss) from discontinued operations for the year ended December 31, 2011 increased by $5.8 million compared to the year ended December 31, 2010. Additionally, as of December 31, 2011, we wrote-off $5.4 million of liabilities due to affiliates as a decrease to asset management fees in discontinued operations, as we determined that it was unlikely that we would meet the requirements at any future date to be obligated to reimburse our advisor for this amount. See “— Contractual Commitments and Contingencies — Other Obligations.” Income (loss) from discontinued operations is comprised of the results of operations from properties sold and properties held for sale as of December 31, 2011. During 2011, we sold seven industrial properties and three office properties, transferred, through our consolidated joint venture, the National Industrial Portfolio, consisting of 23 industrial properties and a master lease, to the lender in full satisfaction of the debt secured by the properties, and designated three office properties and 247 of the GKK Properties as held for sale. During 2010, we disposed of one office and one industrial property. Accordingly, we classified these properties as discontinued operations for all periods presented in our consolidated financial statements. Total revenues and other income from discontinued operations decreased from $84.4 million during the year ended December 31, 2010 to $82.6 million during the year ended December 31, 2011. Total expenses from discontinued operations decreased from $86.1 million during the year ended December 31, 2010 to $78.4 million during the year ended December 31, 2011.
During the year ended December 31, 2011, we recognized an impairment charge on real estate from discontinued operations of $36.8 million with respect to 11 properties held for sale or sold during the year ended December 31, 2011. The impairment charge was a result of a change in estimated holding period for these investments and a change in the estimated cash flows during the holding period. During the year ended December 31, 2010, we recognized an impairment charge on real estate from discontinued operations of $123.5 million with respect to 17 properties within the National Industrial Portfolio joint venture. As of December 31, 2010, we held an 80% membership interest in the joint venture and consolidated the joint venture in our financial statements. As a result of revising our cash flow projections and holding period for the National Industrial Portfolio joint venture, we determined that the estimated undiscounted cash flows during the revised holding period (including proceeds from the disposal of the investment) were not sufficient to recover the carrying value of certain of the properties in the National Industrial Portfolio; therefore, we recognized an impairment charge of $123.5 million with respect to 17 properties within the National Industrial Portfolio to reduce the carrying value of these properties to their estimated fair values.
During the year ended December 31, 2011, we recognized a gain on extinguishment of debt from discontinued operations of $115.5 million related to the National Industrial Portfolio Mortgage and Mezzanine Loans. See “— Contractual Commitments and Contingencies — Extinguishment of National Industrial Portfolio Mortgage and Mezzanine Loans.”
Comparison of the year ended December 31, 2010 versus the year ended December 31, 2009
The following table provides summary information about our results of operations for the years ended December 31, 2010 and 2009 (dollar amounts in thousands):
|
| | | | | | | | | | | | | | |
| | For the Years Ended December 31, | | Increase (Decrease) | | Percentage Change |
| | 2010 | | 2009 | |
| Rental income | $ | 98,008 |
| | $ | 101,879 |
| | $ | (3,871 | ) | | (4 | )% |
| Tenant reimbursements | 17,935 |
| | 21,041 |
| | (3,106 | ) | | (15 | )% |
| Interest income from real estate loans receivable | 42,321 |
| | 56,161 |
| | (13,840 | ) | | (25 | )% |
| Interest income from real estate securities | 3,090 |
| | 3,507 |
| | (417 | ) | | (12 | )% |
| Parking revenues and other operating income | 2,339 |
| | 1,999 |
| | 340 |
| | 17 | % |
| Operating, maintenance, and management costs | 27,954 |
| | 27,683 |
| | 271 |
| | 1 | % |
| Real estate taxes, property-related taxes, and insurance | 17,422 |
| | 17,417 |
| | 5 |
| | 0 | % |
| Asset management fees to affiliate | 15,228 |
| | 16,460 |
| | (1,232 | ) | | (7 | )% |
| General and administrative expenses | 7,045 |
| | 6,697 |
| | 348 |
| | 5 | % |
| Depreciation and amortization expense | 50,121 |
| | 60,034 |
| | (9,913 | ) | | (17 | )% |
| Interest expense | 39,553 |
| | 38,287 |
| | 1,266 |
| | 3 | % |
| Provision for loan losses | 11,046 |
| | 178,813 |
| | (167,767 | ) | | (94 | )% |
| Other-than-temporary impairment of real estate securities | — |
| | 5,067 |
| | (5,067 | ) | | (100 | )% |
| Gain on sales of foreclosed real estate held for sale | 2,011 |
| | — |
| | 2,011 |
| | 100 | % |
| Income from unconsolidated joint venture | 7,701 |
| | 4,038 |
| | 3,663 |
| | 91 | % |
| Other interest income | 112 |
| | 126 |
| | (14 | ) | | (11 | )% |
| Gain on sales of real estate, net | 5,646 |
| | — |
| | 5,646 |
| | 100 | % |
| Income (loss) from discontinued operations | (1,720 | ) | | (24,628 | ) | | 22,908 |
| | (93 | )% |
| Impairment charge on discontinued operations | (123,453 | ) | | — |
| | (123,453 | ) | | (100 | )% |
The $3.9 million decrease in rental income primarily relates to lower occupancy, a net decrease in amortization of below‑market in‑place leases and lower rental rates and high lease concessions for new and renewing tenants and as a result of lease renewals, partially offset by an increase in lease termination fees. Occupancy decreased from 90% at December 31, 2009 to 82% at December 31, 2010.
The $3.1 million decrease in tenant reimbursements was primarily due to lower occupancy (as a result of tenants vacating or tenants reducing leased space), lower recovery of operating expenses caused by the reset of tenant base years (as a result of new tenants and lease renewals) and lower reimbursable utility expenses and property taxes for certain properties.
The $13.8 million decrease in interest income from loans receivable was primarily due to the following:
| |
| • | A decrease of $6.9 million related to the Arden Portfolio Mezzanine Loans was due to the fact that we released the borrowers under this investment from liability and received preferred membership interests in a joint venture that indirectly owns the properties that had served as collateral for the loans on July 8, 2009; revenues generated by this investment are now recognized as income from unconsolidated joint venture, discussed below. |
| |
| • | A decrease of $2.6 million related to the 18301 Von Karman Loans consisted of a decrease of $2.2 million in contractual interest income and a decrease of $0.4 million in amortization of purchase discounts. We gained control of the property securing the 18301 Von Karman Loans on October 6, 2009 as a result of receiving a deed-in-lieu of foreclosure; revenues generated and expenses incurred by this investment were recognized in our real estate operations until we sold the property on June 30, 2010. |
| |
| • | A decrease of $2.1 million related to the 55 East Monroe Mezzanine Loan Origination was a result of the pay-off of the loan on September 9, 2010. |
| |
| • | A decrease of $1.9 million related to the Tribeca Loans was a result of ceasing recognition of revenue on the First and Second Tribeca Mezzanine Loans during the second quarter of 2009. In addition, the borrowers under the Tribeca Loans defaulted and we foreclosed on the project on February 19, 2010. |
| |
| • | A decrease of $1.2 million, of which $0.6 million related to the restructuring of the Sandmar Mezzanine Loan during the third quarter of 2009 and another $0.6 million related to the Artisan Multifamily Portfolio Mezzanine Loan as a result of the borrower ceasing to make payments during the third quarter of 2010. Subsequent to December 31, 2010, the first mortgage lender foreclosed on the properties secured by the Artisan Multifamily Mezzanine Loan. |
| |
| • | A net increase of $1.2 million related to the GKK Mezzanine Loan was primarily due to the amortization of the fee paid by the borrower to extend this loan to March 2011, partially offset by a decrease in interest income due to the $12.8 million decrease in the principal balance from December 31, 2009 to December 31, 2010 due to principal pay downs on the loan from partial sales of the underlying collateral. |
| |
| • | A decrease of $0.7 million related to the 2600 Michelson Mezzanine Loan consisted of a decrease of $0.6 million in contractual interest income due to the impairment of this loan in the second quarter of 2009 and a decrease of $0.1 million in amortization of purchase discount. |
| |
| • | A decrease of $0.1 million related to the 200 Professional Drive Loan Origination was a result of ceasing recognition of revenue during the first quarter of 2009. In December 2010, we foreclosed on the 200 Professional Drive Loan Origination and received $4.1 million upon the sale of the property. |
| |
| • | An increase of $0.3 million related to the 11 South LaSalle Loan was due to an increase in the principal balance of $3.6 million from December 31, 2009 to December 31, 2010. |
The $0.4 million decrease in interest income from real estate securities is primarily due to a decrease in accretion on our fixed rate securities as a result of a change in our cash flow estimates for these securities beginning in April 2009.
The $0.3 million increase in property operating, maintenance, and management costs is due to a $0.7 million increase in repairs and maintenance expenses, partially offset by a $0.4 million decrease in utility expenses as a result of lower occupancy, lower utility rates, conservation efforts and utility credits recognized during the year ended December 31, 2010.
The $1.2 million decrease in asset management fees was primarily due to the exclusion of certain impaired real estate loans receivable from our asset management fee calculation beginning in the fourth quarter of 2009 and a reduction in the outstanding principal balance of the GKK Mezzanine Loan, as a result of principal repayments on the loan.
The $0.3 million increase in general and administrative expenses primarily relates to higher legal fees incurred for various transaction consultations. General and administrative expenses consist primarily of legal fees, audit fees, transfer agent fees, state and local income taxes and other professional fees.
The $9.9 million decrease in depreciation and amortization expense is primarily due to decreased amortization of tenant origination and absorption costs resulting from lease expirations, partially offset by an increase of accelerated depreciation and amortization for early lease terminations or renewals during the year ended December 31, 2010.
The $1.3 million increase in interest expense was primarily due to the increase in interest expense on the Tribecca Building as a result of the foreclosure on the Tribeca Loans in 2010. This increase is slightly offset by a decrease in interest expense under floating rate notes payable and repurchase agreements as a result of decreases in LIBOR. One-month LIBOR averaged 0.33% during the year ended December 31, 2009 and averaged 0.27% during the year ended December 31, 2010.
The provision for loan losses for the year ended December 31, 2010 decreased by $167.8 million compared to the year ended December 31, 2009 as a result of the $208.8 million provision for loan losses related to the 200 Professional Drive Loan Origination, the Tribeca Mezzanine Loans, the 18301 Von Karman Loans, the Arden Portfolio Mezzanine Loans, the 2600 Michelson Mezzanine Loan and Sandmar Mezzanine Loan recorded during the year ended December 31, 2009 as compared to the $16.9 million provision for loan losses related to the Artisan Multifamily Portfolio Mezzanine Loan during the year ended December 31, 2010. This was offset by a reduction of $5.9 million and $30.0 million in our provision for portfolio-based loan losses during the years ended December 31, 2010 and 2009, respectively.
We did not recognize any other-than-temporary impairments during the year ended December 31, 2010. We recognized other-than-temporary impairments related to real estate securities of $5.1 million during the year ended December 31, 2009, which related to our investment in fixed rate securities. Since April 1, 2009, as a result of adopting a new accounting principle, we are required to distinguish between other-than-temporary impairments related to credit and other‑than‑temporary impairments related to other factors (e.g., market fluctuations) on our real estate securities that we do not intend to sell and where it is not likely that we will be required to sell the security prior to the anticipated recovery of its amortized cost basis. The credit component of any such other‑than‑temporary impairments is charged to earnings and the component related to other factors is recorded to other comprehensive income (loss).
We recognized a gain of $2.0 million on the sales of foreclosed real estate held for sale. During the year ended December 31, 2010, we sold 16 condominium units of the Tribeca Building, which we foreclosed on in February 2010.
We recognized $7.7 million and $4.0 million in income from an unconsolidated joint venture related to the Arden Portfolio for the years ended December 31, 2010 and 2009, respectively. On July 8, 2009, we released the borrowers under the Arden Portfolio Mezzanine Loans and received preferred membership interests in an unconsolidated joint venture that indirectly owns the properties that served as the collateral for these loans. Although there was no income from the unconsolidated joint venture until July 8, 2009, we recognized $6.9 million of interest income from the real estate loans receivable relating to the Arden Portfolio Mezzanine Loans during the year ended December 31, 2009.
We recognized a gain on sale of real estate of $5.6 million related to the disposition of the 18301 Von Karman Building and Southpark Commerce Center II Buildings during the year ended December 31, 2010. We did not dispose of any real estate during the year ended December 31, 2009.
Income (loss) from discontinued operations for the year ended December 31, 2010 increased by $22.9 million compared to the year ended December 31, 2009. Please see “Comparison of the year ended December 31, 2011 versus the year ended December 31, 2010” above for a discussion of properties sold and properties held for sale included in discontinued operations. Total revenues and other income from discontinued operations decreased from $96.3 million during the year ended December 31, 2009 to $84.4 million during the year ended December 31, 2010. Total expenses from discontinued operations decreased from $120.9 million during the year ended December 31, 2009 to $86.1 million during the year ended December 31, 2010.
During the year ended December 31, 2010, we recognized an impairment charge on real estate from discontinued operations of $123.5 million with respect to 17 properties within the National Industrial Portfolio joint venture. Please see “Comparison of the year ended December 31, 2011 versus the year ended December 31, 2010” above for our discussion on the National Industrial Portfolio joint venture.
Funds from Operations and Modified Funds from Operations
We believe that funds from operations (“FFO”) is a beneficial indicator of the performance of an equity REIT. We compute FFO in accordance with the current NAREIT definition. FFO represents net income, excluding gains and losses from sales of operating real estate assets (which can vary among owners of identical assets in similar conditions based on historical cost accounting and useful-life estimates), impairment losses on real estate assets, depreciation and amortization of real estate assets, and adjustments for unconsolidated partnerships and joint ventures. In connection with NAREIT’s recent Accounting and Financial Standards Hot Topics, we are excluding impairment charges on real estate assets in our calculation of FFO as of December 31, 2011. We have also restated FFO from prior periods to exclude these impairment charges. NAREIT believes that impairment charges on real estate assets are often early recognition of losses on prospective sales of properties, and therefore, the exclusion of these impairments is consistent with the exclusion of gains and losses recognized from the sales of real estate. Although these losses are included in the calculation of net income (loss), we have excluded these impairment charges in our calculation of FFO because impairments do not impact the current operating performance of our investments, and may or may not provide an indication of future operating performance. We believe FFO facilitates comparisons of operating performance between periods and among other REITs. However, our computation of FFO may not be comparable to other REITs that do not define FFO in accordance with the NAREIT definition or that interpret the current NAREIT definition differently than we do.
Our management believes that historical cost accounting for real estate assets in accordance with GAAP implicitly assumes that the value of real estate assets diminishes predictably over time. Since real estate values have historically risen or fallen with market conditions, many industry investors and analysts have considered the presentation of operating results for real estate companies that use historical cost accounting to be insufficient by themselves. As a result, we believe that the use of FFO, together with the required GAAP presentations, provides a more complete understanding of our performance relative to our competitors and a more informed and appropriate basis on which to make decisions involving operating, financing, and investing activities.
Changes in accounting rules have resulted in a substantial increase in the number of non-operating and non-cash items included in the calculation of FFO. As a result, our management also uses modified funds from operations (“MFFO”) as an indicator of our ongoing performance as well as our dividend sustainability. We believe that MFFO is helpful as a measure of ongoing operating performance because it excludes non-operating items included in FFO and MFFO also excludes non-cash items such as straight-line rental revenue. Additionally, we believe that MFFO provides investors with supplemental performance information that is consistent with the performance indicators and analysis used by management, in addition to net income (loss) and cash flows from operating activities as defined by GAAP, to evaluate the sustainability of our operating performance. MFFO excludes from FFO: acquisition fees and expenses; adjustments related to contingent purchase price obligations; amounts relating to straight-line rents and amortization of above and below market intangible lease assets and liabilities; accretion of discounts and amortization of premiums on debt investments; amortization of closing costs; impairments of real estate-related investments; mark-to-market adjustments included in net income; and gains or losses included in net income for the extinguishment or sale of debt or hedges. We compute MFFO in accordance with the definition of MFFO included in the practice guideline issued by the Investment Program Association (“IPA”) in November 2010. Our computation of MFFO may not be comparable to other REITs that do not compute MFFO in accordance with the current IPA definition or that interpret the current IPA definition differently than we do.
FFO and MFFO are non-GAAP financial measures and do not represent net income as defined by GAAP. Net income as defined by GAAP is the most relevant measure in determining our operating performance because FFO and MFFO include adjustments that investors may deem subjective, such as adding back expenses such as depreciation and amortization and the other items described above. Accordingly, FFO and MFFO should not be considered as alternatives to net income as an indicator of our current and historical operating performance. In addition, MFFO does not represent cash flows from operating activities determined in accordance with GAAP and should not be considered an indication of our liquidity. We believe FFO and MFFO, in addition to net income (loss) and cash flows from operating activities as defined by GAAP, are meaningful supplemental performance measures and are useful in understanding how our management evaluates our ongoing operating performance.
Although MFFO includes other adjustments, the exclusion of impairment charges related to our real estate related investments, straight-line rent and gain on extinguishment of debt are the most significant adjustments to us at the present time. We have excluded these items based on the following economic considerations:
| |
| • | Impairment charge on real estate loans receivable. An impairment charge on real estate loans receivable represents a write-down of the carrying value of a real estate loan to reflect the current valuation of the asset, whether or not the asset is intended to be held long-term. Although these losses are included in the calculation of net income (loss), we have excluded these impairment charges in our calculation of MFFO because impairments do not impact the current operating performance of our investments, and may or may not provide an indication of future operating performance. We believe it is useful to investors to have a supplemental metric that addresses core operating performance directly and therefore excludes such things as impairment charges on real estate loans receivable; |
| |
| • | Adjustments for straight-line rent. These are adjustments to rental revenue as required by GAAP to recognize contractual lease payments on a straight-line basis over the life of the respective lease. We have excluded these adjustments in our calculation of MFFO to more appropriately reflect the current economic impact of our in-place leases, also providing investors with a useful supplemental metric that addresses core operating performance by removing rent we hope to receive in a future period or rent that was received in a prior period; and |
| |
| • | Gain on extinguishment of debt. A gain on extinguishment of debt represents the difference between the fair value of any consideration transferred to the lender in return for the extinguishment of a debt and the net carrying value of the debt at the time of settlement. We have excluded the gain from extinguishment of debt in our calculation of MFFO because these gains do not impact the current operating performance of our investments and do not provide an indication of future operating performance. |
Our calculation of FFO and MFFO is presented in the table below for the years ended December 31, 2011, 2010 and 2009, respectively (in thousands). No conclusions or comparisons should be made from the presentation of these periods.
|
| | | | | | | | | | | |
| | For the Years Ended December 31, |
| | 2011 | | 2010 | | 2009 |
| Net income (loss) attributable to common stockholders | $ | (19,338 | ) | | $ | (90,352 | ) | | $ | (182,966 | ) |
| Depreciation of real estate assets | 42,954 |
| | 25,275 |
| | 23,257 |
|
| Depreciation of real estate assets - discontinued operations | 17,948 |
| | 17,861 |
| | 18,448 |
|
| Amortization of lease-related costs | 39,356 |
| | 24,846 |
| | 36,777 |
|
| Amortization of lease-related costs - discontinued operations | 9,780 |
| | 12,691 |
| | 41,829 |
|
| Impairment charges on real estate | 15,823 |
| | — |
| | — |
|
| Impairment charges on real estate - discontinued operations | 36,754 |
| | 123,453 |
| | — |
|
| Gain on sales of foreclosed real estate held for sale | (134 | ) | | (2,011 | ) | | — |
|
| Gain on sales of real estate, net | (5,141 | ) | | (5,646 | ) | | — |
|
Adjustments for noncontrolling interest - consolidated entity (1) | (2,053 | ) | | (27,699 | ) | | (8,183 | ) |
| FFO | 135,949 |
| | 78,418 |
| | (70,838 | ) |
| Impairment charges on real estate loans receivable | 11,999 |
| | 11,046 |
| | 178,813 |
|
| Other-than-temporary impairments of real estate securities | — |
| | — |
| | 5,067 |
|
| Straight-line rent and amortization of above- and below-market leases | (16,188 | ) | | (8,912 | ) | | (9,184 | ) |
| Amortization of discounts and closing costs | (860 | ) | | (3,563 | ) | | (2,938 | ) |
| Amortization of discount on mortgage loans related to the GKK Properties | 3,983 |
| | — |
| | — |
|
| Gain from extinguishment of debt | (115,531 | ) | | — |
| | — |
|
Adjustments for noncontrolling interest - consolidated entity (1) | 23,867 |
| | 22 |
| | 590 |
|
| MFFO | $ | 43,219 |
| | $ | 77,011 |
| | $ | 101,510 |
|
_____________________
(1) The noncontrolling interest holder’s share of our consolidated venture’s real estate depreciation was $1.7 million, $1.8 million and $2.0 million, respectively, in 2011, 2010 and 2009. Its share of amortization of lease-related costs was $0.3 million, $1.2 million and $6.2 million, respectively, in 2011, 2010 and 2009.
FFO and MFFO may be used to fund all or a portion of certain capitalizable items that are excluded from FFO and MFFO, such as tenant improvements, building improvements and deferred leasing costs. During the year ended December 31, 2011, the GKK Properties generated $5.1 million and $2.4 million of FFO and MFFO, respectively, which are included in the calculation above. FFO and MFFO generated by the GKK Properties are restricted for the repayment of principal outstanding under the Amended Repurchase Agreements and expenditures related to the GKK Properties.
Distributions
Distributions declared, distributions paid and cash flows from operations were as follows during 2011 (in thousands, except per share amounts):
|
| | | | | | | | | | | | | | | | | | | | | | | |
| | Distributions
Declared (1) | | Distributions Declared Per
Share (1) (2) | | Distributions Paid (3) | | Cash Flows From (Used in) Operations |
| Period | Cash | | Reinvested | | Total | |
| First Quarter 2011 | $ | 24,090 |
| | $ | 0.129 |
| | $ | 12,493 |
| | $ | 11,533 |
| | $ | 24,026 |
| | $ | 1,667 |
|
| Second Quarter 2011 | 24,538 |
| | 0.131 |
| | 13,041 |
| | 11,706 |
| | 24,747 |
| | 22,218 |
|
| Third Quarter 2011 | 24,987 |
| | 0.132 |
| | 13,232 |
| | 11,698 |
| | 24,930 |
| | 18,945 |
|
| Fourth Quarter 2011 | 25,161 |
| | 0.133 |
| | 13,274 |
| | 11,555 |
| | 24,829 |
| | (3,771 | ) |
| | $ | 98,776 |
| | $ | 0.525 |
| | $ | 52,040 |
| | $ | 46,492 |
| | $ | 98,532 |
| | $ | 39,059 |
|
(1) Distributions for the period from January 1, 2011 through December 31, 2011 are based on daily record dates and are calculated at a rate of $0.00143836 per share per day.
(2) Assumes share was issued and outstanding each day during the period presented.
(3) Distributions during the periods presented were paid on a monthly basis.
For the year ended December 31, 2011, we paid aggregate distributions of $98.5 million, including $52.0 million of distributions paid in cash and $46.5 million of distributions reinvested through our dividend reinvestment plan (which will terminate effective April 10, 2012). We funded our total distributions paid, which includes net cash distributions and dividends reinvested by stockholders, with $39.1 million of current period cash flows from operations and $59.4 million of a combination of operating cash reserves from prior periods, proceeds from the sale of properties in 2011 and 2010 and proceeds from debt financing. FFO for the year ended December 31, 2011 was $135.9 million. For purposes of determining the sources of our distributions paid, we assume first that we use cash flow from operations, assets sales and financings from the relevant periods to fund distribution payments. See the reconciliation of FFO to net loss above.
We have paid distributions from asset sales, financings and our cash flow from operations. On March 20, 2012, our board of directors approved the suspension of monthly distribution payments in order to manage our reduced cash flows from operations and to redirect available funds to reduce our debt. Our primary concern is the repayment of our Amended Repurchase Agreements, but we expect to use available funds to repay other debt obligations as well. Reducing our debt will allow us to hold certain assets in our portfolio to improve their value and the returns to our stockholders. After repaying our Amended Repurchase Agreements and some of our other debt obligations through the suspension of monthly distribution payments and the sale of certain assets, we plan to make certain strategic asset sales and, from time to time, may declare special distributions to our stockholders that would be funded with the net proceeds from those asset sales or from cash flow from other sources. We will continue our existing strategy to sell assets when we believe the assets have reached the stage that disposition will assist in improving returns to our investors.
As a result of general economic conditions over the last several years, our portfolio has experienced increasing pressure from declines in cash flow from a number of our investments. The most significant factor has been a decline in cash flow from our real estate-related investments. In particular, our investments in mezzanine and mortgage loans have been impacted as the operating performance and values of buildings directly or indirectly securing our investment positions have decreased from the date of our acquisition or origination of these investments. In such instances, some of the borrowers have not been able to refinance their debt to us or sell the collateral at a price sufficient to repay our note balances in full when they become due. In addition, current economic conditions have impacted the ability of some borrowers under our loans to make contractual interest payments to us. Economic conditions have also impacted our real estate investments resulting in a decline in the occupancy of our portfolio, an important element to the continued growth of our portfolio, that has resulted in lower current cash flow. Tenant-specific issues, including bankruptcy and down-sizing, have placed downward pressure on our operating cash flow because these tenants have terminated their leases early, not renewed their leases or have not paid their contractual rent to us. Projected future declines in rental rates, slower or potentially negative net absorption of leased space and expectations of increases in future rental concessions, including three or more months of free rent to retain tenants who are up for renewal or to sign new tenants, are expected to result in additional decreases in cash flow. Moreover, asset sales in 2011 and expected future asset sales to meet our liquidity needs will result in further decreases in operating cash flow.
Due to these factors, we may not generate sufficient operating cash flow on a quarterly basis to cover our operations. If our cash flow from operations continues to deteriorate, we will be more dependent on asset sales to fund our operations and for our liquidity needs. These factors could also reduce our stockholders’ overall investment return.
In connection with the change to our distribution policy, our board of directors has terminated our dividend reinvestment plan effective April 10, 2012. In addition, our board of directors has amended and restated our share redemption program to provide only for redemptions sought upon a stockholder’s death, “qualifying disability” or “determination of incompetence” (each as defined in the share redemption program). Such redemptions are subject to an annual dollar limitation, which shall be $10.0 million in the aggregate for the calendar year 2012 (subject to review and adjustment during the year by the board of directors), and further subject to the limitations described in the share redemption program plan document. Based on historical redemption activity, we believe the $10.0 million redemption limitation for the calendar year 2012 will be sufficient for these special redemptions. During each calendar year, the annual dollar limitation for the share redemption program will be reviewed and adjusted from time to time.
On April 28, 2011, in connection with the execution of the Amended Repurchase Agreements, we agreed that during the term of the Amended Repurchase Agreements and except for distributions to stockholders necessary to maintain our REIT status, we would limit distributions to stockholders to an amount not to exceed $6.0 million per month, excluding any distributions to stockholders reinvested in our dividend reinvestment plan (which will terminate effective April 10, 2012). Additionally, any net cash flows from operations generated by the GKK Properties are restricted for the repayment of principal outstanding under the Amended Repurchase Agreements and expenditures related to the GKK Properties. See Part I, Item 1, “Business — Investment Portfolio — GKK Properties — Repurchase Agreements.”
In order that our stockholders could begin earning cash distributions, our advisor agreed to advance funds to us equal to the amount by which the cumulative amount of distributions declared by our board of directors from January 1, 2006 through the period ending August 31, 2010 exceeded the amount of our Funds from Operations (as defined in the advisory agreement) for the same period. From inception, our advisor had advanced an aggregate unreimbursed amount of $1.6 million to us and no amount had been advanced since January 2007. We were only obligated to reimburse our advisor for these expenses if and to the extent that our cumulative Funds from Operations for the period commencing January 1, 2006 through the date of any such reimbursement exceeded the lesser of (i) the cumulative amount of any distributions declared and payable to our stockholders as of the date of such reimbursement or (ii) an amount that is equal to a 7.0% cumulative, non-compounded, annual return on invested capital for our stockholders for the period from July 18, 2006 through the date of such reimbursement. No interest accrued on the advances made by our advisor. On March 20, 2012, we entered into an amendment to the advisory agreement with our advisor pursuant to which our advisor agreed to forgive the debt related to the $1.6 million of advances, and as such, we are no longer obligated to reimburse our advisor for this amount.
Our operating performance cannot be accurately predicted and may deteriorate in the future due to numerous factors, including those discussed under “Forward-Looking Statements,” Part I, Item 1,“Business — Market Outlook — Real Estate and Real Estate Finance Markets,” Part I, Item 1A, “Risk Factors” and “ — Results of Operations.” Those factors include: the future operating performance of our investments in the existing real estate and financial environment; the success and economic viability of our tenants; the ability of our borrowers and their sponsors to continue to make their debt service payments and/or to repay their loans upon maturity; our ability to refinance existing indebtedness at comparable terms; changes in interest rates on our variable rate debt obligations; our ability to sell assets to cover liquidity needs; our ability to successfully operate and sell the GKK Properties transferred to us under the Settlement Agreement given current economic conditions and the concentration of the GKK Properties in the financial services sector; the significant debt obligations we have assumed with respect to the GKK Properties; and our advisor’s limited experience operating and selling bank branch properties.
Critical Accounting Policies
Below is a discussion of the accounting policies that management considers critical in that they involve significant management judgments and assumptions, require estimates about matters that are inherently uncertain and because they are important for understanding and evaluating our reported financial results. These judgments affect the reported amounts of assets and liabilities and our disclosure of contingent assets and liabilities at the dates of the financial statements and the reported amounts of revenue and expenses during the reporting periods. With different estimates or assumptions, materially different amounts could be reported in our financial statements. Additionally, other companies may utilize different estimates that may impact the comparability of our results of operations to those of companies in similar businesses.
Revenue Recognition
Real Estate
We recognize minimum rent, including rental abatements, lease incentives and contractual fixed increases attributable to operating leases, on a straight‑line basis over the term of the related leases when collectibility is reasonably assured and record amounts expected to be received in later years as deferred rent receivable. If the lease provides for tenant improvements, we determine whether the tenant improvements, for accounting purposes, are owned by the tenant or by us. When we are the owner of the tenant improvements, the tenant is not considered to have taken physical possession or have control of the physical use of the leased asset until the tenant improvements are substantially completed. When the tenant is the owner of the tenant improvements, any tenant improvement allowance that is funded is treated as a lease incentive and amortized as a reduction of revenue over the lease term. Tenant improvement ownership is determined based on various factors including, but not limited to:
| |
| • | whether the lease stipulates how a tenant improvement allowance may be spent; |
| |
| • | whether the amount of a tenant improvement allowance is in excess of market rates; |
| |
| • | whether the tenant or landlord retains legal title to the improvements at the end of the lease term; |
| |
| • | whether the tenant improvements are unique to the tenant or general‑purpose in nature; and |
| |
| • | whether the tenant improvements are expected to have any residual value at the end of the lease. |
We record property operating expense reimbursements due from tenants for common area maintenance, real estate taxes, and other recoverable costs in the period the related expenses are incurred.
We make estimates of the collectibility of our tenant receivables related to base rents, including deferred rent receivable, expense reimbursements and other revenue or income. Management specifically analyzes accounts receivable, deferred rent receivable, historical bad debts, customer creditworthiness, current economic trends and changes in customer payment terms when evaluating the adequacy of the allowance for doubtful accounts. In addition, with respect to tenants in bankruptcy, management makes estimates of the expected recovery of pre‑petition and post‑petition claims in assessing the estimated collectibility of the related receivable. In some cases, the ultimate resolution of these claims can exceed one year. When a tenant is in bankruptcy, we will record a bad debt reserve for the tenant’s receivable balance and generally will not recognize subsequent rental revenue until cash is received or until the tenant is no longer in bankruptcy and has the ability to make rental payments.
Real Estate Loans Receivable
Interest income on our real estate loans receivable is recognized on an accrual basis over the life of the investment using the interest method. Direct loan origination fees and origination or acquisition costs, as well as acquisition premiums or discounts, are amortized over the term of the loan as an adjustment to interest income. We place loans on nonaccrual status when any portion of principal or interest is 90 days past due, or earlier when concern exists as to the ultimate collection of principal or interest. When a loan is placed on nonaccrual status, we reverse the accrual for unpaid interest and generally do not recognize subsequent interest income until cash is received, or the loan returns to accrual status. We will resume the accrual of interest if we determine the collection of interest according to the contractual terms of the loan is probable.
We generally recognize income on impaired loans on either a cash basis, where interest income is only recorded when received in cash, or on a cost‑recovery basis, where all cash receipts are applied against the carrying value of the loan. We consider the collectibility of the loan’s principal balance in determining whether to recognize income on impaired loans on a cash basis or a cost‑recovery basis.
Real Estate Securities
We recognize interest income on real estate securities that are beneficial interests in securitized financial assets and are rated “AA” and above on an accrual basis according to the contractual terms of the securities. Discounts or premiums are amortized to interest income over the life of the investment using the interest method.
We recognize interest income on real estate securities that are beneficial interests in securitized financial assets that are rated below “AA” using the effective yield method, which requires us to periodically project estimated cash flows related to these securities and recognize interest income at an interest rate equivalent to the estimated yield on the security, as calculated using the security’s estimated cash flows and amortized cost basis, or reference amount. Changes in the estimated cash flows are recognized through an adjustment to the yield on the security on a prospective basis. Projecting cash flows for these types of securities requires significant judgment, which may have a significant impact on the timing of revenue recognized on these investments.
Cash and Cash Equivalents
We recognize interest income on our cash and cash equivalents as it is earned and classify such amounts as other interest income.
Real Estate
Depreciation and Amortization
Real estate costs related to the acquisition and improvement of properties are capitalized and amortized over the expected useful life of the asset on a straight-line basis. Repair and maintenance costs are charged to expense as incurred and significant replacements and betterments are capitalized. Repair and maintenance costs include all costs that do not extend the useful life of the real estate asset. We consider the period of future benefit of an asset to determine its appropriate useful life. Expenditures for tenant improvements are capitalized and amortized over the shorter of the tenant’s lease term or expected useful life. We anticipate the estimated useful lives of our assets by class to be generally as follows:
|
| |
| Buildings | 15 - 40 years |
| Building improvements | 10 - 25 years |
| Tenant improvements | Shorter of lease term or expected useful life |
| Tenant origination and absorption costs | Remaining term of related leases, including below-market renewal periods |
Real Estate Acquisition Valuation
We record the acquisition of income‑producing real estate or real estate that will be used for the production of income as a business combination. All assets acquired and liabilities assumed in a business combination are measured at their acquisition‑date fair values. Acquisition costs are expensed as incurred and restructuring costs that do not meet the definition of a liability at the acquisition date are expensed in periods subsequent to the acquisition date. Estimates of the fair values of the tangible assets, identifiable intangibles and assumed liabilities require us to make significant assumptions to estimate market lease rates, property‑operating expenses, carrying costs during lease‑up periods, discount rates, market absorption periods, and the number of years the property will be held for investment. The use of inappropriate assumptions would result in an incorrect valuation of our acquired tangible assets, identifiable intangibles and assumed liabilities, which would impact the amount of our net income.
Impairment of Real Estate and Related Intangible Assets and Liabilities
We continually monitor events and changes in circumstances that could indicate that the carrying amounts of our real estate and related intangible assets and liabilities may not be recoverable or realized. When indicators of potential impairment suggest that the carrying value of real estate and related intangible assets and liabilities may not be recoverable, we assess the recoverability by estimating whether we will recover the carrying value of the real estate and related intangible assets and liabilities through its undiscounted future cash flows and its eventual disposition. If, based on this analysis, we do not believe that we will be able to recover the carrying value of the real estate and related intangible assets and liabilities, we would record an impairment loss to the extent that the carrying value exceeds the estimated fair value of the real estate and related intangible assets and liabilities.
Projecting future cash flows involves estimating expected future operating income and expenses related to the real estate and its related intangible assets and liabilities as well as market and other trends. Using inappropriate assumptions to estimate cash flows could result in incorrect fair values of the real estate and its related intangible assets and liabilities and could result in the overstatement of the carrying values of our real estate and related intangible assets and liabilities and an overstatement of our net income.
Real Estate Held for Sale and Discontinued Operations
We generally consider non-foreclosed real estate to be “held for sale” when the following criteria are met: (i) management commits to a plan to sell the property, (ii) the property is available for sale immediately, (iii) the property is actively being marketed for sale at a price that is reasonable in relation to its current fair value, (iv) the sale of the property within one year is considered probable and (v) significant changes to the plan to sell are not expected. Real estate that is held for sale and its related assets are classified as “real estate held for sale” and “assets related to real estate held for sale,” respectively, for all periods presented in the accompanying consolidated financial statements. Notes payable and other liabilities related to real estate held for sale are classified as “notes payable related to real estate held for sale” and “liabilities related to real estate held for sale,” respectively, for all periods presented in the accompanying consolidated financial statements. Real estate classified as held for sale is no longer depreciated and reported at the lower of its carrying value or its estimated fair value less costs to sell. Additionally, we record the operating results related to real estate that has either been disposed of or is deemed to be held for sale as discontinued operations for all periods presented if the operations have been or are expected to be eliminated and we will not have any significant continuing involvement in the operations of the property following the sale.
Foreclosed Real Estate Held for Sale
Foreclosed real estate held for sale consists of properties acquired through foreclosure or by deed-in-lieu of foreclosure in full or partial satisfaction of non-performing loans that we intend to market for sale in the near term. Foreclosed real estate held for sale is recorded at the estimated fair value of the real estate (net of liabilities assumed) less costs to sell, or the fair value of the loan satisfied if more clearly evident. The excess of the carrying value of the loan over the fair value of the property less estimated costs to sell, if any, is charged-off against the reserve for loan losses when title to the property is obtained. Costs of holding the property are expensed as incurred in our consolidated statements of operations. The gain or loss on final disposition of foreclosed real estate held for sale will be recorded as other income and is considered income (loss) from continuing operations as it represents the final stage of our loan collection process.
Real Estate Loans Receivable
Our real estate loans receivable are recorded at amortized cost, net of loan loss reserves, and evaluated for impairment at each balance sheet date. The amortized cost of a real estate loan receivable is the outstanding unpaid principal balance, net of unamortized acquisition premiums or discounts and unamortized costs and fees directly associated with the origination or acquisition of the loan.
The reserve for loan losses is a valuation allowance that reflects our estimate of loan losses inherent in the loan portfolio as of the balance sheet date. The reserve is adjusted through “Provision for loan losses” in our consolidated statements of operations and is decreased by charge‑offs to specific loans when losses are confirmed. The reserve for loan losses includes a portfolio‑based component and an asset‑specific component.
An asset‑specific reserve relates to reserves for losses on loans considered impaired. We consider a loan to be impaired when, based upon current information and events, we believe that it is probable that we will be unable to collect all amounts due under the contractual terms of the loan agreement. We also consider a loan to be impaired if we grant the borrower a concession through a modification of the loan terms or if we expect to receive assets (including equity interests in the borrower) with fair values that are less than the carrying value of our loan in satisfaction of the loan. A reserve is established when the present value of payments expected to be received, observable market prices, the estimated fair value of the collateral (for loans that are dependent on the collateral for repayment) or amounts expected to be received in satisfaction of a loan are lower than the carrying value of that loan.
A portfolio‑based reserve covers the pool of loans that do not have asset‑specific reserves. A provision for loan losses is recorded when available information as of each balance sheet date indicates that it is probable that a loss occurred in the pool of loans and the amount of the loss can be reasonably estimated, but we do not know which specific loans within the pool will ultimately result in losses. Required reserve balances for this pool of loans are derived from estimated probabilities of default and estimated loss severities assuming a default occurs. On a quarterly basis, we assign estimated probabilities of default and loss severities to each loan in the portfolio based on factors such as the debt service coverage of the underlying collateral, the estimated fair value of the collateral, the significance of the borrower’s investment in the collateral, the financial condition of the borrower and/or its sponsors, the likelihood that the borrower and/or its sponsors would allow the loan to default, our willingness and ability to step in as owner in the event of default, and other pertinent factors.
Failure to recognize impairments would result in the overstatement of earnings and the carrying value of our real estate loans held for investment. Actual losses, if any, could differ significantly from estimated amounts.
Investment in Unconsolidated Joint Venture
On July 8, 2009, we released the borrowers under two investments in mezzanine loans from liability and received preferred membership interests in a joint venture that indirectly owns the properties that had served as collateral for the loans. The interests were initially recorded by us at a fair value of $0 based on the estimated fair value of the collateral at the time of receipt of the preferred membership interests. We account for our preferred membership interests in the real estate joint venture under the equity method of accounting since we are not the primary beneficiary of the joint venture, but do have more than a minor interest. Since we will most likely only receive preferred distributions equivalent to the interest income we would have earned on our mezzanine loan investments, our application of the equity method of accounting to these preferred interests results in us recording all distributions received as income. We do not record our share of the changes in the book value of the joint venture as we are not required to absorb losses and do not expect increases in the book value of the joint venture to have any material impact on the cash flows we will receive over the course of the investment.
Real Estate Securities
We classify our investments in real estate securities as available‑for‑sale, since we may sell them prior to their maturity but do not hold them principally for the purpose of making frequent investments and sales with the objective of generating profits on short‑term differences in price. These investments are carried at estimated fair value, with unrealized gains and losses reported in accumulated other comprehensive income (loss). Estimated fair values are generally based on quoted market prices, when available, or on estimates provided by independent pricing sources or dealers who make markets in such securities. In certain circumstances, such as when the market for the securities becomes inactive, we may determine it is appropriate to perform an internal valuation of the securities. Upon the sale of a security, the previously recognized unrealized gain (loss) would be reversed and the actual realized gain (loss) recognized.
On a quarterly basis, we evaluate our real estate securities for impairment. We review the projected future cash flows from these securities for changes in assumptions due to prepayments, credit loss experience and other factors. If, based on our quarterly estimate of cash flows, there has been an adverse change in the estimated cash flows from the cash flows previously estimated, the present value of the revised cash flows is less than the present value previously estimated, and the fair value of the securities is less than our amortized cost basis, an other‑than‑temporary impairment is deemed to have occurred.
Prior to April 1, 2009, when a security was deemed to be other‑than‑temporarily impaired, the security was written down to its fair value (with the reduction in fair value recorded as a charge to earnings) and a new cost basis was established. We would calculate a revised yield based on the new cost basis of the investment (including any other‑than‑temporary impairments recognized to date) and estimate future cash flows expected to be realized, which was applied prospectively to recognize interest income.
Beginning April 1, 2009, as a result of adopting a new accounting principle, we are required to distinguish between other‑than‑temporary impairments related to credit and other‑than‑temporary impairments related to other factors (e.g., market fluctuations) on our real estate securities that we do not intend to sell and where it is not likely that we will be required to sell the security prior to the anticipated recovery of our amortized cost basis. We calculate the credit component of the other‑than‑temporary impairment as the difference between the amortized cost basis of the security and the present value of its estimated cash flows discounted at the yield used to recognize interest income. The credit component will be charged to earnings and the component related to other factors will be recorded to other comprehensive income (loss).
On April 1, 2009, we recognized a cumulative transition adjustment of $14.8 million as an adjustment to the opening balance of retained earnings with a corresponding adjustment to accumulated other comprehensive income (loss) and to the amortized cost basis of our real estate securities. The transition adjustment was calculated as the difference between the present value of our estimated cash flows for our real estate securities as of April 1, 2009 discounted at the yield used to recognize income prior to the recognition of any other‑than‑temporary impairments and the April 1, 2009 amortized cost basis of the securities, which reflects the cumulative other‑than‑temporary impairment losses that have been recorded on our real estate securities that are not related to credit. Although we increased our amortized cost basis in the securities as a result of this transition adjustment, the securities are ultimately presented at fair value in the accompanying consolidated balance sheets with differences between fair value and amortized cost basis presented as unrealized gains or losses in accumulated other comprehensive income (loss) within the equity section of the accompanying consolidated balance sheets.
Fair Value Measurements
Under GAAP, we are required to measure certain financial instruments at fair value on a recurring basis. In addition, we are required to measure other financial instruments and balances at fair value on a non‑recurring basis (e.g., carrying value of impaired real estate loans receivable and long‑lived assets). Fair value is defined as the price that would be received upon the sale of an asset or paid to transfer a liability in an orderly transaction between market participants at the measurement date. The GAAP fair value framework uses a three‑tiered approach. Fair value measurements are classified and disclosed in one of the following three categories:
| |
| • | Level 1: unadjusted quoted prices in active markets that are accessible at the measurement date for identical assets or liabilities; |
| |
| • | Level 2: quoted prices for similar instruments in active markets, quoted prices for identical or similar instruments in markets that are not active, and model‑derived valuations in which significant inputs and significant value drivers are observable in active markets; and |
| |
| • | Level 3: prices or valuation techniques where little or no market data is available that requires inputs that are both significant to the fair value measurement and unobservable. |
When available, we utilize quoted market prices from independent third‑party sources to determine fair value and classify such items in Level 1 or Level 2. In instances where the market for a financial instrument is not active, regardless of the availability of a nonbinding quoted market price, observable inputs might not be relevant and could require us to make a significant adjustment to derive a fair value measurement. Additionally, in an inactive market, a market price quoted from an independent third party may rely more on models with inputs based on information available only to that independent third party. When we determine the market for a financial instrument owned by us to be illiquid or when market transactions for similar instruments do not appear orderly, we use several valuation sources (including internal valuations, discounted cash flow analysis and quoted market prices) and establish a fair value by assigning weights to the various valuation sources. Additionally, when determining the fair value of liabilities in circumstances in which a quoted price in an active market for an identical liability is not available, we measure fair value using (i) a valuation technique that uses the quoted price of the identical liability when traded as an asset or quoted prices for similar liabilities when traded as assets or (ii) another valuation technique that is consistent with the principles of fair value measurement, such as the income approach or the market approach.
Changes in assumptions or estimation methodologies can have a material effect on these estimated fair values. In this regard, the derived fair value estimates cannot be substantiated by comparison to independent markets and, in many cases, may not be realized in an immediate settlement of the instrument.
We consider the following factors to be indicators of an inactive market: (i) there are few recent transactions, (ii) price quotations are not based on current information, (iii) price quotations vary substantially either over time or among market makers (for example, some brokered markets), (iv) indexes that previously were highly correlated with the fair values of the asset or liability are demonstrably uncorrelated with recent indications of fair value for that asset or liability, (v) there is a significant increase in implied liquidity risk premiums, yields, or performance indicators (such as delinquency rates or loss severities) for observed transactions or quoted prices when compared with our estimate of expected cash flows, considering all available market data about credit and other nonperformance risk for the asset or liability, (vi) there is a wide bid‑ask spread or significant increase in the bid‑ask spread, (vii) there is a significant decline or absence of a market for new issuances (that is, a primary market) for the asset or liability or similar assets or liabilities, and (viii) little information is released publicly (for example, a principal‑to‑principal market).
We consider the following factors to be indicators of non‑orderly transactions: (i) there was not adequate exposure to the market for a period before the measurement date to allow for marketing activities that are usual and customary for transactions involving such assets or liabilities under current market conditions, (ii) there was a usual and customary marketing period, but the seller marketed the asset or liability to a single market participant, (iii) the seller is in or near bankruptcy or receivership (that is, distressed), or the seller was required to sell to meet regulatory or legal requirements (that is, forced), and (iv) the transaction price is an outlier when compared with other recent transactions for the same or similar assets or liabilities.
Income Taxes
We have elected to be taxed as a REIT under the Internal Revenue Code. To qualify as a REIT, we must meet certain organizational and operational requirements, including a requirement to distribute at least 90% of our annual REIT taxable income to stockholders (which is computed without regard to the dividends‑paid deduction or net capital gain and which does not necessarily equal net income as calculated in accordance with GAAP). As a REIT, we generally will not be subject to federal income tax on income that we distribute as dividends to our stockholders. If we fail to qualify as a REIT in any taxable year, we will be subject to federal income tax on our taxable income at regular corporate income tax rates and generally will not be permitted to qualify for treatment as a REIT for federal income tax purposes for the four taxable years following the year during which qualification is lost, unless the Internal Revenue Service grants us relief under certain statutory provisions. Such an event could materially and adversely affect our net income and net cash available for distribution to stockholders. However, we believe that we are organized and operate in such a manner as to qualify for treatment as a REIT.
We have concluded that there are no significant uncertain tax positions requiring recognition in our financial statements. Neither we nor our subsidiaries have been assessed interest or penalties by any major tax jurisdictions. Our evaluations were performed for the tax years ended December 31, 2011, 2010 and 2009. As of December 31, 2011, returns for the calendar years 2007 through 2010 remain subject to examination by major tax jurisdictions.
Subsequent Events
We evaluate subsequent events up until the date the consolidated financial statements are issued.
Distributions Paid
On January 13, 2012, we paid distributions of $8.5 million, which related to distributions declared for each day in the period from December 1, 2011 through December 31, 2011. On February 15, 2012, we paid distributions of $8.5 million, which related to distributions declared for each day in the period from January 1, 2012 through January 31, 2012.
Distributions Declared
On January 30, 2012, our board of directors declared distributions based on daily record dates for the period from February 1, 2012 through February 28, 2012, which we expect to pay on March 30, 2012. Investors may choose to receive cash distributions or purchase additional shares through our dividend reinvestment plan (which will terminate effective April 10, 2012).
Distributions for these periods will be calculated based on stockholders of record each day during these periods at a rate of $0.00143836 per share per day and if paid each day for a 365-day period, would equal a 5.25% annualized rate based on a purchase price of $10.00 per share.
Amendment and Restatement of Share Redemption Program
On March 20, 2012, our board of directors amended and restated our share redemption program to provide only for redemptions sought upon a stockholder’s death, “qualifying disability” or “determination of incompetence” (each as defined in the share redemption program). Such redemptions are subject to an annual dollar limitation, which shall be $10.0 million in the aggregate for the calendar year 2012 (subject to review and adjustment during the year by the board of directors), and further subject to the limitations described in the share redemption program plan document. See Part II, Item 5, “Market for Registrant’s Common Equity, Related Stockholder Matters and Issuer Purchases of Equity Securities — Share Redemption Program.”
Termination of Dividend Reinvestment Plan
Effective April 10, 2012, our board of directors terminated our dividend reinvestment plan. See Part II, Item 5, “Market for Registrant’s Common Equity, Related Stockholder Matters and Issuer Purchases of Equity Securities — Distribution Information.”
Amendment to Advisory Agreement
On March 20, 2012, we entered into an amendment to the advisory agreement with our advisor pursuant to which our advisor agreed to forgive the debt related to certain advances from our advisor to us in the amount of $1.6 million and to waive certain performance fees related to the National Industrial Portfolio joint venture owed by us to our advisor in the amount of approximately $5.4 million. See Part II, Item 7, “Management’s Discussion and Analysis of Financial Condition and Results of Operations — Contractual Commitments and Contingencies — Other Obligations.”
Disposition of Properties Subsequent to December 31, 2011
Subsequent to December 31, 2011 and through March 26, 2012, we sold three office properties, which were classified as held for sale as of December 31, 2011, for $120.5 million, which resulted in net sales proceeds after the repayment of debt outstanding of $44.4 million. The carrying value of these properties was $119.7 million resulting in a gain on sale of approximately $0.8 million. Additionally, we sold 13 of the GKK Properties, which were classified as held for sale as of December 31, 2011, consisting of seven bank branch properties and six office properties for $20.7 million, which resulted in net sales proceeds after the repayment of debt outstanding of $4.3 million. The net sales proceeds from the sales of the GKK Properties were used to repay debt outstanding under the Amended Repurchase Agreements. The carrying value of these properties was $21.2 million resulting in a loss on sale of approximately $479,000.
| |
| ITEM 7A. | QUANTITATIVE AND QUALITATIVE DISCLOSURES ABOUT MARKET RISK |
We are exposed to the effects of interest rate changes as a result of borrowings used to maintain liquidity and that we need to fund the financing and refinancing of our real estate investment portfolio and operations. We are also exposed to the effects of changes in interest rates as a result of our investment in mortgage, mezzanine, bridge, B-Notes and other loans and the acquisition of real estate securities. Our profitability and the value of our investment portfolio may be adversely affected during any period as a result of interest rate changes. Our interest rate risk management objectives are to limit the impact of interest rate changes on earnings, prepayment penalties and cash flows and to lower overall borrowing costs. We have managed and will continue to manage interest rate risk by maintaining a ratio of fixed rate, long-term debt such that floating rate exposure is kept at an acceptable level. In addition, we utilize a variety of financial instruments, including interest rate caps, floors, and swap agreements, in order to limit the effects of changes in interest rates on our operations. When we use these types of derivatives to hedge the risk of interest‑earning assets or interest-bearing liabilities, we may be subject to certain risks, including the risk that losses on a hedge position will reduce the funds available for payments to holders of our common stock and that the losses may exceed the amount we invested in the instruments.
The table below summarizes the book values and the weighted-average interest rates of our real estate loans receivable and notes payable for each category as of December 31, 2011 based on the maturity dates and the notional amounts and average pay and receive rates of our derivative instruments as of December 31, 2011 based on maturity dates (dollars in thousands):
|
| | | | | | | | | | | | | | | | | | | | | | | | | | | | | | | | |
| | | Maturity Date | | Total Book Value or Notional Amounts (1) | | |
| | | 2012 | | 2013 | | 2014 | | 2015 | | 2016 | | Thereafter | | | Fair Value |
| Assets | |
| | | | | | | | | | | | | | |
| Loans receivable | |
|
| | | | | | | | | | | | | | |
| Mortgage loans - fixed rate | | $ | 45,658 |
| | $ | — |
| | $ | — |
| | $ | — |
| | $ | — |
| | $ | — |
| | $ | 45,658 |
| | $ | 23,858 |
|
Average effective interest rate (2) | | 1.4 | % | | — |
| | — |
| | — |
| | — |
| | — |
| | 1.4 | % | | |
| Mezzanine loans - fixed rate | | $ | — |
| | $ | — |
| | $ | — |
| | $ | — |
| | $ | — |
| | $ | 5,040 |
| | $ | 5,040 |
| | $ | 2,684 |
|
Average effective interest rate (2) | | — |
| | — |
| | — |
| | — |
| | — |
| | 5.3 | % | | 5.3 | % | | |
| Mezzanine loans - variable | | $ | — |
| | $ | — |
| | $ | — |
| | $ | — |
| | $ | — |
| | $ | — |
| | $ | — |
| | $ | — |
|
Average effective interest rate (2) | | — |
| | — |
| | — |
| | — |
| | — |
| | — |
| | — |
| | |
| B-notes - fixed rate | | $ | — |
| | $ | — |
| | $ | — |
| | $ | — |
| | $ | — |
| | $ | 18,460 |
| | $ | 18,460 |
| | $ | 16,008 |
|
Average effective interest rate (2) | | — |
| | — |
| | — |
| | — |
| | — |
| | 11.4 | % | | 11.4 | % | | |
| Unsecured loans - fixed rate | | $ | 50,000 |
| | $ | — |
| | $ | — |
| | $ | — |
| | $ | — |
| | $ | — |
| | $ | 50,000 |
| | $ | — |
|
Average effective interest rate (2) | | 0.0 | % | | — |
| | — |
| | — |
| | — |
| | — |
| | 0.0 | % | | |
| Real estate securities | | | | | | | | | | | | | | | | |
| Fixed rate | | $ | — |
| | $ | — |
| | $ | — |
| | $ | — |
| | $ | — |
| | $ | 46,249 |
| | $ | 46,249 |
| | $ | 46,249 |
|
Average interest rate (3) | | — |
| | — |
| | — |
| | — |
| | — |
| | 4.5 | % | | 4.5 | % | | |
| Liabilities | | | | | | | | | | | | | | | | |
| Notes payable and repurchase agreements | | | | | | | | | | | | | | | | |
| Fixed rate | | $ | 62,991 |
| | $ | 88,442 |
| | $ | 152,525 |
| | $ | — |
| | $ | 62,200 |
| | $ | — |
| | $ | 366,158 |
| | $ | 380,675 |
|
Average interest rate (4) | | 5.8 | % | | 5.8 | % | | 5.4 | % | | — |
| | 5.9 | % | | — |
| | 5.6 | % | | |
| Fixed rate - GKK Properties mortgage loans | | $ | 54,084 |
| | $ | 410,025 |
| | $ | — |
| | $ | 36,997 |
| | $ | 65,223 |
| | $ | 463,144 |
| | $ | 1,029,473 |
| | $ | 996,723 |
|
Average interest rate (4) | | 5.7 | % | | 5.6 | % | | — |
| | 5.1 | % | | 5.5 | % | | 6.1 | % | | 5.8 | % | | |
| Variable rate | | $ | 107,946 |
| | $ | 149,657 |
| | $ | — |
| | $ | 172,500 |
| | $ | — |
| | $ | — |
| | $ | 430,103 |
| | $ | 428,233 |
|
Average interest rate (4) | | 3.8 | % | | 3.6 | % | | — |
| | 2.9 | % | | — |
| | — |
| | 3.4 | % | | |
| Variable rate - GKK Properties mortgage loans | | $ | 266,997 |
| | $ | 206,477 |
| | $ | — |
| | $ | — |
| | $ | — |
| | $ | — |
| | $ | 473,474 |
| | $ | 452,058 |
|
Average interest rate (4) | | 5.2 | % | | 1.9 | % | | — |
| | — |
| | — |
| | — |
| | 3.7 | % | | |
| Derivative instruments | | | | | | | | | | | | | | | | |
| Interest rate swaps, notional amount | | $ | 39,679 |
| | $ | 45,700 |
| | $ | — |
| | $ | — |
| | $ | — |
| | $ | — |
| | $ | 85,379 |
| | $ | 1,463 |
|
Average pay rate (5) | | 3.8 | % | | 2.3 | % | | — |
| | — |
| | — |
| | — |
| | 3.0 | % | | |
Average receive rate (6) | | 0.3 | % | | 0.3 | % | | — |
| | — |
| | — |
| | — |
| | 0.3 | % | | |
(1) Book value of loans receivable is presented gross of portfolio-based reserve and asset-specific reserves.
(2) The average effective interest rate is calculated based on actual interest income recognized in 2011, including interest income recognized through accretion of discounts, calculated using the interest method divided by the average cost basis of the investment less the unamortized discount. The annual effective interest rates and maturity dates presented are as of December 31, 2011.
(3) Average interest rate is the weighted‑average interest rate. The average interest rates presented are as of December 31, 2011.
(4) Average interest rate is the weighted‑average interest rate. Weighted-average interest rate as of December 31, 2011 is calculated as the actual interest rate in effect at December 31, 2011 (consisting of the contractual interest rate and the effect of contractual floor rates and interest rate caps, floors and swaps), using interest rate indices at December 31, 2011, where applicable.
(5) Average pay rate is the interest rate swap fixed rate.
(6) Average receive rate is the 30‑day LIBOR rate at December 31, 2011.
We borrow funds and made investments at a combination of fixed and variable rates. Interest rate fluctuations will generally not affect our future earnings or cash flows on our fixed rate debt or fixed rate real estate loans receivable unless such instruments mature or are otherwise terminated. However, interest rate changes will affect the fair value of our fixed rate instruments. As of December 31, 2011, the fair value and book value of our fixed rate real estate loans receivable were $42.6 million and $45.0 million, respectively. The fair value estimate of our real estate loans receivable is calculated using an internal valuation model that considers the expected cash flows for the loans, underlying collateral values (for collateral‑dependent loans) and the estimated yield requirements of institutional investors for loans with similar characteristics, including remaining loan term, loan-to-value, type of collateral and other credit enhancements. As of December 31, 2011, the fair value of our fixed rate debt was $1.4 billion and the carrying value of our fixed rate debt was $1.4 billion. The fair value estimate of our fixed rate debt was calculated using a discounted cash flow analysis utilizing rates we would expect to pay for debt of a similar type and remaining maturity if the loans were originated as of December 31, 2011. As we expect to hold our fixed rate instruments to maturity and the amounts due under such instruments would be limited to the outstanding principal balance and any accrued and unpaid interest, we do not expect that fluctuations in interest rates, and the resulting changes in fair value of our fixed rate instruments, would have a significant impact on our operations.
Conversely, movements in interest rates on variable rate debt and loans receivable would change our future earnings and cash flows, but would not significantly affect the fair value of those instruments. However, changes in required risk premiums would result in changes in the fair value of floating rate instruments. As of December 31, 2011, we were exposed to market risks related to fluctuations in interest rates on $831.2 million of our $916.6 million of variable rate debt outstanding, after giving consideration to the impact of interest rate swap agreements on approximately $85.4 million of our variable rate debt. Based on interest rates as of December 31, 2011, if interest rates are 100 basis points higher during the 12 months ending December 31, 2012, interest expense on our variable rate debt outstanding would increase by approximately $7.7 million. As of December 31, 2011, one-month LIBOR was 0.295% and if this index was reduced to 0% during the 12 months ending December 31, 2012, interest expense on our variable rate debt would decrease by $2.0 million.
The weighted-average annual effective interest rate of our fixed rate real estate loans receivable as of December 31, 2011 was 2.5%. The weighted-average annual effective interest rate represents the effective interest rate as of December 31, 2011, using the interest method that we use to recognize interest income on our real estate loans receivable without asset-specific loan loss reserves. The weighted-average interest rates of our fixed rate debt and variable rate debt as of December 31, 2011 were 5.8% and 3.5%, respectively. The weighted-average interest rate represents the actual interest rate in effect as of December 31, 2011 (consisting of the contractual interest rate and the effect of interest rate caps, floors and swaps), using interest rate indices as of December 31, 2011, where applicable.
For a discussion of the interest rate risks related to the current capital and credit markets, see Part I, Item 1, “Business — Market Outlook” and Part I, Item 1A, “Risk Factors.” For developments related to our loans receivable and notes payable, see Part II, Item 7, “Management’s Discussion and Analysis of Financial Conditions and Results of Operations.”
| |
| ITEM 8. | FINANCIAL STATEMENTS AND SUPPLEMENTARY DATA |
See the Index to Financial Statements at page F‑1 of this report.
| |
| ITEM 9. | CHANGES IN AND DISAGREEMENTS WITH ACCOUNTANTS ON ACCOUNTING AND FINANCIAL DISCLOSURE |
None.
| |
| ITEM 9A. | CONTROLS AND PROCEDURES |
As discussed in Part I, Item 1, “Business — Investment Portfolio — GKK Properties,” on September 1, 2011, we, through KBS, entered into the Settlement Agreement whereby we, through KBS, have received, through the Transfers of the Equity Interests in certain subsidiaries of Gramercy, either fee simple title to or leasehold interests in the GKK Properties. All Transfers occurred on or prior to December 15, 2011. We consolidated in our financial statements as of September 1, 2011 (except with respect to a change in our interest in the Citizens Bank Joint Venture, which was consolidated as of October 24, 2011), all assets and liabilities assumed by us in connection with the Transfers of the Equity Interests and the GKK Properties under the Settlement Agreement (the “GKK Transaction”), including the related assumption of the mortgages on the GKK Properties and other liabilities related to the GKK Properties.
Disclosure Controls and Procedures
As of the end of the period covered by this report, management, including our chief executive officer and chief financial officer, evaluated the effectiveness of the design and operation of our disclosure controls and procedures. Based upon, and as of the date of, the evaluation, our chief executive officer and chief financial officer concluded that, except with respect to the GKK Transaction and other Gramercy controls related to the GKK Properties for which we have not completed documentation, evaluation and testing of internal controls over financial reporting, our disclosure controls and procedures were effective as of the end of the period covered by this report to ensure that information required to be disclosed in the reports we file and submit under the Exchange Act is recorded, processed, summarized and reported as and when required. Disclosure controls and procedures include, without limitation, controls and procedures designed to ensure that information required to be disclosed by us in the reports we file and submit under the Exchange Act is accumulated and communicated to our management, including our chief executive officer and our chief financial officer, as appropriate to allow timely decisions regarding required disclosure.
Management’s Report on Internal Control Over Financial Reporting
Our management is responsible for establishing and maintaining adequate internal control over financial reporting, as such term is defined in Rule 13a‑15(f) or 15d‑15(f) promulgated under the Securities Exchange Act of 1934, as amended.
In connection with the preparation of our Form 10‑K, our management assessed the effectiveness of our internal control over financial reporting as of December 31, 2011. In making that assessment, management used the criteria set forth by the Committee of Sponsoring Organizations of the Treadway Commission (COSO) in Internal Control‑Integrated Framework.
We adopted certain new accounting policies and accounting systems as a result of the GKK Transaction. We continue to evaluate additional processes and other components of internal control over financial reporting resulting from the GKK Transaction, including Gramercy’s historical internal control over financial reporting and its integration into our internal control over financial reporting. As a result, we excluded the GKK Transaction and other Gramercy controls related to the GKK Properties from our assessment of and conclusion on the effectiveness of our internal control over financial reporting as of December 31, 2011. As of December 31, 2011, the GKK Properties represented 65% of our total assets and 65% of our total investments in real estate. During the year ended December 31, 2011, the GKK Properties provided 44% of our revenue.
Based on its assessment, our management believes that, as of December 31, 2011, our internal control over financial reporting was effective based on those criteria. There have been no changes in our internal control over financial reporting that occurred during the quarter ended December 31, 2011 that have materially affected, or are reasonably likely to materially affect, our internal control over financial reporting.
| |
| ITEM 9B. | OTHER INFORMATION |
Amendment to Advisory Agreement
On March 20, 2012, we entered into an amendment (the “Amendment”) to our advisory agreement with KBS Capital Advisors. Pursuant to the Amendment, our advisor agreed to: forgive the debt related to the $1.6 million of advances by the advisor to us for the payment of distributions and to cover expenses, excluding depreciation and amortization, in excess of our revenues from January 1, 2006 to August 31, 2010; and waive the approximately $5.4 million of performance fees earned by our advisor related to its management of our former joint venture investment in the National Industrial Portfolio. Prior to the Amendment, we were obligated to reimburse our advisor for the advances only if and to the extent our Funds from Operations (as defined in the advisory agreement) from January 1, 2006 through the date of the reimbursement exceeded certain thresholds and we were obligated to pay the performance fees to the advisor only after the repayment of the advances from the advisor.
The full text of the Amendment is filed as an exhibit to this annual report.
PART III
We will file a definitive Proxy Statement for our 2012 Annual Meeting of Stockholders (the “2012 Proxy Statement”) with the SEC, pursuant to Regulation 14A, not later than 120 days after the end of our fiscal year. Accordingly, certain information required by Part III has been omitted under General Instruction G(3) to Form 10‑K. Only those sections of the 2012 Proxy Statement that specifically address the items required to be set forth herein are incorporated by reference.
| |
| ITEM 10. | DIRECTORS, EXECUTIVE OFFICERS AND CORPORATE GOVERNANCE |
We have adopted a Code of Conduct and Ethics that applies to all of our executive officers and directors, including but not limited to, our principal executive officer and principal financial officer. Our Code of Conduct and Ethics can be found at http://www.kbsreit.com.
The other information required by this Item is incorporated by reference from our 2012 Proxy Statement.
| |
| ITEM 11. | EXECUTIVE COMPENSATION |
The information required by this Item is incorporated by reference from our 2012 Proxy Statement.
| |
| ITEM 12. | SECURITY OWNERSHIP OF CERTAIN BENEFICIAL OWNERS AND MANAGEMENT AND RELATED STOCKHOLDER MATTERS |
The information required by this Item is incorporated by reference from our 2012 Proxy Statement.
| |
| ITEM 13. | CERTAIN RELATIONSHIPS AND RELATED TRANSACTIONS AND DIRECTOR INDEPENDENCE |
The information required by this Item is incorporated by reference from our 2012 Proxy Statement.
| |
| ITEM 14. | PRINCIPAL ACCOUNTING FEES AND SERVICES |
The information required by this Item is incorporated by reference from our 2012 Proxy Statement.
PART IV
| |
| ITEM 15. | EXHIBITS, FINANCIAL STATEMENT SCHEDULES |
| |
| (a) | Financial Statement Schedules |
See the Index to Financial Statements at page F‑1 of this report.
The following financial statement schedules are included herein at pages F‑57 through F‑89 of this report:
Schedule II - Valuation and Qualifying Accounts
Schedule III - Real Estate Assets and Accumulated Depreciation and Amortization
Schedule IV - Mortgage Loans on Real Estate
EXHIBIT LIST
|
| | |
| Ex. | | Description |
| | |
| 3.1 | | Articles of Amendment and Restatement of the Company, incorporated by reference to Exhibit 3.1 to the Company’s Quarterly Report on Form 10-Q for the period ended March 31, 2006
|
| | |
| 3.2 | | Amended and Restated Bylaws of the Company, incorporated by reference to Exhibit 3.2 to the Company’s Quarterly Report on Form 10-Q for the period ended March 31, 2006 |
| | |
| 4.1 | | Statement regarding restrictions on transferability of shares of common stock (to appear on stock certificate or to be sent upon request and without charge to stockholders issued shares without certificates), incorporated by reference to Exhibit 4.2 to the Company’s Registration Statement on Form S-11, Commission File No. 333-126087 |
| | |
| 4.2 | | Third Amended and Restated Dividend Reinvestment Plan, incorporated by reference to Exhibit 4.1 to the Company’s Current Report on Form 8-K filed October 28, 2009 |
| | |
| 4.3 | | Amended and Restated Share Redemption Program |
| | |
| 10.1 | | Guaranty of Recourse Obligations (related to the Collateral Transfer and Settlement Agreement (BBD1)), by American Financial Realty Trust and First States Group, L.P. for the benefit of German American Capital Corporation, dated as of June 30, 2003 |
| | |
| 10.2 | | Amended and Restated Loan and Security Agreement (related to the Collateral Transfer and Settlement Agreement (BBD1)), by and between First States Investors 5000A, LLC and German American Capital Corporation, dated as of October 1, 2003 |
| | |
| 10.3 | | Omnibus Amendment to Loan Documents (related to the Collateral Transfer and Settlement Agreement (BBD1)), by and between First States Investors 5000A, LLC, American Financial Realty Trust, First States Group, L.P., First States Management Corp., LLC, German American Capital Corporation and PNC Bank, National Association, dated as of October 1, 2003 |
| | | |
| 10.4 | | Consolidated, Amended and Restated Note (related to the Collateral Transfer and Settlement Agreement (BBD1)), by First States Investors 5000A, LLC, for the benefit of German American Capital Corporation, dated as of October 1, 2003 |
| | |
| 10.5 | | Second Omnibus Amendment to Loan Documents (related to the Collateral Transfer and Settlement Agreement (BBD1)), by and between First States Investors 5000A, LLC, American Financial Realty Trust, First States Group, L.P., First States Management Corp., LLC, German American Capital Corporation and PNC Bank, National Association, dated as of December 1, 2003 |
| | |
| 10.6 | | Promissory Note A1 (related to the Collateral Transfer and Settlement Agreement (BBD1)) by First States Investors 5000A, LLC, for the benefit of German American Capital Corporation, dated as of December 1, 2003 |
| | |
| 10.7 | | Promissory Note A2 (related to the Collateral Transfer and Settlement Agreement (BBD1)) by First States Investors 5000A, LLC, for the benefit of German American Capital Corporation, dated as of December 1, 2003 |
| | | |
| 10.8 | | Promissory Note A3 (related to the Collateral Transfer and Settlement Agreement (BBD1)) by First States Investors 5000A, LLC, for the benefit of German American Capital Corporation, dated as of December 1, 2003 |
| | | |
| 10.9 | | Promissory Note B (related to the Collateral Transfer and Settlement Agreement (BBD1)) by First States Investors 5000A, LLC, for the benefit of German American Capital Corporation, dated as of December 1, 2003 |
|
| | |
| Ex. | | Description |
| | | |
| 10.10 | | Amended and Restated Promissory Note A4 (related to the Collateral Transfer and Settlement Agreement (BBD1)) by First States Investors 5000A, LLC, for the benefit of German American Capital Corporation, dated as of March 31, 2004 |
| | | |
| 10.11 | | Promissory Note A5 (related to the Collateral Transfer and Settlement Agreement (BBD1)) by First States Investors 5000A, LLC, for the benefit of German American Capital Corporation, dated as of March 31, 2004 |
| | | |
| 10.12 | | Promissory Note A6 (related to the Collateral Transfer and Settlement Agreement (BBD1)) by First States Investors 5000A, LLC, for the benefit of German American Capital Corporation, dated as of March 31, 2004 |
| | | |
| 10.13 | | Third Omnibus Amendment to Loan Documents (related to the Collateral Transfer and Settlement Agreement (BBD1)), by and between First States Investors 5000A, LLC, American Financial Realty Trust, First States Group, L.P., First States Management Corp., LLC, LaSalle Bank National Association and PNC Bank, National Association, dated as of March 31, 2004 |
| | | |
| 10.14 | | Master Agreement Regarding Leases (related to the Collateral Transfer and Settlement Agreement (PB Capital - Wells Fargo Leases)), by and between First States Investors 3300, LLC and Wachovia Bank, National Association, dated as of September 22, 2004 |
| | | |
| 10.15 | | Lease (related to the Collateral Transfer and Settlement Agreement (PB Capital - Wells Fargo Leases, branch property)), by and between First States Investors 3300, LLC and Wachovia Bank, National Association, dated as of September 22, 2004, with attached schedule referencing substantially similar branch property leases omitted |
| | | |
| 10.16 | | Lease (related to the Collateral Transfer and Settlement Agreement (PB Capital - Wells Fargo Leases, office property)), by and between First States Investors 3300, LLC and Wachovia Bank, National Association, dated as of September 22, 2004, with attached schedule referencing substantially similar office property leases omitted |
| | | |
| 10.17 | | Lease (related to the Collateral Transfer and Settlement Agreement (PB Capital - Wells Fargo Leases, ops. center)), by and between First States Investors 3300, LLC and Wachovia Bank, National Association, dated as of September 22, 2004, with attached schedule referencing substantially similar ops. center leases omitted |
| | | |
| 10.18 | | Master Lease Agreement (related to the Collateral Transfer and Settlement Agreement (BBD2 - Bank of America Leases)), by and between First States Investors 5200, LLC and Bank of America, N.A., dated as of October 1, 2004 |
| | | |
| 10.19 | | Amended and Restated Master Lease Agreement (related to the Collateral Transfer and Settlement Agreement (BBD1 - Bank of America Leases)), by and between First States Investors 5000A, LLC and Bank of America, N.A., dated as of January 1, 2005 |
| | | |
| 10.20 | | First Amendment to Amended and Restated Master Lease Agreement (related to the Collateral Transfer and Settlement Agreement (BBD1 - Bank of America Leases)), by and between First States Investors 5000A, LLC and Bank of America, N.A., dated as of January 1, 2005 |
| | | |
| 10.21 | | First Amendment to Master Lease Agreement (related to the Collateral Transfer and Settlement Agreement (BBD2 - Bank of America Leases)), by and between First States Investors 5200, LLC and Bank of America, N.A., dated as of February 28, 2005 |
| | | |
| 10.22 | | Guaranty of Recourse Obligations (related to the Collateral Transfer and Settlement Agreement (BBD2)), by and between First States Group, L.P., for the benefit of German American Capital Corporation and Bear Stearns Commercial Mortgage, Inc., dated as of March 4, 2005 |
| | | |
| 10.23 | | Loan and Security Agreement (related to the Collateral Transfer and Settlement Agreement (BBD2)), by and between First States Investors 5200, LLC, German American Capital Corporation and Bear Stearns Commercial Mortgage, Inc., dated as of March 4, 2005 |
| | | |
| 10.24 | | Promissory Note (A-1) (related to the Collateral Transfer and Settlement Agreement (BBD2)), by First States Investors 5200, LLC, for the benefit of German American Capital Corporation, dated as of March 4, 2005 |
| | | |
| 10.25 | | Promissory Note (A-2) (related to the Collateral Transfer and Settlement Agreement (BBD2)), by First States Investors 5200, LLC, for the benefit of Bear Stearns Commercial Mortgage, Inc., dated as of March 4, 2005 |
| | | |
| 10.26 | | First Amendment to Loan Agreement (related to the Collateral Transfer and Settlement Agreement (BBD2)), by and between First States Investors 5200, LLC, German American Capital Corporation and Bear Stearns Commercial Mortgage, Inc., dated as of April 12, 2005 |
| | | |
| 10.27 | | First Amendment to Guaranty of Recourse Obligations (related to the Collateral Transfer and Settlement Agreement (BBD2)), by and between First States Group, L.P., for the benefit of German American Capital Corporation and Bear Stearns Commercial Mortgage, Inc., dated as of April 12, 2005 |
|
| | |
| Ex. | | Description |
| | | |
| 10.28 | | Second Amendment to Loan Agreement (related to the Collateral Transfer and Settlement Agreement (BBD2)), by and between First States Investors 5200, LLC, German American Capital Corporation and Bear Stearns Commercial Mortgage, Inc., dated as of June 9, 2005 |
| | | |
| 10.29 | | First Amendment to Master Agreement (related to the Collateral Transfer and Settlement Agreement (PB Capital - Wells Fargo Leases)), by and between Wachovia Bank, National Association and First States Investors 3300, LLC, dated as of June __, 2005 |
| | | |
| 10.30 | | Letter of Amendment Relating to Amended and Restated Loan Agreement (related to the Collateral Transfer and Settlement Agreement (BBD1)), by and between First States investors 5000A, LLC, German American Capital Corporation and GMAC Commercial Mortgage Corporation, as Master Servicer for LaSalle Bank National Association, dated July 7, 2005 |
| | | |
| 10.31 | | Second Amendment to Master Lease Agreement (related to the Collateral Transfer and Settlement Agreement (BBD2 - Bank of America Leases)), by and between First States Investors 5200, LLC and Bank of America, N.A., dated as of September 1, 2005 |
| | | |
| 10.32 | | Fourth Omnibus Amendment to Loan Documents (related to the Collateral Transfer and Settlement Agreement (BBD1)), by and between First States Investors 5000A, LLC, American Financial Realty Trust, First States Group, L.P., First States Management Corp., L.P., LaSalle Bank National Association and PNC Bank, National Association, dated as of June 30, 2006 |
| | | |
| 10.33 | | Fifth Omnibus Amendment to Loan Documents (related to the Collateral Transfer and Settlement Agreement (BBD1)), by and between First States Investors 5000A, LLC, American Financial Realty Trust, First States Group, L.P., First States Management Corp., L.P., LaSalle Bank National Association and PNC Bank, National Association, dated as of July 31, 2006 |
| | | |
| 10.34 | | Sixth Omnibus Amendment to Loan Documents (related to the Collateral Transfer and Settlement Agreement (BBD1)), by and between First States Investors 5000A, LLC, American Financial Realty Trust, First States Group, L.P., First States Management Corp., L.P., LaSalle Bank National Association and PNC Bank, National Association, dated as of September 29, 2006 |
| | | |
| 10.35 | | Agreement Regarding BBD2 Master Lease (related to the Collateral Transfer and Settlement Agreement (BBD2 - Bank of America Leases)), by and between First States Investors 5200, LLC and Bank of America, N.A., dated as of October 26, 2006 |
| | | |
| 10.36 | | Third Amendment to Master Lease Agreement (related to the Collateral Transfer and Settlement Agreement (BBD2 - Bank of America Leases)), by and between First States Investors 5200, LLC and Bank of America, N.A., dated as of January 1, 2007 |
| | | |
| 10.37 | | Second Amendment to Amended and Restated Master Lease Agreement (related to the Collateral Transfer and Settlement Agreement (BBD1 - Bank of America Leases)), by and between First States Investors 5000A, LLC and Bank of America, N.A., dated as of January 1, 2007 |
| | | |
| 10.38 | | Seventh Omnibus Amendment to Loan Documents (related to the Collateral Transfer and Settlement Agreement (BBD1)), by and between First States Investors 5000A, LLC, American Financial Realty Trust, First States Group, L.P., First States Management Corp., L.P., LaSalle Bank National Association and PNC Bank, National Association, dated as of December 19, 2006 |
| | | |
| 10.39 | | Notice of Substitution Pursuant to Loan and Security Agreement (related to the Collateral Transfer and Settlement Agreement (BBD2)), by First States Investors 5200, LLC to Midland Loan Services, Inc., dated as of February 6, 2007 |
| | | |
| 10.40 | | Eighth Omnibus Amendment to Loan Documents (related to the Collateral Transfer and Settlement Agreement (BBD1)), by and between First States Investors 5000A, LLC, American Financial Realty Trust, First States Group, L.P., First States Management Corp., L.P., LaSalle Bank National Association and PNC Bank, National Association, dated as of February 8, 2007 |
| | | |
| 10.41 | | Ninth Omnibus Amendment to Loan Documents (related to the Collateral Transfer and Settlement Agreement (BBD1)), by and between First States Investors 5000A, LLC, American Financial Realty Trust, First States Group, L.P., First States Management Corp., L.P., LaSalle Bank National Association and PNC Bank, National Association, dated as of March 30, 2007 |
| | | |
| 10.42 | | Tenth Omnibus Amendment to Loan Documents (related to the Collateral Transfer and Settlement Agreement (BBD1)), by and between First States Investors 5000A, LLC, American Financial Realty Trust, First States Group, L.P., First States Management Corp., L.P., LaSalle Bank National Association and PNC Bank, National Association, dated as of May 18, 2007 |
|
| | |
| Ex. | | Description |
| | | |
| 10.43 | | Third Amendment to Loan Agreement (related to the Collateral Transfer and Settlement Agreement (BBD2)), by and between First States Investors 5200, LLC and Wells Fargo Bank, N.A., dated as of July 19, 2007 |
| | | |
| 10.44 | | Partial Lease Termination Agreement (related to the Collateral Transfer and Settlement Agreement (BBD2 - Bank of America Leases)), by and between First States Investors 5200, LLC, First States Group, L.P. and Bank of America, N.A., dated as of July 19, 2007 |
| | | |
| 10.45 | | Eleventh Omnibus Amendment to Loan Documents (related to the Collateral Transfer and Settlement Agreement (BBD1)), by and between First States Investors 5000A, LLC, American Financial Realty Trust, First States Group, L.P., First States Management Corp., L.P., LaSalle Bank National Association and PNC Bank, National Association, dated as of July 25, 2007 |
| | | |
| 10.46 | | Twelfth Omnibus Amendment to Loan Documents (related to the Collateral Transfer and Settlement Agreement (BBD1)), by and between First States Investors 5000A, LLC, American Financial Realty Trust, First States Group, L.P., First States Management Corp., L.P., LaSalle Bank National Association and PNC Bank, National Association, dated as of March 13, 2008 |
| | | |
| 10.47 | | Loan Agreement (related to the Collateral Transfer and Settlement Agreement (PB Capital)), by and between First States Investors 3300 B, L.P. and PB Capital Corporation, dated as of April 1, 2008 |
| | | |
| 10.48 | | Promissory Note (related to the Collateral Transfer and Settlement Agreement (PB Capital)), by First States Investors 3300 B, L.P., for the benefit of PB Capital Corporation, dated as of April 1, 2008 |
| | | |
| 10.49 | | Recourse Liability Agreement (related to the Collateral Transfer and Settlement Agreement (PB Capital)), by and between Gramercy Capital Corp and PB Capital Corporation, dated as of April 1, 2008 |
| | | |
| 10.50 | | Assignment of Agreements (related to the Collateral Transfer and Settlement Agreement (PB Capital)), by and between First States Investors 3300 B, L.P. and PB Capital Corporation, dated as of April 1, 2008 |
| | |
| 10.51 | | Second Amendment to Master Agreement (related to the Collateral Transfer and Settlement Agreement (PB Capital)), by and between Wachovia Bank, National Association, First States Investors 3300, LLC and First States Investors 3300 B, L.P., dated as of April 1, 2008 |
| | | |
| 10.52 | | First Amendment to Loan Agreement (related to the Collateral Transfer and Settlement Agreement (PB Capital)), by and between First States Investors 3300 B, L.P. and PB Capital Corporation, dated as of August 22, 2008 |
| | | |
| 10.53 | | Memorandum of Understanding (related to the Collateral Transfer and Settlement Agreement (BBD1 and BBD2)), by and between Bank of America, N.A. and First States Group, L.P., dated as of October 7, 2008 |
| | | |
| 10.54 | | Advisory Agreement, by and between the Company and KBS Capital Advisors dated November 8, 2010, incorporated by reference to Exhibit 10.1 to the Company’s Quarterly Report on Form 10-Q for the period ended September 30, 2010 |
| | | |
| 10.55 | | Extension of Master Repurchase Agreement (related to the extension of the GKK Mezzanine Loan), by and between KBS GKK Participation Holdings I, LLC and Goldman Sachs Mortgage Company, dated as of March 9, 2011, incorporated by reference to Exhibit 10.1 to the Company’s Quarterly Report on Form 10-Q for the period ended March 31, 2011, incorporated by reference to Exhibit 10.1 to the Company’s Quarterly Report on Form 10-Q for the period ended March 31, 2011 |
| | | |
| 10.56 | | Extension of Master Repurchase Agreement (related to the extension of the GKK Mezzanine Loan), by and between KBS GKK Participation Holdings II, LLC and Citigroup Financial Products Inc., dated as of March 9, 2011, incorporated by reference to Exhibit 10.2 to the Company’s Quarterly Report on Form 10-Q for the period ended March 31, 2011 |
| | | |
| 10.57 | | Omnibus Extension of Loan Agreements (related to the extension of the GKK Mezzanine Loan), by and between Goldman Sachs Mortgage Company, Citicorp North America, Inc. and SL Green Realty Corp., collectively as mortgage lender and junior mezzanine lender, KBS GKK Participation Holdings I, LLC and KBS GKK Participation Holdings II, LLC, collectively as senior mezzanine lender, and certain subsidiaries of Gramercy Capital Corp., collectively as borrower, dated as of March 11, 2011, incorporated by reference to Exhibit 10.3 to the Company’s Quarterly Report on Form 10-Q for the period ended March 31, 2011 |
| | | |
| 10.58 | | Amendment #1 to Extension Agreement (related to the extension of the GKK Mezzanine Loan), by and between KBS GKK Participation Holdings I, LLC and Goldman Sachs Mortgage Company, dated as of March 13, 2011, incorporated by reference to Exhibit 10.4 to the Company’s Quarterly Report on Form 10-Q for the period ended March 31, 2011 |
| | | |
| 10.59 | | Amendment #1 to Extension Agreement (related to the extension of the GKK Mezzanine Loan), by and between KBS GKK Participation Holdings II, LLC and Citigroup Financial Products Inc., dated as of March 13, 2011, incorporated by reference to Exhibit 10.5 to the Company’s Quarterly Report on Form 10-Q for the period ended March 31, 2011 |
|
| | |
| Ex. | | Description |
| | | |
| 10.60 | | Omnibus Extension of Loan Agreements (related to the extension of the GKK Mezzanine Loan), by and between Goldman Sachs Mortgage Company, Citicorp North America, Inc. and SL Green Realty Corp., collectively as mortgage lender and junior mezzanine lender, KBS GKK Participation Holdings I, LLC, KBS GKK Participation Holdings II, LLC and KBS Debt Holdings, LLC, collectively as senior mezzanine lender, and GKK Stars Junior Mezz 2 LLC and certain subsidiaries of Gramercy Capital Corp., collectively as borrower, dated as of March 13, 2011, incorporated by reference to Exhibit 10.6 to the Company’s Quarterly Report on Form 10-Q for the period ended March 31, 2011 |
| | | |
| 10.61 | | Omnibus Extension of Loan Agreements (related to the extension of the GKK Mortgage Loan, GKK Senior Mezzanine Loan and GKK Junior Mezzanine Loan), by and between Goldman Sachs Mortgage Company, Citicorp North America, Inc., SL Green Realty Corp., KBS GKK Participation Holdings I, LLC, KBS GKK Participation Holdings II, LLC, KBS Debt Holdings, LLC, Gramercy Capital Corp., certain subsidiaries of Gramercy Capital Corp. and GKK Stars Junior Mezz I, LLC, dated as of April 15, 2011, incorporated by reference to Exhibit 10.1 to the Company’s Quarterly Report on Form 10-Q for the period ended June 30, 2011 |
| | | |
| 10.62 | | Amendment #2 to Extension Agreement (related to the Master Repurchase Agreement), by and between KBS GKK Participation Holdings I, LLC and Goldman Sachs Mortgage Company, dated as of April 22, 2011, incorporated by reference to Exhibit 10.2 to the Company’s Quarterly Report on Form 10-Q for the period ended June 30, 2011 |
| | | |
| 10.63 | | Amendment #2 to Extension Agreement (related to the Master Repurchase Agreement), by and between KBS GKK Participation Holdings II, LLC and Citigroup Financial Products Inc., dated as of April 22, 2011, incorporated by reference to Exhibit 10.3 to the Company’s Quarterly Report on Form 10-Q for the period ended June 30, 2011 |
| | | |
| 10.64 | | Amendment #3 to Extension Agreement (related to the Master Repurchase Agreement), by and between KBS GKK Participation Holdings I, LLC and Goldman Sachs Mortgage Company, dated as of April 25, 2011, incorporated by reference to Exhibit 10.4 to the Company’s Quarterly Report on Form 10-Q for the period ended June 30, 2011 |
| | | |
| 10.65 | | Amendment #3 to Extension Agreement (related to the Master Repurchase Agreement), by and between KBS GKK Participation Holdings II, LLC and Citigroup Financial Products Inc., dated as of April 25, 2011, incorporated by reference to Exhibit 10.5 to the Company’s Quarterly Report on Form 10-Q for the period ended June 30, 2011 |
| | | |
| 10.66 | | Amendment #4 to Extension Agreement (related to the Master Repurchase Agreement), by and between KBS GKK Participation Holdings I, LLC and Goldman Sachs Mortgage Company, dated as of April 26, 2011, incorporated by reference to Exhibit 10.6 to the Company’s Quarterly Report on Form 10-Q for the period ended June 30, 2011 |
| | | |
| 10.67 | | Amendment #4 to Extension Agreement (related to the Master Repurchase Agreement), by and between KBS GKK Participation Holdings II, LLC and Citigroup Financial Products Inc., dated as of April 26, 2011, incorporated by reference to Exhibit 10.7 to the Company’s Quarterly Report on Form 10-Q for the period ended June 30, 2011 |
| | |
| 10.68 | | Amendment #5 to Extension Agreement (related to the Master Repurchase Agreement), by and between KBS GKK Participation Holdings I, LLC and Goldman Sachs Mortgage Company, dated as of April 27, 2011, incorporated by reference to Exhibit 10.8 to the Company’s Quarterly Report on Form 10-Q for the period ended June 30, 2011 |
| | | |
| 10.69 | | Amendment #5 to Extension Agreement (related to the Master Repurchase Agreement), by and between KBS GKK Participation Holdings II, LLC and Citigroup Financial Products Inc., dated as of April 27, 2011, incorporated by reference to Exhibit 10.9 to the Company’s Quarterly Report on Form 10-Q for the period ended June 30, 2011 |
| | | |
| 10.70 | | Amended and Restated Master Repurchase Agreement, by and between KBS GKK Participation Holdings I, LLC and Goldman Sachs Mortgage Company, dated as of April 28, 2011, incorporated by reference to Exhibit 10.10 to the Company’s Quarterly Report on Form 10-Q for the period ended June 30, 2011 |
| | | |
| 10.71 | | Amended and Restated Master Repurchase Agreement, by and between KBS GKK Participation Holdings II, LLC and Citigroup Financial Products Inc., dated as of April 28, 2011, incorporated by reference to Exhibit 10.11 to the Company’s Quarterly Report on Form 10-Q for the period ended June 30, 2011 |
| | | |
| 10.72 | | Amended and Restated Parent Guaranty and Indemnity (related to the Amended and Restated Master Repurchase Agreement), by and between the Company and Goldman Sachs Mortgage Company, dated as of April 28, 2011, incorporated by reference to Exhibit 10.12 to the Company’s Quarterly Report on Form 10-Q for the period ended June 30, 2011 |
| | | |
| 10.73 | | Amended and Restated Parent Guaranty and Indemnity (related to the Amended and Restated Master Repurchase Agreement), by and between the Company and Citigroup Financial Products Inc., dated as of April 28, 2011, incorporated by reference to Exhibit 10.13 to the Company’s Quarterly Report on Form 10-Q for the period ended June 30, 2011 |
| | | |
| 10.74 | | Contribution Agreement (related to the GKK Mezzanine Loan), by and between KBS Debt Holdings, LLC and KBS Debt Holdings Mezz Holder, LLC, dated as of April 28, 2011, incorporated by reference to Exhibit 10.14 to the Company’s Quarterly Report on Form 10-Q for the period ended June 30, 2011 |
|
| | |
| Ex. | | Description |
| | | |
| 10.75 | | Guarantor Pledge and Security Agreement (related to the Amended and Restated Master Repurchase Agreement), by and between KBS Debt Holdings Mezz Holder, LLC and Goldman Sachs Mortgage Company, dated as of April 28, 2011, incorporated by reference to Exhibit 10.15 to the Company’s Quarterly Report on Form 10-Q for the period ended June 30, 2011 |
| | | |
| 10.76 | | Guarantor Pledge and Security Agreement (related to the Amended and Restated Master Repurchase Agreement), by and between KBS Debt Holdings Mezz Holder, LLC and Citigroup Financial Products Inc., dated as of April 28, 2011, incorporated by reference to Exhibit 10.16 to the Company’s Quarterly Report on Form 10-Q for the period ended June 30, 2011 |
| | | |
| 10.77 | | Omnibus Guaranty and Indemnity (related to the Amended and Restated Master Repurchase Agreement), by and between KBS Debt Holdings Mezz Holder, LLC, KBS Debt Holdings, LLC and various subsidiaries of the Company, for the benefit of Goldman Sachs Mortgage Company, dated as of April 28, 2011, incorporated by reference to Exhibit 10.17 to the Company’s Quarterly Report on Form 10-Q for the period ended June 30, 2011 |
| | | |
| 10.78 | | Omnibus Guaranty and Indemnity (related to the Amended and Restated Master Repurchase Agreement), by and between KBS Debt Holdings Mezz Holder, LLC, KBS Debt Holdings, LLC and various subsidiaries of the Company, for the benefit of Citigroup Financial Products Inc., dated as of April 28, 2011, incorporated by reference to Exhibit 10.18 to the Company’s Quarterly Report on Form 10-Q for the period ended June 30, 2011 |
| | | |
| 10.79 | | Omnibus Extension of Loan Agreements (related to the extension of the GKK Mortgage Loan, GKK Senior Mezzanine Loan and GKK Junior Mezzanine Loan), by and between Goldman Sachs Mortgage Company, Citicorp North America, Inc., SL Green Realty Corp., KBS GKK Participation Holdings I, LLC, KBS GKK Participation Holdings II, LLC, KBS Debt Holdings, LLC, Gramercy Capital Corp., certain subsidiaries of Gramercy Capital Corp. and GKK Stars Junior Mezz I, LLC, dated as of April 29, 2011, incorporated by reference to Exhibit 10.19 to the Company’s Quarterly Report on Form 10-Q for the period ended June 30, 2011 |
| | | |
| 10.80 | | First Amendment to Co-Lender Agreement (related to the GKK Mortgage Loan), by and between Goldman Sachs Mortgage Company, Citicorp North America, Inc., KBS GKK Participation Holdings I, LLC and Archon Group, L.P., dated as of May 9, 2011, incorporated by reference to Exhibit 10.20 to the Company’s Quarterly Report on Form 10-Q for the period ended June 30, 2011 |
| | | |
| 10.81 | | Assignment and Assumption Agreement (related to the GKK Mortgage Loan and GKK Junior Mezzanine Loan), by and between SLG Stars Mortgage Loan LLC, SLG Stars Mezz Loan LLC and KBS GKK Participation Holdings I, LLC, dated as of May 10, 2011, incorporated by reference to Exhibit 10.21 to the Company’s Quarterly Report on Form 10-Q for the period ended June 30, 2011 |
| | | |
| 10.82 | | Amendment No. 1 to Amended and Restated Master Repurchase Agreement, by and between Goldman Sachs Mortgage Company and KBS GKK Participation Holdings I, LLC, dated as of May 10, 2011, incorporated by reference to Exhibit 10.22 to the Company’s Quarterly Report on Form 10-Q for the period ended June 30, 2011 |
| | |
| 10.83 | | Amendment No. 1 to Amended and Restated Master Repurchase Agreement, by and between Citigroup Financial Products Inc. and KBS GKK Participation Holdings II, LLC, dated as of May 10, 2011, incorporated by reference to Exhibit 10.23 to the Company’s Quarterly Report on Form 10-Q for the period ended June 30, 2011 |
| | | |
| 10.84 | | Guaranty Supplement for the Benefit of Goldman Sachs Mortgage Company (related to Amendment No. 1 to the Amended and Restated Master Repurchase Agreement), by KBS Acquisition Holdings, LLC and KBS Acquisition Sub, LLC, dated May 10, 2011, incorporated by reference to Exhibit 10.24 to the Company’s Quarterly Report on Form 10-Q for the period ended June 30, 2011 |
| | | |
| 10.85 | | Guaranty Supplement for the Benefit of Citigroup Financial Products Inc. (related to Amendment No. 1 to the Amended and Restated Master Repurchase Agreement), by KBS Acquisition Holdings, LLC and KBS Acquisition Sub, LLC, dated May 10, 2011, incorporated by reference to Exhibit 10.24 to the Company’s Quarterly Report on Form 10-Q for the period ended June 30, 2011 |
| | | |
| 10.86 | | Joinder Agreement (related to Amendment No. 1 to the Amended and Restated Master Repurchase Agreement), by and between KBS Acquisition Holdings, LLC, KBS Acquisition Sub, LLC and Goldman Sachs Mortgage Company, dated May 10, 2011, incorporated by reference to Exhibit 10.26 to the Company’s Quarterly Report on Form 10-Q for the period ended June 30, 2011 |
| | | |
| 10.87 | | Joinder Agreement (related to Amendment No. 1 to the Amended and Restated Master Repurchase Agreement), by and between KBS Acquisition Holdings, LLC, KBS Acquisition Sub, LLC and Citigroup Financial Products Inc., dated May 10, 2011, incorporated by reference to Exhibit 10.27 to the Company’s Quarterly Report on Form 10-Q for the period ended June 30, 2011 |
|
| | |
| Ex. | | Description |
| | | |
| 10.88 | | Contribution Agreement (related to the GKK Mortgage Loan and GKK Junior Mezzanine Loan), by and between KBS GKK Participation Holdings I, LLC and KBS Acquisition Holdings, LLC, dated May 10, 2011, incorporated by reference to Exhibit 10.28 to the Company’s Quarterly Report on Form 10-Q for the period ended June 30, 2011 |
| | | |
| 10.89 | | Contribution Agreement (related to the GKK Mortgage Loan and GKK Junior Mezzanine Loan), by and between KBS Acquisition Holdings, LLC and KBS Acquisition Sub, LLC, dated May 10, 2011, incorporated by reference to Exhibit 10.29 to the Company’s Quarterly Report on Form 10-Q for the period ended June 30, 2011 |
| | | |
| 10.90 | | Collateral Transfer and Settlement Agreement, by and between GKK Stars Acquisition LLC, KBS Acquisition Sub, LLC, KBS Debt Holdings Mezz Holder, LLC, KBS GKK Participation Holdings I, LLC, KBS GKK Participation Holdings II, LLC and KBS Acquisition Holdings, LLC, dated as of September 1, 2011, incorporated by reference to Exhibit 10.1 to the Company’s Quarterly Report on Form 10-Q for the period ended September 30, 2011 |
| | | |
| 10.91 | | Amended and Restated Guaranty (related to the Collateral Transfer and Settlement Agreement), by and between Gramercy Capital Corp., KBS Debt Holdings Mezz Holder, LLC, KBS GKK Participation Holdings I, LLC, KBS GKK Participation Holdings II, LLC, KBS Acquisition Sub, LLC and KBS Acquisition Holdings, LLC, dated as of September 1, 2011, incorporated by reference to Exhibit 10.2 to the Company’s Quarterly Report on Form 10-Q for the period ended September 30, 2011 |
| | | |
| 10.92 | | Acknowledgment and Consent Agreement (related to the Collateral Transfer and Settlement Agreement), by and between GKK Stars Acquisition LLC, Goldman Sachs Mortgage Company, Citicorp North America, Inc., Citigroup Financial Products Inc., KBS Acquisition Sub, LLC, KBS Debt Holdings Mezz Holder, LLC, KBS Participation Holdings I, LLC, KBS GKK Participation Holdings II, LLC, and KBS Acquisition Holdings, LLC, dated as of September 1, 2011, incorporated by reference to Exhibit 10.3 to the Company’s Quarterly Report on Form 10-Q for the period ended September 30, 2011 |
| | | |
| 10.93 | | Amendment No. 2 to Amended and Restated Master Repurchase Agreement, by and between KBS GKK Participation Holdings II, LLC and Citigroup Financial Products Inc., dated as of September 1, 2011, incorporated by reference to Exhibit 10.4 to the Company’s Quarterly Report on Form 10-Q for the period ended September 30, 2011 |
| | | |
| 10.94 | | Amendment No. 2 to Amended and Restated Master Repurchase Agreement, by and between KBS GKK Participation Holdings I, LLC and Goldman Sachs Mortgage Company, dated as of September 1, 2011, incorporated by reference to Exhibit 10.5 to the Company’s Quarterly Report on Form 10-Q for the period ended September 30, 2011 |
| | | |
| 10.95 | | Guaranty Supplement for the Benefit of Citigroup Financial Products Inc. (related to Amendment No. 2 to the Amended and Restated Master Repurchase Agreement), by KBS Acquisition Sub-Owner 1, LLC, KBS Acquisition Sub-Owner 4, LLC, KBS Acquisition Sub-Owner 5, LLC, KBS Acquisition Sub-Owner 6, LLC, KBS Acquisition Sub-Owner 7, LLC and KBS Acquisition Sub-Owner 8, LLC, dated as of September 1, 2011, incorporated by reference to Exhibit 10.6 to the Company’s Quarterly Report on Form 10-Q for the period ended September 30, 2011 |
| | |
| 10.96 | | Guaranty Supplement for the Benefit of Goldman Sachs Mortgage Company (related to Amendment No. 2 to the Amended and Restated Master Repurchase Agreement), by KBS Acquisition Sub-Owner 1, LLC, KBS Acquisition Sub-Owner 4, LLC, KBS Acquisition Sub-Owner 5, LLC, KBS Acquisition Sub-Owner 6, LLC, KBS Acquisition Sub-Owner 7, LLC and KBS Acquisition Sub-Owner 8, LLC, dated as of September 1, 2011, incorporated by reference to Exhibit 10.7 to the Company’s Quarterly Report on Form 10-Q for the period ended September 30, 2011 |
| | | |
| 10.97 | | Joinder Agreement (related to Amendment No. 2 to the Amended and Restated Master Repurchase Agreement), by and between KBS Acquisition Sub-Owner 1, LLC, KBS Acquisition Sub-Owner 4, LLC, KBS Acquisition Sub-Owner 5, LLC, KBS Acquisition Sub-Owner 6, LLC, KBS Acquisition Sub-Owner 7, LLC, KBS Acquisition Sub-Owner 8, LLC and Goldman Sachs Mortgage Company, dated as of September 1, 2011, incorporated by reference to Exhibit 10.8 to the Company’s Quarterly Report on Form 10-Q for the period ended September 30, 2011 |
| | | |
| 10.98 | | Joinder Agreement (related to Amendment No. 2 to the Amended and Restated Master Repurchase Agreement), by and between KBS Acquisition Sub-Owner 1, LLC, KBS Acquisition Sub-Owner 4, LLC, KBS Acquisition Sub-Owner 5, LLC, KBS Acquisition Sub-Owner 6, LLC, KBS Acquisition Sub-Owner 7, LLC, KBS Acquisition Sub-Owner 8, LLC and Citigroup Financial Products Inc., dated as of September 1, 2011, incorporated by reference to Exhibit 10.9 to the Company’s Quarterly Report on Form 10-Q for the period ended September 30, 2011 |
| | | |
| 10.99 | | Amendment No. 1 to Participation Agreement, by and between KBS Debt Holdings Mezz Holder, LLC, KBS GKK Participation Holdings I, LLC and KBS GKK Participation Holdings II, LLC, dated as of September 1, 2011, incorporated by reference to Exhibit 10.10 to the Company’s Quarterly Report on Form 10-Q for the period ended September 30, 2011 |
|
| | |
| Ex. | | Description |
| | | |
| 10.100 | | Third Amendment to Loan Agreement (related to the GKK Mortgage Loan), by and among Goldman Sachs Commercial Mortgage Capital, L.P., Citicorp North America, Inc., KBS Acquisition Sub, LLC, KBS Acquisition Sub-Owner 1, LLC and various subsidiaries of the Company, dated as of September 1, 2011, incorporated by reference to Exhibit 10.11 to the Company’s Quarterly Report on Form 10-Q for the period ended September 30, 2011 |
| | | |
| 10.101 | | Pledge and Security Agreement (related to the GKK Mortgage Loan), by KBS Acquisition Sub-Owner 1, LLC, for the benefit of Goldman Sachs Commercial Mortgage Capital, L.P., Citicorp North America, Inc. and KBS Acquisition Sub, LLC, dated as of September 1, 2011, incorporated by reference to Exhibit 10.12 to the Company’s Quarterly Report on Form 10-Q for the period ended September 30, 2011 |
| | | |
| 10.102 | | Limited Guaranty (related to the GKK Mortgage Loan), by KBS Acquisition Sub-Owner 1, LLC, for the benefit of Goldman Sachs Mortgage Company, Citicorp North America, Inc. and KBS Acquisition Sub, LLC, dated as of September 1, 2011, incorporated by reference to Exhibit 10.13 to the Company’s Quarterly Report on Form 10-Q for the period ended September 30, 2011 |
| | | |
| 10.103 | | Guaranty (related to the GKK Mortgage Loan), by KBS Acquisition Sub, LLC, for the benefit of Goldman Sachs Mortgage Company, Citicorp North America, Inc. and KBS Acquisition Sub, LLC, dated as of September 1, 2011, incorporated by reference to Exhibit 10.14 to the Company’s Quarterly Report on Form 10-Q for the period ended September 30, 2011 |
| | | |
| 10.104 | | Advisory Agreement, by and between the Company and KBS Capital Advisors LLC, dated November 8, 2011, incorporated by reference to Exhibit 10.15 to the Company’s Quarterly Report on Form 10-Q for the period ended September 30, 2011 |
| | | |
| 10.105 | | Assignment and Assumption (related to the Collateral Transfer and Settlement Agreement (PB Capital)), by and between First States Group, L.P. and KBS Acquisition Sub-Owner 3, LLC, dated as of September 1, 2011 |
| | | |
| 10.106 | | Assignment and Assumption (related to the Collateral Transfer and Settlement Agreement (BBD1)), by and between First States Investors 5000, LLC and KBS Acquisition Sub-Owner 2, LLC, dated as of September 1, 2011 |
| | | |
| 10.107 | | Assignment and Assumption (related to the Collateral Transfer and Settlement Agreement (BBD2)), by and between First States Group, L.P. and KBS Acquisition Sub-Owner 9, LLC, dated as of September 1, 2011 |
| | |
| 10.108 | | Amendment No. 3 to Amended and Restated Master Repurchase Agreement, by and between KBS GKK Participation Holdings I, LLC and Goldman Sachs Mortgage Company, dated as of December 15, 2011 |
| | | |
| 10.109 | | Amendment No. 3 to Amended and Restated Master Repurchase Agreement, by and between KBS GKK Participation Holdings II, LLC and Citigroup Financial Products Inc., dated as of December 15, 2011 |
| | | |
| 10.110 | | Guaranty Supplement for the Benefit of Goldman Sachs Mortgage Company (related to Amendment No. 3 to the Amended and Restated Master Repurchase Agreement), by and between various indirect wholly owned subsidiaries of the Company and Goldman Sachs Mortgage Company, dated as of December 15, 2011 |
| | | |
| 10.111 | | Guaranty Supplement for the Benefit of Citigroup Financial Products Inc. (related to Amendment No. 3 to the Amended and Restated Master Repurchase Agreement), by and between various indirect wholly owned subsidiaries of the Company and Citigroup Financial Products Inc., dated as of December 15, 2011 |
| | | |
| 10.112 | | Joinder Agreement (related to Amendment No. 3 to the Amended and Restated Master Repurchase Agreement), by and between KBS GKK Participation Holdings I, LLC, various indirect wholly owned subsidiaries of the Company and Goldman Sachs Mortgage Company, dated as of December 15, 2011 |
| | | |
| 10.113 | | Joinder Agreement (related to Amendment No. 3 to the Amended and Restated Master Repurchase Agreement), by and between KBS GKK Participation Holdings II, LLC, various indirect wholly owned subsidiaries of the Company and Citigroup Financial Products Inc., dated as of December 15, 2011 |
| | | |
| 10.114 | | Supplemental Guaranty of Recourse Obligations (related to the Collateral Transfer and Settlement Agreement (BBD2)), by KBS Acquisition Holdings, LLC, for the benefit of Wells Fargo Bank, N.A., dated as of December 15, 2011 |
| | | |
| 10.115 | | Consent Agreement (related to the Collateral Transfer and Settlement Agreement (BBD2)), by and between First States Investors 5200, LLC, First States Group, L.P., KBS Acquisition Holdings, LLC and Wells Fargo Bank, N.A., dated December 15, 2011 |
| | | |
| 10.116 | | Supplemental Recourse Liability Agreement (related to the Collateral Transfer and Settlement Agreement (PB Capital)), by and between KBS Debt Holdings, LLC and PB Capital Corporation, dated as of December 15, 2011 |
|
| | |
| Ex. | | Description |
| | | |
| 10.117 | | Omnibus Amendment and Reaffirmation of Loan Documents (related to the Collateral Transfer and Settlement Agreement (PB Capital)), by and between First States Investors 3300 B, L.P. and PB Capital Corporation, dated as of December 15, 2011 |
| | | |
| 10.118 | | Assignment and Assumption (related to the Collateral Transfer and Settlement Agreement (PB Capital)), by and between GKK Stars Acquisition, LLC and KBS Acquisition Sub-Upper Tier Owner, LLC, dated as of December 15, 2011 |
| | | |
| 10.119 | | Agreement in Lieu of Foreclosure (related to the National Industrial Portfolio joint venture), by and between National Industrial Portfolio, LLC, NIP JV, LLC, National Industrial Mezz A, LLC, National Industrial Mezz B, LLC, NIPB Mezz C, LLC, NIPB Mezz D, LLC, NIBP Mezz E, LLC, and consented and agreed to by Hackman Capital Partners, LLC, Michael D. Hackman, Jonathan Epstein, William Manley and Calare Properties, Inc., dated as of December 23, 2011 |
| | | |
| 10.120 | | NIP JV, LLC Limited Liability Company Agreement (related to the National Industrial Portfolio joint venture), by and between, HC KBS NIP JV, LLC and OCM NIP JV Holdings, L.P., dated as of December 23, 2011 |
| | | |
| 10.121 | | Operating Agreement of HC KBS NIP JV, LLC (related to the National Industrial Portfolio joint venture), by and between HC NIP JV, LLC and KBS NIP JV Member, LLC, dated as of December 28, 2011 |
| | | |
| 10.122 | | First Amendment to Operating Agreement of HC KBS NIP JV, LLC (related to the National Industrial Portfolio joint venture), by and between HC NIP JV, LLC and KBS NIP JV Member LLC, dated March 5, 2012. |
| | | |
| 10.123 | | Amendment No. 1 to the Advisory Agreement, by and between the Company and KBS Capital Advisors LLC, dated March 20, 2012. |
| | | |
| 21.1 | | Subsidiaries of the Company |
| | | |
| 23.1 | | Consent of Ernst & Young LLP |
| | | |
| 31.1 | | Certification of Chief Executive Officer pursuant to Section 302 of the Sarbanes-Oxley Act of 2002 |
| | |
| 31.2 | | Certification of Chief Financial Officer pursuant to Section 302 of the Sarbanes-Oxley Act of 2002 |
| | | |
| 32.1 | | Certification of Chief Executive Officer pursuant to 18 U.S.C. 1350, as created by Section 906 of the Sarbanes-Oxley Act of 2002 |
| | | |
| 32.2 | | Certification of Chief Financial Officer pursuant to 18 U.S.C. 1350, as created by Section 906 of the Sarbanes-Oxley Act of 2002 |
| | | |
| 101.1 | | The following information from the Company’s annual report on Form 10-K for the year ended December 31, 2011, formatted in XBRL (eXtensible Business Reporting Language): (i) Consolidated Balance Sheets; (ii) Consolidated Statements of Operations; (iii) Consolidated Statements of Equity; and (vi) Consolidated Statements of Cash Flows |
INDEX TO CONSOLIDATED FINANCIAL STATEMENTS
|
| | |
| Consolidated Financial Statements | |
| | | |
| | | |
| | | |
| | | |
| | | |
| | | |
| | | |
| Financial Statement Schedule | |
| | | |
| | | |
| | | |
| | | |
All other schedules are omitted because they are not applicable or the required information is shown in the financial statements or notes thereto.
REPORT OF INDEPENDENT REGISTERED PUBLIC ACCOUNTING FIRM
The Board of Directors and Stockholders
KBS Real Estate Investment Trust, Inc.
We have audited the accompanying consolidated balance sheets of KBS Real Estate Investment Trust, Inc. as of December 31, 2011 and 2010, and the related consolidated statements of operations, equity, and cash flows for each of the three years in the period ended December 31, 2011. Our audits also included the financial statement schedules listed in Item 15(a). These financial statements and schedules are the responsibility of the Company's management. Our responsibility is to express an opinion on these financial statements and schedules based on our audits.
We conducted our audits in accordance with the standards of the Public Company Accounting Oversight Board (United States). Those standards require that we plan and perform the audit to obtain reasonable assurance about whether the financial statements are free of material misstatement. We were not engaged to perform an audit of the Company's internal control over financial reporting. Our audits included consideration of internal control over financial reporting as a basis for designing audit procedures that are appropriate in the circumstances, but not for the purpose of expressing an opinion on the effectiveness of the Company's internal control over financial reporting. Accordingly, we express no such opinion. An audit includes examining, on a test basis, evidence supporting the amounts and disclosures in the financial statements. An audit also includes assessing the accounting principles used and significant estimates made by management, as well as evaluating the overall financial statement presentation. We believe that our audits provide a reasonable basis for our opinion.
In our opinion, the financial statements referred to above present fairly, in all material respects, the consolidated financial position of KBS Real Estate Investment Trust, Inc. at December 31, 2011 and 2010, and the consolidated results of its operations and its cash flows for each of the three years in the period ended December 31, 2011, in conformity with U.S. generally accepted accounting principles. Also, in our opinion, the financial statement schedules referred to above, when considered in relation to the basic financial statements taken as a whole, present fairly, in all material respects, the information set forth therein.
/s/ Ernst & Young LLP
Irvine, California
March 26, 2012
KBS REAL ESTATE INVESTMENT TRUST, INC.
CONSOLIDATED BALANCE SHEETS
(in thousands, except share and per share amounts)
|
| | | | | | | |
| | December 31, |
| | 2011 | | 2010 |
| | | | |
| Assets | | | |
| Real estate held for investment: | | | |
| Land | $ | 525,131 |
| | $ | 198,747 |
|
| Buildings and improvements | 1,919,857 |
| | 1,147,925 |
|
| Tenant origination and absorption costs | 269,746 |
| | 64,227 |
|
| Total real estate held for investment, at cost and net of impairment charges | 2,714,734 |
| | 1,410,899 |
|
| Less accumulated depreciation and amortization | (152,900 | ) | | (140,175 | ) |
| Total real estate held for investment, net | 2,561,834 |
| | 1,270,724 |
|
| Real estate held for sale, net | 402,399 |
| | 319,853 |
|
| Foreclosed real estate held for sale | 28,848 |
| | 49,110 |
|
| Total real estate, net | 2,993,081 |
| | 1,639,687 |
|
| Real estate loans receivable, net | 45,024 |
| | 546,236 |
|
| Real estate securities | 46,249 |
| | 18,275 |
|
| Total real estate and real estate-related investments, net | 3,084,354 |
| | 2,204,198 |
|
| Cash and cash equivalents | 53,991 |
| | 151,908 |
|
| Restricted cash | 122,090 |
| | 7,082 |
|
| Pledged government securities | 91,541 |
| | — |
|
| Rents and other receivables, net | 46,621 |
| | 26,437 |
|
| Above-market leases, net | 41,815 |
| | 5,553 |
|
| Assets related to real estate held for sale | 19,371 |
| | 10,100 |
|
| Deferred financing costs, prepaid expenses and other assets | 45,005 |
| | 28,112 |
|
| Total assets | $ | 3,504,788 |
| | $ | 2,433,390 |
|
| Liabilities and equity | | | |
| Notes payable and repurchase agreements: | | | |
| Notes payable | $ | 1,835,365 |
| | $ | 1,005,233 |
|
| Repurchase agreements | 149,657 |
| | 277,614 |
|
| Notes payable related to real estate held for sale | 314,186 |
| | 196,168 |
|
| Total notes payable and repurchase agreements | 2,299,208 |
| | 1,479,015 |
|
| Accounts payable and accrued liabilities | 57,355 |
| | 19,164 |
|
| Due to affiliates | — |
| | 6,995 |
|
| Distributions payable | 8,498 |
| | 8,254 |
|
| Below-market leases, net | 178,583 |
| | 13,468 |
|
| Liabilities related to real estate held for sale | 23,754 |
| | 4,260 |
|
| Other liabilities | 77,133 |
| | 17,350 |
|
| Total liabilities | 2,644,531 |
| | 1,548,506 |
|
| Commitments and contingencies (Note 18) |
|
| |
|
|
| Redeemable common stock | 45,376 |
| | 45,382 |
|
| Equity | | | |
| KBS Real Estate Investment Trust, Inc. stockholders’ equity: | | | |
| Preferred stock, $.01 par value; 10,000,000 shares authorized, no shares issued and outstanding | — |
| | — |
|
| Common stock, $.01 par value; 1,000,000,000 shares authorized, 190,731,533 and 185,320,095 shares issued and outstanding as of December 31, 2011 and December 31, 2010, respectively | 1,907 |
| | 1,853 |
|
| Additional paid-in capital | 1,639,228 |
| | 1,600,848 |
|
| Cumulative distributions and net losses | (850,032 | ) | | (731,918 | ) |
| Accumulated other comprehensive loss | 23,778 |
| | (8,945 | ) |
| Total KBS Real Estate Investment Trust, Inc. stockholders’ equity | 814,881 |
| | 861,838 |
|
| Noncontrolling interest | — |
| | (22,336 | ) |
| Total equity | 814,881 |
| | 839,502 |
|
| Total liabilities and equity | $ | 3,504,788 |
| | $ | 2,433,390 |
|
| | | | |
See accompanying notes to consolidated financial statements.
KBS REAL ESTATE INVESTMENT TRUST, INC.
CONSOLIDATED STATEMENTS OF OPERATIONS
(in thousands, except share and per share amounts)
|
| | | | | | | | | | | |
| | Years Ended December 31, |
| | 2011 | | 2010 | | 2009 |
| Revenues: | | | | | |
| Rental income | $ | 156,060 |
| | $ | 98,008 |
| | $ | 101,879 |
|
| Tenant reimbursements | 53,708 |
| | 17,935 |
| | 21,041 |
|
| Interest income from real estate loans receivable | 13,383 |
| | 42,321 |
| | 56,161 |
|
| Interest income from real estate securities | 2,857 |
| | 3,090 |
| | 3,507 |
|
| Parking revenues and other operating income | 2,530 |
| | 2,339 |
| | 1,999 |
|
| Total revenues | 228,538 |
| | 163,693 |
| | 184,587 |
|
| Expenses: | | | | | |
| Operating, maintenance, and management | 73,185 |
| | 27,954 |
| | 27,683 |
|
| Real estate taxes, property-related taxes, and insurance | 29,822 |
| | 17,422 |
| | 17,417 |
|
| Asset management fees to affiliate | 14,546 |
| | 15,228 |
| | 16,460 |
|
| General and administrative expenses | 20,232 |
| | 7,045 |
| | 6,697 |
|
| Depreciation and amortization | 82,310 |
| | 50,121 |
| | 60,034 |
|
| Interest expense | 70,970 |
| | 39,553 |
| | 38,287 |
|
| Impairment charge on real estate held for investment | 15,823 |
| | — |
| | — |
|
| Provision for loan losses | 11,999 |
| | 11,046 |
| | 178,813 |
|
| Other-than-temporary impairments of real estate securities | — |
| | — |
| | 5,067 |
|
| Total expenses | 318,887 |
| | 168,369 |
| | 350,458 |
|
| Other income | | | | | |
| Gain on sales of foreclosed real estate held for sale | 134 |
| | 2,011 |
| | — |
|
| Income from unconsolidated joint venture | 5,029 |
| | 7,701 |
| | 4,038 |
|
| Other interest income | 103 |
| | 112 |
| | 126 |
|
| Other income | 1,600 |
| | — |
| | — |
|
| Total other income | 6,866 |
| | 9,824 |
| | 4,164 |
|
| Income (loss) from continuing operations | (83,483 | ) | | 5,148 |
| | (161,707 | ) |
| Discontinued operations: | | | | | |
| Gain on sales of real estate, net | 5,141 |
| | 5,646 |
| | — |
|
| Income (loss) from discontinued operations | 4,122 |
| | (1,720 | ) | | (24,628 | ) |
| Impairment charges on discontinued operations | (36,754 | ) | | (123,453 | ) | | — |
|
| Gain from extinguishment of debt | 115,531 |
| | — |
| | — |
|
| Total income (loss) from discontinued operations | 88,040 |
| | (119,527 | ) | | (24,628 | ) |
| Net income (loss) | 4,557 |
| | (114,379 | ) | | (186,335 | ) |
| Net (income) loss attributable to noncontrolling interest in discontinued operations | (23,895 | ) | | 24,027 |
| | 3,369 |
|
| Net loss attributable to common stockholders | $ | (19,338 | ) | | $ | (90,352 | ) | | $ | (182,966 | ) |
| Basic and diluted loss per common share: | | | | | |
| Continuing operations | (0.57 | ) | | 0.16 |
| | (0.89 | ) |
| Discontinued operations | 0.47 |
| | (0.66 | ) | | (0.14 | ) |
| Net loss per common share | $ | (0.10 | ) | | $ | (0.50 | ) | | $ | (1.03 | ) |
Weighted-average number of common shares outstanding, basic and diluted | 188,134,294 |
| | 182,437,352 |
| | 177,959,297 |
|
| Distributions declared per common share | $ | 0.525 |
| | $ | 0.525 |
| | $ | 0.612 |
|
See accompanying notes to consolidated financial statements.
KBS REAL ESTATE INVESTMENT TRUST, INC.
CONSOLIDATED STATEMENTS OF EQUITY
(dollars in thousands)
|
| | | | | | | | | | | | | | | | | | | | | | | | | | | | | | |
| | Common Stock | | Additional Paid-in Capital | | Cumulative Distributions and Net Income (Losses) | | Accumulated Other Comprehensive Income (Loss) | | Total Stockholders’ Equity | | Noncontrolling Interest | | Total Equity |
| | Shares | | Amounts | | | | | | |
| Balance, December 31, 2008 | 177,002,778 |
| | $ | 1,770 |
| | $ | 1,528,718 |
| | $ | (268,808 | ) | | $ | (6,539 | ) | | $ | 1,255,141 |
| | $ | 12,051 |
| | $ | 1,267,192 |
|
| Comprehensive loss: | | | | | | | | | | | | | | | |
| Net loss | — |
| | — |
| | — |
| | (182,966 | ) | | — |
| | (182,966 | ) | | (3,369 | ) | | (186,335 | ) |
Unrealized change in market value on real estate securities | — |
| | — |
| | — |
| | — |
| | 4,973 |
| | 4,973 |
| | — |
| | 4,973 |
|
Unrealized gains (losses) on derivative instruments | — |
| | — |
| | — |
| | — |
| | (322 | ) | | (322 | ) | | (38 | ) | | (360 | ) |
| Total comprehensive loss | | | | | | | | | | | (178,315 | ) | | (3,407 | ) | | (181,722 | ) |
Cumulative transition adjustment to real estate securities (See Note 7) | — |
| | — |
| | — |
| | 14,780 |
| | (14,780 | ) | | — |
| | — |
| | — |
|
| Noncontrolling interest contributions | — |
| | — |
| | — |
| | — |
| | — |
| | — |
| | 427 |
| | 427 |
|
| Distributions to noncontrolling interest | — |
| | — |
| | — |
| | — |
| | — |
| | — |
| | (4,284 | ) | | (4,284 | ) |
| Issuance of common stock | 6,256,333 |
| | 62 |
| | 58,173 |
| | — |
| | — |
| | 58,235 |
| | — |
| | 58,235 |
|
| Redemptions of common stock | (3,827,518 | ) | | (38 | ) | | (35,898 | ) | | — |
| | — |
| | (35,936 | ) | | — |
| | (35,936 | ) |
| Transfers to redeemable common stock | — |
| | — |
| | (833 | ) | | — |
| | — |
| | (833 | ) | | — |
| | (833 | ) |
| Distributions declared | — |
| | — |
| | — |
| | (108,811 | ) | | — |
| | (108,811 | ) | | — |
| | (108,811 | ) |
Commissions on stock issuances to affiliate | — |
| | — |
| | (1,494 | ) | | — |
| | — |
| | (1,494 | ) | | — |
| | (1,494 | ) |
| Other offering costs | — |
| | — |
| | (154 | ) | | — |
| | — |
| | (154 | ) | | — |
| | (154 | ) |
| Balance, December 31, 2009 | 179,431,593 |
| | 1,794 |
| | 1,548,512 |
| | (545,805 | ) | | (16,668 | ) | | 987,833 |
| | 4,787 |
| | 992,620 |
|
| Comprehensive loss: | | | | | | | | | | | | | | | |
| Net loss | — |
| | — |
| | — |
| | (90,352 | ) | | — |
| | (90,352 | ) | | (24,027 | ) | | (114,379 | ) |
Unrealized change in market value on real estate securities | — |
| | — |
| | — |
| | — |
| | 6,145 |
| | 6,145 |
| | — |
| | 6,145 |
|
Unrealized gains (losses) on derivative instruments | — |
| | — |
| | — |
| | — |
| | 1,578 |
| | 1,578 |
| | (29 | ) | | 1,549 |
|
| Total comprehensive loss | | | | | | | | | | | (82,629 | ) | | (24,056 | ) | | (106,685 | ) |
| Noncontrolling interest contributions | — |
| | — |
| | — |
| | — |
| | — |
| | — |
| | 158 |
| | 158 |
|
| Distributions to noncontrolling interest | — |
| | — |
| | — |
| | — |
| | — |
| | — |
| | (3,225 | ) | | (3,225 | ) |
| Issuance of common stock | 6,480,377 |
| | 65 |
| | 46,475 |
| | — |
| | — |
| | 46,540 |
| | — |
| | 46,540 |
|
| Redemptions of common stock | (591,875 | ) | | (6 | ) | | (4,241 | ) | | — |
| | — |
| | (4,247 | ) | | — |
| | (4,247 | ) |
| Transfers to redeemable common stock | — |
| | — |
| | 11,359 |
| | — |
| | — |
| | 11,359 |
| | — |
| | 11,359 |
|
| Distributions declared | — |
| | — |
| | — |
| | (95,761 | ) | | — |
| | (95,761 | ) | | — |
| | (95,761 | ) |
Commissions on stock issuances to affiliate | — |
| | — |
| | (1,160 | ) | | — |
| | — |
| | (1,160 | ) | | — |
| | (1,160 | ) |
| Other offering costs | — |
| | — |
| | (97 | ) | | — |
| | — |
| | (97 | ) | | — |
| | (97 | ) |
| Balance, December 31, 2010 | 185,320,095 |
| | 1,853 |
| | 1,600,848 |
| | (731,918 | ) | | (8,945 | ) | | 861,838 |
| | (22,336 | ) | | 839,502 |
|
| Comprehensive loss: | | | | | | | | | | | | | | | |
| Net loss | — |
| | — |
| | — |
| | (19,338 | ) | | — |
| | (19,338 | ) | | 23,895 |
| | 4,557 |
|
Unrealized change in market value on real estate securities | — |
| | — |
| | — |
| | — |
| | 28,902 |
| | 28,902 |
| | — |
| | 28,902 |
|
Unrealized gains on derivative instruments | — |
| | — |
| | — |
| | — |
| | 3,821 |
| | 3,821 |
| | 91 |
| | 3,912 |
|
| Total comprehensive income | | | | | | | | | | | 13,385 |
| | 23,986 |
| | 37,371 |
|
| Distributions to noncontrolling interest | — |
| | — |
| | — |
| | — |
| | — |
| | — |
| | (1,650 | ) | | (1,650 | ) |
| Issuance of common stock | 6,351,438 |
| | 63 |
| | 46,429 |
| | — |
| | — |
| | 46,492 |
| | — |
| | 46,492 |
|
| Redemptions of common stock | (940,000 | ) | | (9 | ) | | (6,872 | ) | | — |
| | — |
| | (6,881 | ) | | — |
| | (6,881 | ) |
| Transfers to redeemable common stock | — |
| | — |
| | 6 |
| | — |
| | — |
| | 6 |
| | — |
| | 6 |
|
| Distributions declared | — |
| | — |
| | — |
| | (98,776 | ) | | — |
| | (98,776 | ) | | — |
| | (98,776 | ) |
Commissions on stock issuances to affiliate | — |
| | — |
| | (1,115 | ) | | — |
| | — |
| | (1,115 | ) | | — |
| | (1,115 | ) |
| Other offering costs | — |
| | — |
| | (68 | ) | | — |
| | — |
| | (68 | ) | | — |
| | (68 | ) |
| Balance, December 31, 2011 | 190,731,533 |
| | $ | 1,907 |
| | $ | 1,639,228 |
| | $ | (850,032 | ) | | $ | 23,778 |
| | $ | 814,881 |
| | $ | — |
| | $ | 814,881 |
|
See accompanying notes to consolidated financial statements.
KBS REAL ESTATE INVESTMENT TRUST, INC.
CONSOLIDATED STATEMENTS OF CASH FLOWS
(in thousands)
|
| | | | | | | | | | | |
| | Years Ended December 31, |
| | 2011 | | 2010 | | 2009 |
| Cash Flows from Operating Activities: | | | | | |
| Net income (loss) | $ | 4,557 |
| | $ | (114,379 | ) | | $ | (186,335 | ) |
| Adjustments to reconcile net income (loss) to net cash provided by operating activities: | | | | | |
| Depreciation and amortization | | | | | |
| Continuing operations | 82,310 |
| | 50,121 |
| | 60,034 |
|
| Discontinued operations | 27,728 |
| | 30,552 |
| | 60,277 |
|
| Income from unconsolidated joint venture | (5,029 | ) | | (7,701 | ) | | (4,038 | ) |
| Distribution of earnings from unconsolidated joint venture | 5,029 |
| | 7,701 |
| | 3,552 |
|
| Impairment charges on real estate - continuing operations | 15,823 |
| | — |
| | — |
|
| Impairment charges on real estate - discontinued operations | 36,754 |
| | 123,453 |
| | — |
|
| Amortization of investment in master lease | 436 |
| | 647 |
| | 858 |
|
| Noncash interest income on real estate-related investments | (860 | ) | | (3,563 | ) | | (2,938 | ) |
| Change in provision for loan losses | 11,935 |
| | 11,046 |
| | 178,634 |
|
| Other-than-temporary impairments of real estate securities | — |
| | — |
| | 5,067 |
|
| Deferred rent | (7,654 | ) | | (6,932 | ) | | (4,024 | ) |
| Bad debt expense | 2,276 |
| | 654 |
| | 2,430 |
|
| Amortization of deferred financing costs | 8,112 |
| | 2,460 |
| | 4,857 |
|
| Amortization of above- and below-market leases, net | (8,970 | ) | | (2,627 | ) | | (6,018 | ) |
| Amortization of cost of derivative instruments | 474 |
| | 121 |
| | 1,773 |
|
| Unrealized loss on derivative instruments | — |
| | — |
| | 8 |
|
| Gain on sales of foreclosed real estate held for sale | (134 | ) | | (2,011 | ) | | — |
|
| Gain on sales of real estate, net | (5,141 | ) | | (5,646 | ) | | — |
|
| Gain on extinguishment of debt | (115,531 | ) | | — |
| | — |
|
| Amortization of discount/premium on notes payable assumed | 3,983 |
| | — |
| | — |
|
| Other amortization | — |
| | 718 |
| | — |
|
| Changes in operating assets and liabilities: | | | | | |
| Restricted cash for operational expenditures | 6,782 |
| | 1,909 |
| | (549 | ) |
| Rents and other receivables | (218 | ) | | (4,034 | ) | | (1,069 | ) |
| Prepaid expenses and other assets | (15,330 | ) | | (10,585 | ) | | (5,549 | ) |
| Accounts payable and accrued liabilities | (391 | ) | | (6,713 | ) | | (5,225 | ) |
| Due to affiliates | (6,995 | ) | | 514 |
| | 2,037 |
|
| Other liabilities | (887 | ) | | (12,317 | ) | | (4,044 | ) |
| Net cash provided by operating activities | 39,059 |
| | 53,388 |
| | 99,738 |
|
| Cash Flows from Investing Activities: | | | | | |
| Improvements to real estate | (34,685 | ) | | (20,793 | ) | | (23,794 | ) |
| Proceeds from sales of real estate, net | 176,857 |
| | 71,118 |
| | — |
|
| Proceeds from sales of foreclosed real estate held for sale | 20,396 |
| | 44,819 |
| | — |
|
| Investments in real estate loans receivable | (41,159 | ) | | — |
| | — |
|
| Principal repayments on real estate loans receivable | 360 |
| | 70,768 |
| | 27,483 |
|
| Proceeds from foreclosure of real estate loan receivable | — |
| | 4,084 |
| | — |
|
| Proceeds from sale of real estate loan receivable | 32,381 |
| | — |
| | — |
|
| Extension fees related to real estate loans receivable | 83 |
| | 3,547 |
| | — |
|
| Advances on real estate loans receivable | — |
| | (4,105 | ) | | (5,859 | ) |
| Cash collateral received on impaired real estate loans receivable | — |
| | — |
| | 3,992 |
|
| Cash received from the Transfer of the GKK Properties | 32,141 |
| | — |
| | — |
|
| Net change in restricted cash for capital expenditures | 2,948 |
| | (2,507 | ) | | (464 | ) |
| Net cash provided by investing activities | 189,322 |
| | 166,931 |
| | 1,358 |
|
| Cash Flows from Financing Activities: | | | | | |
| Proceeds from notes payable and repurchase agreements | 172,839 |
| | 43,015 |
| | 48,028 |
|
| Principal payments on notes payable | (260,312 | ) | | (98,270 | ) | | (28,228 | ) |
| Cash surrendered from NIP deed in lieu | (2,349 | ) | | — |
| | — |
|
| Principal payments on repurchase agreements | (162,396 | ) | | (9,660 | ) | | (14,886 | ) |
| Purchase of derivative instruments | — |
| | (179 | ) | | (420 | ) |
| Payments of deferred financing costs | (12,326 | ) | | (1,217 | ) | | (1,229 | ) |
| Payments to redeem common stock | (6,881 | ) | | (4,247 | ) | | (35,936 | ) |
| Payments of commissions on stock issuances | (1,115 | ) | | (1,160 | ) | | (1,494 | ) |
| Payments of other offering costs | (68 | ) | | (97 | ) | | (154 | ) |
| Distributions paid to common stockholders | (52,040 | ) | | (48,958 | ) | | (53,130 | ) |
| Noncontrolling interest contributions | — |
| | 158 |
| | 427 |
|
| Distributions paid to noncontrolling interest | (1,650 | ) | | (3,225 | ) | | (4,284 | ) |
| Net cash used in financing activities | (326,298 | ) | | (123,840 | ) | | (91,306 | ) |
| Net (decrease) increase in cash and cash equivalents | (97,917 | ) | | 96,479 |
| | 9,790 |
|
| Cash and cash equivalents, beginning of period | 151,908 |
| | 55,429 |
| | 45,639 |
|
| Cash and cash equivalents, end of period | $ | 53,991 |
| | $ | 151,908 |
| | $ | 55,429 |
|
See accompanying notes to consolidated financial statements.
KBS REAL ESTATE INVESTMENT TRUST, INC.
NOTES TO CONSOLIDATED FINANCIAL STATEMENTS
December 31, 2011
KBS Real Estate Investment Trust, Inc. (the “Company”) was formed on June 13, 2005 as a Maryland corporation and has elected to be taxed as a real estate investment trust (“REIT”). Substantially all of the Company’s assets are held by, and the Company conducts substantially all of its operations through, KBS Limited Partnership, a Delaware limited partnership (the “Operating Partnership”), and its subsidiaries. The Company is the sole general partner of and directly owns a 99% partnership interest in the Operating Partnership. The Company’s wholly owned subsidiary, KBS REIT Holdings LLC, a Delaware limited liability company (“KBS REIT Holdings”), owns the remaining 1% partnership interest in the Operating Partnership and is its sole limited partner.
The Company owns a diverse portfolio of real estate and real estate-related investments. As of December 31, 2011, the Company owned 892 real estate properties (of which 250 properties were held for sale), including the GKK Properties (defined below). In addition, as of December 31, 2011, the Company owned seven real estate loans receivable, two investments in securities directly or indirectly backed by commercial mortgage loans, a preferred membership interest in a real estate joint venture, a participation interest with respect to another real estate joint venture and a 10-story condominium building with 62 units acquired through foreclosure, of which four condominium units, two retail spaces and parking spaces have not been sold and are held for sale.
On September 1, 2011 (the “Effective Date”), the Company, through indirect wholly owned subsidiaries (collectively, “KBS”), entered into a Collateral Transfer and Settlement Agreement (the “Settlement Agreement”) with, among other parties, GKK Stars Acquisition LLC (“GKK Stars”), the wholly owned subsidiary of Gramercy Capital Corp. (“Gramercy”) that indirectly owned the Gramercy real estate portfolio, to effect the orderly transfer of certain assets and liabilities of the Gramercy real estate portfolio to KBS in satisfaction of certain debt obligations owed by wholly owned subsidiaries of Gramercy to KBS. The Settlement Agreement resulted in the transfer of the equity interests in certain subsidiaries of Gramercy (the “Equity Interests”) that indirectly own or, with respect to a limited number of properties, hold a leasehold interest in, 867 properties (the “GKK Properties”), including 576 bank branch properties and 291 office buildings, operations centers and other properties. As of December 15, 2011, GKK Stars had transferred all of the Equity Interests to the Company, giving the Company title to or, with respect to a limited number of GKK Properties, a leasehold interest in, 867 GKK Properties. For more information, see Note 3, “Collateral Transfer and Settlement Agreement Related to the GKK Mezzanine Loan.”
Subject to certain restrictions and limitations, the business of the Company is managed by KBS Capital Advisors LLC (the “Advisor”), an affiliate of the Company, pursuant to an advisory agreement, as amended, with the Company (the “Advisory Agreement”) in effect through November 8, 2012. The Advisory Agreement may be renewed for an unlimited number of one‑year periods upon the mutual consent of the Advisor and the Company. Either party may terminate the Advisory Agreement upon 60 days written notice. The Advisor owns 20,000 shares of the Company’s common stock.
Upon commencing its initial public offering (the “Offering”), the Company retained KBS Capital Markets Group LLC (the “Dealer Manager”), an affiliate of the Advisor, to serve as the dealer manager of the Offering pursuant to a dealer manager agreement dated January 27, 2006 (the “Dealer Manager Agreement”). The Company ceased offering shares of common stock in its primary offering on May 30, 2008. The Company’s dividend reinvestment plan will terminate effective April 10, 2012.
The Company sold 171,109,494 shares of common stock in its primary offering for gross offering proceeds of $1.7 billion. As of December 31, 2011, the Company had sold 26,592,090 shares of common stock under its dividend reinvestment plan for gross offering proceeds of $222.6 million. Also as of December 31, 2011, the Company had redeemed 6,990,051 of the shares sold in the Offering for $62.4 million.
KBS REAL ESTATE INVESTMENT TRUST, INC.
NOTES TO CONSOLIDATED FINANCIAL STATEMENTS (CONTINUED)
December 31, 2011
| |
| 2. | SUMMARY OF SIGNIFICANT ACCOUNTING POLICIES |
Principles of Consolidation and Basis of Presentation
The consolidated financial statements include the accounts of the Company, KBS REIT Holdings, the Operating Partnership, their direct and indirect wholly owned subsidiaries, and joint ventures the Company controls or for which it is the primary beneficiary, as well as the related amounts of noncontrolling interests. All significant intercompany balances and transactions are eliminated in consolidation.
The Company evaluates the need to consolidate joint ventures and consolidates joint ventures that it determines to be variable interest entities for which it is the primary beneficiary. The Company also consolidates joint ventures that are not determined to be variable interest entities, but for which it exercises control over major operating decisions through substantive participation rights, such as approval of budgets, selection of property managers, asset management, investment activity and changes in financing.
The consolidated financial statements are prepared in accordance with U.S. generally accepted accounting principles (“GAAP”) as contained within the Financial Accounting Standards Board (“FASB”) Accounting Standards Codification (“ASC”) and the rules and regulations of the Securities and Exchange Commission (“SEC”).
Risk and Uncertainties
The Company's projected cash flow from operations will not be sufficient to cover capital expenditures, amortization payment requirements on debt obligations and principal pay-down requirements for debt obligations at maturity or to allow the Company to meet the conditions for extension of loans, therefore, requiring it to sell assets in order to meet capital requirements. If the Company's cash flow from operations continues to deteriorate, the Company will be more dependent on asset sales to fund operations and for liquidity needs. Moreover, the Company may be unable to meet financial and operating covenants in debt obligations, and its lenders may take action against the Company. These factors could also have a material adverse effect on the Company and its stockholders' return.
Use of Estimates
The preparation of the consolidated financial statements in conformity with GAAP requires management to make estimates and assumptions that affect the amounts reported in the consolidated financial statements and accompanying notes. Actual results could materially differ from those estimates.
Reclassifications
Certain amounts in the Company’s prior period consolidated financial statements have been reclassified to conform to the current period presentation. These reclassifications have not changed the results of operations of prior periods. In addition, the Company disposed of ten properties and transferred a portfolio of 23 industrial properties and a master lease with respect to another industrial property pursuant to an agreement in lieu of foreclosure during the year ended December 31, 2011, and classified 250 properties as held for sale as of December 31, 2011, of which 247 properties were GKK Properties transferred to the Company in 2011 pursuant to the Settlement Agreement. As a result, certain reclassifications were made to the consolidated balance sheets, statements of operations and footnote disclosures for all periods presented.
KBS REAL ESTATE INVESTMENT TRUST, INC.
NOTES TO CONSOLIDATED FINANCIAL STATEMENTS (CONTINUED)
December 31, 2011
Revenue Recognition
Real Estate
The Company recognizes minimum rent, including rental abatements, lease incentives and contractual fixed increases attributable to operating leases, on a straight-line basis over the term of the related leases when collectibility is reasonably assured and records amounts expected to be received in later years as deferred rent receivable. If the lease provides for tenant improvements, the Company determines whether the tenant improvements, for accounting purposes, are owned by the tenant or the Company. When the Company is the owner of the tenant improvements, the tenant is not considered to have taken physical possession or have control of the physical use of the leased asset until the tenant improvements are substantially completed. When the tenant is the owner of the tenant improvements, any tenant improvement allowance that is funded is treated as a lease incentive and amortized as a reduction of revenue over the lease term. Tenant improvement ownership is determined based on various factors including, but not limited to:
| |
| • | whether the lease stipulates how a tenant improvement allowance may be spent; |
| |
| • | whether the amount of a tenant improvement allowance is in excess of market rates; |
| |
| • | whether the tenant or landlord retains legal title to the improvements at the end of the lease term; |
| |
| • | whether the tenant improvements are unique to the tenant or general‑purpose in nature; and |
| |
| • | whether the tenant improvements are expected to have any residual value at the end of the lease. |
The Company makes estimates of the collectibility of its tenant receivables related to base rents, including deferred rent receivable, expense reimbursements and other revenue or income. Management specifically analyzes accounts receivable, deferred rent receivable, historical bad debts, customer creditworthiness, current economic trends and changes in customer payment terms when evaluating the adequacy of the allowance for doubtful accounts. In addition, with respect to tenants in bankruptcy, management makes estimates of the expected recovery of pre‑petition and post‑petition claims in assessing the estimated collectibility of the related receivable. In some cases, the ultimate resolution of these claims can exceed one year. When a tenant is in bankruptcy, the Company will record a bad debt reserve for the tenant’s receivable balance and generally will not recognize subsequent rental revenue until cash is received or until the tenant is no longer in bankruptcy and has the ability to make rental payments.
Real Estate Loans Receivable
Interest income on the Company’s real estate loans receivable is recognized on an accrual basis over the life of the investment using the interest method. Direct loan origination fees and origination or acquisition costs, as well as acquisition premiums or discounts, are amortized over the term of the loan as an adjustment to interest income. The Company places loans on nonaccrual status when any portion of principal or interest is 90 days past due, or earlier when concern exists as to the ultimate collection of principal or interest. When a loan is placed on nonaccrual status, the Company reverses the accrual for unpaid interest and generally does not recognize subsequent interest income until cash is received, or the loan returns to accrual status. The Company will resume the accrual of interest if it determines the collection of interest according to the contractual terms of the loan is probable.
The Company generally recognizes income on impaired loans on either a cash basis, where interest income is only recorded when received in cash, or on a cost‑recovery basis, where all cash receipts are applied against the carrying value of the loan. The Company considers the collectibility of the loan’s principal balance in determining whether to recognize income on impaired loans on a cash basis or a cost‑recovery basis.
KBS REAL ESTATE INVESTMENT TRUST, INC.
NOTES TO CONSOLIDATED FINANCIAL STATEMENTS (CONTINUED)
December 31, 2011
Real Estate Securities
The Company recognizes interest income on real estate securities that are beneficial interests in securitized financial assets and are rated “AA” and above on an accrual basis according to the contractual terms of the securities. Discounts or premiums are amortized to interest income over the life of the investment using the interest method.
The Company recognizes interest income on real estate securities that are beneficial interests in securitized financial assets that are rated below “AA” using the effective yield method, which requires the Company to periodically project estimated cash flows related to these securities and recognize interest income at an interest rate equivalent to the estimated yield on the security, as calculated using the security’s estimated cash flows and amortized cost basis, or reference amount. Changes in the estimated cash flows are recognized through an adjustment to the yield on the security on a prospective basis. Projecting cash flows for these types of securities requires significant judgment, which may have a significant impact on the timing of revenue recognized on these investments.
Cash and Cash Equivalents
The Company recognizes interest income on its cash and cash equivalents as it is earned and classifies such amounts as other interest income.
Real Estate
Depreciation and Amortization
Real estate costs related to the acquisition and improvement of properties are capitalized and amortized over the expected useful life of the asset on a straight-line basis. Repair and maintenance costs are charged to expense as incurred and significant replacements and betterments are capitalized. Repair and maintenance costs include all costs that do not extend the useful life of the real estate asset. The Company considers the period of future benefit of an asset to determine its appropriate useful life. Expenditures for tenant improvements are capitalized and amortized over the shorter of the tenant’s lease term or expected useful life. The Company anticipates the estimated useful lives of our assets by class to be generally as follows:
|
| |
| Buildings | 15 - 40 years |
| Building improvements | 10 - 25 years |
| Tenant improvements | Shorter of lease term or expected useful life |
| Tenant origination and absorption costs | Remaining term of related leases, including below-market renewal periods |
Real Estate Acquisition Valuation
The Company records the acquisition of income‑producing real estate or real estate that will be used for the production of income as a business combination. All assets acquired and liabilities assumed in a business combination are measured at their acquisition‑date fair values. Acquisition costs are expensed as incurred and restructuring costs that do not meet the definition of a liability at the acquisition date are expensed in periods subsequent to the acquisition date.
Estimates of the fair values of the tangible assets, identifiable intangibles and assumed liabilities require the Company to make significant assumptions to estimate market lease rates, property‑operating expenses, carrying costs during lease‑up periods, discount rates, market absorption periods, and the number of years the property will be held for investment. The use of inappropriate assumptions would result in an incorrect valuation of the Company’s acquired tangible assets, identifiable intangibles and assumed liabilities, which would impact the amount of the Company’s net income.
KBS REAL ESTATE INVESTMENT TRUST, INC.
NOTES TO CONSOLIDATED FINANCIAL STATEMENTS (CONTINUED)
December 31, 2011
Impairment of Real Estate and Related Intangible Assets and Liabilities
The Company continually monitors events and changes in circumstances that could indicate that the carrying amounts of its real estate and related intangible assets and liabilities may not be recoverable or realized. When indicators of potential impairment suggest that the carrying value of real estate and related intangible assets and liabilities may not be recoverable, the Company assesses the recoverability by estimating whether the Company will recover the carrying value of the real estate and related intangible assets and liabilities through its undiscounted future cash flows and its eventual disposition. If, based on this analysis, the Company does not believe that it will be able to recover the carrying value of the real estate and related intangible assets and liabilities, the Company would record an impairment loss to the extent that the carrying value exceeds the estimated fair value of the real estate and related intangible assets and liabilities.
Real Estate Held for Sale and Discontinued Operations
The Company generally considers real estate to be “held for sale” when the following criteria are met: (i) management commits to a plan to sell the property, (ii) the property is available for sale immediately, (iii) the property is actively being marketed for sale at a price that is reasonable in relation to its current fair value, (iv) the sale of the property within one year is considered probable and (v) significant changes to the plan to sell are not expected. Real estate that is held for sale and its related assets are classified as “real estate held for sale” and “assets related to real estate held for sale,” respectively, for all periods presented in the accompanying consolidated financial statements. Notes payable and other liabilities related to real estate held for sale are classified as “notes payable related to real estate held for sale” and “liabilities related to real estate held for sale,” respectively, for all periods presented in the accompanying consolidated financial statements. Real estate classified as held for sale is no longer depreciated and is reported at the lower of its carrying value or its estimated fair value less costs to sell. Additionally, the Company records the operating results related to real estate that has either been disposed of or is deemed to be held for sale as discontinued operations for all periods presented if the operations have been or are expected to be eliminated and the Company will not have any significant continuing involvement in the operations of the property following the sale.
Foreclosed Real Estate Held for Sale
Foreclosed real estate held for sale consists of properties acquired through foreclosure or by deed-in-lieu of foreclosure in full or partial satisfaction of non-performing loans that the Company intends to market for sale in the near term. Foreclosed real estate held for sale is recorded at the estimated fair value of the real estate less costs to sell, or the fair value of the loan satisfied if more clearly evident. The excess of the carrying value of the loan over the fair value of the property less estimated costs to sell, if any, is charged-off against the reserve for loan losses when title to the property is obtained. Costs of holding the property are expensed as incurred in the Company’s consolidated statements of operations. The gain or loss on final disposition of foreclosed real estate held for sale is recorded as other income and is considered income (loss) from continuing operations as it represents the final stage of the Company’s loan collection process.
Real Estate Loans Receivable
The Company’s real estate loans receivable are recorded at amortized cost, net of loan loss reserves, and evaluated for impairment at each balance sheet date. The amortized cost of a real estate loan receivable is the outstanding unpaid principal balance, net of unamortized acquisition premiums or discounts and unamortized costs and fees directly associated with the origination or acquisition of the loan.
The reserve for loan losses is a valuation allowance that reflects management’s estimate of loan losses inherent in the loan portfolio as of the balance sheet date. The reserve is adjusted through “Provision for loan losses” on the Company’s consolidated statements of operations and is decreased by charge-offs to specific loans when losses are confirmed. The reserve for loan losses includes a portfolio-based component and an asset-specific component.
An asset-specific reserve relates to reserves for losses on loans considered impaired. The Company considers a loan to be impaired when, based upon current information and events, it believes that it is probable that the Company will be unable to collect all amounts due under the contractual terms of the loan agreement. The Company also considers a loan to be impaired if it grants the borrower a concession through a modification of the loan terms or if it expects to receive assets (including equity interests in the borrower) with fair values that are less than the carrying value of the loan in satisfaction of the loan. A reserve is established when the present value of payments expected to be received, observable market prices, the estimated fair value of the collateral (for loans that are dependent on the collateral for repayment) or amounts expected to be received in satisfaction of a loan are lower than the carrying value of that loan.
KBS REAL ESTATE INVESTMENT TRUST, INC.
NOTES TO CONSOLIDATED FINANCIAL STATEMENTS (CONTINUED)
December 31, 2011
A portfolio-based reserve covers the pool of loans that do not have asset-specific reserves. A provision for loan losses is recorded when available information as of each balance sheet date indicates that it is probable that a loss occurred in the pool of loans and the amount of the loss can be reasonably estimated, but the Company does not know which specific loans within the pool will ultimately result in losses. Required reserve balances for this pool of loans are derived from estimated probabilities of default and estimated loss severities assuming a default occurs. On a quarterly basis, the Company’s management assigns estimated probabilities of default and loss severities to each loan in the portfolio based on factors such as the debt service coverage of the underlying collateral, the estimated fair value of the collateral, the significance of the borrower’s investment in the collateral, the financial condition of the borrower and/or its sponsors, the likelihood that the borrower and/or its sponsors would allow the loan to default, the Company’s willingness and ability to step in as owner in the event of default, and other pertinent factors.
Failure to recognize impairments would result in the overstatement of earnings and the carrying value of the Company’s real estate loans held for investment. Actual losses, if any, could differ significantly from estimated amounts.
Investment in Unconsolidated Joint Venture
On July 8, 2009, the Company released the borrowers under two investments in mezzanine loans from liability and received preferred membership interests in a joint venture that indirectly owns the properties that had served as collateral for the loans. The interests were initially recorded by the Company at a fair value of $0 based on the estimated fair value of the collateral at the time of receipt of the preferred membership interests. The Company accounts for its preferred membership interests in the real estate joint venture under the equity method of accounting since the Company is not the primary beneficiary of the joint venture, but does have more than a minor interest. Since the Company will most likely only receive preferred distributions equivalent to the interest income it would have earned on its mezzanine loan investments, the Company’s application of the equity method of accounting to these preferred interests results in the Company recording all distributions received as income. The Company does not record its share of the changes in the book value of the joint venture as it is not required to absorb losses and does not expect increases in the book value of the joint venture to have any material impact on the cash flows it will receive over the course of the investment. See Note 14, “Investment in Unconsolidated Joint Ventures — HSC Partners Joint Venture.”
Real Estate Securities
The Company classifies its investments in real estate securities as available-for-sale, since the Company may sell them prior to their maturity but does not hold them principally for the purpose of making frequent investments and sales with the objective of generating profits on short-term differences in price. These investments are carried at estimated fair value, with unrealized gains and losses reported in accumulated other comprehensive income (loss). Estimated fair values are generally based on quoted market prices, when available, or on estimates provided by independent pricing sources or dealers who make markets in such securities. In certain circumstances, such as when the market for the securities becomes inactive, the Company may determine it is appropriate to perform an internal valuation of the securities. Upon the sale of a security, the previously recognized unrealized gain (loss) would be reversed and the actual realized gain (loss) recognized.
On a quarterly basis, the Company evaluates its real estate securities for impairment. The Company reviews the projected future cash flows from these securities for changes in assumptions due to prepayments, credit loss experience and other factors. If, based on the Company’s quarterly estimate of cash flows, there has been an adverse change in the estimated cash flows from the cash flows previously estimated, the present value of the revised cash flows is less than the present value previously estimated, and the fair value of the securities is less than its amortized cost basis, an other-than-temporary impairment is deemed to have occurred.
Prior to April 1, 2009, when a security was deemed to be other-than-temporarily impaired, the security was written down to its fair value (with the reduction in fair value recorded as a charge to earnings) and a new cost basis was established. The Company would calculate a revised yield based on the new cost basis of the investment (including any other‑than‑temporary impairments recognized to date) and estimate future cash flows expected to be realized, which was applied prospectively to recognize interest income.
KBS REAL ESTATE INVESTMENT TRUST, INC.
NOTES TO CONSOLIDATED FINANCIAL STATEMENTS (CONTINUED)
December 31, 2011
Since April 1, 2009, as a result of adopting a new accounting principle, the Company is required to distinguish between other-than-temporary impairments related to credit and other-than-temporary impairments related to other factors (e.g., market fluctuations) on its real estate securities that it does not intend to sell and where it is not likely that the Company will be required to sell the security prior to the anticipated recovery of its amortized cost basis. The Company calculates the credit component of the other-than-temporary impairment as the difference between the amortized cost basis of the security and the present value of its estimated cash flows discounted at the yield used to recognize interest income. The credit component will be charged to earnings and the component related to other factors is recorded to other comprehensive income (loss).
On April 1, 2009, the Company recognized a cumulative transition adjustment of $14.8 million as an adjustment to the opening balance of retained earnings with a corresponding adjustment to accumulated other comprehensive income (loss) and to the amortized cost basis of its real estate securities. The transition adjustment was calculated as the difference between the present value of the Company’s estimated cash flows for its real estate securities as of April 1, 2009 discounted at the yield used to recognize income prior to the recognition of any other-than-temporary impairments and the April 1, 2009 amortized cost basis of the securities, which reflects the cumulative other-than-temporary impairment losses that have been recorded on the Company’s real estate securities that are not related to credit. Although the Company increased its amortized cost basis in the securities as a result of this transition adjustment, the securities are ultimately presented at fair value in the accompanying consolidated balance sheets with differences between fair value and amortized cost basis presented as unrealized gains or losses in accumulated other comprehensive income (loss) within the equity section of the accompanying consolidated balance sheets.
Cash and Cash Equivalents
The Company considers all short‑term (with an original maturity of three months or less), highly‑liquid investments utilized as part of the Company’s cash‑management activities to be cash equivalents. Cash equivalents may include cash and short‑term investments. Short‑term investments are stated at cost, which approximates fair value.
The Company’s cash and cash equivalents balance exceeded federally insurable limits as of December 31, 2011. The Company monitors the cash balances in its operating accounts and adjusts the cash balances as appropriate; however, these cash balances could be impacted if the underlying financial institutions fail or are subject to other adverse conditions in the financial markets. To date, the Company has experienced no loss or lack of access to cash in its operating accounts.
Restricted Cash
Restricted cash is comprised of lender impound reserve accounts on the Company’s borrowings for security deposits, property taxes, insurance, rent from master lease, letters of credit, and capital improvements and replacements.
Pledged Government Securities
In connection with the Settlement Agreement, the Company received a portfolio of treasury securities that is pledged to provide a portion of the principal and interest payments for mortgage debt collateralized by certain GKK Properties. Since the Company does not intend to sell the securities, the securities are classified as held to maturity and are presented on an amortized cost basis and not at fair value.
Derivative Instruments
The Company enters into derivative instruments for risk management purposes to hedge its exposure to cash flow variability caused by changing interest rates on its variable rate real estate loans receivable and notes payable. The Company records these derivative instruments at fair value on the accompanying consolidated balance sheets. Derivative instruments designated and qualifying as a hedge of the exposure to variability in expected future cash flows or other types of forecasted transactions are considered cash flow hedges. The change in fair value of the effective portion of a derivative instrument that is designated as a cash flow hedge is recorded as other comprehensive income (loss) in the accompanying consolidated statements of equity. The changes in fair value for derivative instruments that are not designated as a hedge or that do not meet the hedge accounting criteria are recorded as gain or loss on derivative instruments in the accompanying consolidated statements of operations.
In addition to recording any changes in fair value for interest rate caps and floors, the purchase price of an interest rate cap or floor is amortized over the contractual life of the instrument. Interest rate caps (floors) are viewed as a series of call (put) options or caplets (floorlets) and as the caplets (floorlets) expire, the related cost of the expiring caplet (floorlet) is amortized to interest expense (income) and the remaining caplets and floorlets are carried at fair value.
KBS REAL ESTATE INVESTMENT TRUST, INC.
NOTES TO CONSOLIDATED FINANCIAL STATEMENTS (CONTINUED)
December 31, 2011
The Company formally documents all relationships between hedging instruments and hedged items, as well as its risk-management objectives and strategy for undertaking various hedge transactions. This process includes designating all derivative instruments that are part of a hedging relationship to specific forecasted transactions or recognized obligations on the consolidated balance sheets. The Company also assesses and documents, both at the hedging instrument’s inception and on a quarterly basis thereafter, whether the derivative instruments that are used in hedging transactions are highly effective in offsetting changes in cash flows associated with the respective hedged items. When it is determined that a derivative instrument ceases to be highly effective as a hedge, or that it is probable the underlying forecasted transaction will not occur, the Company discontinues hedge accounting prospectively and reclassifies amounts recorded to accumulated other comprehensive income (loss) to earnings.
For further information regarding the Company’s derivative instruments, see Note 11, “Derivative Instruments.”
Deferred Financing Costs
Deferred financing costs represent commitment fees, loan fees, legal fees and other third‑party costs associated with obtaining financing. These costs are amortized over the terms of the respective financing agreements using the interest method. Unamortized deferred financing costs are generally expensed when the associated debt is refinanced or repaid before maturity unless specific rules are met that would allow for the carryover of such costs to the refinanced debt. Costs incurred in seeking financing transactions that do not close are expensed in the period in which it is determined that the financing will not close.
Fair Value Measurements
Under GAAP, the Company is required to measure certain financial instruments at fair value on a recurring basis. In addition, the Company is required to measure other financial instruments and balances at fair value on a non‑recurring basis (e.g., carrying value of impaired real estate loans receivable and long‑lived assets). Fair value is defined as the price that would be received upon the sale of an asset or paid to transfer a liability in an orderly transaction between market participants at the measurement date. The GAAP fair value framework uses a three‑tiered approach. Fair value measurements are classified and disclosed in one of the following three categories:
| |
| • | Level 1: unadjusted quoted prices in active markets that are accessible at the measurement date for identical assets or liabilities; |
| |
| • | Level 2: quoted prices for similar instruments in active markets, quoted prices for identical or similar instruments in markets that are not active, and model‑derived valuations in which significant inputs and significant value drivers are observable in active markets; and |
| |
| • | Level 3: prices or valuation techniques where little or no market data is available that requires inputs that are both significant to the fair value measurement and unobservable. |
When available, the Company utilizes quoted market prices from independent third‑party sources to determine fair value and classifies such items in Level 1 or Level 2. In instances where the market for a financial instrument is not active, regardless of the availability of a nonbinding quoted market price, observable inputs might not be relevant and could require the Company to make a significant adjustment to derive a fair value measurement. Additionally, in an inactive market, a market price quoted from an independent third party may rely more on models with inputs based on information available only to that independent third party. When the Company determines the market for a financial instrument owned by the Company to be illiquid or when market transactions for similar instruments do not appear orderly, the Company uses several valuation sources (including internal valuations, discounted cash flow analysis and quoted market prices) and establishes a fair value by assigning weights to the various valuation sources. Additionally, when determining the fair value of liabilities in circumstances in which a quoted price in an active market for an identical liability is not available, the Company measures fair value using (i) a valuation technique that uses the quoted price of the identical liability when traded as an asset or quoted prices for similar liabilities when traded as assets or (ii) another valuation technique that is consistent with the principles of fair value measurement, such as the income approach or the market approach.
Changes in assumptions or estimation methodologies can have a material effect on these estimated fair values. In this regard, the derived fair value estimates cannot be substantiated by comparison to independent markets and, in many cases, may not be realized in an immediate settlement of the instrument.
KBS REAL ESTATE INVESTMENT TRUST, INC.
NOTES TO CONSOLIDATED FINANCIAL STATEMENTS (CONTINUED)
December 31, 2011
The Company considers the following factors to be indicators of an inactive market: (i) there are few recent transactions, (ii) price quotations are not based on current information, (iii) price quotations vary substantially either over time or among market makers (for example, some brokered markets), (iv) indexes that previously were highly correlated with the fair values of the asset or liability are demonstrably uncorrelated with recent indications of fair value for that asset or liability, (v) there is a significant increase in implied liquidity risk premiums, yields, or performance indicators (such as delinquency rates or loss severities) for observed transactions or quoted prices when compared with the Company’s estimate of expected cash flows, considering all available market data about credit and other nonperformance risk for the asset or liability, (vi) there is a wide bid‑ask spread or significant increase in the bid‑ask spread, (vii) there is a significant decline or absence of a market for new issuances (that is, a primary market) for the asset or liability or similar assets or liabilities, and (viii) little information is released publicly (for example, a principal‑to‑principal market).
The Company considers the following factors to be indicators of non‑orderly transactions: (i) there was not adequate exposure to the market for a period before the measurement date to allow for marketing activities that are usual and customary for transactions involving such assets or liabilities under current market conditions, (ii) there was a usual and customary marketing period, but the seller marketed the asset or liability to a single market participant, (iii) the seller is in or near bankruptcy or receivership (that is, distressed), or the seller was required to sell to meet regulatory or legal requirements (that is, forced), and (iv) the transaction price is an outlier when compared with other recent transactions for the same or similar assets or liabilities.
Share Redemption Program
The Company has a share redemption program that may enable stockholders to sell their shares to the Company in connection with a stockholder’s death, “qualifying disability” or “determination of incompetence” (each as defined in the share redemption program). In December 2010, the Company announced that, based on 2011 budgeted expenditures, and except with respect to redemptions sought upon a stockholder’s death, “qualifying disability” or “determination of incompetence,” the Company did not expect to have funds available for the share redemption program in 2011. On April 28, 2011, in connection with the amendment and restatement of the repurchase agreements related to the Company’s investment in the GKK Mezzanine Loan, the Company agreed that during the term of the Amended Repurchase Agreements the Company would continue to limit redemptions under the share redemption program to those sought upon a stockholder’s death, “qualifying disability” or “determination of incompetence.”
On March 20, 2012, the Company’s board of directors amended and restated the share redemption program to provide only for redemptions sought upon a stockholder’s death, “qualifying disability” or “determination of incompetence” (each as defined in the share redemption program). Such redemptions are subject to an annual dollar limitation and further subject to the other limitations described in the share redemption program plan document, including:
| |
| • | During each calendar year, redemptions sought in connection with a stockholder’s death, “qualifying disability” or “determination of incompetence” (each as defined under the share redemption program) will be limited to an annual amount determined by the board of directors. The annual dollar limitation for the share redemption program may be reviewed and adjusted from time to time during the year. The dollar limitation for calendar year 2012 is $10.0 million in the aggregate, which may be reviewed and adjusted during the year by the board of directors. |
| |
| • | During any calendar year, the Company may redeem no more than 5% of the weighted-average number of shares outstanding during the prior calendar year. |
| |
| • | The Company has no obligation to redeem shares if the redemption would violate the restrictions on distributions under Maryland law, which prohibits distributions that would cause a corporation to fail to meet statutory tests of solvency. |
The amended and restated share redemption program will be effective on April 25, 2012.
KBS REAL ESTATE INVESTMENT TRUST, INC.
NOTES TO CONSOLIDATED FINANCIAL STATEMENTS (CONTINUED)
December 31, 2011
Prior to the March 20, 2012 amendment and restatement of the share redemption program, the limitations on the Company’s ability to redeem shares under the share redemption program were as follows:
| |
| • | Unless the shares were being redeemed in connection with a stockholder’s death, “qualifying disability” or “determination of incompetence” (each as defined under the share redemption program), the Company could not redeem shares until the stockholder had held the shares for one year. |
| |
| • | During each calendar year, redemptions were limited to the amount of net proceeds from the issuance of shares under the dividend reinvestment plan during the prior calendar year less amounts the Company deemed necessary from such proceeds to fund current and future: capital expenditures, tenant improvement costs and leasing costs related to the Company’s investments in real estate properties; reserves required by financings of the Company’s investments in real estate properties; and funding obligations under the Company’s real estate loans receivable, as each may be adjusted from time to time by management, provided that if the shares were submitted for redemption in connection with the stockholder’s death, “qualifying disability” or “determination of incompetence”, the Company would honor such redemptions to the extent that all redemptions for the calendar year were less than the amount of the net proceeds from the issuance of shares under the dividend reinvestment plan during the prior calendar year. |
| |
| • | During any calendar year, the Company could redeem no more than 5% of the weighted‑average number of shares outstanding during the prior calendar year. |
| |
| • | The Company had no obligation to redeem shares if the redemption would have violated the restrictions on distributions under Maryland law, which prohibits distributions that would cause a corporation to fail to meet statutory tests of solvency. |
Pursuant to the terms of the share redemption program, once the Company establishes an estimated value per share, the redemption price per share for all stockholders whose shares are eligible for redemption is equal to the estimated value per share, as determined by the Company’s Advisor or another firm chosen for that purpose.
On December 2, 2010, the Company’s board of directors approved an estimated value per share of the Company’s common stock of $7.32 (unaudited) based on the estimated value of the Company’s assets less the estimated value of the Company’s liabilities divided by the number of shares outstanding, all as of September 30, 2010. Effective for the December 2010 redemption date and through the February 2012 redemption date, the redemption price for all stockholders whose shares were eligible for redemption was $7.32 (unaudited) per share. In addition, shares issued under the dividend reinvestment plan (which will terminate effective April 10, 2012) from December 2, 2010 through February 2012 were issued at a price of $7.32 (unaudited) per share.
On March 22, 2012, the Company’s board of directors approved an estimated value per share of the Company’s shares of common stock of $5.16 per share (unaudited), based on the estimated value of the Company’s assets less the estimated value of its liabilities divided by the number of shares outstanding, all as of December 31, 2011. Commencing with the March 2012 redemption date, the redemption price for all shares eligible for redemption is $5.16 per share (unaudited).
The estimated value per share was based upon the recommendation and valuation of the Advisor. The Financial Industry Regulatory Authority rules, which prompted the valuation, provide no guidance on the methodology an issuer must use to determine its estimated value per share. As with any valuation methodology, the Advisor’s methodology is based upon a number of estimates and assumptions that may not be accurate or complete. Different parties with different assumptions and estimates could derive a different estimated value per share, and these differences could be significant. The estimated value per share is not audited and does not represent the fair value of the Company’s assets, liabilities or equity computed in accordance with GAAP.
The value of the Company’s shares will fluctuate over time in response to developments related to individual assets in the portfolio and the management of those assets and in response to the real estate and finance markets. The Company expects to engage the Advisor and/or an independent valuation firm to update the estimated value per share in December 2012, though the Company may wait up to 18 months to update the estimated value per share.
KBS REAL ESTATE INVESTMENT TRUST, INC.
NOTES TO CONSOLIDATED FINANCIAL STATEMENTS (CONTINUED)
December 31, 2011
The Company’s board of directors may amend, suspend or terminate the share redemption program with 30 days’ notice to its stockholders. The Company may provide this notice by including such information in a Current Report on Form 8‑K or in the Company’s annual or quarterly reports, all publicly filed with the SEC, or by a separate mailing to its stockholders.
The Company records amounts that are redeemable under the share redemption program as redeemable common stock in the accompanying consolidated balance sheets because the shares are mandatorily redeemable at the option of the holder upon the stockholder’s death, “qualifying disability” or “determination of incompetence” and therefore their redemption is outside the control of the Company. The maximum amount redeemable under the Company’s share redemption program under these special circumstances was limited to the number of shares the Company could redeem with the amount of net proceeds from the sale of shares under the dividend reinvestment plan during the prior calendar year. However, because the amounts that can be redeemed in future periods are determinable and only contingent on an event that is likely to occur (e.g., the passage of time), the Company presents the net proceeds from the current year dividend reinvestment plan as redeemable common stock in the accompanying balance sheets.
The Company classifies financial instruments that represent a mandatory obligation of the Company to redeem shares as liabilities. The Company’s redeemable common shares are contingently redeemable at the option of the holder upon the stockholder’s death, “qualifying disability” or “determination of incompetence.” When shares are tendered for redemption and the Company determines that it has a mandatory obligation to redeem shares under the amended and restated share redemption program, it will reclassify such obligations from temporary equity to a liability based upon their respective settlement values.
The Company limits the dollar value of shares that may be redeemed under the program as described above. During the year ended December 31, 2011, the Company redeemed $6.9 million of common stock. The only redemptions the Company made under the share redemption program in 2011 were those that qualified as, and met the requirements for, special redemptions under the share redemption program, i.e., all redemptions under the plan were made in connection with a stockholder’s death, “qualifying disability” or “determination of incompetence.” In 2011, the Company fulfilled all redemption requests that qualified as special redemptions under the Company’s share redemption program.
Related Party Transactions
Pursuant to the Advisory Agreement, the Company is obligated to pay the Advisor specified fees upon the provision of certain services, including the management of the Company’s investments and other services (including, but not limited to, the disposition of investments). The Company also reimbursed the Advisor for offering costs related to the dividend reinvestment plan (which will terminate effective April 10, 2012) and acquisition and origination expenses, and reimburses certain operating expenses incurred by the Advisor on behalf of the Company or incurred in connection with providing services to the Company such as certain costs of managing or selling the Company’s assets. As detailed in the Advisory Agreement, the Advisor is also entitled to certain other fees, including an incentive fee, upon achieving certain performance goals, and the Advisor and its affiliates may receive compensation in the form of stock-based awards.
Also, under the Dealer Manager Agreement, and to the extent permitted under state securities laws, if the Company paid selling commissions in connection with the issuance of shares to an investor in the primary offering, the Company may pay the Dealer Manager selling commissions of up to 3.0% of gross offering proceeds from the issuance of shares to that investor under the dividend reinvestment plan (which will terminate effective April 10, 2012). The Dealer Manager reallows all such selling commissions to the broker‑dealer associated with such account. The Company also reimburses the Dealer Manager for certain expenses related to the dividend reinvestment plan offering.
The Company records all related party fees as incurred, subject to any limitations described in the Advisory Agreement. The Company has granted no stock‑based compensation awards to the Advisor or its affiliates and it did not incur any subordinated participation in net cash flows or subordinated incentive listing fees during the year ended December 31, 2011 or any previous periods.
KBS REAL ESTATE INVESTMENT TRUST, INC.
NOTES TO CONSOLIDATED FINANCIAL STATEMENTS (CONTINUED)
December 31, 2011
Organization and Offering Costs
Organization and offering costs (other than selling commissions and dealer manager fees) of the Company were paid in part by the Advisor, the Dealer Manager and their affiliates on behalf of the Company.
Pursuant to the Advisory Agreement and the Dealer Manager Agreement, the Company is obligated to reimburse the Advisor, the Dealer Manager or their affiliates, as applicable, for organization and offering costs paid by them on behalf of the Company, provided that the Advisor is obligated to reimburse the Company to the extent selling commissions, dealer manager fees and organization and other offering costs incurred by the Company in relation to the Offering exceed 15% of gross offering proceeds. Organization costs are expensed as incurred, and offering costs, which include selling commissions and dealer manager fees, are charged as incurred as a reduction to equity.
The Company ceased offering shares in its primary offering on May 30, 2008 and terminated the primary offering upon the completion of review of subscriptions submitted in accordance with its processing procedures. The Company’s dividend reinvestment plan will terminate effective April 10, 2012.
Operating Expenses
Under the Advisory Agreement, the Advisor has the right to seek reimbursement from the Company for all costs and expenses it incurs in connection with the provision of services to the Company, including the Company’s allocable share of the Advisor’s overhead, such as rent, employee costs, utilities and information technology costs. Commencing July 1, 2010, the Company has reimbursed the Advisor for the Company’s allocable portion of the salaries, benefits and overhead of internal audit department personnel providing services to the Company. In the future, the Advisor may seek reimbursement for additional employee costs. The Company will not reimburse the Advisor for employee costs in connection with services for which the Advisor earns acquisition, origination or disposition fees (other than reimbursement of travel and communication expenses) or for the salaries and benefits the Advisor or its affiliates may pay to the Company’s executive officers.
Asset Management Fee
With respect to investments in real estate, the Company pays the Advisor a monthly asset management fee equal to one‑twelfth of 0.75% of the amount paid or allocated to acquire the investment. This amount includes any portion of the investment that was debt financed and is inclusive of acquisition fees and expenses related thereto. In the case of investments made through joint ventures, the asset management fee will be determined based on the Company’s proportionate share of the underlying investment.
With respect to investments in loans and any investments other than real estate, the Company pays the Advisor a monthly fee calculated, each month, as one‑twelfth of 0.75% of the lesser of (i) the amount paid or allocated to acquire or fund the loan or other investment (which amount includes any portion of the investment that was debt financed and is inclusive of acquisition or origination fees and expenses related thereto) and (ii) the outstanding principal amount of such loan or other investment, plus the acquisition or origination fees and expenses related to the acquisition or funding of such investment, as of the time of calculation.
Notwithstanding the above, with respect to the Company’s investment in a previously consolidated joint venture (the “National Industrial Portfolio”) with New Leaf Industrial Partners Fund, L.P. (“New Leaf”), the asset management fee was calculated as a monthly fee equal to one-twelfth of 0.27% of the cost of the joint venture investment (inclusive of acquisition fees and expenses related thereto and the amount of debt associated with the Company’s investment), as defined in the Advisory Agreement. The Advisor earned a performance fee related to the Company’s investment in this joint venture that would in effect make the Advisor’s cumulative asset management fees related to the investment equal to 0.75% of the cost of the joint venture investment (inclusive of acquisition fees and expenses related thereto and the amount of debt associated with the Company’s investment) on an annualized basis from the date of the Company’s investment in the joint venture through the date of calculation. This fee was conditioned upon the Company achieving certain performance thresholds and was only to be paid after the repayment of certain advances from the Advisor. The Company’s operations from the date of the Company’s investment through March 31, 2010 were sufficient to meet the performance threshold in the Advisory Agreement; beginning in April 2010, the Company’s operations did not meet the performance threshold in the Advisory Agreement.
KBS REAL ESTATE INVESTMENT TRUST, INC.
NOTES TO CONSOLIDATED FINANCIAL STATEMENTS (CONTINUED)
December 31, 2011
With respect to an investment that has suffered an impairment in value, reduction in cash flow or other negative circumstances, such investment shall either be excluded from the calculation of the asset management fee described above or included in such calculation at a reduced value that is recommended by the Advisor and the Company’s management and then approved by a majority of the Company’s independent directors, and this change in the fee shall be applicable to an investment upon the earlier to occur of the date on which (i) such investment is sold, (ii) such investment is surrendered to a person other than the Company, its direct or indirect wholly owned subsidiary or a joint venture or partnership in which the Company has an interest, (iii) the Advisor determines that it will no longer pursue collection or other remedies related to such investment, or (iv) the Advisor recommends a revised fee arrangement with respect to such investment. As of December 31, 2011, the Company excluded two non-performing real estate loans receivable from the calculation of asset management fees. The Company also reduced the asset management fee calculation for its investment in the Tribeca Building (defined below) to reflect sales of condominium units and will continue to adjust the asset management fee calculation for future sales.
Disposition Fees
For substantial assistance in connection with the sale of properties or other investments, the Company will pay the Advisor or its affiliates a disposition fee of 1% of the contract sales price of the properties or other investments sold. However, in no event may the real estate commissions paid to the Advisor, its affiliates and unaffiliated third parties exceed 6% of the contract sales price of the properties or other investments sold.
Income Taxes
The Company has elected to be taxed as a REIT under the Internal Revenue Code of 1986, as amended (the “Internal Revenue Code”). To qualify as a REIT, the Company must meet certain organizational and operational requirements, including a requirement to distribute at least 90% of the Company’s annual REIT taxable income to stockholders (which is computed without regard to the dividends‑paid deduction or net capital gain and which does not necessarily equal net income as calculated in accordance with GAAP). As a REIT, the Company generally will not be subject to federal income tax on income that it distributes as dividends to its stockholders. If the Company fails to qualify as a REIT in any taxable year, it will be subject to federal income tax on its taxable income at regular corporate income tax rates and generally will not be permitted to qualify for treatment as a REIT for federal income tax purposes for the four taxable years following the year during which qualification is lost, unless the Internal Revenue Service grants the Company relief under certain statutory provisions. Such an event could materially and adversely affect the Company’s net income and net cash available for distribution to stockholders. However, the Company believes that it is organized and operates in such a manner as to qualify for treatment as a REIT.
The Company has concluded that there are no significant uncertain tax positions requiring recognition in its financial statements. Neither the Company nor its subsidiaries have been assessed interest or penalties by any major tax jurisdictions. The Company’s evaluations were performed for the tax years ended December 31, 2011, 2010 and 2009. As of December 31, 2011, returns for the calendar years 2007 through 2010 remain subject to examination by major tax jurisdictions.
Per Share Data
Basic net income (loss) per share of common stock is calculated by dividing net income (loss) attributable to common stockholders by the weighted-average number of shares of common stock issued and outstanding during such period. Diluted net income (loss) per share of common stock equals basic net income (loss) per share of common stock as there were no potentially dilutive securities outstanding during the years ended December 31, 2011, 2010 and 2009, respectively.
Distributions declared per common share assumes each share was issued and outstanding each day during the years ended December 31, 2011, 2010 and 2009, and was based on daily record dates for distributions from January 1, 2009 through June 30, 2009 of $0.0019178 per share per day and from July 1, 2009 through December 31, 2011 of $0.00143836 per share per day. Each day during the periods from January 1, 2009 through December 31, 2011 was a record date for distributions.
Segments
The Company’s segments are based on the Company’s method of internal reporting which classifies its operations by investment type: (i) real estate, (ii) real estate-related and (iii) commercial properties primarily leased to financial institutions received under the Settlement Agreement. For financial data by segment, see Note 16, “Segment Information.”
KBS REAL ESTATE INVESTMENT TRUST, INC.
NOTES TO CONSOLIDATED FINANCIAL STATEMENTS (CONTINUED)
December 31, 2011
Square Footage, Occupancy and Other Measures
Square footage, occupancy and other measures used to describe real estate and real estate‑related investments included in the Notes to Consolidated Financial Statements are presented on an unaudited basis.
Recently Issued Accounting Standards Updates
In June 2011, the FASB issued ASU No. 2011-05, Comprehensive Income (Topic 220): Presentation of Comprehensive Income (“ASU No. 2011-05”). ASU No. 2011-05 requires an entity to present the total of comprehensive income, the components of net income, and the components of other comprehensive income either in a single continuous statement of comprehensive income or in two separate but consecutive statements. In a single continuous statement, the entity is required to present the components of net income and total net income, the components of other comprehensive income and a total for other comprehensive income, along with the total of comprehensive income in that statement. In the two-statement approach, an entity is required to present components of net income and total net income in the statement of net income. The statement of other comprehensive income should immediately follow the statement of net income and include the components of other comprehensive income and a total for other comprehensive income, along with a total for comprehensive income. ASU No. 2011-05 eliminates the option to present the components of other comprehensive income as part of the statement of equity. Additionally, ASU No. 2011-05 requires an entity to present reclassification adjustments on the face of the financial statements from other comprehensive income to net income. The amendments in this update are effective for the first interim or annual period beginning after December 15, 2011. In December 2011, the FASB issued ASU No. 2011-12, Comprehensive Income (Topic 220): Deferral of the Effective Date for Amendments to the Presentation of Reclassification of Items Out of Accumulated Other Comprehensive Income in Accounting Standards Update No. 2011-05 (“ASU No. 2011-12”). ASU No. 2011-12 defers the effective date of the specific requirement in ASU 2011-05 to present items that are reclassified out of accumulated other comprehensive income to net income alongside their respective components of net income and other comprehensive income. The adoption of ASU No. 2011-05 will require the Company to change the presentation of comprehensive income in its consolidated financial statements.
In May 2011, the FASB issued ASU No. 2011-04, Fair Value Measurement (Topic 820): Amendments to Achieve Common Fair Value Measurement and Disclosure Requirements in U.S. GAAP and IFRSs (“ASU No. 2011-04”). ASU No. 2011-04 updates and further clarifies requirements in U.S. GAAP for measuring fair value and for disclosing information about fair value measurements. Additionally, ASU No. 2011-04 clarifies the FASB’s intent about the application of existing fair value measurements. ASU No. 2011-04 is effective for interim and annual periods beginning after December 15, 2011 and is applied prospectively. The Company does not expect the adoption of ASU No. 2011-04 will have a material impact to its consolidated financial statements.
KBS REAL ESTATE INVESTMENT TRUST, INC.
NOTES TO CONSOLIDATED FINANCIAL STATEMENTS (CONTINUED)
December 31, 2011
| |
| 3. | COLLATERAL TRANSFER AND SETTLEMENT AGREEMENT RELATED TO THE GKK MEZZANINE LOAN |
Background
On August 22, 2008, the Company, through an indirect wholly owned subsidiary, acquired a senior mezzanine loan with a face amount of $500.0 million for $496.0 million plus closing costs (the “GKK Mezzanine Loan”). The GKK Mezzanine Loan was used to finance a portion of Gramercy’s acquisition of American Financial Realty Trust (“AFR”) and its real estate portfolio that closed on April 1, 2008. Also in connection with its acquisition of AFR, Gramercy, through wholly owned subsidiaries, secured senior mortgage financing (the “Goldman/Citi Mortgage Loan”) and junior mezzanine financing (the “Junior Mezzanine Loan”) from Goldman Sachs Mortgage Company (“Goldman”), Citicorp North America, Inc. (“Citi”) and SL Green Realty Corp. Commencing on March 11, 2011, the Company, through indirect wholly owned subsidiaries, entered into a series of extension agreements to extend the maturity date of the GKK Mezzanine Loan to May 6, 2011. The extension agreements related to the GKK Mezzanine Loan also extended the maturity dates of the Goldman/Citi Mortgage Loan and the Junior Mezzanine Loan to May 6, 2011. On May 6, 2011, the Goldman/Citi Mortgage Loan, the GKK Mezzanine Loan and the Junior Mezzanine Loan (collectively, the “GKK Loans”) matured and all amounts outstanding under these loans became due and payable by the wholly owned subsidiaries of Gramercy that were the borrowers under the respective loan agreements (collectively, the “GKK Borrower”). As such, as of May 6, 2011, the GKK Loans were in default.
Repurchase Agreements
The GKK Mezzanine Loan served as security for two repurchase agreements held by the Company: one with Goldman and one originally with Citigroup Financial Products Inc. (“Citigroup” and, together with Goldman, the “GKK Lenders”). On April 28, 2011, the Company’s subsidiaries that are the borrowers under the repurchase agreements (individually and collectively, “KBS GKK”) and the GKK Lenders amended and restated the repurchase agreements, which agreements were further amended on May 10, 2011 and on September 1, 2011 (the “Amended Repurchase Agreements”). The purposes of the Amended Repurchase Agreements were, among others, to (i) extend the maturity dates of the existing repurchase agreements between KBS GKK, and Goldman and Citigroup, respectively, dated August 22, 2008, as amended, (ii) provide for additional security for the GKK Lenders under the Amended Repurchase Agreements, and (iii) set certain conditions that, on the date met (the “Conversion Date”), would automatically convert the Amended Repurchase Agreements into a mezzanine loan. On December 30, 2011, Citigroup sold its interest in its Amended Repurchase Agreement to Midtown Acquisitions L.P. (“Midtown”), who replaced Citigroup as one of the “GKK Lenders.”
The Amended Repurchase Agreements will terminate on the earliest to occur of (i) April 28, 2013, (ii) the Conversion Date, (iii) the full payment of all obligations under the Amended Repurchase Agreements, or (iv) upon an event causing the Amended Repurchase Agreements to otherwise terminate.
As part of the closing of the Amended Repurchase Agreements, the Company paid $120 million in the aggregate to the GKK Lenders, of which approximately $115 million was used for the reduction of the principal balance under the Amended Repurchase Agreements (the “Principal Payment”), with the remaining $5 million used for accrued interest, and costs and expenses incurred by the GKK Lenders in connection with the closing of the Amended Repurchase Agreements. On May 10, 2011, the GKK Lenders advanced an additional $34.4 million under the Amended Repurchase Agreements to fund the Company’s acquisition, through KBS GKK, of a subordinated portion of the Goldman/Citi Mortgage Loan (the “GKK Subordinated Mortgage Loan”). Additionally, in connection with the acquisition of the GKK Subordinated Mortgage Loan, on May 10, 2011, the GKK Lenders provided financing of $8.5 million to fund the Company’s acquisition, through KBS GKK, of a subordinated portion of the Junior Mezzanine Loan (the “GKK Junior Mezzanine Tranche”).
KBS REAL ESTATE INVESTMENT TRUST, INC.
NOTES TO CONSOLIDATED FINANCIAL STATEMENTS (CONTINUED)
December 31, 2011
The Amended Repurchase Agreements are secured by, among other things, the Equity Interests. The Amended Repurchase Agreements bear interest at an annual rate of 350 basis points over one-month LIBOR. In addition to monthly interest payments under the terms of the Amended Repurchase Agreements, the Company, through KBS GKK, was and is required to make certain mandatory payments to the GKK Lenders as follows:
| |
| (i) | on October 15, 2011, the Company made an amortization payment of $35 million; |
| |
| (ii) | every three months from January 15, 2012 through April 2013, the Company is required to make additional amortization payments of approximately $24.3 million, which payments may be decreased by KBS GKK making any prepayments of principal, including any mandatory or voluntary prepayments of principal; |
| |
| (iii) | on October 15, 2011, the Company made payments relating to the acquisition of the GKK Subordinated Mortgage Loan and the GKK Junior Mezzanine Tranche in the amount of $1.6 million, and the Company must make payments in the amount of $1.1 million every three months thereafter through April 2013; and |
| |
| (iv) | the Company is required to pay 75% to 100% of excess cash flows or net cash proceeds from: (a) the operations of the GKK Properties, net of debt service and capital reserves; (b) the sale of the GKK Properties; (c) the sale of certain real estate-related debt investments owned by the Company; (d) the sale of substantially all other properties owned by the Company, in excess of $75 million in the aggregate in any calendar year; and (e) certain indebtedness incurred or equity issued (excluding proceeds from the Company’s dividend reinvestment plan, which will terminate effective April 10, 2012), by the Company. |
As of December 31, 2011, the Amended Repurchase Agreements had an aggregate outstanding principal balance of $143.0 million. KBS GKK may voluntarily prepay amounts outstanding under the Amended Repurchase Agreements without prepayment penalties.
The Amended Repurchase Agreements require KBS GKK and its subsidiaries, and the Company and certain of its subsidiaries that indirectly own most of the Company’s assets (collectively, the “Guarantors”), to meet certain financial and other covenants, which include, among other covenants, the requirements for the Guarantors to maintain minimum liquidity of $19.0 million. The Guarantors have guaranteed, and other subsidiaries of the Company as may be added in the future will guarantee, all amounts owed by KBS GKK to the GKK Lenders under the Amended Repurchase Agreements. The Company also agreed that, unless permitted by or pursuant to the terms of the Amended Repurchase Agreements, during the term of the Amended Repurchase Agreements it would not create or incur additional liens or indebtedness on its assets, make additional investments, or make certain dispositions except pursuant to the mandatory payment provisions discussed above. During the term of the Amended Repurchase Agreements, the Company also agreed (i) except for distributions to stockholders necessary to maintain the Company’s REIT status, to limit distributions to stockholders to an amount not to exceed $6.0 million per month, excluding any distributions to stockholders reinvested in the Company pursuant to the dividend reinvestment plan (which will terminate effective April 10, 2012), and (ii) to continue to limit redemptions under the share redemption program to those redemptions sought upon a stockholder’s death, “qualifying disability” or “determination of incompetence” (each as defined in the share redemption program).
In connection with its execution of the Settlement Agreement (discussed below), KBS GKK agreed that a default by KBS on any of the five loans specified in the Amended Repurchase Agreements (a “Mortgage Default”), including the Goldman/Citi Mortgage Loan, may, in certain circumstances, constitute a default under the Amended Repurchase Agreements. Under certain conditions, a Mortgage Default would not trigger a default under the Amended Repurchase Agreements if KBS were to transfer the Equity Interests in the owner of the property subject to the Mortgage Default to the GKK Lenders.
Settlement Agreement
On the Effective Date, the Company, through KBS, entered into (a) the Settlement Agreement with, among other parties, GKK Stars, to effect the orderly transfer of certain assets and liabilities of the Gramercy real estate portfolio to KBS in satisfaction of certain debt obligations owed by the GKK Borrower to KBS, and (b) an Acknowledgment and Consent Agreement with, among other parties, Goldman and Citi.
KBS REAL ESTATE INVESTMENT TRUST, INC.
NOTES TO CONSOLIDATED FINANCIAL STATEMENTS (CONTINUED)
December 31, 2011
Under the Settlement Agreement, GKK Stars agreed to cause the Transfers (defined below) to KBS of the Equity Interests in the indirect owners of, or, with respect to a limited number of GKK Properties, the holders of a leasehold interest in, the GKK Properties, with Transfers to commence on the Effective Date. The Settlement Agreement contemplated the transfer of Equity Interests in entities that own or hold leasehold interests in 815 GKK Properties, including 524 bank branch properties and 291 office buildings, operations centers and other properties, as well as a 99% interest in the Citizen’s Bank Joint Venture, which owned 52 bank properties. Pursuant to the Settlement Agreement, on September 1, 2011, KBS indirectly took title to or, with respect to a limited number of GKK Properties, took a leasehold interest in, 317 of the GKK Properties. On October 24, 2011, the minority interest members of the Citizens Bank Joint Venture assigned their entire interest in the joint venture to the 99% interest holder. On December 1, 2011, KBS, through the transfer of certain Equity Interests, indirectly took title to 116 GKK Properties, all of which are office buildings or operations centers. On December 14, 2011 and December 15, 2011, KBS, through the transfer of certain Equity Interests, indirectly took title to or, with respect to a limited number of GKK Properties, indirectly took a leasehold interest in, the remaining 382 GKK Properties, consisting of 287 bank branch properties and 95 office buildings, operations centers and other properties. Such transfers of the Equity Interests in the owners of, or in the holders of leasehold interests in, the GKK Properties are referred to herein as the “Transfers.” The Company’s calculated fair values of the underlying GKK Properties and related current assets and liabilities is approximately $1.9 billion and supports the approximately $1.9 billion total of the combined outstanding mortgage loan balance encumbering the GKK Properties (including the GKK Subordinated Mortgage Loan) plus the Company’s carrying value of the GKK Mezzanine Loan and GKK Junior Mezzanine Tranche prior to the Company’s entry into the Settlement Agreement. As a result, no gain or loss was recorded upon the signing of the Settlement Agreement and the consolidation of the underlying GKK Properties and related assets and liabilities into the Company’s consolidated financial statements. The fair value of the individual GKK Properties was determined using either a direct capitalization approach (generally for stabilized properties with long-term leases) or a discounted cash flow analysis. With respect to the GKK Properties marketed for sale or that have been sold subsequent to December 31, 2011, the estimated fair values were based on actual offers received or brokers estimated selling prices, net of expected selling costs. The GKK Properties that are or will be wholly owned by indirect wholly owned subsidiaries of the Company have a total of approximately 20.7 million rentable square feet and are located in 36 different states.
Below is a summary of the GKK Properties as of the Effective Date:
|
| | | | | | | | | | | | |
| Property Type | | Number of Properties | | Number of States (1) | | Rentable Square Feet | | Average Remaining Lease Term in Years | | Occupancy |
Bank branch properties (2) | | 524 | | 28 | | 3,397,659 |
| | 6.6 | | 89 | % |
| Office buildings/ Operations centers | | 288 | | 36 | | 17,275,203 |
| | 9.4 | | 83 | % |
| Land & parking | | 3 | | 3 | | 4,587 |
| | 8.0 | | N/A |
|
| | | 815 | | | | 20,677,449 |
| | 9.2 | | 84 | % |
(1) The GKK Properties are located in 36 different states throughout the United States.
(2) Does not include 52 bank branch properties previously owned by the Citizens Bank Joint Venture. These properties are 100% occupied, primarily by RBA Citizens, N.A., and were consolidated as of October 24, 2011.
KBS REAL ESTATE INVESTMENT TRUST, INC.
NOTES TO CONSOLIDATED FINANCIAL STATEMENTS (CONTINUED)
December 31, 2011
Because the Settlement Agreement provided that KBS accept the Transfer of all of the remaining Equity Interests that had not been transferred as of December 15, 2011, with the only requirement being the passage of time, and because for accounting purposes (although not for legal purposes), the Company was deemed to control the decisions that affect the economic outcome of all of the Equity Interests and all of the GKK Properties as of the Effective Date, the Company consolidated in its financial statements as of the Effective Date all assets and liabilities assumed by the Company in connection with the Transfers of the Equity Interests and the wholly owned GKK Properties or the GKK Properties in which the Company holds long-term leasehold interests, including the related assumption of the Mortgage Pools and other liabilities, with the exception of the assets and liabilities owned by the Citizens Bank Joint Venture, which was consolidated as of October 24, 2011. The Citizens Bank Joint Venture owned 52 bank branch properties that are 100% occupied and encompass 237,172 rentable square feet. The Citizens Bank Joint Venture properties are located in 10 different states with an average remaining lease term of 5.7 years. Additionally, the outstanding indebtedness under the GKK Mezzanine Loan, the GKK Subordinated Mortgage Loan and the GKK Junior Mezzanine Tranche have been eliminated in consolidation in the Company’s consolidated financial statements.
As of the Effective Date, GKK Stars had agreed to provide: standard asset management services relating to the GKK Properties transferred pursuant to the Settlement Agreement (the “Services”) through December 31, 2013, which Services may be terminated by either GKK Stars or KBS at any time on 90 days prior written notice, subject to certain additional termination rights and restrictions; and to provide the Company with financial information for the GKK Properties for fiscal year 2011. As compensation for the Services, KBS agreed to pay to GKK Stars: (i) an annual fee of $10 million (prorated for incomplete years) plus all property-related expenses incurred by GKK Stars, (ii) subject to certain terms and conditions in the Settlement Agreement, participation interests in the amounts by which the net sales proceeds from the sale of the GKK Properties plus the remaining net value of KBS’ remaining assets exceed certain threshold amounts, and (iii) subject to certain conditions in the Settlement Agreement, a minimum of $3.5 million. Accordingly, the Company has recorded as part of its purchase accounting a contingent liability of $12.0 million based on the expected consideration to be paid as a result of GKK Stars’ participation interests. GKK Stars and KBS have agreed to negotiate a separate management services agreement to further outline the terms and conditions under which GKK Stars or one of its affiliates would continue to provide the Services for KBS. The terms of such an agreement have not yet been finalized, however, and there can be no assurance that GKK Stars or one of its affiliates and KBS will ever consummate such an agreement. In the event KBS and GKK Stars or one of its affiliates are unable to consummate such an agreement by March 31, 2012, the terms for the provision of the Services under the Settlement Agreement may be terminated on June 30, 2012, though, in certain circumstances, GKK Stars will retain its right to the participation interests and minimum threshold described above.
So long as KBS is still obligated under certain Mortgage Pools, the Guarantor and the indirect wholly owned subsidiaries of the Company created to receive the Equity Interests may not incur debt for borrowed money in excess of $180 million (which may be increased to $200 million under certain circumstances), other than mortgage financing secured by, among other things, interests in real property.
The Company allocated the fair value of the GKK Properties to tangible assets received and identifiable intangibles assumed as follows (in thousands):
|
| | | | | | | | | | | | | | | | | | | | | | | | |
| | | | | | | Intangibles | | |
| Property Type | | Land (1) | | Building and Improvements (1) | | Tenant Origination and Absorption Costs (1) (2) | | Above-Market Lease Assets (1) (2) | | Below-Market Lease Liabilities (1) (2) | | Total Fair Value |
Bank branch properties (3) | | $ | 176,017 |
| | $ | 331,347 |
| | $ | 53,432 |
| | $ | 45,667 |
| | $ | (32,233 | ) | | $ | 574,230 |
|
| Office buildings/ Operations centers | | 272,949 |
| | 866,024 |
| | 205,419 |
| | 8,583 |
| | (166,975 | ) | | 1,186,000 |
|
| Land & parking | | 685 |
| | 485 |
| | 52 |
| | — |
| | (20 | ) | | 1,202 |
|
| | | $ | 449,651 |
| | $ | 1,197,856 |
| | $ | 258,903 |
| | $ | 54,250 |
| | $ | (199,228 | ) | | $ | 1,761,432 |
|
_____________________
(1) Subsequent to September 30, 2011, the Company obtained additional information with respect to the GKK Properties and revised its preliminary purchase price allocation. The purchase price allocation has been updated and is finalized as of December 31, 2011.
(2) The weighted-average remaining life for tenant origination and absorption costs, above-market lease assets and below-market lease liabilities is 9.3 years, 10.3 years and 9.8 years, respectively.
(3) Does not include 52 bank branch properties previously owned by the Citizens Bank Joint Venture. See “— Citizens Bank Joint Venture.”
KBS REAL ESTATE INVESTMENT TRUST, INC.
NOTES TO CONSOLIDATED FINANCIAL STATEMENTS (CONTINUED)
December 31, 2011
The Company allocated the tangible assets, identifiable intangibles and assumed liabilities (consisting of tenant origination and absorption costs and above- and below-market leases) related to the GKK Properties based on estimates of fair value. The Company estimated the fair value of real estate using either a direct capitalization approach (generally for stabilized properties with long-term leases) or a discounted cash flow analysis. With respect to the GKK Properties marketed for sale or that have been sold subsequent to December 31, 2011, the estimated fair values were based on actual offers received or brokers estimated selling prices, net of expected selling costs. The Company estimated the fair value of notes payable using a discounted cash flow analysis based on estimates of current market interest rates for instruments with similar characteristics. The Company recorded the Transfers as a business combination and expensed $7.8 million of costs related to the Transfers, which are included in general and administrative expenses in the accompanying consolidated statements of operations for the year ended December 31, 2011. During the year ended December 31, 2011, the Company recognized $99.7 million of total revenues and $11.3 million of operating income from the GKK Properties.
With the exception of 52 unencumbered properties, including 38 properties in which the Company has received leasehold interests, the GKK Properties subject to the Transfers are divided into 25 separate property pools with each property pool being encumbered by a mortgage loan in favor of a third-party lender (collectively, the “Mortgage Pools and individually, a “Mortgage Pool”), except for the $34.3 million GKK Subordinated Mortgage Loan that the Company owns and is therefore eliminated in consolidation. As of December 31, 2011, the aggregate outstanding principal balance of the Mortgage Pools was $1.5 billion, including the GKK Subordinated Mortgage Loan. The GKK Subordinated Mortgage Loan is a subordinated portion of the Goldman/Citi Mortgage Loan, which had an outstanding principal balance of $238.8 million as of December 31, 2011. As of December 31, 2011, the Mortgage Pools had a total of $1.0 billion of fixed rate notes payable with a weighted-average annual effective interest rate of 5.8% and a total of $486.5 million of variable rate notes payable with a weighted-average annual effective interest rate of 3.7%.
Below is summary information of the mortgage debt related to the GKK Properties assumed by the Company as of the Effective Date (dollars in thousands):
|
| | | | | | | | | | | | | | |
| Mortgage Loan Name | | Fair Value as of September 1, 2011 | (1) | | Principal Balance as of September 1, 2011 | (1) | | Contractual Interest Rate as of September 1, 2011 | | Maturity Date |
Bank of America - BBD1 (2) | | $ | 356,276 |
| | | $ | 329,596 |
| | | 5.5% | | 12/01/2013 |
Goldman/Citi Mortgage Loan (3) | | 205,211 |
| | | 205,211 |
| | | LIBOR + 3.0% | | 08/31/2012 |
| PB Capital | | 203,385 |
| | | 219,513 |
| | | LIBOR + 1.7% | | 04/01/2013 |
| Bank of America - BBD2 | | 202,352 |
| | | 207,643 |
| | | 6.0% | | 09/08/2019 |
| 101 Independence | | 65,387 |
| | | 71,470 |
| | | 5.5% | | 11/01/2016 |
FSI (3) | | 62,378 |
| | | 62,378 |
| | | LIBOR + 3.0% | | 06/11/2012 |
| Pitney Bowes - Bank of America | | 44,571 |
| | | 45,634 |
| | | 5.3% | | 10/10/2022 |
| One Citizens Plaza | | 37,683 |
| | | 43,500 |
| | | 5.7% | | 01/11/2012 |
| 801 Market Street | | 38,839 |
| | | 38,734 |
| | | 6.2% | | 02/01/2013 |
| Beaver Valley | | 37,198 |
| | | 38,042 |
| | | 5.1% | | 01/01/2015 |
| FSI 6000D | | 28,925 |
| | | 30,839 |
| | | 5.8% | | 06/05/2017 |
| FSI 6000B | | 28,621 |
| | | 29,590 |
| | | 5.8% | | 06/05/2017 |
Other (2) (5) | | 137,385 |
| | | 138,073 |
| | | (4) | | (4) |
| | | $ | 1,448,211 |
| (1) | | $ | 1,460,223 |
| (1) | | | | |
_____________________
(1) The fair value and principal balance of mortgage debt assumed does not include the mortgage debt secured by 52 bank branch properties previously owned by the Citizens Bank Joint Venture. See “— Citizens Bank Joint Venture.”
(2) As of September 1, 2011, $80.7 million of the Bank of America - BBD1 loan and $3.9 million related to two other mortgage loans had been defeased by $93.6 million of pledged treasury securities, net of discounts and premiums.
(3) Prior to the Effective Date, the Company purchased the GKK Subordinated Mortgage Loan, which is a $34.3 million subordinated interest in the Goldman/Citi Mortgage Loan. The principal balance of the Goldman/Citi Mortgage Loan as of September 1, 2011 excludes the $34.3 million GKK Subordinated Mortgage Loan, as such amount was eliminated in conjunction with the assets and liabilities consolidated in the Transfers.
(4) This loan contains recourse provisions against the Company's subsidiary that directly or indirectly owns all of the Equity Interests.
(5) Includes 13 separate fixed-rate mortgage loans, each of which has an outstanding principal balance of $26.5 million or less. These mortgage loans have maturity dates between October 1, 2012 and August 11, 2030 and the weighted-average remaining term of these loans is approximately 7.0 years as of September 1, 2011. As of September 1, 2011, the weighted-average interest rate of these loans was 6.6%.
KBS REAL ESTATE INVESTMENT TRUST, INC.
NOTES TO CONSOLIDATED FINANCIAL STATEMENTS (CONTINUED)
December 31, 2011
In addition to the real estate and the mortgage debt transferred under the Settlement Agreement, the Company, through KBS, consolidated the following assets and liabilities as of September 1, 2011 (in thousands):
|
| | | | |
| Assets | | |
| Cash | | $ | 31,754 |
|
| Restricted cash | | 123,815 |
|
| Pledged government securities | | 93,623 |
|
| Rent and other receivables, net | | 22,083 |
|
| Other assets | | 15,829 |
|
| Building improvements | | 4,769 |
|
| Liabilities | | |
| Accounts payable and accrued liabilities | | $ | 40,280 |
|
| Deferred rent | | 33,962 |
|
| Other liabilities | | 31,450 |
|
Citizens Bank Joint Venture
Pursuant to the Settlement Agreement, the Company received a 99% interest in the Citizens Bank Joint Venture. The Citizens Bank Joint Venture owns approximately 52 bank branch properties occupied primarily by Citizens Bank. On the Effective Date, the Company accounted for its interest in the Citizens Bank Joint Venture under the equity method of accounting and recorded its interest in the joint venture at a fair value of $0 based on the estimated net fair value of the underlying assets and liabilities.
On October 24, 2011, the minority interest members of the Citizens Bank Joint Venture that held a 1% interest and the majority of the voting rights assigned their entire interest in the joint venture to the 99% interest holder. As a result of the assignment, the Company is deemed to have control of the Citizens Bank Joint Venture and consolidated the Citizens Bank Joint Venture as of October 24, 2011. On December 15, 2011, KBS, through the transfer of certain Equity Interests, indirectly took title to 52 bank branch properties previously owned by the Citizens Bank Joint Venture. The Company allocated the fair value of these properties to the tangible assets and identifiable intangibles assumed as follows: $12.7 million to land, $42.8 million to buildings and improvements, $5.2 million to tenant origination and absorption costs, $2.5 million to above-market leases and $(1.9) million to below-market leases. The 52 properties were also security for a fixed-rate mortgage loan with an outstanding principal balance and fair value of $62.4 million and $61.5 million, respectively, as of October 24, 2011.
Pro Forma Financial Information (Unaudited)
The following table summarizes, on an unaudited pro forma basis, the combined results of operations of the Company for the years ended December 31, 2011 and 2010 to give effect to the Transfers as if the Transfers occurred on January 1, 2010. Because of maturities and amortization payment requirements under certain of the Company’s debt obligations, subsequent to the Transfers under the Settlement Agreement, the Company has commenced the strategic disposition of certain GKK Properties. However, the Company’s management has not yet identified all of the GKK Properties that will be the subject of early dispositions. Because of the strategic disposition of some of the GKK Properties, the following pro forma financial information presented is not indicative of future results of operations of the Company or of actual results that would have been achieved had the Transfers been consummated as of January 1, 2010 (in thousands, except share and per share amounts).
|
| | | | | | | | |
| | | For the Years Ended December 31, |
| | | 2011 | | 2010 |
| Revenues | | $ | 451,914 |
| | $ | 505,195 |
|
| Depreciation and amortization | | $ | 149,127 |
| | $ | 150,346 |
|
| Net income (loss) attributable to common stockholders | | $ | (26,609 | ) | | $ | (83,116 | ) |
| Net income (loss) per common share, basic and diluted | | $ | (0.14 | ) | | $ | (0.46 | ) |
| Weighted-average number of common shares outstanding, basic and diluted | | 188,134,294 |
| | 182,437,352 |
|
KBS REAL ESTATE INVESTMENT TRUST, INC.
NOTES TO CONSOLIDATED FINANCIAL STATEMENTS (CONTINUED)
December 31, 2011
| |
| 4. | REAL ESTATE HELD FOR INVESTMENT |
As of December 31, 2011, the Company’s portfolio of real estate held for investment, including the GKK Properties held for investment, was composed of approximately 24.4 million rentable square feet and was 85% occupied. The properties are located in 34 states and include office properties, industrial properties and bank branch properties. Included in the Company’s portfolio of real estate held for investment was 18.0 million rentable square feet related to the GKK Properties, which were 85% occupied as of December 31, 2011. The following table summarizes the Company’s investments in real estate as of December 31, 2011 and December 31, 2010 (in thousands): |
| | | | | | | | | | | | | | | | |
| | | Land | | Buildings and Improvements | | Tenant Origination and Absorption Costs | | Total Real Estate Held for Investment |
| As of December 31, 2011: | | | | | | | | |
| Office | | $ | 111,701 |
| | $ | 680,808 |
| | $ | 32,090 |
| | $ | 824,599 |
|
Industrial (wholly owned) | | 33,683 |
| | 169,022 |
| | 6,524 |
| | 209,229 |
|
| GKK Properties | | 379,747 |
| | 1,070,027 |
| | 231,132 |
| | 1,680,906 |
|
Real estate held for investment, at cost and net of impairment charges (1) | | $ | 525,131 |
| | $ | 1,919,857 |
| | $ | 269,746 |
| | $ | 2,714,734 |
|
| Accumulated depreciation/amortization | | — |
| | (118,225 | ) | | (34,675 | ) | | (152,900 | ) |
| Real estate held for investment, net | | $ | 525,131 |
| | $ | 1,801,632 |
| | $ | 235,071 |
| | $ | 2,561,834 |
|
| As of December 31, 2010: | | | | | | | | |
| Office | | $ | 112,769 |
| | $ | 694,193 |
| | $ | 47,424 |
| | $ | 854,386 |
|
Industrial (wholly owned) | | 35,380 |
| | 188,147 |
| | 13,201 |
| | 236,728 |
|
Industrial (held through consolidated joint venture VIE) | | 50,598 |
| | 265,585 |
| | 3,602 |
| | 319,785 |
|
Real estate held for investment, at cost and net of impairment charges (1) | | $ | 198,747 |
| | $ | 1,147,925 |
| | $ | 64,227 |
| | $ | 1,410,899 |
|
| Accumulated depreciation/amortization | | — |
| | (105,474 | ) | | (34,701 | ) | | (140,175 | ) |
| Real estate held for investment, net | | $ | 198,747 |
| | $ | 1,042,451 |
| | $ | 29,526 |
| | $ | 1,270,724 |
|
(1) See “—Impairment of Real Estate.”
Operating Leases
The Company’s real estate assets are leased to tenants under operating leases for which the terms and expirations vary. Excluding the GKK Properties, the leases have remaining terms of up to 10.9 years with a weighted-average remaining term of 4.3 years. Leases related to the GKK Properties have remaining terms of up to 15.2 years with a weighted-average remaining term of 9.4 years. The leases may have provisions to extend the lease agreements, options for early termination after paying a specified penalty, rights of first refusal to purchase the property at competitive market rates, and other terms and conditions as negotiated. Additionally, the Company has assumed several leases related to the GKK Properties which contain shedding right provisions. As of December 31, 2011, these shedding rights totaled approximately 1.1 million square feet and can be exercised at various dates during 2012-2017. The Company has already been notified that 344,886 square feet will be shed in 2012, pursuant to these provisions. The Company retains substantially all of the risks and benefits of ownership of the real estate assets leased to tenants. Generally, upon the execution of a lease, the Company requires a security deposit from tenants in the form of a cash deposit and/or a letter of credit. Amounts required as a security deposit vary depending upon the terms of the respective leases and the creditworthiness of the tenant, but generally are not significant amounts. Therefore, exposure to credit risk exists to the extent that a receivable from a tenant exceeds the amount of its security deposit. Security deposits received in cash related to tenant leases are included in other liabilities in the accompanying consolidated balance sheets and totaled $4.3 million and $3.1 million as of December 31, 2011 and December 31, 2010, respectively.
KBS REAL ESTATE INVESTMENT TRUST, INC.
NOTES TO CONSOLIDATED FINANCIAL STATEMENTS (CONTINUED)
December 31, 2011
During the years ended December 31, 2011, 2010 and 2009, the Company recognized deferred rent from tenants of $5.1 million, $4.4 million and $3.6 million, respectively. These excess amounts for the years ended December 31, 2011, 2010 and 2009 are net of $0.6 million, $0.5 million and $0.4 million, respectively, of lease incentive amortization. As of December 31, 2011 and 2010, the cumulative deferred rent receivable balance was $24.6 million and $21.4 million, respectively, and is included in rents and other receivables on the accompanying balance sheets. The cumulative deferred rent balance included $5.5 million and $5.3 million of unamortized lease incentives as of December 31, 2011 and 2010, respectively. The Company records property operating expense reimbursements due from tenants for common area maintenance, real estate taxes, and other recoverable costs in the period the related expenses are incurred.
The future minimum rental income from the Company’s properties under non-cancelable operating leases as of December 31, 2011 for the years ending December 31 is as follows (in thousands):
|
| | | |
| 2012 | $ | 255,923 |
|
| 2013 | 241,573 |
|
| 2014 | 220,037 |
|
| 2015 | 197,786 |
|
| 2016 | 179,724 |
|
| Thereafter | 854,525 |
|
| | $ | 1,949,568 |
|
As of December 31, 2011, the Company’s highest tenant industry concentration (greater than 10% of annualized base rent) was as follows:
|
| | | | | | | | | |
| Industry | | Number of Tenants | | Annualized
Base Rent (1) (in thousands) | | Percentage of Annualized Base Rent |
| Finance | | 110 | | $ | 143,943 |
| | 57.3 | % |
_____________________
(1) Annualized base rent represents annualized contractual base rental income as of December 31, 2011, adjusted for any contractual tenant concessions (including free rent).
The increase in the finance industry concentration from the prior period is due to the concentration in the GKK Properties. As of December 31, 2011, no other tenant industries accounted for more than 10% of the Company’s annualized base rent. The Company currently has approximately 700 tenants over a diverse range of industries and geographical regions. As of December 31, 2011 and 2010, the Company had a bad debt reserve of $5.0 million and $0.6 million, respectively, which represented approximately 2% of the Company’s annualized base rent. The Company’s bad debt reserve included $4.2 million related to the GKK Properties. During the years ended December 31, 2011, 2010 and 2009, the Company recorded bad debt expense related to its tenant receivables of $2.2 million, $0.5 million and $0.2 million respectively. The Company did not record a provision for bad debt expense related to its deferred rent receivables at December 31, 2011, 2010 and 2009, respectively.
KBS REAL ESTATE INVESTMENT TRUST, INC.
NOTES TO CONSOLIDATED FINANCIAL STATEMENTS (CONTINUED)
December 31, 2011
As of December 31, 2011, the Company had a concentration of credit risk related to leases with the following tenant that represented more than 10% of the Company’s annualized base rent:
|
| | | | | | | | | | | | | | | | | | | | | | |
| | | | | | | | | Annualized Base Rent Statistics | | |
| Tenant | | Property | | Tenant Industry | | Rentable Square Feet | | % of Portfolio Net Rentable Square Feet | | Annualized Base Rent(1) (in thousands) | | % of Portfolio Annualized Base Rent | | Annualized Base Rent per Square Foot | | Lease Expiration |
| Bank of America, N.A. | | Various | | Finance | | 8,273,999 | | 33.9 | % | | $ | 72,800 |
| | 29.2 | % | | $ | 8.80 |
| | (2) |
_____________________
(1) Annualized base rent represents annualized contractual base rental income as of December 31, 2011, adjusted for any contractual tenant concessions (including free rent).
(2) As of December 31, 2011, lease expiration dates ranged from 2012 to 2026 with a weighted-average remaining term of 10.0 years. Additionally, as of December 31, 2011, some of Bank of America’s leases contained shedding right provisions. These shedding rights totaled approximately 627,000 square feet and can be exercised at various dates from 2012 to 2017.
Bank of America Corporation is the guarantor of various leases that its subsidiary, Bank of America, N.A., has with the Company. The condensed consolidated financial information of Bank of America Corporation has been included herein because of the significant credit concentration the Company has with this guarantor. Bank of America Corporation currently files its financial statements in reports filed with the SEC, and the following unaudited summary financial data regarding Bank of America Corporation is taken from its previously filed public reports. For more detailed financial information regarding Bank of America Corporation, please refer to its financial statements, which are publicly available with the SEC at http://www.sec.gov.
|
| | | | | | | | | | | |
| | Years Ended December 31, |
| | 2011 | | 2010 | | 2009 |
| Unaudited Condensed Consolidated Statements of Income (in millions) | | | | | |
| Total revenue, net of interest expense | $ | 93,454 |
| | $ | 110,220 |
| | $ | 119,643 |
|
| Income (loss) before income taxes | (230 | ) | | (1,323 | ) | | 4,360 |
|
| Net income (loss) | 1,446 |
| | (2,238 | ) | | 6,276 |
|
| | | | | | |
| | As of December 31, | | |
| | 2011 | | 2010 | | |
| Unaudited Condensed Consolidated Balance Sheets (in millions) | | | | | |
| Total assets | $ | 2,129,046 |
| | $ | 2,264,909 |
| | |
| Total liabilities | 1,898,945 |
| | 2,036,661 |
| | |
| Total shareholders’ equity | 230,101 |
| | 228,248 |
| | |
Geographic Concentration Risk
As of December 31, 2011, the Company’s net investments in real estate in North Carolina represented 10.9% of the Company’s total assets. As a result, the geographic concentration of the Company’s portfolio makes it particularly susceptible to adverse economic developments in North Carolina’s real estate market. Any adverse economic or real estate developments in this market, such as business layoffs or downsizing, industry slowdowns, relocations of businesses, changing demographics and other factors, or any decrease in demand for office space resulting from the local business climate, could adversely affect the Company’s operating results.
KBS REAL ESTATE INVESTMENT TRUST, INC.
NOTES TO CONSOLIDATED FINANCIAL STATEMENTS (CONTINUED)
December 31, 2011
Impairment of Real Estate
Due to changes in cash flow estimates and hold periods, the Company has recognized non-cash impairment charges to write-down the carrying value of certain of its real estate investments to their estimated fair values. During the year ended December 31, 2011, the Company recorded an impairment charge of $15.8 million with respect to eight of its real estate properties held for investment. See Note 8, “Real Estate Held for Sale and Discontinued Operations,” for information regarding impairments of assets related to real estate held for sale.
| |
| 5. | TENANT ORIGINATION AND ABSORPTION COSTS, ABOVE-MARKET LEASE ASSETS AND BELOW-MARKET LEASE LIABILITIES |
As of December 31, 2011 and 2010, the Company’s tenant origination and absorption costs, above-market lease assets, and below-market lease liabilities (excluding fully amortized assets and liabilities and accumulated amortization) were as follows (in thousands):
|
| | | | | | | | | | | | | | | | | | | | | | | |
| | Tenant Origination and Absorption Costs | | Above-Market Lease Assets | | Below-Market Lease Liabilities |
| | December 31, 2011 | | December 31, 2010 | | December 31, 2011 | | December 31, 2010 | | December 31, 2011 | | December 31, 2010 |
Cost, net of impairments (1) | $ | 269,746 |
| | $ | 64,227 |
| | $ | 50,619 |
| | $ | 12,846 |
| | $ | (197,872 | ) | | $ | (28,031 | ) |
Accumulated Amortization (1) | (34,675 | ) | | (34,701 | ) | | (8,804 | ) | | (7,293 | ) | | 19,289 |
| | 14,563 |
|
| Net Amount | $ | 235,071 |
| | $ | 29,526 |
| | $ | 41,815 |
| | $ | 5,553 |
| | $ | (178,583 | ) | | $ | (13,468 | ) |
_____________________
(1) In 2011 and 2010, the Company wrote-off fully amortized tenant origination and absorption costs of $22.1 million and $32.8 million, respectively, above-market lease assets of $4.3 million and $6.2 million, respectively, and below-market lease liabilities of $7.9 million and $4.3 million, respectively.
Increases (decreases) in net income as a result of amortization of the Company’s tenant origination and absorption costs, above-market lease assets and below-market lease liabilities for the years ended December 31, 2011, 2010 and 2009 were as follows (in thousands):
|
| | | | | | | | | | | | | | | | | | | | | | | | | | | | | | | | | | | |
| | Tenant Origination and Absorption Costs | | Above-Market Lease Assets | | Below-Market Lease Liabilities |
| | For the Years Ended December 31, | | For the Years Ended December 31, | | For the Years Ended December 31, |
| | 2011 | | 2010 | | 2009 | | 2011 | | 2010 | | 2009 | | 2011 | | 2010 | | 2009 |
| Amortization expense | $ | (22,114 | ) | | $ | (14,254 | ) | | $ | (22,987 | ) | | $ | (5,817 | ) | | $ | (3,842 | ) | | $ | (5,242 | ) | | $ | 12,625 |
| | $ | 5,542 |
| | $ | 5,824 |
|
The remaining unamortized balance for these outstanding intangible assets and liabilities as of December 31, 2011 is expected to be amortized for the years ending December 31 (in thousands) as follows:
|
| | | | | | | | | | | |
| | Tenant Origination and Absorption Costs | | Above-Market Lease Assets | | Below-Market Lease Liabilities |
| 2012 | $ | (39,025 | ) | | $ | (7,215 | ) | | $ | 23,945 |
|
| 2013 | (32,011 | ) | | (5,771 | ) | | 21,589 |
|
| 2014 | (27,571 | ) | | (4,453 | ) | | 20,749 |
|
| 2015 | (22,904 | ) | | (4,025 | ) | | 19,456 |
|
| 2016 | (20,140 | ) | | (3,692 | ) | | 18,428 |
|
| Thereafter | (93,420 | ) | | (16,659 | ) | | 74,416 |
|
| | $ | (235,071 | ) | | $ | (41,815 | ) | | $ | 178,583 |
|
Weighted-Average Remaining Amortization Period | 8.8 years |
| | 9.4 years |
| | 9.4 years |
|
KBS REAL ESTATE INVESTMENT TRUST, INC.
NOTES TO CONSOLIDATED FINANCIAL STATEMENTS (CONTINUED)
December 31, 2011
| |
| 6. | REAL ESTATE LOANS RECEIVABLE |
As of December 31, 2011 and 2010, the Company, through wholly owned subsidiaries, had invested in real estate loans receivable as follows (dollars in thousands):
|
| | | | | | | | | | | | | | | | | | | | | | | | | |
Loan Name Location of Related Property or Collateral | | Date Acquired/ Originated | | Property Type | | Loan Type | | Outstanding Principal Balance as of December 31, 2011 (1) | | Book Value as of December 31, 2011 (2) | | Book Value as of December 31, 2010 (2) | | Contractual Interest Rate (3) | | Annualized Effective Interest Rate (3) | | Maturity Date (3) |
Sandmar Mezzanine Loan Southeast U.S. (4) | | 01/09/2007 | | Retail | | Mezzanine | | $ | 5,000 |
| | $ | 5,040 |
| | $ | 5,046 |
| | 5.40% | | 5.29 | % | | 01/01/2017 |
Lawrence Village Plaza Loan Origination New Castle, Pennsylvania (5) | | 08/06/2007 | | Retail | | Mortgage | | 6,920 |
| | 6,864 |
| | 6,878 |
| | 8.00% | | 9.16 | % | | 09/01/2012 |
11 South LaSalle Loan Origination Chicago, Illinois (4) (6) | | 08/08/2007 | | Office | | Mortgage | | 38,794 |
| | 38,794 |
| | 38,794 |
| | 8.00% | | (6 | ) | | 09/01/2010 |
San Diego Office Portfolio B-Note San Diego, California | | 10/26/2007 | | Office | | B-Note | | 20,000 |
| | 15,455 |
| | 14,926 |
| | 5.78% | | 11.18 | % | | 10/11/2017 |
Petra Subordinated Debt Tranche A (4) | | 10/26/2007 | | Unsecured | | Subordinated | | 25,000 |
| | 25,000 |
| | 25,000 |
| | 11.50% | | (4 | ) | | 04/27/2009 |
Petra Subordinated Debt Tranche B (4) | | 10/26/2007 | | Unsecured | | Subordinated | | 25,000 |
| | 25,000 |
| | 25,000 |
| | 11.50% | | (4 | ) | | 10/26/2009 |
4929 Wilshire B-Note Los Angeles, California | | 11/19/2007 | | Office | | B-Note | | 4,000 |
| | 3,005 |
| | 2,887 |
| | 6.05% | | 12.33 | % | | 07/11/2017 |
Park Central Mezzanine Loan New York, New York (7) | | 03/23/2007 | | Hotel | | Mezzanine | | — |
| | — |
| | 14,981 |
| | One-month LIBOR + 4.48% | | (7 | ) | | 11/09/2011 |
Artisan Multifamily Portfolio Mezzanine Loan Las Vegas, Nevada (8) | | 12/11/2007 | | Multi Family Residential | | Mezzanine | | — |
| | — |
| | 18,351 |
| | One-month LIBOR + 2.50% | | (8 | ) | | 08/09/2010 |
San Antonio Business Park Mortgage Loan San Antonio, Texas (9) | | 03/28/2008 | | Office | | Mortgage | | — |
| | — |
| | 25,329 |
| | 6.94% | | (9 | ) | | 11/11/2017 |
2600 Michelson Mezzanine Loan Irvine, California (10) | | 06/02/2008 | | Office | | Mezzanine | | — |
| | — |
| | 8,895 |
| | 8.00% | | (10 | ) | | 05/11/2017 |
GKK Mezzanine Loan National Portfolio (11) | | 08/22/2008 | | Office/ Bank Branch | | Mezzanine | | — |
| | — |
| | 457,949 |
| | One-month LIBOR + 9.20% | | (11 | ) | | 05/06/2011 |
GKK Subordinated Mortgage Loan National Portfolio (11) | | 05/10/2011 | | Office/ Bank Branch | | Mortgage | | — |
| | — |
| | — |
| | One-month LIBOR + 5.99% | | (11 | ) | | 05/06/2011 |
GKK Junior Mezzanine Tranche National Portfolio (11) | | 05/10/2011 | | Office/ Bank Branch | | Mezzanine | | — |
| | — |
| | — |
| | One-month LIBOR + 10.00% | | (11 | ) | | 05/06/2011 |
| | | | | | | | | $ | 124,714 |
| | $ | 119,158 |
| | $ | 644,036 |
| | | | | | |
Reserve for Loan Losses (12) | | | | | | | | — |
| | (74,134 | ) | | (97,800 | ) | | | | | | |
| | | | | | | | | $ | 124,714 |
| | $ | 45,024 |
| | $ | 546,236 |
| | | | | | |
(1) Outstanding principal balance as of December 31, 2011 represents original principal balance outstanding under the loan, increased for any subsequent fundings and reduced for any principal repayments.
(2) Book value of real estate loans receivable represents outstanding principal balance adjusted for unamortized acquisition discounts, origination fees, and direct origination and acquisition costs. Loan balances are presented gross of any asset-specific reserves.
(3) Contractual interest rates are the stated interest rates on the face of the loans. Annualized effective interest rates are calculated as the actual interest income recognized in 2011, using the interest method, divided by the average amortized cost basis of the investment during 2011. The annualized effective interest rates and contractual interest rates presented are for the year ended December 31, 2011. Maturity dates are as of December 31, 2011.
(4) The Company had recorded an asset-specific loan loss reserve against these investments as of December 31, 2011 and 2010. See “—Reserve for Loan Losses.”
(5) The borrower under this loan has a one-year extension option, subject to certain terms and conditions.
(6) See “— Recent Transactions — 11 South LaSalle Loan Origination.”
(7) On December 29, 2011, the Company released the borrower from all outstanding debt and liabilities under a discounted payoff agreement. See “—Recent Transactions – Park Central Mezzanine Loan.”
(8) The Company wrote-off its investment in the Artisan Multifamily Portfolio Mezzanine Loan during the year ended December 31, 2011. See “—Recent Transactions – Artisan Multifamily Portfolio Mezzanine Loan.”
(9) On December 1, 2011, the Company sold the San Antonio Business Park Mortgage Loan to an unaffiliated buyer. See “— Recent Transactions — San Antonio Business Park Mortgage Loan.”
(10) The Company wrote-off its investment in the 2600 Michelson Mezzanine Loan during the year ended December 31, 2011. See “—Recent Transactions – 2600 Michelson Mezzanine Loan.”
(11) On September 1, 2011, the Company, through KBS, entered into the Settlement Agreement to effect the orderly transfer of certain assets and liabilities of the Gramercy real estate portfolio to KBS in satisfaction of certain debt obligations owed by the GKK Borrower to KBS. As the assets and liabilities securing these debt obligations have been consolidated in the Company’s financial statements as of December 31, 2011, the book values of the GKK Mezzanine Loan, the GKK Subordinated Mortgage Loan and the GKK Junior Mezzanine Tranche have been reduced to $0. See Note 3, “Collateral Transfer and Settlement Agreement Related to the GKK Mezzanine Loan.”
(12) See “—Reserve for Loan Losses.”
KBS REAL ESTATE INVESTMENT TRUST, INC.
NOTES TO CONSOLIDATED FINANCIAL STATEMENTS (CONTINUED)
December 31, 2011
As of December 31, 2011, the Company had outstanding funding commitments of $1.4 million on its loans receivable, subject to the satisfaction of certain conditions by the borrowers.
As of December 31, 2011 and 2010, interest receivable from real estate loans receivable was $1.1 million and $2.3 million, respectively, and is included in rents and other receivables.
The following is a schedule of maturities for all real estate loans receivable outstanding as of December 31, 2011 (in thousands):
|
| | | | | | | | | | | | | | | |
| | Current Maturity | | Fully Extended Maturity (1) |
| | Face Value (Funded) | | Book Value before Reserve for Loan Loss | | Face Value (Funded) | | Book Value before Reserve for Loan Loss |
| 2012 | $ | 95,714 |
| | $ | 95,658 |
| | $ | 88,794 |
| | $ | 88,794 |
|
| 2013 | — |
| | — |
| | 6,920 |
| | 6,864 |
|
| 2014 | — |
| | — |
| | — |
| | — |
|
| 2015 | — |
| | — |
| | — |
| | — |
|
| 2016 | — |
| | — |
| | — |
| | — |
|
| Thereafter | 29,000 |
| | 23,500 |
| | 29,000 |
| | 23,500 |
|
| | $ | 124,714 |
| | $ | 119,158 |
| | $ | 124,714 |
| | $ | 119,158 |
|
(1) Represents the maturities of all real estate loans receivable outstanding as of December 31, 2011 assuming the borrowers exercise all available extension options.
The following summarizes the activity related to real estate loans receivable for the year ended December 31, 2011 (in thousands):
|
| | | |
| Real estate loans receivable, net - December 31, 2010 | $ | 546,236 |
|
| Principal repayments received on real estate loans receivable | (360 | ) |
| Face value of real estate loans receivable acquired | 41,159 |
|
| Extension fees received on real estate loans receivable | (83 | ) |
| Accretion of discounts on purchased real estate loans receivable | 1,099 |
|
| Amortization of origination fees and costs on purchased and originated real estate loans receivable | 692 |
|
| Change in loan loss reserve | 23,666 |
|
| Foreclosure by mortgage lender of Artisan Multifamily Portfolio Mezzanine Loan | (18,351 | ) |
| Write-off of the 2600 Michelson Mezzanine Loan | (8,894 | ) |
| Settlement of the GKK Loans | (499,404 | ) |
| Sale of San Antonio Business Park Mortgage Loan | (25,744 | ) |
| Discounted payoff of Park Central Mezzanine Loan | (14,992 | ) |
| Real estate loans receivable, net - December 31, 2011 | $ | 45,024 |
|
KBS REAL ESTATE INVESTMENT TRUST, INC.
NOTES TO CONSOLIDATED FINANCIAL STATEMENTS (CONTINUED)
December 31, 2011
The following summarizes the Company’s investments in real estate loans receivable as of December 31, 2011 (in thousands):
|
| | | |
| Outstanding principal balance | $ | 124,714 |
|
| Discounts on real estate loans receivable | (8,060 | ) |
| Accumulated accretion of discounts on purchases of real estate loans receivable | 2,347 |
|
| Origination fees and costs on purchases and originations of real estate loans receivable | 119 |
|
| Accumulated amortization of origination fees and costs on purchases and originations of real estate loans receivable | 38 |
|
| Reserve for loan losses | (74,134 | ) |
| Real estate loans receivable, net - December 31, 2011 | $ | 45,024 |
|
For the years ended December 31, 2011, 2010 and 2009, interest income from real estate loans receivable consisted of the following (in thousands):
|
| | | | | | | | | | | |
| | Years Ended December 31, |
| | 2011 | | 2010 | | 2009 |
| Contractual interest income | $ | 11,592 |
| | $ | 37,937 |
| | $ | 50,466 |
|
| Interest income from interest rate floor agreements | — |
| | — |
| | 3,951 |
|
| Accretion of purchase discounts | 1,099 |
| | 2,101 |
| | 5,764 |
|
| Amortization of origination fees and costs and acquisition costs, net | 692 |
| | 2,283 |
| | (2,445 | ) |
| Amortization of cost of interest rate floor agreements | — |
| | — |
| | (1,575 | ) |
| Interest income from real estate loans receivable | $ | 13,383 |
| | $ | 42,321 |
| | $ | 56,161 |
|
The Company generally recognizes income on impaired loans on either a cash basis, where interest income is only recorded when received in cash, or on a cost-recovery basis, where all cash receipts are applied against the carrying value of the loan. The Company will resume the accrual of interest if it determines the collection of interest according to the contractual terms of the loan is probable. The Company considers the collectibility of the loan’s principal balance in determining whether to recognize income on impaired loans on a cash basis or a cost-recovery basis. During the years ended December 31, 2011 and 2010, the Company recognized $0.3 million and $1.0 million of interest income related to impaired loans with asset-specific reserves, respectively. Additionally, as of December 31, 2011, the Company had interest income receivable of $0.9 million related to two of the impaired loans with asset-specific reserves, of which $0.8 million was reserved for.
Recent Transactions
Artisan Multifamily Portfolio Mezzanine Loan
On December 11, 2007, the Company, through an indirect wholly owned subsidiary, made an investment in a mezzanine loan to fund the acquisition of two garden-style multifamily apartment complexes in Las Vegas, Nevada (the “Artisan Multifamily Portfolio Mezzanine Loan”). As of December 31, 2010, the outstanding principal balance on the loan was $20.0 million and the carrying value of the loan was $18.4 million before asset-specific impairments recorded as of December 31, 2010 that reduced its carrying value to $0. The Company wrote-off its investment in the Artisan Multifamily Portfolio Mezzanine Loan during the year ended December 31, 2011.
KBS REAL ESTATE INVESTMENT TRUST, INC.
NOTES TO CONSOLIDATED FINANCIAL STATEMENTS (CONTINUED)
December 31, 2011
11 South LaSalle Loan Origination
On August 8, 2007, the Company, through an indirectly wholly owned subsidiary, originated a senior mortgage loan of up to $43.3 million on 11 South LaSalle (the “11 South LaSalle Loan”), a 35-story office building containing 329,271 square feet located in Chicago, Illinois. As of December 31, 2011, the outstanding principal balance and book value before asset-specific impairments of the loan was $38.8 million. On August 2, 2011, the Company entered into a discounted pay-off agreement with the borrower under the 11 South LaSalle Loan to release the borrower from all outstanding debt and liabilities, including the outstanding principal balance and any unpaid interest under the loan, at a discounted amount between $32.0 million and $32.5 million. In connection with the discounted pay-off agreement, the borrower was required to make an initial payment of $20.0 million (the “Initial Payment”) by November 30, 2011. The borrower failed to make the Initial Payment and, as a result, the Company entered into a mortgage loan sale agreement on February 24, 2012 to sell the 11 South LaSalle Loan to an unaffiliated buyer for $17.0 million. There can be no assurance that the Company will be able to finalize the sale of the loan. As a result, during the year ended December 31, 2011, the Company recorded a loan loss reserve of $21.8 million to reduce the Company’s net investment to $17.0 million and wrote-off $0.8 million of accrued interest receivable.
2600 Michelson Mezzanine Loan
On June 2, 2008, the Company, through an indirect wholly owned subsidiary, purchased at a discount a $15.0 million mezzanine loan (the “2600 Michelson Mezzanine Loan”) secured by, among other things, a pledge by the mezzanine borrower of all of its right, title and interest in the entity that holds title to a 16-story office building with a five-level parking structure located at 2600 Michelson Avenue in Irvine, California. As of December 31, 2010, the outstanding principal balance on the loan was $15.0 million and the carrying value of the loan was $8.9 million before asset-specific impairments recorded as of December 31, 2010 that reduced its carrying value to $0. On May 26, 2011, the Company entered into a purchase and sale agreement with a third party to sell the 2600 Michelson Mezzanine Loan at a discount. On June 30, 2011, the Company received $52,000 upon the sale of the loan and wrote-off its investment in the 2600 Michelson Mezzanine Loan.
Park Central Mezzanine Loan
On March 23, 2007, the Company, through an indirect wholly owned subsidiary, purchased a $15.0 million interest in a $58.0 million mezzanine loan (the “Park Central Mezzanine Loan”) secured by, among other things, a pledge by the borrower under the Park Central Mezzanine Loan of its interests in the limited liability company that holds title to the Park Central Hotel, a 934-room, four-star, full-service hotel located in Midtown Manhattan in New York City, New York. On August 30, 2011, the Company entered into a discounted payoff agreement with the borrower under the Park Central Mezzanine Loan and extended the maturity date of the Park Central Mezzanine Loan from November 9, 2011 to December 31, 2011. On December 29, 2011, the Company released the borrower from all outstanding debt and liabilities under the discounted payoff agreement, including the outstanding principal balance and any unpaid interest under the loan, at a discounted amount of $7.3 million and wrote-off the remaining $7.7 million of its investment in the Park Central Mezzanine Loan.
Settlement Agreement
On September 1, 2011, the Company entered into the Settlement Agreement to effect the orderly transfer of certain assets and liabilities of the Gramercy real estate portfolio to KBS in satisfaction of certain debt obligations owed by the GKK Borrower to KBS. As these liabilities and the assets securing them were consolidated in the Company’s financial statements as of the Effective Date, with the exception of the assets of the Citizens Bank Joint Venture, which were consolidated on October 24, 2011, the book values of the GKK Mezzanine Loan, the GKK Subordinated Mortgage Loan and the GKK Junior Mezzanine Tranche have been reduced to $0. See Note 3, “Collateral Transfer and Settlement Agreement Related to the GKK Mezzanine Loan.”
KBS REAL ESTATE INVESTMENT TRUST, INC.
NOTES TO CONSOLIDATED FINANCIAL STATEMENTS (CONTINUED)
December 31, 2011
San Antonio Business Park Mortgage Loan
On March 28, 2008, the Company, through an indirect wholly owned subsidiary, purchased a first mortgage loan secured by the San Antonio Business Park (the “San Antonio Business Park Mortgage Loan”) from an unaffiliated seller. The San Antonio Business Park consists of two office-flex properties containing 411,959 square feet in San Antonio, Texas. On October 14, 2011, the Company sold the San Antonio Business Park Mortgage Loan to an unaffiliated buyer (the “SABPML Buyer”) for $22.0 million. The Company retained a subordinated participation interest in the loan, whereby the SABPML Buyer would receive 100% of cash flows from the loan until such time as its $22.0 million investment, plus any accrued interest and expenses incurred by the SABPML Buyer, had been repaid in full. On December 1, 2011, the Company repurchased the San Antonio Business Park Mortgage Loan for $22.6 million and subsequently resold the mortgage loan to a separate unaffiliated buyer for $26.0 million. The Company recognized a loan loss of $0.9 million as a result of the sale of the San Antonio Business Park Mortgage Loan.
Reserve for Loan Losses
Changes in the Company’s reserve for loan losses for the year ended December 31, 2011 were as follows (in thousands):
|
| | | |
| Reserve for loan losses, December 31, 2010 | $ | 97,800 |
|
| Provision for loan losses | 11,740 |
|
| Charge-offs to reserve for loan losses | (35,406 | ) |
| Reserve for loan losses, December 31, 2011 | $ | 74,134 |
|
As of December 31, 2011, the total reserve for loan losses consisted of $74.1 million of asset-specific reserves on impaired real estate loans receivable with an amortized cost basis of $93.8 million. As of December 31, 2011, real estate loans receivable with an amortized cost basis of $88.8 million were on nonaccrual status. Also as of December 31, 2011, two of the six borrowers under the Company’s real estate loans receivable were delinquent. The asset-specific reserves relate to the following impaired loans: the Sandmar Mezzanine Loan, the subordinated debt investment in Petra Fund REIT Corp and the 11 South LaSalle Loan Origination.
The Company recorded provision for loan loss reserve of $12.0 million, $11.0 million and $178.8 million during the years ended December 31, 2011, 2010 and 2009, respectively. For the year ended December 31, 2011, the provision for loan losses was comprised of an increase of $30.1 million to the asset-specific loan loss reserves, offset by a decrease of $18.1 million of loan loss reserves previously calculated on a portfolio-basis. During the year ended December 31, 2011, the Company also charged-off $35.4 million of reserves for loan losses. During the year ended December 31, 2011, the Company recovered $0.1 million of reserves for loan losses related to the foreclosure of the 200 Professional Drive Loan Origination. For the year ended December 31, 2010, the provision for loan losses was comprised of an increase of $16.9 million to the asset-specific loan loss reserves, offset by a reduction of $5.9 million calculated on a portfolio-basis. During the year ended December 31, 2010, the Company also charged-off $18.5 million of reserves for loan losses related to the Tribeca Loans (see Note 9, “Foreclosed Real Estate Held for Sale”) in conjunction with the Company’s foreclosure on the collateral securing the loans and $5.2 million of reserves for loan losses related to foreclosure of the 200 Professional Drive Loan Origination. For the year ended December 31, 2009, the change in loan loss reserves was comprised of $208.8 million, calculated on an asset‑specific basis, partially offset by a reduction of $30.0 million to the portfolio‑based reserve. During the year ended December 31, 2009, the Company also charged-off $172.2 million of reserves for loan losses. As of December 31, 2011, the Company did not record a portfolio-based loan loss reserve, as each loan was evaluated for an asset-specific reserve.
KBS REAL ESTATE INVESTMENT TRUST, INC.
NOTES TO CONSOLIDATED FINANCIAL STATEMENTS (CONTINUED)
December 31, 2011
Securities Held to Maturity
In connection with the Settlement Agreement, the Company received a portfolio of treasury securities that is pledged to provide a portion of the principal and interest payments for mortgage debt collateralized by certain GKK Properties. Since the Company does not intend to sell the securities, the securities are classified as held to maturity and are presented on an amortized cost basis and not at fair value. These securities had a carrying value and fair value of $91.5 million and $91.5 million, respectively, as of December 31, 2011 and have maturities that extend through November 2013. The Company did not record any other-than-temporary impairments related to its held to maturity securities during the year ended December 31, 2011.
Securities Available for Sale
As of December 31, 2011, the Company held two investments in real estate securities classified as available-for-sale: commercial mortgage-backed securities (“CMBS”) that accrued interest at a coupon rate of one-month LIBOR plus 2.30% with a contractual maturity of November 2011 and an original purchase price of $17.7 million (“Floating Rate CMBS”) and securities backed by CMBS that accrue interest at a coupon rate of 4.5% with a contractual maturity of December 2017 and an original purchase price of $44.2 million (“Fixed Rate Securities”). The Company’s investments in real estate securities are held at fair value and reviewed for impairment on a quarterly basis. See Note 2, “Summary of Significant Accounting Policies.”
From acquisition through March 31, 2009, the Company had recognized through earnings other‑than‑temporary impairments of $18.2 million and $37.0 million on the Floating Rate CMBS and Fixed Rate Securities, respectively.
Beginning April 1, 2009, the Company was required to distinguish between other‑than‑temporary impairments related to credit and other‑than‑temporary impairments related to other factors (e.g., market fluctuations) on its real estate securities that it does not intend to sell and where it is not more likely than not that the Company will be required to sell the security prior to the anticipated recovery of its amortized cost basis. On April 1, 2009, the Company determined the portion of the previously recorded other‑than‑temporary impairments that were not due to credit losses to be $14.8 million and recorded this amount as a cumulative transition adjustment to retained earnings, accumulated other comprehensive income and the amortized cost basis of the securities as of April 1, 2009, which effectively reversed $14.8 million of cumulative non‑credit related other-than-temporary impairment charges from retained earnings. The Company recorded the amounts as unrealized losses within accumulated other comprehensive loss in the consolidated balance sheet. The entire adjustment of $14.8 million related to the Company’s investment in the Fixed Rate Securities; the Company determined that the entire other‑than‑temporary impairment previously recorded for the Floating Rate CMBS was credit‑related.
As of December 31, 2011, the Company determined the fair value of the Fixed Rate Securities to be $46.2 million, resulting in unrealized gains of $28.9 million for the year ended December 31, 2011 and a cumulative unrealized gain of $25.2 million as of December 31, 2011. The fair value as of December 31, 2011 was based on the estimated net sales proceeds the Company expects to receive upon the sale of these securities. The Company initiated a trade transaction with an unaffiliated buyer to sell its Fixed Rate Securities subsequent to December 31, 2011. As of December 31, 2011, the Company’s Floating Rate CMBS had a fair value of $0. The fair value of the Floating Rate CMBS is consistent with its December 31, 2010 value, resulting in no unrealized gain or loss for the year ended December 31, 2011.
During the years ended December 31, 2011 and 2010, the Company did not recognize any other-than temporary impairments on its real estate securities. During the year ended December 31, 2009, the Company recognized other‑than‑temporary impairments on its real estate securities of $5.1 million, all of which were recognized prior to April 1, 2009. On April 1, 2009, through its cumulative transition adjustment, the Company effectively reversed $14.8 million of cumulative non‑credit related other‑than‑temporary impairment charges from retained earnings and recorded the amounts as unrealized losses within accumulated other comprehensive loss in the consolidated balance sheets. It is difficult to predict the timing or magnitude of these other‑than‑temporary impairments and significant judgments are required in determining impairments, including, but not limited to, assumptions regarding estimated prepayments, loss assumptions, and assumptions with respect to changes in interest rates. As a result, actual realized losses could materially differ from these estimates.
KBS REAL ESTATE INVESTMENT TRUST, INC.
NOTES TO CONSOLIDATED FINANCIAL STATEMENTS (CONTINUED)
December 31, 2011
The following summarizes the activity related to real estate securities for the year ended December 31, 2011 (in thousands): |
| | | | | | | | | | | |
| | Amortized Cost Basis | | Unrealized Gains (Losses) | | Total |
| Real estate securities - December 31, 2010 | $ | 21,937 |
| | $ | (3,662 | ) | | $ | 18,275 |
|
| Unrealized gain | — |
| | 28,902 |
| | 28,902 |
|
| Interest accretion on real estate securities | (928 | ) | | — |
| | (928 | ) |
| Real estate securities - December 31, 2011 | $ | 21,009 |
| | $ | 25,240 |
| | $ | 46,249 |
|
The following table presents the fair value and unrealized gains (losses) of the Company’s investments in real estate securities as of December 31, 2011: |
| | | | | | | | | | | | | | | | | | | | | | | |
| | Holding Period of Unrealized Gains (Losses) of Investments in Real Estate Securities (in thousands) |
| | Less than 12 Months | | 12 Months or More | | Total |
| Investment | Fair Value | | Unrealized Gains (Losses) | | Fair Value | | Unrealized Gains | | Fair Value | | Unrealized (Losses) |
| Floating Rate CMBS | $ | — |
| | $ | — |
| | $ | — |
| | $ | — |
| | $ | — |
| | $ | — |
|
| Fixed Rate Securities | — |
| | — |
| | 46,249 |
| | 25,240 |
| | 46,249 |
| | 25,240 |
|
| | $ | — |
| | $ | — |
| | $ | 46,249 |
| | $ | 25,240 |
| | $ | 46,249 |
| | $ | 25,240 |
|
| |
| 8. | REAL ESTATE HELD FOR SALE AND DISCONTINUED OPERATIONS |
The operations of properties held for sale or to be disposed of and the aggregate net gains recognized upon their disposition are presented as discontinued operations in the accompanying consolidated statements of operations for all periods presented. During the year ended December 31, 2010, the Company disposed of one office property and one industrial property. During the year ended December 31, 2011, the Company disposed of an additional three office properties and seven industrial properties, and through a consolidated joint venture transferred a portfolio of 23 industrial properties and a master lease in full satisfaction of the debt outstanding to an affiliate of the lender. The Company also classified three office properties and 247 of the GKK Properties with an aggregate net book value of $402.4 million as held for sale. During the year ended December 31, 2011, the Company recorded an impairment loss of $36.8 million related to discontinued operations. The impairment charge was a result of a change in the estimated holding period for these investments and a change in the estimated cash flows during the holding period. See Note 4, “Real Estate Held for Investment – Impairment of Real Estate” for information regarding impairments related to real estate held for investment. The following table summarizes operating income from discontinued operations for the years ended December 31, 2011, 2010 and 2009 (in thousands):
|
| | | | | | | | | | | |
| | Years Ended December 31, |
| | 2011 | | 2010 | | 2009 |
| Total revenues and other income | $ | 82,568 |
| | $ | 84,413 |
| | $ | 96,318 |
|
| Total expenses | 78,446 |
| | 86,133 |
| | 120,946 |
|
| Income (loss) from discontinued operations before gain on sales of real estate, net, impairment charge and gain from extinguishment of debt | 4,122 |
| | (1,720 | ) | | (24,628 | ) |
| Gain on sales of real estate, net | 5,141 |
| | 5,646 |
| | — |
|
| Impairment charge | (36,754 | ) | | (123,453 | ) | | — |
|
| Gain from extinguishment of debt | 115,531 |
| | — |
| | — |
|
| Income (loss) from discontinued operations | $ | 88,040 |
| | $ | (119,527 | ) | | $ | (24,628 | ) |
KBS REAL ESTATE INVESTMENT TRUST, INC.
NOTES TO CONSOLIDATED FINANCIAL STATEMENTS (CONTINUED)
December 31, 2011
The following summary presents the major components of real estate held for sale and liabilities related to real estate held for sale as of December 31, 2011 and 2010 (in thousands):
|
| | | | | | | |
| | December 31, |
| | 2011 | | 2010 |
| Assets related to real estate held for sale | | | |
| Total real estate, at cost | $ | 414,827 |
| | $ | 357,733 |
|
| Accumulated depreciation and amortization | (12,428 | ) | | (37,880 | ) |
| Other assets | 19,371 |
| | 10,100 |
|
| Total assets | $ | 421,770 |
| | $ | 329,953 |
|
| Liabilities related to real estate held for sale | | | |
| Notes payable | 314,186 |
| | 196,168 |
|
| Other liabilities | 23,754 |
| | 4,260 |
|
| Total liabilities | $ | 337,940 |
| | $ | 200,428 |
|
National Industrial Portfolio
In August 2007, the Company entered a joint venture (the “KBS-New Leaf Joint Venture”) with New Leaf to acquire the National Industrial Portfolio, for approximately $515.9 million plus closing costs. The National Industrial Portfolio consisted of 23 industrial properties and a master lease with respect to another industrial property. The Company owned an 80% membership interest in the KBS-New Leaf Joint Venture and consolidated the joint venture in its financial statements.
The KBS-New Leaf Joint Venture financed the National Industrial Portfolio properties with a mortgage loan in the amount of $300 million (the “Mortgage Loan”). In addition, there were five outstanding mezzanine loans on the National Industrial Portfolio totaling $143.6 million (the “Mezzanine Loans” and, together with the Mortgage Loans, the “Loans”), which were secured by a pledge of 100% of the ownership interests in the wholly owned subsidiaries of the KBS-New Leaf Joint Venture that directly or indirectly owned the National Industrial Portfolio properties. As of December 28, 2011, an affiliate of Oaktree Capital Management, L.P. (“Oaktree”) owned each of the Loans.
The Loans were to mature on December 31, 2011. However, due to a decline in the operating performance of the National Industrial Portfolio resulting from increased vacancies, lower rental rates and tenant bankruptcies, in addition to declines in market value across all real estate types in the period following the initial investment, it became unlikely that the KBS-New Leaf Joint Venture would be able to refinance or extend the Loans upon their maturities. As a result, on December 28, 2011, the Company entered into an agreement in lieu of foreclosure and related documents (collectively, the “Agreement”) to transfer the National Industrial Portfolio properties to certain indirect wholly owned subsidiaries of the NIP JV (defined below) in full satisfaction of the debt outstanding under, and other obligations related to, the Loans. As a result, the Company recorded a gain on extinguishment of debt of $115.5 million (including amounts for noncontrolling interest of approximately $24.2 million), which represents the difference between the carrying amount of the outstanding debt and other liabilities of approximately $446.1 million and the carrying value of the real estate properties and other assets of approximately $328.3 million, net of closing costs of $2.3 million, upon transfer of the properties.
KBS REAL ESTATE INVESTMENT TRUST, INC.
NOTES TO CONSOLIDATED FINANCIAL STATEMENTS (CONTINUED)
December 31, 2011
In addition, on December 28, 2011, the Company, through an indirect wholly-owned subsidiary (the “KBS Member”), entered into a joint venture (the “HC KBS JV”) with an affiliate of New Leaf (the “HC Member”), and on the date of the Agreement, the HC KBS JV entered into a joint venture (the “NIP JV”, which now indirectly owns the National Industrial Portfolio) with an affiliate of Oaktree (the “Oaktree Member”). The HC KBS JV indirectly manages the day-to-day affairs of the NIP JV; however, its authority is limited, as major decisions involving the NIP JV must receive approval from an Oaktree Member-controlled board of representatives. Pursuant to the terms of the NIP JV agreement, as subsequently amended, the HC KBS JV, or either the KBS Member or the HC Member, through the HC KBS JV, has an option, but is under no obligation, to contribute up to $20.0 million in equity to the NIP JV by April 16, 2012, or a maximum of 15% of the pre-leveraged equity of the NIP JV. The KBS Member does not intend to exercise its right to make any portion of the $20.0 million contribution. Additionally, the HC KBS JV may be subject to future optional capital calls as determined by the Oaktree Member; however, should the HC KBS JV not make a capital contribution pursuant to such a capital call, the Oaktree Member may make the capital contribution, which capital contribution would be treated as an equity loan by the Oaktree Member to the NIP JV. The KBS Member has no intention of contributing funds in response to future capital calls. Under the NIP JV agreement, the HC KBS JV was also granted a participation interest in certain future profits generated by the NIP JV. This participation interest is separate from any equity interest that the HC KBS JV would receive if it chose to make an equity contribution to the NIP JV. As of December 31, 2011, the book value of the Company’s participation interest in the NIP JV was $0.
| |
| 9. | FORECLOSED REAL ESTATE HELD FOR SALE |
In 2006 and 2007, the Company originally made three debt investments (collectively, the “Tribeca Loans”) related to the conversion of an eight-story loft building into a 10-story condominium building with 62 units (the “Tribeca Building”) located at 415 Greenwich Street in New York, New York. On February 19, 2010, the borrowers under the Company’s investment in the Tribeca Loans defaulted and the Company foreclosed on the Tribeca Building by exercising its right to accept 100% of the ownership interest of the borrower. The Company acquired the remaining unsold condominium units of the Tribeca Building and assumed the project liabilities. The Company recorded the Tribeca Building at fair value using a discounted cash flow valuation model based on net realizable value (expected sales price less estimated costs to sell the unsold units) of the real estate.
As of December 31, 2011, the Company’s investment in the Tribeca Building consisted of four condominium units, two retail spaces and parking spaces with a carrying value of $28.8 million and is presented as foreclosed real estate held for sale on the Company’s consolidated balance sheets. In addition, the Company had $43,000 of other liabilities related to the Tribeca Building outstanding at December 31, 2011. During the year ended December 31, 2011, the Company sold seven condominium units of the Tribeca Building and recognized a gain on sale of $0.1 million. During the year ended December 31, 2011, the Company recorded expenses of $2.3 million related to foreclosed real estate held for sale.
KBS REAL ESTATE INVESTMENT TRUST, INC.
NOTES TO CONSOLIDATED FINANCIAL STATEMENTS (CONTINUED)
December 31, 2011
| |
| 10. | NOTES PAYABLE AND REPURCHASE AGREEMENTS |
As of December 31, 2011 and 2010, the Company’s notes payable and repurchase agreements consisted of the following (dollars in thousands):
|
| | | | | | | | | | | | | |
| Loan Type | Principal as of December 31, 2011 | | Principal as of December 31, 2010 | | Contractual Interest Rate as of December 31, 2011 (1) | | Weighted-Average Interest Rate as of December 31, 2011 (1) | | Weighted-Average Remaining Term in Years (2) |
| Fixed Rate | | | | | | | | | |
| Mortgage loans | $ | 366,158 |
| | $ | 557,492 |
| | 4.1% - 6.1% | | 5.6% | | 2.3 |
GKK Properties mortgage loans (3) | 1,025,421 |
| | — |
| | 5.1% - 10.3% | | 5.8% | | 5.8 |
| | 1,391,579 |
| | 557,492 |
| | | | | | |
| Variable Rate | | | | | | | | | |
Mortgage loans (4) (5) | 280,446 |
| | 504,417 |
| | (6) | | 3.2% | | 2.4 |
GKK Properties mortgage loans (3) | 486,510 |
| | — |
| | (6) | | 3.7% | | 0.9 |
Mezzanine loans (5) | — |
| | 139,492 |
| | (5) | | (5) | | (5) |
Repurchase agreements (7) | 149,657 |
| | 277,614 |
| | (8) | | 3.6% | | 1.3 |
| | 916,613 |
| | 921,523 |
| | | | | | |
| Total Notes Payable and Repurchase Agreements outstanding | 2,308,192 |
| | 1,479,015 |
| | | | | | |
Discount on notes payable, net (9) | (8,984 | ) | | — |
| | | | | | |
| Total Notes Payable and Repurchase Agreements, net | $ | 2,299,208 |
| | $ | 1,479,015 |
| | | | | | |
(1) Contractual interest rate as of December 31, 2011 represents the range of interest rates in effect under these loans as of December 31, 2011. Weighted-average interest rate as of December 31, 2011 is calculated as the actual interest rate in effect as of December 31, 2011 (consisting of the contractual interest rate and the effect of contractual floor rates and interest rate caps, floors and swaps), using interest rate indices at December 31, 2011, where applicable.
(2) Weighted-average remaining term in years represents the initial maturity dates or the maturity dates as extended as of December 31, 2011; subject to certain conditions, the maturity dates of certain loans may be further extended.
(3) As of September 1, 2011, in connection with its entry into the Settlement Agreement through KBS, the Company consolidated $1.5 billion of mortgage loans secured by the GKK Properties. As of December 31, 2011, the Company had assumed all of the mortgage loans secured by the GKK Properties in the aggregate amount of $1.5 billion. See Note 3, “Collateral Transfer and Settlement Agreement Related to the GKK Mezzanine Loan.”
(4) The Company has entered into separate interest rate cap or swap agreements related to certain of these loans. See Note 11, “Derivative Instruments.”
(5) Through a consolidated joint venture, the Company had entered a $300.0 million mortgage loan and $143.6 million of mezzanine loans that were to mature on December 31, 2011. On December 28, 2011, the Company entered into an agreement in lieu of foreclosure and related documents to transfer the National Industrial Portfolio properties through a consolidated joint venture to an affiliate of the lender in full satisfaction of the debt outstanding under the Loans. As a result, the transaction resulted in a gain on extinguishment of debt. See “— Recent Transactions — Extinguishment of National Industrial Portfolio Mortgage and Mezzanine Loans.”
(6) The contractual interest rates of these loans will vary based on one-month LIBOR plus a fixed spread. The spreads on the mortgage loans and GKK Properties mortgage loans range from 2.0% to 2.2%, and from 1.7% to 4.5%, respectively.
(7) See “—Repurchase Agreements.”
(8) The contractual interest rate of these repurchase agreements varies based on one-month LIBOR plus a fixed spread and one-week LIBOR plus a fixed spread. The spread on the repurchase agreements ranges from 1.0% to 3.5%.
(9) Represents the unamortized discount on notes payable due to the below-market interest rate when the note was assumed. The premium is amortized over the remaining life of the loan.
As of December 31, 2011 and 2010, the Company’s deferred financing costs were $6.6 million and $2.5 million, respectively, net of amortization. During the years ended December 31, 2011, 2010 and 2009, the Company incurred interest expense of $71.0 million, $39.6 million and $38.3 million, respectively. Included in interest expense were the amortization of deferred financing costs of $7.3 million, $1.5 million and $1.4 million for the years ended December 31, 2011, 2010 and 2009, respectively, and interest expense incurred as a result of the Company’s interest rate swap agreements of $3.3 million, $4.1 million and $3.9 million for the years ended December 31, 2011, 2010 and 2009, respectively. As of December 31, 2011, the Company’s discount on notes payable was $14.7 million, net of amortization. Included in interest expense was the amortization of discount on notes payable of $4.0 million for the year ended December 31, 2011. As of December 31, 2011 and 2010, $9.2 million and $3.9 million of interest was payable, respectively.
KBS REAL ESTATE INVESTMENT TRUST, INC.
NOTES TO CONSOLIDATED FINANCIAL STATEMENTS (CONTINUED)
December 31, 2011
The following is a schedule of maturities for all notes payable and repurchase agreements outstanding as of December 31, 2011 (in thousands):
|
| | | | | | | | | | | |
| | Notes Payable | | Repurchase Agreements | | Total |
| 2012 | $ | 519,398 |
| | $ | 94,352 |
| | $ | 613,750 |
|
| 2013 | 692,100 |
| | 55,305 |
| | 747,405 |
|
| 2014 | 163,921 |
| | — |
| | 163,921 |
|
| 2015 | 220,136 |
| | — |
| | 220,136 |
|
| 2016 | 137,611 |
| | — |
| | 137,611 |
|
| Thereafter | 425,369 |
| | — |
| | 425,369 |
|
| | $ | 2,158,535 |
| | $ | 149,657 |
| | $ | 2,308,192 |
|
Subsequent to December 31, 2011, the One Citizens Loan, with an outstanding principal balance of $43.5 million, matured without repayment. The Company is in negotiations with the One Citizens Loan lender to restructure or extend this loan; however, there is no guarantee that the lender would extend or refinance the balance due under this loan and it may choose to attempt to exercise certain of its rights under the loan and security documents, including without limitation, requiring the repayment of principal outstanding or foreclosing on the underlying properties securing the loan. In addition, the lender has imposed a "cash trap" on the properties securing the One Citizens Loan.
Debt Covenants
The documents evidencing the Company’s debt obligations typically require that specified loan-to-value and debt service coverage ratios be maintained with respect to the financed properties before the Company can exercise certain rights under the loan documents relating to such properties. A breach of the financial covenants in these documents may result in the lender imposing additional restrictions on the Company’s operations, such as the Company’s ability to incur debt, or may allow the lender to impose “cash traps” with respect to cash flow from the property securing the loan. In addition, such a breach may constitute an event of default and the lender could require the Company to repay the debt immediately. If the Company fails to make such repayment in a timely manner, the lender may be entitled to take possession of any property securing the loan.
As of December 31, 2011, the Company and/or its subsidiaries that are the borrowers under the loan and security documents were in compliance with the financial covenants in such documents included in the Company’s consolidated financial statements, except that, as of December 31, 2011, the borrowers under two mortgage loans that the Company assumed pursuant to the Settlement Agreement were out of debt service coverage compliance. The loans had outstanding principal balances of $206.2 million (the “BBD2 Loan”) and $13.6 million (the “Jenkins Loan”), respectively, as of December 31, 2011. Such non-compliance does not constitute an event of default under the applicable loan and security documents. However, as a result of such non-compliance, under the BBD2 Loan, the lender has imposed a “cash trap” to restrict distributions to the Company to the budgeted property operating expenses and requires lender consent regarding the release of properties securing the loan, and under the Jenkins Loan, the lender has also imposed a “cash trap” and has the right to replace the property manager of the property.
The loan agreements and security documents relating to the FSI 6000A, FSI 6000B, FSI 6000C, FSI 6000D and 801 Market Street loans contain provisions that prohibit the pledge of certain Equity Interests in the mortgage borrowers or their direct or indirect owners. As a result of the Transfers under the Settlement Agreement and the Company’s subsequent pledge of certain Equity Interests as security for certain of the Company’s repurchase agreements, the lenders under these mortgage loans may view certain pledges as being prohibited. If they do, they may attempt to exercise certain remedies detailed in the respective loan and security documents, including without limitation, accelerating the outstanding amount under each mortgage loan or foreclosing on the underlying properties securing the mortgage loans. As of December 31, 2011, the total outstanding debt on these five loans was $147.8 million.
KBS REAL ESTATE INVESTMENT TRUST, INC.
NOTES TO CONSOLIDATED FINANCIAL STATEMENTS (CONTINUED)
December 31, 2011
Repurchase Agreements
The carrying values of the Company’s repurchase agreements, the book values of the underlying collateral and the repurchase agreement counterparties as of December 31, 2011 are as follows (dollars in thousands):
|
| | | | | | | | | | | | | | |
| Collateral | | Balance Sheet Classification of Collateral | | Carrying Value of Repurchase Agreement | | Book Value of Underlying Collateral | | Maturity Date of Collateral | | Repurchase Agreement Counterparties |
GKK I (1) | | GKK Properties | | $ | 80,418 |
| | $ | 261,304 |
| | N/A | | Goldman Sachs Mortgage Company |
GKK II (1) | | GKK Properties | | 62,548 |
| | 203,237 |
| | N/A | | Citigroup Financial Products, Inc. |
| Fixed Rate Securities | | Real estate securities | | 6,691 |
| | 46,249 |
| | 12/31/2017 | | Deutsche Bank Securities, Inc. |
| | | | | $ | 149,657 |
| | $ | 510,790 |
| | | | |
(1) The Company is a guarantor of these repurchase agreements. On September 1, 2011, the Company, through KBS, entered into the Settlement Agreement with, among other parties, GKK Stars to effect the orderly transfer of the GKK Properties, which secure these repurchase agreements, and their related liabilities to KBS in satisfaction of certain debt obligations owed by the GKK Borrower to KBS. See Note 3, “Collateral Transfer and Settlement Agreement Related to the GKK Mezzanine Loan.”
Recent Financing Transactions
Wells Bridge Loan
On April 28, 2011, the Company, through indirect wholly owned subsidiaries (collectively, the “Wells Bridge Loan Borrower”), entered into a loan with Wells Fargo Bank, National Association for an amount of up to $50.0 million (the “Wells Bridge Loan”). As of December 31, 2011, the Company had no outstanding debt under the Wells Bridge Loan. The Wells Bridge Loan matured on January 26, 2012.
Extension and Modification of the Millennium I Building Revolving Loan
On February 11, 2010, the Company, through an indirect wholly owned subsidiary, completed the secured financing of the Millennium I Building. The Company obtained a three-year revolving loan from an unaffiliated lender that allowed the Company to draw up to $29.5 million, subject to certain terms and restrictions, at a floating interest rate equal to 375 basis points over one-month LIBOR (the “Millennium I Building Revolving Loan”). On April 21, 2011, the Company drew the entire $29.5 million then available under the Millennium I Building Revolving Loan, which amount was used for the principal payment and fees required under the Amended Repurchase Agreements. On July 6, 2011, the Company, through an indirect wholly owned subsidiary, entered into a loan extension and modification agreement allowing the Company to draw up to $40.0 million under the Millennium I Building Revolving Loan, subject to certain terms and restrictions set forth in the loan agreement, with an option to increase borrowings to $95.0 million with the addition of additional real estate collateral (the “Accordion Option”). The loan matures on July 1, 2015, subject to a one-year extension option. On October 31, 2011, the Company exercised the Accordion Option by pledging the Woodfield Preserve Office Center as additional collateral and the Company made an additional draw on the Millennium I Building Revolving Loan such that an aggregate principal amount of $85.0 million was outstanding under the loan as of that date. As of December 31, 2011, $10.0 million was available for disbursement under the Millennium I Building Revolving Loan. The interest rate on the Millennium I Building Revolving Loan decreased from 225 basis points over one-month LIBOR to 210 basis points over one-month LIBOR upon the execution of the Accordion Option.
KBS REAL ESTATE INVESTMENT TRUST, INC.
NOTES TO CONSOLIDATED FINANCIAL STATEMENTS (CONTINUED)
December 31, 2011
Extension and Modification of the Small Portfolio Mortgage Loan Facility
On February 5, 2009, certain of the Company’s wholly owned subsidiaries (the “Small Portfolio Mortgage Loan Borrowers”) entered into a three-year mortgage loan agreement with an unaffiliated lender related to the following properties that secure the loan: North Creek Parkway Center, City Gate Plaza, the University Park Buildings and Meridian Tower. The principal amount of the loan facility is $54.0 million (the “Small Portfolio Mortgage Loan Facility”). At closing, $45.7 million was disbursed to the Company and up to $8.3 million was available for a one-time future disbursement, subject to certain conditions set forth in the loan agreement. On April 21, 2011, the Company drew the remaining $8.3 million available under the Small Portfolio Mortgage Loan Facility, which amount was used to pay the principal and fees required under the Amended Repurchase Agreements. On July 6, 2011, the Small Portfolio Mortgage Loan Borrower entered into a loan extension and modification agreement to increase the principal amount available under the Small Portfolio Mortgage Loan Facility by an additional $6.0 million. The Company drew the entire additional $6.0 million available under the Small Portfolio Mortgage Loan Facility on July 8, 2011. The Small Portfolio Mortgage Loan Facility, as amended, bears interest at a floating rate equal to 210 basis points over one-month LIBOR. The Small Portfolio Mortgage Loan Facility, as amended, matures on July 1, 2015, subject to a one-year extension option.
Extension, Modification and Pay-off of the Woodfield Preserve Office Center and South Towne Corporate Center I and II Mortgage Loans
On May 1, 2011, the Company, through indirect wholly owned subsidiaries, entered into a loan extension and modification agreement to extend the maturity date of a $106.5 million mortgage loan secured by the Woodfield Preserve Office Center and South Towne Corporate Center I and II to October 31, 2011. In connection with the extension, the Company paid $0.5 million of extension fees and waived the right to draw an additional $4.0 million previously available for future funding under the terms of the original loan agreement. During the extension period, interest was calculated at a fixed rate of 5.30% per annum. Monthly payments were interest-only, with the entire principal amount, plus any outstanding interest and fees, due at maturity, assuming no prior payments. On October 31, 2011, the Company paid off the entire principal balance outstanding and accrued interest in the amount of $103.0 million.
GKK Mortgage Loans
As of September 1, 2011, in connection with its entry into the Settlement Agreement, the Company, through KBS, consolidated $1.5 billion of mortgage loans secured by the GKK Properties. See Note 3, “Collateral Transfer and Settlement Agreement Related to the GKK Mezzanine Loan.”
South Towne Corporate Center I and II Mortgage Loan
On October 25, 2011, the Company, through an indirect wholly owned subsidiary, entered into a mortgage loan with an unaffiliated lender, for $27.5 million secured by South Towne Corporate Center I and II (the “South Towne Corporate Center I and II Mortgage Loan”). The South Towne Corporate Center I and II Mortgage Loan matures on November 1, 2015, with an option to extend the maturity date to November 1, 2016, subject to certain conditions contained in the loan agreement. The South Towne Corporate Center I and II Mortgage Loan bears interest at a variable rate of 200 basis points over one-month LIBOR. Monthly payments on the South Towne Corporate Center I and II Mortgage Loan are interest-only, with the entire principal amount, plus any outstanding interest and fees, due at maturity.
Pay-off of the Sabal VI Mortgage Loan and Addition to the Portfolio Secured Mortgage Loan Facility
On March 5, 2007, in connection with the acquisition of the Sabal VI Building, the Company, through an indirect wholly owned subsidiary, entered into a mortgage loan with an unaffiliated lender for $11.0 million secured by the Sabal VI Building (the “Sabal VI Mortgage Loan”). The Sabal VI Mortgage Loan bore interest at a fixed rate of 5.14% per annum for the first two years and 5.84% thereafter and matured on October 1, 2011. On October 3, 2011, the Company paid off the entire principal balance outstanding and accrued interest in the amount of $11.1 million.
KBS REAL ESTATE INVESTMENT TRUST, INC.
NOTES TO CONSOLIDATED FINANCIAL STATEMENTS (CONTINUED)
December 31, 2011
On July 9, 2008, certain of the Company’s wholly owned subsidiaries, entered into a secured four-year mortgage loan agreement with an unaffiliated lender providing for a mortgage loan facility in the maximum principal amount of $158.7 million (the “Portfolio Secured Mortgage Loan Facility”), subject to certain borrowing limitations, secured by various real estate properties owned by these wholly owned subsidiaries of the Company. The determination of the maximum principal amount of the Portfolio Secured Mortgage Loan Facility was based on a percentage of the appraised value of the properties in the portfolio that secure the loan. The maturity date of the loan is July 9, 2012, with two one-year extension options subject to certain conditions contained in the loan documents. On October 27, 2011, the Sabal VI Building was added to the Portfolio Secured Mortgage Loan Facility and an additional $7.5 million was funded to the Company. The Portfolio Secured Mortgage Loan, including the additional $7.5 million secured by the Sabal VI Building, bears interest at a floating rate of 220 basis points over one-month LIBOR. Because of the prior removal from the portfolio of some of the real estate properties that secured the Portfolio Secured Mortgage Loan, as of October 27, 2011, and after the funding of the additional $7.5 million, the aggregate principal amount outstanding under the loan is $107.9 million, which is the maximum amount that may be drawn under the loan.
| |
| 11. | DERIVATIVE INSTRUMENTS |
The Company enters into derivative instruments for risk management purposes to hedge its exposure to cash flow variability caused by changing interest rates on its variable rate real estate loans receivable and notes payable. The primary goal of the Company’s risk management practices related to interest rate risk is to prevent changes in interest rates from adversely impacting the Company’s ability to achieve its investment return objectives. When the Company purchases or originates a variable rate debt instrument for investment, or obtains variable rate financing, it considers several factors in determining whether or not to use a derivative instrument to hedge the related interest rate risk. These factors include the Company’s return objectives, the expected life of the investment, the expected life of the financing instrument, interest rates, costs to purchase hedging instruments, the terms of the debt investment, the terms of the financing instrument, the overall interest rate risk exposure of the Company, and other factors.
The Company enters into interest rate swaps as a fixed rate payer to mitigate its exposure to rising interest rates on its variable rate notes payable. The value of interest rate swaps is primarily impacted by interest rates, market expectations about interest rates, and the remaining life of the instrument. In general, increases in interest rates, or anticipated increases in interest rates, will increase the value of the fixed rate payer position and decrease the value of the variable rate payer position. As the remaining life of the interest rate swap decreases, the value of both positions will generally move towards zero. All of the Company’s derivative instruments are designated as cash flow hedges.
The following table summarizes the notional and fair value of the Company’s derivative financial instruments as of December 31, 2011 and 2010. The notional value is an indication of the extent of the Company’s involvement in each instrument at that time, but does not represent exposure to credit, interest rate or market risks (dollars in thousands):
|
| | | | | | | | | | | | | | | | | | | |
| | | | | | | | | | | | Fair Value of Asset (Liability) |
| Derivative Instruments | | Effective Date | | Maturity Date | | Notional Value | | | Reference Rate | | December 31, 2011 | | December 31, 2010 |
| Interest Rate Swap | | 07/11/2008 | | 07/11/2012 | | $ | 39,679 |
| (1) | | One-month LIBOR/Fixed at 3.82% | | $ | (718 | ) | | $ | (3,608 | ) |
| Interest Rate Swap | | 02/05/2009 | | 03/01/2013 | | 45,700 |
| | | One-month LIBOR/Fixed at 2.26% | | (745 | ) | | (1,313 | ) |
| Interest Rate Cap | | 08/15/2009 | | 08/15/2011 | | 46,000 |
| | | One-month LIBOR at 2.50% | | — |
| | — |
|
| Interest Rate Cap | | 08/15/2010 | | 08/15/2011 | | 405,000 |
| | | One-month LIBOR at 1.00% | | — |
| | 20 |
|
| Total derivatives designated as hedging instruments | | | | | | $ | 536,379 |
| | | | | $ | (1,463 | ) | | $ | (4,901 | ) |
(1) The notional value of this interest rate swap was $119.0 million prior to August 1, 2011.
KBS REAL ESTATE INVESTMENT TRUST, INC.
NOTES TO CONSOLIDATED FINANCIAL STATEMENTS (CONTINUED)
December 31, 2011
Asset derivatives are recorded as deferred financing costs, prepaid expenses and other assets on the accompanying consolidated balance sheets, and liability derivatives are recorded as other liabilities on the accompanying consolidated balance sheets. The change in fair value of the effective portion of a derivative instrument that is designated as a cash flow hedge is recorded as other comprehensive income (loss) in the accompanying consolidated statements of equity. The Company recorded unrealized gains (losses) of $3.9 million, $1.5 million and $(0.4) million on derivative instruments designated as cash flow hedges in accumulated other comprehensive income (loss) during the years ended December 31, 2011, 2010 and 2009, respectively. Amounts in other comprehensive income (loss) will be reclassified into earnings in the periods in which earnings are affected by the hedged cash flow. As a result of utilizing derivative instruments designated as cash flow hedges to hedge variable rate notes payable and repurchase agreements, the Company recognized an additional $4.1 million, $5.9 million and $3.8 million of interest expense related to the effective portion of cash flow hedges during the years ended December 31, 2011, 2010 and 2009, respectively. The ineffective portion, reported as a component of interest expense, did not have a material impact on earnings and the Company does not anticipate that it will have a material impact in the future. During the next twelve months, the Company expects to recognize additional interest expense related to derivative instruments designated as cash flow hedges. The present value of this additional interest expense totals $1.4 million as of December 31, 2011 and is included in accumulated other comprehensive loss.
| |
| 12. | FAIR VALUE DISCLOSURES |
The fair value for certain financial instruments is derived using a combination of market quotes, pricing models and valuation techniques that involve significant management judgment. The price transparency of financial instruments is a key determinant of the degree of judgment involved in determining the fair value of the Company’s financial instruments. Financial instruments for which actively quoted prices or pricing parameters are available and for which markets contain orderly transactions will generally have a higher degree of price transparency than financial instruments for which markets are inactive or consist of non-orderly trades. The Company evaluates several factors when determining if a market is inactive or when market transactions are not orderly. The following is a summary of the methods and assumptions used by management in estimating the fair value of each class of assets and liabilities for which it is practicable to estimate the fair value:
Cash and cash equivalents, restricted cash, rent and other receivables, and accounts payable and accrued liabilities: These balances reasonably approximate their fair values due to the short maturities of these items.
Pledged government securities: In connection with the Settlement Agreement, the Company received a portfolio of treasury securities that is pledged to provide a portion of the principal and interest payments for mortgage debt collateralized by certain GKK Properties. These securities are classified as held to maturity and are presented on an amortized cost basis and not at fair value. The fair values were based upon valuations obtained from dealers of those securities, and accordingly, the Company classified these inputs as Level 2 inputs.
Real estate loans receivable: These instruments are presented in the accompanying consolidated balance sheets at their amortized cost net of recorded loan loss reserves and not at fair value. The fair values of real estate loans receivable were estimated using an internal valuation model that considered the expected cash flows for the loans, underlying collateral values (for collateral-dependent loans) and estimated yield requirements of institutional investors for loans with similar characteristics, including remaining loan term, loan-to-value, type of collateral and other credit enhancements.
Investment in unconsolidated joint ventures: These investments are presented in the accompanying consolidated balance sheets at acquisition-date or transfer-date fair values and not at current fair values. The fair values of the investments in the unconsolidated joint ventures were estimated using an internal valuation model that considered the Company’s expected cash flows from the joint ventures and estimated yield requirements of institutional investors for equity investments in real estate joint ventures with similar characteristics, including the capitalization of the joint ventures, the operating performance of the joint ventures’ real estate and the liquidation priority of the Company’s investments.
KBS REAL ESTATE INVESTMENT TRUST, INC.
NOTES TO CONSOLIDATED FINANCIAL STATEMENTS (CONTINUED)
December 31, 2011
Real estate securities: These investments are classified as available-for-sale and are presented at fair value. Prior to December 31, 2011, the Company based its fair value measurements for the Fixed Rate Securities on quotes provided by the dealer of these securities. Since the market for these securities was determined to be inactive, the Company deemed the use of the dealer quotes as its point estimate of fair value to be appropriate by establishing a range of estimated fair values using various internal valuation techniques and concluding that the dealer quotes were within a reasonable range of fair values. The dealer utilizes a proprietary valuation model that contains unobservable inputs. The Company classified these inputs as Level 3 inputs. As of December 31, 2011, the Company based its fair value measurements for the Fixed Rate Securities on the estimated net sales proceeds as the Company initiated a trade transaction with an unaffiliated buyer to sell these securities subsequent to December 31, 2011.
The Company based its fair value measurements of the Floating Rate CMBS on an internal valuation model that considered expected cash flows from the underlying loans and yields required by market participants. As such, the Company classifies these inputs as Level 3 inputs.
Derivative instruments: These instruments are presented at fair value in the accompanying consolidated balance sheets. The valuation of these instruments is determined by a third-party expert using a proprietary model that utilizes observable inputs. As such, the Company classifies these inputs as Level 2 inputs. The proprietary model uses the contractual terms of the derivatives, including the period to maturity, as well as observable market-based inputs, including interest rate curves and volatility. The fair values of interest rate swaps, caps and floors are estimated using the market standard methodology of netting the discounted fixed cash payments and the discounted expected variable cash payments (receipts). The variable cash payments (receipts) are based on an expectation of interest rates (forward curves) derived from observable market interest rate curves. In addition, credit valuation adjustments, which consider the impact of any credit enhancements to the contracts, are incorporated in the fair values to account for potential nonperformance risk. The fair value of interest rate caps (floors) are determined using the market standard methodology of discounting the future expected cash payments (receipts) which would occur if variable interest rates rise above (below) the strike rate of the caps (floors). The variable interest rates used in the calculation of projected payments (receipts) on the cap (floor) are based on an expectation of future interest rates derived from observed market interest rate curves and volatilities.
Notes payable and repurchase agreements: The fair value of the Company’s notes payable and repurchase agreements is estimated using a discounted cash flow analysis based on management’s estimates of current market interest rates for instruments with similar characteristics, including remaining loan term, loan-to-value ratio, type of collateral and other credit enhancements. Additionally, when determining the fair value of liabilities in circumstances in which a quoted price in an active market for an identical liability is not available, the Company measures fair value using (i) a valuation technique that uses the quoted price of the identical liability when traded as an asset or quoted prices for similar liabilities when traded as assets or (ii) another valuation technique that is consistent with the principles of fair value measurement, such as the income approach or the market approach.
KBS REAL ESTATE INVESTMENT TRUST, INC.
NOTES TO CONSOLIDATED FINANCIAL STATEMENTS (CONTINUED)
December 31, 2011
The following are the face values, carrying amounts and fair values of the Company’s financial instruments as of December 31, 2011 and 2010, which carrying amounts do not approximate the fair values:
|
| | | | | | | | | | | | | | | | | | | | | | | |
| | December 31, 2011 | | December 31, 2010 |
| | (amounts in thousands) | | (amounts in thousands) |
| | Face Value | | Carrying Amount | | Fair Value | | Face Value | | Carrying Amount | | Fair Value |
| Financial assets: | | | | | | | | | | | |
Real estate loans receivable (1) | $ | 124,714 |
| | $ | 45,024 |
| | $ | 42,550 |
| | $ | 663,919 |
| | $ | 546,236 |
| | $ | 499,584 |
|
| Investment in unconsolidated joint venture | — |
| | — |
| | — |
| | — |
| | — |
| | 11,779 |
|
| Pledged government securities | 91,527 |
| | 91,541 |
| | 91,472 |
| | — |
| | — |
| | — |
|
| Financial liabilities: | | | | | | | | | | | |
| Notes payable and repurchase agreements | $ | 2,308,192 |
| | $ | 2,299,208 |
| | $ | 2,257,689 |
| | $ | 1,479,015 |
| | $ | 1,479,015 |
| | $ | 1,206,780 |
|
(1) Face value of real estate loans receivable is net of unfunded commitments. Carrying amount of real estate loans receivable includes loan loss reserves.
Disclosure of the fair value of financial instruments is based on pertinent information available to the Company as of December 31, 2011 and 2010, respectively, and requires a significant amount of judgment. The actual values of these investments could be materially different from the Company’s estimate of value.
Assets and Liabilities Recorded at Fair Value
During the year ended December 31, 2011, the Company measured the following assets and liabilities at fair value on a recurring basis (in thousands):
|
| | | | | | | | | | | | | | | |
| | | | Fair Value Measurements Using |
| | Total | | Quoted Prices in Active Markets for Identical Assets (Level 1) | | Significant Other Observable Inputs (Level 2) | | Significant Unobservable Inputs (Level 3) |
| Recurring Basis: | | | | | | | |
| Real estate securities | $ | 46,249 |
| | $ | — |
| | $ | — |
| | $ | 46,249 |
|
| Liability derivatives | $ | (1,463 | ) | | $ | — |
| | $ | (1,463 | ) | | $ | — |
|
| GKK Properties - contingent liability | $ | (11,951 | ) | | $ | — |
| | $ | — |
| | $ | (11,951 | ) |
During the year ended December 31, 2011, the Company measured the following assets and liabilities at fair value on a nonrecurring basis at the time each event occurred (in thousands):
|
| | | | | | | | | | | | | | | |
| | | | Fair Value Measurements Using |
| | Total | | Quoted Prices in Active Markets for Identical Assets (Level 1) | | Significant Other Observable Inputs (Level 2) | | Significant Unobservable Inputs (Level 3) |
Nonrecurring Basis (1): | | | | | | | |
| Impaired real estate - continuing operations | $ | 163,204 |
| | $ | — |
| | $ | — |
| | $ | 163,204 |
|
| Impaired real estate - discontinued operations | $ | 226,525 |
| | $ | — |
| | $ | — |
| | $ | 226,525 |
|
GKK Properties (2) | $ | 1,806,097 |
| | $ | — |
| | $ | — |
| | $ | 1,806,097 |
|
GKK Properties - mortgage debt assumed (2) (3) | $ | 1,509,673 |
| | $ | — |
| | $ | — |
| | $ | 1,509,673 |
|
| GKK Properties - pledged government securities | $ | 93,623 |
| | $ | — |
| | $ | — |
| | $ | 93,623 |
|
(1) Represent amounts at the time each event occurred.
(2) These include amounts related to the Citizens Bank Joint Venture, which was consolidated on October 24, 2011.
(3) Amount does not include the $34.3 million GKK Subordinated Mortgage Loan, which is eliminated in consolidated.
KBS REAL ESTATE INVESTMENT TRUST, INC.
NOTES TO CONSOLIDATED FINANCIAL STATEMENTS (CONTINUED)
December 31, 2011
When the Company has a collateral-dependent loan that is identified as being impaired, it is evaluated for impairment by comparing the estimated fair value of the underlying collateral, less costs to sell, to the carrying value of the loan. Due to the nature of the properties collateralizing the Company’s impaired collateral-dependent loans, the Company estimated the fair value of the collateral by using an internally developed valuation model that utilizes the income approach to valuing real estate. This approach requires the Company to make significant judgments with respect to capitalization rates, market rental rates, occupancy rates, and operating expenses that are considered Level 3 inputs.
When the Company has a loan that is identified as being impaired in connection with a troubled debt restructuring resulting from a concession granted by the Company to the borrower through a modification of the loan terms, the loan is evaluated for impairment by comparing the carrying value of the loan to the present value of the modified cash flow stream discounted at the rate used to recognize interest income. This rate may not be indicative of a market rate and, therefore, the resulting present value may not be considered to be a fair value. Thus, such financial assets involved in a troubled debt restructuring are not considered to be carried at fair value.
The Company estimated the fair value of impaired real estate by using a 10-year discounted cash flow analysis. The cash flow analysis utilized internally prepared cash flow estimates, terminal capitalization rates within historical average ranges and discount rates that fall within ranges the Company believes are used by market participants. The capitalization rate ranges and discount rate ranges were obtained from third-party service providers and the capitalization rate ranges were gathered for specific metro areas and applied on a property-by-property basis. The Company estimated the fair value of impaired real estate held for sale based on its estimated fair value less costs to sell.
The table below presents a reconciliation of the beginning and ending balances of financial instruments of the Company having recurring fair value measurements based on significant unobservable inputs (Level 3) for the year ended December 31, 2011 (in thousands):
|
| | | |
| Balance, December 31, 2010 | $ | 18,275 |
|
| Unrealized gain on real estate securities | 28,902 |
|
| Interest accretion on real estate securities | (928 | ) |
| Balance, December 31, 2011 | $ | 46,249 |
|
| Unrealized gain included in other comprehensive income | $ | 28,902 |
|
| |
| 13. | RELATED PARTY TRANSACTIONS |
The Company has entered into an Advisory Agreement with the Advisor that is in effect through November 8, 2012 and a Dealer Manager Agreement with the Dealer Manager. These agreements entitled the Advisor and/or the Dealer Manager to specified fees upon the provision of certain services with regard to the Offering and entitle the Advisor to specified fees upon management and disposition of investments, among other services, as well as reimbursement of organization and offering costs incurred by the Advisor, the Dealer Manager, and their affiliates on behalf of the Company and certain costs incurred by the Advisor in providing services to the Company. The Advisor and Dealer Manager also serve as the advisor and dealer manager, respectively, for KBS Real Estate Investment Trust II, Inc., KBS Real Estate Investment Trust III, Inc., KBS Strategic Opportunity REIT, Inc. and KBS Legacy Partners Apartment REIT, Inc. During the years ended December 31, 2011, 2010 and 2009, no transactions occurred between the Company and these other KBS-sponsored programs.
KBS REAL ESTATE INVESTMENT TRUST, INC.
NOTES TO CONSOLIDATED FINANCIAL STATEMENTS (CONTINUED)
December 31, 2011
Pursuant to the terms of the Advisory Agreement and Dealer Management Agreement, summarized below are the related-party costs incurred by the Company for the years ended December 31, 2011, 2010 and 2009, respectively, and any related amounts payable as of December 31, 2011 and 2010 (in thousands):
|
| | | | | | | | | | | | | | | | | | | |
| | Incurred | | Payable |
| | 2011 | | 2010 | | 2009 | | 2011 | | 2010 |
| Expensed | | | | | | | | | |
Asset management fees(1) | $ | 12,328 |
| | $ | 19,636 |
| | $ | 22,108 |
| | $ | — |
| | $ | 5,386 |
|
Reimbursement of operating expenses(2) | 94 |
| | 38 |
| | 292 |
| | — |
| | 9 |
|
| Disposition fees | 2,089 |
| | 726 |
| | — |
| | — |
| | — |
|
| Additional Paid-in Capital | | | | | | | | | |
| Selling commissions | 1,115 |
| | 1,160 |
| | 1,494 |
| | — |
| | — |
|
| Reimbursable other offering costs | — |
| | — |
| | 79 |
| | — |
| | — |
|
| Capitalized | | | | | | | | | |
Advances from Advisor(1) | — |
| | — |
| | — |
| | — |
| | 1,600 |
|
| | $ | 15,626 |
| | $ | 21,560 |
| | $ | 23,973 |
| | $ | — |
| | $ | 6,995 |
|
_____________________
(1) Amounts include asset management fees from discontinued operations totaling $(2.2) million, $4.4 million and $5.6 million for the years ended December 31, 2011, 2010 and 2009, respectively. On March 20, 2012, the Company entered into an amendment to the Advisory Agreement with the Advisor pursuant to which the Advisor agreed to forgive the debt related to the $1.6 million of advances and to waive the approximately $5.4 million of performance fees related to the National Industrial Portfolio.
(2) The Advisor may seek reimbursement for certain employee costs under the Advisory Agreement. Commencing July 1, 2010, the Company has reimbursed the Advisor for the Company’s allocable portion of the salaries, benefits and overhead of internal audit department personnel providing services to the Company. These amounts were the only employee costs reimbursed under the Advisory Agreement through December 31, 2011. The Company will not reimburse for employee costs in connection with services for which the Advisor earns acquisition, origination or disposition fees (other than reimbursement of travel and communication expenses) or for the salaries or benefits the Advisor or its affiliates may pay to the Company’s executive officers.
Advances from Advisor and Joint Venture Performance Fees
Pursuant to the Advisory Agreement, the Advisor agreed to advance funds to the Company equal to the amount by which the cumulative amount of distributions declared by the Company from January 1, 2006 through the period ending August 31, 2010 exceeded the amount of the Company’s cumulative Funds from Operations (as defined in the Advisory Agreement) from January 1, 2006 through August 31, 2010. The Advisor agreed that the Company would only be obligated to reimburse the Advisor for these advances if and to the extent that the Company’s cumulative Funds from Operations for the period commencing January 1, 2006 through the date of any such reimbursement exceeded the lesser of (i) the cumulative amount of any distributions declared and payable to the Company’s stockholders as of the date of such reimbursement or (ii) an amount that was equal to a 7.0% cumulative, non-compounded, annual return on invested capital for the Company’s stockholders for the period from July 18, 2006 through the date of such reimbursement. No interest accrued on the advance made by the Advisor. No amounts were advanced from January 2007 through December 31, 2011. The Advisory Agreement defines Funds from Operations as funds from operations as defined by the National Association of Real Estate Investment Trusts plus (i) any acquisition expenses and acquisition fees expensed by the Company and that are related to any property, loan or other investment acquired or expected to be acquired by the Company and (ii) any non-operating noncash charges incurred by the Company, such as impairments of property or loans, any other than temporary impairments of real estate securities, or other similar charges. The Company and the Advisor agreed that the Advisor would not extend the agreement to advance funds for distribution record dates after August 31, 2010.
KBS REAL ESTATE INVESTMENT TRUST, INC.
NOTES TO CONSOLIDATED FINANCIAL STATEMENTS (CONTINUED)
December 31, 2011
Pursuant to the Advisory Agreement, the Advisor earned a performance fee related to the Company’s former investment in the National Industrial Portfolio that would in effect make the Advisor’s cumulative fees related to the investment equal to 0.75% of the cost of the joint venture investment on an annualized basis from the date of the Company’s investment in the joint venture through the date of calculation. This fee was conditioned upon the amount of the Company’s Funds from Operations (as defined in the Advisory Agreement). The Company’s operations from the date of the Company’s investment through March 31, 2010 were sufficient to meet the Funds from Operations condition per the Advisory Agreement. Beginning in April 2010, the Company’s operations did not meet the Funds from Operations condition per the Advisory Agreement. As a result, as of December 31, 2011, the Company had accrued for incurred but unpaid performance fees of approximately $5.4 million from inception through March 31, 2010. Although these performance fees had been incurred as of December 31, 2011, the Advisory Agreement further provided that the payment of these fees could only be made after the repayment of advances from the Advisor.
As of December 31, 2011, the Company determined that it was unlikely that the Company would meet the requirements at any future date to be obligated to reimburse the Advisor for the advances and performance fees and wrote-off, as an increase to other income and a decrease to asset management fees related to discontinued operations, amounts due to affiliates of $1.6 million related to advances and $5.4 million related to previously accrued performance fees, respectively.
| |
| 14. | INVESTMENT IN UNCONSOLIDATED JOINT VENTURES |
HSC Partners Joint Venture
On July 8, 2009, the Company released the borrowers under two investments in mezzanine loans from liability and received preferred membership interests in a joint venture (the “HSC Partners Joint Venture”) that indirectly owns the properties that had served as collateral for the loans. The interests were initially recorded by the Company at a fair value of $0 based on the estimated fair value of the collateral at the time of receipt of the preferred membership interests. The Company accounts for its preferred membership interests in the HSC Partners Joint Venture under the equity method of accounting since the Company is not the primary beneficiary of the HSC Partners Joint Venture, but does have more than a minor interest. Since the Company will most likely only receive preferred distributions equivalent to the interest income it would have earned on its mezzanine loan investments, the Company’s application of the equity method of accounting to these preferred interests results in the Company recording all distributions received as income. The Company does not record its share of the changes in the book value of the HSC Partners Joint Venture as it is not required to absorb losses and does not expect increases in the book value of the HSC Partners Joint Venture to have any material impact on the cash flows it will receive over the course of the investment. On July 8, 2011, the members of the HSC Partners Joint Venture entered into an amendment to its joint venture operating agreement to convert another lender’s $30.0 million of outstanding mezzanine debt into preferred membership interests. The HSC Partners Joint Venture also agreed that any cash flows from the joint venture remaining after monthly debt service payments to existing mortgage and mezzanine lenders would be used to pay down principal. Accordingly, the Company does not expect to receive future income from its investment in the HSC Partners Joint Venture. During the years ended December 31, 2011, 2010 and 2009, the Company recognized $5.0 million, $7.7 million and $4.0 million, respectively, of preferred distributions as income from unconsolidated joint venture. On March 7, 2012, and effective as of February 1, 2012, the Company’s Conflicts Committee approved the termination of the payment of the asset management fee relating to the HSC Partners Joint Venture to the Advisor.
KBS REAL ESTATE INVESTMENT TRUST, INC.
NOTES TO CONSOLIDATED FINANCIAL STATEMENTS (CONTINUED)
December 31, 2011
| |
| 15. | SUPPLEMENTAL CASH FLOW AND SIGNIFICANT NONCASH TRANSACTION DISCLOSURES |
Supplemental cash flow and significant noncash transaction disclosures were as follows (in thousands):
|
| | | | | | | | | | | |
| | For the Years Ended December 31, |
| | 2011 | | 2010 | | 2009 |
| Supplemental Disclosure of Cash Flow Information: | | | | | |
| Interest paid | $ | 84,389 |
| | $ | 55,952 |
| | $ | 55,779 |
|
| Supplemental Disclosure of Significant Noncash Transactions: | | | | | |
Assets (liabilities) assumed in connection with the Settlement Agreement (1) | | | | | |
| Transfer of the GKK Properties | 1,827,553 |
| | — |
| | — |
|
| Restricted cash | 124,261 |
| | — |
| | — |
|
| Pledged government securities | 93,623 |
| | — |
| | — |
|
| Accounts receivable and assets | 37,524 |
| | — |
| | — |
|
| Liabilities related to the GKK Properties | (1,509,673 | ) | | — |
| | — |
|
| Accounts payable and other liabilities | (106,027 | ) | | — |
| | — |
|
| Real estate acquired through foreclosure | — |
| | 90,606 |
| | 40,750 |
|
| Liabilities assumed through foreclosure of real estate | — |
| | 52,483 |
| | — |
|
| Increase (Decrease) in distributions payable | 244 |
| | 263 |
| | (2,554 | ) |
| Increase in capital expenses payable | 191 |
| | — |
| | — |
|
| Distributions paid to common stockholders through common stock issuances pursuant to the dividend reinvestment plan | 46,492 |
| | 46,540 |
| | 58,235 |
|
_____________________
(1) These include amounts related to the Citizens Bank Joint Venture, which was consolidated on October 24, 2011.
KBS REAL ESTATE INVESTMENT TRUST, INC.
NOTES TO CONSOLIDATED FINANCIAL STATEMENTS (CONTINUED)
December 31, 2011
The Company presently operates in three business segments based on its investment types: real estate, real estate-related and commercial properties primarily leased to financial institutions received under the Settlement Agreement, or the GKK Properties. Under the real estate segment, the Company has invested primarily in office and industrial properties located throughout the United States. The real estate segment excludes all real estate sold or held for sale as of December 31, 2011. Under the real estate-related segment, the Company has invested in and originated mortgage loans, mezzanine loans and other real estate-related assets, including mortgage-backed securities and preferred membership interest investments. Under the GKK Properties segment (excluding GKK Properties held for sale), the Company has received transfers of the Equity Interests in the indirect owners of, or holders of a leasehold interest in, primarily office properties, bank branch properties and operations centers located in 34 states. All revenues earned from the Company’s three reporting segments were from external customers and there were no intersegment sales or transfers. The Company does not allocate corporate-level accounts to its reporting segments. Corporate-level accounts include corporate general and administrative expenses, non-operating interest income and other corporate-level expenses. The accounting policies of the reporting segments are consistent with those described in Note 2, “Summary of Significant Accounting Policies.”
The Company evaluates the performance of its segments based upon net operating income from continuing operations (“NOI”), which is a non-GAAP supplemental financial measure. The Company defines NOI for its real estate segment and the GKK Properties segment as operating revenues (rental income, tenant reimbursements and other operating income) less property and related expenses (property operating expenses, real estate taxes, insurance, asset management fees and provision for bad debt) less interest expense. The Company defines NOI for its real estate-related segment as interest income and income from its unconsolidated joint venture investment less loan servicing costs, asset management fees and interest expense. NOI excludes certain items that are not considered to be controllable in connection with the management of an asset such as non-property income and expenses, depreciation and amortization, and corporate general and administrative expenses. The Company uses NOI to evaluate the operating performance of the Company’s real estate investments, real estate-related investments and the GKK Properties segment and to make decisions about resource allocations. The Company believes that net income is the GAAP measure that is most directly comparable to NOI; however, NOI should not be considered as an alternative to net income as the primary indicator of operating performance as it excludes the items described above. Additionally, NOI as defined above may not be comparable to other REITs or companies as their definitions of NOI may differ from the Company’s definition.
KBS REAL ESTATE INVESTMENT TRUST, INC.
NOTES TO CONSOLIDATED FINANCIAL STATEMENTS (CONTINUED)
December 31, 2011
The following tables summarize total revenues and NOI for each reportable segment for the years ended December 31, 2011, 2010 and 2009, and total assets and total liabilities for each reportable segment as of December 31, 2011 and 2010 (in thousands):
|
| | | | | | | | | | | |
| | Years Ended December 31, |
| | 2011 | | 2010 | | 2009 |
| Revenues: | | | | | |
| Real estate segment | $ | 112,581 |
| | $ | 118,282 |
| | $ | 124,919 |
|
| Real estate-related segment | 16,240 |
| | 45,411 |
| | 59,668 |
|
| GKK Properties segment | 99,717 |
| | — |
| | — |
|
| Total revenues | $ | 228,538 |
| | $ | 163,693 |
| | $ | 184,587 |
|
| Interest Expense: | | | | | |
| Real estate segment | $ | 32,741 |
| | $ | 34,439 |
| | $ | 32,745 |
|
| Real estate-related segment | 7,808 |
| | 5,114 |
| | 5,542 |
|
| GKK Properties segment | 30,421 |
| | — |
| | — |
|
| Total interest expense | $ | 70,970 |
| | $ | 39,553 |
| | $ | 38,287 |
|
| NOI: | | | | | |
| Real estate segment | $ | 25,535 |
| | $ | 29,530 |
| | $ | 38,411 |
|
| Real estate-related segment | 8,244 |
| | 41,707 |
| | 50,367 |
|
| GKK Properties segment | 11,265 |
| | — |
| | — |
|
| Total NOI | $ | 45,044 |
| | $ | 71,237 |
| | $ | 88,778 |
|
| | | | | | |
| | December 31, | | |
| | 2011 | | 2010 | | |
Assets:(1) | | | | | |
| Real estate segment | $ | 974,126 |
| | $ | 1,350,729 |
| | |
| Real estate-related segment | 99,294 |
| | 568,149 |
| | |
| GKK Properties segment | 1,971,100 |
| | — |
| | |
| Total segment assets | 3,044,520 |
| | 1,918,878 |
| | |
| Real estate held for sale | 421,770 |
| | 329,953 |
| | |
| Foreclosed real estate held for sale | 28,848 |
| | 49,110 |
| | |
Corporate-level(2) | 9,650 |
| | 135,449 |
| | |
| Total assets | $ | 3,504,788 |
| | $ | 2,433,390 |
| | |
| Liabilities: | | | | | |
| Real estate segment | $ | 598,575 |
| | $ | 1,059,219 |
| | |
| Real estate-related segment | 6,863 |
| | 278,211 |
| | |
| GKK Properties segment | 1,691,261 |
| | — |
| | |
| Total segment liabilities | 2,296,699 |
| | 1,337,430 |
| | |
| Real estate held for sale | 337,940 |
| | 200,428 |
| | |
Corporate-level(3) | 9,892 |
| | 10,648 |
| | |
| Total liabilities | $ | 2,644,531 |
| | $ | 1,548,506 |
| | |
(1) The Company had $34.7 million and $20.8 million in additions to long-lived assets in the real estate and the GKK Properties segments during the years ended December 31, 2011 and 2010, respectively. There are no long-lived assets in the real estate-related segment.
(2) Total corporate-level assets consisted primarily of cash and cash equivalents of approximately $9.1 million and $135.3 million as of December 31, 2011 and 2010, respectively.
(3) As of December 31, 2011 and 2010, corporate-level liabilities consisted primarily of distributions payable.
KBS REAL ESTATE INVESTMENT TRUST, INC.
NOTES TO CONSOLIDATED FINANCIAL STATEMENTS (CONTINUED)
December 31, 2011
The following table reconciles the Company’s net income (loss) to its NOI for the years ended December 31, 2011, 2010 and 2009 (amounts in thousands):
|
| | | | | | | | | | | |
| | Years Ended December 31, |
| | 2011 | | 2010 | | 2009 |
| Net income (loss) | $ | 4,557 |
| | $ | (114,379 | ) | | $ | (186,335 | ) |
| Gain on sales of foreclosed real estate held for sale | (134 | ) | | (2,011 | ) | | — |
|
| Other income and other interest income | (1,703 | ) | | (112 | ) | | (126 | ) |
| General and administrative expenses | 20,232 |
| | 7,045 |
| | 6,697 |
|
| Depreciation and amortization | 82,310 |
| | 50,121 |
| | 60,034 |
|
| Impairment charge on real held for investment | 15,823 |
| | — |
| | — |
|
| Provision for loan losses | 11,999 |
| | 11,046 |
| | 178,813 |
|
| Other-than-temporary impairments of real estate securities | — |
| | — |
| | 5,067 |
|
| Total (income) loss from discontinued operations | (88,040 | ) | | 119,527 |
| | 24,628 |
|
| NOI | $ | 45,044 |
| | $ | 71,237 |
| | $ | 88,778 |
|
| |
| 17. | SELECTED QUARTERLY FINANCIAL DATA (UNAUDITED) |
Presented below is a summary of the unaudited quarterly financial information for the years ended December 31, 2011 and 2010 (in thousands, except per share amounts):
|
| | | | | | | | | | | | | | | | |
| | | 2011 |
| | | First Quarter | | Second Quarter | | Third Quarter | | Fourth Quarter |
| Revenues | | $ | 37,897 |
| | $ | 32,240 |
| | $ | 53,531 |
| | $ | 104,870 |
|
| Net income (loss) attributable to common stockholders | | $ | 941 |
| | $ | (28,379 | ) | | $ | (29,623 | ) | | $ | 37,723 |
|
| Income (loss) per common share, basic and diluted | | $ | 0.01 |
| | $ | (0.15 | ) | | $ | (0.16 | ) | | $ | 0.20 |
|
Distributions declared per common share (1) | | $ | 0.129 |
| | $ | 0.131 |
| | $ | 0.132 |
| | $ | 0.133 |
|
|
| | | | | | | | | | | | | | | | |
| | | 2010 |
| | | First Quarter | | Second Quarter | | Third Quarter | | Fourth Quarter |
| Revenues | | $ | 42,267 |
| | $ | 42,924 |
| | $ | 40,601 |
| | $ | 37,901 |
|
| Net income (loss) attributable to common stockholders | | $ | 4,418 |
| | $ | (95,706 | ) | | $ | 3,783 |
| | $ | (2,847 | ) |
| Income (loss) per common share, basic and diluted | | $ | 0.03 |
| | $ | (0.53 | ) | | $ | 0.02 |
| | $ | (0.02 | ) |
Distributions declared per common share (1) | | $ | 0.129 |
| | $ | 0.131 |
| | $ | 0.132 |
| | $ | 0.133 |
|
____________________
(1) Distributions declared per common shares assumes each share was issued and outstanding each day during the respective quarterly period from January 1, 2010 through December 31, 2011. Each day during the period from January 1, 2010 through December 31, 2011 was a record date for distributions. Distributions were calculated at a rate of $0.00143836 per share per day from January 1, 2010 through December 31, 2011.
KBS REAL ESTATE INVESTMENT TRUST, INC.
NOTES TO CONSOLIDATED FINANCIAL STATEMENTS (CONTINUED)
December 31, 2011
| |
| 18. | COMMITMENTS AND CONTINGENCIES |
Lease Obligations
Pursuant to the Settlement Agreement, the Company indirectly received leasehold interests in certain commercial properties. The property leases have expiration dates between 2012 and 2085 and the ground leases have expiration dates between 2012 and 2101. These lease obligations generally contain rent increases and renewal options. In certain instances, the rent owed by the Company to the owner of the property under the lease is greater than the revenue received by the Company from the tenants occupying the properties.
Future minimum lease payments owed by the Company under non-cancelable operating leases as of December 31, 2011 are as follows (in thousands):
|
| | | |
| 2012 | $ | 20,695 |
|
| 2013 | 20,356 |
|
| 2014 | 19,914 |
|
| 2015 | 19,256 |
|
| 2016 | 18,372 |
|
| Thereafter | 140,137 |
|
| | $ | 238,730 |
|
Economic Dependency
The Company is dependent on the Advisor for certain services that are essential to the Company, including the management of the Company’s real estate and real estate-related investment portfolio; the disposition of real estate and real estate-related investments; and other general and administrative responsibilities. In the event that the Advisor is unable to provide these services, the Company will be required to obtain such services from other sources. The Company is also dependent on GKK Stars or one of its affiliates for asset management services including the operations, leasing and eventual dispositions of the GKK Properties.
Environmental
As an owner of real estate, the Company is subject to various environmental laws of federal, state and local governments. Although there can be no assurance, the Company is not aware of any environmental liability that could have a material adverse effect on its financial condition or results of operations. However, changes in applicable environmental laws and regulations, the uses and conditions of properties in the vicinity of the Company’s properties, the activities of its tenants and other environmental conditions of which the Company is unaware with respect to the properties could result in future environmental liabilities.
Since under the Settlement Agreement, the Company indirectly took title to or, with respect to a limited number of the GKK Properties, indirectly took a leasehold interest in, the GKK Properties through the Transfers of Equity Interests, the GKK Properties were transferred to the Company on an “as is” basis. As such, the Company was not able to inspect the GKK Properties or conduct standard due diligence on certain of the GKK Properties before the Transfers. Additionally, the Company did not receive representations, warranties and indemnities relating to the GKK Properties from Gramercy and/or its affiliates. Thus, the value of the GKK Properties may decline if the Company subsequently discovers environmental problems with the GKK Properties.
Legal Matters
From time to time, the Company is party to legal proceedings that arise in the ordinary course of its business. Management is not aware of any legal proceedings of which the outcome is probable or reasonably possible to have a material adverse effect on its results of operations or financial condition, which would require accrual or disclosure of the contingency and possible range of loss. Additionally, the Company has not recorded any loss contingencies related to legal proceedings in which the potential loss is deemed to be remote.
KBS REAL ESTATE INVESTMENT TRUST, INC.
NOTES TO CONSOLIDATED FINANCIAL STATEMENTS (CONTINUED)
December 31, 2011
The Company evaluates subsequent events up until the date the consolidated financial statements are issued.
Distributions Paid
On January 13, 2012, the Company paid distributions of $8.5 million, which related to distributions declared for each day in the period from December 1, 2011 through December 31, 2011. On February 15, 2012, the Company paid distributions of $8.5 million, which related to distributions declared for each day in the period from January 1, 2012 through January 31, 2012.
Distributions Declared
On January 30, 2012, the Company’s board of directors declared distributions based on daily record dates for the period from February 1, 2012 through February 28, 2012, which the Company expects to pay on March 30, 2012. Investors may choose to receive cash distributions or purchase additional shares through the Company’s dividend reinvestment plan (which will terminate effective April 10, 2012).
Distributions for these periods will be calculated based on stockholders of record each day during these periods at a rate of $0.00143836 per share per day and equal a daily amount that, if paid each day for a 365-day period, would equal a 5.25% annualized rate based on a purchase price of $10.00 per share.
Amendment and Restatement of Share Redemption Program
On March 20, 2012, the Company’s board of directors amended and restated its share redemption program to provide only for redemptions sought upon a stockholder’s death, “qualifying disability” or “determination of incompetence” (each as defined in the share redemption program). Such redemptions are subject to an annual dollar limitation, which shall be $10.0 million in the aggregate for the calendar year 2012 (subject to review and adjustment during the year by the board of directors), and further subject to the limitations described in the share redemption program plan document. See Note 2, “Summary of Significant Accounting Policies — Share Redemption Program.”
Termination of Dividend Reinvestment Plan
Effective April 10, 2012, the Company’s board of directors terminated the Company’s dividend reinvestment plan.
Amendment to Advisory Agreement
On March 20, 2012, the Company entered into an amendment to the Advisory Agreement with the Advisor pursuant to which the Advisor agreed to forgive the debt related to certain advances from the Advisor to the Company in the amount of $1.6 million and to waive certain performance fees related to the National Industrial Portfolio joint venture owed by the Company to the Advisor in the amount of approximately $5.4 million. See Note 13, “Related Party Transactions — Advances from Advisor and Joint Venture Performance Fees.”
Disposition of Properties Subsequent to December 31, 2011
Subsequent to December 31, 2011 and through March 26, 2012, the Company sold three office properties, which were classified as held for sale as of December 31, 2011, for $120.5 million, which resulted in net sales proceeds after the repayment of debt outstanding of $44.4 million. The carrying value of these properties was $119.7 million resulting in a gain on sale of approximately $0.8 million. Additionally, the Company sold 13 of the GKK Properties, which were classified as held for sale as of December 31, 2011, consisting of seven bank branch properties and six office properties for $20.7 million, which resulted in net sales proceeds after the repayment of debt outstanding of $4.3 million. The net sales proceeds from the sales of the GKK Properties were used to repay debt outstanding under the Repurchase Agreements. The carrying value of these properties was $21.2 million resulting in a loss on sale of approximately $479,000.
KBS REAL ESTATE INVESTMENT TRUST, INC.
SCHEDULE II
VALUATION AND QUALIFYING ACCOUNTS
(in thousands)
|
| | | | | | | | | | | | | | | | |
| Description | | Balance at Beginning of Year | | Additions Charged Against Operations | | Uncollectible Accounts Written-off | | Balance at End of Year |
| Year Ended December 31, 2011 | | | | | | | | |
| Allowance for doubtful accounts | | $ | 617 |
| | $ | 2,207 |
| | $ | 2,183 |
| | $ | 5,007 |
|
| Reserve for loan losses | | 97,800 |
| | 11,740 |
| | (35,406 | ) | | 74,134 |
|
| | | | | | | | | |
| Year Ended December 31, 2010 | | | | | | | | |
| Allowance for doubtful accounts | | $ | 2,555 |
| | $ | 654 |
| | $ | (2,592 | ) | | $ | 617 |
|
| Reserve for loan losses | | 110,478 |
| | 11,046 |
| | (23,724 | ) | | 97,800 |
|
| | | | | | | | | |
| Year Ended December 31, 2009 | | | | | | | | |
| Allowance for doubtful accounts | | $ | 760 |
| | $ | 2,430 |
| | $ | (635 | ) | | $ | 2,555 |
|
| Reserve for loan losses | | 104,000 |
| | 178,634 |
| | (172,156 | ) | | 110,478 |
|
KBS REAL ESTATE INVESTMENT TRUST, INC.
SCHEDULE III
REAL ESTATE ASSETS AND ACCUMULATED DEPRECIATION AND AMORTIZATION
December 31, 2011
(dollar amounts in thousands) |
| | | | | | | | | | | | | | | | | | | | | | | | | | | | | | | | | | | | | | | | | | | | | |
| | | | | | | | | Initial Cost to Company | | | | Gross Amount at which Carried at Close of Period | | | | | | |
| Description | | Location | | Ownership Percent | | Encumbrances | | Land | | Building and Improvements (1) | | Total | | Cost Capitalized Subsequent to Acquisition | | Land | | Building and Improvements (1) | | Total (2) | | Accumulated Depreciation and Amortization | | Original Date of Construction | | Date Acquired |
| Properties Held for Investment | | | | | | | | | | | | | | | | | | | | | | | | | | |
| Plaza in Clayton | | Saint Louis, MO | | 100 | % | | $ | 62,200 |
| | $ | 2,793 |
| | $ | 91,162 |
| | $ | 93,955 |
| | $ | (2,198 | ) | | $ | 2,793 |
| | $ | 88,964 |
| | $ | 91,757 |
| | $ | (13,499 | ) | | 2001 | | 09/27/2006 |
| 825 University Avenue Building | | Norwood, MA | | 100 | % | | 19,000 |
| | 4,165 |
| | 27,087 |
| | 31,252 |
| | (9,030 | ) | | 3,676 |
| | 18,546 |
| | 22,222 |
| | — |
| | 2004/2006 | | 12/05/2006 |
| Crescent Green Buildings | | Cary, NC | | 100 | % | | 32,400 |
| | 6,200 |
| | 42,508 |
| | 48,708 |
| | (1,329 | ) | | 6,200 |
| | 41,179 |
| | 47,379 |
| | (8,539 | ) | | 1996/1997/1998 | | 01/31/2007 |
| Sabal VI Building | | Tampa, FL | | 100 | % | | 7,500 |
| | 2,600 |
| | 14,917 |
| | 17,517 |
| | (192 | ) | | 2,600 |
| | 14,725 |
| | 17,325 |
| | (2,551 | ) | | 1988 | | 03/05/2007 |
| Royal Ridge Building | | Alpharetta, GA | | 100 | % | | 21,718 |
| | 3,500 |
| | 33,166 |
| | 36,666 |
| | (3,249 | ) | | 3,500 |
| | 29,917 |
| | 33,417 |
| | (6,199 | ) | | 2001 | | 06/21/2007 |
| Bridgeway Technology Center | | Newark, CA | | 100 | % | | 26,824 |
| | 11,299 |
| | 34,705 |
| | 46,004 |
| | (3,500 | ) | | 11,299 |
| | 31,205 |
| | 42,504 |
| | (3,671 | ) | | 1996 | | 06/27/2007 |
Opus National Industrial Portfolio (3) | | Various | | 100 | % | | 27,778 |
| | 7,634 |
| | 52,761 |
| | 60,395 |
| | (10,285 | ) | | 6,786 |
| | 43,324 |
| | 50,110 |
| | (3,124 | ) | | Various | | 07/25/2007 |
| Plano Corporate Center I & II | | Plano, TX | | 100 | % | | 30,591 |
| | 5,344 |
| | 45,273 |
| | 50,617 |
| | (11,323 | ) | | 4,857 |
| | 34,437 |
| | 39,294 |
| | (184 | ) | | 1999/2001 | | 08/28/2007 |
| ADP Plaza | | Portland, OR | | 100 | % | | 20,900 |
| | 5,100 |
| | 28,755 |
| | 33,855 |
| | (994 | ) | | 5,100 |
| | 27,761 |
| | 32,861 |
| | (3,305 | ) | | 1981 | | 11/07/2007 |
| Woodfield Preserve Office Center | | Schaumburg, IL | | 100 | % | | 55,000 |
| | 7,001 |
| | 121,603 |
| | 128,604 |
| | (3,238 | ) | | 7,001 |
| | 118,365 |
| | 125,366 |
| | (23,106 | ) | | 2001 | | 11/13/2007 |
| Nashville Flex Portfolio | | Nashville, TN | | 100 | % | | 25,633 |
| | 8,350 |
| | 46,441 |
| | 54,791 |
| | (6,458 | ) | | 7,991 |
| | 40,342 |
| | 48,333 |
| | (3,152 | ) | | Various | | 11/15/2007 |
| Patrick Henry Corporate Center | | Newport News, VA | | 100 | % | | 8,773 |
| | 5,050 |
| | 13,900 |
| | 18,950 |
| | (2,796 | ) | | 4,781 |
| | 11,373 |
| | 16,154 |
| | — |
| | 1989 | | 11/29/2007 |
| South Towne Corporate Center I and II | | Sandy, UT | | 100 | % | | 27,500 |
| | 4,600 |
| | 45,921 |
| | 50,521 |
| | (8,541 | ) | | 4,412 |
| | 37,568 |
| | 41,980 |
| | — |
| | 1999/2006 | | 11/30/2007 |
| Rivertech I and II | | Billerica, MA | | 100 | % | | 21,578 |
| | 3,931 |
| | 42,111 |
| | 46,042 |
| | 19 |
| | 3,931 |
| | 42,130 |
| | 46,061 |
| | (7,873 | ) | | 1983/2001,2007 | | 02/20/2008 |
| Millennium I Building | | Addison, TX | | 100 | % | | 30,000 |
| | 3,350 |
| | 71,657 |
| | 75,007 |
| | (38 | ) | | 3,350 |
| | 71,619 |
| | 74,969 |
| | (8,866 | ) | | 2000 | | 06/05/2008 |
| Tysons Dulles Plaza | | McLean, VA | | 100 | % | | 76,375 |
| | 38,839 |
| | 121,210 |
| | 160,049 |
| | 1,510 |
| | 38,839 |
| | 122,720 |
| | 161,559 |
| | (17,877 | ) | | 1986-1990 | | 06/06/2008 |
| Great Oaks Center | | Alpharetta, GA | | 100 | % | | 16,684 |
| | 7,743 |
| | 28,330 |
| | 36,073 |
| | (813 | ) | | 7,618 |
| | 27,642 |
| | 35,260 |
| | (3,526 | ) | | 1999 | | 07/18/2008 |
| University Park Buildings | | Sacramento, CA | | 100 | % | | 12,729 |
| | 4,520 |
| | 22,029 |
| | 26,549 |
| | (853 | ) | | 4,520 |
| | 21,176 |
| | 25,696 |
| | (2,284 | ) | | 1981 | | 07/31/2008 |
| Meridian Tower | | Tulsa, OK | | 100 | % | | 12,403 |
| | 2,050 |
| | 16,728 |
| | 18,778 |
| | (233 | ) | | 2,050 |
| | 16,495 |
| | 18,545 |
| | (3,280 | ) | | 1982 | | 08/18/2008 |
| North Creek Parkway Center | | Bothell, WA | | 100 | % | | 23,768 |
| | 11,200 |
| | 30,755 |
| | 41,955 |
| | (375 | ) | | 11,200 |
| | 30,380 |
| | 41,580 |
| | (3,600 | ) | | 1986-1987 | | 08/28/2008 |
| City Gate Plaza | | Sacramento, CA | | 100 | % | | 11,100 |
| | 2,880 |
| | 18,895 |
| | 21,775 |
| | (319 | ) | | 2,880 |
| | 18,576 |
| | 21,456 |
| | (3,022 | ) | | 1988-1990 | | 11/25/2008 |
| Independence - Main Building - 0104 | | Charlotte, NC | | 100 | % | | 70,961 |
| | 6,112 |
| | 66,908 |
| | 73,020 |
| | 601 |
| | 6,112 |
| | 67,509 |
| | 73,621 |
| | (1,219 | ) | | 1983 | | 09/01/2011 |
| Orange City | | Orange City, FL | | 100 | % | | (4) | | 294 |
| | 1,107 |
| | 1,401 |
| | — |
| | 294 |
| | 1,107 |
| | 1,401 |
| | (23 | ) | | 1987 | | 09/01/2011 |
| Barbee Chapel Road | | Chapel Hill, NC | | 100 | % | | (4) | | 117 |
| | 610 |
| | 727 |
| | — |
| | 117 |
| | 610 |
| | 727 |
| | (9 | ) | | 2005 | | 09/01/2011 |
| Bernwood Park | | Bonita Springs, FL | | 100 | % | | (4) | | 1,106 |
| | 1,891 |
| | 2,997 |
| | — |
| | 1,106 |
| | 1,891 |
| | 2,997 |
| | (28 | ) | | 2003 | | 09/01/2011 |
| Charlotte Harbor Office | | Port Charlotte, FL | | 100 | % | | (4) | | 191 |
| | 633 |
| | 824 |
| | — |
| | 191 |
| | 633 |
| | 824 |
| | (18 | ) | | 1981 | | 09/01/2011 |
| Cypress Point | | Palm Coast, FL | | 100 | % | | (4) | | 984 |
| | 2,456 |
| | 3,440 |
| | — |
| | 984 |
| | 2,456 |
| | 3,440 |
| | (39 | ) | | 1995 | | 09/01/2011 |
| Hudson Office | | Hudson, FL | | 100 | % | | (4) | | 1,000 |
| | 2,478 |
| | 3,478 |
| | — |
| | 1,000 |
| | 2,478 |
| | 3,478 |
| | (49 | ) | | 1978 | | 09/01/2011 |
| Marco Island Office | | Marco Island, FL | | 100 | % | | (4) | | 768 |
| | 2,021 |
| | 2,789 |
| | — |
| | 768 |
| | 2,021 |
| | 2,789 |
| | (52 | ) | | 1967 | | 09/01/2011 |
| North Lockwood Ridge | | Sarasota, FL | | 100 | % | | (4) | | 468 |
| | 1,231 |
| | 1,699 |
| | — |
| | 468 |
| | 1,231 |
| | 1,699 |
| | (17 | ) | | 2000 | | 09/01/2011 |
| West Bradenton | | Bradenton, FL | | 100 | % | | (4) | | 382 |
| | 1,368 |
| | 1,750 |
| | — |
| | 382 |
| | 1,368 |
| | 1,750 |
| | (26 | ) | | 1989 | | 09/01/2011 |
| Cheshire Sheridan | | Atlanta, GA | | 100 | % | | (4) | | 861 |
| | 2,261 |
| | 3,122 |
| | — |
| | 861 |
| | 2,261 |
| | 3,122 |
| | (59 | ) | | 1971 | | 09/01/2011 |
KBS REAL ESTATE INVESTMENT TRUST, INC.
SCHEDULE III
REAL ESTATE ASSETS AND ACCUMULATED DEPRECIATION AND AMORTIZATION (CONTINUED)
December 31, 2011
(dollar amounts in thousands)
|
| | | | | | | | | | | | | | | | | | | | | | | | | | | | | | | | | | | | | | | | | | | | | |
| | | | | | | | | Initial Cost to Company | | | | Gross Amount at which Carried at Close of Period | | | | | | |
| Description | | Location | | Ownership Percent | | Encumbrances | | Land | | Building and Improvements (1) | | Total | | Cost Capitalized Subsequent to Acquisition | | Land | | Building and Improvements (1) | | Total (2) | | Accumulated Depreciation and Amortization | | Original Date of Construction | | Date Acquired |
| Edgewood | | Columbus, GA | | 100 | % | | (4) | | $ | 146 |
| | $ | 387 |
| | $ | 533 |
| | $ | (1 | ) | | $ | 146 |
| | $ | 386 |
| | $ | 532 |
| | $ | (18 | ) | | 1974 | | 09/01/2011 |
| University Place Office | | Charlotte, NC | | 100 | % | | (4) | | 862 |
| | 1,990 |
| | 2,852 |
| | — |
| | 862 |
| | 1,990 |
| | 2,852 |
| | (36 | ) | | 1993 | | 09/01/2011 |
| Forest Drive Office | | Columbia, SC | | 100 | % | | (4) | | 363 |
| | 1,035 |
| | 1,398 |
| | — |
| | 363 |
| | 1,035 |
| | 1,398 |
| | (20 | ) | | 1996 | | 09/01/2011 |
| Land O'Lakes Office | | Lutz, FL | | 100 | % | | (4) | | 431 |
| | 1,764 |
| | 2,195 |
| | — |
| | 431 |
| | 1,764 |
| | 2,195 |
| | (33 | ) | | 1988 | | 09/01/2011 |
| West Placerville Branch | | Placerville, CA | | 100 | % | | (4) | | 388 |
| | 873 |
| | 1,261 |
| | — |
| | 388 |
| | 873 |
| | 1,261 |
| | (30 | ) | | 1984 | | 09/01/2011 |
| New Smyrna Beach East | | New Smyrna Beach, FL | | 100 | % | | (5) | | 472 |
| | 861 |
| | 1,333 |
| | — |
| | 472 |
| | 861 |
| | 1,333 |
| | (19 | ) | | 1983 | | 09/01/2011 |
| Hamilton Square | | Hamilton Square, NJ | | 100 | % | | (5) | | 361 |
| | 1,251 |
| | 1,612 |
| | — |
| | 361 |
| | 1,251 |
| | 1,612 |
| | (51 | ) | | 1940 | | 09/01/2011 |
| East Commercial Blvd (Relo) | | Fort Lauderdale, FL | | 100 | % | | (5) | | 523 |
| | 1,857 |
| | 2,380 |
| | — |
| | 523 |
| | 1,857 |
| | 2,380 |
| | (48 | ) | | 1975 | | 09/01/2011 |
| Largo Office | | Largo, FL | | 100 | % | | (5) | | 757 |
| | 1,577 |
| | 2,334 |
| | — |
| | 757 |
| | 1,577 |
| | 2,334 |
| | (38 | ) | | 1980 | | 09/01/2011 |
| New Citrus Park | | Tampa, FL | | 100 | % | | (5) | | 853 |
| | 2,069 |
| | 2,922 |
| | — |
| | 853 |
| | 2,069 |
| | 2,922 |
| | (28 | ) | | 2001 | | 09/01/2011 |
| Providence Square | | Marietta, GA | | 100 | % | | (5) | | 536 |
| | 1,573 |
| | 2,109 |
| | — |
| | 536 |
| | 1,573 |
| | 2,109 |
| | (32 | ) | | 1982 | | 09/01/2011 |
| Ashley Village | | Cary, NC | | 100 | % | | (5) | | 428 |
| | 1,373 |
| | 1,801 |
| | — |
| | 428 |
| | 1,373 |
| | 1,801 |
| | (22 | ) | | 1996 | | 09/01/2011 |
| West Market Street | | Greensboro, NC | | 100 | % | | (5) | | 304 |
| | 1,034 |
| | 1,338 |
| | — |
| | 304 |
| | 1,034 |
| | 1,338 |
| | (16 | ) | | 1996 | | 09/01/2011 |
| Harbison Office | | Irmo, SC | | 100 | % | | (5) | | 369 |
| | 1,338 |
| | 1,707 |
| | — |
| | 369 |
| | 1,338 |
| | 1,707 |
| | (23 | ) | | 1994 | | 09/01/2011 |
| Virginia Beach Shore Drive | | Virginia Beach, VA | | 100 | % | | (5) | | 276 |
| | 1,593 |
| | 1,869 |
| | — |
| | 276 |
| | 1,593 |
| | 1,869 |
| | (31 | ) | | 1979 | | 09/01/2011 |
| Cypress Lake Drive | | Fort Myers, FL | | 100 | % | | (5) | | 795 |
| | 1,829 |
| | 2,624 |
| | — |
| | 795 |
| | 1,829 |
| | 2,624 |
| | (27 | ) | | 1998 | | 09/01/2011 |
| Woodstock Crossing | | Woodstock, GA | | 100 | % | | (5) | | 606 |
| | 1,376 |
| | 1,982 |
| | — |
| | 606 |
| | 1,376 |
| | 1,982 |
| | (27 | ) | | 1994 | | 09/01/2011 |
| The Avenues | | Jacksonville, FL | | 100 | % | | (5) | | 438 |
| | 1,163 |
| | 1,601 |
| | — |
| | 438 |
| | 1,163 |
| | 1,601 |
| | (18 | ) | | 1999 | | 09/01/2011 |
| Roseville Branch | | Roseville, CA | | 100 | % | | (5) | | 655 |
| | 1,870 |
| | 2,525 |
| | — |
| | 655 |
| | 1,870 |
| | 2,525 |
| | (46 | ) | | 1987 | | 09/01/2011 |
| Valley Springs | | Valley Springs, CA | | 100 | % | | (5) | | 123 |
| | 886 |
| | 1,009 |
| | — |
| | 123 |
| | 886 |
| | 1,009 |
| | (19 | ) | | 1992 | | 09/01/2011 |
| Lake Community Bank | | Lakeport, CA | | 100 | % | | (5) | | 564 |
| | 2,211 |
| | 2,775 |
| | — |
| | 564 |
| | 2,211 |
| | 2,775 |
| | (53 | ) | | 1994 | | 09/01/2011 |
| Park Hill | | N. Little Rock, AR | | 100 | % | | (6) | | 175 |
| | 691 |
| | 866 |
| | — |
| | 175 |
| | 691 |
| | 866 |
| | (27 | ) | | 1965 | | 09/01/2011 |
| Holiday | | Holiday, FL | | 100 | % | | (6) | | 734 |
| | 1,324 |
| | 2,058 |
| | — |
| | 734 |
| | 1,324 |
| | 2,058 |
| | (46 | ) | | 1973 | | 09/01/2011 |
| Village Circle | | Chapel Hill, NC | | 100 | % | | (6) | | 367 |
| | 2,312 |
| | 2,679 |
| | — |
| | 367 |
| | 2,312 |
| | 2,679 |
| | (52 | ) | | 2005 | | 09/01/2011 |
| Bloomingdale | | Brandon, FL | | 100 | % | | (6) | | 379 |
| | 787 |
| | 1,166 |
| | — |
| | 379 |
| | 787 |
| | 1,166 |
| | (21 | ) | | 1980 | | 09/01/2011 |
| Cedar Shores Office | | Ocala, FL | | 100 | % | | (6) | | 749 |
| | 943 |
| | 1,692 |
| | — |
| | 749 |
| | 943 |
| | 1,692 |
| | (18 | ) | | 1990 | | 09/01/2011 |
| Grove City Office | | Grove City, FL | | 100 | % | | (6) | | 536 |
| | 1,217 |
| | 1,753 |
| | — |
| | 536 |
| | 1,217 |
| | 1,753 |
| | (24 | ) | | 1978 | | 09/01/2011 |
| Bluegrass Office | | Alpharetta, GA | | 100 | % | | (6) | | 595 |
| | 1,521 |
| | 2,116 |
| | — |
| | 595 |
| | 1,521 |
| | 2,116 |
| | (24 | ) | | 1997 | | 09/01/2011 |
| LaVista Road | | Tucker, GA | | 100 | % | | (6) | | 659 |
| | 1,225 |
| | 1,884 |
| | — |
| | 659 |
| | 1,225 |
| | 1,884 |
| | (24 | ) | | 2002 | | 09/01/2011 |
| Garner Office | | Garner, NC | | 100 | % | | (6) | | 526 |
| | 1,372 |
| | 1,898 |
| | — |
| | 526 |
| | 1,372 |
| | 1,898 |
| | (21 | ) | | 1998 | | 09/01/2011 |
| James Island | | Charleston, SC | | 100 | % | | (6) | | 665 |
| | 1,258 |
| | 1,923 |
| | — |
| | 665 |
| | 1,258 |
| | 1,923 |
| | (20 | ) | | 1999 | | 09/01/2011 |
| Chester | | Chester, VA | | 100 | % | | (6) | | 187 |
| | 368 |
| | 555 |
| | — |
| | 187 |
| | 368 |
| | 555 |
| | (12 | ) | | 1986 | | 09/01/2011 |
| Haddonfield - Kings | | Haddonfield, NJ | | 100 | % | | (6) | | 196 |
| | 914 |
| | 1,110 |
| | — |
| | 196 |
| | 914 |
| | 1,110 |
| | (14 | ) | | 1986 | | 09/01/2011 |
| Staples Mill | | Richmond, VA | | 100 | % | | (6) | | 368 |
| | 737 |
| | 1,105 |
| | (1 | ) | | 368 |
| | 736 |
| | 1,104 |
| | (24 | ) | | 1974 | | 09/01/2011 |
KBS REAL ESTATE INVESTMENT TRUST, INC.
SCHEDULE III
REAL ESTATE ASSETS AND ACCUMULATED DEPRECIATION AND AMORTIZATION (CONTINUED)
December 31, 2011
(dollar amounts in thousands)
|
| | | | | | | | | | | | | | | | | | | | | | | | | | | | | | | | | | | | | | | | | | | | | |
| | | | | | | | | Initial Cost to Company | | | | Gross Amount at which Carried at Close of Period | | | | | | |
| Description | | Location | | Ownership Percent | | Encumbrances | | Land | | Building and Improvements (1) | | Total | | Cost Capitalized Subsequent to Acquisition | | Land | | Building and Improvements (1) | | Total (2) | | Accumulated Depreciation and Amortization | | Original Date of Construction | | Date Acquired |
| Cameron Park | | Cameron Park, CA | | 100 | % | | (6) | | $ | 454 |
| | $ | 1,566 |
| | $ | 2,020 |
| | $ | (1 | ) | | $ | 454 |
| | $ | 1,565 |
| | $ | 2,019 |
| | $ | (37 | ) | | 1993 | | 09/01/2011 |
| Sonora - Branch | | Sonora, CA | | 100 | % | | (6) | | 27 |
| | 1,284 |
| | 1,311 |
| | — |
| | 27 |
| | 1,284 |
| | 1,311 |
| | (33 | ) | | 1980 | | 09/01/2011 |
| Simpsonville Main Office | | Simpsonville, SC | | 100 | % | | (7) | | 292 |
| | 677 |
| | 969 |
| | — |
| | 292 |
| | 677 |
| | 969 |
| | (20 | ) | | 1981 | | 09/01/2011 |
| Banner Elk | | Banner Elk, NC | | 100 | % | | (7) | | 221 |
| | 492 |
| | 713 |
| | — |
| | 221 |
| | 492 |
| | 713 |
| | (19 | ) | | 1985 | | 09/01/2011 |
| 47th Terrace Office | | Cape Coral, FL | | 100 | % | | (7) | | 567 |
| | 1,509 |
| | 2,076 |
| | — |
| | 567 |
| | 1,509 |
| | 2,076 |
| | (22 | ) | | 1986 | | 09/01/2011 |
| Altamonte Crossing Office | | Altamonte Springs, FL | | 100 | % | | (7) | | 799 |
| | 1,254 |
| | 2,053 |
| | — |
| | 799 |
| | 1,254 |
| | 2,053 |
| | (25 | ) | | 1992 | | 09/01/2011 |
| Bradenton City | | Bradenton, FL | | 100 | % | | (7) | | 674 |
| | 1,097 |
| | 1,771 |
| | — |
| | 674 |
| | 1,097 |
| | 1,771 |
| | (15 | ) | | 1999 | | 09/01/2011 |
| Brandon | | Brandon, FL | | 100 | % | | (7) | | 373 |
| | 1,022 |
| | 1,395 |
| | — |
| | 373 |
| | 1,022 |
| | 1,395 |
| | (23 | ) | | 1981 | | 09/01/2011 |
| Cordova Office - Pensacola | | Pensacola, FL | | 100 | % | | (7) | | 270 |
| | 759 |
| | 1,029 |
| | — |
| | 270 |
| | 759 |
| | 1,029 |
| | (14 | ) | | 1986 | | 09/01/2011 |
| Deerfield Beach (H.S.) | | Deerfield Beach, FL | | 100 | % | | (7) | | 1,239 |
| | 2,278 |
| | 3,517 |
| | — |
| | 1,239 |
| | 2,278 |
| | 3,517 |
| | (35 | ) | | 1986 | | 09/01/2011 |
| Holly Hill Office | | Holly Hill, FL | | 100 | % | | (7) | | 301 |
| | 756 |
| | 1,057 |
| | — |
| | 301 |
| | 756 |
| | 1,057 |
| | (23 | ) | | 1961 | | 09/01/2011 |
| Sawgrass | | Plantation, FL | | 100 | % | | (7) | | 1,094 |
| | 1,345 |
| | 2,439 |
| | — |
| | 1,094 |
| | 1,345 |
| | 2,439 |
| | (25 | ) | | 1995 | | 09/01/2011 |
| Vero-West (1st Am.) | | Vero Beach, FL | | 100 | % | | (7) | | 344 |
| | 1,011 |
| | 1,355 |
| | — |
| | 344 |
| | 1,011 |
| | 1,355 |
| | (32 | ) | | 1984 | | 09/01/2011 |
| Lilburn Office | | Lilburn, GA | | 100 | % | | (7) | | 493 |
| | 870 |
| | 1,363 |
| | — |
| | 493 |
| | 870 |
| | 1,363 |
| | (21 | ) | | 1986 | | 09/01/2011 |
| Stonehenge Office | | Raleigh, NC | | 100 | % | | (7) | | 766 |
| | 1,485 |
| | 2,251 |
| | — |
| | 766 |
| | 1,485 |
| | 2,251 |
| | (23 | ) | | 1994 | | 09/01/2011 |
| Centerville | | Manakin-Sabot, VA | | 100 | % | | (7) | | 797 |
| | 832 |
| | 1,629 |
| | — |
| | 797 |
| | 832 |
| | 1,629 |
| | (22 | ) | | 1973 | | 09/01/2011 |
| El Dorado Hills Branch | | El Dorado Hills, CA | | 100 | % | | (7) | | 618 |
| | 1,548 |
| | 2,166 |
| | — |
| | 618 |
| | 1,548 |
| | 2,166 |
| | (38 | ) | | 2000 | | 09/01/2011 |
| Sutter Creek | | Sutter Creek, CA | | 100 | % | | (7) | | 215 |
| | 522 |
| | 737 |
| | — |
| | 215 |
| | 522 |
| | 737 |
| | (16 | ) | | 1984 | | 09/01/2011 |
| 801 Market Associates | | Philadelphia, PA | | 100 | % | | 38,468 |
| | 6,325 |
| | 32,306 |
| | 38,631 |
| | — |
| | 6,325 |
| | 32,306 |
| | 38,631 |
| | (1,610 | ) | | 1928/2002 | | 09/01/2011 |
| Camelback Uptown - Main Bldg | | Phoenix, AZ | | 100 | % | | (8) | | — |
| | 472 |
| | 472 |
| | — |
| | — |
| | 472 |
| | 472 |
| | (15 | ) | | 1971 | | 09/01/2011 |
| Camelback - BOA Center | | Phoenix, AZ | | 100 | % | | (8) | | — |
| | 7,168 |
| | 7,168 |
| | — |
| | — |
| | 7,168 |
| | 7,168 |
| | (130 | ) | | 1989 | | 09/01/2011 |
| Catalina - BOA Center | | Phoenix, AZ | | 100 | % | | (8) | | — |
| | 21,167 |
| | 21,167 |
| | — |
| | — |
| | 21,167 |
| | 21,167 |
| | (336 | ) | | 1989/2005 | | 09/01/2011 |
| Maricopa - BOA Center | | Phoenix, AZ | | 100 | % | | (8) | | — |
| | 7,103 |
| | 7,103 |
| | — |
| | — |
| | 7,103 |
| | 7,103 |
| | (137 | ) | | 1989 | | 09/01/2011 |
| McDowell - BOA Center | | Phoenix, AZ | | 100 | % | | (8) | | — |
| | 7,008 |
| | 7,008 |
| | 18 |
| | — |
| | 7,026 |
| | 7,026 |
| | (126 | ) | | 1989 | | 09/01/2011 |
| Mesa Main - Main Building | | Mesa, AZ | | 100 | % | | (8) | | 1,213 |
| | 1,305 |
| | 2,518 |
| | — |
| | 1,213 |
| | 1,305 |
| | 2,518 |
| | (35 | ) | | 1980 | | 09/01/2011 |
| South Mountain - Bank of America | | Phoenix, AZ | | 100 | % | | (8) | | — |
| | 19,172 |
| | 19,172 |
| | — |
| | — |
| | 19,172 |
| | 19,172 |
| | (283 | ) | | 1996 | | 09/01/2011 |
| Auburn | | Auburn, CA | | 100 | % | | (8) | | 461 |
| | 724 |
| | 1,185 |
| | 83 |
| | 461 |
| | 807 |
| | 1,268 |
| | (27 | ) | | 1968/1979 | | 09/01/2011 |
| Bixby - Atlantic | | Long Beach, CA | | 100 | % | | (8) | | 476 |
| | 692 |
| | 1,168 |
| | — |
| | 476 |
| | 692 |
| | 1,168 |
| | (21 | ) | | 1955 | | 09/01/2011 |
| Calwa | | Fresno, CA | | 100 | % | | (8) | | 837 |
| | 734 |
| | 1,571 |
| | — |
| | 837 |
| | 734 |
| | 1,571 |
| | (29 | ) | | 1981 | | 09/01/2011 |
| Cedar & Shields | | Fresno, CA | | 100 | % | | (8) | | 680 |
| | 1,035 |
| | 1,715 |
| | — |
| | 680 |
| | 1,035 |
| | 1,715 |
| | (31 | ) | | 1981 | | 09/01/2011 |
| Coronado Branch | | Coronado, CA | | 100 | % | | (8) | | 619 |
| | 2,556 |
| | 3,175 |
| | — |
| | 619 |
| | 2,556 |
| | 3,175 |
| | (66 | ) | | 1983 | | 09/01/2011 |
| East Bakersfield Office | | Bakersfield, CA | | 100 | % | | (8) | | 612 |
| | 805 |
| | 1,417 |
| | 162 |
| | 612 |
| | 967 |
| | 1,579 |
| | (32 | ) | | 1900 | | 09/01/2011 |
| East Compton Branch | | Compton, CA | | 100 | % | | (8) | | 611 |
| | 539 |
| | 1,150 |
| | — |
| | 611 |
| | 539 |
| | 1,150 |
| | (23 | ) | | 1961 | | 09/01/2011 |
| El Segundo | | El Segundo, CA | | 100 | % | | (8) | | 694 |
| | 625 |
| | 1,319 |
| | (1 | ) | | 694 |
| | 624 |
| | 1,318 |
| | (25 | ) | | 1980 | | 09/01/2011 |
KBS REAL ESTATE INVESTMENT TRUST, INC.
SCHEDULE III
REAL ESTATE ASSETS AND ACCUMULATED DEPRECIATION AND AMORTIZATION (CONTINUED)
December 31, 2011
(dollar amounts in thousands)
|
| | | | | | | | | | | | | | | | | | | | | | | | | | | | | | | | | | | | | | | | | | | | | |
| | | | | | | | | Initial Cost to Company | | | | Gross Amount at which Carried at Close of Period | | | | | | |
| Description | | Location | | Ownership Percent | | Encumbrances | | Land | | Building and Improvements (1) | | Total | | Cost Capitalized Subsequent to Acquisition | | Land | | Building and Improvements (1) | | Total (2) | | Accumulated Depreciation and Amortization | | Original Date of Construction | | Date Acquired |
| Escondido Main Office | | Escondido, CA | | 100 | % | | (8) | | $ | 531 |
| | $ | 1,672 |
| | $ | 2,203 |
| | $ | (1 | ) | | $ | 531 |
| | $ | 1,671 |
| | $ | 2,202 |
| | $ | (40 | ) | | 1978 | | 09/01/2011 |
| Fresno Proof/Vault | | Fresno, CA | | 100 | % | | (8) | | 447 |
| | 1,606 |
| | 2,053 |
| | — |
| | 447 |
| | 1,606 |
| | 2,053 |
| | (42 | ) | | 1965 | | 09/01/2011 |
| Gardena Main | | Gardena, CA | | 100 | % | | (8) | | 1,248 |
| | 1,514 |
| | 2,762 |
| | 89 |
| | 1,248 |
| | 1,603 |
| | 2,851 |
| | (42 | ) | | 1979/1983 | | 09/01/2011 |
| Glendale Main | | Glendale, CA | | 100 | % | | (8) | | 831 |
| | 3,030 |
| | 3,861 |
| | — |
| | 831 |
| | 3,030 |
| | 3,861 |
| | (77 | ) | | 1968 | | 09/01/2011 |
| Inglewood Main Office | | Inglewood, CA | | 100 | % | | (8) | | 1,071 |
| | 1,021 |
| | 2,092 |
| | — |
| | 1,071 |
| | 1,021 |
| | 2,092 |
| | (29 | ) | | 1948 | | 09/01/2011 |
| Inland Empire Cash Vault | | Ontario, CA | | 100 | % | | (8) | | 1,736 |
| | 3,930 |
| | 5,666 |
| | — |
| | 1,736 |
| | 3,930 |
| | 5,666 |
| | (91 | ) | | 1988 | | 09/01/2011 |
| Irvine Industrial | | Newport Beach, CA | | 100 | % | | (8) | | 533 |
| | 1,654 |
| | 2,187 |
| | — |
| | 533 |
| | 1,654 |
| | 2,187 |
| | (41 | ) | | 1969 | | 09/01/2011 |
| Lincoln Heights | | Los Angeles, CA | | 100 | % | | (8) | | 672 |
| | 933 |
| | 1,605 |
| | — |
| | 672 |
| | 933 |
| | 1,605 |
| | (31 | ) | | 1976 | | 09/01/2011 |
| Long Beach Financial | | Long Beach, CA | | 100 | % | | (8) | | 1,258 |
| | 4,421 |
| | 5,679 |
| | — |
| | 1,258 |
| | 4,421 |
| | 5,679 |
| | (90 | ) | | 1981 | | 09/01/2011 |
| Lynwood Branch | | Lynwood, CA | | 100 | % | | (8) | | 517 |
| | 622 |
| | 1,139 |
| | — |
| | 517 |
| | 622 |
| | 1,139 |
| | (23 | ) | | 1974 | | 09/01/2011 |
| North Hollywood | | North Hollywood, CA | | 100 | % | | (8) | | 765 |
| | 1,793 |
| | 2,558 |
| | — |
| | 765 |
| | 1,793 |
| | 2,558 |
| | (49 | ) | | 1971 | | 09/01/2011 |
| North Sacramento Branch | | Sacramento, CA | | 100 | % | | (8) | | 853 |
| | 909 |
| | 1,762 |
| | — |
| | 853 |
| | 909 |
| | 1,762 |
| | (29 | ) | | 1954/1980 | | 09/01/2011 |
| Oak Park Branch | | Sacramento, CA | | 100 | % | | (8) | | 520 |
| | 514 |
| | 1,034 |
| | — |
| | 520 |
| | 514 |
| | 1,034 |
| | (18 | ) | | 1960 | | 09/01/2011 |
| Palmdale Branch | | Palmdale, CA | | 100 | % | | (8) | | 354 |
| | 538 |
| | 892 |
| | — |
| | 354 |
| | 538 |
| | 892 |
| | (22 | ) | | 1980 | | 09/01/2011 |
| Pico - Vermont Branch | | Los Angeles, CA | | 100 | % | | (8) | | 326 |
| | 581 |
| | 907 |
| | — |
| | 326 |
| | 581 |
| | 907 |
| | (17 | ) | | 1959 | | 09/01/2011 |
| Pomona Main | | Pomona, CA | | 100 | % | | (8) | | 1,760 |
| | 1,509 |
| | 3,269 |
| | — |
| | 1,760 |
| | 1,509 |
| | 3,269 |
| | (42 | ) | | 1979 | | 09/01/2011 |
| Red Bluff Branch | | Red Bluff, CA | | 100 | % | | (8) | | 360 |
| | 1,878 |
| | 2,238 |
| | — |
| | 360 |
| | 1,878 |
| | 2,238 |
| | (31 | ) | | 1983/2001 | | 09/01/2011 |
| Redding Main Branch | | Redding, CA | | 100 | % | | (8) | | 953 |
| | 877 |
| | 1,830 |
| | — |
| | 953 |
| | 877 |
| | 1,830 |
| | (30 | ) | | 1978 | | 09/01/2011 |
| Riverside Main | | Riverside, CA | | 100 | % | | (8) | | 923 |
| | 2,710 |
| | 3,633 |
| | — |
| | 923 |
| | 2,710 |
| | 3,633 |
| | (77 | ) | | 1976 | | 09/01/2011 |
| Salinas Main Branch | | Salinas, CA | | 100 | % | | (8) | | 865 |
| | 1,273 |
| | 2,138 |
| | — |
| | 865 |
| | 1,273 |
| | 2,138 |
| | (38 | ) | | 1968 | | 09/01/2011 |
| San Bernardino Main | | San Bernardino, CA | | 100 | % | | (8) | | 925 |
| | 3,240 |
| | 4,165 |
| | — |
| | 925 |
| | 3,240 |
| | 4,165 |
| | (85 | ) | | 1970 | | 09/01/2011 |
| Santa Barbara | | Santa Barbara, CA | | 100 | % | | (8) | | 517 |
| | 1,812 |
| | 2,329 |
| | — |
| | 517 |
| | 1,812 |
| | 2,329 |
| | (46 | ) | | 1926/1963 | | 09/01/2011 |
| Santa Maria Branch | | Santa Maria, CA | | 100 | % | | (8) | | 605 |
| | 1,512 |
| | 2,117 |
| | 22 |
| | 605 |
| | 1,534 |
| | 2,139 |
| | (45 | ) | | 1976 | | 09/01/2011 |
| Sepulveda - Devonshire Branch | | Mission Hills, CA | | 100 | % | | (8) | | 536 |
| | 793 |
| | 1,329 |
| | — |
| | 536 |
| | 793 |
| | 1,329 |
| | (33 | ) | | 1951 | | 09/01/2011 |
| Stockdale - Main Building | | Bakersfield, CA | | 100 | % | | (8) | | 1,247 |
| | 716 |
| | 1,963 |
| | 158 |
| | 1,247 |
| | 874 |
| | 2,121 |
| | (29 | ) | | 1900 | | 09/01/2011 |
| Stockton Main Office | | Stockton, CA | | 100 | % | | (8) | | 535 |
| | 2,137 |
| | 2,672 |
| | — |
| | 535 |
| | 2,137 |
| | 2,672 |
| | (39 | ) | | 1973/1995 | | 09/01/2011 |
| Sunnyvale Main Branch | | Sunnyvale, CA | | 100 | % | | (8) | | 1,887 |
| | 1,732 |
| | 3,619 |
| | — |
| | 1,887 |
| | 1,732 |
| | 3,619 |
| | (54 | ) | | 1978 | | 09/01/2011 |
| Torrance Sartori | | Torrance, CA | | 100 | % | | (8) | | 357 |
| | 760 |
| | 1,117 |
| | — |
| | 357 |
| | 760 |
| | 1,117 |
| | (22 | ) | | 1936 | | 09/01/2011 |
| Ventura Main Office | | Ventura, CA | | 100 | % | | (8) | | 514 |
| | 1,171 |
| | 1,685 |
| | — |
| | 514 |
| | 1,171 |
| | 1,685 |
| | (35 | ) | | 1978 | | 09/01/2011 |
| Whittier Office | | Whittier, CA | | 100 | % | | (8) | | 1,272 |
| | 1,881 |
| | 3,153 |
| | 63 |
| | 1,272 |
| | 1,944 |
| | 3,216 |
| | (64 | ) | | 1980 | | 09/01/2011 |
| Willow - Daisy Branch | | Long Beach, CA | | 100 | % | | (8) | | 171 |
| | 371 |
| | 542 |
| | — |
| | 171 |
| | 371 |
| | 542 |
| | (11 | ) | | 1962 | | 09/01/2011 |
| Yuba City Branch | | Yuba City, CA | | 100 | % | | (8) | | 382 |
| | 786 |
| | 1,168 |
| | 43 |
| | 382 |
| | 829 |
| | 1,211 |
| | (44 | ) | | 1981 | | 09/01/2011 |
| Century Park | | Tampa, FL | | 100 | % | | (8) | | 1,439 |
| | 5,381 |
| | 6,820 |
| | (1 | ) | | 1,439 |
| | 5,380 |
| | 6,819 |
| | (98 | ) | | 1984 | | 09/01/2011 |
| Clermont - Main Building | | Clermont, FL | | 100 | % | | (8) | | — |
| | 356 |
| | 356 |
| | — |
| | — |
| | 356 |
| | 356 |
| | (19 | ) | | 1973 | | 09/01/2011 |
KBS REAL ESTATE INVESTMENT TRUST, INC.
SCHEDULE III
REAL ESTATE ASSETS AND ACCUMULATED DEPRECIATION AND AMORTIZATION (CONTINUED)
December 31, 2011
(dollar amounts in thousands)
|
| | | | | | | | | | | | | | | | | | | | | | | | | | | | | | | | | | | | | | | | | | | | | |
| | | | | | | | | Initial Cost to Company | | | | Gross Amount at which Carried at Close of Period | | | | | | |
| Description | | Location | | Ownership Percent | | Encumbrances | | Land | | Building and Improvements (1) | | Total | | Cost Capitalized Subsequent to Acquisition | | Land | | Building and Improvements (1) | | Total (2) | | Accumulated Depreciation and Amortization | | Original Date of Construction | | Date Acquired |
| Cordova | | Pensacola, FL | | 100 | % | | (8) | | $ | 659 |
| | $ | 1,344 |
| | $ | 2,003 |
| | $ | 1 |
| | $ | 659 |
| | $ | 1,345 |
| | $ | 2,004 |
| | $ | (74 | ) | | 1975 | | 09/01/2011 |
| Gulf to Bay - Main Building | | Clearwater, FL | | 100 | % | | (8) | | 480 |
| | 1,505 |
| | 1,985 |
| | — |
| | 480 |
| | 1,505 |
| | 1,985 |
| | (44 | ) | | 1971/2001 | | 09/01/2011 |
| Hallandale Beach | | Hallandale, FL | | 100 | % | | (8) | | 1,194 |
| | 4,583 |
| | 5,777 |
| | — |
| | 1,194 |
| | 4,583 |
| | 5,777 |
| | (189 | ) | | 1960/1996 | | 09/01/2011 |
| Jacksonville Ops Center #100 | | Jacksonville, FL | | 100 | % | | (8) | | 3,472 |
| | 20,896 |
| | 24,368 |
| | — |
| | 3,472 |
| | 20,896 |
| | 24,368 |
| | (396 | ) | | 1990 | | 09/01/2011 |
| Jacksonville Ops Center #200 | | Jacksonville, FL | | 100 | % | | (8) | | 1,911 |
| | 8,905 |
| | 10,816 |
| | — |
| | 1,911 |
| | 8,905 |
| | 10,816 |
| | (175 | ) | | 1990 | | 09/01/2011 |
| Jacksonville Ops Center #300 | | Jacksonville, FL | | 100 | % | | (8) | | 1,818 |
| | 8,859 |
| | 10,677 |
| | — |
| | 1,818 |
| | 8,859 |
| | 10,677 |
| | (192 | ) | | 1990 | | 09/01/2011 |
| Jacksonville Ops Center #400 | | Jacksonville, FL | | 100 | % | | (8) | | 2,824 |
| | 12,973 |
| | 15,797 |
| | 93 |
| | 2,824 |
| | 13,066 |
| | 15,890 |
| | (257 | ) | | 1990 | | 09/01/2011 |
| Jacksonville Ops Center #500 | | Jacksonville, FL | | 100 | % | | (8) | | 1,904 |
| | 8,755 |
| | 10,659 |
| | — |
| | 1,904 |
| | 8,755 |
| | 10,659 |
| | (190 | ) | | 1990 | | 09/01/2011 |
| Jacksonville Ops Center #600 | | Jacksonville, FL | | 100 | % | | (8) | | 4,653 |
| | 21,450 |
| | 26,103 |
| | — |
| | 4,653 |
| | 21,450 |
| | 26,103 |
| | (427 | ) | | 1988/1990 | | 09/01/2011 |
| Jacksonville Ops Center #700 | | Jacksonville, FL | | 100 | % | | (8) | | 1,902 |
| | 8,784 |
| | 10,686 |
| | — |
| | 1,902 |
| | 8,784 |
| | 10,686 |
| | (175 | ) | | 1990 | | 09/01/2011 |
| Jacksonville Ops Center/Daycare | | Jacksonville, FL | | 100 | % | | (8) | | 331 |
| | 1,094 |
| | 1,425 |
| | 53 |
| | 331 |
| | 1,147 |
| | 1,478 |
| | (25 | ) | | 1990 | | 09/01/2011 |
| Jacksonville Ops Center/Garage#2 | | Jacksonville, FL | | 100 | % | | (8) | | 49 |
| | 487 |
| | 536 |
| | — |
| | 49 |
| | 487 |
| �� | 536 |
| | (8 | ) | | 1990 | | 09/01/2011 |
| Jacksonville Ops Center/School | | Jacksonville, FL | | 100 | % | | (8) | | 353 |
| | 1,039 |
| | 1,392 |
| | 57 |
| | 353 |
| | 1,096 |
| | 1,449 |
| | (27 | ) | | 1990 | | 09/01/2011 |
| Lighthouse Point | | Lighthouse Point, FL | | 100 | % | | (8) | | 704 |
| | 791 |
| | 1,495 |
| | — |
| | 704 |
| | 791 |
| | 1,495 |
| | (34 | ) | | 1970 | | 09/01/2011 |
| North Hialeah - Main Building | | Hialeah, FL | | 100 | % | | (8) | | 307 |
| | 734 |
| | 1,041 |
| | 119 |
| | 307 |
| | 853 |
| | 1,160 |
| | (31 | ) | | 1963 | | 09/01/2011 |
| Ocala Downtown | | Ocala, FL | | 100 | % | | (8) | | 1,005 |
| | 3,990 |
| | 4,995 |
| | — |
| | 1,005 |
| | 3,990 |
| | 4,995 |
| | (103 | ) | | 1965 | | 09/01/2011 |
| Plaza | | Stuart, FL | | 100 | % | | (8) | | 602 |
| | 2,280 |
| | 2,882 |
| | — |
| | 602 |
| | 2,280 |
| | 2,882 |
| | (60 | ) | | 1973 | | 09/01/2011 |
| Port Charlotte - Main Building | | Port Charlotte, FL | | 100 | % | | (8) | | 322 |
| | 1,355 |
| | 1,677 |
| | — |
| | 322 |
| | 1,355 |
| | 1,677 |
| | (36 | ) | | 1971/2002 | | 09/01/2011 |
| San Jose - Main Building | | Jacksonville, FL | | 100 | % | | (8) | | 274 |
| | 630 |
| | 904 |
| | — |
| | 274 |
| | 630 |
| | 904 |
| | (20 | ) | | 1997 | | 09/01/2011 |
| South Region TPC | | Miami Lakes, FL | | 100 | % | | (8) | | 4,804 |
| | 7,813 |
| | 12,617 |
| | 77 |
| | 4,804 |
| | 7,890 |
| | 12,694 |
| | (177 | ) | | 1995 | | 09/01/2011 |
| Westshore Mall | | Tampa, FL | | 100 | % | | (8) | | 507 |
| | 1,602 |
| | 2,109 |
| | — |
| | 507 |
| | 1,602 |
| | 2,109 |
| | (42 | ) | | 1977 | | 09/01/2011 |
| Winter Park | | Winter Park, FL | | 100 | % | | (8) | | 780 |
| | 1,684 |
| | 2,464 |
| | — |
| | 780 |
| | 1,684 |
| | 2,464 |
| | (76 | ) | | 1955 | | 09/01/2011 |
| Bull Street | | Savannah, GA | | 100 | % | | (8) | | 210 |
| | 2,128 |
| | 2,338 |
| | — |
| | 210 |
| | 2,128 |
| | 2,338 |
| | (33 | ) | | 1905/1995 | | 09/01/2011 |
| Moultrie Main | | Moultrie, GA | | 100 | % | | (8) | | 298 |
| | 1,111 |
| | 1,409 |
| | — |
| | 298 |
| | 1,111 |
| | 1,409 |
| | (37 | ) | | 1971 | | 09/01/2011 |
| Valdosta Main | | Valdosta, GA | | 100 | % | | (8) | | 380 |
| | 1,807 |
| | 2,187 |
| | — |
| | 380 |
| | 1,807 |
| | 2,187 |
| | (69 | ) | | 1970 | | 09/01/2011 |
| Winder Main Building | | Winder, GA | | 100 | % | | (8) | | 237 |
| | 294 |
| | 531 |
| | — |
| | 237 |
| | 294 |
| | 531 |
| | (11 | ) | | 1970 | | 09/01/2011 |
| Bank of America Center | | Chicago, IL | | 100 | % | | (8) | | 23,574 |
| | 66,898 |
| | 90,472 |
| | — |
| | 23,574 |
| | 66,898 |
| | 90,472 |
| | (1,373 | ) | | 1924/1954 | | 09/01/2011 |
| Mission Facility | | Overland Park, KS | | 100 | % | | (8) | | 441 |
| | 1,250 |
| | 1,691 |
| | — |
| | 441 |
| | 1,250 |
| | 1,691 |
| | (36 | ) | | 1964 | | 09/01/2011 |
| Penn Street Facility | | Independence, KS | | 100 | % | | (8) | | 291 |
| | 1,396 |
| | 1,687 |
| | — |
| | 291 |
| | 1,396 |
| | 1,687 |
| | (55 | ) | | 1980 | | 09/01/2011 |
| Annapolis Church Circle - BAL | | Annapolis, MD | | 100 | % | | (8) | | 249 |
| | 1,597 |
| | 1,846 |
| | — |
| | 249 |
| | 1,597 |
| | 1,846 |
| | (38 | ) | | 1970 | | 09/01/2011 |
| Highlandtown - BAL | | Baltimore, MD | | 100 | % | | (8) | | 451 |
| | 1,385 |
| | 1,836 |
| | — |
| | 451 |
| | 1,385 |
| | 1,836 |
| | (35 | ) | | 1910 | | 09/01/2011 |
| Columbia Facility - Main Building | | Columbia, MO | | 100 | % | | (8) | | 337 |
| | 781 |
| | 1,118 |
| | — |
| | 337 |
| | 781 |
| | 1,118 |
| | (22 | ) | | 1948 | | 09/01/2011 |
| Concord Village | | St. Louis, MO | | 100 | % | | (8) | | 384 |
| | 1,476 |
| | 1,860 |
| | — |
| | 384 |
| | 1,476 |
| | 1,860 |
| | (46 | ) | | 1975 | | 09/01/2011 |
| Downtown Facility - Main Building | | Rolla, MO | | 100 | % | | (8) | | — |
| | 887 |
| | 887 |
| | — |
| | — |
| | 887 |
| | 887 |
| | (23 | ) | | 1927 | | 09/01/2011 |
KBS REAL ESTATE INVESTMENT TRUST, INC.
SCHEDULE III
REAL ESTATE ASSETS AND ACCUMULATED DEPRECIATION AND AMORTIZATION (CONTINUED)
December 31, 2011
(dollar amounts in thousands)
|
| | | | | | | | | | | | | | | | | | | | | | | | | | | | | | | | | | | | | | | | | | | | | |
| | | | | | | | | Initial Cost to Company | | | | Gross Amount at which Carried at Close of Period | | | | | | |
| Description | | Location | | Ownership Percent | | Encumbrances | | Land | | Building and Improvements (1) | | Total | | Cost Capitalized Subsequent to Acquisition | | Land | | Building and Improvements (1) | | Total (2) | | Accumulated Depreciation and Amortization | | Original Date of Construction | | Date Acquired |
| Florissant Facility | | Florissant, MO | | 100 | % | | (8) | | $ | 235 |
| | $ | 649 |
| | $ | 884 |
| | $ | — |
| | $ | 235 |
| | $ | 649 |
| | $ | 884 |
| | $ | (26 | ) | | 1970 | | 09/01/2011 |
| Hampton Main Facility | | St. Louis, MO | | 100 | % | | (8) | | 597 |
| | 2,173 |
| | 2,770 |
| | — |
| | 597 |
| | 2,173 |
| | 2,770 |
| | (84 | ) | | 1972 | | 09/01/2011 |
| Independence Square | | Independence, MO | | 100 | % | | (8) | | 300 |
| | 1,637 |
| | 1,937 |
| | 11 |
| | 300 |
| | 1,648 |
| | 1,948 |
| | (65 | ) | | 1929 | | 09/01/2011 |
| Lexington Facility - Main Building | | Lexington, MO | | 100 | % | | (8) | | 39 |
| | 259 |
| | 298 |
| | — |
| | 39 |
| | 259 |
| | 298 |
| | (13 | ) | | 1894 | | 09/01/2011 |
| Mexico Facility | | Mexico, MO | | 100 | % | | (8) | | 101 |
| | 632 |
| | 733 |
| | 25 |
| | 101 |
| | 657 |
| | 758 |
| | (28 | ) | | 1979 | | 09/01/2011 |
| Oak Trafficway Facility | | N. Kansas City, MO | | 100 | % | | (8) | | 400 |
| | 921 |
| | 1,321 |
| | — |
| | 400 |
| | 921 |
| | 1,321 |
| | (42 | ) | | 1978 | | 09/01/2011 |
| Richland Facility - Main Building | | Richland, MO | | 100 | % | | (8) | | 92 |
| | 867 |
| | 959 |
| | — |
| | 92 |
| | 867 |
| | 959 |
| | (23 | ) | | 1951 | | 09/01/2011 |
| South Glenstone - Main Building | | Springfield, MO | | 100 | % | | (8) | | 445 |
| | 1,069 |
| | 1,514 |
| | 40 |
| | 445 |
| | 1,109 |
| | 1,554 |
| | (34 | ) | | 1970 | | 09/01/2011 |
| West Sunshine Facility - Main Bldg | | Springfield, MO | | 100 | % | | (8) | | — |
| | 1,045 |
| | 1,045 |
| | — |
| | — |
| | 1,045 |
| | 1,045 |
| | (38 | ) | | 1965 | | 09/01/2011 |
| 525 N Tryon-Odell Building | | Charlotte, NC | | 100 | % | | (8) | | 7,624 |
| | 38,060 |
| | 45,684 |
| | 214 |
| | 7,624 |
| | 38,274 |
| | 45,898 |
| | (852 | ) | | 1988 | | 09/01/2011 |
| Albuquerque Ops Center | | Albuquerque, NM | | 100 | % | | (8) | | 1,193 |
| | 2,023 |
| | 3,216 |
| | — |
| | 1,193 |
| | 2,023 |
| | 3,216 |
| | (63 | ) | | 1973/1987 | | 09/01/2011 |
| Admiral - Main Building | | Tulsa, OK | | 100 | % | | (8) | | 199 |
| | 409 |
| | 608 |
| | — |
| | 199 |
| | 409 |
| | 608 |
| | (23 | ) | | 1952 | | 09/01/2011 |
| Muskogee Main Facility | | Muskogee, OK | | 100 | % | | (8) | | — |
| | 379 |
| | 379 |
| | — |
| | — |
| | 379 |
| | 379 |
| | (14 | ) | | 1970 | | 09/01/2011 |
| Aiken Main Office | | Aiken, SC | | 100 | % | | (8) | | 108 |
| | 530 |
| | 638 |
| | — |
| | 108 |
| | 530 |
| | 638 |
| | (16 | ) | | 1898/1998 | | 09/01/2011 |
| Murfreeboro Main Office | | Murfreeboro, TN | | 100 | % | | (8) | | 144 |
| | 929 |
| | 1,073 |
| | — |
| | 144 |
| | 929 |
| | 1,073 |
| | (55 | ) | | 1978 | | 09/01/2011 |
| Aransas Pass (CCNB) - Main Bldg | | Aransas Pass, TX | | 100 | % | | (8) | | 212 |
| | 417 |
| | 629 |
| | — |
| | 212 |
| | 417 |
| | 629 |
| | (21 | ) | | 1972 | | 09/01/2011 |
| Brownwood - Main Building | | Brownwood, TX | | 100 | % | | (8) | | 169 |
| | 1,507 |
| | 1,676 |
| | — |
| | 169 |
| | 1,507 |
| | 1,676 |
| | (50 | ) | | 1972 | | 09/01/2011 |
| Carrollton - Main Building | | Carrollton, TX | | 100 | % | | (8) | | 365 |
| | 1,281 |
| | 1,646 |
| | — |
| | 365 |
| | 1,281 |
| | 1,646 |
| | (42 | ) | | 1978 | | 09/01/2011 |
| Denison | | Denison, TX | | 100 | % | | (8) | | 388 |
| | 1,790 |
| | 2,178 |
| | — |
| | 388 |
| | 1,790 |
| | 2,178 |
| | (43 | ) | | 1965 | | 09/01/2011 |
| Dumas Banking Center - Main Bldg | | Dumas, TX | | 100 | % | | (8) | | 59 |
| | 314 |
| | 373 |
| | — |
| | 59 |
| | 314 |
| | 373 |
| | (14 | ) | | 1976 | | 09/01/2011 |
| Fort Sam Houston - Main Building | | San Antonio, TX | | 100 | % | | (8) | | 985 |
| | 2,474 |
| | 3,459 |
| | — |
| | 985 |
| | 2,474 |
| | 3,459 |
| | (82 | ) | | 1968 | | 09/01/2011 |
| Fort Worth East - Main Building | | Fort Worth, TX | | 100 | % | | (8) | | 481 |
| | 1,388 |
| | 1,869 |
| | 79 |
| | 481 |
| | 1,467 |
| | 1,948 |
| | (46 | ) | | 1956 | | 09/01/2011 |
| Greenspoint | | Houston, TX | | 100 | % | | (8) | | 468 |
| | 2,106 |
| | 2,574 |
| | — |
| | 468 |
| | 2,106 |
| | 2,574 |
| | (58 | ) | | 1976 | | 09/01/2011 |
| Mission - Main Building | | Mission, TX | | 100 | % | | (8) | | 367 |
| | 849 |
| | 1,216 |
| | — |
| | 367 |
| | 849 |
| | 1,216 |
| | (26 | ) | | 1950 | | 09/01/2011 |
| Mount Pleasant | | Mt. Pleasant, TX | | 100 | % | | (8) | | 396 |
| | 1,340 |
| | 1,736 |
| | — |
| | 396 |
| | 1,340 |
| | 1,736 |
| | (42 | ) | | 1960 | | 09/01/2011 |
| Old Hampton | | Hampton, VA | | 100 | % | | (8) | | 128 |
| | 417 |
| | 545 |
| | — |
| | 128 |
| | 417 |
| | 545 |
| | (13 | ) | | 1970 | | 09/01/2011 |
| Aberdeen Building/Branch | | Aberdeen, WA | | 100 | % | | (8) | | — |
| | 951 |
| | 951 |
| | — |
| | — |
| | 951 |
| | 951 |
| | (61 | ) | | 1960 | | 09/01/2011 |
| Bellingham | | Bellingham, WA | | 100 | % | | (8) | | 325 |
| | 1,822 |
| | 2,147 |
| | — |
| | 325 |
| | 1,822 |
| | 2,147 |
| | (47 | ) | | 1960 | | 09/01/2011 |
| Bremerton | | Bremerton, WA | | 100 | % | | (8) | | 145 |
| | 606 |
| | 751 |
| | 95 |
| | 145 |
| | 701 |
| | 846 |
| | (33 | ) | | 1970 | | 09/01/2011 |
| Richland - Main Building | | Richland, WA | | 100 | % | | (8) | | 420 |
| | 1,792 |
| | 2,212 |
| | — |
| | 420 |
| | 1,792 |
| | 2,212 |
| | (59 | ) | | 1979 | | 09/01/2011 |
| Spokane Bankcard Services | | Spokane, WA | | 100 | % | | (8) | | 1,288 |
| | 5,598 |
| | 6,886 |
| | 60 |
| | 1,288 |
| | 5,658 |
| | 6,946 |
| | (184 | ) | | 1983 | | 09/01/2011 |
| Walla Walla - Main Building | | Walla Walla, WA | | 100 | % | | (8) | | 220 |
| | 557 |
| | 777 |
| | 24 |
| | 220 |
| | 581 |
| | 801 |
| | (34 | ) | | 1980 | | 09/01/2011 |
| Bentonville | | Benton, AR | | 100 | % | | (9) | | 167 |
| | 607 |
| | 774 |
| | — |
| | 167 |
| | 607 |
| | 774 |
| | (24 | ) | | 1973 / 1981 | | 09/01/2011 |
| Mountain Home - Main Building | | Mountain Home, AR | | 100 | % | | (9) | | 380 |
| | 438 |
| | 818 |
| | — |
| | 380 |
| | 438 |
| | 818 |
| | (32 | ) | | 1980 | | 09/01/2011 |
KBS REAL ESTATE INVESTMENT TRUST, INC.
SCHEDULE III
REAL ESTATE ASSETS AND ACCUMULATED DEPRECIATION AND AMORTIZATION (CONTINUED)
December 31, 2011
(dollar amounts in thousands)
|
| | | | | | | | | | | | | | | | | | | | | | | | | | | | | | | | | | | | | | | | | | | | | |
| | | | | | | | | Initial Cost to Company | | | | Gross Amount at which Carried at Close of Period | | | | | | |
| Description | | Location | | Ownership Percent | | Encumbrances | | Land | | Building and Improvements (1) | | Total | | Cost Capitalized Subsequent to Acquisition | | Land | | Building and Improvements (1) | | Total (2) | | Accumulated Depreciation and Amortization | | Original Date of Construction | | Date Acquired |
| RH Johnson - Main Building | | Sun City, AZ | | 100 | % | | (9) | | $ | 949 |
| | $ | 546 |
| | $ | 1,495 |
| | $ | — |
| | $ | 949 |
| | $ | 546 |
| | $ | 1,495 |
| | $ | (21 | ) | | 1981 | | 09/01/2011 |
| Arnold | | Arnold, CA | | 100 | % | | (9) | | 213 |
| | 684 |
| | 897 |
| | — |
| | 213 |
| | 684 |
| | 897 |
| | (27 | ) | | 1981 | | 09/01/2011 |
| Bay - Fair | | San Leandro, CA | | 100 | % | | (9) | | 913 |
| | 594 |
| | 1,507 |
| | 91 |
| | 913 |
| | 685 |
| | 1,598 |
| | (39 | ) | | 1981 | | 09/01/2011 |
| Burlingame - Main Building | | Burlingame, CA | | 100 | % | | (9) | | 671 |
| | 467 |
| | 1,138 |
| | — |
| | 671 |
| | 467 |
| | 1,138 |
| | (23 | ) | | 1961 | | 09/01/2011 |
| Canoga Park Branch | | Canoga Park, CA | | 100 | % | | (9) | | 886 |
| | 467 |
| | 1,353 |
| | — |
| | 886 |
| | 467 |
| | 1,353 |
| | (22 | ) | | 1957 | | 09/01/2011 |
| College Heights | | Bakersfield, CA | | 100 | % | | (9) | | 582 |
| | 523 |
| | 1,105 |
| | — |
| | 582 |
| | 523 |
| | 1,105 |
| | (24 | ) | | 1979 | | 09/01/2011 |
| Dinuba | | Dinuba, CA | | 100 | % | | (9) | | 496 |
| | 357 |
| | 853 |
| | — |
| | 496 |
| | 357 |
| | 853 |
| | (15 | ) | | 1972 | | 09/01/2011 |
| East Fresno | | Fresno, CA | | 100 | % | | (9) | | 373 |
| | 463 |
| | 836 |
| | — |
| | 373 |
| | 463 |
| | 836 |
| | (18 | ) | | 1959 | | 09/01/2011 |
| Eureka Main | | Eureka, CA | | 100 | % | | (9) | | 427 |
| | 482 |
| | 909 |
| | — |
| | 427 |
| | 482 |
| | 909 |
| | (23 | ) | | 1900 | | 09/01/2011 |
| Folsum | | Folsum, CA | | 100 | % | | (9) | | 506 |
| | 402 |
| | 908 |
| | — |
| | 506 |
| | 402 |
| | 908 |
| | (37 | ) | | 1981 | | 09/01/2011 |
| Fort Bragg | | Fort Bragg, CA | | 100 | % | | (9) | | 332 |
| | 528 |
| | 860 |
| | — |
| | 332 |
| | 528 |
| | 860 |
| | (35 | ) | | 1975 | | 09/01/2011 |
| Hanford - Main Building | | Hanford, CA | | 100 | % | | (9) | | 466 |
| | 614 |
| | 1,080 |
| | — |
| | 466 |
| | 614 |
| | 1,080 |
| | (24 | ) | | 1976 | | 09/01/2011 |
| Healdsburg | | Healdsburg, CA | | 100 | % | | (9) | | 850 |
| | 407 |
| | 1,257 |
| | — |
| | 850 |
| | 407 |
| | 1,257 |
| | (23 | ) | | 1979 | | 09/01/2011 |
| Hemet Branch | | Hemet, CA | | 100 | % | | (9) | | 1,200 |
| | 780 |
| | 1,980 |
| | — |
| | 1,200 |
| | 780 |
| | 1,980 |
| | (31 | ) | | 1982 | | 09/01/2011 |
| Hilltop | | Redding, CA | | 100 | % | | (9) | | 773 |
| | 437 |
| | 1,210 |
| | — |
| | 773 |
| | 437 |
| | 1,210 |
| | (28 | ) | | 1982 | | 09/01/2011 |
| Lemoore | | Lemoore, CA | | 100 | % | | (9) | | 175 |
| | 407 |
| | 582 |
| | 82 |
| | 175 |
| | 489 |
| | 664 |
| | (13 | ) | | 1959 | | 09/01/2011 |
| Lincoln Village | | Stockton, CA | | 100 | % | | (9) | | 642 |
| | 484 |
| | 1,126 |
| | — |
| | 642 |
| | 484 |
| | 1,126 |
| | (28 | ) | | 1980 | | 09/01/2011 |
| Livermore | | Livermore, CA | | 100 | % | | (9) | | 755 |
| | 655 |
| | 1,410 |
| | — |
| | 755 |
| | 655 |
| | 1,410 |
| | (31 | ) | | 1982 | | 09/01/2011 |
| Martin Luther King Jr. | | Los Angeles, CA | | 100 | % | | (9) | | 1,278 |
| | 626 |
| | 1,904 |
| | — |
| | 1,278 |
| | 626 |
| | 1,904 |
| | (27 | ) | | 1971 | | 09/01/2011 |
| Mission-23rd | | San Francisco, CA | | 100 | % | | (9) | | 618 |
| | 471 |
| | 1,089 |
| | — |
| | 618 |
| | 471 |
| | 1,089 |
| | (17 | ) | | 1925 | | 09/01/2011 |
| Montrose Branch | | Montrose, CA | | 100 | % | | (9) | | 906 |
| | 402 |
| | 1,308 |
| | — |
| | 906 |
| | 402 |
| | 1,308 |
| | (19 | ) | | 1952 | | 09/01/2011 |
| Ontario Plaza Branch | | Ontario, CA | | 100 | % | | (9) | | 370 |
| | 439 |
| | 809 |
| | — |
| | 370 |
| | 439 |
| | 809 |
| | (15 | ) | | 1982 | | 09/01/2011 |
| Orangevale Branch | | Orangevale, CA | | 100 | % | | (9) | | 469 |
| | 798 |
| | 1,267 |
| | — |
| | 469 |
| | 798 |
| | 1,267 |
| | (56 | ) | | 1978 | | 09/01/2011 |
| Oroville | | Oroville, CA | | 100 | % | | (9) | | 669 |
| | 381 |
| | 1,050 |
| | — |
| | 669 |
| | 381 |
| | 1,050 |
| | (36 | ) | | 1981 | | 09/01/2011 |
| Pleasanton | | Pleasanton, CA | | 100 | % | | (9) | | 944 |
| | 448 |
| | 1,392 |
| | — |
| | 944 |
| | 448 |
| | 1,392 |
| | (26 | ) | | 1981 | | 09/01/2011 |
| Porterville - Main Building | | Porterville, CA | | 100 | % | | (9) | | 729 |
| | 457 |
| | 1,186 |
| | — |
| | 729 |
| | 457 |
| | 1,186 |
| | (23 | ) | | 1974 | | 09/01/2011 |
| Reedley | | Reedley, CA | | 100 | % | | (9) | | 450 |
| | 541 |
| | 991 |
| | — |
| | 450 |
| | 541 |
| | 991 |
| | (31 | ) | | 1964 | | 09/01/2011 |
| Reseda Branch | | Reseda, CA | | 100 | % | | (9) | | 449 |
| | 388 |
| | 837 |
| | — |
| | 449 |
| | 388 |
| | 837 |
| | (20 | ) | | 1958 | | 09/01/2011 |
| Ridgecrest | | Ridgecrest, CA | | 100 | % | | (9) | | 634 |
| | 478 |
| | 1,112 |
| | — |
| | 634 |
| | 478 |
| | 1,112 |
| | (24 | ) | | 1973 | | 09/01/2011 |
| Sherman Oaks | | Sherman Oaks, CA | | 100 | % | | (9) | | 957 |
| | 483 |
| | 1,440 |
| | — |
| | 957 |
| | 483 |
| | 1,440 |
| | (21 | ) | | 1958 | | 09/01/2011 |
| Slauson - Vermont | | Los Angeles, CA | | 100 | % | | (9) | | 1,159 |
| | 609 |
| | 1,768 |
| | — |
| | 1,159 |
| | 609 |
| | 1,768 |
| | (27 | ) | | 1971 | | 09/01/2011 |
| St. Helena | | St. Helena, CA | | 100 | % | | (9) | | 824 |
| | 763 |
| | 1,587 |
| | — |
| | 824 |
| | 763 |
| | 1,587 |
| | (34 | ) | | 1976 | | 09/01/2011 |
| Stockton Agri-Center | | Stockton, CA | | 100 | % | | (9) | | 591 |
| | 508 |
| | 1,099 |
| | — |
| | 591 |
| | 508 |
| | 1,099 |
| | (25 | ) | | 1982 | | 09/01/2011 |
| Susanville | | Susanville, CA | | 100 | % | | (9) | | 182 |
| | 317 |
| | 499 |
| | 26 |
| | 182 |
| | 343 |
| | 525 |
| | (17 | ) | | 1979 | | 09/01/2011 |
KBS REAL ESTATE INVESTMENT TRUST, INC.
SCHEDULE III
REAL ESTATE ASSETS AND ACCUMULATED DEPRECIATION AND AMORTIZATION (CONTINUED)
December 31, 2011
(dollar amounts in thousands)
|
| | | | | | | | | | | | | | | | | | | | | | | | | | | | | | | | | | | | | | | | | | | | | |
| | | | | | | | | Initial Cost to Company | | | | Gross Amount at which Carried at Close of Period | | | | | | |
| Description | | Location | | Ownership Percent | | Encumbrances | | Land | | Building and Improvements (1) | | Total | | Cost Capitalized Subsequent to Acquisition | | Land | | Building and Improvements (1) | | Total (2) | | Accumulated Depreciation and Amortization | | Original Date of Construction | | Date Acquired |
| Toluca Lake | | Burbank, CA | | 100 | % | | (9) | | $ | 522 |
| | $ | 869 |
| | $ | 1,391 |
| | $ | — |
| | $ | 522 |
| | $ | 869 |
| | $ | 1,391 |
| | $ | (24 | ) | | 1978 | | 09/01/2011 |
| Turlock - Main Building | | Turlock, CA | | 100 | % | | (9) | | 805 |
| | 556 |
| | 1,361 |
| | — |
| | 805 |
| | 556 |
| | 1,361 |
| | (25 | ) | | 1971 | | 09/01/2011 |
| Vacaville Financial Center | | Vacaville, CA | | 100 | % | | (9) | | 577 |
| | 489 |
| | 1,066 |
| | — |
| | 577 |
| | 489 |
| | 1,066 |
| | (26 | ) | | 1980 | | 09/01/2011 |
| Vernon Branch | | Vernon, CA | | 100 | % | | (9) | | 1,102 |
| | 566 |
| | 1,668 |
| | — |
| | 1,102 |
| | 566 |
| | 1,668 |
| | (23 | ) | | 1960 | | 09/01/2011 |
| West Los Angeles Branch | | W. Los Angeles, CA | | 100 | % | | (9) | | 991 |
| | 570 |
| | 1,561 |
| | — |
| | 991 |
| | 570 |
| | 1,561 |
| | (22 | ) | | 1957 | | 09/01/2011 |
| Williow Glenn | | San Jose, CA | | 100 | % | | (9) | | 353 |
| | 295 |
| | 648 |
| | — |
| | 353 |
| | 295 |
| | 648 |
| | (25 | ) | | 1955 | | 09/01/2011 |
| Batterson | | Farmington, CT | | 100 | % | | (9) | | 3,390 |
| | 7,113 |
| | 10,503 |
| | — |
| | 3,390 |
| | 7,113 |
| | 10,503 |
| | (319 | ) | | 1970 | | 09/01/2011 |
| Greenwich | | Greenwich, CT | | 100 | % | | (9) | | 1,353 |
| | 5,675 |
| | 7,028 |
| | 71 |
| | 1,353 |
| | 5,746 |
| | 7,099 |
| | (176 | ) | | 1927 | | 09/01/2011 |
| North Wakefield Drive | | Newark, DE | | 100 | % | | (9) | | 1,662 |
| | 10,166 |
| | 11,828 |
| | — |
| | 1,662 |
| | 10,166 |
| | 11,828 |
| | (237 | ) | | 1996 | | 09/01/2011 |
| Baypoint | | Miami, FL | | 100 | % | | (9) | | 246 |
| | 619 |
| | 865 |
| | — |
| | 246 |
| | 619 |
| | 865 |
| | (63 | ) | | 1958 | | 09/01/2011 |
| Bayshore - Main Building | | Bradentown, FL | | 100 | % | | (9) | | 391 |
| | 445 |
| | 836 |
| | — |
| | 391 |
| | 445 |
| | 836 |
| | (16 | ) | | 1971 | | 09/01/2011 |
| Blountstown - Main Building | | Blountstown, FL | | 100 | % | | (9) | | 69 |
| | 365 |
| | 434 |
| | — |
| | 69 |
| | 365 |
| | 434 |
| | (13 | ) | | 1981 | | 09/01/2011 |
| Charlotte Harbor - Main Building | | Port Charlotte, FL | | 100 | % | | (9) | | 272 |
| | 500 |
| | 772 |
| | — |
| | 272 |
| | 500 |
| | 772 |
| | (40 | ) | | 1990 | | 09/01/2011 |
| Coral Ridge - Main Building | | Ft. Lauderdale, FL | | 100 | % | | (9) | | 835 |
| | 1,099 |
| | 1,934 |
| | — |
| | 835 |
| | 1,099 |
| | 1,934 |
| | (71 | ) | | 1969 | | 09/01/2011 |
| Crystal River - Main Building | | Crystal River, FL | | 100 | % | | (9) | | 119 |
| | 329 |
| | 448 |
| | — |
| | 119 |
| | 329 |
| | 448 |
| | (31 | ) | | 1970 | | 09/01/2011 |
| Ft. Myers Beach - Main Building | | Ft. Myers Beach, FL | | 100 | % | | (9) | | 230 |
| | 407 |
| | 637 |
| | — |
| | 230 |
| | 407 |
| | 637 |
| | (41 | ) | | 1968 | | 09/01/2011 |
| Ft. Walton Beach - Main Building | | Ft. Walton Beach, FL | | 100 | % | | (9) | | 427 |
| | 478 |
| | 905 |
| | — |
| | 427 |
| | 478 |
| | 905 |
| | (42 | ) | | 1975 | | 09/01/2011 |
| Homestead - Main Building | | Homestead, FL | | 100 | % | | (9) | | 1,113 |
| | 578 |
| | 1,691 |
| | — |
| | 1,113 |
| | 578 |
| | 1,691 |
| | (45 | ) | | 1973 | | 09/01/2011 |
| Live Oak - Main Building | | Live Oak, FL | | 100 | % | | (9) | | 679 |
| | 942 |
| | 1,621 |
| | — |
| | 679 |
| | 942 |
| | 1,621 |
| | (55 | ) | | 1965 | | 09/01/2011 |
| Midway - Main Building | | Miami, FL | | 100 | % | | (9) | | 1,401 |
| | 826 |
| | 2,227 |
| | 35 |
| | 1,401 |
| | 861 |
| | 2,262 |
| | (38 | ) | | 1974 | | 09/01/2011 |
| Plantation - Main Building | | Plantation, FL | | 100 | % | | (9) | | 1,189 |
| | 1,092 |
| | 2,281 |
| | 105 |
| | 1,189 |
| | 1,197 |
| | 2,386 |
| | (54 | ) | | 1976/2002 | | 09/01/2011 |
| Trouble Creek - Main Building | | New Port Richey, FL | | 100 | % | | (9) | | 453 |
| | 478 |
| | 931 |
| | — |
| | 453 |
| | 478 |
| | 931 |
| | (36 | ) | | 1970 | | 09/01/2011 |
| West Sunrise - Main Building | | Plantation, FL | | 100 | % | | (9) | | 1,060 |
| | 1,146 |
| | 2,206 |
| | — |
| | 1,060 |
| | 1,146 |
| | 2,206 |
| | (54 | ) | | 1976 | | 09/01/2011 |
| Weeki Wachee - Main Building | | Brooksville, FL | | 100 | % | | (9) | | 407 |
| | 813 |
| | 1,220 |
| | — |
| | 407 |
| | 813 |
| | 1,220 |
| | (36 | ) | | 1970 | | 09/01/2011 |
| Westside - Main Building | | Bradenton, FL | | 100 | % | | (9) | | 608 |
| | 388 |
| | 996 |
| | — |
| | 608 |
| | 388 |
| | 996 |
| | (23 | ) | | 1964 | | 09/01/2011 |
| Aberdeen Village - Main Building | | Peachtree City, GA | | 100 | % | | (9) | | 564 |
| | 1,830 |
| | 2,394 |
| | — |
| | 564 |
| | 1,830 |
| | 2,394 |
| | (45 | ) | | 1981 | | 09/01/2011 |
| East Point - Main Building | | East Point, GA | | 100 | % | | (9) | | 319 |
| | 337 |
| | 656 |
| | 6 |
| | 319 |
| | 343 |
| | 662 |
| | (39 | ) | | 1981 | | 09/01/2011 |
| Exchange Street | | Malden, MA | | 100 | % | | (9) | | 6,856 |
| | 10,795 |
| | 17,651 |
| | 5 |
| | 6,856 |
| | 10,800 |
| | 17,656 |
| | (338 | ) | | 1984 | | 09/01/2011 |
| Waltham Main (I & II) | | Waltham, MA | | 100 | % | | (9) | | 8,971 |
| | 13,064 |
| | 22,035 |
| | 334 |
| | 8,971 |
| | 13,398 |
| | 22,369 |
| | (456 | ) | | 1968/1976 | | 09/01/2011 |
| Wheaton - Main Building | | Wheaton, MD | | 100 | % | | (9) | | 1,245 |
| | 939 |
| | 2,184 |
| | — |
| | 1,245 |
| | 939 |
| | 2,184 |
| | (76 | ) | | 1960/2003 | | 09/01/2011 |
| Court Street | | Auburn, ME | | 100 | % | | (9) | | 149 |
| | 352 |
| | 501 |
| | — |
| | 149 |
| | 352 |
| | 501 |
| | (27 | ) | | 1969 | | 09/01/2011 |
| Gannett Drive | | South Portland, ME | | 100 | % | | (9) | | 953 |
| | 1,905 |
| | 2,858 |
| | — |
| | 953 |
| | 1,905 |
| | 2,858 |
| | (56 | ) | | 1997 | | 09/01/2011 |
| Ballwin Facility - Main Building | | Ballwin, MO | | 100 | % | | (9) | | 114 |
| | 464 |
| | 578 |
| | — |
| | 114 |
| | 464 |
| | 578 |
| | (32 | ) | | 1972 | | 09/01/2011 |
| Belton Facility - Main Building | | Belton, MO | | 100 | % | | (9) | | 454 |
| | 574 |
| | 1,028 |
| | — |
| | 454 |
| | 574 |
| | 1,028 |
| | (65 | ) | | 1976 | | 09/01/2011 |
KBS REAL ESTATE INVESTMENT TRUST, INC.
SCHEDULE III
REAL ESTATE ASSETS AND ACCUMULATED DEPRECIATION AND AMORTIZATION (CONTINUED)
December 31, 2011
(dollar amounts in thousands)
|
| | | | | | | | | | | | | | | | | | | | | | | | | | | | | | | | | | | | | | | | | | | | | |
| | | | | | | | | Initial Cost to Company | | | | Gross Amount at which Carried at Close of Period | | | | | | |
| Description | | Location | | Ownership Percent | | Encumbrances | | Land | | Building and Improvements (1) | | Total | | Cost Capitalized Subsequent to Acquisition | | Land | | Building and Improvements (1) | | Total (2) | | Accumulated Depreciation and Amortization | | Original Date of Construction | | Date Acquired |
| Forsyth Facility - Main Building | | Forsyth, MO | | 100 | % | | (9) | | $ | 83 |
| | $ | 239 |
| | $ | 322 |
| | $ | — |
| | $ | 83 |
| | $ | 239 |
| | $ | 322 |
| | $ | (14 | ) | | 1960 | | 09/01/2011 |
| I-70 & Noland Facility - Main Bldg | | Independence, MO | | 100 | % | | (9) | | 598 |
| | 640 |
| | 1,238 |
| | — |
| | 598 |
| | 640 |
| | 1,238 |
| | (55 | ) | | 1981 | | 09/01/2011 |
| Metropolitan/Holmes - Main Bldg | | Kansas City, MO | | 100 | % | | (9) | | 339 |
| | 426 |
| | 765 |
| | — |
| | 339 |
| | 426 |
| | 765 |
| | (28 | ) | | 1981 | | 09/01/2011 |
| Gateway Center - Charlotte | | Charlotte, NC | | 100 | % | | (9) | | 6,334 |
| | 22,712 |
| | 29,046 |
| | — |
| | 6,334 |
| | 22,712 |
| | 29,046 |
| | (576 | ) | | 1987/1988 | | 09/01/2011 |
| Nashua Main | | Nashua, NH | | 100 | % | | (9) | | 334 |
| | 2,639 |
| | 2,973 |
| | — |
| | 334 |
| | 2,639 |
| | 2,973 |
| | (91 | ) | | 1800 | | 09/01/2011 |
| Portsmouth Pleasant | | Portsmouth, NH | | 100 | % | | (9) | | 317 |
| | 673 |
| | 990 |
| | — |
| | 317 |
| | 673 |
| | 990 |
| | (24 | ) | | 1860s | | 09/01/2011 |
| Arthur Street | | East Brunswick, NJ | | 100 | % | | (9) | | 1,010 |
| | 941 |
| | 1,951 |
| | — |
| | 1,010 |
| | 941 |
| | 1,951 |
| | (40 | ) | | 1972 | | 09/01/2011 |
| Beechwood Road | | Summit, NJ | | 100 | % | | (9) | | 465 |
| | 651 |
| | 1,116 |
| | — |
| | 465 |
| | 651 |
| | 1,116 |
| | (23 | ) | | 1957 | | 09/01/2011 |
| Bellevue Avenue | | Hammonton, NJ | | 100 | % | | (9) | | 382 |
| | 2,200 |
| | 2,582 |
| | 17 |
| | 382 |
| | 2,217 |
| | 2,599 |
| | (64 | ) | | 1964 | | 09/01/2011 |
| Bergenline Avenue | | Union City, NJ | | 100 | % | | (9) | | 179 |
| | 370 |
| | 549 |
| | — |
| | 179 |
| | 370 |
| | 549 |
| | (20 | ) | | 1970 | | 09/01/2011 |
| Bridgewater | | Bridgewater, NJ | | 100 | % | | (9) | | 1,493 |
| | 2,530 |
| | 4,023 |
| | 28 |
| | 1,493 |
| | 2,558 |
| | 4,051 |
| | (287 | ) | | 1974/1980 | | 09/01/2011 |
| Lakewood Route 70 | | Lakewood, NJ | | 100 | % | | (9) | | 1,328 |
| | 953 |
| | 2,281 |
| | 17 |
| | 1,328 |
| | 970 |
| | 2,298 |
| | (38 | ) | | 1988 | | 09/01/2011 |
| Maplewood Avenue | | Maplewood, NJ | | 100 | % | | (9) | | 406 |
| | 497 |
| | 903 |
| | — |
| | 406 |
| | 497 |
| | 903 |
| | (44 | ) | | 1926/1983 | | 09/01/2011 |
| Pennsauken | | Pennsauken, NJ | | 100 | % | | (9) | | 750 |
| | 794 |
| | 1,544 |
| | — |
| | 750 |
| | 794 |
| | 1,544 |
| | (35 | ) | | 1966 | | 09/01/2011 |
| South Orange Avenue | | South Orange, NJ | | 100 | % | | (9) | | 110 |
| | 316 |
| | 426 |
| | — |
| | 110 |
| | 316 |
| | 426 |
| | (12 | ) | | 1944 | | 09/01/2011 |
| Springfield Avenue | | Summit, NJ | | 100 | % | | (9) | | 2,166 |
| | 769 |
| | 2,935 |
| | — |
| | 2,166 |
| | 769 |
| | 2,935 |
| | (26 | ) | | 1929 | | 09/01/2011 |
| Wood Avenue | | Linden, NJ | | 100 | % | | (9) | | 1,657 |
| | 1,043 |
| | 2,700 |
| | — |
| | 1,657 |
| | 1,043 |
| | 2,700 |
| | (41 | ) | | 1955/1970 | | 09/01/2011 |
| Amador (Las Cruces) - Main Bldg | | Las Cruces, NM | | 100 | % | | (9) | | 120 |
| | 634 |
| | 754 |
| | — |
| | 120 |
| | 634 |
| | 754 |
| | (110 | ) | | 1970/1991 | | 09/01/2011 |
| Santa Fe-Metro Bank - Main Bldg | | Santa Fe, NM | | 100 | % | | (9) | | — |
| | 1,646 |
| | 1,646 |
| | — |
| | — |
| | 1,646 |
| | 1,646 |
| | (48 | ) | | 1972 / 1985 | | 09/01/2011 |
| Broadway | | Albany, NY | | 100 | % | | (9) | | 1,047 |
| | 2,556 |
| | 3,603 |
| | — |
| | 1,047 |
| | 2,556 |
| | 3,603 |
| | (59 | ) | | 1898 | | 09/01/2011 |
| Genesee Street | | Auburn, NY | | 100 | % | | (9) | | 284 |
| | 1,241 |
| | 1,525 |
| | 38 |
| | 284 |
| | 1,279 |
| | 1,563 |
| | (38 | ) | | 1928 | | 09/01/2011 |
| Hempstead Tpke | | East Meadow, NY | | 100 | % | | (9) | | 169 |
| | 464 |
| | 633 |
| | — |
| | 169 |
| | 464 |
| | 633 |
| | (13 | ) | | 1955/1990 | | 09/01/2011 |
| Jamaica | | Jamaica, NY | | 100 | % | | (9) | | 185 |
| | 953 |
| | 1,138 |
| | — |
| | 185 |
| | 953 |
| | 1,138 |
| | (17 | ) | | 1960/2001 | | 09/01/2011 |
| Levittown | | Levittown, NY | | 100 | % | | (9) | | 543 |
| | 389 |
| | 932 |
| | — |
| | 543 |
| | 389 |
| | 932 |
| | (16 | ) | | 1962 | | 09/01/2011 |
| Merrick Avenue | | Merrick, NY | | 100 | % | | (9) | | 259 |
| | 1,846 |
| | 2,105 |
| | — |
| | 259 |
| | 1,846 |
| | 2,105 |
| | (81 | ) | | 1952 | | 09/01/2011 |
| Middle Neck Road | | Great Neck, NY | | 100 | % | | (9) | | 349 |
| | 281 |
| | 630 |
| | — |
| | 349 |
| | 281 |
| | 630 |
| | (17 | ) | | 1956 | | 09/01/2011 |
| Park Avenue | | Wantagh, NY | | 100 | % | | (9) | | 213 |
| | 360 |
| | 573 |
| | — |
| | 213 |
| | 360 |
| | 573 |
| | (33 | ) | | 1953 | | 09/01/2011 |
| State Street | | Allbany, NY | | 100 | % | | (9) | | 865 |
| | 7,631 |
| | 8,496 |
| | 63 |
| | 865 |
| | 7,694 |
| | 8,559 |
| | (277 | ) | | 1927/1980s | | 09/01/2011 |
| Transit Road | | West Seneca, NY | | 100 | % | | (9) | | 665 |
| | 6,065 |
| | 6,730 |
| | 65 |
| | 665 |
| | 6,130 |
| | 6,795 |
| | (223 | ) | | 1972 | | 09/01/2011 |
| Wantagh | | West Hempstead, NY | | 100 | % | | (9) | | 928 |
| | 1,787 |
| | 2,715 |
| | — |
| | 928 |
| | 1,787 |
| | 2,715 |
| | (45 | ) | | 1940/2002 | | 09/01/2011 |
| 31st Street - Main Building | | Tulsa, OK | | 100 | % | | (9) | | 400 |
| | 591 |
| | 991 |
| | — |
| | 400 |
| | 591 |
| | 991 |
| | (31 | ) | | 1972/1979 | | 09/01/2011 |
| Broken Arrow - Main Building | | Broken Arrow, OK | | 100 | % | | (9) | | 357 |
| | 463 |
| | 820 |
| | — |
| | 357 |
| | 463 |
| | 820 |
| | (43 | ) | | 1972/1979 | | 09/01/2011 |
| Catoosa - Main Building | | Catoosa, OK | | 100 | % | | (9) | | 174 |
| | 354 |
| | 528 |
| | — |
| | 174 |
| | 354 |
| | 528 |
| | (27 | ) | | 1964/1972 | | 09/01/2011 |
| Gresham - Main Building | | Gresham, OR | | 100 | % | | (9) | | 374 |
| | 668 |
| | 1,042 |
| | — |
| | 374 |
| | 668 |
| | 1,042 |
| | (35 | ) | | 1978 | | 09/01/2011 |
KBS REAL ESTATE INVESTMENT TRUST, INC.
SCHEDULE III
REAL ESTATE ASSETS AND ACCUMULATED DEPRECIATION AND AMORTIZATION (CONTINUED)
December 31, 2011
(dollar amounts in thousands)
|
| | | | | | | | | | | | | | | | | | | | | | | | | | | | | | | | | | | | | | | | | | | | | |
| | | | | | | | | Initial Cost to Company | | | | Gross Amount at which Carried at Close of Period | | | | | | |
| Description | | Location | | Ownership Percent | | Encumbrances | | Land | | Building and Improvements (1) | | Total | | Cost Capitalized Subsequent to Acquisition | | Land | | Building and Improvements (1) | | Total (2) | | Accumulated Depreciation and Amortization | | Original Date of Construction | | Date Acquired |
| Parkrose - Main Building | | Portland, OR | | 100 | % | | (9) | | $ | 216 |
| | $ | 326 |
| | $ | 542 |
| | $ | — |
| | $ | 216 |
| | $ | 326 |
| | $ | 542 |
| | $ | (28 | ) | | 1967 | | 09/01/2011 |
| Blair Mill Road | | Horsham, PA | | 100 | % | | (9) | | 1,171 |
| | 1,794 |
| | 2,965 |
| | — |
| | 1,171 |
| | 1,794 |
| | 2,965 |
| | (47 | ) | | 1985 | | 09/01/2011 |
| Bustleton Avenue | | Philadelphia, PA | | 100 | % | | (9) | | 188 |
| | 788 |
| | 976 |
| | — |
| | 188 |
| | 788 |
| | 976 |
| | (23 | ) | | 1953 | | 09/01/2011 |
| Dupont Drive | | Providence, RI | | 100 | % | | (9) | | 1,330 |
| | 8,737 |
| | 10,067 |
| | (24 | ) | | 1,330 |
| | 8,713 |
| | 10,043 |
| | (323 | ) | | 1963 | | 09/01/2011 |
| Post Road | | North Kingstown, RI | | 100 | % | | (9) | | 825 |
| | 1,527 |
| | 2,352 |
| | — |
| | 825 |
| | 1,527 |
| | 2,352 |
| | (58 | ) | | 1988 | | 09/01/2011 |
| Hilton Head-Pope Ave - Main Bldg | | Hilton Head, SC | | 100 | % | | (9) | | 527 |
| | 646 |
| | 1,173 |
| | — |
| | 527 |
| | 646 |
| | 1,173 |
| | (37 | ) | | 1981 | | 09/01/2011 |
| Rock Hill MO - Main Building | | Rock Hill, SC | | 100 | % | | (9) | | 553 |
| | 538 |
| | 1,091 |
| | — |
| | 553 |
| | 538 |
| | 1,091 |
| | (23 | ) | | 1986 | | 09/01/2011 |
| Lebanon Main - Main Building | | Lebanon, TN | | 100 | % | | (9) | | 125 |
| | 237 |
| | 362 |
| | — |
| | 125 |
| | 237 |
| | 362 |
| | (16 | ) | | 1962 | | 09/01/2011 |
| Beaumont - Main Building | | Beaumont, TX | | 100 | % | | (9) | | 181 |
| | 369 |
| | 550 |
| | — |
| | 181 |
| | 369 |
| | 550 |
| | (18 | ) | | 1958 | | 09/01/2011 |
| Harlandale - Main Building | | San Antonio, TX | | 100 | % | | (9) | | 282 |
| | 418 |
| | 700 |
| | — |
| | 282 |
| | 418 |
| | 700 |
| | (33 | ) | | 1970 | | 09/01/2011 |
| Nederland - Main Building | | Nederland, TX | | 100 | % | | (9) | | 49 |
| | 510 |
| | 559 |
| | — |
| | 49 |
| | 510 |
| | 559 |
| | (27 | ) | | 1946 | | 09/01/2011 |
| Northern Hills - Main Building | | San Antonio, TX | | 100 | % | | (9) | | 342 |
| | 449 |
| | 791 |
| | — |
| | 342 |
| | 449 |
| | 791 |
| | (23 | ) | | 1979 | | 09/01/2011 |
| Steeplechase - Main Building | | Houston, TX | | 100 | % | | (9) | | 286 |
| | 637 |
| | 923 |
| | — |
| | 286 |
| | 637 |
| | 923 |
| | (65 | ) | | 1981 | | 09/01/2011 |
| Witchita Falls - Main Building | | Wichita Falls, TX | | 100 | % | | (9) | | 566 |
| | 780 |
| | 1,346 |
| | — |
| | 566 |
| | 780 |
| | 1,346 |
| | (68 | ) | | 1978 | | 09/01/2011 |
| Abingdon - Main Building | | Abingdon, VA | | 100 | % | | (9) | | 375 |
| | 295 |
| | 670 |
| | — |
| | 375 |
| | 295 |
| | 670 |
| | (13 | ) | | 1964/1980 | | 09/01/2011 |
| Coliseum-Riverdale - Main Bldg | | Hampton, VA | | 100 | % | | (9) | | 352 |
| | 403 |
| | 755 |
| | — |
| | 352 |
| | 403 |
| | 755 |
| | (19 | ) | | 1974/1998 | | 09/01/2011 |
| Fairfax Courthouse | | Fairfax, VA | | 100 | % | | (9) | | 590 |
| | 968 |
| | 1,558 |
| | 28 |
| | 590 |
| | 996 |
| | 1,586 |
| | (28 | ) | | 1932/2000 | | 09/01/2011 |
| Orange - Main Building | | Orange, VA | | 100 | % | | (9) | | 48 |
| | 266 |
| | 314 |
| | — |
| | 48 |
| | 266 |
| | 314 |
| | (16 | ) | | 1925 | | 09/01/2011 |
| Robinson & Broad - Main Building | | Richmond, VA | | 100 | % | | (9) | | 291 |
| | 573 |
| | 864 |
| | — |
| | 291 |
| | 573 |
| | 864 |
| | (26 | ) | | 1947/1985 | | 09/01/2011 |
| Camas - Main Building | | Camas, WA | | 100 | % | | (9) | | 386 |
| | 243 |
| | 629 |
| | — |
| | 386 |
| | 243 |
| | 629 |
| | (18 | ) | | 1951 | | 09/01/2011 |
| Clarkston - Main Building | | Clarkston, WA | | 100 | % | | (9) | | 205 |
| | 610 |
| | 815 |
| | — |
| | 205 |
| | 610 |
| | 815 |
| | (25 | ) | | 1958 | | 09/01/2011 |
| Edmonds - Main Building | | Edmonds, WA | | 100 | % | | (9) | | 367 |
| | 348 |
| | 715 |
| | 41 |
| | 367 |
| | 389 |
| | 756 |
| | (17 | ) | | 1956 | | 09/01/2011 |
| Greenwood - Main Building | | Seattle, WA | | 100 | % | | (9) | | 104 |
| | 221 |
| | 325 |
| | — |
| | 104 |
| | 221 |
| | 325 |
| | (11 | ) | | 1948 | | 09/01/2011 |
| Kennewick - Main Building | | Kennewick, WA | | 100 | % | | (9) | | 243 |
| | 673 |
| | 916 |
| | — |
| | 243 |
| | 673 |
| | 916 |
| | (25 | ) | | 1977/1991 | | 09/01/2011 |
| Lynden - Main Building | | Lynden, WA | | 100 | % | | (9) | | — |
| | 186 |
| | 186 |
| | — |
| | — |
| | 186 |
| | 186 |
| | (9 | ) | | 1973 | | 09/01/2011 |
| Port Townsend | | Port Townsend, WA | | 100 | % | | (9) | | 73 |
| | 235 |
| | 308 |
| | — |
| | 73 |
| | 235 |
| | 308 |
| | (13 | ) | | 1974 | | 09/01/2011 |
| Quincy - Main Building | | Quincy, WA | | 100 | % | | (9) | | 138 |
| | 275 |
| | 413 |
| | — |
| | 138 |
| | 275 |
| | 413 |
| | (10 | ) | | 1977/1991 | | 09/01/2011 |
| Sequim - Main Building | | Sequim, WA | | 100 | % | | (9) | | 377 |
| | 370 |
| | 747 |
| | — |
| | 377 |
| | 370 |
| | 747 |
| | (21 | ) | | 1979 | | 09/01/2011 |
| Wenatchee Valley - Main Building | | Wenatchee, WA | | 100 | % | | (9) | | 19 |
| | 456 |
| | 475 |
| | 62 |
| | 19 |
| | 518 |
| | 537 |
| | (18 | ) | | 1965/1992 | | 09/01/2011 |
| Ballard - Main Building | | Seattle, WA | | 100 | % | | (9) | | 270 |
| | 326 |
| | 596 |
| | 45 |
| | 270 |
| | 371 |
| | 641 |
| | (13 | ) | | 1951 | | 09/01/2011 |
| Daytona Beach Spdwy - Main Bldg | | Daytona Beach, FL | | 100 | % | | (9) | | 1,060 |
| | 638 |
| | 1,698 |
| | 26 |
| | 1,060 |
| | 664 |
| | 1,724 |
| | (26 | ) | | 1974 | | 09/01/2011 |
| Palm Beach Vault | | West Palm Beach, FL | | 100 | % | | (9) | | 854 |
| | 533 |
| | 1,387 |
| | — |
| | 854 |
| | 533 |
| | 1,387 |
| | (41 | ) | | 1997 | | 09/01/2011 |
| Redmond - Main Building | | Redmond, OR | | 100 | % | | (9) | | 50 |
| | 206 |
| | 256 |
| | — |
| | 50 |
| | 206 |
| | 256 |
| | (7 | ) | | 1925/1982 | | 09/01/2011 |
| Las Vegas Ops Center | | Las Vegas, NV | | 100 | % | | (9) | | 5,313 |
| | 4,474 |
| | 9,787 |
| | — |
| | 5,313 |
| | 4,474 |
| | 9,787 |
| | (160 | ) | | 1972/1990 | | 09/01/2011 |
KBS REAL ESTATE INVESTMENT TRUST, INC.
SCHEDULE III
REAL ESTATE ASSETS AND ACCUMULATED DEPRECIATION AND AMORTIZATION (CONTINUED)
December 31, 2011
(dollar amounts in thousands)
|
| | | | | | | | | | | | | | | | | | | | | | | | | | | | | | | | | | | | | | | | | | | | | |
| | | | | | | | | Initial Cost to Company | | | | Gross Amount at which Carried at Close of Period | | | | | | |
| Description | | Location | | Ownership Percent | | Encumbrances | | Land | | Building and Improvements (1) | | Total | | Cost Capitalized Subsequent to Acquisition | | Land | | Building and Improvements (1) | | Total (2) | | Accumulated Depreciation and Amortization | | Original Date of Construction | | Date Acquired |
| FS Wilmington, LP | | Wilmington, DE | | 100 | % | | $ | 37,762 |
| | $ | 9,200 |
| | $ | 41,046 |
| | $ | 50,246 |
| | $ | — |
| | $ | 9,200 |
| | $ | 41,046 |
| | $ | 50,246 |
| | $ | (1,270 | ) | | 1995 | | 09/01/2011 |
| Berkeley Heights | | Berkeley Height, NJ | | 100 | % | | 453 |
| | 196 |
| | 1,051 |
| | 1,247 |
| | — |
| | 196 |
| | 1,051 |
| | 1,247 |
| | (51 | ) | | 1972 | | 09/01/2011 |
| Citizens - Clinton East Main | | Clinton, CT | | 100 | % | | (10) | | 172 |
| | 641 |
| | 813 |
| | — |
| | 172 |
| | 641 |
| | 813 |
| | (9 | ) | | 1972 | | 10/24/2011 |
| Citizens - Railroad Avenue | | Plainfield, CT | | 100 | % | | (10) | | 232 |
| | 426 |
| | 658 |
| | — |
| | 232 |
| | 426 |
| | 658 |
| | (7 | ) | | 1980 | | 10/24/2011 |
| Citizens - Shunpike Road | | Cromwell, CT | | 100 | % | | (10) | | 281 |
| | 484 |
| | 765 |
| | — |
| | 281 |
| | 484 |
| | 765 |
| | (8 | ) | | 1976 | | 10/24/2011 |
| Citizens - Whalley Avenue | | New Haven, CT | | 100 | % | | (10) | | 186 |
| | 416 |
| | 602 |
| | — |
| | 186 |
| | 416 |
| | 602 |
| | (7 | ) | | 1943 | | 10/24/2011 |
| Citizens - Lockport | | Lockport, IL | | 100 | % | | (10) | | 287 |
| | 1,129 |
| | 1,416 |
| | — |
| | 287 |
| | 1,129 |
| | 1,416 |
| | (14 | ) | | 1981/1996 | | 10/24/2011 |
| Citizens - Columbia Road | | Dorchester, MA | | 100 | % | | (10) | | 370 |
| | 1,433 |
| | 1,803 |
| | — |
| | 370 |
| | 1,433 |
| | 1,803 |
| | (21 | ) | | 1930 | | 10/24/2011 |
| Citizens - East Boston Square | | East Boston, MA | | 100 | % | | (10) | | 192 |
| | 785 |
| | 977 |
| | — |
| | 192 |
| | 785 |
| | 977 |
| | (11 | ) | | 1928 | | 10/24/2011 |
| Citizens - Massachusetts Avenue | | Arllington Heights, MA | | 100 | % | | (10) | | 401 |
| | 395 |
| | 796 |
| | — |
| | 401 |
| | 395 |
| | 796 |
| | (6 | ) | | 1979 | | 10/24/2011 |
| Citizens - Rogers Road | | Gloucester, MA | | 100 | % | | (10) | | 251 |
| | 1,174 |
| | 1,425 |
| | — |
| | 251 |
| | 1,174 |
| | 1,425 |
| | (16 | ) | | 1950 | | 10/24/2011 |
| Citizens - Union Sq - Somerville | | Somerville, MA | | 100 | % | | (10) | | 647 |
| | 952 |
| | 1,599 |
| | — |
| | 647 |
| | 952 |
| | 1,599 |
| | (13 | ) | | 1970 | | 10/24/2011 |
| Citizens - 18 Mile Road | | Sterling Height, MI | | 100 | % | | (10) | | 207 |
| | 835 |
| | 1,042 |
| | — |
| | 207 |
| | 835 |
| | 1,042 |
| | (11 | ) | | 1977 | | 10/24/2011 |
| Citizens - Allen Road - Southgate | | Southgate, MI | | 100 | % | | (10) | | 422 |
| | 2,949 |
| | 3,371 |
| | — |
| | 422 |
| | 2,949 |
| | 3,371 |
| | (36 | ) | | 1973 | | 10/24/2011 |
Citizens - Ford Road Heights | | Dearborn Heights, MI | | 100 | % | | (10) | | 494 |
| | 1,130 |
| | 1,624 |
| | — |
| | 494 |
| | 1,130 |
| | 1,624 |
| | (13 | ) | | 1981 | | 10/24/2011 |
| Citizens - Grand River | | Detroit, MI | | 100 | % | | (10) | | 52 |
| | 611 |
| | 663 |
| | — |
| | 52 |
| | 611 |
| | 663 |
| | (10 | ) | | 1920 | | 10/24/2011 |
| Citizens - Greater Mack | | St. Clair Shores, MI | | 100 | % | | (10) | | 626 |
| | 1,150 |
| | 1,776 |
| | — |
| | 626 |
| | 1,150 |
| | 1,776 |
| | (17 | ) | | 1980 | | 10/24/2011 |
| Citizens - Grosse Pointe Woods | | Grosse Pointe Woods, MI | | 100 | % | | (10) | | 249 |
| | 572 |
| | 821 |
| | — |
| | 249 |
| | 572 |
| | 821 |
| | (8 | ) | | 1955 | | 10/24/2011 |
| Citizens - Hoover Road | | Warren, MI | | 100 | % | | (10) | | 133 |
| | 741 |
| | 874 |
| | — |
| | 133 |
| | 741 |
| | 874 |
| | (10 | ) | | 1997 | | 10/24/2011 |
| Citizens - Joy Road | | Detroit, MI | | 100 | % | | (10) | | 66 |
| | 591 |
| | 657 |
| | — |
| | 66 |
| | 591 |
| | 657 |
| | (10 | ) | | 1957 | | 10/24/2011 |
| Citizens - Main Street - Belleville | | Belleville, MI | | 100 | % | | (10) | | 181 |
| | 1,228 |
| | 1,409 |
| | — |
| | 181 |
| | 1,228 |
| | 1,409 |
| | (10 | ) | | 1998 | | 10/24/2011 |
| Citizens - North Adams | | Rochester, MI | | 100 | % | | (10) | | 227 |
| | 1,417 |
| | 1,644 |
| | — |
| | 227 |
| | 1,417 |
| | 1,644 |
| | (16 | ) | | 1976 | | 10/24/2011 |
| Citizens - Plymouth Road - Detroit | | Detroit, MI | | 100 | % | | (10) | | 66 |
| | 539 |
| | 605 |
| | — |
| | 66 |
| | 539 |
| | 605 |
| | (9 | ) | | Early 1960's | | 10/24/2011 |
| Citizens - Roseville | | Roseville, MI | | 100 | % | | (10) | | 347 |
| | 906 |
| | 1,253 |
| | — |
| | 347 |
| | 906 |
| | 1,253 |
| | (12 | ) | | 1981 | | 10/24/2011 |
| Citizens - Schoenherr | | Warren, MI | | 100 | % | | (10) | | 145 |
| | 1,088 |
| | 1,233 |
| | — |
| | 145 |
| | 1,088 |
| | 1,233 |
| | (14 | ) | | 1979 | | 10/24/2011 |
| Citizens - West Fort Street | | Southgate, MI | | 100 | % | | (10) | | 122 |
| | 1,315 |
| | 1,437 |
| | — |
| | 122 |
| | 1,315 |
| | 1,437 |
| | (12 | ) | | 1984 | | 10/24/2011 |
| Citizens - West Maple | | Bloomfield Hills, MI | | 100 | % | | (10) | | 317 |
| | 1,675 |
| | 1,992 |
| | — |
| | 317 |
| | 1,675 |
| | 1,992 |
| | (23 | ) | | 1962 | | 10/24/2011 |
| Citizens - Woodward - Ferndale | | Ferndale, MI | | 100 | % | | (10) | | 313 |
| | 798 |
| | 1,111 |
| | — |
| | 313 |
| | 798 |
| | 1,111 |
| | (12 | ) | | 1960 | | 10/24/2011 |
| Citizens - Barrington | | Barrington, NH | | 100 | % | | (10) | | 176 |
| | 335 |
| | 511 |
| | — |
| | 176 |
| | 335 |
| | 511 |
| | (8 | ) | | 1985 | | 10/24/2011 |
| Citizens - Coliseum Avenue | | Nashua, NH | | 100 | % | | (10) | | 206 |
| | 655 |
| | 861 |
| | — |
| | 206 |
| | 655 |
| | 861 |
| | (9 | ) | | 1981 | | 10/24/2011 |
| Citizens - One Constitution Way | | Somersworth, NH | | 100 | % | | (10) | | 135 |
| | 1,013 |
| | 1,148 |
| | — |
| | 135 |
| | 1,013 |
| | 1,148 |
| | (10 | ) | | 1985 | | 10/24/2011 |
| Citizens - Endicott | | Endicott, NY | | 100 | % | | (10) | | 117 |
| | 2,001 |
| | 2,118 |
| | — |
| | 117 |
| | 2,001 |
| | 2,118 |
| | (29 | ) | | 1927 | | 10/24/2011 |
| Citizens - Genesee - Utica | | Utica, NY | | 100 | % | | (10) | | 91 |
| | 2,001 |
| | 2,092 |
| | — |
| | 91 |
| | 2,001 |
| | 2,092 |
| | (29 | ) | | 1956/1968 | | 10/24/2011 |
| Citizens - Glens Falls | | Glens Falls, NY | | 100 | % | | (10) | | 167 |
| | 1,234 |
| | 1,401 |
| | — |
| | 167 |
| | 1,234 |
| | 1,401 |
| | (17 | ) | | 1956 | | 10/24/2011 |
KBS REAL ESTATE INVESTMENT TRUST, INC.
SCHEDULE III
REAL ESTATE ASSETS AND ACCUMULATED DEPRECIATION AND AMORTIZATION (CONTINUED)
December 31, 2011
(dollar amounts in thousands)
|
| | | | | | | | | | | | | | | | | | | | | | | | | | | | | | | | | | | | | | | | | | | | | |
| | | | | | | | | Initial Cost to Company | | | | Gross Amount at which Carried at Close of Period | | | | | | |
| Description | | Location | | Ownership Percent | | Encumbrances | | Land | | Building and Improvements (1) | | Total | | Cost Capitalized Subsequent to Acquisition | | Land | | Building and Improvements (1) | | Total (2) | | Accumulated Depreciation and Amortization | | Original Date of Construction | | Date Acquired |
| Citizens - Main Street - Beacon | | Beacon, NY | | 100 | % | | (10) | | $ | 440 |
| | $ | 1,247 |
| | $ | 1,687 |
| | $ | — |
| | $ | 440 |
| | $ | 1,247 |
| | $ | 1,687 |
| | $ | (18 | ) | | 1955 | | 10/24/2011 |
| Citizens - Meadow Avenue | | Newburgh, NY | | 100 | % | | (10) | | 364 |
| | 1,232 |
| | 1,596 |
| | — |
| | 364 |
| | 1,232 |
| | 1,596 |
| | (18 | ) | | 1972 | | 10/24/2011 |
| Citizens - Montcalm Street | | Ticonderoga, NY | | 100 | % | | (10) | | 16 |
| | 607 |
| | 623 |
| | — |
| | 16 |
| | 607 |
| | 623 |
| | (9 | ) | | 1920 | | 10/24/2011 |
| Citizens - Chagrin Falls | | Chagrin Falls, OH | | 100 | % | | (10) | | 188 |
| | 596 |
| | 784 |
| | — |
| | 188 |
| | 596 |
| | 784 |
| | (9 | ) | | Pre 1884 | | 10/24/2011 |
| Citizens - Dover Center Road | | Bay Village, OH | | 100 | % | | (10) | | 196 |
| | 484 |
| | 680 |
| | — |
| | 196 |
| | 484 |
| | 680 |
| | (8 | ) | | 1967 | | 10/24/2011 |
| Citizens - East Street - Euclid | | Euclid, OH | | 100 | % | | (10) | | 86 |
| | 708 |
| | 794 |
| | — |
| | 86 |
| | 708 |
| | 794 |
| | (8 | ) | | 1975 | | 10/24/2011 |
| Citizens - Fairview Park | | Fairview Park, OH | | 100 | % | | (10) | | 289 |
| | 374 |
| | 663 |
| | — |
| | 289 |
| | 374 |
| | 663 |
| | (7 | ) | | 1966 | | 10/24/2011 |
| Citizens - Girard | | Girard, OH | | 100 | % | | (10) | | 88 |
| | 1,091 |
| | 1,179 |
| | — |
| | 88 |
| | 1,091 |
| | 1,179 |
| | (12 | ) | | 1977/1983 | | 10/24/2011 |
| Citizens - Lake Shore Boulevard | | Euclid, OH | | 100 | % | | (10) | | 234 |
| | 622 |
| | 856 |
| | — |
| | 234 |
| | 622 |
| | 856 |
| | (11 | ) | | 1971 | | 10/24/2011 |
| Citizens - Lorain Road | | North Olmsted, OH | | 100 | % | | (10) | | 254 |
| | 599 |
| | 853 |
| | — |
| | 254 |
| | 599 |
| | 853 |
| | (6 | ) | | 1981 | | 10/24/2011 |
| Citizens - Mentor Avenue | | Mentor, OH | | 100 | % | | (10) | | 690 |
| | 1,283 |
| | 1,973 |
| | — |
| | 690 |
| | 1,283 |
| | 1,973 |
| | (24 | ) | | 1958 | | 10/24/2011 |
| Citizens - Navarre Avenue | | Oregon, OH | | 100 | % | | (10) | | 107 |
| | 1,015 |
| | 1,122 |
| | — |
| | 107 |
| | 1,015 |
| | 1,122 |
| | (13 | ) | | 1980 | | 10/24/2011 |
| Citizens - Richmond Heights | | Richmond Heights, OH | | 100 | % | | (10) | | 353 |
| | 683 |
| | 1,036 |
| | — |
| | 353 |
| | 683 |
| | 1,036 |
| | (11 | ) | | 2002 | | 10/24/2011 |
| Citizens - Toledo Main | | Toledo, OH | | 100 | % | | (10) | | 83 |
| | 664 |
| | 747 |
| | — |
| | 83 |
| | 664 |
| | 747 |
| | (10 | ) | | 1952 | | 10/24/2011 |
| Citizens - University Heights | | University Heights, OH | | 100 | % | | (10) | | 426 |
| | 505 |
| | 931 |
| | — |
| | 426 |
| | 505 |
| | 931 |
| | (7 | ) | | 1989/2002 | | 10/24/2011 |
| Citizens - Westlake | | Westlake, OH | | 100 | % | | (10) | | 283 |
| | 596 |
| | 879 |
| | — |
| | 283 |
| | 596 |
| | 879 |
| | (8 | ) | | 1981 | | 10/24/2011 |
| Citizens - Burgettstown | | Burgettstown, PA | | 100 | % | | (10) | | 68 |
| | 1,165 |
| | 1,233 |
| | — |
| | 68 |
| | 1,165 |
| | 1,233 |
| | (16 | ) | | 1921 | | 10/24/2011 |
| Citizens - Zelienople | | Zelienople, PA | | 100 | % | | (10) | | 26 |
| | 1,054 |
| | 1,080 |
| | — |
| | 26 |
| | 1,054 |
| | 1,080 |
| | (14 | ) | | 1920/1971 | | 10/24/2011 |
| Citizens - Portsmouth East Main | | Portsmouth, RI | | 100 | % | | (10) | | 446 |
| | 518 |
| | 964 |
| | — |
| | 446 |
| | 518 |
| | 964 |
| | (10 | ) | | 1979 | | 10/24/2011 |
| Citizens - Pearl St - Essex Junction | | Essex Junction, VT | | 100 | % | | (10) | | 170 |
| | 415 |
| | 585 |
| | — |
| | 170 |
| | 415 |
| | 585 |
| | (5 | ) | | 1986 | | 10/24/2011 |
| Feasterville | | Feasterville, PA | | 100 | % | | 801 |
| | 319 |
| | 2,064 |
| | 2,383 |
| | — |
| | 319 |
| | 2,064 |
| | 2,383 |
| | (75 | ) | | 1964 | | 09/01/2011 |
| Ocean Ridge | | Boynton Beach, FL | | 100 | % | | (11) | | 343 |
| | 768 |
| | 1,111 |
| | — |
| | 343 |
| | 768 |
| | 1,111 |
| | (83 | ) | | 1980 | | 09/01/2011 |
| NBOC Operations Center | | North Brunswick, NJ | | 100 | % | | (11) | | 30 |
| | 40 |
| | 70 |
| | 55 |
| | 30 |
| | 95 |
| | 125 |
| | (2 | ) | | 1950 | | 09/01/2011 |
| NBOC Operations Center | | North Brunswick, NJ | | 100 | % | | (11) | | 1,701 |
| | 3,999 |
| | 5,700 |
| | — |
| | 1,701 |
| | 3,999 |
| | 5,700 |
| | (107 | ) | | 1950/1959 | | 09/01/2011 |
| Cobb Parkway | | Smyra, GA | | 100 | % | | (11) | | 272 |
| | 478 |
| | 750 |
| | — |
| | 272 |
| | 478 |
| | 750 |
| | (46 | ) | | 2008 | | 09/01/2011 |
| Church Street | | Selma, AL | | 100 | % | | (11) | | 20 |
| | 126 |
| | 146 |
| | — |
| | 20 |
| | 126 |
| | 146 |
| | (2 | ) | | 1960 | | 09/01/2011 |
| East Alton | | East Alton, IL | | 100 | % | | (11) | | 75 |
| | 309 |
| | 384 |
| | — |
| | 75 |
| | 309 |
| | 384 |
| | (16 | ) | | 1969 | | 09/01/2011 |
| Park Avenue | | Aiken, SC | | 100 | % | | (11) | | 227 |
| | 700 |
| | 927 |
| | — |
| | 227 |
| | 700 |
| | 927 |
| | (106 | ) | | 1980 | | 09/01/2011 |
| South First Street | | Lufkin, TX | | 100 | % | | (11) | | 191 |
| | 572 |
| | 763 |
| | — |
| | 191 |
| | 572 |
| | 763 |
| | (26 | ) | | 1957 | | 09/01/2011 |
| Kansas City Ops Center | | Kansas City, MO | | 100 | % | | (11) | | 1,939 |
| | 9,772 |
| | 11,711 |
| | — |
| | 1,939 |
| | 9,772 |
| | 11,711 |
| | (494 | ) | | 1981 | | 09/01/2011 |
| 4008 St. Clr Ave | | Cleveland, OH | | 100 | % | | (12) | | 26 |
| | 149 |
| | 175 |
| | — |
| | 26 |
| | 149 |
| | 175 |
| | (6 | ) | | 1978 | | 09/01/2011 |
| Madisonville | | Cincinnati, OH | | 100 | % | | (12) | | 103 |
| | 247 |
| | 350 |
| | — |
| | 103 |
| | 247 |
| | 350 |
| | (6 | ) | | 1979 | | 09/01/2011 |
| Baymeadows Ops Center | | Jacksonville, FL | | 100 | % | | (12) | | 3,027 |
| | 3,973 |
| | 7,000 |
| | — |
| | 3,027 |
| | 3,973 |
| | 7,000 |
| | (83 | ) | | 1982 | | 09/01/2011 |
| Oakwoods | | N. Wilkesboro, NC | | 100 | % | | (12) | | 1,934 |
| | 2,066 |
| | 4,000 |
| | — |
| | 1,934 |
| | 2,066 |
| | 4,000 |
| | (68 | ) | | 1976 | | 09/01/2011 |
KBS REAL ESTATE INVESTMENT TRUST, INC.
SCHEDULE III
REAL ESTATE ASSETS AND ACCUMULATED DEPRECIATION AND AMORTIZATION (CONTINUED)
December 31, 2011
(dollar amounts in thousands)
|
| | | | | | | | | | | | | | | | | | | | | | | | | | | | | | | | | | | | | | | | | | | | | |
| | | | | | | | | Initial Cost to Company | | | | Gross Amount at which Carried at Close of Period | | | | | | |
| Description | | Location | | Ownership Percent | | Encumbrances | | Land | | Building and Improvements (1) | | Total | | Cost Capitalized Subsequent to Acquisition | | Land | | Building and Improvements (1) | | Total (2) | | Accumulated Depreciation and Amortization | | Original Date of Construction | | Date Acquired |
| Lincolnton Main Office | | Lincolnton, NC | | 100 | % | | (12) | | $ | 73 |
| | $ | 977 |
| | $ | 1,050 |
| | $ | — |
| | $ | 73 |
| | $ | 977 |
| | $ | 1,050 |
| | $ | (20 | ) | | 1977 | | 09/01/2011 |
| Market Street | | Wilmington, NC | | 100 | % | | (12) | | 120 |
| | 255 |
| | 375 |
| | — |
| | 120 |
| | 255 |
| | 375 |
| | (16 | ) | | 1972 | | 09/01/2011 |
| Peoria Main | | Peoria, IL | | 100 | % | | (12) | | — |
| | 1,935 |
| | 1,935 |
| | — |
| | — |
| | 1,935 |
| | 1,935 |
| | (161 | ) | | 1924/1970 | | 09/01/2011 |
| Arcadia | | Kalamazoo, MI | | 100 | % | | (12) | | — |
| | 3,020 |
| | 3,020 |
| | — |
| | — |
| | 3,020 |
| | 3,020 |
| | (410 | ) | | 1872 | | 09/01/2011 |
| Grants Pass - Main Building | | Grants Pass, OR | | 100 | % | | (12) | | 428 |
| | 622 |
| | 1,050 |
| | — |
| | 428 |
| | 622 |
| | 1,050 |
| | (55 | ) | | 1963 | | 09/01/2011 |
| Jenkins Court - Tower | | Jenkintown, PA | | 100 | % | | 13,622 |
| | 1,683 |
| | 7,362 |
| | 9,045 |
| | — |
| | 1,683 |
| | 7,362 |
| | 9,045 |
| | (360 | ) | | 1931/1990 | | 09/01/2011 |
| Kenilworth | | Kenilworth, NJ | | 100 | % | | 371 |
| | 100 |
| | 912 |
| | 1,012 |
| | — |
| | 100 |
| | 912 |
| | 1,012 |
| | (34 | ) | | 1955 | | 09/01/2011 |
| Millburn | | Millburn, NJ | | 100 | % | | 756 |
| | 228 |
| | 1,875 |
| | 2,103 |
| | — |
| | 228 |
| | 1,875 |
| | 2,103 |
| | (68 | ) | | 1976 | | 09/01/2011 |
| One Citizens Plaza | | Providence, RI | | 100 | % | | 43,500 |
| | — |
| | 39,426 |
| | 39,426 |
| | — |
| | — |
| | 39,426 |
| | 39,426 |
| | (1,411 | ) | | 1990 | | 09/01/2011 |
| Dade City | | Dade City, FL | | 100 | % | | (13) | | 249 |
| | 578 |
| | 827 |
| | — |
| | 249 |
| | 578 |
| | 827 |
| | (16 | ) | | 1989 | | 09/01/2011 |
| Downtown Lakeland | | Lakeland, FL | | 100 | % | | (13) | | 443 |
| | 465 |
| | 908 |
| | 46 |
| | 443 |
| | 511 |
| | 954 |
| | (17 | ) | | 1940/1964 | | 09/01/2011 |
| Kings Point | | Delray Beach, FL | | 100 | % | | (13) | | 336 |
| | 499 |
| | 835 |
| | — |
| | 336 |
| | 499 |
| | 835 |
| | (21 | ) | | 1980 | | 09/01/2011 |
| New Warrington Road | | Pensacola, FL | | 100 | % | | (13) | | 1,017 |
| | 1,324 |
| | 2,341 |
| | — |
| | 1,017 |
| | 1,324 |
| | 2,341 |
| | (65 | ) | | 1970 | | 09/01/2011 |
| Okeechob Turnpike | | West Palm Beach, FL | | 100 | % | | (13) | | 778 |
| | 1,157 |
| | 1,935 |
| | — |
| | 778 |
| | 1,157 |
| | 1,935 |
| | (57 | ) | | 1985 | | 09/01/2011 |
| South Fort Myers | | Fort Myers, FL | | 100 | % | | (13) | | 1,602 |
| | 1,312 |
| | 2,914 |
| | — |
| | 1,602 |
| | 1,312 |
| | 2,914 |
| | (62 | ) | | 1973 | | 09/01/2011 |
| West Hollywood | | Hollywood, FL | | 100 | % | | (13) | | 173 |
| | 640 |
| | 813 |
| | — |
| | 173 |
| | 640 |
| | 813 |
| | (42 | ) | | 1991 | | 09/01/2011 |
| Westward | | West Palm Beach, FL | | 100 | % | | (13) | | 321 |
| | 607 |
| | 928 |
| | — |
| | 321 |
| | 607 |
| | 928 |
| | (27 | ) | | 1963 | | 09/01/2011 |
| Atlanta Ops Center | | Atlanta, GA | | 100 | % | | (13) | | 2,669 |
| | 22,178 |
| | 24,847 |
| | 108 |
| | 2,669 |
| | 22,286 |
| | 24,955 |
| | (347 | ) | | 1986/2001 | | 09/01/2011 |
| Columbus Main | | Columbus, GA | | 100 | % | | (13) | | 648 |
| | 1,343 |
| | 1,991 |
| | — |
| | 648 |
| | 1,343 |
| | 1,991 |
| | (22 | ) | | 1940/2002 | | 09/01/2011 |
| Dalton Main Office | | Dalton, GA | | 100 | % | | (13) | | 482 |
| | 468 |
| | 950 |
| | — |
| | 482 |
| | 468 |
| | 950 |
| | (45 | ) | | 1968 | | 09/01/2011 |
| Pikesville Branch | | Baltimore, MD | | 100 | % | | (13) | | 497 |
| | 1,187 |
| | 1,684 |
| | — |
| | 497 |
| | 1,187 |
| | 1,684 |
| | (20 | ) | | 1966/1997 | | 09/01/2011 |
| Burlington | | Burlington, NC | | 100 | % | | (13) | | 358 |
| | 432 |
| | 790 |
| | — |
| | 358 |
| | 432 |
| | 790 |
| | (13 | ) | | 1971 | | 09/01/2011 |
| Goldsboro | | Goldsboro, NC | | 100 | % | | (13) | | 138 |
| | 411 |
| | 549 |
| | — |
| | 138 |
| | 411 |
| | 549 |
| | (16 | ) | | 1983 | | 09/01/2011 |
| Greenville Sals | | Winterville, NC | | 100 | % | | (13) | | 833 |
| | 6,186 |
| | 7,019 |
| | — |
| | 833 |
| | 6,186 |
| | 7,019 |
| | (106 | ) | | 1999/2001 | | 09/01/2011 |
| Market Street | | Smithfield, NC | | 100 | % | | (13) | | 52 |
| | 171 |
| | 223 |
| | — |
| | 52 |
| | 171 |
| | 223 |
| | (4 | ) | | 1979 | | 09/01/2011 |
| Mortgage Center | | Raleigh, NC | | 100 | % | | (13) | | 6,076 |
| | 28,852 |
| | 34,928 |
| | 5 |
| | 6,076 |
| | 28,857 |
| | 34,933 |
| | (463 | ) | | 1998/1999 | | 09/01/2011 |
| West End Center | | Winstom Salem, NC | | 100 | % | | (13) | | 1,170 |
| | 23,178 |
| | 24,348 |
| | 200 |
| | 1,170 |
| | 23,378 |
| | 24,548 |
| | (337 | ) | | 1948/1986 | | 09/01/2011 |
| Winston Salem | | Winstom Salem, NC | | 100 | % | | (13) | | 1,211 |
| | 12,452 |
| | 13,663 |
| | — |
| | 1,211 |
| | 12,452 |
| | 13,663 |
| | (238 | ) | | 1983 | | 09/01/2011 |
| Haddon Township | | Hadden Township, NJ | | 100 | % | | (13) | | 919 |
| | 5,433 |
| | 6,352 |
| | 49 |
| | 919 |
| | 5,482 |
| | 6,401 |
| | (142 | ) | | 1964/1975 | | 09/01/2011 |
| Main Street Office | | Toms River, NJ | | 100 | % | | (13) | | 488 |
| | 1,678 |
| | 2,166 |
| | — |
| | 488 |
| | 1,678 |
| | 2,166 |
| | (52 | ) | | 1910 | | 09/01/2011 |
| Morristown Office | | Morristown, NJ | | 100 | % | | (13) | | 379 |
| | 6,163 |
| | 6,542 |
| | — |
| | 379 |
| | 6,163 |
| | 6,542 |
| | (181 | ) | | 1964 | | 09/01/2011 |
| Red Bank Main Office | | Red Bank, NJ | | 100 | % | | (13) | | 883 |
| | 1,136 |
| | 2,019 |
| | — |
| | 883 |
| | 1,136 |
| | 2,019 |
| | (48 | ) | | 1966 | | 09/01/2011 |
| Trenton - Brunswick | | Trenton, NJ | | 100 | % | | (13) | | 316 |
| | 486 |
| | 802 |
| | — |
| | 316 |
| | 486 |
| | 802 |
| | (16 | ) | | 1927/1954 | | 09/01/2011 |
| Lancaster Square | | Lancaster, PA | | 100 | % | | (13) | | 280 |
| | 3,794 |
| | 4,074 |
| | — |
| | 280 |
| | 3,794 |
| | 4,074 |
| | (72 | ) | | 1977 | | 09/01/2011 |
KBS REAL ESTATE INVESTMENT TRUST, INC.
SCHEDULE III
REAL ESTATE ASSETS AND ACCUMULATED DEPRECIATION AND AMORTIZATION (CONTINUED)
December 31, 2011
(dollar amounts in thousands)
|
| | | | | | | | | | | | | | | | | | | | | | | | | | | | | | | | | | | | | | | | | | | | | |
| | | | | | | | | Initial Cost to Company | | | | Gross Amount at which Carried at Close of Period | | | | | | |
| Description | | Location | | Ownership Percent | | Encumbrances | | Land | | Building and Improvements (1) | | Total | | Cost Capitalized Subsequent to Acquisition | | Land | | Building and Improvements (1) | | Total (2) | | Accumulated Depreciation and Amortization | | Original Date of Construction | | Date Acquired |
| Media Office | | Media, PA | | 100 | % | | (13) | | $ | 188 |
| | $ | 689 |
| | $ | 877 |
| | $ | — |
| | $ | 188 |
| | $ | 689 |
| | $ | 877 |
| | $ | (20 | ) | | 1958 | | 09/01/2011 |
| Plaza | | Philadelphia, PA | | 100 | % | | (13) | | 10,546 |
| | 30,988 |
| | 41,534 |
| | 28 |
| | 10,546 |
| | 31,016 |
| | 41,562 |
| | (726 | ) | | 1971 | | 09/01/2011 |
| West Chester Office | | West Chester, PA | | 100 | % | | (13) | | 297 |
| | 1,078 |
| | 1,375 |
| | — |
| | 297 |
| | 1,078 |
| | 1,375 |
| | (30 | ) | | 1837 | | 09/01/2011 |
| York Square | | York, PA | | 100 | % | | (13) | | 199 |
| | 1,106 |
| | 1,305 |
| | — |
| | 199 |
| | 1,106 |
| | 1,305 |
| | (24 | ) | | 1920/1980 | | 09/01/2011 |
| Bennettsville Main | | Bennettsville, SC | | 100 | % | | (13) | | 65 |
| | 130 |
| | 195 |
| | — |
| | 65 |
| | 130 |
| | 195 |
| | (5 | ) | | 1975 | | 09/01/2011 |
| Charleston 16 Brd | | Charleston, SC | | 100 | % | | (13) | | 959 |
| | 8,196 |
| | 9,155 |
| | 120 |
| | 959 |
| | 8,316 |
| | 9,275 |
| | (100 | ) | | 1817/2004 | | 09/01/2011 |
| Columbia Grystn | | Colombia, SC | | 100 | % | | (13) | | 2,083 |
| | 15,638 |
| | 17,721 |
| | — |
| | 2,083 |
| | 15,638 |
| | 17,721 |
| | (322 | ) | | 1977/1982 | | 09/01/2011 |
| Amherst Sth Main | | Amherst, VA | | 100 | % | | (13) | | 19 |
| | 123 |
| | 142 |
| | — |
| | 19 |
| | 123 |
| | 142 |
| | (7 | ) | | 1964 | | 09/01/2011 |
| Blacksburg | | Blacksburg, VA | | 100 | % | | (13) | | 162 |
| | 468 |
| | 630 |
| | — |
| | 162 |
| | 468 |
| | 630 |
| | (22 | ) | | 1956 | | 09/01/2011 |
| Brookneal | | Brookneal, VA | | 100 | % | | (13) | | 93 |
| | 208 |
| | 301 |
| | — |
| | 93 |
| | 208 |
| | 301 |
| | (8 | ) | | 1961 | | 09/01/2011 |
| Christainsburg Main | | Christainsburg, VA | | 100 | % | | (13) | | 97 |
| | 459 |
| | 556 |
| | — |
| | 97 |
| | 459 |
| | 556 |
| | (12 | ) | | 1963/1980 | | 09/01/2011 |
| Clintwood | | Clintwood, VA | | 100 | % | | (13) | | 64 |
| | 294 |
| | 358 |
| | — |
| | 64 |
| | 294 |
| | 358 |
| | (8 | ) | | 1979 | | 09/01/2011 |
| Market St Office | | Harrisinburg, VA | | 100 | % | | (13) | | 145 |
| | 727 |
| | 872 |
| | — |
| | 145 |
| | 727 |
| | 872 |
| | (21 | ) | | 1960 | | 09/01/2011 |
| Virgina Beach Pembrk | | Virginia Beach, VA | | 100 | % | | (13) | | 141 |
| | 1,284 |
| | 1,425 |
| | — |
| | 141 |
| | 1,284 |
| | 1,425 |
| | (32 | ) | | 1985 | | 09/01/2011 |
| WVOC - Four Story | | Roanoke, VA | | 100 | % | | (13) | | 1,624 |
| | 29,122 |
| | 30,746 |
| | 7 |
| | 1,624 |
| | 29,129 |
| | 30,753 |
| | (452 | ) | | 1968/1990 | | 09/01/2011 |
| West End Center | | Winston Salem, NC | | 100 | % | | (13) | | 1,052 |
| | 4,174 |
| | 5,226 |
| | — |
| | 1,052 |
| | 4,174 |
| | 5,226 |
| | (60 | ) | | 1948/1997 | | 09/01/2011 |
| Albemarle Road | | Charlotte, NC | | 100 | % | | (14) | | 240 |
| | 563 |
| | 803 |
| | — |
| | 240 |
| | 563 |
| | 803 |
| | (16 | ) | | 1979 | | 09/01/2011 |
| Beatties Ford Road | | Charlotte, NC | | 100 | % | | (14) | | 184 |
| | 490 |
| | 674 |
| | — |
| | 184 |
| | 490 |
| | 674 |
| | (14 | ) | | 1970 | | 09/01/2011 |
| Belhaven Boulevard | | Charlotte, NC | | 100 | % | | (14) | | 240 |
| | 501 |
| | 741 |
| | — |
| | 240 |
| | 501 |
| | 741 |
| | (17 | ) | | 1966 | | 09/01/2011 |
| Boger City | | Lincolnton, NC | | 100 | % | | (14) | | 182 |
| | 588 |
| | 770 |
| | — |
| | 182 |
| | 588 |
| | 770 |
| | (18 | ) | | 1971 | | 09/01/2011 |
| Boone Main Office | | Boone, NC | | 100 | % | | (14) | | 128 |
| | 753 |
| | 881 |
| | — |
| | 128 |
| | 753 |
| | 881 |
| | (22 | ) | | 1970 | | 09/01/2011 |
| Burgaw Main Office | | Burgaw, NC | | 100 | % | | (14) | | 106 |
| | 382 |
| | 488 |
| | — |
| | 106 |
| | 382 |
| | 488 |
| | (12 | ) | | 1963 | | 09/01/2011 |
| Burlington Main Office | | Burlington, NC | | 100 | % | | (14) | | 213 |
| | 1,220 |
| | 1,433 |
| | — |
| | 213 |
| | 1,220 |
| | 1,433 |
| | (29 | ) | | 1982 | | 09/01/2011 |
| Cameron Village | | Raleigh, NC | | 100 | % | | (14) | | 300 |
| | 822 |
| | 1,122 |
| | — |
| | 300 |
| | 822 |
| | 1,122 |
| | (22 | ) | | 1985 | | 09/01/2011 |
| Candler | | Candler, NC | | 100 | % | | (14) | | 157 |
| | 431 |
| | 588 |
| | — |
| | 157 |
| | 431 |
| | 588 |
| | (13 | ) | | 1977 | | 09/01/2011 |
| Carmel Commons | | Charlotte, NC | | 100 | % | | (14) | | 502 |
| | 898 |
| | 1,400 |
| | — |
| | 502 |
| | 898 |
| | 1,400 |
| | (23 | ) | | 1980 | | 09/01/2011 |
| Carolina Beach | | Carolina Beach, NC | | 100 | % | | (14) | | 194 |
| | 1,045 |
| | 1,239 |
| | — |
| | 194 |
| | 1,045 |
| | 1,239 |
| | (26 | ) | | 1971 | | 09/01/2011 |
| Cary Village | | Cary, NC | | 100 | % | | (14) | | 132 |
| | 540 |
| | 672 |
| | — |
| | 132 |
| | 540 |
| | 672 |
| | (11 | ) | | 1997 | | 09/01/2011 |
| Cherryville | | Cherryville, NC | | 100 | % | | (14) | | 96 |
| | 468 |
| | 564 |
| | — |
| | 96 |
| | 468 |
| | 564 |
| | (13 | ) | | 1965 | | 09/01/2011 |
| Columbus | | Columbus, NC | | 100 | % | | (14) | | 58 |
| | 307 |
| | 365 |
| | — |
| | 58 |
| | 307 |
| | 365 |
| | (9 | ) | | 1971 | | 09/01/2011 |
| Cornelius | | Cornelius, NC | | 100 | % | | (14) | | 983 |
| | 989 |
| | 1,972 |
| | — |
| | 983 |
| | 989 |
| | 1,972 |
| | (21 | ) | | 1989 | | 09/01/2011 |
| Cumberland | | Fayetteville, NC | | 100 | % | | (14) | | 186 |
| | 551 |
| | 737 |
| | — |
| | 186 |
| | 551 |
| | 737 |
| | (15 | ) | | 1982 | | 09/01/2011 |
| Dallas | | Dallas, NC | | 100 | % | | (14) | | 110 |
| | 379 |
| | 489 |
| | — |
| | 110 |
| | 379 |
| | 489 |
| | (12 | ) | | 1972 | | 09/01/2011 |
| Denver | | Denver, NC | | 100 | % | | (14) | | 75 |
| | 333 |
| | 408 |
| | — |
| | 75 |
| | 333 |
| | 408 |
| | (10 | ) | | 1974 | | 09/01/2011 |
KBS REAL ESTATE INVESTMENT TRUST, INC.
SCHEDULE III
REAL ESTATE ASSETS AND ACCUMULATED DEPRECIATION AND AMORTIZATION (CONTINUED)
December 31, 2011
(dollar amounts in thousands)
|
| | | | | | | | | | | | | | | | | | | | | | | | | | | | | | | | | | | | | | | | | | | | | |
| | | | | | | | | Initial Cost to Company | | | | Gross Amount at which Carried at Close of Period | | | | | | |
| Description | | Location | | Ownership Percent | | Encumbrances | | Land | | Building and Improvements (1) | | Total | | Cost Capitalized Subsequent to Acquisition | | Land | | Building and Improvements (1) | | Total (2) | | Accumulated Depreciation and Amortization | | Original Date of Construction | | Date Acquired |
| Dixie Village | | Gastonia, NC | | 100 | % | | (14) | | $ | 137 |
| | $ | 513 |
| | $ | 650 |
| | $ | — |
| | $ | 137 |
| | $ | 513 |
| | $ | 650 |
| | $ | (15 | ) | | 1972 | | 09/01/2011 |
| Eden Main Office | | Eden, NC | | 100 | % | | (14) | | 219 |
| | 662 |
| | 881 |
| | — |
| | 219 |
| | 662 |
| | 881 |
| | (21 | ) | | 1980 | | 09/01/2011 |
| Elizabethtown Main | | Elizabethtown, NC | | 100 | % | | (14) | | 71 |
| | 592 |
| | 663 |
| | — |
| | 71 |
| | 592 |
| | 663 |
| | (15 | ) | | 1962 | | 09/01/2011 |
| Farmville | | Farmville, NC | | 100 | % | | (14) | | 112 |
| | 892 |
| | 1,004 |
| | — |
| | 112 |
| | 892 |
| | 1,004 |
| | (24 | ) | | 1965 | | 09/01/2011 |
| Fayetteville Dwntown | | Fayetteville, NC | | 100 | % | | (14) | | 216 |
| | 452 |
| | 668 |
| | — |
| | 216 |
| | 452 |
| | 668 |
| | (16 | ) | | 1980 | | 09/01/2011 |
| Garner | | Garner, NC | | 100 | % | | (14) | | 126 |
| | 704 |
| | 830 |
| | — |
| | 126 |
| | 704 |
| | 830 |
| | (19 | ) | | 1971 | | 09/01/2011 |
| Gastonia Main Office | | Gastonia, NC | | 100 | % | | (14) | | 313 |
| | 1,277 |
| | 1,590 |
| | — |
| | 313 |
| | 1,277 |
| | 1,590 |
| | (33 | ) | | 1977 | | 09/01/2011 |
| Guilford College | | Greensboro, NC | | 100 | % | | (14) | | 235 |
| | 803 |
| | 1,038 |
| | — |
| | 235 |
| | 803 |
| | 1,038 |
| | (19 | ) | | 1983 | | 09/01/2011 |
| Henderson Mo Relc | | Henderson, NC | | 100 | % | | (14) | | 116 |
| | 1,145 |
| | 1,261 |
| | — |
| | 116 |
| | 1,145 |
| | 1,261 |
| | (22 | ) | | 1994 | | 09/01/2011 |
| Hillsborough | | Hillsborough, NC | | 100 | % | | (14) | | 55 |
| | 383 |
| | 438 |
| | — |
| | 55 |
| | 383 |
| | 438 |
| | (11 | ) | | 1920 | | 09/01/2011 |
| Hilltop Plaza | | Monroe, NC | | 100 | % | | (14) | | 352 |
| | 935 |
| | 1,287 |
| | — |
| | 352 |
| | 935 |
| | 1,287 |
| | (19 | ) | | 1993 | | 09/01/2011 |
| Hospital - Greenville | | Greenville, NC | | 100 | % | | (14) | | 407 |
| | 737 |
| | 1,144 |
| | — |
| | 407 |
| | 737 |
| | 1,144 |
| | (16 | ) | | 1991 | | 09/01/2011 |
| Kenansville | | Kenansville, NC | | 100 | % | | (14) | | 90 |
| | 463 |
| | 553 |
| | — |
| | 90 |
| | 463 |
| | 553 |
| | (13 | ) | | 1970 | | 09/01/2011 |
| Kinston Main Office | | Kinston, NC | | 100 | % | | (14) | | 136 |
| | 1,121 |
| | 1,257 |
| | — |
| | 136 |
| | 1,121 |
| | 1,257 |
| | (25 | ) | | 1982 | | 09/01/2011 |
| Landfall | | Wilmington, NC | | 100 | % | | (14) | | 353 |
| | 1,116 |
| | 1,469 |
| | — |
| | 353 |
| | 1,116 |
| | 1,469 |
| | (23 | ) | | 1989 | | 09/01/2011 |
| Marion Main Office | | Marion, NC | | 100 | % | | (14) | | 232 |
| | 1,341 |
| | 1,573 |
| | — |
| | 232 |
| | 1,341 |
| | 1,573 |
| | (27 | ) | | 1982 | | 09/01/2011 |
| Mooresville Main | | Mooresville, NC | | 100 | % | | (14) | | 195 |
| | 756 |
| | 951 |
| | — |
| | 195 |
| | 756 |
| | 951 |
| | (22 | ) | | 1957 | | 09/01/2011 |
| Mt Olive Main Office | | Mount Olive, NC | | 100 | % | | (14) | | 119 |
| | 404 |
| | 523 |
| | — |
| | 119 |
| | 404 |
| | 523 |
| | (13 | ) | | 1962 | | 09/01/2011 |
| Myers Park | | Charlotte, NC | | 100 | % | | (14) | | 340 |
| | 1,477 |
| | 1,817 |
| | — |
| | 340 |
| | 1,477 |
| | 1,817 |
| | (38 | ) | | 1974 | | 09/01/2011 |
| North Asheville | | Asheville, NC | | 100 | % | | (14) | | 73 |
| | 430 |
| | 503 |
| | — |
| | 73 |
| | 430 |
| | 503 |
| | (11 | ) | | 1973 | | 09/01/2011 |
| North Boulevard - Raleigh | | Raleigh, NC | | 100 | % | | (14) | | 266 |
| | 689 |
| | 955 |
| | — |
| | 266 |
| | 689 |
| | 955 |
| | (15 | ) | | 1986 | | 09/01/2011 |
| North Durham | | Durham, NC | | 100 | % | | (14) | | 202 |
| | 429 |
| | 631 |
| | — |
| | 202 |
| | 429 |
| | 631 |
| | (13 | ) | | 1982 | | 09/01/2011 |
| North Henderson | | Henderson, NC | | 100 | % | | (14) | | 92 |
| | 247 |
| | 339 |
| | — |
| | 92 |
| | 247 |
| | 339 |
| | (10 | ) | | 1969 | | 09/01/2011 |
| North Raleigh | | Raleigh, NC | | 100 | % | | (14) | | 188 |
| | 472 |
| | 660 |
| | — |
| | 188 |
| | 472 |
| | 660 |
| | (13 | ) | | 1979 | | 09/01/2011 |
| Northeast | | Charlotte, NC | | 100 | % | | (14) | | 538 |
| | 766 |
| | 1,304 |
| | — |
| | 538 |
| | 766 |
| | 1,304 |
| | (23 | ) | | 1962 | | 09/01/2011 |
| Northwood | | High Point, NC | | 100 | % | | (14) | | 184 |
| | 396 |
| | 580 |
| | — |
| | 184 |
| | 396 |
| | 580 |
| | (13 | ) | | 1980 | | 09/01/2011 |
| Park Road | | Charlotte, NC | | 100 | % | | (14) | | 376 |
| | 766 |
| | 1,142 |
| | — |
| | 376 |
| | 766 |
| | 1,142 |
| | (21 | ) | | 1971 | | 09/01/2011 |
| Pavilions | | Winston-Salem, NC | | 100 | % | | (14) | | 574 |
| | 1,284 |
| | 1,858 |
| | — |
| | 574 |
| | 1,284 |
| | 1,858 |
| | (24 | ) | | 1989 | | 09/01/2011 |
| Pinehurst | | Pinehurst, NC | | 100 | % | | (14) | | 214 |
| | 602 |
| | 816 |
| | — |
| | 214 |
| | 602 |
| | 816 |
| | (20 | ) | | 1904 | | 09/01/2011 |
| Pleasant Garden | | Pleasant Garden, NC | | 100 | % | | (14) | | 97 |
| | 235 |
| | 332 |
| | — |
| | 97 |
| | 235 |
| | 332 |
| | (9 | ) | | 1935 | | 09/01/2011 |
| Reidsville Main Office | | Reidsville, NC | | 100 | % | | (14) | | 160 |
| | 349 |
| | 509 |
| | — |
| | 160 |
| | 349 |
| | 509 |
| | (14 | ) | | 1900 | | 09/01/2011 |
| Reynolda | | Winston-Salem, NC | | 100 | % | | (14) | | 236 |
| | 518 |
| | 754 |
| | — |
| | 236 |
| | 518 |
| | 754 |
| | (16 | ) | | 1972 | | 09/01/2011 |
| Salisbury Main Office | | Salisbury, NC | | 100 | % | | (14) | | 413 |
| | 987 |
| | 1,400 |
| | — |
| | 413 |
| | 987 |
| | 1,400 |
| | (23 | ) | | 1983 | | 09/01/2011 |
| Salisbury West | | Salisbury, NC | | 100 | % | | (14) | | 351 |
| | 189 |
| | 540 |
| | — |
| | 351 |
| | 189 |
| | 540 |
| | (8 | ) | | 1994 | | 09/01/2011 |
KBS REAL ESTATE INVESTMENT TRUST, INC.
SCHEDULE III
REAL ESTATE ASSETS AND ACCUMULATED DEPRECIATION AND AMORTIZATION (CONTINUED)
December 31, 2011
(dollar amounts in thousands)
|
| | | | | | | | | | | | | | | | | | | | | | | | | | | | | | | | | | | | | | | | | | | | | |
| | | | | | | | | Initial Cost to Company | | | | Gross Amount at which Carried at Close of Period | | | | | | |
| Description | | Location | | Ownership Percent | | Encumbrances | | Land | | Building and Improvements (1) | | Total | | Cost Capitalized Subsequent to Acquisition | | Land | | Building and Improvements (1) | | Total (2) | | Accumulated Depreciation and Amortization | | Original Date of Construction | | Date Acquired |
| Sardis Village | | Charlotte, NC | | 100 | % | | (14) | | $ | 624 |
| | $ | 747 |
| | $ | 1,371 |
| | $ | — |
| | $ | 624 |
| | $ | 747 |
| | $ | 1,371 |
| | $ | (22 | ) | | 1982 | | 09/01/2011 |
| Signal Hill | | Statesville, NC | | 100 | % | | (14) | | 407 |
| | 657 |
| | 1,064 |
| | — |
| | 407 |
| | 657 |
| | 1,064 |
| | (20 | ) | | 1975 | | 09/01/2011 |
| Six Forks | | Raleigh, NC | | 100 | % | | (14) | | 338 |
| | 1,053 |
| | 1,391 |
| | — |
| | 338 |
| | 1,053 |
| | 1,391 |
| | (22 | ) | | 1986 | | 09/01/2011 |
| South Elm | | Greensboro, NC | | 100 | % | | (14) | | 220 |
| | 575 |
| | 795 |
| | — |
| | 220 |
| | 575 |
| | 795 |
| | (19 | ) | | 1969 | | 09/01/2011 |
| South Park Greenville | | Greenville, NC | | 100 | % | | (14) | | 237 |
| | 478 |
| | 715 |
| | — |
| | 237 |
| | 478 |
| | 715 |
| | (14 | ) | | 1980 | | 09/01/2011 |
| South Square | | Durham, NC | | 100 | % | | (14) | | 288 |
| | 482 |
| | 770 |
| | — |
| | 288 |
| | 482 |
| | 770 |
| | (14 | ) | | 1983 | | 09/01/2011 |
| South Pines Main Office | | Southern Pines, NC | | 100 | % | | (14) | | 399 |
| | 742 |
| | 1,141 |
| | — |
| | 399 |
| | 742 |
| | 1,141 |
| | (25 | ) | | 1974 | | 09/01/2011 |
| Southwinds | | Spring Lake, NC | | 100 | % | | (14) | | 395 |
| | 886 |
| | 1,281 |
| | — |
| | 395 |
| | 886 |
| | 1,281 |
| | (19 | ) | | 1994 | | 09/01/2011 |
| Southwood Square | | High Point, NC | | 100 | % | | (14) | | 348 |
| | 716 |
| | 1,064 |
| | — |
| | 348 |
| | 716 |
| | 1,064 |
| | (23 | ) | | 1981 | | 09/01/2011 |
| Spruce Pine Main | | Spruce Pine, NC | | 100 | % | | (14) | | 172 |
| | 953 |
| | 1,125 |
| | — |
| | 172 |
| | 953 |
| | 1,125 |
| | (26 | ) | | 1930 | | 09/01/2011 |
| Statesville Main Office | | Statesville, NC | | 100 | % | | (14) | | 130 |
| | 1,852 |
| | 1,982 |
| | — |
| | 130 |
| | 1,852 |
| | 1,982 |
| | (45 | ) | | 1910 | | 09/01/2011 |
| Swansboro | | Swansboro, NC | | 100 | % | | (14) | | 92 |
| | 272 |
| | 364 |
| | — |
| | 92 |
| | 272 |
| | 364 |
| | (8 | ) | | 1975 | | 09/01/2011 |
| Troutman | | Troutman, NC | | 100 | % | | (14) | | 319 |
| | 400 |
| | 719 |
| | — |
| | 319 |
| | 400 |
| | 719 |
| | (29 | ) | | 1975 | | 09/01/2011 |
| Tryon Main Office | | Tryon, NC | | 100 | % | | (14) | | 87 |
| | 1,067 |
| | 1,154 |
| | — |
| | 87 |
| | 1,067 |
| | 1,154 |
| | (25 | ) | | 1966 | | 09/01/2011 |
| Twin Rivers | | New Bern, NC | | 100 | % | | (14) | | 255 |
| | 414 |
| | 669 |
| | — |
| | 255 |
| | 414 |
| | 669 |
| | (14 | ) | | 1979 | | 09/01/2011 |
| Union Road | | Gastonia, NC | | 100 | % | | (14) | | 203 |
| | 750 |
| | 953 |
| | — |
| | 203 |
| | 750 |
| | 953 |
| | (21 | ) | | 1981 | | 09/01/2011 |
| University | | Wilmington, NC | | 100 | % | | (14) | | 397 |
| | 852 |
| | 1,249 |
| | — |
| | 397 |
| | 852 |
| | 1,249 |
| | (25 | ) | | 1974 | | 09/01/2011 |
| Village Drive | | Fayetteville, NC | | 100 | % | | (14) | | 293 |
| | 406 |
| | 699 |
| | — |
| | 293 |
| | 406 |
| | 699 |
| | (13 | ) | | 1973 | | 09/01/2011 |
| Combee | | Lakeland, FL | | 100 | % | | (15) | | 198 |
| | 501 |
| | 699 |
| | — |
| | 198 |
| | 501 |
| | 699 |
| | (16 | ) | | 1980 | | 09/01/2011 |
| Lantana | | Lantana, FL | | 100 | % | | (15) | | 604 |
| | 781 |
| | 1,385 |
| | — |
| | 604 |
| | 781 |
| | 1,385 |
| | (31 | ) | | 1963 | | 09/01/2011 |
| Monument Road | | Jacksonville, FL | | 100 | % | | (15) | | 947 |
| | 2,475 |
| | 3,422 |
| | — |
| | 947 |
| | 2,475 |
| | 3,422 |
| | (47 | ) | | 1986 | | 09/01/2011 |
| North Boca Raton | | Boca Raton, FL | | 100 | % | | (15) | | 276 |
| | 806 |
| | 1,082 |
| | — |
| | 276 |
| | 806 |
| | 1,082 |
| | (22 | ) | | 1981 | | 09/01/2011 |
| Ridge Road | | New Port Richey, FL | | 100 | % | | (15) | | 152 |
| | 554 |
| | 706 |
| | — |
| | 152 |
| | 554 |
| | 706 |
| | (15 | ) | | 1981 | | 09/01/2011 |
| Rockledge | | Rockledge, FL | | 100 | % | | (15) | | 230 |
| | 627 |
| | 857 |
| | — |
| | 230 |
| | 627 |
| | 857 |
| | (21 | ) | | 1982 | | 09/01/2011 |
| S. Mandarin | | Jacksonville, FL | | 100 | % | | (15) | | 241 |
| | 613 |
| | 854 |
| | — |
| | 241 |
| | 613 |
| | 854 |
| | (14 | ) | | 1986 | | 09/01/2011 |
| Westside | | Jacksonville, FL | | 100 | % | | (15) | | 495 |
| | 2,057 |
| | 2,552 |
| | — |
| | 495 |
| | 2,057 |
| | 2,552 |
| | (52 | ) | | 1962 | | 09/01/2011 |
| Hapeville | | Hapeville, GA | | 100 | % | | (15) | | 648 |
| | 1,859 |
| | 2,507 |
| | — |
| | 648 |
| | 1,859 |
| | 2,507 |
| | (47 | ) | | 1958 | | 09/01/2011 |
| Perimeter Center | | Atlanta, GA | | 100 | % | | (15) | | 756 |
| | 2,523 |
| | 3,279 |
| | — |
| | 756 |
| | 2,523 |
| | 3,279 |
| | (46 | ) | | 1994 | | 09/01/2011 |
| Stephenson | | Savannah, GA | | 100 | % | | (15) | | 305 |
| | 621 |
| | 926 |
| | — |
| | 305 |
| | 621 |
| | 926 |
| | (20 | ) | | 1967 | | 09/01/2011 |
| Toco Hills | | Atlanta, GA | | 100 | % | | (15) | | 230 |
| | 692 |
| | 922 |
| | — |
| | 230 |
| | 692 |
| | 922 |
| | (18 | ) | | 1986 | | 09/01/2011 |
| Walton Way | | Augusta, GA | | 100 | % | | (15) | | 431 |
| | 1,144 |
| | 1,575 |
| | — |
| | 431 |
| | 1,144 |
| | 1,575 |
| | (28 | ) | | 1985 | | 09/01/2011 |
| Washington Road | | Augusta, GA | | 100 | % | | (15) | | 395 |
| | 1,421 |
| | 1,816 |
| | — |
| | 395 |
| | 1,421 |
| | 1,816 |
| | (34 | ) | | 1984 | | 09/01/2011 |
| Clemmons | | Clemmons, NC | | 100 | % | | (15) | | 179 |
| | 506 |
| | 685 |
| | — |
| | 179 |
| | 506 |
| | 685 |
| | (17 | ) | | 1973 | | 09/01/2011 |
| King Main | | King, NC | | 100 | % | | (15) | | 133 |
| | 600 |
| | 733 |
| | — |
| | 133 |
| | 600 |
| | 733 |
| | (15 | ) | | 1978 | | 09/01/2011 |
KBS REAL ESTATE INVESTMENT TRUST, INC.
SCHEDULE III
REAL ESTATE ASSETS AND ACCUMULATED DEPRECIATION AND AMORTIZATION (CONTINUED)
December 31, 2011
(dollar amounts in thousands)
|
| | | | | | | | | | | | | | | | | | | | | | | | | | | | | | | | | | | | | | | | | | | | | |
| | | | | | | | | Initial Cost to Company | | | | Gross Amount at which Carried at Close of Period | | | | | | |
| Description | | Location | | Ownership Percent | | Encumbrances | | Land | | Building and Improvements (1) | | Total | | Cost Capitalized Subsequent to Acquisition | | Land | | Building and Improvements (1) | | Total (2) | | Accumulated Depreciation and Amortization | | Original Date of Construction | | Date Acquired |
| Marion Main | | Marion, NC | | 100 | % | | (15) | | $ | 230 |
| | $ | 897 |
| | $ | 1,127 |
| | $ | — |
| | $ | 230 |
| | $ | 897 |
| | $ | 1,127 |
| | $ | (25 | ) | | 1980 | | 09/01/2011 |
| Roxboro Main | | Roxboro, NC | | 100 | % | | (15) | | 424 |
| | 1,307 |
| | 1,731 |
| | — |
| | 424 |
| | 1,307 |
| | 1,731 |
| | (39 | ) | | 1980 | | 09/01/2011 |
| Russ Avenue | | Waynesville, NC | | 100 | % | | (15) | | 296 |
| | 897 |
| | 1,193 |
| | — |
| | 296 |
| | 897 |
| | 1,193 |
| | (34 | ) | | 1972 | | 09/01/2011 |
| Sardis Road | | Charlotte, NC | | 100 | % | | (15) | | 149 |
| | 480 |
| | 629 |
| | — |
| | 149 |
| | 480 |
| | 629 |
| | (12 | ) | | 1986 | | 09/01/2011 |
| Valdese Main | | Valdese, NC | | 100 | % | | (15) | | 198 |
| | 1,218 |
| | 1,416 |
| | — |
| | 198 |
| | 1,218 |
| | 1,416 |
| | (30 | ) | | 1952 | | 09/01/2011 |
| Viewmont | | Hickory, NC | | 100 | % | | (15) | | 147 |
| | 735 |
| | 882 |
| | — |
| | 147 |
| | 735 |
| | 882 |
| | (20 | ) | | 1974 | | 09/01/2011 |
| Wilkesboro Main | | Wilkesboro, NC | | 100 | % | | (15) | | 130 |
| | 645 |
| | 775 |
| | — |
| | 130 |
| | 645 |
| | 775 |
| | (15 | ) | | 1986 | | 09/01/2011 |
| Winterpark Temple | | Winter Park, FL | | 100 | % | | (16) | | 323 |
| | 891 |
| | 1,214 |
| | — |
| | 323 |
| | 891 |
| | 1,214 |
| | (36 | ) | | 1994 | | 09/01/2011 |
| Ballantyne | | Charlotte, NC | | 100 | % | | (16) | | 617 |
| | 1,674 |
| | 2,291 |
| | — |
| | 617 |
| | 1,674 |
| | 2,291 |
| | (56 | ) | | 1999 | | 09/01/2011 |
| Cary Preston | | Cary, NC | | 100 | % | | (16) | | 645 |
| | 1,862 |
| | 2,507 |
| | — |
| | 645 |
| | 1,862 |
| | 2,507 |
| | (66 | ) | | 1993 | | 09/01/2011 |
| Clemmons | | Clemmons, NC | | 100 | % | | (16) | | 557 |
| | 1,723 |
| | 2,280 |
| | — |
| | 557 |
| | 1,723 |
| | 2,280 |
| | (69 | ) | | 1970 | | 09/01/2011 |
| Wakefield Fc | | Raleigh, NC | | 100 | % | | (16) | | 672 |
| | 1,978 |
| | 2,650 |
| | — |
| | 672 |
| | 1,978 |
| | 2,650 |
| | (63 | ) | | 2000 | | 09/01/2011 |
| Westinghouse | | Charlotte, NC | | 100 | % | | (16) | | 614 |
| | 1,514 |
| | 2,128 |
| | — |
| | 614 |
| | 1,514 |
| | 2,128 |
| | (61 | ) | | 1986 | | 09/01/2011 |
| Sea Pines Main | | Hilton Head, SC | | 100 | % | | (16) | | 1,128 |
| | 4,753 |
| | 5,881 |
| | — |
| | 1,128 |
| | 4,753 |
| | 5,881 |
| | (140 | ) | | 1991 | | 09/01/2011 |
| Champions | | Houston, TX | | 100 | % | | (17) | | 390 |
| | 1,935 |
| | 2,325 |
| | — |
| | 390 |
| | 1,935 |
| | 2,325 |
| | (27 | ) | | 1997 | | 09/01/2011 |
| Clear Lake | | Houston, TX | | 100 | % | | (17) | | 434 |
| | 1,772 |
| | 2,206 |
| | — |
| | 434 |
| | 1,772 |
| | 2,206 |
| | (29 | ) | | 1981/2005 | | 09/01/2011 |
| Cypress Station | | Houston, TX | | 100 | % | | (17) | | 203 |
| | 982 |
| | 1,185 |
| | — |
| | 203 |
| | 982 |
| | 1,185 |
| | (35 | ) | | 1996 | | 09/01/2011 |
| Deer Park | | Deer Park, TX | | 100 | % | | (17) | | 191 |
| | 646 |
| | 837 |
| | — |
| | 191 |
| | 646 |
| | 837 |
| | (13 | ) | | 1990 | | 09/01/2011 |
| Duncanville | | Duncanville, TX | | 100 | % | | (17) | | 65 |
| | 322 |
| | 387 |
| | — |
| | 65 |
| | 322 |
| | 387 |
| | (23 | ) | | 1980 | | 09/01/2011 |
| Galleria | | Dallas, TX | | 100 | % | | (17) | | 480 |
| | 1,593 |
| | 2,073 |
| | — |
| | 480 |
| | 1,593 |
| | 2,073 |
| | (33 | ) | | 1980 | | 09/01/2011 |
| Heights | | Houston, TX | | 100 | % | | (17) | | 298 |
| | 1,590 |
| | 1,888 |
| | — |
| | 298 |
| | 1,590 |
| | 1,888 |
| | (22 | ) | | 1992 | | 09/01/2011 |
| Helotes | | San Antonio, TX | | 100 | % | | (17) | | 201 |
| | 522 |
| | 723 |
| | — |
| | 201 |
| | 522 |
| | 723 |
| | (13 | ) | | 1982 | | 09/01/2011 |
| Highway 290 | | Houston, TX | | 100 | % | | (17) | | 1,822 |
| | 3,466 |
| | 5,288 |
| | — |
| | 1,822 |
| | 3,466 |
| | 5,288 |
| | (165 | ) | | 1981 | | 09/01/2011 |
| Highway 6 | | Houston, TX | | 100 | % | | (17) | | 970 |
| | 2,151 |
| | 3,121 |
| | — |
| | 970 |
| | 2,151 |
| | 3,121 |
| | (30 | ) | | 1997 | | 09/01/2011 |
| Humble | | Humble, TX | | 100 | % | | (17) | | 446 |
| | 1,811 |
| | 2,257 |
| | — |
| | 446 |
| | 1,811 |
| | 2,257 |
| | (28 | ) | | 1998 | | 09/01/2011 |
| Mangum | | Houston, TX | | 100 | % | | (17) | | 271 |
| | 1,383 |
| | 1,654 |
| | — |
| | 271 |
| | 1,383 |
| | 1,654 |
| | (26 | ) | | 1988 | | 09/01/2011 |
| Northshore | | Houston, TX | | 100 | % | | (17) | | 149 |
| | 676 |
| | 825 |
| | — |
| | 149 |
| | 676 |
| | 825 |
| | (11 | ) | | 1995 | | 09/01/2011 |
| Port of Houston | | Houston, TX | | 100 | % | | (17) | | 114 |
| | 510 |
| | 624 |
| | — |
| | 114 |
| | 510 |
| | 624 |
| | (11 | ) | | 1980 | | 09/01/2011 |
| Brainard | | Chattanooga, TN | | 100 | % | | — |
| | — |
| | — |
| | — |
| | — |
| | — |
| | — |
| | — |
| | — |
| | 1973 | | 09/01/2011 |
| East Colonial Drive Thr | | Orlando, FL | | 100 | % | | — |
| | — |
| | — |
| | — |
| | — |
| | — |
| | — |
| | — |
| | — |
| | 1986 | | 09/01/2011 |
| Barnstable | | Barnstable, MA | | 100 | % | | — |
| | — |
| | — |
| | — |
| | — |
| | — |
| | — |
| | — |
| | — |
| | 1950 | | 09/01/2011 |
| Inverness | | Inverness, FL | | 100 | % | | — |
| | — |
| | — |
| | — |
| | — |
| | — |
| | — |
| | — |
| | — |
| | 1994 | | 09/01/2011 |
| Paoli | | Paoli, PA | | 100 | % | | — |
| | — |
| | — |
| | — |
| | — |
| | — |
| | — |
| | — |
| | — |
| | 1989 | | 09/01/2011 |
| Forest Hill Banking Center | | Germantown, TN | | 100 | % | | — |
| | — |
| | — |
| | — |
| | — |
| | — |
| | — |
| | — |
| | — |
| | 1975 | | 09/01/2011 |
KBS REAL ESTATE INVESTMENT TRUST, INC.
SCHEDULE III
REAL ESTATE ASSETS AND ACCUMULATED DEPRECIATION AND AMORTIZATION (CONTINUED)
December 31, 2011
(dollar amounts in thousands)
|
| | | | | | | | | | | | | | | | | | | | | | | | | | | | | | | | | | | | | | | | | | | | | |
| | | | | | | | | Initial Cost to Company | | | | Gross Amount at which Carried at Close of Period | | | | | | |
| Description | | Location | | Ownership Percent | | Encumbrances | | Land | | Building and Improvements (1) | | Total | | Cost Capitalized Subsequent to Acquisition | | Land | | Building and Improvements (1) | | Total (2) | | Accumulated Depreciation and Amortization | | Original Date of Construction | | Date Acquired |
| Upper Montclair Drive Up | | Upper Montclair, NJ | | 100 | % | | $ | — |
| | $ | — |
| | $ | — |
| | $ | — |
| | $ | — |
| | $ | — |
| | $ | — |
| | $ | — |
| | $ | — |
| | 1941 | | 09/01/2011 |
| Ardmore | | Ardmore, PA | | 100 | % | | — |
| | — |
| | — |
| | — |
| | — |
| | — |
| | — |
| | — |
| | — |
| | 1980 | | 09/01/2011 |
| Milltown | | Milltown, NJ | | 100 | % | | — |
| | — |
| | — |
| | — |
| | — |
| | — |
| | — |
| | — |
| | — |
| | 1975 | | 09/01/2011 |
| Fairgrounds | | Allentown, PA | | 100 | % | | — |
| | — |
| | — |
| | — |
| | — |
| | — |
| | — |
| | — |
| | — |
| | 1975 | | 09/01/2011 |
| West Goshen | | West Chester, PA | | 100 | % | | — |
| | — |
| | — |
| | — |
| | — |
| | — |
| | — |
| | — |
| | — |
| | 1975 | | 09/01/2011 |
| Mountainville | | Allentown, PA | | 100 | % | | — |
| | — |
| | — |
| | — |
| | — |
| | — |
| | — |
| | — |
| | — |
| | 1975 | | 09/01/2011 |
| Fort Washington | | Fort Washington, PA | | 100 | % | | — |
| | — |
| | — |
| | — |
| | — |
| | — |
| | — |
| | — |
| | — |
| | 1968 | | 09/01/2011 |
| Reading Airport | | Reading Airport, PA | | 100 | % | | — |
| | — |
| | — |
| | — |
| | — |
| | — |
| | — |
| | — |
| | — |
| | 1975 | | 09/01/2011 |
| East Brunswick | | East Brunswick, NJ | | 100 | % | | — |
| | — |
| | — |
| | — |
| | — |
| | — |
| | — |
| | — |
| | — |
| | 1972 | | 09/01/2011 |
| Concordia | | Cranbury, NJ | | 100 | % | | — |
| | — |
| | — |
| | — |
| | — |
| | — |
| | — |
| | — |
| | — |
| | 1975 | | 09/01/2011 |
| Thorndale | | Thorndale, PA | | 100 | % | | — |
| | — |
| | — |
| | — |
| | — |
| | — |
| | — |
| | — |
| | — |
| | 1975 | | 09/01/2011 |
| Devon | | Devon, PA | | 100 | % | | — |
| | — |
| | — |
| | — |
| | — |
| | — |
| | — |
| | — |
| | — |
| | 1975 | | 09/01/2011 |
| Wind Gap | | Wind Gap, PA | | 100 | % | | — |
| | — |
| | — |
| | — |
| | — |
| | — |
| | — |
| | — |
| | — |
| | 1975 | | 09/01/2011 |
| Harborside | | Jersey City, NJ | | 100 | % | | — |
| | — |
| | — |
| | — |
| | — |
| | — |
| | — |
| | — |
| | — |
| | 2002 | | 09/01/2011 |
| Hickory Parking Lot | | Hickory, NC | | 100 | % | | — |
| | 59 |
| | 50 |
| | 109 |
| | — |
| | 59 |
| | 50 |
| | 109 |
| | (1 | ) | | 1986 | | 09/01/2011 |
| Torrance | | Torrance, CA | | 100 | % | | — |
| | — |
| | — |
| | — |
| | — |
| | — |
| | — |
| | — |
| | — |
| | 1975 | | 09/01/2011 |
| Santa Monica | | Santa Monica, CA | | 100 | % | | — |
| | — |
| | — |
| | — |
| | — |
| | — |
| | — |
| | — |
| | — |
| | 1975 | | 09/01/2011 |
| Las Vegas - Sahara | | Las Vegas, NV | | 100 | % | | — |
| | — |
| | — |
| | — |
| | — |
| | — |
| | — |
| | — |
| | — |
| | 1975 | | 09/01/2011 |
| East Independence | | Matthews, NC | | 100 | % | | — |
| | — |
| | — |
| | — |
| | — |
| | — |
| | — |
| | — |
| | — |
| | 1987 | | 09/01/2011 |
| East Pembrok Pins | | Pembroke Pines, FL | | 100 | % | | — |
| | — |
| | — |
| | — |
| | — |
| | — |
| | — |
| | — |
| | — |
| | 1975 | | 09/01/2011 |
| Chapel Hill | | Chapel Hill, NC | | 100 | % | | — |
| | — |
| | — |
| | — |
| | — |
| | — |
| | — |
| | — |
| | — |
| | 1942/1993 | | 09/01/2011 |
| Greenville Main | | Greenville, SC | | 100 | % | | — |
| | — |
| | — |
| | — |
| | — |
| | — |
| | — |
| | — |
| | — |
| | 1997 | | 09/01/2011 |
| Del Prado | | Cape Coral, FL | | 100 | % | | — |
| | — |
| | — |
| | — |
| | — |
| | — |
| | — |
| | — |
| | — |
| | 1990 | | 09/01/2011 |
| Parkside Marketplace | | Glen Allen, VA | | 100 | % | | — |
| | — |
| | 61 |
| | 61 |
| | — |
| | — |
| | 61 |
| | 61 |
| | (3 | ) | | 1988 | | 09/01/2011 |
| Livingston | | Livingston, NJ | | 100 | % | | — |
| | — |
| | — |
| | — |
| | — |
| | — |
| | — |
| | — |
| | — |
| | 1980 | | 09/01/2011 |
| Downtown St. Petersburg | | St. Petersburg, FL | | 100 | % | | — |
| | — |
| | — |
| | — |
| | — |
| | — |
| | — |
| | — |
| | — |
| | 1912/1981 | | 09/01/2011 |
| Black Mountain - Acu | | Black Mountain, NC | | 100 | % | | — |
| | 72 |
| | 196 |
| | 268 |
| | — |
| | 72 |
| | 196 |
| | 268 |
| | (6 | ) | | 1970 | | 09/01/2011 |
| Calabash/Sublease | | Calabash, NC | | 100 | % | | — |
| | 267 |
| | 541 |
| | 808 |
| | — |
| | 267 |
| | 541 |
| | 808 |
| | (19 | ) | | 1984 | | 09/01/2011 |
| Draper(Abandond) | | Eden, NC | | 100 | % | | — |
| | 20 |
| | 60 |
| | 80 |
| | — |
| | 20 |
| | 60 |
| | 80 |
| | (2 | ) | | 1938 | | 09/01/2011 |
| Dunn Main Office | | Dunn, NC | | 100 | % | | — |
| | 386 |
| | 1,496 |
| | 1,882 |
| | — |
| | 386 |
| | 1,496 |
| | 1,882 |
| | (48 | ) | | 1969 | | 09/01/2011 |
| Fairplains/Aban | | N Wilkesboro, NC | | 100 | % | | — |
| | 156 |
| | 390 |
| | 546 |
| | — |
| | 156 |
| | 390 |
| | 546 |
| | (20 | ) | | 1958 | | 09/01/2011 |
| Havelock-Abandnd | | Havelock, NC | | 100 | % | | — |
| | 75 |
| | 151 |
| | 226 |
| | — |
| | 75 |
| | 151 |
| | 226 |
| | (6 | ) | | 1971 | | 09/01/2011 |
| North Main Street - Acu | | Tarboro, NC | | 100 | % | | — |
| | 65 |
| | 177 |
| | 242 |
| | — |
| | 65 |
| | 177 |
| | 242 |
| | (11 | ) | | 1970 | | 09/01/2011 |
| Richlands/Sublease | | Richlands, NC | | 100 | % | | — |
| | 133 |
| | 427 |
| | 560 |
| | — |
| | 133 |
| | 427 |
| | 560 |
| | (18 | ) | | 1970/1980 | | 09/01/2011 |
KBS REAL ESTATE INVESTMENT TRUST, INC.
SCHEDULE III
REAL ESTATE ASSETS AND ACCUMULATED DEPRECIATION AND AMORTIZATION (CONTINUED)
December 31, 2011
(dollar amounts in thousands)
|
| | | | | | | | | | | | | | | | | | | | | | | | | | | | | | | | | | | | | | | | | | | | | |
| | | | | | | | | Initial Cost to Company | | | | Gross Amount at which Carried at Close of Period | | | | | | |
| Description | | Location | | Ownership Percent | | Encumbrances | | Land | | Building and Improvements (1) | | Total | | Cost Capitalized Subsequent to Acquisition | | Land | | Building and Improvements (1) | | Total (2) | | Accumulated Depreciation and Amortization | | Original Date of Construction | | Date Acquired |
| Tarboro Main Office | | Tarboro, NC | | 100 | % | | — |
| | $ | 57 |
| | $ | 427 |
| | $ | 484 |
| | $ | — |
| | $ | 57 |
| | $ | 427 |
| | $ | 484 |
| | $ | (18 | ) | | 1970/1985 | | 09/01/2011 |
| Washington Corner | | Washington, NC | | 100 | % | | — |
| | 65 |
| | 212 |
| | 277 |
| | — |
| | 65 |
| | 212 |
| | 277 |
| | (12 | ) | | 1982/1986 | | 09/01/2011 |
| Bank of America Finc - Sub-Lease | | Spokane, WA | | 100 | % | | — |
| | — |
| | — |
| | — |
| | — |
| | — |
| | — |
| | — |
| | — |
| | 1981 | | 09/01/2011 |
| Bank of America Plaza Sub-Lease | | St. Louis, MO | | 100 | % | | — |
| | — |
| | — |
| | — |
| | — |
| | — |
| | — |
| | — |
| | — |
| | 1982 | | 09/01/2011 |
| Gulfgate - Main Building | | Sarasota, FL | | 100 | % | | — |
| | — |
| | 1,165 |
| | 1,165 |
| | — |
| | — |
| | 1,165 |
| | 1,165 |
| | (31 | ) | | 1963 | | 09/01/2011 |
| E Ridgewood Avenue - Main Building | | Ridgewood, NJ | | 100 | % | | — |
| | 298 |
| | 1,302 |
| | 1,600 |
| | — |
| | 298 |
| | 1,302 |
| | 1,600 |
| | (39 | ) | | 1930/1960 | | 09/01/2011 |
| Cocoa Village Dt | | Cocoa, FL | | 100 | % | | — |
| | 483 |
| | 2,167 |
| | 2,650 |
| | — |
| | 483 |
| | 2,167 |
| | 2,650 |
| | (64 | ) | | 1957/1991 | | 09/01/2011 |
| Laurens Road | | Greenville, SC | | 100 | % | | — |
| | — |
| | — |
| | — |
| | — |
| | — |
| | — |
| | — |
| | — |
| | 1994 | | 09/01/2011 |
| 0010 - Howell | | Howell, NJ | | 100 | % | | — |
| | — |
| | — |
| | — |
| | — |
| | — |
| | — |
| | — |
| | — |
| | 1975 | | 09/01/2011 |
| 0011 - Whiting | | Whiting, NJ | | 100 | % | | — |
| | — |
| | (60 | ) | | (60 | ) | | — |
| | — |
| | (60 | ) | | (60 | ) | | 60 |
| | 1975 | | 09/01/2011 |
| 3918 - Plantation - Royal Palm | | Plantation, FL | | 100 | % | | — |
| | — |
| | — |
| | — |
| | — |
| | — |
| | — |
| | — |
| | — |
| | 2000 | | 09/01/2011 |
| 3919 - Decatur Square Office | | Decatur, GA | | 100 | % | | — |
| | — |
| | (360 | ) | | (360 | ) | | — |
| | — |
| | (360 | ) | | (360 | ) | | 360 |
| | 1992 | | 09/01/2011 |
| Edison Township | | Edison Township., NJ | | 100 | % | | (18) | | 386 |
| | 1,180 |
| | 1,566 |
| | — |
| | 386 |
| | 1,180 |
| | 1,566 |
| | (47 | ) | | 1977 | | 09/01/2011 |
| Emmaus | | Emmaus, PA | | 100 | % | | (18) | | 433 |
| | 1,345 |
| | 1,778 |
| | — |
| | 433 |
| | 1,345 |
| | 1,778 |
| | (39 | ) | | 1957 | | 09/01/2011 |
| Highland Park | | Highland Park, NJ | | 100 | % | | (18) | | 187 |
| | 934 |
| | 1,121 |
| | — |
| | 187 |
| | 934 |
| | 1,121 |
| | (36 | ) | | 1970 | | 09/01/2011 |
| Scotch Plains | | Scotch Plains, NJ | | 100 | % | | (18) | | 234 |
| | 1,082 |
| | 1,316 |
| | — |
| | 234 |
| | 1,082 |
| | 1,316 |
| | (31 | ) | | 1962 | | 09/01/2011 |
| South Plainfield | | South Plainfield, NJ | | 100 | % | | (18) | | 280 |
| | 1,073 |
| | 1,353 |
| | — |
| | 280 |
| | 1,073 |
| | 1,353 |
| | (38 | ) | | 1977 | | 09/01/2011 |
| Warminster | | Warminster, PA | | 100 | % | | (18) | | 209 |
| | 559 |
| | 768 |
| | — |
| | 209 |
| | 559 |
| | 768 |
| | (19 | ) | | 1970 | | 09/01/2011 |
| Meadowd Midrs | | Reno, NV | | 100 | % | | (19) | | 729 |
| | 1,103 |
| | 1,832 |
| | — |
| | 729 |
| | 1,103 |
| | 1,832 |
| | (152 | ) | | 1989 | | 09/01/2011 |
| Nassau Bay | | Nassau Bay, TX | | 100 | % | | (19) | | 950 |
| | 3,556 |
| | 4,506 |
| | — |
| | 950 |
| | 3,556 |
| | 4,506 |
| | (187 | ) | | 1981 | | 09/01/2011 |
| Silver Lakes | | Pembroke Pines, FL | | 100 | % | | (19) | | 748 |
| | 1,804 |
| | 2,552 |
| | — |
| | 748 |
| | 1,804 |
| | 2,552 |
| | (52 | ) | | 1996 | | 09/01/2011 |
| Winterpark Alm | | Winter Park, FL | | 100 | % | | (19) | | 473 |
| | 1,282 |
| | 1,755 |
| | — |
| | 473 |
| | 1,282 |
| | 1,755 |
| | (23 | ) | | 1994 | | 09/01/2011 |
| Indigo Run | | Hilton Head, SC | | 100 | % | | (19) | | 890 |
| | 2,528 |
| | 3,418 |
| | — |
| | 890 |
| | 2,528 |
| | 3,418 |
| | (43 | ) | | 1999 | | 09/01/2011 |
| Palatka | | Palatka, FL | | 100 | % | | (19) | | 646 |
| | 1,481 |
| | 2,127 |
| | — |
| | 646 |
| | 1,481 |
| | 2,127 |
| | (41 | ) | | 1974 | | 09/01/2011 |
| Macon Main | | Macon, GA | | 100 | % | | (19) | | 489 |
| | 1,593 |
| | 2,082 |
| | — |
| | 489 |
| | 1,593 |
| | 2,082 |
| | (41 | ) | | 1951 | | 09/01/2011 |
| Morganton Main | | Morganton, NC | | 100 | % | | (19) | | 339 |
| | 1,176 |
| | 1,515 |
| | — |
| | 339 |
| | 1,176 |
| | 1,515 |
| | (49 | ) | | 1967 | | 09/01/2011 |
| Arlington | | Arlington, TX | | 100 | % | | (20) | | 604 |
| | 1,261 |
| | 1,865 |
| | — |
| | 604 |
| | 1,261 |
| | 1,865 |
| | (43 | ) | | 2003 | | 09/01/2011 |
| Ennis - Main Building | | Ennis, TX | | 100 | % | | (20) | | 174 |
| | 1,550 |
| | 1,724 |
| | — |
| | 174 |
| | 1,550 |
| | 1,724 |
| | (60 | ) | | 1965/1973 | | 09/01/2011 |
| Hillsboro-Main Building | | Hillsboro, TX | | 100 | % | | (20) | | 13 |
| | 150 |
| | 163 |
| | — |
| | 13 |
| | 150 |
| | 163 |
| | (12 | ) | | 1885/1982 | | 09/01/2011 |
| Paris - Main Building | | Paris, TX | | 100 | % | | (20) | | 382 |
| | 761 |
| | 1,143 |
| | — |
| | 382 |
| | 761 |
| | 1,143 |
| | (44 | ) | | 1965/1973 | | 09/01/2011 |
| Stephenville - Main Building | | Stephenville, TX | | 100 | % | | (20) | | 257 |
| | 1,197 |
| | 1,454 |
| | — |
| | 257 |
| | 1,197 |
| | 1,454 |
| | (45 | ) | | 1906/1980 | | 09/01/2011 |
| | | Total Properties Held for Investment | | |
| | $ | 527,896 |
| | $ | 2,247,113 |
| | $ | 2,775,009 |
| | $ | (60,275 | ) | | $ | 525,131 |
| | $ | 2,189,603 |
| | $ | 2,714,734 |
| | $ | (152,900 | ) | | |
| |
KBS REAL ESTATE INVESTMENT TRUST, INC.
SCHEDULE III
REAL ESTATE ASSETS AND ACCUMULATED DEPRECIATION AND AMORTIZATION (CONTINUED)
December 31, 2011
(dollar amounts in thousands)
|
| | | | | | | | | | | | | | | | | | | | | | | | | | | | | | | | | | | | | | | | | | | | | |
| | | | | | | | | Initial Cost to Company | | | | Gross Amount at which Carried at Close of Period | | | | | | |
| Description | | Location | | Ownership Percent | | Encumbrances | | Land | | Building and Improvements (1) | | Total | | Cost Capitalized Subsequent to Acquisition | | Land | | Building and Improvements (1) | | Total (2) | | Accumulated Depreciation and Amortization | | Original Date of Construction | | Date Acquired |
| Properties Held for Sale | | | | | | | | | | | | | | | | | | | | | | | | | | |
| The Offices at Kensington | | Sugar Land, TX | | 100 | % | | $ | 18,500 |
| | $ | 1,575 |
| | $ | 27,161 |
| | $ | 28,736 |
| | $ | (1,030 | ) | | $ | 1,575 |
| | $ | 26,131 |
| | $ | 27,706 |
| | $ | (3,973 | ) | | 1998 | | 03/29/2007 |
| 2200 West Loop South Building | | Houston, TX | | 100 | % | | 17,426 |
| | 7,446 |
| | 31,015 |
| | 38,461 |
| | (10,056 | ) | | 6,552 |
| | 21,853 |
| | 28,405 |
| | (193 | ) | | 1974/2000 | | 09/05/2007 |
| Five Tower Bridge Building | | West Conshohocken, PA | | 100 | % | | 40,224 |
| | 10,477 |
| | 65,689 |
| | 76,166 |
| | (12,821 | ) | | 9,706 |
| | 53,639 |
| | 63,345 |
| | (436 | ) | | 2001 | | 10/14/2008 |
| University | | Seattle, WA | | 100 | % | | (8) | | 630 |
| | 2,569 |
| | 3,199 |
| | — |
| | 630 |
| | 2,569 |
| | 3,199 |
| | (61 | ) | | 1957 | | 09/01/2011 |
| Manasquan | | Manasquan, NJ | | 100 | % | | (11) | | 487 |
| | 490 |
| | 977 |
| | — |
| | 487 |
| | 490 |
| | 977 |
| | (19 | ) | | 1980 | | 09/01/2011 |
| Chester Court Realty, LP | | West Chester, PA | | 100 | % | | (11) | | 639 |
| | 3,366 |
| | 4,005 |
| | — |
| | 639 |
| | 3,366 |
| | 4,005 |
| | (80 | ) | | 1976 | | 09/01/2011 |
| Bethel Ohio | | Bethel, OH | | 100 | % | | (11) | | 43 |
| | 255 |
| | 298 |
| | — |
| | 43 |
| | 255 |
| | 298 |
| | (8 | ) | | 1900/1996 | | 09/01/2011 |
| Acworth Office | | Acworth, GA | | 100 | % | | (11) | | 455 |
| | 993 |
| | 1,448 |
| | — |
| | 455 |
| | 993 |
| | 1,448 |
| | (18 | ) | | 2003 | | 09/01/2011 |
Windward Parkway | | Alpharetta, GA | | 100 | % | | (11) | | 656 |
| | 1,004 |
| | 1,660 |
| | — |
| | 656 |
| | 1,004 |
| | 1,660 |
| | (18 | ) | | 2003 | | 09/01/2011 |
| Deland Main | | Deland, FL | | 100 | % | | (11) | | 473 |
| | 669 |
| | 1,142 |
| | — |
| | 473 |
| | 669 |
| | 1,142 |
| | (27 | ) | | 1964 | | 09/01/2011 |
| Asheville Main | | Asheville, NC | | 100 | % | | (11) | | 294 |
| | 3,321 |
| | 3,615 |
| | — |
| | 294 |
| | 3,321 |
| | 3,615 |
| | (77 | ) | | 1971 | | 09/01/2011 |
| Thomasville | | Thomasville, NC | | 100 | % | | (11) | | 212 |
| | 470 |
| | 682 |
| | — |
| | 212 |
| | 470 |
| | 682 |
| | (13 | ) | | 1990 | | 09/01/2011 |
| Anderson Main | | Anderson, SC | | 100 | % | | (11) | | 458 |
| | 1,497 |
| | 1,955 |
| | — |
| | 458 |
| | 1,497 |
| | 1,955 |
| | (34 | ) | | 1991 | | 09/01/2011 |
| Sumter Main | | Sumter, SC | | 100 | % | | (11) | | 247 |
| | 911 |
| | 1,158 |
| | — |
| | 247 |
| | 911 |
| | 1,158 |
| | (40 | ) | | 1980 | | 09/01/2011 |
| North Washington Branch | | Alexandria, VA | | 100 | % | | (11) | | 367 |
| | 1,858 |
| | 2,225 |
| | 6 |
| | 367 |
| | 1,864 |
| | 2,231 |
| | (81 | ) | | 1961 | | 09/01/2011 |
| Williamsburg Main | | Williamsburg, VA | | 100 | % | | (11) | | 274 |
| | 1,058 |
| | 1,332 |
| | — |
| | 274 |
| | 1,058 |
| | 1,332 |
| | (37 | ) | | 1973 | | 09/01/2011 |
| LaFontana | | Boca Raton, FL | | 100 | % | | (11) | | 1,872 |
| | 842 |
| | 2,714 |
| | — |
| | 1,872 |
| | 842 |
| | 2,714 |
| | (17 | ) | | 1986 | | 09/01/2011 |
| Pembroke Pines | | Pembroke Pines, FL | | 100 | % | | (11) | | 2,218 |
| | 1,250 |
| | 3,468 |
| | — |
| | 2,218 |
| | 1,250 |
| | 3,468 |
| | (27 | ) | | 1991 | | 09/01/2011 |
| Douglas | | Horton, AL | | 100 | % | | (11) | | 31 |
| | 121 |
| | 152 |
| | — |
| | 31 |
| | 121 |
| | 152 |
| | (8 | ) | | 1972 | | 09/01/2011 |
| Snellville Presidential | | Snellville, GA | | 100 | % | | (11) | | 778 |
| | 785 |
| | 1,563 |
| | — |
| | 778 |
| | 785 |
| | 1,563 |
| | (15 | ) | | 1997 | | 09/01/2011 |
| Athens | | Athens, AL | | 100 | % | | (11) | | 281 |
| | 460 |
| | 741 |
| | — |
| | 281 |
| | 460 |
| | 741 |
| | (21 | ) | | 1978 | | 09/01/2011 |
| College Street | | Enterprise, AL | | 100 | % | | (11) | | 16 |
| | 1,051 |
| | 1,067 |
| | — |
| | 16 |
| | 1,051 |
| | 1,067 |
| | (34 | ) | | 1991 | | 09/01/2011 |
| Madison Street | | Huntsville, AL | | 100 | % | | (11) | | 370 |
| | 923 |
| | 1,293 |
| | — |
| | 370 |
| | 923 |
| | 1,293 |
| | (30 | ) | | 1996 | | 09/01/2011 |
| Sand Mountain | | Albertville, AL | | 100 | % | | (11) | | — |
| | 1,113 |
| | 1,113 |
| | — |
| | — |
| | 1,113 |
| | 1,113 |
| | (108 | ) | | 1967 | | 09/01/2011 |
| Central Avenue | | Hot Springs, AR | | 100 | % | | (11) | | 240 |
| | 2,161 |
| | 2,401 |
| | 126 |
| | 240 |
| | 2,287 |
| | 2,527 |
| | (228 | ) | | 1940 | | 09/01/2011 |
| Conway | | Conway, AR | | 100 | % | | (11) | | 262 |
| | 727 |
| | 989 |
| | — |
| | 262 |
| | 727 |
| | 989 |
| | (48 | ) | | 1974 | | 09/01/2011 |
| Dewitt Henry Drive | | Beebe, AR | | 100 | % | | (11) | | 69 |
| | 256 |
| | 325 |
| | — |
| | 69 |
| | 256 |
| | 325 |
| | (22 | ) | | 1976/1982 | | 09/01/2011 |
| South Denver | | Russellville, AR | | 100 | % | | (11) | | 102 |
| | 640 |
| | 742 |
| | — |
| | 102 |
| | 640 |
| | 742 |
| | (75 | ) | | 1960 | | 09/01/2011 |
| Marianna | | Marianna, FL | | 100 | % | | (11) | | 286 |
| | 498 |
| | 784 |
| | — |
| | 286 |
| | 498 |
| | 784 |
| | (44 | ) | | 1975/1979 | | 09/01/2011 |
| New Smyrna Beach | | New Smyrna Beach, FL | | 100 | % | | (11) | | 209 |
| | 955 |
| | 1,164 |
| | 61 |
| | 209 |
| | 1,016 |
| | 1,225 |
| | (32 | ) | | 1961/2004 | | 09/01/2011 |
| West Main Street | | Inverness, FL | | 100 | % | | (11) | | 120 |
| | 678 |
| | 798 |
| | — |
| | 120 |
| | 678 |
| | 798 |
| | (22 | ) | | 1971 | | 09/01/2011 |
| Buford Highway | | Norcross, GA | | 100 | % | | (11) | | 192 |
| | 303 |
| | 495 |
| | — |
| | 192 |
| | 303 |
| | 495 |
| | (19 | ) | | 1987/1998 | | 09/01/2011 |
| Larkin Street | | Cornelia, GA | | 100 | % | | (11) | | 97 |
| | 329 |
| | 426 |
| | — |
| | 97 |
| | 329 |
| | 426 |
| | (16 | ) | | 1974 | | 09/01/2011 |
KBS REAL ESTATE INVESTMENT TRUST, INC.
SCHEDULE III
REAL ESTATE ASSETS AND ACCUMULATED DEPRECIATION AND AMORTIZATION (CONTINUED)
December 31, 2011
(dollar amounts in thousands)
|
| | | | | | | | | | | | | | | | | | | | | | | | | | | | | | | | | | | | | | | | | | | | | |
| | | | | | | | | Initial Cost to Company | | | | Gross Amount at which Carried at Close of Period | | | | | | |
| Description | | Location | | Ownership Percent | | Encumbrances | | Land | | Building and Improvements (1) | | Total | | Cost Capitalized Subsequent to Acquisition | | Land | | Building and Improvements (1) | | Total (2) | | Accumulated Depreciation and Amortization | | Original Date of Construction | | Date Acquired |
| South Park Street | | Carrolton, GA | | 100 | % | | (11) | | $ | 263 |
| | $ | 365 |
| | $ | 628 |
| | $ | — |
| | $ | 263 |
| | $ | 365 |
| | $ | 628 |
| | $ | (18 | ) | | 1989 | | 09/01/2011 |
| North Howard | | Indianola, IA | | 100 | % | | (11) | | 92 |
| | 585 |
| | 677 |
| | — |
| | 92 |
| | 585 |
| | 677 |
| | (39 | ) | | 1900/1992 | | 09/01/2011 |
| Belleville | | Belleville, IL | | 100 | % | | (11) | | 250 |
| | 636 |
| | 886 |
| | — |
| | 250 |
| | 636 |
| | 886 |
| | (25 | ) | | 1968 | | 09/01/2011 |
Kickapoo Street | | Lincoln, IL | | 100 | % | | (11) | | 12 |
| | 101 |
| | 113 |
| | — |
| | 12 |
| | 101 |
| | 113 |
| | (3 | ) | | 1979/2003 | | 09/01/2011 |
| Sparta | | Sparta, IL | | 100 | % | | (11) | | 113 |
| | 395 |
| | 508 |
| | — |
| | 113 |
| | 395 |
| | 508 |
| | (22 | ) | | 1980 | | 09/01/2011 |
| Wood River Avenue | | Wood River, IL | | 100 | % | | (11) | | 12 |
| | 209 |
| | 221 |
| | — |
| | 12 |
| | 209 |
| | 221 |
| | (20 | ) | | 1954 | | 09/01/2011 |
| Clarksdale | | Clarksdale, MS | | 100 | % | | (11) | | 86 |
| | 614 |
| | 700 |
| | — |
| | 86 |
| | 614 |
| | 700 |
| | (18 | ) | | 1970/1980 | | 09/01/2011 |
| East College | | Fayetteville, TN | | 100 | % | | (11) | | 174 |
| | 535 |
| | 709 |
| | — |
| | 174 |
| | 535 |
| | 709 |
| | (13 | ) | | 1960/1992 | | 09/01/2011 |
| East Wood Street | | Paris, TN | | 100 | % | | (11) | | 132 |
| | 612 |
| | 744 |
| | — |
| | 132 |
| | 612 |
| | 744 |
| | (18 | ) | | 1970/1993 | | 09/01/2011 |
| Fredonia Street | | Longview, TX | | 100 | % | | (11) | | — |
| | 2,197 |
| | 2,197 |
| | — |
| | — |
| | 2,197 |
| | 2,197 |
| | (69 | ) | | 1939/1955 | | 09/01/2011 |
| Kilgore Street | | Kilgore, TX | | 100 | % | | (11) | | 187 |
| | 578 |
| | 765 |
| | — |
| | 187 |
| | 578 |
| | 765 |
| | (37 | ) | | 1972 | | 09/01/2011 |
| Nacogdoches | | Nacogdoches, TX | | 100 | % | | (11) | | 67 |
| | 786 |
| | 853 |
| | — |
| | 67 |
| | 786 |
| | 853 |
| | (16 | ) | | 1800/2004 | | 09/01/2011 |
| Citizen Square | | Dallas, GA | | 100 | % | | (11) | | 44 |
| | 309 |
| | 353 |
| | — |
| | 44 |
| | 309 |
| | 353 |
| | (18 | ) | | 1989 | | 09/01/2011 |
| Doyle Street | | Toccoa, GA | | 100 | % | | (11) | | 114 |
| | 512 |
| | 626 |
| | — |
| | 114 |
| | 512 |
| | 626 |
| | (26 | ) | | 1963/1978 | | 09/01/2011 |
| Hapeville | | Hapeville, GA | | 100 | % | | (11) | | 55 |
| | 289 |
| | 344 |
| | — |
| | 55 |
| | 289 |
| | 344 |
| | (39 | ) | | 1970 | | 09/01/2011 |
| Lee Street | | Jefferson, GA | | 100 | % | | (11) | | 210 |
| | 426 |
| | 636 |
| | — |
| | 210 |
| | 426 |
| | 636 |
| | (18 | ) | | 1920 | | 09/01/2011 |
| East St Louis Street | | Nashville, IL | | 100 | % | | (11) | | 26 |
| | 49 |
| | 75 |
| | — |
| | 26 |
| | 49 |
| | 75 |
| | (3 | ) | | 1910/1920 | | 09/01/2011 |
| Robinson | | Robinson, IL | | 100 | % | | (11) | | 66 |
| | 703 |
| | 769 |
| | — |
| | 66 |
| | 703 |
| | 769 |
| | (28 | ) | | 1981 | | 09/01/2011 |
| Sesser | | Sesser, IL | | 100 | % | | (11) | | 31 |
| | 115 |
| | 146 |
| | — |
| | 31 |
| | 115 |
| | 146 |
| | (7 | ) | | 1950 | | 09/01/2011 |
| Belle Chasse Highway | | Belle Chasse, LA | | 100 | % | | (11) | | 357 |
| | 640 |
| | 997 |
| | 14 |
| | 357 |
| | 654 |
| | 1,011 |
| | (50 | ) | | 1965 | | 09/01/2011 |
| Lutcher | | Lutcher, LA | | 100 | % | | (11) | | 58 |
| | 237 |
| | 295 |
| | 61 |
| | 58 |
| | 298 |
| | 356 |
| | (22 | ) | | 1956 | | 09/01/2011 |
| Mount Olive | | Mount Olive, MS | | 100 | % | | (11) | | 3 |
| | 45 |
| | 48 |
| | — |
| | 3 |
| | 45 |
| | 48 |
| | (3 | ) | | 1897 | | 09/01/2011 |
| Cookeville | | Cookeville, TN | | 100 | % | | (11) | | 339 |
| | 4,220 |
| | 4,559 |
| | 40 |
| | 339 |
| | 4,260 |
| | 4,599 |
| | (132 | ) | | 1979/2003 | | 09/01/2011 |
| East Church Street | | Lexington, TN | | 100 | % | | (11) | | 138 |
| | 444 |
| | 582 |
| | — |
| | 138 |
| | 444 |
| | 582 |
| | (20 | ) | | 1960 | | 09/01/2011 |
| Roane Street | | Harriman, TN | | 100 | % | | (11) | | 115 |
| | 459 |
| | 574 |
| | — |
| | 115 |
| | 459 |
| | 574 |
| | (13 | ) | | 1992 | | 09/01/2011 |
Shelbyville | | Shelbyville, TN | | 100 | % | | (11) | | 292 |
| | 1,967 |
| | 2,259 |
| | — |
| | 292 |
| | 1,967 |
| | 2,259 |
| | (67 | ) | | 1963/1997 | | 09/01/2011 |
| Hillcrest Road | | Mobile, AL | | 100 | % | | (11) | | — |
| | 1,606 |
| | 1,606 |
| | — |
| | — |
| | 1,606 |
| | 1,606 |
| | (156 | ) | | 2000 | | 09/01/2011 |
| Pearl Road | | Cleveland, OH | | 100 | % | | (11) | | 37 |
| | 227 |
| | 264 |
| | — |
| | 37 |
| | 227 |
| | 264 |
| | (32 | ) | | 1940 | | 09/01/2011 |
St. Clair Avenue | | Cleveland, OH | | 100 | % | | (11) | | 31 |
| | 128 |
| | 159 |
| | — |
| | 31 |
| | 128 |
| | 159 |
| | (12 | ) | | 1923 | | 09/01/2011 |
| Tuscarawas Street | | Canton, OH | | 100 | % | | (11) | | 95 |
| | 701 |
| | 796 |
| | 19 |
| | 95 |
| | 720 |
| | 815 |
| | (115 | ) | | 1982 | | 09/01/2011 |
London Central | | London, KY | | 100 | % | | (11) | | 135 |
| | 1,042 |
| | 1,177 |
| | — |
| | 135 |
| | 1,042 |
| | 1,177 |
| | (82 | ) | | 1988 | | 09/01/2011 |
| LaPorte Main | | LaPorte, IN | | 100 | % | | (11) | | 168 |
| | 815 |
| | 983 |
| | — |
| | 168 |
| | 815 |
| | 983 |
| | (79 | ) | | 1914 | | 09/01/2011 |
| Aurora Main | | Aurora, MO | | 100 | % | | (12) | | 16 |
| | 195 |
| | 211 |
| | — |
| | 16 |
| | 195 |
| | 211 |
| | (5 | ) | | 1962 | | 09/01/2011 |
| Southampton | | Southampton, PA | | 100 | % | | (12) | | 397 |
| | 1,023 |
| | 1,420 |
| | — |
| | 397 |
| | 1,023 |
| | 1,420 |
| | (37 | ) | | 1965 | | 09/01/2011 |
KBS REAL ESTATE INVESTMENT TRUST, INC.
SCHEDULE III
REAL ESTATE ASSETS AND ACCUMULATED DEPRECIATION AND AMORTIZATION (CONTINUED)
December 31, 2011
(dollar amounts in thousands)
|
| | | | | | | | | | | | | | | | | | | | | | | | | | | | | | | | | | | | | | | | | | | | | |
| | | | | | | | | Initial Cost to Company | | | | Gross Amount at which Carried at Close of Period | | | | | | |
| Description | | Location | | Ownership Percent | | Encumbrances | | Land | | Building and Improvements (1) | | Total | | Cost Capitalized Subsequent to Acquisition | | Land | | Building and Improvements (1) | | Total (2) | | Accumulated Depreciation and Amortization | | Original Date of Construction | | Date Acquired |
| Broadmoor | | Pine Bluff, AR | | 100 | % | | (12) | | $ | 29 |
| | $ | 67 |
| | $ | 96 |
| | $ | — |
| | $ | 29 |
| | $ | 67 |
| | $ | 96 |
| | $ | (6 | ) | | 1959 | | 09/01/2011 |
| Ormond Beach | | Ormond Beach, FL | | 100 | % | | (12) | | 578 |
| | 1,366 |
| | 1,944 |
| | — |
| | 578 |
| | 1,366 |
| | 1,944 |
| | (65 | ) | | 1968 | | 09/01/2011 |
| Ponce De Leon | | St. Augustine, FL | | 100 | % | | (12) | | 274 |
| | 331 |
| | 605 |
| | — |
| | 274 |
| | 331 |
| | 605 |
| | (17 | ) | | 1975 | | 09/01/2011 |
| Crossroad Facility | | Fort Dodge, IA | | 100 | % | | (12) | | 138 |
| | 222 |
| | 360 |
| | — |
| | 138 |
| | 222 |
| | 360 |
| | (9 | ) | | 1974 | | 09/01/2011 |
| Sea Bright | | Sea Bright, NJ | | 100 | % | | (12) | | 142 |
| | 900 |
| | 1,042 |
| | — |
| | 142 |
| | 900 |
| | 1,042 |
| | (22 | ) | | 1950 | | 09/01/2011 |
| Woodbury | | Woodbury, NJ | | 100 | % | | (12) | | 467 |
| | 1,872 |
| | 2,339 |
| | — |
| | 467 |
| | 1,872 |
| | 2,339 |
| | (48 | ) | | 1971 | | 09/01/2011 |
Downtown Lakeland | | Lakeland, FL | | 100 | % | | (12) | | — |
| | 175 |
| | 175 |
| | — |
| | — |
| | 175 |
| | 175 |
| | (27 | ) | | 1974 | | 09/01/2011 |
| Abington | | Abington, PA | | 100 | % | | (12) | | 110 |
| | 283 |
| | 393 |
| | — |
| | 110 |
| | 283 |
| | 393 |
| | (7 | ) | | 1953 | | 09/01/2011 |
Avondale | | Avondale, PA | | 100 | % | | (12) | | 47 |
| | 174 |
| | 221 |
| | — |
| | 47 |
| | 174 |
| | 221 |
| | (8 | ) | | 1891/1953 | | 09/01/2011 |
| Cherry Hill | | Cherry Hill, NJ | | 100 | % | | (12) | | 366 |
| | 385 |
| | 751 |
| | — |
| | 366 |
| | 385 |
| | 751 |
| | (18 | ) | | 1977 | | 09/01/2011 |
| Campbelltown | | Cambelltown, PA | | 100 | % | | (12) | | 97 |
| | 282 |
| | 379 |
| | — |
| | 97 |
| | 282 |
| | 379 |
| | (13 | ) | | 1910/1956 | | 09/01/2011 |
| Hightstown | | Hightstown, NJ | | 100 | % | | (12) | | 392 |
| | 706 |
| | 1,098 |
| | — |
| | 392 |
| | 706 |
| | 1,098 |
| | (33 | ) | | 1966 | | 09/01/2011 |
| Kendall Park | | Kendall Park, NJ | | 100 | % | | (12) | | 288 |
| | 516 |
| | 804 |
| | — |
| | 288 |
| | 516 |
| | 804 |
| | (22 | ) | | 1975 | | 09/01/2011 |
Kennett Square | | Kennett Square, PA | | 100 | % | | (12) | | 919 |
| | 2,250 |
| | 3,169 |
| | — |
| | 919 |
| | 2,250 |
| | 3,169 |
| | (61 | ) | | 1963 | | 09/01/2011 |
| Lawrenceville | | Lawrenceville, NJ | | 100 | % | | (12) | | 141 |
| | 1,066 |
| | 1,207 |
| | — |
| | 141 |
| | 1,066 |
| | 1,207 |
| | (37 | ) | | 1972 | | 09/01/2011 |
| Linden | | Linden, NJ | | 100 | % | | (12) | | 603 |
| | 2,034 |
| | 2,637 |
| | — |
| | 603 |
| | 2,034 |
| | 2,637 |
| | — |
| | 1974 | | 09/01/2011 |
| Moosic | | Moosic, PA | | 100 | % | | (12) | | 63 |
| | 427 |
| | 490 |
| | — |
| | 63 |
| | 427 |
| | 490 |
| | (15 | ) | | 1968 | | 09/01/2011 |
| North End | | Pottstown, PA | | 100 | % | | (12) | | 158 |
| | 295 |
| | 453 |
| | — |
| | 158 |
| | 295 |
| | 453 |
| | (12 | ) | | 1959 | | 09/01/2011 |
| North Plainfield | | North Plainfield, NJ | | 100 | % | | (12) | | 16 |
| | 22 |
| | 38 |
| | — |
| | 16 |
| | 22 |
| | 38 |
| | (1 | ) | | 1970 | | 09/01/2011 |
| Phoenixville | | Phoenixville, PA | | 100 | % | | (12) | | 213 |
| | 137 |
| | 350 |
| | — |
| | 213 |
| | 137 |
| | 350 |
| | (4 | ) | | 1983 | | 09/01/2011 |
| Point Pleasant | | Point Pleasant, NJ | | 100 | % | | (12) | | 370 |
| | 561 |
| | 931 |
| | — |
| | 370 |
| | 561 |
| | 931 |
| | (26 | ) | | 1985 | | 09/01/2011 |
| Runnemede | | Runnemede, NJ | | 100 | % | | (12) | | 92 |
| | 100 |
| | 192 |
| | — |
| | 92 |
| | 100 |
| | 192 |
| | (5 | ) | | 1972 | | 09/01/2011 |
| Somerdale | | Somerdale, NJ | | 100 | % | | (12) | | 295 |
| | 209 |
| | 504 |
| | — |
| | 295 |
| | 209 |
| | 504 |
| | (7 | ) | | 1955 | | 09/01/2011 |
| Spring Lake | | Spring Lake, NJ | | 100 | % | | (12) | | 430 |
| | 612 |
| | 1,042 |
| | — |
| | 430 |
| | 612 |
| | 1,042 |
| | (26 | ) | | 1980 | | 09/01/2011 |
| Sunnyside | | Linden, NJ | | 100 | % | | (12) | | 603 |
| | 1,497 |
| | 2,100 |
| | — |
| | 603 |
| | 1,497 |
| | 2,100 |
| | (60 | ) | | 1945 | | 09/01/2011 |
| Leesburg | | Leesburg, VA | | 100 | % | | (12) | | 1,667 |
| | 2,521 |
| | 4,188 |
| | — |
| | 1,667 |
| | 2,521 |
| | 4,188 |
| | (89 | ) | | 1975 | | 09/01/2011 |
Midland | | Midland, NC | | 100 | % | | (12) | | 220 |
| | 457 |
| | 677 |
| | — |
| | 220 |
| | 457 |
| | 677 |
| | (20 | ) | | 1974 | | 09/01/2011 |
| Hinsdale | | Hinsdale, IL | | 100 | % | | (12) | | 579 |
| | 4,120 |
| | 4,699 |
| | — |
| | 579 |
| | 4,120 |
| | 4,699 |
| | (62 | ) | | 2003 | | 09/01/2011 |
| Dripping Springs | | Dripping Springs, TX | | 100 | % | | (12) | | 862 |
| | 673 |
| | 1,535 |
| | — |
| | 862 |
| | 673 |
| | 1,535 |
| | (42 | ) | | 2005 | | 09/01/2011 |
| Prima Vista | | Port St. Lucie, FL | | 100 | % | | (12) | | 871 |
| | 5,629 |
| | 6,500 |
| | 7 |
| | 871 |
| | 5,636 |
| | 6,507 |
| | (185 | ) | | 1989 | | 09/01/2011 |
| Boyertown | | Boyertown, PA | | 100 | % | | (12) | | 182 |
| | 270 |
| | 452 |
| | — |
| | 182 |
| | 270 |
| | 452 |
| | (16 | ) | | 1975 | | 09/01/2011 |
| Collingswood | | Collingswood, NJ | | 100 | % | | (12) | | 207 |
| | 648 |
| | 855 |
| | — |
| | 207 |
| | 648 |
| | 855 |
| | (24 | ) | | 1980 | | 09/01/2011 |
| Pennington | | Pennington, NJ | | 100 | % | | (12) | | 168 |
| | 614 |
| | 782 |
| | — |
| | 168 |
| | 614 |
| | 782 |
| | (37 | ) | | 1933 | | 09/01/2011 |
| Rhawnhurst | | Philadelphia, PA | | 100 | % | | (12) | | 184 |
| | 272 |
| | 456 |
| | — |
| | 184 |
| | 272 |
| | 456 |
| | (8 | ) | | 1975 | | 09/01/2011 |
KBS REAL ESTATE INVESTMENT TRUST, INC.
SCHEDULE III
REAL ESTATE ASSETS AND ACCUMULATED DEPRECIATION AND AMORTIZATION (CONTINUED)
December 31, 2011
(dollar amounts in thousands)
|
| | | | | | | | | | | | | | | | | | | | | | | | | | | | | | | | | | | | | | | | | | | | | |
| | | | | | | | | Initial Cost to Company | | | | Gross Amount at which Carried at Close of Period | | | | | | |
| Description | | Location | | Ownership Percent | | Encumbrances | | Land | | Building and Improvements (1) | | Total | | Cost Capitalized Subsequent to Acquisition | | Land | | Building and Improvements (1) | | Total (2) | | Accumulated Depreciation and Amortization | | Original Date of Construction | | Date Acquired |
| Bensalem | | Bensalem, PA | | 100 | % | | (12) | | $ | 257 |
| | $ | 772 |
| | $ | 1,029 |
| | $ | — |
| | $ | 257 |
| | $ | 772 |
| | $ | 1,029 |
| | $ | (27 | ) | | 1971 | | 09/01/2011 |
| Fairfield | | Pensacola, FL | | 100 | % | | (12) | | 30 |
| | 93 |
| | 123 |
| | — |
| | 30 |
| | 93 |
| | 123 |
| | (2 | ) | | 1989/1994 | | 09/01/2011 |
| Apex Charlotte | | Apex, NC | | 100 | % | | (12) | | 138 |
| | 110 |
| | 248 |
| | — |
| | 138 |
| | 110 |
| | 248 |
| | (7 | ) | | 1985 | | 09/01/2011 |
| Graham | | Graham, NC | | 100 | % | | (12) | | 511 |
| | 492 |
| | 1,003 |
| | — |
| | 511 |
| | 492 |
| | 1,003 |
| | (30 | ) | | 1984 | | 09/01/2011 |
| Havelock | | Havelock, NC | | 100 | % | | (12) | | 149 |
| | 173 |
| | 322 |
| | — |
| | 149 |
| | 173 |
| | 322 |
| | (12 | ) | | 1981 | | 09/01/2011 |
| Morehead City | | Morehead City, NC | | 100 | % | | (12) | | 409 |
| | 264 |
| | 673 |
| | — |
| | 409 |
| | 264 |
| | 673 |
| | (32 | ) | | 1986 | | 09/01/2011 |
| New Bern | | New Bern, NC | | 100 | % | | (12) | | 412 |
| | 768 |
| | 1,180 |
| | — |
| | 412 |
| | 768 |
| | 1,180 |
| | (42 | ) | | 1983 | | 09/01/2011 |
| Plymouth | | Plymouth, NC | | 100 | % | | (12) | | 299 |
| | 543 |
| | 842 |
| | — |
| | 299 |
| | 543 |
| | 842 |
| | (27 | ) | | 1981 | | 09/01/2011 |
| Wilson | | Wilson, NC | | 100 | % | | (12) | | 928 |
| | 5,467 |
| | 6,395 |
| | — |
| | 928 |
| | 5,467 |
| | 6,395 |
| | (257 | ) | | 1970 | | 09/01/2011 |
| Wilson (Wooten) | | Wilson, NC | | 100 | % | | (12) | | 1,003 |
| | 10,916 |
| | 11,919 |
| | — |
| | 1,003 |
| | 10,916 |
| | 11,919 |
| | (250 | ) | | 1981 | | 09/01/2011 |
| Wilson (Horton) | | Wilson, NC | | 100 | % | | (12) | | 414 |
| | 2,179 |
| | 2,593 |
| | — |
| | 414 |
| | 2,179 |
| | 2,593 |
| | (92 | ) | | 1983 | | 09/01/2011 |
| San Rafael | | San Rafael, CA | | 100 | % | | (12) | | 721 |
| | 1,679 |
| | 2,400 |
| | — |
| | 721 |
| | 1,679 |
| | 2,400 |
| | (64 | ) | | 1957 | | 09/01/2011 |
| 328 Main Street | | Conneaut, OH | | 100 | % | | (12) | | 153 |
| | 389 |
| | 542 |
| | — |
| | 153 |
| | 389 |
| | 542 |
| | (11 | ) | | 1971 | | 09/01/2011 |
| 680 Broadway | | Bedford, OH | | 100 | % | | (12) | | 146 |
| | 875 |
| | 1,021 |
| | — |
| | 146 |
| | 875 |
| | 1,021 |
| | (23 | ) | | 1921 | | 09/01/2011 |
| 4175 Pearl Road | | Cleveland, OH | | 100 | % | | (12) | | 184 |
| | 166 |
| | 350 |
| | — |
| | 184 |
| | 166 |
| | 350 |
| | (11 | ) | | 1924 | | 09/01/2011 |
| 5703 Broadway | | Cleveland, OH | | 100 | % | | (12) | | 263 |
| | 273 |
| | 536 |
| | — |
| | 263 |
| | 273 |
| | 536 |
| | (13 | ) | | 1923 | | 09/01/2011 |
| 5900 St. Clr Ave | | Cleveland, OH | | 100 | % | | (12) | | 234 |
| | 654 |
| | 888 |
| | — |
| | 234 |
| | 654 |
| | 888 |
| | (23 | ) | | 1973 | | 09/01/2011 |
| 14444 Pearl Rd | | Strongville, OH | | 100 | % | | (12) | | 331 |
| | 971 |
| | 1,302 |
| | — |
| | 331 |
| | 971 |
| | 1,302 |
| | (27 | ) | | 1965 | | 09/01/2011 |
| 22481 Lakeshore | | Euclid, OH | | 100 | % | | (12) | | 414 |
| | 753 |
| | 1,167 |
| | — |
| | 414 |
| | 753 |
| | 1,167 |
| | (20 | ) | | 1965 | | 09/01/2011 |
| 26410 Lakeshore | | Euclid, OH | | 100 | % | | (12) | | 120 |
| | 528 |
| | 648 |
| | — |
| | 120 |
| | 528 |
| | 648 |
| | (21 | ) | | 1969 | | 09/01/2011 |
| Ashtabula | | Ashtabula, OH | | 100 | % | | (12) | | 85 |
| | 278 |
| | 363 |
| | — |
| | 85 |
| | 278 |
| | 363 |
| | — |
| | 1941 | | 09/01/2011 |
Beachwood | | Beachwood, OH | | 100 | % | | (12) | | 607 |
| | 1,622 |
| | 2,229 |
| | — |
| | 607 |
| | 1,622 |
| | 2,229 |
| | (36 | ) | | 1979 | | 09/01/2011 |
| Berea | | Berea, OH | | 100 | % | | (12) | | 212 |
| | 481 |
| | 693 |
| | — |
| | 212 |
| | 481 |
| | 693 |
| | (18 | ) | | 1958 | | 09/01/2011 |
| Chagrin Blvd | | Pepper Pike, OH | | 100 | % | | (12) | | 526 |
| | 1,151 |
| | 1,677 |
| | — |
| | 526 |
| | 1,151 |
| | 1,677 |
| | (30 | ) | | 1974 | | 09/01/2011 |
| Euclid Avenue | | Cleveland, OH | | 100 | % | | (12) | | 184 |
| | 524 |
| | 708 |
| | — |
| | 184 |
| | 524 |
| | 708 |
| | (20 | ) | | 1961 | | 09/01/2011 |
| Hamilton Avenue | | Springfield Twp, OH | | 100 | % | | (12) | | 101 |
| | 67 |
| | 168 |
| | — |
| | 101 |
| | 67 |
| | 168 |
| | (6 | ) | | 1970 | | 09/01/2011 |
| Mentor Avenue | | Mentor, OH | | 100 | % | | (12) | | 279 |
| | 502 |
| | 781 |
| | — |
| | 279 |
| | 502 |
| | 781 |
| | (15 | ) | | 1978 | | 09/01/2011 |
| Milford | | Milford, OH | | 100 | % | | (12) | | 131 |
| | 273 |
| | 404 |
| | — |
| | 131 |
| | 273 |
| | 404 |
| | (14 | ) | | 1958 | | 09/01/2011 |
| Plaza Blvd | | Mentor, OH | | 100 | % | | (12) | | 394 |
| | 1,110 |
| | 1,504 |
| | — |
| | 394 |
| | 1,110 |
| | 1,504 |
| | (32 | ) | | 1976 | | 09/01/2011 |
| Public Square | | Medina, OH | | 100 | % | | (12) | | 174 |
| | 331 |
| | 505 |
| | — |
| | 174 |
| | 331 |
| | 505 |
| | (12 | ) | | 1982 | | 09/01/2011 |
| Reading Road | | Mason, OH | | 100 | % | | (12) | | 63 |
| | 108 |
| | 171 |
| | — |
| | 63 |
| | 108 |
| | 171 |
| | (6 | ) | | 1975 | | 09/01/2011 |
Reding Road | | Cincinnati, OH | | 100 | % | | (12) | | 47 |
| | 145 |
| | 192 |
| | — |
| | 47 |
| | 145 |
| | 192 |
| | (7 | ) | | 1968 | | 09/01/2011 |
| Rock Creek | | Rock Creek, OH | | 100 | % | | (12) | | 9 |
| | 54 |
| | 63 |
| | — |
| | 9 |
| | 54 |
| | 63 |
| | (2 | ) | | 1900 | | 09/01/2011 |
South Broadway | | Geneva, OH | | 100 | % | | (12) | | 84 |
| | 694 |
| | 778 |
| | — |
| | 84 |
| | 694 |
| | 778 |
| | (25 | ) | | 1918 | | 09/01/2011 |
KBS REAL ESTATE INVESTMENT TRUST, INC.
SCHEDULE III
REAL ESTATE ASSETS AND ACCUMULATED DEPRECIATION AND AMORTIZATION (CONTINUED)
December 31, 2011
(dollar amounts in thousands)
|
| | | | | | | | | | | | | | | | | | | | | | | | | | | | | | | | | | | | | | | | | | | | | |
| | | | | | | | | Initial Cost to Company | | | | Gross Amount at which Carried at Close of Period | | | | | | |
| Description | | Location | | Ownership Percent | | Encumbrances | | Land | | Building and Improvements (1) | | Total | | Cost Capitalized Subsequent to Acquisition | | Land | | Building and Improvements (1) | | Total (2) | | Accumulated Depreciation and Amortization | | Original Date of Construction | | Date Acquired |
| South Water Street | | Kent, OH | | 100 | % | | (12) | | $ | 78 |
| | $ | 166 |
| | $ | 244 |
| | $ | — |
| | $ | 78 |
| | $ | 166 |
| | $ | 244 |
| | $ | (6 | ) | | 1977 | | 09/01/2011 |
| Turney Road | | Garfield Height, OH | | 100 | % | | (12) | | 51 |
| | 556 |
| | 607 |
| | — |
| | 51 |
| | 556 |
| | 607 |
| | (14 | ) | | 1958 | | 09/01/2011 |
| Warrensville Center | | Shaker Heights, OH | | 100 | % | | (12) | | 660 |
| | 1,114 |
| | 1,774 |
| | — |
| | 660 |
| | 1,114 |
| | 1,774 |
| | (28 | ) | | 1957 | | 09/01/2011 |
| West 117th | | Cleveland, OH | | 100 | % | | (12) | | 273 |
| | 452 |
| | 725 |
| | — |
| | 273 |
| | 452 |
| | 725 |
| | (23 | ) | | 1960 | | 09/01/2011 |
| West Jefferson | | Jefferson, OH | | 100 | % | | (12) | | 159 |
| | 696 |
| | 855 |
| | — |
| | 159 |
| | 696 |
| | 855 |
| | (18 | ) | | 1963 / 2005 | | 09/01/2011 |
| Woodland Avenue | | Cleveland, OH | | 100 | % | | (12) | | 263 |
| | 409 |
| | 672 |
| | — |
| | 263 |
| | 409 |
| | 672 |
| | (22 | ) | | 1975 | | 09/01/2011 |
| Albermarle Road | | Charlotte, NC | | 100 | % | | (12) | | — |
| | 36 |
| | 36 |
| | — |
| | — |
| | 36 |
| | 36 |
| | (36 | ) | | 1994 | | 09/01/2011 |
| Plantation | | Plantation, FL | | 100 | % | | (12) | | 884 |
| | 988 |
| | 1,872 |
| | — |
| | 884 |
| | 988 |
| | 1,872 |
| | (17 | ) | | 2000 | | 09/01/2011 |
| Walnut Avenue | | Dalton, GA | | 100 | % | | (12) | | 396 |
| | 910 |
| | 1,306 |
| | — |
| | 396 |
| | 910 |
| | 1,306 |
| | (30 | ) | | 1999 | | 09/01/2011 |
| Hickory View | | Hickory, NC | | 100 | % | | (12) | | 440 |
| | 923 |
| | 1,363 |
| | — |
| | 440 |
| | 923 |
| | 1,363 |
| | (24 | ) | | 1982 | | 09/01/2011 |
| Cornelius | | Cornelius, NC | | 100 | % | | (12) | | 1,336 |
| | 1,578 |
| | 2,914 |
| | — |
| | 1,336 |
| | 1,578 |
| | 2,914 |
| | (29 | ) | | 1988 | | 09/01/2011 |
| North Cross | | Huntersville, NC | | 100 | % | | (12) | | 703 |
| | 1,048 |
| | 1,751 |
| | — |
| | 703 |
| | 1,048 |
| | 1,751 |
| | (25 | ) | | 1997 | | 09/01/2011 |
| Wilmington | | Wilmington, NC | | 100 | % | | (12) | | 570 |
| | 1,461 |
| | 2,031 |
| | — |
| | 570 |
| | 1,461 |
| | 2,031 |
| | (24 | ) | | 1990 | | 09/01/2011 |
| Cayce Office | | Cayce, SC | | 100 | % | | (12) | | 343 |
| | 737 |
| | 1,080 |
| | — |
| | 343 |
| | 737 |
| | 1,080 |
| | (21 | ) | | 1962 | | 09/01/2011 |
| Clover Main | | Clover, SC | | 100 | % | | (12) | | 10 |
| | 9 |
| | 19 |
| | — |
| | 10 |
| | 9 |
| | 19 |
| | — |
| | 1961 | | 09/01/2011 |
| Rock Hill PP | | Rock Hill, SC | | 100 | % | | (12) | | 294 |
| | 695 |
| | 989 |
| | — |
| | 294 |
| | 695 |
| | 989 |
| | (24 | ) | | 1990 | | 09/01/2011 |
| Stuyvesant Village | | Irvington, NJ | | 100 | % | | (12) | | 303 |
| | 542 |
| | 845 |
| | — |
| | 303 |
| | 542 |
| | 845 |
| | (32 | ) | | 1932/1970 | | 09/01/2011 |
| Abingdon Wall | | Abingdon, VA | | 100 | % | | (12) | | 196 |
| | 1,431 |
| | 1,627 |
| | — |
| | 196 |
| | 1,431 |
| | 1,627 |
| | (27 | ) | | 1924/1988 | | 09/01/2011 |
| Sylvania Main | | Sylvania, GA | | 100 | % | | (12) | | 81 |
| | 500 |
| | 581 |
| | — |
| | 81 |
| | 500 |
| | 581 |
| | (27 | ) | | 1972/1983 | | 09/01/2011 |
| Dunwoody Village | | Dunwoody, GA | | 100 | % | | (12) | | 367 |
| | 836 |
| | 1,203 |
| | — |
| | 367 |
| | 836 |
| | 1,203 |
| | (26 | ) | | 1981 | | 09/01/2011 |
| Cotswold Branch | | Charlotte, NC | | 100 | % | | (12) | | 656 |
| | 1,096 |
| | 1,752 |
| | — |
| | 656 |
| | 1,096 |
| | 1,752 |
| | (22 | ) | | 1984 | | 09/01/2011 |
| West Manchester | | York, PA | | 100 | % | | (12) | | 290 |
| | 450 |
| | 740 |
| | — |
| | 290 |
| | 450 |
| | 740 |
| | (20 | ) | | 1975 | | 09/01/2011 |
| Route 360 | | Richmond, VA | | 100 | % | | (12) | | 173 |
| | 601 |
| | 774 |
| | — |
| | 173 |
| | 601 |
| | 774 |
| | (19 | ) | | 1977 | | 09/01/2011 |
| Richmond West | | Richmond, VA | | 100 | % | | (12) | | 377 |
| | 315 |
| | 692 |
| | — |
| | 377 |
| | 315 |
| | 692 |
| | (15 | ) | | 1963 | | 09/01/2011 |
| Delray Square | | Delray Beach, FL | | 100 | % | | (12) | | 938 |
| | 749 |
| | 1,687 |
| | — |
| | 938 |
| | 749 |
| | 1,687 |
| | (19 | ) | | 1982 | | 09/01/2011 |
| Highland Springs | | Highland Springs, VA | | 100 | % | | (12) | | 115 |
| | 268 |
| | 383 |
| | — |
| | 115 |
| | 268 |
| | 383 |
| | (16 | ) | | 1964 | | 09/01/2011 |
| Country Club Rd | | Harrisonburg, VA | | 100 | % | | (12) | | 491 |
| | 661 |
| | 1,152 |
| | — |
| | 491 |
| | 661 |
| | 1,152 |
| | (43 | ) | | 1979 | | 09/01/2011 |
| Sycamore Springs | | Midlothian, VA | | 100 | % | | (12) | | 450 |
| | 1,032 |
| | 1,482 |
| | — |
| | 450 |
| | 1,032 |
| | 1,482 |
| | (28 | ) | | 1988 | | 09/01/2011 |
| Lawrenceville Suwann | | Lawrenceville, GA | | 100 | % | | (12) | | 425 |
| | 1,290 |
| | 1,715 |
| | — |
| | 425 |
| | 1,290 |
| | 1,715 |
| | (39 | ) | | 1995 | | 09/01/2011 |
| Landing | | Landing, NJ | | 100 | % | | (12) | | 205 |
| | 1,043 |
| | 1,248 |
| | — |
| | 205 |
| | 1,043 |
| | 1,248 |
| | (33 | ) | | 1940 | | 09/01/2011 |
| Nashville Galltn | | Nashville, TN | | 100 | % | | (12) | | 27 |
| | 69 |
| | 96 |
| | — |
| | 27 |
| | 69 |
| | 96 |
| | (2 | ) | | 1964 | | 09/01/2011 |
| Pinellas | | Pinellas Park, FL | | 100 | % | | (12) | | 981 |
| | 888 |
| | 1,869 |
| | — |
| | 981 |
| | 888 |
| | 1,869 |
| | (24 | ) | | 1980 | | 09/01/2011 |
| Battleground Office | | Greensboro, NC | | 100 | % | | (12) | | 216 |
| | 584 |
| | 800 |
| | — |
| | 216 |
| | 584 |
| | 800 |
| | (12 | ) | | 1996 | | 09/01/2011 |
| Wendover Place | | Greensboro, NC | | 100 | % | | (12) | | 312 |
| | 715 |
| | 1,027 |
| | — |
| | 312 |
| | 715 |
| | 1,027 |
| | (18 | ) | | 1998 | | 09/01/2011 |
KBS REAL ESTATE INVESTMENT TRUST, INC.
SCHEDULE III
REAL ESTATE ASSETS AND ACCUMULATED DEPRECIATION AND AMORTIZATION (CONTINUED)
December 31, 2011
(dollar amounts in thousands)
|
| | | | | | | | | | | | | | | | | | | | | | | | | | | | | | | | | | | | | | | | | | | | | |
| | | | | | | | | Initial Cost to Company | | | | Gross Amount at which Carried at Close of Period | | | | | | |
| Description | | Location | | Ownership Percent | | Encumbrances | | Land | | Building and Improvements (1) | | Total | | Cost Capitalized Subsequent to Acquisition | | Land | | Building and Improvements (1) | | Total (2) | | Accumulated Depreciation and Amortization | | Original Date of Construction | | Date Acquired |
| Stonebriar | | Frisco, TX | | 100 | % | | (12) | | $ | 822 |
| | $ | 1,091 |
| | $ | 1,913 |
| | $ | — |
| | $ | 822 |
| | $ | 1,091 |
| | $ | 1,913 |
| | $ | (26 | ) | | 2002 | | 09/01/2011 |
| Wickham Road Office | | Melbourne, FL | | 100 | % | | (12) | | 307 |
| | 761 |
| | 1,068 |
| | — |
| | 307 |
| | 761 |
| | 1,068 |
| | (13 | ) | | 1999 | | 09/01/2011 |
| Walnut Maynard | | Cary, NC | | 100 | % | | (12) | | 408 |
| | 600 |
| | 1,008 |
| | — |
| | 408 |
| | 600 |
| | 1,008 |
| | (16 | ) | | 1997 | | 09/01/2011 |
| Bristol Office | | Bristol, PA | | 100 | % | | (12) | | 129 |
| | 249 |
| | 378 |
| | 7 |
| | 129 |
| | 256 |
| | 385 |
| | (10 | ) | | 1818 | | 09/01/2011 |
| Independnce Hall | | Philadelphia, PA | | 100 | % | | (12) | | 248 |
| | 815 |
| | 1,063 |
| | — |
| | 248 |
| | 815 |
| | 1,063 |
| | (20 | ) | | 1949 | | 09/01/2011 |
| Lebanon | | Lebanon, PA | | 100 | % | | (12) | | 129 |
| | 380 |
| | 509 |
| | 31 |
| | 129 |
| | 411 |
| | 540 |
| | (15 | ) | | 1969 | | 09/01/2011 |
| Oviedo Red Bug | | Oviedo, FL | | 100 | % | | (12) | | 138 |
| | 174 |
| | 312 |
| | — |
| | 138 |
| | 174 |
| | 312 |
| | (5 | ) | | 2003 | | 09/01/2011 |
| Stockbridge | | Stockbridge, GA | | 100 | % | | (12) | | 293 |
| | 480 |
| | 773 |
| | — |
| | 293 |
| | 480 |
| | 773 |
| | (19 | ) | | 1986 | | 09/01/2011 |
| Lake Mary Office | | Lake Mary, FL | | 100 | % | | (12) | | 804 |
| | 1,076 |
| | 1,880 |
| | — |
| | 804 |
| | 1,076 |
| | 1,880 |
| | (20 | ) | | 1990 | | 09/01/2011 |
| Cartersville | | Cartersville, GA | | 100 | % | | (12) | | 207 |
| | 381 |
| | 588 |
| | — |
| | 207 |
| | 381 |
| | 588 |
| | (11 | ) | | 1995 | | 09/01/2011 |
| Lake Hiawatha | | Lake Hiawatha, NJ | | 100 | % | | (12) | | 231 |
| | 387 |
| | 618 |
| | — |
| | 231 |
| | 387 |
| | 618 |
| | (10 | ) | | 1965 | | 09/01/2011 |
| Hometown | | Tamaqua, PA | | 100 | % | | (12) | | 106 |
| | 251 |
| | 357 |
| | — |
| | 106 |
| | 251 |
| | 357 |
| | (9 | ) | | 1988 | | 09/01/2011 |
| Gulfport Hwy 49 | | Gulfport, MS | | 100 | % | | (12) | | 577 |
| | — |
| | 577 |
| | — |
| | 577 |
| | — |
| | 577 |
| | — |
| | N/A | | 09/01/2011 |
| Callahan | | Callahan, FL | | 100 | % | | (12) | | 617 |
| | 592 |
| | 1,209 |
| | — |
| | 617 |
| | 592 |
| | 1,209 |
| | (27 | ) | | 1973 | | 09/01/2011 |
| Conway | | Orlando, FL | | 100 | % | | (12) | | 310 |
| | 668 |
| | 978 |
| | — |
| | 310 |
| | 668 |
| | 978 |
| | (23 | ) | | 1980s | | 09/01/2011 |
| Dale Mabry | | Tampa, FL | | 100 | % | | (12) | | 662 |
| | 2,367 |
| | 3,029 |
| | — |
| | 662 |
| | 2,367 |
| | 3,029 |
| | (88 | ) | | 1975 | | 09/01/2011 |
| Davie | | Davie, FL | | 100 | % | | (12) | | 362 |
| | 898 |
| | 1,260 |
| | — |
| | 362 |
| | 898 |
| | 1,260 |
| | (29 | ) | | 1980s | | 09/01/2011 |
| Eustis | | Eustis, FL | | 100 | % | | (12) | | 460 |
| | 913 |
| | 1,373 |
| | — |
| | 460 |
| | 913 |
| | 1,373 |
| | (36 | ) | | 1957 | | 09/01/2011 |
| Ft. Lauderdale | | Ft. Lauderdale, FL | | 100 | % | | (12) | | 1,520 |
| | 872 |
| | 2,392 |
| | — |
| | 1,520 |
| | 872 |
| | 2,392 |
| | (43 | ) | | 1976 | | 09/01/2011 |
| Green Cov Spring | | Green Cove Spring, FL | | 100 | % | | (12) | | 607 |
| | 722 |
| | 1,329 |
| | — |
| | 607 |
| | 722 |
| | 1,329 |
| | (34 | ) | | 1966 | | 09/01/2011 |
| Indian Rocks | | Largo, FL | | 100 | % | | (12) | | 192 |
| | 216 |
| | 408 |
| | — |
| | 192 |
| | 216 |
| | 408 |
| | (10 | ) | | 1980 | | 09/01/2011 |
| Largo | | Clearwater, FL | | 100 | % | | (12) | | 792 |
| | 678 |
| | 1,470 |
| | — |
| | 792 |
| | 678 |
| | 1,470 |
| | (33 | ) | | 1965 | | 09/01/2011 |
| Normandy | | Jacksonville, FL | | 100 | % | | (12) | | 214 |
| | 786 |
| | 1,000 |
| | — |
| | 214 |
| | 786 |
| | 1,000 |
| | (27 | ) | | 1969 | | 09/01/2011 |
| North Port | | North Port, FL | | 100 | % | | (12) | | 587 |
| | 1,046 |
| | 1,633 |
| | — |
| | 587 |
| | 1,046 |
| | 1,633 |
| | (33 | ) | | 1980s | | 09/01/2011 |
| North East St. Petersburg | | St. Petersburg, FL | | 100 | % | | (12) | | 236 |
| | 313 |
| | 549 |
| | — |
| | 236 |
| | 313 |
| | 549 |
| | (17 | ) | | 1950s | | 09/01/2011 |
| Springfield | | Jacksonville, FL | | 100 | % | | (12) | | 699 |
| | 919 |
| | 1,618 |
| | — |
| | 699 |
| | 919 |
| | 1,618 |
| | (47 | ) | | 1949 | | 09/01/2011 |
| West Dayton | | Daytona Beach, FL | | 100 | % | | (12) | | 297 |
| | 436 |
| | 733 |
| | — |
| | 297 |
| | 436 |
| | 733 |
| | (19 | ) | | 1965 | | 09/01/2011 |
| Alabama Ave | | Breman, GA | | 100 | % | | (12) | | 287 |
| | 672 |
| | 959 |
| | — |
| | 287 |
| | 672 |
| | 959 |
| | (22 | ) | | 1965 | | 09/01/2011 |
| East Lake | | Marietta, GA | | 100 | % | | (12) | | 276 |
| | 302 |
| | 578 |
| | — |
| | 276 |
| | 302 |
| | 578 |
| | (13 | ) | | 1983 | | 09/01/2011 |
| Jimmy Carter Boulevard | | Norcross, GA | | 100 | % | | (12) | | 259 |
| | 692 |
| | 951 |
| | — |
| | 259 |
| | 692 |
| | 951 |
| | (20 | ) | | 1986 | | 09/01/2011 |
| Mableton | | Mabletown, GA | | 100 | % | | (12) | | 427 |
| | 383 |
| | 810 |
| | — |
| | 427 |
| | 383 |
| | 810 |
| | (14 | ) | | 1963 | | 09/01/2011 |
| Newnan Main | | Newnan, NC | | 100 | % | | (12) | | 267 |
| | 1,459 |
| | 1,726 |
| | — |
| | 267 |
| | 1,459 |
| | 1,726 |
| | (53 | ) | | 1955 | | 09/01/2011 |
| Norcross | | Norcross, GA | | 100 | % | | (12) | | 298 |
| | 765 |
| | 1,063 |
| | — |
| | 298 |
| | 765 |
| | 1,063 |
| | (29 | ) | | 1968 | | 09/01/2011 |
| Peachtree Corners | | Norcross, GA | | 100 | % | | (12) | | 332 |
| | 359 |
| | 691 |
| | — |
| | 332 |
| | 359 |
| | 691 |
| | (15 | ) | | 1991 | | 09/01/2011 |
KBS REAL ESTATE INVESTMENT TRUST, INC.
SCHEDULE III
REAL ESTATE ASSETS AND ACCUMULATED DEPRECIATION AND AMORTIZATION (CONTINUED)
December 31, 2011
(dollar amounts in thousands)
|
| | | | | | | | | | | | | | | | | | | | | | | | | | | | | | | | | | | | | | | | | | | | | |
| | | | | | | | | Initial Cost to Company | | | | Gross Amount at which Carried at Close of Period | | | | | | |
| Description | | Location | | Ownership Percent | | Encumbrances | | Land | | Building and Improvements (1) | | Total | | Cost Capitalized Subsequent to Acquisition | | Land | | Building and Improvements (1) | | Total (2) | | Accumulated Depreciation and Amortization | | Original Date of Construction | | Date Acquired |
| Rome Main | | Rome, GA | | 100 | % | | (12) | | $ | 902 |
| | $ | 1,953 |
| | $ | 2,855 |
| | $ | — |
| | $ | 902 |
| | $ | 1,953 |
| | $ | 2,855 |
| | $ | (88 | ) | | 1969 | | 09/01/2011 |
| Traffic Circle | | Savannah, GA | | 100 | % | | (12) | | 249 |
| | 384 |
| | 633 |
| | — |
| | 249 |
| | 384 |
| | 633 |
| | (18 | ) | | 1960 | | 09/01/2011 |
| Tri-County #2 | | Roswell, GA | | 100 | % | | (12) | | 419 |
| | 1,062 |
| | 1,481 |
| | — |
| | 419 |
| | 1,062 |
| | 1,481 |
| | (34 | ) | | 1991 | | 09/01/2011 |
| Vidalia Main | | Vidalia, GA | | 100 | % | | (12) | | 454 |
| | 779 |
| | 1,233 |
| | — |
| | 454 |
| | 779 |
| | 1,233 |
| | (50 | ) | | 1969 | | 09/01/2011 |
| Washington West | | Martinez, GA | | 100 | % | | (12) | | 130 |
| | 770 |
| | 900 |
| | — |
| | 130 |
| | 770 |
| | 900 |
| | (28 | ) | | 1971 | | 09/01/2011 |
| Waynesboro Main | | Waynesboro, GA | | 100 | % | | (12) | | 52 |
| | 1,038 |
| | 1,090 |
| | — |
| | 52 |
| | 1,038 |
| | 1,090 |
| | (38 | ) | | 1967 | | 09/01/2011 |
| Advance Main | | Advance, NC | | 100 | % | | (12) | | 203 |
| | 253 |
| | 456 |
| | — |
| | 203 |
| | 253 |
| | 456 |
| | (12 | ) | | 1973 | | 09/01/2011 |
| Blowing Rock Main | | Blowing Rock, NC | | 100 | % | | (12) | | 169 |
| | 95 |
| | 264 |
| | — |
| | 169 |
| | 95 |
| | 264 |
| | (8 | ) | | 1960 | | 09/01/2011 |
| Brevard Main | | Brevard, NC | | 100 | % | | (12) | | 69 |
| | 243 |
| | 312 |
| | — |
| | 69 |
| | 243 |
| | 312 |
| | (6 | ) | | 1923 | | 09/01/2011 |
| Canton Main | | Canton, NC | | 100 | % | | (12) | | 119 |
| | 427 |
| | 546 |
| | — |
| | 119 |
| | 427 |
| | 546 |
| | (16 | ) | | 1930 | | 09/01/2011 |
| China Grove | | China Grove, NC | | 100 | % | | (12) | | 142 |
| | 319 |
| | 461 |
| | — |
| | 142 |
| | 319 |
| | 461 |
| | (13 | ) | | 1975 | | 09/01/2011 |
| Conover Main | | Conover, NC | | 100 | % | | (12) | | 154 |
| | 314 |
| | 468 |
| | — |
| | 154 |
| | 314 |
| | 468 |
| | (16 | ) | | 1970 | | 09/01/2011 |
| Derita | | Charlotte, NC | | 100 | % | | (12) | | 264 |
| | 242 |
| | 506 |
| | — |
| | 264 |
| | 242 |
| | 506 |
| | (11 | ) | | 1971 | | 09/01/2011 |
| Fayetteville Main | | Fayetteville, NC | | 100 | % | | (12) | | 351 |
| | 2,557 |
| | 2,908 |
| | — |
| | 351 |
| | 2,557 |
| | 2,908 |
| | (76 | ) | | 1978 | | 09/01/2011 |
| Forest City Main | | Forest City, NC | | 100 | % | | (12) | | 229 |
| | 592 |
| | 821 |
| | — |
| | 229 |
| | 592 |
| | 821 |
| | (17 | ) | | 1965 | | 09/01/2011 |
| Goldsboro Main | | Goldsboro, NC | | 100 | % | | (12) | | 50 |
| | 214 |
| | 264 |
| | — |
| | 50 |
| | 214 |
| | 264 |
| | (6 | ) | | 1967 | | 09/01/2011 |
| Harrisburg | | Harrisburg, NC | | 100 | % | | (12) | | 277 |
| | 372 |
| | 649 |
| | — |
| | 277 |
| | 372 |
| | 649 |
| | (15 | ) | | 1973 | | 09/01/2011 |
| High Point Road | | Greensboro, NC | | 100 | % | | (12) | | 225 |
| | 538 |
| | 763 |
| | — |
| | 225 |
| | 538 |
| | 763 |
| | (18 | ) | | 1988 | | 09/01/2011 |
| Jackson Park | | Kannapolis, NC | | 100 | % | | (12) | | 138 |
| | 334 |
| | 472 |
| | — |
| | 138 |
| | 334 |
| | 472 |
| | (12 | ) | | 1958 | | 09/01/2011 |
| Jefferson Main | | Jefferson, NC | | 100 | % | | (12) | | 31 |
| | 79 |
| | 110 |
| | — |
| | 31 |
| | 79 |
| | 110 |
| | (2 | ) | | 1900 | | 09/01/2011 |
| Kildaire Farms | | Cary, NC | | 100 | % | | (12) | | 216 |
| | 192 |
| | 408 |
| | — |
| | 216 |
| | 192 |
| | 408 |
| | (10 | ) | | 1984 | | 09/01/2011 |
| Knightdale | | Knightdale, NC | | 100 | % | | (12) | | 125 |
| | 226 |
| | 351 |
| | — |
| | 125 |
| | 226 |
| | 351 |
| | (9 | ) | | 1987 | | 09/01/2011 |
| Lexington Main | | Lexington, NC | | 100 | % | | (12) | | 350 |
| | 1,419 |
| | 1,769 |
| | — |
| | 350 |
| | 1,419 |
| | 1,769 |
| | (53 | ) | | 1966 | | 09/01/2011 |
| Newton Main | | Newton, NC | | 100 | % | | (12) | | 134 |
| | 502 |
| | 636 |
| | — |
| | 134 |
| | 502 |
| | 636 |
| | (21 | ) | | 1956 | | 09/01/2011 |
| Rockingham Main | | Rockingham, NC | | 100 | % | | (12) | | 22 |
| | 718 |
| | 740 |
| | — |
| | 22 |
| | 718 |
| | 740 |
| | (21 | ) | | 1977 | | 09/01/2011 |
| Rocky Mount Main | | Rocky Mount, NC | | 100 | % | | (12) | | 31 |
| | 199 |
| | 230 |
| | — |
| | 31 |
| | 199 |
| | 230 |
| | (5 | ) | | 1941 | | 09/01/2011 |
| W. Jefferson Main | | W. Jefferson, NC | | 100 | % | | (12) | | 316 |
| | 580 |
| | 896 |
| | — |
| | 316 |
| | 580 |
| | 896 |
| | (24 | ) | | 1976 | | 09/01/2011 |
| Merchant's Walk (Sub) | | Marietta, GA | | 100 | % | | (12) | | 565 |
| | 1,903 |
| | 2,468 |
| | — |
| | 565 |
| | 1,903 |
| | 2,468 |
| | (26 | ) | | 1994 | | 09/01/2011 |
| Asheville Main Office | | Asheville, NC | | 100 | % | | (12) | | 166 |
| | 3,768 |
| | 3,934 |
| | — |
| | 166 |
| | 3,768 |
| | 3,934 |
| | (90 | ) | | 1972 | | 09/01/2011 |
| College Street | | Asheville, NC | | 100 | % | | (12) | | 116 |
| | 449 |
| | 565 |
| | — |
| | 116 |
| | 449 |
| | 565 |
| | (9 | ) | | 1993 | | 09/01/2011 |
| East End | | Greenville, NC | | 100 | % | | (12) | | 152 |
| | 147 |
| | 299 |
| | — |
| | 152 |
| | 147 |
| | 299 |
| | (4 | ) | | 1996 | | 09/01/2011 |
| Greenville Main Office | | Greenville, NC | | 100 | % | | (12) | | 323 |
| | 2,101 |
| | 2,424 |
| | — |
| | 323 |
| | 2,101 |
| | 2,424 |
| | (125 | ) | | 1975 | | 09/01/2011 |
| Mint Hill | | Charlotte, NC | | 100 | % | | (12) | | 134 |
| | 519 |
| | 653 |
| | — |
| | 134 |
| | 519 |
| | 653 |
| | (11 | ) | | 1983 | | 09/01/2011 |
| Lake Street | | Addison, IL | | 100 | % | | (12) | | 207 |
| | 259 |
| | 466 |
| | — |
| | 207 |
| | 259 |
| | 466 |
| | (24 | ) | | 1979/1994 | | 09/01/2011 |
KBS REAL ESTATE INVESTMENT TRUST, INC.
SCHEDULE III
REAL ESTATE ASSETS AND ACCUMULATED DEPRECIATION AND AMORTIZATION (CONTINUED)
December 31, 2011
(dollar amounts in thousands)
|
| | | | | | | | | | | | | | | | | | | | | | | | | | | | | | | | | | | | | | | | | | | | | |
| | | | | | | | | Initial Cost to Company | | | | Gross Amount at which Carried at Close of Period | | | | | | |
| Description | | Location | | Ownership Percent | | Encumbrances | | Land | | Building and Improvements (1) | | Total | | Cost Capitalized Subsequent to Acquisition | | Land | | Building and Improvements (1) | | Total (2) | | Accumulated Depreciation and Amortization | | Original Date of Construction | | Date Acquired |
| Executive Drive | | Lansing, MI | | 100 | % | | (12) | | $ | 276 |
| | $ | 664 |
| | $ | 940 |
| | $ | — |
| | $ | 276 |
| | $ | 664 |
| | $ | 940 |
| | $ | (24 | ) | | 1973 | | 09/01/2011 |
| 12th Street | | Paso Robles, CA | | 100 | % | | (12) | | 830 |
| | 2,005 |
| | 2,835 |
| | — |
| | 830 |
| | 2,005 |
| | 2,835 |
| | (43 | ) | | 1980 | | 09/01/2011 |
| Vine Street | | Paso Robles, CA | | 100 | % | | (12) | | 1,907 |
| | 4,092 |
| | 5,999 |
| | — |
| | 1,907 |
| | 4,092 |
| | 5,999 |
| | (66 | ) | | 2005 | | 09/01/2011 |
| Arroyo Grande | | Arroyo Grande, CA | | 100 | % | | (12) | | 937 |
| | 452 |
| | 1,389 |
| | — |
| | 937 |
| | 452 |
| | 1,389 |
| | (17 | ) | | 1980 | | 09/01/2011 |
| Santa Maria | | Santa Maria, CA | | 100 | % | | (12) | | 1,307 |
| | 902 |
| | 2,209 |
| | — |
| | 1,307 |
| | 902 |
| | 2,209 |
| | (23 | ) | | 2002 | | 09/01/2011 |
| 25th Street | | Columbus, IN | | 100 | % | | (12) | | 308 |
| | 717 |
| | 1,025 |
| | — |
| | 308 |
| | 717 |
| | 1,025 |
| | (29 | ) | | 1974 | | 09/01/2011 |
| Brentwood | | Columbus, IN | | 100 | % | | (12) | | 156 |
| | 419 |
| | 575 |
| | — |
| | 156 |
| | 419 |
| | 575 |
| | (15 | ) | | 1985 | | 09/01/2011 |
| Tipton | | Seymour, IN | | 100 | % | | (12) | | 191 |
| | 802 |
| | 993 |
| | — |
| | 191 |
| | 802 |
| | 993 |
| | (20 | ) | | 1982 | | 09/01/2011 |
| 2nd Street | | Seymour, IN | | 100 | % | | (12) | | 56 |
| | 1,262 |
| | 1,318 |
| | — |
| | 56 |
| | 1,262 |
| | 1,318 |
| | (31 | ) | | 1971 | | 09/01/2011 |
| Merced | | Merced, CA | | 100 | % | | (12) | | 1,177 |
| | 1,567 |
| | 2,744 |
| | — |
| | 1,177 |
| | 1,567 |
| | 2,744 |
| | (40 | ) | | 1980 | | 09/01/2011 |
| Deland | | Deland, FL | | 100 | % | | (12) | | 1,480 |
| | 2,945 |
| | 4,425 |
| | — |
| | 1,480 |
| | 2,945 |
| | 4,425 |
| | (203 | ) | | 1972 | | 09/01/2011 |
| Decatur (BS) - Main Building | | Decatur, GA | | 100 | % | | (12) | | 243 |
| | 409 |
| | 652 |
| | — |
| | 243 |
| | 409 |
| | 652 |
| | (19 | ) | | 1985 | | 09/01/2011 |
| Shoal Creek - Main Building | | Austin, TX | | 100 | % | | (12) | | 800 |
| | 658 |
| | 1,458 |
| | — |
| | 800 |
| | 658 |
| | 1,458 |
| | (24 | ) | | 1975 | | 09/01/2011 |
| | | Total Properties Held for Sales | | | | | $ | 102,089 |
| | $ | 336,273 |
| | $ | 438,362 |
| | $ | (23,535 | ) | | $ | 100,424 |
| | $ | 314,403 |
| | $ | 414,827 |
| | $ | (12,428 | ) | | | | |
| | | | | TOTAL |
| | | | $ | 628,331 |
| | $ | 2,573,129 |
| | $ | 3,201,460 |
| | $ | (71,899 | ) | | $ | 625,555 |
| | $ | 2,504,006 |
| | $ | 3,129,561 |
| | $ | (165,328 | ) | | | | |
KBS REAL ESTATE INVESTMENT TRUST, INC.
SCHEDULE III
REAL ESTATE ASSETS AND ACCUMULATED DEPRECIATION AND AMORTIZATION (CONTINUED)
December 31, 2011
(dollar amounts in thousands)
____________________
(1) Building and improvements include tenant origination and absorption costs.
(2) The aggregate cost of real estate for federal income tax purposes was approximately $3.4 billion as of December 31, 2011.
(3) On September 8, 2011, the Company sold five industrial properties within the Opus Industrial Portfolio.
(4) These properties are security for the FSI 6000A Mortgage Loan, which had an outstanding principal balance of $26.4 million as of December 31, 2011.
(5) These properties are security for the FSI 6000B Mortgage Loan, which had an outstanding principal balance of $29.5 million as of December 31, 2011.
(6) These properties are security for the FSI 6000C Mortgage Loan, which had an outstanding principal balance of $22.7 million as of December 31, 2011.
(7) These properties are security for the FSI 6000D Mortgage Loan, which had an outstanding principal balance of $30.7 million as of December 31, 2011.
(8) These properties are security for the BBD1 Mortgage Loan, which had an outstanding principal balance of $325.4 million as of December 31, 2011.
(9) These properties are security for the BBD2 Mortgage Loan, which had an outstanding principal balance of $206.2 million as of December 31, 2011.
(10) These properties are security for the CRE Mortgage Loan, which had an outstanding principal balance of $62.2 million as of December 31, 2011.
(11) These properties are security for the FSI Mortgage Loan, which had an outstanding principal balance of $62.4 million as of December 31, 2011.
(12) These properties are security for the Goldman Mortgage Loan, which had an outstanding principal balance of $204.6 million as of December 31, 2011.
(13) These properties are security for the PB Capital Mortgage Loan, which had an outstanding principal balance of $219.5 million as of December 31, 2011.
(14) These properties are security for the Pitney Bowes - Bank of America Mortgage Loan, which had an outstanding principal balance of $43.9 million as of December 31, 2011.
(15) These properties are security for the Pitney Bowes - Wachovia A Mortgage Loan, which had an outstanding principal balance of $19.0 million as of December 31, 2011.
(16) These properties are security for the RBC Centura Mortgage Loan, which had an outstanding principal balance of $8.1 million as of December 31, 2011.
(17) These properties are security for the Sterling Bank Mortgage Loan, which had an outstanding principal balance of $19.9 million as of December 31, 2011.
(18) These properties are security for the Wachovia 8 Mortgage Loan, which had an outstanding principal balance of $4.5 million as of December 31, 2011.
(19) These properties are security for the Wachovia 9 Mortgage Loan, which had an outstanding principal balance of $14.0 million as of December 31, 2011.
(20) These properties are security for the BOA Windsor Mortgage Loan, which had an outstanding principal balance of $6.2 million as of December 31, 2011.
KBS REAL ESTATE INVESTMENT TRUST, INC.
SCHEDULE III
REAL ESTATE ASSETS AND ACCUMULATED DEPRECIATION AND AMORTIZATION (CONTINUED)
December 31, 2011
(dollar amounts in thousands)
|
| | | | | | | | | | | | |
| | | 2011 | | 2010 | | 2009 |
Real Estate (1) | | | | | | |
| Balance at the beginning of the year | | $ | 1,768,632 |
| | $ | 2,004,924 |
| | $ | 2,007,576 |
|
Acquisitions (2) | | — |
| | — |
| | 39,440 |
|
| Transfer of the GKK Properties | | 1,971,943 |
| | — |
| | — |
|
| Improvements | | 34,876 |
| | 20,792 |
| | 21,218 |
|
| Transfer of real estate in connection with the extinguishment of debt | | (329,367 | ) | | — |
| | — |
|
| Write-off of fully depreciated and fully amortized assets | | (30,346 | ) | | (35,081 | ) | | (63,310 | ) |
| Impairments | | (102,003 | ) | | (154,742 | ) | | — |
|
| Sales | | (184,174 | ) | | (67,261 | ) | | — |
|
| Balance at the end of the year | | $ | 3,129,561 |
| | $ | 1,768,632 |
| | $ | 2,004,924 |
|
| | | | | | | |
Accumulated depreciation (1) | | | | | | |
| Balance at the beginning of the year | | $ | 178,055 |
| | $ | 176,321 |
| | $ | 120,685 |
|
| Depreciation expense | | 106,134 |
| | 77,912 |
| | 118,946 |
|
| Write-off of fully depreciated and fully amortized assets | | (30,346 | ) | | (35,081 | ) | | (63,310 | ) |
| Impairment | | (50,278 | ) | | (37,169 | ) | | — |
|
| Sales | | (18,811 | ) | | (3,928 | ) | | — |
|
| Transfer of real estate in connection with the extinguishment of debt | | (19,426 | ) | | — |
| | — |
|
| Balance at the end of the year | | $ | 165,328 |
| | $ | 178,055 |
| | $ | 176,321 |
|
____________________
(1) Amounts include real estate held for sale.
(2) Acquisition in 2009 relates to the 18301 Von Karman Building, which the Company received in satisfaction of its investment in the 18301 Von Karman Loans on October 6, 2009.
KBS REAL ESTATE INVESTMENT TRUST, INC.
SCHEDULE IV
MORTGAGE LOANS ON REAL ESTATE
December 31, 2011
(dollar amounts in thousands) |
| | | | | | | | | | | | | | | | | | | |
| | Interest Rate (1) | | Interest Rate as of December 31, 2011 (1) | | Final Maturity Date (2) | | Periodic Payment Terms | | Prior Liens | | Face Amount of Mortgages | | Carrying Amount of Mortgages |
| Notes Payable | | | | | | | | | | | | | |
| Plaza in Clayton Mortgage Loan | 5.90% | | 5.90% | | 10/06/2016 | | Interest Only | | $ | — |
| | $ | 62,200 |
| | $ | 62,200 |
|
| Crescent Green Building Mortgage Loan | 5.68% | | 5.68% | | 02/01/2012 | | Interest Only | | — |
| | 32,400 |
| | 32,400 |
|
| The Offices at Kensington Mortgage Loan | 5.52% | | 5.52% | | 04/01/2014 | | Interest Only | | — |
| | 18,500 |
| | 18,500 |
|
| Royal Ridge Building Mortgage Loan | 5.96% | | 5.96% | | 09/01/2013 | | Interest Only | | — |
| | 21,718 |
| | 21,718 |
|
| Plano Corporate Center I & II Mortgage Loan | 5.90% | | 5.90% | | 09/01/2012 | | Interest Only | | — |
| | 30,591 |
| | 30,591 |
|
| 2200 West Loop South Building Mortgage Loan | 5.89% | | 5.89% | | 10/01/2014 | | Interest Only | | — |
| | 17,426 |
| | 17,426 |
|
| ADP Plaza Mortgage Loan | 5.56% | | 5.56% | | 10/01/2013 | | Interest Only | | — |
| | 20,900 |
| | 20,900 |
|
| Tysons Dulles Plaza Mortgage Loan | 5.90% | | 5.90% | | 03/10/2014 | | Interest Only | | — |
| | 76,375 |
| | 76,375 |
|
| Five Tower Bridge Revolving Loan | 4.05% | | 4.05% | | 11/10/2014 | | Principal and interest | | — |
| | 40,224 |
| | 40,224 |
|
| 825 University Avenue Building Mortgage Loan | 5.59% | | 5.59% | | 12/06/2013 | | Interest Only | | — |
| | 19,000 |
| | 19,000 |
|
| Bridgeway Technology Center Mortgage Loan | 6.07% | | 6.07% | | 08/01/2013 | | Interest Only | | — |
| | 26,824 |
| | 26,824 |
|
| SouthTowne Mortgage Loan | One-month LIBOR +2.00% | | 2.27% | | 11/01/2015 | | Interest Only | | — |
| | 27,500 |
| | 27,500 |
|
| Millennium I Building Revolving Loan | One-month LIBOR +2.10% | | 2.37% | | 07/01/2015 | | Interest Only | | — |
| | 85,000 |
| | 85,000 |
|
| Portfolio Mortgage Loan #1 | One-month LIBOR +2.20% | | 3.87% | | 07/09/2012 | | Interest Only | | — |
| | 107,946 |
| | 107,946 |
|
| Portfolio Mortgage Loan #2 | One-month LIBOR +2.10% | | 3.88% | | 07/01/2015 | | Interest Only | | — |
| | 60,000 |
| | 60,000 |
|
| Total Notes Payable | | | | | | | | | — |
| | 646,604 |
| | 646,604 |
|
| | | | | | | | | | | | | | |
| GKK Properties Notes Payable | | | | | | | | | | | | | |
| Bank of America - BBD1 Mortgage Loan | 5.47% | | 5.47% | | 12/01/2013 | | Principal and interest | | — |
| | 325,353 |
| | 348,173 |
|
| PB Capital Mortgage Loan | One-month LIBOR +1.65% | | 1.92% | | 04/01/2013 | | Interest Only | | — |
| | 219,513 |
| | 206,477 |
|
| Bank of America - BBD2 Mortgage Loan | 5.96% | | 5.96% | | 09/08/2019 | | Principal and interest | | — |
| | 206,247 |
| | 201,150 |
|
| Goldman Mortgage Loan | One-month LIBOR +4.50% | | 4.78% | | 08/31/2012 | | Interest Only | | — |
| | 204,618 |
| | 204,618 |
|
| 101 Independence Mortgage Loan | 5.53% | | 5.53% | | 11/01/2016 | | Principal and interest | | — |
| | 70,961 |
| | 65,223 |
|
| CRE Mortgage Loan | 6.24% | | 6.24% | | 07/01/2036 | | Interest Only | | — |
| | 62,216 |
| | 61,269 |
|
| FSI Mortgage Loan | One-month LIBOR +3.00% | | 6.50% | | 09/11/2012 | | Principal and interest | | — |
| | 62,379 |
| | 62,379 |
|
| Pitney Bowes - Bank of America Mortgage Loan | 5.33% | | 5.33% | | 10/10/2022 | | Principal and interest | | — |
| | 43,931 |
| | 42,898 |
|
| One Citizens Plaza Mortgage Loan | 5.70% | | 5.70% | | 01/11/2012 | | Interest Only | | — |
| | 43,500 |
| | 42,241 |
|
| 801 Market Street Mortgage Loan | 6.17% | | 6.17% | | 02/01/2013 | | Principal and interest | | — |
| | 38,468 |
| | 38,550 |
|
| Beaver Valley Mortgage Loan | 5.06% | | 5.06% | | 01/01/2015 | | Principal and interest | | — |
| | 37,762 |
| | 36,998 |
|
| FSI 6000D Mortgage Loan | 5.80% | | 5.80% | | 06/05/2017 | | Principal and interest | | — |
| | 30,710 |
| | 28,890 |
|
| FSI 6000B Mortgage Loan | 5.80% | | 5.80% | | 06/05/2017 | | Principal and interest | | — |
| | 29,467 |
| | 28,546 |
|
| FSI 6000A Mortgage Loan | 6.80% | | 6.80% | | 10/05/2017 | | Principal and interest | | — |
| | 26,400 |
| | 27,377 |
|
| FSI 6000C Mortgage Loan | 6.80% | | 6.80% | | 10/05/2017 | | Principal and interest | | — |
| | 22,710 |
| | 23,999 |
|
| Sterling Bank Mortgage Loan | 5.57% | | 5.57% | | 01/11/2017 | | Interest Only | | — |
| | 19,900 |
| | 19,466 |
|
| Pitney Bowes - Wachovia A Mortgage Loan | 5.50% | | 5.50% | | 06/10/2023 | | Principal and interest | | — |
| | 18,962 |
| | 19,032 |
|
| Wachovia 9 Mortgage Loan Portfolio | 5.81% | | 5.81% | | 02/11/2013 | | Principal and interest | | — |
| | 13,997 |
| | 14,106 |
|
KBS REAL ESTATE INVESTMENT TRUST, INC.
SCHEDULE IV
MORTGAGE LOANS ON REAL ESTATE (CONTINUED)
December 31, 2011
(dollar amounts in thousands) |
| | | | | | | | | | | | | | | | | | | |
| | Interest Rate (1) | | Interest Rate as of December 31, 2011 (1) | | Final Maturity Date (2) | | Periodic Payment Terms | | Prior Liens | | Face Amount of Mortgages | | Carrying Amount of Mortgages |
| Jenkins Court Mortgage Loan | 10.29% | | 10.29% | | 08/11/2030 | | Principal and interest | | — |
| | 13,622 |
| | 8,781 |
|
| RBC Centura Mortgage Loan Portfolio | 5.89% | | 5.89% | | 10/01/2013 | | Principal and interest | | — |
| | 8,061 |
| | 8,369 |
|
| BOA Windsor Mortgage Loan Portfolio | 5.73% | | 5.73% | | 10/01/2012 | | Principal and interest | | — |
| | 6,241 |
| | 7,167 |
|
| Wachovia 8 Mortgage Loan Portfolio | 5.89% | | 5.89% | | 12/11/2012 | | Principal and interest | | — |
| | 4,532 |
| | 4,675 |
|
| Feasterville Mortgage Loan | 5.75% | | 5.75% | | 09/01/2013 | | Principal and interest | | — |
| | 801 |
| | 828 |
|
| Millburn Mortgage Loan | 6.06% | | 6.06% | | 09/01/2023 | | Principal and interest | | — |
| | 756 |
| | 830 |
|
| Berkeley Heights Mortgage Loan | 6.06% | | 6.06% | | 09/01/2023 | | Principal and interest | | — |
| | 453 |
| | 497 |
|
| Kenilworth Mortgage Loan | 6.06% | | 6.06% | | 09/01/2023 | | Principal and interest | | — |
| | 371 |
| | 408 |
|
| | | | | | | | | | — |
| | 1,511,931 |
| | 1,502,947 |
|
| | | | | | | | | | | | | | |
| Repurchase Agreements | | | | | | | | | | | | | |
| GKK I - Mezzanine Loan Repurchase Agreement | One-month LIBOR + 3.50% | | 3.73% | | 04/28/2013 | | Principal and interest | | — |
| | 80,418 |
| | 80,418 |
|
| GKK II - Mezzanine Loan Repurchase Agreement | One-month LIBOR + 3.50% | | 3.73% | | 04/28/2013 | | Principal and interest | | — |
| | 62,548 |
| | 62,548 |
|
| Fixed Rate Securities Repurchase Agreement | One-month LIBOR + 1.00% | | 1.23% | | 08/14/2013 | | Interest Only | | — |
| | 6,691 |
| | 6,691 |
|
| Total Repurchase Agreements | | | | | | | | | $ | — |
| | $ | 149,657 |
| | $ | 149,657 |
|
| Total Notes Payable and Repurchase Agreements, Net | | | | | | | | | $ | — |
| | $ | 2,308,192 |
| | $ | 2,299,208 |
|
____________________
(1) Contractual interest rate represents the interest rate in effect under the loan as of December 31, 2011. Interest rate is calculated as the actual interest rate in effect at December 31, 2011 (consisting of the contractual interest rate and the effect of contractual floor rates and interest rate caps, floors and swaps), using interest rate indices at December 31, 2011, where applicable.
(2) Represents the initial maturity date or the maturity date as extended as of December 31, 2011; subject to certain conditions, the maturity dates of certain loans may be extended beyond the date shown.
KBS REAL ESTATE INVESTMENT TRUST, INC.
SCHEDULE IV
MORTGAGE LOANS ON REAL ESTATE (CONTINUED)
December 31, 2011
(dollar amounts in thousands)
|
| | | | |
| Reconciliation of Mortgage Loans on Real Estate | | |
| Balance at December 31, 2010 | | $ | 1,479,015 |
|
| Additions during period: | | |
| Assumption of debt | | 1,522,639 |
|
| Net discount/premium on debt assumed | | (12,966 | ) |
| New mortgage loans | | 134,300 |
|
| Additions to repurchase agreements | | 34,439 |
|
| Draws on mezzanine loan | | 4,100 |
|
| Deductions during period: | | |
| Pay-off of prior existing debt | | (113,540 | ) |
| Pay-off of loan with property disposition | | (135,347 | ) |
| Extinguishment of debt - National Industrial Portfolio | | (441,244 | ) |
| Collections of principal on repurchase agreements | | (162,396 | ) |
| Collections of principal | | (13,774 | ) |
| Amortization of discount/premium on notes payable | | 3,982 |
|
| Balance at December 31, 2011 | | $ | 2,299,208 |
|
SIGNATURES
Pursuant to the requirements of Section 13 or 15(d) of the Securities Exchange Act of 1934, the registrant has duly caused this report to be signed on its behalf by the undersigned, thereunto duly authorized, in the City of Newport Beach, State of California, on March 26, 2012.
|
| | | |
| | | KBS REAL ESTATE INVESTMENT TRUST, INC. |
| | | | |
| | | By: | /s/ Charles J. Schreiber, Jr. |
| | | Charles J. Schreiber, Jr. |
| | | Chairman of the Board, Chief Executive Officer and Director |
Pursuant to the requirements of the Securities Exchange Act of 1934, this report has been signed below by the following persons on behalf of the registrant and in the capacities and on the dates indicated:
|
| | | | |
| Name | | Title | | Date |
| | | | | |
| /s/ CHARLES J. SCHREIBER, JR. | | Chairman of the Board, Chief Executive Officer and Director | | March 26, 2012 |
| Charles J. Schreiber, Jr. | | | | |
| /s/ DAVID E. SNYDER | | Chief Financial Officer | | March 26, 2012 |
| David E. Snyder | | | | |
| /s/ PETER MCMILLAN III | | Executive Vice President, Treasurer, Secretary and Director | | March 26, 2012 |
| Peter McMillan III | | | | |
| /s/ STACIE K. YAMANE | | Chief Accounting Officer | | March 26, 2012 |
| Stacie K. Yamane | | | | |
| /s/ HANK ADLER | | Director | | March 26, 2012 |
| Hank Adler | | | | |
| /s/ BARBARA R. CAMBON | | Director | | March 26, 2012 |
| Barbara R. Cambon | | | | |
| /s/ STUART A. GABRIEL, PH.D. | | Director | | March 26, 2012 |
| Stuart A. Gabriel, Ph.D. | | | | |