| |
| UNITED STATES |
| SECURITIES AND EXCHANGE COMMISSION |
| Washington, D.C. 20549 |
| |
| FORM N-CSR |
| |
| CERTIFIED SHAREHOLDER REPORT OF REGISTERED MANAGEMENT INVESTMENT |
| COMPANIES |
| Investment Company Act file number 811-21779 |
| |
| JOHN HANCOCK FUNDS II |
| --------------------------------------------------------- |
| (Exact name of registrant as specified in charter) |
| |
| 601 CONGRESS STREET, BOSTON, MA 02210-2805 |
| ------------------------------------------------------------- |
| (Address of principal executive offices) (Zip code) |
| |
| MICHAEL J. LEARY, 601 CONGRESS STREET, BOSTON, MA 02210-2805 |
| ------------------------------------------------------------------------------------------ |
| (Name and address of agent for service) |
| |
| Registrant's telephone number, including area code: (617) 663-4490 |
| -------------- |
| Date of fiscal year end: 12/31 |
| ------ | |
| |
| Date of reporting period: 12/31/10 |
| ------- | |
ITEM 1. REPORTS TO STOCKHOLDERS.

John Hancock
Lifestyle Aggressive Portfolio
Goal and strategy
The Portfolio seeks long-term growth of capital. Current income is not a consideration. The Portfolio operates as a fund of funds and normally invests 100% of its assets in underlying funds that invest primarily in equity securities.
| |
| Asset Allocation | |
| | |
| Equity | 98% of Total |
|
| U.S. Large Cap | 46% |
|
| International Large Cap | 11% |
|
| U.S. Mid Cap | 10% |
|
| Emerging Markets | 9% |
|
| U.S. Small Cap | 6% |
|
| Large Blend | 5% |
|
| International Small Cap | 4% |
|
| Natural Resources | 3% |
|
| Real Estate | 2% |
|
| Small Value | 1% |
|
| Small Growth | 1% |
|
| Fixed Income | 2% of Total |
|
| Currency | 2% |
|
As a percentage of net assets on 12-31-10.
Portfolio results
For the 12 months ended December 31, 2010, John Hancock Lifestyle Aggressive Portfolio’s Class A, Class B, Class C, Class R1, Class R3, Class R4, Class R5 and Class 1 shares returned 15.50%, 14.61%, 14.61%, 14.99%, 15.21%, 15.56%, 15.84% and 16.01%, respectively, at net asset value. In comparison, the Portfolio’s benchmark indexes — the S&P 500 Index and the MSCI EAFE Index — returned 15.06% and 8.21% respectively, during the same period. The Portfolio also topped the 14.01% average return of Morningstar, Inc.’s large blend fund category.1
Performance review
Our asset allocation positioning drove the Portfolio’s performance as compared to the S&P 500 Index. In particular, allocations to assets viewed as having higher levels of risk relative to the index made the biggest positive contributions, including U.S. small- and mid-cap, international small-cap and emerging-market stocks. Among non-traditional investments, our allocation to natural resource equities also helped performance. These positive contributions were partially offset by weightings in international large-cap stocks, which lagged for the first time in seven years.
Results were mixed for performance of our underlying funds. On the positive front, four of our active international large-cap funds outperformed the MSCI EAFE Index. International Core Fund (GMO), for example, was helped by strong stock selection in almost all sectors. International Value Fund (Franklin) had success with good selection among financials and tech stocks. International Opportunities Fund (Marsico) added value with a focus on growth stocks over value. Additionally, in a very strong year for international small-cap and emerging-market equities, all three of our active managers topped their benchmarks in their asset classes. For example, Emerging Markets Fund (DFA) beat its index by overweighting smaller-cap issues.
Several of our domestic large-cap managers had less successful relative results. U.S. Multi Sector Fund (GMO), for example, was hurt by its high-quality weightings. Fundamental Value Fund (Davis) trailed its large-cap benchmark because of selections in the energy sector. Technical Opportunities Fund (Wellington) had a large cash position for most of the year, which detracted from performance in a strong market. Among the bright spots was the outperformance of Value & Restructuring Fund (Columbia) whose investments in the metals and mining sector were helped by surging commodity prices. One key to our success is evaluating managers using a long-term perspective. Maintaining a fund’s position in the Portfolio reflects our confidence in the manager’s fundamental strength and our belief that short-term setbacks soon give way to outperformance.
1 Figures from Morningstar, Inc. include reinvested dividends and do not take into account sales charges. Actual load-adjusted performance is lower.
This commentary reflects the views of the portfolio managers through the end of the Portfolio’s period discussed in this report. The managers’ statements reflect their own opinions. As such, they are in no way guarantees of future events and are not intended to be used as investment advice or a recommendation regarding any specific security. They are also subject to change at any time as market and other conditions warrant.
Past performance is no guarantee of future results.
| |
| 4 | Lifestyle Portfolios | Annual report |
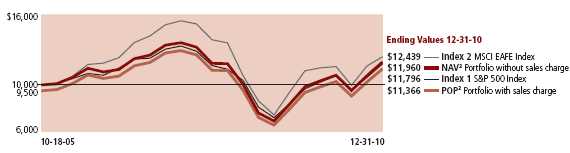
Growth of $10,000
This chart shows what happened to a hypothetical $10,000 investment in John Hancock Lifestyle Aggressive Portfolio Class A shares for the period indicated. For comparison, we’ve shown the same investment in two separate indexes.
| | | | | | | |
| | Class B | Class C | Class R11 | Class R31 | Class R41 | Class R51 | Class 11 |
|
| Period beginning | 10-18-05 | 10-18-05 | 9-18-06 | 10-18-05 | 10-18-05 | 10-18-05 | 10-15-05 |
|
| Without sales charge | $11,519 | $11,535 | $10,564 | $11,836 | $12,005 | $12,181 | $12,266 |
|
| With maximum sales charge | 11,421 | 11,535 | 10,564 | 11,836 | 12,005 | 12,181 | 12,266 |
|
| Index 1 | 11,796 | 11,796 | 10,449 | 11,796 | 11,796 | 11,796 | 11,831 |
|
| Index 22 | 12,439 | 12,439 | 10,220 | 12,439 | 12,439 | 12,439 | 12,380 |
|
Assuming all distributions were reinvested for the period indicated, the table above shows the value of a $10,000 investment in the Portfolio’s Class B, Class C, Class R1, Class R3, Class R4, Class R5 and Class 1 shares, respectively, as of 12-31-10. Performance of the classes will vary based on the difference in sales charges paid by shareholders investing in the different classes and the fee structure of those classes.
S&P 500 Index — Index 1 — is an unmanaged index that includes 500 widely traded common stocks.
MSCI EAFE Index (gross of foreign withholding taxes on dividends) (Europe, Australasia, Far East) — Index 2 — is a free floating adjusted market capitalization index that is designed to measure developed market equity performance, excluding the U.S. and Canada.
Performance chart
Total returns with maximum sales charge (POP) for the period ended 12-31-10
| | | | | | | | |
| | Class A | Class B | Class C | Class R11 | Class R31 | Class R41 | Class R51 | Class 11 |
|
| Inception | 10-18-05 | 10-18-05 | 10-18-05 | 9-18-06 | 10-18-05 | 10-18-05 | 10-18-05 | 10-15-05 |
|
| Average annual returns — 1 year | 9.72% | 9.61% | 13.61% | 14.99% | 15.21% | 15.56% | 15.84% | 16.01% |
|
| Average annual returns — 5 years | 1.32% | 1.26% | 1.63% | — | 2.15% | 2.43% | 2.72% | 2.86% |
|
| Average annual returns — Since inception | 2.49% | 2.59% | 2.78% | 1.29% | 3.29% | 3.57% | 3.86% | 4.00% |
|
| Cumulative returns — 1 year | 9.72% | 9.61% | 13.61% | 14.99% | 15.21% | 15.56% | 15.84% | 16.01% |
|
| Cumulative returns — 5 years | 6.77% | 6.44% | 8.44% | — | 11.24% | 12.78% | 14.37% | 15.15% |
|
| Cumulative returns — Since inception | 13.66% | 14.21% | 15.35% | 5.64% | 18.36% | 20.05% | 21.81% | 22.66% |
|
Performance figures assume all distributions are reinvested. Returns with maximum sales charge reflect a sales charge on Class A shares of 5%, and the applicable contingent deferred sales charge (CDSC) on Class B shares and Class C shares. The Class B shares’ CDSC declines annually between years 1–6 according to the following schedule: 5, 4, 3, 3, 2, 1%. No sales charges will be assessed after the sixth year. Class C shares held for less than one year are subject to a 1% CDSC. Sales charges are not applicable for Class R1, Class R3, Class R4, Class R5 and Class 1 shares.
The expense ratios of the Portfolio, both net (including any fee waivers or expense limitations) and gross (excluding any fee waivers or expense limitations), are set forth according to the most recent publicly available prospectuses for the Portfolio and may differ from the expense ratios disclosed in the Financial Highlights tables in this report. The waivers and expense limitations are contractual at least until 4-30-11, for Class A, Class B, Class C, Class R1, Class R3, Class R4 and Class R5 shares. The following expense ratios include expenses of the underlying affiliated funds in which the Portfolio invests. The net expenses are as follows: Class A — 1.54%, Class B — 2.24%, Class C — 2.24% and Class R1 — 1.99%. Had the fee waivers and expense limitations not been in place, the gross expenses would be as follows: Class A — 1.61%, Class B — 2.49%, Class C — 2.32% and Class R1 — 2.05%. For the other classes, the net expenses equal the gross expenses and are as follows: Class R3 — 1.84%, Class R4 — 1.51%, Class R5 — 1.21% and Class 1 — 1.00%.
The returns reflect past results and should not be considered indicative of future performance. The return and principal value of an investment will fluctuate so that shares, when redeemed, may be worth more or less than their original cost. Due to market volatility, the Portfolio’s current performance may be higher or lower than the performance shown. For performance data current to the most recent month end, please call 1-800-225-5291 or visit the Portfolio’s Web site at www.jhfunds.com.
This performance information does not reflect the deduction of taxes that a shareholder may pay on Portfolio distributions or the redemption of Portfolio shares.
The Portfolio’s performance results reflect any applicable expense reductions, without which the expenses would increase and results would have been less favorable.
1 For certain types of investors, as described in the Portfolio’s Class R1, Class R3, Class R4, Class R5 and Class 1 shares prospectuses.
2 NAV represents net asset value and POP represents public offering price.
It is not possible to invest directly in an index. Index figures do not reflect sales charges, which would have resulted in lower values if they did.
| | |
| | Annual report | Lifestyle Portfolios | 5 |
John Hancock
Lifestyle Growth Portfolio
Goal and strategy
The Portfolio seeks long-term growth of capital. Current income is also a consideration. The Portfolio operates as a fund of funds and normally invests approximately 20% of its assets in underlying funds that invest primarily in fixed-income securities and approximately 80% of its assets in underlying funds that invest primarily in equity securities.
| |
| Asset Allocation | |
| | |
| Equity | 80% of Total |
|
| U.S. Large Cap | 41% |
|
| International Large Cap | 9% |
|
| Emerging Markets | 7% |
|
| U.S. Mid Cap | 7% |
|
| Large Blend | 5% |
|
| International Small Cap | 3% |
|
| U.S. Small Cap | 3% |
|
| Natural Resources | 2% |
|
| Real Estate | 2% |
|
| Small Value | 1% |
|
| Fixed Income | 20% of Total |
|
| Multi-Sector Bond | 5% |
|
| High-Yield Bond | 4% |
|
| Intermediate Bond | 4% |
|
| Bank Loan | 3% |
|
| Currency | 2% |
|
| Global Bond | 1% |
|
| Treasury Inflation- | |
| Protected Securities | 1% |
|
As a percentage of net assets on 12-31-10.
Portfolio results
For the 12 months ended December 31, 2010, John Hancock Lifestyle Growth Portfolio’s Class A, Class B, Class C, Class R1, Class R3, Class R4, Class R5, Class 1 and Class 5 shares returned 14.77%, 13.81%, 13.93%, 14.28%, 14.46%, 14.80%, 15.06%, 15.30%, and 15.28%, respectively, at net asset value. In comparison, the broad S&P 500 Index returned 15.06%, the Barclays Capital U.S. Aggregate Bond Index returned 6.54% and a blended index combining 80% S&P 500 Index and 20% Barclays Capital U.S. Aggregate Bond Index returned 13.68% during the same period. The Portfolio’s Class A shares topped the 14.01% average return of Morningstar, Inc.’s large blend fund category.1
Performance review
Our asset allocation positioning drove the Portfolio’s outperformance of the blended index. In particular, allocations to assets viewed as having higher levels of risk relative to the index made the biggest positive contributions, including U.S. small- and mid-cap, international small-cap and emerging-market stocks. Among non-traditional investments, our allocation to natural resource equities also helped performance. These positive contributions were partially offset by weightings in international large-cap stocks, which lagged for the first time in seven years.
Results were mixed for performance of our underlying funds. On the positive front, four of our active international funds outperformed the MSCI EAFE Index. International Core Fund (GMO), for example, was helped by strong stock selection in almost all sectors. International Value Fund (Franklin) had success with good selection among financials and tech stocks. International Opportunities Fund (Marsico) added value with a focus on growth stocks over value. Additionally, in a very strong year for international small-cap and emerging-market equities, all three of our active managers topped their benchmarks in their asset classes. For example, Emerging Markets Fund (DFA) beat its index by overweighting smaller-cap issues.
Several of our domestic large-cap managers had less successful relative results. U.S. Multi Sector Fund (GMO), for example, was hurt by its high-quality weightings. Fundamental Value Fund (Davis) trailed its large-cap benchmark because of selections in the energy sector. Technical Opportunities Fund (Wellington) had a large cash position for most of the year, which detracted from performance in a strong market. Among the bright spots was the outperformance of Value & Restructuring Fund (Columbia) whose investments in the metals and mining sector were helped by surging commodity prices. One key to our success is evaluating managers using a long-term perspective. Maintaining a fund’s position in the Portfolio reflects our confidence in the manager’s fundamental strength and our belief that short-term setbacks soon give way to outperformance.
The Portfolio’s fixed-income managers added value, with seven of eleven beating their benchmarks. Managers with flexibility to choose among credit sectors such as High Income Fund (John Hancock) and Active Bond Fund (John Hancock/Declaration) were especially strong contributors.
1 Figures from Morningstar, Inc. include reinvested dividends and do not take into account sales charges. Actual load-adjusted performance is lower.
This commentary reflects the views of the portfolio managers through the end of the Portfolio’s period discussed in this report. The managers’ statements reflect their own opinions. As such, they are in no way guarantees of future events and are not intended to be used as investment advice or a recommendation regarding any specific security. They are also subject to change at any time as market and other conditions warrant.
Past performance is no guarantee of future results.
| |
| 6 | Lifestyle Portfolios | Annual report |
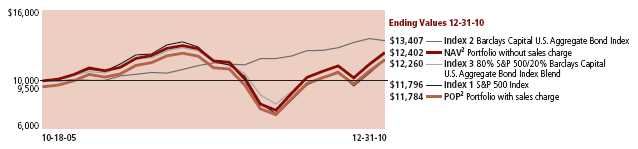
Growth of $10,000
This chart shows what happened to a hypothetical $10,000 investment in John Hancock Lifestyle Growth Portfolio Class A shares for the period indicated. For comparison, we’ve shown the same investment in a blended index and two separate indexes.
| | | | | | | | |
| | Class B | Class C | Class R11 | Class R31 | Class R41 | Class R51 | Class 11 | Class 51 |
|
| Period beginning | 10-18-05 | 10-18-05 | 9-18-06 | 10-18-05 | 10-18-05 | 10-18-05 | 10-15-05 | 7-3-06 |
|
| Without sales charge | $11,932 | $11,960 | $11,101 | $12,258 | $12,441 | $12,627 | $12,703 | $11,685 |
|
| With maximum sales charge | 11,835 | 11,960 | 11,101 | 12,258 | 12,441 | 12,627 | 12,703 | 11,685 |
|
| Index 1 | 11,796 | 11,796 | 10,449 | 11,796 | 11,796 | 11,796 | 11,831 | 10,904 |
|
| Index 2 | 13,407 | 13,407 | 12,979 | 13,407 | 13,407 | 13,407 | 13,412 | 13,352 |
|
| Index 3 | 12,260 | 12,260 | 11,051 | 12,260 | 12,260 | 12,260 | 12,290 | 11,499 |
|
Assuming all distributions were reinvested for the period indicated, the table above shows the value of a $10,000 investment in the Portfolio’s Class B, Class C, Class R1, Class R3, Class R4, Class R5, Class 1 and Class 5 shares, respectively, as of 12-31-10. Performance of the classes will vary based on the difference in sales charges paid by shareholders investing in the different classes and the fee structure of those classes.
S&P 500 Index — Index 1 — is an unmanaged index that includes 500 widely traded common stocks.
Barclays Capital U.S. Aggregate Bond Index — Index 2 — is an unmanaged index of dollar-denominated and non-convertible investment grade debt issues.
80% S&P 500/20% Barclays Capital U.S. Aggregate Bond Index Blend — Index 3 — is comprised of 80% S&P 500 Index and 20% Barclays Capital U.S. Aggregate Bond Index.
Performance chart
Total returns with maximum sales charge (POP) for the period ended 12-31-10
| | | | | | | | | |
| | Class A | Class B | Class C | Class R11 | Class R31 | Class R41 | Class R51 | Class 11 | Class 51 |
|
| Inception | 10-18-05 | 10-18-05 | 10-18-05 | 9-18-06 | 10-18-05 | 10-18-05 | 10-18-05 | 10-15-05 | 7-3-06 |
|
| Average annual returns — 1 year | 8.99% | 8.81% | 12.93% | 14.28% | 14.46% | 14.80% | 15.06% | 15.30% | 15.28% |
|
| Average annual returns — 5 years | 2.27% | 2.21% | 2.60% | — | 3.10% | 3.39% | 3.69% | 3.81% | — |
|
| Average annual returns — Since inception | 3.20% | 3.29% | 3.50% | 2.46% | 3.99% | 4.28% | 4.58% | 4.70% | 3.52% |
|
| Cumulative returns — 1 year | 8.99% | 8.81% | 12.93% | 14.28% | 14.46% | 14.80% | 15.06% | 15.30% | 15.28% |
|
| Cumulative returns — 5 years | 11.88% | 11.57% | 13.68% | — | 16.48% | 18.16% | 19.87% | 20.56% | — |
|
| Cumulative returns — Since inception | 17.84% | 18.35% | 19.60% | 11.01% | 22.58% | 24.41% | 26.27% | 27.03% | 16.85% |
|
Performance figures assume all distributions are reinvested. Returns with maximum sales charge reflect a sales charge on Class A shares of 5%, and the applicable contingent deferred sales charge (CDSC) on Class B shares and Class C shares. The Class B shares’ CDSC declines annually between years 1–6 according to the following schedule: 5, 4, 3, 3, 2, 1%. No sales charges will be assessed after the sixth year. Class C shares held for less than one year are subject to a 1% CDSC. Sales charges are not applicable for Class R1, Class R3, Class R4, Class R5, Class 1 and Class 5 shares.
The expense ratios of the Portfolio, both net (including any fee waivers or expense limitations) and gross (excluding any fee waivers or expense limitations), are set forth according to the most recent publicly available prospectuses for the Portfolio and may differ from the expense ratios disclosed in the Financial Highlights tables in this report. The waivers and expense limitations are contractual at least until 4-30-11, for Class A, Class B and Class C shares. The following expense ratios include expenses of the underlying affiliated funds in which the Portfolio invests. The net expenses are as follows: Class B — 2.18%. Had the fee waivers and expense limitations not been in place, the gross expenses would be as follows: Class B — 2.31%. For the other classes, the net expenses equal the gross expenses and are as follows: Class A — 1.47%, Class C — 2.18%, Class R1 — 1.85%, Class R3 — 1.71%, Class R4 — 1.37%, Class R5 — 1.09%, Class 1 — 0.94% and Class 5 — 0.90%.
The returns reflect past results and should not be considered indicative of future performance. The return and principal value of an investment will fluctuate so that shares, when redeemed, may be worth more or less than their original cost. Due to market volatility, the Portfolio’s current performance may be higher or lower than the performance shown. For performance data current to the most recent month end, please call 1-800-225-5291 or visit the Portfolio’s Web site at www.jhfunds.com.
This performance information does not reflect the deduction of taxes that a shareholder may pay on Portfolio distributions or the redemption of Portfolio shares.
The Portfolio’s performance results reflect any applicable expense reductions, without which the expenses would increase and results would have been less favorable.
1 For certain types of investors, as described in the Portfolio’s Class R1, Class R3, Class R4, Class R5, Class 1 and Class 5 shares prospectuses.
2 NAV represents net asset value and POP represents public offering price.
It is not possible to invest directly in an index. Index figures do not reflect sales charges, which would have resulted in lower values if they did.
| | |
| | Annual report | Lifestyle Portfolios | 7 |
John Hancock
Lifestyle Balanced Portfolio
Goal and strategy
The Portfolio seeks a balance between a high level of current income and growth of capital, with a greater emphasis on growth of capital. The Portfolio operates as a fund of funds and normally invests approximately 40% of its assets in underlying funds that invest primarily in fixed-income securities and approximately 60% of its assets in underlying funds that invest primarily in equity securities.
| |
| Asset Allocation | |
| | |
| Equity | 58% of Total |
|
| U.S. Large Cap | 32% |
|
| International Large Cap | 6% |
|
| Emerging Markets | 4% |
|
| U.S. Mid Cap | 4% |
|
| Large Blend | 4% |
|
| Real Estate | 2% |
|
| International Small Cap | 2% |
|
| U.S. Small Cap | 2% |
|
| Natural Resources | 2% |
|
| Fixed Income | 42% of Total |
|
| Intermediate Bond | 12% |
|
| Multi-Sector Bond | 10% |
|
| High-Yield Bond | 9% |
|
| Bank Loan | 3% |
|
| Global Bond | 3% |
|
| Treasury Inflation- | |
| Protected Securities | 3% |
|
| Currency | 2% |
|
As a percentage of net assets on 12-31-10.
Portfolio results
For the 12 months ended December 31, 2010, John Hancock Lifestyle Balanced Portfolio’s Class A, Class B, Class C, Class R1, Class R3, Class R4, Class R5, Class 1 and Class 5 shares returned 13.13%, 12.23%, 12.34%, 12.75%, 12.89%, 13.19%, 13.52%, 13.57%, and 13.71%, respectively, at net asset value. In comparison, the broad S&P 500 Index returned 15.06%, the Barclays Capital U.S. Aggregate Bond Index returned 6.54% and a blended index combining 60% S&P 500 Index and 40% Barclays Capital U.S. Aggregate Bond Index returned 12.13% during the same period. The Portfolio’s results also topped the 11.83% average return of Morningstar, Inc.’s moderate allocation fund category.1
Performance review
Our asset allocation positioning drove the Portfolio’s outperformance of the combined index. Allocations to credit sectors including non-investment-grade bonds were major contributors to the positive results. In the equity portion of the Portfolio, weightings in small- and mid-cap stocks, emerging markets and non-traditional investments such as real estate helped relative performance. However, this was partially offset by allocations to international large-cap stocks, which lagged for the first time in seven years.
Fixed-income managers overall topped their funds’ indexes. Strategic Income Opportunities Fund (John Hancock) performed well due to its holdings in non-investment-grade bonds and its favorable currency positioning throughout the year. High Income Fund (John Hancock) and Active Bond Fund (John Hancock/Declaration) also contributed positively to results.
Results were mixed for equity managers, with the biggest positive contributions coming from the international sector. Strong stock selection by all four of our large-cap international managers — International Core Fund (GMO), International Value Fund (Franklin), International Growth Stock Fund (Invesco) and International Opportunities Fund (Marsico) –- helped them outperform the MSCI EAFE Index. Emerging Markets Fund (DFA) beat its index by overweighting smaller-cap issues.
Several of our domestic large-cap managers had less successful relative results. The U.S. Multi Sector Fund (GMO), for example, was hurt by its high-quality weightings. Fundamental Value Fund (Davis) trailed its large-cap benchmark because of selections in the energy sector. Technical Opportunities Fund (Wellington) had a large cash position for most of the year, which detracted from performance in a strong market. Among the bright spots was the outperformance of Value & Restructuring Fund (Columbia) whose investments in the metals and mining sector were helped by surging commodity prices. One key to our success is evaluating managers using a long-term perspective. Maintaining a fund’s position in the Portfolio reflects our confidence in the manager’s fundamental strength and our belief that short-term setbacks soon give way to outperformance.
1 Figures from Morningstar, Inc. include reinvested dividends and do not take into account sales charges. Actual load-adjusted performance is lower.
This commentary reflects the views of the portfolio managers through the end of the Portfolio’s period discussed in this report. The managers’ statements reflect their own opinions. As such, they are in no way guarantees of future events and are not intended to be used as investment advice or a recommendation regarding any specific security. They are also subject to change at any time as market and other conditions warrant.
Past performance is no guarantee of future results.
| |
| 8 | Lifestyle Portfolios | Annual report |
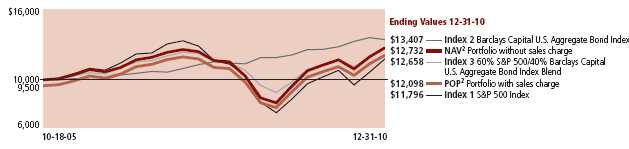
Growth of $10,000
This chart shows what happened to a hypothetical $10,000 investment in John Hancock Lifestyle Balanced Portfolio Class A shares for the period indicated. For comparison, we’ve shown the same investment in a blended index and two separate indexes.
| | | | | | | | |
| | Class B | Class C | Class R11 | Class R31 | Class R41 | Class R51 | Class 11 | Class 51 |
|
| Period beginning | 10-18-05 | 10-18-05 | 9-18-06 | 10-18-05 | 10-18-05 | 10-18-05 | 10-15-05 | 7-3-06 |
|
| Without sales charge | $12,233 | $12,286 | $11,434 | $12,583 | $12,768 | $12,964 | $13,015 | $12,180 |
|
| With maximum sales charge | 12,135 | 12,286 | 11,434 | 12,583 | 12,768 | 12,964 | 13,015 | 12,180 |
|
| Index 1 | 11,796 | 11,796 | 10,449 | 11,796 | 11,796 | 11,796 | 11,831 | 10,904 |
|
| Index 2 | 13,407 | 13,407 | 12,979 | 13,407 | 13,407 | 13,407 | 13,412 | 13,352 |
|
| Index 3 | 12,658 | 12,658 | 11,613 | 12,658 | 12,658 | 12,658 | 12,683 | 12,049 |
|
Assuming all distributions were reinvested for the period indicated, the table above shows the value of a $10,000 investment in the Portfolio’s Class B, Class C, Class R1, Class R3, Class R4, Class R5, Class 1, and Class 5 shares, respectively, as of 12-31-10. Performance of the classes will vary based on the difference in sales charges paid by shareholders investing in the different classes and the fee structure of those classes.
S&P 500 Index — Index 1 — is an unmanaged index that includes 500 widely traded common stocks.
Barclays Capital U.S. Aggregate Bond Index — Index 2 — is an unmanaged index of dollar-denominated and non-convertible investment grade debt issues.
60% S&P 500/40% Barclays Capital U.S. Aggregate Bond Index Blend — Index 3 — is comprised of 60% S&P 500 Index and 40% Barclays Capital U.S. Aggregate Bond Index.
Performance chart
Total returns with maximum sales charge (POP) for the period ended 12-31-10
| | | | | | | | | |
| | Class A | Class B | Class C | Class R11 | Class R31 | Class R41 | Class R51 | Class 11 | Class 51 |
|
| Inception | 10-18-05 | 10-18-05 | 10-18-05 | 9-18-06 | 10-18-05 | 10-18-05 | 10-18-05 | 10-15-05 | 7-3-06 |
|
| Average annual returns — 1 year | 7.50% | 7.23% | 11.34% | 12.75% | 12.89% | 13.19% | 13.52% | 13.57% | 13.71% |
|
| Average annual returns — 5 years | 3.00% | 2.92% | 3.34% | — | 3.85% | 4.14% | 4.45% | 4.52% | — |
|
| Average annual returns — Since inception | 3.73% | 3.79% | 4.03% | 3.17% | 4.51% | 4.81% | 5.11% | 5.18% | 4.48% |
|
| Cumulative returns — 1 year | 7.50% | 7.23% | 11.34% | 12.75% | 12.89% | 13.19% | 13.52% | 13.57% | 13.71% |
|
| Cumulative returns — 5 years | 15.94% | 15.48% | 17.86% | — | 20.77% | 22.49% | 24.30% | 24.76% | — |
|
| Cumulative returns — Since inception | 20.98% | 21.35% | 22.86% | 14.34% | 25.83% | 27.68% | 29.64% | 30.15% | 21.80% |
|
Performance figures assume all distributions are reinvested. Returns with maximum sales charge reflect a sales charge on Class A shares of 5% and the applicable contingent deferred sales charge (CDSC) on Class B shares and Class C shares. The Class B shares’ CDSC declines annually between years 1–6 according to the following schedule: 5, 4, 3, 3, 2, 1%. No sales charges will be assessed after the sixth year. Class C shares held for less than one year are subject to a 1% CDSC. Sales charges are not applicable for Class R1, Class R3, Class R4, Class R5, Class 1 and Class 5 shares.
The expense ratios of the Portfolio, both net (including any fee waivers or expense limitations) and gross (excluding any fee waivers or expense limitations), are set forth according to the most recent publicly available prospectuses for the Portfolio and may differ from the expense ratios disclosed in the Financial Highlights tables in this report. The waivers and expense limitations are contractual at least until 4-30-11, for Class A, Class B and Class C shares. The following expense ratios include expenses of the underlying affiliated funds in which the Portfolio invests. The net expenses are as follows: Class B — 2.16%. Had the fee waivers and expense limitations not been in place, the gross expenses would be as follows: Class B — 2.21%. For the other classes, the net expenses equal the gross expenses and are as follows: Class A — 1.38%, Class C — 2.08%, Class R1 — 1.88%, Class R3 — 1.65%, Class R4 — 1.34%, Class R5 — 1.03%, Class 1 — 0.92% and Class 5 — 0.88%.
The returns reflect past results and should not be considered indicative of future performance. The return and principal value of an investment will fluctuate so that shares, when redeemed, may be worth more or less than their original cost. Due to market volatility, the Portfolio’s current performance may be higher or lower than the performance shown. For performance data current to the most recent month end, please call 1-800-225-5291 or visit the Portfolio’s Web site at www.jhfunds.com.
This performance information does not reflect the deduction of taxes that a shareholder may pay on Portfolio distributions or the redemption of Portfolio shares.
The Portfolio’s performance results reflect any applicable expense reductions, without which the expenses would increase and results would have been less favorable.
1 For certain types of investors, as described in the Portfolio’s Class R1, Class R3, Class R4, Class R5, Class 1 and Class 5 shares prospectuses.
2 NAV represents net asset value and POP represents public offering price.
It is not possible to invest directly in an index. Index figures do not reflect sales charges, which would have resulted in lower values if they did.
| | |
| | Annual report | Lifestyle Portfolios | 9 |
John Hancock
Lifestyle Moderate Portfolio
Goal and strategy
The Portfolio seeks a balance between a high level of current income and growth of capital, with a greater emphasis on income. The Portfolio operates as a fund of funds and normally invests approximately 60% of its assets in underlying funds that invest primarily in fixed-income securities and approximately 40% of its assets in underlying funds that invest primarily in equity securities.
| |
| Asset Allocation | |
| | |
| Equity | 37% of Total |
|
| U.S. Large Cap | 20% |
|
| International Large Cap | 6% |
|
| Real Estate | 3% |
|
| U.S. Mid Cap | 3% |
|
| Large Blend | 2% |
|
| U.S. Small Cap | 1% |
|
| Natural Resources | 1% |
|
| Emerging Markets | 1% |
|
| Fixed Income | 63% of Total |
|
| Intermediate Bond | 25% |
|
| Multi-Sector Bond | 14% |
|
| High-Yield Bond | 9% |
|
| Bank Loan | 5% |
|
| Global Bond | 4% |
|
| Treasury Inflation- | |
| Protected Securities | 4% |
|
| Currency | 2% |
|
As a percentage of net assets on 12-31-10.
Portfolio results
For the 12 months ended December 31, 2010, John Hancock Lifestyle Moderate Portfolio’s Class A, Class B, Class C, Class R1, Class R3, Class R4, Class R5, Class 1 and Class 5 shares returned 11.85%, 11.05%, 11.15%, 11.45%, 11.56%, 11.84%, 12.35%, 12.43%, and 12.50%, respectively, at net asset value. In comparison, the broad Barclays Capital U.S. Aggregate Bond Index returned 6.54%, the S&P 500 Index returned 15.06% and a blended index combining 40% S&P 500 Index and 60% Barclays Capital U.S. Aggregate Bond Index returned 10.41% during the same period. The Portfolio’s results also topped the average 10.03% return of Morningstar, Inc.’s conservative allocation fund category.1
Performance review
Our overall asset allocation was the primary driver of the Portfolio’s outperformance of the blended index. Allocations to credit sectors including non-investment-grade bonds were the biggest contributors to the positive results. In the equity portion of the Portfolio, weightings in small- and mid-cap stocks, emerging markets and non-traditional investments such as real estate helped relative performance. However, this was partially offset by allocations to international large-cap stocks, which lagged for the first time in seven years.
Fixed-income managers overall topped their indexes. Strategic Income Opportunities Fund (John Hancock) performed well due to its holdings in non-investment-grade bonds and its favorable currency positioning throughout the year. High Income Fund (John Hancock) and Active Bond Fund (John Hancock/Declaration) also contributed positively to results.
Results were mixed for active equity managers, with the biggest positive contributions coming from the international sector. Strong stock selection by all four of our large-cap international managers — International Core Fund (GMO), International Value Fund (Franklin), International Growth Stock Fund (Invesco) and International Opportunities Fund (Marsico) — helped them outperform the MSCI EAFE Index. Emerging Markets Fund (DFA) beat its index by overweighting smaller-cap issues.
Several of our domestic large-cap managers had less successful results. U.S. Multi Sector Fund (GMO), for example, was hurt by its high-quality weightings. Fundamental Value Fund (Davis) trailed its large-cap benchmark because of selections in the energy sector. One key to our success is evaluating managers using a long-term perspective. Maintaining a fund’s position in the Portfolio reflects our confidence in the manager’s fundamental strength and our belief that short-term setbacks soon give way to outperformance.
1 Figures from Morningstar, Inc. include reinvested dividends and do not take into account sales charges. Actual load-adjusted performance is lower.
This commentary reflects the views of the portfolio managers through the end of the Portfolio’s period discussed in this report. The managers’ statements reflect their own opinions. As such, they are in no way guarantees of future events and are not intended to be used as investment advice or a recommendation regarding any specific security. They are also subject to change at any time as market and other conditions warrant.
Past performance is no guarantee of future results.
| |
| 10 | Lifestyle Portfolios | Annual report |
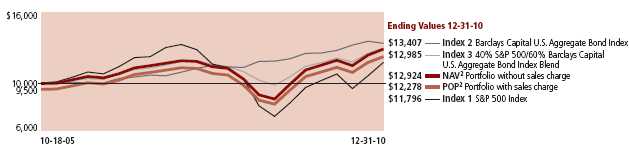
Growth of $10,000
This chart shows what happened to a hypothetical $10,000 investment in John Hancock Lifestyle Moderate Portfolio Class A shares for the period indicated. For comparison, we’ve shown the same investment in a blended index and two separate indexes.
| | | | | | | | |
| | Class B | Class C | Class R11 | Class R31 | Class R41 | Class R51 | Class 11 | Class 51 |
|
| Period beginning | 10-18-05 | 10-18-05 | 9-18-06 | 10-18-05 | 10-18-05 | 10-18-05 | 10-15-05 | 7-3-06 |
|
| Without sales charge | $12,409 | $12,468 | $11,867 | $12,754 | $12,914 | $13,141 | $13,216 | $12,607 |
|
| With maximum sales charge | 12,311 | 12,468 | 11,867 | 12,754 | 12,914 | 13,141 | 13,216 | 12,607 |
|
| Index 1 | 11,796 | 11,796 | 10,449 | 11,796 | 11,796 | 11,796 | 11,831 | 10,904 |
|
| Index 2 | 13,407 | 13,407 | 12,979 | 13,407 | 13,407 | 13,407 | 13,412 | 13,352 |
|
| Index 3 | 12,985 | 12,985 | 12,126 | 12,985 | 12,985 | 12,985 | 13,003 | 12,546 |
|
Assuming all distributions were reinvested for the period indicated, the table above shows the value of a $10,000 investment in the Portfolio’s Class B, Class C, Class R1, Class R3, Class R4, Class R5, Class 1 and Class 5 shares, respectively, as of 12-31-10. Performance of the classes will vary based on the difference in sales charges paid by shareholders investing in the different classes and the fee structure of those classes.
S&P 500 Index — Index 1 — is an unmanaged index that includes 500 widely traded common stocks.
Barclays Capital U.S. Aggregate Bond Index — Index 2 — is an unmanaged index of dollar-denominated and non-convertible investment grade debt issues.
40% S&P 500/60% Barclays Capital U.S. Aggregate Bond Index Blend — Index 3 — is comprised of 40% S&P 500 Index and 60% Barclays Capital U.S. Aggregate Bond Index.
Performance chart
Total returns with maximum sales charge (POP) for the period ended 12-31-10
| | | | | | | | | |
| | Class A | Class B | Class C | Class R11 | Class R31 | Class R41 | Class R51 | Class 11 | Class 51 |
|
| Inception | 10-18-05 | 10-18-05 | 10-18-05 | 9-18-06 | 10-18-05 | 10-18-05 | 10-18-05 | 10-15-05 | 7-3-06 |
|
| Average annual returns — 1 year | 6.26% | 6.05% | 10.15% | 11.45% | 11.56% | 11.84% | 12.35% | 12.43% | 12.50% |
|
| Average annual returns — 5 years | 3.54% | 3.46% | 3.87% | — | 4.34% | 4.59% | 4.95% | 5.08% | — |
|
| Average annual returns — Since inception | 4.02% | 4.08% | 4.33% | 4.07% | 4.78% | 5.04% | 5.39% | 5.49% | 5.28% |
|
| Cumulative returns — 1 year | 6.26% | 6.05% | 10.15% | 11.45% | 11.56% | 11.84% | 12.35% | 12.43% | 12.50% |
|
| Cumulative returns — 5 years | 18.99% | 18.54% | 20.93% | — | 23.67% | 25.16% | 27.30% | 28.11% | — |
|
| Cumulative returns — Since inception | 22.78% | 23.11% | 24.68% | 18.67% | 27.54% | 29.14% | 31.41% | 32.16% | 26.07% |
|
Performance figures assume all distributions are reinvested. Returns with maximum sales charge reflect a sales charge on Class A shares of 5%, and the applicable contingent deferred sales charge (CDSC) on Class B shares and Class C shares. The Class B shares’ CDSC declines annually between years 1–6 according to the following schedule: 5, 4, 3, 3, 2, 1%. No sales charges will be assessed after the sixth year. Class C shares held for less than one year are subject to a 1% CDSC. Sales charges are not applicable for Class R1, Class R3, Class R4, Class R5, Class 1 and Class 5 shares.
The expense ratios of the Portfolio, both net (including any fee waivers or expense limitations) and gross (excluding any fee waivers or expense limitations), are set forth according to the most recent publicly available prospectuses for the Portfolio and may differ from the expense ratios disclosed in the Financial Highlights tables in this report. The waivers and expense limitations are contractual at least until 4-30-11, for Class A, Class B, Class C, Class R1, Class R3, Class R4 and Class R5 shares. The following expense ratios include expenses of the underlying affiliated funds in which the Portfolio invests. The net expenses are as follows: Class B — 2.13% and Class R1 — 1.88%. Had the fee waivers and expense limitations not been in place, the gross expenses would be as follows: Class B — 2.19% and Class R1 — 1.92%. For the other classes, the net expenses equal the gross expenses and are as follows: Class A — 1.32%, Class C — 2.03%, Class R3 — 1.73%, Class R4 — 1.48%, Class R5 — 1.10%, Class 1 — 0.89% and Class 5 — 0.85%.
The returns reflect past results and should not be considered indicative of future performance. The return and principal value of an investment will fluctuate so that shares, when redeemed, may be worth more or less than their original cost. Due to market volatility, the Portfolio’s current performance may be higher or lower than the performance shown. For performance data current to the most recent month end, please call 1-800-225-5291 or visit the Portfolio’s Web site at www.jhfunds.com.
This performance information does not reflect the deduction of taxes that a shareholder may pay on Portfolio distributions or the redemption of Portfolio shares.
The Portfolio’s performance results reflect any applicable expense reductions, without which the expenses would increase and results would have been less favorable.
1 For certain types of investors, as described in the Portfolio’s Class R1, Class R3, Class R4, Class R5, Class 1 and Class 5 shares prospectuses.
2 NAV represents net asset value and POP represents public offering price.
It is not possible to invest directly in an index. Index figures do not reflect sales charges, which would have resulted in lower values if they did.
| | |
| | Annual report | Lifestyle Portfolios | 11 |
John Hancock
Lifestyle Conservative Portfolio
Goal and strategy
The Portfolio seeks a high level of current income with some consideration given to growth of capital. The Portfolio operates as a fund of funds and normally invests approximately 80% of its assets in underlying funds that invest primarily in fixed-income securities and approximately 20% of its assets in underlying funds that invest primarily in equity securities.
| |
| Asset Allocation | |
| | |
| Equity | 20% of Total |
|
| U.S. Large Cap | 10% |
|
| International Large Cap | 4% |
|
| Real Estate | 3% |
|
| U.S. Mid Cap | 1% |
|
| U.S. Small Cap | 1% |
|
| Natural Resources | 1% |
|
| Fixed Income | 80% of Total |
|
| Intermediate Bond | 36% |
|
| Multi-Sector Bond | 17% |
|
| High-Yield Bond | 8% |
|
| Bank Loan | 5% |
|
| Global Bond | 4% |
|
| Short-Term Bond | 4% |
|
| Treasury Inflation- | |
| Protected Securities | 4% |
|
| Currency | 2% |
|
As a percentage of net assets on 12-31-10.
Portfolio results
For the 12 months ended December 31, 2010, John Hancock Lifestyle Conservative Portfolio’s Class A, Class B, Class C, Class R1, Class R3, Class R4, Class R5 and Class 1 shares returned 9.96%, 9.16%, 9.28%, 9.56%, 9.68%, 9.90%, 10.34% and 10.51% respectively, at net asset value. In comparison, the broad Barclays Capital U.S. Aggregate Bond Index returned 6.54%, the S&P 500 Index returned 15.06% and a blended index combining 20% S&P 500 Index and 80% Barclays Capital U.S. Aggregate Bond Index returned 8.55% during the same period. The Portfolio’s Class A shares underperformed the average 10.03% return of Morningstar, Inc.’s conservative allocation category.1
Performance review
Asset allocation and strong manager performance both helped the Portfolio outperform the blended index. Allocations to credit sectors including non-investment grade bonds were major contributors to the positive results, which were partially offset by weightings to short-term and global bonds — sectors that underperformed their benchmarks. Positive equity contributions came from weightings to non-traditional sectors such as real estate and natural resources. These positive contributions were partially offset by allocations to international large-cap stocks, which lagged for the first time in seven years.
Fixed-income managers overall topped their indexes. Strategic Income Opportunities Fund (John Hancock) performed well due to its holdings in non-investment-grade bonds and its favorable currency positioning throughout the year. High Income Fund (John Hancock) and Active Bond Fund (John Hancock/Declaration) also contributed positively to results.
Results were mixed for active equity managers, with the biggest positive contributions coming from the international sector. Strong stock selection by our large-cap international managers — International Core Fund (GMO) and International Value Fund (Franklin) — helped them outperform the MSCI EAFE Index.
Several of our domestic large-cap managers had less successful results. U.S. Multi Sector Fund (GMO), for example, was hurt by its high-quality weightings — investors favored riskier issues. Fundamental Value Fund (Davis) trailed its large-cap benchmark because of selections in the energy sector. One key to our success is evaluating managers using a long-term perspective. Maintaining a fund’s position in the Portfolio reflects our confidence in the manager’s fundamental strength and our belief that short-term setbacks soon give way to outperformance.
1 Figures from Morningstar, Inc. include reinvested dividends and do not take into account sales charges. Actual load-adjusted performance is lower.
This commentary reflects the views of the portfolio managers through the end of the Portfolio’s period discussed in this report. The managers’ statements reflect their own opinions. As such, they are in no way guarantees of future events and are not intended to be used as investment advice or a recommendation regarding any specific security. They are also subject to change at any time as market and other conditions warrant.
Past performance is no guarantee of future results.
| |
| 12 | Lifestyle Portfolios | Annual report |
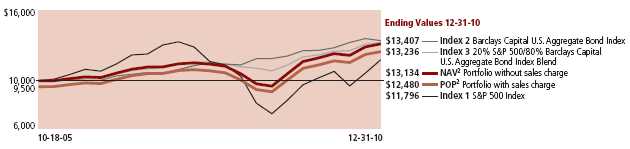
Growth of $10,000
This chart shows what happened to a hypothetical $10,000 investment in John Hancock Lifestyle Conservative Portfolio Class A shares for the period indicated. For comparison, we’ve shown the same investment in a blended index and two separate indexes.
| | | | | | | |
| | Class B | Class C | Class R11 | Class R31 | Class R41 | Class R51 | Class 11 |
|
| Period beginning | 10-18-05 | 10-18-05 | 9-18-06 | 10-18-05 | 10-18-05 | 10-18-05 | 10-15-05 |
|
| Without sales charge | $12,624 | $12,658 | $12,254 | $12,975 | $13,119 | $13,353 | $13,436 |
|
| With maximum sales charge | 12,527 | 12,658 | 12,254 | 12,975 | 13,119 | 13,353 | 13,436 |
|
| Index 1 | 11,796 | 11,796 | 10,449 | 11,796 | 11,796 | 11,796 | 11,831 |
|
| Index 2 | 13,407 | 13,407 | 12,979 | 13,407 | 13,407 | 13,407 | 13,412 |
|
| Index 3 | 13,236 | 13,236 | 12,583 | 13,236 | 13,236 | 13,236 | 13,248 |
|
Assuming all distributions were reinvested for the period indicated, the table above shows the value of a $10,000 investment in the Portfolio’s Class B, Class C, Class R1, Class R3, Class R4, Class R5 and Class 1 shares, respectively, as of 12-31-10. Performance of the classes will vary based on the difference in sales charges paid by shareholders investing in the different classes and the fee structure of those classes.
S&P 500 Index — Index 1 — is an unmanaged index that includes 500 widely traded common stocks.
Barclays Capital U.S. Aggregate Bond Index — Index 2 — is an unmanaged index of dollar-denominated and non-convertible investment grade debt issues.
20% S&P 500/80% Barclays Capital U.S. Aggregate Bond Index Blend — Index 3 — is comprised of 20% S&P 500 Index and 80% Barclays Capital U.S. Aggregate Bond Index.
Performance chart
Total returns with maximum sales charge (POP) for the period ended 12-31-10
| | | | | | | | |
| | Class A | Class B | Class C | Class R11 | Class R31 | Class R41 | Class R51 | Class 11 |
|
| Inception | 10-18-05 | 10-18-05 | 10-18-05 | 9-18-06 | 10-18-05 | 10-18-05 | 10-18-05 | 10-15-05 |
|
| Average annual returns — 1 year | 4.46% | 4.16% | 8.28% | 9.56% | 9.68% | 9.90% | 10.34% | 10.51% |
|
| Average annual returns — 5 years | 4.13% | 4.07% | 4.46% | — | 4.96% | 5.18% | 5.54% | 5.67% |
|
| Average annual returns — Since inception | 4.35% | 4.42% | 4.63% | 4.85% | 5.13% | 5.35% | 5.71% | 5.83% |
|
| Cumulative returns — 1 year | 4.46% | 4.16% | 8.28% | 9.56% | 9.68% | 9.90% | 10.34% | 10.51% |
|
| Cumulative returns — 5 years | 22.45% | 22.05% | 24.40% | — | 27.39% | 28.74% | 30.97% | 31.75% |
|
| Cumulative returns — Since inception | 24.80% | 25.27% | 26.58% | 22.54% | 29.75% | 31.19% | 33.53% | 34.36% |
|
Performance figures assume all distributions are reinvested. Returns with maximum sales charge reflect a sales charge on Class A shares of 5%, and the applicable contingent deferred sales charge (CDSC) on Class B shares and Class C shares. The Class B shares’ CDSC declines annually between years 1–6 according to the following schedule: 5, 4, 3, 3, 2, 1%. No sales charges will be assessed after the sixth year. Class C shares held for less than one year are subject to a 1% CDSC. Sales charges are not applicable for Class R1, Class R3, Class R4, Class R5 and Class 1 shares.
The expense ratios of the Portfolio, both net (including any fee waivers or expense limitations) and gross (excluding any fee waivers or expense limitations), are set forth according to the most recent publicly available prospectuses for the Portfolio and may differ from the expense ratios disclosed in the Financial Highlights tables in this report. The waivers and expense limitations are contractual at least until 4-30-11, for Class R1, Class R3, Class R4 and Class R5 shares. The following expense ratios include expenses of the underlying affiliated funds in which the Portfolio invests. The net expenses are as follows: Class R1 — 1.85% and Class R4 — 1.45%. Had the fee waivers and expense limitations not been in place, the gross expenses would be as follows: Class R1 — 1.91% and Class R4 — 1.52%. For the other classes, the net expenses equal the gross expenses and are as follows: Class A — 1.27%, Class B — 2.10%, Class C — 1.99%, Class R3 — 1.67%, Class R5 — 1.08% and Class 1 — 0.87%.
The returns reflect past results and should not be considered indicative of future performance. The return and principal value of an investment will fluctuate so that shares, when redeemed, may be worth more or less than their original cost. Due to market volatility, the Portfolio’s current performance may be higher or lower than the performance shown. For performance data current to the most recent month end, please call 1-800-225-5291 or visit the Portfolio’s Web site at www.jhfunds.com.
This performance information does not reflect the deduction of taxes that a shareholder may pay on Portfolio distributions or the redemption of Portfolio shares.
The Portfolio’s performance results reflect any applicable expense reductions, without which the expenses would increase and results would have been less favorable.
1 For certain types of investors, as described in the Portfolio’s Class R1, Class R3, Class R4, Class R5 and Class 1 shares prospectuses.
2 NAV represents net asset value and POP represents public offering price.
It is not possible to invest directly in an index. Index figures do not reflect sales charges, which would have resulted in lower values if they did.
| | |
| | Annual report | Lifestyle Portfolios | 13 |
Your expenses
As a shareholder of a John Hancock Funds II Lifestyle Portfolio, you incur two types of costs: (1) transaction costs, including sales charges (loads) on certain purchase and redemption fees on certain exchanges and redemptions, and (2) ongoing costs, including management fees, distribution and service (12b-1) fees and other Portfolio expenses. In addition to the operating expenses which the Portfolio bears directly, the Portfolio indirectly bears a pro rata share of the operating expenses of the affiliated underlying funds in which the Portfolio invests. Because the affiliated underlying funds have varied operating expenses and transaction costs and the Portfolio may own different proportions of the underlying funds at different times, the amount of expenses incurred indirectly by the Portfolio will vary. Had these indirect expenses been reflected in the following analysis, total expenses would have been higher than the amounts shown.
This example is intended to help you understand your ongoing costs (in dollars) of investing in the Portfolio so you can compare these costs with the ongoing costs of investing in other mutual funds. The example is based on an investment of $1,000 at the beginning of the period and held for the entire period (July 1, 2010 through December 31, 2010).
Actual expenses:
The first line of each share class in the table on the following pages provides information about actual account values and actual expenses. You may use the information in this line, together with the amount you invested, to estimate the expenses that you paid over the period. Simply divide your account value by $1,000 (for example, an $8,600 account value divided by $1,000 = 8.6), then multiply the result by the number in the first line under the heading entitled “Expenses paid during period” to estimate the expenses you paid on your account during this period.
Hypothetical example for comparison purposes:
The second line of each share class in the table on the following pages provides information about hypothetical account values and hypothetical expenses based on the actual expense ratio for the share class and an assumed annualized rate of return of 5% per year before expenses, which is not the actual return of the share class. The hypothetical account values and expenses may not be used to estimate the actual ending account balance or expenses you paid for the period. You may use this information to compare the ongoing costs of investing in the Portfolio and other funds. To do so, compare this 5% hypothetical example with the 5% hypothetical examples that appear in the shareholder reports of the other funds.
Please note that the expenses shown in the table are meant to highlight your ongoing costs only and do not reflect any transactional costs and insurance-related charges. Therefore, the second line of each share class in the table is useful in comparing ongoing costs only, and will not help you determine the relative total costs of owning different funds. In addition, if these transactional costs were included, your costs would have been higher.
| |
| 14 | Lifestyle Portfolios | Annual report |
Shareholder expense example chart
| | | | | |
| | | Beginning | Ending | Expenses Paid | |
| | | Account Value | Account Value | During Period1 | Annualized |
| | | 7-1-10 | 12-31-10 | 7-1-10–12-31-10 | Expense Ratio2 |
| Lifestyle Aggressive Portfolio | | | | |
|
| Class A | Actual | $1,000.00 | $1,254.70 | $3.30 | 0.58% |
| | Hypothetical (5% annualized return before expenses) | 1,000.00 | 1,022.30 | 2.96 | 0.58% |
|
| Class B | Actual | 1,000.00 | 1,249.60 | 7.65 | 1.35% |
| | Hypothetical (5% annualized return before expenses) | 1,000.00 | 1,018.40 | 6.87 | 1.35% |
|
| Class C | Actual | 1,000.00 | 1,249.60 | 7.48 | 1.32% |
| | Hypothetical (5% annualized return before expenses) | 1,000.00 | 1,018.60 | 6.72 | 1.32% |
|
| Class R1 | Actual | 1,000.00 | 1,252.50 | 5.22 | 0.92% |
| | Hypothetical (5% annualized return before expenses) | 1,000.00 | 1,020.60 | 4.69 | 0.92% |
|
| Class R3 | Actual | 1,000.00 | 1,252.80 | 4.94 | 0.87% |
| | Hypothetical (5% annualized return before expenses) | 1,000.00 | 1,020.80 | 4.43 | 0.87% |
|
| Class R4 | Actual | 1,000.00 | 1,254.20 | 3.58 | 0.63% |
| | Hypothetical (5% annualized return before expenses) | 1,000.00 | 1,022.00 | 3.21 | 0.63% |
|
| Class R5 | Actual | 1,000.00 | 1,256.00 | 1.65 | 0.29% |
| | Hypothetical (5% annualized return before expenses) | 1,000.00 | 1,023.70 | 1.48 | 0.29% |
|
| Class 1 | Actual | 1,000.00 | 1,256.90 | 0.63 | 0.11% |
| | Hypothetical (5% annualized return before expenses) | 1,000.00 | 1,024.70 | 0.56 | 0.11% |
| |
| Lifestyle Growth Portfolio | | | | |
|
| Class A | Actual | $1,000.00 | $1,209.80 | $3.06 | 0.55% |
| | Hypothetical (5% annualized return before expenses) | 1,000.00 | 1,022.40 | 2.80 | 0.55% |
|
| Class B | Actual | 1,000.00 | 1,203.90 | 7.50 | 1.35% |
| | Hypothetical (5% annualized return before expenses) | 1,000.00 | 1,018.40 | 6.87 | 1.35% |
|
| Class C | Actual | 1,000.00 | 1,205.10 | 6.95 | 1.25% |
| | Hypothetical (5% annualized return before expenses) | 1,000.00 | 1,018.90 | 6.36 | 1.25% |
|
| Class R1 | Actual | 1,000.00 | 1,207.50 | 4.79 | 0.86% |
| | Hypothetical (5% annualized return before expenses) | 1,000.00 | 1,020.90 | 4.38 | 0.86% |
|
| Class R3 | Actual | 1,000.00 | 1,207.60 | 4.67 | 0.84% |
| | Hypothetical (5% annualized return before expenses) | 1,000.00 | 1,021.00 | 4.28 | 0.84% |
|
| Class R4 | Actual | 1,000.00 | 1,209.00 | 2.90 | 0.52% |
| | Hypothetical (5% annualized return before expenses) | 1,000.00 | 1,022.60 | 2.65 | 0.52% |
|
| Class R5 | Actual | 1,000.00 | 1,211.70 | 1.28 | 0.23% |
| | Hypothetical (5% annualized return before expenses) | 1,000.00 | 1,024.00 | 1.17 | 0.23% |
|
| Class 1 | Actual | 1,000.00 | 1,212.30 | 0.61 | 0.11% |
| | Hypothetical (5% annualized return before expenses) | 1,000.00 | 1,024.70 | 0.56 | 0.11% |
|
| Class 5 | Actual | 1,000.00 | 1,212.10 | 0.33 | 0.06% |
| | Hypothetical (5% annualized return before expenses) | 1,000.00 | 1,024.90 | 0.31 | 0.06% |
| | |
| | Annual report | Lifestyle Portfolios | 15 |
Shareholder expense example chart, continued
| | | | | |
| | | Beginning | Ending | Expenses Paid | |
| | | Account Value | Account Value | During Period1 | Annualized |
| | | 7-1-10 | 12-31-10 | 7-1-10–12-31-10 | Expense Ratio2 |
| Lifestyle Balanced Portfolio | | | | |
|
| Class A | Actual | $1,000.00 | $1,165.40 | $3.00 | 0.55% |
| | Hypothetical (5% annualized return before expenses) | 1,000.00 | 1,022.40 | 2.80 | 0.55% |
|
| Class B | Actual | 1,000.00 | 1,160.90 | 6.86 | 1.26% |
| | Hypothetical (5% annualized return before expenses) | 1,000.00 | 1,018.90 | 6.41 | 1.26% |
|
| Class C | Actual | 1,000.00 | 1,161.30 | 6.81 | 1.25% |
| | Hypothetical (5% annualized return before expenses) | 1,000.00 | 1,018.90 | 6.36 | 1.25% |
|
| Class R1 | Actual | 1,000.00 | 1,163.00 | 4.80 | 0.88% |
| | Hypothetical (5% annualized return before expenses) | 1,000.00 | 1,020.80 | 4.48 | 0.88% |
|
| Class R3 | Actual | 1,000.00 | 1,163.30 | 4.42 | 0.81% |
| | Hypothetical (5% annualized return before expenses) | 1,000.00 | 1,021.10 | 4.13 | 0.81% |
|
| Class R4 | Actual | 1,000.00 | 1,165.40 | 2.73 | 0.50% |
| | Hypothetical (5% annualized return before expenses) | 1,000.00 | 1,022.70 | 2.55 | 0.50% |
|
| Class R5 | Actual | 1,000.00 | 1,167.40 | 1.09 | 0.20% |
| | Hypothetical (5% annualized return before expenses) | 1,000.00 | 1,024.20 | 1.02 | 0.20% |
|
| Class 1 | Actual | 1,000.00 | 1,167.60 | 0.60 | 0.11% |
| | Hypothetical (5% annualized return before expenses) | 1,000.00 | 1,024.70 | 0.56 | 0.11% |
|
| Class 5 | Actual | 1,000.00 | 1,168.80 | 0.33 | 0.06% |
| | Hypothetical (5% annualized return before expenses) | 1,000.00 | 1,024.90 | 0.31 | 0.06% |
| |
| Lifestyle Moderate Portfolio | | | | |
|
| Class A | Actual | $1,000.00 | $1,122.30 | $3.05 | 0.57% |
| | Hypothetical (5% annualized return before expenses) | 1,000.00 | 1,022.30 | 2.91 | 0.57% |
|
| Class B | Actual | 1,000.00 | 1,118.80 | 7.05 | 1.32% |
| | Hypothetical (5% annualized return before expenses) | 1,000.00 | 1,018.60 | 6.72 | 1.32% |
|
| Class C | Actual | 1,000.00 | 1,119.30 | 6.78 | 1.27% |
| | Hypothetical (5% annualized return before expenses) | 1,000.00 | 1,018.80 | 6.46 | 1.27% |
|
| Class R1 | Actual | 1,000.00 | 1,121.00 | 5.29 | 0.99% |
| | Hypothetical (5% annualized return before expenses) | 1,000.00 | 1,020.20 | 5.04 | 0.99% |
|
| Class R3 | Actual | 1,000.00 | 1,121.70 | 4.87 | 0.91% |
| | Hypothetical (5% annualized return before expenses) | 1,000.00 | 1,020.60 | 4.63 | 0.91% |
|
| Class R4 | Actual | 1,000.00 | 1,122.60 | 3.42 | 0.64% |
| | Hypothetical (5% annualized return before expenses) | 1,000.00 | 1,022.00 | 3.26 | 0.64% |
|
| Class R5 | Actual | 1,000.00 | 1,125.20 | 1.45 | 0.27% |
| | Hypothetical (5% annualized return before expenses) | 1,000.00 | 1,023.80 | 1.38 | 0.27% |
|
| Class 1 | Actual | 1,000.00 | 1,125.80 | 0.59 | 0.11% |
| | Hypothetical (5% annualized return before expenses) | 1,000.00 | 1,024.70 | 0.56 | 0.11% |
|
| Class 5 | Actual | 1,000.00 | 1,126.20 | 0.32 | 0.06% |
| | Hypothetical (5% annualized return before expenses) | 1,000.00 | 1,024.90 | 0.31 | 0.06% |
|
| |
| 16 | Lifestyle Portfolios | Annual report |
Shareholder expense example chart, continued
| | | | | |
| | | Beginning | Ending | Expenses Paid | |
| | | Account Value | Account Value | During Period1 | Annualized |
| | | 7-1-10 | 12-31-10 | 7-1-10–12-31-10 | Expense Ratio2 |
| Lifestyle Conservative Portfolio | | | | |
|
| Class A | Actual | $1,000.00 | $1,080.30 | $2.99 | 0.57% |
| | Hypothetical (5% annualized return before expenses) | 1,000.00 | 1,022.30 | 2.91 | 0.57% |
|
| Class B | Actual | 1,000.00 | 1,076.30 | 6.80 | 1.30% |
| | Hypothetical (5% annualized return before expenses) | 1,000.00 | 1,018.70 | 6.61 | 1.30% |
|
| Class C | Actual | 1,000.00 | 1,077.40 | 6.65 | 1.27% |
| | Hypothetical (5% annualized return before expenses) | 1,000.00 | 1,018.80 | 6.46 | 1.27% |
|
| Class R1 | Actual | 1,000.00 | 1,078.10 | 4.77 | 0.91% |
| | Hypothetical (5% annualized return before expenses) | 1,000.00 | 1,020.60 | 4.63 | 0.91% |
|
| Class R3 | Actual | 1,000.00 | 1,078.80 | 4.72 | 0.90% |
| | Hypothetical (5% annualized return before expenses) | 1,000.00 | 1,020.70 | 4.58 | 0.90% |
|
| Class R4 | Actual | 1,000.00 | 1,080.60 | 3.46 | 0.66% |
| | Hypothetical (5% annualized return before expenses) | 1,000.00 | 1,021.90 | 3.36 | 0.66% |
|
| Class R5 | Actual | 1,000.00 | 1,082.90 | 1.37 | 0.26% |
| | Hypothetical (5% annualized return before expenses) | 1,000.00 | 1,023.90 | 1.33 | 0.26% |
|
| Class 1 | Actual | 1,000.00 | 1,083.40 | 0.58 | 0.11% |
| | Hypothetical (5% annualized return before expenses) | 1,000.00 | 1,024.70 | 0.56 | 0.11% |
|
1 Expenses are equal to the annualized expense ratio, multiplied by the average account value over the period, multiplied by the number of days in the period (184) and divided by 365 (to reflect the one-half year period).
2 The Portfolios’ expense ratios do not include fees and expenses indirectly incurred by the underlying funds whose expense ratios can vary based on the mix of underlying funds held by the Portfolios. The range of expense ratios of the underlying funds held by the Portfolios was as follows:
| | | | | |
| | Lifestyle | Lifestyle | Lifestyle | Lifestyle | Lifestyle |
| Period ended | Aggressive | Growth | Balanced | Moderate | Conservative |
| 12-31-10 | 0.48%–1.39% | 0.48%–1.39% | 0.48%–1.39% | 0.48%–1.14% | 0.48%–1.13% |
| | |
| | Annual report | Lifestyle Portfolios | 17 |
Portfolio’s investments
| | | |
| Investment companies | | | |
| | | | |
| Underlying Funds’ Subadvisers | | | |
| | | |
| American Century Management, Inc. | (American Century) | | |
| | | | |
| Columbia Management Investment | | | |
| Advisors, LLC | (Columbia) | | |
| | | | |
| Davis Selected Advisors, L.P. | (Davis) | | |
| | | | |
| Declaration Management & | (Declaration) | | |
| Research LLC | | | |
| | | | |
| Deutsche Asset Management | (Deutsche) | | |
| | | | |
| Dimensional Fund Advisors, Inc. | (DFA) | | |
| | | | |
| Epoch Investment Partners, Inc. | (Epoch) | | |
| | | | |
| First Quadrant L.P. | (First Quadrant) | | |
| Franklin Mutual Advisers | | | |
| | | | |
| Franklin Templeton Investment Corp. | (Franklin) | | |
| Templeton Investment Counsel, LLC | | | |
| | | | |
| Frontier Capital Management Company | (Frontier) | | |
| | | | |
| Grantham, Mayo, Van Otterloo & Co. LLC | (GMO) | | |
| | | | |
| Invesco Advisers, Inc. | (Invesco) | | |
| | | | |
| Jennison Associates LLC | (Jennison) | | |
| | | | |
| John Hancock Asset Management* | (John Hancock) | | |
| | | | |
| Lord Abbett | (Lord Abbett) | | |
| | | | |
| Marsico Capital Management, LLC | (Marsico) | | |
| | | | |
| Pacific Investment Management Company | (PIMCO) | | |
| | | | |
| Perimeter Capital Management, LLC | (Perimeter) | | |
| | | | |
| QS Investors, LLC | (QS Investors) | | |
| | | | |
| Rainier Investment Management, Inc. | (Rainier) | | |
| | | | |
| Robeco Investment Management, Inc. | (Robeco) | | |
| | | | |
| SSgA Funds Management, Inc. | (SSgA) | | |
| | | | |
| Stone Harbor Investment Partners, LP | (Stone Harbor) | | |
| | | | |
| T. Rowe Price Associates, Inc. | (T. Rowe Price) | | |
| UBS Global Asset Management | | | |
| | | | |
| (Americas) Inc. | (UBS) | | |
| | | | |
| Wellington Management Company, LLP | (Wellington) | | |
| | | | |
| Wells Capital Management, Inc. | (Wells Capital) | | |
| | | | |
| Western Asset Management Company | (WAMCO) | | |
* Manulife Asset Management (US) LLC and Manulife Asset Management (North America) Limited are doing business as John Hancock Asset Management.
Lifestyle Aggressive Portfolio
Securities owned by the Portfolio on 12-31-10
| | |
| | Shares | Value |
| Affiliated Investment Companies — 99.99% | |
|
| EQUITY 98.00% | | |
| | | |
| John Hancock Funds (G) 1.00% | | |
|
| Small Cap Intrinsic Value, Class NAV | | |
| (John Hancock1) (A) | 2,877,780 | $38,648,586 |
| | | |
| John Hancock Funds II (G) 88.16% | | |
|
| All Cap Core, Class NAV (QS Investors) | 11,170,112 | 96,621,465 |
|
| All Cap Value, Class NAV (Lord Abbett) | 5,723,223 | 65,702,596 |
|
| Alpha Opportunities, Class NAV (Wellington) | 17,055,717 | 199,040,216 |
|
| Blue Chip Growth, Class NAV (T. Rowe Price) | 11,150,448 | 228,026,655 |
|
| Capital Appreciation, Class NAV (Jennison) | 16,788,836 | 189,378,070 |
|
| Emerging Markets, Class NAV (DFA) | 29,996,859 | 367,161,564 |
|
| Equity-Income, Class NAV (T. Rowe Price) | 13,345,882 | 189,378,070 |
|
| Fundamental Value, Class NAV (Davis) | 13,207,712 | 199,040,217 |
|
| Global Real Estate, Class NAV (Deutsche) | 2,593,865 | 19,324,293 |
|
| Heritage, Class NAV (American Century) (I) | 5,239,776 | 48,310,732 |
|
| Index 500, Class NAV (John Hancock2) (A) | 20,395,618 | 189,271,337 |
|
| International Equity Index, Class NAV (SSgA) | 1,626,444 | 28,771,790 |
|
| International Growth Stock , Class NAV (Invesco) (I) | 2,635,497 | 28,726,913 |
|
| International Opportunities, Class NAV (Marsico) | 8,123,004 | 114,940,502 |
|
| International Small Cap, Class NAV (Franklin) | 2,971,140 | 48,310,732 |
|
| International Small Company, Class NAV (DFA) | 5,572,172 | 48,310,732 |
|
| International Value, Class NAV (Franklin) | 9,908,156 | 143,866,422 |
|
| Large Cap Value, Class NAV (T. Rowe Price) | 3,140,459 | 57,972,879 |
|
| Large Cap, Class NAV (UBS) | 2,970,025 | 38,610,329 |
|
| Mid Cap Index, Class NAV (John Hancock2) (A) | 3,945,746 | 77,297,172 |
|
| Mid Cap Stock, Class NAV (Wellington) (I) | 6,083,779 | 106,283,611 |
|
| Mid Cap Value Equity, Class NAV (Columbia) | 3,880,380 | 38,648,586 |
|
| Mid Value, Class NAV (T. Rowe Price) | 5,290,703 | 77,297,172 |
|
| Mutual Shares, Class NAV (Franklin) | 3,536,750 | 38,196,903 |
|
| Natural Resources, Class NAV (Wellington) | 4,906,718 | 115,945,757 |
|
| Optimized Value, Class NAV (John Hancock2) (A) | 4,950,716 | 57,972,879 |
|
| Real Estate Equity, Class NAV (T. Rowe Price) | 2,483,842 | 19,324,293 |
|
| Small Cap Growth, Class NAV (Wellington) (I) | 3,357,503 | 34,783,727 |
|
| Small Cap Index, Class NAV (John Hancock2) (A)(I) | 1,443,188 | 19,324,293 |
|
| Small Cap Opportunities, Class NAV (Invesco/DFA) | 1,816,193 | 38,648,586 |
|
| Small Cap Value, Class NAV (Wellington) | 2,346,605 | 38,648,586 |
|
| Small Company Growth, Class NAV (Invesco) | 2,317,756 | 30,918,869 |
|
| Small Company Value, Class NAV (T. Rowe Price) | 2,257,511 | 57,972,879 |
|
| Smaller Company Growth, Class NAV | | |
| (Frontier/ John Hancock2 (A)/Perimeter) (I) | 2,709,804 | 30,918,869 |
|
| Technical Opportunities, Class NAV (Wellington) (I) | 5,094,278 | 57,972,879 |
|
| U.S. Multi Sector, Class NAV (GMO) | 15,451,384 | 148,951,341 |
|
| Value & Restructuring, Class NAV (Columbia) | 6,324,919 | 73,432,313 |
|
| Value, Class NAV (Invesco) | 3,927,702 | 38,648,586 |
| | | |
| John Hancock Funds III (G) 8.84% | | |
|
| Disciplined Value, Class NAV (Robeco) | 5,193,881 | 65,702,596 |
|
| International Core, Class NAV (GMO) | 4,920,076 | 143,863,023 |
|
| Rainier Growth, Class NAV (Rainier) | 6,341,949 | 131,405,192 |
| | | |
| FIXED INCOME 1.99% | | |
| John Hancock Funds II (G) 1.99% | | |
|
| Currency Strategies, Class NAV (First Quadrant) (I) | 8,421,205 | 76,632,965 |
| | | |
| Total Investments (Lifestyle Aggressive Portfolio) |
| (Cost $3,237,325,320) 99.99% | | $3,858,205,177 |
| Other assets and liabilities, net 0.01% | | 406,790 |
|
| TOTAL NET ASSETS 100.00% | | $3,858,611,967 |
Percentages are based upon net assets.
See notes to financial statements
| |
| 18 | Lifestyle Portfolios | Annual report |
Lifestyle Growth Portfolio
Securities owned by the Portfolio on 12-31-10
| | |
| | Shares | Value |
| Affiliated Investment Companies — 99.99% | |
|
| EQUITY 80.58% | | |
| | | |
| John Hancock Funds (G) 0.52% | | |
|
| Small Cap Intrinsic Value, Class NAV | | |
| (John Hancock1) (A) | 4,460,217 | $59,900,717 |
| | | |
| John Hancock Funds II (G) 72.55% | | |
|
| All Cap Core, Class NAV (QS Investors) | 33,965,492 | 293,801,508 |
|
| All Cap Value, Class NAV (Lord Abbett) | 15,664,580 | 179,829,378 |
|
| Alpha Opportunities, Class NAV (Wellington) | 51,236,634 | 597,931,524 |
|
| Blue Chip Growth, Class NAV (T. Rowe Price) | 30,288,419 | 619,398,165 |
|
| Capital Appreciation, Class NAV (Jennison) | 41,749,645 | 470,935,990 |
|
| Emerging Markets, Class NAV (DFA) | 64,723,733 | 792,218,498 |
|
| Equity-Income, Class NAV (T. Rowe Price) | 31,846,246 | 451,898,226 |
|
| Fundamental Value, Class NAV (Davis) | 38,725,255 | 583,589,588 |
|
| Global Real Estate, Class NAV (Deutsche) | 22,798,369 | 169,847,853 |
|
| Heritage, Class NAV (American Century) (I) | 9,620,418 | 88,700,251 |
|
| Index 500, Class NAV (John Hancock2) (A) | 37,834,036 | 351,099,858 |
|
| International Equity Index, Class NAV (SSgA) | 6,360,362 | 112,514,805 |
|
| International Growth Stock , Class NAV (Invesco) | 5,121,969 | 55,829,458 |
|
| International Opportunities, Class NAV (Marsico) | 20,354,662 | 288,018,470 |
|
| International Small Cap, Class NAV (Franklin) | 5,278,712 | 85,831,863 |
|
| International Small Company, Class NAV (DFA) | 10,139,995 | 87,913,757 |
|
| International Value, Class NAV (Franklin) | 23,328,906 | 338,735,721 |
|
| Large Cap Value, Class NAV (T. Rowe Price) | 7,893,253 | 145,709,448 |
|
| Large Cap, Class NAV (UBS) | 9,025,099 | 117,326,293 |
|
| Mid Cap Index, Class NAV (John Hancock2) (A) | 12,224,799 | 239,483,805 |
|
| Mid Cap Stock, Class NAV (Wellington) (I) | 12,017,598 | 209,947,444 |
|
| Mid Cap Value Equity, Class NAV (Columbia) | 6,024,579 | 60,004,812 |
|
| Mid Value, Class NAV (T. Rowe Price) | 12,015,738 | 175,549,929 |
|
| Mutual Shares, Class NAV (Franklin) | 10,479,081 | 113,174,071 |
|
| Natural Resources, Class NAV (Wellington) | 10,150,543 | 239,857,322 |
|
| Optimized Value, Class NAV (John Hancock2) (A) | 12,460,943 | 145,917,638 |
|
| Real Estate Equity, Class NAV (T. Rowe Price) | 14,656,807 | 114,029,961 |
|
| Small Cap Growth, Class NAV (Wellington) (I) | 5,224,831 | 54,129,244 |
|
| Small Cap Opportunities, Class NAV (Invesco/DFA) | 2,823,036 | 60,074,208 |
|
| Small Cap Value, Class NAV (Wellington) | 3,624,934 | 59,702,655 |
|
| Small Company Growth, Class NAV (Invesco) | 3,592,941 | 47,929,826 |
|
| Small Company Value, Class NAV (T. Rowe Price) | 3,495,158 | 89,755,653 |
|
| Smaller Company Growth, Class NAV | | |
| (Frontier/ John Hancock2 (A)/Perimeter) (I) | 4,207,449 | 48,006,993 |
|
| Technical Opportunities, Class NAV (Wellington) (I) | 15,594,894 | 177,469,898 |
|
| U.S. Multi Sector, Class NAV (GMO) | 47,365,728 | 456,605,620 |
|
| Value & Restructuring, Class NAV (Columbia) | 18,174,980 | 211,011,524 |
|
| Value, Class NAV (Invesco) | 6,018,122 | 59,218,318 |
| | | |
| John Hancock Funds III (G) 7.51% | | |
|
| Disciplined Value, Class NAV (Robeco) | 13,733,917 | 173,734,055 |
|
| International Core, Class NAV (GMO) | 11,593,371 | 338,990,174 |
|
| Rainier Growth, Class NAV (Rainier) | 17,164,908 | 355,656,893 |
| | | |
| FIXED INCOME 19.41% | | |
| | | |
| John Hancock Funds II (G) 19.41% | | |
|
| Active Bond, Class NAV | | |
| (John Hancock1/Declaration) (A) | 9,906,896 | 99,861,516 |
|
| Currency Strategies, Class NAV (First Quadrant) (I) | 25,007,351 | 227,566,892 |
|
| Floating Rate Income, Class NAV (WAMCO) | 35,037,050 | 332,501,605 |
|
| Global Bond, Class NAV (PIMCO) | 9,172,767 | 111,265,669 |
|
| Global High Yield, Class NAV (Stone Harbor) | 5,153,871 | 53,909,489 |
|
| High Income, Class NAV (John Hancock1) (A) | 16,386,576 | 139,449,759 |
|
| High Yield, Class NAV (WAMCO) | 18,436,405 | 166,112,009 |
|
| Multi-Sector Bond, Class NAV (Stone Harbor) | 16,909,355 | 175,180,921 |
|
| Real Return Bond, Class NAV (PIMCO) | 9,066,557 | 110,883,988 |
|
| Spectrum Income, Class NAV (T. Rowe Price) | 17,041,965 | 180,985,664 |
|
| Strategic Income Opportunities, Class NAV | | |
| (John Hancock1) (A) | 15,053,045 | 164,379,251 |
|
| Total Return, Class NAV (PIMCO) | 27,189,090 | 374,937,544 |
|
| U.S. High Yield Bond, Class NAV (Wells Capital) | 8,650,329 | 109,426,662 |
| | | |
| Total Investments (Lifestyle Growth Portfolio) | |
| (Cost $10,018,563,351) 99.99% | | $11,567,742,383 |
| Other assets and liabilities, net 0.01% | | 1,063,029 |
|
| TOTAL NET ASSETS 100.00% | | $11,568,805,412 |
Percentages are based upon net assets.
Lifestyle Balanced Portfolio
Securities owned by the Portfolio on 12-31-10
| | |
| | Shares | Value |
| Affiliated Investment Companies — 100.00% | |
|
| EQUITY 58.83% | | |
| | | |
| John Hancock Funds (G) 0.26% | | |
|
| Small Cap Intrinsic Value, Class NAV | | |
(John Hancock1) (A) | 2,195,855 | $29,490,336 |
| | |
| John Hancock Funds II (G) 52.93% | | |
|
| All Cap Core, Class NAV (QS Investors) | 26,871,904 | 232,441,971 |
|
| All Cap Value, Class NAV (Lord Abbett) | 11,901,267 | 136,626,540 |
|
| Alpha Opportunities, Class NAV (Wellington) | 34,601,270 | 403,796,817 |
|
| Blue Chip Growth, Class NAV (T. Rowe Price) | 23,627,257 | 483,177,412 |
|
| Capital Appreciation, Class NAV (Jennison) | 29,870,771 | 336,942,293 |
|
| Emerging Markets, Class NAV (DFA) | 41,217,404 | 504,501,020 |
|
| Equity-Income, Class NAV (T. Rowe Price) | 18,217,612 | 258,507,913 |
|
| Fundamental Value, Class NAV (Davis) | 27,989,211 | 421,797,412 |
|
| Global Real Estate, Class NAV (Deutsche) | 22,432,136 | 167,119,412 |
|
| Heritage, Class NAV (American Century) (I) | 6,328,618 | 58,349,862 |
|
| Index 500, Class NAV (John Hancock2) (A) | 36,191,908 | 335,860,906 |
|
| International Growth Stock , Class NAV (Invesco) | 5,209,551 | 56,784,103 |
|
| International Opportunities, Class NAV (Marsico) | 13,005,467 | 184,027,355 |
|
| International Small Cap, Class NAV (Franklin) | 1,736,083 | 28,228,717 |
|
| International Small Company, Class NAV (DFA) | 3,322,169 | 28,803,204 |
|
| International Value, Class NAV (Franklin) | 16,508,008 | 239,696,278 |
|
| Large Cap Value, Class NAV (T. Rowe Price) | 6,269,894 | 115,742,246 |
|
| Large Cap, Class NAV (UBS) | 8,916,247 | 115,911,213 |
|
| Mid Cap Stock, Class NAV (Wellington) (I) | 10,109,636 | 176,615,346 |
|
| Mid Cap Value Equity, Class NAV (Columbia) | 5,912,706 | 58,890,556 |
|
| Mid Value, Class NAV (T. Rowe Price) | 7,960,675 | 116,305,469 |
|
| Mutual Shares, Class NAV (Franklin) | 10,352,866 | 111,810,952 |
|
| Natural Resources, Class NAV (Wellington) | 7,525,207 | 177,820,642 |
|
| Optimized Value, Class NAV (John Hancock2) (A) | 9,843,650 | 115,269,139 |
|
| Real Estate Equity, Class NAV (T. Rowe Price) | 14,488,865 | 112,723,373 |
|
| Small Cap Growth, Class NAV (Wellington) (I) | 4,556,884 | 47,209,319 |
|
| Small Cap Opportunities, Class NAV (Invesco/DFA) | 1,384,765 | 29,467,807 |
|
| Small Cap Value, Class NAV (Wellington) | 1,778,171 | 29,286,475 |
|
| Small Company Growth, Class NAV (Invesco) | 2,643,853 | 35,269,000 |
|
| Small Company Value, Class NAV (T. Rowe Price) | 3,428,564 | 88,045,533 |
|
| Smaller Company Growth, Class NAV | | |
| (Frontier/ John Hancock2 (A)/Perimeter) (I) | 3,223,270 | 36,777,508 |
|
| Technical Opportunities, Class NAV (Wellington) (I) | 15,424,777 | 175,533,958 |
|
| U.S. Multi Sector, Class NAV (GMO) | 33,956,948 | 327,344,980 |
|
| Value & Restructuring, Class NAV (Columbia) | 14,343,985 | 166,533,661 |
|
| Value, Class NAV (Invesco) | 5,948,180 | 58,530,093 |
| | | |
| John Hancock Funds III (G) 5.64% | | |
|
| Disciplined Value, Class NAV (Robeco) | 10,938,540 | 138,372,530 |
|
| International Core, Class NAV (GMO) | 8,417,520 | 246,128,280 |
|
| Rainier Growth, Class NAV (Rainier) | 12,139,731 | 251,535,217 |
| | | |
| FIXED INCOME 41.17% | | |
| John Hancock Funds II (G) 41.17% | | |
|
| Active Bond, Class NAV | | |
| (John Hancock1/Declaration) (A) | 43,265,330 | 436,114,530 |
|
| Core Bond, Class NAV (Wells Capital) | 21,106,767 | 270,166,621 |
|
| Currency Strategies, Class NAV (First Quadrant) (I) | 24,578,574 | 223,665,019 |
|
| Floating Rate Income, Class NAV (WAMCO) | 40,095,040 | 380,501,930 |
|
| Global Bond, Class NAV (PIMCO) | 29,620,959 | 359,302,231 |
|
| Global High Yield, Class NAV (Stone Harbor) | 10,289,851 | 107,631,841 |
|
| High Income, Class NAV (John Hancock1) (A) | 30,736,534 | 261,567,905 |
|
| High Yield, Class NAV (WAMCO) | 36,356,301 | 327,570,269 |
|
| Investment Quality Bond, Class NAV (Wellington) | 7,105,698 | 86,263,175 |
|
| Multi-Sector Bond, Class NAV (Stone Harbor) | 36,510,572 | 378,249,524 |
|
| Real Return Bond, Class NAV (PIMCO) | 25,721,267 | 314,571,091 |
|
| Spectrum Income, Class NAV (T. Rowe Price) | 36,174,097 | 384,168,906 |
|
| Strategic Income Opportunities, Class NAV | | |
| (John Hancock1) (A) | 30,099,978 | 328,691,762 |
|
| Total Return, Class NAV (PIMCO) | 37,430,709 | 516,169,474 |
|
| U.S. High Yield Bond, Class NAV (Wells Capital) | 21,408,692 | 270,819,959 |
| | | |
| Total Investments (Lifestyle Balanced Portfolio) | |
| (Cost $9,818,288,562) 100.00% | | $11,282,729,085 |
| | | |
| Other assets and liabilities, net 0.00% | | 127,633 |
|
| TOTAL NET ASSETS 100.00% | | $11,282,856,718 |
Percentages are based upon net assets.
See notes to financial statements
| | |
| | Annual report | Lifestyle Portfolios | 19 |
Lifestyle Moderate Portfolio
Securities owned by the Portfolio on 12-31-10
| | |
| | Shares | Value |
| Affiliated Investment Companies — 99.99% | |
|
| EQUITY 37.61% | | |
| | | |
| John Hancock Funds II (G) 33.04% | | |
|
| Alpha Opportunities, Class NAV (Wellington) | 5,495,064 | $64,127,396 |
|
| Blue Chip Growth, Class NAV (T. Rowe Price) | 8,100,853 | 165,662,438 |
|
| Capital Appreciation, Class NAV (Jennison) | 4,421,708 | 49,876,863 |
|
| Emerging Markets, Class NAV (DFA) | 3,201,713 | 39,188,963 |
|
| Equity-Income, Class NAV (T. Rowe Price) | 7,280,927 | 103,316,360 |
|
| Fundamental Value, Class NAV (Davis) | 8,037,792 | 121,129,526 |
|
| Global Real Estate, Class NAV (Deutsche) | 7,153,272 | 53,291,877 |
|
| Index 500, Class NAV (John Hancock2) (A) | 11,133,228 | 103,316,359 |
|
| International Growth Stock , Class NAV (Invesco) (I) | 1,626,334 | 17,727,044 |
|
| International Opportunities, Class NAV (Marsico) | 2,512,036 | 35,545,315 |
|
| International Value, Class NAV (Franklin) | 3,925,767 | 57,002,130 |
|
| Mid Cap Stock, Class NAV (Wellington) (I) | 3,058,929 | 53,439,497 |
|
| Mid Value, Class NAV (T. Rowe Price) | 3,657,734 | 53,439,497 |
|
| Natural Resources, Class NAV (Wellington) | 753,837 | 17,813,166 |
|
| Real Estate Equity, Class NAV (T. Rowe Price) | 4,579,220 | 35,626,331 |
|
| Small Cap Growth, Class NAV (Wellington) (I) | 859,709 | 8,906,583 |
|
| Small Cap Value, Class NAV (Wellington) | 540,776 | 8,906,583 |
|
| Small Company Growth, Class NAV (Invesco) | 667,660 | 8,906,583 |
|
| Small Company Value, Class NAV (T. Rowe Price) | 693,659 | 17,813,166 |
|
| Smaller Company Growth, Class NAV | | |
| (Frontier/ John Hancock2 (A)/Perimeter) (I) | 849,688 | 9,694,940 |
|
| U.S. Multi Sector, Class NAV (GMO) | 8,869,626 | 85,503,195 |
|
| Value & Restructuring, Class NAV (Columbia) | 4,296,026 | 49,876,864 |
| | | |
| John Hancock Funds III (G) 4.57% | | |
|
| Global Shareholder Yield, Class NAV (Epoch) | 9,223,058 | 84,206,515 |
|
| International Core, Class NAV (GMO) | 1,821,105 | 53,249,099 |
|
| Rainier Growth, Class NAV (Rainier) | 1,117,621 | 23,157,115 |
| | | |
| FIXED INCOME 62.38% | | |
| | | |
| John Hancock Funds II (G) 62.38% | | |
|
| Active Bond, Class NAV | | |
| (John Hancock1/Declaration) (A) | 24,065,614 | 242,581,391 |
|
| Core Bond, Class NAV (Wells Capital) | 13,549,548 | 173,434,208 |
|
| Currency Strategies, Class NAV (First Quadrant) (I) | 7,645,375 | 69,572,916 |
|
| Floating Rate Income, Class NAV (WAMCO) | 18,225,976 | 172,964,511 |
|
| Global Bond, Class NAV (PIMCO) | 10,940,685 | 132,710,510 |
|
| Global High Yield, Class NAV (Stone Harbor) | 4,943,139 | 51,705,237 |
|
| High Income, Class NAV (John Hancock1) (A) | 14,061,488 | 119,663,263 |
|
| High Yield, Class NAV (WAMCO) | 9,649,243 | 86,939,677 |
|
| Investment Quality Bond, Class NAV (Wellington) | 9,430,889 | 114,490,987 |
|
| Multi-Sector Bond, Class NAV (Stone Harbor) | 16,123,312 | 167,037,515 |
|
| Real Return Bond, Class NAV (PIMCO) | 10,797,296 | 132,050,926 |
|
| Spectrum Income, Class NAV (T. Rowe Price) | 15,881,464 | 168,661,149 |
|
| Strategic Income Opportunities, Class NAV | | |
| (John Hancock1) (A) | 13,062,937 | 142,647,270 |
|
| Total Bond Market, Class NAV (Declaration) (A) | 6,774,774 | 69,373,683 |
|
| Total Return, Class NAV (PIMCO) | 20,117,232 | 277,416,630 |
|
| U.S. High Yield Bond, Class NAV (Wells Capital) | 5,474,759 | 69,255,701 |
| | | |
| Total Investments (Lifestyle Moderate Portfolio) | |
| (Cost $3,191,821,921) 99.99% | | $3,511,228,979 |
| | | |
| Other assets and liabilities, net 0.01% | | 415,210 |
|
| TOTAL NET ASSETS 100.00% | | $3,511,644,189 |
Percentages are based upon net assets.
Lifestyle Conservative Portfolio
Securities owned by the Portfolio on 12-31-10
| | |
| | Shares | Value |
| Affiliated Investment Companies — 99.99% | |
|
| EQUITY 19.96% | | |
| | |
| John Hancock Funds II (G) 16.22% | | |
|
| Blue Chip Growth, Class NAV (T. Rowe Price) | 3,491,546 | $71,402,114 |
|
| Emerging Markets, Class NAV (DFA) | 1,166,701 | 14,280,422 |
|
| Equity-Income, Class NAV (T. Rowe Price) | 5,535,048 | 78,542,325 |
|
| Fundamental Value, Class NAV (Davis) | 4,738,030 | 71,402,114 |
|
| Global Real Estate, Class NAV (Deutsche) | 5,750,506 | 42,841,268 |
|
| Index 500, Class NAV (John Hancock2) (A) | 5,385,935 | 49,981,479 |
|
| International Value, Class NAV (Franklin) | 2,458,750 | 35,701,057 |
|
| Mid Cap Stock, Class NAV (Wellington) (I) | 408,713 | 7,140,211 |
|
| Mid Value, Class NAV (T. Rowe Price) | 488,721 | 7,140,211 |
|
| Natural Resources, Class NAV (Wellington) | 604,334 | 14,280,423 |
|
| Real Estate Equity, Class NAV (T. Rowe Price) | 3,671,060 | 28,560,846 |
|
| Small Cap Growth, Class NAV (Wellington) (I) | 689,210 | 7,140,211 |
|
| Small Company Value, Class NAV (T. Rowe Price) | 278,046 | 7,140,211 |
|
| U.S. Multi Sector, Class NAV (GMO) | 2,962,743 | 28,560,846 |
| | | |
| John Hancock Funds III (G) 3.74% | | |
|
| Global Shareholder Yield, Class NAV (Epoch) | 7,820,604 | 71,402,114 |
|
| International Core, Class NAV (GMO) | 1,220,966 | 35,701,057 |
| | | |
| FIXED INCOME 80.03% | | |
| | | |
| John Hancock Funds II (G) 80.03% | | |
|
| Active Bond, Class NAV | | |
| (John Hancock1/Declaration) (A) | 25,217,413 | 254,191,525 |
|
| Core Bond, Class NAV (Wells Capital) | 13,164,765 | 168,508,989 |
|
| Currency Strategies, Class NAV (First Quadrant) (I) | 6,294,197 | 57,277,193 |
|
| Floating Rate Income, Class NAV (WAMCO) | 15,047,864 | 142,804,228 |
|
| Global Bond, Class NAV (PIMCO) | 10,595,532 | 128,523,805 |
|
| Global High Yield, Class NAV (Stone Harbor) | 4,778,344 | 49,981,480 |
|
| High Income, Class NAV (John Hancock1) (A) | 5,687,805 | 48,403,218 |
|
| High Yield, Class NAV (WAMCO) | 8,717,239 | 78,542,325 |
|
| Investment Quality Bond, Class NAV (Wellington) | 13,174,690 | 159,940,735 |
|
| Multi-Sector Bond, Class NAV (Stone Harbor) | 14,819,327 | 153,528,230 |
|
| Real Return Bond, Class NAV (PIMCO) | 9,341,241 | 114,243,382 |
|
| Short Term Government Income, Class NAV | | |
| (John Hancock1) (A) | 12,839,541 | 128,523,805 |
|
| Spectrum Income, Class NAV (T. Rowe Price) | 14,485,793 | 153,839,121 |
|
| Strategic Income Opportunities, Class NAV | | |
| (John Hancock1) (A) | 14,540,568 | 158,783,002 |
|
| Total Bond Market, Class NAV (Declaration) (A) | 13,666,811 | 139,948,143 |
|
| Total Return, Class NAV (PIMCO) | 20,918,386 | 288,464,540 |
|
| U.S. High Yield Bond, Class NAV (Wells Capital) | 5,079,992 | 64,261,902 |
| | | |
| Total Investments (Lifestyle Conservative Portfolio) |
| (Cost $2,667,835,592) 99.99% | | $2,860,982,532 |
| | | |
| Other assets and liabilities, net 0.01% | | 346,093 |
|
| TOTAL NET ASSETS 100.00% | | $2,861,328,625 |
Percentages are based upon net assets.
Footnote Legend:
(A) The subadviser is an affiliate of the adviser.
(G) The underlying fund’s subadviser is shown parenthetically.
(I) Non-income producing.
1 Manulife Asset Management (US) LLC is doing business as John Hancock Asset Management.
2 Manulife Asset Management (North America) Limited is doing business as John Hancock Asset Management.
See notes to financial statements
| |
| 20 | Lifestyle Portfolios | Annual report |
F I N A N C I A L S T A T E M E N T S
Financial statements
Statements of assets and liabilities 12-31-10
These Statements of Assets and Liabilities are the Portfolios’ balance sheets. They show the value of what each Portfolio owns, is due and owes. You’ll also find the net asset value and the maximum offering price per share for each Portfolio. Net asset value is calculated by dividing the net assets of each class of shares by the number of outstanding shares in the class.
| | | |
| | Lifestyle | Lifestyle | Lifestyle |
| | Aggressive | Growth | Balanced |
| Assets | | | |
|
| Investments in affiliated funds, at value (Note 7) | $3,858,205,177 | $11,567,742,383 | $11,282,729,085 |
| Receivable for investments sold | 31,058,695 | 69,632,503 | 114,043,703 |
| Receivable for fund shares sold | 1,287,382 | 4,503,167 | 4,235,658 |
| Dividends and interest receivable | — | 7,138,815 | 11,621,048 |
| Other assets | 61,733 | 81,662 | 83,237 |
| Total assets | 3,890,612,987 | 11,649,098,530 | 11,412,712,731 |
| | | |
| Liabilities | | | |
|
| Payable for investments purchased | — | 7,249,262 | 66,794,751 |
| Payable for fund shares repurchased | 31,810,468 | 72,550,234 | 62,515,990 |
| Distributions payable | 369 | — | 94 |
| Payable to affiliates (Note 4): Accounting and legal services fees | 38,711 | 118,834 | 119,114 |
| Transfer agent fees | 52,832 | 178,272 | 184,749 |
| Trustees’ fees | 2,459 | 7,217 | 7,054 |
| Distribution and service fees | 18,443 | 38,298 | 54,981 |
| Investment management fees | 182 | 1,084 | — |
| Other liabilities and accrued expenses | 77,556 | 149,917 | 179,280 |
| Total liabilities | 32,001,020 | 80,293,118 | 129,856,013 |
| | | | |
| Net assets | | | |
|
| Capital paid-in | $3,941,191,727 | $11,716,132,820 | $11,462,670,852 |
| Undistributed net investment income | — | 439,378 | 861,809 |
| Accumulated net realized loss on investments | (703,459,617) | (1,696,945,818) | (1,645,116,466) |
| Net unrealized appreciation (depreciation) on investments | 620,879,857 | 1,549,179,032 | 1,464,440,523 |
| Net assets | $3,858,611,967 | $11,568,805,412 | $11,282,856,718 |
| Investments in affiliated funds, at cost | $3,237,325,320 | $10,018,563,351 | $9,818,288,562 |
| | | | |
| Net asset value per share | | | |
|
| The Portfolios have an unlimited number of shares authorized with par value of $0.01 | | | |
| per share. Net asset value is calculated by dividing the net assets of each class of | | | |
| shares by the number of outstanding shares in the class. | | | |
| Class A: Net assets | $184,695,937 | $593,331,509 | $587,817,506 |
| Shares outstanding | 14,968,693 | 46,030,023 | 45,344,681 |
| Net asset value and redemption price per share | $12.34 | $12.89 | $12.96 |
| Class B:1 Net assets | $24,073,534 | $89,353,594 | $74,409,716 |
| Shares outstanding | 1,946,355 | 6,913,331 | 5,739,759 |
| Net asset value, offering price and redemption price per share | $12.37 | $12.92 | $12.96 |
| Class C:1 Net assets | $110,881,377 | $403,982,378 | $448,232,752 |
| Shares outstanding | 8,964,787 | 31,290,624 | 34,549,919 |
| Net asset value, offering price and redemption price per share | $12.37 | $12.91 | $12.97 |
| Class R1: Net assets | $8,368,027 | $15,216,688 | $14,530,534 |
| Shares outstanding | 675,791 | 1,174,585 | 1,124,232 |
| Net asset value, offering price and redemption price per share | $12.38 | $12.95 | $12.92 |
| Class R3: Net assets | $12,138,237 | $23,330,231 | $39,218,661 |
| Shares outstanding | 984,512 | 1,811,305 | 3,030,505 |
| Net asset value, offering price and redemption price per share | $12.33 | $12.88 | $12.94 |
| Class R4: Net assets | $8,198,954 | $19,414,695 | $28,921,253 |
| Shares outstanding | 665,644 | 1,506,993 | 2,234,732 |
| Net asset value, offering price and redemption price per share | $12.32 | $12.88 | $12.94 |
| Class R5: Net assets | $11,420,906 | $21,820,763 | $38,272,702 |
| Shares outstanding | 927,404 | 1,693,990 | 2,954,044 |
| Net asset value, offering price and redemption price per share | $12.31 | $12.88 | $12.96 |
| Class 1: Net assets | $3,498,834,995 | $10,304,523,989 | $10,002,867,876 |
| Shares outstanding | 284,863,923 | 802,733,333 | 775,174,456 |
| Net asset value, offering price and redemption price per share | $12.28 | $12.84 | $12.90 |
| Class 5: Net assets | — | $97,831,565 | $48,585,718 |
| Shares outstanding | — | 7,629,536 | 3,763,890 |
| Net asset value, offering price and redemption price per share | — | $12.82 | $12.91 |
| Maximum public offering price per share | | | |
| Class A (net asset value per share ÷ 95%)2 | $12.99 | $13.57 | $13.64 |
1 Redemption price per share is equal to net asset value less any applicable contingent deferred sales charge.
2 On single retail sales of less than $50,000. On sales of $50,000 or more and on group sales the offering price is reduced.
See notes to financial statements
| | |
| | Annual report | Lifestyle Portfolios | 21 |
F I N A N C I A L S T A T E M E N T S
Statements of assets and liabilities 12-31-10
Continued
| | |
| | Lifestyle | Lifestyle |
| | Moderate | Conservative |
| Assets | | |
|
| Investments in affiliated funds, at value (Note 7) | $3,511,228,979 | $2,860,982,532 |
| Receivable for investments sold | 26,646,006 | 18,426,270 |
| Receivable for fund shares sold | 1,444,636 | 1,449,070 |
| Dividends and interest receivable | 5,355,954 | 5,243,411 |
| Other assets | 69,889 | 73,609 |
| Total assets | 3,544,745,464 | 2,886,174,892 |
|
| Liabilities | | |
|
| Payable for investments purchased | 5,435,588 | 5,319,257 |
| Payable for fund shares repurchased | 27,437,685 | 19,288,679 |
| Distributions payable | — | — |
| Payable to affiliates (Note 4): Accounting and legal services fees | 37,869 | 36,211 |
| Transfer agent fees | 70,897 | 72,325 |
| Trustees’ fees | 2,100 | 1,706 |
| Distribution and service fees | 17,729 | 19,839 |
| Investment management fees | — | — |
| Other liabilities and accrued expenses | 99,407 | 108,250 |
| Total liabilities | 33,101,275 | 24,846,267 |
| | |
| Net assets | | |
|
| Capital paid-in | $3,491,425,143 | $2,822,204,138 |
| Undistributed net investment income | 391,781 | 367,054 |
| Accumulated net realized loss on investments | (299,579,793) | (154,389,507) |
| Net unrealized appreciation (depreciation) on investments | 319,407,058 | 193,146,940 |
| | | |
| Net assets | $3,511,644,189 | $2,861,328,625 |
| Investments in affiliated funds, at cost | $3,191,821,921 | $2,667,835,592 |
| | | |
| Net asset value per share | | |
|
| The Portfolios have an unlimited number of shares authorized with par value of $0.01 | | |
| per share. Net asset value is calculated by dividing the net assets of each class of | | |
| shares by the number of outstanding shares in the class. | | |
| Class A: Net assets | $220,128,592 | $217,961,366 |
| Shares outstanding | 17,422,385 | 17,067,901 |
| Net asset value and redemption price per share | $12.63 | $12.77 |
| Class B:1 Net assets | $25,891,816 | $28,136,623 |
| Shares outstanding | 2,050,560 | 2,202,770 |
| Net asset value, offering price and redemption price per share | $12.63 | $12.77 |
| Class C:1 Net assets | $182,838,859 | $189,389,686 |
| Shares outstanding | 14,469,131 | 14,833,157 |
| Net asset value, offering price and redemption price per share | $12.64 | $12.77 |
| Class R1: Net assets | $6,743,287 | $8,420,474 |
| Shares outstanding | 533,774 | 658,659 |
| Net asset value, offering price and redemption price per share | $12.63 | $12.78 |
| Class R3: Net assets | $9,540,101 | $10,667,830 |
| Shares outstanding | 755,964 | 836,213�� |
| Net asset value, offering price and redemption price per share | $12.62 | $12.76 |
| Class R4: Net assets | $7,360,533 | $6,519,175 |
| Shares outstanding | 584,023 | 511,013 |
| Net asset value, offering price and redemption price per share | $12.60 | $12.76 |
| Class R5: Net assets | $11,275,740 | $9,387,903 |
| Shares outstanding | 893,763 | 735,246 |
| Net asset value, offering price and redemption price per share | $12.62 | $12.77 |
| Class 1: Net assets | $3,025,800,145 | $2,390,845,568 |
| Shares outstanding | 239,954,093 | 187,440,823 |
| Net asset value, offering price and redemption price per share | $12.61 | $12.76 |
| Class 5: Net assets | $22,065,116 | — |
| Shares outstanding | 1,751,325 | — |
| Net asset value, offering price and redemption price per share | $12.60 | — |
| | | |
| Maximum public offering price per share | | |
|
| Class A (net asset value per share ÷ 95%)2 | $13.29 | $13.44 |
1 Redemption price per share is equal to net asset value less any applicable contingent deferred sales charge.
2 On single retail sales of less than $50,000. On sales of $50,000 or more and on group sales the offering price is reduced.
See notes to financial statements
| |
| 22 | Lifestyle Portfolios | Annual report |
F I N A N C I A L S T A T E M E N T S
Statements of operations For the year ended 12-31-10
These Statements of Operations summarize the Portfolios’ investment income earned and expenses directly incurred in operating each Portfolio. They also show net gains (losses) for the period stated.
| | | | | |
| | Lifestyle | Lifestyle | Lifestyle | Lifestyle | Lifestyle |
| | Aggressive | Growth | Balanced | Moderate | Conservative |
| Investment income | | | | | |
|
| Income distributions received from affiliated | | | | | |
| underlying funds | $31,447,762 | $211,744,775 | $304,631,249 | $119,639,871 | $108,476,683 |
| | | | | | |
| Expenses | | | | | |
| Investment management fees (Note 4) | 1,633,934 | 4,519,283 | 4,240,148 | 1,300,395 | 1,060,064 |
| Distribution and service fees (Note 4) | 3,361,489 | 10,612,064 | 10,917,612 | 3,765,939 | 3,544,278 |
| Transfer agent fees (Note 4) | 605,300 | 1,716,132 | 1,676,545 | 621,567 | 612,874 |
| Accounting and legal services fees (Note 4) | 486,871 | 1,460,324 | 1,430,467 | 444,456 | 368,130 |
| State registration fees (Note 4) | 52,295 | 73,432 | 79,003 | 63,923 | 61,514 |
| Professional fees | 85,679 | 189,800 | 185,856 | 80,032 | 70,822 |
| Printing and postage (Note 4) | 20,848 | 41,265 | 36,913 | 21,959 | 21,742 |
| Custodian fees | 12,000 | 12,000 | 12,000 | 12,000 | 12,000 |
| Trustees’ fees (Note 4) | 33,044 | 98,845 | 96,996 | 30,081 | 24,547 |
| Registration and filing fees | 36,196 | 18,567 | 73,281 | 78,085 | 94,697 |
| Miscellaneous | 35,849 | 98,032 | 95,166 | 32,259 | 26,363 |
| | | | | | |
| Total expenses before reductions and | | | | | |
| amounts recaptured | 6,363,505 | 18,839,744 | 18,843,987 | 6,450,696 | 5,897,031 |
| | | | | | |
| Net expense reductions and amounts recaptured | | | | | |
| (Note 4) | (116,636) | (188,621) | (25,103) | 11,921 | 7,338 |
| | | | | | |
| Total expenses | 6,246,869 | 18,651,123 | 18,818,884 | 6,462,617 | 5,904,369 |
| | | | | | |
| Net investment income | 25,200,893 | 193,093,652 | 285,812,365 | 113,177,254 | 102,572,314 |
| | | | | |
| Realized and unrealized gain (loss) | | | | | |
|
| Net realized gain (loss) on | | | | | |
| Investments in affiliated underlying funds | (101,636,205) | (32,569,240) | (68,513,281) | (31,743,048) | 1,276,033 |
| Capital gain distributions received from affiliated | | | | | |
| underlying funds | 67,005,289 | 188,194,770 | 168,624,775 | 48,710,366 | 36,103,308 |
| | (34,630,916) | 155,625,530 | 100,111,494 | 16,967,318 | 37,379,341 |
| Change in net unrealized appreciation | | | | | |
| (depreciation) of | | | | | |
| Investments in affiliated underlying funds | 539,816,745 | 1,163,853,629 | 939,029,364 | 243,513,038 | 115,923,453 |
| | 539,816,745 | 1,163,853,629 | 939,029,364 | 243,513,038 | 115,923,453 |
| Net realized and unrealized gain | 505,185,829 | 1,319,479,159 | 1,039,140,858 | 260,480,356 | 153,302,794 |
| | | | | | |
| Increase in net assets from operations | $530,386,722 | $1,512,572,811 | $1,324,953,223 | $373,657,610 | $255,875,108 |
See notes to financial statements
| | |
| | Annual report | Lifestyle Portfolios | 23 |
F I N A N C I A L S T A T E M E N T S
Statements of changes in net assets
These Statements of Changes in Net Assets show how the value of the Portfolios’ net assets have changed during the period. They reflect earnings less expenses, any investment gains and losses, distributions, if any, paid to shareholders and the net of Portfolio share transactions.
| | | | |
| | Lifestyle Aggressive | | Lifestyle Growth | |
| | Year Ended 12-31-10 | Year Ended 12-31-09 | Year Ended 12-31-10 | Year Ended 12-31-09 |
| Increase (decrease) in net assets | | | | |
|
| From operations | | | | |
| Net investment income | $25,200,893 | $28,276,848 | $193,093,652 | $201,128,938 |
| Net realized gain (loss) | (34,630,916) | (270,314,079) | 155,625,530 | (790,676,249) |
| Change in net unrealized appreciation (depreciation) | 539,816,745 | 1,134,320,799 | 1,163,853,629 | 3,109,916,824 |
| | | | | |
| Increase in net assets resulting from | 530,386,722 | 892,283,568 | 1,512,572,811 | 2,520,369,513 |
| operations | | | | |
| |
| Distributions to shareholders | | | | |
| From net investment income | | | | |
| Class A | (475,639) | (630,612) | (7,830,429) | (7,070,624) |
| Class B | — | — | (552,736) | (809,211) |
| Class C | — | — | (2,857,718) | (3,420,732) |
| Class R1 | — | (5,516) | (159,043) | (138,441) |
| Class R3 | (11,124) | (25,799) | (263,910) | (283,371) |
| Class R4 | (31,239) | (38,089) | (277,122) | (281,708) |
| Class R5 | (69,856) | (72,599) | (354,466) | (351,449) |
| Class 1 | (25,224,475) | (27,656,032) | (179,130,375) | (188,654,587) |
| Class 5 | — | — | (1,723,497) | (1,452,733) |
| From net realized gain | | | | |
| Class A | (1,806,250) | (510,730) | (5,892,066) | (1,570,157) |
| Class B | (146,492) | (56,216) | (896,445) | (287,229) |
| Class C | (673,946) | (229,565) | (4,050,175) | (1,159,785) |
| Class R1 | (79,528) | (22,322) | (150,736) | (41,136) |
| Class R3 | (122,075) | (37,553) | (233,328) | (71,616) |
| Class R4 | (81,627) | (30,848) | (193,531) | (61,644) |
| Class R5 | (113,836) | (36,760) | (214,353) | (66,680) |
| Class 1 | (34,861,743) | (11,484,426) | (103,498,945) | (34,093,560) |
| Class 5 | — | — | (970,645) | (257,438) |
| | | | | |
| Total distributions | (63,697,830) | (40,837,067) | (309,249,520) | (240,072,101) |
| | | | | |
| From Portfolio share transactions (Note 5) | 55,504,569 | 186,719,081 | 533,198,162 | 607,855,954 |
| |
| Total increase | 522,193,461 | 1,038,165,582 | 1,736,468,453 | 2,888,153,366 |
| | | | |
| Net assets | | | | |
|
| Beginning of year | 3,336,418,506 | 2,298,252,924 | 9,832,283,959 | 6,944,130,593 |
| | | | | |
| End of year | $3,858,611,967 | $3,336,418,506 | $11,568,805,412 | $9,832,283,959 |
| | | | | |
| Undistributed net investment income | — | $78,939 | $439,378 | $498,463 |
See notes to financial statements
| |
| 24 | Lifestyle Portfolios | Annual report |
F I N A N C I A L S T A T E M E N T S
Statements of changes in net assets
Continued
| | | | |
| | Lifestyle Balanced | | Lifestyle Moderate | |
| | Year Ended 12-31-10 | Year Ended 12-31-09 | Year Ended 12-31-10 | Year Ended 12-31-09 |
| Increase (decrease) in net assets | | | | |
|
| From operations | | | | |
| Net investment income | $285,812,365 | $281,471,402 | $113,177,254 | $104,101,297 |
| Net realized gain (loss) | 100,111,494 | (828,430,095) | 16,967,318 | (189,874,901) |
| Change in net unrealized appreciation | 939,029,364 | 2,852,959,551 | 243,513,038 | 681,861,530 |
| (depreciation) | | | | |
| Increase in net assets resulting from | 1,324,953,223 | 2,306,000,858 | 373,657,610 | 596,087,926 |
| operations | | | | |
| |
| Distributions to shareholders | | | | |
| From net investment income | | | | |
| Class A | (12,316,849) | (10,196,327) | (6,004,885) | (4,645,678) |
| Class B | (1,103,762) | (1,279,662) | (551,703) | (524,569) |
| Class C | (6,932,674) | (6,481,199) | (3,984,622) | (3,042,754) |
| Class R | — | (30,044) | — | (17,911) |
| Class R1 | (276,506) | (180,223) | (180,227) | (139,229) |
| Class R2 | — | (46,524) | — | (16,491) |
| Class R3 | (775,357) | (738,787) | (263,761) | (251,695) |
| Class R4 | (662,605) | (637,423) | (196,346) | (153,794) |
| Class R5 | (952,191) | (770,253) | (359,442) | (257,339) |
| Class I | (261,408,646) | (261,455,836) | (100,806,164) | (94,893,766) |
| Class 5 | (1,197,779) | (898,953) | (692,426) | (485,292) |
| From net realized gain | | | | |
| Class A | (5,827,726) | (1,313,724) | (2,171,717) | (443,807) |
| Class B | (744,111) | (208,278) | (255,928) | (60,005) |
| Class C | (4,473,888) | (1,056,007) | (1,809,705) | (354,383) |
| Class R1 | (144,968) | (33,287) | (66,482) | (17,415) |
| Class R3 | (390,408) | (97,447) | (93,970) | (25,265) |
| Class R4 | (288,408) | (78,956) | (72,832) | (13,526) |
| Class R5 | (393,208) | (89,346) | (111,349) | (23,001) |
| Class I | (100,572,024) | (27,872,312) | (30,164,371) | (7,657,451) |
| Class 5 | (482,593) | (101,460) | (218,560) | (42,708) |
| Total distributions | (398,943,703) | (313,566,048) | (148,004,490) | (113,066,079) |
| From Portfolio share transactions (Note 5) | 875,814,605 | 669,110,101 | 460,538,401 | 291,315,446 |
| |
| Total increase | 1,801,824,125 | 2,661,544,911 | 686,191,521 | 774,337,293 |
| | | | |
| Net assets | | | | |
|
| Beginning of year | 9,481,032,593 | 6,819,487,682 | 2,825,452,668 | 2,051,115,375 |
| End of year | $11,282,856,718 | $9,481,032,593 | $3,511,644,189 | $2,825,452,668 |
| | | | | |
| Undistributed net investment income | $861,809 | $679,983 | $391,781 | $255,527 |
See notes to financial statements
| | |
| | Annual report | Lifestyle Portfolios | 25 |
F I N A N C I A L S T A T E M E N T S
Statements of changes in net assets
Continued
| | | | |
| | Lifestyle Conservative | | | |
| | Year Ended 12-31-10 | Year Ended 12-31-09 | | |
| Increase (decrease) in net assets | | | | |
| | |
| From operations | | | | |
| Net investment income | $102,572,314 | $91,629,920 | | |
| Net realized gain (loss) | 37,379,341 | (112,405,266) | | |
| Change in net unrealized appreciation | 115,923,453 | 409,480,142 | | |
| (depreciation) | | | | |
| Increase in net assets resulting from | 255,875,108 | 388,704,796 | | |
| operations | | | | |
| | | | | |
| Distributions to shareholders | | | | |
| From net investment income | | | | |
| Class A | (6,707,189) | (5,075,375) | | |
| Class B | (717,507) | (629,455) | | |
| Class C | (4,766,114) | (3,571,788) | | |
| Class R | — | (25,511) | | |
| Class R1 | (256,696) | (190,701) | | |
| Class R2 | — | (10,451) | | |
| Class R3 | (331,001) | (301,534) | | |
| Class R4 | (191,961) | (136,489) | | |
| Class R5 | (394,781) | (322,972) | | |
| Class I | (89,108,986) | (81,718,889) | | |
| From net realized gain | | | | |
| Class A | (2,079,581) | (511,233) | | |
| Class B | (269,077) | (75,135) | | |
| Class C | (1,811,410) | (430,087) | | |
| Class R1 | (81,023) | (23,998) | | |
| Class R3 | (101,731) | (29,565) | | |
| Class R4 | (61,882) | (13,888) | | |
| Class R5 | (101,354) | (31,020) | | |
| Class I | (22,926,013) | (7,025,408) | | |
| | | | | |
| Total distributions | (129,906,306) | (100,123,499) | | |
| | | | | |
| From Portfolio share transactions (Note 5) | 496,509,122 | 364,299,113 | | |
| | | |
| Total increase | 622,477,924 | 652,880,410 | | |
| | | | | |
| Net assets | | | | |
| | |
|
| Beginning of year | 2,238,850,701 | 1,585,970,291 | | |
| | | | | |
| End of year | $2,861,328,625 | $2,238,850,701 | | |
| | | | | |
| Undistributed net investment income | $367,054 | $269,866 | | |
See notes to financial statements
| |
| 26 | Lifestyle Portfolios | Annual report |
Financial highlights
These Financial Highlights show how each Portfolio’s net asset value for a share has changed since the beginning of the period.
Lifestyle Aggressive
| | | | | | | | | | | | | | | |
| Per share operating performance for a share outstanding throughout the period | Ratios and supplemental data | |
|
| | | Income (loss) from | | | | | | | | | | | | |
| | | investment operations | | Less distributions | | | | | Ratios to average net assets | | | |
| | |
| |
| |
| |
| | | | Net | | | | | | | | | Expenses | | | |
| | | | realized | Total | | | | | | | Expenses | including | | Net | |
| | Net asset | Net | and | from | From net | | | | | | before re- | reduc- | | assets, | |
| | value, | invest- | unrealized | invest- | invest- | | | | Net asset | | ductions and | tions and | Net | end of | |
| | beginning | ment in- | gain (loss) | ment | ment | From net | From | Total value, | end | Total | amounts | amounts | investment | period (in | Portfolio |
| | of period | come (loss) | on invest- | operations | income | realized | capital | distribu- | of period | return | recaptured | recaptured | income | millions) | turnover |
| Period ended | ($) | ($)1,2 | ments ($) | ($) | ($) | gain ($) | paid-in ($) | tions ($) | ($) | (%)3 | (%) | (%) | (loss) (%)1 | ($) | (%) |
|
| CLASS A | | | | | | | | | | | | | | | |
|
| 12-31-2010 | 10.82 | 0.04 | 1.64 | 1.68 | (0.04) | (0.12) | — | (0.16) | 12.34 | 15.504 | 0.595 | 0.615,6 | 0.34 | 185 | 19 |
| 12-31-2009 | 8.02 | 0.06 | 2.83 | 2.89 | (0.05) | (0.04) | — | (0.09) | 10.82 | 36.044 | 0.725 | 0.655 | 0.70 | 138 | 23 |
| 12-31-2008 | 15.22 | 0.10 | (6.58) | (6.48) | (0.09) | (0.63) | — | (0.72) | 8.02 | (42.40)4 | 0.665 | 0.615 | 0.77 | 78 | 36 |
| 12-31-2007 | 14.72 | 0.11 | 1.05 | 1.16 | (0.12) | (0.54) | — | (0.66) | 15.22 | 8.004 | 0.595 | 0.595 | 0.69 | 116 | 21 |
| 12-31-20067 | 14.06 | 0.08 | 1.24 | 1.32 | (0.37) | (0.29) | — | (0.66) | 14.72 | 9.404,8 | 0.659,10 | 0.649,10 | 1.6910 | 56 | 5 |
| 8-31-200611 | 12.63 | (0.07) | 1.56 | 1.49 | (0.06) | — | — | (0.06) | 14.06 | 11.854,8 | 0.849,10 | 0.659,10 | (0.59)10 | 35 | 23 |
|
| CLASS B | | | | | | | | | | | | | | | |
|
| 12-31-2010 | 10.86 | (0.05) | 1.64 | 1.59 | — | (0.08) | — | (0.08) | 12.37 | 14.614 | 1.375 | 1.355,6 | (0.46) | 24 | 19 |
| 12-31-2009 | 8.06 | (0.01) | 2.84 | 2.83 | — | (0.03) | — | (0.03) | 10.86 | 35.094 | 1.605 | 1.355 | (0.15) | 22 | 23 |
| 12-31-2008 | 15.23 | —12 | (6.54) | (6.54) | — | (0.63) | — | (0.63) | 8.06 | (42.84)4 | 1.515 | 1.355 | 0.01 | 16 | 36 |
| 12-31-2007 | 14.72 | (0.02) | 1.07 | 1.05 | — | (0.54) | — | (0.54) | 15.23 | 7.234 | 1.375 | 1.355 | (0.13) | 24 | 21 |
| 12-31-20067 | 14.00 | 0.05 | 1.23 | 1.28 | (0.27) | (0.29) | — | (0.56) | 14.72 | 9.154,8 | 1.549,10 | 1.359,10 | 1.0710 | 13 | 5 |
| 8-31-200611 | 12.63 | (0.15) | 1.56 | 1.41 | (0.04) | — | — | (0.04) | 14.00 | 11.224,8 | 2.009,10 | 1.349,10 | (1.23)10 | 8 | 23 |
|
| CLASS C | | | | | | | | | | | | | | | |
|
| 12-31-2010 | 10.86 | (0.04) | 1.63 | 1.59 | — | (0.08) | — | (0.08) | 12.37 | 14.614 | 1.295 | 1.335,6 | (0.39) | 111 | 19 |
| 12-31-2009 | 8.06 | (0.01) | 2.84 | 2.83 | — | (0.03) | — | (0.03) | 10.86 | 35.094 | 1.435 | 1.355 | (0.14) | 89 | 23 |
| 12-31-2008 | 15.23 | 0.01 | (6.55) | (6.54) | — | (0.63) | — | (0.63) | 8.06 | (42.79)4 | 1.365 | 1.315 | 0.05 | 62 | 36 |
| 12-31-2007 | 14.73 | —12 | 1.05 | 1.05 | (0.01) | (0.54) | — | (0.55) | 15.23 | 7.214 | 1.325 | 1.315 | 0.03 | 95 | 21 |
| 12-31-20067 | 14.00 | 0.05 | 1.24 | 1.29 | (0.27) | (0.29) | — | (0.56) | 14.73 | 9.224,8 | 1.369,10 | 1.359,10 | 1.1010 | 39 | 5 |
| 8-31-200611 | 12.63 | (0.15) | 1.57 | 1.42 | (0.05) | — | — | (0.05) | 14.00 | 11.224,8 | 1.609,10 | 1.349,10 | (1.27)10 | 25 | 23 |
|
| CLASS R1 | | | | | | | | | | | | | | | |
|
| 12-31-2010 | 10.87 | —14 | 1.63 | 1.63 | — | (0.12) | — | (0.12) | 12.38 | 14.994 | 0.915 | 0.965,6 | (0.03) | 8 | 19 |
| 12-31-2009 | 8.05 | 0.08 | 2.79 | 2.87 | (0.01) | (0.04) | — | (0.05) | 10.87 | 35.664 | 1.165 | 1.055 | 0.81 | 6 | 23 |
| 12-31-2008 | 15.27 | 0.10 | (6.63) | (6.53) | (0.06) | (0.63) | — | (0.69) | 8.05 | (42.56)4 | 1.495 | 0.855 | 0.83 | 2 | 36 |
| 12-31-2007 | 14.76 | 0.15 | 1.00 | 1.15 | (0.10) | (0.54) | — | (0.64) | 15.27 | 7.924 | 3.545 | 0.725,13 | 0.92 | 1 | 21 |
| 12-31-20067,11 | 14.11 | 0.08 | 1.23 | 1.31 | (0.37) | (0.29) | — | (0.66) | 14.76 | 9.254,8 | 12.899,10 | 0.709,10 | 1.7910 | —15 | 5 |
|
| CLASS R3 | | | | | | | | | | | | | | | |
|
| 12-31-2010 | 10.82 | 0.01 | 1.63 | 1.64 | (0.01) | (0.12) | — | (0.13) | 12.33 | 15.214 | 0.855 | 0.845 | 0.06 | 12 | 19 |
| 12-31-2009 | 8.03 | 0.03 | 2.83 | 2.86 | (0.03) | (0.04) | — | (0.07) | 10.82 | 35.594 | 0.955 | 0.955 | 0.31 | 10 | 23 |
| 12-31-2008 | 15.22 | 0.07 | (6.57) | (6.50) | (0.06) | (0.63) | — | (0.69) | 8.03 | (42.54)4 | 0.915 | 0.865 | 0.59 | 6 | 36 |
| 12-31-2007 | 14.72 | 0.11 | 1.03 | 1.14 | (0.10) | (0.54) | — | (0.64) | 15.22 | 7.854 | 1.215 | 0.815,13 | 0.68 | 7 | 21 |
| 12-31-20067 | 14.06 | 0.08 | 1.24 | 1.32 | (0.37) | (0.29) | — | (0.66) | 14.72 | 9.364,8 | 2.219,10 | 0.729,10 | 1.7010 | 2 | 5 |
| 8-31-200611 | 12.63 | (0.05) | 1.54 | 1.49 | (0.06) | — | — | (0.06) | 14.06 | 11.814,8 | 8.079,10 | 0.699,10 | (0.47)10 | 1 | 23 |
|
| CLASS R4 | | | | | | | | | | | | | | | |
|
| 12-31-2010 | 10.81 | 0.04 | 1.64 | 1.68 | (0.05) | (0.12) | — | (0.17) | 12.32 | 15.564 | 0.555 | 0.555 | 0.34 | 8 | 19 |
| 12-31-2009 | 8.01 | 0.06 | 2.83 | 2.89 | (0.05) | (0.04) | — | (0.09) | 10.81 | 36.094 | 0.625 | 0.625 | 0.68 | 9 | 23 |
| 12-31-2008 | 15.21 | 0.18 | (6.66) | (6.48) | (0.09) | (0.63) | — | (0.72) | 8.01 | (42.38)4 | 0.665 | 0.565 | 1.56 | 6 | 36 |
| 12-31-2007 | 14.71 | 0.11 | 1.07 | 1.18 | (0.14) | (0.54) | — | (0.68) | 15.21 | 8.134 | 0.965 | 0.545,13 | 0.70 | 5 | 21 |
| 12-31-20067 | 14.07 | 0.08 | 1.25 | 1.33 | (0.40) | (0.29) | — | (0.69) | 14.71 | 9.464,8 | 1.389,10 | 0.539,10 | 1.7110 | 2 | 5 |
| 8-31-200611 | 12.63 | (0.05) | 1.55 | 1.50 | (0.06) | — | — | (0.06) | 14.07 | 11.944,8 | 4.089,10 | 0.499,10 | (0.38)10 | 2 | 23 |
|
| | |
| | Annual report | Lifestyle Portfolios | 27 |
See notes to financial statements
Financial highlights
Continued
Lifestyle Aggressive continued
| | | | | | | | | | | | | | | |
| Per share operating performance for a share outstanding throughout the period | Ratios and supplemental data | |
|
| | | Income (loss) from | | | | | | | | | | | | |
| | | investment operations | | Less distributions | | | | | Ratios to average net assets | | | |
| | |
| |
| |
| |
| | | | Net | | | | | | | | | | | | |
| | | | realized | Total | | | | | | | Expenses | Expenses | | Net | |
| | Net asset | Net | and | from | From net | | | | | | before re- | including | | assets, | |
| | value, | invest- | unrealized | invest- | invest- | | | | Net asset | | ductions and | reductions | Net | end of | |
| | beginning | ment in- | gain (loss) | ment | ment | From net | From | Total value, | end | Total | amounts | and amounts | investment | period (in | Portfolio |
| | of period | come (loss) | on invest- | operations | income | realized | capital | distribu- | of period | return | recaptured | recaptured | income | millions) | turnover |
| Period ended | ($) | ($)1,2 | ments ($) | ($) | ($) | gain ($) | paid-in ($) | tions ($) | ($) | (%)3 | (%) | (%) | (loss) (%)1 | ($) | (%) |
|
| CLASS R5 | | | | | | | | | | | | | | | |
|
| 12-31-2010 | 10.80 | 0.08 | 1.63 | 1.71 | (0.08) | (0.12) | — | (0.20) | 12.31 | 15.844 | 0.265 | 0.255 | 0.68 | 11 | 19 |
| 12-31-2009 | 8.00 | 0.09 | 2.83 | 2.92 | (0.08) | (0.04) | — | (0.12) | 10.80 | 36.514 | 0.325 | 0.325 | 0.97 | 10 | 23 |
| 12-31-2008 | 15.21 | 0.17 | (6.62) | (6.45) | (0.13) | (0.63) | — | (0.76) | 8.00 | (42.18)4 | 0.325 | 0.245 | 1.42 | 6 | 36 |
| 12-31-2007 | 14.71 | 0.22 | 1.00 | 1.22 | (0.18) | (0.54) | — | (0.72) | 15.21 | 8.424 | 1.115 | 0.235,13 | 1.40 | 3 | 21 |
| 12-31-20067 | 14.09 | 0.09 | 1.26 | 1.35 | (0.44) | (0.29) | — | (0.73) | 14.71 | 9.574,8 | 4.079,10 | 0.239,10 | 1.9010 | 1 | 5 |
| 8-31-200611 | 12.63 | 0.01 | 1.52 | 1.53 | (0.07) | — | — | (0.07) | 14.09 | 12.164,8 | 8.269,10 | 0.209,10 | 0.0510 | —15 | 23 |
|
| CLASS 1 | | | | | | | | | | | | | | | |
|
| 12-31-2010 | 10.77 | 0.09 | 1.63 | 1.72 | (0.09) | (0.12) | — | (0.21) | 12.28 | 16.014 | 0.125 | 0.115 | 0.79 | 3,499 | 19 |
| 12-31-2009 | 7.98 | 0.10 | 2.83 | 2.93 | (0.10) | (0.04) | — | (0.14) | 10.77 | 36.704 | 0.115 | 0.115 | 1.11 | 3,052 | 23 |
| 12-31-2008 | 15.18 | 0.15 | (6.57) | (6.42) | (0.15) | (0.63) | — | (0.78) | 7.98 | (42.08)4 | 0.125 | 0.125 | 1.24 | 2,120 | 36 |
| 12-31-2007 | 14.68 | 0.15 | 1.09 | 1.24 | (0.20) | (0.54) | — | (0.74) | 15.18 | 8.54 | 0.115 | 0.115 | 0.94 | 3,416 | 21 |
| 12-31-20067 | 14.07 | 0.10 | 1.25 | 1.35 | (0.45) | (0.29) | — | (0.74) | 14.68 | 9.598 | 0.119,10 | 0.119,10 | 2.0910 | 2,782 | 5 |
| 8-31-200611 | 12.60 | 0.06 | 1.48 | 1.54 | (0.07) | — | — | (0.07) | 14.07 | 12.278 | 0.119,10 | 0.119,10 | 0.4810 | 2,422 | 23 |
|
1 Recognition of net investment income by the Portfolio is affected by the timing of the declaration of dividends by the underlying funds in which the Portfolio invests.
2 Based on the average daily shares outstanding.
3 Does not reflect the effect of sales charges, if any.
4 Total returns would have been lower had certain expenses not been reduced during the periods shown.
5 Ratios do not include expenses indirectly incurred from underlying funds whose expense ratios can vary based on the mix of underlying funds held by the Portfolio. The range of expense ratios of the underlying funds held by the Portfolio was as follows: 0.48%–1.39%, 0.49%–1.40%, 0.49%–2.84% and 0.79%–0.91%, for the years ended 12-31-10, 12-31-09, 12-31-08 and 12-31-07, respectively.
6 Includes the impact of expense recapture which amounted to 0.03%, 0.03%, 0.05% and 0.05% of average net assets for Class A, Class B, Class C and Class R1 shares, respectively. See Note 4.
7 The fiscal year-end changed from August 31 to December 31.
8 Not annualized.
9 Does not include expenses of the underlying affiliated funds in which the Portfolio invests.
10 Annualized.
11 The inception date for Class A, Class B, Class C, Class R3, Class R4 and Class R5 shares is 10-18-05 and the inception dates for Class R1 and Class 1 shares are 9-18-06 and 10-15-05, respectively.
12 Less than $0.005 per share.
13 Includes transfer agent fee earned credits of less than 0.01% of average net assets.
14 Less than ($0.005) per share.
15 Less than $500,000.
Lifestyle Growth
| | | | | | | | | | | | | | | |
| Per share operating performance for a share outstanding throughout the period | Ratios and supplemental data | |
|
| | | Income (loss) from | | | | | | | | | | | | |
| | | investment operations | | Less distributions | | | | | Ratios to average net assets | | | |
| | |
| |
| |
| |
| | | | Net | | | | | | | | | | | | |
| | | | realized | Total | | | | | | | Expenses | Expenses | | Net | |
| | Net asset | Net | and | from | From net | | | | | | before re- | including | | assets, | |
| | value, | invest- | unrealized | invest- | invest- | | | | Net asset | | ductions and | reductions | Net | end of | |
| | beginning | ment in- | gain (loss) | ment | ment | From net | From | Total value, | end | Total | amounts | and amounts | investment | period (in | Portfolio |
| | of period | come (loss) | on invest- | operations | income | realized | capital | distribu- | of period | return | recaptured | recaptured | income | millions) | turnover |
| Period ended | ($) | ($)1,2 | ments ($) | ($) | ($) | gain ($) | paid-in ($) | tions ($) | ($) | (%)3 | (%) | (%) | (loss) (%)1 | ($) | (%) |
|
| CLASS A | | | | | | | | | | | | | | | |
|
| 12-31-2010 | 11.50 | 0.19 | 1.51 | 1.70 | (0.18) | (0.13) | — | (0.31) | 12.89 | 14.774 | 0.565 | 0.555 | 1.58 | 593 | 19 |
| 12-31-2009 | 8.73 | 0.21 | 2.81 | 3.02 | (0.21) | (0.04) | — | (0.25) | 11.50 | 34.544 | 0.645 | 0.625 | 2.17 | 417 | 26 |
| 12-31-2008 | 15.05 | 0.27 | (5.85) | (5.58) | (0.26) | (0.48) | — | (0.74) | 8.73 | (36.89)4 | 0.595 | 0.575 | 2.14 | 251 | 37 |
| 12-31-2007 | 14.72 | 0.28 | 0.73 | 1.01 | (0.23) | (0.45) | — | (0.68) | 15.05 | 6.964 | 0.545 | 0.535 | 1.79 | 332 | 18 |
| 12-31-20066 | 14.63 | 0.16 | 1.01 | 1.17 | (0.43) | (0.36) | (0.29) | (1.08) | 14.72 | 8.004,7 | 0.588,13 | 0.588,13 | 3.188 | 165 | 4 |
| 8-31-20069 | 13.35 | 0.07 | 1.28 | 1.35 | (0.07) | — | — | (0.07) | 14.63 | 10.184,7 | 0.728,13 | 0.618,13 | 0.558 | 103 | 26 |
|
See notes to financial statements
| |
| 28 | Lifestyle Portfolios | Annual report |
Financial highlights
Continued
Lifestyle Growth continued
| | | | | | | | | | | | | | | |
| Per share operating performance for a share outstanding throughout the period | | | Ratios and supplemental data | |
|
| | | Income (loss) from | | | | | | | | | | | | |
| | | investment operations | | Less distributions | | | Ratios to average net assets | | |
| | |
| |
| |
| |
| | | | Net | | | | | | | | | | | | |
| | | | realized | Total | | | | | | | Expenses | Expenses | | Net | |
| | Net asset | Net | and | from | From net | | | | | | before re- | including | | assets, | |
| | value, | invest- | unrealized | invest- | invest- | | | | Net asset | | ductions and | reductions | Net | end of | |
| | beginning | ment in- | gain (loss) | ment | ment | From net | From | Total value, | end | Total | amounts | and amounts | investment | period (in | Portfolio |
| | of period | come (loss) | on invest- | operations | income | realized | capital | distribu- | of period | return | recaptured | recaptured | income | millions) | turnover |
| Period ended | ($) | ($)1,2 | ments ($) | ($) | ($) | gain ($) | paid-in ($) | tions ($) | ($) | (%)3 | (%) | (%) | (loss) (%)1 | ($) | (%) |
|
| CLASS B | | | | | | | | | | | | | | | |
|
| 12-31-2010 | 11.54 | 0.08 | 1.51 | 1.59 | (0.08) | (0.13) | — | (0.21) | 12.92 | 13.814 | 1.295 | 1.355,10 | 0.69 | 89 | 19 |
| 12-31-2009 | 8.77 | 0.13 | 2.81 | 2.94 | (0.13) | (0.04) | — | (0.17) | 11.54 | 33.534 | 1.485 | 1.355 | 1.32 | 75 | 26 |
| 12-31-2008 | 15.06 | 0.16 | (5.81) | (5.65) | (0.16) | (0.48) | — | (0.64) | 8.77 | (37.35)4 | 1.415 | 1.325 | 1.30 | 54 | 37 |
| 12-31-2007 | 14.73 | 0.16 | 0.73 | 0.89 | (0.11) | (0.45) | — | (0.56) | 15.06 | 6.144 | 1.305 | 1.295 | 1.02 | 78 | 18 |
| 12-31-20066 | 14.57 | 0.12 | 1.01 | 1.13 | (0.36) | (0.36) | (0.25) | (0.97) | 14.73 | 7.774,7 | 1.408,13 | 1.358,13 | 2.458 | 39 | 4 |
| 8-31-20069 | 13.35 | (0.02) | 1.30 | 1.28 | (0.06) | — | — | (0.06) | 14.57 | 9.574,7 | 1.698,13 | 1.348,13 | (0.19)8 | 24 | 26 |
|
| CLASS C | | | | | | | | | | | | | | | |
|
| 12-31-2010 | 11.53 | 0.10 | 1.51 | 1.61 | (0.10) | (0.13) | — | (0.23) | 12.91 | 13.934 | 1.255 | 1.255 | 0.84 | 404 | 19 |
| 12-31-2009 | 8.76 | 0.14 | 2.81 | 2.95 | (0.14) | (0.04) | — | (0.18) | 11.53 | 33.634 | 1.355 | 1.345 | 1.37 | 305 | 26 |
| 12-31-2008 | 15.05 | 0.17 | (5.81) | (5.64) | (0.17) | (0.48) | — | (0.65) | 8.76 | (37.33)4 | 1.305 | 1.295 | 1.36 | 206 | 37 |
| 12-31-2007 | 14.72 | 0.16 | 0.74 | 0.90 | (0.12) | (0.45) | — | (0.57) | 15.05 | 6.194 | 1.255 | 1.255 | 1.05 | 294 | 18 |
| 12-31-20066 | 14.57 | 0.13 | 0.99 | 1.12 | (0.36) | (0.36) | (0.25) | (0.97) | 14.72 | 7.734,7 | 1.298,13 | 1.298,13 | 2.538 | 152 | 4 |
| 8-31-20069 | 13.35 | (0.02) | 1.30 | 1.28 | (0.06) | — | — | (0.06) | 14.57 | 9.574,7 | 1.448,13 | 1.338,13 | (0.14)8 | 93 | 26 |
|
| CLASS R1 | | | | | | | | | | | | | | | |
|
| 12-31-2010 | 11.57 | 0.15 | 1.50 | 1.65 | (0.14) | (0.13) | — | (0.27) | 12.95 | 14.284 | 0.875 | 0.865 | 1.24 | 15 | 19 |
| 12-31-2009 | 8.77 | 0.25 | 2.75 | 3.00 | (0.16) | (0.04) | — | (0.20) | 11.57 | 34.154 | 1.025 | 1.025 | 2.45 | 11 | 26 |
| 12-31-2008 | 15.10 | 0.34 | (5.96) | (5.62) | (0.23) | (0.48) | — | (0.71) | 8.77 | (37.05)4 | 1.345 | 0.835 | 2.81 | 3 | 37 |
| 12-31-2007 | 14.77 | 0.32 | 0.66 | 0.98 | (0.20) | (0.45) | — | (0.65) | 15.10 | 6.754 | 2.425 | 0.735 | 2.02 | 2 | 18 |
| 12-31-20066,9 | 14.70 | 0.14 | 1.00 | 1.14 | (0.42) | (0.36) | (0.29) | (1.07) | 14.77 | 7.754,7 | 12.958,13 | 0.698,13 | 3.238 | —11 | 4 |
|
| CLASS R3 | | | | | | | | | | | | | | | |
|
| 12-31-2010 | 11.50 | 0.15 | 1.51 | 1.66 | (0.15) | (0.13) | — | (0.28) | 12.88 | 14.464 | 0.815 | 0.815 | 1.24 | 23 | 19 |
| 12-31-2009 | 8.73 | 0.18 | 2.81 | 2.99 | (0.18) | (0.04) | — | (0.22) | 11.50 | 34.264 | 0.885 | 0.885 | 1.77 | 19 | 26 |
| 12-31-2008 | 15.03 | 0.24 | (5.84) | (5.60) | (0.22) | (0.48) | — | (0.70) | 8.73 | (37.06)4 | 0.845 | 0.835 | 1.93 | 12 | 37 |
| 12-31-2007 | 14.71 | 0.28 | 0.69 | 0.97 | (0.20) | (0.45) | — | (0.65) | 15.03 | 6.694 | 0.985 | 0.805 | 1.83 | 14 | 18 |
| 12-31-20066 | 14.61 | 0.16 | 1.01 | 1.17 | (0.42) | (0.36) | (0.29) | (1.07) | 14.71 | 8.004,7 | 1.358,13 | 0.718,13 | 3.138 | 4 | 4 |
| 8-31-20069 | 13.35 | 0.07 | 1.26 | 1.33 | (0.07) | — | — | (0.07) | 14.61 | 9.984,7 | 5.078,13 | 0.688,13 | 0.628 | 2 | 26 |
|
| CLASS R4 | | | | | | | | | | | | | | | |
|
| 12-31-2010 | 11.50 | 0.19 | 1.51 | 1.70 | (0.19) | (0.13) | — | (0.32) | 12.88 | 14.804 | 0.485 | 0.485 | 1.57 | 19 | 19 |
| 12-31-2009 | 8.72 | 0.21 | 2.82 | 3.03 | (0.21) | (0.04) | — | (0.25) | 11.50 | 34.734 | 0.545 | 0.545 | 2.11 | 16 | 26 |
| 12-31-2008 | 15.03 | 0.29 | (5.86) | (5.57) | (0.26) | (0.48) | — | (0.74) | 8.72 | (36.87)4 | 0.565 | 0.565 | 2.34 | 13 | 37 |
| 12-31-2007 | 14.71 | 0.27 | 0.74 | 1.01 | (0.24) | (0.45) | — | (0.69) | 15.03 | 6.954 | 0.645 | 0.535 | 1.76 | 15 | 18 |
| 12-31-20066 | 14.64 | 0.16 | 1.01 | 1.17 | (0.44) | (0.36) | (0.30) | (1.10) | 14.71 | 8.044,7 | 0.808,13 | 0.538,13 | 3.128 | 7 | 4 |
| 8-31-20069 | 13.35 | 0.08 | 1.29 | 1.37 | (0.08) | — | — | (0.08) | 14.64 | 10.264,7 | 1.788,13 | 0.498,13 | 0.698 | 5 | 26 |
|
| CLASS R5 | | | | | | | | | | | | | | | |
|
| 12-31-2010 | 11.50 | 0.21 | 1.52 | 1.73 | (0.22) | (0.13) | — | (0.35) | 12.88 | 15.064 | 0.215 | 0.215 | 1.80 | 22 | 19 |
| 12-31-2009 | 8.72 | 0.25 | 2.81 | 3.06 | (0.24) | (0.04) | — | (0.28) | 11.50 | 35.094 | 0.265 | 0.265 | 2.48 | 18 | 26 |
| 12-31-2008 | 15.04 | 0.33 | (5.87) | (5.54) | (0.30) | (0.48) | — | (0.78) | 8.72 | (36.64)4 | 0.245 | 0.245 | 2.67 | 10 | 37 |
| 12-31-2007 | 14.71 | 0.39 | 0.67 | 1.06 | (0.28) | (0.45) | — | (0.73) | 15.047 | 7.314 | 0.545 | 0.215 | 2.53 | 8 | 18 |
| 12-31-20066 | 14.66 | 0.18 | 1.02 | 1.20 | (0.47) | (0.36) | (0.32) | (1.15) | 14.71 | 8.154,7 | 1.408,13 | 0.208,13 | 3.548 | 2 | 4 |
| 8-31-20069 | 13.35 | 0.09 | 1.30 | 1.39 | (0.08) | — | — | (0.08) | 14.66 | 10.474,7 | 2.528,13 | 0.198,13 | 0.708 | 2 | 26 |
|
| CLASS 1 | | | | | | | | | | | | | | | |
|
| 12-31-2010 | 11.45 | 0.23 | 1.52 | 1.75 | (0.23) | (0.13) | — | (0.36) | 12.84 | 15.304 | 0.115 | 0.115 | 1.92 | 10,305 | 19 |
| 12-31-2009 | 8.68 | 0.25 | 2.81 | 3.06 | (0.25) | (0.04) | — | (0.29) | 11.45 | 35.274 | 0.115 | 0.115 | 2.55 | 8,903 | 26 |
| 12-31-2008 | 15.00 | 0.32 | (5.85) | (5.53) | (0.31) | (0.48) | — | (0.79) | 8.68 | (36.63)4 | 0.125 | 0.125 | 2.49 | 6,345 | 37 |
| 12-31-2007 | 14.67 | 0.30 | 0.77 | 1.07 | (0.29) | (0.45) | — | (0.74) | 15.007 | 7.444 | 0.115 | 0.115 | 1.94 | 9,574 | 18 |
| 12-31-20066 | 14.63 | 0.17 | 1.03 | 1.20 | (0.48) | (0.36) | (0.32) | (1.16) | 14.67 | 8.187 | 0.118,13 | 0.118,13 | 3.348 | 8,059 | 4 |
| 8-31-20069 | 13.31 | 0.15 | 1.25 | 1.40 | (0.08) | — | — | (0.08) | 14.63 | 10.587 | 0.118,13 | 0.118,13 | 1.178 | 7,081 | 26 |
|
See notes to financial statements
| | |
| | Annual report | Lifestyle Portfolios | 29 |
Financial highlights
Continued
Lifestyle Growth continued
| | | | | | | | | | | | | | | |
| Per share operating performance for a share outstanding throughout the period | | | Ratios and supplemental data | |
|
| | | Income (loss) from | | | | | | | | | | | | |
| | | investment operations | | Less distributions | | | Ratios to average net assets | | |
| | |
| |
| |
| |
| | | | Net | | | | | | | | | | | | |
| | | | realized | Total | | | | | | | Expenses | Expenses | | Net | |
| | Net asset | Net | and | from | From net | | | | | | before re- | including | | assets, | |
| | value, | invest- | unrealized | invest- | invest- | | | | Net asset | | ductions and | reductions | Net | end of | |
| | beginning | ment in- | gain (loss) | ment | ment | From net | From | Total value, | end | Total | amounts | and amounts | investment | period (in | Portfolio |
| | of period | come (loss) | on invest- | operations | income | realized | capital | distribu- | of period | return | recaptured | recaptured | income | millions) | turnover |
| Period ended | ($) | ($)1,2 | ments ($) | ($) | ($) | gain ($) | paid-in ($) | tions ($) | ($) | (%)3 | (%) | (%) | (loss) (%)1 | ($) | (%) |
|
| CLASS 5 | | | | | | | | | | | | | | | |
|
| 12-31-2010 | 11.44 | 0.25 | 1.50 | 1.75 | (0.24) | (0.13) | — | (0.37) | 12.82 | 15.284 | 0.065 | 0.065 | 2.07 | 98 | 19 |
| 12-31-2009 | 8.67 | 0.27 | 2.80 | 3.07 | (0.26) | (0.04) | — | (0.30) | 11.44 | 35.374 | 0.075 | 0.075 | 2.70 | 68 | 26 |
| 12-31-2008 | 14.98 | 0.35 | (5.86) | (5.51) | (0.32) | (0.48) | — | (0.80) | 8.67 | (36.57)4 | 0.075 | 0.075 | 2.78 | 41 | 37 |
| 12-31-2007 | 14.66 | 0.37 | 0.70 | 1.07 | (0.30) | (0.45) | — | (0.75) | 14.98 | 7.424 | 0.065 | 0.065 | 2.39 | 46 | 18 |
| 12-31-20066 | 14.62 | 0.24 | 0.97 | 1.21 | (0.48) | (0.36) | (0.33) | (1.17) | 14.66 | 8.247 | 0.068,13 | 0.068,13 | 4.688 | 15 | 4 |
| 8-31-20069 | 14.40 | —12 | 0.22 | 0.22 | — | — | — | — | 14.62 | 1.537 | 0.068,13 | 0.068,13 | (0.02)8 | 3 | 26 |
|
1 Recognition of net investment income by the Portfolio is affected by the timing of the declaration of dividends by the underlying funds in which the Portfolio invests.
2 Based on the average daily shares outstanding.
3 Does not reflect the effect of sales charges, if any.
4 Total returns would have been lower had certain expenses not been reduced during the periods shown.
5 Ratios do not include expenses indirectly incurred from underlying funds whose expense ratios can vary based on the mix of underlying funds held by the Portfolio. The range of expense ratios of the underlying funds held by the Portfolio was as follows: 0.48%–1.39%, 0.49%–1.40%, 0.49%–2.84% and 0.79%–0.91%, for the years ended 12-31-10, 12-31-09, 12-31-08 and 12-31-07.
6 The fiscal year-end changed from August 31 to December 31.
7 Not annualized.
8 Annualized.
9 The inception date for Class A, Class B, Class C, Class R3, Class R4 and Class R5 shares is 10-18-05 and the inception dates for Class R1, Class 1 and Class 5 shares are 9-18-06, 10-15-05 and 7-3-06, respectively.
10 Includes the impact of expense recapture which amounted to 0.07% of average net assets. See Note 4.
11 Less than $500,000.
12 Less than $0.005 per share.
13 Does not include expenses of the underlying affiliated funds in which the Portfolio invests.
Lifestyle Balanced
| | | | | | | | | | | | | | | |
| Per share operating performance for a share outstanding throughout the period | | | Ratios and supplemental data | |
|
| | | Income (loss) from | | | | | | | | | | | | |
| | | investment operations | | Less distributions | | | | | Ratios to average net assets | | | |
| | |
| |
| |
| |
| | | | Net | | | | | | | | | | | | |
| | | | realized | Total | | | | | | | Expenses | Expenses | | Net | |
| | Net asset | Net | and | from | From net | | | | | | before re- | including | | assets, | |
| | value, | invest- | unrealized | invest- | invest- | | | | Net asset | | ductions and | reductions | Net | end of | |
| | beginning | ment in- | gain (loss) | ment | ment | From net | From | Total value, | end | Total | amount | and amounts | investment | period (in | Portfolio |
| | of period | come (loss) | on invest- | operations | income | realized | capital | distribu- | of period | return | recaptured | recaptured | income | millions) | turnover |
| Period ended | ($) | ($)1,2 | ments ($) | ($) | ($) | gain ($) | paid-in ($) | tions ($) | ($) | (%)3 | (%) | (%) (loss) | (%)1 | ($) | (%) |
|
| CLASS A | | | | | | | | | | | | | | | |
|
| 12-31-2010 | 11.85 | 0.31 | 1.23 | 1.54 | (0.30) | (0.13) | — | (0.43) | 12.96 | 13.134 | 0.545 | 0.545 | 2.55 | 588 | 19 |
| 12-31-2009 | 9.22 | 0.35 | 2.65 | 3.00 | (0.33) | (0.04) | — | (0.37) | 11.85 | 32.874 | 0.575 | 0.565 | 3.35 | 408 | 316 |
| 12-31-2008 | 14.54 | 0.45 | (4.96) | (4.51) | (0.42) | (0.39) | — | (0.81) | 9.22 | (31.63)4 | 0.545 | 0.545 | 3.60 | 249 | 36 |
| 12-31-2007 | 14.37 | 0.42 | 0.42 | 0.84 | (0.35) | (0.32) | — | (0.67) | 14.54 | 5.904 | 0.515 | 0.505 | 2.84 | 284 | 14 |
| 12-31-20067 | 14.38 | 0.24 | 0.81 | 1.05 | (0.43) | (0.27) | (0.36) | (1.06) | 14.37 | 7.258 | 0.559,17 | 0.559,17 | 4.779 | 125 | 3 |
| 8-31-200610 | 13.35 | 0.19 | 1.01 | 1.20 | (0.17) | —11 | — | (0.17) | 14.38 | 9.084,8 | 0.709,17 | 0.589,17 | 1.609 | 81 | 23 |
|
| CLASS B | | | | | | | | | | | | | | | |
|
| 12-31-2010 | 11.85 | 0.20 | 1.24 | 1.44 | (0.20) | (0.13) | — | (0.33) | 12.96 | 12.234 | 1.285 | 1.315,12 | 1.67 | 74 | 19 |
| 12-31-2009 | 9.21 | 0.25 | 2.68 | 2.93 | (0.25) | (0.04) | — | (0.29) | 11.85 | 31.994 | 1.405 | 1.355 | 2.44 | 64 | 316 |
| 12-31-2008 | 14.53 | 0.33 | (4.94) | (4.61) | (0.32) | (0.39) | — | (0.71) | 9.21 | (32.22)4 | 1.365 | 1.325 | 2.66 | 46 | 36 |
| 12-31-2007 | 14.37 | 0.29 | 0.42 | 0.71 | (0.23) | (0.32) | — | (0.55) | 14.53 | 5.024 | 1.305 | 1.305 | 1.95 | 60 | 14 |
| 12-31-20067 | 14.37 | 0.20 | 0.81 | 1.01 | (0.40) | (0.27) | (0.34) | (1.01) | 14.37 | 6.968 | 1.419,17 | 1.349,17 | 4.009 | 32 | 3 |
| 8-31-200610 | 13.35 | 0.10 | 1.02 | 1.12 | (0.10) | —11 | — | (0.10) | 14.37 | 8.474,8 | 1.739,17 | 1.349,17 | 0.849 | 20 | 23 |
|
See notes to financial statements
| |
| 30 | Lifestyle Portfolios | Annual report |
Financial highlights
Continued
Lifestyle Balanced continued
| | | | | | | | | | | | | | | |
| Per share operating performance for a share outstanding throughout the period | | | Ratios and supplemental data | |
|
| | | Income (loss) from | | | | | | | | | | | | |
| | | investment operations | | Less distributions | | | | | Ratios to average net assets | | | |
| | |
| |
| |
| |
| | | | Net | | | | | | | | | | | | |
| | | | realized | Total | | | | | | | Expenses | Expenses | | Net | |
| | Net asset | Net | and | from | From net | | | | | | before re- | including | | assets, | |
| | value, | invest- | unrealized | invest- | invest- | | | | Net asset | | ductions and | reductions | Net | end of | |
| | beginning | ment in- | gain (loss) | ment | ment | From net | From | Total value, | end | Total | amounts | and amounts | investment | period (in | Portfolio |
| | of period | come (loss) | on invest- | operations | income | realized | capital | distribu- | of period | return | recaptured | recaptured | income | millions) | turnover |
| Period ended | ($) | ($)1,2 | ments ($) | ($) | ($) | gain ($) | paid-in ($) | tions ($) | ($) | (%)3 | (%) | (%) (loss) | (%)1 | ($) | (%) |
|
| CLASS C | | | | | | | | | | | | | | | |
|
| 12-31-2010 | 11.86 | 0.22 | 1.23 | 1.45 | (0.21) | (0.13) | — | (0.34) | 12.97 | 12.344 | 1.245 | 1.245 | 1.82 | 448 | 19 |
| 12-31-2009 | 9.22 | 0.27 | 2.67 | 2.94 | (0.26) | (0.04) | — | (0.30) | 11.86 | 32.084 | 1.275 | 1.265 | 2.63 | 327 | 316 |
| 12-31-2008 | 14.55 | 0.34 | (4.95) | (4.61) | (0.33) | (0.39) | — | (0.72) | 9.22 | (32.19)4 | 1.245 | 1.245 | 2.76 | 209 | 36 |
| 12-31-2007 | 14.39 | 0.31 | 0.42 | 0.73 | (0.25) | (0.32) | — | (0.57) | 14.55 | 5.104 | 1.225 | 1.215 | 2.09 | 268 | 14 |
| 12-31-20067 | 14.38 | 0.20 | 0.82 | 1.02 | (0.40) | (0.27) | (0.34) | (1.01) | 14.39 | 7.038 | 1.259,17 | 1.259,17 | 4.109 | 128 | 3 |
| 8-31-200610 | 13.35 | 0.12 | 1.01 | 1.13 | (0.10) | —11 | — | (0.10) | 14.38 | 8.554,8 | 1.419,17 | 1.299,17 | 0.979 | 79 | 23 |
|
| CLASS R1 | | | | | | | | | | | | | | | |
|
| 12-31-2010 | 11.82 | 0.26 | 1.23 | 1.49 | (0.26) | (0.13) | — | (0.39) | 12.92 | 12.754 | 0.885 | 0.885 | 2.17 | 15 | 19 |
| 12-31-2009 | 9.20 | 0.43 | 2.51 | 2.94 | (0.28) | (0.04) | — | (0.32) | 11.82 | 32.214 | 1.075 | 1.075 | 3.96 | 10 | 316 |
| 12-31-2008 | 14.53 | 0.44 | (5.01) | (4.57) | (0.37) | (0.39) | — | (0.76) | 9.20 | (32.01)4 | 2.585 | 1.065 | 3.69 | 1 | 36 |
| 12-31-2007 | 14.38 | 0.49 | 0.31 | 0.80 | (0.33) | (0.32) | — | (0.65) | 14.53 | 5.584 | 7.355 | 0.785,13 | 3.25 | 1 | 14 |
| 12-31-20067,10 | 14.44 | 0.21 | 0.78 | 0.99 | (0.42) | (0.27) | (0.36) | (1.05) | 14.38 | 6.844,8 | 13.069,17 | 0.709,17 | 4.969 | —14 | 3 |
|
| CLASS R3 | | | | | | | | | | | | | | | |
|
| 12-31-2010 | 11.83 | 0.28 | 1.23 | 1.51 | (0.27) | (0.13) | — | (0.40) | 12.94 | 12.894 | 0.795 | 0.795 | 2.28 | 39 | 19 |
| 12-31-2009 | 9.20 | 0.30 | 2.67 | 2.97 | (0.30) | (0.04) | — | (0.34) | 11.83 | 32.624 | 0.845 | 0.845 | 2.94 | 30 | 316 |
| 12-31-2008 | 14.52 | 0.40 | (4.95) | (4.55) | (0.38) | (0.39) | — | (0.77) | 9.20 | (31.89)4 | 0.815 | 0.805 | 3.21 | 20 | 36 |
| 12-31-2007 | 14.36 | 0.43 | 0.37 | 0.80 | (0.32) | (0.32) | — | (0.64) | 14.52 | 5.654 | 0.855 | 0.765,13 | 2.90 | 23 | 14 |
| 12-31-20067 | 14.37 | 0.22 | 0.82 | 1.04 | (0.42) | (0.27) | (0.36) | (1.05) | 14.36 | 7.224,8 | 1.249,17 | 0.729,17 | 4.559 | 5 | 3 |
| 8-31-200610 | 13.35 | 0.36 | 0.82 | 1.18 | (0.16) | —11 | — | (0.16) | 14.37 | 8.924,8 | 3.709,17 | 0.699,17 | 3.109 | 3 | 23 |
|
| CLASS R4 | | | | | | | | | | | | | | | |
|
| 12-31-2010 | 11.84 | 0.31 | 1.23 | 1.54 | (0.31) | (0.13) | — | (0.44) | 12.94 | 13.194 | 0.455 | 0.455 | 2.53 | 29 | 19 |
| 12-31-2009 | 9.20 | 0.35 | 2.66 | 3.01 | (0.33) | (0.04) | — | (0.37) | 11.84 | 33.104 | 0.535 | 0.535 | 3.37 | 24 | 316 |
| 12-31-2008 | 14.52 | 0.43 | (4.94) | (4.51) | (0.42) | (0.39) | — | (0.81) | 9.20 | (31.68)4 | 0.525 | 0.525 | 3.51 | 14 | 36 |
| 12-31-2007 | 14.36 | 0.39 | 0.45 | 0.84 | (0.36) | (0.32) | — | (0.68) | 14.52 | 5.914 | 0.585 | 0.515,13 | 2.63 | 18 | 14 |
| 12-31-20067 | 14.38 | 0.23 | 0.81 | 1.04 | (0.43) | (0.27) | (0.36) | (1.06) | 14.36 | 7.274,8 | 0.709,17 | 0.529,17 | 4.559 | 10 | 3 |
| 8-31-200610 | 13.35 | 0.16 | 1.06 | 1.22 | (0.19) | —11 | — | (0.19) | 14.38 | 9.194,8 | 1.469,17 | 0.489,17 | 1.379 | 7 | 23 |
|
| CLASS R5 | | | | | | | | | | | | | | | |
|
| 12-31-2010 | 11.85 | 0.35 | 1.23 | 1.58 | (0.34) | (0.13) | — | (0.47) | 12.96 | 13.524 | 0.185 | 0.185 | 2.89 | 38 | 19 |
| 12-31-2009 | 9.21 | 0.39 | 2.65 | 3.04 | (0.36) | (0.04) | — | (0.40) | 11.85 | 33.454 | 0.225 | 0.225 | 3.74 | 27 | 316 |
| 12-31-2008 | 14.52 | 0.54 | (5.01) | (4.47) | (0.45) | (0.39) | — | (0.84) | 9.21 | (31.40)4 | 0.215 | 0.215 | 4.46 | 15 | 36 |
| 12-31-2007 | 14.36 | 0.50 | 0.38 | 0.88 | (0.40) | (0.32) | — | (0.72) | 14.52 | 6.184 | 0.435 | 0.215,13 | 3.35 | 10 | 14 |
| 12-31-20067 | 14.38 | 0.24 | 0.82 | 1.06 | (0.44) | (0.27) | (0.37) | (1.08) | 14.36 | 7.414,8 | 1.699,17 | 0.209,17 | 4.859 | 2 | 3 |
| 8-31-200610 | 13.35 | 0.18 | 1.06 | 1.24 | (0.21) | —11 | — | (0.21) | 14.38 | 9.394,8 | 2.589,17 | 0.199,17 | 1.489 | 1 | 23 |
|
| CLASS 1 | | | | | | | | | | | | | | | |
|
| 12-31-2010 | 11.80 | 0.35 | 1.23 | 1.58 | (0.35) | (0.13) | — | (0.48) | 12.90 | 13.574 | 0.115 | 0.115 | 2.88 | 10,003 | 19 |
| 12-31-2009 | 9.17 | 0.38 | 2.66 | 3.04 | (0.37) | (0.04) | — | (0.41) | 11.80 | 33.59 | 0.115 | 0.115 | 3.65 | 8,557 | 316 |
| 12-31-2008 | 14.47 | 0.47 | (4.91) | (4.44) | (0.47) | (0.39) | — | (0.86) | 9.17 | (31.37) | 0.125 | 0.125 | 3.79 | 6,241 | 36 |
| 12-31-2007 | 14.31 | 0.42 | 0.47 | 0.89 | (0.41) | (0.32) | — | (0.73) | 14.47 | 6.30 | 0.115 | 0.115 | 2.84 | 8,928 | 14 |
| 12-31-20067 | 14.34 | 0.24 | 0.82 | 1.06 | (0.45) | (0.27) | (0.37) | (1.09) | 14.31 | 7.408 | 0.119,17 | 0.119,17 | 4.849 | 7,609 | 3 |
| 8-31-200610 | 13.31 | 0.22 | 1.03 | 1.25 | (0.22) | ���11 | — | (0.22) | 14.34 | 9.478 | 0.119,17 | 0.119,17 | 1.819 | 6,736 | 23 |
|
| CLASS 5 | | | | | | | | | | | | | | | |
|
| 12-31-2010 | 11.80 | 0.37 | 1.23 | 1.60 | (0.36) | (0.13) | — | (0.49) | 12.91 | 13.714 | 0.065 | 0.065 | 3.07 | 49 | 19 |
| 12-31-2009 | 9.17 | 0.40 | 2.65 | 3.05 | (0.38) | (0.04) | — | (0.42) | 11.80 | 33.66 | 0.075 | 0.075 | 3.89 | 32 | 316 |
| 12-31-2008 | 14.48 | 0.50 | (4.95) | (4.45) | (0.47) | (0.39) | — | (0.86) | 9.17 | (31.38) | 0.075 | 0.075 | 4.07 | 18 | 36 |
| 12-31-2007 | 14.32 | 0.50 | 0.40 | 0.90 | (0.42) | (0.32) | — | (0.74) | 14.48 | 6.35 | 0.065 | 0.065 | 3.39 | 19 | 14 |
| 12-31-20067 | 14.35 | 0.33 | 0.74 | 1.07 | (0.45) | (0.27) | (0.38) | (1.10) | 14.32 | 7.428 | 0.069,17 | 0.069,17 | 6.639 | 79 | 3 |
| 8-31-200615 | 14.17 | —16 | 0.31 | 0.31 | (0.13) | — | — | (0.13) | 14.35 | 2.238 | 0.019,17 | 0.019,17 | (0.01)9 | 19 | 23 |
|
See notes to financial statements
| | |
| | Annual report | Lifestyle Portfolios | 31 |
Financial highlights
Continued
Lifestyle Balanced continued
1 Recognition of net investment income by the Portfolio is affected by the timing of the declaration of dividends by the underlying funds in which the Portfolio invests.
2 Based on the average daily shares outstanding.
3 Does not reflect the effect of sales charges, if any.
4 Total returns would have been lower had certain expenses not been reduced during the periods shown.
5 Ratios do not include expenses indirectly incurred from underlying funds whose expense ratios can vary based on the mix of underlying funds held by the Portfolio. The range of expense ratios of the underlying funds held by the Portfolio was as follows: 0.48%–1.39%, 0.49%–1.40%, 0.49%–2.84% and 0.79%–0.91%, for the years ended 12-31-10, 12-31-09, 12-31-08 and 12-31-07, respectively.
6 Excludes merger activity.
7 The fiscal year-end changed from August 31 to December 31.
8 Not annualized.
9 Annualized.
10 The inception date for Class A, Class B, Class C, Class R3, Class R4 and Class R5 shares is 10-18-05 and the inception dates for Class R1 and Class 1 shares are 9-18-06 and 10-15-05, respectively.
11 Less than ($0.005) per share.
12 Includes the impact of expense recapture which amounted to 0.03% of average net assets. See Note 4.
13 Includes transfer agent fee earned credits of less than 0.01% of average net assets.
14 Less than $500,000.
15 The inception date for Class 5 shares is 7-3-06.
16 Less than $0.005 per share.
17 Does not include expenses of the underlying affiliated funds in which the Portfolio invests.
Lifestyle Moderate
| | | | | | | | | | | | | | | |
| Per share operating performance for a share outstanding throughout the period | | | Ratios and supplemental data | |
|
| | | Income (loss) from | | | | | | | | | | | | |
| | | investment operations | | Less distributions | | | | | Ratios to average net assets | | | |
| | |
| |
| |
| |
| | | | Net | | | | | | | | | | | | |
| | | | realized | Total | | | | | | | Expenses | Expenses | | Net | |
| | Net asset | Net | and | from | From net | | | | | | before re- | including | | assets, | |
| | value, | invest- | unrealized | invest- | invest- | | | | Net asset | | ductions and | reductions | Net | end of | |
| | beginning | ment in- | gain (loss) | ment | ment | From net | From | Total value, | end | Total | amounts | and amounts | investment | period (in | Portfolio |
| | of period | come (loss) | on invest- | operations | income | realized | capital | distribu- | of period | return | recaptured | recaptured | income | millions) | turnover |
| Period ended | ($) | ($)1,2 | ments ($) | ($) | ($) | gain ($) | paid-in ($) | tions ($) | ($) | (%)3 | (%) | (%) | (loss) (%)1 | ($) | (%) |
|
| CLASS A | | | | | | | | | | | | | | | |
|
| 12-31-2010 | 11.77 | 0.41 | 0.97 | 1.38 | (0.39) | (0.13) | — | (0.52) | 12.63 | 11.854 | 0.555 | 0.555 | 3.37 | 220 | 20 |
| 12-31-2009 | 9.59 | 0.45 | 2.19 | 2.64 | (0.42) | (0.04) | — | (0.46) | 11.77 | 27.884 | 0.545 | 0.545 | 4.27 | 146 | 29 |
| 12-31-2008 | 13.57 | 0.58 | (3.76) | (3.18) | (0.54) | (0.26) | — | (0.80) | 9.59 | (23.88)4 | 0.535 | 0.535 | 4.81 | 86 | 32 |
| 12-31-2007 | 13.53 | 0.50 | 0.14 | 0.64 | (0.41) | (0.19) | — | (0.60) | 13.57 | 4.784 | 0.535 | 0.535 | 3.57 | 76 | 13 |
| 12-31-20066 | 13.64 | 0.27 | 0.52 | 0.79 | (0.36) | (0.21) | (0.33) | (0.90) | 13.53 | 5.774,7 | 0.578,9 | 0.568,9 | 5.868 | 37 | 1 |
| 8-31-200610 | 12.94 | 0.25 | 0.66 | 0.91 | (0.21) | — | — | (0.21) | 13.64 | 7.104,7 | 0.838,9 | 0.578,9 | 2.218 | 25 | 24 |
|
| CLASS B | | | | | | | | | | | | | | | |
|
| 12-31-2010 | 11.76 | 0.30 | 0.99 | 1.29 | (0.29) | (0.13) | — | (0.42) | 12.63 | 11.054 | 1.305 | 1.345,11 | 2.50 | 26 | 20 |
| 12-31-2009 | 9.58 | 0.35 | 2.20 | 2.55 | (0.33) | (0.04) | — | (0.37) | 11.76 | 26.914 | 1.415 | 1.355 | 3.33 | 20 | 29 |
| 12-31-2008 | 13.56 | 0.45 | (3.74) | (3.29) | (0.43) | (0.26) | — | (0.69) | 9.58 | (24.56)4 | 1.395 | 1.365 | 3.70 | 14 | 32 |
| 12-31-2007 | 13.52 | 0.38 | 0.15 | 0.53 | (0.30) | (0.19) | — | (0.49) | 13.56 | 3.974 | 1.435 | 1.355 | 2.73 | 15 | 13 |
| 12-31-20066 | 13.62 | 0.23 | 0.52 | 0.75 | (0.33) | (0.21) | (0.31) | (0.85) | 13.52 | 5.494,7 | 1.668,9 | 1.358,9 | 4.878 | 7 | 1 |
| 8-31-200610 | 12.94 | 0.15 | 0.68 | 0.83 | (0.15) | — | — | (0.15) | 13.62 | 6.424,7 | 2.438,9 | 1.348,9 | 1.288 | 5 | 24 |
|
| CLASS C | | | | | | | | | | | | | | | |
|
| 12-31-2010 | 11.77 | 0.32 | 0.98 | 1.30 | (0.30) | (0.13) | — | (0.43) | 12.64 | 11.154 | 1.255 | 1.255 | 2.67 | 183 | 20 |
| 12-31-2009 | 9.59 | 0.38 | 2.18 | 2.56 | (0.34) | (0.04) | — | (0.38) | 11.77 | 27.004 | 1.255 | 1.255 | 3.58 | 116 | 29 |
| 12-31-2008 | 13.57 | 0.48 | (3.75) | (3.27) | (0.45) | (0.26) | — | (0.71) | 9.59 | (24.44)4 | 1.255 | 1.255 | 4.02 | 69 | 32 |
| 12-31-2007 | 13.53 | 0.41 | 0.13 | 0.54 | (0.31) | (0.19) | — | (0.50) | 13.57 | 4.054 | 1.245 | 1.245 | 2.94 | 69 | 13 |
| 12-31-20066 | 13.63 | 0.24 | 0.51 | 0.75 | (0.33) | (0.21) | (0.31) | (0.85) | 13.53 | 5.494,7 | 1.328,9 | 1.288,9 | 5.138 | 29 | 1 |
| 8-31-200610 | 12.94 | 0.17 | 0.67 | 0.84 | (0.15) | — | — | (0.15) | 13.63 | 6.494,7 | 1.678,9 | 1.298,9 | 1.518 | 18 | 24 |
|
| CLASS R1 | | | | | | | | | | | | | | | |
|
| 12-31-2010 | 11.76 | 0.33 | 1.00 | 1.33 | (0.33) | (0.13) | — | (0.46) | 12.63 | 11.454 | 0.935 | 0.985,11 | 2.72 | 7 | 20 |
| 12-31-2009 | 9.58 | 0.50 | 2.09 | 2.59 | (0.37) | (0.04) | — | (0.41) | 11.76 | 27.354 | 1.145 | 1.065 | 4.57 | 6 | 29 |
| 12-31-2008 | 13.58 | 0.64 | (3.87) | (3.23) | (0.51) | (0.26) | — | (0.77) | 9.58 | (24.21)4 | 1.975 | 0.855 | 5.39 | 2 | 32 |
| 12-31-2007 | 13.54 | 0.52 | 0.10 | 0.62 | (0.39) | (0.19) | — | (0.58) | 13.58 | 4.634 | 4.105 | 0.715,12 | 3.73 | 1 | 13 |
| 12-31-20066,10 | 13.69 | 0.25 | 0.50 | 0.75 | (0.36) | (0.21) | (0.33) | (0.90) | 13.54 | 5.434,7 | 13.148,9 | 0.708,9 | 6.078 | —13 | 1 |
|
See notes to financial statements
| |
| 32 | Lifestyle Portfolios | Annual report |
Financial highlights
Continued
Lifestyle Moderate continued
| | | | | | | | | | | | | | | |
| Per share operating performance for a share outstanding throughout the period | | | Ratios and supplemental data | |
|
| | | Income (loss) from | | | | | | | | | | | | |
| | | investment operations | | Less distributions | | | | | Ratios to average net assets | | | |
| | |
| |
| |
| |
| | | | Net | | | | | | | | | | | | |
| | | | realized | Total | | | | | | | Expenses | Expenses | | Net | |
| | Net asset | Net | and | from | From net | | | | | | before re- | including | | assets, | |
| | value, | invest- | unrealized | invest- | invest- | | | | Net asset | | ductions and | reductions | Net | end of | |
| | beginning | ment in- | gain (loss) | ment | ment | From net | From | Total value, | end | Total | amounts | and amounts | investment | period (in | Portfolio |
| | of period | come (loss) | on invest- | operations | income | realized | capital | distribu- | of period | return | recaptured | recaptured | income | millions) | turnover |
| Period ended | ($) | ($)1,2 | ments ($) | ($) | ($) | gain ($) | paid-in ($) | tions ($) | ($) | (%)3 | (%) | (%) | (loss) (%)1 | ($) | (%) |
|
| CLASS R3 | | | | | | | | | | | | | | | |
|
| 12-31-2010 | 11.76 | 0.35 | 0.99 | 1.34 | (0.35) | (0.13) | — | (0.48) | 12.62 | 11.564 | 0.875 | 0.875 | 2.87 | 10 | 20 |
| 12-31-2009 | 9.58 | 0.39 | 2.21 | 2.60 | (0.38) | (0.04) | — | (0.42) | 11.76 | 27.434 | 0.955 | 0.955 | 3.72 | 8 | 29 |
| 12-31-2008 | 13.57 | 0.55 | (3.78) | (3.23) | (0.50) | (0.26) | — | (0.76) | 9.58 | (24.22)4 | 1.005 | 0.865 | 4.55 | 5 | 32 |
| 12-31-2007 | 13.53 | 0.47 | 0.15 | 0.62 | (0.39) | (0.19) | — | (0.58) | 13.57 | 4.614 | 1.515 | 0.835,12 | 3.40 | 4 | 13 |
| 12-31-20066 | 13.65 | 0.23 | 0.55 | 0.78 | (0.36) | (0.21) | (0.33) | (0.90) | 13.53 | 5.664,7 | 3.138,9 | 0.788,9 | 4.898 | 1 | 1 |
| 8-31-200610 | 12.94 | 0.33 | 0.58 | 0.91 | (0.20) | — | — | (0.20) | 13.65 | 7.104,7 | 8.448,9 | 0.698,9 | 2.938 | 1 | 24 |
|
| CLASS R4 | | | | | | | | | | | | | | | |
|
| 12-31-2010 | 11.74 | 0.40 | 0.97 | 1.37 | (0.38) | (0.13) | — | (0.51) | 12.60 | 11.844 | 0.585 | 0.605,11 | 3.30 | 7 | 20 |
| 12-31-2009 | 9.57 | 0.40 | 2.22 | 2.62 | (0.41) | (0.04) | — | (0.45) | 11.74 | 27.714 | 0.705 | 0.665 | 3.83 | 5 | 29 |
| 12-31-2008 | 13.55 | 0.56 | (3.75) | (3.19) | (0.53) | (0.26) | — | (0.79) | 9.57 | (23.94)4 | 0.795 | 0.575 | 4.66 | 4 | 32 |
| 12-31-2007 | 13.51 | 0.47 | 0.18 | 0.65 | (0.42) | (0.19) | — | (0.61) | 13.55 | 4.874 | 1.135 | 0.545,12 | 3.38 | 4 | 13 |
| 12-31-20066 | 13.63 | 0.25 | 0.53 | 0.78 | (0.36) | (0.21) | (0.33) | (0.90) | 13.51 | 5.804,7 | 1.538,9 | 0.528,9 | 5.448 | 2 | 1 |
| 8-31-200610 | 12.94 | 0.30 | 0.62 | 0.92 | (0.23) | — | — | (0.23) | 13.63 | 7.144,7 | 4.658,9 | 0.498,9 | 2.598 | 1 | 24 |
|
| CLASS R5 | | | | | | | | | | | | | | | |
|
| 12-31-2010 | 11.75 | 0.46 | 0.97 | 1.43 | (0.43) | (0.13) | — | (0.56) | 12.62 | 12.354 | 0.245 | 0.245 | 3.75 | 11 | 20 |
| 12-31-2009 | 9.58 | 0.46 | 2.19 | 2.65 | (0.44) | (0.04) | — | (0.48) | 11.75 | 28.104 | 0.325 | 0.325 | 4.39 | 8 | 29 |
| 12-31-2008 | 13.56 | 0.63 | (3.78) | (3.15) | (0.57) | (0.26) | — | (0.83) | 9.58 | (23.67)4 | 0.365 | 0.235 | 5.27 | 5 | 32 |
| 12-31-2007 | 13.52 | 0.58 | 0.11 | 0.69 | (0.46) | (0.19) | — | (0.65) | 13.56 | 5.154 | 0.975 | 0.215,12 | 4.21 | 4 | 13 |
| 12-31-20066 | 13.64 | 0.32 | 0.48 | 0.80 | (0.37) | (0.21) | (0.34) | (0.92) | 13.52 | 5.934,7 | 2.838,9 | 0.208,9 | 6.838 | 1 | 1 |
| 8-31-200610 | 12.94 | 0.22 | 0.73 | 0.95 | (0.25) | — | — | (0.25) | 13.64 | 7.404,7 | 4.868,9 | 0.198,9 | 1.928 | 1 | 24 |
|
| CLASS 1 | | | | | | | | | | | | | | | |
|
| 12-31-2010 | 11.74 | 0.44 | 1.00 | 1.44 | (0.44) | (0.13) | — | (0.57) | 12.61 | 12.434 | 0.115 | 0.115 | 3.66 | 3,026 | 20 |
| 12-31-2009 | 9.56 | 0.47 | 2.21 | 2.68 | (0.46) | (0.04) | — | (0.50) | 11.74 | 28.494 | 0.115 | 0.115 | 4.49 | 2,503 | 29 |
| 12-31-2008 | 13.54 | 0.59 | (3.73) | (3.14) | (0.58) | (0.26) | — | (0.84) | 9.56 | (23.63)4 | 0.125 | 0.125 | 4.90 | 1,857 | 32 |
| 12-31-2007 | 13.50 | 0.49 | 0.21 | 0.70 | (0.47) | (0.19) | — | (0.66) | 13.54 | 5.25 | 0.115 | 0.115,12 | 3.53 | 2,339 | 13 |
| 12-31-20066 | 13.63 | 0.27 | 0.54 | 0.81 | (0.38) | (0.21) | (0.35) | (0.94) | 13.50 | 5.907 | 0.118,9 | 0.118,9 | 5.808 | 2,008 | 1 |
| 8-31-200610 | 12.93 | 0.26 | 0.70 | 0.96 | (0.26) | — | — | (0.26) | 13.63 | 7.477 | 0.118,9 | 0.118,9 | 2.238 | 1,820 | 24 |
|
| CLASS 5 | | | | | | | | | | | | | | | |
|
| 12-31-2010 | 11.73 | 0.47 | 0.97 | 1.44 | (0.44) | (0.13) | — | (0.57) | 12.60 | 12.504 | 0.065 | 0.065 | 3.87 | 22 | 20 |
| 12-31-2009 | 9.56 | 0.51 | 2.17 | 2.68 | (0.47) | (0.04) | — | (0.51) | 11.73 | 28.454 | 0.075 | 0.075 | 4.78 | 14 | 29 |
| 12-31-2008 | 13.54 | 0.67 | (3.80) | (3.13) | (0.59) | (0.26) | — | (0.85) | 9.56 | (23.59)4 | 0.075 | 0.075 | 5.70 | 8 | 32 |
| 12-31-2007 | 13.49 | 0.53 | 0.19 | 0.72 | (0.48) | (0.19) | — | (0.67) | 13.54 | 5.39 | 0.065 | 0.06 | 3.80 | 5 | 13 |
| 12-31-20066 | 13.62 | 0.34 | 0.47 | 0.81 | (0.38) | (0.21) | (0.35) | (0.94) | 13.49 | 5.937 | 0.068,9 | 0.068,9 | 7.218 | 3 | 1 |
| 8-31-200614 | 13.48 | —15 | 0.30 | 0.30 | (0.16) | — | — | (0.16) | 13.62 | 2.277 | 0.018,9 | 0.018,9 | (0.01)8 | 1 | 24 |
|
1 Recognition of net investment income by the Portfolio is affected by the timing of the declaration of dividends by the underlying funds in which the Portfolio invests.
2 Based on the average daily shares outstanding.
3 Does not reflect the effect of sales charges, if any.
4 Total returns would have been lower had certain expenses not been reduced during the periods shown.
5 Ratios do not include expenses indirectly incurred from underlying funds whose expense ratios can vary based on the mix of underlying funds held by the Portfolio. The range of expense ratios of the underlying funds held by the Portfolio was as follows: 0.48%–1.14%, 0.49%–1.17%, 0.49%–2.40% and 0.79%–0.91% for the years ended 12-31-10, 12-31-09, 12-31-08 and 12-31-07, respectively.
6 The fiscal year-end changed from August 31 to December 31.
7 Not annualized.
8 Annualized.
9 Does not include expenses of the underlying affiliated funds in which the Portfolio invests.
10 The inception date for Class A, Class B, Class C, Class R3, Class R4 and Class R5 shares is 10-18-05; the inception date for Class R, Class R1 and Class R2 shares is 9-18-06; and the inception date for Class 1 shares is 10-15-05.
11 Includes the impact of expense recapture which amounted to 0.04%, 0.05% and 0.02% for Class B, Class R1 and Class R4 shares, respectively, of average net assets. See Note 4.
12 Includes transfer agent fee earned credits of less than 0.01% of average net assets.
13 Less than $500,000.
14 The inception date for Class 5 shares is 7-3-06.
15 Less than $0.005 per share.
See notes to financial statements
| | |
| | Annual report | Lifestyle Portfolios | 33 |
Financial highlights
Continued
Lifestyle Conservative
| | | | | | | | | | | | | | | |
| Per share operating performance for a share outstanding throughout the period | | | Ratios and supplemental data | |
|
| | | Income (loss) from | | | | | | | | | | | | |
| | | investment operations | | Less distributions | | | | | Ratios to average net assets | | | |
| | |
| |
| |
| |
| | | | Net | | | | | | | | Expenses | | | | |
| | | | realized | Total | | | | | | | before | Expenses | | Net | |
| | Net asset | Net | and | from | From net | | | | | | reduc- | including | | assets, | |
| | value, | invest- | unrealized | invest- | invest- | | | | Net asset | | tions | and reductions | Net | end of | |
| | beginning | ment in- | gain (loss) | ment | ment | From net | From | Total value, | end | Total | amounts and | amounts | investment | period (in | Portfolio |
| | of period | come (loss) | on invest- | operations | income | realized | capital | distribu- | of period | return | recaptured | recaptured | income | millions) | turnover |
| Period ended | ($) | ($)1,2 | ments ($) | ($) | ($) | gain ($) | paid-in ($) | tions ($) | ($) | (%)3 | (%) | (%) (loss) | (%)1 | ($) | (%) |
|
| CLASS A | | | | | | | | | | | | | | | |
|
| 12-31-2010 | 12.15 | 0.48 | 0.71 | 1.19 | (0.45) | (0.12) | — | (0.57) | 12.77 | 9.96 | 0.555 | 0.555 | 3.78 | 218 | 24 |
| 12-31-2009 | 10.39 | 0.54 | 1.77 | 2.31 | (0.50) | (0.05) | — | (0.55) | 12.15 | 22.534 | 0.525 | 0.525 | 4.80 | 141 | 24 |
| 12-31-2008 | 13.32 | 0.73 | (2.75) | (2.02) | (0.63) | (0.28) | — | (0.91) | 10.39 | (15.41)4 | 0.535 | 0.535 | 6.01 | 87 | 33 |
| 12-31-2007 | 13.29 | 0.59 | 0.05 | 0.64 | (0.49) | (0.12) | — | (0.61) | 13.32 | 4.894 | 0.555 | 0.545 | 4.38 | 44 | 13 |
| 12-31-20066 | 13.63 | 0.33 | 0.23 | 0.56 | (0.38) | (0.16) | (0.36) | (0.90) | 13.29 | 4.114,7 | 0.648,9 | 0.568,9 | 7.208 | 20 | 2 |
| 8-31-200610 | 13.16 | 0.31 | 0.41 | 0.72 | (0.25) | — | — | (0.25) | 13.63 | 5.534,7 | 1.028,9 | 0.578,9 | 2.758 | 12 | 20 |
|
| CLASS B | | | | | | | | | | | | | | | |
|
| 12-31-2010 | 12.15 | 0.37 | 0.73 | 1.10 | (0.36) | (0.12) | — | (0.48) | 12.77 | 9.16 | 1.295 | 1.295,13 | 2.96 | 28 | 24 |
| 12-31-2009 | 10.40 | 0.44 | 1.77 | 2.21 | (0.41) | (0.05) | — | (0.46) | 12.15 | 21.464 | 1.355 | 1.355 | 3.88 | 21 | 24 |
| 12-31-2008 | 13.32 | 0.59 | (2.70) | (2.11) | (0.53) | (0.28) | — | (0.81) | 10.40 | (16.04)4 | 1.365 | 1.345 | 4.81 | 13 | 33 |
| 12-31-2007 | 13.29 | 0.50 | 0.04 | 0.54 | (0.39) | (0.12) | — | (0.51) | 13.32 | 4.114 | 1.545 | 1.325 | 3.71 | 10 | 13 |
| 12-31-20066 | 13.63 | 0.29 | 0.22 | 0.51 | (0.35) | (0.16) | (0.34) | (0.85) | 13.29 | 3.754,7 | 1.888,9 | 1.338,9 | 6.208 | 4 | 2 |
| 8-31-200610 | 13.16 | 0.24 | 0.41 | 0.65 | (0.18) | — | — | (0.18) | 13.63 | 4.994,7 | 3.128,9 | 1.338,9 | 2.088 | 3 | 20 |
|
| CLASS C | | | | | | | | | | | | | | | |
|
| 12-31-2010 | 12.14 | 0.39 | 0.72 | 1.11 | (0.36) | (0.12) | — | (0.48) | 12.77 | 9.28 | 1.245 | 1.245 | 3.10 | 189 | 24 |
| 12-31-2009 | 10.39 | 0.46 | 1.76 | 2.22 | (0.42) | (0.05) | — | (0.47) | 12.14 | 21.58 | 1.245 | 1.245 | 4.08 | 119 | 24 |
| 12-31-2008 | 13.32 | 0.62 | (2.73) | (2.11) | (0.54) | (0.28) | — | (0.82) | 10.39 | (16.03)4 | 1.245 | 1.245 | 5.05 | 73 | 33 |
| 12-31-2007 | 13.28 | 0.52 | 0.04 | 0.56 | (0.40) | (0.12) | — | (0.52) | 13.32 | 4.224 | 1.285 | 1.285,11 | 3.88 | 44 | 13 |
| 12-31-20066 | 13.62 | 0.30 | 0.21 | 0.51 | (0.35) | (0.16) | (0.34) | (0.85) | 13.28 | 3.764,7 | 1.418,9 | 1.298,9 | 6.558 | 14 | 2 |
| 8-31-200610 | 13.16 | 0.29 | 0.35 | 0.64 | (0.18) | — | — | (0.18) | 13.62 | 4.914,7 | 2.058,9 | 1.318,9 | 2.548 | 8 | 20 |
|
| CLASS R1 | | | | | | | | | | | | | | | |
|
| 12-31-2010 | 12.15 | 0.41 | 0.74 | 1.15 | (0.40) | (0.12) | — | (0.52) | 12.78 | 9.56 | 0.885 | 0.935,13 | 3.24 | 8 | 24 |
| 12-31-2009 | 10.41 | 0.57 | 1.66 | 2.23 | (0.44) | (0.05) | — | (0.49) | 12.15 | 21.744 | 1.165 | 1.065 | 5.00 | 7 | 24 |
| 12-31-2008 | 13.34 | 1.02 | (3.07) | (2.05) | (0.60) | (0.28) | — | (0.88) | 10.41 | (15.62)4 | 2.315 | 0.885 | 8.75 | 2 | 33 |
| 12-31-2007 | 13.30 | 0.57 | 0.07 | 0.64 | (0.48) | (0.12) | — | (0.60) | 13.34 | 4.834 | 9.695 | 0.715,11 | 4.21 | —12 | 13 |
| 12-31-20066 | 13.67 | 0.30 | 0.23 | 0.53 | (0.38) | (0.16) | (0.36) | (0.90) | 13.30 | 3.854,7 | 13.248,9 | 0.708,9 | 7.383,8 | —12 | 2 |
|
| CLASS R3 | | | | | | | | | | | | | | | |
|
| 12-31-2010 | 12.14 | 0.42 | 0.74 | 1.16 | (0.42) | (0.12) | — | (0.54) | 12.76 | 9.68 | 0.865 | 0.865 | 3.36 | 11 | 24 |
| 12-31-2009 | 10.40 | 0.46 | 1.79 | 2.25 | (0.46) | (0.05) | — | (0.51) | 12.14 | 21.94 | 0.925 | 0.925 | 4.14 | 8 | 24 |
| 12-31-2008 | 13.33 | 0.54 | (2.59) | (2.05) | (0.60) | (0.28) | — | (0.88) | 10.40 | (15.62)4 | 0.905 | 0.835 | 4.27 | 6 | 33 |
| 12-31-2007 | 13.29 | 0.70 | (0.07) | 0.63 | (0.47) | (0.12) | — | (0.59) | 13.33 | 4.814 | 1.895 | 0.815,11 | 5.17 | 4 | 13 |
| 12-31-20066 | 13.65 | 0.29 | 0.25 | 0.54 | (0.38) | (0.16) | (0.36) | (0.90) | 13.29 | 3.934,7 | 6.238,9 | 0.778,9 | 6.238 | —12 | 2 |
| 8-31-200610 | 13.16 | 0.28 | 0.44 | 0.72 | (0.23) | — | — | (0.23) | 13.65 | 5.554,7 | 14.728,9 | 0.688,9 | 2.468 | —12 | 20 |
|
| CLASS R4 | | | | | | | | | | | | | | | |
|
| 12-31-2010 | 12.13 | 0.47 | 0.72 | 1.19 | (0.44) | (0.12) | — | (0.56) | 12.76 | 9.90 | 0.615 | 0.675,13 | 3.77 | 7 | 24 |
| 12-31-2009 | 10.39 | 0.52 | 1.75 | 2.27 | (0.48) | (0.05) | — | (0.53) | 12.13 | 22.224 | 0.775 | 0.665 | 4.60 | 4 | 24 |
| 12-31-2008 | 13.31 | 0.64 | (2.65) | (2.01) | (0.63) | (0.28) | — | (0.91) | 10.39 | (15.38)4 | 0.875 | 0.575 | 5.21 | 3 | 33 |
| 12-31-2007 | 13.28 | 0.53 | 0.12 | 0.65 | (0.50) | (0.12) | — | (0.62) | 13.31 | 4.974 | 1.465 | 0.535,11 | 3.96 | 3 | 13 |
| 12-31-20066 | 13.64 | 0.28 | 0.27 | 0.55 | (0.38) | (0.16) | (0.37) | (0.91) | 13.28 | 4.064,7 | 2.878,9 | 0.518,9 | 6.178 | 1 | 2 |
| 8-31-200610 | 13.16 | 0.44 | 0.30 | 0.74 | (0.26) | — | — | (0.26) | 13.64 | 5.664,7 | 10.018,9 | 0.458,9 | 3.898 | 1 | 20 |
|
| CLASS R5 | | | | | | | | | | | | | | | |
|
| 12-31-2010 | 12.15 | 0.50 | 0.74 | 1.24 | (0.50) | (0.12) | — | (0.62) | 12.77 | 10.34 | 0.235 | 0.235 | 3.96 | 9 | 24 |
| 12-31-2009 | 10.40 | 0.57 | 1.75 | 2.32 | (0.52) | (0.05) | — | (0.57) | 12.15 | 22.67 | 0.335 | 0.335 | 5.08 | 9 | 24 |
| 12-31-2008 | 13.32 | 0.86 | (2.83) | (1.97) | (0.67) | (0.28) | — | (0.95) | 10.40 | (15.10)4 | 0.525 | 0.255 | 7.19 | 4 | 33 |
| 12-31-2007 | 13.29 | 0.57 | 0.12 | 0.69 | (0.54) | (0.12) | — | (0.66) | 13.32 | 5.274 | 3.425 | 0.225,11 | 4.23 | 1 | 13 |
| 12-31-20066 | 13.65 | 0.28 | 0.29 | 0.57 | (0.40) | (0.16) | (0.37) | (0.93) | 13.29 | 4.194,7 | 6.378,9 | 0.208,9 | 6.018 | —12 | 2 |
| 8-31-200610 | 13.16 | 0.28 | 0.49 | 0.77 | (0.28) | — | — | (0.28) | 13.65 | 5.944,7 | 9.188,9 | 0.198,9 | 2.448 | —12 | 20 |
|
See notes to financial statements
| |
| 34 | Lifestyle Portfolios | Annual report |
Financial highlights
Continued
Lifestyle Conservative continued
| | | | | | | | | | | | | | | |
| Per share operating performance for a share outstanding throughout the period | | | Ratios and supplemental data | |
|
| | | Income (loss) from | | | | | | | | | | | | |
| | | investment operations | | Less distributions | | | | | Ratios to average net assets | | | |
| | |
| |
| |
| |
| | | | Net | | | | | | | | | | | | |
| | | | realized | Total | | | | | | | Expenses | Expenses | | Net | |
| | Net asset | Net | and | from | From net | | | | | | before re- | including | | assets, | |
| | value, | invest- | unrealized | invest- | invest- | | | | Net asset | | ductions and | reductions | Net | end of | |
| | beginning | ment in- | gain (loss) | ment | ment | From net | From | Total value, | end | Total | amounts | and amounts | investment | period (in | Portfolio |
| | of period | come (loss) on | invest- | operations | income | realized | capital | distribu- | of period | return | recaptured | recaptured | income | millions) | turnover |
| Period ended | ($) | ($)1,2 | ments ($) | ($) | ($) | gain ($) | paid-in ($) | tions ($) | ($) | (%)3 | (%) | (%) | (loss) (%)1 | ($) | (%) |
|
| CLASS 1 | | | | | | | | | | | | | | | |
|
| 12-31-2010 | 12.13 | 0.51 | 0.75 | 1.26 | (0.51) | (0.12) | — | (0.63) | 12.76 | 10.51 | 0.115 | 0.115 | 4.08 | 2,391 | 24 |
| 12-31-2009 | 10.38 | 0.56 | 1.78 | 2.34 | (0.54) | (0.05) | — | (0.59) | 12.13 | 22.96 | 0.125 | 0.125 | 4.99 | 1,931 | 24 |
| 12-31-2008 | 13.30 | 0.71 | (2.67) | (1.96) | (0.68) | (0.28) | — | (0.96) | 10.38 | (15.02)4 | 0.125 | 0.125 | 5.71 | 1,393 | 33 |
| 12-31-2007 | 13.27 | 0.57 | 0.14 | 0.71 | (0.56) | (0.12) | — | (0.68) | 13.30 | 5.384 | 0.115 | 0.115 | 4.24 | 1,401 | 13 |
| 12-31-20066 | 13.64 | 0.32 | 0.25 | 0.57 | (0.40) | (0.16) | (0.38) | (0.94) | 13.27 | 4.167 | 0.118,9 | 0.118 | 6.968 | 1,184 | 2 |
| 8-31-200610 | 13.15 | 0.30 | 0.48 | 0.78 | (0.29) | — | — | (0.29) | 13.64 | 6.017 | 0.128,9 | 0.128 | 2.548 | 1,097 | 20 |
|
1 Recognition of net investment income by the Portfolio is affected by the timing of the declaration of dividends by the underlying funds in which the Portfolio invests.
2 Based on the average daily shares outstanding.
3 Does not reflect the effect of sales charges, if any.
4 Total returns would have been lower had certain expenses not been reduced during the periods shown.
5 Ratios do not include expenses indirectly incurred from underlying funds whose expense ratios can vary based on the mix of underlying funds held by the Portfolio. The range of expense ratios of the underlying funds held by the Portfolio was as follows: 0.48%–1.13%, 0.49%–1.09% , 0.49%–2.40% and 0.79%–0.91% for the years ended 12-31-10, 12-31-09, 12-31-08 and 12-31-07, respectively.
6 The fiscal year-end changed from August 31 to December 31.
7 Not annualized.
8 Annualized.
9 Does not include expenses of the underlying affiliated funds in which the Portfolio invests.
10 The inception date for Class A, Class B, Class C, Class R3, Class R4 and Class R5 shares is 10-18-05 and the inception dates for Class R1 and Class 1 shares are 9-18-06 and 10-15-05, respectively.
11 Includes transfer agent fee earned credits of less than 0.01% of average net assets.
12 Less than $500,000.
13 Includes the impact of expense recapture, which amounted to less than 0.005%, 0.05% and 0.06% of average net assets for Class B, Class R1 and Class R4 shares, respectively. See Note 4.
See notes to financial statements
| | |
| | Annual report | Lifestyle Portfolios | 35 |
Notes to financial statements
Note 1 — Organization
John Hancock Funds II (the Trust) is an open-end management investment company organized as a Massachusetts business trust. The Trust is a series company which means it has several funds, each with a stated investment objective that it pursues through separate investment policies. The Trust currently offers multiple investment funds, five of which (collectively, Lifestyle Portfolios or the Portfolios, and individually the Portfolio) are presented in this report. The Lifestyle Portfolios are series of the Trust and operate as “funds of funds” that invest in shares of underlying funds of the Trust, John Hancock Funds III (JHF III) and also in other affiliated funds of the John Hancock funds complex. Each Portfolio is diversified for purposes of the Investment Company Act of 1940, as amended (1940 Act).
The Portfolios may offer multiple classes of shares. The shares currently offered by the Trust are detailed in the Statements of Assets and Liabilities. Class A, Class B and Class C shares are open to all investors. Class R1, Class R3, Class R4 and Class R5 shares are available only to certain retirement plans. Class 1 and Class 5 shares are offered only to certain affiliates of Manulife Financial Corporation (MFC). Shareholders of each class have exclusive voting rights to matters that affect that class. The distribution and service fees, if any, and transfer agent fees for each class may differ. Class B shares convert to Class A shares eight years after purchase. Effective at the close of business on August 21, 2009, Class R converted into Class R1 and Class R2 converted into Class A.
The accounting policies of the underlying funds of the Portfolios are outlined in the underlying funds’ shareholder reports, available without charge by calling 1-800-344-1029, at jhfunds.com and on the Securities and Exchange Commission (SEC) Web site at www.sec.gov or at the SEC’s public reference room in Washington, D.C. The underlying funds are not covered by this report.
Note 2 — Significant accounting policies
The financial statements have been prepared in conformity with accounting principles generally accepted in the United States of America, which require management to make certain estimates and assumptions at the date of the financial statements. Actual results could differ from those estimates. Events or transactions occurring after the end of the fiscal period through the date that the financial statements were issued have been evaluated in the preparation of the financial statements. The following summarizes the significant accounting policies of the Portfolios:
Security valuation. Investments are stated at value as of the close of regular trading on the New York Stock Exchange (NYSE), normally at 4:00 p.m., Eastern Time. The Portfolios use a three-tier hierarchy to prioritize the pricing assumptions, referred to as inputs, used in valuation techniques to measure fair value. Level 1 includes securities valued using quoted prices in active markets for identical securities. Level 2 includes securities valued using significant observable inputs. Observable inputs may include quoted prices for similar securities, interest rates, prepayment speeds and credit risk. Prices for securities valued using these inputs are received from independent pricing vendors and brokers and are based on an evaluation of the inputs described. Level 3 includes securities valued using significant unobservable inputs when market prices are not readily available or reliable, including the Portfolios’ own assumptions in determining the fair value of investments. Factors used in determining value may include market or issuer specific events, changes in interest rates and credit quality. The inputs or methodology used for valuing securities are not necessarily an indication of the risk associated with investing in those securities.
As of December 31, 2010, all investments for the Portfolios are categorized as Level 1 under the hierarchy discussed above. During the year ended December 31, 2010, there were no significant transfers in or out of Level 1 assets.
Investments by the Portfolios in underlying affiliated funds and/or other investment companies are valued at their respective net asset values each business day.
Security transactions and related investment income. Investment security transactions are accounted for on a trade date plus one basis for daily net asset value calculations. However, for financial reporting purposes, investment transactions are reported on trade date. Income and capital gain distributions from underlying funds are recorded on ex-date. Interest income is accrued as earned. Gains and losses on securities sold are determined on the basis of identified cost and may include proceeds from litigation.
Line of credit. The Portfolios may borrow from banks for temporary or emergency purposes, including meeting redemption requests that otherwise might require the untimely sale of securities. Pursuant to the custodian agreement, the custodian may loan money to a portfolio to make properly authorized payments. The Portfolios are obligated to repay the custodian for any overdraft, including any related costs or expenses. The custodian has a lien, security interest or security entitlement in any Portfolio property that is not segregated, to the maximum extent permitted by law for any overdraft.
In addition, the Portfolios and other affiliated funds have entered into an agreement with State Street Bank and Trust Company which enables them to participate in a $200 million unsecured committed line of credit. A commitment fee, payable at the end of each calendar quarter, based on the average daily unused portion of the line of credit, is charged to each participating fund on a
| |
| 36 | Lifestyle Portfolios | Annual report |
pro rata basis and is reflected in miscellaneous expenses on the Statements of Operations. For the year ended December 31, 2010, the Portfolios had no borrowings under the line of credit.
Expenses. The majority of expenses are directly attributable to an individual portfolio. Expenses that are not readily attributable to a specific portfolio are allocated among all portfolios in an equitable manner, taking into consideration, among other things, the nature and type of expense and the portfolio’s relative assets. Expense estimates are accrued in the period to which they relate and adjustments are made when actual amounts are known.
Class allocations. Income, common expenses, and realized and unrealized gains (losses) are determined at the Portfolio level and allocated daily to each class of shares based on the net asset value of the class. Class-specific expenses, such as distribution and service fees, if any, and transfer agent fees, are calculated daily for each class, based on the net asset value and the specific expense rates applicable to each class.
Federal income taxes. The Portfolios intend to continue to qualify as regulated investment companies by complying with the applicable provisions of the Internal Revenue Code and will not be subject to federal income tax on taxable income that is distributed to shareholders. Therefore, no federal income tax provisions are required.
For federal income tax purposes, the Portfolios have capital loss carryforwards available to offset future net realized capital gains. The following table details the capital loss carryforwards available as of December 31, 2010:
| | | | |
| | Capital Loss Carryforward | | |
| | Expiring at December 31, | | |
| |
| Portfolio | 2016 | 2017 | 2018 | |
| |
| Lifestyle Aggressive | $129,404,422 | $364,659,388 | $69,543,765 | |
| Lifestyle Growth | 331,154,610 | 966,013,756 | — | |
| Lifestyle Balanced | 164,498,926 | 987,127,767 | 57,259,117 | |
| Lifestyle Moderate | 39,351,498 | 168,786,302 | 17,270,240 | |
| Lifestyle Conservative | — | 89,776,301 | 4,984,075 | |
Under the recently enacted Regulated Investment Company Modernization Act of 2010, the Portfolios will be permitted to carry forward capital losses incurred in taxable years beginning after December 22, 2010 for an unlimited period. However, any losses incurred during those future taxable years will be required to be utilized prior to the losses incurred in pre-enactment taxable years. As a result of this ordering rule, pre-enactment capital loss carryforwards may be more likely to expire unused. Additionally, post-enactment capital losses that are carried forward will retain their character as either short-term or long-term capital losses rather than being considered all short-term as under previous law.
As of December 31, 2010, the Portfolios had no uncertain tax positions that would require financial statement recognition, de-recognition or disclosure. The Portfolios’ federal tax returns are subject to examination by the Internal Revenue Service for a period of three years.
The cost of investments owned on December 31, 2010, including short-term investments, for federal income tax purposes, was as follows:
| | | | |
| | | | | Net Unrealized |
| | | Unrealized | Unrealized | Appreciation/ |
| Portfolio | Aggregate Cost | Appreciation | Depreciation | (Depreciation) |
|
| Lifestyle Aggressive | $3,377,177,362 | $495,180,679 | ($14,152,864) | $481,027,815 |
| Lifestyle Growth | 10,418,340,803 | 1,243,665,361 | (94,263,781) | 1,149,401,580 |
| Lifestyle Balanced | 10,254,519,218 | 1,081,652,877 | (53,443,010) | 1,028,209,867 |
| Lifestyle Moderate | 3,265,993,674 | 251,425,117 | (6,189,812) | 245,235,305 |
| Lifestyle Conservative | 2,727,464,723 | 139,694,592 | (6,176,783) | 133,517,809 |
Distribution of income and gains. Distributions to shareholders from net investment income and net realized gains, if any, are recorded on the ex-date. The Lifestyle Aggressive and Lifestyle Growth Portfolios declare and pay income dividends and capital gain distributions, if any, at least annually. The Lifestyle Balanced, Lifestyle Moderate and Lifestyle Conservative Portfolios generally declare and pay income dividends quarterly and capital gain distributions, if any, at least annually.
During the year ended December 31, 2010, the tax character of distributions paid was as follows:
| | | | | |
| | | 2010 Distributions | | |
| |
| |
| | | Long Term | | | |
| Portfolio | Ordinary Income | Capital Gains | Return of Capital | Total | |
| |
| Lifestyle Aggressive | $63,697,830 | — | — | $63,697,830 | |
| Lifestyle Growth | 309,249,520 | — | — | 309,249,520 | |
| Lifestyle Balanced | 398,943,703 | — | — | 398,943,703 | |
| Lifestyle Moderate | 148,004,490 | — | — | 148,004,490 | |
| Lifestyle Conservative | 129,906,306 | — | — | 129,906,306 | |
| | |
| | Annual report | Lifestyle Portfolios | 37 |
During the year ended December 31, 2009, the tax character of distributions paid was as follows:
| | | | | |
| | | 2009 Distributions | | |
|
| |
| | | Long Term | | | |
| Portfolio | Ordinary Income | Capital Gains | Return of Capital | Total | |
| |
| Lifestyle Aggressive | $40,837,067 | — | — | $40,837,067 | |
| Lifestyle Growth | 240,072,101 | — | — | 240,072,101 | |
| Lifestyle Balanced | 313,566,048 | — | — | 313,566,048 | |
| Lifestyle Moderate | 113,066,079 | — | — | 113,066,079 | |
| Lifestyle Conservative | 100,123,499 | — | — | 100,123,499 | |
Distributions paid by the Portfolios with respect to each class of shares are calculated in the same manner, at the same time and are in the same amount, except for the effect of expenses that may be applied differently to each class. Net capital losses that are a result of security transactions occurring after October 31, 2010 (post-October deferral), are treated as occurring on January 1, 2011, the first day of the Portfolios’ next taxable year.
As of December 31, 2010, the components of distributable earnings on a tax basis were as follows:
| | | | |
| | | Undistributed | | |
| | Undistributed | Long Term | Capital Loss | Post-October |
| Portfolio | Ordinary Income | Capital Gains | Carryforward | Deferral |
|
| Lifestyle Aggressive | — | — | $563,607,575 | — |
| Lifestyle Growth | $439,378 | — | 1,297,168,366 | — |
| Lifestyle Balanced | 861,809 | — | 1,208,885,810 | — |
| Lifestyle Moderate | 391,781 | — | 225,408,040 | — |
| Lifestyle Conservative | 367,054 | — | 94,760,376 | — |
Such distributions and distributable earnings, on a tax basis, are determined in conformity with income tax regulations, which may differ from accounting principles generally accepted in the United States of America. Material distributions in excess of tax basis earnings and profits, if any, are reported in the Portfolios’ financial statements as a return of capital. Short term gains from underlying funds are treated as ordinary income for tax purposes.
Capital accounts within financial statements are adjusted for permanent book-tax differences. These adjustments have no impact on net assets or the results of operations. Book-tax differences, if any, will reverse in a subsequent period. Book-tax differences are primarily attributable to wash sale loss deferrals for all Portfolios.
Note 3 — Guarantees and indemnifications
Under the Trust’s organizational documents, its Officers and Trustees are indemnified against certain liabilities arising out of the performance of their duties to the Portfolios. Additionally, in the normal course of business, the Portfolios enter into contracts with service providers that contain general indemnification clauses. The Portfolios’ maximum exposure under these arrangements is unknown, as this would involve future claims that may be made against the Trust that have not yet occurred. The risk of material loss from such claims is considered remote.
Note 4 — Fees and transactions with affiliates
John Hancock Investment Management Services, LLC (the Adviser) serves as investment adviser for the Portfolios. John Hancock Funds, LLC (the Distributor), an affiliate of the Adviser, serves as principal underwriter of the Portfolios. The Adviser and the Distributor are indirect wholly owned subsidiaries of MFC.
Management fee. The Portfolios pay the Adviser a management fee for its services to the Portfolios. The management fee has two components: (a) a fee on net assets invested in affiliated funds (Affiliated Fund Assets) and (b) a fee on net assets not invested in affiliated funds (Other Assets). Affiliated funds are any funds of the Trust, John Hancock Trust (JHT) and John Hancock Funds III (JHF III) excluding John Hancock Money Market Trust B, John Hancock 500 Index Trust B, John Hancock International Equity Index Trust B and John Hancock Total Bond Market Trust B. The fee on assets invested in Affiliated Fund Assets is stated as an annual percentage of the current value of the aggregate net assets of all the Portfolios and is equivalent to the sum of: (a) 0.05% of the first $7.5 billion of aggregate net assets and (b) 0.04% of the excess over $7.5 billion of aggregate net assets. The fee on Other Assets is stated as an annual percentage of the current value of the aggregate net assets of all the Portfolios and is equivalent to the sum of: (a) 0.50% of the first $7.5 billion of aggregate net assets and (b) 0.49% of the excess over $7.5 billion of aggregate net assets and is applied to the Other Assets of the Portfolios.
| |
| 38 | Lifestyle Portfolios | Annual report |
John Hancock Asset Management a division of Manulife Asset Management (North America) Limited (formerly MFC Global Investment Management (U.S.A.) Limited), an indirect owned subsidiary of MFC and an affiliate of the Adviser, and QS Investors, LLC act as subadvisers to the Lifestyle Portfolios. Effective January 1, 2011, John Hancock Asset Management a division of Manulife Asset Management (US) LLC (formerly MFC Global Investment Management (U.S.) LLC), an indirect owned subsidiary of MFC and an affiliate of the Adviser, also acts as subadviser. The Portfolios are not responsible for the payment of subadvisory fees. The investment management fees incurred for the year ended December 31, 2010 were equivalent to an annual effective rate of each Portfolio’s average daily net assets as follows:
| | | | |
| Portfolio | Annual Effective Rate | | | |
| | | |
| Lifestyle Aggressive | 0.05% | | | |
| Lifestyle Growth | 0.04% | | | |
| Lifestyle Balanced | 0.04% | | | |
| Lifestyle Moderate | 0.04% | | | |
| Lifestyle Conservative | 0.04% | | | |
Expense reimbursements. The Adviser voluntarily agreed to waive a portion of its management fee if certain expenses of the Lifestyle Portfolios exceed 0.10% of average net assets. Expenses excluded from this waiver are taxes, brokerage commissions, interest, litigation and indemnification expenses and other extraordinary expenses not incurred in the ordinary course of the Portfolios’ business, advisory fees, Rule 12b-1 fees, printing fees, transfer agent fees, state registration fees, service fees and underlying fund expenses. This expense reduction will continue in effect until terminated by the Adviser.
The Adviser has voluntarily agreed to waive its advisory fee or reimburse the Portfolios so that the aggregate advisory fee retained by the Adviser with respect to both the Portfolios and the underlying investments does not exceed 0.51% of the Lifestyle Portfolios’ first $7.5 billion of average daily net assets and 0.50% of the Portfolios’ average daily net assets in excess of $7.5 billion. This voluntary waiver may terminate at any time.
The Adviser has contractually agreed to waive fees and/or reimburse certain class specific expenses, including 12b-1 fees, transfer agent fees, service fees, state registration fees, and printing and postage fees for Class A, Class B, Class C, Class R1, Class R3, Class R4 and Class R5 shares, to the extent that the above expenses for each class exceed 0.59%, 1.29%, 1.29%, 1.04%, 0.94%, 0.64% and 0.34%, respectively, of the average daily net assets attributable to the classes. This expense fee waiver and/or reimbursement will continue in effect until at least April 30, 2011.
For the year ended December 31, 2010, the expense reductions related to these plans amounted to the following and are reflected as a reduction of total expenses in the Statements of Operations:
| | | | | | | | | | |
| Expense Reimbursement by Class |
|
| Portfolio | Class A | Class B | Class C | Class R1 | Class R3 | Class R4 | Class R5 | Class 1 | Class 5 | Total |
|
| Lifestyle Aggressive | $9,072 | $9,140 | $5,601 | $429 | $651 | $448 | $584 | $185,723 | — | $211,648 |
| Lifestyle Growth | 11,006 | 5,528 | 7,855 | 297 | 483 | 395 | 458 | 213,331 | $1,820 | 241,173 |
| Lifestyle Balanced | 2,208 | 292 | 1,731 | 57 | 159 | 110 | 152 | 39,194 | 178 | 44,081 |
Expense recapture. The Adviser may recapture operating expenses reimbursed or fees waived under previous expense limitation or waiver arrangements made subsequent to January 1, 2009, for a period of three years following the beginning of the month in which such reimbursements or waivers originally occurred. The table below outlines the amounts recovered during the year ended December 31, 2010 and the amount of waived or reimbursed expenses subject to potential recovery and the respective expiration dates. Certain reimbursements or waivers are not subject to recapture.
| | | | |
| | Amounts eligible for | Amounts eligible for | Amount recovered | |
| | recovery through | recovery through | during the year ended | |
| Portfolio | December 1, 2012 | December 1, 2013 | December 31, 2010 | |
| |
| Lifestyle Aggressive | $31,151 | $7,850 | $95,012 | |
| Lifestyle Growth | 11,307 | 3,715 | 52,552 | |
| Lifestyle Balanced | — | — | 18,978 | |
| Lifestyle Moderate | — | — | 11,921 | |
| Lifestyle Conservative | — | — | 7,338 | |
Accounting and legal services. Pursuant to the service agreement, the Portfolios reimburse the Adviser for all expenses associated with providing the administrative, financial, legal, accounting and recordkeeping services of the Portfolio, including the preparation of all tax returns, periodic reports to shareholders and regulatory reports, among other services. These expenses are allocated to each share class based on its relative net assets at the time the expense was incurred. The accounting and legal services fees incurred for the year ended December 31, 2010 amounted to an annual rate of 0.01% of each Portfolio’s average daily net assets.
Distribution and service plans. The Trust has a distribution agreement with the Distributor. The Portfolios have adopted distribution and service plans with respect to Class A, Class B, Class C, Class R1, Class R3, Class R4 and Class 1 shares pursuant to Rule 12b-1 under the 1940 Act, to pay the Distributor for services provided as the distributor of shares of the Portfolios. In addition, under a service plan for Class R1, Class R3, Class R4 and Class R5 shares, the Portfolios pay for certain other services. The Portfolios may pay up to the following contractual rates of distribution and service fees under these arrangements, expressed as an annual percentage of average daily net assets for each class of the Portfolios’ shares:
| | |
| | Annual report | Lifestyle Portfolios | 39 |
| | | | |
| Class | 12b-1 Fee | Service Fee | | |
| | |
| A | 0.30% | — | | |
| B | 1.00% | — | | |
| C | 1.00% | — | | |
| R1 | 0.50% | 0.25% | | |
| R3 | 0.50% | 0.15% | | |
| R4 | 0.25% | 0.10% | | |
| R5 | — | 0.05% | | |
| 1 | 0.05% | — | | |
Sales charges. Class A shares are assessed up-front sales charges of up to 5% of the net asset value of such shares. The following summarizes the net up-front sales charges received by the Distributor during the year ended December 31, 2010:
| | | | | |
| Lifestyle Aggressive | Lifestyle Growth | Lifestyle Balanced | Lifestyle Moderate | Lifestyle Conservative |
|
| |
| Net sales charges | $631,724 | $3,079,812 | $3,038,657 | $1,296,065 | $1,503,560 |
| Retained for printing prospectuses, | | | | | |
| advertising and sales literature | 98,698 | 489,251 | 489,114 | 209,693 | 249,405 |
| Sales commission to unrelated broker-dealers | 520,471 | 2,550,709 | 2,513,397 | 1,079,777 | 1,247,747 |
| Sales commission to affiliated sales personnel | 12,555 | 39,852 | 36,146 | 6,595 | 6,408 |
Class B shares that are redeemed within six years of purchase are subject to a contingent deferred sales charge (CDSC) at declining rates, beginning at 5.00% of the lesser of the current market value at the time of redemption or the original purchase cost of the shares being redeemed. Class C shares that are redeemed within one year of purchase are subject to a CDSC at a rate of 1.00% of the lesser of the current market value at the time of redemption or the original purchase cost of the shares being redeemed. Proceeds from the CDSCs are paid to the Distributor and are used, in whole or in part, to defray its expenses for providing distribution-related services to the Portfolios in connection with the sale of Class B and Class C shares. During the year ended December 31, 2010, CDSCs received by the Distributor for Class B and Class C were as follows:
| | | | |
| Portfolio | Class B | Class C | | |
| | |
| Lifestyle Aggressive | $65,546 | $14,463 | | |
| Lifestyle Growth | 189,067 | 60,807 | | |
| Lifestyle Balanced | 175,797 | 70,050 | | |
| Lifestyle Moderate | 56,023 | 37,434 | | |
| Lifestyle Conservative | 48,500 | 30,727 | | |
Transfer agent fees. The Portfolios have a transfer agent agreement with John Hancock Signature Services, Inc. (Signature Services or Transfer Agent), an affiliate of the Adviser. Class 1 and Class 5 shares do not pay transfer agent fees. The transfer agent fees paid to Signature Services are determined based on the cost to Signature Services (Signature Services Cost) of providing recordkeeping services. The Signature Services Cost includes a component of allocated John Hancock corporate overhead for providing transfer agent services to the Portfolios and to all other John Hancock affiliated funds. It also includes out-of-pocket expenses that are comprised of payments made to third-parties for recordkeeping services provided to their clients who invest in one or more John Hancock funds. In addition, Signature Services Cost may be reduced by certain revenues that Signature Services receive in connection with the service they provide to the funds. Signature Services Cost is calculated monthly and allocated, as applicable, to four categories of share classes: Institutional Share Classes, Retirement Share Classes, Municipal Bond Classes and all other Retail Share Classes. Within each of these categories, the applicable costs are allocated to the affected John Hancock affiliated funds and/or classes, based on the relative average daily net assets.
Prior to July 1, 2010, the transfer agent fees were made up of three components:
• The Portfolios paid a monthly transfer agent fee at an annual rate of 0.05% for Class A, Class B, Class C, Class R1, Class R3, Class R4 and Class R5 shares, based on each class’s average daily net assets.
• The Portfolios paid a monthly fee based on an annual rate of $16.50 per shareholder account for Class A, Class B, Class C, Class R1, Class R3, Class R4 and Class R5 shares.
• Signature Services was reimbursed for certain out-of-pocket expenses.
| |
| 40 | Lifestyle Portfolios | Annual report |
Class level expenses. Class level expenses for the year ended December 31, 2010 were:
| | | | | |
| | | Distribution and | Transfer | State | Printing and |
| Portfolio | Share class | service fees | agent fees | registration fees | postage |
|
| Lifestyle Aggressive | Class A | $462,564 | $324,580 | $10,747 | $11,220 |
| | Class B | 218,845 | 56,170 | 7,528 | 1,773 |
| | Class C | 951,872 | 201,221 | 7,741 | 6,199 |
| | Class R1 | 50,864 | 5,858 | 4,335 | 512 |
| | Class R3 | 72,121 | 7,208 | 6,786 | 519 |
| | Class R4 | 24,742 | 4,609 | 7,037 | 156 |
| | Class R5 | 5,057 | 5,654 | 8,121 | 469 |
| | Class 1 | 1,575,424 | — | — | — |
| | Total | $3,361,489 | $605,300 | $52,295 | $20,848 |
|
| Lifestyle Growth | Class A | $1,439,668 | $885,630 | $24,859 | $23,529 |
| | Class B | 792,164 | 171,104 | 6,774 | 3,013 |
| | Class C | 3,426,304 | 617,927 | 12,981 | 13,276 |
| | Class R1 | 88,502 | 9,835 | 4,943 | 935 |
| | Class R3 | 136,539 | 12,193 | 8,219 | 915 |
| | Class R4 | 56,756 | 9,257 | 7,016 | (1,099) |
| | Class R5 | 10,615 | 10,186 | 8,640 | 696 |
| | Class 1 | 4,661,516 | — | — | — |
| | Total | $10,612,064 | $1,716,132 | $73,432 | $41,265 |
|
| Lifestyle Balanced | Class A | $1,446,178 | $840,050 | $23,436 | $18,773 |
| | Class B | 678,889 | 137,650 | 7,268 | 3,110 |
| | Class C | 3,840,611 | 642,734 | 19,381 | 14,265 |
| | Class R1 | 90,103 | 8,387 | 3,757 | 521 |
| | Class R3 | 219,664 | 18,519 | 7,822 | 1,101 |
| | Class R4 | 79,197 | 13,102 | 9,753 | (1,672) |
| | Class R5 | 15,414 | 16,103 | 7,586 | 815 |
| | Class 1 | 4,547,556 | — | — | — |
| | Total | $10,917,612 | $1,676,545 | $79,003 | $36,913 |
|
| Lifestyle Moderate | Class A | $530,781 | $303,753 | $15,487 | $10,516 |
| | Class B | 223,184 | 44,355 | 6,998 | 1,710 |
| | Class C | 1,504,004 | 253,083 | 15,358 | 8,464 |
| | Class R1 | 47,627 | 4,775 | 4,660 | 445 |
| | Class R3 | 58,927 | 6,309 | 7,187 | 507 |
| | Class R4 | 19,435 | 3,811 | 6,986 | (81) |
| | Class R5 | 3,712 | 5,481 | 7,247 | 398 |
| | Class 1 | 1,378,269 | — | — | — |
| | Total | $3,765,939 | $621,567 | $63,923 | $21,959 |
|
| Lifestyle Conservative | Class A | $527,538 | $292,533 | $18,190 | $9,721 |
| | Class B | 241,460 | 45,202 | 7,455 | 1,846 |
| | Class C | 1,540,929 | 254,003 | 14,141 | 8,587 |
| | Class R1 | 58,579 | 5,773 | 976 | 509 |
| | Class R3 | 62,633 | 6,370 | 6,860 | 525 |
| | Class R4 | 17,074 | 3,338 | 6,899 | 94 |
| | Class R5 | 3,411 | 5,655 | 6,993 | 460 |
| | Class 1 | 1,092,654 | — | — | — |
| | Total | $3,544,278 | $612,874 | $61,514 | $21,742 |
|
Trustee expenses. The Trust compensates each Trustee who is not an employee of the Adviser or its affiliates. The costs of paying Trustee compensation and expenses are allocated to each Portfolio based on its average daily net assets.
| | |
| | Annual report | Lifestyle Portfolios | 41 |
Note 5 — Portfolio share transactions
Transactions in Portfolio shares for the years ended December 31, 2010 and 2009 were as follows:
| | | | |
| Lifestyle Aggressive | | | | |
| | | Year ended 12-31-10 | | Year ended 12-31-09 |
| | Shares | Amount | Shares | Amount |
| Class A shares | | | | |
|
| Sold | 6,305,037 | $70,594,208 | 5,393,918 | $49,553,716 |
| Exchanged from Class R2 | — | — | 555,063 | 5,514,891 |
| Distributions reinvested | 179,719 | 2,208,744 | 101,292 | 1,098,270 |
| Repurchased | (4,272,684) | (47,184,373) | (3,032,530) | (27,478,545) |
| Net increase | 2,212,072 | $25,618,579 | 3,017,743 | $28,688,332 |
| |
| Class B shares | | | | |
|
| Sold | 304,055 | $3,382,176 | 460,786 | $4,037,532 |
| Distributions reinvested | 11,119 | 136,983 | 4,818 | 52,850 |
| Repurchased | (381,053) | (4,236,010) | (392,000) | (3,521,146) |
| Net increase (decrease) | (65,879) | ($716,851) | 73,604 | $569,236 |
| |
| Class C shares | | | | |
|
| Sold | 2,508,754 | $27,954,313 | 2,572,549 | $22,589,783 |
| Distributions reinvested | 51,465 | 634,050 | 19,654 | 213,891 |
| Repurchased | (1,821,170) | (20,136,171) | (2,078,724) | (18,670,746) |
| Net increase | 739,049 | $8,452,192 | 513,479 | $4,132,928 |
| |
| Class R shares | | | | |
|
| Sold | — | — | 102,359 | $810,679 |
| Exchanged for Class R1 | — | — | (217,916) | (2,170,600) |
| Repurchased | — | — | (81,154) | (639,467) |
| Net decrease | — | — | (196,711) | ($1,999,388) |
| |
| Class R1 shares | | | | |
|
| Sold | 331,421 | $3,708,886 | 214,172 | $2,031,197 |
| Exchanged from Class R | — | — | 218,013 | 2,170,600 |
| Distributions reinvested | 5,029 | 62,001 | 2,155 | 23,468 |
| Repurchased | (223,167) | (2,514,129) | (94,312) | (853,688) |
| Net increase | 113,283 | $1,256,758 | 340,028 | $3,371,577 |
| |
| Class R2 shares | | | | |
|
| Sold | — | — | 434,308 | $3,793,245 |
| Exchanged for Class A | — | — | (554,800) | (5,514,891) |
| Repurchased | — | — | (68,953) | (630,606) |
| Net decrease | — | — | (189,445) | ($2,352,252) |
| |
| Class R3 shares | | | | |
|
| Sold | 407,234 | $4,509,668 | 561,647 | $4,906,273 |
| Distributions reinvested | 10,847 | 133,199 | 5,797 | 62,992 |
| Repurchased | (380,475) | (4,275,316) | (352,738) | (3,269,588) |
| Net increase | 37,606 | $367,551 | 214,706 | $1,699,677 |
| |
| Class R4 shares | | | | |
|
| Sold | 228,047 | $2,518,760 | 483,613 | $4,352,134 |
| Distributions reinvested | 9,198 | 112,863 | 6,365 | 68,937 |
| Repurchased | (359,415) | (3,862,856) | (487,525) | (4,187,328) |
| Net increase (decrease) | (122,170) | ($1,231,233) | 2,453 | $233,743 |
| |
| Class R5 shares | | | | |
|
| Sold | 357,321 | $3,960,507 | 497,800 | $4,558,425 |
| Distributions reinvested | 14,983 | 183,692 | 10,107 | 109,359 |
| Repurchased | (359,621) | (4,022,202) | (304,790) | (2,888,196) |
| Net increase | 12,683 | $121,997 | 203,117 | $1,779,588 |
| |
| Class 1 shares | | | | |
|
| Sold | 14,472,185 | $161,177,263 | 26,499,244 | $228,826,778 |
| Distributions reinvested | 4,913,019 | 60,086,218 | 3,627,475 | 39,140,458 |
| Repurchased | (17,954,899) | (199,627,905) | (12,412,965) | (117,371,596) |
| Net increase | 1,430,305 | $21,635,576 | 17,713,754 | $150,595,640 |
| |
| Net increase | 4,356,949 | $55,504,569 | 21,692,728 | $186,719,081 |
|
| |
| 42 | Lifestyle Portfolios | Annual report |
| | | | |
| Lifestyle Growth | | | | |
| | | Year ended 12-31-10 | | Year ended 12-31-09 |
| | Shares | Amount | Shares | Amount |
| Class A shares | | | | |
|
| Sold | 18,814,650 | $225,001,303 | 14,352,411 | $146,202,366 |
| Exchanged from Class R2 | — | — | 601,503 | 6,459,715 |
| Distributions reinvested | 1,030,999 | 13,227,661 | 717,905 | 8,269,027 |
| Repurchased | (10,099,050) | (119,743,641) | (8,178,840) | (79,244,982) |
| Net increase | 9,746,599 | $118,485,323 | 7,492,979 | $81,686,126 |
| |
| Class B shares | | | | |
|
| Sold | 1,265,708 | $15,127,498 | 1,494,544 | $14,722,280 |
| Distributions reinvested | 102,276 | 1,316,279 | 88,768 | 1,026,160 |
| Repurchased | (978,368) | (11,624,127) | (1,179,186) | (11,226,752) |
| Net increase | 389,616 | $4,819,650 | 404,126 | $4,521,688 |
| |
| Class C shares | | | | |
|
| Sold | 9,702,393 | $115,563,855 | 7,971,450 | $79,773,645 |
| Distributions reinvested | 492,454 | 6,327,921 | 357,727 | 4,131,730 |
| Repurchased | (5,375,747) | (63,668,960) | (5,346,607) | (51,289,408) |
| Net increase | 4,819,100 | $58,222,816 | 2,982,570 | $32,615,967 |
| |
| Class R shares | | | | |
|
| Sold | — | — | 154,297 | $1,355,103 |
| Exchanged for Class R1 | — | — | (361,089) | (3,892,766) |
| Repurchased | — | — | (75,575) | (653,613) |
| Net decrease | — | — | (282,367) | ($3,191,276) |
| |
| Class R1 shares | | | | |
|
| Sold | 502,427 | $5,987,652 | 393,537 | $4,183,798 |
| Exchanged from Class R | — | — | 361,619 | 3,892,766 |
| Distributions reinvested | 18,671 | 240,862 | 12,529 | 145,088 |
| Repurchased | (289,081) | (3,493,178) | (179,674) | (1,884,017) |
| Net increase | 232,017 | $2,735,336 | 588,011 | $6,337,635 |
| |
| Class R2 shares | | | | |
|
| Sold | — | — | 379,506 | $3,591,796 |
| Exchanged for Class A | — | — | (600,523) | (6,459,715) |
| Repurchased | — | — | (509,838) | (4,566,133) |
| Net decrease | — | — | (730,855) | ($7,434,052) |
| |
| Class R3 shares | | | | |
|
| Sold | 661,010 | $7,911,722 | 731,415 | $6,994,890 |
| Distributions reinvested | 38,602 | 494,881 | 30,785 | 354,642 |
| Repurchased | (507,021) | (6,122,404) | (528,975) | (5,196,178) |
| Net increase | 192,591 | $2,284,199 | 233,225 | $2,153,354 |
| |
| Class R4 shares | | | | |
|
| Sold | 730,506 | $8,662,769 | 730,467 | $7,382,293 |
| Distributions reinvested | 36,712 | 470,653 | 29,805 | 343,352 |
| Repurchased | (671,736) | (7,797,633) | (803,245) | (7,608,619) |
| Net increase (decrease) | 95,482 | $1,335,789 | (42,973) | $117,026 |
| |
| Class R5 shares | | | | |
|
| Sold | 734,800 | $8,763,730 | 716,169 | $7,022,351 |
| Distributions reinvested | 44,173 | 566,295 | 36,152 | 416,107 |
| Repurchased | (624,225) | (7,547,846) | (366,045) | (3,662,895) |
| Net increase | 154,748 | $1,782,179 | 386,276 | $3,775,563 |
| |
| Class 1 shares | | | | |
|
| Sold | 37,252,046 | $443,658,442 | 58,541,779 | $561,888,928 |
| Distributions reinvested | 22,114,970 | 282,629,320 | 19,420,065 | 222,748,147 |
| Repurchased | (33,910,544) | (402,925,018) | (31,392,850) | (310,161,132) |
| Net increase | 25,456,472 | $323,362,744 | 46,568,994 | $474,475,943 |
| |
| Class 5 shares | | | | |
|
| Sold | 1,615,561 | $19,248,023 | 1,407,676 | $14,108,155 |
| Distributions reinvested | 211,140 | 2,694,142 | 149,230 | 1,710,171 |
| Repurchased | (149,920) | (1,772,039) | (329,293) | (3,020,346) |
| Net increase | 1,676,781 | $20,170,126 | 1,227,613 | $12,797,980 |
| |
| Net increase | 42,763,406 | $533,198,162 | 58,827,599 | $607,855,954 |
|
| | |
| | Annual report | Lifestyle Portfolios | 43 |
| | | | |
| Lifestyle Balanced | | | | |
| | | Year ended 12-31-10 | | Year ended 12-31-09 |
| | Shares | Amount | Shares | Amount |
| Class A shares | | | | |
|
| Sold | 19,580,426 | $240,102,252 | 14,615,163 | $154,720,951 |
| Exchanged from Class R2 | — | — | 636,297 | 7,077,123 |
| Distributions reinvested | 1,373,063 | 17,275,109 | 968,873 | 10,789,622 |
| Repurchased | (10,042,103) | (122,781,303) | (8,793,428) | (88,170,645) |
| Net increase | 10,911,386 | $134,596,058 | 7,426,905 | $84,417,051 |
| |
| Class B shares | | | | |
|
| Sold | 1,180,688 | $14,435,721 | 1,341,474 | $13,824,238 |
| Distributions reinvested | 130,755 | 1,655,395 | 122,200 | 1,363,802 |
| Repurchased | (993,298) | (12,095,506) | (1,022,705) | (10,042,054) |
| Net increase | 318,145 | $3,995,610 | 440,969 | $5,145,986 |
| |
| Class C shares | | | | |
|
| Sold | 12,290,967 | $150,133,097 | 9,973,381 | $106,033,040 |
| Distributions reinvested | 810,001 | 10,258,850 | 580,625 | 6,522,968 |
| Repurchased | (6,152,559) | (75,155,891) | (5,633,636) | (55,304,113) |
| Net increase | 6,948,409 | $85,236,056 | 4,920,370 | $57,251,895 |
| |
| Class R shares | | | | |
|
| Sold | — | — | 320,081 | $3,136,327 |
| Exchanged for Class R1 | — | — | (498,542) | (5,538,767) |
| Distributions reinvested | — | — | 3,132 | 30,044 |
| Repurchased | — | — | (136,833) | (1,351,052) |
| Net decrease | — | — | (312,162) | ($3,723,448) |
| |
| Class R1 shares | | | | |
|
| Sold | 618,303 | $7,531,435 | 485,685 | $4,980,858 |
| Exchanged from Class R | — | — | 499,598 | 5,538,767 |
| Distributions reinvested | 25,021 | 314,158 | 14,390 | 166,999 |
| Repurchased | (391,958) | (4,806,555) | (234,211) | (2,371,706) |
| Net increase | 251,366 | $3,039,038 | 765,462 | $8,314,918 |
| |
| Class R2 shares | | | | |
|
| Sold | — | — | 425,204 | $4,225,280 |
| Exchanged for Class A | — | — | (637,650) | (7,077,123) |
| Distributions reinvested | — | — | 4,800 | 46,524 |
| Repurchased | — | — | (180,650) | (1,699,784) |
| Net decrease | — | — | (388,296) | ($4,505,103) |
| |
| Class R3 shares | | | | |
|
| Sold | 1,574,471 | $18,999,404 | 1,194,998 | $11,833,000 |
| Distributions reinvested | 92,237 | 1,161,080 | 75,232 | 834,261 |
| Repurchased | (1,175,431) | (14,485,233) | (859,207) | (8,707,827) |
| Net increase | 491,277 | $5,675,251 | 411,023 | $3,959,434 |
| |
| Class R4 shares | | | | |
|
| Sold | 1,183,979 | $14,474,628 | 1,310,661 | $13,375,078 |
| Distributions reinvested | 75,526 | 947,259 | 64,869 | 716,379 |
| Repurchased | (1,087,613) | (13,126,262) | (883,577) | (8,836,631) |
| Net increase | 171,892 | $2,295,625 | 491,953 | $5,254,826 |
| |
| Class R5 shares | | | | |
|
| Sold | 1,413,916 | $17,398,471 | 1,166,195 | $11,864,446 |
| Distributions reinvested | 107,201 | 1,345,399 | 77,561 | 859,599 |
| Repurchased | (884,630) | (10,964,930) | (586,927) | (5,929,081) |
| Net increase | 636,487 | $7,778,940 | 656,829 | $6,794,964 |
| |
| Class 1 shares | | | | |
|
| Sold | 48,988,036 | $599,105,962 | 60,845,624 | $627,910,053 |
| Distributions reinvested | 29,027,359 | 361,980,670 | 26,404,269 | 289,328,148 |
| Repurchased | (28,069,764) | (341,123,667) | (42,500,742) | (419,118,196) |
| Net increase | 49,945,631 | $619,962,965 | 44,749,151 | $498,120,005 |
| |
| Class 5 shares | | | | |
|
| Sold | 1,182,532 | $14,454,724 | 826,551 | $8,763,637 |
| Distributions reinvested | 134,459 | 1,680,372 | 90,578 | 1,000,413 |
| Repurchased | (243,328) | (2,900,034) | (173,919) | (1,684,477) |
| Net increase | 1,073,663 | $13,235,062 | 743,210 | $8,079,573 |
| |
| Net increase | 70,748,256 | $875,814,605 | 59,905,414 | $669,110,101 |
|
| |
| 44 | Lifestyle Portfolios | Annual report |
| | | | |
| Lifestyle Moderate | | | | |
| | | Year ended 12-31-10 | | Year ended 12-31-09 |
| | Shares | Amount | Shares | Amount |
| Class A shares | | | | |
|
| Sold | 7,839,288 | $95,797,648 | 5,995,257 | $64,253,345 |
| Exchanged from Class R2 | — | — | 226,147 | 2,539,140 |
| Distributions reinvested | 619,398 | 7,647,128 | 416,764 | 4,660,459 |
| Repurchased | (3,445,806) | (41,973,126) | (3,245,431) | (33,789,958) |
| Net increase | 5,012,880 | $61,471,650 | 3,392,737 | $37,662,986 |
| |
| Class B shares | | | | |
|
| Sold | 638,918 | $7,781,974 | 544,886 | $5,784,206 |
| Distributions reinvested | 57,501 | 710,843 | 46,602 | 521,685 |
| Repurchased | (306,127) | (3,734,736) | (342,500) | (3,509,077) |
| Net increase | 390,292 | $4,758,081 | 248,988 | $2,796,814 |
| |
| Class C shares | | | | |
|
| Sold | 6,582,442 | $79,898,068 | 4,505,216 | $48,432,667 |
| Distributions reinvested | 417,998 | 5,173,078 | 252,849 | 2,842,914 |
| Repurchased | (2,412,411) | (29,434,773) | (2,068,697) | (21,116,835) |
| Net increase | 4,588,029 | $55,636,373 | 2,689,368 | $30,158,746 |
| |
| Class R shares | | | | |
|
| Sold | — | — | 138,491 | $1,324,777 |
| Exchanged for Class R1 | — | — | (200,158) | (2,243,414) |
| Distributions reinvested | — | — | 1,808 | 17,911 |
| Repurchased | — | — | (50,359) | (489,228) |
| Net decrease | — | — | (110,218) | ($1,389,954) |
| |
| Class R1 shares | | | | |
|
| Sold | 307,418 | $3,717,017 | 179,547 | $1,948,712 |
| Exchanged from Class R | — | — | 200,011 | 2,243,414 |
| Distributions reinvested | 17,242 | 212,703 | 12,629 | 143,952 |
| Repurchased | (280,296) | (3,438,717) | (66,118) | (698,631) |
| Net increase | 44,364 | $491,003 | 326,069 | $3,637,447 |
| |
| Class R2 shares | | | | |
|
| Sold | — | — | 216,278 | $2,249,595 |
| Exchanged for Class A | — | — | (226,467) | (2,539,142) |
| Distributions reinvested | — | — | 1,600 | 16,491 |
| Repurchased | — | — | (12,561) | (129,603) |
| Net decrease | — | — | (21,150) | ($402,659) |
| |
| Class R3 shares | | | | |
|
| Sold | 283,692 | $3,466,476 | 310,906 | $3,264,341 |
| Distributions reinvested | 29,029 | 357,731 | 24,829 | 276,912 |
| Repurchased | (264,667) | (3,255,213) | (175,560) | (1,850,673) |
| Net increase | 48,054 | $568,994 | 160,175 | $1,690,580 |
| |
| Class R4 shares | | | | |
|
| Sold | 326,284 | $3,934,571 | 209,323 | $2,180,617 |
| Distributions reinvested | 21,817 | 268,881 | 15,200 | 167,320 |
| Repurchased | (150,156) | (1,811,443) | (229,299) | (2,361,820) |
| Net increase (decrease) | 197,945 | $2,392,009 | (4,776) | ($13,883) |
| |
| Class R5 shares | | | | |
|
| Sold | 524,830 | $6,382,507 | 256,618 | $2,751,945 |
| Distributions reinvested | 38,129 | 469,165 | 25,024 | 278,219 |
| Repurchased | (330,550) | (4,064,450) | (191,685) | (1,884,941) |
| Net increase | 232,409 | $2,787,222 | 89,957 | $1,145,223 |
| |
| Class 1 shares | | | | |
|
| Sold | 25,257,401 | $306,609,811 | 23,088,571 | $249,217,878 |
| Distributions reinvested | 10,659,990 | 130,970,535 | 9,273,776 | 102,551,217 |
| Repurchased | (9,137,901) | (111,993,007) | (13,386,853) | (140,124,043) |
| Net increase | 26,779,490 | $325,587,339 | 18,975,494 | $211,645,052 |
| |
| Class 5 shares | | | | |
|
| Sold | 599,558 | $7,284,955 | 502,763 | $5,335,211 |
| Distributions reinvested | 74,120 | 910,986 | 47,407 | 528,000 |
| Repurchased | (111,299) | (1,350,211) | (148,917) | (1,478,117) |
| Net increase | 562,379 | $6,845,730 | 401,253 | $4,385,094 |
| |
| Net increase | 37,855,842 | $460,538,401 | 26,147,897 | $291,315,446 |
|
| | |
| | Annual report | Lifestyle Portfolios | 45 |
| | | | |
| Lifestyle Conservative | | | | |
| | | Year ended 12-31-10 | | Year ended 12-31-09 |
| | Shares | Amount | Shares | Amount |
| Class A shares | | | | |
|
| Sold | 10,041,016 | $126,533,979 | 6,745,652 | $77,003,665 |
| Exchanged from Class R2 | — | — | 76,008 | 896,350 |
| Distributions reinvested | 622,255 | 7,844,596 | 407,282 | 4,762,263 |
| Repurchased | (5,202,312) | (65,496,196) | (3,971,263) | (44,128,047) |
| Net increase | 5,460,959 | $68,882,379 | 3,257,679 | $38,534,231 |
| |
| Class B shares | | | | |
|
| Sold | 838,104 | $10,539,336 | 789,204 | $8,849,628 |
| Distributions reinvested | 64,666 | 815,716 | 54,066 | 632,538 |
| Repurchased | (401,195) | (5,021,870) | (393,191) | (4,350,412) |
| Net increase | 501,575 | $6,333,182 | 450,079 | $5,131,754 |
| |
| Class C shares | | | | |
|
| Sold | 7,384,187 | $92,601,801 | 5,086,004 | $57,843,594 |
| Distributions reinvested | 427,536 | 5,392,803 | 256,632 | 3,012,711 |
| Repurchased | (2,745,826) | (34,549,114) | (2,622,152) | (28,592,748) |
| Net increase | 5,065,897 | $63,445,490 | 2,720,484 | $32,263,557 |
| |
| Class R shares | | | | |
|
| Sold | — | — | 173,331 | $1,843,722 |
| Exchanged for Class R1 | — | — | (247,090) | (2,913,364) |
| Distributions reinvested | — | — | 2,164 | 23,127 |
| Repurchased | — | — | (37,533) | (400,509) |
| Net decrease | — | — | (109,128) | ($1,447,024) |
| |
| Class R1 shares | | | | |
|
| Sold | 337,200 | $4,245,154 | 166,059 | $1,848,870 |
| Exchanged from Class R | — | — | 247,037 | 2,913,364 |
| Distributions reinvested | 23,156 | 292,218 | 15,382 | 182,066 |
| Repurchased | (246,997) | (3,145,624) | (85,466) | (978,438) |
| Net increase | 113,359 | $1,391,748 | 343,012 | $3,965,862 |
| |
| Class R2 shares | | | | |
|
| Sold | — | — | 44,671 | $491,604 |
| Exchanged for Class A | — | — | (75,962) | (896,350) |
| Distributions reinvested | — | — | 972 | 10,451 |
| Repurchased | — | — | (304,716) | (3,186,104) |
| Net decrease | — | — | (335,035) | ($3,580,399) |
| |
| Class R3 shares | | | | |
|
| Sold | 438,423 | $5,515,699 | 319,911 | $3,492,606 |
| Distributions reinvested | 34,350 | 432,732 | 28,539 | 331,079 |
| Repurchased | (309,773) | (3,930,221) | (215,360) | (2,432,388) |
| Net increase | 163,000 | $2,018,210 | 133,090 | $1,391,297 |
| |
| Class R4 shares | | | | |
|
| Sold | 315,088 | $3,965,586 | 265,688 | $2,989,366 |
| Distributions reinvested | 20,102 | 253,285 | 12,930 | 150,377 |
| Repurchased | (137,036) | (1,733,405) | (267,700) | (2,900,378) |
| Net increase | 198,154 | $2,485,466 | 10,918 | $239,365 |
| |
| Class R5 shares | | | | |
|
| Sold | 430,442 | $5,380,666 | 419,850 | $4,646,869 |
| Distributions reinvested | 39,422 | 496,135 | 30,386 | 353,949 |
| Repurchased | (438,988) | (5,550,349) | (161,722) | (1,793,563) |
| Net increase | 30,876 | $326,452 | 288,514 | $3,207,255 |
| |
| Class 1 shares | | | | |
|
| Sold | 28,313,977 | $353,882,230 | 24,401,009 | $274,926,863 |
| Distributions reinvested | 8,906,887 | 112,034,998 | 7,651,342 | 88,744,297 |
| Repurchased | (8,990,485) | (114,291,033) | (7,025,853) | (79,077,945) |
| Net increase | 28,230,379 | $351,626,195 | 25,026,498 | $284,593,215 |
| |
| Net increase | 39,764,199 | $496,509,122 | 31,786,111 | $364,299,113 |
|
| |
| 46 | Lifestyle Portfolios | Annual report |
Note 6 — Purchase and sale of securities
The following summarizes the purchases and sales of the affiliated underlying funds for the year ended December 31, 2010:
| | | |
| Portfolio | Purchases | Sales | |
| |
| Lifestyle Aggressive | $736,133,387 | $652,478,697 | |
| Lifestyle Growth | 2,560,846,495 | 1,956,311,677 | |
| Lifestyle Balanced | 2,874,049,700 | 1,942,478,286 | |
| Lifestyle Moderate | 1,110,719,323 | 635,896,483 | |
| Lifestyle Conservative | 1,119,650,311 | 614,417,579 | |
Note 7 — Investment in affiliated underlying funds
The Portfolios invest primarily in affiliated underlying funds that are managed by the Adviser and affiliates. The Portfolios do not invest in the affiliated underlying funds for the purpose of exercising management or control; however, the Portfolios’ investment may represent a significant portion of each underlying fund’s net assets. For the year ended December 31, 2010, the following Portfolios held 5% or more of an affiliated underlying fund’s net assets:
| |
| | Percent of Underlying |
| Portfolio Affiliate Class NAV | Funds’ Net Assets |
|
| Lifestyle Aggressive | |
| John Hancock Investment Trust | |
| Small Cap Intrinsic Value | 8.99% |
| John Hancock Funds II | |
| All Cap Core | 15.51% |
| All Cap Value | 12.38% |
| Alpha Opportunities | 14.38% |
| Blue Chip Growth | 10.07% |
| Capital Appreciation | 10.48% |
| Currency Strategies | 10.15% |
| Emerging Markets Value | 17.51% |
| Equity-Income | 14.12% |
| Fundamental Value | 12.45% |
| Heritage | 20.93% |
| Index 500 | 8.93% |
| International Equity Index | 6.38% |
| International Growth Stock | 16.33% |
| International Opportunities | 15.32% |
| International Small Cap | 13.86% |
| International Small Company | 23.72% |
| International Value | 11.39% |
| Large Cap | 12.23% |
| Large Cap Value | 11.93% |
| Mid Cap Index | 24.27% |
| Mid Cap Stock | 10.77% |
| Mid Value | 15.89% |
| Mid Cap Value Equity | 20.92% |
| Mutual Shares | 11.09% |
| Natural Resources | 13.07% |
| Optimized Value | 15.84% |
| Real Estate Equity | 5.55% |
| Small Cap Growth | 19.28% |
| Small Cap Index | 22.41% |
| Small Cap Opportunities | 9.95% |
| Small Cap Value | 24.31% |
| Small Company Growth | 22.02% |
| Small Company Value | 13.63% |
| Smaller Company Growth | 10.83% |
| Technical Opportunities | 8.88% |
| U.S. Multi Sector | 14.22% |
| Value | 21.01% |
| Value & Restructuring | 12.04% |
| John Hancock Funds III | |
| International Core | 9.70% |
| Rainier Growth | 7.99% |
| |
| | Percent of Underlying |
| Portfolio Affiliate Class NAV | Funds’ Net Assets |
|
| Lifestyle Growth | |
| John Hancock Investment Trust | |
| Small Cap Intrinsic Value | 13.94% |
| John Hancock Funds II | |
| Active Bond | 9.15% |
| All Cap Core | 47.16% |
| All Cap Value | 33.90% |
| Alpha Opportunities | 43.19% |
| Blue Chip Growth | 27.35% |
| Capital Appreciation | 26.05% |
| Currency Strategies | 30.15% |
| Emerging Markets Value | 37.79% |
| Equity-Income | 33.70% |
| Floating Rate Income | 19.09% |
| Fundamental Value | 36.50% |
| Global Bond | 12.55% |
| Global High Yield | 17.36% |
| Global Real Estate | 33.52% |
| Heritage | 38.42% |
| High Income | 24.21% |
| High Yield | 20.19% |
| Index 500 | 16.57% |
| International Equity Index | 24.95% |
| International Growth Stock | 31.73% |
| International Opportunities | 38.38% |
| International Small Cap | 24.63% |
| International Small Company | 43.17% |
| International Value | 26.83% |
| Large Cap | 37.17% |
| Large Cap Value | 30.00% |
| Mid Cap Index | 75.20% |
| Mid Cap Stock | 21.28% |
| Mid Value | 36.09% |
| Mid Cap Value Equity | 32.48% |
| Multi-Sector Bond | 18.42% |
| Mutual Shares | 32.85% |
| Natural Resources | 27.04% |
| Optimized Value | 39.86% |
| Real Estate Equity | 32.73% |
| Real Return Bond | 13.23% |
| Small Cap Growth | 30.00% |
| Small Cap Opportunities | 15.47% |
| Small Cap Value | 37.56% |
| Small Company Growth | 34.14% |
| Small Company Value | 21.10% |
| Smaller Company Growth | 16.81% |
| Spectrum Income | 18.75% |
| Strategic Income Opportunities | 13.10% |
| Technical Opportunities | 27.18% |
| Total Return | 16.81% |
| U.S. High Yield Bond | 17.63% |
| U.S. Multi Sector | 43.59% |
| Value | 32.20% |
| Value & Restructuring | 34.59% |
| John Hancock Funds III | |
| Discipline Value | 13.21% |
| International Core | 22.86% |
| Rainier Growth | 21.62% |
| | |
| | Annual report | Lifestyle Portfolios | 47 |
| |
| | Percent of Underlying |
| Portfolio Affiliate Class NAV | Funds’ Net Assets |
|
| Lifestyle Balanced | |
| John Hancock Investment Trust | |
| Small Cap Intrinsic Value | 6.86% |
| John Hancock Funds II | |
| Active Bond | 39.96% |
| All Cap Core | 37.31% |
| All Cap Value | 25.75% |
| Alpha Opportunities | 29.17% |
| Blue Chip Growth | 21.33% |
| Capital Appreciation | 18.64% |
| Core Bond | 43.16% |
| Currency Strategies | 29.63% |
| Emerging Markets Value | 24.07% |
| Equity-Income | 19.28% |
| Floating Rate Income | 21.85% |
| Fundamental Value | 26.38% |
| Global Bond | 40.54% |
| Global High Yield | 34.66% |
| Global Real Estate | 32.98% |
| Heritage | 25.27% |
| High Income | 45.41% |
| High Yield | 39.82% |
| Index 500 | 15.85% |
| International Growth Stock | 32.27% |
| International Opportunities | 24.53% |
| International Small Cap | 8.10% |
| International Small Company | 14.14% |
| International Value | 18.98% |
| Investment Quality Bond | 20.01% |
| Large Cap | 36.72% |
| Large Cap Value | 23.83% |
| Mid Cap Stock | 17.91% |
| Mid Value | 23.91% |
| Mid Cap Value Equity | 31.87% |
| Multi-Sector Bond | 39.78% |
| Mutual Shares | 32.45% |
| Natural Resources | 20.05% |
| Optimized Value | 31.49% |
| Real Estate Equity | 32.36% |
| Real Return Bond | 37.53% |
| Small Cap Growth | 26.16% |
| Small Cap Opportunities | 7.59% |
| Small Cap Value | 18.42% |
| Small Company Growth | 25.12% |
| Small Company Value | 20.70% |
| Smaller Company Growth | 12.88% |
| Spectrum Income | 39.79% |
| Strategic Income Opportunities | 26.19% |
| Technical Opportunities | 26.88% |
| Total Return | 23.14% |
| U.S. High Yield Bond | 43.62% |
| U.S. Multi Sector | 31.25% |
| Value | 31.82% |
| Value & Restructuring | 27.30% |
| John Hancock Funds III | |
| Disciplined Value | 10.52% |
| International Core | 16.60% |
| Rainier Growth | 15.29% |
| |
| | Percent of Underlying |
| Portfolio Affiliate Class NAV | Funds’ Net Assets |
|
| Lifestyle Moderate | |
| John Hancock Funds II | |
| Active Bond | 22.23% |
| Blue Chip Growth | 7.31% |
| Core Bond | 27.71% |
| Currency Strategies | 9.22% |
| Equity-Income | 7.71% |
| Floating Rate Income | 9.93% |
| Fundamental Value | 7.58% |
| Global Bond | 14.97% |
| Global High Yield | 16.65% |
| Global Real Estate | 10.52% |
| High Income | 20.77% |
| High Yield | 10.57% |
| International Growth Stock | 10.08% |
| Investment Quality Bond | 26.56% |
| Mid Cap Stock | 5.42% |
| Mid Value | 10.98% |
| Multi-Sector Bond | 17.57% |
| Real Estate Equity | 10.23% |
| Real Return Bond | 15.75% |
| Small Cap Value | 5.60% |
| Small Company Growth | 6.34% |
| Spectrum Income | 17.47% |
| Strategic Income Opportunities | 11.37% |
| Total Bond Market | 14.46% |
| Total Return | 12.44% |
| U.S. High Yield Bond | 11.16% |
| U.S. Multi Sector | 8.16% |
| Value & Restructuring | 8.18% |
| John Hancock Funds III | |
| Global Shareholder Yield | 26.78% |
| |
| | Percent of Underlying |
| Portfolio Affiliate Class NAV | Funds’ Net Assets |
|
| Lifestyle Conservative | |
| John Hancock Funds II | |
| Active Bond | 23.29% |
| Core Bond | 26.92% |
| Currency Strategies | 7.59% |
| Equity-Income | 5.86% |
| Floating Rate Income | 8.20% |
| Global Bond | 14.50% |
| Global High Yield | 16.10% |
| Global Real Estate | 8.46% |
| High Income | 8.40% |
| High Yield | 9.55% |
| Investment Quality Bond | 37.10% |
| Multi-Sector Bond | 16.15% |
| Real Estate Equity | 8.20% |
| Real Return Bond | 13.63% |
| Short Term Government Income | 100.00% |
| Spectrum Income | 15.94% |
| Strategic Income Opportunities | 12.65% |
| Total Bond Market | 29.17% |
| Total Return | 12.93% |
| U.S. High Yield Bond | 10.35% |
| John Hancock Funds III | |
| Global Shareholder Yield | 22.71% |
| |
| 48 | Lifestyle Portfolios | Annual report |
Auditors’ report
Report of Independent Registered Public Accounting Firm
To the Board of Trustees and Shareholders of John Hancock Funds II:
In our opinion, the accompanying statements of assets and liabilities, including the portfolios of securities owned, and the related statements of operations and of changes in net assets and the financial highlights present fairly, in all material respects, the financial position of each of the portfolios which are part of John Hancock Funds II (the “Trust”) identified in Note 5 at December 31, 2010, and the results of each of their operations, the changes in each of their net assets and the financial highlights for each of the periods indicated, in conformity with accounting principles generally accepted in the United States of America. These financial statements and financial highlights (hereafter referred to as “financial statements”) are the responsibility of the Trust’s management; our responsibility is to express an opinion on these financial statements based on our audits. We conducted our audits of these financial statements in accordance with the standards of the Public Company Accounting Oversight Board (United States). Those standards require that we plan and perform the audits to obtain reasonable assurance about whether the financial statements are free of material misstatement. An audit includes examining, on a test basis, evidence supporting the amounts and disclosures in the financial statements, assessing the accounting principles used and significant estimates made by management, and evaluating the overall financial statement presentation. We believe that our audits, which included confirmation of securities at December 31, 2010 by correspondence with the transfer agent, provide a reasonable basis for our opinion.
PricewaterhouseCoopers LLP
Boston, Massachusetts
February 24, 2011
| | |
| | Annual report | Lifestyle Portfolios | 49 |
Tax information
Unaudited
For federal income tax purposes, the following information is furnished with respect to the distributions of the Portfolios, if any, paid during its taxable year ended December 31, 2010.
Dividend Received Deduction. Corporate shareholders are generally entitled to take the dividend received deduction on the portion of a Portfolio’s dividend distribution that qualifies under tax law. The percentage of the Portfolio’s 2010 ordinary income dividends that qualifies for the dividend received deduction is set forth below:
| | | |
| | Dividend Received | | |
| Portfolio | Deduction | | |
| | |
| Lifestyle Aggressive | 32.17% | | |
| Lifestyle Growth | 16.59% | | |
| Lifestyle Balanced | 9.39% | | |
| Lifestyle Moderate | 7.22% | | |
| Lifestyle Conservative | 4.31% | | |
Qualified Dividend Income. The Portfolios designate the maximum amount allowable of their net taxable income as qualified dividend income as provided in the Jobs and Growth Tax Relief Reconciliation Act of 2003. This amount will be reflected on Form 1099-DIV for the calendar year 2010.
Shareholders were mailed a 2010 Form 1099-DIV in January 2011. This reflected the total of all distributions that were taxable for the calendar year 2010.
| |
| 50 | Lifestyle Portfolios | Annual report |
EVALUATION OF SUBADVISORY AGREEMENT BY THE BOARD OF TRUSTEES
At its meeting on December 17, 2010, the Board of Trustees (the “Board”) of John Hancock Funds II (the “Trust”), including all of the Independent Trustees, approved the appointment of John Hancock Asset Management a division of Manulife Asset Management (US) LLC (“John Hancock Asset Management” or the “Subadviser”) as an additional subadviser to the following funds (the “Portfolios”), each a series of the Trust.
Portfolios
a. Lifestyle Aggressive Portfolio
b. Lifestyle Balanced Portfolio
c. Lifestyle Conservative Portfolio
d. Lifestyle Growth Portfolio
e. Lifestyle Moderate Portfolio
This section describes the evaluation by the Board of Trustees of the amendment to the subadvisory agreement between John Hancock Investment Management Services, LLC (the “Adviser”), the adviser to the Portfolios, and the Subadviser relating to each of the Portfolios (the “Subadvisory Agreement Amendment”).
Evaluation of Subadvisory Agreement by the Board of Trustees
The Board, including the Independent Trustees, is responsible for approving the Adviser’s selection of fund subadvisers and approving the funds’ subadvisory agreements, their periodic continuation and any amendments. Consistent with SEC rules, the Board regularly evaluates the Trust’s subadvisory arrangements, including consideration of the factors listed below. The Board may also consider other factors (including conditions and trends prevailing generally in the economy, the securities markets and the industry) and does not treat any single factor as determinative, and each Trustee may attribute different weights to different factors. The Board is furnished with an analysis of its fiduciary obligations in connection with its evaluation and, throughout the evaluation process, the Board is assisted by counsel for the Trust and the Independent Trustees are also separately assisted by independent legal counsel. The factors considered by the Board with respect to each fund are:
1. the nature, extent and quality of the services to be provided by the subadviser to the fund;
2. the investment performance of the fund and its subadviser;
3. the extent to which economies of scale would be realized as a fund grows and whether fee levels reflect these economies of scale for the benefit of fund shareholders;
4. the costs of the services to be provided and the profits to be realized by the subadviser from its relationship with the Trust; and
5. comparative services rendered and comparative subadvisory fee rates.
In making its determination and with reference to the factors that it considers, the Board reviews:
1. information relating to the subadviser’s business, including current subadvisory services to the Trust (and other funds in the John Hancock family of funds);
2. the performance of the fund and the performance of other John Hancock funds managed by the subadviser; and
3. the subadvisory fee for the fund, including any breakpoints.
The Board approved the Subadvisory Agreement Amendment with the Subadviser for each of the Portfolios at its meeting on December 17, 2010. Particular considerations of the Board in approving the Subadvisory Agreement Amendment included the following:
1. The subadvisory fees for the Portfolios are paid by the Adviser, not the Portfolios, and approval of the Subadvisory Agreement Amendment will not result in any change in the advisory fees for any of the Portfolios.
2. Approval of the Subadvisory Agreement Amendment reflects the re-allocation of subadvisory services between the Subadviser and John Hancock Asset Management a division of Manulife Asset Management (North America) Limited (“John Hancock Asset Management (North America)”), each of which is affiliated with the Adviser.
3. The personnel of John Hancock Asset Management (North America) and the Adviser who have currently and previously managed the assets of the Portfolios, with John Hancock Asset Management (North America) and the Subadviser, are expected to continue to manage the Portfolios and the Board is generally satisfied with their skill and experience and with the performance of the Portfolios.
| | |
| | Annual report | Lifestyle Portfolios | 51 |
4. The performance of each Portfolio as noted below and management’s discussion of the same:
a. The Lifestyle Aggressive Portfolio has outperformed its peer group and benchmark index for the one year and since inception periods ended September 30, 2010;
b. The Lifestyle Balanced Portfolio has outperformed its peer group and benchmark index for the one year and since inception periods ended September 30, 2010;
c. The Lifestyle Conservative Portfolio has outperformed its peer group and benchmark index for the one year and since inception periods ended September 30, 2010;
d. The Lifestyle Growth Portfolio has outperformed its peer group and benchmark index for the one year and since inception periods ended September 30, 2010;
e. The Lifestyle Moderate Portfolio has outperformed its peer group and benchmark index for the one year and since inception periods ended September 30, 2010;
5. John Hancock Asset Management has demonstrated skill as a manager, is currently the subadviser to multiple funds of the Trust and John Hancock Funds II and may be expected to provide a high quality of investment management services and personnel to each of the Portfolios.
In addition, the Board reviewed the subadvisory fees to be paid to the Subadviser with respect to the Portfolios, each of which operates as a fund of funds and invests in underlying funds. The Board concluded, with respect to each such fund of funds, that the subadvisory fee is based on services provided that are in addition to, rather than duplicative of, the services provided pursuant to the advisory agreements for the underlying funds. The Board also concluded that the additional services are necessary because of the differences between the investment policies, strategies and techniques of the fund of funds and those of its underlying funds.
| |
| 52 | Lifestyle Portfolios | Annual report |
Trustees and Officers
This chart provides information about the Trustees and Officers of John Hancock Funds II who oversee your John Hancock fund. Officers elected by the Trustees manage the day-to-day operations of the Portfolio and execute policies formulated by the Trustees.
| | |
| Independent Trustees | | |
| |
| | | Number of |
| Name, Year of Birth | Trustee of | John Hancock |
| Position(s) held with Fund | the Trust | funds overseen |
| Principal occupation(s) and other directorships during past 5 years | since1 | by Trustee |
| |
| Charles L. Bardelis, Born: 1941 | 2005 | 208 |
|
| Director, Island Commuter Corp. (Marine Transport). Trustee of John Hancock Trust | | |
| (since 1988), John Hancock Funds II (since 2005) and former Trustee of John Hancock Funds III | | |
| (2005–2006). | | |
| |
| Peter S. Burgess, Born: 1942 | 2005 | 208 |
|
| Consultant (financial, accounting and auditing matters) (since 1999); Certified Public | | |
| Accountant. Partner, Arthur Andersen (independent public accounting firm) (prior to 1999). | | |
| Director of the following publicly traded companies: Lincoln Educational Services Corporation | | |
| (since 2004), Symetra Financial Corporation (since 2010) and PMA Capital Corporation | | |
| (2004–2010). Trustee of John Hancock Trust (since 2005), John Hancock Funds II (since 2005), | | |
| and former Trustee of John Hancock Funds III (2005–2006). | | |
| |
| Grace K. Fey, Born: 1946 | 2008 | 208 |
|
| Chief Executive Officer, Grace Fey Advisors (since 2007); Director & Executive Vice President, | | |
| Frontier Capital Management Company (1988–2007); Director, Fiduciary Trust (since 2009). | | |
| Trustee of John Hancock Trust (since 2008) and John Hancock Funds II (since 2008). | | |
| |
| Theron S. Hoffman,2 Born: 1947 | 2008 | 208 |
|
| Chief Executive Officer, T. Hoffman Associates, LLC (since 2003); Director, The Todd | | |
| Organization (since 2003); President, Westport Resources Management (2006–2008); | | |
| Partner/Operating Head & Senior Managing Director, Putnam Investments (2000–2003); | | |
| Executive Vice President, Thomson Corp. (1997–2000) (financial information publishing). | | |
| Trustee of John Hancock Trust (since 2008) and John Hancock Funds II (since 2008). | | |
| |
| Hassell H. McClellan, Born: 1945 | 2005 | 208 |
|
| Associate Professor, The Graduate School of The Wallace E. Carroll School of Management, | | |
| Boston College (since 1984). Trustee of John Hancock Trust (since 2005), John Hancock Funds II | | |
| (since 2005) and Trustee of Phoenix Edge Series Funds (since 2008). | | |
| |
| James M. Oates, Born: 1946 | 2005 | 208 |
|
| Managing Director, Wydown Group (financial consulting firm) (since 1994); Chairman, | | |
| Emerson Investment Management, Inc. (since 2000); Chairman, Hudson Castle Group, Inc. | | |
| (formerly IBEX Capital Markets, Inc.) (financial services company) (since 1997) (Independent | | |
| Chairman, 1997–2006). Director of the following publicly traded companies: Stifel Financial | | |
| (since 1996); Investor Financial Services Corporation (1995–2007); and Connecticut River | | |
| Bancorp (since 1998); Director of the following Mutual Funds: Phoenix Mutual Funds | | |
| (1988–2008); Virtus Funds (since 2008); and Emerson Investment Management (since 2000). | | |
| Chairman of the Boards of John Hancock Trust and John Hancock Funds II (since 2005). Trustee | | |
| of John Hancock Trust (since 2004), John Hancock Funds II (since 2005) and former Trustee of | | |
| John Hancock Funds III (2005–2006). | | |
| |
| Steven M. Roberts, Born: 1944 | 2008 | 208 |
|
| Board of Governors Deputy Director Division of Banking Supervision and Regulation, Federal | | |
| Reserve System (2005–2008); Partner, KPMG (1987–2004). Trustee of John Hancock Trust | | |
| (since 2008) and John Hancock Funds II (since September 2008). | | |
| | |
| | Annual report | Lifestyle Portfolios | 53 |
| | |
| Non-Independent Trustee2 | | |
| |
| | | Number of |
| Name, Year of Birth | Trustee of | John Hancock |
| Position(s) held with Fund | the Trust | funds overseen |
| Principal occupation(s) and other directorships during past 5 years | since1 | by Trustee |
| |
| James R. Boyle,3 Born: 1959 | 2005 | 208 |
|
| Senior Executive Vice President, John Hancock Financial Services (since 1999, including | | |
| prior positions); Chairman and Director, John Hancock Advisers, LLC, John Hancock Funds, | | |
| LLC, and John Hancock Investment Management Services, LLC (2005–2010); Trustee, | | |
| John Hancock Trust (since 2005), John Hancock Funds II (since 2005), and John Hancock retail | | |
| funds (2005–2010). | | |
1 Because the Trust does not hold regular annual shareholders meetings, each Trustee holds office for an indefinite term until his/her successor is duly elected and qualified or until he/she dies, retires, resigns, is removed or becomes disqualified.
2 Non-Independent Trustees hold positions or are affiliated with the Fund’s investment adviser, subadviser, underwriter or their affiliates.
3 Mr. Boyle is an “interested person” (as defined in the 1940 Act) due to his position with Manulife Financial Corporation (or its affiliates), the ultimate parent of the Adviser.
| |
| Principal officers who are not Trustees | |
| |
| Name, Year of Birth | Officer |
| Position(s) held with Fund | of the |
| Principal occupation(s) and other | Trust |
| directorships during past 5 years | since |
| |
| Hugh McHaffie, Born: 1959 | 2009 |
|
| President | |
| Executive Vice President, John Hancock Financial Services (since 2006, including prior positions); Chairman | |
| and Director, John Hancock Advisers, LLC, John Hancock Investment Management Services, LLC and | |
| John Hancock Funds, LLC (since 2010); Non Independent Trustee, John Hancock retail funds (since 2010); | |
| (President of John Hancock Trust and John Hancock Funds II (since 2009); Trustee, John Hancock retail funds | |
| (since 2010); Senior Vice President, Individual Business Product Management, MetLife, Inc. (1999–2006). | |
| |
| Thomas M. Kinzler, Born: 1955 | 2008 |
|
| Secretary and Chief Legal Officer | |
| Vice President, John Hancock Financial Services (since 2006); Secretary and Chief Legal Counsel, | |
| John Hancock Advisers, LLC, John Hancock Investment Management Services, LLC and John Hancock Funds, | |
| LLC (since 2007); Secretary and Chief Legal Officer, John Hancock retail funds, John Hancock Funds II and | |
| John Hancock Trust (since 2006); Vice President and Associate General Counsel, Massachusetts Mutual | |
| Life Insurance Company (1999–2006); Secretary and Chief Legal Counsel, MML Series Investment Fund | |
| (2000–2006); Secretary and Chief Legal Counsel, MassMutual Select Funds and MassMutual Premier Funds | |
| (2004–2006). | |
| |
| 54 | Lifestyle Portfolios | Annual report |
| |
| Principal officers who are not Trustees (continued) | |
| |
| | Officer |
| Name, Year of Birth | of the |
| Position(s) held with Fund | Trust |
| Principal occupation(s) and other directorships during past 5 years | since |
| |
| Francis V. Knox, Jr., Born: 1947 | 2008 |
|
| Chief Compliance Officer | |
| Vice President, John Hancock Financial Services (since 2005); Chief Compliance Officer, John Hancock | |
| retail funds, John Hancock Funds II, John Hancock Trust, John Hancock Advisers, LLC and John Hancock | |
| Investment Management Services, LLC (since 2005); Vice President and Chief Compliance Officer, MFC | |
| Global Investment Management (U.S.), LLC (2005–2008). | |
| |
| Michael J. Leary, Born: 1965 | 2008 |
|
| Treasurer | |
| Assistant Vice President, John Hancock Financial Services (since 2007); Treasurer, John Hancock Funds II | |
| and John Hancock Trust (since 2009); Treasurer, John Hancock retail funds (2009–2010); Vice President, | |
| John Hancock Advisers, LLC and John Hancock Investment Management Services, LLC (since 2007); | |
| Assistant Treasurer, John Hancock retail funds (2007–2009 & 2010), John Hancock Funds II and | |
| John Hancock Trust (2007–2009) and John Hancock Funds III (since 2009); Vice President and Director of | |
| Fund Administration, JP Morgan (2004–2007). | |
| |
| Charles A. Rizzo, Born: 1957 | 2008 |
|
| Chief Financial Officer | |
| Vice President, John Hancock Financial Services (since 2008); Chief Financial Officer, John Hancock retail funds, | |
| John Hancock Funds II and John Hancock Trust (since 2007); Senior Vice President, John Hancock Advisers, LLC | |
| and John Hancock Investment Management Services, LLC (since 2008); Assistant Treasurer, Goldman Sachs | |
| Mutual Fund Complex (2005–2007); Vice President, Goldman Sachs (2005–2007); Managing Director and | |
| Treasurer, Scudder Funds, Deutsche Asset Management (2003–2005). | |
| |
| John G. Vrysen, Born: 1955 | 2008 |
|
| Chief Operating Officer | |
| Senior Vice President, John Hancock Financial Services (since 2006); Director, Executive Vice President and | |
| Chief Operating Officer, John Hancock Advisers, LLC, John Hancock Investment Management Services, | |
| LLC and John Hancock Funds, LLC (since 2005); Chief Operating Officer, John Hancock Funds II and | |
| John Hancock Trust (since 2007); Chief Operating Officer, John Hancock retail funds (until 2009); Trustee, | |
| John Hancock retail funds (since 2009). | |
The business address for all Trustees and Officers is 601 Congress Street, Boston, Massachusetts 02210-2805.
The Statement of Additional Information of the Fund includes additional information about members of the Board of Trustees of the Fund and is available without charge, upon request, by calling 1-800-225-5291.
| | |
| | Annual report | Lifestyle Portfolios | 55 |
More information
| |
| Trustees | Investment adviser |
| James M. Oates, Chairman | John Hancock Investment Management Services, LLC |
| James R. Boyle† | |
| Grace K. Fey | Subadvisers |
| Charles L. Bardelis* | John Hancock Asset Management |
| Peter S. Burgess* | Principal distributor |
| Theron S. Hoffman | John Hancock Funds, LLC |
| Hassell H. McClellan | |
| Steven M. Roberts* | Custodian |
| | State Street Bank and Trust Company |
| Officers |
| Hugh McHaffie | Transfer agent |
| President | John Hancock Signature Services, Inc. |
| Legal counsel |
| Thomas M. Kinzler | K&L Gates LLP |
| Secretary and Chief Legal Officer | |
| Independent registered |
| Francis V. Knox, Jr. | public accounting firm |
| Chief Compliance Officer | PricewaterhouseCoopers LLP |
| |
| Michael J. Leary |
|
| Treasurer | The report is certified under the Sarbanes-Oxley Act, which |
| | requires mutual funds and other public companies to affirm |
| Charles A. Rizzo | that, to the best of their knowledge, the information in |
| Chief Financial Officer | their financial reports is fairly and accurately stated in all |
| | material respects. |
| John G. Vrysen |
|
| Chief Operating Officer | |
| | |
| *Member of the Audit Committee | |
| †Non-Independent Trustee | |
The Fund’s proxy voting policies and procedures, as well as the Fund’s proxy voting record for the most recent twelvemonth period ended June 30, are available free of charge on the Securities and Exchange Commission (SEC) Web site at www.sec.gov or on our Web site.
The Fund’s complete list of portfolio holdings, for the first and third fiscal quarters, is filed with the SEC on Form N-Q. The Fund’s Form N-Q is available on our Web site and the SEC’s Web site, www.sec.gov, and can be reviewed and copied (for a fee) at the SEC’s Public Reference Room in Washington, DC. Call 1-800-SEC-0330 to receive information on the operation of the SEC’s Public Reference Room.
We make this information on your fund, as well as monthly portfolio holdings, and other fund details available on our Web site www.jhfunds.com or by calling 1-800-225-5291.
| | |
| You can also contact us: | | |
| 1-800-225-5291 | Regular mail: | Express mail: |
| jhfunds.com | John Hancock Signature Services, Inc. | John Hancock Signature Services, Inc. |
| | P.O. Box 55913 | Mutual Fund Image Operations |
| | Boston, MA 02205-5913 | 30 Dan Road |
| | | Canton, MA 02021 |
|
| |
| 56 | Lifestyle Portfolios | Annual report |


Management’s discussion of
Portfolio performance
From the Portfolio Management Team of
John Hancock Asset Management1
Aided by a powerful surge in the final four months of the year, U.S. stocks delivered robust gains for the 12 months ended December 31, 2010. Factors lifting share prices included further progress toward economic recovery, optimism over the Federal Reserve Board’s plans to engage in another round of quantitative easing (QE2) and the extension of tax cuts that had been set to expire at the end of 2010. In the bond market, despite rising yields in the fourth quarter, Treasury yields declined for the year overall, which bolstered bond prices. For the 12 months ended December 31, 2010, the S&P 500 Index returned 15.06%, the Barclays Capital U.S. Aggregate Bond Index returned 6.54% and a blended benchmark using 50% S&P 500 Index and 50% Barclays Capital U.S. Aggregate Bond Index returned 11.29%. Meanwhile, the Morningstar, Inc. average retirement income fund posted an 8.94% gain over the same period.
During the past year, John Hancock Retirement Distribution Portfolio returned 8.99%, at net asset value, trailing the blended index but edging out the peer group average. Defensive asset allocation in the final quarter of the year — reflected in a roughly 30% stake in cash and cash equivalents at year end — was the primary factor detracting from performance. Turning to manager contribution, outperformance by our fixed-income funds modestly outweighed underperformance from our equity funds. In fixed income, the largest contributors were Total Return Fund (PIMCO) and Strategic Income Opportunities Fund (John Hancock). Total Return Fund benefited from tactical positioning in a volatile interest-rate environment, while Strategic Income Opportunities Fund was lifted by its exposure to corporate and non-U.S. debt securities. Notable detractors among our equity funds included Mid Value Fund (T. Rowe Price), as its emphasis on larger-capitalization, higher-quality stocks worked against it, given the sizable outperformance of smaller-cap, lower-quality shares during the period.
This commentary reflects the views of the portfolio management team through the end of the Portfolio’s period discussed in this report. The team’s statements reflect its own opinions. As such, they are in no way guarantees of future events and are not intended to be used as investment advice or a recommendation regarding any specific security. They are also subject to change at any time as market and other conditions warrant.
Past performance is no guarantee of future results.
1 Effective 1-1-11, Manulife Asset Management (US) LLC has been added as a subadviser. Manulife Asset Management (US) LLC and Manulife Asset Management (North America) Limited are doing business as John Hancock Asset Management.
| |
| 6 | Retirement Distribution Portfolio | Annual report |
A look at performance
For the period ended December 31, 2010
| | | | | | | | | |
| | Average annual total returns (%) | | | Cumulative total returns (%) | |
| | with maximum sales charge (POP) | | | with maximum sales charge (POP) | |
|
| | | | Since | | | | | Since |
| | 1-year | 5-year | 10-year | inception1 | | 1-year | 5-year | 10-year | inception1 |
|
| Class A | 3.54 | — | — | –0.16 | | 3.54 | — | — | –0.48 |
|
Performance figures assume all distributions are reinvested. Public offering price (POP) figures reflect maximum sales charges on Class A shares of 5%.
The expense ratios of the Portfolio, both net (including any fee waivers or expense limitations) and gross (excluding any fee waivers or expense limitations), are set forth according to the most recent publicly available prospectus for the Portfolio and may differ from the expense ratios disclosed in the Financial Highlights tables in this report. The waivers and expense limitations are contractual until 4-30-11. The following expense ratios include expenses of the underlying affiliated funds in which the Portfolio invests. The net expenses for Class A are 1.29%. Had the fee waivers and expense limitations not been in place, the gross expenses for Class A would be 3.03%.
The returns reflect past results and should not be considered indicative of future performance. The return and principal value of an investment will fluctuate so that shares, when redeemed, may be worth more or less than their original cost. Due to market volatility, the Portfolio’s current performance may be higher or lower than the performance shown. For current to the most recent month end performance data, please call 1–800–225–5291 or visit the Portfolio’s Web site at www.jhfunds.com.
The performance table above and the chart on the next page do not reflect the deduction of taxes that a shareholder may pay on portfolio distributions or the redemption of portfolio shares.
The Portfolio’s performance results reflect any applicable expense reductions, without which the expenses would increase and results would have been less favorable.
1 From 1-2-08.
| |
| Annual report | Retirement Distribution Portfolio | 7 |
A look at performance
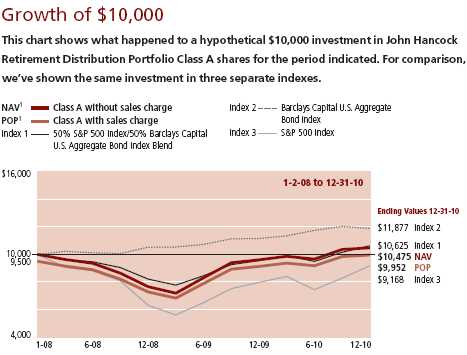
| | | | | | |
| | | | With | | | |
| | Period | Without | maximum | | | |
| | beginning | sales charge | sales charge | Index 1 | Index 2 | Index 3 |
|
| Class A | 1-2-08 | $10,475 | $9,952 | $10,625 | $11,877 | $9,168 |
|
50% S&P 500 Index/50% Barclays Capital U.S. Aggregate Bond Index Blend — Index 1 — is comprised of 50% S&P 500 Index and 50% Barclays Capital U.S. Aggregate Bond Index.
Barclays Capital U.S. Aggregate Bond Index — Index 2 — is an unmanaged index of dollar-denominated and nonconvertible investment-grade debt issues.
S&P 500 Index — Index 3 — is an unmanaged index that includes 500 widely traded common stocks.
It is not possible to invest directly in an index. Index figures do not reflect sales charges or expenses and commissions that would have been incurred if an investor purchased or sold the securities represented in the index, which would have resulted in lower values if they did.
1 NAV represents net asset value and POP represents public offering price.
| |
| 8 | Retirement Distribution Portfolio | Annual report |
Your expenses
These examples are intended to help you understand your ongoing operating expenses.
Understanding portfolio expenses
As a shareholder of the Portfolio, you incur two types of costs:
▪ Transaction costs which include sales charges (loads) on purchases or redemptions (varies by share class), minimum account fee charge, etc.
▪ Ongoing operating expenses including management fees, distribution and service fees (if applicable), and other portfolio expenses.
We are going to present only your ongoing operating expenses here.
Actual expenses/actual returns
This example is intended to provide information about your portfolio’s actual ongoing operating expenses, and is based on your portfolio’s actual return. It assumes an account value of $1,000.00 on July 1, 2010 with the same investment held until December 31, 2010.
| | | |
| | Account value | Ending value | Expenses paid during |
| | on 7-1-10 | on 12-31-10 | period ended 12-31-101,2 |
|
| Class A | $1,000.00 | $1,084.40 | $3.63 |
|
Together with the value of your account, you may use this information to estimate the operating expenses that you paid over the period. Simply divide your account value at December 31, 2010, by $1,000.00, then multiply it by the “expenses paid” for your share class from the table above. For example, for an account value of $8,600.00, the operating expenses should be calculated as follows:
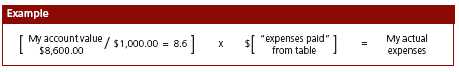
| |
| Annual report | Retirement Distribution Portfolio | 9 |
Your expenses
Hypothetical example for comparison purposes
This table allows you to compare your portfolio’s ongoing operating expenses with those of any other fund. It provides an example of the Portfolio’s hypothetical account values and hypothetical expenses based on each class’s actual expense ratio and an assumed 5% annualized return before expenses (which is not your portfolio’s actual return). It assumes an account value of $1,000.00 on July 1, 2010, with the same investment held until December 31, 2010. Look in any other fund shareholder report to find its hypothetical example and you will be able to compare these expenses.
| | | |
| | Account value | Ending value | Expenses paid during |
| | on 7-1-10 | on 12-31-10 | period ended 12-31-101,2 |
|
| Class A | $1,000.00 | $1,021.70 | $3.52 |
|
Remember, these examples do not include any transaction costs, therefore, these examples will not help you to determine the relative total costs of owning different funds. If transaction costs were included, your expenses would have been higher. See the prospectus for details regarding transaction costs.
1 Expenses are equal to the Portfolio’s annualized expense ratio of 0.69% for Class A shares, multiplied by the average account value over the period, multiplied by 184/365 (to reflect the one-half year period).
2 Ratios do not include expenses indirecrtly incurred from underlying funds whose expense ratios can vary based on the mix of underlying funds held by the Portfolio. The range of expense ratios of the underlying funds held by the Portfolio was 0.52% – 1.00%.
| |
| 10 | Retirement Distribution Portfolio | Annual report |
Portfolio summary
| | | | |
| Asset Allocation1 | | | | |
|
| Fixed Income — Unaffiliated | 12% | | Fixed Income — Affiliated | 37% |
| |
|
| Equity — Unaffiliated | 12% | | Intermediate Bond | 27% |
| |
|
| Equity — Affiliated | 9% | | Global Bond | 5% |
| |
|
| U.S. Mid Cap | 6% | | Multi-Sector Bond | 5% |
| |
|
| U.S. Large Cap | 3% | | Short-Term Investments & Other | 30% |
| |
|
1 As a percentage of net assets on 12-31-10.
| |
| Annual report | Retirement Distribution Portfolio | 11 |
Portfolio’s investments
As of 12-31-10
| | |
| | Shares/Par value | Value |
| |
| Investment Companies 69.54% | | $4,160,646 |
|
| Affiliated Investment Companies 45.78% | | 2,739,225 |
| | | |
| Equity (G) 9.29% | | |
| | | |
| John Hancock Funds II 9.29% | | 556,092 |
| | | |
| Capital Appreciation, Class NAV (Jennison) | 2,585 | 29,154 |
|
| Equity-Income, Class NAV (T. Rowe Price) | 4,116 | 58,412 |
|
| Fundamental Value, Class NAV (Davis) | 3,886 | 58,568 |
|
| Mid Cap Stock, Class NAV (Wellington) (I) | 3,361 | 58,715 |
|
| Mid Value, Class NAV (T. Rowe Price) | 12,019 | 175,597 |
|
| Value, Class NAV (Invesco) | 11,836 | 116,469 |
|
| Value & Restructuring, Class NAV (Columbia) | 5,097 | 59,177 |
| | | |
| Fixed Income (G) 36.49% | | |
| | | |
| John Hancock Funds II 36.49% | | 2,183,133 |
| | | |
| Active Bond, Class NAV (John Hancock1/Declaration) (A) | 29,206 | 294,397 |
|
| Core Bond, Class NAV (Wells Capital) | 23,724 | 303,669 |
|
| Global Bond, Class NAV (PIMCO) | 24,481 | 296,956 |
|
| Strategic Income Opportunities, Class NAV (John Hancock1) (A) | 24,258 | 264,893 |
|
| Total Bond Market, Class NAV (Declaration) (A) | 44,313 | 453,761 |
|
| Total Return, Class NAV (PIMCO) | 41,295 | 569,457 |
| | | |
| Unaffiliated Investment Companies 23.76% | | 1,421,421 |
| | | |
| Fixed Income 12.25% | | |
| | | |
| iShares Barclays 1-3 Year Treasury Bond Fund | 350 | 29,393 |
|
| iShares Barclays Aggregate Bond Fund | 1,600 | 169,200 |
|
| iShares Barclays TIPS Bond Fund | 530 | 56,986 |
|
| iShares iBoxx Investment Grade Corporate Bond Fund | 4,400 | 477,136 |
| | | |
| Equity 11.51% | | |
| | | |
| WisdomTree High-Yielding Equity Fund | 17,700 | 688,706 |
|
| |
| Short-Term Investments* 30.08% | | $1,799,885 |
|
| Federal Home Loan Bank Discount Notes, 0.070%, 2-3-11 | $1,800,000 | 1,799,885 |
| |
| Total investments (Cost $5,939,430)† 99.62% | | $5,960,531 |
|
| |
| Other assets and liabilities, net 0.38% | | $22,584 |
|
| |
| Total net assets 100.00% | | $5,983,115 |
|
Percentages are stated as a percent of net assets.
| | |
| 12 | Retirement Distribution Portfolio | Annual report | See notes to financial statements |
Notes to Schedule of Investments
(A) The subadviser is an affiliate of the adviser.
(G) The underlying fund’s subadviser is shown parenthetically.
(I) Non-income producing
† At 12-31-10, the aggregate cost of investment securities for federal income tax purposes was $5,942,666. Net unrealized appreciation aggregated $17,865, of which $119,266 related to appreciated investment securities and $101,401 related to depreciated investment securities.
* Yield represents either the annualized yield at the date of purchase, the stated coupon rate or, for floating rate securities, the rate at period end.
1 Manulife Asset Managment (US) LLC is doing business as John Hancock Asset Management.
Underlying Funds’ Investment Managers
| |
| Columbia Management Advisors, LLC | (Columbia) |
| Davis Advisors | (Davis) |
| Declaration Management/John Hancock Advisors | (Declaration) |
| Invesco Advisers, Inc. | (Invesco) |
| Jennison Associates, LLC | (Jennison) |
| John Hancock Asset Management1 | (John Hancock) |
| Pacific Investment Management Company | (PIMCO) |
| T. Rowe Price Associates, Inc. | (T. Rowe Price) |
| Wellington Management Company, LLP | (Wellington) |
| Wells Capital Management, Inc. | (Wells Capital) |
| | |
| See notes to financial statements | Annual report | Retirement Distribution Portfolio | 13 |
F I N A N C I A L S T A T E M E N T S
Financial statements
Statement of assets and liabilities 12-31-10
This Statement of Assets and Liabilities is the Portfolio’s balance sheet. It shows the value of what the Portfolio owns, is due and owes. You’ll also find the net asset value and the maximum offering price per share.
| |
| Assets | |
|
| Investments in unaffiliated issuers, at value (Cost $3,195,552) | $3,221,306 |
| Investments in affiliated funds, at value (Cost $2,743,878) (Note 7) | 2,739,225 |
| | |
| Total investments, at value (Cost $5,939,430) | 5,960,531 |
| Cash | 49,388 |
| Dividends receivable | 6,788 |
| Receivable due from adviser | 2,717 |
| Other receivables and prepaid expenses | 11,802 |
| | |
| Total assets | 6,031,226 |
| |
| Liabilities | |
|
| Payable for investments purchased | 4,235 |
| Distributions payable | 4,665 |
| Payable to affiliates (Note 4) | |
| Accounting and legal services fees | 68 |
| Transfer agent fees | 991 |
| Trustees’ fees | 102 |
| Other liabilities and accrued expenses | 38,050 |
| | |
| Total liabilities | 48,111 |
| |
| Net assets | |
|
| Capital paid-in | $6,235,895 |
| Accumulated net realized loss on investments | (273,881) |
| Net unrealized appreciation (depreciation) on investments | 21,101�� |
| | |
| Net assets | $5,983,115 |
| |
| Net asset value per share | |
|
| Based on net asset values and shares outstanding — the Portfolio has an | |
| unlimited number of shares authorized with no par value | |
| Class A ($5,983,115 ÷ 518,309 shares) | $11.54 |
| |
| Maximum offering price per share | |
|
| Class A (net asset value per share ÷ 95%)1 | $12.15 |
1 On single retail sales of less than $50,000. On sales of $50,000 or more and on group sales the offering price is reduced.
| | |
| 14 | Retirement Distribution Portfolio | Annual report | See notes to financial statements |
F I N A N C I A L S T A T E M E N T S
Statement of operations For the year ended 12-31-10
This Statement of Operations summarizes the Portfolio’s investment income earned and expenses incurred in operating the Portfolio. It also shows net gains for the period stated.
| |
| Investment income | |
|
| Income distributions received from affiliated underlying funds | $119,477 |
| Dividends | 86,008 |
| Interest | 477 |
| | |
| Total investment income | 205,962 |
| |
| Expenses | |
|
| Investment management fees (Note 4) | 13,299 |
| Distribution and service fees (Note 4) | 16,810 |
| Accounting and legal services fees (Note 4) | 787 |
| Transfer agent fees (Note 4) | 6,802 |
| Trustees’ fees (Note 4) | 267 |
| State registration fees | 15,324 |
| Printing and postage | 2,548 |
| Professional fees | 33,549 |
| Custodian fees | 12,000 |
| Registration and filing fees | 20,528 |
| Other | 1,159 |
| | |
| Total expenses | 123,073 |
| Less expense reductions (Note 4) | (85,120) |
| | |
| Net expenses | 37,953 |
| | |
| Net investment income | 168,009 |
| |
| Realized and unrealized gain (loss) | |
|
| Net realized gain (loss) on | |
| Investments in unaffiliated issuers | (75,146) |
| Investments in affiliated issuers | (23,673) |
| Capital gain distributions received from affiliated underlying funds | 66,285 |
| | (32,534) |
| | |
| Change in net unrealized appreciation (depreciation) of | |
| Investments in unaffiliated issuers | 159,771 |
| Investments in affiliated issuers | 191,643 |
| | 351,414 |
| Net realized and unrealized gain | 318,880 |
| | |
| Increase in net assets from operations | $486,889 |
| | |
| See notes to financial statements | Annual report | Retirement Distribution Portfolio | 15 |
F I N A N C I A L S T A T E M E N T S
Statements of changes in net assets
These Statement of Changes in Net Assets shows how the value of the Portfolio’s net assets has changed during the period. The difference reflects earnings less expenses, any investment gains and losses, distributions, if any, paid to shareholders and the net of Portfolio share transactions.
| | |
| | Year | Year |
| | ended | ended |
| | 12-31-10 | 12-31-09 |
|
| Increase (decrease) in net assets | | |
|
| From operations | | |
| Net investment income | $168,009 | $174,807 |
| Net realized loss | (32,534) | (153,756) |
| Change in net unrealized appreciation (depreciation) | 351,414 | 1,049,829 |
| | | |
| Increase in net assets resulting from operations | 486,889 | 1,070,880 |
| | | |
| Distributions to shareholders | | |
| From net investment income | (167,912) | (174,807) |
| From net realized gain | (54,983) | (17,462) |
| From tax return of capital | (74,325) | (71,788) |
| | | |
| Total distributions | (297,220) | (264,057) |
| | | |
| From Portfolio share transactions (Note 5) | 575,237 | 585,112 |
| | | |
| Total increase | 764,906 | 1,391,935 |
| |
| Net assets | | |
|
| Beginning of year | 5,218,209 | 3,826,274 |
| | | |
| End of year | $5,983,115 | $5,218,209 |
| | |
| 16 | Retirement Distribution Portfolio | Annual report | See notes to financial statements |
Financial highlights
The Financial Highlights show how the Portfolio’s net asset value for a share has changed since the beginning of the period.
| | | |
| CLASS A SHARES Period ended | 12-31-10 | 12-31-09 | 12-31-081 |
| |
| Per share operating performance | | | |
|
| Net asset value, beginning of year | $11.16 | $9.44 | $13.18 |
| Net investment income2 | 0.34 | 0.39 | 0.46 |
| Net realized and unrealized gain (loss) on investments | 0.64 | 1.93 | (3.45) |
| Total from investment operations | 0.98 | 2.32 | (2.99) |
| Less distributions | | | |
| From net investment income | (0.34) | (0.40) | (0.58) |
| From net realized gain | (0.11) | (0.04) | — |
| From tax return of capital | (0.15) | (0.16) | (0.17) |
| Total distributions | (0.60) | (0.60) | (0.75) |
| Net asset value, end of year | $11.54 | $11.16 | $9.44 |
| Total return (%)3,4 | 8.99 | 25.35 | (23.47) |
| |
| Ratios and supplemental data | | | |
|
| Net assets, end of year (in millions) | $6 | $5 | $4 |
| Ratios (as a percentage of average net assets): | | | |
| Expenses before reductions5 | 2.20 | 2.38 | 1.71 |
| Expenses net of fee waivers5 | 0.68 | 0.64 | 0.60 |
| Net investment income | 3.00 | 3.94 | 3.97 |
| Portfolio turnover (%) | 29 | 38 | 16 |
1 The inception date for Class A shares is 1-2-08.
2 Based on the average daily shares outstanding.
3 Total returns would have been lower had certain expenses not been reduced during the periods shown.
4 Does not reflect the effect of sales charges, if any.
5 Ratios do not include expenses indirectly incurred from underlying funds whose expense ratios can vary based on the mix of underlying funds held by the Portfolio. The range of expense ratios of the underlying funds held by the Portfolio was 0.52%–1.00%, 0.53%–1.09% and 0.61%–1.13%, for the years ended 12-31-10, 12-31-09 and 12-31-08, respectively.
| | |
| See notes to financial statements | Annual report | Retirement Distribution Portfolio | 17 |
Notes to financial statements
Note 1 — Organization
John Hancock Retirement Distribution Portfolio (the Portfolio) is a diversified series of John Hancock Funds II (the Trust), an open-end management investment company organized as a Massachusetts business trust and registered under the Investment Company Act of 1940, as amended (the 1940 Act). The Portfolio seeks to provide a stated, targeted (non-guaranteed) quarterly distribution. As a secondary objective, the Portfolio seeks capital appreciation.
The Portfolio operates as a “fund of funds” that invest in Class NAV shares of underlying funds of the Trust, John Hancock Funds III (JHF III) and also in other affiliated funds of the John Hancock funds complex. The Portfolio may also invest in unaffiliated underlying funds and other permitted security investments.
The accounting policies of the underlying funds of the Portfolio are outlined in the underlying funds’ shareholder reports, available without charge by calling 1-800-344-1029 or on the Securities and Exchange Commission (SEC) Web site at www.sec.gov or at the SEC’s public reference room in Washington, D.C. The underlying funds are not covered by this report.
Note 2 — Significant accounting policies
The financial statements have been prepared in conformity with accounting principles generally accepted in the United States of America, which require management to make certain estimates and assumptions at the date of the financial statements. Actual results could differ from those estimates. Events or transactions occurring after the end of the fiscal period through the date that the financial statements were issued have been evaluated in the preparation of the financial statements. The following summarizes the significant accounting policies of the Portfolio:
Security valuation. Investments are stated at value as of the close of regular trading on the New York Stock Exchange (NYSE), normally at 4:00 P.M., Eastern Time. The Portfolio uses a three-tier hierarchy to prioritize the pricing assumptions, referred to as inputs, used in valuation techniques to measure fair value. Level 1 includes securities valued using quoted prices in active markets for identical securities. Level 2 includes securities valued using significant observable inputs. Observable inputs may include quoted prices for similar securities, interest rates, prepayment speeds and credit risk. Prices for securities valued using these inputs are received from independent pricing vendors and brokers and are based on an evaluation of the inputs described. Level 3 includes securities valued using significant unobservable inputs when market prices are not readily available or reliable, including the Portfolio’s own assumptions in determining the fair value of investments. Factors used in determining value may include market or issuers specific events, changes in interest rates and credit quality. The inputs or methodology used for valuing securities are not necessarily an indication of the risk associated with investing in those securities. As of December 31, 2010, all investments are categorized as Level 1, except for short-term investments which are Level 2, under the hierarchy discussed above. During the year ended December 31, 2010, there were no significant transfers in or out of Level 1 or Level 2 assets.
In order to value the securities, the Portfolio uses the following valuation techniques: Investments by the Portfolio in underlying affiliated funds and/or other investment companies are valued at their respective net asset values each business day. Certain short-term securities are valued at amortized cost.
| |
| 18 | Retirement Distribution Portfolio | Annual report |
Security transactions and related investment income. Investment security transactions are accounted for on a trade date plus one basis for daily net asset value calculations. However, for financial reporting purposes, investment transactions are reported on trade date. Interest income is accrued as earned. Gains and losses on securities sold are determined on the basis of identified cost and may include proceeds from litigation. Dividend and capital gain distributions from underlying funds are recorded on ex-date.
Line of credit. The Portfolio may borrow from banks for temporary or emergency purposes, including meeting redemption requests that otherwise might require the untimely sale of securities. Pursuant to the custodian agreement, the custodian may loan money to a portfolio to make properly authorized payments. The Portfolio is obligated to repay the custodian for any overdraft, including any related costs or expenses. The custodian has a lien, security interest or security entitlement in any Portfolio property that is not segregated, to the maximum extent permitted by law for any overdraft.
In addition, the Portfolio and other affiliated funds have entered into an agreement with State Street Bank and Trust Company which enables them to participate in a $200 million unsecured committed line of credit. A commitment fee, payable at the end of each calendar quarter, based on the average daily unused portion of the line of credit, is charged to each participating fund on a pro rata basis and is reflected in other expenses on the Statement of Operations. For the year ended December 31, 2010, the Portfolio had no borrowings under the line of credit.
Expenses. The majority of expenses are directly attributable to an individual portfolio. Expenses that are not readily attributable to a specific portfolio are allocated among all portfolios in an equitable manner, taking into consideration, among other things, the nature and type of expense and the portfolio’s relative assets. Expense estimates are accrued in the period to which they relate and adjustments are made when actual amounts are known.
Federal income taxes. The Portfolio intends to continue to qualify as regulated investment companies by complying with the applicable provisions of the Internal Revenue Code and will not be subject to federal income tax on taxable income that is distributed to shareholders. Therefore, no federal income tax provision is required.
For federal income tax purposes, the Portfolio has a capital loss carryforward of $270,645 available to offset future net realized capital gains as of December 31, 2010. The loss carryforward expires as follows: December 31, 2017 — $172,106 and December 31, 2018 — $98,539.
Under the recently enacted Regulated Investment Company Modernization Act of 2010, the Portfolio will be permitted to carry forward capital losses incurred in taxable years beginning after December 22, 2010 for an unlimited period. However, any losses incurred during those future taxable years will be required to be utilized prior to the losses incurred in pre-enactment taxable years. As a result of this ordering rule, pre-enactment capital loss carryforwards may be more likely to expire unused. Additionally, post-enactment capital losses that are carried forward will retain their character as either short-term or long-term capital losses rather than being considered all short-term as under previous law.
As of December 31, 2010, the Portfolio had no uncertain tax positions that would require financial statement recognition, de-recognition or disclosure. The Portfolio’s federal tax returns are subject to examination by the Internal Revenue Service for a period of three years.
Distribution of income and gains. Distributions to shareholders from net investment income and net realized gains, if any, are recorded on the ex-date. The Portfolio uses a quarterly targeted distribution strategy and distributes substantially all of its net income quarterly and capital gains, if any, annually. If the Portfolio has not met its distribution goal from net income and capital gains,
| |
| Annual report | Retirement Distribution Portfolio | 19 |
then the distributions may consist of a return of capital. The tax character of distributions for the year ended December 31, 2010 and December 31, 2009 was as follows:
| | | | |
| | DECEMBER 31, 2010 | DECEMBER 31, 2009 | | |
| | |
| Ordinary Income | $222,895 | $192,269 | | |
| Return of Capital | $74,325 | $71,788 | | |
As of December 31, 2010, the Portfolio has no distributable earnings on a tax basis.
Such distributions and distributable earnings, on a tax basis, are determined in conformity with income tax regulations, which may differ from accounting principles generally accepted in the United States of America. Material distributions in excess of tax basis earnings and profits, if any, are reported in the Portfolio’s financial statements as a return of capital. Short-term gains from underlying funds are treated as ordinary income for tax purposes.
Capital accounts within financial statements are adjusted for permanent book-tax differences. These adjustments have no impact on net assets or the results of operations. Temporary book-tax differences, if any, will reverse in a subsequent period. Book-tax differences are primarily attributable to wash sale loss deferrals.
Note 3 — Guarantees and indemnifications
Under the Trust’s organizational documents, its Officers and Trustees are indemnified against certain liabilities arising out of the performance of their duties to the Trust. Additionally, in the normal course of business, the Trust enters into contracts with service providers that contain general indemnification clauses. The Trust’s maximum exposure under these arrangements is unknown, as this would involve future claims that may be made against the Portfolio that have not yet occurred. The risk of material loss from such claims is considered remote.
Note 4 — Fees and transactions with affiliates
John Hancock Investment Management Services, LLC (the Adviser) serves as investment adviser for the Trust. John Hancock Funds, LLC (the Distributor), an affiliate of the Adviser, serves as principal underwriter of the Trust. The Adviser and the Distributor are indirect wholly owned subsidiaries of Manulife Financial Corporation (MFC).
Management fee. The Portfolio pays the Adviser a management fee for its services to the Portfolio. The management fee has two components: (a) a fee on net assets invested in a fund of the Trust or JHF III (Affiliated Fund Assets); and (b) a fee on net assets invested in investments other than a fund of the Trust or JHF III (Other Assets). The fee on assets invested in Affiliated Fund Assets is stated as an annual percentage of the current value of the aggregate net assets of the Portfolio and the Retirement Rising Distribution Portfolio and is equivalent to the sum of: (a) 0.06% of the first $500 million of aggregate net assets and (b) 0.05% of the excess over $500 million of aggregate net assets. The fee on Other Assets is stated as an annual percentage of the current value of the aggregate net assets of the Portfolio and the Retirement Rising Distribution Portfolio and is equivalent to the sum of: (a) 0.51% of the first $500 million of aggregate net assets and (b) 0.50% of the excess over $500 million of aggregate net assets and is applied to the Other Assets of the Portfolio. The investment management fees incurred for the year ended December 31, 2010 were equivalent to an annual effective rate of 0.24% of the Portfolio’s average daily net assets.
John Hancock Asset Management a division of Manulife Asset Management (North America) LLC (formerly MFC Global Investment Management (U.S.A.), Limited) and, effective January 1, 2011, John Hancock Asset Management a division of Manulife Asset Management (US) LLC (formerly MFC Global Investment Management (US) LLC) act as subadvisers to the Portfolio. The Portfolio is not responsible for the payment of subadvisory fees.
| |
| 20 | Retirement Distribution Portfolio | Annual report |
The Adviser has contractually agreed to waive fees and/or reimburse certain Portfolio level expenses to 0.09% of the Portfolio’s average annual net assets. This agreement excludes management fees, underlying fund expenses, taxes, portfolio brokerage commissions, interest, Rule 12b-1 fees, transfer agency fees, state registration fees, printing and postage, litigation and indemnification expenses, and other extraordinary expenses not incurred in the ordinary course of the Portfolio’s business. In addition, fees incurred under any agreement or plans of the Portfolio dealing with services for the shareholders and others with beneficial interest in shares of the Portfolio, are excluded. The Adviser has also agreed to a contractual expense limit on Class A specific expenses (which include 12b-1 fees, transfer agent fees, state registration fees, and printing and postage fees) of 0.35%. These expense waivers and/or reimbursements will continue in effect until at least April 30, 2011.
Accordingly, the expense reductions amounted to $85,120 for the year ended December 31, 2010.
Expense recapture. The Adviser may recapture operating expenses reimbursed or fees waived under previous expense limitation or waiver arrangements made for a period of three years following the beginning of the month in which such reimbursements or waivers originally occurred. For the year ended December 31, 2010, the amounts of waived or reimbursed expenses subject to potential recovery and the respective expiration dates were $76,944 — December 1, 2012 and $85,120 — December 1, 2013, respectively. Certain reimbursements or waivers are not subject to recapture.
Accounting and legal services. Pursuant to the service agreement, the Portfolios reimburse the Adviser for all expenses associated with providing the administrative, financial, legal, accounting and recordkeeping services of the Portfolio, including the preparation of all tax returns, periodic reports to shareholders and regulatory reports, among other services. The accounting and legal services fees incurred for the year ended December 31, 2010 amounted to an annual rate of 0.01% of each Portfolio’s average daily net assets.
Distribution and service plans. The Portfolio has a distribution agreement with the Distributor. The Portfolio has adopted distribution and service plans with respect to Class A shares pursuant to Rule 12b-1 under the 1940 Act, to pay the Distributor for services provided as the distributor of shares of the Portfolio. Accordingly, the Portfolio may pay up to an annual rate of 0.30% of average daily net assets for Class A shares for distribution and service fees.
Sales charges. Class A shares are assessed up-front sales charges, which resulted in payments to the Distributor amounting to $19,302 for the year ended December 31, 2010. Of this amount, $3,381 was retained and used for printing prospectuses, advertising, sales literature and other purposes, $15,921 was paid as sales commissions to broker-dealers.
Transfer agent fees. The Portfolios have a transfer agent agreement with John Hancock Signature Services, Inc. (Signature Services or Transfer Agent), an affiliate of the Adviser. The transfer agent fees paid to Signature Services are determined based on the cost to Signature Services (Signature Services Cost) of providing recordkeeping services. The Signature Services Cost includes a component of allocated John Hancock corporate overhead for providing transfer agent services to the Portfolios and to all other John Hancock affiliated funds. It also includes out-of-pocket expenses that are comprised of payments made to third-parties for recordkeeping services provided to their clients who invest in one or more John Hancock funds. In addition, Signature Services Cost may be reduced by certain revenues that Signature Services receive in connection with the service they provide to the funds. Signature Services Cost is calculated monthly and allocated, as applicable, to four categories of share classes: Institutional Share Classes, Retirement Share Classes, Municipal Bond Classes and all other Retail Share Classes. Within each of these categories, the applicable costs are allocated to the affected John Hancock affiliated funds and/or classes, based on the relative average daily net assets.
| |
| Annual report | Retirement Distribution Portfolio | 21 |
Prior to July 1, 2010, the transfer agent fees were made up of three components:
• The Portfolio paid a monthly transfer agent fee at an annual rate of 0.015% of average daily net assets.
• The Portfolio paid a monthly fee based on an annual rate of $17.50 shareholder account.
• Signature Services was reimbursed for certain out-of-pocket expenses.
Trustee expenses. The Trust compensates each Trustee who is not an employee of the Adviser or its affiliates. The costs of paying Trustee compensation and expenses are allocated to each Portfolio based on its average daily net assets.
Note 5 — Portfolio share transactions
Transactions in Portfolio shares for the years ended December 31, 2010 and December 31, 2009 were as follows:
| | | | |
| | Year ended 12-31-10 | Year ended 12-31-09 |
| | Shares | Amount | Shares | Amount |
| Class A shares | | | | |
|
| Sold | 49,254 | $563,290 | 57,815 | $557,996 |
| Distributions reinvested | 25,084 | 284,065 | 25,434 | 258,488 |
| Repurchased | (23,740) | (272,118) | (21,074) | (231,372) |
| | | | | |
| Net increase | 50,598 | $575,237 | 62,175 | $585,112 |
Affiliates of the Portfolio owned 85% of the shares of beneficial interest of Class A shares on December 31, 2010.
Note 6 — Purchase and sale of securities
Purchases and sales of securities, other than short-term securities, aggregated to $1,448,932 and $2,607,092, respectively, for the year ended December 31, 2010.
Note 7 — Investment in affiliated underlying funds
The Portfolio invests in affiliated underlying funds that are managed by the Adviser and affiliates. The Portfolio does not invest in the affiliated underlying funds for the purpose of exercising management or control; however, the Portfolio’s investment may represent a significant portion of each underlying fund’s net assets. For the year ended December 31, 2010, the Portfolio held less than 5% of the total net assets in any of the underlying funds.
| |
| 22 | Retirement Distribution Portfolio | Annual report |
Auditors’ report
Report of Independent Registered Public Accounting Firm
To the Board of Trustees of John Hancock Funds II and Shareholder of
John Hancock Retirement Distribution Portfolio:
In our opinion, the accompanying statement of assets and liabilities, including the portfolio of investments, and the related statement of operations and of changes in net assets and the financial highlights present fairly, in all material respects, the financial position of John Hancock Retirement Distribution Portfolio (the “Portfolio”), a portfolio of John Hancock Funds II, at December 31, 2010, and the results of its operations, the changes in its net assets and the financial highlights for each of the periods indicated, in conformity with accounting principles generally accepted in the United States of America. These financial statements and financial highlights (hereafter referred to as “financial statements”) are the responsibility of the Portfolio’s management; our responsibility is to express an opinion on these financial statements based on our audits. We conducted our audits of these financial statements in accordance with the standards of the Public Company Accounting Oversight Board (United States). Those standards require that we plan and perform the audit to obtain reasonable assurance about whether the financial statements are free of material misstatement. An audit includes examining, on a test basis, evidence supporting the amounts and disclosures in the financial statements, assessing the accounting principles used and significant estimates made by management, and evaluating the overall financial statement presentation. We believe that our audits, which included confirmation of securities at December 31, 2010 by correspondence with the custodian and transfer agent, provide a reasonable basis for our opinion.
PricewaterhouseCoopers LLP
Boston, Massachusetts
February 24, 2011
| |
| Annual report | Retirement Distribution Portfolio | 23 |
Tax information
Unaudited
For federal income tax purposes, the following information is furnished with respect to the distributions of the Portfolio paid during its taxable year ended December 31, 2010.
With respect to the ordinary dividends paid by the Portfolio for the fiscal year ended December 31, 2010, 15.15% of the dividends qualify for the corporate dividends-received deduction.
The Portfolio designates the maximum amount allowable of its net taxable income as qualified dividend income as provided in the Jobs and Growth Tax Relief Reconciliation Act of 2003. This amount will be reflected on Form 1099-DIV for the calendar year 2010.
Shareholders were mailed a 2010 1099-DIV in January 2011. This reflected the total of all distributions that are taxable for calendar year 2010.
| |
| 24 | Retirement Distribution Portfolio | Annual report |
Evaluation of Subadvisory Agreement by the Board Of Trustees
At its meeting on December 17, 2010, the Board of Trustees (the “Board”) of John Hancock Funds II (the “Trust”), including all of the Independent Trustees, approved the appointment of John Hancock Asset Management a division of Manulife Asset Management (US) LLC (“John Hancock Asset Management” or the “Subadviser”) as an additional subadviser to the Retirement Distribution Portfolio (the “Portfolio”), a series of the Trust.
This section describes the evaluation by the Board of Trustees of the amendment to the subadvisory agreement between John Hancock Investment Management Services, LLC (the “Adviser”), the adviser to the Portfolio, and the Subadviser relating to the Portfolio (the “Subadvisory Agreement Amendment”).
Evaluation of Subadvisory Agreement by the Board of Trustees
The Board, including the Independent Trustees, is responsible for approving the Adviser’s selection of fund subadvisers and approving the funds’ subadvisory agreements, their periodic continuation and any amendments. Consistent with SEC rules, the Board regularly evaluates the Trust’s subadvisory arrangements, including consideration of the factors listed below. The Board may also consider other factors (including conditions and trends prevailing generally in the economy, the securities markets and the industry) and does not treat any single factor as determinative, and each Trustee may attribute different weights to different factors. The Board is furnished with an analysis of its fiduciary obligations in connection with its evaluation and, throughout the evaluation process, the Board is assisted by counsel for the Trust and the Independent Trustees are also separately assisted by independent legal counsel. The factors considered by the Board with respect to each fund are:
1. the nature, extent and quality of the services to be provided by the subadviser to the fund;
2. the investment performance of the fund and its subadviser;
3. the extent to which economies of scale would be realized as a fund grows and whether fee levels reflect these economies of scale for the benefit of fund shareholders;
4. the costs of the services to be provided and the profits to be realized by the subadviser from its relationship with the Trust; and
5. comparative services rendered and comparative subadvisory fee rates.
In making its determination and with reference to the factors that it considers, the Board reviews:
1. information relating to the subadviser’s business, including current subadvisory services to the Trust (and other funds in the John Hancock family of funds);
2. the performance of the fund and the performance of other John Hancock funds managed by the subadviser; and
3. the subadvisory fee for the fund, including any breakpoints.
| |
| Annual report | Retirement Distribution Portfolio | 25 |
The Board approved the Subadvisory Agreement Amendment with the Subadviser for the Portfolio at its meeting on December 17, 2010. Particular considerations of the Board in approving the Subadvisory Agreement Amendment included the following:
1. The subadvisory fees for the Portfolio are paid by the Adviser, not the Portfolio, and approval of the Subadvisory Agreement Amendment will not result in any change in the advisory fees for the Portfolio.
2. Approval of the Subadvisory Agreement Amendment reflects the re-allocation of subadvisory services between the Subadviser and John Hancock Asset Management a division of Manulife Asset Management (North America) Limited (“John Hancock Asset Management (North America)”), each of which is affiliated with the Adviser.
3. The personnel of John Hancock Asset Management (North America) and the Adviser who have currently and previously managed the assets of the Portfolio, with John Hancock Asset Managment (North America) and the Subadviser, are expected to continue to manage the Portfolio and the Board is generally satisfied with their skill and experience and with the performance of the Portfolio.
4. The performance of the Portfolio as noted below and management’s discussion of the same:
a. The Retirement Distribution Portfolio has outperformed its peer group and benchmark index for the one-year period ended September 30, 2010, and outperformed its benchmark and underperformed its peer group for the period from inception to September 30, 2010.
5. John Hancock Asset Management has demonstrated skill as a manager, is currently the subadviser to multiple funds of the Trust and John Hancock Funds II and may be expected to provide a high quality of investment management services and personnel to the Portfolio.
In addition, the Board reviewed the subadvisory fees to be paid to the Subadviser with respect to the Portfolios, each of which operates as a fund of funds and invests in underlying funds. The Board concluded, with respect to each such fund of funds, that the subadvisory fee is based on services provided that are in addition to, rather than duplicative of, the services provided pursuant to the advisory agreements for the underlying funds. The Board also concluded that the additional services are necessary because of the differences between the investment policies, strategies and techniques of the fund of funds and those of its underlying funds.
| |
| 26 | Retirement Distribution Portfolio | Annual report |
Trustees and Officers
This chart provides information about the Trustees and Officers of John Hancock Funds II who oversee your John Hancock fund. Officers elected by the Trustees manage the day-to-day operations of the Portfolio and execute policies formulated by the Trustees.
| | |
| Independent Trustees | | |
| | | |
| Name, Year of Birth | Trustee | Number of |
| Position(s) held with Fund | of the | John Hancock |
| Principal occupation(s) and other | Trust | funds overseen |
| directorships during past 5 years | since1 | by Trustee |
| |
| Charles L. Bardelis, Born: 1941 | 2005 | 208 |
|
| Director, Island Commuter Corp. (Marine Transport). Trustee of John Hancock Trust (since 1988), |
| John Hancock Funds II (since 2005) and former Trustee of John Hancock Funds III (2005–2006). |
|
| |
| Peter S. Burgess, Born: 1942 | 2005 | 208 |
|
| Consultant (financial, accounting and auditing matters) (since 1999); Certified Public Accountant. |
| Partner, Arthur Andersen (independent public accounting firm) (prior to 1999). Director of the |
| following publicly traded companies: Lincoln Educational Services Corporation (since 2004), Symetra |
| Financial Corporation (since 2010) and PMA Capital Corporation (2004–2010). Trustee of John Hancock |
| Trust (since 2005), John Hancock Funds II (since 2005), and former Trustee of John Hancock |
| Funds III (2005–2006). | | |
|
| |
| Grace K. Fey, Born: 1946 | 2008 | 208 |
|
| Chief Executive Officer, Grace Fey Advisors (since 2007); Director & Executive Vice President, Frontier |
| Capital Management Company (1988–2007); Director, Fiduciary Trust (since 2009). Trustee of |
| John Hancock Trust (since 2008) and John Hancock Funds II (since 2008). | | |
|
| |
| Theron S. Hoffman, Born: 1947 | 2008 | 208 |
|
| Chief Executive Officer, T. Hoffman Associates, LLC (since 2003); Director, The Todd Organization |
| (since 2003); President, Westport Resources Management (2006–2008); Partner/Operating Head & |
| Senior Managing Director, Putnam Investments (2000–2003); Executive Vice President, Thomson |
| Corp. (1997–2000) (financial information publishing). Trustee of John Hancock Trust (since 2008) and |
| John Hancock Funds II (since 2008). | | |
|
| |
| Hassell H. McClellan, Born: 1945 | 2005 | 208 |
|
| Associate Professor, The Graduate School of The Wallace E. Carroll School of Management, Boston |
| College (since 1984). Trustee of John Hancock Trust (since 2005), John Hancock Funds II (since 2005) |
| and Trustee of Phoenix Edge Series Funds (since 2008). | | |
|
| |
| James M. Oates, Born: 1946 | 2005 | 208 |
|
| Managing Director, Wydown Group (financial consulting firm) (since 1994); Chairman, Emerson |
| Investment Management, Inc. (since 2000); Chairman, Hudson Castle Group, Inc. (formerly IBEX Capital |
| Markets, Inc.) (financial services company) (since 1997) (Independent Chairman, 1997–2006). Director |
| of the following publicly traded companies: Stifel Financial (since 1996); Investor Financial Services |
| Corporation (1995–2007); and Connecticut River Bancorp (since 1998); Director of the following |
| Mutual Funds: Phoenix Mutual Funds (1988–2008); Virtus Funds (since 2008); and Emerson Investment |
| Management (since 2000). Chairman of the Boards of John Hancock Trust and John Hancock Funds II |
| (since 2005). Trustee of John Hancock Trust (since 2004), John Hancock Funds II (since 2005) and former |
| Trustee of John Hancock Funds III (2005–2006). | | |
| |
| Annual report | Retirement Distribution Portfolio | 27 |
| | |
| Independent Trustees (continued) | | |
| |
| Name, Year of Birth | Trustee | Number of |
| Position(s) held with Fund | of the | John Hancock |
| Principal occupation(s) and other | Trust | funds overseen |
| directorships during past 5 years | since1 | by Trustee |
| |
| Steven M. Roberts, Born: 1944 | 2008 | 208 |
|
| Board of Governors Deputy Director Division of Banking Supervision and Regulation, Federal Reserve |
| System (2005–2008); Partner, KPMG (1987–2004). Trustee of John Hancock Trust (since 2008) and |
| John Hancock Funds II (since September 2008). | | |
| |
| Non-Independent Trustee2 | | |
| | | |
| Name, Year of Birth | Trustee | Number of |
| Position(s) held with Fund | of the | John Hancock |
| Principal occupation(s) and other | Trust | funds overseen |
| directorships during past 5 years | since1 | by Trustee |
| |
| James R. Boyle,3 Born: 1959 | 2005 | 208 |
|
| Senior Executive Vice President, John Hancock Financial Services (since 1999, including prior positions); |
| Chairman and Director, John Hancock Advisers, LLC, John Hancock Funds, LLC, and John Hancock |
| Investment Management Services, LLC (2005–2010); Trustee, John Hancock Trust (since 2005), |
| John Hancock Funds II (since 2005), and John Hancock retail funds (2005–2010). | |
1 Because the Trust does not hold regular annual shareholders meetings, each Trustee holds office for an indefinite term until his/her successor is duly elected and qualified or until he/she dies, retires, resigns, is removed or becomes disqualified.
2 Non-Independent Trustees hold positions or are affiliated with the Fund’s investment adviser, subadviser, underwriter or their affiliates.
3 Mr. Boyle is an “interested person” (as defined in the 1940 Act) due to his position with Manulife Financial Corporation (or its affiliates), the ultimate parent of the Adviser.
| |
| Principal officers who are not Trustees | |
| | |
| Name, Year of Birth | Officer |
| Position(s) held with Fund | of the |
| Principal occupation(s) and other | Trust |
| directorships during past 5 years | since |
| |
| Hugh McHaffie, Born: 1959 | 2009 |
|
| President | |
| Executive Vice President, John Hancock Financial Services (since 2006, including prior positions); | |
| President of John Hancock Trust and John Hancock Funds II (since 2009); Trustee, John Hancock retail |
| funds (since 2010); Chairman and Director, John Hancock Advisers, LLC, John Hancock Investment | |
| Management Services, LLC and John Hancock Funds, LLC (since 2010); Senior Vice President, Individual |
| Business Product Management, MetLife, Inc. (1999–2006). | |
|
| |
| Thomas M. Kinzler, Born: 1955 | 2008 |
|
| Secretary and Chief Legal Officer | |
| Vice President, John Hancock Financial Services (since 2006); Secretary and Chief Legal Counsel, | |
| John Hancock Advisers, LLC, John Hancock Investment Management Services, LLC and John Hancock |
| Funds, LLC (since 2007); Secretary and Chief Legal Officer, John Hancock retail funds, John Hancock |
| Funds II and John Hancock Trust (since 2006); Vice President and Associate General Counsel, | |
| Massachusetts Mutual Life Insurance Company (1999–2006); Secretary and Chief Legal Counsel, MML |
| Series Investment Fund (2000–2006); Secretary and Chief Legal Counsel, MassMutual Select Funds and |
| MassMutual Premier Funds (2004–2006). | |
| |
| 28 | Retirement Distribution Portfolio | Annual report |
| |
| Principal officers who are not Trustees (continued) | |
| |
| Name, Year of Birth | Officer |
| Position(s) held with Fund | of the |
| Principal occupation(s) and other | Trust |
| directorships during past 5 years | since |
| |
| Francis V. Knox, Jr., Born: 1947 | 2008 |
|
| Chief Compliance Officer | |
| Vice President, John Hancock Financial Services (since 2005); Chief Compliance Officer, John Hancock |
| retail funds, John Hancock Funds II, John Hancock Trust, John Hancock Advisers, LLC and John Hancock |
| Investment Management Services, LLC (since 2005); Vice President and Chief Compliance Officer, MFC |
| Global Investment Management (U.S.), LLC (2005–2008). | |
|
| |
| Michael J. Leary, Born: 1965 | 2008 |
|
| Treasurer | |
| Assistant Vice President, John Hancock Financial Services (since 2007); Treasurer, John Hancock | |
| Funds II and John Hancock Trust (since 2009); Treasurer, John Hancock retail funds (2009–2010); Vice |
| President, John Hancock Advisers, LLC and John Hancock Investment Management Services, LLC (since |
| 2007); Assistant Treasurer, John Hancock retail funds (2007–2009 & 2010), John Hancock Funds II and |
| John Hancock Trust (2007–2009) and John Hancock Funds III (since 2009); Vice President and Director |
| of Fund Administration, JP Morgan (2004–2007). | |
|
| | |
| Charles A. Rizzo, Born: 1957 | 2008 |
|
| Chief Financial Officer | |
| Vice President, John Hancock Financial Services (since 2008); Senior Vice President, John Hancock | |
| Advisers, LLC and John Hancock Investment Management Services, LLC (since 2008); Chief | |
| Financial Officer, John Hancock retail funds, John Hancock Funds II and John Hancock Trust (since | |
| 2007); Assistant Treasurer, Goldman Sachs Mutual Fund Complex (2005–2007); Vice President, | |
| Goldman Sachs (2005–2007); Managing Director and Treasurer, Scudder Funds, Deutsche Asset | |
| Management (2003–2005). | |
|
| |
| John G. Vrysen, Born: 1955 | 2008 |
|
| Chief Operating Officer | |
| Senior Vice President, John Hancock Financial Services (since 2006); Director, Executive Vice President |
| and Chief Operating Officer, John Hancock Advisers, LLC, John Hancock Investment Management | |
| Services, LLC and John Hancock Funds, LLC (since 2005); Chief Operating Officer, John Hancock | |
| Funds II and John Hancock Trust (since 2007); Chief Operating Officer, John Hancock retail funds (until |
| 2009); Trustee, John Hancock retail funds (since 2009). | |
The business address for all Trustees and Officers is 601 Congress Street, Boston, Massachusetts 02210-2805.
The Statement of Additional Information of the Fund includes additional information about members of the Board of Trustees of the Fund and is available without charge, upon request, by calling 1-800-225-5291.
| |
| Annual report | Retirement Distribution Portfolio | 29 |
More information
| | |
| Trustees | Investment adviser | |
| James M. Oates, Chairman | John Hancock Investment Management | |
| James R. Boyle† | Services, LLC | |
| Grace K. Fey | | |
| Charles L. Bardelis* | Subadvisers | |
| Peter S. Burgess* | John Hancock Asset Management | |
| Theron S. Hoffman | | |
| Hassell H. McClellan | Principal distributor | |
| Steven M. Roberts* | John Hancock Funds, LLC | |
| | | |
| Officers | Custodian | |
| Hugh McHaffie | State Street Bank and Trust Company | |
| President | | |
| | Transfer agent | |
| Thomas M. Kinzler | John Hancock Signature Services, Inc. | |
| Secretary and Chief Legal Officer | | |
| | Legal counsel | |
| Francis V. Knox, Jr. | K&L Gates LLP | |
| Chief Compliance Officer | | |
| | Independent registered | |
| Michael J. Leary | public accounting firm | |
| Treasurer | PricewaterhouseCoopers LLP | |
| | | |
| Charles A. Rizzo |
| |
| Chief Financial Officer | The report is certified under the Sarbanes-Oxley | |
| | Act, which requires mutual funds and other public | |
| John G. Vrysen | companies to affirm that, to the best of their | |
| Chief Operating Officer | knowledge, the information in their financial reports | |
| | is fairly and accurately stated in all material respects. | |
| *Member of the Audit Committee |
| |
| †Non-Independent Trustee | | |
| | | |
The Fund’s proxy voting policies and procedures, as well as the Fund’s proxy voting record for the most recent twelve-month period ended June 30, are available free of charge on the Securities and Exchange Commission (SEC) Web site at www.sec.gov or on our Web site.
The Fund’s complete list of portfolio holdings, for the first and third fiscal quarters, is filed with the SEC on Form N-Q. The Fund’s Form N-Q is available on our Web site and the SEC’s Web site, www.sec.gov, and can be reviewed and copied (for a fee) at the SEC’s Public Reference Room in Washington, DC. Call 1-800-SEC-0330 to receive information on the operation of the SEC’s Public Reference Room.
We make this information on your fund, as well as monthly portfolio holdings, and other fund details available on our Web site www.jhfunds.com or by calling 1-800-225-5291.
| | |
| You can also contact us: | | |
| 1-800-225-5291 | Regular mail: | Express mail: |
| jhfunds.com | John Hancock Signature Services, Inc. | John Hancock Signature Services, Inc. |
| | P.O. Box 55913 | Mutual Fund Image Operations |
| | Boston, MA 02205-5913 | 30 Dan Road |
| | | Canton, MA 02021 |
| |
| 30 | Retirement Distribution Portfolio | Annual report |

1-800-225-5291
1-800-554-6713 TDD
1-800-338-8080 EASI-Line
www.jhfunds.com
Now available: electronic delivery
www.jhfunds.com/edelivery
| |
| This report is for the information of the shareholders of John Hancock Retirement Distribution Portfolio. | 3300A 12/10 |
| It is not authorized for distribution to prospective investors unless preceded or accompanied by a prospectus. | 2/11 |

Management’s discussion of
Portfolio performance
From the Portfolio Management Team of
John Hancock Asset Management1
Aided by a powerful surge in the final four months of the year, U.S. stocks delivered robust gains for the 12 months ended December 31, 2010. Factors lifting share prices included further progress toward economic recovery, optimism over the Federal Reserve Board’s plans to engage in another round of quantitative easing (QE2) and the extension of tax cuts that had been set to expire at the end of 2010. In the bond market, despite rising yields in the fourth quarter, Treasury yields declined for the year overall, which bolstered bond prices. For the 12 months ended December 31, 2010, the S&P 500 Index returned 15.06%, the Barclays Capital U.S. Aggregate Bond Index returned 6.54% and a blended index using 50% S&P 500 Index and 50% Barclays Capital U.S. Aggregate Bond Index returned 11.29%. Meanwhile, the Morningstar, Inc. average retirement income fund posted an 8.94% gain over the same period.
During the past year, John Hancock Retirement Rising Distribution Portfolio’s Class A shares returned 7.88% at net asset value, trailing the blended index and peer-group average. Defensive asset allocation in the final quarter of the year — reflected in a roughly 32% stake in cash and cash equivalents at year end — was the primary factor detracting from performance. Turning to manager contribution, outperformance by our fixed-income funds modestly outweighed underperformance from our equity funds. In fixed income, the largest contributors were Total Return Fund (PIMCO) and Strategic Income Opportunities Fund (John Hancock), which outperformed their benchmarks by a wide margin. Notable detractors among our equity funds included Mid Value Fund (T. Rowe Price), as its emphasis on larger-capitalization, higher-quality stocks worked against it, given the sizable outperformance of smaller-cap, lower-quality stocks during the period. Mid Cap Stock Fund (Wellington) also underperformed.
This commentary reflects the views of the portfolio managers through the end of the Portfolio’s period discussed in this report. The managers’ statements reflect their own opinions. As such, they are in no way guarantees of future events and are not intended to be used as investment advice or a recommendation regarding any specific security. They are also subject to change at any time as market and other conditions warrant.
Past performance is no guarantee of future results.
1 Effective 1-1-11, Manulife Asset Management (US) LLC has been added as a subadviser. Manulife Asset Management (US) LLC and Manulife Asset Management (North America) Limited are doing business as John Hancock Asset Management.
| |
| 6 | Retirement Rising Distribution Portfolio | Annual report |
A look at performance
For the period ended December 31, 2010
| | | | | | | | | |
| | Average annual total returns (%) | | | Cumulative total returns (%) | |
| | with maximum sales charge (POP) | | | with maximum sales charge (POP) | |
|
| | | | Since | | | | | Since |
| | 1-year | 5-year | 10-year | inception 1 | | 1-year | 5-year | 10-year | inception 1 |
|
| Class A | 2.49 | — | — | –0.15 | | 2.49 | — | — | –0.44 |
|
Performance figures assume all distributions are reinvested. Public offering price (POP) figures reflect maximum sales charges on Class A shares of 5%.
The expense ratios of the Portfolio, both net (including any fee waivers or expense limitations) and gross (excluding any fee waivers or expense limitations), are set forth according to the most recent publicly available prospectus for the Portfolio and may differ from the expense ratios disclosed in the Financial Highlights tables in this report. The waivers and expense limitations are contractual until 4-30-11. The following expense ratios include expenses of the underlying affiliated funds in which the Portfolio invests. The net expenses for Class A are 1.29%. Had the fee waivers and expense limitations not been in place, the gross expenses for Class A would be 3.15%.
The returns reflect past results and should not be considered indicative of future performance. The return and principal value of an investment will fluctuate so that shares, when redeemed, may be worth more or less than their original cost. Due to market volatility, the Portfolio’s current performance may be higher or lower than the performance shown. For current to the most recent month end performance data, please call 1-800-225-5291 or visit the Portfolio’s Web site at www.jhfunds.com.
The performance table above and the chart on the next page do not reflect the deduction of taxes that a shareholder may pay on portfolio distributions or the redemption of portfolio shares.
The Portfolio’s performance results reflect any applicable expense reductions, without which the expenses would increase and results would have been less favorable.
1 From 1-2-08.
| |
| Annual report | Retirement Rising Distribution Portfolio | 7 |
A look at performance
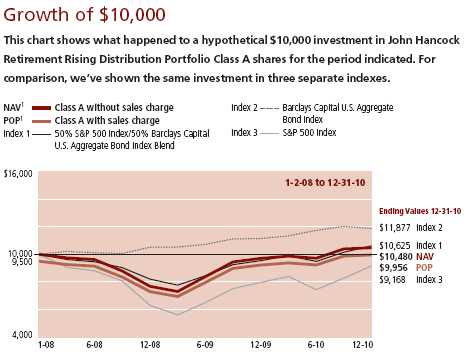
| | | | | | |
| | Period | Without | With maximum | | | |
| | beginning | sales charge | sales charge | Index 1 | Index 2 | Index 3 |
|
| Class A | 1-2-08 | $10,480 | $9,956 | $10,625 | $11,877 | $9,168 |
|
50% S&P 500 Index/50% Barclays Capital U.S. Aggregate Bond Index Blend — Index 1 — is comprised of 50% S&P 500 Index and 50% Barclays Capital U.S. Aggregate Bond Index.
Barclays Capital U.S. Aggregate Bond Index — Index 2 — is an unmanaged index of dollar-denominated and nonconvertible investment-grade debt issues.
S&P 500 Index — Index 3 — is an unmanaged index that includes 500 widely traded common stocks.
It is not possible to invest directly in an index. Index figures do not reflect sales charges or expenses and commissions that would have been incurred if an investor purchased or sold the securities represented in the index, which would have resulted in lower values if they did.
1 NAV represents net asset value and POP represents public offering price.
| |
| 8 | Retirement Rising Distribution Portfolio | Annual report |
Your expenses
These examples are intended to help you understand your ongoing operating expenses.
Understanding portfolio expenses
As a shareholder of the Portfolio, you incur two types of costs:
▪ Transaction costs which include sales charges (loads) on purchases or redemptions (varies by share class), minimum account fee charge, etc.
▪ Ongoing operating expenses including management fees, distribution and service fees (if applicable), and other Portfolio expenses.
We are going to present only your ongoing operating expenses here.
Actual expenses/actual returns
This example is intended to provide information about your portfolio’s actual ongoing operating expenses, and is based on your portfolio’s actual return. It assumes an account value of $1,000.00 on July 1, 2010 with the same investment held until December 31, 2010.
| | | |
| | Account value | Ending value | Expenses paid during |
| | on 7-1-10 | on 12-31-10 | period ended 12-31-101,2 |
|
| Class A | $1,000.00 | $1,078.10 | $3.72 |
|
Together with the value of your account, you may use this information to estimate the operating expenses that you paid over the period. Simply divide your account value at December 31, 2010, by $1,000.00, then multiply it by the “expenses paid” for your share class from the table above. For example, for an account value of $8,600.00, the operating expenses should be calculated as follows:
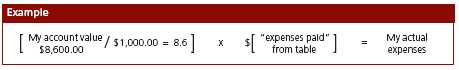
| |
| Annual report | Retirement Rising Distribution Portfolio | 9 |
Your expenses
Hypothetical example for comparison purposes
This table allows you to compare your portfolio’s ongoing operating expenses with those of any other fund. It provides an example of the Portfolio’s hypothetical account values and hypothetical expenses based on each class’s actual expense ratio and an assumed 5% annualized return before expenses (which is not your portfolio’s actual return). It assumes an account value of $1,000.00 on July 1, 2010, with the same investment held until December 31, 2010. Look in any other fund shareholder report to find its hypothetical example and you will be able to compare these expenses.
| | | |
| | Account value | Ending value | Expenses paid during |
| | on 7-1-10 | on 12-31-10 | period ended 12-31-101,2 |
|
| Class A | $1,000.00 | $1,021.60 | $3.62 |
|
Remember, these examples do not include any transaction costs, therefore, these examples will not help you to determine the relative total costs of owning different funds. If transaction costs were included, your expenses would have been higher. See the prospectus for details regarding transaction costs.
1 Expenses are equal to the Portfolio’s annualized expense ratio of 0.71% for Class A shares, multiplied by the average account value over the period, multiplied by 184/365 (to reflect the one-half year period).
2 Ratios do not include expenses indirectly incurred from underlying funds whose expense ratios can vary based on the mix of underlying funds held by the Portfolio. The range of expense ratios of the underlying funds held by the Portfolio was 0.52%–1.06%.
| |
| 10 | Retirement Rising Distribution Portfolio | Annual report |
Portfolio summary
| | | | |
| Asset Allocation1 | | | | |
|
| Fixed Income — Unaffiliated | 13% | | Fixed Income — Affiliated | 39% |
| |
|
| Equity — Unaffiliated | 7% | | Intermediate Bond | 22% |
| |
|
| Equity — Affiliated | 9% | | U.S. Government & Agency | 9% |
| |
|
| U.S. Mid Cap | 6% | | Multi-Sector Bond | 4% |
| |
|
| U.S. Large Cap | 2% | | Global Bond | 4% |
| |
|
| Real Estate | 1% | | Short-Term Investments and Other | 32% |
| |
|
1 As a percentage of net assets on 12-31-10.
| |
| Annual report | Retirement Rising Distribution Portfolio | 11 |
Portfolio’s investments
As of 12-31-10
| | |
| | Shares/Par value | Value |
| |
| Investment Companies 68.04% | | $3,660,340 |
|
| | | |
| Affiliated Investment Companies 48.00% | | 2,582,372 |
| | | |
| Equity (G) 9.14% | | |
| | | |
| John Hancock Funds II 9.14% | | 491,511 |
| | | |
| Equity-Income, Class NAV (T. Rowe Price) | 4,109 | 58,308 |
|
| Fundamental Value, Class NAV (Davis) | 1,932 | 29,118 |
|
| Global Real Estate, Class NAV (Deutsche) | 7,370 | 54,904 |
|
| Mid Cap Stock, Class NAV (Wellington) (I) | 6,668 | 116,496 |
|
| Mid Value, Class NAV (T. Rowe Price) | 7,971 | 116,459 |
|
| Value, Class NAV (Invesco) | 11,812 | 116,226 |
| | | |
| Fixed Income (G) 38.86% | | |
| | | |
| John Hancock Funds II 38.86% | | 2,090,861 |
| | | |
| Active Bond, Class NAV (John Hancock1/Declaration) (A) | 23,775 | 239,648 |
|
| Core Bond, Class NAV (Wells Capital) | 26,506 | 339,280 |
|
| Global Bond, Class NAV (PIMCO) | 17,292 | 209,755 |
|
| Real Return Bond, Class NAV (PIMCO) | 38,784 | 474,332 |
|
| Strategic Income Opportunities, Class NAV (John Hancock1) (A) | 20,136 | 219,881 |
|
| Total Bond Market, Class NAV (Declaration) (A) | 21,136 | 216,436 |
|
| Total Return, Class NAV (PIMCO) | 28,392 | 391,529 |
| | | |
| Unaffiliated Investment Companies 20.04% | | 1,077,968 |
| | | |
| Fixed Income 13.12% | | |
| | | |
| iShares Barclays Aggregate Bond Fund | 2,763 | 292,187 |
|
| iShares Barclays TIPS Bond Fund | 520 | 55,910 |
|
| iShares iBoxx Investment Grade Corporate Bond Fund | 3,300 | 357,852 |
| | | |
| Equity 6.92% | | |
| | | |
| WisdomTree High-Yielding Equity Fund | 9,562 | 372,019 |
|
| |
| Short-Term Investments* 31.60% | | $1,699,891 |
|
| | | |
| Federal Home Loan Bank Discount Notes, 0.070%, 2-3-11 | $1,700,000 | 1,699,891 |
| |
| Total investments (Cost $5,455,542)† 99.64% | | $5,360,231 |
|
| |
| Other assets and liabilities, net 0.36% | | $19,603 |
|
| |
| Total net assets 100.00% | | $5,379,834 |
|
Percentages are stated as a percent of net assets.
| | |
| 12 | Retirement Rising Distribution Portfolio | Annual report | See notes to financial statements |
Notes to Schedule of Investments
(A) The subadviser is an affiliate of the adviser.
(G) The underlying fund’s subadviser is shown parenthetically.
(I) Non-income producing security.
† At 12-31-10, the aggregate cost of investment securities for federal income tax purposes was $5,469,094. Net unrealized depreciation aggregated $108,863, of which $93,558 related to appreciated investment securities and $202,421 related to depreciated investment securities.
* Yield represents either the annualized yield at the date of purchase, the stated coupon rate or, for floating rate securities, the rate at period end.
1 Manulife Asset Management (US) LLC is doing business as John Hancock Asset Management.
Underlying Funds’ Investment Managers
| |
| Davis Advisors | (Davis) |
| Declaration Management/John Hancock Advisors | (Declaration) |
| Deutsche Asset Management | (Deutsche) |
| Invesco Advisers, Inc. | (Invesco) |
| John Hancock Asset Management1 | (John Hancock) |
| Pacific Investment Management Company | (PIMCO) |
| T. Rowe Price Associates, Inc. | (T. Rowe Price) |
| Wellington Management Company, LLP | (Wellington) |
| Wells Capital Management, Inc. | (Wells Capital) |
| | |
| See notes to financial statements | Annual report | Retirement Rising Distribution Portfolio | 13 |
F I N A N C I A L S T A T E M E N T S
Financial statements
Statement of assets and liabilities 12-31-10
This Statement of Assets and Liabilities is the Portfolio’s balance sheet. It shows the value of what the Portfolio owns, is due and owes. You’ll also find the net asset value and the maximum offering price per share.
| |
| Assets | |
|
| Investments in unaffiliated issuers, at value (Cost $2,823,213) | $2,777,859 |
| Investments in affiliated funds, at value (Cost $2,632,329) (Note 7) | 2,582,372 |
| | |
| Total investments, at value (Cost $5,455,542) | 5,360,231 |
| Cash | 43,594 |
| Dividends receivable | 5,821 |
| Receivable due from adviser | 795 |
| Other receivables and prepaid expenses | 11,787 |
| | |
| Total assets | 5,422,228 |
| |
| Liabilities | |
|
| Payable for investments purchased | 3,358 |
| Payable to affiliates (Note 4) | |
| Accounting and legal services fees | 65 |
| Transfer agent fees | 882 |
| Trustees’ fees | 101 |
| Other liabilities and accrued expenses | 37,988 |
| | |
| Total liabilities | 42,394 |
| |
| Net assets | |
|
| Capital paid-in | $5,807,358 |
| Undistributed net investment income | 1,284 |
| Accumulated net realized loss on investments | (333,497) |
| Net unrealized appreciation (depreciation) on investments | (95,311) |
| | |
| Net assets | $5,379,834 |
| |
| Net asset value per share | |
|
| Based on net asset values and shares outstanding — the Portfolio has an | |
| unlimited number of shares authorized with no par value | |
| Class A ($5,379,834 ÷ 466,954 shares) | $11.52 |
| |
| Maximum offering price per share | |
|
| Class A (net asset value per share ÷ 95%)1 | $12.13 |
1 On single retail sales of less than $50,000. On sales of $50,000 or more and on group sales the offering price is reduced.
| | |
| 14 | Retirement Rising Distribution Portfolio | Annual report | See notes to financial statements |
F I N A N C I A L S T A T E M E N T S
Statement of operations For the year ended 12-31-10
This Statement of Operations summarizes the Portfolio’s investment income earned and expenses incurred in operating the Portfolio. It also shows net gains (losses) for the period stated.
| |
| Investment income | |
|
| Income distributions received from affiliated underlying funds | $108,586 |
| Dividends | 70,675 |
| Interest | 461 |
| | |
| Total investment income | 179,722 |
| |
| Expenses | |
|
| Investment management fees (Note 4) | 11,830 |
| Distribution and service fees (Note 4) | 15,262 |
| Accounting and legal services fees (Note 4) | 717 |
| Transfer agent fees (Note 4) | 6,053 |
| Trustees’ fees (Note 4) | 261 |
| State registration fees | 15,290 |
| Printing and postage | 1,456 |
| Professional fees | 31,713 |
| Custodian fees | 12,000 |
| Registration and filing fees | 20,086 |
| Tax expense | 2,684 |
| Other | 1,155 |
| | |
| Total expenses | 118,507 |
| Less expense reductions (Note 4) | (81,608) |
| | |
| Net expenses | 36,899 |
| | |
| Net investment income | 142,823 |
| |
| Realized and unrealized gain (loss) | |
|
| Net realized gain (loss) on | |
| Investments in unaffiliated issuers | (120,692) |
| Investments in affiliated issuers | 25,626 |
| Capital gain distributions received from affiliated underlying funds | 69,164 |
| | (25,902) |
| Change in net unrealized appreciation (depreciation) of | |
| Investments in unaffiliated issuers | 168,109 |
| Investments in affiliated issuers | 104,786 |
| | |
| | 272,895 |
| | |
| Net realized and unrealized gain | 246,993 |
| | |
| Increase in net assets from operations | $389,816 |
| | |
| See notes to financial statements | Annual report | Retirement Rising Distribution Portfolio | 15 |
F I N A N C I A L S T A T E M E N T S
Statements of changes in net assets
These Statement of Changes in Net Assets shows how the value of the Portfolio’s net assets has changed during the period. The difference reflects earnings less expenses, any investment gains and losses, distributions, if any, paid to shareholders and the net of Portfolio share transactions.
| | |
| | Year | Year |
| | ended | ended |
| | 12-31-10 | 12-31-09 |
| |
| Increase (decrease) in net assets | | |
|
| From operations | | |
| Net investment income | $142,823 | $149,238 |
| Net realized loss | (25,902) | (136,854) |
| Change in net unrealized appreciation (depreciation) | 272,895 | 1,002,619 |
| | | |
| Increase in net assets resulting from operations | 389,816 | 1,015,003 |
| | | |
| Distributions to shareholders | | |
| From net investment income | (227,921) | (155,933) |
| From net realized gain | (83,344) | (15,415) |
| | | |
| Total distributions | (311,265) | (171,348) |
| | | |
| From Portfolio share transactions (Note 5) | 395,890 | 221,352 |
| | | |
| Total increase | 474,441 | 1,065,007 |
| |
| Net assets | | |
|
| Beginning of year | 4,905,393 | 3,840,386 |
| | | |
| End of year | $5,379,834 | $4,905,393 |
| | | |
| Undistributed net investment income | $1,284 | $50,230 |
| | |
| 16 | Retirement Rising Distribution Portfolio | Annual report | See notes to financial statements |
Financial highlights
The Financial Highlights show how the Portfolio’s net asset value for a share has changed since the beginning of the period.
| | | | |
| CLASS A SHARES Period ended | | 12-31-10 | 12-31-09 | 12-31-081 |
| |
| Per share operating performance | | | | |
|
| Net asset value, beginning of year | | $11.34 | $9.34 | $12.70 |
| Net investment income2 | | 0.32 | 0.36 | 0.41 |
| Net realized and unrealized gain (loss) on investments | | 0.55 | 2.05 | (3.29) |
| Total from investment operations | | 0.87 | 2.41 | (2.88) |
| Less distributions | | | | |
| From net investment income | | (0.51) | (0.37) | (0.48) |
| From net realized gain | | (0.18) | (0.04) | — |
| Total distributions | | (0.69) | (0.41) | (0.48) |
| Net asset value, end of year | | $11.52 | $11.34 | $9.34 |
| Total return (%)3,4 | | 7.88 | 26.35 | (23.21) |
| |
| Ratios and supplemental data | | | | |
|
| Net assets, end of year (in millions) | | $5 | $5 | $4 |
| Ratios (as a percentage of average net assets): | | | | |
| Expenses before reductions5 | | 2.336 | 2.556 | 1.71 |
| Expenses net of fee waivers5 | | 0.736 | 0.696 | 0.62 |
| Net investment income | | 2.81 | 3.54 | 3.59 |
| Portfolio turnover (%) | | 29 | 38 | 17 |
1 The inception date for Class A shares is 1-2-08.
2 Based on the average daily shares outstanding.
3 Total returns would have been lower had certain expenses not been reduced during the periods shown.
4 Does not reflect the effect of sales charges, if any.
5 Ratios do not include expenses indirectly incurred from underlying funds whose expense ratios can vary based on the mix of underlying funds held by the Portfolio. The range of expense ratios of the underlying funds held by the Portfolio was 0.52%–1.06%, 0.53%–1.18% and 0.61%–1.13%, for the periods ended 12-31-10, 12-31-09 and 12-31-08, respectively.
6 Includes tax expense, which was 0.05% of average net assets.
| | |
| See notes to financial statements | Annual report | Retirement Rising Distribution Portfolio | 17 |
Notes to financial statements
Note 1 — Organization
John Hancock Retirement Rising Distribution Portfolio (the Portfolio) is a diversified series of John Hancock Funds II (the Trust), an open-end management investment company organized as a Massachusetts business trust and registered under the Investment Company Act of 1940, as amended (the 1940 Act). The Portfolio seeks to provide a stated, targeted (non-guaranteed) quarterly distribution. As a secondary objective, the Portfolio seeks capital appreciation.
The Portfolio operates as a “fund of funds” that invest in Class NAV shares of underlying funds of the Trust, John Hancock Funds III (JHF III) and also in other affiliated funds of the John Hancock funds complex. The Portfolio may also invest in unaffiliated underlying funds and other permitted security investments.
The accounting policies of the underlying funds of the Portfolio are outlined in the underlying funds’ shareholder reports, available without charge by calling 1-800-344-1029 or on the Securities and Exchange Commission (SEC) Web site at www.sec.gov or at the SEC’s public reference room in Washington, D.C. The underlying funds are not covered by this report.
Note 2 — Significant accounting policies
The financial statements have been prepared in conformity with accounting principles generally accepted in the United States of America, which require management to make certain estimates and assumptions at the date of the financial statements. Actual results could differ from those estimates. Events or transactions occurring after the end of the fiscal period through the date that the financial statements were issued have been evaluated in the preparation of the financial statements. The following summarizes the significant accounting policies of the Portfolio:
Security valuation. Investments are stated at value as of the close of regular trading on the New York Stock Exchange (NYSE), normally at 4:00 P.M., Eastern Time. The Portfolio uses a three-tier hierarchy to prioritize the pricing assumptions, referred to as inputs, used in valuation techniques to measure fair value. Level 1 includes securities valued using quoted prices in active markets for identical securities. Level 2 includes securities valued using significant observable inputs. Observable inputs may include quoted prices for similar securities, interest rates, prepayment speeds and credit risk. Prices for securities valued using these inputs are received from independent pricing vendors and brokers and are based on an evaluation of the inputs described. Level 3 includes securities valued using significant unobservable inputs when market prices are not readily available or reliable, including the Portfolio’s own assumptions in determining the fair value of investments. Factors used in determining value may include market or issuers specific events, changes in interest rates and credit quality. The inputs or methodology used for valuing securities are not necessarily an indication of the risk associated with investing in those securities. As of December 31, 2010, all investments are categorized as Level 1, except for short-term investments which are Level 2, under the hierarchy discussed above. During the year ended December 31, 2010, there were no significant transfers in or out of Level 1 or Level 2 assets.
In order to value the securities, the Portfolio uses the following valuation techniques: Investments by the Portfolio in underlying affiliated funds and/or other investment companies are valued at their respective net asset values each business day. Certain short-term securities are valued at amortized cost.
| |
| 18 | Retirement Rising Distribution Portfolio | Annual report |
Security transactions and related investment income. Investment security transactions are accounted for on a trade date plus one basis for daily net asset value calculations. However, for financial reporting purposes, investment transactions are reported on trade date. Interest income is accrued as earned. Gains and losses on securities sold are determined on the basis of identified cost and may include proceeds from litigation. Dividend and capital gain distributions from underlying funds are recorded on ex-date.
Line of credit. The Portfolio may borrow from banks for temporary or emergency purposes, including meeting redemption requests that otherwise might require the untimely sale of securities. Pursuant to the custodian agreement, the custodian may loan money to a portfolio to make properly authorized payments. The Portfolio is obligated to repay the custodian for any overdraft, including any related costs or expenses. The custodian has a lien, security interest or security entitlement in any Portfolio property that is not segregated, to the maximum extent permitted by law for any overdraft.
In addition, the Portfolio and other affiliated funds have entered into an agreement with State Street Bank and Trust Company which enables them to participate in a $200 million unsecured committed line of credit. A commitment fee, payable at the end of each calendar quarter, based on the average daily unused portion of the line of credit, is charged to each participating fund on a pro rata basis and is reflected in other expenses on the Statement of Operations. For the year ended December 31, 2010, the Portfolio had no borrowings under the line of credit.
Expenses. The majority of expenses are directly attributable to an individual portfolio. Expenses that are not readily attributable to a specific portfolio are allocated among all portfolios in an equitable manner, taking into consideration, among other things, the nature and type of expense and the portfolio’s relative assets. Expense estimates are accrued in the period to which they relate and adjustments are made when actual amounts are known.
Federal income taxes. The Portfolio intends to continue to qualify as regulated investment companies by complying with the applicable provisions of the Internal Revenue Code and will not be subject to federal income tax on taxable income that is distributed to shareholders. Therefore, no federal income tax provision is required.
Under the recently enacted Regulated Investment Company Modernization Act of 2010, the Portfolio will be permitted to carry forward capital losses incurred in taxable years beginning after December 22, 2010 for an unlimited period. However, any losses incurred during those future taxable years will be required to be utilized prior to the losses incurred in pre-enactment taxable years. As a result of this ordering rule, pre-enactment capital loss carryforwards may be more likely to expire unused. Additionally, post-enactment capital losses that are carried forward will retain their character as either short-term or long-term capital losses rather than being considered all short-term as under previous law.
As of December 31, 2010, the Portfolio had no uncertain tax positions that would require financial statement recognition, de-recognition or disclosure. The Portfolio’s federal tax returns are subject to examination by the Internal Revenue Service for a period of three years.
Distribution of income and gains. Distributions to shareholders from net investment income and net realized gains, if any, are recorded on the ex-date. The Portfolio uses a quarterly targeted distribution strategy and distributes substantially all of its net income quarterly and capital gains, if any, annually. If the Portfolio has not met its distribution goal from net income and capital gains, then the distributions may consist of a return of capital. The tax character of distributions for the year ended December 31, 2010 and December 31, 2009 was as follows:
| |
| Annual report | Retirement Rising Distribution Portfolio | 19 |
| | | | | |
| | DECEMBER 31, 2010 | DECEMBER 31, 2009 | | | |
| | | |
| Ordinary Income | $279,041 | $171,348 | | | |
| Long-term capital gains | $32,224 | — | | | |
As of December 31, 2010, the components of distributable earnings on a tax basis included $57,131 of undistributed ordinary income.
Such distributions and distributable earnings, on a tax basis, are determined in conformity with income tax regulations, which may differ from accounting principles generally accepted in the United States of America. Material distributions in excess of tax basis earnings and profits, if any, are reported in the Portfolio’s financial statements as a return of capital. Short-term gains from underlying funds are treated as ordinary income for tax purposes.
Capital accounts within financial statements are adjusted for permanent book-tax differences. These adjustments have no impact on net assets or the results of operations. Temporary book-tax differences, if any, will reverse in a subsequent period. Book-tax differences are primarily attributable to short-term capital gain distribution received from underlying funds, wash sale loss deferrals, distribution reclassifications, non-deductible excise tax and treatment of certain realized capital losses.
Note 3 — Guarantees and indemnifications
Under the Trust’s organizational documents, its Officers and Trustees are indemnified against certain liabilities arising out of the performance of their duties to the Trust. Additionally, in the normal course of business, the Trust enters into contracts with service providers that contain general indemnification clauses. The Trust’s maximum exposure under these arrangements is unknown, as this would involve future claims that may be made against the Portfolio that have not yet occurred. The risk of material loss from such claims is considered remote.
Note 4 — Fees and transactions with affiliates
John Hancock Investment Management Services, LLC (the Adviser) serves as investment adviser for the Trust. John Hancock Funds, LLC (the Distributor), an affiliate of the Adviser, serves as principal underwriter of the Trust. The Adviser and the Distributor are indirect wholly owned subsidiaries of Manulife Financial Corporation (MFC).
Management fee. The Portfolio pays the Adviser a management fee for its services to the Portfolio. The management fee has two components: (a) a fee on net assets invested in a fund of the Trust or JHF III (Affiliated Fund Assets); and (b) a fee on net assets invested in investments other than a fund of the Trust or JHF III (Other Assets). The fee on assets invested in Affiliated Fund Assets is stated as an annual percentage of the current value of the aggregate net assets of the Portfolio and the Retirement Distribution Portfolio and is equivalent to the sum of: (a) 0.06% of the first $500 million of aggregate net assets and (b) 0.05% of the excess over $500 million of aggregate net assets. The fee on Other Assets is stated as an annual percentage of the current value of the aggregate net assets of the Portfolio and the Retirement Distribution Portfolio and is equivalent to the sum of: (a) 0.51% of the first $500 million of aggregate net assets and (b) 0.50% of the excess over $500 million of aggregate net assets and is applied to the Other Assets of the Portfolio. The investment management fees incurred for the year ended December 31, 2010 were equivalent to an annual effective rate of 0.24% of the Portfolio’s average daily net assets.
John Hancock Asset Management a division of Manulife Asset Management (North America) LLC (formerly MFC Global Investment Management (U.S.A.) Limited) and, effective January 1, 2011, John Hancock Asset Management a division of Manulife Asset Management (US) LLC (formerly MFC Global Investment Management (US) LLC) act as subadvisers to the Portfolio. The Portfolio is not responsible for the payment of subadvisory fees.
| |
| 20 | Retirement Rising Distribution Portfolio | Annual report |
The Adviser has contractually agreed to waive fees and/or reimburse certain Portfolio level expenses to 0.09% of the Portfolio’s average annual net assets. This agreement excludes management fees, underlying fund expenses, taxes, portfolio brokerage commissions, interest, Rule 12b-1 fees, transfer agency fees, state registration fees, printing and postage, litigation and indemnification expenses, and other extraordinary expenses not incurred in the ordinary course of the Portfolio’s business. In addition, fees incurred under any agreement or plans of the Portfolio dealing with services for the shareholders and others with beneficial interest in shares of the Portfolio, are excluded. The Adviser has also agreed to a contractual expense limit on Class A specific expenses (which include 12b-1 fees, transfer agent fees, state registration fees, and printing and postage fees) of 0.35%. These expense waivers and/or reimbursements will continue in effect until at least April 30, 2011.
Accordingly, the expense reductions amounted to $81,608 for the year ended December 31, 2010.
Expense recapture. The Adviser may recapture operating expenses reimbursed or fees waived under previous expense limitation or waiver arrangements made, for a period of three years following the beginning of the month in which such reimbursements or waivers originally occurred. For the year ended December 31, 2010, the amounts of waived or reimbursed expenses subject to potential recovery and the respective expiration dates were $78,403 — December 1, 2012 and $81,608 — December 1, 2013, respectively. Certain reimbursements or waivers are not subject to recapture.
Accounting and legal services. Pursuant to the service agreement, the Portfolio reimburses the Adviser for all expenses associated with providing the administrative, financial, legal, accounting and recordkeeping services of the Portfolio, including the preparation of all tax returns, periodic reports to shareholders and regulatory reports, among other services. The accounting and legal services fees incurred for the year ended December 31, 2010 amounted to an annual rate of 0.01% of the Portfolio’s average daily net assets.
Distribution and service plans. The Portfolio has a distribution agreement with the Distributor. The Portfolio has adopted distribution and service plans with respect to Class A shares pursuant to Rule 12b-1 under the 1940 Act, to pay the Distributor for services provided as the distributor of shares of the Portfolio. Accordingly, the Portfolio may pay up to an annual rate of 0.30% of average daily net assets for Class A shares for distribution and service fees.
Sales charges. Class A shares are assessed up-front sales charges, which resulted in payments to the Distributor amounting to $4,174 for the year ended December 31, 2010. Of this amount, $710 was retained and used for printing prospectuses, advertising, sales literature and other purposes, $3,464 was paid as sales commissions to broker-dealers.
Transfer agent fees. The Portfolio has a transfer agent agreement with John Hancock Signature Services, Inc. (Signature Services or Transfer Agent), an affiliate of the Adviser. The transfer agent fees paid to Signature Services are determined based on the cost to Signature Services (Signature Services Cost) of providing recordkeeping services. The Signature Services Cost includes a component of allocated John Hancock corporate overhead for providing transfer agent services to the Portfolio and to all other John Hancock affiliated funds. It also includes out-of-pocket expenses that are comprised of payments made to third-parties for recordkeeping services provided to their clients who invest in one or more John Hancock funds. In addition, Signature Services Cost may be reduced by certain revenues that Signature Services receive in connection with the service they provide to the funds. Signature Services Cost is calculated monthly and allocated, as applicable, to four categories of share classes: Institutional Share Classes, Retirement Share Classes, Municipal Bond Classes and all other Retail Share Classes. Within each of these categories, the applicable costs are allocated to the affected John Hancock affiliated funds and/or classes, based on the relative average daily net assets.
| |
| Annual report | Retirement Rising Distribution Portfolio | 21 |
Prior to July 1, 2010, the transfer agent fees were made up of three components:
• The Portfolio paid a monthly transfer agent fee at an annual rate of 0.015% average daily net assets.
• The Portfolio paid a monthly fee based on an annual rate of $17.50 shareholder account.
• Signature Services was reimbursed for certain out-of-pocket expenses.
Trustee expenses. The Trust compensates each Trustee who is not an employee of the Adviser or its affiliates. The costs of paying Trustee compensation and expenses are allocated to each Portfolio based on its average daily net assets.
Note 5 — Portfolio share transactions
Transactions in Portfolio shares for the years ended December 31, 2010 and December 31, 2009 were as follows:
| | | | |
| | Year ended 12-31-10 | Year ended 12-31-09 |
| | Shares | Amount | Shares | Amount |
| Class A shares | | | | |
|
| Sold | 7,729 | $88,185 | 4,488 | $50,004 |
| Distributions reinvested | 27,103 | 311,265 | 16,775 | 171,348 |
| Repurchased | (303) | (3,560) | — | — |
| Net increase | 34,529 | $395,890 | 21,263 | $221,352 |
| |
| Net increase | 34,529 | $395,890 | 21,263 | $221,352 |
|
Affiliates of the Portfolio owned 97% of the shares of beneficial interest of Class A shares on December 31, 2010.
Note 6 — Purchase and sale of securities
Purchases and sales of securities, other than short-term securities, aggregated to $1,284,942 and $2,626,241, respectively, for the year ended December 31, 2010.
Note 7 — Investment in affiliated underlying funds
The Portfolio invests in affiliated underlying funds that are managed by the Adviser and affiliates. The Portfolio does not invest in the affiliated underlying funds for the purpose of exercising management or control; however, the Portfolio’s investment may represent a significant portion of each underlying fund’s net assets. For the year ended December 31, 2010, the Portfolio held less than 5% of the total net assets in any of the underlying funds.
| |
| 22 | Retirement Rising Distribution Portfolio | Annual report |
Auditors’ report
Report of Independent Registered Public Accounting Firm
To the Board of Trustees of John Hancock Funds II and Shareholder of John Hancock Retirement Rising Distribution Portfolio:
In our opinion, the accompanying statement of assets and liabilities, including the portfolio of investments, and the related statement of operations and of changes in net assets and the financial highlights present fairly, in all material respects, the financial position of John Hancock Retirement Rising Distribution Portfolio (the “Portfolio”), a portfolio of John Hancock Funds II, at December 31, 2010, and the results of its operations, the changes in its net assets and the financial highlights for each of the periods indicated, in conformity with accounting principles generally accepted in the United States of America. These financial statements and financial highlights (hereafter referred to as “financial statements”) are the responsibility of the Portfolio’s management; our responsibility is to express an opinion on these financial statements based on our audits. We conducted our audits of these financial statements in accordance with the standards of the Public Company Accounting Oversight Board (United States). Those standards require that we plan and perform the audit to obtain reasonable assurance about whether the financial statements are free of material misstatement. An audit includes examining, on a test basis, evidence supporting the amounts and disclosures in the financial statements, assessing the accounting principles used and significant estimates made by management, and evaluating the overall financial statement presentation. We believe that our audits, which included confirmation of securities at December 31, 2010 by correspondence with the custodian and transfer agent, provide a reasonable basis for our opinion.
PricewaterhouseCoopers LLP
Boston, Massachusetts
February 24, 2011
| |
| Annual report | Retirement Rising Distribution Portfolio | 23 |
Tax information
Unaudited
For federal income tax purposes, the following information is furnished with respect to the distributions of the Portfolio paid during its taxable year ended December 31, 2010.
The Portfolio has designated distributions to shareholders of $32,224 as a long-term capital gain dividend.
With respect to the ordinary dividends paid by the Portfolio for the fiscal year ended December 31, 2010, 6.71% of the dividends qualify for the corporate dividends-received deduction.
The Portfolio designates the maximum amount allowable of its net taxable income as qualified dividend income as provided in the Jobs and Growth Tax Relief Reconciliation Act of 2003. This amount will be reflected on Form 1099-DIV for the calendar year 2010.
Shareholders were mailed a 2010 1099-DIV in January 2011. This reflected the total of all distributions that are taxable for calendar year 2010.
| |
| 24 | Retirement Rising Distribution Portfolio | Annual report |
Evaluation of Subadvisory Agreement by the Board Of Trustees
At its meeting on December 17, 2010, the Board of Trustees (the “Board”) of John Hancock Funds II (the “Trust”), including all of the Independent Trustees, approved the appointment of John Hancock Asset Management a division of Manulife Asset Management (US) LLC (“John Hancock Asset Management” or the “Subadviser”) as an additional subadviser to the Retirement Rising Distribution Portfolio (the “Portfolio”), a series of the Trust.
This section describes the evaluation by the Board of Trustees of the amendment to the subadvisory agreement between John Hancock Investment Management Services, LLC (the “Adviser”), the adviser to the Portfolio, and the Subadviser relating to the Portfolio (the “Subadvisory Agreement Amendment”).
Evaluation of Subadvisory Agreement by the Board of Trustees
The Board, including the Independent Trustees, is responsible for approving the Adviser’s selection of fund subadvisers and approving the funds’ subadvisory agreements, their periodic continuation and any amendments. Consistent with SEC rules, the Board regularly evaluates the Trust’s subadvisory arrangements, including consideration of the factors listed below. The Board may also consider other factors (including conditions and trends prevailing generally in the economy, the securities markets and the industry) and does not treat any single factor as determinative, and each Trustee may attribute different weights to different factors. The Board is furnished with an analysis of its fiduciary obligations in connection with its evaluation and, throughout the evaluation process, the Board is assisted by counsel for the Trust and the Independent Trustees are also separately assisted by independent legal counsel. The factors considered by the Board with respect to each fund are:
1. the nature, extent and quality of the services to be provided by the subadviser to the fund;
2. the investment performance of the fund and its subadviser;
3. the extent to which economies of scale would be realized as a fund grows and whether fee levels reflect these economies of scale for the benefit of fund shareholders;
4. the costs of the services to be provided and the profits to be realized by the subadviser from its relationship with the Trust; and
5. comparative services rendered and comparative subadvisory fee rates.
In making its determination and with reference to the factors that it considers, the Board reviews:
1. information relating to the subadviser’s business, including current subadvisory services to the Trust (and other funds in the John Hancock family of funds);
2. the performance of the fund and the performance of other John Hancock funds managed by the subadviser; and
3. the subadvisory fee for the fund, including any breakpoints.
| |
| Annual report | Retirement Rising Distribution Portfolio | 25 |
The Board approved the Subadvisory Agreement Amendment with the Subadviser for the Portfolio at its meeting on December 17, 2010. Particular considerations of the Board in approving the Subadvisory Agreement Amendment included the following:
1. The subadvisory fees for the Portfolio are paid by the Adviser, not the Portfolio, and approval of the Subadvisory Agreement Amendment will not result in any change in the advisory fees for the Portfolio.
2. Approval of the Subadvisory Agreement Amendment reflects the re-allocation of subadvisory services between the Subadviser and John Hancock Asset Management a division of Manulife Asset Management (North America) Limited (“John Hancock Asset Management (North America)”), each of which is affiliated with the Adviser.
3. The personnel of John Hancock Asset Management (North America) and the Adviser who have currently and previously managed the assets of the Portfolio, with John Hancock Asset Management (North America) and the Subadviser, are expected to continue to manage the Portfolio and the Board is generally satisfied with their skill and experience and with the performance of the Portfolio.
4. The performance of the Portfolio as noted below and management’s discussion of the same:
a. The Retirement Rising Distribution Portfolio has outperformed its peer group and benchmark index for the one-year period ended September 30, 2010, and outperformed its benchmark and underperformed its peer group for the period from inception to September 30, 2010.
5. John Hancock Asset Management has demonstrated skill as a manager, is currently the subadviser to multiple funds of the Trust and John Hancock Funds II and may be expected to provide a high quality of investment management services and personnel to the Portfolio.
In addition, the Board reviewed the subadvisory fees to be paid to the Subadviser with respect to the Portfolios, each of which operates as a fund of funds and invests in underlying funds. The Board concluded, with respect to each such fund of funds, that the subadvisory fee is based on services provided that are in addition to, rather than duplicative of, the services provided pursuant to the advisory agreements for the underlying funds. The Board also concluded that the additional services are necessary because of the differences between the investment policies, strategies and techniques of the fund of funds and those of its underlying funds.
| |
| 26 | Retirement Rising Distribution Portfolio | Annual report |
Trustees and Officers
This chart provides information about the Trustees and Officers of John Hancock Funds II who oversee your John Hancock fund. Officers elected by the Trustees manage the day-to-day operations of the Portfolio and execute policies formulated by the Trustees.
| | |
| Independent Trustees | | |
| | | |
| Name, Year of Birth | Trustee | Number of |
| Position(s) held with Fund | of the | John Hancock |
| Principal occupation(s) and other | Trust | funds overseen |
| directorships during past 5 years | since1 | by Trustee |
| |
| Charles L. Bardelis, Born: 1941 | 2005 | 208 |
|
| Director, Island Commuter Corp. (Marine Transport). Trustee of John Hancock Trust (since 1988), |
| John Hancock Funds II (since 2005) and former Trustee of John Hancock Funds III (2005–2006). |
|
| |
| Peter S. Burgess, Born: 1942 | 2005 | 208 |
|
| Consultant (financial, accounting and auditing matters) (since 1999); Certified Public Accountant. |
| Partner, Arthur Andersen (independent public accounting firm) (prior to 1999). Director of the |
| following publicly traded companies: Lincoln Educational Services Corporation (since 2004), Symetra |
| Financial Corporation (since 2010) and PMA Capital Corporation (2004–2010). Trustee of John Hancock |
| Trust (since 2005), John Hancock Funds II (since 2005), and former Trustee of John Hancock |
| Funds III (2005–2006). | | |
|
| |
| Grace K. Fey, Born: 1946 | 2008 | 208 |
|
| Chief Executive Officer, Grace Fey Advisors (since 2007); Director & Executive Vice President, Frontier |
| Capital Management Company (1988–2007); Director, Fiduciary Trust (since 2009). Trustee of |
| John Hancock Trust (since 2008) and John Hancock Funds II (since 2008). | | |
|
| |
| Theron S. Hoffman, Born: 1947 | 2008 | 208 |
|
| Chief Executive Officer, T. Hoffman Associates, LLC (since 2003); Director, The Todd Organization |
| (since 2003); President, Westport Resources Management (2006–2008); Partner/Operating Head & |
| Senior Managing Director, Putnam Investments (2000–2003); Executive Vice President, Thomson |
| Corp. (1997–2000) (financial information publishing). Trustee of John Hancock Trust (since 2008) and |
| John Hancock Funds II (since 2008). | | |
|
| |
| Hassell H. McClellan, Born: 1945 | 2005 | 208 |
|
| Associate Professor, The Graduate School of The Wallace E. Carroll School of Management, Boston |
| College (since 1984). Trustee of John Hancock Trust (since 2005), John Hancock Funds II (since 2005) |
| and Trustee of Phoenix Edge Series Funds (since 2008). | | |
|
| |
| James M. Oates, Born: 1946 | 2005 | 208 |
|
| Managing Director, Wydown Group (financial consulting firm) (since 1994); Chairman, Emerson |
| Investment Management, Inc. (since 2000); Chairman, Hudson Castle Group, Inc. (formerly IBEX Capital |
| Markets, Inc.) (financial services company) (since 1997) (Independent Chairman, 1997–2006). Director |
| of the following publicly traded companies: Stifel Financial (since 1996); Investor Financial Services |
| Corporation (1995–2007); and Connecticut River Bancorp (since 1998); Director of the following |
| Mutual Funds: Phoenix Mutual Funds (1988–2008); Virtus Funds (since 2008); and Emerson Investment |
| Management (since 2000). Chairman of the Boards of John Hancock Trust and John Hancock Funds II |
| (since 2005). Trustee of John Hancock Trust (since 2004), John Hancock Funds II (since 2005) and former |
| Trustee of John Hancock Funds III (2005–2006). | | |
| |
| Annual report | Retirement Rising Distribution Portfolio | 27 |
| | |
| Independent Trustees (continued) | | |
| |
| Name, Year of Birth | Trustee | Number of |
| Position(s) held with Fund | of the | John Hancock |
| Principal occupation(s) and other | Trust | funds overseen |
| directorships during past 5 years | since1 | by Trustee |
| |
| Steven M. Roberts, Born: 1944 | 2008 | 208 |
|
| Board of Governors Deputy Director Division of Banking Supervision and Regulation, Federal Reserve |
| System (2005–2008); Partner, KPMG (1987–2004). Trustee of John Hancock Trust (since 2008) and |
| John Hancock Funds II (since September 2008). | | |
| |
| Non-Independent Trustee2 | | |
| | | |
| Name, Year of Birth | Trustee | Number of |
| Position(s) held with Fund | of the | John Hancock |
| Principal occupation(s) and other | Trust | funds overseen |
| directorships during past 5 years | since1 | by Trustee |
| |
| James R. Boyle,3 Born: 1959 | 2005 | 208 |
|
| Senior Executive Vice President, John Hancock Financial Services (since 1999, including prior positions); |
| Chairman and Director, John Hancock Advisers, LLC, John Hancock Funds, LLC, and John Hancock |
| Investment Management Services, LLC (2005–2010); Trustee, John Hancock Trust (since 2005), |
| John Hancock Funds II (since 2005), and John Hancock retail funds (2005–2010). | |
1 Because the Trust does not hold regular annual shareholders meetings, each Trustee holds office for an indefinite term until his/her successor is duly elected and qualified or until he/she dies, retires, resigns, is removed or becomes disqualified.
2 Non-Independent Trustees hold positions or are affiliated with the Fund’s investment adviser, subadviser, underwriter or their affiliates.
3 Mr. Boyle is an “interested person” (as defined in the 1940 Act) due to his position with Manulife Financial Corporation (or its affiliates), the ultimate parent of the Adviser.
| |
| Principal officers who are not Trustees | |
| | |
| Name, Year of Birth | Officer |
| Position(s) held with Fund | of the |
| Principal occupation(s) and other | Trust |
| directorships during past 5 years | since |
| |
| Hugh McHaffie, Born: 1959 | 2009 |
|
| President | |
| Executive Vice President, John Hancock Financial Services (since 2006, including prior positions); | |
| President of John Hancock Trust and John Hancock Funds II (since 2009); Trustee, John Hancock retail |
| funds (since 2010); Chairman and Director, John Hancock Advisers, LLC, John Hancock Investment | |
| Management Services, LLC and John Hancock Funds, LLC (since 2010); Senior Vice President, Individual |
| Business Product Management, MetLife, Inc. (1999–2006). | |
|
| |
| Thomas M. Kinzler, Born: 1955 | 2008 |
|
| Secretary and Chief Legal Officer | |
| Vice President, John Hancock Financial Services (since 2006); Secretary and Chief Legal Counsel, | |
| John Hancock Advisers, LLC, John Hancock Investment Management Services, LLC and John Hancock |
| Funds, LLC (since 2007); Secretary and Chief Legal Officer, John Hancock retail funds, John Hancock |
| Funds II and John Hancock Trust (since 2006); Vice President and Associate General Counsel, | |
| Massachusetts Mutual Life Insurance Company (1999–2006); Secretary and Chief Legal Counsel, MML |
| Series Investment Fund (2000–2006); Secretary and Chief Legal Counsel, MassMutual Select Funds and |
| MassMutual Premier Funds (2004–2006). | |
| |
| 28 | Retirement Rising Distribution Portfolio | Annual report |
| |
| Principal officers who are not Trustees (continued) | |
| |
| Name, Year of Birth | Officer |
| Position(s) held with Fund | of the |
| Principal occupation(s) and other | Trust |
| directorships during past 5 years | since |
| |
| Francis V. Knox, Jr., Born: 1947 | 2008 |
|
| Chief Compliance Officer | |
| Vice President, John Hancock Financial Services (since 2005); Chief Compliance Officer, John Hancock |
| retail funds, John Hancock Funds II, John Hancock Trust, John Hancock Advisers, LLC and John Hancock |
| Investment Management Services, LLC (since 2005); Vice President and Chief Compliance Officer, MFC |
| Global Investment Management (U.S.), LLC (2005–2008). | |
|
| |
| Michael J. Leary, Born: 1965 | 2008 |
|
| Treasurer | |
| Assistant Vice President, John Hancock Financial Services (since 2007); Treasurer, John Hancock | |
| Funds II and John Hancock Trust (since 2009); Treasurer, John Hancock retail funds (2009–2010); Vice |
| President, John Hancock Advisers, LLC and John Hancock Investment Management Services, LLC (since |
| 2007); Assistant Treasurer, John Hancock retail funds (2007–2009 & 2010), John Hancock Funds II and |
| John Hancock Trust (2007–2009) and John Hancock Funds III (since 2009); Vice President and Director |
| of Fund Administration, JP Morgan (2004–2007). | |
|
| |
| Charles A. Rizzo, Born: 1957 | 2008 |
|
| Chief Financial Officer | |
| Vice President, John Hancock Financial Services (since 2008); Senior Vice President, John Hancock | |
| Advisers, LLC and John Hancock Investment Management Services, LLC (since 2008); Chief | |
| Financial Officer, John Hancock retail funds, John Hancock Funds II and John Hancock Trust (since | |
| 2007); Assistant Treasurer, Goldman Sachs Mutual Fund Complex (2005–2007); Vice President, | |
| Goldman Sachs (2005–2007); Managing Director and Treasurer, Scudder Funds, Deutsche Asset | |
| Management (2003–2005). | |
|
| |
| John G. Vrysen, Born: 1955 | 2008 |
|
| Chief Operating Officer | |
| Senior Vice President, John Hancock Financial Services (since 2006); Director, Executive Vice President |
| and Chief Operating Officer, John Hancock Advisers, LLC, John Hancock Investment Management | |
| Services, LLC and John Hancock Funds, LLC (since 2005); Chief Operating Officer, John Hancock | |
| Funds II and John Hancock Trust (since 2007); Chief Operating Officer, John Hancock retail funds (until |
| 2009); Trustee, John Hancock retail funds (since 2009). | |
The business address for all Trustees and Officers is 601 Congress Street, Boston, Massachusetts 02210-2805.
The Statement of Additional Information of the Fund includes additional information about members of the Board of Trustees of the Fund and is available without charge, upon request, by calling 1-800-225-5291.
| |
| Annual report | Retirement Rising Distribution Portfolio | 29 |
More information
| | |
| Trustees | Investment adviser | |
| James M. Oates, Chairman | John Hancock Investment Management | |
| James R. Boyle† | Services, LLC | |
| Grace K. Fey | | |
| Charles L. Bardelis* | Subadvisers | |
| Peter S. Burgess* | John Hancock Asset Management | |
| Theron S. Hoffman | | |
| Hassell H. McClellan | Principal distributor | |
| Steven M. Roberts* | John Hancock Funds, LLC | |
| | | |
| Officers | Custodian | |
| Hugh McHaffie | State Street Bank and Trust Company | |
| President | | |
| | Transfer agent | |
| Thomas M. Kinzler | John Hancock Signature Services, Inc. | |
| Secretary and Chief Legal Officer | | |
| | Legal counsel | |
| Francis V. Knox, Jr. | K&L Gates LLP | |
| Chief Compliance Officer | | |
| | Independent registered | |
| Michael J. Leary | public accounting firm | |
| Treasurer | PricewaterhouseCoopers LLP | |
| | | |
| Charles A. Rizzo |
| |
| Chief Financial Officer | The report is certified under the Sarbanes-Oxley | |
| | Act, which requires mutual funds and other public | |
| John G. Vrysen | companies to affirm that, to the best of their | |
| Chief Operating Officer | knowledge, the information in their financial reports | |
| | is fairly and accurately stated in all material respects. | |
| *Member of the Audit Committee |
| |
| †Non-Independent Trustee | | |
| | | |
The Fund’s proxy voting policies and procedures, as well as the Fund’s proxy voting record for the most recent twelve-month period ended June 30, are available free of charge on the Securities and Exchange Commission (SEC) Web site at www.sec.gov or on our Web site.
The Fund’s complete list of portfolio holdings, for the first and third fiscal quarters, is filed with the SEC on Form N-Q. The Fund’s Form N-Q is available on our Web site and the SEC’s Web site, www.sec.gov, and can be reviewed and copied (for a fee) at the SEC’s Public Reference Room in Washington, DC. Call 1-800-SEC-0330 to receive information on the operation of the SEC’s Public Reference Room.
We make this information on your fund, as well as monthly portfolio holdings, and other fund details available on our Web site www.jhfunds.com or by calling 1-800-225-5291.
| | |
| You can also contact us: | | |
| 1-800-225-5291 | Regular mail: | Express mail: |
| jhfunds.com | John Hancock Signature Services, Inc. | John Hancock Signature Services, Inc. |
| P.O. Box 55913 | Mutual Fund Image Operations |
| Boston, MA 02205-5913 | 30 Dan Road |
| | Canton, MA 02021 |
| |
| 30 | Retirement Rising Distribution Portfolio | Annual report |

1-800-225-5291
1-800-554-6713 TDD
1-800-338-8080 EASI-Line
www.jhfunds.com
Now available: electronic delivery
www.jhfunds.com/edelivery
| |
| This report is for the information of the shareholders of John Hancock Retirement Rising Distribution Portfolio. | 3320A 12/10 |
| It is not authorized for distribution to prospective investors unless preceded or accompanied by a prospectus. | 2/11 |
ITEM 2. CODE OF ETHICS.
(a) As of the end of the fiscal year, December 31, 2010, the registrant has adopted a code of ethics, as defined in Item 2 of Form N-CSR), that applies to its Chief Executive Officer and Chief Financial Officer (respectively, the principal executive officer, the principal financial officer, the “Covered Officers”). A copy of the code of ethics is filed as an exhibit to this Form N-CSR.
(b) Not applicable
(c) Not applicable
(d) Not applicable
(e) Not applicable
(f)(1) A copy of the Code of Ethics is attached hereto.
John Hancock Trust
John Hancock Funds
John Hancock Funds II
John Hancock Funds III
Sarbanes-Oxley Code of Ethics
for
Principal Executive, Principal Financial Officers & Treasurer
I. Covered Officers/Purpose of the Code
This code of ethics (this “Code”) for John Hancock Trust, John Hancock Funds[1], John Hancock Funds II and John Hancock Funds III, each a registered management investment company under the Investment Company Act of 1940, as amended (“1940 Act”), which may issue shares in separate and distinct series (each investment company and series thereunder to be hereinafter referred to as a “Fund”), applies to each Fund’s Principal Executive Officer (“President”), Principal Financial Officer (“Chief Financial Officer”) and Treasurer (“Treasurer”) (the “Covered Officers” as set forth in Exhibit A) for the purpose of promoting:
⇒ honest and ethical conduct, including the ethical handling of actual or apparent conflicts of interest between personal and professional relationships;
⇒ full, fair, accurate, timely and understandable disclosure in reports and documents that the Fund files with, or submits to, the Securities and Exchange Commission (“SEC”) and in other public communications made by the Fund;
⇒ compliance with applicable laws and governmental rules and regulations;
⇒ the prompt internal reporting of violations of the Code to an appropriate person or persons identified in the Code; and
⇒ accountability for adherence to the Code.
Each of the Covered Officers should adhere to a high standard of business ethics and should be sensitive to situations that may give rise to actual as well as apparent conflicts of interest.
II. Covered Officers Should Handle Ethically Actual and Apparent Conflicts of Interest
Overview
A “conflict of interest” occurs when a Covered Officer’s private interest interferes with the interests of, or his service to, the Fund. For example, a conflict of interest would arise if a Covered Officer, or a member of his family, receives improper personal benefits as a result of his position with the Fund. Certain conflicts of interest arise out of the relationships between the Covered Officers and the Fund and already are subject to conflict of interest provisions in the Investment Company Act of 1940, as amended (the “Investment Company Act”) and the Investment Advisers Act of 1940, as amended (the “Investment Advisers Act”). For example, Covered Officers may not individually engage in certain transactions (such as the purchase or sale of securities or other property) with the Fund because of their status as “affiliated persons” of the Fund. Each of the Covered Officers is an officer or employee of the investment adviser or a service provider (“Service Provider”) to the Fund. The Fund’s, the investment adviser’s and the Service Provider’s compliance programs and procedures are designed to prevent, or identify and correct, violations of these provisions. This Code does not, and is not intended to, repeat or replace these programs and procedures, and such conflicts fall outside of the parameters of this Code.
Although typically not presenting an opportunity for improper personal benefit, conflicts arise from, or as a result of, the contractual relationship between the Fund and the investment adviser and the Service Provider of which the Covered Officers are also officers or employees. As a result, this Code recognizes that the Covered Officers will, in the normal course of their duties (whether formally for the Fund, for the investment adviser or for the Service Provider), be involved in establishing policies and implementing decisions which will have different effects on the investment adviser, the Service Provider and the Fund. The participation of the Covered Officers in such activities is inherent in the contractual relationship between the Fund and the investment adviser and the Service Provider and is consistent with the performance by the Covered Officers of their duties as officers of the Fund. Thus, if such participation is performed in conformity with the provisions of the Investment Company Act and the Investment Advisers Act, it will be deemed to have been handled ethically. In addition, it is recognized by the Fund’s Board of Trustees/Directors (the “Board”) that the Covered Officers may also be officers or employees of one or more other investment companies covered by other Codes.
Other conflicts of interest are covered by the Code, even if such conflicts of interest are not subject to provisions in the Investment Company Act and the Investment Advisers Act. The following list provides examples of conflicts of interest under the Code, but the Covered Officers should keep in mind that these examples are not exhaustive. The overarching principle is that the personal interest of an Covered Officer should not be placed improperly before the interest of the Fund.
* * *
Each Covered Officer must:
⇒ not use his/her personal influence or personal relationships improperly to influence investment decisions or financial reporting by the Fund whereby the Covered Officer would benefit personally to the detriment of the Fund;
⇒ not cause the Fund to take action, or fail to take action, for the individual personal benefit of the Covered Officer rather than for the benefit of the Fund; and
⇒ not use material non-public knowledge of portfolio transactions made or contemplated for the Fund to trade personally or cause others to trade personally in contemplation of the market effect of such transactions.
Additionally, conflicts of interest may arise in other situations, the propriety of which may be discussed, if material, with the Fund’s Chief Compliance Officer (“CCO”). Examples of these include:
⇒ service as a director/trustee on the board of any public or private company;
⇒ the receipt of any non-nominal gifts;
⇒ the receipt of any entertainment from any company with which the Fund has current or prospective business dealings unless such entertainment is business-related, reasonable in cost, appropriate as to time and place, and not so frequent as to raise any question of impropriety (or other formulation as the Fund already uses in another code of conduct);
⇒ any ownership interest in, or any consulting or employment relationship with, any of the Fund’s service providers, other than its investment adviser, any sub-adviser, principal underwriter, administrator or any affiliated person thereof; and
⇒ a direct or indirect financial interest in commissions, transaction charges or spreads paid by the Fund for effecting portfolio transactions or for selling or redeeming shares other than an interest arising from the Covered Officer’s employment, such as compensation or equity ownership.
III. Disclosure & Compliance
⇒ Each Covered Officer should familiarize himself or herself with the disclosure requirements generally applicable to the Fund;
⇒ Each Covered Officer should not knowingly misrepresent, or cause others to misrepresent, facts about the Fund to others, whether within or outside the Fund, including to the Fund’s directors and auditors, and to governmental regulators and self-regulatory organizations;
⇒ Each Covered Officer should, to the extent appropriate within his/her area of responsibility, consult with other officers and employees of the Fund and the Fund’s adviser or any sub-adviser with the goal of promoting full, fair, accurate, timely and understandable disclosure in the reports and documents the Fund files with, or submits to, the SEC and in other public communications made by the Fund; and
⇒ It is the responsibility of each Covered Officer to promote compliance with the standards and restrictions imposed by applicable laws, rules and regulations.
IV. Reporting & Accountability
Each Covered Officer must:
⇒ upon adoption of the Code (or thereafter as applicable, upon becoming an Covered Officer), affirm in writing to the Fund’s CCO that he/she has received, read, and understands the Code;
⇒ annually thereafter affirm to the Fund’s CCO that he/she has complied with the requirements of the Code;
⇒ not retaliate against any employee or Covered Officer or their affiliated persons for reports of potential violations that are made in good faith;
⇒ notify the Fund’s CCO promptly if he/she knows of any violation of this Code (Note: failure to do so is itself a violation of this Code); and
⇒ report at least annually any change in his/her affiliations from the prior year.
The Fund’s CCO is responsible for applying this Code to specific situations in which questions are presented under it and has the authority to interpret this Code in any particular situation. However, any approvals or waivers sought by the Principal Executive Officer will be considered by the Fund’s Board or the Compliance Committee thereof (the “Committee”).
The Fund will follow these procedures in investigating and enforcing this Code:
⇒ the Fund’s CCO will take all appropriate action to investigate any potential violations reported to him/her;
⇒ if, after such investigation, the CCO believes that no violation has occurred, the CCO is not required to take any further action;
⇒ any matter that the CCO believes is a violation will be reported to the Board or, if applicable, Compliance Committee;
⇒ if the Board or, if applicable, Compliance Committee concurs that a violation has occurred, the Board, either upon its determination of a violation or upon recommendation of the Compliance Committee, if applicable, will consider appropriate action, which may include review of, and appropriate modifications to, applicable policies and procedures; notification to appropriate personnel of the Service Provider or the investment adviser or its board; or a recommendation to dismiss the Registrant’s Executive Officer;
⇒ the Board, or if applicable the Compliance Committee, will be responsible for granting waivers, as appropriate; and
⇒ any changes to or waivers of this Code will, to the extent required, be disclosed as provided by SEC rules.
V. Other Policies & Procedures
This Code shall be the sole code of ethics adopted by the Fund for purposes of Section 406 of the Sarbanes-Oxley Act of 2002 and the rules and forms applicable to registered investment companies thereunder. Insofar as other policies or procedures of the Fund, the Fund’s adviser, any sub-adviser, principal underwriter or other service providers govern or purport to govern the behavior or activities of the Covered Officers who are subject to this Code, they are superseded by this Code to the extent that they overlap or conflict with the provisions of this Code. The Fund’s and its investment adviser’s codes of ethics under Rule 204A-1 under the Investment Advisers Act and Rule 17j-1 under the Investment Company Act, respectively, are separate requirements applying to the Covered Officers and others, and are not part of this Code.
VI. Amendments
Any amendments to this Code, other than amendments to Exhibit A, must be approved or ratified by a majority vote of the Fund’s Board, including a majority of independent directors.
VII. Confidentiality
All reports and records prepared or maintained pursuant to this Code will be considered confidential and shall be maintained and protected accordingly. Except as otherwise required by law or this Code, such matters shall not be disclosed to anyone other than the Fund’s Board and its counsel, the investment adviser and the relevant Service Providers.
VIII. Internal Use
The Code is intended solely for the internal use by the Fund and does not constitute an admission, by or on behalf of the Fund, as to any fact, circumstance, or legal conclusion.
Exhibit A
Persons Covered by this Code of Ethics
(As of September 2010)
John Hancock Trust
⇒ Principal Executive Officer and President – Hugh McHaffie
⇒ Principal Financial Officer and Chief Financial Officer – Charles Rizzo
⇒ Treasurer – Michael J. Leary
John Hancock Funds
⇒ Principal Executive Officer and President – Keith Hartstein
⇒ Principal Financial Officer and Chief Financial Officer – Charles Rizzo
⇒ Treasurer – Salvatore Schiavone
John Hancock Funds II
⇒ Principal Executive Officer and President – Hugh McHaffie
⇒ Principal Financial Officer and Chief Financial Officer – Charles Rizzo
⇒ Treasurer – Michael J. Leary
John Hancock Funds III
⇒ Principal Executive Officer and President – Keith Hartstein
⇒ Principal Financial Officer and Chief Financial Officer – Charles Rizzo
⇒ Treasurer – Salvatore Schiavone
[1] John Hancock Funds includes the following trusts: John Hancock Bank and Thrift Opportunity Fund; John Hancock Bond Trust; John Hancock California Tax-Free Income Fund; John Hancock Capital Series; John Hancock Current Interest; John Hancock Equity Trust; John Hancock Income Securities Trust; John Hancock Investment Trust; John Hancock Investment Trust II; John Hancock Investment Trust III; John Hancock Investors Trust; John Hancock Municipal Securities Trust; John Hancock Patriot Premium Dividend Fund II; Trust; John Hancock Preferred Income Fund; John Hancock Preferred Income Fund II; John Hancock Preferred Income Fund III; John Hancock Series Trust; John Hancock Sovereign Bond Fund; John Hancock Strategic Series; John Hancock Tax-Exempt Series Fund; John Hancock World Fund; John Hancock Tax-Advantaged Dividend Income Fund and John Hancock Tax-Advantaged Global Shareholder Yield Fund.
(f)(2) Not applicable
(f)(3) The Registrant will provide a copy of the Code of Ethics to any person without charge, upon request by calling the following toll free number (800) 344-1029.
ITEM 3. AUDIT COMMITTEE FINANCIAL EXPERT.
The Board of Trustees of the Registrant has determined that it has one “audit committee financial expert” as that term is defined in Item 3(b) of Form N-CSR: Peter S. Burgess, who is “independent” as that term is defined in Item 3(a) (2) of Form N-CSR.
ITEM 4. PRINCIPAL ACCOUNTANT FEES AND SERVICES.
(a) AUDIT FEES:
2010: $160,644
2009: $175,604
These fees represent aggregate fees billed for the last two fiscal years (the “Reporting Periods”) for professional services rendered by the principal accountant for the audits of the Registrant’s annual financial statements or services that are normally provided by the accountant in connection with statutory and regulatory filing or engagements for such Reporting Periods.
(b) AUDIT RELATED FEES:
2010: $42,233
2009: $38,646
These fees represent the aggregate fees billed for the Reporting Periods for assurance and related services by the principal accountant that are reasonably relate to the performance of the audit of the Registrant’s financial statements and are not reported under paragraph (a) of this Item. Such fees relate to professional services rendered by PwC for separate audit reports in connection with
security counts pursuant to Rule 17f-2 under the Investment Company Act of 1940 and fund merger audit services.
(c) TAX FEES:
2010: $13,906
2009: $13,501
These fees represent aggregate fees billed for the Reporting Periods for professional services rendered by the principal accountant for tax compliance, tax advice and tax planning. The tax services provided by the principal accountant relate to the review of the Registrant’s federal and state income tax returns, excise tax calculations and returns and a review of the Registrant’s calculations of capital gain and income distributions.
(d) ALL OTHER FEES:
2010: $777
2009: $7,836
These fees represent other fees for John Hancock Funds II billed to the registrant or to control affiliates.
(e) (1) Audit Committee Pre-Approval Policies and Procedures:
The Trust’s Audit Committee must pre-approve all audit and non-audit services provided by the independent registered public accounting firm (the “Auditor”) relating to the operations or financial reporting of the funds. Prior to the commencement of any audit or non-audit services to a fund, the Audit Committee reviews the services to determine whether they are appropriate and permissible under applicable law.
The Trust’s Audit Committee has adopted policies and procedures to, among other purposes, provide a framework for the Committee’s consideration of audit-related and non-audit services by the Auditor. The policies and procedures require that any audit-related and non-audit service provided by the Auditor and any non-audit service provided by the Auditor to a fund service provider that relates directly to the operations and financial reporting of a fund are subject to approval by the Audit Committee before such service is provided. Audit-related services provided by the Auditor that are expected to exceed $25,000 per instance/per fund are subject to specific pre-approval by the Audit Committee. Tax services provided by the Auditor that are expected to exceed $30,000 per instance/per fund are subject to specific pre-approval by the Audit Committee.
All audit services, as well as the audit-related and non-audit services that are expected to exceed the amounts stated above, must be approved in advance of provision of the service by formal resolution of the Audit Committee. At the regularly scheduled Audit Committee meetings, the Committee reviews a report summarizing the services, including fees, provided by the Auditor.
(2) Amount approved by the Audit Committee pursuant paragraph (c) (7) (i) (C) of Rule 2-01 of Regulation S-X: None.
(f) Not Applicable.
(g) The aggregate non-audit fees billed by PwC for services rendered to the registrant and rendered to the registrant's control affiliates for each of the last two fiscal years of the registrant were $2,702,253 for the fiscal year ended December 31, 2010 and $5,891,473 for the fiscal year ended December 31, 2009.
(h) The Registrant’s audit committee of the Board of Trustees has considered the provision of non-audit services that were rendered to the Registrant’s investment adviser and service affiliates that were not pre-approved pursuant to paragraph (c) (7ii) of Rule 2-01 of Regulation S-X, to be
compatible with maintaining PWC’s independence.
ITEM 5. AUDIT COMMITTEE OF LISTED REGISTRANTS
Peter S. Burgess - Chairman
Charles L. Bardelis
Steven M. Roberts
ITEM 6. SCHEDULE OF INVESTMENTS.
(a) Included with Item 1.
(b) Not Applicable.
ITEM 7. DISCLOSURE OF PROXY VOTING POLICIES AND PROCEDURES FOR CLOSED-END MANAGEMENT INVESTMENT COMPANIES. Not Applicable.
ITEM 8. PORTFOLIO MANAGERS OF CLOSED-END MANAGEMENT INVESTMENT COMPANIES. Not Applicable.
ITEM 9. PURCHASE OF EQUITY SECURITIES BY CLOSED-END MANAGEMENT INVESTMENT COMPANIES AND AFFILIATED PURCHASERS. Not Applicable.
ITEM 10. SUBMISSION OF MATTERS TO VOTE OF SECURITY HOLDERS. Not Applicable.
ITEM 11. CONTROLS AND PROCEDURES.
(a) EVALUATION OF DISCLOSURE CONTROLS AND PROCEDURES. The Registrant maintains disclosure controls and procedures that are designed to ensure that information required to be disclosed in this Form N-CSR is recorded, processed, summarized and reported within the periods specified in the rules and forms of the Securities and Exchange Commission. Such disclosure controls and procedures include controls and procedures designed to ensure that such information is accumulated and communicated to the Registrant's management, including its principal executive officer and principal financial officer, as appropriate, to allow timely decisions regarding required disclosure.
Within 90 days prior to the filing date of this Form N-CSR, the Registrant had carried out an evaluation, under the supervision and with the participation of the Registrant's management, including the Registrant's principal executive officer and the Registrant's principal financial officer, of the effectiveness of the design and operation of the Registrant's disclosure controls and procedures relating to information required to be disclosed on Form N-CSR. Based on such evaluation, the Registrant's principal executive officer and principal financial officer concluded that the Registrant's disclosure controls and procedures are operating effectively to ensure that:
(i) information required to be disclosed in this Form N-CSR is recorded, processed, summarized and reported within the periods specified in the rules and forms of the Securities and Exchange Commission, and
(ii) information is accumulated and communicated to the Registrant’s management, including its principal executive officer and principal financial officer, as appropriate, to allow timely decisions regarding required disclosure.
(b) CHANGE IN REGISTRANT’S INTERNAL CONTROL: Not Applicable.
ITEM 12. EXHIBITS.
(a)(1) SEE ATTACHED CODE OF ETHICS.
(a)(2)(i) CERTIFICATION OF PRINCIPAL EXECUTIVE OFFICER.
(a)(2)(ii) CERTIFICATION OF PRINCIPAL FINANCIAL OFFICER.
(b) CERTIFICATION PURSUANT TO Rule 30a-2(b) OF THE INVESTMENT COMPANY ACT OF 1940
Pursuant to the requirements of the Securities Exchange Act of 1934 and the Investment Company Act of 1940, the registrant has duly caused this report to be signed on its behalf by the undersigned, thereunto duly authorized.
JOHN HANCOCK FUNDS II
/s/ Hugh McHaffie
Hugh McHaffie
President
Date: February 24, 2011
Pursuant to the requirements of the Securities Exchange Act of 1934 and the Investment Company Act of 1940, this report has been signed below by the following persons on behalf of the registrant and in the capacities and on the dates indicated.
/s/ Hugh McHaffie
Hugh McHaffie
President
Date: February 24, 2011
/s/ Charles A. Rizzo
Charles A. Rizzo
Chief Financial Officer
Date: February 24, 2011