| |
| UNITED STATES |
| SECURITIES AND EXCHANGE COMMISSION |
| Washington, D.C. 20549 |
| |
| FORM N-CSR |
| |
| CERTIFIED SHAREHOLDER REPORT OF REGISTERED MANAGEMENT INVESTMENT |
| COMPANIES |
| Investment Company Act file number 811-21779 |
| |
| JOHN HANCOCK FUNDS II |
| --------------------------------------------------------- |
| (Exact name of registrant as specified in charter) |
| |
| 601 CONGRESS STREET, BOSTON, MA 02210-2805 |
| ------------------------------------------------------------- |
| (Address of principal executive offices) (Zip code) |
| |
| MICHAEL J. LEARY, 601 CONGRESS STREET, BOSTON, MA 02210-2805 |
| ------------------------------------------------------------------------------------------ |
| (Name and address of agent for service) |
| |
| Registrant's telephone number, including area code: (617) 663-4490 |
| -------------- |
| Date of fiscal year end: 7/31 |
| ------ | |
| |
| Date of reporting period: 7/31/10 |
| ------- | |
| |
| ITEM 1. REPORTS TO STOCKHOLDERS. |
The Registrant prepared three annual reports to shareholders for the year ended July 31, 2010 for series of John Hancock Funds with July 31 fiscal year end. The first report applies to the Technical Opportunities Fund, the second report applies to the Global High Yield Fund and the third report applies to Multi Sector Bond Fund. All three funds began operations during the fiscal year ended July 31, 2010.

Management’s discussion of
Fund performance
By Wellington Management Company, LLP
Global equities rallied in 2009 and throughout the early part of 2010 against a strengthening economic backdrop. During the period ended July 31, 2010, the U.S. economy showed signs of life as it emerged from a deep and difficult recession. Markets reacted to the momentum and trended positive. The positive trend eroded toward the end of the period, shifting from a reflection of hopeful optimism early in the period to one of cautious fear as concerns about a global growth slowdown resurfaced. Sovereign debt and solvency troubles in the Eurozone, slowing economic expansion in China and the U.S., and uncertainty about the sustainability of corporate earnings growth combined to send global equities down later in the period.
For the 12 months ended July 31, 2010, the Fund’s Class A shares returned –1.40% at net asset value, underperforming both the 11.61% return of the MSCI All Country World Index and the 11.40% average return of its Morningstar, Inc. world stock fund peer group. Stock selection in the energy, materials, financials and industrials sectors drove underperformance during the period. An overweight to cash in periods when the market rallied also caused the Fund to lag its benchmark index. Detractors from absolute results included energy and mining company PT Bumi Resources and oil and gas production company Sandridge Energy. We bought PT Bumi given the stock’s ability to respond positively to important price supports. After the trend broke down toward the end of the period, our sell discipline had us exit the stock. After establishing a period of stability, Sandridge Energy tracked sideways for several months then broke down. We sold the stock at the end of 2009. The biggest contributions came from the information technology sector. Top performers included server virtualization software leader VMware, Inc. and consumer electronics company Apple, Inc. Earlier in 2009, VMware had emerged from a period of stability into a positive trend that continued throughout the period. With the launch of the iPad and iPhone 4, Apple’s stock price has maintained a positive trend structure.
This commentary reflects the views of the portfolio manager through the end of the Fund’s period discussed in this report. The manager’s statements reflect his own opinions. As such, they are in no way guarantees of future events and are not intended to be used as investment advice or a recommendation regarding any specific security. They are also subject to change at any time as market and other conditions warrant.
Past performance is no guarantee of future results.
International investing involves special risks such as political, economic and currency risks and differences in accounting standards and financial reporting. These risks are more significant in emerging markets. Sector investing is subject to greater risks than the market as a whole. Because the Fund may focus on particular sectors of the economy, its performance may depend on the performance of those sectors. The Fund is non-diversified, which generally means that it may invest a greater percentage of its total assets in the securities of fewer issuers than a diversified fund. As a result, credit, market and other risks associated with the Fund’s investment strategies or techniques may be more pronounced for the Fund than for funds that are diversified.
| |
| 6 | Technical Opportunities Fund | Annual report |
A look at performance
For the period ended July 31, 2010
| | | | | | | | | |
| | Average annual returns (%) | | | Cumulative total returns (%) | |
| | with maximum sales charge (POP) | | | with maximum sales charge (POP) | |
| |
|
| | | | | Since | | | | | Since |
| | 1-year | 5-year | 10-year | inception1 | | 1-year | 5-year | 10-year | inception1 |
|
| Class A | –6.36 | — | — | –6.36 | | –6.36 | — | — | –6.36 |
|
| Class I2 | –1.10 | — | — | –1.10 | | –1.10 | — | — | –1.10 |
|
| Class NAV2 | –1.00 | — | — | –1.00 | | –1.00 | — | — | –1.00 |
|
Performance figures assume all distributions are reinvested. Public offering price (POP) figures reflect maximum sales charges on Class A shares of 5.00%.
The expense ratios of the Fund, both net (including any fee waivers or expense limitations) and gross (excluding any fee waivers or expense limitations), are set forth according to the most recent publicly available prospectuses for the Fund and may differ from the expense ratios disclosed in the Financial Highlights tables in this report. The waivers and expense limitations are contractual for Class A. The net expenses are as follows: Class A — 2.05%. Had the fee waivers and expense limitations not been in place, the gross expenses would be as follows: Class A — 2.28%. For the other classes, the net expenses equal the gross expenses and are as follows: Class I — 1.50% and Class NAV — 1.40%.
The returns reflect past results and should not be considered indicative of future performance. The return and principal value of an investment will fluctuate so that shares, when redeemed, may be worth more or less than their original cost. Due to market volatility, the Fund’s current performance may be higher or lower than the performance shown. For current to the most recent month-end performance data, please call 1–800–225–5291 or visit the Fund’s Web site at www.jhfunds.com.
The performance table above and the chart on the next page do not reflect the deduction of taxes that a shareholder may pay on fund distributions or on the redemption of fund shares.
The Fund’s performance results reflect any applicable fee waivers or expense reductions, without which the expenses would increase and results would have been less favorable.
1 From 8-3-09.
2 For certain types of investors, as described in the Fund’s Class I and Class NAV shares prospectuses.
| |
| Annual report | Technical Opportunities Fund | 7 |
A look at performance
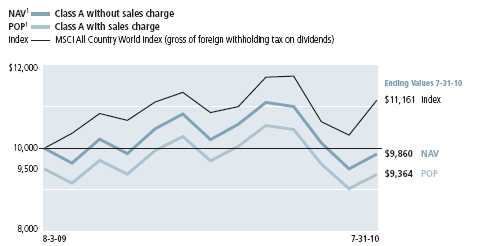
Growth of $10,000
This chart shows what happened to a hypothetical $10,000 investment in John Hancock Technical Opportunities Fund Class A shares for the period indicated. For comparison, we’ve shown the same investment in the MSCI All Country World Index.
| | | | |
| | | | With maximum | |
| | Period beginning | Without sales charge | sales charge | Index |
|
| Class I2,3 | 8-3-09 | $9,890 | $9,890 | $11,161 |
|
| Class NAV2,3 | 8-3-09 | 9,900 | 9,900 | 11,161 |
|
Assuming all distributions were reinvested for the period indicated, the table above shows the value of a $10,000 investment in the Fund’s Class I and Class NAV shares, respectively, as of 7-31-10.
MSCI All Country World Index (gross of foreign withholding tax on dividends) is a free float-adjusted market capitalization weighted index that is designed to measure the equity market performance of developed and emerging markets.
It is not possible to invest directly in an index. Index figures do not reflect expenses, which would have resulted in lower values if they did.
1 NAV represents net asset value and POP represents public offering price.
2 No contingent deferred sales charges applicable.
3 For certain types of investors, as described in the Fund’s Class I and Class NAV shares prospectuses.
| |
| 8 | Technical Opportunities Fund | Annual report |
Your expenses
These examples are intended to help you understand your ongoing operating expenses.
As a shareholder of the Fund, you incur two types of costs:
▪ Transaction costs which include sales charges (loads) on purchases or redemptions (varies by share class), minimum account fee charge, etc.
▪ Ongoing operating expenses including management fees, distribution and service fees (if applicable), and other fund expenses.
We are going to present only your ongoing operating expenses here.
Actual expenses/actual returns
This example is intended to provide information about your fund’s actual ongoing operating expenses, and is based on your fund’s actual return. It assumes an account value of $1,000.00 on February 1, 2010 with the same investment held until July 31, 2010.
| | | |
| | Account value | Ending value | Expenses paid during |
| | on 2-1-10 | on 7-31-10 | period ended 7-31-101 |
|
| Class A | $1,000.00 | $965.70 | $9.11 |
|
| Class I | 1,000.00 | 966.80 | 7.36 |
|
| Class NAV | 1,000.00 | 966.80 | 6.68 |
|
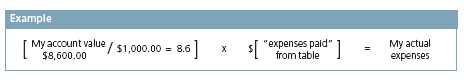
Together with the value of your account, you may use this information to estimate the operating expenses that you paid over the period. Simply divide your account value at July 31, 2010, by $1,000.00, then multiply it by the “expenses paid” for your share class from the table above. For example, for an account value of $8,600.00, the operating expenses should be calculated as follows:
| |
| Annual report | Technical Opportunities Fund | 9 |
Your expenses
Hypothetical example for comparison purposes
This table allows you to compare your fund’s ongoing operating expenses with those of any other fund. It provides an example of the Fund’s hypothetical account values and hypothetical expenses based on each class’s actual expense ratio and an assumed 5% annualized return before expenses (which is not your fund’s actual return). It assumes an account value of $1,000.00 on February 1, 2010, with the same investment held until July 31, 2010. Look in any other fund shareholder report to find its hypothetical example and you will be able to compare these expenses.
| | | |
| | Account value | Ending value | Expenses paid during |
| | on 2-1-10 | on 7-31-10 | period ended 7-31-101 |
|
| Class A | $1,000.00 | $1,015.50 | $9.35 |
|
| Class I | 1,000.00 | 1,017.30 | 7.55 |
|
| Class NAV | 1,000.00 | 1,018.00 | 6.85 |
|
Remember, these examples do not include any transaction costs, therefore, these examples will not help you to determine the relative total costs of owning different funds. If transaction costs were included, your expenses would have been higher. See the prospectus for details regarding transaction costs.
1 Expenses are equal to the Fund’s annualized expense ratio of 1.87%, 1.51% and 1.37% for Class A, Class I and Class NAV shares, respectively, multiplied by the average account value over the period, multiplied by 181/365 (to reflect the one-half year period).
| |
| 10 | Technical Opportunities Fund | Annual report |
Portfolio summary
| | | | |
| Top 10 Holdings1 | | | | |
|
| EMC Corp. | 2.9% | | Eli Lilly & Company | 2.5% |
| |
|
| Xilinx, Inc. | 2.9% | | Bristol-Myers Squibb Company | 2.5% |
| |
|
| Baidu, Inc. | 2.8% | | Salesforce.com, Inc. | 2.4% |
| |
|
| Broadcom Corp., Class A | 2.8% | | American Tower Corp., Class A | 2.2% |
| |
|
| NetApp, Inc. | 2.5% | | Apple, Inc. | 2.0% |
| |
|
| |
| Sector Composition2,3,4 | | | | |
|
| Information Technology | 39% | | Consumer Staples | 4% |
| |
|
| Consumer Discretionary | 12% | | Financials | 3% |
| |
|
| Industrials | 7% | | Energy | 2% |
| |
|
| Health Care | 6% | | Materials | 1% |
| |
|
| Telecommunication Services | 5% | | Short-Term Investments & Other | 21% |
| |
|
| |
| Country Composition2,3 | | | | |
|
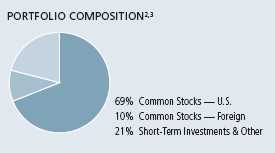
| United States | 69% | | Hong Kong | 1% |
| |
|
| China | 4% | | Argentina | 1% |
| |
|
| South Korea | 2% | | Indonesia | 1% |
| |
|
| Mexico | 1% | | Short-Term Investments & Other | 21% |
| |
|
1 As a percentage of net assets on 7-31-10. Excludes cash and cash equivalents.
2 As a percentage of net assets on 7-31-10.
3 International investing involves special risks such as political, economic and currency risks and differences in accounting standards and financial reporting. Sector investing is subject to greater risks than the market as a whole. Because the Fund may focus on particular sectors of the economy, its performance may depend on the performance of those sectors.
4 The Fund may invest up to 100% of its assets in cash.
| |
| Annual report | Technical Opportunities Fund | 11 |
Fund’s investments
As of 7-31-10
| | |
| | Shares | Value |
|
| Common Stocks 79.16% | | $469,009,554 |
|
| (Cost $435,471,129) | | |
| | |
| Consumer Discretionary 11.86% | | 70,281,993 |
| | |
| Auto Components 1.74% | | |
|
| Cooper Tire & Rubber Company (L) | 55,500 | 1,199,355 |
|
| TRW Automotive Holdings Corp. (I) | 258,800 | 9,081,292 |
| | | |
| Automobiles 1.03% | | |
|
| Ford Motor Company (I)(L) | 478,400 | 6,109,168 |
| | | |
| Hotels, Restaurants & Leisure 3.95% | | |
|
| Las Vegas Sands Corp. (I)(L) | 316,500 | 8,501,190 |
|
| Starbucks Corp. (L) | 207,800 | 5,163,830 |
|
| Starwood Hotels & Resorts Worldwide, Inc. | 60,700 | 2,940,915 |
|
| Wendy’s/Arby’s Group, Inc., Class A | 1,563,211 | 6,815,600 |
| | | |
| Media 3.39% | | |
|
| CBS Corp., Class B | 107,900 | 1,594,762 |
|
| Comcast Corp., Class A | 382,000 | 7,437,540 |
|
| Time Warner Cable, Inc. | 75,300 | 4,304,901 |
|
| Virgin Media, Inc. (L) | 313,300 | 6,745,349 |
| | | |
| Textiles, Apparel & Luxury Goods 1.75% | | |
|
| Under Armour, Inc., Class A (I)(L) | 133,400 | 5,010,504 |
|
| XTEP International Holdings | 7,493,500 | 5,377,587 |
| | | |
| Consumer Staples 4.11% | | 24,326,645 |
| | | |
| Beverages 0.95% | | |
|
| Dr. Pepper Snapple Group, Inc. | 149,700 | 5,621,235 |
| | | |
| Food Products 0.41% | | |
|
| The J.M. Smucker Company | 5,300 | 325,579 |
|
| Tingyi (Cayman Islands) Holding Corp. | 822,000 | 2,095,469 |
| | | |
| Household Products 0.99% | | |
|
| Clorox Company | 90,400 | 5,865,152 |
| | | |
| Tobacco 1.76% | | |
|
| Altria Group, Inc. | 345,200 | 7,649,632 |
|
| Reynolds American, Inc. | 47,900 | 2,769,578 |
| | | |
| Energy 1.52% | | 9,028,610 |
| | | |
| Energy Equipment & Services 0.39% | | |
|
| CARBO Ceramics, Inc. | 29,300 | 2,349,860 |
| | | |
| Oil, Gas & Consumable Fuels 1.13% | | |
|
| EOG Resources, Inc. | 68,500 | 6,678,750 |
| | |
| 12 | Technical Opportunities Fund | Annual report | See notes to financial statements |
| | |
| | Shares | Value |
| Financials 3.54% | | $20,969,158 |
|
| Commercial Banks 0.55% | | |
|
| Bank Rakyat Indonesia Tbk PT | 2,949,000 | 3,257,408 |
| | | |
| Real Estate Investment Trusts 2.99% | | |
|
| AvalonBay Communities, Inc. | 27,600 | 2,900,484 |
|
| HCP, Inc. (L) | 167,200 | 5,930,584 |
|
| Ventas, Inc. (L) | 116,500 | 5,908,880 |
|
| Vornado Realty Trust | 35,900 | 2,971,802 |
| | | |
| Health Care 6.30% | | 37,304,810 |
| | | |
| Life Sciences Tools & Services 0.40% | | |
|
| Pharmaceutical Product Development, Inc. | 97,900 | 2,375,054 |
| | | |
| Pharmaceuticals 5.90% | | |
|
| Allergan, Inc. | 82,600 | 5,043,556 |
|
| Bristol-Myers Squibb Company | 599,000 | 14,927,080 |
|
| Eli Lilly & Company | 420,200 | 14,959,120 |
| | | |
| Industrials 6.87% | | 40,712,054 |
| | | |
| Aerospace & Defense 2.30% | | |
|
| BE Aerospace, Inc. (I) | 192,000 | 5,644,800 |
|
| Cubic Corp. | 197,501 | 8,002,741 |
| | | |
| Airlines 1.36% | | |
|
| US Airways Group, Inc. (I)(L) | 742,600 | 8,057,210 |
| | | |
| Commercial Services & Supplies 1.01% | | |
|
| Republic Services, Inc. | 187,500 | 5,973,750 |
| | | |
| Industrial Conglomerates 0.92% | | |
|
| Beijing Enterprises Holdings, Ltd. | 829,000 | 5,474,505 |
| | | |
| Machinery 1.28% | | |
|
| Deere & Company | 91,800 | 6,121,224 |
|
| Pall Corp. | 37,600 | 1,437,824 |
| | | |
| Information Technology 38.69% | | 229,225,014 |
| | | |
| Communications Equipment 3.25% | | |
|
| F5 Networks, Inc. (I)(L) | 137,000 | 12,032,710 |
|
| Riverbed Technology, Inc. (I)(L) | 194,237 | 7,204,250 |
| | | |
| Computers & Peripherals 8.58% | | |
|
| Apple, Inc. (I) | 47,100 | 12,116,475 |
|
| EMC Corp. (I) | 879,300 | 17,401,347 |
|
| NetApp, Inc. (I)(L) | 356,000 | 15,058,800 |
|
| SanDisk Corp. (I) | 143,300 | 6,262,210 |
| | | |
| Electronic Equipment, Instruments & Components 1.42% | | |
|
| National Instruments Corp. | 27,300 | 870,870 |
|
| Samsung SDI Company, Ltd. | 52,852 | 7,571,014 |
| | | |
| Internet Software & Services 3.77% | | |
|
| Alibaba.com, Ltd. | 511,000 | 1,055,183 |
|
| Baidu, Inc., SADR (I) | 205,300 | 16,713,473 |
|
| MercadoLibre, Inc. (I)(L) | 75,400 | 4,561,700 |
| | | |
| IT Services 1.72% | | |
|
| Cognizant Technology Solutions Corp., Class A (I) | 186,900 | 10,197,264 |
| | |
| See notes to financial statements | Annual report | Technical Opportunities Fund | 13 |
| | |
| | Shares | Value |
| Semiconductors & Semiconductor Equipment 13.14% | | |
|
| Broadcom Corp., Class A | 453,000 | $16,321,590 |
|
| Cavium Networks, Inc. (I)(L) | 191,800 | 5,145,994 |
|
| Cree, Inc. (I)(L) | 126,000 | 8,925,840 |
|
| Netlogic Microsystems, Inc. (I) | 134,600 | 3,978,776 |
|
| OmniVision Technologies, Inc. (I)(L) | 478,900 | 10,684,259 |
|
| Samsung Electronics Company, Ltd. | 6,928 | 4,754,940 |
|
| Skyworks Solutions, Inc. (I)(L) | 631,500 | 11,070,195 |
|
| Xilinx, Inc. (L) | 607,400 | 16,958,608 |
| | | |
| Software 6.81% | | |
|
| Citrix Systems, Inc. (I) | 163,700 | 9,006,774 |
|
| Rovi Corp. (I) | 177,700 | 7,907,650 |
|
| Salesforce.com, Inc. (I)(L) | 142,400 | 14,090,480 |
|
| VMware, Inc., Class A (I)(L) | 120,400 | 9,334,612 |
| | | |
| Materials 1.02% | | 6,056,315 |
| | | |
| Chemicals 1.02% | | |
|
| The Mosaic Company | 127,100 | 6,056,315 |
| | | |
| Telecommunication Services 5.25% | | 31,104,955 |
| | | |
| Wireless Telecommunication Services 5.25% | | |
|
| America Movil SAB de CV, Series L, ADR | 173,900 | 8,627,179 |
|
| American Tower Corp., Class A (I) | 279,600 | 12,928,704 |
|
| Crown Castle International Corp. (I) | 149,200 | 5,894,892 |
|
| SBA Communications Corp., Class A (I) | 101,000 | 3,654,180 |
| | Par value | Value |
| |
| Short-Term Investments 39.08% | | $231,557,292 |
|
| (Cost $231,531,433) | | |
| | | |
| Repurchase Agreement 23.63% | | 140,000,000 |
| Bank of America Tri-Party Repurchase Agreement dated 7-30-10 at | | |
| 0.210% to be repurchased at $69,501,216 on 8-2-10, collateralized by | | |
| $181,429,255 Federal National Mortgage Association, 5.713%–5.864% | | |
| due 8-01-37 – 11-01-37 (valued at $69,806,824, including interest) | $69,500,000 | 69,500,000 |
|
| BNP Paribas Tri-Party Repurchase Agreement dated 7-30-10 at 0.210% to | | |
| be repurchased at $70,501,234 on 8-2-10, collateralized by $81,317,645 | | |
| Federal National Mortgage Association, 3.500%–7.500% due 12-1-17 – | | |
| 6-1-48 (valued at $51,624,618 including interest), $45,879,234 Federal | | |
| Home Loan Mortgage Corp., 4.000%–7.000% due 4-1-18 – 7-1-40 | | |
| (valued at $17,435,406 including interest) and $1,643,677 Government | | |
| National Mortgage Association, 5.750% due 10-15-50 (valued at | | |
| $1,721,583, including interest) | 70,500,000 | 70,500,000 |
| | | |
| Securities Lending Collateral 15.45% | | 91,557,292 |
| | | |
| John Hancock Collateral Investment Trust, 0.3385% (W)(Y) | 9,146,217 | 91,557,292 |
| |
| Total investments (Cost $667,002,562)† 118.24% | | $700,566,846 |
|
| Other assets and liabilities, net (18.24%) | | ($108,084,707) |
|
| Total net assets 100.00% | | $592,482,139 |
|
The percentage shown for each investment category is the total value of the category as a percentage of the net assets of the Fund.
| | |
| 14 | Technical Opportunities Fund | Annual report | See notes to financial statements |
Notes to Schedule of Investments
ADR American Depositary Receipts
SADR Sponsored American Depositary Receipts
(I) Non-income producing security.
(L) All or a portion of this security is on loan as of 7-31-10.
(W) Investment is an affiliate of the Fund, the adviser and/or subadviser. Also, it represents the investment of securities lending collateral received.
(Y) The rate shown is the annualized seven-day yield as of 7-31-10.
† At 7-31-10, the aggregate cost of investment securities for federal income tax purposes was $672,799,677. Net unrealized appreciation aggregated $27,767,169, of which $38,696,785 related to appreciated investment securities and $10,929,616 related to depreciated investment securities.
The Fund had the following country concentration as a percentage of net assets on 7-31-10:
| | | |
| United States | 69% | | |
| China | 4% | | |
| South Korea | 2% | | |
| Mexico | 1% | | |
| Hong Kong | 1% | | |
| Argentina | 1% | | |
| Indonesia | 1% | | |
| Short-Term Investments & Other | 21% | | |
| | |
| See notes to financial statements | Annual report | Technical Opportunities Fund | 15 |
F I N A N C I A L S T A T E M E N T S
Financial statements
Statement of assets and liabilities 7-31-10
This Statement of Assets and Liabilities is the Fund’s balance sheet. It shows the value of what the Fund owns, is due and owes. You’ll also find the net asset value and the maximum offering price per share.
| |
| Assets | |
|
| Investments in unaffiliated issuers, at value (Cost $435,471,129) including | |
| $89,240,839 of securities loaned (Note 2) | $469,009,554 |
| Investments in affiliated issuers, at value (Cost $91,531,433) (Note 2) | 91,557,292 |
| Repurchase agreements, at value (Cost $140,000,000) (Note 2) | 140,000,000 |
| | |
| Total investments, at value (Cost $667,002,562) | 700,566,846 |
| Cash | 58,459 |
| Receivable for investments sold | 18,793,189 |
| Receivable for fund shares sold | 1,394,382 |
| Dividends and interest receivable | 60,697 |
| Receivable for securities lending income | 23,017 |
| Other receivables and prepaid assets | 57,970 |
| | |
| Total assets | 720,954,560 |
| |
| Liabilities | |
|
| Payable for investments purchased | 36,262,588 |
| Payable for fund shares repurchased | 509,481 |
| Payable upon return of securities loaned (Note 2) | 91,554,178 |
| Payable to affiliates | |
| Accounting and legal services fees | 8,498 |
| Transfer agent fees | 32,839 |
| Trustees’ fees | 205 |
| Other liabilities and accrued expenses | 104,632 |
| | |
| Total liabilities | 128,472,421 |
|
| Net assets | |
|
| Capital paid-in | $608,841,124 |
| Accumulated net realized loss on investments and foreign | |
| currency transactions | (49,923,135) |
| Net unrealized appreciation (depreciation) on investments and translation | |
| of assets and liabilities in foreign currencies | 33,564,150 |
| | |
| Net assets | $592,482,139 |
|
| Net asset value per share | |
|
| Based on net asset values and shares outstanding — the Fund has an | |
| unlimited number of shares authorized with no par value | |
| Class A ($164,732,297 ÷ 16,711,324 shares) | $9.86 |
| Class I ($79,242,237 ÷ 8,008,894 shares) | $9.89 |
| Class NAV ($348,507,605 ÷ 35,185,499 shares) | $9.90 |
|
| Maximum offering price per share | |
| Class A (net asset value per share ÷ 95%)1 | $10.38 |
1 On single retail sales of less than $50,000. On sales of $50,000 or more and on group sales the offering price is reduced.
| | |
| 16 | Technical Opportunities Fund | Annual report | See notes to financial statements |
F I N A N C I A L S T A T E M E N T SStatement of operations For the period ended 7-31-101
This Statement of Operations summarizes the Fund’s investment income earned and expenses incurred in operating the Fund. It also shows net gains (losses) for the period stated.
| |
| Investment income | |
|
| Dividends | $3,142,758 |
| Interest | 125,794 |
| Securities lending | 89,387 |
| Less foreign taxes withheld | (58,465) |
| |
| Total investment income | 3,299,474 |
| |
| Expenses | |
|
| Investment management fees (Note 4) | 6,632,512 |
| Distribution and service fees (Note 4) | 374,516 |
| Accounting and legal services fees (Note 4) | 73,652 |
| Transfer agent fees (Note 4) | 270,840 |
| Trustees’ fees (Note 4) | 5,020 |
| State registration fees (Note 4) | 23,503 |
| Printing and postage fees (Note 4) | 10,677 |
| Professional fees | 44,066 |
| Custodian fees | 194,299 |
| Registration and filing fees | 10,300 |
| Other | 6,087 |
| | |
| Total expenses | 7,645,472 |
| Less expense reductions and amounts recaptured (Note 4) | (5,857) |
| | |
| Net expenses | 7,639,615 |
| | |
| Net investment loss | (4,340,141) |
|
| Realized and unrealized gain (loss) | |
|
| Net realized loss on | |
| Investments in unaffiliated issuers | (49,900,390) |
| Investments in affiliated issuers | (22,745) |
| Foreign currency transactions | (86,663) |
| | (50,009,798) |
| Change in net unrealized appreciation (depreciation) of | |
| Investments in unaffiliated issuers | 33,538,425 |
| Investments in affiliated issuers | 25,859 |
| Translation of assets and liabilities in foreign currencies | (134) |
| | 33,564,150 |
| Net realized and unrealized loss | (16,445,648) |
| | |
| Decrease in net assets from operations | ($20,785,789) |
1 Period from 8-3-09 (inception date) to 7-31-10.
| | |
| See notes to financial statements | Annual report | Technical Opportunities Fund | 17 |
F I N A N C I A L S T A T E M E N T SStatement of changes in net assets
This Statement of Changes in Net Assets shows how the value of the Fund’s net assets has changed during the period.
| |
| | Period |
| | ended |
| | 7-31-101 |
|
| Increase (decrease) in net assets | |
|
| From operations | |
| Net investment loss | ($4,340,141) |
| Net realized loss | (50,009,798) |
| Change in net unrealized appreciation (depreciation) | 33,564,150 |
| |
| Decrease in net assets resulting from operations | (20,785,789) |
| |
| From Fund share transactions (Note 5) | 613,267,928 |
| |
| Total increase | 592,482,139 |
| |
| Net assets | |
|
| Beginning of period | — |
| |
| End of period | $592,482,139 |
1 Period from 8-3-09 (inception date) to 7-31-10.
| | |
| 18 | Technical Opportunities Fund | Annual report | See notes to financial statements |
Financial highlights
The Financial Highlights show how the Fund’s net asset value for a share has changed since the beginning of the period.
| |
| CLASS A SHARES Period ended | 7-31-101 |
| |
| Per share operating performance | |
|
| Net asset value, beginning of period | $10.00 |
| Net investment loss2 | (0.13) |
| Net realized and unrealized loss on investments | (0.01) |
| Total from investment operations | (0.14) |
| Net asset value, end of period | $9.86 |
| Total return (%)3,4 | (1.40)5 |
| |
| Ratios and supplemental data | |
|
| Net assets, end of period (in millions) | $165 |
| Ratios (as a percentage of average net assets): | |
| Expenses before reductions and amounts recaptured | 1.876 |
| Expenses including reductions and amounts recaptured | 1.876 |
| Net investment loss | (1.23)6 |
| Portfolio turnover (%) | 389 |
| |
1 Period from 8-3-09 (inception date) to 7-31-10.
2 Based on the average daily shares outstanding.
3 Assumes dividend reinvestment (if applicable).
4 Total returns would have been lower had certain expenses not been reduced during the period shown.
5 Not annualized.
6 Annualized.
| |
| CLASS I SHARES Period ended | 7-31-101 |
| |
| Per share operating performance | |
|
| Net asset value, beginning of period | $10.00 |
| Net investment loss2 | (0.09) |
| Net realized and unrealized loss on investments | (0.02) |
| Total from investment operations | (0.11) |
| Net asset value, end of period | $9.89 |
| Total return (%)3,4 | (1.10)5 |
| |
| Ratios and supplemental data | |
|
| Net assets, end of period (in millions) | $79 |
| Ratios (as a percentage of average net assets): | |
| Expenses before reductions and amounts recaptured | 1.526 |
| Expenses including reductions and amounts recaptured | 1.526 |
| Net investment loss | (0.89)6 |
| Portfolio turnover (%) | 389 |
1 Period from 8-3-09 (inception date) to 7-31-10.
2 Based on the average daily shares outstanding.
3 Assumes dividend reinvestment (if applicable).
4 Total returns would have been lower had certain expenses not been reduced during the period shown.
5 Not annualized.
6 Annualized.
| | |
| See notes to financial statements | Annual report | Technical Opportunities Fund | 19 |
| |
| CLASS NAV SHARES Period ended | 7-31-101 |
| |
| Per share operating performance | |
|
| Net asset value, beginning of period | $10.00 |
| Net investment loss2 | (0.07) |
| Net realized and unrealized loss on investments | (0.03) |
| Total from investment operations | (0.10) |
| Net asset value, end of period | $9.90 |
| Total return (%)3,4 | (1.00)5 |
| |
| Ratios and supplemental data | |
|
| Net assets, end of period (in millions) | $349 |
| Ratios (as a percentage of average net assets): | |
| Expenses before reductions and amounts recaptured | 1.396 |
| Expenses including reductions and amounts recaptured | 1.396 |
| Net investment loss | (0.72)6 |
| Portfolio turnover (%) | 389 |
1 Period from 8-3-09 (inception date) to 7-31-10.
2 Based on the average daily shares outstanding.
3 Assumes dividend reinvestment (if applicable).
4 Total returns would have been lower had certain expenses not been reduced during the period shown.
5 Not annualized.
6 Annualized.
| | |
| 20 | Technical Opportunities Fund | Annual report | See notes to financial statements |
Notes to financial statements
Note 1 — Organization
John Hancock Technical Opportunities Fund (the Fund) is a non-diversified series of John Hancock Funds II (the Trust), an open-end management investment company organized as a Massachusetts business trust and registered under the Investment Company Act of 1940, as amended (the 1940 Act). The investment objective of the Fund is to seek long-term capital appreciation. The Fund commenced operations on August 3, 2009.
The Fund may offer multiple classes of shares. The shares currently offered are detailed in the Statement of Assets and Liabilities. Class A shares are offered to all investors. Class I shares are offered to institutions and certain investors. Class NAV shares are sold to John Hancock affiliated funds of funds. Shareholders of each class have exclusive voting rights to matters that affect that class. The distribution and service fees, transfer agent fees, registration fees and printing and postage fees for each class may differ.
Note 2 — Significant accounting policies
The financial statements have been prepared in conformity with accounting principles generally accepted in the United States of America, which require management to make certain estimates and assumptions at the date of the financial statements. Actual results could differ from those estimates. Events or transactions occurring after the end of the fiscal period through the date that the financial statements were issued have been evaluated in the preparation of the financial statements. The following summarizes the significant accounting policies of the Fund:
Security valuation. Investments are stated at value as of the close of regular trading on the New York Stock Exchange (NYSE), normally at 4:00 P.M., Eastern Time. The Fund uses a three-tier hierarchy to prioritize the pricing assumptions, referred to as inputs, used in valuation techniques to measure fair value. Level 1 includes quoted prices in active markets for identical securities. Level 2 includes significant observable inputs. Observable inputs may include quoted prices for similar securities, interest rates, prepayment speeds and credit risk. Prices for securities valued using these techniques are received from independent pricing vendors and brokers and are based on an evaluation of the inputs described. Level 3 includes significant unobservable inpu ts when market prices are not readily available or reliable, including the Fund’s own assumptions in determining the fair value of investments. The inputs or methodology used for valuing securities are not necessarily an indication of the risk associated with investing in those securities.
The following is a summary of the values by input classification of the Fund’s investments as of July 31, 2010, by major security category or type:
| |
| Annual report | Technical Opportunities Fund | 21 |
| | | | |
| | | | | LEVEL 3 |
| | | | LEVEL 2 | SIGNIFICANT |
| | TOTAL MARKET | LEVEL 1 | SIGNIFICANT | UNOBSERVABLE |
| | VALUE AT 7-31-10 | QUOTED PRICE | OBSERVABLE INPUTS | INPUTS |
|
| Common Stocks | | | | |
|
| Consumer Discretionary | $70,281,993 | $64,904,406 | $5,377,587 | — |
|
| Consumer Staples | 24,326,645 | 22,231,176 | 2,095,469 | — |
|
| Energy | 9,028,610 | 9,028,610 | — | — |
|
| Financials | 20,969,158 | 17,711,750 | 3,257,408 | — |
|
| Health Care | 37,304,810 | 37,304,810 | — | — |
|
| Industrials | 40,712,054 | 35,237,549 | 5,474,505 | — |
|
| Information Technology | 229,225,014 | 215,843,877 | 13,381,137 | — |
|
| Materials | 6,056,315 | 6,056,315 | — | — |
| Telecommunication | | | | |
| Services | 31,104,955 | 31,104,955 | — | — |
|
| Short-Term Investments | 231,557,292 | 91,557,292 | 140,000,000 | — |
| |
|
| Total Investments in | | | | |
| Securities | $700,566,846 | $530,980,740 | $169,586,106 | — |
During the period ended July 31, 2010, there were no significant transfers in or out of Level 1 or Level 2 assets.
In order to value the securities, the Fund uses the following valuation techniques. Equity securities held by the Fund are valued at the last sale price or official closing price on the principal securities exchange on which they trade. In the event there were no sales during the day or closing prices are not available, then securities are valued using the last quoted bid or evaluated price. Foreign securities and currencies are valued in U.S. dollars, based on foreign currency exchange rates supplied by an independent pricing service. Certain securities traded only in the over-the-counter market are valued at the last bid price quoted by brokers making markets in the securities at the close of trading. Certain short-term securities are valued at amortized cost. John Hancock Collateral Investment Trust (JHCIT), an affiliate of the Fund, is valued at its closing net asset value. JHCIT has a floating net asset value and invests in short-term investments as pa rt of a securities lending program.
Other portfolio securities and assets, where market quotations are not readily available, are valued at fair value, as determined in good faith by the Fund’s Pricing Committee, following procedures established by the Board of Trustees. Generally, trading in non-U.S. securities is substantially completed each day at various times prior to the close of trading on the NYSE. Significant market events that affect the values of non-U.S. securities may occur after the time when the valuation of the securities is generally determined and the close of the NYSE. During significant market events, these securities will be valued at fair value, as determined in good faith, following procedures established by the Board of Trustees. The Fund may use a fair valuation model to value non-U.S. securities in order to adjust for events which may occur between the close of foreign exchanges and the close of the NYSE.
Repurchase agreements. The Fund may enter into repurchase agreements. When a Fund enters into a repurchase agreement, it receives collateral which is held in a segregated account by the Fund’s custodian. The collateral amount is marked-to-market and monitored on a daily basis to ensure that the collateral held is in an amount not less than the principal amount of the repurchase agreement plus any accrued interest. In the event of a default by the counterparty, realization of the collateral proceeds could be delayed, during which time the collateral value may decline. Collateral for certain tri-party repurchase agreements is held at a third-party custodian bank in a segregated account for the benefit of the Fund.
| |
| 22 | Technical Opportunities Fund | Annual report |
Security transactions and related investment income. Investment security transactions are accounted for on a trade date plus one basis for daily net asset value calculations. However, for financial reporting purposes, investment transactions are reported on trade date. Interest income is accrued as earned. Gains and losses on securities sold are determined on the basis of identified cost and may include proceeds from litigation. Dividend income is recorded on the ex-date except for certain foreign dividends where the ex-date may have passed, which are recorded when the Fund becomes aware of the dividends.
Securities lending. The Fund may lend its securities to earn additional income. It receives and maintains cash collateral received from the borrower in an amount not less than the market value of the loaned securities. The Fund will invest its collateral in JHCIT, as a result, the Fund will receive the benefit of any gains and bear any losses generated by JHCIT. Although risk of the loss of the securities lent is mitigated by holding the collateral, the Fund could experience a delay in recovering its securities and a possible loss of income or value if the borrower fails to return the securities or if collateral investments decline in value. The Fund may receive compensation for lending its securities by retaining a portion of the return on the investment of the collateral and compensation from fees earned from borrowers of the securities. Income received from JHCIT is a component of securities lending income as re corded on the Statement of Operations.
Foreign currency translation. Assets, including investments and liabilities denominated in foreign currencies, are translated into U.S. dollar values each day at the prevailing exchange rate. Purchases and sales of securities, income and expenses are translated into U.S. dollars at the prevailing exchange rate on the date of the transaction. The effect of changes in foreign currency exchange rates on securities is reflected as a component of the realized and unrealized gains (losses) on investments.
Funds that invest internationally generally carry more risk than funds that invest strictly in U.S. securities. Funds investing in a single country or in a limited geographic region tend to be riskier than funds that invest more broadly. Risks can result from differences in economic and political conditions, regulations, market practices (including higher transaction costs) and accounting standards. Foreign investments are also subject to a decline in the value of a foreign currency versus the U.S. dollar, which reduces the dollar value of securities denominated in that currency.
Line of credit. The Fund may borrow from banks for temporary or emergency purposes, including meeting redemption requests that otherwise might require the untimely sale of securities. Pursuant to the custodian agreement, the custodian may loan money to the Fund to make properly authorized payments. The Fund is obligated to repay the custodian for any overdraft, including any related costs or expenses. The custodian has a lien, security interest or security entitlement in any Fund property that is not segregated, to the maximum extent permitted by law for any overdraft.
In addition, the Fund and other affiliated funds have entered into an agreement with the custodian which enables them to participate in a $200 million unsecured committed line of credit. Prior to March 31, 2010, the amount of the line of credit was $300 million. A commitment fee, payable at the end of each calendar quarter, based on the average daily unused portion of the line of credit, is charged to each participating fund on a pro rata basis based on their relative average net assets. At July 31, 2010, the Fund did not have an outstanding balance from the line of credit.
Expenses. The majority of expenses are directly attributable to an individual fund. Expenses that are not readily attributable to a specific fund are allocated among all funds in an equitable manner, taking into consideration, among other things, the nature and type of expense and the fund’s relative assets. Expense estimates are accrued in the year to which they relate and adjustments are made when actual amounts are known.
Class allocations. Income, common expenses, and realized and unrealized gains (losses) are determined at the fund level and allocated daily to each class of shares based on the net asset value
| |
| Annual report | Technical Opportunities Fund | 23 |
of the class. Class-specific expenses, such as distribution and service fees, if any, transfer agent fees, state registration fees and printing and postage fees, for all classes are calculated daily at the class level based on the appropriate net asset value of each class and the specific expense rates applicable to each class.
Federal income taxes. The Fund intends to qualify as a regulated investment company by complying with the applicable provisions of the Internal Revenue Code and will not be subject to federal income tax on taxable income that is distributed to shareholders. Therefore, no federal income tax provision is required.
For federal income tax purposes, the Fund had a capital loss carryforward of $1,124,489 available to offset future net realized capital gains which expires on July 31, 2018. Net capital losses of $43,001,531, that are a result of security transactions occurring after October 31, 2009 are treated as occurring on August 1, 2010, the first day of the Fund’s next taxable year.
As of July 31, 2010, the Fund had no uncertain tax positions that would require financial statement recognition, de-recognition or disclosure. The Fund’s federal tax return is subject to examination by the Internal Revenue Service for a period of three years.
Distribution of income and gains. Distributions to shareholders from net investment income and net realized gains, if any, are recorded on the ex-date. The Fund generally declares and pays dividends and capital gain distributions, if any, at least annually.
Distributions paid by the Fund with respect to each class of shares are calculated in the same manner, at the same time and are in the same amount, except for the effect of expenses that may be applied differently to each class. As of July 31, 2010, the Fund has no distributable earnings on a tax basis.
Such distributions and distributable earnings, on a tax basis, are determined in conformity with income tax regulations, which may differ from accounting principles generally accepted in the United States of America. Material distributions in excess of tax basis earnings and profits, if any, are reported in the Fund’s financial statements as a return of capital.
Capital accounts within financial statements are adjusted for permanent book/tax differences. These adjustments have no impact on net assets or the results of operations. Temporary book/tax differences, if any, will reverse in a subsequent period. Permanent book/tax differences are primarily attributable to net operating losses.
Note 3 — Guarantees and indemnifications
Under the Fund’s organizational documents, its Officers and Trustees are indemnified against certain liabilities arising out of the performance of their duties to the Fund. Additionally, in the normal course of business, the Fund enters into contracts with service providers that contain general indemnification clauses. The Fund’s maximum exposure under these arrangements is unknown, as this would involve future claims that may be made against the Fund that have not yet occurred. The risk of material loss from such claims is considered remote.
Note 4 — Fees and transactions with affiliates
John Hancock Investment Management Services, LLC (the Adviser) serves as investment adviser for the Fund. John Hancock Funds, LLC (the Distributor), an affiliate of the Adviser, serves as principal underwriter of the Fund. The Adviser and the Distributor are indirect wholly owned subsidiaries of Manulife Financial Corporation (MFC).
Management fee. The Fund has an investment management contract with the Adviser under which the Fund pays a daily management fee to the Adviser equivalent, on an annual basis, to the
| |
| 24 | Technical Opportunities Fund | Annual report |
sum of: a) 1.35% of the first $250,000,000 of the Fund’s average daily net assets, b) 1.30% of the next $250,000,000 and c) 1.25% of the Fund’s average daily net assets in excess of $500,000,000. The Adviser has a subadvisory agreement with Wellington Management Company, LLP. The Fund is not responsible for payment of the subadvisory fees.
The investment management fees incurred for the period ended July 31, 2010 were equivalent to an annual effective rate of 1.32% of the Fund’s average daily net assets.
Effective January 1, 2010, the Adviser contractually agreed to waive a portion of the management fee for certain funds of the Trust. The waiver equals, on an annualized basis 0.01% of that portion of the aggregate net assets of all the participating funds that exceeds $85 billion. The amount of the reimbursement is calculated daily and allocated among all the funds in proportion of the daily net assets of each Fund.
The Adviser had contractually agreed to waive fees and/or reimburse certain expenses for each share class of the Fund. This agreement excluded taxes, portfolio brokerage commissions, interest, overdraft, litigation and other extraordinary expenses not incurred in the ordinary course of the Fund’s business. For the period discussed in this report, the fee waivers and/or reimbursements were such that these expenses will not exceed 2.05% and 1.55% for Class A and Class I shares, respectively. Such fee waivers and/or reimbursements have been lowered subsequent to the period. In addition, the Adviser voluntarily waived certain other expenses.
Additionally, the Adviser has voluntarily agreed to waive other fund level expenses excluding advisory fees, 12b-1 fees, service fees, transfer agent fees, blue sky fees, taxes, brokerage commissions, interest expenses, acquired fund fees, litigation and indemnification expenses and other extraordinary expenses not incurred in the ordinary course of business. The waivers are such that these expenses will not exceed 0.20% of average net assets.
Accordingly, these expense reductions described above amounted to $2,405, $614 and $2,838 for Class A, Class I and Class NAV shares, respectively, for the period ended July 31, 2010.
Accounting and legal services. Pursuant to the Service Agreement, the Fund reimburses the Adviser for all expenses associated with providing the administrative, financial, legal, accounting and recordkeeping services of the Fund, including the preparation of all tax returns, periodic reports to shareholders and regulatory reports, among other services. These expenses are allocated to each share class based on its relative net assets at the time the expense was incurred. The accounting and legal services fees incurred for the period ended July 31, 2010 amounted to an annual rate of 0.01% of the Fund’s average daily net assets.
Distribution and service plans. The Fund has a distribution agreement with the Distributor. The Fund has adopted distribution and service plans with respect to Class A shares pursuant to Rule 12b-1 under the 1940 Act, to pay the Distributor for services provided as the distributor of shares of the Fund. Accordingly, the Fund may pay up to 0.30% for Class A shares for distribution and service fees, expressed as an annual percentage of average daily net assets.
Sales charges. Class A shares are assessed up-front sales charges, which resulted in payments to the Distributor amounting to $2,645,764 for the period ended July 31, 2010. Of this amount, $414,293 was retained and used for printing prospectuses, advertising, sales literature and other purposes, $2,231,037 was paid as sales commissions to broker-dealers and $434 was paid as sales commissions to sales personnel of Signator Investors, Inc. (Signator Investors), a broker-dealer affiliate of the Adviser.
Transfer agent fees. The Fund has a transfer agent agreement with John Hancock Signature Services, Inc. (Signature Services or Transfer Agent), an affiliate of the Adviser. Class NAV shares do not pay transfer agent fees. Prior to July 1, 2010, the transfer agent fees were made up of three components:
| |
| Annual report | Technical Opportunities Fund | 25 |
• The Fund paid a monthly transfer agent fee at an annual rate of 0.05% and 0.04% for Class A and Class I shares, respectively, based on each class’s average daily net assets.
• The Fund paid a monthly fee based on an annual rate of $16.50 per shareholder account for Class A and Class I shares.
• In addition, Signature Services was reimbursed for certain out-of-pocket expenses.
Effective July 1, 2010, the transfer agent fees paid to Signature Services are determined based on the cost to Signature Services (Signature Services Cost) of providing recordkeeping services. The Signature Services Cost is comprised of a component of allocated John Hancock corporate overhead for providing transfer agent services to the Fund and to all other John Hancock affiliated funds. It also includes out-of-pocket expenses that are comprised of payments made to third-parties for recordkeeping services provided to their clients who invest in one or more John Hancock funds. In addition, Signature Services Cost may be reduced by certain revenues that Signature Services received in connection with the performance of the service they provide to the funds. Signature Services Cost is calculated monthly and allocated, as applicable, to four categories of share classes: Institutional Share Classes, Retirement Share Classes, Municipal Bond Classes and all other Retail Share Classes. Within each of these categories, the applicable costs are allocated to the affected John Hancock affiliated funds and/or classes, based on the relative average daily net assets.
Class level expenses. Class level expenses for the period ended July 31, 2010 were:
| | | | |
| | DISTRIBUTION | TRANSFER | STATE | PRINTING AND |
| CLASS | AND SERVICE FEES | AGENT FEES | REGISTRATION FEES | POSTAGE FEES |
|
| Class A | $374,516 | $210,299 | $16,963 | $7,682 |
|
| Class I | — | 60,541 | 6,540 | 2,995 |
| | | | | |
| Total | $374,516 | $270,840 | $23,503 | $10,677 |
Trustee expenses. The Trust compensates each Trustee who is not an employee of the Adviser or its affiliates. The costs of paying Trustee compensation and expenses are allocated to each Fund based on its average daily net assets.
Note 5 — Fund share transactions
Transactions in Fund shares for the period ended July 31, 2010 were as follows:
| | |
| | Period ended 7-31-10 |
| | Shares | Amount |
| Class A shares | | |
|
| Sold | 22,796,591 | $240,781,737 |
| Repurchased | (6,085,267) | (62,239,897) |
| Net increase | 16,711,324 | $178,541,840 |
| |
| Class I shares | | |
|
| Sold | 10,412,153 | $110,650,156 |
| Repurchased | (2,403,259) | (24,891,985) |
| Net increase | 8,008,894 | $85,758,171 |
| |
| Class NAV shares | | |
|
| Sold | 35,772,158 | $355,210,980 |
| Repurchased | (586,659) | (6,243,063) |
| Net increase | 35,185,499 | $348,967,917 |
| |
| Net increase | 59,905,717 | $613,267,928 |
|
26 Technical Opportunities Fund | Annual report
Note 6 — Purchase and sale of securities
Purchases and sales of securities, other than short-term securities, aggregated $2,186,463,721 and $1,701,043,736, respectively, for the period ended July 31, 2010.
Note 7 — Investment by affiliated funds
Certain investors in the Fund are affiliated funds and are managed by the Adviser and its affiliates. The affiliated funds do not invest in the Fund for the purpose of exercising management or control; however, this investment may represent a significant portion of the Fund’s net assets. For the period ended July 31, 2010, the following funds had an affiliate ownership concentration of 5% or more of the Fund’s net assets:
| | | |
| | AFFILIATE | | |
| FUND | CONCENTRATION | | |
| | |
| Lifestyle Aggressive Portfolio | 8.5% | | |
| | |
| Lifestyle Balanced Portfolio | 25.4% | | |
| | |
| Lifestyle Growth Portfolio | 24.6% | | |
| |
| Annual report | Technical Opportunities Fund | 27 |
Auditors’ report
Report of Independent Registered Public Accounting Firm
To the Board of Trustees of John Hancock Funds II and Shareholders of
John Hancock Technical Opportunities Fund:
In our opinion, the accompanying statement of assets and liabilities, including the portfolio of investments, and the related statements of operations and of changes in net assets and the financial highlights present fairly, in all material respects, the financial position of John Hancock Technical Opportunities Fund (the “Fund”) at July 31, 2010, and the results of its operations, the changes in its net assets and the financial highlights for the period August 3, 2009 (commencement of operations) through July 31, 2010, in conformity with accounting principles generally accepted in the United States of America. These financial statements and financial highlights (hereafter referred to as “financial statements”) are the responsibility of the Fund’s management; our responsibility is to express an opinion on these financial statements based on our audit. We conducted our audit of these financial statements in accordance with the standa rds of the Public Company Accounting Oversight Board (United States). Those standards require that we plan and perform the audit to obtain reasonable assurance about whether the financial statements are free of material misstatement. An audit includes examining, on a test basis, evidence supporting the amounts and disclosures in the financial statements, assessing the accounting principles used and significant estimates made by management, and evaluating the overall financial statement presentation. We believe that our audit, which included confirmation of securities at July 31, 2010 by correspondence with the custodian and brokers and the application of alternative auditing procedures where securities purchased confirmations had not been received, provides a reasonable basis for our opinion.
PricewaterhouseCoopers LLP
Boston, Massachusetts
September 20, 2010
| |
| 28 | Technical Opportunities Fund | Annual report |
Trustees and Officers
This chart provides information about the Trustees and Officers of John Hancock Funds II who oversee your John Hancock fund. Officers elected by the Trustees manage the day-to-day operations of the Portfolio and execute policies formulated by the Trustees.
| | |
| Independent Trustees | | |
| | | |
| Name, Year of Birth | | Number of |
| Position(s) held with Fund | Trustee | John Hancock |
| Principal occupation(s) and other | of Trust | funds overseen |
| directorships during past 5 years | since1 | by Trustee |
| |
| Charles L. Bardelis, Born: 1941 | 2005 | 210 |
|
| Director, Island Commuter Corp. (Marine Transport). Trustee of John Hancock Trust (since 1988), |
| John Hancock Funds II (since 2005) and former Trustee of John Hancock Funds III (2005–2006). |
|
| |
| Peter S. Burgess, Born: 1942 | 2005 | 210 |
|
| Consultant (financial, accounting and auditing matters) (since 1999); Certified Public Accountant. |
| Partner, Arthur Andersen (independent public accounting firm) (prior to 1999). Director of the |
| following publicly traded companies: PMA Capital Corporation (since 2004) and Lincoln Educational |
| Services Corporation (since 2004). Trustee of John Hancock Trust (since 2005), John Hancock Funds II |
| (since 2005), and former Trustee of John Hancock Funds III (2005–2006). | | |
|
| |
| Theron S. Hoffman, Born: 1947 | 2008 | 210 |
|
| Chief Executive Officer, T. Hoffman Associates, LLC (since 2003); Director, The Todd Organization |
| (since 2003); President, Westport Resources Management (2006–2008); Partner/Operating Head & |
| Senior Managing Director, Putnam Investments (2000–2003); Executive Vice President, Thomson |
| Corp. (1997–2000) (financial information publishing). Trustee of John Hancock Trust (since 2008) and |
| John Hancock Funds II (since 2008). | | |
|
| |
| Hassell H. McClellan, Born: 1945 | 2005 | 210 |
|
| Associate Professor, The Graduate School of The Wallace E. Carroll School of Management, Boston |
| College (since 1984). Trustee of John Hancock Trust (since 2005), John Hancock Funds II (since 2005) |
| and Trustee of Phoenix Edge Series Funds (since 2008). | | |
|
| |
| James M. Oates, Born: 1946 | 2005 | 210 |
|
| Managing Director, Wydown Group (financial consulting firm) (since 1994); Chairman, Emerson |
| Investment Management, Inc. (since 2000); Chairman, Hudson Castle Group, Inc. (formerly IBEX Capital |
| Markets, Inc.) (financial services company) (since 1997) (Independent Chairman, 1997–2006). Director |
| of the following publicly traded companies: Stifel Financial (since 1996); Investor Financial Services |
| Corporation (1995–2007); and Connecticut River Bancorp (since 1998); Director of the following |
| Mutual Funds: Phoenix Mutual Funds (1988–2008); Virtus Funds (since 2008); and Emerson Investment |
| Management (since 2000). Chairman of the Boards of John Hancock Trust and John Hancock Funds II |
| (since 2005). Trustee of John Hancock Trust (since 2004), John Hancock Funds II (since 2005) and former |
| Trustee of John Hancock Funds III (2005–2006). | | |
| |
| Annual report | Technical Opportunities Fund | 29 |
| | |
| Independent Trustees (continued) | | |
| |
| Name, Year of Birth | | Number of |
| Position(s) held with Fund | Trustee | John Hancock |
| Principal occupation(s) and other | of Trust | funds overseen |
| directorships during past 5 years | since1 | by Trustee |
|
| Steven M. Roberts, Born: 1944 | 2008 | 210 |
|
| Board of Governors Deputy Director Division of Banking Supervision and Regulation, Federal Reserve |
| System (2005–2008); Partner, KPMG (1987–2004). Trustee of John Hancock Trust (since 2008) and |
| John Hancock Funds II (since September 2008). | | |
| |
| Non-Independent Trustees2 | | |
| | |
| Name, Year of Birth | | Number of |
| Position(s) held with Fund | Trustee | John Hancock |
| Principal occupation(s) and other | of Trust | funds overseen |
| directorships during past 5 years | since1 | by Trustee |
| |
| James R. Boyle,3 Born: 1959 | 2005 | 210 |
|
| President, John Hancock Financial Services (since 2010); Chairman and Director, John Hancock Advisers, |
| LLC, John Hancock Funds, LLC, and John Hancock Investment Management Services, LLC (until 2010); |
| Trustee, John Hancock Trust, John Hancock Funds II, and John Hancock retail funds (since 2005). |
|
| |
| Grace K. Fey,4 Born: 1946 | 2008 | 210 |
|
| Chief Executive Officer, Grace Fey Advisors (since 2007); Director & Executive Vice President, Frontier |
| Capital Management Company (1988–2007); Director, Fiduciary Trust (since 2009). Trustee of |
| John Hancock Trust (since 2008) and John Hancock Funds II (since 2008). | | |
1 Because the Trust does not hold regular annual shareholders meetings, each Trustee holds office for an indefinite term until his/her successor is duly elected and qualified or until he/she dies, retires, resigns, is removed or becomes disqualified. Trustees may be removed (provided the aggregate number of Trustees after such removal shall not be less than one) with cause or without cause, by the action of two-thirds of the remaining Trustees or by action of two-thirds of the outstanding Shares of the Trust.
2 Non-Independent Trustees hold positions or are affiliated with the Fund’s investment adviser, subadviser, underwriter or their affiliates.
3 Mr. Boyle is an “interested person” (as defined in the 1940 Act) due to his position with Manulife Financial Corporation (or its affiliates), the ultimate parent of the Adviser.
4 Ms. Fey is an “interested person” (as defined by the 1940 Act) due to a deferred compensation arrangement with her former employer, Frontier Capital Management Company, which is a subadviser of certain funds of John Hancock Funds II and John Hancock Trust.
| |
| Principal officers who are not Trustees | |
| | |
| Name, Year of Birth | |
| Position(s) held with Fund | Officer |
| Principal occupation(s) and other | of Trust |
| directorships during past 5 years | since |
|
| Hugh McHaffie, Born: 1959 | 2009 |
|
| President | |
| Executive Vice President, John Hancock Financial Services (since 2006); Director, John Hancock | |
| Investment Management Services, LLC, John Hancock Advisers, LLC and John Hancock Funds, LLC |
| (since 2010); President, John Hancock Trust and John Hancock Funds II (since 2009); Senior | |
| Vice President, Individual Business Product Management, MetLife, Inc. (1999–2006). | |
| |
| 30 | Technical Opportunities Fund | Annual report |
| |
| Principal officers who are not Trustees (continued) | |
| |
| Name, Year of Birth | |
| Position(s) held with Fund | Officer |
| Principal occupation(s) and other | of Trust |
| directorships during past 5 years | since |
| |
| Thomas M. Kinzler, Born: 1955 | 2009 |
|
| Secretary and Chief Legal Officer | |
| Vice President, John Hancock Financial Services (since 2006); Secretary and Chief Legal Officer, | |
| John Hancock retail funds, John Hancock Funds II and John Hancock Trust (since 2006); Secretary and |
| Chief Legal Counsel, John Hancock Advisers, LLC, John Hancock Investment Management Services, |
| LLC and John Hancock Funds, LLC (since 2007); Vice President and Associate General Counsel, | |
| Massachusetts Mutual Life Insurance Company (1999–2006); Secretary and Chief Legal Counsel, MML |
| Series Investment Fund (2000–2006); Secretary and Chief Legal Counsel, MassMutual Select Funds and |
| MassMutual Premier Funds (2004–2006). | |
|
| |
| Francis V. Knox, Jr., Born: 1947 | 2009 |
|
| Chief Compliance Officer | |
| Vice President, John Hancock Financial Services (since 2005); Chief Compliance Officer, John Hancock |
| retail funds, John Hancock Funds II, John Hancock Trust, Chief Compliance Officer, John Hancock | |
| Advisers, LLC and John Hancock Investment Management Services, LLC (since 2005); Vice President and |
| Chief Compliance Officer, MFC Global Investment Management (U.S.), LLC (2005–2008). | |
|
| |
| Michael J. Leary, Born: 1965 | 2009 |
|
| Treasurer | |
| Assistant Vice President, John Hancock Financial Services (since 2007); Treasurer, John Hancock retail |
| funds, John Hancock Funds II and John Hancock Trust (since 2009); Vice President, John Hancock | |
| Advisers, LLC and John Hancock Investment Management Services, LLC (since 2007); Assistant | |
| Treasurer, John Hancock retail funds, John Hancock Funds II and John Hancock Trust (2007–2009); |
| Vice President and Director of Fund Administration, JP Morgan (2004–2007). | |
|
| |
| Charles A. Rizzo, Born: 1957 | 2009 |
|
| Chief Financial Officer | |
| Vice President, John Hancock Financial Services (since 2008); Chief Financial Officer, John Hancock retail |
| funds, John Hancock Funds II and John Hancock Trust (since 2007); Senior Vice President, John Hancock |
| Advisers, LLC and John Hancock Investment Management Services, LLC (since 2008); Assistant Treasurer, |
| Goldman Sachs Mutual Fund Complex (2005–2007); Vice President, Goldman Sachs (2005–2007); | |
| Managing Director and Treasurer, Scudder Funds, Deutsche Asset Management (2003–2005). | |
|
| |
| John G. Vrysen, Born: 1955 | 2009 |
|
| Chief Operating Officer | |
| Senior Vice President, John Hancock Financial Services (since 2006); Director, Executive Vice President |
| and Chief Operating Officer, John Hancock Advisers, LLC, John Hancock Investment Management |
| Services, LLC and John Hancock Funds, LLC (since 2005); Chief Operating Officer, John Hancock | |
| Funds II and John Hancock Trust (since 2007); Chief Operating Officer, John Hancock retail funds (until |
| 2009); Trustee, John Hancock retail funds (since 2009). | |
The business address for all Trustees and Officers is 601 Congress Street, Boston, Massachusetts 02210-2805.
The Statement of Additional Information of the Fund includes additional information about members of the Board of Trustees of the Fund and is available without charge, upon request, by calling 1-800-225-5291.
| |
| Annual report | Technical Opportunities Fund | 31 |
More information
| | |
| Trustees | Investment adviser |
| James M. Oates, Chairman | John Hancock Investment Management |
| James R. Boyle† | Services, LLC |
| Grace K. Fey† | |
| Charles L. Bardelis* | Subadviser |
| Peter S. Burgess* | Wellington Management Company, LLC |
| Theron S. Hoffman | |
| Hassell H. McClellan | Principal distributor |
| Steven M. Roberts* | John Hancock Funds, LLC |
| | |
| Officers | Custodian |
| Hugh McHaffie | State Street Bank and Trust Company |
| President | |
| | Transfer agent |
| Thomas M. Kinzler | John Hancock Signature Services, Inc. |
| Secretary and Chief Legal Officer | |
| | Legal counsel |
| Francis V. Knox, Jr. | K&L Gates LLP |
| Chief Compliance Officer | |
| Independent registered |
| Michael J. Leary | public accounting firm |
| Treasurer | PricewaterhouseCoopers LLP |
| |
| Charles A. Rizzo |
| |
| Chief Financial Officer | The report is certified under the Sarbanes-Oxley |
| Act, which requires mutual funds and other public |
| John G. Vrysen | companies to affirm that, to the best of their |
| Chief Operating Officer | knowledge, the information in their financial reports |
| | is fairly and accurately stated in all material respects. |
| *Member of the Audit Committee |
| |
| †Non-Independent Trustee | |
| | |
The Fund’s proxy voting policies and procedures, as well as the Fund’s proxy voting record for the most recent twelve-month period ended June 30, are available free of charge on the Securities and Exchange Commission (SEC) Web site at www.sec.gov or on our Web site.
The Fund’s complete list of portfolio holdings, for the first and third fiscal quarters, is filed with the SEC on Form N-Q. The Fund’s Form N-Q is available on our Web site and the SEC’s Web site, www.sec.gov, and can be reviewed and copied (for a fee) at the SEC’s Public Reference Room in Washington, DC. Call 1-800-SEC-0330 to receive information on the operation of the SEC’s Public Reference Room.
We make this information on your fund, as well as monthly portfolio holdings, and other fund details available on our Web site www.jhfunds.com or by calling 1-800-225-5291.
| | |
| You can also contact us: | | |
| 1-800-225-5291 | Regular mail: | Express mail: |
| jhfunds.com | John Hancock Signature Services, Inc. | John Hancock Signature Services, Inc. |
| | P.O. Box 55913 | Mutual Fund Image Operations |
| | Boston, MA 02205-5913 | 30 Dan Road |
| | | Canton, MA 02021 |
|
| |
| 32 | Technical Opportunities Fund | Annual report |

1-800-225-5291
1-800-554-6713 TDD
1-800-338-8080 EASI-Line
www.jhfunds.com
Now available: electronic delivery
www.jhfunds.com/edelivery
| |
| This report is for the information of the shareholders of John Hancock Technical Opportunities Fund. | 3470A 7/10 |
| It is not authorized for distribution to prospective investors unless preceded or accompanied by a prospectus. | 9/10 |
| |
| |
| |
| |
| |
| |
| | John Hancock |
| | Global High Yield Fund |
|
|
|
|
|
|
|
|
|
|
|
|
| |
| |
| |
| |
| Annual Report | |
| 7.31.10 | |
| |
| |
| |
| |
| |
| |
| |
| |
| |
| |
| | | | |
| John Hancock Global High Yield Fund | | | | |
| |
| Table of Contents | | | | |
| | | | |
| Management’s Discussion of Fund Performance | | | | Page 2 |
| | | | |
| A look at performance | | | | Page 3 |
| | | | |
| Your expenses | | | | Page 5 |
| | | | |
| Portfolio Summary | | | | Page 6 |
| | | | |
| Portfolio of Investments | | | | Page 7 |
| | | | |
| Financial Statements | | | | Page 18 |
| | | | |
| Financial Highlights | | | | Page 21 |
| | | | |
| Notes to Financial Statements | | | | Page 24 |
| | | | |
| Trustees and Officers | | | | Page 35 |
| | | | |
| More information | | | | Page 42 |
John Hancock Global High Yield Fund
Management’s Discussion of Fund Performance
By Stone Harbor Investment Partners LP
The positive momentum within risk assets, such as high-yield bonds, that began at the start of 2009 picked up speed in the latter half, leading to significant spread contraction as the U.S. and global economy showed signs of stabilization. Better-than-expected economic indicators, as well as continued monetary and fiscal stimulus out of Washington, buoyed investor sentiment. Constructive earnings and improvement in domestic manufacturing and global production sustained strong inflows into these asset classes at the end of the first quarter of 2010. Yet despite just over a year of strong performance, concerns over the stability of U.S. and global growth led to wider risk premiums. Market focus shifted overseas as developments regarding a sovereign debt crisis in Greece, EU efforts to limit its spread to other European countries and a pullback on Chinese growth challenged the viability of a synchronized global recovery. Tracking equity volatility, a sharp dec line across risk assets in May reflected investor unease and uncertainty regarding the negative impact of global events on U.S. growth. High-yield and emerging-markets debt remained resilient during this period of volatility, rallying in July.
From the Fund’s inception on November 2, 2009 through July 31, 2010, John Hancock Global High Yield Fund’s Class A, Class I and Class NAV shares posted total returns of 9.66%, 9.89% and 9.96%, respectively, at net asset value. The Fund’s return compares with the 10.15% return of the Fund’s benchmark, the Bank of America Merrill Lynch Global High Yield and Emerging Markets Plus Index, the 12.16% return of a blended index – 50% Bank of America Merrill Lynch U.S. High Yield Master II Constrained Index/50% JPMorgan Global EMBI Global Diversified Index – and the 3.75% average return of the world bond funds tracked by Morningstar, Inc. The benefits of holding a large stake in high-yield assets were more than offset by issue selection decisions in sectors such as cable and media and utilities. An underweight allocation to financials also detracted from relative returns. Within the high-yield bond universe, we have focused on mid-quali ty investments, which, despite strong absolute returns, lagged the broader market indexes until the May-June period of volatility. The Fund’s relative performance was helped by its stake in strong-performing emerging-markets debt, especially by an allocation to Argentina. The country benefited from a debt exchange for previously defaulted bonds, an event that was viewed favorably as the country’s capacity to borrow in the capital markets was restored. Other high beta (higher volatility) credits such as Ukraine also outperformed. As evidence of a global economic turnaround became more entrenched, we increased the portfolio’s exposure to local currency debt in Brazil, Colombia and Mexico, which also boosted performance.
This commentary reflects the views of the portfolio managers through the end of the Fund’s period discussed in this report. The managers' statements reflect their own opinions. As such, they are in no way guarantees of future events, and are not intended to be used as investment advice or a recommendation regarding any specific security. They are also subject to change at any time as market and other conditions warrant.
Past performance is no guarantee of future results. The major factors in this Fund's performance are interest rate and credit risk. When interest rates rise, bond prices usually fall. Generally, an increase in the Fund's average maturity will make it more sensitive to interest-rate risk. International investing involves special risks such as political, economic and currency risks and differences in accounting standards and financial reporting. Higher-yielding bonds are riskier than lower-yielding bonds, and their value may fluctuate more in response to market conditions. The Fund may not be appropriate for all investors. Sector investing is subject to greater risks than the market as a whole. Because the Fund may focus on particular sectors of the economy, its performance may depend on the performance of those sectors.
A look at Performance
Global High Yield Fund
For the period ended July 31, 2010
| | | | | | | | |
| | Average annual total return (%) | | Cumulative total returns (%) | |
| | with maximum sales charge (POP) | | with maximum sales charge (POP) | |
|
|
| | | | | Since | | | | Since |
| Class | 1-year | 5-year | 10-year | Inception1 | 1-year | 5-year | 10-year | Inception1 |
|
| A | - | - | - | 4.14% | - | - | - | 4.14% |
|
| I2 | - | - | - | 9.89% | - | - | - | 9.89% |
|
| NAV2 | - | - | - | 9.96% | - | - | - | 9.96% |
|
Performance figures assume all distributions are reinvested. Public offering price (POP) figures reflect maximum sales charges on Class A shares of 5.00%.
The expense ratios of the Fund, both net (including any fee waivers or expense limitations) and gross (excluding any fee waivers or expense limitations), are set forth according to the
most recent publicly available prospectuses for the Fund and may diffe r from the expense ratios disclosed in the Financial Highlights tables in this report. The waivers and expense
limitations are contractual at least until 10 31 10. The net expenses are as follows: Class A – 1.30% and Class I 1.00%. Had the fee waivers and expense limitations not been in place,
the gross expenses would be as follows: Class A – 1.58% and Class I – 1.10%. For Class NAV, the net expenses equal the gross expenses and are 0.95%.
The returns reflect past results and should not be considered indicative of future performance. The return and principal value of an investment will fluctuate so that shares, when redeemed,
may be worth more or less than their original cost. Due to market volatility, the Fund’s current performance may be higher or lower than the performance shown. For current to the most
recent month end performance data, please call 1–800–225–5291 or visit the Fund’s Web site at www.jhfunds.com.
The performance table above and the chart on the next page do not reflect the deduction of taxes that a shareholder would pay on fund distributions or the redemption of fund shares.
The Fund’s performance results reflect any applicable expense reductions, without which the expenses would increase and results would have been less favorable.
1 From 11 2 09.
2 For certain types of investors, as described in the Fund’s Class I and Class NAV share prospectuses.
Growth of $10,000
This chart shows what happened to a hypothetical $10,000 investment in John Hancock Global High Yield Fund Class A shares for the period indicated. For comparison, we’ve shown the same investment in two separate indexes.
| | | | | |
| | | Without sales | With maximum | | |
| Class | Period beginning | charge | sales charge | Index 1 | Index 2 |
|
| I1,2 | 11-2-09 | $10,989 | $10,989 | $11,015 | $11,216 |
|
| NAV1,2 | 11-2-09 | 10,996 | 10,996 | 11,015 | 11,216 |
|
Assuming all distributions were reinvested for the period indicated, the table above shows the value of a $10,000 investment in the Fund’s Class I and Class NAV shares, respectively, as of 7-31-10.
Bank of America/Merrill Lynch Global High Yield and Emerging Markets Plus Index — Index 1 — tracks the performance of the below and border-line investment grade global debt markets denominated in the major developed market currencies.
50% Bank of America Merrill Lynch U.S. High Yield Master II Constrained Index/50% JPMorgan Global EMBI Global Diversified Index — Index 2 — is comprised of 50% JPMorgan Global EMBI Global Diversified Index and 50% Bank of America Merrill Lynch High Yield Master II Constrained Index.
It is not possible to invest directly in an index. Index figures do not reflect sales charges, which would have resulted in lower values if they did.
1 No contingent deferred sales charges applicable.
2 For certain types of investors, as described in the Fund’s Class I and Class NAV share prospectuses.
3 Index as closest month end to inception date.
| | |
| | Annual report | Global High Yield Fund |
| 4 | |
Global High Yield Fund
Your Expenses
These examples are intended to help you understand your ongoing operating expenses.
Understanding fund expenses
As a shareholder of the Fund, you incur two types of costs:
• Transaction costs which include sales charges (loads) on purchases or redemptions (varies by share class), minimum account fee charge, etc.
• Ongoing operating expenses which include management fees, distribution and service fees (if applicable) and other fund expenses.
We are going to present only your ongoing operating expenses here.
Actual expenses/actual returns
This example is intended to provide information about your fund’s actual ongoing operating expenses, and is based on your fund’s actual return. It assumes an account value of $1,000.00 on February 1, 2010, with the same investment held until July 31, 2010.
| | | |
| | Account value | Ending value | Expenses paid during |
| | on 2-1-10 | on 7-31-10 | period ended 7-31-101 |
|
| Class A | $1,000.00 | $1,096.60 | $6.76 |
|
| Class I | 1,000.00 | 1,098.90 | 5.20 |
|
| Class NAV | 1,000.00 | 1,099.60 | 4.84 |
|
Together with the value of your account, you may use this information to estimate the operating expenses that you paid over the period. Simply divide your account value at July 31, 2010, by $1,000.00, then multiply it by the “expenses paid” for your share class from the table above. For example, for an account value of $8,600.00, the operating expenses should be calculated as follows:
Example
[ My account value $8,600.00 / $1,000.00 = 8.6 ] x $[ “expenses paid” from table ] = My actual expenses
Hypothetical example for comparison purposes
This table allows you to compare your fund’s ongoing operating expenses with those of any other fund. It provides an example of the Fund’s hypothetical account values and hypothetical expenses based on each class’s actual expense ratio and an assumed 5% annualized return before expenses (which is not your fund’s actual return). It assumes an account value of $1,000.00 on February 1, 2010, with the same investment held until July 31, 2010. Look in any other fund shareholder report to find its hypothetical example and you will be able to compare these expenses.
| | | |
| | Account value | Ending value | Expenses paid during |
| | on 2-1-10 | on 7-31-10 | period ended 7-31-101 |
|
| Class A | $1,000.00 | $1,018.30 | $6.51 |
|
| Class I | 1,000.00 | 1,019.80 | 5.01 |
|
| Class NAV | 1,000.00 | 1,020.20 | 4.66 |
|
Remember, these examples do not include any transaction costs, therefore, these examples will not help you to determine the relative total costs of owning different funds. If transaction costs were included, your expenses would have been higher. See the prospectuses for details regarding transaction costs.
1 Expenses are equal to the Fund's annualized expense ratio of 1.30%, 1.00% and 0.93% for Class A, Class I and Class NAV shares, respectively, multiplied by the average account value over the period, multiplied by 181/365 (to reflect the one-half year period).
| |
| Global High Yield Fund | |
| |
| Portfolio Summary | |
| | Percentage of |
| Portfolio Composition1 | Net Assets |
| Corporate Bonds | 58% |
| Foreign Government Obligations3 | 32% |
| Structured Notes | 3% |
| Short-Term Investments & Other | 7% |
| |
| |
| |
| | Percentage of |
| Sector Composition1,2 | Net Assets |
| Foreign Government | 32% |
| Consumer Discretionary | 14% |
| Energy | 12% |
| Financials | 8% |
| Telecommunication Services | 7% |
| Industrials | 6% |
| Health Care | 5% |
| Materials | 4% |
| Consumer Staples | 3% |
| Utilities | 3% |
| Information Technology | 2% |
| Short-Term Investments & Other | 4% |
| |
| |
| | Percentage of |
| Top Five Countries1 | Net Assets |
| United States | 53% |
| Brazil | 5% |
| Venezuela | 4% |
| Mexico | 3% |
| Russia | 3% |
1 As a percentage of net assets on 7-31-10.
2 Sector investing is subject to greater risks than the market as a whole. Because the Fund may focus on particular sectors of the economy, its performance may depend on the performance of those sectors.
3 Typically, sovereign debt of developing countries may involve a high degree of risk and may be in default or present the risk of default, however, sovereign debt of developed counties may also present these risks. For further details, see the Fund’s Prospectuses and Statement of Additional Information.
Global High Yield Fund
Portfolio of Investments
As of July 31, 2010
| | | | |
| | | Maturity | | |
| | Rate | date | Par value | Value |
|
| Corporate Bonds 57.61% | | | | $157,109,473 |
|
| (Cost $152,740,509) | | | | |
| |
| Argentina 0.11% | | | | 287,323 |
|
| IRSA Inversiones y Representaciones SA (S) | 11.500% | 07/20/20 | $284,000 | 287,323 |
| | | | | |
| Bermuda 0.87% | | | | 2,368,710 |
|
| Digicel Group, Ltd., PIK (S) | 9.125 | 01/15/15 | 171,000 | 172,710 |
| Intelsat Jackson Holdings SA | 11.250 | 06/15/16 | 1,200,000 | 1,296,000 |
| Petroplus Finance, Ltd. (S) | 9.375 | 09/15/19 | 1,000,000 | 900,000 |
| | | | | |
| Brazil 0.33% | | | | 901,493 |
|
| BM&FBovespa SA (S) | 5.500 | 07/16/20 | 875,000 | 901,493 |
| | | | | |
| Canada 0.97% | | | | 2,653,250 |
|
| Gibson Energy ULC/GEP Midstream Finance Corp. | 10.000 | 01/15/18 | 250,000 | 257,500 |
| Nova Chemicals Corp. | 8.375 | 11/01/16 | 1,000,000 | 1,023,750 |
| Videotron Ltee | 9.125 | 04/15/18 | 1,225,000 | 1,372,000 |
| | | | | |
| Cayman Islands 0.29% | | | | 788,828 |
|
| Offshore Group Investments, Ltd. (S) | 11.500 | 08/01/15 | 75,000 | 74,625 |
| Pemex Finance, Ltd. | 9.150 | 11/15/18 | 520,000 | 655,174 |
| Petrobras International Finance Company | 7.875 | 03/15/19 | 49,000 | 59,029 |
| Chile 0.23% | | | | 638,893 |
|
| Corporacion Nacional del Cobre de Chile (S) | 6.150 | 10/24/36 | 255,000 | 288,484 |
| Corporacion Nacional del Cobre de Chile | 7.500 | 01/15/19 | 280,000 | 350,409 |
| | | | | |
| Germany 0.20% | | | | 536,812 |
|
| Unitymedia Hessen GmbH & Company KG/Unitymedia NRW | | | | |
| GmbH (S) | 8.125 | 12/01/17 | 525,000 | 536,812 |
| | | | | |
| Luxembourg 0.56% | | | | 1,519,566 |
|
| CSN Resources SA (S) | 6.500 | 07/21/20 | 398,000 | 401,980 |
| MHP SA | 10.250 | 04/29/15 | 102,000 | 104,407 |
| Wind Acquisition Finance SA (S) | 11.750 | 07/15/17 | 600,000 | 637,500 |
| Wind Acquisition Holdings Finance SA, PIK (S) | 12.250 | 07/15/17 | 401,796 | 375,679 |
| | | | | |
| Malaysia 1.73% | | | | 4,728,658 |
|
| Petronas Capital, Ltd. | 7.875 | 05/22/22 | 3,645,000 | 4,728,658 |
| | | | | |
| Marshall Islands 0.33% | | | | 904,625 |
|
| General Maritime Corp. | 12.000 | 11/15/17 | 650,000 | 684,125 |
| Navios Maritime Holdings, Inc. | 9.500 | 12/15/14 | 225,000 | 220,500 |
| | | | | |
| Mexico 0.08% | | | | 214,075 |
|
| Axtel SAB de CV (S) | 7.625 | 02/01/17 | 38,000 | 34,010 |
| Axtel SAB de CV | 9.000 | 09/22/19 | 187,000 | 169,235 |
| Hipotecaria Su Casita SA de CV (S) | 8.500 | 10/04/16 | 14,000 | 7,980 |
| Hipotecaria Su Casita SA de CV | 8.500 | 10/04/16 | 5,000 | 2,850 |
| | | | | |
| Netherlands 0.81% | | | | 2,199,021 |
|
| Indo Integrated Energy II BV | 9.750 | 11/05/16 | 102,000 | 109,905 |
| Indosat Palapa Company BV (S) | 7.375 | 07/29/20 | 136,000 | 142,120 |
| KazMunaiGaz Finance Sub BV (S) | 7.000 | 05/05/20 | 325,000 | 350,188 |
| KazMunaiGaz Finance Sub BV (S) | 9.125 | 07/02/18 | 435,000 | 526,698 |
Global High Yield Fund
Portfolio of Investments
As of July 31, 2010
| | | | |
| | | Maturity | | |
| | Rate | date | Par value | Value |
| |
| Netherlands (continued) | | | | |
|
| Myriad International Holding BV (S) | 6.375% | 07/28/17 | $304,000 | $312,360 |
| NXP BV/NXP Funding LLC | 9.500 | 10/15/15 | 425,000 | 416,500 |
| NXP BV/NXP Funding LLC (S) | 9.750 | 08/01/18 | 325,000 | 341,250 |
| |
| Spain 0.16% | | | | 438,878 |
|
| Cemex Espana Luxembourg (S) | 9.250 | 05/12/20 | 201,000 | 180,398 |
| Cemex Espana Luxembourg | 9.250 | 05/12/20 | 288,000 | 258,480 |
| |
| Tunisia 0.33% | | | | 905,501 |
|
| Banque Centrale de Tunisie | 7.375 | 04/25/12 | 680,000 | 742,900 |
| Banque Centrale de Tunisie, EMTN (EUR) (Q) | 6.250 | 02/20/13 | 115,000 | 162,601 |
| |
| Turkey 0.31% | | | | 834,608 |
|
| Akbank TAS (S) | 5.125 | 07/22/15 | $836,000 | $834,608 |
| |
| United Arab Emirates 0.09% | | | | 251,569 |
|
| DP World, Ltd. | 6.850 | 07/02/37 | 300,000 | 251,569 |
| |
| United Kingdom 0.79% | | | | 2,148,250 |
|
| Vedanta Resources PLC (S) | 9.500 | 07/18/18 | 575,000 | 632,500 |
| Virgin Media Finance PLC | 8.375 | 10/15/19 | 825,000 | 895,125 |
| Virgin Media Finance PLC | 9.125 | 08/15/16 | 525,000 | 564,375 |
| Virgin Media Finance PLC | 9.500 | 08/15/16 | 50,000 | 56,250 |
| |
| United States 48.19% | | | | 131,432,208 |
|
| AES Corp. | 8.000 | 06/01/20 | 100,000 | 105,875 |
| Alere, Inc. | 9.000 | 05/15/16 | 350,000 | 355,250 |
| Allison Transmission, Inc. (S) | 11.000 | 11/01/15 | 325,000 | 349,375 |
| Allison Transmission, Inc., PIK (S) | 11.250 | 11/01/15 | 100,000 | 107,500 |
| Ally Financial, Inc. | 8.000 | 11/01/31 | 775,000 | 756,594 |
| AMC Entertainment, Inc. | 8.000 | 03/01/14 | 950,000 | 950,000 |
| AMC Entertainment, Inc. | 8.750 | 06/01/19 | 525,000 | 551,250 |
| American Renal Holdings (S) | 8.375 | 05/15/18 | 325,000 | 330,281 |
| American Residential Services LLC (S) | 12.000 | 04/15/15 | 400,000 | 403,000 |
| American Tire Distributors, Inc. (S) | 9.750 | 06/01/17 | 675,000 | 703,687 |
| Ameristar Casinos, Inc. | 9.250 | 06/01/14 | 575,000 | 613,812 |
| ARAMARK Corp. | 8.500 | 02/01/15 | 1,400,000 | 1,447,250 |
| Arch Coal, Inc. (S) | 8.750 | 08/01/16 | 325,000 | 348,562 |
| Arch Western Finance LLC | 6.750 | 07/01/13 | 500,000 | 502,500 |
| Ashland, Inc. (S) | 9.125 | 06/01/17 | 300,000 | 340,875 |
| Atlantic Broadband Finance LLC | 9.375 | 01/15/14 | 525,000 | 530,250 |
| Atlas Pipeline Partners LP | 8.750 | 06/15/18 | 775,000 | 771,125 |
| B&G Foods, Inc. | 7.625 | 01/15/18 | 250,000 | 258,438 |
| Belo Corp. | 8.000 | 11/15/16 | 1,375,000 | 1,448,906 |
| Boise Paper Holdings LLC/Boise Company | 8.000 | 04/01/20 | 350,000 | 362,250 |
| Bristow Group, Inc. | 6.125 | 06/15/13 | 775,000 | 776,937 |
| BWAY Holding Company (S) | 10.000 | 06/15/18 | 350,000 | 371,000 |
| Cablevision Systems Corp. (S) | 8.625 | 09/15/17 | 850,000 | 912,687 |
| Calpine Corp. (S) | 7.875 | 07/31/20 | 850,000 | 858,500 |
| Case New Holland, Inc. (S) | 7.875 | 12/01/17 | 725,000 | 759,437 |
| CB Richard Ellis Services, Inc. | 11.625 | 06/15/17 | 575,000 | 651,187 |
| CCO Holdings LLC/CCO Holdings Capital Corp. (S) | 7.875 | 04/30/18 | 150,000 | 157,125 |
| Central Garden and Pet Company | 8.250 | 03/01/18 | 350,000 | 355,250 |
| Cenveo Corp. | 7.875 | 12/01/13 | 750,000 | 731,250 |
Global High Yield Fund
Portfolio of Investments
As of July 31, 2010
| | | | |
| | | Maturity | | |
| | Rate | date | Par value | Value |
| |
| United States (continued) | | | | |
|
| Cenveo Corp. | 8.875% | 02/01/18 | $400,000 | $378,000 |
| Cequel Communications Holdings I LLC/Cequel Capital | | | | |
| Corp. (S) | 8.625 | 11/15/17 | 775,000 | 790,500 |
| Cincinnati Bell, Inc. | 8.250 | 10/15/17 | 675,000 | 668,250 |
| Cinemark USA, Inc. | 8.625 | 06/15/19 | 700,000 | 728,000 |
| Citizens Communications Company | 9.000 | 08/15/31 | 1,325,000 | 1,358,125 |
| Claire's Stores, Inc., PIK | 9.625 | 06/01/15 | 920,392 | 791,537 |
| Clean Harbors, Inc. | 7.625 | 08/15/16 | 750,000 | 774,375 |
| Cloud Peak Energy Resources LLC/Cloud Peak Energy | | | | |
| Finance Corp (S) | 8.500 | 12/15/19 | 675,000 | 708,750 |
| Community Health Systems, Inc. | 8.875 | 07/15/15 | 1,250,000 | 1,309,375 |
| Complete Production Services, Inc. | 8.000 | 12/15/16 | 725,000 | 734,062 |
| Consol Energy, Inc. (S) | 8.000 | 04/01/17 | 425,000 | 451,562 |
| Consol Energy, Inc. (S) | 8.250 | 04/01/20 | 275,000 | 295,625 |
| Constellation Brands, Inc. | 7.250 | 09/01/16 | 1,625,000 | 1,694,062 |
| Copano Energy LLC | 8.125 | 03/01/16 | 100,000 | 102,500 |
| Corrections Corp. of America | 6.750 | 01/31/14 | 400,000 | 410,000 |
| Corrections Corp. of America | 7.750 | 06/01/17 | 1,425,000 | 1,521,187 |
| Cott Beverages, Inc. (S) | 8.375 | 11/15/17 | 675,000 | 698,625 |
| Crosstex Energy LP/Crosstex Energy Finance Corp. | 8.875 | 02/15/18 | 325,000 | 339,625 |
| Crown Americas LLC (S) | 7.625 | 05/15/17 | 650,000 | 689,000 |
| Crown Castle International Corp. | 7.125 | 11/01/19 | 400,000 | 415,000 |
| Crown Castle International Corp. | 9.000 | 01/15/15 | 950,000 | 1,040,250 |
| CSC Holdings LLC | 8.500 | 04/15/14 | 1,075,000 | 1,161,000 |
| DaVita, Inc. | 7.250 | 03/15/15 | 1,450,000 | 1,488,062 |
| Dean Foods Company | 6.900 | 10/15/17 | 700,000 | 646,625 |
| Dean Foods Company | 7.000 | 06/01/16 | 125,000 | 119,688 |
| Del Monte Corp. | 7.500 | 10/15/19 | 650,000 | 684,937 |
| Deluxe Corp. | 5.125 | 10/01/14 | 425,000 | 399,500 |
| DISH DBS Corp. | 7.000 | 10/01/13 | 925,000 | 962,000 |
| DISH DBS Corp. | 7.875 | 09/01/19 | 450,000 | 478,125 |
| Dole Food Company, Inc. (S) | 8.000 | 10/01/16 | 1,275,000 | 1,319,625 |
| Dole Food Company, Inc. | 8.750 | 07/15/13 | 50,000 | 52,625 |
| Drummond Company, Inc. | 7.375 | 02/15/16 | 700,000 | 700,000 |
| Dynegy Holdings, Inc. | 7.750 | 06/01/19 | 1,900,000 | 1,330,000 |
| E*Trade Financial Corp., PIK | 12.500 | 11/30/17 | 600,000 | 675,000 |
| Edison Mission Energy | 7.000 | 05/15/17 | 875,000 | 595,000 |
| Edison Mission Energy | 7.750 | 06/15/16 | 850,000 | 605,625 |
| Education Management LLC/Education Management | | | | |
| Finance Corp. | 8.750 | 06/01/14 | 725,000 | 720,469 |
| El Paso Corp. | 7.000 | 06/15/17 | 600,000 | 627,839 |
| El Paso Corp. | 7.250 | 06/01/18 | 750,000 | 795,340 |
| El Paso Corp. | 7.800 | 08/01/31 | 100,000 | 100,163 |
| Elizabeth Arden, Inc. | 7.750 | 01/15/14 | 650,000 | 651,625 |
| Encore Acquisition Company | 9.500 | 05/01/16 | 650,000 | 711,750 |
| Express LLC/Express Finance Corp. (S) | 8.750 | 03/01/18 | 325,000 | 338,000 |
| FGI Holding Company, Inc., PIK (S) | 11.250 | 10/01/15 | 200,000 | 198,500 |
| Fidelity National Information Services, Inc. (S) | 7.625 | 07/15/17 | 225,000 | 234,000 |
| Ford Motor Credit Company LLC | 8.700 | 10/01/14 | 2,925,000 | 3,162,697 |
| Forest Oil Corp. | 7.250 | 06/15/19 | 700,000 | 708,750 |
| Fox Acquisition Sub LLC (S) | 13.375 | 07/15/16 | 350,000 | 348,250 |
| Freedom Group, Inc. (S) | 10.250 | 08/01/15 | 625,000 | 660,156 |
| GCI, Inc. | 8.625 | 11/15/19 | 400,000 | 414,000 |
Global High Yield Fund
Portfolio of Investments
As of July 31, 2010
| | | | |
| | | Maturity | | |
| | Rate | date | Par value | Value |
| |
| United States (continued) | | | | |
|
| Georgia-Pacific LLC (S) | 8.250% | 05/01/16 | $700,000 | $759,500 |
| Goodman Global Group, Inc. (S) | Zero | 12/15/14 | 600,000 | 375,000 |
| Graphic Packaging International, Inc. (S) | 9.500 | 06/15/17 | 1,325,000 | 1,417,750 |
| Greif, Inc. | 6.750 | 02/01/17 | 675,000 | 691,875 |
| GXS Worldwide, Inc. (S) | 9.750 | 06/15/15 | 700,000 | 672,000 |
| HCA, Inc. | 6.750 | 07/15/13 | 1,050,000 | 1,060,500 |
| HCA, Inc. | 9.250 | 11/15/16 | 1,400,000 | 1,512,000 |
| Healthsouth Corp. | 8.125 | 02/15/20 | 825,000 | 837,375 |
| Hercules Offshore, Inc. (S) | 10.500 | 10/15/17 | 750,000 | 671,250 |
| Hornbeck Offshore Services, Inc. | 6.125 | 12/01/14 | 650,000 | 583,375 |
| Host Hotels & Resorts LP | 6.375 | 03/15/15 | 800,000 | 806,000 |
| Hughes Network Systems LLC | 9.500 | 04/15/14 | 650,000 | 676,000 |
| IASIS Healthcare LLC | 8.750 | 06/15/14 | 725,000 | 743,125 |
| Inergy LP | 8.250 | 03/01/16 | 750,000 | 787,500 |
| Inergy LP | 8.750 | 03/01/15 | 25,000 | 26,563 |
| Insight Communications Company, Inc. (S) | 9.375 | 07/15/18 | 250,000 | 264,375 |
| Inverness Medical Innovations, Inc. | 7.875 | 02/01/16 | 725,000 | 725,000 |
| Iron Mountain, Inc. | 7.750 | 01/15/15 | 1,250,000 | 1,262,500 |
| Iron Mountain, Inc. | 8.375 | 08/15/21 | 75,000 | 79,688 |
| Isle of Capri Casinos, Inc. | 7.000 | 03/01/14 | 475,000 | 435,812 |
| ITC Deltacom, Inc. | 10.500 | 04/01/16 | 500,000 | 492,500 |
| Jarden Corp. | 7.500 | 01/15/20 | 275,000 | 280,500 |
| Koppers, Inc. | 7.875 | 12/01/19 | 650,000 | 672,750 |
| Lamar Media Corp., Series D | 6.625 | 08/15/15 | 825,000 | 812,625 |
| LBI Escrow Corp. (S) | 8.000 | 11/01/17 | 175,000 | 183,969 |
| Level 3 Financing, Inc. | 10.000 | 02/01/18 | 1,475,000 | 1,344,094 |
| Levi Strauss & Company | 8.875 | 04/01/16 | 750,000 | 787,500 |
| Libbey Glass, Inc. (S) | 10.000 | 02/15/15 | 100,000 | 106,500 |
| Limited Brands, Inc. | 7.000 | 05/01/20 | 1,300,000 | 1,342,250 |
| MacDermid, Inc. (S) | 9.500 | 04/15/17 | 425,000 | 435,625 |
| Mariner Energy, Inc. | 8.000 | 05/15/17 | 725,000 | 797,500 |
| MarkWest Energy Partners LP | 8.750 | 04/15/18 | 625,000 | 672,656 |
| MarkWest Energy Partners LP, Series B | 6.875 | 11/01/14 | 400,000 | 402,000 |
| Maxim Crane Works LP (S) | 12.250 | 04/15/15 | 200,000 | 187,000 |
| MetroPCS Wireless, Inc. | 9.250 | 11/01/14 | 800,000 | 836,000 |
| MGM Resorts International | 6.750 | 09/01/12 | 550,000 | 518,375 |
| MGM Resorts International | 6.750 | 04/01/13 | 125,000 | 114,375 |
| MGM Resorts International (S) | 9.000 | 03/15/20 | 600,000 | 630,000 |
| Michael Foods, Inc. (S) | 9.750 | 07/15/18 | 275,000 | 288,750 |
| Michaels Stores, Inc. | 11.375 | 11/01/16 | 1,225,000 | 1,313,812 |
| Mirant Americas Generation LLC | 9.125 | 05/01/31 | 100,000 | 94,000 |
| Mylan, Inc. (S) | 7.625 | 07/15/17 | 475,000 | 504,687 |
| Nalco Company | 8.875 | 11/15/13 | 750,000 | 767,812 |
| NetFlix, Inc. | 8.500 | 11/15/17 | 425,000 | 461,125 |
| New Albertsons, Inc. | 8.000 | 05/01/31 | 1,700,000 | 1,470,500 |
| Newfield Exploration Company | 6.875 | 02/01/20 | 700,000 | 728,000 |
| NewMarket Corp. | 7.125 | 12/15/16 | 400,000 | 402,000 |
| Nextel Communications, Inc. | 7.375 | 08/01/15 | 1,425,000 | 1,410,750 |
| NFR Energy LLC/NFR Energy Finance Corp. (S) | 9.750 | 02/15/17 | 450,000 | 459,000 |
| Niska Gas Storage US LLC (S) | 8.875 | 03/15/18 | 700,000 | 735,000 |
| Norcraft Companies LP/Norcraft Finance Corp. | 10.500 | 12/15/15 | 700,000 | 735,000 |
Global High Yield Fund
Portfolio of Investments
As of July 31, 2010
| | | | |
| | | Maturity | | |
| | Rate | date | Par value | Value |
| |
| United States (continued) | | | | |
|
| NRG Energy, Inc. | 7.375% | 02/01/16 | $1,125,000 | $1,147,500 |
| NRG Energy, Inc. | 8.500 | 06/15/19 | 1,075,000 | 1,128,750 |
| Owens-Illinois, Inc. | 7.800 | 05/15/18 | 1,350,000 | 1,454,625 |
| Peabody Energy Corp. | 7.375 | 11/01/16 | 750,000 | 817,500 |
| Penn National Gaming, Inc. | 6.750 | 03/01/15 | 700,000 | 700,875 |
| Penn Virginia Corp. | 10.375 | 06/15/16 | 650,000 | 715,000 |
| Penn Virginia Resource Partners LP | 8.250 | 04/15/18 | 350,000 | 355,250 |
| Phillips-Van Heusen Corp. | 7.375 | 05/15/20 | 250,000 | 260,625 |
| Photronics, Inc. | 5.500 | 10/01/14 | 15,000 | 17,232 |
| Pinnacle Entertainment, Inc. | 8.625 | 08/01/17 | 1,300,000 | 1,358,500 |
| Pinnacle Foods Finance LLC (S) | 9.250 | 04/01/15 | 375,000 | 387,656 |
| Pinnacle Foods Finance LLC | 10.625 | 04/01/17 | 650,000 | 693,875 |
| Pioneer Natural Resources Company | 6.875 | 05/01/18 | 775,000 | 808,663 |
| Plains Exploration & Production Company | 7.625 | 06/01/18 | 300,000 | 304,500 |
| Plains Exploration & Production Company | 7.625 | 04/01/20 | 375,000 | 379,687 |
| Provident Funding Associates (S) | 10.250 | 04/15/17 | 650,000 | 663,000 |
| Psychiatric Solutions, Inc. | 7.750 | 07/15/15 | 400,000 | 413,500 |
| Psychiatric Solutions, Inc., Series 1 | 7.750 | 07/15/15 | 225,000 | 232,313 |
| Quicksilver Resources, Inc. | 8.250 | 08/01/15 | 400,000 | 415,000 |
| Quiksilver, Inc. | 6.875 | 04/15/15 | 625,000 | 587,500 |
| QVC, Inc. (S) | 7.500 | 10/01/19 | 650,000 | 669,500 |
| Qwest Corp. | 7.125 | 11/15/43 | 1,975,000 | 1,836,750 |
| Qwest Corp. | 8.375 | 05/01/16 | 1,150,000 | 1,308,125 |
| Radiation Therapy Services, Inc. (S) | 9.875 | 04/15/17 | 725,000 | 719,562 |
| Radio One, Inc. | 6.375 | 02/15/13 | 900,000 | 751,500 |
| RBS Global, Inc./Rexnord LLC (S) | 8.500 | 05/01/18 | 1,650,000 | 1,666,500 |
| Regal Cinemas Corp. | 8.625 | 07/15/19 | 650,000 | 672,750 |
| Regency Energy Partners LP (S) | 9.375 | 06/01/16 | 575,000 | 626,750 |
| Reynolds Group Issuer, Inc. (S) | 7.750 | 10/15/16 | 675,000 | 705,375 |
| Reynolds Group Issuer, Inc. (S) | 8.500 | 05/15/18 | 775,000 | 796,312 |
| Sabine Pass LNG LP | 7.250 | 11/30/13 | 400,000 | 373,000 |
| Sabine Pass LNG LP | 7.500 | 11/30/16 | 600,000 | 522,000 |
| SandRidge Energy, Inc. (S) | 8.750 | 01/15/20 | 300,000 | 306,000 |
| SandRidge Energy, Inc., PIK | 8.625 | 04/01/15 | 950,000 | 957,125 |
| SBA Telecommunications, Inc. | 8.000 | 08/15/16 | 650,000 | 698,750 |
| Seneca Gaming Corp. | 7.250 | 05/01/12 | 650,000 | 640,250 |
| Sensus USA, Inc. | 8.625 | 12/15/13 | 250,000 | 248,438 |
| Sinclair Broadcast Group, Inc. | 8.000 | 03/15/12 | 675,000 | 672,469 |
| Sinclair Television Group, Inc. (S) | 9.250 | 11/01/17 | 50,000 | 52,250 |
| Smithfield Foods, Inc. (S) | 10.000 | 07/15/14 | 725,000 | 810,187 |
| Sprint Capital Corp. | 8.750 | 03/15/32 | 1,075,000 | 1,089,781 |
| SSI Investments II/SSI Company-Issuer LLC (S) | 11.125 | 06/01/18 | 625,000 | 657,031 |
| Stallion Oilfield Holdings, Ltd. (S) | 10.500 | 02/15/15 | 50,000 | 49,250 |
| Starwood Hotels & Resorts Worldwide, Inc. | 7.150 | 12/01/19 | 575,000 | 598,000 |
| Surgical Care Affiliates, Inc. (S) | 10.000 | 07/15/17 | 500,000 | 501,250 |
| Surgical Care Affiliates, Inc., PIK (S) | 8.875 | 07/15/15 | 250,000 | 249,375 |
| Terex Corp. | 8.000 | 11/15/17 | 175,000 | 169,750 |
| The AES Corp. | 9.750 | 04/15/16 | 1,250,000 | 1,403,125 |
| The Geo Group, Inc. (S) | 7.750 | 10/15/17 | 670,000 | 691,775 |
| The Manitowoc Company, Inc. | 9.500 | 02/15/18 | 500,000 | 510,000 |
| The Neiman Marcus Group, Inc. | 10.375 | 10/15/15 | 325,000 | 338,813 |
| The Neiman Marcus Group, Inc., PIK | 9.000 | 10/15/15 | 500,000 | 511,875 |
| The ServiceMaster Company | 7.450 | 08/15/27 | 375,000 | 282,187 |
Global High Yield Fund
Portfolio of Investments
As of July 31, 2010
| | | | |
| | | Maturity | | |
| | Rate | date | Par value | Value |
| |
| United States (continued) | | | | |
|
| The ServiceMaster Company, PIK (S) | 10.750% | 07/15/15 | $425,000 | $445,719 |
| Toys R Us Property Company LLC | 10.750 | 07/15/17 | 950,000 | 1,072,312 |
| Trans Union LLC/TransUnion Financing Corp. (S) | 11.375 | 06/15/18 | 300,000 | 321,750 |
| TransDigm, Inc. | 7.750 | 07/15/14 | 650,000 | 669,500 |
| Triumph Group, Inc. (S) | 8.625 | 07/15/18 | 575,000 | 600,875 |
| TRW Automotive, Inc. (S) | 8.875 | 12/01/17 | 450,000 | 479,250 |
| United Surgical Partners International, Inc., PIK | 9.250 | 05/01/17 | 450,000 | 463,500 |
| Vanguard Health Holding Company II LLC | 8.000 | 02/01/18 | 1,575,000 | 1,575,000 |
| Windstream Corp. | 7.875 | 11/01/17 | 275,000 | 279,813 |
| Windstream Corp. | 8.625 | 08/01/16 | 550,000 | 573,375 |
| Wynn Las Vegas LLC (S) | 7.875 | 11/01/17 | 675,000 | 690,187 |
| Xerox Capital Trust I | 8.000 | 02/01/27 | 1,350,000 | 1,361,814 |
| |
| Venezuela 1.23% | | | | 3,357,205 |
|
| Petroleos de Venezuela SA | 4.900 | 10/28/14 | 325,000 | 203,450 |
| Petroleos de Venezuela SA | 5.250 | 04/12/17 | 2,581,000 | 1,561,505 |
| Petroleos de Venezuela SA | 5.375 | 04/12/27 | 3,300,000 | 1,592,250 |
| |
| Foreign Government Obligations 32.41% | | | | $88,395,802 |
|
| (Cost $83,180,662) | | | | |
| |
| Argentina 1.28% | | | | 3,494,706 |
|
| Republic of Argentina | | | | |
| Bond | Zero | 12/15/35 | 6,004,884 | 594,484 |
| Bond (P) | 0.389 | 08/03/12 | 1,000,000 | 230,000 |
| Bond (ARS) (P)(Q) | 6.403 | 12/31/33 | 631,614 | 185,910 |
| Bond | 8.280 | 12/31/33 | $1,514,858 | $1,147,505 |
| Bond | 8.750 | 06/02/17 | 327,283 | 306,664 |
| Note | 7.000 | 10/03/15 | 633,000 | 553,875 |
| Note (EUR) (P)(Q) | 7.572 | 12/31/33 | 557,126 | 476,268 |
| |
| Brazil 2.82% | | | | 7,677,788 |
|
| Federative Republic of Brazil | | | | |
| Bond | 4.875 | 01/22/21 | $1,116,000 | $1,155,060 |
| Bond | 7.125 | 01/20/37 | 655,000 | 812,200 |
| Bond | 8.875 | 10/14/19 | 370,000 | 499,500 |
| Bond | 11.000 | 08/17/40 | 1,465,000 | 1,998,260 |
| Note | 5.875 | 01/15/19 | 248,000 | 280,736 |
| Note | 8.000 | 01/15/18 | 50,000 | 59,300 |
| Note | 8.750 | 02/04/25 | 1,461,000 | 2,038,095 |
| Notas do Tesouro Nacional, Series F | | | | |
| Note (BRL) (Q) | 10.000 | 01/01/21 | 1,650,000 | 834,637 |
| |
| Colombia 2.72% | | | | 7,420,065 |
|
| Republic of Colombia | | | | |
| Bond | 7.375 | 01/27/17 | $980,000 | $1,173,550 |
| Bond | 7.375 | 09/18/37 | 2,655,000 | 3,305,475 |
| Bond | 11.750 | 02/25/20 | 145,000 | 221,488 |
| Bond (COP) (Q) | 9.850 | 06/28/27 | 717,000,000 | 517,417 |
| Santa Fe de Bogota DC (COP) (Q) | 9.750 | 07/26/28 | 3,235,000,000 | 2,202,135 |
Global High Yield Fund
Portfolio of Investments
As of July 31, 2010
| | | | |
| | | Maturity | | |
| | Rate | date | Par value | Value |
| |
| Croatia 0.21% | | | | $574,943 |
|
| Republic of Croatia (S) | 6.625% | 07/14/20 | $536,000 | 574,943 |
| |
| El Salvador 0.59% | | | | 1,620,825 |
|
| Republic of El Salvador | | | | |
| Bond | 7.375 | 12/01/19 | 995,000 | 1,079,575 |
| Bond | 8.250 | 04/10/32 | 500,000 | 541,250 |
| |
| Indonesia 1.68% | | | | 4,574,793 |
|
| Republic of Indonesia | | | | |
| Bond | 6.875 | 03/09/17 | 1,435,000 | 1,675,248 |
| Bond | 7.750 | 01/17/38 | 270,000 | 348,570 |
| Note | 11.625 | 03/04/19 | 1,695,000 | 2,550,975 |
| |
| Iraq 1.27% | | | | 3,463,200 |
|
| Republic of Iraq | 5.800 | 01/15/28 | 4,160,000 | 3,463,200 |
| |
| Malaysia 0.80% | | | | 2,181,753 |
|
| Government of Malaysia | | | | |
| Bond (MYR) (Q) | 3.741 | 02/27/15 | 3,430,000 | 1,090,955 |
| Bond (MYR) (Q) | 3.835 | 08/12/15 | 3,420,000 | 1,090,798 |
| |
| Mexico 3.42% | | | | 9,326,459 |
|
| Government of Mexico | | | | |
| Bond (MXN) (Q) | 8.000 | 12/17/15 | 18,100,000 | 1,558,487 |
| Bond (MXN) (Q) | 8.000 | 06/11/20 | 8,420,000 | 737,199 |
| Bond | 8.000 | 09/24/22 | $170,000 | $226,525 |
| Note | 5.950 | 03/19/19 | 972,000 | 1,097,388 |
| Note | 6.625 | 03/03/15 | 1,311,000 | 1,507,650 |
| Note | 6.750 | 09/27/34 | 110,000 | 130,900 |
| Note | 7.500 | 04/08/33 | 3,166,000 | 4,068,310 |
| |
| Pakistan 0.11% | | | | 311,821 |
|
| Islamic Republic of Pakistan | 7.125 | 03/31/16 | 325,000 | 311,821 |
| |
| Panama 1.51% | | | | 4,105,475 |
|
| Republic of Panama | | | | |
| Bond | 5.200 | 01/30/20 | 1,795,000 | 1,920,650 |
| Bond | 7.250 | 03/15/15 | 1,680,000 | 1,967,700 |
| Bond | 9.375 | 04/01/29 | 150,000 | 217,125 |
| |
| Peru 1.42% | | | | 3,876,791 |
|
| Republic of Peru | | | | |
| Bond (PEN) (Q) | 2.774 | 08/12/20 | 690,000 | 282,421 |
| Bond | 6.550 | 03/14/37 | $357,000 | $414,120 |
| Bond | 7.350 | 07/21/25 | 1,085,000 | 1,356,250 |
| Bond | 8.750 | 11/21/33 | 1,280,000 | 1,824,000 |
| |
| Philippines 2.50% | | | | 6,816,850 |
|
| Republic of Philippines | | | | |
| Bond | 6.375 | 01/15/32 | 215,000 | 235,425 |
| Bond | 7.750 | 01/14/31 | 3,850,000 | 4,774,000 |
Global High Yield Fund
Portfolio of Investments
As of July 31, 2010
| | | | |
| | | Maturity | | |
| | Rate | date | Par value | Value |
| |
| Philippines (continued) | | | | |
|
| Bond | 9.375% | 01/18/17 | $1,385,000 | $1,807,425 |
| |
| Poland 0.96% | | | | 2,627,175 |
|
| Republic of Poland | 6.375 | 07/15/19 | 2,315,000 | 2,627,175 |
| |
| Qatar 0.62% | | | | 1,692,000 |
|
| Government of Qatar (S) | 5.250 | 01/20/20 | 1,600,000 | 1,692,000 |
| |
| Russia 3.03% | | | | 8,255,302 |
|
| Government of Russia | | | | |
| Eurobond | 3.625 | 04/29/15 | 455,000 | 452,725 |
| Eurobond (S) | 5.000 | 04/29/20 | 500,000 | 503,750 |
| Eurobond | 7.500 | 03/31/30 | 6,293,720 | 7,298,827 |
| |
| South Africa 0.67% | | | | 1,827,512 |
|
| Republic of South Africa | | | | |
| Bond (ZAR) (Q) | 7.500 | 01/15/14 | 2,080,000 | 284,536 |
| Bond (ZAR) (Q) | 8.000 | 12/21/18 | 2,175,000 | 294,526 |
| Note | 6.500 | 06/02/14 | $250,000 | $281,875 |
| Note | 6.875 | 05/27/19 | 820,000 | 966,575 |
| |
| South Korea 0.26% | | | | 710,529 |
|
| Republic of Korea | 7.125 | 04/16/19 | 585,000 | 710,529 |
| |
| Turkey 0.97% | | | | 2,648,412 |
|
| Republic of Turkey | | | | |
| Note | 7.250 | 03/15/15 | 1,130,000 | 1,300,912 |
| Note | 7.250 | 03/05/38 | 195,000 | 219,375 |
| Note | 7.500 | 11/07/19 | 950,000 | 1,128,125 |
| |
| Ukraine 1.36% | | | | 3,719,721 |
|
| Republic of Ukraine | | | | |
| Bond (JPY) (Q) | 3.200 | 12/19/10 | 210,000,000 | 2,397,743 |
| Bond | 6.875 | 03/04/11 | $685,000 | $691,918 |
| Bond | 7.650 | 06/11/13 | 600,000 | 630,060 |
| |
| Uruguay 1.22% | | | | 3,322,150 |
|
| Republic of Uruguay | | | | |
| Bond | 7.625 | 03/21/36 | 380,000 | 460,750 |
| Note | 8.000 | 11/18/22 | 2,280,000 | 2,861,400 |
| |
| Venezuela 2.99% | | | | 8,147,532 |
|
| Republic of Venezuela | | | | |
| Bond | 5.750 | 02/26/16 | 85,000 | 58,225 |
| Bond | 7.000 | 12/01/18 | 75,000 | 48,375 |
| Bond | 7.650 | 04/21/25 | 265,000 | 161,650 |
| Bond | 8.250 | 10/13/24 | 610,000 | 392,535 |
| Bond | 8.500 | 10/08/14 | 1,461,000 | 1,190,715 |
| Bond | 9.000 | 05/07/23 | 1,788,000 | 1,229,250 |
| Bond | 9.250 | 05/07/28 | 2,685,000 | 1,819,087 |
| Bond | 13.625 | 08/15/18 | 810,000 | 747,225 |
| Note (P) | 1.513 | 04/20/11 | 2,646,000 | 2,500,470 |
Global High Yield Fund
Portfolio of Investments
As of July 31, 2010
| | | | |
| | | Maturity | | |
| | Rate | date | Par value | Value |
|
| |
| Structured Notes (K) 3.31% | | | | $9,025,129 |
| (Cost $8,403,590) | | | | |
| |
| Brazil 2.15% | | | | 5,849,113 |
|
| Federative Republic of Brazil (JPMorgan Chase & Company) | | | |
| Note (BRL)(Q) | 10.000% | 05/11/11 | 1,400,000 | 706,536 |
| Notas do Tesouro Nacional (HSBC Bank USA) | | | | |
| Note (BRL) (Q) | 10.000 | 01/01/17 | 8,450,000 | 4,456,900 |
| Notas do Tesouro Nacional (JPMorgan Chase Bank) | | | | |
| Bond (BRL) (Q) | 10.000 | 12/07/10 | 1,300,000 | 685,677 |
| |
| Indonesia 0.97% | | | | 2,650,508 |
|
| Federative Republic of Brazil (JPMorgan Chase & Company) | | | |
| Note (IDR) (Q) | 12.800 | 06/11/21 | 9,200,000,000 | 1,360,595 |
| Republic of Indonesia (Barclays Bank PLC, EMTN) | | | | |
| Note (IDR) (Q) | 12.800 | 06/17/21 | 3,600,000,000 | 534,559 |
| Note (IDR) (Q) | 11.500 | 09/18/19 | 2,000,000,000 | 272,604 |
| Republic of Indonesia (Citigroup Funding, Inc.) | | | | |
| Bond (IDR) (Q) | 11.000 | 11/15/20 | 3,600,000,000 | 482,750 |
| |
| Russia 0.19% | | | | 525,508 |
|
| Government of Russia (Barclays Bank PLC) | | | | |
| Bond (RUB) (Q) | 11.200 | 12/17/14 | 13,500,000 | 525,508 |
|
| |
| Convertible Bonds 1.25% | | | | $3,413,712 |
| (Cost $3,414,134) | | | | |
| |
| Cayman Islands 0.03% | | | | 92,863 |
|
| Transocean, Inc., Series A | 1.625 | 12/15/37 | $95,000 | 92,863 |
| |
| Jersey, C.I. 0.28% | | | | 755,475 |
|
| Aldar Funding, Ltd. | 5.767 | 11/10/11 | 537,000 | 516,862 |
| Shire PLC | 2.750 | 05/09/14 | 240,000 | 238,613 |
| |
| Singapore 0.17% | | | | 458,434 |
|
| Enercoal Resources Pte, Ltd. | 5.000 | 11/25/16 | 100,000 | 94,951 |
| Enercoal Resources Pte, Ltd. | 9.250 | 08/05/14 | 400,000 | 363,483 |
| |
| United States 0.77% | | | | 2,106,940 |
|
| Alcatel-Lucent USA, Inc. | 2.875 | 06/15/25 | 170,000 | 150,663 |
| Amgen, Inc. | 0.125 | 02/01/11 | 65,000 | 64,513 |
| CommScope, Inc. | 3.250 | 07/01/15 | 115,000 | 116,006 |
| Comtech Telecommunications Corp. (S) | 3.000 | 05/01/29 | 220,000 | 204,600 |
| FTI Consulting, Inc. | 3.750 | 07/15/12 | 50,000 | 62,688 |
| Gilead Sciences, Inc. | 0.500 | 05/01/11 | 235,000 | 238,525 |
| Gilead Sciences, Inc. (S) | 1.000 | 05/01/14 | 90,000 | 89,709 |
| Life Technologies Corp. | 3.250 | 06/15/25 | 290,000 | 308,850 |
| Micron Technology, Inc. | 1.875 | 06/01/14 | 180,000 | 156,150 |
| ON Semiconductor Corp. | 1.875 | 12/15/25 | 27,000 | 31,016 |
| ON Semiconductor Corp., Series B | Zero | 04/15/24 | 105,000 | 101,588 |
| ON Semiconductor Corp. | 2.625 | 12/15/26 | 27,000 | 26,393 |
| Owens-Brockway Glass Container, Inc. (S) | 3.000 | 06/01/15 | 140,000 | 133,175 |
Global High Yield Fund
Portfolio of Investments
As of July 31, 2010
| | | | |
| | | Maturity | | |
| | Rate | date | Par value | Value |
| United States (continued) | | | | |
|
| PDL BioPharma, Inc. | 2.000% | 02/15/12 | $70,000 | $68,075 |
| Smithfield Foods, Inc. | 4.000 | 06/30/13 | 90,000 | 86,963 |
| Symantec Corp. | 0.750 | 06/15/11 | 115,000 | 114,138 |
| Tyson Foods, Inc. | 3.250 | 10/15/13 | 50,000 | 61,063 |
| Xilinx, Inc. | 3.125 | 03/15/37 | 94,000 | 92,825 |
|
| Term Loans (M) 1.11% | | | | $3,023,740 |
| (Cost $3,023,686) | | | | |
| |
| United States 1.11% | | | | 3,023,740 |
|
| American General Finance Corp. | 7.300 | 04/21/15 | 325,000 | 320,430 |
| Harrah's Operating Company, Inc. | 3.500 | 01/28/15 | 825,000 | 706,819 |
| Ocwen Financial Corp. | 1.000 | 07/28/15 | 650,000 | 650,000 |
| Texas Competitive Electric Holdings Company LLC | 4.000 | 10/10/14 | 1,736,607 | 1,346,491 |
| |
| | | | Shares | Value |
|
| Preferred Stocks 0.13% | | | | $358,808 |
|
| (Cost $358,909) | | | | |
| |
| United States 0.13% | | | | 358,808 |
|
| Apache Corp., Series D, 6.000% (I) | | | 100 | 5,434 |
| Archer-Daniels-Midland Company, 6.250% | | | 3,000 | 115,230 |
| El Paso Corp., 4.990% | | | 77 | 82,144 |
| Wells Fargo & Company, 7.500% | | | 160 | 156,000 |
| |
| Short-Term Investments 2.46% | | | | $6,708,674 |
|
| (Cost $6,708,674) | | | | |
| |
| | Yield* | | | Value |
| United States 2.46% | | | | 6,708,674 |
|
| State Street Institutional Reserves Fund | 0.2701% | | 6,708,674 | 6,708,674 |
| |
| Total investments (Cost $257,830,164)† 98.28% | | | | $268,035,338 |
|
| Other assets and liabilities, net 1.72% | | | | $4,677,594 |
|
| Total net assets 100.00% | | | | $272,712,932 |
|
| The percentage shown for each investment category is the total value of that category as a percentage of the net assets of the Fund. |
Currency abbreviations
ARS – Argentine Peso
BRL - Brazilian Real
COP - Colombian Peso
EUR - Euro
IDR - Indonesian Rupiah
Global High Yield Fund
Portfolio of Investments
As of July 31, 2010
Currency abbreviations (continued)
JPY - Japanese Yen
MXN - Mexican Peso
MYR - Malaysian Ringgit
PEN – Peruvian Nuevo Sol
RUB – Russian Ruble
ZAR - South African Rand
| |
| Abbreviations |
|
| EMTN European Medium Term Note |
| | |
| PIK | Paid In Kind |
Notes to Portfolio of Investments
(I) Non-income producing security.
(K) Underlying issuer is shown parenthetically in security description.
(M) Term loans are variable rate obligations. The coupon rate shown represents the rate at period end unless the investment is unsettled.
(P) Variable rate obligation. The coupon rate shown represents the rate at period end.
(Q) Par value of foreign bonds is expressed in local currency as shown parenthetically in security description.
(S) These securities are exempt from registration under Rule 144A of the Securities Act of 1933. Such securities may be resold, normally to qualified institutional buyers, in transactions exempt from registration. Rule 144A securities amounted to $40,843,852 or 14.98% of the Fund's net assets as of 7-31-10.
* Yield represents either the annualized yield at the date of purchase, the stated coupon rate or, for floating rate securities, the rate at period end.
† At 7-31-10, the aggregate cost of investment securities for federal income tax purposes was $258,350,806. Net unrealized appreciation aggregated $9,684,532, of which $11,127,643 related to appreciated investment securities and $1,443,111 related to depreciated investment securities.
The Fund had the following sector composition as of 7-31-10 (as a percentage of total net assets):
| | | |
| Foreign Government | 32% | | |
| Consumer Discretionary | 14% | | |
| Energy | 12% | | |
| Financials | 9% | | |
| Telecommunication Services | 7% | | |
| Industrials | 5% | | |
| Health Care | 5% | | |
| Materials | 4% | | |
| Consumer Staples | 3% | | |
| Utilities | 3% | | |
| Information Technology | 2% | | |
| Short-Term Investments & Other | 4% | | |
Global High Yield Fund
Statement of Assets and Liabilities — July 31, 2010
| | |
| Assets | | |
|
| Investments, at value (Cost $257,830,164) | $ | 268,035,338 |
| Foreign currency, at value (Cost $45,319) | | 45,789 |
| Receivable for investments sold | | 3,517,387 |
| Receivable for forward foreign currency | | |
| exchange contracts (Note 3) | | 639 |
| Receivable for fund shares sold | | 26,878 |
| Dividends and interest receivable | | 4,719,983 |
| | |
| Total assets | | 276,346,014 |
| |
| |
| Liabilities | | |
|
| Payable for investments purchased | | 3,475,741 |
| Payable for forward foreign currency exchange | | |
| contracts (Note 3) | | 51,267 |
| Distributions payable | | 297 |
| Payable to affiliates | | |
| Accounting and legal services fees | | 4,052 |
| Transfer agent fees | | 6 |
| Trustees' fees | | 17 |
| Other liabilities and accrued expenses | | 101,702 |
| | | |
| Total liabilities | | 3,633,082 |
| |
| |
| Net assets | | |
|
| Capital paid-in | $ | 260,665,450 |
| Undistributed net investment income | | 66,461 |
| Accumulated net realized gain on investments | | |
| and foreign currency transactions | | 1,823,956 |
| Net unrealized appreciation on investments and | | |
| translation of assets and liabilities in foreign | | |
| currencies | | 10,157,065 |
| | | |
| Net assets | $ | 272,712,932 |
| |
| |
| Net asset value per share | | |
|
| Based on net asset values and shares | | |
| outstanding - the Fund has an unlimited | | |
| number of shares authorized with no par value | | |
| Class A ($26,182 ÷ 2,500 shares) | $ | 10.47 |
| Class I ($26,182 ÷ 2,500 shares) | $ | 10.47 |
| Class NAV ($272,660,568 ÷ 26,035,347 shares) | $ | 10.47 |
| |
| Maximum offering price per share | | |
| Class A (net asset value per share ÷ 95%)1 | $ | 11.02 |
1 On single retail sales of less than $100,000. On sales of $100,000 or more and on group sales the offering price is reduced.
| | |
| The accompanying notes are an integral part of the financial statements. | | |
| | 18 | |
Global High Yield Fund
Statement of Operations — July 31, 20101
| | |
| Investment income | | |
|
| Interest | $ | 13,238,350 |
| Less foreign taxes withheld | | (7,682) |
| Total investment income | | 13,230,668 |
| |
| Expenses | | |
|
| Investment management fees (Note 5) | | 1,464,932 |
| Distribution and service fees (Note 5) | | 56 |
| Accounting and legal services fees (Note 5) | | 32,148 |
| Transfer agent fees (Note 5) | | 98 |
| Trustees' fees (Note 5) | | 2,555 |
| Professional fees | | 50,025 |
| Custodian fees | | 107,292 |
| Registration and filing fees | | 5,825 |
| Other | | 4,428 |
| | | |
| Total expenses before reductions and | | |
| amounts recaptured | | 1,667,359 |
| Net expense reductions and amounts | | |
| recaptured (Note 5) | | (2,125) |
| | | |
| Total expenses | | 1,665,234 |
| |
| Net investment income | | 11,565,434 |
| |
| |
| Realized and unrealized gain (loss) | | |
|
| Net realized gain (loss) on | | |
| Investments | | 2,524,092 |
| Foreign currency transactions | | (89,349) |
| | | 2,434,743 |
| |
| Change in net unrealized appreciation | | |
| (depreciation) of | | |
| Investments | | 10,205,174 |
| Translation of assets and liabilities in foreign | | |
| currencies | | (48,109) |
| | | 10,157,065 |
| |
| Net realized and unrealized gain | | 12,591,808 |
| |
| Increase in net assets from operations | $ | 24,157,242 |
1 Period from 11-2-09 (inception date) to 7-31-10.
| | |
| The accompanying notes are an integral part of the financial statements. | | |
| | 19 | |
Global High Yield Fund
Statements of Changes in Net Assets
| | |
| |
| |
| | Period |
| | ended |
| | 7/31/101 |
| Increase (decrease) in net assets | | |
|
| From operations | | |
| Net investment income | $ | 11,565,434 |
| Net realized gain | | 2,434,743 |
| Change in net unrealized appreciation | | |
| (depreciation) | | 10,157,065 |
| Increase in net assets resulting from | | |
| operations | | 24,157,242 |
| |
| Distributions to shareholders | | |
| From net investment income | | |
| Class A | | (1,177) |
| Class I | | (1,231) |
| Class NAV | | (12,107,371) |
| |
| Total distributions | | (12,109,779) |
| |
| From Fund share transactions (Note 6) | | 260,665,469 |
| |
| Total increase | | 272,712,932 |
| |
| Net assets | | |
|
| Beginning of period | | — |
| End of period | $ | 272,712,932 |
| |
| Undistributed net investment income | $ | 66,461 |
1 Period from 11-2-09 (inception date) to 7-31-10.
| | |
| The accompanying notes are an integral part of the financial statements. | | |
| | 20 | |
Global High Yield Fund
Financial Highlights (For a share outstanding throughout the period)
| | |
| Class A Shares | | |
| |
| Period ended | | |
| | | 7/31/20101 |
| Per share operating performance | | |
|
| Net asset value, beginning of period | $ | 10.00 |
| Net investment income2 | | 0.45 |
| Net realized and unrealized gain on investments | | 0.49 |
| | |
| Total from investment operations | | 0.94 |
| |
| Less distributions | | |
| From net investment income | | (0.47) |
| | | |
| Total distributions | | (0.47) |
| |
| Net asset value, end of period | $ | 10.47 |
| |
| Total return (%)3,4 | | 9.665 |
| |
| Ratios and supplemental data | | |
|
| Net assets, end of period (in thousands) | $ | 26 |
| Ratios (as a percentage of average net assets): | | |
| Expenses before reductions and amounts | | |
| recaptured | | 1.346 |
| Expenses including reductions and amounts | | |
| recaptured | | 1.306 |
| Net investment income | | 5.976 |
| Portfolio turnover (%) | | 49 |
1 Period from 11-2-09 (inception date) to 7-31-10.
2 Based on the average daily shares outstanding.
3 Assumes dividend reinvestment (if applicable).
4 Total returns would have been lower had certain expenses not been reduced during the period shown.
5 Not annualized.
6 Annualized.
| | |
| The accompanying notes are an integral part of the financial statements. | | |
| | 21 | |
Global High Yield Fund
Financial Highlights (For a share outstanding throughout the period)
| | |
| Class I Shares | | |
| |
| Period ended | | |
| | | 7/31/20101 |
| Per share operating performance | | |
|
| Net asset value, beginning of period | $ | 10.00 |
| Net investment income2 | | 0.47 |
| Net realized and unrealized gain on investments | | 0.49 |
| | |
| Total from investment operations | | 0.96 |
| |
| Less distributions | | |
| From net investment income | | (0.49) |
| Total distributions | | (0.49) |
| |
| Net asset value, end of period | $ | 10.47 |
| |
| Total return (%)3,4 | | 9.895 |
| |
| Ratios and supplemental data | | |
|
| Net assets, end of period (in thousands) | $ | 26 |
| Ratios (as a percentage of average net assets): | | |
| Expenses before reductions and amounts | | |
| recaptured | | 1.356 |
| Expenses including reductions and amounts | | |
| recaptured | | 1.006 |
| Net investment income | | 6.256 |
| Portfolio turnover (%) | | 49 |
1 Period from 11-2-09 (inception date) to 7-31-10.
2 Based on the average daily shares outstanding.
3 Assumes dividend reinvestment (if applicable).
4 Total returns would have been lower had certain expenses not been reduced during the period shown.
5 Not annualized.
6 Annualized.
| | |
| The accompanying notes are an integral part of the financial statements. | | |
| | 22 | |
Global High Yield Fund
Financial Highlights (For a share outstanding throughout the period)
| | |
| Class NAV Shares | | |
| |
| Period ended | | |
| | | 7/31/20101 |
| Per share operating performance | | |
|
| Net asset value, beginning of period | $ | 10.00 |
| Net investment income2 | | 0.49 |
| Net realized and unrealized gain on investments | | 0.48 |
| | | |
| Total from investment operations | | 0.97 |
| |
| Less distributions | | |
| From net investment income | | (0.50) |
| Total distributions | | (0.50) |
| |
| Net asset value, end of period | $ | 10.47 |
| |
| Total return (%)3,4 | | 9.965 |
| |
| Ratios and supplemental data | | |
|
| Net assets, end of period (in millions) | $ | 273 |
| Ratios (as a percentage of average net assets): | | |
| Expenses before reductions and amounts | | |
| recaptured | | 0.946 |
| Expenses including reductions and amounts | | |
| recaptured | | 0.946 |
| Net investment income | | 6.516 |
| Portfolio turnover (%) | | 49 |
1 Period from 11-2-09 (inception date) to 7-31-10.
2 Based on the average daily shares outstanding.
3 Assumes dividend reinvestment (if applicable).
4 Total returns would have been lower had certain expenses not been reduced during the period shown.
5 Not annualized.
6 Annualized.
| | |
| The accompanying notes are an integral part of the financial statements. | | |
| | 23 | |
Global High Yield Fund
Notes to Financial Statements
Note 1 — Organization
John Hancock Global High Yield Fund (the Fund) is a non-diversified series of John Hancock Funds II (the Trust), an open-end management investment company organized as a Massachusetts business trust and registered under the Investment Company Act of 1940, as amended (the 1940 Act). The investment objective of the Fund is to seek maximum total return, which consists of income on its investments and capital appreciation.
The Fund may offer multiple classes of shares. The shares currently offered are detailed in the Statement of Assets and Liabilities. Class A shares are offered to all investors. Class I shares are offered to institutions and certain investors. Class NAV shares are sold to John Hancock affiliated funds of funds. Shareholders of each class have exclusive voting rights to matters that affect that class. The distribution and service fees, transfer agent fees, registration fees and printing and postage fees for each class may differ.
Affiliates of the Fund owned 100% of shares of beneficial interest of Class A, Class I and Class NAV shares on July 31, 2010.
Note 2 — Significant accounting policies
The financial statements have been prepared in conformity with accounting principles generally accepted in the United States of America, which require management to make certain estimates and assumptions at the date of the financial statements. Actual results could differ from those estimates. Events or transactions occurring after the end of the fiscal period through the date that the financial statements were issued have been evaluated in the preparation of the financial statements. The following summarizes the significant accounting policies of the Fund:
Security valuation. Investments are stated at value as of the close of regular trading on the New York Stock Exchange (NYSE), normally at 4:00 P.M., Eastern Time. The Fund uses a three-tier hierarchy to prioritize the pricing assumptions, referred to as inputs, used in valuation techniques to measure fair value. Level 1 includes quoted prices in active markets for identical securities. Level 2 includes significant observable inputs. Observable inputs may include quoted prices for similar securities, interest rates, prepayment speeds and credit risk. Prices for securities valued using these techniques are received from independent pricing vendors and brokers and are based on an evaluation of the inputs described. Level 3 includes significant unobservable inputs when mar ket prices are not readily available or reliable, including the Fund’s own assumptions in determining the fair value of investments. The inputs or methodology used for valuing securities are not necessarily an indication of the risk associated with investing in those securities.
The following is a summary of the values by input classification of the Fund’s investments as of July 31, 2010, by major security category or type:
| | | | | | | | |
| | | | | | | Level 2 | | Level 3 |
| | | Total Market | | | | Significant | | Significant |
| | | Value at | | Level 1 Quoted | | Observable | | Unobservable |
| | | 07/31/10 | | Price | | Inputs | | Inputs |
| Corporate Bonds | $ | 157,109,473 | | — | $ | 157,109,473 | | — |
| Foreign Government Obligations | | 88,395,802 | | — | | 84,568,133 | $ | 3,827,669 |
| Structured Notes | | 9,025,129 | | — | | 482,750 | | 8,542,379 |
| Convertible Bonds | | 3,413,712 | | — | | 3,413,712 | | — |
| Term Loans | | 3,023,740 | | — | | 3,023,740 | | — |
| Preferred Stocks | | 358,807 | $ | 276,663 | | 82,144 | | — |
| Short-Term Investments | $ | 6,708,674 | $ | 6,708,674 | | — | | — |
| Total investments in Securities | $ | 268,035,337 | $ | 6,985,337 | $ | 248,679,952 | $ | 12,370,048 |
| Forward foreign currency contracts | | ($50,628) | | — | | ($50,628) | | — |
| Totals | $ | 267,984,709 | $ | 6,985,337 | $ | 248,629,324 | $ | 12,370,048 |
The following is a reconciliation of Level 3 assets for which significant unobservable inputs were used to determine fair value:
| | | | | | | | | |
| | | Foreign Government | | | | | | |
| | | | Obligations | | | Structured Notes | | | Totals |
|
| Balance as of | | | | | | | | | |
| November 2, 2009 | | | — | | | — | | | — |
| Accrued discount/ | | | | | | | | | |
| premiums | | $ | 206,939 | | | — | | $ | 206,939 |
| Realized gain (loss) | | | — | | | ($716) | | | (716) |
| Change in | | | | | | | | | |
| unrealized | | | | | | | | | |
| appreciation | | | | | | | | | |
| (depreciation) | | | 314,679 | | | 538,560 | | | 853,239 |
| Net purchases | | | | | | | | | |
| (sales) | | | 3,306,051 | | | 8,004,535 | | | 11,310,586 |
| Net transfers in | | | | | | | | | |
| and/out of Level 3 | | | — | | | — | | | — |
| Balance as of July | | | | | | | | | |
| 31, 2010 | | $ | 3,827,669 | | $ | 8,542,379 | | $ | 12,370,048 |
During the period ended July 31, 2010, there were no significant transfers in or out of Level 1 or Level 2 assets.
In order to value the securities, the Fund uses the following valuation techniques. Equity securities held by the Fund are valued at the last sale price or official closing price on the principal securities exchange on which they trade. In the event there were no sales during the day or closing prices are not available, then securities are valued using the last quoted bid or evaluated price. Investments by the Funds in other investment companies are valued at their respective net asset values each business day. Debt obligations are valued based on the evaluated prices provided by an independent pricing service, which utilizes both dealer-supplied and electronic data processing techniques, taking into account factors such as institutional-size trading in similar groups of securities, yield, quality, coupon rate, maturity, type of issue, trading characteristics and other market data. Foreign securities and currencies are valued in U.S. dollars, based on foreign currency exchange rates supplied by an independent pricing service. Certain securities traded only in the over-the-counter market are valued at the last bid price quoted by brokers making markets in the securities at the close of trading. Certain short-term securities are valued at amortized cost.
Other portfolio securities and assets, where market quotations are not readily available, are valued at fair value, as determined in good faith by the Fund’s Pricing Committee, following procedures established by the Board of Trustees. Generally, trading in non-U.S. securities is substantially completed each day at various times prior to the close of trading on the NYSE. Significant market events that affect the values of non-U.S. securities may occur after the time when the valuation of the securities is generally determined and the close of the NYSE. During significant market events, these securities will be valued at fair value, as determined in good faith, following procedures established by the Board of Trustees. The Fund may use a fair valuation model to value non-U.S. securities in order to adjust for events which may occur between the close of foreign exchanges and the close of the NYSE.
Structured Notes. The Fund may invest in structured notes. The Fund invests in an entity, such as a trust, organized and operated solely for the purpose of restructuring the investment characteristics of various securities. This type of restructuring involves the deposit or purchase of specified instruments and the issuance of one or more classes of securities backed by, or representing interests, in the underlying instruments. The cash flow on the underlying instruments may be apportioned among the newly issued structured notes to create securities with different investment characteristics, such as varying maturities, payment priorities or interest rate provisions. The extent of the income paid by the structured notes is dependent on the cash flow of the underlying instruments.
Term loans (Floating rate loans). Term loans are generally subject to legal or contractual restrictions on resale. The liquidity of floating rate loans, including the volume and frequency of secondary market trading in such loans, varies significantly over time and among individual loans. During periods of infrequent trading, valuing a floating rate loan can be more difficult and buying and selling a floating rate loan at an acceptable price can be more difficult and delayed, which could result in a loss.
A Fund’s ability to receive payments of principal, interest and other amounts in connection with term loans will depend primarily on the financial condition of the borrower. A Fund’s failure to receive scheduled payments on a term loan due to a default, bankruptcy or other reason, would adversely affect the Fund’s income and would likely reduce the value of its assets. Because many term loans are not rated by independent credit rating agencies, a decision to invest in a particular loan could depend exclusively on the subadviser’s credit analysis of the borrower and/or term loan agents. A Fund may have limited rights to enforce the terms of an underlying loan.
Security transactions and related investment income. Investment security transactions are accounted for on a trade date plus one basis for daily net asset value calculations. However, for financial reporting purposes, investment transactions are reported on trade date. Interest income is accrued as earned. Gains and losses on securities sold are determined on the basis of identified cost and may include proceeds from litigation. Interest income includes coupon interest and amortization/accretion of premiums/discounts on debt securities. Debt obligations may be placed in a non-accrual status and related interest income may be reduced by stopping current accruals and writing off interest receivable when the collection of all or a portion of interest has become doubtful.
Foreign currency translation. Assets, including investments and liabilities denominated in foreign currencies, are translated into U.S. dollar values each day at the prevailing exchange rate. Purchases and sales of securities, income and expenses are translated into U.S. dollars at the prevailing exchange rate on the date of the transaction. The effect of changes in foreign currency exchange rates on securities is reflected as a component of the realized and unrealized gains (losses) on investments.
Funds that invest internationally generally carry more risk than funds that invest strictly in U.S. securities. Funds investing in a single country or in a limited geographic region tend to be riskier than funds that invest more broadly. Risks can result from differences in economic and political conditions, regulations, market practices (including higher transaction costs) and accounting standards. Foreign investments are also subject to a decline in the value of a foreign currency versus the U.S. dollar, which reduces the dollar value of securities denominated in that currency.
Line of credit. The Fund may borrow from banks for temporary or emergency purposes, including meeting redemption requests that otherwise might require the untimely sale of securities. Pursuant to the custodian agreement, the custodian may loan money to the Fund to make properly authorized payments. The Fund is obligated to repay the custodian for any overdraft, including any related costs or expenses. The custodian has a lien, security interest or security entitlement in any Fund property that is not segregated, to the maximum extent permitted by law for any overdraft.
In addition, the Fund and other affiliated funds have entered into an agreement with the custodian which enables them to participate in a $200 million unsecured committed line of credit. Prior to March 31, 2010, the amount of the line of credit was $300 million. A commitment fee, payable at the end of each calendar quarter, based on the average daily unused portion of the line of credit, is charged to each participating fund on a pro rata basis based on their relative average net assets. At July 31, 2010, the Fund did not have an outstanding balance from the line of credit.
Expenses. The majority of expenses are directly attributable to an individual fund. Expenses that are not readily attributable to a specific fund are allocated among all funds in an equitable manner, taking into consideration, among other things, the nature and type of expense and the fund’s relative assets. Expense estimates are accrued in the period to which they relate and adjustments are made when actual amounts are known.
Class allocations. Income, common expenses, and realized and unrealized gains (losses) are determined at the fund level and allocated daily to each class of shares based on the net asset value of the class. Class-specific expenses, such as distribution and service fees, if any, transfer agent fees, state registration fees and printing and postage fees, for all classes are calculated daily at the class level based on the appropriate net asset value of each class and the specific expense rates applicable to each class.
Federal income taxes. The Fund intends to qualify as a regulated investment company by complying with the applicable provisions of the Internal Revenue Code and will not be subject to federal income tax on taxable income that is distributed to shareholders. Therefore, no federal income tax provision is required.
As of July 31, 2010, the Fund had no uncertain tax positions that would require financial statement recognition, de-recognition or disclosure. The Fund’s federal tax return is subject to examination by the Internal Revenue Service for a period of three years.
Distribution of income and gains. Distributions to shareholders from net investment income and net realized gains, if any, are recorded on the ex-date. The Fund generally declares dividends daily and pays them monthly. Capital gain distributions, if any, are paid annually. The tax character of distributions for the period ended July 31, 2010 was $12,109,779 of ordinary income.
Distributions paid by the Fund with respect to each class of shares are calculated in the same manner, at the same time and are in the same amount, except for the effect of expenses that may be applied differently to each class. As of July 31, 2010, the components of distributable earnings on a tax basis included $2,360,728 of undistributed ordinary income.
Such distributions and distributable earnings, on a tax basis, are determined in conformity with income tax regulations, which may differ from accounting principles generally accepted in the United States of America. Material distributions in excess of tax basis earnings and profits, if any, are reported in the Fund’s financial statements as a return of capital.
Capital accounts within financial statements are adjusted for permanent book/tax differences. These adjustments have no impact on net assets or the results of operations. Temporary book/tax differences, if any, will reverse in a subsequent period. Permanent book/tax differences are primarily attributable to amortization and accretion on debt securities.
Note 3 — Derivative instruments
The Fund may invest in derivatives, including forward foreign currency contracts, in order to meet its investment objectives. The use of derivatives may involve risks different from, or potentially greater than, the risks associated with investing directly in securities. Specifically, derivatives expose the Fund to the risk that the counterparty to an over-the-counter (OTC) derivatives contract will be unable or unwilling to make timely settlement payments or otherwise honor its obligations. OTC derivatives transactions typically can only be closed out with the other party to the transaction. If the counterparty defaults, the Fund will have contractual remedies, but there is no assurance that the counterparty will meet its contractual obligations or that the Fund will succeed in enforcing them.
For more information regarding the Fund’s use of derivatives, please refer to the Fund’s Prospectuses and Statement of Additional Information.
Forward foreign currency contracts. A forward foreign currency contract is an agreement between two parties to buy and sell a specific currency at a price that is set on the date of the contract. The forward contract calls for delivery of the currency on a future date that is specified in the contract. Risks related to the use of forwards include the possible failure of counterparties to meet the terms of the forward agreement, the failure of the counterparties to timely post collateral, the risk that currency movements will not occur thereby reducing the Fund’s total return and the potential for losses in excess of the Fund’s initial investment.
The market value of a forward foreign currency contract fluctuates with changes in foreign currency exchange rates. Forward foreign currency contracts are marked-to-market daily and the change in value is recorded by a Fund as an unrealized gain or loss. Realized gains or losses, equal to the difference between the value of the contract at the time it was opened and the value at the time it was closed, are recorded upon delivery or receipt of the currency.
During the period ended July 31, 2010, the Fund used forward foreign currency contracts to gain exposure to foreign currency and to manage against anticipated currency exchange rates. The following table summarizes the contracts held at July 31, 2010. The range of forward foreign currency contracts principal amounts held by the Fund during the period ended July 31, 2010, was $0 to $5.04 million.
| | | | | | | | | | |
| | | | | Principal | | | | | | |
| | | Principal Amount | | Amount | | | | | | Unrealized |
| | | Covered by | | Covered by | | | | Settlement | | Appreciation |
| Currency | | Contract | | Contract (USD) | | Counterparty | | Date | | (Depreciation) |
|
| Buys | | | | | | | | | | |
|
| Chinese Yuan | | | | | | | | | | |
| Renminbi | | 6,840,987 | | $1,020,000 | | Citibank N.A. | | 11/23/2010 | | ($9,043) |
| Chinese Yuan | | | | | | | | | | |
| Renminbi | | 3,708,000 | | 555,755 | | Citibank N.A. | | 5/20/2011 | | (4,608) |
|
| | | | | $1,575,755 | | | | | | ($13,651) |
| |
| Sells | | | | | | | | | | |
|
| Chinese Yuan | | | | | | | | | | |
| Renminbi | | 3,046,000 | | $450,775 | | Citibank N.A. | | 11/23/2010 | | $639 |
| |
| Euro | | 487,000 | | 632,908 | | Citibank N.A. | | 9/2/2010 | | (1,708) |
| |
| Japanese Yen | | 207,909,000 | | 2,371,225 | | Citibank N.A. | | 9/2/2010 | | (35,908) |
|
| | | | | $3,454,908 | | | | | | ($36,977) |
Fair value of derivative instruments by risk category
The table below summarizes the fair value of derivatives held by the Fund at July 31, 2010, by risk category:
| | | | | | | | |
| | | | | Financial | | Asset | | Liability |
| | | Statement of Assets | | Instruments | | Derivatives | | Derivatives |
| Risk | | and Liabilities Location | | Location | | Fair Value | | Fair Value |
|
| | | | | Foreign | | | | |
| Foreign | | Receivable/Payable for | | forward | | | | |
| exchange | | forward foreign currency | | currency | | | | |
| contracts | | exchange contracts | | contracts | | $639 | | ($51,267) |
|
| Total | | | | | | $639 | | ($51,267) |
Effect of derivative instruments on the Statement of Operations
The table below summarizes the net realized gain (loss) included in the net increase (decrease) in net assets from operations, classified by derivative instrument and risk category, for the period ended July 31, 2010:
| | | | | | | | |
| | | Statement of | | | | Investments | | |
| | | Operations | | Foreign Currency | | (Purchased | | |
| Risk | | Location | | Transactions* | | Options) | | Total |
|
| Foreign exchange | | Net realized gain | | | | | | |
| contracts | | (loss) | | ($15,070) | | $103,176 | | $88,106 |
|
| Total | | | | ($15,070) | | $103,176 | | $88,106 |
* Realized gain/loss associated with forward foreign currency contracts is included in the caption on the Statement of Operations.
The table below summarizes the net change in unrealized appreciation (depreciation) included in the net increase (decrease) in net assets from operations, classified by derivative instrument and risk category, for the period ended July 31, 2010:
| | | | | | | | | |
| | | | | | | Translation of Assets | | | |
| | | | Statement of Operations | | | and Liabilities in | | | |
| Risk | | | Location | | | Foreign Currencies* | | | Total |
|
| Foreign | | | | | | | | | |
| exchange | | | Change in unrealized | | | | | | |
| contracts | | | appreciation (depreciation) | | | ($50,628) | | | ($50,628) |
|
| Total | | | | | | ($50,628) | | | ($50,628) |
* Change in unrealized appreciation/depreciation associated with forward foreign currency contracts is included in the caption on the Statement of Operations.
Note 4 — Guarantees and indemnifications
Under the Fund’s organizational documents, its Officers and Trustees are indemnified against certain liabilities arising out of the performance of their duties to the Fund. Additionally, in the normal course of business, the Fund enters into contracts with service providers that contain general indemnification clauses. The Fund’s maximum exposure under these arrangements is unknown, as this would involve future claims that may be made against the Fund that have not yet occurred. The risk of material loss from such claims is considered remote.
Note 5 — Fees and transactions with affiliates
John Hancock Investment Management Services, LLC (the Adviser) serves as investment adviser for the Fund. John Hancock Funds, LLC (the Distributor), an affiliate of the Adviser, serves as principal underwriter of the Fund. The Adviser and the Distributor are indirect wholly owned subsidiaries of Manulife Financial Corporation (MFC).
Management fee. The Fund has an investment management contract with the Adviser under which the Fund pays a daily management fee to the Adviser equivalent, on an annual basis, to the sum of: a) 0.825% of the first $250,000,000 of the Fund’s average daily net assets, b) 0.790% of the next $500,000,000 and c) 0.770% of the Fund’s average daily net assets in excess of $750,000,000. The Adviser has a subadvisory agreement with Stone Harbor Investment Partners LP. The Fund is not responsible for payment of the subadvisory fees.
The investment management fees incurred for the period ended July 31, 2010, were equivalent to an annual effective rate of 0.82% of the Fund’s average daily net assets.
Effective January 1, 2010, the Adviser contractually agreed to waive a portion of the management fee for certain funds of the Trust. The waiver equals, on an annualized basis, 0.01% of that portion of the aggregate net assets of all the participating funds that exceeds $85 billion. The amount of the reimbursement is calculated daily and allocated among all the funds in proportion of the daily net assets of each Fund.
The Adviser has contractually agreed to waive fees and/or reimburse certain expenses for each share class of the Fund. This agreement excludes taxes, portfolio brokerage commissions, interest, overdraft, litigation and other extraordinary expenses not incurred in the ordinary course of the Fund’s business. The fee waivers and/or reimbursements are such that these expenses will not exceed 1.30% and 1.00% of the average daily net assets for Class A and Class I shares, respectively. The fee waivers and/or reimbursements will continue in effect at least until October 31, 2010.
Accordingly, these expense reductions, described above, amounted to $7, $65 and $2,053 for Class A, Class I and Class NAV shares, respectively, for the period ended July 31, 2010.
Expense recapture. The Adviser may recapture operating expenses reimbursed or fees waived under previous expense limitation or waiver arrangements made subsequent to November 2, 2009, for a period of three years following the beginning of the month in which such reimbursements or waivers originally occurred. Certain reimbursements or waivers are not subject to recapture. The expenses waived or reimbursed subject to potential recovery through July 1, 2013 are $73. For the period ended July 31, 2010, the Fund did not recapture any expenses.
Accounting and legal services. Pursuant to the Service Agreement, the Fund reimburses the Adviser for all expenses associated with providing the administrative, financial, legal, accounting and recordkeeping services of the Fund, including the preparation of all tax returns, periodic reports to shareholders and regulatory reports, among other services. These expenses are allocated to each share class based on its relative net assets at the time the expense was incurred. The accounting and legal services fees incurred for the period ended July 31, 2010, amounted to an annual rate of 0.02% of the Fund’s average daily net assets.
Distribution and service plans. The Fund has a distribution agreement with the Distributor. The Fund has adopted distribution and service plans with respect to Class A shares, pursuant to Rule 12b-1 under the 1940 Act, to pay the Distributor for services provided as the distributor of shares of the Fund. Accordingly, the Fund may pay up to 0.30% for Class A shares for distribution and service fees, expressed as an annual percentage of average daily net assets.
Sales charges. Class A shares may be assessed up-front sales charges. During the period ended July 31, 2010, there were no upfront sales charges for Class A Shares.
Transfer agent fees. The Fund has a transfer agent agreement with John Hancock Signature Services, Inc. (Signature Services or Transfer Agent), an affiliate of the Adviser. Additionally, Class NAV shares do not pay transfer agent fees. Prior to July 1, 2010, the transfer agent fees were made up of the following components:
• The Fund paid a monthly transfer agent fee at an annual rate of 0.015% for Class A and Class I shares, based on each class’s average daily net assets.
• The Fund paid a monthly fee based on an annual rate of $17.50 per shareholder account for Class A and Class I shares.
• In addition, Signature Services was reimbursed for certain out-of-pocket expenses.
Effective July 1, 2010, the transfer agent fees paid to Signature Services are determined based on the cost to Signature Services (Signature Services Cost) of providing recordkeeping services. The Signature Services Cost is comprised of a component of allocated John Hancock corporate overhead for providing transfer agent services to the Funds and to all other John Hancock affiliated funds. It also includes out-of-pocket expenses that are comprised of payments made to third-parties for recordkeeping services provided to their clients who invest in one or more John Hancock funds. In addition, Signature Services Cost may be reduced by certain revenues that Signature Services received in connection with the performance of the service they provide to the funds. Signature Services Cost is calculated monthly and allocated, as applicable, to four categories of share classes: Institutional Share Classes, Retirement Share Classes, Municipal Bond Classes and all other Retail Share Classes. Within each of these categories, the applicable costs are allocated to the affected John Hancock affiliated funds and/or classes, based on the relative average daily net assets.
Class level expenses for the period ended July 31, 2010 were:
| | | | |
| | Distribution and | Transfer agent | | |
| Class | service fees | fees | | |
| A | $56 | $20 | | |
| I | — | 78 | | |
| NAV | — | — | | |
| Total | $56 | $98 | | |
Trustee expenses. The Trust compensates each Trustee who is not an employee of the Adviser or its affiliates. The costs of paying Trustee compensation and expenses are allocated to each Fund based on its average daily net assets.
Note 6 — Fund share transactions
Transactions in Fund shares for the period ended July 31, 2010, were as follows:
| | | |
| | Period ended |
| | 7/31/101 |
| |
|
| | Shares | | Amount |
| Class A shares | | | |
| Sold | 2,500 | $ | 25,000 |
| |
| |
|
| Net increase | 2,500 | $ | 25,000 |
| |
| |
|
| Class I shares | | | |
| Sold | 2,500 | $ | 25,000 |
| |
| |
|
| Net increase | 2,500 | $ | 25,000 |
| |
| |
|
| Class NAV shares | | | |
| Sold | 26,141,666 | $ | 261,521,185 |
| Distributions reinvested | 1,192,847 | | 12,107,371 |
| Repurchased | (1,299,166) | | (13,013,087) |
|
| |
|
| Net increase | 26,035,347 | $ | 260,615,469 |
| |
| |
|
| Net increase | 26,040,347 | $ | 260,665,469 |
| |
| |
|
| 1 Period from 11-2-09 (inception date) to 7-31-10. | | | |
Note 7 — Purchase and sale of securities
Purchases and sales of securities, other than short-term securities, aggregated $363,773,840 and $115,268,931, respectively, for the period ended July 31, 2010.
Note 8 — Investment by affiliated funds
Certain investors in the Fund are affiliated Funds and are managed by the Adviser and its affiliates. The affiliated Funds do not invest in the Fund for the purpose of exercising management or control; however, this investment may represent a significant portion of the Fund’s net assets. For the period ended July 31, 2010, the following Funds had an affiliate ownership concentration of 5% or more of the Fund’s net assets:
| |
| | Affiliate |
| Fund | Concentration |
|
| Lifestyle Balanced Portfolio | 37.1% |
| Lifestyle Conservative Portfolio | 17.5% |
| Lifestyle Growth Portfolio | 18.1% |
| Lifestyle Moderate Portfolio | 12.7% |
Report of the Independent Registered Public Accounting Firm
To the Board of Trustees of John Hancock Funds II and Shareholders of John Hancock Global High Yield Fund:
In our opinion, the accompanying statement of assets and liabilities, including the portfolio of investments, and the related statements of operations and of changes in net assets and the financial highlights present fairly, in all material respects, the financial position of John Hancock Global High Yield Fund (the “Fund”) at July 31, 2010, and the results of its operations, the changes in its net assets and the financial highlights for the period November 2, 2009 (commencement of operations) through July 31, 2010, in conformity with accounting principles generally accepted in the United States of America. These financial statements and financial highlights (hereafter referred to as “financial statements”) are the responsibility of the Fund’s management; our responsibility is to express an opinion on these financial statements based on our audit. We conducted our audit of these financial statements in accordance with the standards of the Public Company Accounting Oversight Board (United States). Those standards require that we plan and perform the audit to obtain reasonable assurance about whether the financial statements are free of material misstatement. An audit includes examining, on a test basis, evidence supporting the amounts and disclosures in the financial statements, assessing the accounting principles used and significant estimates made by management, and evaluating the overall financial statement presentation. We believe that our audit, which included confirmation of securities at July 31, 2010 by correspondence with the custodian and brokers and the application of alternative auditing procedures where securities purchased confirmations had not been received, provides a reasonable basis for our opinion.
PricewaterhouseCoopers LLP
Boston, Massachusetts
September 20, 2010
Tax information
Unaudited
For federal income tax purposes, the following information is furnished with respect to the distributions of the Fund, if any, paid during its taxable year ended July 31, 2010.
The Fund hereby designates the maximum amount allowable of its net taxable income as qualified dividend income as provided in the Jobs and Growth Tax Relief Reconciliation Act of 2003. This amount will be reflected on Form 1099-DIV for the calendar year 2010.
Shareholders will be mailed a 2010 Form 1099-DIV in January 2011. This will reflect the total of all distributions that are taxable for calendar year 2010.
JHF II Independent Trustees
| | | | |
| Name | DOB | Bio | Trustee of | Number |
| | | | Trust Since1 | of John |
| | | | | Hancock |
| | | | | funds |
| | | | | overseen |
| | | | | by Trustee |
|
| Charles L. Bardelis | 1941 | Director, Island Commuter Corp. | 2005 | 210 |
| | | (Marine Transport). | | |
| | | Trustee of John Hancock Trust (since | | |
| | | 1988), John Hancock Funds II (since | | |
| | | 2005) and former Trustee of John | | |
| | | Hancock Funds III (2005–2006). | | |
|
| Peter S. Burgess | 1942 | Consultant (financial, accounting | 2005 | 210 |
| | | and auditing matters) (since 1999); | | |
| | Certified Public Accountant. | | |
| | | Partner, Arthur Andersen | | |
| | (independent public accounting | | |
| | | firm) (prior to 1999). | | |
| | | | |
| | | Director of the following publicly | | |
| | traded companies: PMA Capital | | |
| | Corporation (since 2004) and | | |
| | Lincoln Educational Services | | |
| | | Corporation (since 2004). | | |
| | | | |
| | | Trustee of John Hancock Trust (since | | |
| | | 2005), John Hancock Funds II (since | | |
| | | 2005), and former Trustee of John | | |
| | | Hancock Funds III (2005–2006). | | |
|
| Theron S. | 1947 | Chief Executive Officer, T. | 2008 | 210 |
| Hoffman | | Hoffman Associates, LLC (since | | |
| | | 2003); Director, The Todd | | |
| | | Organization (since 2003); | | |
| | President, Westport Resources | | |
| | | Management (2006–2008); | | |
| | | Partner/Operating Head & Senior | | |
|
1 Because the Trust does not hold regular annual shareholders meetings, each Trustee holds office for an indefinite term until his/her successor is duly elected and qualified or until he/she dies, retires, resigns, is removed or becomes disqualified. Trustees may be removed (provided the aggregate number of Trustees after such removal shall not be less than one) with cause or without cause, by action of two-thirds of the remaining Trustees or by action of two-thirds of the Outstanding shares of the Trust.
| | | | |
| | | Managing Director, Putnam | | |
| | | Investments (2000–2003); | | |
| | | Executive Vice President, Thomson | | |
| | | Corp. (1997–2000) (financial | | |
| | information publishing). | | |
| | | | |
| | | Trustee of John Hancock Trust (since | | |
| | | 2008) and John Hancock Funds II | | |
| | | (since 2008). | | |
|
| Hassell H. | 1945 | Associate Professor, The Graduate | 2005 | 210 |
| McClellan | | School of The Wallace E. Carroll | | |
| | | School of Management, Boston | | |
| | College (since 1984). | | |
| |
| | | Trustee of John Hancock Trust (since | | |
| | | 2005), John Hancock Funds II (since | | |
| | | 2005) and Trustee of Phoenix Edge | | |
| | | Series Funds (since 2008). | | |
|
| James M. Oates | 1946 | Managing Director, Wydown Group | 2005 | 210 |
| | | (financial consulting firm) (since | | |
| | | 1994); Chairman, Emerson | | |
| | | Investment Management, Inc. (since | | |
| | | 2000); Chairman, Hudson Castle | | |
| | | Group, Inc. (formerly IBEX Capital | | |
| | | Markets, Inc.) (financial services | | |
| | | company) (since 1997) (Independent | | |
| | Chairman, 1997–2006). | | |
| |
| | | Director of the following publicly | | |
| | | traded companies: Stifel Financial | | |
| | | (since 1996); Investor Financial | | |
| | | Services Corporation (1995–2007); | | |
| | | and Connecticut River Bancorp (since | | |
| | | 1998); Director of the following | | |
| | | Mutual Funds: Phoenix Mutual Funds | | |
| | | (1988–2008); Virtus Funds (since | | |
| | | 2008); and Emerson Investment | | |
| | | Management (since 2000). | | |
| |
| | | Chairman of the Boards of John | | |
| | | Hancock Trust and John Hancock | | |
| | Funds II (since 2005). | | |
| |
| | | Trustee of John Hancock Trust | | |
| | | (since 2004), John Hancock Funds II | | |
| | | (since 2005) and former Trustee of | | |
|
| | | | |
| | | John Hancock Funds III (2005– | | |
| | | 2006). | | |
|
| Steven M. Roberts | 1944 | Board of Governors Deputy Director | 2008 | 210 |
| | | Division of Banking Supervision and | | |
| | | Regulation, Federal Reserve System | | |
| | | (2005-2008); Partner, KPMG (1987- | | |
| | | 2004). | | |
| | | | |
| | | Trustee of John Hancock Trust (since | | |
| | | 2008) and John Hancock Funds II | | |
| | (since September 2008). | | |
|
|
Non-Independent Trustees2
| | | | |
| James R. Boyle3 | 1959 | President, John | 2005 | 251 |
| | | Hancock Financial | | |
| | | Services (since 2010); | | |
| | | Chairman and Director, | | |
| | John Hancock | | |
|
| | | Advisers, LLC, John | | |
| | | Hancock Funds, LLC, | | |
| | | and John Hancock | | |
| | | Investment | | |
| | | Management Services, | | |
| | | LLC (until 2010); | | |
| | | Trustee, John Hancock | | |
| | | Trust, John Hancock | | |
| | | Funds II, and John | | |
| | | Hancock retail funds | | |
|
|
| Grace K. Fey4 | 1946 | Chief Executive | 2008 | 210 |
| | | Officer, Grace Fey | | |
| | | Advisors (since 2007); | | |
| | | Director & Executive | | |
| | Vice President, | | |
| | Frontier Capital | | |
| | | Management Company | | |
| | | (1988-2007); Director, | | |
| | | Fiduciary Trust (since | | |
| | | 2009). | | |
| | | | |
| | Trustee of John | | |
| | | Hancock Trust (since | | |
| | 2008) and John | | |
| | | Hancock Funds II | | |
| | (since 2008). | | |
|
Principal Officers who are not Trustees
2 Non-Independent Trustees hold positions or are affiliated with the Fund’s investment adviser, subadviser, underwriter or their affiliates.
3 Mr. Boyle is an “interested person” (as defined by the 1940 Act) due to his position with Manulife Financial Corporation (or its affiliates), the ultimate parent of the Adviser.
4 Ms. Fey is an “interested person” (as defined by the 1940 Act) due to a deferred compensation arrangement with her former employer, Frontier Capital Management Company, which is a subadviser of certain funds of John Hancock Funds II and John Hancock Trust.
| | | | |
| Hugh McHaffie | 1959 | Executive Vice President, | 2009 | |
| | | John Hancock Financial | | |
| | | Services (since 2006); | | |
| | | Director, John Hancock | | |
| | | Investment Management | | |
| | | Services, LLC, John | | |
| | | Hancock Advisers, LLC | | |
| | | and John Hancock Funds, | | |
| | | LLC (since 2010); | | |
| | | President, John Hancock | | |
| | | Trust and John Hancock | | |
| | | Funds II (since 2009); | | |
| | | Senior Vice President, | | |
| | | Individual Business Product | | |
| | | Management, MetLife, Inc. | | |
| | | (1999–2006). | | |
|
|
| Thomas M. Kinzler | 1955 | Vice President, John | 2009 | |
| | | Hancock Financial Services | | |
| | | (since 2006); Secretary and | | |
| | | Chief Legal Officer, John | | |
| | | Hancock retail funds, John | | |
| | | Hancock Funds II and John | | |
| | | Hancock Trust (since | | |
| | | 2006); Secretary and Chief | | |
| | | Legal Counsel, John | | |
| | | Hancock Advisers, LLC, | | |
| | | John Hancock Investment | | |
| | | Management Services, LLC | | |
| | | and John Hancock Funds, | | |
| | | LLC (since 2007); Vice | | |
| | | President and Associate | | |
| | | General Counsel, | | |
| | | Massachusetts Mutual Life | | |
| | | Insurance Company (1999– | | |
| | | 2006); Secretary and Chief | | |
| | | Legal Counsel, MML | | |
| | | Series Investment Fund | | |
| | | (2000–2006); Secretary and | | |
| | | Chief Legal Counsel, | | |
| | | MassMutual Select Funds | | |
| | | and MassMutual Premier | | |
| | | Funds (2004–2006). | | |
|
|
| Francis V. Knox, Jr. | 1947 | Vice President, John | 2009 | |
| | | Hancock Financial Services | | |
|
|
| | | | |
| | | (since 2005); Chief | | |
| | | Compliance Officer, John | | |
| | | Hancock retail funds, John | | |
| | | Hancock Funds II, John | | |
| | | Hancock Trust, Chief | | |
| | | Compliance Officer, John | | |
| | | Hancock Advisers, LLC | | |
| | | and John Hancock | | |
| | | Investment Management | | |
| | | Services, LLC (since 2005); | | |
| | | Vice President and Chief | | |
| | | Compliance Officer, MFC | | |
| | | Global Investment | | |
| | | Management (U.S.), LLC | | |
| | | (2005–2008). | | |
|
|
| | |
| Michael J. Leary | 1965 | Assistant Vice President, | 2009 | |
| | | John Hancock Financial | | |
| | | Services (since 2007); | | |
| | | Treasurer, John Hancock | | |
| | | retail funds, John Hancock | | |
| | | Funds II and John Hancock | | |
| | | Trust (since 2009); Vice | | |
| | | President, John Hancock | | |
| | | Advisers, LLC and John | | |
| | | Hancock Investment | | |
| | | Management Services, LLC | | |
| | | (since 2007); Assistant | | |
| | | Treasurer, John Hancock | | |
| | | retail funds, John Hancock | | |
| | | Funds II and John Hancock | | |
| | | Trust (2007–2009); Vice | | |
| | | President and Director of | | |
| | | Fund Administration, JP | | |
| | | Morgan (2004-2007). | | |
|
|
| | |
| Charles A. Rizzo | 1957 | Vice President, John | 2009 | |
| | | Hancock Financial Services | | |
| | | (since 2008); Chief | | |
| | | Financial Officer, John | | |
| | | Hancock retail funds, John | | |
| | | Hancock Funds II and John | | |
| | | Hancock Trust (since | | |
| | | 2007); Senior Vice | | |
| | | President, John Hancock | | |
| | | Advisers, LLC and John | | |
|
|
| | | | |
| | | Hancock Investment | | |
| | | Management Services, LLC | | |
| | | (since 2008); Assistant | | |
| | | Treasurer, Goldman Sachs | | |
| | | Mutual Fund Complex | | |
| | | (2005–2007); Vice | | |
| | | President, Goldman Sachs | | |
| | | (2005–2007); Managing | | |
| | | Director and Treasurer, | | |
| | | Scudder Funds, Deutsche | | |
| | | Asset Management (2003– | | |
| | | 2005). | | |
|
|
| | |
| John G. Vrysen | 1955 | Senior Vice President, John | 2009 | |
| | | Hancock Financial Services | | |
| | | (since 2006); Director, | | |
| | | Executive Vice President | | |
| | | and Chief Operating | | |
| | | Officer, John Hancock | | |
| | | Advisers, LLC, John | | |
| | | Hancock Investment | | |
| | | Management Services, LLC | | |
| | | and John Hancock Funds, | | |
| | | LLC (since 2005); Chief | | |
| | | Operating Officer, John | | |
| | | Hancock Funds II and John | | |
| | | Hancock Trust (since | | |
| | | 2007); Chief Operating | | |
| | | Officer, John Hancock | | |
| | | retail funds (until 2009); | | |
| | | Trustee, John Hancock | | |
| | | retail funds (since 2009). | | |
More information
| | |
| Trustees | Investment adviser |
| James M. Oates, Chairman | John Hancock Investment Management Services, LLC |
| James R. Boyle† | |
| Grace K. Fey† | Investment subadviser |
| Charles L. Bardelis* | Stone Harbor Investment Partners LP |
| Peter S. Burgess* | |
| Theron S. Hoffman | Principal distributor |
| Hassell H. McClellan | John Hancock Funds, LLC |
| Steven M. Roberts* | |
| *Member of the Audit Committee | Custodian |
| †Non-Independent Trustee | State Street Bank and Trust Company |
| | |
| Officers | Transfer agent |
| Hugh McHaffie | John Hancock Signature Services, Inc. |
| President | |
| Legal counsel |
| Thomas M. Kinzler | K&L Gates LLP |
| Secretary and Chief Legal Officer | |
| Independent registered public accounting firm |
| Francis V. Knox, Jr. | PricewaterhouseCoopers LLP |
| Chief Compliance Officer | |
|
| |
| Michael J. Leary | The report is certified under the Sarbanes-Oxley Act, which |
| Treasurer | requires mutual funds and other public companies to affirm |
| that, to the best of their knowledge, the information in |
| Charles A. Rizzo | their financial reports is fairly and accurately stated in all |
| Chief Financial Officer | material respects. |
|
| |
| John G. Vrysen | |
| Chief Operating Officer | |
| | |
The Fund’s proxy voting policies and procedures, as well as the Fund’s proxy voting record, if any, for the most recent twelve-month period ended June 30, are available free of charge on the Securities and Exchange Commission (SEC) Web site at www.sec.gov or on our Web site.
The Fund’s complete list of portfolio holdings, for the first and third fiscal quarters, is filed with the SEC on Form N-Q. The Fund’s Form N-Q is available on our Web site and the SEC’s Web site, www.sec.gov, and can be reviewed and copied (for a fee) at the SEC’s Public Reference Room in Washington, DC. Call 1-800-SEC-0330 to receive information on the operation of the SEC's Public Reference Room.
We make this information on your fund, as well as monthly portfolio holdings, and other fund details available on our Web site www.jhfunds.com or by calling 1-800-225-5291.
| | |
| You can also contact us: | | |
| 1-800-225-5291 | Regular mail: | Express mail: |
| jhfunds.com | John Hancock Signature Services, Inc. | John Hancock Signature Services, Inc. |
| | P.O. Box 55913 | Mutual Fund Image Operations |
| | Boston, MA 02205-5913 | 30 Dan Road |
| | | Canton, MA 02021 |
| |
| |
| |
| |
| |
| |
| |
| | John Hancock |
| | Multi Sector Bond Fund |
| |
| |
|
|
|
|
|
|
|
|
|
|
|
|
|
| |
| |
| Annual Report | |
| 7.31.10 | |
| |
| |
| |
| |
| |
| |
| |
| | | | |
| John Hancock Multi Sector Bond Fund | | | | |
| |
| Table of Contents | | | | |
| |
| Management’s discussion of Fund performance | | | | Page 2 |
| | | | |
| A look at performance | | | | Page 3 |
| | | | |
| Your expenses | | | | Page 5 |
| | | | |
| Portfolio summary | | | | Page 6 |
| | | | |
| Fund’s investments | | | | Page 7 |
| | | | |
| Financial statements | | | | Page 27 |
| | | | |
| Financial highlights | | | | Page 30 |
| | | | |
| Notes to financial statements | | | | Page 33 |
| | | | |
| Trustees and Officers | | | | Page 47 |
| | | | |
| More information | | | | Page 54 |
John Hancock Multi Sector Bond Fund
Management’s Discussion of Fund Performance
By Stone Harbor Investment Partners LP
The nine months between the Fund’s inception on November 2, 2009 and July 31, 2010 continued to be positive in tone in the fixed-income markets, driven by lower interest rates and strong demand. However, that demand was somewhat offset by a widening of credit spreads in higher-risk assets, resulting from volatility in European sovereign debt and global equity markets. The rally in credit risk assets that began in March 2009 lost some momentum toward the end of the year, although returns remained positive on an absolute basis. The potential default of Dubai on some government-sponsored corporate debt foreshadowed sovereign default concerns in the eurozone that intensified in 2010. Treasuries staged a rally as a weak equity market and mixed economic data caused investors to reassess the strength of the recovery and put them into a defensive mode. Relief and a gradual pick-up in overall demand were finally ushered in by upbeat news in those areas of the e conomy that have lagged in the recovery, supporting a more broadly based path to growth. However, credit spread momentum shifted sharply as sovereign risk concerns resurfaced and ultimately led to a reversal of gains. Several factors colluded to undermine investor confidence, mostly macroeconomic in theme, triggering a selloff in spreads over most of the May – June period. Broad fixed-income credit markets escaped the buffeting incurred by equities because of the decline in underlying interest rates.
From inception on November 2, 2009 through July 31, 2010, John Hancock Multi Sector Bond Class A shares posted a total return of 5.06% at net asset value. The Fund’s return compares with the 5.45% return of the Fund’s benchmark, the Barclays Capital 1-5 Year Credit Index, and the 8.60% average return of the multi-sector bond funds tracked by Morningstar, Inc. The Fund’s underperformance of its benchmark index was dominated by movement in credit-risk assets led by high-yield market underperformance, as well as that of credit-oriented investment-grade bonds, those assets which were more vulnerable to the spike in volatility. Within the investment-grade market, we benefited from favorable corporate and commercial mortgage-backed security selection, but gains were offset by an underweight in Treasuries and a quality bias in our leveraged loan security selection. Futures activity during the period also detracted from Fund performance.
This commentary reflects the views of the portfolio managers through the end of the Fund’s period discussed in this report. The managers' statements reflect their own opinions. As such, they are in no way guarantees of future events, and are not intended to be used as investment advice or a recommendation regarding any specific security. They are also subject to change at any time as market and other conditions warrant.
Past performance is no guarantee of future results. The major factors in this Fund's performance are interest rate and credit risk. When interest rates rise, bond prices usually fall. Generally, an increase in the Fund's average maturity will make it more sensitive to interest-rate risk. International investing involves special risks such as political, economic and currency risks and differences in accounting standards and financial reporting. Higher-yielding bonds are riskier then lower-yielding bonds, and their value may fluctuate more in response to market conditions. The Fund may not be appropriate for all investors. Sector investing is subject to greater risks than the market as a whole. Because the Fund may focus on particular sectors of the economy, its performance may depend on the performance of those sectors.
Multi Sector Bond Fund
For the period ended July 31, 2010
| | | | | | | | |
| | Average annual total return (%) | | Cumulative total returns (%) | |
| | with maximum sales charge (POP) | | with maximum sales charge (POP) | |
|
| | | | | Since | | | | Since |
| Class | 1-year | 5-year | 10-year | Inception | 1-year | 5-year | 10-year | Inception1 |
|
| A | - | - | - | -0.23% | - | - | - | -0.23% |
|
| I2 | - | - | - | 5.18% | - | - | - | 5.18% |
|
| NAV2 | - | - | - | 5.32% | - | - | - | 5.32% |
|
Performance figures assume all distributions are reinvested. Public offering price (POP) figures reflect maximum sales charges on Class A shares of 5.0%.
The expense ratios of the Fund, both net (including any fee waivers or expense limitations) and gross (excluding any fee waivers or expense limitations), are set forth according to
the most recent publicly available prospectuses for the Fund and may differ from the expense ratios disclosed in the Financial Highlights&n bsp;tables in this report. The waivers and
expense limitations are contractual at least until 10-31-10. The net expenses are as follows: Class A – 1.25% and Class I – 0.95%. Had the fee waivers and expense limitations
not been in place, the gross expenses would be as follows: Class A – 1.45% and Class I – 0.97%. For Class NAV, the net expenses equal the gross expenses and are 0.82%.
The returns reflect past results and should not be considered indicative of future performance. The return and principal value of an investment will fluctuate so that shares, when
redeemed, may be worth more or less than their original cost. Due to market volatility, the Fund’s current performance may be higher or lower than the performance shown.
For current to the most recent month end performance data, please call 1–800–225–5291 or visit the Fund’s Web site at www.jhfunds.com.
The performance table above and the chart on the next page do not reflect the deduction of taxes that a shareholder would pay on fund distributions or the redemption of fund shares.
The Fund’s performance results reflect any applicable expense reductions, without which the expenses would increase and results would have been less favorable.
1 From 11-2-09.
2 For certain types of investors, as described in the Fund&# 146;s Class I and Class NAV share prospectuses.
Growth of $10,000
This chart shows what happened to a hypothetical $10,000 investment in John Hancock Multi Sector Bond Fund Class A shares for the period indicated. For comparison, we’ve shown the same investment in the Barclays Capital 1-5 year U.S. Credit Index.
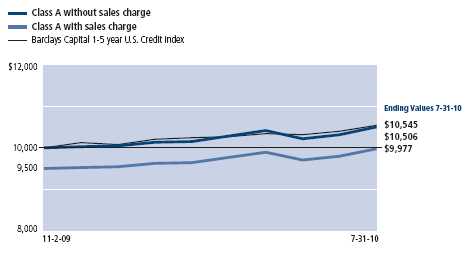
| | | | |
| | Period | Without | With maximum | |
| Class | beginning | sales charge | sales charge | Index |
|
| I1,2 | 11-2-09 | $10,518 | $10,518 | $10,545 |
|
| NAV1,2 | 11-2-09 | 10,532 | 10,532 | 10,545 |
|
Assuming all distributions were reinvested for the period indicated, the table above shows the value of a $10,000 investment in the Fund’s Class I and Class NAV shares, respectively, as 7-31-10.
Barclays Capital 1-5 year U.S. Credit Index includes investment-grade corporate and international dollar-denominated bonds with maturities of 1 to 5 years.
It is not possible to invest directly in an index. Index figures do not reflect sales charges, which would have resulted in lower values if they did.
1 No contingent deferred sales charges applicable
2 For certain types of investors, as described in the Fund’s Class I and Class NAV shares prospectuses.
| Annual report | Multi Sector Bond Fund |
| 4 |
Multi Sector Bond Fund
Your expenses
These examples are intended to help you understand your ongoing operating expenses.
Understanding your fund expenses
As a shareholder of the Fund, you incur two types of costs:
• Transaction costs which include sales charges (loads) on purchases or redemptions (varies by share class), minimum account fee charge, etc.
• Ongoing operating expenses including management fees, distribution and service fees (if applicable), and other fund expenses.
We are going to present only your ongoing operating expenses here.
Actual expenses/actual returns
This example is intended to provide information about your fund’s actual ongoing operating expenses, and is based on your fund’s actual return. It assumes an account value of $1,000.00 on February 1, 2010 (commencement of operations) with the same investment held until July 31, 2010.
| | | |
| | Account value | Ending value | Expenses paid during |
| | on 2-1-10 | on 7-31-10 | period ended 7-31-101 |
|
| Class A | $1,000.00 | $1,036.80 | $5.86 |
|
| Class I | 1,000.00 | 1,037.20 | 4.80 |
|
| Class NAV | 1,000.00 | 1,038.10 | 3.89 |
|
Together with the value of your account, you may use this information to estimate the operating expenses that you paid over the period. Simply divide your account value at July 31, 2010, by $1,000.00, then multiply it by the “expenses paid” for your share class from the table above. For example, for an account value of $8,600.00, the operating expenses should be calculated as follows:
Example
[ My account value $8,600.00 / $1,000.00 = 8.6 ] x $[ “expenses paid” from table ] = My actual expenses
Hypothetical example for comparison purposes
This table allows you to compare your fund’s ongoing operating expenses with those of any other fund. It provides an example of the Fund’s hypothetical account values and hypothetical expenses based on each class’s actual expense ratio and an assumed 5% annualized return before expenses (which is not your fund’s actual return). It assumes an account value of $1,000.00 on February 1, 2010, with the same investment held until July 31, 2010. Look in any other fund shareholder report to find its hypothetical example and you will be able to compare these expenses.
| | | |
| | Account value | Ending value | Expenses paid during |
| | on 2-1-10 | on 7-31-10 | period ended 7-31-101 |
|
| Class A | $1,000.00 | $1,019.00 | $5.81 |
|
| Class I | 1,000.00 | 1,020.10 | 4.76 |
|
| Class NAV | 1,000.00 | 1,021.00 | 3.86 |
|
Remember, these examples do not include any transaction costs, therefore, these examples will not help you to determine the relative total costs of owning different funds. If transaction costs were included, your expenses would have been higher. See the prospectuses for details regarding transaction costs.
1 Expenses are equal to the Fund's annualized expense ratio of 1.16%, 0.95% and 0.77% for Class A, Class I and Class NAV shares, respectively, multiplied by the average account value over the period, multiplied by 181/365 (to reflect the one-half year period).
John Hancock Multi Sector Bond Fund
| |
| Portfolio Summary | |
| | Value as a |
| | percentage of |
| Portfolio Composition1 | Fund's net assets |
| Corporate Bonds | 34% |
| Term Loans | 19% |
| U.S. Government & Agency Obligations | 11% |
| Collateralized Mortgage Obligations | 10% |
| Foreign Government Obligations3 | 9% |
| Structured Notes | 3% |
| Asset Backed Securities | 2% |
| Convertible Bonds | 1% |
| Short-Term Investments & Other | 11% |
| |
| | Value as a |
| | percentage of |
| Sector Composition1,2 | Fund's net assets |
| Financials | 24% |
| Consumer Discretionary | 12% |
| U.S. Government Agency | 11% |
| Foreign Government | 9% |
| Industrials | 6% |
| Energy | 5% |
| Health Care | 5% |
| Telecommunication Services | 4% |
| Utilities | 4% |
| Materials | 4% |
| Consumer Staples | 3% |
| Information Technology | 2% |
| Short-Term Investments & Other | 11% |
| |
| | Value as a |
| | percentage of Fund's |
| Quality Composition1.4 | net assets |
| AAA | 15% |
| AA | 3% |
| A | 12% |
| BBB | 18% |
| BB | 22% |
| B | 12% |
| Not Rated | 7% |
| Short-Term Investments & Other | 11% |
1 As a percentage of net assets on 7-31-10.
2 Sector investing is subject to greater risks than the market as a whole. Because the Fund may focus on particular sectors of the economy, its performance may depend on the performance of those sectors.
3 There are risk factors involving investments in sovereign debt that may play a role in shaping the Fund’s overall risk profile. For further details, see the Fund’s Prospectuses and Statement of Additional Information.
4 Ratings are from Moody’s Investors Services, Inc. if not available, we have used S&P ratings. In the absence of ratings from these agencies, we have used Fitch, Inc. ratings. “Not Rated securities are those with no ratings available. They may have internal ratings similar to those shown. All as of 7-31-10 and do not reflect subsequent changes.”
Multi Sector Bond Fund
Portfolio of Investments - As of July 31, 2010
| | | | |
| | | Maturity | | |
| | Rate | date | Par value | Value |
| | | | |
| Corporate Bonds 34.51% | | | | $236,063,835 |
|
| (Cost $228,026,637) | | | | |
| |
| Consumer Discretionary 6.15% | | | | 42,072,812 |
|
| Auto Components 0.24% | | | | |
| Accuride Corp. (S) | 9.500% | 08/01/18 | $500,000 | 508,750 |
| Allison Transmission, Inc. (S) | 11.000 | 11/01/15 | 150,000 | 161,250 |
| Allison Transmission, Inc., PIK (S) | 11.250 | 11/01/15 | 50,000 | 53,750 |
| American Tire Distributors, Inc. (S) | 9.750 | 06/01/17 | 400,000 | 417,000 |
| Tenneco, Inc. (S) | 7.750 | 08/15/18 | 500,000 | 506,250 |
| | | | | |
| Auto Manufacturers 0.19% | | | | |
| Volvo Treasury AB (S) | 5.950 | 04/01/15 | 1,235,000 | 1,321,350 |
| | | | | |
| Automobiles 0.09% | | | | |
| Ford Motor Credit Company LLC | 6.625 | 08/15/17 | 325,000 | 321,750 |
| TRW Automotive, Inc. (S) | 8.875 | 12/01/17 | 250,000 | 266,250 |
| | | | | |
| Commercial Services & Supplies 0.07% | | | | |
| Interactive Data Corp. (S) | 10.250 | 08/01/18 | 475,000 | 491,625 |
| | | | | |
| Diversified Consumer Services 0.15% | | | | |
| Education Management LLC/Education Management Finance | | | | |
| Corp. | 8.750 | 06/01/14 | 475,000 | 472,031 |
| SSI Investments II/SSI Company-Issuer LLC (S) | 11.125 | 06/01/18 | 350,000 | 367,938 |
| The ServiceMaster Company | 7.450 | 08/15/27 | 250,000 | 188,125 |
| | | | | |
| Hotels, Restaurants & Leisure 0.91% | | | | |
| Ameristar Casinos, Inc. | 9.250 | 06/01/14 | 635,000 | 677,862 |
| Harrah's Operating Company, Inc. | 11.250 | 06/01/17 | 350,000 | 378,000 |
| International Game Technology | 7.500 | 06/15/19 | 1,330,000 | 1,554,201 |
| Isle of Capri Casinos, Inc. | 7.000 | 03/01/14 | 525,000 | 481,688 |
| MGM Resorts International | 6.750 | 09/01/12 | 300,000 | 282,750 |
| MGM Resorts International | 6.750 | 04/01/13 | 200,000 | 183,000 |
| MGM Resorts International (S) | 9.000 | 03/15/20 | 350,000 | 367,500 |
| Penn National Gaming, Inc. | 6.750 | 03/01/15 | 375,000 | 375,469 |
| Pinnacle Entertainment, Inc. | 8.625 | 08/01/17 | 700,000 | 731,500 |
| Seneca Gaming Corp. | 7.250 | 05/01/12 | 350,000 | 344,750 |
| Starwood Hotels & Resorts Worldwide, Inc. | 7.150 | 12/01/19 | 425,000 | 442,000 |
| Wynn Las Vegas LLC (S) | 7.875 | 11/01/17 | 375,000 | 383,438 |
| | | | | |
| Household Durables 0.35% | | | | |
| Jarden Corp. | 7.500 | 01/15/20 | 150,000 | 153,000 |
| Libbey Glass, Inc. (S) | 10.000 | 02/15/15 | 400,000 | 426,000 |
| Newell Rubbermaid, Inc. | 5.500 | 04/15/13 | 1,250,000 | 1,348,497 |
| Norcraft Companies LP/Norcraft Finance Corp. | 10.500 | 12/15/15 | 450,000 | 472,500 |
| | | | | |
| Internet & Catalog Retail 0.06% | | | | |
| NetFlix, Inc. | 8.500 | 11/15/17 | 350,000 | 379,750 |
| | | | | |
| Leisure Equipment & Products 0.19% | | | | |
| Hasbro, Inc. | 6.300 | 09/15/17 | 1,238,000 | 1,329,254 |
| | | | | |
| Media 2.56% | | | | |
| AMC Entertainment, Inc. | 8.000 | 03/01/14 | 379,000 | 379,000 |
| AMC Entertainment, Inc. | 8.750 | 06/01/19 | 500,000 | 525,000 |
| Belo Corp. | 8.000 | 11/15/16 | 300,000 | 316,125 |
| British Sky Broadcasting Group PLC (S) | 9.500 | 11/15/18 | 1,000,000 | 1,337,493 |
| Cablevision Systems Corp. (S) | 8.625 | 09/15/17 | 800,000 | 859,000 |
| CCO Holdings LLC/CCO Holdings Capital Corp. (S) | 7.875 | 04/30/18 | 75,000 | 78,563 |
Multi Sector Bond Fund
Portfolio of Investments - As of July 31, 2010
| | | | |
| | | Maturity | | |
| | Rate | date | Par value | Value |
| |
| Consumer Discretionary (continued) | | | | |
|
| Cequel Communications Holdings I LLC/Cequel Capital Corp. | | | | |
| (S) | 8.625% | 11/15/17 | $550,000 | $561,000 |
| Cinemark USA, Inc. | 8.625 | 06/15/19 | 375,000 | 390,000 |
| COX Communications, Inc. (S) | 6.250 | 06/01/18 | 500,000 | 570,603 |
| CSC Holdings LLC | 8.500 | 04/15/14 | 225,000 | 243,000 |
| DIRECTV Holdings LLC | 5.200 | 03/15/20 | 550,000 | 583,766 |
| DISH DBS Corp. | 7.000 | 10/01/13 | 325,000 | 338,000 |
| DISH DBS Corp. | 7.875 | 09/01/19 | 725,000 | 770,312 |
| Entravision Communications Corp. (S) | 8.750 | 08/01/17 | 475,000 | 479,750 |
| Insight Communications Company, Inc. (S) | 9.375 | 07/15/18 | 460,000 | 486,450 |
| Lamar Media Corp. (S) | 7.875 | 04/15/18 | 200,000 | 206,500 |
| Lamar Media Corp., Series D | 6.625 | 08/15/15 | 450,000 | 443,250 |
| Myriad International Holding BV (S) | 6.375 | 07/28/17 | 177,000 | 181,868 |
| News America, Inc. | 6.650 | 11/15/37 | 1,400,000 | 1,558,361 |
| Nielsen Finance LLC | 10.000 | 08/01/14 | 475,000 | 495,187 |
| Radio One, Inc. | 6.375 | 02/15/13 | 475,000 | 396,625 |
| Regal Cinemas Corp. | 8.625 | 07/15/19 | 525,000 | 543,375 |
| Sinclair Broadcast Group, Inc. | 8.000 | 03/15/12 | 400,000 | 398,500 |
| Sinclair Television Group, Inc. (S) | 9.250 | 11/01/17 | 25,000 | 26,125 |
| TCM Sub LLC (S) | 3.550 | 01/15/15 | 1,325,000 | 1,365,314 |
| Time Warner Cable, Inc. | 8.250 | 02/14/14 | 991,000 | 1,181,629 |
| Time Warner, Inc. | 7.700 | 05/01/32 | 1,339,000 | 1,634,947 |
| Unitymedia Hessen GmbH & Company KG/Unitymedia NRW | | | | |
| GmbH (S) | 8.125 | 12/01/17 | 350,000 | 357,875 |
| Videotron Ltee | 9.125 | 04/15/18 | 700,000 | 784,000 |
| | | | | |
| Multiline Retail 0.30% | | | | |
| Michaels Stores, Inc. | 11.375 | 11/01/16 | 700,000 | 750,750 |
| QVC, Inc. (S) | 7.125 | 04/15/17 | 25,000 | 25,625 |
| QVC, Inc. (S) | 7.500 | 10/01/19 | 350,000 | 360,500 |
| Reynolds Group Issuer, Inc. (S) | 8.500 | 05/15/18 | 450,000 | 462,375 |
| The Neiman Marcus Group, Inc. | 10.375 | 10/15/15 | 276,000 | 287,730 |
| The Neiman Marcus Group, Inc., PIK | 9.000 | 10/15/15 | 150,000 | 153,563 |
| | | | | |
| Specialty Retail 0.91% | | | | |
| Claire's Stores, Inc., PIK | 9.625 | 06/01/15 | 473,344 | 407,076 |
| Express LLC/Express Finance Corp. (S) | 8.750 | 03/01/18 | 375,000 | 390,000 |
| Freedom Group, Inc. (S) | 10.250 | 08/01/15 | 350,000 | 369,688 |
| Home Depot, Inc. | 5.400 | 03/01/16 | 1,250,000 | 1,402,294 |
| Limited Brands, Inc. | 7.000 | 05/01/20 | 700,000 | 722,750 |
| Limited Brands, Inc. | 8.500 | 06/15/19 | 100,000 | 111,250 |
| Lowe's Companies, Inc. | 4.625 | 04/15/20 | 1,075,000 | 1,166,568 |
| TJX Companies, Inc. | 6.950 | 04/15/19 | 900,000 | 1,118,797 |
| Toys R Us Property Company LLC | 10.750 | 07/15/17 | 500,000 | 564,375 |
| | | | | |
| Textiles, Apparel & Luxury Goods 0.13% | | | | |
| Levi Strauss & Company (S) | 7.625 | 05/15/20 | 250,000 | 255,000 |
| Levi Strauss & Company | 8.875 | 04/01/16 | 175,000 | 183,750 |
| Phillips-Van Heusen Corp. | 7.375 | 05/15/20 | 150,000 | 156,375 |
| Quiksilver, Inc. | 6.875 | 04/15/15 | 325,000 | 305,500 |
| |
| Consumer Staples 2.18% | | | | 14,939,548 |
|
| Beverages 0.43% | | | | |
| Anheuser-Busch InBev Worldwide, Inc. | 4.125 | 01/15/15 | 1,350,000 | 1,433,002 |
| Constellation Brands, Inc. | 7.250 | 09/01/16 | 875,000 | 912,187 |
| Constellation Brands, Inc. | 7.250 | 05/15/17 | 225,000 | 234,000 |
Multi Sector Bond Fund
Portfolio of Investments - As of July 31, 2010
| | | | |
| | | Maturity | | |
| | Rate | date | Par value | Value |
| |
| Consumer Staples (continued) | | | | |
|
| Cott Beverages, Inc. (S) | 8.375% | 11/15/17 | $375,000 | $388,125 |
| | | | | |
| Food & Staples Retailing 0.61% | | | | |
| Michael Foods, Inc. (S) | 9.750 | 07/15/18 | 450,000 | 472,500 |
| New Albertsons, Inc. | 8.000 | 05/01/31 | 300,000 | 259,500 |
| SUPERVALU, Inc. | 8.000 | 05/01/16 | 470,000 | 473,525 |
| The Kroger Company | 6.150 | 01/15/20 | 1,255,000 | 1,467,671 |
| Wal-Mart Stores, Inc. | 3.625 | 07/08/20 | 1,525,000 | 1,532,453 |
| | | | | |
| Food Products 0.55% | | | | |
| B&G Foods, Inc. | 7.625 | 01/15/18 | 400,000 | 413,500 |
| Dean Foods Company | 7.000 | 06/01/16 | 100,000 | 95,750 |
| Dean Foods Company | 6.900 | 10/15/17 | 375,000 | 346,406 |
| Del Monte Corp. | 7.500 | 10/15/19 | 350,000 | 368,813 |
| Dole Food Company, Inc. | 8.750 | 07/15/13 | 25,000 | 26,313 |
| Dole Food Company, Inc. (S) | 8.000 | 10/01/16 | 675,000 | 698,625 |
| HJ Heinz Company | 5.350 | 07/15/13 | 678,000 | 748,519 |
| Mead Johnson Nutrition Company | 4.900 | 11/01/19 | 650,000 | 694,270 |
| Smithfield Foods, Inc. (S) | 10.000 | 07/15/14 | 330,000 | 368,775 |
| | | | | |
| Household Products 0.06% | | | | |
| Central Garden and Pet Company | 8.250 | 03/01/18 | 375,000 | 380,625 |
| | | | | |
| Personal Products 0.05% | | | | |
| Elizabeth Arden, Inc. | 7.750 | 01/15/14 | 350,000 | 350,875 |
| | | | | |
| Tobacco 0.48% | | | | |
| Altria Group, Inc. | 7.750 | 02/06/14 | 1,060,000 | 1,244,565 |
| Philip Morris International, Inc. | 5.650 | 05/16/18 | 1,800,000 | 2,029,549 |
| |
| Energy 4.24% | | | | 29,025,564 |
|
| |
| Energy Equipment & Services 0.47% | | | | |
| Bristow Group, Inc. | 7.500 | 09/15/17 | 250,000 | 248,750 |
| Bristow Group, Inc. | 6.125 | 06/15/13 | 125,000 | 125,313 |
| Complete Production Services, Inc. | 8.000 | 12/15/16 | 400,000 | 405,000 |
| Hercules Offshore, Inc. (S) | 10.500 | 10/15/17 | 425,000 | 380,375 |
| Hornbeck Offshore Services, Inc. | 8.000 | 09/01/17 | 25,000 | 23,406 |
| Hornbeck Offshore Services, Inc. | 6.125 | 12/01/14 | 375,000 | 336,563 |
| Offshore Group Investments, Ltd. (S) | 11.500 | 08/01/15 | 50,000 | 49,750 |
| Parker Drilling Company (S) | 9.125 | 04/01/18 | 475,000 | 472,625 |
| Stallion Oilfield Holdings, Ltd. (S) | 10.500 | 02/15/15 | 25,000 | 24,625 |
| Weatherford International, Ltd. | 7.000 | 03/15/38 | 1,105,000 | 1,156,374 |
| | | | | |
| Oil, Gas & Consumable Fuels 3.77% | | | | |
| Adaro Indonesia PT (S) | 7.625 | 10/22/19 | 305,000 | 321,394 |
| Arch Coal, Inc. (S) | 8.750 | 08/01/16 | 175,000 | 187,688 |
| Arch Western Finance LLC | 6.750 | 07/01/13 | 300,000 | 301,500 |
| Atlas Energy Operating Company, LLC | 12.125 | 08/01/17 | 300,000 | 346,500 |
| Atlas Pipeline Partners LP | 8.750 | 06/15/18 | 425,000 | 422,875 |
| Cloud Peak Energy Finance Company (S) | 8.250 | 12/15/17 | 20,000 | 20,900 |
| Cloud Peak Energy Resources LLC/Cloud Peak Energy Finance | | | | |
| Corp (S) | 8.500 | 12/15/19 | 350,000 | 367,500 |
| Consol Energy, Inc. (S) | 8.250 | 04/01/20 | 175,000 | 188,125 |
| Consol Energy, Inc. (S) | 8.000 | 04/01/17 | 225,000 | 239,063 |
| Copano Energy LLC | 8.125 | 03/01/16 | 351,000 | 359,775 |
| Crosstex Energy LP/Crosstex Energy Finance Corp. | 8.875 | 02/15/18 | 450,000 | 470,250 |
| Drummond Company, Inc. | 7.375 | 02/15/16 | 375,000 | 375,000 |
| El Paso Corp. | 7.800 | 08/01/31 | 125,000 | 125,204 |
Multi Sector Bond Fund
Portfolio of Investments - As of July 31, 2010
| | | | |
| | | Maturity | | |
| | Rate | date | Par value | Value |
| |
| Energy (continued) | | | | |
|
| El Paso Corp. | 7.750% | 01/15/32 | $25,000 | $25,040 |
| El Paso Corp. | 7.250 | 06/01/18 | 175,000 | 185,579 |
| El Paso Corp. | 7.000 | 06/15/17 | 550,000 | 575,519 |
| Encore Acquisition Company | 9.500 | 05/01/16 | 350,000 | 383,250 |
| EXCO Resources, Inc. | 7.250 | 01/15/11 | 175,000 | 176,313 |
| Forest Oil Corp. | 7.250 | 06/15/19 | 550,000 | 556,875 |
| Gazprom Via Gaz Capital SA (S) | 6.510 | 03/07/22 | 515,000 | 518,244 |
| General Maritime Corp. | 12.000 | 11/15/17 | 350,000 | 368,375 |
| Gibson Energy ULC/GEP Midstream Finance Corp. | 10.000 | 01/15/18 | 150,000 | 154,500 |
| Inergy LP | 8.250 | 03/01/16 | 350,000 | 367,500 |
| KazMunaiGaz Finance Sub BV (S) | 7.000 | 05/05/20 | 700,000 | 754,250 |
| Marathon Oil Corp. | 7.500 | 02/15/19 | 1,150,000 | 1,414,302 |
| Mariner Energy, Inc. | 8.000 | 05/15/17 | 400,000 | 440,000 |
| MarkWest Energy Partners LP | 8.750 | 04/15/18 | 350,000 | 376,688 |
| MarkWest Energy Partners LP, Series B | 6.875 | 11/01/14 | 200,000 | 201,000 |
| Newfield Exploration Company | 6.875 | 02/01/20 | 450,000 | 468,000 |
| NFR Energy LLC/NFR Energy Finance Corp. (S) | 9.750 | 02/15/17 | 400,000 | 408,000 |
| Niska Gas Storage US LLC (S) | 8.875 | 03/15/18 | 375,000 | 393,750 |
| Peabody Energy Corp. | 7.375 | 11/01/16 | 317,000 | 345,530 |
| Penn Virginia Corp. | 10.375 | 06/15/16 | 375,000 | 412,500 |
| Penn Virginia Resource Partners LP | 8.250 | 04/15/18 | 425,000 | 431,375 |
| Petrobras International Finance Company | 7.875 | 03/15/19 | 139,000 | 167,449 |
| Petroleos de Venezuela SA | 5.375 | 04/12/27 | 2,425,000 | 1,170,062 |
| Petroleos de Venezuela SA | 5.250 | 04/12/17 | 1,159,000 | 701,195 |
| Petroleos de Venezuela SA | 4.900 | 10/28/14 | 300,000 | 187,800 |
| Petronas Capital, Ltd. | 7.875 | 05/22/22 | 1,640,000 | 2,127,572 |
| Petroplus Finance, Ltd. (S) | 9.375 | 09/15/19 | 535,000 | 481,500 |
| Pioneer Natural Resources Company | 6.875 | 05/01/18 | 175,000 | 182,601 |
| Plains Exploration & Production Company | 7.625 | 04/01/20 | 400,000 | 405,000 |
| Quicksilver Resources, Inc. | 8.250 | 08/01/15 | 85,000 | 88,188 |
| Regency Energy Partners LP (S) | 9.375 | 06/01/16 | 325,000 | 354,250 |
| Sabine Pass LNG LP | 7.500 | 11/30/16 | 450,000 | 391,500 |
| Sabine Pass LNG LP | 7.250 | 11/30/13 | 400,000 | 373,000 |
| SandRidge Energy, Inc. (S) | 8.750 | 01/15/20 | 375,000 | 382,500 |
| SandRidge Energy, Inc., PIK | 8.625 | 04/01/15 | 550,000 | 554,125 |
| Shell International Finance BV | 4.300 | 09/22/19 | 1,175,000 | 1,234,850 |
| Transcanada Pipelines, Ltd. | 7.250 | 08/15/38 | 1,200,000 | 1,495,524 |
| Valero Energy Corp. | 6.125 | 02/01/20 | 1,275,000 | 1,383,297 |
| Williams Partners LP | 7.250 | 02/01/17 | 1,225,000 | 1,440,006 |
| |
| Financials 8.29% | | | | 56,712,181 |
|
| Capital Markets 0.53% | | | | |
| Bank of New York Mellon Corp. | 4.300 | 05/15/14 | 500,000 | 541,701 |
| E*Trade Financial Corp., PIK | 12.500 | 11/30/17 | 300,000 | 337,500 |
| Morgan Stanley | 6.000 | 04/28/15 | 1,950,000 | 2,100,690 |
| The Goldman Sachs Group, Inc. | 6.150 | 04/01/18 | 600,000 | 647,263 |
| | | | | |
| Commercial Banks 2.11% | | | | |
| Akbank TAS (S) | 5.125 | 07/22/15 | 481,000 | 480,199 |
| Ally Financial, Inc. | 8.000 | 11/01/31 | 400,000 | 390,500 |
| Banque Centrale de Tunisie, EMTN (EUR) (Q) | 6.250 | 02/20/13 | 60,000 | 84,835 |
| Barclays Bank PLC | 6.750 | 05/22/19 | 1,100,000 | 1,271,150 |
| HSBC Holdings PLC | 6.500 | 09/15/37 | 2,025,000 | 2,193,988 |
| ICICI Bank, Ltd. (S) | 5.500 | 03/25/15 | 1,950,000 | 2,026,857 |
| Lloyds TSB Bank PLC (S) | 4.375 | 01/12/15 | 1,325,000 | 1,342,463 |
Multi Sector Bond Fund
Portfolio of Investments - As of July 31, 2010
| | | | |
| | | Maturity | | |
| | Rate | date | Par value | Value |
| |
| Financials (continued) | | | | |
|
| PNC Funding Corp. | 4.250% | 09/21/15 | $1,276,000 | $1,347,788 |
| Standard Chartered PLC (6.409% to 01/30/2017, then 3 month | | | | |
| LIBOR + 1.510%) | 6.409 | 12/31/49 | 2,350,000 | 2,133,964 |
| Wachovia Corp., MTN | 5.500 | 05/01/13 | 800,000 | 878,178 |
| Wells Fargo Bank NA | 5.750 | 05/16/16 | 900,000 | 993,078 |
| Woori Bank (S) | 6.125 | 05/03/16 | 1,300,000 | 1,316,545 |
| Consumer Finance 0.65% | | | | |
| Capital One Financial Corp. | 6.150 | 09/01/16 | 1,900,000 | 2,046,471 |
| Discover Bank | 7.000 | 04/15/20 | 650,000 | 691,997 |
| Ford Motor Credit Company LLC | 8.700 | 10/01/14 | 1,550,000 | 1,675,959 |
| Diversified Financial Services 3.05% | | | | |
| American General Finance Corp., MTN | 6.900 | 12/15/17 | 1,800,000 | 1,534,500 |
| Atlantic Broadband Finance LLC | 9.375 | 01/15/14 | 200,000 | 202,000 |
| Bank of America Corp. | 5.750 | 12/01/17 | 1,050,000 | 1,109,594 |
| BM&FBovespa SA (S) | 5.500 | 07/16/20 | 450,000 | 463,625 |
| Citigroup, Inc. | 8.125 | 07/15/39 | 400,000 | 486,705 |
| Citigroup, Inc. | 5.500 | 02/15/17 | 900,000 | 909,878 |
| Citigroup, Inc. | 5.000 | 09/15/14 | 2,000,000 | 2,039,172 |
| Countrywide Financial Corp. | 6.250 | 05/15/16 | 1,025,000 | 1,086,189 |
| ERAC USA Finance LLC (S) | 2.750 | 07/01/13 | 825,000 | 835,850 |
| Fox Acquisition Sub LLC (S) | 13.375 | 07/15/16 | 200,000 | 199,000 |
| General Electric Capital Corp. | 6.875 | 01/10/39 | 1,840,000 | 2,074,692 |
| Hyundai Capital Services, Inc. (S) | 6.000 | 05/05/15 | 1,250,000 | 1,348,895 |
| JPMorgan Chase & Company | 6.300 | 04/23/19 | 1,850,000 | 2,100,686 |
| JPMorgan Chase & Company | 5.125 | 09/15/14 | 630,000 | 684,193 |
| LBI Escrow Corp. (S) | 8.000 | 11/01/17 | 100,000 | 105,125 |
| Merrill Lynch & Company, Inc. | 6.050 | 05/16/16 | 2,155,000 | 2,263,696 |
| NASDAQ OMX Group, Inc. | 4.000 | 01/15/15 | 700,000 | 721,654 |
| Pemex Finance, Ltd. | 9.150 | 11/15/18 | 255,000 | 321,287 |
| Pinnacle Foods Finance LLC | 10.625 | 04/01/17 | 350,000 | 373,625 |
| Pinnacle Foods Finance LLC (S) | 9.250 | 04/01/15 | 225,000 | 232,594 |
| Provident Funding Associates (S) | 10.250 | 04/15/17 | 375,000 | 382,500 |
| Reynolds Group Issuer, Inc. (S) | 7.750 | 10/15/16 | 375,000 | 391,875 |
| TNK-BP Finance SA (S) | 7.875 | 03/13/18 | 200,000 | 220,400 |
| TNK-BP Finance SA (S) | 7.500 | 07/18/16 | 175,000 | 188,125 |
| TNK-BP Finance SA (S) | 6.250 | 02/02/15 | 275,000 | 284,625 |
| TransCapitalInvest, Ltd. (S) | 8.700 | 08/07/18 | 100,000 | 121,248 |
| Wind Acquisition Holdings Finance SA, PIK (S) | 12.250 | 07/15/17 | 214,291 | 200,362 |
| | | | | |
| Insurance 1.60% | | | | |
| AXA SA | 8.600 | 12/15/30 | 1,100,000 | 1,223,411 |
| Fidelity National Financial, Inc. | 6.600 | 05/15/17 | 1,375,000 | 1,382,935 |
| Hartford Financial Services Group, Inc. | 6.000 | 01/15/19 | 1,375,000 | 1,421,464 |
| MetLife, Inc. | 6.750 | 06/01/16 | 1,809,000 | 2,079,853 |
| Midamerican Energy Holdings Company | 5.750 | 04/01/18 | 1,275,000 | 1,451,594 |
| Prudential Financial, Inc. | 4.750 | 09/17/15 | 1,256,000 | 1,331,815 |
| Unitrin, Inc. | 6.000 | 05/15/17 | 1,550,000 | 1,542,487 |
| ZFS Finance USA Trust I (6.150% to 12/31/10, | | | | |
| 3 month LIBOR + 1.750%) (S) | 6.150 | 12/15/65 | 500,000 | 485,000 |
| | | | | |
| Real Estate Investment Trusts 0.27% | | | | |
| Host Hotels & Resorts LP | 6.375 | 03/15/15 | 475,000 | 478,563 |
| Simon Property Group LP | 6.750 | 05/15/14 | 1,225,000 | 1,393,109 |
Multi Sector Bond Fund
Portfolio of Investments - As of July 31, 2010
| | | | |
| | | Maturity | | |
| | Rate | date | Par value | Value |
| |
| Financials (continued) | | | | |
|
| Real Estate Management & Development 0.07% | | | | |
| CB Richard Ellis Services, Inc. | 11.625% | 06/15/17 | $300,000 | $339,750 |
| IRSA Inversiones y Representaciones SA (S) | 11.500 | 07/20/20 | 164,000 | 165,919 |
| | | | | |
| Thrifts & Mortgage Finance 0.01% | | | | |
| Hipotecaria Su Casita SA de CV | 8.500 | 10/04/16 | 15,000 | 8,550 |
| Hipotecaria Su Casita SA de CV (S) | 8.500 | 10/04/16 | 43,000 | 24,510 |
| |
| Health Care 2.12% | | | | 14,489,419 |
|
| Health Care Equipment & Supplies 0.39% | | | | |
| Alere, Inc. | 9.000 | 05/15/16 | 75,000 | 76,125 |
| IASIS Healthcare LLC | 8.750 | 06/15/14 | 400,000 | 410,000 |
| Inverness Medical Innovations, Inc. | 7.875 | 02/01/16 | 873,000 | 873,000 |
| Surgical Care Affiliates, Inc., PIK (S) | 8.875 | 07/15/15 | 600,000 | 598,500 |
| United Surgical Partners International, Inc., PIK | 9.250 | 05/01/17 | 100,000 | 103,000 |
| Zimmer Holdings, Inc. | 4.625 | 11/30/19 | 575,000 | 606,831 |
| | | | | |
| Health Care Providers & Services 1.28% | | | | |
| American Renal Holdings (S) | 8.375 | 05/15/18 | 500,000 | 508,125 |
| Community Health Systems, Inc. | 8.875 | 07/15/15 | 750,000 | 785,625 |
| DaVita, Inc. | 7.250 | 03/15/15 | 825,000 | 846,656 |
| HCA, Inc. | 9.250 | 11/15/16 | 300,000 | 324,000 |
| HCA, Inc. | 6.750 | 07/15/13 | 1,125,000 | 1,136,250 |
| HCA, Inc. | 6.375 | 01/15/15 | 575,000 | 562,062 |
| Healthsouth Corp. | 8.125 | 02/15/20 | 775,000 | 786,625 |
| Humana, Inc. | 8.150 | 06/15/38 | 1,550,000 | 1,638,565 |
| Psychiatric Solutions, Inc. | 7.750 | 07/15/15 | 100,000 | 103,375 |
| Psychiatric Solutions, Inc., Series 1 | 7.750 | 07/15/15 | 450,000 | 464,625 |
| Radiation Therapy Services, Inc. (S) | 9.875 | 04/15/17 | 600,000 | 595,500 |
| Vanguard Health Holding Company II LLC | 8.000 | 02/01/18 | 1,025,000 | 1,025,000 |
| Life Sciences Tools & Services 0.10% | | | | |
| Life Technologies Corp. | 6.000 | 03/01/20 | 600,000 | 661,504 |
| Pharmaceuticals 0.35% | | | | |
| Abbott Laboratories | 4.125 | 05/27/20 | 1,975,000 | 2,091,863 |
| Mylan, Inc. (S) | 7.625 | 07/15/17 | 275,000 | 292,188 |
| |
| Industrials 2.95% | | | | 20,208,014 |
|
| Aerospace & Defense 0.53% | | | | |
| L-3 Communications Corp. | 5.200 | 10/15/19 | 1,375,000 | 1,452,155 |
| L-3 Communications Corp., Series B | 6.375 | 10/15/15 | 750,000 | 768,750 |
| RBS Global, Inc./Rexnord LLC (S) | 8.500 | 05/01/18 | 650,000 | 656,500 |
| TransDigm, Inc. | 7.750 | 07/15/14 | 375,000 | 386,250 |
| Triumph Group, Inc. (S) | 8.625 | 07/15/18 | 325,000 | 339,625 |
| | | | | |
| Building Products 0.04% | | | | |
| Cemex Espana Luxembourg (S) | 9.250 | 05/12/20 | 117,000 | 105,008 |
| Goodman Global Group, Inc. (S) | Zero | 12/15/14 | 325,000 | 203,125 |
| | | | | |
| Commercial Services & Supplies 0.92% | | | | |
| ARAMARK Corp. | 8.500 | 02/01/15 | 775,000 | 801,156 |
| Cenveo Corp. | 8.875 | 02/01/18 | 350,000 | 330,750 |
| Cenveo Corp. | 7.875 | 12/01/13 | 400,000 | 390,000 |
| Clean Harbors, Inc. | 7.625 | 08/15/16 | 350,000 | 361,375 |
| Corrections Corp. of America | 7.750 | 06/01/17 | 375,000 | 400,313 |
Multi Sector Bond Fund
Portfolio of Investments - As of July 31, 2010
| | | | |
| | | Maturity | | |
| | Rate | date | Par value | Value |
| |
| Industrials (continued) | | | | |
|
| Corrections Corp. of America | 6.750% | 01/31/14 | $600,000 | $615,000 |
| Deluxe Corp. | 7.375 | 06/01/15 | 275,000 | 281,188 |
| Deluxe Corp. | 5.125 | 10/01/14 | 100,000 | 94,000 |
| Iron Mountain, Inc. | 8.375 | 08/15/21 | 450,000 | 478,125 |
| Iron Mountain, Inc. | 7.750 | 01/15/15 | 250,000 | 252,500 |
| The Geo Group, Inc. (S) | 7.750 | 10/15/17 | 373,000 | 385,123 |
| The ServiceMaster Company, PIK (S) | 10.750 | 07/15/15 | 275,000 | 288,406 |
| Waste Management, Inc. | 4.750 | 06/30/20 | 1,550,000 | 1,610,797 |
| | | | | |
| Electronic Equipment, Instruments & Components 0.06% | | | | |
| Sensus USA, Inc. | 8.625 | 12/15/13 | 400,000 | 397,500 |
| | | | | |
| Industrial Conglomerates 0.54% | | | | |
| Hutchison Whampoa International, Ltd. (S) | 7.625 | 04/09/19 | 1,800,000 | 2,191,820 |
| Koninklijke (Royal) Philips Electronics N.V. | 5.750 | 03/11/18 | 625,000 | 710,141 |
| NBC Universal, Inc. (S) | 5.150 | 04/30/20 | 775,000 | 823,743 |
| | | | | |
| Machinery 0.13% | | | | |
| Case New Holland, Inc. (S) | 7.875 | 12/01/17 | 425,000 | 445,188 |
| Maxim Crane Works LP (S) | 12.250 | 04/15/15 | 100,000 | 93,500 |
| Terex Corp. | 8.000 | 11/15/17 | 100,000 | 97,000 |
| The Manitowoc Company, Inc. | 9.500 | 02/15/18 | 250,000 | 255,000 |
| | | | | |
| Marine 0.03% | | | | |
| Navios Maritime Holdings, Inc. | 9.500 | 12/15/14 | 175,000 | 171,500 |
| | | | | |
| Road & Rail 0.59% | | | | |
| Canadian National Railway Company | 4.950 | 01/15/14 | 230,000 | 252,514 |
| Norfolk Southern Corp. | 5.750 | 01/15/16 | 650,000 | 741,246 |
| Ryder System, Inc. | 6.000 | 03/01/13 | 1,500,000 | 1,625,026 |
| Union Pacific Corp. | 7.875 | 01/15/19 | 1,125,000 | 1,448,371 |
| | | | | |
| Trading Companies & Distributors 0.07% | | | | |
| Aircastle, Ltd. (S) | 9.750 | 08/01/18 | 500,000 | 503,750 |
| | | | | |
| Transportation Infrastructure 0.04% | | | | |
| DP World, Ltd. | 6.850 | 07/02/37 | 300,000 | 251,569 |
| |
| Information Technology 1.13% | | | | 7,710,786 |
|
| Communications Equipment 0.06% | | | | |
| Hughes Network Systems LLC | 9.500 | 04/15/14 | 375,000 | 390,000 |
| | | | | |
| Electronic Equipment, Instruments & Components 0.53% | | | | |
| Agilent Technologies, Inc. | 6.500 | 11/01/17 | 1,225,000 | 1,393,158 |
| NXP BV/NXP Funding LLC (S) | 9.750 | 08/01/18 | 225,000 | 236,250 |
| NXP BV/NXP Funding LLC | 9.500 | 10/15/15 | 425,000 | 416,500 |
| Tyco Electronics Group SA | 6.550 | 10/01/17 | 1,368,000 | 1,564,069 |
| | | | | |
| Internet & Catalog Retail 0.06% | | | | |
| GXS Worldwide, Inc. (S) | 9.750 | 06/15/15 | 400,000 | 384,000 |
| | | | | |
| IT Services 0.02% | | | | |
| Fidelity National Information Services, Inc. (S) | 7.625 | 07/15/17 | 160,000 | 166,400 |
| | | | | |
| Office Electronics 0.11% | | | | |
| Xerox Capital Trust I | 8.000 | 02/01/27 | 725,000 | 731,344 |
| | | | | |
| Semiconductors & Semiconductor Equipment 0.00% | | | | |
| Photronics, Inc. | 5.500 | 10/01/14 | 26,000 | 29,869 |
Multi Sector Bond Fund
Portfolio of Investments - As of July 31, 2010
| | | | |
| | | Maturity | | |
| | Rate | date | Par value | Value |
| |
| Information Technology (continued) | | | | |
|
| Software 0.35% | | | | |
| Adobe Systems, Inc. | 4.750% | 02/01/20 | $1,400,000 | $1,453,094 |
| Oracle Corp. (S) | 3.875 | 07/15/20 | 925,000 | 946,102 |
| |
| Materials 2.17% | | | | 14,807,291 |
|
| |
| Chemicals 0.90% | | | | |
| Ashland, Inc. (S) | 9.125 | 06/01/17 | 335,000 | 380,644 |
| Koppers, Inc. | 7.875 | 12/01/19 | 375,000 | 388,125 |
| Lyondell Chemical Company | 11.000 | 05/01/18 | 1,996,936 | 2,149,202 |
| MacDermid, Inc. (S) | 9.500 | 04/15/17 | 225,000 | 230,625 |
| Nalco Company | 8.875 | 11/15/13 | 175,000 | 179,156 |
| NewMarket Corp. | 7.125 | 12/15/16 | 100,000 | 100,500 |
| Nova Chemicals Corp. | 8.375 | 11/01/16 | 525,000 | 537,469 |
| Scotts Miracle-Gro Company | 7.250 | 01/15/18 | 375,000 | 382,969 |
| The Dow Chemical Company | 8.550 | 05/15/19 | 1,425,000 | 1,779,644 |
| | | | | |
| Containers & Packaging 0.43% | | | | |
| BWAY Holding Company (S) | 10.000 | 06/15/18 | 475,000 | 503,500 |
| Crown Americas LLC (S) | 7.625 | 05/15/17 | 350,000 | 371,000 |
| Graphic Packaging International, Inc. (S) | 9.500 | 06/15/17 | 850,000 | 909,500 |
| Greif, Inc. | 6.750 | 02/01/17 | 350,000 | 358,750 |
| Owens-Illinois, Inc. | 7.800 | 05/15/18 | 725,000 | 781,187 |
| | | | | |
| Metals & Mining 0.52% | | | | |
| ArcelorMittal | 9.850 | 06/01/19 | 1,050,000 | 1,356,492 |
| Barrick Australian Finance Ltd. | 5.950 | 10/15/39 | 1,400,000 | 1,513,627 |
| CSN Resources SA (S) | 6.500 | 07/21/20 | 285,000 | 287,850 |
| Vedanta Resources PLC (S) | 9.500 | 07/18/18 | 350,000 | 385,000 |
| | | | | |
| Paper & Forest Products 0.32% | | | | |
| Boise Paper Holdings LLC/Boise Company | 8.000 | 04/01/20 | 400,000 | 414,000 |
| Georgia-Pacific LLC (S) | 8.250 | 05/01/16 | 350,000 | 379,750 |
| International Paper Company | 7.950 | 06/15/18 | 1,175,000 | 1,418,301 |
| |
| Telecommunication Services 3.12% | | | | 21,333,221 |
|
| Diversified Telecommunication Services 2.31% | | | | |
| AT&T, Inc. | 6.500 | 09/01/37 | 1,750,000 | 1,991,075 |
| Axtel SAB de CV | 9.000 | 09/22/19 | 201,000 | 181,905 |
| Axtel SAB de CV (S) | 7.625 | 02/01/17 | 22,000 | 19,690 |
| British Telecommunications PLC | 9.375 | 12/15/10 | 1,500,000 | 1,544,407 |
| Cincinnati Bell, Inc. | 8.250 | 10/15/17 | 425,000 | 420,750 |
| Citizens Communications Company | 9.000 | 08/15/31 | 800,000 | 820,000 |
| GCI, Inc. | 8.625 | 11/15/19 | 100,000 | 103,500 |
| Indosat Palapa Company BV (S) | 7.375 | 07/29/20 | 103,000 | 107,635 |
| Intelsat Jackson Holdings SA | 11.250 | 06/15/16 | 675,000 | 729,000 |
| ITC Deltacom, Inc. | 10.500 | 04/01/16 | 300,000 | 295,500 |
| Level 3 Financing, Inc. | 10.000 | 02/01/18 | 825,000 | 751,781 |
| MetroPCS Wireless, Inc. | 9.250 | 11/01/14 | 100,000 | 104,500 |
| Qwest Corp. | 8.375 | 05/01/16 | 1,050,000 | 1,194,375 |
| Qwest Corp. | 7.125 | 11/15/43 | 450,000 | 418,500 |
| Telecom Italia Capital SA | 7.175 | 06/18/19 | 1,225,000 | 1,384,970 |
| Telefonica Emisiones SA | 4.949 | 01/15/15 | 1,350,000 | 1,453,105 |
| Verizon Wireless Capital LLC | 8.500 | 11/15/18 | 1,657,000 | 2,190,569 |
| Virgin Media Finance PLC | 9.500 | 08/15/16 | 25,000 | 28,125 |
| Virgin Media Finance PLC | 9.125 | 08/15/16 | 500,000 | 537,500 |
Multi Sector Bond Fund
Portfolio of Investments - As of July 31, 2010
| | | | |
| | | Maturity | | |
| | Rate | date | Par value | Value |
| |
| Telecommunication Services (continued) | | | | |
|
| Virgin Media Finance PLC | 8.375% | 10/15/19 | $225,000 | $244,125 |
| Wind Acquisition Finance SA (S) | 11.750 | 07/15/17 | 324,000 | 344,250 |
| Windstream Corp. | 8.625 | 08/01/16 | 325,000 | 338,813 |
| Windstream Corp. (S) | 8.125 | 09/01/18 | 450,000 | 456,188 |
| Windstream Corp. | 7.875 | 11/01/17 | 150,000 | 152,625 |
| | | | | |
| Wireless Telecommunication Services 0.81% | | | | |
| America Movil SAB de CV (S) | 6.125 | 03/30/40 | 1,900,000 | 2,050,862 |
| Crown Castle International Corp. | 9.000 | 01/15/15 | 825,000 | 903,375 |
| MetroPCS Wireless, Inc. | 9.250 | 11/01/14 | 375,000 | 391,875 |
| MTS International Funding, Ltd. (S) | 8.625 | 06/22/20 | 185,000 | 206,127 |
| Nextel Communications, Inc. | 7.375 | 08/01/15 | 750,000 | 742,500 |
| SBA Telecommunications, Inc. | 8.000 | 08/15/16 | 350,000 | 376,250 |
| Sprint Capital Corp. | 8.750 | 03/15/32 | 725,000 | 734,969 |
| VIP Finance Ireland, Ltd. for OJSC Vimpel Communications (S) | 9.125 | 04/30/18 | 100,000 | 114,375 |
| |
| Utilities 2.16% | | | | 14,764,999 |
|
| Electric Utilities 1.53% | | | | |
| Ameren Energy Generating Company | 7.950 | 06/01/32 | 1,295,000 | 1,324,042 |
| Duke Energy Carolinas LLC | 5.300 | 02/15/40 | 1,950,000 | 2,060,319 |
| Edison Mission Energy | 7.750 | 06/15/16 | 200,000 | 142,500 |
| Edison Mission Energy | 7.000 | 05/15/17 | 1,275,000 | 867,000 |
| Exelon Generation Company LLC | 5.200 | 10/01/19 | 1,300,000 | 1,410,370 |
| FPL Group Capital, Inc. (6.350% to 10/31/2016, then 3 month | | | | |
| LIBOR + 2.068%) | 6.350 | 10/01/66 | 2,525,000 | 2,326,156 |
| Mirant Americas Generation LLC | 9.125 | 05/01/31 | 50,000 | 47,000 |
| Oncor Electric Delivery Company | 5.950 | 09/01/13 | 1,775,000 | 1,971,940 |
| PPL Electric Utilities Corp. | 6.250 | 05/15/39 | 265,000 | 311,422 |
| | | | | |
| Independent Power Producers & Energy Traders 0.63% | | | | |
| AES Corp. | 8.000 | 10/15/17 | 75,000 | 79,594 |
| AES Corp. | 8.000 | 06/01/20 | 225,000 | 238,219 |
| Calpine Corp. (S) | 7.875 | 07/31/20 | 1,000,000 | 1,010,000 |
| Dynegy Holdings, Inc. | 7.750 | 06/01/19 | 1,000,000 | 700,000 |
| NRG Energy, Inc. | 8.500 | 06/15/19 | 1,325,000 | 1,391,250 |
| NRG Energy, Inc. | 7.375 | 02/01/16 | 125,000 | 127,500 |
| The AES Corp. | 9.750 | 04/15/16 | 675,000 | 757,687 |
|
| |
| U.S. Government & Agency Obligations 10.51% | | | | $71,869,563 |
| (Cost $71,481,028) | | | | |
| |
| U.S. Government Agency 10.51% | | | | 71,869,563 |
|
| Federal Home Loan Mortgage Corp. | | | | |
| Freddie Mac Gold Pool | 4.500 | TBA | 1,000,000 | 1,044,734 |
| Freddie Mac Gold Pool | 5.000 | TBA | 2,500,000 | 2,653,042 |
| Freddie Mac Gold Pool | 5.500 | TBA | 5,000,000 | 5,382,682 |
| Freddie Mac Non Gold Pool (P) | 5.366 | 01/01/37 | 746,298 | 796,906 |
| Freddie Mac Non Gold Pool (P) | 5.816 | 11/01/36 | 1,084,323 | 1,143,273 |
| Freddie Mac Non Gold Pool (P) | 6.456 | 01/01/37 | 1,573,214 | 1,670,817 |
| Federal National Mortgage Association | | | | |
| Fannie Mae Pool | 4.500 | TBA | 12,000,000 | 12,528,410 |
| Fannie Mae Pool (P) | 4.848 | 07/01/38 | 3,597,770 | 3,833,728 |
| Fannie Mae Pool | 5.000 | TBA | 11,000,000 | 11,720,222 |
| Fannie Mae Pool (P) | 5.054 | 11/01/35 | 1,261,685 | 1,340,412 |
Multi Sector Bond Fund
Portfolio of Investments - As of July 31, 2010
| | | | |
| | | Maturity | | |
| | Rate | date | Par value | Value |
| |
| U.S. Government Agency (continued) | | | | |
|
| Fannie Mae Pool (P) | 5.275% | 04/01/37 | $2,769,633 | $2,904,172 |
| Fannie Mae Pool | 5.500 | TBA | 10,000,000 | 10,773,958 |
| Fannie Mae Pool (P) | 5.630 | 10/01/38 | 1,922,089 | 2,031,647 |
| Fannie Mae Pool (P) | 5.785 | 01/01/37 | 931,577 | 994,750 |
| Fannie Mae Pool | 6.000 | TBA | 10,000,000 | 10,862,674 |
| Fannie Mae Pool | 6.500 | TBA | 2,000,000 | 2,188,136 |
|
| |
| Foreign Government Obligations 9.03% | | | | $61,735,722 |
|
| (Cost $58,888,925) | | | | |
| |
| Argentina 0.33% | | | | 2,277,848 |
|
| Republic of Argentina | | | | |
| Bond | Zero | 12/15/35 | 3,207,304 | 317,523 |
| Bond (ARS) (Q) | 5.830 | 12/31/33 | 366,551 | 107,891 |
| Bond | 8.280 | 12/31/33 | 1,198,516 | 907,876 |
| Bond | 8.750 | 06/02/17 | 456,715 | 427,942 |
| Note | 7.000 | 10/03/15 | 272,000 | 238,000 |
| Note (EUR) (Q) | 7.820 | 12/31/33 | 325,917 | 278,616 |
| |
| Brazil 0.64% | | | | 4,372,315 |
|
| Federative Republic of Brazil | | | | |
| Bond | 4.875 | 01/22/21 | 894,000 | 925,290 |
| Bond | 8.250 | 01/20/34 | 329,000 | 455,665 |
| Bond | 11.000 | 08/17/40 | 190,000 | 259,160 |
| Note | 5.875 | 01/15/19 | 955,000 | 1,081,060 |
| Note | 8.000 | 01/15/18 | 225,000 | 266,850 |
| Note | 8.750 | 02/04/25 | 753,000 | 1,050,435 |
| Notas do Tesouro Nacional, Series F | | | | |
| Note (BRL) (Q) | 10.000 | 01/01/21 | 6,600,000 | 333,855 |
| |
| Colombia 0.60% | | | | 4,128,065 |
|
| Republic of Colombia | | | | |
| Bond | 7.375 | 01/27/17 | 195,000 | 233,513 |
| Bond | 7.375 | 09/18/37 | 1,321,000 | 1,644,645 |
| Bond | 8.125 | 05/21/24 | 715,000 | 918,775 |
| Bond (COP) (Q) | 9.850 | 06/28/27 | 274,000,000 | 197,730 |
| Santa Fe de Bogota DC (COP) (Q) | 9.750 | 07/26/28 | 1,665,000,000 | 1,133,402 |
| |
| Croatia 0.08% | | | | 560,999 |
|
| Republic of Croatia (S) | 6.625 | 07/14/20 | 523,000 | 560,999 |
| |
| El Salvador 0.14% | | | | 938,275 |
|
| Republic of El Salvador | | | | |
| Bond | 7.375 | 12/01/19 | 765,000 | 830,025 |
| Bond | 8.250 | 04/10/32 | 100,000 | 108,250 |
| |
| Indonesia 0.39% | | | | 2,664,136 |
|
| Republic of Indonesia | | | | |
| Bond | 6.875 | 03/09/17 | 300,000 | 350,226 |
| Bond | 7.750 | 01/17/38 | 510,000 | 658,410 |
| Note (S) | 11.625 | 03/04/19 | 1,100,000 | 1,655,500 |
Multi Sector Bond Fund
Portfolio of Investments - As of July 31, 2010
| | | | |
| | | Maturity | | |
| | Rate | date | Par value | Value |
| |
| Iraq 0.30% | | | | $2,035,462 |
|
| Republic of Iraq | 5.800% | 01/15/28 | $2,445,000 | 2,035,462 |
| |
| Malaysia 0.83% | | | | 5,685,222 |
|
| Government of Malaysia | | | | |
| Bond (MYR) (Q) | 3.741 | 02/27/15 | 1,810,000 | 575,693 |
| Bond (MYR) (Q) | 3.835 | 08/12/15 | 16,020,000 | 5,109,529 |
| |
| Mexico 1.57% | | | | 10,707,828 |
|
| Government of Mexico | | | | |
| Bond (MXN) (Q) | 8.000 | 12/17/15 | 10,890,000 | 937,675 |
| Bond (MXN) (Q) | 8.000 | 06/11/20 | 67,620,000 | 5,920,353 |
| Bond | 8.000 | 09/24/22 | 100,000 | 133,250 |
| Note | 6.750 | 09/27/34 | 1,525,000 | 1,814,750 |
| Note | 7.500 | 04/08/33 | 1,480,000 | 1,901,800 |
| |
| Pakistan 0.02% | | | | 143,917 |
|
| Islamic Republic of Pakistan | 7.125 | 03/31/16 | 150,000 | 143,917 |
| |
| Panama 0.35% | | | | 2,377,856 |
|
| Republic of Panama | | | | |
| Bond | 5.200 | 01/30/20 | 1,420,000 | 1,519,400 |
| Bond | 6.700 | 01/26/36 | 340,000 | 397,800 |
| Bond | 7.250 | 03/15/15 | 245,000 | 286,956 |
| Bond | 9.375 | 04/01/29 | 120,000 | 173,700 |
| |
| Peru 0.31% | | | | 2,086,481 |
|
| Republic of Peru | | | | |
| Bond | 6.550 | 03/14/37 | 321,000 | 372,360 |
| Bond | 7.350 | 07/21/25 | 960,000 | 1,200,000 |
| Bond (PEN) (Q) | 7.840 | 08/12/20 | 330,000 | 135,071 |
| Bond | 8.750 | 11/21/33 | 266,000 | 379,050 |
| |
| Philippines 0.61% | | | | 4,146,940 |
|
| Republic of Philippines | | | | |
| Bond | 6.375 | 10/23/34 | 490,000 | 539,000 |
| Bond | 7.500 | 09/25/24 | 378,000 | 464,940 |
| Bond | 7.750 | 01/14/31 | 2,240,000 | 2,777,600 |
| Bond | 9.375 | 01/18/17 | 280,000 | 365,400 |
| |
| Poland 0.20% | | | | 1,395,864 |
|
| Republic of Poland | 6.375 | 07/15/19 | 1,230,000 | 1,395,864 |
| |
| Qatar 0.13% | | | | 888,300 |
|
| Government of Qatar (S) | 5.250 | 01/20/20 | 840,000 | 888,300 |
| |
| Russia 0.70% | | | | 4,769,470 |
|
| Government of Russia | | | | |
| Eurobond (S) | 3.625 | 04/29/15 | 305,000 | 303,475 |
| Eurobond (S) | 5.000 | 04/29/20 | 200,000 | 201,500 |
| Eurobond | 7.500 | 03/31/30 | 3,677,240 | 4,264,495 |
| |
| South Africa 0.29% | | | | 2,009,534 |
|
| Republic of South Africa | | | | |
| Bond (ZAR) (Q) | 7.500 | 01/15/14 | 1,010,000 | 138,164 |
Multi Sector Bond Fund
Portfolio of Investments - As of July 31, 2010
| | | | |
| | | Maturity | | |
| | Rate | date | Par value | Value |
| |
| South Africa (continued) | | | | |
|
| Bond (ZAR) (Q) | 8.000% | 12/21/18 | 9,225,000 | $1,249,195 |
| Note | 6.500 | 06/02/14 | 50,000 | 56,375 |
| Note | 6.875 | 05/27/19 | 480,000 | 565,800 |
| |
| South Korea 0.04% | | | | 303,645 |
|
| Republic of Korea | 7.125 | 04/16/19 | 250,000 | 303,645 |
| |
| Turkey 0.23% | | | | 1,539,481 |
|
| Republic of Turkey | | | | |
| Note | 7.250 | 03/15/15 | 235,000 | 270,544 |
| Note | 7.250 | 03/05/38 | 145,000 | 163,125 |
| Note | 7.375 | 02/05/25 | 300,000 | 351,750 |
| Note | 7.500 | 11/07/19 | 635,000 | 754,062 |
| |
| Ukraine 0.29% | | | | 2,010,846 |
|
| Republic of Ukraine | | | | |
| Bond (JPY) (Q) | 3.200 | 12/19/10 | 100,000,000 | 1,141,783 |
| Bond | 6.580 | 11/21/16 | 500,000 | 500,675 |
| Bond | 6.875 | 03/04/11 | 250,000 | 252,525 |
| Bond (S) | 6.875 | 03/04/11 | 115,000 | 115,863 |
| |
| Uruguay 0.29% | | | | 1,972,488 |
|
| Republic of Uruguay | | | | |
| Bond | 7.625 | 03/21/36 | 245,000 | 297,063 |
| Note | 8.000 | 11/18/22 | 1,335,000 | 1,675,425 |
| |
| Venezuela 0.69% | | | | 4,720,750 |
|
| Republic of Venezuela | | | | |
| Bond | 7.000 | 12/01/18 | 40,000 | 25,800 |
| Bond | 7.650 | 04/21/25 | 350,000 | 213,500 |
| Bond | 8.250 | 10/13/24 | 160,000 | 102,960 |
| Bond | 8.500 | 10/08/14 | 1,542,000 | 1,256,730 |
| Bond | 9.000 | 05/07/23 | 635,000 | 436,563 |
| Bond | 9.250 | 05/07/28 | 2,215,000 | 1,500,662 |
| Bond | 13.625 | 08/15/18 | 400,000 | 369,000 |
| Note (P) | 1.513 | 04/20/11 | 863,000 | 815,535 |
|
| |
| Convertible Bonds 0.69% | | | | $4,739,560 |
|
| (Cost $4,765,812) | | | | |
| |
| Consumer Staples 0.02% | | | | 157,419 |
|
| Smithfield Foods, Inc. | 4.000 | 06/30/13 | 125,000 | 120,781 |
| Tyson Foods, Inc. | 3.250 | 10/15/13 | 30,000 | 36,638 |
| |
| Energy 0.04% | | | | 243,325 |
|
| Enercoal Resources Pte, Ltd. | 9.250 | 08/05/14 | 200,000 | 181,742 |
| Transocean, Inc., Series A | 1.625 | 12/15/37 | 63,000 | 61,583 |
| |
| Financials 0.03% | | | | 184,800 |
|
| Aldar Funding, Ltd. | 5.767 | 11/10/11 | 192,000 | 184,800 |
| |
| Health Care 0.31% | | | | 2,098,158 |
|
| Amgen, Inc. | 0.125 | 02/01/11 | 770,000 | 764,225 |
| Gilead Sciences, Inc. | 0.500 | 05/01/11 | 350,000 | 355,250 |
| Gilead Sciences, Inc. (S) | 1.000 | 05/01/14 | 135,000 | 134,563 |
| Life Technologies Corp. | 3.250 | 06/15/25 | 420,000 | 447,300 |
| PDL BioPharma, Inc. | 2.000 | 02/15/12 | 40,000 | 38,900 |
Multi Sector Bond Fund
Portfolio of Investments - As of July 31, 2010
| | | | |
| | | Maturity | | |
| | Rate | date | Par value | Value |
| |
| Health Care (continued) | | | | |
|
| Shire PLC | 2.750% | 05/09/14 | $360,000 | $357,920 |
| |
| Industrials 0.04% | | | | 298,550 |
|
| FTI Consulting, Inc. | 3.750 | 07/15/12 | 75,000 | 94,031 |
| Owens-Brockway Glass Container, Inc. (S) | 3.000 | 06/01/15 | 215,000 | 204,519 |
| |
| Information Technology 0.24% | | | | 1,668,683 |
|
| CommScope, Inc. | 3.250 | 07/01/15 | 400,000 | 403,500 |
| Comtech Telecommunications Corp. (S) | 3.000 | 05/01/29 | 316,000 | 293,880 |
| Micron Technology, Inc. | 1.875 | 06/01/14 | 480,000 | 416,400 |
| ON Semiconductor Corp. | 1.875 | 12/15/25 | 41,000 | 47,099 |
| ON Semiconductor Corp., Series B | Zero | 04/15/24 | 160,000 | 154,800 |
| ON Semiconductor Corp. | 2.625 | 12/15/26 | 41,000 | 40,078 |
| Symantec Corp. | 0.750 | 06/15/11 | 175,000 | 173,688 |
| Xilinx, Inc. | 3.125 | 03/15/37 | 141,000 | 139,238 |
| |
| Telecommunication Services 0.01% | | | | 88,625 |
|
| Lucent Technologies, Inc. | 2.875 | 06/15/25 | 100,000 | 88,625 |
|
| Structured Notes (K) 2.98% | | | | $20,384,975 |
|
| (Cost $19,307,700) | | | | |
| |
| Brazil 1.30% | | | | 8,881,195 |
|
| Federal Republic of Brazil (JPMorgan Chase & Company ) | | | | |
| Note (BRL) (Q) | 10.000 | 05/11/11 | 12,289,500 | 6,507,699 |
| Notas do Tesouro Nacional (HSBC Bank USA) | | | | |
| Note (BRL) (Q) | 10.000 | 01/01/17 | 3,100,000 | 1,635,075 |
| Notas do Tesouro Nacional (JPMorgan Chase Bank) | | | | |
| Bond (BRL) (Q) | 10.000 | 12/07/10 | 1,400,000 | 738,421 |
| |
| Colombia 0.52% | | | | 3,581,083 |
|
| Republic of Colombia (Citigroup Funding, Inc.) | | | | |
| Note (COP) (Q) | 11.000 | 07/27/20 | 5,300,000,000 | 3,581,083 |
| |
| Indonesia 1.12% | | | | 7,665,782 |
|
| Republic of Indonesia (Barclays Bank PLC, EMTN ) | | | | |
| Note (IDR) (Q) | 11.500 | 09/18/19 | 48,000,000,000 | 6,542,504 |
| Note (IDR) (Q) | 12.800 | 06/17/21 | 4,100,000,000 | 608,803 |
| Republic of Indonesia (HSBC Bank USA) | | | | |
| Bond (IDR) (Q) | 11.000 | 11/15/20 | 1,300,000,000 | 174,326 |
| Republic of Indonesia (JPMorgan Chase & Company ) | | | | |
| Note (IDR) (Q) | 12.800 | 06/11/21 | 2,300,000,000 | 340,149 |
| |
| Russia 0.04% | | | | 256,915 |
|
| Government of Russia (Barclays Bank PLC) | | | | |
| Bond (RUB) (Q) | 11.200 | 12/17/14 | 6,600,000 | 256,915 |
|
| Term Loans (M)19.31% | | | | $132,080,558 |
|
| (Cost $131,387,652) | | | | |
| |
| Consumer Discretionary 5.36% | | | | 36,675,800 |
|
| Auto Components 0.69% | | | | |
| Allison Transmission, Inc. | 3.100 | 08/07/14 | 2,895,767 | 2,704,525 |
| Dana Holding Corp. | 4.709 | 01/30/15 | 2,049,577 | 2,003,461 |
| | | | | |
| Automobiles 0.40% | | | | |
| Ford Motor Company | 3.337 | 12/16/13 | 1,761,668 | 1,710,653 |
Multi Sector Bond Fund
Portfolio of Investments - As of July 31, 2010
| | | | |
| | | Maturity | | |
| | Rate | date | Par value | Value |
| |
| Consumer Discretionary (continued) | | | | |
|
| Ford Motor Company | 3.350% | 12/16/13 | $1,040,039 | $1,001,967 |
| | | | | |
| Commercial Services & Supplies 0.25% | | | | |
| Interactive Data Corp. (T) | - | 01/29/17 | 1,711,000 | 1,705,653 |
| | | | | |
| Hotels, Restaurants & Leisure 0.91% | | | | |
| Ameristar Casinos, Inc. | 3.588 | 11/10/12 | 626,112 | 622,851 |
| Harrah's Operating Company, Inc. | 3.498 | 01/28/15 | 3,000,000 | 2,570,250 |
| Isle of Capri Casinos, Inc. (T) | - | 11/30/13 | 1,851,784 | 1,747,159 |
| Penn National Gaming, Inc. | 2.105 | 10/03/12 | 1,350,000 | 1,318,901 |
| | | | | |
| Leisure Equipment & Products 0.08% | | | | |
| Greenwood Racing, Inc. | 2.570 | 11/28/11 | 603,125 | 580,508 |
| | | | | |
| Media 2.56% | | | | |
| Advantage Sale & Marketing LLC | 5.000 | 05/05/16 | 937,650 | 927,492 |
| Advantage Sale & Marketing LLC | 8.500 | 05/05/17 | 175,000 | 173,469 |
| Carmike Cinemas, Inc. | 5.500 | 01/27/16 | 919,528 | 915,587 |
| Charter Communications Operating LLC | 2.320 | 03/06/14 | 965,773 | 915,191 |
| Charter Communications Operating LLC | 3.790 | 09/06/16 | 1,767,223 | 1,684,227 |
| Cinemark USA, Inc. | 3.604 | 04/29/16 | 539,598 | 525,241 |
| CSC Holdings LLC | 2.091 | 03/29/16 | 1,426,063 | 1,391,600 |
| Cumulus Media, Inc. | 4.079 | 06/11/14 | 2,142,084 | 1,920,736 |
| Mediacom Broadband LLC | 4.500 | 10/23/17 | 1,525,000 | 1,456,375 |
| Mediacom LLC | 4.500 | 10/23/17 | 750,000 | 702,500 |
| Nextmedia Group, Inc. | 8.250 | 05/27/16 | 723,188 | 719,572 |
| Nielsen Finance LLC | 2.345 | 08/09/13 | 2,265,868 | 2,148,326 |
| RH Donnelley, Inc. | 9.250 | 10/24/14 | 826,418 | 727,936 |
| Sinclair Television Group, Inc. | 6.750 | 10/29/15 | 1,924,242 | 1,937,039 |
| Univision Communications, Inc. | 2.566 | 09/29/14 | 1,582,691 | 1,381,338 |
| | | | | |
| Multiline Retail 0.47% | | | | |
| Michaels Stores, Inc. | 2.762 | 10/31/13 | 1,891,068 | 1,767,351 |
| Neiman Marcus Group, Inc. | 2.473 | 04/05/13 | 1,240,336 | 1,167,466 |
| QVC, Inc. | 5.829 | 03/30/14 | 248,986 | 248,426 |
| |
| Consumer Staples 0.99% | | | | 6,747,928 |
|
| Food & Staples Retailing 0.16% | | | | |
| Michael Foods, Inc. (T) | - | 06/29/16 | 1,075,000 | 1,075,537 |
| | | | | |
| Food Products 0.51% | | | | |
| Dean Foods Company | 3.540 | 04/02/16 | 1,254,744 | 1,172,289 |
| Dole Food Company, Inc. | 8.000 | 08/30/10 | 238,318 | 238,231 |
| Dole Food Company, Inc. | 5.041 | 03/02/17 | 602,725 | 602,505 |
| Dole Food Company, Inc. | 5.021 | 03/02/17 | 1,497,017 | 1,496,473 |
| | | | | |
| Household Products 0.15% | | | | |
| JohnsonDiversey, Inc. | 5.500 | 11/24/15 | 995,000 | 991,891 |
| | | | | |
| Personal Products 0.17% | | | | |
| Revlon, Inc. | 6.000 | 03/09/15 | 1,197,000 | 1,171,002 |
| |
| Energy 1.06% | | | | 7,254,280 |
|
| Energy Equipment & Services 0.64% | | | | |
| Hercules Offshore, Inc. | 6.000 | 07/11/13 | 2,441,246 | 2,162,028 |
| Precision Drilling Corp. | 9.250 | 09/30/14 | 2,236,459 | 2,236,459 |
| | | | | |
| Oil, Gas & Consumable Fuels 0.42% | | | | |
| Atlas Pipeline Holdings LP | 6.750 | 07/27/14 | 1,907,282 | 1,896,157 |
| Targa Resources, Inc. | 5.750 | 07/05/16 | 962,644 | 959,636 |
Multi Sector Bond Fund
Portfolio of Investments - As of July 31, 2010
| | | | |
| | | Maturity | | |
| | Rate | date | Par value | Value |
| |
| Financials 1.06% | | | | $7,282,583 |
|
| Diversified Financial Services 0.77% | | | | |
| American General Finance Corp. | 7.250% | 04/21/15 | $625,000 | 616,211 |
| FoxCo Acquisition Sub LLC | 7.500 | 07/14/15 | 2,692,900 | 2,582,941 |
| Pinnacle Foods Finance LLC | 2.848 | 04/02/14 | 2,238,705 | 2,101,273 |
| | | | | |
| Real Estate Management & Development 0.14% | | | | |
| CB Richard Ellis Services, Inc. | 6.000 | 12/21/15 | 932,562 | 932,158 |
| | | | | |
| Thrifts & Mortgage Finance 0.15% | | | | |
| Ocwen Financial Corp. (T) | - | 07/28/15 | 1,050,000 | 1,050,000 |
| |
| Health Care 2.37% | | | | 16,207,887 |
|
| Health Care Equipment & Supplies 0.14% | | | | |
| Inverness Medical Innovations, Inc. | 2.423 | 06/26/14 | 974,481 | 929,655 |
| | | | | |
| Health Care Providers & Services 1.98% | | | | |
| Community Health Systems, Inc. | 2.788 | 07/25/14 | 2,487,433 | 2,355,275 |
| DaVita, Inc. | 1.858 | 10/05/12 | 1,705,000 | 1,663,323 |
| HCA, Inc. | 3.783 | 03/31/17 | 957,163 | 931,290 |
| HCA, Inc. | 2.783 | 11/18/13 | 1,663,869 | 1,605,815 |
| Healthsouth Corp. | 4.290 | 09/10/15 | 1,836,125 | 1,810,223 |
| Universal Health Services, Inc. (T) | - | 07/28/16 | 1,865,000 | 1,860,921 |
| US Renal Care, Inc. | 6.750 | 05/23/16 | 675,308 | 671,931 |
| Vanguard Health Holding Company I LLC | 5.000 | 01/29/16 | 2,693,250 | 2,661,604 |
| | | | | |
| Pharmaceuticals 0.25% | | | | |
| Warner Chilcott PLC | 5.750 | 04/30/15 | 1,076,122 | 1,074,909 |
| Warner Chilcott PLC | 5.500 | 10/30/14 | 644,068 | 642,941 |
| |
| Industrials 3.13% | | | | 21,409,297 |
|
| Aerospace & Defense 0.60% | | | | |
| Sequa Corp. | 3.790 | 12/03/14 | 1,885,000 | 1,755,406 |
| TransDigm, Inc. | 2.538 | 06/23/13 | 1,000,000 | 968,571 |
| Triumph Group, Inc. | 4.500 | 06/16/16 | 1,400,000 | 1,403,938 |
| | | | | |
| Building Products 0.20% | | | | |
| Goodman Global Holdings, Inc. | 6.250 | 02/13/14 | 1,333,174 | 1,334,840 |
| | | | | |
| Commercial Services & Supplies 0.61% | | | | |
| ARAMARK Corp. | 3.783 | 07/26/16 | 1,204,093 | 1,156,591 |
| ARAMARK Corp. | 3.598 | 07/26/16 | 79,187 | 76,063 |
| ARAMARK Corp. | 2.408 | 01/27/14 | 607,075 | 567,615 |
| ARAMARK Corp. | 2.073 | 01/27/14 | 43,961 | 41,103 |
| DynCorp International, Inc. | 6.250 | 07/05/16 | 1,000,000 | 1,003,500 |
| The Hertz Corp. | 2.093 | 12/21/12 | 1,164,364 | 1,124,575 |
| The Hertz Corp. | 2.087 | 12/21/12 | 215,338 | 207,979 |
| | | | | |
| Containers & Packaging 0.07% | | | | |
| Graham Packaging Company, Inc. | 2.636 | 10/07/11 | 492,317 | 490,130 |
| | | | | |
| Energy Equipment & Services 0.34% | | | | |
| Dresser, Inc. | 2.695 | 05/04/14 | 2,504,600 | 2,315,861 |
| | | | | |
| Industrial Conglomerates 0.34% | | | | |
| Reynolds Group Holdings, Inc. | 6.250 | 05/05/16 | 1,788,750 | 1,779,806 |
| Reynolds Group Holdings, Inc. | 5.750 | 05/05/16 | 512,000 | 508,586 |
Multi Sector Bond Fund
Portfolio of Investments - As of July 31, 2010
| | | | |
| | | Maturity | | |
| | Rate | date | Par value | Value |
| |
| Industrials (continued) | | | | |
|
| Machinery 0.90% | | | | |
| Blount International, Inc. | 5.750% | 02/09/12 | $755,348 | $753,460 |
| Bucyrus International, Inc. | 4.500 | 02/19/16 | 748,157 | 749,404 |
| Manitowoc Company, Inc. | 8.000 | 11/06/14 | 1,844,908 | 1,842,089 |
| Mueller Water Products, Inc. | 5.487 | 05/23/14 | 868,042 | 862,399 |
| Oshkosh Trucking Corp. | 6.540 | 12/06/13 | 493,325 | 493,542 |
| Rexnord Holdings, Inc. | 2.875 | 07/19/13 | 1,540,000 | 1,464,925 |
| | | | | |
| Professional Services 0.07% | | | | |
| Trans Union LLC/TransUnion Financing Corp. | 6.750 | 06/15/17 | 505,000 | 508,914 |
| |
| Information Technology 1.03% | | | | 7,061,471 |
|
| Internet Software & Services 0.32% | | | | |
| Savvis Communications Corp. (T) | - | 07/30/16 | 968,000 | 938,960 |
| Skillsoft Corp. | 6.500 | 05/19/17 | 1,257,000 | 1,257,000 |
| | | | | |
| IT Services 0.34% | | | | |
| Fidelity National Information Services, Inc. | 5.250 | 07/18/14 | 2,345,000 | 2,356,237 |
| | | | | |
| Software 0.37% | | | | |
| Dealer Computer Services, Inc. | 5.250 | 04/21/17 | 643,475 | 635,834 |
| SunGard Data Systems, Inc. | 2.095 | 02/28/14 | 1,984,576 | 1,873,440 |
| |
| Materials 1.48% | | | | 10,124,042 |
|
| Chemicals 0.78% | | | | |
| Chemtura Corp. | 6.000 | 03/22/11 | 1,750,000 | 1,745,625 |
| ISP Chemco, Inc. | 1.875 | 06/04/14 | 992,327 | 935,269 |
| Lyondell Chemical Company | 5.500 | 04/08/16 | 875,000 | 880,605 |
| Nalco Company (T) | - | 05/13/16 | 1,000,000 | 1,003,542 |
| Rockwood Holdings, Inc. | 6.000 | 05/15/14 | 740,532 | 740,162 |
| | | | | |
| Containers & Packaging 0.49% | | | | |
| BWAY Corp. | 5.501 | 06/16/17 | 1,062,500 | 1,059,844 |
| Graphic Packaging International Corp. | 3.280 | 05/16/14 | 1,780,811 | 1,742,969 |
| Smurfit-Stone Container Enterprises, Inc. | 6.750 | 02/22/16 | 560,000 | 561,296 |
| | | | | |
| Paper & Forest Products 0.21% | | | | |
| Georgia-Pacific Corp. | 2.528 | 12/21/12 | 1,481,840 | 1,454,730 |
| |
| Telecommunication Services 0.93% | | | | 7,238,730 |
|
| Diversified Telecommunication Services 0.92% | | | | |
| Cincinnati Bell, Inc. | 6.500 | 06/09/17 | 1,182,038 | 1,158,608 |
| Level 3 Financing, Inc. | 2.724 | 03/13/14 | 2,000,000 | 1,792,084 |
| PanAmSat Corp. | 3.033 | 01/03/14 | 1,835,696 | 1,729,570 |
| Telesat Canada | 3.320 | 10/31/14 | 1,638,678 | 1,582,686 |
| | | | | |
| Wireless Telecommunication Services 0.01% | | | | |
| MetroPCS Wireless, Inc. | 2.625 | 11/04/13 | 83,422 | 81,023 |
| MetroPCS Wireless, Inc. | 3.875 | 11/03/16 | 908,846 | 894,759 |
| |
| Utilities 1.77% | | | | 12,078,540 |
|
| Electric Utilities 0.98% | | | | |
| Mirant North America LLC | 2.066 | 01/03/13 | 2,210,899 | 2,183,263 |
| Texas Competitive Electric Holdings Company LLC | 3.975 | 10/10/14 | 5,809,962 | 4,504,795 |
Multi Sector Bond Fund
Portfolio of Investments - As of July 31, 2010
| | | | |
| | | Maturity | | |
| | Rate | date | Par value | Value |
| |
| Utilities (continued) | | | | |
|
| Independent Power Producers & Energy Traders 0.79% | | | | |
| Calpine Corp. | 3.415% | 03/29/14 | $1,900,853 | $1,801,653 |
| New Development Holdings, Inc. | 7.000 | 06/08/17 | 1,111,000 | 1,117,944 |
| NRG Energy, Inc. | 3.783 | 08/31/15 | 1,215,124 | 1,189,809 |
| NRG Energy, Inc. | 2.283 | 02/01/13 | 323,124 | 309,290 |
| NRG Energy, Inc. | 2.183 | 02/01/13 | 1,015,251 | 971,786 |
|
| Collateralized Mortgage Obligations 9.84% | | | | $67,327,460 |
| (Cost $66,240,830) | | | | |
| |
| American Home Mortgage Assets | | | | |
| Series 2006-4, Class 1A (P) | 0.519 | 10/25/46 | 4,871,224 | 2,441,190 |
| BCAP LLC Trust | | | | |
| Series 2009, Class 7A1 (S) | 6.120 | 08/26/36 | 3,338,373 | 3,049,217 |
| BCRR Trust, Series 2009-1, Class 2A1 | 5.858 | 07/17/40 | 3,200,000 | 3,411,596 |
| Citicorp Mortgage Securities Trust | | | | |
| Series 2007-8, Class 1A3 | 6.000 | 09/25/37 | 1,664,170 | 1,541,439 |
| CitiMortgage Alternative Loan Trust, | | | | |
| Series 2007-A7, Class 2A1 (P) | 0.729 | 07/25/37 | 772,277 | 443,598 |
| Commercial Mortgage Pass Through Certificates | | | | |
| Series 2006, Class C8 | 5.377 | 12/10/46 | 3,525,000 | 1,871,432 |
| Countrywide Home Loan Mortgage Pass Through Trust | | | | |
| Series 2006-3, Class 3A1 (P) | 0.579 | 02/25/36 | 4,008,489 | 2,267,610 |
| Series 2004-25, Class 1A1 (P) | 0.659 | 02/25/35 | 1,667,700 | 1,176,996 |
| Series 2004-25, Class 2A1 (P) | 0.669 | 02/25/35 | 1,722,569 | 1,132,675 |
| Credit Suisse Mortgage Capital Certificates | | | | |
| Series 2009-ASG, Class A (P)(S) | 1.597 | 11/28/39 | 9,568 | 9,568 |
| GS Mortgage Securities Corp. | | | | |
| Series 2007, Class G10 (P) | 5.808 | 08/10/45 | 2,875,000 | 2,014,240 |
| GS Mortgage Securities Corp. II | | | | |
| Series 2007-GG10, Class A4 (P) | 6.000 | 08/10/45 | 2,850,000 | 2,874,983 |
| Harborview Mortgage Loan Trust | | | | |
| Series 2005-8, Class 1A2A (P) | 0.671 | 09/19/35 | 2,911,284 | 1,636,261 |
| Jefferies & Company, Inc. | | | | |
| Series 2009-R2, Class 4A (P)(S) | 5.338 | 05/26/37 | 3,883,312 | 3,845,635 |
| Series 2009-R9, Class 1A1 (P)(S) | 5.762 | 08/26/46 | 2,764,825 | 2,799,468 |
| JP Morgan Chase Commercial Mortgage Securities Corp. | | | | |
| Series 2005-CB13, Class A2FX (S) | 5.130 | 01/12/43 | 2,443,981 | 2,434,047 |
| JPMorgan Chase Commercial Mortgage Securities Corp. | | | | |
| Series 2010-C1, Class A1 (S) | 3.853 | 06/15/43 | 2,645,471 | 2,746,468 |
| JPMorgan REREMIC | | | | |
| Series 2009-12, Class 1A1 (S) | 5.750 | 07/26/37 | 2,125,969 | 2,245,911 |
| LB-UBS Commercial Mortgage Trust | | | | |
| Series 2006-C6, Class A4 | 5.372 | 09/15/39 | 526,000 | 558,453 |
| Merrill Lynch Mortgage Investors, Inc. | | | | |
| Series 2005-A9, 2A1A (P) | 5.062 | 12/25/35 | 776,927 | 773,090 |
| Merrill Lynch/Countrywide Commercial Mortgage Trust (P) | | | | |
| Series 2006-4, Class A | 0.463 | 12/12/49 | 3,825,000 | 3,610,134 |
| OBP Depositor LLC Trust, | | | | |
| Series 2010-OBP, Class A (S) | 4.646 | 07/15/45 | 2,500,000 | 2,599,371 |
| RBSSP Resecuritization Trust | | | | |
| Series 2010-3, Class 3A1 (P)(S) | 0.507 | 01/26/46 | 3,640,865 | 3,322,395 |
| Series 2010-4, Class 3A1 (P)(S) | 0.497 | 04/26/35 | 2,239,765 | 2,053,187 |
| Series 2010-4, Class 5A1 (P)(S) | 0.507 | 02/26/37 | 3,492,208 | 3,202,121 |
Multi Sector Bond Fund
Portfolio of Investments - As of July 31, 2010
| | | | |
| | | Maturity | | |
| | Rate | date | Par value | Value |
| |
| Collateralized Mortgage Obligations (continued) | | | | |
|
| WaMu Mortgage Pass Through Certificates | | | | |
| Series 2004-13, Class A1 (P) | 0.735% | 11/25/34 | $1,716,472 | $1,412,038 |
| Series 2005-11, Class A1 (P) | 0.649 | 08/25/45 | 634,732 | 502,946 |
| Series 2005-AR13, Class A1B2 (P) | 0.759 | 10/25/45 | 3,030,143 | 1,873,395 |
| Series 2005-AR17, Class A1A2 (P) | 0.619 | 12/25/45 | 348,024 | 256,071 |
| Series 2005-AR6, Class 2A1A (P) | 0.559 | 04/25/45 | 3,646,964 | 2,902,312 |
| Series 2005-AR8, Class 1A1A (P) | 0.599 | 07/25/45 | 1,929,422 | 1,522,001 |
| Wells Fargo Mortgage Backed Securities Trust | | | | |
| Series 2005-AR12, Class 2A6 (P) | 2.908 | 07/25/35 | 2,619,566 | 2,455,099 |
| Series 2005-AR4, Class 2A2 (P) | 2.964 | 04/25/35 | 1,231,162 | 1,144,901 |
| Series 2005-AR9, Class 3A1 (P) | 2.887 | 05/25/35 | 1,275,631 | 1,197,612 |
| |
| Asset Backed Securities 2.33% | | | | $15,020,274 |
|
| (Cost $14,944,424) | | | | |
| |
| Countrywide Asset-Backed Certificates | | | | |
| Series 2007-1, Class 2A1 (P) | 0.379 | 07/25/37 | 1,146,724 | 1,100,076 |
| Series 2006-25, Class 2A1 (P) | 0.399 | 06/25/47 | 558,457 | 534,847 |
| First Franklin Mortgage Loan Asset Backed Certificates | | | | |
| Series 2004-FF11, Class 2A3 (P) | 0.779 | 01/25/35 | 145,813 | 138,642 |
| Home Equity Asset Trust | | | | |
| Series 2006-3, Class 2A3 (P) | 0.509 | 07/25/36 | 1,484,530 | 1,351,965 |
| Home Equity Mortgage Trust | | | | |
| Series 2006-1, Class A2 | 5.300 | 05/25/36 | 811,000 | 270,945 |
| Morgan Stanley Asset Backed Securities Capital I | | | | |
| Series 2007-HE1, Class A2A (P) | 0.379 | 11/25/36 | 542,322 | 533,606 |
| Novastar Home Equity Loan | | | | |
| Series 2006-2, Class A2B (P) | 0.439 | 06/25/36 | 1,716,983 | 1,686,719 |
| SLC Student Loan Trust | | | | |
| Series 2010-B, Class A1 (S) | 4.000 | 07/15/42 | 2,808,016 | 2,806,837 |
| Structured Asset Securities Corp. | | | | |
| Series 2006-BC6, Class A2 (P) | 0.409 | 01/25/37 | 463,742 | 449,686 |
| Series 2008-BC4, Class A3 (P) | 0.579 | 11/25/37 | 6,527,927 | 6,146,951 |
| | | | | |
| | | | Shares | Value |
| |
| Preferred Stocks 0.12% | | | | $820,032 |
|
| (Cost $841,156) | | | | |
| |
| Consumer Staples 0.02% | | | | 153,640 |
|
| Food Products 0.02% | | | | |
| Archer-Daniels-Midland Company, 6.250% | | | 4,000 | 153,640 |
| |
| Energy 0.02% | | | | 124,954 |
|
| Oil, Gas & Consumable Fuels 0.02% | | | | |
| Apache Corp., Series D, 6.000% | | | 140 | 7,606 |
| El Paso Corp., 4.990% | | | 110 | 117,348 |
| |
| Financials 0.08% | | | | 541,438 |
|
| Commercial Banks 0.04% | | | | |
| Wells Fargo & Company, Series L, 7.500% | | | 250 | 243,750 |
| | | | | |
| Consumer Finance 0.04% | | | | |
| Capital One Capital V, 10.250% | | | 275,000 | 297,688 |
Multi Sector Bond Fund
Portfolio of Investments - As of July 31, 2010
| | | | |
| | | | Shares | Value |
| |
| Convertible Preferred Stocks 0.20% | | | | $1,356,968 |
|
| (Cost $1,324,152) | | | | |
| |
| Consumer Discretionary 0.20% | | | | 1,356,968 |
|
| Media 0.20% | | | | |
| Comcast Corp., 5.300%, Class A | | | 1,225,000 | 1,356,968 |
| |
| Options Purchased 0.07% | | | | $485,023 |
|
| (Cost $1,090,000) | | | | |
| |
| Call Options 0.07% | | | | 485,023 |
|
| Over the Counter Purchase Call on the USD vs EUR | | | | |
| (Expiration Date: 01/19/2011; Strike Price: 1.214) (Counterparty: Barclays | | |
| Capital, Inc.) (I) | | | 27,250,000 | 356,975 |
| Over the Counter Purchase Call on the USD vs EUR | | | | |
| (Expiration Date: 11/16/2010; Strike Price: 1.18) (Counterparty: Barclays | | |
| Capital, Inc.) (I) | | | 27,250,000 | 128,048 |
| | | | | |
| | | | Shares | Value |
| |
| Short-Term Investments 19.91% | | | | $136,207,557 |
|
| (Cost $136,207,557) | | | | |
| |
| Repurchase Agreement 0.01% | | | | 37,091 |
|
| Repurchase Agreement with State Street Corp., dated | | | | |
| 07/30/2010 at 0.010% to be repurchased at $37,091 on | | | | |
| 08/02/2010, collateralized by $40,000 United States Treasury | | | | |
| Notes., 3.125% due 04/30/2017 (valued at $42,175, including | | | | |
| interest) | | | 37,091 | 37,091 |
| | | | | |
| | | | Par value | |
| | | Yield* | | Value |
| Short-Term Securities 19.90% | | | | 136,170,466 |
|
| State Street Institutional Liquid Reserves Fund | | 0.2701% | $136,170,466 | 136,170,466 |
| |
| Total investments (Cost $734,505,873)† 109.37% | | | | $748,091,527 |
|
| Other assets and liabilities, net (9.37%) | | | | ($64,105,610) |
|
| Total net assets 100.00% | | | | $683,985,917 |
|
| The percentage shown for each investment category is the total value of the category as a percentage of the net |
| assets of the Fund. | | | | |
Currency abbreviations
ARS – Argentine Peso
BRL - Brazilian Real
COP - Colombian Peso
EUR - Euro
IDR - Indonesian Rupiah
JPY - Japanese Yen
MXN - Mexican Peso
MYR - Malaysian Ringgit
PEN – Peruvian Nuevo Sol
Multi Sector Bond Fund
Portfolio of Investments - As of July 31, 2010
Currency abbreviations (continued)
RUB – Russian Ruble
ZAR - South African Rand
| |
| Abbreviations |
| |
| EMTN | European Medium Term Note |
| |
| MTN | Medium Term Note |
| |
| PIK | Paid in Kind |
| |
| REMIC | Real Estate Mortgage Investment Conduit |
Notes to Portfolio of Investments
(I) Non-income producing security.
(K) Underlying issuer is shown parenthetically in security description.
(M) Term loans are variable rate obligations. The coupon rate shown represents the rate at period end unless the investment is unsettled.
(P) Variable rate obligation. The coupon rate shown represents the rate at period end.
(Q) Par value of foreign bonds is expressed in local currency as shown parenthetically in security description.
(S) These securities are exempt from registration under Rule 144A of the Securities Act of 1933. Such securities may be resold, normally to qualified institutional buyers, in transactions exempt from registration. Rule 144A securities amounted to $90,471,344 or 13.23% of the Fund's net assets as of 7-31-10.
(T) All or a portion of this position represents unsettled loan commitment. The coupon rate will be determined at time of settlement.
* Yield represents either the annualized yield at the date of purchase, the stated coupon rate or, for floating rate securities, the rate at period end.
† At 7-31-10, the aggregate cost of investment securities for federal income tax purposes was $735,204,623. Net unrealized appreciation aggregated $12,886,904, of which $16,453,360 related to appreciated investment securities and $3,566,456 related to depreciated investment securities.
Multi Sector Bond Fund
Statement of Assets and Liabilities — July 31, 2010
| | |
| Assets | | |
|
| Investments, at value (Cost $734,505,873) | $ | 748,091,527 |
| Foreign currency, at value (Cost $18,319) | | 18,316 |
| Cash held at broker for futures contracts | | 1,072,600 |
| Receivable for collateral held by the Fund | | 2,250,000 |
| Receivable for investments sold | | 11,370,649 |
| Receivable for forward foreign currency exchange | | |
| contracts (Note 3) | | 276 |
| Receivable for fund shares sold | | 11,437 |
| Dividends and interest receivable | | 6,237,689 |
| | |
| Total assets | | 769,052,494 |
| |
| |
| Liabilities | | |
|
| Payable for investments purchased | | 24,684,652 |
| Payable for delayed delivery securities purchased | | 56,900,790 |
| Payable for forward foreign currency exchange | | |
| contracts (Note 3) | | 24,762 |
| Swap contracts, at value (includes unamortized | | |
| upfront amounts received of $2,520,591) (Note 3) | | 2,793,833 |
| Payable for futures variation margin (Note 3) | | 555,500 |
| Distributions payable | | 180 |
| Payable to affiliates (Note 5) | | |
| Accounting and legal services fees | | 7,007 |
| Transfer agent fees | | 6 |
| Trustees' fees | | 63 |
| Management fees | | 37 |
| Other liabilities and accrued expenses | | 99,747 |
| | |
| Total liabilities | | 85,066,577 |
| |
| |
| Net assets | | |
|
| Capital paid-in | $ | 671,165,390 |
| Undistributed net investment income | | 1,479,821 |
| Accumulated net realized gain on investments, | | |
| futures contracts, options written, foreign | | |
| currency transactions and swap agreements | | 1,168,869 |
| Net unrealized appreciation on investments, | | |
| futures contracts, translation of assets and | | |
| liabilities in foreign currencies and swap | | |
| agreements | | 10,171,837 |
| | |
| Net assets | $ | 683,985,917 |
| |
| |
| Net asset value per share | | |
|
| Based on net asset values and shares | | |
| outstanding-the Fund has an unlimited number of | | |
| shares authorized with no par value | | |
| Class A ($25,620 ÷ 2,500 shares) | $ | 10.25 |
| Class I ($25,610 ÷ 2,500 shares) | $ | 10.24 |
| Class NAV ($683,934,687 ÷ 66,762,096 shares) | $ | 10.24 |
| |
| Maximum offering price per share | | |
| Class A (net asset value per share ÷ 95%)1 | $ | 10.79 |
1 On single retail sales of less than $50,000. On sales of $50,000 or more and on group sales the offering price is reduced.
| | |
| The accompanying notes are an integral part of the financial statements. | | |
| | 27 | |
Multi Sector Bond Fund
Statement of Operations — For the Period Ended July 31, 20101
| | |
| Investment income | | |
|
| Interest | $ | 17,260,526 |
| Less foreign taxes withheld | | (8,527) |
| | | |
| Total investment income | | 17,251,999 |
| |
| Expenses | | |
|
| Investment management fees (Note 5) | | 2,655,074 |
| Distribution and service fees (Note 5) | | 56 |
| Accounting and legal services fees (Note 5) | | 43,925 |
| Transfer agent fees (Note 5) | | 98 |
| Trustees' fees | | 2,429 |
| Professional fees | | 53,494 |
| Custodian fees | | 96,082 |
| Registration and filing fees | | 5,693 |
| Other | | 3,796 |
| | |
| Total expenses | | 2,860,647 |
| | |
| Less expense reductions (Note 5) | | (4,438) |
| | |
| Net expenses | | 2,856,209 |
| |
| Net investment income | | 14,395,790 |
| |
| |
| Realized and unrealized gain (loss) | | |
|
| Net realized gain (loss) on | | |
| Investments | | 6,370,677 |
| Futures contracts (Note 3) | | (3,590,326) |
| Written options (Note 3) | | 454,040 |
| Swap contracts (Note 3) | | (117,123) |
| Foreign currency transactions | | (43,999) |
| | | 3,073,269 |
| |
| Change in net unrealized appreciation | | |
| (depreciation) of | | |
| Investments | | 13,585,654 |
| Futures contracts (Note 3) | | (3,123,073) |
| Swap contracts (Note 3) | | (273,242) |
| Translation of assets and liabilities in foreign | | |
| currencies | | (17,502) |
| | | 10,171,837 |
| |
| Net realized and unrealized gain | | 13,245,106 |
| |
| Increase in net assets from operations | $ | 27,640,896 |
1 Period from 11-2-09 (inception date) to 7-31-10.
| | |
| The accompanying notes are an integral part of the financial statements. | | |
| | 28 | |
Multi Sector Bond Fund
Statements of Change in Net Assets
| | |
| | | Period ended |
| | | 7/31/10 1 |
| |
| Increase (decrease) in net assets | | |
|
| From operations | | |
| Net investment income | $ | 14,395,790 |
| Net realized gain | | 3,073,269 |
| Change in net unrealized appreciation | | |
| (depreciation) | | 10,171,837 |
| | | |
| Increase in net assets resulting from | | |
| operations | | 27,640,896 |
| |
| Distributions to shareholders | | |
| From net investment income | | |
| Class A | | (624) |
| Class I | | (677) |
| Class NAV | | (14,819,087) |
| | |
| Total distributions | | (14,820,388) |
| | |
| From Fund share transactions (Note 6) | | 671,165,409 |
| |
| Total increase | | 683,985,917 |
| | | |
| Net assets | | |
|
| Beginning of period | | — |
| | |
| End of period | $ | 683,985,917 |
| | |
| Undistributed net investment income | $ | 1,479,821 |
1 Period from 11-2-09 (inception date) to 7-31-10.
| | |
| The accompanying notes are an integral part of the financial statements. | | |
| | 29 | |
Multi Sector Bond Fund
Financial Highlights (For a share outstanding throughout the period)
| | |
| Class A Shares | | |
| |
| Period ended | | |
| | | 7-31-101 |
| Per share operating performance | | |
|
| Net asset value, beginning of period | $ | 10.00 |
| Net investment income2 | | 0.25 |
| Net realized and unrealized gain on investments | | 0.25 |
| | |
| Total from investment operations | | 0.50 |
| |
| Less distributions | | |
| From net investment income | | (0.25) |
| | |
| Net asset value, end of period | $ | 10.25 |
| |
| Total return (%)3,4 | | 5.065 |
| |
| Ratios and supplemental data | | |
|
| Net assets, end of period (in thousands) | $ | 26 |
| Ratios (as a percentage of average net assets): | | |
| Expenses before reductions | | 1.196 |
| Expenses net of fee waivers and credits | | 1.196 |
| Net investment income | | 3.266 |
| Portfolio turnover (%) | | 68 7 |
1 Period from 11-2-09 (inception date) to 7-31-10.
2 Based on the average daily shares outstanding.
3 Assumes dividend reinvestment (if applicable).
4 Total returns would have been lower had certain expenses not been reduced during the periods shown.
5 Not annualized.
6 Annualized.
7 The Portfolio turnover rate, including the effect of “TBA” (to be announced) securities for the year ended 7-31-10 was 219%.
| | |
| See notes to financial statements | | Multi Sector Bond Fund |
| | 30 | |
Multi Sector Bond Fund
Financial Highlights (For a share outstanding throughout the period)
| | |
| Class I Shares | | |
| |
| Period ended | | |
| | | 7-31-101 |
| Per share operating performance | | |
|
| Net asset value, beginning of period | $ | 10.00 |
| Net investment income2 | | 0.26 |
| Net realized and unrealized gain on investments | | 0.25 |
| | | |
| Total from investment operations | | 0.51 |
| |
| Less distributions | | |
| From net investment income | | (0.27) |
| | |
| Net asset value, end of period | $ | 10.24 |
| |
| Total return (%)3,4 | | 5.185 |
| |
| Ratios and supplemental data | | |
|
| Net assets, end of period (in thousands) | $ | 26 |
| Ratios (as a percentage of average net assets): | | |
| Expenses before reductions | | 1.206 |
| Expenses net of fee waivers and credits | | 0.956 |
| Net investment income | | 3.496 |
| Portfolio turnover (%) | | 68 7 |
1 Period from 11-2-09 (inception date) to 7-31-10.
2 Based on the average daily shares outstanding.
3 Assumes dividend reinvestment (if applicable).
4 Total returns would have been lower had certain expenses not been reduced during the periods shown.
5 Not annualized.
6 Annualized.
7 The Portfolio turnover rate, including the effect of “TBA” (to be announced) securities for the year ended 7-31-10 was 219%.
| | |
| See notes to financial statements | | Multi Sector Bond Fund |
| | 31 | |
Multi Sector Bond Fund
Financial Highlights (For a share outstanding throughout the period)
| | |
| Class NAV Shares | | |
| |
| Period ended | | |
| | | 7-31-101 |
| Per share operating performance | | |
|
| Net asset value, beginning of period | $ | 10.00 |
| Net investment income2 | | 0.29 |
| Net realized and unrealized gain on investments | | 0.24 |
| | | |
| Total from investment operations | | 0.53 |
| |
| Less distributions | | |
| From net investment income | | (0.29) |
| Net asset value, end of period | $ | 10.24 |
| |
| Total return (%)3,4 | | 5.325 |
| |
| Ratios and supplemental data | | |
|
| Net assets, end of period (in millions) | $ | 684 |
| Ratios (as a percentage of average net assets): | | |
| Expenses before reductions | | 0.786 |
| Expenses net of fee waivers and credits | | 0.776 |
| Net investment income | | 3.906 |
| Portfolio turnover (%) | | 68 7 |
1 Period from 11-2-09 (inception date) to 7-31-10.
2 Based on the average daily shares outstanding.
3 Assumes dividend reinvestment (if applicable).
4 Total returns would have been lower had certain expenses not been reduced during the periods shown.
5 Not annualized.
6 Annualized.
7 The Portfolio turnover rate, including the effect of “TBA” (to be announced) securities for the year ended 7-31-10 was 219%.
| | |
| See notes to financial statements | | Multi Sector Bond Fund |
| | 32 | |
Note 1 — Organization
John Hancock Multi Sector Bond Fund (the Fund) is a non-diversified series of John Hancock Funds II (the Trust), an open-end management investment company organized as a Massachusetts business trust and registered under the Investment Company Act of 1940, as amended (the 1940 Act). The investment objective of the Fund is to seek to maximize total return, which consists of income on its investments and capital appreciation.
The Fund may offer multiple classes of shares. The shares currently offered are detailed in the Statement of Assets and Liabilities. Class A shares are offered to all investors. Class I shares are offered to institutions and certain investors. Class NAV shares are sold to John Hancock affiliated funds of funds. Shareholders of each class have exclusive voting rights to matters that affect that class. The distribution and service fees, transfer agent fees, registration fees and printing and postage fees for each class may differ.
Affiliates of the Fund owned 100% of shares of beneficial interest of both Class A and Class I shares on July 31, 2010.
Note 2 — Significant accounting policies
The financial statements have been prepared in conformity with accounting principles generally accepted in the United States of America, which require management to make certain estimates and assumptions at the date of the financial statements. Actual results could differ from those estimates. Events or transactions occurring after the end of the fiscal period through the date that the financial statements were issued have been evaluated in the preparation of the financial statements. The following summarizes the significant accounting policies of the Fund:
Security valuation. Investments are stated at value as of the close of regular trading on the New York Stock Exchange (NYSE), normally at 4:00 P.M., Eastern Time. The Fund uses a three-tier hierarchy to prioritize the pricing assumptions, referred to as inputs, used in valuation techniques to measure fair value. Level 1 includes quoted prices in active markets for identical securities. Level 2 includes significant observable inputs. Observable inputs may include quoted prices for similar securities, interest rates, prepayment speeds and credit risk. Prices for securities valued using these techniques are received from independent pricing vendors and brokers and are based on an evaluation of the inputs described. Level 3 includes significant unobservable inputs when mar ket prices are not readily available or reliable, including the Fund’s own assumptions in determining the fair value of investments. The inputs or methodology used for valuing securities are not necessarily an indication of the risk associated with investing in those securities.
The following is a summary of the values by input classification of the Fund’s investments as of July 31, 2010, by major security category or type:
| | | | | | | | |
| | | | | | | Level 2 | | |
| | | Total Market | | | | Significant | | Level 3 Significant |
| | | Value at | | Level 1 Quoted | | Observable | | Unobservable |
| | | 07-31-10 | | Price | | Inputs | | Inputs |
| Corporate Bonds | | $236,063,835 | | — | | $236,063,835 | | — |
| U.S. Government & Agency Obligations | | 71,869,563 | | — | | 71,869,563 | | — |
| Foreign Government Obligations | | 61,735,722 | | — | | 59,550,992 | | $2,184,730 |
| Convertible Bonds | | 4,739,560 | | — | | 4,739,560 | | — |
| Structured Notes | | 20,384,975 | | — | | 174,326 | | 20,210,649 |
| Term Loans | | 132,080,558 | | — | | 132,080,558 | | — |
| Collateralized Mortgage Obligations | | 67,327,460 | | — | | 67,317,892 | | 9,568 |
| Asset Backed Securities | | 15,020,274 | | — | | 15,020,274 | | — |
| Preferred Stocks | | 820,032 | | $404,996 | | 415,036 | | — |
| Convertible Preferred Stocks | | 1,356,968 | | — | | 1,356,968 | | — |
| Options Purchased | | 485,023 | | — | | 485,023 | | — |
| Short-Term Investments | | 136,207,557 | | 136,170,466 | | 37,091 | | — |
| Total investments in Securities | | $748,091,527 | | $136,575,462 | | $589,111,118 | | $22,404,947 |
| | | | | | | | |
| | | | | | | Level 2 | | |
| | | Total Market | | | | Significant | | Level 3 Significant |
| | | Value at | | Level 1 Quoted | | Observable | | Unobservable |
| | | 07-31-10 | | Price | | Inputs | | Inputs |
| Other Financial Instruments | | | | | | | |
| Futures | (3,123,073) | | (3,123,073) | | — | | — |
| Forward Foreign Currency Contracts | (24,486) | | — | | (24,486) | | — |
| Interest Rate Swaps | (723,467) | | — | | (723,467) | | — |
| Credit Default Swaps | (2,070,366) | | — | | (2,070,366) | | — |
| Totals | ($742,150,135) | | ($133,452,389) | | (586,292,799) | | $22,404,947 |
The following is a reconciliation of Level 3 assets for which significant unobservable inputs were used to determine fair value:
| | | | | | | | |
| | | Collateralized | | | | Foreign | | |
| | | Mortgage | | Structured | | Government | | |
| | | Obligations | | Notes | | Obligation | | Total |
|
| Balance as of 11-2-09 | - | | - | | - | | - |
| Accrued discounts/premiums | - | | - | | $91,867 | | $91,867 |
| Realized gain (loss) | - | | ($537) | | - | | (537) |
| Change in unrealized appreciation (depreciation) | - | | 1,047,311 | | 185,761 | | 1,233,072 |
| Net purchases (sales) | $9,568 | | 19,163,875 | | 1,907,102 | | 21,080,545 |
| Net transfers in and/out of Level 3 | - | | - | | - | | - |
| Balance as of 7-31-10 | $9,568 | | $20,210,649 | | $2,184,730 | | $22,404,947 |
During the period ended July 31, 2010, there were no significant transfers in or out of Level 1 or Level 2 assets.
In order to value the securities, the Fund uses the following valuation techniques. Debt obligations are valued based on the evaluated prices provided by an independent pricing service, which utilizes both dealer-supplied and electronic data processing techniques, taking into account factors such as institutional-size trading in similar groups of securities, yield, quality, coupon rate, maturity, type of issue, trading characteristics and other market data. Foreign securities and currencies are valued in U.S. dollars, based on foreign currency exchange rates supplied by an independent pricing service. Certain securities traded only in the over-the-counter market are valued at the last bid price quoted by brokers making markets in the securities at the close of trading. Certain short-term securities are valued at amortized cost.
Other portfolio securities and assets, where market quotations are not readily available, are valued at fair value, as determined in good faith by the Fund’s Pricing Committee, following procedures established by the Board of Trustees. Generally, trading in non-U.S. securities is substantially completed each day at various times prior to the close of trading on the NYSE. Significant market events that affect the values of non-U.S. securities may occur after the time when the valuation of the securities is generally determined and the close of the NYSE. During significant market events, these securities will be valued at fair value, as determined in good faith, following procedures established by the Board of Trustees. The Fund may use a fair valuation model to value non-U.S. securities in order to adjust for events which may occur between the close of foreign exchanges and the close of the NYSE.
When-issued/delayed delivery securities. The Fund may purchase or sell debt securities on a when-issued or delayed-delivery basis, or in a “To Be Announced” (TBA) or “forward commitment” transaction, with delivery or payment to occur at a later date beyond the normal settlement period. TBA securities resulting from these transactions are included in the Portfolio of Investments. At the time that the Fund enters into a commitment to purchase or sell a security, the transaction is recorded and the value of the security is reflected in the Fund’s net asset value. The price of such security and the date that the security will be delivered and paid for are fixed at the time the transaction is negotiated. The value of the security may vary with market fluctuations. No interest accrues to the Fund until payment takes place. At the time that the Fund enters into this type of
transaction, the Fund is required to have sufficient cash and/or liquid securities to cover its commitments.
Certain risks may arise upon entering into when-issued or delayed-delivery securities transactions, including the potential inability of counterparties to meet the terms of their contracts, and the issuer’s failure to issue the securities due to political, economic, or other factors. Additionally, losses may arise due to declines in the value of the securities prior to settlement date.
Structured notes. The Fund may invest in structured notes. The Fund invests in an entity, such as a trust, organized and operated solely for the purpose of restructuring the investment characteristics of various securities. This type of restructuring involves the deposit or purchase of specified instruments and the issuance of one or more classes of securities backed by, or representing interests, in the underlying instruments. The cash flow on the underlying instruments may be apportioned among the newly issued structured notes to create securities with different investment characteristics, such as varying maturities, payment priorities or interest rate provisions. The extent of the income paid by the structured notes is dependent on the cash flow of the underlying instruments.
Term loans (Floating rate loans). Term loans are generally subject to legal or contractual restrictions on resale. The liquidity of floating rate loans, including the volume and frequency of secondary market trading in such loans, varies significantly over time and among individual loans. During periods of infrequent trading, valuing a floating rate loan can be more difficult and buying and selling a floating rate loan at an acceptable price can be more difficult and delayed, which could result in a loss.
A Fund’s ability to receive payments of principal, interest and other amounts in connection with term loans will depend primarily on the financial condition of the borrower. A Fund’s failure to receive scheduled payments on a term loan due to a default, bankruptcy or other reason, would adversely affect the Fund’s income and would likely reduce the value of its assets. Because many term loans are not rated by independent credit rating agencies, a decision to invest in a particular loan could depend exclusively on the subadviser’s credit analysis of the borrower and/or term loan agents. A Fund may have limited rights to enforce the terms of an underlying loan.
Security transactions and related investment income. Investment security transactions are accounted for on a trade date plus one basis for daily net asset value calculations. However, for financial reporting purposes, investment transactions are reported on trade date. Interest income is accrued as earned. Gains and losses on securities sold are determined on the basis of identified cost and may include proceeds from litigation. Interest income includes coupon interest and amortization/accretion of premiums/discounts on debt securities. Debt obligations may be placed in a non-accrual status and related interest income may be reduced by stopping current accruals and writing off interest receivable when the collection of all or a portion of interest has become doubtful.
Foreign currency translation. Assets, including investments and liabilities denominated in foreign currencies, are translated into U.S. dollar values each day at the prevailing exchange rate. Purchases and sales of securities, income, and expenses are translated into U.S. dollars at the prevailing exchange rate on the date of the transaction. The effect of changes in foreign currency exchange rates on securities is reflected as a component of the realized and unrealized gains (losses) on investments.
Funds that invest internationally generally carry more risk than funds that invest strictly in U.S. securities. Funds investing in a single country or in a limited geographic region tend to be riskier than funds that invest more broadly. Risks can result from differences in economic and political conditions, regulations, market practices (including higher transaction costs) and accounting
standards. Foreign investments are also subject to a decline in the value of a foreign currency versus the U.S. dollar, which reduces the dollar value of securities denominated in that currency.
Line of credit. The Fund may borrow from banks for temporary or emergency purposes, including meeting redemption requests that otherwise might require the untimely sale of securities. Pursuant to the custodian agreement, the custodian may loan money to the Fund to make properly authorized payments. The Fund is obligated to repay the custodian for any overdraft, including any related costs or expenses. The custodian has a lien, security interest or security entitlement in any Fund property that is not segregated, to the maximum extent permitted by law for any overdraft.
In addition, the Fund and other affiliated funds have entered into an agreement with the custodian which enables them to participate in a $200 million unsecured committed line of credit. Prior to March 31, 2010, the amount of the line of credit was $300 million. A commitment fee, payable at the end of each calendar quarter, based on the average daily unused portion of the line of credit, is charged to each participating fund on a pro rata basis based on their relative average net assets. At July 31, 2010, the Fund did not have an outstanding balance from the line of credit.
Expenses. The majority of expenses are directly attributable to an individual fund. Expenses that are not readily attributable to a specific fund are allocated among all funds in an equitable manner, taking into consideration, among other things, the nature and type of expense and the fund’s relative assets. Expense estimates are accrued in the period to which they relate and adjustments are made when actual amounts are known.
Class allocations. Income, common expenses, and realized and unrealized gains (losses) are determined at the fund level and allocated daily to each class of shares based on the net asset value of the class. Class-specific expenses, such as distribution and service fees, if any, transfer agent fees, state registration fees and printing and postage fees, for all classes are calculated daily at the class level based on the appropriate net asset value of each class and the specific expense rates applicable to each class.
Federal income taxes. The Fund intends to qualify as a regulated investment company by complying with the applicable provisions of the Internal Revenue Code and will not be subject to federal income tax on taxable income that is distributed to shareholders. Therefore, no federal income tax provision is required.
Net capital losses of $1,300,272, that are a result of security transactions occurring after November 2, 2009, are treated as occurring on August 1, 2010, the first day of the Fund’s next taxable year
As of July 31, 2010, the Fund had no uncertain tax positions that would require financial statement recognition, de-recognition or disclosure. The Fund’s federal tax return is subject to examination by the Internal Revenue Service for a period of three years.
Distribution of income and gains. Distributions to shareholders from net investment income and net realized gains, if any, are recorded on the ex-date. The Fund generally declares dividends daily and pays them monthly. Capital gain distributions, if any, are paid annually. The tax character of distributions for the period ended July 31, 2010 was $14,820,388 of ordinary income.
Distributions paid by the Fund with respect to each class of shares are calculated in the same manner, at the same time and are in the same amount, except for the effect of expenses that may be applied differently to each class. As of July 31, 2010, the components of distributable earnings on a tax basis included $1,904,856 of undistributed ordinary income.
Such distributions, on a tax basis, are determined in conformity with income tax regulations, which may differ from accounting principles generally accepted in the United States of America. Material distributions in excess of tax basis earnings and profits, if any, are reported in the Fund’s financial statements as a return of capital.
Capital accounts within financial statements are adjusted for permanent book/tax differences. These adjustments have no impact on net assets or the results of operations. Temporary book/tax differences will reverse in a subsequent period. Permanent book/tax differences are primarily attributable to foreign currency transactions, paydowns, derivative transactions, and amortization and accretion on debt securities.
Note 3 — Derivative instruments
The Fund may invest in derivatives, including futures contracts, forward foreign currency contracts and swap contracts, in order to meet its investment objectives. The use of derivatives may involve risks different from, or potentially greater than, the risks associated with investing directly in securities. Specifically, derivatives expose the Fund to the risk that the counterparty to an over-the-counter (OTC) derivatives contract will be unable or unwilling to make timely settlement payments or otherwise honor its obligations. OTC derivatives transactions typically can only be closed out with the other party to the transaction. If the counterparty defaults, the Fund will have contractual remedies, but there is no assurance that the counterparty will meet its contractual obligations or that the Fund will succeed in enforcing them.
For more information regarding the Fund’s use of derivatives, please refer to the Fund’s Prospectuses and Statement of Additional Information.
Futures. A futures contract is a contractual agreement to buy or sell a particular commodity, currency, or financial instrument at a pre-determined price in the future. Risks related to the use of futures contracts include possible illiquidity of the futures markets, contract prices that can be highly volatile and imperfectly correlated to movements in hedged security values and/or interest rates and potential losses in excess of the Fund’s initial investment.
Futures contracts are valued at the quoted daily settlement prices established by the exchange on which they trade. Upon entering into a futures contract, the Fund is required to deposit initial margin with the broker in the form of cash or securities. The amount of required margin is generally based on a percentage of the contract value; this amount is the initial margin for the trade. The margin deposit must then be maintained at the established level over the life of the contract. Futures contracts are marked-to-market daily and an appropriate payable or receivable for the change in value (variation margin) is recorded by the Fund.
During the period ended July 31, 2010, the Fund used futures contracts to manage duration of the portfolio and to manage against anticipated interest rate changes. The following table summarizes the contracts held at July 31, 2010. The range of futures contracts notional amounts held by the Fund during the period ended July 31, 2010 was $0.0 million to $100.5 million.
| | | | | |
| | Number | | | | Unrealized |
| | of | | Expiration | Notional | Appreciation |
| Open Contracts | Contracts | Position | Date | Value | (Depreciation) |
|
| U.S. Treasury 5-Year | | | | | |
| Note Futures | 114 | Short | Sep 2010 | $13,660,406 | ($360,242) |
| U.S. Treasury 10-Year | | | | | |
| Note Futures | 701 | Short | Sep 2010 | 86,792,563 | (2,762,831) |
|
| | | | | $100,452,969 | ($3,123,073) |
Forward foreign currency contracts. A forward foreign currency contract is an agreement between two parties to buy and sell a specific currency at a price that is set on the date of the contract. The forward contract calls for delivery of the currency on a future date that is specified in
the contract. Risks related to the use of forwards include the possible failure of counterparties to meet the terms of the forward agreement, the failure of the counterparties to timely post collateral, the risk that currency movements will not occur thereby reducing the Fund’s total return, and the potential for losses in excess of the Fund’s initial investment.
The market value of a forward foreign currency contract fluctuates with changes in foreign currency exchange rates. Forward foreign currency contracts are marked-to-market daily and the change in value is recorded by a Fund as an unrealized gain or loss. Realized gains or losses, equal to the difference between the value of the contract at the time it was opened and the value at the time it was closed, are recorded upon delivery or receipt of the currency.
During the period ended July 31, 2010, the Fund used forward foreign currency contracts to manage against anticipated currency exchange rates and gain exposure to foreign currency. The following table summarizes the contracts held at July 31, 2010. The range of forward foreign currency contracts principal amounts held by the Fund during the period ended July 31, 2010 was $0.0 million to $1.7 million.
| | | | | | | | | | |
| | | Principal | | Principal | | | | | | |
| | | Amount | | Amount | | | | | | Unrealized |
| | | Covered by | | Covered by | | | | Settlement | | Appreciation |
| Currency | | Contract | | Contract (USD) | | Counterparty | | Date | | (Depreciation) |
|
| |
| Buys | | | | | | | | | | |
|
| Chinese Yuan Renminbi | | 3,353,425 | | $500,000 | | Citibank N.A. | | 11/23/2010 | | ($4,433) |
| Chinese Yuan Renminbi | | 1,818,000 | | 272,482 | | Citibank N.A. | | 5/20/2011 | | (2,259) |
|
| | | | | $772,482 | | | | | | ($6,692) |
| |
| Sells | | | | | | | | | | |
|
| Chinese Yuan Renminbi | | 1,333,000 | | $197,266 | | Citibank N.A. | | 11/23/2010 | | $276 |
| Euro | | 277,000 | | 359,991 | | Citibank N.A. | | 9/2/2010 | | (971) |
| Japanese Yen | | 99,004,000 | | 1,129,151 | | Citibank N.A. | | 9/2/2010 | | (17,099) |
|
| | | | | $1,686,408 | | | | | | ($17,794) |
Options. There are two types of options, a put option and a call option. Options are traded either over-the-counter or by means of an exchange. A call option gives the purchaser of the option the right to buy (and the seller the obligation to sell) the underlying instrument at the exercise price. A put option gives the purchaser of the option the right to sell (and the writer the obligation to buy) the underlying instrument at the exercise price. Writing puts and buying calls may increase the Fund’s exposure to changes in the value of the underlying instrument. Buying puts and writing calls may decrease the Fund’s exposure to such changes. Risks related to the use of options include the loss of the premium, possible illiquidity of the options markets, trading restrictions imposed by an exchange, movements in underlying security values, and for written options, potential losses in excess of the Fund&# 146;s initial investment.
Options listed on an exchange are valued at their closing price. If no closing price is available, then they are valued at the mean between the last bid and ask prices from the exchange on which they are principally traded. For options not listed on an exchange, an independent pricing source is used to value the options at the mean between the last bid and ask prices. When the Fund purchases an option, the premium paid by the Fund is included in the Portfolio of Investments and subsequently “marked-to-market” to reflect current market value. If the purchased option expires, the Fund realizes a loss equal to the cost of the option. If the Fund enters into a closing sale transaction, the Fund realizes a gain or loss, depending on whether proceeds from the closing sale are greater or less than the original cost. If the Fund exercises a call option, the cost of the securities acquired by exercising the call is increased by the premium
paid to buy the call. If the Fund exercises a put option, it realizes a gain or loss from the sale of the underlying security and the proceeds from such sale are decreased by the premium paid.
During the period ended July 31, 2010, the Fund wrote option contracts to manage against anticipated currency exchange rates. The following table summarizes the Fund’s written options activities during the period ended July 31, 2010.
| | |
| | NUMBER OF | PREMIUMS |
| | CONTRACTS | RECEIVED |
| | | (PAID) |
|
| Outstanding, beginning of period | - | - |
| Options written | 74,750,000 | $622,840 |
| Options closed | (74,750,000) | (622,840) |
| Options exercised | - | - |
| Outstanding, end of period | - | - |
Swaps. The Fund may enter into interest rate swap agreements. Swap agreements are privately negotiated agreements between a Fund and counterparty to exchange cash flows, assets, foreign currencies or market-linked returns at specified intervals. Swaps are marked-to-market daily based upon values from third party vendors or broker quotations, and the change in value is recorded as unrealized appreciation/depreciation of swap contracts. The value of the swap will typically implicate collateral posting obligations by the party that is considered out-of-the-money on the swap.
Upfront payments made/received by the Fund are amortized/accreted for financial reporting purposes, with the unamortized/unaccreted portion included in the Statement of Assets and Liabilities. A termination payment by the counterparty or the Fund is recorded as realized gain or loss, as well as the net periodic payments received or paid by a Fund.
Entering into swap agreements involves, to varying degrees, elements of credit, market and documentation risk that may amount to values that are in excess of the amounts recognized on the Statement of Assets and Liabilities. Such risks involve the possibility that there will be no liquid market for the swap, that a counterparty may default on its obligation or delay payment under the swap terms. The counterparty may disagree or contest the terms of the swap. Market risks may also accompany the swap, including interest rate risk. The Fund may also suffer losses if it is unable to terminate or assign outstanding swaps or reduce its exposure through offsetting transactions.
Interest rate swaps. Interest rate swaps represent an agreement between a Fund and counterparty to exchange cash flows based on the difference between two interest rates applied to a notional amount. The payment flows are usually netted against each other, with the difference being paid by one party to the other. The Fund settles accrued net interest receivable or payable under the swap contracts on a periodic basis.
During the period ended July 31, 2010, the Fund used interest rate swaps to manage duration of the portfolio and to manage against anticipated interest rate changes. The following table summarizes the interest rate swap contracts held as of July 31, 2010, which are generally representative of the interest rate swap activity.
| | | | | | |
| | | Payments | Payments | | | |
| | Notional | Made by | Received | Effective | Maturity | Unrealized |
| Counterparty | Amount | Fund | by Fund | Date | Date | Depreciation |
|
| 3-month |
| Citibank | $10,160,000 | 3.5825% | LIBOR (a) | 12-9-2009 | 12-9-2019 | ($723,467) |
(a) At July 31, 2010, the 3-month LIBOR rate was 0.45375%.
Credit default swaps. Credit default swaps (CDS) involve the exchange of a fixed rate premium (paid by the Buyer), for protection against the loss in value of an underlying debt instrument, referenced entity or index, in the event of a defined credit event (such as payment default or bankruptcy). Under the terms of the swap, one party acts as a “guarantor” (the Seller), receiving the premium and agreeing to remedies that are specified within the credit default agreement. The Fund may enter into CDS in which it may act as either Buyer or Seller. By acting as the Seller, the Fund may incur economic leverage since it would be obligated to pay the Buyer the notional amount of the contract in the event of a default. The amount of loss in such case would be reduced by any recovery value on the underlying credit. The maximum potential amount of future payments (undiscounted) that the Fund as the Seller coul d be required to make under a CDS agreement would be an amount equal to the notional amount of the agreement.
The Fund used CDS as a Seller of protection during the period ended July 31, 2010 to take a long exposure to the reference credit index. The following table summarizes the credit default swap contracts the Fund held as of July 31, 2010 where the Fund acted as a Seller of protection. During the period ended July 31, 2010, the Fund acted as Seller on credit default swap contracts with total notional values ranging from $0.0 million to $11.0 million.
| | | | | | | | | | | | | | | | |
| | | | | | | | | | | | | Unamortized | | Unrealized | | |
| | | Reference | | Notional | | | | (Pay)/Received | | Maturity | | Upfront | | Appreciation | | Market |
| Counterparty | | Obligation | | Amount | | Currency | | Fixed Rate | | Date | | Payment | | (Depreciation) | | Value |
|
| Citibank | | CMBX NA AAA 4 | | 4,000,000 | | USD | | 0.35% | | Feb 2051 | | ($821,288) | | $351,561 | | ($469,727) |
| Citibank | | CMBX NA AM 4S | | 5,000,000 | | USD | | 0.50% | | Feb 2051 | | (1,165,501) | | 22,167 | | (1,143,334) |
| Citibank | | CMBX NA AM 4 | | 2,000,000 | | USD | | 0.50% | | Feb 2051 | | (533,802) | | 76,497 | | (457,305) |
| Total | | | | 11,000,000 | | USD | | | | | | ($2,520,591) | | $450,225 | | ($2,070,366) |
Fair value of derivative instruments by risk category
The table below summarizes the fair value of derivatives held by the Fund at July 31, 2010 by risk category:
| | | | | | | | |
| RISK | | STATEMENT OF | | FINANCIAL | | ASSET | | LIABILITY |
| | | ASSETS AND | | INSTRUMENTS | | DERIVATIVES | | DERIVATIVES |
| | | LIABILITIES | | LOCATION | | FAIR VALUE | | FAIR VALUE |
| | | LOCATION | | | | | | |
|
| Interest rate | | Receivable/Payable for | | Futures†/Interest | | - | | ($3,846,540) |
| contracts | | futures; Swap contracts, | | rate swaps | | | | |
| | | at value | | | | | | |
| | | | | | | | |
| Credit contracts | | Unrealized | | Credit default | | - | | (2,070,366) |
| | | appreciation/depreciation | | swaps | | | | |
| | | of swap contracts | | | | | | |
| | | | | | | | |
| Foreign exchange | | Receivable/Payable for | | Foreign forward | | $485,299 | | (24,762) |
| contracts | | foreign forward currency | | currency | | | | |
| | | exchange contracts | | contracts/Purchased | | | | |
| | | | | options | | | | |
|
| Total | | | | | | $485,299 | | ($5,941,668) |
† Reflects cumulative appreciation/depreciation on futures as disclosed in Note 3. Only the period end variation margin is separately disclosed in the Statement of Assets and Liabilities.
Effect of derivative instruments on the Statement of Operations
The table below summarizes the net realized gain (loss) included in the net increase (decrease) in net assets from operations, classified by derivative instrument and risk category, for the period ended July 31, 2010:
| | | | | | | | | | | | | | |
| | | STATEMENT | | | | | | | | | | | | |
| | | OF | | INVESTMENTS | | | | | | | | FOREIGN | | |
| | | OPERATIONS | | (PURCHASED | | WRITTEN | | FUTURES | | SWAP | | CURRENCY | | |
| RISK | | LOCATION | | OPTIONS) | | OPTIONS | | CONTRACTS | | CONTRACTS | | TRANSACTIONS* | | TOTAL |
|
| Credit | | Net realized gain | | | | | | | | | | | | |
| contracts | | (loss) on | | - | | - | | - | | $51,766 | | - | | $51,766 |
| |
| Foreign | | | | | | | | | | | | | | |
| exchange | | Net realized gain | | | | | | | | | | | | |
| contracts | | (loss) on | | $351,123 | | $454,040 | | - | | - | | ($11,702) | | 793,461 |
| | | | | | | | | | | | | | | |
| Interest | | | | | | | | | | | | | | |
| rate | | Net realized gain | | | | | | | | | | | | |
| contracts | | (loss) on | | - | | - | | ($3,590,326) | | (168,889) | | - | | (3,759,215) |
|
| Total | | | | $351,123 | | $454,040 | | ($3,590,326) | | ($117,123) | | ($11,702) | | ($2,913,988) |
* Realized gain/loss associated with forward foreign currency contracts is included in this caption on the Statements of Operations.
The table below summarizes the net change in unrealized appreciation (depreciation) included in the net increase (decrease) in net assets from operations, classified by derivative instrument and risk category, for the period ended July 31, 2010:
| | | | | | | | | | |
| | | | | | | | | TRANSLATION OF | | |
| | | STATEMENT | | | | | | ASSETS AND | | |
| | | OF | | | | | | LIABILITIES IN | | |
| | | OPERATIONS | | FUTURES | | SWAP | | FOREIGN | | |
| RISK | | LOCATION | | CONTRACTS | | CONTRACTS | | CURRENCIES | | TOTAL |
|
| |
| Credit contracts | | Change in | | | | | | | | |
| | | unrealized | | | | | | | | |
| | | appreciation | | | | | | | | |
| | | (depreciation) of | | - | | $450,225 | | - | | $450,225 |
| | | | | | | | | | |
| | | Change in | | | | | | | | |
| Foreign | | unrealized | | | | | | | | |
| exchange | | appreciation | | | | | | | | |
| contracts | | (depreciation) of | | - | | - | | ($24,486) | | (24,486) |
| | | | | | | | | | |
| | | Change in | | | | | | | | |
| | | unrealized | | | | | | | | |
| Interest rate | | appreciation | | | | | | | | |
| contracts | | (depreciation) of | | ($3,123,073) | | (723,467) | | | | (3,846,540) |
|
| Total | | | | ($3,123,073) | | ($273,242) | | ($24,486) | | ($3,420,801) |
Note 4 — Guarantees and indemnifications
Under the Fund’s organizational documents, its Officers and Trustees are indemnified against certain liabilities arising out of the performance of their duties to the Fund. Additionally, in the normal course of business, the Fund enters into contracts with service providers that contain general indemnification clauses. The Fund’s maximum exposure under these arrangements is unknown, as this would involve future claims that may be made against the Fund that have not yet occurred. The risk of material loss from such claims is considered remote.
Note 5 — Fees and transactions with affiliates
John Hancock Investment Management Services, LLC (the Adviser) serves as investment adviser for the Fund. John Hancock Funds, LLC (the Distributor), an affiliate of the Adviser, serves as principal underwriter of the Fund. The Adviser and the Distributor are indirect wholly owned subsidiaries of Manulife Financial Corporation (MFC).
Management fee. The Fund has an investment management contract with the Adviser under which the Fund pays a daily management fee to the Adviser equivalent, on an annual basis, to the sum of: a) 0.740% of the first $250,000,000 of the Fund’s average daily net assets, b) 0.700% of the next
$500,000,000 and c) 0.675% of the Fund’s average daily net assets in excess of $750,000,000. The Adviser has a subadvisory agreement with Stone Harbor Investment Partners LP. The Fund is not responsible for payment of the subadvisory fees.
The investment management fees incurred for the period ended July 31, 2010 were equivalent to an annual effective rate of 0.72% of the Fund’s average daily net assets.
Effective January 1, 2010, the Adviser contractually agreed to waive a portion of the management fee for certain funds of the Trust. The waiver equals, on an annualized basis 0.01% of that portion of the aggregate net assets of all the participating funds that exceeds $85 billion. The amount of the reimbursement is calculated daily and allocated among all the funds in proportion of the daily net assets of each Fund.
The Adviser has contractually agreed to waive fees and/or reimburse certain expenses for each share class of the Fund. This agreement excludes taxes, portfolio brokerage commissions, interest, overdraft, litigation and other extraordinary expenses not incurred in the ordinary course of the Fund’s business. The fee waivers and/or reimbursements are such that these expenses will not exceed 1.25% and 0.95% of the average daily net assets for Class A and Class I shares, respectively. The fee waivers and/or reimbursements will continue in effect at least until October 31, 2010.
Accordingly, these expense reductions amounted to $46 and $4,392 for Class I shares and Class NAV shares, respectively, for the period ended July 31, 2010.
Expense recapture. The Adviser may recapture operating expenses reimbursed or fees waived under previous expense limitation or waiver arrangements made subsequent to November 2, 2009, for a period of three years following the beginning of the month in which such reimbursements or waivers originally occurred. The table below outlines the amounts recovered during the period ended July 31, 2010, and the amount of waived or reimbursed expenses subject to potential recovery and the respective expiration dates. Certain reimbursements or waivers are not subject to recapture.
| |
| Amounts eligible for recovery | Amounts eligible for recovery |
| the period ended 7-31-10 | through 7-1-13 |
|
| - | $46 |
Accounting and legal services. Pursuant to the Service Agreement, the Fund reimburses the Adviser for all expenses associated with providing the administrative, financial, legal, accounting and recordkeeping services of the Fund, including the preparation of all tax returns, periodic reports to shareholders and regulatory reports, among other services. These expenses are allocated to each share class based on its relative net assets at the time the expense was incurred. The accounting and legal services fees incurred for the period ended July 31, 2010 amounted to an annual rate of 0.01% of the Fund’s average daily net assets.
Distribution and service plans. The Fund has a distribution agreement with the Distributor. The Fund has adopted distribution and service plans with respect to Class A shares pursuant to Rule 12b-1 under the 1940 Act, to pay the Distributor for services provided as the distributor of shares of the Fund. Accordingly, the Fund may pay up to 0.30% for Class A shares for distribution and service fees, expressed as an annual percentage of average daily net assets.
Sales charges. Class A shares are assessed up-front sales charges. During the period ended July 31, 2010, there were no upfront sales charges for Class A shares.
Transfer agent fees. The Fund has a transfer agent agreement with John Hancock Signature Services, Inc. (Signature Services or Transfer Agent), an affiliate of the Adviser. Additionally, Class NAV shares did not pay transfer agent fees. Prior to July 1, 2010, the transfer agent fees were
made up of the following components:
• The Fund paid a monthly transfer agent fee at an annual rate of 0.015% for Class A and Class I shares, based on each class’s average daily net assets.
• The Fund paid a monthly fee based on an annual rate of $17.50 per shareholder account for Class A and Class I shares.
• Signature Services was reimbursed for certain out-of-pocket expenses.
Effective July 1, 2010, the transfer agent fees paid to Signature Services are determined based on the cost to Signature Services (Signature Services Cost) of providing recordkeeping services. The Signature Services Cost is comprised of a component of allocated John Hancock corporate overhead for providing transfer agent services to the Funds and to all other John Hancock affiliated funds. It also includes out-of-pocket expenses that are comprised of payments made to third-parties for recordkeeping services provided to their clients who invest in one or more John Hancock funds. In addition, Signature Services Cost may be reduced by certain revenues that Signature Services received in connection with the performance of the service they provide to the funds. Signature Services Cost is calculated monthly and allocated, as applicable, to four categories of share classes: Institutional Share Classes, Retirement Share Classes, Municipal Bond Classes and all other Retail Share Classes. Within each of these categories, the applicable costs are allocated to the affected John Hancock affiliated funds and/or classes, based on the relative average daily net assets.
Class level expenses for the period ended July 31, 2010 were:
| | | | |
| | Distribution and | Transfer agent | | |
| Class | service fees | fees | | |
| | |
| A | $56 | $20 | | |
| | |
| I | - | 78 | | |
| | |
| Total | $56 | $98 | | |
| | |
Trustee expenses. The Trust compensates each Trustee who is not an employee of the Adviser or its affiliates. The costs of paying Trustee compensation and expenses are allocated to each Fund based on its average daily net assets.
Note 6 — Fund share transactions
Transactions in Fund shares for the period ended July 31, 2010 were as follows:
| | | |
| | Period ended |
| | 7/31/101 |
| |
|
| | Shares | | Amount |
| Class A shares | | | |
| Sold | 2,500 | $ | 25,000 |
| |
| |
|
| Net increase | 2,500 | $ | 25,000 |
| |
| |
|
| Class I shares | | | |
| Sold | 2,500 | $ | 25,000 |
| |
| |
|
| Net increase | 2,500 | $ | 25,000 |
| |
| |
|
| Class NAV shares | | | |
| Sold | 66,791,801 | $ | 671,273,381 |
| Distributions reinvested | 1,462,968 | | 14,819,087 |
| Repurchased | (1,492,673) | | (14,977,059) |
|
| |
|
| Net increase | 66,762,096 | $ | 671,115,409 |
| |
| |
|
| Net increase | 66,767,096 | $ | 671,165,409 |
| |
| |
|
| |
| 1 Period from 11-2-09 (inception date) to 7-31-10. | | | |
Note 7 — Purchase and sale of securities
Purchases and sales of securities, other than short-term securities, aggregated $1,692,233,213 and $1,102,322,981, respectively, for the period ended July 31, 2010.
Note 8 - Investment by affiliated funds
Certain investors in the Fund are affiliated Funds and are managed by the Adviser and its affiliates. The affiliated Funds do not invest in the Fund for the purpose of exercising management or control; however, this investment may represent a significant portion of the Fund’s net assets. For the period ended July 31, 2010, the following Funds had an affiliate ownership concentration of 5% or more of the Fund’s net assets:
| |
| | Affiliate |
| Fund | Concentration |
|
| Lifestyle Balanced Portfolio | 37.6% |
| Lifestyle Conservative Portfolio | 20.6% |
| Lifestyle Growth Portfolio | 20.3% |
| Lifestyle Moderate Portfolio | 13.1% |
Report of Independent Registered Public Accounting Firm
To the Board of Trustees of John Hancock Funds II and Shareholders of John Hancock Multi Sector Bond Fund:
In our opinion, the accompanying statement of assets and liabilities, including the portfolio of investments, and the related statements of operations and of changes in net assets and the financial highlights present fairly, in all material respects, the financial position of John Hancock Multi Sector Bond Fund (the “Fund") at July 31, 2010, and the results of its operations, the changes in its net assets and the financial highlights for the period November 2, 2009 (commencement of operations) through July 31, 2010, in conformity with accounting principles generally accepted in the United States of America. These financial statements and financial highlights (hereafter referred to as “financial statements”) are the responsibility of the Fund's management; our responsibility is to express an opinion on these financial statements based on our audit. We conducted our audit of these financial statements in accordance with the standards of th e Public Company Accounting Oversight Board (United States). Those standards require that we plan and perform the audit to obtain reasonable assurance about whether the financial statements are free of material misstatement. An audit includes examining, on a test basis, evidence supporting the amounts and disclosures in the financial statements, assessing the accounting principles used and significant estimates made by management, and evaluating the overall financial statement presentation. We believe that our audit, which included confirmation of securities at July 31, 2010 by correspondence with the custodian and brokers and the application of alternative auditing procedures where securities purchased confirmations had not been received, provides a reasonable basis for our opinion.
PricewaterhouseCoopers LLP
Boston, Massachusetts
September 20, 2010
Tax information
Unaudited
For federal income tax purposes, the following information is furnished with respect to the distributions of the Fund, if any, paid during its taxable period ended July 31, 2010.
The Fund hereby designates the maximum amount allowable of its net taxable income as qualified dividend income as provided in the Jobs and Growth Tax Relief Reconciliation Act of 2003. This amount will be reflected on Form 1099-DIV for the calendar year 2010.
Shareholders will be mailed a 2010 Form 1099-DIV in January 2011. This will reflect the total of all distributions that are taxable for calendar year 2010.
JHF II Independent Trustees
| | | | |
| Name | DOB | Bio | Trustee of | Number |
| | | | Trust Since1 | of John |
| | | | | Hancock |
| | | | | funds |
| | | | | overseen |
| | | | | by Trustee |
|
| Charles L. Bardelis | 1941 | Director, Island Commuter Corp. | 2005 | 210 |
| | | (Marine Transport). | | |
| | | | |
| | | Trustee of John Hancock Trust (since | | |
| | | 1988), John Hancock Funds II (since | | |
| | | 2005) and former Trustee of John | | |
| | | Hancock Funds III (2005–2006). | | |
|
| Peter S. Burgess | 1942 | Consultant (financial, accounting | 2005 | 210 |
| | | and auditing matters) (since 1999); | | |
| | Certified Public Accountant. | | |
| | | Partner, Arthur Andersen | | |
| | (independent public accounting | | |
| | | firm) (prior to 1999). | | |
| | | | |
| | | Director of the following publicly | | |
| | traded companies: PMA Capital | | |
| | Corporation (since 2004) and | | |
| | Lincoln Educational Services | | |
| | | Corporation (since 2004). | | |
| | | | |
| | | Trustee of John Hancock Trust (since | | |
| | | 2005), John Hancock Funds II (since | | |
| | | 2005), and former Trustee of John | | |
| | | Hancock Funds III (2005–2006). | | |
|
| Theron S. | 1947 | Chief Executive Officer, T. | 2008 | 210 |
| Hoffman | | Hoffman Associates, LLC (since | | |
| | | 2003); Director, The Todd | | |
| | | Organization (since 2003); | | |
| | President, Westport Resources | | |
| | | Management (2006–2008); | | |
| | | Partner/Operating Head & Senior | | |
|
1 Because the Trust does not hold regular annual shareholders meetings, each Trustee holds office for an indefinite term until his/her successor is duly elected and qualified or until he/she dies, retires, resigns, is removed or becomes disqualified. Trustees may be removed (provided the aggregate number of Trustees after such removal shall not be less than one) with cause or without cause, by action of two-thirds of the remaining Trustees or by action of two-thirds of the Outstanding shares of the Trust.
| | | | |
| | | Managing Director, Putnam | | |
| | | Investments (2000–2003); | | |
| | | Executive Vice President, Thomson | | |
| | | Corp. (1997–2000) (financial | | |
| | information publishing). | | |
| | | | |
| | | Trustee of John Hancock Trust (since | | |
| | | 2008) and John Hancock Funds II | | |
| | | (since 2008). | | |
|
| Hassell H. | 1945 | Associate Professor, The Graduate | 2005 | 210 |
| McClellan | | School of The Wallace E. Carroll | | |
| | | School of Management, Boston | | |
| | College (since 1984). | | |
| |
| | | Trustee of John Hancock Trust (since | | |
| | | 2005), John Hancock Funds II (since | | |
| | | 2005) and Trustee of Phoenix Edge | | |
| | | Series Funds (since 2008). | | |
|
| James M. Oates | 1946 | Managing Director, Wydown Group | 2005 | 210 |
| | | (financial consulting firm) (since | | |
| | | 1994); Chairman, Emerson | | |
| | | Investment Management, Inc. (since | | |
| | | 2000); Chairman, Hudson Castle | | |
| | | Group, Inc. (formerly IBEX Capital | | |
| | | Markets, Inc.) (financial services | | |
| | | company) (since 1997) (Independent | | |
| | Chairman, 1997–2006). | | |
| |
| | | Director of the following publicly | | |
| | | traded companies: Stifel Financial | | |
| | | (since 1996); Investor Financial | | |
| | | Services Corporation (1995–2007); | | |
| | | and Connecticut River Bancorp (since | | |
| | | 1998); Director of the following | | |
| | | Mutual Funds: Phoenix Mutual Funds | | |
| | | (1988–2008); Virtus Funds (since | | |
| | | 2008); and Emerson Investment | | |
| | | Management (since 2000). | | |
| |
| | | Chairman of the Boards of John | | |
| | | Hancock Trust and John Hancock | | |
| | Funds II (since 2005). | | |
| |
| | | Trustee of John Hancock Trust | | |
| | | (since 2004), John Hancock Funds II | | |
| | | (since 2005) and former Trustee of | | |
|
| | | John Hancock Funds III (2005– | | |
| | | 2006). | | |
|
| Steven M. Roberts | 1944 | Board of Governors Deputy Director | 2008 | 210 |
| | | Division of Banking Supervision and | | |
| | | Regulation, Federal Reserve System | | |
| | | (2005-2008); Partner, KPMG (1987- | | |
| | | 2004). | | |
| | | | |
| | | Trustee of John Hancock Trust (since | | |
| | | 2008) and John Hancock Funds II | | |
| | (since September 2008). | | |
|
Non-Independent Trustees2
| | | | |
| James R. Boyle3 | 1959 | President, John | 2005 | 251 |
| | | Hancock Financial | | |
| | | Services (since 2010); | | |
| | | Chairman and Director, | | |
| | John Hancock | | |
| | | Advisers, LLC, John | | |
| | | Hancock Funds, LLC, | | |
| | | and John Hancock | | |
| | | Investment | | |
| | | Management Services, | | |
| | | LLC (until 2010); | | |
| | | Trustee, John Hancock | | |
| | | Trust, John Hancock | | |
| | | Funds II, and John | | |
| | | Hancock retail funds | | |
| | (since 2005). | | |
|
| Grace K. Fey4 | 1946 | Chief Executive | 2008 | 210 |
| | | Officer, Grace Fey | | |
| | | Advisors (since 2007); | | |
| | | Director & Executive | | |
| | Vice President, | | |
| | Frontier Capital | | |
| | | Management Company | | |
| | | (1988-2007); Director, | | |
| | | Fiduciary Trust (since | | |
| | | 2009). | | |
| |
| | Trustee of John | | |
| | | Hancock Trust (since | | |
| | 2008) and John | | |
| | | Hancock Funds II | | |
| | (since 2008). | | |
|
Principal Officers who are not Trustees
2 Non-Independent Trustees hold positions or are affiliated with the Fund’s investment adviser, subadviser, underwriter or their affiliates.
3 Mr. Boyle is an “interested person” (as defined by the 1940 Act) due to his position with Manulife Financial Corporation (or its affiliates), the ultimate parent of the Adviser.
4 Ms. Fey is an “interested person” (as defined by the 1940 Act) due to a deferred compensation arrangement with her former employer, Frontier Capital Management Company, which is a subadviser of certain funds of John Hancock Funds II and John Hancock Trust.
| Hugh McHaffie | 1959 | Executive Vice President, | 2009 | |
| | | John Hancock Financial | | |
| | | Services (since 2006); | | |
| | | Director, John Hancock | | |
| | | Investment Management | | |
| | | Services, LLC, John | | |
| | | Hancock Advisers, LLC | | |
| | | and John Hancock Funds, | | |
| | | LLC (since 2010); | | |
| | | President, John Hancock | | |
| | | Trust and John Hancock | | |
| | | Funds II (since 2009); | | |
| | | Senior Vice President, | | |
| | | Individual Business Product | | |
| | | Management, MetLife, Inc. | | |
| | | (1999–2006). | | |
|
| Thomas M. Kinzler | 1955 | Vice President, John | 2009 | |
| | | Hancock Financial Services | | |
| | | (since 2006); Secretary and | | |
| | | Chief Legal Officer, John | | |
| | | Hancock retail funds, John | | |
| | | Hancock Funds II and John | | |
| | | Hancock Trust (since | | |
| | | 2006); Secretary and Chief | | |
| | | Legal Counsel, John | | |
| | | Hancock Advisers, LLC, | | |
| | | John Hancock Investment | | |
| | | Management Services, LLC | | |
| | | and John Hancock Funds, | | |
| | | LLC (since 2007); Vice | | |
| | | President and Associate | | |
| | | General Counsel, | | |
| | | Massachusetts Mutual Life | | |
| | | Insurance Company (1999– | | |
| | | 2006); Secretary and Chief | | |
| | | Legal Counsel, MML | | |
| | | Series Investment Fund | | |
| | | (2000–2006); Secretary and | | |
| | | Chief Legal Counsel, | | |
| | | MassMutual Select Funds | | |
| | | and MassMutual Premier | | |
| | | Funds (2004–2006). | | |
|
| Francis V. Knox, Jr. | 1947 | Vice President, John | 2009 | |
| | | Hancock Financial Services | | |
|
| | | | |
| | | (since 2005); Chief | | |
| | | Compliance Officer, John | | |
| | | Hancock retail funds, John | | |
| | | Hancock Funds II, John | | |
| | | Hancock Trust, Chief | | |
| | | Compliance Officer, John | | |
| | | Hancock Advisers, LLC | | |
| | | and John Hancock | | |
| | | Investment Management | | |
| | | Services, LLC (since 2005); | | |
| | | Vice President and Chief | | |
| | | Compliance Officer, MFC | | |
| | | Global Investment | | |
| | | Management (U.S.), LLC | | |
| | | (2005–2008). | | |
|
| Michael J. Leary | 1965 | Assistant Vice President, | 2009 | |
| | | John Hancock Financial | | |
| | | Services (since 2007); | | |
| | | Treasurer, John Hancock | | |
| | | retail funds, John Hancock | | |
| | | Funds II and John Hancock | | |
| | | Trust (since 2009); Vice | | |
| | | President, John Hancock | | |
| | | Advisers, LLC and John | | |
| | | Hancock Investment | | |
| | | Management Services, LLC | | |
| | | (since 2007); Assistant | | |
| | | Treasurer, John Hancock | | |
| | | retail funds, John Hancock | | |
| | | Funds II and John Hancock | | |
| | | Trust (2007–2009); Vice | | |
| | | President and Director of | | |
| | | Fund Administration, JP | | |
| | | Morgan (2004-2007). | | |
|
| Charles A. Rizzo | 1957 | Vice President, John | 2009 | |
| | | Hancock Financial Services | | |
| | | (since 2008); Chief | | |
| | | Financial Officer, John | | |
| | | Hancock retail funds, John | | |
| | | Hancock Funds II and John | | |
| | | Hancock Trust (since | | |
| | | 2007); Senior Vice | | |
| | | President, John Hancock | | |
| | | Advisers, LLC and John | | |
|
| | | | |
| | | Hancock Investment | | |
| | | Management Services, LLC | | |
| | | (since 2008); Assistant | | |
| | | Treasurer, Goldman Sachs | | |
| | | Mutual Fund Complex | | |
| | | (2005–2007); Vice | | |
| | | President, Goldman Sachs | | |
| | | (2005–2007); Managing | | |
| | | Director and Treasurer, | | |
| | | Scudder Funds, Deutsche | | |
| | | Asset Management (2003– | | |
| | | 2005). | | |
|
| John G. Vrysen | 1955 | Senior Vice President, John | 2009 | |
| | | Hancock Financial Services | | |
| | | (since 2006); Director, | | |
| | | Executive Vice President | | |
| | | and Chief Operating | | |
| | | Officer, John Hancock | | |
| | | Advisers, LLC, John | | |
| | | Hancock Investment | | |
| | | Management Services, LLC | | |
| | | and John Hancock Funds, | | |
| | | LLC (since 2005); Chief | | |
| | | Operating Officer, John | | |
| | | Hancock Funds II and John | | |
| | | Hancock Trust (since | | |
| | | 2007); Chief Operating | | |
| | | Officer, John Hancock | | |
| | | retail funds (until 2009); | | |
| | | Trustee, John Hancock | | |
| | | retail funds (since 2009). | | |
|
More information
| | |
| Trustees | Investment adviser |
| James M. Oates, Chairman | John Hancock Investment Management Services, LLC |
| James R. Boyle† | |
| Grace K. Fey† | Investment subadviser |
| Charles L. Bardelis* | Stone Harbor Investment Partners LP |
| Peter S. Burgess* | |
| Theron S. Hoffman | Principal distributor |
| Hassell H. McClellan | John Hancock Funds, LLC |
| Steven M. Roberts* | |
| *Member of the Audit Committee | Custodian |
| †Non-Independent Trustee | State Street Bank and Trust Company |
| | |
| Officers | Transfer agent |
| Hugh McHaffie | John Hancock Signature Services, Inc. |
| President | |
| Legal counsel |
| Thomas M. Kinzler | K&L Gates LLP |
| Secretary and Chief Legal Officer | |
| Independent registered public accounting firm |
| Francis V. Knox, Jr. | PricewaterhouseCoopers LLP |
| Chief Compliance Officer | |
|
| |
| Michael J. Leary | The report is certified under the Sarbanes-Oxley Act, which |
| Treasurer | requires mutual funds and other public companies to affirm |
| that, to the best of their knowledge, the information in |
| Charles A. Rizzo | their financial reports is fairly and accurately stated in all |
| Chief Financial Officer | material respects. |
|
| |
| John G. Vrysen | |
| Chief Operating Officer | |
| | |
The Fund’s proxy voting policies and procedures, as well as the Fund’s proxy voting record, if any, for the most recent twelve-month period ended June 30, are available free of charge on the Securities and Exchange Commission (SEC) Web site at www.sec.gov or on our Web site.
The Fund’s complete list of portfolio holdings, for the first and third fiscal quarters, is filed with the SEC on Form N-Q. The Fund’s Form N-Q is available on our Web site and the SEC’s Web site, www.sec.gov, and can be reviewed and copied (for a fee) at the SEC’s Public Reference Room in Washington, DC. Call 1-800-SEC-0330 to receive information on the operation of the SEC's Public Reference Room.
We make this information on your fund, as well as monthly portfolio holdings, and other fund details available on our Web site www.jhfunds.com or by calling 1-800-225-5291.
| | |
| You can also contact us: | | |
| 1-800-225-5291 | Regular mail: | Express mail: |
| jhfunds.com | John Hancock Signature Services, Inc. | John Hancock Signature Services, Inc. |
| | P.O. Box 55913 | Mutual Fund Image Operations |
| | Boston, MA 02205-5913 | 30 Dan Road |
| | | Canton, MA 02021 |
ITEM 2. CODE OF ETHICS.
(a) As of the end of the fiscal year July 31, 2010 the registrant has adopted a code of ethics, as defined in Item 2 of Form N-CSR, that applies to its Principal Executive Officer and Principal Chief Financial Officer. A copy of the code of ethics is filed as an exhibit to this Form N-CSR.
(b) Not applicable
(c) Not applicable
(d) Not applicable
(e) Not applicable
(f)(1) A copy of the Code of Ethics is attached hereto.
|
| JOHN HANCOCK TRUST |
| JOHN HANCOCK FUNDS |
| JOHN HANCOCK FUNDS II |
| JOHN HANCOCK FUNDS III |
| |
| SARBANES-OXLEY CODE OF ETHICS |
| FOR |
| PRINCIPAL EXECUTIVE, PRINCIPAL FINANCIAL OFFICERS & TREASURER |
I. Covered Officers/Purpose of the Code
This code of ethics (this “Code”) for John Hancock Trust, John Hancock Funds1, John Hancock Funds II and John Hancock Funds III, each a registered management investment company under the Investment Company Act of 1940, as amended (“1940 Act”), which may issue shares in separate and distinct series (each investment company and series thereunder to be hereinafter referred to as a “Fund”), applies to each Fund’s Principal Executive Officer (“President”), Principal Financial Officer (“Chief Financial Officer”) and Treasurer (“Treasurer”) (the “Covered Officers” as set forth in Exhibit A) for the purpose of promoting:
► honest and ethical conduct, including the ethical handling of actual or apparent conflicts of interest between personal and professional relationships;
► full, fair, accurate, timely and understandable disclosure in reports and documents that the Fund files with, or submits to, the Securities and Exchange Commission (“SEC”) and in other public communications made by the Fund;
► compliance with applicable laws and governmental rules and regulations;
► the prompt internal reporting of violations of the Code to an appropriate person or persons identified in the Code; and
► accountability for adherence to the Code.
_________________________________
1 John Hancock Funds includes the following trusts: John Hancock Bank and Thrift Opportunity Fund; John Hancock Bond Trust; John Hancock California Tax-Free Income Fund; John Hancock Capital Series; John Hancock Current Interest; John Hancock Equity Trust; John Hancock Income Securities Trust; John Hancock Investment Trust; John Hancock Investment Trust II; John Hancock Investment Trust III; John Hancock Investors Trust; John Hancock Municipal Securities Trust; John Hancock Patriot Premium Dividend Fund II; Trust; John Hancock Preferred Income Fund; John Hancock Preferred Income Fund II; John Hancock Preferred Income Fund III; John Hancock Series Trust; John Hancock Sovereign Bond Fund; John Hancock Strategic Series; John Hancock Tax-Exempt Series Fund; John Hancock World Fund; John Hancock Tax-Advantaged Dividend Income Fund and John Hancock Tax-Advantaged Global Shareholder Yield Fund.
Each of the Covered Officers should adhere to a high standard of business ethics and should be sensitive to situations that may give rise to actual as well as apparent conflicts of interest.
II. Covered Officers Should Handle Ethically Actual and Apparent Conflicts of Interest
Overview
A “conflict of interest” occurs when a Covered Officer’s private interest interferes with the interests of, or his service to, the Fund. For example, a conflict of interest would arise if a Covered Officer, or a member of his family, receives improper personal benefits as a result of his position with the Fund. Certain conflicts of interest arise out of the relationships between the Covered Officers and the Fund and already are subject to conflict of interest provisions in the Investment Company Act of 1940, as amended (the “Investment Company Act”) and the Investment Advisers Act of 1940, as amended (the “Investment Advisers Act”). For example, Covered Officers may not individually engage in certain transactions (such as the purchase or sale of securities or other property) with the Fund because of their status as “affiliated persons” of the Fund. Each of the Covered Officers is an officer or employee of th e investment adviser or a service provider (“Service Provider”) to the Fund. The Fund’s, the investment adviser’s and the Service Provider’s compliance programs and procedures are designed to prevent, or identify and correct, violations of these provisions. This Code does not, and is not intended to, repeat or replace these programs and procedures, and such conflicts fall outside of the parameters of this Code.
Although typically not presenting an opportunity for improper personal benefit, conflicts arise from, or as a result of, the contractual relationship between the Fund and the investment adviser and the Service Provider of which the Covered Officers are also officers or employees. As a result, this Code recognizes that the Covered Officers will, in the normal course of their duties (whether formally for the Fund, for the investment adviser or for the Service Provider), be involved in establishing policies and implementing decisions which will have different effects on the investment adviser, the Service Provider and the Fund. The participation of the Covered Officers in such activities is inherent in the contractual relationship between the Fund and the investment adviser and the Service Provider and is consistent with the performance by the Covered Officers of their duties as officers of the Fund. Thus, if such participation is performed in conformity with the provisions of the Investment Company Act and the Investment Advisers Act, it will be deemed to have been handled ethically. In addition, it is recognized by the Fund’s Board of Trustees/Directors (the “Board”) that the Covered Officers may also be officers or employees of one or more other investment companies covered by other Codes.
Other conflicts of interest are covered by the Code, even if such conflicts of interest are not subject to provisions in the Investment Company Act and the Investment Advisers Act. The following list provides examples of conflicts of interest under the Code, but the Covered Officers should keep in mind that these examples are not exhaustive. The overarching principle is that the personal interest of an Covered Officer should not be placed improperly before the interest of the Fund.
Each Covered Officer must:
► not use his/her personal influence or personal relationships improperly to influence investment decisions or financial reporting by the Fund whereby the Covered Officer would benefit personally to the detriment of the Fund;
► not cause the Fund to take action, or fail to take action, for the individual personal benefit of the Covered Officer rather than for the benefit of the Fund; and
► not use material non-public knowledge of portfolio transactions made or contemplated for the Fund to trade personally or cause others to trade personally in contemplation of the market effect of such transactions.
Additionally, conflicts of interest may arise in other situations, the propriety of which may be discussed, if material, with the Fund’s Chief Compliance Officer (“CCO”). Examples of these include:
► service as a director/trustee on the board of any public or private company;
► the receipt of any non-nominal gifts;
► the receipt of any entertainment from any company with which the Fund has current or prospective business dealings unless such entertainment is business-related, reasonable in cost, appropriate as to time and place, and not so frequent as to raise any question of impropriety (or other formulation as the Fund already uses in another code of conduct);
► any ownership interest in, or any consulting or employment relationship with, any of the Fund’s service providers, other than its investment adviser, any sub-adviser, principal underwriter, administrator or any affiliated person thereof; and
► a direct or indirect financial interest in commissions, transaction charges or spreads paid by the Fund for effecting portfolio transactions or for selling or redeeming shares other than an interest arising from the Covered Officer’s employment, such as compensation or equity ownership.
III. Disclosure & Compliance
► Each Covered Officer should familiarize himself or herself with the disclosure requirements generally applicable to the Fund;
► Each Covered Officer should not knowingly misrepresent, or cause others to misrepresent, facts about the Fund to others, whether within or outside the Fund, including to the Fund’s directors and auditors, and to governmental regulators and self-regulatory organizations;
► Each Covered Officer should, to the extent appropriate within his/her area of responsibility, consult with other officers and employees of the Fund and the Fund’s adviser or any sub-adviser with the goal of promoting full, fair, accurate, timely and understandable disclosure in the reports and documents the Fund files with, or submits to, the SEC and in other public communications made by the Fund; and
► It is the responsibility of each Covered Officer to promote compliance with the standards and restrictions imposed by applicable laws, rules and regulations.
IV. Reporting & Accountability
Each Covered Officer must:
► upon adoption of the Code (or thereafter as applicable, upon becoming an Covered Officer), affirm in writing to the Fund’s CCO that he/she has received, read, and understands the Code;
► annually thereafter affirm to the Fund’s CCO that he/she has complied with the requirements of the Code;
► not retaliate against any employee or Covered Officer or their affiliated persons for reports of potential violations that are made in good faith;
► notify the Fund’s CCO promptly if he/she knows of any violation of this Code (Note: failure to do so is itself a violation of this Code); and
► report at least annually any change in his/her affiliations from the prior year.
The Fund’s CCO is responsible for applying this Code to specific situations in which questions are presented under it and has the authority to interpret this Code in any particular situation. However, any approvals or waivers sought by the Principal Executive Officer will be considered by the Fund’s Board or the Compliance Committee thereof (the “Committee”).
The Fund will follow these procedures in investigating and enforcing this Code:
► the Fund’s CCO will take all appropriate action to investigate any potential violations reported to him/her;
► if, after such investigation, the CCO believes that no violation has occurred, the CCO is not required to take any further action;
► any matter that the CCO believes is a violation will be reported to the Board or, if applicable, Compliance Committee;
► if the Board or, if applicable, Compliance Committee concurs that a violation has occurred, the Board, either upon its determination of a violation or upon recommendation of the Compliance Committee, if applicable, will consider appropriate action, which may include review of, and appropriate modifications to, applicable policies and procedures; notification to appropriate personnel of the Service Provider or the investment adviser or its board; or a recommendation to dismiss the Registrant’s Executive Officer;
► the Board, or if applicable the Compliance Committee, will be responsible for granting waivers, as appropriate; and
► any changes to or waivers of this Code will, to the extent required, be disclosed as provided by SEC rules.
V. Other Policies & Procedures
This Code shall be the sole code of ethics adopted by the Fund for purposes of Section 406 of the Sarbanes-Oxley Act of 2002 and the rules and forms applicable to registered investment companies thereunder. Insofar as other policies or procedures of the Fund, the Fund’s adviser, any sub-adviser, principal underwriter or other service providers govern or purport to govern the behavior or activities of the Covered Officers who are subject to this Code, they are superseded by this Code to the extent that they overlap or conflict with the provisions of this Code. The Fund’s and its investment adviser’s codes of ethics under Rule 204A-1 under the Investment Advisers Act and Rule 17j-1 under the Investment Company Act, respectively, are separate requirements applying to the Covered Officers and others, and are not part of this Code.
VI. Amendments
Any amendments to this Code, other than amendments to Exhibit A, must be approved or ratified by a majority vote of the Fund’s Board, including a majority of independent directors.
VII. Confidentiality
All reports and records prepared or maintained pursuant to this Code will be considered confidential and shall be maintained and protected accordingly. Except as otherwise required by law or this Code, such matters shall not be disclosed to anyone other than the Fund’s Board and its counsel, the investment adviser and the relevant Service Providers.
VIII. Internal Use
The Code is intended solely for the internal use by the Fund and does not constitute an admission, by or on behalf of the Fund, as to any fact, circumstance, or legal conclusion.
|
| Exhibit A |
| Persons Covered by this Code of Ethics |
| (As of September 2010) |
John Hancock Trust
► Principal Executive Officer and President – Hugh McHaffie
► Principal Financial Officer and Chief Financial Officer – Charles Rizzo
► Treasurer – Michael J. Leary
John Hancock Funds
► Principal Executive Officer and President – Keith Hartstein
► Principal Financial Officer and Chief Financial Officer – Charles Rizzo
► Treasurer (Open-End Funds) – Michael J. Leary
► Treasurer – Salvatore Schiavone
John Hancock Funds II
► Principal Executive Officer and President – Hugh McHaffie
► Principal Financial Officer and Chief Financial Officer – Charles Rizzo
► Treasurer – Michael J. Leary
John Hancock Funds III
► Principal Executive Officer and President – Keith Hartstein
► Principal Financial Officer and Chief Financial Officer – Charles Rizzo
► Treasurer – Salvatore Schiavone
(f)(2) Not applicable.
(f)(3) The Registrant will provide a copy of the Code of Ethics to any person without charge, upon request by calling the following toll free number (800) 344-1029.
ITEM 3. AUDIT COMMITTEE FINANCIAL EXPERT.
The Board of Trustees has determined that at least one member of its audit committee is an “audit committee financial expert”. Peter S. Burgess is an audit committee financial expert and is “independent”, pursuant to general instructions on Form N-CSR Item 3.
ITEM 4. PRINCIPAL ACCOUNTANT FEES AND SERVICES.
| |
(a) AUDIT FEES: |
| 2010: | $133,236 |
| 2009: | $0 |
These fees represent aggregate fees billed for the last two fiscal years (the “Reporting Periods”) for professional services rendered by the principal accountant for the audits of the Registrant’s annual financial statements or services that are normally provided by the accountant in connection with statutory and regulatory filing or engagements for such Reporting Periods.
| |
| (b) AUDIT RELATED FEES: |
| 2010: | $0 |
| 2009: | $0 |
These fees represent the aggregate fees billed for the Reporting Periods for assurance and related services by the principal accountant that are reasonably related to the performance of the audit of the Registrant’s financial statements and are not reported under paragraph (a) of this Item. Such fees relate to professional services rendered by the principal accountant for separate audit reports in connection with security counts pursuant to Rule 17f-2 under the Investment Company Act of 1940 and fund merger audit services.
| |
(c) TAX FEES: |
| 2010: | $10,404 |
| 2009: | $0 |
These fees represent aggregate fees billed for the Reporting Periods for professional services rendered by the principal accountant for tax compliance, tax advice and tax planning. The tax services provided by the principal accountant related to the review of the Registrant’s federal and state income tax returns, excise tax calculations and returns and a review of the Registrant’s calculations of capital gain and income distributions.
| |
| (d) ALL OTHER FEES: |
| 2010: | $501 |
| 2009: | $0 |
These fees represent all other fees billed to the Registrant for products and services provided by the principal accountant. These fees were billed to the Registrant and were approved by the Registrant’s audit committee.
(e) (1) Audit Committee Pre-Approval Policies and Procedures:
The Trust’s Audit Committee must pre-approve all audit and non-audit services provided by the independent registered public accounting firm (the “Auditor”) relating to the operations or financial reporting of the funds. Prior to the commencement of any audit or non-audit services to a fund, the Audit Committee reviews the services to determine whether they are appropriate and permissible under applicable law.
The Trust’s Audit Committee has adopted policies and procedures to, among other purposes, provide a framework for the Committee’s consideration of audit-related and non-audit services by the Auditor. The policies and procedures require that any audit-related and non-audit service provided by the Auditor and any non-audit service provided by the Auditor to a fund service provider that relates directly to the operations and financial reporting of a fund are subject to approval by the Audit Committee before such service is provided. Audit-related services provided by the Auditor that are expected to exceed $25,000 per instance/per fund are subject to specific pre-approval by the Audit Committee. Tax services provided by the Auditor that are expected to exceed $30,000 per instance/per fund are subject to specific pre-approval by the Audit Committee.
All audit services, as well as the audit-related and non-audit services that are expected to exceed the amounts stated above, must be approved in advance of provision of the service by formal resolution of the Audit Committee. At the regularly scheduled Audit Committee meetings, the Committee reviews a report summarizing the services, including fees, provided by the Auditor.
(2) Amount approved by the Audit Committee pursuant paragraph (c) (7) (i) (C) of Rule 2-01 of Regulation S-X: None.
(f) Not applicable.
(g) The aggregate non-audit fees billed by the registrant’s principal accountant for services rendered to the registrant and rendered to the registrant’s control affiliates for each of the last two fiscal years of the registrant were $4,977,397 for the fiscal year ended July 31, 2010 and $9,666,806 for the fiscal year ended July 31, 2009.
(h) The audit committee of the registrant has considered the non-audit services provided by the registrant’s principal accountant to the control affiliates and has determined that the services that were non pre-approved are compatible with maintaining the principal accountant’s independence.
ITEM 5. AUDIT COMMITTEE OF LISTED REGISTRANTS
Peter S. Burgess – Chairman
Charles L. Bardelis
Steven M. Roberts
ITEM 6. SCHEDULE OF INVESTMENTS.
(a) This schedule is included as part of the Report to shareholders filed under Item 1 of this form.
(b) Not applicable.
ITEM 7. DISCLOSURE OF PROXY VOTING POLICIES AND PROCEDURES FOR CLOSED-END MANAGEMENT INVESTMENT COMPANIES.
Not applicable.
ITEM 8. PORTFOLIO MANAGERS OF CLOSED-END MANAGEMENT INVESTMENT COMPANIES.
Not applicable.
ITEM 9. PURCHASE OF EQUITY SECURITIES BY CLOSED-END MANAGEMENT INVESTMENT COMPANIES AND AFFILIATED PURCHASERS.
Not applicable.
ITEM 10. SUBMISSION OF MATTERS TO VOTE OF SECURITY HOLDERS.
No material changes.
ITEM 11. CONTROLS AND PROCEDURES.
(a) EVALUATION OF DISCLOSURE CONTROLS AND PROCEDURES. The Registrant maintains disclosure controls and procedures that are designed to ensure that information required to be disclosed in this Form N-CSR is recorded, processed, summarized and reported within the periods specified in the rules and forms of the Securities and Exchange Commission. Such disclosure controls and procedures include controls and procedures designed to ensure that such information is accumulated and communicated to the Registrant's management, including its principal executive officer and principal financial officer, as appropriate, to allow timely decisions regarding required disclosure.
Within 90 days prior to the filing date of this Form N-CSR, the Registrant had carried out an evaluation, under the supervision and with the participation of the Registrant's management, including the Registrant's principal executive officer and the Registrant's principal financial officer, of the effectiveness of the design and operation of the Registrant's disclosure controls and procedures relating to information required to be disclosed on Form N-CSR. Based on such evaluation, the Registrant's principal executive officer and principal financial officer concluded that the Registrant's disclosure controls and procedures are operating effectively to ensure that:
(i) information required to be disclosed in this Form N-CSR is recorded, processed, summarized and reported within the periods specified in the rules and forms of the Securities and Exchange Commission, and
(ii) information is accumulated and communicated to the Registrant’s management, including its principal executive officer and principal financial officer, as appropriate, to allow timely decisions regarding required disclosure.
(b) CHANGE IN REGISTRANT’S INTERNAL CONTROL: Not applicable.
ITEM 12. EXHIBITS.
(a)(1) Code of Ethics for Principal Executive Officer and Principal Financial Officer.
(a)(2) The certifications required by Rule 30a-2(a) under the 1940 Act.
(b) The certifications required by Rule 30a-2(b) under the 1940 Act.
(c)(1) Contact person at the registrant.
Pursuant to the requirements of the Securities Exchange Act of 1934 and the Investment Company Act of 1940, the registrant has duly caused this report to be signed on its behalf by the undersigned, thereunto duly authorized.
JOHN HANCOCK FUNDS II
/s/ Hugh McHaffie
Hugh McHaffie
President
Date: September 16, 2010
Pursuant to the requirements of the Securities Exchange Act of 1934 and the Investment Company Act of 1940, this report has been signed below by the following persons on behalf of the registrant and in the capacities and on the dates indicated.
/s/ Hugh McHaffie
Hugh McHaffie
President
Date: September 16, 2010
/s/ Charles A. Rizzo
Charles A. Rizzo
Chief Financial Officer
Date: September 16, 2010