|
| UNITED STATES |
| SECURITIES AND EXCHANGE COMMISSION |
| Washington, D.C. 20549 |
| |
| FORM N-CSR |
| |
| CERTIFIED SHAREHOLDER REPORT OF REGISTERED MANAGEMENT INVESTMENT COMPANIES |
| Investment Company Act file number 811-21779 |
| |
| JOHN HANCOCK FUNDS II |
| --------------------------------------------------------- |
| (Exact name of registrant as specified in charter) |
| |
| 601 CONGRESS STREET, BOSTON, MA 02210-2805 |
| ------------------------------------------------------------- |
| (Address of principal executive offices) (Zip code) |
| |
| GORDON M. SHONE, 601 CONGRESS STREET, BOSTON, MA 02210-2805 |
| ------------------------------------------------------------------------------------------ |
| (Name and address of agent for service) |
| |
| Registrant's telephone number, including area code: (617) 663-2168 |
| -------------- |
| |
| Date of fiscal year end: 12/31 |
| ------ |
| |
| Date of reporting period: 12/31/08 |
| ------- |
ITEM 1. REPORTS TO STOCKHOLDERS.

John Hancock
Lifestyle Aggressive Portfolio
Goal and strategy
The Portfolio seeks long-term growth of capital. Current income is not a consideration. To pursue this goal, the Portfolio, which is a fund of funds, normally invests approximately 100% of its assets in underlying funds that invest primarily in equity securities.
Asset Allocation
| | | |
| Equity | % of Total | | |
| | |
| U.S. Large Cap | 43% | | |
| | |
| U.S. Mid Cap | 12% | | |
| | |
| U.S. Small Cap | 8% | | |
| | |
| International Large Cap | 21% | | |
| | |
| International Small Cap | 4% | | |
| | |
| Emerging Markets | 4% | | |
| | |
| Natural Resources | 3% | | |
| | |
| Large Blend | 2% | | |
| | |
| Small Growth | 2% | | |
| | |
| Small Value | 1% | | |
| | |
As a percentage of net assets on December 31, 2008.
Portfolio results
For the 12 months ended December 31, 2008, John Hancock Lifestyle Aggressive Portfolio’s Class A, Class B, Class C, Class R, Class R1, Class R2, Class R3, Class R4, Class R5 and Class 1 shares returned –42.40%, –42.84%, –42.79%, –42.76%, –42.56%, –42.49%, –42.54%, –42.38%, –42.18% and –42.08%, respectively, at net asset value. In comparison, the Portfolio’s benchmark index —the Standard & Poor’s 500 Index — returned –37.00% during the same period.
Performance review
Asset allocation had a negative impact on the Portfolio during the year, as the benefit of exposure to U.S. small caps was more than offset by an allocation to domestic mid caps, as well as by exposure to foreign equities, which accounted for roughly 29% of the Portfolio. A large negative impact versus the broad benchmark also came from the challenging performance of some of our individual managers.
Core Equity (Legg Mason) was a significant detractor. The fund’s exposure to beaten-down stocks in the financials and consumer discretionary sectors contributed to its underperformance. After considerable deliberation, we removed Core Equity from the Portfolio and replaced it with Alpha Opportunities (Wellington), a unique fund combining traditional growth, value and more eclectic styles in an attempt to deliver consistent outperformance over time. We also made some adjustments to our small-cap growth lineup, eliminating Small Cap (Independence) and adding positions in Small Cap Growth (Wellington) and Smaller Company Growth (Frontier/MFC Global U.S.A./Perim eter).
Other detractors included Blue Chip Growth (T. Rowe Price), which had a disappointing showing due to an overweighting in financials and an underweighting in consumer staples. Conversely, performance was aided by U.S. Multi Sector (GMO), which benefited from its overall quality bias and from underweighting in financials and overweighting in consumer staples.
This commentary reflects the views of the portfolio managers through the end of the Portfolio’s period discussed in this report. The managers’ statements reflect their own opinions. As such, they are in no way guarantees of future events and are not intended to be used as investment advice or a recommendation regarding any specific security. They are also subject to change at any time as market and other conditions warrant.
Past performance is no guarantee of future results.
SCORECARD
| | |
| INVESTMENT | | PERIOD’S PERFORMANCE ... AND WHAT’S BEHIND THE NUMBERS |
| |
| U.S. Multi Sector | ▲ | Underweighting in financials |
| (GMO) | | |
| |
| Core Equity | ▼ | Large stake in hard-hit financials |
| (Legg Mason) | | |
| |
| Blue Chip Growth | ▼ | Overweighting in financials |
| (T. Rowe Price) | | |
| |
| 4 | Lifestyle Portfolios | Annual report |
Growth of $10,000
This chart shows what happened to a hypothetical $10,000 investment in Class A shares for the period indicated. For comparison, we’ve shown the same investment in two similar indexes.

| | | | | | | | | |
| | Class B | Class C | Class R1 | Class R11 | Class R21 | Class R31 | Class R41 | Class R51 | Class 11 |
|
| Period beginning | 10-18-05 | 10-18-05 | 9-18-06 | 9-18-06 | 9-18-06 | 10-18-05 | 10-18-05 | 10-18-05 | 10-15-05 |
|
| Without sales charge | 7,441 | 7,451 | 6,720 | 6,772 | 6,801 | 7,577 | 7,634 | 7,703 | 7,735 |
|
| With maximum sales charge | 7,249 | 7,451 | 6,720 | 6,772 | 6,801 | 7,577 | 7,634 | 7,703 | 7,735 |
|
| S&P 500 Index | 8,107 | 8,107 | 7,181 | 7,181 | 7,181 | 8,107 | 8,107 | 8,107 | 8,131 |
|
| MSCI EAFE Gross Index2 | 8,648 | 8,648 | 7,017 | 7,017 | 7,017 | 8,648 | 8,648 | 8,648 | 8,396 |
|
Performance chart
Cumulative total returns with maximum sales charge (POP) for the period ended December 31, 2008
| | | | | | | | | | |
| | Class A | Class B | Class C | Class R1 | Class R11 | Class R21 | Class R31 | Class R41 | Class R51 | Class 11 |
|
| Inception | 10-18-05 | 10-18-05 | 10-18-05 | 9-18-06 | 9-18-06 | 9-18-06 | 10-18-05 | 10-18-05 | 10-18-05 | 10-15-05 |
|
| Average annual returns — 1 year | –45.28% | –45.49% | –43.32% | –42.76% | –42.56% | –42.49% | –42.54% | –42.38% | –42.18% | –42.08% |
|
| Average annual returns — Since inception | –9.61% | –9.55% | –8.77% | –15.92% | –15.63% | –15.47% | –8.29% | –8.08% | –7.82% | –7.68% |
|
| Cumulative total returns — 1 year | –45.28% | –45.49% | –43.32% | –42.76% | –42.56% | –42.49% | –42.54% | –42.38% | –42.18% | –42.08% |
|
| Cumulative total returns —Since inception | –27.66% | –27.51% | –25.49% | –32.81% | –32.28% | –31.99% | –24.23% | –23.66% | –22.97% | –22.65% |
|
Performance figures assume all distributions are reinvested. Returns with maximum sales charge reflect a sales charge on Class A shares of 5%, and the applicable contingent deferred sales charge (CDSC) on Class B and Class C shares. The Class B shares’ CDSC declines annually between years 1–6 according to the following schedule: 5, 4, 3, 3, 2, 1%. No sales charge will be assessed after the sixth year. Class C shares held for less than one year are subject to a 1% CDSC. Sales charge is not applicable for Class R, Class R1, Class R2, Class R3, Class R4, Class R5 and Class 1 shares.
The expense ratios of the Portfolio, both net (including any fee waivers or expense limitations) and gross (excluding any fee waivers or expense limitations), are set forth according to the most recent publicly available prospectuses for the Portfolio and may differ from the expense ratios disclosed in the Financial Highlights tables in this report. The waivers and expense limitations are contractual at least until May 1, 2009. The following expense ratios include expenses of the underlying affiliated funds in which the Portfolio invests. The net expenses are as follows: Class B — 2.28%, Class C — 2.24%, Class R — 2.01%, Class R1 — 1.65%, Class R2 — 1.45%, Class R3 — 1.74%, Class R4 — 1.47%, Class R5 — 1.16%. Had the fee waivers and expense limitations not been in place, the gross expenses would be as follows: Class B — 2.30%, Class C — 2.25%, Class R — 4.59%, Class R1 — 4.47%, Class R2 — 3.55%, Cla ss R3 — 2.14%, Class R4 — 1.89%, Class R5 — 2.04%. For the other classes, the net expenses equal the gross expenses and are as follows: Class A — 1.52%, Class 1 — 1.04%.
The returns reflect past results and should not be considered indicative of future performance. The return and principal value of an investment will fluctuate so that shares, when redeemed, may be worth more or less than their original cost. Due to market volatility, the Portfolio’s current performance may be higher or lower than the performance shown. For performance data current to the most recent month end, please call 1-800-225-5291 or visit the Portfolio’s Web site at www.jhfunds.com.
The performance table above and the chart on the next page do not reflect the deduction of taxes that a shareholder may pay on Portfolio distributions or the redemption of Portfolio shares.
The Portfolio’s performance results reflect any applicable expense reductions, without which the expenses would increase and results would have been less favorable.
Since inception performance is calculated with an opening price (prior day’s close) on inception date.
1 For certain types of investors, as described in the Portfolio’s Class R, Class R1, Class R2, Class R3, Class R4, Class R5 and Class 1 share prospectuses.
2 Index as of closest month end to inception date.
| |
| Annual report | Lifestyle Portfolios | 5 |
John Hancock
Lifestyle Growth Portfolio
Goal and strategy
The Portfolio seeks long-term growth of capital. Current income is also a consideration. To pursue this goal, the Portfolio, which is a fund of funds, normally invests approximately 80% of its assets in underlying funds that invest primarily in equity securities and approximately 20% of its assets in underlying funds that invest primarily in fixed-income securities.
Asset Allocation
| | | |
| Equity | % of Total | | |
| | |
| U.S. Large Cap | 44% | | |
| | |
| U.S. Mid Cap | 5% | | |
| | |
| U.S. Small Cap | 4% | | |
| | |
| International Large Cap | 11% | | |
| | |
| International Small Cap | 3% | | |
| | |
| Real Estate | 3% | | |
| | |
| Emerging Markets | 3% | | |
| | |
| Large Blend | 2% | | |
| | |
| Natural Resources | 1% | | |
| | |
| Small Growth | 1% | | |
| | |
| | | | |
| Fixed Income | % of Total | | |
| | |
| High Yield Bond | 6% | | |
| | |
| Multi-Sector Bond | 5% | | |
| | |
| Intermediate Bond | 5% | | |
| | |
| Treasury Inflation- | | | |
| Protected Securities | 3% | | |
| | |
| Bank Loan | 3% | | |
| | |
| Global Bond | 1% | | |
| | |
As a percentage of net assets on December 31, 2008.
Portfolio results
For the 12 months ended December 31, 2008, John Hancock Lifestyle Growth Portfolio’s Class A, Class B, Class C, Class R, Class R1, Class R2, Class R3, Class R4, Class R5, Class 1 and Class 5 shares returned –36.89%, –37.35%, –37.33%, –37.26%, –37.05%, –36.80%, –37.06%, –36.87%, –36.64%, –36.63% and –36.57%, respectively, at net asset value. In comparison, the Portfolio’s benchmark index — a blended index combining 80% S&P 500 Index and 20% Barclays Capital (formerly Lehman Brothers) U.S. Aggregate Bond Index — returned –29.83% during the same period.
Performance review
Asset allocation had a negative impact on the Portfolio during the year, as the benefit of exposure to U.S. small caps was more than offset by an allocation to domestic mid caps, as well as by exposure to foreign equities. Within fixed income, allocations to high-yield bonds, bank loans and Treasury Inflation-Protected Securities (TIPS) detracted, while exposure to global bonds benefited the Portfolio. A large impact versus the broad benchmark also came from the challenging performance of some of our individual managers.
Core Equity (Legg Mason) was a significant detractor. The fund’s exposure to beaten-down stocks in the financials and consumer discretionary sectors contributed to its underperformance. After considerable deliberation, we removed Core Equity from the Portfolio and replaced it with Alpha Opportunities (Wellington), a unique fund combining traditional growth, value and more eclectic styles in an attempt to deliver consistent outperformance over time. We also made some adjustments to our small-cap growth lineup, eliminating Small Cap (Independence) and adding positions in Small Cap Growth (Wellington) and Smaller Company Growth (Frontier/ MFC Global U.S.A./Peri meter).
Other detractors included Blue Chip Growth (T. Rowe Price), which had a disappointing showing due to an overweighting in financials and an underweighting in consumer staples. Conversely, performance was aided by U.S. Multi Sector (GMO), which benefited from its overall quality bias and from underweighting financials and overweighting consumer staples.
This commentary reflects the views of the portfolio managers through the end of the Portfolio’s period discussed in this report. The managers’ statements reflect their own opinions. As such, they are in no way guarantees of future events and are not intended to be used as investment advice or a recommendation regarding any specific security. They are also subject to change at any time as market and other conditions warrant.
Past performance is no guarantee of future results.
SCORECARD
| | |
| INVESTMENT | | PERIOD’S PERFORMANCE ... AND WHAT’S BEHIND THE NUMBERS |
| |
| U.S. Multi Sector | ▲ | Underweighting in financials |
| (GMO) | | |
| |
| Core Equity | ▼ | Large stake in hard-hit financials |
| (Legg Mason) | | |
| |
| Blue Chip Growth | ▼ | Overweighting in financials |
| (T. Rowe Price) | | |
| |
| 6 | Lifestyle Portfolios | Annual report |
Growth of $10,000
This chart shows what happened to a hypothetical $10,000 investment in Class A shares for the period indicated. For comparison, we’ve shown the same investment in a blended Index.

| | | | | | | | | | |
| | Class B | Class C | Class R1 | Class R11 | Class R21 | Class R31 | Class R41 | Class R51 | Class 11 | Class 51 |
|
| Period beginning | 10-18-05 | 10-18-05 | 9-18-06 | 9-18-06 | 9-18-06 | 10-18-05 | 10-18-05 | 10-18-05 | 10-15-05 | 7-3-06 |
|
| Without sales charge | 7,851 | 7,856 | 7,191 | 7,241 | 7,283 | 7,977 | 8,043 | 8,124 | 8,144 | 7,488 |
|
| With maximum sales charge | 7,654 | 7,856 | 7,191 | 7,241 | 7,283 | 7,977 | 8,043 | 8,124 | 8,144 | 7,488 |
|
| Index 2,3 | 8,708 | 8,708 | 7,844 | 7,844 | 7,844 | 8,708 | 8,708 | 8,708 | 8,579 | 8,259 |
|
Performance chart
Cumulative total returns with maximum sales charge (POP) for the period ended December 31, 2008
| | | | | | | | | | | |
| | Class A | Class B | Class C | Class R1 | Class R11 | Class R21 | Class R31 | Class R41 | Class R51 | Class 11 | Class 51 |
|
| Inception | 10-18-05 | 10-18-05 | 10-18-05 | 9-18-06 | 9-18-06 | 9-18-06 | 10-18-05 | 10-18-05 | 10-18-05 | 10-15-05 | 7-3-06 |
|
| Average annual returns — 1 year | –40.04% | –40.27% | –37.91% | –37.26% | –37.05% | –36.80% | –37.06% | –36.87% | –36.64% | –36.63% | –36.57% |
|
| Average annual returns — Since inception | –8.09% | –8.00% | –7.25% | –13.40% | –13.13% | –12.91% | –6.81% | –6.57% | –6.28% | –6.19% | –10.91% |
|
| Cumulative total returns — 1 year | –40.04% | –40.27% | –37.91% | –37.26% | –37.05% | –36.80% | –37.06% | –36.87% | –36.64% | –36.63% | –36.57% |
|
| Cumulative total returns — Since inception | –23.68% | –23.46% | –21.44% | –28.10% | –27.59% | –27.17% | –20.23% | –19.57% | –18.76% | –18.56% | –25.12% |
|
Performance figures assume all distributions are reinvested. Returns with maximum sales charge reflect a sales charge on Class A shares of 5%, and the applicable contingent deferred sales charge (CDSC) on Class B and Class C shares. The Class B shares’ CDSC declines annually between years 1–6 according to the following schedule: 5, 4, 3, 3, 2, 1%. No sales charge will be assessed after the sixth year. Class C shares held for less than one year are subject to a 1% CDSC. Sales charge is not applicable for Class R, Class R1, Class R2, Class R3, Class R4, Class R5, Class 1 and Class 5 shares.
The expense ratios of the Portfolio, both net (including any fee waivers or expense limitations) and gross (excluding any fee waivers or expense limitations), are set forth according to the most recent publicly available prospectuses for the Portfolio and may differ from the expense ratios disclosed in the Financial Highlights tables in this report. The waivers and expense limitations are contractual at least until May 1, 2009. The following expense ratios include expenses of the underlying affiliated funds in which the Portfolio invests. The net expenses are as follows: Class A — 1.41%, Class B — 2.17%, Class R — 1.94%, Class R1 — 1.61%, Class R2 — 1.50%, Class R3 — 1.68%, Class R4 — 1.41%, Class R5 — 1.09%. Had the fee waivers and expense limitations not been in place, the gross expenses would be as follows: Class A — 1.42%, Class B — 2.18%, Class R — 6.15%, Class R1 — 3.30%, Class R2 — 4.06%, Cla ss R3 — 1.86%, Class R4 — 1.52%, Class R5 — 1.42%. For the other classes, the net expenses equal the gross expenses and are as follows: Class C — 2.13%, Class 1 — 0.99%, Class 5 — 0.94%.
The returns reflect past results and should not be considered indicative of future performance. The return and principal value of an investment will fluctuate so that shares, when redeemed, may be worth more or less than their original cost. Due to market volatility, the Portfolio’s current performance may be higher or lower than the performance shown. For performance data current to the most recent month end, please call 1-800-225-5291 or visit the Portfolio’s Web site at www.jhfunds.com.
The performance table above and the chart on the next page do not reflect the deduction of taxes that a shareholder may pay on Portfolio distributions or the redemption of Portfolio shares.
The Portfolio’s performance results reflect any applicable expense reductions, without which the expenses would increase and results would have been less favorable.
Since inception performance is calculated with an opening (prior day’s close) on the inception date.
1 For certain types of investors, as described in the Portfolio’s Class R, Class R1, Class R2, Class R3, Class R4, Class R5, Class 1 and Class 5 share prospectuses.
2 Index as of closest month end to inception date.
3 The blended index is comprised of 80% of the Standard & Poor’s 500 Index and 20% of the Barclays Capital U.S. Aggregate Bond Index (previously known as Lehman Brothers Aggregate Bond Index).
| |
| Annual report | Lifestyle Portfolios | 7 |
John Hancock
Lifestyle Balanced Portfolio
Goal and strategy
The Portfolio seeks a balance between a high level of current income and growth of capital, with greater emphasis on growth of capital. To pursue this goal, the Portfolio, which is a fund of funds, normally invests approximately 60% of its assets in underlying funds that invest primarily in equity securities and approximately 40% of its assets in underlying funds that invest primarily in fixed-income securities.
Asset Allocation
| | | |
| Equity | % of Total | | |
| | |
| U.S. Large Cap | 35% | | |
| | |
| U.S. Small Cap | 3% | | |
| | |
| U.S. Mid Cap | 2% | | |
| | |
| International Large Cap | 7% | | |
| | |
| International Small Cap | 2% | | |
| | |
| Real Estate | 3% | | |
| | |
| Emerging Markets | 3% | | |
| | |
| Large Blend | 2% | | |
| | |
| Natural Resources | 1% | | |
| | |
| | | | |
| Fixed Income | % of Total | | |
| | |
| High Yield Bond | 13% | | |
| | |
| Intermediate Bond | 11% | | |
| | |
| Multi-Sector Bond | 10% | | |
| | |
| Treasury Inflation- | | | |
| Protected Securities | 4% | | |
| | |
| Bank Loan | 2% | | |
| | |
| Global Bond | 2% | | |
| | |
As a percentage of net assets on December 31, 2008.
Portfolio results
For the 12 months ended December 31, 2008, John Hancock Lifestyle Balanced Portfolio’s Class A, Class B, Class C, Class R, Class R1, Class R2, Class R3, Class R4, Class R5, Class 1 and Class 5 shares returned –31.63%, –32.22%, –32.19%, –32.09%, –32.01%, –31.68%, –31.89%, –31.68%, –31.40%, –31.37% and –31.38%, respectively, at net asset value. In comparison, the Portfolio’s benchmark index — a blended index combining 60% S&P 500 Index and 40% Barclays Capital (formerly Lehman Brothers) U.S. Aggregate Bond Index — returned –22.06% during the same period.
Performance review
Asset allocation had a negative impact on the Portfolio during the year, as the benefit of exposure to U.S. small caps was more than offset by an allocation to domestic mid caps, as well as by exposure to foreign equities. Within fixed income, allocations to high-yield bonds, bank loans and Treasury Inflation-Protected Securities (TIPS) detracted, while exposure to global bonds benefited the Portfolio. A large impact versus the broad benchmark also came from the challenging performance of some of our individual managers.
Core Equity (Legg Mason) was a significant detractor. The fund’s exposure to beaten-down stocks in the financials and consumer discretionary sectors contributed to its underperformance. After considerable deliberation, we removed Core Equity from the Portfolio and replaced it with Alpha Opportunities (Wellington), a unique fund combining traditional growth, value and more eclectic styles in an attempt to deliver consistent outperformance over time.
Other detractors included Blue Chip Growth (T. Rowe Price), which had a disappointing showing due to an overweighting in financials and an underweighting in consumer staples. High Income (MFC Global U.S.A.), a high-yield bond fund, underperformed because of overweightings in airlines and gaming. Conversely, performance was aided by U.S. Multi Sector (GMO), which benefited from its overall quality bias and from underweighting in financials and overweighting in consumer staples.
This commentary reflects the views of the portfolio managers through the end of the Portfolio’s period discussed in this report. The managers’ statements reflect their own opinions. As such, they are in no way guarantees of future events and are not intended to be used as investment advice or a recommendation regarding any specific security. They are also subject to change at any time as market and other conditions warrant.
Past performance is no guarantee of future results.
SCORECARD
| | |
| INVESTMENT | | PERIOD’S PERFORMANCE ... AND WHAT’S BEHIND THE NUMBERS |
| |
| U.S. Multi Sector | ▲ | Underweighting in financials |
| (GMO) | | |
| |
| Core Equity | ▼ | Large stake in hard-hit financials |
| (Legg Mason) | | |
| |
| Blue Chip Growth | ▼ | Overweighting in financials |
| (T. Rowe Price) | | |
| |
| 8 | Lifestyle Portfolios | Annual report |
Growth of $10,000
This chart shows what happened to a hypothetical $10,000 investment in Class A shares for the period indicated. For comparison, we’ve shown the same investment in a blended index.

| | | | | | | | | | |
| | Class B | Class C | Class R1 | Class R11 | Class R21 | Class R31 | Class R41 | Class R51 | Class 11 | Class 51 |
|
| Period beginning | 10-18-05 | 10-18-05 | 9-18-06 | 9-18-06 | 9-18-06 | 10-18-05 | 10-18-05 | 10-18-05 | 10-15-05 | 7-3-06 |
|
| Without sales charge | 8,258 | 8,280 | 7,638 | 7,670 | 7,726 | 8,404 | 8,476 | 8,558 | 8,578 | 8,014 |
|
| With maximum sales charge | 8,051 | 8,280 | 7,638 | 7,670 | 7,726 | 8,404 | 8,476 | 8,558 | 8,578 | 8,014 |
|
| Index2,3 | 9,462 | 9,462 | 8,651 | 8,651 | 8,651 | 9,462 | 9,462 | 9,462 | 9,338 | 9,077 |
|
Performance chart
Cumulative total returns with maximum sales charge (POP) for the period ended December 31, 2008
| | | | | | | | | | | |
| | Class A | Class B | Class C | Class R1 | Class R11 | Class R21 | Class R31 | Class R41 | Class R51 | Class 11 | Class 51 |
|
| Inception | 10-18-05 | 10-18-05 | 10-18-05 | 9-18-06 | 9-18-06 | 9-18-06 | 10-18-05 | 10-18-05 | 10-18-05 | 10-15-05 | 7-3-06 |
|
| Average annual returns — 1 year | –35.07% | –35.39% | –32.82% | –32.09% | –32.01% | –31.68% | –31.89% | –31.68% | –31.40% | –31.37% | –31.38% |
|
| Average annual returns — Since inception | –6.55% | –6.54% | –5.72% | –11.09% | –10.92% | –10.64% | –5.28% | –5.03% | –4.74% | –4.66% | –8.46% |
|
| Cumulative total returns — 1 year | –35.07% | –35.39% | –32.82% | –32.09% | –32.01% | –31.68% | –31.89% | –31.68% | –31.40% | –31.37% | –31.38% |
|
| Cumulative total returns — Since inception | –19.51% | –19.49% | –17.20% | –23.62% | –23.30% | –22.74% | –15.96% | –15.24% | –14.42% | –14.22% | –19.86% |
|
Performance figures assume all distributions are reinvested. Returns with maximum sales charge reflect a sales charge on Class A shares of 5% and the applicable contingent deferred sales charge (CDSC) on Class B and Class C shares. The returns for Class C shares have been adjusted to reflect the elimination of the front-end sales charge effective July 15, 2004. The Class B shares’ CDSC declines annually between years 1–6 according to the following schedule: 5, 4, 3, 3, 2, 1%. No sales charge will be assessed after the sixth year. Class C shares held for less than one year are subject to a 1% CDSC. Sales charge is not applicable for Class R, Class R1, Class R2, Class R3, Class R4, Class R5, Class 1 and Class 5 shares.
The expense ratios of the Portfolio, both net (including any fee waivers or expense limitations) and gross (excluding any fee waivers or expense limitations), are set forth according to the most recent publicly available prospectuses for the Portfolio and may differ from the expense ratios disclosed in the Financial Highlights tables in this report. The waivers and expense limitations are contractual at least until May 1, 2009. The following expense ratios include expenses of the underlying affiliated funds in which the Portfolio invests. The net expenses are as follows: Class A — 1.36%, Class C — 2.07%, Class R — 1.93%, Class R1 — 1.64%, Class R2 — 1.42%, Class R3 — 1.62%, Class R4 — 1.37%, Class R5 — 1.07%. Had the fee waivers and expense limitations not been in place, the gross expenses would be as follows: Class A — 1.37%, Class C — 2.08%, Class R — 5.35%, Class R1 — 8.21%, Class R2 — 3.70%, Cla ss R3 — 1.71%, Class R4 — 1.44%, Class R5 — 1.29%. For the other classes, the net expenses equal the gross expenses and are as follows: Class B — 2.16%, Class 1 — 0.97%, Class 5 — 0.92%.
The returns reflect past results and should not be considered indicative of future performance. The return and principal value of an investment will fluctuate so that shares, when redeemed, may be worth more or less than their original cost. Due to market volatility, the Portfolio’s current performance may be higher or lower than the performance shown. For performance data current to the most recent month end, please call 1-800-225-5291 or visit the Portfolio’s Web site at www.jhfunds.com.
The performance table above and the chart on the next page do not reflect the deduction of taxes that a shareholder may pay on Portfolio distributions or the redemption of Portfolio shares.
The Portfolio’s performance results reflect any applicable expense reductions, without which the expenses would increase and results would have been less favorable.
Since inception performance is calculated with an opening price (prior day’s close) on the inception date.
1 For certain types of investors, as described in the Portfolio’s Class R, Class R1, Class R2, Class R3, Class R4, Class R5, Class 1 and Class 5 share prospectuses.
2 Index as of closest month end to inception date.
3 The blended index is comprised of 60% of the Standard & Poor’s 500 Index and 40% of the Barclays Capital U.S. Aggregate Bond Index (previously known as Lehman Brothers Aggregate Bond Index).
| |
| Annual report | Lifestyle Portfolios | 9 |
John Hancock
Lifestyle Moderate Portfolio
Goal and strategy
The Portfolio seeks a balance between a high level of current income and growth of capital, with a greater emphasis on income. To pursue this goal, the Portfolio, which is a fund of funds, normally invests approximately 60% of its assets in underlying funds that invest primarily in fixed-income securities and approximately 40% of its assets in underlying funds that invest primarily in equity securities.
Asset Allocation
| | | |
| Equity | % of Total | | |
| | |
| U.S. Large Cap | 22% | | |
| | |
| U.S. Small Cap | 3% | | |
| | |
| U.S. Mid Cap | 2% | | |
| | |
| International Large Cap | 10% | | |
| | |
| Real Estate | 3% | | |
| | |
| | | | |
| Fixed Income | % of Total | | |
| | |
| Intermediate Bond | 24% | | |
| | |
| Multi-Sector Bond | 14% | | |
| | |
| High Yield Bond | 11% | | |
| | |
| Global Bond | 4% | | |
| | |
| Treasury Inflation- | | | |
| Protected Securities | 4% | | |
| | |
| Bank Loan | 3% | | |
| | |
As a percentage of net assets on December 31, 2008.
Portfolio results
For the 12 months ended December 31, 2008, John Hancock Lifestyle Moderate Portfolio’s Class A, Class B, Class C, Class R, Class R1, Class R2, Class R3, Class R4, Class R5, Class 1 and Class 5 shares returned –23.88%, –24.56%, –24.44%, –24.54%, –24.21%, –23.96%, –24.22%, –23.94%, –23.67%, –23.63% and –23.59%, respectively, at net asset value. In comparison, the Portfolio’s benchmark index — a blended index combining 40% S&P 500 Index and 60% Barclays Capital (formerly Lehman Brothers) U.S. Aggregate Bond Index — returned –13.65% during the same period.
Performance review
Asset allocation had a negative impact on the Portfolio during the year, particularly within fixed income, where allocations to high-yield bonds, bank loans and Treasury Inflation-Protected Securities (TIPS) detracted, while exposure to global bonds benefited the Portfolio. Within equities, the benefit of an allocation to U.S. small caps was more than offset by an allocation to domestic mid caps, as well as by exposure to foreign equities. A large impact versus the broad benchmark also came from the challenging performance of some of our individual managers.
Core Equity (Legg Mason) was a significant detractor. The fund’s exposure to beaten-down stocks in the financials and consumer discretionary sectors contributed to its underperformance. After considerable deliberation, we removed Core Equity from the Portfolio and replaced it with Index 500 (MFC Global U.S.A.).
Other detractors included Active Bond (MFC Global U.S.A./Declaration), which lagged in part due to its exposure to high-yield securities. High Income (MFC Global U.S.), a high-yield bond fund, underperformed because of overweightings in airlines and gaming. Conversely, performance was aided by U.S. Multi Sector (GMO), which benefited from its overall quality bias and from underweighting financials and consumer staples.
This commentary reflects the views of the portfolio managers through the end of the Portfolio’s period discussed in this report. The managers’ statements reflect their own opinions. As such, they are in no way guarantees of future events and are not intended to be used as investment advice or a recommendation regarding any specific security. They are also subject to change at any time as market and other conditions warrant.
Past performance is no guarantee of future results.
SCORECARD
| | |
| INVESTMENT | | PERIOD’S PERFORMANCE ... AND WHAT’S BEHIND THE NUMBERS |
| |
| U.S. Multi Sector | ▲ | Underweighting in financials |
| (GMO) | | |
| |
| Core Equity | ▼ | Large stake in hard-hit financials |
| (Legg Mason) | | |
| |
| Active Bond | ▼ | High-yield exposure |
| (Declaration/MFC | | |
| Global USA) | | |
| |
| 10 | Lifestyle Portfolios | Annual report |
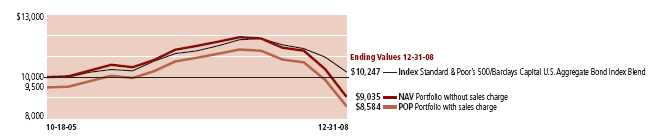
Growth of $10,000
This chart shows what happened to a hypothetical $10,000 investment in Class A shares for the period indicated. For comparison, we’ve shown the same investment in a blended index.
| | | | | | | | | | |
| | Class B | Class C | Class R1 | Class R11 | Class R21 | Class R31 | Class R41 | Class R51 | Class 11 | Class 51 |
|
| Period beginning | 10-18-05 | 10-18-05 | 9-18-06 | 9-18-06 | 9-18-06 | 10-18-05 | 10-18-05 | 10-18-05 | 10-15-05 | 7-3-06 |
|
| Without sales charge | 8,805 | 8,832 | 8,292 | 8,361 | 8,413 | 8,972 | 9,041 | 9,131 | 9,148 | 8,724 |
|
| With maximum sales charge | 8,583 | 8,832 | 8,292 | 8,361 | 8,413 | 8,972 | 9,041 | 9,131 | 9,148 | 8,724 |
|
| Index2,3 | 10,247 | 10,247 | 9,511 | 9,511 | 9,511 | 10,247 | 10,247 | 10,247 | 10,130 | 9,944 |
|
Performance chart
Cumulative total returns with maximum sales charge (POP) for the period ended December 31, 2008
| | | | | | | | | | | |
| | Class A | Class B | Class C | Class R1 | Class R11 | Class R21 | Class R31 | Class R41 | Class R51 | Class 11 | Class 51 |
|
| Inception | 10-18-05 | 10-18-05 | 10-18-05 | 9-18-06 | 9-18-06 | 9-18-06 | 10-18-05 | 10-18-05 | 10-18-05 | 10-15-05 | 7-3-06 |
|
| Average annual returns — 1 year | –27.66% | –28.09% | –25.15% | –24.54% | –24.21% | –23.96% | –24.22% | –23.94% | –23.67% | –23.63% | –23.59% |
|
| Average annual returns — Since inception | –4.65% | –4.65% | –3.80% | –7.84% | –7.51% | –7.26% | –3.33% | –3.10% | –2.80% | –2.73% | –5.30% |
|
| Cumulative total returns — 1 year | –27.66% | –28.09% | –25.15% | –24.54% | –24.21% | –23.96% | –24.22% | –23.94% | –23.67% | –23.63% | –23.59% |
|
| Cumulative total returns — Since inception | –14.16% | –14.17% | –11.68% | –17.08% | –16.39% | –15.87% | –10.28% | –9.59% | –8.69% | –8.52% | –12.76% |
|
Performance figures assume all distributions are reinvested. Returns with maximum sales charge reflect a sales charge on Class A shares of 5%, and the applicable contingent deferred sales charge (CDSC) on Class B and Class C shares. The Class B shares’ CDSC declines annually between years 1–6 according to the following schedule: 5, 4, 3, 3, 2, 1%. No sales charge will be assessed after the sixth year. Class C shares held for less than one year are subject to a 1% CDSC. Sales charge is not applicable for Class R, Class R1, Class R2, Class R3, Class R4, Class R5, Class 1 and Class 5 shares.
The expense ratios of the Portfolio, both net (including any fee waivers or expense limitations) and gross (excluding any fee waivers or expense limitations), are set forth according to the most recent publicly available prospectuses for the Portfolio and may differ from the expense ratios disclosed in the Financial Highlights tables in this report. The waivers and expense limitations are contractual at least until May 1, 2009. The following expense ratios include expenses of the underlying affiliated funds in which the Portfolio invests. The net expenses are as follows: Class B — 2.18%, Class R — 1.89%, Class R1 — 1.54%, Class R2 — 1.28%, Class R3 — 1.66%, Class R4 — 1.37%, Class R5 — 1.04%. Had the fee waivers and expense limitations not been in place, the gross expenses would be as follows: Class B — 2.26%, Class R — 7.15%, Class R1 — 4.93%, Class R2 — 19.95%, Class R3 — 2.34%, Class R4 — 1.96%, Class R5 — 1.80%. For the other classes, the net expenses equal the gross expenses and are as follows: Class A – 1.36%, Class C — 2.07%, Class 1 — 0.94%, Class 5 — 0.89%.
The returns reflect past results and should not be considered indicative of future performance. The return and principal value of an investment will fluctuate so that shares, when redeemed, may be worth more or less than their original cost. Due to market volatility, the Portfolio’s current performance may be higher or lower than the performance shown. For performance data current to the most recent month end, please call 1-800-225-5291 or visit the Portfolio’s Web site at www.jhfunds.com.
The performance table above and the chart on the next page do not reflect the deduction of taxes that a shareholder may pay on Portfolio distributions or the redemption of Portfolio shares.
The Portfolio’s performance results reflect any applicable expense reductions, without which the expenses would increase and results would have been less favorable.
Since inception performance is calculated with an opening price (prior day’s close) on the inception date.
1 For certain types of investors, as described in the Portfolio’s Class R, Class R1, Class R2, Class R3, Class R4, Class R5, Class 1 and Class 5 share prospectuses.
2 Index as of closest month end to inception date.
3 The blended index is comprised of 40% of the Standard & Poor’s 500 Index and 60% of the Barclays Capital U.S. Aggregate Bond Index (previously known as Lehman Brothers Aggregate Bond Index).
| |
| Annual report | Lifestyle Portfolios | 11 |
John Hancock
Lifestyle Conservative Portfolio
Goal and strategy
The Portfolio seeks a high level of current income, with some consideration given to growth of capital. To pursue this goal, the Portfolio, which is a fund of funds, normally invests approximately 80% of its assets in underlying funds that invest primarily in fixed-income securities and approximately 20% of its assets in underlying funds that invest primarily in equity securities.
Asset Allocation
| | | |
| Equity | % of Total | | |
| | |
| U.S. Large Cap | 12% | | |
| | |
| Real Estate | 4% | | |
| | |
| International Large Cap | 3% | | |
| | |
| | | | |
| Fixed Income | % of Total | | |
| | |
| Intermediate Bond | 35% | | |
| | |
| Multi-Sector Bond | 17% | | |
| | |
| High Yield Bond | 9% | | |
| | |
| Short-Term Bond | 7% | | |
| | |
| Global Bond | 6% | | |
| | |
| Bank Loan | 4% | | |
| | |
| Treasury Inflation- | | | |
| Protected Securities | 3% | | |
| | |
As a percentage of net assets on December 31, 2008.
Portfolio results
For the 12 months ended December 31, 2008, John Hancock Lifestyle Conservative Portfolio’s Class A, Class B, Class C, Class R, Class R1, Class R2, Class R3, Class R4, Class R5 and Class 1 shares returned –15.41%, –16.04%, –16.03%, –15.88%, –15.62%, –15.39%, –15.62%, –15.38%, –15.10% and –15.02%, respectively, at net asset value. In comparison, the Portfolio’s benchmark index — a blended index combining 20% S&P 500 Index and 80% Barclays Capital (formerly Lehman Brothers) U.S. Aggregate Bond Index — returned –4.56% during the same period.
Performance review
Asset allocation had a negative impact on the Portfolio during the year as the benefit of exposure to global bonds and short-term Treasuries was more than offset by allocations to high-yield bonds, bank loans and Treasury Inflation-Protected Securities (TIPS). A large impact versus the broad benchmark also came from the challenging performance of some of our individual managers.
One of the largest detractors was Active Bond (MFC Global U.S.A./Declaration), which lagged in part due to its exposure to high-yield securities. Another under-performer was High Income (MFC Global U.S.). In that case, overweightings in airlines and gaming hurt the fund’s return. Other underperformaners included High Yield (WAMCO) and Global Bond (PIMCO), which lagged its benchmark due to an overweighting in corporate bonds, primarily in the financial sector. Conversely, a small position in International Core (GMO), benefited from an overweighting in the relatively strong health care sector.
This commentary reflects the views of the portfolio managers through the end of the Portfolio’s period discussed in this report. The managers’ statements reflect their own opinions. As such, they are in no way guarantees of future events and are not intended to be used as investment advice or a recommendation regarding any specific security. They are also subject to change at any time as market and other conditions warrant.
Past performance is no guarantee of future results.
SCORECARD
| | |
| INVESTMENT | | PERIOD’S PERFORMANCE ... AND WHAT’S BEHIND THE NUMBERS |
| |
| International Core | ▲ | Overweighting in health care |
| (GMO) | | |
| |
| Active Bond | ▼ | High-yield exposure |
| (Declaration/MFC | | |
| Global USA) | | |
| |
| High Income | ▼ | Overweightings in airlines and gaming |
| (MFC Global USA) | | |
| |
| 12 | Lifestyle Portfolios | Annual report |
Growth of $10,000
This chart shows what happened to a hypothetical $10,000 investment in Class A shares for the period indicated. For comparison, we’ve shown the same investment in a blended index.

| | | | | | | | | |
| | Class B | Class C | Class R1 | Class R11 | Class R21 | Class R31 | Class R41 | Class R51 | Class 11 |
|
| Period beginning | 10-18-05 | 10-18-05 | 9-18-06 | 9-18-06 | 9-18-06 | 10-18-05 | 10-18-05 | 10-18-05 | 10-15-05 |
|
| Without sales charge | 9,522 | 9,527 | 9,123 | 9,187 | 9,232 | 9,701 | 9,766 | 9,865 | 9,887 |
|
| With maximum sales charge | 9,285 | 9,527 | 9,123 | 9,187 | 9,232 | 9,701 | 9,766 | 9,865 | 9,887 |
|
| Index2,3 | 11,064 | 11,064 | 10,426 | 10,426 | 10,426 | 11,064 | 11,064 | 11,064 | 10,957 |
|
Performance chart
Cumulative total returns with maximum sales charge (POP) for the period ended December 31, 2008
| | | | | | | | | | |
| | Class A | Class B | Class C | Class R1 | Class R11 | Class R21 | Class R31 | Class R41 | Class R51 | Class 11 |
|
| Inception | 10-18-05 | 10-18-05 | 10-18-05 | 9-18-06 | 9-18-06 | 9-18-06 | 10-18-05 | 10-18-05 | 10-18-05 | 10-15-05 |
|
| Average annual returns — 1 year | –19.63% | –19.95% | –16.81% | –15.88% | –15.62% | –15.39% | –15.62% | –15.38% | –15.10% | –15.02% |
|
| Average annual returns — Since inception | –2.36% | –2.29% | –1.50% | –3.92% | –3.63% | –3.43% | –0.94% | –0.74% | –0.42% | –0.35% |
|
| Cumulative total returns — 1 year | –19.63% | –19.95% | –16.81% | –15.88% | –15.62% | –15.39% | –15.62% | –15.38% | –15.10% | –15.02% |
|
| Cumulative total returns — Since inception | –7.37% | –7.15% | –4.73% | –8.77% | –8.13% | –7.68% | –2.99% | –2.34% | –1.35% | –1.13% |
|
Performance figures assume all distributions are reinvested. Returns with maximum sales charge reflect a sales charge on Class A shares of 5%, and the applicable contingent deferred sales charge (CDSC) on Class B and Class C shares. The Class B shares’ CDSC declines annually between years 1–6 according to the following schedule: 5, 4, 3, 3, 2, 1%. No sales charge will be assessed after the sixth year. Class C shares held for less than one year are subject to a 1% CDSC. Sales charge is not applicable for Class R, Class R1, Class R2, Class R3, Class R4, Class R5 and Class 1 shares.
The expense ratios of the Portfolio, both net (including any fee waivers or expense limitations) and gross (excluding any fee waivers or expense limitations), are set forth according to the most recent publicly available prospectuses for the Portfolio and may differ from the expense ratios disclosed in the Financial Highlights tables in this report. The waivers and expense limitations are contractual at least until May 1, 2009. The following expense ratios include expenses of the underlying affiliated funds in which the Portfolio invests. The net expenses are as follows: Class A — 1.34%, Class B — 2.12%, Class R — 1.81%, Class R1 — 1.51%, Class R2 — 1.33%, Class R3 — 1.61%, Class R4 — 1.33%, Class R5 — 1.02%. Had the fee waivers and expense limitations not been in place, the gross expenses would be as follows: Class A — 1.35%, Class B — 2.34%, Class R — 14.64%, Class R1 — 10.49%, Class R2 — 8.39%, C lass R3 — 2.69%, Class R4 — 2.26%, Class R5 — 4.22%. For the other classes, the net expenses equal the gross expenses and are as follows: Class C — 2.08%, Class 1 — 0.91%.
The returns reflect past results and should not be considered indicative of future performance. The return and principal value of an investment will fluctuate so that shares, when redeemed, may be worth more or less than their original cost. Due to market volatility, the Portfolio’s current performance may be higher or lower than the performance shown. For performance data current to the most recent month end, please call 1-800-225-5291 or visit the Portfolio’s Web site at www.jhfunds.com.
The performance table above and the chart on the next page do not reflect the deduction of taxes that a shareholder may pay on Portfolio distributions or the redemption of Portfolio shares.
The Portfolio’s performance results reflect any applicable expense reductions, without which the expenses would increase and results would have been less favorable.
Since inception performance is calculated with an opening price (prior day’s close) on the inception date.
1 For certain types of investors, as described in the Portfolio’s Class R, Class R1, Class R2, Class R3, Class R4, Class R5 and Class 1 share prospectuses.
2 Index as of closest month end to inception date.
3 The blended index is comprised of 20% of the Standard & Poor’s 500 Index and 80% of the Barclays Capital U.S. Aggregate Bond Index (previously known as Lehman Brothers Aggregate Bond Index).
| |
| Annual report | Lifestyle Portfolios | 13 |
Your expenses
As a shareholder of John Hancock Funds II Lifestyle Portfolios, you incur two types of costs: (1) transaction costs, including sales charges (loads) on certain purchases, redemption fees, and exchange fees, and (2) ongoing costs, including management fees, distribution and service (12b-1) fees and other Portfolio expenses. In addition to the operating expenses which the Portfolio bears directly, the Portfolio indirectly bears a pro rata share of the operating expenses of the affiliated underlying funds in which the Portfolio invests. Because the affiliated underlying funds have varied operating expenses and transaction costs and the Portfolio may own different proportions of the underlying funds at different times, the amount of expenses incurred indirectly by the Portfolios will vary. Had these indirect expenses been reflected in the following analysis, total expenses would have been higher than the amounts shown.
This example is intended to help you understand your ongoing costs (in dollars) of investing in the Portfolios so you can compare these costs with the ongoing costs of investing in other mutual funds. The example is based on an investment of $1,000 at the beginning of the period and held for the entire period (July 1, 2008 through December 31, 2008).
Actual expenses:
The first line of each share class in the table below and on the following pages provides information about actual account values and actual expenses. You may use the information in this line, together with the amount you invested, to estimate the expenses that you paid over the period. Simply divide your account value by $1,000 (for example, an $8,600 account value divided by $1,000 = 8.6), then multiply the result by the number in the first line under the heading entitled “Expenses paid during period” to estimate the expenses you paid on your account during this period.
Hypothetical example for comparison purposes:
The second line of each share class in the table below and on the following pages provides information about hypothetical account values and hypothetical expenses based on the actual expense ratio for the share class and an assumed annualized rate of return of 5% per year before expenses, which is not the actual return of the share class. The hypothetical account values and expenses may not be used to estimate the actual ending account balance or expenses you paid for the period. You may use this information to compare the ongoing costs of investing in the Portfolios and other funds. To do so, compare this 5% hypothetical example with the 5% hypothetical examples that appear in the shareholder reports of the other funds.
Please note that the expenses shown in the table are meant to highlight your ongoing costs only and do not reflect any transactional costs and insurance-related charges. Therefore, the second line of each share class in the table is useful in comparing ongoing costs only, and will not help you determine the relative total costs of owning different funds. In addition, if these transactional costs were included, your costs would have been higher.
| |
| 14 | Lifestyle Portfolios | Annual report |
Shareholder expense example chart
| | | | | |
| | | Beginning | Ending | Expenses Paid | |
| | | Account Value | Account Value | During Period1 | Annualized |
| | | 7-1-08 | 12-31-08 | 7-1-08–12-31-08 | Expense Ratio2,3 |
| Lifestyle Aggressive | | | | |
|
| Class A | Actual | $1,000.00 | $644.60 | $2.69 | 0.65% |
| | Hypothetical (5% annualized return before expenses) | 1,000.00 | $1,021.90 | $3.30 | 0.65% |
|
| Class B | Actual | 1,000.00 | $642.50 | $5.62 | 1.36% |
| | Hypothetical (5% annualized return before expenses) | 1,000.00 | $1,018.30 | $6.90 | 1.36% |
|
| Class C | Actual | 1,000.00 | $642.60 | $5.49 | 1.33% |
| | Hypothetical (5% annualized return before expenses) | 1,000.00 | $1,018.50 | $6.75 | 1.33% |
|
| Class R | Actual | 1,000.00 | $642.20 | $6.19 | 1.50% |
| | Hypothetical (5% annualized return before expenses) | 1,000.00 | $1,017.60 | $7.61 | 1.50% |
|
| Class R1 | Actual | 1,000.00 | $643.50 | $3.88 | 0.94% |
| | Hypothetical (5% annualized return before expenses) | 1,000.00 | $1,020.40 | $4.77 | 0.94% |
|
| Class R2 | Actual | 1,000.00 | $643.50 | $3.97 | 0.96% |
| | Hypothetical (5% annualized return before expenses) | 1,000.00 | $1,020.30 | $4.88 | 0.96% |
|
| Class R3 | Actual | 1,000.00 | $644.00 | $3.84 | 0.93% |
| | Hypothetical (5% annualized return before expenses) | 1,000.00 | $1,020.50 | $4.72 | 0.93% |
|
| Class R4 | Actual | 1,000.00 | $644.90 | $2.52 | 0.61% |
| | Hypothetical (5% annualized return before expenses) | 1,000.00 | $1,022.10 | $3.10 | 0.61% |
|
| Class R5 | Actual | 1,000.00 | $646.20 | $1.08 | 0.26% |
| | Hypothetical (5% annualized return before expenses) | 1,000.00 | $1,023.80 | $1.32 | 0.26% |
|
| Class 1 | Actual | 1,000.00 | $646.90 | $0.50 | 0.12% |
| | Hypothetical (5% annualized return before expenses) | 1,000.00 | $1,024.50 | $0.61 | 0.12% |
| |
| Lifestyle Growth | | | | |
|
| Class A | Actual | $1,000.00 | $693.30 | $2.64 | 0.62% |
| | Hypothetical (5% annualized return before expenses) | 1,000.00 | $1,022.00 | $3.15 | 0.62% |
|
| Class B | Actual | 1,000.00 | $691.20 | $5.70 | 1.34% |
| | Hypothetical (5% annualized return before expenses) | 1,000.00 | $1,018.40 | $6.80 | 1.34% |
|
| Class C | Actual | 1,000.00 | $691.00 | $5.70 | 1.34% |
| | Hypothetical (5% annualized return before expenses) | 1,000.00 | $1,018.40 | $6.80 | 1.34% |
|
| Class R | Actual | 1,000.00 | $691.40 | $5.31 | 1.25% |
| | Hypothetical (5% annualized return before expenses) | 1,000.00 | $1,025.10 | $6.36 | 1.25% |
|
| Class R1 | Actual | 1,000.00 | $692.80 | $3.87 | 0.91% |
| | Hypothetical (5% annualized return before expenses) | 1,000.00 | $1,020.60 | $4.62 | 0.91% |
|
| Class R2 | Actual | 1,000.00 | $694.20 | $1.96 | 0.46% |
| | Hypothetical (5% annualized return before expenses) | 1,000.00 | $1,022.80 | $2.34 | 0.46% |
|
| Class R3 | Actual | 1,000.00 | $692.50 | $3.74 | 0.88% |
| | Hypothetical (5% annualized return before expenses) | 1,000.00 | $1,020.70 | $4.47 | 0.88% |
|
| Class R4 | Actual | 1,000.00 | $693.60 | $2.64 | 0.62% |
| | Hypothetical (5% annualized return before expenses) | 1,000.00 | $1,022.00 | $3.15 | 0.62% |
|
| Class R5 | Actual | 1,000.00 | $695.10 | $1.15 | 0.27% |
| | Hypothetical (5% annualized return before expenses) | 1,000.00 | $1,023.80 | $1.37 | 0.27% |
|
| Class 1 | Actual | 1,000.00 | $694.80 | $0.51 | 0.12% |
| | Hypothetical (5% annualized return before expenses) | 1,000.00 | $1,024.50 | $0.61 | 0.12% |
|
| Class 5 | Actual | 1,000.00 | $695.10 | $0.30 | 0.07% |
| | Hypothetical (5% annualized return before expenses) | 1,000.00 | $1,024.80 | $0.36 | 0.07% |
|
| |
| Annual report | Lifestyle Portfolios | 15 |
Shareholder expense example chart, continued
| | | | | |
| | | Beginning | Ending | Expenses Paid | |
| | | Account Value | Account Value | During Period1 | Annualized |
| | | 7-1-08 | 12-31-08 | 7-1-08–12-31-08 | Expense Ratio2,3 |
| Lifestyle Balanced | | | | |
|
| Class A | Actual | $1,000.00 | $734.90 | $2.53 | 0.58% |
| | Hypothetical (5% annualized return before expenses) | 1,000.00 | $1,022.20 | $2.95 | 0.58% |
|
| Class B | Actual | 1,000.00 | $731.10 | $5.83 | 1.34% |
| | Hypothetical (5% annualized return before expenses) | 1,000.00 | $1,018.40 | $6.80 | 1.34% |
|
| Class C | Actual | 1,000.00 | $731.30 | $5.57 | 1.28% |
| | Hypothetical (5% annualized return before expenses) | 1,000.00 | $1,018.70 | $6.50 | 1.28% |
|
| Class R | Actual | 1,000.00 | $732.20 | $5.57 | 1.28% |
| | Hypothetical (5% annualized return before expenses) | 1,000.00 | $1,018.70 | $6.50 | 1.28% |
|
| Class R1 | Actual | 1,000.00 | $732.00 | $5.62 | 1.29% |
| | Hypothetical (5% annualized return before expenses) | 1,000.00 | $1,018.70 | $6.55 | 1.29% |
|
| Class R2 | Actual | 1,000.00 | $734.80 | $2.09 | 0.48% |
| | Hypothetical (5% annualized return before expenses) | 1,000.00 | $1,022.70 | $2.44 | 0.48% |
|
| Class R3 | Actual | 1,000.00 | $733.20 | $3.79 | 0.87% |
| | Hypothetical (5% annualized return before expenses) | 1,000.00 | $1,020.80 | $4.42 | 0.87% |
|
| Class R4 | Actual | 1,000.00 | $734.50 | $2.40 | 0.55% |
| | Hypothetical (5% annualized return before expenses) | 1,000.00 | $1,022.40 | $2.80 | 0.55% |
|
| Class R5 | Actual | 1,000.00 | $735.90 | $0.96 | 0.22% |
| | Hypothetical (5% annualized return before expenses) | 1,000.00 | $1,024.00 | $1.12 | 0.22% |
|
| Class 1 | Actual | 1,000.00 | $736.20 | $0.52 | 0.12% |
| | Hypothetical (5% annualized return before expenses) | 1,000.00 | $1,024.50 | $0.61 | 0.12% |
|
| Class 5 | Actual | 1,000.00 | $736.00 | $0.31 | 0.07% |
| | Hypothetical (5% annualized return before expenses) | 1,000.00 | $1,024.80 | $0.36 | 0.07% |
| |
| Lifestyle Moderate | | | | |
|
| Class A | Actual | $1,000.00 | $801.10 | $2.49 | 0.55% |
| | Hypothetical (5% annualized return before expenses) | 1,000.00 | 1,022.40 | 2.80 | 0.55% |
|
| Class B | Actual | 1,000.00 | 797.50 | 6.19 | 1.37% |
| | Hypothetical (5% annualized return before expenses) | 1,000.00 | 1,018.20 | 6.95 | 1.37% |
|
| Class C | Actual | 1,000.00 | 797.80 | 5.78 | 1.28% |
| | Hypothetical (5% annualized return before expenses) | 1,000.00 | 1,018.70 | 6.50 | 1.28% |
|
| Class R | Actual | 1,000.00 | 796.40 | 6.68 | 1.48% |
| | Hypothetical (5% annualized return before expenses) | 1,000.00 | 1,017.70 | 7.51 | 1.48% |
|
| Class R1 | Actual | 1,000.00 | 798.60 | 4.34 | 0.96% |
| | Hypothetical (5% annualized return before expenses) | 1,000.00 | 1,020.30 | 4.88 | 0.96% |
|
| Class R2 | Actual | 1,000.00 | 800.10 | 3.39 | 0.75% |
| | Hypothetical (5% annualized return before expenses) | 1,000.00 | 1,021.40 | 3.81 | 0.75% |
|
| Class R3 | Actual | 1,000.00 | 799.40 | 4.12 | 0.91% |
| | Hypothetical (5% annualized return before expenses) | 1,000.00 | 1,020.60 | 4.62 | 0.91% |
|
| Class R4 | Actual | 1,000.00 | 800.50 | 2.85 | 0.63% |
| | Hypothetical (5% annualized return before expenses) | 1,000.00 | 1,022.00 | 3.20 | 0.63% |
|
| Class R5 | Actual | 1,000.00 | 802.10 | 1.13 | 0.25% |
| | Hypothetical (5% annualized return before expenses) | 1,000.00 | 1,023.90 | 1.27 | 0.25% |
|
| Class 1 | Actual | 1,000.00 | 800.80 | 0.54 | 0.12% |
| | Hypothetical (5% annualized return before expenses) | 1,000.00 | 1,024.50 | 0.61 | 0.12% |
|
| Class 5 | Actual | 1,000.00 | 802.80 | 0.32 | 0.07% |
| | Hypothetical (5% annualized return before expenses) | 1,000.00 | 1,024.80 | 0.36 | 0.07% |
|
| |
| 16 | Lifestyle Portfolios | Annual report |
Shareholder expense example chart, continued
| | | | | |
| | | Beginning | Ending | Expenses Paid | |
| | | Account Value | Account Value | During Period1 | Annualized |
| | | 7-1-08 | 12-31-08 | 7-1-08–12-31-08 | Expense Ratio2,3 |
| Lifestyle Conservative | | | | |
|
| Class A | Actual | $1,000.00 | $867.10 | $2.63 | 0.56% |
| | Hypothetical (5% annualized return before expenses) | 1,000.00 | 1,022.30 | 2.85 | 0.56% |
|
| Class B | Actual | 1,000.00 | 863.70 | 6.37 | 1.36% |
| | Hypothetical (5% annualized return before expenses) | 1,000.00 | 1,018.30 | 6.90 | 1.36% |
|
| Class C | Actual | 1,000.00 | 864.30 | 5.90 | 1.26% |
| | Hypothetical (5% annualized return before expenses) | 1,000.00 | 1,018.80 | 6.39 | 1.26% |
|
| Class R | Actual | 1,000.00 | 864.70 | 6.05 | 1.29% |
| | Hypothetical (5% annualized return before expenses) | 1,000.00 | 1,025.10 | 6.57 | 1.29% |
|
| Class R1 | Actual | 1,000.00 | 866.00 | 4.41 | 0.94% |
| | Hypothetical (5% annualized return before expenses) | 1,000.00 | 1,020.40 | 4.77 | 0.94% |
|
| Class R2 | Actual | 1,000.00 | 867.50 | 2.16 | 0.46% |
| | Hypothetical (5% annualized return before expenses) | 1,000.00 | 1,022.80 | 2.34 | 0.46% |
|
| Class R3 | Actual | 1,000.00 | 866.10 | 4.27 | 0.91% |
| | Hypothetical (5% annualized return before expenses) | 1,000.00 | 1,020.60 | 4.62 | 0.91% |
|
| Class R4 | Actual | 1,000.00 | 867.40 | 2.96 | 0.63% |
| | Hypothetical (5% annualized return before expenses) | 1,000.00 | 1,022.00 | 3.20 | 0.63% |
|
| Class R5 | Actual | 1,000.00 | 869.00 | 1.27 | 0.27% |
| | Hypothetical (5% annualized return before expenses) | 1,000.00 | 1,023.80 | 1.37 | 0.27% |
|
| Class 1 | Actual | 1,000.00 | 868.90 | 0.56 | 0.12% |
| | Hypothetical (5% annualized return before expenses) | 1,000.00 | 1,024.50 | 0.61 | 0.12% |
|
1 Expenses are equal to the annualized expense ratio, multiplied by the average account value over the period, multiplied by the number of days in the period (184), and divided by 366 (to reflect the one-half year period).
2 Lifestyle Portfolios’ expense ratios do not include fees and expenses indirectly incurred by the Portfolios from the underlying portfolio.
3 The annualized weighted average expense ratio of the underlying funds reflects the indirect expense impact to the portfolios from their investment in the underlying funds, based on the actual expense ratio of each underlying fund weighted for the portfolio’s relative average investment therein are as follows:
| | | | | |
| | Lifestyle | Lifestyle | Lifestyle | Lifestyle | Lifestyle |
| Year ended | Aggressive | Growth | Balanced | Moderate | Conservative |
| 12/31/08 | 0.49%–2.84% | 0.49%–2.84% | 0.49%–2.84% | 0.49%–2.40% | 0.49%–2.40% |
| |
| Annual report | Lifestyle Portfolios | 17 |
F I N A N C I A L S T A T E M E N T S
Portfolio’s investments
Investment companies
| | | |
| Underlying Funds’ Subadvisers | | | |
| | | | |
| AIM Capital Management, Inc. | (AIM) | | |
| | | | |
| American Century Management, Inc. | (American Century) | | |
| | | | |
| BlackRock Investment Management, LLC | (BlackRock) | | |
| (formerly Mercury Advisors) | | | |
| | | | |
| Columbia Management Advisors, LLC | (Columbia) | | |
| | | | |
| Davis Advisors | (Davis) | | |
| | | | |
| Declaration Management/ | (Declaration) | | |
| John Hancock Advisers | | | |
| | | | |
| Deutsche Asset Management | (Deutsche) | | |
| | | | |
| Dimensional Fund Advisors, Inc. | (DFA) | | |
| | | | |
| Epoch Investment Partners | (Epoch) | | |
| | | | |
| Franklin®Templeton® | (Templeton) | | |
| | | | |
| Frontier Capital Management Company | (Frontier) | | |
| | | | |
| Grantham, Mayo, Van Otterloo & Co. | (GMO) | | |
| | | | |
| Independence Investment, LLC | (Independence) | | |
| | | | |
| Jennison Associates LLC | (Jennison) | | |
| | | | |
| Legg Mason Funds Management, Inc. | (Legg Mason) | | |
| | | | |
| Lord, Abbett | (Lord, Abbett) | | |
| | | | |
| Marsico Capital Management, LLC | (Marsico) | | |
| | | | |
| MFC Global Investment Management | (MFC Global U.S.A.) | | |
| (U.S.A.) Limited | | | |
| | | | |
| MFC Global Investment Management | (MFC Global U.S.) | | |
| (U.S.), LLC | | | |
| | | | |
| Munder Capital Management | (Munder) | | |
| | | | |
| Pacific Investment Management Company | (PIMCO) | | |
| | | | |
| Perimeter Capital Management, LLC | (Perimeter) | | |
| | | | |
| Rainier Investments Management, Inc. | (Rainier) | | |
| | | | |
| RiverSource Investments, LLC | (RiverSource) | | |
| | | | |
| SSgA Funds Management, Inc. | (SSgA) | | |
| | | | |
| T. Rowe Price Associates, Inc. | (T. Rowe Price) | | |
| | | | |
| UBS Global Asset Management | | | |
| (Americas) Inc. | (UBS) | | |
| | | | |
| Wellington Management Company, LLP | (Wellington) | | |
| | | | |
| Wells Capital Management, Inc. | (Wells Capital) | | |
| | | | |
| Western Asset Management Company | (WAMCO) | | |
| | |
| Lifestyle Aggressive Portfolio | |
| | |
| Securities owned by the Portfolio on 12-31-08 | |
| | | |
| Issuer | Shares | Value |
| |
| Investment companies 100.00% | | |
|
| John Hancock Funds 1.50% (g) | | |
|
| Small Cap Intrinsic Value (MFC Global U.S.) (f) | 5,769,006 | $34,383,278 |
| | | |
| John Hancock Funds II 89.51% (g) | | |
|
| All Cap Core (Deutsche) | 7,515,471 | 45,844,370 |
|
| All Cap Value (Lord, Abbett) | 3,687,975 | 29,798,841 |
|
| Alpha Opportunites (Wellington) | 5,878,813 | 51,322,039 |
|
| Blue Chip Growth (T. Rowe Price) | 11,136,284 | 137,533,111 |
|
| Capital Appreciation (Jennison) | 14,471,270 | 103,035,441 |
|
| Emerging Markets Value (DFA) | 15,857,730 | 85,948,899 |
|
| Equity-Income (T. Rowe Price) | 5,916,860 | 60,056,125 |
|
| Fundamental Value (Davis) | 11,052,163 | 114,610,926 |
|
| Index 500 (MFC Global U.S.A.) (f) | 26,763,293 | 178,243,533 |
|
| International Equity Index (SSgA) | 5,566,011 | 67,849,668 |
|
| International Opportunities (Marsico) | 14,737,417 | 137,205,355 |
|
| International Small Cap (Templeton) | 6,053,094 | 48,364,222 |
|
| International Small Company (DFA) | 9,712,790 | 51,574,917 |
|
| International Value (Templeton) | 13,562,307 | 136,436,805 |
|
| Large Cap (UBS) | 3,252,296 | 28,652,731 |
|
| Large Cap Value (BlackRock) | 3,370,910 | 52,721,026 |
|
| Mid Cap Index (MFC Global U.S.A.) (f) | 5,549,872 | 65,876,981 |
|
| Mid Cap Intersection (Wellington) | 10,927,522 | 58,680,794 |
|
| Mid Cap Stock (Wellington) | 3,897,614 | 42,406,043 |
|
| Mid Cap Value (Lord, Abbett) | 3,542,520 | 38,967,715 |
|
| Mid Cap Value Equity (RiverSource) | 3,833,141 | 22,922,185 |
|
| Natural Resources (Wellington) | 5,182,352 | 68,769,814 |
|
| Optimized Value (MFC Global U.S.A.) (f) | 6,187,914 | 52,721,026 |
|
| Small Cap Growth (Wellington) | 4,362,476 | 30,755,456 |
|
| Small Cap Index (MFC Global U.S.A.) (f) | 8,811,933 | 75,518,264 |
|
| Small Cap Value (Wellington) | 1,024,455 | 11,002,649 |
|
| Small Company Value (T. Rowe Price) | 2,805,686 | 47,219,701 |
|
| Smaller Company Growth | | |
| (Frontier/MFC Global U.S.A./Perimeter) (f) | 5,528,360 | 47,212,193 |
|
| U.S. Multi Sector (GMO) | 10,510,039 | 80,086,499 |
|
| Value & Restructuring (Columbia) | 6,423,621 | 43,552,152 |
|
| Vista (American Century) | 6,906,522 | 42,406,043 |
|
| | | 2,057,295,524 |
| | | |
| John Hancock Funds III 8.99% (g) | | |
|
| International Core (GMO) | 5,905,243 | 137,533,111 |
|
| Rainier Growth (Rainier) | 5,159,731 | 69,037,195 |
|
| | | 206,570,306 |
| | | |
| Total investment companies | | |
| (Cost $3,351,506,795) | | $2,298,249,108 |
| | | |
| Total investments | | |
| (Cost $3,351,506,795) 100.00% | | $2,298,249,108 |
| | |
| Other assets in excess of liabilities (0.00%) | 3,816 |
|
| Total net assets 100.00% | | $2,298,252,924 |
Percentages are stated as a percent of net assets.
(f) The subadviser is an affiliate of the adviser.
(g) The underlying fund’s subadviser is shown parenthetically.
See notes to financial statements
| |
| 18 | Lifestyle Portfolios | Annual report |
F I N A N C I A L S T A T E M E N T S
| | |
| Lifestyle Growth Portfolio | |
| |
| Securities owned by the Portfolio on 12-31-08 | |
| |
| Issuer | Shares | Value |
| |
| Investment companies 100.02% | | |
|
| John Hancock Funds 0.41% (g) | | |
|
| Small Cap Intrinsic Value (MFC Global U.S.) (f) | 4,789,727 | $28,546,771 |
| | | |
| John Hancock Funds II 94.05% (g) | | |
|
| Active Bond (MFC Global U.S./Declaration) (f) | 4,385,227 | 36,090,418 |
|
| All Cap Core (Deutsche) | 35,864,204 | 218,771,647 |
|
| Alpha Opportunites (Wellington) | 14,400,153 | 125,713,334 |
|
| Blue Chip Growth (T. Rowe Price) | 30,824,051 | 380,677,024 |
|
| Capital Appreciation (Jennison) | 42,187,811 | 300,377,213 |
|
| Emerging Markets Value (DFA) | 32,181,004 | 174,421,043 |
|
| Equity-Income (T. Rowe Price) | 17,777,071 | 180,437,267 |
|
| Floating Rate Income (WAMCO) | 29,454,880 | 209,718,744 |
|
| Fundamental Value (Davis) | 38,241,204 | 396,561,285 |
|
| Global Bond (PIMCO) | 7,196,176 | 80,021,479 |
|
| Global Real Estate (Deutsche) | 25,175,079 | 129,651,656 |
|
| High Income (MFC Global U.S.) (f) | 15,256,150 | 70,025,728 |
|
| High Yield (WAMCO) | 48,338,863 | 293,416,897 |
|
| Index 500 (MFC Global U.S.A.) (f) | 100,543,418 | 669,619,164 |
|
| International Equity Index (SSgA) | 10,041,061 | 122,400,539 |
|
| International Opportunities (Marsico) | 24,716,276 | 230,108,530 |
|
| International Small Cap (Templeton) | 7,781,876 | 62,177,193 |
|
| International Small Company (DFA) | 23,902,207 | 126,920,716 |
|
| International Value (Templeton) | 20,203,719 | 203,249,413 |
|
| Large Cap (UBS) | 6,327,016 | 55,741,009 |
|
| Large Cap Value (BlackRock) | 7,433,429 | 116,258,828 |
|
| Mid Cap Index (MFC Global U.S.A.) (f) | 8,505,722 | 100,962,916 |
|
| Mid Cap Intersection (Wellington) | 13,264,465 | 71,230,177 |
|
| Mid Cap Stock (Wellington) | 7,166,656 | 77,973,215 |
|
| Mid Cap Value Equity (RiverSource) | 5,859,046 | 35,037,093 |
|
| Natural Resources (Wellington) | 6,853,332 | 90,943,716 |
|
| Optimized Value (MFC Global U.S.A.) (f) | 25,446,907 | 216,807,647 |
|
| Real Estate Equity (T. Rowe Price) | 14,204,436 | 68,039,251 |
|
| Real Return Bond (PIMCO) | 22,157,657 | 236,643,772 |
|
| Small Cap Growth (Wellington) | 5,066,354 | 35,717,799 |
|
| Small Cap Opportunities (Munder) | 5,097,525 | 63,005,407 |
|
| Small Company Growth (AIM) | 4,467,031 | 35,378,884 |
|
| Small Company Value (T. Rowe Price) | 6,341,578 | 106,728,760 |
|
| Smaller Company Growth | | |
| (Frontier/MFC Global U.S.A./Perimeter) (f) | 8,312,095 | 70,985,291 |
|
| Spectrum Income (T. Rowe Price) | 20,534,300 | 181,523,215 |
|
| Strategic Bond (WAMCO) | 9,522,054 | 86,841,128 |
|
| Strategic Income (MFC Global U.S.) (f) | 11,319,102 | 91,345,153 |
|
| Total Return (PIMCO) | 24,032,191 | 306,891,078 |
|
| U.S. High Yield Bond (Wells Capital) | 8,933,941 | 82,281,598 |
|
| U.S. Multi Sector (GMO) | 32,028,696 | 244,058,661 |
|
| Value & Restructuring (Columbia) | 16,450,730 | 111,535,953 |
|
| Vista (American Century) | 5,678,850 | 34,868,136 |
|
| | | 6,531,157,977 |
| | | |
| John Hancock Funds III 5.56% (g) | | |
|
| International Core (GMO) | 9,437,019 | 219,788,177 |
|
| Rainier Growth (Rainier) | 12,422,107 | 166,207,795 |
|
| | | 385,995,972 |
| Total investment companies | | |
| (Cost $9,670,292,141) | | $6,945,700,720 |
| | | |
| Total Investments 100.02% | | |
| (Cost $9,670,292,141) | | $6,945,700,720 |
| | |
| Liabilities in excess of other assets (0.02%) | (1,570,127) |
|
| Total net assets 100.00% | | $6,944,130,593 |
Percentages are stated as a percent of net assets.
(f) The subadviser is an affiliate of the adviser.
(g) The underlying fund’s subadviser is shown parenthetically.
| | |
| Lifestyle Balanced Portfolio | |
| |
| Securities owned by the Portfolio on 12-31-08 | |
| |
| Issuer | Shares | Value |
| |
| Investment companies 100.00% | | |
|
| John Hancock Funds II 95.03% (g) | | |
|
| Active Bond (MFC Global U.S./Declaration) (f) | 19,155,677 | $157,651,223 |
|
| All Cap Core (Deutsche) | 11,686,148 | 71,285,500 |
|
| Alpha Opportunites (Wellington) | 13,616,662 | 118,873,457 |
|
| Blue Chip Growth (T. Rowe Price) | 30,340,498 | 374,705,155 |
|
| Capital Appreciation (Jennison) | 13,460,148 | 95,836,257 |
|
| Core Bond (Wells Capital) | 8,419,162 | 102,797,974 |
|
| Emerging Markets Value (DFA) | 32,318,200 | 175,164,641 |
|
| Equity-Income (T. Rowe Price) | 22,752,523 | 230,938,112 |
|
| Floating Rate Income (WAMCO) | 20,171,040 | 143,617,807 |
|
| Fundamental Value (Davis) | 19,794,336 | 205,267,263 |
|
| Global Bond (PIMCO) | 12,315,940 | 136,953,254 |
|
| Global Real Estate (Deutsche) | 34,732,866 | 178,874,262 |
|
| High Income (MFC Global U.S.) (f) | 28,170,471 | 129,302,460 |
|
| High Yield (WAMCO) | 102,310,478 | 621,024,600 |
|
| Index 500 (MFC Global U.S.A.) (f) | 100,143,782 | 666,957,589 |
|
| International Opportunities (Marsico) | 11,501,215 | 107,076,311 |
|
| International Small Cap (Templeton) | 6,799,097 | 54,324,785 |
|
| International Small Company (DFA) | 10,890,878 | 57,830,561 |
|
| International Value (Templeton) | 17,512,989 | 176,180,668 |
|
| Large Cap (UBS) | 8,364,654 | 73,692,598 |
|
| Large Cap Value (BlackRock) | 10,510,147 | 164,378,698 |
|
| Mid Cap Index (MFC Global U.S.A.) (f) | 5,828,046 | 69,178,907 |
|
| Mid Cap Stock (Wellington) | 6,313,390 | 68,689,688 |
|
| Natural Resources (Wellington) | 7,185,436 | 95,350,730 |
|
| Optimized Value (MFC Global U.S.A.) (f) | 8,754,947 | 74,592,145 |
|
| Real Estate Equity (T. Rowe Price) | 10,511,960 | 50,352,288 |
|
| Real Return Bond (PIMCO) | 24,716,549 | 263,972,740 |
|
| Small Company Growth (AIM) | 8,753,803 | 69,330,123 |
|
| Small Company Value (T. Rowe Price) | 6,211,032 | 104,531,668 |
|
| Spectrum Income (T. Rowe Price) | 44,848,777 | 396,463,189 |
|
| Strategic Bond (WAMCO) | 16,503,450 | 150,511,465 |
|
| Strategic Income (MFC Global U.S.) (f) | 18,505,764 | 149,341,514 |
|
| Total Bond Market (Declaration) (f) | 13,621,251 | 140,026,465 |
|
| Total Return (PIMCO) | 26,144,910 | 333,870,495 |
|
| U.S. High Yield Bond (Wells Capital) | 20,159,009 | 185,664,472 |
|
| U.S. Multi Sector (GMO) | 23,984,306 | 182,760,411 |
|
| Value & Restructuring (Columbia) | 15,180,618 | 102,924,593 |
|
| | | 6,480,294,068 |
| | | |
| John Hancock Funds III 4.97% (g) | | |
|
| International Core (GMO) | 8,685,797 | 202,292,204 |
|
| Rainier Growth (Rainier) | 10,240,310 | 137,015,344 |
|
| | | 339,307,548 |
| Total investment companies | | |
| (Cost $9,147,150,008) | | $6,819,601,616 |
| | | |
| Total investments | | |
| (Cost $9,147,150,008) 100.00% | | $6,819,601,616 |
| |
| Liabilities in excess of other assets | 0.00% | (113,934) |
|
| Total net assets 100.00% | | $6,819,487,682 |
Percentages are stated as a percent of net assets.
(f) The subadviser is an affiliate of the adviser.
(g) The underlying fund’s subadviser is shown parenthetically.
See notes to financial statements
| |
| Annual report | Lifestyle Portfolios | 19 |
F I N A N C I A L S T A T E M E N T S
| | |
| Lifestyle Moderate Portfolio | |
| | |
| Securities owned by the Portfolio on 12-31-08 | |
| | | |
| Issuer | Shares | Value |
|
| Investment companies 100.01% | | |
| | | |
| John Hancock Funds II 94.02% (g) | | |
|
| Active Bond (MFC Global U.S./Declaration) (f) | 19,831,335 | $163,211,888 |
|
| Blue Chip Growth (T. Rowe Price) | 6,824,892 | 84,287,422 |
|
| Core Bond (Wells Capital) | 3,337,686 | 40,753,150 |
|
| Equity-Income (T. Rowe Price) | 4,033,218 | 40,937,162 |
|
| Floating Rate Income (WAMCO) | 8,618,407 | 61,363,055 |
|
| Fundamental Value (Davis) | 6,919,737 | 71,757,669 |
|
| Global Bond (PIMCO) | 7,292,878 | 81,096,807 |
|
| Global Real Estate (Deutsche) | 8,048,375 | 41,449,130 |
|
| High Income (MFC Global U.S.) (f) | 13,107,562 | 60,163,711 |
|
| High Yield (WAMCO) | 13,861,704 | 84,140,544 |
|
| Index 500 (MFC Global U.S.A.) (f) | 18,176,983 | 121,058,706 |
|
| International Equity Index (SSgA) | 3,327,824 | 40,566,177 |
|
| International Opportunities (Marsico) | 4,360,236 | 40,593,793 |
|
| International Value (Templeton) | 4,021,154 | 40,452,814 |
|
| Investment Quality Bond (Wellington) | 3,755,976 | 41,503,532 |
|
| Mid Cap Index (MFC Global U.S.A.) (f) | 3,759,631 | 44,626,823 |
|
| Real Estate Equity (T. Rowe Price) | 4,403,076 | 21,090,736 |
|
| Real Return Bond (PIMCO) | 7,279,158 | 77,741,408 |
|
| Small Cap Index (MFC Global U.S.A.) (f) | 2,167,611 | 18,576,427 |
|
| Small Company Growth (AIM) | 2,618,973 | 20,742,263 |
|
| Small Company Value (T. Rowe Price) | 1,232,646 | 20,745,433 |
|
| Spectrum Income (T. Rowe Price) | 18,756,530 | 165,807,728 |
|
| Strategic Bond (WAMCO) | 6,919,900 | 63,109,491 |
|
| Strategic Income (MFC Global U.S.) (f) | 7,743,012 | 62,486,104 |
|
| Total Bond Market (Declaration) (f) | 9,866,895 | 101,431,678 |
|
| Total Return (PIMCO) | 11,012,522 | 140,629,912 |
|
| U.S. High Yield Bond (Wells Capital) | 9,307,912 | 85,725,867 |
|
| U.S. Multi Sector (GMO) | 6,719,931 | 51,205,877 |
|
| Value & Restructuring (Columbia) | 6,064,989 | 41,120,628 |
|
| | | 1,928,375,935 |
| | | |
| John Hancock Funds III 5.99% (g) | | |
|
| Global Shareholder Yield (Epoch) | 5,885,144 | 41,490,265 |
|
| International Core (GMO) | 3,497,929 | 81,466,767 |
|
| | | 122,957,032 |
| | | |
| Total investment companies | | |
| (Cost $2,657,300,477) | | $2,051,332,967 |
| | | |
| Total investments | | |
| (Cost $2,657,300,477) 100.01% | | $2,051,332,967 |
| | |
| Liabilities in excess of other assets (0.01%) | (217,592) |
|
| Total net assets 100.00% | | $2,051,115,375 |
Percentages are stated as a percent of net assets.
(f) The subadviser is an affiliate of the adviser.
(g) The underlying fund’s subadviser is shown parenthetically.
| | |
| Lifestyle Conservative Portfolio |
| | |
| Securities owned by the Portfolio on 12-31-08 | |
| |
| Issuer | Shares | Value |
| |
| Investment companies 100.03% | | |
|
| John Hancock Funds II 95.99% (g) | | |
|
| Active Bond (MFC Global U.S./Declaration) (f) | 19,079,525 | $157,024,492 |
|
| Blue Chip Growth (T. Rowe Price) | 2,543,122 | 31,407,556 |
|
| Core Bond (Wells Capital) | 2,641,387 | 32,251,336 |
|
| Equity-Income (T. Rowe Price) | 4,658,693 | 47,285,732 |
|
| Floating Rate Income (WAMCO) | 8,387,982 | 59,722,429 |
|
| Fundamental Value (Davis) | 3,802,501 | 39,431,940 |
|
| Global Bond (PIMCO) | 8,480,467 | 94,302,796 |
|
| Global Real Estate (Deutsche) | 10,570,248 | 54,436,776 |
|
| High Income (MFC Global U.S.) (f) | 5,246,429 | 24,081,109 |
|
| High Yield (WAMCO) | 10,118,616 | 61,420,000 |
|
| Index 500 (MFC Global U.S.A.) (f) | 5,902,985 | 39,313,879 |
|
| International Value (Templeton) | 1,579,771 | 15,892,498 |
|
| Investment Quality Bond (Wellington) | 4,677,539 | 51,686,803 |
|
| Real Estate Equity (T. Rowe Price) | 2,611,783 | 12,510,442 |
|
| Real Return Bond (PIMCO) | 4,362,938 | 46,596,180 |
|
| Spectrum Income (T. Rowe Price) | 16,139,190 | 142,670,438 |
|
| Strategic Bond (WAMCO) | 7,112,319 | 64,864,351 |
|
| Strategic Income (MFC Global U.S.) (f) | 7,846,152 | 63,318,449 |
|
| Total Bond Market (Declaration) (f) | 15,258,519 | 156,857,576 |
|
| Total Return (PIMCO) | 12,292,142 | 156,970,659 |
|
| U.S. Government Securities (WAMCO) | 9,172,867 | 105,487,974 |
|
| U.S. High Yield Bond (Wells Capital) | 5,318,156 | 48,980,221 |
|
| Value & Restructuring (Columbia) | 2,332,969 | 15,817,530 |
|
| | | 1,522,331,166 |
| John Hancock Funds III 4.04% (g) | | |
|
| Global Shareholder Yield (Epoch) | 4,494,191 | 31,684,050 |
|
| International Core (GMO) | 1,392,909 | 32,440,861 |
|
| | | 64,124,911 |
| | | |
| Total investment companies | | |
| (Cost $1,918,712,732) | | $1,586,456,077 |
| | | |
| Total investments | | |
| (Cost $1,918,712,732) 100.03% | | $1,586,456,077 |
| | |
| Liabilities in excess of other assets (0.03%) | (485,786) |
|
| Total net assets 100.00% | | $1,585,970,291 |
Percentages are stated as a percent of net assets.
(f) The subadviser is an affiliate of the adviser.
(g) The underlying fund’s subadviser is shown parenthetically.
See notes to financial statements
| |
| 20 | Lifestyle Portfolios | Annual report |
F I N A N C I A L S T A T E M E N T S
Financial statements
Statements of assets and liabilities 12-31-08
These Statements of Assets and Liabilities are the Portfolios’ balance sheets. They show the value of what each Portfolio owns, is due and owes. You’ll also find the net asset value and the maximum offering price per share for each Portfolio. Net asset value is calculated by dividing the net assets of each class of shares by the number of outstanding shares in the class.
| | | |
| | Lifestyle | Lifestyle | Lifestyle |
| | Aggressive | Growth | Balanced |
| Assets | | | |
|
| Investments in affiliated funds, at value (Note 8) | $2,298,249,108 | $6,945,700,720 | $6,819,601,616 |
| Total investments, at value | 2,298,249,108 | 6,945,700,720 | 6,819,601,616 |
| Receivable for investments sold | 12,380,932 | 40,083,356 | 46,962,208 |
| Receivable for fund shares sold | 1,049,498 | 2,174,778 | 2,705,919 |
| Dividends receivable | — | 1,675,409 | 1,132,800 |
| Receivable due from adviser | 86 | 100 | 70,053 |
| Other assets | — | — | 131 |
| Total assets | 2,311,679,624 | 6,989,634,363 | 6,870,472,727 |
| Liabilities | | | |
|
| Payable for investments purchased | — | 1,675,409 | 1,132,800 |
| Payable for fund shares repurchased | 12,971,889 | 42,611,554 | 48,698,996 |
| Distributions payable | — | 1,420 | — |
| Payable to affiliates: Fund administration fees | 86,404 | 246,525 | 223,227 |
| Transfer agent fees | 207,388 | 640,057 | 519,770 |
| Trustees’ fees | 1,572 | 4,502 | 4,256 |
| Other payables and accrued expenses | 159,447 | 324,303 | 405,996 |
| Total liabilities | 13,426,700 | 45,503,770 | 50,985,045 |
| Net assets | | | |
|
| Capital paid-in | 3,698,983,528 | 10,575,078,703 | 9,917,746,146 |
| Undistributed net investment income (loss) | 231,280 | 1,831,715 | 1,924,865 |
| Accumulated undistributed net realized gain (loss) on investments | (347,704,197) | (908,188,404) | (772,634,937) |
| Net unrealized appreciation (depreciation) on investments | (1,053,257,687) | (2,724,591,421) | (2,327,548,392) |
| Net assets | $2,298,252,924 | $6,944,130,593 | $6,819,487,682 |
| Investments in affiliated funds, at cost | $3,351,506,795 | $9,670,292,141 | $9,147,150,008 |
| Net asset value per share | | | |
|
| The Portfolios have an unlimited number of shares authorized with no par value. | | | |
| Class A: Net assets | $78,131,264 | $251,379,606 | $248,868,756 |
| Shares outstanding | 9,738,878 | 28,790,445 | 27,006,390 |
| Net asset value and redemption price per share | $8.02 | $8.73 | $9.22 |
| Class B:1 Net assets | $15,626,237 | $53,662,415 | $45,893,164 |
| Shares outstanding | 1,938,630 | 6,119,589 | 4,980,645 |
| Net asset value, offering price and redemption price per share | $8.06 | $8.77 | $9.21 |
| Class C:1 Net assets | $62,151,713 | $205,797,421 | $209,232,191 |
| Shares outstanding | 7,712,259 | 23,488,954 | 22,681,140 |
| Net asset value, offering price and redemption price per share | $8.06 | $8.76 | $9.22 |
| Class R: Net assets | $1,588,667 | $2,485,188 | $2,876,698 |
| Shares outstanding | 196,711 | 282,367 | 312,162 |
| Net asset value, offering price and redemption price per share | $8.08 | $8.80 | $9.22 |
| Class R1: Net assets | $1,792,064 | $3,109,741 | $987,773 |
| Shares outstanding | 222,480 | 354,557 | 107,404 |
| Net asset value, offering price and redemption price per share | $8.05 | $8.77 | $9.20 |
| Class R2: Net assets | $1,522,017 | $6,395,401 | $3,572,252 |
| Shares outstanding | 189,445 | 730,855 | 388,296 |
| Net asset value, offering price and redemption price per share | $8.03 | $8.75 | $9.20 |
| Class R3: Net assets | $5,878,103 | $12,100,594 | $19,588,986 |
| Shares outstanding | 732,200 | 1,385,489 | 2,128,205 |
| Net asset value, offering price and redemption price per share | $8.03 | $8.73 | $9.20 |
| Class R4: Net assets | $6,290,523 | $12,687,466 | $14,455,622 |
| Shares outstanding | 785,361 | 1,454,484 | 1,570,887 |
| Net asset value, offering price and redemption price per share | $8.01 | $8.72 | $9.20 |
| Class R5: Net assets | $5,694,424 | $10,051,637 | $15,290,472 |
| Shares outstanding | 711,604 | 1,152,966 | 1,660,728 |
| Net asset value, offering price and redemption price per share | $8.00 | $8.72 | $9.21 |
| Class 1: Net assets | $2,119,577,912 | $6,345,473,515 | $6,240,859,090 |
| Shares outstanding | 265,719,864 | 730,707,867 | 680,479,674 |
| Net asset value, offering price and redemption price per share | $7.98 | $8.68 | $9.17 |
| Class 5: Net assets | — | $40,987,609 | $17,862,678 |
| Shares outstanding | — | 4,725,142 | 1,947,017 |
| Net asset value, offering price and redemption price per share | — | $8.67 | $9.17 |
| Maximum public offering price per share | | | |
|
| Class A (net asset value per share ÷ 95%)2 | $8.44 | $9.19 | $9.71 |
1 Redemption price per share is equal to net asset value less any applicable contingent deferred sales charge.
2 On single retail sales of less than $50,000. On sales of $50,000 or more and on group sales the offering price is reduced.
See notes to financial statements
| |
| Annual report | Lifestyle Portfolios | 21 |
F I N A N C I A L S T A T E M E N T S
Statements of assets and liabilities 12-31-08
Continued
| | |
| | Lifestyle | Lifestyle |
| | Moderate | Conservative |
| Assets | | |
|
| Investments in affiliated funds, at value (Note 8) | $2,051,332,967 | $1,586,456,077 |
| Total investments, at value | 2,051,332,967 | 1,586,456,077 |
| Receivable for investments sold | 12,423,229 | 8,600,000 |
| Receivable for fund shares sold | 869,830 | 726,945 |
| Dividends receivable | 474,173 | 461,875 |
| Receivable due from adviser | 91 | 58 |
| Total assets | 2,065,100,290 | 1,596,244,955 |
| Liabilities | | |
|
| Payable for investments purchased | 474,173 | 779,540 |
| Payable for fund shares repurchased | 13,163,102 | 9,211,541 |
| Payable to affiliates: Fund administration fees | 50,072 | 26,036 |
| Transfer agent fees | 150,318 | 129,913 |
| Trustees’ fees | 1,148 | 772 |
| Other payables and accrued expenses | 146,102 | 126,862 |
| Total liabilities | 13,984,915 | 10,274,664 |
| Net assets | | |
|
| Capital paid-in | $2,739,571,296 | $1,961,395,902 |
| Undistributed net investment income (loss) | 583,256 | 624,034 |
| Accumulated undistributed net realized gain (loss) on investments | (83,071,667) | (43,792,990) |
| Net unrealized appreciation (depreciation) on investments | (605,967,510) | (332,256,655) |
| Net assets | $2,051,115,375 | $1,585,970,291 |
| Investments in affiliated funds, at cost | $2,657,300,477 | $1,918,712,732 |
| Net asset value per share | | |
|
| The Portfolios have an unlimited number of shares authorized with no par value. | | |
| Class A: Net assets | $86,430,802 | $86,784,579 |
| Shares outstanding | 9,016,768 | 8,349,263 |
| Net asset value and redemption price per share | $9.59 | $10.39 |
| Class B:1 Net assets | $13,518,868 | $13,012,662 |
| Shares outstanding | 1,411,280 | 1,251,116 |
| Net asset value, offering price and redemption price per share | $9.58 | $10.40 |
| Class C:1 Net assets | $68,950,157 | $73,245,510 |
| Shares outstanding | 7,191,734 | 7,046,776 |
| Net asset value, offering price and redemption price per share | $9.59 | $10.39 |
| Class R: Net assets | $1,056,288 | $1,135,724 |
| Shares outstanding | 110,218 | 109,128 |
| Net asset value, offering price and redemption price per share | $9.58 | $10.41 |
| Class R1: Net assets | $1,565,527 | $2,105,395 |
| Shares outstanding | 163,341 | 202,288 |
| Net asset value, offering price and redemption price per share | $9.58 | $10.41 |
| Class R2: Net assets | $202,549 | $3,484,936 |
| Shares outstanding | 21,150 | 335,035 |
| Net asset value, offering price and redemption price per share | $9.58 | $10.40 |
| Class R3: Net assets | $5,248,008 | $5,615,656 |
| Shares outstanding | 547,735 | 540,123 |
| Net asset value, offering price and redemption price per share | $9.58 | $10.40 |
| Class R4: Net assets | $3,738,526 | $3,136,439 |
| Shares outstanding | 390,854 | 301,941 |
| Net asset value, offering price and redemption price per share | $9.57 | $10.39 |
| Class R5: Net assets | $5,471,652 | $4,324,049 |
| Shares outstanding | 571,397 | 415,856 |
| Net asset value, offering price and redemption price per share | $9.58 | $10.40 |
| Class 1: Net assets | $1,857,404,610 | $1,393,125,341 |
| Shares outstanding | 194,199,109 | 134,183,946 |
| Net asset value, offering price and redemption price per share | $9.56 | $10.38 |
| Class 5: Net assets | $7,528,388 | — |
| Shares outstanding | 787,693 | — |
| Net asset value, offering price and redemption price per share | $9.56 | — |
| Maximum public offering price per share | | |
|
| Class A (net asset value per share ÷ 95%)2 | $10.09 | $10.94 |
1 Redemption price per share is equal to net asset value less any applicable contingent deferred sales charge.
2 On single retail sales of less than $50,000. On sales of $50,000 or more and on group sales the offering price is reduced.
See notes to financial statements
| |
| 22 | Lifestyle Portfolios | Annual report |
F I N A N C I A L S T A T E M E N T S
Statements of operations For the year ended 12-31-08
These Statements of Operations summarize the Portfolios’ investment income earned and expenses directly incurred in operating each Portfolio. They also show net gains (losses) for the period stated.
| | | |
| | Lifestyle | Lifestyle | Lifestyle |
| | Aggressive | Growth | Balanced |
| Investment income | | | |
|
| Income distributions received from affiliated underlying funds | $42,541,961 | $238,491,254 | $340,727,686 |
| Total investment income | 42,541,961 | 238,491,254 | 340,727,686 |
| Expenses | | | |
|
| Investment management fees (Note 5) | 1,299,039 | 3,775,569 | 3,603,198 |
| Distribution and service fees (Note 5) | 2,930,343 | 8,687,739 | 8,273,603 |
| Transfer agent fees (Note 5) | 580,489 | 1,409,546 | 1,011,112 |
| Blue sky fees (Note 5) | 115,387 | 145,276 | 158,089 |
| Fund administration fees (Note 5) | 541,066 | 1,559,968 | 1,470,871 |
| Audit and legal fees | 130,174 | 284,430 | 272,109 |
| Printing and postage fees (Note 5) | 48,189 | 112,447 | 89,431 |
| Custodian fees | 10,200 | 10,607 | 10,759 |
| Trustees’ fees (Note 5) | 40,937 | 118,429 | 112,472 |
| Registration and filing fees | 102,980 | 280,478 | 267,402 |
| Miscellaneous | 4,481 | — | — |
| Total expenses | 5,803,285 | 16,384,489 | 15,269,046 |
| | | | |
| Less: expense reductions (Note 5) | (183,926) | (175,113) | (70,151) |
| Net expenses | 5,619,359 | 16,209,376 | 15,198,895 |
| | | | |
| Net investment income | 36,922,602 | 222,281,878 | 325,528,791 |
| Realized and unrealized gain (loss) | | | |
|
| Net realized gain (loss) on | | | |
| Investments in affiliated underlying funds | (399,533,164) | (999,901,628) | (860,627,316) |
| Capital gain distributions received from affiliated underlying funds | 63,843,785 | 162,448,061 | 166,472,858 |
| | (335,689,379) | (837,453,567) | (694,154,458) |
| Change in net unrealized appreciation (depreciation) of | | | |
| Investments in affiliated underlying funds | (1,321,229,979) | (3,342,761,433) | (2,775,768,529) |
| | (1,321,229,979) | (3,342,761,433) | (2,775,768,529) |
| Net realized and unrealized loss | (1,656,919,358) | (4,180,215,000) | (3,469,922,987) |
| | | | |
| Decrease in net assets from operations | ($1,619,996,756) | ($3,957,933,122) | ($3,144,394,196) |
See notes to financial statements
| |
| Annual report | Lifestyle Portfolios | 23 |
F I N A N C I A L S T A T E M E N T S
Statements of operations For the year ended 12-31-08
Continued
| | |
| | Lifestyle | Lifestyle |
| | Moderate | Conservative |
| Investment income | | |
|
| Income distributions received from affiliated underlying funds | $120,708,040 | $98,014,291 |
| Total investment income | 120,708,040 | 98,014,291 |
| Expenses | | |
|
| Investment management fees (Note 5) | 993,588 | 691,118 |
| Distribution and service fees (Note 5) | 2,335,839 | 1,878,599 |
| Transfer agent fees (Note 5) | 278,294 | 221,861 |
| Blue sky fees (Note 5) | 121,889 | 125,434 |
| Fund administration fees (Note 5) | 391,184 | 260,141 |
| Audit and legal fees | 107,958 | 83,963 |
| Printing and postage fees (Note 5) | 24,928 | 23,075 |
| Custodian fees | 10,200 | 10,200 |
| Trustees’ fees (Note 5) | 30,681 | 21,063 |
| Registration and filing fees | 77,992 | 62,563 |
| Miscellaneous | 3,210 | 2,179 |
| Total expenses | 4,375,763 | 3,380,196 |
| | | |
| Less: expense reductions (Note 5) | (68,925) | (62,655) |
| Net expenses | 4,306,838 | 3,317,541 |
| | | |
| Net investment income | 116,401,202 | 94,696,750 |
| Realized and unrealized gain (loss) | | |
|
| Net realized gain (loss) on | | |
| Investments in affiliated underlying funds | (95,629,484) | (52,731,872) |
| Capital gain distributions received from affiliated underlying funds | 39,832,667 | 42,617,171 |
| | (55,796,817) | (10,114,701) |
| | | |
| Change in net unrealized appreciation (depreciation) of | | |
| Investments in affiliated underlying funds | (694,746,436) | (362,573,083) |
| | (694,746,436) | (362,573,083) |
| Net realized and unrealized loss | (750,543,253) | (372,687,784) |
| | | |
| Decrease in net assets from operations | ($634,142,051) | ($277,991,034) |
See notes to financial statements
| |
| 24 | Lifestyle Portfolios | Annual report |
F I N A N C I A L S T A T E M E N T S
Statements of changes in net assets
These Statements of Changes in Net Assets show how the value of the Portfolios’ net assets have changed during the period. They reflect earnings less expenses, any investment gains and losses, distributions, if any, paid to shareholders and the net of Portfolio share transactions.
| | |
| Lifestyle Aggressive | | |
| | Year Ended 12-31-08 | Year Ended 12-31-07 |
| Increase (decrease) in net assets | | |
|
| From operations | | |
| Net investment income (loss) | $36,922,602 | $31,156,187 |
| Net realized gain (loss) | (335,689,379) | 275,547,874 |
| Change in net unrealized appreciation (depreciation) | (1,321,229,979) | (47,390,826) |
| Increase (decrease) in net assets | (1,619,996,756) | 259,313,235 |
| resulting from operations | | |
| |
| Distributions to shareholders | | |
| From net investment income | | |
| Class A | (770,001) | (865,763) |
| Class B | — | — |
| Class C | — | (37,410) |
| Class R | (1,815) | (5,646) |
| Class R1 | (12,639) | (7,790) |
| Class R2 | (12,613) | (24,856) |
| Class R3 | (37,583) | (43,473) |
| Class R4 | (64,605) | (45,073) |
| Class R5 | (85,435) | (40,586) |
| Series I | (35,705,581) | (41,624,959) |
| From net realized gain | | |
| Class A | (5,552,655) | (3,931,597) |
| Class B | (1,095,486) | (826,498) |
| Class C | (4,440,044) | (3,255,234) |
| Class R | (110,593) | (50,797) |
| Class R1 | (126,438) | (41,601) |
| Class R2 | (104,817) | (95,811) |
| Class R3 | (418,658) | (239,298) |
| Class R4 | (433,985) | (177,973) |
| Class R5 | (402,984) | (122,754) |
| Series I | (151,009,310) | (116,344,468) |
| | | |
| Total distributions | (200,385,242) | (167,781,587) |
| | | |
| From Portfolio share transactions (Note 6) | 445,766,908 | 686,985,206 |
| |
| Total increase (decrease) | (1,374,615,090) | 778,516,854 |
| Net assets | | |
|
| Beginning of year | 3,672,868,014 | 2,894,351,160 |
| | | |
| End of year | $2,298,252,924 | $3,672,868,014 |
| |
| Undistributed net investment income (loss) | $231,280 | — |
See notes to financial statements
| |
| Annual report | Lifestyle Portfolios | 25 |
F I N A N C I A L S T A T E M E N T S
Statements of changes in net assets
Continued
| | |
| Lifestyle Growth | | |
| | Year Ended 12-31-08 | Year Ended 12-31-07 |
| Increase (decrease) in net assets | | |
|
| From operations | | |
| Net investment income (loss) | $222,281,878 | $185,987,458 |
| Net realized gain (loss) | (837,453,567) | 584,936,846 |
| Change in net unrealized appreciation (depreciation) | (3,342,761,433) | (116,180,921) |
| Increase (decrease) in net assets | (3,957,933,122) | 654,743,383 |
| resulting from operations | | |
| |
| Distributions to shareholders | | |
| From net investment income | | |
| Class A | (6,760,004) | (4,725,491) |
| Class B | (878,511) | (536,260) |
| Class C | (3,541,992) | (2,164,482) |
| Class R | (44,937) | (8,325) |
| Class R1 | (72,076) | (26,245) |
| Class R2 | (169,988) | (16,164) |
| Class R3 | (276,716) | (171,150) |
| Class R4 | (337,019) | (229,572) |
| Class R5 | (307,704) | (137,338) |
| Series 1 | (206,683,776) | (177,370,025) |
| Series 5 | (1,365,101) | (855,570) |
| From net realized gain | | |
| Class A | (12,859,693) | (9,486,373) |
| Class B | (2,755,787) | (2,241,004) |
| Class C | (10,576,406) | (8,493,776) |
| Class R | (123,292) | (23,494) |
| Class R1 | (156,280) | (59,653) |
| Class R2 | (325,034) | (31,775) |
| Class R3 | (614,311) | (393,528) |
| Class R4 | (641,118) | (443,269) |
| Class R5 | (507,536) | (225,310) |
| Series 1 | (323,698,472) | (276,785,876) |
| Series 5 | (2,093,965) | (1,300,555) |
| | | |
| Total distributions | (574,789,718) | (485,725,235) |
| | | |
| From Portfolio share transactions (Note 6) | 1,112,410,104 | 1,752,091,092 |
| |
| Total increase (decrease) | (3,420,312,736) | 1,921,109,240 |
| Net assets | | |
|
| Beginning of year | 10,364,443,329 | 8,443,334,089 |
| | | |
| End of year | $6,944,130,593 | $10,364,443,329 |
| |
| Undistributed net investment income (loss) | $1,831,715 | — |
See notes to financial statements
| |
| 26 | Lifestyle Portfolios | Annual report |
F I N A N C I A L S T A T E M E N T S
Statements of changes in net assets
Continued
| | |
| Lifestyle Balanced | | |
| | Year Ended 12-31-08 | Year Ended 12-31-07 |
| Increase (decrease) in net assets | | |
|
| From operations | | |
| Net investment income (loss) | $325,528,791 | $253,128,038 |
| Net realized gain (loss) | (694,154,458) | 406,707,598 |
| Change in net unrealized appreciation (depreciation) | (2,775,768,529) | (135,354,678) |
| Increase (decrease) in net assets | (3,144,394,196) | 524,480,958 |
| resulting from operations | | |
| |
| Distributions to shareholders | | |
| From net investment income | | |
| Class A | (10,278,563) | (5,976,896) |
| Class B | (1,519,107) | (895,406) |
| Class C | (7,076,610) | (4,178,342) |
| Class R | (85,054) | (15,963) |
| Class R1 | (33,334) | (12,013) |
| Class R2 | (143,903) | (28,297) |
| Class R3 | (752,040) | (456,666) |
| Class R4 | (585,521) | (411,637) |
| Class R5 | (644,826) | (227,337) |
| Series 1 | (301,646,852) | (240,703,208) |
| Series 5 | (828,353) | (453,955) |
| From net realized gain | | |
| Class A | (9,971,175) | (5,869,438) |
| Class B | (1,929,377) | (1,250,971) |
| Class C | (8,639,271) | (5,589,293) |
| Class R | (103,169) | (18,872) |
| Class R1 | (35,726) | (13,923) |
| Class R2 | (147,129) | (25,620) |
| Class R3 | (771,338) | (483,304) |
| Class R4 | (552,270) | (382,280) |
| Class R5 | (607,725) | (202,091) |
| Series 1 | (255,551,635) | (190,689,518) |
| Series 5 | (717,450) | (384,893) |
| | | |
| Total distributions | (602,620,428) | (458,269,923) |
| | | |
| From Portfolio share transactions (Note 6) | 955,073,423 | 1,628,653,977 |
| |
| Total increase (decrease) | (2,791,941,201) | 1,694,865,012 |
| Net assets | | |
|
| Beginning of year | 9,611,428,883 | 7,916,563,871 |
| | | |
| End of year | $6,819,487,682 | $9,611,428,883 |
| |
| Undistributed net investment income (loss) | $1,924,865 | ($200) |
See notes to financial statements
| |
| Annual report | Lifestyle Portfolios | 27 |
F I N A N C I A L S T A T E M E N T S
Statements of changes in net assets
Continued
| | |
| Lifestyle Moderate | | |
| | Year Ended 12-31-08 | Year Ended 12-31-07 |
| Increase (decrease) in net assets | | |
|
| From operations | | |
| Net investment income (loss) | $116,401,202 | $82,349,580 |
| Net realized gain (loss) | (55,796,817) | 60,369,990 |
| Change in net unrealized appreciation (depreciation) | (694,746,436) | (26,791,828) |
| Increase (decrease) in net assets | (634,142,051) | 115,927,742 |
| resulting from operations | | |
| |
| Distributions to shareholders | | |
| From net investment income | | |
| Class A | (4,339,766) | (1,973,109) |
| Class B | (585,242) | (315,485) |
| Class C | (2,970,127) | (1,420,472) |
| Class R | (40,923) | (13,881) |
| Class R1 | (62,532) | (23,168) |
| Class R2 | (10,871) | (3,596) |
| Class R3 | (246,261) | (104,504) |
| Class R4 | (184,974) | (118,312) |
| Class R5 | (291,691) | (105,520) |
| Series 1 | (106,725,494) | (78,167,282) |
| Series 5 | (357,684) | (169,157) |
| From net realized gain | | |
| Class A | (2,238,230) | (947,891) |
| Class B | (366,168) | (195,985) |
| Class C | (1,828,820) | (871,621) |
| Class R | (25,903) | (7,574) |
| Class R1 | (33,889) | (11,021) |
| Class R2 | (4,871) | (1,578) |
| Class R3 | (139,064) | (52,869) |
| Class R4 | (96,988) | (52,753) |
| Class R5 | (138,806) | (49,247) |
| Series 1 | (49,026,507) | (30,871,062) |
| Series 5 | (174,587) | (65,666) |
| | | |
| Total distributions | (169,889,398) | (115,541,753) |
| | | |
| From Portfolio share transactions (Note 6) | 337,315,014 | 429,277,132 |
| |
| Total increase (decrease) | (466,716,435) | 429,663,121 |
| Net assets | | |
|
| Beginning of year | 2,517,831,810 | 2,088,168,689 |
| | | |
| End of year | $2,051,115,375 | $2,517,831,810 |
| |
| Undistributed net investment income (loss) | $583,256 | — |
See notes to financial statements
| |
| 28 | Lifestyle Portfolios | Annual report |
F I N A N C I A L S T A T E M E N T S
Statements of changes in net assets
Continued
| | |
| Lifestyle Conservative | | |
| | Year Ended 12-31-08 | Year Ended 12-31-07 |
| Increase (decrease) in net assets | | |
|
| From operations | | |
| Net investment income (loss) | $94,696,750 | $57,943,258 |
| Net realized gain (loss) | (10,114,701) | 20,507,832 |
| Change in net unrealized appreciation (depreciation) | (362,573,083) | (7,532,402) |
| Increase (decrease) in net assets | (277,991,034) | 70,918,688 |
| resulting from operations | | |
| |
| Distributions to shareholders | | |
| From net investment income | | |
| Class A | (4,572,782) | (1,314,962) |
| Class B | (580,704) | (238,437) |
| Class C | (3,488,207) | (1,070,619) |
| Class R | (38,412) | (5,823) |
| Class R1 | (74,694) | (9,925) |
| Class R2 | (189,409) | (13,687) |
| Class R3 | (334,098) | (99,674) |
| Class R4 | (194,620) | (84,714) |
| Class R5 | (190,553) | (27,298) |
| Series 1 | (84,407,205) | (55,116,587) |
| From net realized gain | | |
| Class A | (2,221,568) | (355,959) |
| Class B | (328,151) | (80,613) |
| Class C | (1,925,144) | (362,145) |
| Class R | (23,621) | (1,586) |
| Class R1 | (47,507) | (2,649) |
| Class R2 | (92,847) | (3,212) |
| Class R3 | (143,882) | (31,487) |
| Class R4 | (86,428) | (21,759) |
| Class R5 | (102,648) | (6,351) |
| Series 1 | (36,054,246) | (11,979,079) |
| | | |
| Total distributions | (135,096,726) | (70,826,566) |
| | | |
| From Portfolio share transactions (Note 6) | 492,710,351 | 281,966,127 |
| |
| Total increase (decrease) | 79,622,591 | 282,058,249 |
| Net assets | | |
|
| Beginning of year | 1,506,347,700 | 1,224,289,451 |
| | | |
| End of year | $1,585,970,291 | $1,506,347,700 |
| |
| Undistributed net investment income (loss) | $624,034 | — |
See notes to financial statements
| |
| Annual report | Lifestyle Portfolios | 29 |
F I N A N C I A L S T A T E M E N T S
Financial highlights
These Financial Highlights show how each Portfolio’s net asset value for a share has changed since the beginning of the period.
| | | | | | | | | | | | | | | | |
| Lifestyle Aggressive | | | | | | | | | | | | | | |
| Per share operating performance for a share outstanding throughout the period | | | Ratios and supplemental data | |
| |
|
| | | Income (loss) from | | | | | | | | | | | | | |
| | | investment operations | | Less distributions | | | | | Ratios to average net assets | | |
| | |
| |
| | |
| |
| |
| | | | Net | | | | | | | | | | | Ratio of net | | |
| | | | realized | Total | | | | | | | | Ratio of | | investment | Net | |
| | Net asset | Net | and | from | From net | | | | | | | gross | Ratio of net | income | assets, | |
| | value, | invest- | unrealized | invest- | invest- | | | | Net asset | | | expenses | expenses | (loss) to | end of | |
| | beginning | ment in- | gain (loss) | ment | ment | From net | From | Total | value, end | Total | | to average | to average | average | period (in | Portfolio |
| | of period | come (loss) | on invest- | operations | income | realized | capital | distribu- | of period | return | | net assets | net assets | net assets | millions) | turnover |
| Period ended | ($) | ($)1,2 | ments ($) | ($) | ($) | gain ($) | paid-in ($) | tions ($) | ($) | (%)3 | | (%)4 | (%)4 | (%)1 | ($) | (%) |
|
| CLASS A | | | | | | | | | | | | | | | | |
|
| 12-31-2008 | 15.22 | 0.10 | (6.58) | (6.48) | (0.09) | (0.63) | — | (0.72) | 8.02 | (42.40)5 | | 0.666 | 0.617 | 0.77 | 78 | 36 |
| 12-31-2007 | 14.72 | 0.11 | 1.05 | 1.16 | (0.12) | (0.54) | — | (0.66) | 15.22 | 8.005 | | 0.596 | 0.597 | 0.69 | 116 | 21 |
| 12-31-20068 | 14.06 | 0.08 | 1.24 | 1.32 | (0.37) | (0.29) | — | (0.66) | 14.72 | 9.405,9 | | 0.656,10 | 0.6410 | 1.6910 | 56 | 59 |
| 8-31-200611 | 12.63 | (0.07) | 1.56 | 1.49 | (0.06) | — | — | (0.06) | 14.06 | 11.855,9 | | 0.846,10 | 0.6510 | (0.59)10 | 35 | 239 |
|
| CLASS B | | | | | | | | | | | | | | | | |
|
| 12-31-2008 | 15.23 | —12 | (6.54) | (6.54) | — | (0.63) | — | (0.63) | 8.06 | (42.84)5 | | 1.516 | 1.357 | 0.01 | 16 | 36 |
| 12-31-2007 | 14.72 | (0.02) | 1.07 | 1.05 | — | (0.54) | — | (0.54) | 15.23 | 7.235 | | 1.376 | 1.357 | (0.13) | 24 | 21 |
| 12-31-20068 | 14.00 | 0.05 | 1.23 | 1.28 | (0.27) | (0.29) | — | (0.56) | 14.72 | 9.155,9 | | 1.546,10 | 1.3510 | 1.0710 | 13 | 59 |
| 8-31-200611 | 12.63 | (0.15) | 1.56 | 1.41 | (0.04) | — | — | (0.04) | 14.00 | 11.225,9 | | 2.006,10 | 1.3410 | (1.23)10 | 8 | 239 |
|
| CLASS C | | | | | | | | | | | | | | | | |
|
| 12-31-2008 | 15.23 | 0.01 | (6.55) | (6.54) | — | (0.63) | — | (0.63) | 8.06 | (42.79)5 | | 1.366 | 1.317 | 0.05 | 62 | 36 |
| 12-31-2007 | 14.73 | —12 | 1.05 | 1.05 | (0.01) | (0.54) | — | (0.55) | 15.23 | 7.215 | | 1.326 | 1.317 | 0.03 | 95 | 21 |
| 12-31-20068 | 14.00 | 0.05 | 1.24 | 1.29 | (0.27) | (0.29) | — | (0.56) | 14.73 | 9.225,9 | | 1.366,10 | 1.3510 | 1.1010 | 39 | 59 |
| 8-31-200611 | 12.63 | (0.15) | 1.57 | 1.42 | (0.05) | — | — | (0.05) | 14.00 | 11.225,9 | | 1.606,10 | 1.3410 | (1.27)10 | 25 | 239 |
|
| CLASS R | | | | | | | | | | | | | | | | |
|
| 12-31-2008 | 15.28 | 0.05 | (6.61) | (6.56) | (0.01) | (0.63) | — | (0.64) | 8.08 | (42.76)5 | | 2.066 | 1.297 | 0.42 | 2 | 36 |
| 12-31-2007 | 14.79 | 0.11 | 0.98 | 1.09 | (0.06) | (0.54) | — | (0.60) | 15.28 | 7.485 | | 3.666 | 1.087,13 | 0.69 | 1 | 21 |
| 12-31-20068,11 | 14.11 | 0.13 | 1.17 | 1.30 | (0.33) | (0.29) | — | (0.62) | 14.79 | 9.225,9 | | 10.666,10 | 0.9510 | 2.9410 | —14 | 59 |
|
| CLASS R1 | | | | | | | | | | | | | | | | |
|
| 12-31-2008 | 15.27 | 0.10 | (6.63) | (6.53) | (0.06) | (0.63) | — | (0.69) | 8.05 | (42.56)5 | | 1.496 | 0.857 | 0.83 | 2 | 36 |
| 12-31-2007 | 14.76 | 0.15 | 1.00 | 1.15 | (0.10) | (0.54) | — | (0.64) | 15.27 | 7.925 | | 3.546 | 0.727,13 | 0.92 | 1 | 21 |
| 12-31-20068,11 | 14.11 | 0.08 | 1.23 | 1.31 | (0.37) | (0.29) | — | (0.66) | 14.76 | 9.255,9 | | 12.896,10 | 0.7010 | 1.7910 | —14 | 59 |
|
| CLASS R2 | | | | | | | | | | | | | | | | |
|
| 12-31-2008 | 15.24 | 0.07 | (6.58) | (6.51) | (0.07) | (0.63) | — | (0.70) | 8.03 | (42.49)5 | | 1.266 | 0.707 | 0.58 | 2 | 36 |
| 12-31-2007 | 14.74 | 0.37 | 0.81 | 1.18 | (0.14) | (0.54) | — | (0.68) | 15.24 | 8.135 | | 2.626 | 0.527,13 | 2.31 | 3 | 21 |
| 12-31-20068,11 | 14.11 | 0.09 | 1.23 | 1.32 | (0.40) | (0.29) | — | (0.69) | 14.74 | 9.375,9 | | 12.246,10 | 0.4510 | 2.0710 | —14 | 59 |
|
| CLASS R3 | | | | | | | | | | | | | | | | |
|
| 12-31-2008 | 15.22 | 0.07 | (6.57) | (6.50) | (0.06) | (0.63) | — | (0.69) | 8.03 | (42.54)5 | | 0.916 | 0.867 | 0.59 | 6 | 36 |
| 12-31-2007 | 14.72 | 0.11 | 1.03 | 1.14 | (0.10) | (0.54) | — | (0.64) | 15.22 | 7.855 | | 1.216 | 0.817,13 | 0.68 | 7 | 21 |
| 12-31-20068 | 14.06 | 0.08 | 1.24 | 1.32 | (0.37) | (0.29) | — | (0.66) | 14.72 | 9.365,9 | | 2.216,10 | 0.7210 | 1.7010 | 2 | 59 |
| 8-31-200611 | 12.63 | (0.05) | 1.54 | 1.49 | (0.06) | — | — | (0.06) | 14.06 | 11.815,9 | | 8.076,10 | 0.6910 | (0.47)10 | 1 | 239 |
|
| CLASS R4 | | | | | | | | | | | | | | | | |
|
| 12-31-2008 | 15.21 | 0.18 | (6.66) | (6.48) | (0.09) | (0.63) | — | (0.72) | 8.01 | (42.38)5 | | 0.666 | 0.567 | 1.56 | 6 | 36 |
| 12-31-2007 | 14.71 | 0.11 | 1.07 | 1.18 | (0.14) | (0.54) | — | (0.68) | 15.21 | 8.135 | | 0.966 | 0.547,13 | 0.70 | 5 | 21 |
| 12-31-20068 | 14.07 | 0.08 | 1.25 | 1.33 | (0.40) | (0.29) | — | (0.69) | 14.71 | 9.465,9 | | 1.386,10 | 0.5310 | 1.7110 | 2 | 59 |
| 8-31-200611 | 12.63 | (0.05) | 1.55 | 1.50 | (0.06) | — | — | (0.06) | 14.07 | 11.945,9 | | 4.086,10 | 0.4910 | (0.38)10 | 2 | 239 |
|
| CLASS R5 | | | | | | | | | | | | | | | | |
|
| 12-31-2008 | 15.21 | 0.17 | (6.62) | (6.45) | (0.13) | (0.63) | — | (0.76) | 8.00 | (42.18)5 | | 0.326 | 0.247 | 1.42 | 6 | 36 |
| 12-31-2007 | 14.71 | 0.22 | 1.00 | 1.22 | (0.18) | (0.54) | — | (0.72) | 15.21 | 8.425 | | 1.116 | 0.237,13 | 1.40 | 3 | 21 |
| 12-31-20068 | 14.09 | 0.09 | 1.26 | 1.35 | (0.44) | (0.29) | — | (0.73) | 14.71 | 9.575,9 | | 4.076,10 | 0.2310 | 1.9010 | 1 | 59 |
| 8-31-200611 | 12.63 | 0.01 | 1.52 | 1.53 | (0.07) | — | — | (0.07) | 14.09 | 12.165,9 | | 8.266,10 | 0.2010 | 0.0510 | —14 | 239 |
|
| CLASS 1 | | | | | | | | | | | | | | | | |
|
| 12-31-2008 | 15.18 | 0.15 | (6.57) | (6.42) | (0.15) | (0.63) | — | (0.78) | 7.98 | (42.08)5 | | 0.126 | 0.127 | 1.24 | 2,120 | 36 |
| 12-31-2007 | 14.68 | 0.15 | 1.09 | 1.24 | (0.20) | (0.54) | — | (0.74) | 15.18 | 8.54 | | 0.11 | 0.117 | 0.94 | 3,416 | 21 |
| 12-31-20068 | 14.07 | 0.10 | 1.25 | 1.35 | (0.45) | (0.29) | — | (0.74) | 14.68 | 9.599 | | 0.1110 | 0.1110 | 2.0910 | 2,782 | 59 |
| 8-31-200611 | 12.60 | 0.06 | 1.48 | 1.54 | (0.07) | — | — | (0.07) | 14.07 | 12.279 | | 0.1110 | 0.1110 | 0.4810 | 2,422 | 239 |
|
See notes to financial statements
| |
| 30 | Lifestyle Portfolios | Annual report |
F I N A N C I A L S T A T E M E N T S
Financial highlights
Continued
| | | | | | | | | | | | | | | | |
| Lifestyle Growth | | | | | | | | | | | | | | | |
| Per share operating performance for a share outstanding throughout the period | | | Ratios and supplemental data | |
| |
|
| | | Income (loss) from | | | | | | | | | | | | | |
| | | investment operations | | Less distributions | | | | | | Ratios to average net assets | | |
| | |
| |
| | |
| |
| |
| | | | Net | | | | | | | | | | | Ratio of net | | |
| | | | realized | Total | | | | | | | | Ratio of | | investment | Net | |
| | Net asset | Net | and | from | From net | | | | | | | gross | Ratio of net | income | assets, | |
| | value, | invest- | unrealized | invest- | invest- | | | | Net asset | | | expenses | expenses | (loss) to | end of | |
| | beginning | ment in- | gain (loss) | ment | ment | From net | From | Total | value, end | Total | | to average | to average | average | period (in | Portfolio |
| | of period | come (loss) | on invest- | operations | income | realized | capital | distribu- | of period | return | | net assets | net assets | net assets | millions) | turnover |
| Period ended | ($) | ($)1,2 | ments ($) | ($) | ($) | gain ($) | paid-in ($) | tions ($) | ($) | (%)3 | | (%)4 | (%)4 | (%)1 | ($) | (%) |
|
| CLASS A | | | | | | | | | | | | | | �� | | |
|
| 12–31–2008 | 15.05 | 0.27 | (5.85) | (5.58) | (0.26) | (0.48) | — | (0.74) | 8.73 | (36.89)5 | | 0.596 | 0.577 | 2.14 | 251 | 37 |
| 12–31–2007 | 14.72 | 0.28 | 0.73 | 1.01 | (0.23) | (0.45) | — | (0.68) | 15.05 | 6.965 | | 0.546 | 0.537 | 1.79 | 332 | 18 |
| 12–31–20068 | 14.63 | 0.16 | 1.01 | 1.17 | (0.43) | (0.36) | (0.29) | (1.08) | 14.72 | 8.005,9 | | 0.586,10 | 0.5810 | 3.1810 | 165 | 49 |
| 8–31–200611 | 13.35 | 0.07 | 1.28 | 1.35 | (0.07) | — | — | (0.07) | 14.63 | 10.185,9 | | 0.726,10 | 0.6110 | 0.5510 | 103 | 269 |
|
| CLASS B | | | | | | | | | | | | | | | | |
|
| 12–31–2008 | 15.06 | 0.16 | (5.81) | (5.65) | (0.16) | (0.48) | — | (0.64) | 8.77 | (37.35) | | 1.416 | 1.327 | 1.30 | 54 | 37 |
| 12–31–2007 | 14.73 | 0.16 | 0.73 | 0.89 | (0.11) | (0.45) | — | (0.56) | 15.06 | 6.145,6 | | 1.306 | 1.297 | 1.02 | 78 | 18 |
| 12–31–20068 | 14.57 | 0.12 | 1.01 | 1.13 | (0.36) | (0.36) | (0.25) | (0.97) | 14.73 | 7.775,6 | | 1.406,10 | 1.3510 | 2.4510 | 39 | 49 |
| 8–31–200611 | 13.35 | (0.02) | 1.30 | 1.28 | (0.06) | — | — | (0.06) | 14.57 | 9.575,6 | | 1.696,10 | 1.3410 | (0.19) 10 | 24 | 269 |
|
| CLASS C | | | | | | | | | | | | | | | | |
|
| 12–31–2008 | 15.05 | 0.17 | (5.81) | (5.64) | (0.17) | (0.48) | — | (0.65) | 8.76 | (37.33)5 | | 1.306 | 1.297 | 1.36 | 206 | 37 |
| 12–31–2007 | 14.72 | 0.16 | 0.74 | 0.90 | (0.12) | (0.45) | — | (0.57) | 15.05 | 6.195 | | 1.256 | 1.257 | 1.05 | 294 | 18 |
| 12–31–20068 | 14.57 | 0.13 | 0.99 | 1.12 | (0.36) | (0.36) | (0.25) | (0.97) | 14.72 | 7.735,9 | | 1.296,10 | 1.2910 | 2.5310 | 152 | 49 |
| 8–31–200611 | 13.35 | (0.02) | 1.30 | 1.28 | (0.06) | — | — | (0.06) | 14.57 | 9.575,9 | | 1.446,10 | 1.3310 | (0.14) 10 | 93 | 269 |
|
| CLASS R | | | | | | | | | | | | | | | | |
|
| 12–31–2008 | 15.12 | 0.30 | (5.96) | (5.66) | (0.18) | (0.48) | — | (0.66) | 8.80 | (37.26) 5 | | 1.876 | 1.197 | 2.46 | 2 | 37 |
| 12–31–2007 | 14.79 | 0.27 | 0.67 | 0.94 | (0.16) | (0.45) | — | (0.61) | 15.12 | 6.475 | | 5.276 | 1.067,13 | 1.72 | 1 | 18 |
| 12–31–20068,11 | 14.70 | 0.15 | 0.98 | 1.13 | (0.40) | (0.36) | (0.28) | (1.04) | 14.79 | 7.645,9 | | 12.416,10 | 0.9510 | 3.3910 | —14 | 49 |
|
| CLASS R1 | | | | | | | | | | | | | | | | |
|
| 12–31–2008 | 15.10 | 0.34 | (5.96) | (5.62) | (0.23) | (0.48) | — | (0.71) | 8.77 | (37.05) 5 | | 1.346 | 0.837 | 2.81 | 3 | 37 |
| 12–31–2007 | 14.77 | 0.32 | 0.66 | 0.98 | (0.20) | (0.45) | — | (0.65) | 15.10 | 6.755 | | 2.426 | 0.737,13 | 2.02 | 2 | 18 |
| 12–31–20068,11 | 14.70 | 0.14 | 1.00 | 1.14 | (0.42) | (0.36) | (0.29) | (1.07) | 14.77 | 7.755,9 | | 12.956,10 | 0.6910 | 3.2310 | —14 | 49 |
|
| CLASS R2 | | | | | | | | | | | | | | | | |
|
| 12–31–2008 | 15.06 | 0.35 | (5.92) | (5.57) | (0.26) | (0.48) | — | (0.74) | 8.75 | (36.80) 5 | | 0.676 | 0.527 | 2.87 | 6 | 37 |
| 12–31–2007 | 14.74 | 0.31 | 0.69 | 1.00 | (0.23) | (0.45) | — | (0.68) | 15.06 | 6.915 | | 3.186 | 0.627,13 | 1.95 | 1 | 18 |
| 12–31–20068,11 | 14.70 | 0.15 | 0.99 | 1.14 | (0.44) | (0.36) | (0.30) | (1.10) | 14.74 | 7.805,9 | | 12.746,10 | 0.4510 | 3.4810 | —14 | 49 |
|
| CLASS R3 | | | | | | | | | | | | | | | | |
|
| 12–31–2008 | 15.03 | 0.24 | (5.84) | (5.60) | (0.22) | (0.48) | — | (0.70) | 8.73 | (37.06)5 | | 0.846 | 0.837 | 1.93 | 12 | 37 |
| 12–31–2007 | 14.71 | 0.28 | 0.69 | 0.97 | (0.20) | (0.45) | — | (0.65) | 15.03 | 6.695 | | 0.986 | 0.807,13 | 1.83 | 14 | 18 |
| 12–31–20068 | 14.61 | 0.16 | 1.01 | 1.17 | (0.42) | (0.36) | (0.29) | (1.07) | 14.71 | 8.005,9 | | 1.356,10 | 0.7110 | 3.1310 | 4 | 49 |
| 8–31–200611 | 13.35 | 0.07 | 1.26 | 1.33 | (0.07) | — | — | (0.07) | 14.61 | 9.985,9 | | 5.076,10 | 0.6810 | 0.6210 | 2 | 269 |
|
| CLASS R4 | | | | | | | | | | | | | | | | |
|
| 12–31–2008 | 15.03 | 0.29 | (5.86) | (5.57) | (0.26) | (0.48) | — | (0.74) | 8.72 | (36.87) 5 | | 0.566 | 0.567 | 2.34 | 13 | 37 |
| 12–31–2007 | 14.71 | 0.27 | 0.74 | 1.01 | (0.24) | (0.45) | — | (0.69) | 15.03 | 6.955 | | 0.647,13 | 0.537,13 | 1.76 | 15 | 18 |
| 12–31–20068 | 14.64 | 0.16 | 1.01 | 1.17 | (0.44) | (0.36) | (0.30) | (1.10) | 14.71 | 8.045,9 | | 0.806,10 | 0.5310 | 3.1210 | 7 | 49 |
| 8–31–200611 | 13.35 | 0.08 | 1.29 | 1.37 | (0.08) | — | — | (0.08) | 14.64 | 10.265,9 | | 1.786,10 | 0.4910 | 0.6910 | 5 | 269 |
|
| CLASS R5 | | | | | | | | | | | | | | | | |
|
| 12–31–2008 | 15.04 | 0.33 | (5.87) | (5.54) | (0.30) | (0.48) | — | (0.78) | 8.72 | (36.64) 5 | | 0.246 | 0.247 | 2.67 | 10 | 37 |
| 12–31–2007 | 14.71 | 0.39 | 0.67 | 1.06 | (0.28) | (0.45) | — | (0.73) | 15.046 | 7.315 | | 0.546 | 0.217,13 | 2.53 | 8 | 18 |
| 12–31–20068 | 14.66 | 0.18 | 1.02 | 1.20 | (0.47) | (0.36) | (0.32) | (1.15) | 14.71 | 8.155,9 | | 1.406,10 | 0.2010 | 3.5410 | 2 | 49 |
| 8–31–200611 | 13.35 | 0.09 | 1.30 | 1.39 | (0.08) | — | — | (0.08) | 14.66 | 10.475,9 | | 2.526,10 | 0.1910 | 0.7010 | 2 | 269 |
|
| CLASS 1 | | | | | | | | | | | | | | | | |
|
| 12–31–2008 | 15.00 | 0.32 | (5.85) | (5.53) | (0.31) | (0.48) | — | (0.79) | 8.68 | (36.63) 5 | | 0.12 | 0.127 | 2.49 | 6,345 | 37 |
| 12–31–2007 | 14.67 | 0.30 | 0.77 | 1.07 | (0.29) | (0.45) | — | (0.74) | 15.006 | 7.445 | | 0.11 | 0.117 | 1.94 | 9,574 | 18 |
| 12–31–20068 | 14.63 | 0.17 | 1.03 | 1.20 | (0.48) | (0.36) | (0.32) | (1.16) | 14.67 | 8.189 | | 0.1110 | 0.1110 | 3.3410 | 8,059 | 49 |
| 8–31–200611 | 13.31 | 0.15 | 1.25 | 1.40 | (0.08) | — | — | (0.08) | 14.63 | 10.589 | | 0.1110 | 0.1110 | 1.1710 | 7,081 | 269 |
|
| CLASS 5 | | | | | | | | | | | | | | | | |
|
| 12–31–2008 | 14.98 | 0.35 | (5.86) | (5.51) | (0.32) | (0.48) | — | (0.80) | 8.67 | (36.57) 5 | | 0.07 | 0.077 | 2.78 | 41 | 37 |
| 12–31–2007 | 14.66 | 0.37 | 0.70 | 1.07 | (0.30) | (0.45) | — | (0.75) | 14.98 | 7.425 | | 0.06 | 0.067 | 2.39 | 46 | 18 |
| 12–31–20068 | 14.62 | 0.24 | 0.97 | 1.21 | (0.48) | (0.36) | (0.33) | (1.17) | 14.66 | 8.249 | | 0.0610 | 0.0610 | 4.6810 | 15 | 49 |
| 8–31–200615 | 14.40 | —12 | 0.22 | 0.22 | — | — | — | — | 14.62 | 1.539 | | 0.0610 | 0.0610 | (0.02) 10 | 3 | 269 |
|
See notes to financial statements
| |
| Annual report | Lifestyle Portfolios | 31 |
F I N A N C I A L S T A T E M E N T S
Financial highlights
Continued
| | | | | | | | | | | | | | | | |
| Lifestyle Balanced | | | | | | | | | | | | | | | |
| Per share operating performance for a share outstanding throughout the period | | | Ratios and supplemental data | |
| |
|
| | | Income (loss) from | | | | | | | | | | | | | |
| | | investment operations | | Less distributions | | | | | | Ratios to average net assets | | |
| | |
| |
| | |
| |
| |
| | | | Net | | | | | | | | | | | Ratio of net | | |
| | | | realized | Total | | | | | | | | Ratio of | | investment | Net | |
| | Net asset | Net | and | from | From net | | | | | | | gross | Ratio of net | income | assets, | |
| | value, | invest- | unrealized | invest- | invest- | | | | Net asset | | | expenses | expense | (loss) to | end of | |
| | beginning | ment in- | gain (loss) | ment | ment | From net | From | Total | value, end | Total | | to average | to average | average | period (in | Portfolio |
| | of period | come (loss) | on invest- | operations | income | realized | capital | distribu- | of period | return | | net assets | net assets | net assets | millions) | turnover |
| Period ended | ($) | ($)1,2 | ments ($) | ($) | ($) | gain ($) | paid-in ($) | tions ($) | ($) | (%)3 | | (%)4 | (%)4 | (%)1 | ($) | (%) |
|
| CLASS A | | | | | | | | | | | | | | | | |
|
| 12-31-2008 | 14.54 | 0.45 | (4.96) | (4.51) | (0.42) | (0.39) | — | (0.81) | 9.22 | (31.63)5 | | 0.546 | 0.547 | 3.60 | 249 | 36 |
| 12-31-2007 | 14.37 | 0.42 | 0.42 | 0.84 | (0.35) | (0.32) | — | (0.67) | 14.54 | 5.905 | | 0.516 | 0.507 | 2.84 | 284 | 14 |
| 12-31-20068 | 14.38 | 0.24 | 0.81 | 1.05 | (0.43) | (0.27) | (0.36) | (1.06) | 14.37 | 7.259 | | 0.5510 | 0.5510 | 4.7710 | 125 | 39 |
| 8-31-200611 | 13.35 | 0.19 | 1.01 | 1.20 | (0.17) | —12 | — | (0.17) | 14.38 | 9.085,9 | | 0.706,10 | 0.5810 | 1.6010 | 81 | 239 |
|
| CLASS B | | | | | | | | | | | | | | | | |
|
| 12-31-2008 | 14.53 | 0.33 | (4.94) | (4.61) | (0.32) | (0.39) | — | (0.71) | 9.21 | (32.22)5 | | 1.366 | 1.327 | 2.66 | 46 | 36 |
| 12-31-2007 | 14.37 | 0.29 | 0.42 | 0.71 | (0.23) | (0.32) | — | (0.55) | 14.53 | 5.025 | | 1.306 | 1.307 | 1.95 | 60 | 14 |
| 12-31-20068 | 14.37 | 0.20 | 0.81 | 1.01 | (0.40) | (0.27) | (0.34) | (1.01) | 14.37 | 6.965,9 | | 1.416,10 | 1.3410 | 4.0010 | 32 | 39 |
| 8-31-200611 | 13.35 | 0.10 | 1.02 | 1.12 | (0.10) | —12 | — | (0.10) | 14.37 | 8.475,9 | | 1.736,10 | 1.3410 | 0.8410 | 20 | 239 |
|
| CLASS C | | | | | | | | | | | | | | | | |
|
| 12-31-2008 | 14.55 | 0.34 | (4.95) | (4.61) | (0.33) | (0.39) | — | (0.72) | 9.22 | (32.19)5 | | 1.246 | 1.247 | 2.76 | 209 | 36 |
| 12-31-2007 | 14.39 | 0.31 | 0.42 | 0.73 | (0.25) | (0.32) | — | (0.57) | 14.55 | 5.105 | | 1.226 | 1.217 | 2.09 | 268 | 14 |
| 12-31-20068 | 14.38 | 0.20 | 0.82 | 1.02 | (0.40) | (0.27) | (0.34) | (1.01) | 14.39 | 7.039 | | 1.2510 | 1.2510 | 4.1010 | 128 | 39 |
| 8-31-200611 | 13.35 | 0.12 | 1.01 | 1.13 | (0.10) | —12 | — | (0.10) | 14.38 | 8.555,9 | | 1.416,10 | 1.2910 | 0.9710 | 79 | 239 |
|
| CLASS R | | | | | | | | | | | | | | | | |
|
| 12-31-2008 | 14.54 | 0.50 | (5.09) | (4.59) | (0.34) | (0.39) | — | (0.73) | 9.22 | (32.09)5 | | 1.886 | 1.227 | 4.29 | 3 | 36 |
| 12-31-2007 | 14.39 | 0.36 | 0.40 | 0.76 | (0.29) | (0.32) | — | (0.61) | 14.54 | 5.315 | | 4.496 | 1.077,13 | 2.40 | 1 | 14 |
| 12-31-20068,11 | 14.44 | 0.32 | 0.66 | 0.98 | (0.41) | (0.27) | (0.35) | (1.03) | 14.39 | 6.795,9 | | 8.416,10 | 0.9510 | 7.3710 | —14 | 39 |
|
| CLASS R1 | | | | | | | | | | | | | | | | |
|
| 12-31-2008 | 14.53 | 0.44 | (5.01) | (4.57) | (0.37) | (0.39) | — | (0.76) | 9.20 | (32.01)5 | | 2.586 | 1.067 | 3.69 | 1 | 36 |
| 12-31-2007 | 14.38 | 0.49 | 0.31 | 0.80 | (0.33) | (0.32) | — | (0.65) | 14.53 | 5.585 | | 7.356 | 0.787,13 | 3.25 | 1 | 14 |
| 12-31-20068,11 | 14.44 | 0.21 | 0.78 | 0.99 | (0.42) | (0.27) | (0.36) | (1.05) | 14.38 | 6.845,9 | | 13.066,10 | 0.7010 | 4.9610 | —14 | 39 |
|
| CLASS R2 | | | | | | | | | | | | | | | | |
|
| 12-31-2008 | 14.51 | 0.45 | (4.96) | (4.51) | (0.41) | (0.39) | — | (0.80) | 9.20 | (31.68)5 | | 0.876 | 0.567 | 3.62 | 4 | 36 |
| 12-31-2007 | 14.37 | 0.43 | 0.39 | 0.82 | (0.36) | (0.32) | — | (0.68) | 14.51 | 5.775 | | 2.846 | 0.567,13 | 2.90 | 1 | 14 |
| 12-31-20068,11 | 14.44 | 0.22 | 0.77 | 0.99 | (0.43) | (0.27) | (0.36) | (1.06) | 14.37 | 6.905,9 | | 12.706,10 | 0.4510 | 5.2110 | —14 | 39 |
|
| CLASS R3 | | | | | | | | | | | | | | | | |
|
| 12-31-2008 | 14.52 | 0.40 | (4.95) | (4.55) | (0.38) | (0.39) | — | (0.77) | 9.20 | (31.89)5 | | 0.816 | 0.807 | 3.21 | 20 | 36 |
| 12-31-2007 | 14.36 | 0.43 | 0.37 | 0.80 | (0.32) | (0.32) | — | (0.64) | 14.52 | 5.655 | | 0.856 | 0.767,13 | 2.90 | 23 | 14 |
| 12-31-20068 | 14.37 | 0.22 | 0.82 | 1.04 | (0.42) | (0.27) | (0.36) | (1.05) | 14.36 | 7.225,9 | | 1.246,10 | 0.7210 | 4.5510 | 5 | 39 |
| 8-31-200611 | 13.35 | 0.36 | 0.82 | 1.18 | (0.16) | —12 | — | (0.16) | 14.37 | 8.925,9 | | 3.706,10 | 0.6910 | 3.1010 | 3 | 239 |
|
| CLASS R4 | | | | | | | | | | | | | | | | |
|
| 12-31-2008 | 14.52 | 0.43 | (4.94) | (4.51) | (0.42) | (0.39) | — | (0.81) | 9.20 | (31.68)5 | | 0.526 | 0.527 | 3.51 | 14 | 36 |
| 12-31-2007 | 14.36 | 0.39 | 0.45 | 0.84 | (0.36) | (0.32) | — | (0.68) | 14.52 | 5.915 | | 0.586 | 0.517,13 | 2.63 | 18 | 14 |
| 12-31-20068 | 14.38 | 0.23 | 0.81 | 1.04 | (0.43) | (0.27) | (0.36) | (1.06) | 14.36 | 7.275,9 | | 0.706,10 | 0.5210 | 4.5510 | 10 | 39 |
| 8-31-200611 | 13.35 | 0.16 | 1.06 | 1.22 | (0.19) | —12 | — | (0.19) | 14.38 | 9.195,9 | | 1.466,10 | 0.4810 | 1.3710 | 7 | 239 |
|
| CLASS R5 | | | | | | | | | | | | | | | | |
|
| 12-31-2008 | 14.52 | 0.54 | (5.01) | (4.47) | (0.45) | (0.39) | — | (0.84) | 9.21 | (31.40)5 | | 0.216 | 0.217 | 4.46 | 15 | 36 |
| 12-31-2007 | 14.36 | 0.50 | 0.38 | 0.88 | (0.40) | (0.32) | — | (0.72) | 14.52 | 6.185 | | 0.436 | 0.217,13 | 3.35 | 10 | 14 |
| 12-31-20068 | 14.38 | 0.24 | 0.82 | 1.06 | (0.44) | (0.27) | (0.37) | (1.08) | 14.36 | 7.415,9 | | 1.696,10 | 0.2010 | 4.8510 | 2 | 39 |
| 8-31-200611 | 13.35 | 0.18 | 1.06 | 1.24 | (0.21) | —12 | — | (0.21) | 14.38 | 9.395,9 | | 2.586,10 | 0.1910 | 1.4810 | 1 | 239 |
|
| CLASS 1 | | | | | | | | | | | | | | | | |
|
| 12-31-2008 | 14.47 | 0.47 | (4.91) | (4.44) | (0.47) | (0.39) | — | (0.86) | 9.17 | (31.37) | | 0.12 | 0.127 | 3.79 | 6,241 | 36 |
| 12-31-2007 | 14.31 | 0.42 | 0.47 | 0.89 | (0.41) | (0.32) | — | (0.73) | 14.47 | 6.30 | | 0.11 | 0.117 | 2.84 | 8,928 | 14 |
| 12-31-20068 | 14.34 | 0.24 | 0.82 | 1.06 | (0.45) | (0.27) | (0.37) | (1.09) | 14.31 | 7.409 | | 0.1110 | 0.1110 | 4.8410 | 7,609 | 39 |
| 8-31-200611 | 13.31 | 0.22 | 1.03 | 1.25 | (0.22) | —12 | — | (0.22) | 14.34 | 9.479 | | 0.1110 | 0.1110 | 1.8110 | 6,736 | 239 |
|
| CLASS 5 | | | | | | | | | | | | | | | | |
|
| 12-31-2008 | 14.48 | 0.50 | (4.95) | (4.45) | (0.47) | (0.39) | — | (0.86) | 9.17 | (31.38) | | 0.07 | 0.077 | 4.07 | 18 | 36 |
| 12-31-2007 | 14.32 | 0.50 | 0.40 | 0.90 | (0.42) | (0.32) | — | (0.74) | 14.48 | 6.35 | | 0.06 | 0.067 | 3.39 | 19 | 14 |
| 12-31-20068 | 14.35 | 0.33 | 0.74 | 1.07 | (0.45) | (0.27) | (0.38) | (1.10) | 14.32 | 7.429 | | 0.0610 | 0.0610 | 6.6310 | 7 | 39 |
| 8-31-200615 | 14.17 | —12 | 0.31 | 0.31 | (0.13) | — | — | (0.13) | 14.35 | 2.239 | | 0.0110 | 0.0110 | (0.01)10 | 1 | 239 |
|
See notes to financial statements
| |
| 32 | Lifestyle Portfolios | Annual report |
F I N A N C I A L S T A T E M E N T S
Financial highlights
Continued
| | | | | | | | | | | | | | | | |
| Lifestyle Moderate | | | | | | | | | | | | | | | |
| Per share operating performance for a share outstanding throughout the period | | | Ratios and supplemental data | |
| |
|
| | | Income (loss) from | | | | | | | | | | | | | |
| | | investment operations | | Less distributions | | | | | | Ratios to average net assets | | |
| | |
| |
| | |
| |
| |
| | | | Net | | | | | | | | | | | Ratio of net | | |
| | | | realized | Total | | | | | | | | Ratio of | | investment | Net | |
| | Net asset | Net | and | from | From net | | | | | | | gross | Ratio of net | income | assets, | |
| | value, | invest- | unrealized | invest- | invest- | | | | Net asset | | | expenses | expenses | (loss) to | end of | |
| | beginning | ment in- | gain (loss) | ment | ment | From net | From | Total | value, end | Total | | to average | to average | average | period (in | Portfolio |
| | of period | come (loss) | on invest- | operations | income | realized | capital | distribu- | of period | return | | net assets | net assets | net assets | millions) | turnover |
| Period ended | ($) | ($)1,2 | ments ($) | ($) | ($) | gain ($) | paid-in ($) | tions ($) | ($) | (%)3 | | (%)4 | (%)4 | (%)1 | ($) | (%) |
|
| CLASS A | | | | | | | | | | | | | | | | |
|
| 12-31-2008 | 13.57 | 0.58 | (3.76) | (3.18) | (0.54) | (0.26) | — | (0.80) | 9.59 | (23.88)5 | | 0.536 | 0.537 | 4.81 | 86 | 32 |
| 12-31-2007 | 13.53 | 0.50 | 0.14 | 0.64 | (0.41) | (0.19) | — | (0.60) | 13.57 | 4.785 | | 0.536 | 0.537 | 3.57 | 76 | 13 |
| 12-31-20068 | 13.64 | 0.27 | 0.52 | 0.79 | (0.36) | (0.21) | (0.33) | (0.90) | 13.53 | 5.775,9 | | 0.576,10 | 0.5610 | 5.8610 | 37 | 19 |
| 8-31-200611 | 12.94 | 0.25 | 0.66 | 0.91 | (0.21) | — | — | (0.21) | 13.64 | 7.105,9 | | 0.836,10 | 0.5710 | 2.2110 | 25 | 249 |
|
| CLASS B | | | | | | | | | | | | | | | | |
|
| 12-31-2008 | 13.56 | 0.45 | (3.74) | (3.29) | (0.43) | (0.26) | — | (0.69) | 9.58 | (24.56)5 | | 1.396 | 1.367 | 3.70 | 14 | 32 |
| 12-31-2007 | 13.52 | 0.38 | 0.15 | 0.53 | (0.30) | (0.19) | — | (0.49) | 13.565 | 3.975 | | 1.436 | 1.357 | 2.73 | 15 | 13 |
| 12-31-20068 | 13.62 | 0.23 | 0.52 | 0.75 | (0.33) | (0.21) | (0.31) | (0.85) | 13.52 | 5.495,9 | | 1.666,10 | 1.3510 | 4.8710 | 7 | 19 |
| 8-31-200611 | 12.94 | 0.15 | 0.68 | 0.83 | (0.15) | — | — | (0.15) | 13.62 | 6.425,9 | | 2.436,10 | 1.3410 | 1.2810 | 5 | 249 |
|
| CLASS C | | | | | | | | | | | | | | | | |
|
| 12-31-2008 | 13.57 | 0.48 | (3.75) | (3.27) | (0.45) | (0.26) | — | (0.71) | 9.59 | (24.44)5 | | 1.256 | 1.257 | 4.02 | 69 | 32 |
| 12-31-2007 | 13.53 | 0.41 | 0.13 | 0.54 | (0.31) | (0.19) | — | (0.50) | 13.57 | 4.055 | | 1.246 | 1.247 | 2.94 | 69 | 13 |
| 12-31-20068 | 13.63 | 0.24 | 0.51 | 0.75 | (0.33) | (0.21) | (0.31) | (0.85) | 13.53 | 5.495,9 | | 1.326,10 | 1.2810 | 5.1310 | 29 | 19 |
| 8-31-200611 | 12.94 | 0.17 | 0.67 | 0.84 | (0.15) | — | — | (0.15) | 13.63 | 6.495,9 | | 1.676,10 | 1.2910 | 1.5110 | 18 | 249 |
|
| CLASS R | | | | | | | | | | | | | | | | |
|
| 12-31-2008 | 13.58 | 0.57 | (3.85) | (3.28) | (0.46) | (0.26) | — | (0.72) | 9.58 | (24.54)5 | | 2.896 | 1.327 | 4.84 | 1 | 32 |
| 12-31-2007 | 13.55 | 0.47 | 0.11 | 0.58 | (0.36) | (0.19) | — | (0.55) | 13.58 | 4.285 | | 6.326 | 1.067,13 | 3.41 | 1 | 13 |
| 12-31-20068,11 | 13.69 | 0.24 | 0.50 | 0.74 | (0.35) | (0.21) | (0.32) | (0.88) | 13.55 | 5.385,9 | | 13.406,10 | 0.9510 | 5.8310 | —14 | 19 |
|
| CLASS R1 | | | | | | | | | | | | | | | | |
|
| 12-31-2008 | 13.58 | 0.64 | (3.87) | (3.23) | (0.51) | (0.26) | — | (0.77) | 9.58 | (24.21)5 | | 1.976 | 0.857 | 5.39 | 2 | 32 |
| 12-31-2007 | 13.54 | 0.52 | 0.10 | 0.62 | (0.39) | (0.19) | — | (0.58) | 13.58 | 4.635 | | 4.106 | 0.717,13 | 3.73 | 1 | 13 |
| 12-31-20068,11 | 13.69 | 0.25 | 0.50 | 0.75 | (0.36) | (0.21) | (0.33) | (0.90) | 13.54 | 5.435,9 | | 13.146,10 | 0.7010 | 6.0710 | —14 | 19 |
|
| CLASS R2 | | | | | | | | | | | | | | | | |
|
| 12-31-2008 | 13.57 | 0.51 | (3.70) | (3.19) | (0.54) | (0.26) | — | (0.80) | 9.58 | (23.96)5 | | 6.016 | 0.597 | 4.24 | —14 | 32 |
| 12-31-2007 | 13.53 | 0.44 | 0.22 | 0.66 | (0.43) | (0.19) | — | (0.62) | 13.57 | 4.895 | | 19.126 | 0.457,13 | 3.18 | —14 | 13 |
| 12-31-20068,11 | 13.69 | 0.26 | 0.48 | 0.74 | (0.36) | (0.21) | (0.33) | (0.90) | 13.53 | 5.485,9 | | 12.876,10 | 0.4510 | 6.3310 | —14 | 19 |
|
| CLASS R3 | | | | | | | | | | | | | | | | |
|
| 12-31-2008 | 13.57 | 0.55 | (3.78) | (3.23) | (0.50) | (0.26) | — | (0.76) | 9.58 | (24.22)5 | | 1.006 | 0.867 | 4.55 | 5 | 32 |
| 12-31-2007 | 13.53 | 0.47 | 0.15 | 0.62 | 7 (0.39) | (0.19) | — | (0.58) | 13.57 | 4.615 | | 1.516 | 0.837,13 | 3.40 | 4 | 13 |
| 12-31-20068 | 13.65 | 0.23 | 0.55 | 0.78 | (0.36) | (0.21) | (0.33) | (0.90) | 13.53 | 5.665,9 | | 3.136,10 | 0.7810 | 4.8910 | 1 | 19 |
| 8-31-200611 | 12.94 | 0.33 | 0.58 | 0.91 | (0.20) | — | — | (0.20) | 13.65 | 7.105,9 | | 8.446,10 | 0.6910 | 2.9310 | 1 | 249 |
|
| CLASS R4 | | | | | | | | | | | | | | | | |
|
| 12-31-2008 | 13.55 | 0.56 | (3.75) | (3.19) | (0.53) | (0.26) | — | (0.79) | 9.57 | (23.94)5 | | 0.796 | 0.577 | 4.66 | 4 | 32 |
| 12-31-2007 | 13.51 | 0.47 | 0.18 | 0.65 | (0.42) | (0.19) | — | (0.61) | 13.55 | 4.875 | | 1.136 | 0.547,13 | 3.38 | 4 | 13 |
| 12-31-20068 | 13.63 | 0.25 | 0.53 | 0.78 | (0.36) | (0.21) | (0.33) | (0.90) | 13.51 | 5.805,9 | | 1.536,10 | 0.5210 | 5.4410 | 2 | 19 |
| 8-31-200611 | 12.94 | 0.30 | 0.62 | 0.92 | (0.23) | — | — | (0.23) | 13.63 | 7.145,9 | | 4.656,10 | 0.4910 | 2.5910 | 1 | 249 |
|
| CLASS R5 | | | | | | | | | | | | | | | | |
|
| 12-31-2008 | 13.56 | 0.63 | (3.78) | (3.15) | (0.57) | (0.26) | — | (0.83) | 9.58 | (23.67)5 | | 0.366 | 0.237 | 5.27 | 5 | 32 |
| 12-31-2007 | 13.52 | 0.58 | 0.11 | 0.69 | (0.46) | (0.19) | — | (0.65) | 13.56 | 5.155 | | 0.976 | 0.217,13 | 4.21 | 4 | 13 |
| 12-31-20068 | 13.64 | 0.32 | 0.48 | 0.80 | (0.37) | (0.21) | (0.34) | (0.92) | 13.52 | 5.935,9 | | 2.836,10 | 0.2010 | 6.8310 | 1 | 19 |
| 8-31-200611 | 12.94 | 0.22 | 0.73 | 0.95 | (0.25) | — | — | (0.25) | 13.64 | 7.405,9 | | 4.866,10 | 0.1910 | 1.9210 | 1 | 249 |
|
| CLASS 1 | | | | | | | | | | | | | | | | |
|
| 12-31-2008 | 13.54 | 0.59 | (3.73) | (3.14) | (0.58) | (0.26) | — | (0.84) | 9.56 | (23.63) | | 0.12 | 0.127 | 4.90 | 1,857 | 32 |
| 12-31-2007 | 13.50 | 0.49 | 0.21 | 0.70 | (0.47) | (0.19) | — | (0.66) | 13.54 | 5.25 | | 0.11 | 0.117 | 3.53 | 2,339 | 13 |
| 12-31-20068 | 13.63 | 0.27 | 0.54 | 0.81 | (0.38) | (0.21) | (0.35) | (0.94) | 13.50 | 5.909 | | 0.1110 | 0.1110 | 5.8010 | 2,008 | 19 |
| 8-31-200611 | 12.93 | 0.26 | 0.70 | 0.96 | (0.26) | — | — | (0.26) | 13.63 | 7.479 | | 0.1110 | 0.1110 | 2.2310 | 1,820 | 249 |
|
| CLASS 5 | | | | | | | | | | | | | | | | |
|
| 12-31-2008 | 13.54 | 0.67 | (3.80) | (3.13) | (0.59) | (0.26) | — | (0.85) | 9.56 | (23.59) | | 0.07 | 0.077 | 5.70 | 8 | 32 |
| 12-31-2007 | 13.49 | 0.53 | 0.19 | 0.72 | (0.48) | (0.19) | — | (0.67) | 13.54 | 5.39 | | 0.06 | 0.067 | 3.80 | 5 | 13 |
| 12-31-20068 | 13.62 | 0.34 | 0.47 | 0.81 | (0.38) | (0.21) | (0.35) | (0.94) | 13.49 | 5.939 | | 0.0610 | 0.0610 | 7.2110 | 3 | 19 |
| 8-31-200615 | 13.48 | —12 | 0.30 | 0.30 | (0.16) | — | — | (0.16) | 13.62 | 2.279 | | 0.0110 | 0.0110 | (0.01)10 | 1 | 249 |
|
See notes to financial statements
| |
| Annual report | Lifestyle Portfolios | 33 |
F I N A N C I A L S T A T E M E N T S
Financial highlights
Continued
| | | | | | | | | | | | | | | | |
| Lifestyle Conservative | | | | | | | | | | | | | | |
| Per share operating performance for a share outstanding throughout the period | | | Ratios and supplemental data | |
| |
|
| | | Income (loss) from | | | | | | | | | | | | | |
| | | investment operations | | Less distributions | | | | | | Ratios to average net assets | | |
| | |
| |
| | |
| |
| |
| | | | Net | | | | | | | | | | | Ratio of net | | |
| | | | realized | Total | | | | | | | | Ratio of | | investment | Net | |
| | Net asset | Net | and | from | From net | | | | | | | gross | Ratio of net | income | assets, | |
| | value, | invest- | unrealized | invest- | invest- | | | | Net asset | | | expenses | expenses | (loss) to | end of | |
| | beginning | ment in- | gain (loss) | ment | ment | From net | From | Total | value, end | Total | | to average | to average | average | period (in | Portfolio |
| | of period | come (loss) | on invest- | operations | income | realized | capital | distribu- | of period | return | | net assets | net assets | net assets | millions) | turnover |
| Period ended | ($) | ($)1,2 | ments ($) | ($) | ($) | gain ($) | paid-in ($) | tions ($) | ($) | (%)3 | | (%)4 | (%)4 | (%)1 | ($) | (%) |
|
| CLASS A | | | | | | | | | | | | | | | | |
|
| 12-31-2008 | 13.32 | 0.73 | (2.75) | (2.02) | (0.63) | (0.28) | — | (0.91) | 10.39 | (15.41)5 | | 0.536 | 0.537 | 6.01 | 87 | 33 |
| 12-31-2007 | 13.29 | 0.59 | 0.05 | 0.64 | (0.49) | (0.12) | — | (0.61) | 13.32 | 4.895 | | 0.556 | 0.547 | 4.38 | 44 | 13 |
| 12-31-20068 | 13.63 | 0.33 | 0.23 | 0.56 | (0.38) | (0.16) | (0.36) | (0.90) | 13.29 | 4.115,9 | | 0.646,10 | 0.5610 | 7.2010 | 20 | 29 |
| 8-31-200611 | 13.16 | 0.31 | 0.41 | 0.72 | (0.25) | — | — | (0.25) | 13.63 | 5.535,9 | | 1.026,10 | 0.5710 | 2.7510 | 12 | 209 |
|
| CLASS B | | | | | | | | | | | | | | | | |
|
| 12-31-2008 | 13.32 | 0.59 | (2.70) | (2.11) | (0.53) | (0.28) | — | (0.81) | 10.40 | (16.04)5 | | 1.366 | 1.347 | 4.81 | 13 | 33 |
| 12-31-2007 | 13.29 | 0.50 | 0.04 | 0.54 | (0.39) | (0.12) | — | (0.51) | 13.32 | 4.115 | | 1.546 | 1.327 | 3.71 | 10 | 13 |
| 12-31-20068 | 13.63 | 0.29 | 0.22 | 0.51 | (0.35) | (0.16) | (0.34) | (0.85) | 13.29 | 3.755,9 | | 1.886,10 | 1.3310 | 6.2010 | 4 | 29 |
| 8-31-200611 | 13.16 | 0.24 | 0.41 | 0.65 | (0.18) | — | — | (0.18) | 13.63 | 4.995,9 | | 3.126,10 | 1.3310 | 2.0810 | 3 | 209 |
|
| CLASS C | | | | | | | | | | | | | | | | |
|
| 12-31-2008 | 13.32 | 0.62 | (2.73) | (2.11) | (0.54) | (0.28) | — | (0.82) | 10.39 | (16.03)5 | | 1.246 | 1.247 | 5.05 | 73 | 33 |
| 12-31-2007 | 13.28 | 0.52 | 0.04 | 0.56 | (0.40) | (0.12) | — | (0.52) | 13.32 | 4.225 | | 1.286 | 1.287,13 | 3.88 | 44 | 13 |
| 12-31-20068 | 13.62 | 0.30 | 0.21 | 0.51 | (0.35) | (0.16) | (0.34) | (0.85) | 13.28 | 3.765,9 | | 1.416,10 | 1.2910 | 6.5510 | 14 | 29 |
| 8-31-200611 | 13.16 | 0.29 | 0.35 | 0.64 | (0.18) | — | — | (0.18) | 13.62 | 4.915,9 | | 2.056,10 | 1.3110 | 2.5410 | 8 | 209 |
|
| CLASS R | | | | | | | | | | | | | | | | |
|
| 12-31-2008 | 13.34 | 0.78 | (2.87) | (2.09) | (0.56) | (0.28) | — | (0.84) | 10.41 | (15.88)5 | | 3.386 | 1.217 | 6.55 | 1 | 33 |
| 12-31-2007 | 13.31 | 0.48 | 0.11 | 0.59 | (0.44) | (0.12) | — | (0.56) | 13.34 | 4.495 | | 13.846 | 1.017,13 | 3.53 | —14 | 13 |
| 12-31-20068 | 13.67 | 0.29 | 0.23 | 0.52 | (0.37) | (0.16) | (0.35) | (0.88) | 13.31 | 3.805,9 | | 13.496,10 | 0.9510 | 7.1410 | —14 | 29 |
|
| CLASS R1 | | | | | | | | | | | | | | | | |
|
| 12-31-2008 | 13.34 | 1.02 | (3.07) | (2.05) | (0.60) | (0.28) | — | (0.88) | 10.41 | (15.62)5 | | 2.316 | 0.887 | 8.75 | 2 | 33 |
| 12-31-2007 | 13.30 | 0.57 | 0.07 | 0.64 | (0.48) | (0.12) | — | (0.60) | 13.34 | 4.835 | | 9.696 | 0.717,13 | 4.21 | —14 | 13 |
| 12-31-20068 | 13.67 | 0.30 | 0.23 | 0.53 | (0.38) | (0.16) | (0.36) | (0.90) | 13.30 | 3.855,9 | | 13.246,10 | 0.7010 | 7.3810 | —14 | 29 |
|
| CLASS R2 | | | | | | | | | | | | | | | | |
|
| 12-31-2008 | 13.32 | 0.75 | (2.77) | (2.02) | (0.62) | (0.28) | — | (0.90) | 10.40 | (15.39)5 | | 0.866 | 0.537 | 6.24 | 3 | 33 |
| 12-31-2007 | 13.30 | 0.56 | 0.09 | 0.65 | (0.51) | (0.12) | — | (0.63) | 13.32 | 4.935 | | 7.596 | 0.537,13 | 4.14 | —14 | 13 |
| 12-31-20068 | 13.67 | 0.31 | 0.23 | 0.54 | (0.38) | (0.16) | (0.37) | (0.91) | 13.30 | 3.985,9 | | 12.986,10 | 0.4510 | 7.6410 | —14 | 29 |
|
| CLASS R3 | | | | | | | | | | | | | | | | |
|
| 12-31-2008 | 13.33 | 0.54 | (2.59) | (2.05) | (0.60) | (0.28) | — | (0.88) | 10.40 | (15.62)5 | | 0.906 | 0.837 | 4.27 | 6 | 33 |
| 12-31-2007 | 13.29 | 0.70 | (0.07) | 0.63 | (0.47) | (0.12) | — | (0.59) | 13.33 | 4.815 | | 1.896 | 0.817,13 | 5.17 | 4 | 13 |
| 12-31-20068 | 13.65 | 0.29 | 0.25 | 0.54 | (0.38) | (0.16) | (0.36) | (0.90) | 13.29 | 3.935,9 | | 6.236,10 | 0.7710 | 6.2310 | —14 | 29 |
| 8-31-200611 | 13.16 | 0.28 | 0.44 | 0.72 | (0.23) | — | — | (0.23) | 13.65 | 5.555,9 | | 14.726,10 | 0.6810 | 2.4610 | —14 | 209 |
|
| CLASS R4 | | | | | | | | | | | | | | | | |
|
| 12-31-2008 | 13.31 | 0.64 | (2.65) | (2.01) | (0.63) | (0.28) | — | (0.91) | 10.39 | (15.38)5 | | 0.876 | 0.577 | 5.21 | 3 | 33 |
| 12-31-2007 | 13.28 | 0.53 | 0.12 | 0.65 | (0.50) | (0.12) | — | (0.62) | 13.31 | 4.975 | | 1.466 | 0.537,13 | 3.96 | 3 | 13 |
| 12-31-20068 | 13.64 | 0.28 | 0.27 | 0.55 | (0.38) | (0.16) | (0.37) | (0.91) | 13.28 | 4.065,9 | | 2.876,10 | 0.5110 | 6.1710 | 1 | 29 |
| 8-31-200611 | 13.16 | 0.44 | 0.30 | 0.74 | (0.26) | — | — | (0.26) | 13.64 | 5.665,9 | | 10.016,10 | 0.4510 | 3.8910 | 1 | 209 |
|
| CLASS R5 | | | | | | | | | | | | | | | | |
|
| 12-31-2008 | 13.32 | 0.86 | (2.83) | (1.97) | (0.67) | (0.28) | — | (0.95) | 10.40 | (15.10)5 | | 0.526 | 0.257 | 7.19 | 4 | 33 |
| 12-31-2007 | 13.29 | 0.57 | 0.12 | 0.69 | (0.54) | (0.12) | — | (0.66) | 13.32 | 5.275 | | 3.426 | 0.227,13 | 4.23 | 1 | 13 |
| 12-31-20068 | 13.65 | 0.28 | 0.29 | 0.57 | (0.40) | (0.16) | (0.37) | (0.93) | 13.29 | 4.195,9 | | 6.376,10 | 0.2010 | 6.0110 | —14 | 29 |
| 8-31-200611 | 13.16 | 0.28 | 0.49 | 0.77 | (0.28) | — | — | (0.28) | 13.65 | 5.945,9 | | 9.186,10 | 0.1910 | 2.4410 | —14 | 209 |
|
| CLASS 1 | | | | | | | | | | | | | | | | |
|
| 12-31-2008 | 13.30 | 0.71 | (2.67) | (1.96) | (0.68) | (0.28) | — | (0.96) | 10.38 | (15.02)5 | | 0.12 | 0.127 | 5.71 | 1,393 | 33 |
| 12-31-2007 | 13.27 | 0.57 | 0.14 | 0.71 | (0.56) | (0.12) | — | (0.68) | 13.30 | 5.385 | | 0.11 | 0.117 | 4.24 | 1,401 | 13 |
| 12-31-20068 | 13.64 | 0.32 | 0.25 | 0.57 | (0.40) | (0.16) | (0.38) | (0.94) | 13.27 | 4.169 | | 0.1110 | 0.1110 | 6.9610 | 1,184 | 29 |
| 8-31-200611 | 13.15 | 0.30 | 0.48 | 0.78 | (0.29) | — | — | (0.29) | 13.64 | 6.019 | | 0.1210 | 0.1210 | 2.5410 | 1,097 | 209 |
|
See notes to financial statements
| |
| 34 | Lifestyle Portfolios | Annual report |
F I N A N C I A L S T A T E M E N T S
Notes to Financial Highlights
1 Recognition of net investment income by the Portfolio is affected by the timing of the declaration of dividends by the underlying funds in which the Portfolio invests.
2 Based on the average of the shares outstanding.
3 Assumes dividend reinvestment and does not reflect the effect of sales charges for Class A, Class B and Class C.
4 Does not include expenses of the underlying affiliated funds in which the Portfolio invests.
5 Total returns would have been lower had certain expenses not been reduced during the periods shown.
6 Does not take into consideration expense reductions during the periods shown.
7 Ratios do not include expenses indirectly incurred from underlying funds whose expense ratios can vary based on the mix of underlying funds held by the Portfolio. The range of expense ratios of the underlying funds held by the Portfolios was as follows:
| | | | | |
| | Lifestyle | Lifestyle | Lifestyle | Lifestyle | Lifestyle |
| Year ended | Aggressive | Growth | Balanced | Moderate | Conservative |
| 12/31/08 | 0.49%–2.84% | 0.49%–2.84% | 0.49%–2.84% | 0.49%–2.40% | 0.49%–2.40% |
| 12/31/07 | 0.79%–0.91% | 0.79%–0.91% | 0.79%–0.91% | 0.79%–0.91% | 0.79%–0.91% |
8 Effective 1-18-07, the fiscal year-end changed from August 31 to December 31.
9 Not annualized.
10 Annualized.
11 Class A, Class B, Class C, Class R3, Class R4 and Class R5 shares began operations on 10-18-05, Class R, Class R1 and Class R2 began operations on 9-18-06 and Class 1 shares began operation on 10-15-05.
12 Less than $0.01 per share.
13 Includes transfer agent fee earned credits equal to 0.01% of average net assets.
14 Less than $500,000.
15 Class 5 shares began operation on 7-3-06.
See notes to financial statements
| |
| Annual report | Lifestyle Portfolios | 35 |
Notes to financial statements
1. Organization of the Trust
John Hancock Funds II (the Trust or JHF II) is an open-end management investment company organized as a Massachusetts business trust. It is a series company, which means that it has several funds, each with a stated investment objective that it pursues through separate investment policies. The Trust currently offers seventy-two separate investment Portfolios, five of which are presented in this report and are diversified for purposes of the Investment Company Act of 1940, as amended (the 1940 Act).
The Lifestyle Portfolios operate as “fund of funds”, investing in Class NAV shares of underlying funds of the Trust and John Hancock Funds III (JHF III) and also in other affiliated funds of the John Hancock funds complex. The Portfolios may also invest in unaffiliated underlying funds and other permitted investments.
The JHF III funds are retail mutual funds advised by John Hancock Investment Management Services, LLC (JHIMS or the Adviser) and distributed by John Hancock Funds, LLC (the Distributor).
The accounting policies of the affiliated underlying funds of the Trust are outlined in the shareholder reports for such funds, available without charge by calling 1-800-225-5291 or on the Securities and Exchange Commission (SEC) Web site at www.sec.gov, or at the Commission’s public reference room in Washington, D.C. The affiliated underlying funds are not covered by this report.
JHIMS, a Delaware limited liability company controlled by John Hancock Life Insurance Company (U.S.A.) (John Hancock USA), serves as investment adviser for the Trust and the Distributor, an affiliate of the Adviser, serves as principal underwriter. John Hancock Life Insurance Company of New York (John Hancock New York) is a wholly owned subsidiary of John Hancock USA. John Hancock USA and John Hancock New York are indirect wholly owned subsidiaries of the Manufacturers Life Insurance Company (Manulife), which in turn is a wholly owned subsidiary of Manulife Financial Corporation (MFC), a publicly traded company. MFC and its subsidiaries are known collectively as “Manulife Financial.”
The Board of Trustees have authorized the issuance of multiple classes of shares of the Portfolios, including classes designated as Class A, Class B, Class C, Class R, Class R1, Class R2, Class R3, Class R4, Class R5 , Class 1 and Class 5 shares. Class A, Class B and Class C shares are open to all retail investors. Class R, Class R1, Class R2, Class R3, Class R4 and Class R5 shares are available only to certain retirement plans. Class 1 shares are sold only to certain exempt separate accounts of John Hancock USA and John Hancock New York. Class 5 shares currently are available only to the John Hancock Freedom 529 Plan. The shares of each class represent an interest in the same portfolio of investments of the Portfolios, and have equal rights as to voting, redemptions, dividends and liquidation, except that certain expenses, subject to the approval of the Trustees, may be applied differently to each class of shares in accordance with current regulations of the SEC and the Internal Revenue Service. Shareholders of a class that bears distribution and service expenses under the terms of a distribution plan have exclusive voting rights to that distribution plan. Class B shares will convert to Class A shares eight years after purchase.
2. Significant accounting policies
The financial statements have been prepared in conformity with accounting principles generally accepted in the United States of America, which require management to make certain estimates and assumptions at the date of the financial statements. Actual results could differ from those estimates. The following summarizes the significant accounting policies of the Portfolios:
Security valuation
Investments are stated at value as of the close of the regular trading on New York Stock Exchange (NYSE), normally at 4:00 p.m., Eastern Time. Investments by the Portfolio in underlying affiliated funds are valued at their respective net asset values each business day and securities in the underlying funds are valued in accordance with their respective valuation polices, as outlined in the underlying funds’ financial statements. All other securities held by the Portfolio and by the underlying affiliated funds are valued at the last sale price or official closing price (closing bid price or last evaluated quote if no sale has occurred) as of the close of business on the principal securities exchange (domestic or foreign) on which they trade. Short-term debt investments that have a remaining maturity of 60 days or less are valued at amortized cost, and thereafter assume a constant amortization to maturity of any discount or premium, which approximates market value.
Valuations change in response to many factors including the historical and prospective earnings of the issuer, the value of the issuer’s assets, general economic conditions, interest rates, investor perceptions and market liquidity.
The Portfolio adopted Statement of Financial Accounting Standards No. 157 (FAS 157), Fair Value Measurements, effective with the beginning of the Portfolio’s fiscal year. FAS 157 establishes a hierarchy that prioritizes the inputs to valuation techniques giving the highest priority to readily available unadjusted quoted prices in active markets for identical assets (level 1 measurements) and the lowest priority to unobservable inputs (level 3 measurements) when market prices are not readily available or reliable.
| |
| 36 | Lifestyle Portfolios | Annual report |
The three levels of hierarchy are described below:
Level 1 — Quoted prices in active markets for identical securities.
Level 2 — Prices determined using other significant observable inputs. Inputs other than quoted prices included in Level 1 that are observable either directly or indirectly through corroboration with observable market data. These may include quoted prices for similar securities, interest rates, prepayment speeds, credit risk and others.
Level 3 — Prices determined using significant unobservable inputs. In situations where quoted prices or observable inputs are unavailable, such as when there is little or no market activity for an investment, unobservable inputs may be used. Unobservable inputs reflect the Portfolio’s own assumptions about the factors that market participants would use in pricing an investment and would be based on the best information available.
The inputs or methodology used for valuing securities are not necessarily an indication of the risk associated with investing in those securities.
The following tables are a summary of the inputs used to value the Portfolios’ net assets as of December 31, 2008. Other financial instruments are derivative instruments not reflected in the Portfolio of Investments, such as futures, forwards and swap contracts, which are valued at the unrealized appreciation/depreciation on the instrument.
| | | |
| Valuation Inputs: | Investments in Funds | Other Financial Instruments | |
| Lifestyle Aggressive | | | |
| Level 1 — Quoted Prices | $2,298,249,108 | — | |
| Level 2 — Other Significant Observable Inputs | — | — | |
| Level 3 — Significant Unobservable Inputs | — | — | |
| Total | $2,298,249,108 | — | |
| | |
| Lifestyle Growth | | | |
| Level 1 — Quoted Prices | $6,945,700,720 | — | |
| Level 2 — Other Significant Observable Inputs | — | — | |
| Level 3 — Significant Unobservable Inputs | — | — | |
| Total | $6,945,700,720 | — | |
| | |
| Lifestyle Balanced | | | |
| Level 1 — Quoted Prices | $6,819,601,616 | — | |
| Level 2 — Other Significant Observable Inputs | — | — | |
| Level 3 — Significant Unobservable Inputs | — | — | |
| Total | $6,819,601,616 | — | |
| | |
| Lifestyle Moderate | | | |
| Level 1 — Quoted Prices | $2,051,332,967 | — | |
| Level 2 — Other Significant Observable Inputs | — | — | |
| Level 3 — Significant Unobservable Inputs | — | — | |
| Total | $2,051,332,967 | — | |
| | |
| Lifestyle Conservative | | | |
| Level 1 — Quoted Prices | $1,586,456,077 | — | |
| Level 2 — Other Significant Observable Inputs | — | — | |
| Level 3 — Significant Unobservable Inputs | — | — | |
| Total | $1,586,456,077 | — | |
Repurchase agreement
Each Portfolio may enter into repurchase agreements. When a Portfolio enters into a repurchase agreement through its custodian, it receives delivery of securities, the amount of which at the time of purchase and each subsequent business day is required to be maintained at such a level that the market value is generally at least 102% of the repurchase amount. Each Portfolio will take constructive receipt of all securities underlying the repurchase agreements it has entered into until such agreements expire. If the seller defaults, a Portfolio would suffer a loss to the extent that proceeds from the sale of underlying securities were less than the repurchase amount. Each Portfolio may enter into repurchase agreements maturing within seven days with domestic dealers, banks or other financial institutions deemed to be creditworthy by the Adviser. Collateral for certain tri-party repurchase agreements is held at the custodian bank in a segregated account for the benefit of the P ortfolio and the counterparty.
| |
| Annual report | Lifestyle Portfolios | 37 |
Security transactions and related investment income
Investment security transactions are accounted for on a trade date plus one basis for daily net asset value calculations. However, for financial reporting purposes, investment transactions are reported on trade date. Interest income is accrued as earned. Dividend income and distributions to shareholders are recorded on the ex-dividend date. Foreign dividends are recorded on the ex-date or when the Portfolio becomes aware of the dividends from cash collections. Discounts/premiums are accreted/amortized for financial reporting purposes. Non-cash dividends are recorded at the fair market value of the securities received. Debt obligations may be placed in a non-accrual status and related interest income may be reduced by ceasing current accruals and writing off interest receivables when the collection of all or a portion of interest has become doubtful, based upon consistently applied procedures.
The Portfolio uses the specific identification method for determining realized gain or loss on investments for both financial statement and federal income tax reporting purposes.
Expenses
The majority of expenses are directly identifiable to an individual Portfolio. Trust expenses that are not readily identifiable to a specific Portfolio are allocated in such a manner as deemed equitable, taking into consideration, among other things, the nature and type of expense and the relative size of the Portfolios. Expense estimates are accrued in the period to which they relate and adjustments are made when actual amounts are known.
Class allocations
Income, common expenses and realized and unrealized gains (losses) are determined at the Portfolio level and allocated daily to each series of shares based on the appropriate net asset value of the respective series. Class-specific expenses, such as Distribution (Rule 12b-1) fees are calculated daily at the series level based on the appropriate net asset value of each series and the specific expense rate(s) applicable to each class.
Federal income taxes
Each Portfolio qualifies as a regulated investment company by complying with the applicable provisions of the Internal Revenue Code and will not be subject to federal income tax on taxable income that is distributed to shareholders. Therefore, no federal income tax provision is required. For federal income tax purposes, certain Portfolios have a capital loss carryforward available, to the extent provided by regulations, to offset future net realized capital gains. To the extent that such carryforward is used by the Portfolio, no capital gain distributions will be made.
At December 31, 2008, capital loss carryforwards available to offset future realized gains were as follows:
| | | |
| | Capital Loss Carryforwards | | |
| | Expiring at | | |
| Portfolio | December 31, 2016 | | |
| | |
| Lifestyle Aggressive | $129,404,422 | | |
| Lifestyle Growth | 354,305,219 | | |
| Lifestyle Balanced | 164,498,926 | | |
| Lifestyle Moderate | 39,351,498 | | |
| Lifestyle Conservative | — | | |
As of December 31, 2008, the Portfolios had no uncertain tax positions that would require financial statement recognition, de-recognition, or disclosure. Each of the Portfolios’ federal tax returns filed in the three year period ended December 31, 2008 remain subject to examination by the Internal Revenue Service.
The cost of investments owned on December 31, 2008, including short-term investments, for federal income tax purposes, was as follows:
| | | | |
| | | | | Net Unrealized |
| | | Unrealized | Unrealized | Appreciation/ |
| Portfolio | Aggregate Cost | Appreciation | (Depreciation) | (Depreciation) |
|
| Lifestyle Aggressive | $3,434,012,409 | $758,097 | ($1,136,521,398) | ($1,135,763,301) |
| Lifestyle Growth | 9,938,755,213 | — | (2,993,054,493) | (2,993,054,493) |
| Lifestyle Balanced | 9,489,637,409 | 7,412,807 | (2,677,448,600) | (2,670,035,793) |
| Lifestyle Moderate | 2,685,748,066 | 5,630,861 | (640,045,960) | (634,415,099) |
| Lifestyle Conservative | 1,954,956,115 | 7,543,001 | (376,043,039) | (368,500,038) |
Distribution of income and gains
The Portfolios record distributions to shareholders from net investment income and net realized gains, if any, on the ex-dividend date. The Lifestyle Aggressive and Lifestyle Growth Portfolios declare and pay income dividends and capital gains distributions, if any, annually. The Lifestyle Balanced, Lifestyle Moderate and Lifestyle Conservative Portfolios generally declare and pay income dividends quarterly and capital gains distributions, if any, annually. Distributions paid by the Portfolios with respect to each series of shares are calculated in the same manner, at the same time and are in the same amount, except for the effect of expenses that may be applied differently to each class.
| |
| 38 | Lifestyle Portfolios | Annual report |
During the year ended December 31, 2007, the tax character of distributions paid was as follows:
| | | | |
| Long Term | | |
| Portfolio | Ordinary Income | Capital Gains | Return of Capital | Total |
|
| |
| Lifestyle Aggressive | $123,815,341 | $43,966,246 | — | $167,781,587 |
| Lifestyle Growth | 403,632,376 | 82,092,859 | — | 485,725,235 |
| Lifestyle Balanced | 413,394,944 | 44,874,979 | — | 458,269,923 |
| Lifestyle Moderate | 108,022,601 | 7,519,152 | — | 115,541,753 |
| Lifestyle Conservative | 68,963,500 | 1,863,066 | — | 70,826,566 |
During the year ended December 31, 2008, the tax character of distributions paid was as follows:
| | | | |
| | Long Term | | |
| Portfolio | Ordinary Income | Capital Gains | Return of Capital | Total |
|
| |
| Lifestyle Aggressive | $46,077,067 | $154,308,175 | — | $200,385,242 |
| Lifestyle Growth | 289,483,652 | 285,306,066 | — | 574,789,718 |
| Lifestyle Balanced | 398,231,794 | 204,388,634 | — | 602,620,428 |
| Lifestyle Moderate | 141,159,282 | 28,730,116 | — | 169,889,398 |
| Lifestyle Conservative | 123,772,450 | 11,324,276 | — | 135,096,726 |
As of December 31, 2008, the components of distributable earnings on a tax basis, were as follows:
| | | | |
| | Undistributed | | |
| | Undistributed | Long Term | Capital Loss | Post-October |
| Portfolio | Ordinary Income | Capital Gains | Carryforward | Loss Deferral |
|
| |
| Lifestyle Aggressive | $231,280 | — | $129,404,422 | $135,794,161 |
| Lifestyle Growth | 1,831,715 | — | 354,305,219 | 285,420,113 |
| Lifestyle Balanced | 1,924,865 | — | 164,498,926 | 269,644,703 |
| Lifestyle Moderate | 583,256 | — | 39,351,498 | 15,272,580 |
| Lifestyle Conservative | 624,034 | — | — | 7,549,607 |
Such distributions and distributable earnings, on a tax basis, are determined in conformity with income tax regulations, which may differ from accounting principles generally accepted in the United States of America. Distributions in excess of tax basis earnings and profits, if any, are reported in the Portfolios’ financial statements as a return of capital. Net capital losses that are attributable to security transactions incurred after October 31, 2008, are treated as arising on January 1, 2009, the first day of the Portfolio’s next taxable year.
Capital accounts within financial statements are adjusted for permanent book/tax differences. These adjustments have no impact on net assets or the results of operations. Temporary book/tax differences will reverse in a subsequent period. For the year ended December 31, 2008, there were no permanent book/tax differences.
3. Risks & Uncertainties
Concentration Risk
The Portfolios may concentrate investments in a particular industry or sector of the economy or invest in a limited number of companies. Accordingly, the concentration may make the Portfolios’ value more volatile and investment values may rise and fall more rapidly. In addition, a Portfolio with a concentration is particularly susceptible to the impact of market, economic, regulatory and other factors affecting the specific concentration.
4. Guarantees and indemnifications
Under the Trust’s organizational documents, its Officers and Trustees are indemnified against certain liabilities arising out of the performance of their duties to the Trust. Additionally, in the normal course of business, the Trust enters into contracts with service providers that contain general indemnification clauses. The Trust’s maximum exposure under these arrangements is unknown, as this would involve future claims that may be made against the Trust that have not yet occurred. However, based on experience, the Trust believes the risk of loss to be remote.
5. Investment advisory and other agreements
The Trust has entered into an Investment Advisory Agreement with the Adviser. The Adviser is responsible for managing the corporate and business affairs of the Trust and for selecting and compensating subadvisers to handle the investment of the assets of the Portfolios, subject to the supervision of the Board of Trustees. The advisory fee has two components: (a) a fee on assets invested in a fund of JHF II or John Hancock Funds III (JHF III) and (b) a fee on assets invested in investments other than a fund of JHF II or JHF III (“Other Assets”). Under the Advisory Agreement, the Portfolios pay a monthly management fee to the Adviser as stated below:
| |
| Annual report | Lifestyle Portfolios | 39 |
The fee on assets invested in a fund of JHF II or JHF III is stated as an annual percentage of the current value of the aggregate net assets of the fund, the four other Lifestyle funds, and of the five corresponding Lifestyle Trusts of John Hancock Trust (JHT) (but only for the period during which the subadviser to the fund also serves as the subadviser for such other JHT and JHF II funds), determined in accordance with the following schedule.
| | |
| | First $7.5 billion of | Excess over $7.5 billion of |
| Portfolio | Aggregate Net Assets | Aggregate Net Assets |
|
| Lifestyle Portfolios | 0.050% | 0.040% |
The fee on other assets is stated as an annual percentage of the current value of the aggregate net assets of the fund, the four other Lifestyle funds, and of the five corresponding Lifestyle Trusts of JHT (but only for the period during which the subadviser to the fund also serves as the subadviser for such other JHT and JHF II funds) determined in accordance with the following schedule.
| | |
| | First $7.5 billion of | Excess over $7.5 billion of |
| Portfolio | Aggregate Net Assets | Aggregate Net Assets |
|
| Lifestyle Portfolios | 0.500% | 0.490% |
The Portfolios are not responsible for the payment of subadvisory fees.
The investment management fees incurred for the year ended December 31, 2008, were equivalent to an annual effective rate of the Portfolios’ average daily net assets as detailed below:
| | |
| Portfolio | Annual Effective Rate | |
| |
| Lifestyle Aggressive | 0.04% | |
| Lifestyle Growth | 0.04% | |
| Lifestyle Balanced | 0.04% | |
| Lifestyle Moderate | 0.04% | |
| Lifestyle Conservative | 0.04% | |
John Hancock Funds II are retail mutual funds advised by JHIMS and distributed by an affiliate of JHIMS, John Hancock Funds, LLC.
MFC Global Investment Management (U.S.A.) Limited acts as Subadviser to the Lifestyle Portfolios.
Expense reimbursements
The Adviser has contractually agreed to waive advisory fees or reimburse Portfolio expenses for Class A, Class B, Class C, Class R, Class R1, Class R2, Class R3, Class R4 and Class R5 shares to the extent that registration fees and printing and postage expenses attributable to each class exceed 0.09% of the average annual net assets attributable to the classes. This agreement remains in effect until May 1, 2009, and may thereafter be terminated by the Adviser at any time.
For the year ended December 31, 2008, the expense reductions amounted to the following and are reflected as a reduction of total expenses in the Statement of Operations:
| | | | | | | | | |
| Expense Reimbursement by Class |
|
| Portfolio | Class A | Class B | Class C | Class R | Class R1 | Class R2 | Class R3 | Class R4 | Class R5 |
|
| |
| Lifestyle Aggressive | — | — | — | $11,826 | $12,091 | $11,419 | $2,764 | $4,887 | $4,155 |
| Lifestyle Growth | — | — | — | 12,720 | 11,950 | 8,301 | — | — | 12 |
| Lifestyle Balanced | — | — | — | 13,160 | 12,802 | 12,169 | — | — | — |
| Lifestyle Moderate | — | $345 | — | 12,404 | 12,603 | 12,887 | 6,565 | 8,088 | 6,564 |
| Lifestyle Conservative | — | 1,339 | — | 12,552 | 11,824 | 10,273 | 4,733 | 10,761 | 6,639 |
In addition, the Adviser has agreed to reimburse or limit certain Fund level expenses to 0.07% of the Portfolios’ average annual net assets which are allocated pro rata to all share classes. This agreement excludes taxes, portfolio brokerage commissions, interest, Rule 12b-1 fees, transfer agency fees, blue sky fees, printing and postage and litigation and indemnification expenses and other extraordinary expenses not incurred in the ordinary course of the Portfolios’ business. In addition, fees incurred under any agreement or plans of the Portfolios dealing with services for the shareholders with beneficial interest in shares of the Portfolios, are excluded. This voluntary expense reimbursement may be terminated at any time. For the year ended December 31, 2008, there were no reimbursements associated with this agreement.
| |
| 40 | Lifestyle Portfolios | Annual report |
Fund administration fees
Pursuant to the Advisory Agreement, the Portfolios reimburse the Adviser for all expenses associated with providing the administrative, financial, legal, accounting and recordkeeping services of the Portfolios, including the preparation of all tax returns, annual, semiannual and periodic reports to shareholders and the preparation of all regulatory reports. These expenses are allocated based on the relative share of net assets of each Portfolio at the time the expense was incurred.
The fund administration fees incurred for the year ended December 31, 2008, were equivalent to an annual effective rate of 0.02% of each Portfolio’s average daily net assets.
Distribution plans
The Trust has a Distribution Agreement with the Distributor. The Portfolios have adopted Distribution Plans with respect to Class A, Class B, Class C, Class R, Class R1, Class R2, Class R3, Class R4 and Class 1, pursuant to Rule 12b-1 under the 1940 Act, to reimburse the Distributor for the services it provides as distributor of shares of the Portfolios. Accordingly, the Portfolios make monthly payments to the Distributor at an annual rate not to exceed 0.30%, 1.00%, 1.00%, 0.75%, 0.50%, 0.25%, 0.50%, 0.25% and 0.05% of the average daily net assets of Class A, Class B, Class C, Class R, Class R1, Class R2, Class R3, Class R4 and Class 1, respectively. A maximum of 0.25% of average daily net assets may be service fees, as defined by the Conduct Rules of the Financial Industry Regulatory Authority (formerly, National Association of Securities Dealers). Under the Conduct Rules, curtailment of a portion of the Portfolio’s 12b-1 payments could occur under certain circumstan ces.
The Service Plan fees incurred for the year ended December 31, 2008, were equivalent to an annual effective rate of the Portfolio’s average daily net assets as follows:
| | | |
| Portfolio | Annual Effective Rate | | |
| | |
| Lifestyle Aggressive | 0.09% | | |
| Lifestyle Growth | 0.10% | | |
| Lifestyle Balanced | 0.10% | | |
| Lifestyle Moderate | 0.10% | | |
| Lifestyle Conservative | 0.11% | | |
The Portfolios have also adopted a Service Plan with respect to Class R, Class R1, Class R2, Class R3, Class R4 and Class R5 shares (the “Service Plan”). Under the Service Plan, the Portfolios pay up to 0.25%, 0.25%, 0.25%, 0.15%, 0.10% and 0.05% of average daily net assets of Class R, Class R1, Class R2, Class R3, Class R4 and Class R5 shares, respectively, for certain other services.
Sales charges
Class A shares are assessed up-front sales charges of up to 5% of the net asset value of such shares. The following summarizes the net up-front sales charges received by the Distributor during the year ended December 31, 2008:
| | | | | |
| | Lifestyle Aggressive | Lifestyle Growth | Lifestyle Balanced | Lifestyle Moderate | Lifestyle Conservative |
|
| Net sales charges | $1,092,148 | $3,714,331 | $3,281,736 | $1,094,783 | $1,066,912 |
| Retained for printing prospectuses, | | | | | |
| advertising and sales literature | 172,456 | 592,503 | 533,832 | 181,572 | 177,781 |
| Sales commission to unrelated | | | | | |
| broker-dealers | 903,368 | 3,088,926 | 2,715,921 | 908,063 | 880,913 |
| Sales commission to affiliated | | | | | |
| sales personnel | 16,324 | 32,902 | 31,983 | 5,148 | 8,218 |
Class B shares that are redeemed within six years of purchase are subject to a contingent deferred sales charge (CDSC) at declining rates, beginning at 5.00% of the lesser of the current market value at the time of redemption or the original purchase cost of the shares being redeemed. Class C shares that are redeemed within one year of purchase are subject to a CDSC at a rate of 1.00% of the lesser of the current market value at the time of redemption or the original purchase cost of the shares being redeemed. Proceeds from the CDSCs are paid to the Distributor and are used, in whole or in part, to defray its expenses for providing distribution-related services to the Portfolios in connection with the sale of Class B and Class C shares. During the year ended December 31, 2008, CDSCs received by the Distributor amounted to $76,610, $244,267, $222,309, $46,075 and $51,387 for Class B shares and $36,928, $80,081, $88,981, $40,529 and $94,280 for Class C shares of Lifestyle Aggressive, Lifestyle Growth, Lifestyle Balanced, Lifestyle Moderate and Lifestyle Conservative, respectively.
| |
| Annual report | Lifestyle Portfolios | 41 |
Transfer agent fees
The Portfolios have a Transfer Agency Agreement with John Hancock Signature Services, Inc. (Signature Services), an indirect subsidiary of MFC. For Class A, Class B, Class C, Class R, Class R1, Class R2, Class R3, Class R4 and Class R5 shares, the Portfolios pay a monthly transfer agent fee at an annual rate of 0.05% of each class’s average daily net assets, plus a fee based on the number of shareholder accounts and reimbursement for certain out-of-pocket expenses. Expenses not directly attributable to a particular class of shares are aggregated and allocated to each class on the basis of its relative net asset value.
Signature Services has contractually agreed to limit the transfer agent fees so that such fees do not exceed 0.20% annually of Class A, Class B, Class C, Class R, Class R1, Class R2, Class R3, Class R4 and Class R5 shares average daily net assets. This agreement was effective until December 31, 2008.
In addition, Signature Services voluntarily agreed to further limit transfer agent fees for Class R, Class R1, Class R2, Class R3, Class R4 and Class R5 shares so that such fees did not exceed 0.05% annually of each class’s average daily net assets. This voluntary agreement was terminated on June 1, 2008. For the year ended December 31, 2008, the transfer agent voluntary fee reductions amounted to the following and are reflected as a reduction of total expenses in the Statement of Operations:
| | | | | | | | | |
| Transfer agent fee reduction by class |
|
| Portfolio | Class A | Class B | Class C | Class R | Class R1 | Class R2 | Class R3 | Class R4 | Class R5 |
|
| Lifestyle Aggressive | $53,975 | $32,995 | $42,247 | $912 | $543 | $435 | $1,207 | $674 | $534 |
| Lifestyle Growth | 38,571 | 62,864 | 29,014 | 745 | 564 | 428 | 1,404 | 739 | 551 |
| Lifestyle Balanced | 678 | 22,655 | — | 717 | 506 | 421 | 1,479 | 667 | 499 |
| Lifestyle Moderate | — | 4,452 | — | 657 | 417 | 734 | 1,062 | 557 | 502 |
| Lifestyle Conservative | — | 544 | — | 791 | 403 | 343 | 871 | 522 | 451 |
The Portfolios receive earnings credits from the transfer agent as a result of uninvested cash balances. These credits are used to reduce a portion of the Portfolios’ transfer agent fees and out of pocket expenses. During the year ended December 31, 2008, the Portfolios’ transfer agent fees and out of pocket expenses were reduced by $3,262, $7,250, $4,398, $1,088 and $609 for Lifestyle Aggressive, Lifestyle Growth, Lifestyle Balanced, Lifestyle Moderate and Lifestyle Conservative, respectively, for transfer agent credits earned.
| |
| 42 | Lifestyle Portfolios | Annual report |
Class level expenses for the year ended December 31, 2008, were as follows:
| | | | | |
| | | Distribution and | Transfer | | Printing and |
| Portfolio | Share Class | service fees | agent fees | Blue sky fees | postage fees |
|
| Lifestyle Aggressive | Class A | $313,028 | $265,544 | $18,998 | $20,958 |
| | Class B | 210,803 | 75,577 | 11,932 | 5,983 |
| | Class C | 854,217 | 215,309 | 16,699 | 19,450 |
| | Class R | 16,631 | 3,163 | 13,183 | 142 |
| | Class R1 | 11,263 | 2,722 | 13,756 | 98 |
| | Class R2 | 9,794 | 2,186 | 13,228 | 103 |
| | Class R3 | 46,928 | 7,054 | 9,029 | 516 |
| | Class R4 | 17,361 | 4,446 | 9,035 | 639 |
| | Class R5 | 1,431 | 4,488 | 9,527 | 300 |
| | Class 1 | 1,448,887 | — | — | — |
| | Total | $2,930,343 | $580,489 | $115,387 | $48,189 |
|
| Lifestyle Growth | Class A | $948,672 | $627,463 | $29,315 | $39,175 |
| | Class B | 708,956 | 207,494 | 16,871 | 17,238 |
| | Class C | 2,662,400 | 536,987 | 27,312 | 52,251 |
| | Class R | 18,239 | 3,192 | 14,370 | 152 |
| | Class R1 | 13,993 | 3,214 | 14,018 | 148 |
| | Class R2 | 17,616 | 4,197 | 13,470 | 128 |
| | Class R3 | 90,153 | 11,501 | 10,723 | 996 |
| | Class R4 | 47,446 | 8,620 | 9,713 | 1,775 |
| | Class R5 | 2,676 | 6,878 | 9,484 | 584 |
| | Class 1 | 4,177,588 | — | — | — |
| | Total | $8,687,739 | $1,409,546 | $145,276 | $112,447 |
|
| Lifestyle Balanced | Class A | $859,864 | $436,839 | $33,740 | $34,668 |
| | Class B | 580,173 | 141,284 | 17,371 | 11,958 |
| | Class C | 2,591,995 | 389,055 | 30,366 | 37,906 |
| | Class R | 19,848 | 3,309 | 14,946 | 114 |
| | Class R1 | 5,537 | 2,889 | 13,526 | 66 |
| | Class R2 | 13,526 | 3,218 | 15,713 | 115 |
| | Class R3 | 146,083 | 16,088 | 11,225 | 1,560 |
| | Class R4 | 52,052 | 9,932 | 11,505 | 2,229 |
| | Class R5 | 2,363 | 8,498 | 9,697 | 815 |
| | Class 1 | 4,002,162 | — | — | — |
| | Total | $8,273,603 | $1,011,112 | $158,089 | $89,431 |
|
| Lifestyle Moderate | Class A | $271,969 | $117,857 | $18,302 | $9,439 |
| | Class B | 159,421 | 36,511 | 11,195 | 3,498 |
| | Class C | 745,294 | 105,862 | 19,074 | 10,682 |
| | Class R | 8,339 | 1,945 | 13,095 | 56 |
| | Class R1 | 6,633 | 1,772 | 13,612 | 38 |
| | Class R2 | 758 | 1,079 | 13,095 | 18 |
| | Class R3 | 33,900 | 5,679 | 11,124 | 356 |
| | Class R4 | 13,432 | 3,498 | 11,136 | 531 |
| | Class R5 | 556 | 4,091 | 11,256 | 310 |
| | Class 1 | 1,095,537 | — | — | — |
| | Total | $2,335,839 | $278,294 | $121,889 | $24,928 |
|
| Lifestyle Conservative | Class A | $230,217 | $95,378 | $19,799 | $8,774 |
| | Class B | 123,076 | 23,168 | 9,763 | 2,652 |
| | Class C | 701,950 | 85,292 | 23,315 | 10,498 |
| | Class R | 5,417 | 1,793 | 13,045 | 59 |
| | Class R1 | 4,937 | 1,624 | 12,567 | 26 |
| | Class R2 | 9,391 | 2,484 | 13,043 | 71 |
| | Class R3 | 46,662 | 6,281 | 11,233 | 488 |
| | Class R4 | 12,730 | 3,287 | 13,743 | 384 |
| | Class R5 | 313 | 2,554 | 8,926 | 123 |
| | Class 1 | 743,906 | — | — | — |
| | Total | $1,878,599 | $221,861 | $125,434 | $23,075 |
|
| |
| Annual report | Lifestyle Portfolios | 43 |
6. Portfolio share transactions
Share activities for the Portfolios for the year ended December 31, 2008, and December 31, 2007, were as follows:
| | | | | | | | |
| | | | | | | | |
| | | | |
| Lifestyle Aggressive | | | | |
| |
| | | Year ended 12-31-08 | | | Year ended 12-31-07 | |
| | Shares | Amount | Shares | Amount |
| Class A shares | | | | |
|
| Sold | 4,321,883 | $52,726,554 | 4,614,640 | $72,343,725 |
| Distributions reinvested | 788,162 | 6,031,385 | 310,614 | 4,631,245 |
| Repurchased | (2,980,848) | (35,198,789) | (1,114,340) | (17,460,253) |
| Net increase | 2,129,197 | $23,559,150 | 3,810,914 | $59,514,717 |
| | | | | |
| Class B shares | | | | |
|
| Sold | 585,946 | $7,285,514 | 885,174 | $13,809,960 |
| Distributions reinvested | 134,186 | 1,030,283 | 53,226 | 794,126 |
| Repurchased | (384,823) | (4,769,030) | (185,248) | (2,895,713) |
| Net increase | 335,309 | $3,546,767 | 753,152 | $11,708,373 |
| | | | | |
| Class C shares | | | | |
|
| Sold | 2,850,549 | $35,156,577 | 3,975,449 | $62,163,168 |
| Distributions reinvested | 519,937 | 3,991,761 | 213,164 | 3,180,423 |
| Repurchased | (1,909,295) | (22,429,988) | (580,591) | (9,086,220) |
| Net increase | 1,461,191 | $16,718,350 | 3,608,022 | $56,257,371 |
| | | | | |
| Class R shares | | | | |
|
| Sold | 143,160 | $1,764,466 | 95,511 | $1,518,424 |
| Distributions reinvested | 14,599 | 112,408 | 3,768 | 56,443 |
| Repurchased | (52,580) | (670,379) | (22,307) | (352,211) |
| Net increase | 105,179 | $1,206,495 | 76,972 | $1,222,656 |
| | | | | |
| Class R1 shares | | | | |
|
| Sold | 189,545 | $2,413,143 | 82,704 | $1,317,018 |
| Distributions reinvested | 14,392 | 110,534 | 3,302 | 49,391 |
| Repurchased | (54,763) | (543,974) | (20,102) | (313,226) |
| Net increase | 149,174 | $1,979,703 | 65,904 | $1,053,183 |
| | | | | |
| Class R2 shares | | | | |
|
| Sold | 72,439 | $846,995 | 242,808 | $3,920,147 |
| Distributions reinvested | 15,330 | 117,430 | 8,082 | 120,667 |
| Repurchased | (74,798) | (885,701) | (82,461) | (1,346,875) |
| Net increase | 12,971 | $78,724 | 168,429 | $2,693,939 |
| | | | | |
| Class R3 shares | | | | |
|
| Sold | 462,534 | $5,872,371 | 439,108 | $6,857,290 |
| Distributions reinvested | 59,639 | 456,241 | 18,965 | 282,771 |
| Repurchased | (262,195) | (3,223,428) | (93,518) | (1,469,502) |
| Net increase | 259,978 | $3,105,184 | 364,555 | $5,670,559 |
| | | | | |
| Class R4 shares | | | | |
|
| Sold | 737,329 | $8,370,464 | 255,282 | $3,953,647 |
| Distributions reinvested | 65,279 | 498,076 | 14,937 | 222,558 |
| Repurchased | (347,930) | (3,769,188) | (106,180) | (1,675,926) |
| Net increase | 454,678 | $5,099,352 | 164,039 | $2,500,279 |
| | | | | |
| Class R5 shares | | | | |
|
| Sold | 580,407 | $7,390,192 | 219,853 | $3,498,153 |
| Distributions reinvested | 64,013 | 488,419 | 10,962 | 163,340 |
| Repurchased | (162,129) | (2,083,487) | (39,228) | (602,706) |
| Net increase | 482,291 | $5,795,124 | 191,587 | $3,058,787 |
| | | | | |
| Class 1 shares | | | | |
|
| Sold | 25,884,443 | $307,743,934 | 29,308,050 | $454,167,442 |
| Distributions reinvested | 24,567,749 | 186,714,891 | 10,630,513 | 157,969,428 |
| Repurchased | (9,767,323) | (109,780,766) | (4,388,943) | (68,831,528) |
| Net increase | 40,684,869 | $384,678,059 | 35,549,620 | $543,305,342 |
| | | | | |
| Net increase | 46,074,837 | $445,766,908 | 44,753,194 | $686,985,206 |
|
| |
| 44 | Lifestyle Portfolios | Annual report |
| | | | | | | | |
| | | | |
| Lifestyle Growth | | | | |
| | | Year ended 12-31-08 | | | Year ended 12-31-07 | |
| | Shares | Amount | Shares | Amount |
| Class A shares | | | | |
|
| Sold | 12,322,471 | $157,749,384 | 12,295,840 | $190,386,484 |
| Issued in reorganization | — | — | 241,993 | 3,888,349 |
| Distributions reinvested | 2,193,952 | 18,412,385 | 920,135 | 13,618,005 |
| Repurchased | (7,796,611) | (94,844,267) | (2,628,552) | (40,696,080) |
| Net increase | 6,719,812 | $81,317,502 | 10,829,416 | $167,196,758 |
| | | | | |
| Class B shares | | | | |
|
| Sold | 1,863,012 | $23,997,441 | 2,904,046 | $44,766,258 |
| Issued in reorganization | — | — | 58,080 | 928,637 |
| Distributions reinvested | 403,166 | 3,392,440 | 179,850 | 2,663,601 |
| Repurchased | (1,340,379) | (16,358,712) | (562,601) | (8,720,822) |
| Net increase | 925,799 | $11,031,169 | 2,579,375 | $39,637,674 |
| | | | | |
| Class C shares | | | | |
|
| Sold | 8,114,584 | $102,871,539 | 10,421,470 | $160,626,549 |
| Issued in reorganization | — | — | 86,401 | 1,381,344 |
| Distributions reinvested | 1,489,824 | 12,544,916 | 692,231 | 10,251,966 |
| Repurchased | (5,641,214) | (69,079,342) | (1,988,367) | (30,811,386) |
| Net increase | 3,963,194 | $46,337,113 | 9,211,735 | $141,448,473 |
| | | | | |
| Class R shares | | | | |
|
| Sold | 253,861 | $3,277,907 | 45,255 | $697,576 |
| Distributions reinvested | 19,885 | 168,229 | 2,138 | 31,819 |
| Repurchased | (39,657) | (488,964) | (8,305) | (126,466) |
| Net increase | 234,089 | $2,957,172 | 39,088 | $602,929 |
| | | | | |
| Class R1 shares | | | | |
|
| Sold | 266,379 | $3,183,756 | 131,620 | $2,072,737 |
| Issued in reorganization | — | — | 7,433 | 119,711 |
| Distributions reinvested | 24,351 | 205,276 | 5,782 | 85,856 |
| Repurchased | (66,280) | (844,350) | (22,023) | (346,417) |
| Net increase | 224,450 | $2,544,682 | 122,812 | $1,931,887 |
| | | | | |
| Class R2 shares | | | | |
|
| Sold | 757,334 | $10,724,839 | 65,934 | $1,009,920 |
| Distributions reinvested | 58,931 | 495,022 | 3,233 | 47,939 |
| Repurchased | (151,421) | (1,956,080) | (10,469) | (159,415) |
| Net increase | 664,844 | $9,263,781 | 58,698 | $898,444 |
| | | | | |
| Class R3 shares | | | | |
|
| Sold | 656,831 | $8,520,379 | 753,663 | $11,632,645 |
| Distributions reinvested | 106,168 | 890,751 | 38,168 | 564,498 |
| Repurchased | (290,293) | (3,586,453) | (132,164) | (2,050,727) |
| Net increase | 472,706 | $5,824,677 | 659,667 | $10,146,416 |
| | | | | |
| Class R4 shares | | | | |
|
| Sold | 657,926 | $8,172,048 | 594,949 | $9,104,267 |
| Distributions reinvested | 116,723 | 978,136 | 45,493 | 672,840 |
| Repurchased | (317,179) | (4,041,817) | (130,810) | (2,014,185) |
| Net increase | 457,470 | $5,108,367 | 509,632 | $7,762,922 |
| | | | | |
| Class R5 shares | | | | |
|
| Sold | 801,506 | $10,388,224 | 386,916 | $6,103,831 |
| Distributions reinvested | 97,400 | 815,240 | 24,520 | 362,648 |
| Repurchased | (268,487) | (3,358,985) | (46,657) | (717,962) |
| Net increase | 630,419 | $7,844,479 | 364,779 | $5,748,517 |
| |
| Annual report | Lifestyle Portfolios | 45 |
| | | | | | | | |
| | | | |
| Lifestyle Growth, continued | | | | |
| | | Year ended 12-31-08 | | | Year ended 12-31-07 | |
| | Shares | Amount | Shares | Amount |
| Class 1 shares | | | | |
|
| Sold | 54,232,514 | $683,569,067 | 68,743,446 | $1,053,001,279 |
| Distributions reinvested | 63,594,994 | 530,382,248 | 30,811,120 | 454,155,901 |
| Repurchased | (25,571,393) | (293,727,258) | (10,434,155) | (162,148,953) |
| Net increase | 92,256,115 | $920,224,057 | 89,120,411 | $1,345,008,227 |
| | | | | |
| Class 5 shares | | | | |
|
| Sold | 1,417,964 | $18,489,407 | 2,047,722 | $31,534,003 |
| Distributions reinvested | 415,254 | 3,459,066 | 146,377 | 2,156,125 |
| Repurchased | (194,490) | (1,991,368) | (123,241) | (1,981,283) |
| Net increase | 1,638,728 | $19,957,105 | 2,070,858 | $31,708,845 |
| | | | | |
| Net increase | 108,187,626 | $1,112,410,104 | 115,566,471 | $1,752,091,092 |
|
| |
| 46 | Lifestyle Portfolios | Annual report |
| | | | | | | | |
| | | | |
| Lifestyle Balanced | | | | |
| | | Year ended 12-31-08 | | | Year ended 12-31-07 | |
| | Shares | Amount | Shares | Amount |
| Class A shares | | | | |
|
| Sold | 14,097,578 | $175,434,692 | 12,010,789 | $178,914,507 |
| Issued in reorganization | — | — | 407,719 | 6,254,241 |
| Distributions reinvested | 1,788,966 | 18,911,864 | 764,823 | 11,089,399 |
| Repurchased | (8,403,769) | (99,552,864) | (2,326,002) | (34,789,873) |
| Net increase | 7,482,775 | $94,793,692 | 10,857,329 | $161,468,274 |
| | | | | |
| Class B shares | | | | |
|
| Sold | 1,957,504 | $25,018,368 | 2,125,099 | $31,561,856 |
| Issued in reorganization | — | — | 94,071 | 1,440,223 |
| Distributions reinvested | 306,428 | 3,208,406 | 138,849 | 2,004,146 |
| Repurchased | (1,386,630) | (16,322,210) | (458,683) | (6,838,206) |
| Net increase | 877,302 | $11,904,564 | 1,899,336 | $28,168,019 |
| | | | | |
| Class C shares | | | | |
|
| Sold | 9,412,591 | $118,620,388 | 10,622,392 | $158,371,850 |
| Issued in reorganization | — | — | 112,341 | 1,722,024 |
| Distributions reinvested | 1,343,095 | 14,163,975 | 629,263 | 9,097,060 |
| Repurchased | (6,482,589) | (76,526,911) | (1,856,133) | (27,693,913) |
| Net increase | 4,273,097 | $56,257,452 | 9,507,863 | $141,497,021 |
| | | | | |
| Class R shares | | | | |
|
| Sold | 318,502 | $3,952,035 | 41,703 | $624,192 |
| Distributions reinvested | 18,360 | 188,223 | 2,262 | 32,758 |
| Repurchased | (77,083) | (850,789) | (14,135) | (206,357) |
| Net increase | 259,779 | $3,289,469 | 29,830 | $450,593 |
| | | | | |
| Class R1 shares | | | | |
|
| Sold | 97,623 | $1,227,004 | 36,079 | $544,741 |
| Issued in reorganization | — | — | 7,260 | 111,372 |
| Distributions reinvested | 5,960 | 62,398 | 1,795 | 25,936 |
| Repurchased | (36,320) | (474,781) | (12,423) | (182,489) |
| Net increase | 67,263 | $814,621 | 32,711 | $499,560 |
| | | | | |
| Class R2 shares | | | | |
|
| Sold | 696,478 | $9,445,772 | 83,244 | $1,218,082 |
| Distributions reinvested | 27,735 | 291,032 | 3,716 | 53,917 |
| Repurchased | (411,225) | (5,338,974) | (19,236) | (287,738) |
| Net increase | 312,988 | $4,397,830 | 67,724 | $984,261 |
| | | | | |
| Class R3 shares | | | | |
|
| Sold | 1,142,647 | $14,335,321 | 1,482,901 | $22,213,387 |
| Distributions reinvested | 144,883 | 1,518,636 | 64,976 | 939,970 |
| Repurchased | (763,981) | (9,450,491) | (268,440) | (4,012,566) |
| Net increase | 523,549 | $6,403,466 | 1,279,437 | $19,140,791 |
| | | | | |
| Class R4 shares | | | | |
|
| Sold | 835,561 | $10,121,104 | 787,368 | $11,686,142 |
| Distributions reinvested | 108,597 | 1,137,791 | 54,756 | 793,917 |
| Repurchased | (595,297) | (6,830,272) | (294,166) | (4,408,844) |
| Net increase | 348,861 | $4,428,623 | 547,958 | $8,071,215 |
| | | | | |
| Class R5 shares | | | | |
|
| Sold | 1,393,974 | $17,843,961 | 615,276 | $9,235,488 |
| Distributions reinvested | 119,524 | 1,251,791 | 29,612 | 429,428 |
| Repurchased | (529,292) | (6,407,996) | (86,230) | (1,298,027) |
| Net increase | 984,206 | $12,687,756 | 558,658 | $8,366,889 |
| |
| Annual report | Lifestyle Portfolios | 47 |
| | | | | | | | |
| | | | |
| Lifestyle Balanced, continued | | | | |
| | | Year ended 12-31-08 | | | Year ended 12-31-07 | |
| | Shares | Amount | Shares | Amount |
| Class 1 shares | | | | |
|
| Sold | 48,661,329 | $615,621,597 | 66,344,430 | $978,825,969 |
| Distributions reinvested | 52,637,492 | 557,198,487 | 29,782,065 | 431,392,726 |
| Repurchased | (37,631,381) | (420,930,918) | (10,958,523) | (162,475,516) |
| Net increase | 63,667,440 | $751,889,166 | 85,167,972 | $1,247,743,179 |
| | | | | |
| Class 5 shares | | | | |
|
| Sold | 669,853 | $8,712,970 | 800,605 | $11,911,857 |
| Distributions reinvested | 146,499 | 1,545,803 | 57,977 | 838,848 |
| Repurchased | (175,318) | (2,051,989) | (32,771) | (486,530) |
| Net increase | 641,034 | $8,206,784 | 825,811 | $12,264,175 |
| | | | | |
| Net increase | 79,438,294 | $955,073,423 | 110,774,629 | $1,628,653,977 |
|
| |
| 48 | Lifestyle Portfolios | Annual report |
| | | | | | | | |
| | | | |
| Lifestyle Moderate | | | | |
| | | Year ended 12-31-08 | | | Year ended 12-31-07 | |
| | Shares | Amount | Shares | Amount |
| Class A shares | | | | |
|
| Sold | 5,672,001 | $69,765,054 | 3,689,701 | $51,041,634 |
| Distributions reinvested | 584,570 | 6,151,173 | 193,694 | 2,633,345 |
| Repurchased | (2,859,758) | (33,515,461) | (1,019,236) | (14,186,223) |
| Net increase | 3,396,813 | $42,400,766 | 2,864,159 | $39,488,756 |
| | | | | |
| Class B shares | | | | |
|
| Sold | 637,598 | $7,811,614 | 685,413 | $9,480,517 |
| Distributions reinvested | 82,592 | 864,965 | 34,752 | 470,834 |
| Repurchased | (438,058) | (5,030,618) | (121,981) | (1,693,366) |
| Net increase | 282,132 | $3,645,961 | 598,184 | $8,257,985 |
| | | | | |
| Class C shares | | | | |
|
| Sold | 4,127,514 | $50,157,183 | 3,309,558 | $45,891,231 |
| Distributions reinvested | 396,381 | 4,162,610 | 152,871 | 2,071,690 |
| Repurchased | (2,400,019) | (27,894,688) | (511,957) | (7,087,439) |
| Net increase | 2,123,876 | $26,425,105 | 2,950,472 | $40,875,482 |
| | | | | |
| Class R shares | | | | |
|
| Sold | 113,480 | $1,329,719 | 42,365 | $587,129 |
| Distributions reinvested | 6,484 | 66,826 | 1,578 | 21,455 |
| Repurchased | (47,099) | (524,531) | (14,367) | (196,971) |
| Net increase | 72,865 | $872,014 | 29,576 | $411,613 |
| | | | | |
| Class R1 shares | | | | |
|
| Sold | 130,901 | $1,501,429 | 63,256 | $886,586 |
| Distributions reinvested | 9,272 | 95,031 | 2,515 | 34,189 |
| Repurchased | (35,063) | (409,432) | (15,327) | (211,504) |
| Net increase | 105,110 | $1,187,028 | 50,444 | $709,271 |
| | | | | |
| Class R2 shares | | | | |
|
| Sold | 40,893 | $517,956 | 887 | $12,290 |
| Distributions reinvested | 1,484 | 15,742 | 380 | 5,174 |
| Repurchased | (30,189) | (379,370) | (154) | (2,155) |
| Net increase | 12,188 | $154,328 | 1,113 | $15,309 |
| | | | | |
| Class R3 shares | | | | |
|
| Sold | 313,652 | $3,903,252 | 342,265 | $4,717,918 |
| Distributions reinvested | 36,795 | 385,317 | 11,583 | 157,373 |
| Repurchased | (112,215) | (1,279,728) | (109,186) | (1,497,041) |
| Net increase | 238,232 | $3,008,841 | 244,662 | $3,378,250 |
| | | | | |
| Class R4 shares | | | | |
|
| Sold | 239,086 | $2,906,733 | 189,497 | $2,619,552 |
| Distributions reinvested | 26,936 | 281,897 | 12,584 | 171,065 |
| Repurchased | (171,358) | (2,025,026) | (57,795) | (800,604) |
| Net increase | 94,664 | $1,163,604 | 144,286 | $1,990,013 |
| | | | | |
| Class R5 shares | | | | |
|
| Sold | 437,268 | $5,409,496 | 291,654 | $4,060,770 |
| Distributions reinvested | 40,857 | 430,438 | 11,406 | 154,744 |
| Repurchased | (199,503) | (2,425,332) | (95,191) | (1,333,546) |
| Net increase | 278,622 | $3,414,602 | 207,869 | $2,881,968 |
| |
| Annual report | Lifestyle Portfolios | 49 |
| | | | | | | | |
| | | | |
| Lifestyle Moderate, continued | | | | |
| | | Year ended 12-31-08 | | | Year ended 12-31-07 | |
| | Shares | Amount | Shares | Amount |
| Class 1 shares | | | | |
|
| Sold | 19,082,650 | $229,909,130 | 20,668,456 | $285,222,178 |
| Distributions reinvested | 14,718,836 | 155,752,001 | 8,014,611 | 109,038,344 |
| Repurchased | (12,278,117) | (135,472,038) | (4,707,379) | (65,151,346) |
| Net increase | 21,523,369 | $250,189,093 | 23,975,688 | $329,109,176 |
| | | | | |
| Class 5 shares | | | | |
|
| Sold | 431,643 | $5,057,570 | 196,146 | $2,705,630 |
| Distributions reinvested | 51,224 | 532,271 | 17,271 | 234,823 |
| Repurchased | (67,906) | (736,169) | (55,900) | (781,144) |
| Net increase | 414,961 | $4,853,672 | 157,517 | $2,159,309 |
| | | | | |
| Net increase | 28,542,832 | $337,315,014 | 31,223,970 | $429,277,132 |
|
| |
| 50 | Lifestyle Portfolios | Annual report |
| | | | | | | | |
| | | | |
| Lifestyle Conservative | | | | |
| | | Year ended 12-31-08 | | | Year ended 12-31-07 | |
| | Shares | Amount | Shares | Amount |
| Class A shares | | | | |
|
| Sold | 7,752,097 | $97,402,429 | 2,389,609 | $32,202,666 |
| Distributions reinvested | 550,174 | 6,044,078 | 110,478 | 1,471,783 |
| Repurchased | (3,236,705) | (39,097,294) | (700,324) | (9,450,827) |
| Net increase | 5,065,566 | $64,349,213 | 1,799,763 | $24,223,622 |
| | | | | |
| Class B shares | | | | |
|
| Sold | 845,899 | $10,448,797 | 533,348 | $7,196,400 |
| Distributions reinvested | 74,409 | 811,968 | 20,568 | 273,746 |
| Repurchased | (408,557) | (4,885,144) | (121,906) | (1,643,199) |
| Net increase | 511,751 | $6,375,621 | 432,010 | $5,826,947 |
| | | | | |
| Class C shares | | | | |
|
| Sold | 6,434,786 | $80,783,908 | 2,645,517 | $35,649,056 |
| Distributions reinvested | 367,258 | 4,061,940 | 91,873 | 1,222,078 |
| Repurchased | (3,027,110) | (35,678,170) | (551,105) | (7,442,310) |
| Net increase | 3,774,934 | $49,167,678 | 2,186,285 | $29,428,824 |
| | | | | |
| Class R shares | | | | |
|
| Sold | 120,385 | $1,443,218 | 9,081 | $122,134 |
| Distributions reinvested | 4,744 | 50,771 | 554 | 7,409 |
| Repurchased | (32,619) | (390,971) | (816) | (11,024) |
| Net increase | 92,510 | $1,103,018 | 8,819 | $118,519 |
| | | | | |
| Class R1 shares | | | | |
|
| Sold | 238,728 | $2,781,809 | 19,327 | $263,101 |
| Distributions reinvested | 11,398 | 120,927 | 942 | 12,574 |
| Repurchased | (63,568) | (728,552) | (12,347) | (165,600) |
| Net increase | 186,558 | $2,174,184 | 7,922 | $110,075 |
| | | | | |
| Class R2 shares | | | | |
|
| Sold | 508,936 | $6,715,907 | 40,208 | $543,146 |
| Distributions reinvested | 25,708 | 282,256 | 1,265 | 16,899 |
| Repurchased | (219,762) | (2,711,800) | (29,185) | (393,962) |
| Net increase | 314,882 | $4,286,363 | 12,288 | $166,083 |
| | | | | |
| Class R3 shares | | | | |
|
| Sold | 881,883 | $11,544,157 | 321,852 | $4,357,181 |
| Distributions reinvested | 42,837 | 477,386 | 9,844 | 131,160 |
| Repurchased | (662,693) | (8,545,796) | (81,606) | (1,105,400) |
| Net increase | 262,027 | $3,475,747 | 250,090 | $3,382,941 |
| | | | | |
| Class R4 shares | | | | |
|
| Sold | 258,614 | $3,269,155 | 280,198 | $3,747,727 |
| Distributions reinvested | 25,296 | 281,017 | 7,988 | 106,474 |
| Repurchased | (181,604) | (2,083,020) | (148,989) | (1,994,253) |
| Net increase | 102,306 | $1,467,152 | 139,197 | $1,859,948 |
| | | | | |
| Class R5 shares | | | | |
|
| Sold | 428,178 | $5,297,957 | 54,757 | $742,856 |
| Distributions reinvested | 27,098 | 291,483 | 2,522 | 33,650 |
| Repurchased | (96,298) | (1,198,340) | (22,114) | (300,568) |
| Net increase | 358,978 | $4,391,100 | 35,165 | $475,938 |
| | | | | |
| Class 1 shares | | | | |
|
| Sold | 25,218,456 | $320,030,038 | 17,102,516 | $230,347,734 |
| Distributions reinvested | 10,887,014 | 120,461,450 | 5,034,597 | 67,095,666 |
| Repurchased | (7,268,203) | (84,571,213) | (6,026,728) | (81,070,170) |
| Net increase | 28,837,267 | $355,920,275 | 16,110,385 | $216,373,230 |
| | | | | |
| Net increase | 39,506,779 | $492,710,351 | 20,981,924 | $281,966,127 |
|
| |
| Annual report | Lifestyle Portfolios | 51 |
7. Purchases and sales of securities
The following summarizes the purchases and sales of the affiliated underlying funds for the year ended December 31, 2008:
| | | |
| Portfolio | Purchases | Sales | |
| |
| Lifestyle Aggressive | $1,494,384,052 | $1,147,937,141 | |
| Lifestyle Growth | 4,360,272,917 | 3,435,215,596 | |
| Lifestyle Balanced | 4,009,412,224 | 3,164,015,530 | |
| Lifestyle Moderate | 1,101,907,081 | 770,984,885 | |
| Lifestyle Conservative | 1,045,724,138 | 550,028,007 | |
8. Investment in affiliated underlying funds
The Portfolios invest primarily in affiliated underlying funds that are managed by affiliates of the Adviser. The Portfolios do not invest in affiliated underlying funds for the purpose of exercising management or control; however, the Portfolios’ investments may represent a significant portion of each underlying fund’s net assets. For the year ended December 31, 2008, the following Portfolios held 5% or more of the underlying fund’s net assets:
| |
| | Percent of Underlying |
| Portfolio Affiliate Class NAV | Funds’ Net Assets |
|
| Lifestyle Aggressive | |
John Hancock Funds II | |
| All Cap Core | 13.6% |
| All Cap Value | 28.6% |
| Alpha Opportunities | 16.2% |
| Blue Chip Growth | 11.6% |
| Capital Appreciation | 14.4% |
| Emerging Markets Value | 17.4% |
| Equity-Income | 8.9% |
| Fundamental Value | 11.5% |
| Index 500 | 8.8% |
| International Equity Index | 18.3% |
| International Opportunities | 24.0% |
| International Small Cap | 18.6% |
| International Small Company | 18.8% |
| International Value | 14.7% |
| Large Cap | 16.4% |
| Large Cap Value | 11.6% |
| Mid Cap Index | 18.7% |
| Mid Cap Intersection | 44.6% |
| Mid Cap Stock | 9.1% |
| Mid Cap Value Equity | 34.5% |
| Mid Cap Value | 40.4% |
| Natural Resources | 18.2% |
| Optimized Value | 13.5% |
| Small Cap Growth | 30.4% |
| Small Cap Index | 59.6% |
| Small Cap Value | 97.4% |
| Smaller Company Growth | 40.0% |
| Small Company Value | 12.0% |
| U.S. Multi Sector | 14.4% |
| Value & Restructuring | 12.5% |
| Vista | 54.5% |
| |
| John Hancock Funds III | |
| International Core | 16.4% |
| Rainier Growth | 7.9% |
| |
| | Percent of Underlying |
| Portfolio Affiliate Class NAV | Funds’ Net Assets |
|
| Lifestyle Growth | |
| John Hancock Funds | |
| Small Cap Intrinsic Value | 15.8% |
| |
| John Hancock Funds II | |
| Active Bond | 6.6% |
| All Cap Core | 65.1% |
| Alpha Opportunities | 39.6% |
| Blue Chip Growth | 32.0% |
| Capital Appreciation | 42.0% |
| Emerging Markets Value | 35.2% |
| Equity-Income | 26.7% |
| Floating Rate Income | 42.4% |
| Fundamental Value | 39.6% |
| Global Bond | 16.3% |
| Global Real Estate | 30.5% |
| High Income | 22.6% |
| High Yield | 25.4% |
| Index 500 | 33.0% |
| International Equity Index | 33.0% |
| International Opportunities | 40.3% |
| International Small Cap | 23.9% |
| International Small Company | 46.3% |
| International Value | 21.9% |
| Large Cap | 31.9% |
| Large Cap Value | 25.6% |
| Mid Cap Index | 28.6% |
| Mid Cap Intersection | 54.2% |
| Mid Cap Stock | 16.7% |
| Mid Cap Value Equity | 52.7% |
| Natural Resources | 24.1% |
| Optimized Value | 55.7% |
| Real Estate Equity | 39.4% |
| Real Return Bond | 32.3% |
| Small Cap Growth | 35.3% |
| Small Cap Opportunities | 63.1% |
| Small Company Growth | 28.2% |
| Small Company Value | 27.0% |
| Smaller Company Growth | 60.1% |
| Spectrum Income | 20.0% |
| Strategic Bond | 20.2% |
| Strategic Income | 23.3% |
| Total Return | 21.8% |
| U.S. High Yield Bond | 18.6% |
| U.S. Multi Sector | 43.7% |
| Value & Restructuring | 32.0% |
| Vista | 44.8% |
| |
| John Hancock Funds III | |
| International Core | 26.1% |
| Rainier Growth | 19.1% |
| |
| 52 | Lifestyle Portfolios | Annual report |
| |
| | Percent of Underlying |
| Portfolio Affiliate Class NAV | Funds’ Net Assets |
|
| Lifestyle Balanced | |
| John Hancock Funds II | |
| Active Bond | 28.9% |
| All Cap Core | 21.2% |
| Alpha Opportunities | 37.4% |
| Blue Chip Growth | 31.5% |
| Capital Appreciation | 13.4% |
| Core Bond | 56.8% |
| Emerging Markets Value | 35.4% |
| Equity-Income | 34.2% |
| Floating Rate Income | 29.0% |
| Fundamental Value | 20.5% |
| Global Bond | 27.8% |
| Global Real Estate | 42.0% |
| High Income | 41.8% |
| High Yield | 53.7% |
| Index 500 | 32.9% |
| International Opportunities | 18.7% |
| International Small Cap | 20.9% |
| International Small Company | 21.1% |
| International Value | 19.0% |
| Large Cap | 42.1% |
| Large Cap Value | 36.1% |
| Mid Cap Index | 19.6% |
| Mid Cap Stock | 14.7% |
| Natural Resources | 25.2% |
| Optimized Value | 19.2% |
| Real Estate Equity | 29.1% |
| Real Return Bond | 36.0% |
| Small Company Growth | 55.2% |
| Small Company Value | 26.5% |
| Spectrum Income | 43.6% |
| Strategic Bond | 35.0% |
| Strategic Income | 38.1% |
| Total Bond Market | 31.6% |
| Total Return | 23.7% |
| U.S. High Yield Bond | 41.9% |
| U.S. Multi Sector | 32.8% |
| Value & Restructuring | 29.5% |
| |
| John Hancock Funds III | |
| International Core | 24.1% |
| Rainier Growth | 15.7% |
| |
| | Percent of Underlying |
| Portfolio Affiliate Class NAV | Funds’ Net Assets |
|
| Lifestyle Moderate | |
| John Hancock Funds II | |
| Active Bond | 30.0% |
| Blue Chip Growth | 7.1% |
| Core Bond | 22.5% |
| Equity-Income | 6.1% |
| Floating Rate Income | 12.4% |
| Fundamental Value | 7.2% |
| Global Bond | 16.5% |
| Global Real Estate | 9.7% |
| High Income | 19.4% |
| High Yield | 7.3% |
| Index 500 | 6.0% |
| International Equity Index | 10.9% |
| International Opportunities | 7.1% |
| International Value | 4.4% |
| Investment Quality Bond | 26.5% |
| Mid Cap Index | 12.6% |
| Real Estate Equity | 12.2% |
| Real Return Bond | 10.6% |
| Small Cap Index | 14.6% |
| Small Company Growth | 16.5% |
| Small Company Value | 5.3% |
| Spectrum Income | 18.2% |
| Strategic Bond | 14.7% |
| Strategic Income | 16.0% |
| Total Bond Market | 22.9% |
| Total Return | 10.0% |
| U.S. High Yield Bond | 19.3% |
| U.S. Multi Sector | 9.2% |
| Value & Restructuring | 11.8% |
| |
| John Hancock Funds III | |
| Global Shareholder Yield | 27.9% |
| International Core | 9.7% |
| |
| Lifestyle Conservative | |
| John Hancock Funds II | |
| Active Bond | 28.8% |
| Blue Chip Growth | 2.6% |
| Core Bond | 17.8% |
| Equity-Income | 7.0% |
| Floating Rate Income | 12.1% |
| Fundamental Value | 3.9% |
| Global Bond | 19.2% |
| Global Real Estate | 12.8% |
| High Income | 7.8% |
| High Yield | 5.3% |
| Index 500 | 1.9% |
| International Value | 1.7% |
| Investment Quality Bond | 33.0% |
| Real Estate Equity | 7.2% |
| Real Return Bond | 6.4% |
| Spectrum Income | 15.7% |
| Strategic Bond | 15.1% |
| Strategic Income | 16.2% |
| Total Bond Market | 35.3% |
| Total Return | 11.2% |
| U.S. Government Securities | 70.1% |
| U.S. High Yield Bond | 11.0% |
| Value & Restructuring | 4.5% |
| |
| John Hancock Funds III | |
| Global Shareholder Yield | 21.3% |
| International Core | 3.9% |
| |
| Annual report | Lifestyle Portfolios | 53 |
9. Fund mergers
On June 29, 2007, the Board of Trustees of the Trust approved the following two merger transactions: (i) John Hancock Allocation Core Portfolio (a Target Fund), a series of John Hancock Capital Series Trust, to be merged into Lifestyle Balanced Portfolio (an Acquiring Fund) and (ii) John Hancock Allocation Growth + Value Portfolio (a Target Fund), a series of John Hancock Capital Series Trust, to be merged into Lifestyle Growth Portfolio (an Acquiring Fund).
After shareholder approval was obtained, the mergers were effective after the close of business on September 28, 2007. Each Acquiring Fund acquired all of the assets and liabilities of the corresponding Target Fund as shown in the table below. Each merger qualified as a tax-free reorganization for federal income tax purposes with no gain or loss recognized by the Target Fund or their shareholders.
Pursuant to the Agreement and Plan of Reorganization, shareholders of each Target Fund received a number of shares of the corresponding class in the corresponding Acquiring Fund with a value equal to their holdings in the Target Fund as of the close of business on date of the reorganization.
The following is a summary of Shares Outstanding, Net Assets and Net Unrealized Appreciation immediately before and after the reorganizations:
| | | | | | |
| | | Acquired Net | Appreciation | | | Acquiring Fund |
| | | Asset Value of | of Target | | Acquiring Fund | Total Net Assets |
| | | the Target | Fund’s | Shares issued by | Net Assets Prior | After |
| Acquiring Fund | Target Fund | Fund | Investments | Acquiring Fund | to Combination | Combination |
|
| Lifestyle Growth | JH Allocation Growth & Value | $6,318,041 | $519,679 | 393,907 | $10,401,426,390 | $10,407,744,431 |
| Lifestyle Balanced | JH Allocation Core | 9,527,860 | 498,757 | 621,391 | 9,535,359,035 | 9,544,886,895 |
| |
| 54 | Lifestyle Portfolios | Annual report |
Auditors report
Report of Independent Registered Public Accounting Firm
To the Board of Trustees and Shareholders of John Hancock Funds II:
In our opinion, the accompanying statements of assets and liabilities, including the schedules of securities owned, and the related statements of operations and of changes in net assets and the financial highlights present fairly, in all material respects, the finan-cial position of each of the portfolios (identified in Note 6) which are part of John Hancock Funds II (the “Trust”) at December 31, 2008, and the results of each of their operations, the changes in each of their net assets and the financial highlights for each of the periods indicated, in conformity with accounting principles generally accepted in the United States of America. These financial statements and financial highlights (hereafter referred to as “financial statements”) are the responsibility of the Trust’s management; our responsibility is to express an opinion on these financial statements based on our audits. We conducted our audits of these financial statements in accordance with the standards of the Public Company Accounting Oversight Board (United States). Those standards require that we plan and perform the audits to obtain reasonable assurance about whether the financial statements are free of material misstatement. An audit includes examining, on a test basis, evidence supporting the amounts and disclosures in the financial statements, assessing the accounting principles used and significant estimates made by management, and evaluating the overall financial statement presentation. We believe that our audits, which included confirmation of securities at December 31, 2008, by correspondence with the transfer agent, provide a reasonable basis for our opinion.
PricewaterhouseCoopers LLP
Boston, Massachusetts
February 26, 2009
| |
| Annual report | Lifestyle Portfolios | 55 |
Tax information
Unaudited
For federal income tax purposes, the following information is furnished with respect to the distributions of the Portfolios, if any, paid during its taxable year ended December 31, 2008.
Long Term Capital Gains The Portfolios below have designated the following amounts as capital gain dividends paid during the year:
| | | |
| Portfolio | Capital Gain | | |
| | |
| Lifestyle Aggressive | $154,308,175 | | |
| Lifestyle Growth | 285,306,066 | | |
| Lifestyle Balanced | 204,388,634 | | |
| Lifestyle Moderate | 28,730,116 | | |
| Lifestyle Conservative | 11, 324, 275 | | |
Dividend Received Deduction Corporate shareholders are generally entitled to take the dividends received deduction on the portion of a Portfolio’s dividend distribution that qualifies under tax law. The percentage of the Portfolio’s fiscal 2008 ordinary income dividends that qualifies for the corporate dividend received deduction is set forth below:
| | | |
| Dividend Received | | |
| Portfolio | Deduction | | |
| | |
| Lifestyle Aggressive | 39.68% | | |
| Lifestyle Growth | 18.14% | | |
| Lifestyle Balanced | 10.27% | | |
| Lifestyle Moderate | 2.33% | | |
| Lifestyle Conservative | 3.69% | | |
Shareholders were mailed a 2008 U.S. Treasury Department Form 1099-DIV in January 2009. This will reflect the total of all distributions that are taxable for the calendar year 2008.
| |
| 56 | Lifestyle Portfolios | Annual report |
F I N A N C I A L S T A T E M E N T S
Trustees and Officers
This chart provides information about the Trustees and Officers of John Hancock Funds II who oversee your John Hancock fund. Officers elected by the Trustees manage the day-to-day operations of the Portfolio and execute policies formulated by the Trustees.
| | |
| Independent Trustees | | |
| |
| | | Number of |
| Name, Year of Birth | | John Hancock |
| Position(s) held with Fund | Trustee of | funds overseen |
| Principal occupation(s) and other directorships during past 5 years | Fund since1 | by Trustee |
| |
| Charles L. Bardelis, Born: 1941 | 2005 | 212 |
|
| Director, Island Commuter Corp. (Marine Transport). Trustee of John Hancock Trust (since | | |
| 1988) and former Trustee of John Hancock Funds III (2005–2006). | | |
|
| |
| Peter S. Burgess, Born: 1942 | 2005 | 212 |
|
| Consultant (financial, accounting and auditing matters) (since 1999); Certified Public | | |
| Accountant. Partner, Arthur Andersen (independent public accounting firm) (prior to 1999). | | |
| Director of the following publicly traded companies: PMA Capital Corporation (since 2004) | | |
| and Lincoln Educational Services Corporation (since 2004). Trustee of John Hancock Trust | | |
| (since 2005), and former Trustee of John Hancock Funds III (2005–2006). | | |
|
| |
| Elizabeth G. Cook, Born: 1937 | 2005 | 212 |
|
| Expressive Arts Therapist, Massachusetts General Hospital (September 2001 to June 2007); | | |
| Expressive Arts Therapist, Dana Farber Cancer Institute (September 2000 to January 2004); | | |
| Trustee of John Hancock Trust (since 2005) and former Trustee of John Hancock Funds III | | |
| (2005–2006). | | |
|
| |
| Theron S. Hoffman,2 Born: 1947 | 2008 | 212 |
|
| Trustee of John Hancock Trust and John Hancock Funds II (since September 2008); Chief | | |
| Executive Officer, T. Hoffman Associates, LLC (since 2003); Director, The Todd Organization | | |
| (since 2003); President, Westport Resources Management (2006–2008); Partner/Operating | | |
| Head & Senior Managing Director, Putnam Investments (2000–2003). | | |
|
| |
| Hassell H. McClellan, Born: 1945 | 2005 | 212 |
|
| Associate Professor, The Graduate School of The Wallace E. Carroll School of Management, | | |
| Boston College. Trustee of John Hancock Trust (since 2005), former Trustee of John Hancock | | |
| Funds III (2005–2006) and Trustee of Phoenix Edge Series Fund (since 2008). | | |
|
| |
| James M. Oates, Born: 1946 | 2005 | 212 |
|
| Managing Director, Wydown Group (financial consulting firm) (since 1994); Chairman, | | |
| Emerson Investment Management, Inc. (since 2000); Chairman, Hudson Castle Group, Inc. | | |
| (formerly IBEX Capital Markets, Inc.) (financial services company) (1997–2006). Director of the | | |
| following publicly traded companies: Stifel Financial (since 1996); Investor Financial Services | | |
| Corporation (since 1995); and Connecticut River Bancorp, Director (since 1998). Director, | | |
| Virtus Investment Management (since 2009); and Emerson Investment Management (since | | |
| 2000). Trustee of John Hancock Trust (since 2004), and former Trustee of John Hancock | | |
| Funds III (2005-2006). | | |
See notes to financial statements
| |
| Annual report | Lifestyle Portfolios | 57 |
| | |
| Independent Trustees (continued) | | |
| |
| | | Number of |
| Name, Year of Birth | | John Hancock |
| Position(s) held with Fund | Trustee of | funds overseen |
| Principal occupation(s) and other directorships during past 5 years | Fund since1 | by Trustee |
| |
| Steven M. Roberts,2 Born: 1944 | 2008 | 212 |
|
| Trustee of John Hancock Trust and John Hancock Funds II (since September 2008); Board of | | |
| Governors Deputy Director, Federal Reserve System (2005–2008); Partner, KPMG | | |
| (1987–2004). | | |
1 Because the Trust does not hold regular annual shareholders meetings, each Trustee holds office for an indefinite term until his/her successor is duly elected and qualified or until he/she dies, retires, resigns, is removed or becomes disqualified. Trustees may be removed (provided the aggregate number of Trustees after such removal shall not be less than one) with cause or without cause, by the action of two-thirds of the remaining Trustees or by action of two-thirds of the outstanding Shares of the Trust.
2 Mr. Hoffman and Mr. Roberts were appointed by the Board as Trustees on September 26, 2008.
| | |
| Trustee Emeritus | | |
| |
| | | Number of |
| Name, Year of Birth | | John Hancock |
| Position(s) held with Fund | Trustee of | funds overseen |
| Principal occupation(s) and other directorships during past 5 years | Fund since | by Trustee |
| |
| John D. Richardson,1 Born: 1938 | 2006 | 212 |
|
| Former Trustee of JHT (Retired, December 14, 2006). Former Senior Executive Vice President, | | |
| Office of the President, MFC, February 2000 to March 2002 (Retired, March 2002); Executive | | |
| Vice President and General Manager, U.S. Operations, Manulife Financial, January 1995 to | | |
| January 2000. | | |
1 Mr. Richardson became a non-voting Trustee Emeritus on December 14, 2006.
| | |
| Non-Independent Trustees1,2 | | |
| |
| | | Number of |
| Name, Year of Birth | Trustee | John Hancock |
| Position(s) held with Fund | of Fund | funds overseen |
| Principal occupation(s) and other directorships during past 5 years | since1,2 | by Trustee |
| |
| James R. Boyle,3 Born: 1959 | 2005 | 267 |
|
| Executive Vice President, Manulife Financial Corporation (since 1999); Director and President, John Hancock Variable Life Insurance |
| Company (since 2007); Director and Executive Vice President, John Hancock Life Insurance Company (since 2004); Chairman and |
| Director, John Hancock Advisers, LLC (the Adviser), John Hancock Funds, LLC (John Hancock Funds) and The Berkeley Financial Group, |
| LLC (The Berkeley Group) (holding company) (since 2005); Chairman and Director, John Hancock Investment Management Services, LLC |
| (since 2006); Senior Vice President, The Manufacturers Life Insurance Company (U.S.A.) (until 2004). | | |
|
| |
| Grace K. Fey,4,5 Born: 1946 | 2008 | 212 |
|
| Trustee of John Hancock Trust and John Hancock Funds II (since September 2008); Chief | | |
| Executive Officer, Grace Fey Advisors (since 2007); Director & Executive Vice President, Frontier | | |
| Capital Management Company (1988–2007). | | |
| |
| 58 | Lifestyle Portfolios | Annual report |
1 Non-Independent Trustee holds positions with the Fund’s investment adviser, underwriter and certain other affiliates.
2 Because the Trust does not hold regular annual shareholders meetings, each Trustee holds office for an indefinite term until his/her successor is duly elected and qualified or until he/she dies, retires, resigns, is removed or becomes disqualified. Trustees may be removed (provided the aggregate number of Trustees after such removal shall not be less than one) with cause or without cause, by the action of two-thirds of the remaining Trustees or by action of two-thirds of the outstanding Shares of the Trust holds positions with the Fund’s investment adviser, underwriter and certain other affiliates.
3 Mr. Boyle is an “interested person” (as defined in the 1940 Act) due to his position with Manulife Financial Corporation (or its affiliates), the ultimate parent of the Adviser.
4 Ms. Fey was appointed by the Board as Trustee on September 26, 2008.
5 Ms. Fey is an “interested person” (as defined by the 1940 Act) due to a deferred compensation arrangement with her former employer, Frontier Capital Management Company, which is a subadviser of certain funds of John Hancock Funds II and John Hancock Trust.
|
| Principal officers who are not Trustees |
| |
| Name, Year of Birth |
| Position(s) held with Fund |
| Principal occupation(s) and other |
| directorships during past 5 years |
| |
| Keith F. Hartstein, Born: 1956 |
|
| President and Chief Executive Officer |
| Senior Vice President, Manulife Financial Corporation (since 2004); Director, President and Chief Executive |
| Officer, the Adviser, The Berkeley Group and John Hancock Funds, LLC (since 2005); Director, MFC Global |
| Investment Management (U.S.), LLC (MFC Global (U.S.)) (since 2005); Chairman and Director, John |
| Hancock Signature Services, Inc. (since 2005); Director, President and Chief Executive Officer, John Hancock |
| Investment Management Services, LLC (since 2006); President and Chief Executive Officer, John Hancock |
| Funds, John Hancock Funds II, John Hancock Funds III and John Hancock Trust (since 2005); Director, |
| Chairman and President, NM Capital Management, Inc. (since 2005); Member and former Chairman, |
| Investment Company Institute Sales Force Marketing Committee (since 2003); Director, President and Chief |
| Executive Officer, MFC Global (U.S.) (2005–2006); Executive Vice President, John Hancock Funds, LLC |
| (until 2005). |
|
| |
| Thomas M. Kinzler, Born: 1955 |
|
| Secretary and Chief Legal Officer |
| Vice President and Counsel, John Hancock Life Insurance Company (U.S.A.) (since 2006); Secretary and |
| Chief Legal Officer, John Hancock Funds, John Hancock Funds II and John Hancock Trust (since 2006); Vice |
| President and Associate General Counsel, Massachusetts Mutual Life Insurance Company (1999–2006); |
| Secretary and Chief Legal Counsel, MML Series Investment Fund (2000–2006); Secretary and Chief Legal |
| Counsel, MassMutual Institutional Funds (2000–2004); Secretary and Chief Legal Counsel, MassMutual |
| Select Funds and MassMutual Premier Funds (2004–2006). |
|
| |
| Francis V. Knox, Jr., Born: 1947 |
|
| Chief Compliance Officer |
| Vice President and Chief Compliance Officer, John Hancock Investment Management Services, LLC, the |
| Adviser and MFC Global (U.S.) (since 2005); Chief Compliance Officer, John Hancock Funds, John Hancock |
| Funds II, John Hancock Funds III and John Hancock Trust (since 2005); Vice President and Assistant Treasurer, |
| Fidelity Group of Funds (until 2004); Vice President and Ethics & Compliance Officer, Fidelity Investments |
| (until 2001). |
| |
| Annual report | Lifestyle Portfolios | 59 |
|
| Principal officers who are not Trustees (continued) |
| |
| Name, Year of Birth |
| Position(s) held with Fund |
| Principal occupation(s) and other |
| directorships during past 5 years |
| |
| Charles A. Rizzo, Born: 1957 |
|
| Chief Financial Officer |
| Chief Financial Officer, John Hancock Funds, John Hancock Funds II, John Hancock Funds III and John |
| Hancock Trust (since 2007); Assistant Treasurer, Goldman Sachs Mutual Fund Complex (registered |
| investment companies) (2005–2007); Vice President, Goldman Sachs (2005–2007); Managing Director |
| and Treasurer of Scudder Funds, Deutsche Asset Management (2003–2005); Director, Tax and Financial |
| Reporting, Deutsche Asset Management (2002–2003); Vice President and Treasurer, Deutsche Global Fund |
| Services (1999–2002). |
|
| |
| Gordon M. Shone, Born: 1956 |
|
| Treasurer |
| Senior Vice President, John Hancock Life Insurance Company (U.S.A.) (since 2001); Treasurer, John Hancock |
| Funds (since 2006), John Hancock Funds II, John Hancock Funds III and John Hancock Trust (since 2005); |
| Vice President and Chief Financial Officer, John Hancock Trust (2003–2005); Vice President, John Hancock |
| Investment Management Services, LLC, John Hancock Advisers, LLC (since 2006) and The Manufacturers Life |
| Insurance Company (U.S.A.) (1998–2000). |
|
| |
| John G. Vrysen, Born: 1955 |
|
| Chief Operating Officer |
| Senior Vice President, Manulife Financial Corporation (since 2006); Director, Executive Vice President and |
| Chief Operating Officer, the Adviser, The Berkley Group, John Hancock Investment Management Services, |
| LLC and John Hancock Funds, LLC (since 2007); Chief Operating Officer, John Hancock Funds, John Hancock |
| Funds II, John Hancock Funds III and John Hancock Trust (since 2007); Director, John Hancock Signature |
| Services, Inc. (since 2005); Chief Financial Officer, the Adviser, The Berkley Group, Manulife Financial |
| Corporation Global Investment Management (U.S.), LLC, John Hancock Investment Management Services, |
| LLC, John Hancock Funds, LLC, John Hancock Funds, John Hancock Funds II, John Hancock Funds III and John |
| Hancock Trust (2005–2007); Vice President, Manulife Financial Corporation (until 2006). |
The business adddress for all Trustees and Officers is 601 Congress Street, Boston, Massachusetts 02210-2805.
The Statement of Additional Information of the Fund includes additional information about members of the Board of Trustees of the Fund and is available without charge, upon request, by calling 1-800-225-5291.
| |
| 60 | Lifestyle Portfolios | Annual report |
More information
| |
| Trustees | Investment adviser |
| James M. Oates, Chairman | John Hancock Investment Management Services, LLC |
| James R. Boyle† | |
| Grace K. Fey†** | Investment Subadviser |
| Charles L. Bardelis* | MFC Global Investment Management (U.S.A.) Limited |
| Peter S. Burgess* | |
| Elizabeth G. Cook** | Principal distributor |
| Theron S. Hoffman** | John Hancock Funds, LLC |
| Hassell H. McClellan** | |
| Steven M. Roberts* | Custodian |
| John D. Richardson* | State Street Bank & Trust Company |
| Trustee Emeritus | |
| *Members of the Audit Committee | Transfer agent |
| **Members of the Compliance Committee | John Hancock Signature Services, Inc. |
| †Non-Independent Trustees | |
| | Legal counsel |
| Officers | K&L Gates LLP |
| Keith F. Hartstein | |
| President and Chief Executive Officer | Independent registered |
| | public accounting firm |
| Thomas M. Kinzler | PricewaterhouseCoopers LLP |
| Secretary and Chief Legal Officer | |
| | |
| Francis V. Knox, Jr. | |
| Chief Compliance Officer | |
| | |
| Charles A. Rizzo | |
| Chief Financial Officer | |
| | |
| Gordon M. Shone | |
| Treasurer | |
| | |
| John G. Vrysen | |
| Chief Operating Officer | |
Additional information about your fund is available without charge in several ways. As required by the SEC, you can access proxy voting information and quarterly portfolio information on your fund. The proxy voting information includes a description of proxy voting policies, procedures and information regarding how the fund voted proxies relating to portfolio securities during the most recent twelve-month period ended June 30. The quarterly portfolio information that includes a complete list of the fund’s holdings for the first and third quarters of the fund’s fiscal period is filed on Form N-Q. You have access to this information:
| | |
| By phone | On the fund’s Website | At the SEC |
| 1-800-225-5291 | www.jhfunds.com | www.sec.gov |
| | | 1-800-SEC-0330 |
| | | SEC Public Reference Room |
|
| You can also contact us: | | |
| Regular mail | | Express mail |
| John Hancock Signature Services, Inc. | John Hancock Signature Services, Inc. |
| P.O. Box 9510 | | Mutual Fund Image Operations |
| Portsmouth, NH 03802-9510 | | 164 Corporate Drive |
| | | Portsmouth, NH 03801 |
| |
Month-end portfolio holdings are available at www.jhfunds.com.
| |
| Annual report | Lifestyle Portfolios | 61 |

1-800-225-5291
1-800-554-6713 TDD
1-800-338-8080 EASI-Line
www.jhfunds.com
|
| Now available: electronic delivery |
| www.jhfunds.com/edelivery |
| |
| This report is for the information of the shareholders of John Hancock Lifecycle Portfolios. | |
| It is not authorized for distribution to prospective investors unless preceded or accompanied by a prospectus. | LS00A 12/08 |
| | 2/09 |

Discussion of Fund performance
By MFC Global Investment Management (U.S.A.) Limited
U.S. stocks finished 2008 with their worst performance since 1931, as the credit crisis that had begun in the subprime mortgage sector broadened into a full-scale recession. The second half of the year was particularly harsh for investors. After a series of shocks during September — including the bankruptcy of investment bank Lehman Brothers and government bailouts of mortgage securitizers Fannie Mae and Freddie Mac — stocks tumbled in October. Few asset classes had positive returns during the year, with natural resources, emerging markets, real estate equities and high-yield bonds all posting steep declines. However, Treasury securities delivered positive returns across the board, except for Treasury Inflation-Protected Securities, which sold off in the fourth quarter on deflation fears.
“U.S. stocks finished 2008 with their
worst performance since 1931…”
During the past year, John Hancock Retirement Distribution Portfolio’s Class A shares returned –23.47%, at net asset value. By comparison, the S&P 500 Index returned –37.00%, the Barclays Capital U.S. Aggregate Bond Index returned 5.24% and the Portfolio’s blended benchmark —50% S&P 500 Index/50% Barclays Capital (formerly Lehman Brothers) U.S. Aggregate Bond Index — returned –17.94% over the same period. The Portfolio’s underperformance was due to both unrewarding asset allocation and the challenging performance of our individual funds. Exposure to the high-yield bond sector detracted significantly, while allocations to foreign equities, including emerging markets, global real estate and global natural resources also detracted. At the fund level, detractors included Active Bond (MFC Global U.S./Declaration), and to a lesser extent Core Bond (Wells Capital), Total Return (PIMCO) and High Incom e (MFC Global U.S.). On the equity side, International Small Cap (Franklin Templeton) dampened our results. Conversely, U.S. High Yield Bond (Wells Capital) performed relatively well in the weak high-yield market.
This commentary reflects the views of the portfolio management team through the end of the Fund’s period discussed in this report. The managers’ statements reflect their own opinions. As such, they are in no way guarantees of future events and are not intended to be used as investment advice or a recommendation regarding any specific security. They are also subject to change at any time as market and other conditions warrant.
| |
| 6 | Retirement Distribution Portfolio | Annual report |
A look at performance
For the period ended December 31, 2008
| | | | | | | | | |
| | | Average annual returns (%) | Cumulative total returns (%) | | |
| | | with maximum sales charge (POP) | with maximum sales charge (POP) | | |
| |
|
|
| | Inception | | | | Since | | | | Since |
| Class | date | 1-year | 5-year | 10-year | inception | 1-year | 5-year | 10-year | inception |
|
| A | 12-31-07 | –27.16 | — | — | –27.16 | –27.16 | — | — | –27.16 |
|
Performance figures assume all distributions are reinvested. Public offering price (POP) figures reflect maximum sales charges on Class A shares of 5%.
The expense ratios of the Fund, both net (including any fee waivers or expense limitations) and gross (excluding any fee waivers or expense limitations), are set forth according to the most recent publicly available prospectus for the Fund and may differ from the expense ratios disclosed in the Financial Highlights tables in this report. The waivers and expense limitations were contractual until December 31, 2008. The waivers have been voluntarily renewed until December 31, 2009. The net expenses are as follows: Class A — 1.25%. Had the fee waivers and expense limitations not been in place, the gross expenses would be as follows: Class A — 1.55%.
The returns reflect past results and should not be considered indicative of future performance. The return and principal value of an investment will fluctuate so that shares, when redeemed, may be worth more or less than their original cost. Due to market volatility, the Fund’s current performance may be higher or lower than the performance shown. For current to the most recent month end performance data, please call 1–800–225–5291 or visit the Fund’s Web site at www.jhfunds.com.
The performance table above and the chart on the next page do not reflect the deduction of taxes that a shareholder would pay on fund distributions or the redemption of fund shares.
The Fund’s performance results reflect any applicable expense reductions, without which the expenses would increase and results would have been less favorable.
| | |
| | Annual report | Retirement Distribution Portfolio | 7 |
A look at performance
Growth of $10,000
This chart shows what happened to a hypothetical $10,000 investment in JHF II Retirement Distribution Portfolio Class A shares for the period indicated. For comparison, we’ve shown the same investment in the 50% Standard and Poor’s 500 / 50% Barclays Capital U.S. Aggregate Blended Index.
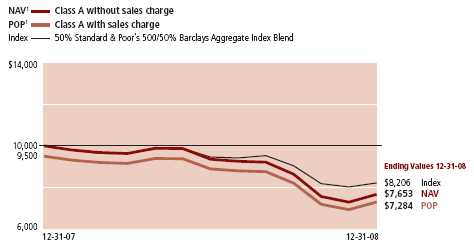
Assuming all distributions were reinvested for the period indicated, the table above shows the value of a $10,000 investment for Fund Class A, respectively, as of December 31, 2008.
Combined index consists of 50% Standard and Poor’s 500 / 50% Barclays Capital U.S. Aggregate Blended Index. The S&P 500 Index is composed of 500 widely held common stocks. The Barclays Capital U.S. Aggregate Index includes U.S. government, corporate and mortgage-backed securities with maturities up to 30 years.
It is not possible to invest directly in an index. Index figures do not reflect sales charges, which would have resulted in lower values if they did.
1 NAV represents net asset value and POP represents public offering price.
| |
| 8 | Retirement Distribution Portfolio | Annual report |
Your expenses
These examples are intended to help you understand your ongoing operating expenses.
Understanding fund expenses
As a shareholder of the Fund, you incur two types of costs:
▪ Transaction costs which include sales charges (loads) on purchases or redemptions (varies by share class), minimum account fee charge, etc.
▪ Ongoing operating expenses including management fees, distribution and service fees (if applicable), and other fund expenses.
We are going to present only your ongoing operating expenses here.
Actual expenses/actual returns
This example is intended to provide information about your fund’s actual ongoing operating expenses, and is based on your fund’s actual return. It assumes an account value of $1,000.00 on July 1, 2008, with the same investment held until December 31, 2008.
| | | |
| | Account value | Ending value | Expenses paid during |
| | on 7-1-08 | on 12-31-08 | period ended 12-31-081,2 |
|
| Class A | $1,000.00 | $818.00 | $2.83 |
|
Together with the value of your account, you may use this information to estimate the operating expenses that you paid over the period. Simply divide your account value at December 31, 2008, by $1,000.00, then multiply it by the “expenses paid” for your share class from the table above. For example, for an account value of $8,600.00, the operating expenses should be calculated as follows:
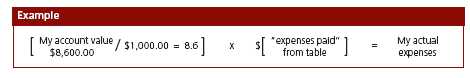
| | |
| | Annual report | Retirement Distribution Portfolio | 9 |
Your expenses
Hypothetical example for comparison purposes
This table allows you to compare your fund’s ongoing operating expenses with those of any other fund. It provides an example of the Fund’s hypothetical account values and hypothetical expenses based on each class’s actual expense ratio and an assumed 5% annualized return before expenses (which is not your fund’s actual return). It assumes an account value of $1,000.00 on July 1, 2008, with the same investment held until December 31, 2008. Look in any other fund shareholder report to find its hypothetical example and you will be able to compare these expenses.
| | | |
| | Account value | Ending value | Expenses paid during |
| | on 7-1-08 | on 12-31-08 | period ended 12-31-081,2 |
|
| Class A | $1,000.00 | $1,022.00 | $3.15 |
|
Remember, these examples do not include any transaction costs, such as sales charges; therefore, these examples will not help you to determine the relative total costs of owning different funds. If transaction costs were included, your expenses would have been higher. See the prospectus for details regarding transaction costs.
1 Expenses are equal to the Fund’s annualized expense ratio of 0.62% for Class A, respectively, multiplied by the average account value over the period, multiplied by 184/366 (to reflect the one-half year period).
2 Ratios do not include expenses indirectly incurred from underlying funds whose expense ratios can vary based on the mix of underlying funds held by the portfolio. The range of expense ratios of the underlying funds held by the porfolio was 0.61% –1.13%.
| |
| 10 | Retirement Distribution Portfolio | Annual report |
Portfolio summary
| | | | |
| Asset allocation1 | | | | |
|
| Equities | % of Total | | Fixed income | |
| |
|
| Commodities | 16% | | Intermediate bond | 32% |
| |
|
| U.S. mid cap | 9% | | Short-term securities | 7% |
| |
|
| U.S. large cap | 6% | | High-yield bond | 6% |
| |
|
| Emerging markets | 5% | | Global bond | 5% |
| |
|
| International small cap | 5% | | | |
| | |
| Real estate | 4% | | | |
| | |
| International large cap | 3% | | | |
| | |
| Natural resources | 2% | | | |
| | |
1As a percentage of net assets on December 31, 2008.
| | |
| | Annual report | Retirement Distribution Portfolio | 11 |
F I N A N C I A L S T A T E M E N T S
Portfolio’s investments
Securities owned by the Portfolio on 12-31-08
| | |
| Issuer | Shares | Value |
|
| Investment companies 93.88% | | $3,591,590 |
|
| (Cost $4,971,732) | | |
| | | |
| Unaffiliated Investment Companies 16.05% | | 614,184 |
|
| WisdomTree DEFA High-Yielding Equity Fund | 6,900 | 235,221 |
|
| WisdomTree High-Yielding Equity Fund | 12,300 | 378,963 |
| | | |
| John Hancock Funds II (f) 76.76% | | 2,936,573 |
|
| Active Bond (MFC Global U.S./Declaration) (g) | 30,632 | 252,103 |
|
| Capital Appreciation (Jennison) | 10,816 | 77,011 |
|
| Core Bond (Wells Capital) | 26,980 | 329,422 |
|
| Emerging Markets Value (DFA) | 37,963 | 205,758 |
|
| Equity-Income (T. Rowe Price) | 3,885 | 39,428 |
|
| Fundamental Value (Davis) | 3,764 | 39,030 |
|
| Global Bond (PIMCO) | 17,191 | 191,162 |
|
| Global Real Estate (Deutsche) | 32,444 | 167,087 |
|
| High Income (MFC Global U.S.) (g) | 15,612 | 71,660 |
|
| High Yield (WAMCO) | 12,181 | 73,937 |
|
| International Opportunities (Marsico) | 4,391 | 40,878 |
|
| International Small Cap (Templeton) | 14,200 | 113,461 |
|
| International Small Company (DFA) | 15,182 | 80,615 |
|
| International Value (Templeton) | 3,997 | 40,210 |
|
| Large Cap Value (BlackRock) | 2,582 | 40,384 |
|
| Mid Cap Intersection (Wellington) | 15,327 | 82,305 |
|
| Mid Cap Stock (Wellington) | 7,509 | 81,703 |
|
| Mid Cap Value (Lord Abbett) | 7,171 | 78,884 |
|
| Natural Resources (Wellington) | 5,925 | 78,626 |
|
| Total Bond Market (Declaration) (g) | 31,591 | 324,758 |
|
| Total Return (PIMCO) | 26,046 | 332,607 |
|
| U.S. High Yield Bond (Wells Capital) | 8,060 | 74,228 |
|
| Value & Restructuring (Columbia) | 5,911 | 40,076 |
|
| Value (Van Kampen) | 13,040 | 81,240 |
| | | |
| John Hancock Funds III (f) 1.07% | | 40,833 |
|
| International Core (GMO) | 1,753 | 40,833 |
See notes to financial statements
| |
| 12 | Retirement Distribution Portfolio | Annual report |
F I N A N C I A L S T A T E M E N T S
| | |
| | Principal | |
| Issuer | amount | Value |
|
| Short-term investments 7.06% | | $269,997 |
| (Cost $269,997) | | |
| Federal Home Loan Bank Discount Notes | | |
| 0.01% due 2-12-09 | $270,000 | 269,997 |
|
| Total investments (Cost $5,241,729)† 100.94% | | $3,861,587 |
|
| Liabilities in excess of other assets (0.94%) | | ($35,313) |
|
| Total net assets 100.00% | | $3,826,274 |
|
Percentages are stated as a percent of net assets.
(f) The underlying fund’s subadviser is shown parenthetically.
(g) The subadviser is an affiliate of the adviser.
† At December 31, 2008 the aggregate cost of investment securities for federal income tax purpose was $5,251,323. Net unrealized depreciation aggregated $1,389,736, of which $5,307 related to appreciated investment securities and $1,395,043 related to depreciated investment securities.
See notes to financial statements
| | |
| | Annual report | Retirement Distribution Portfolio | 13 |
F I N A N C I A L S T A T E M E N T S
Financial statements
Statement of assets and liabilities 12-31-08
This Statement of Assets and Liabilities is the Fund’s balance sheet. It shows the value of what the Fund owns, is due and owes. You’ll also find the net asset value and the maximum offering price per share.
| |
| Assets | |
|
| Investments in unaffiliated issuers, at value (Cost $1,254,649) | $884,181 |
| Investments in affiliated funds, at value (cost $3,987,080) (Note 8) | 2,977,406 |
| | |
| Total investments, at value (cost $5,241,729) | 3,861,587 |
| Cash | 3,767 |
| Receivable due from adviser | 754 |
| | |
| Total assets | 3,866,108 |
| |
| Liabilities | |
|
| Payable for investments purchased | 30,512 |
| Payable to affiliates | |
| Fund administration fees | 113 |
| Transfer agent fees | 165 |
| Other payables and accrued expenses | 9,044 |
| | |
| Total liabilities | 39,834 |
| |
| Net assets | |
|
| Capital paid-in | $5,221,659 |
| Accumulated net realized loss on investments | (15,243) |
| Net unrealized appreciation (depreciation) on investments | (1,380,142) |
| | |
| Net assets | $3,826,274 |
| |
| Net asset value per share | |
|
| Based on net asset values and shares outstanding — the Fund has an | |
| unlimited number of shares authorized with no par value. | |
| Class A ($3,826,274 ÷ 405,536 shares) | $9.44 |
| |
| Maximum public offering price per share | |
|
| Class A (9.44 ÷ 95%)1 | $9.94 |
1 On single retail sales of less than $50,000. On sales of $50,000 or more and on group sales the offering price is reduced.
See notes to financial statements
| |
| 14 | Retirement Distribution Portfolio | Annual report |
F I N A N C I A L S T A T E M E N T S
Statement of operations For the period ended 12-31-081
This Statement of Operations summarizes the Portfolio’s investment income earned and expenses incurred in operating the Portfolio. It also shows net gains for the period stated.
| |
| Investment income | |
|
| Income distributions received from affiliated underlying funds | $157,561 |
| Dividends | 42,149 |
| Interest | 4,456 |
| | |
| Total investment income | 204,166 |
| |
| Expenses | |
|
| Investment management fees (Note 5) | 7,096 |
| Distribution and service fees (Note 5) | 13,414 |
| Transfer agent fees (Note 5) | 165 |
| Fund administration fees (Note 5) | 703 |
| Audit and legal fees | 34,969 |
| Printing and postage fees (Note 5) | 1,820 |
| Custodian fees | 10,578 |
| Trustees’ fees (Note 5) | 54 |
| Registration and filing fees | 7,515 |
| Miscellaneous | 15 |
| | |
| Total expenses | 76,329 |
| Less: expense reductions (Note 5) | (49,473) |
| | |
| Net expenses | 26,856 |
| | |
| Net investment income (loss) | 177,310 |
| |
| Realized and unrealized gain (loss) | |
|
| Net realized gain (loss) on | |
| Investments in unaffiliated issuers | (38,924) |
| Investments in affiliated underlying funds | (28,358) |
| Capital gain distributions received from affiliated underlying funds | 96,388 |
| | 29,106 |
| Change in net unrealized appreciation (depreciation) of | |
| Investments in unaffiliated issuers | (370,467) |
| Investments in affiliated underlying funds | (1,009,675) |
| | (1,380,142) |
| Net realized and unrealized loss | (1,351,036) |
| | |
| Decrease in net assets from operations | ($1,173,726) |
1 Period from 1-2-08 (commencement of operations) to 12-31-08.
See notes to financial statements
| | |
| | Annual report | Retirement Distribution Portfolio | 15 |
F I N A N C I A L S T A T E M E N T S
Statements of changes in net assets
This Statement of Changes in Net Assets shows how the value of the Portfolio’s net assets has changed during the period. The difference reflects earnings less expenses, any investment gains and losses, distributions, if any, paid to shareholders and the net of Portfolio share transactions.
| |
| | Period |
| | ended |
| | 12-31-081 |
|
| Increase (decrease) in net assets | |
|
| From operations | |
| Net investment income | $177,310 |
| Net realized gain | 29,106 |
| Change in net unrealized appreciation (depreciation) | (1,380,142) |
| | |
| Decrease in net assets resulting from operations | (1,173,726) |
| | |
| Distributions to shareholders | |
| From net investment income | (225,220) |
| From tax return capital | (64,700) |
| | |
| Total distributions | (289,920) |
| | |
| From Fund share transactions (Note 6) | 5,289,920 |
| | |
| Total increase | 3,826,274 |
| |
| Net assets | |
|
| Beginning of period | — |
| | |
| End of period | $3,826,274 |
1 Period from 1-2-08 (commencement of operations) to 12-31-08.
See notes to financial statements
| |
| 16 | Retirement Distribution Portfolio | Annual report |
F I N A N C I A L S T A T E M E N T S
Financial highlights
The Financial Highlights show how the Fund’s net asset value for a share has changed since the beginning of the period.
CLASS A SHARES
| |
| Period ended | 12-31-081,2 |
|
| Per share operating performance | |
|
| Net asset value, beginning of period | $13.18 |
| Net investment income | 0.463 |
| Net realized and unrealized loss on investments | (3.45) |
| Total from investment operations | (2.99) |
| Less distributions | |
| From net investment income | (0.58) |
| From tax return of capital | (0.17) |
| Total distributions | (0.75) |
| Net asset value, end of period | $9.44 |
| Total return (%)4,5 | (23.47) |
| |
| Ratios and supplemental data | |
|
| Net assets, end of period | |
| (in millions) | $4 |
| Ratios (as a percentage of average net assets): | |
| Expenses before reductions | 1.716 |
| Expenses net of all fee waivers, if any | 0.606 |
| Expenses net of all fee waivers and credits | 0.606 |
| Net investment income (loss) | 3.976 |
| Portfolio turnover (%) | 16 |
1 Class A shares began operations on 1-2-08.
2 Per share data has been restated to reflect the effects of a 1-for-1.317576 reverse stock split effective on October 7, 2008.
3 Based on the average of the shares outstanding.
4 Total returns would have been lower had certain expenses not been reduced during the periods shown.
5 Assumes dividend reinvestment.
6 Ratios do not include expenses indirectly incurred from underlying funds whose expense ratios can vary based on the mix of underlying funds held by the Portfolio. The range of expense ratios of the underlying funds held by the portfolio was 0.61% –1.13%.
See notes to financial statements
| | |
| | Annual report | Retirement Distribution Portfolio | 17 |
Notes to financial statements
Note 1
Organization of the Trust
Retirement Distribution Portfolio (the Portfolio) is a series of John Hancock Funds II (the Trust or JHF II). The Portfolio commenced investment operations on January 2, 2008. The Trust is an open-end management investment company organized as a Massachusetts business trust. It is a series company, which means that it has several funds, each with a stated investment objective that it pursues through separate investment policies. The Trust currently offers seventy-two separate investment funds.
The Portfolio is non-diversified for purposes of the Investment Company Act of 1940, as amended (the “1940 Act”).
The Portfolio operates as a “fund of funds”, investing in Class NAV shares of underlying funds of the Trust, John Hancock Funds III (JHF III) and also in other affiliated funds of the John Hancock funds complex. The Portfolio may also invest in unaffiliated underlying funds and other permitted investments.
The JHF III funds are retail mutual funds advised by John Hancock Investment Management Services, LLC (JHIMS or the Adviser) and distributed by John Hancock Funds, LLC (the Distributor).
The accounting policies of the affiliated underlying funds of the Trust are outlined in the shareholder reports for such funds, available without charge by calling 1-800-225-5291, or on the Securities and Exchange Commission (SEC) Web site at www.sec.gov, or at the commission’s public reference room in Washington, D.C. The affiliated underlying funds are not covered by this report.
JHIMS, a Delaware limited liability company controlled by John Hancock Life Insurance Company (U.S.A.) (John Hancock USA), serves as investment adviser for the Trust and the Distributor, an affiliate of the Adviser, serves as principal underwriter. John Hancock USA and John Hancock New York are indirect wholly owned subsidiaries of the Manufacturers Life Insurance Company (Manulife), which in turn is a wholly owned subsidiary of Manulife Financial Corporation (MFC), a publicly traded company. MFC and its subsidiaries are known collectively as “Manulife Financial.”
The Board of Trustees has authorized the issuance of Class A shares of the Portfolio. Class A shares are open to all retail investors.
Note 2
Significant accounting policies
In the preparation of the financial statements, the Portfolio follows the policies described below. The preparation of financial statements in conformity with accounting principles generally accepted in the United States of America requires management to make estimates and assumptions that affect the reported amounts of assets and liabilities at the date of the financial statements and the reported amounts of income and expenses during the reporting period. Actual results may differ from these estimates.
Securities valuation
Investments are stated at value as of the close of the regular trading on the New York Stock Exchange (NYSE), normally at 4:00 P.M., Eastern Time. Investments by the Portfolio in underlying affiliated funds are valued at their respective net asset values each business day and securities in the underlying funds are valued in accordance with their respective valuation polices, as outlined in the underlying funds’ financial statements. Short-term debt investments that have a remaining maturity of 60 days or less are valued at amortized cost, and thereafter assume a constant amortization to maturity of any discount or premium, which approximates market value. All other securities held by the Portfolio and by the underlying affiliated funds are valued at the last sale price
| |
| 18 | Retirement Distribution Portfolio | Annual report |
or official closing price (closing bid price or last evaluated quote if no sale has occurred) as of the close of business on the principal securities exchange (domestic or foreign) on which they trade or, lacking any sales, at the closing bid price.
The Portfolio adopted Statement of Financial Accounting Standards No. 157 (FAS 157), “Fair Value Measurements”, effective with the beginning of the Portfolio’s fiscal year. FAS 157 establishes a hierarchy that prioritizes the inputs to valuation techniques giving the highest priority to readily available unadjusted quoted prices in active markets for identical assets (level 1 measurements) and the lowest priority to unobservable inputs (level 3 measurements) when market prices are not readily available or reliable. The three levels of hierarchy are described below:
Level 1 — Quoted prices in active markets for identical securities.
Level 2 — Prices determined using other significant observable inputs. Observable inputs are inputs that other market participants would use to price a security. These may include quoted prices for similar securities, interest rates, prepayment speeds, credit risk and others.
Level 3 — Prices determined using significant unobservable inputs. In situations where quoted prices or observable inputs are unavailable, such as when there is little or no market activity for an investment, unobservable inputs may be used. Unobservable inputs reflect the Portfolio’s own assumptions about the factors that market participants would use in pricing an investment and would be based on the best information available.
The inputs or methodology used for valuing securities are not necessarily an indication of the risk associated with investing in those securities.
The following table is a summary of the inputs used to value the Portfolio’s net assets as of December 31, 2008:
| | |
| | Investments in | Other Financial |
| Valuation Inputs | Securities | Instruments* |
|
| Level 1 — Quoted Prices | $3,591,590 | — |
|
| Level 2 — Other Significant Observable Inputs | 269,997 | — |
|
| Level 3 — Significant Unobservable Inputs | — | — |
| Total | $3,861,587 | — |
| | | |
| *Other financial instruments are derivative instruments not reflected in the Portfolio of Investments, |
| such as futures, forwards and swap contracts, which are valued at the unrealized appreciation/ |
| depreciation of the instrument. | | |
Overdrafts
Pursuant to the custodian agreements, the Custodian may, in its discretion, advance funds to a Portfolio to make properly authorized payments. When such payments result in an overdraft, the Portfolio is obligated to repay the Custodian for any overdraft, including any costs or expenses associated with the overdraft. The Custodian has a lien and security interest in any Portfolio property, that is not segregated, to the extent of any overdraft.
Security transactions and related investment income
Investment security transactions are accounted for on a trade date plus one basis for daily net asset value calculations. However, for financial reporting purposes, investment transactions are reported on trade date. Interest income is accrued as earned. Dividend income and distributions to shareholders are recorded on the ex-dividend date. Foreign dividends are recorded on the ex-date or when the Portfolio becomes aware of the dividends from cash collections. Discounts/premiums
| | |
| | Annual report | Retirement Distribution Portfolio | 19 |
are accreted/amortized for financial reporting purposes. Non-cash dividends are recorded at the fair market value of the securities received. Distributions received from underlying funds will continue to reflect the character of these distributions. Debt obligations may be placed in a non-accrual status and related interest income may be reduced by ceasing current accruals and writing off interest receivables when the collection of all or a portion of interest has become doubtful, based upon consistently applied procedures.
The Portfolio uses the identified cost method for determining realized gain or loss on investments for both financial statement and federal income tax reporting purposes.
Expenses
The majority of expenses are directly iden-tifiable to an individual Portfolio. Trust expenses that are not readily identifiable to a specific Portfolio are allocated in such a manner as deemed equitable, taking into consideration, among other things, the nature and type of expense and the relative size of the Portfolios. Expense estimates are accrued in the period to which they relate and adjustments are made when actual amounts are known.
Federal income taxes
The Portfolio qualifies as a regulated investment company by complying with the applicable provisions of the Internal Revenue Code and will not be subject to federal income tax on taxable income that is distributed to shareholders. Therefore, no federal income tax provision is required.
As of December 31, 2008, the Portfolio had no uncertain tax positions that would require financial statement recognition, de-recognition, or disclosure. The Portfolio’s federal tax return to be filed for the year ended December 31, 2008 will be subject to examination by the Internal Revenue Service.
Distribution of income and gains
The Portfolio records distributions to shareholders from net investment income and net realized gains, if any, on the ex-dividend date. The Portfolio uses a quarterly targeted distribution strategy and distributes substantially all of its net income quarterly and capital gains distributions, if any, annually. If the Portfolio has not met its distribution goal from net income and capital gains, then the distributions may consist of a return of capital.
During the year ended December 31, 2008, tax character of distributions paid was $225,220 from net investment income and $64,700 from tax return of capital.
Such distributions and distributable earnings, on a tax basis, are determined in conformity with income tax regulations, which may differ from accounting principles generally accepted in the United States of America. Distributions in excess of tax basis earnings and profits, if any, are reported in the Portfolio’s financial statements as a return of capital.
Capital accounts within financial statements are adjusted for permanent book/tax differences. These adjustments have no impact on net assets or the results of operations. Temporary book/tax differences will reverse in a subsequent period. Permanent book/tax differences are primarily attributable to short term distributions received from underlying funds.
Net capital losses of $5,649 that are attributable to securities transactions incurred after October 31, 2008, are treated as arising on January 1, 2009, the first day of the Fund’s next taxable year.
Note 3
Risks & uncertainties
Concentration risk
The Portfolio may concentrate investments in a particular industry, sector of the economy or invest in a limited number of companies. Accordingly, the concentration may make the Portfolio’s value more volatile and investment values may rise and fall more rapidly. In addition, a Portfolio with a concentration is particularly susceptible to the impact of market, economic, regulatory and other factors affecting the specific concentration.
Note 4
Guarantees and indemnifications
Under the Trust’s organizational documents, its Officers and Trustees are indemnified against
| |
| 20 | Retirement Distribution Portfolio | Annual report |
certain liabilities arising out of the performance of their duties to the Trust. Additionally, in the normal course of business, the Trust enters into contracts with service providers that contain general indemnification clauses. The Trust’s maximum exposure under these arrangements is unknown, as this would involve future claims that may be made against the Trust that have not yet occurred. However, based on experience, the Trust believes the risk of loss to be remote.
Note 5
Investment advisory and other
agreements
The Trust has entered into an Investment Advisory Agreement with the Adviser. The Adviser is responsible for managing the corporate and business affairs of the Trust and for selecting and compensating subadvisers to handle the investment of the assets of the Portfolios, subject to the supervision of the Board of Trustees. The Portfolio and the Adviser has a sub-advisory agreement with MFC Global (U.S.A.) and is a wholly-owned subsidiary of MFC. The Portfolio is not responsible for the payment of sub-advisory fees.
Each fund pays the adviser a management fee for its services to the fund. The management fee has two components: (a) a fee on assets invested in a fund of John Hancock Funds II (JHF II) or John Hancock Funds III (JHF III); and (b) a fee on assets invested in investments other than a fund of JHF II or JHF III (Other Assets).
The fee on assets invested in a fund of JHF II or JHF III is stated as an annual percentage of the current value of the aggregate net assets of the Portfolio and the Retirement Distribution Portfolio and is equivalent to the sum of: (a) 0.060% of the first $500 million of Aggregate Net Assets and (b) 0.050% of the Excess over $500 million of Aggregate Net Assets.
The fee on Other Assets is stated as an annual percentage of the current value of the aggregate net assets of the Portfolio and the Retirement Distribution Portfolio and is equivalent to the sum of: (a) 0.510% of the first $500 million of Aggregate Net Assets and (b) 0.500% of the Excess over $500 million of Aggregate Net Assets and is applied to the Other Assets of the Portfolio.
The investment management fees incurred for the year ended December 31, 2008, were equivalent to an annual effective rate of 0.16% of the Portfolio’s average daily net assets.
Expense reimbursements
The Adviser has contractually agreed to reimburse or limit certain Portfolio level expenses to 0.09% of the Portfolio’s average annual net assets. This agreement excludes management fees, underlying fund expenses, taxes, portfolio brokerage commissions, interest, Rule 12b-1 fees, transfer agency fees, registration fees, printing and postage and litigation and indemnification expenses and other extraordinary expenses not incurred in the ordinary course of the Portfolio’s business. In addition, fees incurred under any agreement or plans of the Portfolio dealing with services for the shareholders and others with beneficial interest in shares of the Portfolio, are excluded.
The Adviser has also agreed to a contractual expense limit on Class A specific expenses (which include 12b-1, transfer agent, service fees, registration, and printing and postage) of 0.35%.
Accordingly, the expense reductions amounted to $49,473 for the year ended December 31, 2008. These expense reimbursements shall continue in effect until December 31, 2008 and thereafter until terminated by the Adviser.
Fund administration fees
Pursuant to the Advisory Agreement, the Portfolio reimburses the Adviser for all expenses associated with providing the administrative, financial, legal, accounting and recordkeeping services of the Portfolio, including the preparation of all tax returns, annual, semiannual and periodic reports to shareholders and the preparation of all regulatory reports.
The fund administration fees incurred for the year ended December 31, 2008, were equivalent to an annual effective rate of 0.01% of the Portfolio’s average daily net assets.
| | |
| | Annual report | Retirement Distribution Portfolio | 21 |
Distribution and service plans
The Trust has a Distribution Agreement with the Distributor. The Portfolio has adopted a Distribution Plan with respect to Class A pursuant to Rule 12b-1 under the 1940 Act, to reimburse the Distributor for the services it provides as distributor of shares of the Portfolio. Accordingly, the Portfolio makes daily payments to the Distributor at an annual rate not to exceed 0.30% of the average daily net assets of Class A. A maximum of 0.25% of average daily net assets may be service fees, as defined by the Conduct Rules of the Financial Industry Regulatory Authority (formerly, National Association of Securities Dealers). Under the Conduct Rules, curtailment of a portion of the Portfolio’s 12b-1 payments could occur under certain circumstances.
Sales charges
Class A shares are assessed up-front sales charges. During the year ended December 31, 2008, John Hancock USA was the sole investor in the Portfolio and was not assessed sales charges.
Transfer agent fees
The Portfolio has a Transfer Agency Agreement with John Hancock Signature Services, Inc. (Signature Services), an indirect subsidiary of MFC. For Class A shares, the Portfolio pays a monthly transfer agent fee at an annual rate of 0.05% of each class’s average daily net assets, plus a fee based on the number of shareholder accounts and reimbursement for certain out-of-pocket expenses. The Portfolio pays a monthly fee which is based on an annual rate of $15.00 for each Class A shareholder account.
Signature Services has agreed to limit the transfer agent fees so that such fees do not exceed 0.20% annually of Class A share average daily net assets. This agreement was effective until December 31, 2008. Signature Services reserves the right to terminate this limitation in the future. There were no transfer agent fee reductions for Class A shares during the year ended December 31, 2008.
The Portfolio receives earnings credits from its transfer agent as a result of uninvested cash balances. These credits are used to reduce a portion of the Portfolio’s transfer agent fees and out-of-pocket expenses. During the year ended December 31, 2008, there were no transfer agent credits earned.
Note 6
Portfolio share transactions
This listing illustrates the number of Portfolio shares sold, reinvested and repurchased during the years ended December 31, 2008, along with the corresponding dollar value.
| | |
| | | Year ended 12-31-08 |
| | Shares | Amount |
| Class A shares | | |
|
| Sold | 379,485 | $5,000,000 |
| Distributions reinvested | 26,051 | 289,920 |
| Net increase | 405,536 | $5,289,920 |
|
John Hancock USA owned 405,536 Class A shares of beneficial interest of the Portfolio on December 31, 2008.
On September 26, 2008, the Board of Trustees approved a 1-for-1.317576 reverse stock split for Class A shares, effective October 7, 2008. Per share amounts, shares sold, shares reinvested and shares outstanding have been adjusted to reflect this transaction. The reverse stock split had no impact on the overall value of a shareholder’s investment in the Fund.
| |
| 22 | Retirement Distribution Portfolio | Annual report |
Note 7
Purchases and sales of securities
Purchases and sales of the affiliated and unaf-filiated underlying funds during the year ended December 31, 2008, aggregated $5,729,025 and $690,010, respectively.
Note 8
Investment in affiliated underlying funds
The Portfolio invests primarily in affiliated underlying funds that are managed by affiliates of the Adviser. The Portfolio does not invest in affiliated underlying funds for the purpose of exercising management or control; however, the Portfolio’s investments may represent a significant portion of each underlying fund’s net assets. For the year ended December 31, 2008, the Portfolio did not hold a significant position in any of the underlying funds.
| | |
| | Annual report | Retirement Distribution Portfolio | 23 |
Auditors’ report
Report of Independent Registered Public Accounting Firm
To the Board of Trustees of John Hancock Funds II and
Shareholder of John Hancock Retirement Distribution Portfolio:
In our opinion, the accompanying statements of assets and liabilities, including the portfolio of investments, and the related statements of operations and of changes in net assets and the financial highlights present fairly, in all material respects, the financial position of John Hancock Retirement Distribution Portfolio, (the “Fund”), a portfolio of John Hancock Funds II, at December 31, 2008, and the results of its operations, the changes in its net assets and the financial highlights for the period January 2, 2008 (commencement of operations) through December 31, 2008, in conformity with accounting principles generally accepted in the United States of America. These financial statements and financial highlights (hereafter referred to as “financial statements”) are the responsibility of the Fund’s management; our responsibility is to express an opinion on these financial statements based on our audit. We conducted our audit of these financial statements in accordance with the standards of the Public Company Accounting Oversight Board (United States). Those standards require that we plan and perform the audit to obtain reasonable assurance about whether the financial statements are free of material misstatement. An audit includes examining, on a test basis, evidence supporting the amounts and disclosures in the financial statements, assessing the accounting principles used and significant estimates made by management, and evaluating the overall financial statement presentation. We believe that our audit, which included confirmation of securities at December 31, 2008 by correspondence with the custodian and transfer agent, provides a reasonable basis for our opinion.
PricewaterhouseCoopers LLP
Boston, Massachusetts
February 26, 2009
| |
| 24 | Retirement Distribution Portfolio | Annual report |
Tax information
Unaudited
For federal income tax purposes, the following information is furnished with respect to the distributions of the Portfolio, if any, paid during its taxable year ended December 31, 2008.
With respect to the ordinary dividends paid by the Portfolio for the fiscal year ended December 31, 2008, 9.05% of the dividends qualifies for the corporate dividends-received deduction.
The Portfolio hereby designates the maximum amount allowable of its net taxable income as qualified dividend income as provided in the Jobs and Growth Tax Relief Reconciliation Act of 2003. This amount will be reflected on Form 1099-DIV for the calendar year 2008.
Shareholders will be mailed a 2008 U.S. Treasury Department Form 1099-DIV in January 2009. This will reflect the total of all distributions that are taxable for calendar year 2008.
| | |
| | Annual report | Retirement Distribution Portfolio | 25 |
Trustees and Officers
This chart provides information about the Trustees and Officers of John Hancock Funds II who oversee your John Hancock fund. Officers elected by the Trustees manage the day-to-day operations of the Portfolio and execute policies formulated by the Trustees.
| | |
| Independent Trustees | | |
| Name, Year of Birth | | Number of |
| Position(s) held with Fund | Trustee | John Hancock |
| Principal occupation(s) and other | of Fund | funds overseen |
| directorships during past 5 years | since1 | by Trustee |
| |
| Charles L. Bardelis, Born: 1941 | 2008 | 212 |
|
| Director, Island Commuter Corp. (Marine Transport). Trustee of John Hancock Trust (since 1988) and |
| former Trustee of John Hancock Funds III (2005–2006). | | |
|
| |
| Peter S. Burgess, Born: 1942 | 2008 | 212 |
|
| Consultant (financial, accounting and auditing matters) (since 1999); Certified Public Accountant. Partner, |
| Arthur Andersen (independent public accounting firm) (prior to 1999). Director of the following publicly |
| traded companies: PMA Capital Corporation (since 2004) and Lincoln Educational Services Corporation |
| (since 2004). Trustee of John Hancock Trust (since 2005), and former Trustee of John Hancock Funds III |
| (2005–2006). | | |
|
| |
| Elizabeth G. Cook, Born: 1937 | 2008 | 212 |
| Expressive Arts Therapist, Massachusetts General Hospital (September 2001 to June 2007); Expressive Arts |
| Therapist, Dana Farber Cancer Institute (September 2000 to January 2004); Trustee of John Hancock Trust |
| (since 2005) and former Trustee of John Hancock Funds III (2005–2006). | | |
|
| |
| Theron S. Hoffman,2 Born: 1947 | 2008 | 212 |
| Trustee of John Hancock Trust and John Hancock Funds II (since September 2008); Chief Executive |
| Officer, T. Hoffman Associates, LLC (since 2003); Director, The Todd Organization (since 2003); President, |
| Westport Resources Management (2006–2008); Partner/Operating Head & Senior Managing Director, |
| Putnam Investments (2000–2003). | | |
|
| |
| Hassell H. McClellan, Born: 1945 | 2008 | 212 |
|
| Associate Professor, The Graduate School of The Wallace E. Carroll School of Management, Boston |
| College. Trustee of John Hancock Trust (since 2005), former Trustee of John Hancock Funds III (2005– |
| 2006) and Trustee of Phoenix Edge Series Fund (since 2008). | | |
|
| |
| James M. Oates, Born: 1946 | 2008 | 212 |
|
| Chairman of the Board of John Hancock Funds II; Managing Director, Wydown Group (financial con- |
| sulting firm) (since 1994); Chairman, Emerson Investment Management, Inc. (since 2000); Chairman, |
| Hudson Castle Group, Inc. (formerly IBEX Capital Markets, Inc.) (financial services company) (1997–2006). |
| Director of the following publicly traded companies: Stifel Financial (since 1996); Investor Financial |
| Services Corporation (since 1995); and Connecticut River Bancorp, Director (since 1998); Virtus Investment |
| Management (since 2009); and Emerson Investment Management (since 2000). Trustee of John Hancock |
| Trust (since 2004) and former Trustee of John Hancock Funds III (2005–2006). | | |
| |
| 26 | Retirement Distribution Portfolio | Annual report |
| | |
| Independent Trustees (continued) | | |
| Name, Year of Birth | | Number of |
| Position(s) held with Fund | Trustee | John Hancock |
| Principal occupation(s) and other | of Fund | funds overseen |
| directorships during past 5 years | since1 | by Trustee |
| |
| Steven M. Roberts,2 Born: 1944 | 2008 | 212 |
|
| Trustee of John Hancock Trust and John Hancock Funds II (since September 2008); Board of Governors |
| Deputy Director, Federal Reserve System (2005–2008); Partner, KPMG (1987–2004). | |
| |
| 1 Because the Trust does not hold regular annual shareholders meetings, each Trustee holds office for an indefinite |
| term until his/her successor is duly elected and qualified or until he/she dies, retires, resigns, is removed or becomes |
| disqualified. Trustees may be removed (provided the aggregate number of Trustees after such removal shall not be less |
| than one) with cause or without cause, by the action of two-thirds of the remaining Trustees or by action of two-thirds |
| of the outstanding Shares of the Trust. | | |
| | | |
| 2 Mr. Hoffman and Mr. Roberts were appointed by the Board as Trustees on September 26, 2008. | |
| |
| |
| Trustee Emeritus | | |
| |
| Name, Year of Birth | | Number of |
| Position(s) held with Fund | Trustee | John Hancock |
| Principal occupation(s) and other | of Fund | funds overseen |
| directorships during past 5 years | since | by Trustee |
| |
| John D. Richardson,1 Born: 1938 | 2008 | 212 |
|
| Former Trustee of JHT (Retired, December 14, 2006). Former Senior Executive Vice President, Office of |
| the President, MFC, February 2000 to March 2002 (Retired, March 2002); Executive Vice President and |
| General Manager, U.S. Operations, Manulife Financial, January 1995 to January 2000. | |
| |
| 1 Mr. Richardson became a non-voting Trustee Emeritus on December 14, 2006. | | |
| |
| |
| Non-Independent Trustees1,2 | | |
| Name, Year of Birth | | Number of |
| Position(s) held with Fund | Trustee | John Hancock |
| Principal occupation(s) and other | of Fund | funds overseen |
| directorships during past 5 years | since1,2 | by Trustee |
| |
| James R. Boyle,3 Born: 1959 | 2008 | 269 |
|
| Executive Vice President, Manulife Financial Corporation (since 1999); Director and President, John |
| Hancock Variable Life Insurance Company (since 2007); Director and Executive Vice President, John |
| Hancock Life Insurance Company (since 2004); Chairman and Director, John Hancock Advisers, LLC (the |
| Adviser), John Hancock Funds, LLC (John Hancock Funds) and The Berkeley Financial Group, LLC (The |
| Berkeley Group) (holding company) (since 2005); Chairman and Director, John Hancock Investment |
| Management Services, LLC (since 2006); Senior Vice President, The Manufacturers Life Insurance |
| Company (U.S.A.) (until 2004). | | |
|
| |
| Grace K. Fey,4,5 Born: 1946 | 2008 | 212 |
|
| Trustee of John Hancock Trust and John Hancock Funds II (since September 2008); Chief Executive Officer, |
| Grace Fey Advisors (since 2007); Director & Executive Vice President, Frontier Capital Management |
| Company (1988–2007). | | |
| | |
| | Annual report | Retirement Distribution Portfolio | 27 |
| |
| 1 Non-Independent Trustee holds positions with the Fund’s investment adviser, underwriter and certain other affiliates. |
| |
| 2 Because the Trust does not hold regular annual shareholders meetings, each Trustee holds office for an indefinite |
| term until his/her successor is duly elected and qualified or until he/she dies, retires, resigns, is removed or becomes |
| disqualified. Trustees may be removed (provided the aggregate number of Trustees after such removal shall not be less |
| than one) with cause or without cause, by the action of two-thirds of the remaining Trustees or by action of two-thirds |
| of the outstanding Shares of the Trust holds positions with the Fund’s investment adviser, underwriter and certain |
| other affiliates. | |
| | |
| 3 Mr. Boyle is an “interested person” (as defined in the 1940 Act) due to his position with Manulife Financial Corporation |
| (or its affiliates), the ultimate parent of the Adviser. | |
| | |
| 4 Ms. Fey was appointed by the Board as Trustee on September 26, 2008. | |
| | |
| 5 Ms. Fey is an “interested person” (as defined by the 1940 Act) due to a deferred compensation arrangement | |
| with her former employer, Frontier Capital Management Company, which is a subadviser of certain funds of | |
| John Hancock Funds II and John Hancock Trust. | |
| |
| |
| Principal officers who are not Trustees | |
| |
| Name, Year of Birth | |
| Position(s) held with Fund | Officer |
| Principal occupation(s) and other | of Fund |
| directorships during past 5 years | since |
| |
| Keith F. Hartstein, Born: 1956 | 2008 |
|
| President and Chief Executive Officer | |
| Senior Vice President, Manulife Financial Corporation (since 2004); Director, President and Chief | |
| Executive Officer, the Adviser, The Berkeley Group and John Hancock Funds, LLC (since 2005); Director, |
| MFC Global Investment Management (U.S.), LLC (MFC Global (U.S.)) (since 2005); Chairman and | |
| Director, John Hancock Signature Services, Inc. (since 2005); Director, President and Chief Executive |
| Officer, John Hancock Investment Management Services, LLC (since 2006); President and Chief Executive |
| Officer, John Hancock Funds, John Hancock Funds II, John Hancock Funds III and John Hancock Trust |
| (since 2005); Director, Chairman and President, NM Capital Management, Inc. (since 2005); Member |
| and former Chairman, Investment Company Institute Sales Force Marketing Committee (since 2003); |
| Director, President and Chief Executive Officer, MFC Global (U.S.) (2005–2006); Executive Vice President, |
| John Hancock Funds, LLC (until 2005). | |
|
| |
| Thomas M. Kinzler, Born: 1955 | 2008 |
|
| Secretary and Chief Legal Officer | |
| Vice President and Counsel, John Hancock Life Insurance Company (U.S.A.) (since 2006); Secretary and |
| Chief Legal Officer, John Hancock Funds, John Hancock Funds II and John Hancock Trust (since 2006); |
| Vice President and Associate General Counsel, Massachusetts Mutual Life Insurance Company (1999– |
| 2006); Secretary and Chief Legal Counsel, MML Series Investment Fund (2000–2006); Secretary and |
| Chief Legal Counsel, MassMutual Institutional Funds (2000–2004); Secretary and Chief Legal Counsel, |
| MassMutual Select Funds and MassMutual Premier Funds (2004–2006). | |
|
| |
| Francis V. Knox, Jr., Born: 1947 | 2008 |
|
| Chief Compliance Officer | |
| Vice President and Chief Compliance Officer, John Hancock Investment Management Services, LLC, |
| the Adviser and MFC Global (U.S.) (since 2005); Chief Compliance Officer, John Hancock Funds, John |
| Hancock Funds II, John Hancock Funds III and John Hancock Trust (since 2005); Vice President and | |
| Assistant Treasurer, Fidelity Group of Funds (until 2004); Vice President and Ethics & Compliance Officer, |
| Fidelity Investments (until 2001). | |
| |
| 28 | Retirement Distribution Portfolio | Annual report |
| |
| Principal officers who are not Trustees (continued) | |
| |
| Name, Year of Birth | |
| Position(s) held with Fund | Officer |
| Principal occupation(s) and other | of Fund |
| directorships during past 5 years | since |
| |
| Charles A. Rizzo, Born: 1957 | 2008 |
|
| Chief Financial Officer | |
| Chief Financial Officer, John Hancock Funds, John Hancock Funds II, John Hancock Funds III and John |
| Hancock Trust (since 2007); Assistant Treasurer, Goldman Sachs Mutual Fund Complex (registered | |
| investment companies) (2005–2007); Vice President, Goldman Sachs (2005–2007); Managing Director |
| and Treasurer of Scudder Funds, Deutsche Asset Management (2003–2005); Director, Tax and Financial |
| Reporting, Deutsche Asset Management (2002–2003); Vice President and Treasurer, Deutsche Global |
| Fund Services (1999–2002). | |
|
| |
| Gordon M. Shone, Born: 1956 | 2008 |
|
| Treasurer | |
| Senior Vice President, John Hancock Life Insurance Company (U.S.A.) (since 2001); Treasurer, John | |
| Hancock Funds (since 2006), John Hancock Funds II, John Hancock Funds III and John Hancock Trust |
| (since 2005); Vice President and Chief Financial Officer, John Hancock Trust (2003–2005); Vice President, |
| John Hancock Investment Management Services, LLC, John Hancock Advisers, LLC (since 2006) and The |
| Manufacturers Life Insurance Company (U.S.A.) (1998–2000). | |
|
| |
| John G. Vrysen, Born: 1955 | 2008 |
|
| Chief Operating Officer | |
| Senior Vice President, Manulife Financial Corporation (since 2006); Director, Executive Vice President |
| and Chief Operating Officer, the Adviser, The Berkeley Group, John Hancock Investment Management |
| Services, LLC and John Hancock Funds, LLC (since 2007); Chief Operating Officer, John Hancock Funds, |
| John Hancock Funds II, John Hancock Funds III and John Hancock Trust (since 2007); Director, John | |
| Hancock Signature Services, Inc. (since 2005); Chief Financial Officer, the Adviser, The Berkeley Group, |
| Manulife Financial Corporation Global Investment Management (U.S.), LLC, John Hancock Investment |
| Management Services, LLC, John Hancock Funds, LLC, John Hancock Funds, John Hancock Funds II, John |
| Hancock Funds III and John Hancock Trust (2005–2007); Vice President, Manulife Financial Corporation |
| (until 2006). | |
The business address for all Trustees and Officers is 601 Congress Street, Boston, Massachusetts 02210-2805.
The Statement of Additional Information of the Fund includes additional information about members of the Board of Trustees of the Fund and is available without charge, upon request, by calling 1-800-225-5291.
| | |
| | Annual report | Retirement Distribution Portfolio | 29 |
More information
PROXY VOTING POLICY AND PROXY VOTING RECORD. A description of the Portfolio’s proxy voting policies and procedures, and information regarding how the Portfolio voted proxies relating to portfolio securities during the most recent twelve-month period ended June 30 are available without charge upon request.
| | |
| By phone | On the Portfolio’s Web site | On the SEC’s Web site |
| 1-800-225-5291 | www.jhfunds.com/proxy | www.sec.gov |
|
| |
| Trustees | Francis V. Knox, Jr. | Principal distributor |
| James M. Oates, Chairman | Chief Compliance Officer | John Hancock Funds, LLC |
| James R. Boyle† | | 601 Congress Street |
| Grace K. Fey†** | | Boston, MA 02210-2805 |
| Charles L. Bardelis* | Charles A. Rizzo | |
| Peter S. Burgess* | Chief Financial Officer | Custodian |
| Elizabeth G. Cook** | | State Street Bank & Trust Co. |
| Theron S. Hoffman** | Gordon M. Shone | 2 Avenue de Lafayette |
| Hassell H. McClellan** | Treasurer | Boston, MA 02111 |
| Steven M. Roberts* | | |
| John D. Richardson*, | John G. Vrysen | Transfer agent |
| Trustee Emeritus | Chief Operating Officer | John Hancock Signature |
| *Members of the Audit Committee | | Services, Inc. |
| **Members of the | Investment adviser | P.O. Box 9510 |
| Compliance Committee | John Hancock Investment | Portsmouth, NH 03802-9510 |
| †Non-Independent Trustees | Management Services, LLC | |
| | 601 Congress Street | Legal counsel |
| Officers | Boston, MA 02210-2805 | K&L Gates LLP |
| Keith F. Hartstein | | One Lincoln Street |
| President and | Subadviser | Boston, MA 02111-2950 |
| Chief Executive Officer | MFC Global Investment | |
| Management (U.S.A.) Limited | Independent registered |
| Thomas M. Kinzler | 200 Bloor Street East | public accounting firm |
| Secretary and Chief Legal Officer | Toronto, Ontario, Canada | PricewaterhouseCoopers LLP |
| M4W 1E5 | 125 High Street |
| | | Boston, MA 02110 |
|
| | |
| How to contact us | |
|
| |
| Internet | www.jhfunds.com | |
|
| |
| Mail | Regular mail: | Express mail: |
| | John Hancock Signature | John Hancock Signature |
| | Services, Inc. | Services, Inc. |
| | P.O. Box 9510 | Mutual Fund Image Operations |
| | Portsmouth, NH 03802-9510 | 164 Corporate Drive |
| | | Portsmouth, NH 03801 |
|
| |
| Phone | Customer service representatives | 1-800-225-5291 |
| | EASI-Line | 1-800-338-8080 |
| | TDD line | 1-800-554-6713 |
|
The Portfolio files its complete schedule of portfolio holdings with the SEC for the first and third quarters of each fiscal year on Form N-Q. Form N-Q is available on the SEC’s Web site at www.sec.gov. The Portfolio’s Form N-Q may be reviewed and copied at the SEC’s Public Reference Room in Washington, DC. Information on the operation of the Public Reference Room may be obtained by calling 1-800-SEC-0330. In addition, the Portfolio’s complete schedule of holdings can be found in its semiannual or annual report on www.jhfunds.com.
| |
| 30 | Retirement Distribution Portfolio | Annual report |

1-800-225-5291
1-800-554-6713 TDD
1-800-338-8080 EASI-Line
www.jhfunds.com
Now available: electronic delivery
www.jhfunds.com/edelivery
| |
| This report is for the information of the shareholders of John Hancock Retirement Distribution Portfolio. | 3300A 12/08 |
| It is not authorized for distribution to prospective investors unless preceded or accompanied by a prospectus. | 2/09 |

Discussion of Fund performance
By MFC Global Investment Management (U.S.A.) Limited
U.S. stocks finished 2008 with their worst performance since 1931, as the credit crisis that had begun in the subprime mortgage sector broadened into a full-scale recession. The second half of the year was particularly harsh for investors. After a series of shocks during September —including the bankruptcy of investment bank Lehman Brothers and government bailouts of mortgage securitizers Fannie Mae and Freddie Mac — stocks tumbled in October. Few asset classes had positive returns during the year, with natural resources, emerging markets, real estate equities and high-yield bonds all posting steep declines. However, Treasury securities delivered positive returns across the board, except for Treasury Inflation-Protected Securities, which sold off in the fourth quarter on deflation fears.
“U.S. stocks finished 2008 with their
worst performance since 1931…”
During the past year, John Hancock Retirement Rising Distribution Portfolio’s Class A shares returned –23.21% at net asset value. By comparison, the S&P 500 Index returned –37.00%, the Barclays Capital (formerly Lehman Brothers) U.S. Aggregate Bond Index returned 5.24% and the Portfolio’s blended benchmark — 50% S&P 500 Index/50% Barclays Capital U.S. Aggregate Bond Index — returned –17.94% over the same period. The Portfolio’s underperformance was due to both unrewarding asset allocation and the challenging performance of our individual funds. Exposure to the high-yield bond sector detracted significantly, while allocations to foreign equities, including emerging markets, global real estate and global natural resources also detracted. At the fund level, detractors included Active Bond (MFC Global U.S./Declaration), and to a lesser extent, Core Bond (Wells Capital), Total Return (PIMCO) and Hi gh Income (MFC Global U.S.). On the equity side, International Small Cap (Franklin Templeton) dampened our results. Conversely, U.S. High Yield Bond (Wells Capital) performed relatively well in the weak high-yield market.
This commentary reflects the views of the portfolio management team through the end of the Fund’s period discussed in this report. The managers’ statements reflect their own opinions. As such, they are in no way guarantees of future events and are not intended to be used as investment advice or a recommendation regarding any specific security. They are also subject to change at any time as market and other conditions warrant.
| |
| 6 | Retirement Rising Distribution Portfolio | Annual report |
A look at performance
For the period ended December 31, 2008
| | | | | | | | | | | |
| | | | | | | | | | |
| | | | Average annual returns (%) | | Cumulative total returns (%) | | |
| | | | with maximum sales charge (POP) | | with maximum sales charge (POP) | | |
| | |
| |
|
| | Inception | | | | | Since | | | | | Since |
| Class | date | | 1-year | 5-year | 10-year | inception | | 1-year | 5-year | 10-year | inception |
|
| A | 12-31-07 | | –26.97 | — | — | –26.97 | | –26.97 | — | — | –26.97 |
|
Performance figures assume all distributions are reinvested. Public offering price (POP) figures reflect maximum sales charges on Class A shares of 5%.
The expense ratios of the Fund, both net (including any fee waivers or expense limitations) and gross (excluding any fee waivers or expense limitations), are set forth according to the most recent publicly available prospectus for the Fund and may differ from the expense ratios disclosed in the Financial Highlights tables in this report. The waivers and expense limitations were contractual until December 31, 2008. The waivers have been voluntarily renewed until December 31, 2009. The net expenses are as follows: Class A — 1.25%. Had the fee waivers and expense limitations not been in place, the gross expenses would be as follows Class A — 1.55%.
The returns reflect past results and should not be considered indicative of future performance. The return and principal value of an investment will fluctuate so that shares, when redeemed, may be worth more or less than their original cost. Due to market volatility, the Fund’s current performance may be higher or lower than the performance shown. For current to the most recent month end performance data, please call 1–800–225–5291 or visit the Fund’s Web site at www.jhfunds.com.
The performance table above and the chart on the next page do not reflect the deduction of taxes that a shareholder would pay on fund distributions or the redemption of fund shares.
The Fund’s performance results reflect any applicable expense reductions, without which the expenses would increase and results would have been less favorable.
| |
| Annual report | Retirement Rising Distribution Portfolio | 7 |
A look at performance
Growth of $10,000
This chart shows what happened to a hypothetical $10,000 investment in JHF II Retirement Rising Distribution Portfolio Class A shares for the period indicated. For comparison, we’ve shown the same investment in the 50% Standard and Poor’s 500 / 50% Barclays Capital U.S. Aggregate Blended Index.
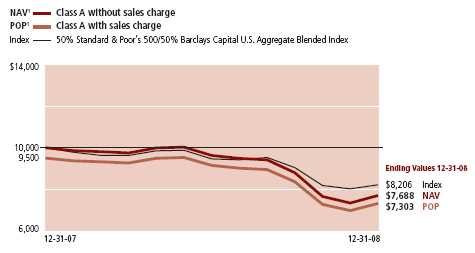
Assuming all distributions were reinvested for the period indicated, the table above shows the value of a $10,000 investment for Fund Class A, respectively, as of December 31, 2008.
Combined index consists of 50% Standard and Poor’s 500 / 50% Barclays Capital U.S. Aggregate Blended Index. The S&P 500 Index is composed of 500 widely held common stocks. The Barclays Capital U.S. Aggregate Index includes U.S. government, corporate and mortgage-backed securities with maturities up to 30 years.
It is not possible to invest directly in an index. Index figures do not reflect sales charges, which would have resulted in lower values if they did.
1 NAV represents net asset value and POP represents public offering price.
| |
| 8 | Retirement Rising Distribution Portfolio | Annual report |
Your expenses
These examples are intended to help you understand your ongoing operating expenses.
Understanding fund expenses
As a shareholder of the Fund, you incur two types of costs:
■ Transaction costs which include sales charges (loads) on purchases or redemptions (varies by share class), minimum account fee charge, etc.
■ Ongoing operating expenses including management fees, distribution and service fees (if applicable), and other fund expenses.
We are going to present only your ongoing operating expenses here.
Actual expenses/actual returns
This example is intended to provide information about your fund’s actual ongoing operating expenses, and is based on your fund’s actual return. It assumes an account value of $1,000.00 on July 1, 2008 with the same investment held until December 31, 2008.
| | | |
| | Account value | Ending value | Expenses paid during |
| | on 7-1-08 | on 12-31-08 | period ended 12-31-081,2 |
|
| Class A | $1,000.00 | $797.70 | $2.85 |
|
Together with the value of your account, you may use this information to estimate the operating expenses that you paid over the period. Simply divide your account value at December 31, 2008, by $1,000.00, then multiply it by the “expenses paid” for your share class from the table above. For example, for an account value of $8,600.00, the operating expenses should be calculated as follows:
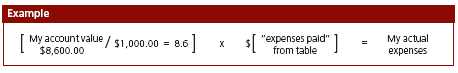
| |
| Annual report | Retirement Rising Distribution Portfolio | 9 |
Your expenses
Hypothetical example for comparison purposes
This table allows you to compare your fund’s ongoing operating expenses with those of any other fund. It provides an example of the Fund’s hypothetical account values and hypothetical expenses based on each class’s actual expense ratio and an assumed 5% annualized return before expenses (which is not your fund’s actual return). It assumes an account value of $1,000.00 on July 1, 2008, with the same investment held until December 31, 2008. Look in any other fund shareholder report to find its hypothetical example and you will be able to compare these expenses.
| | | |
| | Account value | Ending value | Expenses paid during |
| | on 7-1-08 | on 12-31-08 | period ended 12-31-081,2 |
|
| Class A | $1,000.00 | $1,022.00 | $3.20 |
|
Remember, these examples do not include any transaction costs, such as sales charges; therefore, these examples will not help you to determine the relative total costs of owning different funds. If transaction costs were included, your expenses would have been higher. See the prospectus for details regarding transaction costs.
1 Expenses are equal to the Fund’s annualized expense ratio of 0.63%, multiplied by the average account value over the period, multiplied by number of days in the period (184) and divided by 366.
2 Ratios do not include expenses indirectly incurred from underlying funds whose expense ratios can vary based on the mix of underlying funds held by the portfolio. The range of expense ratios of the underlying funds held by the portfolio was 0.61% –1.13%.
| |
| 10 | Retirement Rising Distribution Portfolio | Annual report |
Portfolio summary
| | | | |
| Asset allocation1 | | | | |
|
| Equities | % of Total | | Fixed income | |
| |
|
| Commodities | 19% | | Intermediate bond | 26% |
| |
|
| U.S. mid cap | 12% | | Treasury inflation-protected securities | 8% |
| |
|
| Emerging markets | 5% | | Short-term securities | 8% |
| |
|
| International small cap | 4% | | High-yield bond | 5% |
| |
|
| U.S. large cap | 3% | | Global bond | 4% |
| |
|
| International large cap | 2% | | | |
| | |
| Real estate | 2% | | | |
| | |
| Natural resources | 2% | | | |
| | |
1As a percentage of net assets on December 31, 2008.
| |
| Annual report | Retirement Rising Distribution Portfolio | 11 |
F I N A N C I A L S T A T E M E N T S
Portfolio’s investments
Securities owned by the Portfolio on 12-31-08
| | |
| Issuer | Shares | Value |
| |
| Investment companies 93.30% | | $3,582,456 |
|
| (Cost $4,953,281) | | |
| | | |
| Unaffilated investment companies 19.16% | | 735,508 |
|
| PowerShares DB Commodity | | |
| Index Tracking Fund | 6,400 | 135,616 |
|
| WisdomTree DEFA High-Yielding Equity Fund | 6,300 | 214,767 |
|
| WisdomTree High-Yielding Equity Fund | 12,500 | 385,125 |
| | | |
| John Hancock Funds II (f) 74.14% | | 2,846,948 |
|
| Active Bond (MFC Global U.S./Declaration) (g) | 26,497 | 218,068 |
|
| Capital Appreciation (Jennison) | 5,458 | 38,858 |
|
| Core Bond (Wells Capital) | 21,176 | 258,565 |
|
| Emerging Markets Value (DFA) | 38,031 | 206,127 |
|
| Equity-Income (T. Rowe Price) | 3,920 | 39,790 |
|
| Fundamental Value (Davis) | 3,798 | 39,387 |
|
| Global Bond (PIMCO) | 13,879 | 154,331 |
|
| Global Real Estate (Deutsche) | 16,251 | 83,694 |
|
| High Income (MFC Global U.S.) (g) | 15,755 | 72,317 |
|
| High Yield (WAMCO) | 6,146 | 37,307 |
|
| International Opportunities (Marsico) | 4,399 | 40,952 |
|
| International Small Cap (Templeton) | 9,554 | 76,334 |
|
| International Small Company (DFA) | 15,321 | 81,354 |
|
| International Value (Templeton) | 4,034 | 40,578 |
|
| Mid Cap Intersection (Wellington) | 23,201 | 124,589 |
|
| Mid Cap Stock (Wellington) | 11,366 | 123,666 |
|
| Mid Cap Value (Lord Abbett) | 10,855 | 119,410 |
|
| Natural Resources (Wellington) | 5,979 | 79,346 |
|
| Real Return Bond (PIMCO) | 31,780 | 339,414 |
|
| Total Bond Market (Declaration) (g) | 24,796 | 254,904 |
|
| Total Return (PIMCO) | 20,444 | 261,065 |
|
| U.S. High Yield Bond (Wells Capital) | 8,133 | 74,908 |
|
| Value (Van Kampen) | 13,160 | 81,984 |
See notes to financial statements
| |
| 12 | Retirement Rising Distribution Portfolio | Annual report |
F I N A N C I A L S T A T E M E N T S
| | |
| | Principal | |
| Issuer | amount | Value |
| |
| Short-term investments 7.55% | | $289,997 |
|
| (Cost $289,997) | | |
| | | |
| Federal Home Loan Bank Discount Notes | | |
| 0.01% due 2-12-09 | $290,000 | 289,997 |
| |
| Total investments (Cost $5,243,278)† 100.85% | | $3,872,453 |
|
| Liabilities in excess of other assets (0.85%) | | ($32,067) |
|
| Total net assets 100.00% | | $3,840,386 |
|
Percentages are stated as a percent of net assets.
(f) The underlying fund’s subadviser is shown parenthetically.
(g) The subadviser is an affiliate of the adviser.
† At December 31, 2008 the aggregate cost of investment securities for federal income tax purposes was $5,259,459. Net unrealized depreciation aggregated $1,387,006, of which $4,166 related to appreciated investment securities and $1,391,172 related to depreciated investment securities.
See notes to financial statements
| |
| Annual report | Retirement Rising Distribution Portfolio | 13 |
F I N A N C I A L S T A T E M E N T S
Financial statements
Statement of assets and liabilities 12-31-08
This Statement of Assets and Liabilities is the Fund’s balance sheet. It shows the value of what the Fund owns, is due and owes. You’ll also find the net asset value and the maximum offering price per share.
| |
| Assets | |
|
| Investments in unaffiliated issuers at value (Cost $1,441,866) | $1,025,505 |
| Investments in affiliated funds, at value (cost $3,801,412) (Note 9) | 2,846,948 |
| | |
| Total investments, at value (cost $5,243,278) | 3,872,453 |
| Cash | 7,017 |
| Receivable due from adviser | 754 |
| | |
| Total assets | 3,880,224 |
| |
| Liabilities | |
|
| Payable for investments purchased | 30,512 |
| Payable to affiliates | |
| Fund administration fees | 115 |
| Transfer agent fees | 172 |
| Other payables and accrued expenses | 9,039 |
| | |
| Total liabilities | 39,838 |
| |
| Net assets | |
|
| Capital paid-in | $5,189,513 |
| Accumulated undistributed net investment income | 47,914 |
| Accumulated net realized loss on investments | (26,216) |
| Net unrealized appreciation (depreciation) on investments | (1,370,825) |
| | |
| Net assets | $3,840,386 |
| |
| Net asset value per share | |
|
| Based on net asset values and shares outstanding — the fund has an | |
| unlimited number of shares authorized with no par value. | |
| Class A ($3,840,386 ÷ 411,162 shares) | $9.34 |
| |
| Maximum public offering price per share | |
|
| Class A (9.34 ÷ 95%)1 | $9.83 |
1 On single retail sales of less than $50,000. On sales of $50,000 or more and on group sales the offering price is reduced.
See notes to financial statements
| |
| 14 | Retirement Rising Distribution Portfolio | Annual report |
F I N A N C I A L S T A T E M E N T S
Statement of operations For the period ended 12-31-081
This Statement of Operations summarizes the Fund’s investment income earned and expenses incurred in operating the Fund. It also shows net gains (losses) for the period stated.
| |
| Investment income | |
|
| Income distributions received from affiliated underlying funds | $145,259 |
| Dividends | 40,652 |
| Interest | 5,088 |
| | |
| Total investment income | 190,999 |
| |
| Expenses | |
|
| Investment management fees (Note 5) | 8,028 |
| Distribution and service fees (Note 5) | 13,633 |
| Transfer agent fees (Note 5) | 172 |
| Fund administration fees (Note 5) | 714 |
| Audit and legal fees | 34,970 |
| Printing and postage fees (Note 5) | 1,820 |
| Custodian fees | 10,581 |
| Trustees’ fees (Note 5) | 55 |
| Registration and filing fees | 7,514 |
| Miscellaneous | 13 |
| | |
| Total expenses | 77,500 |
| Less: expense reductions (Note 5) | (49,423) |
| | |
| Net expenses | 28,077 |
| | |
| Net investment income | 162,922 |
| |
| Realized and unrealized gain (loss) | |
|
| Net realized gain (loss) on | |
| Investments in unaffiliated issuers | (39,232) |
| Investments in affiliated underlying funds | (34,950) |
| Capital gain distributions received from affiliated underlying funds | 122,475 |
| | 48,293 |
| Change in net unrealized appreciation (depreciation) of | |
| Investments in unaffiliated issuers | (416,361) |
| Investments in affiliated underlying funds | (954,464) |
| | (1,370,825) |
| Net realized and unrealized loss | (1,322,532) |
| | |
| Decrease in net assets from operations | ($1,159,610) |
1 Period from 1-2-08 (commencement of operations) to 12-31-08.
See notes to financial statements
| |
| Annual report | Retirement Rising Distribution Portfolio | 15 |
F I N A N C I A L S T A T E M E N T S
Statements of changes in net assets
This Statement of Changes in Net Assets shows how the value of the Portfolio’s net assets has changed during the period. The difference reflects earnings less expenses, any investment gains and losses, distributions, if any, paid to shareholders and the net of Portfolio share transactions.
| |
| | Period |
| | ended |
| | 12-31-081 |
| |
| Increase (decrease) in net assets | |
|
| From operations | |
| Net investment income | $162,922 |
| Net realized gain | 48,293 |
| Change in net unrealized appreciation (depreciation) | (1,370,825) |
| | |
| Decrease in net assets resulting from operations | (1,159,610) |
| | |
| Distributions to shareholders | |
| From net investment income | (193,076) |
| | |
| From Fund share transactions (Note 6) | 5,193,072 |
| | |
| Total increase | 3,840,386 |
| |
| Net assets | |
|
| Beginning of period | — |
| | |
| End of period | $3,840,386 |
| | |
| Accumulated undistributed net investment income | $47,914 |
1 Period from 1-2-08 (commencement of operations) to 12-31-08.
See notes to financial statements
| |
| 16 | Retirement Rising Distribution Portfolio | Annual report |
F I N A N C I A L S T A T E M E N T S
Financial highlights
The Financial Highlights show how the Fund’s net asset value for a share has changed since the beginning of the period.
CLASS A SHARES
| |
| Period ended | 12-31-081,2 |
| |
| Per share operating performance | |
|
| Net asset value, beginning of period | $12.70 |
| Net investment income | 0.413 |
| Net realized and unrealized loss on investments | (3.29) |
| Total from investment operations | (2.88) |
| Less distributions | |
| From net investment income | (0.48) |
| Total distributions | (0.48) |
| Net asset value, end of period | $9.34 |
| Total return (%)4,5 | (23.21) |
| |
| Ratios and supplemental data | |
|
| Net assets, end of period | |
| (in millions) | $4 |
| Ratios (as a percentage of average net assets): | |
| Expenses before reductions | 1.716 |
| Expenses net of all fee waivers, if any | 0.626 |
| Expenses net of all fee waivers and credits | 0.626 |
| Net investment income (loss) | 3.596 |
| Portfolio turnover (%) | 17 |
1 Class A shares began operations on 1-2-08.
2 Per share data has been restated to reflect the effects of a 1-for-1.269970 reverse stock split effective on October 7, 2008.
3 Based on the average of the shares outstanding.
4 Assumes dividend reinvestment.
5 Total returns would have been lower had certain expenses not been reduced during the periods shown.
6 Ratios do not include expenses directly incurred from underlying funds whose expense ratios can vary based on the mix of underlying funds held by the portfolio. The range of expense ratios of the underlying funds held by the portfolio was 0.61% –1.13%.
See notes to financial statements
| |
| Annual report | Retirement Rising Distribution Portfolio | 17 |
Notes to financial statements
Note 1
Organization of the Trust
Retirement Rising Distribution Portfolio (the Portfolio) is a series of John Hancock Funds II (the Trust or JHF II). The Portfolio commenced investment operations on January 2, 2008. The Trust is an open-end management investment company organized as a Massachusetts business trust. It is a series company, which means that it has several funds, each with a stated investment objective that it pursues through separate investment policies. The Trust currently offers seventy-two separate investment funds.
The Portfolio is non-diversified for purposes of the Investment Company Act of 1940, as amended (the 1940 Act).
The Portfolio operates as a “fund of funds”, investing in Class NAV shares of underlying funds of the Trust, John Hancock Funds III (JHF III) and also in other affiliated funds of the John Hancock funds complex. The Portfolio may also invest in unaffiliated underlying funds and other permitted investments.
The JHF III funds are retail mutual funds advised by John Hancock Investment Management Services, LLC (JHIMS or the Adviser) and distributed by John Hancock Funds, LLC (the Distributor).
The accounting policies of the affiliated underlying funds of the Trust are outlined in the shareholder reports for such funds, available without charge by calling 1-800-225-5291 or on the Securities and Exchange Commission (SEC) Web site at www.sec.gov, or at the commission’s public reference room in Washington, D.C. The affiliated underlying funds are not covered by this report.
JHIMS, a Delaware limited liability company controlled by John Hancock Life Insurance Company (U.S.A.) (John Hancock USA), serves as investment adviser for the Trust and the Distributor, an affiliate of the Adviser, serves as principal underwriter. John Hancock USA and John Hancock New York are indirect wholly owned subsidiaries of the Manufacturers Life Insurance Company (Manulife), which in turn is a wholly owned subsidiary of Manulife Financial Corporation (MFC), a publicly traded company. MFC and its subsidiaries are known collectively as “Manulife Financial.”
The Board of Trustees has authorized the issuance of Class A shares of the Portfolio. Class A shares are open to all retail investors.
Note 2
Significant accounting policies
The financial statements have been prepared in conformity with accounting principles generally accepted in the United States of America, which require management to make certain estimates and assumptions at the date of the financial statements. Actual results could differ from those estimates. The following summarizes the significant accounting policies of the Portfolio:
Securities valuation
Investments are stated at value as of the close of the regular trading on New York Stock Exchange (NYSE), normally at 4:00 P.M., Eastern Time. Investments by the Portfolio in underlying affiliated funds are valued at their respective net asset values each business day and securities in the underlying funds are valued in accordance with their respective valuation polices, as outlined in the underlying funds’ financial statements. All other securities held by the Portfolio and by the underlying affiliated funds are valued at the last sale price or official closing price (closing bid price or last evaluated quote if no sale has occurred) as of the close
| |
| 18 | Retirement Rising Distribution Portfolio | Annual report |
of business on the principal securities exchange (domestic or foreign) on which they trade. Short-term debt investments that have a remaining maturity of 60 days or less are valued at amortized cost, and thereafter assume a constant amortization to maturity of any discount or premium, which approximates market value.
Valuations change in response to many factors including the historical and prospective earnings of the issuer, the value of the issuer’s assets, general economic conditions, interest rates, investor perceptions and market liquidity.
The Portfolio adopted Statement of Financial Accounting Standards No. 157 (FAS 157), “Fair Value Measurements”, effective with the beginning of the Portfolio’s fiscal year. FAS 157 establishes a hierarchy that prioritizes the inputs to valuation techniques giving the highest priority to readily available unadjusted quoted prices in active markets for identical assets (level 1 measurements) and the lowest priority to unobservable inputs (level 3 measurements) when market prices are not readily available or reliable.
The three levels of hierarchy are described below:
Level 1 — Quoted prices in active markets for identical securities.
Level 2 — Prices determined using other significant observable inputs. Observable inputs are inputs that other market participants would use to price a security. These may include quoted prices for similar securities, interest rates, prepayment speeds, credit risk and others.
Level 3 — Prices determined using significant unobservable inputs. In situations where quoted prices or observable inputs are unavailable, such as when there is little or no market activity for an investment, unobservable inputs may be used. Unobservable inputs reflect the Portfolio’s own assumptions about the factors that market participants would use in pricing an investment and would be based on the best information available.
The inputs or methodology used for valuing securities are not necessarily an indication of the risk associated with investing in those securities.
The following table is a summary of the inputs used to value the Portfolio’s net assets as of December 31, 2008:
| | |
| | Investments in | Other Financial |
| Valuation Inputs | Securities | Instruments* |
|
| Level 1 — Quoted Prices | $3,582,456 | — |
| Level 2 — Other Significant Observable Inputs | 289,997 | — |
| Level 3 — Significant Unobservable Inputs | — | — |
| Total | $3,872,453 | — |
*Other financial instruments are derivative instruments not reflected in the Portfolio of Investments, such as futures, forwards and swap contracts, which are valued at the unrealized appreciation/ depreciation of the instrument.
Overdrafts
Pursuant to the custodian agreements, the Custodian may, in its discretion, advance funds to a Portfolio to make properly authorized payments. When such payments result in an overdraft, the Portfolio is obligated to repay the Custodian for any overdraft, including any costs or expenses associated with the overdraft. The Custodian has a lien and security interest in any Portfolio property, that is not segregated, to the extent of any overdraft.
Security transactions and related
investment income
Investment security transactions are accounted for on a trade date plus one basis for daily net asset value calculations. However, for financial reporting purposes, investment transactions are reported on trade date. Interest income is accrued as earned. Dividend income and distributions to shareholders are recorded on the ex-dividend date. Foreign dividends are recorded on the ex-date or when
| |
| Annual report | Retirement Rising Distribution Portfolio | 19 |
the Portfolio becomes aware of the dividends from cash collections. Discounts/premiums are accreted/amortized for financial reporting purposes. Non-cash dividends are recorded at the fair market value of the securities received. Distributions received from underlying funds will continue to reflect the character of these distributions. Debt obligations may be placed in a non-accrual status and related interest income may be reduced by ceasing current accruals and writing off interest receivables when the collection of all or a portion of interest has become doubtful, based upon consistently applied procedures.
The Portfolio uses the identified cost method for determining realized gain or loss on investments for both financial statement and federal income tax reporting purposes.
Expenses
The majority of expenses are directly identifiable to an individual Portfolio. Trust expenses that are not readily identifiable to a specific Portfolio are allocated in such a manner as deemed equitable, taking into consideration, among other things, the nature and type of expense and the relative size of the Portfolios. Expense estimates are accrued in the period to which they relate and adjustments are made when actual amounts are known.
Federal income taxes
The Portfolio qualifies as a regulated investment company by complying with the applicable provisions of the Internal Revenue Code and will not be subject to federal income tax on taxable income that is distributed to shareholders. Therefore, no federal income tax provision is required.
As of December 31, 2008, the Portfolio had no uncertain tax positions that would require financial statement recognition, de-recognition, or disclosure. The Portfolio’s federal tax returns to be filed for the year ended December 31, 2008 will be subject to examination by the Internal Revenue Service.
Distribution of income and gains
The Portfolio records distributions to shareholders from net investment income and net realized gains, if any, on the ex-dividend date. The Portfolio uses a quarterly targeted distribution strategy and distributes substantially all of its net income quarterly and capital gains distributions, if any, annually. If the Portfolio has not met its distribution goal from net income and capital gains, then the distributions may consist of a return of capital.
During the year ended December 31, 2008, tax character of distributions paid was $193,076 from net investment income.
As of December 31, 2008, the components of distributable earnings on a tax basis, included $54,926 of ordinary income.
Such distributions and distributable earnings, on a tax basis, are determined in conformity with income tax regulations, which may differ from accounting principles generally accepted in the United States of America. Distributions in excess of tax basis earnings and profits, if any, are reported in the Portfolio’s financial statements as a return of capital.
Capital accounts within financial statements are adjusted for permanent book/tax differences. These adjustments have no impact on net assets or the results of operations. Temporary book/tax differences will reverse in a subsequent period. Permanent book/tax differences are primarily attributable to short term distributions received from underlying funds.
Net capital losses of $17,047 that are attributable to securities transactions incurred after October 31, 2008, are treated as arising on January 1, 2009, the first day of the Fund’s next taxable year.
Note 3
Risks & uncertainties
Concentration risk
The Portfolio may concentrate investments in a particular industry, sector of the economy or invest in a limited number of companies. Accordingly, the concentration may make the Portfolio’s value more volatile and investment values may rise and fall more rapidly. In addition, a Portfolio with a concentration is particularly susceptible to the impact of market, economic, regulatory and other factors affecting the specific concentration.
| |
| 20 | Retirement Rising Distribution Portfolio | Annual report |
Note 4
Guarantees and indemnifications
Under the Trust’s organizational documents, its Officers and Trustees are indemnified against certain liabilities arising out of the performance of their duties to the Trust. Additionally, in the normal course of business, the Trust enters into contracts with service providers that contain general indemnification clauses. The Trust’s maximum exposure under these arrangements is unknown, as this would involve future claims that may be made against the Trust that have not yet occurred. However, based on experience, the Trust believes the risk of loss to be remote.
Note 5
Investment advisory and other
agreements
The Trust has entered into an Investment Advisory Agreement with the Adviser. The Adviser is responsible for managing the corporate and business affairs of the Trust and for selecting and compensating subadvisers to handle the investment of the assets of the Portfolios, subject to the supervision of the Board of Trustees. The Portfolio and the Adviser has a sub-advisory agreement with MFC Global (U.S.A.), a wholly-owned subsidiary of MFC. The Portfolio is not responsible for the payment of sub-advisory fees.
Each fund pays the adviser a management fee for its services to the fund. The management fee has two components: (a) a fee on assets invested in a fund of John Hancock Funds II (JHF II) or John Hancock Funds III (JHF III); and (b) a fee on assets invested in investments other than a fund of JHF II or JHF III (Other Assets).
The fee on assets invested in a fund of JHF II or JHF III is stated as an annual percentage of the current value of the aggregate net assets of the Portfolio and the Retirement Distribution Portfolio and is equivalent to the sum of: (a) 0.060% of the first $500 million of Aggregate Net Assets and (b) 0.050% of the Excess over $500 million of Aggregate Net Assets.
The fee on Other Assets is stated as an annual percentage of the current value of the aggregate net assets of the Portfolio and the Retirement Distribution Portfolio and is equivalent to the sum of: (a) 0.510% of the first $500 million of Aggregate Net Assets and (b) 0.500% of the Excess over $500 million of Aggregate Net Assets and is applied to the Other Assets of the Portfolio.
The investment management fees incurred for the year ended December 31, 2008, were equivalent to an annual effective rate of 0.18% of the Portfolio’s average daily net assets.
Expense reimbursements
The Adviser has contractually agreed to reimburse or limit certain Portfolio level expenses to 0.09% of the Portfolio’s average annual net assets. This agreement excludes management fees, underlying fund expenses, taxes, portfolio brokerage commissions, interest, Rule 12b-1 fees, transfer agency fees, registration fees, printing and postage and litigation and indemnification expenses and other extraordinary expenses not incurred in the ordinary course of the Portfolio’s business. In addition, fees incurred under any agreement or plans of the Portfolio dealing with services for the shareholders and others with beneficial interest in shares of the Portfolio, are excluded.
The Adviser has also agreed to a contractual expense limit on Class A specific expenses (which include 12b-1, transfer agent, service fees, registration, and printing and postage) of 0.35%.
Accordingly, the expense reductions amounted to $49,423 for the year ended December 31, 2008. These expense reimbursements shall continue in effect until December 31, 2008 and thereafter until terminated by the Adviser.
Fund administration fees
Pursuant to the Advisory Agreement, the Portfolio reimburses the Adviser for all expenses associated with providing the administrative, financial, legal, accounting and recordkeeping services of the Portfolio, including the preparation of all tax returns, annual, semiannual and periodic reports to shareholders and the preparation of all regulatory reports.
| |
| Annual report | Retirement Rising Distribution Portfolio | 21 |
The fund administration fees incurred for the year ended December 31, 2008, were equivalent to an annual effective rate of 0.01% of the Portfolio’s average daily net assets.
Distribution and service plans
The Trust has a Distribution Agreement with the Distributor. The Portfolio has adopted a Distribution Plan with respect to Class A pursuant to Rule 12b-1 under the 1940 Act, to reimburse the Distributor for the services it provides as distributor of shares of the Portfolio. Accordingly, the Portfolio makes daily payments to the Distributor at an annual rate not to exceed 0.30% of the average daily net assets of Class A. A maximum of 0.25% of average daily net assets may be service fees, as defined by the Conduct Rules of the Financial Industry Regulatory Authority (formerly, National Association of Securities Dealers). Under the Conduct Rules, curtailment of a portion of the Portfolio’s 12b-1 payments could occur under certain circumstances.
Sales charges
Class A shares are assessed up-front sales charges. During the year ended December 31, 2008, John Hancock USA was the sole investor in the Portfolio and was not assessed sales charges.
Transfer agent fees
The Portfolio has a Transfer Agency Agreement with John Hancock Signature Services, Inc. (Signature Services), an indirect subsidiary of MFC. For Class A shares, the Portfolio pays a monthly transfer agent fee at an annual rate of 0.05% of each class’s average daily net assets, plus a fee based on the number of shareholder accounts and reimbursement for certain out-of-pocket expenses. The Portfolio pays a monthly fee which is based on an annual rate of $15.00 for each Class A shareholder account.
Signature Services has agreed to limit the transfer agent fees so that such fees do not exceed 0.20% annually of Class A share average daily net assets. This agreement was effective until December 31, 2008. Signature Services reserves the right to terminate this limitation in the future. There were no transfer agent fee reductions for Class A shares during the year ended December 31, 2008.
The Portfolio receives earnings credits from its transfer agent as a result of uninvested cash balances. These credits are used to reduce a portion of the Portfolio’s transfer agent fees and out-of-pocket expenses. During the year ended December 31, 2008, there were no transfer agent credits earned.
Note 6
Portfolio share transactions
This listing illustrates the number of Portfolio shares sold, reinvested and repurchased during the years ended December 31, 2008, along with the corresponding dollar value.
| | |
| | Period ended 12-31-08 |
| | Shares | Amount |
| Class A shares | | |
|
| Sold | 393,710 | $4,999,996 |
| Distributions reinvested | 17,452 | 193,076 |
| Net increase | 411,162 | $5,193,072 |
|
John Hancock USA owned 411,162 Class A shares of beneficial interest of the Portfolio on December 31, 2008.
On September 26, 2008, the Board of Trustees approved a 1-for-1.269970 reverse stock split for Class A shares, effective October 7, 2008. Per share amounts, shares sold, shares reinvested and shares outstanding have been adjusted to reflect this transaction. The reverse stock split had no impact on the overall value of a shareholder’s investment in the Fund.
| |
| 22 | Retirement Rising Distribution Portfolio | Annual report |
Note 7
Purchases and sales of securities
Purchases and sales of the affiliated and unaffiliated underlying funds during the year ended December 31, 2008, aggregated $5,742,544 and $715,081, respectively.
Note 8
Investment in affiliated
underlying funds
The Portfolio invests primarily in affiliated underlying funds that are managed by affiliates of the Adviser. The Portfolio does not invest in affiliated underlying funds for the purpose of exercising management or control; however, the Portfolio’s investments may represent a significant portion of each underlying fund’s net assets. For the year ended December 31, 2008 the Portfolio did not hold a significant position in any of the underlying funds.
| |
| Annual report | Retirement Rising Distribution Portfolio | 23 |
Auditors’ report
Report of Independent Registered Public Accounting Firm
To the Board of Trustees of John Hancock Funds II and
Shareholder of John Hancock Retirement Rising Distribution Portfolio:
In our opinion, the accompanying statement of assets and liabilities, including the portfolio of investments, and the related statements of operations and of changes in net assets and the financial highlights present fairly, in all material respects, the financial position of John Hancock Retirement Rising Distribution Portfolio, (the “Fund”), a portfolio of John Hancock Funds II, at December 31, 2008, and the results of its operations, the changes in its net assets and the financial highlights for the period January 2, 2008 (commencement of operations) through December 31, 2008, in conformity with accounting principles generally accepted in the United States of America. These financial statements and financial highlights (hereafter referred to as “financial statements”) are the responsibility of the Fund’s management; our responsibility is to express an opinion on these financial statements based on our audit. We conducted our audit of these fin ancial statements in accordance with the standards of the Public Company Accounting Oversight Board (United States). Those standards require that we plan and perform the audit to obtain reasonable assurance about whether the financial statements are free of material misstatement. An audit includes examining, on a test basis, evidence supporting the amounts and disclosures in the financial statements, assessing the accounting principles used and significant estimates made by management, and evaluating the overall financial statement presentation. We believe that our audit, which included confirmation of securities at December 31, 2008 by correspondence with the custodian and transfer agent, provides a reasonable basis for our opinion.
PricewaterhouseCoopers LLP
Boston, Massachusetts
February 26, 2009
| |
| 24 | Retirement Rising Distribution Portfolio | Annual report |
Tax information
Unaudited
For federal income tax purposes, the following information is furnished with respect to the distributions of the Portfolio, if any, paid during its taxable year ended December 31, 2008.
With respect to the ordinary dividends paid by the Portfolio for the fiscal year ended December 31, 2008, 6.92% of the dividends qualifies for the corporate dividends-received deduction.
The Portfolio hereby designates the maximum amount allowable of its net taxable income as qualified dividend income as provided in the Jobs and Growth Tax Relief Reconciliation Act of 2003. This amount will be reflected on Form 1099-DIV for the calendar year 2008.
Shareholders will be mailed a 2008 U.S. Treasury Department Form 1099-DIV in January 2009. This will reflect the total of all distributions that are taxable for calendar year 2008.
| |
| Annual report | Retirement Rising Distribution Portfolio | 25 |
Trustees and Officers
This chart provides information about the Trustees and Officers of John Hancock Funds II who oversee your John Hancock fund. Officers elected by the Trustees manage the day-to-day operations of the Portfolio and execute policies formulated by the Trustees.
| | |
| Independent Trustees | | |
| | | |
| Name, Year of Birth | | Number of |
| Position(s) held with Fund | Trustee | John Hancock |
| Principal occupation(s) and other | of Fund | funds overseen |
| directorships during past 5 years | since1 | by Trustee |
| |
| Charles L. Bardelis, Born: 1941 | 2008 | 212 |
|
| Director, Island Commuter Corp. (Marine Transport). Trustee of John Hancock Trust (since 1988) and |
| former Trustee of John Hancock Funds III (2005–2006). | | |
|
| |
| Peter S. Burgess, Born: 1942 | 2008 | 212 |
|
| Consultant (financial, accounting and auditing matters) (since 1999); Certified Public Accountant. Partner, |
| Arthur Andersen (independent public accounting firm) (prior to 1999). Director of the following publicly |
| traded companies: PMA Capital Corporation (since 2004) and Lincoln Educational Services Corporation |
| (since 2004). Trustee of John Hancock Trust (since 2005), and former Trustee of John Hancock Funds III |
| (2005–2006). | | |
|
| |
| Elizabeth G. Cook, Born: 1937 | 2008 | 212 |
|
| Expressive Arts Therapist, Massachusetts General Hospital (September 2001 to June 2007); Expressive Arts |
| Therapist, Dana Farber Cancer Institute (September 2000 to January 2004); Trustee of John Hancock Trust |
| (since 2005) and former Trustee of John Hancock Funds III (2005–2006). | | |
|
| |
| Theron S. Hoffman,2 Born: 1947 | 2008 | 212 |
|
| Trustee of John Hancock Trust and John Hancock Funds II (since September 2008); Chief Executive |
| Officer, T. Hoffman Associates, LLC (since 2003); Director, The Todd Organization (since 2003); President, |
| Westport Resources Management (2006–2008); Partner/Operating Head & Senior Managing Director, |
| Putnam Investments (2000–2003). | | |
|
| |
| Hassell H. McClellan, Born: 1945 | 2008 | 212 |
|
| Associate Professor, The Graduate School of The Wallace E. Carroll School of Management, Boston |
| College. Trustee of John Hancock Trust (since 2005), former Trustee of John Hancock Funds III |
| (2005–2006) and Trustee of Phoenix Edge Series Fund (since 2008). | | |
|
| |
| James M. Oates, Born: 1946 | 2008 | 212 |
|
| Chairman of the Board of John Hancock Funds II; Managing Director, Wydown Group (financial con- |
| sulting firm) (since 1994); Chairman, Emerson Investment Management, Inc. (since 2000); Chairman, |
| Hudson Castle Group, Inc. (formerly IBEX Capital Markets, Inc.) (financial services company) (1997–2006). |
| Director of the following publicly traded companies: Stifel Financial (since 1996); Investor Financial |
| Services Corporation (since 1995); and Connecticut River Bancorp, Director (since 1998); Virtus Investment�� |
| Management (since 2009); and Emerson Investment Management (since 2000). Trustee of John Hancock |
| Trust (since 2004) and former Trustee of John Hancock Funds III (2005–2006). | | |
| |
| 26 | Retirement Rising Distribution Portfolio | Annual report |
| | |
| Independent Trustees (continued) | | |
| | | |
| Name, Year of Birth | | Number of |
| Position(s) held with Fund | Trustee | John Hancock |
| Principal occupation(s) and other | of Fund | funds overseen |
| directorships during past 5 years | since1 | by Trustee |
| |
| Steven M. Roberts,2 Born: 1944 | 2008 | 212 |
|
| Trustee of John Hancock Trust and John Hancock Funds II (since September 2008); Board of Governors |
| Deputy Director, Federal Reserve System (2005–2008); Partner, KPMG (1987–2004). | |
1 Because the Trust does not hold regular annual shareholders meetings, each Trustee holds office for an indefinite term until his/her successor is duly elected and qualified or until he/she dies, retires, resigns, is removed or becomes disqualified. Trustees may be removed (provided the aggregate number of Trustees after such removal shall not be less than one) with cause or without cause, by the action of two-thirds of the remaining Trustees or by action of two-thirds of the outstanding Shares of the Trust.
2 Mr. Hoffman and Mr. Roberts were appointed by the Board as Trustees on September 26, 2008.
| | |
| Trustee Emeritus | | |
| |
| Name, Year of Birth | | Number of |
| Position(s) held with Fund | Trustee | John Hancock |
| Principal occupation(s) and other | of Fund | funds overseen |
| directorships during past 5 years | since | by Trustee |
| |
| John D. Richardson,1 Born: 1938 | 2008 | 212 |
|
| Former Trustee of JHT (Retired, December 14, 2006). Former Senior Executive Vice President, Office of |
| the President, MFC, February 2000 to March 2002 (Retired, March 2002); Executive Vice President and |
| General Manager, U.S. Operations, Manulife Financial, January 1995 to January 2000. | |
1 Mr. Richardson became a non-voting Trustee Emeritus on December 14, 2006.
| | |
| Non-Independent Trustees1,2 | | |
| | | |
| Name, Year of Birth | | Number of |
| Position(s) held with Fund | Trustee | John Hancock |
| Principal occupation(s) and other | of Fund | funds overseen |
| directorships during past 5 years | since1,2 | by Trustee |
| |
| James R. Boyle,3 Born: 1959 | 2008 | 269 |
|
| Executive Vice President, Manulife Financial Corporation (since 1999); Director and President, John |
| Hancock Variable Life Insurance Company (since 2007); Director and Executive Vice President, John |
| Hancock Life Insurance Company (since 2004); Chairman and Director, John Hancock Advisers, LLC (the |
| Adviser), John Hancock Funds, LLC (John Hancock Funds) and The Berkeley Financial Group, LLC (The |
| Berkeley Group) (holding company) (since 2005); Chairman and Director, John Hancock Investment |
| Management Services, LLC (since 2006); Senior Vice President, The Manufacturers Life Insurance |
| Company (U.S.A.) (until 2004). | | |
|
| |
| Grace K. Fey,4,5 Born: 1946 | 2008 | 212 |
|
| Trustee of John Hancock Trust and John Hancock Funds II (since September 2008); Chief Executive Officer, |
| Grace Fey Advisors (since 2007); Director & Executive Vice President, Frontier Capital Management |
| Company (1988–2007). | | |
| |
| Annual report | Retirement Rising Distribution Portfolio | 27 |
1 Non-Independent Trustee holds positions with the Fund’s investment adviser, underwriter and certain other affiliates.
2 Because the Trust does not hold regular annual shareholders meetings, each Trustee holds office for an indefinite term until his/her successor is duly elected and qualified or until he/she dies, retires, resigns, is removed or becomes disqualified. Trustees may be removed (provided the aggregate number of Trustees after such removal shall not be less than one) with cause or without cause, by the action of two-thirds of the remaining Trustees or by action of two-thirds of the outstanding Shares of the Trust holds positions with the Fund’s investment adviser, underwriter and certain other affiliates.
3 Mr. Boyle is an “interested person” (as defined in the 1940 Act) due to his position with Manulife Financial Corporation (or its affiliates), the ultimate parent of the Adviser.
4 Ms. Fey was appointed by the Board as Trustee on September 26, 2008.
5 Ms. Fey is an “interested person” (as defined by the 1940 Act) due to a deferred compensation arrangement with her former employer, Frontier Capital Management Company, which is a subadviser of certain funds of John Hancock Funds II and John Hancock Trust.
| |
| Principal officers who are not Trustees | |
| |
| Name, Year of Birth | |
| Position(s) held with Fund | Officer |
| Principal occupation(s) and other | of Fund |
| directorships during past 5 years | since |
| |
| Keith F. Hartstein, Born: 1956 | 2008 |
|
| President and Chief Executive Officer | |
| Senior Vice President, Manulife Financial Corporation (since 2004); Director, President and Chief | |
| Executive Officer, the Adviser, The Berkeley Group and John Hancock Funds, LLC (since 2005); Director, |
| MFC Global Investment Management (U.S.), LLC (MFC Global (U.S.)) (since 2005); Chairman and | |
| Director, John Hancock Signature Services, Inc. (since 2005); Director, President and Chief Executive |
| Officer, John Hancock Investment Management Services, LLC (since 2006); President and Chief Executive |
| Officer, John Hancock Funds, John Hancock Funds II, John Hancock Funds III and John Hancock Trust |
| (since 2005); Director, Chairman and President, NM Capital Management, Inc. (since 2005); Member |
| and former Chairman, Investment Company Institute Sales Force Marketing Committee (since 2003); |
| Director, President and Chief Executive Officer, MFC Global (U.S.) (2005–2006); Executive Vice President, |
| John Hancock Funds, LLC (until 2005). | |
|
| |
| Thomas M. Kinzler, Born: 1955 | 2008 |
|
| Secretary and Chief Legal Officer | |
| Vice President and Counsel, John Hancock Life Insurance Company (U.S.A.) (since 2006); Secretary |
| and Chief Legal Officer, John Hancock Funds, John Hancock Funds II and John Hancock Trust (since |
| 2006); Vice President and Associate General Counsel, Massachusetts Mutual Life Insurance Company |
| (1999–2006); Secretary and Chief Legal Counsel, MML Series Investment Fund (2000–2006); Secretary |
| and Chief Legal Counsel, MassMutual Institutional Funds (2000–2004); Secretary and Chief Legal | |
| Counsel, MassMutual Select Funds and MassMutual Premier Funds (2004–2006). | |
|
| |
| Francis V. Knox, Jr., Born: 1947 | 2008 |
|
| Chief Compliance Officer | |
| Vice President and Chief Compliance Officer, John Hancock Investment Management Services, LLC, |
| the Adviser and MFC Global (U.S.) (since 2005); Chief Compliance Officer, John Hancock Funds, John |
| Hancock Funds II, John Hancock Funds III and John Hancock Trust (since 2005); Vice President and | |
| Assistant Treasurer, Fidelity Group of Funds (until 2004); Vice President and Ethics & Compliance Officer, |
| Fidelity Investments (until 2001). | |
| |
| 28 | Retirement Rising Distribution Portfolio | Annual report |
| |
| Principal officers who are not Trustees (continued) | |
| |
| Name, Year of Birth | |
| Position(s) held with Fund | Officer |
| Principal occupation(s) and other | of Fund |
| directorships during past 5 years | since |
| |
| Charles A. Rizzo, Born: 1957 | 2008 |
|
| Chief Financial Officer | |
| Chief Financial Officer, John Hancock Funds, John Hancock Funds II, John Hancock Funds III and John |
| Hancock Trust (since 2007); Assistant Treasurer, Goldman Sachs Mutual Fund Complex (registered | |
| investment companies) (2005–2007); Vice President, Goldman Sachs (2005–2007); Managing Director |
| and Treasurer of Scudder Funds, Deutsche Asset Management (2003–2005); Director, Tax and Financial |
| Reporting, Deutsche Asset Management (2002–2003); Vice President and Treasurer, Deutsche Global |
| Fund Services (1999–2002). | |
|
| |
| Gordon M. Shone, Born: 1956 | 2008 |
|
| Treasurer | |
| Senior Vice President, John Hancock Life Insurance Company (U.S.A.) (since 2001); Treasurer, John | |
| Hancock Funds (since 2006), John Hancock Funds II, John Hancock Funds III and John Hancock Trust |
| (since 2005); Vice President and Chief Financial Officer, John Hancock Trust (2003–2005); Vice President, |
| John Hancock Investment Management Services, LLC, John Hancock Advisers, LLC (since 2006) and The |
| Manufacturers Life Insurance Company (U.S.A.) (1998–2000). | |
|
| |
| John G. Vrysen, Born: 1955 | 2008 |
|
| Chief Operating Officer | |
| Senior Vice President, Manulife Financial Corporation (since 2006); Director, Executive Vice President |
| and Chief Operating Officer, the Adviser, The Berkeley Group, John Hancock Investment Management |
| Services, LLC and John Hancock Funds, LLC (since 2007); Chief Operating Officer, John Hancock Funds, |
| John Hancock Funds II, John Hancock Funds III and John Hancock Trust (since 2007); Director, John | |
| Hancock Signature Services, Inc. (since 2005); Chief Financial Officer, the Adviser, The Berkeley Group, |
| Manulife Financial Corporation Global Investment Management (U.S.), LLC, John Hancock Investment |
| Management Services, LLC, John Hancock Funds, LLC, John Hancock Funds, John Hancock Funds II, John |
| Hancock Funds III and John Hancock Trust (2005–2007); Vice President, Manulife Financial Corporation |
| (until 2006). | |
The business address for all Trustees and Officers is 601 Congress Street, Boston, Massachusetts 02210-2805.
The Statement of Additional Information of the Fund includes additional information about members of the Board of Trustees of the Fund and is available without charge, upon request, by calling 1-800-225-5291.
| |
| Annual report | Retirement Rising Distribution Portfolio | 29 |
More information
PROXY VOTING POLICY AND PROXY VOTING RECORD. A description of the Portfolio’s proxy voting policies and procedures, and information regarding how the Portfolio voted proxies relating to portfolio securities during the most recent twelve-month period ended June 30 are available without charge upon request.
| | |
| By phone | On the Portfolio’s Web site | On the SEC’s Web site |
| 1-800-225-5291 | www.jhfunds.com/proxy | www.sec.gov |
|
| Trustees | Francis V. Knox, Jr. | Principal distributor |
| James M. Oates, Chairman | Chief Compliance Officer | John Hancock Funds, LLC |
| James R. Boyle† | | 601 Congress Street |
| Grace K. Fey†** | Charles A. Rizzo | Boston, MA 02210-2805 |
| Charles L. Bardelis* | Chief Financial Officer | |
| Peter S. Burgess* | | Custodian |
| Elizabeth G. Cook** | Gordon M. Shone | State Street Bank & Trust Co. |
| Theron S. Hoffman** | Treasurer | 2 Avenue de Lafayette |
| Hassell H. McClellan** | | Boston, MA 02111 |
| Steven M. Roberts* | John G. Vrysen | |
| John D. Richardson*, | Chief Operating Officer | Transfer agent |
| Trustee Emeritus | | John Hancock Signature |
| *Members of the Audit Committee | Investment adviser | Services, Inc. |
| **Members of the | John Hancock Investment | P.O. Box 9510 |
| Compliance Committee | Management Services, LLC | Portsmouth, NH 03802-9510 |
| †Non-Independent Trustees | 601 Congress Street | |
| | Boston, MA 02210-2805 | Legal counsel |
| Officers | | K&L Gates LLP |
| Keith F. Hartstein | Subadviser | One Lincoln Street |
| President and | MFC Global Investment | Boston, MA 02111-2950 |
| Chief Executive Officer | Management (U.S.A.) Limited | |
| 200 Bloor Street East | Independent registered |
| Thomas M. Kinzler | Toronto, Ontario, Canada | public accounting firm |
| Secretary and Chief Legal Officer | M4W 1E5 | PricewaterhouseCoopers LLP |
| | | 125 High Street |
| | Boston, MA 02110 |
|
| | |
| How to contact us | |
|
| Internet | www.jhfunds.com | |
|
| Mail | Regular mail: | Express mail: |
| | John Hancock Signature | John Hancock Signature |
| | Services, Inc. | Services, Inc. |
| | P.O. Box 9510 | Mutual Fund Image Operations |
| | Portsmouth, NH 03802-9510 | 164 Corporate Drive |
| | | Portsmouth, NH 03801 |
|
| Phone | Customer service representatives | 1-800-225-5291 |
| | EASI-Line | 1-800-338-8080 |
| | TDD line | 1-800-554-6713 |
|
The Portfolio files its complete schedule of portfolio holdings with the SEC for the first and third quarters of each fiscal year on Form N-Q. Form N-Q is available on the SEC’s Web site at www.sec.gov. The Portfolio’s Form N-Q may be reviewed and copied at the SEC’s Public Reference Room in Washington, DC. Information on the operation of the Public Reference Room may be obtained by calling 1-800-SEC-0330. In addition, the Portfolio’s complete schedule of holdings can be found in its semiannual or annual report on www.jhfunds.com.
| |
| 30 | Retirement Rising Distribution Portfolio | Annual report |

1-800-225-5291
1-800-554-6713 TDD
1-800-338-8080 EASI-Line
www.jhfunds.com
Now available: electronic delivery
www.jhfunds.com/edelivery
| |
| This report is for the information of the shareholders of John Hancock Retirement Rising Distribution Portfolio. | 3320A 12/08 |
| It is not authorized for distribution to prospective investors unless preceded or accompanied by a prospectus. | 2/09 |
ITEM 2. CODE OF ETHICS.
(a) As of the end of the fiscal year, December 31, 2008, the registrant has adopted a code of ethics, as defined in Item 2 of Form N-CSR), that applies to its Chief Executive Officer and Chief Financial Officer (respectively, the principal executive officer, the principal financial officer, the “Covered Officers”). A copy of the code of ethics is filed as an exhibit to this Form N-CSR.
(b) Not applicable
(c) Not applicable
(d) Not applicable
(e) Not applicable
(f)(1) Not applicable
(f)(2) Not applicable
(f)(3) The Registrant will provide a copy of the Code of Ethics to any person without charge, upon request by calling the following toll free number (800) 344-1029.
ITEM 3. AUDIT COMMITTEE FINANCIAL EXPERT.
The Board of Trustees of the Registrant has determined that it has one “audit committee financial expert” as that term is defined in Item 3(b) of Form N-CSR: Peter S. Burgess, who is “independent” as that term is defined in Item 3(a) (2) of Form N-CSR.
ITEM 4. PRINCIPAL ACCOUNTANT FEES AND SERVICES.
(a) AUDIT FEES:
2008: $237,474
2007: $78,985
These fees represent aggregate fees billed for the last two fiscal years (the “Reporting Periods”) for professional services rendered by the principal accountant for the audits of the Registrant’s annual financial statements or services that are normally provided by the accountant in connection with statutory and regulatory filing or engagements for such Reporting Periods.
(b) AUDIT RELATED FEES:
2008: $38,646
2007: $25,960
These fees represent the aggregate fees billed for the Reporting Periods for assurance and related services by the principal accountant that are reasonably relate to the performance of the audit of the Registrant’s financial statements and are not reported under paragraph (a) of this Item. Such fees relate to professional services rendered by PwC for separate audit reports in connection with security counts pursuant to Rule 17f-2 under the Investment Company Act of 1940 and fund merger audit services.
(c) TAX FEES:
2008: $21,775
2007: $15,395
These fees represent aggregate fees billed for the Reporting Periods for professional services rendered by the principal accountant for tax compliance, tax advice and tax planning. The tax services provided by the principal accountant relate to the review of the Registrant’s federal and state income tax returns, excise tax calculations and returns and a review of the Registrant’s calculations of capital gain and income distributions.
(d) ALL OTHER FEES: None
(e) (1) Audit Committee Pre-Approval Policies and Procedures:
The Trust’s Audit Committee must pre-approve all audit and non-audit services provided by the independent registered public accounting firm (the “Auditor”) relating to the operations or financial reporting of the funds. Prior to the commencement of any audit or non-audit services to a fund, the Audit Committee reviews the services to determine whether they are appropriate and permissible under applicable law.
The Trust’s Audit Committee has adopted policies and procedures to, among other purposes, provide a framework for the Committee’s consideration of audit-related and non-audit services by the Auditor. The policies and procedures require that any audit-related and non-audit service provided by the Auditor and any non-audit service provided by the Auditor to a fund service provider that relates directly to the operations and financial reporting of a fund are subject to approval by the Audit Committee before such service is provided. Audit-related services provided by the Auditor that are expected to exceed $25,000 per instance/per fund are subject to specific pre-approval by the Audit Committee. Tax services provided by the Auditor that are expected to exceed $30,000 per instance/per fund are subject to specific pre-approval by the Audit Committee.
All audit services, as well as the audit-related and non-audit services that are expected to exceed the amounts stated above, must be approved in advance of provision of the service by formal resolution of the Audit Committee. At the regularly scheduled Audit Committee meetings, the Committee reviews a report summarizing the services, including fees, provided by the Auditor.
(2) Amount approved by the Audit Committee pursuant paragraph (c) (7) (i) (C) of Rule 2-01 of Regulation S-X: None.
(f) Not Applicable.
(g) The aggregate non-audit fees billed by PwC for services rendered to the registrant and rendered to the registrant's control affiliates for each of the last two fiscal years of the registrant were $7,793,908 for the fiscal year ended December 31, 2008, and $1,566,218 for the fiscal year ended December 31, 2007.
(h) The Registrant’s audit committee of the Board of Trustees has considered the provision of non-audit services that were rendered to the Registrant’s investment adviser and service affiliates that were not pre-approved pursuant to paragraph (c) (7ii) of Rule 2-01 of Regulation S-X, to be compatible with maintaining PWC’s independence
ITEM 5. AUDIT COMMITTEE OF LISTED REGISTRANTS Not Applicable.
ITEM 6. SCHEDULE OF INVESTMENTS. Included with Item 1.
ITEM 7. DISCLOSURE OF PROXY VOTING POLICIES AND PROCEDURES FOR CLOSED-END MANAGEMENT INVESTMENT COMPANIES. Not Applicable.
ITEM 8. PORTFOLIO MANAGERS OF CLOSED-END MANAGEMENT INVESTMENT COMPANIES. Not Applicable.
ITEM 9. PURCHASE OF EQUITY SECURITIES BY CLOSED-END MANAGEMENT INVESTMENT COMPANIES AND AFFILIATED PURCHASERS. Not Applicable.
ITEM 10. SUBMISSION OF MATTERS TO VOTE OF SECURITY HOLDERS. Not Applicable.
ITEM 11. CONTROLS AND PROCEDURES.
(a) EVALUATION OF DISCLOSURE CONTROLS AND PROCEDURES. The Registrant maintains disclosure controls and procedures that are designed to ensure that information required to be disclosed in this Form N-CSR is recorded, processed, summarized and reported within the periods specified in the rules and forms of the Securities and Exchange Commission. Such disclosure controls and procedures include controls and procedures designed to ensure that such information is accumulated and communicated to the Registrant's management, including its principal executive officer and principal financial officer, as appropriate, to allow timely decisions regarding required disclosure.
Within 90 days prior to the filing date of this Form N-CSR, the Registrant had carried out an evaluation, under the supervision and with the participation of the Registrant's management, including the Registrant's principal executive officer and the Registrant's principal financial officer, of the effectiveness of the design and operation of the Registrant's disclosure controls and procedures relating to information required to be disclosed on Form N-CSR. Based on such evaluation, the Registrant's principal executive officer and principal financial officer concluded that the Registrant's disclosure controls and procedures are operating effectively to ensure that:
(i) information required to be disclosed in this Form N-CSR is recorded, processed, summarized and reported within the periods specified in the rules and forms of the Securities and Exchange Commission, and
(ii) information is accumulated and communicated to the Registrant’s management, including its principal executive officer and principal financial officer, as appropriate, to allow timely decisions regarding required disclosure.
(b) CHANGE IN REGISTRANT’S INTERNAL CONTROL: Not Applicable.
ITEM 12. EXHIBITS.
(a)(1) SEE ATTACHED CODE OF ETHICS.
(a)(2)(i) CERTIFICATION OF PRINCIPAL EXECUTIVE OFFICER.
(a)(2)(ii) CERTIFICATION OF PRINCIPAL FINANCIAL OFFICER.
(b) CERTIFICATION PURSUANT TO Rule 30a-2(b) OF THE INVESTMENT COMPANY ACT OF 1940
Pursuant to the requirements of the Securities Exchange Act of 1934 and the Investment Company Act of 1940, the registrant has duly caused this report to be signed on its behalf by the undersigned, thereunto duly authorized.
JOHN HANCOCK FUNDS II
/S/ Keith F. Hartstein
Keith F. Hartstein
President and
Chief Executive Officer
Date: February 26, 2009
Pursuant to the requirements of the Securities Exchange Act of 1934 and the Investment Company Act of 1940, this report has been signed below by the following persons on behalf of the registrant and in the capacities and on the dates indicated.
/S/ Keith F. Hartstein
Keith F. Hartstein
President and
Chief Executive Officer
Date: February 26, 2009
/S/ Charles A. Rizzo
Charles A. Rizzo
Chief Financial Officer
Date: February 26, 2009