|
| UNITED STATES |
| SECURITIES AND EXCHANGE COMMISSION |
| Washington, D.C. 20549 |
| |
| FORM N-CSR |
| |
| CERTIFIED SHAREHOLDER REPORT OF REGISTERED MANAGEMENT INVESTMENT |
| COMPANIES |
| Investment Company Act file number 811-21779 |
| |
| JOHN HANCOCK FUNDS II |
| --------------------------------------------------------- |
| (Exact name of registrant as specified in charter) |
| |
| 601 CONGRESS STREET, BOSTON, MA 02210-2805 |
| ------------------------------------------------------------- |
| (Address of principal executive offices) (Zip code) |
| |
| GORDON M. SHONE, 601 CONGRESS STREET, BOSTON, MA 02210-2805 |
| ------------------------------------------------------------------------------------------ |
| (Name and address of agent for service) |
| |
| Registrant's telephone number, including area code: (617) 663-3000 |
| -------------- |
|
| Date of fiscal year end: 12/31 |
| ------ |
| |
| Date of reporting period: 12/31/07 |
| ------- |
| |
| ITEM 1. REPORTS TO STOCKHOLDERS. |

John Hancock
Lifestyle Aggressive Portfolio
Goal and strategy
The Portfolio seeks long-term growth of capital. Current income is not a consideration. To pursue this goal, the Portfolio, which is a fund-of-funds, normally invests 100% of its assets in affiliated underlying funds that invest primarily in equity securities.
Target Asset Allocation
| Equity | % of Total |
|
| U.S. Large Cap | 40% |
|
| U.S. Mid Cap | 13% |
|
| U.S. Small Cap | 12% |
|
| Foreign Small Cap | 12% |
|
| Foreign Large Cap | 8% |
|
| Foreign Mid Cap | 8% |
|
| Natural Resources | 4% |
|
| Emerging Markets | 3% |
|
As a percentage of net assets on December 31, 2007.
Performance review
For the 12 months ended December 31, 2007, John Hancock Lifestyle Aggressive Portfolio’s Class A, Class B, Class C, Class R, Class R1, Class R2, Class R3, Class R4, Class R5 and Class 1 shares returned 8.00%, 7.23%, 7.21%, 7.48%, 7.92%, 8.13%, 7.85%, 8.13%, 8.42% and 8.54%, respectively, at net asset value. In comparison, the Portfolio’s benchmark index — the S&P 500 Index — returned 5.49% during the same period.
Outperformance
The Portfolio benefited significantly from its international allocations. International Core (GMO), with an 8% position in the Portfolio, performed well, helped by positions in the German consumer discretionary sector and in United Kingdom telecommunications stocks. Also contributing to the Portfolio was a 3% position we initiated in May to Emerging Markets Value (DFA). Emerging markets as an asset class benefited from strong economic growth across a variety of developing nations. Natural Resources (Wellington), a 4% stake in the Portfolio, finished the year with exceptional gains fueled by strength in crude oil prices, industrial metals and other commodities. Excellent stock selection in both the energy, and metals and mining segments helped the fund significantly beat its benchmark.
One of the Portfolio’s largest holdings and best contributors was Blue Chip Growth (T. Rowe Price). This large-cap growth fund benefited from a combination of excellent stock picks in the energy sector and an overweighting in technology, one of the stronger sectors in 2007. Two mid-cap growth funds, Vista (American Century) and Mid Cap Stock (Wellington), also added to the Portfolio’s performance. Both funds benefited from their materials and industrial holdings and from excellent security selection in the consumer discretionary sector.
One holding that detracted from performance was Quantitative Value (MFC Global U.S.A.), a large-cap value strategy that was hurt by its exposure to the troubled financials sector. Likewise, Core Equity (Legg Mason), run by well-known value manager Bill Miller, suffered because of its relatively high exposure to stocks linked to housing. Poor security selection in telecommunications and an underweight to the energy sector also hurt performance.
Over the course of the year, in addition to the move into emerging-market equities, we made a small shift from small caps to mid caps. Additionally, toward the end of the year, we began a reallocation from small- and mid-cap holdings into large-caps. We believe large caps have greater potential to outperform during periods of slower economic growth.
This commentary reflects the views of the portfolio management team through the end of the Fund’s period discussed in this report. The team’s statements reflect their own opinions. As such, they are in no way guarantees of future events and are not intended to be used as investment advice or a recommendation regarding any specific security. They are also subject to change at any time as market and other conditions warrant.
SCORECARD
| | |
| INVESTMENT | | PERIOD’S PERFORMANCE . . . AND WHAT’S BEHIND THE NUMBERS |
| |
| Natural Resources | ▲ | Robust commodity prices |
| (Wellington) | | |
| |
| Emerging Markets | ▲ | Dynamic growth in developing nations |
| Value (DFA) | | |
| |
| Core Equity | ▼ | Exposure to housing, underweight to energy |
| (Legg Mason) | | |
Lifestyle Portfolios | Annual report
4
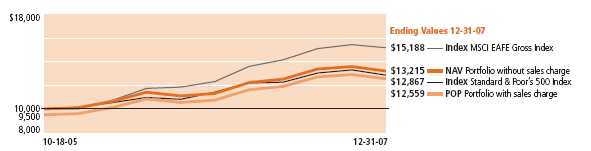
Growth of $10,000
This chart shows what happened to a hypothetical $10,000 investment in Class A shares for the period indicated. For comparison, we’ve shown the same investment in two comparable indices.
| | | | | | | | | |
| | Class B | Class C | Class R1 | Class R11 | Class R21 | Class R31 | Class R41 | Class R51 | Class 11 |
|
| Period beginning | 10-18-05 | 10-18-05 | 9-18-06 | 9-18-06 | 9-18-06 | 10-18-05 | 10-18-05 | 10-18-05 | 10-15-05 |
|
| Without sales charge | 13,017 | 13,023 | 11,739 | 11,790 | 11,826 | 13,187 | 13,249 | 13,323 | 13,355 |
|
| With maximum sales charge | 12,717 | 13,023 | 11,739 | 11,790 | 11,826 | 13,187 | 13,249 | 13,323 | 13,355 |
|
| S&P 500 Index | 12,867 | 12,867 | 11,398 | 11,398 | 11,398 | 12,867 | 12,867 | 12,867 | 12,906 |
|
| MSCI EAFE Gross Index2 | 15,188 | 15,188 | 12,324 | 12,324 | 12,324 | 15,188 | 15,188 | 15,188 | 14,745 |
|
Performance chart
Cumulative total returns with maximum sales charge (POP) for the period ending December 31, 2007
| | | | | | | | | | |
| | Class A | Class B | Class C | Class R1 | Class R11 | Class R21 | Class R31 | Class R41 | Class R51 | Class 11 |
|
| Inception | 10-18-05 | 10-18-05 | 10-18-05 | 9-18-06 | 9-18-06 | 9-18-06 | 10-18-05 | 10-18-05 | 10-18-05 | 10-15-05 |
|
| Since inception | 25.59% | 27.17% | 30.23% | 17.39% | 17.90% | 18.26% | 31.87% | 32.49% | 33.23% | 33.55% |
|
Performance figures assume all distributions are reinvested. Returns with maximum sales charge reflect a sales charge on Class A shares of 5%, and the applicable contingent deferred sales charge (CDSC) on Class B and Class C shares. The Class B shares’ CDSC declines annually between years 1–6 according to the following schedule: 5, 4, 3, 3, 2, 1%. No sales charge will be assessed after the sixth year. Class C shares held for less than one year are subject to a 1% CDSC. Sales charge is not applicable for Class R, Class R1, Class R2, Class R3, Class R4, Class R5 and Class 1 shares.
The expense ratios of the Portfolio, both net (including any fee waivers or expense limitations) and gross (excluding any fee waivers or expense limitations), are set forth according to the most recent publicly available prospectuses for the Portfolio and may differ from the expense ratios disclosed in the Financial Highlights tables in this report. The waivers and expense limitations are contractual at least until 5-1-08. The following expense ratios include expenses of the underlying affiliated funds in which the Portfolio invests. The net expenses are as follows: Class A — 1.55%, Class B — 2.26%, Class C — 2.26%, Class R — 1.86%, Class R1 — 1.61%, Class R2 — 1.36%, Class R3 — 1.63%, Class R4 — 1.44%, Class R5 — 1.14% . Had the fee waivers and expense limitations not been in place, the gross expenses would be as follows: Class A — 1.56%, Class B — 2.45%, Class C — 2.27%, Class R — 11.57%, Class R1 — 13.80%, Class R2 — 13.15%, Class R3 — 3.12%, Class R4 — 2.29%, Class R5 — 4.98% . The net expenses equal the gross expenses and are as follows: Class 1 — 1.02% .
The returns reflect past results and should not be considered indicative of future performance. The return and principal value of an investment will fluctuate so that shares, when redeemed, may be worth more or less than their original cost. Due to market volatility, the Portfolio’s current performance may be higher or lower than the performance shown. For performance data current to the most recent month end, please call 1-800-225-5291 or visit the Portfolio’s Web site at www.jhfunds.com.
The performance table above and the chart on the next page do not reflect the deduction of taxes that a shareholder would pay on Portfolio distributions or the redemption of Portfolio shares.
The Portfolio’s performance results reflect any applicable expense reductions, without which the expenses would increase and results would have been less favorable.
Since inception performance is calculated with an opening price (prior day’s close) on inception date.
1 For certain types of investors as described in the Portfolio’s Class R, Class R1, Class R2, Class R3, Class R4, Class R5 and Class 1 share prospectuses.
2 Index as of closest month end to inception date.
Annual report | Lifestyle Portfolios
5
John Hancock
Lifestyle Growth Portfolio
Goal and strategy
The Portfolio seeks long-term growth of capital. Current income is also a consideration. To pursue this goal, the Portfolio, which is a fund-of-funds, normally invests approximately 80% of its assets in affiliated underlying funds that invest primarily in equity securities and approximately 20% of its assets in affiliated underlying funds that invest primarily in fixed-income securities.
| |
| Target Asset Allocation |
| | |
| Equity | % of Total |
|
| U.S. Large Cap | 40% |
|
| U.S. Mid Cap | 8% |
|
| Foreign Small Cap | 7% |
|
| Foreign Mid Cap | 6% |
|
| Foreign Large Cap | 6% |
|
| U.S. Small Cap | 6% |
|
| Natural Resources | 3% |
|
| Emerging Markets | 2% |
|
| Real Estate | 2% |
|
| | |
| Fixed Income | % of Total |
|
| High Yield Bond | 7% |
|
| Intermediate-term bond | 4% |
|
| Multi-sector bond | 4% |
|
| Treasury Inflation | |
| Protected Securities | 3% |
|
| Global bond | 2% |
|
As a percentage of net assets on December 31, 2007.
Note to shareholders
In September 2007, shareholders of John Hancock Allocation Growth + Value Portfolio approved the merger of their portfolio into John Hancock Lifestyle Growth Portfolio.
Performance review
For the 12 months ended December 31, 2007, John Hancock Lifestyle Growth Portfolio’s Class A, Class B, Class C, Class R, Class R1, Class R2, Class R3, Class R4, Class R5, Class 1 and Class 5 shares returned 6.96%, 6.14%, 6.19%, 6.47%, 6.75%, 6.91%, 6.69%, 6.95%, 7.31%, 7.44% and 7.42%, respectively, at net asset value. In comparison, the Portfolio’s benchmark index — a blended index combining 80% S&P 500 Index and 20% Lehman Brothers U.S. Aggregate Index — returned 5.88% during the same period.
Outperformance
The Portfolio benefited significantly from the strong performance of international funds. International Opportunities (Marsico), with a 4% position in the Portfolio, performed exceptionally well, helped by positions in Hong Kong telecommunications and Canadian materials. Also contributing to the Portfolio was a 2% position we initiated in May to Emerging Markets Value (DFA). Emerging markets as an asset class benefited from strong economic growth across a variety of developing nations. Natural Resources (Wellington), a 3% stake in the Portfolio, finished the year with exceptional gains fueled by strength in crude oil prices, industrial metals and other commodities. Excellent stock selection in both the energy, and metals and mining segments helped the fund significantly beat its benchmark.
Another solid contributor to the Portfolio was Blue Chip Growth (T. Rowe Price). This large-cap growth fund benefited from a combination of excellent stock picks in the energy equipment and services segment as well as an overweighting in technology, one of the stronger sectors in 2007. Two mid-cap growth funds, Vista (American Century) and Mid Cap Stock (Wellington), also added to the Portfolio’s performance.
One holding that detracted from performance was Quantitative Value (MFC Global U.S.A.), a large-cap value strategy that was hurt by its exposure to the troubled financials sector. Likewise, Core Equity (Legg Mason), run by well-known value manager Bill Miller, suffered because of its relatively high exposure to stocks linked to housing. Poor security selection in telecommunications and an underweight to the energy sector also hurt performance. The Portfolio’s performance also was weighed down by its real estate exposure. Both Real Estate Equity (T. Rowe Price) and Global Real Estate (Deutsche) struggled, as real estate markets sold off after a good year in 2006.
Our 20% allocation to fixed income hurt performance, specifically, our allocation to high yield. Partially offsetting this allocation were the strong returns from Real Return Bond (PIMCO) and Global Bond (PIMCO), which benefited from the flight to quality that occurred during the year, and exposure to non-U.S. currencies, respectively. Over the course of the year, in addition to the move into emerging market equities, we made a small shift from small caps to mid caps. Additionally, toward the end of year, we began a reallocation from small- and mid-cap holdings into large caps.
This commentary reflects the views of the portfolio management team through the end of the Fund’s period discussed in this report. The team’s statements reflect their own opinions. As such, they are in no way guarantees of future events and are not intended to be used as investment advice or a recommendation regarding any specific security. They are also subject to change at any time as market and other conditions warrant.
SCORECARD
| | |
| INVESTMENT | | PERIOD’S PERFORMANCE . . . AND WHAT’S BEHIND THE NUMBERS |
| | | |
| Natural Resources | ▲ | Robust commodity prices |
| (Wellington) | | |
| | | |
| Emerging Markets | ▲ | Dynamic growth in developing nations |
| Value (DFA) | | |
| | | |
| Real estate funds | ▼ | Global real estate market selloff |
Lifestyle Portfolios | Annual report
6
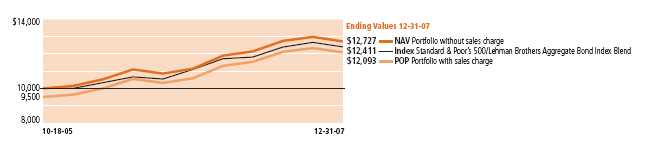
Growth of $10,000
This chart shows what happened to a hypothetical $10,000 investment in Class A shares for the period indicated. For comparison, we’ve shown the same investment in a blended Index.
| | | | | | | | | | |
| | Class B | Class C | Class R1 | Class R11 | Class R21 | Class R31 | Class R41 | Class R51 | Class 11 | Class 51 |
|
| Period beginning | 10-18-05 | 10-18-05 | 9-18-06 | 9-18-06 | 9-18-06 | 10-18-05 | 10-18-05 | 10-18-05 | 10-15-05 | 7-3-06 |
|
| Without sales charge | 12,533 | 12,535 | 11,460 | 11,503 | 11,525 | 12,673 | 12,741 | 12,821 | 12,853 | 11,805 |
|
| With maximum sales charge | 12,233 | 12,535 | 11,460 | 11,503 | 11,525 | 12,673 | 12,741 | 12,821 | 12,853 | 11,805 |
|
| Index 2,3 | 12,411 | 12,411 | 11,180 | 11,180 | 11,180 | 12,411 | 12,411 | 12,411 | 12,226 | 11,771 |
|
Performance chart
Cumulative total returns with maximum sales charge (POP) for the period ending December 31, 2007
| | | | | | | | | | | |
| | Class A | Class B | Class C | Class R1 | Class R11 | Class R21 | Class R31 | Class R41 | Class R51 | Class 11 | Class 51 |
|
| Inception | 10-18-05 | 10-18-05 | 10-18-05 | 9-18-06 | 9-18-06 | 9-18-06 | 10-18-05 | 10-18-05 | 10-18-05 | 10-15-05 | 7-3-06 |
|
| Since inception | 20.93% | 22.33% | 25.35% | 14.60% | 15.03% | 15.25% | 26.73% | 27.41% | 28.21% | 28.53% | 18.05% |
|
Performance figures assume all distributions are reinvested. Returns with maximum sales charge reflect a sales charge on Class A shares of 5%, and the applicable contingent deferred sales charge (CDSC) on Class B and Class C shares. The Class B shares’ CDSC declines annually between years 1–6 according to the following schedule: 5, 4, 3, 3, 2, 1%. No sales charge will be assessed after the sixth year. Class C shares held for less than one year are subject to a 1% CDSC. Sales charge is not applicable for Class R, Class R1, Class R2, Class R3, Class R4, Class R5, Class 1 and Class 5 shares.
The expense ratios of the Portfolio, both net (including any fee waivers or expense limitations) and gross (excluding any fee waivers or expense limitations), are set forth according to the most recent publicly available prospectuses for the Portfolio and may differ from the expense ratios disclosed in the Financial Highlights tables in this report. The waivers and expense limitations are contractual at least until 5-1-08. The following expense ratios include expenses of the underlying affiliated funds in which the Portfolio invests. The net expenses are as follows: Class B — 2.22%, Class R — 1.82%, Class R1 — 1.56%, Class R2 — 1.32%, Class R3 — 1.58%, Class R4 — 1.40%, Class R5 — 1.07% . Had the fee waivers and expense limitations not been in place, the gross expenses would be as follows: Class B — 2.27%, Class R — 13.28%, Class R1 — 13.82%, Class R2 — 13.61%, Class R3 —2.22%, Class R4 — 1.67%, Cla ss R5 — 2.27% . The net expenses equal the gross expenses and are as follows: Class A — 1.45%, Class C — 2.16%, Class 1 — 0.98%, Class 5 — 0.93% .
The returns reflect past results and should not be considered indicative of future performance. The return and principal value of an investment will fluctuate so that shares, when redeemed, may be worth more or less than their original cost. Due to market volatility, the Portfolio’s current performance may be higher or lower than the performance shown. For performance data current to the most recent month end, please call 1-800-225-5291 or visit the Portfolio’s Web site at www.jhfunds.com.
The performance table above and the chart on the next page do not reflect the deduction of taxes that a shareholder would pay on Portfolio distributions or the redemption of Portfolio shares.
The Portfolio’s performance results reflect any applicable expense reductions, without which the expenses would increase and results would have been less favorable.
Since inception performance is calculated with an opening (prior day’s close) on the inception date.
1 For certain types of investors as described in the Portfolio’s Class R, Class R1, Class R2, Class R3, Class R4, Class R5, Class 1 and Class 5 share prospectuses.
2 Index as of closest month end to inception date.
3 The blended index is comprised of 80% of the Standard & Poor’s 500 Index and 20% of the Lehman Brothers Aggregate Bond Index.
Annual report | Lifestyle Portfolios
7
John Hancock
Lifestyle Balanced Portfolio
Goal and strategy
The Portfolio seeks a balance between a high level of current income and growth of capital, with greater emphasis on growth of capital. To pursue this goal, the Portfolio, which is a fund-of-funds, normally invests approximately 60% of its assets in affiliated underlying funds that invest primarily in equity securities and approximately 40% of its assets in affiliated underlying funds that invest primarily in fixed-income securities.
| |
| Target Asset Allocation |
| | |
| Equity | % of Total |
|
| U.S. Large Cap | 37% |
|
| Foreign Small Cap | 5% |
|
| Foreign Mid Cap | 4% |
|
| Real Estate | 4% |
|
| Natural Resources | 3% |
|
| Emerging Markets | 2% |
|
| U.S. Mid Cap | 2% |
|
| Foreign Large Cap | 2% |
|
| U.S. Small Cap | 2% |
|
| | |
| Fixed Income | % of Total |
|
| High Yield Bond | 13% |
|
| Intermediate-term bond | 9% |
|
| Multi-sector bond | 9% |
|
| Treasury Inflation | |
| Protected Securities | 5% |
|
| Global bond | 3% |
|
As a percentage of net assets on December 31, 2007.
Note to shareholders
In September 2007, shareholders of John Hancock Allocation Core Portfolio approved the merger of their portfolio into John Hancock Lifestyle Balanced Portfolio.
Performance review
For the 12 months ended December 31, 2007, John Hancock Lifestyle Balanced Portfolio’s Class A, Class B, Class C, Class R, Class R1, Class R2, Class R3, Class R4, Class R5, Class 1 and Class 5 shares returned 5.90%, 5.02%, 5.10%, 5.31%, 5.58%, 5.77%, 5.65%, 5.91%, 6.18%, 6.30% and 6.35%, respectively, at net asset value. In comparison, the Portfolio’s benchmark index — a blended index combining 60% S&P 500 Index and 40% Lehman Brothers U.S. Aggregate Index — returned 6.22% during the same period.
Competitive returns
The Portfolio benefited significantly from the strong performance of international funds, including a new 2% allocation to Emerging Markets Value (DFA). A 3% stake in Natural Resources (Wellington) also aided the Portfolio. The fund finished the year with solid gains due to strength in the prices of crude oil, industrial metals and other commodities. An allocation to Blue Chip Growth (T. Rowe Price) also helped performance. This large-cap growth fund benefited from a combination of excellent stock picks in the energy sector and an overweighting in technology, one of the stronger sectors in 2007. In the fixed-income area, Real Return Bond (PIMCO) and Global Bond (PIMCO) delivered strong returns. Real Return Bond benefited from the flight to quality that occurred during the year while Global Bond benefited from its exposure to non-U.S. currencies.
Conversely, the Portfolio’s 4% exposure to real estate weighed heavily on overall performance. At approximately 3% of assets, Global Real Estate (Deutsche) declined 10%, while Real Estate Equity (T. Rowe Price), investing exclusively in U.S. REITs, fared even worse. Our dedicated exposure to high yield (a 13% allocation) also weighed on results. Among our equity funds, Core Equity (Legg Mason) suffered from its relatively high exposure to stocks linked to housing and from an underweight to the energy sector.
Over the course of the year, in addition to the move into emerging-market equities, we made a small shift from small caps to mid caps. Additionally, toward the end of year, we began a reallocation from small- and mid-cap holdings into large caps. We feel large caps have greater potential to outperform during periods of slower economic growth.
This commentary reflects the views of the portfolio management team through the end of the Fund’s period discussed in this report. The team’s statements reflect their own opinions. As such, they are in no way guarantees of future events and are not intended to be used as investment advice or a recommendation regarding any specific security. They are also subject to change at any time as market and other conditions warrant.
SCORECARD
| | |
| INVESTMENT | | PERIOD’S PERFORMANCE . . . AND WHAT’S BEHIND THE NUMBERS |
| | | |
| Real estate funds | ▼ | Global real estate market selloff |
| |
| Natural Resources | ▲ | Robust commodity prices |
| (Wellington) | | |
| | | |
| Real Return Bond | ▲ | Flight to quality |
| (PIMCO) | | |
Lifestyle Portfolios | Annual report
8
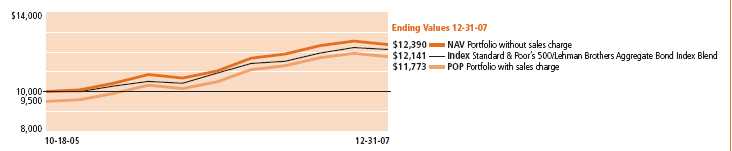
Growth of $10,000
This chart shows what happened to a hypothetical $10,000 investment in Class A shares for the period indicated. For comparison, we’ve shown the same investment in a blended index.
| | | | | | | | | | |
| | Class B | Class C | Class R1 | Class R11 | Class R21 | Class R31 | Class R41 | Class R51 | Class 11 | Class 51 |
|
| Period beginning | 10-18-05 | 10-18-05 | 9-18-06 | 9-18-06 | 9-18-06 | 10-18-05 | 10-18-05 | 10-18-05 | 10-15-05 | 7-3-06 |
|
| Without sales charge | 12,184 | 12,211 | 11,246 | 11,281 | 11,307 | 12,340 | 12,406 | 12,475 | 12,499 | 11,679 |
|
| With maximum sales charge | 11,884 | 12,211 | 11,246 | 11,281 | 11,307 | 12,340 | 12,406 | 12,475 | 12,499 | 11,679 |
|
| Index2,3 | 12,141 | 12,141 | 11,100 | 11,100 | 11,100 | 12,141 | 12,141 | 12,141 | 11,981 | 11,647 |
|
Performance chart
Cumulative total returns with maximum sales charge (POP) for the period ending December 31, 2007
| | | | | | | | | | | |
| | Class A | Class B | Class C | Class R1 | Class R11 | Class R21 | Class R31 | Class R41 | Class R51 | Class 11 | Class 51 |
|
| Inception | 10-18-05 | 10-18-05 | 10-18-05 | 9-18-06 | 9-18-06 | 9-18-06 | 10-18-05 | 10-18-05 | 10-18-05 | 10-15-05 | 7-3-06 |
|
| Since inception | 17.73% | 18.84% | 22.11% | 12.46% | 12.81% | 13.07% | 23.40% | 24.06% | 24.75% | 24.99% | 16.79% |
|
Performance figures assume all distributions are reinvested. Returns with maximum sales charge reflect a sales charge on Class A shares of 5% and the applicable contingent deferred sales charge (CDSC) on Class B and Class C shares. The returns for Class C shares have been adjusted to reflect the elimination of the front-end sales charge effective July 15, 2004. The Class B shares’ CDSC declines annually between years 1–6 according to the following schedule: 5, 4, 3, 3, 2, 1%. No sales charge will be assessed after the sixth year. Class C shares held for less than one year are subject to a 1% CDSC. Sales charge is not applicable for Class R, Class R1, Class R2, Class R3, Class R4, Class R5, Class 1 and Class 5 shares.
The expense ratios of the Portfolio, both net (including any fee waivers or expense limitations) and gross (excluding any fee waivers or expense limitations), are set forth according to the most recent publicly available prospectuses for the Portfolio and may differ from the expense ratios disclosed in the Financial Highlights tables in this report. The waivers and expense limitations are contractual at least until 5-1-08. The following expense ratios include expenses of the underlying affiliated funds in which the Portfolio invests. The net expenses are as follows: Class B — 2.20%, Class R — 1.81%, Class R1 — 1.56%, Class R2 — 1.31%, Class R3 — 1.58%, Class R4 — 1.38%, Class R5 — 1.06% . Had the fee waivers and expense limitations not been in place, the gross expenses would be as follows: Class B — 2.27%, Class R — 9.27%, Class R1 — 13.92%, Class R2 — 13.56%, Class R3 — 2.10%, Class R4 — 1.56%, Cla ss R5 — 2.55% . The net expenses equal the gross expenses and are as follows: Class A — 1.41%, Class C — 2.11%, Class 1 — 0.97%, Class 5 — 0.92% .
The returns reflect past results and should not be considered indicative of future performance. The return and principal value of an investment will fluctuate so that shares, when redeemed, may be worth more or less than their original cost. Due to market volatility, the Portfolio’s current performance may be higher or lower than the performance shown. For performance data current to the most recent month end, please call 1-800-225-5291 or visit the Portfolio’s Web site at www.jhfunds.com.
The performance table above and the chart on the next page do not reflect the deduction of taxes that a shareholder would pay on Portfolio distributions or the redemption of Portfolio shares.
The Portfolio’s performance results reflect any applicable expense reductions, without which the expenses would increase and results would have been less favorable.
Since inception performance is calculated with an opening price (prior day’s close) on the inception date.
1 For certain types of investors as described in the Portfolio’s Class R, Class R1, Class R2, Class R3, Class R4, Class R5, Class 1 and Class 5 share prospectuses.
2 Index as of closest month end to inception date.
3 The blended index is comprised of 60% of the Standard & Poor’s 500 Index and 40% of the Lehman Brothers Aggregate Bond Index.
Annual report | Lifestyle Portfolios
9
John Hancock
Lifestyle Moderate Portfolio
Goal and strategy
The Portfolio seeks a balance between a high level of current income and growth of capital, with a greater emphasis on income. To pursue this goal, the Portfolio, which is a fund-of-funds, normally invests approximately 60% of its assets in affiliated underlying funds that invest primarily in fixed-income securities and approximately 40% of its assets in affiliated underlying funds that invest primarily in equity securities.
| |
| Target Asset Allocation |
| | |
| Equity | % of Total |
|
| U.S. Large Cap | 22% |
|
| Foreign Mid Cap | 5% |
|
| Real Estate | 3% |
|
| Foreign Small Cap | 3% |
|
| Foreign Large Cap | 3% |
|
| U.S. Small Cap | 3% |
|
| U.S. Mid Cap | 1% |
|
| | |
| Fixed Income | % of Total |
|
| Intermediate-term bond | 22% |
|
| Multi-sector bond | 14% |
|
| High Yield Bond | 12% |
|
| Global bond | 6% |
|
| Treasury Inflation | |
| Protected Securities | 4% |
|
| Long-term Bond | 2% |
|
As a percentage of net assets on December 31, 2007.
Performance review
For the 12 months ended December 31, 2007, John Hancock Lifestyle Moderate Portfolio’s Class A, Class B, Class C, Class R, Class R1, Class R2, Class R3, Class R4, Class R5, Class 1 and Class 5 shares returned 4.78%, 3.97%, 4.05%, 4.28%, 4.63%, 4.89%, 4.61%, 4.87%, 5.15%, 5.25% and 5.39%, respectively, at net asset value. In comparison, the Portfolio’s benchmark index — a blended index combining 40% S&P 500 Index and 60% Lehman Brothers U.S. Aggregate Index — returned 6.52% during the same period.
Performance explained
The Portfolio’s largest holding at roughly 12% of assets, Total Return (PIMCO), was a solid contributor to the Portfolio. This fund benefited from its concentration in investment-grade bonds against the backdrop of the subprime meltdown. Another PIMCO-managed fund, Global Bond, also contributed positively to the Portfolio as its return was boosted by the weak dollar. Our 4% position in Real Return Bond (PIMCO) helped as well. This fund invests in Treasury Inflation Protected Securities (TIPS), which benefited from the flight to the safety of U.S. government issues.
Blue Chip Growth (T. Rowe Price) was a solid equity performer. This large-cap growth fund benefited from a combination of excellent stock picks in the energy equipment and services segment. An overweighting in technology, one of the stronger sectors in 2007, also helped performance.
The Portfolio’s performance was weighed down by its real estate exposure. At approximately 2% of assets, Global Real Estate (Deutsche) declined 10%, while Real Estate Equity (T. Rowe Price), investing exclusively in U.S. real estate investment trusts (REITs), fared even worse. Both managers also trailed their respective benchmarks. Our 12% allocation to high yield also detracted from results, with all three managers trailing the Lehman Brothers U.S. Aggregate Index. Among our equity funds, a negative contributor for the year was Core Equity (Legg Mason), which suffered due to its relatively high exposure to stocks linked to housing and from an underweight to the energy sector.
This commentary reflects the views of the portfolio management team through the end of the Fund’s period discussed in this report. The team’s statements reflect their own opinions. As such, they are in no way guarantees of future events and are not intended to be used as investment advice or a recommendation regarding any specific security. They are also subject to change at any time as market and other conditions warrant.
SCORECARD
| | |
| INVESTMENT | | PERIOD’S PERFORMANCE . . . AND WHAT’S BEHIND THE NUMBERS |
| | | |
| Real estate funds | ▼ | Global real estate market selloff |
| | | |
| Total Return | ▲ | Investment-grade bonds outperformed |
| (PIMCO) | | |
| | | |
| Global Bond | ▲ | Weak U.S. dollar relative to world’s major currencies |
| (PIMCO) | | |
Lifestyle Portfolios | Annual report
10
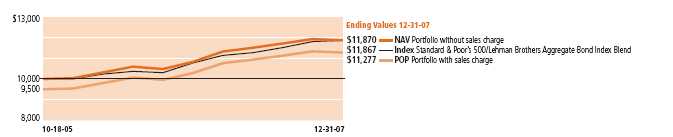
Growth of $10,000
This chart shows what happened to a hypothetical $10,000 investment in Class A shares for the period indicated. For comparison, we’ve shown the same investment in a blended index.
| | | | | | | | | | |
| | Class B | Class C | Class R1 | Class R11 | Class R21 | Class R31 | Class R41 | Class R51 | Class 11 | Class 51 |
|
| Period beginning | 10-18-05 | 10-18-05 | 9-18-06 | 9-18-06 | 9-18-06 | 10-18-05 | 10-18-05 | 10-18-05 | 10-15-05 | 7-3-06 |
|
| Without sales charge | 11,672 | 11,689 | 10,989 | 11,032 | 11,064 | 11,839 | 11,887 | 11,963 | 11,979 | 11,417 |
|
| With maximum sales charge | 11,372 | 11,689 | 10,989 | 11,032 | 11,064 | 11,839 | 11,887 | 11,963 | 11,979 | 11,417 |
|
| Index2,3 | 11,867 | 11,867 | 11,015 | 11,015 | 11,015 | 11,867 | 11,867 | 11,867 | 11,732 | 11,516 |
|
Performance chart
Cumulative total returns with maximum sales charge (POP) for the period ending December 31, 2007
| | | | | | | | | | | |
| | Class A | Class B | Class C | Class R1 | Class R11 | Class R21 | Class R31 | Class R41 | Class R51 | Class 11 | Class 51 |
|
| Inception | 10-18-05 | 10-18-05 | 10-18-05 | 9-18-06 | 9-18-06 | 9-18-06 | 10-18-05 | 10-18-05 | 10-18-05 | 10-15-05 | 7-3-06 |
|
| Since inception | 12.77% | 13.72% | 16.89% | 9.89% | 10.32% | 10.64% | 18.39% | 18.87% | 19.63% | 19.79% | 14.17% |
|
Performance figures assume all distributions are reinvested. Returns with maximum sales charge reflect a sales charge on Class A shares of 5%, and the applicable contingent deferred sales charge (CDSC) on Class B and Class C shares. The Class B shares’ CDSC declines annually between years 1–6 according to the following schedule: 5, 4, 3, 3, 2, 1%. No sales charge will be assessed after the sixth year. Class C shares held for less than one year are subject to a 1% CDSC. Sales charge is not applicable for Class R, Class R1, Class R2, Class R3, Class R4, Class R5, Class 1 and Class 5 shares.
The expense ratios of the Portfolio, both net (including any fee waivers or expense limitations) and gross (excluding any fee waivers or expense limitations), are set forth according to the most recent publicly available prospectuses for the Portfolio and may differ from the expense ratios disclosed in the Financial Highlights tables in this report. The waivers and expense limitations are contractual at least until 5-1-08. The following expense ratios include expenses of the underlying affiliated funds in which the Portfolio invests. The net expenses are as follows: Class A — 1.39%, Class B — 2.18%, Class C — 2.11%, Class R — 1.78%, Class R1 — 1.53%, Class R2 — 1.28%, Class R3 — 1.61%, Class R4 — 1.35%, Class R5 — 1.03% . Had the fee waivers and expense limitations not been in place, the gross expenses would be as follows: Class A — 1.40%, Class B — 2.49%, Class C &# 151; 2.15%, Class R — 14.23%, Class R1 — 13.97%, Class R2 — 13.70%, Class R3 —3.96%, Class R4 — 2.36%, Class R5 — 3.66% . The net expenses equal the gross expenses and are as follows: Class 1 — 0.94%, Class 5 — 0.89% .
The returns reflect past results and should not be considered indicative of future performance. The return and principal value of an investment will fluctuate so that shares, when redeemed, may be worth more or less than their original cost. Due to market volatility, the Portfolio’s current performance may be higher or lower than the performance shown. For performance data current to the most recent month end, please call 1-800-225-5291 or visit the Portfolio’s Web site at www.jhfunds.com.
The performance table above and the chart on the next page do not reflect the deduction of taxes that a shareholder would pay on Portfolio distributions or the redemption of Portfolio shares.
The Portfolio’s performance results reflect any applicable expense reductions, without which the expenses would increase and results would have been less favorable.
Since inception performance is calculated with an opening price (prior day’s close) on the inception date.
1 For certain types of investors as described in the Portfolio’s Class R, Class R1, Class R2, Class R3, Class R4, Class R5, Class 1 and Class 5 share prospectuses.
2 Index as of closest month end to inception date.
3 The blended index is comprised of 40% of the Standard & Poor’s 500 Index and 60% of the Lehman Brothers Aggregate Bond Index.
Annual report | Lifestyle Portfolios
11
John Hancock
Lifestyle Conservative Portfolio
Goal and strategy
The Portfolio seeks a balance between a high level of current income and growth of capital, with a greater emphasis on income. To pursue this goal, the Portfolio, which is a fund-of-funds, normally invests approximately 80% of its assets in affiliated underlying funds that invest primarily in fixed-income securities and approximately 20% of its assets in affiliated underlying funds that invest primarily in equity securities.
| |
| Target Asset Allocation |
| | |
| Equity | % of Total |
|
| U.S. Large Cap | 11% |
|
| Real Estate | 4% |
|
| Foreign Small Cap | 3% |
|
| Foreign Mid Cap | 2% |
|
| | |
| Fixed Income | % of Total |
|
| Intermediate-term bond | 28% |
|
| Multi-sector bond | 16% |
|
| Short-term bond | 11% |
|
| High yield bond | 8% |
|
| Global bond | 8% |
|
| Long-term bond | 5% |
|
| Treasury Inflation | |
| Protected Securities | 4% |
|
As a percentage of net assets on December 31, 2007.
Performance review
For the 12 months ended December 31, 2007, John Hancock Lifestyle Conservative Portfolio’s Class A, Class B, Class C, Class R, Class R1, Class R2, Class R3, Class R4, Class R5 and Class 1 shares returned 4.89%, 4.11%, 4.22%, 4.49%, 4.83%, 4.93%, 4.81%, 4.97%, 5.27% and 5.38%, respectively, at net asset value. In comparison, the Portfolio’s benchmark index — a blended index combining 20% S&P 500 Index and 80% Lehman Brothers U.S. Aggregate Index — returned 6.77% during the same period.
Performance explained
The Portfolio’s largest holding at roughly 16% of assets, Total Return (PIMCO), was a solid contributor to performance. This fund benefited from its concentration in investment-grade bonds against the backdrop of the subprime meltdown. Another PIMCO-managed fund, Global Bond, also contributed positively to the Portfolio as its return was boosted by the weak dollar. Our 4% position in Real Return Bond (PIMCO) helped as well. This fund benefited from the flight to the safety of U.S. government issues. In the equity sector, one significant contributor was Value and Restructuring (Excelsior), a large-cap value fund that benefited from an overweight in the energy and materials sectors.
The Portfolio’s performance was weighed down by its real estate exposure. At approximately 3% of assets, Global Real Estate (Deutsche) declined 10%, while Real Estate Equity (T. Rowe Price), investing exclusively in U.S. real estate investment trusts (REITs), fared even worse. Our 8% allocation to high yield also detracted from results, with all three managers trailing the Lehman Brothers U.S Aggregate Index.
This commentary reflects the views of the portfolio management team through the end of the Fund’s period discussed in this report. The team’s statements reflect their own opinions. As such, they are in no way guarantees of future events and are not intended to be used as investment advice or a recommendation regarding any specific security. They are also subject to change at any time as market and other conditions warrant.
SCORECARD
| | |
| INVESTMENT | | PERIOD’S PERFORMANCE . . . AND WHAT’S BEHIND THE NUMBERS |
| | | |
| Real estate funds | ▼ | Global real estate market selloff |
| | | |
| Total Return | ▲ | Investment-grade bonds outperformed |
| (PIMCO) | | |
| | | |
| Global Bond | ▲ | Weak U.S. dollar relative to world’s major currencies |
| (PIMCO) | | |
Lifestyle Portfolios | Annual report
12
Growth of $10,000
This chart shows what happened to a hypothetical $10,000 investment in Class A shares for the period indicated. For comparison, we’ve shown the same investment in a blended index.

| | | | | | | | | |
| | Class B | Class C | Class R1 | Class R11 | Class R21 | Class R31 | Class R41 | Class R51 | Class 11 |
|
| Period beginning | 10-18-05 | 10-18-05 | 9-18-06 | 9-18-06 | 9-18-06 | 10-18-05 | 10-18-05 | 10-18-05 | 10-15-05 |
|
| Without sales charge | 11,341 | 11,345 | 10,846 | 10,887 | 10,911 | 11,498 | 11,541 | 11,619 | 11,635 |
|
| With maximum sales charge | 11,041 | 11,345 | 10,846 | 10,887 | 10,911 | 11,498 | 11,541 | 11,619 | 11,635 |
|
| Index2,3 | 11,593 | 11,593 | 10,924 | 10,924 | 10,924 | 11,593 | 11,593 | 11,593 | 11,481 |
|
Performance chart
Cumulative total returns with maximum sales charge (POP) for the period ending December 31, 2007
| | | | | | | | | | |
| | Class A | Class B | Class C | Class R1 | Class R11 | Class R21 | Class R31 | Class R41 | Class R51 | Class 11 |
|
| Inception | 10-18-05 | 10-18-05 | 10-18-05 | 9-18-06 | 9-18-06 | 9-18-06 | 10-18-05 | 10-18-05 | 10-18-05 | 10-15-05 |
|
| Since inception | 9.49% | 10.41% | 13.45% | 8.46% | 8.87% | 9.11% | 14.98% | 15.41% | 16.19% | 16.35% |
|
Performance figures assume all distributions are reinvested. Returns with maximum sales charge reflect a sales charge on Class A shares of 5%, and the applicable contingent deferred sales charge (CDSC) on Class B and Class C shares. The Class B shares’ CDSC declines annually between years 1–6 according to the following schedule: 5, 4, 3, 3, 2, 1%. No sales charge will be assessed after the sixth year. Class C shares held for less than one year are subject to a 1% CDSC. Sales charge is not applicable for Class R, Class R1, Class R2, Class R3, Class R4, Class R5 and Class 1 shares.
The expense ratios of the Portfolio, both net (including any fee waivers or expense limitations) and gross (excluding any fee waivers or expense limitations), are set forth according to the most recent publicly available prospectuses for the Portfolio and may differ from the expense ratios disclosed in the Financial Highlights tables in this report. The waivers and expense limitations are contractual at least until 5-1-08. The following expense ratios include expenses of the underlying affiliated funds in which the Portfolio invests. The net expenses are as follows: Class A — 1.35%, Class B — 2.12%, Class C — 2.08%, Class R — 1.74%, Class R1 — 1.49%, Class R2 — 1.24%, Class R3 — 1.56%, Class R4 — 1.30%, Class R5 — 0.99% . Had the fee waivers and expense limitations not been in place, the gross expenses would be as follows: Class A — 1.43%, Class B — 2.67%, Class C — 2.20%, Class R — 14.28%, Class R1 — 14.03%, Class R2 — 13.77%, Class R3 — 7.02%, Class R4 — 3.66%, Class R5 — 7.16% . The net expenses equal the gross expenses and are as follows: Class 1 — 0.90% .
The returns reflect past results and should not be considered indicative of future performance. The return and principal value of an investment will fluctuate so that shares, when redeemed, may be worth more or less than their original cost. Due to market volatility, the Portfolio’s current performance may be higher or lower than the performance shown. For performance data current to the most recent month end, please call 1-800-225-5291 or visit the Portfolio’s Web site at www.jhfunds.com.
The performance table above and the chart on the next page do not reflect the deduction of taxes that a shareholder would pay on Portfolio distributions or the redemption of Portfolio shares.
The Portfolio’s performance results reflect any applicable expense reductions, without which the expenses would increase and results would have been less favorable.
Since inception performance is calculated with an opening price (prior day’s close) on the inception date.
1 For certain types of investors as described in the Portfolio’s Class R, Class R1, Class R2, Class R3, Class R4, Class R5 and Class 1 share prospectuses.
2 Index as of closest month end to inception date.
3 The blended index is comprised of 20% of the Standard & Poor’s 500 Index and 80% of the Lehman Brothers Aggregate Bond Index.
Annual report | Lifestyle Portfolios
13
Your expenses
As a shareholder of John Hancock Funds II Lifestyle Portfolios, you incur two types of costs:
(1) transaction costs, including sales charges (loads) on certain purchase and redemption fees on certain exchanges and redemptions, and (2) ongoing costs, including management fees, distribution and service (12b-1) fees and other Portfolio expenses. In addition to the operating expenses which the Portfolio bears directly, the Portfolio indirectly bears a pro rata share of the operating expenses of the affiliated underlying funds in which the Portfolio invests. Because the affiliated underlying funds have varied operating expenses and transaction costs and the Portfolio may own different proportions of the underlying funds at different times, the amount of expenses incurred indirectly by the Portfolio will vary. Had these indirect expenses been reflected in the following analysis, total expenses would have been higher than the amounts shown.
This example is intended to help you understand your ongoing costs (in dollars) of investing in the portfolios so you can compare these costs with the ongoing costs of investing in other mutual funds. The example is based on an investment of $1,000 at the beginning of the period and held for the entire period (July 1, 2007, through December 31, 2007).
Actual expenses:
The first line of each share class in the table on the following pages provides information about actual account values and actual expenses. You may use the information in this line, together with the amount you invested, to estimate the expenses that you paid over the period. Simply divide your account value by $1,000 (for example, an $8,600 account value divided by $1,000 = 8.6), then multiply the result by the number in the first line under the heading entitled “Expenses paid during period” to estimate the expenses you paid on your account during this period.
Hypothetical example for comparison purposes:
The second line of each share class in the table on the following pages provides information about hypothetical account values and hypothetical expenses based on the actual expense ratio for the share class and an assumed annualized rate of return of 5% per year before expenses, which is not the actual return of the share class. The hypothetical account values and expenses may not be used to estimate the actual ending account balance or expenses you paid for the period. You may use this information to compare the ongoing costs of investing in the Portfolio and other funds. To do so, compare this 5% hypothetical example with the 5% hypothetical examples that appear in the shareholder reports of the other funds.
Please note that the expenses shown in the table are meant to highlight your ongoing costs only and do not reflect any transactional costs and insurance-related charges. Therefore, the second line of each share class in the table is useful in comparing ongoing costs only, and will not help you determine the relative total costs of owning different funds. In addition, if these transactional costs were included, your costs would have been higher.
Lifestyle Portfolios | Annual report
14
Shareholder expense example chart
| | | | | |
| | | Beginning | Ending | Expenses Paid | |
| | | Account Value | Account Value | During Period1 | Annualized |
| | | 7-1-07 | 12-31-07 | 7-1-07–12-31-07 | Expense Ratio2,3 |
| Lifestyle Aggressive | | | | |
|
| Class A | Actual | $1,000.00 | $987.40 | $2.91 | 0.58% |
| | Hypothetical (5% annualized return before expenses) | 1,000.00 | 1,022.28 | 2.96 | 0.58% |
|
| Class B | Actual | 1,000.00 | 983.47 | 6.75 | 1.35% |
| | Hypothetical (5% annualized return before expenses) | 1,000.00 | 1,018.40 | 6.87 | 1.35% |
|
| Class C | Actual | 1,000.00 | 983.27 | 6.55 | 1.31% |
| | Hypothetical (5% annualized return before expenses) | 1,000.00 | 1,018.60 | 6.67 | 1.31% |
|
| Class R | Actual | 1,000.00 | 984.28 | 5.60 | 1.12% |
| | Hypothetical (5% annualized return before expenses) | 1,000.00 | 1,019.56 | 5.70 | 1.12% |
|
| Class R1 | Actual | 1,000.00 | 986.31 | 3.60 | 0.72% |
| | Hypothetical (5% annualized return before expenses) | 1,000.00 | 1,021.58 | 3.67 | 0.72% |
|
| Class R2 | Actual | 1,000.00 | 988.15 | 2.71 | 0.54% |
| | Hypothetical (5% annualized return before expenses) | 1,000.00 | 1,022.48 | 2.75 | 0.54% |
|
| Class R3 | Actual | 1,000.00 | 986.07 | 4.21 | 0.84% |
| | Hypothetical (5% annualized return before expenses) | 1,000.00 | 1,020.97 | 4.28 | 0.84% |
|
| Class R4 | Actual | 1,000.00 | 987.31 | 2.81 | 0.56% |
| | Hypothetical (5% annualized return before expenses) | 1,000.00 | 1,022.38 | 2.85 | 0.56% |
|
| Class R5 | Actual | 1,000.00 | 988.75 | 1.20 | 0.24% |
| | Hypothetical (5% annualized return before expenses) | 1,000.00 | 1,024.00 | 1.22 | 0.24% |
|
| Class 1 | Actual | 1,000.00 | 989.69 | 0.55 | 0.11% |
| | Hypothetical (5% annualized return before expenses) | 1,000.00 | 1,024.65 | 0.56 | 0.11% |
| |
| Lifestyle Growth | | | | |
|
| Class A | Actual | $1,000.00 | $997.73 | $2.67 | 0.53% |
| | Hypothetical (5% annualized return before expenses) | 1,000.00 | 1,022.53 | 2.70 | 0.53% |
|
| Class B | Actual | 1,000.00 | 993.91 | 6.33 | 1.26% |
| | Hypothetical (5% annualized return before expenses) | 1,000.00 | 1,018.85 | 6.41 | 1.26% |
|
| Class C | Actual | 1,000.00 | 993.71 | 6.23 | 1.24% |
| | Hypothetical (5% annualized return before expenses) | 1,000.00 | 1,018.95 | 6.31 | 1.24% |
|
| Class R | Actual | 1,000.00 | 994.76 | 5.63 | 1.12% |
| | Hypothetical (5% annualized return before expenses) | 1,000.00 | 1,019.56 | 5.70 | 1.12% |
|
| Class R1 | Actual | 1,000.00 | 996.66 | 3.72 | 0.74% |
| | Hypothetical (5% annualized return before expenses) | 1,000.00 | 1,021.48 | 3.77 | 0.74% |
|
| Class R2 | Actual | 1,000.00 | 996.72 | 3.22 | 0.64% |
| | Hypothetical (5% annualized return before expenses) | 1,000.00 | 1,021.98 | 3.26 | 0.64% |
|
| Class R3 | Actual | 1,000.00 | 996.47 | 4.23 | 0.84% |
| | Hypothetical (5% annualized return before expenses) | 1,000.00 | 1,020.97 | 4.28 | 0.84% |
|
| Class R4 | Actual | 1,000.00 | 997.65 | 2.82 | 0.56% |
| | Hypothetical (5% annualized return before expenses) | 1,000.00 | 1,022.38 | 2.85 | 0.56% |
|
| Class R5 | Actual | 1,000.00 | 999.10 | 1.11 | 0.22% |
| | Hypothetical (5% annualized return before expenses) | 1,000.00 | 1,024.10 | 1.12 | 0.22% |
|
| Class 1 | Actual | 1,000.00 | 1,000.06 | 0.55 | 0.11% |
| | Hypothetical (5% annualized return before expenses) | 1,000.00 | 1,024.65 | 0.56 | 0.11% |
|
| Class 5 | Actual | 1,000.00 | 999.89 | 0.30 | 0.06% |
| | Hypothetical (5% annualized return before expenses) | 1,000.00 | 1,024.90 | 0.31 | 0.06% |
|
Annual report | Lifestyle Portfolios
15
Shareholder expense example chart, continued
| | | | | |
| | | Beginning | Ending | Expenses Paid | |
| | | Account Value | Account Value | During Period1 | Annualized |
| | | 7-1-07 | 12-31-07 | 7-1-07–12-31-07 | Expense Ratio2,3 |
| Lifestyle Balanced | | | | |
|
| Class A | Actual | $1,000.00 | $1,004.55 | $2.48 | 0.49% |
| | Hypothetical (5% annualized return before expenses) | 1,000.00 | 1,022.74 | 2.50 | 0.49% |
|
| Class B | Actual | 1,000.00 | 1,000.67 | 6.40 | 1.27% |
| | Hypothetical (5% annualized return before expenses) | 1,000.00 | 1,018.80 | 6.46 | 1.27% |
|
| Class C | Actual | 1,000.00 | 1,000.72 | 6.10 | 1.21% |
| | Hypothetical (5% annualized return before expenses) | 1,000.00 | 1,019.11 | 6.16 | 1.21% |
|
| Class R | Actual | 1,000.00 | 1,001.85 | 5.75 | 1.14% |
| | Hypothetical (5% annualized return before expenses) | 1,000.00 | 1,019.46 | 5.80 | 1.14% |
|
| Class R1 | Actual | 1,000.00 | 1,003.11 | 4.09 | 0.81% |
| | Hypothetical (5% annualized return before expenses) | 1,000.00 | 1,021.12 | 4.13 | 0.81% |
|
| Class R2 | Actual | 1,000.00 | 1,003.61 | 3.08 | 0.61% |
| | Hypothetical (5% annualized return before expenses) | 1,000.00 | 1,022.13 | 3.11 | 0.61% |
|
| Class R3 | Actual | 1,000.00 | 1,003.71 | 3.94 | 0.78% |
| | Hypothetical (5% annualized return before expenses) | 1,000.00 | 1,021.27 | 3.97 | 0.78% |
|
| Class R4 | Actual | 1,000.00 | 1,004.81 | 2.68 | 0.53% |
| | Hypothetical (5% annualized return before expenses) | 1,000.00 | 1,022.53 | 2.70 | 0.53% |
|
| Class R5 | Actual | 1,000.00 | 1,006.13 | 1.06 | 0.21% |
| | Hypothetical (5% annualized return before expenses) | 1,000.00 | 1,024.15 | 1.07 | 0.21% |
|
| Class 1 | Actual | 1,000.00 | 1,006.16 | 0.56 | 0.11% |
| | Hypothetical (5% annualized return before expenses) | 1,000.00 | 1,024.65 | 0.56 | 0.11% |
|
| Class 5 | Actual | 1,000.00 | 1,007.18 | 0.30 | 0.06% |
| | Hypothetical (5% annualized return before expenses) | 1,000.00 | 1,024.90 | 0.31 | 0.06% |
| |
| Lifestyle Moderate | | | | |
|
| Class A | Actual | $1,000.00 | $1,013.00 | $2.64 | 0.52% |
| | Hypothetical (5% annualized return before expenses) | 1,000.00 | 1,022.58 | 2.65 | 0.52% |
|
| Class B | Actual | 1,000.00 | 1,008.37 | 6.83 | 1.35% |
| | Hypothetical (5% annualized return before expenses) | 1,000.00 | 1,018.40 | 6.87 | 1.35% |
|
| Class C | Actual | 1,000.00 | 1,008.46 | 6.23 | 1.23% |
| | Hypothetical (5% annualized return before expenses) | 1,000.00 | 1,019.00 | 6.26 | 1.23% |
|
| Class R | Actual | 1,000.00 | 1,009.69 | 5.57 | 1.10% |
| | Hypothetical (5% annualized return before expenses) | 1,000.00 | 1,019.66 | 5.60 | 1.10% |
|
| Class R1 | Actual | 1,000.00 | 1,011.74 | 3.65 | 0.72% |
| | Hypothetical (5% annualized return before expenses) | 1,000.00 | 1,021.58 | 3.67 | 0.72% |
|
| Class R2 | Actual | 1,000.00 | 1,012.86 | 2.33 | 0.46% |
| | Hypothetical (5% annualized return before expenses) | 1,000.00 | 1,022.89 | 2.35 | 0.46% |
|
| Class R3 | Actual | 1,000.00 | 1,011.50 | 4.46 | 0.88% |
| | Hypothetical (5% annualized return before expenses) | 1,000.00 | 1,020.77 | 4.48 | 0.88% |
|
| Class R4 | Actual | 1,000.00 | 1,012.64 | 2.94 | 0.58% |
| | Hypothetical (5% annualized return before expenses) | 1,000.00 | 1,022.28 | 2.96 | 0.58% |
|
| Class R5 | Actual | 1,000.00 | 1,014.70 | 1.07 | 0.21% |
| | Hypothetical (5% annualized return before expenses) | 1,000.00 | 1,024.15 | 1.07 | 0.21% |
|
| Class 1 | Actual | 1,000.00 | 1,014.68 | 0.56 | 0.11% |
| | Hypothetical (5% annualized return before expenses) | 1,000.00 | 1,024.65 | 0.56 | 0.11% |
|
| Class 5 | Actual | 1,000.00 | 1,015.81 | 0.30 | 0.06% |
| | Hypothetical (5% annualized return before expenses) | 1,000.00 | 1,024.90 | 0.31 | 0.06% |
|
Lifestyle Portfolios | Annual report
16
Shareholder expense example chart, continued
| | | | | |
| | | Beginning | Ending | Expenses Paid | |
| | | Account Value | Account Value | During Period1 | Annualized |
| | | 7-1-07 | 12-31-07 | 7-1-07–12-31-07 | Expense Ratio2,3 |
| Lifestyle Conservative | | | | |
|
| Class A | Actual | $1,000.00 | $1,030.05 | $2.76 | 0.54% |
| | Hypothetical (5% annualized return before expenses) | 1,000.00 | 1,022.48 | 2.75 | 0.54% |
|
| Class B | Actual | 1,000.00 | 1,025.77 | 6.79 | 1.33% |
| | Hypothetical (5% annualized return before expenses) | 1,000.00 | 1,018.50 | 6.77 | 1.33% |
|
| Class C | Actual | 1,000.00 | 1,026.86 | 6.54 | 1.28% |
| | Hypothetical (5% annualized return before expenses) | 1,000.00 | 1,018.75 | 6.51 | 1.28% |
|
| Class R | Actual | 1,000.00 | 1,027.72 | 5.42 | 1.06% |
| | Hypothetical (5% annualized return before expenses) | 1,000.00 | 1,019.86 | 5.40 | 1.06% |
|
| Class R1 | Actual | 1,000.00 | 1,029.66 | 3.63 | 0.71% |
| | Hypothetical (5% annualized return before expenses) | 1,000.00 | 1,021.63 | 3.62 | 0.71% |
|
| Class R2 | Actual | 1,000.00 | 1,030.01 | 2.97 | 0.58% |
| | Hypothetical (5% annualized return before expenses) | 1,000.00 | 1,022.28 | 2.96 | 0.58% |
|
| Class R3 | Actual | 1,000.00 | 1,029.47 | 4.35 | 0.85% |
| | Hypothetical (5% annualized return before expenses) | 1,000.00 | 1,020.92 | 4.33 | 0.85% |
|
| Class R4 | Actual | 1,000.00 | 1,030.35 | 2.71 | 0.53% |
| | Hypothetical (5% annualized return before expenses) | 1,000.00 | 1,022.53 | 2.70 | 0.53% |
|
| Class R5 | Actual | 1,000.00 | 1,031.89 | 1.13 | 0.22% |
| | Hypothetical (5% annualized return before expenses) | 1,000.00 | 1,024.10 | 1.12 | 0.22% |
|
| Class 1 | Actual | 1,000.00 | 1,032.67 | 0.61 | 0.12% |
| | Hypothetical (5% annualized return before expenses) | 1,000.00 | 1,024.60 | 0.61 | 0.12% |
|
1 Expenses are equal to the annualized expense ratio, multiplied by the average account value over the period, multiplied by the number of days in the period (184) and divided by 365 (to reflect the one-half year period).
2 Lifestyle Portfolios’ expense ratios do not include fees and expenses indirectly incurred by Portfolios from the underlying funds.
3 Ratios do not include expenses indirectly incurred from underlying portfolios whose expense ratios can vary between 0.79% and 0.91% based on the mix of underlying portfolios held by the portfolio.
Annual report | Lifestyle Portfolios
17
F I N A N C I A L S T A T E M E N T S
Portfolio’s investments
| |
| Investment companies | |
| | |
| Underlying Funds’ Subadviser | |
| |
| AIM Capital Management, Inc. | (AIM) |
| | |
| American Century Management, Inc. | (American Century) |
| BlackRock Investment Management, LLC | (BlackRock) |
| (formerly Mercury Advisors) | |
| |
| Davis Advisors | (Davis) |
| | |
| Declaration Management / | (Declaration) |
| John Hancock Advisers | |
| | |
| Deutsche Asset Management | (Deutsche) |
| | |
| Dimensional Fund Advisors, Inc. | (DFA) |
| | |
| Franklin®Templeton® | (Templeton) |
| | |
| Grantham, Mayo, Van Otterloo & Co. | (GMO) |
| | |
| Independence Investments LLC | (Independence) |
| | |
| Jennison Associates LLC | (Jennison) |
| | |
| Legg Mason Funds Management, Inc | (Legg Mason) |
| | |
| Lord Abbett | (Lord Abbett) |
| | |
| Marsico Capital Management, LLC | (Marsico) |
| | |
| MFC Global Investment Management | (MFC Global U.S.A.) |
| (U.S.A.) Limited | |
| | |
| MFC Global Investment Management | (MFC Global U.S.) |
| (U.S.), LLC | |
| | |
| Munder Capital Management | (Munder) |
| | |
| Pacific Investment Management Company | (PIMCO) |
| | |
| RiverSource Investments, LLC | (RiverSource) |
| | |
| SSgA Funds Management, Inc. | (SSgA) |
| | |
| Sustainable Growth Advisers, L.P. | (Sustainable Growth) |
| | |
| T. Rowe Price Associates, Inc. | (T. Rowe Price) |
| | |
| UBS Global Asset | |
| Management (Americas) Inc. | (UBS) |
| | |
| UST Advisers, Inc. | (UST) |
| |
| Wellington Management Company, LLP | (Wellington) |
| | |
| Wells Capital Management, Inc. | (Wells Capital) |
| | |
| Western Asset Management Company | (WAMCO) |
Lifestyle Aggressive Portfolio
Securities owned by the Portfolio on 12-31-07
| | |
| | Shares or | |
| | Principal | |
| Issuer | Amount | Value |
| |
| Investment companies 99.99% | | |
|
| John Hancock Funds 2.00% | | |
|
| Small Cap Intrinsic Value (MFC Global U.S.) (f) | 4,942,009 | $73,388,841 |
| | | |
| John Hancock Funds II 89.96% | | |
|
| All Cap Core (Deutsche) (f) | 4,647,003 | 47,817,662 |
|
| All Cap Value (Lord Abbett) (f) | 6,201,765 | 73,490,915 |
|
| Blue Chip Growth (T. Rowe Price) (f) | 10,556,975 | 227,819,518 |
|
| Capital Appreciation (Jennison) (f) | 16,296,370 | 185,941,584 |
|
| Core Equity (Legg Mason) (f) | 9,969,608 | 146,952,029 |
|
| Emerging Growth (MFC Global U.S.) (f) | 4,580,476 | 73,150,204 |
|
| Emerging Markets Value (DFA) (f) | 9,283,334 | 108,893,511 |
|
| Equity-Income (T. Rowe Price) (f) | 4,030,687 | 73,116,653 |
|
| Fundamental Value (Davis) (f) | 8,482,063 | 147,503,070 |
|
| International Equity Index (SSgA) (f) | 6,559,872 | 147,662,712 |
|
| International Opportunities (Marsico) (f) | 7,791,225 | 147,409,969 |
|
| International Small Cap (Templeton) (f) | 4,821,699 | 92,576,625 |
|
| International Small Company (DFA) (f) | 9,074,822 | 92,563,180 |
|
| International Value (Templeton) (f) | 13,571,373 | 258,263,222 |
|
| Large Cap (UBS) (f) | 4,789,888 | 72,997,887 |
|
| Large Cap Value (BlackRock) (f) | 1,469,985 | 36,984,823 |
|
| Mid Cap Index (MFC Global U.S.A.) (f) | 4,576,932 | 87,877,097 |
|
| Mid Cap Intersection (Wellington) (f) | 15,785,758 | 146,965,407 |
|
| Mid Cap Stock (Wellington) (f) | 3,835,628 | 74,027,612 |
|
| Mid Cap Value (Lord Abbett) (f) | 3,840,733 | 73,127,552 |
|
| Mid Cap Value Equity (RiverSource) (f) | 3,277,623 | 36,643,820 |
|
| Natural Resources (Wellington) (f) | 3,679,650 | 141,997,702 |
|
| Quantitative Value (MFC Global U.S.A.) (f) | 7,344,829 | 109,952,092 |
|
| Small Cap (Independence) (f) | 5,450,867 | 72,878,086 |
|
| Small Cap Index (MFC Global U.S.A.) (f) | 3,857,786 | 51,308,552 |
|
| Small Company (American Century) (f) | 4,286,999 | 63,276,108 |
|
| Small Company Value (T. Rowe Price) (f) | 4,632,848 | 109,844,827 |
|
| U.S. Global Leaders Growth | | |
| (Sustainable Growth) (f) | 2,449,530 | 33,999,476 |
|
| U.S. Multi Sector (GMO) (f) | 23,994,380 | 257,939,582 |
|
| Value & Restructuring (UST) (f) | 2,840,935 | 37,045,795 |
|
| Vista (American Century) (f) | 4,961,760 | 74,029,459 |
|
| | | 3,304,056,731 |
| John Hancock Funds III 8.03% | | |
|
| International Core (GMO) (f) | 6,861,655 | 295,119,767 |
| | | |
| Total investment companies | | |
| (Cost $3,404,593,047) | | $3,672,565,339 |
| | | |
| Total investments | | |
| (Cost $3,404,593,047) 99.99% | | $3,672,565,339 |
| | |
| Other assets in excess of liabilities 0.01% | 302,675 |
|
| Total net assets 100.00% | | $3,672,868,014 |
Percentages are stated as a percent of net assets.
(f) The underlying fund’s subadviser.
See notes to financial statements
Lifestyle Portfolios | Annual report
18
F I N A N C I A L S T A T E M E N T S
Lifestyle Growth Portfolio
Securities owned by the Portfolio on 12-31-07
| | |
| | Shares or | |
| | Principal | |
| Issuer | Amount | Value |
| |
| Investment companies 99.99% | | |
|
| John Hancock Funds 0.99% | | |
|
| Small Cap Intrinsic Value (MFC Global U.S.) (f) | 6,874,164 | $102,081,329 |
| | | |
| John Hancock Funds II 92.99% | | |
|
| All Cap Core (Deutsche) (f) | 38,161,537 | 392,682,218 |
|
| All Cap Growth (AIM) (f) | 5,662,950 | 104,991,101 |
|
| Blue Chip Growth (T. Rowe Price) (f) | 22,424,649 | 483,923,926 |
|
| Capital Appreciation (Jennison) (f) | 36,973,561 | 421,868,328 |
|
| Core Equity (Legg Mason) (f) | 21,203,704 | 312,542,593 |
|
| Emerging Markets Value (DFA) (f) | 17,531,672 | 205,646,513 |
|
| Equity-Income (T. Rowe Price) (f) | 17,246,089 | 312,844,055 |
|
| Floating Rate Income (WAMCO) (f) | 1,734,000 | 17,340,000 |
|
| Fundamental Value (Davis) (f) | 24,077,822 | 418,713,317 |
|
| Global Bond (PIMCO) (f) | 13,911,650 | 208,674,753 |
|
| Global Real Estate (Deutsche) (f) | 10,472,060 | 102,835,626 |
|
| High Income (MFC Global U.S.) (f) | 10,895,731 | 102,528,827 |
|
| High Yield (WAMCO) (f) | 53,261,680 | 506,518,579 |
|
| Index 500 (MFC Global USA) (f) | 9,722,589 | 104,226,158 |
|
| International Equity Index (SSgA) (f) | 9,155,375 | 206,087,490 |
|
| International Opportunities (Marsico) (f) | 21,986,513 | 415,984,822 |
|
| International Small Cap (Templeton) (f) | 8,121,347 | 155,929,860 |
|
| International Small Company (DFA) (f) | 15,212,848 | 155,171,052 |
|
| International Value (Templeton) (f) | 21,833,764 | 415,496,528 |
|
| Large Cap (UBS) (f) | 6,725,562 | 102,497,566 |
|
| Large Cap Value (BlackRock) (f) | 4,187,432 | 105,355,781 |
|
| Mid Cap Index (MFC Global U.S.A.) (f) | 8,029,535 | 154,167,080 |
|
| Mid Cap Intersection (Wellington) (f) | 22,116,454 | 205,904,189 |
|
| Mid Cap Stock (Wellington) (f) | 10,797,452 | 208,390,815 |
|
| Mid Cap Value (Lord Abbett) (f) | 5,424,884 | 103,289,797 |
|
| Mid Cap Value Equity (RiverSource) (f) | 9,273,710 | 103,680,078 |
|
| Natural Resources (Wellington) (f) | 7,815,291 | 301,592,093 |
|
| Quantitative Value (MFC Global U.S.A.) (f) | 27,868,977 | 417,198,581 |
|
| Real Estate Equity (T. Rowe Price) (f) | 8,360,094 | 70,224,790 |
|
| Real Return Bond (PIMCO) (f) | 22,907,641 | 312,460,218 |
|
| Small Cap (Independence) (f) | 7,608,636 | 101,727,464 |
|
| Small Cap Opportunities (Munder) (f) | 8,150,023 | 177,344,503 |
|
| Small Company Growth (AIM) (f) | 7,925,307 | 102,157,213 |
|
| Small Company Value (T. Rowe Price) (f) | 4,298,591 | 101,919,596 |
|
| Spectrum Income (T. Rowe Price) (f) | 20,012,316 | 208,328,212 |
|
| Strategic Bond (WAMCO) (f) | 9,045,056 | 102,842,287 |
|
| Strategic Income (MFC Global U.S.) (f) | 10,169,431 | 104,236,666 |
|
| Total Return (PIMCO) (f) | 29,747,453 | 416,166,864 |
|
| U.S. Global Leaders Growth | | |
| (Sustainable Growth) (f) | 10,709,400 | 148,646,466 |
|
| U.S. High Yield Bond (Wells Capital) (f) | 8,224,694 | 103,713,388 |
|
| U.S. Multi Sector (GMO) (f) | 68,084,023 | 731,903,249 |
|
| Value & Restructuring (UST) (f) | 8,083,134 | 105,404,070 |
|
| Vista (American Century) (f) | 7,027,732 | 104,853,765 |
|
| | | 9,638,010,477 |
| John Hancock Funds III 6.01% | | |
|
| International Core (GMO) (f) | 14,489,994 | 623,214,653 |
| | | |
| Total investment companies | | |
| (Cost $9,745,136,447) | | $10,363,306,459 |
| | | |
| Total Investments 99.99% | | |
| (Cost $9,745,136,447) | | $10,363,306,459 |
| | |
| Other assets in excess of liabilities 0.01% | 1,136,870 |
|
| |
| Total net assets 100.00% | | $10,364,443,329 |
Percentages are stated as a percent of net assets.
(f) The underlying fund’s subadviser.
Lifestyle Balanced Portfolio
Securities owned by the Portfolio on 12-31-07
| | |
| | Shares or | |
| | Principal | |
| Issuer | Amount | Value |
| |
| Investment companies 99.99% | | |
| | | |
| John Hancock Funds II 95.98% | | |
|
| Active Bond (MFC Global U.S./Declaration) (f) | 20,236,402 | $192,650,544 |
|
| All Cap Core (Deutsche) (f) | 18,910,811 | 194,592,244 |
|
| Blue Chip Growth (T. Rowe Price) (f) | 40,573,018 | 875,565,735 |
|
| Core Bond (Wells Capital) (f) | 15,280,380 | 192,991,205 |
|
| Core Equity (Legg Mason) (f) | 19,638,992 | 289,478,745 |
|
| Emerging Markets Value (DFA) (f) | 16,228,956 | 190,365,656 |
|
| Equity-Income (T. Rowe Price) (f) | 16,058,780 | 291,306,263 |
|
| Floating Rate Income (WAMCO) (f) | 1,600,000 | 16,000,000 |
|
| Fundamental Value (Davis) (f) | 16,755,608 | 291,380,025 |
|
| Global Bond (PIMCO) (f) | 19,270,641 | 289,059,618 |
|
| Global Real Estate (Deutsche) (f) | 29,408,451 | 288,790,985 |
|
| High Income (MFC Global U.S.) (f) | 20,303,178 | 191,052,902 |
|
| High Yield (WAMCO) (f) | 90,980,889 | 865,228,257 |
|
| Index 500 (MFC Global USA) (f) | 8,724,405 | 93,525,623 |
|
| International Opportunities (Marsico) (f) | 10,105,813 | 191,201,977 |
|
| International Small Cap (Templeton) (f) | 7,519,527 | 144,374,918 |
|
| International Value (Templeton) (f) | 17,712,241 | 337,063,949 |
|
| Large Cap (UBS) (f) | 12,591,369 | 191,892,460 |
|
| Large Cap Value (BlackRock) (f) | 11,585,552 | 291,492,495 |
|
| Mid Cap Index (MFC Global U.S.A.) (f) | 4,958,885 | 95,210,584 |
|
| Mid Cap Stock (Wellington) (f) | 5,024,463 | 96,972,135 |
|
| Natural Resources (Wellington) (f) | 7,481,275 | 288,702,383 |
|
| Quantitative Value (MFC Global U.S.A.) (f) | 12,820,466 | 191,922,378 |
|
| Real Estate Equity (T. Rowe Price) (f) | 12,796,159 | 107,487,737 |
|
| Real Return Bond (PIMCO) (f) | 34,761,923 | 474,152,634 |
|
| Small Company Growth (AIM) (f) | 7,314,366 | 94,282,183 |
|
| Small Company Value (T. Rowe Price) (f) | 3,967,203 | 94,062,373 |
|
| Spectrum Income (T. Rowe Price) (f) | 46,212,781 | 481,075,052 |
|
| Strategic Bond (WAMCO) (f) | 16,844,776 | 191,525,101 |
|
| Strategic Income (MFC Global U.S.) (f) | 18,773,387 | 192,427,220 |
|
| Total Return (PIMCO) (f) | 34,392,492 | 481,150,968 |
|
| U.S. Global Leaders Growth | | |
| (Sustainable Growth) (f) | 10,608,400 | 147,244,596 |
|
| U.S. High Yield Bond (Wells Capital) (f) | 15,185,176 | 191,485,065 |
|
| U.S. Multi Sector (GMO) (f) | 45,105,839 | 484,887,772 |
|
| Value & Restructuring (UST) (f) | 14,942,914 | 194,855,595 |
|
| | | 9,225,457,377 |
| John Hancock Funds III 4.01% | | |
|
| International Core (GMO) (f) | 8,954,741 | 385,143,390 |
| | | |
| Total investment companies | | |
| (Cost $9,162,380,630) | | $9,610,600,767 |
| | | |
| Total investments | | |
| (Cost $9,162,380,630) 99.99% | | $9,610,600,767 |
| | | |
| Other assets in excess of liabilities | 0.01% | 828,116 |
|
| Total net assets 100.00% | | $9,611,428,883 |
Percentages are stated as a percent of net assets.
(f) The underlying fund’s subadviser.
See notes to financial statements
Annual report | Lifestyle Portfolios
19
F I N A N C I A L S T A T E M E N T S
Lifestyle Moderate Portfolio
Securities owned by the Portfolio on 12-31-07
| | |
| | Shares or | |
| | Principal | |
| Issuer | Amount | Value |
| |
| Investment companies 99.97% | | |
|
| John Hancock Funds II 94.98% | | |
|
| Active Bond (MFC Global U.S./Declaration) (f) | 21,116,017 | $ 201,024,484 |
|
| Blue Chip Growth (T. Rowe Price) (f) | 6,066,500 | 130,915,080 |
|
| Core Bond (Wells Capital) (f) | 3,987,178 | 50,358,058 |
|
| Core Equity (Legg Mason) (f) | 7,088,208 | 104,480,182 |
|
| Equity-Income (T. Rowe Price) (f) | 2,871,815 | 52,094,730 |
|
| Floating Rate Income (WAMCO) (f) | 1,245,000 | 12,450,000 |
|
| Fundamental Value (Davis) (f) | 6,024,652 | 104,768,702 |
|
| Global Bond (PIMCO) (f) | 10,054,173 | 150,812,596 |
|
| Global Real Estate (Deutsche) (f) | 5,127,695 | 50,353,966 |
|
| High Income (MFC Global U.S.) (f) | 8,019,959 | 75,467,817 |
|
| High Yield (WAMCO) (f) | 15,466,156 | 147,083,147 |
|
| International Equity Index (SSgA) (f) | 2,224,578 | 50,075,251 |
|
| International Opportunities (Marsico) (f) | 1,307,961 | 24,746,613 |
|
| International Value (Templeton) (f) | 3,963,239 | 75,420,446 |
|
| Investment Quality Bond (Wellington) (f) | 4,260,398 | 50,357,905 |
|
| Mid Cap Index (MFC Global U.S.A.) (f) | 1,298,664 | 24,934,342 |
|
| Real Estate Equity (T. Rowe Price) (f) | 3,359,278 | 28,217,933 |
|
| Real Return Bond (PIMCO) (f) | 7,184,588 | 97,997,779 |
|
| Small Company (American Century) (f) | 1,681,036 | 24,812,097 |
|
| Small Company Growth (AIM) (f) | 1,916,802 | 24,707,574 |
|
| Small Company Value (T. Rowe Price) (f) | 1,042,946 | 24,728,245 |
|
| Spectrum Income (T. Rowe Price) (f) | 19,310,466 | 201,021,954 |
|
| Strategic Bond (WAMCO) (f) | 6,637,478 | 75,468,123 |
|
| Strategic Income (MFC Global U.S.) (f) | 7,362,785 | 75,468,550 |
|
| Total Return (PIMCO) (f) | 21,511,729 | 300,949,094 |
|
| U.S. High Yield Bond (Wells Capital) (f) | 5,984,829 | 75,468,693 |
|
| U.S. Multi Sector (GMO) (f) | 9,745,009 | 104,758,849 |
|
| Value & Restructuring (UST) (f) | 4,022,680 | 52,455,745 |
|
| | | 2,391,397,955 |
| John Hancock Funds III 4.99% | | |
|
| International Core (GMO) (f) | 2,922,458 | 125,694,903 |
| | | |
| Total investment companies | | |
| (Cost $2,428,313,932) | | $2,517,092,858 |
| | | |
| Total investments | | |
| (Cost $2,428,313,932) 99.97% | | $2,517,092,858 |
| | |
| Other assets in excess of liabilities 0.03% | 738,952 |
|
| Total net assets 100.00% | | $2,517,831,810 |
Percentages are stated as a percent of net assets.
(f) The underlying fund’s subadviser.
Lifestyle Conservative Portfolio
Securities owned by the Portfolio on 12-31-07
| | |
| | Shares or | |
| | Principal | |
| Issuer | Amount | Value |
| |
| Investment companies 99.98% | | |
|
| John Hancock Funds II 97.98% | | |
|
| Active Bond (MFC Global U.S./Declaration) (f) | 15,805,583 | $ 150,469,149 |
|
| Blue Chip Growth (T. Rowe Price) (f) | 1,517,487 | 32,747,366 |
|
| Core Bond (Wells Capital) (f) | 2,383,617 | 30,105,084 |
|
| Equity-Income (T. Rowe Price) (f) | 1,808,734 | 32,810,431 |
|
| Floating Rate Income (WAMCO) (f) | 733,000 | 7,330,000 |
|
| Fundamental Value (Davis) (f) | 1,888,585 | 32,842,501 |
|
| Global Bond (PIMCO) (f) | 8,025,991 | 120,389,863 |
|
| Global Real Estate (Deutsche) (f) | 4,597,805 | 45,150,450 |
|
| High Income (MFC Global U.S.) (f) | 3,199,214 | 30,104,605 |
|
| High Yield (WAMCO) (f) | 6,329,724 | 60,195,678 |
|
| International Value (Templeton) (f) | 2,372,571 | 45,150,024 |
|
| Investment Quality Bond (Wellington) (f) | 6,365,634 | 75,241,797 |
|
| Real Estate Equity (T. Rowe Price) (f) | 1,952,543 | 16,401,361 |
|
| Real Return Bond (PIMCO) (f) | 4,268,780 | 58,226,153 |
|
| Spectrum Income (T. Rowe Price) (f) | 11,563,676 | 120,377,870 |
|
| Strategic Bond (WAMCO) (f) | 5,294,256 | 60,195,695 |
|
| Strategic Income (MFC Global U.S.) (f) | 5,872,770 | 60,195,891 |
|
| Total Return (PIMCO) (f) | 17,208,364 | 240,745,013 |
|
| U.S. Government Securities (WAMCO) (f) | 12,116,864 | 161,638,968 |
|
| U.S. High Yield Bond (Wells Capital) (f) | 2,387,367 | 30,104,697 |
|
| U.S. Multi Sector (GMO) (f) | 3,040,960 | 32,690,322 |
|
| Value & Restructuring (UST) (f) | 2,518,600 | 32,842,545 |
|
| | | 1,475,955,463 |
| John Hancock Funds III 2.00% | | |
|
| International Core (GMO) (f) | 700,057 | 30,109,438 |
| | | |
| Total investment companies | | |
| (Cost $1,475,748,473) | | $1,506,064,901 |
| | | |
| Total investments | | |
| | | |
| (Cost $1,475,748,473) 99.98% | | $1,506,064,901 |
| | |
| Other assets in excess of liabilities 0.02% | 282,799 |
|
| Total net assets 100.00% | | $1,506,347,700 |
Percentages are stated as a percent of net assets.
(f) The underlying fund’s subadviser.
See notes to financial statements
Lifestyle Portfolios | Annual report
20
F I N A N C I A L S T A T E M E N T S
Financial statements
Statements of assets and liabilities 12-31-07
These Statements of Assets and Liabilities are the Portfolios’ balance sheets. They show the value of what each Portfolio owns, is due and owes. You’ll also find the net asset value and the maximum offering price per share for each Portfolio. Net asset value is calculated by dividing the net assets of each class of shares by the number of outstanding shares in the class.
| | | | |
| | | Lifestyle | Lifestyle | Lifestyle |
| | | Aggressive | Growth | Balanced |
| Assets | | | | |
|
| Investments in affiliated funds, at value (Note 8) | $3,672,565,339 | $10,363,306,459 | $9,610,600,767 |
| Total investments, at value | 3,672,565,339 | 10,363,306,459 | 9,610,600,767 |
| Receivable for investments sold | 14,197,744 | 59,183,706 | 62,190,099 |
| Receivable for fund shares sold | 1,673,703 | 3,532,017 | 4,634,198 |
| Receivable due from adviser | 14,214 | 71,553 | 84,119 |
| Total assets | | 3,688,451,000 | 10,426,093,735 | 9,677,509,183 |
| | | | | |
| Liabilities | | | | |
|
| Payable for investments purchased | 225,972 | 18,521,731 | 18,014,088 |
| Payable for fund shares repurchased | 15,122,319 | 42,541,318 | 47,553,039 |
| Payable to affiliates: Fund administration fees | 37,711 | 108,691 | 101,179 |
| Payable to affiliates: Transfer agent fees | 112,941 | 271,099 | 191,507 |
| Other payables and accrued expenses | 84,043 | 207,567 | 220,487 |
| Total liabilities | | 15,582,986 | 61,650,406 | 66,080,300 |
| |
| Net assets | | | | |
|
| Capital paid-in | | $3,253,216,619 | $9,462,668,599 | $8,962,672,723 |
| Undistributed net investment income (loss) | — | — | (200) |
| Accumulated undistributed net realized gain (loss) on investments | 151,679,103 | 283,604,718 | 200,536,223 |
| Net unrealized appreciation (depreciation) on investments | 267,972,292 | 618,170,012 | 448,220,137 |
| Net assets | | $3,672,868,014 | $10,364,443,329 | $9,611,428,883 |
| Investments in affiliated funds, at cost | $3,404,593,047 | $9,745,136,447 | $9,162,380,630 |
| | | | |
| Net asset value per share | | | |
|
| The Portfolios have an unlimited number of shares authorized with no par value. | | | |
| Class A: Net assets | | $115,851,409 | $332,112,965 | $283,848,631 |
| Shares outstanding | 7,609,681 | 22,070,633 | 19,523,615 |
| Net asset value and redemption price per share | $15.22 | $15.05 | $14.54 |
| Class B:1 Net assets | | $24,419,420 | $78,218,883 | $59,637,744 |
| Shares outstanding | 1,603,321 | 5,193,790 | 4,103,343 |
| Net asset value, offering price and redemption price per share | $15.23 | $15.06 | $14.53 |
| Class C:1 Net assets | | $95,223,015 | $293,923,253 | $267,865,713 |
| Shares outstanding | 6,251,068 | 19,525,760 | 18,408,043 |
| Net asset value, offering price and redemption price per share | $15.23 | $15.05 | $14.55 |
| Class R: Net assets | | $1,398,977 | $729,939 | $761,508 |
| Shares outstanding | 91,532 | 48,278 | 52,383 |
| Net asset value, offering price and redemption price per share | $15.28 | $15.12 | $14.54 |
| Class R1: Net assets | $1,119,540 | $1,964,633 | $583,377 |
| Shares outstanding | 73,306 | 130,107 | 40,141 |
| Net asset value, offering price and redemption price per share | $15.27 | $15.10 | $14.53 |
| Class R2: Net assets | $2,689,455 | $994,001 | $1,092,466 |
| Shares outstanding | 176,474 | 66,011 | 75,308 |
| Net asset value, offering price and redemption price per share | $15.24 | $15.06 | $14.51 |
| Class R3: Net assets | $7,185,725 | $13,720,920 | $23,294,296 |
| Shares outstanding | 472,222 | 912,783 | 1,604,656 |
| Net asset value, offering price and redemption price per share | $15.22 | $15.03 | $14.52 |
| Class R4: Net assets | $5,029,045 | $14,988,191 | $17,741,789 |
| Shares outstanding | 330,683 | 997,014 | 1,222,026 |
| Net asset value, offering price and redemption price per share | $15.21 | $15.03 | $14.52 |
| Class R5: Net assets | $3,488,893 | $7,860,486 | $9,825,502 |
| Shares outstanding | 229,313 | 522,547 | 676,522 |
| Net asset value, offering price and redemption price per share | $15.21 | $15.04 | $14.52 |
| Class 1: Net assets | | $3,416,462,535 | $9,573,685,556 | $8,927,868,379 |
| Shares outstanding | 225,034,995 | 638,451,752 | 616,812,234 |
| Net asset value, offering price and redemption price per share | $15.18 | $15.00 | $14.47 |
| Class 5: Net assets | | — | $46,244,502 | $18,909,478 |
| Shares outstanding | — | 3,086,414 | 1,305,983 |
| Net asset value, offering price and redemption price per share | — | $14.98 | $14.48 |
| | | | |
| Maximum public offering price per share | | | |
|
| Class A (net asset value per share ÷ 95%)2 | $16.02 | $15.84 | $15.31 |
1 Redemption price per share is equal to net asset value less any applicable contingent deferred sales charge.
2 On single retail sales of less than $50,000. On sales of $50,000 or more and on group sales the offering price is reduced.
See notes to financial statements
Annual report | Lifestyle Portfolios
21
F I N A N C I A L S T A T E M E N T S
Statements of assets and liabilities 12-31-07
Continued
| | | | |
| | | | Lifestyle | Lifestyle |
| | | | Moderate | Conservative |
| Assets | | | | |
|
| Investments in affiliated funds, at value (Note 8) | | $2,517,092,858 | $1,506,064,901 |
| Total investments, at value | | 2,517,092,858 | 1,506,064,901 |
| Receivable for investments sold | | 21,338,356 | 14,711,833 |
| Receivable for fund shares sold | | 1,808,334 | 1,226,783 |
| Receivable due from adviser | | 15,897 | 14,643 |
| Total assets | | | 2,540,255,445 | 1,522,018,160 |
| | | | | |
| Liabilities | | | | |
|
| Payable for investments purchased | | 13,168,813 | 7,935,872 |
| Payable for fund shares repurchased | | 9,098,704 | 7,624,764 |
| Payable to affiliates: Fund administration fees | | 26,419 | 15,175 |
| Payable to affiliates: Transfer agent fees | | 47,743 | 25,801 |
| Other payables and accrued expenses | | 81,956 | 68,848 |
| Total liabilities | | | 22,423,635 | 15,670,460 |
| | | | | |
| Net assets | | | | |
|
| Capital paid-in | | | $2,402,256,282 | $1,468,685,548 |
| Undistributed net investment income (loss) | | — | — |
| Accumulated undistributed net realized gain (loss) on investments | | 26,796,602 | 7,345,724 |
| Net unrealized appreciation (depreciation) on investments | | 88,778,926 | 30,316,428 |
| Net assets | | | $2,517,831,810 | $1,506,347,700 |
| Investments in affiliated funds, at cost | | $2,428,313,932 | $1,475,748,473 |
| | | | |
| Net asset value per share | | | |
|
| The Portfolios have an unlimited number of shares authorized with no par value. | | | |
| Class A: Net assets | | | $76,271,319 | $43,738,221 |
| Shares outstanding | | 5,619,955 | 3,283,697 |
| Net asset value and redemption price per share | | $13.57 | $13.32 |
| Class B:1 Net assets | | | $15,313,337 | $9,850,670 |
| Shares outstanding | | 1,129,148 | 739,365 |
| Net asset value, offering price and redemption price per share | | $13.56 | $13.32 |
| Class C:1 Net assets | | | $68,792,799 | $43,566,598 |
| Shares outstanding | | 5,067,858 | 3,271,842 |
| Net asset value, offering price and redemption price per share | | $13.57 | $13.32 |
| Class R: Net assets | | | $507,177 | $221,643 |
| Shares outstanding | | 37,353 | 16,618 |
| Net asset value, offering price and redemption price per share | | $13.58 | $13.34 |
| Class R1: Net assets | | $790,515 | $209,761 |
| Shares outstanding | | 58,231 | 15,730 |
| Net asset value, offering price and redemption price per share | | $13.58 | $13.34 |
| Class R2: Net assets | | $121,645 | $268,428 |
| Shares outstanding | | 8,962 | 20,153 |
| Net asset value, offering price and redemption price per share | | $13.57 | $13.32 |
| Class R3: Net assets | | $4,198,542 | $3,706,107 |
| Shares outstanding | | 309,503 | 278,096 |
| Net asset value, offering price and redemption price per share | | $13.57 | $13.33 |
| Class R4: Net assets | | $4,012,622 | $2,657,686 |
| Shares outstanding | | 296,190 | 199,635 |
| Net asset value, offering price and redemption price per share | | $13.55 | $13.31 |
| Class R5: Net assets | | $3,969,981 | $757,813 |
| Shares outstanding | | 292,775 | 56,878 |
| Net asset value, offering price and redemption price per share | | $13.56 | $13.32 |
| Class 1: Net assets | | | $2,338,808,700 | $1,401,370,773 |
| Shares outstanding | | 172,675,740 | 105,346,679 |
| Net asset value, offering price and redemption price per share | | $13.54 | $13.30 |
| Class 5: Net assets | | | $5,045,173 | — |
| Shares outstanding | | 372,732 | — |
| Net asset value, offering price and redemption price per share | | $13.54 | — |
| | | | |
| Maximum public offering price per share | | | |
|
| Class A (net asset value per share ÷ 95%)2 | | $14.28 | $14.02 |
1 Redemption price per share is equal to net asset value less any applicable contingent deferred sales charge.
2 On single retail sales of less than $50,000. On sales of $50,000 or more and on group sales the offering price is reduced.
See notes to financial statements
Lifestyle Portfolios | Annual report
22
F I N A N C I A L S T A T E M E N T S
Statements of operations For the year ended 12-31-07
These Statements of Operations summarize the Portfolios’ investment income earned and expenses directly incurred in operating each Portfolio. They also show net gains (losses) for the period stated.
| | | | |
| | | Lifestyle | Lifestyle | Lifestyle |
| | | Aggressive | Growth | Balanced |
| Investment income | | | | |
|
| Income distributions received from affiliated underlying funds | $36,493,906 | $201,189,603 | $266,755,550 |
| Total investment income | | 36,493,906 | 201,189,603 | 266,755,550 |
| | | | | |
| Expenses | | | | |
|
| Investment management fees (Note 3) | | 1,414,918 | 4,030,356 | 3,727,384 |
| Distribution and service fees (Note 3) | | 2,828,782 | 8,382,723 | 7,515,495 |
| Transfer agent fees (Note 3) | | 358,852 | 900,204 | 628,621 |
| Blue sky fees (Note 3) | | 185,953 | 209,804 | 200,327 |
| Fund administration fees (Note 3) | | 367,624 | 1,067,797 | 990,344 |
| Audit and legal fees | | 127,047 | 289,700 | 275,949 |
| Printing and postage fees (Note 3) | | 36,435 | 74,912 | 56,061 |
| Custodian fees | | 13,551 | 16,197 | 15,750 |
| Trustees’ fees (Note 4) | | 26,690 | 76,947 | 71,689 |
| Registration and filing fees | | 91,871 | 237,336 | 217,794 |
| Miscellaneous | | 13,912 | 39,916 | 37,680 |
| | | | | |
| Total expenses | | 5,465,635 | 15,325,892 | 13,737,094 |
| | | | | |
| Less: expense reductions (Note 3) | | (127,916) | (123,747) | (109,582) |
| Net expenses | | 5,337,719 | 15,202,145 | 13,627,512 |
| | | | | |
| Net investment income (loss) | | 31,156,187 | 185,987,458 | 253,128,038 |
| | | | | |
| Realized and unrealized gain (loss) | | | | |
|
| Net realized gain (loss) on | | | | |
| Investments in affiliated underlying funds | 46,199,140 | 143,691,466 | 104,248,691 |
| Capital gain distributions received from affiliated underlying funds | 229,348,734 | 441,245,380 | 302,458,907 |
| | | 275,547,874 | 584,936,846 | 406,707,598 |
| Change in net unrealized appreciation (depreciation) of | | | |
| Investments in affiliated underlying funds | (47,390,826) | (116,180,921) | (135,354,678) |
| | | (47,390,826) | (116,180,921) | (135,354,678) |
| Net realized and unrealized gain (loss) | 228,157,048 | 468,755,925 | 271,352,920 |
| Increase (decrease) in net assets from operations | $259,313,235 | $654,743,383 | $524,480,958 |
See notes to financial statements
Annual report | Lifestyle Portfolios
23
F I N A N C I A L S T A T E M E N T S
Statements of operations For the year ended 12-31-07
Continued
| | | |
| | | Lifestyle | Lifestyle |
| | | Moderate | Conservative |
| Investment income | | | |
|
| Income distributions received from affiliated underlying funds | | $85,921,788 | $60,050,306 |
| Total investment income | | 85,921,788 | 60,050,306 |
| | | | |
| Expenses | | | |
|
| Investment management fees (Note 3) | | 970,671 | 566,929 |
| Distribution and service fees (Note 3) | | 1,911,987 | 1,105,542 |
| Transfer agent fees (Note 3) | | 156,294 | 83,766 |
| Blue sky fees (Note 3) | | 177,085 | 179,266 |
| Fund administration fees (Note 3) | | 250,819 | 147,611 |
| Audit and legal fees | | 101,555 | 76,416 |
| Printing and postage fees (Note 3) | | 26,631 | 14,199 |
| Custodian fees | | 13,186 | 12,717 |
| Trustees’ fees (Note 4) | | 18,811 | 10,977 |
| Registration and filing fees | | 67,822 | 43,268 |
| Miscellaneous | | 10,009 | 6,227 |
| | | | |
| Total expenses | | 3,704,870 | 2,246,918 |
| | | | |
| Less: expense reductions (Note 3) | | (132,662) | (139,870) |
| Net expenses | | 3,572,208 | 2,107,048 |
| | | | |
| Net investment income (loss) | | 82,349,580 | 57,943,258 |
| | | | |
| Realized and unrealized gain (loss) | | | |
|
| Net realized gain (loss) on | | | |
| Investments in affiliated underlying funds | | 13,458,220 | 3,998,195 |
| Capital gain distributions received from affiliated underlying funds | | 46,911,770 | 16,509,637 |
| | | 60,369,990 | 20,507,832 |
| Change in net unrealized appreciation (depreciation) of | | | |
| Investments in affiliated underlying funds | | (26,791,828) | (7,532,402) |
| | | (26,791,828) | (7,532,402) |
| Net realized and unrealized gain (loss) | | 33,578,162 | 12,975,430 |
| Increase (decrease) in net assets from operations | | $115,927,742 | $70,918,688 |
See notes to financial statements
Lifestyle Portfolios | Annual report
24
F I N A N C I A L S T A T E M E N T S
Statements of changes in net assets
These Statements of Changes in Net Assets show how the value of the Portfolios’ net assets have changed during the period. They reflect earnings less expenses, any investment gains and losses, distributions, if any, paid to shareholders and the net of Portfolio share transactions.
| | | |
| Lifestyle Aggressive | | | |
| | Year Ended 12-31-07 | Four Months Ended 12-31-061 | Period Ended 8-31-062 |
| Increase (decrease) in net assets | | | |
|
| From operations | | | |
| Net investment income (loss) | $31,156,187 | $18,573,898 | $8,698,334 |
| Net realized gain (loss) | 275,547,874 | 73,892,886 | 61,219,206 |
| Change in net unrealized appreciation | (47,390,826) | 154,787,755 | 160,575,363 |
| (depreciation) | | | |
| Increase (decrease) in net assets | 259,313,235 | 247,254,539 | 230,492,903 |
| resulting from operations | | | |
| |
| Distributions to shareholders | | | |
| From net investment income | | | |
| Class A | (865,763) | (1,349,781) | (10,791) |
| Class B | — | (222,059) | (2,807) |
| Class C | (37,410) | (690,657) | (4,862) |
| Class R | (5,646) | (4,634) | — |
| Class R1 | (7,790) | (2,600) | — |
| Class R2 | (24,856) | (3,084) | — |
| Class R3 | (43,473) | (37,785) | (460) |
| Class R4 | (45,073) | (64,000) | (513) |
| Class R5 | (40,586) | (15,755) | (565) |
| Class 1 | (41,624,959) | (81,795,612) | (10,836,557) |
| From net realized gain | | | |
| Class A | (3,931,597) | (1,051,325) | — |
| Class B | (826,498) | (237,454) | — |
| Class C | (3,255,234) | (738,375) | — |
| Class R | (50,797) | (4,062) | — |
| Class R1 | (41,601) | (2,061) | — |
| Class R2 | (95,811) | (2,227) | — |
| Class R3 | (239,298) | (29,914) | — |
| Class R4 | (177,973) | (46,167) | — |
| Class R5 | (122,754) | (10,422) | — |
| Class 1 | (116,344,468) | (52,688,646) | — |
| From capital paid-in | | | |
| Class A | — | — | — |
| Class B | — | — | — |
| Class C | — | — | — |
| Class R | — | — | — |
| Class R1 | — | — | — |
| Class R2 | — | — | — |
| Class R3 | — | — | — |
| Class R4 | — | — | — |
| Class R5 | — | — | — |
| Class 1 | — | — | — |
| | | | |
| Total distributions | (167,781,587) | (138,996,620) | (10,856,555) |
| From Fund share transactions | 686,985,206 | 292,136,488 | 2,274,320,405 |
| |
| Total increase (decrease) | 778,516,854 | 400,394,407 | 2,493,956,753 |
| Net assets | | | |
|
| Beginning of year | 2,894,351,160 | 2,493,956,753 | — |
| End of year | $3,672,868,014 | $2,894,351,160 | $2,493,956,753 |
| |
| Undistributed net investment | — | $262,628 | $4,475,074 |
| income (loss) | | | |
1 Effective 1-18-07, the fiscal year-end changed from August 31 to December 31.
2 Period from 10-15-05 (commencement of operations) to 8-31-06.
See notes to financial statements
Annual report | Lifestyle Portfolios
25
F I N A N C I A L S T A T E M E N T S
Statements of changes in net assets
Continued
| | | |
| Lifestyle Growth | | | |
| | Year Ended 12-31-07 | Four Months Ended 12-31-061 | Period Ended 8-31-062 |
| Increase (decrease) in net assets | | | |
|
| From operations | | | |
| Net investment income (loss) | $185,987,458 | $87,412,466 | $63,621,234 |
| Net realized gain (loss) | 584,936,846 | 155,266,323 | 173,200,773 |
| Change in net unrealized appreciation | (116,180,921) | 377,077,693 | 356,753,561 |
| (depreciation) | | | |
| Increase (decrease) in net assets | 654,743,383 | 619,756,482 | 593,575,568 |
| resulting from operations | | | |
| |
| Distributions to shareholders | | | |
| From net investment income | | | |
| Class A | (4,725,491) | (4,431,521) | (46,836) |
| Class B | (536,260) | (878,972) | (6,890) |
| Class C | (2,164,482) | (3,493,928) | (19,011) |
| Class R | (8,325) | (3,340) | — |
| Class R1 | (26,245) | (2,862) | — |
| Class R2 | (16,164) | (3,020) | — |
| Class R3 | (171,150) | (99,284) | (519) |
| Class R4 | (229,572) | (200,909) | (571) |
| Class R5 | (137,338) | (68,375) | (2,527) |
| Class 1 | (177,370,025) | (242,862,495) | (35,586,379) |
| Class 5 | (855,570) | (423,491) | — |
| From net realized gain | | | |
| Class A | (9,486,373) | (3,753,671) | — |
| Class B | (2,241,004) | (885,252) | — |
| Class C | (8,493,776) | (3,490,555) | — |
| Class R | (23,494) | (3,040) | — |
| Class R1 | (59,653) | (2,462) | — |
| Class R2 | (31,775) | (2,462) | — |
| Class R3 | (393,528) | (85,475) | — |
| Class R4 | (443,269) | (163,697) | — |
| Class R5 | (225,310) | (52,865) | — |
| Class 1 | (276,785,876) | (184,797,243) | — |
| Class 5 | (1,300,555) | (319,070) | — |
| From capital paid-in | | | |
| Class A | — | (3,047,402) | — |
| Class B | — | (619,415) | — |
| Class C | — | (2,459,169) | — |
| Class R | — | (2,320) | — |
| Class R1 | — | (1,972) | — |
| Class R2 | — | (2,067) | — |
| Class R3 | — | (68,421) | — |
| Class R4 | — | (137,468) | — |
| Class R5 | — | (46,482) | — |
| Class 1 | — | (164,782,068) | — |
| Class 5 | — | (287,001) | — |
| | | | |
| Total distributions | (485,725,235) | (617,477,774) | (35,662,733) |
| From Fund share transactions | 1,752,091,092 | 1,128,312,384 | 6,754,830,162 |
| |
| Total increase (decrease) | 1,921,109,240 | 1,130,591,092 | 7,312,742,997 |
| Net assets | | | |
|
| Beginning of year | 8,443,334,089 | 7,312,742,997 | — |
| End of year | $10,364,443,329 | $8,443,334,089 | $7,312,742,997 |
| |
| Undistributed net investment | — | — | $42,886,862 |
| income (loss) | | | |
1 Effective 1-18-07, the fiscal year-end changed from August 31 to December 31.
2 Period from 10-15-05 (commencement of operations) to 8-31-06.
See notes to financial statements
Lifestyle Portfolios | Annual report
26
F I N A N C I A L S T A T E M E N T S
Statements of changes in net assets
Continued
| | | |
| Lifestyle Balanced | | | |
| | Year Ended 12-31-07 | Four Months Ended 12-31-061 | Period Ended 8-31-062 |
| Increase (decrease) in net assets | | | |
|
| From operations | | | |
| Net investment income (loss) | $253,128,038 | $119,808,173 | $94,245,252 |
| Net realized gain (loss) | 406,707,598 | 122,178,920 | 127,337,590 |
| Change in net unrealized appreciation | (135,354,678) | 286,866,854 | 296,209,041 |
| (depreciation) | | | |
| Increase (decrease) in net assets | 524,480,958 | 528,853,947 | 517,791,883 |
| resulting from operations | | | |
| |
| Distributions to shareholders | | | |
| From net investment income | | | |
| Class A | (5,976,896) | (3,396,000) | (428,612) |
| Class B | (895,406) | (813,690) | (57,145) |
| Class C | (4,178,342) | (3,269,920) | (203,872) |
| Class R | (15,963) | (8,355) | — |
| Class R1 | (12,013) | (2,951) | — |
| Class R2 | (28,297) | (3,072) | — |
| Class R3 | (456,666) | (128,147) | (15,304) |
| Class R4 | (411,637) | (270,764) | (26,987) |
| Class R5 | (227,337) | (48,482) | (15,130) |
| Class 1 | (240,703,208) | (222,183,075) | (95,206,787) |
| Class 5 | (453,955) | (171,997) | (347) |
| From net realized gain | | | |
| Class A | (5,869,438) | (2,150,530) | (1,728) |
| Class B | (1,250,971) | (549,053) | (612) |
| Class C | (5,589,293) | (2,203,348) | (1,299) |
| Class R | (18,872) | (5,608) | — |
| Class R1 | (13,923) | (1,847) | — |
| Class R2 | (25,620) | (1,881) | — |
| Class R3 | (483,304) | (81,916) | (26) |
| Class R4 | (382,280) | (167,165) | (26) |
| Class R5 | (202,091) | (29,224) | (123) |
| Class 1 | (190,689,518) | (132,141,718) | (1,411,319) |
| Class 5 | (384,893) | (109,135) | — |
| From capital paid-in | | | |
| Class A | — | (2,851,033) | — |
| Class B | — | (686,450) | — |
| Class C | — | (2,758,233) | — |
| Class R | — | (7,041) | — |
| Class R1 | — | (2,477) | — |
| Class R2 | — | (2,573) | — |
| Class R3 | — | (107,653) | — |
| Class R4 | — | (226,932) | — |
| Class R5 | — | (40,566) | — |
| Class 1 | — | (185,752,773) | — |
| Class 5 | — | (144,280) | — |
| | | | |
| Total distributions | (458,269,923) | (560,317,889) | (97,369,317) |
| From Fund share transactions | 1,628,653,977 | 1,018,876,827 | 6,508,728,420 |
| |
| Total increase (decrease) | 1,694,865,012 | 987,412,885 | 6,929,150,986 |
| Net assets | | | |
| | | |
| Beginning of year | 7,916,563,871 | 6,929,150,986 | — |
| End of year | $9,611,428,883 | $7,916,563,871 | $6,929,150,986 |
|
| Undistributed net investment | ($200) | — | $8,258,447 |
| income (loss) | | | |
1 Effective 1-18-07, the fiscal year-end changed from August 31 to December 31.
2 Period from 10-15-05 (commencement of operations) to 8-31-06.
See notes to financial statements
Annual report | Lifestyle Portfolios
27
F I N A N C I A L S T A T E M E N T S
Statements of changes in net assets
Continued
| | | |
| Lifestyle Moderate | | | |
| | Year Ended 12-31-07 | Four Months Ended 12-31-061 | Period Ended 8-31-062 |
| Increase (decrease) in net assets | | | |
|
| From operations | | | |
| Net investment income (loss) | $82,349,580 | $38,295,849 | $31,797,303 |
| Net realized gain (loss) | 60,369,990 | 13,928,143 | 32,619,980 |
| Change in net unrealized appreciation | (26,791,828) | 61,379,986 | 54,198,768 |
| (depreciation) | | | |
| Increase (decrease) in net assets | 115,927,742 | 113,603,978 | 118,608,051 |
| resulting from operations | | | |
| |
| Distributions to shareholders | | | |
| From net investment income | | | |
| Class A | (1,973,109) | (902,226) | (171,868) |
| Class B | (315,485) | (163,812) | (22,967) |
| Class C | (1,420,472) | (645,798) | (77,475) |
| Class R | (13,881) | (2,543) | — |
| Class R1 | (23,168) | (2,609) | — |
| Class R2 | (3,596) | (2,689) | — |
| Class R3 | (104,504) | (21,537) | (6,081) |
| Class R4 | (118,312) | (51,478) | (10,781) |
| Class R5 | (105,520) | (28,198) | (8,339) |
| Class 1 | (78,167,282) | (52,481,076) | (31,963,702) |
| Class 5 | (169,157) | (70,845) | (490) |
| From net realized gain | | | |
| Class A | (947,891) | (544,690) | — |
| Class B | (195,985) | (105,282) | — |
| Class C | (871,621) | (416,751) | — |
| Class R | (7,574) | (1,539) | — |
| Class R1 | (11,021) | (1,539) | — |
| Class R2 | (1,578) | (1,550) | — |
| Class R3 | (52,869) | (12,785) | — |
| Class R4 | (52,753) | (29,908) | — |
| Class R5 | (49,247) | (16,746) | — |
| Class 1 | (30,871,062) | (29,380,921) | — |
| Class 5 | (65,666) | (42,201) | — |
| From capital paid-in | | | |
| Class A | — | (828,021) | — |
| Class B | — | (150,334) | — |
| Class C | — | (592,577) | — |
| Class R | — | (2,336) | — |
| Class R1 | — | (2,397) | — |
| Class R2 | — | (2,471) | — |
| Class R3 | — | (19,781) | — |
| Class R4 | — | (47,280) | — |
| Class R5 | — | (25,859) | — |
| Class 1 | — | (48,216,254) | — |
| Class 5 | — | (64,933) | — |
| | | | |
| Total distributions | (115,541,753) | (134,878,966) | (32,261,703) |
| From Fund share transactions | 429,277,132 | 237,576,843 | 1,785,520,486 |
| |
| Total increase (decrease) | 429,663,121 | 216,301,855 | 1,871,866,834 |
| Net assets | | | |
|
| Beginning of year | 2,088,168,689 | 1,871,866,834 | — |
| End of year | $2,517,831,810 | $2,088,168,689 | $1,871,866,834 |
| |
| Undistributed net investment | — | — | $2,800,483 |
| income (loss) | | | |
1 Effective 1-18-07, the fiscal year-end changed from August 31 to December 31.
2 Period from 10-15-05 (commencement of operations) to 8-31-06.
See notes to financial statements
Lifestyle Portfolios | Annual report
28
F I N A N C I A L S T A T E M E N T S
Statements of changes in net assets
Continued
| | | |
| Lifestyle Conservative | | | |
| | Year Ended 12-31-07 | Four Months Ended 12-31-061 | Period Ended 8-31-062 |
| Increase (decrease) in net assets | | | |
| From operations | | | |
| Net investment income (loss) | $57,943,258 | $27,232,158 | $22,016,988 |
| Net realized gain (loss) | 20,507,832 | 7,375,742 | 13,564,145 |
| Change in net unrealized appreciation | (7,532,402) | 13,356,342 | 24,492,488 |
| (depreciation) | | | |
| Increase (decrease) in net assets | 70,918,688 | 47,964,242 | 60,073,621 |
| resulting from operations | | | |
| |
| Distributions to shareholders | | | |
| From net investment income | | | |
| Class A | (1,314,962) | (516,816) | (125,005) |
| Class B | (238,437) | (101,855) | (20,839) |
| Class C | (1,070,619) | (349,399) | (56,558) |
| Class R | (5,823) | (2,720) | — |
| Class R1 | (9,925) | (2,786) | — |
| Class R2 | (13,687) | (2,864) | — |
| Class R3 | (99,674) | (9,817) | (3,046) |
| Class R4 | (84,714) | (22,143) | (6,698) |
| Class R5 | (27,298) | (8,173) | (5,036) |
| Class 1 | (55,116,587) | (33,505,513) | (22,120,363) |
| From net realized gain | | | |
| Class A | (355,959) | (220,889) | — |
| Class B | (80,613) | (45,923) | — |
| Class C | (362,145) | (159,163) | — |
| Class R | (1,586) | (1,157) | — |
| Class R1 | (2,649) | (1,158) | — |
| Class R2 | (3,212) | (1,164) | — |
| Class R3 | (31,487) | (4,141) | — |
| Class R4 | (21,759) | (8,943) | — |
| Class R5 | (6,351) | (3,215) | — |
| Class 1 | (11,979,079) | (13,266,448) | — |
| From capital paid-in | | | |
| Class A | — | (489,987) | — |
| Class B | — | (96,644) | — |
| Class C | — | (331,536) | — |
| Class R | — | (2,579) | — |
| Class R1 | — | (2,640) | — |
| Class R2 | — | (2,714) | — |
| Class R3 | — | (9,308) | — |
| Class R4 | — | (20,988) | — |
| Class R5 | — | (7,744) | — |
| Class 1 | — | (31,745,868) | — |
| | | | |
| Total distributions | (70,826,566) | (80,944,295) | (22,337,545) |
| From Fund share transactions | 281,966,127 | 135,023,828 | 1,084,509,600 |
| |
| Total increase (decrease) | 282,058,249 | 102,043,775 | 1,122,245,676 |
| Net assets | | | |
|
| Beginning of year | 1,224,289,451 | 1,122,245,676 | — |
| End of year | $1,506,347,700 | $1,224,289,451 | $1,122,245,676 |
| |
| Undistributed net investment | — | — | $620,551 |
| income (loss) | | | |
1 Effective 1-18-07, the fiscal year-end changed from August 31 to December 31.
2 Period from 10-15-05 (commencement of operations) to 8-31-06.
See notes to financial statements
Annual report | Lifestyle Portfolios
29
F I N A N C I A L S T A T E M E N T S
Financial highlights
These Financial Highlights show how each Portfolio’s net asset value for a share has changed since the beginning of the period.
| | | | | | | | | | | | | | | |
| Lifestyle Aggressive | | | | | | | | | | | | | |
| Per share operating performance for a share outstanding throughout the period | | | Ratios and supplemental data | |
|
| | | Income (loss) from | | | | | | | | | | | | |
| | | investment operations | | Less distributions | | | | | Ratios to average net assets | | |
| |
| |
| | | | |
| | |
| | | | | | | | | | | | | | Ratio | | |
| | | | Net | | | | | | | | | | of net | | |
| | | | realized | Total | | | | | | | Ratio of | Ratio | investment | Net | |
| | Net asset | Net | and | from | From net | | | | | | gross | of net | income | assets, | |
| | value, | invest- | unrealized | invest- | invest- | | | | Net asset | | expenses | expenses | (loss) to | end of | |
| | beginning | ment in- | gain (loss) | ment | ment | From net | From | Total | value, end | Total | to average | to average | average | period (in | Portfolio |
| | of period | come (loss) | on invest- | operations | income | realized | capital | distribu- | of period | return | net assets | net assets | net assets | millions) | turnover |
| Period ended | ($) | ($)1,2 | ments ($) | ($) | ($) | gain ($) | paid-in ($) | tions ($) | ($) | (%)3 | (%)4 | (%)4 | (%)1 | ($) | (%) |
|
| CLASS A | | | | | | | | | | | | | | | |
|
| 12-31-2007 | 14.72 | 0.11 | 1.05 | 1.16 | (0.12) | (0.54) | — | (0.66) | 15.22 | 8.006 | 0.598 | 0.5914 | 0.69 | 116 | 21 |
| 12-31-20065 | 14.06 | 0.08 | 1.24 | 1.32 | (0.37) | (0.29) | — | (0.66) | 14.72 | 9.406,7 | 0.658,9 | 0.649 | 1.699 | 56 | 57 |
| 08-31-200610 | 12.63 | (0.07) | 1.56 | 1.49 | (0.06) | — | — | (0.06) | 14.06 | 11.856,7 | 0.848,9 | 0.659 | (0.59)9 | 35 | 237 |
|
| CLASS B | | | | | | | | | | | | | | | |
|
| 12-31-2007 | 14.72 | (0.02) | 1.07 | 1.05 | — | (0.54) | — | (0.54) | 15.23 | 7.236 | 1.378 | 1.3514 | (0.13) | 24 | 21 |
| 12-31-20065 | 14.00 | 0.05 | 1.23 | 1.28 | (0.27) | (0.29) | — | (0.56) | 14.72 | 9.156,7 | 1.548,9 | 1.359 | 1.079 | 13 | 57 |
| 08-31-200610 | 12.63 | (0.15) | 1.56 | 1.41 | (0.04) | — | — | (0.04) | 14.00 | 11.226,7 | 2.008,9 | 1.349 | (1.23)9 | 8 | 237 |
|
| CLASS C | | | | | | | | | | | | | | | |
|
| 12-31-2007 | 14.73 | —11 | 1.05 | 1.05 | (0.01) | (0.54) | — | (0.55) | 15.23 | 7.216 | 1.328 | 1.3114 | 0.03 | 95 | 21 |
| 12-31-20065 | 14.00 | 0.05 | 1.24 | 1.29 | (0.27) | (0.29) | — | (0.56) | 14.73 | 9.226,7 | 1.368,9 | 1.359 | 1.109 | 39 | 57 |
| 08-31-200610 | 12.63 | (0.15) | 1.57 | 1.42 | (0.05) | — | — | (0.05) | 14.00 | 11.226,7 | 1.608,9 | 1.349 | (1.27)9 | 25 | 237 |
|
| CLASS R | | | | | | | | | | | | | | | |
|
| 12-31-2007 | 14.79 | 0.11 | 0.98 | 1.09 | (0.06) | (0.54) | — | (0.60) | 15.28 | 7.486 | 3.668 | 1.0814,15 | 0.69 | 1 | 21 |
| 12-31-20065,10 | 14.11 | 0.13 | 1.17 | 1.30 | (0.33) | (0.29) | — | (0.62) | 14.79 | 9.226,7 | 10.668,9 | 0.959 | 2.949 | —12 | 57 |
|
| CLASS R1 | | | | | | | | | | | | | | | |
|
| 12-31-2007 | 14.76 | 0.15 | 1.00 | 1.15 | (0.10) | (0.54) | — | (0.64) | 15.27 | 7.926 | 3.548 | 0.7214,15 | 0.92 | 1 | 21 |
| 12-31-20065,10 | 14.11 | 0.08 | 1.23 | 1.31 | (0.37) | (0.29) | — | (0.66) | 14.76 | 9.256,7 | 12.898,9 | 0.709 | 1.799 | —12 | 57 |
|
| CLASS R2 | | | | | | | | | | | | | | | |
|
| 12-31-2007 | 14.74 | 0.37 | 0.81 | 1.18 | (0.14) | (0.54) | — | (0.68) | 15.24 | 8.136 | 2.628 | 0.5214,15 | 2.31 | 3 | 21 |
| 12-31-20065,10 | 14.11 | 0.09 | 1.23 | 1.32 | (0.40) | (0.29) | — | (0.69) | 14.74 | 9.376,7 | 12.248,9 | 0.459 | 2.079 | —12 | 57 |
|
| CLASS R3 | | | | | | | | | | | | | | | |
|
| 12-31-2007 | 14.72 | 0.11 | 1.03 | 1.14 | (0.10) | (0.54) | — | (0.64) | 15.22 | 7.856 | 1.218 | 0.8114,15 | 0.68 | 7 | 21 |
| 12-31-20065 | 14.06 | 0.08 | 1.24 | 1.32 | (0.37) | (0.29) | — | (0.66) | 14.72 | 9.366,7 | 2.218,9 | 0.729 | 1.709 | 2 | 57 |
| 08-31-200610 | 12.63 | (0.05) | 1.54 | 1.49 | (0.06) | — | — | (0.06) | 14.06 | 11.816,7 | 8.078,9 | 0.699 | (0.47)9 | 1 | 237 |
|
| CLASS R4 | | | | | | | | | | | | | | | |
|
| 12-31-2007 | 14.71 | 0.11 | 1.07 | 1.18 | (0.14) | (0.54) | — | (0.68) | 15.21 | 8.136 | 0.968 | 0.5414,15 | 0.70 | 5 | 21 |
| 12-31-20065 | 14.07 | 0.08 | 1.25 | 1.33 | (0.40) | (0.29) | — | (0.69) | 14.71 | 9.466,7 | 1.388,9 | 0.539 | 1.719 | 2 | 57 |
| 08-31-200610 | 12.63 | (0.05) | 1.55 | 1.50 | (0.06) | — | — | (0.06) | 14.07 | 11.946,7 | 4.088,9 | 0.499 | (0.38)9 | 2 | 237 |
|
| CLASS R5 | | | | | | | | | | | | | | | |
|
| 12-31-2007 | 14.71 | 0.22 | 1.00 | 1.22 | (0.18) | (0.54) | — | (0.72) | 15.21 | 8.426 | 1.118 | 0.2314,15 | 1.40 | 3 | 21 |
| 12-31-20065 | 14.09 | 0.09 | 1.26 | 1.35 | (0.44) | (0.29) | — | (0.73) | 14.71 | 9.576,7 | 4.078,9 | 0.239 | 1.909 | 1 | 57 |
| 08-31-200610 | 12.63 | 0.01 | 1.52 | 1.53 | (0.07) | — | — | (0.07) | 14.09 | 12.166,7 | 8.268,9 | 0.209 | 0.059 | —12 | 237 |
|
| CLASS 1 | | | | | | | | | | | | | | | |
|
| 12-31-2007 | 14.68 | 0.15 | 1.09 | 1.24 | (0.20) | (0.54) | — | (0.74) | 15.18 | 8.54 | 0.11 | 0.1114 | 0.94 | 3,416 | 21 |
| 12-31-20065 | 14.07 | 0.10 | 1.25 | 1.35 | (0.45) | (0.29) | — | (0.74) | 14.68 | 9.597 | 0.119 | 0.119 | 2.099 | 2,782 | 57 |
| 08-31-200610 | 12.60 | 0.06 | 1.48 | 1.54 | (0.07) | — | — | (0.07) | 14.07 | 12.277 | 0.119 | 0.119 | 0.489 | 2,422 | 237 |
|
See notes to financial statements
Lifestyle Portfolios | Annual report
30
F I N A N C I A L S T A T E M E N T S
Financial highlights
Continued
| | | | | | | | | | | | | | | |
| Lifestyle Growth | | | | | | | | | | | | | | |
| Per share operating performance for a share outstanding throughout the period | | | Ratios and supplemental data | |
|
| | | Income (loss) from | | | | | | | | | | | | |
| | | investment operations | | Less distributions | | | | | Ratios to average net assets | | |
| |
| |
| | | | |
| | |
| | | | Net | | | | | | | | | | of net | | |
| | | | realized | Total | | | | | | | Ratio of | Ratio | investment | Net | |
| | Net asset | Net | and | from | From net | | | | | | gross | of net | income | assets, | |
| | value, | invest- | unrealized | invest- | invest- | | | | Net asset | | expenses | expenses | (loss) to | end of | |
| | beginning | ment in- | gain (loss) | ment | ment | From net | From | Total value, | end | Total | to average | to average | average | period (in | Portfolio |
| | of period | come (loss) | on invest- | operations | income | realized | capital | distribu- | of period | return | net assets | net assets | net assets | millions) | turnover |
| Period ended | ($) | ($)1,2 | ments ($) | ($) | ($) | gain ($) | paid-in ($) | tions ($) | ($) | (%)3 | (%)4 | (%)4 | (%)1 | ($) | (%) |
|
| CLASS A | | | | | | | | | | | | | | | |
|
| 12-31-2007 | 14.72 | 0.28 | 0.73 | 1.01 | (0.23) | (0.45) | — | (0.68) | 15.05 | 6.966 | 0.548 | 0.5314 | 1.79 | 332 | 18 |
| 12-31-20065 | 14.63 | 0.16 | 1.01 | 1.17 | (0.43) | (0.36) | (0.29) | (1.08) | 14.72 | 8.007 | 0.589 | 0.589 | 3.189 | 165 | 47 |
| 08-31-200610 | 13.35 | 0.07 | 1.28 | 1.35 | (0.07) | — | — | (0.07) | 14.63 | 10.186,7 | 0.728,9 | 0.619 | 0.559 | 103 | 267 |
|
| CLASS B | | | | | | | | | | | | | | | |
|
| 12-31-2007 | 14.73 | 0.16 | 0.73 | 0.89 | (0.11) | (0.45) | — | (0.56) | 15.06 | 6.146 | 1.308 | 1.2914 | 1.02 | 78 | 18 |
| 12-31-20065 | 14.57 | 0.12 | 1.01 | 1.13 | (0.36) | (0.36) | (0.25) | (0.97) | 14.73 | 7.776,7 | 1.408,9 | 1.359 | 2.459 | 39 | 47 |
| 08-31-200610 | 13.35 | (0.02) | 1.30 | 1.28 | (0.06) | — | — | (0.06) | 14.57 | 9.576,7 | 1.698,9 | 1.349 | (0.19)9 | 24 | 267 |
|
| CLASS C | | | | | | | | | | | | | | | |
|
| 12-31-2007 | 14.72 | 0.16 | 0.74 | 0.90 | (0.12) | (0.45) | — | (0.57) | 15.05 | 6.196 | 1.25 | 1.2514 | 1.05 | 294 | 18 |
| 12-31-20065 | 14.57 | 0.13 | 0.99 | 1.12 | (0.36) | (0.36) | (0.25) | (0.97) | 14.72 | 7.737 | 1.299 | 1.299 | 2.539 | 152 | 47 |
| 08-31-200610 | 13.35 | (0.02) | 1.30 | 1.28 | (0.06) | — | — | (0.06) | 14.57 | 9.576,7 | 1.448,9 | 1.339 | (0.14)9 | 93 | 267 |
|
| CLASS R | | | | | | | | | | | | | | | |
|
| 12-31-2007 | 14.79 | 0.27 | 0.67 | 0.94 | (0.16) | (0.45) | — | (0.61) | 15.12 | 6.476 | 5.278 | 1.0614,15 | 1.72 | 1 | 18 |
| 12-31-20065,10 | 14.70 | 0.15 | 0.98 | 1.13 | (0.40) | (0.36) | (0.28) | (1.04) | 14.79 | 7.646,7 | 12.418,9 | 0.959 | 3.399 | —12 | 47 |
|
| CLASS R1 | | | | | | | | | | | | | | | |
|
| 12-31-2007 | 14.77 | 0.32 | 0.66 | 0.98 | (0.20) | (0.45) | — | (0.65) | 15.10 | 6.756 | 2.428 | 0.7314,15 | 2.02 | 2 | 18 |
| 12-31-20065,10 | 14.70 | 0.14 | 1.00 | 1.14 | (0.42) | (0.36) | (0.29) | (1.07) | 14.77 | 7.756,7 | 12.958,9 | 0.699 | 3.239 | —12 | 47 |
|
| CLASS R2 | | | | | | | | | | | | | | | |
|
| 12-31-2007 | 14.74 | 0.31 | 0.69 | 1.00 | (0.23) | (0.45) | — | (0.68) | 15.06 | 6.916 | 3.188 | 0.6214,15 | 1.95 | 1 | 18 |
| 12-31-20065,10 | 14.70 | 0.15 | 0.99 | 1.14 | (0.44) | (0.36) | (0.30) | (1.10) | 14.74 | 7.806,7 | 12.748,9 | 0.459 | 3.489 | —12 | 47 |
|
| CLASS R3 | | | | | | | | | | | | | | | |
|
| 12-31-2007 | 14.71 | 0.28 | 0.69 | 0.97 | (0.20) | (0.45) | — | (0.65) | 15.03 | 6.696 | 0.988 | 0.8014,15 | 1.83 | 14 | 18 |
| 12-31-20065 | 14.61 | 0.16 | 1.01 | 1.17 | (0.42) | (0.36) | (0.29) | (1.07) | 14.71 | 8.006,7 | 1.358,9 | 0.719 | 3.139 | 4 | 47 |
| 08-31-200610 | 13.35 | 0.07 | 1.26 | 1.33 | (0.07) | — | — | (0.07) | 14.61 | 9.986,7 | 5.078,9 | 0.689 | 0.629 | 2 | 267 |
|
| CLASS R4 | | | | | | | | | | | | | | | |
|
| 12-31-2007 | 14.71 | 0.27 | 0.74 | 1.01 | (0.24) | (0.45) | — | (0.69) | 15.03 | 6.956 | 0.648 | 0.5314,15 | 1.76 | 15 | 18 |
| 12-31-20065 | 14.64 | 0.16 | 1.01 | 1.17 | (0.44) | (0.36) | (0.30) | (1.10) | 14.71 | 8.046,7 | 0.808,9 | 0.539 | 3.129 | 7 | 47 |
| 08-31-200610 | 13.35 | 0.08 | 1.29 | 1.37 | (0.08) | — | — | (0.08) | 14.64 | 10.266,7 | 1.788,9 | 0.499 | 0.699 | 5 | 267 |
|
| CLASS R5 | | | | | | | | | | | | | | | |
|
| 12-31-2007 | 14.71 | 0.39 | 0.67 | 1.06 | (0.28) | (0.45) | — | (0.73) | 15.047 | 7.316 | 0.548 | 0.2114,15 | 2.53 | 8 | 18 |
| 12-31-20065 | 14.66 | 0.18 | 1.02 | 1.20 | (0.47) | (0.36) | (0.32) | (1.15) | 14.71 | 8.156,7 | 1.408,9 | 0.209 | 3.549 | 2 | 47 |
| 08-31-200610 | 13.35 | 0.09 | 1.30 | 1.39 | (0.08) | — | — | (0.08) | 14.66 | 10.476,7 | 2.528,9 | 0.199 | 0.709 | 2 | 267 |
|
| CLASS 1 | | | | | | | | | | | | | | | |
|
| 12-31-2007 | 14.67 | 0.30 | 0.77 | 1.07 | (0.29) | (0.45) | — | (0.74) | 15.007 | 7.446 | 0.11 | 0.1114 | 1.94 | 9,574 | 18 |
| 12-31-20065 | 14.63 | 0.17 | 1.03 | 1.20 | (0.48) | (0.36) | (0.32) | (1.16) | 14.67 | 8.187 | 0.119 | 0.119 | 3.349 | 8,059 | 47 |
| 08-31-200610 | 13.31 | 0.15 | 1.25 | 1.40 | (0.08) | — | — | (0.08) | 14.63 | 10.587 | 0.119 | 0.119 | 1.179 | 7,081 | 267 |
|
| CLASS 5 | | | | | | | | | | | | | | | |
|
| 12-31-2007 | 14.66 | 0.37 | 0.70 | 1.07 | (0.30) | (0.45) | — | (0.75) | 14.98 | 7.426 | 0.06 | 0.0614 | 2.39 | 46 | 18 |
| 12-31-20065 | 14.62 | 0.24 | 0.97 | 1.21 | (0.48) | (0.36) | (0.33) | (1.17) | 14.66 | 8.247 | 0.069 | 0.069 | 4.689 | 15 | 47 |
| 08-31-200613 | 14.40 | —11 | 0.22 | 0.22 | — | — | — | — | 14.62 | 1.537 | 0.069 | 0.069 | (0.02)9 | 3 | 267 |
|
See notes to financial statements
Annual report | Lifestyle Portfolios
31
F I N A N C I A L S T A T E M E N T S
Financial highlights
Continued
| | | | | | | | | | | | | | | |
| Lifestyle Balanced | | | | | | | | | | | | | |
| Per share operating performance for a share outstanding throughout the period | | | Ratios and supplemental data | |
|
| | | Income (loss) from | | | | | | | | | | | | |
| | | investment operations | | Less distributions | | | | | Ratios to average net assets | | |
| |
| |
| | | | |
| | |
| | | | | | | | | | | | | | Ratio | | |
| | | | Net | | | | | | | | | | of net | | |
| | | | realized | Total | | | | | | | Ratio of | Ratio | investment | Net | |
| | Net asset | Net | and | from | From net | | | | | | gross | of net | income | assets, | |
| | value, | invest- | unrealized | invest- | invest- | | | | Net asset | | expenses | expenses | (loss) to | end of | |
| | beginning | ment in- | gain (loss) | ment | ment | From net | From | Total | value, end | Total | to average | to average | average | period (in | Portfolio |
| | of period | come (loss) | on invest- | operations | income | realized | capital | distribu- | of period | return | net assets | net assets | net assets | millions) | turnover |
| Period ended | ($) | ($)1,2 | ments ($) | ($) | ($) | gain ($) | paid-in ($) | tions ($) | ($) | (%)3 | (%)4 | (%)4 | (%)1 | ($) | (%) |
|
| CLASS A | | | | | | | | | | | | | | | |
|
| 12-31-2007 | 14.37 | 0.42 | 0.42 | 0.84 | (0.35) | (0.32) | — | (0.67) | 14.54 | 5.906 | 0.518 | 0.5014 | 2.84 | 284 | 14 |
| 12-31-20065 | 14.38 | 0.24 | 0.81 | 1.05 | (0.43) | (0.27) | (0.36) | (1.06) | 14.37 | 7.257 | 0.559 | 0.559 | 4.779 | 125 | 37 |
| 08-31-200610 | 13.35 | 0.19 | 1.01 | 1.20 | (0.17) | —11 | — | (0.17) | 14.38 | 9.086,7 | 0.708,9 | 0.589 | 1.609 | 81 | 237 |
|
| CLASS B | | | | | | | | | | | | | | | |
|
| 12-31-2007 | 14.37 | 0.29 | 0.42 | 0.71 | (0.23) | (0.32) | — | (0.55) | 14.53 | 5.026 | 1.308 | 1.3014 | 1.95 | 60 | 14 |
| 12-31-20065 | 14.37 | 0.20 | 0.81 | 1.01 | (0.40) | (0.27) | (0.34) | (1.01) | 14.37 | 6.966,7 | 1.418,9 | 1.349 | 4.009 | 32 | 37 |
| 08-31-200610 | 13.35 | 0.10 | 1.02 | 1.12 | (0.10) | —11 | — | (0.10) | 14.37 | 8.476,7 | 1.738,9 | 1.349 | 0.849 | 20 | 237 |
|
| CLASS C | | | | | | | | | | | | | | | |
|
| 12-31-2007 | 14.39 | 0.31 | 0.42 | 0.73 | (0.25) | (0.32) | — | (0.57) | 14.55 | 5.106 | 1.228 | 1.2114 | 2.09 | 268 | 14 |
| 12-31-20065 | 14.38 | 0.20 | 0.82 | 1.02 | (0.40) | (0.27) | (0.34) | (1.01) | 14.39 | 7.037 | 1.259 | 1.259 | 4.109 | 128 | 37 |
| 08-31-200610 | 13.35 | 0.12 | 1.01 | 1.13 | (0.10) | —11 | — | (0.10) | 14.38 | 8.556,7 | 1.418,9 | 1.299 | 0.979 | 79 | 237 |
|
| CLASS R | | | | | | | | | | | | | | | |
|
| 12-31-2007 | 14.39 | 0.36 | 0.40 | 0.76 | (0.29) | (0.32) | — | (0.61) | 14.54 | 5.316 | 4.498 | 1.0714,15 | 2.40 | 1 | 14 |
| 12-31-20065,10 | 14.44 | 0.32 | 0.66 | 0.98 | (0.41) | (0.27) | (0.35) | (1.03) | 14.39 | 6.796,7 | 8.418,9 | 0.959 | 7.379 | —12 | 37 |
|
| CLASS R1 | | | | | | | | | | | | | | | |
|
| 12-31-2007 | 14.38 | 0.49 | 0.31 | 0.80 | (0.33) | (0.32) | — | (0.65) | 14.53 | 5.586 | 7.358 | 0.7814,15 | 3.25 | 1 | 14 |
| 12-31-20065,10 | 14.44 | 0.21 | 0.78 | 0.99 | (0.42) | (0.27) | (0.36) | (1.05) | 14.38 | 6.846,7 | 13.068,9 | 0.709 | 4.969 | —12 | 37 |
|
| CLASS R2 | | | | | | | | | | | | | | | |
|
| 12-31-2007 | 14.37 | 0.43 | 0.39 | 0.82 | (0.36) | (0.32) | — | (0.68) | 14.51 | 5.776 | 2.848 | 0.5614,15 | 2.90 | 1 | 14 |
| 12-31-20065,10 | 14.44 | 0.22 | 0.77 | 0.99 | (0.43) | (0.27) | (0.36) | (1.06) | 14.37 | 6.906,7 | 12.708,9 | 0.459 | 5.219 | —12 | 37 |
|
| CLASS R3 | | | | | | | | | | | | | | | |
|
| 12-31-2007 | 14.36 | 0.43 | 0.37 | 0.80 | (0.32) | (0.32) | — | (0.64) | 14.52 | 5.656 | 0.858 | 0.7614,15 | 2.90 | 23 | 14 |
| 12-31-20065 | 14.37 | 0.22 | 0.82 | 1.04 | (0.42) | (0.27) | (0.36) | (1.05) | 14.36 | 7.226,7 | 1.248,9 | 0.729 | 4.559 | 5 | 37 |
| 08-31-200610 | 13.35 | 0.36 | 0.82 | 1.18 | (0.16) | —11 | — | (0.16) | 14.37 | 8.926,7 | 3.708,9 | 0.699 | 3.109 | 3 | 237 |
|
| CLASS R4 | | | | | | | | | | | | | | | |
|
| 12-31-2007 | 14.36 | 0.39 | 0.45 | 0.84 | (0.36) | (0.32) | — | (0.68) | 14.52 | 5.916 | 0.588 | 0.5114,15 | 2.63 | 18 | 14 |
| 12-31-20065 | 14.38 | 0.23 | 0.81 | 1.04 | (0.43) | (0.27) | (0.36) | (1.06) | 14.36 | 7.276,7 | 0.708,9 | 0.529 | 4.559 | 10 | 37 |
| 08-31-200610 | 13.35 | 0.16 | 1.06 | 1.22 | (0.19) | —11 | — | (0.19) | 14.38 | 9.196,7 | 1.468,9 | 0.489 | 1.379 | 7 | 237 |
|
| CLASS R5 | | | | | | | | | | | | | | | |
|
| 12-31-2007 | 14.36 | 0.50 | 0.38 | 0.88 | (0.40) | (0.32) | — | (0.72) | 14.52 | 6.186 | 0.438 | 0.2114,15 | 3.35 | 10 | 14 |
| 12-31-20065 | 14.38 | 0.24 | 0.82 | 1.06 | (0.44) | (0.27) | (0.37) | (1.08) | 14.36 | 7.416,7 | 1.698,9 | 0.209 | 4.859 | 2 | 37 |
| 08-31-200610 | 13.35 | 0.18 | 1.06 | 1.24 | (0.21) | —11 | — | (0.21) | 14.38 | 9.396,7 | 2.588,9 | 0.199 | 1.489 | 1 | 237 |
|
| CLASS 1 | | | | | | | | | | | | | | | |
|
| 12-31-2007 | 14.31 | 0.42 | 0.47 | 0.89 | (0.41) | (0.32) | — | (0.73) | 14.47 | 6.30 | 0.11 | 0.1114 | 2.84 | 8,928 | 14 |
| 12-31-20065 | 14.34 | 0.24 | 0.82 | 1.06 | (0.45) | (0.27) | (0.37) | (1.09) | 14.31 | 7.407 | 0.119 | 0.119 | 4.849 | 7,609 | 37 |
| 08-31-200610 | 13.31 | 0.22 | 1.03 | 1.25 | (0.22) | —11 | — | (0.22) | 14.34 | 9.477 | 0.119 | 0.119 | 1.819 | 6,736 | 237 |
|
| CLASS 5 | | | | | | | | | | | | | | | |
|
| 12-31-2007 | 14.32 | 0.50 | 0.40 | 0.90 | (0.42) | (0.32) | — | (0.74) | 14.48 | 6.35 | 0.06 | 0.0614 | 3.39 | 19 | 14 |
| 12-31-20065 | 14.35 | 0.33 | 0.74 | 1.07 | (0.45) | (0.27) | (0.38) | (1.10) | 14.32 | 7.427 | 0.069 | 0.069 | 6.639 | 79 | 37 |
| 08-31-200613 | 14.17 | —11 | 0.31 | 0.31 | (0.13) | — | — | (0.13) | 14.35 | 2.237 | 0.019 | 0.019 | (0.01)9 | 19 | 237 |
|
See notes to financial statements
Lifestyle Portfolios | Annual report
32
F I N A N C I A L S T A T E M E N T S
Financial highlights
Continued
| | | | | | | | | | | | | | | |
| Lifestyle Moderate | | | | | | | | | | | | | |
| Per share operating performance for a share outstanding throughout the period | | | Ratios and supplemental data | |
|
| | | Income (loss) from | | | | | | | | | | | | |
| | | investment operations | | Less distributions | | | | | Ratios to average net assets | | |
| |
| |
| | | | |
| | |
| | | | | | | | | | | | | | Ratio | | |
| | | | Net | | | | | | | | | | of net | | |
| | | | realized | Total | | | | | | | Ratio of | Ratio | investment | Net | |
| | Net asset | Net | and | from | From net | | | | | | gross | of net | income | assets, | |
| | value, | invest- | unrealized | invest- | invest- | | | | Net asset | | expenses | expenses | (loss) to | end of | |
| | beginning | ment in- | gain (loss) | ment | ment | From net | From | Total | value, end | Total | to average | to average | average | period (in | Portfolio |
| | of period | come (loss) | on invest- | operations | income | realized | capital | distribu- | of period | return | net assets | net assets | net assets | millions) | turnover |
| Period ended | ($) | ($)1,2 | ments ($) | ($) | ($) | gain ($) | paid-in ($) | tions ($) | ($) | (%)3 | (%)4 | (%)4 | (%)1 | ($) | (%) |
|
| CLASS A | | | | | | | | | | | | | | | |
|
| 12-31-2007 | 13.53 | 0.50 | 0.14 | 0.64 | (0.41) | (0.19) | — | (0.60) | 13.57 | 4.786 | 0.538 | 0.5314 | 3.57 | 76 | 13 |
| 12-31-20065 | 13.64 | 0.27 | 0.52 | 0.79 | (0.36) | (0.21) | (0.33) | (0.90) | 13.53 | 5.776,7 | 0.578,9 | 0.569 | 5.869 | 37 | 17 |
| 08-31-200610 | 12.94 | 0.25 | 0.66 | 0.91 | (0.21) | — | — | (0.21) | 13.64 | 7.106,7 | 0.838,9 | 0.579 | 2.219 | 25 | 247 |
|
| CLASS B | | | | | | | | | | | | | | | |
|
| 12-31-2007 | 13.52 | 0.38 | 0.15 | 0.53 | (0.30) | (0.19) | — | (0.49) | 13.566 | 3.976 | 1.438 | 1.3514 | 2.73 | 15 | 13 |
| 12-31-20065 | 13.62 | 0.23 | 0.52 | 0.75 | (0.33) | (0.21) | (0.31) | (0.85) | 13.52 | 5.496,7 | 1.668,9 | 1.359 | 4.879 | 7 | 17 |
| 08-31-200610 | 12.94 | 0.15 | 0.68 | 0.83 | (0.15) | — | — | (0.15) | 13.62 | 6.426,7 | 2.438,9 | 1.349 | 1.289 | 5 | 247 |
|
| CLASS C | | | | | | | | | | | | | | | |
|
| 12-31-2007 | 13.53 | 0.41 | 0.13 | 0.54 | (0.31) | (0.19) | — | (0.50) | 13.57 | 4.056 | 1.248 | 1.2414 | 2.94 | 69 | 13 |
| 12-31-20065 | 13.63 | 0.24 | 0.51 | 0.75 | (0.33) | (0.21) | (0.31) | (0.85) | 13.53 | 5.496,7 | 1.328,9 | 1.289 | 5.139 | 29 | 17 |
| 08-31-200610 | 12.94 | 0.17 | 0.67 | 0.84 | (0.15) | — | — | (0.15) | 13.63 | 6.496,7 | 1.678,9 | 1.299 | 1.519 | 18 | 247 |
|
| CLASS R | | | | | | | | | | | | | | | |
|
| 12-31-2007 | 13.55 | 0.47 | 0.11 | 0.58 | (0.36) | (0.19) | — | (0.55) | 13.58 | 4.286 | 6.328 | 1.0614,15 | 3.41 | 1 | 13 |
| 12-31-20065,10 | 13.69 | 0.24 | 0.50 | 0.74 | (0.35) | (0.21) | (0.32) | (0.88) | 13.55 | 5.386,7 | 13.408,9 | 0.959 | 5.839 | —12 | 17 |
|
| CLASS R1 | | | | | | | | | | | | | | | |
|
| 12-31-2007 | 13.54 | 0.52 | 0.10 | 0.62 | (0.39) | (0.19) | — | (0.58) | 13.58 | 4.636 | 4.108 | 0.7114,15 | 3.73 | 1 | 13 |
| 12-31-20065,10 | 13.69 | 0.25 | 0.50 | 0.75 | (0.36) | (0.21) | (0.33) | (0.90) | 13.54 | 5.436,7 | 13.148,9 | 0.709 | 6.079 | —12 | 17 |
|
| CLASS R2 | | | | | | | | | | | | | | | |
|
| 12-31-2007 | 13.53 | 0.44 | 0.22 | 0.66 | (0.43) | (0.19) | — | (0.62) | 13.57 | 4.896 | 19.128 | 0.4514,15 | 3.18 | —12 | 13 |
| 12-31-20065,10 | 13.69 | 0.26 | 0.48 | 0.74 | (0.36) | (0.21) | (0.33) | (0.90) | 13.53 | 5.486,7 | 12.878,9 | 0.459 | 6.339 | —12 | 17 |
|
| CLASS R3 | | | | | | | | | | | | | | | |
|
| 12-31-2007 | 13.53 | 0.47 | 0.15 | 0.62 | (0.39) | (0.19) | — | (0.58) | 13.57 | 4.616 | 1.518 | 0.8314,15 | 3.40 | 4 | 13 |
| 12-31-20065 | 13.65 | 0.23 | 0.55 | 0.78 | (0.36) | (0.21) | (0.33) | (0.90) | 13.53 | 5.666,7 | 3.138,9 | 0.789 | 4.899 | 1 | 17 |
| 08-31-200610 | 12.94 | 0.33 | 0.58 | 0.91 | (0.20) | — | — | (0.20) | 13.65 | 7.106,7 | 8.448,9 | 0.699 | 2.939 | 1 | 247 |
|
| CLASS R4 | | | | | | | | | | | | | | | |
|
| 12-31-2007 | 13.51 | 0.47 | 0.18 | 0.65 | (0.42) | (0.19) | — | (0.61) | 13.55 | 4.876 | 1.138 | 0.5414,15 | 3.38 | 4 | 13 |
| 12-31-20065 | 13.63 | 0.25 | 0.53 | 0.78 | (0.36) | (0.21) | (0.33) | (0.90) | 13.51 | 5.806,7 | 1.538,9 | 0.529 | 5.449 | 2 | 17 |
| 08-31-200610 | 12.94 | 0.30 | 0.62 | 0.92 | (0.23) | — | — | (0.23) | 13.63 | 7.146,7 | 4.658,9 | 0.499 | 2.599 | 1 | 247 |
|
| CLASS R5 | | | | | | | | | | | | | | | |
|
| 12-31-2007 | 13.52 | 0.58 | 0.11 | 0.69 | (0.46) | (0.19) | — | (0.65) | 13.56 | 5.156 | 0.978 | 0.2114,15 | 4.21 | 4 | 13 |
| 12-31-20065 | 13.64 | 0.32 | 0.48 | 0.80 | (0.37) | (0.21) | (0.34) | (0.92) | 13.52 | 5.936,7 | 2.838,9 | 0.209 | 6.839 | 1 | 17 |
| 08-31-200610 | 12.94 | 0.22 | 0.73 | 0.95 | (0.25) | — | — | (0.25) | 13.64 | 7.406,7 | 4.868,9 | 0.199 | 1.929 | 1 | 247 |
|
| CLASS 1 | | | | | | | | | | | | | | | |
|
| 12-31-2007 | 13.50 | 0.49 | 0.21 | 0.70 | (0.47) | (0.19) | — | (0.66) | 13.54 | 5.25 | 0.11 | 0.1114 | 3.53 | 2,339 | 13 |
| 12-31-20065 | 13.63 | 0.27 | 0.54 | 0.81 | (0.38) | (0.21) | (0.35) | (0.94) | 13.50 | 5.907 | 0.119 | 0.119 | 5.809 | 2,008 | 17 |
| 08-31-200610 | 12.93 | 0.26 | 0.70 | 0.96 | (0.26) | — | — | (0.26) | 13.63 | 7.477 | 0.119 | 0.119 | 2.239 | 1,820 | 247 |
|
| CLASS 5 | | | | | | | | | | | | | | | |
|
| 12-31-2007 | 13.49 | 0.53 | 0.19 | 0.72 | (0.48) | (0.19) | — | (0.67) | 13.54 | 5.39 | 0.06 | 0.0614 | 3.80 | 5 | 13 |
| 12-31-20065 | 13.62 | 0.34 | 0.47 | 0.81 | (0.38) | (0.21) | (0.35) | (0.94) | 13.49 | 5.937 | 0.069 | 0.069 | 7.219 | 3 | 17 |
| 08-31-200613 | 13.48 | —11 | 0.30 | 0.30 | (0.16) | — | — | (0.16) | 13.62 | 2.277 | 0.019 | 0.019 | (0.01)9 | 1 | 247 |
|
See notes to financial statements
Annual report | Lifestyle Portfolios
33
F I N A N C I A L S T A T E M E N T S
Financial highlights
Continued
| | | | | | | | | | | | | | | |
| Lifestyle Conservative | | | | | | | | | | | | | |
| Per share operating performance for a share outstanding throughout the period | | | Ratios and supplemental data | |
|
| | | Income (loss) from | | | | | | | | | | | | |
| | | investment operations | | Less distributions | | | | | Ratios to average net assets | | |
| |
| |
| | | | |
| | |
| | | | | | | | | | | | | | Ratio | | |
| | | | Net | | | | | | | | | | of net | | |
| | | | realized | Total | | | | | | | Ratio of | Ratio | investment | Net | |
| | Net asset | Net | and | from | From net | | | | | | gross | of net | income | assets, | |
| | value, | invest- | unrealized | invest- | invest- | | | | Net asset | | expenses | expenses | (loss) to | end of | |
| | beginning | ment in- | gain (loss) | ment | ment | From net | From | Total | value, end | Total to | average | to average | average | period (in | Portfolio |
| | of period | come (loss) | on invest- | operations | income | realized | capital | distribu- | of period | return | net assets | net assets | net assets | millions) | turnover |
| Period ended | ($) | ($)1,2 | ments ($) | ($) | ($) | gain ($) | paid-in ($) | tions ($) | ($) | (%)3 | (%)4 | (%)4 | (%)1 | ($) | (%) |
|
| CLASS A | | | | | | | | | | | | | | | |
|
| 12-31-2007 | 13.29 | 0.59 | 0.05 | 0.64 | (0.49) | (0.12) | — | (0.61) | 13.32 | 4.896 | 0.558 | 0.5414 | 4.38 | 44 | 13 |
| 12-31-20065 | 13.63 | 0.33 | 0.23 | 0.56 | (0.38) | (0.16) | (0.36) | (0.90) | 13.29 | 4.116,7 | 0.648,9 | 0.569 | 7.209 | 20 | 27 |
| 08-31-200610 | 13.16 | 0.31 | 0.41 | 0.72 | (0.25) | — | — | (0.25) | 13.63 | 5.536,7 | 1.028,9 | 0.579 | 2.759 | 12 | 207 |
|
| CLASS B | | | | | | | | | | | | | | | |
|
| 12-31-2007 | 13.29 | 0.50 | 0.04 | 0.54 | (0.39) | (0.12) | — | (0.51) | 13.32 | 4.116 | 1.548 | 1.3214 | 3.71 | 10 | 13 |
| 12-31-20065 | 13.63 | 0.29 | 0.22 | 0.51 | (0.35) | (0.16) | (0.34) | (0.85) | 13.29 | 3.756,7 | 1.888,9 | 1.339 | 6.209 | 4 | 27 |
| 08-31-200610 | 13.16 | 0.24 | 0.41 | 0.65 | (0.18) | — | — | (0.18) | 13.63 | 4.996,7 | 3.128,9 | 1.339 | 2.089 | 3 | 207 |
|
| CLASS C | | | | | | | | | | | | | | | |
|
| 12-31-2007 | 13.28 | 0.52 | 0.04 | 0.56 | (0.40) | (0.12) | — | (0.52) | 13.32 | 4.226 | 1.288 | 1.2814 | 3.88 | 44 | 13 |
| 12-31-20065 | 13.62 | 0.30 | 0.21 | 0.51 | (0.35) | (0.16) | (0.34) | (0.85) | 13.28 | 3.766,7 | 1.418,9 | 1.299 | 6.559 | 14 | 27 |
| 08-31-200610 | 13.16 | 0.29 | 0.35 | 0.64 | (0.18) | — | — | (0.18) | 13.62 | 4.916,7 | 2.058,9 | 1.319 | 2.549 | 8 | 207 |
|
| CLASS R | | | | | | | | | | | | | | | |
|
| 12-31-2007 | 13.31 | 0.48 | 0.11 | 0.59 | (0.44) | (0.12) | — | (0.56) | 13.34 | 4.496 | 13.848 | 1.0114,15 | 3.53 | —12 | 13 |
| 12-31-20065 | 13.67 | 0.29 | 0.23 | 0.52 | (0.37) | (0.16) | (0.35) | (0.88) | 13.31 | 3.806,7 | 13.498,9 | 0.959 | 7.149 | —12 | 27 |
|
| CLASS R1 | | | | | | | | | | | | | | | |
|
| 12-31-2007 | 13.30 | 0.57 | 0.07 | 0.64 | (0.48) | (0.12) | — | (0.60) | 13.34 | 4.836 | 9.698 | 0.7114,15 | 4.21 | —12 | 13 |
| 12-31-20065 | 13.67 | 0.30 | 0.23 | 0.53 | (0.38) | (0.16) | (0.36) | (0.90) | 13.30 | 3.856,7 | 13.248,9 | 0.709 | 7.389 | —12 | 27 |
|
| CLASS R2 | | | | | | | | | | | | | | | |
|
| 12-31-2007 | 13.30 | 0.56 | 0.09 | 0.65 | (0.51) | (0.12) | — | (0.63) | 13.32 | 4.936 | 7.598 | 0.5314,15 | 4.14 | —12 | 13 |
| 12-31-20065 | 13.67 | 0.31 | 0.23 | 0.54 | (0.38) | (0.16) | (0.37) | (0.91) | 13.30 | 3.986,7 | 12.988,9 | 0.459 | 7.649 | —12 | 27 |
|
| CLASS R3 | | | | | | | | | | | | | | | |
|
| 12-31-2007 | 13.29 | 0.70 | (0.07) | 0.63 | (0.47) | (0.12) | — | (0.59) | 13.33 | 4.816 | 1.898 | 0.8114,15 | 5.17 | 4 | 13 |
| 12-31-20065 | 13.65 | 0.29 | 0.25 | 0.54 | (0.38) | (0.16) | (0.36) | (0.90) | 13.29 | 3.936,7 | 6.238,9 | 0.779 | 6.239 | —12 | 27 |
| 08-31-200610 | 13.16 | 0.28 | 0.44 | 0.72 | (0.23) | — | — | (0.23) | 13.65 | 5.556,7 | 14.728,9 | 0.689 | 2.469 | —12 | 207 |
|
| CLASS R4 | | | | | | | | | | | | | | | |
|
| 12-31-2007 | 13.28 | 0.53 | 0.12 | 0.65 | (0.50) | (0.12) | — | (0.62) | 13.31 | 4.976 | 1.468 | 0.5314,15 | 3.96 | 3 | 13 |
| 12-31-20065 | 13.64 | 0.28 | 0.27 | 0.55 | (0.38) | (0.16) | (0.37) | (0.91) | 13.28 | 4.066,7 | 2.878,9 | 0.519 | 6.179 | 1 | 27 |
| 08-31-200610 | 13.16 | 0.44 | 0.30 | 0.74 | (0.26) | — | — | (0.26) | 13.64 | 5.666,7 | 10.018,9 | 0.459 | 3.899 | 1 | 207 |
|
| CLASS R5 | | | | | | | | | | | | | | | |
|
| 12-31-2007 | 13.29 | 0.57 | 0.12 | 0.69 | (0.54) | (0.12) | — | (0.66) | 13.32 | 5.276 | 3.428 | 0.2214,15 | 4.23 | 1 | 13 |
| 12-31-20065 | 13.65 | 0.28 | 0.29 | 0.57 | (0.40) | (0.16) | (0.37) | (0.93) | 13.29 | 4.196,7 | 6.378,9 | 0.209 | 6.019 | —12 | 27 |
| 08-31-200610 | 13.16 | 0.28 | 0.49 | 0.77 | (0.28) | — | — | (0.28) | 13.65 | 5.946,7 | 9.188,9 | 0.199 | 2.449 | —12 | 207 |
|
| CLASS 1 | | | | | | | | | | | | | | | |
|
| 12-31-2007 | 13.27 | 0.57 | 0.14 | 0.71 | (0.56) | (0.12) | — | (0.68) | 13.30 | 5.386 | 0.11 | 0.1114 | 4.24 | 1,401 | 13 |
| 12-31-20065 | 13.64 | 0.32 | 0.25 | 0.57 | (0.40) | (0.16) | (0.38) | (0.94) | 13.27 | 4.167 | 0.119 | 0.119 | 6.969 | 1,184 | 27 |
| 08-31-200610 | 13.15 | 0.30 | 0.48 | 0.78 | (0.29) | — | — | (0.29) | 13.64 | 6.017 | 0.129 | 0.129 | 2.549 | 1,097 | 207 |
|
See notes to financial statements
Lifestyle Portfolios | Annual report
34
F I N A N C I A L S T A T E M E N T S
Notes to Financial Highlights
1 Recognition of net investment income by the Portfolio is affected by the timing of the declaration of dividends by the underlying funds in which the Portfolio invests.
2 Based on the average of the shares outstanding.
3 Assumes dividend reinvestment and does not reflect the effect of sales charges.
4 Does not include expenses of the underlying affiliated funds in which the Portfolio invests.
5 Effective 1-18-07, the fiscal year-end changed from August 31 to December 31.
6 Total returns would have been lower had certain expenses not been reduced during the periods shown.
7 Not annualized.
8 Does not take into consideration expense reductions during the periods shown.
9 Annualized.
10 Class A, Class B, Class C, Class R3, Class R4 and Class R5 shares began operations on 10-18-05; Class R, Class R1 and Class R2 began operations on 9-18-06; and Class 1 shares began operation on 10-15-05.
11 Less than $0.01 per share.
12 Less than $500,000.
13 Class 5 shares began operation on 7-3-06.
14 Ratios do not include expenses indirectly incurred from underlying portfolios whose expense ratios can vary between 0.79% and 0.91% based on the mix of underlying portfolios held by the portfolio.
15 Includes transfer agent fee earned credits of less than 0.01% to average net assets.
See notes to financial statements
Annual report | Lifestyle Portfolios
35
Notes to financial statements
1. Organization of the Trust
The John Hancock Funds II (the “Trust” or “JHF II”) is an open-end management investment company organized as a Massachusetts business trust. It is a series company, which means that it has several funds, each with a stated investment objective that it pursues through separate investment policies. The Trust currently offers seventy-one separate investment funds, five of which are covered by this report: Lifestyle Aggressive, Lifestyle Growth, Lifestyle Balanced, Lifestyle Moderate and Lifestyle Conservative (collectively, “Lifestyle Portfolios” or “the Portfolios”).
Each of the Lifestyle Portfolios is non-diversified for purposes of the Investment Company Act of 1940, as amended (the “1940 Act”).
The Lifestyle Portfolios operate as “fund of funds”, investing in Class NAV shares of underlying funds of the Trust and John Hancock Funds III (“JHF III”) and also in other affiliated funds of the John Hancock funds complex. The Portfolios may also invest in unaffiliated underlying funds and other permitted investments.
The JHF III funds are retail mutual funds advised by JHIMS and distributed by the Distributor.
The accounting policies of the affiliated underlying funds of the Trust are outlined in the shareholder reports for such funds, available without charge by calling 1-800-225-5291 or on the Securities and Exchange Commission (“SEC”) Web site at www.sec.gov, File #811-21779, CIK 0001331971 for JHF II, File #811-21777, CIK 0001329954 for JHF III and File #811-0560, CIK 0000022370 for JH Small Cap Intrinsic Value Fund. The affiliated underlying funds are not covered by this report.
John Hancock Investment Management Services, LLC (“JHIMS” or the “Adviser”), a Delaware limited liability company controlled by John Hancock Life Insurance Company (U.S.A.) (“John Hancock USA”) serves as investment adviser for the Trust and John Hancock Funds, LLC (the “Distributor”), an affiliate of the Adviser, serves as principal underwriter. John Hancock Life Insurance Company of New York (“John Hancock New York”) is a wholly owned subsidiary of John Hancock USA. John Hancock USA and John Hancock New York are indirect wholly owned subsidiaries of the Manufactures Life Insurance Company (“Manulife”), which in turn is a wholly owned subsidiary of Manulife Financial Corporation (“MFC”), a publicly traded company. MFC and its subsidiaries are known collectively as “Manulife Financial.”
The Trustees have authorized the issuance of multiple classes of shares of the Portfolios, including classes designated as Class A, Class B, Class C, Class R, Class R1, Class R2, Class R3, Class R4, Class R5, Class 1 and Class 5 shares. Class A, Class B and Class C shares are open to all retail investors. Class R, Class R1, Class R2, Class R3, Class R4 and Class R5 shares are available only to certain retirement plans. Class 1 shares are sold only to certain exempt separate accounts of John Hancock USA and John Hancock New York. Class 5 shares currently are available only to the John Hancock Freedom 529 Plan. The shares of each class represent an interest in the same portfolio of investments of the Portfolios, and have equal rights as to voting, redemptions, dividends and liquidation, except that certain expenses, subject to the approval of the Trustees, may be applied differently to each class of shares in accordance with current regulations of the SEC and the Internal Revenue Service. Shareholders of a class that bears distribution and service expenses under the terms of a distribution plan have exclusive voting rights to that distribution plan. Class B shares will convert to Class A shares eight years after purchase.
2. Significant accounting policies
In the preparation of the financial statements, the Portfolios follow the policies described below. The preparation of financial statements in conformity with accounting principles generally accepted in the United States of America requires management to make estimates and assumptions that affect the reported amounts of assets and liabilities at the date of the financial statements and the reported amounts of income and expenses during the reporting period. Actual results may differ from these estimates.
Securities valuation
The net asset value of the shares of each Portfolio is determined daily as of the close of the New York Stock Exchange (“NYSE”), normally at 4:00 p.m., Eastern Time. Investments by the Lifestyle Portfolios in underlying affiliated funds are valued at their respective net asset values each business day and securities in the underlying funds are valued in accordance with their respective valuation polices, as outlined in the underlying funds’ financial statements.
In September 2006, Financial Accounting Standards Board (FASB) Standard No. 157, Fair Value Measurements (FAS 157), was issued and is effective for fiscal years beginning after November 15, 2007. FAS 157 defines fair value, establishes a framework for measuring fair value and expands disclosure about fair value measurements. Management is currently evaluating the application of FAS 157 to the Portfolios and the impact, if any, resulting from the adoption of FAS 157 on the Portfolios’ financial statement disclosure.
Lifestyle Portfolios | Annual report
36
Security transactions and related investment income
Investment security and underlying affiliated funds transactions are accounted for on a trade date plus one basis for daily net asset value calculations. However, for financial reporting purposes, investment transactions are reported on trade date. Interest income is accrued as earned. Dividend income is recorded by the underlying affiliated funds on the ex-dividend date. Distributions from the underlying affiliated funds are recorded on the ex-dividend date. Distributions to shareholders are recorded on the ex-dividend date.
The Portfolios use the specific identification method for determining realized gain or loss on investments for both financial statement and federal income tax reporting purposes.
Guarantees and indemnifications
Under the Trust’s organizational documents, its Officers and Trustees are indemnified against certain liabilities arising out of the performance of their duties to the Trust. Additionally, in the normal course of business, the Trust enters into contracts with service providers that contain general indemnification clauses. The Trust’s maximum exposure under these arrangements is unknown, as this would involve future claims that may be made against the Trust that have not yet occurred. However, based on experience, the Trust believes the risk of loss to be remote.
Allocations of income and expenses
All income, expenses (except class-specific expenses), and realized and unrealized gain/loss are allocated to each class of shares based upon the relative net assets of each class. Dividends to shareholders from net investment income are determined at a class level and distributions from capital gains are determined at a Portfolio level.
Expenses not directly attributable to a particular Portfolio or share class are allocated based on the relative share of net assets of each Portfolio or share class at the time the expense was incurred. Class-specific expenses, such as Distribution (Rule 12b-1) fees, transfer agency fees, blue sky fees, and printing and postage fees, are accrued daily and charged directly to the respective share classes. Expenses in the Lifestyle Portfolios’ Statements of Operations reflect the expenses of the Portfolios and do not include any indirect expenses related to the underlying affiliated funds. Because the affiliated underlying funds have varied expense levels and the Lifestyle Portfolios may own different proportions of the affiliated underlying funds at different times, the amount of fees and expenses incurred indirectly by the Lifestyle Portfolios will vary.
Distribution of income and gains
The Portfolios record distributions to shareholders from net investment income and net realized gains, if any, on the ex-dividend date. Distributions paid with respect to each class of shares are calculated in the same manner, at the same time and are in the same amount, except for the effect of expenses that may be applied differently to each class. Such distributions, on a tax basis, are determined in conformity with income tax regulations, which may differ from accounting principles generally accepted in the United States of America. Distributions in excess of tax basis earnings and profits, if any, are reported in each Portfolio’s financial statements as a return of capital.
3. Investment advisory and other agreements
Advisory fees
The Trust has entered into an Investment Advisory Agreement with the Adviser. The Adviser is responsible for managing the corporate and business affairs of the Trust and for selecting and compensating subadvisers to handle the investment of the assets of the Portfolios, subject to the supervision of the Board of Trustees. Under the Advisory Agreement the Portfolios pay a monthly management fee to the Adviser equivalent, on an annual basis, to the sum of: (a) 0.05% of the first $7,500,000,000 of the aggregate daily net assets and (b) 0.04% of the aggregate daily net assets in excess of $7,500,000,000 of each of the five Lifestyle Portfolios of the Trust and its corresponding funds of the five Lifestyle Portfolios of John Hancock Trust (Lifestyle Aggressive, Lifestyle Growth, Lifestyle Balanced, Lifestyle Moderate and Lifestyle Conservative). The Portfolios are not responsible for the payment of subadvisory fees.
MFC Global Investment Management (U.S.A.) Limited acts as Subadviser to the Lifestyle Portfolios. Deutsche Investment Management Americas, Inc. serves as subadviser consultant.
The investment management fees incurred for the year ended December 31, 2007, were equivalent to an annual effective rate of the Portfolio’s average daily net assets as follows:
| | |
| Portfolio | Annual Effective Rate | |
| |
| | |
| Lifestyle Aggressive | 0.04% | |
| Lifestyle Growth | 0.04% | |
| Lifestyle Balanced | 0.04% | |
| Lifestyle Moderate | 0.04% | |
| Lifestyle Conservative | 0.04% | |
Annual report | Lifestyle Portfolios
37
Expense reimbursements
The Adviser has contractually agreed to waive advisory fees or reimburse Portfolios’ expenses for Class A, Class B, Class C, Class R, Class R1, Class R2, Class R3, Class R4 and Class R5 shares to the extent that blue sky fees, and printing and postage expenses attributable to each class exceed 0.09% of the average annual net assets attributable to the classes. This agreement remains in effect until May 1, 2008, and may thereafter be terminated by the Adviser at any time.
The Adviser has contractually agreed to waive advisory fees or reimburse fund expenses for Class 5 shares to the extent that total Portfolio operating expenses attributable to Class 5 exceed 0.07% of the average annual net assets attributable to Class 5. This agreement remains in effect until May 1, 2008, and may thereafter be terminated by the Adviser at any time.
For the year ended December 31, 2007, the expense reductions amounted to the following and are reflected as a reduction of total expenses in the Statement of Operations:
| | | | | | | | | |
| Expense Reimbursement by Class |
|
| Portfolio | Class A | Class B | Class C | Class R | Class R1 | Class R2 | Class R3 | Class R4 | Class R5 |
|
| |
| Lifestyle Aggressive | $3,118 | $2,761 | $2,280 | $20,250 | $20,265 | $20,074 | $16,430 | $17,010 | $18,189 |
| Lifestyle Growth | 6,534 | 2,484 | 5,441 | 20,511 | 20,831 | 20,243 | 13,325 | 10,962 | 14,287 |
| Lifestyle Balanced | 3,675 | 1,472 | 3,198 | 20,450 | 20,565 | 20,229 | 9,228 | 8,613 | 13,507 |
| Lifestyle Moderate | 857 | 9,550 | 709 | 20,594 | 20,409 | 20,846 | 17,911 | 18,394 | 17,401 |
| Lifestyle Conservative | 386 | 14,361 | 2,265 | 20,734 | 20,676 | 20,648 | 18,440 | 18,671 | 19,066 |
Fund administration fees
Pursuant to the Advisory Agreement, the Portfolios reimburse the Adviser for all expenses associated with providing the administrative, financial, legal, accounting and recordkeeping services of the Portfolios, including the preparation of all tax returns, annual, semiannual and periodic reports to shareholders and the preparation of all regulatory reports. These expenses are allocated based on the relative share of net assets of each Portfolio at the time the expense was incurred.
The fund administration fees incurred for the year ended December 31, 2007, were equivalent to an annual effective rate of 0.01% of each Portfolio’s average daily net assets.
Distribution plans
The Trust has a Distribution Agreement with the Distributor. The Portfolios have adopted Distribution Plans with respect to Class A, Class B, Class C, Class R, Class R1, Class R2, Class R3, Class R4 and Class 1, pursuant to Rule 12b-1 under the 1940 Act, to reimburse the Distributor for the services it provides as distributor of shares of the Portfolios. Accordingly, the Portfolios make monthly payments to the Distributor at an annual rate not to exceed 0.30%, 1.00%, 1.00%, 0.75%, 0.50%, 0.25%, 0.50%, 0.25% and 0.05% of the average daily net assets of Class A, Class B, Class C, Class R, Class R1, Class R2, Class R3, Class R4 and Class 1, respectively. A maximum of 0.25% of average daily net assets may be service fees, as defined by the Conduct Rules of the Financial Industry Regulatory Authority (formerly, National Association of Securities Dealers). Under the Conduct Rules, curtailment of a portion of the Portfolio’s 12b-1 payments could occur under certain circums tances.
The Portfolios have also adopted a Service Plan with respect to Class R, Class R1, Class R2, Class R3, Class R4 and Class R5 shares (the “Service Plan”). Under the Service Plan, the Portfolios pay up to 0.25%, 0.25%, 0.25%, 0.15%, 0.10% and 0.05% of average daily net assets of Class R, Class R1, Class R2, Class R3, Class R4 and Class R5 shares, respectively, for certain other services.
The Service Plan fees incurred for the year ended December 31, 2007, were equivalent to an annual effective rate of the Portfolio’s average daily net assets as follows:
| | |
| Portfolio | Annual Effective Rate | |
| |
| | |
| Lifestyle Aggressive | 0.08% | |
| Lifestyle Growth | 0.09% | |
| Lifestyle Balanced | 0.08% | |
| Lifestyle Moderate | 0.08% | |
| Lifestyle Conservative | 0.08% | |
Lifestyle Portfolios | Annual report
38
Sales charges
Class A shares are assessed up-front sales charges of up to 5% of the net asset value of such shares. The following summarizes the net up-front sales charges received by the Distributor during the year ended December 31, 2007:
| | | | | |
| | Lifestyle Aggressive | Lifestyle Growth | Lifestyle Balanced | Lifestyle Moderate | Lifestyle Conservative |
|
| Net Sales Charges | $1,629,067 | $5,632,872 | $4,640,980 | $1,156,709 | $606,343 |
| Retained for printing prospectuses, | | | | | |
| advertising and sales literature | 253,842 | 891,302 | 744,272 | 189,895 | 99,964 |
| Sales commission to unrelated | | | | | |
| broker-dealers | 1,349,726 | 4,657,109 | 3,850,749 | 953,924 | 495,908 |
| Sales commission to affiliated | | | | | |
| sales personnel | 25,499 | 84,461 | 45,959 | 12,890 | 10,471 |
Class B shares that are redeemed within six years of purchase are subject to a contingent deferred sales charge (“CDSC”) at declining rates, beginning at 5.00% of the lesser of the current market value at the time of redemption or the original purchase cost of the shares being redeemed. Class C shares that are redeemed within one year of purchase are subject to a CDSC at a rate of 1.00% of the lesser of the current market value at the time of redemption or the original purchase cost of the shares being redeemed. Proceeds from the CDSCs are paid to the Distributor and are used, in whole or in part, to defray its expenses for providing distribution-related services to the Portfolios in connection with the sale of Class B and Class C shares. During the year ended December 31, 2007, CDSCs received by the Distributor amounted to $46,651, $168,322, $92,550, $18,767 and $12,808 for Class B shares and $31,408, $94,724, $80,521, $17,299 and $16,940 for Class C shares of Lifestyle Aggressive, Lifestyle Growth, Lifestyle Balanced, Lifestyle Moderate and Lifestyle Conservative, respectively.
Transfer agent fees
The Portfolios have a Transfer Agency Agreement with John Hancock Signature Services, Inc. (“Signature Services”), an indirect subsidiary of MFC. For Class A, Class B, Class C, Class R, Class R1, Class R2, Class R3, Class R4 and Class R5 shares, the Portfolio pays a monthly transfer agent fee at an annual rate of 0.05% of each class’s average daily net assets, plus a fee based on the number of shareholder accounts and reimbursement for certain out-of-pocket expenses. Expenses not directly attributable to a particular class of shares are aggregated and allocated to each class on the basis of its relative net asset value.
Signature Services has agreed to limit the transfer agent fees so that such fees do not exceed 0.20% annually of Class A, Class B, Class C, Class R, Class R1, Class R2, Class R3, Class R4 and Class R5 shares average daily net assets. This agreement is effective until December 31, 2008. Signature Services reserves the right to terminate this limitation in the future. In addition, Signature Services has voluntarily agreed to further limit transfer agent fees for Class R, Class R1, Class R2, Class R3, Class R4 and Class R5 shares so that such fees do not exceed 0.05% annually of each class’s average daily net assets. For the year ended December 31, 2007, the transfer agent fees reductions amounted to the following and are reflected as a reduction of total expenses in the Statement of Operations:
| | | | | | |
| Transfer agent fee reduction by class |
|
| Portfolio | Class R | Class R1 | Class R2 | Class R3 | Class R4 | Class R5 |
|
| Lifestyle Aggressive | $998 | $679 | $656 | $2,418 | $1,724 | $1,064 |
| Lifestyle Growth | 757 | 762 | 658 | 3,347 | 2,455 | 1,150 |
| Lifestyle Balanced | 935 | 380 | 682 | 3,293 | 2,325 | 1,030 |
| Lifestyle Moderate | 604 | 599 | 169 | 2,122 | 1,463 | 1,034 |
| Lifestyle Conservative | 245 | 351 | 448 | 1,573 | 1,200 | 806 |
Signature Services reserves the right to terminate this limitation at any time.
In May 2007, the Fund began receiving earnings credits from its transfer agent as a result of uninvested cash balances. These credits are used to reduce a portion of the Fund’s transfer agent fees and out of pocket expenses. During the year ended December 31, 2007, the Fund’s transfer agent fees and out of pocket expenses were reduced by $6,502, $14,589, $8,464, $2,016 and $958 for Lifestyle Aggressive, Lifestyle Growth, Lifestyle Balanced, Lifestyle Moderate and Lifestyle Conservative for transfer agent credits earned.
Annual report | Lifestyle Portfolios
39
Expenses under the agreements described above for the year ended December 31, 2007, were as follows:
| | | | | |
| | | Distribution and | Transfer | | Printing and |
| Portfolio | Share Class | service fees | agent fees | Blue sky fees | postage fees |
|
| |
| Lifestyle Aggressive | Class A | $267,761 | $164,435 | $26,491 | $14,244 |
| | Class B | 194,754 | 39,947 | 16,500 | 2,793 |
| | Class C | 697,546 | 139,911 | 21,558 | 16,251 |
| | Class R | 7,220 | 1,425 | 20,791 | 186 |
| | Class R1 | 3,824 | 1,058 | 20,785 | 142 |
| | Class R2 | 3,062 | 1,153 | 20,784 | 173 |
| | Class R3 | 28,416 | 4,803 | 19,556 | 1,036 |
| | Class R4 | 14,774 | 3,948 | 19,802 | 1,150 |
| | Class R5 | 636 | 2,172 | 19,686 | 460 |
| | Class 1 | 1,610,789 | — | — | — |
| | Total | $2,828,782 | $358,852 | $185,953 | $36,435 |
|
| Lifestyle Growth | Class A | $766,163 | $379,790 | $38,538 | $29,805 |
| | Class B | 610,248 | 118,554 | 20,549 | 6,456 |
| | Class C | 2,340,651 | 378,259 | 31,637 | 31,888 |
| | Class R | 4,321 | 1,026 | 20,798 | 150 |
| | Class R1 | 6,722 | 1,411 | 21,857 | 115 |
| | Class R2 | 3,400 | 1,070 | 20,792 | 180 |
| | Class R3 | 53,689 | 7,908 | 19,328 | 2,039 |
| | Class R4 | 40,937 | 8,646 | 18,813 | 3,218 |
| | Class R5 | 616 | 3,540 | 17,492 | 1,061 |
| | Class 1 | 4,555,976 | — | — | — |
| | Total | $8,382,723 | $900,204 | $209,804 | $74,912 |
|
| |
| Lifestyle Balanced | Class A | $629,262 | $248,497 | $35,495 | $19,315 |
| | Class B | 469,709 | 92,889 | 16,500 | 3,088 |
| | Class C | 2,037,108 | 259,316 | 29,535 | 25,503 |
| | Class R | 5,474 | 1,262 | 20,829 | 170 |
| | Class R1 | 1,851 | 546 | 20,823 | 25 |
| | Class R2 | 3,256 | 1,145 | 20,822 | 228 |
| | Class R3 | 80,796 | 10,585 | 19,752 | 2,433 |
| | Class R4 | 47,259 | 10,049 | 18,530 | 3,921 |
| | Class R5 | 296 | 4,332 | 18,041 | 1,378 |
| | Class 1 | 4,240,484 | — | — | — |
| | Total | $7,515,495 | $628,621 | $200,327 | $56,061 |
|
| |
| Lifestyle Moderate | Class A | $165,662 | $ 61,378 | $22,597 | $9,139 |
| | Class B | 116,921 | 23,614 | 16,500 | 3,204 |
| | Class C | 486,462 | 60,282 | 17,327 | 10,566 |
| | Class R | 3,465 | 813 | 20,845 | 103 |
| | Class R1 | 3,142 | 912 | 20,846 | 116 |
| | Class R2 | 286 | 227 | 20,847 | 98 |
| | Class R3 | 18,380 | 3,635 | 19,333 | 1,190 |
| | Class R4 | 11,525 | 3,171 | 19,867 | 1,560 |
| | Class R5 | 115 | 2,262 | 18,923 | 655 |
| | Class 1 | 1,106,029 | — | —- | — |
| | Total | $1,911,987 | $156,294 | $177,085 | $26,631 |
|
| |
| Lifestyle Conservative | Class A | $90,425 | $31,132 | $17,932 | $5,469 |
| | Class B | 65,673 | 11,221 | 18,247 | 1,870 |
| | Class C | 278,802 | 34,078 | 21,496 | 5,504 |
| | Class R | 1,324 | 332 | 20,834 | 42 |
| | Class R1 | 1,175 | 471 | 20,832 | 51 |
| | Class R2 | 984 | 601 | 20,833 | 80 |
| | Class R3 | 11,313 | 2,533 | 19,642 | 446 |
| | Class R4 | 6,819 | 2,273 | 19,980 | 589 |
| | Class R5 | 81 | 1,125 | 19,470 | 148 |
| | Class 1 | 648,946 | — | — | — |
| | Total | $1,105,542 | $83,766 | $179,266 | $14,199 |
|
4. Trustees’ fees
The Trust compensates each Trustee who is not an employee of the Adviser or its affiliates. Total Trustees’ expenses are allocated to each Portfolio based on its average daily net asset value.
Lifestyle Portfolios | Annual report
40
5. Fund share transactions
Share activity for the Portfolios for the year ended December 31, 2007, and the periods ended December 31, 2006, and August 31, 2006, were as follows:
| | | | | | |
| Lifestyle Aggressive | | | | | | |
| | | Year Ended 12-31-07 | Four Months Ended 12-31-061 | | Period Ended 8-31-062 |
| | Shares | Amount | Shares | Amount | Shares | Amount |
| |
| Class A shares | | | | | | |
|
| Sold | 4,614,640 | $72,343,725 | 1,287,313 | $18,914,525 | 2,656,426 | $37,105,900 |
| Distributions reinvested | 310,614 | 4,631,245 | 158,685 | 2,343,780 | 739 | 9,867 |
| Repurchased | (1,114,340) | (17,460,253) | (139,671) | (2,069,549) | (164,725) | (2,284,281) |
| Net increase | 3,810,914 | $59,514,717 | 1,306,327 | $19,188,756 | 2,492,440 | $34,831,486 |
| |
| Class B shares | | | | | | |
|
| Sold | 885,174 | $13,809,960 | 270,496 | $3,963,999 | 641,314 | $8,963,149 |
| Distributions reinvested | 53,226 | 794,126 | 29,687 | 438,480 | 161 | 2,152 |
| Repurchased | (185,248) | (2,895,713) | (53,687) | (788,566) | (37,802) | (520,561) |
| Net increase | 753,152 | 11,708,373 | 246,496 | $3,613,913 | 603,673 | $8,444,740 |
| |
| Class C shares | | | | | | |
|
| Sold | 3,975,449 | $62,163,168 | 811,127 | $11,860,736 | 1,853,043 | $25,877,041 |
| Distributions reinvested | 213,164 | 3,180,423 | 91,893 | 1,357,255 | 283 | 3,786 |
| Repurchased | (580,591) | (9,086,220) | (64,280) | (948,858) | (49,020) | (685,074) |
| Net increase | 3,608,022 | $56,257,371 | 838,740 | $12,269,133 | 1,804,306 | $25,195,753 |
| |
| Class R shares3 | | | | | | |
|
| Sold | 95,511 | $1,518,424 | 13,974 | $204,356 | — | — |
| Distributions reinvested | 3,768 | 56,443 | 586 | 8,697 | — | — |
| Repurchased | (22,307) | (352,211) | — | (3) | — | — |
| Net increase | 76,972 | $1,222,656 | 14,560 | $213,050 | — | — |
| |
| Class R1 shares3 | | | | | | |
|
| Sold | 82,704 | $1,317,018 | 7,087 | $100,001 | — | — |
| Distributions reinvested | 3,302 | 49,391 | 315 | 4,660 | — | — |
| Repurchased | (20,102) | (313,226) | — | (1) | — | — |
| Net increase | 65,904 | $1,053,183 | 7,402 | $104,660 | — | — |
| |
| Class R2 shares3 | | | | | | |
|
| Sold | 242,808 | $3,920,147 | 7,686 | $108,946 | — | — |
| Distributions reinvested | 8,082 | 120,667 | 359 | 5,311 | — | — |
| Repurchased | (82,461) | (1,346,875) | — | (1) | — | — |
| Net increase | 168,429 | $2,693,939 | 8,045 | $114,256 | — | — |
| |
| Class R3 shares | | | | | | |
|
| Sold | 439,108 | $6,857,290 | 42,310 | $622,204 | 78,517 | $1,063,860 |
| Distributions reinvested | 18,965 | 282,771 | 4,583 | 67,700 | — | — |
| Repurchased | (93,518) | (1,469,502) | (16,559) | (245,807) | (1,184) | (16,116) |
| Net increase | 364,555 | $5,670,559 | 30,334 | $444,097 | 77,333 | $1,047,744 |
| |
| Class R4 shares | | | | | | |
|
| Sold | 255,282 | $3,953,647 | 64,580 | $934,909 | 125,577 | $1,762,808 |
| Distributions reinvested | 14,937 | 222,558 | 7,464 | 110,167 | — | — |
| Repurchased | (106,180) | (1,675,926) | (17,622) | (264,501 | (13,355) | (183,449) |
| Net increase | 164,039 | $2,500,279 | 54,422 | $780,575 | 112,222 | $1,579,359 |
| |
| Class R5 shares | | | | | | |
|
| Sold | 219,853 | $3,498,153 | 10,619 | $159,884 | 38,324 | $533,868 |
| Distributions reinvested | 10,962 | 163,340 | 1,774 | 26,177 | — | — |
| Repurchased | (39,228) | (602,706) | (7,941) | (122,198) | (5,050) | (73,349) |
| Net increase | 191,587 | $3,058,787 | 4,452 | $63,863 | 33,274 | $460,519 |
| |
| Class 1 shares | | | | | | |
|
| Sold | 29,308,050 | $454,167,442 | 9,665,230 | $141,965,510 | 173,760,521 | $2,225,676,778 |
| Distributions reinvested | 10,630,513 | 157,969,428 | 9,129,956 | 134,484,258 | 812,945 | 10,836,557 |
| Repurchased | (4,388,943) | (68,831,528) | (1,447,335) | (21,105,583) | (2,435,942) | (33,752,531) |
| Net increase | 35,549,620 | $543,305,342 | 17,347,851 | $255,344,185 | 172,137,524 | $2,202,760,804 |
| |
| NET INCREASE | 44,753,194 | $686,985,206 | 19,858,629 | $292,136,488 | 177,260,772 | $2,274,320,405 |
|
1Effective 1-18-07, the fiscal year-end changed from August 31 to December 31.
2Class A, Class B, Class C, Class R3, Class R4 and Class R5 shares began operations on 10-18-05 and Class 1 shares began operations on 10-15-05.
3Class R, Class R1 and Class R2 shares began operations on 9-18-06.
Annual report | Lifestyle Portfolios
41
| | | | | | |
| Lifestyle Growth | | | | | | |
| | | Year ended 12-31-07 | Four Months Ended 12-31-061 | | Period Ended 8-31-062 |
| | Shares | Amount | Shares | Amount | Shares | Amount |
| |
| Class A shares | | | | | | |
|
| Sold | 12,295,840 | $190,386,484 | 3,841,069 | $58,423,570 | 7,413,437 | $107,056,385 |
| Issued in reorganization | 241,993 | 3,888,349 | — | — | — | — |
| Distributions reinvested | 920,135 | 13,618,005 | 727,891 | 10,743,675 | 3,180 | 44,453 |
| Repurchased | (2,628,552) | (40,696,080) | (383,350) | (5,839,239) | (361,010) | (5,177,905) |
| Net increase | 10,829,416 | $167,196,758 | 4,185,610 | $63,328,006 | 7,055,607 | $11,922,933 |
| |
| Class B shares | | | | | | |
|
| Sold | 2,904,046 | $44,766,258 | 886,607 | $13,434,315 | 1,720,077 | $24,839,956 |
| Issued in reorganization | 58,080 | 928,637 | — | — | — | — |
| Distributions reinvested | 179,850 | 2,663,601 | 155,491 | 2,296,598 | 435 | 6,092 |
| Repurchased | (562,601) | (8,720,822) | (83,495) | (1,273,331) | (64,700) | (923,569) |
| Net increase | 2,579,375 | $39,637,674 | 958,603 | $14,457,582 | 1,655,812 | $23,922,479 |
| |
| Class C shares | | | | | | |
|
| Sold | 10,421,470 | $160,626,549 | 3,520,680 | $53,321,544 | 6,576,277 | $95,022,521 |
| Issued in reorganization | 86,401 | 1,381,344 | — | — | — | — |
| Distributions reinvested | 692,231 | 10,251,966 | 612,571 | 9,041,554 | 1,182 | 16,531 |
| Repurchased | (1,988,367) | (30,811,386) | (218,687) | (3,318,501) | (177,998) | (2,523,827) |
| Net increase | 9,211,735 | $141,448,473 | 3,914,564 | $59,044,597 | 6,399,461 | $92,515,225 |
| |
| Class R shares3 | | | | | | |
|
| Sold | 45,255 | $697,576 | 8,603 | $128,040 | — | — |
| Distributions reinvested | 2,138 | 31,819 | 587 | 8,700 | — | — |
| Repurchased | (8,305) | (126,466) | — | (3) | — | — |
| Net increase | 39,088 | 602,929 | 9,190 | $136,737 | — | — |
| |
| Class R1 shares3 | | | | | | |
|
| Sold | 131,620 | $2,072,737 | 6,803 | $100,001 | — | — |
| Issued in reorganization | 7,433 | 119,711 | — | — | — | — |
| Distributions reinvested | 5,782 | 85,856 | 492 | 7,296 | — | — |
| Repurchased | (22,023) | (346,417) | — | (1) | — | — |
| Net increase | 122,812 | $1,931,887 | 7,295 | $107,296 | — | — |
| |
| Class R2 shares3 | | | | | | |
|
| Sold | 65,934 | $1,009,920 | 6,803 | $100,001 | — | — |
| Distributions reinvested | 3,233 | 47,939 | 510 | 7,549 | — | — |
| Repurchased | (10,469) | (159,415) | — | (1) | — | — |
| Net increase | 58,698 | 898,444 | 7,313 | $107,549 | — | — |
| |
| Class R3 shares | | | | | | |
|
| Sold | 753,663 | $11,632,645 | 112,022 | $1,698,636 | 152,570 | $2,166,010 |
| Distributions reinvested | 38,168 | 564,498 | 17,157 | 253,064 | — | — |
| Repurchased | (132,164) | (2,050,727) | (28,282) | (437,160) | (351) | (5,030) |
| Net increase | 659,667 | $10,146,416 | 100,897 | $1,514,540 | 152,219 | $2,160,980 |
| |
| Class R4 shares | | | | | | |
|
| Sold | 594,949 | $9,104,267 | 163,347 | $2,452,277 | 330,719 | $4,841,734 |
| Distributions reinvested | 45,493 | 672,840 | 34,039 | 502,074 | — | — |
| Repurchased | (130,810) | (2,014,185) | (24,376) | (378,017) | (16,347) | (238,184) |
| Net increase | 509,632 | 7,762,922 | 173,010 | $2,576,334 | 314,372 | 4,603,550 |
| |
| Class R5 shares | | | | | | |
|
| Sold | 386,916 | $6,103,831 | 50,951 | $783,939 | 113,625 | 1,616,476 |
| Distributions reinvested | 24,520 | 362,648 | 11,371 | 167,722 | 136 | 1,904 |
| Repurchased | (46,657) | (717,962) | (9,676) | (152,668) | (8,639) | (122,977) |
| Net increase | 364,779 | $5,748,517 | 52,646 | $798,993 | 105,122 | $1,495,403 |
Lifestyle Portfolios | Annual report
42
| | | | | | |
| Lifestyle Growth, continued | | | | | |
| | | Year ended 12-31-07 | Four Months Ended 12-31-061 | | Period Ended 8-31-062 |
| | Shares | Amount | Shares | Amount | Shares | Amount |
| |
| Class 1 shares | | | | | | |
|
| Sold | 68,743,446 | $1,053,001,279 | 28,002,092 | $425,819,245 | 486,658,311 | $6,563,462,581 |
| Distributions reinvested | 30,811,120 | 454,155,901 | 40,274,766 | 592,441,806 | 2,554,657 | 35,586,379 |
| Repurchased | (10,434,155) | (162,148,953) | (2,978,465) | (44,028,057) | (5,180,020) | (74,075,698) |
| Net increase | 89,120,411 | $1,345,008,227 | 65,298,393 | $974,232,994 | 484,032,948 | $6,524,973,262 |
| |
| Class 5 shares | | | | | | |
|
| Sold | 2,047,722 | $31,534,003 | 722,012 | $11,006,269 | 225,361 | $3,236,330 |
| Distributions reinvested | 146,377 | 2,156,125 | 70,038 | 1,029,562 | — | — |
| Repurchased | (123,241) | (1,981,283) | (1,855) | (28,075) | — | — |
| Net increase | 2,070,858 | $31,708,845 | 790,195 | $12,007,756 | 225,361 | $3,236,330 |
| |
| Net increase | 115,566,471 | $1,752,091,092 | 75,497,716 | $1,128,312,384 | 499,940,902 | $6,754,830,162 |
|
1Effective 1-18-07, the fiscal year-end changed from August 31 to December 31.
2Class A, Class B, Class C, Class R3, Class R4 and Class R5 shares began operations on 10-18-05 and Class 1 shares began operations on 10-15-05.
3Class R, Class R1 and Class R2 shares began operations on 9-18-06.
Annual report | Lifestyle Portfolios
43
| | | | | | |
| Lifestyle Balanced | | | | | | |
| | | Year ended 12-31-07 | Four Months Ended 12-31-061 | | Period Ended 8-31-062 |
| | Shares | Amount | Shares | Amount | Shares | Amount |
| |
| Class A shares | | | | | | |
|
| Sold | 12,010,789 | $178,914,507 | 2,301,145 | $34,441,210 | 6,009,152 | $85,302,501 |
| Issued in reorganization | 407,719 | 6,254,241 | — | — | — | — |
| Distributions reinvested | 764,823 | 11,089,399 | 1,044,385 | 15,033,362 | 27,765 | 389,529 |
| Repurchased | (2,326,002) | (34,789,873) | (323,345) | (4,801,204) | (392,816) | (5,635,273) |
| Net increase | 10,857,329 | $161,468,274 | 3,022,185 | $44,673,368 | 5,644,101 | $80,056,757 |
| |
| Class B shares | | | | | | |
|
| Sold | 2,125,099 | $31,561,856 | 615,659 | $9,186,277 | 1,452,791 | $20,544,736 |
| Issued in reorganization | 94,071 | 1,440,223 | — | — | — | — |
| Distributions reinvested | 138,849 | 2,004,146 | 247,931 | 3,568,430 | 3,722 | 52,170 |
| Repurchased | (458,683) | (6,838,206) | (58,199) | (868,062) | (57,897) | (818,019) |
| Net increase | 1,899,336 | $28,168,019 | 805,391 | $11,886,645 | 1,398,616 | $19,778,887 |
| |
| Class C shares | | | | | | |
|
| Sold | 10,622,392 | $158,371,850 | 2,638,805 | $39,340,147 | 5,676,144 | $80,561,010 |
| Issued in reorganization | 112,341 | 1,722,024 | — | — | — | — |
| Distributions reinvested | 629,263 | 9,097,060 | 961,016 | 13,850,949 | 13,319 | 187,092 |
| Repurchased | (1,856,133) | (27,693,913) | (196,570) | (2,936,192) | (192,534) | (2,732,138) |
| Net increase | 9,507,863 | $141,497,021 | 3,403,251 | $50,254,904 | 5,496,929 | $78,015,964 |
| |
| Class R shares3 | | | | | | |
|
| Sold | 41,703 | $624,192 | 19,663 | $293,680 | — | — |
| Distributions reinvested | 2,262 | 32,758 | 2,890 | 41,655 | — | — |
| Repurchased | (14,135) | (206,357) | — | (2) | — | — |
| Net increase | 29,830 | $450,593 | 22,553 | $335,333 | — | — |
| |
| Class R1 shares3 | | | | | | |
|
| Sold | 36,079 | $544,741 | 6,449 | $93,141 | — | — |
| Issued in reorganization | 7,260 | 111,372 | — | — | — | — |
| Distributions reinvested | 1,795 | 25,936 | 981 | 14,134 | — | — |
| Repurchased | (12,423) | (182,489) | — | (1) | — | — |
| Net increase | 32,711 | $499,560 | 7,430 | $107,274 | — | — |
| |
| Class R2 shares3 | | | | | | |
|
| Sold | 83,244 | $1,218,082 | 6,571 | $94,999 | — | — |
| Distributions reinvested | 3,716 | 53,917 | 1,013 | 14,575 | — | — |
| Repurchased | (19,236) | (287,738) | — | (1) | — | — |
| Net increase | 67,724 | $984,261 | 7,584 | $109,573 | — | — |
| |
| Class R3 shares | | | | | | |
|
| Sold | 1,482,901 | $22,213,387 | 119,898 | $1,788,302 | 246,488 | $3,431,004 |
| Distributions reinvested | 64,976 | 939,970 | 43,210 | 621,539 | 1,003 | 14,088 |
| Repurchased | (268,440) | (4,012,566) | (26,310) | (392,280) | (59,070) | (818,494) |
| Net increase | 1,279,437 | $19,140,791 | 136,798 | $2,017,561 | 188,421 | $2,626,598 |
| |
| Class R4 shares | | | | | | |
|
| Sold | 787,368 | $11,686,142 | 99,034 | $1,473,004 | 532,830 | $7,589,789 |
| Distributions reinvested | 54,756 | 793,917 | 89,691 | 1,291,112 | 1,821 | 25,583 |
| Repurchased | (294,166) | (4,408,844) | (14,043) | (209,570) | (35,265) | (504,224) |
| Net increase | 547,958 | $8,071,215 | 174,682 | $2,554,546 | 499,386 | $7,111,148 |
| |
| Class R5 shares | | | | | | |
|
| Sold | 615,276 | $9,235,488 | 15,246 | $237,920 | 102,605 | $1,431,987 |
| Distributions reinvested | 29,612 | 429,428 | 15,867 | 228,255 | 974 | 13,638 |
| Repurchased | (86,230) | (1,298,027) | (12,125) | (184,561) | (4,703) | (65,769) |
| Net increase | 558,658 | $8,366,889 | 18,988 | $281,614 | 98,876 | $1,379,856 |
Lifestyle Portfolios | Annual report
44
| | | | | | |
| Lifestyle Balanced, continued | | | | | |
| | | Year ended 12-31-07 | Four Months Ended 12-31-061 | | Period Ended 8-31-062 |
| | Shares | Amount | Shares | Amount | Shares | Amount |
| |
| Class 1 shares | | | | | | |
|
| Sold | 66,344,430 | $978,825,969 | 26,696,656 | $395,003,122 | 468,643,365 | $6,306,035,420 |
| Distributions reinvested | 29,782,065 | 431,392,726 | 37,653,392 | 540,077,565 | 6,945,128 | 96,618,106 |
| Repurchased | (10,958,523) | (162,475,516) | (2,380,654) | (34,347,226) | (5,913,625) | (84,025,930) |
| Net increase | 85,167,972 | $1,247,743,179 | 61,969,394 | $900,733,461 | 469,674,868 | $6,318,627,596 |
| |
| Class 5 shares | | | | | | |
|
| Sold | 800,605 | $11,911,857 | 351,001 | $5,226,710 | 80,813 | $1,140,151 |
| Distributions reinvested | 57,977 | 838,848 | 58,593 | 840,371 | 25 | 347 |
| Repurchased | (32,771) | (486,530) | (9,627) | (144,533) | (633) | (8,884) |
| Net increase | 825,811 | $12,264,175 | 399,967 | $5,922,548 | 80,205 | $1,131,614 |
| |
| Net increase | 110,774,629 | $1,628,653,977 | 69,968,223 | $1,018,876,827 | 483,081,402 | $6,508,728,420 |
|
1Effective 1-18-07, the fiscal year-end changed from August 31 to December 31.
2Class A, Class B, Class C, Class R3, Class R4 and Class R5 shares began operations on 10-18-05 and Class 1 shares began operations on 10-15-05.
3Class R, Class R1 and Class R2 shares began operations on 9-18-06.
Annual report | Lifestyle Portfolios
45
| | | | | | |
| Lifestyle Moderate | | | | | | |
| | | Year ended 12-31-07 | Four Months Ended 12-31-061 | | Period Ended 8-31-062 |
| | Shares | Amount | Shares | Amount | Shares | Amount |
| |
| Class A shares | | | | | | |
|
| Sold | 3,689,701 | $51,041,634 | 816,494 | $11,462,461 | 1,906,772 | $25,643,938 |
| Distributions reinvested | 193,694 | 2,633,345 | 153,623 | 2,082,610 | 11,786 | 156,721 |
| Repurchased | (1,019,236) | (14,186,223) | (83,703) | (1,177,380) | (49,176) | (660,565) |
| Net increase | 2,864,159 | $39,488,756 | 886,414 | $12,367,691 | 1,869,382 | $25,140,094 |
| |
| Class B shares | | | | | | |
|
| Sold | 685,413 | $9,480,517 | 170,346 | $2,381,553 | 394,049 | $5,293,647 |
| Distributions reinvested | 34,752 | 470,834 | 27,685 | 375,204 | 1,374 | 18,275 |
| Repurchased | (121,981) | (1,693,366) | (32,385) | (455,472) | (30,195) | (405,623) |
| Net increase | 598,184 | $8,257,985 | 165,736 | $2,301,285 | 365,228 | $4,906,299 |
| |
| Class C shares | | | | | | |
|
| Sold | 3,309,558 | $45,891,231 | 759,619 | $10,592,267 | 1,313,617 | $17,670,307 |
| Distributions reinvested | 152,871 | 2,071,690 | 113,517 | 1,538,471 | 5,335 | 70,936 |
| Repurchased | (511,957) | (7,087,439) | (43,709) | (614,937) | (30,993) | (417,164) |
| Net increase | 2,950,472 | $40,875,482 | 829,427 | $11,515,801 | 1,287,959 | $17,324,079 |
| |
| Class R shares3 | | | | | | |
|
| Sold | 42,365 | $587,129 | 7,305 | $100,003 | — | — |
| Distributions reinvested | 1,578 | 21,455 | 472 | 6,417 | — | — |
| Repurchased | (14,367) | (196,971) | — | (3) | — | — |
| Net increase | 29,576 | $411,613 | 7,777 | $106,417 | — | — |
| |
| Class R1 shares3 | | | | | | |
|
| Sold | 63,256 | $886,586 | 7,305 | $100,001 | — | — |
| Distributions reinvested | 2,515 | 34,189 | 482 | 6,545 | — | — |
| Repurchased | (15,327) | (211,504) | — | (1) | — | — |
| Net increase | 50,444 | $709,271 | 7,787 | $106,545 | — | — |
| |
| Class R2 shares3 | | | | | | |
|
| Sold | 887 | $12,290 | 7,355 | $100,714 | — | — |
| Distributions reinvested | 380 | 5,174 | 494 | 6,710 | — | — |
| Repurchased | (154) | (2,155) | — | (1) | — | — |
| Net increase | 1,113 | $15,309 | 7,849 | $107,423 | — | — |
| |
| Class R3 shares | | | | | | |
|
| Sold | 342,265 | $4,717,918 | 19,080 | $265,714 | 61,803 | $824,287 |
| Distributions reinvested | 11,583 | 157,373 | 3,942 | 53,482 | 339 | 4,515 |
| Repurchased | (109,186) | (1,497,041) | (14,417) | (203,739) | (5,906) | (79,750) |
| Net increase | 244,662 | $3,378,250 | 8,605 | $115,457 | 56,236 | $749,052 |
| |
| Class R4 shares | | | | | | |
|
| Sold | 189,497 | $2,619,552 | 77,706 | $1,070,385 | 81,786 | $1,104,574 |
| Distributions reinvested | 12,584 | 171,065 | 9,444 | 127,980 | 680 | 9,033 |
| Repurchased | (57,795) | (800,604) | (15,696) | (220,828) | (2,016) | (27,039) |
| Net increase | 144,286 | $1,990,013 | 71,454 | $977,537 | 80,450 | $1,086,568 |
| |
| Class R5 shares | | | | | | |
|
| Sold | 291,654 | $4,060,770 | 43,027 | $611,395 | 48,649 | $647,657 |
| Distributions reinvested | 11,406 | 154,744 | 5,172 | 70,052 | 482 | 6,410 |
| Repurchased | (95,191) | (1,333,546) | (10,492) | (150,063) | (1,932) | (26,226) |
| Net increase | 207,869 | $2,881,968 | 37,707 | $531,384 | 47,199 | $627,841 |
| |
| Class 1 shares | | | | | | |
|
| Sold | 20,668,456 | $285,222,178 | 6,640,443 | $92,685,843 | 134,937,718 | $1,753,494,793 |
| Distributions reinvested | 8,014,611 | 109,038,344 | 9,603,688 | 130,078,250 | 2,410,929 | 31,963,702 |
| Repurchased | (4,707,379) | (65,151,346) | (1,089,036) | (15,016,278) | (3,803,690) | (51,025,836) |
| Net increase | 23,975,688 | $329,109,176 | 15,155,095 | $207,747,815 | 133,544,957 | $1,734,432,659 |
Lifestyle Portfolios | Annual report
46
| | | | | | |
| Lifestyle Moderate, continued | | | | | |
| | | Year ended 12-31-07 | Four Months Ended 12-31-061 | | Period Ended 8-31-062 |
| | Shares | Amount | Shares | Amount | Shares | Amount |
| |
| Class 5 shares | | | | | | |
|
| Sold | 196,146 | $2,705,630 | 123,203 | $1,733,403 | 93,828 | $1,253,556 |
| Distributions reinvested | 17,271 | 234,823 | 13,160 | 177,978 | 37 | 490 |
| Repurchased | (55,900) | (781,144) | (15,002) | (211,893) | (11) | (152) |
| Net increase | 157,517 | $2,159,309 | 121,361 | $1,699,488 | 93,854 | $1,253,894 |
|
| Net increase | 31,223,970 | $429,277,132 | 17,299,212 | $237,576,843 | 137,345,265 | $1,785,520,486 |
1Effective 1-18-07, the fiscal year-end changed from August 31 to December 31.
2Class A, Class B, Class C, Class R3, Class R4 and Class R5 shares began operations on 10-18-05 and Class 1 shares began operations on 10-15-05.
3Class R, Class R1 and Class R2 shares began operations on 9-18-06.
Annual report | Lifestyle Portfolios
47
| | | | | | |
| Lifestyle Conservative | | | | | | |
| | | Year Ended 12-31-07 | Four Months Ended 12-31-061 | | Period Ended 8-31-062 |
| | Shares | Amount | Shares | Amount | Shares | Amount |
| |
| Class A shares | | | | | | |
|
| Sold | 2,389,609 | $32,202,666 | 579,284 | $8,044,116 | 970,480 | $13,042,633 |
| Distributions reinvested | 110,478 | 1,471,783 | 80,861 | 1,077,212 | 8,061 | $106,760 |
| Repurchased | (700,324) | (9,450,827) | (82,674) | (1,154,624) | (72,078) | (970,334) |
| Net increase | 1,799,763 | $24,223,622 | 577,471 | $7,966,704 | 906,463 | $12,179,059 |
| |
| Class B shares | | | | | | |
|
| Sold | 533,348 | $7,196,400 | 101,217 | $1,408,223 | 227,435 | $3,046,846 |
| Distributions reinvested | 20,568 | 273,746 | 14,743 | 196,481 | 1,215 | 16,097 |
| Repurchased | (121,906) | (1,643,199) | (25,828) | (359,242) | (11,427) | (153,081) |
| Net increase | 432,010 | $5,826,947 | 90,132 | $1,245,462 | 217,223 | $2,909,862 |
| |
| Class C shares | | | | | | |
|
| Sold | 2,645,517 | $35,649,056 | 459,156 | $6,364,493 | 621,340 | $8,332,624 |
| Distributions reinvested | 91,873 | 1,222,078 | 55,270 | 735,796 | 3,508 | 46,442 |
| Repurchased | (551,105) | (7,442,310) | (38,676) | (540,025) | (15,041) | (203,312) |
| Net increase | 2,186,285 | $29,428,824 | 475,750 | $6,560,264 | 609,807 | $8,175,754 |
| |
| Class R shares3 | | | | | | |
|
| Sold | 9,081 | $122,134 | 7,316 | $100,003 | — | — |
| Distributions reinvested | 554 | 7,409 | 483 | 6,456 | — | — |
| Repurchased | (816) | (11,024) | — | (3) | — | — |
| Net increase | 8,819 | $118,519 | 7,799 | $106,456 | — | — |
| |
| Class R1 shares3 | | | | | | |
|
| Sold | 19,327 | $263,101 | 7,315 | $100,001 | — | — |
| Distributions reinvested | 942 | 12,574 | 493 | 6,584 | — | — |
| Repurchased | (12,347) | (165,600) | — | (1) | — | — |
| Net increase | 7,922 | $110,075 | 7,808 | $106,584 | — | — |
| |
| Class R2 shares3 | | | | | | |
|
| Sold | 40,208 | $543,146 | 7,360 | $100,626 | — | — |
| Distributions reinvested | 1,265 | 16,899 | 505 | 6,743 | — | — |
| Repurchased | (29,185) | (393,962) | — | (1) | — | — |
| Net increase | 12,288 | 166,083 | 7,865 | $107,368 | — | — |
| |
| Class R3 shares | | | | | | |
|
| Sold | 321,852 | $4,357,181 | 13,627 | $190,563 | 21,755 | $290,487 |
| Distributions reinvested | 9,844 | 131,160 | 1,695 | 22,593 | 96 | 1,277 |
| Repurchased | (81,606) | (1,105,400) | (9,143) | (129,072) | (24) | (327) |
| Net increase | 250,090 | $3,382,941 | 6,179 | $84,084 | 21,827 | $291,437 |
| |
| Class R4 shares | | | | | | |
|
| Sold | 280,198 | $3,747,727 | 13,788 | $190,041 | 51,727 | $693,385 |
| Distributions reinvested | 7,988 | 106,474 | 3,850 | 51,335 | 359 | 4,751 |
| Repurchased | (148,989) | (1,994,253) | (8,772) | (123,762) | (514) | (6,839) |
| Net increase | 139,197 | $1,859,948 | 8,866 | $117,614 | 51,572 | $691,297 |
| |
| Class R5 shares | | | | | | |
|
| Sold | 54,757 | $742,856 | 6,571 | $91,562 | 22,121 | $294,449 |
| Distributions reinvested | 2,522 | 33,650 | 1,375 | 18,329 | 219 | 2,896 |
| Repurchased | (22,114) | (300,568) | (7,868) | (111,132) | (705) | (9,504) |
| Net increase (decrease) | 35,165 | $475,938 | 78 | ($1,241) | 21,635 | $287,841 |
| |
| Class 1 shares | | | | | | |
|
| Sold | 17,102,516 | $230,347,734 | 4,076,366 | $56,702,014 | 82,605,957 | $1,088,806,246 |
| Distributions reinvested | 5,034,597 | 67,095,666 | 5,891,179 | 78,517,828 | 1,669,737 | 22,120,363 |
| Repurchased | (6,026,728) | (81,070,170) | (1,209,359) | (16,489,309) | (3,797,586) | (50,952,259) |
| Net increase | 16,110,385 | $216,373,230 | 8,758,186 | $118,730,533 | 80,478,108 | $1,059,974,350 |
| |
| Net increase | 20,981,924 | $281,966,127 | 9,940,134 | $135,023,828 | 82,306,635 | $1,084,509,600 |
|
1Effective 1-18-07, the fiscal year-end changed from August 31 to December 31.
2Class A, Class B, Class C, Class R3, Class R4 and Class R5 shares began operations on 10-18-05 and Class 1 shares began operations on 10-15-05.
3Class R, Class R1 and Class R2 shares began operations on 9-18-06.
Lifestyle Portfolios | Annual report
48
6. Purchases and sales of securities
The following summarizes the purchases and sales of the affiliated underlying funds for the year ended December 31, 2007:
| | | |
| Portfolio | Purchase | Sales | |
| |
| | |
| Lifestyle Aggressive | $1,497,526,416 | $717,592,963 | |
| Lifestyle Growth | 3,631,519,691 | 1,738,489,635 | |
| Lifestyle Balanced | 3,025,073,493 | 1,298,987,056 | |
| Lifestyle Moderate | 743,977,072 | 307,907,172 | |
| Lifestyle Conservative | 459,554,431 | 173,921,617 | |
7. Federal income tax information
Federal income tax regulations may differ from generally accepted accounting principles, and income and capital gain distributions determined in accordance with tax regulations may differ from net investment income and realized gains recognized for financial reporting purposes. Accordingly, the composition of net assets for tax purposes differs from amounts reflected in the accompanying financial statements. These differences are primarily due to differing treatment for losses deferred with respect to wash sales and excise tax regulations.
Each Portfolio’s policy is to qualify as a regulated investment company by complying with the applicable provisions of the Internal Revenue Code and will not be subject to federal income tax. Therefore, no federal income tax provision is required. Each Portfolio is treated as a separate taxpayer for federal income tax purposes.
Capital accounts
Capital accounts within financial statements are adjusted for permanent book-tax differences. These adjustments have no impact on net assets or the results of operations. Temporary book-tax differences will reverse in a subsequent period. Book-tax differences are primarily attributable to short-term capital gain distributions received from underlying funds.
The cost of investments owned on December 31, 2007, including short-term investments, for federal income tax purposes, was as follows:
| | | | |
| | | | | Net Unrealized |
| | | Unrealized | Unrealized | Appreciation/ |
| Portfolio | Aggregate Cost | Appreciation | (Depreciation) | (Depreciation) |
|
| |
| Lifestyle Aggressive | $3,397,587,778 | $332,195,796 | ($57,218,235) | $274,977,561 |
| Lifestyle Growth | 9,754,676,408 | 754,551,766 | (145,921,715) | 608,630,051 |
| Lifestyle Balanced | 9,168,473,769 | 600,284,086 | (158,157,088) | 442,126,998 |
| Lifestyle Moderate | 2,430,679,572 | 86,413,286 | — | 86,413,286 |
| Lifestyle Conservative | 1,477,718,754 | 44,432,480 | (16,086,333) | 28,346,147 |
The tax-basis components of distributable earnings at December 31, 2007, were as follows:
| | | | |
| | Undistributed | Undistributed Long Term | | |
| Portfolio | Ordinary Income | Capital Gains | | |
|
| | | |
| Lifestyle Aggressive | $4,376,197 | $154,308,175 | | |
| Lifestyle Growth | 7,838,613 | 285,306,066 | | |
| Lifestyle Balanced | 3,181,352 | 204,388,634 | | |
| Lifestyle Moderate | 432,126 | 28,730,116 | | |
| Lifestyle Conservative | 211,645 | 9,104,360 | | |
The tax character of distributions paid during 2007 and 2006 was as follows:
| | | | | | | | | | | |
| | 12/31/07 Distributions | | | | 12/31/06 Distributions1 | | 8/31/06 Distributions |
| | | Long Term | | | | Long Term | | | | Long Term | |
| | Ordinary | Capital | Return of | | Ordinary | Capital | Return of | | Ordinary | Capital | |
| Portfolio | Income | Gains | Capital | Total | Income | Gains | Capital | Total | Income | Gains | Total |
|
| |
| Lifestyle Aggressive | $123,815,341 | $43,966,246 | — | $167,781,587 | $138,977,239 | $19,381 | — | $138,996,620 | $10,856,555 | — | $10,856,555 |
| Lifestyle Growth | 403,632,376 | 82,092,859 | — | 485,725,235 | 411,384,565 | 34,665,916 | $171,427,293 | 617,477,774 | 35,662,733 | — | 35,662,733 |
| Lifestyle Balanced | 413,394,944 | 44,874,979 | — | 458,269,923 | 346,895,730 | 20,886,971 | 192,535,188 | 560,317,889 | 97,369,317 | — | 97,369,317 |
| Lifestyle Moderate | 108,022,601 | 7,519,152 | — | 115,541,753 | 83,942,028 | 998,369 | 49,938,569 | 134,878,966 | 32,261,703 | — | 32,261,703 |
| Lifestyle Conservative | 68,963,500 | 1,863,066 | — | 70,826,566 | 47,533,711 | 707,783 | 32,702,801 | 80,944,295 | 22,337,545 | — | 22,337,545 |
1Effective 1-18-07, the fiscal year-end changed from August 31 to December 31.
At December 31, 2007, there were no capital loss carry forwards available to offset future realized gains.
Annual report | Lifestyle Portfolios
49
The Trust adopted the provisions of FASB Interpretation No. 48, Accounting for Uncertainty in Income Taxes, an interpretation of FASB Statement 109 (“FIN 48”), on January 1, 2007. FIN 48 prescribes a minimum threshold for financial statement recognition of the benefit of a tax position taken or expected to be taken in a tax return. The implementation of FIN 48 did not result in any unrecognized tax benefits in the accompanying financial statements. Each of the Trust’s federal tax returns for the prior three fiscal years remains subject to examination by the Internal Revenue Service.
8. Investment in affiliated underlying funds
The Portfolios invest primarily in affiliated underlying funds that are managed by affiliates of the Adviser. The Portfolios do not invest in affiliated underlying funds for the purpose of exercising management or control; however, the Portfolios’ investments may represent a significant portion of each underlying fund’s net assets. A summary of the Portfolios’ investments in affiliated funds during the year ended December 31, 2007, is set forth below:
| | | | | | | | | |
| | | | | | | | Capital Gain | | |
| | | Beginning | | | Ending | | Distribution | | |
| | Affiliate — | Share | Shares | Shares | Share | Sale | From Under- | Dividend | Ending |
| Portfolio | Series NAV | Amount | Purchased | Sold | Amount | Proceeds | lying Funds | Income | Value |
|
| Lifestyle Aggressive | | | | | | | | |
| John Hancock Funds | | | | | | | | |
| Small Cap Intrinsic Value | — | 5,044,200 | 102,191 | 4,942,009 | $1,684,841 | $1,796,822 | $110,949 | $73,388,841 |
| |
| John Hancock Funds II | | | | | | | | |
| All Cap Core | — | 4,647,003 | — | 4,647,003 | — | $1,160,425 | $282,810 | $47,817,662 |
| All Cap Growth | 3,270,836 | 299,102 | 3,569,938 | — | $67,078,175 | — | — | — |
| All Cap Value | 3,577,206 | 2,648,705 | 24,146 | 6,201,765 | 397,076 | 22,916,850 | 936,959 | 73,490,915 |
| Blue Chip Growth | 7,503,645 | 3,283,082 | 229,752 | 10,556,975 | 4,697,533 | 877,062 | 787,927 | 227,819,518 |
| Capital Appreciation | 11,312,854 | 5,560,463 | 576,947 | 16,296,370 | 6,232,651 | — | 539,536 | 185,941,584 |
| Core Equity | 5,417,429 | 4,654,883 | 102,704 | 9,969,608 | 1,728,074 | 3,133,215 | 164,407 | 146,952,029 |
| Emerging Growth | 3,498,404 | 1,455,331 | 373,259 | 4,580,476 | 6,617,698 | 5,073,261 | 514,434 | 73,150,204 |
| Emerging Markets Value | — | 10,233,968 | 950,634 | 9,283,334 | 11,661,919 | 949,458 | 890,984 | 108,893,511 |
| Equity-Income | 3,077,127 | 986,684 | 33,124 | 4,030,687 | 659,212 | 3,500,221 | 1,249,528 | 73,116,653 |
| Fundamental Value | 6,800,039 | 1,793,511 | 111,487 | 8,482,063 | 1,975,489 | 1,248,808 | 1,492,748 | 147,503,070 |
| International Equity Index | 7,068,530 | 1,302,719 | 1,811,377 | 6,559,872 | 40,694,298 | 3,528,146 | 3,536,325 | 147,662,712 |
| International Opportunities | 6,454,539 | 2,179,209 | 842,523 | 7,791,225 | 17,953,384 | 16,615,041 | 1,774,720 | 147,409,969 |
| International Small Cap | 4,172,362 | 1,580,247 | 930,910 | 4,821,699 | 22,479,502 | 12,261,688 | 2,570,332 | 92,576,625 |
| International Small Company | 8,272,786 | 2,288,468 | 1,486,432 | 9,074,822 | 17,642,147 | 6,901,517 | 1,207,306 | 92,563,180 |
| International Value | 10,849,920 | 3,459,518 | 738,065 | 13,571,373 | 14,870,622 | 12,473,247 | 4,648,142 | 258,263,222 |
| Large Cap | 3,702,322 | 1,136,195 | 48,629 | 4,789,888 | 807,234 | 1,862,763 | 682,460 | 72,997,887 |
| Large Cap Value | 1,149,067 | 329,061 | 8,143 | 1,469,985 | 218,807 | 925,863 | 334,814 | 36,984,823 |
| Mid Cap Index | 5,859,816 | 1,386,826 | 2,669,710 | 4,576,932 | 55,984,358 | 7,733,480 | 1,193,347 | 87,877,097 |
| Mid Cap Intersection | — | 15,901,504 | 115,746 | 15,785,758 | 1,168,730 | — | 96,657 | 146,965,407 |
| Mid Cap Stock | 3,447,720 | 648,301 | 260,393 | 3,835,628 | 5,091,020 | 4,786,971 | 1,153 | 74,027,612 |
| Mid Cap Value | 2,879,077 | 1,010,435 | 48,779 | 3,840,733 | 1,056,260 | 3,558,198 | 566,710 | 73,127,552 |
| Mid Cap Value Equity | 2,770,613 | 574,093 | 67,083 | 3,277,623 | 788,103 | 679,874 | 351,217 | 36,643,820 |
| Natural Resources | 4,060,960 | 2,597,816 | 2,979,126 | 3,679,650 | 123,307,432 | 32,930,375 | 756,779 | 141,997,702 |
| Quantitative Mid Cap | 3,782,103 | 364,535 | 4,146,638 | — | 67,572,592 | — | — | — |
| Quantitative Value | 5,018,113 | 2,358,971 | 32,255 | 7,344,829 | 570,420 | 8,080,804 | 1,858,313 | 109,952,092 |
| Small Cap | 5,605,832 | 2,070,268 | 2,225,233 | 5,450,867 | 35,675,912 | 10,037,933 | 60,479 | 72,878,086 |
| Small Cap Index | 3,428,771 | 1,941,657 | 1,512,642 | 3,857,786 | 22,818,108 | 10,714,101 | 1,109,540 | 51,308,552 |
| Small Company | 3,437,117 | 1,509,154 | 659,272 | 4,286,999 | 10,189,020 | 4,341,851 | 1,077 | 63,276,108 |
| Small Company Value | 3,452,364 | 1,260,173 | 79,689 | 4,632,848 | 2,135,461 | 4,861,096 | 238,030 | 109,844,827 |
| Special Value | 2,662,953 | 844,034 | 3,506,987 | — | 67,342,724 | 9,602,481 | 64,439 | — |
| U.S. Global Leaders Growth | 2,133,558 | 3,280,247 | 2,964,275 | 2,449,530 | 40,772,046 | — | 627,673 | 33,999,476 |
| U.S. Multi Sector | 21,083,701 | 6,137,275 | 3,226,596 | 23,994,380 | 36,939,781 | 8,120,789 | 3,200,903 | 257,939,582 |
| Value & Restructuring | 2,401,870 | 474,549 | 35,484 | 2,840,935 | 485,682 | 120,060 | 509,231 | 37,045,795 |
| Vista | 5,015,555 | 660,277 | 714,072 | 4,961,760 | 10,424,068 | 5,270,145 | — | 74,029,459 |
| |
| John Hancock Funds III | | | | | | | | |
| International Core | 5,433,055 | 1,815,166 | 386,566 | 6,861,655 | $17,872,584 | $23,286,189 | $4,133,977 | $295,119,767 |
Lifestyle Portfolios | Annual report
50
| | | | | | | | | |
| | | | | | | | Capital Gain | | |
| | | Beginning | | | Ending | | Distribution | | |
| | Affiliate — | Share | Shares | Shares | Share | Sale | From Under- | Dividend | Ending |
| Portfolio | Series NAV | Amount | Purchased | Sold | Amount | Proceeds | lying Funds | Income | Value |
|
| Lifestyle Growth | | | | | | | | |
| John Hancock Funds | | | | | | | | |
| Small Cap Intrinsic Value | — | 7,018,657 | 144,493 | 6,874,164 | $2,372,813 | $2,497,966 | $154,243 | $102,081,329 |
| |
| John Hancock Funds II | | | | | | | | |
| All Cap Core | 15,849,195 | 23,553,770 | 1,241,428 | 38,161,537 | $13,684,612 | $16,377,996 | $3,961,999 | $392,682,218 |
| All Cap Growth | 4,776,494 | 992,561 | 106,105 | 5,662,950 | 2,073,919 | 6,742,686 | 136,768 | 104,991,101 |
| All Cap Value | 10,471,873 | 767,064 | 11,238,937 | — | 191,511,129 | — | — | —- |
| Blue Chip Growth | 17,558,955 | 5,562,609 | 696,915 | 22,424,649 | 14,781,885 | 1,974,560 | 1,773,887 | 483,923,926 |
| Capital Appreciation | 33,085,055 | 5,497,363 | 1,608,857 | 36,973,561 | 18,546,807 | — | 1,221,425 | 421,868,328 |
| Core Equity | 15,842,368 | 6,056,930 | 695,594 | 21,203,704 | 11,790,867 | 6,678,220 | 350,422 | 312,542,593 |
| Emerging Markets Value | — | 18,638,294 | 1,106,622 | 17,531,672 | 13,858,897 | 1,779,808 | 1,670,194 | 205,646,513 |
| Equity-Income | 13,528,131 | 3,930,683 | 212,725 | 17,246,089 | 4,293,466 | 14,949,777 | 5,336,855 | 312,844,055 |
| Floating Rate Income | — | 1,734,000 | — | 1,734,000 | — | — | — | 17,340,000 |
| Fundamental Value | 19,902,134 | 4,437,142 | 261,454 | 24,077,822 | 4,738,495 | 3,558,142 | 4,253,184 | 418,713,317 |
| Global Bond | 11,705,521 | 4,140,094 | 1,933,965 | 13,911,650 | 29,504,356 | 1,540,860 | 9,639,724 | 208,674,753 |
| Global Real Estate | 7,231,690 | 3,548,604 | 308,234 | 10,472,060 | 3,855,887 | 4,104,967 | 3,259,576 | 102,835,626 |
| High Income | 7,745,928 | 3,358,223 | 208,420 | 10,895,731 | 2,321,827 | 4,352,538 | 6,314,030 | 102,528,827 |
| High Yield | 41,471,626 | 15,932,430 | 4,142,376 | 53,261,680 | 41,056,671 | 4,219,328 | 38,143,322 | 506,518,579 |
| Index 500 | — | 9,723,386 | 797 | 9,722,589 | 8,572 | 262,569 | 468,307 | 104,226,158 |
| International Equity Index | 8,264,997 | 1,365,055 | 474,677 | 9,155,375 | 11,083,161 | 4,968,085 | 4,979,601 | 206,087,490 |
| International Opportunities | 18,834,129 | 5,883,541 | 2,731,157 | 21,986,513 | 57,587,381 | 46,600,535 | 4,977,593 | 415,984,822 |
| International Small Cap | 8,123,514 | 2,544,459 | 2,546,626 | 8,121,347 | 62,276,363 | 20,626,120 | 4,323,709 | 155,929,860 |
| International Small Company | 16,106,293 | 3,614,652 | 4,508,097 | 15,212,848 | 53,744,344 | 11,505,452 | 2,012,688 | 155,171,052 |
| International Value | 18,105,422 | 4,720,792 | 992,450 | 21,833,764 | 20,270,435 | 20,115,988 | 7,496,200 | 415,496,528 |
| Large Cap | 5,418,073 | 1,350,768 | 43,279 | 6,725,562 | 725,400 | 2,650,219 | 970,960 | 102,497,566 |
| Large Cap Value | 3,375,795 | 851,388 | 39,751 | 4,187,432 | 1,087,899 | 2,635,981 | 953,232 | 105,355,781 |
| Mid Cap Index | 21,415,982 | 2,568,113 | 15,954,560 | 8,029,535 | 339,002,517 | 14,349,631 | 2,214,279 | 154,167,080 |
| Mid Cap Intersection | — | 22,368,481 | 252,027 | 22,116,454 | 2,624,454 | — | 136,410 | 205,904,189 |
| Mid Cap Stock | 5,030,627 | 6,544,996 | 778,171 | 10,797,452 | 15,289,238 | 13,536,113 | 3,260 | 208,390,815 |
| Mid Cap Value | — | 5,466,478 | 41,594 | 5,424,884 | 939,652 | 5,029,403 | 801,027 | 103,289,797 |
| Mid Cap Value Equity | 8,106,565 | 1,474,352 | 307,207 | 9,273,710 | 3,665,363 | 1,922,180 | 992,979 | 103,680,078 |
| Natural Resources | 9,483,524 | 3,227,197 | 4,895,430 | 7,815,291 | 206,632,787 | 69,552,618 | 1,598,402 | 301,592,093 |
| Quantitative Value | 14,685,722 | 13,403,801 | 220,546 | 27,868,977 | 4,054,225 | 30,666,096 | 7,052,172 | 417,198,581 |
| Real Estate Equity | 6,841,689 | 1,519,588 | 1,183 | 8,360,094 | 14,391 | 8,367,636 | 853,366 | 70,224,790 |
| Real Return Bond | 19,609,601 | 6,896,544 | 3,598,504 | 22,907,641 | 48,106,936 | — | 16,314,981 | 312,460,218 |
| Small Cap | 5,446,349 | 2,434,567 | 272,280 | 7,608,636 | 4,449,314 | 14,052,767 | 84,669 | 101,727,464 |
| Small Cap Index | 5,004,947 | 470,906 | 5,475,853 | — | 97,360,408 | — | — | — |
| Small Cap Opportunities | 6,599,007 | 2,883,739 | 1,332,723 | 8,150,023 | 29,946,730 | 582,069 | 2,939,801 | 177,344,503 |
| Small Company Growth | 7,023,448 | 1,223,509 | 321,650 | 7,925,307 | 4,336,579 | 2,357,827 | — | 102,157,213 |
| Small Company Value | 3,354,031 | 1,022,762 | 78,202 | 4,298,591 | 2,130,877 | 4,542,291 | 222,420 | 101,919,596 |
| Special Value | 3,882,069 | 1,071,921 | 4,953,990 | — | 94,958,382 | 13,702,149 | 91,951 | — |
| Spectrum Income | 16,190,977 | 4,731,125 | 909,786 | 20,012,316 | 9,648,579 | 2,687,484 | 9,095,525 | 208,328,212 |
| Strategic Bond | 7,068,956 | 2,253,202 | 277,102 | 9,045,056 | 3,278,894 | — | 4,676,585 | 102,842,287 |
| Strategic Income | 8,445,849 | 2,170,306 | 446,724 | 10,169,431 | 4,536,821 | — | 2,748,185 | 104,236,666 |
| Total Return | 24,828,685 | 9,131,453 | 4,212,685 | 29,747,453 | 58,375,830 | 1,561,789 | 20,589,281 | 416,166,864 |
| U.S. Global Leaders Growth | 18,812,145 | 3,940,615 | 12,043,360 | 10,709,400 | 169,600,773 | — | 1,790,149 | 148,646,466 |
| U.S. High Yield Bond | 6,382,353 | 2,122,530 | 280,189 | 8,224,694 | 3,730,751 | 27,333 | 7,290,078 | 103,713,388 |
| U.S. Multi Sector | 54,008,568 | 14,931,367 | 855,912 | 68,084,023 | 9,573,706 | 23,098,627 | 9,104,592 | 731,903,249 |
| Value & Restructuring | 7,053,772 | 1,355,636 | 326,274 | 8,083,134 | 4,456,407 | 341,669 | 1,449,171 | 105,404,070 |
| Vista | 7,320,314 | 887,398 | 1,179,980 | 7,027,732 | 16,886,444 | 7,481,024 | — | 104,853,765 |
| |
| John Hancock Funds III | | | | | | | | |
| International Core | 11,887,939 | 3,402,866 | 800,811 | 14,489,994 | $37,413,446 | $49,244,877 | $8,742,401 | $623,214,653 |
| |
| Lifestyle Balanced | | | | | | | | |
| John Hancock Funds II | | | | | | | | |
| Active Bond | 16,605,822 | 4,585,532 | 954,952 | 20,236,402 | $9,139,805 | — | $7,744,749 | $192,650,544 |
| All Cap Core | 14,868,844 | 4,445,677 | 403,710 | 18,910,811 | 4,518,549 | $9,311,390 | 2,241,408 | 194,592,244 |
| Blue Chip Growth | 32,948,123 | 10,462,507 | 2,837,612 | 40,573,018 | 60,639,316 | 3,673,564 | 3,300,222 | 875,565,735 |
| Core Bond | 12,647,626 | 3,620,807 | 988,053 | 15,280,380 | 12,377,940 | — | 8,557,029 | 192,991,205 |
| Core Equity | 14,852,940 | 5,490,250 | 704,198 | 19,638,992 | 11,943,340 | 6,284,407 | 329,758 | 289,478,745 |
| Emerging Markets Value | — | 17,301,920 | 1,072,964 | 16,228,956 | 13,354,063 | 1,631,093 | 1,530,639 | 190,365,656 |
| Equity-Income | 12,697,050 | 3,735,491 | 373,761 | 16,058,780 | 7,506,865 | 14,009,587 | 5,001,220 | 291,306,263 |
Annual report | Lifestyle Portfolios
51
| | | | | | | | | |
| | | | | | | | Capital Gain | | |
| | | Beginning | | | Ending | | Distribution | | |
| | Affiliate — | Share | Shares | Shares | Share | Sale | From Under- | Dividend | Ending |
| Portfolio | Series NAV | Amount | Purchased | Sold | Amount | Proceeds | lying Funds | Income | Value |
|
| Lifestyle Balanced, continued | | | | | | | | |
| Floating Rate Income | — | 1,600,000 | —- | 1,600,000 | — | — | — | $16,000,000 |
| Fundamental Value | 14,020,910 | 3,210,889 | 476,191 | 16,755,608 | $8,580,364 | $2,501,258 | $ 2,989,849 | 291,380,025 |
| Global Bond | 16,420,225 | 5,303,385 | 2,452,969 | 19,270,641 | 37,320,050 | 2,126,808 | 13,305,456 | 289,059,618 |
| Global Real Estate | 20,306,129 | 10,530,251 | 1,427,929 | 29,408,451 | 17,589,206 | 11,619,594 | 9,226,615 | 288,790,985 |
| High Income | 14,537,749 | 6,099,193 | 333,764 | 20,303,178 | 3,715,971 | 8,088,306 | 11,725,517 | 191,052,902 |
| High Yield | 70,011,150 | 24,219,772 | 3,250,033 | 90,980,889 | 32,913,518 | 7,000,831 | 63,254,602 | 865,228,257 |
| Index 500 | — | 8,727,291 | 2,886 | 8,724,405 | 30,635 | 241,182 | 430,164 | 93,525,623 |
| International Opportunities | 8,870,406 | 2,567,923 | 1,332,516 | 10,105,813 | 27,971,697 | 21,210,748 | 2,265,606 | 191,201,977 |
| International Small Cap | 7,640,715 | 2,381,891 | 2,503,079 | 7,519,527 | 61,113,311 | 19,016,388 | 3,986,272 | 144,374,918 |
| International Value | 16,997,036 | 4,024,573 | 3,309,368 | 17,712,241 | 67,047,540 | 16,260,684 | 6,059,525 | 337,063,949 |
| Large Cap | 5,076,459 | 7,560,092 | 45,182 | 12,591,369 | 729,392 | 4,966,236 | 1,819,480 | 191,892,460 |
| Large Cap Value | 9,537,510 | 2,597,211 | 549,169 | 11,585,552 | 14,612,363 | 7,421,736 | 2,683,874 | 291,492,495 |
| Mid Cap Index | — | 5,132,575 | 173,690 | 4,958,885 | 3,879,168 | 7,572,251 | 1,168,467 | 95,210,584 |
| Mid Cap Stock | 4,706,912 | 817,790 | 500,239 | 5,024,463 | 9,575,407 | 6,243,571 | 1,504 | 96,972,135 |
| Natural Resources | 8,902,585 | 3,807,605 | 5,228,915 | 7,481,275 | 218,059,159 | 65,393,690 | 1,502,825 | 288,702,383 |
| Quantitative Value | 9,216,897 | 3,824,462 | 220,893 | 12,820,466 | 4,067,541 | 14,208,204 | 3,267,410 | 191,922,378 |
| Real Estate Equity | 12,408,223 | 2,804,528 | 2,416,592 | 12,796,159 | 31,012,283 | 12,807,702 | 1,306,183 | 107,487,737 |
| Real Return Bond | 30,614,083 | 9,822,789 | 5,674,949 | 34,761,923 | 75,958,050 | — | 25,003,492 | 474,152,634 |
| Small Cap | 5,093,666 | 480,282 | 5,573,948 | — | 89,337,555 | — | — | — |
| Small Cap Opportunities | 3,133,126 | 54,984 | 3,188,110 | — | 80,901,467 | — | — | — |
| Small Company Growth | — | 7,443,661 | 129,295 | 7,314,366 | 1,760,696 | 2,174,565 | — | 94,282,183 |
| Small Company Value | 3,136,953 | 959,518 | 129,268 | 3,967,203 | 3,528,241 | 4,189,056 | 205,123 | 94,062,373 |
| Spectrum Income | 37,945,236 | 10,043,714 | 1,776,169 | 46,212,781 | 18,809,603 | 6,201,210 | 20,979,166 | 481,075,052 |
| Strategic Bond | 13,242,802 | 3,953,413 | 351,439 | 16,844,776 | 4,173,676 | — | 8,633,732 | 191,525,101 |
| Strategic Income | 15,822,235 | 3,557,997 | 606,845 | 18,773,387 | 6,149,890 | 628 | 5,094,161 | 192,427,220 |
| Total Return | 29,064,377 | 8,841,780 | 3,513,665 | 34,392,492 | 48,781,071 | 1,800,164 | 23,740,767 | 481,150,968 |
| U.S. Global Leaders Growth | 17,596,078 | 3,689,250 | 10,676,928 | 10,608,400 | 150,320,190 | — | 1,704,247 | 147,244,596 |
| U.S. High Yield Bond | 11,969,638 | 3,575,889 | 360,351 | 15,185,176 | 4,804,078 | 50,430 | 13,462,678 | 191,485,065 |
| U.S. Multi Sector | 43,487,197 | 10,797,761 | 9,179,119 | 45,105,839 | 105,075,401 | 15,475,458 | 6,099,831 | 484,887,772 |
| Value & Restructuring | 13,264,569 | 3,105,415 | 1,427,070 | 14,942,914 | 19,226,816 | 648,254 | 2,749,535 | 194,855,595 |
| |
| John Hancock Funds III | | | | | | | | |
| International Core | 7,447,711 | 1,995,164 | 488,134 | 8,954,741 | $23,001,665 | $30,329,912 | $5,384,444 | $385,143,390 |
| |
| Lifestyle Moderate | | | | | | | | |
| John Hancock Funds II | | | | | | | | |
| Active Bond | 17,583,695 | 4,605,550 | 1,073,228 | 21,116,017 | $10,259,533 | — | $8,046,488 | $201,024,484 |
| Blue Chip Growth | 5,442,693 | 1,612,635 | 988,828 | 6,066,500 | 20,684,080 | $604,401 | 542,976 | 130,915,080 |
| Core Bond | 3,320,383 | 817,309 | 150,514 | 3,987,178 | 1,883,498 | — | 2,220,789 | 50,358,058 |
| Core Equity | 5,240,971 | 2,455,247 | 608,010 | 7,088,208 | 10,148,344 | 2,217,352 | 116,350 | 104,480,182 |
| Equity-Income | 2,242,612 | 794,125 | 164,922 | 2,871,815 | 3,333,239 | 2,484,029 | 886,763 | 52,094,730 |
| Floating Rate Income | — | 1,245,000 | — | 1,245,000 | — | — | — | 12,450,000 |
| Fundamental Value | 4,963,142 | 1,526,180 | 464,670 | 6,024,652 | 8,371,755 | 888,541 | 1,062,108 | 104,768,702 |
| Global Bond | 8,654,339 | 2,703,790 | 1,303,956 | 10,054,173 | 22,165,510 | 1,110,009 | 6,944,289 | 150,812,596 |
| Global Real Estate | 3,602,901 | 1,879,065 | 354,271 | 5,127,695 | 4,370,878 | 2,017,629 | 1,602,111 | 50,353,966 |
| High Income | 5,791,943 | 2,347,359 | 119,343 | 8,019,959 | 1,313,506 | 3,173,634 | 4,595,485 | 75,467,817 |
| High Yield | 12,281,718 | 3,803,011 | 618,573 | 15,466,156 | 9,889,407 | 1,213,537 | 10,946,976 | 147,083,147 |
| International Equity Index | 2,063,921 | 428,694 | 268,037 | 2,224,578 | 6,079,455 | 1,204,651 | 1,207,442 | 50,075,251 |
| International Opportunities | 1,192,804 | 504,100 | 388,943 | 1,307,961 | 8,123,939 | 2,580,859 | 275,672 | 24,746,613 |
| International Value | 3,381,283 | 996,036 | 414,080 | 3,963,239 | 8,277,470 | 3,665,900 | 1,366,093 | 75,420,446 |
| Investment Quality Bond | 3,538,219 | 871,629 | 149,450 | 4,260,398 | 1,754,611 | — | 2,391,281 | 50,357,905 |
| Mid Cap Index | — | 1,302,101 | 3,437 | 1,298,664 | 74,966 | 1,980,651 | 305,633 | 24,934,342 |
| Real Estate Equity | 3,295,309 | 725,480 | 661,511 | 3,359,278 | 8,485,327 | 3,362,308 | 342,902 | 28,217,933 |
| Real Return Bond | 6,419,772 | 1,683,204 | 918,388 | 7,184,588 | 12,326,477 | — | 5,199,709 | 97,997,779 |
| Small Cap | 1,344,381 | 140,563 | 1,484,944 | — | 23,783,169 | — | — | —- |
| Small Company | 2,488,367 | 598,825 | 1,406,156 | 1,681,036 | 25,849,461 | 1,582,211 | 393 | 24,812,097 |
| Small Company Growth | — | 1,980,138 | 63,336 | 1,916,802 | 864,659 | 568,769 | — | 24,707,574 |
| Small Company Value | 828,023 | 276,636 | 61,713 | 1,042,946 | 1,680,879 | 1,095,546 | 53,645 | 24,728,245 |
| Spectrum Income | 15,983,974 | 3,791,158 | 464,666 | 19,310,466 | 4,907,523 | 2,593,584 | 8,730,810 | 201,021,954 |
| Strategic Bond | 3,481,687 | 3,237,903 | 82,112 | 6,637,478 | 966,466 | — | 3,088,626 | 75,468,123 |
| Strategic Income | 4,159,023 | 3,339,262 | 135,500 | 7,362,785 | 1,368,276 | — | 1,712,095 | 75,468,550 |
| Total Return | 18,391,053 | 5,504,801 | 2,384,125 | 21,511,729 | 33,019,261 | 1,124,165 | 14,790,943 | 300,949,094 |
| U.S. Government Securities | 3,063,092 | 273,024 | 3,336,116 | — | 45,405,320 | —- | 428,273 | — |
| U.S. High Yield Bond | 4,735,805 | 1,327,818 | 78,794 | 5,984,829 | 1,050,619 | 19,781 | 5,259,157 | 75,468,693 |
| U.S. Multi Sector | 7,662,582 | 2,638,400 | 555,973 | 9,745,009 | 6,423,601 | 3,299,742 | 1,300,632 | 104,758,849 |
| Value & Restructuring | 3,507,182 | 1,104,691 | 589,193 | 4,022,680 | 7,924,029 | 173,911 | 737,633 | 52,455,745 |
Lifestyle Portfolios | Annual report
52
| | | | | | | | | |
| | | | | | | | Capital Gain | | |
| | | Beginning | | | Ending | | Distribution | | |
| | Affiliate — | Share | Shares | Shares | Share | Sale | From Under- | Dividend | Ending |
| Portfolio | Series NAV | Amount | Purchased | Sold | Amount | Proceeds | lying Funds | Income | Value |
|
| Lifestyle Moderate, continued | | | | | | | | |
| John Hancock Funds III | | | | | | | | |
| International Core | 2,460,741 | 825,450 | 363,733 | 2,922,458 | $17,121,913 | $9,950,560 | $1,766,514 | $125,694,903 |
| |
| Lifestyle Conservative | | | | | | | | |
| John Hancock Funds II | | | | | | | | |
| Active Bond | 12,897,935 | 3,558,215 | 650,567 | 15,805,583 | $6,197,479 | — | $5,900,098 | $150,469,149 |
| Blue Chip Growth | 1,288,395 | 541,730 | 312,638 | 1,517,487 | 6,588,489 | $151,153 | 135,792 | 32,747,366 |
| Core Bond | 1,965,128 | 476,793 | 58,304 | 2,383,617 | 728,212 | — | 1,295,788 | 30,105,084 |
| Equity-Income | 1,324,744 | 710,455 | 226,465 | 1,808,734 | 4,541,122 | 1,558,146 | 556,236 | 32,810,431 |
| Floating Rate Income | — | 733,000 | — | 733,000 | — | — | — | 7,330,000 |
| Fundamental Value | 1,462,801 | 714,844 | 289,060 | 1,888,585 | 5,188,404 | 276,839 | 330,915 | 32,842,501 |
| Global Bond | 6,776,603 | 2,221,253 | 971,865 | 8,025,991 | 14,546,075 | 886,946 | 5,548,791 | 120,389,863 |
| Global Real Estate | 3,127,336 | 2,607,040 | 1,136,571 | 4,597,805 | 13,554,147 | 1,807,120 | 1,434,956 | 45,150,450 |
| High Income | 2,254,461 | 1,059,982 | 115,229 | 3,199,214 | 1,264,003 | 1,282,688 | 1,812,420 | 30,104,605 |
| High Yield | 4,804,984 | 1,648,388 | 123,648 | 6,329,724 | 1,253,260 | 483,717 | 4,292,135 | 60,195,678 |
| International Value | 1,965,622 | 950,910 | 543,961 | 2,372,571 | 10,832,300 | 2,172,889 | 809,725 | 45,150,024 |
| Investment Quality Bond | 5,235,146 | 1,326,235 | 195,747 | 6,365,634 | 2,296,757 | — | 3,495,977 | 75,241,797 |
| Real Estate Equity | 1,904,003 | 452,830 | 404,290 | 1,952,543 | 5,085,239 | 1,954,456 | 199,323 | 16,401,361 |
| Real Return Bond | 3,778,896 | 1,016,769 | 526,885 | 4,268,780 | 7,055,750 | — | 3,020,161 | 58,226,153 |
| Spectrum Income | 12,908,984 | 2,603,147 | 3,948,455 | 11,563,676 | 42,051,456 | 1,547,078 | 5,536,192 | 120,377,870 |
| Strategic Bond | 2,057,537 | 3,304,470 | 67,751 | 5,294,256 | 787,020 | — | 2,311,455 | 60,195,695 |
| Strategic Income | 3,687,173 | 2,287,044 | 101,447 | 5,872,770 | 1,025,574 | — | 1,399,165 | 60,195,891 |
| Total Return | 14,378,775 | 4,147,742 | 1,318,153 | 17,208,364 | 18,134,415 | 892,220 | 11,607,103 | 240,745,013 |
| U.S. Government Securities | 9,973,410 | 3,014,330 | 870,876 | 12,116,864 | 11,652,710 | — | 7,028,803 | 161,638,968 |
| U.S. High Yield Bond | 1,856,216 | 567,322 | 36,171 | 2,387,367 | 476,669 | 7,861 | 2,060,477 | 30,104,697 |
| U.S. Multi Sector | 2,263,774 | 1,148,304 | 371,118 | 3,040,960 | 4,279,116 | 1,029,194 | 405,669 | 32,690,322 |
| Value & Restructuring | 2,068,110 | 1,200,133 | 749,643 | 2,518,600 | 9,962,623 | 106,430 | 451,417 | 32,842,545 |
| |
| John Hancock Funds III | | | | | | | | |
| International Core | 574,108 | 264,121 | 138,172 | 700,057 | $6,420,797 | $2,352,900 | $417,708 | $30,109,438 |
9. Fund mergers
On June 29, 2007, the Board of Trustees of the Trust approved the following two proposed merger transactions: (i) John Hancock Allocation Core Portfolio (a “Target Fund”), a series of John Hancock Capital Series Trust, to be merged into Lifestyle Balanced Portfolio (an “Acquiring Fund”) and (ii) John Hancock Allocation Growth + Value Portfolio (a “Target Fund”), a series of John Hancock Capital Series Trust, to be merged into Lifestyle Growth Portfolio (an “Acquiring Fund”).
After shareholder approval was obtained, the mergers were effective after the close of business on September 28, 2007. Each Acquiring Fund acquired all of the assets and liabilities of the corresponding Target Fund as shown in the table below. Each merger qualified as a tax-free reorganization for federal income tax purposes with no gain or loss recognized by the Target Fund or their shareholders.
Pursuant to the Agreement and Plan of Reorganization, shareholders of each Target Fund received a number of shares of the corresponding class in the corresponding Acquiring Fund with a value equal to their holdings in the Target Fund as of the close of business on date of the reorganization.
The following is a summary of Shares Outstanding, Net Assets and Net Unrealized Appreciation immediately before and after the reorganizations:
| | | | | | |
| | | | Appreciation of | | | |
| | | Acquired Net Asset | Transferor | | Acquiring Fund | Acquiring Fund |
| | | Value of the | Fund’s | Shares Issued by | Net Assets Prior to | Total Net Assets |
| Acquiring Fund | Transferor Fund | Transferor Fund | Investments | Acquiring Fund | Combination | After Combination |
|
| |
| Lifestyle Growth | JH Allocation Growth & Value | $6,318,041 | $519,679 | 393,907 | $10,401,426,390 | $10,407,744,431 |
| Lifestyle Balanced | JH Allocation Core | 9,527,860 | 498,757 | 621,391 | 9,535,359,035 | 9,544,886,895 |
Annual report | Lifestyle Portfolios
53
Auditors report
Report of Independent Registered Public Accounting Firm
To the Board of Trustees and Shareholders of John Hancock Fund II:
In our opinion, the accompanying statements of assets and liabilities, including the schedules of securities owned, and the related statements of operations and of changes in net assets and the financial highlights present fairly, in all material respects, the finan-cial position of each of the portfolios (identified in Note 1) comprising John Hancock Funds II (the “Trust”) at December 31, 2007, and the results of each of their operations, the changes in each of their net assets and the financial highlights for each of the periods indicated, in conformity with accounting principles generally accepted in the United States of America. These financial statements and financial highlights (hereafter referred to as “financial statements”) are the responsibility of the Trust’s management. Our responsibility is to express an opinion on these financial statements based on our audits. We conducted our audits of these financial statements in accordance with th e standards of the Public Company Accounting Oversight Board (United States). Those standards require that we plan and perform the audits to obtain reasonable assurance about whether the financial statements are free of material misstatement. An audit includes examining, on a test basis, evidence supporting the amounts and disclosures in the financial statements, assessing the accounting principles used and significant estimates made by management, and evaluating the overall financial statement presentation. We believe that our audits, which included confirmation of securities at December 31, 2007, by correspondence with the transfer agent, provide a reasonable basis for our opinion.
PricewaterhouseCoopers LLP
Boston, Massachusetts
February 29, 2008
Lifestyle Portfolios | Annual report
54
Tax information
Unaudited
For federal income tax purposes, the following information is furnished with respect to the distributions of the Portfolios, if any, paid during its taxable year ended December 31, 2007.
The Portfolios below have designated the following amounts as capital gain dividends paid during the fiscal year.
| | |
| Portfolio | Capital Gains | |
| Lifestyle Aggressive | $43,966,246 | |
| Lifestyle Growth | 82,092,859 | |
| Lifestyle Balanced | 44,874,979 | |
| Lifestyle Moderate | 7,519,152 | |
| Lifestyle Conservative | 1,863,066 | |
Annual report | Lifestyle Portfolios
55
EVALUATION BY THE BOARD OF AMENDMENTS TO ADVISORY AGREEMENT
At its meeting on September 27–28, 2007, the Board, including all of the Independent Trustees, approved amendments to the Advisory Agreement with respect to each of the Lifestyle Funds (the “Lifestyle Funds”) of John Hancock Funds II (“JHF II or the “Trust”):
1. Transferring to a new Service Agreement with the Adviser the financial, accounting and administrative services currently performed by the Adviser under the Advisory Agreement (“Amendment 1”), and
2. Restructuring the advisory fee by applying different advisory fee rates to “Affiliated Fund Assets” and “Other Assets.” Affiliated Fund Assets are each of the JHF II funds and the funds of JHF III. Other Assets are any assets that are not Affiliated Fund Assets. (“Amendment 2”).
Each of these amendments were subsequently also approved by shareholders of the Lifestyle Funds at a meeting of shareholders held on January 8, 2008, and are described in a proxy statement for the Trust dated November 9, 2007 which was mailed to shareholders of record on October 29, 2007.
The Board, including the Independent Trustees, is responsible for selecting JHF II’s investment adviser, approving the Adviser’s selection of Fund subadvisers and approving JHF II’s advisory and subadvisory agreements, their periodic continuation and any amendments. Consistent with SEC rules, the Board regularly evaluates JHF II’s advisory and subadvisory arrangements, including consideration of the factors listed below. The Board may also consider other factors (including conditions and trends prevailing generally in the economy, the securities markets and the industry) and does not treat any single factor as determinative, and each Trustee may attribute different weights to different factors. The Board is furnished with an analysis of its fiduciary obligations in connection with its evaluation and, throughout the evaluation process, the Board is assisted by counsel for JHF II and the Independent Trustees are also separately assisted by independent l egal counsel. The factors considered by the Board are:
1. the nature, extent and quality of the services to be provided by the Adviser to JHF II and by the subadvisers to the Funds;
2. the investment performance of the Funds and their subadvisers;
3. the extent to which economies of scale would be realized as a Fund grows and whether fee levels reflect these economies of scale for the benefit of Fund shareholders;
4. the costs of the services to be provided and the profits to be realized by the Adviser and its affiliates (including any subadvisers affiliated with the Adviser) from the Adviser’s relationship with JHF II; and
5. comparative services rendered and comparative advisory and subadvisory fee rates.
The Board believes that information relating to all these factors is relevant to its evaluation of JHF II’s advisory agreements. With respect to its evaluation of subadvisory agreements with subadvisers not affiliated with the Adviser, the Board believes that, in view of JHF II’s “manager-of-managers” advisory structure, the costs of the services to be provided and the profits to be realized by such unaffiliated subadvisers from their relationship with JHF II, generally, are not a material factor in the Board’s consideration of these subadvisory agreements because such fees are paid to subadvisers by the Adviser and not by the Funds and because the Board relies on the ability of the Adviser to negotiate such subadvisory fees at arms-length.
At its meeting on June 8, 2007, the Board approved the annual continuation of the Advisory Agreement with respect to each of the Funds and considered each of the factors listed above. A discussion of the basis of the Board’s approval of the Advisory Agreement and the factors considered by the Board at that meeting is available in JHF II’s annual report to shareholders for the year ended August 31, 2007. This report was mailed to shareholders of JHF II on or about October 30, 2007. A copy of the report may be obtained by calling 1-800-225-5291 (TDD 1-800-544-6713) or by writing to JHF II at 601 Congress Street, Boston, Massachusetts 02210, Attn.: Gordon Shone.
In approving each of the amendments to the Advisory Agreement at its September 27–28, 2007 meeting, the Board determined that it was appropriate to rely upon its recent consideration at its June 8, 2007 meeting of such factors as: fund performance; the realization of economies of scale; profitability of the Advisory Agreement to the Adviser; and comparative advisory fee rates (as well as its conclusions with respect to those factors). The Board noted that it had, at the June 8, 2007 meeting, concluded that each of these factors supported the continuation of the Advisory Agreement. The Board, at the September 27–28, 2007 meeting, revisited particular factors to the extent relevant to the proposed amendments. In particular, the Board noted the skill and competency of the Adviser in its past management of JHF II’s affairs and subadvisory relationships, the qualifications of the Adviser’s personnel who perform services for JHF II and the Funds, including those who served as officers of JHF II, and the high level and quality of services that the Adviser may reasonably be expected to continue to provide the Funds and concluded that the Adviser may reasonably be expected to perform its services ably under the Advisory Agreement as proposed to be amended.
Specific factors considered by the Board in approving Amendments 1 and 2 are set forth below.
Amendment 1. The Board considered with respect to Amendment 1 and the new Service Agreement with the Adviser that the transfer to the Service Agreement of the non-advisory services currently performed by the Adviser under the Advisory Agreement would not result in any change in the level and quality of services provided to the Funds, would provide greater flexibility in that future changes to the non-advisory services arrangements for the Funds would no longer require the expense of obtaining shareholder approval and would not, without further Board approval, result in any material increase in the costs to the Funds of the Adviser’s provision of such services.
Amendment 2. The Board considered with respect to Amendment 2 the benefit to each Lifestyle Fund of having a different advisory fee on Affiliated Fund Assets than on Other Assets. The Board noted that the Adviser currently receives an advisory fee at the underlying fund level with respect to Affiliated Fund Assets but would not receive any comparable compensation with respect to investments in Other Assets, that it was reasonable to
Lifestyle Portfolios | Annual report
56
provide for such compensation in view of the services to be provided by the Adviser. The Board also noted that providing the Adviser with the ability to invest in both Affiliated Fund Assets and Other Assets as deemed appropriate by the Adviser was a benefit to each Fund. The Board took into account that, although the advisory fee with respect to investments in Other Assets will increase, the increase is expected to be offset in whole or in part by a decrease in underlying fund expenses. The Board also noted that in the event that a Fund should invest in Other Assets that are shares of an underlying fund that is advised by the Adviser or one of its affiliates but is not a fund of JHF II or JHF III, the Adviser intends to waive a portion of its advisory fee or reimburse the Fund and that this fee waiver is intended to provide the Adviser and its affiliate with the same aggregate advisory fee at the Fund and underlying fund levels that the Adviser would receive if such Other Assets were Affiliated Fund Assets.
Annual report | Lifestyle Portfolios
57
Trustees and Officers
This chart provides information about the Trustees and Officers who oversee your John Hancock fund. Officers elected by the Trustees manage the day-to-day operations of the Portfolio and execute policies formulated by the Trustees.
| | |
| Independent Trustees | | |
| |
| Name, age | | Number of |
| Position(s) held with Portfolio | Trustee of | John Hancock |
| Principal occupation(s) and other | Portfolio | funds overseen |
| directorships during past 5 years | since2 | by Trustee |
| |
| Charles L. Bardelis, Born: 1941 | 2005 | 209 |
|
| Director, Island Commuter Corp. (Marine Transport). Trustee of John Hancock Trust | | |
| (since 1988); John Hancock Funds II (since 2005) and John Hancock Funds III (from | | |
| October 2005 to December 2006). | | |
| |
| Peter S. Burgess, Born: 1942 | 2005 | 209 |
|
| Consultant (financial, accounting and auditing matters (since 1999); | | |
| Certified Public Accountant; Partner, Arthur Andersen (prior to 1999). | | |
| Director of the following publicly traded companies: PMA Capital Corporation | | |
| (since 2004) and Lincoln Educational Services Corporation (since 2004). | | |
| Trustee of John Hancock Trust and John Hancock Funds II (since 2005), and | | |
| John Hancock Funds III (from October 2005 to December 2006). | | |
| |
| Elizabeth G. Cook, Born: 1937 | 2005 | 209 |
|
| Expressive Arts Therapist, Massachusetts General Hospital (September 2001 | | |
| to present); Expressive Arts Therapist, Dana Farber Cancer Institute | | |
| (September 2000 to January 2004); President, The Advertising Club of Greater Boston. | | |
| Trustee of John Hancock Trust and John Hancock Funds II (since 2005) and | | |
| John Hancock Funds III (from October 2005 to December 2006). | | |
| |
| Hassell H. McClellan, Born: 1945 | 2005 | 209 |
|
| Associate Professor, The Wallace E. Carroll School of Management, Boston College. | | |
| Trustee of John Hancock Trust and John Hancock Funds II (since 2005), and | | |
| John Hancock Funds III (from October 2005 to December 2006). | | |
|
| James. M. Oates, Born: 1946 | 2005 | 209 |
|
| Managing Director, Wydown Group (financial consulting firm) (since 1994); | | |
| Chairman, Emerson Investment Management, Inc. (since 2000); Chairman, | | |
| Hudson Castle Group, Inc. (formerly IBEX Capital Markets, Inc.) (financial services | | |
| company) (1997 to 2006); Independent Chairman, Hudson Castle Group, Inc. (since 2007). | | |
| Director of the following publicly traded companies: Stifel Financial (since 1996); Investor | | |
| Financial Services Corporation (1995 to 2007); Investors Bank & Trust (1995 to 2007); Phoenix | | |
| Mutual Funds (since 1988); and Connecticut River Bancorp, Director (since 1998). Trustee of | | |
| John Hancock Trust (since 2004); Chairman of John Hancock Trust and John Hancock Funds II | | |
| (since 2005) and John Hancock Funds III (from October 2005 to December 2006). | | |
| |
| Non-Independent Trustee | | |
| Name, age | | Number of |
| Position(s) held with Portfolio | Trustee of | John Hancock |
| Principal occupation(s) and other | Portfolio | funds overseen |
| directorships during past 5 years | since2 | by Trustee |
| |
| James R. Boyle1, Born: 1959 | 2005 | 262 |
|
| Executive Vice President, Manulife Financial Corporation (since 1999); President, John Hancock Variable Life | | |
| Insurance Company (since March, 2007); Executive Vice President, John Hancock Life Insurance Company | | |
| (since June, 2004); Chairman and Director, John Hancock Advisers, LLC (the “Adviser”), the Berkeley Financial | | |
| Group, LLC (“The Berkeley Group”) (holding company); and John Hancock Funds, LLC (“John Hancock | | |
| Funds”) (since 2005); Senior Vice President, The Manufacturers Life Insurance Company (U.S.A) (until 2004). | | |
1 Affiliated with the investment adviser.
2 Each Trustee serves until resignation, retirement age or until her or his successor is elected.
Lifestyle Portfolios | Annual report
58
| |
| Principal officers who are not Trustees | |
| |
| Name, age | |
| Position(s) held with Portfolio | Officer of |
| Principal occupation(s) and | Portfolio |
| directorships during past 5 years | since |
| |
| Keith F. Hartstein1, Born: 1956 | 2005 |
|
| President and Chief Executive Officer | |
| Senior Vice President, Manulife Financial Corporation (since 2004); Director, President and Chief Executive | |
| Officer, the Adviser, The Berkeley Group, John Hancock Funds, LLC (since 2005); Director, MFC Global Investment | |
| Management (U.S.), LLC (“MFC Global (U.S.)”) (since 2005); Director, John Hancock Signature Services, Inc. (since | |
| 2005); President and Chief Executive Officer, John Hancock Investment Management Services, LLC (since 2006); | |
| President and Chief Executive Officer, John Hancock Funds II, John Hancock Funds III, and John Hancock Trust; | |
| Director, Chairman and President, NM Capital Management, Inc. (since 2005); Member, Investment Company | |
| Institute Sales Force Marketing Committee (since 2003); President and Chief Executive Officer, MFC Global (U.S.) | |
| (2005-2006); Executive Vice President, John Hancock Funds, LLC (until 2005) | |
| |
| John G. Vrysen1, Born: 1955 | 2005 |
|
| Chief Operating Officer | |
| Senior Vice President, Manulife Financial Corporation (since 2006); Director, Executive Vice President and Chief | |
| Operating Officer, the Adviser, The Berkeley Group and John Hancock Funds, LLC (since June 2007); Executive | |
| Vice President and Chief Operating Officer, John Hancock Investment Management Services, LLC (since December | |
| 2007); Chief Operating Officer, John Hancock Funds, John Hancock Funds II, John Hancock Funds III and John | |
| Hancock Trust (since June 2007); Executive Vice President and Chief Financial Officer, the Adviser, The Berkeley | |
| Group and John Hancock Funds, LLC (2005-2007); Executive Vice President and Chief Financial Officer, John | |
| Hancock Investment Management Services, LLC (2005-December 2007), Executive Vice President and Chief | |
| Financial Officer, MFC Global (U.S.) (2005-until December 2007); Director, John Hancock Signature Services, | |
| Inc. (since 2005); Chief Financial Officer, John Hancock Funds, John Hancock Funds II, John Hancock Funds III, | |
| and John Hancock Trust (2005-June 2007); Vice President and General Manager, Fixed Annuities, U.S. Wealth | |
| Management (2004-2005); Vice President, Operations Manulife Wood Logan (2000-2004). | |
| |
| Charles A. Rizzo1, Born: 1957 | 2007 |
|
| Chief Financial Officer | |
| Vice President and Chief Financial Officer, John Hancock Funds, John Hancock Funds II, John Hancock Funds III | |
| and John Hancock Trust (June 2007- Present); Assistant Treasurer, Goldman Sachs Mutual Fund Complex (reg- | |
| istered investment companies) (2005-June 2007); Vice President, Goldman Sachs (2005-June 2007); Managing | |
| Director and Treasurer of Scudder Funds, Deutsche Asset Management (2003-2005); Director, Tax and Financial | |
| Reporting, Deutsche Asset Management (2002-2003); Vice President and Treasurer, Deutsche Global Fund | |
| Services (Deutshce Registered Investment Companies) (1999-2002). | |
| |
| Francis V. Knox, Jr.1, Born: 1947 | 2005 |
|
| Chief Compliance Officer | |
| Vice President and Chief Compliance Officer, John Hancock Investment Management Services, LLC, the Adviser | |
| and MFC Global (U.S.) (since 2005); Vice President and Chief Compliance Officer, John Hancock Funds, John | |
| Hancock Funds II, John Hancock Funds III and John Hancock Trust (since 2005); Vice President and Assistant | |
| Treasurer, Fidelity Group of Funds (until 2004); Vice President and Ethics & Compliance Officer, Fidelity Investments | |
| (until 2001). | |
| |
| Gordon M. Shone1, Born: 1956 | 2005 |
|
| Treasurer | |
| Senior Vice President, John Hancock Life Insurance Company, (U.S.A.) (since 2001); Treasurer for John Hancock | |
| Funds (since 2006); for John Hancock Funds II, John Hancock Funds III and John Hancock Trust (since 2005); Vice | |
| President and Chief Financial Officer, John Hancock Trust (2003-2005); Vice President, John Hancock Investment | |
| Management Services, Inc., John Hancock Advisers, LLC (since 2006), and The Manufacturers Life Insurance | |
| Company (U.S.A.) (1998-2000). | |
| |
| Thomas M. Kinzler1, Born: 1955 | 2006 |
|
| Secretary and Chief Legal Officer | |
| Vice President and Counsel, John Hancock Life Insurance Company (U.S.A.) (since 2006); Secretary and Chief | |
| Legal Officer, John Hancock Funds and John Hancock Funds II (since 2006), and Chief Legal Officer and Assistant | |
| Secretary, John Hancock Funds III and John Hancock Trust (since 2006); Vice President and Associate General | |
| Counsel, Massachusetts Mutual Life Insurance Company (1999-2006); Secretary and Chief Legal Counsel, MML | |
| Series Investment Fund (2000-2006); Secretary and Chief Legal Counsel, MassMutual Institutional Funds (2000- | |
| 2004); Secretary and Chief Legal Counsel, MassMutual Select Funds and MassMutual Premier Funds (2004-2006). | |
1 Affiliated with the investment adviser.
Annual report | Lifestyle Portfolios
59
For more information
PROXY VOTING POLICY AND PROXY VOTING RECORD. A description of the Portfolios’ proxy voting policies and procedures, and information regarding how the Portfolios voted proxies relating to portfolio securities during the most recent twelve-month period ended June 30 are available without charge: upon request.
| | |
| By phone | On the Portfolios’ Web site | On the SEC’s Web site |
| 1-800-225-5291 | www.jhfunds.com/proxy | www.sec.gov |
|
| |
| |
| Investment adviser | Custodian | Legal counsel |
| John Hancock Investment | State Street Bank & Trust Co. | Kirkpatrick & Lockhart |
| Management Services, LLC | 2 Avenue de Lafayette | Preston Gates Ellis LLP |
| 601 Congress Street | Boston, MA 02111 | One Lincoln Street |
| Boston, MA 02210-2805 | | Boston, MA 02111 |
| | Transfer agent | |
| Subadviser | John Hancock Signature | Independent registered |
| MFC Global Investment | Services, Inc. | public accounting firm |
| Management (U.S.A.) Limited | One John Hancock Way, | PricewaterhouseCoopers LLP |
| 200 Bloor Street East | Suite 1000 | 125 High Street |
| Toronto, Ontario, Canada | Boston, MA 02217-1000 | Boston, MA 02110 |
| M4W 1E5 | | |
Principal distributor
John Hancock Funds, LLC
601 Congress Street
Boston, MA 02210-2805
Each underlying fund’s accounting policies are outlined in the underlying fund’s shareholder report, available without charge by calling 1-800-344-1029 or on the Securities and Exchange Commission (“SEC”) Web site at www.sec.gov, File # 811-21779, CIK 0001331971 for JHF II and File # 811-21777, CIK 0003129954 for JHF III.
| | |
| How to contact us | |
|
| |
| |
| Internet | www.jhfunds.com | |
|
| |
| |
| Mail | Regular mail: | Express mail: |
| | John Hancock | Mutual Fund Operations |
| | Signature Services, Inc. | John Hancock |
| | 164 Corporate Drive | Signature Services, Inc. |
| | Portsmouth, NH 03801 | 164 Corporate Drive |
| | | Portsmouth, NH 03801 |
|
| |
| |
| Phone | Customer service representatives | 1-888-225-5291 |
| | EASI-Line | 1-800-338-8080 |
| | TDD line | 1-800-554-6713 |
QUARTERLY PORTFOLIO DISCLOSURE. The Portfolios file a complete schedule of portfolio holdings with the SEC for the first and third quarters of each fiscal year on Form N-Q. The Portfolios’ Form N-Q is available electronically on the SEC Web site (www.sec.gov); hard copies may be reviewed and copied at the SEC’s Public Reference Room in Washington, DC. For more information on the Public Reference Room, call 1-202-551-8090.
Lifestyle Portfolios | Annual report
60

1-800-225-5291
1-800-554-6713 TDD
1-800-338-8080 EASI-Line
www.jhfunds.com
Now available: electronic delivery
www.jhfunds.com/edelivery
| | |
| | LS00A | 12/07 |
| This report is for the information of the shareholders of John Hancock Lifestyle Portfolios. | | 2/08 |
ITEM 2. CODE OF ETHICS.
(a) As of the end of the fiscal year, December 31, 2007, the registrant has adopted a code of ethics, as defined in Item 2 of Form N-CSR), that applies to its Chief Executive Officer and Chief Financial Officer (respectively, the principal executive officer, the principal financial officer, the “Covered Officers”). A copy of the code of ethics is filed as an exhibit to this Form N-CSR.
(b) Not applicable
(c) Not applicable
(d) Not applicable
(e) Not applicable
(f)(1) A copy of the Code of Ethics is attached hereto.
JOHN HANCOCK TRUST
JOHN HANCOCK FUNDS
JOHN HANCOCK FUNDS II
JOHN HANCOCK FUNDS III
SARBANES-OXLEY CODE OF ETHICS
FOR
PRINCIPAL EXECUTIVE & PRINCIPAL FINANCIAL OFFICERS
I. Covered Officers/Purpose of the Code
This code of ethics (this “Code”) for John Hancock Trust, John Hancock Funds1, John Hancock Funds II and John Hancock Funds III, each a registered management investment company under the Investment Company Act of 1940, as amended (“1940 Act”), which may issue shares in separate and distinct series (each investment company and series thereunder to be hereinafter referred to as a “Fund”), applies to each Fund’s Principal Executive Officer (“President”) and Principal Financial Officer (“Chief Financial Officer”) (the “Registrant’s Executive Officers” or “Executive Officers” as set forth in Exhibit A) for the purpose of promoting:
► honest and ethical conduct, including the ethical handling of actual or apparent conflicts of interest between personal and professional relationships;
► full, fair, accurate, timely and understandable disclosure in reports and documents that the Fund files with, or submits to, the Securities and Exchange Commission (“SEC”) and in other public communications made by the Fund;
► compliance with applicable laws and governmental rules and regulations;
► the prompt internal reporting of violations of the Code to an appropriate person or persons identified in the Code; and
► accountability for adherence to the Code.
___________________________________________
1 John Hancock Funds includes the following trusts: John Hancock Bank and Thrift Opportunity Fund; John Hancock Bond Trust; John Hancock California Tax-Free Income Fund; John Hancock Capital Series; John Hancock Current Interest; John Hancock Equity Trust; John Hancock Income Securities Trust; John Hancock Investment Trust; John Hancock Investment Trust II; John Hancock Investment Trust III; John Hancock Investors Trust; John Hancock Municipal Securities Trust; John Hancock Patriot Premium Dividend Fund II; Trust; John Hancock Preferred Income Fund; John Hancock Preferred Income Fund II; John Hancock Preferred Income Fund III; John Hancock Series Trust; John Hancock Sovereign Bond Fund; John Hancock Strategic Series; John Hancock Tax-Exempt Series Fund; John Hancock World Fund; John Hancock Tax-Advantaged Dividend Income Fund and John Hancock Tax-Advantaged Global Shareholder Yield Fund.
1 of 6
Each of the Registrant’s Executive Officers should adhere to a high standard of business ethics and should be sensitive to situations that may give rise to actual as well as apparent conflicts of interest.
II. Covered Officers Should Handle Ethically Actual and Apparent Conflicts of Interest
Overview
A “conflict of interest” occurs when an Executive Officer’s private interest interferes with the interests of, or his service to, the Fund. For example, a conflict of interest would arise if a Registrant’s Executive Officers, or a member of his family, receives improper personal benefits as a result of his position with the Fund. Certain conflicts of interest arise out of the relationships between the Executive Officers and the Fund and already are subject to conflict of interest provisions in the Investment Company Act of 1940, as amended (the “Investment Company Act”) and the Investment Advisers Act of 1940, as amended (the “Investment Advisers Act”). For example, Executive Officers may not individually engage in certain transactions (such as the purchase or sale of securities or other property) with the Fund because of their status as “affiliated persons” of the Fund. Each of the Registrant’s Executive Officers is an off icer or employee of the investment adviser or a service provider (“Service Provider”) to the Fund. The Fund’s, the investment adviser’s and the Service Provider’s compliance programs and procedures are designed to prevent, or identify and correct, violations of these provisions. This Code does not, and is not intended to, repeat or replace these programs and procedures, and such conflicts fall outside of the parameters of this Code.
Although typically not presenting an opportunity for improper personal benefit, conflicts arise from, or as a result of, the contractual relationship between the Fund and the investment adviser and the Service Provider of which the Executive Officers are also officers or employees. As a result, this Code recognizes that the Registrant’s Executive Officers will, in the normal course of their duties (whether formally for the Fund, for the investment adviser or for the Service Provider), be involved in establishing policies and implementing decisions which will have different effects on the investment adviser, the Service Provider and the Fund. The participation of the Executive Officers in such activities is inherent in the contractual relationship between the Fund and the investment adviser and the Service Provider and is consistent with the performance by the Executive Officers of their duties as officers of the Fund. Thus, if such participation is performed in conformity with the provisions of the Investment Company Act and the Investment Advisers Act, it will be deemed to have been handled ethically. In addition, it is recognized by the Fund’s Board of Trustees/Directors (the “Board”) that the Executive Officers may also be officers or employees of one or more other investment companies covered by other Codes.
Other conflicts of interest are covered by the Code, even if such conflicts of interest are not subject to provisions in the Investment Company Act and the Investment Advisers Act. The following list provides examples of conflicts of interest under the Code, but the Registrant’s Executive Officers should keep in mind that these examples are not exhaustive. The overarching principle is that the personal interest of an Executive Officer should not be placed improperly before the interest of the Fund.
2 of 6
* * *
Each Covered Officer must:
► not use his/her personal influence or personal relationships improperly to influence investment decisions or financial reporting by the Fund whereby the Executive Officer would benefit personally to the detriment of the Fund;
► not cause the Fund to take action, or fail to take action, for the individual personal benefit of the Executive Officer rather than for the benefit of the Fund; and
► not use material non-public knowledge of portfolio transactions made or contemplated for the Fund to trade personally or cause others to trade personally in contemplation of the market effect of such transactions.
Additionally, conflicts of interest may arise in other situations, the propriety of which may be discussed, if material, with the Fund’s Chief Compliance Officer (“CCO”). Examples of these include:
► service as a director/trustee on the board of any public or private company;
► the receipt of any non-nominal gifts;
► the receipt of any entertainment from any company with which the Fund has current or prospective business dealings unless such entertainment is business-related, reasonable in cost, appropriate as to time and place, and not so frequent as to raise any question of impropriety (or other formulation as the Fund already uses in another code of conduct);
► any ownership interest in, or any consulting or employment relationship with, any of the Fund’s service providers, other than its investment adviser, any sub-adviser, principal underwriter, administrator or any affiliated person thereof; and
► a direct or indirect financial interest in commissions, transaction charges or spreads paid by the Fund for effecting portfolio transactions or for selling or redeeming shares other than an interest arising from the Executive Officer’s employment, such as compensation or equity ownership.
III. Disclosure & Compliance
► Each Executive Officer should familiarize himself or herself with the disclosure requirements generally applicable to the Fund;
► Each Executive Officer should not knowingly misrepresent, or cause others to misrepresent, facts about the Fund to others, whether within or outside the Fund,
3 of 6
including to the Fund’s directors and auditors, and to governmental regulators and self-regulatory organizations;
► Each Executive Officer should, to the extent appropriate within his/her area of responsibility, consult with other officers and employees of the Fund and the Fund’s adviser or any sub-adviser with the goal of promoting full, fair, accurate, timely and understandable disclosure in the reports and documents the Fund files with, or submits to, the SEC and in other public communications made by the Fund; and
► It is the responsibility of each Executive Officer to promote compliance with the standards and restrictions imposed by applicable laws, rules and regulations.
IV. Reporting & Accountability
Each Executive Officer must:
► upon adoption of the Code (or thereafter as applicable, upon becoming an Executive Officer), affirm in writing to the Fund’s CCO that he/she has received, read, and understands the Code;
► annually thereafter affirm to the Fund’s CCO that he/she has complied with the requirements of the Code;
► not retaliate against any employee or Executive Officer or their affiliated persons for reports of potential violations that are made in good faith;
► notify the Fund’s CCO promptly if he/she knows of any violation of this Code (Note: failure to do so is itself a violation of this Code); and
► report at least annually any change in his/her affiliations from the prior year.
The Fund’s CCO is responsible for applying this Code to specific situations in which questions are presented under it and has the authority to interpret this Code in any particular situation. However, any approvals or waivers sought by the Principal Executive Officer will be considered by the Fund’s Board or the Compliance Committee thereof (the “Committee”).
The Fund will follow these procedures in investigating and enforcing this Code:
► the Fund’s CCO will take all appropriate action to investigate any potential violations reported to him/her;
► if, after such investigation, the CCO believes that no violation has occurred, the CCO is not required to take any further action;
► any matter that the CCO believes is a violation will be reported to the Board or, if applicable, Compliance Committee;
4 of 6
► if the Board or, if applicable, Compliance Committee concurs that a violation has occurred, the Board, either upon its determination of a violation or upon recommendation of the Compliance Committee, if applicable, will consider appropriate action, which may include review of, and appropriate modifications to, applicable policies and procedures; notification to appropriate personnel of the Service Provider or the investment adviser or its board; or a recommendation to dismiss the Registrant’s Executive Officer;
► the Board, or if applicable the Compliance Committee, will be responsible for granting waivers, as appropriate; and
► any changes to or waivers of this Code will, to the extent required, be disclosed as provided by SEC rules.
V. Other Policies & Procedures
This Code shall be the sole code of ethics adopted by the Fund for purposes of Section 406 of the Sarbanes-Oxley Act of 2002 and the rules and forms applicable to registered investment companies thereunder. Insofar as other policies or procedures of the Fund, the Fund’s adviser, any sub-adviser, principal underwriter or other service providers govern or purport to govern the behavior or activities of the Registrant’s Executive Officers who are subject to this Code, they are superseded by this Code to the extent that they overlap or conflict with the provisions of this Code. The Fund’s and its investment adviser’s codes of ethics under Rule 204A-1 under the Investment Advisers Act and Rule 17j-1 under the Investment Company Act, respectively, are separate requirements applying to the Registrant’s Executive Officers and others, and are not part of this Code.
VI. Amendments
Any amendments to this Code, other than amendments to Exhibit A, must be approved or ratified by a majority vote of the Fund’s Board, including a majority of independent directors.
VII. Confidentiality
All reports and records prepared or maintained pursuant to this Code will be considered confidential and shall be maintained and protected accordingly. Except as otherwise required by law or this Code, such matters shall not be disclosed to anyone other than the Fund’s Board and its counsel, the investment adviser and the relevant Service Providers.
VIII. Internal Use
The Code is intended solely for the internal use by the Fund and does not constitute an admission, by or on behalf of the Fund, as to any fact, circumstance, or legal conclusion.
5 of 6
Exhibit A
Persons Covered by this Code of Ethics
(As of June 2007)
John Hancock Trust
► Principal Executive Officer and President – Keith Hartstein
► Principal Financial Officer and Chief Financial Officer – Charles Rizzo
John Hancock Funds
► Principal Executive Officer and President – Keith Hartstein
► Principal Financial Officer and Chief Financial Officer – Charles Rizzo
John Hancock Funds II
► Principal Executive Officer and President – Keith Hartstein
► Principal Financial Officer and Chief Financial Officer – Charles Rizzo
John Hancock Funds III
► Principal Executive Officer and President – Keith Hartstein
► Principal Financial Officer and Chief Financial Officer – Charles Rizzo
6 of 6
(f)(2) Not applicable(f)(3) The Registrant will provide a copy of the Code of Ethics to any person without charge, upon request by calling the following toll free number (800) 344-1029.
ITEM 3. AUDIT COMMITTEE FINANCIAL EXPERT.
The Board of Trustees of the Registrant has determined that it has one “audit committee financial expert” as that term is defined in Item 3(b) of Form N-CSR: Peter S. Burgess, who is “independent” as that term is defined in Item 3(a) (2) of Form N-CSR.
ITEM 4. PRINCIPAL ACCOUNTANT FEES AND SERVICES.
(a) AUDIT FEES:
2007: 78,985
From 9/1/06 to 12/31/06 $63,685
These fees represent aggregate fees billed for the fiscal year ended (12/31/07) and the period from 9/1/06 to fiscal year end (12/31/06) (the “Reporting Periods”) for professional services rendered by the principal accountant, PricewaterhouseCoopers LLP (“PWC”), for the audits of the Registrant’s annual financial statements or services that are normally provided by the accountant in connection with statutory and regulatory filing or engagements for such period.
(b) AUDIT RELATED FEES:
2007: 25,960
From 9/1/06 to 12/31/06 $ $24,960
These fees represent the aggregate fees billed for the Reporting Periods for assurance and related services by PWC that are reasonably related to the performance of the audit of the Registrant’s financial statements and are not reported under paragraph (a) of this Item. Such fees relate to professional services rendered by PWC for separate audit reports in connection with security
counts pursuant to Rule 17f-2 under the Investment Company Act of 1940 and fund merger audit services.
(c) TAX FEES:
2007: 15,395
From 9/1/06 to 12/31/06 $14,805
These fees represent aggregate fees billed for the Reporting Periods for professional services rendered by PWC for tax compliance, tax advice and tax planning. The tax services provided by PWC related to the review of the Registrant’s federal and state income tax returns, excise tax calculations and returns and a review of the Registrant’s calculations of capital gain and income distributions.
(d) ALL OTHER FEES; NONE.
(e) (1) The audit committee’s pre-approval policies and procedures described in paragraph (c) (7) of Rule 2-01 of Regulation S-X are attached.
John Hancock Funds II
Audit Committee
Audit and Non-Audit Services Pre-Approval Policy
I. Statement of Principles
Under the Sarbanes-Oxley Act of 2002 (the “Act”), the Audit Committee of the Board of Trustees is responsible for the appointment, compensation and oversight of the services provided by the independent auditor to John Hancock Funds II (the “Trust”). As part of this responsibility, the Audit Committee is required to pre-approve the audit and non-audit services performed by the Trust’s independent auditor (the “Auditor”) in order to assure that these services do not impair the Auditor’s independence. In addition, these procedures also require the Audit Committee to pre-approve non-audit services provided by the Auditor to Manulife Financial Corporation (or any subsidiary thereof) where such services provided have a direct impact on the operations or financial reporting of the Trust as further assurance that such services do not impair the Auditor’s independence.
This Policy follows two different approaches to pre-approving services: (1) proposed services may be pre-approved (“general pre-approval”), or (2) proposed services will require specific pre-approval (“specific pre-approval”). Unless a type of service provided by the Auditor has received general pre-approval, it will require specific pre-approval by the Audit Committee.
Exhibit I to this Policy describes the Audit, Audit-related, Tax and All Other Services that have been pre-approved by the Audit Committee. The Audit Committee will annually review these services. It is expected that such review will occur at the regularly scheduled April Audit Committee meeting.
II. Delegation
The Audit Committee may delegate pre-approval authority to its chairperson or any other member or members. The member to whom such authority is delegated must report, for informational purposes only, any pre-approval decisions to the Audit Committee at its next meeting following the pre-approval. If pre-approval of any services to be provided by the Auditors is required before the next regularly scheduled Audit Committee meeting, the Audit Committee hereby authorizes its chairman to provide such pre-approval.
III. Audit Services
The Trust’s annual audit services engagement scope and terms will be subject to the general pre-approval of the Audit Committee. Audit services include the annual financial statement audit and other procedures required to be performed by the independent auditor in order to be able to form an opinion on the Trust’s financial statements. The Audit services that are pre-approved are set forth in Exhibit I.
IV. Audit-related Services
Audit-related services are assurance and related services that are reasonably related to the performance of the audit or review of the Trust’s financial statements or that are traditionally performed by the independent auditor.
The audit-related services that are pre-approved are set forth in Exhibit I.
V. Tax Services
The SEC has stated generally that an independent auditor may provide tax services to a mutual fund, such as tax compliance, tax planning and tax advice, since such services do not impair the auditor’s independence.
The tax services that are pre-approved are listed in Exhibit I.
VI. All Other Services
The Audit Committee believes that other types of non-audit services are also permitted and that it may grant general pre-approval to non-audit services that it believes (a) are routine and recurring services, (b) would not impair the independence of the auditor and (c) are consistent with the Act and the rules relating thereto.
The non-audit services for which the Audit Committee has granted general pre-approval are set forth in Exhibit I.
The Auditor is permitted to assist management with internal investigations and fact-finding into alleged improprieties; however, these services are subject to specific pre-approval and engagement by the Audit Committee.
VII. Prohibited Services
Services which result in the auditor losing independence status under the rule include (1) Bookkeeping or other services related to the accounting records or financial statements of the Trust; (2) Financial information systems design and implementation; (3) Appraisal or valuation services, fairness opinions, or contribution-in-kind reports; (4) Actuarial services (ie., setting actuarial reserves versus actuarial audit work); (5) Internal audit outsourcing services; (6) Management functions or human resources; (7) Broker or dealer, investment advisor, or investment banking services; (8) Legal services and expert services unrelated to the audit; (9) Any other service that the Public Company Accounting Oversight Board determines, by regulation, is impermissible.
VIII. Procedures
At least annually, the Trust’s Chief Financial Officer and the Auditor shall jointly submit to the Audit Committee for approval a revised EXHIBIT I. If any of the fee amounts listed on EXHIBIT I change materially subsequent to the Audit Committees approval, an updated EXHIBIT I will be presented to the Audit Committee at the next regularly scheduled meeting.
EXHIBIT I
John Hancock Funds II
Schedule of Audit, Audit-Related, Tax and Other Non-Audit Services
Subject to General Pre-Approval
| | | |
| Service | | Summary of Services | Projected Fees/ Fee Cap |
|
| Audit Services | | | |
|
| Audit | Recurring audit of financial statements of the Trust in | As pre-approved by the Committee and |
| | accordance with generally accepted auditing standards | referenced in the Auditor’s Engagement Letter. |
| | including, but not limited to: | |
| |
| | · | Annual letter regarding the Trust’s internal control to be | |
| | | included in the annual report to the SEC on Form N- | |
| | | SAR; | |
| | · | Review of the annual poet-effective amendment to the | |
| | | Trust’s registration statement on SEC Form N-1A, and | |
| | | consent to the incorporation by reference of our report | |
| | | on the Trust’s financial statements in such SEC filing; | |
| | · | Review of each Trust portfolio’s tax provision and RIC | |
| | | qualification calculation | |
| | · | Accounting consultations and tax services required to | |
| | | perform an audit in accordance with Generally | |
| | | Accepted Auditing Standards. | |
|
| |
| |
| |
| |
| | Other audit and special reports including, but not limited to: | Up to but not to exceed $30,000 per instance. |
| |
| | · | All services relating to any subsequent filings of | |
| | | registration statements (including amendments thereto) | |
| | | for the Trust with the SEC, including issuance of | |
| | | auditor consents. | |
|
| | | |
| Service | | Summary of Services | Projected Fees/ Fee Cap |
|
| Audit-Related Services | | | |
|
| Consultations | Includes consultations relating to new regulatory rules and | Up to but not to exceed $25,000 per instance |
| concerning accounting | guidance, unusual or non-recurring transactions and other | |
| and financial reporting | regulatory or financial reporting matters which are generally | |
| standards | non-recurring. | |
|
| Other auditing | Auditing procedures and special reports, including those | As pre-approved by the Committee and |
| procedures and | needed for: | referenced in the Auditor’s Engagement Letter. |
| issuance of special | · | Separate audit reports in connection with 17f-2 security | |
| purpose reports | | counts | |
|
| | · | Various government agencies tax authorities and Fund | Up to but not to exceed $25,000 per instance |
| | | mergers | |
|
| Tax Services | | | |
|
| |
| Tax Services | Recurring tax services including, but not limited to: | As pre-approved by the Committee and |
| | · | Review of each Trust portfolio’s federal, and if | referenced in the Auditor’s Engagement Letter. |
| | | applicable, state tax returns | |
| | · | Review required Trust portfolio distributions to avoid | |
| | | excise tax and review related excise tax returns | |
|
| |
| Consultations on various | Consultation on U.S. tax matters, such as, funs | Up to but not to exceed $30,000 per instance |
| tax matters | reorganizations; tax basis earnings and profits | |
| | computations, evaluating the tax characteristics if certain | |
| | expenses and income items; advice on accounting methods, | |
| | timing issues, compliance matters and characterization | |
| | issues. | |
|
| Other Non-Audit | Training and industry updates | Up to but not to exceed $25,000 per instance |
| Services | | | |
|
| Overall Cap | In addition to the per instance caps, this reflect an overall | Up to but not to exceed $50,000 ($100,000 with |
| | cap on the Trust. | the approval of the Chairman of the Audit |
| | | | Committee) |
|
(2) Amount approved by the Audit Committee pursuant paragraph (c) (7) (i) (C) of Rule 2-01 of Regulation S-X: None.
(f) Not Applicable.
(g) The aggregate non-audit fees billed by PwC for services rendered to the registrant and rendered to the registrant's control affiliates for each of the last two fiscal years of the registrant were $1,566,218 for the fiscal year ended December 31, 2007, and $1,832,000 for the period from commencement of operations (10/15/05) to fiscal year end (8/31/06).
(h) The Registrant’s audit committee of the Board of Trustees has considered the provision of non-audit services that were rendered to the Registrant’s investment adviser and service affiliates that were not pre-approved pursuant to paragraph (c) (7ii) of Rule 2-01 of Regulation S-X, to be compatible with maintaining PWC’s independence
ITEM 5. AUDIT COMMITTEE OF LISTED REGISTRANTS Not Applicable.
ITEM 6. SCHEDULE OF INVESTMENTS. Included with Item 1.
ITEM 7. DISCLOSURE OF PROXY VOTING POLICIES AND PROCEDURES FOR CLOSED-END MANAGEMENT INVESTMENT COMPANIES. Not Applicable.
ITEM 8. PORTFOLIO MANAGERS OF CLOSED-END MANAGEMENT INVESTMENT COMPANIES. Not Applicable.
ITEM 9. PURCHASE OF EQUITY SECURITIES BY CLOSED-END MANAGEMENT INVESTMENT COMPANIES AND AFFILIATED PURCHASERS. Not Applicable.
ITEM 10. SUBMISSION OF MATTERS TO VOTE OF SECURITY HOLDERS. Not Applicable.
ITEM 11. CONTROLS AND PROCEDURES.
(a) EVALUATION OF DISCLOSURE CONTROLS AND PROCEDURES. The Registrant maintains disclosure controls and procedures that are designed to ensure that information required to be disclosed in this Form N-CSR is recorded, processed, summarized and reported within the periods specified in the rules and forms of the Securities and Exchange Commission. Such disclosure controls and procedures include controls and procedures designed to ensure that such information is accumulated and communicated to the Registrant's management, including its principal executive officer and principal financial officer, as appropriate, to allow timely decisions regarding required disclosure.
Within 90 days prior to the filing date of this Form N-CSR, the Registrant had carried out an evaluation, under the supervision and with the participation of the Registrant's management, including the Registrant's principal executive officer and the Registrant's principal financial officer, of the effectiveness of the design and operation of the Registrant's disclosure controls and procedures relating to information required to be disclosed on Form N-CSR. Based on such evaluation, the Registrant's principal executive officer and principal financial officer concluded that the Registrant's disclosure controls and procedures are operating effectively to ensure that:
(i) information required to be disclosed in this Form N-CSR is recorded, processed, summarized and reported within the periods specified in the rules and forms of the Securities and Exchange Commission, and
(ii) information is accumulated and communicated to the Registrant’s management, including its principal executive officer and principal financial officer, as appropriate, to allow timely decisions regarding required disclosure.
(b) CHANGE IN REGISTRANT’S INTERNAL CONTROL: Not Applicable.
ITEM 12. EXHIBITS.
(a)(1) SEE ATTACHED CODE OF ETHICS.
(a)(2)(i) CERTIFICATION OF PRINCIPAL EXECUTIVE OFFICER.
(a)(2)(ii) CERTIFICATION OF PRINCIPAL FINANCIAL OFFICER.
(b) CERTIFICATION PURSUANT TO Rule 30a-2(b) OF THE INVESTMENT COMPANY ACT OF 1940
SIGNATURES
Pursuant to the requirements of the Securities Exchange Act of 1934 and the Investment Company Act of 1940, the registrant has duly caused this report to be signed on its behalf by the undersigned, thereunto duly authorized.
JOHN HANCOCK FUNDS II
/S/ Keith F. Hartstein
Keith F. Hartstein
President and
Chief Executive Officer
Date: February 28, 2008
Pursuant to the requirements of the Securities Exchange Act of 1934 and the Investment Company Act of 1940, this report has been signed below by the following persons on behalf of the registrant and in the capacities and on the dates indicated.
/S/ Keith F. Hartstein
Keith F. Hartstein
President and
Chief Executive Officer
Date: February 28, 2008
/S/ Charles A. Rizzo
Charles A. Rizzo
Chief Financial Officer
Date: February 28, 2008