UNITED STATES
SECURITIES AND EXCHANGE COMMISSION
Washington, D.C. 20549
FORM N-CSR
CERTIFIED SHAREHOLDER REPORT OF REGISTERED MANAGEMENT INVESTMENT COMPANIES
Investment Company Act file number 811-21779
JOHN HANCOCK FUNDS II
- ---------------------------------------------------------
(Exact name of registrant as specified in charter)
601 CONGRESS STREET, BOSTON, MA 02210-2805
-------------------------------------------------------------
(Address of principal executive offices) (Zip code)
GORDON M. SHONE, 601 CONGRESS STREET, BOSTON, MA 02210-2805
- ------------------------------------------------------------------------------------------
(Name and address of agent for service)
Registrant's telephone number, including area code: (617) 663-3000
- --------------
Date of fiscal year end: 12/31
- ------
Date of reporting period: 12/31/06
ITEM 1. REPORTS TO STOCKHOLDERS.
The first report applies to Lifestyle Aggressive Portfolio, the second report applies to Lifestyle Balanced Portfolio, the third report applies to Lifestyle Conservative Portfolio, the fourth report applies to Lifestyle Growth Portfolio and the fifth report applies to Lifestyle Moderate Portfolio


| TABLE OF CONTENTS |
|
| Your fund at a glance |
| page 1 |
|
| Managers’ report |
| page 2 |
|
| A look at performance |
| page 6 |
|
| Your expenses |
| page 8 |
|
| Fund’s investments |
| page 1 0 |
|
| Financial statements |
| page 1 2 |
|
| Notes to financial |
| statements |
| page 2 5 |
|
| Trustees and officers |
| page 3 5 |
|
| For more information |
| page 4 0 |
|
CEO corner
January 2007
To Our Shareholders,
The financial markets surprised many investors in 2006 by beating their expectations. At the beginning of the year, fears abounded about rising inflation – with sky high energy prices – stronger than expected economic growth, a decline in the housing boom and more interest rate hikes from the Federal Reserve. But by June, the economic data suggested the desired “soft landing” for the economy, energy prices stabilized, corporate earnings remained strong and the Fed stopped raising rates. With that, the market took off, producing double-digit returns instead of the single-digit ones originally thought to be the best the market would do. The ascent was widespread and the broad Standard & Poor’s 500 Index returned 15.79% .
The bond market also turned in a solid result, registering its seventh consecutive year of positive performance. Continuing the trend of the last several years, the best performances came from the high yield sector. A healthy corporate earnings environment drove default rates down to near historical low levels and bolstered strong demand from yield-hungry investors. The broad Lehman Brothers Aggregate Bond Index returned 4.33% for the year, while the Merrill Lynch High Yield Master II Index returned 11.74% .
After such a year, we encourage investors to sit back, take stock and set some realistic expectations. While history argues for another good year (since 1945, the S&P 500 Index has always produced positive results in the third year of a presidential term) opinions are divided on the future of this more-than-four-year-old bull market.
We believe it’s wise to work with your financial professional to determine whether changes are now in order to your mix of portfolios. Some stock groups have had long runs of outperformance, such as small-cap stocks, value stocks and real estate investment trusts. Others had truly outsized returns in 2006, such as the telecom and energy sectors, China and emerging markets – not to mention the continued outperformance in general of international markets versus the U.S. Among bonds, the high yield category has become richly valued after such a long run up. These trends argue for a look to determine if these categories now represent a larger stake in your portfolios than prudent diversification would suggest they should, based on your risk profile, investment objectives and time horizons.
Sincerely,

Keith F. Hartstein,
President and Chief Executive Officer
This commentary reflects the CEO’s views as of December 31, 2006. They are subject to change at any time.
Your portfolio at a glance
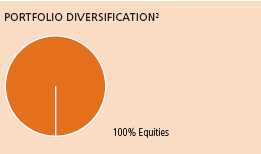
The Portfolio seeks long-term growth of capital. Current income is not a consideration.
To pursue this goal, the Portfolio, which is a fund-of-funds, normally invests 100% of
its assets in affiliated underlying funds that invest primarily in equity securities.
Over the last twelve months
► Stocks representing all market-capitalization ranges and investment styles benefited from a generally positive environment for equities.
► Except for a significant correction in May and June 2006, U.S. and international stock markets rose steadily throughout the year.
► The Portfolio’s exposure to international equity funds was particularly helpful to performance, while several of our domestic large-cap funds detracted.
| Asset allocation | |
| | |
| Equity | % of Total |
|
| U.S. Large Cap | 38.0 |
|
| International Large Cap | 24.0 |
|
| U.S. Small Cap | 14.0 |
|
| U.S. Mid Cap | 13.0 |
|
| International Small Cap | 6.0 |
|
| Natural Resources | 5.0 |
|
As a percentage of net assets on December 31, 2006.
1
Managers’ report
John Hancock
Lifestyle Aggressive Portfolio
Recently, the Portfolio’s fiscal year-end changed from August to
December. What follows is a commentary for the 12 months ended
December 31, 2006.
Large and small, value and growth, domestic and international, stocks of all types gained ground against a mostly favorable market backdrop in 2006. Corporate earnings remained strong throughout the year, while consumer spending also held up surprisingly well. Although oil prices rose sharply during the year’s first half, they fell from their summertime peak of nearly $80 per barrel to finish the year closer to $60. Concerns about rising inflation led to a significant stock market correction in May and June. However, better-than-anticipated inflation reports during the year’s second half finally enabled the Federal Reserve Board, in a long-awaited move, to refrain from raising short-term interest rates for the first time in more than two years. Beginning at its August meeting, the Fed left its benchmark federal funds rate alone at 5.25% at each of its subsequent meetings during the year. Against this backdrop, the U.S. stoc k market rose steadily following its summertime decline.
Overall, the S&P 500 Index gained 15.79% during the 12 months ending December 31, 2006. Value stocks in all market-capitalization ranges beat their growth-stock counterparts, while small- and mid-cap stocks generally
SCORECARD
| INVESTMENT | | PERIOD’S PERFORMANCE ... AND WHAT’S BEHIND THE NUMBERS |
| |
| International | ▲ | Benefited from strong stock selection, an underweighting in Japan |
| Value (Franklin | | and currency gains for U.S. investors in European stocks. |
| Templeton) | | |
| | | |
| U.S. Multi Sector | ▼ | Weak individual stock selection — especially in health care and banks |
| (GMO) | | — hurt this fund’s results. |
| | | |
| Capital | ▼ | An overweighting in the information technology sector — and |
| Appreciation | | especially in the semiconductor industry — was a negative. |
| (Jennison) | | |
2
From the MFC Global Investment Management (U.S.A.), LLC’s
Portfolio Management Team
outperformed large caps. International equities did particularly well, with the MSCI EAFE returning an impressive 26.87% . In addition to benefiting from many of the same fundamental trends helping U.S. companies, international stocks were further helped by strength in the euro and British pound relative to the U.S. dollar. Also gaining ground were natural resources stocks, which benefited from rising commodity prices for much of the period and excellent supply/demand fundamentals.
“Large and small, value and growth,
domestic and international,
stocks of all types gained ground
against a mostly favorable market
backdrop in 2006.”
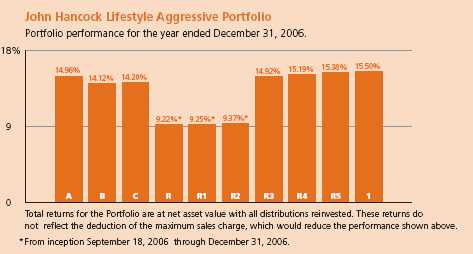
Performance results
During the 12 months ending December 31, 2006, John Hancock Lifestyle Aggressive Portfolio’s Class A, Class B, Class C, Class R3, Class R4, Class R5 and Class 1 shares produced total returns of 14.96%, 14.12%, 14.20%,14.92%, 15.19%, 15.38% and 15.50%, respectively, at net asset value. Class R, Class R1 and Class R2 shares returned 9.22%, 9.25% and 9.37%, respectively, at net asset value, since beginning operations on September 18, 2006. In comparison, the Portfolio’s benchmark, the S&P 500 Index, returned 15.79% and Morningstar’s average large blend fund returned 14.15% .1 Keep in mind that your net asset value return will be different from the Portfolio’s performance if you were not invested in the Portfolio for the entire period and did not reinvest all distributions. Please see pages six and seven for historical performance information.
International, large-cap value gains
All of the Portfolio’s assets are invested in equity securities. During the period, our allocation to international equities was a significant positive. International Value (Franklin Templeton) — the Portfolio’s best performer
Lifestyle Aggressive Portfolio
3
overall — and International Core (GMO) were two standouts among our large-cap international holdings. International small-cap stocks enjoyed particularly good results, as the Portfolio benefited from positions in International Small Company (Dimensional Fund Advisors) and International Small Cap (Templeton).
Some of the Portfolio’s best performers during the year were U.S. large-cap value funds. In particular, Quantitative Value (MFC Global) and Equity Income (T. Rowe Price) turned in solid performances relative to the S&P 500 Index, thanks in large part to favorable market conditions for large-cap value stocks.
Another notable positive was our 5% position in Natural Resources (Wellington). It is important to remember that while natural resource equities can be relatively volatile on a stand-alone basis, they can be excellent complements to other asset classes within a fully diversified portfolio. This is exactly what happened in 2006.
During the year, a select number of our domestic large-cap blend funds underperformed in relative terms. U.S. Multi Sector (GMO) was an 8% position in the Portfolio and as a result had a relatively meaningful negative impact on performance. Core Equity (Legg Mason) also under-performed, driven largely by poor returns from its Internet holdings and lack of exposure to the energy sector. Large-cap growth fund Capital Appreciation (Jennison) was also a detractor, as was mid-cap blend fund Quantitative Mid Cap (MFC Global). Of final note, although the small-cap asset class provided a modestly favorable impact on performance, select holdings in this part of the market were relative laggards, including Small Company (American Century) and Small Cap (Independence).
Outlook
Global financial markets, and especially certain higher-risk asset classes, have benefited from ample global liquidity. Should that liquidity dry up, we could see a significant market correction, with higher-risk assets beginning to lag, while cash-rich, mega-cap companies could reverse their recent trend of underperformance. The Portfolio is well exposed to both types of stocks, and we believe our emphasis on diversification should position us well if market conditions shift suddenly over the coming months, or if they remain as they have over the last few years.
Lifestyle Aggressive Portfolio
4
As so many investors inevitably discover, trying to time asset class moves based on generalizations often has regrettable consequences and defeats the long-term smoothing effect of diversification. Our focus as portfolio managers is not on the latest quarter or even the past year’s performance. Rather our focus is on designing a portfolio that can compound shareholder wealth over time while evening out some of the inevitable bumps that occur along the way.
“Some of the Portfolio’s best
performers during the year were
U.S. large-cap value funds.”
This commentary reflects the views of the portfolio managers through the end of the Portfolio’s period discussed in this report. The managers’ statements reflect their own opinions. As such, they are in no way guarantees of future events and are not intended to be used as investment advice or a recommendation regarding any specific security. They are also subject to change at any time as market and other conditions warrant.
International investing involves special risks such as political, economic and currency risks and differences in accounting standards and financial reporting. See the prospectus for the risks of investing in small-cap stocks. See the prospectus for the risks of investing in high-yield bonds.
1 Figures from Morningstar, Inc. include reinvested dividends and do not take into account sales charges. Actual load-adjusted performance is lower.
2 As a percentage of net assets on December 31, 2006.
Lifestyle Aggressive Portfolio
5
A look at performance
For the periods ending December 31, 2006
| | | | Average annual returns | | | | Cumulative total returns | | |
| | | | with maximum sales charge (POP) | | | | with maximum sales charge (POP) | | |
| | Inception | | | | | Since | | | | | Since |
| Class | date | | 1-year | 5-year | 10-year | inception | | 1-year | 5-year | 10-year | inceptiona |
|
| 1a | 10-15-05 | | 15.50% | — | — | 18.63% | | 15.50% | — | — | 23.04% |
|
| A | 10-18-05 | | 9.25 | — | — | 13.34 | | 9.25 | — | — | 16.29 |
|
| B | 10-18-05 | | 9.12 | — | — | 14.23 | | 9.12 | — | — | 17.39 |
|
| C | 10-18-05 | | 13.20 | — | — | 17.52 | | 13.20 | �� | — | 21.48 |
|
| Ra | 9-18-06 | | — | — | — | — | | — | — | — | 9.22 |
|
| R1a | 9-18-06 | | — | — | — | — | | — | — | — | 9.25 |
|
| R2a | 9-18-06 | | — | — | — | — | | — | — | — | 9.37 |
|
| R3a | 10-18-05 | | 14.92 | — | — | 18.15 | | 14.92 | — | — | 22.27 |
|
| R4a | 10-18-05 | | 15.19 | — | — | 18.43 | | 15.19 | — | — | 22.62 |
|
| R5a | 10-18-05 | | 15.38 | — | — | 18.64 | | 15.38 | — | — | 22.88 |
|
Performance figures assume all distributions are reinvested. Returns with maximum sales charge reflect a sales charge on Class A shares of 5%, and the applicable contingent deferred sales charge (CDSC) on Class B and Class C shares. The Class B shares’ CDSC declines annually between years 1–6 according to the following schedule: 5, 4, 3, 3, 2, 1%. No sales charge will be assessed after the sixth year. Class C shares held for less than one year are subject to a 1% CDSC. Sales charge is not applicable for Class R, Class R1, Class R2, Class R3, Class R4, Class R5 and Class 1 shares.
The returns reflect past results and should not be considered indicative of future performance. The return and principal value of an investment will fluctuate so that shares, when redeemed, may be worth more or less than their original cost. Due to market volatility, the Portfolio’s current performance may be higher or lower than the performance shown. For performance data current to the most recent month-end, please call 1-800-225-5291 or visit the Portfolio’s Web site at www.jhfunds.com.
The performance table above and the chart on the next page do not reflect the deduction of taxes that a shareholder would pay on fund distributions or the redemption of fund shares.
The Portfolio’s performance results reflect any applicable expense reductions, without which the expenses would increase and results would have been less favorable.
Since inception performance is calculated with an opening price (prior day’s close) on inception date.
a For certain types of investors as described in the Portfolio’s Class R, Class R1, Class R2, Class R3, Class R4, Class R5 and Class 1 share prospectuses.
Lifestyle Aggressive Portfolio
6
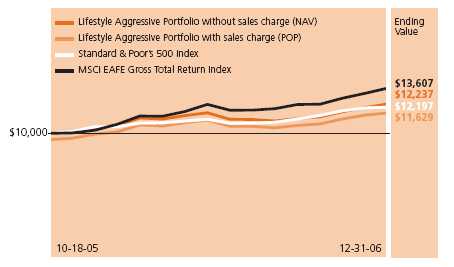
Growth of $10,000
This chart shows what happened to a hypothetical $10,000 investment in Class A shares
for the period indicated. For comparison, we’ve shown the same investment in two
separate indexes.
| | | Without sales | With maximum | | |
| Class | Period beginning | charge | sales charge | Index 1 | Index 2 |
|
| 11,3 | 10-15-05 | $12,304 | $12,304 | $12,233 | $13,210 |
|
| B1 | 10-18-05 | 12,139 | 11,739 | 12,197 | 13,607 |
|
| C1,2 | 10-18-05 | 12,148 | 12,148 | 12,197 | 13,607 |
|
| R1,3 | 9-18-06 | 10,922 | 10,922 | 10,804 | 11,041 |
|
| R11,3 | 9-18-06 | 10,925 | 10,925 | 10,804 | 11,041 |
|
| R21,3 | 9-18-06 | 10,937 | 10,937 | 10,804 | 11,041 |
|
| R31,3 | 10-18-05 | 12,227 | 12,227 | 12,197 | 13,607 |
|
| R41,3 | 10-18-05 | 12,262 | 12,262 | 12,197 | 13,607 |
|
| R51,3 | 10-18-05 | 12,288 | 12,288 | 12,197 | 13,607 |
|
Assuming all distributions were reinvested for the period indicated, the table above shows the value of a $10,000 investment in the Portfolio’s Class B, Class C, Class R, Class R1, Class R2, Class R3, Class R4, Class R5 and Class 1 shares, respectively, as of December 31, 2006. Performance of the classes will vary based on the difference in sales charges paid by shareholders investing in the different classes and the fee structure of those classes.
Standard & Poor’s 500 Index — Index 1 — is an unmanaged index that includes 500 widely traded common stocks.
MSCI EAFE Gross Total Return Index — Index 1 — (Europe, Australasia, Far East) is a free float-adjusted market capitalization index that is designed to measure developed market equity performance, excluding the U.S. & Canada. As of June 2006 the MSCI EAFE Index consisted of the following 21 developed market country indices: Australia, Belgium, Denmark, Finland, France, Germany, Greece, Hong Kong, Ireland, Italy, Japan, the Netherlands, New Zealand, Norway, Portugal, Singapore, Spain, Sweden, Switzerland and the United Kingdom.
It is not possible to invest directly in an index. Index figures do not reflect sales charges and would be lower if they did.
1 Index 2 figure as of closest month end to inception date.
2 No contingent deferred sales charge applicable.
3 For certain types of investors as described in the Portfolio’s Class R, Class R1, Class R2, Class R3, Class R4, Class R5 and Class 1 share prospectuses.
Lifestyle Aggressive Portfolio
7
Your expenses
These examples are intended to help you understand your ongoing
operating expenses.
Understanding portfolio expenses
As a shareholder of the Portfolio, you incur two types of costs:
■ Transaction costs which include sales charges (loads) on purchases or redemptions (varies by share class), minimum account fee charge, etc.
■ Ongoing operating expenses including management fees, distribution and service fees (if applicable) and other portfolio expenses.
In addition to the operating expenses which the Portfolio bears directly, the Portfolio indirectly bears a pro rata share of the operating expenses of the affiliated underlying funds in which the Portfolio invests. Because the affiliated underlying funds have varied operating expenses and transaction costs and the Portfolio may own different proportions of the affiliated underlying funds at different times, the amount of expenses incurred indirectly by the Portfolio will vary. If these indirect expenses were included, your expenses paid during the period would have been higher.
We are going to present only your ongoing operating expenses here.
Actual expenses/actual returns
This example is intended to provide information about your portfolio’s actual ongoing operating expenses, and is based on your portfolio’s actual return. It assumes an account value of $1,000.00 on July 1, 2006, with the same investment held until December 31, 2006.
| | Account value | Ending value | Expenses paid during period |
| | on 7-1-06 | on 12-31-06 | ended 12-31-06a |
|
| Class A | $1,000.00 | $1,101.80 | $3.44 |
|
| Class B | 1,000.00 | 1,097.80 | 7.14 |
|
| Class C | 1,000.00 | 1,097.70 | 7.14 |
|
| Class R | 1,000.00 | 1,092.20 | 2.83 |
|
| Class R1 | 1,000.00 | 1,092.50 | 2.09 |
|
| Class R2 | 1,000.00 | 1,093.70 | 1.34 |
|
| Class R3 | 1,000.00 | 1,101.40 | 3.76 |
|
| Class R4 | 1,000.00 | 1,103.20 | 2.54 |
|
| Class R5 | 1,000.00 | 1,104.30 | 1.06 |
|
| Class 1 | 1,000.00 | 1,104.60 | 0.53 |
|
Lifestyle Aggressive Portfolio
8
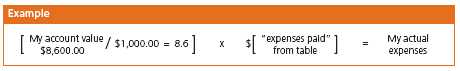
Together with the value of your account, you may use this information to estimate the operating expenses that you paid over the period. Simply divide your account value at December 31, 2006 by $1,000.00, then multiply it by the “expenses paid” for your share class from the table above. For example, for an account value of $8,600.00, the operating expenses should be calculated as follows:
Hypothetical example for comparison purposes
This table allows you to compare your portfolio’s ongoing operating expenses with those of any other portfolio. It provides an example of the Portfolio’s hypothetical account values and hypothetical expenses based on each class’s actual expense ratio and an assumed 5% annual return before expenses (which is not your portfolio’s actual return). It assumes an account value of $1,000.00 on July 1, 2006, with the same investment held until December 31, 2006. Look in any other portfolio shareholder report to find its hypothetical example and you will be able to compare these expenses.
| | Account value | Ending value | Expenses paid during period |
| | on 7-1-06 | on 12-31-06 | ended 12-31-06a |
|
| Class A | $1,000.00 | $1,021.93 | $3.31 |
|
| Class B | 1,000.00 | 1,018.40 | 6.87 |
|
| Class C | 1,000.00 | 1,018.40 | 6.87 |
|
| Class R | 1,000.00 | 1,011.54 | 2.72 |
|
| Class R1 | 1,000.00 | 1,012.25 | 2.01 |
|
| Class R2 | 1,000.00 | 1,012.96 | 1.29 |
|
| Class R3 | 1,000.00 | 1,021.63 | 3.62 |
|
| Class R4 | 1,000.00 | 1,022.79 | 2.45 |
|
| Class R5 | 1,000.00 | 1,024.20 | 1.02 |
|
| Class 1 | 1,000.00 | 1,024.70 | 0.51 |
|
Remember, these examples do not include any transaction costs, such as sales charges; therefore, these examples will not help you to determine the relative total costs of owning different portfolios. If transaction costs were included, your expenses would have been higher. See the prospectus for details regarding transaction costs.
a Expenses are equal to the Portfolio’s annualized expense ratio of 0.65%, 1.35%, 1.35%, 0.95%, 0.70%, 0.45%, 0.71%, 0.48%, 0.20% and 0.10% for Class A, Class B, Class C, Class R, Class R1, Class R2, Class R3, Class R4, Class R5 and Class 1, respectively, multiplied by the average account value over the period, multiplied by the number of days in the period (inception date for Class R, Class R1 and Class R2) /365 or 366 (to reflect the one-half year period).
b Class R, R1 and R2 shares began operations on 9-18-06.
Lifestyle Aggressive Portfolio
9
F I N A N C I A L S T A T E M E N T S
Portfolio’s investments
Securities owned by the Portfolio on 12-31-06
Portfolio of investments, showing all affiliated underlying funds.
| Issuer | Shares | Value |
|
| Investment companies 99.98% | | $2,893,823,572 |
|
| (Cost $2,578,460,454) | | |
| | | |
| John Hancock Funds II 91.97% | | 2,662,103,782 |
|
| All Cap Growth Fund Class NAV | 3,270,836 | 57,926,504 |
|
| All Cap Value Fund Class NAV | 3,577,206 | 57,664,564 |
|
| Blue Chip Growth Fund Class NAV | 7,503,645 | 144,895,377 |
|
| Capital Appreciation Fund Class NAV | 11,312,854 | 115,956,752 |
|
| Core Equity Fund Class NAV | 5,417,429 | 86,787,212 |
|
| Emerging Growth Fund Class NAV | 3,498,404 | 58,073,499 |
|
| Equity-Income Fund Class NAV | 3,077,127 | 57,788,436 |
|
| Fundamental Value Fund Class NAV | 6,800,039 | 115,600,671 |
|
| International Equity Index Fund Class NAV | 7,068,530 | 144,904,862 |
|
| International Opportunities Fund Class NAV | 6,454,539 | 115,988,074 |
|
| International Small Cap Fund Class NAV | 4,172,362 | 87,035,481 |
|
| International Small Company Fund Class NAV | 8,272,786 | 87,029,713 |
|
| International Value Fund Class NAV | 10,849,920 | 202,785,006 |
|
| Large Cap Fund Class NAV | 3,702,322 | 57,793,242 |
|
| Large Cap Value Fund Class NAV | 1,149,067 | 28,761,149 |
|
| Mid Cap Index Fund Class NAV | 5,859,816 | 115,203,989 |
|
| Mid Cap Stock Fund Class NAV | 3,447,720 | 57,714,828 |
|
| Mid Cap Value Equity Fund Class NAV | 2,770,613 | 28,758,959 |
|
| Mid Cap Value Fund Class NAV | 2,879,077 | 57,725,490 |
|
| Natural Resources Fund Class NAV | 4,060,960 | 144,895,069 |
|
| Quantitative Mid Cap Fund Class NAV | 3,782,103 | 57,639,253 |
|
| Quantitative Value Fund Class NAV | 5,018,113 | 87,014,073 |
|
| Small Cap Fund Class NAV | 5,605,832 | 86,441,931 |
|
| Small Cap Index Fund Class NAV | 3,428,771 | 57,809,078 |
|
| Small Company Fund Class NAV | 3,437,117 | 57,743,563 |
|
| Small Company Value Fund Class NAV | 3,452,364 | 86,861,470 |
|
| Special Value Fund Class NAV | 2,662,953 | 57,839,340 |
|
| U.S. Global Leaders Growth Fund Class NAV | 2,133,558 | 28,781,700 |
|
| U.S. Multi Sector Fund Class NAV | 21,083,701 | 231,709,869 |
|
| Value & Restructuring Fund Class NAV | 2,401,870 | 28,894,501 |
|
| Vista Fund Class NAV | 5,015,555 | 58,080,127 |
See notes to financial statements
Lifestyle Aggressive Portfolio
10
F I N A N C I A L S T A T E M E N T S
| Issuer | Shares | Value |
| | | |
| John Hancock Funds III 8.01% | | $231,719,790 |
|
| International Core Fund Class NAV | $5,433,055 | 231,719,790 |
| |
| Total investments 99.98% | | $2,893,823,572 |
|
| Other assets in excess of liabilities 0.02% | | $527,588 |
|
| Total net assets 100.00% | | $2,894,351,160 |
|
Percentages are stated as a percent of net assets of the Portfolio.
See notes to financial statements
Lifestyle Aggressive Portfolio
11
F I N A N C I A L S T A T E M E N T S
Financial statements
Statement of assets and liabilities 12-31-06
This Statement of Assets and Liabilities is the Portfolio’s balance sheet. It shows the value
of what the Portfolio owns, is due and owes. You’ll also find the net asset value and the
maximum offering price per share.
| Assets | |
|
| Investments in affiliated underlying funds, at value (cost $2,578,460,454) | $2,893,823,572 |
| Receivable for investments sold | 12,807,727 |
| Receivable for fund shares sold | 1,105,762 |
| Receivable from affiliates | 7,687 |
| | |
| Total assets | 2,907,744,748 |
| |
| Liabilities | |
|
| Due to custodian | 376,558 |
| Payable for investments purchased | 107,600 |
| Payable for fund shares repurchased | 12,461,037 |
| Payable to affiliates | |
| Fund administration fees | 76,546 |
| Transfer agent fees | 95,568 |
| Trustees’ fees | 8,823 |
| Investment management fees | 228 |
| Other payables and accrued expenses | 267,228 |
| | |
| Total liabilities | 13,393,588 |
| |
| Net assets | |
|
| Capital paid-in | 2,566,231,412 |
| Accumulated net realized gain on investments | 12,494,002 |
| Net unrealized appreciation on investments in affiliated underlying funds | 315,363,118 |
| Accumulated net investment income | 262,628 |
| | |
| Net assets | $2,894,351,160 |
| |
| Net asset value per share | |
|
| Based on net asset values and shares outstanding — the Portfolio has an | |
| unlimited number of shares authorized with no par value. | |
| Class A ($55,913,835 ÷ 3,798,767 shares) | $14.72 |
| Class B ($12,517,682 ÷ 850,169 shares) | $14.72 |
| Class C ($38,920,102 ÷ 2,643,046 shares) | $14.73 |
| Class R ($215,285 ÷ 14,560 shares) | $14.79 |
| Class R1 ($109,263 ÷ 7,402 shares) | $14.76 |
| Class R2 ($118,546 ÷ 8,045 shares) | $14.74 |
| Class R3 ($1,584,810 ÷ 107,667 shares) | $14.72 |
| Class R4 ($2,451,413 ÷ 166,644 shares) | $14.71 |
| Class R5 ($554,940 ÷ 37,726 shares) | $14.71 |
| Class 1 ($2,781,965,284 ÷ 189,485,375 shares) | $14.68 |
| |
| Maximum offering price per share | |
|
| Class A1 ($14.72 ÷ 95%) | $15.49 |
1 On single retail sales of less than $50,000. On sales of $50,000 or more and on group sales the offering price is reduced.
See notes to financial statements
Lifestyle Aggressive Portfolio
12
F I N A N C I A L S T A T E M E N T S
Statement of operations For the year ended 12-31-06.
This Statement of Operations summarizes the Portfolio’s investment income earned
and expenses incurred in operating the Portfolio. It also shows net gains (losses) for
the period stated.
| | Period | Four months |
| | endeda | endedb |
| | 8-31-06 | 12-31-06 |
| |
| Investment income | | |
|
| Income distributions received from affiliated underlying funds | $11,032,304 | $19,804,944 |
| | | |
| Total investment income | 11,032,304 | 19,804,944 |
| |
| Expenses | | |
|
| Investment management fees (Note 3) | 793,633 | 376,281 |
| Distribution and service fees (Note 3) | 1,087,115 | 626,891 |
| Transfer agent fees (Note 3) | 52,221 | 60,035 |
| Blue sky fees (Note 3) | 99,466 | 47,118 |
| Printing and postage fees (Note 3) | 51,472 | 21,193 |
| Fund administration fees (Note 3) | 166,487 | 63,275 |
| Audit and legal fees | 85,026 | 31,906 |
| Custodian fees | 10,944 | 4,020 |
| Trustees’ fees (Note 3) | 21,991 | 8,357 |
| Registration and filing fees | 70,700 | 26,870 |
| Miscellaneous | 17,551 | 4,756 |
| | | |
| Total expenses | 2,456,606 | 1,270,702 |
| Less expense reductions (Note 3) | (122,636) | (39,656) |
| | | |
| Net expenses | 2,333,970 | 1,231,046 |
| | | |
| Net investment income | 8,698,334 | 18,573,898 |
| |
| Realized and unrealized gain | | |
|
| Net realized and unrealized gain on | | |
| Investments | 54,792,008 | 11,467,280 |
| Capital gain distributions received from affiliated underlying funds | 6,427,198 | 62,425,606 |
| Change in net unrealized appreciation of investments in affiliated | | |
| underlying funds | 160,575,363 | 154,787,755 |
| | | |
| Net realized and unrealized gain | 221,794,569 | 228,680,641 |
| | | |
| Increase in net assets from operations | $230,492,903 | $247,254,539 |
a Period from 10-15-05 (commencement of operations) to 8-31-06.
b Effective 1-18-07, the fiscal year-end changed from August 31 to December 31.
See notes to financial statements
Lifestyle Aggressive Portfolio
13
F I N A N C I A L S T A T E M E N T S
Statement of changes in net assets
These Statements of Changes in Net Assets show how the value of the Portfolio’s net
assets has changed during the last two periods. The difference reflects earnings less
expenses, any investment gains and losses, distributions, if any, paid to shareholders and
the net of Portfolio share transactions.
| | Period | Four months |
| | endeda | endedb |
| | 8-31-06 | 12-31-06 |
| |
| Increase (decrease) in net assets | | |
|
| From operations | | |
| Net investment income | $8,698,334 | $18,573,898 |
| Net realized gain | 61,219,206 | 73,892,886 |
| Change in net unrealized appreciation | 160,575,363 | 154,787,755 |
| | | |
| Increase in net assets resulting from operations | 230,492,903 | 247,254,539 |
| | | |
| Distributions to shareholders | | |
| From net investment income | | |
| Class A | (10,791) | (1,349,781) |
| Class B | (2,807) | (222,059) |
| Class C | (4,862) | (690,657) |
| Class R | — | (4,634) |
| Class R1 | — | (2,600) |
| Class R2 | — | (3,084) |
| Class R3 | (460) | (37,785) |
| Class R4 | (513) | (64,000) |
| Class R5 | (565) | (15,755) |
| Class1 | (10,836,557) | (81,795,612) |
| From net realized gain | | |
| Class A | — | (1,051,325) |
| Class B | — | (237,454) |
| Class C | — | (738,375) |
| Class R | — | (4,062) |
| Class R1 | — | (2,061) |
| Class R2 | — | (2,227) |
| Class R3 | — | (29,914) |
| Class R4 | — | (46,167) |
| Class R5 | — | (10,422) |
| Class1 | — | (52,688,646) |
| | (10,856,555) | (138,996,620) |
| From Fund share transactions | 2,274,320,405 | 292,136,488 |
| |
| Net assets | | |
|
| Beginning of period | — | $2,493,956,753 |
| End of period | $2,493,956,753 | $2,894,351,160 |
| | | |
| Accumulated net investment income | $4,475,074 | $262,628 |
a Period from 10-15-05 (commencement of operations) to 8-31-06.
b Effective 1-18-07, the fiscal year-end changed from August 31 to December 31.
See notes to financial statements
Lifestyle Aggressive Portfolio
14
F I N A N C I A L S T A T E M E N T S
Financial highlights
The Financial highlights show how the Portfolio’s net asset value for a share has changed
since the end of the previous period.
| CLASS A SHARES | | |
| |
| Period ended | 8-31-06a | 12-31-06b |
| |
| Per share operating performance | | |
|
| Net asset value, beginning of period | $12.63 | $14.06 |
| Net investment income (loss) h,v | (0.07) | 0.08 |
| Net realized and unrealized | | |
| gain on investments | 1.56 | 1.24 |
| Total from investment operations | 1.49 | 1.32 |
| Less distributions | | |
| From net investment income | (0.06) | (0.37) |
| From net realized gain | — | (0.29) |
| | (0.06) | (0.66) |
| Net asset value, end of period | $14.06 | $14.72 |
| Total return k,m (%) | 11.85 l | 9.40 |
| |
| Ratios and supplemental data | | |
|
| Net assets, end of period | | |
| (in millions) | $35 | $56 |
| Ratio of net expenses to average | | |
| net assets q,r (%) | 0.65 | 0.64 |
| Ratio of gross expenses to average | | |
| net assets q,r (%) | 0.84p | 0.65 |
| Ratio of net investment income | | |
| (loss) to average net assets r,v (%) | (0.59) | 1.69 |
| Portfolio turnover m (%) | 23 | 5 |
See notes to financial statements
Lifestyle Aggressive Portfolio
15
F I N A N C I A L S T A T E M E N T S
Financial highlights
| CLASS B SHARES | | |
| |
| Period ended | 8-31-06a | 12-31-06b |
| |
| Per share operating performance | | |
|
| Net asset value, beginning of period | $12.63 | $14.00 |
| Net investment income (loss) h,v | (0.15) | 0.05 |
| Net realized and unrealized | | |
| gain on investments | 1.56 | 1.23 |
| Total from investment operations | 1.41 | 1.28 |
| Less distributions | | |
| From net investment income | (0.04) | (0.27) |
| From net realized gain | — | (0.29) |
| | (0.04) | (0.56) |
| Net asset value, end of period | $14.00 | $14.72 |
| Total return k,l,m (%) | 11.22 | 9.15 |
| |
| Ratios and supplemental data | | |
|
| Net assets, end of period | | |
| (in millions) | $8 | $13 |
| Ratio of net expenses to average | | |
| net assets q,r (%) | 1.34 | 1.35 |
| Ratio of gross expenses to average | | |
| net assets p,q,r (%) | 2.00 | 1.54 |
| Ratio of net investment income | | |
| (loss) to average net assets r,v (%) | (1.23) | 1.07 |
| Portfolio turnover m (%) | 23 | 5 |
See notes to financial statements
Lifestyle Aggressive Portfolio
16
F I N A N C I A L S T A T E M E N T S
Financial highlights
| CLASS C SHARES | | |
| |
| Period ended | 8-31-06a | 12-31-06b |
| |
| Per share operating performance | | |
|
| Net asset value, beginning of period | $12.63 | $14.00 |
| Net investment income (loss) h,v | (0.15) | 0.05 |
| Net realized and unrealized | | |
| gain (loss) on investments | 1.57 | 1.24 |
| Total from investment operations | 1.42 | 1.29 |
| Less distributions | | |
| From net investment income | (0.05) | (0.27) |
| From net realized gain | — | (0.29) |
| | (0.05) | (0.56) |
| Net asset value, end of period | $14.00 | $14.73 |
| Total return k,l,m (%) | 11.22 | 9.22 |
| |
| Ratios and supplemental data | | |
|
| Net assets, end of period | | |
| (in millions) | $25 | $39 |
| Ratio of net expenses to average | | |
| net assets q,r (%) | 1.34 | 1.35 |
| Ratio of gross expenses to average | | |
| net assets p,q,r (%) | 1.60 | 1.36 |
| Ratio of net investment income | | |
| (loss) to average net assets r,v (%) | (1.27) | 1.10 |
| Portfolio turnover m (%) | 23 | 5 |
See notes to financial statements
Lifestyle Aggressive Portfolio
17
F I N A N C I A L S T A T E M E N T S
Financial highlights
| CLASS R SHARES | |
| |
| Period ended | 12-31-06b,c |
| |
| Per share operating performance | |
|
| Net asset value, beginning of period | $14.11 |
| Net investment income h,v | 0.13 |
| Net realized and unrealized | |
| gain on investments | 1.17 |
| Total from investment operations | 1.30 |
| Less distributions | |
| From net investment income | (0.33) |
| From net realized gain | (0.29) |
| | (0.62) |
| Net asset value, end of period | $14.79 |
| Total return k,l (%) | 9.22m |
| |
| Ratios and supplemental data | |
|
| Net assets, end of period | |
| (in millions) | —i |
| Ratio of net expenses to average | |
| net assets q (%) | 0.95r |
| Ratio of gross expenses to average | |
| net assets p,q (%) | 10.66r |
| Ratio of net investment income | |
| to average net assets v (%) | 2.94r |
| Portfolio turnover (%) | 5m |
See notes to financial statements
Lifestyle Aggressive Portfolio
18
F I N A N C I A L S T A T E M E N T S
Financial highlights
| CLASS R1 SHARES | |
| |
| Period ended | 12-31-06 b,c |
| |
| Per share operating performance | |
|
| Net asset value, beginning of period | $14.11 |
| Net investment income h,v | 0.08 |
| Net realized and unrealized | |
| gain on investments | 1.23 |
| Total from investment operations | 1.31 |
| Less distributions | |
| From net investment income | (0.37) |
| From net realized gain | (0.29) |
| | (0.66) |
| Net asset value, end of period | $14.76 |
| Total return k,l (%) | 9.25m |
| |
| Ratios and supplemental data | |
|
| Net assets, end of period | |
| (in millions) | —i |
| Ratio of net expenses to average | |
| net assets q (%) | 0.70r |
| Ratio of gross expenses to average | |
| net assets p,q (%) | 12.89r |
| Ratio of net investment income | |
| to average net assets v (%) | 1.79r |
| Portfolio turnover (%) | 5m |
See notes to financial statements
Lifestyle Aggressive Portfolio
19
F I N A N C I A L S T A T E M E N T S
Financial highlights
| CLASS R2 SHARES | |
| |
| Period ended | 12-31-06b,c |
| |
| Per share operating performance | |
|
| Net asset value, beginning of period | $14.11 |
| Net investment income h,v | 0.09 |
| Net realized and unrealized | |
| gain on investments | 1.23 |
| Total from investment operations | 1.32 |
| Less distributions | |
| From net investment income | (0.40) |
| From net realized gain | (0.29) |
| | (0.69) |
| Net asset value, end of period | $14.74 |
| Total return k,l (%) | 9.37m |
| |
| Ratios and supplemental data | |
|
| Net assets, end of period | |
| (in millions) | —i |
| Ratio of net expenses to average | |
| net assets q (%) | 0.45r |
| Ratio of gross expenses to average | |
| net assets p,q (%) | 12.24r |
| Ratio of net investment income | |
| to average net assets v (%) | 2.07r |
| Portfolio turnover (%) | 5m |
See notes to financial statements
Lifestyle Aggressive Portfolio
20
F I N A N C I A L S T A T E M E N T S
Financial highlights
| CLASS R3 SHARES | | |
| |
| Period ended | 8-31-06a | 12-31-06b |
| |
| Per share operating performance | | |
|
| Net asset value, beginning of period | $12.63 | $14.06 |
| Net investment income h,v (loss) | (0.05) | 0.08 |
| Net realized and unrealized | | |
| gain on investments | 1.54 | 1.24 |
| Total from investment operations | 1.49 | 1.32 |
| Less distributions | | |
| From net investment income | (0.06) | (0.37) |
| From net realized gain | — | (0.29) |
| | (0.06) | (0.66) |
| Net asset value, end of period | $14.06 | $14.72 |
| Total return k,l,m (%) | 11.81 | 9.36 |
| |
| Ratios and supplemental data | | |
|
| Net assets, end of period | | |
| (in millions) | $1 | $2 |
| Ratio of net expenses to average | | |
| net assets q,r (%) | 0.69 | 0.72 |
| Ratio of gross expenses to average | | |
| net assets p,q,r (%) | 8.07 | 2.21 |
| Ratio of net investment loss | | |
| to average net assets r,v (%) | (0.47) | 1.70 |
| Portfolio turnover m (%) | 23 | 5 |
See notes to financial statements
Lifestyle Aggressive Portfolio
21
F I N A N C I A L S T A T E M E N T S
Financial highlights
| CLASS R4 SHARES | | |
| |
| Period ended | 8-31-06a | 12-31-06b |
| |
| Per share operating performance | | |
|
| Net asset value, beginning of period | $12.63 | $14.07 |
| Net investment income (loss) h,v | (0.05) | 0.08 |
| Net realized and unrealized | | |
| gain on investments | 1.55 | 1.25 |
| Total from investment operations | 1.50 | 1.33 |
| Less distributions | | |
| From net investment income | (0.06) | (0.40) |
| From net realized gain | — | (0.29) |
| | (0.06) | (0.69) |
| Net asset value, end of period | $14.07 | $14.71 |
| Total return k,l,m (%) | 11.94 | 9.46 |
| |
| Ratios and supplemental data | | |
|
| Net assets, end of period | | |
| (in millions) | $2 | $2 |
| Ratio of net expenses to average | | |
| net assets q,r (%) | 0.49 | 0.53 |
| Ratio of gross expenses to average | | |
| net assets p,q,r (%) | 4.08 | 1.38 |
| Ratio of net investment income | | |
| (loss) to average net assets r,v (%) | (0.38) | 1.71 |
| Portfolio turnover m (%) | 23 | 5 |
See notes to financial statements
Lifestyle Aggressive Portfolio
22
F I N A N C I A L S T A T E M E N T S
Financial highlights
| CLASS R5 SHARES | | |
| |
| Period ended | 8-31-06a | 12-31-06b |
| |
| Per share operating performance | | |
|
| Net asset value, beginning of period | $12.63 | $14.09 |
| Net investment income h,v | 0.01 | 0.09 |
| Net realized and unrealized | | |
| gain on investments | 1.52 | 1.26 |
| Total from investment operations | 1.53 | 1.35 |
| Less distributions | | |
| From net investment income | (0.07) | (0.44) |
| From net realized gain | — | (0.29) |
| | (0.07) | (0.73) |
| Net asset value, end of period | $14.09 | $14.71 |
| Total return k,l,m (%) | 12.16 | 9.57 |
| |
| Ratios and supplemental data | | |
|
| Net assets, end of period | | |
| (in millions) | —i | $1 |
| Ratio of net expenses to average | | |
| net assets q,r (%) | 0.20 | 0.23 |
| Ratio of gross expenses to average | | |
| net assets p,q,r (%) | 8.26 | 4.07 |
| Ratio of net investment income | | |
| to average net assets r,v (%) | 0.05 | 1.90 |
| Portfolio turnover m (%) | 23 | 5 |
See notes to financial statements
Lifestyle Aggressive Portfolio
23
F I N A N C I A L S T A T E M E N T S
Financial highlights
| CLASS 1 SHARES | | |
| |
| Period ended | 8-31-06a | 12-31-06 b |
| |
| Per share operating performance | | |
|
| Net asset value, beginning of period | $12.60 | $14.07 |
| Net investment income h,v | 0.06 | 0.10 |
| Net realized and unrealized | | |
| gain on investments | 1.48 | 1.25 |
| Total from investment operations | 1.54 | 1.35 |
| Less distributions | | |
| From net investment income | (0.07) | (0.45) |
| From net realized gain | — | (0.29) |
| | (0.07) | (0.74) |
| Net asset value, end of period | $14.07 | $14.68 |
| Total return k,m (%) | 12.27 | 9.59 |
| |
| Ratios and supplemental data | | |
|
| Net assets, end of period | | |
| (in millions) | $2,422 | $2,782 |
| Ratio of net expenses to average | | |
| net assets q,r (%) | 0.11 | 0.11 |
| Ratio of net investment income | | |
| to average net assets r,v (%) | 0.48 | 2.09 |
| Portfolio turnover m (%) | 23 | 5 |
a Class A, Class B, Class C, Class R3, Class R4 and Class R5 shares began operations on 10-18-05, and Class 1 shares began operation on 10-15-05.
b Effective 1-18-07, the fiscal year-end changed from August 31 to December 31.
c Class R, Class R1 and Class R2 shares began operations on 9-18-06.
h Based on the average of the shares outstanding.
i Less than $500,000.
k Assumes dividend reinvestment and does not reflect the effect of sales charges.
l Total returns would have been lower had certain expenses not been reduced during the period shown.
m Not annualized.
p Does not take into consideration expense reductions during the period shown.
q Does not include expenses of the investment companies in which the Portfolio invests.
r Annualized.
v Recognition of net investment income by the Portfolio is affected by the timing of the declaration of dividends by the underlying investment companies in which the Portfolio invests.
See notes to financial statements
Lifestyle Aggressive Portfolio
24
Notes to financial statements
1. Organization
The John Hancock Lifestyle Aggressive Portfolio (the “Portfolio”) is a non-diversified series of John Hancock Funds II (the “Trust”). The Trust was established as a Massachusetts business trust on June 28, 2005. The Trust is registered under the Investment Company Act of 1940 (the “1940 Act”), as amended, as an open-end investment management company.
The Portfolio operates as a “fund of funds”, investing in Class NAV shares of affiliated underlying funds of the Trust and John Hancock Funds III and in other permitted investments. The affiliated underlying funds’ accounting policies are outlined in the shareholder reports, available without charge by calling 1-800-225-5291 or on the Securities & Exchange Commission (“SEC”) Web site at www.sec.gov, File #811-21779, CIK 0001331971. The affiliated underlying funds are not covered by this report.
John Hancock Investment Management Services, LLC (the “Adviser”), a Delaware limited liability company controlled by John Hancock Life Insurance Company (U.S.A.) (“John Hancock USA”) serves as investment adviser for the Trust and John Hancock Funds, LLC (the “Distributor”), an affiliate of the Adviser, serves as principal underwriter. John Hancock Life Insurance Company of New York (“John Hancock New York”) is a wholly owned subsidiary of John Hancock USA. John Hancock USA and John Hancock New York are indirect wholly owned subsidiaries of The Manufactures Life Insurance Company (“Manulife”), which in turn is a wholly owned subsidiary of Manulife Financial Corporation (“MFC”), a publicly traded company. MFC and its subsidiaries are known collectively as “Manulife Financial.”
The Portfolio commenced operations after certain separate accounts of John Hancock USA redeemed their interests in portfolios of John Hancock Trust and certain unaffiliated mutual funds of approximately $350 million at the close of business on October 14, 2005, with additional redemption proceeds of approximately $1.5 billion received on October 28, 2005, and invested such proceeds in Class 1 shares of the Portfolio, which in turn invested the proceeds in affiliated underlying funds of the Trust.
The Board of Trustees has authorized the issuance of multiple classes of shares of the Portfolio, including classes designated as Class A, Class B, Class C, Class R, Class R1, Class R2, Class R3, Class R4, Class R5 and Class 1 shares.
Class A, B and C shares are open to all retail investors. Class 1 shares are sold only to certain exempt separate accounts of John Hancock USA and John Hancock New York. Class R, Class R1, Class R2, Class R3, Class R4 and Class R5 shares are available only to certain retirement plans.
The shares of each class represent an interest in the same portfolio of investments of the Portfolio and have equal rights as to voting, redemptions, dividends and liquidation, except that certain expenses, subject to the approval of the Trustees, may be applied differently to each class of shares in accordance with current regulations of the SEC and the Internal Revenue Service. Shareholders of a class that bears distribution and service expenses under the terms of a distribution plan have exclusive voting rights to that distribution plan. Class B shares will convert to Class A shares eight years after purchase.
On January 18, 2007, the Board of Trustees approved a change in the fiscal year end of the Portfolio from August 31 to December 31. Accordingly, the Portfolio’s financial statements and related notes include information as of the four-month period ended December 31, 2006 and the period ended August 31, 2006.
Lifestyle Aggressive Portfolio
25
2. Significant accounting policies
In the preparation of the financial statements, the Portfolio follows the policies described below. The preparation of financial statements in conformity with accounting principles generally accepted in the United States of America requires management to make estimates and assumptions that affect the reported amounts of assets and liabilities at the date of the financial statements and the reported amounts of income and expenses during the reporting period. Actual results may differ from these estimates.
Securities valuation
The net asset value of the shares of the Portfolio is determined daily as of the close of the New York Stock Exchange, normally at 4:00 p.m. Eastern Time. Investments in the affiliated underlying funds are valued at their respective net asset values each business day, or at fair value as determined in good faith in accordance with procedures approved by the Trustees. Securities in the affiliated underlying funds’ portfolios are valued in accordance with their respective valuation polices, as outlined in the affiliated underlying funds’ financial statements. Short-term debt in vestments that have a remaining maturity of 60 days or less are valued at amortized cost.
Security transactions and related
investment income
Investment security transactions in the affiliated underlying funds are accounted for on a trade date plus one basis for daily net asset value calculations. However, for financial reporting purposes, investment transactions are reported on trade date. Interest income is accrued as earned. Dividend income and capital gain distributions from the affiliated underlying funds are recorded on the ex-dividend date.
Gains and losses on securities sold are determined on the basis of specific identified cost for both financial and federal income tax reporting purposes.
Multi-class operations
All income, expenses (except for class-specific expenses) and realized and unrealized gains (losses) are allocated to each class of shares based upon the relative net assets of each class. Dividends to shareholders from net investment income are determined at a class level and distributions from capital gains are determined at a Portfolio level.
Expense allocation
Expenses not directly attributable to a particular Portfolio or class of shares are allocated based on the relative share of net assets of the Portfolio at the time the expense was incurred. Class-specific expenses, such as transfer agency fees, blue sky fees, printing and postage fees and distribution and service fees, are accrued daily and charged directly to the respective share classes. Expenses in the Portfolio’s Statements of Operations reflect the expenses of the Portfolio and do not include any indirect expenses related to the affiliated underlying funds. Because the affiliated underlying funds have varied expense levels and the Portfolio may own different proportions of the affiliated underlying funds at different times, the amount of fees and expenses incurred indirectly by the Portfolio will vary.
Federal income taxes
The Portfolio seeks to qualify as a “regulated investment company” by complying with the applicable provisions of the Internal Revenue Code and will not be subject to federal income tax on taxable income that is distributed to shareholders. Therefore, no federal income tax provision is required.
New accounting pronouncements
In June 2006, Financial Accounting Standards Board (“FASB”) Interpretation No. 48, Accounting for Uncertainty in Income Taxes (the “Interpretation”) was issued, and is effective for fiscal years beginning after December 15, 2006 and is to be applied to all open tax years as of the effective date. The Interpretation prescribes a minimum threshold for financial statement recognition of the benefit of a tax position taken or expected to be taken in a tax return, and requires certain expanded disclosures. Management is currently evaluating the application of the Interpretation to the Portfolio, and has not at this time quantified the impact, if any, resulting from the adoption of the Interpretation on the Portfolio’s financial statements. The Portfolio will implement this pronouncement no later than June 29, 2007.
Lifestyle Aggressive Portfolio
26
In September 2006, FASB Standard No. 157, Fair Value Measurements (“FAS 157”) was issued, and is effective for fiscal years beginning after November 15, 2007. FAS 157 defines fair value, establishing a framework for measuring fair value and expands disclosure about fair value measurements. Management is currently evaluating the application of FAS 157 to the Fund, and its impact, if any, resulting from the adoption of FAS 157 on the Fund’s financial statements.
Distribution of income and gains
The Portfolio records distributions to shareholders from net investment income and net realized gains, if any, on the ex-dividend date.
During the period ended August 31, 2006, the tax character of distributions paid was as follows: ordinary income $10,856,555. During the four-month period ended December 31, 2006, the tax character of distributions paid was as follows: ordinary income $138,977,239 and long-term capital gains $19,381. Distributions paid by the Portfolio with respect to each class of shares are calculated in the same manner, at the same time and are in the same amount, except for the effect of expenses that may be applied differently to each class. Such distributions, on a tax basis, are determined in conformity with income tax regulations, which may differ from accounting principles generally accepted in the United States of America. Distributions in excess of tax basis earnings and profits, if any, are reported in the Portfolio’s financial statements as a return of capital. As of December 31, 2006, the components of distributable earnings on a t ax basis included $1,664,482 of undistributed ordinary income and $11,766,656 of undistributed long-term gain.
Capital accounts
The Portfolio reports the undistributed net investment income and accumulated undistributed net realized gain (loss) accounts on a basis approximating amounts available for future tax distributions (or to offset future taxable realized gains when a capital loss carry-forward is available). Accordingly, the Portfolio may periodically make reclassifications among certain capital accounts, without affecting its net asset value.
3. Investment advisory and
other agreements
Advisory fees
The Trust has entered into an Investment Advisory Agreement with the Adviser. The Adviser is responsible for managing the corporate and business affairs of the Trust and for selecting and compensating subadvisers to handle the investment of the assets of the Portfolio, subject to the supervision of the Board of Trustees. Under the Advisory Agreement, the Portfolio pays a monthly management fee to the Adviser equivalent, on an annual basis, to its pro rata portion of the sum of: (a) 0.05% of the first $7,500,000,000 of the aggregate daily net assets and (b) 0.04% of the aggregate daily net assets in excess of $7,500,000,000 of each of the five Lifestyle Portfolios of the Trust (Lifestyle Aggressive, Lifestyle Growth, Lifestyle Balanced, Lifestyle Moderate and Lifestyle Conservative) and its corresponding funds of the five Lifestyle Portfolios of John Hancock Trust (Lifestyle Aggressive, Lifestyle Growth, Lifestyle Balanced, Lifestyle Moderate and Lifestyle Conservative). The Portfolio is not responsible for payment of the subadvisory fees.
Expense reimbursements
The Adviser has contractually agreed to waive advisory fees or reimburse Portfolio’s expenses for Class A, Class B, Class C, Class R3, Class R, Class R1, Class R2, Class R4 and Class R5 shares to the extent that blue sky fees and printing and postage expenses attributable to each class exceed 0.09% of the average annual net assets attributable to the classes, at least until December 31, 2007, and may thereafter be terminated by the Adviser at any time. Accordingly, the expense reductions related to this expense limitation amounted to $24,863, $22,518, $21,975, $17,405, $17,026 and $17,584 for Class A, Class B, Class C, Class R3, Class R4 and Class R5, respectively, for the period ended August 31, 2006. The expense reductions related to this expense limitation amounted to $358, $6,598, $1,645, $3,641, $3,648, $3,647, $6,269, $5,947 and $6,579 for Class A, Class B, Class C, Class R, Class R1, Class R2, Class R3, Class R4 and Class R5, respectively, for the four-month period ended December 31, 2006.
Lifestyle Aggressive Portfolio
27
Administration fees
The Portfolio has an agreement with the Adviser that requires the Portfolio to reimburse the Adviser for all expenses associated with providing the administrative, financial, accounting and recordkeeping services of the Portfolio, including the preparation of all tax returns, annual, semiannual and periodic reports to shareholders and the preparation of all regulatory reports.
Distribution plans
The Trust has a Distribution Agreement with the Distributor. The Portfolio has adopted Distribution Plans with respect to Class A, Class B, Class C, Class R, Class R1, Class R2, Class R3, Class R4 and Class 1, pursuant to Rule 12b-1 under the 1940 Act, to reimburse the Distributor for the services it provides as distributor of shares of the Portfolio. Accordingly, the Portfolio makes monthly payments to the Distributor at an annual rate not to exceed 0.30%, 1.00%, 1.00%, 0.75%, 0.50%, 0.25%, 0.50%, 0.25% and 0.05% of the average daily net assets of Class A, Class B, Class C, Class R, Class R1, Class R2, Class R3, Class R4 and Class 1, respectively. A maximum of 0.25% of such payments may be service fees, as defined by the Conduct Rules of the National Association of Securities Dealers. Under the Conduct Rules, curtailment of a portion of the Portfolio’s 12b-1 payments could occur under certain circumstances.
The Portfolio has also adopted a Service Plan with respect to Class R, Class R1, Class R2, Class R3, Class R4 and Class R5 shares (the “Service Plan”). Under the Service Plan, the Fund pays up to 0.25%, 0.25%, 0.25%, 0.15%, 0.10% and 0.05% of average daily net assets of Class R, Class R1, Class R2, Class R3, Class R4 and Class R5 shares, respectively, for certain other services.
Sales charges
Class A shares are assessed up-front sales charges of up to 5% of the net asset value of such shares. During the four-month period ended December 31, 2006, the Portfolio was informed that the Distributer received net up-front sales charges of $474,296 with regard to sales of Class A shares. Of this amount, $73,196 was retained and used for printing prospectuses, advertising, sales literature and other purposes, $398,348 was paid as sales commissions to unrelated broker-dealers and $2,752 was paid as sales commissions to sales personnel of Signator Investors, Inc. (“Signator Investors”), a related broker-dealer, an indirect subsidiary of MFC.
Class B shares that are redeemed within six years of purchase are subject to a contingent deferred sales charge (“CDSC”) at declining rates, beginning at 5.00% of the lesser of the current market value at the time of redemption or the original purchase cost of the shares being redeemed. Class C shares that are redeemed within one year of purchase are subject to a CDSC at a rate of 1.00% of the lesser of the current market value at the time of redemption or the original purchase cost of the shares being redeemed. Proceeds from the CDSCs are paid to the Distributor and are used, in whole or in part, to defray its expenses for providing distribution-related services to the Portfolio in connection with the sale of Class B and Class C shares. During the four-month period ended December 31, 2006, the Portfolio was informed that CDSCs received by the Distributor amounted to $16,594 for Class B shares and $5,229 for Class C shares.
Transfer agent fees
The Portfolio has a Transfer Agency Agreement with John Hancock Signature Services, Inc. (“Signature Services”), an indirect subsidiary of MFC. For Class A, Class B, Class C, Class R, Class R1, Class R2, Class R3, Class R4 and Class R5 shares, the Portfolio pays a monthly transfer agent fee at an annual rate of 0.05% of each class’s average daily net assets, plus a fee based on the number of shareholder accounts and reimbursement for certain out-of-pocket expenses. Expenses not directly attributable to a particular class of shares are aggregated and allocated to each class on the basis of its relative net asset value.
Signature Services has agreed to limit the transfer agent fees so that such fees do not exceed 0.20% annually of Class A, Class B, Class C, Class R, Class R1, Class R2, Class R3, Class R4 and Class R5 share average daily net assets. This agreement is effective until December 31,
Lifestyle Aggressive Portfolio
28
2007. Signature Services reserves the right to terminate this limitation in the future. In addition, Signature Service has voluntarily agreed to further limit transfer agent fees for Class R, Class R1, Class R2, Class R3, Class R4 and Class R5 shares so that such fees do not exceed 0.05% annually of each class’s average daily net assets. Accordingly, the transfer agent fees reductions amounted to $304, $638 and $323 for Class R3, Class R4 and Class R5 shares, respectively, during the period ended August 31, 2006. The transfer agent fees reductions amounted to $54, $42, $44, $482, $435 and $267 for Class R, Class R1, Class R2, Class R3, Class R4 and Class R5 shares, respectively, during the four-month period ended December 31, 2006. Signature Services reserves the right to terminate this limitation at any time.
Expenses under the agreements described above for the period ended August 31, 2006 and the four-month period ended December 31, 2006, were as follows:
| Period ended 8-31-06 | | | | |
| | Distribution and | Transfer | | Printing and |
| Share Class | service fees | agent | Blue sky | postage |
|
| |
| Class A | $39,384 | $26,457 | $17,638 | $19,040 |
| Class B | 34,257 | 6,917 | 16,149 | 9,452 |
| Class C | 84,676 | 17,156 | 17,423 | 12,174 |
| Class R3 | 1,226 | 397 | 15,925 | 1,698 |
| Class R4 | 1,455 | 877 | 15,925 | 1,550 |
| Class R5 | 7 | 417 | 16,406 | 1,379 |
| Class 1 | 926,110 | — | — | 6,179 |
| Total | $1,087,115 | $52,221 | $99,466 | $51,472 |
| |
| Four months ended 12-31-06 | | | | |
| | Distribution and | Transfer | | Printing and |
| Share Class | service fees | agent | Blue sky | postage |
|
| |
| Class A | $45,311 | $29,719 | $6,680 | $7,271 |
| Class B | 34,648 | 6,930 | 6,116 | 3,600 |
| Class C | 106,611 | 21,322 | 6,598 | 4,642 |
| Class R | 282 | 73 | 3,150 | 525 |
| Class R1 | 150 | 57 | 3,150 | 525 |
| Class R2 | 78 | 60 | 3,150 | 525 |
| Class R3 | 2,393 | 709 | 6,030 | 647 |
| Class R4 | 2,457 | 809 | 6,030 | 591 |
| Class R5 | 48 | 356 | 6,214 | 526 |
| Class 1 | 434,913 | — | — | 2,341 |
| Total | $626,891 | $60,035 | $47,118 | $21,193 |
Trustees’ fees
The Trust compensates each Trustee who is not an employee of the Adviser or its affiliates. Total Trustees’ expenses are allocated based on each portfolio’s average daily net asset value.
4. Guarantees and indemnifications
Under the Trust’s organizational documents, its Officers and Trustees are indemnified against certain liability arising out of the performance of their duties to the Trust. Additionally, in the normal course of business, the Trust enters into contracts with service providers that contain general indemnification clauses. The Trust’s maximum exposure under these arrangements is unknown, as this would involve future claims that may be made against the Trust that have not yet occurred. However, based on experience, the Trust believes the risk of loss to be remote.
Lifestyle Aggressive Portfolio
29
5. Capital shares
Share activities for the Portfolio during the last two periods were as follows:
| | Period ended 8-31-06a | Four months ended 12-31-06b |
| | Shares | Amount | Shares | Amount |
|
| Class A share | | | | |
|
| Sold | 2,656,426 | $37,105,900 | 1,287,313 | $18,914,525 |
| Distributions reinvested | 739 | 9,867 | 158,685 | 2,343,780 |
| Repurchased | (164,725) | (2,284,281) | (139,671) | (2,069,549) |
| Net increase | 2,492,440 | $34,831,486 | 1,306,327 | $19,188,756 |
| |
| Class B shares | | | | |
|
| Sold | 641,314 | $8,963,149 | 270,496 | $3,963,999 |
| Distributions reinvested | 161 | 2,152 | 29,687 | 438,480 |
| Repurchased | (37,802) | (520,561) | (53,687) | (788,566) |
| Net increase | 603,673 | $8,444,740 | 246,496 | $3,613,913 |
| |
| Class C shares | | | | |
|
| Sold | 1,853,043 | $25,877,041 | 811,127 | $11,860,736 |
| Distributions reinvested | 283 | 3,786 | 91,893 | 1,357,255 |
| Repurchased | (49,020) | (685,074) | (64,280) | (948,858) |
| Net increase | 1,804,306 | $25,195,753 | 838,740 | $12,269,133 |
| |
| Class R shares c | | | | |
|
| Sold | — | — | 13,974 | $204,356 |
| Distributions reinvested | — | — | 586 | 8,697 |
| Repurchased | — | — | — | (3) |
| Net increase | — | — | 14,560 | $213,050 |
| |
| Class R1 shares c | | | | |
|
| Sold | — | — | 7,087 | $100,001 |
| Distributions reinvested | — | — | 315 | 4,660 |
| Repurchased | — | — | — | (1) |
| Net increase | — | — | 7,402 | $104,660 |
| |
| Class R2 shares c | | | | |
|
| Sold | — | — | 7,686 | $108,946 |
| Distributions reinvested | — | — | 359 | 5,311 |
| Repurchased | — | — | — | (1) |
| Net increase | — | — | 8,045 | $114,256 |
| |
| Class R3 shares | | | | |
|
| Sold | 78,517 | $1,063,860 | 42,310 | $622,204 |
| Distributions reinvested | — | — | 4,583 | 67,700 |
| Repurchased | (1,184) | (16,116) | (16,559) | (245,807) |
| Net increase | 77,333 | $1,047,744 | 30,334 | $444,097 |
| |
| Class R4 shares | | | | |
|
| Sold | 125,577 | $1,762,808 | 64,580 | $934,909 |
| Distributions reinvested | — | — | 7,464 | 110,167 |
| Repurchased | (13,355) | (183,449) | (17,622) | (264,501) |
| Net increase | 112,222 | $1,579,359 | 54,422 | $780,575 |
Lifestyle Aggressive Portfolio
30
| | Period ended 8-31-06a | Four months ended 12-31-06b |
| | Shares | Amount | Shares | Amount |
| |
| Class R5 shares | | | | |
|
| Sold | 38,324 | $533,868 | 10,619 | $159,884 |
| Distributions reinvested | — | — | 1,774 | 26,177 |
| Repurchased | (5,050) | (73,349) | (7,941) | (122,198) |
| Net increase | 33,274 | $460,519 | 4,452 | $63,863 |
| |
| Class 1 shares | | | | |
|
| Sold | 173,760,521 | $2,225,676,778 | 9,665,230 | $141,965,510 |
| Distributions reinvested | 812,945 | 10,836,557 | 9,129,956 | 134,484,258 |
| Repurchased | (2,435,942) | (33,752,531) | (1,447,335) | (21,105,583) |
| Net increase | 172,137,524 | $2,202,760,804 | 17,347,851 | $255,344,185 |
|
| Net increase | 177,260,772 | $2,274,320,405 | 19,858,629 | $292,136,488 |
a Class A, Class B, Class C, Class R3, Class R4 and Class R5 share began operations on 10-18-05 and Class 1 shares began operation on 10-15-05.
b Effective 1-18-07, the fiscal year-end changed from August 31 to December 31.
c Class R, Class R1 and Class R2 shares began operations on 9-18-06.
6. Investment transactions
Purchases and sales of the affiliated underlying funds during the four-month period ended December 31, 2006, aggregated $356,840,025 and $122,597,235, respectively.
The cost of investments owned on December 31, 2006, including short-term investments, for federal income tax purposes, was $2,579,134,962. Gross unrealized appreciation and depreciation of investments aggregated $317,028,858 and $2,340,248, respectively, resulting in net unrealized appreciation of $314,688,610.
7. Investment in affiliated
underlying funds
The Portfolio invests primarily in affiliated underlying funds that are managed by affiliates of the Adviser. The Portfolio does not invest in the affiliated underlying funds for the purpose of exercising management or control.
A summary of the Portfolio’s transactions in the securities of affiliated issuers in which the Portfolio’s holdings represent 5% or more of the outstanding voting securities of the issuer, during the four-month period ended December 31, 2006, is set forth below.
Lifestyle Aggressive Portfolio
31
| | Beginning | | | | | |
| Affiliate — | Shares | Shares | Shares | Ending Share | | Ending |
| Class NAV | Amount | Purchased | Sold | Amount | Proceeds | Value |
|
| All Cap Growth | 3,022,333 | 250,328 | 1,825 | 3,270,836 | $32,070 | $57,926,504 |
| All Cap Value | 3,136,053 | 442,838 | 1,685 | 3,577,206 | 27,937 | 57,664,564 |
| Blue Chip Growth | 6,985,892 | 549,634 | 31,881 | 7,503,645 | 592,237 | 144,895,377 |
| Capital Appreciation | 10,532,521 | 948,139 | 167,806 | 11,312,854 | 1,646,640 | 115,956,752 |
| Core Equity | 5,286,718 | 147,502 | 16,791 | 5,417,429 | 249,648 | 86,787,212 |
| Emerging Growth | 2,789,800 | 764,183 | 55,579 | 3,498,404 | 1,046,366 | 58,073,499 |
| Equity-Income | 2,736,026 | 342,715 | 1,614 | 3,077,127 | 31,646 | 57,788,436 |
| Fundamental Value | 6,280,209 | 524,866 | 5,036 | 6,800,039 | 86,307 | 115,600,671 |
| International Core* | 5,057,125 | 544,062 | 168,132 | 5,433,055 | 6,991,707 | 231,719,790 |
| International | | | | | | |
| Equity Index | 6,555,210 | 657,073 | 143,753 | 7,068,530 | 2,939,707 | 144,904,862 |
| International | | | | | | |
| Opportunities | 6,182,381 | 459,253 | 187,095 | 6,454,539 | 3,358,236 | 115,988,074 |
| International | | | | | | |
| Small Cap | 3,557,189 | 747,983 | 132,810 | 4,172,362 | 2,897,275 | 87,035,481 |
| International | | | | | | |
| Small Company | 7,989,553 | 599,035 | 315,802 | 8,272,786 | 3,260,805 | 87,029,713 |
| International Value | 9,755,233 | 1,255,681 | 160,994 | 10,849,920 | 3,057,391 | 202,785,006 |
| Large Cap | 3,379,099 | 325,452 | 2,229 | 3,702,322 | 35,423 | 57,793,242 |
| Large Cap Value | 1,069,803 | 79,849 | 585 | 1,149,067 | 14,542 | 28,761,149 |
| Mid Cap Core | 4,327,223 | 150,976 | 4,478,199 | — | 83,113,684 | — |
| Mid Cap Index | 1,361,218 | 4,501,059 | 2,461 | 5,859,816 | 48,829 | 115,203,989 |
| Mid Cap Stock | 3,170,730 | 279,213 | 2,223 | 3,447,720 | 38,373 | 57,714,828 |
| Mid Cap Value Equity | 2,578,332 | 193,586 | 1,305 | 2,770,613 | 13,505 | 28,758,959 |
| Mid Cap Value | 2,635,211 | 245,319 | 1,453 | 2,879,077 | 29,826 | 57,725,490 |
| Natural Resources | 3,492,935 | 887,425 | 319,400 | 4,060,960 | 11,763,376 | 144,895,069 |
| Quantitative Mid Cap | 3,479,128 | 304,939 | 1,964 | 3,782,103 | 29,992 | 57,639,253 |
| Quantitative Value | 4,497,753 | 534,320 | 13,960 | 5,018,113 | 244,263 | 87,014,073 |
| Small Cap | 5,402,799 | 214,380 | 11,347 | 5,605,832 | 165,841 | 86,441,931 |
| Small Cap Index | 3,174,474 | 256,239 | 1,942 | 3,428,771 | 33,219 | 57,809,078 |
| Small Company | 3,224,770 | 214,384 | 2,037 | 3,437,117 | 33,670 | 57,743,563 |
| Small Company Value | 3,199,392 | 254,723 | 1,751 | 3,452,364 | 44,086 | 86,861,470 |
| Special Value | 2,441,971 | 222,458 | 1,476 | 2,662,953 | 31,963 | 57,839,340 |
| U.S. Global | | | | | | |
| Leaders Growth | 1,958,976 | 175,900 | 1,318 | 2,133,558 | 17,877 | 28,781,700 |
| U.S. Multi Sector | 19,130,584 | 2,010,593 | 57,476 | 21,083,701 | 629,759 | 231,709,869 |
| Value & Restructuring | 2,239,676 | 163,420 | 1,226 | 2,401,870 | 14,758 | 28,894,501 |
| Vista | 4,636,102 | 383,620 | 4,167 | 5,015,555 | 48,125 | 58,080,127 |
*Represents the Portfolio’s investment in John Hancock Funds III International Core Fund.
8. Reclassification of accounts
During the four-month period ended December 31, 2006, the Portfolio reclassified amounts to reflect a decrease in accumulated net realized gain on investments of $61,399,623 and an increase in accumulated net investment income of $61,399,623. This represents the amounts necessary to report these balances on a tax basis, excluding certain temporary differences, as of December 31, 2006. Additional adjustments may be needed in subsequent reporting periods. These reclassifications, which have no impact on the net asset value of the Portfolio, are primarily attributable to certain differences in the computation of distributable income and capital gains under federal tax rules versus accounting principles generally accepted in the United States of America, book and tax differences in accounting for overdistribution. The calculation of net investment income per share in th e Portfolio’s Financial Highlights excludes these adjustments.
Lifestyle Aggressive Portfolio
32
Auditors’ report
Report of Independent Registered Public Accounting Firm
To the Board of Trustees of John Hancock Funds II and Shareholders of
John Hancock Lifestyle Aggressive Portfolio:
In our opinion, the accompanying statement of assets and liabilities, including the schedule of securities owned, and the related statements of operations and of changes in net assets and the financial highlights present fairly, in all material respects, the financial position of John Hancock Lifestyle Aggressive Portfolio (the “Portfolio”) at December 31, 2006, the results of its operations, the changes in its net assets, and the financial highlights for each of the periods indicated, in conformity with accounting principles generally accepted in the United States of America. These financial statements and financial highlights (hereafter referred to as “financial statements”) are the responsibility of the Portfolio’s management; our responsibility is to express an opinion on these financial statements based on our audits. We conducted our audits of these financial statements in accordance with the standards of the Public Company Accounting Oversight Board (United States). Those standards require that we plan and perform the audits to obtain reasonable assurance about whether the financial statements are free of material misstatement. An audit includes examining, on a test basis, evidence supporting the amounts and disclosures in the financial statements, assessing the accounting principles used and significant estimates made by management, and evaluating the overall financial statement presentation. We believe that our audits, which included confirmation of securities at December 31, 2006, by correspondence with the transfer agent, provide a reasonable basis for our opinion.
PricewaterhouseCoopers LLP
Boston, Massachusetts
March 1, 2007
33
Tax information
Unaudited
For federal income tax purposes, the following information is furnished with respect to the distributions of the Portfolio, if any, paid during its taxable year ended December 31, 2006.
The Portfolio has designated distributions to shareholders of $19,381 as long-term capital gain dividend.
With respect to the ordinary dividends paid by the Portfolio for the fiscal period ended December 31, 2006, 9.69% of the dividends qualify for the corporate dividends-received deduction.
The Portfolio hereby designates the maximum amount allowable of its net taxable income as qualified dividend income as provided in the Jobs and Growth Tax Relief Reconciliation Act of 2003. This amount will be reflected on Form 1099-DIV for the calendar year 2006.
Shareholders were mailed a 2006 U.S. Treasury Department Form 1099-DIV in January 2007.
This will reflect the total of all distributions that are taxable for calendar year 2006.
34
Trustees and Officers
This chart provides information about the Trustees and Officers of John Hancock
Funds II who oversee your John Hancock fund. Officers elected by the Trustees
manage the day-to-day operations of the Portfolio and execute policies formulated
by the Trustees.
| Independent Trustees | | |
| |
| Name, Year of Birth | | Number of |
| Position(s) held with Portfolio | Trustee | John Hancock |
| Principal occupation(s) and other | of Portfolio | funds overseen |
| directorships during past 5 years | since1 | by Trustee |
| |
| Charles L. Bardelis, Born: 1941 | 2005 | 209 |
|
| Director, Island Commuter Corp. (marine transport). Trustee of John | | |
| Hancock Trust (since 1988). | | |
| |
| Peter S. Burgess, Born: 1942 | 2005 | 209 |
|
| Consultant (financial, accounting and auditing matters (since 1999); | | |
| Certified Public Accountant; Partner, Arthur Andersen (prior to 1999). | | |
| Director of the following publicly traded companies: PMA Capital Corporation | | |
| (since 2004) and Lincoln Educational Services Corporation (since 2004). | | |
| Trustee of John Hancock Trust (since 2005). | | |
| |
| Elizabeth G. Cook, Born: 1937 | 2005 | 209 |
|
| Expressive Arts Therapist, Massachusetts General Hospital (September 2001 | | |
| to present); Expressive Arts Therapist, Dana Farber Cancer Institute | | |
| (September 2000 to January 2004); President, The Advertising Club of Greater Boston. | |
| Trustee of John Hancock Trust (since 2005). | | |
| |
| Hassell H. McClellan, Born: 1945 | 2005 | 209 |
|
| Associate Professor, The Wallace E. Carroll School of Management, Boston College. | |
| Trustee of John Hancock Trust (since 2005). | | |
| |
| James M. Oates, Born: 1946 | 2005 | 209 |
|
| Managing Director, Wydown Group (financial consulting firm) (since 1994); | | |
| Chairman, Emerson Investment Management, Inc. (since 2000); Chairman, | | |
| Hudson Castle Group, Inc. (formerly IBEX Capital Markets, Inc.) (financial services | |
| company) (since 1997). Director of the following publicly traded companies: | | |
| Stifel Financial (since 1996); Investor Financial Services Corporation (since 1995); | |
| and Connecticut River Bancorp, Director (since 1998). Director, Phoenix Mutual | |
| Funds (since 1988). Trustee of John Hancock Trust (since 2004). | | |
1 Because the Trust does not hold regular annual shareholders meetings, each Trustee holds office for an indefinite term until his/her successor is duly elected and qualified or until he/she dies, retires, resigns, is removed or becomes disqualified.
35
| Non-Independent Trustee3 | | |
| |
| Name, Year of Birth | | Number of |
| Position(s) held with Portfolio | Trustee | John Hancock |
| Principal occupation(s) and other | of Portfolio | funds overseen |
| directorships during past 5 years | since1 | by Trustee |
| |
| James R. Boyle, Born: 1959 | 2005 | 259 |
|
| Chairman and Director, John Hancock Advisers, LLC, The Berkeley Financial | | |
| Group, LLC (holding company) and John Hancock Funds, LLC; President, | | |
| John Hancock Annuities; Executive Vice President, John Hancock Life | | |
| Insurance Company (since June 2004); President, U.S. Annuities; Senior | | |
| Vice President, The Manufacturers Life Insurance Company (U.S.A.) (prior | | |
| to 2004). | | |
| |
| Principal officers who are not Trustees | | |
| |
| Name, Year of Birth | | |
| Position(s) held with Portfolio | | Officer |
| Principal occupation(s) and | | of Portfolio |
| directorships during past 5 years | | since |
| |
| Keith F. Hartstein,2 Born: 1956 | | 2005 |
|
| President | | |
| Senior Vice President, Manulife Financial Corporation (since 2004); Director, | | |
| President and Chief Executive Officer, the Adviser, The Berkeley Group, John | | |
| Hancock Funds, LLC (since 2005); Director, MFC Global Investment Management | |
| (U.S.), LLC (“MFC Global (U.S.)”) (since 2005); Director, John Hancock Signature | |
| Services, Inc. (since 2005); President and Chief Executive Officer, John Hancock | |
| Investment Management Services, LLC (since 2006); President and Chief Executive | |
| Officer, John Hancock Funds II, John Hancock Funds III and John Hancock Trust; | |
| Director, Chairman and President, NM Capital Management, Inc. (since 2005); | | |
| Chairman, Investment Company Institute Sales Force Marketing Committee | | |
| (since 2003); Director, President and Chief Executive Officer, MFC Global (U.S.) | |
| (2005–2006); Executive Vice President, John Hancock Funds, LLC (until 2005). | | |
| |
| Thomas M. Kinzler,2 Born: 1955 | | 2006 |
|
| Secretary | | |
| Vice President and Counsel, John Hancock Life Insurance Company (U.S.A.) | | |
| (since 2006); Secretary and Chief Legal Officer, John Hancock Funds, John | | |
| Hancock Funds II, John Hancock Funds III and John Hancock Trust (since 2006); | |
| Vice President and Associate General Counsel, Massachusetts Mutual Life | | |
| Insurance Company (1999–2006); Secretary and Chief Legal Counsel, MML | | |
| Series Investment Fund (2000–2006); Secretary and Chief Legal Counsel, | | |
| MassMutual Institutional Funds (2000–2004); Secretary and Chief Legal Counsel, | |
| MassMutual Select Funds and MassMutual Premier Funds (2004–2006). | | |
| |
| Francis V. Knox, Jr.,2 Born: 1947 | | 2005 |
|
| Chief Compliance Officer | | |
| Vice President and Chief Compliance Officer, John Hancock Investment | | |
| Management Services, LLC, the Adviser and MFC Global (U.S.) (since 2005); | | |
| Vice President and Chief Compliance Officer, John Hancock Funds II, John | | |
| Hancock Funds III and John Hancock Trust (since 2005); Vice President and | | |
| Assistant Treasurer, Fidelity Group of Funds (until 2004); Vice President and | | |
| Ethics & Compliance Officer, Fidelity Investments (until 2001). | | |
36
| Principal officers who are not Trustees (continued) | |
| |
| Name, Year of Birth | |
| Position(s) held with Portfolio | Officer |
| Principal occupation(s) and other | of Portfolio |
| directorships during past 5 years | since |
| |
| Gordon M. Shone,2 Born: 1956 | 2006 |
|
| Treasurer | |
| Treasurer, John Hancock Funds (since 2006), John Hancock Funds II, John | |
| Hancock Funds III and John Hancock Trust (since 2005); Vice President and | |
| Chief Financial Officer, John Hancock Trust (2003–2005); Senior Vice President, | |
| John Hancock Life Insurance Company (U.S.A.) (since 2001); Vice President, | |
| John Hancock Investment Management Services, Inc., John Hancock Advisers, | |
| LLC (since 2006) and The Manufacturers Life Insurance Company (U.S.A.) | |
| (1998–2000). | |
| |
| John G. Vrysen,2 Born: 1955 | 2005 |
|
| Chief Financial Officer | |
| Senior Vice President, Manulife Financial Corporation (since 2006); Director, | |
| Executive Vice President and Chief Financial Officer, the Adviser, The Berkeley | |
| Group and John Hancock Funds, LLC (since 2005); Executive Vice President and | |
| Chief Financial Officer, John Hancock Investment Management Services, LLC | |
| (since 2005); Vice President and Chief Financial Officer, MFC Global (U.S.) | |
| (since 2005); Director, John Hancock Signature Services, Inc. (since 2005); | |
| Chief Financial Officer, John Hancock Funds II, John Hancock Funds III and John | |
| Hancock Trust (since 2005); Vice President and General Manager, Fixed Annuities, | |
| U.S. Wealth Management (until 2005); Vice President, Operations, Manulife | |
| Wood Logan (2000–2004). | |
1 Because the Trust does not hold regular annual shareholders meetings, each Trustee holds office for an indefinite term until his successor is duly elected and qualified or until he dies, retires, resigns, is removed or becomes disqualified.
2Affiliated with the investment adviser.
3 Non-Independent Trustee: holds positions with the Fund’s investment adviser, underwriter, and/ or certain other affiliates.
37
For more information
The Fund’s proxy voting policies, procedures and records are available without charge, upon request:
| By phone | On the Fund’s Web site | On the SEC’s Web site |
| 1-800-225-5291 | www.jhfunds.com/proxy | www.sec.gov |
|
| Investment adviser | Custodian | Legal counsel |
| John Hancock Investment | State Street Bank & Trust Co. | Kirkpatrick & Lockhart |
| Management Services, Inc. | 2 Avenue de Lafayette | Preston Gates Ellis LLP |
| 601 Congress Street | Boston, MA 02111 | 1 Lincoln Street |
| Boston, MA 02210-2805 | | Boston, MA 02110-2950 |
| | Transfer agent | |
| Principal distributor | John Hancock Signature | Independent registered |
| John Hancock Funds, LLC | Services, Inc. | public accounting firm |
| 601 Congress Street | 1 John Hancock Way, | PricewaterhouseCoopers LLP |
| Boston, MA 02210-2805 | Suite 1000 | 125 High Street |
| | Boston, MA 02217-1000 | Boston, MA 02110 |
Each underlying fund’s accounting policies are outlined in the underlying fund’s shareholder report, available without charge by calling 1-800-344-1029 or on the Securities and Exchange Commission (“SEC”) Web site at www.sec.gov, File # 811-21779, CIK 0001331971.
The Portfolio’s investment objective, risks, charges and expenses are included in the prospectus and should be considered carefully before investing. For a prospectus, call your financial professional, call John Hancock Funds at 1-800-225-5291 or visit the Portfolio’s Web site at www.jhfunds.com. Please read the prospectus carefully before investing or sending money.
| How to contact us | |
|
| |
| Internet | www.jhfunds.com | |
|
| Mail | Regular mail: | Express mail: |
| | John Hancock | John Hancock |
| | Signature Services, Inc. | Signature Services, Inc. |
| | 1 John Hancock Way, Suite 1000 | Mutual Fund Image Operations |
| | Boston, MA 02217-1000 | 380 Stuart Street |
| | | Boston, MA 02116 |
|
| Phone | Customer service representatives | 1-800-225-5291 |
| | 24-hour automated information | 1-800-338-8080 |
| | TDD line | 1-800-554-6713 |
A listing of month-end portfolio holdings is available on our Web site, www.jhfunds.com. A more detailed portfolio holdings summary is available on a quarterly basis 60 days after the fiscal quarter on our Web site or upon request by calling 1-800-225-5291, or on the Securities and Exchange Commission’s Web site, www.sec.gov.
40
J O H N H A N C O C K F A M I L Y O F F U N D S
| EQUITY | INTERNATIONAL |
| Balanced Fund | Greater China Opportunities Fund |
| Classic Value Fund | International Allocation Portfolio |
| Classic Value Fund II | International Classic Value Fund |
| Core Equity Fund | International Core Fund |
| Focused Equity Fund | International Fund |
| Growth Fund | International Growth Fund |
| Growth Opportunities Fund | |
| Growth Trends Fund | INCOME |
| Intrinsic Value Fund | Bond Fund |
| Large Cap Equity Fund | Government Income Fund |
| Large Cap Select Fund | High Yield Fund |
| Mid Cap Equity Fund | Investment Grade Bond Fund |
| Mid Cap Growth Fund | Strategic Income Fund |
| Multi Cap Growth Fund | |
| Small Cap Equity Fund | TAX-FREE INCOME |
| Small Cap Fund | California Tax-Free Income Fund |
| Small Cap Intrinsic Value Fund | High Yield Municipal Bond Fund |
| Sovereign Investors Fund | Massachusetts Tax-Free Income Fund |
| U.S. Core Fund | New York Tax-Free Income Fund |
| U.S. Global Leaders Growth Fund | Tax-Free Bond Fund |
| Value Opportunities Fund | |
| | MONEY MARKET |
| ASSET ALLOCATION | Money Market Fund |
| Allocation Core Portfolio | U.S. Government Cash Reserve |
| Allocation Growth + Value Portfolio | |
| Lifecycle 2010 Portfolio | CLOSED-END |
| Lifecycle 2015 Portfolio | Bank and Thrift Opportunity Fund |
| Lifecycle 2020 Portfolio | Financial Trends Fund, Inc. |
| Lifecycle 2025 Portfolio | Income Securities Trust |
| Lifecycle 2030 Portfolio | Investors Trust |
| Lifecycle 2035 Portfolio | Patriot Global Dividend Fund |
| Lifecycle 2040 Portfolio | Patriot Preferred Dividend Fund |
| Lifecycle 2045 Portfolio | Patriot Premium Dividend Fund I |
| Lifecycle Retirement Portfolio | Patriot Premium Dividend Fund II |
| Lifestyle Aggressive Portfolio | Patriot Select Dividend Fund |
| Lifestyle Balanced Portfolio | Preferred Income Fund |
| Lifestyle Conservative Portfolio | Preferred Income II Fund |
| Lifestyle Growth Portfolio | Preferred Income III Fund |
| Lifestyle Moderate Portfolio | Tax-Advantaged Dividend Income Fund |
| |
| SECTOR | |
| Financial Industries Fund | |
| Health Sciences Fund | |
| Real Estate Fund | |
| Regional Bank Fund | |
| Technology Fund | |
| Technology Leaders Fund | |
For more complete information on any John Hancock Fund and an Open-End fund prospectus, which includes charges and expenses, call your financial professional, or John Hancock Funds at 1-800-225-5291 for Open-End fund information and 1-800-852-0218 for Closed-End fund information. Please read the Open-End fund prospectus carefully before investing or sending money.

1-800-225-5291
1-800-554-6713 TDD
1-800-338-8080 EASI-Line
www.jhfunds.com
Now available: electronic delivery
www.jhfunds.com/edelivery
This report is for the information of the shareholders of John Hancock Lifestyle Aggressive Portfolio.
9600A 12/06
2/07


| TABLE OF CONTENTS |
|
| Your portfolio at a |
| glance |
| page 1 |
|
| Managers’ report |
| page 2 |
|
| A look at performance |
| page 6 |
|
| Your expenses |
| page 8 |
|
| Portfolio’s investments |
| page 1 0 |
|
| Financial statements |
| page 1 2 |
|
| Notes to financial |
| statements |
| page 2 7 |
|
| Trustees and officers |
| page 3 7 |
|
| For more information |
| page 4 0 |
|
CEO corner
To Our Shareholders,
The financial markets surprised many investors in 2006 by beating their expectations. At the beginning of the year, fears abounded about rising inflation – with sky high energy prices – stronger than expected economic growth, a decline in the housing boom and more interest rate hikes from the Federal Reserve. But by June, the economic data suggested the desired “soft landing” for the economy, energy prices stabilized, corporate earnings remained strong and the Fed stopped raising rates. With that, the market took off, producing double-digit returns instead of the single-digit ones originally thought to be the best the market would do. The ascent was widespread and the broad Standard & Poor’s 500 Index returned 15.79% .
The bond market also turned in a solid result, registering its seventh consecutive year of positive performance. Continuing the trend of the last several years, the best performances came from the high yield sector. A healthy corporate earnings environment drove default rates down to near historical low levels and bolstered strong demand from yield-hungry investors. The broad Lehman Brothers Aggregate Bond Index returned 4.33% for the year, while the Merrill Lynch High Yield Master II Index returned 11.74% .
After such a year, we encourage investors to sit back, take stock and set some realistic expectations. While history argues for another good year (since 1945, the S&P 500 Index has always produced positive results in the third year of a presidential term) opinions are divided on the future of this more-than-four-year-old bull market.
We believe it’s wise to work with your financial professional to determine whether changes are now in order to your mix of portfolios. Some stock groups have had long runs of outperformance, such as small-cap stocks, value stocks and real estate investment trusts. Others had truly outsized returns in 2006, such as the telecom and energy sectors, China and emerging markets – not to mention the continued outperformance in general of international markets versus the U.S. Among bonds, the high yield category has become richly valued after such a long run up. These trends argue for a look to determine if these categories now represent a larger stake in your portfolios than prudent diversification would suggest they should, based on your risk profile, investment objectives and time horizons.
Sincerely,

Keith F. Hartstein,
President and Chief Executive Officer
This commentary reflects the CEO’s views as of December 31, 2006. They are subject to change at any time.
Your portfolio at a glance
The Portfolio seeks a balance between a high level of current income and growth of capital, with greater emphasis on growth of capital. To pursue this goal, the Portfolio, which is a fund-of-funds, normally invests approximately 40% of its assets in affiliated underlying funds that invest primarily in fixed-income securities and approximately 60% of its assets in affiliated underlying funds that invest primarily in equity securities.
Over the last twelve months
► Stocks representing all market-capitalization ranges and investment styles
benefited from a generally positive environment for equities.
► Bonds fell during the first half of 2006 but later bounced back, as the economy
slowed and the Fed kept interest rates steady beginning in August.
► The Portfolio’s exposure to international equity funds was particularly helpful to
performance, while several of our domestic large-cap equity funds detracted.
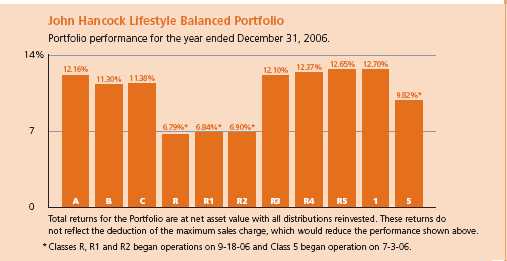
| Asset allocation | | | | |
| | | | |
| Equity | % of Total | | Fixed Income | % of Total |
|
| U.S. Large Cap | 36.2 | | High Yield Bond | 13.0 |
|
| International Large Cap | 10.0 | | Intermediate Term Bond | 9.0 |
|
| Real Estate | 4.9 | | Multi-Sector Bond | 9.0 |
|
| Natural Resources | 4.0 | | Treasury Inflation Protected Securities | 5.0 |
|
| U.S. Small Cap | 2.9 | | Global Bond | 3.0 |
|
| International Small Cap | 2.0 | | | |
| | |
| U.S. Mid Cap | 1.0 | | | |
| | |
As a percentage of net assets on December 31, 2006.
1
Managers’ report
John Hancock
Lifestyle Balanced Portfolio
Recently, the Portfolio’s fiscal year-end changed from August to
December. What follows is a commentary for the 12 months ended
December 31, 2006.
Stocks of all types gained ground against a mostly favorable market backdrop in 2006. Corporate earnings remained strong throughout the year, while consumer spending also held up surprisingly well. Concerns about rising inflation led to a significant stock market correction in May and June. However, better-than-anticipated inflation reports during the year’s second half — thanks in large part to declining energy prices — finally enabled the Federal Reserve Board, in a long-awaited move, to refrain from raising short-term interest rates for the first time in more than two years. Against this backdrop, the U.S. stock market rose steadily following its summertime decline.
Overall, the S&P 500 Index gained 15.79% during the 12 months ending December 31, 2006. International equities did particularly well, with the MSCI EAFE returning an impressive 26.87% . In addition to benefiting from many of the same fundamental trends helping U.S. companies, international stocks were further helped by strength in the euro and British pound relative to the U.S. dollar.
SCORECARD
| INVESTMENT | | PERIOD’S PERFORMANCE . . . AND WHAT’S BEHIND THE NUMBERS |
| | | |
| International | ▲ | Benefited from strong stock selection, an underweighting in Japan |
| Value (Franklin | | and currency gains for U.S. investors in European stocks. |
| Templeton) | | |
| High Yield | ▲ | Generally favorable environment for high yield bonds. |
| (Western Asset | | |
| Management) | | |
| U.S. Multi Sector | ▼ | Weak individual stock picks — especially in health care and |
| (GMO) | | banks — hurt this fund’s results. |
2
From the MFC Global Investment Management (U.S.A.), LLC’s
Portfolio Management Team
Also gaining ground were natural resources stocks, which benefited from rising commodity prices for much of the period and excellent supply/demand fundamentals. Real estate securities were helped by their continued strong fundamentals, investors’ demand for yield and an apparent increase in speculative investment.
“Stocks of all types gained ground
against a mostly favorable market
backdrop in 2006.”
The environment for bonds shifted markedly during the year. The first half of 2006 was a challenging period for bonds — economic growth was stronger than expected, inflation spiked higher in the spring and the Fed raised short-term interest rates at each of its meetings. In this environment, bonds declined in value as interest rates rose sharply. Over the last six months, however, bonds staged a healthy rebound thanks to slowing economic growth and moderating inflation. The weaker economic environment led to the Fed’s long-awaited interest rate pause.
As a whole, fixed-income securities — which make up approximately 40% of the Portfolio’s assets — posted positive returns in 2006, overcoming a modest rise in interest rates. The Lehman Brothers Aggregate Bond Index, a broad measure of bond market performance, posted its seventh consecutive calendar year of positive results, gaining 4.33% .
Performance results
During the 12 months ending December 31, 2006, John Hancock Lifestyle Balanced Portfolio’s Class A, Class B, Class C, Class R3, Class R4, Class R5 and Class 1 shares produced total returns of 12.16%, 11.30%, 11.38%, 12.10%, 12.37%, 12.65% and 12.70%, respectively, at net asset value. Class R, Class R1 and Class R2 shares returned 6.79%, 6.84% and 6.90%
Lifestyle Balanced Portfolio
3
at net asset value since beginning operations on September 18, 2006. Class 5 shares returned 9.82% at net asset value since beginning operations on July 3, 2006. In comparison, the Portfolio’s benchmark, the 60% S&P 500 Index/40% Lehman Brothers Aggregate Bond combined index, returned 11.12% and Morningstar’s average moderate allocation fund returned 11.26% for the 12-month period.1 Keep in mind that your net asset value return will be different from the Portfolio’s performance if you were not invested in the Portfolio for the entire period and did not reinvest all distributions. Please see pages six and seven for historical performance information.
Broad performance gains
During the period, our allocation to international equities was a significant positive. International Value (Franklin Templeton) — the Portfolio’s best performer overall — and International Core (GMO) were two standouts among our large-cap international holdings. International small-cap stocks also enjoyed particularly good results, and the Portfolio benefited from positions in International Small Cap (Templeton) and International Small Company (Dimensional Fund Advisors).
Other strong performers during the year were U.S. large-cap value funds. In particular, Quantitative Value (MFC Global) turned in solid relative performance, thanks in large part to favorable market conditions for large-cap value stocks.
Another notable positive was our position in Natural Resources (Wellington). It is important to remember that while natural resource equities can be relatively volatile performers on a stand-alone basis, they can be excellent complements to other asset classes within the context of a fully diversified portfolio. This is exactly what happened in 2006.
Further adding to performance was our exposure to the real estate securities market. In fact, the fourth quarter marked the continuation of a long period of significant outperformance for U.S. Real Estate Investment Trusts (REITs) relative to historical averages. While we remain convinced of the diversification benefits offered by real estate securities, the asset class has become more volatile and increasingly risky in recent years as non-traditional investors have entered the market. These factors led us to freeze new investments in U.S. REITs in the fourth quarter.
Lifestyle Balanced Portfolio
4
Performance was adversely impacted by a select number of our domestic large-cap equity funds, including U.S. Multi Sector (GMO) and U.S. Global Leaders Growth (Sustainable Growth Advisers). Within fixed income, our allocation to Real Return Bond (PIMCO) detracted from performance, as Treasury Inflation-Protected Securities (TIPS) underperformed traditional high-quality fixed-income instruments. On the other hand, the Portfolio’s fixed-income performance was helped by exposure to several high-yield bond funds. These holdings benefited from low corporate default rates and investors’ continued penchant for risk-oriented securities during the year. Overall, fixed-income securities made up approximately 40% of the Portfolio’s assets.
“Other strong performers during
the year were U.S. large-cap
value funds.”
Outlook
Global financial markets, and especially certain higher-risk asset classes — such as high yield bonds and smaller-cap stocks — have benefited from ample global liquidity. Should that liquidity dry up, we could see a significant market correction, with higher-risk assets beginning to lag their higher-quality equity and fixed-income counterparts. The Portfolio is exposed to both types of securities, and we believe our emphasis on diversification should position us well if market conditions shift over the coming months.
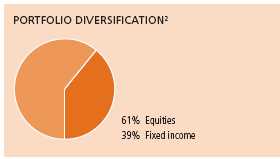
This commentary reflects the views of the portfolio managers through the end of the Portfolio’s period discussed in this report. The managers’ statements reflect their own opinions. As such, they are in no way guarantees of future events and are not intended to be used as investment advice or a recommendation regarding any specific security. They are also subject to change at any time as market and other conditions warrant.
International investing involves special risks such as political, economic and currency risks and differences in accounting standards and financial reporting. See the prospectus for the risks of investing in small-cap stocks. See the prospectus for the risks of investing in high-yield bonds.
1 Figures from Morningstar, Inc. include reinvested dividends and do not take into account sales charges. Actual load-adjusted performance is lower.
2 As a percentage of net assets on December 31, 2006.
Lifestyle Balanced Portfolio
5
A look at performance
For the periods ending December 31, 2006
| | | Average annual returns | | | Cumulative total returns |
| | | with maximum sales charge (POP) | | with maximum sales charge (POP) |
| | Inception | | | | Since | | | | Since |
| Class | dates | 1-year | 5-year | 10-year | inception | 1-year | 5-year | 10-year | inception |
|
| 1a | 10-15-05 | 12.70% | — | — | 14.26% | 12.70% | — | — | 17.57% |
|
| 5a | 7-3-06 | — | — | — | — | — | — | — | 9.82 |
|
| A | 10-18-05 | 6.54 | — | — | 9.18 | 6.54 | — | — | 11.16 |
|
| B | 10-18-05 | 6.30 | — | — | 9.87 | 6.30 | — | — | 12.02 |
|
| C | 10-18-05 | 10.38 | — | — | 13.19 | 10.38 | — | — | 16.10 |
|
| Ra | 9-18-06 | — | — | — | — | — | — | — | 6.79 |
|
| R1a | 9-18-06 | — | — | — | — | — | — | — | 6.84 |
|
| R2a | 9-18-06 | — | — | — | — | — | — | — | 6.90 |
|
| R3a | 10-18-05 | 12.10 | — | — | 13.74 | 12.10 | — | — | 16.79 |
|
| R4a | 10-18-05 | 12.37 | — | — | 14.02 | 12.37 | — | — | 17.14 |
|
| R5a | 10-18-05 | 12.65 | — | — | 14.30 | 12.65 | — | — | 17.49 |
|
Performance figures assume all distributions are reinvested. Returns with maximum sales charge reflect a sales charge on Class A shares of 5%, and the applicable contingent deferred sales charge (CDSC) on Class B and Class C shares. The Class B shares’ CDSC declines annually between years 1–6 according to the following schedule: 5, 4, 3, 3, 2, 1%. No sales charge will be assessed after the sixth year. Class C shares held for less than one year are subject to a 1% CDSC. Sales charge is not applicable for Class R, Class R1, Class R2, Class R3, Class R4, Class R5, Class 1 and Class 5 shares.
The returns reflect past results and should not be considered indicative of future performance. The return and principal value of an investment will fluctuate so that shares, when redeemed, may be worth more or less than their original cost. Due to market volatility, the Portfolio’s current performance may be higher or lower than the performance shown. For performance data current to the most recent month-end, please call 1-800-225-5291 or visit the Portfolio’s Web site at www.jhfunds.com.
The performance table above and the chart on the next page do not reflect the deduction of taxes that a shareholder would pay on fund distributions or the redemption of fund shares.
The Portfolio’s performance results reflect any applicable expense reductions, without which the expenses would increase and results would have been less favorable.
Since inception performance is calculated with an opening price (prior day’s close) on the inception date.
a For certain types of investors as described in the Portfolio’s Class R, Class R1, Class R2, Class R3, Class R4, Class R5, Class 1 and Class 5 share prospectuses.
Lifestyle Balanced Portfolio
6
Growth of $10,000
This chart shows what happened to a hypothetical $10,000 investment in Class A shares for the period indicated. For comparison, we’ve shown the same investment in a blended index.

| | Period | | With maximum | |
| Class | beginning | Without sales charge | sales charge | Index |
|
| 11,3 | 10-15-05 | $11,757 | $11,757 | $11,279 |
|
| 51,3 | 7-3-06 | 10,982 | 10,982 | 10,964 |
|
| B1 | 10-18-05 | 11,602 | 11,202 | 11,430 |
|
| C1,2 | 10-18-05 | 11,610 | 11,610 | 11,430 |
|
| R1,3 | 9-18-06 | 10,679 | 10,679 | 10,450 |
|
| R11,3 | 9-18-06 | 10,684 | 10,684 | 10,450 |
|
| R21,3 | 9-18-06 | 10,690 | 10,690 | 10,450 |
|
| R31,3 | 10-18-05 | 11,679 | 11,679 | 11,430 |
|
| R41,3 | 10-18-05 | 11,714 | 11,714 | 11,430 |
|
| R51,3 | 10-18-05 | 11,749 | 11,749 | 11,430 |
|
Assuming all distributions were reinvested for the period indicated, the table above shows the value of a $10,000 investment in the Portfolio’s Class B, Class C, Class R, Class R1, Class R2, Class R3, Class R4, Class R5, Class 1 and Class 5 shares, respectively, as of December 31, 2006. Performance of the classes will vary based on the difference in sales charges paid by shareholders investing in the different classes and the fee structure of those classes.
A blended index is used combining 60% of the Standard & Poor’s 500 Index, an unmanaged index that includes 500 widely traded common stocks, and 40% of the Lehman Brothers Aggregate Bond Index, an unmanaged index of dollar-denominated and nonconvertible investment-grade debt issues.
It is not possible to invest directly in an index. Index figures do not reflect sales charges and would be lower if they did.
1 Index figures as of closest month end to inception date.
2 No contingent deferred sales charge applicable.
3 For certain types of investors as described in the Portfolio’s Class R, Class R1, Class R2, Class R3, Class R4, Class R5, Class 1 and Class 5 share prospectuses.
Lifestyle Balanced Portfolio
7
Your expenses
These examples are intended to help you understand your ongoing operating expenses.
Understanding portfolio expenses
As a shareholder of the Portfolio, you incur two types of costs:
▪ Transaction costs which include sales charges (loads) on purchases or redemptions (varies by share class), minimum account fee charge, etc.
▪ Ongoing operating expenses including management fees, distribution and service fees (if applicable) and other fund expenses.
In addition to the operating expenses which the Portfolio bears directly, the Portfolio indirectly bears a pro rata share of the operating expenses of the affiliated underlying funds in which the Portfolio invests. Because the affiliated underlying funds have varied operating expenses and transaction costs and the Portfolio may own different proportions of the affiliated underlying funds at different times, the amount of expenses incurred indirectly by the Portfolio will vary. If these indirect expenses were included, your expenses paid during the period would have been higher.
We are going to present only your ongoing operating expenses here.
Actual expenses/actual returns
This example is intended to provide information about your portfolio’s actual ongoing operating expenses, and is based on your portfolio’s actual return. It assumes an account value of $1,000.00 on July 1, 2006, with the same investment held until December 31, 2006.
| | Account value | Ending value | Expenses paid during period |
| | on 7-1-06 | on 12-31-06 | ended 12-31-06a |
|
| Class A | $1,000.00 | $1,094.70 | $2.80 |
|
| Class B | 1,000.00 | 1,091.00 | 7.06 |
|
| Class C | 1,000.00 | 1,091.00 | 6.54 |
|
| Class R b | 1,000.00 | 1,067.10 | 2.80 |
|
| Class R1 b | 1,000.00 | 1,068.40 | 2.06 |
|
| Class R2 b | 1,000.00 | 1,069.00 | 1.33 |
|
| Class R3 | 1,000.00 | 1,094.10 | 3.75 |
|
| Class R4 | 1,000.00 | 1,095.20 | 2.53 |
|
| Class R5 | 1,000.00 | 1,097.20 | 0.95 |
|
| Class 1 | 1,000.00 | 1,096.80 | 0.53 |
|
| Class 5 c | 1,000.00 | 1,098.20 | 0.26 |
|
Lifestyle Balanced Portfolio
8
Together with the value of your account, you may use this information to estimate the operating expenses that you paid over the period. Simply divide your account value at December 31, 2006 by $1,000.00, then multiply it by the “expenses paid” for your share class from the table above. For example, for an account value of $8,600.00, the operating expenses should be calculated as follows:

Hypothetical example for comparison purposes
This table allows you to compare your portfolio’s ongoing operating expenses with those of any other fund. It provides an example of the Portfolio’s hypothetical account values and hypothetical expenses based on each class’s actual expense ratio and an assumed 5% annual return before expenses (which is not your fund’s actual return). It assumes an account value of $1,000.00 on July 1, 2006, with the same investment held until December 31, 2006. Look in any other fund shareholder report to find its hypothetical example and you will be able to compare these expenses.
| | Account value | Ending value | Expenses paid during period |
| | on 7-1-06 | on 12-31-06 | ended 12-31-06a |
|
| Class A | $1,000.00 | $1,022.53 | $2.70 |
|
| Class B | 1,000.00 | 1,018.45 | 6.82 |
|
| Class C | 1,000.00 | 1,018.95 | 6.31 |
|
| Class Rb | 1,000.00 | 1,011.54 | 2.72 |
|
| Class R1b | 1,000.00 | 1,012.25 | 2.01 |
|
| Class R2b | 1,000.00 | 1,012.96 | 1.29 |
|
| Class R3 | 1,000.00 | 1,021.63 | 3.62 |
|
| Class R4 | 1,000.00 | 1,022.79 | 2.45 |
|
| Class R5 | 1,000.00 | 1,024.30 | 0.92 |
|
| Class 1 | 1,000.00 | 1,024.70 | 0.51 |
|
| Class 5c | 1,000.00 | 1,024.55 | 0.25 |
|
Remember, these examples do not include any transaction costs, such as sales charges; therefore, these examples will not help you to determine the relative total costs of owning different funds. If transaction costs were included, your expenses would have been higher. See the prospectus for details regarding transaction costs.
a Expenses are equal to the Fund’s annualized expense ratio of 0.55%, 1.34%, 1.25%, 0.95%, 0.70%, 0.45%, 0.72%, 0.52%, 0.20%, 0.11% and 0.06% for Class A, Class B, Class C, Class R, Class R1, Class R2, Class R3, Class R4, Class R5, Class 1 and Class 5, respectively, multiplied by the average account value over the period, multiplied by the number of days in the period (inception date for Class R, Class R1 and Class R2) /365 or 366 (to reflect the one-half year period).
b Class R, R1 and R2 shares began operation on 9-18-06.
c Class 5 shares began operation on 7-3-06.
Lifestyle Balanced Portfolio
9
Portfolio’s investments
F I N A N C I A L S T A T E M E N T S
Securities owned by the Portfolio on 12-31-06
Portfolio of investments, showing all affiliated underlying funds.
| Issuer | Shares | Value |
|
| Investment companies 99.98% | | $7,915,121,398 |
| (Cost $7,332,045,503) | | |
| | |
| John Hancock Funds II 95.97% | | |
|
| Active Bond Fund Class NAV | 16,605,822 | $157,589,253 |
|
| All Cap Core Fund Class NAV | 14,868,844 | 158,501,877 |
|
| Blue Chip Growth Fund Class NAV | 32,948,123 | 636,228,258 |
|
| Core Bond Fund Class NAV | 12,647,626 | 157,462,939 |
|
| Core Equity Fund Class NAV | 14,852,940 | 237,944,105 |
|
| Equity-Income Fund Class NAV | 12,697,050 | 238,450,607 |
|
| Fundamental Value Fund Class NAV | 14,020,910 | 238,355,477 |
|
| Global Bond Fund Class NAV | 16,420,225 | 237,272,244 |
|
| Global Real Estate Fund Class NAV | 20,306,129 | 238,597,012 |
|
| High Income Fund Class NAV | 14,537,749 | 157,879,959 |
|
| High Yield Fund Class NAV | 70,011,150 | 713,413,616 |
|
| International Opportunities Fund Class NAV | 8,870,406 | 159,401,187 |
|
| International Small Cap Fund Class NAV | 7,640,715 | 159,385,307 |
|
| International Value Fund Class NAV | 16,997,036 | 317,674,607 |
|
| Large Cap Fund Class NAV | 5,076,459 | 79,243,522 |
|
| Large Cap Value Fund Class NAV | 9,537,510 | 238,723,865 |
|
| Mid Cap Stock Fund Class NAV | 4,706,912 | 78,793,704 |
|
| Natural Resources Fund Class NAV | 8,902,585 | 317,644,230 |
|
| Quantitative Value Fund Class NAV | 9,216,897 | 159,820,996 |
|
| Real Estate Equity Fund Class NAV | 12,408,223 | 146,417,035 |
|
| Real Return Bond Fund Class NAV | 30,614,083 | 396,146,237 |
|
| Small Cap Fund Class NAV | 5,093,666 | 78,544,333 |
|
| Small Cap Opportunities Fund Class NAV | 3,133,126 | 75,508,338 |
|
| Small Company Value Fund Class NAV | 3,136,953 | 78,925,727 |
|
| Spectrum Income Fund Class NAV | 37,945,236 | 395,768,813 |
|
| Strategic Bond Fund Class NAV | 13,242,802 | 157,589,338 |
|
| Strategic Income Fund Class NAV | 15,822,235 | 157,589,462 |
|
| Total Return Fund Class NAV | 29,064,377 | 395,856,811 |
See notes to financial statements
Lifestyle Balanced Portfolio
10
F I N A N C I A L S T A T E M E N T S
| Issuer | Shares | Value |
| John Hancock Funds II — continued | | |
|
| U.S. Global Leaders Growth Fund Class NAV | 17,596,078 | $237,371,092 |
|
| U.S. High Yield Bond Fund Class NAV | 11,969,638 | 157,879,522 |
|
| U.S. Multi Sector Fund Class NAV | 43,487,197 | 477,924,300 |
|
| Value & Restructuring Fund Class NAV | 13,264,569 | 159,572,764 |
| | |
| John Hancock Funds III 4.01% | | |
|
| International Core Fund Class NAV | 7,447,711 | 317,644,861 |
|
| Total investments 99.98% | | $7,915,121,398 |
|
| Other assets in excess of liabilities 0.02% | | $1,442,473 |
|
| Total net assets 100.00% | | $7,916,563,871 |
Percentages are stated as a percent of net assets of the Portfolio.
See notes to financial statements
Lifestyle Balanced Portfolio
11
Financial statements
F I N A N C I A L S T A T E M E N T S
Statement of assets and liabilities 12-31-06
This Statement of Assets and Liabilities is the Portfolio’s balance sheet. It shows the value
of what the Portfolio owns, is due and owes. You’ll also find the net asset value and the
maximum offering price per share.
| Assets | |
|
| Investments in affiliated funds, at value (cost $7,332,045,503) | $7,915,121,398 |
| Receivable for investments sold | 24,734,333 |
| Receivable for fund shares sold | 3,103,800 |
| Receivable from affiliates | 25,172 |
| Other assets | 389 |
| |
| Total assets | 7,942,985,092 |
|
| |
| Liabilities | |
|
| Due to custodian | 2,973,704 |
| Payable for investments purchased | 466,663 |
| Payable for fund shares repurchased | 22,001,821 |
| Payable to affiliates | |
| Fund administration fees | 196,131 |
| Transfer agent fees | 176,798 |
| Trustees’ fees | 24,983 |
| Investment management fees | 3,953 |
| Other payables and accrued expenses | 577,168 |
| |
| Total liabilities | 26,421,221 |
|
| |
| Net assets | |
|
| Capital paid-in | 7,334,428,600 |
| Accumulated net realized loss on investments | (940,624) |
| Net unrealized appreciation on investments in affiliated underlying funds | 583,075,895 |
| |
| Net assets | $7,916,563,871 |
|
| |
| Net asset value per share | |
|
| Based on net asset values and shares outstanding | |
| — The Portfolio has an unlimited number of shares authorized with no par value | |
| Class A ($124,561,602 ÷ 8,666,286 shares) | $14.37 |
| Class B ($31,669,159 ÷ 2,204,007 shares) | $14.37 |
| Class C ($128,038,028 ÷ 8,900,180 shares) | $14.39 |
| Class R ($324,431 ÷ 22,553 shares) | $14.39 |
| Class R1 ($106,817 ÷ 7,430 shares) | $14.38 |
| Class R2 ($108,973 ÷ 7,584 shares) | $14.37 |
| Class R3 ($4,669,502 ÷ 325,219 shares) | $14.36 |
| Class R4 ($9,677,759 ÷ 674,068 shares) | $14.36 |
| Class R5 ($1,692,217 ÷ 117,864 shares) | $14.36 |
| Class 1 ($7,608,841,286 ÷ 531,644,262 shares) | $14.31 |
| Class 5 ($6,874,097 ÷ 480,172 shares) | $14.32 |
|
| |
| Maximum offering price per share | |
|
| Class A1 ($14.37 ÷ 95%) | $15.13 |
1 On single retail sales of less than $50,000. On sales of $50,000 or more and on group sales the offering price is reduced.
See notes to financial statements
Lifestyle Balanced Portfolio
12
F I N A N C I A L S T A T E M E N T S
Statement of operations For the period ended 12-31-06
This Statement of Operations summarizes the Portfolio’s investment income earned
and expenses incurred in operating the Portfolio. It also shows net gains (losses) for
the period stated.
| | Period | Four months |
| | ended a | endedb |
| | 8-31-06 | 12-31-06 |
|
| Investment income | | |
|
| Income distributions received from affiliated underlying funds | $100,574,302 | $123,117,215 |
| Total investment income | 100,574,302 | 123,117,215 |
|
| Expenses | | |
|
| Investment management fees (Note 3) | 2,203,879 | 1,036,439 |
| Distribution and service fees (Note 3) | 3,010,082 | 1,749,052 |
| Transfer agent fees (Note 3) | 96,586 | 109,968 |
| Blue sky fees (Note 3) | 108,068 | 50,378 |
| Printing and postage fees (Note 3) | 114,386 | 45,238 |
| Fund administration fees (Note 3) | 452,525 | 171,988 |
| Audit and legal fees | 175,565 | 66,317 |
| Custodian fees | 12,619 | 4,030 |
| Trustees’ fees (Note 3) | 62,341 | 23,692 |
| Registration and filing fees | 197,349 | 75,004 |
| Miscellaneous | 49,624 | 13,218 |
| Total expenses | 6,483,024 | 3,345,324 |
| Less expense reductions (Note 3) | (153,974) | (36,282) |
| Net expenses | 6,329,050 | 3,309,042 |
| Net investment income | 94,245,252 | 119,808,173 |
|
| Realized and unrealized gain | | |
|
| Net realized gain on investments | 117,969,301 | 23,738,084 |
| Capital gain distributions received from affiliated underlying funds | 9,368,289 | 98,440,836 |
| Change in net unrealized appreciation of investments in | | |
| affiliated underlying funds | 296,209,041 | 286,866,854 |
| Net realized and unrealized gain | 423,546,631 | 409,045,774 |
| Increase in net assets from operations | $517,791,883 | $528,853,947 |
a Period from 10-15-05 (commencement of operations) to 8-31-06.
b Effective 1-18-07, the fiscal year-end changed from August 31 to December 31.
See notes to financial statements
Lifestyle Balanced Portfolio
13
F I N A N C I A L S T A T E M E N T S
Statement of changes in net assets
These Statements of Changes in Net Assets show how the value of the Portfolio’s net
assets has changed during the last two periods. The difference reflects earnings less
expenses, any investment gains and losses, distributions, if any, paid to shareholders and
the net of Fund share transactions.
| | Period | Four months |
| | endeda | endedb |
| | 8-31-06 | 12-31-06 |
|
| Increase (decrease) in net assets | | |
|
| From operations | | |
| Net investment income | $94,245,252 | $119,808,173 |
| Net realized gain | 127,337,590 | 122,178,920 |
| Change in net unrealized appreciation | 296,209,041 | 286,866,854 |
| | |
| Increase in net assets resulting from operations | 517,791,883 | 528,853,947 |
| | |
| Distributions to shareholders | | |
| From net investment income | | |
| Class A | (428,612) | (3,396,000) |
| Class B | (57,145) | (813,690) |
| Class C | (203,872) | (3,269,920) |
| Class R | — | (8,355) |
| Class R1 | — | (2,951) |
| Class R2 | — | (3,072) |
| Class R3 | (15,304) | (128,147) |
| Class R4 | (26,987) | (270,764) |
| Class R5 | (15,130) | (48,482) |
| Class 1 | (95,206,787) | (222,183,075) |
| Class 5 | (347) | (171,997) |
| From net realized gain | | |
| Class A | (1,728) | (2,150,530) |
| Class B | (612) | (549,053) |
| Class C | (1,299) | (2,203,348) |
| Class R | — | (5,608) |
| Class R1 | — | (1,847) |
| Class R2 | — | (1,881) |
| Class R3 | (26) | (81,916) |
| Class R4 | (26) | (167,165) |
| Class R5 | (123) | (29,224) |
| Class 1 | (1,411,319) | (132,141,718) |
| Class 5 | — | (109,135) |
See notes to financial statements
Lifestyle Balanced Portfolio
14
F I N A N C I A L S T A T E M E N T S
Statement of changes in net assets (continued)
| | Period | Four months |
| | endeda | endedb |
| | 8-31-06 | 12-31-06 |
| | |
| Distributions to shareholders (continued) | | |
| From capital paid-in | | |
| Class A | — | $(2,851,033) |
| Class B | — | (686,450) |
| Class C | — | (2,758,233) |
| Class R | — | (7,041) |
| Class R1 | — | (2,477) |
| Class R2 | — | (2,573) |
| Class R3 | — | (107,653) |
| Class R4 | — | (226,932) |
| Class R5 | — | (40,566) |
| Class 1 | — | (185,752,773) |
| Class 5 | — | (144,280) |
| | (97,369,317) | (560,317,889) |
| From Fund share transactions | 6,508,728,420 | 1,018,876,827 |
|
| Net assets | | |
|
| Beginning of period | — | 6,929,150,986 |
| End of period | $6,929,150,986 | $7,916,563,871 |
| Accumulated net investment income | $8,258,447 | — |
a Period from 10-15-05 (commencement of operations) to 8-31-06.
b Effective January 18, 2007, the fiscal year-end changed from August 31 to December 31.
See notes to financial statements
Lifestyle Balanced Portfolio
15
F I N A N C I A L S T A T E M E N T S
Financial highlights
The Financial highlights show how the Fund’s net asset value for a share has changed since the end of the previous period.
| CLASS A SHARES | | | |
| |
| Period ended | | 8-31-06a | 12-31-06b |
|
| Per share operating performance | | | |
|
| Net asset value, beginning of period | | $13.35 | $14.38 |
| Net investment income h,v | | 0.19 | 0.24 |
| Net realized and unrealized | | | |
| gain on investments | | 1.01 | 0.81 |
| | | |
| Total from investment operations | | 1.20 | 1.05 |
| | | |
| Less distributions | | | |
| From net investment income | | (0.17) | (0.43) |
| From net realized gain | | —j | (0.27) |
| From capital paid-in | | — | (0.36) |
| | | (0.17) | (1.06) |
| Net asset value, end of period | | $14.38 | $14.37 |
| Total return k,m (%) | | 9.08l | 7.25 |
|
| Ratios and supplemental data | | | |
|
| Net assets, end of period | | | |
| (in millions) | | $81 | $125 |
| Ratio of net expenses to average | | | |
| net assets q,r (%) | | 0.58 | 0.55 |
| Ratio of gross expenses to average | | | |
| net assets q,r (%) | | 0.70p | 0.55 |
| Ratio of net investment income | | | |
| to average net assets r,v (%) | | 1.60 | 4.77 |
| Portfolio turnover m (%) | | 23 | 3 |
See notes to financial statements
Lifestyle Balanced Portfolio
16
F I N A N C I A L S T A T E M E N T S
Financial highlights
| CLASS B SHARES | | | |
| |
| Period ended | | 8-31-06a | 12-31-06b |
|
| Per share operating performance | | | |
|
| Net asset value, beginning of period | | $13.35 | $14.37 |
| Net investment income h,v | | 0.10 | 0.20 |
| Net realized and unrealized | | | |
| gain on investments | | 1.02 | 0.81 |
| | | |
| Total from investment operations | | 1.12 | 1.01 |
| | | |
| Less distributions | | | |
| From net investment income | | (0.10) | (0.40) |
| From net realized gain | | —j | (0.27) |
| From capital paid-in | | — | (0.34) |
| | | (0.10) | (1.01) |
| Net asset value, end of period | | $14.37 | $14.37 |
| Total return k,l,m (%) | | 8.47 | 6.96 |
|
| Ratios and supplemental data | | | |
|
| Net assets, end of period | | | |
| (in millions) | | $20 | $32 |
| Ratio of net expenses to average | | | |
| net assets q,r (%) | | 1.34 | 1.34 |
| Ratio of gross expenses to average | | | |
| net assets p,q,r (%) | | 1.73 | 1.41 |
| Ratio of net investment income | | | |
| to average net assets r,v (%) | | 0.84 | 4.00 |
| Portfolio turnover m (%) | | 23 | 3 |
See notes to financial statements
Lifestyle Balanced Portfolio
17
F I N A N C I A L S T A T E M E N T S
Financial highlights
| CLASS C SHARES | | | |
| |
| Period ended | | 8-31-06a | 12-31-06b |
|
| Per share operating performance | | | |
|
| Net asset value, beginning of period | | $13.35 | $14.38 |
| Net investment income h,v | | 0.12 | 0.20 |
| Net realized and unrealized | | | |
| gain on investments | | 1.01 | 0.82 |
| | | |
| Total from investment operations | | 1.13 | 1.02 |
| | | |
| Less distributions | | | |
| From net investment income | | (0.10) | (0.40) |
| From net realized gain | | —j | (0.27) |
| From capital paid-in | | — | (0.34) |
| | | (0.10) | (1.01) |
| Net asset value, end of period | | $14.38 | $14.39 |
| Total return k,m (%) | | 8.55l | 7.03 |
|
| Ratios and supplemental data | | | |
|
| Net assets, end of period | | | |
| (in millions) | | $79 | $128 |
| Ratio of net expenses to average | | | |
| net assets q,r (%) | | 1.29 | 1.25 |
| Ratio of gross expenses to average | | | |
| net assetsq,r (%) | | 1.41p | 1.25 |
| Ratio of net investment income | | | |
| to average net assets r,v (%) | | 0.97 | 4.10 |
| Portfolio turnover m (%) | | 23 | 3 |
See notes to financial statements
Lifestyle Balanced Portfolio
18
F I N A N C I A L S T A T E M E N T S
Financial highlights
| CLASS R SHARES | |
| |
| Period ended | 12-31-06b,c |
|
| Per share operating performance | |
|
| Net asset value, beginning of period | $14.44 |
| Net investment income h,v | 0.32 |
| Net realized and unrealized | |
| gain on investments | 0.66 |
| |
| Total from investment operations | 0.98 |
| |
| Less distributions | |
| From net investment income | (0.41) |
| From net realized gain | (0.27) |
| From capital paid-in | (0.35) |
| | (1.03) |
| Net asset value, end of period | $14.39 |
| Total return k,l,m (%) | 6.79 |
|
| Ratios and supplemental data | |
|
| Net assets, end of period | |
| (in millions) | —i |
| Ratio of net expenses to average | |
| net assets q,r (%) | 0.95 |
| Ratio of gross expenses to average | |
| net assets p,q,r (%) | 8.41 |
| Ratio of net investment income | |
| to average net assets r,v (%) | 7.37 |
| Portfolio turnover m (%) | 3 |
See notes to financial statements
Lifestyle Balanced Portfolio
19
F I N A N C I A L S T A T E M E N T S
Financial highlights
| CLASS R1 SHARES | |
| |
| Period ended | 12-31-06b,c |
|
| Per share operating performance | |
|
| Net asset value, beginning of period | $14.44 |
| Net investment income h,v | 0.21 |
| Net realized and unrealized | |
| gain on investments | 0.78 |
| |
| Total from investment operations | 0.99 |
| |
| Less distributions | |
| From net investment income | (0.42) |
| From net realized gain | (0.27) |
| From capital paid-in | (0.36) |
| | (1.05) |
| Net asset value, end of period | $14.38 |
| Total return k,l,m (%) | 6.84 |
|
| Ratios and supplemental data | |
|
| Net assets, end of period | |
| (in millions) | —i |
| Ratio of net expenses to average | |
| net assets q,r (%) | 0.70 |
| Ratio of gross expenses to average | |
| net assets p,q,r (%) | 13.06 |
| Ratio of net investment income | |
| to average net assets v,r (%) | 4.96 |
| Portfolio turnover m (%) | 3 |
See notes to financial statements
Lifestyle Balanced Portfolio
20
F I N A N C I A L S T A T E M E N T S
Financial highlights
| CLASS R2 SHARES | |
| |
| Period ended | 12-31-06b,c |
|
| Per share operating performance | |
|
| Net asset value, beginning of period | $14.44 |
| Net investment income h,v | 0.22 |
| Net realized and unrealized | |
| gain on investments | 0.77 |
| |
| Total from investment operations | 0.99 |
| |
| Less distributions | |
| From net investment income | (0.43) |
| From net realized gain | (0.27) |
| From capital paid-in | (0.36) |
| | (1.06) |
| Net asset value, end of period | $14.37 |
| Total return k,l,m (%) | 6.90 |
|
| Ratios and supplemental data | |
|
| Net assets, end of period | |
| (in millions) | —i |
| Ratio of net expenses to average | |
| net assets q,r (%) | 0.45 |
| Ratio of gross expenses to average | |
| net assets p,q,r (%) | 12.70 |
| Ratio of net investment income | |
| to average net assets r,v (%) | 5.21 |
| Portfolio turnover m (%) | 3 |
See notes to financial statements
Lifestyle Balanced Portfolio
21
F I N A N C I A L S T A T E M E N T S
Financial highlights
| CLASS R3 SHARES | | | |
| |
| Period ended | | 8-31-06a | 12-31-06b |
|
| Per share operating performance | | | |
|
| Net asset value, beginning of period | | $13.35 | $14.37 |
| Net investment income h,v | | 0.36 | 0.22 |
| Net realized and unrealized | | | |
| gain on investments | | 0.82 | 0.82 |
| | | |
| Total from investment operations | | 1.18 | 1.04 |
| | | |
| Less distributions | | | |
| From net investment income | | (0.16) | (0.42) |
| From net realized gain | | —j | (0.27) |
| From capital paid-in | | — | (0.36) |
| | | (0.16) | (1.05) |
| Net asset value, end of period | | $14.37 | $14.36 |
| Total return k,l,m (%) | | 8.92 | 7.22 |
|
| Ratios and supplemental data | | | |
|
| Net assets, end of period | | | |
| (in millions) | | $3 | $5 |
| Ratio of net expenses to average | | | |
| net assets q,r (%) | | 0.69 | 0.72 |
| Ratio of gross expenses to average | | | |
| net assets p,q,r (%) | | 3.70 | 1.24 |
| Ratio of net investment income | | | |
| to average net assets r,v (%) | | 3.10 | 4.55 |
| Portfolio turnover m (%) | | 23 | 3 |
See notes to financial statements
Lifestyle Balanced Portfolio
22
F I N A N C I A L S T A T E M E N T S
Financial highlights
| CLASS R4 SHARES | | | |
| |
| Period ended | | 8-31-06a | 12-31-06b |
|
| Per share operating performance | | | |
|
| Net asset value, beginning of period | | $13.35 | $14.38 |
| Net investment income h,v | | 0.16 | 0.23 |
| Net realized and unrealized | | | |
| gain on investments | | 1.06 | 0.81 |
| | | |
| Total from investment operations | | 1.22 | 1.04 |
| | | |
| Less distributions | | | |
| From net investment income | | (0.19) | (0.43) |
| From net realized gain | | —j | (0.27) |
| From capital paid-in | | — | (0.36) |
| | | (0.19) | (1.06) |
| Net asset value, end of period | | $14.38 | $14.36 |
| Total return k,l,m (%) | | 9.19 | 7.27 |
|
| Ratios and supplemental data | | | |
|
| Net assets, end of period | | | |
| (in millions) | | $7 | $10 |
| Ratio of net expenses to average | | | |
| net assets q,r (%) | | 0.48 | 0.52 |
| Ratio of gross expenses to average | | | |
| net assets p,q,r (%) | | 1.46 | 0.70 |
| Ratio of net investment income | | | |
| to average net assets r,v (%) | | 1.37 | 4.55 |
| Portfolio turnover m (%) | | 23 | 3 |
See notes to financial statements
Lifestyle Balanced Portfolio
23
Financial highlights
F I N A N C I A L S T A T E M E N T S
| CLASS R5 SHARES | | | |
| |
| Period ended | | 8-31-06a | 12-31-06b |
|
| Per share operating performance | | | |
|
| Net asset value, beginning of period | | $13.35 | $14.38 |
| Net investment income h,v | | 0.18 | 0.24 |
| Net realized and unrealized | | | |
| gain on investments | | 1.06 | 0.82 |
| | | |
| Total from investment operations | | 1.24 | 1.06 |
| | | |
| Less distributions | | | |
| From net investment income | | (0.21) | (0.44) |
| From net realized gain | | —j | (0.27) |
| From capital paid-in | | — | (0.37) |
| | | (0.21) | (1.08) |
| Net asset value, end of period | | $14.38 | $14.36 |
| Total return k,l,m (%) | | 9.39 | 7.41 |
|
| Ratios and supplemental data | | | |
|
| Net assets, end of period | | | |
| (in millions) | | $1 | $2 |
| Ratio of net expenses to average | | | |
| net assets q,r (%) | | 0.19 | 0.20 |
| Ratio of gross expenses to average | | | |
| net assets p,q,r (%) | | 2.58 | 1.69 |
| Ratio of net investment income | | | |
| to average net assets r,v (%) | | 1.48 | 4.85 |
| Portfolio turnover m (%) | | 23 | 3 |
See notes to financial statements
Lifestyle Balanced Portfolio
24
F I N A N C I A L S T A T E M E N T S
Financial highlights
| CLASS 1 SHARES | | | |
| |
| Period ended | | 8-31-06a | 12-31-06b |
|
| Per share operating performance | | | |
|
| Net asset value, beginning of period | | $13.31 | $14.34 |
| Net investment income h,v | | 0.22 | 0.24 |
| Net realized and unrealized | | | |
| gain on investments | | 1.03 | 0.82 |
| | | |
| Total from investment operations | | 1.25 | 1.06 |
| | | |
| Less distributions | | | |
| From net investment income | | (0.22) | (0.45) |
| From net realized gain | | —j | (0.27) |
| From capital paid-in | | — | (0.37) |
| | | (0.22) | (1.09) |
| Net asset value, end of period | | $14.34 | $14.31 |
| Total return k,m (%) | | 9.47 | 7.40 |
|
| Ratios and supplemental data | | | |
|
| Net assets, end of period | | | |
| (in millions) | | $6,736 | $7,609 |
| Ratio of net expenses to average | | | |
| net assets q,r (%) | | 0.11 | 0.11 |
| Ratio of net investment income | | | |
| to average net assets r,v (%) | | 1.81 | 4.84 |
| Portfolio turnover m (%) | | 23 | 3 |
See notes to financial statements
Lifestyle Balanced Portfolio
25
F I N A N C I A L S T A T E M E N T S
Financial highlights
| CLASS 5 SHARES | | | |
| |
| Period ended | | 8-31-06a | 12-31-06b |
|
| Per share operating performance | | | |
|
| Net asset value, beginning of period | | $14.17 | $14.35 |
| Net investment gain (loss) h,v | | —j | 0.33 |
| Net realized and unrealized | | | |
| gain on investments | | 0.31 | 0.74 |
| | | |
| Total from investment operations | | 0.31 | 1.07 |
| | | |
| Less distributions | | | |
| From net investment income | | (0.13) | (0.45) |
| From net realized gain | | — | (0.27) |
| From capital paid-in | | — | (0.38) |
| | | (0.13) | (1.10) |
| Net asset value, end of period | | $14.35 | $14.32 |
| Total return k,m (%) | | 2.23 | 7.42 |
|
| Ratios and supplemental data | | | |
|
| Net assets, end of period | | | |
| (in millions) | | $1 | $7 |
| Ratio of net expenses to average | | | |
| net assets q,r (%) | | 0.01 | 0.06 |
| Ratio of net investment gain (loss) | | | |
| to average net assets r,v (%) | | (0.01) | 6.63 |
| Portfolio turnover m (%) | | 23 | 3 |
a Class A, Class B, Class C, Class R3, Class R4 and Class R5 shares began operations on 10-18-05, Class 1 shares began operation on 10-15-05, and Class 5 shares began operation on 7-3-06 .
b Effective 1-18-07, the fiscal year-end changed from August 31 to December 31.
c Class R, Class R1 and Class R2 shares began operations on 9-18-06.
h Based on the average of the shares outstanding.
i Less than $500,000.
j Less than $0.01 per share.
k Assumes dividend reinvestment and does not reflect the effect of sales charges.
l Total returns would have been lower had certain expenses not been reduced during the period shown.
m Not annualized.
p Does not take into consideration expense reductions during the period shown.
q Does not include expenses of the affiliated underlying funds.
r Annualized.
v Recognition of net investment income by the Portfolio is affected by the timing of the declaration of dividends by the affiliated underlying funds in which the Portfolio invests.
See notes to financial statements
Lifestyle Balanced Portfolio
26
Notes to financial statements
1. Organization
The John Hancock Lifestyle Balanced Portfolio (the “Portfolio”) is a non-diversified series of John Hancock Funds II (the “Trust”). The Trust was established as a Massachusetts business trust on June 28, 2005. The Trust is registered under the Investment Company Act of 1940 (the “1940 Act”), as amended, as an open-end investment management company.
The Portfolio operates as a “fund of funds,” investing in Class NAV shares of affiliated underlying funds of the Trust and John Hancock Funds III and in other permitted investments. The affiliated underlying funds’ accounting policies are outlined in the shareholder reports, available without charge by calling 1-800-225-5291 or on the Securities and Exchange Commission (“SEC”) Web site at www.sec.gov, File #811-21779, CIK 0001331971. The affiliated underlying funds are not covered by this report.
John Hancock Investment Management Services, LLC (the “Adviser”), a Delaware limited liability company controlled by John Hancock Life Insurance Company (U.S.A.) (“John Hancock USA”), serves as investment adviser for the Trust and John Hancock Funds, LLC (the “Distributor”), an affiliate of the Adviser, serves as the principal underwriter. John Hancock Life Insurance Company of New York (“John Hancock New York”) is a wholly owned subsidiary of John Hancock USA. John Hancock USA and John Hancock New York are indirect wholly owned subsidiaries of The Manufacturers Life Insurance Company (“Manulife”), which in turn is a wholly owned subsidiary of Manulife Financial Corporation (“MFC”), a publicly traded company. MFC and its subsidiaries are known collectively as “Manulife Financial.”
The Portfolio commenced operations after certain separate accounts of John Hancock USA redeemed their interests in portfolios of John Hancock Trust and certain unaffiliated mutual funds of approximately $1.2 billion at the close of business on October 14, 2005, with additional redemption proceeds of approximately $4.2 billion received on October 28, 2005, and invested such proceeds in Class 1 shares of the Portfolio, which in turn invested the proceeds in affiliated underlying funds of the Trust.
The Board of Trustees has authorized the issuance of multiple classes of shares of the Portfolio, including classes designated as Class A, Class B, Class C, Class R, Class R1, Class R2, Class R3, Class R4, Class R5, Class 1 and Class 5 shares.
Class A, Class B, and Class C shares are open to all retail investors. Class 1 shares are sold only to certain exempt separate accounts of John Hancock USA and John Hancock New York. Class R, Class R1, Class R2, Class R3, Class R4 and Class R5 shares are available only to certain retirement plans. Class 5 shares currently are available only to the John Hancock Freedom 529 Plan.
The shares of each class represent an interest in the same portfolio of investments of the Portfolio, and have equal rights as to voting, redemptions, dividends and liquidation, except that certain expenses, subject to the approval of the Trustees, may be applied differently to each class of shares in accordance with current regulations of the Securities and Exchange Commission and the Internal Revenue Service. Shareholders of a class that bears distribution and service expenses under the terms of a distribution plan have exclusive voting rights to that distribution plan. Class B shares will convert to Class A shares eight years after purchase.
On January 18, 2007, the Board of Trustees approved a change in the fiscal year end of the Portfolio from August 31 to December 31. Accordingly, the Portfolio’s financial statements and related notes include information as of the
Lifestyle Balanced Portfolio
27
four-month period ended December 31, 2006 and the period ended August 31, 2006.
2. Significant accounting policies
In the preparation of the financial statements, the Portfolio follows the policies described below. The preparation of financial statements in conformity with accounting principles generally accepted in the United States of America requires management to make estimates and assumptions that affect the reported amounts of assets and liabilities at the date of the financial statements and the reported amounts of income and expenses during the reporting period. Actual results may differ from these estimates.
Securities valuation
The net asset value of the shares of the Portfolio is determined daily as of the close of the New York Stock Exchange, normally at 4:00 p.m. Eastern Time. Investments in the affiliated underlying funds are valued at their respective net asset values each business day, or at fair value as determined in good faith in accordance with procedures approved by the Trustees. Securities in the affiliated underlying funds’ portfolios are valued in accordance with their respective valuation polices, as outlined in the affiliated underlying funds’ financial statements. Short-term debt investments that have a remaining maturity of 60 days or less are valued at amortized cost.
Security transactions and related
investment income
Investment security transactions in the affiliated underlying funds are accounted for on a trade date plus one basis for daily net asset value calculations. However, for financial reporting purposes, investment transactions are reported on trade date. Interest income is accrued as earned. Dividend income and capital gain distributions from the affiliated underlying funds are recorded on the ex-dividend date.
Gains and losses on securities sold are determined on the basis of specific identified cost for both financial and federal income tax reporting purposes.
Multi-class operations
All income, expenses (except for class-specific expenses) and realized and unrealized gains (losses) are allocated to each class of shares based upon the relative net assets of each class. Dividends to shareholders from net investment income are determined at a class level and distributions from capital gains are determined at a Portfolio level.
Expense allocation
Expenses not directly attributable to a particular Portfolio or class of shares are allocated based on the relative share of net assets of the Portfolio at the time the expense was incurred. Class-specific expenses, such as transfer agency fees, blue sky fees, printing and postage fees and distribution and service fees, are accrued daily and charged directly to the respective share classes. Expenses in the Portfolio’s Statement of Operations reflect the expenses of the Portfolio and do not include any indirect expenses related to the affiliated underlying funds. Because the affiliated underlying funds have varied expense levels and the Portfolio may own different proportions of the affiliated underlying funds at different times, the amount of fees and expenses incurred indirectly by the Portfolio will vary.
Federal income taxes
The Portfolio seeks to qualify as a “regulated investment company” by complying with the applicable provisions of the Internal Revenue Code and will not be subject to federal income tax on taxable income that is distributed to shareholders. Therefore, no federal income tax provision is required.
New accounting pronouncements
In June 2006, Financial Accounting Standards Board (FASB) Interpretation No. 48, Accounting for Uncertainty in Income Taxes (the “Interpretation”) was issued and is effective for fiscal years beginning after December 15, 2006 and is to be applied to all open tax years as of the effective date. This Interpretation prescribes a minimum threshold for financial statement recognition of the benefit of a tax position taken or expected to be taken in a tax return, and requires certain expanded disclosures. Management is currently evaluating the application of the Interpretation to the Portfolio, and has not at this time quantified the impact, if any, resulting from the adoption of this Interpretation on the
Lifestyle Balanced Portfolio
28
Portfolio’s financial statements. The Portfolio will implement this pronouncement no later than June 29, 2007.
In September 2006, FASB Standard No. 157, Fair Value Measurements (“FAS 157”) was issued, and is effective for fiscal years beginning after November 15, 2007. FAS 157 defines fair value, establishing a framework for measuring fair value and expands disclosure about fair value measurements. Management is currently evaluating the application of FAS 157 to the Portfolio, and its impact, if any, resulting from the adoption of FAS 157 on the Portfolio’s financial statements.
Distribution of income and gains
The Portfolio records distributions to shareholders from net investment income and net realized gains, if any, on the ex-dividend date.
During the period ended August 31, 2006, the tax character of distributions paid was as follows: ordinary income $97,369,317. During the four-month period ended December 31, 2006, the tax character of distributions paid was as follows: ordinary income $346,895,730, tax return of capital $192,535,188 and long-term capital gains $20,886,971. Distributions paid by the Portfolio with respect to each class of shares are calculated in the same manner, at the same time and are in the same amount, except for the effect of expenses that may be applied differently to each class. Such distributions, on a tax basis, are determined in conformity with income tax regulations, which may differ from accounting principles generally accepted in the United States of America. Distributions in excess of tax basis earnings and profits, if any, are reported in the Portfolio’s financial statements as a return of capital. As of December 31, 2006, there were no distributable earnings on a tax basis.
Capital accounts
The Portfolio reports the undistributed net investment income and accumulated undistributed net realized gain (loss) accounts on a basis approximating amounts available for future tax distributions (or to offset future taxable realized gains when a capital loss carryforward is available). Accordingly, the Portfolio may periodically make reclassifications among certain capital accounts, without affecting its net asset value.
3. Investment advisory and
other agreements
Advisory fees
The Trust has entered into an Investment Advisory Agreement with the Adviser. The Adviser is responsible for managing the corporate and business affairs of the Trust and for selecting and compensating subadvisers to handle the investment of the assets of the Portfolio, subject to the supervision of the Board of Trustees. Under the Advisory Agreement, the Portfolio pays a monthly management fee to the Adviser equivalent, on an annual basis, to its pro rata portion of the sum of: (a) 0.05% of the first $7,500,000,000 of the aggregate daily net assets and (b) 0.04% of the aggregate daily net assets in excess of $7,500,000,000 of each of the five Lifestyle Portfolios of the Trust (Lifestyle Aggressive, Lifestyle Growth, Lifestyle Balanced, Lifestyle Moderate and Lifestyle Conservative) and its corresponding fund of the five Lifestyle Portfolios of John Hancock Trust (Lifestyle Aggressive, Lifestyle Growth, Lifestyle Balanced, Lifestyle Moderate and Lifestyle Conservative). T he Portfolio is not responsible for payment of the subadvisory fees.
Expense reimbursements
The Adviser has contractually agreed to waive advisory fees or reimburse the Portfolio’s expenses for Class A, Class B, Class C, Class R, Class R1, Class R2, Class R3, Class R4 and Class R5 shares to the extent that blue sky fees and printing and postage expenses attributable to each class exceed 0.09% of the average annual net assets attributable to the classes, at least until November 1, 2006, and may thereafter be terminated by the Adviser at any time. Accordingly, the expense reductions related to this expense limitation amounted to $5,784, $3,631, $3,648, $3,648, $6,013, $4,708 and $7,303 for Class B, Class R, Class R1, Class R2, Class R3, Class R4 and Class R5, respectively, for the four-month period ended December 31, 2006.
The Adviser has contractually agreed to waive advisory fees or reimburse Portfolio expenses for Class 5 shares to the extent that total Portfolio operating expenses attributable to Class 5 exceed 0.07% of the average annual net assets attributable to Class 5. There were no expense reductions related to this expense limitation during the four-month period ended
Lifestyle Balanced Portfolio
29
December 31, 2006. This agreement remains in effect until June 30, 2007 and may thereafter be terminated by the Adviser at any time.
Administration fees
The Portfolio has an agreement with the Adviser that requires the Portfolio to reimburse the Adviser for all expenses associated with providing the administrative, financial, accounting and recordkeeping services of the Portfolio, including the preparation of all tax returns, annual, semiannual and periodic reports to shareholders and the preparation of all regulatory reports.
Distribution plans
The Trust has a Distribution Agreement with the Distributor. The Portfolio has adopted Distribution Plans with respect to Class A, Class B, Class C, Class R, Class R1, Class R2, Class R3, Class R4 and Class 1, pursuant to Rule 12b-1 under the 1940 Act to reimburse the Distributor for the services it provides as distributor of shares of the Portfolio. Accordingly, the Portfolio makes monthly payments to the Distributor at an annual rate not to exceed 0.30%, 1.00%, 1.00%, 0.75%, 0.50%, 0.25% 0.50%, 0.25% and 0.05% of the average daily net assets of Class A, Class B, Class C, Class R, Class R1, Class R2, Class R3, Class R4 and Class 1, respectively. A maximum of 0.25% of such payments may be service fees, as defined by the Conduct Rules of the National Association of Securities Dealers. Under the Conduct Rules, curtailment of a portion of the Portfolio’s 12b-1 payments could occur under certain circumstances.
The Portfolio has also adopted a Service Plan with respect to Class R, Class R1, Class R2, Class R3, Class R4 and Class R5 shares (the “Service Plan”). Under the Service Plan, the Portfolio pays up to 0.25%, 0.25%, 0.25%, 0.15%, 0.10% and 0.05% of the average daily net assets of Class R, Class R1, Class R2, Class R3, Class R4 and Class R5 shares, respectively, for certain other services.
Sales charges
Class A shares are assessed up-front sales charges of up to 5% of the net asset value of such shares. During the four-month period ended December 31, 2006, the Portfolio was informed that the Distributor received net up-front sales charges of $1,213,803 with regard to sales of Class A shares. Of this amount, $200,955 was retained and used for printing prospectuses, advertising, sales literature and other purposes, $1,001,449 was paid as sales commissions to unrelated broker-dealers and $11,399 was paid as sales commissions to sales personnel of Signator Investors, Inc. (“Signator Investors”), a related broker-dealer, an indirect subsidiary of MFC.
Class B shares that are redeemed within six years of purchase are subject to a contingent deferred sales charge (“CDSC”) at declining rates, beginning at 5.00% of the lesser of the current market value at the time of redemption or the original purchase cost of the shares being redeemed. Class C shares that are redeemed within one year of purchase are subject to a CDSC at a rate of 1.00% of the lesser of the current market value at the time of redemption or the original purchase cost of the shares being redeemed. Proceeds from the CDSCs are paid to the Distributor and are used, in whole or in part, to defray its expenses for providing distribution-related services to the Portfolio in connection with the sale of Class B and Class C shares. During the four-month period ended December 31, 2006, the Portfolio was informed that CDSCs received by the Distributor amounted to $9,045 for Class B shares and $14,570 for Class C shares.
Transfer agent fees
The Portfolio has a Transfer Agency Agreement with John Hancock Signature Services, Inc. (“Signature Services”), an indirect subsidiary of MFC. For Class A, Class B, Class C, Class R, Class R1, Class R2, Class R3, Class R4 and Class R5 shares, the Portfolio pays a monthly transfer agent fee at an annual rate of 0.05% of each class’s average daily net assets, plus a fee based on the number of shareholder accounts and reimbursement for certain out-of-pocket expenses. Expenses not directly attributable to a particular class of shares are aggregated and allocated to each class on the basis of its relative net asset value.
Lifestyle Balanced Portfolio
30
Signature Services has agreed to limit the transfer agent fees so that such fees do not exceed 0.20% annually of each of Class A, Class B, Class C, Class R, Class R1, Class R2, Class R3, Class R4 and Class R5 share average daily net assets. This agreement is effective until December 31, 2006. Signature Services reserves the right to terminate this limitation in the future. In addition, Signature Services has voluntarily agreed to further limit transfer agent fees for Class R, Class R1, Class R2, Class R3, Class R4 and Class R5 shares so that such fees do not exceed 0.05% annually of each class’s average daily net assets. Accordingly, the transfer agent fees reductions amounted to $71, $42, $33, $580, $459 and $362 for Class R, Class R1, Class R2, Class R3, Class R4 and Class R5 shares, respectively, during the four-month period ended December 31, 2006. Signature Services reserves the right to terminate this limitation at any time.
Expenses under the agreements described above for the four-month period ended December 31, 2006, were as follows:
| Period ended 8-31-06 | | | | |
| |
| | Distribution | Transfer | | Printing and |
| Share Class | and service fees | agent | Blue sky | postage |
|
| |
| Class A | $83,686 | $38,106 | $20,586 | $38,489 |
| Class B | 74,189 | 14,872 | 16,689 | 19,014 |
| Class C | 268,990 | 39,526 | 20,807 | 36,361 |
| Class R3 | 3,157 | 809 | 16,074 | 2,802 |
| Class R4 | 5,410 | 2,006 | 16,244 | 3,005 |
| Class R5 | 5 | 1,267 | 17,668 | 2,798 |
| Class 1 | 2,574,645 | — | — | 11,917 |
| Total | $3,010,082 | $96,586 | $108,068 | $114,386 |
| |
| Four months ended 12-31-06 | | | | |
| |
| | Distribution and | Transfer | | Printing and |
| Share Class | service fees | agent | Blue sky | postage |
|
| |
| Class A | $102,355 | $43,046 | $7,797 | $14,729 |
| Class B | 86,563 | 17,082 | 6,321 | 7,254 |
| Class C | 345,136 | 45,913 | 7,880 | 13,885 |
| Class R | 367 | 95 | 3,150 | 525 |
| Class R1 | 147 | 57 | 3,150 | 525 |
| Class R2 | 74 | 48 | 3,150 | 525 |
| Class R3 | 6,591 | 1,213 | 6,087 | 1,065 |
| Class R4 | 9,329 | 1,895 | 6,151 | 1,142 |
| Class R5 | 4 | 619 | 6,692 | 1,073 |
| Class 1 | 1,198,486 | — | — | 4,515 |
| Total | $1,749,052 | $109,968 | $50,378 | $45,238 |
Trustees’ fees
The Trust compensates each Trustee who is not an employee of the Adviser or its affiliates. Total Trustees’ expenses are allocated based on each Portfolio’s average daily net asset value.
Lifestyle Balanced Portfolio
31
4. Guarantees and Indemnifications
Under the Trust’s organizational documents, its Officers and Trustees are indemnified against certain liability arising out of the performance of their duties to the Trust. Additionally, in the normal course of business, the Trust enters into contracts with service providers that contain general indemnification clauses. The Trust’s maximum exposure under these arrangements is unknown, as this would involve future claims that may be made against the Trust that have not yet occurred. However, based on experience, the Trust believes the risk of loss to be remote.
5. Capital shares
Share activities for the Portfolio for the four-month period ended December 31, 2006 were as follows:
| | Period ended 8-31-06a | Four months ended 12-31-06b |
| | Shares | Amount | Shares | Amount |
|
| Class A shares | | | | |
|
| Sold | 6,009,152 | $85,302,501 | 2,301,145 | $34,441,210 |
| Distributions reinvested | 27,765 | 389,529 | 1,044,385 | 15,033,362 |
| Repurchased | (392,816) | (5,635,273) | (323,345) | (4,801,204) |
| Net increase | 5,644,101 | $80,056,757 | 3,022,185 | $44,673,368 |
| |
| Class B shares | | | | |
|
| Sold | 1,452,791 | $20,544,736 | 615,659 | $9,186,277 |
| Distributions reinvested | 3,722 | 52,170 | 247,931 | 3,568,430 |
| Repurchased | (57,897) | (818,019) | (58,199) | (868,062) |
| Net increase | 1,398,616 | $19,778,887 | 805,391 | $11,886,645 |
| |
| Class C shares | | | | |
|
| Sold | 5,676,144 | $80,561,010 | 2,638,805 | $39,340,147 |
| Distributions reinvested | 13,319 | 187,092 | 961,016 | 13,850,949 |
| Repurchased | (192,534) | (2,732,138) | (196,570) | (2,936,192) |
| Net increase | 5,496,929 | $78,015,964 | 3,403,251 | $50,254,904 |
| |
| Class R shares c | | | | |
|
| Sold | — | — | 19,663 | $293,680 |
| Distributions reinvested | — | — | 2,890 | 41,655 |
| Repurchased | — | — | — | (2) |
| Net increase | — | — | 22,553 | $335,333 |
| |
| Class R1 shares c | | | | |
|
| Sold | — | — | 6,449 | $93,141 |
| Distributions reinvested | — | — | 981 | 14,134 |
| Repurchased | — | — | — | (1) |
| Net increase | — | — | 7,430 | $107,274 |
| |
| Class R2 sharesc | | | | |
|
| Sold | — | — | 6,571 | $94,999 |
| Distributions reinvested | — | — | 1,013 | 14,575 |
| Repurchased | — | — | — | (1) |
| Net increase | — | — | 7,584 | $109,573 |
| |
| Class R3 shares | | | | |
|
| Sold | 246,488 | $3,431,004 | 119,898 | $1,788,302 |
| Distributions reinvested | 1,003 | 14,088 | 43,210 | 621,539 |
| Repurchased | (59,070) | (818,494) | (26,310) | (392,280) |
| Net increase | 188,421 | $2,626,598 | 136,798 | $2,017,561 |
Lifestyle Balanced Portfolio
32
| | Period ended 8-31-06a | Four months ended 12-31-06b |
| | Shares | Amount | Shares | Amount |
| |
| Class R4 shares | | | | |
|
| Sold | 532,830 | $7,589,789 | 99,034 | $1,473,004 |
| Distributions reinvested | 1,821 | 25,583 | 89,691 | 1,291,112 |
| Repurchased | (35,265) | (504,224) | (14,043) | (209,570) |
| Net increase | 499,386 | $7,111,148 | 174,682 | $2,554,546 |
| |
| Class R5 shares | | | | |
|
| Sold | 102,605 | $1,431,987 | 15,246 | $237,920 |
| Distributions reinvested | 974 | 13,638 | 15,867 | 228,255 |
| Repurchased | (4,703) | (65,769) | (12,125) | (184,561) |
| Net increase | 98,876 | $1,379,856 | 18,988 | $281,614 |
| |
| Class 1 shares | | | | |
|
| Sold | 468,643,365 | $6,306,035,420 | 26,696,656 | $395,003,122 |
| Distributions reinvested | 6,945,128 | 96,618,106 | 37,653,392 | 540,077,565 |
| Repurchased | (5,913,625) | (84,025,930) | (2,380,654) | (34,347,226) |
| Net increase | 469,674,868 | $6,318,627,596 | 61,969,394 | $900,733,461 |
| |
| Class 5 shares | | | | |
|
| Sold | 80,813 | $1,140,151 | 351,001 | $5,226,710 |
| Distributions reinvested | 25 | 347 | 58,593 | 840,371 |
| Repurchased | (633) | (8,884) | (9,627) | (144,533) |
| Net increase | 80,205 | $1,131,614 | 399,967 | $5,922,548 |
|
| |
| Net increase | 483,081,402 | $6,508,728,420 | 69,968,223 | $1,018,876,827 |
a Class A, Class B, Class C, Class R3, Class R4 and Class R5 shares began operations on 10-18-05, Class 1 shares began
operation on 10-15-05 and Class 5 shares began operation on 7-3-06 .
b Effective 1-18-07, the fiscal year-end changed from August 31 to December 31.
c Class R, Class R1 and Class R2 shares began operations on 9-18-06.
6. Investment transactions
Purchases and sales of the affiliated underlying funds, during the four-month period ended December 31, 2006, aggregated $916,651,094 and $239,531,066, respectively.
The cost of investments owned on December 31, 2006, including short-term investments, for federal income tax purposes, was $7,332,985,767. Gross unrealized appreciation and depreciation of investments aggregated $598,478,810 and $16,343,179, respectively, resulting in net unrealized appreciation of $582,135,631.
7. Investment in affiliated
underlying funds
The Portfolio invests primarily in affiliated underlying funds. The Portfolio does not invest in the affiliated underlying funds for the purpose of exercising management or control.
A summary of the Portfolio’s transactions in the securities of affiliated issuers in which the Portfolio’s holdings represent 5% or more of the outstanding voting securities of the issuer, during the period ended August 31, 2006 is set forth below.
Lifestyle Balanced Portfolio
33
| Affiliate — | Beginning Share | Shares | Shares | Ending Share | | Ending |
| Class NAV | Amount | Purchased | Sold | Amount | Proceeds | Value |
|
| Active Bond | 14,348,698 | 2,259,266 | 2,142 | 16,605,822 | $20,800 | $157,589,253 |
| All Cap Core | 13,949,346 | 921,478 | 1,980 | 14,868,844 | 21,056 | 158,501,877 |
| Blue Chip Growth | 31,187,742 | 1,883,523 | 123,142 | 32,948,123 | 2,259,908 | 636,228,258 |
| Core Bond | 11,009,165 | 1,640,051 | 1,590 | 12,647,626 | 20,052 | 157,462,939 |
| Core Equity | 14,775,230 | 301,393 | 223,683 | 14,852,940 | 3,514,166 | 237,944,105 |
| Equity-Income | 11,450,490 | 1,248,412 | 1,852 | 12,697,050 | 36,381 | 238,450,607 |
| Fundamental Value | 13,044,559 | 978,828 | 2,477 | 14,020,910 | 42,535 | 238,355,477 |
| Global Bond | 13,973,572 | 2,531,111 | 84,458 | 16,420,225 | 1,295,588 | 237,272,244 |
| Global Real Estate | 20,365,152 | 1,109,035 | 1,168,058 | 20,306,129 | 13,605,024 | 238,597,012 |
| High Income | 13,960,804 | 730,383 | 153,438 | 14,537,749 | 1,669,431 | 157,879,959 |
| High Yield | 61,755,028 | 8,348,211 | 92,089 | 70,011,150 | 940,328 | 713,413,616 |
| International Core | 7,021,623 | 526,751 | 100,663 | 7,447,711 | 4,210,577 | 317,644,861 |
| International Opportunities | 8,635,136 | 441,117 | 205,847 | 8,870,406 | 3,698,306 | 159,401,187 |
| International Small Cap | 6,612,982 | 1,188,341 | 160,608 | 7,640,715 | 3,484,671 | 159,385,307 |
| International Value | 15,561,937 | 1,743,208 | 308,109 | 16,997,036 | 5,904,082 | 317,674,607 |
| Large Cap | 4,716,545 | 360,705 | 791 | 5,076,459 | 12,618 | 79,243,522 |
| Large Cap Value | 5,962,792 | 3,575,938 | 1,220 | 9,537,510 | 30,345 | 238,723,865 |
| Mid Cap Stock | 4,428,541 | 279,142 | 771 | 4,706,912 | 13,356 | 78,793,704 |
| Natural Resources | 7,738,262 | 2,056,681 | 892,358 | 8,902,585 | 32,903,985 | 317,644,230 |
| Quantitative Value | 4,173,449 | 5,044,684 | 1,236 | 9,216,897 | 22,495 | 159,820,996 |
| Real Estate Equity | 12,751,108 | 646,438 | 989,323 | 12,408,223 | 11,964,262 | 146,417,035 |
| Real Return Bond | 25,973,686 | 4,645,723 | 5,326 | 30,614,083 | 70,188 | 396,146,237 |
| Small Cap | 5,025,819 | 135,366 | 67,519 | 5,093,666 | 1,043,685 | 78,544,333 |
| Small Cap Opportunities | 3,014,427 | 118,703 | 4 | 3,133,126 | 87 | 75,508,338 |
| Small Company Value | 2,978,978 | 158,450 | 475 | 3,136,953 | 11,987 | 78,925,727 |
| Spectrum Income | 33,620,812 | 4,329,906 | 5,482 | 37,945,236 | 57,632 | 395,768,813 |
| Strategic Bond | 11,694,497 | 1,550,085 | 1,780 | 13,242,802 | 21,391 | 157,589,338 |
| Strategic Income | 13,690,046 | 2,133,935 | 1,746 | 15,822,235 | 17,449 | 157,589,462 |
| Strategic Value | 12,711,120 | 115,930 | 12,827,050 | — | 152,300,490 | — |
| Total Return | 25,123,452 | 3,946,131 | 5,206 | 29,064,377 | 72,715 | 395,856,811 |
| U.S. Global | | | | | | |
| Leaders Growth | 16,419,986 | 1,179,809 | 3,717 | 17,596,078 | 50,472 | 237,371,092 |
| U.S. High Yield Bond | 10,536,141 | 1,435,093 | 1,596 | 11,969,638 | 21,241 | 157,879,522 |
| U.S. Multi Sector | 40,079,468 | 3,414,926 | 7,197 | 43,487,197 | 79,210 | 477,924,300 |
| Value & Restructuring | 12,513,767 | 752,676 | 1,874 | 13,264,569 | 22,455 | 159,572,764 |
*Represents the Portfolio’s investment in John Hancock Funds III International Core Fund.
8. Reclassification of accounts
During the four-month period ended December 31, 2006, the Portfolio reclassified amounts to reflect a decrease in accumulated net realized gain on investments of $122,788,964, a decrease in distributions in excess of net investment income of $315,324,152 and a decrease in capital paid-in of $192,535,188. This represents the amounts necessary to report these balances on a tax basis, excluding certain temporary differences, as of August 31, 2006. Additional adjustments may be needed in subsequent reporting periods. These reclassifications, which have no impact on the net asset value of the Portfolio, are primarily attributable to certain differences in the computation of distributable income and capital gains under federal tax rules versus accounting principles generally accepted in the United States of America and book and tax differences in accounting for overdistribution. The calculation of net investment income per share in the Port folio’s Financial Highlights excludes these adjustments.
Lifestyle Balanced Portfolio
34
Auditors’ report
Report of Independent Registered Public Accounting Firm
To the Board of Trustees of John Hancock Funds II and Shareholders of
John Hancock Lifestyle Balanced Portfolio:
In our opinion, the accompanying statement of assets and liabilities, including the schedule of securities owned, and the related statements of operations and of changes in net assets and the financial highlights present fairly, in all material respects, the financial position of John Hancock Lifestyle Balanced Portfolio (the “Portfolio”) at December 31, 2006, the results of its operations, the changes in its net assets, and the financial highlights for each of the periods indicated, in conformity with accounting principles generally accepted in the United States of America. These financial statements and financial highlights (hereafter referred to as “financial statements”) are the responsibility of the Portfolio’s management; our responsibility is to express an opinion on these financial statements based on our audits. We conducted our audits of these financial statements in accordance with the standards of the Public Company Accounting Oversight Board (United States). Those standards require that we plan and perform the audits to obtain reasonable assurance about whether the financial statements are free of material misstatement. An audit includes examining, on a test basis, evidence supporting the amounts and disclosures in the financial statements, assessing the accounting principles used and significant estimates made by management, and evaluating the overall financial statement presentation. We believe that our audits, which included confirmation of securities at December 31, 2006, by correspondence with the transfer agent, provide a reasonable basis for our opinion.
PricewaterhouseCoopers LLP
Boston, Massachusetts
March 1, 2007
35
Tax information
Unaudited
For federal income tax purposes, the following information is furnished with respect to the distributions of the Portfolio, if any, paid during its taxable year ended December 31, 2006.
The Portfolio has designated distributions to shareholders of $20,886,971 as a long-term capital gain dividend.
With respect to the ordinary dividends paid by the Portfolio for the fiscal period ended December 31, 2006, 9.82% of the dividends qualify for the corporate dividends-received deduction.
The Portfolio hereby designates the maximum amount allowable of its net taxable income as qualified dividend income as provided in the Jobs and Growth Tax Relief Reconciliation Act of 2003. This amount will be reflected on Form 1099-DIV for the calendar year 2006.
Shareholders were mailed a 2006 U.S. Treasury Department Form 1099-DIV in January 2007 This will reflect the total of all distributions that are taxable for calendar year 2006.
36
Trustees and Officers
This chart provides information about the Trustees and Officers of John Hancock Funds II who oversee your John Hancock fund. Officers elected by the Trustees manage the day-to-day operations of the Portfolio and execute policies formulated by the Trustees.
| Independent Trustees | | |
| |
| Name, Year of Birth | | Number of |
| Position(s) held with Portfolio | Trustee | John Hancock |
| Principal occupation(s) and other | of Portfolio | funds overseen |
| directorships during past 5 years | since1 | by Trustee |
|
| Charles L. Bardelis, Born: 1941 | 2005 | 209 |
|
| Director, Island Commuter Corp. (marine transport). Trustee of John | | |
| Hancock Trust (since 1988). | | |
|
| |
| Peter S. Burgess, Born: 1942 | 2005 | 209 |
|
| Consultant (financial, accounting and auditing matters (since 1999); | | |
| Certified Public Accountant; Partner, Arthur Andersen (prior to 1999). | | |
| Director of the following publicly traded companies: PMA Capital Corporation | | |
| (since 2004) and Lincoln Educational Services Corporation (since 2004). | | |
| Trustee of John Hancock Trust (since 2005). | | |
|
| |
| Elizabeth G. Cook, Born: 1937 | 2005 | 209 |
|
| Expressive Arts Therapist, Massachusetts General Hospital (September 2001 | | |
| to present); Expressive Arts Therapist, Dana Farber Cancer Institute | | |
| (September 2000 to January 2004); President, The Advertising Club of Greater Boston. | |
| Trustee of John Hancock Trust (since 2005). | | |
|
| |
| Hassell H. McClellan, Born: 1945 | 2005 | 209 |
|
| Associate Professor, The Wallace E. Carroll School of Management, Boston College. | |
| Trustee of John Hancock Trust (since 2005). | | |
|
| |
| James M. Oates, Born: 1946 | 2005 | 209 |
|
| Managing Director, Wydown Group (financial consulting firm) (since 1994); | | |
| Chairman, Emerson Investment Management, Inc. (since 2000); Chairman, | | |
| Hudson Castle Group, Inc. (formerly IBEX Capital Markets, Inc.) (financial services | |
| company) (since 1997). Director of the following publicly traded companies: | | |
| Stifel Financial (since 1996); Investor Financial Services Corporation (since 1995); | |
| and Connecticut River Bancorp, Director (since 1998). Director, Phoenix Mutual | |
| Funds (since 1988). Trustee of John Hancock Trust (since 2004). | | |
1 Because the Trust does not hold regular annual shareholders meetings, each Trustee holds office for an indefinite term until his/her successor is duly elected and qualified or until he/she dies, retires, resigns, is removed or becomes disqualified.
37
| Non-Independent Trustee3 | | |
| |
| Name, Year of Birth | | Number of |
| Position(s) held with Portfolio | Trustee | John Hancock |
| Principal occupation(s) and other | of Portfolio | funds overseen |
| directorships during past 5 years | since1 | by Trustee |
|
| James R. Boyle, Born: 1959 | 2005 | 259 |
|
| Chairman and Director, John Hancock Advisers, LLC, The Berkeley Financial | | |
| Group, LLC (holding company) and John Hancock Funds, LLC; President, | | |
| John Hancock Annuities; Executive Vice President, John Hancock Life | | |
| Insurance Company (since June 2004); President, U.S. Annuities; Senior | | |
| Vice President, The Manufacturers Life Insurance Company (U.S.A.) (prior | | |
| to 2004). | | |
| |
| Principal officers who are not Trustees | | |
| |
| Name, Year of Birth | | |
| Position(s) held with Portfolio | | Officer |
| Principal occupation(s) and | | of Portfolio |
| directorships during past 5 years | | since |
|
| Keith F. Hartstein,2 Born: 1956 | | 2005 |
|
| President | | |
| Senior Vice President, Manulife Financial Corporation (since 2004); Director, | | |
| President and Chief Executive Officer, the Adviser, The Berkeley Group, John | | |
| Hancock Funds, LLC (since 2005); Director, MFC Global Investment Management | |
| (U.S.), LLC (“MFC Global (U.S.)”) (since 2005); Director, John Hancock Signature | |
| Services, Inc. (since 2005); President and Chief Executive Officer, John Hancock | |
| Investment Management Services, LLC (since 2006); President and Chief Executive | |
| Officer, John Hancock Funds II, John Hancock Funds III and John Hancock Trust; | |
| Director, Chairman and President, NM Capital Management, Inc. (since 2005); | | |
| Chairman, Investment Company Institute Sales Force Marketing Committee | | |
| (since 2003); Director, President and Chief Executive Officer, MFC Global (U.S.) | |
| (2005–2006); Executive Vice President, John Hancock Funds, LLC (until 2005). | | |
|
| |
| Thomas M. Kinzler,2 Born: 1955 | | 2006 |
|
| Secretary | | |
| Vice President and Counsel, John Hancock Life Insurance Company (U.S.A.) | | |
| (since 2006); Secretary and Chief Legal Officer, John Hancock Funds, John | | |
| Hancock Funds II, John Hancock Funds III and John Hancock Trust (since 2006); | |
| Vice President and Associate General Counsel, Massachusetts Mutual Life | | |
| Insurance Company (1999–2006); Secretary and Chief Legal Counsel, MML | | |
| Series Investment Fund (2000–2006); Secretary and Chief Legal Counsel, | | |
| MassMutual Institutional Funds (2000–2004); Secretary and Chief Legal Counsel, | |
| MassMutual Select Funds and MassMutual Premier Funds (2004–2006). | | |
|
| |
| Francis V. Knox, Jr.,2 Born: 1947 | | 2005 |
|
| Chief Compliance Officer | | |
| Vice President and Chief Compliance Officer, John Hancock Investment | | |
| Management Services, LLC, the Adviser and MFC Global (U.S.) (since 2005); | | |
| Vice President and Chief Compliance Officer, John Hancock Funds II, John | | |
| Hancock Funds III and John Hancock Trust (since 2005); Vice President and | | |
| Assistant Treasurer, Fidelity Group of Funds (until 2004); Vice President and | | |
| Ethics & Compliance Officer, Fidelity Investments (until 2001). | | |
38
| Principal officers who are not Trustees (continued) | |
| |
| Name, Year of Birth | |
| Position(s) held with Portfolio | Officer |
| Principal occupation(s) and other | of Portfolio |
| directorships during past 5 years | since |
|
| Gordon M. Shone,2 Born: 1956 | 2006 |
|
| Treasurer | |
| Treasurer, John Hancock Funds (since 2006), John Hancock Funds II, John | |
| Hancock Funds III and John Hancock Trust (since 2005); Vice President and | |
| Chief Financial Officer, John Hancock Trust (2003–2005); Senior Vice President, | |
| John Hancock Life Insurance Company (U.S.A.) (since 2001); Vice President, | |
| John Hancock Investment Management Services, Inc., John Hancock Advisers, | |
| LLC (since 2006) and The Manufacturers Life Insurance Company (U.S.A.) | |
| (1998–2000). | |
|
| |
| John G. Vrysen,2 Born: 1955 | 2005 |
|
| Chief Financial Officer | |
| Senior Vice President, Manulife Financial Corporation (since 2006); Director, | |
| Executive Vice President and Chief Financial Officer, the Adviser, The Berkeley | |
| Group and John Hancock Funds, LLC (since 2005); Executive Vice President and | |
| Chief Financial Officer, John Hancock Investment Management Services, LLC | |
| (since 2005); Vice President and Chief Financial Officer, MFC Global (U.S.) | |
| (since 2005); Director, John Hancock Signature Services, Inc. (since 2005); | |
| Chief Financial Officer, John Hancock Funds II, John Hancock Funds III and John | |
| Hancock Trust (since 2005); Vice President and General Manager, Fixed Annuities, | |
| U.S. Wealth Management (until 2005); Vice President, Operations, Manulife | |
| Wood Logan (2000–2004). | |
1 Because the Trust does not hold regular annual shareholders meetings, each Trustee holds office for an indefinite term until his successor is duly elected and qualified or until he dies, retires, resigns, is removed or becomes disqualified.
2Affiliated with the investment adviser.
3 Non-Independent Trustee: holds positions with the Fund’s investment adviser, underwriter, and/ or certain other affiliates.
39
For more information
The Portfolio’s proxy voting policies, procedures and records are available without charge,proxy voting policies, procedures without charge, upon request:
| By phone | On the Portfolio’s Web site | On the SEC’s Web site |
| 1-800-225-5291 | www.jhfunds.com/proxy | www.sec.gov |
|
| |
| Investment adviser | Custodian | Legal counsel |
| John Hancock Investment | State Street Bank & Trust Co. | Kirkpatrick & Lockhart |
| Management Services, Inc. | 2 Avenue de Lafayette | Preston Gates Ellis LLP |
| 601 Congress Street | Boston, MA 02111 | 1 Lincoln Street |
| Boston, MA 02210-2805 | | Boston, MA 02110-2950 |
| | Transfer agent | |
| Principal distributor | John Hancock Signature | Independent registered |
| John Hancock Funds, LLC | Services, Inc. | public accounting firm |
| 601 Congress Street | 1 John Hancock Way, | PricewaterhouseCoopers LLP |
| Boston, MA 02210-2805 | Suite 1000 | 125 High Street |
| | Boston, MA 02217-1000 | Boston, MA 02110 |
Each underlying fund’s accounting policies are outlined in the underlying fund’s shareholder report, available without charge by calling 1-800-344-1029 or on the Securities and Exchange Commission (“SEC”) Web site at www.sec.gov, File # 811-21779, CIK 0001331971.
The Portfolio’s investment objective, risks, charges and expenses are included in the prospectus and should be considered carefully before investing. For a prospectus, call your financial professional, call John Hancock Funds at 1-800-225-5291 or visit the Portfolio’s Web site at www.jhfunds.com. Please read the prospectus and in carefully before investing or sending money.
| How to contact us | | |
|
| Internet | www.jhfunds.com | |
|
| Mail | Regular mail: | Express: |
| John Hancock | John Hancock |
| | Signature Services, Inc. | Mutual Fund Image Operations |
| | 1 John Hancock Way, Suite 1000 | Signature Services, Inc. |
| | Boston, MA 02217-1000 | 380 Stuart Street |
| | | Boston, MA 02116 |
| | | |
|
| Phone | Customer service representatives | 1-800-225-5291 |
| | 24-hour- automated information | 1-800-338-8080 |
| | TDD line | | 1-800-554-6713 |
|
A listing of month-end portfolio holdings is available on our Web site, www.jhfunds.com. A more detailed portfolio holdings
summary is available on a quarterly basis days after the the fiscal quarter on our Web site or upon request by calling
Commission’s Web site, www.sec.gov.
40
J O H N H A N C O C K F A M I L Y O F F U N D S
| EQUITY | INTERNATIONAL |
| Balanced Fund | Greater China Opportunities Fund |
| Classic Value Fund | International Allocation Portfolio |
| Classic Value Fund II | International Classic Value Fund |
| Core Equity Fund | International Core Fund |
| Focused Equity Fund | International Fund |
| Growth Fund | International Growth Fund |
| Growth Opportunities Fund | |
| Growth Trends Fund | INCOME |
| Intrinsic Value Fund | Bond Fund |
| Large Cap Equity Fund | Government Income Fund |
| Large Cap Select Fund | High Yield Fund |
| Mid Cap Equity Fund | Investment Grade Bond Fund |
| Mid Cap Growth Fund | Strategic Income Fund |
| Multi Cap Growth Fund | |
| Small Cap Equity Fund | TAX-FREE INCOME |
| Small Cap Fund | California Tax-Free Income Fund |
| Small Cap Intrinsic Value Fund | High Yield Municipal Bond Fund |
| Sovereign Investors Fund | Massachusetts Tax-Free Income Fund |
| U.S. Core Fund | New York Tax-Free Income Fund |
| U.S. Global Leaders Growth Fund | Tax-Free Bond Fund |
| Value Opportunities Fund | |
| | MONEY MARKET |
| ASSET ALLOCATION | Money Market Fund |
| Allocation Core Portfolio | U.S. Government Cash Reserve |
| Allocation Growth + Value Portfolio | |
| Lifecycle 2010 Portfolio | CLOSED-END |
| Lifecycle 2015 Portfolio | Bank and Thrift Opportunity Fund |
| Lifecycle 2020 Portfolio | Financial Trends Fund, Inc. |
| Lifecycle 2025 Portfolio | Income Securities Trust |
| Lifecycle 2030 Portfolio | Investors Trust |
| Lifecycle 2035 Portfolio | Patriot Global Dividend Fund |
| Lifecycle 2040 Portfolio | Patriot Preferred Dividend Fund |
| Lifecycle 2045 Portfolio | Patriot Premium Dividend Fund I |
| Lifecycle Retirement Portfolio | Patriot Premium Dividend Fund II |
| Lifestyle Aggressive Portfolio | Patriot Select Dividend Fund |
| Lifestyle Balanced Portfolio | Preferred Income Fund |
| Lifestyle Conservative Portfolio | Preferred Income II Fund |
| Lifestyle Growth Portfolio | Preferred Income III Fund |
| Lifestyle Moderate Portfolio | Tax-Advantaged Dividend Income Fund |
| |
| SECTOR | |
| Financial Industries Fund | |
| Health Sciences Fund | |
| Real Estate Fund | |
| Regional Bank Fund | |
| Technology Fund | |
| Technology Leaders Fund | |
For more complete information on any John Hancock Fund and an Open-End fund prospectus, which includes charges and expenses, call your financial professional, or John Hancock Funds at 1-800-225-5291 for Open-End fund information and 1-800-852-0218 for Closed-End fund information. Please read the Open-End fund prospectus carefully before investing or sending money.

1-800-225-5291
1-800-554-6713 TDD
1-800-338-8080 EASI-Line
www.jhfunds. com
Now available: electronic delivery
www.jhfunds. com/edelivery
This report is for the information of the shareholders of John Hancock Lifestyle Balanced Portfolio.
0700A 12/06
2/07

CEO corner

| TABLE OF CONTENTS |
|
| |
| Your portfolio at a |
| glance |
| page 1 |
|
| |
| Managers’ report |
| page 2 |
|
| |
| A look at performance |
| page 6 |
|
| |
| Your expenses |
| page 8 |
|
| |
| Portfolio’s investments |
| page 1 0 |
|
| |
| Financial statements |
| page 1 2 |
|
| |
| Notes to financial |
| statements |
| page 2 6 |
|
| |
| Trustees and officers |
| page 3 6 |
|
| |
| For more information |
| page 4 0 |
|
January 2007
To Our Shareholders,
The financial markets surprised many investors in 2006 by beating their expectations. At the beginning of the year, fears abounded about rising inflation – with sky high energy prices – stronger than expected economic growth, a decline in the housing boom and more interest rate hikes from the Federal Reserve. But by June, the economic data suggested the desired “soft landing” for the economy, energy prices stabilized, corporate earnings remained strong and the Fed stopped raising rates. With that, the market took off, producing double-digit returns instead of the single-digit ones originally thought to be the best the market would do. The ascent was widespread and the broad Standard & Poor’s 500 Index returned 15.79% .
The bond market also turned in a solid result, registering its seventh consecutive year of positive performance. Continuing the trend of the last several years, the best performances came from the high yield sector. A healthy corporate earnings environment drove default rates down to near historical low levels and bolstered strong demand from yield-hungry investors. The broad Lehman Brothers Aggregate Bond Index returned 4.33% for the year, while the Merrill Lynch High Yield Master II Index returned 11.74% .
After such a year, we encourage investors to sit back, take stock and set some realistic expectations. While history argues for another good year (since 1945, the S&P 500 Index has always produced positive results in the third year of a presidential term) opinions are divided on the future of this more-than-four-year-old bull market.
We believe it’s wise to work with your financial professional to determine whether changes are now in order to your mix of portfolios. Some stock groups have had long runs of outperformance, such as small-cap stocks, value stocks and real estate investment trusts. Others had truly outsized returns in 2006, such as the telecom and energy sectors, China and emerging markets – not to mention the continued outperformance in general of international markets versus the U.S. Among bonds, the high yield category has become richly valued after such a long run up. These trends argue for a look to determine if these categories now represent a larger stake in your portfolios than prudent diversification would suggest they should, based on your risk profile, investment objectives and time horizons.
Sincerely,

Keith F. Hartstein,
President and Chief Executive Officer
This commentary reflects the CEO’s views as of December 31, 2006. They are subject to change at any time.
Your portfolio at a glance
The Portfolio seeks a balance between a high level of current income and growth of capital, with a greater emphasis on income. To pursue this goal, the Portfolio, which is a fund-of-funds, normally invests approximately 80% of its assets in affiliated underlying funds that invest primarily in fixed-income securities and approximately 20% of its assets in affiliated underlying funds that invest primarily in equity securities.
Over the last twelve months
► Bonds fell during the first half of 2006 but later bounced back, as the economy slowed and the Fed kept interest rates steady beginning in August.
► The fixed-income market’s best performing asset class was high yield, which continued to benefit from low corporate default rates and investors’ demand for income.
► The Portfolio especially benefited from its allocations to international equities and risk-oriented bonds, while Treasury Inflation-Protected Securities underperformed.
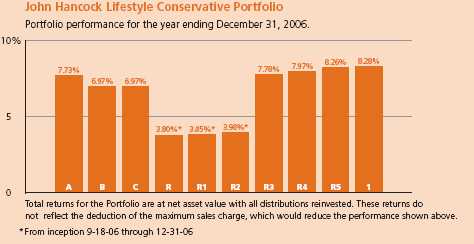
| Asset allocation | |
| Equity | % of Total |
|
| U.S. Large Cap | 10.2 |
|
| International Large Cap | 5.0 |
|
| Real Estate | 4.8 |
|
| Fixed Income | % of Total |
|
| Intermediate-Term Bond | 28.0 |
|
| Multi-Sector Bond | 16.0 |
|
| Short-Term Bond | 11.0 |
|
| High Yield Bond | 8.0 |
|
| Global Bond | 8.0 |
|
| Long-Term Bond | 5.0 |
|
| Treasury Inflation-Protected Securities | 4.0 |
|
As a percentage of net assets on December 31, 2006.
1
Managers’ report
John Hancock
Lifestyle Conservative Portfolio
Recently, the Portfolio’s fiscal year-end changed from August to December. What follows is a commentary for the 12 months ended December 31, 2006.
The environment for bonds — which make up 80% of the Portfolio — shifted markedly during the year. The first half of 2006 was a challenging period — economic growth was stronger than expected, inflation spiked higher in the spring and the Federal Reserve raised short-term interest rates for the 17th time in two years. In this environment, bonds declined in value as interest rates rose sharply. Over the last six months, however, bonds staged a healthy rebound thanks to slowing economic growth, most notably in the slumping housing market, and moderating inflation, which largely reflected a decline in energy prices. The weaker economic environment led the Fed to hold short-term interest rates steady throughout the last half of 2006. For the full year, the Lehman Brothers Aggregate Bond Index, a broad measure of bond market performance, gained 4.33% .
Bond yields finished the year slightly higher than where they started. Despite the significant yield fluctuations during the year, the yield curve remained “inverted” — meaning short-term bond yields were higher than the yields of longer-term bonds — throughout 2006. From a sector perspective, every segment of the bond market gained
SCORECARD
| INVESTMENT | | PERIOD’S PERFORMANCE... AND WHAT’S BEHIND THE NUMBERS |
| |
| Spectrum Income | ▲ | Benefited from its broad exposure to risk-oriented asset classes, |
| (T. Rowe Price) | | including high yield, international bonds and equities. |
| High Yield | ▲ | Generally favorable environment for high yield bonds |
| (Western Asset | | |
| Management) | | |
| U.S. Multi Sector | ▼ | Weak individual stock selection — especially in health care and |
| (GMO) | | banks — hurt this fund’s results. |
2
From the MFC Global Investment Management (U.S.A.), LLC’s Portfolio Management Team
| “From a sector perspective, every |
| segment of the bond market |
| gained ground during the year, |
| but high-yield corporate bonds |
| were by far the top performers.” |
ground during the year, but high-yield corporate bonds were by far the top performers. Strong balance sheets, a lack of credit defaults and increasing demand for yield led to double-digit gains for high yield bonds.
Stocks of all types gained ground against a mostly favorable equity market backdrop in 2006. Corporate earnings remained strong throughout the year, while consumer spending also held up surprisingly well. Although oil prices rose sharply during the year’s first half, they fell from their summertime peak of nearly $80 per barrel to finish the year closer to $60. Concerns about rising inflation led to a significant stock market correction in May and June. However, better-than-anticipated inflation reports led to the Fed’s long-awaited interest rate pause.
Against this backdrop, the U.S. stock market rose steadily following its summertime decline. Overall, the S&P 500 Index gained 15.79% during the 12 months ending December 31, 2006. Thanks to a stronger euro and British pound relative to the U.S. dollar, international equities did particularly well, with the MSCI EAFE returning 26.87% . Also gaining ground were global and domestic real estate securities, which benefited from continued strong fundamentals, investors’ demand for yield and an apparent increase in speculative investment.
Performance summary
During the 12 months ending December 31, 2006, John Hancock Lifestyle Conservative Portfolio’s Class A, Class B, Class C, Class R3, Class R4, Class R5 and Class 1 shares posted total returns of 7.73%, 6.97%, 6.97%, 7.78%, 7.97%, 8.26% and 8.28%, respectively, at net asset value. Class R,
Lifestyle Conservative Portfolio
3
R1 and R2 shares returned 3.80%, 3.85% and 3.98% at net asset value since beginning operations on September 18, 2006. In comparison, the Portfolio’s benchmark — a 20/80 blend of the S&P 500 Index and the Lehman Brothers Aggregate Bond Index — returned 6.57% and Morningstar’s average conservative allocation portfolio returned 8.18% .1 Keep in mind that your net asset value return will be different from the Portfolio’s performance if you were not invested in the Portfolio for the entire period and did not reinvest all distributions. Please see pages six and seven for historical performance information.
Riskier funds did best, TIPS lagged
During the period, the Portfolio outperformed the overall bond market without exposing our shareholders to excess levels of volatility. Our approximately 20% stake in domestic and international equity offerings helped, which is further evidence of the benefits of diversification. Also adding to performance was our exposure to the real estate securities market. In fact, the fourth quarter marked the continuation of a long period of significant outperformance for U.S. Real Estate Investment Trusts (REITs) relative to historical averages. While we remain convinced of the diversification benefits offered by real estate securities, the asset class has become more volatile and increasingly risky in recent years as non-traditional investors have entered the market. These factors led us to freeze new investments in U.S. REITs in the fourth quarter.
Within the fixed-income portion of the Portfolio, the best performance was found in higher-risk asset classes, such as high-yield bond funds. High Income (MFC Global (U.S.), in particular, did very well in absolute terms as well as relative to its peers. Our allocation to Global Bond (PIMCO) also contributed positively to performance, as it benefited from the strength of foreign currencies relative to the U.S. dollar.
Another positive contributor during the year was our 11% position in Spectrum Income (T. Rowe Price). This multi-sector bond fund benefited from its exposure to high yield and global bonds — including emerging-markets debt — as well as equities. Most of our other largest positions, however, performed roughly in line with the broad bond market, including Total Return (PIMCO), U.S. Government (Western Asset Management) and Active Bond (Declaration/Strategic Asset Management). One notable fixed-income negative was Real Return Bond (PIMCO).
Lifestyle Conservative Portfolio
4
Although this fund performed right in line with its Treasury Inflation-Protected Securities (TIPS) benchmark, it was hampered by disappointing results from TIPS generally, as these securities underperformed the broader bond market due to declining inflation expectations.
On the Portfolio’s domestic equity side, we were helped by our position in Equity Income (T. Rowe Price), which benefited from favorable market conditions for large-cap value stocks. In contrast, large-cap blend fund U.S. Multi-Sector (GMO) lagged the broad equity market as a result of disappointing individual stock selection. The Portfolio’s allocation to international equities was a significant positive, led by strong performance from International Value (Franklin Templeton).
| “During the period, the Portfolio |
| outperformed the overall bond |
| market without exposing our |
| shareholders to excess levels |
| of volatility.” |
Outlook
As interest rates have risen, bonds have encountered some difficulty. However, the diversification provided by the Portfolio benefited shareholders during the period. Although it may seem like a contradiction, maintaining a small allocation to more aggressive assets such as stocks, global bonds and real estate actually reduced risk and improved returns in a predominantly fixed-income portfolio. This is an excellent example of the power of diversification and asset allocation — and why we believe the Portfolio can be an important component of a conservative investor’s investment portfolio.
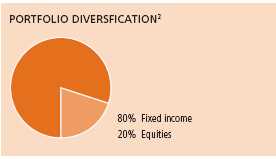
This commentary reflects the views of the portfolio managers through the end of the Portfolio’s period discussed in this report. The managers’ statements reflect their own opinions. As such, they are in no way guarantees of future events and are not intended to be used as investment advice or a recommendation regarding any specific security. They are also subject to change at any time as market and other conditions warrant.
International investing involves special risks such as political, economic and currency risks and differences in accounting standards and financial reporting. See the prospectus for the risks of investing in small-cap stocks. See the prospectus for the risks of investing in high-yield bonds.
1 Figures from Morningstar, Inc. include reinvested dividends and do not take into account sales charges. Actual load-adjusted performance is lower.
2 As a percentage of net assets on December 31, 2006.
Lifestyle Conservative Portfolio
5
A look at performance
For the periods ending December 31, 2006
| | | Average annual returns | | | Cumulative total returns | | |
| | | with maximum sales charge (POP) | | with maximum sales charge (POP) | | |
| | Inception | | | | Since | | | | Since |
| Class | date | 1-year | 5-year | 10-year | inception | 1-year | 5-year | 10-year | inception |
|
| 1a | 10-15-05 | 8.28% | — | — | 8.51% | 8.28% | — | — | 10.42% |
|
| A | 10-18-05 | 2.35 | — | — | 3.57 | 2.35 | — | — | 4.31 |
|
| B | 10-18-05 | 1.99 | — | — | 4.08 | 1.99 | — | — | 4.94 |
|
| C | 10-18-05 | 5.98 | — | — | 7.29 | 5.98 | — | — | 8.85 |
|
| Ra | 9-18-06 | — | — | — | — | — | — | — | 3.80 |
|
| R1a | 9-18-06 | — | — | — | — | — | — | — | 3.85 |
|
| R2a | 9-18-06 | — | — | — | — | — | — | — | 3.98 |
|
| R3a | 10-18-05 | 7.78 | — | — | 8.05 | 7.78 | — | — | 9.78 |
|
| R4a | 10-18-05 | 7.97 | — | — | 8.25 | 7.97 | — | — | 10.03 |
|
| R5a | 10-18-05 | 8.26 | — | — | 8.53 | 8.26 | — | — | 10.37 |
|
Performance figures assume all distributions are reinvested. Returns with maximum sales charge reflect a sales charge on Class A shares of 5%, and the applicable contingent deferred sales charge (CDSC) on Class B and Class C shares. The Class B shares’ CDSC declines annually between years 1–6 according to the following schedule: 5, 4, 3, 3, 2, 1%. No sales charge will be assessed after the sixth year. Class C shares held for less than one year are subject to a 1% CDSC. Sales charge is not applicable for Class R, Class R1, Class R2, Class R3, Class R4, Class R5 and Class 1 shares.
The returns reflect past results and should not be considered indicative of future performance. The return and principal value of an investment will fluctuate so that shares, when redeemed, may be worth more or less than their original cost. Due to market volatility, the Portfolio’s current performance may be higher or lower than the performance shown. For performance data current to the most recent month-end, please call 1-800-225-5291 or visit the Portfolio’s Web site at www.jhfunds.com.
The performance table above and the chart on the next page do not reflect the deduction of taxes that a shareholder would pay on fund distributions or the redemption of fund shares.
The Portfolio’s performance results reflect any applicable expense reductions, without which the expenses would increase and results would have been less favorable.
Since inception performance is calculated with an opening price (prior day’s close) on the inception date.
a For certain types of investors as described in the Portfolio’s Class R, Class R1, Class R2, Class R3, Class R4, Class R5 and Class 1 share prospectuses.
Lifestyle Conservative Portfolio
6
Growth of $10,000
This chart shows what happened to a hypothetical $10,000 investment in Class A shares for the period indicated. For comparison, we’ve shown the same investment in a blended index.

| | | | With maximum | |
| Class | Period beginning | Without sales charge | sales charge | Index |
|
| 11,3 | 10-15-05 | $11,042 | $11,042 | $10,753 |
|
| B1 | 10-18-05 | 10,894 | 10,494 | 10,858 |
|
| C1,2 | 10-18-05 | 10,885 | 10,885 | 10,858 |
|
| R1,3 | 9-18-06 | 10,380 | 10,380 | 10,232 |
|
| R11,3 | 9-18-06 | 10,385 | 10,385 | 10,232 |
|
| R21,3 | 9-18-06 | 10,398 | 10,398 | 10,232 |
|
| R31,3 | 10-18-05 | 10,978 | 10,978 | 10,858 |
|
| R41,3 | 10-18-05 | 11,003 | 11,003 | 10,858 |
|
| R51,3 | 10-18-05 | 11,037 | 11,037 | 10,858 |
|
Assuming all distributions were reinvested for the period indicated, the table above shows the value of a $10,000 investment in the Portfolio’s Class B, Class C, Class R, Class R1, Class R2, Class R3, Class R4, Class R5 and Class 1 shares, respectively, as of December 31, 2006. Performance of the classes will vary based on the difference in sales charges paid by shareholders investing in the different classes and the fee structure of those classes.
A blended index is used combining 20% of the Standard & Poor’s 500 Index, an unmanaged index that includes 500 widely traded common stocks, and 80% of the Lehman Brothers Aggregate Bond Index, an unmanaged index of dollar-denominated and nonconvertible investment-grade debt issues.
It is not possible to invest directly in an index. Index figures do not reflect sales charges and would be lower if they did.
1 Index figures as of closest month to inception date.
2 No contingent deferred sales charge applicable.
3 For certain types of investors as described in the Portfolio’s Class R, Class R1, Class R2, Class R3, Class R4, Class R5 and Class 1 share prospectuses.
Lifestyle Conservative Portfolio
7
Your expenses
These examples are intended to help you understand your ongoing operating expenses.
Understanding portfolio expenses
As a shareholder of the Portfolio, you incur two types of costs:
■ Transaction costs which include sales charges (loads) on purchases or redemptions (varies by share class), minimum account fee charge, etc.
■ Ongoing operating expenses including management fees, distribution and service fees (if applicable) and other portfolio expenses.
In addition to the operating expenses which the Portfolio bears directly, the Portfolio indirectly bears a pro rata share of the operating expenses of the affiliated underlying funds in which the Portfolio invests. Because the affiliated underlying funds have varied operating expenses and transaction costs and the Portfolio may own different proportions of the affiliated underlying funds at different times, the amount of expenses incurred indirectly by the Portfolio will vary. If these indirect expenses were included, your expenses paid during the period would have been higher.
We are going to present only your ongoing operating expenses here.
Actual expenses/actual returns
This example is intended to provide information about your Portfolio’s actual ongoing operating expenses, and is based on your Portfolio’s actual return. It assumes an account value of $1,000.00 on July 1, 2006, with the same investment held until December 31, 2006.
| | Account value | Ending value | Expenses paid during period |
| | on 7-1-06 | on 12-31-06 | ended 12-31-06 |
|
| Class A | $1,000.00 | $1,067.60 | $2.76 |
|
| Class B | 1,000.00 | 1,064.20 | 6.92 |
|
| Class C | 1,000.00 | 1,064.20 | 6.71 |
|
| Class R | 1,000.00 | 1,038.00 | 2.76 |
|
| Class R1 | 1,000.00 | 1,038.50 | 2.03 |
|
| Class R2 | 1,000.00 | 1,039.80 | 1.31 |
|
| Class R3 | 1,000.00 | 1,068.20 | 3.86 |
|
| Class R4 | 1,000.00 | 1,069.30 | 2.50 |
|
| Class R5 | 1,000.00 | 1,070.50 | 0.94 |
|
| Class 1 | 1,000.00 | 1,070.70 | 0.57 |
|
Lifestyle Conservative Portfolio
8
Together with the value of your account, you may use this information to estimate the operating expenses that you paid over the period. Simply divide your account value at December 31, 2006 by $1,000.00, then multiply it by the “expenses paid” for your share class from the table above. For example, for an account value of $8,600.00, the operating expenses should be calculated as follows:
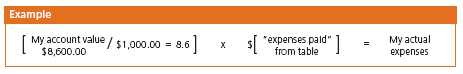
Hypothetical example for comparison purposes
This table allows you to compare your portfolio’s ongoing operating expenses with those of any other fund. It provides an example of the Portfolio’s hypothetical account values and hypothetical expenses based on each class’s actual expense ratio and an assumed 5% annual return before expenses (which is not your portfolio’s actual return). It assumes an account value of $1,000.00 on July 1, 2006, with the same investment held until December 31, 2006. Look in any other fund shareholder report to find its hypothetical example and you will be able to compare these expenses.
| | Account value | Ending value | Expenses paid during period |
| | on 7-1-06 | on 12-31-06 | ended 12-31-06a |
|
| Class A | $1,000.00 | $1,022.53 | $2.70 |
|
| Class B | 1,000.00 | 1,018.50 | 6.77 |
|
| Class C | 1,000.00 | 1,018.70 | 6.56 |
|
| Class R | 1,000.00 | 1,011.54 | 2.72 |
|
| Class R1 | 1,000.00 | 1,012.25 | 2.01 |
|
| Class R2 | 1,000.00 | 1,012.96 | 1.29 |
|
| Class R3 | 1,000.00 | 1,021.48 | 3.77 |
|
| Class R4 | 1,000.00 | 1,022.79 | 2.45 |
|
| Class R5 | 1,000.00 | 1,024.30 | 0.92 |
|
| Class 1 | 1,000.00 | 1,024.65 | 0.56 |
|
Remember, these examples do not include any transaction costs, such as sales charges; therefore, these examples will not help you to determine the relative total costs of owning different funds. If transaction costs were included, your expenses would have been higher. See the prospectus for details regarding transaction costs.
a Expenses are equal to the Fund’s annualized expense ratio of 0.53%, 1.33%, 1.29%, 0.95%, 0.70%, 0.45%, 0.74%, 0.48%, 0.18% and 0.11% for Class A, Class B, Class C, Class R, Class R1, Class R2, Class R3, Class R4, Class R5 and Class 1, respectively, multiplied by the average account value over the period, multiplied by the number of days in the period (inception date for Class R, Class R1 and Class R2) /365 or 366 (to reflect the one-half year period).
b Class R, R1 and R2 shares began operations on 9-18-06.
Lifestyle Conservative Portfolio
9
F I N A N C I A L S T A T E M E N T S
Portfolio’s investments
Securities owned by the Portfolio on 12-31-06
Portfolio of investments, showing all affiliated underlying funds.
| Issuer | Shares | Value |
|
| Investment companies 99.97% | | $1,223,966,294 |
| (Cost $1,186,117,464) | | |
| John Hancock Funds II 97.97% | | 1,199,480,595 |
|
| Active Bond Fund Class NAV | 12,897,935 | 122,401,403 |
|
| Blue Chip Growth Fund Class NAV | 1,288,395 | 24,878,907 |
|
| Core Bond Fund Class NAV | 1,965,128 | 24,465,846 |
|
| Equity-Income Fund Class NAV | 1,324,744 | 24,878,689 |
|
| Fundamental Value Fund Class NAV | 1,462,801 | 24,867,619 |
|
| Global Bond Fund Class NAV | 6,776,603 | 97,921,915 |
|
| Global Real Estate Fund Class NAV | 3,127,336 | 36,746,198 |
|
| High Income Fund Class NAV | 2,254,461 | 24,483,445 |
|
| High Yield Fund Class NAV | 4,804,984 | 48,962,788 |
|
| International Value Fund Class NAV | 1,965,622 | 36,737,476 |
|
| Investment Quality Bond Fund Class NAV | 5,235,146 | 61,198,862 |
|
| Real Estate Equity Fund Class NAV | 1,904,003 | 22,467,234 |
|
| Real Return Bond Fund Class NAV | 3,778,896 | 48,898,912 |
|
| Spectrum Income Fund Class NAV | 12,908,984 | 134,640,700 |
|
| Strategic Bond Fund Class NAV | 2,057,537 | 24,484,691 |
|
| Strategic Income Fund Class NAV | 3,687,173 | 36,724,246 |
|
| Total Return Fund Class NAV | 14,378,775 | 195,838,915 |
|
| U.S. Government Securities Fund Class NAV | 9,973,410 | 134,641,029 |
|
| U.S. High Yield Bond Fund Class NAV | 1,856,216 | 24,483,487 |
|
| U.S. Multi Sector Fund Class NAV | 2,263,774 | 24,878,873 |
|
| Value & Restructuring Fund Class NAV | 2,068,110 | 24,879,360 |
See notes to financial statements
Lifestyle Conservative Portfolio
10
F I N A N C I A L S T A T E M E N T S
| Issuer | Shares | Value |
| John Hancock Funds III 2.00% | | $24,485,699 |
|
| International Core Fund Class NAV | 574,108 | 24,485,699 |
|
| Total investments 99.97% | | $1,223,966,294 |
|
| Other assets in excess of liabilities 0.03% | | $323,157 |
|
| Total net assets 100.00% | | $1,224,289,451 |
Percentages are stated as a percent of net assets of the Portfolio.
See notes to financial statements
Lifestyle Conservative Portfolio
11
F I N A N C I A L S T A T E M E N T S
Financial statements
Statement of assets and liabilities 12-31-06
This Statement of Assets and Liabilities is the Portfolio’s balance sheet. It shows the value of what the Portfolio owns, is due and owes. You’ll also find the net asset value and the maximum offering price per share.
| Assets | |
|
| Investments in affiliated underlying funds, at value (cost $1,186,117,464) | 1,223,966,294 |
| Receivable for investments sold | 5,864,213 |
| Receivable for fund shares sold | 658,372 |
| Receivable from affiliates | 9,707 |
| Total assets | 1,230,498,586 |
| |
| |
| Liabilities | |
|
| Due to custodian | 477,608 |
| Payable for investments purchased | 111,034 |
| Payable for fund shares repurchased | 5,396,509 |
| Payable to affiliates | |
| Fund administration fees | 34,431 |
| Transfer agent fees | 21,123 |
| Trustees’ fees | 4,293 |
| Investment management fees | 335 |
| Other payables and accrued expenses | 163,802 |
| Total liabilities | 6,209,135 |
| |
| |
| Net assets | |
|
| Capital paid-in | 1,186,719,421 |
| Accumulated net realized loss on investments | (278,800) |
| Net unrealized appreciation on investments in affiliated underlying funds | 37,848,830 |
| Net assets | $1,224,289,451 |
| |
| |
| Net asset value per share | |
|
| Based on net asset values and shares outstanding — the Portfolio has an | |
| unlimited number of shares authorized with no par value. | |
| Class A ($19,716,985 ÷ 1,483,934 shares) | $13.29 |
| Class B ($4,085,354 ÷ 307,355 shares) | $13.29 |
| Class C ($14,420,754 ÷ 1,085,557 shares) | $13.28 |
| Class R ($103,805 ÷ 7,799 shares) | $13.31 |
| Class R1 ($103,879 ÷ 7,808 shares) | $13.30 |
| Class R2 ($104,579 ÷ 7,865 shares) | $13.30 |
| Class R3 ($372,336 ÷ 28,006 shares) | $13.29 |
| Class R4 ($802,829 ÷ 60,438 shares) | $13.28 |
| Class R5 ($288,547 ÷ 21,713 shares) | $13.29 |
| Class 1 ($1,184,290,383 ÷ 89,236,294 shares) | $13.27 |
| |
| |
| Maximum offering price per share | |
|
| Class A1 ($13.29 ÷ 95%) | $13.99 |
1 On single retail sales of less than $50,000. On sales of $50,000 or more and on group sales the offering price is reduced.
See notes to financial statements
Lifestyle Conservative Portfolio
12
F I N A N C I A L S T A T E M E N T S
Statement of operations For the year ended 12-31-06.
This Statement of Operations summarizes the Portfolio’s investment income earned and expenses incurred in operating the Portfolio. It also shows net gains (losses) for the period stated.
| | Period | Four months |
| | ended | ended |
| | 8-31-06a | 12-31-06b |
| |
| Investment income | | |
|
| Income distributions received from affiliated underlying funds | 23,080,110 | 27,750,745 |
| Total investment income | 23,080,110 | 27,750,745 |
| |
| Expenses | | |
|
| Investment management fees (Note 3) | 365,900 | 163,577 |
| Distribution and service fees (Note 3) | 477,073 | 256,323 |
| Transfer agent fees (Note 3) | 11,912 | 13,899 |
| Blue sky fees (Note 3) | 95,830 | 45,742 |
| Printing and postage fees (Note 3) | 22,906 | 10,625 |
| Fund administration fees (Note 3) | 77,124 | 29,312 |
| Audit and legal fees | 58,980 | 22,007 |
| Custodian fees | 10,438 | 4,020 |
| Trustees’ fees (Note 3) | 10,734 | 4,080 |
| Registration and filing fees | 32,664 | 12,415 |
| Miscellaneous | 7,906 | 2,446 |
| Total expenses | 1,171,467 | 564,446 |
| Less expense reductions (Note 3) | (108,345) | (45,859) |
| Net expenses | 1,063,122 | 518,587 |
| Net investment income | 22,016,988 | 27,232,158 |
| |
| Realized and unrealized gain | | |
|
| Net realized gain on investments | 12,725,793 | 906,484 |
| Capital gain distributions received from affiliated underlying funds | 838,352 | 6,469,258 |
| Change in net unrealized appreciation of investments | | |
| in affiliated underlying funds | 24,492,488 | 13,356,342 |
| Net realized and unrealized gain | 38,056,633 | 20,732,084 |
| Increase in net assets from operations | $60,073,621 | $47,964,242 |
a Period from 10-15-05 (commencement of operations) to 8-31-06.
b Effective 1-18-07, the fiscal year-end changed from August 31 to December 31.
See notes to financial statements
Lifestyle Conservative Portfolio
13
F I N A N C I A L S T A T E M E N T S
Statement of changes in net assets
These Statements of Changes in Net Assets show how the value of the Portfolio’s net assets has changed during the last two periods. The difference reflects earnings less expenses, any investment gains and losses, distributions, if any, paid to shareholders and the net of Portfolio share transactions.
| | Period | Four months |
| | ended | ended |
| | 8-31-06a | 12-31-06b |
| |
| Increase (decrease) in net assets | | |
|
| From operations | | |
| Net investment income | $22,016,988 | $27,232,158 |
| Net realized gain | 13,564,145 | 7,375,742 |
| Change in net unrealized appreciation | 24,492,488 | 13,356,342 |
| Increase in net assets resulting from operations | 60,073,621 | 47,964,242 |
| Distributions to shareholders | | |
| From net investment income | | |
| Class A | (125,005) | (516,816) |
| Class B | (20,839) | (101,855) |
| Class C | (56,558) | (349,399) |
| Class R | — | (2,720) |
| Class R1 | — | (2,786) |
| Class R2 | — | (2,864) |
| Class R3 | (3,046) | (9,817) |
| Class R4 | (6,698) | (22,143) |
| Class R5 | (5,036) | (8,173) |
| Class 1 | (22,120,363) | (33,505,513) |
| From net realized gain | | |
| Class A | — | (220,889) |
| Class B | — | (45,923) |
| Class C | — | (159,163) |
| Class R | — | (1,157) |
| Class R1 | — | (1,158) |
| Class R2 | — | (1,164) |
| Class R3 | — | (4,141) |
| Class R4 | — | (8,943) |
| Class R5 | — | (3,215) |
| Class 1 | — | (13,266,448) |
| From capital paid-in | | |
| Class A | — | (489,987) |
| Class B | — | (96,644) |
| Class C | — | (331,536) |
| Class R | — | (2,579) |
| Class R1 | — | (2,640) |
| Class R2 | — | (2,714) |
| Class R3 | — | (9,308) |
| Class R4 | — | (20,988) |
| Class R5 | — | (7,744) |
| Class 1 | — | (31,745,868) |
| | (22,337,545) | (80,944,295) |
| From Fund share transactions | 1,084,509,600 | 135,023,828 |
See notes to financial statements
Lifestyle Conservative Portfolio
14
F I N A N C I A L S T A T E M E N T S
Statement of changes in net assets (continued)
| | Period | Four months |
| | ended | ended |
| | 8-31-06a | 12-31-06b |
| |
| Net assets | | |
|
| Beginning of period | — | $1,122,245,676 |
| End of period | $1,122,245,676 | $1,224,289,451 |
| Accumulated net investment income | $620,551 | — |
a Period from 10-15-05 (commencement of operations) to 8-31-06.
b Effective 1-18-07, the fiscal year-end changed from August 31 to December 31.
See notes to financial statements
Lifestyle Conservative Portfolio
15
F I N A N C I A L S T A T E M E N T S
Financial highlights
The Financial highlights show how the Portfolio’s net asset value for a share has changed since the end of the previous period.
| CLASS A SHARES | | |
| |
| Period ended | 8-31-06a | 12-31-06b |
|
| Per share operating performance | | |
|
| Net asset value, beginning of period | $13.16 | $13.63 |
| Net investment income h,v | 0.31 | 0.33 |
| Net realized and unrealized | | |
| gain on investments | 0.41 | 0.23 |
| Total from investment operations | 0.72 | 0.56 |
| Less distributions | | |
| From net investment income | (0.25) | (0.38) |
| From net realized gain | — | (0.16) |
| From capital paid-in | — | (0.36) |
| | (0.25) | (0.90) |
| Net asset value, end of period | $13.63 | $13.29 |
| Total return k,l,m (%) | 5.53 | 4.11 |
| |
| Ratios and supplemental data | | |
|
| Net assets, end of period | | |
| (in millions) | $12 | $20 |
| Ratio of net expenses to average | | |
| net assets q,r (%) | 0.57 | 0.56 |
| Ratio of gross expenses to average | | |
| net assets p,q,r (%) | 1.02 | 0.64 |
| Ratio of net investment income | | |
| to average net assets r,v (%) | 2.75 | 7.20 |
| Portfolio turnover m (%) | 20 | 2 |
See notes to financial statements
Lifestyle Conservative Portfolio
16
F I N A N C I A L S T A T E M E N T S
Financial highlights
| CLASS B SHARES | | |
| |
| Period ended | 8-31-06a | 12-31-06b |
| |
| Per share operating performance | | |
|
| Net asset value, beginning of period | $13.16 | $13.63 |
| Net investment income h,v | 0.24 | 0.29 |
| Net realized and unrealized | | |
| gain on investments | 0.41 | 0.22 |
| Total from investment operations | 0.65 | 0.51 |
| Less distributions | | |
| From net investment income | (0.18) | (0.35) |
| From net realized gain | — | (0.16) |
| From capital paid-in | — | (0.34) |
| | (0.18) | (0.85) |
| Net asset value, end of period | $13.63 | $13.29 |
| Total return k,l,m (%) | 4.99 | 3.75 |
| |
| Ratios and supplemental data | | |
|
| Net assets, end of period | | |
| (in millions) | $3 | $4 |
| Ratio of net expenses to average | | |
| net assets q,r (%) | 1.33 | 1.33 |
| Ratio of gross expenses to average | | |
| net assets p,q,r (%) | 3.12 | 1.88 |
| Ratio of net investment income | | |
| to average net assets r,v (%) | 2.08 | 6.20 |
| Portfolio turnover m (%) | 20 | 2 |
See notes to financial statements
Lifestyle Conservative Portfolio
17
F I N A N C I A L S T A T E M E N T S
Financial highlights
| CLASS C SHARES | | |
| |
| Period ended | 8-31-06a | 12-31-06b |
| |
| Per share operating performance | | |
|
| Net asset value, beginning of period | $13.16 | $13.62 |
| Net investment income h,v | 0.29 | 0.30 |
| Net realized and unrealized | | |
| gain on investments | 0.35 | 0.21 |
| Total from investment operations | 0.64 | 0.51 |
| Less distributions | | |
| From net investment income | (0.18) | (0.35) |
| From net realized gain | — | (0.16) |
| From capital paid-in | — | (0.34) |
| | (0.18) | (0.85) |
| Net asset value, end of period | $13.62 | $13.28 |
| Total return k,l,m (%) | 4.91 | 3.76 |
| |
| Ratios and supplemental data | | |
|
| Net assets, end of period | | |
| (in millions) | $8 | $14 |
| Ratio of net expenses to average | | |
| net assets q,r (%) | 1.31 | 1.29 |
| Ratio of gross expenses to average | | |
| net assets p,q,r (%) | 2.05 | 1.41 |
| Ratio of net investment income | | |
| to average net assets r,v (%) | 2.54 | 6.55 |
| Portfolio turnover m (%) | 20 | 2 |
See notes to financial statements
Lifestyle Conservative Portfolio
18
F I N A N C I A L S T A T E M E N T S
Financial highlights
| CLASS R SHARES | |
| |
| Period ended | 12-31-06b,c |
| |
| Per share operating performance | |
|
| Net asset value, beginning of period | $13.67 |
| Net investment income h,v | 0.29 |
| Net realized and unrealized | |
| gain on investments | 0.23 |
| Total from investment operations | 0.52 |
| Less distributions | |
| From net investment income | (0.37) |
| From net realized gain | (0.16) |
| From capital paid-in | (0.35) |
| | (0.88) |
| Net asset value, end of period | $13.31 |
| Total return k,l (%) | 3.80m |
| |
| Ratios and supplemental data | |
|
| Net assets, end of period | |
| (in millions) | —i |
| Ratio of net expenses to average | |
| net assets q (%) | 0.95r |
| Ratio of gross expenses to average | |
| net assets p,q (%) | 13.49r |
| Ratio of net investment income | |
| to average net assets v (%) | 7.14r |
| Portfolio turnover (%) | 2m |
See notes to financial statements
Lifestyle Conservative Portfolio
19
F I N A N C I A L S T A T E M E N T S
Financial highlights
| CLASS R1 SHARES | |
| |
| Period ended | 12-31-06b,c |
| |
| Per share operating performance | |
|
| Net asset value, beginning of period | $13.67 |
| Net investment income h,v | 0.30 |
| Net realized and unrealized | |
| gain on investments | 0.23 |
| Total from investment operations | 0.53 |
| Less distributions | |
| From net investment income | (0.38) |
| From net realized gain | (0.16) |
| From capital paid-in | (0.36) |
| | (0.90) |
| Net asset value, end of period | $13.30 |
| Total return k,l (%) | 3.85m |
|
| Ratios and supplemental data | |
|
| Net assets, end of period | |
| (in millions) | —i |
| Ratio of net expenses to average | |
| net assets q (%) | 0.70r |
| Ratio of gross expenses to average | |
| net assets p,q (%) | 13.24r |
| Ratio of net investment income | |
| to average net assets v (%) | 7.38r |
| Portfolio turnover (%) | 2m |
See notes to financial statements
Lifestyle Conservative Portfolio
20
F I N A N C I A L S T A T E M E N T S
Financial highlights
| CLASS R2 SHARES | |
| |
| Period ended | 12-31-06b,c |
| |
| Per share operating performance | |
|
| Net asset value, beginning of period | $13.67 |
| Net investment income h,v | 0.31 |
| Net realized and unrealized | |
| gain on investments | 0.23 |
| Total from investment operations | 0.54 |
| Less distributions | |
| From net investment income | (0.38) |
| From net realized gain | (0.16) |
| From capital paid-in | (0.37) |
| | (0.91) |
| Net asset value, end of period | $13.30 |
| Total return k,l (%) | 3.98m |
| |
| Ratios and supplemental data | |
|
| Net assets, end of period | |
| (in millions) | —i |
| Ratio of net expenses to average | |
| net assets q (%) | 0.45r |
| Ratio of gross expenses to average | |
| net assets p,q (%) | 12.98r |
| Ratio of net investment income | |
| to average net assets v (%) | 7.64r |
| Portfolio turnover (%) | 2m |
See notes to financial statements
Lifestyle Conservative Portfolio
21
F I N A N C I A L S T A T E M E N T S
Financial highlights
| CLASS R3 SHARES | | |
| |
| Period ended | 8-31-06a | 12-31-06b |
|
| Per share operating performance | | |
|
| Net asset value, beginning of period | $13.16 | $13.65 |
| Net investment income h,v | 0.28 | 0.29 |
| Net realized and unrealized | | |
| gain on investments | 0.44 | 0.25 |
| Total from investment operations | 0.72 | 0.54 |
| Less distributions | | |
| From net investment income | (0.23) | (0.38) |
| From net realized gain | — | (0.16) |
| From capital paid-in | — | (0.36) |
| | (0.23) | (0.90) |
| Net asset value, end of period | $13.65 | $13.29 |
| Total return k,l,m (%) | 5.55 | 3.93 |
| |
| Ratios and supplemental data | | |
|
| Net assets, end of period | | |
| (in millions) | —i | —i |
| Ratio of net expenses to average | | |
| net assets q,r (%) | 0.68 | 0.77 |
| Ratio of gross expenses to average | | |
| net assets p,q,r (%) | 14.72 | 6.23 |
| Ratio of net investment income | | |
| to average net assets r,v (%) | 2.46 | 6.23 |
| Portfolio turnover m (%) | 20 | 2 |
See notes to financial statements
Lifestyle Conservative Portfolio
22
F I N A N C I A L S T A T E M E N T S
Financial highlights
| CLASS R4 SHARES | | |
| |
| Period ended | 8-31-06a | 12-31-06b |
|
| Per share operating performance | | |
|
| Net asset value, beginning of period | $13.16 | $13.64 |
| Net investment income h,v | 0.44 | 0.28 |
| Net realized and unrealized | | |
| gain on investments | 0.30 | 0.27 |
| Total from investment operations | 0.74 | 0.55 |
| Less distributions | | |
| From net investment income | (0.26) | (0.38) |
| From net realized gain | — | (0.16) |
| From capital paid-in | — | (0.37) |
| | (0.26) | (0.91) |
| Net asset value, end of period | $13.64 | $13.28 |
| Total return k,l,m (%) | 5.66 | 4.06 |
| |
| Ratios and supplemental data | | |
|
| Net assets, end of period | | |
| (in millions) | $1 | $1 |
| Ratio of net expenses to average | | |
| net assets q,r (%) | 0.45 | 0.51 |
| Ratio of gross expenses to average | | |
| net assets p,q,r (%) | 10.01 | 2.87 |
| Ratio of net investment income | | |
| to average net assets r,v (%) | 3.89 | 6.17 |
| Portfolio turnover m (%) | 20 | 2 |
See notes to financial statements
Lifestyle Conservative Portfolio
23
F I N A N C I A L S T A T E M E N T S
Financial highlights
| CLASS R5 SHARES | | |
| |
| Period ended | 8-31-06a | 12-31-06b |
| |
| Per share operating performance | | |
|
| Net asset value, beginning of period | $13.16 | $13.65 |
| Net investment income h,v | 0.28 | 0.28 |
| Net realized and unrealized | | |
| gain on investments | 0.49 | 0.29 |
| Total from investment operations | 0.77 | 0.57 |
| Less distributions | | |
| From net investment income | (0.28) | (0.40) |
| From net realized gain | — | (0.16) |
| From capital paid-in | — | (0.37) |
| | (0.28) | (0.93) |
| Net asset value, end of period | $13.65 | $13.29 |
| Total return k,l,m (%) | 5.94 | 4.19 |
| |
| Ratios and supplemental data | | |
|
| Net assets, end of period | | |
| (in millions) | —i | —i |
| Ratio of net expenses to average | | |
| net assets q,r (%) | 0.19 | 0.20 |
| Ratio of gross expenses to average | | |
| net assets p,q,r (%) | 9.18 | 6.37 |
| Ratio of net investment income | | |
| to average net assets r,v (%) | 2.44 | 6.01 |
| Portfolio turnover m (%) | 20 | 2 |
See notes to financial statements
Lifestyle Conservative Portfolio
24
F I N A N C I A L S T A T E M E N T S
Financial highlights
| CLASS 1 SHARES | | |
| |
| Period ended | 8-31-06a | 12-31-06b |
| |
| Per share operating performance | | |
|
| Net asset value, beginning of period | $13.15 | $13.64 |
| Net investment income h,v | 0.30 | 0.32 |
| Net realized and unrealized | | |
| gain on investments | 0.48 | 0.25 |
| Total from investment operations | 0.78 | 0.57 |
| Less distributions | | |
| From net investment income | (0.29) | (0.40) |
| From net realized gain | — | (0.16) |
| From capital paid-in | — | (0.38) |
| | (0.29) | (0.94) |
| Net asset value, end of period | $13.64 | $13.27 |
| Total return k,m (%) | 6.01 | 4.16 |
| |
| Ratios and supplemental data | | |
|
| Net assets, end of period | | |
| (in millions) | $1,097 | $1,184 |
| Ratio of net expenses to average | | |
| net assets q,r (%) | 0.12 | 0.11 |
| Ratio of net investment income | | |
| to average net assets r,v (%) | 2.54 | 6.96 |
| Portfolio turnover m (%) | 20 | 2 |
a Class A, Class B, Class C, Class R3, Class R4 and Class R5 shares began operations on 10-18-05, and Class 1 shares began operation on 10-15-05.
b Effective 1-18-07, the fiscal year-end changed from August 31 to December 31.
c Class R, Class R1 and Class R2 shares began operations on 9-18-06.
h Based on the average of the shares outstanding.
i Less than $500,000.
k Assumes dividend reinvestment and does not reflect the effect of sales charges
l Total returns would have been lower had certain expenses not been reduced during the period shown.
m Not annualized.
p Does not take into consideration expense reductions during the period shown.
q Does not include expenses of the affiliated underlying funds.
r Annualized.
v Recognition of net investment income by the Portfolio is affected by the timing of the declaration of dividends by the affiliated underlying funds in which the Portfolio invests.
See notes to financial statements
Lifestyle Conservative Portfolio
25
Notes to financial statements
1. Organization
The John Hancock Lifestyle Conservative Portfolio (the “Portfolio”) is a non-diversified series of John Hancock Funds II (the “Trust”). The Trust was established as a Massachusetts business trust on June 28, 2005. The Trust is registered under the Investment Company Act of 1940 (the “1940 Act”), as amended, as an open-end investment management company.
The Portfolio operates as a “fund of funds,” investing in Class NAV shares of affiliated underlying funds of the Trust and John Hancock Funds III and in other permitted investments. The affiliated underlying funds’ accounting policies are outlined in the shareholder reports, available without charge by calling 1-800-225-5291 or on the Securities & Exchange Commission (“SEC”) Web site at www.sec.gov, File #811-21779, CIK 0001331971. The affili-ated underlying funds are not covered by this report.
John Hancock Investment Management Services, LLC (the “Adviser”), a Delaware limited liability company controlled by John Hancock Life Insurance Company (U.S.A.) (“John Hancock USA”), serves as investment adviser for the Trust and John Hancock Funds, LLC, (the “Distributor”), an affiliate of the Adviser, serves as principal underwriter. John Hancock Life Insurance Company of New York (“John Hancock New York”) is a wholly owned subsidiary of John Hancock USA. John Hancock USA and John Hancock New York are indirect wholly owned subsidiaries of The Manufacturers Life Insurance Company (“Manulife”), which in turn is a wholly owned subsidiary of Manulife Financial Corporation (“MFC”), a publicly traded company. MFC and its subsidiaries are known collectively as “Manulife Financial.”
The Portfolio commenced operations after certain separate accounts of John Hancock USA redeemed their interests in portfolios of John Hancock Trust and certain unaffiliated mutual funds of approximately $214 million at the close of business on October 14, 2005, with additional redemption proceeds of approximately $741 million received on October 28, 2005, and invested such proceeds in Class 1 shares of the Portfolio, which in turn invested the proceeds in affiliated underlying funds of the Trust.
The Board of Trustees has authorized the issuance of multiple classes of shares of the Portfolio, including classes designated as Class A, Class B, Class C, Class R, Class R1, Class R2, Class R3, Class R4, Class R5 and Class 1 shares.
Class A, B, and C shares are open to all retail investors. Class 1 shares are sold only to certain exempt separate accounts of John Hancock USA and John Hancock New York. Class R, R1, R2, R3, R4 and R5 shares are available only to certain retirement plans.
The shares of each class represent an interest in the same portfolio of investments of the Portfolio, and have equal rights as to voting, redemptions, dividends and liquidation, except that certain expenses, subject to the approval of the Trustees, may be applied differently to each class of shares in accordance with current regulations of the SEC and the Internal Revenue Service. Shareholders of a class that bears distribution and service expenses under the terms of a distribution plan have exclusive voting rights to that distribution plan. Class B shares will convert to Class A shares eight years after purchase.
On January 18, 2007, the Board of Trustees approved a change in the fiscal year-end of the Portfolio from August 31 to December 31. Accordingly, the Portfolio’s financial statements and related notes include information as of the four-month period ended December 31, 2006 and the period ended August 31, 2006.
Lifestyle Conservative Portfolio
26
2. Significant accounting policies
In the preparation of the financial statements, the Portfolio follows the policies described below. The preparation of financial statements in conformity with accounting principles generally accepted in the United States of America requires management to make estimates and assumptions that affect the reported amounts of assets and liabilities at the date of the financial statements and the reported amounts of income and expenses during the reporting period. Actual results may differ from these estimates.
Securities valuation
The net asset value of the shares of the Portfolio is determined daily as of the close of the New York Stock Exchange, normally at 4:00 p.m. Eastern Time. Investments in the affiliated underlying funds are valued at their respective net asset values each business day, or at fair value as determined in good faith in accordance with procedures approved by the Trustees.
Securities in the affiliated underlying funds’ portfolios are valued in accordance with their respective valuation polices, as outlined in the affiliated underlying funds’ financial statements. Short-term debt investments that have a remaining maturity of 60 days or less are valued at amortized cost.
Security transactions and related investment income
Investment security transactions in the affiliated underlying funds are accounted for on a trade date plus one basis for daily net asset value calculations. However, for financial reporting purposes, investment transactions are reported on trade date. Interest income is accrued as earned. Dividend income and capital gain distributions from the affiliated underlying funds are recorded on the ex-dividend date.
Gains and losses on securities sold are determined on the basis of specific identified cost for both financial and federal income tax reporting purposes.
Multi-class operations
All income, expenses (except for class-specific expenses) and realized and unrealized gains (losses) are allocated to each class of shares based upon the relative net assets of each class. Dividends to shareholders from net investment income are determined at a class level and distributions from capital gains are determined at a Portfolio level.
Expense allocation
Expenses not directly attributable to a particular Portfolio or class of shares are allocated based on the relative share of net assets of the Portfolio at the time the expense was incurred. Class-specific expenses, such as transfer agency fees, blue sky fees, printing and postage fees and distribution and service fees, are accrued daily and charged directly to the respective share classes. Expenses in the Portfolio’s Statement of Operations reflect the expenses of the Portfolio and do not include any indirect expenses related to the affiliated underlying funds. Because the affiliated underlying funds have varied expense levels and the Portfolio may own different proportions of the affiliated underlying funds at different times, the amount of fees and expenses incurred indirectly by the Portfolio will vary.
Federal income taxes
The Portfolio seeks to qualify as a “regulated investment company” by complying with the applicable provisions of the Internal Revenue Code and will not be subject to federal income tax on taxable income that is distributed to shareholders. Therefore, no federal income tax provision is required.
New accounting pronouncements
In June 2006, Financial Accounting Standards Board (FASB) Interpretation No. 48, Accounting for Uncertainty in Income Taxes (the “Interpretation”) was issued and is effective for fiscal years beginning after December 15, 2006 and is to be applied to all open tax years as of the effective date. This Interpretation prescribes a minimum threshold for financial statement recognition of the benefit of a tax position taken or expected to be taken in a tax return, and requires certain expanded disclosures. Management is currently evaluating the application of the Interpretation to the Portfolio and has not at this time quantified the impact, if any, resulting from the adoption of this Interpretation on the Portfolio’s financial statements. The Portfolio
Lifestyle Conservative Portfolio
27
will implement this pronouncement no later than June 29, 2007.
In September 2006, FASB Standard No. 157, Fair Value Measurements (“FAS 157”) was issued, and is effective for fiscal years beginning after November 15, 2007. FAS 157 defines fair value, establishing a framework for measuring fair value and expands disclosure about fair value measurements. Management is currently evaluating the application of FAS 157 to the Portfolio, and its impact, if any, resulting from the adoption of FAS 157 on the Portfolio’s financial statements.
Distribution of income and gains
The Portfolio records distributions to shareholders from net investment income and net realized gains, if any, on the ex-dividend date. During the period ended August 31, 2006, the tax character of distributions paid was as follows: ordinary income $22,337,545. During the four-month period ended December 31, 2006, the tax character of distributions paid was as follows: ordinary income $47,533,711, tax return of capital $32,702,801 and long-term capital gains $707,783. Distributions paid by the Portfolio with respect to each class of shares are calculated in the same manner, at the same time and are in the same amount, except for the effect of expenses that may be applied differently to each class. Such distributions, on a tax basis, are determined in conformity with income tax regulations, which may differ from accounting principles generally accepted in the United States of America. Distributions in excess of tax basis earnings and profits, if any, are reported in the P ortfolio’s financial statements as a return of capital. As of December 31, 2006, there were no distributable earnings on a tax basis.
Capital accounts
The Portfolio reports the undistributed net investment income and accumulated undistributed net realized gain (loss) accounts on a basis approximating amounts available for future tax distributions (or to offset future taxable realized gains when a capital loss carry-forward is available). Accordingly, the Portfolio may periodically make reclassifications among certain capital accounts, without affecting its net asset value.
3. Investment advisory and
other agreements
Advisory fees
The Trust has entered into an Investment Advisory Agreement with the Adviser. The Adviser is responsible for managing the corporate and business affairs of the Trust and for selecting and compensating subadvisers to handle the investment of the assets of the Portfolio, subject to the supervision of the Board of Trustees. Under the Advisory Agreement, the Portfolio pays a monthly management fee to the Adviser equivalent, on an annual basis, to its pro rata portion of the sum of: (a) 0.05% of the first $7,500,000,000 of the aggregate daily net assets and (b) 0.04% of the aggregate daily net assets in excess of $7,500,000,000 of each of the five Lifestyle Portfolios of the Trust (Lifestyle Aggressive, Lifestyle Growth, Lifestyle Balanced, Lifestyle Moderate and Lifestyle Conservative) and its corresponding funds of the five Lifestyle Portfolios of John Hancock Trust (Lifestyle Aggressive, Lifestyle Growth, Lifestyle Balanced, Lifestyle Moderate and Lifestyle Conservative). The Portfolio is not responsible for payment of the subadvisory fees.
Expense reimbursements
The Adviser has contractually agreed to waive advisory fees or reimburse the Portfolio’s expenses for Class A, Class B, Class C, Class R, Class R1, Class R2, Class R3, Class R4 and Class R5 shares to the extent that blue sky fees and printing and postage expenses attributable to each class exceed 0.09% of the average annual net assets attributable to the classes, at least until November 1, 2006, and may thereafter be terminated by the Adviser at any time. Accordingly, the expense reductions related to this expense limitation amounted to $19,988, $18,459, $17,947, $17,104, $16,789 and $17,356 for Class A, Class B, Class C, Class R3, Class R4 and Class R5, respectively, for the period ended August 31, 2006. The expense reductions related to this expense limitation amounted to $4,291, $6,314, $4,335, $3,649, $3,649, $3,649, $6,415, $6,173 and $6,546 for Class A, Class B, Class C, Class R, Class R1, Class R2, Class R3, Class R4 and Class R5, respectively, for the four-m onth period ended December 31, 2006.
Lifestyle Conservative Portfolio
28
Administration fees
The Portfolio has an agreement with the Adviser that requires the Portfolio to reimburse the Adviser for all expenses associated with providing the administrative, financial, accounting and recordkeeping services of the Portfolio, including the preparation of all tax returns, annual, semiannual and periodic reports to shareholders and the preparation of all regulatory reports.
Distribution plans
The Trust has a Distribution Agreement with the Distributor. The Portfolio has adopted Distribution Plans with respect to Class A, Class B, Class C, Class R, Class R1, Class R2, Class R3, Class R4 and Class 1, pursuant to Rule 12b-1 under the 1940 Act to reimburse the Distributor for the services it provides as distributor of shares of the Portfolio. Accordingly, the Portfolio makes monthly payments to the Distributor at an annual rate not to exceed 0.30%, 1.00%, 1.00%, 0.75%, 0.50%, 0.25%, 0.50%, 0.25% and 0.05% of the average daily net assets of Class A, Class B, Class C, Class R, Class R1, Class R2, Class R3, Class R4 and Class 1, respectively. A maximum of 0.25% of such payments may be service fees, as defined by the Conduct Rules of the National Association of Securities Dealers. Under the Conduct Rules, curtailment of a portion of the Portfolio’s 12b-1 payments could occur under certain circumstances.
The Portfolio has also adopted a Service Plan with respect to Class R, Class R1, Class R2, Class R3, Class R4 and Class R5 shares (the “Service Plan”). Under the Service Plan, the Portfolio pays up to 0.25%, 0.25%, 0.25%, 0.15%, 0.10% and 0.05% of the average daily net assets of Class R, Class R1, Class R2, Class R3, Class R4 and Class R5 shares, respectively, for certain other services.
Sales charges
Class A shares are assessed up-front sales charges of up to 5% of the net asset value of such shares. During the four-month period ended December 31, 2006, the Portfolio was informed that the Distributor received net up-front sales charges of $201,440 with regard to sales of Class A shares. Of this amount, $34,742 was retained and used for printing prospectuses, advertising, sales literature and other purposes, $158,242 was paid as sales commissions to unrelated broker-dealers and $8,456 was paid as sales commissions to sales personnel of Signator Investors, Inc. (“Signator Investors”), a related broker-dealer, an indirect subsidiary of MFC.
Class B shares that are redeemed within six years of purchase are subject to a contingent deferred sales charge (“CDSC”) at declining rates, beginning at 5.00% of the lesser of the current market value at the time of redemption or the original purchase cost of the shares being redeemed. Class C shares that are redeemed within one year of purchase are subject to a CDSC at a rate of 1.00% of the lesser of the current market value at the time of redemption or the original purchase cost of the shares being redeemed. Proceeds from the CDSCs are paid to the Distributor and are used, in whole or in part, to defray its expenses for providing distribution-related services to the Portfolio in connection with the sale of Class B and Class C shares. During the four-month period ended December 31, 2006, the Portfolio was informed that CDSCs received by the Distributor amounted to $3,697 for Class B shares and $1,081 for Class C shares.
Transfer agent fees
The Portfolio has a Transfer Agency Agreement with John Hancock Signature Services, Inc. (“Signature Services”), an indirect subsidiary of MFC. For Class A, Class B, Class C, Class R, Class R1, Class R2, Class R3, Class R4 and Class R5 shares, the Portfolio pays a monthly transfer agent fee at an annual rate of 0.05% of each class’s average daily net assets, plus a fee based on the number of shareholder accounts and reimbursement for certain out-of-pocket expenses. Expenses not directly attributable to a particular class of shares are aggregated and allocated to each class on the basis of its relative net asset value.
Signature Services has agreed to limit the transfer agent fees so that such fees do not exceed 0.20% annually of each of Class A, Class B, Class C, Class R, Class R1, Class R2, Class R3, Class R4 and Class R5 share average daily net assets. This agreement is effective until December 31, 2007. Signature
Lifestyle Conservative Portfolio
29
Services reserves the right to terminate this limitation in the future. In addition, Signature Services has voluntarily agreed to further limit transfer agent fees for Class R, Class R1, Class R2, Class R3, Class R4 and Class R5 shares so that such fees do not exceed 0.05% annually of each class’s average daily net assets. Accordingly, the transfer agent fees reductions amounted to $166, $244 and $292 for Class R3, Class R4 and Class R5 shares, respectively, during the period ended August 31, 2006. The transfer agent fees reductions amounted to $41, $41, $41, $182, $370 and $163 for Class R, Class R1, Class R2, Class R3, Class R4 and Class R5 shares, respectively, during the four-month period ended December 31, 2006. Signature Services reserves the right to terminate this limitation at any time.
Expenses under the agreements described above for the period ended August 31, 2006 and the four-month period ended December 31, 2006, were as follows:
| Period ended 8-31-06 | | | | |
| | Distribution | Transfer | | Printing and |
| Share Class | and service fees | agent | Blue sky | postage |
|
| |
| Class A | $13,027 | $5,061 | $16,139 | $7,758 |
| Class B | 10,235 | 1,954 | 15,948 | 3,432 |
| Class C | 24,052 | 4,006 | 16,089 | 4,023 |
| Class R3 | 621 | 211 | 15,774 | 1,441 |
| Class R4 | 460 | 319 | 15,774 | 1,176 |
| Class R5 | 1 | 361 | 16,106 | 1,429 |
| Class 1 | 428,677 | — | — | 3,647 |
| Total | $477,073 | $11,912 | $95,830 | $22,906 |
| |
| Four months ended 12-31-06 | | | | |
| | Distribution | Transfer | | Printing and |
| Share Class | and service fees | agent | Blue sky | postage |
|
| |
| Class A | $15,956 | $5,625 | $6,112 | $2,966 |
| Class B | 11,486 | 2,094 | 6,040 | 1,308 |
| Class C | 36,559 | 5,045 | 6,093 | 1,532 |
| Class R | 218 | 56 | 3,150 | 525 |
| Class R1 | 146 | 56 | 3,150 | 525 |
| Class R2 | 73 | 56 | 3,150 | 525 |
| Class R3 | 691 | 242 | 5,975 | 549 |
| Class R4 | 855 | 508 | 5,973 | 449 |
| Class R5 | 2 | 217 | 6,099 | 545 |
| Class 1 | 190,337 | — | — | 1,701 |
| Total | $256,323 | $13,899 | $45,742 | $10,625 |
Trustees’ fees
The Trust compensates each Trustee who is not an employee of the Adviser or its affiliates. Total Trustees’ expenses are allocated based on each Portfolio’s average daily net asset value.
4. Guarantees and indemnifications
Under the Trust’s organizational documents, its Officers and Trustees are indemnified against certain liability arising out of the performance of their duties to the Trust. Additionally, in the normal course of business, the Trust enters into contracts with service providers that contain general indemnification clauses. The Trust’s maximum exposure under these arrangements is unknown, as this would involve future claims that may be made against the Trust that have not yet occurred. However, based on experience, the Trust believes the risk of loss to be remote.
Lifestyle Conservative Portfolio
30
5. Capital shares
Share activities for the Portfolio for the four-month period ended December 31, 2006 and the period ended August 31, 2006 were as follows:
| | Period ended 8-31-06a | Four months ended 12-31-06b |
| | Shares | Amount | Shares | Amount |
|
| Class A shares | | | | |
| Sold | 970,480 | $13,042,633 | 579,284 | $8,044,116 |
| Distributions reinvested | 8,061 | 106,760 | 80,861 | 1,077,212 |
| Repurchased | (72,078) | (970,334) | (82,674) | (1,154,624) |
| Net increase | 906,463 | $12,179,059 | 577,471 | $7,966,704 |
|
| |
| Class B shares | | | | |
| Sold | 227,435 | $3,046,846 | 101,217 | $1,408,223 |
| Distributions reinvested | 1,215 | 16,097 | 14,743 | 196,481 |
| Repurchased | (11,427) | (153,081) | (25,828) | (359,242) |
| Net increase | 217,223 | $2,909,862 | 90,132 | $1,245,462 |
|
| |
| Class C shares | | | | |
| Sold | 621,340 | $8,332,624 | 459,156 | $6,364,493 |
| Distributions reinvested | 3,508 | 46,442 | 55,270 | 735,796 |
| Repurchased | (15,041) | (203,312) | (38,676) | (540,025) |
| Net increase | 609,807 | $8,175,754 | 475,750 | $6,560,264 |
|
| |
| Class R sharesc | | | | |
| Sold | — | — | 7,316 | $100,003 |
| Distributions reinvested | — | — | 483 | 6,456 |
| Repurchased | — | — | — | (3) |
| Net increase | — | — | 7,799 | $106,456 |
|
| |
| Class R1 sharesc | | | | |
| Sold | — | — | 7,315 | $100,001 |
| Distributions reinvested | — | — | 493 | 6,584 |
| Repurchased | — | — | — | (1) |
| Net increase | — | — | 7,808 | $106,584 |
|
| |
| Class R2 sharesc | | | | |
| Sold | — | — | 7,360 | $100,626 |
| Distributions reinvested | — | — | 505 | 6,743 |
| Repurchased | — | — | — | (1) |
| Net increase | — | — | 7,865 | $107,368 |
|
| |
| Class R3 shares | | | | |
| Sold | 21,755 | $290,487 | 13,627 | $190,563 |
| Distributions reinvested | 96 | 1,277 | 1,695 | 22,593 |
| Repurchased | (24) | (327) | (9,143) | (129,072) |
| Net increase | 21,827 | $291,437 | 6,179 | $84,084 |
Lifestyle Conservative Portfolio
31
| | Period ended 8-31-06a | Four months ended 12-31-06b |
| | Shares | Amount | Shares | Amount |
|
| Class R4 shares | | | | |
| Sold | 51,727 | $693,385 | 13,788 | $190,041 |
| Distributions reinvested | 359 | 4,751 | 3,850 | 51,335 |
| Repurchased | (514) | (6,839) | (8,772) | (123,762) |
| Net increase | 51,572 | $691,297 | 8,866 | $117,614 |
|
| |
| Class R5 shares | | | | |
| Sold | 22,121 | $294,449 | 6,571 | $91,562 |
| Distributions reinvested | 219 | 2,896 | 1,375 | 18,329 |
| Repurchased | (705) | (9,504) | (7,868) | (111,132) |
| Net increase (decrease) | 21,635 | $287,841 | 78 | ($1,241) |
|
| |
| Class 1 shares | | | | |
| Sold | 82,605,957 | $1,088,806,247 | 4,076,366 | $56,702,014 |
| Distributions reinvested | 1,669,737 | 22,120,362 | 5,891,179 | 78,517,828 |
| Repurchased | (3,797,586) | (50,952,259) | (1,209,359) | (16,489,309) |
| Net increase | 80,478,108 | $1,059,974,350 | 8,758,186 | $118,730,533 |
|
| |
| Net increase | 82,306,635 | $1,084,509,600 | 9,940,134 | $135,023,828 |
a Class A, Class B, Class C, Class R3, Class R4 and Class R5 shares began operations on 10-18-05, and Class 1 shares began operation on 10-15-05.
b Effective 1-18-07, the fiscal year-end changed from August 31 to December 31.
c Class R, Class R1 and Class R2 shares began operations on 9-18-06.
6. Investment transactions
Purchases and sales of the affiliated underlying funds during the four-month period ended December 31, 2006, aggregated $109,188,890 and $21,579,113, respectively.
The cost of investments owned on December 31, 2006, including short-term investments, for federal income tax purposes, was $1,186,396,264. Gross unrealized appreciation and depreciation of investments aggregated $41,626,129 and $4,056,099, respectively, resulting in net unrealized appreciation of $37,570,030.
7. Investment in affiliated underlying funds
The Portfolio invests primarily in affiliated underlying funds that are managed by affiliates of the Adviser. The Portfolio does not invest in the affiliated underlying funds for the purpose of exercising management or control.
A summary of the Portfolio’s transactions in the securities of affiliated issuers in which the Portfolio’s holdings represent 5% or more of the outstanding voting securities of the issuer, during the four-month period ended December 31, 2006, is set forth below.
Lifestyle Conservative Portfolio
32
| | Beginning | | | | | |
| Affiliate — | Share | Shares | Shares | Ending Share | | Ending |
| Class NAV | Amount | Purchased | Sold | Amount | Proceeds | Value |
|
| Active Bond | 11,676,853 | 1,252,020 | 30,938 | 12,897,935 | $296,177 | $122,401,403 |
| Blue Chip Growth | 1,266,323 | 65,879 | 43,807 | 1,288,395 | 814,966 | 24,878,907 |
| Core Bond | 1,787,816 | 179,213 | 1,901 | 1,965,128 | 23,967 | 24,465,846 |
| Equity-Income | 1,240,334 | 118,849 | 34,439 | 1,324,744 | 654,121 | 24,878,689 |
| Fundamental Value | 1,410,630 | 76,688 | 24,517 | 1,462,801 | 410,135 | 24,867,619 |
| Global Bond | 6,061,926 | 873,830 | 159,153 | 6,776,603 | 2,400,739 | 97,921,915 |
| Global Real Estate | 3,307,474 | 184,007 | 364,145 | 3,127,336 | 4,096,865 | 36,746,198 |
| High Income | 2,267,633 | 110,982 | 124,154 | 2,254,461 | 1,317,362 | 24,483,445 |
| High Yield | 4,442,772 | 405,995 | 43,783 | 4,804,984 | 445,957 | 48,962,788 |
| International Core* | 567,057 | 36,189 | 29,138 | 574,108 | 1,197,072 | 24,485,699 |
| International Value | 1,896,422 | 190,358 | 121,158 | 1,965,622 | 2,295,658 | 36,737,476 |
| Investment Quality | | | | | | |
| Bond | 4,765,388 | 474,852 | 5,094 | 5,235,146 | 60,360 | 61,198,862 |
| Real Estate Equity | 2,072,821 | 124,253 | 293,071 | 1,904,003 | 3,480,129 | 22,467,234 |
| Real Return Bond | 3,368,735 | 413,876 | 3,715 | 3,778,896 | 48,735 | 48,898,912 |
| Spectrum Income | 12,007,658 | 950,730 | 49,404 | 12,908,984 | 515,799 | 134,640,700 |
| Strategic Bond | 1,900,350 | 162,247 | 5,060 | 2,057,537 | 60,461 | 24,484,691 |
| Strategic Income | 3,339,826 | 356,921 | 9,574 | 3,687,173 | 95,512 | 36,724,246 |
| Total Return | 13,052,538 | 1,400,271 | 74,034 | 14,378,775 | 1,021,696 | 195,838,915 |
| U.S. Government | | | | | | |
| Securities | 9,094,286 | 907,266 | 28,142 | 9,973,410 | 381,714 | 134,641,029 |
| U.S. High Yield Bond | 1,712,137 | 157,571 | 13,492 | 1,856,216 | 178,164 | 24,483,487 |
| U.S. Multi Sector | 2,170,038 | 148,161 | 54,425 | 2,263,774 | 588,964 | 24,878,873 |
| Value & Restructuring | 2,032,200 | 130,397 | 94,487 | 2,068,110 | 1,102,936 | 24,879,360 |
*Represents the Portfolio’s investment in John Hancock Funds III International Core Fund.
8. Reclassification of accounts
During the four-month period ended December 31, 2006, the Portfolio reclassified amounts to reflect an increase in accumulated net realized loss on investments of $7,298,914, a decrease in accumulated net investment loss of $40,001,716 and a decrease in capital paid-in of $32,702,802. This represents the amounts necessary to report these balances on a tax basis, excluding certain temporary differences, as of December 31, 2006. Additional adjustments may be needed in subsequent reporting periods. These reclassifications, which have no impact on the net asset value of the Portfolio, are primarily attributable to certain differences in the computation of distributable income and capital gains under federal tax rules versus accounting principles generally accepted in the United States of America and book and tax differences in accounting for overdistribution. The calculation of net investment income per share in the Portfolio’s Financial Highlights excludes these adjust ments.
Lifestyle Conservative Portfolio
33
Auditors’ report
Report of Independent Registered Public Accounting Firm
To the Board of Trustees of John Hancock Funds II and Shareholders of John Hancock Lifestyle Conservative Portfolio:
In our opinion, the accompanying statement of assets and liabilities, including the schedule of securities owned, and the related statements of operations and of changes in net assets and the financial highlights present fairly, in all material respects, the financial position of John Hancock Lifestyle Conservative Portfolio (the “Portfolio”) at December 31, 2006, and the results of its operations, the changes in its net assets, and the financial highlights for each of the periods indicated, in conformity with accounting principles generally accepted in the United States of America. These financial statements and financial highlights (hereafter referred to as “financial statements”) are the responsibility of the Portfolio’s management; our responsibility is to express an opinion on these financial statements based on our audits. We conducted our audits of these financial statements in accordance with the standards of the Public Company Accounting Oversight Board (United States). Those standards require that we plan and perform the audits to obtain reasonable assurance about whether the financial statements are free of material misstatement. An audit includes examining, on a test basis, evidence supporting the amounts and disclosures in the financial statements, assessing the accounting principles used and significant estimates made by management, and evaluating the overall financial statement presentation. We believe that our audits, which included confirmation of securities at December 31, 2006, by correspondence with the transfer agent, provide a reasonable basis for our opinion.
PricewaterhouseCoopers LLP
Boston, Massachusetts
March 1, 2007
34
Tax information
Unaudited
For federal income tax purposes, the following information is furnished with respect to the distributions of the Portfolio, if any, paid during its taxable year ended December 31, 2006.
The Portfolio has designated distributions to shareholders of $707,783 as a long-term capital gain dividend.
With respect to the ordinary dividends paid by the Portfolio for the fiscal period ended December 31, 2006, 5.73% of the dividends qualify for the corporate dividends-received deduction.
The Portfolio hereby designates the maximum amount allowable of its net taxable income as qualified dividend income as provided in the Jobs and Growth Tax Relief Reconciliation Act of 2003. This amount will be reflected on Form 1099-DIV for the calendar year 2006.
Shareholders were mailed a 2006 U.S. Treasury Department Form 1099-DIV in January 2007. This will reflect the total of all distributions that are taxable for calendar year 2006.
35
Trustees and Officers
This chart provides information about the Trustees and Officers of John Hancock Funds II who oversee your John Hancock fund. Officers elected by the Trustees manage the day-to-day operations of the Portfolio and execute policies formulated by the Trustees.
| Independent Trustees | | |
| |
| Name, Year of Birth | | Number of |
| Position(s) held with Portfolio | Trustee | John Hancock |
| Principal occupation(s) and other | of Portfolio | funds overseen |
| directorships during past 5 years | since1 | by Trustee |
|
| Charles L. Bardelis, Born: 1941 | 2005 | 209 |
| Director, Island Commuter Corp. (marine transport). Trustee of John | | |
| Hancock Trust (since 1988). | | |
|
| Peter S. Burgess, Born: 1942 | 2005 | 209 |
| Consultant (financial, accounting and auditing matters (since 1999); | | |
| Certified Public Accountant; Partner, Arthur Andersen (prior to 1999). | | |
| Director of the following publicly traded companies: PMA Capital Corporation | | |
| (since 2004) and Lincoln Educational Services Corporation (since 2004). | | |
| Trustee of John Hancock Trust (since 2005). | | |
|
| Elizabeth G. Cook, Born: 1937 | 2005 | 209 |
| Expressive Arts Therapist, Massachusetts General Hospital (September 2001 | | |
| to present); Expressive Arts Therapist, Dana Farber Cancer Institute | | |
| (September 2000 to January 2004); President, The Advertising Club of Greater Boston. | |
| Trustee of John Hancock Trust (since 2005). | | |
|
| Hassell H. McClellan, Born: 1945 | 2005 | 209 |
| Associate Professor, The Wallace E. Carroll School of Management, Boston College. | |
| Trustee of John Hancock Trust (since 2005). | | |
|
| James M. Oates, Born: 1946 | 2005 | 209 |
| Managing Director, Wydown Group (financial consulting firm) (since 1994); | | |
| Chairman, Emerson Investment Management, Inc. (since 2000); Chairman, | | |
| Hudson Castle Group, Inc. (formerly IBEX Capital Markets, Inc.) (financial services | |
| company) (since 1997). Director of the following publicly traded companies: | | |
| Stifel Financial (since 1996); Investor Financial Services Corporation (since 1995); | |
| and Connecticut River Bancorp, Director (since 1998). Director, Phoenix Mutual | |
| Funds (since 1988). Trustee of John Hancock Trust (since 2004). | | |
1 Because the Trust does not hold regular annual shareholders meetings, each Trustee holds office for an indefinite term until his/her successor is duly elected and qualified or until he/she dies, retires, resigns, is removed or becomes disqualified.
36
| Non-Independent Trustee3 | | |
| |
| Name, Year of Birth | | Number of |
| Position(s) held with Portfolio | Trustee | John Hancock |
| Principal occupation(s) and other | of Portfolio | funds overseen |
| directorships during past 5 years | since1 | by Trustee |
|
| James R. Boyle, Born: 1959 | 2005 | 259 |
| Chairman and Director, John Hancock Advisers, LLC, The Berkeley Financial | | |
| Group, LLC (holding company) and John Hancock Funds, LLC; President, | | |
| John Hancock Annuities; Executive Vice President, John Hancock Life | | |
| Insurance Company (since June 2004); President, U.S. Annuities; Senior | | |
| Vice President, The Manufacturers Life Insurance Company (U.S.A.) (prior | | |
| to 2004). | | |
| |
| Principal officers who are not Trustees | | |
| |
| Name, Year of Birth | | |
| Position(s) held with Portfolio | | Officer |
| Principal occupation(s) and | | of Portfolio |
| directorships during past 5 years | | since |
|
| Keith F. Hartstein,2 Born: 1956 | | 2005 |
| President | | |
| Senior Vice President, Manulife Financial Corporation (since 2004); Director, | | |
| President and Chief Executive Officer, the Adviser, The Berkeley Group, John | | |
| Hancock Funds, LLC (since 2005); Director, MFC Global Investment Management | |
| (U.S.), LLC (“MFC Global (U.S.)”) (since 2005); Director, John Hancock Signature | |
| Services, Inc. (since 2005); President and Chief Executive Officer, John Hancock | |
| Investment Management Services, LLC (since 2006); President and Chief Executive | |
| Officer, John Hancock Funds II, John Hancock Funds III and John Hancock Trust; | |
| Director, Chairman and President, NM Capital Management, Inc. (since 2005); | | |
| Chairman, Investment Company Institute Sales Force Marketing Committee | | |
| (since 2003); Director, President and Chief Executive Officer, MFC Global (U.S.) | |
| (2005–2006); Executive Vice President, John Hancock Funds, LLC (until 2005). | | |
|
| Thomas M. Kinzler,2 Born: 1955 | | 2006 |
| Secretary | | |
| Vice President and Counsel, John Hancock Life Insurance Company (U.S.A.) | | |
| (since 2006); Secretary and Chief Legal Officer, John Hancock Funds, John | | |
| Hancock Funds II, John Hancock Funds III and John Hancock Trust (since 2006); | |
| Vice President and Associate General Counsel, Massachusetts Mutual Life | | |
| Insurance Company (1999–2006); Secretary and Chief Legal Counsel, MML | | |
| Series Investment Fund (2000–2006); Secretary and Chief Legal Counsel, | | |
| MassMutual Institutional Funds (2000–2004); Secretary and Chief Legal Counsel, | |
| MassMutual Select Funds and MassMutual Premier Funds (2004–2006). | | |
|
| Francis V. Knox, Jr.,2 Born: 1947 | | 2005 |
| Chief Compliance Officer | | |
| Vice President and Chief Compliance Officer, John Hancock Investment | | |
| Management Services, LLC, the Adviser and MFC Global (U.S.) (since 2005); | | |
| Vice President and Chief Compliance Officer, John Hancock Funds II, John | | |
| Hancock Funds III and John Hancock Trust (since 2005); Vice President and | | |
| Assistant Treasurer, Fidelity Group of Funds (until 2004); Vice President and | | |
| Ethics & Compliance Officer, Fidelity Investments (until 2001). | | |
37
| Principal officers who are not Trustees (continued) | |
| |
| Name, Year of Birth | |
| Position(s) held with Portfolio | Officer |
| Principal occupation(s) and other | of Portfolio |
| directorships during past 5 years | since |
|
| Gordon M. Shone,2 Born: 1956 | 2006 |
| Treasurer | |
| Treasurer, John Hancock Funds (since 2006), John Hancock Funds II, John | |
| Hancock Funds III and John Hancock Trust (since 2005); Vice President and | |
| Chief Financial Officer, John Hancock Trust (2003–2005); Senior Vice President, | |
| John Hancock Life Insurance Company (U.S.A.) (since 2001); Vice President, | |
| John Hancock Investment Management Services, Inc., John Hancock Advisers, | |
| LLC (since 2006) and The Manufacturers Life Insurance Company (U.S.A.) | |
| (1998–2000). | |
|
| John G. Vrysen,2 Born: 1955 | 2005 |
| Chief Financial Officer | |
| Senior Vice President, Manulife Financial Corporation (since 2006); Director, | |
| Executive Vice President and Chief Financial Officer, the Adviser, The Berkeley | |
| Group and John Hancock Funds, LLC (since 2005); Executive Vice President and | |
| Chief Financial Officer, John Hancock Investment Management Services, LLC | |
| (since 2005); Vice President and Chief Financial Officer, MFC Global (U.S.) | |
| (since 2005); Director, John Hancock Signature Services, Inc. (since 2005); | |
| Chief Financial Officer, John Hancock Funds II, John Hancock Funds III and John | |
| Hancock Trust (since 2005); Vice President and General Manager, Fixed Annuities, | |
| U.S. Wealth Management (until 2005); Vice President, Operations, Manulife | |
| Wood Logan (2000–2004). | |
1 Because the Trust does not hold regular annual shareholders meetings, each Trustee holds office for an indefinite term until his successor is duly elected and qualified or until he dies, retires, resigns, is removed or becomes disqualified.
2Affiliated with the investment adviser.
3 Non-Independent Trustee: holds positions with the Fund’s investment adviser, underwriter, and/ or certain other affiliates.
38
For more information
The Portfolio’s proxy voting policies, procedures and records are available without charge, upon request:
| By phone | On the Portfolio’s Web site | On the SEC’s Web site |
| 1-800-225-5291 | www.jhfunds.com/proxy | www.sec.gov |
|
| |
| Investment adviser | Custodian | Legal counsel |
| John Hancock Investment | State Street Bank & Trust Co. | Kirkpatrick & Lockhart |
| Management Services, Inc. | 2 Avenue de Lafayette | Preston Gates Ellis LLP |
| 601 Congress Street | Boston, MA 02111 | 1 Lincoln Street |
| Boston, MA 02210-2805 | | Boston, MA 02110-2950 |
| | Transfer agent | |
| Principal distributor | John Hancock Signature | Independent registered |
| John Hancock Funds, LLC | Services, Inc. | public accounting firm |
| 601 Congress Street | 1 John Hancock Way, | PricewaterhouseCoopers LLP |
| Boston, MA 02210-2805 | Suite 1000 | 125 High Street |
| | Boston, MA 02217-1000 | Boston, MA 02110 |
Each underlying fund’s accounting policies are outlined in the underlying fund’s shareholder report, available without charge by calling 1-800-344-1029 or on the Securities and Exchange Commission (“SEC”) Web site at www.sec.gov, File # 811-21779, CIK 0001331971.
The Portfolio’s investment objective, risks, charges and expenses are included in the prospectus and should be considered carefully before investing. For a prospectus, call your financial professional, call John Hancock Funds at 1-800-225-5291 or visit the Portfolio’s Web site at www.jhfunds.com. Please read the prospectus carefully before investing or sending money.
| How to contact us | |
|
| |
| Internet | www.jhfunds.com | |
|
| |
| Mail | Regular mail: | Express mail: |
| | John Hancock | John Hancock |
| | Signature Services, Inc. | Signature Services, Inc. |
| | 1 John Hancock Way, Suite 1000 | Mutual Fund Image Operations |
| | Boston, MA 02217-1000 | 380 Stuart Street |
| | | Boston, MA 02116 |
|
| |
| Phone | Customer service representatives | 1-800-225-5291 |
| | 24-hour automated information | 1-800-338-8080 |
| | TDD line | 1-800-554-6713 |
A listing of month-end portfolio holdings is available on our Web site, www.jhfunds.com. A more detailed portfolio holdings summary is available on a quarterly basis 60 days after the fiscal quarter on our Web site or upon request by calling 1-800-225-5291, or on the Securities and Exchange Commission’s Web site, www.sec.gov.
40
J O H N H A N C O C K F A M I L Y O F F U N D S
| EQUITY | INTERNATIONAL |
| Balanced Fund | Greater China Opportunities Fund |
| Classic Value Fund | International Allocation Portfolio |
| Classic Value Fund II | International Classic Value Fund |
| Core Equity Fund | International Core Fund |
| Focused Equity Fund | International Fund |
| Growth Fund | International Growth Fund |
| Growth Opportunities Fund | |
| Growth Trends Fund | INCOME |
| Intrinsic Value Fund | Bond Fund |
| Large Cap Equity Fund | Government Income Fund |
| Large Cap Select Fund | High Yield Fund |
| Mid Cap Equity Fund | Investment Grade Bond Fund |
| Mid Cap Growth Fund | Strategic Income Fund |
| Multi Cap Growth Fund | |
| Small Cap Equity Fund | TAX-FREE INCOME |
| Small Cap Fund | California Tax-Free Income Fund |
| Small Cap Intrinsic Value Fund | High Yield Municipal Bond Fund |
| Sovereign Investors Fund | Massachusetts Tax-Free Income Fund |
| U.S. Core Fund | New York Tax-Free Income Fund |
| U.S. Global Leaders Growth Fund | Tax-Free Bond Fund |
| Value Opportunities Fund | |
| | MONEY MARKET |
| ASSET ALLOCATION | Money Market Fund |
| Allocation Core Portfolio | U.S. Government Cash Reserve |
| Allocation Growth + Value Portfolio | |
| Lifecycle 2010 Portfolio | CLOSED-END |
| Lifecycle 2015 Portfolio | Bank and Thrift Opportunity Fund |
| Lifecycle 2020 Portfolio | Financial Trends Fund, Inc. |
| Lifecycle 2025 Portfolio | Income Securities Trust |
| Lifecycle 2030 Portfolio | Investors Trust |
| Lifecycle 2035 Portfolio | Patriot Global Dividend Fund |
| Lifecycle 2040 Portfolio | Patriot Preferred Dividend Fund |
| Lifecycle 2045 Portfolio | Patriot Premium Dividend Fund I |
| Lifecycle Retirement Portfolio | Patriot Premium Dividend Fund II |
| Lifestyle Aggressive Portfolio | Patriot Select Dividend Fund |
| Lifestyle Balanced Portfolio | Preferred Income Fund |
| Lifestyle Conservative Portfolio | Preferred Income II Fund |
| Lifestyle Growth Portfolio | Preferred Income III Fund |
| Lifestyle Moderate Portfolio | Tax-Advantaged Dividend Income Fund |
| |
| SECTOR | |
| Financial Industries Fund | |
| Health Sciences Fund | |
| Real Estate Fund | |
| Regional Bank Fund | |
| Technology Fund | |
| Technology Leaders Fund | |
For more complete information on any John Hancock Fund and an Open-End fund prospectus, which includes charges and expenses, call your financial professional, or John Hancock Funds at 1-800-225-5291 for Open-End fund information and 1-800-852-0218 for Closed-End fund information. Please read the Open-End fund prospectus carefully before investing or sending money.

1-800-225-5291
1-800-554-6713 TDD
1-800-338-8080 EASI-Line
www.jhfunds.com
Now available: electronic delivery
www.jhfunds.com/edelivery
This report is for the information of the shareholders of John Hancock Lifestyle Conservative Portfolio.
9800A 12/06
2/07


| TABLE OF CONTENTS |
|
| |
| Your portfolio at a |
| glance |
| page 1 |
|
| |
| Managers’ report |
| page 2 |
|
| |
| A look at performance |
| page 6 |
|
| |
| Your expenses |
| page 8 |
|
| |
| Portfolio’s investments |
| page 1 0 |
|
| |
| Financial statements |
| page 1 2 |
|
| |
| Notes to financial |
| statements |
| page 2 7 |
|
| |
| Trustees and officers |
| page 3 8 |
|
| |
| For more information |
| page 4 4 |
|
CEO corner
January 2007
To Our Shareholders,
The financial markets surprised many investors in 2006 by beating their expectations. At the beginning of the year, fears abounded about rising inflation – with sky high energy prices – stronger than expected economic growth, a decline in the housing boom and more interest rate hikes from the Federal Reserve. But by June, the economic data suggested the desired “soft landing” for the economy, energy prices stabilized, corporate earnings remained strong and the Fed stopped raising rates. With that, the market took off, producing double-digit returns instead of the single-digit ones originally thought to be the best the market would do. The ascent was widespread and the broad Standard & Poor’s 500 Index returned 15.79% .
The bond market also turned in a solid result, registering its seventh consecutive year of positive performance. Continuing the trend of the last several years, the best performances came from the high yield sector. A healthy corporate earnings environment drove default rates down to near historical low levels and bolstered strong demand from yield-hungry investors. The broad Lehman Brothers Aggregate Bond Index returned 4.33% for the year, while the Merrill Lynch High Yield Master II Index returned 11.74% .
After such a year, we encourage investors to sit back, take stock and set some realistic expectations. While history argues for another good year (since 1945, the S&P 500 Index has always produced positive results in the third year of a presidential term) opinions are divided on the future of this more-than-four-year-old bull market.
We believe it’s wise to work with your financial professional to determine whether changes are now in order to your mix of portfolios. Some stock groups have had long runs of outperformance, such as small-cap stocks, value stocks and real estate investment trusts. Others had truly outsized returns in 2006, such as the telecom and energy sectors, China and emerging markets – not to mention the continued outperformance in general of international markets versus the U.S. Among bonds, the high yield category has become richly valued after such a long run up. These trends argue for a look to determine if these categories now represent a larger stake in your portfolios than prudent diversification would suggest they should, based on your risk profile, investment objectives and time horizons.
Sincerely,

Keith F. Hartstein,
President and Chief Executive Officer
This commentary reflects the CEO’s views as of December 31, 2006. They are subject to change at any time.
Your portfolio at a glance
The Portfolio seeks long-term growth of capital. Current income is also a consideration. To pursue this goal, the Portfolio, which is a fund-of-funds, normally invests approximately 20% of its assets in affiliated underlying funds that invest primarily in fixed-income securities and approximately 80% of its assets in affiliated underlying funds that invest primarily in equity securities.
Over the last twelve months
► Stocks representing all market-capitalization ranges and investment styles benefited from a generally positive environment for equities.
► Except for a significant correction in May and June 2006, U.S. and international stock markets rose steadily throughout the year.
► The Portfolio’s exposure to international equity funds was particularly helpful to performance, while several of our domestic large-cap funds detracted.

| Asset allocation | | | |
| Equity | % of Total | | Fixed Income | % of Total |
|
| U.S. Large Cap | 39.1 | | High Yield Bond | 7.0 |
|
| International Large Cap | 16.0 | | Intermediate Term Bond | 4.0 |
|
| U.S. Mid Cap | 8.0 | | Multi-Sector Bond | 4.0 |
|
| U.S. Small Cap | 6.9 | | Treasury Inflation-Protected Securities | 3.0 |
|
| International Small Cap | 4.0 | | Global Bond | 2.0 |
|
| Natural Resources | 4.0 | | |
| |
| Real Estate | 2.0 | | |
| |
| As a percentage of net assets on December 31, 2006. | | |
1
Managers’ report
John Hancock
Lifestyle Growth Portfolio
Recently, the Portfolio’s fiscal year-end changed from August to December. What follows is a commentary for the 12 months ended December 31, 2006.
Large and small, value and growth, domestic and international, stocks of all types gained ground against a mostly favorable market backdrop in 2006. Corporate earnings remained strong throughout the year, while consumer spending also held up surprisingly well. Although oil prices rose sharply during the year’s first half, they fell from their summertime peak of nearly $80 per barrel to finish the year closer to $60. Concerns about rising inflation led to a significant stock market correction in May and June. However, better-than-anticipated inflation reports during the year’s second half finally enabled the Federal Reserve Board, in a long-awaited move, to refrain from raising short-term interest rates for the first time in more than two years. Beginning at its August meeting, the Fed left its benchmark federal funds rate alone at 5.25% at each of its subsequent meetings during the year. Against this backdrop, the U.S. stock market rose steadily following its s ummertime decline.
Overall, the S&P 500 Index gained 15.79% during the 12 months ending December 31, 2006. Value stocks in all market-capitalization ranges beat their growth-stock counterparts, while small- and mid-cap
SCORECARD
| INVESTMENT | | PERIOD’S PERFORMANCE... AND WHAT’S BEHIND THE NUMBERS |
| International | ▲ | Benefited from strong stock selection, an underweighting in Japan |
| Value (Franklin | | and currency gains for U.S. investors in European stocks. |
| Templeton) | | |
U.S. Multi Sector | ▼ | Weak individual stock picks — especially in health care and |
| (GMO) | | banks — hurt this fund’s results. |
Capital | ▼ | An overweighting in the information technology sector — and |
| Appreciation | | especially in the semiconductor industry— was a negative. |
| (Jennison) | | |
2
From the MFC Global Investment Management (U.S.A.), LLC’s Portfolio Management Team
stocks generally outperformed large caps. International equities did particularly well, with the MSCI EAFE returning an impressive 26.87% . In addition to benefiting from many of the same fundamental trends helping U.S. companies, international stocks were further helped by strength in the euro and British pound relative to the U.S. dollar. Also gaining ground were natural resources stocks, which benefited from rising commodity prices for much of the period and excellent supply/demand fundamentals, while real estate securities were helped by their continued strong fundamentals, investors’ demand for yield and an apparent increase in speculative investment.
“Large and small, value
and growth, domestic and
international, stocks of all types
gained ground against a mostly
favorable market backdrop
in 2006.”
As a whole, fixed-income securities — which make up approximately 20% of the Portfolio’s assets — posted positive returns in 2006, overcoming a modest rise in interest rates. The Lehman Brothers Aggregate Bond Index, a broad measure of bond market performance, posted its seventh consecutive calendar year of positive results, gaining 4.33% .
Performance results
During the 12 months ending December 31, 2006, John Hancock Lifestyle Growth Portfolio’s Class A, Class B, Class C, Class R3, Class R4, Class R5 and Class 1 shares produced total returns of 13.02%, 12.24%, 12.20%, 12.87%, 13.22%, 13.41% and 13.54%, respectively, at net asset value. Class R, Class R1 and Class R2 shares returned 7.64%, 7.75% and 7.80% at net asset value since beginning operations on September 18, 2006. Class 5 shares returned 9.89% at net asset value since beginning operation on July 3, 2006. In comparison, the Portfolio’s benchmark, the 80% S&P 500 Index/20% Lehman Brothers Aggregate Bond combined
Lifestyle Growth Portfolio 3
index, returned 13.43% and Morningstar’s average large blend fund returned 14.15% for the 12-month period.1 Keep in mind that your net asset value return will be different from the Portfolio’s performance if you were not invested in the Portfolio for the entire period and did not reinvest all distributions. Please see pages six and seven for historical performance information.
International, large-cap value gains
During the period, our allocation to international equities was a significant positive. International Value (Franklin Templeton) — the Portfolio’s best performer overall — and International Core (GMO) were two standouts among our large-cap international holdings. International small-cap stocks also enjoyed particularly good results and the Portfolio benefited from positions in International Small Cap (Templeton) and International Small Company (Dimensional Fund Advisors).
Some of the Portfolio’s best performers during the year were U.S. large-cap value funds. In particular, Quantitative Value (MFC Global) and Equity Income (T. Rowe Price) turned in solid performances relative to the benchmark, thanks in large part to favorable market conditions for large-cap value stocks.
Another notable positive was our position in Natural Resources (Wellington). It is important to remember that while natural resource equities can be relatively volatile on a stand-alone basis, they can be excellent complements to other asset classes within a fully diversified portfolio. This is exactly what happened in 2006. Also helping was the Portfolio’s small allocation to domestic and global real estate securities.
U.S. Multi Sector (GMO) held a 7% position in the Portfolio and as a result had a relatively meaningful negative impact on performance. Core Equity (Legg Mason) also underperformed, driven largely by poor returns from its Internet holdings and lack of exposure to the energy sector. Two large-cap growth funds, Capital Appreciation (Jennison) and U.S. Global Leaders Growth (Sustainable Growth Advisers) were also relative detractors.
Within fixed income, our allocation to Real Return Bond (PIMCO) detracted from performance, as Treasury Inflation-Protected Securities (TIPS) underperformed traditional high-quality fixed-income instruments. On the other hand, fixed-income performance was helped by exposure to
4 Lifestyle Growth Portfolio
several high-yield bond funds. These holdings benefited from low corporate default rates and investors’ continued penchant for risk-oriented securities during the year. Overall, fixed-income securities made up approximately 20% of the Portfolio’s assets.
“Some of the Portfolio’s best
performers during the year were
U.S. large-cap value funds.”
Outlook
Global financial markets, and especially certain higher-risk asset classes, have benefited from ample global liquidity. Should that liquidity dry up, we could see a significant market correction, with higher-risk assets beginning to lag while cash-rich, mega-cap companies reverse their recent underperformance trend. The Portfolio is well exposed to both types of stocks, and we believe our emphasis on diversification should position us well if market conditions shift suddenly over the coming months, or if they remain as they have over the last five years.
As so many investors inevitably discover, trying to time asset class moves based on generalizations often has regrettable consequences and defeats the long-term smoothing effect of diversification. Our focus as portfolio managers is not on the latest quarter or even the past year’s performance. Rather our focus is on designing a portfolio that can compound shareholder wealth over time while evening out some of the inevitable bumps that occur along the way.
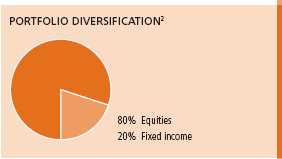
This commentary reflects the views of the portfolio managers through the end of the Portfolio’s period discussed in this report. The managers’ statements reflect their own opinions. As such, they are in no way guarantees of future events and are not intended to be used as investment advice or a recommendation regarding any specific security. They are also subject to change at any time as market and other conditions warrant.
International investing involves special risks such as political, economic and currency risks and differences in accounting standards and financial reporting. See the prospectus for the risks of investing in small-cap stocks. See the prospectus for the risks of investing in high-yield bonds.
1 Figures from Morningstar, Inc. include reinvested dividends and do not take into account sales charges. Actual load-adjusted performance is lower.
2 As a percentage of net assets on December 31, 2006.
Lifestyle Growth Portfolio 5
A look at performance
| For the periods ending December 31, 2006 | | | | | |
| |
| | | Average annual returns | | | Cumulative total returns | | |
| | | with maximum sales charge (POP) | | with maximum sales charge (POP) | | |
| | Inception | | | | Since | | | | Since |
| Class | date | 1-year | 5-year | 10-year | inception | 1-year | 5-year | 10-year | inception |
|
| 1a | 10-15-05 | 13.54% | — | — | 15.91% | 13.54% | — | — | 19.63% |
|
| 5a | 7-3-06 | — | — | — | — | — | — | — | 9.89 |
|
| A | 10-18-05 | 7.34 | — | — | 10.72 | 7.34 | — | — | 13.06 |
|
| B | 10-18-05 | 7.24 | — | — | 11.55 | 7.24 | — | — | 14.08 |
|
| C | 10-18-05 | 11.20 | — | — | 14.75 | 11.20 | — | — | 18.04 |
|
| Ra | 9-18-06 | — | — | — | — | — | — | — | 7.64 |
|
| R1a | 9-18-06 | — | — | — | — | — | — | — | 7.75 |
|
| R2a | 9-18-06 | — | — | — | — | — | — | — | 7.80 |
|
| R3a | 10-18-05 | 12.87 | — | — | 15.35 | 12.87 | — | — | 18.78 |
|
| R4a | 10-18-05 | 13.22 | — | — | 15.69 | 13.22 | — | — | 19.21 |
|
| R5a | 10-18-05 | 13.41 | — | — | 15.90 | 13.41 | — | — | 19.47 |
|
Performance figures assume all distributions are reinvested. Returns with maximum sales charge reflect a sales charge on Class A shares of 5%, and the applicable contingent deferred sales charge (CDSC) on Class B and Class C shares. The Class B shares’ CDSC declines annually between years 1–6 according to the following schedule: 5, 4, 3, 3, 2, 1%. No sales charge will be assessed after the sixth year. Class C shares held for less than one year are subject to a 1% CDSC. Sales charge is not applicable for Class R, Class R1, Class R2, Class R3, Class R4, Class R5, Class 1 and Class 5 shares.
The returns reflect past results and should not be considered indicative of future performance. The return and principal value of an investment will fluctuate so that shares, when redeemed, may be worth more or less than their original cost. Due to market volatility, the Portfolio’s current performance may be higher or lower than the performance shown. For performance data current to the most recent month-end, please call 1-800-225-5291 or visit the Portfolio’s Web site at www.jhfunds.com.
The performance table above and the chart on the next page do not reflect the deduction of taxes that a shareholder would pay on fund distributions or the redemption of fund shares.
The Portfolio’s performance results reflect any applicable expense reductions, without which the expenses would increase and results would have been less favorable.
Since inception performance is calculated with an opening (prior day’s close) on the inception date.
a For certain types of investors as described in the Portfolio’s Class R, Class R1, Class R2, Class R3, Class R4, Class R5, Class 1 and Class 5 share prospectuses.
6 Lifestyle Growth Portfolio
Growth of $10,000
This chart shows what happened to a hypothetical $10,000 investment in Class A shares
for the period indicated. For comparison, we’ve shown the same investment in a blended Index.
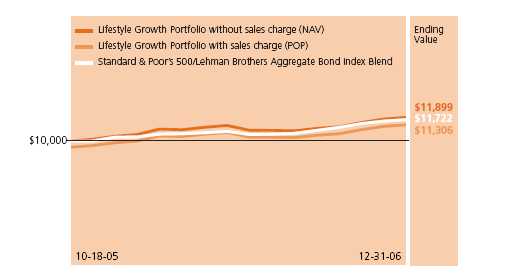
| | | | With maximum | |
| Class | Period beginning | Without sales charge | sales charge | Index |
|
| 12,3 | 10-15-05 | $11,963 | $11,963 | $11,547 |
|
| 52,3 | 7-3-06 | 10,989 | 10,989 | 11,118 |
|
| B2 | 10-18-05 | 11,808 | 11,408 | 11,722 |
|
| C1,2 | 10-18-05 | 11,804 | 11,804 | 11,722 |
|
| R2,3 | 9-18-06 | 10,764 | 10,764 | 10,559 |
|
| R12,3 | 9-18-06 | 10,775 | 10,775 | 10,559 |
|
| R22,3 | 9-18-06 | 10,780 | 10,780 | 10,559 |
|
| R32,3 | 10-18-05 | 11,878 | 11,878 | 11,722 |
|
| R42,3 | 10-18-05 | 11,921 | 11,921 | 11,722 |
|
| R52,3 | 10-18-05 | 11,947 | 11,947 | 11,722 |
|
Assuming all distributions were reinvested for the period indicated, the table above shows the value of a $10,000 investment in the Portfolio Class B, Class C, Class R, Class R1, Class R2, Class R3, Class R4, Class R5, Class 1 and Class 5 shares, respectively, as of December 31, 2006. Performance of the classes will vary based on the difference in sales charges paid by shareholders investing in the different classes and the fee structure of those classes.
A blended index is used combining 80% of the Standard & Poor’s 500 Index, an unmanaged index that includes 500 widely traded common stocks, and 20% of the Lehman Brothers Aggregate Bond Index, an unmanaged index of dollar-denominated and nonconvertible investment-grade debt issues.
It is not possible to invest directly in an index. Index figures do not reflect sales charges and would be lower if they did.
1 No contingent deferred sales charge applicable.
2 Index figure as of closest month end to inception date.
3 For certain types of investors as described in the Portfolio’s Class R, Class R1, Class R2, Class R3, Class R4, Class R5, Class 1 and Class 5 share prospectuses.
Lifestyle Growth Portfolio 7
Your expenses
These examples are intended to help you understand your ongoing operating expenses.
Understanding portfolio expenses
As a shareholder of the Portfolio, you incur two types of costs:
■ Transaction costs which include sales charges (loads) on purchases or redemptions (varies by share class), minimum account fee charge, etc.
■ Ongoing operating expenses including management fees, distribution and service fees (if applicable) and other fund expenses.
In addition to the operating expenses which the Portfolio bears directly, the Portfolio indirectly bears a pro rata share of the operating expenses of the affiliated underlying funds in which the Portfolio invests. Because the affiliated underlying funds have varied operating expenses and transaction costs and the Portfolio may own different proportions of the affiliated underlying funds at different times, the amount of expenses incurred indirectly by the Portfolio will vary. If these indirect expenses were included, your expenses paid during the period would have been higher.
We are going to present only your ongoing operating expenses here.
Actual expenses/actual returns
This example is intended to provide information about your portfolio’s actual ongoing operating expenses, and is based on your portfolio’s actual return. It assumes an account value of $1,000.00 on July 1, 2006, with the same investment held until December 31, 2006.
| | Account value | Ending value | Expenses paid during period |
| | on 7-1-06 | on 12-31-06 | ended 12-31-06a |
|
| Class A | $1,000.00 | $1,095.70 | $3.01 |
|
| Class B | 1,000.00 | 1,091.90 | 7.07 |
|
| Class C | 1,000.00 | 1,091.60 | 6.85 |
|
| Class Rb | 1,000.00 | 1,076.40 | 2.81 |
|
| Class R1b | 1,000.00 | 1,077.50 | 2.07 |
|
| Class R2b | 1,000.00 | 1,078.00 | 1.33 |
|
| Class R3 | 1,000.00 | 1,095.80 | 3.70 |
|
| Class R4 | 1,000.00 | 1,097.60 | 2.54 |
|
| Class R5 | 1,000.00 | 1,098.00 | 0.95 |
|
| Class 1 | 1,000.00 | 1,099.10 | 0.53 |
|
| Class 5 | 1,000.00 | 1,098.90 | 0.26 |
|
8 Lifestyle Growth Portfolio
Together with the value of your account, you may use this information to estimate the operating expenses that you paid over the period. Simply divide your account value at December 31, 2006 by $1,000.00, then multiply it by the “expenses paid” for your share class from the table above. For example, for an account value of $8,600.00, the operating expenses should be calculated as follows:
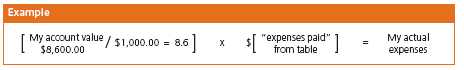
Hypothetical example for comparison purposes
This table allows you to compare your portfolio’s ongoing operating expenses with those of any other portfolio. It provides an example of the Portfolio’s hypothetical account values and hypothetical expenses based on each class’s actual expense ratio and an assumed 5% annual return before expenses (which is not your portfolio’s actual return). It assumes an account value of $1,000.00 on July 1, 2006, with the same investment held until December 31, 2006. Look in any other portfolio shareholder report to find its hypothetical example and you will be able to compare these expenses.
| | Account value | Ending value | Expenses paid during period |
| | on 7-1-06 | on 12-31-06 | ended 12-31-06a |
|
| Class A | $1,000.00 | $1,022.33 | $2.91 |
|
| Class B | 1,000.00 | 1,018.45 | 6.82 |
|
| Class C | 1,000.00 | 1,018.65 | 6.61 |
|
| Class Rb | 1,000.00 | 1,011.54 | 2.72 |
|
| Class R1b | 1,000.00 | 1,012.25 | 2.01 |
|
| Class R2b | 1,000.00 | 1,012.96 | 1.29 |
|
| Class R3 | 1,000.00 | 1,021.68 | 3.57 |
|
| Class R4 | 1,000.00 | 1,022.79 | 2.45 |
|
| Class R5 | 1,000.00 | 1,024.30 | 0.92 |
|
| Class 1 | 1,000.00 | 1,024.70 | 0.51 |
|
| Class 5 | 1,000.00 | 1,024.55 | 0.25 |
|
Remember, these examples do not include any transaction costs, such as sales charges; therefore, these examples will not help you to determine the relative total costs of owning different funds. If transaction costs were included, your expenses would have been higher. See the prospectus for details regarding transaction costs.
a Expenses are equal to the Fund’s annualized expense ratio of 0.57%, 1.34%, 1.30%, 0.95%, 0.70%, 0.45%, 0.70%, 0.48% 0.18%, 0.10% and 0.05% for Class A, Class B, Class C, Class R, Class R1, Class R2, Class R3, Class R4, Class R5, Class 1 and Class 5, respectively, multiplied by the average account value over the period, multiplied by the number of days in the period (inception date for Class R, Class R1 and Class R2) /365 or 366 (to reflect the one-half year period).
b Class R, Class R1 and Class R2 shares began operations 9-18-06.
c Class 5 shares began operations on 7-3-06.
Lifestyle Growth Portfolio 9
F I N A N C I A L S T A T E M E N T S
Portfolio’s investments
Securities owned by the Portfolio on 12-31-06
Portfolio of investments, showing all affiliated underlying funds.
| Issuer | Shares | Value |
|
| Investment companies 99.99% | | $8,442,246,179 |
| (Cost $7,708,414,925) | | |
| John Hancock Funds II | | |
|
| All Cap Core Fund Class NAV | 15,849,195 | $168,952,416 |
|
| All Cap Growth Fund Class NAV | 4,776,494 | 84,591,707 |
|
| All Cap Value Fund Class NAV | 10,471,873 | 168,806,600 |
|
| Blue Chip Growth Fund Class NAV | 17,558,955 | 339,063,428 |
|
| Capital Appreciation Fund Class NAV | 33,085,055 | 339,121,814 |
|
| Core Equity Fund Class NAV | 15,842,368 | 253,794,731 |
|
| Equity-Income Fund Class NAV | 13,528,131 | 254,058,301 |
|
| Fundamental Value Fund Class NAV | 19,902,134 | 338,336,284 |
|
| Global Bond Fund Class NAV | 11,705,521 | 169,144,777 |
|
| Global Real Estate Fund Class NAV | 7,231,690 | 84,972,356 |
|
| High Income Fund Class NAV | 7,745,928 | 84,120,779 |
|
| High Yield Fund Class NAV | 41,471,626 | 422,595,868 |
|
| International Equity Index Fund Class NAV | 8,264,997 | 169,432,446 |
|
| International Opportunities Fund Class NAV | 18,834,129 | 338,449,295 |
|
| International Small Cap Fund Class NAV | 8,123,514 | 169,456,498 |
|
| International Small Company Fund Class NAV | 16,106,293 | 169,438,202 |
|
| International Value Fund Class NAV | 18,105,422 | 338,390,330 |
|
| Large Cap Fund Class NAV | 5,418,073 | 84,576,120 |
|
| Large Cap Value Fund Class NAV | 3,375,795 | 84,496,152 |
|
| Mid Cap Index Fund Class NAV | 21,415,982 | 421,038,199 |
|
| Mid Cap Stock Fund Class NAV | 5,030,627 | 84,212,693 |
|
| Mid Cap Value Equity Fund Class NAV | 8,106,565 | 84,146,143 |
|
| Natural Resources Fund Class NAV | 9,483,524 | 338,372,140 |
|
| Quantitative Value Fund Class NAV | 14,685,722 | 254,650,416 |
|
| Real Estate Equity Fund Class NAV | 6,841,689 | 80,731,933 |
|
| Real Return Bond Fund Class NAV | 19,609,601 | 253,748,231 |
|
| Small Cap Fund Class NAV | 5,446,349 | 83,982,696 |
|
| Small Cap Index Fund Class NAV | 5,004,947 | 84,383,414 |
|
| Small Cap Opportunities Fund Class NAV | 6,599,007 | 159,036,070 |
|
| Small Company Growth Fund Class NAV | 7,023,448 | 84,000,441 |
|
| Small Company Value Fund Class NAV | 3,354,031 | 84,387,412 |
|
| Special Value Fund Class NAV | 3,882,069 | 84,318,532 |
See notes to financial statements
10 Lifestyle Growth Portfolio
F I N A N C I A L S T A T E M E N T S
| Issuer | Shares | Value |
| John Hancock Funds II (continued) | | |
|
| Spectrum Income Fund Class NAV | 16,190,977 | $168,871,890 |
|
| Strategic Bond Fund Class NAV | 7,068,956 | 84,120,571 |
|
| Strategic Income Fund Class NAV | 8,445,849 | 84,120,652 |
|
| Total Return Fund Class NAV | 24,828,685 | 338,166,695 |
|
| U.S. Global Leaders Growth Fund Class NAV | 18,812,145 | 253,775,834 |
|
| U.S. High Yield Bond Fund Class NAV | 6,382,353 | 84,183,241 |
|
| U.S. Multi Sector Fund Class NAV | 54,008,568 | 593,554,164 |
|
| Value & Restructuring Fund Class NAV | 7,053,772 | 84,856,872 |
|
| Vista Fund Class NAV | 7,320,314 | 84,769,237 |
| John Hancock Funds III 6.00% | | |
|
| International Core Fund Class NAV | 11,887,939 | 507,020,599 |
|
| Total investments 99.99% (Cost $7,708,414,925) | | $8,442,246,179 |
|
| |
| Other assets in excess of liabilities 0.01% | | $1,087,910 |
|
| |
| Total net assets 100.00% | | $8,443,334,089 |
Percentages are stated as a percent of net assets of the Portfolio.
See notes to financial statements
Lifestyle Growth Portfolio 11
F I N A N C I A L S T A T E M E N T S
Financial statements
Statement of assets and liabilities 12-31-06
This Statement of Assets and Liabilities is the Portfolio’s balance sheet. It shows the value of what the Portfolio owns, is due and owes. You’ll also find the net asset value and the maximum offering price per share.
| Assets | |
|
| Investments in affiliated funds, at value (cost $7,708,414,925) | $8,442,246,179 |
| Receivable for investments sold | 28,812,816 |
| Receivable for fund shares sold | 4,591,723 |
| Receivable from affiliates | 9,108 |
| Other assets | 13,275 |
| Total assets | 8,475,673,101 |
|
| |
| Liabilities | |
|
| Due to custodian | 2,491,430 |
| Payable for investments purchased | 2,274,243 |
| Payable for fund shares repurchased | 26,448,315 |
| Payable to affiliates | |
| Fund administration fees | 208,248 |
| Transfer agent fees | 266,743 |
| Trustees’ fees | 26,156 |
| Other payables and accrued expenses | 623,877 |
| Total liabilities | 32,339,012 |
|
| |
| Net assets | |
|
| Capital paid-in | 7,711,045,242 |
| Accumulated net realized loss on investments | (1,542,407) |
| Net unrealized appreciation on investments in affiliated underlying funds | 733,831,254 |
| Net assets | $8,443,334,089 |
|
| |
| Net asset value per share | |
|
| Based on net asset values and shares outstanding — The Portfolio has an | |
| unlimited number of shares authorized with no par value. | |
| Class A ($165,493,663 ÷ 11,241,217 shares) | $14.72 |
| Class B ($38,510,077 ÷ 2,614,415 shares) | $14.73 |
| Class C ($151,869,219 ÷ 10,314,025 shares) | $14.72 |
| Class R ($135,966 ÷ 9,190 shares) | $14.79 |
| Class R1 ($107,747 ÷ 7,295 shares) | $14.77 |
| Class R2 ($107,824 ÷ 7,313 shares) | $14.74 |
| Class R3 ($3,723,467 ÷ 253,116 shares) | $14.71 |
| Class R4 ($7,168,934 ÷ 487,382 shares) | $14.71 |
| Class R5 ($2,321,496 ÷ 157,768 shares) | $14.71 |
| Class 1 ($8,059,007,923 ÷ 549,331,341 shares) | $14.67 |
| Class 5 ($14,887,773 ÷ 1,015,556 shares) | $14.66 |
|
| |
| Maximum offering price per share | |
|
| Class A1 ($14.72 ÷ 95%) | $15.49 |
1 On single retail sales of less than $50,000. On sales of $50,000 or more and on group sales the offering price is reduced.
See notes to financial statements
12 Lifestyle Growth Portfolio
F I N A N C I A L S T A T E M E N T S
Statement of operations For the period ended 12-31-06.
This Statement of Operations summarizes the Portfolio’s investment income earned and expenses incurred in operating the Portfolio. It also shows net gains (losses) for the period stated.
| | Period | Four months |
| | ended | ended |
| | 8-31-06a | 12-31-06b |
|
| Investment income | | |
| Income distributions received from affiliated underlying funds | $70,403,278 | $91,035,551 |
| Total investment income | 70,403,278 | 91,035,551 |
|
| Expenses | | |
| Investment management fees (Note 3) | 2,324,445 | 1,099,213 |
| Distribution and service fees (Note 3) | 3,231,975 | 1,919,780 |
| Transfer agent fees (Note 3) | 144,604 | 164,164 |
| Blue sky fees (Note 3) | 110,195 | 51,185 |
| Printing and postage fees (Note 3) | 135,707 | 53,447 |
| Fund administration fees (Note 3) | 477,403 | 181,443 |
| Audit and legal fees | 182,437 | 68,929 |
| Custodian fees | 12,763 | 4,014 |
| Trustees’ fees (Note 3) | 65,233 | 24,792 |
| Registration and filing fees | 206,837 | 78,611 |
| Miscellaneous | 53,195 | 13,709 |
| Total expenses | 6,944,794 | 3,659,287 |
| Less expense reductions (Note 3) | (162,750) | (36,202) |
| Net expenses | 6,782,044 | 3,623,085 |
| Net investment income | 63,621,234 | 87,412,466 |
|
| Realized and unrealized gain | | |
| Net realized gain on investments | 158,888,831 | 34,492,470 |
| Capital gain distributions received from affiliated underlying funds | 14,311,942 | 120,773,853 |
| Change in net unrealized appreciation of investments | | |
| in affiliated underlying funds | 356,753,561 | 377,077,693 |
| Net realized and unrealized gain | 529,954,334 | 532,344,016 |
| Increase in net assets from operations | $593,575,568 | $619,756,482 |
a Period from 10-15-05 (commencement of operations) to 8-31-06.
b Effective 1-18-07, the fiscal year-end changed from August 31 to December 31.
See notes to financial statements
Lifestyle Growth Portfolio 13
F I N A N C I A L S T A T E M E N T S
Statement of changes in net assets
These Statements of Changes in Net Assets show how the value of the Portfolio’s net assets has changed during the last two periods. It reflects earnings less expenses, any investment gains and losses, distributions, if any, paid to shareholders and the net of Portfolio share transactions.
| | Period | Four months |
| | ended | ended |
| | 8-31-06a | 12-31-06b |
|
| Increase (decrease) in net assets | | |
| From operations | | |
| Net investment income | $63,621,234 | $87,412,466 |
| Net realized gain | 173,200,773 | 155,266,323 |
| Change in net unrealized appreciation | 356,753,561 | 377,077,693 |
| Increase in net assets resulting from operations | 593,575,568 | 619,756,482 |
| Distributions to shareholders | | |
| From net investment income | | |
| Class A | (46,836) | (4,431,521) |
| Class B | (6,890) | (878,972) |
| Class C | (19,011) | (3,493,928) |
| Class R | — | (3,340) |
| Class R1 | — | (2,862) |
| Class R2 | — | (3,020) |
| Class R3 | (519) | (99,284) |
| Class R4 | (571) | (200,909) |
| Class R5 | (2,527) | (68,375) |
| Class 1 | (35,586,379) | (242,862,495) |
| Class 5 | — | (423,491) |
| From net realized gain | | |
| Class A | — | (3,753,671) |
| Class B | — | (885,252) |
| Class C | — | (3,490,555) |
| Class R | — | (3,040) |
| Class R1 | — | (2,462) |
| Class R2 | — | (2,462) |
| Class R3 | — | (85,475) |
| Class R4 | — | (163,697) |
| Class R5 | — | (52,865) |
| Class 1 | — | (184,797,243) |
| Class 5 | — | (319,070) |
See notes to financial statements
14 Lifestyle Growth Portfolio
F I N A N C I A L S T A T E M E N T S
Statement of changes in net assets (continued)
| | Period | Four months |
| | ended | ended |
| | 8-31-06a | 12-31-06b |
|
| Distributions to shareholders (continued) | | |
| From capital paid-in | | |
| Class A | — | $(3,047,402) |
| Class B | — | (619,415) |
| Class C | — | (2,459,169) |
| Class R | — | (2,320) |
| Class R1 | — | (1,972) |
| Class R2 | — | (2,067) |
| Class R3 | — | (68,421) |
| Class R4 | — | (137,468) |
| Class R5 | — | (46,482) |
| Class 1 | — | (164,782,068) |
| Class 5 | — | (287,001) |
| | (35,662,733) | (617,477,774) |
| From Fund share transactions | 6,754,830,162 | 1,128,312,384 |
|
| Net assets | | |
| Beginning of period | — | 7,312,742,997 |
| End of period | $7,312,742,997 | $8,443,334,089 |
| Accumulated net investment income | $42,886,862 | — |
a Period from 10-15-05 (commencement of operations) to 8-31-06.
b Effective 1-18-07, the fiscal year-end changed from August 31 to December 31.
See notes to financial statements
Lifestyle Growth Portfolio 15
F I N A N C I A L S T A T E M E N T S
Financial highlights
The Financial highlights show how the Fund’s net asset value for a share has changed since the end of the previous period.
| CLASS A SHARES | | |
| |
| Period ended | 8-31-06a | 12-31-06b |
|
| Per share operating performance | | |
| Net asset value, beginning of period | $13.35 | $14.63 |
| Net investment income h,v | 0.07 | 0.16 |
| Net realized and unrealized | | |
| gain on investments | 1.28 | 1.01 |
| Total from investment operations | 1.35 | 1.17 |
| Less distributions | | |
| From net investment income | (0.07) | (0.43) |
| From net realized gain | — | (0.36) |
| From capital paid-in | — | (0.29) |
| | (0.07) | (1.08) |
| Net asset value, end of period | $14.63 | $14.72 |
| Total return k,m (%) | 10.18l | 8.00 |
| Ratios and supplemental data | | |
| | |
| Net assets, end of period | | |
| (in millions) | $103 | $165 |
| Ratio of net expenses to average | | |
| net assets q,r (%) | 0.61 | 0.58 |
| Ratio of gross expenses to average | | |
| net assets q,r (%) | 0.72p | 0.58 |
| Ratio of net investment income | | |
| to average net assets r,v (%) | 0.55 | 3.18 |
| Portfolio turnover m (%) | 26 | 4 |
See notes to financial statements
16 Lifestyle Growth Portfolio
F I N A N C I A L S T A T E M E N T S
Financial highlights
| CLASS B SHARES | | |
| |
| Period ended | 8-31-06a | 12-31-06b |
|
| Per share operating performance | | |
| Net asset value, beginning of period | $13.35 | $14.57 |
| Net investment income (loss) h,v | (0.02) | 0.12 |
| Net realized and unrealized | | |
| gain on investments | 1.30 | 1.01 |
| Total from investment operations | 1.28 | 1.13 |
| Less distributions | | |
| From net investment income | (0.06) | (0.36) |
| From net realized gain | — | (0.36) |
| From capital paid-in | — | (0.25) |
| | (0.06) | (0.97) |
| Net asset value, end of period | $14.57 | $14.73 |
| Total return k,l,m (%) | 9.57 | 7.77 |
| Ratios and supplemental data | | |
|
| Net assets, end of period | | |
| (in millions) | $24 | $39 |
| Ratio of net expenses to average | | |
| net assets q,r (%) | 1.34 | 1.35 |
| Ratio of gross expenses to average | | |
| net assets p,q,r (%) | 1.69 | 1.40 |
| Ratio of net investment income | | |
| (loss) to average net assets r,v (%) | (0.19) | 2.45 |
| Portfolio turnover m (%) | 26 | 4 |
See notes to financial statements
Lifestyle Growth Portfolio 17
F I N A N C I A L S T A T E M E N T S
Financial highlights
| CLASS C SHARES | | |
| |
| Period ended | 8-31-06a | 12-31-06b |
|
| Per share operating performance | | |
| Net asset value, beginning of period | $13.35 | $14.57 |
| Net investment income (loss) h,v | (0.02) | 0.13 |
| Net realized and unrealized | | |
| gain on investments | 1.30 | 0.99 |
| Total from investment operations | 1.28 | 1.12 |
| Less distributions | | |
| From net investment income | (0.06) | (0.36) |
| From net realized gain | — | (0.36) |
| From capital paid-in | — | (0.25) |
| | (0.06) | (0.97) |
| Net asset value, end of period | $14.57 | $14.72 |
| Total return k,m (%) | 9.57l | 7.73 |
| Ratios and supplemental data | | |
|
| Net assets, end of period | | |
| (in millions) | $93 | $152 |
| Ratio of net expenses to average | | |
| net assets q,r (%) | 1.33 | 1.29 |
| Ratio of gross expenses to average | | |
| net assets q,r (%) | 1.44p | 1.29 |
| Ratio of net investment income | | |
| (loss) to average net assets r,v (%) | (0.14) | 2.53 |
| Portfolio turnover m (%) | 26 | 4 |
See notes to financial statements
18 Lifestyle Growth Portfolio
F I N A N C I A L S T A T E M E N T S
Financial highlights
| CLASS R SHARES | |
| |
| Period ended | 12-31-06b,c |
| Per share operating performance | |
|
| Net asset value, beginning of period | $14.70 |
| Net investment income h,v | 0.15 |
| Net realized and unrealized | |
| gain on investments | 0.98 |
| Total from investment operations | 1.13 |
| Less distributions | |
| From net investment income | (0.40) |
| From net realized gain | (0.36) |
| From capital paid-in | (0.28) |
| | (1.04) |
| Net asset value, end of period | $14.79 |
| Total return k,l (%) | 7.64m |
| Ratios and supplemental data | |
|
| Net assets, end of period | |
| (in millions) | —i |
| Ratio of net expenses to average | |
| net assets q (%) | 0.95r |
| Ratio of gross expenses to average | |
| net assets p,q (%) | 12.41r |
| Ratio of net investment income | |
| to average net assets v (%) | 3.39r |
| Portfolio turnover (%) | 4m |
See notes to financial statements
Lifestyle Growth Portfolio 19
F I N A N C I A L S T A T E M E N T S
Financial highlights
| CLASS R1 SHARES | |
| |
| Period ended | 12-31-06b,c |
| Per share operating performance | |
|
| Net asset value, beginning of period | $14.70 |
| Net investment income h,v | 0.14 |
| Net realized and unrealized | |
| gain on investments | 1.00 |
| Total from investment operations | 1.14 |
| Less distributions | |
| From net investment income | (0.42) |
| From net realized gain | (0.36) |
| From capital paid-in | (0.29) |
| | (1.07) |
| Net asset value, end of period | $14.77 |
| Total return k,l (%) | 7.75m |
| Ratios and supplemental data | |
|
| Net assets, end of period | |
| (in millions) | —i |
| Ratio of net expenses to average | |
| net assets q (%) | 0.69r |
| Ratio of gross expenses to average | |
| net assets p,q (%) | 12.95r |
| Ratio of net investment income | |
| to average net assets v (%) | 3.23r |
| Portfolio turnover (%) | 4m |
See notes to financial statements
20 Lifestyle Growth Portfolio
F I N A N C I A L S T A T E M E N T S
Financial highlights
| CLASS R2 SHARES | |
| |
| Period ended | 12-31-06b,c |
| Per share operating performance | |
|
| Net asset value, beginning of period | $14.70 |
| Net investment income h,v | 0.15 |
| Net realized and unrealized | |
| gain on investments | 0.99 |
| Total from investment operations | 1.14 |
| Less distributions | |
| From net investment income | (0.44) |
| From net realized gain | (0.36) |
| From capital paid-in | (0.30) |
| | (1.10) |
| Net asset value, end of period | $14.74 |
| Total return k,l (%) | 7.80m |
| Ratios and supplemental data | |
|
| Net assets, end of period | |
| (in millions) | —i |
| Ratio of net expenses to average | |
| net assets q (%) | 0.45r |
| Ratio of gross expenses to average | |
| net assets p,q (%) | 12.74r |
| Ratio of net investment income | |
| to average net assets v (%) | 3.48r |
| Portfolio turnover (%) | 4m |
See notes to financial statements
Lifestyle Growth Portfolio 21
F I N A N C I A L S T A T E M E N T S
Financial highlights
| CLASS R3 SHARES | | |
| |
| Period ended | 8-31-06a | 12-31-06b |
| Per share operating performance | | |
|
| Net asset value, beginning of period | $13.35 | $14.61 |
| Net investment income h,v | 0.07 | 0.16 |
| Net realized and unrealized | | |
| gain on investments | 1.26 | 1.01 |
| Total from investment operations | 1.33 | 1.17 |
| Less distributions | | |
| From net investment income | (0.07) | (0.42) |
| From net realized gain | — | (0.36) |
| From capital paid-in | | (0.29) |
| | (0.07) | (1.07) |
| Net asset value, end of period | $14.61 | $14.71 |
| Total return k,l,m (%) | 9.98 | 8.00 |
| Ratios and supplemental data | | |
|
| Net assets, end of period | | |
| (in millions) | $2 | $4 |
| Ratio of net expenses to average | | |
| net assets q,r (%) | 0.68 | 0.71 |
| Ratio of gross expenses to average | | |
| net assets p,q,r (%) | 5.07 | 1.35 |
| Ratio of net investment income | | |
| to average net assets r,v (%) | 0.62 | 3.13 |
| Portfolio turnover m (%) | 26 | 4 |
See notes to financial statements
22 Lifestyle Growth Portfolio
F I N A N C I A L S T A T E M E N T S
Financial highlights
| CLASS R4 SHARES | | |
| |
| Period ended | 8-31-06a | 12-31-06b |
| Per share operating performance | | |
|
| Net asset value, beginning of period | $13.35 | $14.64 |
| Net investment income h,v | 0.08 | 0.16 |
| Net realized and unrealized | | |
| gain on investments | 1.29 | 1.01 |
| Total from investment operations | 1.37 | 1.17 |
| Less distributions | | |
| From net investment income | (0.08) | (0.44) |
| From net realized gain | — | (0.36) |
| From capital paid-in | | (0.30) |
| | (0.08) | (1.10) |
| Net asset value, end of period | $14.64 | $14.71 |
| Total return k,l,m (%) | 10.26 | 8.04 |
| Ratios and supplemental data | | |
|
| Net assets, end of period | | |
| (in millions) | $5 | $7 |
| Ratio of net expenses to average | | |
| net assets q,r (%) | 0.49 | 0.53 |
| Ratio of gross expenses to average | | |
| net assets p,q,r (%) | 1.78 | 0.80 |
| Ratio of net investment income | | |
| to average net assets r,v (%) | 0.69 | 3.12 |
| Portfolio turnover m (%) | 26 | 4 |
See notes to financial statements
Lifestyle Growth Portfolio 23
F I N A N C I A L S T A T E M E N T S
Financial highlights
| CLASS R5 SHARES | | |
| |
| Period ended | 8-31-06a | 12-31-06b |
| Per share operating performance | | |
|
| Net asset value, beginning of period | $13.35 | $14.66 |
| Net investment income h,v | 0.09 | 0.18 |
| Net realized and unrealized | | |
| gain on investments | 1.30 | 1.02 |
| Total from investment operations | 1.39 | 1.20 |
| Less distributions | | |
| From net investment income | (0.08) | (0.47) |
| From net realized gain | — | (0.36) |
| From capital paid-in | | (0.32) |
| | (0.08) | (1.15) |
| Net asset value, end of period | $14.66 | $14.71 |
| Total return k,l,m (%) | 10.47 | 8.15 |
| Ratios and supplemental data | | |
|
| Net assets, end of period | | |
| (in millions) | $2 | $2 |
| Ratio of net expenses to average | | |
| net assets q,r (%) | 0.19 | 0.20 |
| Ratio of gross expenses to average | | |
| net assets p,q,r (%) | 2.52 | 1.40 |
| Ratio of net investment income | | |
| to average net assets r,v (%) | 0.70 | 3.54 |
| Portfolio turnover m (%) | 26 | 4 |
See notes to financial statements
24 Lifestyle Growth Portfolio
F I N A N C I A L S T A T E M E N T S
Financial highlights
| CLASS 1 SHARES | | |
| |
| Period ended | 8-31-06a | 12-31-06b |
| Per share operating performance | | |
|
| Net asset value, beginning of period | $13.31 | $14.63 |
| Net investment income h,v | 0.15 | 0.17 |
| Net realized and unrealized | | |
| gain on investments | 1.25 | 1.03 |
| Total from investment operations | 1.40 | 1.20 |
| Less distributions | | |
| From net investment income | (0.08) | (0.48) |
| From net realized gain | — | (0.36) |
| From capital paid-in | — | (0.32) |
| | (0.08) | (1.16) |
| Net asset value, end of period | $14.63 | $14.67 |
| Total return k,m (%) | 10.58 | 8.18 |
| Ratios and supplemental data | | |
|
| Net assets, end of period | | |
| (in millions) | $7,081 | $8,059 |
| Ratio of net expenses to average | | |
| net assets q,r (%) | 0.11 | 0.11 |
| Ratio of net investment income | | |
| to average net assets r,v (%) | 1.17 | 3.34 |
| Portfolio turnover m (%) | 26 | 4 |
See notes to financial statements
Lifestyle Growth Portfolio 25
F I N A N C I A L S T A T E M E N T S
Financial highlights
| CLASS 5 SHARES | | �� |
| |
| Period ended | 8-31-06a | 12-31-06b |
| Per share operating performance | | |
|
| Net asset value, beginning of period | $14.40 | $14.62 |
| Net investment gain (loss) h,v | —j | 0.24 |
| Net realized and unrealized | | |
| gain on investments | 0.22 | 0.97 |
| Total from investment operations | 0.22 | 1.21 |
| Less distributions | | |
| From net investment income | — | (0.48) |
| From net realized gain | — | (0.36) |
| From capital paid-in | — | (0.33) |
| | — | (1.17) |
| Net asset value, end of period | $14.62 | $14.66 |
| Total return k,m (%) | 1.53 | 8.24 |
| Ratios and supplemental data | | |
|
| Net assets, end of period | | |
| (in millions) | $3 | $15 |
| Ratio of net expenses to average | | |
| net assets q,r (%) | 0.06 | 0.06 |
| Ratio of net investment loss | | |
| to average net assets r,v (%) | (0.02) | 4.68 |
| Portfolio turnover m (%) | 26 | 4 |
a Class A, Class B, Class C, Class R3, Class R4 and Class R5 shares began operations on 10-18-05, Class 1 shares began operation on 10-15-05, and Class 5 shares began operation on 7-3-06.
b Effective 1-18-07, the fiscal year-end changed from August 31 to December 31.
c Class R, Class R1 and Class R2 shares began operations on 9-18-06.
h Based on the average of the shares outstanding.
i Less than $500,000.
j Less than $0.01 per share.
k Assumes dividend reinvestment and does not reflect the effect of sales charges.
l Total returns would have been lower had certain expenses not been reduced during the period shown.
m Not annualized.
p Does not take into consideration expense reductions during the period shown.
q Does not include expenses of the investment companies in which the Portfolio invests.
r Annualized.
v Recognition of net investment income by the Portfolio is affected by the timing of the declaration of dividends by the underlying investment companies in which the Portfolio invests.
See notes to financial statements
26 Lifestyle Growth Portfolio
Notes to financial statements
1. Organization
The John Hancock Lifestyle Growth Portfolio (the “Portfolio”) is a non-diversified series of John Hancock Funds II (the “Trust”). The Trust was established as a Massachusetts business trust on June 28, 2005. The Trust is registered under the Investment Company Act of 1940 (the “1940 Act”), as amended, as an open-end investment management company.
The Portfolio operates as a “fund of funds,” investing in Class NAV shares of affiliated underlying funds of the Trust and John Hancock Funds III and in other permitted investments. The affiliated underlying funds’ accounting policies are outlined in the shareholder reports, available without charge by calling 1-800-225-5291 or on the Securities & Exchange Commission (“SEC”) Web site at www.sec.gov, File #811-21779, CIK 0001331971. The affiliated underlying funds are not covered by this report.
John Hancock Investment Management Services, LLC (the “Adviser”), a Delaware limited liability company controlled by John Hancock Life Insurance Company (U.S.A.) (“John Hancock USA”) serves as investment adviser for the Trust and John Hancock Funds, LLC (the “Distributor”), an affiliate of the Adviser, serves as principal underwriter. John Hancock Life Insurance Company of New York (“John Hancock New York”) is a wholly owned subsidiary of John Hancock USA. John Hancock USA and John Hancock New York are indirect wholly owned subsidiaries of The Manufactures Life Insurance Company (“Manulife”), which in turn is a wholly owned subsidiary of Manulife Financial Corporation (“MFC”), a publicly traded company. MFC and its subsidiaries are known collectively as “Manulife Financial.”
The Portfolio commenced operations after certain separate accounts of John Hancock USA redeemed their interests in portfolios of John Hancock Trust and certain unaffiliated mutual funds of approximately $1.2 billion at the close of business on October 14, 2005, with additional redemption proceeds of approximately $4.4 billion received on October 28, 2005, and invested such proceeds in Class 1 shares of the Portfolio, which in turn invested the proceeds in affiliated underlying funds of the Trust.
The Board of Trustees has authorized the issuance of multiple classes of shares of the Portfolio, including classes designated as Class A, Class B, Class C, Class R, Class R1, Class R2, Class R3, Class R4, Class R5, Class 1 and Class 5 shares.
Class A, Class B and Class C shares are open to all retail investors. Class 1 shares are sold only to certain exempt separate accounts of John Hancock USA and John Hancock New York. Class R, Class R1, Class R2, Class R3, Class R4 and Class R5 shares are available only to certain retirement plans. Class 5 shares currently are available only to the John Hancock Freedom 529 Plan.
The shares of each class represent an interest in the same portfolio of investments of the Portfolio, and have equal rights as to voting, redemptions, dividends and liquidation, except that certain expenses, subject to the approval of the Trustees, may be applied differently to each class of shares in accordance with current regulations of the Securities and Exchange Commission and the Internal Revenue Service. Shareholders of a class that bears distribution and service expenses under the terms of a distribution plan have exclusive voting rights to that distribution plan. Class B shares will convert to Class A shares eight years after purchase.
On January 18, 2007, the Board of Trustees approved a change in the fiscal year end of the Portfolio from August 31 to December 31.
Lifestyle Growth Portfolio 27
Accordingly, the Portfolio’s financial statements and related notes include information as of the four-month period ended December 31, 2006 and the period ended August 31, 2006.
2. Significant accounting policies
In the preparation of the financial statements, the Portfolio follows the policies described below. The preparation of financial statements in conformity with accounting principles generally accepted in the United States of America requires management to make estimates and assumptions that affect the reported amounts of assets and liabilities at the date of the financial statements and the reported amounts of income and expenses during the reporting period. Actual results may differ from these estimates.
Securities valuation
The net asset value of the shares of the Portfolio is determined daily as of the close of the New York Stock Exchange, normally at 4:00 P.M. Eastern Time. Investments in the affiliated underlying funds are valued at their respective net asset values each business day, or at fair value as determined in good faith in accordance with procedures approved by the Trustees. Securities in the affiliated underlying funds’ portfolios are valued in accordance with their respective valuation polices, as outlined in the affiliated underlying funds’ financial statements. Short-term debt investments that have a remaining maturity of 60 days or less are valued at amortized cost.
Security transactions and related investment income
Investment security transactions in the affiliated underlying funds are accounted for on a trade date plus one basis for daily net asset value calculations. However, for financial reporting purposes, investment transactions are reported on trade date. Interest income is accrued as earned. Dividend income and capital gain distributions from the affiliated underlying funds are recorded on the ex-dividend date.
Gains and losses on securities sold are determined on the basis of specific identified cost for both financial and federal income tax reporting purposes.
Multi-class operations
All income, expenses (except for class-specific expenses) and realized and unrealized gains (losses) are allocated to each class of shares based upon the relative net assets of each class. Dividends to shareholders from net investment income are determined at a class level and distributions from capital gains are determined at a Portfolio level.
Expense allocation
Expenses not directly attributable to a particular Portfolio or class of shares are allocated based on the relative share of net assets of the Portfolio at the time the expense was incurred. Class-specific expenses, such as transfer agency fees, blue sky fees, printing and postage fees and distribution and service fees, are accrued daily and charged directly to the respective share classes. Expenses in the Portfolio’s Statements of Operations reflect the expenses of the Portfolio and do not include any indirect expenses related to the affiliated underlying funds. Because the affiliated underlying funds have varied expense levels and the Portfolio may own different proportions of the affiliated underlying funds at different times, the amount of fees and expenses incurred indirectly by the Portfolio will vary.
Federal income taxes
The Portfolio seeks to qualify as a “regulated investment company” by complying with the applicable provisions of the Internal Revenue Code and will not be subject to federal income tax on taxable income that is distributed to shareholders. Therefore, no federal income tax provision is required.
New accounting pronouncements
In June 2006, Financial Accounting Standards Board (“FASB”) Interpretation No. 48, Accounting for Uncertainty in Income Taxes (the “Interpretation”) was issued, and is effective for fiscal years beginning after December 15, 2006 and is to be applied to all open tax years as of the effective date. The Interpretation prescribes a minimum threshold for financial statement recognition of the benefit of a tax position taken or expected to be taken in a tax return, and requires certain expanded disclosures. Management is currently evaluating the application of the Interpretation to the Portfolio, and has not at this time quantified the impact, if any, resulting
28 Lifestyle Growth Portfolio
from the adoption of the Interpretation on the Portfolio’s financial statements. The Portfolio will implement this pronouncement no later than June 29, 2007.
In September 2006, FASB Standard No. 157, Fair Value Measurements (“FAS 157”) was issued, and is effective for fiscal years beginning after November 15, 2007. FAS 157 defines fair value, establishing a framework for measuring fair value and expands disclosure about fair value measurements. Management is currently evaluating the application of FAS 157 to the Portfolio, and its impact, if any, resulting from the adoption of FAS 157 on the Portfolio’s financial statements.
Distribution of income and gains
The Portfolio records distributions to shareholders from net investment income and net realized gains, if any, on the ex-dividend date.
During the period ended August 31, 2006, the tax character of distributions paid was as follows: ordinary income $35,662,733. During the four-month period ended December 31, 2006, the tax character of distributions paid was as follows: ordinary income $411,384,565, tax return of capital $171,427,293 and long-term capital gain $34,665,916. Distributions paid by the Portfolio with respect to each class of shares are calculated in the same manner, at the same time and are in the same amount, except for the effect of expenses that may be applied differently to each class. Such distributions, on a tax basis, are determined in conformity with income tax regulations, which may differ from accounting principles generally accepted in the United States of America. Distributions in excess of tax basis earnings and profits, if any, are reported in the Portfolio’s financial statements as a return of capital. As of December 31, 2006, there were no distributable earnings on a tax basis.
Capital accounts
The Portfolio reports the undistributed net investment income and accumulated undistributed net realized gain (loss) accounts on a basis approximating amounts available for future tax distributions (or to offset future taxable realized gains when a capital loss carryforward is available). Accordingly, the Portfolio may periodically make reclassifications among certain capital accounts, without affecting its net asset value.
3. Investment advisory and other agreements
Advisory fees
The Trust has entered into an Investment Advisory Agreement with the Adviser. The Adviser is responsible for managing the corporate and business affairs of the Trust and for selecting and compensating subadvisers to handle the investment and reinvestment of the assets of the Portfolio, subject to the supervision of the Board of Trustees. Under the Advisory Agreement, the Portfolio pays a monthly management fee to the Adviser equivalent, on an annual basis, to the sum of: (a) 0.05% of the first $7,500,000,000 of the aggregate daily net assets and (b) 0.04% of the aggregate daily net assets in excess of $7,500,000,000 of each of the five Lifestyle Portfolios of the Trust (Lifestyle Aggressive, Lifestyle Growth, Lifestyle Balanced, Lifestyle Moderate and Lifestyle Conservative) and its corresponding funds of the five Lifestyle Portfolios of John Hancock Trust (Lifestyle Aggressive, Lifestyle Growth, Lifestyle Balanced, Lifestyle Moderate and Lifestyle Conservative). The Por tfolio is not responsible for payment of the subadvisory fees.
Expense reimbursements
The Adviser has contractually agreed to waive advisory fees or reimburse Portfolio’s expenses for Class A, Class B, Class C, Class R, Class R1, Class R2, Class R3, Class R4 and Class R5 shares to the extent that blue sky fees and printing and postage expenses attributable to each class exceed 0.09% of the average annual net assets attributable to the classes, at least until November 1, 2006, and may thereafter be terminated by the Adviser at any time. During the period ended August 31, 2006, the expense reductions related to these expense limitation amounted to $41,134, $30,659, $33,679, $17,776, $17,357 and $19,973 for Class A, Class B, Class C, Class R3, Class R4 and Class R5, respectively. During the four-month period ended December 31, 2006, the expense reductions related to this expense limitation amounted to $5,269, $3,646, $3,648, $3,648, $5,956, $5,157 and $7,306 for Class B, Class R,
Lifestyle Growth Portfolio 29
Class R1, Class R2, Class R3, Class R4 and Class R5, respectively.
The Adviser has contractually agreed to waive advisory fees or reimburse Portfolio expenses for Class 5 shares to the extent that total Portfolio operating expenses attributable to Class 5 exceed 0.07% of the average annual net assets attributable to the Class 5. There were no expense reductions related to this expense limitation during the period ended August 31, 2006 and the four-month period ended December 31, 2006. This agreement remains in effect until June 30, 2007 and may thereafter be terminated by the Adviser at any time.
Administration fees
The Portfolio has an agreement with the Adviser that requires the Portfolio to reimburse the Adviser for all expenses associated with providing the administrative, financial, accounting and recordkeeping services of the Portfolio, including the preparation of all tax returns, annual, semiannual and periodic reports to shareholders and the preparation of all regulatory reports.
Distribution plans
The Trust has a Distribution Agreement with John Hancock Funds, LLC (“JH Funds”), the Distributor. The Portfolio has adopted Distribution Plans with respect to Class A, Class B, Class C, Class R, Class R1, Class R2, Class R3, Class R4 and Class 1, pursuant to Rule 12b-1 under the 1940 Act, to reimburse the Distributor for the services it provides as distributor of shares of the Portfolio. Accordingly, the Portfolio makes monthly payments to the Distributor at an annual rate not to exceed 0.30%, 1.00%, 1.00%, 0.75%, 0.50%, 0.25%, 0.50%, 0.25% and 0.05% of average daily net asset value of Class A, Class B, Class C, Class R, Class R1, Class R2, Class R3, Class R4 and Class 1, respectively. A maximum of 0.25% of such payments may be service fees, as defined by the Conduct Rules of the National Association of Securities Dealers. Under the Conduct Rules, curtailment of a portion of the Fund’s 12b-1 payments could occur under certain circumstances.
The Portfolio has also adopted a Service Plan with respect to Class R, Class R1, Class R2, Class R3, Class R4 and Class R5 shares (the “Service Plan”). Under the Service Plan, the Portfolio pays up to 0.25%, 0.25%, 0.25%, 0.15%, 0.10% and 0.05% of average daily net assets of Class R, Class R1, Class R2, Class R3, Class R4 and Class R5 shares, respectively, for certain other services.
Sales charges
Class A shares are assessed up-front sales charges of up to 5% of the net asset value of such shares. During the four-month period ended December 31, 2006, the Portfolio was informed that the Distributor received net up-front sales charges of $1,610,431 with regard to sales of Class A shares. Of this amount, $260,333 was retained and used for printing prospectuses, advertising, sales literature and other purposes, $1,335,109 was paid as sales commissions to unrelated broker-dealers and $14,989 was paid as sales commissions to sales personnel of Signator Investors, Inc. (“Signator Investors”), a related broker-dealer, an indirect subsidiary of MFC.
Class B shares that are redeemed within six years of purchase are subject to a contingent deferred sales charge (“CDSC”) at declining rates, beginning at 5.00% of the lesser of the current market value at the time of redemption or the original purchase cost of the shares being redeemed. Class C shares that are redeemed within one year of purchase are subject to a CDSC at a rate of 1.00% of the lesser of the current market value at the time of redemption or the original purchase cost of the shares being redeemed. Proceeds from the CDSCs are paid to the Distributor and are used, in whole or in part, to defray its expenses for providing distribution-related services to the Portfolio in connection with the sale of Class B and Class C shares. During the four-month period ended December 31, 2006, the Portfolio was informed that CDSCs received by the Distributor amounted to $25,024 for Class B shares and $26,519 for Class C shares.
Transfer agent fees
The Portfolio has a Transfer Agency Agreement with John Hancock Signature Services, Inc. (“Signature Services”), an indirect subsidiary of MFC. For Class A, Class B, Class C, Class R, Class R1, Class R2, Class R3, Class R4 and
30 Lifestyle Growth Portfolio
Class R5 shares, the Portfolio pays a monthly transfer agent fee at an annual rate of 0.05% of each class’s average daily net assets, plus a fee based on the number of shareholder accounts and reimbursement for certain out-of-pocket expenses. Expenses not directly attributable to a particular class of shares are aggregated and allocated to each class on the basis of its relative net asset value.
Signature Services has agreed to limit the transfer agent fees so that such fees do not exceed 0.20% annually of Class A, Class B, Class C, Class R, Class R1, Class R2, Class R3, Class R4 and Class R5 share average daily net assets. This agreement is effective until December 31, 2006. Signature Services reserves the right to terminate this limitation in the future. In addition, Signature Services has voluntarily agreed to further limit transfer agent fees for Class R3, Class R4 and Class R5 shares so that such fees do not exceed 0.05% annually of each class’s average daily net assets. During the period ended August 31, 2006, the transfer agent fees reductions amounted to $457, $797 and $918 for Class R3, Class R4 and Class R5 shares, respectively. Accordingly, the transfer agent fee reductions amounted to $45, $30, $42, $600, $478 and $377 for Class R, Class R1, Class R2, Class R3, Class R4 and Class R5 shares, respectively, duri ng the four-month period ended December 31, 2006. Signature Services reserves the right to terminate this limitation at any time.
Expenses under the agreements described above for the period ended August 31, 2006 and the four-month period ended December 31, 2006, were as follows:
| Period ended 8-31-06 | | | | |
| | Distribution and | Transfer | | Printing and |
| Share Class | service fees | agent | Blue sky | postage |
|
| |
| Class A | $114,180 | $62,773 | $22,848 | $52,540 |
| Class B | 86,746 | 17,572 | 17,171 | 21,296 |
| Class C | 314,958 | 60,828 | 20,105 | 41,921 |
| Class R | — | — | — | — |
| Class R1 | — | — | — | — |
| Class R2 | — | — | — | — |
| Class R3 | 2,098 | 644 | 16,055 | 2,098 |
| Class R4 | 4,260 | 1,510 | 16,055 | 2,587 |
| Class R5 | 28 | 1,277 | 17,961 | 2,828 |
| Class 1 | 2,709,705 | — | — | 12,437 |
| Class 5 | — | — | — | — |
| Total | $3,231,975 | $144,604 | $110,195 | $135,707 |
| |
| Four months ended 12-31-06 | | | | |
| | Distribution and | Transfer | | Printing and |
| Share Class | service fees | agent | Blue sky | postage |
|
| |
| Class A | $132,941 | $69,490 | $8,653 | $20,101 |
| Class B | 103,803 | 20,761 | 6,503 | 8,108 |
| Class C | 405,896 | 70,402 | 7,614 | 15,993 |
| Class R | 239 | 61 | 3,150 | 525 |
| Class R1 | 149 | 45 | 3,150 | 525 |
| Class R2 | 74 | 57 | 3,150 | 525 |
| Class R3 | 5,285 | 1,113 | 6,081 | 798 |
| Class R4 | 7,081 | 1,537 | 6,081 | 983 |
| Class R5 | 40 | 698 | 6,803 | 1,082 |
| Class 1 | 1,264,272 | — | — | 4,807 |
| Class 5 | — | — | — | — |
| Total | $1,919,780 | $164,164 | $51,185 | $53,447 |
Lifestyle Growth Portfolio 31
Trustees’ fees
The Trust compensates each Trustee who is not an employee of the Adviser or its affiliates. Total Trustees’ expenses are allocated based on each Portfolio’s average daily net asset value.
4. Guarantees and Indemnifications
Under the Trust’s organizational documents, its Officers and Trustees are indemnified against certain liability arising out of the performance of their duties to the Trust. Additionally, in the normal course of business, the Trust enters into contracts with service providers that contain general indemnification clauses. The Trust’s maximum exposure under these arrangements is unknown, as this would involve future claims that may be made against the Trust that have not yet occurred. However, based on experience, the Trust believes the risk of loss to be remote.
5. Capital shares
Share activities for the Portfolio during the last two periods were as follows:
| | Period ended 8-31-06a | Four months ended 12-31-06b |
| | Shares | Amount | Shares | Amount |
|
| Class A shares | | | | |
| Sold | 7,413,437 | $107,056,385 | 3,841,069 | $58,423,570 |
| Distributions reinvested | 3,180 | 44,453 | 727,891 | 10,743,675 |
| Repurchased | (361,010) | (5,177,905) | (383,350) | (5,839,239) |
| Net increase | 7,055,607 | $101,922,933 | 4,185,610 | $63,328,006 |
|
| |
| Class B shares | | | | |
| Sold | 1,720,077 | $24,839,956 | 886,607 | $13,434,315 |
| Distributions reinvested | 435 | 6,092 | 155,491 | 2,296,598 |
| Repurchased | (64,700) | (923,569) | (83,495) | (1,273,331) |
| Net increase | 1,655,812 | $23,922,479 | 958,603 | $14,457,582 |
|
| |
| Class C shares | | | | |
| Sold | 6,576,277 | $95,022,521 | 3,520,680 | $53,321,544 |
| Distributions reinvested | 1,182 | 16,531 | 612,571 | 9,041,554 |
| Repurchased | (177,998) | (2,523,827) | (218,687) | (3,318,501) |
| Net increase | 6,399,461 | $92,515,225 | 3,914,564 | $59,044,597 |
|
| |
| Class R shares c | | | | |
| Sold | — | — | 8,603 | $128,040 |
| Distributions reinvested | — | — | 587 | 8,700 |
| Repurchased | — | — | — | (3) |
| Net increase | — | — | 9,190 | $136,737 |
|
| |
| Class R1 shares c | | | | |
| Sold | — | — | 6,803 | $100,001 |
| Distributions reinvested | — | — | 492 | 7,296 |
| Repurchased | — | — | — | (1) |
| Net increase | — | — | 7,295 | $107,296 |
|
| |
| Class R2 shares c | | | | |
| Sold | — | — | 6,803 | $100,001 |
| Distributions reinvested | — | — | 510 | 7,549 |
| Repurchased | — | — | — | (1) |
| Net increase | — | — | 7,313 | $107,549 |
|
| |
| Class R3 shares | | | | |
| Sold | 152,570 | $2,166,010 | 112,022 | $1,698,636 |
| Distributions reinvested | — | — | 17,157 | 253,064 |
| Repurchased | (351) | (5,030) | (28,282) | (437,160) |
| Net increase | 152,219 | $2,160,980 | 100,897 | $1,514,540 |
32 Lifestyle Growth Portfolio
| | Period ended 8-31-06a | Four months ended 12-31-06b |
| | Shares | Amount | Shares | Amount |
|
| Class R4 shares | | | | |
| Sold | 330,719 | $4,841,734 | 163,347 | $2,452,277 |
| Distributions reinvested | — | — | 34,039 | 502,074 |
| Repurchased | (16,347) | (238,184) | (24,376) | (378,017) |
| Net increase | 314,372 | $4,603,550 | 173,010 | $2,576,334 |
|
| |
| Class R5 shares | | | | |
| Sold | 113,625 | $1,616,476 | 50,951 | $783,939 |
| Distributions reinvested | 136 | 1,904 | 11,371 | 167,722 |
| Repurchased | (8,639) | (122,977) | (9,676) | (152,668) |
| Net increase | 105,122 | $1,495,403 | 52,646 | $798,993 |
|
| |
| Class 1 shares | | | | |
| Sold | 486,658,311 | $6,563,462,581 | 28,002,092 | $425,819,245 |
| Distributions reinvested | 2,554,657 | 35,586,379 | 40,274,766 | 592,441,806 |
| Repurchased | (5,180,020) | (74,075,698) | (2,978,465) | (44,028,057) |
| Net increase | 484,032,948 | $6,524,973,262 | 65,298,393 | $974,232,994 |
|
| |
| Class 5 shares | | | | |
| Sold | 225,361 | $3,236,330 | 722,012 | $11,006,269 |
| Distributions reinvested | — | — | 70,038 | 1,029,562 |
| Repurchased | — | — | (1,855) | (28,075) |
| Net increase | 225,361 | $3,236,330 | 790,195 | $12,007,756 |
|
| Net increase | 499,940,902 | $6,754,830,162 | $75,497,716 | $1,128,312,384 |
a Class A, Class B, Class C, Class R3, Class R4 and Class R5 shares began operations on 10-18-05, and Class 1 shares began operation on 10-15-05 and Class 5 shares began operation on 7-3-06.
b Effective 1-18-07, the fiscal year-end changed from August 31 to December 31.
c Class R, Class R1 and Class R2 shares began operations on 9-18-06.
6. Investment transactions
Purchases and sales of the affiliated underlying funds during the four-month period ended December 31, 2006, aggregated $1,056,179,618 and $336,307,170, respectively.
The cost of investments owned on December 31, 2006, including short-term investments, for federal income tax purposes, was $7,709,957,332. Gross unrealized appreciation and depreciation of investments aggregated $742,160,253 and $9,871,406, respectively, resulting in net unrealized appreciation of $732,288,847.
7. Investment in affiliated underlying funds
The Portfolio invests primarily in the affiliated underlying funds that are managed by affiliates of the Adviser. The Portfolio does not invest in the affiliated underlying funds for the purpose of exercising management or control.
A summary of the Portfolio’s transactions in the securities of affiliated issuers in which the Portfolio’s holdings represent 5% or more of the outstanding voting securities of the issuer, during the four-month period ended December 31, 2006 is set forth below.
Lifestyle Growth Portfolio 33
| | Beginning | | | | | |
| Affiliate — | Share | Shares | Shares | Ending Share | | Ending |
| Class NAV | Amount | Purchased | Sold | Amount | Proceeds | Value |
|
| All Cap Core | 14,681,919 | 1,169,734 | 2,458 | 15,849,195 | $26,140 | $168,952,416 |
| All Cap Growth | 4,441,115 | 336,021 | 642 | 4,776,494 | 11,319 | 84,591,707 |
| All Cap Value | 9,211,950 | 1,261,668 | 1,745 | 10,471,873 | 28,850 | 168,806,600 |
| Blue Chip Growth | 16,408,692 | 1,153,876 | 3,613 | 17,558,955 | 68,926 | 339,063,428 |
| Capital Appreciation | 30,983,896 | 2,459,347 | 358,188 | 33,085,055 | 3,526,427 | 339,121,814 |
| Core Equity | 15,550,538 | 405,938 | 114,108 | 15,842,368 | 1,775,155 | 253,794,731 |
| Equity-Income | 12,065,362 | 1,465,609 | 2,840 | 13,528,131 | 55,329 | 254,058,301 |
| Fundamental Value | 18,421,529 | 1,486,026 | 5,421 | 19,902,134 | 92,123 | 338,336,284 |
| Global Bond | 9,830,446 | 1,991,436 | 116,361 | 11,705,521 | 1,785,405 | 169,144,777 |
| Global Real Estate | 7,148,278 | 395,499 | 312,087 | 7,231,690 | 3,625,466 | 84,972,356 |
| High Income | 7,347,765 | 434,821 | 36,658 | 7,745,928 | 398,673 | 84,120,779 |
| High Yield | 36,182,183 | 5,423,896 | 134,453 | 41,471,626 | 1,243,619 | 422,595,868 |
| International Core* | 11,118,538 | 1,093,999 | 324,598 | 11,887,939 | 13,329,729 | 507,020,599 |
| International | | | | | | |
| Equity Index | 7,696,629 | 641,581 | 73,213 | 8,264,997 | 1,447,324 | 169,432,446 |
| International | | | | | | |
| Opportunities | 18,186,292 | 1,192,052 | 544,215 | 18,834,129 | 9,644,801 | 338,449,295 |
| International | | | | | | |
| Small Cap | 6,963,951 | 1,361,959 | 202,396 | 8,123,514 | 4,325,348 | 169,456,498 |
| International | | | | | | |
| Small Company | 15,667,344 | 943,293 | 504,344 | 16,106,293 | 5,147,457 | 169,438,202 |
| International Value | 16,379,362 | 2,011,892 | 285,832 | 18,105,422 | 5,362,532 | 338,390,330 |
| Large Cap | 4,966,896 | 452,174 | 997 | 5,418,073 | 15,821 | 84,576,120 |
| Large Cap Value | 3,141,475 | 234,906 | 586 | 3,375,795 | 14,506 | 84,496,152 |
| Mid Cap Core | 12,729,621 | 301,420 | 13,031,041 | — | 241,852,246 | — |
| Mid Cap Index | 8,008,519 | 13,410,504 | 3,041 | 21,415,982 | 59,720 | 421,038,199 |
| Mid Cap Stock | 4,663,342 | 368,290 | 1,005 | 5,030,627 | 17,180 | 84,212,693 |
| Mid Cap Value Equity | 7,584,913 | 523,197 | 1,545 | 8,106,565 | 15,876 | 84,146,143 |
| Natural Resources | 8,191,364 | 2,258,138 | 965,978 | 9,483,524 | 35,316,188 | 338,372,140 |
| Quantitative Value | 13,197,327 | 1,518,174 | 29,779 | 14,685,722 | 440,892 | 254,650,416 |
| Real Estate Equity | 6,709,222 | 400,243 | 267,776 | 6,841,689 | 3,309,229 | 80,731,933 |
| Real Return Bond | 16,403,954 | 3,228,167 | 22,520 | 19,609,601 | 219,005 | 253,748,231 |
| Small Cap | 5,288,773 | 189,880 | 32,304 | 5,446,349 | 499,008 | 83,982,696 |
| Small Cap Index | 4,668,215 | 337,945 | 1,213 | 5,004,947 | 20,708 | 84,383,414 |
| Small Cap Opportunities | 6,348,995 | 250,012 | — | 6,599,007 | — | 159,036,070 |
| Small Company Growth | 6,665,328 | 359,537 | 1,417 | 7,023,448 | 16,994 | 84,000,441 |
| Small Company Value | 3,136,883 | 218,007 | 859 | 3,354,031 | 21,630 | 84,387,412 |
| Special Value | 3,591,654 | 291,305 | 890 | 3,882,069 | 19,168 | 84,318,532 |
| Spectrum Income | 14,156,989 | 2,036,489 | 2,501 | 16,190,977 | 26,181 | 168,871,890 |
| Strategic Bond | 6,157,718 | 912,135 | 897 | 7,068,956 | 10,727 | 84,120,571 |
| Strategic Income | 7,208,455 | 1,238,435 | 1,041 | 8,445,849 | 10,393 | 84,120,652 |
| Total Return | 21,207,881 | 3,652,827 | 32,023 | 24,828,685 | 335,619 | 338,166,695 |
| U.S. Global | | | | | | |
| Leaders Growth | 17,289,398 | 1,526,677 | 3,930 | 18,812,145 | 53,214 | 253,775,834 |
| U.S. High Yield Bond | 5,547,813 | 835,393 | 853 | 6,382,353 | 11,311 | 84,183,241 |
| U.S. Multi Sector | 49,218,806 | 4,814,566 | 24,804 | 54,008,568 | 106,097 | 593,554,164 |
| Value & Restructuring | 6,588,884 | 466,360 | 1,472 | 7,053,772 | 17,575 | 84,856,872 |
| Vista | 6,819,209 | 502,492 | 1,387 | 7,320,314 | 15,753 | 84,769,237 |
* Represents the Portfolio’s investment in John Hancock Funds III International Core Fund.
34 Lifestyle Growth Portfolio
8. Reclassification of accounts
During the four-month period ended December 31, 2006, the Portfolio reclassified amounts to reflect a decrease in accumulated net realized gain on investments of $156,668,748, a decrease in accumulated net investment loss of $328,096,041 and a decrease in capital paid-in of $171,427,293. This represents the amounts necessary to report these balances on a tax basis, excluding certain temporary differences, as of December 31, 2006. Additional adjustments may be needed in subsequent reporting periods. These reclassifications, which have no impact on the net asset value of the Portfolio, are primarily attributable to certain differences in the computation of distributable income and capital gains under federal tax rules versus accounting principles generally accepted in the United States of America, book and tax differences in accounting for overdistribution. The calculation of net investment income per share in the Portfolio’s Financial Highlights excludes these adjust ments.
Lifestyle Growth Portfolio 35
Auditors’ report
Report of Independent Registered Public Accounting Firm
To the Board of Trustees of John Hancock Funds II and Shareholders of
John Hancock Lifestyle Growth Portfolio:
In our opinion, the accompanying statement of assets and liabilities, including the schedule of securities owned, and the related statements of operations and of changes in net assets and the financial highlights present fairly, in all material respects, the financial position of John Hancock Lifestyle Growth Portfolio (the “Portfolio”) at December 31, 2006, the results of its operations, the changes in its net assets, and the financial highlights for each of the periods indicated, in conformity with accounting principles generally accepted in the United States of America. These financial statements and financial highlights (hereafter referred to as “financial statements”) are the responsibility of the Portfolio’s management; our responsibility is to express an opinion on these financial statements based on our audits. We conducted our audits of these financial statements in accordance with the standards of the Public Company Accounting Oversight Board (United States). Those standards require that we plan and perform the audits to obtain reasonable assurance about whether the financial statements are free of material misstatement. An audit includes examining, on a test basis, evidence supporting the amounts and disclosures in the financial statements, assessing the accounting principles used and significant estimates made by management, and evaluating the overall financial statement presentation. We believe that our audits, which included confirmation of securities at December 31, 2006, by correspondence with the transfer agent, provide a reasonable basis for our opinion.
PricewaterhouseCoopers LLP
Boston, Massachusetts
March 1, 2007
36
Tax information
Unaudited
For federal income tax purposes, the following information is furnished with respect to the distributions of the Portfolio, if any, paid during its taxable year ended December 31, 2006.
The Portfolio has designated distributions to shareholders of $34,665,916 as a long-term capital gain dividend.
With respect to the ordinary dividends paid by the Portfolio for the fiscal period ended December 31, 2006, 7.88% of the dividends qualify for the corporate dividends-received deduction.
The Portfolio hereby designates the maximum amount allowable of its net taxable income as qualified dividend income as provided in the Jobs and Growth Tax Relief Reconciliation Act of 2003. This amount will be reflected on Form 1099-DIV for the calendar year 2006.
Shareholders were mailed a 2006 U.S. Treasury Department Form 1099-DIV in January 2007. This will reflect the total of all distributions that are taxable for calendar year 2006.
37
Trustees and Officers
This chart provides information about the Trustees and Officers of John Hancock Funds II who oversee your John Hancock fund. Officers elected by the Trustees manage the day-to-day operations of the Portfolio and execute policies formulated by the Trustees.
| Independent Trustees | | |
| |
| Name, Year of Birth | | Number of |
| Position(s) held with Portfolio | Trustee | John Hancock |
| Principal occupation(s) and other | of Portfolio | funds overseen |
| directorships during past 5 years | since1 | by Trustee |
|
| Charles L. Bardelis, Born: 1941 | 2005 | 209 |
| Director, Island Commuter Corp. (marine transport). Trustee of John | | |
| Hancock Trust (since 1988). | | |
|
| |
| Peter S. Burgess, Born: 1942 | 2005 | 209 |
| Consultant (financial, accounting and auditing matters (since 1999); | | |
| Certified Public Accountant; Partner, Arthur Andersen (prior to 1999). | | |
| Director of the following publicly traded companies: PMA Capital Corporation | | |
| (since 2004) and Lincoln Educational Services Corporation (since 2004). | | |
| Trustee of John Hancock Trust (since 2005). | | |
|
| |
| Elizabeth G. Cook, Born: 1937 | 2005 | 209 |
| Expressive Arts Therapist, Massachusetts General Hospital (September 2001 | | |
| to present); Expressive Arts Therapist, Dana Farber Cancer Institute | | |
| (September 2000 to January 2004); President, The Advertising Club of Greater Boston. | |
| Trustee of John Hancock Trust (since 2005). | | |
|
| |
| Hassell H. McClellan, Born: 1945 | 2005 | 209 |
| Associate Professor, The Wallace E. Carroll School of Management, Boston College. | |
| Trustee of John Hancock Trust (since 2005). | | |
|
| |
| James M. Oates, Born: 1946 | 2005 | 209 |
| Managing Director, Wydown Group (financial consulting firm) (since 1994); | | |
| Chairman, Emerson Investment Management, Inc. (since 2000); Chairman, | | |
| Hudson Castle Group, Inc. (formerly IBEX Capital Markets, Inc.) (financial services | |
| company) (since 1997). Director of the following publicly traded companies: | | |
| Stifel Financial (since 1996); Investor Financial Services Corporation (since 1995); | |
| and Connecticut River Bancorp, Director (since 1998). Director, Phoenix Mutual | |
| Funds (since 1988). Trustee of John Hancock Trust (since 2004). | | |
1 Because the Trust does not hold regular annual shareholders meetings, each Trustee holds office for an indefinite term until his/her successor is duly elected and qualified or until he/she dies, retires, resigns, is removed or becomes disqualified.
38
| Non-Independent Trustee3 | | |
| |
| Name, Year of Birth | | Number of |
| Position(s) held with Portfolio | Trustee | John Hancock |
| Principal occupation(s) and other | of Portfolio | funds overseen |
| directorships during past 5 years | since1 | by Trustee |
|
| |
| James R. Boyle, Born: 1959 | 2005 | 259 |
| Chairman and Director, John Hancock Advisers, LLC, The Berkeley Financial | | |
| Group, LLC (holding company) and John Hancock Funds, LLC; President, | | |
| John Hancock Annuities; Executive Vice President, John Hancock Life | | |
| Insurance Company (since June 2004); President, U.S. Annuities; Senior | | |
| Vice President, The Manufacturers Life Insurance Company (U.S.A.) (prior | | |
| to 2004). | | |
| |
| Principal officers who are not Trustees | | |
| |
| Name, Year of Birth | | |
| Position(s) held with Portfolio | | Officer |
| Principal occupation(s) and | | of Portfolio |
| directorships during past 5 years | | since |
|
| Keith F. Hartstein,2 Born: 1956 | | | 2005 |
| President | | |
| Senior Vice President, Manulife Financial Corporation (since 2004); Director, | | |
| President and Chief Executive Officer, the Adviser, The Berkeley Group, John | | |
| Hancock Funds, LLC (since 2005); Director, MFC Global Investment Management | |
| (U.S.), LLC (“MFC Global (U.S.)”) (since 2005); Director, John Hancock Signature | |
| Services, Inc. (since 2005); President and Chief Executive Officer, John Hancock | |
| Investment Management Services, LLC (since 2006); President and Chief Executive | |
| Officer, John Hancock Funds II, John Hancock Funds III and John Hancock Trust; | |
| Director, Chairman and President, NM Capital Management, Inc. (since 2005); | | |
| Chairman, Investment Company Institute Sales Force Marketing Committee | | |
| (since 2003); Director, President and Chief Executive Officer, MFC Global (U.S.) | |
| (2005–2006); Executive Vice President, John Hancock Funds, LLC (until 2005). | | |
|
| |
| Thomas M. Kinzler,2 Born: 1955 | | 2006 |
| Secretary | | |
| Vice President and Counsel, John Hancock Life Insurance Company (U.S.A.) | | |
| (since 2006); Secretary and Chief Legal Officer, John Hancock Funds, John | | |
| Hancock Funds II, John Hancock Funds III and John Hancock Trust (since 2006); | |
| Vice President and Associate General Counsel, Massachusetts Mutual Life | | |
| Insurance Company (1999–2006); Secretary and Chief Legal Counsel, MML | | |
| Series Investment Fund (2000–2006); Secretary and Chief Legal Counsel, | | |
| MassMutual Institutional Funds (2000–2004); Secretary and Chief Legal Counsel, | |
| MassMutual Select Funds and MassMutual Premier Funds (2004–2006). | | |
|
| |
| Francis V. Knox, Jr.,2 Born: 1947 | | 2005 |
| Chief Compliance Officer | | |
| Vice President and Chief Compliance Officer, John Hancock Investment | | |
| Management Services, LLC, the Adviser and MFC Global (U.S.) (since 2005); | | |
| Vice President and Chief Compliance Officer, John Hancock Funds II, John | | |
| Hancock Funds III and John Hancock Trust (since 2005); Vice President and | | |
| Assistant Treasurer, Fidelity Group of Funds (until 2004); Vice President and | | |
| Ethics & Compliance Officer, Fidelity Investments (until 2001). | | |
39
| Principal officers who are not Trustees (continued) | |
| |
| Name, Year of Birth | |
| Position(s) held with Portfolio | Officer |
| Principal occupation(s) and other | of Portfolio |
| directorships during past 5 years | since |
|
| |
| Gordon M. Shone,2 Born: 1956 | 2006 |
| Treasurer | |
| Treasurer, John Hancock Funds (since 2006), John Hancock Funds II, John | |
| Hancock Funds III and John Hancock Trust (since 2005); Vice President and | |
| Chief Financial Officer, John Hancock Trust (2003–2005); Senior Vice President, | |
| John Hancock Life Insurance Company (U.S.A.) (since 2001); Vice President, | |
| John Hancock Investment Management Services, Inc., John Hancock Advisers, | |
| LLC (since 2006) and The Manufacturers Life Insurance Company (U.S.A.) | |
| (1998–2000). | |
|
| |
| John G. Vrysen,2 Born: 1955 | 2005 |
| Chief Financial Officer | |
| Senior Vice President, Manulife Financial Corporation (since 2006); Director, | |
| Executive Vice President and Chief Financial Officer, the Adviser, The Berkeley | |
| Group and John Hancock Funds, LLC (since 2005); Executive Vice President and | |
| Chief Financial Officer, John Hancock Investment Management Services, LLC | |
| (since 2005); Vice President and Chief Financial Officer, MFC Global (U.S.) | |
| (since 2005); Director, John Hancock Signature Services, Inc. (since 2005); | |
| Chief Financial Officer, John Hancock Funds II, John Hancock Funds III and John | |
| Hancock Trust (since 2005); Vice President and General Manager, Fixed Annuities, | |
| U.S. Wealth Management (until 2005); Vice President, Operations, Manulife | |
| Wood Logan (2000–2004). | |
1 Because the Trust does not hold regular annual shareholders meetings, each Trustee holds office for an indefinite term until his successor is duly elected and qualified or until he dies, retires, resigns, is removed or becomes disqualified.
2Affiliated with the investment adviser.
3 Non-Independent Trustee: holds positions with the Fund’s investment adviser, underwriter, and/ or certain other affiliates.
40
For more information
The Fund’s proxy voting policies, procedures and records are available without charge, upon request:
| By phone | On the Fund’s Web site | On the SEC’s Web site |
| 1-800-225-5291 | www.jhfunds.com/proxy | www.sec.gov |
|
| |
| Investment adviser | Custodian | Legal counsel |
| John Hancock Investment | State Street Bank & Trust Co. | Kirkpatrick & Lockhart |
| Management Services, Inc. | 2 Avenue de Lafayette | Preston Gates Ellis LLP |
| 601 Congress Street | Boston, MA 02111 | 1 Lincoln Street |
| Boston, MA 02210-2805 | | Boston, MA 02110-2950 |
| | Transfer agent | |
| Principal distributor | John Hancock Signature | Independent registered |
| John Hancock Funds, LLC | Services, Inc. | public accounting firm |
| 601 Congress Street | 1 John Hancock Way, | PricewaterhouseCoopers LLP |
| Boston, MA 02210-2805 | Suite 1000 | 125 High Street |
| | Boston, MA 02217-1000 | Boston, MA 02110 |
Each underlying fund’s accounting policies are outlined in the underlying fund’s shareholder report, available without charge by calling 1-800-344-1029 or on the Securities and Exchange Commission (“SEC”) Web site at www.sec.gov, File # 811-21779, CIK 0001331971.
The Portfolio’s investment objective, risks, charges and expenses are included in the prospectus and should be considered carefully before investing. For a prospectus, call your financial professional, call John Hancock Funds at 1-800-225-5291 or visit the Portfolio’s Web site at www.jhfunds.com. Please read the prospectus carefully before investing or sending money.
| How to contact us | |
|
| |
| Internet | www.jhfunds.com | |
|
| |
| Mail | Regular mail: | Express mail: |
| | John Hancock | John Hancock |
| | Signature Services, Inc. | Signature Services, Inc. |
| | 1 John Hancock Way, Suite 1000 | Mutual Fund Image Operations |
| | Boston, MA 02217-1000 | 380 Stuart Street |
| | | Boston, MA 02116 |
|
| |
| Phone | Customer service representatives | 1-800-225-5291 |
| | 24-hour automated information | 1-800-338-8080 |
| | TDD line | 1-800-554-6713 |
A listing of month-end portfolio holdings is available on our Web site, www.jhfunds.com. A more detailed portfolio holdings summary is available on a quarterly basis 60 days after the fiscal quarter on our Web site or upon request by calling 1-800-225-5291, or on the Securities and Exchange Commission’s Web site, www.sec.gov.
44
J O H N H A N C O C K F A M I L Y O F F U N D S
EQUITY
Balanced Fund
Classic Value Fund
Classic Value Fund II
Core Equity Fund
Focused Equity Fund
Growth Fund
Growth Opportunities Fund
Growth Trends Fund
Intrinsic Value Fund
Large Cap Equity Fund
Large Cap Select Fund
Mid Cap Equity Fund
Mid Cap Growth Fund
Multi Cap Growth Fund
Small Cap Equity Fund
Small Cap Fund
Small Cap Intrinsic Value Fund
Sovereign Investors Fund
U.S. Core Fund
U.S. Global Leaders Growth Fund
Value Opportunities Fund
ASSET ALLOCATION
Allocation Core Portfolio
Allocation Growth + Value Portfolio
Lifecycle 2010 Portfolio
Lifecycle 2015 Portfolio
Lifecycle 2020 Portfolio
Lifecycle 2025 Portfolio
Lifecycle 2030 Portfolio
Lifecycle 2035 Portfolio
Lifecycle 2040 Portfolio
Lifecycle 2045 Portfolio
Lifecycle Retirement Portfolio
Lifestyle Aggressive Portfolio
Lifestyle Balanced Portfolio
Lifestyle Conservative Portfolio
Lifestyle Growth Portfolio
Lifestyle Moderate Portfolio
SECTOR
Financial Industries Fund
Health Sciences Fund
Real Estate Fund
Regional Bank Fund
Technology Fund
Technology Leaders Fund
INTERNATIONAL
Greater China Opportunities Fund
International Allocation Portfolio
International Classic Value Fund
International Core Fund
International Fund
International Growth Fund
INCOME
Bond Fund
Government Income Fund
High Yield Fund
Investment Grade Bond Fund
Strategic Income Fund
TAX-FREE INCOME
California Tax-Free Income Fund
High Yield Municipal Bond Fund
Massachusetts Tax-Free Income Fund
New York Tax-Free Income Fund
Tax-Free Bond Fund
MONEY MARKET
Money Market Fund
U.S. Government Cash Reserve
CLOSED-END
Bank and Thrift Opportunity Fund
Financial Trends Fund, Inc.
Income Securities Trust
Investors Trust
Patriot Global Dividend Fund
Patriot Preferred Dividend Fund
Patriot Premium Dividend Fund I
Patriot Premium Dividend Fund II
Patriot Select Dividend Fund
Preferred Income Fund
Preferred Income II Fund
Preferred Income III Fund
Tax-Advantaged Dividend Income Fund
For more complete information on any John Hancock Fund and an Open-End fund prospectus, which includes charges and expenses, call your financial professional, or John Hancock Funds at 1-800-225-5291 for Open-End fund information and 1-800-852-0218 for Closed-End fund information. Please read the Open-End fund prospectus carefully before investing or sending money.

1-800-225-5291
1-800-554-6713 TDD
1-800-338-8080 EASI-Line
www.jhfunds. com
Now available: electronic delivery
www.jhfunds. com/edelivery
This report is for the information of the shareholders of John Hancock Lifestyle Growth Portfolio.
0400A 12/06
2/07

CEO corner

| TABLE OF CONTENTS |
|
| |
| Your fund at a glance |
| page 1 |
|
| |
| Managers’ report |
| page 2 |
|
| |
| A look at performance |
| page 6 |
|
| |
| Your expenses |
| page 8 |
|
| |
| Fund’s investments |
| page 1 0 |
|
| |
| Financial statements |
| page 1 2 |
|
| |
| Notes to financial |
| statements |
| page 2 7 |
|
| |
| Trustees and officers |
| page 3 7 |
|
| |
| For more information |
| page 4 0 |
|
January 2007
To Our Shareholders,
The financial markets surprised many investors in 2006 by beating their expectations. At the beginning of the year, fears abounded about rising inflation – with sky high energy prices – stronger than expected economic growth, a decline in the housing boom and more interest rate hikes from the Federal Reserve. But by June, the economic data suggested the desired “soft landing” for the economy, energy prices stabilized, corporate earnings remained strong and the Fed stopped raising rates. With that, the market took off, producing double-digit returns instead of the single-digit ones originally thought to be the best the market would do. The ascent was widespread and the broad Standard & Poor’s 500 Index returned 15.79% .
The bond market also turned in a solid result, registering its seventh consecutive year of positive performance. Continuing the trend of the last several years, the best performances came from the high yield sector. A healthy corporate earnings environment drove default rates down to near historical low levels and bolstered strong demand from yield-hungry investors. The broad Lehman Brothers Aggregate Bond Index returned 4.33% for the year, while the Merrill Lynch High Yield Master II Index returned 11.74% .
After such a year, we encourage investors to sit back, take stock and set some realistic expectations. While history argues for another good year (since 1945, the S&P 500 Index has always produced positive results in the third year of a presidential term) opinions are divided on the future of this more-than-four-year-old bull market.
We believe it’s wise to work with your financial professional to determine whether changes are now in order to your mix of portfolios. Some stock groups have had long runs of outperformance, such as small-cap stocks, value stocks and real estate investment trusts. Others had truly outsized returns in 2006, such as the telecom and energy sectors, China and emerging markets – not to mention the continued outperformance in general of international markets versus the U.S. Among bonds, the high yield category has become richly valued after such a long run up. These trends argue for a look to determine if these categories now represent a larger stake in your portfolios than prudent diversification would suggest they should, based on your risk profile, investment objectives and time horizons.
Sincerely,

Keith F. Hartstein,
President and Chief Executive Officer
This commentary reflects the CEO’s views as of December 31, 2006. They are subject to change at any time.
Your portfolio at a glance
The Portfolio seeks a balance between a high level of current income and growth of capital, with a greater emphasis on income. To pursue this goal, the Portfolio, which is a fund-of-funds, normally invests approximately 60% of its assets in affiliated underlying funds that invest primarily in fixed-income securities and approximately 40% of its assets in affiliated underlying funds that invest primarily in equity securities.
Over the last twelve months
► Bonds fell during the first half of 2006 but later bounced back, as the economy slowed and the Fed kept interest rates steady beginning in August.
► Stocks representing all market-capitalization ranges and investment styles benefited from a generally positive environment for equities.
► The Portfolio especially benefited from its allocations to international equities and risk-oriented bonds, while Treasury Inflation-Protected Securities underperformed.
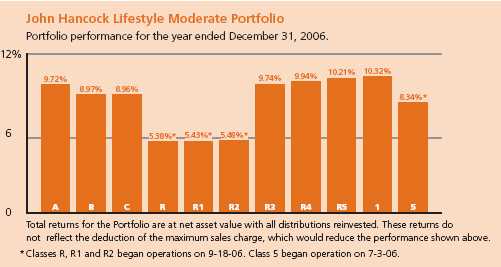
| Asset allocation | |
| | |
| Equity | % of Total |
|
| U.S. Large Cap | 21.2 |
|
| International Large Cap | 11.1 |
|
| U.S. Small Cap | 4.0 |
|
| Real Estate | 3.9 |
|
| Fixed Income | % of Total |
|
| Intermediate Term Bond | 21.9 |
|
| High Yield Bond | 12.0 |
|
| Multi-Sector Bond | 11.9 |
|
| Global Bond | 6.0 |
|
| Treasury Inflation-Protected Securities | 4.0 |
|
| Long-Term Bond | 2.0 |
|
| Short-Term Bond | 2.0 |
|
As a percentage of net assets on December 31, 2006.
1
Managers’ report
John Hancock
Lifestyle Moderate Portfolio
Recently, the Portfolio’s fiscal year-end changed from August to December. What follows is a commentary for the 12 months ended December 31, 2006.
The environment for bonds, which make up approximately 60% of the Portfolio, shifted markedly during the year. The first half of 2006 was a challenging period — economic growth was stronger than expected, inflation spiked higher in the spring and the Federal Reserve raised short-term interest rates for the 17th time in two years. In this environment, bonds declined in value as interest rates rose sharply. Over the last six months, however, bonds staged a healthy rebound thanks to slowing economic growth, most notably in the slumping housing market, and moderating inflation, which largely reflected a decline in energy prices. The weaker economic environment led the Fed to hold short-term interest rates steady throughout the last half of 2006. For the full year, the Lehman Brothers Aggregate Bond Index, a broad measure of bond market performance, gained 4.33% .
Bond yields finished the year slightly higher than where they started. Despite the significant yield fluctuations during the year, the yield curve remained “inverted” — meaning short-term bond yields were higher than the yields of longer-term bonds — throughout 2006. From a sector perspective, every segment of the bond market gained ground during the
SCORECARD
| INVESTMENT | | PERIOD’S PERFORMANCE... AND WHAT’S BEHIND THE NUMBERS |
| Spectrum Income | ▲ | Benefited from its broad exposure to risk-oriented asset classes, |
| (T. Rowe Price) | | including high yield, international bonds and equities. |
| High Yield | ▲ | Generally favorable environment for high yield bonds |
| (Western Asset | | |
| Management) | | |
| U.S. Multi Sector | ▼ | Weak individual stock selection — especially in health care and banks |
| (GMO) | | — hurt this fund’s results. |
2
From the MFC Global Investment Management (U.S.A.), LLC’s Portfolio Management Team
year, but high-yield corporate bonds were by far the top performers. Strong balance sheets, a lack of credit defaults and increasing demand for yield led to double-digit gains for high yield bonds.
Stocks of all types gained ground against a mostly favorable equity market backdrop in 2006. Corporate earnings remained strong throughout the year, while consumer spending also held up surprisingly well and energy prices declined. Concerns about rising inflation led to a significant stock market correction in May and June. However, better-than-anticipated inflation reports led to the Fed’s long-awaited interest rate pause.
Against this backdrop, the U.S. stock market rose steadily following its summertime decline. Overall, the S&P 500 Index gained 15.79% during the 12 months ending December 31, 2006. Thanks in large part to a stronger euro and British pound relative to the U.S. dollar, international equities did particularly well, with the MSCI EAFE returning 26.87% .
| “From a sector perspective, every |
| segment of the bond market |
| gained ground during the year, |
| but high yield corporate bonds |
| were by far the top performers.” |
Performance summary
During the 12 months ending December 31, 2006, John Hancock Lifestyle Moderate Portfolio’s Class A, Class B, Class C, Class R3, Class R4, Class R5 and Class 1 shares posted total returns of 9.72%, 8.97%, 8.96%, 9.74%, 9.94%, 10.21% and 10.32%, respectively, at net asset value. Class R, Class R1 and Class R2 shares returned 5.38%, 5.43% and 5.48% at net asset value since beginning operations on September 18, 2006. Class 5 shares returned 8.34% at net asset value since beginning operation on July 3, 2006. In comparison, the Portfolio’s benchmark — a 40/60 blend of the S&P 500 Index and the Lehman
Lifestyle Moderate Portfolio
3
Brothers Aggregate Bond Index — returned 8.83% and Morningstar’s average conservative allocation portfolio returned 8.18% .1 Keep in mind that your net asset value return will be different from the Portfolio’s performance if you were not invested in the Portfolio for the entire period and did not reinvest all distributions. Please see pages six and seven for historical performance information.
Riskier funds did best, TIPS lagged
Approximately 60% of the Portfolio is allocated to fixed income. Within this portion, the best performance was found in the higher-risk asset classes, such as high-yield bond funds. High Income (MFC Global Investment Management (U.S.)), in particular, did very well in absolute terms as well as relative to its peers. Our allocation to Global Bond (PIMCO) also contributed positively to performance as it benefited from the strength of foreign currencies relative to the U.S. dollar.
Another positive contributor during the year was our 8% position in Spectrum Income (T. Rowe Price). This multisector bond fund benefited from its exposure to high yield and global bonds — including emerging-markets debt — as well as its small allocation to equities. Most of our other largest positions performed roughly in line with the broad bond market. One notable fixed-income negative was Real Return Bond (PIMCO). Although this fund performed in line with its Treasury Inflation-Protected Securities (TIPS) benchmark, it was hampered by disappointing results from TIPS generally, as these securities underperformed the broader bond market due to declining inflation expectations.
Within the domestic equity allocation, performance was helped by a position in Equity Income (T. Rowe Price), which benefited from favorable market conditions for large-cap value stocks. In contrast, large-cap blend funds U.S. Multi-Sector (GMO) and Core Equity (Legg Mason) lagged the broad equity market. Meanwhile, the Portfolio’s allocation to international equities was a significant positive, led by a strong performance from International Value (Franklin Templeton).
Further adding to performance was our exposure to the real estate securities market. In fact, the fourth quarter marked the continuation of a long period of significant outperformance of REITs relative to historical averages. While we remain convinced of the diversification benefits offered by real estate
Lifestyle Moderate Portfolio
4
securities, the asset class has become more volatile and increasingly risky in recent years as non-traditional investors have entered the market. These factors led us to freeze new investments in U.S. REITs in the fourth quarter.
| “Approximately 60% of the |
| Portfolio is allocated to fixed |
| income. Within this portion, the |
| best performance was found in |
| the higher-risk asset classes, such |
| as high-yield bond funds.” |
Outlook
After the broad fixed-income market’s rally in the second half of 2006, investors’ anticipation of a cut in short-term rates from the Fed in 2007 is already reflected in bond prices. Bonds could rally further if inflation remains tame. However, an unexpected increase in consumer prices could be a short-term negative for fixed-income securities.
Global financial markets, and especially certain higher-risk asset classes — such as high yield bonds and smaller-cap stocks — have benefited from ample global liquidity. Should that liquidity dry up, we could see a significant market correction, with higher-risk assets beginning to lag their higher-quality fixed-income and equity counterparts. The Portfolio is well exposed to both groups of securities, and we believe our emphasis on diversification should position us well if market conditions shift over the coming months.
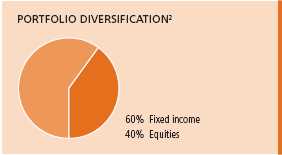
This commentary reflects the views of the portfolio managers through the end of the Portfolio’s period discussed in this report. The managers’ statements reflect their own opinions. As such, they are in no way guarantees of future events and are not intended to be used as investment advice or a recommendation regarding any specific security. They are also subject to change at any time as market and other conditions warrant. International investing involves special risks such as political, economic and currency risks and differences in accounting standards and financial reporting. See the prospectus for the risks of investing in small-cap stocks. See the prospectus for the risks of investing in high yield bonds.
1 Figures from Morningstar, Inc. include reinvested dividends and do not take into account sales charges. Actual load-adjusted performance is lower.
2 As a percentage of net assets on December 31, 2006.
Lifestyle Moderate Portfolio
5
A look at performance
For the periods ending December 31, 2006
| | | Average annual returns | | | Cumulative total returns | | |
| | | with maximum sales charge (POP) | | with maximum sales charge (POP) | | |
| | Inception | | | | Since | | | | Since |
| Class | date | 1-year | 5-year | 10-year | inception | 1-year | 5-year | 10-year | inception |
|
| 1a | 10-15-05 | 10.32% | — | — | 11.24% | 10.32% | — | — | 13.81% |
|
| 5a | 7-3-06 | — | — | — | — | — | — | — | 8.34 |
|
| A | 10-18-05 | 4.22 | — | — | 6.22 | 4.22 | — | — | 7.55 |
|
| B | 10-18-05 | 3.97 | — | — | 6.81 | 3.97 | — | — | 8.26 |
|
| C | 10-18-05 | 7.96 | — | — | 10.13 | 7.96 | — | — | 12.34 |
|
| Ra | 9-18-06 | — | — | — | — | — | — | — | 5.38 |
|
| R1a | 9-18-06 | — | — | — | — | — | — | — | 5.43 |
|
| R2a | 9-18-06 | — | — | — | — | — | — | — | 5.48 |
|
| R3a | 10-18-05 | 9.74 | — | — | 10.81 | 9.74 | — | — | 13.17 |
|
| R4a | 10-18-05 | 9.94 | — | — | 11.02 | 9.94 | — | — | 13.43 |
|
| R5a | 10-18-05 | 10.21 | — | — | 11.29 | 10.21 | — | — | 13.77 |
|
Performance figures assume all distributions are reinvested. Returns with maximum sales charge reflect a sales charge on Class A shares of 5%, and the applicable contingent deferred sales charge (CDSC) on Class B and Class C shares. The Class B shares’ CDSC declines annually between years 1–6 according to the following schedule: 5, 4, 3, 3, 2, 1%. No sales charge will be assessed after the sixth year. Class C shares held for less than one year are subject to a 1% CDSC. Sales charge is not applicable for Class R, Class R1, Class R2, Class R3, Class R4, Class R5, Class 1 and Class 5 shares.
The returns reflect past results and should not be considered indicative of future performance. The return and principal value of an investment will fluctuate so that shares, when redeemed, may be worth more or less than their original cost. Due to market volatility, the Portfolio’s current performance may be higher or lower than the performance shown. For performance data current to the most recent month-end, please call 1-800-225-5291 or visit the Portfolio’s Web site at www.jhfunds.com.
The performance table above and the chart on the next page do not reflect the deduction of taxes that a shareholder would pay on fund distributions or the redemption of fund shares.
The Portfolio’s performance results reflect any applicable expense reductions, without which the expenses would increase and results would have been less favorable.
Since inception performance is calculated with an opening price (prior day’s close) on the inception date.
a For certain types of investors as described in the Portfolio’s Class R, Class R1, Class R2, Class R3, Class R4, Class R5, Class 1 and Class 5 share prospectuses.
Lifestyle Moderate Portfolio
6
Growth of $10,000
This chart shows what happened to a hypothetical $10,000 investment in Class A shares for the period indicated. For comparison, we’ve shown the same investment in a blended index.
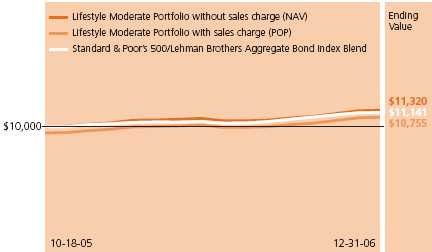
| | | | With maximum | |
| Class | Period beginning | Without sales charge | sales charge | Index |
|
| 11,3 | 10-15-05 | $11,381 | $11,381 | $11,014 |
|
| 51,3 | 7-3-06 | 10,834 | 10,834 | 10,811 |
|
| B1 | 10-18-05 | 11,226 | 10,826 | 11,141 |
|
| C1,2 | 10-18-05 | 11,234 | 11,234 | 11,141 |
|
| R1,3 | 9-18-06 | 10,538 | 10,538 | 10,340 |
|
| R11,3 | 9-18-06 | 10,543 | 10,543 | 10,340 |
|
| R21,3 | 9-18-06 | 10,548 | 10,548 | 10,340 |
|
| R31,3 | 10-18-05 | 11,317 | 11,317 | 11,141 |
|
| R41,3 | 10-18-05 | 11,343 | 11,343 | 11,141 |
|
| R51,3 | 10-18-05 | 11,377 | 11,377 | 11,141 |
|
Assuming all distributions were reinvested for the period indicated, the table above shows the value of a $10,000 investment in the Portfolio’s Class B, Class C, Class R, Class R1, Class R2, Class R3, Class R4, Class R5, Class 1 and Class 5 shares, respectively, as of December 31, 2006. Performance of the classes will vary based on the difference in sales charges paid by shareholders investing in the different classes and the fee structure of those classes.
A blended index is used when combining 40% of the Standard & Poor’s 500 Index, an unmanaged index that includes 500 widely traded common stocks, and 60% of the Lehman Brothers Aggregate Bond Index, an unmanaged index of dollar-denominated and nonconvertible investment-grade debt issues.
It is not possible to invest directly in an index. Index figures do not reflect sales charges and would be lower if they did.
1 Index figure as of closest month end to inception date.
2 No contingent deferred sales charge applicable.
3 For certain types of investors as described in the Portfolio’s Class R, Class R1, Class R2, Class R3, Class R4, Class R5, Class 1 and Class 5 share prospectuses.
Lifestyle Moderate Portfolio
7
Your expenses
These examples are intended to help you understand your ongoing operating expenses.
Understanding portfolio expenses
As a shareholder of the Portfolio, you incur two types of costs:
■ Transaction costs which include sales charges (loads) on purchases or redemptions (varies by share class), minimum account fee charge, etc.
■ Ongoing operating expenses including management fees, distribution and service fees (if applicable) and other fund expenses.
In addition to the operating expenses which the Portfolio bears directly, the Portfolio indirectly bears a pro rata share of the operating expenses of the affiliated underlying funds in which the Portfolio invests. Because the affiliated underlying funds have varied operating expenses and transaction costs and the Portfolio may own different proportions of the affiliated underlying funds at different times, the amount of expenses incurred indirectly by the Portfolio will vary. If these indirect expenses were included, your expenses paid during the period would have been higher.
We are going to present only your ongoing operating expenses here.
Actual expenses/actual returns
This example is intended to provide information about your portfolio’s actual ongoing operating expenses, and is based on your portfolio’s actual return. It assumes an account value of $1,000.00 on July 1, 2006, with the same investment held until December 31, 2006.
| | Account value | Ending value | Expenses paid during period |
| | on 7-1-06 | on 12-31-06 | ended 12-31-06a |
|
| Class A | $1,000.00 | $1,080.10 | $2.83 |
|
| Class B | 1,000.00 | 1,075.90 | 7.06 |
|
| Class C | 1,000.00 | 1,076.70 | 6.65 |
|
| Class R b | 1,000.00 | 1,054.30 | 2.78 |
|
| Class R1 b | 1,000.00 | 1,054.80 | 2.05 |
|
| Class R2 b | 1,000.00 | 1,097.40 | 1.34 |
|
| Class R3 | 1,000.00 | 1,080.30 | 3.93 |
|
| Class R4 | 1,000.00 | 1,082.20 | 2.47 |
|
| Class R5 | 1,000.00 | 1,082.30 | 0.95 |
|
| Class 1 | 1,000.00 | 1,083.50 | 0.53 |
|
| Class 5 | 1,000.00 | 1,083.40 | 0.26 |
|
Together with the value of your account, you may use this information to estimate the operating expenses that you paid over the period. Simply divide your account value
Lifestyle Moderate Portfolio
8
at December 31, 2006 by $1,000.00, then multiply it by the “expenses paid” for your share class from the table above. For example, for an account value of $8,600.00, the operating expenses should be calculated as follows:
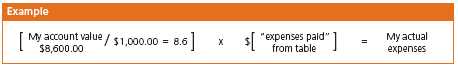
Hypothetical example for comparison purposes
This table allows you to compare your fund’s ongoing operating expenses with those of any other fund. It provides an example of the Fund’s hypothetical account values and hypothetical expenses based on each class’s actual expense ratio and an assumed 5% annual return before expenses (which is not your fund’s actual return). It assumes an account value of $1,000.00 on July 1, 2006, with the same investment held until December 31, 2006. Look in any other fund shareholder report to find its hypothetical example and you will be able to compare these expenses.
| | Account value | Ending value | Expenses paid during period |
| | on 7-1-06 | on 12-31-06 | ended 12-31-06a |
|
| Class A | $1,000.00 | $1,022.48 | $2.75 |
|
| Class B | 1,000.00 | 1,018.40 | 6.87 |
|
| Class C | 1,000.00 | 1,018.80 | 6.46 |
|
| Class Rb | 1,000.00 | 1,011.54 | 2.72 |
|
| Class R1b | 1,000.00 | 1,012.25 | 2.01 |
|
| Class R2b | 1,000.00 | 1,012.96 | 1.29 |
|
| Class R3 | 1,000.00 | 1,021.42 | 3.82 |
|
| Class R4 | 1,000.00 | 1,022.84 | 2.40 |
|
| Class R5 | 1,000.00 | 1,024.30 | 0.92 |
|
| Class 1 | 1,000.00 | 1,024.70 | 0.51 |
|
| Class 5c | 1,000.00 | 1,024.55 | 0.25 |
|
Remember, these examples do not include any transaction costs, such as sales charges; therefore, these examples will not help you to determine the relative total costs of owning different funds. If transaction costs were included, your expenses would have been higher. See the prospectus for details regarding transaction costs.
a Expenses are equal to the Fund’s annualized expense ratio of 0.54%, 1.35%, 1.27%, 0.95%, 0.70%, 0.45%, 0.75%, 0.47% 0.18%, 0.10% and 0.05% for Class A, Class B, Class C, Class R, Class R1, Class R2, Class R3, Class R4, Class R5, Class 1 and Class 5, respectively, multiplied by the average account value over the period, multiplied by the number of days in the period (inception date for Class R, Class R1 and Class R2) /365 or 366 (to reflect the one-half year period).
b Class R, Class R1 and Class R2 shares began operations on 9-18-06.
c Class 5 shares began operations on 7-3-06.
Lifestyle Moderate Portfolio
9
F I N A N C I A L S T A T E M E N T S
Portfolio’s investments
Securities owned by the Portfolio on 12-31-06
Portfolio of investments, showing all affiliated underlying funds.
| Issuer | Shares | Value |
|
| Investment companies 99.99% | | $2,088,050,199 |
| (Cost $1,972,479,445) | | |
| John Hancock Funds II 94.97% | | |
|
| Active Bond Fund Class NAV | 17,583,695 | $166,869,270 |
|
| Blue Chip Growth Fund Class NAV | 5,442,693 | 105,098,393 |
|
| Core Bond Fund Class NAV | 3,320,383 | 41,338,768 |
|
| Core Equity Fund Class NAV | 5,240,971 | 83,960,356 |
|
| Equity-Income Fund Class NAV | 2,242,612 | 42,116,247 |
|
| Fundamental Value Fund Class NAV | 4,963,142 | 84,373,413 |
|
| Global Bond Fund Class NAV | 8,654,339 | 125,055,203 |
|
| Global Real Estate Fund Class NAV | 3,602,901 | 42,334,083 |
|
| High Income Fund Class NAV | 5,791,943 | 62,900,502 |
|
| High Yield Fund Class NAV | 12,281,718 | 125,150,710 |
|
| International Equity Index Fund Class NAV | 2,063,921 | 42,310,376 |
|
| International Opportunities Fund Class NAV | 1,192,804 | 21,434,693 |
|
| International Value Fund Class NAV | 3,381,283 | 63,196,178 |
|
| Investment Quality Bond Fund Class NAV | 3,538,219 | 41,361,785 |
|
| Real Estate Equity Fund Class NAV | 3,295,309 | 38,884,649 |
|
| Real Return Bond Fund Class NAV | 6,419,772 | 83,071,852 |
|
| Small Cap Fund Class NAV | 1,344,381 | 20,730,358 |
|
| Small Company Fund Class NAV | 2,488,367 | 41,804,559 |
|
| Small Company Value Fund Class NAV | 828,023 | 20,833,066 |
|
| Spectrum Income Fund Class NAV | 15,983,974 | 166,712,853 |
|
| Strategic Bond Fund Class NAV | 3,481,687 | 41,432,074 |
|
| Strategic Income Fund Class NAV | 4,159,023 | 41,423,868 |
|
| Total Return Fund Class NAV | 18,391,053 | 250,486,142 |
|
| U.S. Government Securities Fund Class NAV | 3,063,092 | 41,351,743 |
|
| U.S. High Yield Bond Fund Class NAV | 4,735,805 | 62,465,269 |
|
| U.S. Multi Sector Fund Class NAV | 7,662,582 | 84,211,774 |
|
| Value & Restructuring Fund Class NAV | 3,507,182 | 42,191,396 |
See notes to financial statements
Lifestyle Moderate Portfolio
10
F I N A N C I A L S T A T E M E N T S
| Issuer | Shares | Value |
| John Hancock Funds III 5.02% | | |
|
| International Core Fund Class NAV | 2,460,741 | $104,950,619 |
|
| Total investments 99.99% (cost $1,972,479,445) | | $2,088,050,199 |
|
| Other assets in excess of liabilities 0.01% | | $118,490 |
|
| Total net assets 100.00% | | $2,088,168,689 |
Percentages are stated as a percent of net assets of the Portfolio.
See notes to financial statements
Lifestyle Moderate Portfolio
11
F I N A N C I A L S T A T E M E N T S
Financial statements
Statement of assets and liabilities 12-31-06
This Statement of Assets and Liabilities is the Portfolio’s balance sheet. It shows the value of what the Portfolio owns, is due and owes. You’ll also find the net asset value and the maximum offering price per share.
| Assets | |
|
| Investments in affiliated funds, at value (cost $1,972,479,445) | $2,088,050,199 |
| Receivable for investments sold | 4,670,942 |
| Receivable for fund shares sold | 682,733 |
| Receivable from affiliates | 8,754 |
| Other assets | 3,524 |
| |
| Total assets | 2,093,416,152 |
| |
| |
| Liabilities | |
|
| Due to custodian | 675,182 |
| Payable for investments purchased | 202,635 |
| Payable for fund shares repurchased | 4,037,535 |
| Payable to affiliates | |
| Fund administration fees | 60,450 |
| Transfer agent fees | 42,340 |
| Trustees’ fees | 6,971 |
| Investment management fees | 188 |
| Other payables and accrued expenses | 222,162 |
| |
| Total liabilities | 5,247,463 |
| |
| |
| Net assets | |
|
| Capital paid-in | 1,972,979,150 |
| Accumulated net realized loss on investments | (381,215) |
| Net unrealized appreciation on investments in affiliated underlying funds | 115,570,754 |
| |
| Net assets | $2,088,168,689 |
| |
| |
| Net asset value per share | |
|
| Based on net asset values and shares outstanding — | |
| the Portfolio has an unlimited number of shares authorized with no par value. | |
| Class A ($37,279,106 ÷ 2,755,796 shares) | $13.53 |
| Class B ($7,178,498 ÷ 530,964 shares) | $13.52 |
| Class C ($28,651,381 ÷ 2,117,386 shares) | $13.53 |
| Class R ($105,341 ÷ 7,777 shares) | $13.55 |
| Class R1 ($105,416 ÷ 7,787 shares) | $13.54 |
| Class R2 ($106,211 ÷ 7,849 shares) | $13.53 |
| Class R3 ($877,243 ÷ 64,841 shares) | $13.53 |
| Class R4 ($2,052,295 ÷ 151,904 shares) | $13.51 |
| Class R5 ($1,147,802 ÷ 84,906 shares) | $13.52 |
| Class 1 ($2,007,761,665 ÷ 148,700,052 shares) | $13.50 |
| Class 5 ($2,903,731 ÷ 215,215 shares) | $13.49 |
| |
| |
| Maximum offering price per share | |
|
| Class A 1 ($13.53 ÷ 95%) | $14.24 |
1 On single retail sales of less than $50,000. On sales of $50,000 or more and on group sales the offering price is reduced.
See notes to financial statements
Lifestyle Moderate Portfolio
12
F I N A N C I A L S T A T E M E N T S
Statement of operations For the year ended 12-31-06.
This Statement of Operations summarizes the Portfolio’s investment income earned and expenses incurred in operating the Portfolio. It also shows net gains (losses) for the period stated.
| | Period | Four months |
| | ended | ended |
| | 8-31-06a | 12-31-06b |
| |
| Investment income | | |
|
| Income distributions received from affiliated underlying funds | $33,550,119 | $39,183,496 |
| Total investment income | 33,550,119 | 39,183,496 |
| |
| Expenses | | |
|
| Investment management fees (Note 3) | 603,786 | 276,442 |
| Distribution and service fees (Note 3) | 806,941 | 452,336 |
| Transfer agent fees (Note 3) | 24,255 | 27,240 |
| Blue sky fees (Note 3) | 98,749 | 46,848 |
| Printing and postage fees (Note 3) | 36,479 | 15,536 |
| Fund administration fees (Note 3) | 129,402 | 49,181 |
| Audit and legal fees | 74,078 | 27,745 |
| Custodian fees | 10,722 | 4,022 |
| Trustees’ fees (Note 3) | 17,410 | 6,617 |
| Registration and filing fees | 53,994 | 20,522 |
| Miscellaneous | 13,541 | 3,620 |
| Total expenses | 1,869,357 | 930,109 |
| Less expense reductions (Note 3) | (116,541) | (42,462) |
| Net expenses | 1,752,816 | 887,647 |
| Net investment income | 31,797,303 | 38,295,849 |
| |
| Realized and unrealized gain | | |
|
| Net realized gain on investments | 29,511,991 | 959,934 |
| Capital gain distributions received from | | |
| affiliated underlying funds | 3,107,989 | 12,968,209 |
| Change in net unrealized appreciation of investments | | |
| in affiliated underlying funds | 54,190,768 | 61,379,986 |
| Net realized and unrealized gain | 86,810,748 | 75,308,129 |
| |
| Increase in net assets from operations | $118,608,051 | $113,603,978 |
a Period from 10-15-05 (commencement of operations) to 8-31-06.
b Effective 1-18-07, the fiscal year-end changed from August 31 to December 31.
See notes to financial statements
Lifestyle Moderate Portfolio
13
F I N A N C I A L S T A T E M E N T S
Statement of changes in net assets
These Statements of Changes in Net Assets show how the value of the Portfolio’s net assets has changed during the last two periods. The difference reflects earnings less expenses, any investment gains and losses, distributions, if any, paid to shareholders and the net of Portfolio share transactions.
| | Period | Four months |
| | ended | ended |
| | 8-31-06a | 12-31-06b |
|
| |
| Increase (decrease) in net assets | | |
|
| From operations | | |
| Net investment income | $31,797,303 | $38,295,849 |
| Net realized gain | 32,619,980 | 13,928,143 |
| Change in net unrealized appreciation | 54,190,768 | 61,379,986 |
| Increase in net assets resulting from operations | 118,608,051 | 113,603,978 |
| Distributions to shareholders | | |
| From net investment income | | |
| Class A | (171,868) | (902,226) |
| Class B | (22,967) | (163,812) |
| Class C | (77,475) | (645,798) |
| Class R | — | (2,543) |
| Class R1 | — | (2,609) |
| Class R2 | — | (2,689) |
| Class R3 | (6,081) | (21,537) |
| Class R4 | (10,781) | (51,478) |
| Class R5 | (8,339) | (28,198) |
| Class 1 | (31,963,702) | (52,481,076) |
| Class 5 | (490) | (70,845) |
| From net realized gain | | |
| Class A | — | (544,690) |
| Class B | — | (105,282) |
| Class C | — | (416,751) |
| Class R | — | (1,539) |
| Class R1 | — | (1,539) |
| Class R2 | — | (1,550) |
| Class R3 | — | (12,785) |
| Class R4 | — | (29,908) |
| Class R5 | — | (16,746) |
| Class 1 | — | (29,380,921) |
| Class 5 | — | (42,201) |
| From capital paid-in | | |
| Class A | — | (828,021) |
| Class B | — | (150,334) |
| Class C | — | (592,577) |
| Class R | — | (2,336) |
| Class R1 | — | (2,397) |
| Class R2 | — | (2,471) |
| Class R3 | — | (19,781) |
| Class R4 | — | (47,280) |
| Class R5 | — | (25,859) |
| Class 1 | — | (48,216,254) |
| Class 5 | — | (64,933) |
| | (32,261,703) | (134,878,966) |
| |
| From Fund share transactions | 1,785,520,486 | 237,576,843 |
See notes to financial statements
Lifestyle Moderate Portfolio
14
F I N A N C I A L S T A T E M E N T S
Statement of changes in net assets (continued)
| | Period | Four months |
| | ended | ended |
| | 8-31-06a | 12-31-06b |
|
| Net assets | | |
|
| Beginning of period | — | 1,871,866,834 |
| End of period | $1,871,866,834 | $2,088,168,689 |
| Accumulated net investment income | $2,800,483 | — |
a Period from 10-15-05 (commencement of operations) to 8-31-06.
b Effective 1-18-07, the fiscal year-end changed from August 31 to December 31.
See notes to financial statements
Lifestyle Moderate Portfolio
15
F I N A N C I A L S T A T E M E N T S
Financial highlights
The Financial highlights show how the Portfolio’s net asset value for a share has changed since the end of the previous period.
| CLASS A SHARES | | |
| |
| Period ended | 8-31-06a | 12-31-06b |
| |
| Per share operating performance | | |
|
| Net asset value, beginning of period | $12.94 | $13.64 |
| Net investment income h,v | 0.25 | 0.27 |
| Net realized and unrealized | | |
| gain on investments | 0.66 | 0.52 |
| Total from investment operations | 0.91 | 0.79 |
| Less distributions | | |
| From net investment income | (0.21) | (0.36) |
| From net realized gain | — | (0.21) |
| From capital paid-in | — | (0.33) |
| | (0.21) | (0.90) |
| Net asset value, end of period | $13.64 | $13.53 |
| Total return k,l,m (%) | 7.10 | 5.77 |
| |
| Ratios and supplemental data | | |
|
| Net assets, end of period | | |
| (in millions) | $25 | $37 |
| Ratio of net expenses to average | | |
| net assets q,r (%) | 0.57 | 0.56 |
| Ratio of gross expenses to average | | |
| net assets p,q,r (%) | 0.83 | 0.57 |
| Ratio of net investment income | | |
| to average net assets r,v (%) | 2.21 | 5.86 |
| Portfolio turnover m (%) | 24 | 1 |
See notes to financial statements
Lifestyle Moderate Portfolio
16
F I N A N C I A L S T A T E M E N T S
Financial highlights
| CLASS B SHARES | | |
| |
| Period ended | 8-31-06a | 12-31-06b |
| |
| Per share operating performance | | |
|
| Net asset value, beginning of period | $12.94 | $13.62 |
| Net investment income h,v | 0.15 | 0.23 |
| Net realized and unrealized | | |
| gain on investments | 0.68 | 0.52 |
| Total from investment operations | 0.83 | 0.75 |
| Less distributions | | |
| From net investment income | (0.15) | (0.33) |
| From net realized gain | — | (0.21) |
| From capital paid-in | — | (0.31) |
| | (0.15) | (0.85) |
| Net asset value, end of period | $13.62 | $13.52 |
| Total return k,l,m (%) | 6.42 | 5.49 |
| |
| Ratios and supplemental data | | |
|
| Net assets, end of period | | |
| (in millions) | $5 | $7 |
| Ratio of net expenses to average | | |
| net assets q,r (%) | 1.34 | 1.35 |
| Ratio of gross expenses to average | | |
| net assets p,q,r (%) | 2.43 | 1.66 |
| Ratio of net investment income | | |
| to average net assets r,v (%) | 1.28 | 4.87 |
| Portfolio turnover m (%) | 24 | 1 |
See notes to financial statements
Lifestyle Moderate Portfolio
17
F I N A N C I A L S T A T E M E N T S
Financial highlights
| CLASS C SHARES | | |
| |
| Period ended | 8-31-06a | 12-31-06b |
| |
| Per share operating performance | | |
|
| Net asset value, beginning of period | $12.94 | $13.63 |
| Net investment income h,v | 0.17 | 0.24 |
| Net realized and unrealized | | |
| gain on investments | 0.67 | 0.51 |
| Total from investment operations | 0.84 | 0.75 |
| Less distributions | | |
| From net investment income | (0.15) | (0.33) |
| From net realized gain | — | (0.21) |
| From capital paid-in | — | (0.31) |
| | (0.15) | (0.85) |
| Net asset value, end of period | $13.63 | $13.53 |
| Total return k,l,m (%) | 6.49 | 5.49 |
| |
| Ratios and supplemental data | | |
|
| Net assets, end of period | | |
| (in millions) | $18 | $29 |
| Ratio of net expenses to average | | |
| net assets q,r (%) | 1.29 | 1.28 |
| Ratio of gross expenses to average | | |
| net assets p,q,r (%) | 1.67 | 1.32 |
| Ratio of net investment income | | |
| to average net assets r,v (%) | 1.51 | 5.13 |
| Portfolio turnover m (%) | 24 | 1 |
See notes to financial statements
Lifestyle Moderate Portfolio
18
F I N A N C I A L S T A T E M E N T S
Financial highlights
| CLASS R SHARES | |
| |
| Period ended | 12-31-06b,c |
|
| Per share operating performance | |
|
| Net asset value, beginning of period | $13.69 |
| Net investment income h,v | 0.24 |
| Net realized and unrealized | |
| gain on investments | 0.50 |
| Total from investment operations | 0.74 |
| Less distributions | |
| From net investment income | (0.35) |
| From net realized gain | (0.21) |
| From capital paid-in | (0.32) |
| | (0.88) |
| Net asset value, end of period | $13.55 |
| Total return (%) k,l | 5.38 m |
| |
| Ratios and supplemental data | |
|
| Net assets, end of period | |
| (in millions) | —i |
| Ratio of net expenses to average | |
| net assets q (%) | 0.95r |
| Ratio of gross expenses to average | |
| net assets p,q (%) | 13.40r |
| Ratio of net investment income | |
| to average net assets v (%) | 5.83r |
| Portfolio turnover (%) | 1m |
See notes to financial statements
Lifestyle Moderate Portfolio
19
F I N A N C I A L S T A T E M E N T S
Financial highlights
| CLASS R1 SHARES | |
| |
| Period ended | 12-31-06b,c |
|
| Per share operating performance | |
|
| Net asset value, beginning of period | $13.69 |
| Net investment income h,v | 0.25 |
| Net realized and unrealized | |
| gain on investments | 0.50 |
| Total from investment operations | 0.75 |
| Less distributions | |
| From net investment income | (0.36) |
| From net realized gain | (0.21) |
| From capital paid-in | (0.33) |
| | (0.90) |
| Net asset value, end of period | $13.54 |
| Total return k,l (%) | 5.43m |
| |
| Ratios and supplemental data | |
|
| Net assets, end of period | |
| (in millions) | —n |
| Ratio of net expenses to average | |
| net assets q (%) | 0.70r |
| Ratio of gross expenses to average | |
| net assets p,q (%) | 13.14r |
| Ratio of net investment income | |
| to average net assets v (%) | 6.07r |
| Portfolio turnover (%) | 1m |
See notes to financial statements
Lifestyle Moderate Portfolio
20
F I N A N C I A L S T A T E M E N T S
Financial highlights
| CLASS R2 SHARES | |
| |
| Period ended | 12-31-06b,c |
| |
| Per share operating performance | |
|
| Net asset value, beginning of period | $13.69 |
| Net investment income h,v | 0.26 |
| Net realized and unrealized | |
| gain on investments | 0.48 |
| Total from investment operations | 0.74 |
| Less distributions | |
| From net investment income | (0.36) |
| From net realized gain | (0.21) |
| From capital paid-in | (0.33) |
| | (0.90) |
| Net asset value, end of period | $13.53 |
| Total return k,l (%) | 5.48m |
| |
| Ratios and supplemental data | |
|
| Net assets, end of period | |
| (in millions) | —n |
| Ratio of net expenses to average | |
| net assets q (%) | 0.45r |
| Ratio of gross expenses to average | |
| net assets p,q (%) | 12.87r |
| Ratio of net investment income | |
| to average net assets v (%) | 6.33r |
| Portfolio turnover (%) | 1m |
See notes to financial statements
Lifestyle Moderate Portfolio
21
F I N A N C I A L S T A T E M E N T S
Financial highlights
| CLASS R3 SHARES | | |
| |
| Period ended | 8-31-06a | 12-31-06b |
| |
| Per share operating performance | | |
|
| Net asset value, beginning of period | $12.94 | $13.65 |
| Net investment income h,v | 0.33 | 0.23 |
| Net realized and unrealized | | |
| gain on investments | 0.58 | 0.55 |
| Total from investment operations | 0.91 | 0.78 |
| Less distributions | | |
| From net investment income | (0.20) | (0.36) |
| From net realized gain | — | (0.21) |
| From capital paid-in | — | (0.33) |
| | (0.20) | (0.90) |
| Net asset value, end of period | $13.65 | $13.53 |
| Total return k,l,m (%) | 7.10 | 5.66 |
| |
| Ratios and supplemental data | | |
|
| Net assets, end of period | | |
| (in millions) | $1 | $1 |
| Ratio of net expenses to average | | |
| net assets q,r (%) | 0.69 | 0.78 |
| Ratio of gross expenses to average | | |
| net assets p,q,r (%) | 8.44 | 3.13 |
| Ratio of net investment income | | |
| to average net assets r,v (%) | 2.93 | 4.89 |
| Portfolio turnover m (%) | 24 | 1 |
See notes to financial statements
Lifestyle Moderate Portfolio
22
F I N A N C I A L S T A T E M E N T S
Financial highlights
| CLASS R4 SHARES | | |
| |
| Period ended | 8-31-06a | 12-31-06b |
| |
| Per share operating performance | | |
|
| Net asset value, beginning of period | $12.94 | $13.63 |
| Net investment income h,v | 0.30 | 0.25 |
| Net realized and unrealized | | |
| gain on investments | 0.62 | 0.53 |
| Total from investment operations | 0.92 | 0.78 |
| Less distributions | | |
| From net investment income | (0.23) | (0.36) |
| From net realized gain | — | (0.21) |
| From capital paid-in | — | (0.33) |
| | (0.23) | (0.90) |
| Net asset value, end of period | $13.63 | $13.51 |
| Total return k,l,m (%) | 7.14 | 5.80 |
| |
| Ratios and supplemental data | | |
|
| Net assets, end of period | | |
| (in millions) | $1 | $2 |
| Ratio of net expenses to average | | |
| net assets q,r (%) | 0.49 | 0.52 |
| Ratio of gross expenses to average | | |
| net assets p,q,r (%) | 4.65 | 1.53 |
| Ratio of net investment income | | |
| to average net assets r,v (%) | 2.59 | 5.44 |
| Portfolio turnover m (%) | 24 | 1 |
See notes to financial statements
Lifestyle Moderate Portfolio
23
F I N A N C I A L S T A T E M E N T S
Financial highlights
| CLASS R5 SHARES | | |
| |
| Period ended | 8-31-06a | 12-31-06b |
| |
| Per share operating performance | | |
|
| Net asset value, beginning of period | $12.94 | $13.64 |
| Net investment income h,v | 0.22 | 0.32 |
| Net realized and unrealized | | |
| gain on investments | 0.73 | 0.48 |
| Total from investment operations | 0.95 | 0.80 |
| Less distributions | | |
| From net investment income | (0.25) | (0.37) |
| From net realized gain | — | (0.21) |
| From capital paid-in | — | (0.34) |
| | (0.25) | (0.92) |
| Net asset value, end of period | $13.64 | $13.52 |
| Total return k,l,m (%) | 7.40 | 5.93 |
| |
| Ratios and supplemental data | | |
|
| Net assets, end of period | | |
| (in millions) | $1 | $1 |
| Ratio of net expenses to average | | |
| net assets q,r (%) | 0.19 | 0.20 |
| Ratio of gross expenses to average | | |
| net assets p,q,r (%) | 4.86 | 2.83 |
| Ratio of net investment income | | |
| to average net assets r,v (%) | 1.92 | 6.83 |
| Portfolio turnover m (%) | 24 | 1 |
See notes to financial statements
Lifestyle Moderate Portfolio
24
F I N A N C I A L S T A T E M E N T S
Financial highlights
| CLASS 1 SHARES | | |
| |
| Period ended | 8-31-06a | 12-31-06b |
| |
| Per share operating performance | | |
|
| Net asset value, beginning of period | $12.93 | $13.63 |
| Net investment income h,v | 0.26 | 0.27 |
| Net realized and unrealized | | |
| gain on investments | 0.70 | 0.54 |
| Total from investment operations | 0.96 | 0.81 |
| Less distributions | | |
| From net investment income | (0.26) | (0.38) |
| From net realized gain | — | (0.21) |
| From capital paid-in | — | (0.35) |
| | (0.26) | (0.94) |
| Net asset value, end of period | $13.63 | $13.50 |
| Total return k,m (%) | 7.47 | 5.90 |
|
| Ratios and supplemental data | | |
|
| Net assets, end of period | | |
| (in millions) | $1,820 | $2,008 |
| Ratio of net expenses to average | | |
| net assets q,r (%) | 0.11 | 0.11 |
| Ratio of net investment income | | |
| to average net assets r,v (%) | 2.23 | 5.80 |
| Portfolio turnover m (%) | 24 | 1 |
See notes to financial statements
Lifestyle Moderate Portfolio
25
F I N A N C I A L S T A T E M E N T S
Financial highlights
| CLASS 5 SHARES | | |
| |
| Period ended | 8-31-06a | 12-31-06b |
|
| Per share operating performance | | |
|
| Net asset value, beginning of period | $13.48 | $13.62 |
| Net investment gain (loss) h,v | — j | 0.34 |
| Net realized and unrealized | | |
| gain on investments | 0.30 | 0.47 |
| Total from investment operations | 0.30 | 0.81 |
| Less distributions | | |
| From net investment income | (0.16) | (0.38) |
| From net realized gain | — | (0.21) |
| From capital paid-in | — | (0.35) |
| | (0.16) | (0.94) |
| Net asset value, end of period | $13.62 | $13.49 |
| Total return k,m (%) | 2.27 | 5.93 |
| |
| Ratios and supplemental data | | |
|
| Net assets, end of period | | |
| (in millions) | $1 | $3 |
| Ratio of net expenses to average | | |
| net assets q,r (%) | 0.01 | 0.06 |
| Ratio of net investment gain (loss) | | |
| to average net assets r,v (%) | (0.01) | 7.21 |
| Portfolio turnover m (%) | 24 | 1 |
a Class A, Class B, Class C, Class R3, Class R4 and Class R5 shares began operations on 10-18-05, Class 1 shares began operation on 10-15-05 and Class 5 shares began operation on 7-3-06.
b Effective 1-18-07, the fiscal year-end changed from August 31 to December 31.
c Class R, Class R1 and Class R2 shares began operations on 9-18-06.
h Based on the average of the shares outstanding.
i Less than $500,000.
j Less than $0.01 per share.
k Assumes dividend reinvestment and does not reflect the effect of sales charges.
l Total returns would have been lower had certain expenses not been reduced during the period shown.
m Not annualized.
p Does not take into consideration expense reductions during the period shown.
q Does not include expenses of the investment companies in which the Fund invests.
r Annualized.
v Recognition of net investment income by the Portfolio is affected by the timing of the declaration of dividends by the underlying investment companies in which the Portfolio invests.
See notes to financial statements
Lifestyle Moderate Portfolio
26
Notes to financial statements
1. Organization
The John Hancock Lifestyle Moderate Portfolio (the “Portfolio”) is a non-diversified series of John Hancock Funds II (the “Trust”). The Trust was established as a Massachusetts business trust on June 28, 2005. The Trust is registered under the Investment Company Act of 1940 (the “1940 Act”), as amended, as an open-end investment management company.
The Portfolio operates as a “fund of funds”, investing in Class NAV shares of affiliated underlying funds of the Trust and John Hancock Funds III and in other permitted investments. The affiliated underlying funds’ accounting policies are outlined in the shareholder reports, available without charge by calling 1-800-225-5291 or on the Securities & Exchange Commission (“SEC”) Web site at www.sec.gov, File #811-21779, CIK 0001331971. The affiliated underlying funds are not covered by this report.
John Hancock Investment Management Services, LLC (the “Adviser”), a Delaware limited liability company controlled by John Hancock Life Insurance Company (U.S.A.) (“John Hancock USA”) serves as investment adviser for the Trust and John Hancock Funds, LLC (the “Distributor”), an affiliate of the Adviser, serves as principal underwriter. John Hancock Life Insurance Company of New York (“John Hancock New York”) is a wholly owned subsidiary of John Hancock USA. John Hancock USA and John Hancock New York are indirect wholly owned subsidiaries of The Manufactures Life Insurance Company (“Manulife”), which in turn is a wholly owned subsidiary of Manulife Financial Corporation (“MFC”), a publicly traded company. MFC and its subsidiaries are known collectively as “Manulife Financial.”
The Portfolio commenced operations after certain separate accounts of John Hancock USA redeemed their interests in portfolios of John Hancock Trust and certain unaffiliated mutual funds of approximately $340 million at the close of business on October 14, 2005, with additional redemption proceeds of approximately $1.2 billion received on October 28, 2005, and invested such proceeds in Class 1 shares of the Portfolio, which in turn invested the proceeds in affiliated underlying funds of the Trust.
The Board of Trustees has authorized the issuance of multiple classes of shares of the Portfolio, including classes designated as Class A, Class B, Class C, Class R, Class R1, Class R2, Class R3, Class R4, Class R5, Class 1 and Class 5 shares.
Class A, B and C shares are open to all retail investors. Class 1 shares are sold only to certain exempt separate accounts of John Hancock USA and John Hancock New York. Class R, R1, R2, R3, R4 and R5 shares are available only to certain retirement plans. Class 5 shares currently are available only to the John Hancock Freedom 529 Plan.
The shares of each class represent an interest in the same portfolio of investments of the Portfolio, and have equal rights as to voting, redemptions, dividends and liquidation, except that certain expenses, subject to the approval of the Trustees, may be applied differently to each class of shares in accordance with current regulations of the SEC and the Internal Revenue Service. Shareholders of a class that bears distribution and service expenses under the terms of a distribution plan have exclusive voting rights to that distribution plan. Class B shares will convert to Class A shares eight years after purchase.
On January 18, 2007, the Board of Trustees approved a change in the fiscal year end of the Portfolio from August 31 to December 31. Accordingly, the Portfolio’s financial statements and related notes include information as of the four-month period ended December 31, 2006 and the period ended August 31, 2006.
Lifestyle Moderate Portfolio
27
2. Significant accounting policies
In the preparation of the financial statements, the Portfolio follows the policies described below. The preparation of financial statements in conformity with accounting principles generally accepted in the United States of America requires management to make estimates and assumptions that affect the reported amounts of assets and liabilities at the date of the financial statements and the reported amounts of income and expenses during the reporting period. Actual results may differ from these estimates.
Securities valuation
The net asset value of the shares of the Portfolio is determined daily as of the close of the New York Stock Exchange, normally at 4:00 p.m. Eastern Time. Investments in the affiliated underlying funds are valued at their respective net asset values each business day, or at fair value as determined in good faith in accordance with procedures approved by the Trustees. Securities in the affiliated underlying funds’ portfolios are valued in accordance with their respective valuation polices, as outlined in the affiliated underlying funds’ financial statements. Short-term debt investments that have a remaining maturity of 60 days or less are valued at amortized cost.
Security transactions and related investment income
Investment security transactions in the affiliated underlying funds are accounted for on a trade date plus one basis for daily net asset value calculations. However, for financial reporting purposes, investment transactions are reported on trade date. Interest income is accrued as earned. Dividend income and capital gain distributions from the underlying afiliated funds are recorded on the ex-dividend date.
Gains and losses on securities sold are determined on the basis of specific identified cost for both financial and federal income tax reporting purposes.
Multi-class operations
All income, expenses (except for class-specific expenses) and realized and unrealized gains (losses) are allocated to each class of shares based upon the relative net assets of each class. Dividends to shareholders from net investment income are determined at a class level and distributions from capital gains are determined at a Portfolio level.
Expense allocation
Expenses not directly attributable to a particular Portfolio or class of shares are allocated based on the relative share of net assets of the Portfolio at the time the expense was incurred. Class-specific expenses, such as transfer agency fees, blue sky fees, printing and postage fees and distribution and service fees, are accrued daily and charged directly to the respective share classes. Expenses in the Portfolio’s Statements of Operations reflect the expenses of the Portfolio and do not include any indirect expenses related to the affiliated underlying funds. Because the affiliated underlying funds have varied expense levels and the Portfolio may own different proportions of the affiliated underlying funds at different times, the amount of fees and expenses incurred indirectly by the Portfolio will vary.
Federal income taxes
The Portfolio seeks to qualify as a “regulated investment company” by complying with the applicable provisions of the Internal Revenue Code and will not be subject to federal income tax on taxable income that is distributed to shareholders. Therefore, no federal income tax provision is required.
New accounting pronouncements
In June 2006, Financial Accounting Standards Board (“FASB”) Interpretation No. 48, Accounting for Uncertainty in Income Taxes (the “Interpretation”) was issued, and is effective for fiscal years beginning after December 15, 2006 and is to be applied to all open tax years as of the effective date. The Interpretation prescribes a minimum threshold for financial statement recognition of the benefit of a tax position taken or expected to be taken in a tax return, and requires certain expanded disclosures. Management is currently evaluating the application of the Interpretation to the Portfolio, and has not at this time quantified the impact, if any, resulting from the adoption of the Interpretation on the Portfolio’s financial statements. The Portfolio will implement this pronouncement no later than June 29, 2007.
28
Lifestyle Moderate Portfolio
In September 2006, FASB Standard No. 157, Fair Value Measurements (“FAS 157”) was issued, and is effective for fiscal years beginning after November 15, 2007. FAS 157 defines fair value, establishing a framework for measuring fair value and expands disclosure about fair value measurements. Management is currently evaluating the application of FAS 157 to the Portfolio, and its impact, if any, resulting from the adoption of FAS 157 on the Fund’s financial statements.
Distribution of income and gains
The Portfolio records distributions to shareholders from net investment income and net realized gains, if any, on the ex-dividend date.
During the period ended August 31, 2006, the tax character of distributions paid was as follows: ordinary income $32,261,703. During the four-month period ended December 31, 2006, the tax character of distributions paid was as follows: ordinary income $83,942,028, tax return of capital $49,938,569 and long-term capital gain $998,369. Distributions paid by the Portfolio with respect to each class of shares are calculated in the same manner, at the same time and are in the same amount, except for the effect of expenses that may be applied differently to each class. Such distributions, on a tax basis, are determined in conformity with income tax regulations, which may differ from accounting principles generally accepted in the United States of America. Distributions in excess of tax basis earnings and profits, if any, are reported in the Portfolio’s financial statements as a return of capital. As of December 31, 2006, there were no distributable earnings on a tax basis.
Capital accounts
The Portfolio reports the undistributed net investment income and accumulated undistributed net realized gain (loss) accounts on a basis approximating amounts available for future tax distributions (or to offset future taxable realized gains when a capital loss carryforward is available). Accordingly, the Portfolio may periodically make reclassifications among certain capital accounts, without affecting its net asset value.
3. Investment advisory and other agreements Advisory fees
The Trust has entered into an Investment Advisory Agreement with the Adviser. The Adviser is responsible for managing the corporate and business affairs of the Trust and for selecting and compensating subadvisers to handle the investment and reinvestment of the assets of the Portfolio, subject to the supervision of the Board of Trustees. Under the Advisory Agreement, the Portfolio pays a monthly management fee to the Adviser equivalent, on an annual basis, to the sum of: (a) 0.05% of the first $7,500,000,000 of the aggregate daily net assets and (b) 0.04% of the aggregate daily net assets in excess of $7,500,000,000 of each of the five Lifestyle Portfolios of the Trust (Lifestyle Aggressive, Lifestyle Growth, Lifestyle Balanced, Lifestyle Moderate and Lifestyle Conservative) and its corresponding funds of the five Lifestyle Portfolios of John Hancock Trust (Lifestyle Aggressive, Lifestyle Growth, Lifestyle Balanced, Lifestyle Moderate and Lifestyle Conservative). The Portfolio is not responsible for payment of the subadvisory fees.
Expense reimbursements
The Adviser has contractually agreed to waive advisory fees or reimburse Portfolio’s expenses for Class A, Class B, Class C, Class R, Class R1, Class R2, Class R3, Class R4 and Class R5 shares to the extent that blue sky fees and printing and postage expenses attributable to each class exceed 0.09% of the average annual net assets attributable to the classes, at least until November 1, 2006, and may thereafter be terminated by the Adviser at any time. During the period ended August 31, 2006, the expense reductions related to this expense limitation amounted to $21,158, $19,954, $21,099, $17,474, $17,021 and $18,272 for Class A, Class B, Class C, Class R3, Class R4 and Class R5, respectively. During the four-month period ended December 31, 2006, the expense reductions related to this expense limitation amounted to $1,612, $6,370, $2,947, $3,649, $3,649, $3,649, $6,436, $6,021, and $6,821 for Class A, Class B, Class C, Class R, Class R1, Class R2, Class R3, Class R4 and Class R5, respectively.
Lifestyle Moderate Portfolio
29
The Adviser has contractually agreed to waive advisory fees or reimburse fund expenses for Class 5 shares to the extent that total Portfolio operating expenses attributable to Class 5 exceed 0.07% of the average annual net assets attributable to the Class 5. There were no expense reductions related to this expense limitation during the period ended August 31, 2006 and four-month period ended December 31, 2006. This agreement remains in effect until June 30, 2007 and may thereafter be terminated by the Adviser at any time.
Administration fees
The Portfolio has an agreement with the Adviser that requires the Portfolio to reimburse the Adviser for all expenses associated with providing the administrative, financial, accounting and recordkeeping services of the Portfolio, including the preparation of all tax returns, annual, semiannual and periodic reports to shareholders and the preparation of all regulatory reports.
Distribution plans
The Trust has a Distribution Agreement with the Distributor. The Portfolio has adopted Distribution Plans with respect to Class A, Class B, Class C, Class R, Class R1, Class R2, Class R3, Class R4 and Class 1, pursuant to Rule 12b-1 under the 1940 Act, to reimburse for the services it provides as distributor of shares of the Portfolio. Accordingly, the Portfolio makes monthly payments to the Distributor at an annual rate not to exceed 0.30%, 1.00%, 1.00%, 0.25%, 0.25%, 0.25%, 0.50%, 0.25% and 0.05% of average daily net asset value of Class A, Class B, Class C, Class R, Class R1, Class R2, Class R3, Class R4 and Class 1, respectively. A maximum of 0.25% of such payments may be service fees, as defined by the Conduct Rules of the National Association of Securities Dealers. Under the Conduct Rules, curtailment of a portion of the Portfolio’s 12b-1 payments could occur under certain circumstances.
The Portfolio has also adopted a Service Plan with respect to Class R, Class R1, Class R2, Class R3, Class R4 and Class R5 shares (the “Service Plan”). Under the Service Plan, the Portfolio pays up to 0.25%, 0.25%, 0.25%, 0.15%, 0.10% and 0.05% of average daily net assets of Class R, Class R1, Class R2, Class R3, Class R4 and Class R5 shares, respectively, for certain other services.
Sales charges
Class A shares are assessed up-front sales charges of up to 5% of the net asset value of such shares. During the four-month period ended December 31, 2006, the Portfolio was informed that the Distributor received net up-front sales charges of $313,667 with regard to sales of Class A shares. Of this amount, $52,846 was retained and used for printing prospectuses, advertising, sales literature and other purposes, $258,101 was paid as sales commissions to unrelated broker-dealers and $2,720 was paid as sales commissions to sales personnel of Signator Investors, Inc. (“Signator Investors”), a related broker-dealer, an indirect subsidiary of MFC.
Class B shares that are redeemed within six years of purchase are subject to a contingent deferred sales charge (“CDSC”) at declining rates, beginning at 5.00% of the lesser of the current market value at the time of redemption or the original purchase cost of the shares being redeemed. Class C shares that are redeemed within one year of purchase are subject to a CDSC at a rate of 1.00% of the lesser of the current market value at the time of redemption or the original purchase cost of the shares being redeemed. Proceeds from the CDSCs are paid to JH Funds and are used, in whole or in part, to defray its expenses for providing distribution-related services to the Portfolio in connection with the sale of Class B and Class C shares. During the four-month period ended December 31, 2006, the Portfolio was informed that CDSCs received by the Distributor amounted to $1,319 for Class B shares and $1,090 for Class C shares.
Transfer agent fees
The Portfolio has a Transfer Agency Agreement with John Hancock Signature Services, Inc. (“Signature Services”), an indirect subsidiary of MFC. For Class A, Class B, Class C, Class R, Class R1, Class R2, Class R3, Class R4 and Class R5 shares, the Portfolio pays a monthly transfer agent fee at an annual rate of 0.05% of each class’s average daily net assets, plus a fee based on the number of shareholder accounts and reimbursement for certain out-of-pocket expenses. Expenses not directly attributable to a particular class of shares are aggregated and allocated to each class on the basis of its relative net asset value.
Lifestyle Moderate Portfolio
30
Signature Services has agreed to limit the transfer agent fees so that such fees do not exceed 0.20% annually of Class A, Class B, Class C, Class R, Class R1, Class R2, Class R3, Class R4 and Class R5 share average daily net assets. This agreement is effective until December 31, 2006. Signature Services reserves the right to terminate this limitation in the future. In addition, Signature Service has voluntarily agreed to further limit transfer agent fees for Class R3, Class R4 and Class R5 shares so that such fees do not exceed 0.05% annually of each class’s average daily net assets. During the period ended August 31, 2006, the transfer agent fees reductions amounted to $327, $615 and $621 for Class R3, Class R4 and Class R5 shares, respectively. During the four-month period ended December 31, 2006, the transfer agent fee reductions amounted to $41, $41, $41, $437, $418 and $330 for Class R, Class R1, Class R2, Class R3, Class R4 and C lass R5 shares, respectively Signature Services reserves the right to terminate this limitation at any time.
Expenses under the agreements described above for the period ended August 31, 2006 and the four-month period ended December 31, 2006, were as follows:
| Period ended 8-31-06 | | | | |
| | Distribution | Transfer | | Printing and |
| Share Class | and service fees | agent | Blue sky | postage |
|
| |
| Class A | $24,411 | $10,212 | $16,557 | $11,925 |
| Class B | 18,261 | 3,658 | 16,196 | 5,402 |
| Class C | 55,889 | 8,369 | 17,409 | 8,720 |
| Class R | — | — | — | — |
| Class R1 | — | — | — | — |
| Class R2 | — | — | — | — |
| Class R3 | 1,158 | 427 | 15,925 | 1,757 |
| Class R4 | 1,256 | 817 | 15,925 | 1,481 |
| Class R5 | 2 | 772 | 16,737 | 1,903 |
| Class 1 | 705,964 | — | — | 5,291 |
| Class 5 | — | — | — | — |
| Total | $806,941 | $24,255 | $98,749 | $36,479 |
| |
| |
| Four months ended 12-31-06 | | | | |
| | Distribution | Transfer | | Printing and |
| Share Class | and service fees | agent | Blue sky | postage |
|
| |
| Class A | $30,695 | $11,118 | $6,271 | $4,549 |
| Class B | 20,231 | 4,046 | 6,133 | 2,058 |
| Class C | 77,506 | 10,123 | 6,593 | 3,329 |
| Class R | 220 | 56 | 3,150 | 525 |
| Class R1 | 147 | 56 | 3,150 | 525 |
| Class R2 | 74 | 56 | 3,150 | 525 |
| Class R3 | 1,689 | 583 | 6,031 | 669 |
| Class R4 | 2,027 | 736 | 6,031 | 564 |
| Class R5 | 6 | 466 | 6,339 | 727 |
| Class 1 | 319,741 | — | — | 2,065 |
| Class 5 | — | — | — | — |
| Total | $452,336 | $27,240 | $46,848 | $15,536 |
Trustees’ fees
The Trust compensates each Trustee who is not an employee of the Adviser or its affiliates. Total Trustees’ expenses are allocated based on each Portfolio’s average daily net asset value.
4. Guarantees and Indemnifications
Under the Trust’s organizational documents, its Officers and Trustees are indemnified against certain liability arising out of the performance of their duties to the Trust. Additionally, in the
Lifestyle Moderate Portfolio
31
normal course of business, the Trust enters into contracts with service providers that contain general indemnification clauses. The Trust’s maximum exposure under these arrangements is unknown, as this would involve future claims that may be made against the Trust that have not yet occurred. However, based on experience, the Trust believes the risk of loss to be remote.
| 5. Capital shares | | | | |
| Share activities for the Portfolio during the last two periods were as follows: | |
| | Period ended 8-31-06 a | Four-months ended 12-31-06 b |
| | Shares | Amount | Shares | Amount |
|
| |
| Class A shares | | | | |
| Sold | 1,906,772 | $25,643,938 | 816,494 | $11,462,461 |
| Distributions reinvested | 11,786 | 156,721 | 153,623 | 2,082,610 |
| Repurchased | (49,176) | (660,565) | (83,703) | (1,177,380) |
| Net increase | 1,869,382 | $25,140,094 | 886,414 | $12,367,691 |
|
| |
| Class B shares | | | | |
| Sold | 394,049 | $5,293,647 | 170,436 | $2,381,553 |
| Distributions reinvested | 1,374 | 18,275 | 27,685 | 375,204 |
| Repurchased | (30,195) | (405,623) | (32,385) | (455,472) |
| Net increase | 365,228 | $4,906,299 | 165,736 | $2,301,285 |
|
| |
| Class C shares | | | | |
| Sold | 1,313,617 | $17,670,307 | 759,619 | $10,592,267 |
| Distributions reinvested | 5,335 | 70,936 | 113,517 | 1,538,471 |
| Repurchased | (30,993) | (417,164) | (43,709) | (614,937) |
| Net increase | 1,287,959 | $17,324,079 | 829,427 | $11,515,801 |
|
| |
| Class R sharesc | | | | |
| Sold | — | — | 7,305 | $100,003 |
| Distributions reinvested | — | — | 472 | 6,417 |
| Repurchased | — | — | — | (3) |
| Net increase | — | — | 7,777 | $106,417 |
|
| |
| Class R1 sharesc | | | | |
| Sold | — | — | 7,305 | $100,001 |
| Distributions reinvested | — | — | 482 | 6,545 |
| Repurchased | — | — | — | (1) |
| Net increase | — | — | 7,787 | $106,545 |
|
| |
| Class R2 sharesc | | | | |
| Sold | — | — | 7,355 | $100,714 |
| Distributions reinvested | — | — | 494 | 6,710 |
| Repurchased | — | — | — | (1) |
| Net increase | — | — | 7,849 | $107,423 |
|
| Class R3 shares | | | | |
| Sold | 61,803 | $824,287 | 19,080 | $265,714 |
| Distributions reinvested | 339 | 4,515 | 3,942 | 53,482 |
| Repurchased | (5,906) | (79,750) | (14,417) | (203,739) |
| Net increase | 56,236 | $749,052 | 8,605 | $115,457 |
|
| |
| Class R4 shares | | | | |
| Sold | 81,786 | $1,104,574 | 77,706 | $1,070,385 |
| Distributions reinvested | 680 | 9,033 | 9,444 | 127,980 |
| Repurchased | (2,016) | (27,039) | (15,696) | (220,828) |
| Net increase | 80,450 | $1,086,568 | 71,454 | $977,537 |
|
Lifestyle Moderate Portfolio
32
| | Period ended 8-31-06 a | Four months ended 12-31-06 b |
| | Shares | Amount | Shares | Amount |
|
| |
| Class R5 shares | | | | |
| Sold | 48,649 | $647,657 | 43,027 | $611,395 |
| Distributions reinvested | 482 | 6,410 | 5,172 | 70,052 |
| Repurchased | (1,932) | (26,226) | (10,492) | (150,063) |
| Net increase | 47,199 | $627,841 | 37,707 | $531,384 |
|
| |
| Class 1 shares | | | | |
| Sold | 134,937,718 | $1,753,494,793 | $6,640,443 | $92,685,843 |
| Distributions reinvested | 2,410,929 | 31,963,702 | 9,603,688 | 130,078,250 |
| Repurchased | (3,803,690) | (51,025,836) | (1,089,036) | (15,016,278) |
| Net increase | 133,544,957 | $1,734,432,659 | $15,155,095 | $207,747,815 |
|
| |
| Class 5 shares | | | | |
| Sold | 93,828 | $1,253,556 | $123,203 | $1,733,403 |
| Distributions reinvested | 37 | 490 | 13,160 | 177,978 |
| Repurchased | (11) | (152) | (15,002) | (211,893) |
| Net increase | 93,854 | $1,253,894 | 121,361 | $1,699,488 |
|
| Net increase | 137,345,265 | $1,785,520,486 | $17,299,212 | $237,576,843 |
a Class A, Class B, Class C, Class R3, Class R4 and Class R5 shares began operations on 10-18-05, and Class 1 shares began operation on 10-15-05.
b Effective 1-18-07, the fiscal year-end changed from August 31 to December 31.
c Class R, Class R1 and Class R2 shares began operations on 9-18-06.
6. Investment transactions
Purchases and sales of the affiliated underlying funds during the four month period ended December 31, 2006, aggregated $180,023,808 and $25,638,241, respectively.
The cost of investments owned on December 31, 2006, including short-term investments, for federal income tax purposes, was $1,972,860,660. Gross unrealized appreciation and depreciation of investments aggregated $120,929,733 and $5,740,194, respectively, resulting in net unrealized appreciation of $115,189,539.
7. Investment in affiliated underlying funds
The Portfolio invests primarily in the affiliated underlying funds that are managed by affiliates of the Adviser. The Portfolio does not invest in the affiliated underlying funds for the purpose of exercising management or control.
A summary of the Portfolio’s transactions in the securities of affiliated issuers in which the Portfolio’s holdings represent 5% or more of the outstanding voting securities of the issuer, during the four-month period ended December 31, 2006, is set forth below.
Lifestyle Moderate Portfolio
33
| | Beginning | | | | | |
| Affiliate — | Share | Shares | Shares | Ending Share | | Ending |
| Class NAV | Amount | Purchased | Sold | Amount | Proceeds | Value |
|
| Active Bond | 15,570,987 | 2,028,328 | 15,620 | 17,583,695 | $151,546 | $166,869,270 |
| Blue Chip Growth | 5,262,462 | 252,917 | 72,686 | 5,442,693 | 1,363,108 | 105,098,393 |
| Core Bond | 2,973,803 | 349,137 | 2,557 | 3,320,383 | 32,244 | 41,338,768 |
| Core Equity | 5,321,191 | 98,608 | 178,828 | 5,240,971 | 2,697,698 | 83,960,356 |
| Equity-Income | 2,060,856 | 183,638 | 1,882 | 2,242,612 | 36,810 | 42,116,247 |
| Fundamental Value | 4,714,343 | 258,939 | 10,140 | 4,963,142 | 170,540 | 84,373,413 |
| Global Bond | 7,576,371 | 1,188,889 | 110,921 | 8,654,339 | 1,693,105 | 125,055,203 |
| Global Real Estate | 3,666,366 | 177,354 | 240,819 | 3,602,901 | 2,738,411 | 42,334,083 |
| High Income | 5,665,191 | 291,457 | 164,705 | 5,791,943 | 1,768,595 | 62,900,502 |
| High Yield | 11,116,571 | 1,176,315 | 11,168 | 12,281,718 | 115,347 | 125,150,710 |
| International Core* | 2,372,200 | 172,221 | 83,680 | 2,460,741 | 3,391,590 | 104,950,619 |
| International | | | | | | |
| Equity Index | 1,974,971 | 134,461 | 45,511 | 2,063,921 | 912,741 | 42,310,376 |
| International | | | | | | |
| Opportunities | 1,165,892 | 41,049 | 14,137 | 1,192,804 | 245,951 | 21,434,693 |
| International Value | 3,151,314 | 331,438 | 101,469 | 3,381,283 | 1,923,649 | 63,196,178 |
| Investment | | | | | | |
| Quality Bond | 3,166,140 | 374,913 | 2,834 | 3,538,219 | 33,598 | 41,361,785 |
| Real Estate Equity | 3,443,977 | 172,322 | 320,990 | 3,295,309 | 3,848,264 | 38,884,649 |
| Real Return Bond | 5,602,786 | 821,592 | 4,606 | 6,419,772 | 60,466 | 83,071,852 |
| Small Cap | 1,357,954 | 27,197 | 40,770 | 1,344,381 | 624,824 | 20,730,358 |
| Small Company | 2,434,385 | 121,309 | 67,327 | 2,488,367 | 1,111,118 | 41,804,559 |
| Small Company Value | 804,498 | 41,832 | 18,307 | 828,023 | 466,010 | 20,833,066 |
| Spectrum Income | 14,555,152 | 1,441,772 | 12,950 | 15,983,974 | 136,124 | 166,712,853 |
| Strategic Bond | 3,160,762 | 323,765 | 2,840 | 3,481,687 | 34,110 | 41,432,074 |
| Strategic Income | 3,699,314 | 462,682 | 2,973 | 4,159,023 | 29,723 | 41,423,868 |
| Total Return | 16,315,260 | 2,132,243 | 56,450 | 18,391,053 | 783,675 | 250,486,142 |
| U.S. Government | | | | | | |
| Securities | 2,743,515 | 321,951 | 2,374 | 3,063,092 | 32,492 | 41,351,743 |
| U.S. High Yield Bond | 4,284,689 | 454,981 | 3,865 | 4,735,805 | 51,414 | 62,465,269 |
| U.S. Multi Sector | 7,213,778 | 478,837 | 30,033 | 7,662,582 | 327,064 | 84,211,774 |
| Value & Restructuring | 3,378,940 | 190,176 | 61,934 | 3,507,182 | 743,645 | 42,191,396 |
*Represents the Portfolio’s investment in John Hancock Funds III International Core Fund.
8. Reclassification of accounts
During the four-month period ended December 31, 2006, the Portfolio reclassified amounts to reflect a decrease in accumulated net realized gain on investments of $14,190,839, a decrease in accumulated net investment loss of $64,129,408 and a decrease in capital paid-in of $49,938,569. This represents the amounts necessary to report these balances on a tax basis, excluding certain temporary differences, as of December 31, 2006. Additional adjustments may be needed in subsequent reporting periods. These reclassifications, which have no impact on the net asset value of the Portfolio, are primarily attributable to certain differences in the computation of distributable income and capital gains under federal tax rules versus accounting principles generally accepted in the United States of America, book and tax differences in accounting for over-distribution. The calculation of net investment income per share in the Portfolio’s Financial Hig hlights excludes these adjustments.
Lifestyle Moderate Portfolio
34
Auditors’ report
Report of Independent Registered Public Accounting Firm
To the Board of Trustees of John Hancock Portfolios II and Shareholders of John Hancock Lifestyle Moderate Portfolio:
In our opinion, the accompanying statement of assets and liabilities, including the schedule of securities owned, and the related statements of operations and of changes in net assets and the financial highlights present fairly, in all material respects, the financial position of John Hancock Lifestyle Moderate Portfolio (the “Portfolio”) at December 31, 2006, the results of its operations, the changes in its net assets, and the financial highlights for each of the periods indicated, in conformity with accounting principles generally accepted in the United States of America. These financial statements and financial highlights (hereafter referred to as “financial statements”) are the responsibility of the Portfolio’s management; our responsibility is to express an opinion on these financial statements based on our audits. We conducted our audits of these financial statements in accordance with the standards of the Public Company Accounting Oversight Board (United States). Those standards require that we plan and perform the audits to obtain reasonable assurance about whether the financial statements are free of material misstatement. An audit includes examining, on a test basis, evidence supporting the amounts and disclosures in the financial statements, assessing the accounting principles used and significant estimates made by management, and evaluating the overall financial statement presentation. We believe that our audits, which included confirmation of securities at December 31, 2006, by correspondence with the transfer agent, provide a reasonable basis for our opinion.
PricewaterhouseCoopers LLP
Boston, Massachusetts
March 1, 2007
35
Tax information
Unaudited
For federal income tax purposes, the following information is furnished with respect to the distributions of the Portfolio, if any, paid during its taxable year ended December 31, 2006.
The Portfolio has designated distributions to shareholders of $998,369 as a long-term capital gain dividend.
With respect to the ordinary dividends paid by the Portfolio for the fiscal period ended December 31, 2006, 7.42% of the dividends qualify for the corporate dividends-received deduction.
The Portfolio hereby designates the maximum amount allowable of its net taxable income as qualified dividend income as provided in the Jobs and Growth Tax Relief Reconciliation Act of 2003. This amount will be reflected on Form 1099-DIV for the calendar year 2006.
Shareholders were mailed a 2006 U.S. Treasury Department Form 1099-DIV in January 2007. This will reflect the total of all distributions that are taxable for calendar year 2006.
36
Trustees and Officers
This chart provides information about the Trustees and Officers of John Hancock Funds II who oversee your John Hancock fund. Officers elected by the Trustees manage the day-to-day operations of the Portfolio and execute policies formulated by the Trustees.
| Independent Trustees | | |
| |
| Name, Year of Birth | | Number of |
| Position(s) held with Portfolio | Trustee | John Hancock |
| Principal occupation(s) and other | of Portfolio | funds overseen |
| directorships during past 5 years | since1 | by Trustee |
|
| Charles L. Bardelis, Born: 1941 | 2005 | 209 |
| Director, Island Commuter Corp. (marine transport). Trustee of John | | |
| Hancock Trust (since 1988). | | |
|
| Peter S. Burgess, Born: 1942 | 2005 | 209 |
| Consultant (financial, accounting and auditing matters (since 1999); | | |
| Certified Public Accountant; Partner, Arthur Andersen (prior to 1999). | | |
| Director of the following publicly traded companies: PMA Capital Corporation | | |
| (since 2004) and Lincoln Educational Services Corporation (since 2004). | | |
| Trustee of John Hancock Trust (since 2005). | | |
|
| Elizabeth G. Cook, Born: 1937 | 2005 | 209 |
| Expressive Arts Therapist, Massachusetts General Hospital (September 2001 | | |
| to present); Expressive Arts Therapist, Dana Farber Cancer Institute | | |
| (September 2000 to January 2004); President, The Advertising Club of Greater Boston. | |
| Trustee of John Hancock Trust (since 2005). | | |
|
| Hassell H. McClellan, Born: 1945 | 2005 | 209 |
| Associate Professor, The Wallace E. Carroll School of Management, Boston College. | |
| Trustee of John Hancock Trust (since 2005). | | |
|
| James M. Oates, Born: 1946 | 2005 | 209 |
| Managing Director, Wydown Group (financial consulting firm) (since 1994); | | |
| Chairman, Emerson Investment Management, Inc. (since 2000); Chairman, | | |
| Hudson Castle Group, Inc. (formerly IBEX Capital Markets, Inc.) (financial services | |
| company) (since 1997). Director of the following publicly traded companies: | | |
| Stifel Financial (since 1996); Investor Financial Services Corporation (since 1995); | |
| and Connecticut River Bancorp, Director (since 1998). Director, Phoenix Mutual | |
| Funds (since 1988). Trustee of John Hancock Trust (since 2004). | | |
1 Because the Trust does not hold regular annual shareholders meetings, each Trustee holds office for an indefinite term until his/her successor is duly elected and qualified or until he/she dies, retires, resigns, is removed or becomes disqualified.
37
| Non-Independent Trustee3 | | |
| |
| Name, Year of Birth | | Number of |
| Position(s) held with Portfolio | Trustee | John Hancock |
| Principal occupation(s) and other | of Portfolio | funds overseen |
| directorships during past 5 years | since1 | by Trustee |
|
| James R. Boyle, Born: 1959 | 2005 | 259 |
| Chairman and Director, John Hancock Advisers, LLC, The Berkeley Financial | | |
| Group, LLC (holding company) and John Hancock Funds, LLC; President, | | |
| John Hancock Annuities; Executive Vice President, John Hancock Life | | |
| Insurance Company (since June 2004); President, U.S. Annuities; Senior | | |
| Vice President, The Manufacturers Life Insurance Company (U.S.A.) (prior | | |
| to 2004). | | |
| |
| Principal officers who are not Trustees | | |
| |
| Name, Year of Birth | | |
| Position(s) held with Portfolio | | Officer |
| Principal occupation(s) and | | of Portfolio |
| directorships during past 5 years | | since |
|
| Keith F. Hartstein,2 Born: 1956 | | 2005 |
| President | | |
| Senior Vice President, Manulife Financial Corporation (since 2004); Director, | | |
| President and Chief Executive Officer, the Adviser, The Berkeley Group, John | | |
| Hancock Funds, LLC (since 2005); Director, MFC Global Investment Management | |
| (U.S.), LLC (“MFC Global (U.S.)”) (since 2005); Director, John Hancock Signature | |
| Services, Inc. (since 2005); President and Chief Executive Officer, John Hancock | |
| Investment Management Services, LLC (since 2006); President and Chief Executive | |
| Officer, John Hancock Funds II, John Hancock Funds III and John Hancock Trust; | |
| Director, Chairman and President, NM Capital Management, Inc. (since 2005); | | |
| Chairman, Investment Company Institute Sales Force Marketing Committee | | |
| (since 2003); Director, President and Chief Executive Officer, MFC Global (U.S.) | |
| (2005–2006); Executive Vice President, John Hancock Funds, LLC (until 2005). | | |
|
| Thomas M. Kinzler,2 Born: 1955 | | 2006 |
| Secretary | | |
| Vice President and Counsel, John Hancock Life Insurance Company (U.S.A.) | | |
| (since 2006); Secretary and Chief Legal Officer, John Hancock Funds, John | | |
| Hancock Funds II, John Hancock Funds III and John Hancock Trust (since 2006); | |
| Vice President and Associate General Counsel, Massachusetts Mutual Life | | |
| Insurance Company (1999–2006); Secretary and Chief Legal Counsel, MML | | |
| Series Investment Fund (2000–2006); Secretary and Chief Legal Counsel, | | |
| MassMutual Institutional Funds (2000–2004); Secretary and Chief Legal Counsel, | |
| MassMutual Select Funds and MassMutual Premier Funds (2004–2006). | | |
|
| Francis V. Knox, Jr.,2 Born: 1947 | | 2005 |
| Chief Compliance Officer | | |
| Vice President and Chief Compliance Officer, John Hancock Investment | | |
| Management Services, LLC, the Adviser and MFC Global (U.S.) (since 2005); | | |
| Vice President and Chief Compliance Officer, John Hancock Funds II, John | | |
| Hancock Funds III and John Hancock Trust (since 2005); Vice President and | | |
| Assistant Treasurer, Fidelity Group of Funds (until 2004); Vice President and | | |
| Ethics & Compliance Officer, Fidelity Investments (until 2001). | | |
| Principal officers who are not Trustees (continued) | |
| |
| Name, Year of Birth | |
| Position(s) held with Portfolio | Officer |
| Principal occupation(s) and other | of Portfolio |
| directorships during past 5 years | since |
|
| Gordon M. Shone,2 Born: 1956 | 2006 |
| Treasurer | |
| Treasurer, John Hancock Funds (since 2006), John Hancock Funds II, John | |
| Hancock Funds III and John Hancock Trust (since 2005); Vice President and | |
| Chief Financial Officer, John Hancock Trust (2003–2005); Senior Vice President, | |
| John Hancock Life Insurance Company (U.S.A.) (since 2001); Vice President, | |
| John Hancock Investment Management Services, Inc., John Hancock Advisers, | |
| LLC (since 2006) and The Manufacturers Life Insurance Company (U.S.A.) | |
| (1998–2000). | |
|
| John G. Vrysen,2 Born: 1955 | 2005 |
| Chief Financial Officer | |
| Senior Vice President, Manulife Financial Corporation (since 2006); Director, | |
| Executive Vice President and Chief Financial Officer, the Adviser, The Berkeley | |
| Group and John Hancock Funds, LLC (since 2005); Executive Vice President and | |
| Chief Financial Officer, John Hancock Investment Management Services, LLC | |
| (since 2005); Vice President and Chief Financial Officer, MFC Global (U.S.) | |
| (since 2005); Director, John Hancock Signature Services, Inc. (since 2005); | |
| Chief Financial Officer, John Hancock Funds II, John Hancock Funds III and John | |
| Hancock Trust (since 2005); Vice President and General Manager, Fixed Annuities, | |
| U.S. Wealth Management (until 2005); Vice President, Operations, Manulife | |
| Wood Logan (2000–2004). | |
1 Because the Trust does not hold regular annual shareholders meetings, each Trustee holds office for an indefinite term until his successor is duly elected and qualified or until he dies, retires, resigns, is removed or becomes disqualified.
2Affiliated with the investment adviser.
3 Non-Independent Trustee: holds positions with the Fund’s investment adviser, underwriter, and/ or certain other affiliates.
For more information
The Fund’s proxy voting policies, procedures and records are available without charge, upon request:
| By phone | On the Fund’s Web site | On the SEC’s Web site |
| 1-800-225-5291 | www.jhfunds.com/proxy | www.sec.gov |
|
| |
| Investment adviser | Custodian | Legal counsel |
| John Hancock Investment | State Street Bank & Trust Co. | Kirkpatrick & Lockhart |
| Management Services, Inc. | 2 Avenue de Lafayette | Preston Gates Ellis LLP |
| 601 Congress Street | Boston, MA 02111 | 1 Lincoln Street |
| Boston, MA 02210-2805 | | Boston, MA 02110-2950 |
| | Transfer agent | |
| Principal distributor | John Hancock Signature | Independent registered |
| John Hancock Funds, LLC | Services, Inc. | public accounting firm |
| 601 Congress Street | 1 John Hancock Way, | PricewaterhouseCoopers LLP |
| Boston, MA 02210-2805 | Suite 1000 | 125 High Street |
| | Boston, MA 02217-1000 | Boston, MA 02110 |
Each underlying affiliated fund’s accounting policies are outlined in the underlying affiliated fund’s shareholder report, available without charge by calling 1-800-344-1029 or on the Securities and Exchange Commission (“SEC”) Web site at www.sec.gov, File # 811-21779, CIK 0001331971.
The Portfolio’s investment objective, risks, charges and expenses are included in the prospectus and should be considered carefully before investing. For a prospectus, call your financial professional, call John Hancock Funds at 1-800-225-5291 or visit the Portfolio’s Web site at www.jhfunds.com. Please read the prospectus carefully before investing or sending money.
| How to contact us | |
|
| |
| Internet | www.jhfunds.com | |
|
| |
| Mail | Regular mail: | Express mail: |
| | John Hancock | John Hancock |
| | Signature Services, Inc. | Signature Services, Inc. |
| | 1 John Hancock Way, Suite 1000 | Mutual Fund Image Operations |
| | Boston, MA 02217-1000 | 380 Stuart Street |
| | | Boston, MA 02116 |
|
| |
| Phone | Customer service representatives | 1-800-225-5291 |
| | 24-hour automated information | 1-800-338-8080 |
| | TDD line | 1-800-554-6713 |
A listing of month-end portfolio holdings is available on our Web site, www.jhfunds.com. A more detailed portfolio holdings summary is available on a quarterly basis 60 days after the fiscal quarter on our Web site or upon request by calling 1-800-225-5291, or on the Securities and Exchange Commission’s Web site, www.sec.gov.
40
J O H N H A N C O C K F A M I L Y O F F U N D S
| EQUITY | INTERNATIONAL |
| Balanced Fund | Greater China Opportunities Fund |
| Classic Value Fund | International Allocation Portfolio |
| Classic Value Fund II | International Classic Value Fund |
| Core Equity Fund | International Core Fund |
| Focused Equity Fund | International Fund |
| Growth Fund | International Growth Fund |
| Growth Opportunities Fund | |
| Growth Trends Fund | INCOME |
| Intrinsic Value Fund | Bond Fund |
| Large Cap Equity Fund | Government Income Fund |
| Large Cap Select Fund | High Yield Fund |
| Mid Cap Equity Fund | Investment Grade Bond Fund |
| Mid Cap Growth Fund | Strategic Income Fund |
| Multi Cap Growth Fund | |
| Small Cap Equity Fund | TAX-FREE INCOME |
| Small Cap Fund | California Tax-Free Income Fund |
| Small Cap Intrinsic Value Fund | High Yield Municipal Bond Fund |
| Sovereign Investors Fund | Massachusetts Tax-Free Income Fund |
| U.S. Core Fund | New York Tax-Free Income Fund |
| U.S. Global Leaders Growth Fund | Tax-Free Bond Fund |
| Value Opportunities Fund | |
| | MONEY MARKET |
| ASSET ALLOCATION | Money Market Fund |
| Allocation Core Portfolio | U.S. Government Cash Reserve |
| Allocation Growth + Value Portfolio | |
| Lifecycle 2010 Portfolio | CLOSED-END |
| Lifecycle 2015 Portfolio | Bank and Thrift Opportunity Fund |
| Lifecycle 2020 Portfolio | Financial Trends Fund, Inc. |
| Lifecycle 2025 Portfolio | Income Securities Trust |
| Lifecycle 2030 Portfolio | Investors Trust |
| Lifecycle 2035 Portfolio | Patriot Global Dividend Fund |
| Lifecycle 2040 Portfolio | Patriot Preferred Dividend Fund |
| Lifecycle 2045 Portfolio | Patriot Premium Dividend Fund I |
| Lifecycle Retirement Portfolio | Patriot Premium Dividend Fund II |
| Lifestyle Aggressive Portfolio | Patriot Select Dividend Fund |
| Lifestyle Balanced Portfolio | Preferred Income Fund |
| Lifestyle Conservative Portfolio | Preferred Income II Fund |
| Lifestyle Growth Portfolio | Preferred Income III Fund |
| Lifestyle Moderate Portfolio | Tax-Advantaged Dividend Income Fund |
| |
| SECTOR | |
| Financial Industries Fund | |
| Health Sciences Fund | |
| Real Estate Fund | |
| Regional Bank Fund | |
| Technology Fund | |
| Technology Leaders Fund | |
For more complete information on any John Hancock Fund and an Open-End fund prospectus, which includes charges and expenses, call your financial professional, or John Hancock Funds at 1-800-225-5291 for Open-End fund information and 1-800-852-0218 for Closed-End fund information. Please read the Open-End fund prospectus carefully before investing or sending money.

1-800-225-5291
1-800-554-6713 TDD
1-800-338-8080 EASI-Line
www.jhfunds.com
Now available: electronic delivery
www.jhfunds.com/edelivery
This report is for the information of the shareholders of John Hancock Lifestyle Moderate Portfolio.
9700A 12/06
2/07
ITEM 2. CODE OF ETHICS.
(a) As of the end of the period, December 31, 20061, the registrant has adopted a code of ethics, as defined in Item 2 of Form N-CSR, that applies to its Chief Executive Officer and Chief Financial Officer (respectively, the principal executive officer, the principal financial officer, the “Covered Officers”). A copy of the code of ethics is filed as an exhibit to this Form N-CSR.
1 In the calendar year 2006, the fiscal year end for the Lifestyle Aggressive Portfolio, Lifestyle Balanced Portfolio, Lifestyle Conservative Portfolio, Lifestyle Growth Portfolio and Lifestyle Moderate Portfolio, each a separate series of the Registrant, was changed from August 31 to December 31. The fiscal year end for the other series of the Registrant remains August 31In the calendar year 2006, the fiscal year end for these funds changed from August 31 to December 31.
(b)Not Applicable
(c)Not Applicable
(d)Not Applicable
(e)Not Applicable
(f)(1) A copy of the Code of Ethics is attached hereto.
(f)(3) The Registrant will provide a copy of the Code of Ethics to any person without charge, upon request by calling the following toll free number (800) 344-1029.
ITEM 3. AUDIT COMMITTEE FINANCIAL EXPERT.
The Board of Trustees of the Registrant has determined that it has one “audit committee financial expert” as that term is defined in Item 3(b) of Form N-CSR: Peter S. Burgess, who is “independent” as that term is defined in Item 3(a) (2) of Form N-CSR.
ITEM 4. PRINCIPAL ACCOUNTANT FEES AND SERVICES.
(a) AUDIT FEES:
From 9/1/06 to 12/31/06 $63,685
From 10/15/05 (commencement of operations) to 8/31/06: $1,346,000
These fees relate to professional services rendered by the principal accountant, PricewaterhouseCoopers LLP (“PWC”), for the audits of the Registrant’s annual financial statements or services that are normally provided by the accountant in connection with statutory and regulatory filing or engagements for such period.
(b) AUDIT RELATED FEES:
From 9/1/06 to 12/31/06 $24,960
From 10/15/05 (commencement of operations) to 8/31/06: $629,000
These fees represent the aggregate fees billed for the Reporting Period for assurance and related services by PWC that are reasonably related to the performance of the audit of the Registrant’s financial statements and are not reported under paragraph (a) of this Item. Such fees relate to professional services rendered by PWC for separate audit reports in connection with 17f-2 security counts and fund merger audit services.
(c) TAX FEES:
From 9/1/06 to 12/31/06 $14,805
From 10/15/05 (commencement of operations) to 8/31/06: $374,000
These fees represent aggregate fees billed for the Reporting Period for professional services rendered by PWC for tax compliance, tax advice and tax planning. The tax services provided by PWC related to the review of the Registrant’s federal and state income tax returns, excise tax calculations and returns and a review of the Registrant’s calculations of capital gain and income distributions.
(d) ALL OTHER FEES; None.
(e) (1) The audit committee’s pre-approval policies and procedures described in paragraph (c) (7) of Rule 2-01 of Regulation S-X are attached. (2) Amount approved by the Audit Committee pursuant paragraph (c) (7) (i) (7) of Rule 2-01 of Regulation S-X: None.
(f) Not Applicable.
(g) The aggregate non-audit fees billed by PWC for services rendered to the registrant and rendered to the registrant’s control affiliates for each of the last two fiscal years of the registrant were $1,832,000 for the fiscal year ended 2006, and $0 for the fiscal year ended 2005.
(h) The Registrant’s audit committee of the Board of Trustees has considered the provision of non-audit services that were rendered to the Registrant’s investment adviser and service affiliates that were not pre-approved pursuant to paragraph (c) (7) of Rule 2-01 of Regulation S-X, to be compatible with maintaining PWC’s independence
ITEM 5. AUDIT COMMITTEE OF LISTED REGISTRANTS Not Applicable.
ITEM 6. SCHEDULE OF INVESTMENTS. Included with Item 1.
ITEM 7. DISCLOSURE OF PROXY VOTING POLICIES AND PROCEDURES FOR CLOSED-END MANAGEMENT INVESTMENT COMPANIES. Not Applicable.
ITEM 8. PORTFOLIO MANAGERS OF CLOSED-END MANAGEMENT INVESTMENT COMPANIES. Not Applicable.
ITEM 9. PURCHASE OF EQUITY SECURITIES BY CLOSED-END MANAGEMENT INVESTMENT COMPANIES AND AFFILIATED PURCHASERS. Not Applicable.
ITEM 10. SUBMISSION OF MATTERS TO VOTE OF SECURITY HOLDERS. Not Applicable.
ITEM 11. CONTROLS AND PROCEDURES.
(a) EVALUATION OF DISCLOSURE CONTROLS AND PROCEDURES. The Registrant maintains disclosure controls and procedures that are designed to ensure that information required to be disclosed in this Form N-CSR is recorded, processed, summarized and reported within the periods specified in the rules and forms of the Securities and Exchange Commission. Such disclosure controls and procedures include controls and procedures designed to ensure that such information is accumulated and communicated to the Registrant's management, including its principal executive officer and principal financial officer, as appropriate, to allow timely decisions regarding required disclosure.
Within 90 days prior to the filing date of this Form N-CSR, the Registrant had carried out an evaluation, under the supervision and with the participation of the Registrant's management, including the Registrant's principal executive officer and the Registrant's principal financial officer, of the effectiveness of the design and operation of the Registrant's disclosure controls and procedures relating to information required to be disclosed on Form N-CSR. Based on such evaluation, the Registrant's principal executive officer and principal financial officer concluded that the Registrant's disclosure controls and procedures are operating effectively to ensure that:
(i) information required to be disclosed in this Form N-CSR is recorded, processed, summarized and reported within the periods specified in the rules and forms of the Securities and Exchange Commission, and (ii) information is accumulated and communicated to the Registrant’s management, including its principal executive officer and principal financial officer, as appropriate, to allow timely decisions regarding required disclosure.
(b) CHANGE IN REGISTRANT’S INTERNAL CONTROL: Not Applicable.
ITEM 12. EXHIBITS.
(a)(1) SEE ATTACHED CODE OF ETHICS.
(a)(2)(i) CERTIFICATION OF PRINCIPAL EXECUTIVE OFFICER.
(a)(2)(ii) CERTIFICATION OF PRINCIPAL FINANCIAL OFFICER.
(b) CERTIFICATION PURSUANT TO Rule 30a-2(b) OF THE INVESTMENT COMPANY ACT OF 1940
SIGNATURES
Pursuant to the requirements of the Securities Exchange Act of 1934 and the Investment Company Act of 1940, the registrant has duly caused this report to be signed on its behalf by the undersigned, thereunto duly authorized.
JOHN HANCOCK FUNDS II
By: /s/ Keith F. Hartstein
-------------------------------------
Keith F. Hartstein
President and Chief Executive Officer
Date: March 1, 2007
Pursuant to the requirements of the Securities Exchange Act of 1934 and the Investment Company Act of 1940, this report has been signed below by the following persons on behalf of the registrant and in the capacities and on the dates indicated.
By: /s/ Keith F. Hartstein
-------------------------------------
Keith F. Hartstein
President and Chief Executive Officer
Date: March 1, 2007
By: /s/ John G. Vrysen
-------------------------------------
John G. Vrysen
Chief Financial Officer
Date: March 1, 2007