UNITED STATES
SECURITIES AND EXCHANGE COMMISSION
Washington, D.C. 20549
FORM N-CSR
CERTIFIED SHAREHOLDER REPORT OF REGISTERED MANAGEMENT INVESTMENT COMPANIES
Investment Company Act file number 811-21779
JOHN HANCOCK FUNDS II
---------------------------------------------------------
(Exact name of registrant as specified in charter)
601 CONGRESS STREET, BOSTON, MA 02210-2805
-------------------------------------------------------------
(Address of principal executive offices) (Zip code)
GORDON M. SHONE, 601 CONGRESS STREET, BOSTON, MA 02210-2805
------------------------------------------------------------------------------------------
(Name and address of agent for service)
Registrant's telephone number, including area code: (617) 663-3000
--------------
Date of fiscal year end: 8/31
- ------
Date of reporting period: 8/31/07
- -------
ITEM 1. REPORTS TO STOCKHOLDERS.
The first report applies to the 9 Lifecycle Portfolios and the second report applies to 58 of the Registrant’s Funds


| | |
|
| TABLE OF CONTENTS |
| | |
| |
| Managers’ commentary |
| |
| Market review |
| page 2 |
| | |
| |
| Lifecycle 2045 Portfolio |
| page 4 |
| | |
| |
| Lifecycle 2040 Portfolio |
| page 6 |
| | |
| |
| Lifecycle 2035 Portfolio |
| page 8 |
| | |
| |
| Lifecycle 2030 Portfolio |
| page 10 |
| | |
| |
| Lifecycle 2025 Portfolio |
| page 12 |
| | |
| |
| Lifecycle 2020 Portfolio |
| page 14 |
| | |
| |
| Lifecycle 2015 Portfolio |
| page 16 |
| | |
| |
| Lifecycle 2010 Portfolio |
| page 18 |
| | |
| |
| Lifecycle Retirement |
| Portfolio |
| page 20 |
| | |
| |
| Your expenses |
| page 22 |
| | |
| |
| Portfolio’s investments |
| page 28 |
| | |
| |
| Financial statements |
| page 33 |
| | |
| |
| Financial highlights |
| page 42 |
| | |
| |
| Trustees and Officers |
| page 76 |
| | |
| |
| For more information |
| page 80 |
| | |
CEO corner
To Our Shareholders,
Volatility returned to the U.S. stock market in the 12-month period ended August 31, 2007; however, stocks still posted a strong gain of 15.13%, as measured by the Standard & Poor’s 500 Index. The market experienced a particularly sharp downturn in August, as the subprime mortgage market’s woes increased. Rising defaults and an ensuing credit crunch caused heightened fears about their potential impact on U.S. economic growth. Foreign markets felt some ripple effects from the subprime issue, but they continued nonetheless to benefit from solid economic growth and outperformed the U.S. market in this period.
During this period of volatility, the U.S. stock market also passed a significant milestone — the broad Standard & Poor’s 500 Index climbed beyond the record it had set seven years ago. From its peak in March 2000, the stock market spiraled downward three consecutive years, bottoming in 2002. The upturn began in 2003, and the market has advanced each year since, finally setting a new high for the first time on May 30, 2007. During that period, the S&P 500 Index experienced five significant short-term sell-offs of 6% or more, with the August subprime-induced meltdown being the most recent.
This nearly complete market cycle highlights the importance of two investment principles you have heard us speak of often: diversification and patience. By allocating your investments among different asset classes, investment styles and portfolio managers, you are likely to be well represented through all phases of a complete market cycle, with the winners helping to cushion the fall of the losers.
The challenge for investors with a diversified portfolio is to properly evaluate your investments to tell the difference between an underperforming manager and an out-of-favor style, while also understanding the role each investment plays in your portfolio. That’s where your financial professional can provide true value. He or she can help you make those assessments and also counsel patience, because a properly diversified portfolio by its very nature will typically have something lagging or out of favor — a concept that can be difficult to live with, but necessary to embrace. If everything in your portfolio is “working,” then you are not truly diversified, but rather are leveraged to the current market and the flavor of the day. If so, you are bound to be out of step in the near future.
The recent volatility in the securities markets has prompted many investors to question how long this type of market cycle will last. History tells us it will indeed end and that when it does, today’s leaders may well turn into laggards and vice versa. The subprime mortgage market woes are just the latest example of why investors should be both patient and well-diversified. For with patience and a diversified portfolio, it could be easier to weather the market’s twists and turns and reach your long-term goals.
Sincerely,

Keith F. Hartstein,
President and Chief Executive Officer
This commentary reflects the CEO’s views as of August 31, 2007. They are subject to change at any time.
Managers’ commentary
From the MFC Global Investment Management (U.S.A.) Limited, Portfolio Management Team
Market review
From October 30, 2006, when the Lifecycle Portfolios were launched, through August 31, 2007, equity markets produced positive results, as measured by the broad Standard & Poor’s 500 Index’s 8.75% return. Fixed-income markets also performed well, as measured by the Lehman Brothers U.S. Aggregate Index’s return of 4.04% .
The markets managed these gains despite two sharp corrections in the span of five months and a significant increase in volatility. The first correction occurred in late February after a short-term sell-off in China’s stock market sparked sharp global equity market declines. This adjustment was short-lived and investors soon rekindled their appetite for riskier equities. The desire for higher returns was fed by abundant global liquidity created by low interest rates across the globe. From mid-July through mid-August, the global markets underwent another rough patch. Stocks across the board tumbled as concerns in the credit market caused a flight from riskier asset classes. Market volatility increased in response to problems with subprime mortgage defaults and delinquencies, and the accompanying fears that this crisis could cause a severe slowdown or recession.
Over the reporting period, within the U.S. equity markets, mid-cap stocks, which many believe to be the “sweet spot” of the market capitalization spectrum, outperformed U.S. large- and small-cap stocks. Large-cap stocks outperformed small-cap stocks. Growth stocks, after an extended period of lagging value stocks, reversed the trend and outperformed.
| |
| | Since the |
| | Portfolios’ |
| Market Index Total Returns | inception |
| as of August 31, 2007 | 10-30-06 |
| |
| U.S. Stocks | |
|
| S&P 500 Index | 8.75% |
| Russell Midcap Index | 9.97 |
| Russell 2000 Index | 4.58 |
| FTSE NAREIT Equity REIT Index | –4.74 |
| |
| International Stocks | |
|
| MSCI EAFE Gross Total Return Index | 14.53 |
| MSCI Emerging Markets Index | 30.31 |
| MSCI International Small Cap Index | 13.96 |
| MSCI Natural Resources1 | 23.73 |
| |
| U.S. Fixed Income | |
|
| Lehman Brothers U.S. Aggregate Index | 4.04 |
| Merrill Lynch High Yield Master II Index | 3.93 |
| JPM Global Bond Unhedged Index | 5.72 |
1 A blended index comprised of three MSCI indexes according to the following weightings: 60% Energy/30% Minerals and Mining/10% Paper and Forest.
For the 10 months ended August 31, 2007, overseas markets maintained their edge over the U.S. market. Strong global growth and a relatively weak U.S. dollar led to solid gains for the MSCI EAFE Gross Total Return Index (up 14.53%) and the MSCI International Small Cap Index (up 13.96%) . Global natural resources equities also continued to trend higher, on the strength of the minerals and mining segment. Meanwhile, after a long period of exceptional performance, U.S. real estate investment trusts (REITs) tumbled in the second quarter of 2007 and the FTSE NAREIT Equity REIT Index finished down 4.74% for the reporting period. Global REITs also struggled, but remained in positive territory for this period.
Bonds had slipped lower by the end of the second quarter of 2007, as inflation fears caused many investors to abandon their expectations for a Federal Reserve interest rate cut. As the summer began to heat up, however, the subprime mortgage debacle caused a recession scare that sent high-quality bond prices up. The Lehman Brothers U.S. Aggregate Index gained 4.04% . Meanwhile, the high-yield bond market, as measured by Merrill Lynch U.S. High Yield Master II Index, posted a return of 3.93% over the reporting
Lifecycle Portfolios
2
period. While high yield bonds posted strong returns early in the period, credit spreads widened significantly during this summer’s flight from risk, causing this class to give back some of the gains it had earned.
Global bonds — as measured by the JP Morgan Global Bond Index’s return of 5.72% — were one of the best-performing fixed-income segments over the period, as the U.S. dollar continued to depreciate versus the major currencies of the world.
In sum, investors were rewarded for staying the course through all of the market gyrations. The John Hancock Lifecycle Portfolios’ broad diversification across multiple asset classes and fund managers was valuable during this volatile market environment. In this period, the Lifecycle Portfolios’ performance ranged from 6.19% to 11.97% (A shares), outperforming their benchmark indexes in all but one case. The returns were greater for the portfolios dated further out in time, since these portfolios have a greater allocation to equities, which outperformed in this period.
“For the 10 months ended
August 31, 2007, overseas
markets maintained their
edge over the U.S. market.”
Outlook
Global credit markets continue to experience problems, forcing intervention from central banks in the form of liquidity infusions. A silver lining, however, is that global inflation is currently stable, thus allowing the U.S. Federal Reserve and global central banks ample room to fully utilize their monetary policy arsenal — primarily in the form of interest rate cuts. We expect a rate cut to soften the landing by aiding the consumer, rather than igniting liquidity-induced securitization of risky investments, as was the case with the subprime mortgage market.
We continue to believe that global equity valuations are reasonable and we are maintaining our positive outlook, even when taking into account the potential for a modest contraction in global growth. Our view is that the longer-term trend is upward. Indeed, if rates remain low and the economy remains stable, the bull market may extend into a sixth year. However, the road to higher equity prices, both at home and abroad, could remain bumpy as economic uncertainty and market volatility take center stage.
This commentary reflects the views of the portfolio managers through the end of the period discussed in this report. The managers’ statements reflect their own opinions. As such, they are in no way guarantees of future events, and are not intended to be used as investment advice or a recommendation regarding any specific security. They are also subject to change at any time as market and other conditions warrant.
International investing involves special risks such as political, economic and currency risks and differences in accounting standards and financial reporting. Sector investing is subject to greater risks than the market as a whole. See the prospectus for the risks of investing in small-cap stocks and high yield bonds.

Lifecycle Portfolios
3
John Hancock
Lifecycle 2045 Portfolio
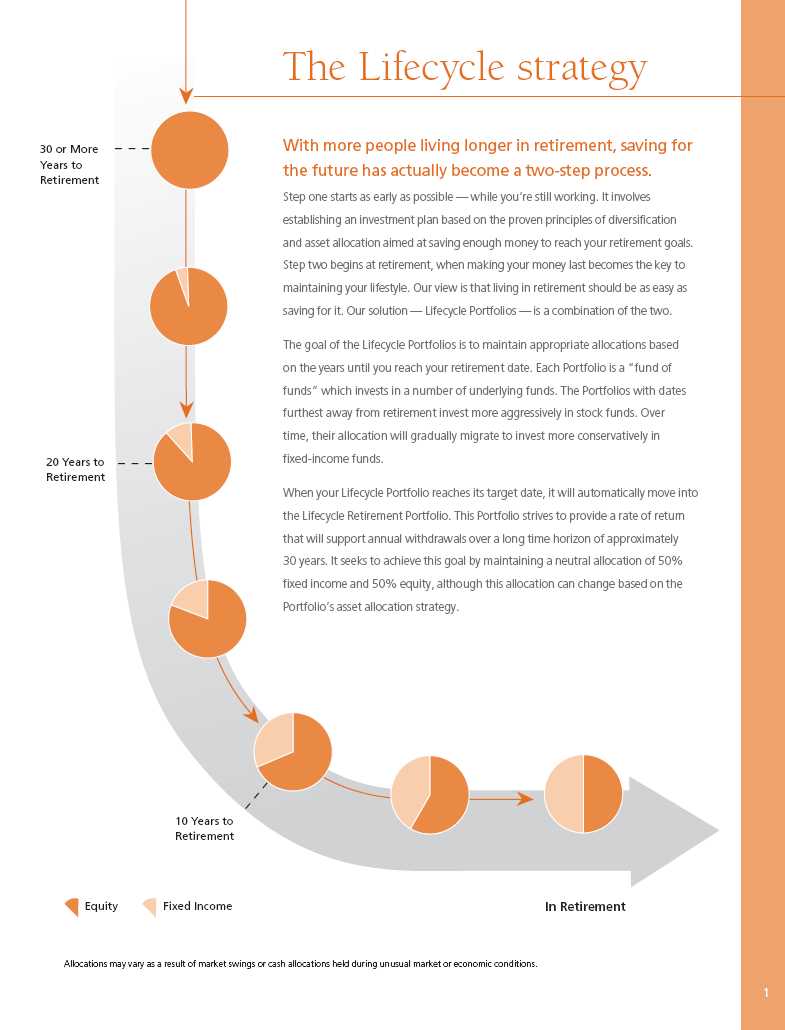
Goal and strategy
The Portfolio seeks high total return until its target retirement date. To pursue this goal, the Portfolio, which is a fund of funds, invests under normal circumstances, substantially all of its assets in affiliated underlying funds using an asset allocation strategy designed for investors expected to retire in 2045.
| |
| Asset Allocation1 | |
| | |
| Equity | % of Total |
|
| U.S. Large Cap | 37.0 |
|
| U.S. Mid Cap | 14.0 |
|
| U.S. Small Cap | 13.0 |
|
| International Blend | 20.0 |
|
| International Small Cap | 10.0 |
|
| Natural Resources | 6.0 |
|
1As a percentage of net assets on August 31, 2007.
Performance review
Since inception October 30, 2006 through August 31, 2007, the Lifecycle 2045 Portfolio’s Class A, Class B, Class C, Class R, Class R1, Class R2, Class R3, Class R4, Class R5 and Class 1 produced total returns of 11.97%, 11.33%, 11.33%, 11.53%, 11.68%, 11.93%, 11.80%, 12.06%, 12.32% and 12.32%, respectively, at net asset value. In comparison, the Portfolio’s benchmark index — the Standard & Poor’s 500 Index — returned 8.75% in the same period.
Broad outperformance
Outperformance versus the broad benchmark can be attributed to strong performance from the Portfolio’s large-cap managers, as well as to allocations to mid-cap stocks, international stocks and alternative assets, such as global natural resource stocks.
The Portfolio’s large-cap value fund — Value & Restructuring (Excelsior) — made positive contributions from an overweight to the energy and metals and mining sectors, and excellent overall security selection, particularly in technology companies. The Portfolio’s large-cap growth fund, Blue Chip Growth (T. Rowe Price), capitalized on an overweight to technology holdings and superior stock selection in the consumer discretionary space. One notable underperforming fund, which detracted from portfolio results, was Core Equity (Legg Mason). This fund suffered from a lack of exposure to the strong-performing energy sector and also demonstrated poor stock selection in the financial sector, particularly with home builder-related stocks. In the mid-cap growth space, Mid Cap Stock (Wellington) performed exceptionally well thanks to its security selection acumen, particularly in the materials and consumer discretionary sectors. Another mid-cap manager, Value Fund (Van Kampen), also contributed significantly through its security selection in the financial and technology sectors. Emerging Small Company (RCM) aided the Portfolio’s outperformance as a result of its stock picking in both the consumer discretionary and staples sectors.
Also aiding the Portfolio was its exposure to international markets, including a standout performance by International Opportunities (Marsico), which benefited from its overweight to Hong Kong and Canada and from excellent security selection within telecommunications and energy. International Small Cap (Templeton) was buoyed by its exposure to high-performing markets, most notably China, Taiwan, Hong Kong and the U.K. An underweight to a slumping Japan market and good overall security selection in the industrial and consumer discretionary sectors also contributed positively. The Portfolio’s exposure to non-traditional asset classes also provided healthy gains. For example, Natural Resources (Wellington) continued its stellar run on the strength of the metals and mining segment.
Lifecycle 2045 Portfolio
4
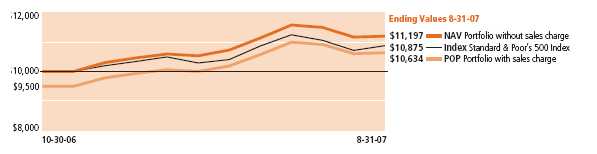
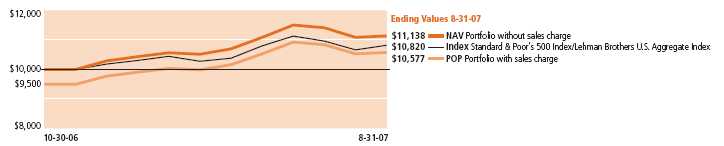
Growth of $10,000
This chart shows what happened to a hypothetical $10,000 investment in Class A shares for the period indicated. For comparison, we’ve shown the same investment in the S&P 500 Index.
| | | | | | | | | |
| | Class B | Class C | Class R1 | Class R11 | Class R21 | Class R31 | Class R41 | Class R51 | Class 11 |
| Period beginning | 10-30-06 | 10-30-06 | 10-30-06 | 10-30-06 | 10-30-06 | 10-30-06 | 10-30-06 | 10-30-06 | 10-30-06 |
|
| Without sales charge | 11,133 | 11,133 | 11,153 | 11,168 | 11,193 | 11,180 | 11,206 | 11,232 | 11,232 |
|
| With maximum sales charge | 10,633 | 11,033 | 11,153 | 11,168 | 11,193 | 11,180 | 11,206 | 11,232 | 11,232 |
|
| Index | 10,875 | 10,875 | 10,875 | 10,875 | 10,875 | 10,875 | 10,875 | 10,875 | 10,875 |
|
Performance chart
Cumulative total returns with maximum sales charge (POP) for the period ending August 31, 2007.
| | | | | | | | | | |
| | Class A | Class B | Class C | Class R1 | Class R11 | Class R21 | Class R31 | Class R41 | Class R51 | Class 11 |
| Inception | 10-30-06 | 10-30-06 | 10-30-06 | 10-30-06 | 10-30-06 | 10-30-06 | 10-30-06 | 10-30-06 | 10-30-06 | 10-30-06 |
|
| Since inception | 6.34% | 6.33% | 10.33% | 11.53% | 11.68% | 11.93% | 11.80% | 12.06% | 12.32% | 12.32% |
|
Performance figures assume all distributions are reinvested. Returns at public offering price (POP) reflect a sales charge on Class A shares of 5%, and the applicable contingent deferred sales charge (CDSC) on Class B and Class C shares. The Class B shares’ CDSC declines annually between years 1–6 according to the following schedule: 5, 4, 3, 3, 2, 1%. No sales charge will be assessed after the sixth year. Class C shares held for less than one year are subject to a 1% CDSC. Sales charge is not applicable for Class R, Class R1, Class R2, Class R3, Class R4, Class R5 and Class 1 shares.
The expense ratios of the Portfolio, both net (including any fee waivers or expense limitations) and gross (excluding any fee waivers or expense limitations), are set forth according to the most recent publicly available Prospectuses for the Fund and may differ from the expense ratios disclosed in the Financial Highlights tables in this report. The waivers and expense limitations are contractual at least until 12-31-07. The net expenses are as follows: Class A — 0.65%, Class B — 1.35%, Class C — 1.35%, Class R — 1.20%, Class R1 — 0.95%, Class R2 — 0.70%, Class R3 — 0.85%, Class R4 — 0.55%, Class R5 — 0.25%, Class 1 — 0.20% . Had the fee waivers and expense limitations not been in place, the gross expenses would be as follows: Class A — 2.31%, Class B — 3.01%, Class C — 3.01%, Class R — 2.86%, Class R1 — 2.61%, Class R2 — 2.36%, Class R3 — ; 2.51%, Class R4 — 2.21%, Class R5 — 1.91%, Class 1 — 0.28% .
The returns reflect past results and should not be considered indicative of future performance. The return and principal value of an investment will fluctuate so that shares, when redeemed, may be worth more or less than their original cost. Due to market volatility, the Portfolio’s current performance may be higher or lower than the performance shown. For performance data current to the most recent month end, please call 1-800-225-5291 or visit the Portfolio’s Web site at www.jhfunds.com.
The performance table and chart do not reflect the deduction of taxes that a shareholder would pay on fund distributions or the redemption of fund shares.
The Portfolio’s performance results reflect any applicable expense reductions, without which the expenses would increase and results would have been less favorable.
It is not possible to invest directly in an index. Index figures do not reflect sales charges and would be lower if they did.
Since inception performance is calculated with an opening price on the inception date of the Portfolio.
1 For certain types of investors as described in the Portfolio’s Class R, Class R1, Class R2, Class R3, Class R4, Class R5 and Class 1 share prospectuses.
Lifecycle 2045 Portfolio
5
John Hancock
Lifecycle 2040 Portfolio
Goal and strategy
The Portfolio seeks high total return until its target retirement date. To pursue this goal, the Portfolio, which is a fund of funds, invests under normal circumstances, substantially all of its assets in affiliated underlying funds using an asset allocation strategy designed for investors expected to retire in 2040.
| |
| Asset Allocation1 | |
| | |
| Equity | % of Total |
|
| U.S. Large Cap | 37.0 |
|
| U.S. Mid Cap | 14.0 |
|
| U.S. Small Cap | 13.0 |
|
| International Blend | 20.0 |
|
| International Small Cap | 10.0 |
|
| Natural Resources | 6.0 |
|
1As a percentage of net assets on August 31, 2007.
Performance review
Since inception October 30, 2006 through August 31, 2007, the Lifecycle 2040 Portfolio’s Class A, Class B, Class C, Class R, Class R1, Class R2, Class R3, Class R4, Class R5 and Class 1 produced total returns of 11.99%,11.35%, 11.35%, 11.55%, 11.70%, 11.95%, 11.82%, 12.07%, 12.33% and 12.34%, respectively, at net asset value. In comparison, the Portfolio’s benchmark index — the Standard & Poor’s 500 Index — returned 8.75% in the same period.
Broad outperformance
Outperformance versus the broad benchmark can be attributed to strong performance from the Portfolio’s large-cap managers, as well as to allocations to mid-cap stocks, international stocks and alternative assets, such as global natural resource stocks.
The Portfolio’s large-cap value fund — Value & Restructuring (Excelsior) — made positive contributions from an overweight to the energy and metals and mining sectors, and excellent overall security selection, particularly in technology companies. The Portfolio’s large-cap growth fund, Blue Chip Growth (T. Rowe Price), capitalized on an overweight to technology holdings and superior stock selection in the consumer discretionary space. One notable underperforming fund, which detracted from portfolio results, was Core Equity (Legg Mason). This fund suffered from a lack of exposure to the strong-performing energy sector and also demonstrated poor stock selection in the financial sector, particularly with home builder-related stocks.
In the mid-cap growth space, Mid Cap Stock (Wellington) performed exceptionally well thanks to its security selection acumen, particularly in the materials and consumer discretionary sectors. Another mid-cap manager, Value Fund (Van Kampen), also contributed significantly through its security selection in the financial and technology sectors. Emerging Small Company (RCM) aided the Portfolio’s outperformance, thanks to its stock picking in both the consumer discretionary and staples sectors.
Also aiding the Portfolio was its exposure to international markets, including a standout performance by International Opportunities (Marsico), which benefited from its overweight to Hong Kong and Canada and from excellent security selection within telecommunications and energy. International Small Cap (Templeton) was buoyed by its exposure to high-performing markets, most notably China, Taiwan, Hong Kong and the U.K. An underweight to a slumping Japan market and good overall security selection in the industrial and consumer discretionary sectors also contributed positively. The Portfolio’s exposure to non-traditional asset classes also provided healthy gains. For example, Natural Resources (Wellington) continued its stellar run on the strength of the metals and mining segment.
Lifecycle 2040 Portfolio
6
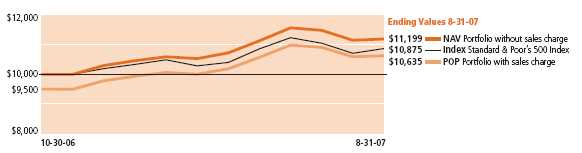
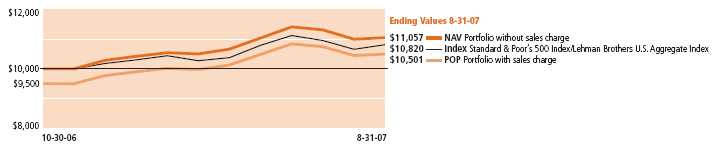
Growth of $10,000
This chart shows what happened to a hypothetical $10,000 investment in Class A shares for the period indicated. For comparison, we’ve shown the same investment in the S&P 500 Index.
| | | | | | | | | |
| | Class B | Class C | Class R1 | Class R11 | Class R21 | Class R31 | Class R41 | Class R51 | Class 11 |
| Period beginning | 10-30-06 | 10-30-06 | 10-30-06 | 10-30-06 | 10-30-06 | 10-30-06 | 10-30-06 | 10-30-06 | 10-30-06 |
|
| Without sales charge | 11,135 | 11,135 | 11,155 | 11,170 | 11,195 | 11,182 | 11,207 | 11,233 | 11,234 |
|
| With maximum sales charge | 10,635 | 11,035 | 11,155 | 11,170 | 11,195 | 11,182 | 11,207 | 11,233 | 11,234 |
|
| Index | 10,875 | 10,875 | 10,875 | 10,875 | 10,875 | 10,875 | 10,875 | 10,875 | 10,875 |
|
Performance chart
Cumulative total returns with maximum sales charge (POP) for the period ending August 31, 2007
| | | | | | | | | | |
| | Class A | Class B | Class C | Class R1 | Class R11 | Class R21 | Class R31 | Class R41 | Class R51 | Class 11 |
| Inception | 10-30-06 | 10-30-06 | 10-30-06 | 10-30-06 | 10-30-06 | 10-30-06 | 10-30-06 | 10-30-06 | 10-30-06 | 10-30-06 |
|
| Since inception | 6.35% | 6.35% | 10.35% | 11.55% | 11.70% | 11.95% | 11.82% | 12.07% | 12.33% | 12.34% |
|
Performance figures assume all distributions are reinvested. Returns at public offering price (POP) reflect a sales charge on Class A shares of 5%, and the applicable contingent deferred sales charge (CDSC) on Class B and Class C shares. The Class B shares’ CDSC declines annually between years 1–6 according to the following schedule: 5, 4, 3, 3, 2, 1%. No sales charge will be assessed after the sixth year. Class C shares held for less than one year are subject to a 1% CDSC. Sales charge is not applicable for Class R, Class R1, Class R2, Class R3, Class R4, Class R5 and Class 1 shares.
The expense ratios of the Portfolio, both net (including any fee waivers or expense limitations) and gross (excluding any fee waivers or expense limitations), are set forth according to the most recent publicly available Prospectuses for the Fund and may differ from the expense ratios disclosed in the Financial Highlights tables in this report. The waivers and expense limitations are contractual at least until 12-31-07. The net expenses are as follows: Class A — 0.65%, Class B — 1.35%, Class C — 1.35%, Class R — 1.20%, Class R1 — 0.95%, Class R2 — 0.70%, Class R3 — 0.85%, Class R4 — 0.55%, Class R5 — 0.25%, Class 1 — 0.20% . Had the fee waivers and expense limitations not been in place, the gross expenses would be as follows: Class A — 1.26%, Class B — 1.96%, Class C — 1.96%, Class R — 1.81%, Class R1 — 1.56%, Class R2 — 1.31%, Class R3 — 1.46%, Class R4 — 1.16%, Class R5 &# 151; 0.86%, Class 1 — 0.20% .
The returns reflect past results and should not be considered indicative of future performance. The return and principal value of an investment will fluctuate so that shares, when redeemed, may be worth more or less than their original cost. Due to market volatility, the Portfolio’s current performance may be higher or lower than the performance shown. For performance data current to the most recent month end, please call 1-800-225-5291 or visit the Portfolio’s Web site at www.jhfunds.com.
The performance table and chart do not reflect the deduction of taxes that a shareholder would pay on fund distributions or the redemption of fund shares.
The Portfolio’s performance results reflect any applicable expense reductions, without which the expenses would increase and results would have been less favorable.
It is not possible to invest directly in an index. Index figures do not reflect sales charges and would be lower if they did.
Since inception performance is calculated with an opening price on the inception date of the Portfolio.
1 For certain types of investors as described in the Portfolio’s Class R, Class R1, Class R2, Class R3, Class R4, Class R5 and Class 1 share prospectuses.
Lifecycle 2040 Portfolio
7
John Hancock
Lifecycle 2035 Portfolio
Goal and strategy
The Portfolio seeks high total return until its target retirement date. To pursue this goal, the Portfolio, which is a fund of funds, invests under normal circumstances, substantially all of its assets in affiliated underlying funds using an asset allocation strategy designed for investors expected to retire in 2035.
| |
| Asset Allocation1 | |
| | |
| Equity | % of Total |
|
| U.S. Large Cap | 37.0 |
|
| U.S. Mid Cap | 14.0 |
|
| U.S. Small Cap | 12.0 |
|
| International Blend | 20.0 |
|
| International Small Cap | 9.0 |
|
| Natural Resources | 6.0 |
|
| Fixed Income | % of Total |
|
| Intermediate-Term Bond | 1.0 |
|
| High Yield Bond | 1.0 |
|
1As a percentage of net assets on August 31, 2007.
Performance review
Since inception October 30, 2006 through August 31, 2007, the Lifecycle 2035 Portfolio’s Class A, Class B, Class C, Class R, Class R1, Class R2, Class R3, Class R4, Class R5 and Class 1 produced total returns of 11.92%, 11.28%, 11.28%, 11.47%, 11.62%, 11.87%, 11.74%, 12.00%, 12.26% and 12.27%, respectively, at net asset value. In comparison, the Portfolio’s benchmark index — the Standard & Poor’s 500 Index — returned 8.75% in the same period.
Broad outperformance
Outperformance versus the broad benchmark can be attributed to strong performance from the Portfolio’s large-cap managers, as well as allocations to mid-cap stocks, international stocks and alternative assets, such as global natural resource stocks.
The Portfolio’s large-cap value fund — Value & Restructuring (Excelsior) — made positive contributions from an overweight to the energy and metals and mining sectors, and excellent overall security selection, particularly in technology companies. The Portfolio’s large-cap growth fund, Blue Chip Growth (T. Rowe Price), capitalized on an overweight to technology holdings and superior stock selection in the consumer discretionary space. One notable underperforming fund, which detracted from portfolio results, was Core Equity (Legg Mason). This fund suffered from a lack of exposure to the strong-performing energy sector and also demonstrated poor stock selection in the financial sector, particularly with home builder-related stocks.
In the mid-cap growth space, Mid Cap Stock (Wellington) performed exceptionally well thanks to its security selection acumen, particularly in the materials and consumer discretionary sectors. Another mid-cap manager, Value Fund (Van Kampen), contributed significantly through its security selection in the financial and technology sectors. Emerging Small Company (RCM) aided the Portfolio’s outperformance through its stock picking in both the consumer discretionary and staples sectors.
Also aiding the Portfolio was its exposure to international markets, including a standout performance by International Opportunities (Marsico), which benefited from its overweight to Hong Kong and Canada and from excellent security selection within telecommunications and energy. International Small Cap (Templeton) was buoyed by its exposure to high-performing markets, most notably China, Taiwan, Hong Kong and the U.K. An underweight to a slumping Japan market and good overall security selection in the industrial and consumer discretionary sectors also contributed positively. The Portfolio’s exposure to non-traditional asset classes also provided healthy gains. For example, Natural Resources (Wellington) continued its stellar run on the strength of the metals and mining segment.
Lifecycle 2035 Portfolio
8
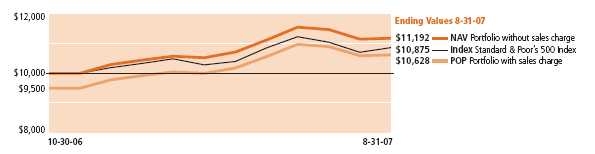
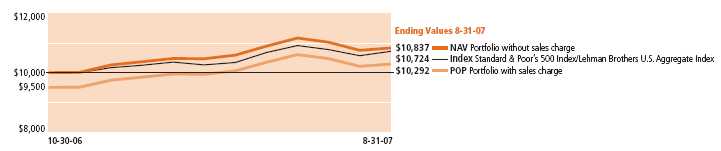
Growth of $10,000
This chart shows what happened to a hypothetical $10,000 investment in Class A shares for the period indicated. For comparison, we’ve shown the same investment in the S&P 500 Index.
| | | | | | | | | |
| | Class B | Class C | Class R1 | Class R11 | Class R21 | Class R31 | Class R41 | Class R51 | Class 11 |
| Period beginning | 10-30-06 | 10-30-06 | 10-30-06 | 10-30-06 | 10-30-06 | 10-30-06 | 10-30-06 | 10-30-06 | 10-30-06 |
|
| Without sales charge | 11,128 | 11,128 | 11,147 | 11,162 | 11,187 | 11,174 | 11,200 | 11,226 | 11,227 |
|
| With maximum sales charge | 10,628 | 11,028 | 11,147 | 11,162 | 11,187 | 11,174 | 11,200 | 11,226 | 11,227 |
|
| Index | 10,875 | 10,875 | 10,875 | 10,875 | 10,875 | 10,875 | 10,875 | 10,875 | 10,875 |
|
Performance chart
Cumulative total returns with maximum sales charge (POP) for the period ending August 31, 2007
| | | | | | | | | | |
| | Class A | Class B | Class C | Class R1 | Class R11 | Class R21 | Class R31 | Class R41 | Class R51 | Class 11 |
| Inception | 10-30-06 | 10-30-06 | 10-30-06 | 10-30-06 | 10-30-06 | 10-30-06 | 10-30-06 | 10-30-06 | 10-30-06 | 10-30-06 |
|
| Since inception | 6.28% | 6.28% | 10.28% | 11.47% | 11.62% | 11.87% | 11.74% | 12.00% | 12.26% | 12.27% |
|
Performance figures assume all distributions are reinvested. Returns at public offering price (POP) reflect a sales charge on Class A shares of 5%, and the applicable contingent deferred sales charge (CDSC) on Class B and Class C shares. The Class B shares’ CDSC declines annually between years 1–6 according to the following schedule: 5, 4, 3, 3, 2, 1%. No sales charge will be assessed after the sixth year. Class C shares held for less than one year are subject to a 1% CDSC. Sales charge is not applicable for Class R, Class R1, Class R2, Class R3, Class R4, Class R5 and Class 1 shares.
The expense ratios of the Portfolio, both net (including any fee waivers or expense limitations) and gross (excluding any fee waivers or expense limitations), are set forth according to the most recent publicly available Prospectuses for the Fund and may differ from the expense ratios disclosed in the Financial Highlights tables in this report. The waivers and expense limitations are contractual at least until 12-31-07. The net expenses are as follows: Class A — 0.65%, Class B — 1.35%, Class C — 1.35%, Class R — 1.20%, Class R1 — 0.95%, Class R2 — 0.70%, Class R3 — 0.85%, Class R4 — 0.55%, Class R5 — 0.25%, Class 1 — 0.20% . Had the fee waivers and expense limitations not been in place, the gross expenses would be as follows: Class A — 1.24%, Class B — 1.94%, Class C — 1.94%, Class R — 1.79%, Class R1 — 1.54%, Class R2 — 1.29%, Class R3 — ; 1.44%, Class R4 — 1.14%, Class R5 — 0.84%, Class 1 — 0.20% .
The returns reflect past results and should not be considered indicative of future performance. The return and principal value of an investment will fluctuate so that shares, when redeemed, may be worth more or less than their original cost. Due to market volatility, the Portfolio’s current performance may be higher or lower than the performance shown. For performance data current to the most recent month end, please call 1-800-225-5291 or visit the Portfolio’s Web site at www.jhfunds.com.
The performance table and chart above do not reflect the deduction of taxes that a shareholder would pay on fund distributions or the redemption of fund shares.
The Portfolio’s performance results reflect any applicable expense reductions, without which the expenses would increase and results would have been less favorable.
It is not possible to invest directly in an index. Index figures do not reflect sales charges and would be lower if they did.
Since inception performance is calculated with an opening price on the inception date of the Portfolio.
1 For certain types of investors as described in the Portfolio’s Class R, Class R1, Class R2, Class R3, Class R4, Class R5 and Class 1 share prospectuses.
Lifecycle 2035 Portfolio
9
John Hancock
Lifecycle 2030 Portfolio
Goal and strategy
The Portfolio seeks high total return until its target retirement date. To pursue this goal, the Portfolio, which is a fund of funds, invests under normal circumstances, substantially all of its assets in affiliated underlying funds using an asset allocation strategy designed for investors expected to retire in 2030.
| |
| Asset Allocation1 | |
| | |
| Equity | % of Total |
|
| U.S. Large Cap | 37.0 |
|
| U.S. Mid Cap | 13.0 |
|
| U.S. Small Cap | 11.0 |
|
| International Blend | 19.0 |
|
| International Small Cap | 8.0 |
|
| Natural Resources | 6.0 |
|
| Real Estate | 1.0 |
|
| Fixed Income | % of Total |
|
| High Yield Bond | 2.0 |
|
| Intermediate-Term Bond | 2.0 |
|
| Treasury Inflation | |
| Protected Securities | 1.0 |
|
1As a percentage of net assets on August 31, 2007.
Performance review
Since inception October 30, 2006 through August 31, 2007, the Lifecycle 2030 Portfolio’s Class A, Class B, Class C, Class R, Class R1, Class R2, Class R3, Class R4, Class R5 and Class 1 produced total returns of 11.38%, 10.64%, 10.64%, 10.73%, 10.98%, 11.23%, 11.00%, 11.36%, 11.62% and 11.63%, respectively, at net asset value. In comparison, the Standard & Poor’s 500 Index returned 8.75%, the Lehman Brothers U.S. Aggregate Index returned 4.04% and the Portfolio’s blended benchmark — 90% S&P 500 Index/10% Lehman Brothers U.S. Aggregate Index — returned 8.20% over the same period.
Broad outperformance
Outperformance versus the broad benchmarks can be attributed to strong performance from the Portfolio’s large-cap managers, as well as allocations to mid-cap stocks, international stocks and alternative assets, such as global natural resource stocks.
The Portfolio’s large-cap value fund —Value & Restructuring (Excelsior) — made positive contributions from an overweight to the energy and metals and mining sectors, and excellent overall security selection, particularly in technology companies. The Portfolio’s large-cap growth fund, Blue Chip Growth (T. Rowe Price), capitalized on an overweight to technology holdings and superior stock selection in the consumer discretionary space. One notable underperforming fund, which detracted from portfolio results, was Core Equity (Legg Mason). This fund suffered from a lack of exposure to the strong-performing energy sector and also demonstrated poor stock selection in the financial sector, particularly with home builder-related stocks.
In the mid-cap growth space, Mid Cap Stock (Wellington) performed exceptionally well thanks to its security selection acumen, particularly in the materials and consumer discretionary sectors. Another mid-cap manager, Value Fund (Van Kampen), also contributed significantly through its security selection in the financial and technology sectors. Emerging Small Company (RCM) aided the Portfolio’s outperformance through its stock picking in both the consumer discretionary and staples sectors.
Also aiding the Portfolio was its exposure to international markets, including a standout performance by International Opportunities (Marsico), which benefited from its overweight to Hong Kong and Canada and from excellent security selection within telecommunications and energy. International Small Cap (Templeton) was buoyed by its exposure to high-performing markets, most notably China, Taiwan, Hong Kong and the U.K. An underweight to a slumping Japan market and good overall security selection in the industrial and consumer discretionary sectors also contributed positively. The Portfolio’s exposure to non-traditional asset classes also provided healthy gains. For example, Natural Resources (Wellington) continued its stellar run on the strength of the metals and mining segment.
Lifecycle 2030 Portfolio
10
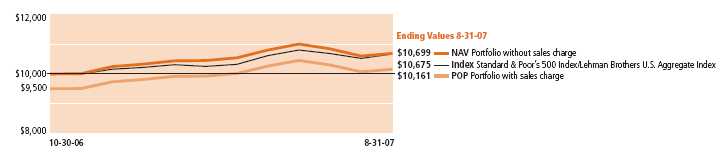
Growth of $10,000
This chart shows what happened to a hypothetical $10,000 investment in Class A shares for the period indicated. For comparison, we’ve shown the same investment in a blended Index.
| | | | | | | | | |
| | Class B | Class C | Class R1 | Class R11 | Class R21 | Class R31 | Class R41 | Class R51 | Class 11 |
| Period beginning | 10-30-06 | 10-30-06 | 10-30-06 | 10-30-06 | 10-30-06 | 10-30-06 | 10-30-06 | 10-30-06 | 10-30-06 |
|
| Without sales charge | 11,064 | 11,064 | 11,073 | 11,098 | 11,123 | 11,100 | 11,136 | 11,162 | 11,163 |
|
| With maximum sales charge | 10,564 | 10,964 | 11,073 | 11,098 | 11,123 | 11,100 | 11,136 | 11,162 | 11,163 |
|
| Index2,3 | 10,820 | 10,820 | 10,820 | 10,820 | 10,820 | 10,820 | 10,820 | 10,820 | 10,820 |
|
Performance chart
Cumulative total returns with maximum sales charge (POP) for the period ending August 31, 2007
| | | | | | | | | | |
| | Class A | Class B | Class C | Class R1 | Class R11 | Class R21 | Class R31 | Class R41 | Class R51 | Class 11 |
| Inception | 10-30-06 | 10-30-06 | 10-30-06 | 10-30-06 | 10-30-06 | 10-30-06 | 10-30-06 | 10-30-06 | 10-30-06 | 10-30-06 |
|
| Since inception | 5.77% | 5.64% | 9.64% | 10.73% | 10.98% | 11.23% | 11.00% | 11.36% | 11.62% | 11.63% |
|
Performance figures assume all distributions are reinvested. Returns at public offering price (POP) reflect a sales charge on Class A shares of 5%, and the applicable contingent deferred sales charge (CDSC) on Class B and Class C shares. The Class B shares’ CDSC declines annually between years 1–6 according to the following schedule: 5, 4, 3, 3, 2, 1%. No sales charge will be assessed after the sixth year. Class C shares held for less than one year are subject to a 1% CDSC. Sales charge is not applicable for Class R, Class R1, Class R2, Class R3, Class R4, Class R5 and Class 1 shares.
The expense ratios of the Portfolio, both net (including any fee waivers or expense limitations) and gross (excluding any fee waivers or expense limitations), are set forth according to the most recent publicly available Prospectuses for the Fund and may differ from the expense ratios disclosed in the Financial Highlights tables in this report. The waivers and expense limitations are contractual at least until 12-31-07. The net expenses are as follows: Class A — 0.65%, Class B — 1.35%, Class C — 1.35%, Class R — 1.20%, Class R1 — 0.95%, Class R2 — 0.70%, Class R3 — 0.85%, Class R4 — 0.55%, Class R5 — 0.25%, Class 1 — 0.20% . Had the fee waivers and expense limitations not been in place, the gross expenses would be as follows: Class A — 1.08%, Class B — 1.78%, Class C — 1.78%, Class R — 1.63%, Class R1 — 1.38%, Class R2 — 1.13%, Class R3 — 1.28%, Class R4 — 0.98%, Class R5 &# 151; 0.68%, Class 1 — 0.20% .
The returns reflect past results and should not be considered indicative of future performance. The return and principal value of an investment will fluctuate so that shares, when redeemed, may be worth more or less than their original cost. Due to market volatility, the Portfolio’s current performance may be higher or lower than the performance shown. For performance data current to the most recent month end, please call 1-800-225-5291 or visit the Portfolio’s Web site at www.jhfunds.com.
The performance table and chart above do not reflect the deduction of taxes that a shareholder would pay on fund distributions or the redemption of fund shares.
The Portfolio’s performance results reflect any applicable expense reductions, without which the expenses would increase and results would have been less favorable.
It is not possible to invest directly in an index. Index figures do not reflect sales charges and would be lower if they did.
Since inception performance is calculated with an opening price on the inception date of the Portfolio.
1 For certain types of investors as described in the Portfolio’s Class R, Class R1, Class R2, Class R3, Class R4, Class R5 and Class 1 share prospectuses.
2 A blended index is used combining 90% of the Standard & Poor’s 500 Index, an unmanaged index that includes 500 widely traded common stocks, and 10% of the Lehman Brothers U.S. Aggregate Index, an unmanaged index of dollar-denominated and nonconvertible investment-grade debt issues.
3 Since inception returns for the index begin on the month end closest to the actual inception date of the Portfolio.
Lifecycle 2030 Portfolio
11
John Hancock
Lifecycle 2025 Portfolio
Goal and strategy
The Portfolio seeks high total return until its target retirement date. To pursue this goal, the Portfolio, which is a fund of funds, invests under normal circumstances, substantially all of its assets in affiliated underlying funds using an asset allocation strategy designed for investors expected to retire in 2025.
| |
| Asset Allocation1 | |
| | |
| Equity | % of Total |
|
| U.S. Large Cap | 37.0 |
|
| U.S. Mid Cap | 11.0 |
|
| U.S. Small Cap | 10.0 |
|
| International Blend | 17.0 |
|
| International Small Cap | 8.0 |
|
| Natural Resources | 5.0 |
|
| Real Estate | 1.0 |
|
| Fixed Income | % of Total |
|
| High Yield Bond | 5.0 |
|
| Intermediate-Term Bond | 4.0 |
|
| Treasury Inflation | |
| Protected Securities | 2.0 |
|
1As a percentage of net assets on August 31, 2007.
Performance review
Since inception October 30, 2006 through August 31, 2007, the Lifecycle 2025 Portfolio’s Class A, Class B, Class C, Class R, Class R1, Class R2, Class R3, Class R4, Class R5 and Class 1 produced total returns of 10.57%, 9.94%, 9.94%, 10.13%, 10.28%, 10.53%, 10.40%, 10.65%, 10.91% and 10.93%, respectively, at net asset value. In comparison, the Standard & Poor’s 500 Index returned 8.75%, the Lehman Brothers U.S. Aggregate Index returned 4.04%, and the Portfolio’s blended benchmark — 90% S&P 500 Index/10% Lehman Brothers U.S. Aggregate Index — returned 8.20% over the same period.
Broad outperformance
Outperformance versus the broad benchmarks can be attributed to strong performance from the Portfolio’s large-cap managers, as well as allocations to mid-cap stocks, international stocks and alternative assets such as global natural resource stocks.
The Portfolio’s large-cap value fund — Value & Restructuring (Excelsior) — made positive contributions from an overweight to the energy and metals and mining sectors, and excellent overall security selection, particularly in technology companies. The Portfolio’s large-cap growth fund, Blue Chip Growth (T. Rowe Price), capitalized on an overweight to technology holdings and superior stock selection in the consumer discretionary space. One notable underperforming fund, which detracted from portfolio results, was Core Equity (Legg Mason). This fund suffered from a lack of exposure to the strong-performing energy sector and also demonstrated poor stock selection in the financial sector, particularly with home builder-related stocks.
In the mid-cap growth space, Mid Cap Stock (Wellington) performed exceptionally well thanks to its security selection acumen, particularly in the materials and consumer discretionary sectors. Another mid-cap manager, Value Fund (Van Kampen), also contributed significantly through its security selection in the financial and technology sectors.
Also aiding the Portfolio was its exposure to international markets, including a standout performance by International Opportunities (Marsico), which benefited from its overweight to Hong Kong and Canada and from excellent security selection within telecommunications and energy. International Small Cap (Templeton) was buoyed by its exposure to high-performing markets, most notably China, Taiwan, Hong Kong and the U.K., as well as by an underweight in a slumping Japan market. The Portfolio’s exposure to non-traditional asset classes also provided healthy gains. For example, Natural Resources (Wellington) continued its stellar run on the strength of the metals and mining segment.
Within fixed income, the high yield manager group contributed positively to the portfolio’s performance, while the balance of the fixed-income managers detracted modestly from performance.
Lifecycle 2025 Portfolio
12
Growth of $10,000
This chart shows what happened to a hypothetical $10,000 investment in Class A shares for the period indicated. For comparison, we’ve shown the same investment in a blended index.
| | | | | | | | | |
| | Class B | Class C | Class R1 | Class R11 | Class R21 | Class R31 | Class R41 | Class R51 | Class 11 |
| Period beginning | 10-30-06 | 10-30-06 | 10-30-06 | 10-30-06 | 10-30-06 | 10-30-06 | 10-30-06 | 10-30-06 | 10-30-06 |
|
| Without sales charge | 10,994 | 10,994 | 11,013 | 11,028 | 11,053 | 11,040 | 11,065 | 11,091 | 11,093 |
|
| With maximum sales charge | 10,494 | 10,894 | 11,013 | 11,028 | 11,053 | 11,040 | 11,065 | 11,091 | 11,093 |
|
| Index2,3 | 10,820 | 10,820 | 10,820 | 10,820 | 10,820 | 10,820 | 10,820 | 10,820 | 10,820 |
|
Performance chart
Cumulative total returns with maximum sales charge (POP) for the period ending August 31, 2007
| | | | | | | | | | |
| | Class A | Class B | Class C | Class R1 | Class R11 | Class R21 | Class R31 | Class R41 | Class R51 | Class 11 |
| Inception | 10-30-06 | 10-30-06 | 10-30-06 | 10-30-06 | 10-30-06 | 10-30-06 | 10-30-06 | 10-30-06 | 10-30-06 | 10-30-06 |
|
| Since inception | 5.01% | 4.94% | 8.94% | 10.13% | 10.28% | 10.53% | 10.40% | 10.65% | 10.91% | 10.93% |
|
Performance figures assume all distributions are reinvested. Returns at public offering price (POP) reflect a sales charge on Class A shares of 5%, and the applicable contingent deferred sales charge (CDSC) on Class B and Class C shares. The Class B shares’ CDSC declines annually between years 1–6 according to the following schedule: 5, 4, 3, 3, 2, 1%. No sales charge will be assessed after the sixth year. Class C shares held for less than one year are subject to a 1% CDSC. Sales charge is not applicable for Class R, Class R1, Class R2, Class R3, Class R4, Class R5 and Class 1 shares.
The expense ratios of the Portfolio, both net (including any fee waivers or expense limitations) and gross (excluding any fee waivers or expense limitations), are set forth according to the most recent publicly available Prospectuses for the Fund and may differ from the expense ratios disclosed in the Financial Highlights tables in this report. The waivers and expense limitations are contractual at least until 12-31-07. The net expenses are as follows: Class A — 0.64%, Class B — 1.34%, Class C — 1.34%, Class R — 1.19%, Class R1 — 0.94%, Class R2 — 0.69%, Class R3 — 0.84%, Class R4 — 0.54%, Class R5 — 0.24%, Class 1 — 0.19% . Had the fee waivers and expense limitations not been in place, the gross expenses would be as follows: Class A — 1.01%, Class B — 1.71%, Class C — 1.71%, Class R — 1.56%, Class R1 — 1.31%, Class R2 — 1.06%, Class R3 — 1.21%, Class R4 — 0.91%, Class R5 &# 151; 0.61%, Class 1 — 0.19% .
The returns reflect past results and should not be considered indicative of future performance. The return and principal value of an investment will fluctuate so that shares, when redeemed, may be worth more or less than their original cost. Due to market volatility, the Portfolio’s current performance may be higher or lower than the performance shown. For performance data current to the most recent month end, please call 1-800-225-5291 or visit the Portfolio’s Web site at www.jhfunds.com.
The performance table and chart above do not reflect the deduction of taxes that a shareholder would pay on fund distributions or the redemption of fund shares.
The Portfolio’s performance results reflect any applicable expense reductions, without which the expenses would increase and results would have been less favorable.
It is not possible to invest directly in an index. Index figures do not reflect sales charges and would be lower if they did.
Since inception performance is calculated with an opening price on the inception date of the Portfolio.
1 For certain types of investors as described in the Portfolio’s Class R, Class R1, Class R2, Class R3, Class R4, Class R5 and Class 1 share prospectuses.
2 A blended index is used combining 90% of the Standard & Poor’s 500 Index, an unmanaged index that includes 500 widely traded common stocks, and 10% of the Lehman Brothers U.S. Aggregate Index, an unmanaged index of dollar-denominated and nonconvertible investment-grade debt issues.
3 Since inception returns for the index begin on the month end closest to the actual inception date of the Portfolio.
Lifecycle 2025 Portfolio
13
John Hancock
Lifecycle 2020 Portfolio
Goal and strategy
The Portfolio seeks high total return until its target retirement date. To pursue this goal, the Portfolio, which is a fund of funds, invests under normal circumstances, substantially all of its assets in affiliated underlying funds using an asset allocation strategy designed for investors expected to retire in 2020.
| |
| Asset Allocation1 | |
| | |
| Equity | % of Total |
|
| U.S. Large Cap | 38.0 |
|
| U.S. Mid Cap | 8.0 |
|
| U.S. Small Cap | 7.0 |
|
| International Blend | 15.0 |
|
| International Small Cap | 6.0 |
|
| Natural Resources | 5.0 |
|
| Real Estate | 2.0 |
|
| Fixed Income | % of Total |
|
| High Yield Bond | 9.0 |
|
| Intermediate-Term Bond | 7.0 |
|
| Treasury Inflation | |
| Protected Securities | 3.0 |
|
1As a percentage of net assets on August 31, 2007.
Performance review
Since inception October 30, 2006 through August 31, 2007, the Lifecycle 2020 Portfolio’s Class A, Class B, Class C, Class R, Class R1, Class R2, Class R3, Class R4, Class R5 and Class 1 produced total returns of 9.87%, 9.24%, 9.24%, 9.33%, 9.58%, 9.72%, 9.59%, 9.85%, 10.11% and 10.12%, respectively, at net asset value. In comparison, the Standard & Poor’s 500 Index returned 8.75%, the Lehman Brothers U.S. Aggregate Index returned 4.04% and the Portfolio’s blended benchmark — 80% S&P 500 Index/20% Lehman Brothers U.S. Aggregate Index — returned 7.73% over the same period.
Broad outperformance
Outperformance versus the broad benchmarks can be attributed to strong performance from the Portfolio’s large-cap managers, as well as allocations to mid-cap stocks, international stocks and global natural resource stocks.
Value & Restructuring (Excelsior) made positive portfolio contributions from an overweight to the energy and metals and mining sectors. Blue Chip Growth (T. Rowe Price) capitalized on an overweight to technology holdings and superior stock selection in the consumer discretionary space. One notable underperforming fund, which detracted from Portfolio results, was Core Equity (Legg Mason), which suffered from a lack of exposure to the strong-performing energy sector and an overweight in housing-related stocks. An 8% allocation to mid-cap funds benefited the Portfolio, as the group outperformed both the broad benchmark and their respective indexes.
Also aiding the Portfolio was its exposure to international markets, including a standout performance by International Opportunities (Marsico), which benefited from its overweight to Hong Kong and Canada and from excellent security selection within telecommunications and energy. International Small Cap (Templeton) was buoyed by its exposure to high-performing markets, most notably China, Taiwan, Hong Kong and the U.K., and by an underweight in a slumping Japan market. The Portfolio’s exposure to non-traditional asset classes also provided healthy gains. For example, Natural Resources (Wellington) continued its stellar run on the strength of the metals and mining segment.
Within fixed income, the high yield group contributed positively to the Portfolio’s performance, as the group outperformed the broad index (Lehman Brother’s U.S. Aggregate Index). The individual managers performed largely in line with their high yield benchmark, with High Income (MFC Global U.S.) contributing the most to the Portfolio’s bottom line. The balance of the fixed-income managers modestly underperformed on a relative basis, with Strategic Bond (WAMCO) detracting the most from Portfolio performance due to its exposure to the mortgage-backed market.
Lifecycle 2020 Portfolio
14
Growth of $10,000
This chart shows what happened to a hypothetical $10,000 investment in Class A shares for the period indicated. For comparison, we’ve shown the same investment in a blended index.

| | | | | | | | | |
| | Class B | Class C | Class R1 | Class R11 | Class R21 | Class R31 | Class R41 | Class R51 | Class 11 |
| Period beginning | 10-30-06 | 10-30-06 | 10-30-06 | 10-30-06 | 10-30-06 | 10-30-06 | 10-30-06 | 10-30-06 | 10-30-06 |
|
| Without sales charge | 10,924 | 10,924 | 10,933 | 10,958 | 10,972 | 10,959 | 10,985 | 11,011 | 11,012 |
|
| With maximum sales charge | 10,424 | 10,824 | 10,933 | 10,958 | 10,972 | 10,959 | 10,985 | 11,011 | 11,012 |
|
| Index2,3 | 10,773 | 10,773 | 10,773 | 10,773 | 10,773 | 10,773 | 10,773 | 10,773 | 10,773 |
|
Performance chart
Cumulative total returns with maximum sales charge (POP) for the period ending August 31, 2007
| | | | | | | | | | |
| | Class A | Class B | Class C | Class R1 | Class R11 | Class R21 | Class R31 | Class R41 | Class R51 | Class 11 |
| Inception | 10-30-06 | 10-30-06 | 10-30-06 | 10-30-06 | 10-30-06 | 10-30-06 | 10-30-06 | 10-30-06 | 10-30-06 | 10-30-06 |
|
| Since inception | 4.34% | 4.24% | 8.24% | 9.33% | 9.58% | 9.72% | 9.59% | 9.85% | 10.11% | 10.12% |
|
Performance figures assume all distributions are reinvested. Returns at public offering price (POP) reflect a sales charge on Class A shares of 5%, and the applicable contingent deferred sales charge (CDSC) on Class B and Class C shares. The Class B shares’ CDSC declines annually between years 1–6 according to the following schedule: 5, 4, 3, 3, 2, 1%. No sales charge will be assessed after the sixth year. Class C shares held for less than one year are subject to a 1% CDSC. Sales charge is not applicable for Class R, Class R1, Class R2, Class R3, Class R4, Class R5 and Class 1 shares.
The expense ratios of the Portfolio, both net (including any fee waivers or expense limitations) and gross (excluding any fee waivers or expense limitations), are set forth according to the most recent publicly available Prospectuses for the Fund and may differ from the expense ratios disclosed in the Financial Highlights tables in this report. The waivers and expense limitations are contractual at least until 12-31-07. The net expenses are as follows: Class A — 0.63%, Class B — 1.33%, Class C — 1.33%, Class R — 1.18%, Class R1 — 0.93%, Class R2 — 0.68%, Class R3 — 0.83%, Class R4 — 0.53%, Class R5 — 0.23%, Class 1 — 0.18% . Had the fee waivers and expense limitations not been in place, the gross expenses would be as follows: Class A — 0.94%, Class B — 1.64%, Class C — 1.64%, Class R — 1.49%, Class R1 — 1.24%, Class R2 — 0.99%, Class R3 — 1.14%, Class R4 — 0.84%, Class R5 &# 151; 0.54%, Class 1 — 0.18% .
The returns reflect past results and should not be considered indicative of future performance. The return and principal value of an investment will fluctuate so that shares, when redeemed, may be worth more or less than their original cost. Due to market volatility, the Portfolio’s current performance may be higher or lower than the performance shown. For performance data current to the most recent month end, please call 1-800-225-5291 or visit the Portfolio’s Web site at www.jhfunds.com.
The performance table and chart above reflect the deduction of taxes that a shareholder would pay on fund distributions or the redemption of fund shares.
The Portfolio’s performance results reflect any applicable expense reductions, without which the expenses would increase and results would have been less favorable.
It is not possible to invest directly in an index. Index figures do not reflect sales charges and would be lower if they did.
Since inception performance is calculated with an opening price on the inception date of the Portfolio.
1 For certain types of investors as described in the Portfolio’s Class R, Class R1, Class R2, Class R3, Class R4, Class R5 and Class 1 share prospectuses.
2 A blended index is used combining 80% of the Standard & Poor’s 500 Index, an unmanaged index that includes 500 widely traded common stocks, and 20% of the Lehman Brothers U.S. Aggregate Index, an unmanaged index of dollar-denominated and nonconvertible investment-grade debt issues.
3 Since inception returns for the index begin on the month end closest to the actual inception date of the Portfolio.
Lifecycle 2020 Portfolio
15
John Hancock
Lifecycle 2015 Portfolio
Goal and strategy
The Portfolio seeks high total return until its target retirement date. To pursue this goal, the Portfolio, which is a fund of funds, invests under normal circumstances, substantially all of its assets in affiliated underlying funds using an asset allocation strategy designed for investors expected to retire in 2015.
| |
| Asset Allocation1 | |
| | |
| Equity | % of Total |
|
| U.S. Large Cap | 35.0 |
|
| U.S. Mid Cap | 5.0 |
|
| U.S. Small Cap | 4.0 |
|
| International Blend | 11.0 |
|
| International Small Cap | 5.0 |
|
| Natural Resources | 5.0 |
|
| Real Estate | 3.0 |
|
| Global Real Estate | 2.0 |
|
| Fixed Income | % of Total |
|
| High Yield Bond | 13.0 |
|
| Intermediate-Term Bond | 13.0 |
|
| Treasury Inflation | |
| Protected Securities | 4.0 |
|
1As a percentage of net assets on August 31, 2007.
Performance review
Since inception October 30, 2006 through August 31, 2007, the Lifecycle 2015 Portfolio’s Class A, Class B, Class C, Class R, Class R1, Class R2, Class R3, Class R4, Class R5 and Class 1 produced total returns of 8.37%, 7.74%, 7.74%, 7.93%, 8.08%, 8.33%, 8.10%, 8.35%, 8.61% and 8.72%, respectively, at net asset value. In comparison, the Standard & Poor’s 500 Index returned 8.75%, the Lehman Brothers U.S. Aggregate Index returned 4.04% and the Portfolio’s blended benchmark — 70% S&P 500 Index/30% Lehman Brothers U.S. Aggregate Index — returned 7.24% over the same period.
Broad outperformance
Outperformance versus the broad benchmarks can be attributed to strong performance from the Portfolio’s large-cap managers, as well as allocations to mid-cap stocks, international stocks and global natural resource stocks. Allocations to real estate detracted from Portfolio performance.
Value & Restructuring (Excelsior) made positive portfolio contributions from an overweight to the energy and metals and mining sectors. Blue Chip Growth (T. Rowe Price) capitalized on an overweight to technology holdings and superior stock selection in the consumer discretionary space. One notable underperforming fund, which detracted from Portfolio results, was Core Equity (Legg Mason), which suffered from a lack of exposure to the strong-performing energy sector and an overweight in housing-related stocks. A 5% allocation to mid-cap funds benefited the Portfolio, as the group outperformed both the broad benchmarks and their respective indexes.
Also aiding the Portfolio was its exposure to international markets. International Small Cap (Templeton), for example, benefited from its exposure to high-performing markets, most notably China, Taiwan, Hong Kong and the U.K., as well as from an underweight to a slumping Japan market. The Portfolio’s exposure to non-traditional asset classes also provided healthy gains as Natural Resources (Wellington) continued its stellar run on the strength of the metals and mining segment. Meanwhile, allocations to real estate hurt Portfolio performance, as U.S. real estate investment trusts (REITs) tumbled in the second quarter of 2007 after peaking in February.
Within fixed income, the high yield group contributed positively to the Portfolio’s performance, as the group outperformed the broad index (Lehman Brother’s U.S. Aggregate Index). The individual managers performed largely in line with their high yield benchmark, with High Income (MFC Global U.S.) contributing the most to the Portfolio’s bottom line. The balance of the fixed-income managers modestly underperformed on a relative basis. Detracting the most from Portfolio performance was Strategic Bond (WAMCO), which underperformed due to its exposure to the mortgage-backed market.
Lifecycle 2015 Portfolio
16
Growth of $10,000
This chart shows what happened to a hypothetical $10,000 investment in Class A shares for the period indicated. For comparison, we’ve shown the same investment in a blended index.
| | | | | | | | | |
| | Class B | Class C | Class R1 | Class R11 | Class R21 | Class R31 | Class R41 | Class R51 | Class 11 |
| Period beginning | 10-30-06 | 10-30-06 | 10-30-06 | 10-30-06 | 10-30-06 | 10-30-06 | 10-30-06 | 10-30-06 | 10-30-06 |
|
| Without sales charge | 10,774 | 10,774 | 10,793 | 10,808 | 10,833 | 10,810 | 10,835 | 10,861 | 10,872 |
|
| With maximum sales charge | 10,274 | 10,674 | 10,793 | 10,808 | 10,833 | 10,810 | 10,835 | 10,861 | 10,872 |
|
| Index2,3 | 10,724 | 10,724 | 10,724 | 10,724 | 10,724 | 10,724 | 10,724 | 10,724 | 10,724 |
|
Performance chart
Cumulative total returns with maximum sales charge (POP) for the period ending August 31, 2007
| | | | | | | | | | |
| | Class A | Class B | Class C | Class R1 | Class R11 | Class R21 | Class R31 | Class R41 | Class R51 | Class 11 |
| Inception | 10-30-06 | 10-30-06 | 10-30-06 | 10-30-06 | 10-30-06 | 10-30-06 | 10-30-06 | 10-30-06 | 10-30-06 | 10-30-06 |
|
| Since inception | 2.92% | 2.74% | 6.74% | 7.93% | 8.08% | 8.33% | 8.10% | 8.35% | 8.61% | 8.72% |
|
Performance figures assume all distributions are reinvested. Returns at public offering price (POP) reflect a sales charge on Class A shares of 5%, and the applicable contingent deferred sales charge (CDSC) on Class B and Class C shares. The Class B shares’ CDSC declines annually between years 1–6 according to the following schedule: 5, 4, 3, 3, 2, 1%. No sales charge will be assessed after the sixth year. Class C shares held for less than one year are subject to a 1% CDSC. Sales charge is not applicable for Class R, Class R1, Class R2, Class R3, Class R4, Class R5 and Class 1 shares.
The expense ratios of the Portfolio, both net (including any fee waivers or expense limitations) and gross (excluding any fee waivers or expense limitations), are set forth according to the most recent publicly available Prospectuses for the Fund and may differ from the expense ratios disclosed in the Financial Highlights tables in this report. The waivers and expense limitations are contractual at least until 12-31-07. The net expenses are as follows: Class A — 0.64%, Class B — 1.34%, Class C — 1.34%, Class R — 1.19%, Class R1 — 0.94%, Class R2 — 0.69%, Class R3 — 0.84%, Class R4 — 0.54%, Class R5 — 0.24%, Class 1 — 0.19% . Had the fee waivers and expense limitations not been in place, the gross expenses would be as follows: Class A — 0.99%, Class B — 1.69%, Class C — 1.69%, Class R — 1.54%, Class R1 — 1.29%, Class R2 — 1.04%, Class R3 — 1.19%, Class R4 — 0.89%, Class R5 &# 151; 0.59%, Class 1 — 0.19% .
The returns reflect past results and should not be considered indicative of future performance. The return and principal value of an investment will fluctuate so that shares, when redeemed, may be worth more or less than their original cost. Due to market volatility, the Portfolio’s current performance may be higher or lower than the performance shown. For performance data current to the most recent month end, please call 1-800-225-5291 or visit the Portfolio’s Web site at www.jhfunds.com.
The performance table and chart above do not reflect the deduction of taxes that a shareholder would pay on fund distributions or the redemption of fund shares.
The Portfolio’s performance results reflect any applicable expense reductions, without which the expenses would increase and results would have been less favorable.
It is not possible to invest directly in an index. Index figures do not reflect sales charges and would be lower if they did.
Since inception performance is calculated with an opening price on the inception date of the Portfolio.
1 For certain types of investors as described in the Portfolio’s Class R, Class R1, Class R2, Class R3, Class R4, Class R5 and Class 1 share prospectuses.
2 A blended index is used combining 70% of the Standard & Poor’s 500 Index, an unmanaged index that includes 500 widely traded common stocks, and 30% of the Lehman Brothers U.S. Aggregate Index, an unmanaged index of dollar-denominated and nonconvertible investment-grade debt issues.
3 Since inception returns for the index begin on the month end closest to the actual inception date of the Portfolio.
Lifecycle 2015 Portfolio
17
John Hancock
Lifecycle 2010 Portfolio
Goal and strategy
The Portfolio seeks high total return until its target retirement date. To pursue this goal, the Portfolio, which is a fund of funds, invests under normal circumstances, substantially all of its assets in affiliated underlying funds using an asset allocation strategy designed for investors expected to retire in 2010.
| |
| Asset Allocation1 | |
| | |
| Equity | % of Total |
|
| U.S. Large Cap | 32.0 |
|
| U.S. Mid Cap | 2.0 |
|
| U.S. Small Cap | 2.0 |
|
| International Large Cap | 8.0 |
|
| International Small Cap | 3.0 |
|
| Natural Resources | 4.0 |
|
| Real Estate | 7.0 |
|
| Fixed Income | % of Total |
|
| High Yield Bond | 16.0 |
|
| Intermediate-Term Bond | 19.0 |
|
| Treasury Inflation | |
| Protected Securities | 5.0 |
|
| Long-Term Bond | 2.0 |
|
1As a percentage of net assets on August 31, 2007.
Performance review
Since inception October 30, 2006 through August 31, 2007, the Lifecycle 2010 Portfolio’s Class A, Class B, Class C, Class R, Class R1, Class R2, Class R3, Class R4, Class R5 and Class 1 produced total returns of 6.99%, 6.36%, 6.46%, 6.56%, 6.70%, 6.95%, 6.82%, 7.08%, 7.33% and 7.34%, respectively, at net asset value. In comparison, the Standard & Poor’s 500 Index returned 8.75%, the Lehman Brothers U.S. Aggregate Index returned 4.04% and the Portfolio’s blended benchmark — 60% S&P 500 Index/40% Lehman Brothers U.S. Aggregate Index — returned 6.75% over the same period.
Broad outperformance
Outperformance versus the broad benchmarks can be attributed to strong performance from the Portfolio’s large-cap managers, as well as favorable allocations to international stocks and global natural resource stocks. Allocations to real estate detracted from Portfolio performance, while a significant weighting in high yield bonds was positive.
Value & Restructuring (Excelsior) made positive portfolio contributions from an overweight to the energy and metals and mining sectors. Blue Chip Growth (T. Rowe Price) capitalized on an overweight to technology holdings and superior stock selection in the consumer discretionary space. One notable underperforming fund, which detracted from Portfolio results, was Core Equity (Legg Mason), which suffered from a lack of exposure to the strong-performing energy sector and an overweight to housing-related stocks.
Also aiding the Portfolio was its exposure to international markets. International Small Cap (Templeton), for example, benefited from its exposure to high-performing markets, most notably China, Taiwan, Hong Kong and the U.K., and from an underweight to a slumping Japan market. The Portfolio’s exposure to non-traditional asset classes also provided healthy gains as Natural Resources (Wellington) continued its stellar run on the strength of the metals and mining segment. On the negative side, allocations to real estate hurt Portfolio performance, as U.S. real estate investment trusts (REITs) tumbled in the second quarter of 2007 after peaking in February.
Within fixed income, the high yield group contributed positively to the Portfolio’s performance, as the group outperformed the broad index (Lehman Brother’s U.S. Aggregate Index). The individual managers performed largely in line with their high yield benchmark, with High Income (MFC Global U.S.) contributing the most to the Portfolio’s bottom line. The balance of the fixed-income managers modestly under performed on a relative basis. Detracting the most from Portfolio performance was Strategic Bond (WAMCO), which underperformed due to its exposure to the mortgage-backed market.
Lifecycle 2010 Portfolio
18
Growth of $10,000
This chart shows what happened to a hypothetical $10,000 investment in Class A shares for the period indicated. For comparison, we’ve shown the same investment in a blended index.
| | | | | | | | | |
| | Class B | Class C | Class R1 | Class R11 | Class R21 | Class R31 | Class R41 | Class R51 | Class 11 |
| Period beginning | 10-30-06 | 10-30-06 | 10-30-06 | 10-30-06 | 10-30-06 | 10-30-06 | 10-30-06 | 10-30-06 | 10-30-06 |
|
| Without sales charge | 10,636 | 10,646 | 10,656 | 10,670 | 10,695 | 10,682 | 10,708 | 10,733 | 10,734 |
|
| With maximum sales charge | 10,136 | 10,546 | 10,656 | 10,670 | 10,695 | 10,682 | 10,708 | 10,733 | 10,734 |
|
| Index2,3 | 10,675 | 10,675 | 10,675 | 10,675 | 10,675 | 10,675 | 10,675 | 10,675 | 10,675 |
|
Performance chart
Cumulative total returns with maximum sales charge (POP) for the period ending August 31, 2007
| | | | | | | | | | |
| | Class A | Class B | Class C | Class R1 | Class R11 | Class R21 | Class R31 | Class R41 | Class R51 | Class 11 |
| Inception | 10-30-06 | 10-30-06 | 10-30-06 | 10-30-06 | 10-30-06 | 10-30-06 | 10-30-06 | 10-30-06 | 10-30-06 | 10-30-06 |
|
| Since inception | 1.61% | 1.36% | 5.46% | 6.56% | 6.70% | 6.95% | 6.82% | 7.08% | 7.33% | 7.34% |
|
Performance figures assume all distributions are reinvested. Returns at public offering price (POP) reflect a sales charge on Class A shares of 5%, and the applicable contingent deferred sales charge (CDSC) on Class B and Class C shares. The Class B shares’ CDSC declines annually between years 1–6 according to the following schedule: 5, 4, 3, 3, 2, 1%. No sales charge will be assessed after the sixth year. Class C shares held for less than one year are subject to a 1% CDSC. Sales charge is not applicable for Class R, Class R1, Class R2, Class R3, Class R4, Class R5 and Class 1 shares.
The expense ratios of the Portfolio, both net (including any fee waivers or expense limitations) and gross (excluding any fee waivers or expense limitations), are set forth according to the most recent publicly available Prospectuses for the Fund and may differ from the expense ratios disclosed in the Financial Highlights tables in this report. The waivers and expense limitations are contractual at least until 12-31-07. The net expenses are as follows: Class A — 0.65%, Class B — 1.35%, Class C — 1.35%, Class R — 1.20%, Class R1 — 0.95%, Class R2 — 0.70%, Class R3 — 0.85%, Class R4 — 0.55%, Class R5 — 0.25%, Class 1 — 0.20% . Had the fee waivers and expense limitations not been in place, the gross expenses would be as follows: Class A — 1.21%, Class B — 1.91%, Class C — 1.91%, Class R — 1.76%, Class R1 — 1.51%, Class R2 — 1.26%, Class R3 — 1.41%, Class R4 — 1.11%, Class R5 &# 151; 0.81%, Class 1 — 0.20% .
The returns reflect past results and should not be considered indicative of future performance. The return and principal value of an investment will fluctuate so that shares, when redeemed, may be worth more or less than their original cost. Due to market volatility, the Portfolio’s current performance may be higher or lower than the performance shown. For performance data current to the most recent month end, please call 1-800-225-5291 or visit the Portfolio’s Web site at www.jhfunds.com.
The performance table and chart above do not reflect the deduction of taxes that a shareholder would pay on fund distributions or the redemption of fund shares.
The Portfolio’s performance results reflect any applicable expense reductions, without which the expenses would increase and results would have been less favorable.
It is not possible to invest directly in an index. Index figures do not reflect sales charges and would be lower if they did.
Since inception performance is calculated with an opening price on the inception date of the Portfolio.
1 For certain types of investors as described in the Portfolio’s Class R, Class R1, Class R2, Class R3, Class R4, Class R5 and Class 1 share prospectuses.
2 A blended index is used combining 60% of the Standard & Poor’s 500 Index, an unmanaged index that includes 500 widely traded common stocks, and 40% of the Lehman Brothers U.S. Aggregate Index, an unmanaged index of dollar-denominated and nonconvertible investment-grade debt issues.
3 Since inception returns for the index begin on the month end closest to the actual inception date of the Portfolio.
Lifecycle 2010 Portfolio
19
John Hancock
Lifecycle Retirement Portfolio
Goal and strategy
The Portfolio seeks maximum real return, consistent with the preservation of capital and prudent investment management. To pursue this goal, the Portfolio, which is a fund of funds, may invest in various funds of the John Hancock Funds complex or affiliated underlying funds that as a group hold a wide variety of equity and fixed-income securities.
| |
| Asset Allocation2 | |
| | |
| Equity | % of Total |
|
| U.S. Large Cap | 17.0 |
|
| U.S. Small Cap | 3.0 |
|
| International Large Cap | 3.0 |
|
| International Small Cap | 4.0 |
|
| Real Estate | 3.0 |
|
| Global Real Estate | 4.0 |
|
| Natural Resources | 2.0 |
|
| Commodities | 2.0 |
|
| Fixed Income | % of Total |
|
| High Yield Bond | 14.0 |
|
| Intermediate-Term Bond | 20.0 |
|
| Treasury Inflation | |
| Protected Securities | 10.0 |
|
| Global Bond | 4.0 |
|
| Long-Term Bond | 4.0 |
|
2As a percentage of net assets on August 31, 2007.
Performance review
Since inception October 30, 2006, the Lifecycle Retirement Portfolio’s Class A, Class B, Class C, Class R, Class R1, Class R2, Class R3, Class R4, Class R5 and Class 1 produced total returns of 6.19%, 5.47%, 5.48%, 5.55%, 5.73%, 5.90%, 5.77%, 6.07%, 6.27% and 6.29%, respectively, at net asset value. In comparison, the Standard & Poor’s 500 Index returned 8.75%, the Lehman Brothers U.S. Aggregate Index returned 4.04% and the Portfolio’s blended benchmark — 50% S&P 500 Index/50% Lehman Brothers U.S. Aggregate Index — returned 6.24% over the same period. One of the key tenets of the Portfolio’s strategy is the generation of an inflation-adjusted average annual withdrawal rate of 4.5% (after fees) over a long-term time horizon (approximately 30 years) while attempting to maintain a low probability of negative returns in any 12-month time period. As another performance measurement, the Consumer Price Index (CPI) plus 4.5% equaled 6.89% in this period.1
Performance explained
Slight underperformance versus the broad benchmarks can be attributed to allocations to real estate and Treasury Inflation Protected Securities (TIPS), relative underperformance from a large-cap manager and underperformance from a select number of the Portfolio’s multi-sector bond funds. Favorable allocations to international equities, global natural resource stocks and commodities, and a healthy weighting in high yield bonds, all were positive contributors to the Portfolio’s performance.
Our best fixed-income performers during the period were High Income (MFC Global U.S.) and Spectrum Income (T. Rowe Price). Real Return Bond Fund (PIMCO) lagged in both absolute and relative terms for the entire period, but started to contribute positively more recently, particularly during this past summer’s volatile patch. Detracting the most from Portfolio performance was Strategic Bond (WAMCO), which underperformed due to its exposure to the mortgage-backed securities market.
Aiding the Portfolio was its exposure to international markets. International Small Cap (Templeton), for example, benefited from its exposure to high-performing markets, most notably China, Taiwan, Hong Kong and the U.K., and from an underweight to a slumping Japan market. The Portfolio’s exposure to non-traditional asset classes also provided healthy gains as Natural Resources (Wellington) continued its stellar run on the strength of the metals and mining segment. On the negative side, allocations to real estate hurt Portfolio performance, as U.S. real estate investment trusts (REITs) tumbled in the second quarter of 2007 after peaking in February. One notable underperforming equity fund, which detracted from Portfolio results, was Core Equity (Legg Mason), which suffered from a lack of exposure to the strong-performing energy sector and an overweight to housing-related stocks.
Toward the end of February, we reduced our U.S. REIT exposure by a modest amount as the asset class has become increasingly risky following a long period of significant outperformance relative to historical averages.
1CPI-U, seasonally adjusted
Lifecycle Retirement Portfolio
20
Growth of $10,000
This chart shows what happened to a hypothetical $10,000 investment in Class A shares for the period indicated. For comparison, we’ve shown the same investment in a blended index.
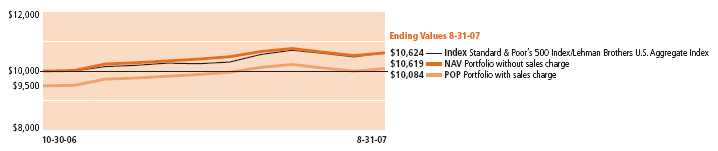
| | | | | | | | | |
| | Class B | Class C | Class R1 | Class R11 | Class R21 | Class R31 | Class R41 | Class R51 | Class 11 |
| Period beginning | 10-30-06 | 10-30-06 | 10-30-06 | 10-30-06 | 10-30-06 | 10-30-06 | 10-30-06 | 10-30-06 | 10-30-06 |
|
| Without sales charge | 10,547 | 10,548 | 10,555 | 10,573 | 10,590 | 10,577 | 10,607 | 10,627 | 10,629 |
|
| With maximum sales charge | 10,047 | 10,448 | 10,555 | 10,573 | 10,590 | 10,577 | 10,607 | 10,627 | 10,629 |
|
| Index2,3 | 10,624 | 10,624 | 10,624 | 10,624 | 10,624 | 10,624 | 10,624 | 10,624 | 10,624 |
|
Performance chart
Cumulative total returns with maximum sales charge (POP) for the period ending August 31, 2007
| | | | | | | | | | |
| | Class A | Class B | Class C | Class R1 | Class R11 | Class R21 | Class R31 | Class R41 | Class R51 | Class 11 |
| Inception | 10-30-06 | 10-30-06 | 10-30-06 | 10-30-06 | 10-30-06 | 10-30-06 | 10-30-06 | 10-30-06 | 10-30-06 | 10-30-06 |
|
| Since inception | 0.84% | 0.47% | 4.48% | 5.55% | 5.73% | 5.90% | 5.77% | 6.07% | 6.27% | 6.29% |
|
Performance figures assume all distributions are reinvested. Returns at public offering price (POP) reflect a sales charge on Class A shares of 5%, and the applicable contingent deferred sales charge (CDSC) on Class B and Class C shares. The Class B shares’ CDSC declines annually between years 1–6 according to the following schedule: 5, 4, 3, 3, 2, 1%. No sales charge will be assessed after the sixth year. Class C shares held for less than one year are subject to a 1% CDSC. Sales charge is not applicable for Class R, Class R1, Class R2, Class R3, Class R4, Class R5 and Class 1 shares.
The expense ratios of the Portfolio, both net (including any fee waivers or expense limitations) and gross (excluding any fee waivers or expense limitations), are set forth according to the most recent publicly available Prospectuses for the Fund and may differ from the expense ratios disclosed in the Financial Highlights tables in this report. The waivers and expense limitations are contractual at least until 12-31-07. The net expenses are as follows: Class A — 0.69%, Class B — 1.39%, Class C — 1.39%, Class R — 1.24%, Class R1 — 0.99%, Class R2 — 0.74%, Class R3 — 0.89%, Class R4 — 0.59%, Class R5 — 0.29%, Class 1 — 0.24% . Had the fee waivers and expense limitations not been in place, the gross expenses would be as follows: Class A — 2.12%, Class B — 2.82%, Class C — 2.82%, Class R — 2.67%, Class R1 — 2.42%, Class R2 — 2.17%, Class R3 — 2.32%, Class R4 — 2.02%, Class R5 &# 151; 1.72%, Class 1 — 0.30% .
The returns reflect past results and should not be considered indicative of future performance. The return and principal value of an investment will fluctuate so that shares, when redeemed, may be worth more or less than their original cost. Due to market volatility, the Portfolio’s current performance may be higher or lower than the performance shown. For performance data current to the most recent month end, please call 1-800-225-5291 or visit the Portfolio’s Web site at www.jhfunds.com.
The performance table and chart above do not reflect the deduction of taxes that a shareholder would pay on fund distributions or the redemption of fund shares.
The Portfolio’s performance results reflect any applicable expense reductions, without which the expenses would increase and results would have been less favorable.
It is not possible to invest directly in an index. Index figures do not reflect sales charges and would be lower if they did.
Since inception performance is calculated with an opening price on the inception date of the Portfolio.
1 For certain types of investors as described in the Portfolio’s Class R, Class R1, Class R2, Class R3, Class R4, Class R5 and Class 1 share prospectuses.
2 A blended index is used combining 50% of the Standard & Poor’s 500 Index, an unmanaged index that includes 500 widely traded common stocks, and 50% of the Lehman Brothers U.S. Aggregate Index, an unmanaged index of dollar-denominated and nonconvertible investment-grade debt issues.
3 Since inception returns for the index begin on the month end closest to the actual inception date of the Portfolio.
Lifecycle Retirement Portfolio
21
Your expenses
As a shareholder of John Hancock Funds II Lifecycle Portfolios, you incur two types of costs: (1) transaction costs, including sales charges (loads) on certain purchase and redemption fees on certain exchanges and redemptions, and (2) ongoing costs, including management fees, distribution and service (12b-1) fees and other Portfolio expenses. In addition to the operating expenses which the Portfolio bears directly, the Portfolio indirectly bears a pro rata share of the operating expenses of the affiliated underlying funds in which the Portfolio invests. Because the affiliated underlying funds have varied operating expenses and transaction costs and the Portfolio may own different proportions of the underlying funds at different times, the amount of expenses incurred indirectly by the Portfolio will vary. Had these indirect expenses been reflected in the following analysis, total expenses would have been higher than the amounts shown.
This example is intended to help you understand your ongoing costs (in dollars) of investing in the Portfolios so you can compare these costs with the ongoing costs of investing in other mutual funds. The example is based on an investment of $1,000 at the beginning of the period and held for the entire period (March 1, 2007 through August 31, 2007).
Actual expenses:
The first line of each share class in the table on the following pages provides information about actual account values and actual expenses. You may use the information in this line, together with the amount you invested, to estimate the expenses that you paid over the period. Simply divide your account value by $1,000 (for example, an $8,600 account value divided by $1,000 = 8.6), then multiply the result by the number in the first line under the heading entitled “Expenses Paid During Period” to estimate the expenses you paid on your account during this period.
Hypothetical example for comparison purposes:
The second line of each share class in the table on the following pages provides information about hypothetical account values and hypothetical expenses based on the actual expense ratio for the share class and an assumed annualized rate of return of 5% per year before expenses, which is not the actual return of the share class. The hypothetical account values and expenses may not be used to estimate the actual ending account balance or expenses you paid for the period. You may use this information to compare the ongoing costs of investing in the Portfolio and other funds. To do so, compare this 5% hypothetical example with the 5% hypothetical examples that appear in the shareholder reports of the other funds.
Please note that the expenses shown in the table are meant to highlight your ongoing costs only and do not reflect any transactional costs, such as sales charges (loads) or redemption fees, and insurance-related charges. Therefore, the second line of each share class in the table is useful in comparing ongoing costs only and will not help you determine the relative total costs of owning different funds. In addition, if these transactional costs were included, your costs would have been higher.
Lifecycle Portfolios
22
Shareholder expense example chart
| | | | | |
| | | Beginning | Ending | Expenses Paid | |
| | | Account Value | Account Value | During Period1 | Annualized |
| | | 3-1-07 | 8-31-07 | 3-1-07–8-31-07 | Expense Ratio2 |
| Lifecycle 2045 Portfolio | | | | |
| Class A | Actual | $1,000.00 | $1,063.17 | $3.33 | 0.64% |
| | Hypothetical (5% annualized return before expenses) | 1,000.00 | 1,021.98 | 3.26 | 0.64% |
|
| Class B | Actual | 1,000.00 | 1,059.34 | 7.22 | 1.39% |
| | Hypothetical (5% annualized return before expenses) | 1,000.00 | 1,018.20 | 7.07 | 1.39% |
|
| Class C | Actual | 1,000.00 | 1,059.34 | 7.27 | 1.40% |
| | Hypothetical (5% annualized return before expenses) | 1,000.00 | 1,018.15 | 7.12 | 1.40% |
|
| Class R | Actual | 1,000.00 | 1,061.28 | 5.25 | 1.01% |
| | Hypothetical (5% annualized return before expenses) | 1,000.00 | 1,020.11 | 5.14 | 1.01% |
|
| Class R1 | Actual | 1,000.00 | 1,062.26 | 4.26 | 0.82% |
| | Hypothetical (5% annualized return before expenses) | 1,000.00 | 1,021.07 | 4.18 | 0.82% |
|
| Class R2 | Actual | 1,000.00 | 1,063.17 | 3.02 | 0.58% |
| | Hypothetical (5% annualized return before expenses) | 1,000.00 | 1,022.28 | 2.96 | 0.58% |
|
| Class R3 | Actual | 1,000.00 | 1,063.23 | 4.06 | 0.78% |
| | Hypothetical (5% annualized return before expenses) | 1,000.00 | 1,021.27 | 3.97 | 0.78% |
|
| Class R4 | Actual | 1,000.00 | 1,064.14 | 2.60 | 0.50% |
| | Hypothetical (5% annualized return before expenses) | 1,000.00 | 1,022.68 | 2.55 | 0.50% |
|
| Class R5 | Actual | 1,000.00 | 1,066.08 | 1.15 | 0.22% |
| | Hypothetical (5% annualized return before expenses) | 1,000.00 | 1,024.10 | 1.12 | 0.22% |
|
| Class 1 | Actual | 1,000.00 | 1,066.08 | 1.04 | 0.20% |
| | Hypothetical (5% annualized return before expenses) | 1,000.00 | 1,024.20 | 1.02 | 0.20% |
| Lifecycle 2040 Portfolio | | | | |
| Class A | Actual | $1,000.00 | $1,063.05 | $3.48 | 0.67% |
| | Hypothetical (5% annualized return before expenses) | 1,000.00 | 1,021.83 | 3.41 | 0.67% |
|
| Class B | Actual | 1,000.00 | 1,059.22 | 7.21 | 1.39% |
| | Hypothetical (5% annualized return before expenses) | 1,000.00 | 1,018.20 | 7.07 | 1.39% |
|
| Class C | Actual | 1,000.00 | 1,059.22 | 7.27 | 1.40% |
| | Hypothetical (5% annualized return before expenses) | 1,000.00 | 1,018.15 | 7.12 | 1.40% |
|
| Class R | Actual | 1,000.00 | 1,061.17 | 5.25 | 1.01% |
| | Hypothetical (5% annualized return before expenses) | 1,000.00 | 1,020.11 | 5.14 | 1.01% |
|
| Class R1 | Actual | 1,000.00 | 1,062.14 | 4.26 | 0.82% |
| | Hypothetical (5% annualized return before expenses) | 1,000.00 | 1,021.07 | 4.18 | 0.82% |
|
| Class R2 | Actual | 1,000.00 | 1,063.05 | 3.07 | 0.59% |
| | Hypothetical (5% annualized return before expenses) | 1,000.00 | 1,022.23 | 3.01 | 0.59% |
|
| Class R3 | Actual | 1,000.00 | 1,063.11 | 4.06 | 0.78% |
| | Hypothetical (5% annualized return before expenses) | 1,000.00 | 1,021.27 | 3.97 | 0.78% |
|
| Class R4 | Actual | 1,000.00 | 1,064.02 | 2.60 | 0.50% |
| | Hypothetical (5% annualized return before expenses) | 1,000.00 | 1,022.68 | 2.55 | 0.50% |
|
| Class R5 | Actual | 1,000.00 | 1,065.96 | 1.15 | 0.22% |
| | Hypothetical (5% annualized return before expenses) | 1,000.00 | 1,024.10 | 1.12 | 0.22% |
|
| Class 1 | Actual | 1,000.00 | 1,065.96 | 1.04 | 0.20% |
| | Hypothetical (5% annualized return before expenses) | 1,000.00 | 1,024.20 | 1.02 | 0.20% |
|
Lifecycle Portfolios
23
Shareholder expense example chart, continued
| | | | | |
| | | Beginning | Ending | Expenses Paid | |
| | | Account Value | Account Value | During Period1 | Annualized |
| | | 3-1-07 | 8-31-07 | 3-1-07–8-31-07 | Expense Ratio2 |
| Lifecycle 2035 Portfolio | | | | |
| Class A | Actual | $1,000.00 | $1,062.68 | $3.43 | 0.66% |
| | Hypothetical (5% annualized return before expenses) | 1,000.00 | 1,021.88 | 3.36 | 0.66% |
|
| Class B | Actual | 1,000.00 | 1,058.88 | 7.06 | 1.36% |
| | Hypothetical (5% annualized return before expenses) | 1,000.00 | 1,018.35 | 6.92 | 1.36% |
|
| Class C | Actual | 1,000.00 | 1,058.88 | 7.11 | 1.37% |
| | Hypothetical (5% annualized return before expenses) | 1,000.00 | 1,018.30 | 6.97 | 1.37% |
|
| Class R | Actual | 1,000.00 | 1,060.81 | 5.14 | 0.99% |
| | Hypothetical (5% annualized return before expenses) | 1,000.00 | 1,020.21 | 5.04 | 0.99% |
|
| Class R1 | Actual | 1,000.00 | 1,061.78 | 4.16 | 0.80% |
| | Hypothetical (5% annualized return before expenses) | 1,000.00 | 1,021.17 | 4.08 | 0.80% |
|
| Class R2 | Actual | 1,000.00 | 1,062.68 | 2.91 | 0.56% |
| | Hypothetical (5% annualized return before expenses) | 1,000.00 | 1,022.38 | 2.85 | 0.56% |
|
| Class R3 | Actual | 1,000.00 | 1,061.72 | 3.90 | 0.75% |
| | Hypothetical (5% annualized return before expenses) | 1,000.00 | 1,021.42 | 3.82 | 0.75% |
|
| Class R4 | Actual | 1,000.00 | 1,063.65 | 2.50 | 0.48% |
| | Hypothetical (5% annualized return before expenses) | 1,000.00 | 1,022.79 | 2.45 | 0.48% |
|
| Class R5 | Actual | 1,000.00 | 1,064.55 | 1.04 | 0.20% |
| | Hypothetical (5% annualized return before expenses) | 1,000.00 | 1,024.20 | 1.02 | 0.20% |
|
| Class 1 | Actual | 1,000.00 | 1,064.55 | 1.04 | 0.20% |
| | Hypothetical (5% annualized return before expenses) | 1,000.00 | 1,024.20 | 1.02 | 0.20% |
|
| Lifecycle 2030 Portfolio | | | | |
| Class A | Actual | $1,000.00 | $1,059.22 | $3.43 | 0.66% |
| | Hypothetical (5% annualized return before expenses) | 1,000.00 | 1,021.88 | 3.36 | 0.66% |
|
| Class B | Actual | 1,000.00 | 1,054.42 | 7.04 | 1.36% |
| | Hypothetical (5% annualized return before expenses) | 1,000.00 | 1,018.35 | 6.92 | 1.36% |
|
| Class C | Actual | 1,000.00 | 1,054.42 | 7.04 | 1.36% |
| | Hypothetical (5% annualized return before expenses) | 1,000.00 | 1,018.35 | 6.92 | 1.36% |
|
| Class R | Actual | 1,000.00 | 1,055.39 | 5.13 | 0.99% |
| | Hypothetical (5% annualized return before expenses) | 1,000.00 | 1,020.21 | 5.04 | 0.99% |
|
| Class R1 | Actual | 1,000.00 | 1,057.34 | 4.15 | 0.80% |
| | Hypothetical (5% annualized return before expenses) | 1,000.00 | 1,021.17 | 4.08 | 0.80% |
|
| Class R2 | Actual | 1,000.00 | 1,058.25 | 2.85 | 0.55% |
| | Hypothetical (5% annualized return before expenses) | 1,000.00 | 1,022.43 | 2.80 | 0.55% |
|
| Class R3 | Actual | 1,000.00 | 1,056.31 | 3.89 | 0.75% |
| | Hypothetical (5% annualized return before expenses) | 1,000.00 | 1,021.42 | 3.82 | 0.75% |
|
| Class R4 | Actual | 1,000.00 | 1,059.22 | 2.49 | 0.48% |
| | Hypothetical (5% annualized return before expenses) | 1,000.00 | 1,022.79 | 2.45 | 0.48% |
|
| Class R5 | Actual | 1,000.00 | 1,060.14 | 1.04 | 0.20% |
| | Hypothetical (5% annualized return before expenses) | 1,000.00 | 1,024.20 | 1.02 | 0.20% |
|
| Class 1 | Actual | 1,000.00 | 1,060.14 | 1.04 | 0.20% |
| | Hypothetical (5% annualized return before expenses) | 1,000.00 | 1,024.20 | 1.02 | 0.20% |
|
Lifecycle Portfolios
24
Shareholder expense example chart, continued
| | | | | |
| | | Beginning | Ending | Expenses Paid | |
| | | Account Value | Account Value | During Period1 | Annualized |
| | | 3-1-07 | 8-31-07 | 3-1-07–8-31-07 | Expense Ratio2 |
| Lifecycle 2025 Portfolio | | | | |
| Class A | Actual | $1,000.00 | $1,052.38 | $3.41 | 0.66% |
| | Hypothetical (5% annualized return before expenses) | 1,000.00 | 1,021.88 | 3.36 | 0.66% |
|
| Class B | Actual | 1,000.00 | 1,049.56 | 7.08 | 1.37% |
| | Hypothetical (5% annualized return before expenses) | 1,000.00 | 1,018.30 | 6.97 | 1.37% |
|
| Class C | Actual | 1,000.00 | 1,049.56 | 7.13 | 1.38% |
| | Hypothetical (5% annualized return before expenses) | 1,000.00 | 1,018.25 | 7.02 | 1.38% |
|
| Class R | Actual | 1,000.00 | 1,051.51 | 5.22 | 1.01% |
| | Hypothetical (5% annualized return before expenses) | 1,000.00 | 1,020.11 | 5.14 | 1.01% |
|
| Class R1 | Actual | 1,000.00 | 1,051.46 | 4.24 | 0.82% |
| | Hypothetical (5% annualized return before expenses) | 1,000.00 | 1,021.07 | 4.18 | 0.82% |
|
| Class R2 | Actual | 1,000.00 | 1,053.40 | 3.00 | 0.58% |
| | Hypothetical (5% annualized return before expenses) | 1,000.00 | 1,022.28 | 2.96 | 0.58% |
|
| Class R3 | Actual | 1,000.00 | 1,052.43 | 4.09 | 0.79% |
| | Hypothetical (5% annualized return before expenses) | 1,000.00 | 1,021.22 | 4.02 | 0.79% |
|
| Class R4 | Actual | 1,000.00 | 1,053.35 | 2.59 | 0.50% |
| | Hypothetical (5% annualized return before expenses) | 1,000.00 | 1,022.68 | 2.55 | 0.50% |
|
| Class R5 | Actual | 1,000.00 | 1,055.29 | 1.14 | 0.22% |
| | Hypothetical (5% annualized return before expenses) | 1,000.00 | 1,024.10 | 1.12 | 0.22% |
|
| Class 1 | Actual | 1,000.00 | 1,055.29 | 1.04 | 0.20% |
| | Hypothetical (5% annualized return before expenses) | 1,000.00 | 1,024.20 | 1.02 | 0.20% |
|
| Lifecycle 2020 Portfolio | | | | |
| Class A | Actual | $1,000.00 | $1,047.53 | $3.41 | 0.66% |
| | Hypothetical (5% annualized return before expenses) | 1,000.00 | 1,021.88 | 3.36 | 0.66% |
|
| Class B | Actual | 1,000.00 | 1,043.69 | 7.06 | 1.37% |
| | Hypothetical (5% annualized return before expenses) | 1,000.00 | 1,018.30 | 6.97 | 1.37% |
|
| Class C | Actual | 1,000.00 | 1,043.69 | 7.06 | 1.37% |
| | Hypothetical (5% annualized return before expenses) | 1,000.00 | 1,018.30 | 6.97 | 1.37% |
|
| Class R | Actual | 1,000.00 | 1,044.66 | 5.21 | 1.01% |
| | Hypothetical (5% annualized return before expenses) | 1,000.00 | 1,020.11 | 5.14 | 1.01% |
|
| Class R1 | Actual | 1,000.00 | 1,046.60 | 4.23 | 0.82% |
| | Hypothetical (5% annualized return before expenses) | 1,000.00 | 1,021.07 | 4.18 | 0.82% |
|
| Class R2 | Actual | 1,000.00 | 1,046.56 | 2.99 | 0.58% |
| | Hypothetical (5% annualized return before expenses) | 1,000.00 | 1,022.28 | 2.96 | 0.58% |
|
| Class R3 | Actual | 1,000.00 | 1,046.60 | 4.02 | 0.78% |
| | Hypothetical (5% annualized return before expenses) | 1,000.00 | 1,021.27 | 3.97 | 0.78% |
|
| Class R4 | Actual | 1,000.00 | 1,047.53 | 2.58 | 0.50% |
| | Hypothetical (5% annualized return before expenses) | 1,000.00 | 1,022.68 | 2.55 | 0.50% |
|
| Class R5 | Actual | 1,000.00 | 1,049.47 | 1.14 | 0.22% |
| | Hypothetical (5% annualized return before expenses) | 1,000.00 | 1,024.10 | 1.12 | 0.22% |
|
| Class 1 | Actual | 1,000.00 | 1,048.45 | 1.03 | 0.20% |
| | Hypothetical (5% annualized return before expenses) | 1,000.00 | 1,024.20 | 1.02 | 0.20% |
|
Lifecycle Portfolios
25
Shareholder expense example chart, continued
| | | | | |
| | | Beginning | Ending | Expenses Paid | |
| | | Account Value | Account Value | During Period1 | Annualized |
| | | 3-1-07 | 8-31-07 | 3-1-07–8-31-07 | Expense Ratio2 |
| Lifecycle 2015 Portfolio | | | | |
| Class A | Actual | $1,000.00 | $1,034.99 | $3.39 | 0.66% |
| | Hypothetical (5% annualized return before expenses) | 1,000.00 | 1,021.88 | 3.36 | 0.66% |
|
| Class B | Actual | 1,000.00 | 1,031.13 | 6.96 | 1.36% |
| | Hypothetical (5% annualized return before expenses) | 1,000.00 | 1,018.35 | 6.92 | 1.36% |
|
| Class C | Actual | 1,000.00 | 1,031.13 | 7.06 | 1.38% |
| | Hypothetical (5% annualized return before expenses) | 1,000.00 | 1,018.25 | 7.02 | 1.38% |
|
| Class R | Actual | 1,000.00 | 1,033.07 | 5.18 | 1.01% |
| | Hypothetical (5% annualized return before expenses) | 1,000.00 | 1,020.11 | 5.14 | 1.01% |
|
| Class R1 | Actual | 1,000.00 | 1,034.05 | 4.20 | 0.82% |
| | Hypothetical (5% annualized return before expenses) | 1,000.00 | 1,021.07 | 4.18 | 0.82% |
|
| Class R2 | Actual | 1,000.00 | 1,034.99 | 2.97 | 0.58% |
| | Hypothetical (5% annualized return before expenses) | 1,000.00 | 1,022.28 | 2.96 | 0.58% |
|
| Class R3 | Actual | 1,000.00 | 1,034.05 | 3.95 | 0.77% |
| | Hypothetical (5% annualized return before expenses) | 1,000.00 | 1,021.32 | 3.92 | 0.77% |
|
| Class R4 | Actual | 1,000.00 | 1,034.99 | 2.56 | 0.50% |
| | Hypothetical (5% annualized return before expenses) | 1,000.00 | 1,022.68 | 2.55 | 0.50% |
|
| Class R5 | Actual | 1,000.00 | 1,036.93 | 1.13 | 0.22% |
| | Hypothetical (5% annualized return before expenses) | 1,000.00 | 1,024.10 | 1.12 | 0.22% |
|
| Class 1 | Actual | 1,000.00 | 1,036.89 | 1.03 | 0.20% |
| | Hypothetical (5% annualized return before expenses) | 1,000.00 | 1,024.20 | 1.02 | 0.20% |
|
| Lifecycle 2010 Portfolio | | | | |
| Class A | Actual | $1,000.00 | $1,023.30 | $3.37 | 0.66% |
| | Hypothetical (5% annualized return before expenses) | 1,000.00 | 1,021.88 | 3.36 | 0.66% |
|
| Class B | Actual | 1,000.00 | 1,019.44 | 7.08 | 1.39% |
| | Hypothetical (5% annualized return before expenses) | 1,000.00 | 1,018.20 | 7.07 | 1.39% |
|
| Class C | Actual | 1,000.00 | 1,020.41 | 7.03 | 1.38% |
| | Hypothetical (5% annualized return before expenses) | 1,000.00 | 1,018.25 | 7.02 | 1.38% |
|
| Class R | Actual | 1,000.00 | 1,021.38 | 5.20 | 1.02% |
| | Hypothetical (5% annualized return before expenses) | 1,000.00 | 1,020.06 | 5.19 | 1.02% |
|
| Class R1 | Actual | 1,000.00 | 1,022.35 | 4.18 | 0.82% |
| | Hypothetical (5% annualized return before expenses) | 1,000.00 | 1,021.07 | 4.18 | 0.82% |
|
| Class R2 | Actual | 1,000.00 | 1,023.30 | 2.91 | 0.57% |
| | Hypothetical (5% annualized return before expenses) | 1,000.00 | 1,022.33 | 2.91 | 0.57% |
|
| Class R3 | Actual | 1,000.00 | 1,023.32 | 3.93 | 0.77% |
| | Hypothetical (5% annualized return before expenses) | 1,000.00 | 1,021.32 | 3.92 | 0.77% |
|
| Class R4 | Actual | 1,000.00 | 1,024.27 | 2.55 | 0.50% |
| | Hypothetical (5% annualized return before expenses) | 1,000.00 | 1,022.68 | 2.55 | 0.50% |
|
| Class R5 | Actual | 1,000.00 | 1,026.21 | 1.12 | 0.22% |
| | Hypothetical (5% annualized return before expenses) | 1,000.00 | 1,024.10 | 1.12 | 0.22% |
|
| Class 1 | Actual | 1,000.00 | 1,025.22 | 1.02 | 0.20% |
| | Hypothetical (5% annualized return before expenses) | 1,000.00 | 1,024.20 | 1.02 | 0.20% |
|
Lifecycle Portfolios
26
Shareholder expense example chart, continued
| | | | | |
| | | Beginning | Ending | Expenses Paid | |
| | | Account Value | Account Value | During Period1 | Annualized |
| | | 3-1-07 | 8-31-07 | 3-1-07–8-31-07 | Expense Ratio2 |
| Lifecycle Retirement Portfolio | | | | |
| Class A | Actual | $1,000.00 | $1,020.49 | $3.51 | 0.69% |
| | Hypothetical (5% annualized return before expenses) | 1,000.00 | 1,021.73 | 3.52 | 0.69% |
|
| Class B | Actual | 1,000.00 | 1,015.76 | 7.21 | 1.42% |
| | Hypothetical (5% annualized return before expenses) | 1,000.00 | 1,018.05 | 7.22 | 1.42% |
|
| Class C | Actual | 1,000.00 | 1,015.81 | 7.16 | 1.41% |
| | Hypothetical (5% annualized return before expenses) | 1,000.00 | 1,018.10 | 7.17 | 1.41% |
|
| Class R | Actual | 1,000.00 | 1,016.63 | 5.44 | 1.07% |
| | Hypothetical (5% annualized return before expenses) | 1,000.00 | 1,019.81 | 5.45 | 1.07% |
|
| Class R1 | Actual | 1,000.00 | 1,016.91 | 4.47 | 0.88% |
| | Hypothetical (5% annualized return before expenses) | 1,000.00 | 1,020.77 | 4.48 | 0.88% |
|
| Class R2 | Actual | 1,000.00 | 1,018.18 | 3.20 | 0.63% |
| | Hypothetical (5% annualized return before expenses) | 1,000.00 | 1,022.03 | 3.21 | 0.63% |
|
| Class R3 | Actual | 1,000.00 | 1,017.17 | 4.17 | 0.82% |
| | Hypothetical (5% annualized return before expenses) | 1,000.00 | 1,021.07 | 4.18 | 0.82% |
|
| Class R4 | Actual | 1,000.00 | 1,019.55 | 2.80 | 0.55% |
| | Hypothetical (5% annualized return before expenses) | 1,000.00 | 1,022.43 | 2.80 | 0.55% |
|
| Class R5 | Actual | 1,000.00 | 1,019.95 | 1.37 | 0.27% |
| | Hypothetical (5% annualized return before expenses) | 1,000.00 | 1,023.84 | 1.38 | 0.27% |
|
| Class 1 | Actual | 1,000.00 | 1,020.09 | 1.27 | 0.25% |
| | Hypothetical (5% annualized return before expenses) | 1,000.00 | 1,023.95 | 1.28 | 0.25% |
|
1 Expenses are equal to the annualized expense ratio, multiplied by the average account value over the period, multiplied by the number of days in the period (184), and divided by 365 (to reflect the one-half year period).
2 Lifecycle Portfolios’ expense ratios do not include fees and expenses indirectly incurred by the underlying funds.
Lifecycle Portfolios
27
F I N A N C I A L S T A T E M E N T S
Portfolio’s investments
| |
| Investment companies | |
| |
| Underlying Funds’ Investment Manager |
| | |
| BlackRock Investment Management, LLC | (BlackRock) |
| (formerly Mercury Advisors) | |
| | |
| Davis Advisors | (Davis) |
| | |
| Declaration Management / | (Declaration) |
| John Hancock Advisers | |
| | |
| Deutsche Asset Management | (Deutsche) |
| | |
| Dimensional Fund Advisors, Inc. | (DFA) |
| | |
| Excelsior Funds, Inc. | (Excelsior) |
| | |
| Franklin®Templeton® | (Templeton) |
| | |
| Grantham, Mayo, Van Otterloo & Co. | (GMO) |
| | |
| Jennison Associates LLC | (Jennison) |
| | |
| Legg Mason Funds Management, Inc | (Legg Mason) |
| | |
| Marsico Capital Management, LLC | (Marsico) |
| | |
| MFC Global Investment Management | (MFC Global U.S.A.) |
| (U.S.A.) Limited | |
| | |
| MFC Global Investment Management | (MFC Global U.S.) |
| (U.S.), LLC | |
| | |
| Pacific Investment Management Company | (PIMCO) |
| | |
| RCM Capital Management, Inc. | (RCM) |
| | |
| SSgA Funds Management, Inc. | (SSgA) |
| | |
| T. Rowe Price Associates, Inc. | (T. Rowe Price) |
| | |
| Van Kampen | (Van Kampen) |
| | |
| Wellington Management Company, LLP | (Wellington) |
| | |
| Wells Capital Management, Inc. | (Wells Capital) |
| | |
| Western Asset Management Company | (WAMCO) |
Lifecycle 2045 Portfolio
Securities owned by the Portfolio on 8-31-07
| | |
| Issuer | Shares | Value |
| |
| Investment companies 100.00% | | |
|
| John Hancock Funds II 96.00% | | |
|
| Blue Chip Growth (T. Rowe Price) | 36,504 | $765,488 |
|
| Capital Appreciation (Jennison) | 70,889 | 765,599 |
|
| Core Equity (Legg Mason) | 48,084 | 764,058 |
|
| Emerging Small Company (RCM) | 24,605 | 766,457 |
|
| Fundamental Value (Davis) | 43,552 | 764,766 |
|
| Index 500 (MFC Global USA) | 448,876 | 4,847,859 |
|
| International Equity Index (SSgA) | 136,161 | 3,064,977 |
|
| International Opportunities (Marsico) | 52,778 | 1,021,782 |
|
| International Small Cap (Templeton) | 31,403 | 770,309 |
|
| International Small Company (DFA) | 66,354 | 765,057 |
|
| International Value (Templeton) | 51,790 | 1,020,255 |
|
| Large Cap Value (BlackRock) | 29,477 | 764,919 |
|
| Mid Cap Index (MFC Global U.S.A.) | 84,285 | 1,785,162 |
|
| Mid Cap Stock (Wellington) | 46,987 | 894,158 |
|
| Natural Resources (Wellington) | 36,199 | 1,534,476 |
|
| Small Cap Index (MFC Global U.S.A.) | 104,912 | 1,786,657 |
|
| Small Company Value (T. Rowe Price) | 29,644 | 764,527 |
|
| Value & Restructuring (Excelsior) | 59,171 | 764,494 |
|
| Value (Van Kampen) | 78,013 | 891,687 |
|
| | | 24,502,687 |
| John Hancock Funds III 4.00% | | |
|
| International Core (GMO) | 21,959 | 1,019,996 |
| | | |
| Total investment companies | | |
| (Cost $25,542,457) | | $25,522,683 |
| | | |
| Total investments | | |
| (Cost $25,542,457) 100.00% | | $25,522,683 |
| | |
| Other assets in excess of liabilities 0.00% | 899 |
|
| Total net assets 100.00% | | $25,523,582 |
Percentages are stated as a percent of net assets.
See notes to financial statements
Lifecycle Portfolios
28
Lifecycle 2040 Portfolio
Securities owned by the Portfolio on 8-31-07
| | |
| Issuer | Shares | Value |
| |
| Investment companies 100.00% | | |
|
| John Hancock Funds II 96.00% | | |
|
| Blue Chip Growth (T. Rowe Price) | 39,620 | $830,823 |
|
| Capital Appreciation (Jennison) | 76,938 | 830,935 |
|
| Core Equity (Legg Mason) | 52,218 | 829,747 |
|
| Emerging Small Company (RCM) | 26,673 | 830,860 |
|
| Fundamental Value (Davis) | 47,273 | 830,108 |
|
| Index 500 (MFC Global USA) | 487,038 | 5,260,008 |
|
| International Equity Index (SSgA) | 147,718 | 3,325,135 |
|
| International Opportunities (Marsico) | 57,279 | 1,108,921 |
|
| International Small Cap (Templeton) | 33,923 | 832,130 |
|
| International Small Company (DFA) | 72,070 | 830,971 |
|
| International Value (Templeton) | 56,233 | 1,107,790 |
|
| Large Cap Value (BlackRock) | 31,982 | 829,941 |
|
| Mid Cap Index (MFC Global U.S.A.) | 91,467 | 1,937,275 |
|
| Mid Cap Stock (Wellington) | 50,970 | 969,955 |
|
| Natural Resources (Wellington) | 39,232 | 1,663,044 |
|
| Small Cap Index (MFC Global U.S.A.) | 113,740 | 1,937,001 |
|
| Small Company Value (T. Rowe Price) | 32,170 | 829,672 |
|
| Value & Restructuring (Excelsior) | 64,253 | 830,152 |
|
| Value (Van Kampen) | 84,733 | 968,496 |
|
| | | 26,582,964 |
| John Hancock Funds III 4.00% | | |
|
| International Core (GMO) | 23,846 | 1,107,647 |
| | | |
| Total investment companies | | |
| (Cost $27,560,813) | | $27,690,611 |
| | | |
| Total investments | | |
| (Cost $27,560,813) 100.00% | | $27,690,611 |
| | |
| Other assets in excess of liabilities 0.00% | 494 |
|
| Total net assets 100.00% | | $27,691,105 |
Percentages are stated as a percent of net assets.
Lifecycle 2035 Portfolio
Securities owned by the Portfolio on 8-31-07
| | |
| Issuer | Shares | Value |
| |
| Investment companies 100.01% | | |
|
| John Hancock Funds II 96.01% | | |
|
| Blue Chip Growth (T. Rowe Price) | 59,499 | $1,247,687 |
|
| Capital Appreciation (Jennison) | 115,539 | 1,247,826 |
|
| Core Equity (Legg Mason) | 78,449 | 1,246,553 |
|
| Emerging Small Company (RCM) | 40,054 | 1,247,667 |
|
| Fundamental Value (Davis) | 71,007 | 1,246,890 |
|
| High Yield (WAMCO) | 41,981 | 414,351 |
|
| Index 500 (MFC Global USA) | 732,451 | 7,910,470 |
|
| International Equity Index (SSgA) | 222,083 | 4,999,091 |
|
| International Opportunities (Marsico) | 75,792 | 1,467,333 |
|
| International Small Cap (Templeton) | 51,517 | 1,263,718 |
|
| International Small Company (DFA) | 108,238 | 1,247,979 |
|
| International Value (Templeton) | 73,913 | 1,456,083 |
|
| Large Cap Value (BlackRock) | 48,042 | 1,246,699 |
|
| Mid Cap Index (MFC Global U.S.A.) | 137,512 | 2,912,513 |
|
| Mid Cap Stock (Wellington) | 76,676 | 1,459,151 |
|
| Natural Resources (Wellington) | 59,272 | 2,512,540 |
|
| Small Cap Index (MFC Global U.S.A.) | 146,532 | 2,495,447 |
|
| Small Company Value (T. Rowe Price) | 48,328 | 1,246,386 |
|
| Strategic Bond (WAMCO) | 35,914 | 414,451 |
|
| Value & Restructuring (Excelsior) | 96,511 | 1,246,920 |
|
| Value (Van Kampen) | 127,296 | 1,454,989 |
|
| | | 39,984,744 |
| John Hancock Funds III 4.00% | | |
|
| International Core (GMO) | 35,827 | 1,664,164 |
| | | |
| Total investment companies | | |
| (Cost $41,310,715) | | $41,648,908 |
| | | |
| Total investments | | |
| (Cost $41,310,715) 100.01% | | $41,648,908 |
| | |
| Liabilities in excess of other assets (0.01)% | (4,261) |
|
| Total net assets 100.00% | | $41,644,647 |
Percentages are stated as a percent of net assets.
See notes to financial statements
Lifecycle Portfolios
29
F I N A N C I A L S T A T E M E N T S
Lifecycle 2030 Portfolio
Securities owned by the Portfolio on 8-31-07
| | |
| Issuer | Shares | Value |
| |
| Investment companies 99.98% | | |
|
| John Hancock Funds II 95.99% | | |
|
| Blue Chip Growth (T. Rowe Price) | 75,217 | $1,577,298 |
|
| Capital Appreciation (Jennison) | 121,623 | 1,313,533 |
|
| Core Equity (Legg Mason) | 99,179 | 1,575,958 |
|
| Emerging Small Company (RCM) | 42,156 | 1,313,164 |
|
| Fundamental Value (Davis) | 89,772 | 1,576,394 |
|
| Index 500 (MFC Global USA) | 976,437 | 10,545,525 |
|
| International Equity Index (SSgA) | 281,901 | 6,345,589 |
|
| International Opportunities (Marsico) | 83,414 | 1,614,895 |
|
| International Small Cap (Templeton) | 44,363 | 1,088,227 |
|
| International Small Company (DFA) | 137,572 | 1,586,203 |
|
| International Value (Templeton) | 80,083 | 1,577,633 |
|
| Large Cap Value (BlackRock) | 60,740 | 1,576,198 |
|
| Mid Cap Index (MFC Global U.S.A.) | 174,062 | 3,686,629 |
|
| Mid Cap Stock (Wellington) | 83,194 | 1,583,175 |
|
| Natural Resources (Wellington) | 75,514 | 3,201,038 |
|
| Real Estate Equity (T. Rowe Price) | 48,478 | 524,531 |
|
| Real Return Bond (PIMCO) | 39,930 | 521,881 |
|
| Small Cap Index (MFC Global U.S.A.) | 185,456 | 3,158,317 |
|
| Small Company Value (T. Rowe Price) | 50,879 | 1,312,181 |
|
| Strategic Bond (WAMCO) | 45,204 | 521,659 |
|
| Total Bond Market (Declaration) | 52,084 | 521,880 |
|
| U.S. High Yield Bond (Wells Capital) | 81,514 | 1,049,082 |
|
| Value & Restructuring (Excelsior) | 101,637 | 1,313,156 |
|
| Value (Van Kampen) | 137,914 | 1,576,354 |
|
| | | 50,660,500 |
| John Hancock Funds III 3.99% | | |
|
| International Core (GMO) | 45,317 | 2,104,975 |
| | | |
| Total investment companies | | |
| (Cost $52,581,110) | | $52,765,475 |
| | | |
| Total investments | | |
| (Cost $52,581,110) 99.98% | | $52,765,475 |
| | |
| Other assets in excess of liabilities 0.02% | 9,160 |
|
| Total net assets 100.00% | | $52,774,635 |
Percentages are stated as a percent of net assets.
Lifecycle 2025 Portfolio
Securities owned by the Portfolio on 8-31-07
| | |
| Issuer | Shares | Value |
| |
| Investment companies 100.00% | | |
|
| John Hancock Funds II 97.00% | | |
|
| Blue Chip Growth (T. Rowe Price) | 98,606 | $2,067,777 |
|
| Capital Appreciation (Jennison) | 127,523 | 1,377,248 |
|
| Core Equity (Legg Mason) | 130,067 | 2,066,772 |
|
| Emerging Small Company (RCM) | 44,230 | 1,377,758 |
|
| Fundamental Value (Davis) | 117,722 | 2,067,202 |
|
| High Income (MFC Global U.S.) | 64,695 | 686,410 |
|
| High Yield (WAMCO) | 209,480 | 2,067,570 |
|
| Index 500 (MFC Global USA) | 1,342,265 | 14,496,464 |
|
| International Equity Index (SSgA) | 338,057 | 7,609,658 |
|
| International Opportunities (Marsico) | 107,400 | 2,079,264 |
|
| International Small Cap (Templeton) | 56,969 | 1,397,442 |
|
| International Small Company (DFA) | 180,229 | 2,078,037 |
|
| International Value (Templeton) | 105,251 | 2,073,442 |
|
| Large Cap Value (BlackRock) | 79,651 | 2,066,936 |
|
| Mid Cap Index (MFC Global U.S.A.) | 195,396 | 4,138,485 |
|
| Mid Cap Stock (Wellington) | 91,116 | 1,733,930 |
|
| Natural Resources (Wellington) | 81,874 | 3,470,639 |
|
| Real Estate Equity (T. Rowe Price) | 64,075 | 693,289 |
|
| Real Return Bond (PIMCO) | 105,404 | 1,377,625 |
|
| Small Cap Index (MFC Global U.S.A.) | 243,021 | 4,138,652 |
|
| Small Company Value (T. Rowe Price) | 53,381 | 1,376,689 |
|
| Strategic Bond (WAMCO) | 59,505 | 686,686 |
|
| Strategic Income (MFC Global U.S.) | 68,262 | 686,720 |
|
| Total Bond Market (Declaration) | 68,551 | 686,878 |
|
| Total Return (PIMCO) | 49,955 | 686,887 |
|
| U.S. High Yield Bond (Wells Capital) | 53,349 | 686,601 |
|
| Value & Restructuring (Excelsior) | 106,973 | 1,382,088 |
|
| Value (Van Kampen) | 150,640 | 1,721,811 |
|
| | | 66,978,960 |
| John Hancock Funds III 3.00% | | |
|
| International Core (GMO) | 44,563 | 2,069,951 |
| | | |
| Total investment companies | | |
| (Cost $68,726,580) | | $69,048,911 |
| | | |
| Total investments | | |
| (Cost $68,726,580) 100.00% | | $69,048,911 |
| | |
| Other assets in excess of liabilities 0.00% | 951 |
|
| Total net assets 100.00% | | $69,049,862 |
Percentages are stated as a percent of net assets.
See notes to financial statements
Lifecycle Portfolios
30
Lifecycle 2020 Portfolio
Securities owned by the Portfolio on 8-31-07
| | |
| Issuer | Shares | Value |
| |
| Investment companies 99.74% | | |
|
| John Hancock Funds II 97.25% | | |
|
| Blue Chip Growth (T. Rowe Price) | 97,629 | $2,047,285 |
|
| Capital Appreciation (Jennison) | 126,237 | 1,363,361 |
|
| Core Equity (Legg Mason) | 85,537 | 1,359,190 |
|
| Emerging Small Company (RCM) | 32,805 | 1,021,877 |
|
| Fundamental Value (Davis) | 116,361 | 2,043,302 |
|
| Global Real Estate (Deutsche) | 60,037 | 682,625 |
|
| High Income (MFC Global U.S.) | 128,123 | 1,359,381 |
|
| High Yield (WAMCO) | 345,434 | 3,409,432 |
|
| Index 500 (MFC Global USA) | 1,455,657 | 15,721,098 |
|
| International Equity Index (SSgA) | 320,398 | 7,212,159 |
|
| International Opportunities (Marsico) | 72,070 | 1,395,275 |
|
| International Small Cap (Templeton) | 57,516 | 1,410,876 |
|
| International Small Company (DFA) | 118,906 | 1,370,985 |
|
| International Value (Templeton) | 69,447 | 1,368,098 |
|
| Large Cap Value (BlackRock) | 78,732 | 2,043,094 |
|
| Mid Cap Index (MFC Global U.S.A.) | 161,261 | 3,415,517 |
|
| Mid Cap Stock (Wellington) | 54,070 | 1,028,950 |
|
| Natural Resources (Wellington) | 81,550 | 3,456,905 |
|
| Real Estate Equity (T. Rowe Price) | 63,461 | 686,644 |
|
| Real Return Bond (PIMCO) | 156,346 | 2,043,448 |
|
| Small Cap Index (MFC Global U.S.A.) | 160,132 | 2,727,051 |
|
| Small Company Value (T. Rowe Price) | 39,539 | 1,019,713 |
|
| Spectrum Income (T. Rowe Price) | 64,190 | 675,921 |
|
| Strategic Bond (WAMCO) | 117,790 | 1,359,301 |
|
| Strategic Income (MFC Global U.S.) | 67,185 | 675,876 |
|
| Total Bond Market (Declaration) | 67,473 | 676,076 |
|
| Total Return (PIMCO) | 98,894 | 1,359,794 |
|
| U.S. High Yield Bond (Wells Capital) | 105,604 | 1,359,127 |
|
| Value & Restructuring (Excelsior) | 105,884 | 1,368,025 |
|
| Value (Van Kampen) | 89,040 | 1,017,726 |
|
| | | 66,678,112 |
| John Hancock Funds III 2.49% | | |
|
| International Core (GMO) | 36,773 | 1,708,106 |
| | | |
| Total investment companies | | |
| (Cost $68,180,009) | | $68,386,218 |
| | | |
| Total investments | | |
| (Cost $68,180,009) 99.74% | | $68,386,218 |
| | |
| Other assets in excess of liabilities 0.26% | 176,768 |
|
| Total net assets 100.00% | | $68,562,986 |
Lifecycle 2015 Portfolio
Securities owned by the Portfolio on 8-31-07
| | |
| Issuer | Shares | Value |
| |
| Investment companies 99.99% | | |
|
| John Hancock Funds II 97.99% | | |
|
| Blue Chip Growth (T. Rowe Price) | 55,321 | $1,160,081 |
|
| Capital Appreciation (Jennison) | 107,384 | 1,159,751 |
|
| Core Equity (Legg Mason) | 72,747 | 1,155,944 |
|
| Emerging Small Company (RCM) | 18,618 | 579,954 |
|
| Fundamental Value (Davis) | 98,802 | 1,734,964 |
|
| Global Real Estate (Deutsche) | 102,447 | 1,164,825 |
|
| High Income (MFC Global U.S.) | 108,498 | 1,151,163 |
|
| High Yield (WAMCO) | 527,625 | 5,207,656 |
|
| Index 500 (MFC Global USA) | 1,180,081 | 12,744,873 |
|
| International Equity Index (SSgA) | 207,103 | 4,661,891 |
|
| International Opportunities (Marsico) | 45,184 | 874,762 |
|
| International Small Cap (Templeton) | 23,868 | 585,484 |
|
| International Small Company (DFA) | 101,176 | 1,166,555 |
|
| International Value (Templeton) | 44,317 | 873,048 |
|
| Large Cap Value (BlackRock) | 44,582 | 1,156,894 |
|
| Mid Cap Index (MFC Global U.S.A.) | 82,194 | 1,740,866 |
|
| Mid Cap Stock (Wellington) | 30,696 | 584,144 |
|
| Natural Resources (Wellington) | 68,975 | 2,923,850 |
|
| Real Estate Equity (T. Rowe Price) | 162,073 | 1,753,632 |
|
| Real Return Bond (PIMCO) | 176,824 | 2,311,095 |
|
| Small Cap Index (MFC Global U.S.A.) | 68,012 | 1,158,243 |
|
| Small Company Value (T. Rowe Price) | 22,431 | 578,507 |
|
| Spectrum Income (T. Rowe Price) | 109,318 | 1,151,117 |
|
| Strategic Bond (WAMCO) | 149,959 | 1,730,531 |
|
| Strategic Income (MFC Global U.S.) | 114,418 | 1,151,049 |
|
| Total Bond Market (Declaration) | 230,652 | 2,311,137 |
|
| Total Return (PIMCO) | 83,736 | 1,151,367 |
|
| U.S. High Yield Bond (Wells Capital) | 89,425 | 1,150,903 |
|
| Value & Restructuring (Excelsior) | 90,054 | 1,163,500 |
|
| Value (Van Kampen) | 50,476 | 576,944 |
|
| | | 56,814,730 |
| John Hancock Funds III 2.00% | | |
|
| International Core (GMO) | 25,020 | 1,162,179 |
| | | |
| Total investment companies | | |
| (Cost $58,041,125) | | $57,976,909 |
| | | |
| Total investments | | |
| (Cost $58,041,125) 99.99% | | $57,976,909 |
| | |
| Other assets in excess of liabilities 0.01% | 6,472 |
|
| Total net assets 100.00% | | $57,983,381 |
Percentages are stated as a percent of net assets.
See notes to financial statements
Lifecycle Portfolios
31
F I N A N C I A L S T A T E M E N T S
Lifecycle 2010 Portfolio
Securities owned by the Portfolio on 8-31-07
| | |
| Issuer | Shares | Value |
| |
| Investment companies 99.98% | | |
|
| John Hancock Funds II 98.47% | | |
|
| Blue Chip Growth (T. Rowe Price) | 26,082 | $546,936 |
|
| Capital Appreciation (Jennison) | 50,628 | 546,779 |
|
| Core Equity (Legg Mason) | 17,130 | 272,191 |
|
| Fundamental Value (Davis) | 31,037 | 545,001 |
|
| Global Real Estate (Deutsche) | 72,357 | 822,701 |
|
| High Income (MFC Global US) | 102,335 | 1,085,777 |
|
| High Yield (WAMCO) | 220,425 | 2,175,591 |
|
| Index 500 (MFC Global USA) | 505,000 | 5,454,000 |
|
| International Equity Index (SSgA) | 79,282 | 1,784,631 |
|
| International Opportunities (Marsico) | 14,199 | 274,893 |
|
| International Small Cap (Templeton) | 11,253 | 276,029 |
|
| International Small Company (DFA) | 23,828 | 274,739 |
|
| International Value (Templeton) | 13,921 | 274,242 |
|
| Investment Quality Bond (Wellington) | 46,268 | 540,874 |
|
| Large Cap Value (BlackRock) | 21,001 | 544,975 |
|
| Mid Cap Index (MFC Global USA) | 25,810 | 546,657 |
|
| Natural Resources (Wellington) | 26,003 | 1,102,267 |
|
| Real Estate Equity (T. Rowe Price) | 101,497 | 1,098,196 |
|
| Real Return Bond (PIMCO) | 104,057 | 1,360,026 |
|
| Small Cap Index (MFC Global U.S.A.) | 32,037 | 545,589 |
|
| Spectrum Income (T. Rowe Price) | 77,254 | 813,487 |
|
| Strategic Bond (WAMCO) | 94,096 | 1,085,872 |
|
| Strategic Income (MFC Global U.S.) | 80,855 | 813,398 |
|
| Total Bond Market (Declaration) | 190,166 | 1,905,463 |
|
| Total Return (PIMCO) | 39,343 | 540,966 |
|
| U.S. High Yield Bond (Wells Capital) | 84,348 | 1,085,560 |
|
| Value & Restructuring (Excelsior) | 42,417 | 548,023 |
|
| | | 26,864,863 |
| John Hancock Funds III 1.51% | | |
|
| International Core (GMO) | 8,842 | 410,711 |
| | | |
| Total investment companies | | |
| (Cost $27,284,797) | | $27,275,574 |
| | | |
| Total investments | | |
| (Cost $27,284,797) 99.98% | | $27,275,574 |
| | |
| Other assets in excess of liabilities 0.02% | 5,355 |
|
| Total net assets 100.00% | | $27,280,929 |
Percentages are stated as a percent of net assets.
Lifecycle Retirement Portfolio
Securities owned by the Portfolio on 8-31-07
| | |
| Issuer | Shares | Value |
| |
| Investment companies 90.65% | | |
|
| Investment Companies 1.64% | | |
|
| PowerShares DB Commodity | | |
| Index Tracking Fund* | 46,002 | $1,181,791 |
| | | |
| John Hancock Funds II 88.01% | | |
|
| Core Equity (Legg Mason) | 181,914 | 2,890,619 |
|
| Fundamental Value (Davis) | 164,770 | 2,893,367 |
|
| Global Bond (PIMCO) | 193,421 | 2,858,762 |
|
| Global Real Estate (Deutsche) | 256,294 | 2,914,062 |
|
| High Income (MFC Global U.S.) | 338,726 | 3,593,881 |
|
| High Yield (WAMCO) | 290,629 | 2,868,505 |
|
| Index 500 (MFC Global USA) | 603,508 | 6,517,889 |
|
| International Equity Index (SSgA) | 97,110 | 2,185,957 |
|
| International Small Cap (Templeton) | 29,779 | 730,471 |
|
| International Small Company (DFA) | 126,406 | 1,457,457 |
|
| International Value (Templeton) | 36,836 | 725,676 |
|
| Investment Quality Bond (Wellington) | 248,748 | 2,907,869 |
|
| Natural Resources (Wellington) | 34,694 | 1,470,679 |
|
| Real Estate Equity (T. Rowe Price) | 202,412 | 2,190,099 |
|
| Real Return Bond (PIMCO) | 552,420 | 7,220,134 |
|
| Small Cap Index (MFC Global U.S.A.) | 85,010 | 1,447,723 |
|
| Small Company Value (T. Rowe Price) | 28,019 | 722,615 |
|
| Spectrum Income (T. Rowe Price) | 204,701 | 2,155,507 |
|
| Strategic Bond (WAMCO) | 186,749 | 2,155,078 |
|
| Strategic Income (MFC Global U.S.) | 250,182 | 2,516,830 |
|
| Total Bond Market (Declaration) | 362,307 | 3,630,312 |
|
| Total Return (PIMCO) | 290,248 | 3,990,903 |
|
| U.S. High Yield Bond (Wells Capital) | 279,062 | 3,591,532 |
|
| | | 63,635,927 |
| John Hancock Funds III 1.00% | | |
|
| International Core (GMO) | 15,588 | 724,063 |
| | | |
| Total investment companies | | |
| (Cost $65,267,103) | | $65,541,781 |
| | Principal | |
| | amount | Value |
|
| Short term investments 9.22% | | |
| Federal National Mortgage Association Discount Notes | |
| 5.13% due 10/24/2007 | $2,000,000 | $1,984,895 |
| 5.161% due 09/26/2007 | 1,000,000 | 996,416 |
|
| U.S. Treasury Bills | | |
| 3.40% due 12/13/2007 | 280,000 | 277,276 |
| 3.85% due 12/13/2007 | 600,000 | 593,448 |
| 3.90% due 11/29/2007 | 1,000,000 | 990,358 |
| 3.95% due 11/29/2007 | 650,000 | 643,653 |
| 4.51% due 11/15/2007 | 200,000 | 198,121 |
| 4.57% due 12/13/2007 | 1,000,000 | 986,925 |
| | | |
| Total short-term investments | | |
| (Cost $6,671,092) | | $6,671,092 |
| | | |
| Total investments | | |
| (Cost $71,938,195) 99.87% | | $72,212,873 |
| | |
| Other assets in excess of liabilities 0.13% | 91,785 |
|
| Total net assets 100.00% | | $72,304,658 |
Percentages are stated as a percent of net assets.
* Non-Income Producing
See notes to financial statements
Lifecycle Portfolios
32
Financial statements
Statements of assets and liabilities 8-31-07
These Statements of Assets and Liabilities are the Portfolios’ balance sheets. They show the value of what each Portfolio owns, is due and owes. You’ll also find the net asset value and the maximum offering price per share for each Portfolio. Net asset value is calculated by dividing the net assets of each class of shares by the number of outstanding shares in the class.
| | | |
| | Lifecycle | Lifecycle | Lifecycle |
| | 2045 Portfolio | 2040 Portfolio | 2035 Portfolio |
| Assets | | | |
| Investments in affiliated funds, at value (Note 9) | $25,522,683 | $27,690,611 | $41,648,908 |
| Total investments, at value | 25,522,683 | 27,690,611 | 41,648,908 |
| Receivable for investments sold | 103 | 71 | 81 |
| Receivable for fund shares sold | 132,199 | 323,432 | 260,565 |
| Receivable due from adviser | 18,386 | 17,793 | 15,105 |
| Other assets | 4,177 | 4,190 | 4,174 |
| Total assets | 25,677,548 | 28,036,097 | 41,928,833 |
| Liabilities | | | |
| Payable for investments purchased | 130,304 | 322,096 | 259,268 |
| Payable for fund shares repurchased | — | 25 | 1,600 |
| Payable to affiliates: Transfer agent fees | 604 | 292 | 399 |
| Other payables and accrued expenses | 23,058 | 22,579 | 22,919 |
| Total liabilities | 153,966 | 344,992 | 284,186 |
| Net assets | | | |
| Capital paid-in | $25,559,400 | $27,573,016 | $41,320,504 |
| Undistributed net investment income (loss) | — | — | — |
| Accumulated undistributed net realized gain (loss) on investments | (16,044) | (11,709) | (14,050) |
| Net unrealized appreciation (depreciation) on investments | (19,774) | 129,798 | 338,193 |
| Net assets | $25,523,582 | $27,691,105 | $41,644,647 |
| Investments in affiliated funds, at cost | $25,542,457 | $27,560,813 | $41,310,715 |
| Net asset value per share | | | |
| The Portfolios have an unlimited number of shares authorized with no par value. | | | |
| Class A: Net assets | $1,347,559 | $583,951 | $609,883 |
| Shares outstanding | 123,132 | 53,286 | 55,323 |
| Net asset value and redemption price per share | $10.94 | $10.96 | $11.02 |
| Class B:1 Net assets | $144,850 | $156,859 | $395,508 |
| Shares outstanding | 13,299 | 14,377 | 36,053 |
| Net asset value, offering price and redemption price per share | $10.89 | $10.91 | $10.97 |
| Class C:1 Net assets | $152,211 | $126,797 | $243,374 |
| Shares outstanding | 13,977 | 11,624 | 22,186 |
| Net asset value, offering price and redemption price per share | $10.89 | $10.91 | $10.97 |
| Class R: Net assets | $120,589 | $115,190 | $114,254 |
| Shares outstanding | 11,053 | 10,541 | 10,399 |
| Net asset value, offering price and redemption price per share | $10.91 | $10.93 | $10.99 |
| Class R1: Net assets | $112,973 | $112,057 | $112,243 |
| Shares outstanding | 10,341 | 10,240 | 10,201 |
| Net asset value, offering price and redemption price per share | $10.92 | $10.94 | $11.00 |
| Class R2: Net assets | $116,627 | $274,086 | $152,601 |
| Shares outstanding | 10,658 | 25,008 | 13,847 |
| Net asset value, offering price and redemption price per share | $10.94 | $10.96 | $11.02 |
| Class R3: Net assets | $117,556 | $141,075 | $111,713 |
| Shares outstanding | 10,756 | 12,888 | 10,149 |
| Net asset value, offering price and redemption price per share | $10.93 | $10.95 | $11.01 |
| Class R4: Net assets | $112,061 | $112,060 | $111,981 |
| Shares outstanding | 10,233 | 10,216 | 10,154 |
| Net asset value, offering price and redemption price per share | $10.95 | $10.97 | $11.03 |
| Class R5: Net assets | $112,329 | $115,253 | $119,104 |
| Shares outstanding | 10,238 | 10,488 | 10,779 |
| Net asset value, offering price and redemption price per share | $10.97 | $10.99 | $11.05 |
| Class 1: Net assets | $23,186,827 | $25,953,777 | $39,673,986 |
| Shares outstanding | 2,113,357 | 2,361,593 | 3,589,367 |
| Net asset value, offering price and redemption price per share | $10.97 | $10.99 | $11.05 |
| Maximum public offering price per share | | | |
| Class A (net asset value per share ÷ 95%)2 | $11.52 | $11.54 | $11.60 |
1 Redemption price per share is equal to net asset value less any applicable contingent deferred sales charge.
2 On single retail sales of less than $50,000. On sales of $50,000 or more and on group sales the offering price is reduced.
See notes to financial statements
Lifecycle Portfolios
33
F I N A N C I A L S T A T E M E N T S
Statements of assets and liabilities 8-31-07
Continued
| | | |
| | Lifecycle | Lifecycle | Lifecycle |
| | 2030 Portfolio | 2025 Portfolio | 2020 Portfolio |
| Assets | | | |
| Investments in affiliated funds, at value (Note 9) | $52,765,475 | $69,048,911 | $68,386,218 |
| Total investments, at value | 52,765,475 | 69,048,911 | 68,386,218 |
| Receivable for investments sold | 173 | 37 | 166 |
| Receivable for fund shares sold | 225,113 | 190,506 | 450,872 |
| Receivable due from adviser | 18,621 | 19,028 | 19,688 |
| Other assets | 4,172 | 4,169 | 4,256 |
| Total assets | 53,013,554 | 69,262,651 | 68,861,200 |
| Liabilities | | | |
| Payable for investments purchased | 215,334 | 189,406 | 273,864 |
| Payable for fund shares repurchased | — | — | 33 |
| Payable to affiliates: Transfer agent fees | 611 | 393 | 809 |
| Other payables and accrued expenses | 22,974 | 22,990 | 23,508 |
| Total liabilities | 238,919 | 212,789 | 298,214 |
| Net assets | | | |
| Capital paid-in | $52,609,342 | $68,680,866 | $68,274,667 |
| Undistributed net investment income (loss) | 5,299 | 65,297 | 140,985 |
| Accumulated undistributed net realized gain (loss) on investments | (24,371) | (18,632) | (58,875) |
| Net unrealized appreciation (depreciation) on investments | 184,365 | 322,331 | 206,209 |
| Net assets | $52,774,635 | $69,049,862 | $68,562,986 |
| Investments in affiliated funds, at cost | $52,581,110 | $68,726,580 | $68,180,009 |
| Net asset value per share | | | |
| The Portfolios have an unlimited number of shares authorized with no par value. | | | |
| Class A: Net assets | $1,135,463 | $661,410 | $1,490,558 |
| Shares outstanding | 104,092 | 60,947 | 137,977 |
| Net asset value and redemption price per share | $10.91 | $10.85 | $10.80 |
| Class B:1 Net assets | $298,228 | $256,947 | $607,301 |
| Shares outstanding | 27,491 | 23,792 | 56,510 |
| Net asset value, offering price and redemption price per share | $10.85 | $10.80 | $10.75 |
| Class C:1 Net assets | $551,411 | $231,595 | $613,471 |
| Shares outstanding | 50,829 | 21,447 | 57,072 |
| Net asset value, offering price and redemption price per share | $10.85 | $10.80 | $10.75 |
| Class R: Net assets | $130,656 | $113,467 | $119,297 |
| Shares outstanding | 12,026 | 10,490 | 11,087 |
| Net asset value, offering price and redemption price per share | $10.86 | $10.82 | $10.76 |
| Class R1: Net assets | $111,836 | $110,711 | $109,539 |
| Shares outstanding | 10,279 | 10,221 | 10,165 |
| Net asset value, offering price and redemption price per share | $10.88 | $10.83 | $10.78 |
| Class R2: Net assets | $142,708 | $117,253 | $213,789 |
| Shares outstanding | 13,095 | 10,807 | 19,806 |
| Net asset value, offering price and redemption price per share | $10.90 | $10.85 | $10.79 |
| Class R3: Net assets | $111,884 | $185,824 | $126,069 |
| Shares outstanding | 10,279 | 17,147 | 11,694 |
| Net asset value, offering price and redemption price per share | $10.88 | $10.84 | $10.78 |
| Class R4: Net assets | $111,310 | $110,621 | $109,866 |
| Shares outstanding | 10,207 | 10,189 | 10,172 |
| Net asset value, offering price and redemption price per share | $10.91 | $10.86 | $10.80 |
| Class R5: Net assets | $111,576 | $112,933 | $271,942 |
| Shares outstanding | 10,212 | 10,382 | 25,128 |
| Net asset value, offering price and redemption price per share | $10.93 | $10.88 | $10.82 |
| Class 1: Net assets | $50,069,563 | $67,149,101 | $64,901,154 |
| Shares outstanding | 4,582,349 | 6,173,023 | 5,995,494 |
| Net asset value, offering price and redemption price per share | $10.93 | $10.88 | $10.82 |
| Maximum public offering price per share | | | |
| Class A (net asset value per share ÷ 95%)2 | $11.48 | $11.42 | $11.37 |
1 Redemption price per share is equal to net asset value less any applicable contingent deferred sales charge.
2 On single retail sales of less than $50,000. On sales of $50,000 or more and on group sales the offering price is reduced.
See notes to financial statements
Lifecycle Portfolios
34
Statements of assets and liabilities 8-31-07
Continued
| | | |
| | | | Lifecycle |
| | Lifecycle | Lifecycle | Retirement |
| | 2015 Portfolio | 2010 Portfolio | Portfolio |
| Assets | | | |
| Investments in unaffiliated issuers, at value | — | — | $7,852,883 |
| Investments in affiliated funds, at value (Note 9) | $57,976,909 | $27,275,574 | 64,359,990 |
| Total investments, at value | 57,976,909 | 27,275,574 | 72,212,873 |
| Cash | — | — | 25,558 |
| Receivable for investments sold | 116 | 120 | — |
| Receivable for fund shares sold | 150,274 | 68,451 | 242,644 |
| Receivable for futures variation margin | — | — | 20,465 |
| Receivable due from adviser | 23,292 | 22,344 | 42,990 |
| Other assets | 4,391 | 4,389 | 3,934 |
| Total assets | 58,154,982 | 27,370,878 | 72,548,464 |
| Liabilities | | | |
| Payable for investments purchased | 148,090 | 66,859 | 213,828 |
| Payable for fund shares repurchased | 12 | — | 5,009 |
| Payable to affiliates: Transfer agent fees | 511 | 379 | 1,770 |
| Other payables and accrued expenses | 22,988 | 22,711 | 23,199 |
| Total liabilities | 171,601 | 89,949 | 243,806 |
| Net assets | | | |
| Capital paid-in | $57,944,265 | $27,184,142 | $72,088,271 |
| Undistributed net investment income (loss) | 175,759 | 140,047 | 10,828 |
| Accumulated undistributed net realized gain (loss) on | | | |
| investments, futures contracts and options written | (72,427) | (34,037) | (69,119) |
| Net unrealized appreciation (depreciation) on investments | (64,216) | (9,223) | 274,678 |
| Net assets | $57,983,381 | $27,280,929 | $72,304,658 |
| Investments in unaffiliated issuers, including repurchase agreements, at cost | — | — | $7,821,756 |
| Investments in affiliated funds, at cost | $58,041,125 | $27,284,797 | $64,116,439 |
| Net asset value per share | | | |
| The Portfolios have an unlimited number of shares authorized with no par value. | | | |
| Class A: Net assets | $835,508 | $665,061 | $4,270,366 |
| Shares outstanding | 78,444 | 63,088 | 413,510 |
| Net asset value and redemption price per share | $10.65 | $10.54 | $10.33 |
| Class B:1 Net assets | $458,266 | $130,777 | $386,631 |
| Shares outstanding | 43,238 | 12,464 | 37,514 |
| Net asset value, offering price and redemption price per share | $10.60 | $10.49 | $10.31 |
| Class C:1 Net assets | $261,117 | $415,136 | $1,357,542 |
| Shares outstanding | 24,637 | 39,546 | 131,688 |
| Net asset value, offering price and redemption price per share | $10.60 | $10.50 | $10.31 |
| Class R: Net assets | $110,484 | $106,557 | $105,542 |
| Shares outstanding | 10,408 | 10,139 | 10,238 |
| Net asset value, offering price and redemption price per share | $10.62 | $10.51 | $10.31 |
| Class R1: Net assets | $108,133 | $106,748 | $105,732 |
| Shares outstanding | 10,173 | 10,143 | 10,255 |
| Net asset value, offering price and redemption price per share | $10.63 | $10.52 | $10.31 |
| Class R2: Net assets | $161,395 | $106,971 | $109,651 |
| Shares outstanding | 15,159 | 10,147 | 10,631 |
| Net asset value, offering price and redemption price per share | $10.65 | $10.54 | $10.31 |
| Class R3: Net assets | $108,137 | $107,087 | $105,847 |
| Shares outstanding | 10,169 | 10,171 | 10,264 |
| Net asset value, offering price and redemption price per share | $10.63 | $10.53 | $10.31 |
| Class R4: Net assets | $108,395 | $107,066 | $106,046 |
| Shares outstanding | 10,174 | 10,149 | 10,278 |
| Net asset value, offering price and redemption price per share | $10.65 | $10.55 | $10.32 |
| Class R5: Net assets | $108,653 | $107,321 | $106,299 |
| Shares outstanding | 10,179 | 10,154 | 10,298 |
| Net asset value, offering price and redemption price per share | $10.67 | $10.57 | $10.32 |
| Class 1: Net assets | $55,723,293 | $25,428,205 | $65,651,002 |
| Shares outstanding | 5,217,757 | 2,405,215 | 6,360,641 |
| Net asset value, offering price and redemption price per share | $10.68 | $10.57 | $10.32 |
| Maximum public offering price per share | | | |
| Class A (net asset value per share ÷ 95%)2 | $11.21 | $11.09 | $10.87 |
1 Redemption price per share is equal to net asset value less any applicable contingent deferred sales charge.
2 On single retail sales of less than $50,000. On sales of $50,000 or more and on group sales the offering price is reduced.
See notes to financial statements
Lifecycle Portfolios
35
F I N A N C I A L S T A T E M E N T S
Statements of operations For the period ended 8-31-07
These Statements of Operations summarize the Portfolios’ investment income earned and expenses directly incurred in operating each Portfolio. They also show net gains (losses) for the period stated.
| | | |
| | Lifecycle | Lifecycle | Lifecycle |
| | 2045 Portfolio1 | 2040 Portfolio1 | 2035 Portfolio1 |
| Investment income | | | |
| Income distributions received from affiliated underlying funds | $9,492 | $9,202 | $21,921 |
| Total investment income | 9,492 | 9,202 | 21,921 |
| Expenses | | | |
| Investment management fees (Note 3) | 4,221 | 4,421 | 6,981 |
| Distribution and service fees (Note 3) | 8,857 | 8,384 | 11,087 |
| Transfer agent fees (Note 3) | 1,432 | 1,007 | 1,202 |
| Blue sky fees (Note 3) | 83,580 | 83,580 | 83,580 |
| Fund administration fees (Note 3) | 237 | 257 | 406 |
| Audit and legal fees | 27,782 | 27,789 | 27,838 |
| Printing and postage fees (Note 3) | 2,774 | 2,304 | 2,489 |
| Custodian fees | 10,001 | 10,001 | 10,001 |
| Trustees’ fees (Note 4) | 14 | 14 | 20 |
| Registration and filing fees | 7,300 | 7,291 | 7,868 |
| Miscellaneous | 27 | 29 | 47 |
| Total expenses | 146,225 | 145,077 | 151,519 |
| Less: expense reductions (Note 3) | (125,508) | (124,781) | (121,921) |
| Net expenses | 20,717 | 20,296 | 29,598 |
| Net investment income (loss) | (11,225) | (11,094) | (7,677) |
| Realized and unrealized gain (loss) | | | |
| Net realized gain (loss) on | | | |
| Investments in affiliated underlying funds | (15,608) | (11,330) | (13,302) |
| Capital gain distributions received from affiliated underlying funds | 25,308 | 24,616 | 28,563 |
| | 9,700 | 13,286 | 15,261 |
| Change in net unrealized appreciation (depreciation) of | | | |
| Investments in affiliated underlying funds | (19,774) | 129,798 | 338,193 |
| | (19,774) | 129,798 | 338,193 |
| Net realized and unrealized gain (loss) | (10,074) | 143,084 | 353,454 |
| Increase (decrease) in net assets from operations | ($21,299) | $131,990 | $345,777 |
1 Period from 10-30-06 (commencement of operations) to 8-31-07.
See notes to financial statements
Lifecycle Portfolios
36
Statements of operations For the period ended 8-31-07
Continued
| | | |
| | Lifecycle | Lifecycle | Lifecycle |
| | 2030 Portfolio1 | 2025 Portfolio1 | 2020 Portfolio1 |
| Investment income | | | |
| Income distributions received from affiliated underlying funds | $52,929 | $128,126 | $209,630 |
| Total investment income | 52,929 | 128,126 | 209,630 |
| Expenses | | | |
| Investment management fees (Note 3) | 9,001 | 12,472 | 12,542 |
| Distribution and service fees (Note 3) | 13,196 | 15,917 | 16,863 |
| Transfer agent fees (Note 3) | 1,369 | 1,266 | 1,774 |
| Blue sky fees (Note 3) | 83,580 | 83,580 | 83,509 |
| Fund administration fees (Note 3) | 491 | 700 | 713 |
| Audit and legal fees | 27,866 | 27,935 | 27,939 |
| Printing and postage fees (Note 3) | 2,573 | 2,569 | 3,078 |
| Custodian fees | 10,001 | 10,001 | 10,001 |
| Trustees’ fees (Note 4) | 24 | 32 | 34 |
| Registration and filing fees | 8,195 | 8,947 | 9,183 |
| Miscellaneous | 56 | 77 | 81 |
| Total expenses | 156,352 | 163,496 | 165,717 |
| Less: expense reductions (Note 3) | (119,412) | (115,285) | (115,869) |
| Net expenses | 36,940 | 48,211 | 49,848 |
| Net investment income (loss) | 15,989 | 79,915 | 159,782 |
| Realized and unrealized gain (loss) | | | |
| Net realized gain (loss) on | | | |
| Investments in affiliated underlying funds | (23,581) | (16,651) | (57,769) |
| Net increase from payments by affiliates (Note 1) | 1,696 | 2,707 | 2,881 |
| Capital gain distributions received from affiliated underlying funds | 38,961 | 46,586 | 39,715 |
| | 17,076 | 32,642 | (15,173) |
| Change in net unrealized appreciation (depreciation) of | | | |
| Investments in affiliated underlying funds | 184,365 | 322,331 | 206,209 |
| | 184,365 | 322,331 | 206,209 |
| Net realized and unrealized gain (loss) | 201,441 | 354,973 | 191,036 |
| Increase (decrease) in net assets from operations | $217,430 | $434,888 | $350,818 |
1 Period from 10-30-06 (commencement of operations) to 8-31-07.
See notes to financial statements
Lifecycle Portfolios
37
F I N A N C I A L S T A T E M E N T S
Statements of operations For the period ended 8-31-07
Continued
| | | |
| | | | Lifecycle |
| | Lifecycle | Lifecycle | Retirement |
| | 2015 Portfolio1 | 2010 Portfolio1 | Portfolio1 |
| Investment income | | | |
| Income distributions received from affiliated underlying funds | $234,920 | $176,040 | $527,714 |
| Interest | — | — | 122,345 |
| Dividends | — | — | 3,477 |
| Total investment income | 234,920 | 176,040 | 653,536 |
| Expenses | | | |
| Investment management fees (Note 3) | 9,868 | 5,178 | 27,779 |
| Distribution and service fees (Note 3) | 14,080 | 9,328 | 22,098 |
| Transfer agent fees (Note 3) | 1,343 | 1,145 | 2,960 |
| Blue sky fees (Note 3) | 83,507 | 83,507 | 84,236 |
| Fund administration fees (Note 3) | 553 | 330 | 1,122 |
| Audit and legal fees | 27,886 | 27,813 | 28,072 |
| Printing and postage fees (Note 3) | 2,601 | 2,460 | 3,969 |
| Custodian fees | 10,001 | 10,001 | 10,001 |
| Trustees’ fees (Note 4) | 26 | 17 | 61 |
| Registration and filing fees | 8,221 | 7,444 | 19,105 |
| Miscellaneous | 62 | 37 | 283 |
| Total expenses | 158,148 | 147,260 | 199,686 |
| Less: expense reductions (Note 3) | (118,166) | (123,934) | (123,334) |
| Net expenses | 39,982 | 23,326 | 76,352 |
| Net investment income (loss) | 194,938 | 152,714 | 577,184 |
| Realized and unrealized gain (loss) | | | |
| Net realized gain (loss) on | | | |
| Investments in unaffiliated issuers | — | — | 1,818 |
| Investments in affiliated underlying funds | (80,098) | (38,978) | (176,170) |
| Net increase from payments by affiliates (Note 1) | 6,640 | 4,286 | 21,459 |
| Capital gain distributions received from affiliated underlying funds | 22,218 | 9,721 | 42,128 |
| Futures contracts | — | — | 53,203 |
| Options | — | — | 27,180 |
| | (51,240) | (24,971) | (30,382) |
| Change in net unrealized appreciation (depreciation) of | | | |
| Investments in unaffiliated issuers | — | — | 31,127 |
| Investments in affiliated underlying funds | (64,216) | (9,223) | 243,551 |
| | (64,216) | (9,223) | 274,678 |
| Net realized and unrealized gain (loss) | (115,456) | (34,194) | 244,296 |
| Increase (decrease) in net assets from operations | $79,482 | $118,520 | $821,480 |
1 Period from 10-30-06 (commencement of operations) to 8-31-07.
See notes to financial statements
Lifecycle Portfolios
38
Statements of changes in net assets
These Statements of Changes in Net Assets show how the value of the Portfolios’ net assets have changed during the period. They reflect earnings less expenses, any investment gains and losses, distributions, if any, paid to shareholders and the net of Portfolio share transactions.
| | | |
| | Lifecycle 2045 Portfolio | Lifecycle 2040 Portfolio | Lifecycle 2035 Portfolio |
| | Period Ended 8-31-071 | Period Ended 8-31-071 | Period Ended 8-31-071 |
| Increase (decrease) in net assets | | | |
| From operations | | | |
| Net investment income (loss) | ($11,225) | ($11,094) | ($7,677) |
| Net realized gain (loss) | 9,700 | 13,286 | 15,261 |
| Change in net unrealized appreciation | (19,774) | 129,798 | 338,193 |
| (depreciation) | | | |
| Increase (decrease) in net assets | (21,299) | 131,990 | 345,777 |
| resulting from operations | | | |
| |
| Distributions to shareholders | | | |
| From net investment income | | | |
| Class A | (577) | (533) | (392) |
| Class B | (457) | (413) | (273) |
| Class C | (457) | (413) | (273) |
| Class R | (449) | (405) | (264) |
| Class R1 | (492) | (448) | (307) |
| Class R2 | (535) | (491) | (350) |
| Class R3 | (509) | (465) | (324) |
| Class R4 | (560) | (516) | (375) |
| Class R5 | (611) | (567) | (427) |
| Class 1 | (2,876) | (2,999) | (6,091) |
| From realized gain | | | |
| Class A | (1,833) | (1,707) | (1,216) |
| Class B | (1,833) | (1,708) | (1,215) |
| Class C | (1,833) | (1,708) | (1,215) |
| Class R | (1,833) | (1,707) | (1,216) |
| Class R1 | (1,833) | (1,707) | (1,215) |
| Class R2 | (1,833) | (1,707) | (1,215) |
| Class R3 | (1,833) | (1,707) | (1,215) |
| Class R4 | (1,833) | (1,707) | (1,216) |
| Class R5 | (1,833) | (1,708) | (1,215) |
| Class 1 | (8,505) | (8,883) | (16,976) |
| Total distributions | (32,525) | (31,499) | (36,990) |
| From Fund share transactions | 25,577,406 | 27,590,614 | 41,335,860 |
| |
| Total increase (decrease) | 25,523,582 | 27,691,105 | 41,644,647 |
| Net assets | | | |
| Beginning of period | — | — | — |
| End of period | $25,523,582 | $27,691,105 | $41,644,647 |
| |
| Undistributed net investment | — | — | — |
| income (loss) | | | |
1 Period from 10-30-06 (commencement of operations) to 8-31-07.
See notes to financial statements
Lifecycle Portfolios
39
F I N A N C I A L S T A T E M E N T S
Statements of changes in net assets
Continued
| | | |
| | Lifecycle 2030 Portfolio | Lifecycle 2025 Portfolio | Lifecycle 2020 Portfolio |
| | Period Ended 8-31-071 | Period Ended 8-31-071 | Period Ended 8-31-071 |
| Increase (decrease) in net assets | | | |
| From operations | | | |
| Net investment income (loss) | $15,989 | $79,915 | $159,782 |
| Net realized gain (loss) | 17,076 | 32,642 | (15,173) |
| Change in net unrealized appreciation | 184,365 | 322,331 | 206,209 |
| (depreciation) | | | |
| Increase (decrease) in net assets | 217,430 | 434,888 | 350,818 |
| resulting from operations | | | |
| |
| Distributions to shareholders | | | |
| From net investment income | | | |
| Class A | (601) | (611) | (681) |
| Class B | (481) | (491) | (561) |
| Class C | (481) | (491) | (561) |
| Class R | (472) | (483) | (552) |
| Class R1 | (515) | (526) | (595) |
| Class R2 | (558) | (568) | (638) |
| Class R3 | (532) | (543) | (612) |
| Class R4 | (584) | (594) | (664) |
| Class R5 | (635) | (645) | (715) |
| Class 1 | (10,215) | (16,425) | (19,382) |
| From realized gain | | | |
| Class A | (1,543) | (1,347) | (1,094) |
| Class B | (1,543) | (1,347) | (1,094) |
| Class C | (1,543) | (1,347) | (1,094) |
| Class R | (1,544) | (1,347) | (1,095) |
| Class R1 | (1,544) | (1,347) | (1,095) |
| Class R2 | (1,544) | (1,347) | (1,094) |
| Class R3 | (1,544) | (1,347) | (1,095) |
| Class R4 | (1,543) | (1,347) | (1,094) |
| Class R5 | (1,543) | (1,348) | (1,094) |
| Class 1 | (24,425) | (33,718) | (29,261) |
| Total distributions | (53,390) | (67,219) | (64,071) |
| From Fund share transactions | 52,610,595 | 68,682,193 | 68,276,239 |
| |
| Total increase (decrease) | 52,774,635 | 69,049,862 | 68,562,986 |
| Net assets | | | |
| Beginning of period | — | — | — |
| End of period | $52,774,635 | $69,049,862 | $68,562,986 |
| |
| Undistributed net investment | $5,299 | $65,297 | $140,985 |
| income (loss) | | | |
1 Period from 10-30-06 (commencement of operations) to 8-31-07.
See notes to financial statements
Lifecycle Portfolios
40
Statements of changes in net assets
Continued
| | | |
| | | | Lifecycle |
| | Lifecycle 2015 Portfolio | Lifecycle 2010 Portfolio | Retirement Portfolio |
| | Period Ended 8-31-071 | Period Ended 8-31-071 | Period Ended 8-31-071 |
| Increase (decrease) in net assets | | | |
| From operations | | | |
| Net investment income (loss) | $194,938 | $152,714 | $577,184 |
| Net realized gain (loss) | (51,240) | (24,971) | (30,382) |
| Change in net unrealized appreciation | (64,216) | (9,223) | 274,678 |
| (depreciation) | | | |
| Increase (decrease) in net assets | 79,482 | 118,520 | 821,480 |
| resulting from operations | | | |
| |
| Distributions to shareholders | | | |
| From net investment income | | | |
| Class A | (852) | (902) | (17,815) |
| Class B | (733) | (783) | (2,628) |
| Class C | (733) | (783) | (4,077) |
| Class R | (724) | (774) | (1,671) |
| Class R1 | (767) | (817) | (1,846) |
| Class R2 | (810) | (859) | (2,022) |
| Class R3 | (784) | (834) | (1,890) |
| Class R4 | (835) | (885) | (2,088) |
| Class R5 | (886) | (936) | (2,285) |
| Class 1 | (12,819) | (5,871) | (529,244) |
| From realized gain | | | |
| Class A | (942) | (638) | (755) |
| Class B | (941) | (638) | (755) |
| Class C | (941) | (638) | (755) |
| Class R | (942) | (639) | (755) |
| Class R1 | (941) | (638) | (755) |
| Class R2 | (941) | (639) | (755) |
| Class R3 | (941) | (639) | (755) |
| Class R4 | (942) | (638) | (755) |
| Class R5 | (942) | (638) | (755) |
| Class 1 | (13,443) | (3,972) | (34,747) |
| Total distributions | (41,859) | (23,161) | (607,108) |
| From Fund share transactions | 57,945,758 | 27,185,570 | 72,090,286 |
| |
| Total increase (decrease) | 57,983,381 | 27,280,929 | 72,304,658 |
| Net assets | | | |
| Beginning of period | — | — | — |
| End of period | $57,983,381 | $27,280,929 | $72,304,658 |
| |
| Undistributed net investment | $175,759 | $140,047 | $10,828 |
| income (loss) | | | |
1 Period from 10-30-06 (commencement of operations) to 8-31-07.
See notes to financial statements
Lifecycle Portfolios
41
Financial highlights
These Financial Highlights show how each Portfolio’s net asset value for a share has changed since the beginning of the period.
| | | | | | | | | | | | | | | |
| Lifecycle 2045 Portfolio | | | | | | | | | | | | | |
| Per share operating performance for a share outstanding throughout the period | | | Ratios and supplemental data | |
| | | Income (loss) from | | | | | | | | | | | | |
| | | investment operations | | Less distributions | | | | | Ratios to average net assets | | |
| |
| |
| |
| |
| | | | | | | | | | | | | | Ratio | | |
| | | | Net | | | | | | | | | | of net | | |
| | | | realized | Total | | | | | | | Ratio of | Ratio | investment | Net | |
| | Net asset | Net | and | from | From net | | | | | | gross | of net | income | assets, | |
| | value, | invest- | unrealized | invest- | invest- | | | | Net asset | | expenses | expenses | (loss) to | end of | |
| | beginning | ment in- | gain (loss) | ment | ment | From net | From | Total | value, end | Total | to average | to average | average | period (in | Portfolio |
| | of period | come (loss) | on invest- | operations | income | realized | capital | distribu- | of period | return | net assets | net assets | net assets | thousands) | turnover |
| Period ended | ($) | ($)1,17 | ments ($) | ($) | ($) | gain ($) | paid-in ($) | tions ($) | ($) | (%)2 | (%)3 | (%)3 | (%)1 | ($) | (%) |
|
| CLASS A | | | | | | | | | | | | | | | |
|
| 8-31-074 | 10.00 | (0.04) | 1.22 | 1.18 | (0.06) | (0.18) | — | (0.24) | 10.94 | 11.975,6 | 1.947,8 | 0.627 | (0.45)7 | 1,348 | 56 |
|
| CLASS B | | | | | | | | | | | | | | | |
|
| 8-31-074 | 10.00 | (0.05) | 1.17 | 1.12 | (0.05) | (0.18) | — | (0.23) | 10.89 | 11.335,6 | 5.287,8 | 1.307 | (0.57)7 | 145 | 56 |
|
| CLASS C | | | | | | | | | | | | | | | |
|
| 8-31-074 | 10.00 | (0.06) | 1.18 | 1.12 | (0.05) | (0.18) | — | (0.23) | 10.89 | 11.335,6 | 5.117,8 | 1.327 | (0.63)7 | 152 | 56 |
|
| CLASS R | | | | | | | | | | | | | | | |
|
| 8-31-074 | 10.00 | (0.03) | 1.17 | 1.14 | (0.05) | (0.18) | — | (0.23) | 10.91 | 11.535,6 | 16.737,8 | 1.087 | (0.31)7 | 121 | 56 |
|
| CLASS R1 | | | | | | | | | | | | | | | |
|
| 8-31-074 | 10.00 | (0.01) | 1.16 | 1.15 | (0.05) | (0.18) | — | (0.23) | 10.92 | 11.685,6 | 16.687,8 | 0.877 | (0.09)7 | 113 | 56 |
|
| CLASS R2 | | | | | | | | | | | | | | | |
|
| 8-31-074 | 10.00 | 0.01 | 1.17 | 1.18 | (0.06) | (0.18) | — | (0.24) | 10.94 | 11.935,6 | 16.317,8 | 0.627 | 0.157 | 117 | 56 |
|
| CLASS R3 | | | | | | | | | | | | | | | |
|
| 8-31-074 | 10.00 | —9 | 1.16 | 1.16 | (0.05) | (0.18) | — | (0.23) | 10.93 | 11.805,6 | 16.457,8 | 0.807 | (0.03)7 | 118 | 56 |
|
| CLASS R4 | | | | | | | | | | | | | | | |
|
| 8-31-074 | 10.00 | 0.02 | 1.17 | 1.19 | (0.06) | (0.18) | — | (0.24) | 10.95 | 12.065,6 | 16.327,8 | 0.527 | 0.267 | 112 | 56 |
|
| CLASS R5 | | | | | | | | | | | | | | | |
|
| 8-31-074 | 10.00 | 0.05 | 1.16 | 1.21 | (0.06) | (0.18) | — | (0.24) | 10.97 | 12.325,6 | 16.027,8 | 0.237 | 0.557 | 112 | 56 |
|
| CLASS 1 | | | | | | | | | | | | | | | |
|
| 8-31-074 | 10.00 | (0.01) | 1.23 | 1.22 | (0.07) | (0.18) | — | (0.25) | 10.97 | 12.325,6 | 0.647,8 | 0.207 | (0.15)7 | 23,187 | 56 |
|
See notes to financial statements
Lifecycle Portfolios
42
Financial highlights
Continued
| | | | | | | | | | | | | | | |
| Lifecycle 2040 Portfolio | | | | | | | | | | | | | |
| Per share operating performance for a share outstanding throughout the period | | | Ratios and supplemental data | |
| | | Income (loss) from | | | | | | | | | | | | |
| | | investment operations | | Less distributions | | | | | Ratios to average net assets | | |
| |
| |
| |
| |
| | | | | | | | | | | | | | Ratio | | |
| | | | Net | | | | | | | | | | of net | | |
| | | | realized | Total | | | | | | | Ratio of | Ratio | investment | Net | |
| | Net asset | Net | and | from | From net | | | | | | gross | of net | income | assets, | |
| | value, | invest- | unrealized | invest- | invest- | | | | Net asset | | expenses | expenses | (loss) to | end of | |
| | beginning | ment in- | gain (loss) | ment | ment | From net | From | Total | value, end | Total | to average | to average | average | period (in | Portfolio |
| | of period | come (loss) | on invest- | operations | income | realized | capital | distribu- | of period | return | net assets | net assets | net assets | thousands) | turnover |
| Period ended | ($) | ($)1,17 | ments ($) | ($) | ($) | gain ($) | paid-in ($) | tions ($) | ($) | (%)2 | (%)3 | (%)3 | (%)1 | ($) | (%) |
|
| CLASS A | | | | | | | | | | | | | | | |
|
| 8-31-074 | 10.00 | (0.02) | 1.20 | 1.18 | (0.05) | (0.17) | — | (0.22) | 10.96 | 11.995,6 | 3.157,8 | 0.627 | (0.18)7 | 584 | 36 |
|
| CLASS B | | | | | | | | | | | | | | | |
|
| 8-31-074 | 10.00 | (0.05) | 1.17 | 1.12 | (0.04) | (0.17) | — | (0.21) | 10.91 | 11.355,6 | 5.177,8 | 1.307 | (0.58)7 | 157 | 36 |
|
| CLASS C | | | | | | | | | | | | | | | |
|
| 8-31-074 | 10.00 | (0.05) | 1.17 | 1.12 | (0.04) | (0.17) | — | (0.21) | 10.91 | 11.355,6 | 5.317,8 | 1.317 | (0.56)7 | 127 | 36 |
|
| CLASS R | | | | | | | | | | | | | | | |
|
| 8-31-074 | 10.00 | (0.03) | 1.17 | 1.14 | (0.04) | (0.17) | — | (0.21) | 10.93 | 11.555,6 | 16.787,8 | 1.087 | (0.30)7 | 115 | 36 |
|
| CLASS R1 | | | | | | | | | | | | | | | |
|
| 8-31-074 | 10.00 | (0.01) | 1.17 | 1.16 | (0.05) | (0.17) | — | (0.22) | 10.94 | 11.705,6 | 16.617,8 | 0.877 | (0.09)7 | 112 | 36 |
|
| CLASS R2 | | | | | | | | | | | | | | | |
|
| 8-31-074 | 10.00 | 0.01 | 1.17 | 1.18 | (0.05) | (0.17) | — | (0.22) | 10.96 | 11.955,6 | 14.717,8 | 0.637 | 0.077 | 274 | 36 |
|
| CLASS R3 | | | | | | | | | | | | | | | |
|
| 8-31-074 | 10.00 | (0.01) | 1.18 | 1.17 | (0.05) | (0.17) | — | (0.22) | 10.95 | 11.825,6 | 15.597,8 | 0.807 | (0.07)7 | 141 | 36 |
|
| CLASS R4 | | | | | | | | | | | | | | | |
|
| 8-31-074 | 10.00 | 0.02 | 1.17 | 1.19 | (0.05) | (0.17) | — | (0.22) | 10.97 | 12.075,6 | 16.237,8 | 0.527 | 0.267 | 112 | 36 |
|
| CLASS R5 | | | | | | | | | | | | | | | |
|
| 8-31-074 | 10.00 | 0.05 | 1.17 | 1.22 | (0.06) | (0.17) | — | (0.23) | 10.99 | 12.335,6 | 15.717,8 | 0.237 | 0.537 | 115 | 36 |
|
| CLASS 1 | | | | | | | | | | | | | | | |
|
| 8-31-074 | 10.00 | (0.01) | 1.23 | 1.22 | (0.06) | (0.17) | — | (0.23) | 10.99 | 12.345,6 | 0.627,8 | 0.207 | (0.16)7 | 25,954 | 36 |
|
See notes to financial statements
Lifecycle Portfolios
43
Financial highlights
Continued
| | | | | | | | | | | | | | | |
| Lifecycle 2035 Portfolio | | | | | | | | | | | | | |
| Per share operating performance for a share outstanding throughout the period | | | Ratios and supplemental data | |
| | | Income (loss) from | | | | | | | | | | | | |
| | | investment operations | | Less distributions | | | | | Ratios to average net assets | | |
| |
| |
| |
| |
| | | | | | | | | | | | | | Ratio | | |
| | | | Net | | | | | | | | | | of net | | |
| | | | realized | Total | | | | | | | Ratio of | Ratio | investment | Net | |
| | Net asset | Net | and | from | From net | | | | | | gross | of net | income | assets, | |
| | value, | invest- | unrealized | invest- | invest- | | | | Net asset | | expenses | expenses | (loss) to | end of | |
| | beginning | ment in- | gain (loss) | ment | ment | From net | From | Total | value, end | Total | to average | to average | average | period (in | Portfolio |
| | of period | come (loss) | on invest- | operations | income | realized | capital | distribu- | of period | return | net assets | net assets | net assets | thousands) | turnover |
| Period ended | ($) | ($)1,17 | ments ($) | ($) | ($) | gain ($) | paid-in ($) | tions ($) | ($) | (%)2 | (%)3 | (%)3 | (%)1 | ($) | (%) |
|
| CLASS A | | | | | | | | | | | | | | | |
|
| 8-31-074 | 10.00 | (0.02) | 1.20 | 1.18 | (0.04) | (0.12) | — | (0.16) | 11.02 | 11.925,6 | 2.477,8 | 0.627 | (0.20)7 | 610 | 46 |
|
| CLASS B | | | | | | | | | | | | | | | |
|
| 8-31-074 | 10.00 | (0.06) | 1.18 | 1.12 | (0.03) | (0.12) | — | (0.15) | 10.97 | 11.285,6 | 4.277,8 | 1.307 | (0.62)7 | 396 | 46 |
|
| CLASS C | | | | | | | | | | | | | | | |
|
| 8-31-074 | 10.00 | (0.06) | 1.18 | 1.12 | (0.03) | (0.12) | — | (0.15) | 10.97 | 11.285,6 | 4.137,8 | 1.317 | (0.66)7 | 243 | 46 |
|
| CLASS R | | | | | | | | | | | | | | | |
|
| 8-31-074 | 10.00 | (0.02) | 1.16 | 1.14 | (0.03) | (0.12) | — | (0.15) | 10.99 | 11.475,6 | 16.487,8 | 1.077 | (0.20)7 | 114 | 46 |
|
| CLASS R1 | | | | | | | | | | | | | | | |
|
| 8-31-074 | 10.00 | —9 | 1.15 | 1.15 | (0.03) | (0.12) | — | (0.15) | 11.00 | 11.625,6 | 16.297,8 | 0.867 | 0.017 | 112 | 46 |
|
| CLASS R2 | | | | | | | | | | | | | | | |
|
| 8-31-074 | 10.00 | 0.02 | 1.16 | 1.18 | (0.04) | (0.12) | — | (0.16) | 11.02 | 11.875,6 | 15.697,8 | 0.617 | 0.247 | 153 | 46 |
|
| CLASS R3 | | | | | | | | | | | | | | | |
|
| 8-31-074 | 10.00 | 0.01 | 1.15 | 1.16 | (0.03) | (0.12) | — | (0.15) | 11.01 | 11.745,6 | 16.227,8 | 0.797 | 0.087 | 112 | 46 |
|
| CLASS R4 | | | | | | | | | | | | | | | |
|
| 8-31-074 | 10.00 | 0.03 | 1.16 | 1.19 | (0.04) | (0.12) | — | (0.16) | 11.03 | 12.005,6 | 15.927,8 | 0.507 | 0.367 | 112 | 46 |
|
| CLASS R5 | | | | | | | | | | | | | | | |
|
| 8-31-074 | 10.00 | 0.06 | 1.15 | 1.21 | (0.04) | (0.12) | — | (0.16) | 11.05 | 12.265,6 | 15.087,8 | 0.227 | 0.627 | 119 | 46 |
|
| CLASS 1 | | | | | | | | | | | | | | | |
|
| 8-31-074 | 10.00 | (0.01) | 1.23 | 1.22 | (0.05) | (0.12) | — | (0.17) | 11.05 | 12.275,6 | 0.457,8 | 0.207 | (0.06)7 | 39,674 | 46 |
|
See notes to financial statements
Lifecycle Portfolios
44
Financial highlights
Continued
| | | | | | | | | | | | | | | |
| Lifecycle 2030 Portfolio | | | | | | | | | | | | | |
| Per share operating performance for a share outstanding throughout the period | | | Ratios and supplemental data | |
| | | Income (loss) from | | | | | | | | | | | | |
| | | investment operations | | Less distributions | | | | | Ratios to average net assets | | |
| |
| |
| |
| |
| | | | | | | | | | | | | | Ratio | | |
| | | | Net | | | | | | | | | | of net | | |
| | | | realized | Total | | | | | | | Ratio of | Ratio | investment | Net | |
| | Net asset | Net | and | from | From net | | | | | | gross | of net | income | assets, | |
| | value, | invest- | unrealized | invest- | invest- | | | | Net asset | | expenses | expenses | (loss) to | end of | |
| | beginning | ment in- | gain (loss) | ment | ment | From net | From | Total | value, end | Total | to average | to average | average | period (in | Portfolio |
| | of period | come (loss) | on invest- | operations | income | realized | capital | distribu- | of period | return | net assets | net assets | net assets | thousands) | turnover |
| Period ended | ($) | ($)1,17 | ments ($) | ($) | ($) | gain ($) | paid-in ($) | tions ($) | ($) | (%)2 | (%)3 | (%)3 | (%)1 | ($) | (%) |
|
| CLASS A | | | | | | | | | | | | | | | |
|
| 8-31-074 | 10.00 | (0.02) | 1.14 | 1.12 | (0.06) | (0.15) | — | (0.21) | 10.91 | 11.385,6,10 | 2.027,8 | 0.637 | (0.23)7 | 1,135 | 36 |
|
| CLASS B | | | | | | | | | | | | | | | |
|
| 8-31-074 | 10.00 | (0.05) | 1.10 | 1.05 | (0.05) | (0.15) | — | (0.20) | 10.85 | 10.645,6,10 | 3.907,8 | 1.317 | (0.57)7 | 298 | 36 |
|
| CLASS C | | | | | | | | | | | | | | | |
|
| 8-31-074 | 10.00 | (0.05) | 1.10 | 1.05 | (0.05) | (0.15) | — | (0.20) | 10.85 | 10.645,6,10 | 3.827,8 | 1.317 | (0.59)7 | 551 | 36 |
|
| CLASS R | | | | | | | | | | | | | | | |
|
| 8-31-074 | 10.00 | (0.01) | 1.07 | 1.06 | (0.05) | (0.15) | — | (0.20) | 10.86 | 10.735,6,10 | 16.047,8 | 1.077 | (0.11)7 | 131 | 36 |
|
| CLASS R1 | | | | | | | | | | | | | | | |
|
| 8-31-074 | 10.00 | 0.01 | 1.08 | 1.09 | (0.06) | (0.15) | — | (0.21) | 10.88 | 10.985,6,10 | 16.247,8 | 0.867 | 0.127 | 112 | 36 |
|
| CLASS R2 | | | | | | | | | | | | | | | |
|
| 8-31-074 | 10.00 | 0.03 | 1.08 | 1.11 | (0.06) | (0.15) | — | (0.21) | 10.90 | 11.235,6,10 | 15.957,8 | 0.617 | 0.377 | 143 | 36 |
|
| CLASS R3 | | | | | | | | | | | | | | | |
|
| 8-31-074 | 10.00 | 0.02 | 1.07 | 1.09 | (0.06) | (0.15) | — | (0.21) | 10.88 | 11.005,6,10 | 16.187,8 | 0.797 | 0.197 | 112 | 36 |
|
| CLASS R4 | | | | | | | | | | | | | | | |
|
| 8-31-074 | 10.00 | 0.04 | 1.08 | 1.12 | (0.06) | (0.15) | — | (0.21) | 10.91 | 11.365,6,10 | 15.887,8 | 0.507 | 0.477 | 111 | 36 |
|
| CLASS R5 | | | | | | | | | | | | | | | |
|
| 8-31-074 | 10.00 | 0.07 | 1.08 | 1.15 | (0.07) | (0.15) | — | (0.22) | 10.93 | 11.625,6,10 | 15.577,8 | 0.227 | 0.767 | 112 | 36 |
|
| CLASS 1 | | | | | | | | | | | | | | | |
|
| 8-31-074 | 10.00 | 0.01 | 1.14 | 1.15 | (0.07) | (0.15) | — | (0.22) | 10.93 | 11.635,6,10 | 0.387,8 | 0.207 | 0.127 | 50,070 | 36 |
|
See notes to financial statements
Lifecycle Portfolios
45
Financial highlights
Continued
| | | | | | | | | | | | | | | |
| Lifecycle 2025 Portfolio | | | | | | | | | | | | | |
| Per share operating performance for a share outstanding throughout the period | | | Ratios and supplemental data | |
| | | Income (loss) from | | | | | | | | | | | | |
| | | investment operations | | Less distributions | | | | | Ratios to average net assets | | |
| |
| |
| |
| |
| | | | | | | | | | | | | | Ratio | | |
| | | | Net | | | | | | | | | | of net | | |
| | | | realized | Total | | | | | | | Ratio of | Ratio | investment | Net | |
| | Net asset | Net | and | from | From net | | | | | | gross | of net | income | assets, | |
| | value, | invest- | unrealized | invest- | invest- | | | | Net asset | | expenses | expenses | (loss) to | end of | |
| | beginning | ment in- | gain (loss) | ment | ment | From net | From | Total | value, end | Total | to average | to average | average | period (in | Portfolio |
| | of period | come (loss) | on invest- | operations | income | realized | capital | distribu- | of period | return | net assets | net assets | net assets | thousands) | turnover |
| Period ended | ($) | ($)1,17 | ments ($) | ($) | ($) | gain ($) | paid-in ($) | tions ($) | ($) | (%)2 | (%)3 | (%)3 | (%)1 | ($) | (%) |
|
| CLASS A | | | | | | | | | | | | | | | |
|
| 8-31-074 | 10.00 | 0.02 | 1.03 | 1.05 | (0.07) | (0.13) | — | (0.20) | 10.85 | 10.575,6,11 | 2.257,8 | 0.637 | 0.197 | 661 | 36 |
|
| CLASS B | | | | | | | | | | | | | | | |
|
| 8-31-074 | 10.00 | (0.03) | 1.01 | 0.98 | (0.05) | (0.13) | — | (0.18) | 10.80 | 9.945,6,11 | 3.827,8 | 1.317 | (0.32)7 | 257 | 36 |
|
| CLASS C | | | | | | | | | | | | | | | |
|
| 8-31-074 | 10.00 | (0.03) | 1.01 | 0.98 | (0.05) | (0.13) | — | (0.18) | 10.80 | 9.945,6,11 | 3.817,8 | 1.327 | (0.32)7 | 232 | 36 |
|
| CLASS R | | | | | | | | | | | | | | | |
|
| 8-31-074 | 10.00 | 0.01 | 0.99 | 1.00 | (0.05) | (0.13) | — | (0.18) | 10.82 | 10.135,6,11 | 16.317,8 | 1.087 | 0.147 | 113 | 36 |
|
| CLASS R1 | | | | | | | | | | | | | | | |
|
| 8-31-074 | 10.00 | 0.03 | 0.99 | 1.02 | (0.06) | (0.13) | — | (0.19) | 10.83 | 10.285,6,11 | 16.147,8 | 0.877 | 0.357 | 111 | 36 |
|
| CLASS R2 | | | | | | | | | | | | | | | |
|
| 8-31-074 | 10.00 | 0.05 | 0.99 | 1.04 | (0.06) | (0.13) | — | (0.19) | 10.85 | 10.535,6,11 | 15.707,8 | 0.627 | 0.597 | 117 | 36 |
|
| CLASS R3 | | | | | | | | | | | | | | | |
|
| 8-31-074 | 10.00 | 0.03 | 1.00 | 1.03 | (0.06) | (0.13) | — | (0.19) | 10.84 | 10.405,6,11 | 14.437,8 | 0.817 | 0.347 | 186 | 36 |
|
| CLASS R4 | | | | | | | | | | | | | | | |
|
| 8-31-074 | 10.00 | 0.06 | 0.99 | 1.05 | (0.06) | (0.13) | — | (0.19) | 10.86 | 10.655,6,11 | 15.777,8 | 0.527 | 0.707 | 111 | 36 |
|
| CLASS R5 | | | | | | | | | | | | | | | |
|
| 8-31-074 | 10.00 | 0.09 | 0.99 | 1.08 | (0.07) | (0.13) | — | (0.20) | 10.88 | 10.915,6,11 | 15.347,8 | 0.237 | 0.987 | 113 | 36 |
|
| CLASS 1 | | | | | | | | | | | | | | | |
|
| 8-31-074 | 10.00 | 0.04 | 1.04 | 1.08 | (0.07) | (0.13) | — | (0.20) | 10.88 | 10.935,6,11 | 0.317,8 | 0.207 | 0.397 | 67,149 | 36 |
|
See notes to financial statements
Lifecycle Portfolios
46
Financial highlights
Continued
| | | | | | | | | | | | | | | |
| Lifecycle 2020 Portfolio | | | | | | | | | | | | | |
| Per share operating performance for a share outstanding throughout the period | | | Ratios and supplemental data | |
| | | Income (loss) from | | | | | | | | | | | | |
| | | investment operations | | Less distributions | | | | | Ratios to average net assets | | |
| |
| |
| | |
| |
| | | | | | | | | | | | | | Ratio | | |
| | | | Net | | | | | | | | | | of net | | |
| | | | realized | Total | | | | | | | Ratio of | Ratio | investment | Net | |
| | Net asset | Net | and | from | From net | | | | | | gross | of net | income | assets, | |
| | value, | invest- | unrealized | invest- | invest- | | | | Net asset | | expenses | expenses | (loss) to | end of | |
| | beginning | ment in- | gain (loss) | ment | ment | From net | From | Total | value, end | Total | to average | to average | average | period (in | Portfolio |
| | of period | come (loss) | on invest- | operations | income | realized | capital | distribu- | of period | return | net assets | net assets | net assets | thousands) | turnover |
| Period ended | ($) | ($)1,17 | ments ($) | ($) | ($) | gain ($) | paid-in ($) | tions ($) | ($) | (%)2 | (%)3 | (%)3 | (%)1 | ($) | (%) |
|
| CLASS A | | | | | | | | | | | | | | | |
|
| 8-31-074 | 10.00 | 0.04 | 0.94 | 0.98 | (0.07) | (0.11) | — | (0.18) | 10.80 | 9.875,6,12 | 1.597,8 | 0.647 | 0.497 | 1,491 | 76 |
|
| CLASS B | | | | | | | | | | | | | | | |
|
| 8-31-074 | 10.00 | 0.01 | 0.91 | 0.92 | (0.06) | (0.11) | — | (0.17) | 10.75 | 9.245,6,12 | 3.297,8 | 1.327 | 0.067 | 607 | 76 |
|
| CLASS C | | | | | | | | | | | | | | | |
|
| 8-31-074 | 10.00 | —9 | 0.92 | 0.92 | (0.06) | (0.11) | — | (0.17) | 10.75 | 9.245,6,12 | 3.527,8 | 1.327 | —7,16 | 613 | 76 |
|
| CLASS R | | | | | | | | | | | | | | | |
|
| 8-31-074 | 10.00 | 0.05 | 0.87 | 0.92 | (0.05) | (0.11) | — | (0.16) | 10.76 | 9.335,6,12 | 16.257,8 | 1.087 | 0.527 | 119 | 76 |
|
| CLASS R1 | | | | | | | | | | | | | | | |
|
| 8-31-074 | 10.00 | 0.07 | 0.88 | 0.95 | (0.06) | (0.11) | — | (0.17) | 10.78 | 9.585,6,12 | 16.147,8 | 0.877 | 0.747 | 110 | 76 |
|
| CLASS R2 | | | | | | | | | | | | | | | |
|
| 8-31-074 | 10.00 | 0.08 | 0.88 | 0.96 | (0.06) | (0.11) | — | (0.17) | 10.79 | 9.725,6,12 | 15.237,8 | 0.627 | 0.927 | 214 | 76 |
|
| CLASS R3 | | | | | | | | | | | | | | | |
|
| 8-31-074 | 10.00 | 0.07 | 0.88 | 0.95 | (0.06) | (0.11) | — | (0.17) | 10.78 | 9.595,6,12 | 15.587,8 | 0.807 | 0.807 | 126 | 76 |
|
| CLASS R4 | | | | | | | | | | | | | | | |
|
| 8-31-074 | 10.00 | 0.10 | 0.88 | 0.98 | (0.07) | (0.11) | — | (0.18) | 10.80 | 9.855,6,12 | 15.757,8 | 0.527 | 1.097 | 110 | 76 |
|
| CLASS R5 | | | | | | | | | | | | | | | |
|
| 8-31-074 | 10.00 | 0.10 | 0.90 | 1.00 | (0.07) | (0.11) | — | (0.18) | 10.82 | 10.115,6,12 | 8.227,8 | 0.237 | 1.087 | 272 | 76 |
|
| CLASS 1 | | | | | | | | | | | | | | | |
|
| 8-31-074 | 10.00 | 0.07 | 0.93 | 1.00 | (0.07) | (0.11) | — | (0.18) | 10.82 | 10.125,6,12 | 0.327,8 | 0.207 | 0.787 | 64,901 | 76 |
|
See notes to financial statements
Lifecycle Portfolios
47
Financial highlights
Continued
| | | | | | | | | | | | | | | |
| Lifecycle 2015 Portfolio | | | | | | | | | | | | | |
| Per share operating performance for a share outstanding throughout the period | | | Ratios and supplemental data | |
| | | Income (loss) from | | | | | | | | | | | | |
| | | investment operations | | Less distributions | | | | | Ratios to average net assets | | |
| |
| |
| |
| |
| | | | | | | | | | | | | | Ratio | | |
| | | | Net | | | | | | | | | | of net | | |
| | | | realized | Total | | | | | | | Ratio of | Ratio | investment | Net | |
| | Net asset | Net | and | from | From net | | | | | | gross | of net | income | assets, | |
| | value, | invest- | unrealized | invest- | invest- | | | | Net asset | | expenses | expenses | (loss) to | end of | |
| | beginning | ment | gain (loss) | ment | ment | From net | From | Total | value, end | Total | to average | to average | average | period (in | Portfolio |
| | of period | income | on invest- | operations | income | realized | capital | distribu- | of period | return | net assets | net assets | net assets | thousands) | turnover |
| Period ended | ($) | (loss) ($)1,17 | ments ($) | ($) | ($) | gain ($) | paid-in ($) | tions ($) | ($) | (%)2 | (%)3 | (%)3 | (%)1 | ($) | (%) |
|
| CLASS A | | | | | | | | | | | | | | | |
|
| 8-31-074 | 10.00 | 0.07 | 0.76 | 0.83 | (0.09) | (0.09) | — | (0.18) | 10.65 | 8.375,6,13 | 2.197,8 | 0.637 | 0.867 | 836 | 96 |
|
| CLASS B | | | | | | | | | | | | | | | |
|
| 8-31-074 | 10.00 | 0.04 | 0.73 | 0.77 | (0.08) | (0.09) | — | (0.17) | 10.60 | 7.745,6,13 | 3.287,8 | 1.327 | 0.467 | 458 | 96 |
|
| CLASS C | | | | | | | | | | | | | | | |
|
| 8-31-074 | 10.00 | 0.06 | 0.71 | 0.77 | (0.08) | (0.09) | — | (0.17) | 10.60 | 7.745,6,13 | 4.017,8 | 1.327 | 0.657 | 261 | 96 |
|
| CLASS R | | | | | | | | | | | | | | | |
|
| 8-31-074 | 10.00 | 0.09 | 0.70 | 0.79 | (0.08) | (0.09) | — | (0.17) | 10.62 | 7.935,6,13 | 16.637,8 | 1.087 | 0.997 | 110 | 96 |
|
| CLASS R1 | | | | | | | | | | | | | | | |
|
| 8-31-074 | 10.00 | 0.11 | 0.69 | 0.80 | (0.08) | (0.09) | — | (0.17) | 10.63 | 8.085,6,13 | 16.477,8 | 0.877 | 1.217 | 108 | 96 |
|
| CLASS R2 | | | | | | | | | | | | | | | |
|
| 8-31-074 | 10.00 | 0.12 | 0.71 | 0.83 | (0.09) | (0.09) | — | (0.18) | 10.65 | 8.335,6,13 | 15.317,8 | 0.627 | 1.347 | 161 | 96 |
|
| CLASS R3 | | | | | | | | | | | | | | | |
|
| 8-31-074 | 10.00 | 0.11 | 0.69 | 0.80 | (0.08) | (0.09) | — | (0.17) | 10.63 | 8.105,6,13 | 16.387,8 | 0.807 | 1.287 | 108 | 96 |
|
| CLASS R4 | | | | | | | | | | | | | | | |
|
| 8-31-074 | 10.00 | 0.14 | 0.69 | 0.83 | (0.09) | (0.09) | — | (0.18) | 10.65 | 8.355,6,13 | 16.087,8 | 0.527 | 1.567 | 108 | 96 |
|
| CLASS R5 | | | | | | | | | | | | | | | |
|
| 8-31-074 | 10.00 | 0.16 | 0.69 | 0.85 | (0.09) | (0.09) | — | (0.18) | 10.67 | 8.615,6,13 | 15.777,8 | 0.237 | 1.847 | 109 | 96 |
|
| CLASS 1 | | | | | | | | | | | | | | | |
|
| 8-31-074 | 10.00 | 0.10 | 0.76 | 0.86 | (0.09) | (0.09) | — | (0.18) | 10.68 | 8.725,6,13 | 0.367,8 | 0.207 | 1.197 | 55,723 | 96 |
|
See notes to financial statements
Lifecycle Portfolios
48
Financial highlights
Continued
| | | | | | | | | | | | | | | |
| Lifecycle 2010 Portfolio | | | | | | | | | | | | | |
| Per share operating performance for a share outstanding throughout the period | | | Ratios and supplemental data | |
| | | Income (loss) from | | | | | | | | | | | | |
| | | investment operations | | Less distributions | | | | | Ratios to average net assets | | |
| |
| |
| | |
| |
| | | | | | | | | | | | | | Ratio | | |
| | | | Net | | | | | | | | | | of net | | |
| | | | realized | Total | | | | | | | Ratio of | Ratio | investment | Net | |
| | Net asset | Net | and | from | From net | | | | | | gross | of net | income | assets, | |
| | value, | invest- | unrealized | invest- | invest- | | | | Net asset | | expenses | expenses | (loss) to | end of | |
| | beginning | ment | gain (loss) | ment | ment | From net | From | Total | value, end | Total | to average | to average | average | period (in | Portfolio |
| | of period | income | on invest- | operations | income | realized | capital | distribu- | of period | return | net assets | net assets | net assets | thousands) | turnover |
| Period ended | ($) | (loss) ($)1,17 | ments ($) | ($) | ($) | gain ($) | paid-in ($) | tions ($) | ($) | (%)2 | (%)3 | (%)3 | (%)1 | ($) | (%) |
|
| CLASS A | | | | | | | | | | | | | | | |
|
| 8-31-074 | 10.00 | 0.12 | 0.57 | 0.69 | (0.09) | (0.06) | — | (0.15) | 10.54 | 6.995,6,14 | 2.457,8 | 0.637 | 1.427 | 665 | 176 |
|
| CLASS B | | | | | | | | | | | | | | | |
|
| 8-31-074 | 10.00 | 0.11 | 0.52 | 0.63 | (0.08) | (0.06) | — | (0.14) | 10.49 | 6.365,6,14 | 5.137,8 | 1.307 | 1.237 | 131 | 176 |
|
| CLASS C | | | | | | | | | | | | | | | |
|
| 8-31-074 | 10.00 | 0.10 | 0.54 | 0.64 | (0.08) | (0.06) | — | (0.14) | 10.50 | 6.465,6,14 | 4.207,8 | 1.327 | 1.157 | 415 | 176 |
|
| CLASS R | | | | | | | | | | | | | | | |
|
| 8-31-074 | 10.00 | 0.13 | 0.52 | 0.65 | (0.08) | (0.06) | — | (0.14) | 10.51 | 6.565,6,14 | 17.127,8 | 1.097 | 1.497 | 107 | 176 |
|
| CLASS R1 | | | | | | | | | | | | | | | |
|
| 8-31-074 | 10.00 | 0.15 | 0.52 | 0.67 | (0.09) | (0.06) | — | (0.15) | 10.52 | 6.705,6,14 | 16.897,8 | 0.877 | 1.707 | 107 | 176 |
|
| CLASS R2 | | | | | | | | | | | | | | | |
|
| 8-31-074 | 10.00 | 0.17 | 0.52 | 0.69 | (0.09) | (0.06) | — | (0.15) | 10.54 | 6.955,6,14 | 16.627,8 | 0.627 | 1.957 | 107 | 176 |
|
| CLASS R3 | | | | | | | | | | | | | | | |
|
| 8-31-074 | 10.00 | 0.16 | 0.52 | 0.68 | (0.09) | (0.06) | — | (0.15) | 10.53 | 6.825,6,14 | 16.817,8 | 0.807 | 1.777 | 107 | 176 |
|
| CLASS R4 | | | | | | | | | | | | | | | |
|
| 8-31-074 | 10.00 | 0.18 | 0.52 | 0.70 | (0.09) | (0.06) | — | (0.15) | 10.55 | 7.085,6,14 | 16.517,8 | 0.527 | 2.067 | 107 | 176 |
|
| CLASS R5 | | | | | | | | | | | | | | | |
|
| 8-31-074 | 10.00 | 0.21 | 0.52 | 0.73 | (0.10) | (0.06) | — | (0.16) | 10.57 | 7.335,6,14 | 16.207,8 | 0.237 | 2.347 | 107 | 176 |
|
| CLASS 1 | | | | | | | | | | | | | | | |
|
| 8-31-074 | 10.00 | 0.16 | 0.57 | 0.73 | (0.10) | (0.06) | — | (0.16) | 10.57 | 7.345,6,14 | 0.567,8 | 0.207 | 1.787 | 25,428 | 176 |
|
See notes to financial statements
Lifecycle Portfolios
49
Financial highlights
Continued
| | | | | | | | | | | | | | | |
| Lifecycle Retirement Portfolio | | | | | | | | | | | | |
| Per share operating performance for a share outstanding throughout the period | | | Ratios and supplemental data | |
| | | Income (loss) from | | | | | | | | | | | | |
| | | investment operations | | Less distributions | | | | | Ratios to average net assets | | |
| |
| |
| |
| |
| | | | | | | | | | | | | | Ratio | | |
| | | | Net | | | | | | | | | | of net | | |
| | | | realized | Total | | | | | | | Ratio of | Ratio | investment | Net | |
| | Net asset | Net | and | from | From net | | | | | | gross | of net | income | assets, | |
| | value, | invest- | unrealized | invest- | invest- | | | | Net asset | | expenses | expenses | (loss) to | end of | |
| | beginning | ment | gain (loss) | ment | ment | From net | From | Total | value, end | Total | to average | to average | average | period (in | Portfolio |
| | of period | income | on invest- | operations | income | realized | capital | distribu- | of period | return | net assets | net assets | net assets | thousands) | turnover |
| Period ended | ($) | (loss) ($)1,17 | ments ($) | ($) | ($) | gain ($) | paid-in ($) | tions ($) | ($) | (%)2 | (%)3 | (%)3 | (%)1 | ($) | (%) |
|
| CLASS A | | | | | | | | | | | | | | | |
|
| 8-31-074 | 10.00 | 0.15 | 0.46 | 0.61 | (0.20) | (0.08) | — | (0.28) | 10.33 | 6.195,6,15 | 1.247,8 | 0.687 | 1.827 | 4,270 | 566 |
|
| CLASS B | | | | | | | | | | | | | | | |
|
| 8-31-074 | 10.00 | 0.15 | 0.39 | 0.54 | (0.15) | (0.08) | — | (0.23) | 10.31 | 5.475,6,15 | 3.177,8 | 1.367 | 1.697 | 387 | 566 |
|
| CLASS C | | | | | | | | | | | | | | | |
|
| 8-31-074 | 10.00 | 0.11 | 0.43 | 0.54 | (0.15) | (0.08) | — | (0.23) | 10.31 | 5.485,6,15 | 2.597,8 | 1.387 | 1.267 | 1,358 | 566 |
|
| CLASS R | | | | | | | | | | | | | | | |
|
| 8-31-074 | 10.00 | 0.18 | 0.37 | 0.55 | (0.16) | (0.08) | — | (0.24) | 10.31 | 5.555,6,15 | 16.327,8 | 1.127 | 2.047 | 106 | 566 |
|
| CLASS R1 | | | | | | | | | | | | | | | |
|
| 8-31-074 | 10.00 | 0.19 | 0.38 | 0.57 | (0.18) | (0.08) | — | (0.26) | 10.31 | 5.735,6,15 | 16.097,8 | 0.917 | 2.257 | 106 | 566 |
|
| CLASS R2 | | | | | | | | | | | | | | | |
|
| 8-31-074 | 10.00 | 0.22 | 0.37 | 0.59 | (0.20) | (0.08) | — | (0.28) | 10.31 | 5.905,6,15 | 15.777,8 | 0.667 | 2.497 | 110 | 566 |
|
| CLASS R3 | | | | | | | | | | | | | | | |
|
| 8-31-074 | 10.00 | 0.20 | 0.37 | 0.57 | (0.18) | (0.08) | — | (0.26) | 10.31 | 5.775,6,15 | 16.017,8 | 0.847 | 2.327 | 106 | 566 |
|
| CLASS R4 | | | | | | | | | | | | | | | |
|
| 8-31-074 | 10.00 | 0.23 | 0.37 | 0.60 | (0.20) | (0.08) | — | (0.28) | 10.32 | 6.075,6,15 | 15.717,8 | 0.557 | 2.607 | 106 | 566 |
|
| CLASS R5 | | | | | | | | | | | | | | | |
|
| 8-31-074 | 10.00 | 0.25 | 0.37 | 0.62 | (0.22) | (0.08) | — | (0.30) | 10.32 | 6.275,6,15 | 15.417,8 | 0.277 | 2.897 | 106 | 566 |
|
| CLASS 1 | | | | | | | | | | | | | | | |
|
| 8-31-074 | 10.00 | 0.19 | 0.43 | 0.62 | (0.22) | (0.08) | — | (0.30) | 10.32 | 6.295,6,15 | 0.387,8 | 0.257 | 2.247 | 65,651 | 566 |
|
1 Recognition of net investment income by the Portfolio is affected by the timing of the declaration of dividends by the underlying funds in which the Portfolio invests.
2 Assumes dividend reinvestment and does not reflect the effect of sales charges.
3 Does not include expenses of the underlying funds in which the Portfolio invests.
4 Class A, Class B, Class C, Class R, Class R1, Class R2, Class R3, Class R4, Class R5 and Class 1 shares began operations on 10-30-06.
5 Total returns would have been lower had certain expenses not been reduced during the periods shown.
6 Not annualized.
7 Annualized.
8 Does not take into consideration expense reductions during the period shown.
9 Less than $0.01 per share.
10 The Adviser made a payment to the Portfolio of $1,696. Excluding this payment, total returns would have been 11.26% and 11.52% for Class R4 and Class R5, respectively. There was no effect to the total returns for Class A, Class B, Class C, Class R, Class R1, Class R2, Class R3 and Class 1. See Note 1.
11 The Adviser made a payment to the Portfolio of $2,707. Excluding this payment, total returns would have been 10.03%, 10.55% and 10.81% for Class R, Class R4 and Class R5, respectively. There was no effect to the total returns for Class A, Class B, Class C, Class R1, Class R2, Class R3 and Class 1. See Note 1.
12 The Adviser made a payment to the Portfolio of $2,881. Excluding this payment, total return would have been 9.48% for Class R1. There was no effect to the total returns for Class A, Class B, Class C, Class R, Class R2, Class R3, Class R4, Class R5 and Class 1. See Note 1.
13 The Adviser made a payment to the Portfolio of $6,640. Excluding this payment, total returns would have been 7.83%, 7.98% and 8.22% for Class R, Class R1 and Class R2, respectively. There was no effect to the total returns for Class A, Class B, Class C, Class R3, Class R4, Class R5 and Class 1. See Note 1.
14 The Adviser made a payment to the Portfolio of $4,286. Excluding this payment, total returns would have been 6.45%, 6.85%, 6.72%, 6.97% and 7.23% for Class R, Class R2, Class R3, Class R4 and Class R5, respectively. There was no effect to the total returns for Class A, Class B, Class C, Class R1 and Class 1. See Note 1.
15 The Adviser made a payment to the Portfolio of $21,459. Excluding this payment, total returns would have been 5.37%, 5.45%, 5.63%, 5.80%, 5.67%, 5.97% and 6.17% for Class B, Class R, Class R1, Class R2, Class R3, Class R4 and Class R5, respectively. There was no effect to the total returns for Class A, Class C and Class 1. See Note 1.
16 Less than 0.01% .
17 Based on the average of the share outstanding.
See notes to financial statements
Lifecycle Portfolios
50
Notes to financial statements
1. Organization of the Trust
The John Hancock Funds II (the “Trust” or “JHF II”) is an open-end management investment company organized as a Massachusetts business trust. It is a series company, which means that it has several funds, each with a stated investment objective that it pursues through separate investment policies. The Trust currently offers seventy-two separate investment funds, nine of which are described here: Lifecycle 2045, Lifecycle 2040, Lifecycle 2035, Lifecycle 2030, Lifecycle 2025, Lifecycle 2020, Lifecycle 2015, Lifecycle 2010 and Lifecycle Retirement (collectively, “Lifecycle Portfolios” or “the Portfolios”).
Each of the Lifecycle Portfolios is non-diversified for purposes of the Investment Company Act of 1940, as amended (“1940 Act”).
The Lifecycle Portfolios operate as “fund of funds”, investing in Class NAV shares of underlying funds of the Trust and John Hancock Funds III (“JHF III”) and also in other affiliated funds of the John Hancock funds complex. The Portfolios may also invest in unaffiliated underlying funds and other permitted investments.
The accounting policies of the affiliated underlying funds of the Trust are outlined in the shareholder reports for such funds, available without charge by calling 1-800-225-5291 or on the Securities & Exchange Commission (“SEC”) Web site at www.sec.gov, File #811-21779, CIK 0001331971 for JHF II and File #811-21777, CIK 0001329954 for JHF III. The affiliated underlying funds are not covered by this report.
John Hancock Investment Management Services, LLC (“JHIMS” or the “Adviser”), a Delaware limited liability company controlled by John Hancock Life Insurance Company (U.S.A.) (“John Hancock USA”) serves as investment adviser for the Trust and John Hancock Funds, LLC (the “Distributor”), an affiliate of the Adviser, serves as principal underwriter. John Hancock Life Insurance Company of New York (“John Hancock New York”) is a wholly owned subsidiary of John Hancock USA. John Hancock USA and John Hancock New York are indirect wholly owned subsidiaries of the Manufactures Life Insurance Company (“Manulife”), which in turn is a wholly owned subsidiary of Manulife Financial Corporation (“MFC”), a publicly traded company. MFC and its subsidiaries are known collectively as “Manulife Financial.”
The JHF III funds are retail mutual funds advised by JHIMS and distributed by the Distributor.
The Trustees have authorized the issuance of multiple classes of shares of the Portfolios, including classes designated as Class A, Class B, Class C, Class R, Class R1, Class R2, Class R3, Class R4, Class R5 and Class 1 shares. Class A, B and C shares are open to all retail investors. Class R, R1, R2, R3, R4 and R5 shares are available only to certain retirement plans. Class 1 shares are sold only to certain exempt separate accounts of John Hancock USA and John Hancock New York. The shares of each class represent an interest in the same portfolio of investments of the Portfolios, and have equal rights as to voting, redemptions, dividends and liquidation, except that certain expenses, subject to the approval of the Trustees, may be applied differently to each class of shares in accordance with current regulations of the SEC and the Internal Revenue Service. Shareholders of a class that bears distribution and service expenses under the terms of a distribution plan have exclusive voting rights to that distribution plan. Class B shares will convert to Class A shares eight years after purchase.
At August 31, 2007, John Hancock USA owned the following shares of beneficial interest of the Lifecycle Portfolios: 102,302 shares of Lifecycle 2045, 102,132 shares of Lifecycle 2040, 101,508 shares of Lifecycle 2035, 102,041 shares of Lifecycle 2030, 101,860 shares of Lifecycle 2025, 101,683 shares of Lifecycle 2020, 101,708 shares of Lifecycle 2015, 101,461 shares of Lifecycle 2010 and 508,703 shares of Lifecycle Retirement.
Payment made by Affiliate
The Adviser made payments to the following Portfolios on February 27, 2007: Lifecycle 2030 in the amount of $1,696, Lifecycle 2025 in the amount of $2,707, Lifecycle 2020 in the amount of $2,881, Lifecycle 2015 in the amount of $6,640, Lifecycle 2010 in the amount of $4,286 and Lifecycle Retirement in the amount of $21,459. These payments were made to reimburse the Portfolios for a lost investment opportunity that resulted from an over allocation to cash and an under allocation to the JHF II Real Estate Equity Fund. These amounts are included in the Portfolios’ Statements of Operations.
2. Significant accounting policies
In the preparation of the financial statements, the Portfolios follow the policies described below. The preparation of financial statements in conformity with accounting principles generally accepted in the United States of America requires management to make estimates and assumptions that affect the reported amounts of assets and liabilities at the date of the financial statements and the reported amounts of income and expenses during the reporting period. Actual results may differ from these estimates.
Securities valuation
The net asset value of the shares of each Portfolio is determined daily as of the close of the New York Stock Exchange (“NYSE”), normally at 4:00 p.m., Eastern Time. Investments by the Lifecycle Portfolios in underlying affiliated funds are valued at their respective net asset values each business day and securities in the underlying funds are valued in accordance with their respective valuation polices,
Lifecycle Portfolios
51
as outlined in the underlying funds’ financial statements. Short-term debt investments that have a remaining maturity of 60 days or less are valued at amortized cost, and thereafter assume a constant amortization to maturity of any discount or premium, which approximates market value. All other securities held by the Portfolios and by the underlying affiliated funds are valued at the last sale price or official closing price (closing bid price or last evaluated quote if no sale has occurred) as of the close of business on the principal securities exchange (domestic or foreign) on which they trade or, lacking any sales, at the closing bid price. Securities traded only in the over-the-counter market are valued at the last bid price quoted by brokers making markets in the securities at the close of trading. Securities for which there are no such quotations, principally debt securities, are valued based on the valuation provided by an independent pricing service, which utilizes both dealer-supplied and electronic data processing techniques, which take into account factors such as institutional-size trading in similar groups of securities, yield, quality, coupon rate, maturity, type of issue, trading characteristics and other market data.
Other assets and securities for which no such quotations are readily available are valued at fair value as determined in good faith under consistently applied procedures established by and under the general supervision of the Board of Trustees. Generally, trading in non-U.S. securities is substantially completed each day at various times prior to the close of trading on the NYSE. The values of such securities used in computing the net asset value of a Portfolio’s shares are generally determined as of such times. Occasionally, significant events that affect the values of such securities may occur between the times at which such values are generally determined and the close of the NYSE. Upon such an occurrence, these securities will be valued at fair value as determined in good faith under consistently applied procedures established by and under the general supervision of the Board of Trustees.
In deciding whether to make a fair value adjustment to the price of a security, the Board of Trustees or their designee may review a variety of factors, including developments in foreign markets, the performance of U.S. securities markets and the performance of instruments trading in U.S. markets that represent foreign securities and baskets of foreign securities. The Portfolios may also fair value securities in other situations, for example, when a particular foreign market is closed, but the Portfolio is calculating the net asset value. In view of these factors, it is likely that Portfolios investing significant amounts of assets in securities in foreign markets will be fair valued more frequently than Portfolios investing significant amounts of assets in frequently traded, U.S. exchange listed securities of large-capitalization U.S. issuers.
For purposes of determining when fair value adjustments may be appropriate with respect to Portfolios that invest in securities in foreign markets that close prior to the NYSE, the Portfolios will, on an ongoing basis, monitor for “significant market events.” A significant market event may be a certain percentage change in the value of an index or of certain Exchange Traded Funds that track foreign markets in which Portfolios have significant investments. If a significant market event occurs due to a change in the value of the index or of Exchange Traded Funds, the pricing for all Portfolios that invest in foreign markets that have closed prior to the NYSE will promptly be reviewed and potential adjustments to the net asset value of such Portfolios will be recommended to the Trust’s Pricing Committee where applicable.
Fair value pricing of securities is intended to help ensure that the net asset value of a Portfolio’s shares reflects the value of the Portfolio’s securities as of the close of the NYSE (as opposed to a value which is no longer accurate as of such close), thus limiting the opportunity for aggressive traders to purchase shares of a Portfolio at deflated prices, reflecting stale security valuations and to promptly sell such shares at a gain. However, a security’s valuation may differ depending on the method used for determining value and no assurance can be given that fair value pricing of securities will successfully eliminate all potential opportunities for such trading gains.
In September 2006, Financial Accounting Standards Board (FASB) Standard No. 157, Fair Value Measurements (FAS 157), was issued and is effective for fiscal years beginning after November 15, 2007. FAS 157 defines fair value, establishing a framework for measuring fair value and expands disclosure about fair value measurements. Management is currently evaluating the application of FAS 157 to the Portfolios and its impact, if any, resulting from the adoption of FAS 157 on the Portfolios’ financial statements.
Security transactions and related investment income
Investment security and underlying funds transactions are accounted for on a trade date plus one basis for daily net asset value calculations. However, for financial reporting purposes, investment transactions are reported on trade date. Interest income is accrued as earned. Dividend income is recorded by the underlying funds on the ex-dividend date. Distributions from the underlying funds are recorded on the ex-dividend date. Dividend income and distributions to shareholders are recorded on the ex-dividend date. Discounts/ premiums are accreted/amortized for financial reporting purposes. Non-cash dividends are recorded at the fair market value of the securities received. Debt obligations may be placed in a non-accrual status and related interest income may be reduced by ceasing current accruals and writing off interest receivables when the collection of all or a portion of interest has become doubtful, based upon consistently applied procedures.
The Portfolios use the specific identification method for determining realized gain or loss on investments for both financial and federal income tax reporting purposes.
Multi-class operations
All income, expenses (except class-specific expenses), and realized and unrealized gains (losses) are allocated to each class of shares based upon the relative net assets of each class. Dividends to shareholders from net investment income are determined at a class level and distributions from capital gains are determined at the Portfolio level.
Lifecycle Portfolios
52
Expense allocation
Expenses not directly attributable to a particular Portfolio or share class are allocated based on the relative share of net assets of each Portfolio or share class at the time the expense was incurred. Class-specific expenses, such as Distribution (Rule 12b-1) fees, transfer agency fees, blue sky fees, and printing and postage fees, are accrued daily and charged directly to the respective share classes. Expenses in the Lifecycle Portfolios’ Statements of Operations reflect the expenses of the Portfolios and do not include any indirect expenses related to the underlying funds. Because the underlying funds have varied expense levels and the Lifecycle Portfolios may own different proportions of the underlying funds at different times, the amount of fees and expenses incurred indirectly by the Lifecycle Portfolios will vary.
Purchased and written options
Lifecycle Retirement may purchase and sell put and call options on securities (whether or not it holds the securities in its portfolio), securities indices, currencies and futures contracts.
When the Portfolio writes a put or call option, an amount equal to the premium received by the Portfolio is recorded as a liability and is subsequently marked-to-market to reflect the current market value of the option written. If an option expires or if the Portfolio enters into an offsetting purchase option, the Portfolio realizes a gain (or loss if the cost of an offsetting purchase option exceeds the premium received when the option was written). If a written call option is exercised, the Portfolio realizes a gain or loss from the sale of the underlying security with the proceeds of the sale increased by the premium originally received. If a written put option is exercised, the amount of the premium originally received reduces the cost of the security that the Portfolio purchases upon exercise of the option.
When the Portfolio purchases a put or call option, the premium paid by the Portfolio is included in the Portfolio of Investments and subsequently “marked-to-market” to reflect the current market value of the option. If the purchased option expires, the Portfolio realizes a loss for the cost of the option. If the Portfolio enters into a closing sale transaction, the Portfolio realizes a gain or loss, depending on whether proceeds from the closing sale transaction are greater or less than the original cost of the option. If the Portfolio exercises a call option, the cost of the securities acquired by exercising the call is increased by the premium paid to buy the call. If the Portfolio exercises a put option, it realizes a gain or loss from the sale of the underlying security and the proceeds from such sale are decreased by the premium originally paid.
The Portfolio may use options to manage exposure to fluctuations in currency values. Writing puts and buying calls may increase the Portfolio’s exposure to the underlying instrument. Buying puts and writing calls may decrease the Portfolio’s exposure to the underlying instrument. Losses may arise from changes in the value of the underlying instruments, if there is an illiquid secondary market for the contracts or if the counterparties do not perform under the terms of the contract.
Written options for the period ended August 31, 2007 were as follows:
| | | |
| Lifecycle Retirement | Number of Contracts | Premiums Received |
|
| |
| Outstanding, beginning of period | — | — |
| Options written | | 20 | $34,940 |
| Option closed | | (20) | (34,940) |
| Outstanding, end of period | — | — |
There were no open written options outstanding as of August 31, 2007.
Futures
Lifecycle Retirement may purchase and sell financial futures contracts and options on those contracts. The Portfolio invests in contracts based on financial instruments such as U.S. Treasury Bonds or Notes, or on securities indices such as the S&P 500 Index, in order to hedge against a decline in the value of securities owned by the Portfolio.
Initial margin deposits required upon entering into futures contracts are satisfied by the delivery of specific securities or cash as collateral to the broker (the Portfolios’ agent in acquiring the futures position). If the position is closed out by taking an opposite position prior to the settlement date of the futures contract, a final determination of variation margin is made, cash is required to be paid to or released by the broker and the Portfolio realizes a gain or loss.
When the Portfolio sells a futures contract based on a financial instrument, the Portfolio becomes obligated to deliver that kind of instrument at an agreed upon date for a specified price. The Portfolio realizes a gain or loss depending on whether the price of an offsetting purchase is less or more than the price of the initial sale or on whether the price of an offsetting sale is more or less than the price of the initial purchase. The Portfolio could be exposed to risks if it could not close out futures positions because of an illiquid secondary market or the inability of counterparties to meet the terms of their contracts. Futures contracts are valued at the quoted daily settlement prices established by the exchange on which they trade.
There were no open futures contracts as of August 31, 2007.
Lifecycle Portfolios
53
Federal income taxes
Each Portfolio’s policy is to qualify as a “regulated investment company” by complying with the applicable provisions of the Internal Revenue Code and will not be subject to federal income tax. Therefore, no federal income tax provision is required. Each Portfolio is treated as a separate taxpayer for federal income tax purposes.
Distribution of income and gains
The Portfolios record distributions to shareholders from net investment income and net realized gains, if any, on the ex-dividend date. Distributions paid with respect to each class of shares are calculated in the same manner, at the same time and are in the same amount, except for the effect of expenses that may be applied differently to each class. Such distributions, on a tax basis, are determined in conformity with income tax regulations, which may differ from accounting principles generally accepted in the United States of America. Distributions in excess of tax basis earnings and profits, if any, are reported in each Portfolio’s financial statements as a return of capital.
Capital accounts
The Portfolios report the undistributed net investment income and accumulated undistributed net realized gain (loss) accounts on a basis approximating amounts available for future tax distributions (or to offset future taxable realized gains when a capital loss carryfor-ward is available). Accordingly, each Portfolio may periodically make reclassifications among certain capital accounts without affecting its net asset value.
3. Investment advisory and other agreements
Advisory fees
The Trust has entered into an Investment Advisory Agreement with the Adviser. The Adviser is responsible for managing the corporate and business affairs of the Trust and for selecting and compensating subadvisers to handle the investment of the assets of the Portfolios, subject to the supervision of the Board of Trustees. The advisory fee has two components: (a) a fee on assets invested in affiliated Funds (“Affiliated Fund Assets”) and (b) a fee on assets not invested in affiliated funds (“Other Assets”). Affiliated Funds are any Fund of JHF II and JHF III. Under the Advisory Agreement, the Portfolios pay a monthly management fee to the Adviser as stated below:
The fee on Affiliated Fund Assets is stated as an annual percentage of the current value of the aggregate net assets of all the Portfolios determined in accordance with the following schedule, and that rate is applied to the Affiliated Fund Assets of each Portfolio.
| | |
| | First $7.5 billion of | Excess over $7.5 billion |
| Portfolio | Aggregate Net Assets | of Aggregate Net Assets |
|
| |
| Lifecycle Portfolios | 0.060% | 0.050% |
The fee on Other Assets is stated as an annual percentage of the current value of the aggregate net assets of all the Portfolios determined in accordance with the following schedule, and that rate is applied to the Other Assets of each Portfolio.
| | |
| | First $7.5 billion of | Excess over $7.5 billion |
| Portfolio | Aggregate Net Assets | of Aggregate Net Assets |
|
| |
| Lifecycle Portfolios | 0.510% | 0.500% |
The Portfolios are not responsible for the payment of subadvisory fees.
The investment management fees incurred for the period ended August 31, 2007 were equivalent to an annual effective rate of the Portfolio’s average daily net assets as follows:
| | | | |
| | Annual | | | Annual |
| Portfolio | Effective Rate | | Portfolio | Effective Rate |
|
| |
| Lifecycle 2045 | 0.06% | | Lifecycle 2020 | 0.06% |
| Lifecycle 2040 | 0.06% | | Lifecycle 2015 | 0.06% |
| Lifecycle 2035 | 0.06% | | Lifecycle 2010 | 0.06% |
| Lifecycle 2030 | 0.06% | | Lifecycle Retirement | 0.11% |
| Lifecycle 2025 | 0.06% | | | |
Expense reimbursements
The Adviser has contractually agreed to reimburse for certain Portfolio level expenses (excluding management fees, underlying fund expenses, Rule 12b-1 fees, transfer agency fees, blue sky fees, printing and postage fees, taxes, Portfolio brokerage commissions, interest, litigation and indemnification expenses, other expenses not incurred in the ordinary course of the Portfolios’ business, and fees under any agreement or plans of the Portfolios dealing with services for shareholders and others with beneficial interests in shares of the Portfolio) that exceed 0.09% of the average annual net assets. Also, the Adviser has agreed to reimburse or to make a payment to a specific class of shares of the Portfolios in an amount equal to the amount by which the expenses attributable to such class of shares exceed the percentage of average annual net assets (on an annualized basis) attributable as follows: 0.65% for Class A, 1.35% for Class B, 1.35% for Class C, 1.20% for Clas s R, 0.95% for Class R1, 0.70% for Class R2, 0.85% for Class R3, 0.55% for Class R4 and 0.25% for Class R5, for Lifecycle 2045, Lifecycle 2040, Lifecycle 2035, Lifecycle 2030, Lifecycle 2025, Lifecycle 2020, Lifecycle 2015 and Lifecycle 2010 and 0.69% for Class A, 1.39% for Class B, 1.39% for Class C, 1.24% for Class R, 0.99% for Class R1, 0.74% for Class R2, 0.89% for Class R3, 0.59% for Class R4, 0.29% for Class R5 for Lifecycle Retirement. These expense reimbursements shall continue in effect
Lifecycle Portfolios
54
until December 31, 2007, and thereafter until terminated by the Adviser on notice to JHF II. For the period ended August 31, 2007, the expense reductions amounted to the following and are reflected as a reduction of total expenses in the Statement of Operations:
| | | | | | | | | | |
| | | | | Expense Reimbursement by Class | | | | |
|
| Portfolio | Class A | Class B | Class C | Class R | Class R1 | Class R2 | Class R3 | Class R4 | Class R5 | Class 1 |
|
| Lifecycle 2045 | $5,435 | $3,858 | $3,930 | $14,401 | $14,397 | $14,401 | $14,402 | $14,398 | $14,399 | $25,754 |
| Lifecycle 2040 | 4,065 | 3,784 | 3,767 | 14,318 | 14,317 | 14,339 | 14,347 | 14,318 | 14,330 | 27,041 |
| Lifecycle 2035 | 3,876 | 3,546 | 3,618 | 14,037 | 14,037 | 14,045 | 14,036 | 14,037 | 14,055 | 26,485 |
| Lifecycle 2030 | 3,800 | 3,520 | 3,499 | 13,954 | 13,948 | 13,949 | 13,948 | 13,949 | 13,949 | 24,763 |
| Lifecycle 2025 | 3,546 | 3,329 | 3,349 | 13,780 | 13,780 | 13,783 | 13,800 | 13,781 | 13,783 | 22,199 |
| Lifecycle 2020 | 3,869 | 3,341 | 3,254 | 13,706 | 13,705 | 13,709 | 13,713 | 13,706 | 13,994 | 22,726 |
| Lifecycle 2015 | 3,794 | 3,510 | 3,350 | 13,887 | 13,887 | 13,893 | 13,887 | 13,888 | 13,888 | 24,067 |
| Lifecycle 2010 | 4,350 | 3,540 | 3,687 | 14,159 | 14,160 | 14,161 | 14,160 | 14,162 | 14,162 | 27,295 |
| Lifecycle Retirement | 5,548 | 2,937 | 3,518 | 13,273 | 13,274 | 13,274 | 13,274 | 13,274 | 13,274 | 31,578 |
Fund administration fees
Pursuant to the Advisory Agreements, the Portfolios reimburse the Adviser for all expenses associated with providing the administrative, financial, accounting and recordkeeping services of the Portfolios, including the preparation of all tax returns, annual, semiannual and periodic reports to shareholders and the preparation of all regulatory reports. These expenses are allocated based on the relative share of net assets of each Portfolio at the time the expense was incurred.
The fund administration fees incurred for the period ended August 31, 2007, were equivalent to the following annual effective rates of each Portfolio’s average daily net assets:
| | | | | | | | | |
| | Lifecycle | Lifecycle | Lifecycle | Lifecycle | Lifecycle | Lifecycle | Lifecycle | Lifecycle | Lifecycle |
| | 2045 | 2040 | 2035 | 2030 | 2025 | 2020 | 2015 | 2010 | Retirement |
|
|
| Annual Effective Rate | 0.0034% | 0.0035% | 0.0035% | 0.0033% | 0.0034% | 0.0034% | 0.0034% | 0.0038% | 0.0043% |
Distribution plans
The Trust has a Distribution Agreement with the Distributor. The Portfolio has adopted Distribution Plans with respect to Class A, Class B, Class C, Class R, Class R1, Class R2, Class R3, Class R4 and Class 1, pursuant to Rule 12b-1 under the 1940 Act, to reimburse the Distributor for the services it provides as distributor of shares of the Portfolios. Accordingly, the Portfolios make monthly payments to the Distributor at an annual rate not to exceed 0.30%, 1.00%, 1.00%, 0.75%, 0.50%, 0.25%, 0.50%, 0.25% and 0.05% of average daily net assets of Class A, Class B, Class C, Class R, Class R1, Class R2, Class R3, Class R4 and Class 1, respectively. A maximum of 0.25% of such payments may be service fees, as defined by the Conduct Rules of the Financial Industry Regulatory Authority (formerly, National Association of Securities Dealers). Under the Conduct Rules, curtailment of a portion of the Portfolio’s 12b-1 payments could occur under certain circumstances.
The Portfolios have also adopted a Service Plan with respect to Class R, Class R1, Class R2, Class R3, Class R4 and Class R5 shares (the “Service Plan”). Under the Service Plan, the Portfolios pay up to 0.25%, 0.25%, 0.25%, 0.15%, 0.10% and 0.05% of average daily net assets of Class R, Class R1, Class R2, Class R3, Class R4 and Class R5 shares, respectively, for certain other services.
The Service Plan fees incurred for the period ended August 31, 2007 were equivalent to an annual effective rate of the fund’s average daily net assets as follows:
| | | | | | |
| | | | Annual Effective Rate | | |
|
| Portfolio | Class R | Class R1 | Class R2 | Class R3 | Class R4 | Class R5 |
|
|
| Lifecycle 2045 | 0.13% | 0.17% | 0.17% | 0.10% | 0.07% | 0.03% |
| Lifecycle 2040 | 0.13% | 0.17% | 0.18% | 0.10% | 0.07% | 0.03% |
| Lifecycle 2035 | 0.13% | 0.17% | 0.17% | 0.10% | 0.07% | 0.03% |
| Lifecycle 2030 | 0.13% | 0.17% | 0.17% | 0.10% | 0.07% | 0.03% |
| Lifecycle 2025 | 0.14% | 0.17% | 0.17% | 0.11% | 0.07% | 0.03% |
| Lifecycle 2020 | 0.13% | 0.17% | 0.18% | 0.10% | 0.07% | 0.03% |
| Lifecycle 2015 | 0.14% | 0.17% | 0.18% | 0.10% | 0.07% | 0.03% |
| Lifecycle 2010 | 0.14% | 0.17% | 0.17% | 0.10% | 0.07% | 0.03% |
| Lifecycle Retirement | 0.14% | 0.17% | 0.17% | 0.10% | 0.07% | 0.03% |
Lifecycle Portfolios
55
Sales charges
Class A shares are assessed up-front sales charges of up to 5% of the net asset value of such shares. The following summarizes the net up-front sales charges received by the Distributor during the period ended August 31, 2007:
| | | | | | | | | |
| | Lifecycle | Lifecycle | Lifecycle | Lifecycle | Lifecycle | Lifecycle | Lifecycle | Lifecycle | Lifecycle |
| | 2045 | 2040 | 2035 | 2030 | 2025 | 2020 | 2015 | 2010 | Retirement |
|
| Net sales charges | $10,290 | $13,255 | $9,171 | $10,292 | $15,386 | $17,785 | $16,989 | $13,826 | $75,720 |
| Retained for printing | | | | | | | | | |
| prospectuses, advertising | | | | | | | | | |
| and sales literature | 1,838 | 2,171 | 1,402 | 1,595 | 2,720 | 2,765 | 2,717 | 904 | 4,983 |
| Sales commission to | | | | | | | | | |
| unrelated broker-dealers | 8,452 | 11,084 | 7,726 | 8,697 | 12,666 | 14,850 | 14,272 | 12,922 | 68,862 |
| Sales commission to | | | | | | | | | |
| affiliated sales personnel | — | — | 43 | — | — | 170 | — | — | 1,875 |
Class B shares that are redeemed within six years of purchase are subject to a contingent deferred sales charge (“CDSC”) at declining rates, beginning at 5.00% of the lesser of the current market value at the time of redemption or the original purchase cost of the shares being redeemed. Class C shares that are redeemed within one year of purchase are subject to a CDSC at a rate of 1.00% of the lesser of the current market value at the time of redemption or the original purchase cost of the shares being redeemed. Proceeds from the CDSCs are paid to the Distributor and are used, in whole or in part, to defray its expenses for providing distribution-related services to the Portfolios in connection with the sale of Class B and Class C shares. During the period ended August 31, 2007, CDSCs received by the Distributor amounted to $206 and $211 for Lifecycle 2040 and Lifecycle 2020, respectively, for Class B shares. There were no CDSCs received by the Distributor for Lifecycle 2045, Lifecycle 2035, Lifecycle 2030, Lifecycle 2025, Lifecycle 2015, Lifecycle 2010 and Lifecycle Retirement for Class B shares. There were no CDSCs received by the Distributor for Class C shares.
Transfer agent fees
The Portfolios have a Transfer Agency Agreement with John Hancock Signature Services, Inc. (“Signature Services”), an indirect subsidiary of MFC. For Class A, Class B, Class C, Class R, Class R1, Class R2, Class R3, Class R4 and Class R5 shares, the Portfolios pay a monthly transfer agent fee at an annual rate of 0.05% of each class’s average daily net assets, plus a fee based on the number of shareholder accounts and reimbursement for certain out-of-pocket expenses. Expenses not directly attributable to a particular class of shares are aggregated and allocated to each class on the basis of its relative net asset value.
Signature Services has agreed to limit the transfer agent fees so that such fees do not exceed 0.20% annually of Class A, Class B, Class C, Class R, Class R1, Class R2, Class R3, Class R4 and Class R5 shares average daily net assets. This agreement is effective until December 31, 2007. Signature Services reserves the right to terminate this limitation in the future. In addition, Signature Service has voluntarily agreed to further limit transfer agent fees for Class R, Class R1, Class R2, Class R3, Class R4 and Class R5 shares so that such fees do not exceed 0.05% annually of each class’s average daily net assets. For the year ended August 31, 2007, the transfer agent fee reductions amounted to the following and are reflected as a reduction of total expenses in the Statement of Operations:
| | | | | | |
| | Transfer agent fee reduction by class | | | |
|
|
| Portfolio | Class R | Class R1 | Class R2 | Class R3 | Class R4 | Class R5 |
|
| Lifecycle 2045 | $29 | $28 | $27 | $23 | $13 | $13 |
| Lifecycle 2040 | 34 | 21 | 30 | 22 | 18 | 30 |
| Lifecycle 2035 | 29 | 29 | 28 | 19 | 14 | 30 |
| Lifecycle 2030 | 29 | 28 | 25 | 19 | 18 | 14 |
| Lifecycle 2025 | 30 | 31 | 30 | 22 | 18 | 24 |
| Lifecycle 2020 | 31 | 25 | 25 | 22 | 18 | 25 |
| Lifecycle 2015 | 25 | 24 | 24 | 15 | 13 | 14 |
| Lifecycle 2010 | 22 | 19 | 15 | 15 | 14 | 13 |
| Lifecycle Retirement | 18 | 19 | 18 | 19 | 18 | 18 |
Signature Services reserves the right to terminate this limitation at any time.
Lifecycle Portfolios
56
Expenses under the agreements described above for the period ended August 31, 2007, were as follows:
| | | | | |
| | | Distribution and | Transfer | | Printing and |
| Portfolio | Share class | service fees | agent fees | Blue sky fees | postage fees |
|
| |
| Lifecycle 2045 | Class A | $1,232 | $714 | $2,244 | $804 |
| | Class B | 967 | 149 | 2,244 | 249 |
| | Class C | 1,032 | 162 | 2,244 | 266 |
| | Class R | 813 | 75 | 12,808 | 243 |
| | Class R1 | 612 | 73 | 12,808 | 242 |
| | Class R2 | 387 | 73 | 12,808 | 243 |
| | Class R3 | 554 | 69 | 12,808 | 243 |
| | Class R4 | 290 | 59 | 12,808 | 242 |
| | Class R5 | 31 | 58 | 12,808 | 242 |
| | Class 1 | 2,939 | — | — | — |
| | Total | $8,857 | $1,432 | $83,580 | $2,774 |
|
| |
| Lifecycle 2040 | Class A | $480 | $277 | $2,244 | $342 |
| | Class B | 976 | 150 | 2,244 | 252 |
| | Class C | 939 | 143 | 2,244 | 246 |
| | Class R | 806 | 80 | 12,808 | 242 |
| | Class R1 | 611 | 66 | 12,808 | 242 |
| | Class R2 | 438 | 81 | 12,808 | 242 |
| | Class R3 | 585 | 70 | 12,808 | 251 |
| | Class R4 | 290 | 64 | 12,808 | 242 |
| | Class R5 | 32 | 76 | 12,808 | 245 |
| | Class 1 | 3,227 | — | — | — |
| | Total | $8,384 | $1,007 | $83,580 | $2,304 |
|
| |
| Lifecycle 2035 | Class A | $628 | $375 | $2,244 | $443 |
| | Class B | 1,188 | 193 | 2,244 | 275 |
| | Class C | 1,278 | 211 | 2,244 | 310 |
| | Class R | 805 | 74 | 12,808 | 242 |
| | Class R1 | 611 | 74 | 12,808 | 242 |
| | Class R2 | 393 | 75 | 12,808 | 245 |
| | Class R3 | 548 | 64 | 12,808 | 241 |
| | Class R4 | 290 | 59 | 12,808 | 242 |
| | Class R5 | 32 | 77 | 12,808 | 249 |
| | Class 1 | 5,314 | — | — | — |
| | Total | $11,087 | $1,202 | $83,580 | $2,489 |
|
| |
| Lifecycle 2030 | Class A | $819 | $503 | $2,244 | $498 |
| | Class B | 1,350 | 227 | 2,244 | 322 |
| | Class C | 1,392 | 234 | 2,244 | 304 |
| | Class R | 822 | 76 | 12,808 | 244 |
| | Class R1 | 609 | 73 | 12,808 | 241 |
| | Class R2 | 384 | 70 | 12,808 | 241 |
| | Class R3 | 546 | 64 | 12,808 | 241 |
| | Class R4 | 289 | 63 | 12,808 | 241 |
| | Class R5 | 31 | 59 | 12,808 | 241 |
| | Class 1 | 6,954 | — | — | — |
| | Total | $13,196 | $1,369 | $83,580 | $2,573 |
|
| |
| Lifecycle 2025 | Class A | $652 | $391 | $2,244 | $466 |
| | Class B | 1,322 | 220 | 2,244 | 319 |
| | Class C | 1,342 | 224 | 2,244 | 328 |
| | Class R | 801 | 75 | 12,808 | 240 |
| | Class R1 | 607 | 76 | 12,808 | 240 |
| | Class R2 | 386 | 76 | 12,808 | 242 |
| | Class R3 | 615 | 72 | 12,808 | 252 |
| | Class R4 | 287 | 63 | 12,808 | 240 |
| | Class R5 | 31 | 69 | 12,808 | 242 |
| | Class 1 | 9,874 | — | — | — |
| | Total | $15,917 | $1,266 | $83,580 | $2,569 |
|
Lifecycle Portfolios
57
| | | | | |
| | | Distribution and | Transfer | | Printing and |
| Portfolio | Share class | service fees | agent fees | Blue sky fees | postage fees |
|
| |
| Lifecycle 2020 | Class A | $1,219 | $769 | $2,173 | $769 |
| | Class B | 1,691 | 294 | 2,244 | 371 |
| | Class C | 1,477 | 250 | 2,244 | 312 |
| | Class R | 799 | 76 | 12,808 | 239 |
| | Class R1 | 603 | 70 | 12,808 | 239 |
| | Class R2 | 399 | 72 | 12,808 | 241 |
| | Class R3 | 560 | 68 | 12,808 | 243 |
| | Class R4 | 287 | 63 | 12,808 | 239 |
| | Class R5 | 53 | 112 | 12,808 | 425 |
| | Class 1 | 9,775 | — | — | — |
| | Total | $16,863 | $1,774 | $83,509 | $3,078 |
|
| |
| Lifecycle 2015 | Class A | $727 | $442 | $2,313 | $484 |
| | Class B | 1,788 | 313 | 2,173 | 395 |
| | Class C | 1,239 | 203 | 2,173 | 295 |
| | Class R | 791 | 70 | 12,808 | 238 |
| | Class R1 | 598 | 68 | 12,808 | 237 |
| | Class R2 | 403 | 71 | 12,808 | 239 |
| | Class R3 | 537 | 59 | 12,808 | 237 |
| | Class R4 | 285 | 58 | 12,808 | 238 |
| | Class R5 | 31 | 59 | 12,808 | 238 |
| | Class 1 | 7,681 | — | — | — |
| | Total | $14,080 | $1,343 | $83,507 | $2,601 |
|
| |
| Lifecycle 2010 | Class A | $713 | $432 | $2,313 | $515 |
| | Class B | 921 | 140 | 2,173 | 241 |
| | Class C | 1,276 | 211 | 2,173 | 288 |
| | Class R | 782 | 66 | 12,808 | 236 |
| | Class R1 | 594 | 63 | 12,808 | 236 |
| | Class R2 | 374 | 59 | 12,808 | 236 |
| | Class R3 | 533 | 59 | 12,808 | 236 |
| | Class R4 | 282 | 58 | 12,808 | 236 |
| | Class R5 | 31 | 57 | 12,808 | 236 |
| | Class 1 | 3,822 | — | — | — |
| | Total | $9,328 | $1,145 | $83,507 | $2,460 |
|
| |
| Lifecycle Retirement | Class A | $2,960 | $1,769 | $2,620 | $1,667 |
| | Class B | 1,619 | 279 | 2,244 | 366 |
| | Class C | 2,907 | 538 | 2,524 | 535 |
| | Class R | 774 | 62 | 12,808 | 233 |
| | Class R1 | 588 | 63 | 12,808 | 233 |
| | Class R2 | 372 | 62 | 12,808 | 234 |
| | Class R3 | 528 | 63 | 12,808 | 233 |
| | Class R4 | 279 | 62 | 12,808 | 234 |
| | Class R5 | 30 | 62 | 12,808 | 234 |
| | Class 1 | 12,041 | — | — | — |
| | Total | $22,098 | $2,960 | $84,236 | $3,969 |
|
4. Trustees’ fees
The Trust compensates each Trustee who is not an employee of the Adviser or its affiliates. Total Trustees’ expenses are allocated to each Portfolio based on its average daily net asset value.
5. Guarantees and indemnifications
Under the Trust’s organizational documents, its Officers and Trustees are indemnified against certain liabilities arising out of the performance of their duties to the Trust. Additionally, in the normal course of business, the Trust enters into contracts with service providers that contain general indemnification clauses. The Trust’s maximum exposure under these arrangements is unknown, as this would involve future claims that may be made against the Trust that have not yet occurred. However, based on experience, the Trust believes the risk of loss to be remote.
Lifecycle Portfolios
58
6. Capital shares
Share activity for the Portfolios for the period ended August 31, 2007, was as follows:
| | |
| Lifecycle 2045 Portfolio | | |
| | Period ended 8-31-071 |
| | Shares | Amount |
|
| Class A shares | | |
| Sold | 124,259 | $1,386,752 |
| Distributions reinvested | 235 | 2,410 |
| Repurchased | (1,362) | (15,519) |
| Net increase | 123,132 | $1,373,643 |
|
| Class B shares | | |
| Sold | 13,076 | $134,159 |
| Distributions reinvested | 223 | 2,290 |
| Net increase | 13,299 | $136,449 |
|
| Class C shares | | |
| Sold | 13,755 | $139,477 |
| Distributions reinvested | 224 | 2,290 |
| Repurchased | (2) | (20) |
| Net increase | 13,977 | $141,747 |
|
| Class R shares | | |
| Sold | 10,833 | $109,197 |
| Distributions reinvested | 222 | 2,282 |
| Repurchased | (2) | (21) |
| Net increase | 11,053 | $111,458 |
|
| Class R1 shares | | |
| Sold | 10,116 | $101,285 |
| Distributions reinvested | 227 | 2,325 |
| Repurchased | (2) | (20) |
| Net increase | 10,341 | $103,590 |
|
| Class R2 shares | | |
| Sold | 10,429 | $104,746 |
| Distributions reinvested | 231 | 2,368 |
| Repurchased | (2) | (22) |
| Net increase | 10,658 | $107,092 |
|
| Class R3 shares | | |
| Sold | 10,529 | $105,905 |
| Distributions reinvested | 229 | 2,342 |
| Repurchased | (2) | (22) |
| Net increase | 10,756 | $108,225 |
|
| Class R4 shares | | |
| Sold | 10,000 | $100,000 |
| Distributions reinvested | 233 | 2,393 |
| Net increase | 10,233 | $102,393 |
|
| Class R5 shares | | |
| Sold | 10,000 | $100,000 |
| Distributions reinvested | 238 | 2,444 |
| Net increase | 10,238 | $102,444 |
|
| Class 1 shares | | |
| Sold | 2,141,873 | $23,604,482 |
| Distributions reinvested | 1,110 | 11,381 |
| Repurchased | (29,626) | (325,498) |
| Net increase | 2,113,357 | $23,290,365 |
|
| Net increase | 2,327,044 | $25,577,406 |
1Period from 10-30-06 (commencement of operations) to 8-31-07.
Lifecycle Portfolios
59
| | |
| Lifecycle 2040 Portfolio | | |
| | Period ended 8-31-071 |
| | Shares | Amount |
|
| |
| Class A shares | | |
| Sold | 53,068 | $571,474 |
| Distributions reinvested | 218 | 2,240 |
| Net increase | 53,286 | $573,714 |
|
| |
| Class B shares | | |
| Sold | 14,639 | $150,579 |
| Distributions reinvested | 206 | 2,121 |
| Repurchased | (468) | (4,938) |
| Net increase | 14,377 | $147,762 |
|
| |
| Class C shares | | |
| Sold | 11,420 | $115,887 |
| Distributions reinvested | 206 | 2,121 |
| Repurchased | (2) | (21) |
| Net increase | 11,624 | $117,987 |
|
| |
| Class R shares | | |
| Sold | 10,337 | $103,722 |
| Distributions reinvested | 206 | 2,112 |
| Repurchased | (2) | (21) |
| Net increase | 10,541 | $105,813 |
|
| |
| Class R1 shares | | |
| Sold | 10,032 | $100,352 |
| Distributions reinvested | 210 | 2,155 |
| Repurchased | (2) | (21) |
| Net increase | 10,240 | $102,486 |
|
| |
| Class R2 shares | | |
| Sold | 24,799 | $261,681 |
| Distributions reinvested | 214 | 2,198 |
| Repurchased | (5) | (53) |
| Net increase | 25,008 | $263,826 |
|
| |
| Class R3 shares | | |
| Sold | 12,679 | $130,104 |
| Distributions reinvested | 211 | 2,172 |
| Repurchased | (2) | (22) |
| Net increase | 12,888 | $132,254 |
|
| |
| Class R4 shares | | |
| Sold | 10,002 | $100,020 |
| Distributions reinvested | 216 | 2,223 |
| Repurchased | (2) | (22) |
| Net increase | 10,216 | $102,221 |
|
| |
| Class R5 shares | | |
| Sold | 10,269 | $102,858 |
| Distributions reinvested | 221 | 2,275 |
| Repurchased | (2) | (22) |
| Net increase | 10,488 | $105,111 |
|
| |
| Class 1 shares | | |
| Sold | 2,375,526 | $26,086,277 |
| Distributions reinvested | 1,157 | 11,882 |
| Repurchased | (15,090) | (158,719) |
| Net increase | 2,361,593 | $25,939,440 |
|
| Net increase | 2,520,261 | $27,590,614 |
1Period from 10-30-06 (commencement of operations) to 8-31-07.
Lifecycle Portfolios
60
| | |
| Lifecycle 2035 Portfolio | | |
| | Period ended 8-31-071 |
| | Shares | Amount |
|
| |
| Class A shares | | |
| Sold | 61,634 | $679,752 |
| Distributions reinvested | 156 | 1,608 |
| Repurchased | (6,467) | (69,755) |
| Net increase | 55,323 | $611,605 |
|
| |
| Class B shares | | |
| Sold | 35,972 | $385,605 |
| Distributions reinvested | 144 | 1,488 |
| Repurchased | (63) | (665) |
| Net increase | 36,053 | $386,428 |
|
| |
| Class C shares | | |
| Sold | 22,044 | $230,444 |
| Distributions reinvested | 144 | 1,488 |
| Repurchased | (2) | (21) |
| Net increase | 22,186 | $231,911 |
|
| |
| Class R shares | | |
| Sold | 10,258 | $102,858 |
| Distributions reinvested | 143 | 1,480 |
| Repurchased | (2) | (21) |
| Net increase | 10,399 | $104,317 |
|
| |
| Class R1 shares | | |
| Sold | 10,056 | $100,617 |
| Distributions reinvested | 147 | 1,522 |
| Repurchased | (2) | (21) |
| Net increase | 10,201 | $102,118 |
|
| |
| Class R2 shares | | |
| Sold | 13,697 | $141,109 |
| Distributions reinvested | 152 | 1,565 |
| Repurchased | (2) | (22) |
| Net increase | 13,847 | $142,652 |
|
| |
| Class R3 shares | | |
| Sold | 10,002 | $100,021 |
| Distributions reinvested | 149 | 1,539 |
| Repurchased | (2) | (22) |
| Net increase | 10,149 | $101,538 |
|
| |
| Class R4 shares | | |
| Sold | 10,000 | $100,000 |
| Distributions reinvested | 154 | 1,591 |
| Net increase | 10,154 | $101,591 |
|
| |
| Class R5 shares | | |
| Sold | 10,622 | $106,656 |
| Distributions reinvested | 159 | 1,642 |
| Repurchased | (2) | (22) |
| Net increase | 10,779 | $108,276 |
|
| |
| Class 1 shares | | |
| Sold | 3,619,334 | $39,775,763 |
| Distributions reinvested | 2,233 | 23,067 |
| Repurchased | (32,200) | (353,406) |
| Net increase | 3,589,367 | $39,445,424 |
|
| Net increase | 3,768,458 | $41,335,860 |
1Period from 10-30-06 (commencement of operations) to 8-31-07.
Lifecycle Portfolios
61
| | |
| Lifecycle 2030 Portfolio | | |
| | Period ended 8-31-071 |
| | Shares | Amount |
|
| Class A shares | | |
| Sold | 104,649 | $1,154,412 |
| Distributions reinvested | 209 | 2,144 |
| Repurchased | (766) | (8,094) |
| Net increase | 104,092 | $1,148,462 |
|
| |
| Class B shares | | |
| Sold | 27,333 | $287,630 |
| Distributions reinvested | 197 | 2,024 |
| Repurchased | (39) | (437) |
| Net increase | 27,491 | $289,217 |
|
| |
| Class C shares | | |
| Sold | 50,632 | $529,920 |
| Distributions reinvested | 197 | 2,024 |
| Net increase | 50,829 | $531,944 |
|
| |
| Class R shares | | |
| Sold | 11,832 | $120,346 |
| Distributions reinvested | 196 | 2,016 |
| Repurchased | (2) | (21) |
| Net increase | 12,026 | $122,341 |
|
| |
| Class R1 shares | | |
| Sold | 10,080 | $100,887 |
| Distributions reinvested | 201 | 2,059 |
| Repurchased | (2) | (21) |
| Net increase | 10,279 | $102,925 |
|
| |
| Class R2 shares | | |
| Sold | 12,892 | $131,544 |
| Distributions reinvested | 205 | 2,102 |
| Repurchased | (2) | (22) |
| Net increase | 13,095 | $133,624 |
|
| |
| Class R3 shares | | |
| Sold | 10,079 | $100,857 |
| Distributions reinvested | 202 | 2,076 |
| Repurchased | (2) | (22) |
| Net increase | 10,279 | $102,911 |
|
| |
| Class R4 shares | | |
| Sold | 10,002 | $100,020 |
| Distributions reinvested | 207 | 2,127 |
| Repurchased | (2) | (22) |
| Net increase | 10,207 | $102,125 |
|
| |
| Class R5 shares | | |
| Sold | 10,000 | $100,000 |
| Distributions reinvested | 212 | 2,178 |
| Net increase | 10,212 | $102,178 |
|
| |
| Class 1 shares | | |
| Sold | 4,625,239 | $50,428,286 |
| Distributions reinvested | 3,380 | 34,640 |
| Repurchased | (46,270) | (488,058) |
| Net increase | 4,582,349 | $49,974,868 |
|
| Net increase | 4,830,859 | $52,610,595 |
1Period from 10-30-06 (commencement of operations) to 8-31-07.
Lifecycle Portfolios
62
| | |
| Lifecycle 2025 Portfolio | | |
| | Period ended 8-31-071 |
| | Shares | Amount |
|
| Class A shares | | |
| Sold | 60,756 | $647,664 |
| Distributions reinvested | 191 | 1,958 |
| Net increase | 60,947 | $649,622 |
|
| |
| Class B shares | | |
| Sold | 23,983 | $250,457 |
| Distributions reinvested | 179 | 1,838 |
| Repurchased | (370) | (3,914) |
| Net increase | 23,792 | $248,381 |
|
| |
| Class C shares | | |
| Sold | 21,270 | $220,502 |
| Distributions reinvested | 179 | 1,838 |
| Repurchased | (2) | (21) |
| Net increase | 21,447 | $222,319 |
|
| |
| Class R shares | | |
| Sold | 10,312 | $103,398 |
| Distributions reinvested | 178 | 1,830 |
| Net increase | 10,490 | $105,228 |
|
| |
| Class R1 shares | | |
| Sold | 10,040 | $100,442 |
| Distributions reinvested | 183 | 1,873 |
| Repurchased | (2) | (21) |
| Net increase | 10,221 | $102,294 |
|
| |
| Class R2 shares | | |
| Sold | 10,622 | $106,772 |
| Distributions reinvested | 187 | 1,915 |
| Repurchased | (2) | (22) |
| Net increase | 10,807 | $108,665 |
|
| |
| Class R3 shares | | |
| Sold | 16,965 | $178,186 |
| Distributions reinvested | 184 | 1,890 |
| Repurchased | (2) | (22) |
| Net increase | 17,147 | $180,054 |
|
| |
| Class R4 shares | | |
| Sold | 10,002 | $100,021 |
| Distributions reinvested | 189 | 1,941 |
| Repurchased | (2) | (22) |
| Net increase | 10,189 | $101,940 |
|
| |
| Class R5 shares | | |
| Sold | 10,190 | $102,021 |
| Distributions reinvested | 194 | 1,993 |
| Repurchased | (2) | (22) |
| Net increase | 10,382 | $103,992 |
|
| |
| Class 1 shares | | |
| Sold | 6,225,701 | $67,419,547 |
| Distributions reinvested | 4,892 | 50,143 |
| Repurchased | (57,570) | (609,992) |
| Net increase | 6,173,023 | $66,859,698 |
|
| Net increase | 6,348,445 | $68,682,193 |
1Period from 10-30-06 (commencement of operations) to 8-31-07.
Lifecycle Portfolios
63
| | |
| Lifecycle 2020 Portfolio | | |
| | Period ended 8-31-071 |
| | Shares | Amount |
|
| Class A shares | | |
| Sold | 142,559 | $1,542,872 |
| Distributions reinvested | 173 | 1,775 |
| Repurchased | (4,755) | (51,607) |
| Net increase | 137,977 | $1,493,040 |
|
| |
| Class B shares | | |
| Sold | 57,441 | $611,012 |
| Distributions reinvested | 161 | 1,655 |
| Repurchased | (1,092) | (11,726) |
| Net increase | 56,510 | $600,941 |
|
| |
| Class C shares | | |
| Sold | 56,913 | $602,495 |
| Distributions reinvested | 161 | 1,655 |
| Repurchased | (2) | (21) |
| Net increase | 57,072 | $604,129 |
|
| |
| Class R shares | | |
| Sold | 10,928 | $110,016 |
| Distributions reinvested | 161 | 1,647 |
| Repurchased | (2) | (21) |
| Net increase | 11,087 | $111,642 |
|
| |
| Class R1 shares | | |
| Sold | 10,000 | $100,000 |
| Distributions reinvested | 165 | 1,690 |
| Net increase | 10,165 | $101,690 |
|
| |
| Class R2 shares | | |
| Sold | 19,640 | $202,008 |
| Distributions reinvested | 169 | 1,732 |
| Repurchased | (3) | (37) |
| Net increase | 19,806 | $203,703 |
|
| |
| Class R3 shares | | |
| Sold | 11,529 | $116,807 |
| Distributions reinvested | 167 | 1,707 |
| Repurchased | (2) | (22) |
| Net increase | 11,694 | $118,492 |
|
| |
| Class R4 shares | | |
| Sold | 10,002 | $100,021 |
| Distributions reinvested | 172 | 1,758 |
| Repurchased | (2) | (22) |
| Net increase | 10,172 | $101,757 |
|
| |
| Class R5 shares | | |
| Sold | 24,951 | $257,900 |
| Distributions reinvested | 177 | 1,809 |
| Net increase | 25,128 | $259,709 |
|
| |
| Class 1 shares | | |
| Sold | 6,122,505 | $66,015,343 |
| Distributions reinvested | 4,746 | 48,643 |
| Repurchased | (131,757) | (1,382,850) |
| Net increase | 5,995,494 | $64,681,136 |
|
| Net increase | 6,335,105 | $68,276,239 |
1Period from 10-30-06 (commencement of operations) to 8-31-07.
Lifecycle Portfolios
64
| | |
| Lifecycle 2015 Portfolio | | |
| | Period ended 8-31-071 |
| | Shares | Amount |
|
| |
| Class A shares | | |
| Sold | 78,279 | $826,395 |
| Distributions reinvested | 176 | 1,794 |
| Repurchased | (11) | (114) |
| Net increase | 78,444 | $828,075 |
|
| |
| Class B shares | | |
| Sold | 43,663 | $461,767 |
| Distributions reinvested | 164 | 1,674 |
| Repurchased | (589) | (6,260) |
| Net increase | 43,238 | $457,181 |
|
| |
| Class C shares | | |
| Sold | 24,475 | $255,866 |
| Distributions reinvested | 164 | 1,674 |
| Repurchased | (2) | (22) |
| Net increase | 24,637 | $257,518 |
|
| |
| Class R shares | | |
| Sold | 10,245 | $102,635 |
| Distributions reinvested | 163 | 1,666 |
| Net increase | 10,408 | $104,301 |
|
| |
| Class R1 shares | | |
| Sold | 10,006 | $100,060 |
| Distributions reinvested | 167 | 1,708 |
| Net increase | 10,173 | $101,768 |
|
| |
| Class R2 shares | | |
| Sold | 15,897 | $162,466 |
| Distributions reinvested | 171 | 1,751 |
| Repurchased | (909) | (9,417) |
| Net increase | 15,159 | $154,800 |
|
| |
| Class R3 shares | | |
| Sold | 10,000 | $100,000 |
| Distributions reinvested | 169 | 1,725 |
| Net increase | 10,169 | $101,725 |
|
| |
| Class R4 shares | | |
| Sold | 10,000 | $100,000 |
| Distributions reinvested | 174 | 1,777 |
| Net increase | 10,174 | $101,777 |
|
| |
| Class R5 shares | | |
| Sold | 10,000 | $100,000 |
| Distributions reinvested | 179 | 1,828 |
| Net increase | 10,179 | $101,828 |
|
| |
| Class 1 shares | | |
| Sold | 5,361,809 | $57,250,879 |
| Distributions reinvested | 2,570 | 26,262 |
| Repurchased | (146,622) | (1,540,356) |
| Net increase | 5,217,757 | $55,736,785 |
|
| Net increase | 5,430,338 | $57,945,758 |
1Period from 10-30-06 (commencement of operations) to 8-31-07.
Lifecycle Portfolios
65
| | |
| Lifecycle 2010 Portfolio | | |
| | Period ended 8-31-071 |
| | Shares | Amount |
|
| Class A shares | | |
| Sold | 92,090 | $965,714 |
| Distributions reinvested | 151 | 1,540 |
| Repurchased | (29,153) | (309,869) |
| Net increase | 63,088 | $657,385 |
|
| Class B shares | | |
| Sold | 12,327 | $124,735 |
| Distributions reinvested | 139 | 1,421 |
| Repurchased | (2) | (21) |
| Net increase | 12,464 | $126,135 |
|
| |
| Class C shares | | |
| Sold | 39,409 | $405,423 |
| Distributions reinvested | 139 | 1,421 |
| Repurchased | (2) | (22) |
| Net increase | 39,546 | $406,822 |
|
| |
| Class R shares | | |
| Sold | 10,000 | $100,000 |
| Distributions reinvested | 139 | 1,413 |
| Net increase | 10,139 | $101,413 |
|
| |
| Class R1 shares | | |
| Sold | 10,000 | $100,000 |
| Distributions reinvested | 143 | 1,455 |
| Net increase | 10,143 | $101,455 |
|
| |
| Class R2 shares | | |
| Sold | 10,000 | $100,000 |
| Distributions reinvested | 147 | 1,498 |
| Net increase | 10,147 | $101,498 |
|
| |
| Class R3 shares | | |
| Sold | 10,027 | $100,273 |
| Distributions reinvested | 144 | 1,473 |
| Net increase | 10,171 | $101,746 |
|
| |
| Class R4 shares | | |
| Sold | 10,000 | $100,000 |
| Distributions reinvested | 149 | 1,523 |
| Net increase | 10,149 | $101,523 |
|
| |
| Class R5 shares | | |
| Sold | 10,000 | $100,000 |
| Distributions reinvested | 154 | 1,574 |
| Net increase | 10,154 | $101,574 |
|
| |
| Class 1 shares | | |
| Sold | 2,520,127 | $26,611,731 |
| Distributions reinvested | 965 | 9,843 |
| Repurchased | (115,877) | (1,235,555) |
| Net increase | 2,405,215 | $25,386,019 |
|
| Net increase | 2,581,216 | $27,185,570 |
1Period from 10-30-06 (commencement of operations) to 8-31-07.
Lifecycle Portfolios
66
| | |
| Lifecycle Retirement Portfolio | | |
| | Period ended 8-31-071 |
| | Shares | Amount |
|
| Class A shares | | |
| Sold | 426,231 | $4,425,214 |
| Distributions reinvested | 1,672 | 17,355 |
| Repurchased | (14,393) | (150,201) |
| Net increase | 413,510 | $4,292,368 |
|
| Class B shares | | |
| Sold | 38,650 | $399,558 |
| Distributions reinvested | 313 | 3,206 |
| Repurchased | (1,449) | (15,078) |
| Net increase | 37,514 | $387,686 |
|
| |
| Class C shares | | |
| Sold | 133,397 | $1,381,684 |
| Distributions reinvested | 456 | 4,700 |
| Repurchased | (2,165) | (22,143) |
| Net increase | 131,688 | $1,364,241 |
|
| Class R shares | | |
| Sold | 10,002 | $100,020 |
| Distributions reinvested | 238 | 2,426 |
| Repurchased | (2) | (20) |
| Net increase | 10,238 | $102,426 |
|
| |
| Class R1 shares | | |
| Sold | 10,002 | $100,020 |
| Distributions reinvested | 255 | 2,601 |
| Repurchased | (2) | (20) |
| Net increase | 10,255 | $102,601 |
|
| Class R2 shares | | |
| Sold | 10,360 | $103,687 |
| Distributions reinvested | 272 | 2,777 |
| Repurchased | (1) | (14) |
| Net increase | 10,631 | $106,450 |
|
| |
| Class R3 shares | | |
| Sold | 10,007 | $100,073 |
| Distributions reinvested | 259 | 2,645 |
| Repurchased | (2) | (21) |
| Net increase | 10,264 | $102,697 |
|
| |
| Class R4 shares | | |
| Sold | 10,002 | $100,020 |
| Distributions reinvested | 278 | 2,843 |
| Repurchased | (2) | (21) |
| Net increase | 10,278 | $102,842 |
|
| |
| Class R5 shares | | |
| Sold | 10,002 | $100,020 |
| Distributions reinvested | 298 | 3,040 |
| Repurchased | (2) | (21) |
| Net increase | 10,298 | $103,039 |
|
| |
| Class 1 shares | | |
| Sold | 7,847,983 | $80,813,062 |
| Distributions reinvested | 54,521 | 563,991 |
| Repurchased | (1,541,863) | (15,951,117) |
| Net increase | 6,360,641 | $65,425,936 |
|
| Net increase | 7,005,317 | $72,090,286 |
1Period from 10-30-06 (commencement of operations) to 8-31-07.
Lifecycle Portfolios
67
7. Investment transactions
The following summarizes the securities transactions (except for short-term investments) for the Portfolios for the period ended August 31, 2007:
| | | | |
| | | Purchases | Sales and Maturities |
|
|
| Portfolio | U.S. Government | Other Issuers | U.S. Government | Other Issuers |
|
| |
| Lifecycle 2045 | — | $25,971,528 | — | $413,463 |
| Lifecycle 2040 | — | 27,878,578 | — | 306,435 |
| Lifecycle 2035 | — | 41,856,484 | — | 532,467 |
| Lifecycle 2030 | — | 53,169,155 | — | 564,464 |
| Lifecycle 2025 | — | 69,450,508 | — | 707,277 |
| Lifecycle 2020 | — | 69,970,825 | — | 1,733,046 |
| Lifecycle 2015 | — | 59,922,905 | — | 1,801,682 |
| Lifecycle 2010 | — | 29,123,332 | — | 1,799,557 |
| Lifecycle Retirement | — | 81,183,930 | — | 15,742,498 |
The cost of investments owned on August 31, 2007, including short-term investments, for federal income tax purposes, was as follows:
| | | | |
| | | | | Net Unrealized |
| | | Unrealized | Unrealized | Appreciation/ |
| Portfolio | Aggregate Cost | Appreciation | (Depreciation) | (Depreciation) |
|
| |
| Lifecycle 2045 | $25,558,501 | $201,914 | ($237,732) | ($35,818) |
| Lifecycle 2040 | 27,572,521 | 281,348 | (163,258) | 118,090 |
| Lifecycle 2035 | 41,324,764 | 536,356 | (212,212) | 324,144 |
| Lifecycle 2030 | 52,605,481 | 547,005 | (387,011) | 159,994 |
| Lifecycle 2025 | 68,745,212 | 822,028 | (518,329) | 303,699 |
| Lifecycle 2020 | 68,238,884 | 776,984 | (629,650) | 147,334 |
| Lifecycle 2015 | 58,122,955 | 515,133 | (661,179) | (146,046) |
| Lifecycle 2010 | 27,327,049 | 298,020 | (349,495) | (51,475) |
| Lifecycle Retirement | 72,217,566 | 838,219 | (842,912) | (4,693) |
8. Federal income tax information
Federal income tax regulations may differ from generally accepted accounting principles, and income and capital gain distributions determined in accordance with tax regulations may differ from net investment income and realized gains recognized for financial reporting purposes. Accordingly, the composition of net assets for tax purposes differs from amounts reflected in the accompanying financial statements. These differences are primarily due to losses deferred with respect to wash sales.
The tax-basis components of distributable earnings at August 31, 2007, were as follows:
| | | | |
| | Undistributed | Undistributed Long | Capital Loss | Post-October |
| Portfolio | Ordinary Income | Term Capital Gains | Carryforward | Deferral |
|
| Lifecycle 2045 | — | — | — | — |
| Lifecycle 2040 | — | — | — | — |
| Lifecycle 2035 | — | — | — | — |
| Lifecycle 2030 | $5,299 | — | — | — |
| Lifecycle 2025 | 65,297 | — | — | — |
| Lifecycle 2020 | 140,985 | — | — | — |
| Lifecycle 2015 | 185,162 | — | — | — |
| Lifecycle 2010 | 148,262 | — | — | — |
| Lifecycle Retirement | 169,460 | $51,620 | — | — |
The tax character of distributions paid during the period ended August 31, 2007, was as follows:
| | | | |
| | | Year Ended August 31, 2007 Distributions | | |
| Portfolio | Ordinary Income | Long Term Capital Gains | Return of Capital | Total |
|
| Lifecycle 2045 | $31,888 | $637 | — | $32,525 |
| Lifecycle 2040 | 30,881 | 618 | — | 31,499 |
| Lifecycle 2035 | 36,296 | 694 | — | 36,990 |
| Lifecycle 2030 | 52,233 | 1,157 | — | 53,390 |
| Lifecycle 2025 | 65,770 | 1,449 | — | 67,219 |
| Lifecycle 2020 | 62,687 | 1,384 | — | 64,071 |
| Lifecycle 2015 | 40,828 | 1,031 | — | 41,859 |
| Lifecycle 2010 | 22,506 | 655 | — | 23,161 |
| Lifecycle Retirement | 607,108 | — | — | 607,108 |
Lifecycle Portfolios
68
At August 31, 2007, there were no capital loss carryforwards available to offset future realized gains.
In July 2006, FASB Interpretation No. 48, Accounting for Uncertainty in Income Taxes, an interpretation of FASB Statement 109 (FIN 48), was issued and is effective for fiscal years beginning after December 15, 2006, and is to be applied to all open tax years as of the effective date. On December 22, 2006, the SEC delayed the implementation of FIN 48 for regulated investment companies for an additional six months. FIN 48 prescribes a minimum threshold for financial statement recognition of the benefit of a tax position taken or expected to be taken in a tax return, and requires certain expanded disclosures. Management has concluded that the adoption of FIN 48 will not result in a material impact on the Portfolios’ net assets, results of operations and financial statement disclosures.
9. Investment in affiliated underlying funds
The Portfolios invest primarily in affiliated underlying funds that are managed by affiliates of the Adviser. The Portfolios do not invest in affiliated underlying funds for the purpose of exercising management or control; however, the Portfolios’ investments may represent a significant portion of each underlying fund’s net assets. A summary of the Portfolios’ investments in affiliated funds during the period ended August 31, 2007, is set forth below:
| | | | | | | |
| | | Beginning | | | Ending | | |
| | Affiliate — | Share | Shares | Shares | Share | Sale | Ending |
| Portfolio | Class NAV | Amount | Purchased | Sold | Amount | Proceeds | Value |
|
| Lifecycle 2045 | | | | | | | |
| | John Hancock Funds II | | | | | | |
| | Blue Chip Growth | — | 37,074 | 570 | 36,504 | $11,818 | $765,488 |
| | Capital Appreciation | — | 71,806 | 917 | 70,889 | 9,805 | 765,599 |
| | Core Equity | — | 48,836 | 752 | 48,084 | 12,632 | 764,058 |
| | Emerging Small Company | — | 24,959 | 354 | 24,605 | 10,795 | 766,457 |
| | Fundamental Value | — | 44,203 | 651 | 43,552 | 11,535 | 764,766 |
| | Index 500 | — | 458,219 | 9,343 | 448,876 | 99,770 | 4,847,859 |
| | International Equity Index | — | 137,921 | 1,760 | 136,161 | 38,957 | 3,064,977 |
| | International Opportunities | — | 53,482 | 704 | 52,778 | 13,192 | 1,021,782 |
| | International Small Cap | — | 31,969 | 566 | 31,403 | 13,398 | 770,309 |
| | International Small Company | — | 67,236 | 882 | 66,354 | 10,155 | 765,057 |
| | International Value | — | 52,712 | 922 | 51,790 | 17,826 | 1,020,255 |
| | Large Cap Value | — | 30,085 | 608 | 29,477 | 15,951 | 764,919 |
| | Mid Cap Index | — | 85,403 | 1,118 | 84,285 | 24,414 | 1,785,162 |
| | Mid Cap Stock | — | 47,640 | 653 | 46,987 | 12,110 | 894,158 |
| | Natural Resources | — | 36,928 | 729 | 36,199 | 30,215 | 1,534,476 |
| | Small Cap Index | — | 106,731 | 1,819 | 104,912 | 31,522 | 1,786,657 |
| | Small Company Value | — | 30,069 | 425 | 29,644 | 11,187 | 764,527 |
| | Value & Restructuring | — | 59,893 | 722 | 59,171 | 9,741 | 764,494 |
| | Value | — | 78,996 | 983 | 78,013 | 11,436 | 891,687 |
| |
| | John Hancock Funds III | | | | | | |
| | International Core | — | 22,334 | 375 | 21,959 | $17,005 | $1,019,996 |
| |
| Lifecycle 2040 | | | | | | | |
| | John Hancock Funds II | | | | | | |
| | Blue Chip Growth | — | 39,936 | 316 | 39,620 | $6,280 | $830,823 |
| | Capital Appreciation | — | 77,463 | 525 | 76,938 | 5,467 | 830,935 |
| | Core Equity | — | 52,556 | 338 | 52,218 | 5,491 | 829,747 |
| | Emerging Small Company | — | 26,892 | 219 | 26,673 | 6,388 | 830,860 |
| | Fundamental Value | — | 47,593 | 320 | 47,273 | 5,529 | 830,108 |
| | Index 500 | — | 491,172 | 4,134 | 487,038 | 43,361 | 5,260,008 |
| | International Equity Index | — | 149,806 | 2,088 | 147,718 | 44,790 | 3,325,135 |
| | International Opportunities | — | 58,019 | 740 | 57,279 | 13,653 | 1,108,921 |
| | International Small Cap | — | 34,780 | 857 | 33,923 | 19,749 | 832,130 |
| | International Small Company | — | 72,965 | 895 | 72,070 | 9,833 | 830,971 |
| | International Value | — | 56,863 | 630 | 56,233 | 12,052 | 1,107,790 |
| | Large Cap Value | — | 32,356 | 374 | 31,982 | 9,475 | 829,941 |
| | Mid Cap Index | — | 92,386 | 919 | 91,467 | 18,916 | 1,937,275 |
| | Mid Cap Stock | — | 51,509 | 539 | 50,970 | 9,535 | 969,955 |
| | Natural Resources | — | 40,140 | 908 | 39,232 | 36,084 | 1,663,044 |
| | Small Cap Index | — | 114,916 | 1,176 | 113,740 | 20,113 | 1,937,001 |
| | Small Company Value | — | 32,437 | 267 | 32,170 | 6,861 | 829,672 |
| | Value & Restructuring | — | 64,958 | 705 | 64,253 | 8,880 | 830,152 |
| | Value | — | 85,409 | 676 | 84,733 | 7,376 | 968,496 |
| |
| | John Hancock Funds III | | | | | | |
| | International Core | — | 24,218 | 372 | 23,846 | $16,601 | $1,107,647 |
Lifecycle Portfolios
69
| | | | | | | |
| | Affiliate — | Share | Shares | Shares | Share | Sale | Ending |
| Portfolio | Class NAV | Amount | Purchased | Sold | Amount | Proceeds | Value |
|
|
| Lifecycle 2035 | | | | | | | |
| | John Hancock Funds II | | | | | | |
| | Blue Chip Growth | — | 60,156 | 657 | 59,499 | $13,425 | $1,247,687 |
| | Capital Appreciation | — | 116,745 | 1,206 | 115,539 | 12,783 | 1,247,826 |
| | Core Equity | — | 78,954 | 505 | 78,449 | 8,156 | 1,246,553 |
| | Emerging Small Company | — | 40,527 | 473 | 40,054 | 14,167 | 1,247,667 |
| | Fundamental Value | — | 71,869 | 862 | 71,007 | 15,216 | 1,246,890 |
| | High Yield | — | 42,473 | 492 | 41,981 | 5,054 | 414,351 |
| | Index 500 | — | 741,560 | 9,109 | 732,451 | 97,868 | 7,910,470 |
| | International Equity Index | — | 225,193 | 3,110 | 222,083 | 67,980 | 4,999,091 |
| | International Opportunities | — | 76,775 | 983 | 75,792 | 18,331 | 1,467,333 |
| | International Small Cap | — | 52,570 | 1,053 | 51,517 | 24,515 | 1,263,718 |
| | International Small Company | — | 109,718 | 1,480 | 108,238 | 16,761 | 1,247,979 |
| | International Value | — | 74,854 | 941 | 73,913 | 18,414 | 1,456,083 |
| | Large Cap Value | — | 48,561 | 519 | 48,042 | 13,655 | 1,246,699 |
| | Mid Cap Index | — | 138,973 | 1,461 | 137,512 | 30,881 | 2,912,513 |
| | Mid Cap Stock | — | 77,609 | 933 | 76,676 | 16,911 | 1,459,151 |
| | Natural Resources | — | 60,840 | 1,568 | 59,272 | 64,252 | 2,512,540 |
| | Small Cap Index | — | 147,812 | 1,280 | 146,532 | 22,133 | 2,495,447 |
| | Small Company Value | — | 48,762 | 434 | 48,328 | 11,289 | 1,246,386 |
| | Strategic Bond | — | 36,346 | 432 | 35,914 | 5,099 | 414,451 |
| | Value & Restructuring | — | 97,849 | 1,338 | 96,511 | 17,590 | 1,246,920 |
| | Value | — | 128,891 | 1,595 | 127,296 | 18,174 | 1,454,989 |
| |
| | John Hancock Funds III | | | | | | |
| | International Core | — | 36,262 | 435 | 35,827 | $19,813 | $1,664,164 |
| |
| Lifecycle 2030 | | | | | | | |
| | John Hancock Funds II | | | | | | |
| | Blue Chip Growth | — | 75,850 | 633 | 75,217 | $12,605 | $1,577,298 |
| | Capital Appreciation | — | 122,608 | 985 | 121,623 | 10,344 | 1,313,533 |
| | Core Equity | — | 100,401 | 1,222 | 99,179 | 20,187 | 1,575,958 |
| | Emerging Small Company | — | 42,503 | 347 | 42,156 | 10,073 | 1,313,164 |
| | Fundamental Value | — | 90,253 | 481 | 89,772 | 8,211 | 1,576,394 |
| | Index 500 | — | 986,174 | 9,737 | 976,437 | 101,737 | 10,545,525 |
| | International Equity Index | — | 286,046 | 4,145 | 281,901 | 89,347 | 6,345,589 |
| | International Opportunities | — | 84,126 | 712 | 83,414 | 13,165 | 1,614,895 |
| | International Small Cap | — | 44,940 | 577 | 44,363 | 13,008 | 1,088,227 |
| | International Small Company | — | 138,660 | 1,088 | 137,572 | 11,761 | 1,586,203 |
| | International Value | — | 80,909 | 826 | 80,083 | 15,842 | 1,577,633 |
| | Large Cap Value | — | 61,576 | 836 | 60,740 | 21,344 | 1,576,198 |
| | Mid Cap Index | — | 175,506 | 1,444 | 174,062 | 29,895 | 3,686,629 |
| | Mid Cap Stock | — | 83,939 | 745 | 83,194 | 13,031 | 1,583,175 |
| | Natural Resources | — | 77,097 | 1,583 | 75,514 | 63,127 | 3,201,038 |
| | Real Estate Equity | — | 48,550 | 72 | 48,478 | 860 | 524,531 |
| | Real Return Bond | — | 40,340 | 410 | 39,930 | 5,376 | 521,881 |
| | Small Cap Index | — | 187,964 | 2,508 | 185,456 | 42,558 | 3,158,317 |
| | Small Company Value | — | 51,231 | 352 | 50,879 | 9,099 | 1,312,181 |
| | Strategic Bond | — | 45,534 | 330 | 45,204 | 3,936 | 521,659 |
| | Total Bond Market | — | 52,581 | 497 | 52,084 | 4,994 | 521,880 |
| | U.S. High Yield Bond | — | 82,772 | 1,258 | 81,514 | 16,502 | 1,049,082 |
| | Value & Restructuring | — | 102,392 | 755 | 101,637 | 9,445 | 1,313,156 |
| | Value | — | 138,918 | 1,004 | 137,914 | 10,948 | 1,576,354 |
| |
| | John Hancock Funds III | | | | | | |
| | International Core | — | 45,924 | 607 | 45,317 | $27,070 | $2,104,975 |
Lifecycle Portfolios
70
| | | | | | | |
| | Affiliate — | Share | Shares | Shares | Share | Sale | Ending |
| Portfolio | Class NAV | Amount | Purchased | Sold | Amount | Proceeds | Value |
|
|
| Lifecycle 2025 | | | | | | | |
| | John Hancock Funds II | | | | | | |
| | Blue Chip Growth | — | 99,399 | 793 | 98,606 | $15,813 | $2,067,777 |
| | Capital Appreciation | — | 128,499 | 976 | 127,523 | 10,415 | 1,377,248 |
| | Core Equity | — | 131,642 | 1,575 | 130,067 | 26,058 | 2,066,772 |
| | Emerging Small Company | — | 44,601 | 371 | 44,230 | 10,990 | 1,377,758 |
| | Fundamental Value | — | 118,584 | 862 | 117,722 | 14,972 | 2,067,202 |
| | High Income | — | 65,266 | 571 | 64,695 | 6,447 | 686,410 |
| | High Yield | — | 211,428 | 1,948 | 209,480 | 20,277 | 2,067,570 |
| | Index 500 | — | 1,354,053 | 11,788 | 1,342,265 | 124,337 | 14,496,464 |
| | International Equity Index | — | 341,980 | 3,923 | 338,057 | 83,539 | 7,609,658 |
| | International Opportunities | — | 108,919 | 1,519 | 107,400 | 27,721 | 2,079,264 |
| | International Small Cap | — | 57,997 | 1,028 | 56,969 | 22,987 | 1,397,442 |
| | International Small Company | — | 181,760 | 1,531 | 180,229 | 16,942 | 2,078,037 |
| | International Value | — | 105,993 | 742 | 105,251 | 14,206 | 2,073,442 |
| | Large Cap Value | — | 80,265 | 614 | 79,651 | 15,991 | 2,066,936 |
| | Mid Cap Index | — | 197,327 | 1,931 | 195,396 | 40,567 | 4,138,485 |
| | Mid Cap Stock | — | 92,327 | 1,211 | 91,116 | 21,606 | 1,733,930 |
| | Natural Resources | — | 82,794 | 920 | 81,874 | 34,020 | 3,470,639 |
| | Real Estate Equity | — | 64,955 | 880 | 64,075 | 9,697 | 693,289 |
| | Real Return Bond | — | 107,946 | 2,542 | 105,404 | 33,229 | 1,377,625 |
| | Small Cap Index | — | 246,570 | 3,549 | 243,021 | 61,473 | 4,138,652 |
| | Small Company Value | — | 53,813 | 432 | 53,381 | 11,479 | 1,376,689 |
| | Strategic Bond | — | 60,086 | 581 | 59,505 | 6,977 | 686,686 |
| | Strategic Income | — | 68,954 | 692 | 68,262 | 6,970 | 686,720 |
| | Total Bond Market | — | 69,821 | 1,270 | 68,551 | 12,765 | 686,878 |
| | Total Return | — | 50,784 | 829 | 49,955 | 11,400 | 686,887 |
| | U.S. High Yield Bond | — | 53,845 | 496 | 53,349 | 6,658 | 686,601 |
| | Value & Restructuring | — | 107,872 | 899 | 106,973 | 11,397 | 1,382,088 |
| | Value | | 151,869 | 1,229 | 150,640 | 13,667 | 1,721,811 |
| |
| | John Hancock Funds III | | | | | | |
| | International Core | — | 44,894 | 331 | 44,563 | $14,677 | $2,069,951 |
| |
| Lifecycle 2020 | | | | | | | |
| | John Hancock Funds II | | | | | | |
| | Blue Chip Growth | — | 99,617 | 1,988 | 97,629 | $39,933 | $2,047,285 |
| | Capital Appreciation | — | 128,366 | 2,129 | 126,237 | 22,298 | 1,363,361 |
| | Core Equity | — | 87,279 | 1,742 | 85,537 | 28,067 | 1,359,190 |
| | Emerging Small Company | — | 33,442 | 637 | 32,805 | 18,868 | 1,021,877 |
| | Fundamental Value | — | 118,440 | 2,079 | 116,361 | 36,077 | 2,043,302 |
| | Global Real Estate | — | 61,154 | 1,117 | 60,037 | 13,376 | 682,625 |
| | High Income | — | 130,498 | 2,375 | 128,123 | 26,036 | 1,359,381 |
| | High Yield | — | 354,291 | 8,857 | 345,434 | 89,792 | 3,409,432 |
| | Index 500 | — | 1,491,727 | 36,070 | 1,455,657 | 382,676 | 15,721,098 |
| | International Equity Index | — | 331,252 | 10,854 | 320,398 | 232,802 | 7,212,159 |
| | International Opportunities | — | 73,720 | 1,650 | 72,070 | 30,149 | 1,395,275 |
| | International Small Cap | — | 58,992 | 1,476 | 57,516 | 32,708 | 1,410,876 |
| | International Small Company | — | 122,615 | 3,709 | 118,906 | 41,064 | 1,370,985 |
| | International Value | — | 71,718 | 2,271 | 69,447 | 43,629 | 1,368,098 |
| | Large Cap Value | — | 80,983 | 2,251 | 78,732 | 57,697 | 2,043,094 |
| | Mid Cap Index | — | 165,417 | 4,156 | 161,261 | 86,498 | 3,415,517 |
| | Mid Cap Stock | — | 55,076 | 1,006 | 54,070 | 17,736 | 1,028,950 |
| | Natural Resources | — | 84,300 | 2,750 | 81,550 | 106,541 | 3,456,905 |
| | Real Estate Equity | — | 64,152 | 691 | 63,461 | 7,890 | 686,644 |
| | Real Return Bond | — | 161,497 | 5,151 | 156,346 | 66,838 | 2,043,448 |
| | Small Cap Index | — | 163,565 | 3,433 | 160,132 | 59,938 | 2,727,051 |
| | Small Company Value | — | 40,225 | 686 | 39,539 | 17,838 | 1,019,713 |
| | Spectrum Income | — | 65,623 | 1,433 | 64,190 | 15,011 | 675,921 |
| | Strategic Bond | — | 121,068 | 3,278 | 117,790 | 38,600 | 1,359,301 |
| | Strategic Income | — | 68,933 | 1,748 | 67,185 | 17,470 | 675,876 |
| | Total Bond Market | — | 69,486 | 2,013 | 67,473 | 20,098 | 676,076 |
| | Total Return | — | 101,905 | 3,011 | 98,894 | 41,154 | 1,359,794 |
| | U.S. High Yield Bond | — | 108,443 | 2,839 | 105,604 | 37,234 | 1,359,127 |
| | Value & Restructuring | — | 108,374 | 2,490 | 105,884 | 31,339 | 1,368,025 |
| | Value | — | 90,449 | 1,409 | 89,040 | 15,348 | 1,017,726 |
| |
| | John Hancock Funds III | | | | | | |
| | International Core | — | 38,081 | 1,308 | 36,773 | $58,341 | $1,708,106 |
Lifecycle Portfolios
71
| | | | | | | |
| | Affiliate — | Share | Shares | Shares | Share | Sale | Ending |
| Portfolio | Class NAV | Amount | Purchased | Sold | Amount | Proceeds | Value |
|
|
| Lifecycle 2015 | | | | | | | |
| | John Hancock Funds II | | | | | | |
| | Blue Chip Growth | — | 56,401 | 1,080 | 55,321 | $21,967 | $1,160,081 |
| | Capital Appreciation | — | 109,680 | 2,296 | 107,384 | 24,263 | 1,159,751 |
| | Core Equity | — | 74,783 | 2,036 | 72,747 | 33,004 | 1,155,944 |
| | Emerging Small Company | — | 18,848 | 230 | 18,618 | 6,791 | 579,954 |
| | Fundamental Value | — | 100,636 | 1,834 | 98,802 | 31,777 | 1,734,964 |
| | Global Real Estate | — | 103,854 | 1,407 | 102,447 | 16,855 | 1,164,825 |
| | High Income | — | 111,740 | 3,242 | 108,498 | 34,676 | 1,151,163 |
| | High Yield | — | 550,408 | 22,783 | 527,625 | 227,622 | 5,207,656 |
| | Index 500 | — | 1,216,169 | 36,088 | 1,180,081 | 384,200 | 12,744,873 |
| | International Equity Index | — | 214,843 | 7,740 | 207,103 | 169,481 | 4,661,891 |
| | International Opportunities | — | 46,452 | 1,268 | 45,184 | 23,683 | 874,762 |
| | International Small Cap | — | 24,400 | 532 | 23,868 | 12,346 | 585,484 |
| | International Small Company | — | 104,546 | 3,370 | 101,176 | 38,167 | 1,166,555 |
| | International Value | — | 45,929 | 1,612 | 44,317 | 30,990 | 873,048 |
| | Large Cap Value | — | 45,582 | 1,000 | 44,582 | 25,489 | 1,156,894 |
| | Mid Cap Index | — | 84,156 | 1,962 | 82,194 | 40,981 | 1,740,866 |
| | Mid Cap Stock | — | 31,234 | 538 | 30,696 | 9,752 | 584,144 |
| | Natural Resources | — | 70,419 | 1,444 | 68,975 | 58,360 | 2,923,850 |
| | Real Estate Equity | — | 163,113 | 1,040 | 162,073 | 11,862 | 1,753,632 |
| | Real Return Bond | — | 186,423 | 9,599 | 176,824 | 124,489 | 2,311,095 |
| | Small Cap Index | — | 68,851 | 839 | 68,012 | 14,507 | 1,158,243 |
| | Small Company Value | — | 22,655 | 224 | 22,431 | 5,837 | 578,507 |
| | Spectrum Income | — | 113,204 | 3,886 | 109,318 | 40,642 | 1,151,117 |
| | Strategic Bond | — | 156,308 | 6,349 | 149,959 | 73,848 | 1,730,531 |
| | Strategic Income | — | 118,937 | 4,519 | 114,418 | 45,245 | 1,151,049 |
| | Total Bond Market | — | 242,489 | 11,837 | 230,652 | 117,600 | 2,311,137 |
| | Total Return | — | 87,641 | 3,905 | 83,736 | 53,262 | 1,151,367 |
| | U.S. High Yield Bond | | 92,915 | 3,490 | 89,425 | 45,175 | 1,150,903 |
| | Value & Restructuring | — | 92,049 | 1,995 | 90,054 | 25,680 | 1,163,500 |
| | Value | — | 51,194 | 718 | 50,476 | 8,085 | 576,944 |
| |
| | John Hancock Funds III | | | | | | |
| | International Core | — | 26,017 | 997 | 25,020 | $45,047 | $1,162,179 |
| |
| Lifecycle 2010 | | | | | | | |
| | John Hancock Funds II | | | | | | |
| | Blue Chip Growth | — | 27,593 | 1,511 | 26,082 | $31,503 | $546,936 |
| | Capital Appreciation | — | 53,185 | 2,557 | 50,628 | 27,433 | 546,779 |
| | Core Equity | — | 18,008 | 878 | 17,130 | 14,745 | 272,191 |
| | Fundamental Value | — | 32,413 | 1,376 | 31,037 | 24,718 | 545,001 |
| | Global Real Estate | — | 75,340 | 2,983 | 72,357 | 35,803 | 822,701 |
| | High Income | — | 107,355 | 5,020 | 102,335 | 55,694 | 1,085,777 |
| | High Yield | — | 236,583 | 16,158 | 220,425 | 164,542 | 2,175,591 |
| | Index 500 | — | 537,861 | 32,861 | 505,000 | 359,658 | 5,454,000 |
| | International Equity Index | — | 85,301 | 6,019 | 79,282 | 136,269 | 1,784,631 |
| | International Opportunities | — | 14,990 | 791 | 14,199 | 15,099 | 274,893 |
| | International Small Cap | — | 11,959 | 706 | 11,253 | 17,154 | 276,029 |
| | International Small Company | — | 25,222 | 1,394 | 23,828 | 16,389 | 274,739 |
| | International Value | — | 14,825 | 904 | 13,921 | 18,108 | 274,242 |
| | Investment Quality Bond | — | 49,279 | 3,011 | 46,268 | 35,008 | 540,874 |
| | Large Cap Value | — | 22,049 | 1,048 | 21,001 | 28,186 | 544,975 |
| | Mid Cap Index | — | 27,097 | 1,287 | 25,810 | 27,954 | 546,657 |
| | Natural Resources | — | 28,110 | 2,107 | 26,003 | 89,900 | 1,102,267 |
| | Real Estate Equity | — | 106,224 | 4,727 | 101,497 | 54,596 | 1,098,196 |
| | Real Return Bond | — | 112,214 | 8,157 | 104,057 | 105,579 | 1,360,026 |
| | Small Cap Index | — | 33,719 | 1,682 | 32,037 | 30,035 | 545,589 |
| | Spectrum Income | — | 81,924 | 4,670 | 77,254 | 49,212 | 813,487 |
| | Strategic Bond | — | 100,694 | 6,598 | 94,096 | 77,249 | 1,085,872 |
| | Strategic Income | — | 86,430 | 5,575 | 80,855 | 55,975 | 813,398 |
| | Total Bond Market | — | 206,132 | 15,966 | 190,166 | 158,497 | 1,905,463 |
| | Total Return | — | 41,880 | 2,537 | 39,343 | 34,449 | 540,966 |
| | U.S. High Yield Bond | — | 90,138 | 5,790 | 84,348 | 76,329 | 1,085,560 |
| | Value & Restructuring | — | 44,748 | 2,331 | 42,417 | 31,306 | 548,023 |
| |
| | John Hancock Funds III | | | | | | |
| | International Core | — | 9,444 | 602 | 8,842 | $28,170 | $410,711 |
Lifecycle Portfolios
72
| | | | | | | |
| | Affiliate — | Share | Shares | Shares | Share | Sale | Ending |
| Portfolio | Class NAV | Amount | Purchased | Sold | Amount | Proceeds | Value |
|
|
| Lifecycle Retirement | | | | | | |
| | John Hancock Funds II | | | | | | |
| | Core Equity | — | 207,294 | 25,380 | 181,914 | $419,614 | $2,890,619 |
| | Emerging Small Company | — | 13,577 | 13,577 | — | 408,913 | — |
| | Fundamental Value | — | 189,374 | 24,604 | 164,770 | 438,378 | 2,893,367 |
| | Global Bond | — | 234,847 | 41,426 | 193,421 | 600,963 | 2,858,762 |
| | Global Real Estate | — | 298,352 | 42,058 | 256,294 | 503,766 | 2,914,062 |
| | High Income | — | 400,238 | 61,512 | 338,726 | 676,889 | 3,593,881 |
| | High Yield | — | 382,120 | 91,491 | 290,629 | 948,136 | 2,868,505 |
| | Index 500 | — | 724,008 | 120,500 | 603,508 | 1,301,705 | 6,517,889 |
| | International Equity Index | — | 114,930 | 17,820 | 97,110 | 397,006 | 2,185,957 |
| | International Small Cap | — | 35,783 | 6,004 | 29,779 | 143,537 | 730,471 |
| | International Small Company | — | 150,314 | 23,908 | 126,406 | 276,868 | 1,457,457 |
| | International Value | — | 42,884 | 6,048 | 36,836 | 119,091 | 725,676 |
| | Investment Quality Bond | — | 338,569 | 89,821 | 248,748 | 1,043,115 | 2,907,869 |
| | Natural Resources | — | 64,723 | 30,029 | 34,694 | 1,286,565 | 1,470,679 |
| | Real Estate Equity | — | 240,694 | 38,282 | 202,412 | 456,321 | 2,190,099 |
| | Real Return Bond | — | 680,759 | 128,339 | 552,420 | 1,664,740 | 7,220,134 |
| | Small Cap Index | — | 111,845 | 26,835 | 85,010 | 474,962 | 1,447,723 |
| | Small Company Value | — | 32,016 | 3,997 | 28,019 | 106,525 | 722,615 |
| | Spectrum Income | — | 238,356 | 33,655 | 204,701 | 354,990 | 2,155,507 |
| | Strategic Bond | — | 216,250 | 29,501 | 186,749 | 346,118 | 2,155,078 |
| | Strategic Income | — | 292,138 | 41,956 | 250,182 | 421,855 | 2,516,830 |
| | Total Bond Market | — | 496,510 | 134,203 | 362,307 | 1,334,461 | 3,630,312 |
| | Total Return | — | 380,619 | 90,371 | 290,248 | 1,230,368 | 3,990,903 |
| | U.S. High Yield Bond | — | 323,676 | 44,614 | 279,062 | 590,079 | 3,591,532 |
| |
| | John Hancock Funds III | | | | | | |
| | International Core | — | 18,209 | 2,621 | 15,588 | $121,180 | $724,063 |
Lifecycle Portfolios
73
Auditors report
Report of Independent Registered Public Accounting Firm
To the Board of Trustees and Shareholders of John Hancock Funds II:
In our opinion, the accompanying statements of assets and liabilities, including the schedules of securities owned, and the related statements of operations and of changes in net assets and the financial highlights present fairly, in all material respects, the financial position of the Funds (identified in Note 1) comprising John Hancock Funds II (the “Trust”) at August 31, 2007, the results of each of their operations, the changes in each of their net assets and the financial highlights for each of the periods indicated therein, in conformity with accounting principles generally accepted in the United States of America. These financial statements and financial highlights (hereafter referred to as “financial statements”) are the responsibility of the Trust’s management; our responsibility is to express an opinion on these financial statements based on our audits. We conducted our audits of these financial statements in accordance with the standards of the Public Company Accounting Oversight Board (United States). Those standards require that we plan and perform the audit to obtain reasonable assurance about whether the financial statements are free of material misstatement. An audit includes examining, on a test basis, evidence supporting the amounts and disclosures in the financial statements, assessing the accounting principles used and significant estimates made by management, and evaluating the overall financial statement presentation. We believe that our audits, which included confirmation of securities at August 31, 2007, by correspondence with the transfer agent, provide a reasonable basis for our opinion.
PricewaterhouseCoopers LLP
Boston, Massachusetts
October 30, 2007
Lifecycle Portfolios
74
Tax information
Unaudited
For federal income tax purposes, the following information is furnished with respect to the distributions of the Portfolios, if any, paid during its taxable year ended August 31, 2007.
The Portfolios below have designated the following amounts as capital gain dividends paid during the fiscal year.
| |
| Portfolio | Capital Gains |
| Lifecycle 2045 | $637 |
| Lifecycle 2040 | 618 |
| Lifecycle 2035 | 694 |
| Lifecycle 2030 | 1,157 |
| Lifecycle 2025 | 1,449 |
| Lifecycle 2020 | 1,384 |
| Lifecycle 2015 | 1,031 |
| Lifecycle 2010 | 655 |
| Lifecycle Retirement | — |
Corporate shareholders are generally entitled to take the dividend received deduction on the portion of the Portfolios’ dividend distribution that qualifies under tax law. The percentage of the Portfolios’ fiscal 2007 ordinary income dividends that qualifies for the corporate dividend received deduction is set forth below.
| |
| | Dividend Received |
| Portfolio | Deductions |
| Lifecycle 2045 | 100.00% |
| Lifecycle 2040 | 100.00% |
| Lifecycle 2035 | 100.00% |
| Lifecycle 2030 | 100.00% |
| Lifecycle 2025 | 100.00% |
| Lifecycle 2020 | 100.00% |
| Lifecycle 2015 | 100.00% |
| Lifecycle 2010 | 100.00% |
| Lifecycle Retirement | 87.45% |
The Portfolios hereby designate the maximum amount allowable of their net taxable income as qualified dividend income as provided in the Jobs and Growth Tax Relief Reconciliation Act of 2003. This amount will be reflected on Form 1099-DIV for the calendar year 2007.
Lifecycle
75
Trustees and Officers
This chart provides information about the Trustees and Officers who oversee your John Hancock fund. Officers elected by the Trustees manage the day-to-day operations of the Portfolio and execute policies formulated by the Trustees.
| | | |
| Independent Trustees | | | |
| |
| Name, age | | | Number of |
| Position(s) held with Portfolio | | Trustee of | John Hancock |
| Principal occupation(s) and other | | Portfolio | funds overseen |
| directorships during past 5 years | | since1 | by Trustee |
| |
| Charles L. Bardelis, Born: 1941 | | 2005 | 209 |
|
| Director, Island Commuter Corp. (Marine Transport). Trustee of John Hancock Trust | | |
| (since 1988) and John Hancock Funds III (since 2005). | | |
|
| |
| Peter S. Burgess, Born: 1942 | | 2005 | 209 |
|
| Consultant (financial, accounting and auditing matters (since 1999); | | |
| Certified Public Accountant; Partner, Arthur Andersen (prior to 1999). | | |
| Director of the following publicly traded companies: PMA Capital Corporation | | |
| (since 2004) and Lincoln Educational Services Corporation (since 2004). | | |
| Trustee of John Hancock Trust (since 2005), John Hancock Funds III (since 2005). | | |
|
| |
| Elizabeth G. Cook, Born: 1937 | | 2005 | 209 |
|
| Expressive Arts Therapist, Massachusetts General Hospital (September 2001 | | |
| to present); Expressive Arts Therapist, Dana Farber Cancer Institute | | |
| (September 2000 to January 2004); President, The Advertising Club of Greater Boston. | | |
| Trustee of John Hancock Trust (since 2005) and John Hancock Funds III (since 2005). | | |
|
| |
| Hassell H. McClellan, Born: 1945 | 2005 | 209 |
|
| Associate Professor, The Wallace E. Carroll School of Management, Boston College. | | |
| Trustee of John Hancock Trust (since 2005), John Hancock Funds III (since 2005). | | |
|
| |
| James. M. Oates, Born: 1946 | | 2005 | 209 |
|
| Managing Director, Wydown Group (financial consulting firm)(since 1994); | | |
| Chairman, Emerson Investment Management, Inc. (since 2000); Chairman, | | |
| Hudson Castle Group, Inc. (formerly IBEX Capital Markets, Inc.) (financial services | | |
| company) (1997-2006). Director of the following publicly traded companies: | | |
| Stifel Financial (since 1996); and Connecticut River Bancorp, Director (since 1998). | | |
| Trustee of John Hancock Trust (since 2004) and John Hancock Funds III (since 2005). | | |
| |
| Non-Independent Trustee3 | | | |
| |
| Name, age | | | Number of |
| Position(s) held with Portfolio | | Trustee of | John Hancock |
| Principal occupation(s) and other | | Portfolio | funds overseen |
| directorships during past 5 years | | since1 | by Trustee |
| |
| James R. Boyle, Born: 1959 | | 2005 | 262 |
|
| President, John Hancock Annuities; Executive Vice President, John Hancock Life Insurance Company (since | | |
| June, 2004); President U.S. Annuities; Senior Vice President, The Manufacturers Life Insurance Company | | |
| (U.S.A) (prior to 2004). | | | |
1 Because the Trust does not hold regular annual shareholders meetings, each Trustee holds office for an indefinite term until his/her successor is duly elected and qualified or until he/she dies, retires, resigns, is removed or becomes disqualified.
Lifecycle Portfolios
76
| | |
| Principal officers who are not Trustees | | |
| |
| Name, age | | |
| Position(s) held with Portfolio | | Officer of |
| Principal occupation(s) and | | Portfolio |
| directorships during past 5 years | | since |
| |
| Keith F. Hartstein2, Born: 1956 | | 2005 |
|
| President and Chief Executive Officer | | |
| Senior Vice President, Manulife Financial Corporation (since 2004); Director, President and Chief Executive | |
| Officer, the Adviser, The Berkeley Group, John Hancock Funds, LLC (since 2005); Director, MFC Global Investment | |
| Management (U.S.), LLC (“MFC Global (U.S.)”) (since 2005); Director, John Hancock Signature Services, Inc. | |
| (since 2005); President and Chief Executive Officer, John Hancock Investment Management Services, LLC (since | |
| 2006); President and Chief Executive Officer, John Hancock Funds, John Hancock Funds II, John Hancock Funds | |
| III, John Hancock Trust,; Director, Chairman and President, NM Capital Management, Inc. (since 2005); Chairman, | |
| Investment Company Institute Sales Force Marketing Committee (since 2003); Director, President and Chief | |
| Executive Officer, MFC Global (U.S.) (2005-2006); Executive Vice President, John Hancock Funds, LLC (until 2005). | |
|
| |
| John G. Vrysen2, Born: 1955 | | 2007 |
|
| Chief Operating Officer | | |
| Senior Vice President, Manulife Financial Corporation (since 2006); Director, Executive Vice President and | |
| Chief Operating Officer, the Adviser, The Berkeley Group and John Hancock Funds, LLC (June 2007-Present); | |
| Chief Operating Officer, John Hancock Funds, John Hancock Funds II, John Hancock Funds III, John Hancock | |
| Trust (June 2007 to Present); Director, Executive Vice President, and Chief Financial Officer, the Adviser, The | |
| Berkeley Group and John Hancock Funds, LLC (until June 2007); Executive Vice President and Chief Financial | |
| Officer, John Hancock Investment Management Services, LLC (since 2005), Vice President and Chief Financial | |
| Officer, MFC Global (U.S.) (since 2005); Director, John Hancock Signature Services, Inc. (since 2005); Chief | |
| Financial Officer, John Hancock Funds, John Hancock Funds II, John Hancock Funds III, John Hancock Trust | |
| (2005-June 2007 ); Vice President and General Manager, Fixed Annuities, U.S. Wealth Management (until 2005); | |
| Vice President, Operations Manulife Wood Logan (2000-2004). | |
|
| |
| Charles A. Rizzo, Born: 1959 | | 2007 |
|
| Chief Financial Officer | | |
| Chief Financial Officer, John Hancock Funds, John Hancock Funds II, John Hancock Funds III and John Hancock | |
| Trust (June 2007-Present); Assistant Treasurer, Goldman Sachs Mutual Fund Complex (registered investment | |
| companies) (2005-June 2007); Vice President, Goldman Sachs (2005-June 2007); Managing Director and Treasurer | |
| of Scudder Funds, Deutsche Asset Management (2003-2005); Director, Tax and Financial Reporting, Deutsche | |
| Asset Management (2002-2003); Vice President and Treasurer, Deutsche Global Fund Services (1999-2002). | |
|
| |
| Francis V. Knox, Jr.2, Born: 1947 | | 2005 |
|
| Vice President and Chief Compliance Officer, John Hancock Investment Management Services, LLC, the Adviser | |
| and MFC Global (U.S.) (since 2005); Chief Compliance Officer, John Hancock Funds, John Hancock Funds II, | |
| John Hancock Funds III and John Hancock Trust (since 2005); Vice President and Assistant Treasurer, Fidelity | |
| Group of Funds (until 2004); Vice President and Ethics & Compliance Officer, Fidelity Investments (until 2001). | |
|
| |
| Gordon M. Shone2, Born: 1956 | | 2005 |
|
| Treasurer, John Hancock Funds (since 2006); John Hancock Funds II, John Hancock Funds III and John Hancock | |
| Trust (since 2005); Vice President and Chief Financial Officer, John Hancock Trust (2003-2005); Senior Vice | |
| President, John Hancock Life Insurance Company (U.S.A.) (since 2001); Vice President, John Hancock Investment | |
| Management Services, LLC and John Hancock Advisers, LLC (since 2006), The Manufacturers Life Insurance | |
| Company (U.S.A.) (1998 to 2000). | | |
|
| |
| Thomas M. Kinzler2, Born: 1955 | | 2006 |
|
| Vice President and Counsel for John Hancock Life Insurance Company (U.S.A.) (since 2006); Secretary and Chief | |
| Legal Officer, John Hancock Funds, John Hancock Funds II and John Hancock Funds III and Chief Legal Officer | |
| and Assistant Secretary of John Hancock Trust (since 2006); Vice President and Associate General Counsel for | |
| Massachusetts Mutual Life Insurance Company (1999-2006); Secretary and Chief Legal Counsel for MML Series | |
| Investment Fund (2000-2006); Secretary and Chief Legal Counsel for MassMutual Institutional Funds (2000-2004); | |
| Secretary and Chief Legal Counsel for MassMutual Select Funds and MassMutual Premier Funds (2004-2006). | |
1 Because the Trust does not hold regular annual shareholders meetings, each Trustee holds office for an indefinite term until his successor is duly elected and qualified or until he dies, retires, resigns, is removed or becomes disqualified.
2Affiliated with the investment adviser.
3 Non-Independent Trustee: holds positions with affiliates of the Fund’s investment adviser.
Lifecycle Portfolios
77
Why John Hancock Funds?
For more than three decades, John Hancock Funds has been helping individual, corporate and institutional clients reach their most important financial goals. With so many fund companies to choose from, why should you invest with us?
► A name you know and trust
When you invest with John Hancock Funds, you are investing with one of the most recognized and respected names in the financial services industry. Our parent company has been helping individuals and institutions increase and protect wealth since 1862.
► Solutions across the investing spectrum
We offer equity, income, international, sector and asset allocation investment solutions managed by leading institutional money managers. Each of our funds utilizes a disciplined, team approach to portfolio management and research, leveraging the expertise of seasoned investment professionals.
► Committed to you
Our shareholders come first. We work hard to provide you with the products you need to build a solid financial foundation. We’re proud to offer you award-winning services and tools, like the www.jhfunds.com Web site, to help you every step of the way.
For immediate insight and answers,
turn to www.jhfunds.com
Discover the new and improved www.jhfunds.com.
■ View accounts, statements and fund information.
■ Access college and retirement planning calculators and investment education.
■ Gain investment ideas, expand your knowledge and become a more informed investor.

This is just the beginning of how much you can do.
Now is the ideal time to experience our Web site that received the following recognition in 2006:

“Best Innovation: Redesigned Web Site” by the Mutual Fund Education Alliance.

“Outstanding Web Site” by the Web Marketing Association.

“Creative excellence on the Web, Silver Award winner” by W3.
Discover convenience and comprehensive resources at one easy-to-access location. Your financial professional can steer you to the tools that will help you the most and enable you to transform your knowledge into action.
See how far www.jhfunds.com can take you!
For more information
The Portfolios’ proxy voting policies, procedures and records are available without charge, upon request:
| | |
| By phone | On the Portfolios’ Web site | On the SEC’s Web site |
| 1-800-225-5291 | www.jhfunds.com/proxy | www.sec.gov |
|
|
|
| Investment adviser | Custodian | Legal counsel |
| John Hancock Investment | State Street Bank & Trust Co. | Kirkpatrick & Lockhart |
| Management Services, LLC | 2 Avenue de Lafayette | Preston Gates Ellis LLP |
| 601 Congress Street | Boston, MA 02111 | 1 Lincoln Street |
| Boston, MA 02210-2805 | | Boston, MA 02111 |
| | Transfer agent | |
| Subadviser | John Hancock Signature | Independent registered |
| MFC Global Investment | Services, Inc. | public accounting firm |
| Management (U.S.A.) Limited | 1 John Hancock Way, | PricewaterhouseCoopers LLP |
| 200 Bloor Street East | Suite 1000 | 125 High Street |
| Toronto, Ontario, Canada | Boston, MA 02217-1000 | Boston, MA 02110 |
| M4W 1E5 | | |
| |
| Principal distributor | | |
| John Hancock Funds, LLC | | |
| 601 Congress Street | | |
| Boston, MA 02210-2805 | | |
Each underlying fund’s accounting policies are outlined in the underlying fund’s shareholder report, available without charge by calling 1-800-344-1029 or on the Securities and Exchange Commission (“SEC”) Web site at www.sec.gov, File # 811-21779, CIK 0001331971 for JHF II and File # 811-21777, CIK 0003129954 for JHF III.
| | |
| How to contact us | |
|
| |
| |
| Internet | www.jhfunds.com | |
|
| |
| |
| Mail | Regular mail: | Express mail: |
| | John Hancock | Mutual Fund Operations |
| | Signature Services, Inc. | John Hancock |
| | 1 John Hancock Way, Suite 1000 | Signature Services, Inc. |
| | Boston, MA 02217-1000 | 164 Corporate Drive |
| | | Portsmouth, NH 03801 |
|
| |
| |
| Phone | Customer service representatives | 1-888-225-5291 |
| | EASI-Line | 1-800-338-8080 |
| | TDD line | 1-800-554-6713 |
John Hancock Family of Funds
| |
| EQUITY | INTERNATIONAL/GLOBAL |
| Balanced Fund | Global Opportunities Fund |
| Classic Value Fund | Global Shareholder Yield Fund |
| Classic Value Fund II | Greater China Opportunities Fund |
| Classic Value Mega Cap Fund | International Allocation Portfolio |
| Core Equity Fund | International Classic Value Fund |
| Growth Fund | International Core Fund |
| Growth Opportunities Fund | International Growth Fund |
| Growth Trends Fund | |
| Intrinsic Value Fund | INCOME |
| Large Cap Equity Fund | Bond Fund |
| Large Cap Select Fund | Government Income Fund |
| Mid Cap Equity Fund | High Yield Fund |
| Multi Cap Growth Fund | Investment Grade Bond Fund |
| Small Cap Equity Fund | Strategic Income Fund |
| Small Cap Fund | |
| Small Cap Intrinsic Value Fund | TAX-FREE INCOME |
| Sovereign Investors Fund | California Tax-Free Income Fund |
| U.S. Core Fund | High Yield Municipal Bond Fund |
| U.S. Global Leaders Growth Fund | Massachusetts Tax-Free Income Fund |
| Value Opportunities Fund | New York Tax-Free Income Fund |
| | Tax-Free Bond Fund |
| ASSET ALLOCATION | |
| | MONEY MARKET |
| Lifecycle 2010 Portfolio | Money Market Fund |
| Lifecycle 2015 Portfolio | |
| Lifecycle 2020 Portfolio | CLOSED-END |
| Lifecycle 2025 Portfolio | Bank and Thrift Opportunity Fund |
| Lifecycle 2030 Portfolio | Financial Trends Fund, Inc. |
| Lifecycle 2035 Portfolio | Income Securities Trust |
| Lifecycle 2040 Portfolio | Investors Trust |
| Lifecycle 2045 Portfolio | Patriot Premium Dividend Fund II |
| Lifecycle Retirement Portfolio | Preferred Income Fund |
| Lifestyle Aggressive Portfolio | Preferred Income II Fund |
| Lifestyle Balanced Portfolio | Preferred Income III Fund |
| Lifestyle Conservative Portfolio | Tax-Advantaged Dividend Income Fund |
| Lifestyle Growth Portfolio | Tax-Advantaged Global Shareholder Yield Fund |
| Lifestyle Moderate Portfolio | |
| | |
| SECTOR | |
| Financial Industries Fund | |
| Health Sciences Fund | |
| Real Estate Fund | |
| Regional Bank Fund | |
| Technology Fund | |
| Technology Leaders Fund | |
The Fund’s investment objectives, risks, charges and expenses are included in the prospectus and should be considered carefully before investing. For a prospectus, contact your financial professional, call John Hancock Funds at 1-800-225-5291 or visit the Fund’s Web site at www.jhfunds.com. Please read the prospectus carefully before investing or sending money.


John Hancock Funds II
President’s Message
To Our Shareholders:
Volatility returned to the U.S. stock market in the 12-month period ended August 31, 2007; however, stocks still posted a strong gain of 15.13%, as measured by the Standard & Poor’s 500 Index. The market experienced a particularly sharp downturn in August, as the subprime mortgage market’s woes increased. Rising defaults and an ensuing credit crunch caused heightened fears about their potential impact on U.S. economic growth. Foreign markets felt some ripple effects from the subprime issue, but they continued nonetheless to benefit from solid economic growth and outperformed the U.S. market in this period.
During this period of volatility, the U.S. stock market also passed a significant milestone — the broad Standard & Poor’s 500 Index climbed beyond the record it had set seven years ago. From its peak in March 2000, the stock market spiraled downward three consecutive years, bottoming in 2002. The upturn began in 2003, and the market has advanced each year since, finally setting a new high for the first time on May 30, 2007. During that period, the S&P 500 Index experienced five significant short-term sell-offs of 6% or more, with the August subprime-induced meltdown being the most recent.
This nearly complete market cycle highlights the importance of two investment principles you have heard us speak of often: diversification and patience. By allocating your investments among different asset classes, investment styles and portfolio managers, you are likely to be well represented through all phases of a complete market cycle, with the winners helping to cushion the fall of the losers.
The challenge for investors with a diversified portfolio is to properly evaluate your investments to tell the difference between an underperforming manager and an out-of-favor style, while also understanding the role each investment plays in your portfolio. That’s where your financial professional can provide true value. He or she can help you make those assessments and also counsel patience, because a properly diversified portfolio by its very nature will typically have something lagging or out of favor — a concept that can be difficult to live with, but necessary to embrace. If everything in your portfolio is “working,” then you are not truly diversified, but rather are leveraged to the current market and the flavor of the day. If so, you are bound to be out of step in the near future.
The recent volatility in the securities markets has prompted many investors to question how long this type of market cycle will last. History tells us it will indeed end and that when it does, today’s leaders may well turn into laggards and vice versa. The subprime mortgage market woes are just the latest example of why investors should be both patient and well-diversified. For with patience and a diversified portfolio, it could be easier to weather the market’s twists and turns and reach your long-term goals.
Sincerely,

Keith F. Hartstein
President and Chief Executive Officer
This commentary reflects the CEO’s views as of August 31, 2007. They are subject to change at any time.
2
John Hancock Funds II
Annual Report — Table of Contents
| |
| Manager’s Commentary and Fund Performance (See below for each Fund’s page #) | 4 |
| Shareholder Expense Example | 63 |
| Statements of Assets and Liabilities | 69 |
| Statements of Operations | 84 |
| Statements of Changes in Net Assets | 99 |
| Financial Highlights | 109 |
| Portfolio of Investments (See below for each Fund’s page #) | 120 |
| Notes to Financial Statements | 412 |
| Report of Independent Registered Public Accounting Firm | 462 |
| Federal Tax Information | 463 |
| Evaluation of Advisory and Subadvisory Agreements by the Board of Trustees | 464 |
| Appendix A | 467 |
| Trustees and Officers Information | 486 |
| | | | | | | | |
| Manager’s Commentary & | Portfolio of | | | Manager’s Commentary & | Portfolio of |
| Fund | Portfolio Performance | Investments | | Fund | Portfolio Performance | Investments |
| Absolute Return Portfolio | | 5 | 120 | | Mid Cap Stock Fund | | 34 | 283 |
| Active Bond Fund | | 6 | 120 | | Mid Cap Value Fund | | 35 | 285 |
| All Cap Core Fund | | 7 | 136 | | Mid Cap Value Equity Fund | | 36 | 287 |
| All Cap Growth Fund | | 8 | 139 | | Natural Resources Fund | | 37 | 289 |
| All Cap Value Fund | | 9 | 140 | | Quantitative All Cap Fund | | 38 | 290 |
| Blue Chip Growth Fund | | 10 | 143 | | Quantitative Mid Cap Fund | | 39 | 292 |
| Capital Appreciation Fund | | 11 | 145 | | Quantitative Value Fund | | 40 | 294 |
| Core Bond Fund | | 12 | 146 | | Real Estate Equity Fund | | 41 | 296 |
| Core Equity Fund | | 13 | 156 | | Real Estate Securities Fund | | 42 | 296 |
| Emerging Growth Fund | | 14 | 157 | | Real Return Bond Fund | | 43 | 297 |
| Emerging Markets Value Fund | | 15 | 159 | | Small Cap Fund | | 44 | 300 |
| Emerging Small Company Fund | | 16 | 171 | | Small Cap Index Fund | | 45 | 301 |
| Equity-Income Fund | | 17 | 173 | | Small Cap Opportunities Fund | 46 | 320 |
| Fundamental Value Fund | | 18 | 175 | | Small Company Fund | | 47 | 323 |
| Global Bond Fund | | 19 | 177 | | Small Company Growth Fund | 48 | 327 |
| Global Real Estate Fund | | 20 | 186 | | Small Company Value Fund | | 49 | 329 |
| High Income Fund | | 21 | 189 | | Special Value Fund | | 50 | 332 |
| High Yield Fund | | 22 | 193 | | Spectrum Income Fund | | 51 | 333 |
| Index 500 Fund | | 23 | 203 | | Strategic Bond Fund | | 52 | 362 |
| International Equity Index Fund | | 24 | 210 | | Strategic Income Fund | | 53 | 372 |
| International Opportunities Fund | | 25 | 231 | | Total Bond Market Fund | | 54 | 378 |
| International Small Cap Fund | | 26 | 233 | | Total Return Fund | | 55 | 380 |
| International Small Company Fund | 27 | 235 | | U.S. Global Leaders Growth Fund | 56 | 387 |
| International Value Fund | | 28 | 259 | | U.S. Government Securities Fund | 57 | 388 |
| Investment Quality Bond Fund | | 29 | 261 | | U.S. High Yield Bond Fund | | 58 | 391 |
| Large Cap Fund | | 30 | 271 | | U.S. Multi Sector Fund | | 59 | 399 |
| Large Cap Value Fund | | 31 | 273 | | Value Fund | | 60 | 406 |
| Mid Cap Index Fund | | 32 | 275 | | Value & Restructuring Fund | | 61 | 407 |
| Mid Cap Intersection Fund | | 33 | 281 | | Vista Fund | | 62 | 409 |
3
John Hancock Funds II
Manager’s Commentary and Fund Performance
Fund Performance
In the following pages we have set forth information regarding the performance of each Fund of the John Hancock Funds II (the “trust”). There are several ways to evaluate a Fund’s historical performance. One can look at the total percentage change in value, the average annual percentage change or the growth of a hypothetical $10,000 investment. With respect to all performance information presented, it is important to understand that past performance does not guarantee future results. Return and principal fluctuate, and shares, when redeemed, may be worth more or less than their original cost. The Funds are still in their first year of operation so a full year of past performance is not available.
Performance Tables
The Performance Tables show two types of total return information: cumulative and average annual total returns. A cumulative total return is an expression of a Fund’s total change in share value in percentage terms over a set period of time — one, five and ten years (or since the Fund’s inception if less than the applicable period). An average annual total return takes the Fund’s cumulative total return for a time period greater than one year and shows what would have happened if the Fund had performed at a constant rate each year. The tables show all cumulative and average annual total returns, net of fees and expenses of the Trust, but do not reflect the insurance (separate account) expenses (including a possible contingent deferred sales charge) that invest in the Fund. If these were included, performance would be lower.
Graph — Change in Value of $10,000 Investment and Comparative Indices
The performance graph for each Fund shows the change in value of a $10,000 investment over the life or ten-year period of each Fund, whichever is shorter. Each Fund’s performance is compared with the performance of one or more broad-based securities indices as a “benchmark.” All performance information includes the reinvestment of dividends and capital gain distributions, as well as the deduction of ongoing management fees and Fund operating expenses. The benchmarks used for comparison are unmanaged and include reinvestment of dividends and capital gains distributions, if any, but do not reflect any fees or expenses. Funds that invest in multiple asset classes are compared with a customized benchmark. This benchmark is comprised of a set percentage allocation from each of the asset classes in which the Fund invests.
Portfolio Manager’s Commentary
Finally, we have provided a commentary by each portfolio manager regarding each Fund’s performance during the period ended August 31, 2007. The views expressed are those of the portfolio manager as of August 31, 2007, and are subject to change based on market and other conditions. Information about a Fund’s holdings, asset allocation or country diversification is historical and is no indication of future fund composition, which will vary. Information provided in this report should not be considered a recommendation to purchase or sell securities. The Funds are not insured by the FDIC, are not a deposit or other obligation of, or guaranteed by banks and are subject to investment risks including loss of principal amount invested. For a more detailed discussion of the risks associated with the Funds, see the Fund prospectus.
“Standard & Poor’s,” “Standard & Poor’s 500,” “S&P 500,” and “S&P MidCap 400 Index” are trademarks of The McGraw-Hill Companies, Inc. “Russell 1000,” “Russell 2000,” “Russell 3000,” and “Russell Midcap” are trademarks of Frank Russell Company. “Wilshire 5000” is a trademark of Wilshire Associates. “Morgan Stanley European Australian Far East Free”, “EAFE” and “MSCI” are trademarks of Morgan Stanley & Co. Incorporated.” “Lehman Brothers” is a registered trademark of Lehman Brothers Inc. “Lipper” is a registered trademark of Reuters S.A. None of the Trusts are sponsored, endorsed, managed, advised, sold or promoted by any of these companies, and none of these companies make any representation regarding the advisability of investing in the Trust.
4
Absolute Return Portfolio
Subadviser: MFC Global Investment Management (U.S.A.) Limited
Portfolio Managers: Steve Orlich and James Robertson
INVESTMENT OBJECTIVE & POLICIES ► To seek maximum real return, consistent with preservation of capital and prudent investment management.
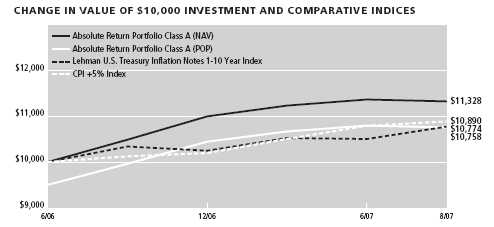
| |
| Sector Weighting* | % of Total |
|
| U.S. Large Cap | 16.80 |
| Multi-Sector Fund | 13.11 |
| High Yield Bond | 12.95 |
| Treasury Inflation-Protected Securities | 10.35 |
| Real Estate | 6.86 |
| Intermediate Bond | 6.06 |
| International Small Cap | 5.46 |
| Long Term Bond | 5.11 |
| Global Bond | 3.12 |
*Top Sectors as a percentage of market value. Does not include short-term securities and investments in the John Hancock Cash Investment Trust.
PORTFOLIO MANAGERS’ COMMENTARY
Performance ► For the year ended August 31, 2007, the Absolute Return Class A returned 8.72%, outperforming the 4.45% return of the Lehman Brothers U.S. TIPS 1-10 Year Index and the 7.47% return of the CPI +5%.
Environment ► U.S. equity markets followed an upward trend for most of the period, supported by strong earnings growth. After reaching a new high in July, the S&P 500 Index pulled back significantly, wiping out much of its year-to-date gains. The volatility was in response to increasing delinquency rates in the U.S. subprime mortgage market and the broader consequences affecting credit markets. The deterioration of the U.S. subprime market triggered fears of a global liquidity crisis, causing heightened volatility within equity markets. Central banks around the world injected much needed liquidity into the financial system.
Overseas markets performed in line with that of the U.S. on a local currency basis, as growth in Asian and Eurozone economies remained strong. China continues to be a key driver of global economic growth, as its economy grows by more than 10% a year. Concerns over an overheated Chinese economy driving up inflation raise the issue of a more effective tightening by Chinese officials which could hold back global growth.
During the course of the year, there had been much debate as to whether the slowing U.S. economy was headed toward a hard or soft landing. While it appears that a soft landing has been engineered, recent economic releases indicate the possibility of greater weakness. In light of a decline in recent jobs numbers, the odds have shifted higher toward economic weakness.
Outlook ► We believe the U.S. economy, while slowing, should continue to grow by at least 2% annually, with moderate inflation. The Fed has started to ease which previously has caused markets to rally strongly. Yields on government securities have fallen and spreads have widened as a result of a flight to quality and a higher risk premium. We expect this to partially reverse as confidence returns to debt markets.
Within the portfolio we have been underweight in equities, commodities and REITs, in favor of fixed income. We reduced our exposure to commodities, locking in gains after the run-up in prices into May. We are prepared to increase our equity exposure, looking for attractive entry points on market weakness as we advance through the seasonally weak September/October period.
| | | | | | | | |
| PERFORMANCE TABLE1,4 | Average Annual Total Returns | | | Cumulative Total Returns | |
|
| | | | | Since | | | | Since |
| Periods Ended August 31, 2007 | 1-year | 5-year | 10-year | inception | 1-year | 5-year | 10-year | inception2 |
|
| Absolute Return Class A (began 6/26/06) | 8.72% | — | — | 11.06% | 8.72% | — | — | 13.28% |
| Absolute Return Class B (began 6/26/06) | 7.96% | — | — | 10.23% | 7.96% | — | — | 12.27% |
| Absolute Return Class C (began 6/26/06) | 7.96% | — | — | 10.23% | 7.96% | — | — | 12.27% |
| Absolute Return Class 1 (began 6/26/06) | 8.98% | — | — | 11.28% | 8.98% | — | — | 13.56% |
| Lehman Brothers U.S. TIPS 1-10 Year Index3,5,7 | 4.45% | — | — | 6.47% | 4.45% | — | — | 7.74% |
| CPI +5%3,6,7 | 7.47% | — | — | 7.56% | 7.47% | — | — | 8.90% |
1 Performance does not reflect the deduction of taxes on fund distributions or redemptions of fund shares. Past performance does not predict future performance.
2 Current subadviser has managed the fund since June 26, 2006.
3 Since inception returns for the indices may begin on the month-end closest to the actual inception date of the fund.
4 Since inception, a portion of the Absolute Return Portfolio expenses were reimbursed. If such expenses had not been reimbursed, returns would be lower.
5 Lehman Brothers U.S. TIPS 1-10 Year Index is an unmanaged index which consists of Inflation-Protection securities issued by the U.S.Treasury.The stocks in this index must have at least one year to final maturity, have at least $250 million par amount outstanding and be rated investment-grade (Baa3/BBB– or higher) by at least two of the following ratings agencies: Moody’s, S&P, Fitch.
6 The CPI + 5% benchmark is created by adding 5% to the annual percentage change in the Consumer Price Index.This index reflects non-seasonably adjusted returns.The Consumer Price Index (CPI) is an unmanaged index representing the rate of inflation in U.S. consumer prices as determined by the U.S. Department of Labor Statistics.There can be no guarantee that the CPI or other indices will reflect the exact level of inflation at any given time. It is not possible to invest directly in an index.
7 It is not possible to invest directly in an index. Index figures do not reflect sales charges and would be lower if they did.
5
Active Bond Fund
Subadviser: Declaration Management & Research, LLC and MFC Global Investment Management (U.S.), LLC
Portfolio Managers: Peter Farley, James E. Shallcross, Barry H. Evans, Howard C. Greene and Jeffrey N. Given
INVESTMENT OBJECTIVE & POLICIES ► The Fund seeks income and capital appreciation by investing at least 80% of its net assets in a diversified mix of debt securities and instruments.
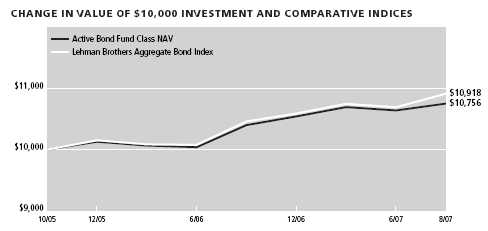
| |
| Sector Weighting* | % of Total |
|
| Government | 37.33 |
| Mortgage Securities | 31.49 |
| Financial | 12.56 |
| Asset Backed Securities | 4.52 |
| Communications | 4.05 |
| Utilities | 2.44 |
| Energy | 2.25 |
| Consumer, Non-cyclical | 1.54 |
| Consumer, Cyclical | 1.52 |
| Industrial | 0.78 |
*Top Sectors as a percentage of market value. Does not include short-term securities and investments in the John Hancock Cash Investment Trust.
PORTFOLIO MANAGERS’ COMMENTARY
MFC Global Investment Management (U.S.), LLC
Environment ► The year ended August 31, 2007 saw a market of relative calm give way to rising turbulence. Ten-year Treasury yields traded within a narrow band - from 4.40% to 4.80% - from August 2006 through May 2007. The yield rose to 5.3% in June, before subprime and housing market concerns fueled a Treasury rally that brought yields down to 4.53% at period end. In spite of ongoing restrictive monetary policy, the economy remained strong during the year. More importantly, inflation had yet to fall below the 2.0% threshold targeted by the Federal Reserve before it would consider lowering the federal funds rate from 5.25% .
As the mortgage crisis unfolded, investors began to anticipate a weaker economy and the Fed responded by cutting its overnight lending rate to banks. In the spring, the long period of outperformance by the credit and mortgage markets ended, as risk premiums began to increase slowly, and then moved sharply higher during July and August, which weakened valuations in non-Treasury bond sectors. The credit markets also lost liquidity, which pressured spreads wider.
The Fund benefited from the steeper yield curve and from various sectors within the credit and mortgage market.
Outlook ► We expect the economy will avoid recession, thanks to this monetary stimulus and the relatively stronger global economy. We continue to be positioned fairly conservatively. We recently began to increase exposure to corporate bonds, based on investment grade yields that are about 60 basis points higher, relative to Treasuries, than a few months ago, and high-yield spreads that have roughly doubled since March. We will likely continue to see heightened volatility over the next few months, but will invest where we think valuations have adjusted to reflect current market conditions.
Declaration Management & Research, LLC
Environment ► Interest rates and fixed-income sectors dramatically changed course during the year. Steady economic growth, modest inflation, range-bound interest rates, low volatility and rising equity markets characterized 2006. Entering 2007, the general market uneasiness mounted over slower economic growth offset by the Federal Reserve’s steadfast concern over rising inflation. Interest rates rose sharply in the second quarter, as the market reassessed the Fed’s firm stance on inflation. Concerns over credit risk began surfacing, with weakness in the subprime mortgage market. Increasing mortgage delinquencies and defaults took center stage. The mortgage problem rippled through fixed-income sectors and the market revalued risk for bank loans, corporate debt and commercial real estate.
Fixed-income sectors severely underperformed U.S. Treasuries, especially in July and August. Mortgage securities performed the worst, with riskier bonds significantly declining in valuation. Corporate debt spreads materially widened, as the credit crunch raised concerns over future economic growth.
The Fund underperformed its benchmark as the credit revaluation erased all of the Fund’s positive performance. The underperformance came from systematic widening across fixed income sectors, rather than fundamental weakness with any one position. The portfolio remained overweight to credit and had more exposure to bank, brokerage and insurance issuers than the benchmark. The Fund had minimal allocation to mortgage companies, but the overall financial exposure underperformed relative to the benchmark. The mortgage position was the main underperformer. Overall, the portfolio maintained an overweight to residential mortgage asset-backed securities and to commercial mortgage bonds.
The portfolio holds a small weighting to AAA sub-prime mortgage bonds, which are performing well and maintain significant enhancement. The commercial mortgage position detracted the most from performance. The portfolio holds mainly AAA securities, with all bonds performing.
Outlook ► The risk of recession has risen recently and presents the Fed with a dilemma. Economic growth is expected to slow, yet consumers have been resilient and inflation remains elevated. We expect fixed income sectors to remain volatile for the balance of the year.
| | | | | | | | |
| PERFORMANCE TABLE1 | Average Annual Total Return | | | Cumulative Total Return | |
|
| | | | | Since | | | | Since |
| Periods Ended August 31, 2007 | 1-year | 5-year | 10-year | inception | 1-year | 5-year | 10-year | inception2 |
|
| Active Bond Class 1 (began 10/15/05) | 4.38% | — | — | 3.76% | 4.38% | — | — | 7.18% |
| Active Bond Class NAV (began 10/27/05) | 4.34% | — | — | 4.02% | 4.34% | — | — | 7.56% |
| Lehman Brothers Aggregate Bond Index (10/15/05)3,4,5 | 5.26% | — | — | 4.59% | 5.26% | — | — | 8.81% |
| Lehman Brothers Aggregate Bond Index (10/27/05)3,4,5 | 5.26% | — | — | 4.87% | 5.26% | — | — | 9.18% |
1 Performance does not reflect the deduction of taxes on fund distributions or redemptions of fund shares. Past performance does not predict future performance.
2 Current subadvisers have managed the fund since October 15, 2005.
3 Since inception returns for the indices may begin on the month-end closest to the actual inception date of the fund.
4 Lehman Brothers Aggregate Bond Index is an unmanaged index of dollar-denominated and nonconvertible investment-grade debt issues.
5 It is not possible to invest directly in an index. Index figures do not reflect sales charges and would be lower if they did.
6
All Cap Core Fund
Subadviser: Deutsche Investment Management Americas Inc.
Portfolio Managers: Julie Abbett, Jin Chen and Robert Wang
INVESTMENT OBJECTIVE & POLICIES ► To seek long-term growth of capital by investing in common stocks and other equity securities within all asset classes primarily in the Russell 3000 Index.
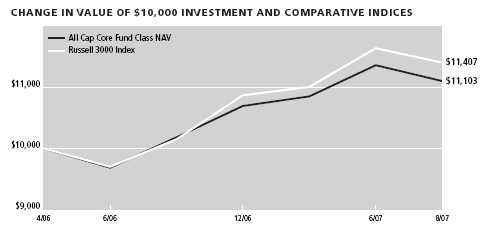
| |
| Sector Weighting* | % of Total |
|
| Financial | 18.69 |
| Consumer, Non-cyclical | 14.56 |
| Energy | 11.81 |
| Technology | 11.20 |
| Industrial | 8.81 |
| Communications | 8.66 |
| Consumer, Cyclical | 8.03 |
| Basic Materials | 4.89 |
| Utilities | 2.64 |
*Top Sectors as a percentage of market value. Does not include short-term securities and investments in the John Hancock Cash Investment Trust.
PORTFOLIO MANAGERS’ COMMENTARY
Performance ► For the year ended August 31, 2007, the All Cap Core Class NAV returned +11.93%, underperforming the +14.94% return of the Russell 3000 Index.
Environment ► Despite a significant increase in market volatility throughout July and August, U.S. equities performed well overall. Robust global growth and better-than-expected corporate profits provided a positive underpinning for stock prices. In addition, heavy buying activity by private equity firms — which purchase the stock of public companies at a premium in order to take them private —boosted the shares of companies that were purchased as well as those viewed as potential acquisition targets. These factors helped the market to rise steadily from October 2006 through mid-July 2007, except for a brief sell-off in early March.
The environment suddenly took a turn for the worse in mid-July. However, when deterioration in housing prices and rising defaults among subprime mortgage holders caused credit markets to freeze up. Investors rapidly grew more risk-averse, leading to a sell-off across virtually all asset classes.
The Fund underperformed its benchmark during the year. Stocks within the Materials, Energy and Telecommunications Services sectors have contributed most to relative performance. The largest detractor from relative performance was the Technology Hardware & Equipment industry group.
Outlook ► Equity markets have been buffeted by the recent loss of risk appetites and by increasing concerns about credit risk, the health of the financial sector and potential broader effects to the broader economy. Our view that the economy will weather the storm without undue weakening remains generally supportive of equities. Equity valuations look reasonable. However, downside risks to the economy have increased. We believe profit growth is likely to slow further because profit margins are apt to narrow. Productivity growth remains cyclically sluggish while labor compensation catches up to the robust productivity gains of previous years. Competitive pressures are preventing firms from passing the full rise in unit labor costs through to prices.
| | | | | | | | |
| PERFORMANCE TABLE1 | Average Annual Total Return | | | Cumulative Total Return | |
|
| | | | | Since | | | | Since |
| Periods Ended August 31, 2007 | 1-year | 5-year | 10-year | inception | 1-year | 5-year | 10-year | inception2 |
|
| All Cap Core Class NAV (began 4/28/06) | 11.93% | — | — | 8.11% | 11.93% | — | — | 11.03% |
| Russell 3000 Index3,4,5 | 14.94% | — | — | 10.31% | 14.94% | — | — | 14.07% |
1 Performance does not reflect the deduction of taxes on fund distributions or redemptions of fund shares. Past performance does not predict future performance.
2 Current subadviser has managed the fund since April 28, 2006.
3 Since inception returns for the indices may begin on the month-end closest to the actual inception date of the fund.
4 Russell 3000 Index is an unmanaged index of the 3,000 largest U.S. companies based on total market capitalization, which represents approximately 98% of the investable U.S. equity market.
5 It is not possible to invest directly in an index. Index figures do not reflect sales charges and would be lower if they did.
7
All Cap Growth Fund
Subadviser: AIM Capital Management, Inc.
Portfolio Managers: Lanny H. Sachnowitz, Kirk L. Anderson, James G. Birdsall and Robert J. Lloyd
INVESTMENT OBJECTIVE & POLICIES ► To seek long-term capital appreciation by investing the Fund’s assets primarily in common stocks of companies that are believed to benefit from new or innovative products, services or processes as well as those that have experienced above-average, long-term growth in earnings and have excellent prospects for future growth.
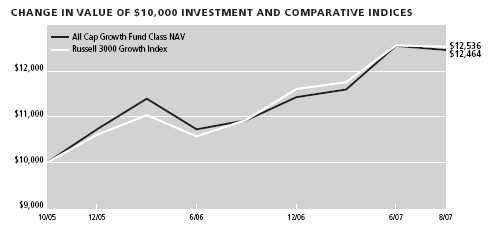
| |
| Sector Weighting* | % of Total |
|
| Consumer, Non-cyclical | 20.36 |
| Industrial | 19.16 |
| Technology | 16.68 |
| Communications | 13.95 |
| Consumer, Cyclical | 9.32 |
| Financial | 8.74 |
| Energy | 5.98 |
| Basic Materials | 1.30 |
*Top Sectors as a percentage of market value. Does not include short-term securities and investments in the John Hancock Cash Investment Trust.
PORTFOLIO MANAGERS’ COMMENTARY
Performance ► For the year ended August 31, 2007, the All Cap Growth Class NAV returned +17.46%, in line with the +17.58% return of the Russell 3000 Growth Index.
Environment ► Domestic equities posted solid returns during the period, despite volatility that began mid-July and extended through August. Strong economic growth, favorable corporate earnings results, and increased merger and acquisition activity drove equity markets, offsetting high energy prices, the slowing housing market and sub-prime loan worries late in the period. In this environment, large-, mid- and small-cap stocks all had double-digit returns, with mid-caps outperforming large-and small-cap stocks. Additionally, growth stocks outperformed value stocks.
During the period, the Fund posted positive returns, but slightly underperformed its benchmark, the Russell 3000 Growth Index. Relative performance was strongest in three sectors — Industrials, Telecommunication Services, and Energy. Performance in the Industrials sector was driven by stock selection across several industries, including aerospace and defense, industrial conglomerates and electrical equipment. In Telecommunication Services, performance was aided by stock selection and an overweight position in wireless telecommunication stocks, an area that performed well during the period. Strong performance in the Energy sector primarily came from stock selection in the energy equipment and services industry.
The Fund’s weakest performance relative to its benchmark index came from the Consumer Discretionary and Financials sectors. Underperformance in these two sectors was driven by both stock selection and overweight positions.
Outlook ► The Fund maintains a disciplined strategy of selecting the best investment opportunities based on earnings, quality and valuation. We are positioned for what we believe will be a rebound for growth stocks. Global valuations have converged in recent years, resulting in little disparity in valuation between growth and value stocks. Current valuations suggest little premium is being paid for high-quality growth stocks. As a result, we expect companies that grow faster than expected and that deliver superior returns on capital will outperform, especially as global economic growth could moderate in the face of higher interest rates.
| | | | | | | | |
| PERFORMANCE TABLE1 | Average Annual Total Return | | | Cumulative Total Return | |
|
| | | | | Since | | | | Since |
| Periods Ended August 31, 2007 | 1-Year | 5-Year | 10-year | inception | 1-year | 5-Year | 10-year | inception2 |
|
| All Cap Growth Class 1 (began 10/15/05) | 17.41% | — | — | 12.37% | 17.41% | — | — | 24.51% |
| All Cap Growth Class NAV (began 10/15/05) | 17.46% | — | — | 12.43% | 17.46% | — | — | 24.64% |
| Russell 3000 Growth Index3,4,5 | 17.58% | — | — | 12.78% | 17.58% | — | — | 25.36% |
1 Performance does not reflect the deduction of taxes on fund distributions or redemptions of fund shares. Past performance does not predict future performance.
2 Current subadviser has managed the fund since October 15, 2005.
3 Since inception returns for the indices may begin on the month-end closest to the actual inception date of the fund.
4 Russell 3000 Growth Index is an unmanaged index that measures the performance of those Russell 3000 Index companies with higher price-to-book ratios and higher forecasted growth values. The stocks in this index are also members of either the Russell 1000 Growth or the Russell 2000 Growth indexes.
5 It is not possible to invest directly in an index. Index figures do not reflect sales charges and would be lower if they did.
8
All Cap Value Fund
Subadviser: Lord, Abbett & Co. LLC
Portfolio Managers: Robert P. Fetch and Howard E. Hansen
INVESTMENT OBJECTIVE & POLICIES ► To seek capital appreciation by investing in equity securities of U.S. and multinational companies that are believed to be undervalued in all capitalization ranges.
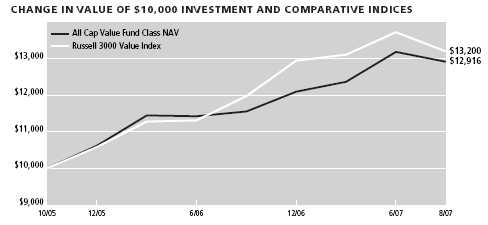
| |
| Sector Weighting* | % of Total |
|
| Industrial | 23.59 |
| Consumer, Non-cyclical | 15.85 |
| Energy | 14.24 |
| Basic Materials | 11.09 |
| Communications | 9.39 |
| Financial | 9.25 |
| Technology | 5.34 |
| Consumer, Cyclical | 4.25 |
| Utilities | 3.85 |
*Top Sectors as a percentage of market value. Does not include short-term securities and investments in the John Hancock Cash Investment Trust.
PORTFOLIO MANAGERS’ COMMENTARY
Performance ► For the year ended August 31, 2007, the All Cap Value Class NAV returned +12.62%, outperforming the +12.31% return of the Russell 3000® Value Index.
Environment ► For the 12 months ended August 31, 2007, large-cap stocks outperformed both mid- and small-cap stocks within the Russell 3000 Value Index. Stock selection within the mid-cap segment was the largest contributor to performance, while stock selection within the large-cap segment detracted. The portfolio’s weighting in large-cap stocks ($10+ billion capitalization) was 59% on average. Exposure to mid-cap stocks ($2-$10 billion) was 31% and the small-cap allocation (below $2 billion) was 4% of the portfolio.
The portfolio’s relative underweight within the Financial Services sector was the largest contributor to performance, particularly within regional banks and real estate investment trusts. By maintaining a significant underweight, the portfolio avoided risks associated with the credit crisis arising from sub-prime mortgage problems. Positive stock selection within the “other” sector, comprised of multi-sector companies, also contributed to relative portfolio performance. Stock selection within Producer Durables was another significant contributor driven by increased demand from Utilities and strength in industrial end markets.
The largest detractor from performance was a relative underweight within the Integrated Oils sector, which was the strongest performing sector during the period. Stock selection within the Utilities sector was another significant detractor.
Outlook ► We feel that rising market volatility has given us the opportunity to take advantage of valuation discrepancies in the market. Our focus continues to be protecting assets from weak areas while investing in companies that we believe can grow earnings in a slowing economic environment through new products and restructuring.
| | | | | | | | |
| PERFORMANCE TABLE1 | Average Annual Total Return | | | Cumulative Total Return | |
|
| | | | | Since | | | | Since |
| Periods Ended August 31, 2007 | 1-year | 5-year | 10-year | inception | 1-year | 5-year | 10-year | inception2 |
|
| All Cap Value Class 1 (began 10/15/05) | 12.64% | — | — | 14.57% | 12.64% | — | — | 29.12% |
| All Cap Value Class NAV (began 10/15/05) | 12.62% | — | — | 14.58% | 12.62% | — | — | 29.16% |
| Russell 3000 Value Index3,4,5 | 12.31% | — | — | 15.92% | 12.31% | — | — | 32.00% |
1 Performance does not reflect the deduction of taxes on fund distributions or redemptions of fund shares. Past performance does not predict future performance.
2 Current subadviser has managed the fund since October 15, 2005.
3 Since inception returns for the indices may begin on the month-end closest to the actual inception date of the fund.
4 Russell 3000 Value Index is an unmanaged index that measures the performance of those Russell 3000 companies with lower price-to-book ratios and lower forecasted growth values. The stocks in this index are also members of either the Russell 1000 Value or Russell 2000 Value indexes.
5 It is not possible to invest directly in an index. Index figures do not reflect sales charges and would be lower if they did.
9
Blue Chip Growth Fund
Subadviser: T. Rowe Price Associates, Inc.
Portfolio Manager: Larry J. Puglia
INVESTMENT OBJECTIVE & POLICIES ► To provide long-term growth of capital with current income as a second objective. The Fund invests at least 80% of its net assets in common stocks of large- and medium-sized blue chip growth companies that are considered well established in their industries and have the potential for above-average earnings growth.

| |
| Sector Weighting* | % of Total |
|
| Financial | 18.17 |
| Communications | 16.96 |
| Consumer, Non-cyclical | 16.88 |
| Technology | 15.5 |
| Industrial | 9.80 |
| Consumer, Cyclical | 9.33 |
| Energy | 8.17 |
| Basic Materials | 1.95 |
*Top Sectors as a percentage of market value. Does not include short-term securities and investments in the John Hancock Cash Investment Trust.
PORTFOLIO MANAGER’S COMMENTARY
Performance ► For the year ended August 31, 2007, the Blue Chip Growth Class NAV returned +18.37%, outperforming the +15.13% return of the S&P 500 Index.
Environment ► The benchmark S&P 500 Index posted a solid gain over the past 12 months, despite the heightened volatility of the past three months. Equity markets have endured a wild ride in response to the subprime mortgage meltdown and the subsequent credit crunch. The Federal Reserve added billions of dollars to the banking system to ease the credit markets’ liquidity problems. By the end of August, investors regained some confidence and equities began to rebound. Information Technology and Energy stocks were the strongest contributors to the S&P 500 Index for the 12-month period. The Financials and Health Care sectors were among the poorest performers over the past year.
The Consumer Discretionary sector produced the portfolio’s strongest relative performance contribution, due to stock selection. An overweight allocation to the Internet and catalog retail industry generated strong relative performance. Stock selection among our holdings in the hotels, restaurants and leisure industry also generated positive performance. The Fund also benefited from a significant overweight allocation to the Information Technology sector.
Stock selection and a slight underweight to the Industrials and Business Services sector detracted from relative performance. Stock selection in the machinery industry, and stock selection and an underweight in aerospace and defense companies detracted from relative returns.
Outlook ► We think the housing correction and subprime market woes may be stubborn, but still manageable, in terms of their effect on economic growth. Although we feel the prospects for corporate earnings growth and relatively stable interest rates are favorable, valuations are clearly not as supportive as they were six or 12 months ago. Nevertheless, we think that high-quality, consistent-growth companies appear attractive because earnings growth remains strong at many well-managed U.S. companies.
| | | | | | | | |
| PERFORMANCE TABLE1,4 | Average Annual Total Return | | | Cumulative Total Return | |
|
| | | | | Since | | | | Since |
| Periods Ended August 31, 2007 | 1-year | 5-year | 10-year | inception | 1-year | 5-year | 10-year | inception2 |
|
| Blue Chip Growth Class 1 (began 10/15/05) | 18.28% | — | — | 13.85% | 18.28% | — | — | 27.61% |
| Blue Chip Growth Class NAV (began 10/15/05) | 18.37% | — | — | 13.91% | 18.37% | — | — | 27.73% |
| S&P 500 Index3,5,6 | 15.13% | — | — | 14.36% | 15.13% | — | — | 28.69% |
1 Performance does not reflect the deduction of taxes on fund distributions or redemptions of fund shares. Past performance does not predict future performance.
2 Current subadviser has managed the fund since October 15, 2005.
3 Since inception returns for the indices may begin on the month-end closest to the actual inception date of the fund.
4 Since inception, a portion of the Blue Chip Growth Fund expenses were reimbursed. If such expenses had not been reimbursed, returns would be lower.
5 S&P 500 Index is an unmanaged index that includes 500 widely traded common stocks.
6 It is not possible to invest directly in an index. Index figures do not reflect sales charges and would be lower if they did.
10
Capital Appreciation Fund
Subadviser: Jennison Associates, LLC
Portfolio Managers: Michael Del Balso, Kathleen A. McCarragher and Spiros Seagalas
INVESTMENT OBJECTIVE & POLICIES ► To seek long-term growth of capital by investing at least 65% of the Fund’s total assets in equity-related securities of companies that exceed $1 billion in market capitalization and that are believed to have above-average growth prospects.
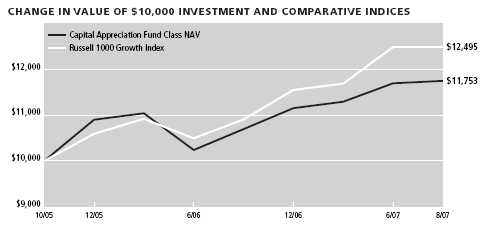
| |
| Sector Weighting* | % of Total |
|
| Consumer, Non-cyclical | 25.88 |
| Technology | 21.37 |
| Communications | 19.10 |
| Financial | 8.68 |
| Consumer, Cyclical | 8.67 |
| Industrial | 7.84 |
| Energy | 4.59 |
| Basic Materials | 1.73 |
*Top Sectors as a percentage of market value. Does not include short-term securities and investments in the John Hancock Cash Investment Trust.
PORTFOLIO MANAGERS’ COMMENTARY
Performance ► For the year ended August 31, 2007, the Capital Appreciation Class NAV returned +14.42%, underperforming the +17.70% return of the Russell 1000 Growth Index.
Environment ► The Federal Reserve held interest rates steady through the period. A decline in oil and natural gas prices and moderation in other commodity prices lifted consumer confidence as 2006 drew to a close. On the negative side, the housing and automotive sectors posted their weakest showings in years. Economic growth in 2007’s first quarter, as measured by gross domestic product (GDP), slowed to 0.6%, but it rebounded in the second quarter to 3.4%, with employment growth, manufacturing output, consumer spending and business investment contributing.
The residential real estate market faced a serious correction. Concerns that problems in the subprime mortgage market might expand into a broader credit crunch led to capital markets volatility. Corporate earnings growth persisted, but fell from the double-digit growth rates of recent years.
The Fund underperformed its benchmark index primarily because of adverse stock selection and an overweight position in the Health Care sector. Stock selection and overexposure in Consumer Discretionary also detracted from relative performance. The greatest contributors to relative performance were stock selection and an overweight stance in Information Technology. Stock selection in Telecommunication Services, Materials and Energy was also positive.
Outlook ► The recent rebound in U.S. economic growth encouraged investors that corporate profits are likely to continue to expand over the intermediate term. Fears about an emerging credit cycle caused spreads to widen for the riskiest portions of the credit spectrum. Recent bond market activity caused the previously inverted yield curve, which had fueled fears of looming economic weakness, to revert to a more normal pattern. Although it may be too soon to assert that investors are steering back toward companies with the greatest expected duration of growth, we are encouraged that the above-average profits growth of the Fund’s holdings has over the past several months translated into better share price appreciation. Believing that our companies can sustain this growth, we are optimistic as we move into the second half of 2007 and 2008.
| | | | | | | | |
| PERFORMANCE TABLE1 | Average Annual Total Return | | | Cumulative Total Return | |
|
| | | | | Since | | | | Since |
| Periods Ended August 31, 2007 | 1-year | 5-year | 10-year | inception | 1-year | 5-year | 10-year | inception2 |
|
| Capital Appreciation Class 1 (began 10/15/05) | 14.43% | — | — | 8.92% | 14.43% | — | — | 17.41% |
| Capital Appreciation Class NAV (began 10/15/05) | 14.42% | — | — | 8.98% | 14.42% | — | — | 17.53% |
| Russell 1000 Growth Index3,4,5 | 17.70% | — | — | 12.58% | 17.70% | — | — | 24.95% |
1 Performance does not reflect the deduction of taxes on fund distributions or redemptions of fund shares. Past performance does not predict future performance.
2 Current subadviser has managed the fund since October 15, 2005.
3 Since inception returns for the indices may begin on the month-end closest to the actual inception date of the fund.
4 Russell 1000 Growth Index is an unmanaged index composed of the Russell 1000 securities that have a greater-than-average growth orientation.
5 It is not possible to invest directly in an index. Index figures do not reflect sales charges and would be lower if they did.
11
Core Bond Fund
Subadviser: Wells Capital Management, Inc.
Portfolio Manager: William Stevens
INVESTMENT OBJECTIVE & POLICIES ► The Fund seeks total return consisting of income and capital appreciation by investing at least 80% of its net assets in a broad range of investment grade debt securities, including U.S. Government obligations, corporate bonds, mortgage-backed and other asset-backed securities and money market instruments.
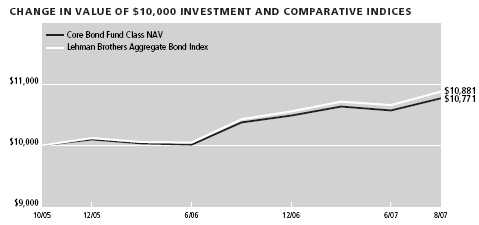
| |
| Sector Weighting* | % of Total |
|
| Mortgage Securities | 68.82 |
| Government | 9.06 |
| Financial | 6.35 |
| Asset Backed Securities | 3.20 |
| Communications | 2.88 |
| Energy | 1.33 |
| Utilities | 1.33 |
| Consumer, Non-cyclical | 1.29 |
| Consumer, Cyclical | 0.84 |
| Industrial | 0.19 |
| Diversified | 0.14 |
*Top Sectors as a percentage of market value. Does not include short-term securities and investments in the John Hancock Cash Investment Trust.
PORTFOLIO MANAGER’S COMMENTARY
Performance ► For the year ended August 31, 2007, the Core Bond Class NAV returned 4.67% versus the 5.26% return of the Lehman Brothers Aggregate Bond Index.
Environment ► Fixed income markets began the period with strong demand from overseas investors and significant structured product creation, including collateralized debt obligations (CDOs), driving credit spreads to historically low levels. Interest rates remained range-bound through the first quarter of 2007, as the first signs of subprime mortgage problems arose and market volatility was triggered by the sudden Chinese equity market sell-off in late February. The increase in market volatility, combined with stronger-than-expected growth during the first part of 2007, drove interest rates higher during the second quarter, with the 10-year Treasury yield peaking at 5.30% in mid-June. Credit spreads also began to widen during the last quarter, especially in shorter-term maturities, as the market started to re-assess required risk premium s.
In July and August, we witnessed a significant re-pricing of risk across all markets as subprime problems spread to other sectors. Hedge fund failures and margin calls pressured market liquidity, even rocking the normally uneventful money market sector. The market saw a “flight to quality” and steeper yield curve, with the 10-year Treasury yield falling to 4.53% at period-end. As the Treasury market rallied, credit spreads widened in all non-Treasury fixed income sectors, causing all sectors to underperform for the year-to-date.
Outlook ► Banks and brokers are rationing capital, and we have seen some reduction in leverage in the system, which has already produced some very attractive trading levels in structured products. The Federal Reserve can and probably will play a big role in maintaining orderly markets. We are confident in the Fed’s ability to avert disaster.
The duration of the Core Bond Fund remains close to that of the benchmark, the Lehman Aggregate Bond Index. Corporate exposure in the Fund is underweighted in expectation of widening spreads and secondary market lack of liquidity. In corporates, the Fund’s largest overweights are in cable/media, insurance and telecom, sectors that are attractive based on improving earnings trends and defensible spread levels. In mortgages, we continue to capitalize on relative value trading opportunities in the agency hybrid ARMs and CMOs sectors. The Fund remains overweight seasoned commercial mortgage-backed securities. We continue to focus on identifying good relative value opportunities through our bottom-up research.
| | | | | | | | |
| PERFORMANCE TABLE1 | Average Annual Total Return | | | Cumulative Total Return | |
|
| | | | | Since | | | | Since |
| Periods Ended August 31, 2007 | 1-year | 5-year | 10-year | inception | 1-year | 5-year | 10-year | inception2 |
|
| Core Bond Class 1 (began 10/15/05) | 4.60% | — | — | 3.97% | 4.60% | — | — | 7.59% |
| Core Bond Class NAV (began 10/15/05) | 4.67% | — | — | 4.03% | 4.67% | — | — | 7.71% |
| Lehman Brothers Aggregate Bond Index3,4,5 | 5.26% | — | — | 4.59% | 5.26% | — | — | 8.81% |
1 Performance does not reflect the deduction of taxes on fund distributions or redemptions of fund shares. Past performance does not predict future performance.
2 Current subadviser has managed the fund since October 15, 2005.
3 Since inception returns for the indices may begin on the month-end closest to the actual inception date of the fund.
4 Lehman Brothers Aggregate Bond Index is an unmanaged index of dollar-denominated and nonconvertible investment-grade debt issues.
5 It is not possible to invest directly in an index. Index figures do not reflect sales charges and would be lower if they did.
12
Core Equity Fund
Subadviser: Legg Mason Capital Management, Inc.
Portfolio Manager: Mary Chris Gay
INVESTMENT OBJECTIVE & POLICIES ► To seek long-term capital growth by investing at least 80% of the Fund’s net assets in equity securities that offer the potential for capital growth.
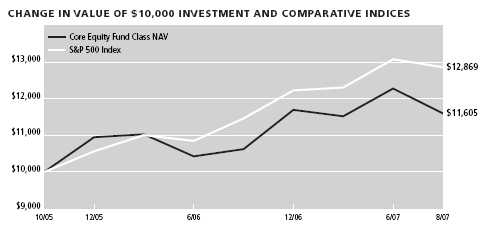
| |
| Sector Weighting* | % of Total |
|
| Communications | 41.11 |
| Financial | 16.82 |
| Consumer, Non-cyclical | 9.47 |
| Technology | 9.16 |
| Consumer, Cyclical | 8.71 |
| Industrial | 8.18 |
| Utilities | 4.61 |
*Top Sectors as a percentage of market value. Does not include short-term securities and investments in the John Hancock Cash Investment Trust.
PORTFOLIO MANAGER’S COMMENTARY
Performance ► For the year ended August 31, 2007, the Core Equity Class NAV returned +11.99%, underperforming the +15.13% return of the S&P 500 Index.
Environment ► After weakness during the summer of 2006, the markets resumed their upward trend, as solid earnings growth and low unemployment seemed to assure investors that the slowing housing market and growing subprime mortgage problems would not affect the broader economy. A brief correction in February and March presaged a larger summer tumble in the equity markets. As worried investors fled anything with a trace of sub-prime exposure, and a credit and liquidity crunch ensued, securities that had seemed on safe footing appeared precarious.
The Fund underperformed its benchmark index for the period. At the sector level, our absence from Energy hurt performance, as a rebound in crude oil prices helped the group lead its counterparts within the benchmark index. Underperformance in Financials, Telecommunication and Utilities also hampered results. On the positive side, our heavy weighting in the Consumer Discretionary sector, where our picks outperformed, aided our returns.
Outlook ► While we continue to monitor issues in the credit and housing markets and the economy overall, we maintain our optimistic forecast for 2007. It is too early to know whether recent weakness has run its course, but the fundamental backdrop of mid- to high-single-digit corporate earnings growth, low unemployment, low inflation and decent productivity growth leads us to remain constructive about the market. After remaining on pause for more than a year now, the Fed is widely expected to cut rates soon, a move that many hope will help keep the economy from slipping into a recession now that economic growth appears to be compromised.
| | | | | | | | |
| PERFORMANCE TABLE1 | Average Annual Total Return | | | Cumulative Total Return | |
|
| | | | | Since | | | | Since |
| Periods Ended August 31, 2007 | 1-year | 5-year | 10-year | inception | 1-year | 5-year | 10-year | inception2 |
|
| Core Equity Class 1 (began 10/15/05) | 11.99% | — | — | 8.21% | 11.99% | — | — | 15.98% |
| Core Equity Class NAV (began 10/15/05) | 11.99% | — | — | 8.24% | 11.99% | — | — | 16.05% |
| S&P 500 Index3,4,5 | 15.13% | — | — | 14.36% | 15.13% | — | — | 28.69% |
1 Performance does not reflect the deduction of taxes on fund distributions or redemptions of fund shares. Past performance does not predict future performance.
2 Current subadviser has managed the fund since October 15, 2005.
3 Since inception returns for the indices may begin on the month-end closest to the actual inception date of the fund.
4 S&P 500 Index is an unmanaged index that includes 500 widely traded common stocks.
5 It is not possible to invest directly in an index. Index figures do not reflect sales charges and would be lower if they did.
13
Emerging Growth Fund
Subadviser: MFC Global Investment Management (U.S.), LLC
Portfolio Managers: Henry E. Mehlman and Alan E. Norton
INVESTMENT OBJECTIVE & POLICIES ► To seek long-term capital appreciation by investing primarily in high-quality securities and convertible instruments of small-cap U.S. companies.
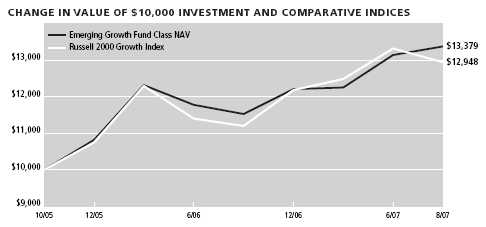
| |
| Sector Weighting* | % of Total |
|
| Consumer, Non-cyclical | 25.10 |
| Technology | 11.14 |
| Industrial | 10.88 |
| Consumer, Cyclical | 9.95 |
| Financial | 5.90 |
| Energy | 5.28 |
| Communications | 3.96 |
| Basic Materials | 0.22 |
*Top Sectors as a percentage of market value. Does not include short-term securities and investments in the John Hancock Cash Investment Trust.
PORTFOLIO MANAGERS’ COMMENTARY
Performance ► For the year ended August 31, 2007, the Emerging Growth Class NAV returned +19.27%, outperforming the +16.36% return of the Russell 2000 Growth Index.
Environment ► A tremendous wave of volatility washed over the markets this summer, driven by sub-prime mortgage concerns. This led to a credit squeeze that hurt many quantitative hedge funds and other investors, who generally employed significant leverage. Losses in subprime-related investments forced the sale of more liquid securities to meet margin calls and investor redemptions. A move to higher quality securities ensued. Investors have become more concerned about the weakening U.S. housing market and the strength of the overall economy. The Federal Reserve has balanced this against its concern of rising inflation. Most observers expect the Fed to begin lowering rates in September to help prevent the economy from slipping into recession. Growth stocks outperformed this year and the trend continued during the summer. A slowing economy generally favors growth stocks over more cyclical names and we expect that to continue.
Outlook ► All eyes are on the Fed. The extent to which interest rates are lowered will have a significant impact on economic strength. We expect markets to be choppy around Fed rate announcements and we hope to add value by maintaining our long-term focus. We expect that prompt Fed action will maintain a generally favorable backdrop for equities. We remain overweight in Health Care and Technology. Health Care will continue to benefit from favorable demographic trends while Technology will be driven by the need for continued productivity gains and from this sector’s exposure to robust international markets. High-quality financial stocks and consumer names that are beaten down could be fertile ground for new ideas heading into 2008. Additionally, as credit fears and interest rates stabilize, we could see a resumption of mergers and a cquisitions. The Fund had benefited from several strategic, as opposed to financial, deals in the first half of 2007. We would expect to benefit again if acquisition activity resumes.
| | | | | | | | |
| PERFORMANCE TABLE1 | Average Annual Total Return | | | Cumulative Total Return | |
|
| | | | | Since | | | | Since |
| Periods Ended August 31, 2007 | 1-year | 5-year | 10-year | inception | 1-year | 5-year | 10-year | inception2 |
|
| Emerging Growth Class 1 (began 10/15/05) | 19.20% | — | — | 16.71% | 19.20% | — | — | 33.70% |
| Emerging Growth Class NAV (began 10/15/05) | 19.27% | — | — | 16.75% | 19.27% | — | — | 33.79% |
| Russell 2000 Growth Index3,4,5 | 16.36% | — | — | 14.73% | 16.36% | — | — | 29.48% |
1 Performance does not reflect the deduction of taxes on fund distributions or redemptions of fund shares. Past performance does not predict future performance.
2 Current subadviser has managed the fund since October 15, 2005.
3 Since inception returns for the indices may begin on the month-end closest to the actual inception date of the fund.
4 Russell 2000 Growth Index is an unmanaged index that contains those securities from the Russell 2000 Index with a greater than average growth orientation.
5 It is not possible to invest directly in an index. Index figures do not reflect sales charges and would be lower if they did.
14
Emerging Markets Value Fund
Subadviser: Dimensional Fund Advisors
Portfolio Manager: Karen E. Umland
INVESTMENT OBJECTIVE & POLICIES ► To seek long-term capital appreciation by investing primarily in companies associated with emerging markets.
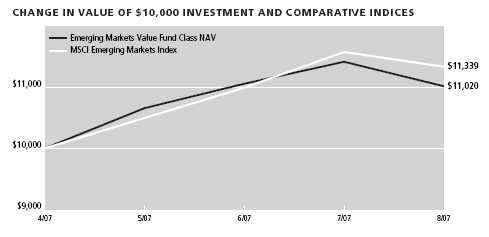
| |
| Sector Weighting* | % of Total |
|
| Financial | 23.71 |
| Basic Materials | 18.77 |
| Industrial | 15.20 |
| Consumer, Cyclical | 12.20 |
| Energy | 7.79 |
| Consumer, Non-cyclical | 7.22 |
| Diversified | 4.66 |
| Technology | 4.47 |
| Communications | 3.61 |
| Utilities | 2.23 |
| |
| Country Weighting * | % of Total |
|
| South Korea | 13.21 |
| India | 12.03 |
| Taiwan | 11.96 |
| South Africa | 11.12 |
| Brazil | 9.49 |
| Mexico | 9.47 |
| Malaysia | 4.87 |
| Chile | 4.39 |
| Turkey | 3.71 |
| Poland | 3.56 |
*Top Sectors as a percentage of market value. Does not include short-term securities and investments in the John Hancock Cash Investment Trust.
PORTFOLIO MANAGER’S COMMENTARY
Performance ► From the Fund’s inception in May 2007 through August 2007, the Emerging Markets Value Class NAV returned 10.20%, underperforming the 13.39% return of the MSCI Emerging Markets Index.
Environment ► For the 12-month period ending August 31, 2007, global equity returns were positive across the board. The broad U.S. equity market, as measured by the Russell 3000 Index, returned +14.9% for the period. International returns for U.S. investors looked slightly better than U.S. returns and were aided by the U.S. dollar’s relative weakness. During the year, the dollar’s depreciation ranged from 1.4% against the yen to 7.2% against the Australian dollar.
Developed-market equities, as measured by the MSCI EAFE Index, returned 18.7% . Dollar-denominated returns on developed-market equities ranged from 17.7% for large-cap value stocks to 19.6% for large-cap growth stocks. Using the EAFE indices as proxies, small-cap stocks underperformed large-cap stocks by 0.5% . Value stocks underperformed growth stocks by 1.9%.
Emerging market equities were the best-performing asset class during the 12 months ending August 2007. Dollar-denominated returns for emerging markets during that period, as measured by the MSCI Emerging Markets Index, were 43.6%. The U.S. dollar generally depreciated against emerging-market currencies, which contributed to dollar-denominated returns on emerging market equities.
For much of the period from its inception in May, the portfolio was in transition as it became fully invested. Differences in country weights between the portfolio and its benchmark index were the primary driver of underperformance. The portfolio’s underweight to China, a newly approved market, hurt relative performance, as did its overweight to South Africa. Offsetting these somewhat, the Fund’s exclusion of Russia helped. The Fund’s allocation to very small stocks contributed to performance while our underweight to the largest stocks hurt results. Because value stocks underperformed during this period, the portfolio’s tilt toward value stocks hurt relative returns.
| | | | | | | | |
| PERFORMANCE TABLE1 | Average Annual Total Return | | | Cumulative Total Return | |
|
| | | | | Since | | | | Since |
| Periods Ended August 31, 2007 | 1-year | 5-year | 10-year | inception | 1-year | 5-year | 10-year | inception2 |
|
| Emerging Markets Value Class NAV (began 5/1/07) | — | — | — | — | — | — | — | 10.20% |
| MSCI Emerging Markets Index3,4,5 | — | — | — | — | — | — | — | 13.39% |
1 Performance does not reflect the deduction of taxes on fund distributions or redemptions of fund shares. Past performance does not predict future performance.
2 Current subadviser has managed the fund since May 1, 2007.
3 Since inception returns for the indices may begin on the month-end closest to the actual inception date of the fund.
4 MSCI Emerging Markets Index is an unmanaged index designed to measure the performance of developing markets.
5 It is not possible to invest directly in an index. Index figures do not reflect sales charges and would be lower if they did.
15
Emerging Small Company Fund
Subadviser: RCM Capital Management
Portfolio Managers: Thomas J. Ross and Louise M. Laufersweiler
INVESTMENT OBJECTIVE & POLICIES ► To seek long-term capital appreciation by investing at least 80% of the Fund’s total net assets in equity securities of U.S. companies with smaller capitalizations. The Fund may also invest up to 15% of its assets in foreign securities including emerging markets and may also from time to time invest a significant percentage of its assets in the Technology and/or Health Care sectors.
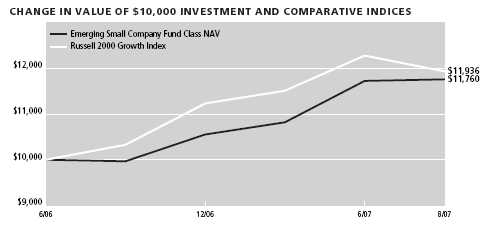
| |
| Sector Weighting* | % of Total |
|
| Consumer, Non-cyclical | 17.57 |
| Consumer, Cyclical | 14.51 |
| Financial | 11.19 |
| Communications | 9.56 |
| Technology | 8.87 |
| Industrial | 6.34 |
| Energy | 5.53 |
| Funds | 0.78 |
| Basic Materials | 0.53 |
*Top Sectors as a percentage of market value. Does not include short-term securities and investments in the John Hancock Cash Investment Trust.
PORTFOLIO MANAGERS’ COMMENTARY
Performance ► For the year ended August 31, 2007, the Emerging Small Company Class NAV returned +19.34%, outperforming the +16.36% return of the Russell 2000 Growth Index.
Environment ► U.S. small-cap equities posted double-digit gains during the 12-month period. The portfolio easily outperformed its benchmark index. Relative returns were boosted by strong stock selection in nearly every sector, led by Consumer Discretionary, Consumer Staples and Technology. In contrast, Industrials stock selection and an overweight exposure to Financials detracted from returns.
Small-cap stocks posted strong gains during the latter part of 2006. This upward trend continued during the first half of 2007, despite some market volatility in February and June. A robust world economy, low interest rates and rising corporate profits contributed to a rally that benefited most major global equity indices.
However, investor optimism gave way to unease as equities came under considerable pressure in July. The Russell 2000 Growth Index peaked in mid-July, along with other U.S. equity indices, including the S&P 500 Index, before correcting on concerns that subprime losses would spread throughout the financial markets. The resulting credit crunch even affected genuinely creditworthy borrowers. Markets re-priced risk, and the Russell 2000 Growth Index lost more than 5% in July before partially recovering in August. During the correction, the market favored growth-style investing and larger, more liquid shares.
Outlook ► We could see more headlines about deteriorating credit quality at some financial institutions. Choppy markets can easily persist for some time. We expect the pace of merger and acquisition transactions to slow, but higher-rated borrowers should still be able to access credit. Should the situation deteriorate further, the Federal Reserve will likely cut rates, and the first cut could happen soon. We continue to monitor developments closely and we expect small-cap companies with sound fundamentals to be rewarded over time.
| | | | | | | | |
| PERFORMANCE TABLE1,4 | Average Annual Total Return | | | Cumulative Total Return | |
|
| | | | | Since | | | | Since |
| Periods Ended August 31, 2007 | 1-year | 5-year | 10-year | inception | 1-year | 5-year | 10-year | inception2 |
|
| Emerging Small Company Class 1 (began 10/15/05) | 19.30% | — | — | 11.50% | 19.30% | — | — | 22.69% |
| Emerging Small Company Class NAV (began 6/26/06) | 19.34% | — | — | 14.60% | 19.34% | — | — | 17.60% |
| Russell 2000 Growth Index (10/15/05)3,5,6 | 16.36% | — | — | 14.73% | 16.36% | — | — | 29.48% |
| Russell 2000 Growth Index (6/26/06)3,5,6 | 16.36% | — | — | 16.05% | 16.36% | — | — | 19.36% |
1 Performance does not reflect the deduction of taxes on fund distributions or redemptions of fund shares. Past performance does not predict future performance.
2 Current subadviser has managed the fund since April 28, 2006.
3 Since inception returns for the indices may begin on the month-end closest to the actual inception date of the fund.
4 Since inception, a portion of the Emerging Small Company Fund expenses were reimbursed. If such expenses had not been reimbursed, returns would be lower.
5 Russell 2000 Growth Index is an unmanaged index that contains those securities from the Russell 2000 Index with a greater than average growth orientation.
6 It is not possible to invest directly in an index. Index figures do not reflect sales charges and would be lower if they did.
16
Equity-Income Fund
Subadviser: T. Rowe Price Associates, Inc.
Portfolio Manager: Brian C. Rogers
INVESTMENT OBJECTIVE & POLICIES ► To seek long-term capital appreciation and to provide dividend income. The Fund invests at least 80% of its total assets in equity securities, with 65% in common stocks of well-established companies paying above-average dividends.
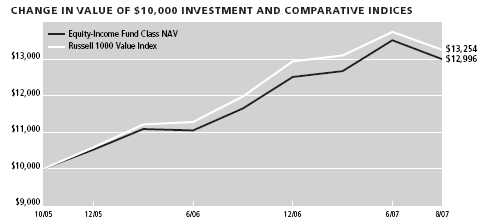
| |
| Sector Weighting* | % of Total |
|
| Consumer, Non-cyclical | 18.14 |
| Financial | 16.28 |
| Communications | 13.20 |
| Industrial | 11.53 |
| Energy | 11.37 |
| Consumer, Cyclical | 5.85 |
| Basic Materials | 5.38 |
| Technology | 5.28 |
| Utilities | 4.06 |
| Government | 0.52 |
*Top Sectors as a percentage of market value. Does not include short-term securities and investments in the John Hancock Cash Investment Trust.
PORTFOLIO MANAGER’S COMMENTARY
Performance ► For the year ended August 31, 2007, the Equity-Income Class NAV returned +14.46%, outperforming the +12.85% return of the Russell 1000 Value Index.
Environment ► Volatility dominated the equities market in recent months. Problems in the sub-prime mortgage market and rising gasoline prices put a damper on investors’ enthusiasm. The major stock indices, however, ended the 12-month period with solid gains despite a significant correction in mid-August.
Slowing growth in employment, led primarily by weakness in the housing market, could lead to a Federal Reserve interest rate cut in September. Private sector job growth has trended lower over the past few months, and the number of mortgage foreclosures hit a record high in the spring. In the midst of the turmoil, investors fled to the safety of Treasury securities.
An underweight position in the weak Financials sector contributed to relative performance, enhanced by good stock selection within the sector. The capital markets had record merger and acquisition activity, private equity transactions and stock buybacks. The Financials sector is our largest underweighting as it makes up one-third of the Index, and a position that large is inconsistent with our diversified approach.
Information Technology provided another boost to relative performance due to stock selection and an overweight position. Stock selection was especially strong in the semiconductors and semiconductor equipment industry. We are overweight the traditionally growth-oriented Information Technology sector, and our weighting is high by historical standards. Our largest exposure is to the software, semiconductors and semiconductor equipment industries.
The Energy sector was the largest detractor from relative performance due to an underweighting coupled with poor stock selection, particularly among oil, gas and consumable fuels companies. Despite our underweight position in Energy, we maintain significant exposure to companies well positioned to find and develop capacity.
Outlook ► Notwithstanding recent market turbulence, we are encouraged by the relatively healthy global economy and the wide range of attractive investment opportunities present today. Our view is that quality is currently selling at an attractive price. Our objective is to identify fairly priced stocks with good upside potential and relatively limited risk.
| | | | | | | | |
| PERFORMANCE TABLE1,4 | Average Annual Total Return | | | Cumulative Total Return | |
|
| | | | | Since | | | | Since |
| Periods Ended August 31, 2007 | 1-year | 5-year | 10-year | inception | 1-year | 5-year | 10-year | inception2 |
|
| Equity-Income Class 1 (began 10/15/05) | 14.37% | — | — | 14.90% | 14.37% | — | — | 29.84% |
| Equity-Income Class NAV (began 10/15/05) | 14.46% | — | — | 14.96% | 14.46% | — | — | 29.96% |
| Russell 1000 Value Index3,5,6 | 12.85% | — | — | 16.17% | 12.85% | — | — | 32.54% |
1 Performance does not reflect the deduction of taxes on fund distributions or redemptions of fund shares. Past performance does not predict future performance.
2 Current subadviser has managed the fund since October 15, 2005.
3 Since inception returns for the indices may begin on the month-end closest to the actual inception date of the fund.
4 Since inception, a portion of the Equity-Income Fund expenses were reimbursed. If such expenses had not been reimbursed, returns would be lower.
5 Russell 1000 Value Index is an unmanaged index containing those securities in the Russell 1000 Index with a less-than-average growth orientation.
6 It is not possible to invest directly in an index. Index figures do not reflect sales charges and would be lower if they did.
17
Fundamental Value Fund
Subadviser: Davis Selected Advisers, L.P.
Portfolio Managers: Christopher C. Davis and Kenneth Charles Feinberg
INVESTMENT OBJECTIVE & POLICIES ► To seek growth of capital. The Fund invests in common stocks of U.S. companies with market capitalization of at least $10 billion.
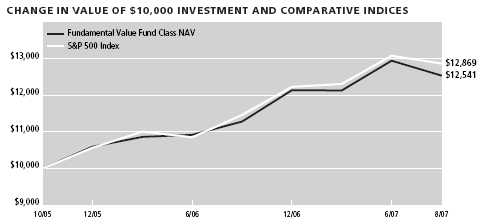
| |
| Sector Weighting* | % of Total |
|
| Financial | 35.37 |
| Consumer, Non-cyclical | 13.95 |
| Energy | 12.85 |
| Consumer, Cyclical | 9.93 |
| Communications | 9.66 |
| Industrial | 7.08 |
| Technology | 4.35 |
| Diversified | 0.79 |
| Basic Materials | 0.52 |
*Top Sectors as a percentage of market value. Does not include short-term securities and investments in the John Hancock Cash Investment Trust.
PORTFOLIO MANAGERS’ COMMENTARY
Performance ► The Fundamental Value Class NAV delivered a total return of 13.12% for the year ended August 31, 2007. Over the same time period, the S&P 500® Index returned 15.13% .
Environment ► The industry groups within the S&P 500 Index that turned in the strongest performance over the 12-month period were energy, telecommunication services and materials. The industry groups that turned in the weakest performance over the 12-month period were financials, health care and consumer staples.
The Fund had more invested in financial companies than in any other industry group. The Fund’s financial companies contributed to the Fund’s absolute performance, but trailed the performance of the overall S&P 500 Index, thus detracting from relative performance. The strong performance of the Fund’s consumer staple companies contributed to both absolute and relative performance. Energy companies made important contributions to the Fund’s performance. The Fund benefited from a slightly higher weighting in this strongly performing industry.
Many of the Fund’s industry groups had strong absolute returns for the year, but lagged the corresponding S&P 500 industry group. This was a key detractor to the Fund’s relative performance. The Fund’s information technology companies and telecommunications service companies underperformed those in the S&P 500 industry group. The Fund’s cash holding reduced relative performance during the strongly rising market.
Outlook ► We have built a portfolio which is quite different in composition from the S&P 500® Index. The Fund’s investment strategy is to perform extensive research to buy companies with durable earnings at prices below our estimates of their intrinsic value and hold them for the long term. We are strong supporters of long-term buy-and-hold investing.
| | | | | | | | |
| PERFORMANCE TABLE1 | Average Annual Total Return | | | Cumulative Total Return | |
|
| | | | | Since | | | | Since |
| Periods Ended August 31, 2007 | 1-year | 5-year | 10-year | inception | 1-year | 5-year | 10-year | inception2 |
|
| Fundamental Value Class 1 (began 10/15/05) | 13.02% | — | — | 12.73% | 13.02% | — | — | 25.27% |
| Fundamental Value Class NAV (began 10/15/05) | 13.12% | — | — | 12.80% | 13.12% | — | — | 25.41% |
| S&P 500 Index3,4,5 | 15.13% | — | — | 14.36% | 15.13% | — | — | 28.69% |
1 Performance does not reflect the deduction of taxes on fund distributions or redemptions of fund shares. Past performance does not predict future performance.
2 Current subadviser has managed the fund since October 15, 2005.
3 Since inception returns for the indices may begin on the month-end closest to the actual inception date of the fund.
4 S&P 500 Index is an unmanaged index that includes 500 widely traded common stocks.
5 It is not possible to invest directly in an index. Index figures do not reflect sales charges and would be lower if they did.
18
Global Bond Fund
Subadviser: Pacific Investment Management Company LLC
Portfolio Manager: Sudi Mariappa
INVESTMENT OBJECTIVE & POLICIES ► To seek maximum total return, consistent with preservation of capital and prudent investment management. The Fund invests at least 80% of its net assets in fixed-income instruments, which may be represented by futures contracts with respect to such securities, and options on such securities.
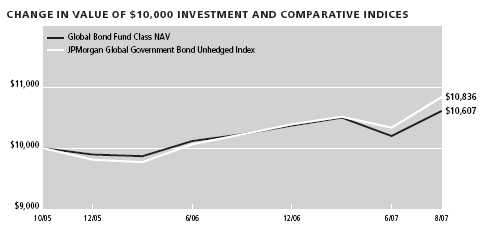
| |
| Sector Weighting* | % of Total |
|
| Mortgage Securities | 37.73 |
| Government | 36.37 |
| Financial | 9.46 |
| Asset Backed Securities | 5.11 |
| Other | 1.06 |
| Utilities | 0.79 |
| Communications | 0.61 |
| Consumer, Cyclical | 0.57 |
| Consumer, Non-cyclical | 0.40 |
| Energy | 0.32 |
| |
| Country Weighting * | % of Total |
|
| United States | 53.56 |
| Germany | 14.13 |
| Japan | 8.62 |
| France | 1.46 |
| Cayman Islands | 1.23 |
| United Kingdom | 1.12 |
| Netherlands | 1.05 |
| Spain | 0.42 |
| Denmark | 0.23 |
| Luxembourg | 0.16 |
*Top Sectors as a percentage of market value. Does not include short-term securities and investments in the John Hancock Cash Investment Trust.
PORTFOLIO MANAGER’S COMMENTARY
Performance ► For the year ended August 31, 2007, the Global Bond Class NAV returned +3.51%, underperforming the +5.77% return of the JPM Global Gov. Bond Unhedged Index.
Environment ► During the year, 10-year yields in the U.S., U.K. and Eurozone briefly touched highs not seen since 2002 before markets regained their composure. U.S. Treasury bond purchases by foreign official institutions are credited with keeping intermediate U.S. yields stable and flattening the term premium despite firm growth and higher than expected inflation. While global reserve accumulation continued at a rapid pace, concerns over diversification into non-Treasury assets were heightened by China’s $3 billion investment in the Blackstone private equity group. The Federal Reserve kept the federal funds rate at 5.25% throughout the period. Even as concerns about the subprime mortgage sector developed, the Fed focused on stronger economic data and inflation concerns, making it difficult to ease rates.
Geopolitical risks and elevated commodity prices contributed to forecasts of inflation and global growth. An overweight to U.S. duration detracted from returns, as yield movements were volatile, which more than offset a decrease in U.S. rates. Strategies designed to benefit from a growing U.S. yield curve added to returns, as the curve steepened. An underweight to U.K. duration added to returns, as U.K. yields rose, while exposure to shorter maturities in the U.K. offset this positive impact, as the U.K. curve flattened slightly. Strategies designed to benefit from a flattening of the Euroland curve added to returns, as the curve also flattened during the period. Exposure to mortgages detracted from returns, as spreads widened relative to Treasuries. Exposure to a basket of currencies added to returns, as most currencies appreciated relative to the U.S. dollar.
Outlook ► We expect global growth to remain firm, underpinned by robust growth in the developing economies. Economic growth in the developed world, however, should most likely slow, faced with tighter monetary policies, higher oil prices and, in some cases, stronger currencies. The U.S. economy is expected to lag its developed counterparts. Persistent weakness in the housing sector combined with higher energy prices may weigh on consumption. The subprime meltdown resulted in a tightening of credit across the U.S. economy, which could add to the housing sector’s problems and dampen corporate activity and investment.
| | | | | | | | |
| PERFORMANCE TABLE1 | Average Annual Total Return | | | Cumulative Total Return | |
|
| | | | | Since | | | | Since |
| Periods Ended August 31, 2007 | 1-year | 5-year | 10-year | inception | 1-year | 5-year | 10-year | inception2 |
|
| Global Bond Class 1 (began 10/15/05) | 3.40% | — | — | 3.12% | 3.40% | — | — | 5.95% |
| Global Bond Class NAV (began 10/15/05) | 3.51% | — | — | 3.19% | 3.51% | — | — | 6.07% |
| JP Morgan Global Government Bond Unhedged Index3,4,5 | 5.77% | — | — | 4.28% | 5.77% | — | — | 8.36% |
1 Performance does not reflect the deduction of taxes on fund distributions or redemptions of fund shares. Past performance does not predict future performance.
2 Current subadviser has managed the fund since October 15, 2005.
3 Since inception returns for the indices may begin on the month-end closest to the actual inception date of the fund.
4 JP Morgan Global Government Bond Unhedged Index is an unmanaged index which measures the performance of leading government bond markets based on total return in U.S. currency. By including only traded issues, the Index provides a realistic measure of market performance for international investors. It is calculated by J.P. Morgan, and reflects reinvestment of all applicable dividends, capital gains and interest.
5 It is not possible to invest directly in an index. Index figures do not reflect sales charges and would be lower if they did.
19
Global Real Estate Fund
Subadviser: Deutsche Investment Management Americas Inc.
Portfolio Managers: John F. Robertson, Daniel Ekins, John Hammond, William Leung and John W. Vojticek
INVESTMENT OBJECTIVE & POLICIES ► The Fund seeks a combination of long-term capital appreciation and current income by primarily investing in equity securities of U.S. REITs, foreign entities with tax-transparent structures similar to REITs, and U.S. and foreign real estate operating companies.
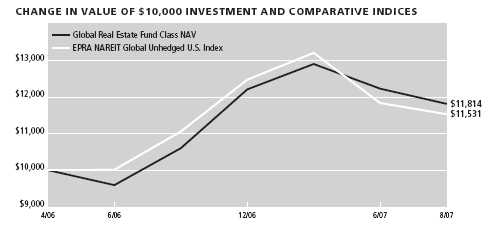
| |
| Sector Weighting* | % of Total |
|
| Financial | 87.03 |
| Consumer, Non-cyclical | 3.77 |
| Consumer, Cyclical | 2.02 |
| Industrial | 0.13 |
| Diversified | 0.11 |
*Top Sectors as a percentage of market value. Does not include short-term securities and investments in the John Hancock Cash Investment Trust.
PORTFOLIO MANAGERS’ COMMENTARY
Performance ► For the year ended August 31, 2007, the Global Real Estate Class NAV returned +14.70% outperforming the +7.41% return of the EPRA NAREIT Global Unhedged U.S. Index.
Environment ► During the first half of the fiscal year, worldwide performance was strong. In Europe, announcements about REIT adoption in the U.K., Germany and Italy drove performance of real estate stocks. In Asia, Japan, Hong Kong and Singapore all benefited from strong fundamentals and robust market sentiment. Australia also gained from strong fundamentals as well as capital flows to real estate. North America posted strong returns, as merger and acquisition activity continued at a record pace. Midway through the fiscal year, performance of U.S. REITs started to slide, followed by deterioration in the international markets. Subprime weakness led to a widening of credit spreads and eventually a freeze in global credit markets. Fears of rising interest rates also damaged market sentiment. Australia was the only region that seemed immun e to the downside volatility in global real estate in the second half of the period.
The Fund outperformed its benchmark for the year due to both positive stock selection and regional allocation. Led by North America and Asia, all regions had positive stock selection. Australia was the only negative in regional allocation, as the underweight position to outperforming Australia detracted from performance.
Outlook ► The performance slide of all global regions reversed at the end of August. However, there remain several concerns regarding the markets, including the true impact of the subprime issue, the level at which interest rates move globally, and decelerating fundamentals across the globe. We remain positive about the long-term outlook for property companies in North America, Europe and Asia due to attractive property fundamentals and expected strong liquidity once the market panic abates. We expect earnings growth to be the primary driver of real estate stock returns. We plan to remain overweight Asia. However, we believe we’ll see continued volatility before the markets stabilize.
| | | | | | | | |
| PERFORMANCE TABLE1 | Average Annual Total Return | | | Cumulative Total Return | |
|
| | | | | Since | | | | Since |
| Periods Ended August 31, 2007 | 1-year | 5-year | 10-year | inception | 1-year | 5-year | 10-year | inception2 |
|
| Global Real Estate Class NAV (began 4/28/06) | 14.70% | — | — | 13.22% | 14.70% | — | — | 18.14% |
| EPRA NAREIT Global Unhedged U.S. Index3,4,5 | 7.41% | — | — | 11.19% | 7.41% | — | — | 15.31% |
1 Performance does not reflect the deduction of taxes on fund distributions or redemptions of fund shares. Past performance does not predict future performance.
2 Current subadviser has managed the fund since April 28, 2006.
3 Since inception returns for the indices may begin on the month-end closest to the actual inception date of the fund.
4 EPRA NAREIT Global Unhedged U.S. Index is an unmanaged index. Designed to track the performance of listed real estate companies and REITs worldwide, the series acts as a performance measure of the overall market and is also suitable for use as the basis for investment products such as derivatives and Exchange Traded Funds (ETFs).
5 It is not possible to invest directly in an index. Index figures do not reflect sales charges and would be lower if they did.
20
High Income Fund
Subadviser: MFC Global Investment Management (U.S.), LLC
Portfolio Manager: Arthur N. Calavritinos
INVESTMENT OBJECTIVE & POLICIES ► To seek high current income with capital appreciation as a secondary goal by investing primarily in U.S. and foreign fixed-income securities that are rated BB/Ba or lower and unrated equivalents.
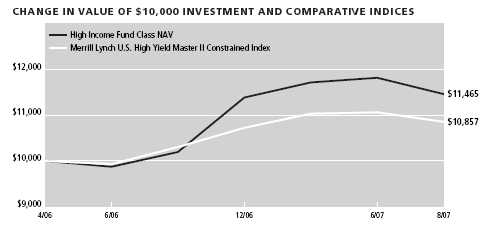
| |
| Sector Weighting* | % of Total |
|
| Consumer, Cyclical | 33.07 |
| Communications | 32.27 |
| Consumer, Non-cyclical | 8.94 |
| Basic Materials | 8.02 |
| Industrial | 4.42 |
| Government | 3.66 |
| Financial | 2.78 |
| Mortgage Securities | 2.42 |
| Asset Backed Securities | 1.32 |
| Utilities | 0.86 |
*Top Sectors as a percentage of market value. Does not include short-term securities and investments in the John Hancock Cash Investment Trust.
PORTFOLIO MANAGER’S COMMENTARY
Performance ► For the year ended August 31, 2007, the High Income Class NAV returned +14.81%, outperforming the +6.72% return of the Merrill Lynch U.S. High Yield Master II Constrained Index.
Environment ► The spread above U.S. Treasuries, 3.49% at the beginning of this period, steadily ground tighter until the end of May, when it reached 2.41% . During the first nine months of the period, the high yield market was very robust and enjoyed a total return of 10.05%, buoyed by low default rates, relatively stable interest rates and continued economic and stock market strength. Demand far outweighed market supply. New issues were very aggressively priced and structured (very loose covenants, payment-in-kind coupons) and allocations were heavily scaled back.
The market began to deteriorate in June 2007 and spreads widened to 4.40% by the end of August. This sell-off was mostly caused by waning investor demand in anticipation of a glut of leveraged buy-out (LBO) financings that still had to be priced. This forward calendar stood at close to $305 billion and consisted of large deals. The leveraged bank loan market, with many of its traditional buyers now on the sideline, quickly declined by approximately 5% and high yield bonds traded down based on the same information. In August, general market fears surrounding exposure to subprime, real estate and the commercial paper re-financing crisis exacerbated the sell-off.
The JHF II High Income Portfolio out-performed the Merrill Lynch US High Yield Master II Index by over 7% over the last year. The performance was boosted by the success of some of our large value positions, such as Northwest Airlines, United Airlines, Freeport-McMoran, and Charter Communications. We also benefited by staying away from the aggressively priced new issue market which underperformed the market during the downturn.
Outlook ► In the short term, we remain cautious until we see how the market digests the large forward calendar. If the clearing level on some of these big deals puts further pressure on the market, we will try to add to some of our existing positions at cheaper levels. By the end of 2007, we should have some clarity on the scope of any Federal Reserve moves, and a better understanding of the economy’s direction.
| | | | | | | | |
| PERFORMANCE TABLE1 | Average Annual Total Return | | | Cumulative Total Return | |
|
| | | | | Since | | | | Since |
| Periods Ended August 31, 2007 | 1-year | 5-year | 10-year | inception | 1-year | 5-year | 10-year | inception2 |
|
| High Income Class NAV (began 4/28/06) | 14.81% | — | — | 10.72% | 14.81% | — | — | 14.65% |
| Merrill Lynch U.S. High Yield Master II Constrained Index3,4,5 | 6.72% | — | — | 6.31% | 6.72% | — | — | 8.57% |
1 Performance does not reflect the deduction of taxes on fund distributions or redemptions of fund shares. Past performance does not predict future performance.
2 Current subadviser has managed the fund since April 28, 2006.
3 Since inception returns for the indices may begin on the month-end closest to the actual inception date of the fund.
4 Merrill Lynch U.S. High Yield Master II Constrained Index is an unmanaged index composed of U.S. currency high-yield bonds issued by U.S. and non-U.S. issuers.
5 It is not possible to invest directly in an index. Index figures do not reflect sales charges and would be lower if they did.
21
High Yield Fund
Subadviser: Western Asset Management Company
Portfolio Manager: S. Kenneth Leech, Steven A. Walsh, Mike Buchanan, Timothy J. Settel and Ian R. Edmonds
INVESTMENT OBJECTIVE & POLICIES ► To realize an above-average total return over a market cycle of three to five years, consistent with reasonable risk, by investing primarily in high yield securities, including corporate bonds, preferred stocks, U.S. government and foreign securities, mortgage-backed securities and loan assignments.
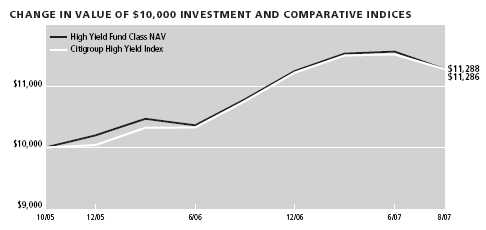
| |
| Sector Weighting* | % of Total |
|
| Communications | 17.13 |
| Consumer, Cyclical | 13.86 |
| Consumer, Non-cyclical | 12.72 |
| Energy | 11.77 |
| Financial | 9.61 |
| Industrial | 9.42 |
| Basic Materials | 6.83 |
| Government | 5.98 |
| Utilities | 3.94 |
| Technology | 1.19 |
*Top Sectors as a percentage of market value. Does not include short-term securities and investments in the John Hancock Cash Investment Trust.
PORTFOLIO MANAGERS’ COMMENTARY
Performance ► For the year ended August 31, 2007, the High Yield Class NAV returned +6.00%, underperforming the +6.34% return of the Citigroup High Yield Index.
Environment ► During the period, the yield curve regained its positive slope as the market concluded the Federal Reserve had reached the end of its tightening cycle and would soon begin easing. Inflation measures showed encouraging signs of moderation while economic growth continued at a sub-trend, but healthy clip. An outright seizure in lending markets ultimately convinced investors that looser monetary conditions are the only plausible way forward, despite the Fed’s insistence that inflation risks remain the predominant concern. Core inflation fell from its peak at the beginning of the period back to within the Fed’s comfort zone for the first time in three-plus years. Employment growth remained supportive of consumer spending, though retail sales and durable goods orders moderated.
Home prices began to fall outright, which should help markets clear the inventory of unsold homes and eventually allow homebuilders to get back on their feet. Credit spreads narrowed during the first half of the period, but widened dramatically in the final months. Rising uncertainty over the degree of subprime losses forced swap spreads higher and had a negative effect on mortgage-backed securities. TIPS underperformed their nominal counterparts as the fear of inflation subsided. The price of a barrel of oil rose over 5% while the dollar continued its descent against a trade-weighted basket of currencies.
The Fund was positioned for a continuation of solid corporate earnings growth and benefited from this strategy for the first nine months of the period. However, these gains were more than wiped out in the last three months as a result of reduced credit market liquidity due to (1) increasing concern about the direction of economic activity due in part to skyrocketing delinquencies in the subprime mortgage market (2) deleveraging (liquidations) by levered investors who became subject to margin calls as the value of their structured product holdings declined and (3) looming supply of historic proportions. These technical factors overwhelmed the positive fundamental backdrop of strong corporate profitability and liquidity as well as leverage metrics that on balance remain well below historical averages. The general risk reduction trade that occurred during the last 3 months of the period were severe on non-investment grade credit and particularly on lower rated non-investment grade issues.
Outlook ► Our outlook calls for continued moderate growth and relatively contained inflation. We are positioned with the expectation that there will be no significant changes in key macro-economic variables, but we also have strategies in place that are designed to hedge against unexpected economic weakness and higher-than-expected inflation.
| | | | | | | | |
| PERFORMANCE TABLE1 | Average Annual Total Return | | | Cumulative Total Return | |
|
| | | | | Since | | | | Since |
| Periods Ended August 31, 2007 | 1-year | 5-year | 10-year | inception | 1-year | 5-year | 10-year | inception2 |
|
| High Yield Class 1 (began 10/15/05) | 6.02% | — | — | 6.63% | 6.02% | — | — | 12.82% |
| High Yield Class NAV (began 10/15/05) | 6.00% | — | — | 6.66% | 6.00% | — | — | 12.88% |
| Citigroup High Yield Index3,4,5 | 6.34% | — | — | 6.51% | 6.34% | — | — | 12.86% |
1 Performance does not reflect the deduction of taxes on fund distributions or redemptions of fund shares. Past performance does not predict future performance.
2 Current subadviser has managed the fund since April 28, 2006.
3 Since inception returns for the indices may begin on the month-end closest to the actual inception date of the fund.
4 Citigroup High Yield Index is an unmanaged index which measures the performance of below-investment grade debt issued by corporations domiciled in the U.S. or Canada.
5 It is not possible to invest directly in an index. Index figures do not reflect sales charges and would be lower if they did.
22
Index 500 Fund
Subadviser: MFC Global Investment Management (U.S.A.) Limited
Portfolio Managers: Carson Jen and Narayan Ramani
INVESTMENT OBJECTIVE & POLICIES ► To approximate the aggregate total return of a broad-based U.S. domestic equity market index by investing at least 80% of the Fund’s net assets in (a) common stocks that are included in the S&P 500 Index and (b) securities that are believed to behave in a manner similar to the Index.
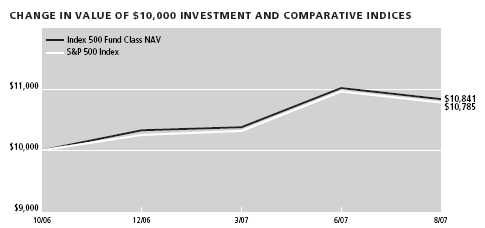
| |
| Sector Weighting* | % of Total |
|
| Government | 19.65 |
| Financial | 15.62 |
| Consumer, Non-cyclical | 15.08 |
| Technology | 9.36 |
| Communications | 9.26 |
| Industrial | 9.18 |
| Energy | 9.11 |
| Consumer, Cyclical | 6.43 |
| Basic Materials | 2.86 |
| Utilities | 2.57 |
*Top Sectors as a percentage of market value. Does not include short-term securities and investments in the John Hancock Cash Investment Trust.
PORTFOLIO MANAGERS’ COMMENTARY
Performance ► Since its inception, the Index 500 Class NAV returned +8.41%, in line with the +7.85% return of the S&P 500 Index.
Environment ► The U.S. economy seems to be slowing down, as the first quarter gross domestic product (GDP) grew at a 0.6% annual rate, before bouncing back in the second quarter to a 4% annual real growth rate. Despite fears of rising U.S. inflation, in the past year the inflation rate was not significant.
The Federal Reserve has left the benchmark federal funds rate unchanged at 5.25% since mid-2006. In August 2007, the unemployment rate remained at 4.6%, a slight increase from the previous quarter’s 4.5% . While employment in manufacturing, construction and local government education declined, there has been a growth in such industries as health care and food products. Over the past three months, total payroll in the U.S. grew by 44,000 per month. The Conference Board’s Consumer Confidence Index dropped to 105 in August from 111.9 in July.
For the period, Energy and Materials were the best performing sectors, returning 32% and 27%, respectively. Health Care and Financials were the worst performers, returning 6% and –0.5% respectively.
Outlook ► Despite an expected slowdown in the U.S. economy, we don’t foresee a recession in the upcoming year. An interest rate cut is expected in the fall of 2007, which may restore confidence and retail spending. Moreover, gaining access to credit may be tougher for many Americans. The Fed believes that the U.S. economy is not at risk.
| | | | | | | | |
| PERFORMANCE TABLE1 | Average Annual Total Return | | | Cumulative Total Return | |
|
| | | | | Since | | | | Since |
| Periods Ended August 31, 2007 | 1-year | 5-year | 10-year | inception | 1-year | 5-year | 10-year | inception2 |
|
| Index 500 Class NAV (began 10/27/06) | — | — | — | — | — | — | — | 8.41% |
| S&P 500 Index3,4,5 | — | — | — | — | — | — | — | 7.85% |
1 Performance does not reflect the deduction of taxes on fund distributions or redemptions of fund shares. Past performance does not predict future performance.
2 Current subadviser has managed the fund since October 27, 2006.
3 Since inception returns for the indices may begin on the month-end closest to the actual inception date of the fund.
4 S&P 500 Index is an unmanaged index that includes 500 widely traded common stocks.
5 It is not possible to invest directly in an index. Index figures do not reflect sales charges and would be lower if they did.
23
International Equity Index Fund
Subadviser: SSgA Funds Management, Inc.
Portfolio Managers: Jeffrey Beach and Thomas Coleman
INVESTMENT OBJECTIVE & POLICIES ► The Fund seeks to track the performance of a broad-based equity index of foreign companies primarily in developed countries and, to a lesser extent, in emerging market countries. The Fund primarily invests in securities listed in the Morgan Stanley Capital International All Country World excluding U.S. Index.
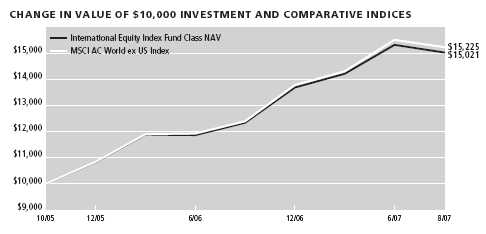
| |
| Sector Weighting* | % of Total |
|
| Financial | 23.72 |
| Consumer, Non-cyclical | 11.58 |
| Industrial | 10.38 |
| Basic Materials | 8.92 |
| Communications | 8.58 |
| Energy | 8.50 |
| Consumer, Cyclical | 8.21 |
| Utilities | 4.28 |
| Technology | 3.26 |
| Diversified | 0.77 |
| |
| Country Weighting * | % of Total |
|
| United Kingdom | 15.14 |
| Japan | 14.32 |
| France | 6.53 |
| Germany | 5.65 |
| Canada | 5.49 |
| Switzerland | 4.63 |
| Australia | 4.16 |
| Spain | 2.79 |
| Netherlands | 2.71 |
| Italy | 2.66 |
*Top Sectors as a percentage of market value. Does not include short-term securities and investments in the John Hancock Cash Investment Trust.
PORTFOLIO MANAGERS’ COMMENTARY
Performance ► For the year ended August 31, 2007, the International Equity Index Class NAV returned +21.97%, underperforming the +22.99% return of the MSCI AC World ex US Index.
Environment ► International equity markets achieved solid returns for the year despite a late summer subprime debt-related pullback. Rising interest rates had little impact as strong economic growth and subdued inflation made for an environment friendly to equities worldwide. All but three ACWI ex U.S. countries achieved positive double-digit returns for the year ending August 31, 2007. As a result, holders of broad-based international equity portfolios were handsomely rewarded. Emerging markets once again outperformed developed markets 43.6% versus 19.0% .
On a regional basis, Latin America was the clear winner, with a return of 53.7% versus 22.3% for Europe and 19.9% for Asia/Pacific. All 10 sectors achieved positive returns for the year. Materials and Telecommunication Services were the sector leaders, returning 44.8% and 42.9%, respectively. Health Care was the sector laggard, returning 0.5% for the year. U.S.-based investors were also helped as the U.S. dollar continued to fall against all major currencies.
Outlook ► The short-term money markets remain a clear source of concern for equity investors. If straightforward borrowing and lending cannot readily proceed at a reasonable price, business confidence will suffer and expenditure plans will face the risk of retreat. However, corporate profits are still strong, and wealth is still accumulating in countries that enjoy resource and manufacturing advantages. Furthermore, the major central banks have recognized the economic challenges that hobbled financing conditions may produce, and they seem likely to lean to the accommodative side in the coming months. We may well be in the early stages of a disruptive process that is transferring economic leadership from an overextended financial sector back to more basic product and service companies. This may create attractive investment opportunities for many businesses that are continuing to gene rate solid earnings. Such a scenario should provide sustainable global growth well into the next year.
| | | | | | | | |
| PERFORMANCE TABLE1 | Average Annual Total Return | | | Cumulative Total Return | |
|
| | | | | Since | | | | Since |
| Periods Ended August 31, 2007 | 1-year | 5-year | 10-year | inception | 1-year | 5-year | 10-year | inception2 |
|
| International Equity Index Fund Class NAV (began 10/29/05) | 21.97% | — | — | 24.73% | 21.97% | — | — | 50.21% |
| MSCI AC World ex US Index3,4,5 | 22.99% | — | — | 25.78% | 22.99% | — | — | 52.25% |
1 Performance does not reflect the deduction of taxes on fund distributions or redemptions of fund shares. Past performance does not predict future performance.
2 Current subadviser has managed the fund since October 29, 2005.
3 Since inception returns for the indices may begin on the month-end closest to the actual inception date of the fund.
4 MSCI AC World ex US Index is a free float-adjusted market capitalization index that is designed to measure equity market performance in the global developed and emerging markets excluding U.S. As of June 2006 the MSCI ACWI consisted of the following 47 developed and emerging market country indices: Argentina,Australia, Austria, Belgium, Brazil, Canada, Chile, China, Colombia, Czech Republic, Denmark, Egypt, Finland, France, Germany, Greece, Hong Kong, Hungary, India, Indonesia, Ireland, Israel, Italy, Japan, Jordan, Korea, Malaysia, Mexico, Morocco, Netherlands, New Zealand, Norway, Pakistan, Peru, Philippines, Poland, Portugal, Russia, Singapore Free, South Africa, Spain, Sweden, Switzerland,Taiwan,Thailand, Turkey, and the United Kingdom.
5 It is not possible to invest directly in an index. Index figures do not reflect sales charges and would be lower if they did.
24
International Opportunities Fund
Subadviser: Marsico Capital Management, LLC
Portfolio Manager: James G.Gendelman
INVESTMENT OBJECTIVE & POLICIES ► To seek long-term growth of capital by investing at least 65% of its assets in common stocks of foreign companies that are selected for their long-term growth potential.
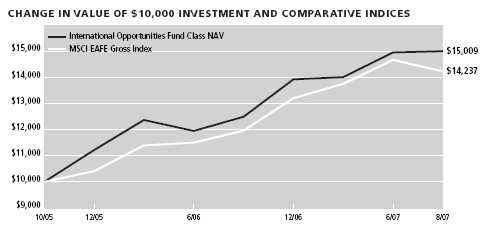
| |
| Sector Weighting* | % of Total |
|
| Consumer, Cyclical | 18.57 |
| Consumer, Non-cyclical | 14.47 |
| Financial | 13.84 |
| Communications | 13.15 |
| Industrial | 10.23 |
| Energy | 7.01 |
| Basic Materials | 5.95 |
| Technology | 5.04 |
| Utilities | 4.67 |
| Government | 4.07 |
| |
| Country Weighting * | % of Total |
|
| Switzerland | 12.16 |
| United kingdom | 9.47 |
| France | 8.39 |
| Japan | 7.86 |
| Hong Kong | 7.28 |
| Brazil | 6.42 |
| Germany | 5.60 |
| Canada | 4.24 |
| United States | 3.56 |
| Mexico | 3.26 |
*Top Sectors as a percentage of market value. Does not include short-term securities and investments in the John Hancock Cash Investment Trust.
PORTFOLIO MANAGER’S COMMENTARY
Performance ► For the year ended August 31, 2007, the International Opportunities Class NAV returned +21.51%, overperforming the +19.20% return of the MSCI EAFE Gross Index.
Environment ► International equity performance in developed markets was solid during the year ended August 31, 2007. Substantial declines in energy and commodity prices and generally strong corporate profit reports bolstered stock prices. Gains in developed markets, as measured by the MSCI EAFE Index, were widespread — nine of the 10 sectors within the Index posted positive returns. The Health Care sector was the laggard with a return of 0% for the period.
The Fund’s stock selection within the Telecommunications Services sector was a material positive contributor to results. Strong performance of Energy holdings and an underweighted posture in that sector further aided performance. During the reporting period, the Fund maintained, on average, an underweighted posture in two of the weaker-performing areas of the benchmark index, the Financials and Health Care sectors, which helped returns. Stock selection in the pharmaceuticals, biotechnology & life sciences industry also added to results.
Although the Fund maintained an underweighted posture in Japan (relative to the Index), weakness among our Japanese holdings hampered results. Consumer Discretionary holdings also hurt performance. In addition, certain holdings in the Financials sector were weak performers. Currency fluctuations may at times affect the Fund’s investment results because its foreign holdings are denominated in foreign currencies whose value may rise or fall against the dollar. These fluctuations hurt the Fund’s performance during the reporting period.
Outlook ► As of period end, the Fund’s economic sector allocations emphasized Consumer Discretionary, Financials, Industrials and Materials. The portfolio’s country weightings emphasized Switzerland, the United Kingdom, Japan and France. Sector and country weightings are primarily a residual of the stock selection process.
| | | | | | | | |
| PERFORMANCE TABLE1 | Average Annual Total Return | | | Cumulative Total Return | |
|
| | | | | Since | | | | Since |
| Periods Ended August 31, 2007 | 1-year | 5-year | 10-year | inception | 1-year | 5-year | 10-year | inception2 |
|
| International Opportunities Class 1 (began 10/15/05) | 21.48% | — | — | 24.02% | 21.48% | — | — | 49.86% |
| International Opportunities Class NAV (began 10/15/05) | 21.51% | — | — | 24.12% | 21.51% | — | — | 50.09% |
| MSCI EAFE Gross Index3,4,5 | 19.20% | — | — | 20.23% | 19.20% | — | — | 42.37% |
1 Performance does not reflect the deduction of taxes on fund distributions or redemptions of fund shares. Past performance does not predict future performance.
2 Current subadviser has managed the fund since October 15, 2005.
3 Since inception returns for the indices may begin on the month-end closest to the actual inception date of the fund.
4 MSCI EAFE Gross Index (Europe,Australia, Far East) is a free-float-adjusted market capitalization index that is designed to measure developed market equity performance, excluding the U.S. & Canada.As of June 2006, the MSCI EAFE Gross Index consisted of the following 21 developed market country indices: Australia,Austria, Belgium, Denmark, Finland, France, Germany, Greece, Hong Kong, Ireland, Italy, Japan, the Netherlands, New Zealand, Norway, Portugal, Singapore, Spain, Sweden, Switzerland and the United Kingdom.
5 It is not possible to invest directly in an index. Index figures do not reflect sales charges and would be lower if they did.
25
International Small Cap Fund
Subadviser: Templeton Investment Counsel, LLC
Portfolio Managers: Tucker Scott, Cindy Sweeting, Peter Nori and Neil Devlin
INVESTMENT OBJECTIVE & POLICIES ► To seek long-term capital appreciation. The Fund will invest at least 80% of its net assets in securities issued by foreign companies which have total stock market capitalizations or annual revenues of $4 billion or less.
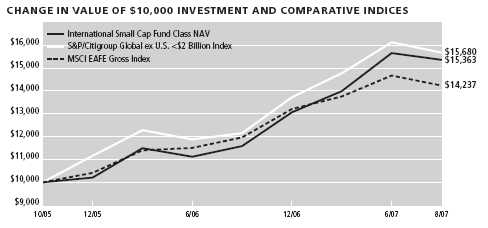
| |
| Sector Weighting* | % of Total |
|
| Consumer, Cyclical | 21.62 |
| Industrial | 18.68 |
| Consumer, Non-cyclical | 14.04 |
| Financial | 9.13 |
| Communications | 6.65 |
| Technology | 5.26 |
| Basic Materials | 4.87 |
| Energy | 2.15 |
| Utilities | 2.08 |
| Diversified | 1.65 |
| |
| Country Weighting * | % of Total |
|
| United Kingdom | 12.07 |
| Taiwan | 11.60 |
| South Korea | 9.51 |
| Canada | 8.20 |
| Bermuda | 5.17 |
| Netherlands | 4.59 |
| Japan | 4.35 |
| Australia | 4.34 |
| Hong Kong | 4.30 |
| Thailand | 3.68 |
*Top Sectors as a percentage of market value. Does not include short-term securities and investments in the John Hancock Cash Investment Trust.
PORTFOLIO MANAGERS’ COMMENTARY
Performance ► For the year ended August 31, 2007, the International Small Cap Class NAV returned +35.01% while its benchmark, the S&P/Citigroup Global Equity ex-U.S. less than $2 Billion Index, returned +29.45% .
Environment ► In spite of elevated energy prices, higher global interest rates, a weaker U.S. housing market and restrained U.S. economic growth, the global economy remained resilient. Sustained consumer and corporate demand, moderate inflation, tight labor markets and moderate global interest rates have supported economic growth since 2002.
Equity markets benefited overall from positive investor sentiment. However, concerns over growing U.S. subprime mortgage market troubles accelerated in August as credit became more difficult to access, contributing to declining risk appetites. The credit crunch reduced the abundant market liquidity that had prevailed in recent months and had supported global asset prices. Largely as a result of this liquidity, bond yield spreads over U.S. Treasuries narrowed during most of the period, and equity and commodity markets generally rose. Narrower corporate credit spreads reflected heightened risk tolerance, while abundant global cash supplies contributed to record-breaking merger and acquisition activity. As credit standards tightened and investors became more cautious, deal making declined toward the end of the period. With this backdrop, most global equity markets achieved double-digit returns. Many stock market indexes reached six-y ear highs, and emerging market indices in Asia, Europe and Latin America neared or reached all-time highs late in the period.
An underweighted position in Japan and overweight to China contributed to the Fund’s relative performance, as did stock selection and an overweighted position in Taiwan. Stock selection in the U.K. also helped relative returns. By sector, the Fund’s performance was aided by stock selection in the Information Technology and Consumer Discretionary sectors. The U.S. dollar depreciated versus most foreign currencies, which also contributed to performance. Stock selection in South Korea, Singapore and Australia hurt relative performance. An underweighted position and stock selection in Materials hindered relative results, as did an overweighted allocation and stock selection in Health Care.
Outlook ► We believe the global economy may remain healthy over the coming year, supported by good performance from large, developing economies. However, many economically sensitive stocks now reflect this optimistic outlook and could be less attractive to value-focused investors. In contrast, defensive-oriented companies in sectors such as Health Care and Telecommunications currently look more attractive.
| | | | | | | | |
| PERFORMANCE TABLE1 | Average Annual Total Return | | | Cumulative Total Return | |
|
| | | | | Since | | | | Since |
| Periods Ended August 31, 2007 | 1-year | 5-year | 10-year | inception | 1-year | 5-year | 10-year | inception2 |
|
| International Small Cap Class 1 (began 10/15/05) | 34.99% | — | — | 25.53% | 34.99% | — | — | 53.32% |
| International Small Cap Class NAV (began 10/15/05) | 35.01% | — | — | 25.67% | 35.01% | — | — | 53.63% |
| S&P/Citigroup Global ex U.S. <$2 Billion Index3,4,6 | 29.45% | — | — | 27.04% | 29.45% | — | — | 56.80% |
| MSCI EAFE Gross Index3,5,6 | 19.20% | — | — | 20.23% | 19.20% | — | — | 42.37% |
1 Performance does not reflect the deduction of taxes on fund distributions or redemptions of fund shares. Past performance does not predict future performance.
2 Current subadviser has managed the fund since October 15, 2005.
3 Since inception returns for the indices may begin on the month-end closest to the actual inception date of the fund.
4 S&P/Citigroup Global ex U.S. <$2 Billion Index is an unmanaged index which follows an objective, free float-weighted, rules based methodology, capturing the broad investable opportunity set.
5 MSCI EAFE Gross Index (Europe, Australia, Far East) is a free-float-adjusted market capitalization index that is designed to measure developed market equity performance, excluding the U.S. & Canada.As of June 2006, the MSCI EAFE Index consisted of the following 21 developed market country indices: Australia,Austria, Belgium, Denmark, Finland, France, Germany, Greece, Hong Kong, Ireland, Italy, Japan, the Netherlands, New Zealand, Norway, Portugal, Singapore, Spain, Sweden, Switzerland and the United Kingdom.
6 It is not possible to invest directly in an index. Index figures do not reflect sales charges and would be lower if they did.
26
International Small Company Fund
Subadviser: Dimensional Fund Advisors
Portfolio Manager: Karen E. Umland
INVESTMENT OBJECTIVE & POLICIES ► The Fund seeks long-term capital appreciation by investing at least 80% of its net assets in securities of small cap companies. The Fund will primarily invest its assets in equity securities of non-U.S. small companies of developed markets but may also invest in emerging markets.

| |
| Sector Weighting* | % of Total |
|
| Industrial | 22.26 |
| Consumer, Non-cyclical | 14.08 |
| Consumer, Cyclical | 13.97 |
| Financial | 9.92 |
| Basic Materials | 7.96 |
| Technology | 4.64 |
| Communications | 4.34 |
| Energy | 4.30 |
| Diversified | 2.09 |
| Utilities | 0.84 |
| |
| Country Weighting * | % of Total |
|
| Japan | 19.88 |
| United Kingdom | 17.04 |
| Canada | 9.24 |
| Australia | 5.91 |
| Germany | 4.28 |
| France | 3.71 |
| Switzerland | 3.54 |
| Italy | 2.41 |
| Netherlands | 2.37 |
| Hong Kong | 1.99 |
*Top Sectors as a percentage of market value. Does not include short-term securities and investments in the John Hancock Cash Investment Trust.
PORTFOLIO MANAGER’S COMMENTARY
Performance ► For the year ended August 31, 2007, the International Small Company Class NAV returned 24.30%, outperforming the +18.63% return of the MSCI EAFE Small Cap Gross Index.
Environment ► For the 12-month period ending August 31, 2007, global equity returns were positive across the board. The broad U.S. equity market, as measured by the Russell 3000 Index, returned +14.9% for the period. International returns for U.S. investors looked slightly better than U.S. returns, and were aided by the U.S. dollar’s relative weakness. During the year, the dollar’s depreciation ranged from 1.4% against the yen to 7.2% against the Australian dollar.
Developed-market equities, as measured by the MSCI EAFE Index, returned 18.7% . Dollar-denominated returns on developed-market equities ranged from 17.7% for large-cap value stocks to 19.6% for large-cap growth stocks. Using the EAFE indices as proxies, small-cap stocks underperformed large-cap stocks by 0.5% . Value stocks underperformed growth stocks by 1.9% .
Emerging market equities were the best-performing asset class during the 12 months ending August 2007. Dollar-denominated returns for emerging markets during that period, as measured by the MSCI Emerging Markets Index, were 43.6% . The U.S. dollar generally depreciated against emerging-market currencies, which contributed to dollar-denominated returns on emerging market equities.
Differences in country weights between the portfolio and its benchmark index contributed to performance differences. For example, the Fund’s overweight to Canada and underweight to Japan both added to relative performance. Because smaller stocks underperformed during the period, the portfolio’s greater exposure to these stocks hurt relative returns.
| | | | | | | | |
| PERFORMANCE TABLE1 | Average Annual Total Return | | | Cumulative Total Return | |
|
| | | | | Since | | | | Since |
| Periods Ended August 31, 2007 | 1-year | 5-year | 10-year | inception | 1-year | 5-year | 10-year | inception2 |
|
| International Small Company Class NAV (began 4/28/06) | 24.30% | — | — | 11.67% | 24.30% | — | — | 15.97% |
| MSCI EAFE Small Cap Gross Index3,4,6,7 | 18.63% | — | — | 7.03% | 18.63% | — | — | 9.51% |
| 80% MSCI EAFE Small Cap Gross Index | | | | | | | | |
| 20% MSCI Emerging Markets Index Blend3,5,6,7 | 23.45% | — | — | 10.43% | 23.45% | — | — | 14.18% |
1 Performance does not reflect the deduction of taxes on fund distributions or redemptions of fund shares. Past performance does not predict future performance.
2 Current subadviser has managed the fund since April 28, 2006.
3 Since inception returns for the indices may begin on the month-end closest to the actual inception date of the fund.
4 MSCI EAFE Small Cap Gross Index is an unmanaged index that is a free float-adjusted market capitalization index that is designed to measure developed market equity performance, excluding the US & Canada.As of June 2006 the MSCI EAFE Index consisted of the following 21 developed market country indices:Australia, Austria, Belgium, Denmark, Finland, France, Germany, Greece, Hong Kong, Ireland, Italy, Japan, the Netherlands, New Zealand, Norway, Portugal, Singapore, Spain, Sweden, Switzerland and the United Kingdom.
5 80% MSCI EAFE Small Cap Gross Index/20% MSCI Emerging Markets Index Blend - A blended index is used combining 80% of the MSCI EAFE(r) Small Cap Index (Europe,Australia, Far East), an unmanaged index that is a free float-adjusted market capitalization index that is designed to measure developed market equity performance, excluding the US & Canada. As of June 2006 the MSCI EAFE Index consisted of the following 21 developed market country indices:Australia,Austria, Belgium, Denmark, Finland, France, Germany, Greece, Hong Kong, Ireland, Italy, Japan, the Netherlands, New Zealand, Norway, Portugal, Singapore, Spain, Sweden, Switzerland and the United Kingdom and 20% of the MSCI Emerging Markets Index, an unmanaged index that is a free float-adjusted market capitalization index that is designed to measure equity market performance in the global emerging markets. As of June 2006 the MSCI Emerging Markets Index consisted of the following 25 emerging market country ind ices:Argentina, Brazil, Chile, China, Colombia, Czech Republic, Egypt, Hungary, India, Indonesia, Israel, Jordan, Korea, Malaysia, Mexico, Morocco, Pakistan, Peru, Philippines, Poland, Russia, South Africa,Taiwan, Thailand, and Turkey.
6 It is not possible to invest directly in an index. Index figures do not reflect sales charges and would be lower if they did.
7 Since May 5, 2007, the index changed from 80% MSCI EAFE Small Cap Gross Index/20% MSCI Emerging Markets Index Blend to MSCI EAFE Small Cap Gross Index to more accurately reflect the investment objective of the International Small Company Fund.
27
International Value Fund
Subadviser: Templeton Investment Counsel, LLC
Portfolio Manager: Tucker Scott
INVESTMENT OBJECTIVE & POLICIES ► To seek long-term growth of capital. The Fund invests at least 65% of its total assets in equity securities of companies located outside the U.S., including emerging markets.
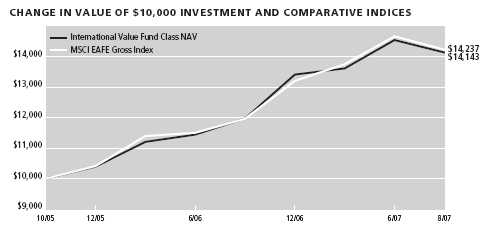
| |
| Sector Weighting* | % of Total |
|
| Communications | 20.26 |
| Financial | 19.10 |
| Consumer, Non-cyclical | 11.77 |
| Consumer, Cyclical | 8.21 |
| Industrial | 8.07 |
| Energy | 7.13 |
| Technology | 4.70 |
| Basic Materials | 2.80 |
| Utilities | 1.66 |
| Diversified | 1.34 |
| |
| Country Weighting * | % of Total |
|
| United Kingdom | 25.34 |
| France | 9.65 |
| Netherlands | 5.67 |
| Japan | 5.65 |
| Taiwan | 5.02 |
| Germany | 4.65 |
| South Korea | 4.05 |
| Switzerland | 3.48 |
| Singapore | 3.43 |
| Italy | 3.30 |
*Top Sectors as a percentage of market value. Does not include short-term securities and investments in the John Hancock Cash Investment Trust.
PORTFOLIO MANAGER’S COMMENTARY
Performance ► For the year ended August 31, 2007, the International Value Class NAV returned +19.50%, outperforming the +19.20 return of the MSCI EAFE Gross Index.
Environment ► In spite of elevated energy prices, higher global interest rates, a weaker U.S. housing market and restrained U.S. economic growth, the global economy remained resilient throughout the period. Global equity markets benefited from positive investor sentiment, although concerns about slower growth and declining asset quality surfaced early in 2007. Investors worldwide worried that troubles in the U.S. subprime mortgage market could spread and potentially undermine global economic and corporate profit growth. These concerns were exacerbated in August as credit became more difficult to access.
The credit crunch reduced the abundant market liquidity that had prevailed during most of the period and had supported global asset prices. Narrower global corporate credit spreads reflected heightened risk tolerance, while abundant cash supplies contributed to record-breaking global merger and acquisition activity. Deal-making declined toward the end of the period, as credit standards tightened and investors became more cautious.
With this backdrop, most global equity markets ended the 12-month period with double-digit total returns. Many stock market indices neared or reached all-time highs late in the period. An underweighted position and stock selection in Japan benefited the Fund’s relative results, as did stock selection in the U.K. and Spain. By sector, the Fund’s relative performance benefited from an overweighted position and stock selection in the Telecommunication Services sector. Stock selection in the Industrials and Consumer Staples sectors also helped relative returns. The U.S. dollar depreciated against most foreign currencies, which also contributed to the Fund’s performance as investments in securities with non-U.S. currency exposure gained value.
The Fund’s allocation to Taiwan, a country not represented in the benchmark index, hindered relative performance. An underweighted allocation and stock selection in Germany also hurt relative results. By sector, an underweighted position and stock selection in the Materials sector hurt relative performance, as did stock selection in the Information Technology sector.
Outlook ► We believe the overall global economic situation may remain healthy, supported by continued good performance from large, developing economies. However, many economically sensitive stocks already reflect this optimistic outlook. In contrast, more defensive-oriented companies in sectors, such as Health Care and Telecommunications, look more attractive to us. We remain focused on our normalized, long-term valuation analysis and forecasts.
| | | | | | | | |
| PERFORMANCE TABLE1,4 | Average Annual Total Return | | | Cumulative Total Return | |
|
| | | | | Since | | | | Since |
| Periods Ended August 31, 2007 | 1-year | 5-year | 10-year | inception | 1-year | 5-year | 10-year | inception2 |
|
| International Value Class 1 (began 10/15/05) | 19.45% | — | — | 20.15% | 19.45% | — | — | 41.21% |
| International Value Class NAV (began 10/15/05) | 19.50% | — | — | 20.25% | 19.50% | — | — | 41.43% |
| MSCI EAFE Gross Index3,5,6 | 19.20% | — | — | 20.23% | 19.20% | — | — | 42.37% |
1 Performance does not reflect the deduction of taxes on fund distributions or redemptions of fund shares. Past performance does not predict future performance.
2 Current subadviser has managed the fund since October 15, 2005.
3 Since inception returns for the indices may begin on the month-end closest to the actual inception date of the fund.
4 Since inception, a portion of the International Value Fund expenses were reimbursed. If such expenses had not been reimbursed, returns would be lower.
5 MSCI EAFE Gross Index (Europe,Australia, Far East) is a free-float-adjusted market capitalization index that is designed to measure developed market equity performance, excluding the U.S. & Canada.As of June 2006, the MSCI EAFE Index consisted of the following 21 developed market country indices: Australia,Austria, Belgium, Denmark, Finland, France, Germany, Greece, Hong Kong, Ireland, Italy, Japan, the Netherlands, New Zealand, Norway, Portugal, Singapore, Spain, Sweden, Switzerland and the United Kingdom.
6 It is not possible to invest directly in an index. Index figures do not reflect sales charges and would be lower if they did.
28
Investment Quality Bond Fund
Subadviser: Wellington Management Company, LLP
Portfolio Managers: Thomas L. Pappas, Christopher L. Gootkind and Christopher A. Jones
INVESTMENT OBJECTIVE & POLICIES ► To provide a high level of current income consistent with the maintenance of principal and liquidity. The Fund invests at least 80% of its net assets in bonds rated investment grade at the time of investment. The Fund will invest primarily in corporate bonds and U.S. government bonds with intermediate to longer term maturities.
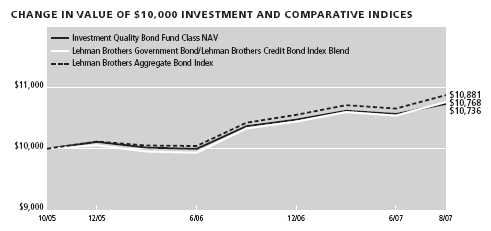
| |
| Sector Weighting* | % of Total |
|
| Government | 34.56 |
| Mortgage Securities | 18.23 |
| Financial | 16.46 |
| Communications | 6.67 |
| Asset Backed Securities | 4.94 |
| Utilities | 2.57 |
| Consumer, Non-cyclical | 2.44 |
| Consumer, Cyclical | 2.08 |
| Energy | 1.13 |
| Basic Materials | 1.07 |
*Top Sectors as a percentage of market value. Does not include short-term securities and investments in the John Hancock Cash Investment Trust.
PORTFOLIO MANAGERS’ COMMENTARY
Performance ► For the year ended August 31, 2007, the Investment Quality Bond Class NAV returned +4.56%, underperforming the +5.24% return of the 50% Lehman Brothers Government Bond/Lehman Brothers Credit Bond Index Blend.
Environment ► Following a prolonged period of low volatility, in July and August 2007 markets witnessed a sharp disruption. Triggered by losses in the subprime mortgage market, a massive re-pricing of risk spread across global fixed income markets, which resulted in a dramatic flight to quality. While the Federal Reserve held the federal funds rate at 5.25% during this period, uncertainty surrounding the recent turmoil prompted an evolving policy response by central banks and national governments. We believe that a slowdown is underway in the U.S. economy, with the risk of it becoming more severe. We expect that the Fed will cut rates in the coming months to help alleviate the credit and liquidity constraints.
Fund performance was aided by an underweight to credit, as investment grade credit underperformed duration-equivalent Treasuries in July and August. The Fund’s allocation to emerging market debt contributed to performance, particularly our exposure to Brazilian interest rates. The Fund also benefited from an underweight to U.S. agencies. Offsetting these positives were allocations to mortgage-backed, commercial mortgage-backed and asset-backed securities, which held back performance. Increased volatility, combined with systemic risk concerns, reflected in wider swap spreads, weighed heavily on the performance of these sectors. Our position in intermediate German government bonds also detracted from performance, as European growth proved surprisingly resilient in the first quarter of 2007. The allocation to Treasury Inflation Protected Securities (TIPS) also detracted from performance, as inflation remained contained.
Outlook ► Markets are showing initial, tentative signs of a recovery. The recovery, however, could take longer than normal, given the diffuse holders of levered risk. We are evaluating our risk posture closely and looking for opportunities where there has been a disproportionate increase in risk premium (spread) relative to our fundamental outlook. We believe that the higher quality segments of the market are more attractive. In addition, market liquidity remains thin and we’ve seen very large bid/ask spreads, especially for riskier assets. In the coming months, opportunities to add risk to portfolios at attractive valuations should present themselves and we are inclined to be patient.
| | | | | | | | |
| PERFORMANCE TABLE1 | Average Annual Total Return | | | Cumulative Total Return | |
|
| | | | | Since | | | | Since |
| Periods Ended August 31, 2007 | 1-year | 5-year | 10-year | inception | 1-year | 5-year | 10-year | inception2 |
|
| Investment Quality Bond Class 1 (began 10/15/05) | 4.49% | — | — | 3.80% | 4.49% | — | — | 7.25% |
| Investment Quality Bond Class NAV (began 10/15/05) | 4.56% | — | — | 3.85% | 4.56% | — | — | 7.36% |
| Lehman Brothers Government Bond/Lehman Brothers | | | | | | | | |
| Credit Bond Index Blend3,4,6 | 5.24% | — | — | 3.93% | 5.24% | — | — | 7.68% |
| Lehman Brothers Aggregate Bond Index3,5,6 | 5.26% | — | — | 4.59% | 5.26% | — | — | 8.81% |
1 Performance does not reflect the deduction of taxes on fund distributions or redemptions of fund shares. Past performance does not predict future performance.
2 Current subadviser has managed the fund since October 15, 2005.
3 Since inception returns for the indices may begin on the month-end closest to the actual inception date of the fund.
4 Lehman Brothers Government Bond Index and Lehman Brothers Credit Bond Index Blend-A blended index is used combining 50% of the Lehman Brothers Government Bond Index which is an unmanaged index that represents securities issued by the U.S. Government (i.e. securities in the Treasury and Agency indices); and 50% Lehman Brothers Credit Bond Index, which is an unmanaged index of publicly issued U.S. corporate and specified foreign debentures and secured notes that meet the specified maturity, liquidity, and quality requirements. To qualify, bonds must be SEC registered.
5 Lehman Brothers Aggregate Bond Index is an unmanaged index of dollar-denominated and non-convertible investment grade debt issues.
6 It is not possible to invest directly in an index. Index figures do not reflect sales charges and would be lower if they did.
29
Large Cap Fund
Subadviser: UBS Global Asset Management (Americas) Inc.
Portfolio Managers: John Leonard, Thomas Cole, Thomas Digenan and Scott Hazen
INVESTMENT OBJECTIVE & POLICIES ► To seek to maximize total return, consisting of capital appreciation and current income. The Fund invests at least 80% of its net assets in equity securities of U.S. large capitalization companies as in the Russell 1000 Index.
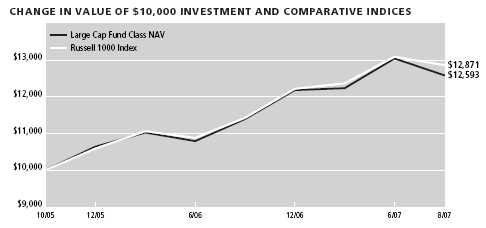
| |
| Sector Weighting* | % of Total |
|
| Financial | 19.57 |
| Consumer, Non-cyclical | 18.47 |
| Technology | 12.48 |
| Communications | 11.69 |
| Consumer, Cyclical | 10.94 |
| Industrial | 9.99 |
| Energy | 5.84 |
| Utilities | 5.72 |
| Mortgage Securities | 1.03 |
| Funds | 0.46 |
*Top Sectors as a percentage of market value. Does not include short-term securities and investments in the John Hancock Cash Investment Trust.
PORTFOLIO MANAGERS’ COMMENTARY
Performance ► For the year ended August 31, 2007, the Large Cap Class NAV returned +13.67%, underperforming the +15.27% return of the Russell 1000 Index.
Environment ► The U.S. economy recovered somewhat in the second quarter of 2007, after setting a slow first quarter. Housing data continues to be weak, and the scope and depth of the growing U.S. subprime credit crunch remains in question. However, survey data has been strong. Inflation appears to be relatively tame. Fed funds futures, responding to recent credit market undulations, have now priced in 50 basis points of cuts by the end of 2007. The federal budget deficit is shrinking, as is the current account deficit, but the household savings rate remains low.
The Russell 1000 Index had a strong absolute return for the 12-month period, but much of it came late in 2006. Investor concerns over issues surrounding subprime lending, the housing market, energy costs and the impact of those issues on economic growth led to increased market volatility. As credit-related issues have hurt the performance of the Financial sector, the Russell 1000 Value Index, which has more exposure to Financials than the broad market, trailed the Russell 1000 Growth index over the past 12 months. They returned 12.85% and 17.70%, respectively. Global cyclical sectors, such as Industrials and the commodity-oriented Energy and Materials sectors, outperformed most others over this period.
The Fund lagged its benchmark index during the period. The primary detractor from results was industry positioning, as stock selection was positive overall. The portfolio’s overweight to Financials worked against it, even though positioning within the sector, which emphasized large, diversified firms, resulted in some strong stock-specific contributors to performance. Also detracting were underweights to oil refining, materials and industrial subcomponents, such as defense and aerospace. Partially offsetting this was the positive impact of overweighting automotive parts manufacturers and oil services, and underweighting energy reserves, which underperformed within the Energy sector.
Outlook ► As of period-end, most market opportunities are more bottom-up in nature. The railways continue to be an attractive area, while the Financial sector also provides us with interesting opportunities. Our portfolios are overweight capital markets, based on global sources. Oil prices remain volatile and we are underweight in this space.
| | | | | | | | |
| PERFORMANCE TABLE1 | Average Annual Total Return | | | Cumulative Total Return | |
|
| | | | | Since | | | | Since |
| Periods Ended August 31, 2007 | 1-year | 5-year | 10-year | inception | 1-year | 5-year | 10-year | inception2 |
|
| Large Cap Class 1 (began 10/15/05) | 13.59% | — | — | 12.98% | 13.59% | — | — | 25.78% |
| Large Cap Class NAV (began 10/15/05) | 13.67% | — | — | 13.05% | 13.67% | — | — | 25.93% |
| Russell 1000 Index3,4,5 | 15.27% | — | — | 14.37% | 15.27% | — | — | 28.71% |
1 Performance does not reflect the deduction of taxes on fund distributions or redemptions of fund shares. Past performance does not predict future performance.
2 Current subadviser has managed the fund since October 15, 2005.
3 Since inception returns for the indices may begin on the month-end closest to the actual inception date of the fund.
4 Russell 1000 Index is an unmanaged index which measures the performance of the 1,000 largest companies in the Russell 3000 Index.
5 It is not possible to invest directly in an index. Index figures do not reflect sales charges and would be lower if they did.
30
Large Cap Value Fund
Subadviser: BlackRock Investment Management, LLC
Portfolio Manager: Robert Doll
INVESTMENT OBJECTIVE & POLICIES ► To seek long-term growth of capital by investing in a diversified portfolio of equity securities of large-cap companies located in the U.S. At least 80% of the Fund’s net assets are invested in equity securities of large-capitalization companies.
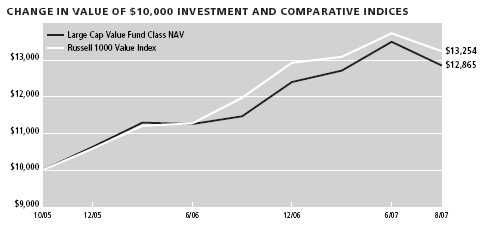
| |
| Sector Weighting* | % of Total |
|
| Financial | 23.88 |
| Energy | 20.73 |
| Consumer, Non-cyclical | 13.66 |
| Industrial | 11.38 |
| Technology | 10.58 |
| Basic Materials | 7.65 |
| Communications | 7.14 |
| Consumer, Cyclical | 3.54 |
| Utilities | 0.48 |
*Top Sectors as a percentage of market value. Does not include short-term securities and investments in the John Hancock Cash Investment Trust.
PORTFOLIO MANAGER’S COMMENTARY
Performance ► For the year ended August 31, 2007, the Large Cap Value Class NAV returned +13.42%, outperforming the +12.85% return of the Russell 1000 Value Index.
Environment ► U.S. equity markets posted strong gains over the past 12 months, but not without some volatility. The S&P 500 Index rose 15.13% for the period. Shares of large-cap growth companies outperformed large-cap value stocks, with the Russell 1000 Growth Index advancing 17.70% versus the 12.85% gain of the Russell 1000 Value Index.
The Federal Reserve has held the target federal funds rate at 5.25% since June 2006. A crisis in the subprime mortgage market rekindled fears of a housing-induced slowdown in the United States and led to increased financial market volatility and expanded risk premiums. In early August 2007, amid the growing fallout from the troubled sub-prime mortgage market, the Fed injected a total of $62 billion into the U.S. financial system to ease the inter-bank funding crunch. The Fed also reduced the discount rate, charged on short-term loans to banks, by 0.50% to 5.75% .
Despite recent mixed data, it appears that overall inflation remains relatively tame. The U.S. gross domestic product (GDP) grew at an estimated annualized rate of 3.4% in the second quarter of 2007, a sharp increase from the 0.6% annualized growth rate for the first quarter.
The Fund benefited from stock selection and overweights in Materials and Industrials, security selection and an underweight in Financials, and overweight allocations to Energy and Information Technology. However, stock selection and an underweight in Telecommunication Services, security selection in Information Technology, Consumer Staples and Energy, and a below-benchmark weighting in Utilities detracted from relative returns.
Outlook ► Investors have begun to focus on corporate profits in an effort to gauge how well companies have held up during the slowing economy and amid ongoing credit problems. A federal funds rate cut should help ease the liquidity squeeze and could help stocks regain sounder footing. Nevertheless, we do not believe credit-related problems are over. We expect market advances will be narrower than the run from 2002 to 2007. In our opinion, likely winners will include globally diversified companies, growth stocks, and selected commodity and industrial-oriented companies.
| | | | | | | | |
| PERFORMANCE TABLE1 | Average Annual Total Return | | | Cumulative Total Return | |
|
| | | | | Since | | | | Since |
| Periods Ended August 31, 2007 | 1-year | 5-year | 10-year | Inception | 1-year | 5-year | 10-year | Inception2 |
|
| Large Cap Value Class 1 (began 10/15/05) | 13.39% | — | — | 14.27% | 13.39% | — | — | 28.50% |
| Large Cap Value Class NAV (began 10/15/05) | 13.42% | — | — | 14.34% | 13.42% | — | — | 28.65% |
| Russell 1000 Value Index3,4,5 | 12.85% | — | — | 16.17% | 12.85% | — | — | 32.54% |
1 Performance does not reflect the deduction of taxes on fund distributions or redemptions of fund shares. Past performance does not predict future performance.
2 Current subadviser has managed the fund since October 15, 2005.
3 Since inception returns for the indices may begin on the month-end closest to the actual inception date of the fund.
4 Russell 1000 Value Index is an unmanaged index containing those securities in the Russell 1000 Index with a less-than-average growth orientation.
5 It is not possible to invest directly in an index. Index figures do not reflect sales charges and would be lower if they did.
31
Mid Cap Index Fund
Subadviser: MFC Global Investment Management (U.S.A.) Limited
Portfolio Managers: Carson Jen and Narayan Ramani
INVESTMENT OBJECTIVE & POLICIES ► The Fund seeks to appropriate the aggregate total return of a mid-capitalization U.S. domestic equity market index by primarily investing in (a) common stocks that are included in the S&P MidCap 400 Index and (b) securities that are believed to behave in a manner similar to the index.
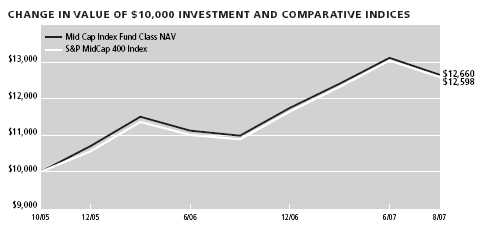
| |
| Sector Weighting* | % of Total |
|
| Consumer, Non-cyclical | 17.80 |
| Industrial | 15.66 |
| Financial | 13.19 |
| Consumer, Cyclical | 12.63 |
| Energy | 8.65 |
| Technology | 8.53 |
| Government | 6.52 |
| Utilities | 6.15 |
| Communications | 5.45 |
| Basic Materials | 5.13 |
*Top Sectors as a percentage of market value. Does not include short-term securities and investments in the John Hancock Cash Investment Trust.
PORTFOLIO MANAGERS’ COMMENTARY
Performance ► For the year ended August 31, 2007, the Mid Cap Index Class NAV returned +15.93%, in line with the +16.47% return of the S&P MidCap 400 Index.
Environment ► The U.S. economy seems to be slowing down, as the first quarter gross domestic product (GDP) grew at a 0.6% annual rate, before bouncing back in the second quarter to a 3.4% annual real growth rate. Despite fears of rising U.S. inflation, in the past year the inflation rate was not significant.
The Federal Reserve has left the benchmark federal funds rate unchanged at 5.25% since mid-2006. In August 2007, the unemployment rate remained at 4.6%, a slight increase from the previous quarter’s 4.5% . While employment in manufacturing, construction and local government education declined, there has been a growth in such industries as health care and food products. Over the past three months, total payroll in the U.S. grew by 44,000 per month. The Conference Board’s Consumer Confidence Index dropped to 105 in August from 111.9 in July.
For the 12-month period ending August 31, 2007, Telecommunication Services and Materials were the best performing sectors, returning 38% and 34%, respectively. Consumer Discretionary and Financials were the weakest performers, returning 7% and 1%, respectively.
Outlook ► Despite an expected slowdown in the U.S. economy, we don’t foresee a recession in the upcoming year. An interest rate cut is expected in the fall of 2007, which may restore confidence and retail spending. Moreover, gaining access to credit may be tougher for many Americans. The Fed believes that the U.S. economy is not at risk.
| | | | | | | | |
| PERFORMANCE TABLE1 | Average Annual Total Return | | | Cumulative Total Return | |
|
| | | | | Since | | | | Since |
| Periods Ended August 31, 2007 | 1-year | 5-year | 10-year | inception | 1-year | 5-year | 10-year | inception2 |
|
| Mid Cap Index Class NAV (began 10/29/05) | 15.93% | — | — | 13.67% | 15.93% | — | — | 26.60% |
| S&P MidCap 400 Index3,4,5 | 16.47% | — | — | 13.43% | 16.47% | — | — | 25.98% |
1 Performance does not reflect the deduction of taxes on fund distributions or redemptions of fund shares. Past performance does not predict future performance.
2 Current subadviser has managed the fund since October 29, 2005.
3 Since inception returns for the indices may begin on the month-end closest to the actual inception date of the fund.
4 S&P MidCap 400 Index is an unmanaged index of 400 domestic stocks of medium-sized companies.
5 It is not possible to invest directly in an index. Index figures do not reflect sales charges and would be lower if they did.
32
Mid Cap Intersection Fund
Subadviser: Wellington Management Company, LLP
Portfolio Manager: Doris T. Dwyer
INVESTMENT OBJECTIVE & POLICIES ► The Fund seeks long-term growth of capital by investing primarily in equity securities of medium-sized companies with significant capital appreciation potential.
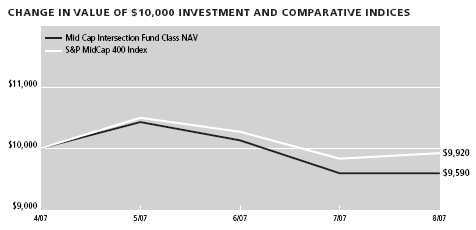
| |
| Sector Weighting* | % of Total |
|
| Consumer, Non-cyclical | 18.85 |
| Industrial | 15.10 |
| Consumer, Cyclical | 13.27 |
| Financial | 13.13 |
| Technology | 11.06 |
| Energy | 9.77 |
| Utilities | 7.48 |
| Communications | 5.21 |
| Basic Materials | 5.06 |
*Top Sectors as a percentage of market value. Does not include short-term securities and investments in the John Hancock Cash Investment Trust.
PORTFOLIO MANAGER’S COMMENTARY
Performance ► From its inception on May 1, 2007, to August 31, 2007, the Mid Cap Intersection Class NAV returned –4.10%, underperforming the –0.80% return of the S&P MidCap 400 Index.
Environment ► Due to issues in the subprime mortgage market, reduced liquidity due to credit tightening and concerns of a slowing U.S. economy, the equity markets experienced weak returns from May through August. Large-cap stocks outperformed both mid-cap and small-cap stocks. Within the S&P MidCap 400 Index, Industrials contributed most significantly to returns while Consumer Discretionary stocks were the largest detractors from performance.
From mid-July through August, mounting credit-related woes forced levered strategies to meet margin calls by selling equities. The consequent delevering had a cascading effect through the market as prices continued to fall, prompting additional margin calls, further perpetuating the cycle. Many of these levered strategies were quantitative model-driven. As a result, they were forced to close short positions by buying back unattractive stocks and selling attractive names to cover margin calls and to reduce leverage. Due to these dynamics, quantitative equity managers experienced an unusually sharp drawdown in performance during the first week of August, as stock prices of many quant model “buys” systematically fell while prices of “sells” rose. However, the market soon recognized this as a liquidity-driven event, rather than a change in long-term fundamentals or sentiment on the underlying stocks. That led to a quick rebound.
The Fund underperformed its benchmark index as a result of weak security selection in the Energy, Industrials and Information Technology sectors. Negative returns were partially offset by positive security selection in Materials.
Outlook ► The Fund’s strength is stock selection within the mid-cap market segment. Our ability to add value consistently stems from strong fundamental and quantitative research. The disciplined portfolio construction process is designed to allow us to assess risk, focus positions accordingly and build a portfolio insulated from factors that may cause significant underperformance versus the benchmark over time. The aim is to avoid surprises from unintended, uncompensated “risks.” Recent market dynamics provide an opportunity to those who can identify companies with strong fundamentals, which, we believe, ultimately drive long-term investment returns.
| | | | | | | | |
| PERFORMANCE TABLE1 | Average Annual Total Return | | | Cumulative Total Return | |
|
| | | | | Since | | | | Since |
| Periods Ended August 31, 2007 | 1-year | 5-year | 10-year | inception | 1-year | 5-year | 10-year | inception2 |
|
| Mid Cap Intersection Class NAV (began 5/1/07) | — | — | — | — | — | — | — | –4.10% |
| S&P MidCap 400 Index3,4,5 | — | — | — | — | — | — | — | –0.80% |
1 Performance does not reflect the deduction of taxes on fund distributions or redemptions of fund shares. Past performance does not predict future performance.
2 Current subadviser has managed the fund since May 1, 2007.
3 Since inception returns for the indices may begin on the month-end closest to the actual inception date of the fund.
4 S&P MidCap 400 Index is an unmanaged index of 400 domestic stocks of medium-sized companies.
5 It is not possible to invest directly in an index. Index figures do not reflect sales charges and would be lower if they did.
33
Mid Cap Stock Fund
Subadviser: Wellington Management Company, LLP
Portfolio Managers: Michael T. Carmen and Mario E. Abularach
INVESTMENT OBJECTIVE & POLICIES ► To seek long-term growth of capital by investing at least 80% of the Fund’s net assets in equity securities of medium-sized companies with significant capital appreciation potential.

| |
| Sector Weighting* | % of Total |
|
| Consumer, Non-cyclical | 19.08 |
| Technology | 16.23 |
| Industrial | 13.14 |
| Consumer, Cyclical | 12.08 |
| Energy | 10.80 |
| Basic Materials | 10.29 |
| Communications | 7.32 |
| Financial | 0.91 |
*Top Sectors as a percentage of market value. Does not include short-term securities and investments in the John Hancock Cash Investment Trust.
PORTFOLIO MANAGERS’ COMMENTARY
Performance ► For the year ended August 31, 2007, the Mid Cap Stock Class NAV returned +25.95%, outperforming the +19.31% return of the Russell Mid Cap Growth Index.
Environment ► Despite issues in the subprime mortgage market, reduced liquidity due to credit tightening and concerns of a slowing U.S. economy, the equity markets experienced positive returns during the period. Mid-cap stocks outperformed large-cap stocks and widely outperformed small caps. Within the Index, Materials was the best performing sector, while Financials delivered the weakest return.
The Fund’s relative outperformance was largely the result of strong stock selection, particularly in the Consumer Discretionary, Materials and Information Technology sectors. In the Materials sector, several fertilizer companies and a glass and packaging firm were among the Fund’s strongest performing stocks. Broad-based, favorable stock selection within the Consumer Discretionary sector also aided performance. Notable contributors included a fashion, watch and accessory manufacturer, a navigation device company and a media company focusing on home entertainment. Strong stock selection in Information Technology partially offset weak performance from several holdings in the sector. Security selection in Energy, Industrials and Financials detracted from relative performance.
Outlook ► As a result of our bottom-up decision making process, the Fund ended the period overweight in the Materials and Information Technology sectors. Holdings among the former are well diversified and include fertilizers, packaging and metals concerns. In Technology, our exposures favor software and service purveyors over hardware and semiconductor stocks. The Fund is underweight in Financials and continues to have no allocation to Utilities. The most significant change in sector exposure during the period was to Consumer Discretionary, which moved from an underweight to an overweight position, largely due to our initiating positions among several retailers we see as having attractive growth prospects.
| | | | | | | | |
| PERFORMANCE TABLE1 | Average Annual Total Return | | | Cumulative Total Return | |
|
| | | | | Since | | | | Since |
| Periods Ended August 31, 2007 | 1-year | 5-year | 10-year | inception | 1-year | 5-year | 10-year | inception2 |
|
| Mid Cap Stock Class 1 (began 10/15/05) | 25.91% | — | — | 21.32% | 25.91% | — | — | 43.79% |
| Mid Cap Stock Class NAV (began 10/15/05) | 25.95% | — | — | 21.38% | 25.95% | — | — | 43.93% |
| Russell Mid Cap Growth Index3,4,5 | 19.31% | — | — | 15.51% | 19.31% | — | — | 31.13% |
1 Performance does not reflect the deduction of taxes on fund distributions or redemptions of fund shares. Past performance does not predict future performance.
2 Current subadviser has managed the fund since October 15, 2005.
3 Since inception returns for the indices may begin on the month-end closest to the actual inception date of the fund.
4 Russell Mid Cap Growth Index is an unmanaged index that contains those stocks from the Russell Mid Cap Index with a greater than average growth orientation.
5 It is not possible to invest directly in an index. Index figures do not reflect sales charges and would be lower if they did.
34
Mid Cap Value Fund
Subadviser: Lord, Abbett & Co. LLC
Portfolio Managers: Edward K. von der Linde and Howard E. Hansen
INVESTMENT OBJECTIVE & POLICIES ► To seek capital appreciation. The Fund invests primarily in equity securities which it believes to be undervalued in the marketplace. Under normal market conditions, at least 80% of its net assets will consist of investments in mid-sized companies.

| |
| Sector Weighting* | % of Total |
|
| Communications | 21.80 |
| Consumer, Non-cyclical | 14.17 |
| Industrial | 11.72 |
| Consumer, Cyclical | 9.56 |
| Basic Materials | 9.14 |
| Utilities | 9.12 |
| Financial | 7.61 |
| Energy | 6.83 |
| Technology | 4.77 |
*Top Sectors as a percentage of market value. Does not include short-term securities and investments in the John Hancock Cash Investment Trust.
PORTFOLIO MANAGER’S COMMENTARY
Performance ► For the year ended August 31, 2007, the Mid Cap Value Class NAV returned +16.83%, outperforming the +12.43% return of the Russell Midcap Value Index.
Environment ► The portfolio’s underweight within the Financial Services sector was the largest contributor to performance during the period, as this sector was hurt by the fallout from the troubled subprime mortgage market. Another major contributor to performance was a holding within Materials and Processing sector that benefited from higher demand and improved pricing for fertilizer. The company also improved the strength of its balance sheet. The largest detractor from performance was stock selection within the Health Care sector and a relative overweight within the sector. Poor stock selection within the Utilities sector hurt performance as well.
Outlook ► Returns in the stock market have been strong for the past four years, particularly in mid-cap stocks. Valuations have compressed across the capitalization spectrum, but based upon our estimates of normalized earnings, the mid cap market does not appear to be overvalued. Profitability at many companies is at peak levels and we feel that we are in the later stages of expansion. The recent financial turmoil and housing market pressure may slow economic growth and perhaps limit profitability going forward.
| | | | | | | | |
| PERFORMANCE TABLE1 | Average Annual Total Return | | | Cumulative Total Return | |
|
| | | | | Since | | | | Since |
| Periods Ended August 31, 2007 | 1-year | 5-year | 10-year | inception | 1-year | 5-year | 10-year | inception2 |
|
| Mid Cap Value Class 1 (began 10/15/05) | 16.76% | — | — | 12.63% | 16.76% | — | — | 25.06% |
| Mid Cap Value NAV (10/15/05) | 16.83% | — | — | 12.72% | 16.83% | — | — | 25.23% |
| Russell Midcap Value Index3,4,5 | 12.43% | — | — | 15.71% | 12.43% | — | — | 31.55% |
1 Performance does not reflect the deduction of taxes on fund distributions or redemptions of fund shares. Past performance does not predict future performance.
2 Current subadviser has managed the fund since October 15, 2005.
3 Since inception returns for the indices may begin on the month-end closest to the actual inception date of the fund.
4 Russell Midcap Value Index is an unmanaged index that measures the performance of those Russell Midcap companies with lower price-to-book ratios and lower forecasted growth values. The stocks are also members of the Russell 1000 Value Index.
5 It is not possible to invest directly in an index. Index figures do not reflect sales charges and would be lower if they did.
35
Mid Cap Value Equity Fund
Subadviser: RiverSource Investments, LLC
Portfolio Managers: Steve Schroll, Laton Spahr, Warren Spitz and Paul Stocking
INVESTMENT OBJECTIVE & POLICIES ► To seek long-term growth of capital. The Fund invests at least 80% of its net assets in equity securities of medium-sized companies.

| |
| Sector Weighting* | % of Total |
|
| Financial | 18.33 |
| Industrial | 17.72 |
| Consumer, Cyclical | 12.12 |
| Energy | 10.63 |
| Consumer, Non-cyclical | 8.78 |
| Basic Materials | 8.10 |
| Technology | 6.76 |
| Utilities | 6.62 |
| Communications | 5.97 |
*Top Sectors as a percentage of market value. Does not include short-term securities and investments in the John Hancock Cash Investment Trust.
PORTFOLIO MANAGERS’ COMMENTARY
Performance ► For the year ended August 31, 2007, the Mid Cap Value Equity Class NAV returned 18.99%, outperforming the +12.43% return of the Russell Midcap Value Index.
Environment ► The 12-month period was marked by continued weakening in the housing market and volatility that swept through the equity markets late in the period. Large- and mid-cap stocks outperformed small-cap stocks, and growth outpaced value equities for the period.
The portfolio’s significant underweight in the Financial sector helped our return relative to the benchmark. Financial was the worst performing sector for the period and the portfolio’s industry selection within the sector helped performance. Stock selection in the producer durables industry contributed positively. Also helping returns were significant positions in Energy, one of the best performing sectors during the period. Stock selection contributed positively. Detracting from performance was the portfolio’s overweight in the Health Care and Information Technology sectors.
Outlook ► We have further reduced the portfolio’s underweight position in Financials, redeploying those assets into opportunities within the Information Technology sector and automobile industry. In particular, we believe Information Technology firms will benefit from several industry tailwinds going forward, and stocks in this sector already have attractive valuations with strong long-term growth potential. Lastly, we have kept the portfolio out of homebuilders stocks, as we do not see strong prospects for this industry. We continue to prefer producer durables and manufacturing companies with attractive valuations.
| | | | | | | | |
| PERFORMANCE TABLE1 | Average Annual Total Return | | | Cumulative Total Return | |
|
| | | | | Since | | | | Since |
| Periods Ended August 31, 2007 | 1-year | 5-year | 10-year | inception | 1-year | 5-year | 10-year | inception2 |
|
| Mid Cap Value Equity Class NAV (began 4/28/06) | 18.99% | — | — | 10.85% | 18.99% | — | — | 14.83% |
| Russell Midcap Value Index3,4,5 | 12.43% | — | — | 9.67% | 12.43% | — | — | 13.20% |
1 Performance does not reflect the deduction of taxes on fund distributions or redemptions of fund shares. Past performance does not predict future performance.
2 Current subadviser has managed the fund since April 28, 2006.
3 Since inception returns for the indices may begin on the month-end closest to the actual inception date of the fund.
4 Russell Midcap Value Index is an unmanaged index that measures the performance of those Russell Midcap companies with lower price-to-book ratios and lower forecasted growth values. The stocks are also members of the Russell 1000 Value Index.
5 It is not possible to invest directly in an index. Index figures do not reflect sales charges and would be lower if they did.
36
Natural Resources Fund
Subadviser: Wellington Management Company, LLP
Portfolio Managers: Karl E. Bandtel and James A. Bevilacqua
INVESTMENT OBJECTIVE & POLICIES ► The Fund seeks long-term total return by investing primarily in equity and equity-related securities of natural resource-related companies worldwide.
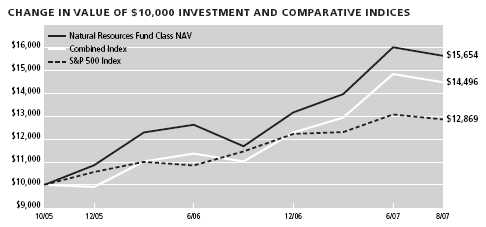
| |
| Sector Weighting* | % of Total |
|
| Energy | 55.56 |
| Basic Materials | 29.71 |
*Top Sectors as a percentage of market value. Does not include short-term securities and investments in the John Hancock Cash Investment Trust.
PORTFOLIO MANAGERS’ COMMENTARY
Performance ► For the year ended August 31, 2007, the Natural Resources Class NAV returned +25.61%, underperforming the +26.09% return of its custom benchmark.
Environment ► Following a period of relative stability during the first part of the year, financial markets suffered from a re-pricing of risk and a loss of confidence related to subprime mortgages. However, despite this general market weakness, strong global demand trends, historically low metals inventories and persistent supply disruptions lay the foundation for continued industry-wide strength in natural resources. The U.S. dollar is at historic lows, putting upward pressure on the price of gold. The price of oil remains strong, based on demand for oil and related services as well as concerns about refining capacity issues and supply shortages.
A couple of metals and mining securities drove the strong relative performance. We continued to underweight our expose to the paper and forest products industry, which benefited the Fund as the industry remains in a period of restructuring, with plant consolidations, asset sales, and merger and acquisition activity. The largest detractors from performance came from the Energy sector, where we were hurt by our overweight position and negative stock selection.
Outlook ► At period end, we remain overweight in the Energy sector, with our most significant position in the oil and gas industry. In this sector, our investment bias continues to be toward companies with the resources and management to create value over time. Metals and mining is the next largest industry in the Fund, and we are in line with the benchmark. The Fund remains underweight in both paper and forest products. Despite increased near-term volatility in the financial markets, we expect a continuation of the supply/demand imbalances that have been driving the Natural Resources sector and we retain our constructive long-term view.
| | | | | | | | |
| PERFORMANCE TABLE1 | Average Annual Total Return | | | Cumulative Total Return | |
|
| | | | | Since | | | | Since |
| Periods Ended August 31, 2007 | 1-year | 5-year | 10-year | inception | 1-year | 5-year | 10-year | inception2 |
|
| Natural Resources Class 1 (began 10/15/05) | 25.57% | — | — | 26.87% | 25.57% | — | — | 56.41% |
| Natural Resources Class NAV (began 10/15/05) | 25.61% | — | — | 26.93% | 25.61% | — | — | 56.54% |
| MSCI World Energy Index, MSCI World Metals, | | | | | | | | |
| MSCI World Paper and Forest Products Index Blend3,4,6 | 26.09% | — | — | 21.36% | 26.09% | — | — | 44.96% |
| S&P 500 Index3,5,6 | 15.13% | — | — | 14.36% | 15.13% | — | — | 28.69% |
1 Performance does not reflect the deduction of taxes on fund distributions or redemptions of fund shares. Past performance does not predict future performance.
2 Current subadviser has managed the fund since October 15, 2005.
3 Since inception returns for the indices may begin on the month-end closest to the actual inception date of the fund.
4 The Combined Index is comprised of 60% MSCI World Energy Index, 30% MSCI World Metals & Mining Index and 10% MSCI World Paper & Forest Products Index.
5 S&P 500 Index is an unmanaged index that includes 500 widely traded common stocks.
6 It is not possible to invest directly in an index. Index figures do not reflect sales charges and would be lower if they did.
37
Quantitative All Cap Fund
Subadviser: MFC Global Investment Management (U.S.A.) Limited
Portfolio Managers: Harpreet Singh, Chris Hensen and Brett Hryb
INVESTMENT OBJECTIVE & POLICIES ► To seek long-term growth of capital by investing at least 65% of the Fund’s assets in equity securities of U.S. companies. The Fund will focus on equity securities of U.S. companies across the three market capitalization ranges of large, mid and small.
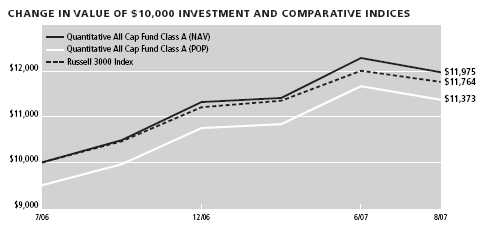
| |
| Sector Weighting* | % of Total |
|
| Financial | 18.15 |
| Consumer, Non-cyclical | 14.40 |
| Industrial | 14.22 |
| Communications | 13.23 |
| Technology | 11.65 |
| Consumer, Cyclical | 10.25 |
| Energy | 8.26 |
| Basic Materials | 2.87 |
| Utilities | 2.48 |
*Top Sectors as a percentage of market value. Does not include short-term securities and investments in the John Hancock Cash Investment Trust.
PORTFOLIO MANAGERS’ COMMENTARY
Performance ► For the year ended August 31, 2007, the Quantitative All Cap Class A returned 18.45%, outperforming the +14.94% return of the Russell 3000 Index.
Environment ► Energy prices were strong. Despite declining in the second half of 2006, oil prices rose again and stood at more than $74 a barrel at the end of August. Economic data has been fairly stable. Employment data has been positive, while key measures of inflation have remained stable. Economic growth moderated over the past year for several reasons. One critical factor curtailing economic growth has been the slowing housing market. Inventories of unsold new and existing homes continued to rise. As a result, prices declined across the U.S.
As low teaser-rate subprime mortgages were reset to higher rates, many marginal homebuyers were unable to cover the higher costs. As a result, defaults and foreclosures spiked dramatically over the past year, and many subprime mortgage market participants were forced into bankruptcy. The ripples were felt throughout the credit market and beyond. Several high-profile hedge funds with subprime and credit exposure were forced to close in 2007.
The strongest sectors within the Russell 3000 Index were Energy, Industrials, Information Technology, Materials and Telecommunications. The Consumer Staples, Financials and Health Care sectors underperformed the Index. The Fund strongly outperformed its benchmark Index for the 12-month period. Stock selection added the most to performance and was particularly strong in the Consumer Discretionary space, where the Fund owned a number of solid performers. Security selection was also positive in the Industrials, Technology and Materials sectors. Selection was weak in the Energy, Financials and Health Care sectors.
Outlook ► We believe U.S. economic growth will slow to 2%, with moderate inflation. We expect the Fed will start to ease monetary policy and cut the federal funds rate. In previous environments of Fed easing, moderate inflation and growth, markets have rallied strongly. In addition, markets are attractively valued. The 2007 estimated P/E ratio for the S&P 500 Index is 15.5, below its long-term historical average.
Over the near term, the U.S. stock market is expected to be volatile. However, given the very favorable factors outlined above, persistent earnings growth and a bullish market sentiment indicator, we believe the stock market could return double digits over the coming 12 months.
| | | | | | | | | | |
| | | | | | | | |
| | | Cumulative Total Return | | | | Cumulative Total Return |
| PERFORMANCE TABLE1,4 | | Without Maximum Sales Charge (NAV) | | | | With Maximum Sales Charge (POP) |
|
| | | | | Since | | | | Since |
| Periods Ended August 31, 2007 | 1-year | 5-year | 10-year | inception | 1-year | 5-year | 10-year | inception2 |
|
| Quantitative All Cap Class A (began 7/28/06) | 18.45% | — | — | 17.93% | 18.45% | — | — | 19.75% |
| Quantitative All Cap Class B (began 7/28/06) | 17.57% | — | — | 17.13% | 17.57% | — | — | 18.87% |
| Quantitative All Cap Class C (began 7/28/06) | 17.57% | — | — | 17.13% | 17.57% | — | — | 18.87% |
| Quantitative All Cap Class I (began 7/28/06) | 18.70% | — | — | 18.26% | 18.70% | — | — | 20.12% |
| Russell 3000 Index3,5,6 | 14.94% | — | — | 16.02% | 14.94% | — | — | 17.64% |
1 Performance does not reflect the deduction of taxes on fund distributions or redemptions of fund shares. Past performance does not predict future performance.
2 Current subadviser has managed the fund since July 28, 2006.
3 Since inception returns for the indices may begin on the month-end closest to the actual inception date of the fund.
4 Since inception, a portion of the Quantitative All Cap Fund expenses were reimbursed. If such expenses had not been reimbursed, returns would be lower.
5 Russell 3000 Index is an unmanaged index of the 3,000 largest U.S. companies based on total market capitalization, which represents approximately 98% of the investable U.S. equity market.
6 It is not possible to invest directly in an index. Index figures do not reflect sales charges and would be lower if they did.
38
Quantitative Mid Cap Fund
Subadviser: MFC Global Investment Management (U.S.A.) Limited
Portfolio Managers: Norman Ali, Rhonda Chang and Harpreet Singh
INVESTMENT OBJECTIVE & POLICIES ► To seek long-term capital growth by investing at least 80% of the Fund’s total assets in U.S. mid-cap stocks, convertible preferred stocks, convertible bonds and warrants. The Fund may also invest up to 20% of its assets in large-cap stocks, convertible preferred stocks, convertible bonds and warrants in an effort to reduce overall Fund volatility and increase performance.
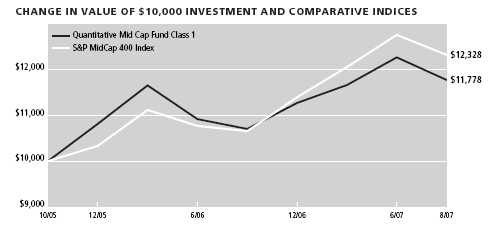
| |
| Sector Weighting* | % of Total |
|
| Industrial | 18.15 |
| Financial | 17.47 |
| Technology | 16.35 |
| Consumer, Cyclical | 13.31 |
| Consumer, Non-cyclical | 12.56 |
| Energy | 8.50 |
| Utilities | 5.34 |
| Communications | 3.93 |
| Basic Materials | 2.75 |
| Government | 1.64 |
*Top Sectors as a percentage of market value. Does not include short-term securities and investments in the John Hancock Cash Investment Trust.
PORTFOLIO MANAGERS’ COMMENTARY
Performance ► For the year ended August 31, 2007, the Quantitative Mid Cap Class 1 returned 11.39%, underperforming the +16.47% return of the S&P MidCap 400 Index.
Environment ► The S&P MidCap 400 Index outperformed both the large-cap S&P 500 Index and the S&P Small Cap Index. While concerns over housing and tight liquidity dominated the latter part of the period, earnings growth remained strong and came in better than expected, which helped drive performance for the major equity indexes. Strong commodity prices, helped by global demand, especially in emerging economies, led the Materials sector to outperform the overall Index. The Industrial sector was the second best performer, helped by global economic growth, a weak U.S. dollar and robust non-residential construction and agricultural end markets in the U.S. Given the turmoil in the capital markets, and the collapse of the mortgage-backed securities market, Financials was the worst performing sector, followed by Utilities.
While performance was challenging during the past year, there were clear signs of a turnaround, as the Fund ranked in the top quartile for the three months ending Aug 31, 2007. The Fund underperformed its benchmark during the year, with the Energy and Industrial sectors detracting most from performance. Gas-exposed drillers and exploration and production names were hurt as natural gas prices fell 7% on mild weather and above-average storage levels. The Technology sector was the most prominent contributor to Fund performance, as growth in earnings was better than expected for our holdings.
Outlook ► We believe U.S. economic growth will slow to 2%, with moderate inflation. We expect the Federal Reserve will start to ease monetary policy and cut the federal funds rate. In previous environments of Fed easing, moderate inflation and growth, markets have rallied strongly. In addition, markets are attractively valued.
Over the near term, the U.S. stock market is expected to be volatile. However, given the very favorable factors outlined above, persistent earnings growth and a bullish market sentiment indicator, we believe the stock market could return double digits over the coming 12 months.
| | | | | | | | |
| PERFORMANCE TABLE1 | Average Annual Total Return | | | Cumulative Total Return | |
|
| | | | | Since | | | | Since |
| Periods Ended August 31, 2007 | 1-year | 5-year | 10-year | inception | 1-year | 5-year | 10-year | inception2 |
|
| Quantitative Mid Cap Class 1 (began 10/15/05) | 11.39% | — | — | 9.10% | 11.39% | — | — | 17.78% |
| S&P MidCap 400 Index (10/15/05)3,4,5 | 16.47% | — | — | 11.53% | 16.47% | — | — | 23.28% |
1 Performance does not reflect the deduction of taxes on fund distributions or redemptions of fund shares. Past performance does not predict future performance.
2 Current subadviser has managed the fund since October 15, 2005.
3 Since inception returns for the indices may begin on the month-end closest to the actual inception date of the fund.
4 S&P MidCap 400 Index is an unmanaged index of 400 domestic stocks of medium-sized companies.
5 It is not possible to invest directly in an index. Index figures do not reflect sales charges and would be lower if they did.
39
Quantitative Value Fund
Subadviser: MFC Global Investment Management (U.S.A.) Limited
Portfolio Managers: Chris Hensen, Brett Hryb and Harpreet Singh
INVESTMENT OBJECTIVE & POLICIES ► To seek long-term capital appreciation by investing at least 65% of the Fund’s assets in large-cap U.S. securities with the potential for long-term growth of capital.
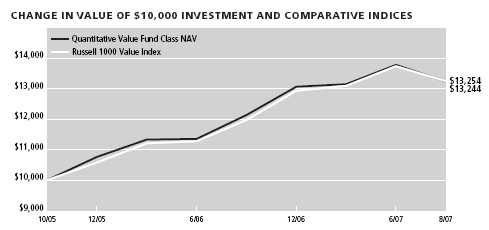
| |
| Sector Weighting* | % of Total |
|
| Financial | 32.21 |
| Energy | 12.54 |
| Communications | 12.05 |
| Industrial | 12.04 |
| Consumer, Non-cyclical | 9.45 |
| Utilities | 5.33 |
| Technology | 4.11 |
| Consumer, Cyclical | 3.63 |
| Basic Materials | 3.44 |
| Government | 1.38 |
*Top Sectors as a percentage of market value. Does not include short-term securities and investments in the John Hancock Cash Investment Trust.
PORTFOLIO MANAGERS’ COMMENTARY
Performance ► For the year ended August 31, 2007, the Quantitative Value Equity Class NAV returned 12.26%, compared to the +12.85% return of the Russell 1000 Value Index.
Environment ► Energy prices were strong. Despite declining in the second half of 2006, oil prices rose again and stood at more than $74 a barrel at the end of August. Economic data has been fairly stable. Employment data has been positive, while key measures of inflation have remained stable. Economic growth moderated over the past year for several reasons. One critical factor curtailing economic growth has been the slowing housing market. Inventories of unsold new and existing homes continued to rise. As a result, prices declined across the U.S.
As low teaser-rate subprime mortgages were reset to higher rates, many marginal homebuyers were unable to cover the higher costs. As a result, defaults and foreclosures spiked dramatically over the past year, and many subprime mortgage market participants were forced into bankruptcy. The ripples were felt throughout the credit market and beyond. Several high-profile hedge funds with subprime and credit exposure were forced to close in 2007.
Among large-cap stocks, growth outperformed value investing by about 5% for the period following several years of value outperforming growth. Within the Russell 1000 Value Index, the strongest sectors were Energy, Materials, Telecommunications, Industrials, Technology and Utilities. The weakest sectors were Financials, Health Care and Consumer Staples. The Fund’s stock selection was strong in the Discretionary and Materials sectors. A number of steel and metals holdings performed extremely well and contributed to performance. Stock selection was weak in the Staples, Energy and Industrials sectors.
Outlook ► We believe U.S. economic growth will slow to 2%, with moderate inflation. We expect the Fed will start to ease monetary policy and cut the federal funds rate. In previous environments of Fed easing, moderate inflation and growth, markets have rallied strongly. In addition, markets are attractively valued.
Over the near term, the U.S. stock market is expected to be volatile. However, given the very favorable factors outlined above, persistent earnings growth and a bullish market sentiment indicator, we believe the stock market could return double digits over the coming 12 months.
| | | | | | | | |
| PERFORMANCE TABLE1 | Average Annual Total Return | | | Cumulative Total Return | |
|
| | | | | Since | | | | Since |
| Periods Ended August 31, 2007 | 1-year | 5-year | 10-year | inception | 1-year | 5-year | 10-year | inception2 |
|
| Quantitative Value Class 1 (began 10/15/05) | 12.12% | — | — | 16.05% | 12.12% | — | — | 32.28% |
| Quantitative Value Class NAV (began 10/15/05) | 12.26% | — | — | 16.13% | 12.26% | — | — | 32.44% |
| Russell 1000 Value Index3,4,5 | 12.85% | — | — | 16.17% | 12.85% | — | — | 32.54% |
1 Performance does not reflect the deduction of taxes on fund distributions or redemptions of fund shares. Past performance does not predict future performance.
2 Current subadviser has managed the fund since October 15, 2005.
3 Since inception returns for the indices may begin on the month-end closest to the actual inception date of the fund.
4 Russell 1000 Value Index is an unmanaged index containing those securities in the Russell 1000 Index with a less-than-average growth orientation.
5 It is not possible to invest directly in an index. Index figures do not reflect sales charges and would be lower if they did.
40
Real Estate Equity Fund
Subadviser: T. Rowe Price Associates, Inc.
Portfolio Manager: David M. Lee
INVESTMENT OBJECTIVE & POLICIES ► The Fund seeks long-term growth through a combination of capital appreciation and current income by primarily investing in the equity securities of real estate companies.
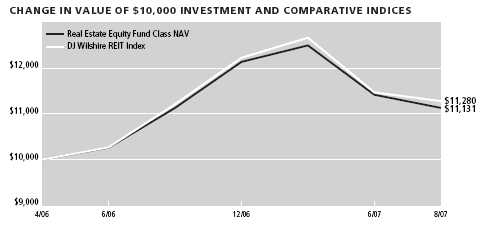
| |
| Sector Weighting* | % of Total |
|
| Financial | 87.07 |
| Consumer, Cyclical | 4.83 |
| Basic Materials | 1.74 |
*Top Sectors as a percentage of market value. Does not include short-term securities and investments in the John Hancock Cash Investment Trust.
PORTFOLIO MANAGER’S COMMENTARY
Performance ► For the year ended August 31, 2007, the Real Estate Equity Class NAV returned +1.28%, underperforming the +2.50% return of the DJ Wilshire REIT Index.
Environment ► The real estate market has been weak as long-term investors took profits after seven consecutive years of outstanding performance and record high valuations. Sluggish consumer spending, disappointing housing starts and weak economic growth also weighed on performance.
Commercial real estate securities reversed their long-standing trend of positive performance during the period. Both public and private investors remained attracted to the sector, but the frenzied pace of real estate deals slowed, affecting the real estate investment trust (REIT) sector. Several major sectors in real estate weakened, as subprime lending and tighter underwriting standards had a negative impact on this sector.
Office stocks were down on concerns that the sub-prime market may hurt economic growth, resulting in slower non-farm payroll growth. Regional malls were positive despite valuation concerns and a weaker consumer affected by rising oil prices. Lodging stocks also had positive results during the period.
The apartment sector was one of the worst performing property types on an absolute basis. Subprime lending woes continued to dominate the headlines and could provide a catalyst for apartment demand as home defaulters turn to the rental market. Multifamily starts remained relatively low, limiting the supply of new rental units, which is positive for companies that operate within the apartment sector.
Relative performance benefited from strong stock selection in lodging and a large underweight position in the self-storage industry. However, due to poor stock selection in the office sector, performance trailed the index.
Outlook ► Our current fundamental outlook remains optimistic as we expect positive job growth to have a beneficial impact on commercial real estate against a backdrop of balanced new supply. The recent slowing in the pace of job creation is a risk we are monitoring, but we are optimistic that the Fed can maintain a steady-growth economy.
| | | | | | | | |
| PERFORMANCE TABLE1,4 | Average Annual Total Return | | | Cumulative Total Return | |
|
| | | | | Since | | | | Since |
| Periods Ended August 31, 2007 | 1-year | 5-year | 10-year | inception | 1-year | 5-year | 10-year | inception2 |
|
| Real Estate Equity Class NAV (began 4/28/06) | 1.28% | — | — | 8.31% | 1.28% | — | — | 11.31% |
| DJ Wilshire REIT Index3,5,6 | 2.50% | — | — | 9.43% | 2.50% | — | — | 12.80% |
1 Performance does not reflect the deduction of taxes on fund distributions or redemptions of fund shares. Past performance does not predict future performance.
2 Current subadviser has managed the fund since April 28, 2006.
3 Since inception returns for the indices may begin on the month-end closest to the actual inception date of the fund.
4 Since inception, a portion of the Real Estate Equity Fund expenses were reimbursed. If such expenses had not been reimbursed, returns would be lower.
5 DJ Wilshire REIT Index is an unmanaged index consisting of actively traded real estate investment trusts.
6 It is not possible to invest directly in an index. Index figures do not reflect sales charges and would be lower if they did.
41
Real Estate Securities Fund
Subadviser: Deutsche Investment Management Americas Inc.
Portfolio Managers: Jerry W. Ehlinger, John F. Robertson, John W. Vojticek and Asad Kazim
INVESTMENT OBJECTIVE & POLICIES ► To seek a combination of long-term capital appreciation and current income by primarily investing in equity securities of REITs and real estate companies.
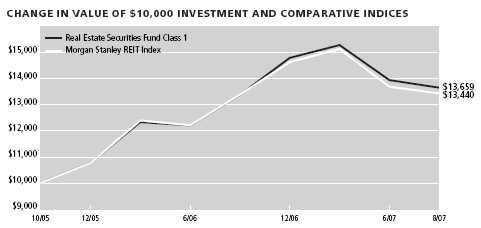
| |
| Sector Weighting* | % of Total |
|
| Financial | 95.44 |
| Consumer, Cyclical | 2.52 |
*Top Sectors as a percentage of market value. Does not include short-term securities and investments in the John Hancock Cash Investment Trust.
PORTFOLIO MANAGERS’ COMMENTARY
Performance ► For the year ended August 31, 2007, the Real Estate Securities Class 1 returned +4.30% outperforming the +2.28% return of the Morgan Stanley REIT Index.
Environment ► The performance of REITs during the fiscal year was driven by privatization and merger activity occurring at premiums and continued strong demand for high dividend yields during the first half of the period. However, during recent months, widespread problems in the credit market exacerbated the problems facing the already weakening U.S. economy. Uncertainty surrounding economic growth, coupled with the disappearance of cheap credit, led to a revaluation of risk and an increase in required returns.
The Fund outperformed its benchmark for the year due to positive stock selection and despite slightly negative sector selection. Holdings in Apartment, Office, Retail, Hotel, Industrial, Mall and Storage sectors performed well on a relative basis, while holdings within the Health Care and Specialty sectors were a drag on the portfolio.
From a sector perspective, the Mall, Hotel and Office sectors outperformed the overall benchmark, while Retail, Apartment and Specialty sectors lagged. As such, the Fund’s relative sector performance was helped by overweight positions in the Mall, Hotel and Office sectors. However, an overweight position in the weak Apartment sector and an underweight in the strong Retail and Specialty sectors hurt performance.
Outlook ► While we continue to feel that the long-term outlook for REIT returns remains compelling, the near term will likely be driven by expectations around a September Federal Reserve rate cut and assessment of broader economic growth and its impact on real estate fundamentals. Expectations have largely been adjusted to reflect a slowing economy in the second half of 2007 and an expected pick-up in 2008.
| | | | | | | | |
| PERFORMANCE TABLE1 | Average Annual Total Return | | | Cumulative Total Return | |
|
| | | | | Since | | | | Since |
| Periods Ended August 31, 2007 | 1-year | 5-year | 10-year | inception | 1-year | 5-year | 10-year | inception2 |
|
| Real Estate Securities Class 1 (began 10/15/05) | 4.30% | — | — | 18.05% | 4.30% | — | — | 36.59% |
| Morgan Stanley REIT Index3,4,5 | 2.28% | — | — | 17.03% | 2.28% | — | — | 34.40% |
1 Performance does not reflect the deduction of taxes on fund distributions or redemptions of fund shares. Past performance does not predict future performance.
2 Current subadviser has managed the fund since October 15, 2005.
3 Since inception returns for the indices may begin on the month-end closest to the actual inception date of the fund.
4 Morgan Stanley REIT Index is an unmanaged index consisting of the most actively traded real estate investment trusts.
5 It is not possible to invest directly in an index. Index figures do not reflect sales charges and would be lower if they did.
42
Real Return Bond Fund
Subadviser: Pacific Investment Management Company LLC
Portfolio Manager: John B. Brynjolfsson
INVESTMENT OBJECTIVE & POLICIES ► The Fund seeks maximum real return, consistent with preservation of real capital and prudent investment management, by investing at least 80% of its net assets in inflation-indexed bonds of varying maturities issued by the U.S. and non-U.S. governments, their agencies or instrumentalities, and corporations.
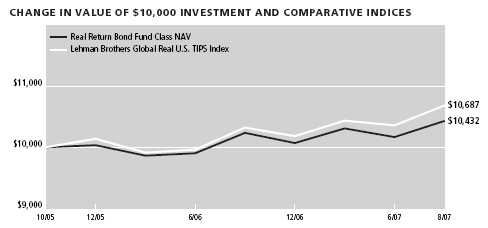
| |
| Sector Weighting* | % of Total |
|
| Government | 65.88 |
| Mortgage Securities | 18.49 |
| Financial | 3.28 |
| Communications | 0.39 |
| Consumer, Non-cyclical | 0.31 |
| Energy | 0.25 |
| Consumer, Cyclical | 0.12 |
| Other | 0.11 |
| Natural Resources | 0.09 |
| Basic Materials | 0.06 |
*Top Sectors as a percentage of market value. Does not include short-term securities and investments in the John Hancock Cash Investment Trust.
PORTFOLIO MANAGER’S COMMENTARY
Performance ► For the year ended August 31, 2007, the Real Return Bond Class NAV returned +1.95%, underperforming the +3.76% return of the Lehman Brothers Global Real U.S. TIPS Index.
Environment ► The Federal Reserve remained on hold, leaving the federal funds rate at 5.25% throughout the period. Even as concerns about the subprime mortgage sector developed, the Fed focused on stronger economic data and inflation concerns, making it difficult to ease rates. Tight labor markets kept the unemployment rate relatively low and produced real wage gains for consumers that helped offset headwinds from the residential property market. In addition, measures of core inflation remained above the Fed’s targeted range. Weakness in the subprime mortgage sector produced a significant tightening of credit conditions for lower quality and first-time borrowers, yet another blow to an already soft housing market. At period end the benchmark 10-year Treasury yielded 4.53%, 20 basis points lower than a year earlier. Ten-year real yi elds ended the period at 2.35%, 10 basis points higher for the year.
Tactical TIPS duration versus the benchmark added to returns, as real yields rose overall during the year. In contrast, above-benchmark total duration detracted from returns, as global interest rates rose. Exposure to mortgages detracted from returns as spreads widened. Similarly, widening spreads in investment grade and high yield credit holdings impaired results. Exposure to short maturity U.K. rates weighed on returns as the U.K. nominal yield curve flattened.
Exposure to a basket of currencies added slightly to returns as most currencies appreciated relative to the U.S. dollar.
Outlook ► We expect strong global growth with a cyclical slowdown in the U.S. Real global growth should continue to advance at an annual rate of around 5% over the next several years, led largely by rapid expansion in China and India. More mature developed economies should grow at annual rates closer to 2%. The U.S. economy should remain weak in 2007 and 2008. The downturn in the residential property market has not found a bottom and the corresponding impact on homeowners and consumers has yet to be fully realized.
| | | | | | | | |
| PERFORMANCE TABLE1 | Average Annual Total Return | | | Cumulative Total Return | |
|
| | | | | Since | | | | Since |
| Periods Ended August 31, 2007 | 1-year | 5-year | 10-year | inception | 1-year | 5-year | 10-year | inception2 |
|
| Real Return Bond Class 1 (began 10/15/05) | 1.97% | — | — | 2.26% | 1.97% | — | — | 4.29% |
| Real Return Bond Class NAV (began 10/15/05) | 1.95% | — | — | 2.27% | 1.95% | — | — | 4.32% |
| Lehman Brothers Global Real U.S. TIPS Index3,4,5 | 3.76% | — | — | 3.60% | 3.76% | — | — | 6.87% |
1 Performance does not reflect the deduction of taxes on fund distributions or redemptions of fund shares. Past performance does not predict future performance.
2 Current subadviser has managed the fund since October 15, 2005.
3 Since inception returns for the indices may begin on the month-end closest to the actual inception date of the fund.
4 Lehman Brothers Global Real U.S.TIPS Index is an unmanaged index that consists of Inflation-Protection securities issued by the U.S.Treasury.
5 It is not possible to invest directly in an index. Index figures do not reflect sales charges and would be lower if they did.
43
Small Cap Fund
Subadviser: Independence Investments, LLC
Portfolio Manager: Charles S. Glovsky
INVESTMENT OBJECTIVE & POLICIES ► To seek maximum capital appreciation consistent with reasonable risk to principal by investing at least 80% of the Fund's net assets in equity securities of small-cap companies.
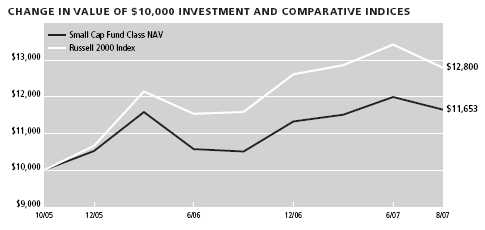
| |
| Sector Weighting* | % of Total |
|
| Consumer, Non-cyclical | 20.41 |
| Financial | 14.18 |
| Consumer, Cyclical | 13.03 |
| Industrial | 11.94 |
| Communications | 8.13 |
| Basic Materials | 4.18 |
| Technology | 4.17 |
| Energy | 3.28 |
| Funds | 1.67 |
*Top Sectors as a percentage of market value. Does not include short-term securities and investments in the John Hancock Cash Investment Trust.
PORTFOLIO MANAGER’S COMMENTARY
Performance ► For the year ended August 31, 2007, the Small Cap Class NAV returned +12.96%, outperforming the +11.36% return of the Russell 2000 Index.
Environment ► Market volatility and strong economic cross-currents characterized the markets for the last 12 months. Small-cap stocks posted a 21% gain from September 2006 through June 2007, helped by favorable economic growth prospects, moderate inflation, and strong corporate liquidity and profitability. However, the market began to retrace some of its progress in July due to concerns about credit issues related to subprime debt and the direction of the economy. Some hedge funds and other managers experienced significant losses, causing disruptions in the market as they liquidated positions. Small-cap stocks plunged almost 10% from June through mid-August, before staging a modest recovery at the end of August. In spite of this difficult environment, the Fund, with its stock-specific focus and disciplined, bottom-up strategy, outperfor med its benchmark.
Health care holdings made a positive contribution to the portfolio. These included an operator of air medical transportation services, a leader in drug delivery technology and a marketer of diagnostic tests. A supplier of engineered equipment used in producing and storing hydrocarbon and industrial gases benefited from growing investment in global energy infrastructure. A supplier of recycled automotive parts also was a major positive contributor. On the down side, a semiconductor supplier saw a drop in orders from its key markets.
Outlook ► We believe that recent market volatility will play itself out and markets will return to a more normal environment. Economic growth will continue for the remainder of the year, although at a somewhat slower pace, while inflation will remain subdued. Small-cap relative valuations remain somewhat high, but growth appears more attractive than value. We will continue to seek out companies with strong growth prospects that are underappreciated by the market. We have confidence that our disciplined strategy of bottom-up, fundamentally driven stock picking can outperform over a full market cycle.
| | | | | | | | |
| PERFORMANCE TABLE1 | Average Annual Total Return | | | Cumulative Total Return | |
|
| | | | | Since | | | | Since |
| Periods Ended August 31, 2007 | 1-year | 5-year | 10-year | inception | 1-year | 5-year | 10-year | inception2 |
|
| Small Cap Class 1 (began 10/15/05) | 12.91% | — | — | 8.41% | 12.91% | — | — | 16.40% |
| Small Cap Class NAV (began 10/15/05) | 12.96% | — | — | 8.48% | 12.96% | — | — | 16.53% |
| Russell 2000 Index3,4,5 | 11.36% | — | — | 14.04% | 11.36% | — | — | 28.00% |
1 Performance does not reflect the deduction of taxes on fund distributions or redemptions of fund shares. Past performance does not predict future performance.
2 Current subadviser has managed the fund since October 15, 2005.
3 Since inception returns for the indices may begin on the month-end closest to the actual inception date of the fund.
4 Russell 2000 Index is an unmanaged index composed of 2,000 U.S. small capitalization stocks.
5 It is not possible to invest directly in an index. Index figures do not reflect sales charges and would be lower if they did.
44
Small Cap Index Fund
Subadviser: MFC Global Investment Management (U.S.A.) Limited
Portfolio Managers: Carson Jen and Narayan Ramani
INVESTMENT OBJECTIVE & POLICIES ► The Fund seeks to approximate the aggregate total return of a small-cap U.S. domestic equity market index that primarily invests in (a) common stocks that are included in the Russell 2000 Index and (b) securities that are believed to behave in a manner similar to the Index.
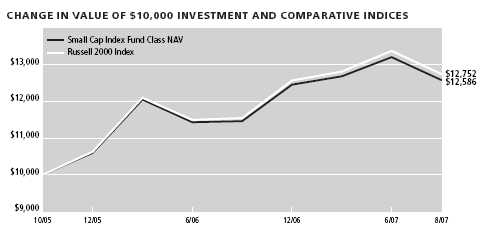
| |
| Sector Weighting* | % of Total |
|
| Consumer, Non-cyclical | 16.56 |
| Financial | 15.74 |
| Industrial | 11.44 |
| Consumer, Cyclical | 10.43 |
| Technology | 7.53 |
| Communications | 7.41 |
| Energy | 3.93 |
| Basic Materials | 3.13 |
| Utilities | 2.22 |
| Diversified | 0.19 |
*Top Sectors as a percentage of market value. Does not include short-term securities and investments in the John Hancock Cash Investment Trust.
PORTFOLIO MANAGERS’ COMMENTARY
Performance ► For the year ended August 31, 2007, the Small Cap Index Class NAV returned +10.70%, in line with the +11.36% return of the Russell 2000 Index.
Environment ► The U.S. economy seems to be slowing down, as the first quarter gross domestic product (GDP) grew at a 0.6% annual rate, before bouncing back in the second quarter to a 3.4% annual real growth rate. Despite fears of rising U.S. inflation, in the past year the inflation rate was not significant.
The Federal Reserve has left the benchmark federal funds rate unchanged at 5.25% since mid-2006. In August 2007, the unemployment rate remained at 4.6%, a slight increase from the previous quarter’s 4.5% . While employment in manufacturing, construction and local government education declined, there has been a growth in such industries as health care and food products. Over the past three months, total payroll in the U.S. grew by 44,000 per month. The Conference Board’s Consumer Confidence Index dropped to 105 in August from 111.9 in July.
For the year, Consumer Staples and Materials & Processing were the best performing sectors, returning 28% and 27%, respectively. Integrated Oils and Financial Services were the worst performers, returning –29% and –4%, respectively.
Outlook ► Despite an expected slowdown in the U.S. economy, we don’t foresee a recession in the upcoming year. An interest rate cut is expected in the fall of 2007, which may restore confidence and retail spending. Moreover, gaining access to credit may be tougher for many Americans. The Fed believes that the U.S. economy is not at risk.
| | | | | | | | |
| PERFORMANCE TABLE1,4 | Average Annual Total Return | | | Cumulative Total Return | |
|
| | | | | Since | | | | Since |
| Periods Ended August 31, 2007 | 1-year | 5-year | 10-year | inception | 1-year | 5-year | 10-year | inception2 |
|
| Small Cap Index Fund Class NAV (began 10/29/05) | 10.70% | — | — | 13.30% | 10.70% | — | — | 25.86% |
| Russell 2000 Index3,5,6 | 11.36% | — | — | 14.12% | 11.36% | — | — | 27.52% |
1 Performance does not reflect the deduction of taxes on fund distributions or redemptions of fund shares. Past performance does not predict future performance.
2 Current subadviser has managed the fund since October 29, 2005.
3 Since inception returns for the indices may begin on the month-end closest to the actual inception date of the fund.
4 Since inception, a portion of the Small Cap Index Fund expenses were reimbursed. If such expenses had not been reimbursed, returns would be lower.
5 Russell 2000 Index is an unmanaged index composed of 2,000 U.S. small capitalization stocks.
6 It is not possible to invest directly in an index. Index figures do not reflect sales charges and would be lower if they did.
45
Small Cap Opportunities Fund
Subadviser: Munder Capital Management, LLC
Portfolio Managers: Robert E. Crosby, Julie R. Hollinshead and John P. Richardson
INVESTMENT OBJECTIVE & POLICIES ► To seek long-term capital appreciation by investing at least 80% of the Fund’s net assets in equity securities of small-capitalization companies.
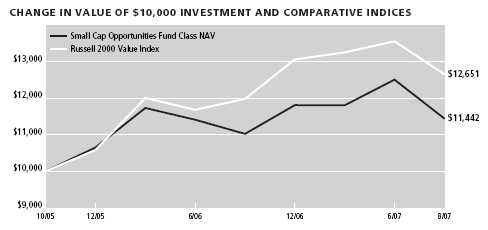
| |
| Sector Weighting* | % of Total |
|
| Financial | 21.44 |
| Industrial | 17.19 |
| Consumer, Cyclical | 15.48 |
| Consumer, Non-cyclical | 8.93 |
| Technology | 6.30 |
| Communications | 4.55 |
| Energy | 4.15 |
| Basic Materials | 3.34 |
| Utilities | 2.40 |
*Top Sectors as a percentage of market value. Does not include short-term securities and investments in the John Hancock Cash Investment Trust.
PORTFOLIO MANAGERS’ COMMENTARY
Performance ► For the year ended August 31, 2007, the Small Cap Opportunities Class NAV returned +4.88%, underperforming the +6.64% return of the Russell 2000 Value Index.
Environment ► With the exception of Financial stocks, every sector of the portfolio had positive absolute returns, with seven of the 10 sectors producing double-digit returns. The contagion of credit concerns, liquidity issues and the subprime mortgage debacle was rapid, broad and unrelenting. It showed little regard for stock fundamentals, and more than three-quarters of the portfolio’s financial holdings produced negative returns during the period. Because the Financial sector represents more than a third of the entire Index weight, any negative sentiment toward the sector can significantly affect its overall performance.
Despite concerns that U.S. consumers would retract, the Consumer Discretionary sector was very strong, with an absolute return of over 20%. Almost half of the stocks within the sector produced double-digit gains, ranging from 11% to 95%. Other areas of significant relative strength included the Information Technology, Industrials, Energy and Utilities sectors.
The strength of the holdings in these sectors was largely due to strong fundamentals and earnings growth, on both an absolute and relative basis. Despite the poor absolute and relative performance of the portfolio’s financial holdings, the earnings performance of a number of companies in the financials sector has continued to meet or exceed guidance, and we remain very positive toward a number of the financials holdings. Most of the weakest performing stocks have experienced significant insider buying, which we view very positively.
In summary, we view the portfolio as attractively structured, based on holdings with strong earnings growth, attractive valuations and profitable business models. Each of these characteristics is compelling, relative to the small-cap segment of the stock market. In addition, we are anticipating that the financials sector will rebound in the fourth quarter.
The overall economy is beginning to show signs of a slowdown, and earnings growth is decelerating. This environment will favor companies that can continue to deliver earnings; it has favored our style in all sectors except Finance. As mentioned, the Financial sector has been in a stressful situation, as credit markets have tightened significantly. Monetary policy will play a big role in steering this key sector through a stressful period. If a soft landing is accomplished, we would expect better performance from Financial stocks, which appear to offer compelling value after lagging over the past 12 months.
Outlook ► We continue to focus on companies with high levels of profitability selling at attractive valuations. Valuations in our portfolio look very attractive relative to the Russell 2000 Value Index, with better fundamentals and superior profitability. The combination of a disciplined focus and attractive relative valuations gives us confidence for the remainder of 2007.
| | | | | | | | |
| PERFORMANCE TABLE1 | Average Annual Total Return | | | Cumulative Total Return | |
|
| | | | | Since | | | | Since |
| Periods Ended August 31, 2007 | 1-year | 5-year | 10-year | inception | 1-year | 5-year | 10-year | inception2 |
|
| Small Cap Opportunities Class 1 (began 10/15/05) | 4.85% | — | — | 7.38% | 4.85% | — | — | 14.32% |
| Small Cap Opportunities Class NAV (began 10/15/05) | 4.88% | — | — | 7.43% | 4.88% | — | — | 14.42% |
| Russell 2000 Value Index3,4,5 | 6.64% | — | — | 13.33% | 6.64% | — | — | 26.51% |
1 Performance does not reflect the deduction of taxes on fund distributions or redemptions of fund shares. Past performance does not predict future performance.
2 Current subadviser has managed the fund since October 15, 2005.
3 Since inception returns for the indices may begin on the month-end closest to the actual inception date of the fund.
4 Russell 2000 Value Index is an unmanaged index that measures the performance of those Russell 2000 companies with lower price-to-book ratios and lower forecasted growth values.
5 It is not possible to invest directly in an index. Index figures do not reflect sales charges and would be lower if they did.
46
Small Company Fund
Subadviser: American Century Investment Management, Inc.
Portfolio Managers: Wilhelmine von Turk, Thomas P. Vaiana and Brian Ertley
INVESTMENT OBJECTIVE & POLICIES ► To seek long-term capital growth by investing at least 80% of the Fund’s net assets in stocks of companies that have market capitalization not greater than that of the largest company in the S&P SmallCap 600 Index.
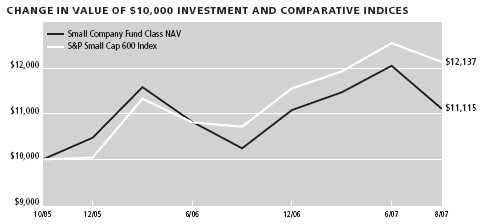
| |
| Sector Weighting* | % of Total |
|
| Consumer, Non-cyclical | 19.88 |
| Industrial | 18.95 |
| Financial | 14.55 |
| Consumer, Cyclical | 11.70 |
| Technology | 7.02 |
| Basic Materials | 5.34 |
| Communications | 5.29 |
| Utilities | 4.42 |
| Energy | 3.83 |
*Top Sectors as a percentage of market value. Does not include short-term securities and investments in the John Hancock Cash Investment Trust.
PORTFOLIO MANAGERS’ COMMENTARY
Performance ► For the year ended August 31, 2007, the Small Company Class NAV returned +9.13%, underperforming the +14.28% return of the S&P Small Cap 600 Index.
Environment ► U.S. stocks produced robust returns during the past year despite increasing volatility and a downturn late in the period. Corporate earnings growth decelerated but continued to outshine expectations, while heavy merger activity provided support for stocks, thanks to a deluge of leveraged buyouts from private equity firms. The market grew choppy in the last several months and ended the period with a sharp decline as higher energy prices and deteriorating credit conditions — sparked by problems in the subprime lending industry —weighed on investor confidence.
Within the portfolio, the economically sensitive Materials and Industrials sectors contributed the most to absolute performance, along with Telecommunication Services stocks. Energy and Financials were the only segments of the portfolio to decline during the one-year period. The portfolio’s underperformance of its benchmark index resulted primarily from disappointing stock selection in the Information Technology sector, most notably among software makers and Internet companies. Stock choices in the Energy sector also detracted from relative results, especially in the energy services and equipment industry. On the positive side, stock selection was more successful in the Financials sector, led by real estate investment trusts and commercial banks. The portfolio’s Materials stocks also added value, particularly an overweight and strong security selection in the chemicals industry.
Outlook ► Substantial market volatility over the last few months created a challenging investment environment. However, we will remain true to our disciplined investment approach, building a portfolio of smaller companies that we believe provides an optimal balance between risk and expected return.
| | | | | | | | |
| PERFORMANCE TABLE1 | Average Annual Total Return | | | Cumulative Total Return | |
|
| | | | | Since | | | | Since |
| Periods Ended August 31, 2007 | 1-year | 5-year | 10-year | inception | 1-year | 5-year | 10-year | inception2 |
|
| Small Company Class 1 (began 10/15/05) | 9.08% | — | — | 5.72% | 9.08% | — | — | 11.02% |
| Small Company Class NAV (began 10/15/05) | 9.13% | — | — | 5.78% | 9.13% | — | — | 11.15% |
| S&P Small Cap 600 Index3,4,5 | 14.28% | — | — | 10.63% | 14.28% | — | — | 21.37% |
1 Performance does not reflect the deduction of taxes on fund distributions or redemptions of fund shares. Past performance does not predict future performance.
2 Current subadviser has managed the fund since October 15, 2005.
3 Since inception returns for the indices may begin on the month-end closest to the actual inception date of the fund.
4 S&P Small Cap 600 Index is an unmanaged index composed of 600 U.S. small-sized companies.
5 It is not possible to invest directly in an index. Index figures do not reflect sales charges and would be lower if they did.
47
Small Company Growth Fund
Subadviser: AIM Capital Management, Inc.
Portfolio Managers: Juliet S. Ellis and Juan R. Hartsfield
INVESTMENT OBJECTIVE & POLICIES ► To seek long-term growth of capital by investing at least 80% of the Fund’s net assets in securities of small-capitalization companies.
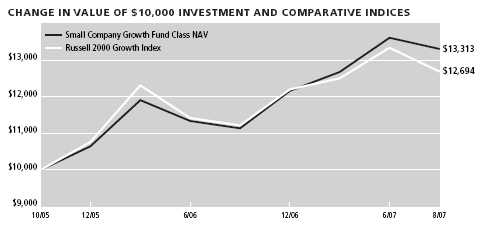
| |
| Sector Weighting* | % of Total |
|
| Consumer, Non-cyclical | 22.34 |
| Technology | 16.26 |
| Industrial | 14.05 |
| Consumer, Cyclical | 8.79 |
| Communications | 7.52 |
| Financial | 6.12 |
| Energy | 3.59 |
| Utilities | 1.30 |
| Basic Materials | 0.90 |
*Top Sectors as a percentage of market value. Does not include short-term securities and investments in the John Hancock Cash Investment Trust.
PORTFOLIO MANAGERS’ COMMENTARY
Performance ► For the year ended August 31, 2007, the Small Company Growth Class NAV returned +20.04%, outperforming the +16.36% return of the Russell 2000 Growth Index.
Environment ► Domestic equities posted solid returns during the period, despite volatility that began mid-July and extended through August. Strong economic growth, favorable corporate earnings results, and increased merger and acquisition activity drove equity markets, offsetting high energy prices, the slowing housing market and subprime loan worries late in the period. In this environment, large-, mid- and small-cap stocks all had double-digit returns, with mid caps outperforming large-and small-cap stocks. Additionally, growth stocks outperformed value stocks.
During the period, the Fund posted positive, double-digit returns and outperformed its benchmark, the Russell 2000 Growth Index, largely due to solid stock selection in three sectors — Information Technology, Health Care and Energy. Outperformance in Information Technology was driven by solid stock selection in several industries, including Internet software/services, semiconductors/semiconductor equipment and communications equipment. Strong performance in Health Care was due to stock selection in the biotechnology and health care technology industries. Within the Energy sector, outperformance came from stock selection in energy equipment and services, as well as stock selection and an underweight position in oil, gas and consumable fuels holdings.
Underperformance was most pronounced in the Consumer Discretionary and Materials sectors. Within the Consumer Discretionary sector, performance was held back by poor stock selection in specialty retail, diversified consumer services and hotels/restaurants/leisure. Underperformance in the Materials sector was driven by stock selection and a slight underweight position, as Materials stocks performed well.
Outlook ► The Fund maintains a disciplined strategy of selecting the best investment opportunities based on earnings, quality and valuation. We are positioned for what we believe will be a rebound for growth stocks. Global valuations have converged in recent years, resulting in little disparity in valuation between growth and value stocks. Current valuations suggest little premium is being paid for high-quality growth stocks. As a result, we expect companies that grow faster than expected and that deliver superior returns on capital will outperform, especially as global economic growth could moderate in the face of higher interest rates.
| | | | | | | | |
| PERFORMANCE TABLE1 | Average Annual Total Return | | | Cumulative Total Return | |
|
| | | | | Since | | | | Since |
| Periods Ended August 31, 2007 | 1-year | 5-year | 10-year | inception | 1-year | 5-year | 10-year | inception2 |
|
| Small Company Growth Class NAV (began 10/29/05) | 20.04% | — | — | 16.71% | 20.04% | — | — | 33.13% |
| Russell 2000 Growth Index3,4,5 | 16.36% | — | — | 13.74% | 16.36% | — | — | 26.94% |
1 Performance does not reflect the deduction of taxes on fund distributions or redemptions of fund shares. Past performance does not predict future performance.
2 Current subadviser has managed the fund since October 29, 2005.
3 Since inception returns for the indices may begin on the month-end closest to the actual inception date of the fund.
4 Russell 2000 Growth Index is an unmanaged index that contains those securities from the Russell 2000 Index with a greater than average growth orientation.
5 It is not possible to invest directly in an index. Index figures do not reflect sales charges and would be lower if they did.
48
Small Company Value Fund
Subadviser: T. Rowe Price Associates, Inc.
Portfolio Manager: Preston G. Athey
INVESTMENT OBJECTIVE & POLICIES ► To seek long-term growth of capital by investing at least 80% of the Fund’s net assets in companies with market capitalizations that do not exceed the maximum market capitalization of any security in the Russell 2000 Value Index at the time of purchase. The Fund also invests in small companies whose common stocks are believed to be undervalued.

| |
| Sector Weighting* | % of Total |
|
| Industrial | 21.41 |
| Financial | 16.14 |
| Consumer, Non-cyclical | 12.98 |
| Consumer, Cyclical | 9.37 |
| Basic Materials | 7.79 |
| Energy | 7.41 |
| Technology | 5.08 |
| Utilities | 3.15 |
| Communications | 2.52 |
| Funds | 0.43 |
*Top Sectors as a percentage of market value. Does not include short-term securities and investments in the John Hancock Cash Investment Trust.
PORTFOLIO MANAGER’S COMMENTARY
Performance ► For the year ended August 31, 2007, the Small Company Value Class NAV returned +11.04%, outperforming the +6.64% return of the Russell 2000 Value Index.
Environment ► The stock market enjoyed a strong rally during much of the 12-month period, although a sharp pullback in July erased much of its gains. Until July, shares were boosted by favorable corporate earnings, the Federal Reserve’s steady monetary policy, and substantial merger and acquisition activity. Then, fears grew that problems originating from the subprime mortgage sector might lead to an overall credit crunch, derailing takeover activity and threatening economic growth.
During the period, large-cap stocks seized market leadership from small caps, and growth shares began to outpace value. Materials led sector returns in the Russell 2000 Value Index by a large margin, followed by Consumer Staples, Industrials and Business Services, and Telecommunication Services. Financials and Utilities were the only sectors in the Index to record losses over the period.
Although unspectacular performers on an absolute basis, Financials holdings contributed significantly to relative results due to stock selection. Several holdings gained after becoming the target of acquisitions. Our underweight position in the struggling sector also helped relative returns.
An overweight position in Industrials and Business Services also helped. Stock selection in Machinery was a large contributor at the industry level due to merger and acquisition activity. Stock selection in Health Care, particularly among biotechnology and health care equipment and supplies firms, also helped relative returns.
Stock selection in Consumer Discretionary detracted from results as the consumer experienced a decrease in discretionary income, in particular, higher-end retailers were hurt the most as the consumer switched to lower-priced options. Stock selection in Energy also detracted, partially offset by an overweight position in the robust sector.
Outlook ► Stock market volatility and the specter of an economic slowdown have increased investor anxiety. The increase in risk aversion has created a challenging environment for small-cap investors. Active management will be at a premium, as it will be important to identify those companies best positioned to weather the storm.
| | | | | | | | |
| PERFORMANCE TABLE1,4 | Average Annual Total Return | | | Cumulative Total Return | |
|
| | | | | Since | | | | Since |
| Periods Ended August 31, 2007 | 1-year | 5-year | 10-year | inception | 1-year | 5-year | 10-year | inception2 |
|
| Small Company Value Class 1 (began 10/15/05) | 10.98% | — | — | 12.49% | 10.98% | — | — | 24.75% |
| Small Company Value Class NAV (began 10/15/05) | 11.04% | — | — | 12.54% | 11.04% | — | — | 24.86% |
| Russell 2000 Value Index3,5,6 | 6.64% | — | — | 13.33% | 6.64% | — | — | 26.51% |
1 Performance does not reflect the deduction of taxes on fund distributions or redemptions of fund shares. Past performance does not predict future performance.
2 Current subadviser has managed the fund since October 15, 2005.
3 Since inception returns for the indices may begin on the month-end closest to the actual inception date of the fund.
4 Since inception, a portion of the Small Company Value expenses were reimbursed. If such expenses had not been reimbursed, returns would be lower.
5 Russell 2000 Value Index is an unmanaged index that measures the performance of those Russell 2000 companies with lower price-to-book ratios and lower forecasted growth values.
6 It is not possible to invest directly in an index. Index figures do not reflect sales charges and would be lower if they did.
49
Special Value Fund6
Subadviser : Wellington Management Company, LLP
Portfolio Managers: Timothy J. McCormack, Stephen T. O'Brien and Shaun F. Pedersen
INVESTMENT OBJECTIVE & POLICIES ► To seek long-term capital growth by primarily investing in common stocks and other equity securities of small-capitalization U.S. companies.

| |
| Sector Weighting* | % of Total |
|
| Financial | 24.41 |
| Industrial | 21.41 |
| Consumer, Cyclical | 16.54 |
| Consumer, Non-cyclical | 14.88 |
| Utilities | 5.39 |
| Energy | 3.27 |
| Technology | 2.80 |
| Basic Materials | 1.41 |
*Top Sectors as a percentage of market value. Does not include short-term securities and investments in the John Hancock Cash Investment Trust.
PORTFOLIO MANAGERS’ COMMENTARY
Performance ► For the year ended August 31, 2007, the Special Value Class NAV returned 8.05%, outperforming the +6.64% return of the Russell 2000 Value Index.
Environment ► The negative news on housing was center stage in recent months. In July and August, markets witnessed a sharp disruption, triggered by problems in the subprime mortgage market. This correction was sparked by tightening lending standards and the increasing interest rates that higher-risk borrowers are being asked to pay. This has hurt the housing market and recently threatened to restrict the number of private equity deals.
While Fund posture is driven by our bottom-up stock selection, Consumer Discretionary was our strongest sector. On a relative basis, Information Technology and Industrials also contributed positively. The Fund’s largest area of underperformance was Financials, where we were hurt by our exposure to real estate-related holdings. Utilities also underperformed the benchmark.
The Fund invests in undervalued securities of high-quality small-cap companies, with a proven track record of above-average profitability. Typically, the companies we own have strong balance sheets and generate healthy levels of cash flow that should enable them to continue to build the value of their businesses. Over the past months, stock prices have been very volatile and we view recent decline in stock prices as a potential opportunity to buy some high-quality companies at attractive valuations.
Outlook ► While Fund posture is driven by our bottom-up stock selection, we ended the fiscal year with an overweight position in Industrials and Consumer Staples and an underweight position in Financials and Materials. We believe that the events of the summer, having spread from the housing downturn to other areas of the financial markets, increase the likelihood of a contraction in the US economy. Banks are likely to tighten credit standards, and we anticipate corporate profits will come under pressure. These developments provide us with an opportunity to identify companies with strong fundamentals and add investment value over time.
| | | | | | | | |
| PERFORMANCE TABLE1 | Average Annual Total Return | | | Cumulative Total Return | |
|
| | | | | Since | | | | Since |
| Periods Ended August 31, 2007 | 1-year | 5-year | 10-year | inception | 1-year | 5-year | 10-year | inception2 |
|
| Special Value Class 1 (began 10/15/05) | 8.05% | — | — | 9.58% | 8.05% | — | — | 18.76% |
| Russell 2000 Value Index3,4,5 | 6.64% | — | — | 13.33% | 6.64% | — | — | 26.51% |
1 Performance does not reflect the deduction of taxes on fund distributions or redemptions of fund shares. Past performance does not predict future performance.
2 Current subadviser assignment became effective June 29, 2007. Clearbridge Special Value is being merged into the stronger performing Wellington Small Cap Value fund. Wellington Small Cap Value has produced solid returns, outperforming the index and peer group over the trailing 1-, 3-, and 5-year periods. Wellington’s approach focuses on high quality companies, with a proven record of above average rates of profitability, selling at a discount relative to the overall small cap market.
3 Since inception returns for the indices may begin on the month-end closest to the actual inception date of the fund.
4 Russell 2000 Value Index is an unmanaged index that measures the performance of those Russell 2000 companies with lower price-to-book ratios and lower forecasted growth values.
5 It is not possible to invest directly in an index. Index figures do not reflect sales charges and would be lower if they did.
6 Board of Trustees approved the merger of Special Value to Small Cap Value on June 29, 2007. Merger will be effective on November 9, 2007.
50
Spectrum Income Fund
Subadviser: T. Rowe Price Associates, Inc.
Portfolio Managers: Edmund M. Notzon III, Daniel O. Shackelford, Mark J. Vaselkiv, Ian Kelson and Brian Rogers
INVESTMENT OBJECTIVE & POLICIES ► To seek a high level of current income with moderate share price fluctuation by maintaining broad exposure primarily to domestic and international fixed-income markets in an attempt to reduce the impact of markets that are declining and to benefit from good performance in particular market segments over time.
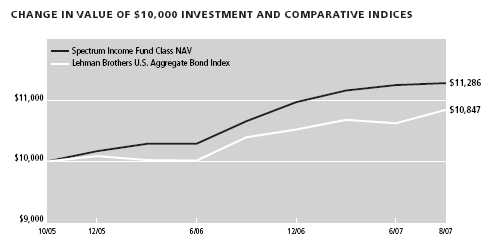
| |
| Sector Weighting* | % of Total |
|
| Mortgage Securities | 25.46 |
| Government | 24.16 |
| Financial | 8.87 |
| Communications | 7.71 |
| Consumer, Non-cyclical | 5.86 |
| Industrial | 4.79 |
| Energy | 4.55 |
| Consumer, Cyclical | 3.76 |
| Utilities | 2.33 |
| Basic Materials | 2.27 |
*Top Sectors as a percentage of market value. Does not include short-term securities and investments in the John Hancock Cash Investment Trust.
PORTFOLIO MANAGERS’ COMMENTARY
Performance ► For the year ended August 31, 2007, the Spectrum Income Class NAV returned +7.00%, outperforming the +5.26% return of the Lehman Brothers Aggregate Bond Index.
Environment ► Economic growth was relatively slow for most of the last 12 months due to the deepening downturn in residential real estate and generally stricter lending standards following an increase in subprime mortgage defaults and delinquencies. The Federal Reserve kept the federal funds target rate at 5.25% throughout the period. However, the sudden evaporation of financial market liquidity following the collapse of several hedge funds with substantial subprime mortgage exposure prompted the Fed to reduce the discount rate from 6.25% to 5.75% on August 17.
In the last 12 months, within the Fixed Income universe, high-yield corporate bonds produced the best returns, though their gains tapered off in recent months as investors turned risk averse. A significant drop in yields, particularly among shorter maturities, benefited Treasury securities. GNMA mortgage-backed securities generally performed in line with the broad fixed-income market, while investment-grade corporate bonds lagged a bit.
The Fund’s outperformance resulted mainly from several diversifying out-of-benchmark elements, including dividend-paying stocks and high yield bonds. Dividend-paying stocks contributed the most to the Fund’s relative performance as stocks outperformed bonds for the period. International and emerging markets also contributed to relative performance. The portfolio’s long-term U.S. Treasury bond holdings also outperformed the Index. At the end of August, the portfolio increased its allocation to high yield bonds as spreads widened notably from historically tight levels in June. We lowered our allocation to investment grade bonds to fund the increase in high yield.
The Fund benefited from its allocation to more economically sensitive sectors of the market over the last year. The portfolio’s underweight to more interest-sensitive sectors may contribute to weaker performance in periods characterized by a flight to quality and strong relative returns from sectors such as Treasury bonds.
Outlook ► The global growth environment remains a positive despite the U.S. economic slowdown. We believe the portfolio’s broad diversification will serve our shareholders well in the coming months.
| | | | | | | | |
| PERFORMANCE TABLE1,4 | Average Annual Total Return | | | Cumulative Total Return | |
|
| | | | | Since | | | | Since |
| Periods Ended August 31, 2007 | 1-year | 5-year | 10-year | inception | 1-year | 5-year | 10-year | inception2 |
|
| Spectrum Income Class NAV (began 10/29/05) | 7.00% | — | — | 6.75% | 7.00% | — | — | 12.86% |
| Lehman Brothers Aggregate Bond Index3,5,6 | 5.26% | — | — | 4.49% | 5.26% | — | — | 8.47% |
1 Performance does not reflect the deduction of taxes on fund distributions or redemptions of fund shares. Past performance does not predict future performance.
2 Current subadviser has managed the fund since October 29, 2005.
3 Since inception returns for the indices may begin on the month-end closest to the actual inception date of the fund.
4 Since inception, a portion of the Spectrum Income Fund expenses were reimbursed. If such expenses had not been reimbursed, returns would be lower.
5 Lehman Brothers Aggregate Bond Index is an unmanaged index of dollar-denominated and nonconvertible investment-grade debt issues.
6 It is not possible to invest directly in an index. Index figures do not reflect sales charges and would be lower if they did.
51
Strategic Bond Fund
Subadviser: Western Asset Management Company
Portfolio Managers: S. Kenneth Leech, Steven A. Walsh, Keith J. Gardner, Matthew C. Duda and Mike Buchanan
INVESTMENT OBJECTIVE & POLICIES ► To seek a high level of total return consistent with preservation of capital by investing at least 80% of the Fund’s net assets in fixed-income securities.
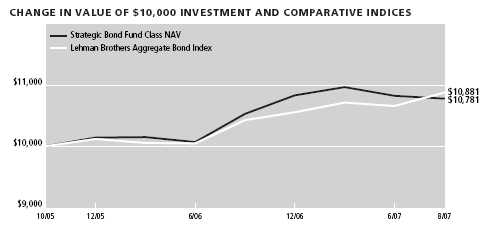
| |
| Sector Weighting* | % of Total |
|
| Mortgage Securities | 33.11 |
| Financial | 13.90 |
| Government | 10.52 |
| Asset Backed Securities | 6.51 |
| Energy | 4.63 |
| Consumer, Cyclical | 4.03 |
| Industrial | 3.18 |
| Utilities | 2.68 |
| Communications | 2.60 |
| Consumer, Non-cyclical | 1.90 |
*Top Sectors as a percentage of market value. Does not include short-term securities and investments in the John Hancock Cash Investment Trust.
PORTFOLIO MANAGERS’ COMMENTARY
Performance ► For the year ended August 31, 2007, the Strategic Bond Class NAV returned +3.44%, underperforming the +5.26% return of the Lehman Brothers Aggregate Bond Index.
Environment ► During the period, the yield curve regained its positive slope as the market concluded the Federal Reserve had reached the end of its tightening cycle and would soon begin easing. Inflation measures showed encouraging signs of moderation while economic growth continued at a sub-trend, but healthy clip. An outright seizure in lending markets ultimately convinced investors that looser monetary conditions are the only plausible way forward, despite the Fed’s insistence that inflation risks remain the predominant concern. Core inflation fell from its peak at the beginning of the period back to within the Fed’s comfort zone for the first time in three-plus years. Employment growth remained supportive of consumer spending, though retail sales and durable goods orders moderated.
Home prices began to fall outright, which should help markets clear the inventory of unsold homes and eventually allow homebuilders to get back on their feet. Credit spreads narrowed during the first half of the period, but widened dramatically in the final months. Rising uncertainty over the degree of subprime losses forced swap spreads higher and had a negative effect on mortgage-backed securities. TIPS underperformed their nominal counterparts as the fear of inflation subsided. The price of a barrel of oil rose over 5% while the dollar continued its descent against a trade-weighted basket of currencies.
The Fund’s underweight to U.S. Treasuries hurt relative performance, as U.S. Treasuries outperformed all other fixed income asset classes. Non US government guaranteed securities, which had performed well during the 1st 9 months of the period, experienced a massive sell off across the board during the last 3 months of the period due to a large spike in subprime mortgage delinquencies. In addition, new issuance volumes were swelled by the need for capital from corporations funding share buyback programs and LBO’s. These technical factors overwhelmed the positive fundamental backdrop of strong corporate profitability and liquidity as well as leverage metrics that on balance remain well below historical averages. In the end the broad allocation to high yield was the major contributor to the Fund’s negative relative performance.
Outlook ► Our outlook calls for continued moderate growth and relatively contained inflation. We are positioned with the expectation that there will be no significant changes in key macro-economic variables, but we also have strategies in place that are designed to hedge against unexpected economic weakness and higher-than-expected inflation.
| | | | | | | | |
| PERFORMANCE TABLE1 | Average Annual Total Return | | | Cumulative Total Return | |
|
| | | | | Since | | | | Since |
| Periods Ended August 31, 2007 | 1-year | 5-year | 10-year | inception | 1-year | 5-year | 10-year | inception2 |
|
| Strategic Bond Class 1 (began 10/15/05) | 3.36% | — | — | 4.01% | 3.36% | — | — | 7.86% |
| Strategic Bond Class NAV (began 10/15/05) | 3.44% | — | — | 4.08% | 3.44% | — | — | 7.81% |
| Lehman Brothers Aggregate Bond Index3,4,5 | 5.26% | — | — | 4.59% | 5.26% | — | — | 8.81% |
1 Performance does not reflect the deduction of taxes on fund distributions or redemptions of fund shares. Past performance does not predict future performance.
2 Current subadviser has managed the fund since April 28, 2006.
3 Since inception returns for the indices may begin on the month-end closest to the actual inception date of the fund.
4 Lehman Brothers Aggregate Bond Index is an unmanaged index of dollar-denominated and nonconvertible investment-grade debt issues.
5 It is not possible to invest directly in an index. Index figures do not reflect sales charges and would be lower if they did.
52
Strategic Income Fund
Subadviser: MFC Global Investment Management (U.S.), LLC
Portfolio Managers: Daniel S. Janis III, John F. Iles and Barry H. Evans
INVESTMENT OBJECTIVE & POLICIES ► The Fund seeks a high level of current income by investing at least 80% of its assets in foreign government and corporate debt securities from developed and emerging markets, U.S. government and agency securities, and domestic high yield bonds.
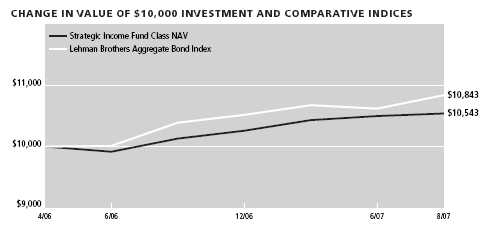
| |
| Sector Weighting* | % of Total |
|
| Government | 47.88 |
| Mortgage Securities | 23.02 |
| Consumer, Cyclical | 6.77 |
| Communications | 5.54 |
| Financial | 5.48 |
| Industrial | 3.50 |
| Energy | 2.53 |
| Consumer, Non-cyclical | 2.43 |
| Basic Materials | 1.94 |
| Utilities | 0.39 |
*Top Sectors as a percentage of market value. Does not include short-term securities and investments in the John Hancock Cash Investment Trust.
PORTFOLIO MANAGERS’ COMMENTARY
Performance ► For the year ended August 31, 2007, the Strategic Income Class NAV returned +4.01%, underperforming the +5.26% return of the Lehman Brothers Aggregate Bond Index.
Environment ► Most of the period witnessed strong global growth, historically tight credit spreads, and a tightening bias by the world’s central banks. With the Federal Reserve on hold, the U.S. dollar depreciated against all major currencies except for the low-yielding Japanese yen. The first nine months saw record debt issuance by high-yield corporate and emerging market sovereigns, as yield-starved investors demanded a seemingly limitless amount of new issues. In June, the environment abruptly changed, as the housing boom, which had been driving the U.S. economy, turned to bust. Fear of widespread mortgage defaults resulted in a general credit crunch and a re-pricing of risky assets. High-yield spreads increased from a low of 2.40% over Treasuries in May to 4.40% as of August 31.
Much of the Fund’s underperformance relative to its benchmark was attributable to subprime mortgage fears, which drove investors to safe-haven U.S. Treasuries in July and August. The Fund maintained an A2 average quality rating and was conservatively positioned relative to other multi-sector bond funds. Our underweight in U.S. Treasury bonds and measured exposure to high yield debt resulted in a two-month underperformance relative to the Index. This two month period alone impacted the funds underperformance for the full period. This is due to the fact that the Lehman Aggregate Index has no High Yield exposure and this sector underperformed. Holdings in Japanese yen-denominated bonds during 2006 detracted from performance. The Fund’s positions in non-dollar Canadian, Australian and Brazilian government bonds added to relative performance. Exposure to U.S. dollar-denominated Brazilian high-yield bonds contributed as well.
Outlook ► Investors have been tentative about making major asset allocation decisions until there is more clarity from the upcoming Fed meeting. Also, volatility has increased in all asset classes from historically low levels. While the U.S. economy has shown signs of weakness, other parts of the world, such as ex-Japan Asia and Europe, have been more resilient. As such, we feel that the U.S. dollar will be challenged and we will look to add value via foreign currency hedging. We will tread cautiously in the current credit environment, but may add to our high-yield and emerging market holdings if spreads widen further and offer compelling value.
| | | | | | | | |
| PERFORMANCE TABLE1 | Average Annual Total Return | | | Cumulative Total Return | |
|
| | | | | Since | | | | Since |
| Periods Ended August 31, 2007 | 1-year | 5-year | 10-year | inception | 1-year | 5-year | 10-year | inception2 |
|
| Strategic Income Class NAV (began 4/28/06) | 4.01% | — | — | 4.02% | 4.01% | — | — | 5.43% |
| Lehman Brothers Aggregate Bond Index3,4,5 | 5.26% | — | — | 6.22% | 5.26% | — | — | 8.43% |
1 Performance does not reflect the deduction of taxes on fund distributions or redemptions of fund shares. Past performance does not predict future performance.
2 Current subadviser has managed the fund since April 28, 2006.
3 Since inception returns for the indices may begin on the month-end closest to the actual inception date of the fund.
4 Lehman Brothers Aggregate Bond Index is an unmanaged index of dollar-denominated and nonconvertible investment-grade debt issues.
5 It is not possible to invest directly in an index. Index figures do not reflect sales charges and would be lower if they did.
53
Total Bond Market Fund
Subadviser: Declaration Management and Research, LLC
Portfolio Managers: Peter Farley and James E. Shallcross
INVESTMENT OBJECTIVE & POLICIES ► The Fund seeks to track the performance of the Lehman Brothers Aggregate Bond Index by investing at least 80% of its net assets listed in this Index.
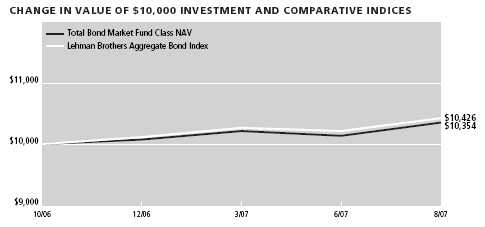
| |
| Sector Weighting* | % of Total |
|
| Mortgage Securities | 44.37 |
| Government | 30.00 |
| Financial | 11.26 |
| Communications | 5.13 |
| Energy | 1.75 |
| Industrial | 1.41 |
| Consumer, Cyclical | 1.32 |
| Utilities | 1.20 |
| Consumer, Non-cyclical | 0.77 |
| Technology | 0.37 |
*Top Sectors as a percentage of market value. Does not include short-term securities and investments in the John Hancock Cash Investment Trust.
PORTFOLIO MANAGERS’ COMMENTARY
Performance ► Since its inception in October 2006, the Total Bond Market Class NAV returned +3.54%, underperforming the +4.26% return of the Lehman Brothers Aggregate Bond Index.
Environment ► Interest rates and fixed-income sectors dramatically changed course during the year. Steady economic growth, modest inflation, range-bound interest rates, low volatility and rising equity markets generally describe most of 2006. Entering 2007, the tide began turning with general market uneasiness over slower economic growth offset by the Federal Reserve’s steadfast concern over rising inflation. Interest rates rose sharply in the second quarter, as the market reassessed the Fed’s firm stance on inflation. Concerns over credit risk and the real estate bubble began surfacing, with weakness in the subprime mortgage market. Increasing mortgage delinquencies and defaults took center stage as fears of systematic risk began to grow. The mortgage problem rippled through fixed sectors and the market generally revalued ris k for bank loans, corporate debt and commercial real estate.
Fixed-income sectors severely underperformed U.S. Treasuries, especially in July and August. Mortgage securities performed the worst, with riskier bonds significantly declining in valuation. Corporate debt spreads have materially widened as the credit crunch raises concerns over future economic growth.
The Fund slightly underperformed its benchmark, though corporate credit positions outperformed relative to the benchmark as the portfolio held no homebuilders securities and had lower exposure to mortgage company bonds. The portfolio’s mortgage positions mostly tracked the benchmark exposure.
Outlook ► The risk of recession has risen in recent months and presents the Fed with a major dilemma. Economic growth is expected to slow, yet consumers have been resilient and inflation remains elevated. Given the overall weakness in the housing market and tightening credit, we expect the Fed will cut interest rates and help to restore investor confidence. We expect fixed-income sectors to remain volatile for the balance of the year.
| | | | | | | | |
| PERFORMANCE TABLE1 | Average Annual Total Return | | | Cumulative Total Return | |
|
| | | | | Since | | | | Since |
| Periods Ended August 31, 2007 | 1-year | 5-year | 10-year | inception | 1-year | 5-year | 10-year | inception2 |
|
| Total Bond Market Class NAV (began 10/27/06) | — | — | — | — | — | — | — | 3.54% |
| Lehman Brothers Aggregate Bond Index3,4,5 | — | — | — | — | — | — | — | 4.26% |
1 Performance does not reflect the deduction of taxes on fund distributions or redemptions of fund shares. Past performance does not predict future performance.
2 Current subadviser has managed the fund since October 27, 2006.
3 Since inception returns for the indices may begin on the month-end closest to the actual inception date of the fund.
4 Lehman Brothers Aggregate Bond Index is an unmanaged index of dollar-denominated and non-convertable investment-grade debt issues.
5 It is not possible to invest directly in an index. Index figures do not reflect sales charges and would be lower if they did.
54
Total Return Fund
Subadviser: Pacific Investment Management Company, LLC
Portfolio Manager: William H. Gross
INVESTMENT OBJECTIVE & POLICIES ► To seek maximum total return, consistent with preservation of capital and prudent investment management, by investing at least 65% of its total assets in a diversified portfolio of fixed-income instruments of varying maturities.

| |
| Sector Weighting* | % of Total |
|
| Mortgage Securities | 54.86 |
| Financial | 21.72 |
| Asset Backed Securities | 7.23 |
| Communications | 1.08 |
| Government | 0.90 |
| Industrial | 0.42 |
| Energy | 0.42 |
| Other | 0.40 |
| Consumer, Non-cyclical | 0.38 |
| Consumer, Cyclical | 0.32 |
*Top Sectors as a percentage of market value. Does not include short-term securities and investments in the John Hancock Cash Investment Trust.
PORTFOLIO MANAGER’S COMMENTARY
Performance ► For the year ended August 31, 2007, the Total Return Class NAV returned +4.26%, underperforming the +5.26% return of the Lehman Brothers Aggregate Bond Index.
Environment ► The Federal Reserve remained on hold, leaving the federal funds rate at 5.25% throughout the period. Even as concerns about the subprime mortgage sector developed, the Fed focused on stronger economic data and inflation concerns, making it difficult to ease rates. Tight labor markets kept the unemployment rate relatively low and produced real wage gains for consumers that helped offset headwinds from the residential property market. In addition, measures of core inflation remained above the Fed’s targeted range. Weakness in the subprime mortgage sector produced a significant tightening of credit conditions for lower-quality and first-time borrowers, yet another blow to an already soft housing market. At period end, the benchmark 10-year Treasury yielded 4.53%, 20 basis points lower than a year earlier.
Broad diversification helped returns amid a challenging environment. Tactical duration positioning detracted from returns, as yields fluctuated. An emphasis on shorter maturities to benefit from a growing U.S. yield curve added to performance, as the curve steepened. An overweight to mortgages detracted from returns, as the sector underperformed like-duration Treasuries for the year. An underweight to investment grade credit added to returns, as the sector underperformed like-duration Treasuries. Exposure to emerging market bonds detracted slightly from returns, as spreads widened. An allocation to a basket of currencies added to returns, as most currencies appreciated relative to the U.S. dollar.
Outlook ► We expect strong global growth with a cyclical slowdown in the U.S. Real global growth should continue to advance at an annual rate of around 5% over the next several years, led largely by rapid expansion in China and India. More mature developed economies should grow at annual rates closer to 2%. The U.S. economy should remain weak in 2007 and 2008. The downturn in the residential property market has not found a bottom and the corresponding impact on homeowners and consumers has yet to be fully realized.
| | | | | | | | |
| PERFORMANCE TABLE1 | Average Annual Total Return | | | Cumulative Total Return | |
|
| | | | | Since | | | | Since |
| Periods Ended August 31, 2007 | 1-year | 5-year | 10-year | inception | 1-year | 5-year | 10-year | inception2 |
|
| Total Return Class 1 (began 10/15/05) | 4.26% | — | — | 3.94% | 4.26% | — | — | 7.53% |
| Total Return Class NAV (began 10/15/05) | 4.26% | — | — | 3.96% | 4.26% | — | — | 7.57% |
| Lehman Brothers Aggregate Bond Index3,4,5 | 5.26% | — | — | 4.59% | 5.26% | — | — | 8.81% |
1 Performance does not reflect the deduction of taxes on fund distributions or redemptions of fund shares. Past performance does not predict future performance.
2 Current subadviser has managed the fund since October 15, 2005.
3 Since inception returns for the indices may begin on the month-end closest to the actual inception date of the fund.
4 Lehman Brothers Aggregate Bond Index is an unmanaged index of dollar-denominated and nonconvertible investment-grade debt issues.
5 It is not possible to invest directly in an index. Index figures do not reflect sales charges and would be lower if they did.
55
U.S. Global Leaders Growth Fund
Subadviser: Sustainable Growth Advisers, LP
Portfolio Managers: George P. Fraise, Gordon M. Marchand and Robert L. Rohn
INVESTMENT OBJECTIVE & POLICIES ► The Fund seeks long-term growth of capital by investing in common stocks of “U.S. Global Leaders”companies that are considered to have a high degree of predictability and above-average sustainable long-term growth.

| |
| Sector Weighting* | % of Total |
|
| Consumer, Non-cyclical | 40.31 |
| Consumer, Cyclical | 17.04 |
| Technology | 15.07 |
| Industrial | 8.85 |
| Financial | 6.14 |
| Communications | 5.70 |
| Basic Materials | 1.92 |
*Top Sectors as a percentage of market value. Does not include short-term securities and investments in the John Hancock Cash Investment Trust.
PORTFOLIO MANAGERS’ COMMENTARY
Performance ► For the year ended August 31, 2007, the U.S. Global Leaders Growth Class NAV returned +8.57%, underperforming the +15.13% return of the S&P 500 Index.
Environment ► A pervasive sense of complacency about risk has developed in the market over the past few years. Inebriated by more than four years of benign global monetary policies, unsustainably high levels of corporate profit growth, and giddy returns from hedge funds and private equity vehicles, investors have flocked to higher-risk strategies while apparently disregarding the pitfalls and uncertainty inherent in these alternatives. During this period, junk bonds easily outperformed investment-grade bonds, while emerging markets surpassed domestic stocks. Lower-quality companies outpaced their high-quality brethren, resulting in the widest sustained valuation gap between high- and low-quality stocks in more than 20 years.
This valuation disconnect is unsustainable, as is the complacency regarding risk that created it. Inevitably, the environment changes and volatility increases, as it has in recent months. When complacency has diminished in the past, high-quality stocks have outperformed. The very recent trend bears that out.
Consumer-related holdings contributed to the portfolio’s underperformance while Health Care and Financials added value. During the past year, we eliminated a biotechnology firm and a computer maker, each of which faced numerous problems. We also replaced a home improvement retailer and an overnight freight shipper with competitors. In each case, we upgraded the quality and earnings visibility of our holdings by adding companies that are gaining market share and executing their business strategy better.
Outlook ► The portfolio holds a stable of high-quality businesses, with strong earnings predictability and high sustainable growth rates, and it trades at very attractive valuations. More than half of our holdings are trading at price-earnings ratios that are more than 25% lower than their 20-year average, an unprecedented occurrence. It is encouraging to see that in the past couple of months, as concerns about the pace of economic growth and the extent of the subprime crisis have spread, investors have gravitated back to high-quality companies and the portfolio has seen a marked improvement in performance.
| | | | | | | | |
| PERFORMANCE TABLE1 | Average Annual Total Return | | | Cumulative Total Return | |
|
| | | | | Since | | | | Since |
| Periods Ended August 31, 2007 | 1-year | 5-year | 10-year | inception | 1-year | 5-year | 10-year | inception2 |
|
| U.S. Global Leaders Growth Class 1 (began 10/15/05) | 8.57% | — | — | 3.93% | 8.57% | — | — | 7.52% |
| U.S. Global Leaders Growth Class NAV (began 10/15/05) | 8.57% | — | — | 3.98% | 8.57% | — | — | 7.61% |
| S&P 500 Index3,4,5 | 15.13% | — | — | 14.36% | 15.13% | — | — | 28.69% |
1 Performance does not reflect the deduction of taxes on fund distributions or redemptions of fund shares. Past performance does not predict future performance.
2 Current subadviser has managed the fund since October 15, 2005.
3 Since inception returns for the indices may begin on the month-end closest to the actual inception date of the fund.
4 S&P 500 Index is an unmanaged index that includes 500 widely traded common stocks.
5 It is not possible to invest directly in an index. Index figures do not reflect sales charges and would be lower if they did.
56
U.S. Government Securities Fund
Subadviser: Western Asset Management Company
Portfolio Managers: S. Kenneth Leech, Steven A. Walsh, Mark S. Lindbloom, Ronald D. Mass and Frederick R. Marki
INVESTMENT OBJECTIVE & POLICIES ► To obtain a high level of current income consistent with preservation of capital and maintenance of liquidity. The Fund invests at least 80% of its net assets in debt obligations and mortgage-backed securities issued or guaranteed by the U.S. government, its agencies or instrumentalities, and derivative securities.
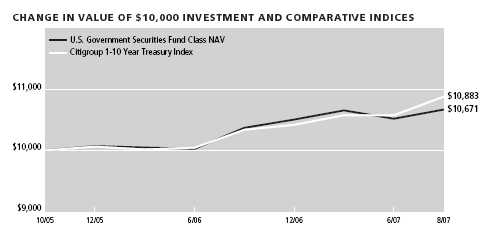
| |
| Sector Weighting* | % of Total |
|
| Mortgage Securities | 62.99 |
| Asset Backed Securities | 8.80 |
| Government | 7.34 |
*Top Sectors as a percentage of market value. Does not include short-term securities and investments in the John Hancock Cash Investment Trust.
PORTFOLIO MANAGERS’ COMMENTARY
Performance ► For the year ended August 31, 2007, the U.S. Government Securities Class NAV returned +3.69%, underperforming the +6.03% return of the Citigroup 1-10 Year Treasury Index.
Environment ► During the period, the yield curve regained its positive slope as the market concluded the Federal Reserve had reached the end of its tightening cycle and would soon begin easing. Inflation measures showed encouraging signs of moderation while economic growth continued at a sub-trend, but healthy clip. An outright seizure in lending markets ultimately convinced investors that looser monetary conditions are the only plausible way forward, despite the Fed’s insistence that inflation risks remain the predominant concern. Core inflation fell from its peak at the beginning of the period back to within the Fed’s comfort zone for the first time in three-plus years. Employment growth remained supportive of consumer spending, though retail sales and durable goods orders moderated.
Home prices began to fall outright, which should help markets clear the inventory of unsold homes and eventually allow homebuilders to get back on their feet. Credit spreads narrowed during the first half of the period, but widened dramatically in the final months. Rising uncertainty over the degree of subprime losses forced swap spreads higher and had a negative effect on mortgage-backed securities. TIPS underperformed their nominal counterparts as the fear of inflation subsided. The price of a barrel of oil rose over 5% while the dollar continued its descent against a trade-weighted basket of currencies.
The Fund’s overweight exposure to the high-quality Agency mortgage-backed sector was a negative as the sector underperformed U.S. Treasury securities. The mortgage backed securities (MBS) sector historically has provided attractive returns versus US Treasury securities. Over the last year they have not for several reasons. As problems in the sub-prime mortgage sectors spread, market volatility also rose, negatively impacting the sector. All non-US Treasury sectors were hurt as spreads widened. The agency mortgage sector was hurt, even without credit concerns, as traders used the sector to hedge their growing inventory of non-agency MBS. More recently, the significant increase in term LIBOR caused many leveraged investors to exit positions as the cost of financing rose.
These factors were the causes of the significant under performance in the MBS sector specifically and in the portfolio as well. We view the MBS sector as very attractive and we remain over weight in the portfolio.
Outlook ► Our outlook calls for continued moderate growth and relatively contained inflation. We are positioned with the expectation that there will be no significant changes in key macro-economic variables, but we also have strategies in place that are designed to hedge against unexpected economic weakness and higher-than-expected inflation.
| | | | | | | | |
| PERFORMANCE TABLE1 | Average Annual Total Return | | | Cumulative Total Return | |
|
| | | | | Since | | | | Since |
| Periods Ended August 31, 2007 | 1-year | 5-year | 10-year | inception | 1-year | 5-year | 10-year | inception |
|
| U.S. Government Securities Class 1 (began 10/15/05) | 3.62% | — | — | 3.45% | 3.62% | — | — | 6.59% |
| U.S. Government Securities Class NAV (began 10/15/05) | 3.69% | — | — | 3.52% | 3.69% | — | — | 6.71% |
| Citigroup 1-10 Year Treasury Index3,4,5 | 6.03% | — | — | 4.51% | 6.03% | — | — | 8.83% |
1 Performance does not reflect the deduction of taxes on fund distributions or redemptions of fund shares. Past performance does not predict future performance.
2 Current subadviser has managed the fund since April 28, 2006.
3 Since inception returns for the indices may begin on the month-end closest to the actual inception date of the fund.
4 Citigroup 1-10 Year Treasury Index is a broad measure of the performance of the short-term and medium-term U.S.Treasury securities.
5 It is not possible to invest directly in an index. Index figures do not reflect sales charges and would be lower if they did.
57
U.S. High Yield Bond Fund
Subadviser: Wells Capital Management, Incorporated
Portfolio Managers: Phil Susser and Niklas Nordenfelt
INVESTMENT OBJECTIVE & POLICIES ► The Fund seeks total return with a high level of current income by primarily investing in corporate debt securities that are below investment grade, including preferred and other convertible securities in below investment grade debt securities. The Fund also invests in corporate debt securities and may buy preferred and other convertible securities and bank loans.
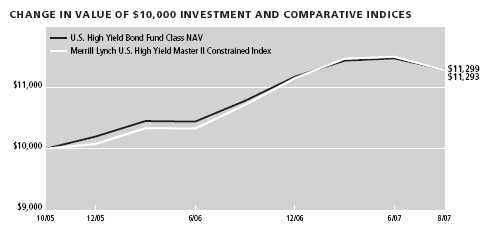
| |
| Sector Weighting* | % of Total |
|
| Communications | 23.50 |
| Consumer, Non-cyclical | 17.95 |
| Consumer, Cyclical | 14.20 |
| Financial | 11.33 |
| Industrial | 8.39 |
| Energy | 7.11 |
| Basic Materials | 5.61 |
| Technology | 4.37 |
| Utilities | 2.96 |
| Asset Backed Securities | 0.32 |
*Top Sectors as a percentage of market value. Does not include short-term securities and investments in the John Hancock Cash Investment Trust.
PORTFOLIO MANAGERS’ COMMENTARY
Performance ► For the year ended August 31, 2007, the U.S. High Yield Bond Class NAV returned 6.02% versus the 6.72% return of the Merrill Lynch U.S. High Yield Master II Constrained Index.
Environment ► Fixed income markets began the period with strong demand from overseas investors and significant structured product creation, including collateralized debt obligations (CDOs), driving credit spreads to historically low levels. Interest rates remained range-bound through the first quarter of 2007, as the first signs of subprime mortgage problems arose and market volatility was triggered by the sudden Chinese equity market sell-off in late February. The increase in market volatility, combined with stronger-than-expected growth during the first part of 2007, drove interest rates higher during the second quarter, with the 10-year Treasury yield peaking at 5.30% in mid-June. Credit spreads also began to widen during the last quarter, especially in shorter-term maturities, as the market started to re-assess required risk premium s.
In July and August, we witnessed a significant repricing of risk across all markets as subprime problems spread to other sectors. Hedge fund failures and margin calls pressured market liquidity, even rocking the normally uneventful money market sector. The market saw a “flight to quality” and steeper yield curve, with the 10-year Treasury yield falling to 4.53% at period-end. As the Treasury market rallied, credit spreads widened in all non-Treasury fixed income sectors, causing all sectors to underperform for the year-to-date.
Outlook ► We continue to be concerned with the impact of the problems in subprime mortgage market on supply/demand imbalances in the high yield market. If these imbalances are not resolved in an orderly fashion, the reduced willingness to lend and/or finance could affect consumer spending and consumer confidence.
The positive default environment remains intact, as the Moody’s default rate for high yield bonds is still only 1.5% . We expect default rates to increase as the credit cycle ages and we feel that the most significant risk to a meaningful spike in defaults rests in market liquidity conditions. Poor liquidity could make it harder for companies to refinance.
The Fund’s current sector overweights include cable/telecommunications and consumer staples; housing-related, finance, and energy sectors are significantly underweight. The Fund’s positions are concentrated in secured non-cyclical issuers with an eye towards purchasing attractively priced (oversold) securities.
| | | | | | | | |
| PERFORMANCE TABLE1 | Average Annual Total Return | | | Cumulative Total Return | |
|
| | | | | Since | | | | Since |
| Periods Ended August 31, 2007 | 1-year | 5-year | 10-year | inception | 1-year | 5-year | 10-year | inception2 |
|
| U.S. High Yield Bond Class Class 1 (began 10/15/05) | 5.94% | — | — | 6.66% | 5.94% | — | — | 12.88% |
| U.S. High Yield Bond Class Class NAV (began 10/15/05) | 6.02% | — | — | 6.71% | 6.02% | — | — | 12.99% |
| Merrill Lynch U.S. High Yield Master II Constrained Index3,4,5 | 6.72% | — | — | 6.55% | 6.72% | — | — | 12.93% |
1 Performance does not reflect the deduction of taxes on fund distributions or redemptions of fund shares. Past performance does not predict future performance.
2 Current subadviser has managed the fund since October 15, 2005.
3 Since inception returns for the indices may begin on the month-end closest to the actual inception date of the fund.
4 Merrill Lynch U.S. High Yield Master II Constrained Index is an unmanaged index composed of U.S. currency high-yield bonds issued by U.S. and non-U.S. issuers.
5 It is not possible to invest directly in an index. Index figures do not reflect sales charges and would be lower if they did.
58
U.S. Multi Sector Fund
Subadviser: Grantham, Mayo, Van Otterloo & Co. LLC
Portfolio Manager: Sam Wilderman
INVESTMENT OBJECTIVE & POLICIES ► The Fund seeks total return greater than its benchmark, the Russell 3000 Index, and invests at least 80% of its net assets in investments tied economically to the U.S.
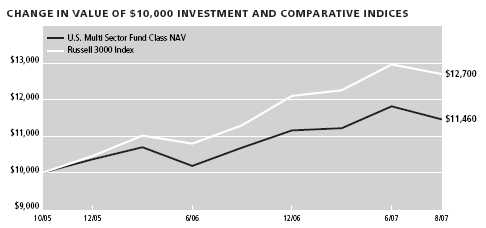
| |
| Sector Weighting* | % of Total |
|
| Consumer, Non-cyclical | 24.70 |
| Consumer, Cyclical | 21.88 |
| Technology | 12.26 |
| Energy | 11.22 |
| Financial | 8.82 |
| Industrial | 6.55 |
| Communications | 4.72 |
| Basic Materials | 1.63 |
| Government | 1.48 |
| Utilities | 0.94 |
*Top Sectors as a percentage of market value. Does not include short-term securities and investments in the John Hancock Cash Investment Trust.
PORTFOLIO MANAGER’S COMMENTARY
Performance ► For the year ended August 31, 2007, the U.S. Multi Sector Class NAV returned +9.93%, underperforming the +14.94% return of the Russell 3000 Index.
Environment ► The period began positively, with historically low market volatility, strong corporate profits and a glut of private equity deals fueled by ubiquitous financial liquidity. However, that spirit of optimism was washed away, as trouble in subprime mortgages spilled over into the broader credit and equity markets in July. Just weeks after the S&P 500 Index hit an all-time high, the Federal Reserve began injecting liquidity into a faltering financial system, in an attempt to curb the turmoil in the credit market. As equity market volatility returned with a vengeance, investor risk tolerance abated and market indexes plunged lower in early August.
The late-period market turmoil notwithstanding, the period as a whole was dominated by strong investor appetite for risky, lower-quality stocks. The lower-risk, higher-quality securities that our valuation discipline found attractive underperformed in a risk-oriented market for much of the period. While these higher-quality selections fared better later in the period, as risk aversion returned, they still finished in negative territory.
Our momentum discipline capitalized on the rising broad market. The discipline is designed to identify stocks that have performed well recently and appear poised to continue outperforming. With this orientation, the momentum discipline added value by selecting many leading performers. The sector detracting most from performance during the period was Health Care, where our stock selection and overweight position hurt returns. Retail also detracted from performance, as our stock selection and overweight position cost the Fund returns. In Technology, our underweight position and weak stock selection detracted from returns. On the positive side, our overweight position in the Oil & Gas sector added to relative returns. In addition, our aversion to risky companies paid off in certain sectors. In particular, our underweight in Financials was positive.
Outlook ► The late-period market volatility left investors wondering if the bull market had finally ended. The upcoming months will show whether the market’s recent trend toward risk aversion will persist or if risk taking will resume in full force. The Fund remains overweight in higher quality stocks and we believe is well positioned to face further market volatility.
| | | | | | | | |
| PERFORMANCE TABLE1 | Average Annual Total Return | | | Cumulative Total Return | |
|
| | | | | Since | | | | Since |
| Periods Ended August 31, 2007 | 1-year | 5-year | 10-year | inception | 1-year | 5-year | 10-year | inception2 |
|
| U.S. Multi Sector Class NAV (began 10/24/05) | 9.93% | — | — | 7.64% | 9.93% | — | — | 14.60% |
| Russell 3000 Index3,4,5 | 14.94% | — | — | 13.77% | 14.94% | — | — | 27.00% |
1 Performance does not reflect the deduction of taxes on fund distributions or redemptions of fund shares. Past performance does not predict future performance.
2 Current subadviser has managed the fund since October 24, 2005.
3 Since inception returns for the indices may begin on the month-end closest to the actual inception date of the fund.
4 Russell 3000 Index is an unmanaged index of the 3,000 largest U.S. companies based on total market capitalization, which represents approximately 98% of the investable U.S. equity market.
5 It is not possible to invest directly in an index. Index figures do not reflect sales charges and would be lower if they did.
59
Value Fund
Subadviser: Van Kampen Investments
Portfolio Managers: James Gilligan, Thomas Bastian, Thomas R. Copper, James Roeder and Sergio Marcheli
INVESTMENT OBJECTIVE & POLICIES ► To realize an above-average total return over a market cycle of three to five years by investing in equity securities of companies with capitalizations similar to the market capitalization of companies in the Russell Midcap Value Index
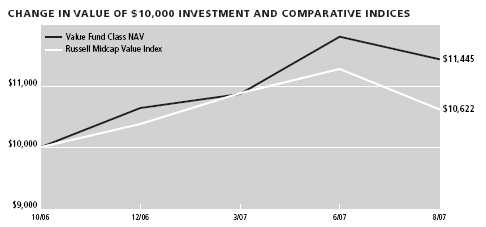
| |
| Sector Weighting* | % of Total |
|
| Consumer, Non-cyclical | 21.44 |
| Financial | 18.18 |
| Consumer, Cyclical | 10.40 |
| Industrial | 8.83 |
| Utilities | 8.66 |
| Energy | 7.34 |
| Government | 7.01 |
| Technology | 6.33 |
| Communications | 5.67 |
| Basic Materials | 5.04 |
*Top Sectors as a percentage of market value. Does not include short-term securities and investments in the John Hancock Cash Investment Trust.
PORTFOLIO MANAGERS’ COMMENTARY
Performance ► Since its inception October 2006, the Value Class NAV returned +14.45%, outperforming the +6.22% return of the Russell Midcap Value Index.
Environment ► Mid-cap stocks performed well on the whole, although progress was hampered by a market correction in August. Mid-cap stocks had benefited from the surge in merger and acquisition and private equity activities for the past several years, as subjects of takeovers or on speculation. However, few, if any, areas of the broad stock market were spared from the tumultuous time in July and August 2007, in which investors digested a string of bad news about the effects of the sub-prime mortgage market’s woes on other areas of the economy. Nonetheless, for the year overall, all sectors within the Russell Midcap Value Index had positive returns, except for Financial Services.
The Fund’s outperformance relative to the Russell Midcap Value Index was driven in large part by positioning within Financial Services. Real estate investment trusts (REITs) and regional banks performed poorly amid the weakening housing market and subprime mortgage problems, but the Fund had no exposure to REITs and limited positions in regional bank stocks. The Consumer Discretionary sector also added value due to stock selection in retail and media companies. Within Technology, a holding in a communications equipment company was a standout positive contributor. The Fund’s relative performance was also boosted by stock selection in the Energy sector, particularly among exploration and production companies, which continued to benefit from high oil prices.
The Consumer Staples sector detracted from the Fund’s relative performance. An underweight allocation to Utilities also hampered relative returns, as the sector performed well. On an absolute basis, all sectors in the portfolio generated positive returns for the year.
Outlook ► We continue to seek value stocks using our bottom-up security selection process. We look for undervalued companies that offer a potential catalyst for change, such as new company management, products, or growth or consolidation within an industry or sector.
| | | | | | | | |
| PERFORMANCE TABLE1 | Average Annual Total Return | | | Cumulative Total Return | |
|
| | | | | Since | | | | Since |
| Periods Ended August 31, 2007 | 1-year | 5-year | 10-year | inception | 1-year | 5-year | 10-year | inception2 |
|
| Value Class NAV (began 10/27/06) | — | — | — | — | — | — | — | 14.45% |
| Russell Midcap Value Index3,4,5 | — | — | — | — | — | — | — | 6.22% |
1 Performance does not reflect the deduction of taxes on fund distributions or redemptions of fund shares. Past performance does not predict future performance.
2 Current subadviser has managed the fund since October 27, 2006.
3 Since inception returns for the indices may begin on the month-end closest to the actual inception date of the fund.
4 Russell Midcap Value Index is an unmanaged index that measures the performance of those Russell Midcap Companies with lower price-to-book ratios and lower forecasted growth value.
5 It is not possible to invest directly in an index. Index figures do not reflect sales charges and would be lower if they did.
60
Value & Restructuring Fund
Subadviser: UST Advisers, Inc.
Portfolio Managers: David J. Williams, Timothy Evnin and John McDermott
INVESTMENT OBJECTIVE & POLICIES ► To seek long-term capital appreciation by investing at least 65% of the Fund’s assets in common stocks of U.S. and foreign companies whose share price does not reflect the economic value of the company's assets, but where its restructuring efforts or industry consolidation will serve to highlight the true value of the company.
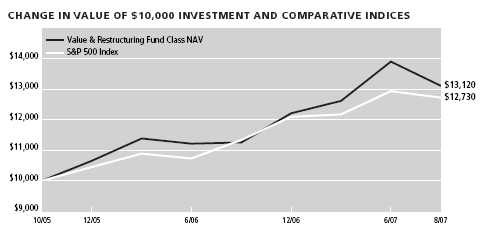
| |
| Sector Weighting* | % of Total |
|
| Financial | 19.87 |
| Energy | 18.54 |
| Industrial | 12.59 |
| Communications | 9.75 |
| Consumer, Non-cyclical | 9.69 |
| Basic Materials | 8.71 |
| Consumer, Cyclical | 7.17 |
| Technology | 1.18 |
| Mortgage Securities | 0.87 |
| Utilities | 0.46 |
*Top Sectors as a percentage of market value. Does not include short-term securities and investments in the John Hancock Cash Investment Trust.
PORTFOLIO MANAGERS’ COMMENTARY
Performance ► For the year ended August 31, 2007, the Value & Restructuring Class NAV returned +18.12%, outperforming the +15.13% return of the S&P 500 Index.
Environment ► Despite heightened concerns over looming subprime mortgage defaults since late June, the Fund continued to perform well. We believe the Fund’s strong performance is primarily the result of its exposure to energy and other natural resource companies. The extent and duration of the commodity price rally has exceeded even our bullish expectations.
Many of the best performing stocks for the past 12 months benefited directly from these global growth trends. Among the weakest performers were companies with some degree of mortgage exposure and a handful that experienced specific operating problems. Fortunately, this latter group made up a relatively small percentage of the portfolio, and was not too detrimental to overall performance.
Recent turmoil in credit markets significantly affected stocks of financial companies. However, this type of market favors a long-term investment focus, as good companies perceived to be facing a degree of near-term distress can be purchased at attractive prices. It’s worth keeping a few salient points in mind. We believed stocks were attractively valued in mid-August and find them all the more so today. Monetary policy appears sufficiently tight to allow for a bit of easing should liquidity become considerably more constrained. Further, we believe corporate earnings and underlying economic conditions seem adequate to support higher stock prices and are unlikely to decline precipitously.
Outlook ► We expect recent market declines will reverse. To the extent stock prices fall further and relative valuations change again, we will make additional changes to the portfolio while continuing to emphasize diversification. We remain fully invested in stocks because the market still appears reasonably priced and restructuring opportunities abound. Stock valuations remain in the middle of their historic range at about 16 times this year’s expected earnings, which is a very good value compared to low bond yields and a dysfunctional real estate market. In comparison, the P/E ratio for the Fund’s holdings currently is about 14 times expected earnings.
| | | | | | | | |
| PERFORMANCE TABLE1 | Average Annual Total Return | | | Cumulative Total Return | |
|
| | | | | Since | | | | Since |
| Periods Ended August 31, 2007 | 1-year | 5-year | 10-year | inception | 1-year | 5-year | 10-year | inception2 |
|
| Value & Restructuring Class NAV (began 10/29/05) | 18.12% | — | — | 15.79% | 18.12% | — | — | 31.20% |
| S&P 500 Index3,4,5 | 15.13% | — | — | 13.92% | 15.13% | — | — | 27.30% |
1 Performance does not reflect the deduction of taxes on fund distributions or redemptions of fund shares. Past performance does not predict future performance.
2 Current subadviser has managed the fund since October 29, 2005.
3 Since inception returns for the indices may begin on the month-end closest to the actual inception date of the fund.
4 S&P 500 Index is an unmanaged index that includes 500 widely traded common stocks.
5 It is not possible to invest directly in an index. Index figures do not reflect sales charges and would be lower if they did.
61
Vista Fund
Subadviser: American Century Investment Management, Inc.
Portfolio Managers: Glen A. Fogle, David M. Holland and Bradley J. Eixmann
INVESTMENT OBJECTIVE & POLICIES ► To seek long-term capital growth by investing in common stocks of companies that are medium-sized and smaller at the time of purchase.

| |
| Sector Weighting* | % of Total |
|
| Industrial | 23.15 |
| Communications | 18.70 |
| Consumer, Cyclical | 13.34 |
| Consumer, Non-cyclical | 11.94 |
| Technology | 8.88 |
| Energy | 5.08 |
| Basic Materials | 2.65 |
| Utilities | 1.43 |
| Financial | 1.22 |
*Top Sectors as a percentage of market value. Does not include short-term securities and investments in the John Hancock Cash Investment Trust.
PORTFOLIO MANAGERS’ COMMENTARY
Performance ► For the year ended August 31, 2007, the Vista Class NAV returned +34.30%, outperforming the +19.31% return of the Russell Midcap Growth Index.
Environment ► U.S. stocks produced healthy returns during the period, despite an economic slowdown brought on by a sharp decline in the housing market. As economic growth cooled, market leadership changed course. For the first time since the technology bubble burst in 2000, mid-and large-cap stocks outperformed small-cap stocks, and growth stocks outpaced their value counterparts. Mid-cap growth stocks, in particular, were the strongest performers. Among mid-cap stocks, the Russell Midcap Growth Index gained 19.31%, compared with 12.43% for the Russell Midcap Value Index.
The Fund held an overweight position in Industrials stocks, which made the largest contribution to portfolio returns. Within the sector, we focused on the aerospace and defense industry, particularly those companies benefiting from a parts replacement cycle and expanding orders in global commercial aviation. An overweight in construction and engineering firms also helped performance. Holdings within this group are involved in a variety of major projects, including the construction of power plants, which have benefited from growing global demand for energy infrastructure. An overweight in Telecommunication Services also contributed to portfolio gains, led by investments in wireless providers serving burgeoning foreign markets. Recognizing the drag that high oil prices have on consumers’ discretionary spending levels, we maintained an underweight position in Consumer Discretionary stocks, which further helped relative performan ce.
The portfolio held an underweight in the Energy sector during the period. This hampered relative performance, as the sector continued to benefit from rising prices. An underweight among oil and gas producers, whose share prices generally benefited from rising prices for crude oil and refined products, held back relative gains.
| | | | | | | | |
| PERFORMANCE TABLE1 | Average Annual Total Return | | | Cumulative Total Return | |
|
| | | | | Since | | | | Since |
| Periods Ended August 31, 2007 | 1-year | 5-year | 10-year | inception | 1-year | 5-year | 10-year | inception2 |
|
| Vista Class NAV (began 10/29/05) | 34.30% | — | — | 21.62% | 34.30% | — | — | 43.70% |
| Russell Midcap Growth Index3,4,5 | 19.31% | — | — | 14.67% | 19.31% | — | — | 28.86% |
1 Performance does not reflect the deduction of taxes on fund distributions or redemptions of fund shares. Past performance does not predict future performance.
2 Current subadviser has managed the fund since October 29, 2005.
3 Since inception returns for the indices may begin on the month-end closest to the actual inception date of the fund.
4 Russell Midcap Growth Index is an unmanaged index that contains those stocks from the Russell Mid Cap Index with a greater than average growth orientation.
5 It is not possible to invest directly in an index. Index figures do not reflect sales charges and would be lower if they did.
62
John Hancock Funds II
Shareholder Expense Example
As a shareholder of John Hancock Funds II, you incur ongoing costs, such as management fees, distribution (12b-1) fees and other expenses. In the case of Absolute Return, in addition to the operating expenses which the Fund bears directly, the Fund indirectly bears a pro rata share of the operating expenses of the underlying funds in which the Fund invests. Because the underlying funds have varied operating expenses and transaction costs and the Fund may own different proportions of the underlying funds at different times, the amount of expenses incurred indirectly by the Fund will vary. Had these indirect expenses been reflected in the following analysis, total expense would be higher than amounts shown.
This example is intended to help you understand your ongoing costs (in dollars) of investing in the funds so you can compare these costs with the ongoing costs of investing in other mutual funds. The example is based on an investment of $1,000 at the beginning of the period and held for the entire period (March 1, 2007 through August 31, 2007).
Actual expenses
The first line of each share class in the table below and on the following pages provides information about actual account values and actual expenses. You may use the information in this line, together with the amount you invested, to estimate the expenses that you paid over the period. Simply divide your account value by $1,000 (for example, an $8,600 account value divided by $1,000 = 8.6), then multiply the result by the number in the first line under the heading entitled “Expenses paid during period” to estimate the expenses you paid on your account during this period.
Hypothetical example for comparison purposes
The second line of each share class in the table below and on the following pages provides information about hypothetical account values and hypothetical expenses based on the actual expense ratio for the share class and an assumed annualized rate of return of 5% per year before expenses, which is not the actual return of the share class. The hypothetical account values and expenses may not be used to estimate the actual ending account balance or expenses you paid for the period. You may use this information to compare the ongoing costs of investing in the Fund and other funds. To do so, compare this 5% hypothetical example with the 5% hypothetical examples that appear in the shareholder reports of the other funds.
Please note that the expenses shown in the table are meant to highlight your ongoing costs only and do not reflect any transactional costs and insurance-related charges. Therefore, the second line of each share class in the table is useful in comparing ongoing costs only, and will not help you determine the relative total costs of owning different funds. In addition, if these transactional costs were included, your costs would have been higher.
| | | | |
| | | | Expenses Paid | |
| | Beginning | Ending | During Period * | Annualized |
| | Account Value | Account Value | 3-1-07 – | Expense |
| | 3-1-07 | 8-31-07 | 8-31-07 | Ratio |
| |
| Absolute Return ** | | | | |
|
| Class A — Actual | $1,000.00 | $1,013.79 | $2.79 | 0.55% |
| Class A — Hypothetical (5% annualized return before expenses) | 1,000.00 | 1,022.43 | 2.80 | 0.55% |
| Class B — Actual | 1,000.00 | 1,009.22 | 6.33 | 1.25% |
| Class B — Hypothetical (5% annualized return before expenses) | 1,000.00 | 1,018.90 | 6.36 | 1.25% |
| Class C — Actual | 1,000.00 | 1,009.22 | 6.33 | 1.25% |
| Class C — Hypothetical (5% annualized return before expenses) | 1,000.00 | 1,018.90 | 6.36 | 1.25% |
| Class 1 — Actual | 1,000.00 | 1,014.69 | 1.52 | 0.30% |
| Class 1 — Hypothetical (5% annualized return before expenses) | 1,000.00 | 1,023.69 | 1.53 | 0.30% |
| |
| Active Bond | | | | |
|
| Class 1 — Actual | $1,000.00 | $1,003.85 | $3.69 | 0.73% |
| Class 1 — Hypothetical (5% annualized return before expenses) | 1,000.00 | 1,021.53 | 3.72 | 0.73% |
| Class NAV — Actual | 1,000.00 | 1,004.10 | 3.43 | 0.68% |
| Class NAV — Hypothetical (5% annualized return before expenses) | 1,000.00 | 1,021.78 | 3.47 | 0.68% |
| |
| All Cap Core | | | | |
|
| Class NAV — Actual | $1,000.00 | $1,030.48 | $4.25 | 0.83% |
| Class NAV — Hypothetical (5% annualized return before expenses) | 1,000.00 | 1,021.02 | 4.23 | 0.83% |
| |
| All Cap Growth | | | | |
|
| Class 1 — Actual | $1,000.00 | $1,094.21 | $5.12 | 0.97% |
| Class 1 — Hypothetical (5% annualized return before expenses) | 1,000.00 | 1,020.32 | 4.94 | 0.97% |
| Class NAV — Actual | 1,000.00 | 1,094.67 | 4.86 | 0.92% |
| Class NAV — Hypothetical (5% annualized return before expenses) | 1,000.00 | 1,020.57 | 4.69 | 0.92% |
63
John Hancock Funds II
Shareholder Expense Example
| | | | |
| | | | Expenses Paid | |
| | Beginning | Ending | During Period * | Annualized |
| | Account Value | Account Value | 3-1-07 – | Expense |
| | 3-1-07 | 8-31-07 | 8-31-07 | Ratio |
| |
| All Cap Value | | | | |
|
| Class 1 — Actual | $1,000.00 | $1,056.95 | $5.24 | 1.01% |
| Class 1 — Hypothetical (5% annualized return before expenses) | 1,000.00 | 1,020.11 | 5.14 | 1.01% |
| Class NAV — Actual | 1,000.00 | 1,055.83 | 4.66 | 0.90% |
| Class NAV — Hypothetical (5% annualized return before expenses) | 1,000.00 | 1,020.67 | 4.58 | 0.90% |
| |
| Blue Chip Growth | | | | |
|
| Class 1 — Actual | $1,000.00 | $1,088.74 | $4.53 | 0.86% |
| Class 1 — Hypothetical (5% annualized return before expenses) | 1,000.00 | 1,020.87 | 4.38 | 0.86% |
| Class NAV — Actual | 1,000.00 | 1,089.35 | 4.27 | 0.81% |
| Class NAV — Hypothetical (5% annualized return before expenses) | 1,000.00 | 1,021.12 | 4.13 | 0.81% |
| |
| Capital Appreciation | | | | |
|
| Class 1 — Actual | $1,000.00 | $1,048.59 | $4.18 | 0.81% |
| Class 1 — Hypothetical (5% annualized return before expenses) | 1,000.00 | 1,021.12 | 4.13 | 0.81% |
| Class NAV — Actual | 1,000.00 | 1,048.54 | 3.92 | 0.76% |
| Class NAV — Hypothetical (5% annualized return before expenses) | 1,000.00 | 1,021.37 | 3.87 | 0.76% |
| |
| Core Bond | | | | |
|
| Class 1 — Actual | $1,000.00 | $1,011.24 | $4.11 | 0.81% |
| Class 1 — Hypothetical (5% annualized return before expenses) | 1,000.00 | 1,021.12 | 4.13 | 0.81% |
| Class NAV — Actual | 1,000.00 | 1,011.49 | 3.85 | 0.76% |
| Class NAV — Hypothetical (5% annualized return before expenses) | 1,000.00 | 1,021.37 | 3.87 | 0.76% |
| |
| Core Equity | | | | |
|
| Class 1 — Actual | $1,000.00 | $997.49 | $4.33 | 0.86% |
| Class 1 — Hypothetical (5% annualized return before expenses) | 1,000.00 | 1,020.87 | 4.38 | 0.86% |
| Class NAV — Actual | 1,000.00 | 997.49 | 4.08 | 0.81% |
| Class NAV — Hypothetical (5% annualized return before expenses) | 1,000.00 | 1,021.12 | 4.13 | 0.81% |
| |
| Emerging Growth | | | | |
|
| Class 1 — Actual | $1,000.00 | $1,083.43 | $4.36 | 0.83% |
| Class 1 — Hypothetical (5% annualized return before expenses) | 1,000.00 | 1,021.02 | 4.23 | 0.83% |
| Class NAV — Actual | 1,000.00 | 1,084.03 | 4.10 | 0.78% |
| Class NAV — Hypothetical (5% annualized return before expenses) | 1,000.00 | 1,021.27 | 3.97 | 0.78% |
| |
| Emerging Markets Value † | | | | |
|
| Class NAV — Actual | $1,000.00 | $1,102.00 | $5.84 | 1.65% |
| Class NAV — Hypothetical (5% annualized return before expenses) | 1,000.00 | 1,011.29 | 5.59 | 1.65% |
| |
| Emerging Small Company | | | | |
|
| Class 1 — Actual | $1,000.00 | $1,095.95 | $5.60 | 1.06% |
| Class 1 — Hypothetical (5% annualized return before expenses) | 1,000.00 | 1,019.86 | 5.40 | 1.06% |
| Class NAV — Actual | 1,000.00 | 1,095.91 | 5.34 | 1.01% |
| Class NAV — Hypothetical (5% annualized return before expenses) | 1,000.00 | 1,020.11 | 5.14 | 1.01% |
| |
| Equity-Income | | | | |
|
| Class 1 — Actual | $1,000.00 | $1,034.99 | $4.36 | 0.85% |
| Class 1 — Hypothetical (5% annualized return before expenses) | 1,000.00 | 1,020.92 | 4.33 | 0.85% |
| Class NAV — Actual | 1,000.00 | 1,035.56 | 4.10 | 0.80% |
| Class NAV — Hypothetical (5% annualized return before expenses) | 1,000.00 | 1,021.17 | 4.08 | 0.80% |
| |
| Fundamental Value | | | | |
|
| Class 1 — Actual | $1,000.00 | $1,041.47 | $4.37 | 0.85% |
| Class 1 — Hypothetical (5% annualized return before expenses) | 1,000.00 | 1,020.92 | 4.33 | 0.85% |
| Class NAV — Actual | 1,000.00 | 1,041.52 | 4.12 | 0.80% |
| Class NAV — Hypothetical (5% annualized return before expenses) | 1,000.00 | 1,021.17 | 4.08 | 0.80% |
| |
| Global Bond | | | | |
|
| Class 1 — Actual | $1,000.00 | $1,015.08 | $4.47 | 0.88% |
| Class 1 — Hypothetical (5% annualized return before expenses) | 1,000.00 | 1,020.77 | 4.48 | 0.88% |
| Class NAV — Actual | 1,000.00 | 1,015.81 | 4.22 | 0.83% |
| Class NAV — Hypothetical (5% annualized return before expenses) | 1,000.00 | 1,021.02 | 4.23 | 0.83% |
64
John Hancock Funds II
Shareholder Expense Example
| | | | |
| | | | Expenses Paid | |
| | Beginning | Ending | During Period * | Annualized |
| | Account Value | Account Value | 3-1-07 – | Expense |
| | 3-1-07 | 8-31-07 | 8-31-07 | Ratio |
| |
| Global Real Estate | | | | |
|
| Class NAV — Actual | $1,000.00 | $920.65 | $5.23 | 1.08% |
| Class NAV — Hypothetical (5% annualized return before expenses) | 1,000.00 | 1,019.76 | 5.50 | 1.08% |
| |
| High Income | | | | |
|
| Class NAV — Actual | $1,000.00 | $978.65 | $3.59 | 0.72% |
| Class NAV — Hypothetical (5% annualized return before expenses) | 1,000.00 | 1,021.58 | 3.67 | 0.72% |
| |
| High Yield | | | | |
|
| Class 1 — Actual | $1,000.00 | $981.52 | $3.70 | 0.74% |
| Class 1 — Hypothetical (5% annualized return before expenses) | 1,000.00 | 1,021.48 | 3.77 | 0.74% |
| Class NAV — Actual | 1,000.00 | 981.67 | 3.45 | 0.69% |
| Class NAV — Hypothetical (5% annualized return before expenses) | 1,000.00 | 1,021.73 | 3.52 | 0.69% |
| |
| Index 500 | | | | |
|
| Class NAV — Actual | $1,000.00 | $1,055.72 | $2.64 | 0.51% |
| Class NAV — Hypothetical (5% annualized return before expenses) | 1,000.00 | 1,022.63 | 2.60 | 0.51% |
| |
| International Equity Index | | | | |
|
| Class NAV — Actual | $1,000.00 | $1,087.97 | $3.00 | 0.57% |
| Class NAV — Hypothetical (5% annualized return before expenses) | 1,000.00 | 1,022.33 | 2.91 | 0.57% |
| |
| International Opportunities | | | | |
|
| Class 1 — Actual | $1,000.00 | $1,094.62 | $5.65 | 1.07% |
| Class 1 — Hypothetical (5% annualized return before expenses) | 1,000.00 | 1,019.81 | 5.45 | 1.07% |
| Class NAV — Actual | 1,000.00 | 1,095.02 | 5.39 | 1.02% |
| Class NAV — Hypothetical (5% annualized return before expenses) | 1,000.00 | 1,020.06 | 5.19 | 1.02% |
| |
| International Small Cap | | | | |
|
| Class 1 — Actual | $1,000.00 | $1,144.12 | $6.22 | 1.15% |
| Class 1 — Hypothetical (5% annualized return before expenses) | 1,000.00 | 1,019.41 | 5.85 | 1.15% |
| Class NAV — Actual | 1,000.00 | 1,144.66 | 5.95 | 1.10% |
| Class NAV — Hypothetical (5% annualized return before expenses) | 1,000.00 | 1,019.66 | 5.60 | 1.10% |
| |
| International Small Company | | | | |
|
| Class NAV — Actual | $1,000.00 | $1,057.80 | $5.81 | 1.12% |
| Class NAV — Hypothetical (5% annualized return before expenses) | 1,000.00 | 1,019.56 | 5.70 | 1.12% |
| |
| International Value | | | | |
|
| Class 1 — Actual | $1,000.00 | $1,062.47 | $5.15 | 0.99% |
| Class 1 — Hypothetical (5% annualized return before expenses) | 1,000.00 | 1,020.21 | 5.04 | 0.99% |
| Class NAV — Actual | 1,000.00 | 1,063.14 | 4.89 | 0.94% |
| Class NAV — Hypothetical (5% annualized return before expenses) | 1,000.00 | 1,020.47 | 4.79 | 0.94% |
| |
| Investment Quality Bond | | | | |
|
| Class 1 — Actual | $1,000.00 | $1,008.84 | $3.90 | 0.77% |
| Class 1 — Hypothetical (5% annualized return before expenses) | 1,000.00 | 1,021.32 | 3.92 | 0.77% |
| Class NAV — Actual | 1,000.00 | 1,009.09 | 3.65 | 0.72% |
| Class NAV — Hypothetical (5% annualized return before expenses) | 1,000.00 | 1,021.58 | 3.67 | 0.72% |
| |
| Large Cap | | | | |
|
| Class 1 — Actual | $1,000.00 | $1,033.33 | $4.10 | 0.80% |
| Class 1 — Hypothetical (5% annualized return before expenses) | 1,000.00 | 1,021.17 | 4.08 | 0.80% |
| Class NAV — Actual | 1,000.00 | 1,033.97 | 3.85 | 0.75% |
| Class NAV — Hypothetical (5% annualized return before expenses) | 1,000.00 | 1,021.42 | 3.82 | 0.75% |
| |
| Large Cap Value | | | | |
|
| Class 1 — Actual | $1,000.00 | $1,033.11 | $4.71 | 0.92% |
| Class 1 — Hypothetical (5% annualized return before expenses) | 1,000.00 | 1,020.57 | 4.69 | 0.92% |
| Class NAV — Actual | 1,000.00 | 1,033.45 | 4.46 | 0.87% |
| Class NAV — Hypothetical (5% annualized return before expenses) | 1,000.00 | 1,020.82 | 4.43 | 0.87% |
65
John Hancock Funds II
Shareholder Expense Example
| | | | |
| | | | Expenses Paid | |
| | Beginning | Ending | During Period * | Annualized |
| | Account Value | Account Value | 3-1-07 – | Expense |
| | 3-1-07 | 8-31-07 | 8-31-07 | Ratio |
| |
| Mid Cap Index | | | | |
|
| Class NAV — Actual | $1,000.00 | $1,032.67 | $2.66 | 0.52% |
| Class NAV — Hypothetical (5% annualized return before expenses) | 1,000.00 | 1,022.58 | 2.65 | 0.52% |
| |
| Mid Cap Intersection † | | | | |
|
| Class NAV — Actual | $1,000.00 | $959.00 | $4.62 | 1.40% |
| Class NAV — Hypothetical (5% annualized return before expenses) | 1,000.00 | 1,012.13 | 4.75 | 1.40% |
| |
| Mid Cap Stock | | | | |
|
| Class 1 — Actual | $1,000.00 | $1,118.30 | $4.91 | 0.92% |
| Class 1 — Hypothetical (5% annualized return before expenses) | 1,000.00 | 1,020.57 | 4.69 | 0.92% |
| Class NAV — Actual | 1,000.00 | 1,118.75 | 4.65 | 0.87% |
| Class NAV — Hypothetical (5% annualized return before expenses) | 1,000.00 | 1,020.82 | 4.43 | 0.87% |
| |
| Mid Cap Value | | | | |
|
| Class 1 — Actual | $1,000.00 | $1,010.56 | $4.66 | 0.92% |
| Class 1 — Hypothetical (5% annualized return before expenses) | 1,000.00 | 1,020.57 | 4.69 | 0.92% |
| Class NAV — Actual | 1,000.00 | 1,011.05 | 4.56 | 0.90% |
| Class NAV — Hypothetical (5% annualized return before expenses) | 1,000.00 | 1,020.67 | 4.58 | 0.90% |
| |
| Mid Cap Value Equity | | | | |
|
| Class NAV — Actual | $1,000.00 | $1,067.29 | $4.79 | 0.92% |
| Class NAV — Hypothetical (5% annualized return before expenses) | 1,000.00 | 1,020.57 | 4.69�� | 0.92% |
| |
| Natural Resources | | | | |
|
| Class 1 — Actual | $1,000.00 | $1,184.73 | $6.39 | 1.16% |
| Class 1 — Hypothetical (5% annualized return before expenses) | 1,000.00 | 1,019.36 | 5.90 | 1.16% |
| Class NAV — Actual | 1,000.00 | 1,184.74 | 6.11 | 1.11% |
| Class NAV — Hypothetical (5% annualized return before expenses) | 1,000.00 | 1,019.61 | 5.65 | 1.11% |
| |
| Quantitative All Cap | | | | |
|
| Class A — Actual | $1,000.00 | $1,064.34 | $5.72 | 1.10% |
| Class A — Hypothetical (5% annualized return before expenses) | 1,000.00 | 1,019.66 | 5.60 | 1.10% |
| Class B — Actual | 1,000.00 | 1,060.82 | 9.35 | 1.80% |
| Class B — Hypothetical (5% annualized return before expenses) | 1,000.00 | 1,016.13 | 9.15 | 1.80% |
| Class C — Actual | 1,000.00 | 1,060.82 | 9.35 | 1.80% |
| Class C — Hypothetical (5% annualized return before expenses) | 1,000.00 | 1,016.13 | 9.15 | 1.80% |
| Class I — Actual | 1,000.00 | 1,065.18 | 4.16 | 0.80% |
| Class I — Hypothetical (5% annualized return before expenses) | 1,000.00 | 1,021.17 | 4.08 | 0.80% |
| |
| Quantitative Mid Cap | | | | |
|
| Class 1 — Actual | $1,000.00 | $1,017.25 | $4.37 | 0.86% |
| Class 1 — Hypothetical (5% annualized return before expenses) | 1,000.00 | 1,020.87 | 4.38 | 0.86% |
| |
| Quantitative Value | | | | |
|
| Class 1 — Actual | $1,000.00 | $1,015.63 | $3.76 | 0.74% |
| Class 1 — Hypothetical (5% annualized return before expenses) | 1,000.00 | 1,021.48 | 3.77 | 0.74% |
| Class NAV — Actual | 1,000.00 | 1,016.78 | 3.51 | 0.69% |
| Class NAV — Hypothetical (5% annualized return before expenses) | 1,000.00 | 1,021.73 | 3.52 | 0.69% |
| |
| Real Estate Equity | | | | |
|
| Class NAV — Actual | $1,000.00 | $866.29 | $4.09 | 0.87% |
| Class NAV — Hypothetical (5% annualized return before expenses) | 1,000.00 | 1,020.82 | 4.43 | 0.87% |
| |
| Real Estate Securities | | | | |
|
| Class 1 — Actual | $1,000.00 | $869.14 | $3.49 | 0.74% |
| Class 1 — Hypothetical (5% annualized return before expenses) | 1,000.00 | 1,021.48 | 3.77 | 0.74% |
| |
| Real Return Bond | | | | |
|
| Class 1 — Actual | $1,000.00 | $1,014.39 | $3.96 | 0.78% |
| Class 1 — Hypothetical (5% annualized return before expenses) | 1,000.00 | 1,021.27 | 3.97 | 0.78% |
| Class NAV — Actual | 1,000.00 | 1,014.74 | 3.71 | 0.73% |
| Class NAV — Hypothetical (5% annualized return before expenses) | 1,000.00 | 1,021.53 | 3.72 | 0.73% |
66
John Hancock Funds II
Shareholder Expense Example
| | | | |
| | | | Expenses Paid | |
| | Beginning | Ending | During Period * | Annualized |
| | Account Value | Account Value | 3-1-07 – | Expense |
| | 3-1-07 | 8-31-07 | 8-31-07 | Ratio |
| |
| Small Cap | | | | |
|
| Class 1 — Actual | $1,000.00 | $1,022.61 | $4.89 | 0.96% |
| Class 1 — Hypothetical (5% annualized return before expenses) | 1,000.00 | 1,020.37 | 4.89 | 0.96% |
| Class NAV — Actual | 1,000.00 | 1,022.57 | 4.64 | 0.91% |
| Class NAV — Hypothetical (5% annualized return before expenses) | 1,000.00 | 1,020.62 | 4.63 | 0.91% |
| |
| Small Cap Index | | | | |
|
| Class NAV — Actual | $1,000.00 | $1,002.35 | $2.78 | 0.55% |
| Class NAV — Hypothetical (5% annualized return before expenses) | 1,000.00 | 1,022.43 | 2.80 | 0.55% |
| |
| Small Cap Opportunities | | | | |
|
| Class 1 — Actual | $1,000.00 | $966.21 | $5.35 | 1.08% |
| Class 1 — Hypothetical (5% annualized return before expenses) | 1,000.00 | 1,019.76 | 5.50 | 1.08% |
| Class NAV — Actual | 1,000.00 | 966.07 | 5.10 | 1.03% |
| Class NAV — Hypothetical (5% annualized return before expenses) | 1,000.00 | 1,020.01 | 5.24 | 1.03% |
| |
| Small Company | | | | |
|
| Class 1 — Actual | $1,000.00 | $983.05 | $6.10 | 1.22% |
| Class 1 — Hypothetical (5% annualized return before expenses) | 1,000.00 | 1,019.06 | 6.21 | 1.22% |
| Class NAV — Actual | 1,000.00 | 983.08 | 5.85 | 1.17% |
| Class NAV — Hypothetical (5% annualized return before expenses) | 1,000.00 | 1,019.31 | 5.96 | 1.17% |
| |
| Small Company Growth | | | | |
|
| Class NAV — Actual | $1,000.00 | $1,063.36 | $5.72 | 1.10% |
| Class NAV — Hypothetical (5% annualized return before expenses) | 1,000.00 | 1,019.66 | 5.60 | 1.10% |
| |
| Small Company Value | | | | |
|
| Class 1 — Actual | $1,000.00 | $1,003.89 | $5.35 | 1.06% |
| Class 1 — Hypothetical (5% annualized return before expenses) | 1,000.00 | 1,019.86 | 5.40 | 1.06% |
| Class NAV — Actual | 1,000.00 | 1,004.28 | 5.10 | 1.01% |
| Class NAV — Hypothetical (5% annualized return before expenses) | 1,000.00 | 1,020.11 | 5.14 | 1.01% |
| |
| Special Value | | | | |
|
| Class 1 — Actual | $1,000.00 | $994.53 | $5.38 | 1.07% |
| Class 1 — Hypothetical (5% annualized return before expenses) | 1,000.00 | 1,019.81 | 5.45 | 1.07% |
| |
| Spectrum Income | | | | |
|
| Class NAV — Actual | $1,000.00 | $1,014.78 | $4.37 | 0.86% |
| Class NAV — Hypothetical (5% annualized return before expenses) | 1,000.00 | 1,020.87 | 4.38 | 0.86% |
| |
| Strategic Bond | | | | |
|
| Class 1 — Actual | $1,000.00 | $983.19 | $3.95 | 0.79% |
| Class 1 — Hypothetical (5% annualized return before expenses) | 1,000.00 | 1,021.22 | 4.02 | 0.79% |
| Class NAV — Actual | 1,000.00 | 983.39 | 3.70 | 0.74% |
| Class NAV — Hypothetical (5% annualized return before expenses) | 1,000.00 | 1,021.48 | 3.77 | 0.74% |
| |
| Strategic Income | | | | |
|
| Class NAV — Actual | $1,000.00 | $1,015.36 | $3.91 | 0.77% |
| Class NAV — Hypothetical (5% annualized return before expenses) | 1,000.00 | 1,021.32 | 3.92 | 0.77% |
| |
| Total Bond Market | | | | |
|
| Class NAV — Actual | $1,000.00 | $1,012.46 | $2.84 | 0.56% |
| Class NAV — Hypothetical (5% annualized return before expenses) | 1,000.00 | 1,022.38 | 2.85 | 0.56% |
| |
| Total Return | | | | |
|
| Class 1 — Actual | $1,000.00 | $1,011.11 | $4.36 | 0.86% |
| Class 1 — Hypothetical (5% annualized return before expenses) | 1,000.00 | 1,020.87 | 4.38 | 0.86% |
| Class NAV — Actual | 1,000.00 | 1,011.38 | 4.11 | 0.81% |
| Class NAV — Hypothetical (5% annualized return before expenses) | 1,000.00 | 1,021.12 | 4.13 | 0.81% |
67
John Hancock Funds II
Shareholder Expense Example
| | | | |
| | | | Expenses Paid | |
| | Beginning | Ending | During Period * | Annualized |
| | Account Value | Account Value | 3-1-07 – | Expense |
| | 3-1-07 | 8-31-07 | 8-31-07 | Ratio |
| |
| U.S. Global Leaders Growth | | | | |
|
| Class 1 — Actual | $1,000.00 | $1,026.26 | $3.93 | 0.77% |
| Class 1 — Hypothetical (5% annualized return before expenses) | 1,000.00 | 1,021.32 | 3.92 | 0.77% |
| Class NAV — Actual | 1,000.00 | 1,026.22 | 3.68 | 0.72% |
| Class NAV — Hypothetical (5% annualized return before expenses) | 1,000.00 | 1,021.58 | 3.67 | 0.72% |
| |
| U.S. Government Securities | | | | |
|
| Class 1 — Actual | $1,000.00 | $1,002.69 | $3.89 | 0.77% |
| Class 1 — Hypothetical (5% annualized return before expenses) | 1,000.00 | 1,021.32 | 3.92 | 0.77% |
| Class NAV — Actual | 1,000.00 | 1,002.96 | 3.63 | 0.72% |
| Class NAV — Hypothetical (5% annualized return before expenses) | 1,000.00 | 1,021.58 | 3.67 | 0.72% |
| |
| U.S. High Yield Bond | | | | |
|
| Class 1 — Actual | $1,000.00 | $991.30 | $4.22 | 0.84% |
| Class 1 — Hypothetical (5% annualized return before expenses) | 1,000.00 | 1,020.97 | 4.28 | 0.84% |
| Class NAV — Actual | 1,000.00 | 991.55 | 3.97 | 0.79% |
| Class NAV — Hypothetical (5% annualized return before expenses) | 1,000.00 | 1,021.22 | 4.02 | 0.79% |
| |
| U.S. Multi Sector | | | | |
|
| Class NAV — Actual | $1,000.00 | $1,025.43 | $4.14 | 0.81% |
| Class NAV — Hypothetical (5% annualized return before expenses) | 1,000.00 | 1,021.12 | 4.13 | 0.81% |
| |
| Value | | | | |
|
| Class NAV — Actual | $1,000.00 | $1,057.35 | $5.13 | 0.99% |
| Class NAV — Hypothetical (5% annualized return before expenses) | 1,000.00 | 1,020.21 | 5.04 | 0.99% |
| |
| Value & Restructuring | | | | |
|
| Class NAV — Actual | $1,000.00 | $1,056.42 | $4.46 | 0.86% |
| Class NAV — Hypothetical (5% annualized return before expenses) | 1,000.00 | 1,020.87 | 4.38 | 0.86% |
| |
| Vista | | | | |
|
| Class NAV — Actual | $1,000.00 | $1,210.61 | $5.29 | 0.95% |
| Class NAV — Hypothetical (5% annualized return before expenses) | 1,000.00 | 1,020.42 | 4.84 | 0.95% |
* Expenses are equal to the annualized expense ratio, multiplied by the average account value over the period, multiplied by the number of days in the period (184), and divided by 365 (to reflect the one-half year period).
** Absolute Return’s expense ratios do not include fees and expenses indirectly incurred by the underlying funds.
† Emerging Markets Value and Mid Cap Intersection commenced operations on May 1, 2007. Expenses are equal to the annualized expense ratio, multiplied by the average account value over the period, multiplied by the number of days in the period (123), and divided by 365 (to reflect the one-half year period).
68
John Hancock Funds II
Statements of Assets and Liabilities — August 31, 2007
| | | | |
| Assets | Absolute Return | Active Bond | All Cap Core | All Cap Growth |
|
| Investments in unaffiliated issuers, at value | $605,303 | $563,976,487 | $426,720,179 | $125,766,390 |
| Investments in affiliated issuers, at value (Note 2) | 5,021,9591 | — | 2,163,206 | 2,507,694 |
| Securities loaned, at value (Note 2) | — | — | 2,120,790 | 2,458,524 |
| Repurchase agreements, at value (Note 2) | — | 3,715,000 | 46,639,000 | 3,546,000 |
| Total investments, at value | 5,627,262 | 567,691,487 | 477,643,175 | 134,278,608 |
| Cash | 30,372 | 661 | 230 | 5 |
| Foreign currency, at value | — | 505,539 | — | 41,417 |
| Receivable for investments sold | — | — | — | 583,300 |
| Receivable for fund shares sold | — | 246,108 | 5,550 | 195 |
| Dividend, interest and other receivable (net of tax) | — | 4,517,503 | 687,228 | 79,924 |
| Receivable for futures variation margin | 4,093 | — | 532,595 | — |
| Receivable due from adviser | 6,243 | — | — | 549 |
| Other assets | 70 | — | — | — |
| Total assets | 5,668,040 | 572,961,298 | 478,868,778 | 134,983,998 |
| |
| Liabilities | | | | |
|
| Payable for investments purchased | — | 141,744 | — | 251,155 |
| Payable for delayed delivery securities purchased | — | 14,112,987 | — | — |
| Payable for forward foreign currency exchange contracts (Note 2) | — | 1,226 | — | — |
| Payable for fund shares repurchased | — | — | — | 11,313 |
| Payable upon return of securities loaned (Note 2) | — | — | 2,163,206 | 2,507,694 |
| Payable to affiliates | | | | |
| Fund administration fees | 54 | 2,542 | 1,506 | 1,399 |
| Trustees’ fees | — | 264 | 124 | 95 |
| Other payables and accrued expenses | 25,128 | 104,030 | 42,108 | 43,075 |
| Total liabilities | 25,182 | 14,362,793 | 2,206,944 | 2,814,731 |
| |
| Net assets | | | | |
|
| Capital paid-in | $5,131,636 | $560,943,920 | $445,490,181 | $98,809,993 |
| Undistributed net investment income (loss) | 103,895 | 5,013,545 | 4,237,201 | 169,879 |
| Accumulated undistributed net realized gain (loss) on investments, futures | | | | |
| contracts, options written and foreign currency transactions | 89,129 | (4,061,963) | 24,116,879 | 8,052,460 |
| Net unrealized appreciation (depreciation) on investments, | | | | |
| futures contracts and translation of assets and liabilities | | | | |
| in foreign currencies | 318,198 | (3,296,997) | 2,817,573 | 25,136,935 |
| Net assets | $5,642,858 | $558,598,505 | $476,661,834 | $132,169,267 |
| Investments in unaffiliated issuers, including repurchase agreements, at cost | $600,496 | $571,002,549 | $471,143,294 | $106,633,833 |
| Investments in affiliated issuers, at cost | $4,708,568 | — | $2,163,206 | $2,507,694 |
| Foreign currency, at cost | — | $490,261 | — | $41,845 |
| |
| Net asset value per share | | | | |
|
| The Funds have an unlimited number of shares authorized with no par value. Net asset value is calculated by dividing the net assets of each class of shares by the number of |
| outstanding shares in the class. | | | | |
| Class A | | | | |
| Net assets | $1,415,495 | — | — | — |
| Shares outstanding | 128,382 | — | — | — |
| Net asset value and redemption price per share | $11.03 | — | — | — |
| Class B2 | | | | |
| Net assets | $1,403,848 | — | — | — |
| Shares outstanding | 128,167 | — | — | — |
| Net asset value, offering price and redemption price per share | $10.95 | — | — | — |
| Class C2 | | | | |
| Net assets | $1,403,853 | — | — | — |
| Shares outstanding | 128,167 | — | — | — |
| Net asset value, offering price and redemption price per share | $10.95 | — | — | — |
| Class 1 | | | | |
| Net assets | $1,419,662 | $36,008,890 | — | $33,044,165 |
| Shares outstanding | 128,457 | 3,774,474 | — | 1,713,780 |
| Net asset value, offering price and redemption price per share | $11.05 | $9.54 | — | $19.28 |
| Class NAV | | | | |
| Net assets | — | $522,589,615 | $476,661,834 | $99,125,102 |
| Shares outstanding | — | 54,810,697 | 43,090,952 | 5,133,002 |
| Net asset value, offering price and redemption price per share | — | $9.53 | $11.06 | $19.31 |
| Maximum public offering price per share: | | | | |
| Class A3 (net asset value per share ÷ 95%) | $11.61 | — | — | — |
1 See Note 10.
2 Redemption price is equal to net asset value less any applicable contingent sales charges (Note 3).
3 On single retail sales of less than $50,000. On sales of $50,000 or more and on group sales the offering price is reduced.
| |
| The accompanying notes are an integral part of the financial statements. | 69 |
John Hancock Funds II
Statements of Assets and Liabilities — August 31, 2007
| | | | |
| Assets | All Cap Value | Blue Chip Growth | Capital Appreciation | Core Bond |
|
| Investments in unaffiliated issuers, at value | $93,017,902 | $1,646,061,327 | $628,300,645 | $293,675,558 |
| Investments in affiliated issuers, at value (Note 2) | 1,590,523 | 43,687,002 | 14,681,132 | — |
| Securities loaned, at value (Note 2) | 1,559,336 | 42,830,394 | 14,393,267 | — |
| Repurchase agreements, at value (Note 2) | 1,485,000 | 2,078,000 | 14,071,000 | 2,519,000 |
| Total investments, at value | 97,652,761 | 1,734,656,723 | 671,446,044 | 296,194,558 |
| Cash | 440 | 289 | 368 | 5,823 |
| Receivable for investments sold | 373,453 | 4,938,290 | — | 1,441,263 |
| Receivable for delayed delivery securities sold | — | — | — | 80,754,898 |
| Receivable for fund shares sold | 30,864 | — | — | 38,292 |
| Dividend, interest and other receivable (net of tax) | 142,292 | 1,364,481 | 478,081 | 1,913,584 |
| Total assets | 98,199,810 | 1,740,959,783 | 671,924,493 | 380,348,418 |
| |
| Liabilities | | | | |
|
| Payable for investments purchased | 460,356 | 9,690,344 | 4,266,033 | 2,075,650 |
| Payable for delayed delivery securities purchased | — | — | — | 109,232,247 |
| Payable for fund shares repurchased | 35,781 | 951,884 | 944,686 | 387 |
| Payable upon return of securities loaned (Note 2) | 1,590,523 | 43,687,002 | 14,681,132 | — |
| Payable to affiliates | | | | |
| Fund administration fees | 1,948 | 7,560 | 2,573 | 1,465 |
| Trustees’ fees | 121 | 866 | 321 | 135 |
| Other payables and accrued expenses | 44,421 | 108,142 | 46,199 | 85,368 |
| Total liabilities | 2,133,150 | 54,445,798 | 19,940,944 | 111,395,252 |
| |
| Net assets | | | | |
|
| Capital paid-in | $52,335,797 | $1,372,257,898 | $590,750,538 | $268,474,367 |
| Undistributed net investment income (loss) | 1,061,250 | 4,492,316 | 1,737,321 | 2,278,759 |
| Accumulated undistributed net realized gain (loss) | | | | |
| on investments, futures contracts and foreign currency transactions | 29,627,728 | 5,435,744 | (27,512,987) | (2,275,688) |
| Net unrealized appreciation (depreciation) on investments and translation | | | | |
| of assets and liabilities in foreign currencies | 13,041,885 | 304,328,027 | 87,008,677 | 475,728 |
| Net assets | $96,066,660 | $1,686,513,985 | $651,983,549 | $268,953,166 |
| Investments in unaffiliated issuers, including repurchase agreements, at cost | $83,020,353 | $1,386,643,104 | $569,756,236 | $295,718,830 |
| Investments in affiliated issuers, at cost | $1,590,523 | $43,687,002 | $14,681,132 | — |
| |
| Net asset value per share | | | | |
|
| The Funds have an unlimited number of shares authorized with no par value. Net asset value is calculated by dividing the net assets of each class of shares by the number of |
| outstanding shares in the class. | | | | |
| Class 1 | | | | |
| Net assets | $26,146,413 | $203,525,150 | $66,183,628 | $1,565,697 |
| Shares outstanding | 1,514,799 | 9,701,548 | 6,133,715 | 125,159 |
| Net asset value, offering price and redemption price per share | $17.26 | $20.98 | $10.79 | $12.51 |
| Class NAV | | | | |
| Net assets | $69,920,247 | $1,482,988,835 | $585,799,921 | $267,387,469 |
| Shares outstanding | 4,061,922 | 70,722,348 | 54,234,285 | 21,390,570 |
| Net asset value, offering price and redemption price per share | $17.21 | $20.97 | $10.80 | $12.50 |
| |
| The accompanying notes are an integral part of the financial statements. | 70 |
John Hancock Funds II
Statements of Assets and Liabilities — August 31, 2007
| | | | |
| | | | Emerging | Emerging |
| Assets | Core Equity | Emerging Growth | Markets Value | Small Company |
|
| Investments in unaffiliated issuers, at value | $809,944,182 | $140,843,889 | $480,487,278 | $38,079,209 |
| Investments in affiliated issuers, at value (Note 2) | — | 59,656,118 | — | 14,816,824 |
| Securities loaned, at value (Note 2) | — | 58,486,390 | — | 14,526,298 |
| Repurchase agreements, at value (Note 2) | 16,042,000 | 61,000 | 670,000 | 2,829,000 |
| Total investments, at value | 825,986,182 | 259,047,397 | 481,157,278 | 70,251,331 |
| Cash | 265 | 648 | 135 | 409 |
| Foreign currency, at value | — | — | 1,199,293 | — |
| Receivable for investments sold | 636,141 | 182,365 | 96,409 | 269,875 |
| Receivable for fund shares sold | 151,971 | 58,717 | — | 31,238 |
| Dividend, interest and other receivable (net of tax) | 414,779 | 7,554 | 1,086,348 | 3,656 |
| Total assets | 827,189,338 | 259,296,681 | 483,539,463 | 70,556,509 |
| |
| Liabilities | | | | |
|
| India capital gains withholding tax | — | — | 96,306 | — |
| Payable for investments purchased | 785,088 | — | 811,869 | 227,979 |
| Payable for fund shares repurchased | 22,925 | 759,783 | 236 | 106,902 |
| Payable upon return of securities loaned (Note 2) | — | 59,656,118 | — | 14,816,824 |
| Payable to affiliates | | | | |
| Fund administration fees | 3,540 | 1,696 | 1,235 | 285 |
| Trustees’ fees | 416 | 202 | — | 30 |
| Investment management fees | — | — | — | 14,364 |
| Other payables and accrued expenses | 58,621 | 76,387 | 154,890 | 32,023 |
| Total liabilities | 870,590 | 60,494,186 | 1,064,536 | 15,198,407 |
| |
| Net assets | | | | |
|
| Capital paid-in | $752,114,253 | $181,602,073 | $457,014,708 | $50,032,299 |
| Undistributed net investment income (loss) | 253,596 | 407,503 | 2,194,721 | — |
| Accumulated undistributed net realized gain (loss) | | | | |
| on investments and foreign currency transactions | 6,698,114 | 11,804,311 | 735,219 | (399,781) |
| Net unrealized appreciation (depreciation) on investments and translation | | | | |
| of assets and liabilities in foreign currencies | 67,252,785 | 4,988,608 | 22,530,2791 | 5,725,584 |
| Net assets | $826,318,748 | $198,802,495 | $482,474,927 | $55,358,102 |
| Investments in unaffiliated issuers, including repurchase agreements, at cost | $758,733,397 | $194,402,671 | $458,534,367 | $49,708,923 |
| Investments in affiliated issuers, at cost | — | $59,656,118 | — | $14,816,824 |
| Foreign currency, at cost | — | — | $1,197,161 | — |
| |
| Net asset value per share | | | | |
|
| The Funds have an unlimited number of shares authorized with no par value. Net asset value is calculated by dividing the net assets of each class of shares by the number of |
| outstanding shares in the class. | | | | |
| Class 1 | | | | |
| Net assets | $13,921,114 | $128,018,794 | — | $48,219,617 |
| Shares outstanding | 877,329 | 7,041,358 | — | 1,548,614 |
| Net asset value, offering price and redemption price per share | $15.87 | $18.18 | — | $31.14 |
| Class NAV | | | | |
| Net assets | $812,397,634 | $70,783,701 | $482,474,927 | $7,138,485 |
| Shares outstanding | 51,116,358 | 3,891,699 | 43,773,906 | 229,141 |
| Net asset value, offering price and redemption price per share | $15.89 | $18.19 | $11.02 | $31.15 |
1 Net of deferred India foreign withholding taxes of $96,306.
| |
| The accompanying notes are an integral part of the financial statements. | 71 |
John Hancock Funds II
Statements of Assets and Liabilities — August 31, 2007
| | | | |
| Assets | Equity-Income | Fundamental Value | Global Bond | Global Real Estate |
|
| Investments in unaffiliated issuers, at value | $887,332,670 | $1,005,072,112 | $1,270,143,975 | $429,738,177 |
| Investments in affiliated issuers, at value (Note 2) | 33,726,420 | 22,322,838 | — | 28,489,756 |
| Securities loaned, at value (Note 2) | 33,065,118 | 21,885,135 | — | 27,242,764 |
| Repurchase agreements, at value (Note 2) | 790,000 | — | 62,429,000 | 5,595,000 |
| Total investments, at value | 954,914,208 | 1,049,280,085 | 1,332,572,975 | 491,065,697 |
| Cash | — | 229 | — | 330 |
| Foreign currency, at value | — | 96,905 | — | 5,877,964 |
| Receivable for investments sold | 2,568,624 | 1,434,333 | 156,785,874 | 948,248 |
| Receivable for delayed delivery securities sold | — | — | 154,752,437 | — |
| Receivable for forward foreign currency exchange contracts (Note 2) | — | — | 9,110,260 | 113,724 |
| Receivable for fund shares sold | 98,829 | 166,702 | — | — |
| Dividend, interest and other receivable (net of tax) | 2,802,284 | 3,060,813 | 8,946,844 | 837,304 |
| Unrealized appreciation of swap contracts (Note 2) | — | — | 25,377,924 | — |
| Receivable due from adviser | 95 | — | — | — |
| Total assets | 960,384,040 | 1,054,039,067 | 1,687,546,314 | 498,843,267 |
| |
| Liabilities | | | | |
|
| Due to custodian | — | — | 9,719,904 | — |
| Payable for investments purchased | 2,437,575 | 351,900 | 334,172,898 | 3,054,228 |
| Payable for delayed delivery securities purchased | — | — | 399,355,852 | — |
| Payable for forward foreign currency exchange contracts (Note 2) | — | — | 1,799,164 | 908,850 |
| Swap premium payable | — | — | 8,200,182 | — |
| Payable for fund shares repurchased | 610,450 | 577,768 | 6,661,041 | 762,339 |
| Payable upon return of securities loaned (Note 2) | 33,726,420 | 22,322,838 | — | 28,489,756 |
| Payable for options written, at value (Note 2) | — | — | 8,086,262 | — |
| Investments sold short, at value (Note 2) | — | — | 109,785,114 | — |
| Payable for interest on securities sold short | — | — | 128,407 | — |
| Interest expense and fees payable on inverse floaters | — | — | 1,987 | — |
| Payable for floating rate notes issued | — | — | 270,000 | — |
| Unrealized depreciation of swap contracts (Note 2) | — | — | 12,503,701 | — |
| Payable for futures variation margin | — | — | 177,824 | — |
| Payable to affiliates | | | | |
| Fund administration fees | 4,371 | 4,551 | 3,476 | 2,398 |
| Trustees’ fees | 489 | 530 | 399 | 134 |
| Other payables and accrued expenses | 68,085 | 79,703 | 202,845 | 144,168 |
| Total liabilities | 36,847,390 | 23,337,290 | 891,069,056 | 33,361,873 |
| |
| Net assets | | | | |
|
| Capital paid-in | $768,978,237 | $887,284,060 | $776,921,687 | $419,836,667 |
| Undistributed net investment income (loss) | 10,884,168 | 8,830,212 | (14,886,701) | (716,991) |
| Accumulated undistributed net realized gain (loss) | | | | |
| on investments, futures contracts, options written, | | | | |
| foreign currency transactions and swap agreements | 36,454,271 | 6,224,399 | 16,373,646 | 15,257,270 |
| Net unrealized appreciation (depreciation) on investments, futures contracts, | | | | |
| options written, short sales, swap agreements and translation | | | | |
| of assets and liabilities in foreign currencies | 107,219,974 | 128,363,106 | 18,068,626 | 31,104,448 |
| Net assets | $923,536,650 | $1,030,701,777 | $796,477,258 | $465,481,394 |
| Investments in unaffiliated issuers, including repurchase agreements, at cost | $813,968,580 | $898,594,197 | $1,322,499,014 | $430,675,588 |
| Investments in affiliated issuers, at cost | $33,726,420 | $22,322,838 | — | $28,489,756 |
| Foreign currency, at cost | — | $96,910 | — | $5,884,591 |
| Proceeds received on short sales | — | — | $108,481,399 | — |
| Premiums received on written options | — | — | $7,188,077 | — |
| |
| Net asset value per share | | | | |
|
| The Funds have an unlimited number of shares authorized with no par value. Net asset value is calculated by dividing the net assets of each class of shares by the number of |
| outstanding shares in the class. | | | | |
| Class 1 | | | | |
| Net assets | $212,159,299 | $84,940,419 | $42,171,700 | — |
| Shares outstanding | 10,867,802 | 4,830,996 | 2,846,590 | — |
| Net asset value, offering price and redemption price per share | $19.52 | $17.58 | $14.81 | — |
| Class NAV | | | | |
| Net assets | $711,377,351 | $945,761,358 | $754,305,558 | $465,481,394 |
| Shares outstanding | 36,463,637 | 53,863,848 | 51,037,745 | 40,926,240 |
| Net asset value, offering price and redemption price per share | $19.51 | $17.56 | $14.78 | $11.37 |
| |
| The accompanying notes are an integral part of the financial statements. | 72 |
John Hancock Funds II
Statements of Assets and Liabilities — August 31, 2007
| | | | |
| | | | | International |
| Assets | High Income | High Yield | Index 500 | Equity Index |
|
| Investments in unaffiliated issuers, at value | $376,429,581 | $1,446,630,933 | $82,810,520 | $368,733,412 |
| Investments in affiliated issuers, at value (Note 2) | 1,428,149 | 46,553,447 | — | 50,429,968 |
| Securities loaned, at value (Note 2) | 1,400,147 | 45,640,634 | — | 48,125,680 |
| Repurchase agreements, at value (Note 2) | 67,000 | 63,600,000 | — | — |
| Total investments, at value | 379,324,877 | 1,602,425,014 | 82,810,520 | 467,289,060 |
| Cash | 525 | 334,131 | 1,704 | — |
| Foreign currency, at value | 2,819 | 2,564,537 | — | 1,595,277 |
| Receivable for investments sold | 550,100 | 10,334,014 | — | 564,463 |
| Receivable for forward foreign currency exchange contracts (Note 2) | — | — | — | 117,919 |
| Receivable for fund shares sold | 47,496 | 930,403 | 403,736 | 78,470 |
| Dividend, interest and other receivable (net of tax) | 6,497,069 | 31,096,555 | 125,787 | 1,200,810 |
| Receivable for futures variation margin | — | — | 166,100 | 759,680 |
| Receivable due from adviser | — | — | 200 | 4,778 |
| Total assets | 386,422,886 | 1,647,684,654 | 83,508,047 | 471,610,457 |
| |
| Liabilities | | | | |
|
| Payable for investments purchased | 1,823,629 | 6,600,136 | — | 731 |
| Payable for forward foreign currency exchange contracts (Note 2) | 41,701 | — | — | 12,267 |
| Payable for fund shares repurchased | — | 158,047 | — | — |
| Payable upon return of securities loaned (Note 2) | 1,428,149 | 46,553,447 | — | 50,429,968 |
| Payable to affiliates | | | | |
| Fund administration fees | 1,968 | 7,175 | 24 | 1,573 |
| Trustees’ fees | 110 | 810 | 14 | 215 |
| Investment management fees | — | — | — | — |
| Other payables and accrued expenses | 52,969 | 141,783 | 29,352 | 33,075 |
| Total liabilities | 3,348,526 | 53,461,398 | 29,390 | 50,477,829 |
| |
| Net assets | | | | |
|
| Capital paid-in | $366,170,003 | $1,617,859,218 | $81,296,406 | $321,961,392 |
| Undistributed net investment income (loss) | 4,932,631 | 21,976,882 | 607,937 | 5,397,216 |
| Accumulated undistributed net realized gain (loss) | | | | |
| on investments, futures contracts, options written and | | | | |
| foreign currency transactions | 13,408,083 | 13,293,615 | (385,772) | 8,980,573 |
| Net unrealized appreciation (depreciation) on investments, futures contracts, | | | | |
| options written and translation of assets and | | | | |
| liabilities in foreign currencies | (1,436,357) | (58,906,459) | 1,960,086 | 84,793,447 |
| Net assets | $383,074,360 | $1,594,223,256 | $83,478,657 | $421,132,628 |
| Investments in unaffiliated issuers, including repurchase agreements, at cost | $379,285,366 | $1,614,819,859 | $80,928,075 | $331,944,852 |
| Investments in affiliated issuers, at cost | $1,428,149 | $46,553,447 | — | $50,429,968 |
| Foreign currency, at cost | $2,813 | $2,527,054 | — | $1,608,675 |
| |
| Net asset value per share | | | | |
|
| The Funds have an unlimited number of shares authorized with no par value. Net asset value is calculated by dividing the net assets of each class of shares by the number of |
| outstanding shares in the class. | | | | |
| Class 1 | | | | |
| Net assets | — | $47,531,526 | — | — |
| Shares outstanding | — | 4,792,575 | — | — |
| Net asset value, offering price and redemption price per share | — | $9.92 | — | — |
| Class NAV | | | | |
| Net assets | $383,074,360 | $1,546,691,730 | $83,478,657 | $421,132,628 |
| Shares outstanding | 36,112,684 | 156,677,422 | 7,731,313 | 18,710,062 |
| Net asset value, offering price and redemption price per share | $10.61 | $9.87 | $10.80 | $22.51 |
| |
| The accompanying notes are an integral part of the financial statements. | 73 |
John Hancock Funds II
Statements of Assets and Liabilities — August 31, 2007
| | | | |
| | International | International | International | International |
| Assets | Opportunities | Small Cap | Small Company | Value |
|
| Investments in unaffiliated issuers, at value | $614,047,386 | $389,013,643 | $205,331,085 | $1,083,091,845 |
| Investments in affiliated issuers, at value (Note 2) | 161,395,398 | 59,817,848 | 46,052,319 | 163,204,173 |
| Securities loaned, at value (Note 2) | 155,154,525 | 56,969,379 | 43,861,760 | 155,493,448 |
| Repurchase agreements, at value (Note 2) | 6,825,000 | 41,000 | — | 876,000 |
| Total investments, at value | 937,422,309 | 505,841,870 | 295,245,164 | 1,402,665,466 |
| Cash | — | 582 | — | 463 |
| Foreign currency, at value | 1,113,581 | 8,681,940 | 2,844,677 | 3,367,018 |
| Receivable for investments sold | 16,444,555 | 84,037 | 78,006 | — |
| Receivable for fund shares sold | — | 820,642 | 16,898 | — |
| Dividend, interest and other receivable (net of tax) | 939,005 | 1,680,710 | 471,900 | 5,556,181 |
| Receivable due from adviser | 1,687 | — | — | 2,307 |
| Total assets | 955,921,137 | 517,109,781 | 298,656,645 | 1,411,591,435 |
| |
| Liabilities | | | | |
|
| Due to custodian | 121,006 | — | 21,046 | — |
| India capital gains withholding tax | — | — | 24,563 | — |
| Payable for investments purchased | 6,423,469 | 689,755 | 1,985,871 | 3,461,821 |
| Payable for fund shares repurchased | 1,077,991 | — | — | 1,188,965 |
| Payable upon return of securities loaned (Note 2) | 161,395,398 | 59,817,848 | 46,052,319 | 163,204,173 |
| Payable to affiliates | | | | |
| Fund administration fees | 2,989 | 3,087 | 1,895 | 6,271 |
| Trustees’ fees | 406 | 271 | 85 | 667 |
| Other payables and accrued expenses | 207,211 | 251,832 | 81,101 | 371,062 |
| Total liabilities | 169,228,470 | 60,762,793 | 48,166,880 | 168,232,959 |
| |
| Net assets | | | | |
|
| Capital paid-in | $593,454,314 | $287,831,857 | $206,792,821 | $951,525,542 |
| Undistributed net investment income (loss) | 7,599,987 | 4,486,507 | 1,986,284 | 25,985,674 |
| Accumulated undistributed net realized gain (loss) | | | | |
| on investments, futures contracts, foreign currency transactions | | | | |
| and swap agreements | 70,995,655 | 66,912,432 | 18,110,486 | 74,949,742 |
| Net unrealized appreciation (depreciation) on investments, | | | | |
| futures contracts and translation of assets and liabilities | | | | |
| in foreign currencies | 114,642,711 | 97,116,192 | 23,600,1741 | 190,897,518 |
| Net assets | $786,692,667 | $456,346,988 | $250,489,765 | $1,243,358,476 |
| Investments in unaffiliated issuers, including repurchase agreements, at cost | $661,379,046 | $348,899,443 | $225,568,054 | $1,048,578,792 |
| Investments in affiliated issuers, at cost | $161,395,398 | $59,817,848 | $46,052,319 | $163,204,173 |
| Foreign currency, at cost | $1,113,428 | $8,688,279 | $2,845,100 | $3,359,138 |
| |
| Net asset value per share | | | | |
|
| The Funds have an unlimited number of shares authorized with no par value. Net asset value is calculated by dividing the net assets of each class of shares by the number of |
| outstanding shares in the class. | | | | |
| Class 1 | | | | |
| Net assets | $22,874,766 | $80,773,411 | — | $161,939,887 |
| Shares outstanding | 1,183,766 | 3,293,431 | — | 8,206,587 |
| Net asset value, offering price and redemption price per share | $19.32 | $24.53 | — | $19.73 |
| Class NAV | | | | |
| Net assets | $763,817,901 | $375,573,577 | $250,489,765 | $1,081,418,589 |
| Shares outstanding | 39,443,887 | 15,311,163 | 21,722,993 | 54,898,154 |
| Net asset value, offering price and redemption price per share | $19.36 | $24.53 | $11.53 | $19.70 |
1 Net of deferred India foreign withholding taxes of $24,563.
| |
| The accompanying notes are an integral part of the financial statements. | 74 |
John Hancock Funds II
Statements of Assets and Liabilities — August 31, 2007
| | | | |
| | Investment | | | |
| Assets | Quality Bond | Large Cap | Large Cap Value | Mid Cap Index |
|
| Investments in unaffiliated issuers, at value | $157,455,925 | $362,953,737 | $536,379,927 | $427,721,841 |
| Investments in affiliated issuers, at value (Note 2) | — | 9,577,765 | 4,276,821 | — |
| Securities loaned, at value (Note 2) | — | 9,389,966 | 4,192,962 | — |
| Repurchase agreements, at value (Note 2) | 14,700,000 | 5,158,000 | 937,000 | — |
| Total investments, at value | 172,155,925 | 387,079,468 | 545,786,710 | 427,721,841 |
| Cash | 71,617 | 860 | 108 | 5,110 |
| Foreign currency, at value | 158,207 | — | — | — |
| Receivable for investments sold | 4,989 | — | — | — |
| Receivable for forward foreign currency exchange contracts (Note 2) | 48,741 | — | — | — |
| Receivable for fund shares sold | 11,326 | 31,681 | 70,632 | 101,960 |
| Dividend, interest and other receivable (net of tax) | 1,546,512 | 666,405 | 927,535 | 375,037 |
| Receivable for futures variation margin | — | — | — | 428,743 |
| Total assets | 173,997,317 | 387,778,414 | 546,784,985 | 428,632,691 |
| |
| Liabilities | | | | |
|
| Payable for investments purchased | 7,782,075 | 24,069 | — | 564,012 |
| Payable for forward foreign currency exchange contracts (Note 2) | 11,959 | — | — | — |
| Payable for fund shares repurchased | 183,541 | 669 | 363,527 | — |
| Payable upon return of securities loaned (Note 2) | — | 9,577,765 | 4,276,821 | — |
| Payable for futures variation margin | 19,656 | — | — | — |
| Payable to affiliates | | | | |
| Fund administration fees | 814 | 575 | 2,238 | 2,430 |
| Trustees’ fees | 84 | 147 | 49 | — |
| Investment management fees | — | — | — | 2,160 |
| Other payables and accrued expenses | 70,853 | 36,255 | 44,484 | 35,964 |
| Total liabilities | 8,068,982 | 9,639,480 | 4,687,119 | 604,566 |
| |
| Net assets | | | | |
|
| Capital paid-in | $166,268,122 | $349,245,565 | $474,438,217 | $376,606,853 |
| Undistributed net investment income (loss) | 1,677,053 | 2,269,390 | 3,303,162 | 3,994,268 |
| Accumulated undistributed net realized gain (loss) | | | | |
| on investments, futures contracts and foreign currency transactions | (526,374) | 6,421,013 | 14,366,275 | 28,938,622 |
| Net unrealized appreciation (depreciation) on investments, | | | | |
| futures contracts and translation of assets and | | | | |
| liabilities in foreign currencies | (1,490,466) | 20,202,966 | 49,990,212 | 18,488,382 |
| Net assets | $165,928,335 | $378,138,934 | $542,097,866 | $428,028,125 |
| Investments in unaffiliated issuers, including repurchase agreements, at cost | $173,678,598 | $357,298,737 | $491,519,677 | $408,218,175 |
| Investments in affiliated issuers, at cost | — | $9,577,765 | $4,276,821 | — |
| Foreign currency, at cost | $158,401 | — | — | — |
| |
| Net asset value per share | | | | |
|
| The Funds have an unlimited number of shares authorized with no par value. Net asset value is calculated by dividing the net assets of each class of shares by the number of |
| outstanding shares in the class. | | | | |
| Class 1 | | | | |
| Net assets | $43,091,530 | $30,618,632 | $130,475,955 | — |
| Shares outstanding | 3,682,907 | 1,898,892 | 5,037,655 | — |
| Net asset value, offering price and redemption price per share | $11.70 | $16.12 | $25.90 | — |
| Class NAV | | | | |
| Net assets | $122,836,805 | $347,520,302 | $411,621,911 | $428,028,125 |
| Shares outstanding | 10,508,535 | 21,545,269 | 15,861,283 | 20,204,951 |
| Net asset value, offering price and redemption price per share | $11.69 | $16.13 | $25.95 | $21.18 |
| |
| The accompanying notes are an integral part of the financial statements. | 75 |
John Hancock Funds II
Statements of Assets and Liabilities — August 31, 2007
| | | | |
| | Mid Cap | | | Mid Cap |
| Assets | Intersection | Mid Cap Stock | Mid Cap Value | Value Equity |
|
| Investments in unaffiliated issuers, at value | $328,819,716 | $448,666,546 | $263,601,750 | $122,225,956 |
| Investments in affiliated issuers, at value (Note 2) | — | 46,785,928 | 6,808,269 | 5,849,359 |
| Securities loaned, at value (Note 2) | — | 45,868,557 | 6,674,774 | 5,734,666 |
| Repurchase agreements, at value (Note 2) | 3,543,000 | 9,100,000 | 8,272,000 | — |
| Total investments, at value | 332,362,716 | 550,421,031 | 285,356,793 | 133,809,981 |
| Cash | 884 | 45,187 | 203 | 68,951 |
| Foreign currency, at value | — | 149 | — | 2,065 |
| Receivable for investments sold | 1,484,892 | 602,640 | — | 1,573,625 |
| Receivable for fund shares sold | 36,225 | 14,069 | 27,203 | 10,793 |
| Dividend, interest and other receivable (net of tax) | 274,008 | 130,273 | 248,980 | 161,590 |
| Total assets | 334,158,725 | 551,213,349 | 285,633,179 | 135,627,005 |
| |
| Liabilities | | | | |
|
| Payable for investments purchased | 21,700 | 1,389,905 | 1,653,142 | 734,860 |
| Payable for fund shares repurchased | — | 494,468 | 367,212 | — |
| Payable upon return of securities loaned (Note 2) | — | 46,785,928 | 6,808,269 | 5,849,359 |
| Payable to affiliates | | | | |
| Fund administration fees | 1,910 | 1,423 | 783 | 648 |
| Trustees’ fees | — | 218 | 111 | — |
| Other payables and accrued expenses | 43,570 | 50,284 | 38,328 | 31,783 |
| Total liabilities | 67,180 | 48,722,226 | 8,867,845 | 6,616,650 |
| |
| Net assets | | | | |
|
| Capital paid-in | $349,727,102 | $402,951,763 | $249,488,661 | $112,910,478 |
| Undistributed net investment income (loss) | 206,283 | (14,538) | 1,379,904 | 1,004,076 |
| Accumulated undistributed net realized gain (loss) | | | | |
| on investments, futures contracts and foreign currency transactions | (5,202,586) | 34,613,325 | 7,908,395 | 1,121,808 |
| Net unrealized appreciation (depreciation) on investments, | | | | |
| futures contracts and translation of assets and | | | | |
| liabilities in foreign currencies | (10,639,254) | 64,940,573 | 17,988,374 | 13,973,993 |
| Net assets | $334,091,545 | $502,491,123 | $276,765,334 | $129,010,355 |
| Investments in unaffiliated issuers, including repurchase agreements, at cost | $343,001,970 | $438,694,676 | $260,560,150 | $113,986,601 |
| Investments in affiliated issuers, at cost | — | $46,785,928 | $6,808,269 | $5,849,359 |
| Foreign currency, at cost | — | $147 | — | $2,046 |
| |
| Net asset value per share | | | | |
|
| The Funds have an unlimited number of shares authorized with no par value. Net asset value is calculated by dividing the net assets of each class of shares by the number of |
| outstanding shares in the class. | | | | |
| Class 1 | | | | |
| Net assets | — | $136,092,040 | $113,481,690 | — |
| Shares outstanding | — | 7,163,446 | 5,391,002 | — |
| Net asset value, offering price and redemption price per share | — | $19.00 | $21.05 | — |
| Class NAV | | | | |
| Net assets | $334,091,545 | $366,399,083 | $163,283,644 | $129,010,355 |
| Shares outstanding | 34,848,919 | 19,255,929 | 7,758,370 | 11,296,099 |
| Net asset value, offering price and redemption price per share | $9.59 | $19.03 | $21.05 | $11.42 |
| |
| The accompanying notes are an integral part of the financial statements. | 76 |
John Hancock Funds II
Statements of Assets and Liabilities — August 31, 2007
| | | | |
| | | Quantitative | Quantitative | Quantitative |
| Assets | Natural Resources | All Cap | Mid Cap | Value |
|
| Investments in unaffiliated issuers, at value | $718,743,951 | $5,642,265 | $115,539,552 | $758,480,412 |
| Investments in affiliated issuers, at value (Note 2) | 93,981,765 | 278,125 | 8,535,564 | 31,314,246 |
| Securities loaned, at value (Note 2) | 91,709,163 | 272,672 | 8,368,200 | 30,700,241 |
| Repurchase agreements, at value (Note 2) | 46,000,000 | — | — | — |
| Total investments, at value | 950,434,879 | 6,193,062 | 132,443,316 | 820,494,899 |
| Cash | 34,032 | 23,695 | 3,402 | 1,296 |
| Foreign currency, at value | 714,688 | — | — | — |
| Receivable for investments sold | — | 32,868 | 365,034 | 13,057,242 |
| Receivable for fund shares sold | 54,331 | — | — | 79,906 |
| Dividend, interest and other receivable (net of tax) | 1,639,094 | 9,561 | 128,712 | 1,326,879 |
| Receivable due from adviser | — | 17,342 | — | — |
| Other assets | — | 65 | — | — |
| Total assets | 952,877,024 | 6,276,593 | 132,940,464 | 834,960,222 |
| |
| Liabilities | | | | |
|
| Payable for investments purchased | 16,122,684 | — | — | 18,110,677 |
| Payable for fund shares repurchased | 19,676 | — | 429,719 | — |
| Payable upon return of securities loaned (Note 2) | 93,981,765 | 278,125 | 8,535,564 | 31,314,246 |
| Payable to affiliates | | | | |
| Fund administration fees | 5,270 | 1,089 | 2,513 | 2,639 |
| Trustees’ fees | 515 | — | 110 | 363 |
| Other payables and accrued expenses | 179,836 | 27,125 | 33,123 | 54,717 |
| Total liabilities | 110,309,746 | 306,339 | 9,001,029 | 49,482,642 |
| |
| Net assets | | | | |
|
| Capital paid-in | $508,308,208 | $5,018,856 | $94,687,994 | $706,556,519 |
| Undistributed net investment income (loss) | 3,503,500 | 22,886 | 590,099 | 9,223,883 |
| Accumulated undistributed net realized gain (loss) | | | | |
| on investments, futures contracts and foreign currency transactions | 162,755,439 | 582,471 | 21,505,245 | 55,604,935 |
| Net unrealized appreciation (depreciation) on investments and | | | | |
| translation of assets and liabilities in foreign currencies | 168,000,131 | 346,041 | 7,156,097 | 14,092,243 |
| Net assets | $842,567,278 | $5,970,254 | $123,939,435 | $785,477,580 |
| Investments in unaffiliated issuers, including repurchase agreements, at cost | $688,450,667 | $5,568,896 | $116,751,655 | $775,088,410 |
| Investments in affiliated issuers, at cost | $93,981,765 | $278,125 | $8,535,564 | $31,314,246 |
| Foreign currency, at cost | $707,402 | — | — | — |
| |
| Net asset value per share | | | | |
|
| The Funds have an unlimited number of shares authorized with no par value. Net asset value is calculated by dividing the net assets of each class of shares by the number of |
| outstanding shares in the class. | | | | |
| Class A | | | | |
| Net assets | — | $1,497,033 | — | — |
| Shares outstanding | — | 125,685 | — | — |
| Net asset value and redemption price per share | — | $11.91 | — | — |
| Class B1 | | | | |
| Net assets | — | $1,485,637 | — | — |
| Shares outstanding | — | 125,280 | — | — |
| Net asset value, offering price and redemption price per share | — | $11.86 | — | — |
| Class C1 | | | | |
| Net assets | — | $1,485,636 | — | — |
| Shares outstanding | — | 125,280 | — | — |
| Net asset value, offering price and redemption price per share | — | $11.86 | — | — |
| Class I | | | | |
| Net assets | — | $1,501,948 | — | — |
| Shares outstanding | — | 125,859 | — | — |
| Net asset value, offering price and redemption price per share | — | $11.93 | — | — |
| Class 1 | | | | |
| Net assets | $111,214,514 | — | $123,939,435 | $105,655,145 |
| Shares outstanding | 2,615,493 | — | 7,783,879 | 6,018,842 |
| Net asset value, offering price and redemption price per share | $42.52 | — | $15.92 | $17.55 |
| Class NAV | | | | |
| Net assets | $731,352,764 | — | — | $679,822,435 |
| Shares outstanding | 17,250,967 | — | — | 38,698,062 |
| Net asset value, offering price and redemption price per share | $42.39 | — | — | $17.57 |
| Maximum public offering price per share: | | | | |
| Class A2 (net asset value per share ÷ 95%) | — | $12.54 | — | — |
1 Redemption price is equal to net asset value less any applicable contingent sales charges (Note 3).
2 On single retail sales of less than $50,000. On sales of $50,000 or more and on group sales the offering price is reduced.
| |
| The accompanying notes are an integral part of the financial statements. | 77 |
John Hancock Funds II
Statements of Assets and Liabilities — August 31, 2007
| | | | |
| | Real Estate | Real Estate | | |
| Assets | Equity | Securities | Real Return Bond | Small Cap |
|
| Investments in unaffiliated issuers, at value | $237,294,310 | $142,536,729 | $1,494,175,878 | $128,304,042 |
| Investments in affiliated issuers, at value (Note 2) | 11,928,320 | 3,024,402 | — | 36,715,806 |
| Securities loaned, at value (Note 2) | 11,694,431 | 2,965,100 | — | 35,995,888 |
| Repurchase agreements, at value (Note 2) | 4,987,000 | — | 4,263,000 | 1,860,000 |
| Total investments, at value | 265,904,061 | 148,526,231 | 1,498,438,878 | 202,875,736 |
| Cash | 72 | — | 581 | 976 |
| Foreign currency, at value | — | — | 5,033,142 | — |
| Receivable for investments sold | 906,305 | 992,171 | — | 8,965,268 |
| Receivable for delayed delivery securities sold | — | — | 29,728,187 | — |
| Receivable for forward foreign currency exchange contracts (Note 2) | — | — | 369,627 | — |
| Receivable for fund shares sold | 1,226 | 83,749 | — | 88,478 |
| Dividend, interest and other receivable (net of tax) | 235,169 | 112,749 | 5,407,515 | 20,433 |
| Unrealized appreciation of swap contracts (Note 2) | — | — | 3,711,591 | — |
| Unrealized appreciation on forward volatility options (Note 2) | — | — | 105,344 | — |
| Receivable for futures variation margin | — | — | 436,768 | — |
| Total assets | 267,046,833 | 149,714,900 | 1,543,231,633 | 211,950,891 |
| |
| Liabilities | | | | |
|
| Due to custodian | — | 145,317 | — | — |
| Payable for investments purchased | 611,379 | 716,707 | 11,440,432 | 6,245,396 |
| Payable for delayed delivery securities purchased | — | — | 543,280,436 | — |
| Payable for forward foreign currency exchange contracts (Note 2) | — | — | 1,642,479 | — |
| Swap premium payable | — | — | 323,418 | — |
| Payable for fund shares repurchased | — | 967,901 | 8,549,536 | 28,991 |
| Payable upon return of securities loaned (Note 2) | 11,928,320 | 3,024,402 | — | 36,715,806 |
| Payable for options written, at value (Note 2) | — | — | 872,494 | — |
| Investments sold short, at value (Note 2) | — | — | 3,661,312 | — |
| Payable for interest on securities sold short | — | — | 17,193 | — |
| Unrealized depreciation of swap contracts (Note 2) | — | — | 3,867,827 | — |
| Payable to affiliates | | | | |
| Fund administration fees | 2,112 | 2,421 | 3,823 | 2,164 |
| Trustees’ fees | 83 | 437 | 480 | 154 |
| Other payables and accrued expenses | 36,342 | 41,569 | 95,862 | 21,619 |
| Total liabilities | 12,578,236 | 4,898,754 | 573,755,292 | 43,014,130 |
| |
| Net assets | | | | |
|
| Capital paid-in | $227,806,773 | $107,364,376 | $982,488,158 | $128,513,654 |
| Undistributed net investment income (loss) | 407,386 | 966,761 | 14,139,935 | — |
| Accumulated undistributed net realized gain (loss) on investments, | | | | |
| futures contracts, options written, foreign currency transactions | | | | |
| and swap agreements | 24,597,447 | 17,773,154 | (22,245,116) | 16,456,216 |
| Net unrealized appreciation (depreciation) on investments, futures contracts, | | | | |
| options written, short sales, swap agreements and translation | | | | |
| of assets and liabilities in foreign currencies | 1,656,991 | 18,711,855 | (4,906,636) | 23,966,891 |
| Net assets | $254,468,597 | $144,816,146 | $969,476,341 | $168,936,761 |
| Investments in unaffiliated issuers, including repurchase agreements, at cost | $252,318,750 | $126,789,974 | $1,499,961,238 | $142,193,039 |
| Investments in affiliated issuers, at cost | $11,928,320 | $3,024,402 | — | $36,715,806 |
| Foreign currency, at cost | — | — | $5,038,683 | — |
| Proceeds received on short sales | — | — | $3,636,491 | — |
| Premiums received on written options | — | — | $838,814 | — |
| |
| Net asset value per share | | | | |
|
| The Funds have an unlimited number of shares authorized with no par value. Net asset value is calculated by dividing the net assets of each class of shares by the number of |
| outstanding shares in the class. | | | | |
| Class 1 | | | | |
| Net assets | — | $144,816,146 | $18,925,751 | $1,256,979 |
| Shares outstanding | — | 8,136,518 | 1,437,536 | 79,423 |
| Net asset value, offering price and redemption price per share | — | $17.80 | $13.17 | $15.83 |
| Class NAV | | | | |
| Net assets | $254,468,597 | — | $950,550,590 | $167,679,782 |
| Shares outstanding | 23,513,713 | — | 72,708,680 | 10,574,353 |
| Net asset value, offering price and redemption price per share | $10.82 | — | $13.07 | $15.86 |
| |
| The accompanying notes are an integral part of the financial statements. | 78 |
John Hancock Funds II
Statements of Assets and Liabilities — August 31, 2007
| | | | |
| | | Small Cap | | Small Company |
| Assets | Small Cap Index | Opportunities | Small Company | Growth |
|
| Investments in unaffiliated issuers, at value | $73,458,237 | $186,628,369 | $88,746,498 | $160,945,132 |
| Investments in affiliated issuers, at value (Note 2) | 15,900,759 | 36,425,716 | 9,381,598 | 45,078,798 |
| Securities loaned, at value (Note 2) | 15,588,980 | 35,711,486 | 9,197,645 | 44,194,900 |
| Repurchase agreements, at value (Note 2) | — | 6,629,000 | 328,000 | 3,450,000 |
| Total investments, at value | 104,947,976 | 265,394,571 | 107,653,741 | 253,668,830 |
| Cash | 818 | 697 | 41 | 470 |
| Receivable for investments sold | 124,914 | 399,148 | 117,266 | 526,866 |
| Receivable for fund shares sold | 115,360 | 699 | 15,019 | 1,138 |
| Dividend, interest and other receivable (net of tax) | 64,508 | 177,564 | 45,221 | 54,680 |
| Receivable for futures variation margin | 81,993 | — | — | — |
| Total assets | 105,335,569 | 265,972,679 | 107,831,288 | 254,251,984 |
| |
| Liabilities | | | | |
|
| Payable for investments purchased | — | 1,196,821 | 292,599 | 830,038 |
| Payable for fund shares repurchased | — | 157,893 | 55,581 | — |
| Payable upon return of securities loaned (Note 2) | 15,900,759 | 36,425,716 | 9,381,598 | 45,078,798 |
| Payable to affiliates | | | | |
| Fund administration fees | 970 | 1,839 | 740 | — |
| Trustees’ fees | 75 | 153 | 90 | 61 |
| Investment management fees | 2,407 | — | — | — |
| Other payables and accrued expenses | 29,095 | 37,268 | 51,394 | 28,990 |
| Total liabilities | 15,933,306 | 37,819,690 | 9,782,002 | 45,937,887 |
| |
| Net assets | | | | |
|
| Capital paid-in | $72,279,486 | $199,001,916 | $86,599,922 | $189,716,090 |
| Undistributed net investment income (loss) | 898,736 | 1,720,966 | — | (2) |
| Accumulated undistributed net realized gain (loss) on investments, | | | | |
| futures contracts and foreign currency transactions | 12,556,807 | 324,010 | 5,693,081 | 4,212,395 |
| Net unrealized appreciation (depreciation) on investments, | | | | |
| futures contracts and translation of assets and | | | | |
| liabilities in foreign currencies | 3,667,234 | 27,106,097 | 5,756,283 | 14,385,614 |
| Net assets | $89,402,263 | $228,152,989 | $98,049,286 | $208,314,097 |
| Investments in unaffiliated issuers, including repurchase agreements, at cost | $85,437,239 | $201,862,758 | $92,515,860 | $194,204,418 |
| Investments in affiliated issuers, at cost | $15,900,759 | $36,425,716 | $9,381,598 | $45,078,798 |
| |
| Net asset value per share | | | | |
|
| The Funds have an unlimited number of shares authorized with no par value. Net asset value is calculated by dividing the net assets of each class of shares by the number of |
| outstanding shares in the class. | | | | |
| Class 1 | | | | |
| Net assets | — | $34,516,207 | $5,270,404 | — |
| Shares outstanding | — | 1,471,814 | 313,332 | — |
| Net asset value, offering price and redemption price per share | — | $23.45 | $16.82 | — |
| Class NAV | | | | |
| Net assets | $89,402,263 | $193,636,782 | $92,778,882 | $208,314,097 |
| Shares outstanding | 5,249,111 | 8,291,245 | 5,505,866 | 15,911,742 |
| Net asset value, offering price and redemption price per share | $17.03 | $23.35 | $16.85 | $13.09 |
| |
| The accompanying notes are an integral part of the financial statements. | 79 |
John Hancock Funds II
Statements of Assets and Liabilities — August 31, 2007
| | | | |
| Small Company | | | |
| Assets | Value | Special Value | Spectrum Income | Strategic Bond |
|
| Investments in unaffiliated issuers, at value | $398,968,575 | $4,189,641 | $974,103,408 | $511,307,069 |
| Investments in affiliated issuers, at value (Note 2) | 63,685,485 | 323,920 | 3,743,553 | 8,183,172 |
| Securities loaned, at value (Note 2) | 62,436,750 | 317,569 | 3,670,150 | 8,022,718 |
| Repurchase agreements, at value (Note 2) | 1,990,000 | 169,000 | 4,141,000 | 88,500,000 |
| Total investments, at value | 527,080,810 | 5,000,130 | 985,658,111 | 616,012,959 |
| Cash | 637 | 203 | 932 | 2,166,961 |
| Foreign currency, at value | — | — | 404,092 | 166,458 |
| Cash segregated for futures contracts | — | — | 60,000 | — |
| Receivable for investments sold | — | — | 1,047,267 | 39,321 |
| Receivable for delayed delivery securities sold | — | — | 561,160 | 69,154,534 |
| Receivable for forward foreign currency exchange contracts (Note 2) | — | — | 206,199 | — |
| Receivable for fund shares sold | 87,771 | — | 357,936 | 163,113 |
| Dividend, interest and other receivable (net of tax) | 436,805 | 3,010 | 10,389,461 | 4,685,859 |
| Unrealized appreciation of swap contracts (Note 2) | — | — | 4,649 | — |
| Receivable for futures variation margin | — | — | 25,080 | 85,065 |
| Receivable due from adviser | — | 5,894 | — | — |
| Total assets | 527,606,023 | 5,009,237 | 998,714,887 | 692,474,270 |
| |
| Liabilities | | | | |
|
| Payable for investments purchased | — | — | 5,523,134 | 3,393,721 |
| Payable for delayed delivery securities purchased | — | — | 9,322,529 | 210,947,897 |
| Payable for forward foreign currency exchange contracts (Note 2) | — | — | 543,267 | — |
| Swap premium payable | — | — | 617 | — |
| Payable for fund shares repurchased | 817,553 | 31,697 | — | 112,255 |
| Payable upon return of securities loaned (Note 2) | 63,685,485 | 323,920 | 3,743,553 | 8,183,172 |
| Payable for options written, at value (Note 2) | — | — | — | 1,067,677 |
| Unrealized depreciation of swap contracts (Note 2) | — | — | 7,840 | — |
| Payable to affiliates | | | | |
| Fund administration fees | 2,326 | — | 4,399 | 1,673 |
| Trustees’ fees | 254 | 70 | 511 | 215 |
| Other payables and accrued expenses | 46,557 | 31,084 | 330,936 | 97,812 |
| Total liabilities | 64,552,175 | 386,771 | 19,476,786 | 223,804,422 |
| |
| Net assets | | | | |
|
| Capital paid-in | $392,015,773 | $3,727,621 | $941,577,302 | $479,415,121 |
| Undistributed net investment income (loss) | 345,267 | 25,548 | 10,011,334 | 3,902,664 |
| Accumulated undistributed net realized gain (loss) | | | | |
| on investments, futures contracts, options written, | | | | |
| foreign currency transactions and swap agreements | 13,794,493 | 1,158,208 | 10,471,897 | (3,146,649) |
| Net unrealized appreciation (depreciation) on investments, | | | | |
| futures contracts, options written, translation of assets and | | | | |
| liabilities in foreign currencies and swap agreements | 56,898,315 | (288,911) | 17,177,568 | (11,501,288) |
| Net assets | $463,053,848 | $4,622,466 | $979,238,101 | $468,669,848 |
| Investments in unaffiliated issuers, including repurchase agreements, at cost | $406,497,010 | $4,965,121 | $964,443,940 | $617,060,495 |
| Investments in affiliated issuers, at cost | $63,685,485 | $323,920 | $3,743,553 | $8,183,172 |
| Foreign currency, at cost | — | — | $400,902 | $164,833 |
| Premiums received on written options | — | — | — | $487,050 |
| |
| Net asset value per share | | | | |
|
| The Funds have an unlimited number of shares authorized with no par value. Net asset value is calculated by dividing the net assets of each class of shares by the number of |
| outstanding shares in the class. | | | | |
| Class 1 | | | | |
| Net assets | $144,229,782 | $4,622,466 | — | $44,828,252 |
| Shares outstanding | 5,588,361 | 296,034 | — | 3,878,238 |
| Net asset value, offering price and redemption price per share | $25.81 | $15.61 | — | $11.56 |
| Class NAV | | | | |
| Net assets | $318,824,066 | — | $979,238,101 | $423,841,596 |
| Shares outstanding | 12,363,124 | — | 93,147,985 | 36,743,288 |
| Net asset value, offering price and redemption price per share | $25.79 | — | $10.51 | $11.54 |
| |
| The accompanying notes are an integral part of the financial statements. | 80 |
John Hancock Funds II
Statements of Assets and Liabilities — August 31, 2007
| | | | |
| | | | | U.S. Global |
| Assets | Strategic Income | Total Bond Market | Total Return | Leaders Growth |
|
| Investments in unaffiliated issuers, at value | $428,590,882 | $51,829,695 | $2,041,846,906 | $645,106,682 |
| Investments in affiliated issuers, at value (Note 2) | — | — | — | 31,899,286 |
| Securities loaned, at value (Note 2) | — | — | — | 31,273,810 |
| Repurchase agreements, at value (Note 2) | 41,000 | 1,284,000 | 33,070,000 | 3,451,000 |
| Total investments, at value | 428,631,882 | 53,113,695 | 2,074,916,906 | 711,730,778 |
| Cash | 619 | 33 | 612 | 449 |
| Foreign currency, at value | 112,815 | — | 10,930,927 | — |
| Receivable for investments sold | — | — | — | 11,180,520 |
| Receivable for delayed delivery securities sold | — | — | 225,235,688 | — |
| Receivable for forward foreign currency exchange contracts (Note 2) | 5,281,367 | — | 2,338,238 | — |
| Receivable for fund shares sold | 162,901 | — | — | 67,053 |
| Dividend, interest and other receivable (net of tax) | 6,377,914 | 518,812 | 6,271,390 | 456,478 |
| Unrealized appreciation of swap contracts (Note 2) | — | — | 4,139,376 | — |
| Swap premium receivable | — | — | 14,131 | — |
| Total assets | 440,567,498 | 53,632,540 | 2,323,847,268 | 723,435,278 |
| |
| Liabilities | | | | |
|
| Payable for investments purchased | 4,814,662 | — | 16,589,087 | 11,235,855 |
| Payable for delayed delivery securities purchased | 8,427,928 | — | 717,647,979 | — |
| Payable for forward foreign currency exchange contracts (Note 2) | 4,546,250 | — | 972,048 | — |
| Payable for fund shares repurchased | — | — | 5,728,774 | 4,262 |
| Payable upon return of securities loaned (Note 2) | — | — | — | 31,899,286 |
| Payable for options written, at value (Note 2) | 2,106 | — | 7,059,616 | — |
| Investments sold short, at value (Note 2) | — | — | 39,699,147 | — |
| Payable for interest on securities sold short | — | — | 495,392 | — |
| Interest expense and fees payable on inverse floaters | — | — | 13,660 | — |
| Payable for floating rate note issued | — | — | 3,033,000 | — |
| Unrealized depreciation of swap contracts (Note 2) | — | — | 4,040,857 | — |
| Payable for futures variation margin | — | — | 2,134,563 | — |
| Payable to affiliates | | | | |
| Fund administration fees | 1,763 | 264 | 6,869 | 2,736 |
| Trustees’ fees | 111 | 21 | 776 | 332 |
| Investment management fees | — | 10,240 | — | — |
| Other payables and accrued expenses | 81,320 | 38,847 | 149,790 | 46,646 |
| Total liabilities | 17,874,140 | 49,372 | 797,571,558 | 43,189,117 |
| |
| Net assets | | | | |
|
| Capital paid-in | $419,956,207 | $53,397,652 | $1,514,881,603 | $658,717,408 |
| Undistributed net investment income (loss) | 2,440,809 | 478,101 | 19,045,374 | 2,643,747 |
| Accumulated undistributed net realized gain (loss) | | | | |
| on investments, futures contracts, options written, | | | | |
| foreign currency transactions and swap agreements | (2,243,918) | (72,568) | (11,987,638) | (16,919,700) |
| Net unrealized appreciation (depreciation) on investments, futures contracts, | | | | |
| options written, short sales, swap agreements and translation | | | | |
| of assets and liabilities in foreign currencies | 2,540,260 | (220,017) | 4,336,371 | 35,804,706 |
| Net assets | $422,693,358 | $53,583,168 | $1,526,275,710 | $680,246,161 |
| Investments in unaffiliated issuers, including repurchase agreements, at cost | $426,864,599 | $53,333,712 | $2,078,106,944 | $644,026,786 |
| Investments in affiliated issuers, at cost | — | — | — | $31,899,286 |
| Foreign currency, at cost | $114,296 | — | $10,928,342 | — |
| Proceeds received on short sales | — | — | $38,658,352 | — |
| Premiums received on written options | $67,108 | — | $4,810,711 | — |
| |
| Net asset value per share | | | | |
|
| The Funds have an unlimited number of shares authorized with no par value. Net asset value is calculated by dividing the net assets of each class of shares by the number of |
| outstanding shares in the class. | | | | |
| Class 1 | | | | |
| Net assets | — | — | $125,809,830 | $17,619,481 |
| Shares outstanding | — | — | 9,126,234 | 1,288,443 |
| Net asset value, offering price and redemption price per share | — | — | $13.79 | $13.68 |
| Class NAV | | | | |
| Net assets | $422,693,358 | $53,583,168 | $1,400,465,880 | $662,626,680 |
| Shares outstanding | 42,006,635 | 5,349,904 | 101,827,950 | 48,377,452 |
| Net asset value, offering price and redemption price per share | $10.06 | $10.02 | $13.75 | $13.70 |
| |
| The accompanying notes are an integral part of the financial statements. | 81 |
John Hancock Funds II
Statements of Assets and Liabilities — August 31, 2007
| | | | |
| U.S. Government | U.S. High | | |
| Assets | Securities | Yield Bond | U.S. Multi Sector | Value |
|
| Investments in unaffiliated issuers, at value | $265,361,258 | $378,804,628 | $1,430,537,326 | $14,250,431 |
| Investments in affiliated issuers, at value (Note 2) | — | 6,762,883 | 26,128,121 | — |
| Securities loaned, at value (Note 2) | — | 6,630,278 | 25,615,805 | — |
| Repurchase agreements, at value (Note 2) | 70,000,000 | 10,391,000 | 60,546,000 | — |
| Total investments, at value | 335,361,258 | 402,588,789 | 1,542,827,252 | 14,250,431 |
| Cash | 1,102,658 | 823 | 985 | 96,093 |
| Cash segregated for futures contracts | — | — | 2,973,600 | — |
| Receivable for investments sold | — | 586,355 | — | 9,086 |
| Receivable for delayed delivery securities sold | 56,370,704 | — | — | — |
| Receivable for fund shares sold | 84,626 | 171,334 | 211,265 | 67,066 |
| Dividend, interest and other receivable (net of tax) | 510,987 | 7,596,243 | 3,565,571 | 21,698 |
| Receivable for futures variation margin | — | — | 434,125 | — |
| Receivable due from adviser | — | — | — | 1,670 |
| Total assets | 393,430,233 | 410,943,544 | 1,550,012,798 | 14,446,044 |
| |
| Liabilities | | | | |
|
| Payable for investments purchased | 2,680,517 | 7,253,986 | — | 486,789 |
| Payable for delayed delivery securities purchased | 193,825,154 | — | — | — |
| Payable for fund shares repurchased | 2,367 | 101,232 | — | — |
| Payable upon return of securities loaned (Note 2) | — | 6,762,883 | 26,128,121 | — |
| Payable for futures variation margin | 17,137 | — | — | — |
| Payable to affiliates | | | | |
| Fund administration fees | 1,391 | 1,447 | 7,776 | 42 |
| Trustees’ fees | 125 | 200 | 830 | — |
| Other payables and accrued expenses | 65,820 | 62,001 | 119,333 | 28,980 |
| Total liabilities | 196,592,511 | 14,181,749 | 26,256,060 | 515,811 |
| |
| Net assets | | | | |
|
| Capital paid-in | $197,963,433 | $400,866,049 | $1,376,223,104 | $13,205,806 |
| Undistributed net investment income (loss) | 1,745,178 | 5,298,608 | 13,928,421 | 54,634 |
| Accumulated undistributed net realized gain (loss) | | | | |
| on investments, futures contracts, options written and | | | | |
| foreign currency transactions | (1,437,224) | 44,815 | 46,198,093 | 470,888 |
| Net unrealized appreciation (depreciation) on investments, | | | | |
| futures contracts and translation of assets and | | | | |
| liabilities in foreign currencies | (1,433,665) | (9,447,677) | 87,407,120 | 198,905 |
| Net assets | $196,837,722 | $396,761,795 | $1,523,756,738 | $13,930,233 |
| Investments in unaffiliated issuers, including repurchase agreements, at cost | $336,713,481 | $405,273,583 | $1,428,979,623 | $14,051,526 |
| Investments in affiliated issuers, at cost | — | $6,762,883 | $26,128,121 | — |
| |
| Net asset value per share | | | | |
|
| The Funds have an unlimited number of shares authorized with no par value. Net asset value is calculated by dividing the net assets of each class of shares by the number of |
| outstanding shares in the class. | | | | |
| Class 1 | | | | |
| Net assets | $43,036,766 | $4,453,141 | — | — |
| Shares outstanding | 3,204,968 | 345,942 | — | — |
| Net asset value, offering price and redemption price per share | $13.43 | $12.87 | — | — |
| Class NAV | | | | |
| Net assets | $153,800,956 | $392,308,654 | $1,523,756,738 | $13,930,233 |
| Shares outstanding | 11,480,664 | 30,485,792 | 134,980,445 | 1,218,756 |
| Net asset value, offering price and redemption price per share | $13.40 | $12.87 | $11.29 | $11.43 |
| |
| The accompanying notes are an integral part of the financial statements. | 82 |
John Hancock Funds II
Statements of Assets and Liabilities — August 31, 2007
| | | | |
| Assets | Value & Restructuring | Vista | | |
|
| Investments in unaffiliated issuers, at value | $350,039,848 | $151,530,071 | | |
| Investments in affiliated issuers, at value (Note 2) | 42,415,346 | 14,843,332 | | |
| Securities loaned, at value (Note 2) | 41,583,673 | 14,552,286 | | |
| Repurchase agreements, at value (Note 2) | 6,840,000 | 11,327,000 | | |
| Total investments, at value | 440,878,867 | 192,252,689 | | |
| Cash | 388 | — | | |
| Foreign currency, at value | 77 | 117 | | |
| Receivable for investments sold | 1,176,343 | 2,000,829 | | |
| Receivable for forward foreign currency exchange contracts (Note 2) | — | 12,699 | | |
| Dividend, interest and other receivable (net of tax) | 680,195 | 6,595 | | |
| Total assets | 442,735,870 | 194,272,929 | | |
| | | |
| Liabilities | | | | |
|
| Due to custodian | — | 7,148,816 | | |
| Payable for investments purchased | 4,578,235 | 2,657,389 | | |
| Payable for forward foreign currency exchange contracts (Note 2) | — | 3,179 | | |
| Payable for fund shares repurchased | 348,319 | 30 | | |
| Payable upon return of securities loaned (Note 2) | 42,415,346 | 14,843,332 | | |
| Payable for options written, at value (Note 2) | 82,800 | — | | |
| Payable to affiliates | | | | |
| Fund administration fees | 1,775 | 919 | | |
| Trustees’ fees | 209 | 87 | | |
| Other payables and accrued expenses | 49,916 | 38,110 | | |
| Total liabilities | 47,476,600 | 24,691,862 | | |
| | | |
| Net assets | | | | |
|
| Capital paid-in | $329,771,691 | $117,445,173 | | |
| Undistributed net investment income (loss) | 4,095,499 | (211,933) | | |
| Accumulated undistributed net realized gain (loss) | | | | |
| on investments, options written and foreign currency transactions | (310,848) | 7,316,440 | | |
| Net unrealized appreciation (depreciation) on investments, | | | | |
| options written and translation of assets and | | | | |
| liabilities in foreign currencies | 61,702,928 | 45,031,387 | | |
| Net assets | $395,259,270 | $169,581,067 | | |
| Investments in unaffiliated issuers, including repurchase agreements, at cost | $336,747,839 | $132,387,497 | | |
| Investments in affiliated issuers, at cost | $42,415,346 | $14,843,332 | | |
| Foreign currency, at cost | $76 | $110 | | |
| Premiums received on written options | $69,175 | — | | |
| | | |
| Net asset value per share | | | | |
|
| The Funds have an unlimited number of shares authorized with no par value. Net asset value is calculated by dividing the net assets of each class of shares by the number of |
| outstanding shares in the class. | | | | |
| Class NAV | | | | |
| Net assets | $395,259,270 | $169,581,067 | | |
| Shares outstanding | 30,586,539 | 11,801,607 | | |
| Net asset value, offering price and redemption price per share | $12.92 | $14.37 | | |
| |
| The accompanying notes are an integral part of the financial statements. | 83 |
John Hancock Funds II
Statements of Operations — for the year ended August 31, 2007
| | | | |
| Investment income | Absolute Return | Active Bond | All Cap Core | All Cap Growth |
|
| Interest | $21,263 | $28,325,123 | $1,756,995 | $275,397 |
| Dividends | 3,736 | 61,411 | 5,551,255 | 1,424,050 |
| Securities lending | — | 95,854 | 38,560 | 9,947 |
| Income distributions received from affiliated underlying funds | 146,484 | — | — | — |
| Less foreign taxes withheld | — | (4,479) | — | (22,664) |
| Total investment income | 171,483 | 28,477,909 | 7,346,810 | 1,686,730 |
| |
| Expenses | | | | |
|
| Investment management fees (Note 3) | 11,069 | 3,013,404 | 2,920,040 | 1,365,087 |
| Class A distribution and service fees (Note 3) | 4,159 | — | — | — |
| Class B distribution and service fees (Note 3) | 13,798 | — | — | — |
| Class C distribution and service fees (Note 3) | 13,798 | — | — | — |
| Class 1 distribution and service fees (Note 3) | 694 | 17,947 | — | 16,690 |
| Fund administration fees (Note 3) | 455 | 38,595 | 26,703 | 11,398 |
| Audit and legal fees | 29,838 | 52,260 | 37,453 | 35,244 |
| Custodian fees | 11,892 | 246,074 | 52,450 | 60,492 |
| Trustees’ fees (Note 4) | 44 | 3,989 | 2,588 | 1,440 |
| Registration and filing fees | 21,158 | 40,631 | 77,215 | 7,579 |
| Miscellaneous | 14 | 30,247 | 6,626 | 2,680 |
| Total expenses | 106,919 | 3,443,147 | 3,123,075 | 1,500,610 |
| Less: expense reductions (Note 3) | (60,630) | — | — | — |
| Net expenses | 46,289 | 3,443,147 | 3,123,075 | 1,500,610 |
| Net investment income (loss) | 125,194 | 25,034,762 | 4,223,735 | 186,120 |
| |
| Realized and unrealized gain (loss) | | | | |
|
| Net realized gain (loss) on | | | | |
| Investments in unaffiliated issuers | 555 | (555,051) | 28,491,006 | 11,055,225 |
| Investments in affiliated underlying funds | 85,427 | — | — | — |
| Capital gain distributions received from affiliated underlying funds | 56,429 | — | — | — |
| Futures contracts | 9,097 | — | 3,803,836 | — |
| Options written | 2,718 | — | — | — |
| Foreign currency transactions | — | 182,241 | — | 1,300 |
| | 154,226 | (372,810) | 32,294,842 | 11,056,525 |
| Change in net unrealized appreciation (depreciation) of | | | | |
| Investments in unaffiliated issuers | 3,167 | (3,981,389) | (321,159) | 15,634,905 |
| Investments in affiliated underlying funds | 154,497 | — | — | — |
| Futures contracts | — | — | (2,131,877) | — |
| Translation of assets and liabilities in foreign currencies | — | 14,007 | — | 714 |
| | 157,664 | (3,967,382) | (2,453,036) | 15,635,619 |
| Net realized and unrealized gain (loss) | 311,890 | (4,340,192) | 29,841,806 | 26,692,144 |
| |
| Increase (decrease) in net assets from operations | $437,084 | $20,694,570 | $34,065,541 | $26,878,264 |
| |
| The accompanying notes are an integral part of the financial statements. | 84 |
John Hancock Funds II
Statements of Operations — for the year ended August 31, 2007
| | | | |
| Investment income | All Cap Value | Blue Chip Growth | Capital Appreciation | Core Bond |
|
| Interest | $512,097 | $658,957 | $620,286 | $12,893,811 |
| Dividends | 3,052,285 | 18,519,0781 | 5,175,835 | — |
| Securities lending | 21,994 | 199,160 | 581,735 | 26,976 |
| Less foreign taxes withheld | (22,264) | (321,850) | (139,033) | (5,851) |
| Total investment income | 3,564,112 | 19,055,345 | 6,238,823 | 12,914,936 |
| |
| Expenses | | | | |
|
| Investment management fees (Note 3) | 1,616,391 | 12,266,999 | 4,121,655 | 1,532,955 |
| Class 1 distribution and service fees (Note 3) | 12,144 | 98,597 | 34,290 | 696 |
| Fund administration fees (Note 3) | 18,846 | 120,368 | 44,261 | 14,458 |
| Audit and legal fees | 37,009 | 71,706 | 45,152 | 45,750 |
| Custodian fees | 56,064 | 227,908 | 52,793 | 188,902 |
| Trustees’ fees (Note 4) | 2,008 | 11,938 | 4,333 | 1,847 |
| Registration and filing fees | 12,189 | 86,847 | 44,070 | 16,260 |
| Miscellaneous | 3,229 | 25,266 | 7,301 | 6,431 |
| Total expenses | 1,757,880 | 12,909,629 | 4,353,855 | 1,807,299 |
| Less: expense reductions (Note 3) | — | (445,218) | — | — |
| Net expenses | 1,757,880 | 12,464,411 | 4,353,855 | 1,807,299 |
| Net investment income (loss) | 1,806,232 | 6,590,934 | 1,884,968 | 11,107,637 |
| |
| Realized and unrealized gain (loss) | | | | |
|
| Net realized gain (loss) on | | | | |
| Investments in unaffiliated issuers | 29,101,229 | 9,364,492 | (10,045,046) | (152,241) |
| Futures contracts | 940,102 | — | — | — |
| Foreign currency transactions | — | (80,032) | (125) | — |
| | 30,041,331 | 9,284,460 | (10,045,171) | (152,241) |
| Change in net unrealized appreciation (depreciation) of | | | | |
| Investments in unaffiliated issuers | (3,683,407) | 233,359,079 | 78,350,841 | (393,618) |
| Translation of assets and liabilities in foreign currencies | — | (2,071) | (11) | — |
| | (3,683,407) | 233,357,008 | 78,350,830 | (393,618) |
| Net realized and unrealized gain (loss) | 26,357,924 | 242,641,468 | 68,305,659 | (545,859) |
| |
| Increase (decrease) in net assets from operations | $28,164,156 | $249,232,402 | $70,190,627 | $10,561,778 |
1 Including special dividend of $2,795,216.
| |
| The accompanying notes are an integral part of the financial statements. | 85 |
John Hancock Funds II
Statements of Operations — for the year ended August 31, 2007
| | | | |
| | | | Emerging | Emerging |
| Investment income | Core Equity | Emerging Growth | Markets Value1 | Small Company |
|
| Interest | $388,933 | $397,291 | $279,810 | $69,451 |
| Dividends | 5,922,233 | 311,281 | 4,476,213 | 177,731 |
| Securities lending | — | 1,353,772 | — | 23,048 |
| Less foreign taxes withheld | — | — | (558,877) | (379) |
| Total investment income | 6,311,166 | 2,062,344 | 4,197,146 | 269,851 |
| |
| Expenses | | | | |
|
| Investment management fees (Note 3) | 5,675,941 | 1,503,124 | 1,237,155 | 506,778 |
| Class 1 distribution and service fees (Note 3) | 6,946 | 62,909 | — | 25,022 |
| Fund administration fees (Note 3) | 50,217 | 3,568 | 10,201 | 397 |
| Audit and legal fees | 49,832 | 22,206 | 32,177 | 10,393 |
| Custodian fees | 95,201 | 22,297 | 129,105 | 11,092 |
| Trustees’ fees (Note 4) | 5,621 | 1,655 | 113 | 458 |
| Registration and filing fees | 49,152 | 4,702 | 13,225 | 2,276 |
| Miscellaneous | 10,456 | 4,337 | 1,986 | 1,696 |
| Total expenses | 5,943,366 | 1,624,798 | 1,423,962 | 558,112 |
| Less: expense reductions (Note 3) | — | — | — | (556) |
| Net expenses | 5,943,366 | 1,624,798 | 1,423,962 | 557,556 |
| Net investment income (loss) | 367,800 | 437,546 | 2,773,184 | (287,705) |
| |
| Realized and unrealized gain (loss) | | | | |
|
| Net realized gain (loss) on | | | | |
| Investments in unaffiliated issuers | 6,947,511 | 11,888,166 | 735,2192 | (289,622) |
| Foreign currency transactions | (5,134) | — | (578,463) | — |
| | 6,942,377 | 11,888,166 | 156,756 | (289,622) |
| Change in net unrealized appreciation (depreciation) of | | | | |
| Investments in unaffiliated issuers | 60,582,402 | 20,337,068 | 22,526,6063 | 9,700,508 |
| Translation of assets and liabilities in foreign currencies | (296) | — | 3,673 | — |
| | 60,582,106 | 20,337,068 | 22,530,279 | 9,700,508 |
| Net realized and unrealized gain (loss) | 67,524,483 | 32,225,234 | 22,687,035 | 9,410,886 |
| |
| Increase (decrease) in net assets from operations | $67,892,283 | $32,662,780 | $25,460,219 | $9,123,181 |
1 Period from 5-1-07 (commencement of operations) to 8-31-07.
2 Net of $2,471 in deferred India foreign withholding taxes.
3 Net of $96,306 in deferred India foreign withholding taxes.
| |
| The accompanying notes are an integral part of the financial statements. | 86 |
John Hancock Funds II
Statements of Operations — for the year ended August 31, 2007
| | | | |
| Investment income | Equity-Income | Fundamental Value | Global Bond | Global Real Estate |
|
| Interest | $2,455,511 | $1,849,937 | $31,568,874 | $203,361 |
| Dividends | 19,535,490 | 16,935,791 | 13,781 | 11,354,168 |
| Securities lending | 105,588 | 40,137 | 3,253 | 138,700 |
| Less foreign taxes withheld | (128,007) | (105,308) | (54,706) | (609,544) |
| Total investment income | 21,968,582 | 18,720,557 | 31,531,202 | 11,086,685 |
| |
| Expenses | | | | |
|
| Investment management fees (Note 3) | 6,920,388 | 7,089,403 | 4,914,310 | 3,961,060 |
| Class 1 distribution and service fees (Note 3) | 103,780 | 40,111 | 19,780 | — |
| Fund administration fees (Note 3) | 57,114 | 72,898 | 52,272 | 32,426 |
| Audit and legal fees | 54,295 | 55,282 | 60,624 | 40,459 |
| Custodian fees | 105,576 | 157,614 | 539,628 | 444,913 |
| Trustees’ fees (Note 4) | 6,774 | 7,201 | 5,535 | 3,210 |
| Registration and filing fees | 36,687 | 53,505 | 43,634 | 67,777 |
| Interest expense and fees on inverse floaters | — | — | 10,497 | — |
| Miscellaneous | 17,364 | 12,984 | 41,882 | 13,879 |
| Total expenses | 7,301,978 | 7,488,998 | 5,688,162 | 4,563,724 |
| Less: expense reductions (Note 3) | (251,500) | — | — | — |
| Net expenses | 7,050,478 | 7,488,998 | 5,688,162 | 4,563,724 |
| Net investment income (loss) | 14,918,104 | 11,231,559 | 25,843,040 | 6,522,961 |
| |
| Realized and unrealized gain (loss) | | | | |
|
| Net realized gain (loss) on | | | | |
| Investments in unaffiliated issuers | 40,706,429 | 11,755,215 | (11,555,049) | 33,926,788 |
| Futures contracts | — | — | (7,004,909) | — |
| Options written | — | — | 2,108,938 | — |
| Short sales | — | — | (446,016) | — |
| Swap contracts | — | — | 6,844,999 | — |
| Foreign currency transactions | (16,600) | (88,242) | (179,671) | (7,155,970) |
| | 40,689,829 | 11,666,973 | (10,231,708) | 26,770,818 |
| Change in net unrealized appreciation (depreciation) of | | | | |
| Investments in unaffiliated issuers | 51,013,753 | 82,612,275 | 5,016,861 | 16,153,119 |
| Futures contracts | — | — | 2,332,287 | — |
| Options written | — | — | (365,358) | — |
| Short sales | — | — | (1,303,715) | — |
| Swap contracts | — | — | 571,118 | — |
| Translation of assets and liabilities in foreign currencies | 766 | (237) | 4,333,058 | (174,755) |
| | 51,014,519 | 82,612,038 | 10,584,251 | 15,978,364 |
| Net realized and unrealized gain (loss) | 91,704,348 | 94,279,011 | 352,543 | 42,749,182 |
| |
| Increase (decrease) in net assets from operations | $106,622,452 | $105,510,570 | $26,195,583 | $49,272,143 |
| |
| The accompanying notes are an integral part of the financial statements. | 87 |
John Hancock Funds II
Statements of Operations — for the year ended August 31, 2007
| | | | |
| | | | | International |
| Investment income | High Income | High Yield | Index 5001 | Equity Index |
|
| Interest | $23,081,177 | $116,316,907 | $263,907 | $334,309 |
| Dividends | 1,558,211 | 219,441 | 655,093 | 10,868,800 |
| Securities lending | 280,371 | 1,255,269 | — | 245,680 |
| Less foreign taxes withheld | (228,508) | (128,483) | — | (953,590) |
| Total investment income | 24,691,251 | 117,663,134 | 919,000 | 10,495,199 |
| |
| Expenses | | | | |
|
| Investment management fees (Note 3) | 2,355,822 | 9,383,099 | 174,303 | 2,005,726 |
| Class 1 distribution and service fees (Note 3) | — | 24,529 | — | — |
| Fund administration fees (Note 3) | 26,386 | 108,169 | 2,699 | 29,752 |
| Audit and legal fees | 51,741 | 79,132 | 29,299 | 40,809 |
| Custodian fees | 48,595 | 300,775 | 10,090 | 12,145 |
| Trustees’ fees (Note 4) | 2,618 | 11,206 | 194 | 2,918 |
| Registration and filing fees | 26,251 | 91,590 | 2,936 | 24,941 |
| Miscellaneous | 20,102 | 25,338 | 584 | 3,633 |
| Total expenses | 2,531,515 | 10,023,838 | 220,105 | 2,119,924 |
| Less: expense reductions (Note 3) | — | — | (26,983) | — |
| Net expenses | 2,531,515 | 10,023,838 | 193,122 | 2,119,924 |
| Net investment income (loss) | 22,159,736 | 107,639,296 | 725,878 | 8,375,275 |
| |
| Realized and unrealized gain (loss) | | | | |
|
| Net realized gain (loss) on | | | | |
| Investments in unaffiliated issuers | 14,150,290 | 12,580,243 | 74,707 | 8,637,164 |
| Futures contracts | — | — | (465,461) | 1,686,929 |
| Options written | 387,539 | — | — | — |
| Foreign currency transactions | 391,123 | 78,167 | — | (152,329) |
| | 14,928,952 | 12,658,410 | (390,754) | 10,171,764 |
| Change in net unrealized appreciation (depreciation) of | | | | |
| Investments in unaffiliated issuers | 4,448,863 | (51,112,978) | 1,882,445 | 55,772,694 |
| Futures contracts | — | — | 77,641 | (871,653) |
| Options written | (41,554) | — | — | — |
| Translation of assets and liabilities in foreign currencies | 136,382 | 551 | — | 55,481 |
| | 4,543,691 | (51,112,427) | 1,960,086 | 54,956,522 |
| Net realized and unrealized gain (loss) | 19,472,643 | (38,454,017) | 1,569,332 | 65,128,286 |
| |
| Increase (decrease) in net assets from operations | $41,632,379 | $69,185,279 | $2,295,210 | $73,503,561 |
1 Period from 10-27-06 (commencement of operations) to 8-31-07.
| |
| The accompanying notes are an integral part of the financial statements. | 88 |
John Hancock Funds II
Statements of Operations — for the year ended August 31, 2007
| | | | |
| | International | International | International | |
| Investment income | Opportunities | Small Cap | Small Company | International Value |
|
| Interest | $1,413,920 | $910,249 | $82,545 | $1,862,684 |
| Dividends | 15,777,272 | 10,533,135 | 5,562,708 | 39,712,396 |
| Securities lending | 234,150 | 331,048 | 385,003 | 689,660 |
| Less foreign taxes withheld | (1,296,017) | (1,084,743) | (385,161) | (3,428,223) |
| Total investment income | 16,129,325 | 10,689,689 | 5,645,095 | 38,836,517 |
| |
| Expenses | | | | |
|
| Investment management fees (Note 3) | 6,044,755 | 4,273,565 | 2,550,825 | 9,445,903 |
| Class 1 distribution and service fees (Note 3) | 8,899 | 27,776 | — | 78,368 |
| Fund administration fees (Note 3) | 52,558 | 36,395 | 20,632 | 86,146 |
| Audit and legal fees | 49,435 | 44,947 | 36,389 | 63,446 |
| Custodian fees | 666,895 | 805,043 | 255,844 | 1,288,921 |
| Trustees’ fees (Note 4) | 5,305 | 3,765 | 2,006 | 9,156 |
| Registration and filing fees | 39,687 | 21,413 | 19,259 | 53,542 |
| Miscellaneous | 12,212 | 16,604 | 9,189 | 24,464 |
| Total expenses | 6,879,746 | 5,229,508 | 2,894,144 | 11,049,946 |
| Less: expense reductions (Note 3) | — | — | — | (161,204) |
| Net expenses | 6,879,746 | 5,229,508 | 2,894,144 | 10,888,742 |
| Net investment income (loss) | 9,249,579 | 5,460,181 | 2,750,951 | 27,947,775 |
| |
| Realized and unrealized gain (loss) | | | | |
|
| Net realized gain (loss) on | | | | |
| Investments in unaffiliated issuers | 76,067,479 | 70,377,3291 | 25,655,9953 | 86,675,525 |
| Foreign currency transactions | (279,024) | 265,949 | (14,638) | (164,172) |
| | 75,788,455 | 70,643,278 | 25,641,357 | 86,511,353 |
| Change in net unrealized appreciation (depreciation) of | | | | |
| Investments in unaffiliated issuers | 47,104,569 | 68,346,8532 | 30,355,5214 | 85,455,055 |
| Translation of assets and liabilities in foreign currencies | (7,209) | 106,055 | (1,428) | (22,439) |
| | 47,097,360 | 68,452,908 | 30,354,093 | 85,432,616 |
| Net realized and unrealized gain (loss) | 122,885,815 | 139,096,186 | 55,995,450 | 171,943,969 |
| |
| Increase (decrease) in net assets from operations | $132,135,394 | $144,556,367 | $58,746,401 | $199,891,744 |
1 Net of Thailand foreign taxes of $58,596.
2 Net of $242,277 decrease in deferred Thailand foreign withholding taxes.
3 Net of India foreign taxes of $8,666.
4 Net of $1,892 decrease and $24,563 increase in deferred Thailand and India foreign withholding taxes, respectively.
| |
| The accompanying notes are an integral part of the financial statements. | 89 |
John Hancock Funds II
Statements of Operations — for the year ended August 31, 2007
| | | | |
| | Investment | | | |
| Investment income | Quality Bond | Large Cap | Large Cap Value | Mid Cap Index |
|
| Interest | $8,151,661 | $305,412 | $124,176 | $1,187,995 |
| Dividends | — | 4,738,008 | 8,778,798 | 6,492,2841 |
| Securities lending | 10,665 | 10,101 | 39,177 | 76,784 |
| Less foreign taxes withheld | (16,332) | — | — | — |
| Total investment income | 8,145,994 | 5,053,521 | 8,942,151 | 7,757,063 |
| |
| Expenses | | | | |
|
| Investment management fees (Note 3) | 869,151 | 1,945,488 | 3,900,589 | 1,992,906 |
| Class 1 distribution and service fees (Note 3) | 19,131 | 6,257 | 63,743 | — |
| Fund administration fees (Note 3) | 10,171 | 17,982 | 36,226 | 34,805 |
| Audit and legal fees | 43,389 | 36,920 | 89,750 | 72,721 |
| Custodian fees | 140,567 | 32,017 | 47,452 | 10,361 |
| Trustees’ fees (Note 4) | 1,172 | 1,845 | 3,773 | 3,312 |
| Registration and filing fees | 9,067 | 19,393 | 42,494 | 47,759 |
| Miscellaneous | 2,462 | 4,017 | 10,249 | 3,835 |
| Total expenses | 1,095,110 | 2,063,919 | 4,194,276 | 2,165,699 |
| Net investment income (loss) | 7,050,884 | 2,989,602 | 4,747,875 | 5,591,364 |
| |
| Realized and unrealized gain (loss) | | | | |
|
| Net realized gain (loss) on | | | | |
| Investments in unaffiliated issuers | (231,037) | 8,248,358 | 15,845,172 | 25,843,720 |
| Futures contracts | 177,505 | 463,873 | — | 3,452,543 |
| Foreign currency transactions | (86,813) | — | — | — |
| | (140,345) | 8,712,231 | 15,845,172 | 29,296,263 |
| Change in net unrealized appreciation (depreciation) of | | | | |
| Investments in unaffiliated issuers | (710,920) | 10,568,545 | 32,088,987 | 21,604,897 |
| Futures contracts | 47,239 | — | — | (1,247,667) |
| Translation of assets and liabilities in foreign currencies | 35,866 | — | — | — |
| | (627,815) | 10,568,545 | 32,088,987 | 20,357,230 |
| Net realized and unrealized gain (loss) | (768,160) | 19,280,776 | 47,934,159 | 49,653,493 |
| |
| Increase (decrease) in net assets from operations | $6,282,724 | $22,270,378 | $52,682,034 | $55,244,857 |
1 Including special dividend of $1,163,600.
| |
| The accompanying notes are an integral part of the financial statements. | 90 |
John Hancock Funds II
Statements of Operations — for the year ended August 31, 2007
| | | | |
| | Mid Cap | | | Mid Cap |
| Investment income | Intersection1 | Mid Cap Stock | Mid Cap Value | Value Equity |
|
| Interest | $169,305 | $573,413 | $457,105 | $98,870 |
| Dividends | 1,080,069 | 3,539,3812 | 2,756,752 | 2,457,145 |
| Securities lending | — | 159,164 | 13,355 | 25,954 |
| Less foreign taxes withheld | — | (40,823) | (521) | (7,974) |
| Total investment income | 1,249,374 | 4,231,135 | 3,226,691 | 2,573,995 |
| |
| Expenses | | | | |
|
| Investment management fees (Note 3) | 968,135 | 3,265,240 | 1,733,794 | 1,041,093 |
| Class 1 distribution and service fees (Note 3) | — | 61,121 | 54,303 | — |
| Fund administration fees (Note 3) | 11,356 | 25,937 | 13,076 | 8,978 |
| Audit and legal fees | 31,302 | 40,355 | 35,542 | 31,513 |
| Custodian fees | 20,383 | 78,607 | 42,635 | 31,204 |
| Trustees’ fees (Note 4) | 90 | 2,823 | 1,371 | 629 |
| Registration and filing fees | 10,414 | 20,006 | 8,053 | 9,459 |
| Miscellaneous | 1,411 | 10,559 | 3,858 | 1,863 |
| Total expenses | 1,043,091 | 3,504,648 | 1,892,632 | 1,124,739 |
| Net investment income (loss) | 206,283 | 726,487 | 1,334,059 | 1,449,256 |
| |
| Realized and unrealized gain (loss) | | | | |
|
| Net realized gain (loss) on | | | | |
| Investments in unaffiliated issuers | (5,164,459) | 35,007,528 | 9,193,183 | 1,917,996 |
| Futures contracts | (38,127) | — | — | — |
| Foreign currency transactions | — | (10,014) | — | 378 |
| | (5,202,586) | 34,997,514 | 9,193,183 | 1,918,374 |
| Change in net unrealized appreciation (depreciation) of | | | | |
| Investments in unaffiliated issuers | (10,639,254) | 48,522,952 | 9,149,210 | 16,439,039 |
| Translation of assets and liabilities in foreign currencies | — | (22) | — | (75) |
| | (10,639,254) | 48,522,930 | 9,149,210 | 16,438,964 |
| Net realized and unrealized gain (loss) | (15,841,840) | 83,520,444 | 18,342,393 | 18,357,338 |
| |
| Increase (decrease) in net assets from operations | ($15,635,557) | $84,246,931 | $19,676,452 | $19,806,594 |
1 Period from 5-1-07 (commencement of operations) to 8-31-07.
2 Including special dividend of $1,452,500.
| |
| The accompanying notes are an integral part of the financial statements. | 91 |
John Hancock Funds II
Statements of Operations — for the year ended August 31, 2007
| | | | |
| | | Quantitative | Quantitative | Quantitative |
| Investment income | Natural Resources | All Cap | Mid Cap | Value |
|
| Interest | $1,411,544 | $1,294 | $160,344 | $480,239 |
| Dividends | 14,191,495 | 105,4561 | 2,010,528 | 15,822,804 |
| Securities lending | 197,687 | 1,153 | 70,556 | 102,903 |
| Less foreign taxes withheld | (628,588) | (327) | (5,841) | (59,245) |
| Total investment income | 15,172,138 | 107,576 | 2,235,587 | 16,346,701 |
| |
| Expenses | | | | |
|
| Investment management fees (Note 3) | 8,826,807 | 40,559 | 1,269,660 | 4,311,789 |
| Class A distribution and service fees (Note 3) | — | 4,308 | — | — |
| Class B distribution and service fees (Note 3) | — | 14,299 | — | — |
| Class C distribution and service fees (Note 3) | — | 14,299 | — | — |
| Class 1 distribution and service fees (Note 3) | 43,362 | — | 66,252 | 55,251 |
| Fund administration fees (Note 3) | 71,930 | 1,559 | 15,071 | 47,773 |
| Audit and legal fees | 55,086 | 29,658 | 35,858 | 46,599 |
| Custodian fees | 456,086 | 14,511 | 25,212 | 65,946 |
| Trustees’ fees (Note 4) | 7,293 | 40 | 1,633 | 4,562 |
| Registration and filing fees | 43,768 | 12,575 | 7,992 | 29,395 |
| Miscellaneous | 41,289 | 28 | 28,253 | 30,030 |
| Total expenses | 9,545,621 | 131,836 | 1,449,931 | 4,591,345 |
| Less: expense reductions (Note 3) | — | (53,054) | — | — |
| Net expenses | 9,545,621 | 78,782 | 1,449,931 | 4,591,345 |
| Net investment income (loss) | 5,626,517 | 28,794 | 785,656 | 11,755,356 |
| |
| Realized and unrealized gain (loss) | | | | |
|
| Net realized gain (loss) on | | | | |
| Investments in unaffiliated issuers | 166,856,301 | 582,269 | 23,424,309 | 61,580,577 |
| Futures contracts | — | — | 835,635 | — |
| Foreign currency transactions | (104,772) | 45 | (402) | (179) |
| | 166,751,529 | 582,314 | 24,259,542 | 61,580,398 |
| Change in net unrealized appreciation (depreciation) of | | | | |
| Investments in unaffiliated issuers | 53,963,485 | 304,309 | (2,813,290) | (15,018,119) |
| Translation of assets and liabilities in foreign currencies | 1,690 | — | — | — |
| | 53,965,175 | 304,309 | (2,813,290) | (15,018,119) |
| Net realized and unrealized gain (loss) | 220,716,704 | 886,623 | 21,446,252 | 46,562,279 |
| |
| Increase (decrease) in net assets from operations | $226,343,221 | $915,417 | $22,231,908 | $58,317,635 |
1 Including special dividend of $12,473.
| |
| The accompanying notes are an integral part of the financial statements. | 92 |
John Hancock Funds II
Statements of Operations — for the year ended August 31, 2007
| | | | |
| | Real Estate | Real Estate | | |
| Investment income | Equity | Securities | Real Return Bond | Small Cap |
|
| Interest | $708,055 | $116,700 | $44,470,961 | $572,347 |
| Dividends | 8,277,221 | 5,800,384 | — | 955,899 |
| Securities lending | 88,207 | 13,492 | 4,743 | 338,582 |
| Less foreign taxes withheld | (11,985) | (8,503) | — | — |
| Total investment income | 9,061,498 | 5,922,073 | 44,475,704 | 1,866,828 |
| |
| Expenses | | | | |
|
| Investment management fees (Note 3) | 2,371,078 | 1,358,136 | 5,872,528 | 2,137,557 |
| Class 1 distribution and service fees (Note 3) | — | 97,010 | 8,872 | 568 |
| Fund administration fees (Note 3) | 23,169 | 9,975 | 66,224 | 20,278 |
| Audit and legal fees | 36,241 | 35,381 | 64,224 | 40,463 |
| Custodian fees | 31,287 | 22,612 | 180,566 | 39,571 |
| Trustees’ fees (Note 4) | 2,383 | 1,919 | 6,573 | 2,249 |
| Registration and filing fees | 20,908 | 7,304 | 59,096 | 18,386 |
| Miscellaneous | 11,428 | 23,039 | 18,718 | 9,272 |
| Total expenses | 2,496,494 | 1,555,376 | 6,276,801 | 2,268,344 |
| Less: expense reductions (Note 3) | (91,163) | — | (38,575) | — |
| Net expenses | 2,405,331 | 1,555,376 | 6,238,226 | 2,268,344 |
| Net investment income (loss) | 6,656,167 | 4,366,697 | 38,237,478 | (401,516) |
| |
| Realized and unrealized gain (loss) | | | | |
|
| Net realized gain (loss) on | | | | |
| Investments in unaffiliated issuers | 23,075,959 | 17,706,597 | (10,052,982) | 17,591,671 |
| Futures contracts | — | — | (7,409,586) | 556,913 |
| Options written | — | — | 442,405 | — |
| Short sales | — | — | (9,518) | — |
| Swap contracts | — | — | (896,131) | — |
| Foreign currency transactions | (5,858) | — | 2,158,943 | — |
| | 23,070,101 | 17,706,597 | (15,766,869) | 18,148,584 |
| Change in net unrealized appreciation (depreciation) of | | | | |
| Investments in unaffiliated issuers | (20,373,734) | (14,129,899) | (1,059,658) | 15,935,147 |
| Futures contracts | — | — | (388,076) | — |
| Options written | — | — | 121,470 | — |
| Short sales | — | — | (24,821) | — |
| Swap contracts | — | — | (128,360) | — |
| Translation of assets and liabilities in foreign currencies | — | — | (614,396) | — |
| | (20,373,734) | (14,129,899) | (2,093,841) | 15,935,147 |
| Net realized and unrealized gain (loss) | 2,696,367 | 3,576,698 | (17,860,710) | 34,083,731 |
| |
| Increase (decrease) in net assets from operations | $9,352,534 | $7,943,395 | $20,376,768 | $33,682,215 |
| |
| The accompanying notes are an integral part of the financial statements. | 93 |
John Hancock Funds II
Statements of Operations — for the year ended August 31, 2007
| | | | |
| | Small Cap | Small Cap | | Small Company |
| Investment income | Index | Opportunities | Small Company | Growth |
|
| Interest | $432,416 | $498,288 | $32,324 | $193,959 |
| Dividends | 1,535,125 | 5,506,125 | 963,766 | 286,581 |
| Securities lending | 191,328 | 225,797 | 64,289 | 25,643 |
| Less foreign taxes withheld | (450) | (6,752) | (2,825) | (34) |
| Total investment income | 2,158,419 | 6,223,458 | 1,057,554 | 506,149 |
| |
| Expenses | | | | |
|
| Investment management fees (Note 3) | 599,166 | 2,547,758 | 1,088,485 | 1,238,892 |
| Class 1 distribution and service fees (Note 3) | — | 17,606 | 3,004 | — |
| Fund administration fees (Note 3) | 10,726 | 20,298 | 7,199 | 6,753 |
| Audit and legal fees | 34,666 | 48,180 | 33,357 | 32,988 |
| Custodian fees | 12,052 | 34,162 | 122,298 | 28,516 |
| Trustees’ fees (Note 4) | 1,159 | 2,256 | 900 | 703 |
| Registration and filing fees | 10,638 | 15,908 | 8,825 | 10,847 |
| Miscellaneous | 7,769 | 7,568 | 2,143 | 1,872 |
| Total expenses | 676,176 | 2,693,736 | 1,266,211 | 1,320,571 |
| Net investment income (loss) | 1,482,243 | 3,529,722 | (208,657) | (814,422) |
| |
| Realized and unrealized gain (loss) | | | | |
|
| Net realized gain (loss) on | | | | |
| Investments in unaffiliated issuers | 12,049,009 | 316,067 | 6,205,057 | 5,186,594 |
| Futures contracts | 1,040,038 | — | 76,661 | — |
| Foreign currency transactions | — | (88) | — | — |
| | 13,089,047 | 315,979 | 6,281,718 | 5,186,594 |
| Change in net unrealized appreciation (depreciation) of | | | | |
| Investments in unaffiliated issuers | 2,593,690 | 11,923,803 | 4,434,469 | 9,504,714 |
| Futures contracts | (141,896) | — | — | — |
| | 2,451,794 | 11,923,803 | 4,434,469 | 9,504,714 |
| Net realized and unrealized gain (loss) | 15,540,841 | 12,239,782 | 10,716,187 | 14,691,308 |
| |
| Increase (decrease) in net assets from operations | $17,023,084 | $15,769,504 | $10,507,530 | $13,876,886 |
| |
| The accompanying notes are an integral part of the financial statements. | 94 |
John Hancock Funds II
Statements of Operations — for the year ended August 31, 2007
| | | | |
| Investment income | Small Company Value | Special Value | Spectrum Income | Strategic Bond |
|
| Interest | $716,059 | $450,258 | $43,641,871 | $24,131,286 |
| Dividends | 4,659,266 | 1,186,128 | 3,872,521 | 107,262 |
| Securities lending | 200,906 | 95,655 | 82,236 | 84,085 |
| Less foreign taxes withheld | — | — | (40,276) | (24,507) |
| Total investment income | 5,576,231 | 1,732,041 | 47,556,352 | 24,298,126 |
| |
| Expenses | | | | |
|
| Investment management fees (Note 3) | 4,511,784 | 998,667 | 6,576,186 | 2,603,060 |
| Class 1 distribution and service fees (Note 3) | 76,694 | 2,264 | — | 22,039 |
| Fund administration fees (Note 3) | 33,730 | 7,223 | 70,877 | 27,140 |
| Audit and legal fees | 42,676 | 34,136 | 63,804 | 50,359 |
| Custodian fees | 64,575 | 29,299 | 1,088,543 | 208,639 |
| Trustees’ fees (Note 4) | 3,565 | 1,174 | 7,120 | 2,935 |
| Registration and filing fees | 21,588 | 11,477 | 70,669 | 17,343 |
| Miscellaneous | 8,326 | 2,648 | 13,613 | 12,252 |
| Total expenses | 4,762,938 | 1,086,888 | 7,890,812 | 2,943,767 |
| Less: expense reductions (Note 3) | (206,663) | (19,418) | (208,169) | — |
| Net expenses | 4,556,275 | 1,067,470 | 7,682,643 | 2,943,767 |
| Net investment income (loss) | 1,019,956 | 664,571 | 39,873,709 | 21,354,359 |
| |
| Realized and unrealized gain (loss) | | | | |
|
| Net realized gain (loss) on | | | | |
| Investments in unaffiliated issuers | 16,732,830 | 26,091,455 | 12,018,695 | (6,096,611) |
| Reimbursement from adviser due to loss from compliance error | — | 99,465 | — | — |
| Futures contracts | — | (385,778) | (314,909) | 5,581,834 |
| Options written | — | — | — | 1,666,336 |
| Swap contracts | — | — | 17,484 | — |
| Foreign currency transactions | — | — | 907,442 | 173,568 |
| | 16,732,830 | 25,805,142 | 12,628,712 | 1,325,127 |
| Change in net unrealized appreciation (depreciation) of | | | | |
| Investments in unaffiliated issuers | 24,741,259 | (7,713,070) | 5,666,506 | (13,086,828) |
| Futures contracts | — | — | 50,302 | (426,960) |
| Options written | — | — | — | (566,645) |
| Swap contracts | — | — | (3,836) | — |
| Translation of assets and liabilities in foreign currencies | — | — | (186,520) | 1,752 |
| | 24,741,259 | (7,713,070) | 5,526,452 | (14,078,681) |
| Net realized and unrealized gain (loss) | 41,474,089 | 18,092,072 | 18,155,164 | (12,753,554) |
| |
| Increase (decrease) in net assets from operations | $42,494,045 | $18,756,643 | $58,028,873 | $8,600,805 |
| |
| The accompanying notes are an integral part of the financial statements. | 95 |
John Hancock Funds II
Statements of Operations — for the year ended August 31, 2007
| | | | |
| | | | | U.S. Global |
| Investment income | Strategic Income | Total Bond Market1 | Total Return | Leaders Growth |
|
| Interest | $20,643,292 | $2,326,029 | $75,433,972 | $399,968 |
| Dividends | 76,680 | — | — | 7,541,902 |
| Securities lending | 63,272 | — | 5,251 | 16,988 |
| Less foreign taxes withheld | (34,227) | — | (32,612) | (62,184) |
| Total investment income | 20,749,017 | 2,326,029 | 75,406,611 | 7,896,674 |
| |
| Expenses | | | | |
|
| Investment management fees (Note 3) | 2,447,867 | 218,143 | 9,530,626 | 4,030,181 |
| Class 1 distribution and service fees (Note 3) | — | — | 60,403 | 10,439 |
| Fund administration fees (Note 3) | 25,627 | 4,211 | 108,335 | 40,907 |
| Audit and legal fees | 46,066 | 40,284 | 78,621 | 45,876 |
| Custodian fees | 165,218 | 10,090 | 374,583 | 43,101 |
| Trustees’ fees (Note 4) | 2,525 | 327 | 10,778 | 4,493 |
| Registration and filing fees | 26,746 | 2,715 | 90,791 | 41,344 |
| Interest expense on securities sold short | — | — | 304,459 | — |
| Interest expense and fees on inverse floaters | — | — | 123,493 | — |
| Miscellaneous | 29,540 | 1,623 | 39,539 | 8,076 |
| Total expenses | 2,743,589 | 277,393 | 10,721,628 | 4,224,417 |
| Less: expense reductions (Note 3) | — | (25,861) | — | — |
| Net expenses | 2,743,589 | 251,532 | 10,721,628 | 4,224,417 |
| Net investment income (loss) | 18,005,428 | 2,074,497 | 64,684,983 | 3,672,257 |
| |
| Realized and unrealized gain (loss) | | | | |
|
| Net realized gain (loss) on | | | | |
| Investments in unaffiliated issuers | (2,592,334) | (55,468) | (2,891,121) | (11,148,125) |
| Futures contracts | — | — | (11,375,643) | — |
| Options written | 527,078 | — | 1,675,721 | — |
| Short sales | — | — | (39,299) | — |
| Swap contracts | — | — | (1,859,014) | — |
| Foreign currency transactions | (6,611,240) | — | 2,718,080 | — |
| | (8,676,496) | (55,468) | (11,771,276) | (11,148,125) |
| Change in net unrealized appreciation (depreciation) of | | | | |
| Investments in unaffiliated issuers | 905,447 | (220,017) | (8,832,561) | 50,427,222 |
| Futures contracts | — | — | 8,665,388 | — |
| Options written | 65,002 | — | (69,123) | — |
| Short sales | — | — | (1,040,795) | — |
| Swap contracts | — | — | 2,260,487 | — |
| Translation of assets and liabilities in foreign currencies | 2,682,134 | — | 2,884,741 | — |
| | 3,652,583 | (220,017) | 3,868,137 | 50,427,222 |
| Net realized and unrealized gain (loss) | (5,023,913) | (275,485) | (7,903,139) | 39,279,097 |
| |
| Increase (decrease) in net assets from operations | $12,981,515 | $1,799,012 | $56,781,844 | $42,951,354 |
1 Period from 10-27-06 (commencement of operations) to 8-31-07.
| |
| The accompanying notes are an integral part of the financial statements. | 96 |
John Hancock Funds II
Statements of Operations — for the year ended August 31, 2007
| | | | |
| | U.S. Government | U.S. High | | |
| Investment income | Securities | Yield Bond | U.S. Multi Sector | Value1 |
|
| Interest | $11,065,462 | $28,140,203 | $2,786,473 | $27,348 |
| Dividends | — | — | 25,872,712 | 104,395 |
| Securities lending | 1,928 | 135,521 | 133,345 | — |
| Total investment income | 11,067,390 | 28,275,724 | 28,792,530 | 131,743 |
| |
| Expenses | | | | |
|
| Investment management fees (Note 3) | 1,275,931 | 2,545,950 | 10,930,532 | 52,126 |
| Class 1 distribution and service fees (Note 3) | 21,022 | 1,640 | — | — |
| Fund administration fees (Note 3) | 17,617 | 27,565 | 115,905 | 548 |
| Audit and legal fees | 45,799 | 48,533 | 73,346 | 28,705 |
| Custodian fees | 123,361 | 86,104 | 274,334 | 14,457 |
| Trustees’ fees (Note 4) | 1,838 | 2,707 | 11,551 | 46 |
| Registration and filing fees | 9,499 | 25,173 | 107,999 | 2,522 |
| Miscellaneous | 5,857 | 4,215 | 21,468 | 132 |
| Total expenses | 1,500,924 | 2,741,887 | 11,535,135 | 98,536 |
| Less: expense reductions (Note 3) | — | — | — | (28,756) |
| Net expenses | 1,500,924 | 2,741,887 | 11,535,135 | 69,780 |
| Net investment income (loss) | 9,566,466 | 25,533,837 | 17,257,395 | 61,963 |
| |
| Realized and unrealized gain (loss) | | | | |
|
| Net realized gain (loss) on | | | | |
| Investments in unaffiliated issuers | 361,193 | 531,282 | 46,544,991 | 470,887 |
| Futures contracts | (92,340) | — | 3,069,455 | — |
| Options written | 20,508 | — | — | — |
| Foreign currency transactions | — | — | (16) | — |
| | 289,361 | 531,282 | 49,614,430 | 470,887 |
| Change in net unrealized appreciation (depreciation) of | | | | |
| Investments in unaffiliated issuers | (1,992,688) | (8,700,116) | 62,588,224 | 198,905 |
| Futures contracts | (70,356) | — | (1,306,292) | — |
| | (2,063,044) | (8,700,116) | 61,281,932 | 198,905 |
| Net realized and unrealized gain (loss) | (1,773,683) | (8,168,834) | 110,896,362 | 669,792 |
| |
| Increase (decrease) in net assets from operations | $7,792,783 | $17,365,003 | $128,153,757 | $731,755 |
1 Period from 10-27-06 (commencement of operations) to 8-31-07.
| |
| The accompanying notes are an integral part of the financial statements. | 97 |
John Hancock Funds II
Statements of Operations — for the year ended August 31, 2007
| | | | |
| Investment income | Value & Restructuring | Vista | | |
|
| Interest | $163,641 | $164,492 | | |
| Dividends | 7,948,1031 | 571,6372 | | |
| Securities lending | 129,562 | 23,606 | | |
| Less foreign taxes withheld | (87,197) | (33,404) | | |
| Total investment income | 8,154,109 | 726,331 | | |
| | | |
| Expenses | | | | |
|
| Investment management fees (Note 3) | 2,950,143 | 1,338,288 | | |
| Fund administration fees (Note 3) | 24,112 | 9,037 | | |
| Audit and legal fees | 49,947 | 34,417 | | |
| Custodian fees | 40,630 | 60,846 | | |
| Trustees’ fees (Note 4) | 2,786 | 1,160 | | |
| Registration and filing fees | 27,297 | 12,068 | | |
| Miscellaneous | 9,742 | 2,287 | | |
| Total expenses | 3,104,657 | 1,458,103 | | |
| Net investment income (loss) | 5,049,452 | (731,772) | | |
| | | |
| Realized and unrealized gain (loss) | | | | |
|
| Net realized gain (loss) on | | | | |
| Investments in unaffiliated issuers | 220,373 | 12,182,936 | | |
| Options written | (231,934) | — | | |
| Foreign currency transactions | (1,962) | (217,665) | | |
| | (13,523) | 11,965,271 | | |
| Change in net unrealized appreciation (depreciation) of | | | | |
| Investments in unaffiliated issuers | 52,506,238 | 34,269,773 | | |
| Options written | (13,625) | — | | |
| Translation of assets and liabilities in foreign currencies | 522 | 10,169 | | |
| | 52,493,135 | 34,279,942 | | |
| Net realized and unrealized gain (loss) | 52,479,612 | 46,245,213 | | |
| | | |
| Increase (decrease) in net assets from operations | $57,529,064 | $45,513,441 | | |
1 Including special dividend of $1,127,343.
2 Including special dividend of $205,194.
| |
| The accompanying notes are an integral part of the financial statements. | 98 |
John Hancock Funds II
Statements of Changes in Net Assets
| | | | | | |
| | Absolute Return | Active Bond | All Cap Core |
| | Year ended | Period ended | Year ended | Period ended | Year ended | Period ended |
| Increase (decrease) in net assets | 8-31-07 | 8-31-061 | 8-31-07 | 8-31-062 | 8-31-07 | 8-31-063 |
|
| From operations | | | | | | |
| Net investment income (loss) | $125,194 | $45,240 | $25,034,762 | $14,322,840 | $4,223,735 | $1,296,069 |
| Net realized gain (loss) | 154,226 | — | (372,810) | (3,175,474) | 32,294,842 | (8,220,127) |
| Change in net unrealized appreciation (depreciation) | 157,664 | 160,534 | (3,967,382) | 670,385 | (2,453,036) | 5,270,609 |
| Increase (decrease) in net assets | | | | | | |
| resulting from operations | 437,084 | 205,774 | 20,694,570 | 11,817,751 | 34,065,541 | (1,653,449) |
| Distributions to shareholders | | | | | | |
| From net investment income | | | | | | |
| Class A | (18,971) | — | — | — | — | — |
| Class B | (16,610) | — | — | — | — | — |
| Class C | (16,611) | — | — | — | — | — |
| Class 1 | (19,810) | — | (1,772,251) | (954,551) | — | — |
| Class NAV | — | — | (22,468,413) | (10,220,932) | (1,050,758) | — |
| From net realized gain | | | | | | |
| Class A | (17,280) | — | — | — | — | — |
| Class B | (17,280) | — | — | — | — | — |
| Class C | (17,280) | — | — | — | — | — |
| Class 1 | (17,280) | — | (187) | — | — | — |
| Class NAV | — | — | (2,291) | — | (235,599) | — |
| Total distributions | (141,122) | — | (24,243,142) | (11,175,483) | (1,286,357) | — |
| From Fund share transactions | 141,122 | 5,000,000 | 125,592,034 | 435,912,775 | 159,859,209 | 285,676,890 |
| Total increase (decrease) | 437,084 | 5,205,774 | 122,043,462 | 436,555,043 | 192,638,393 | 284,023,441 |
| |
| Net assets | | | | | | |
|
| Beginning of year | 5,205,774 | — | 436,555,043 | — | 284,023,441 | — |
| End of year | $5,642,858 | $5,205,774 | $558,598,505 | $436,555,043 | $476,661,834 | $284,023,441 |
| Undistributed net investment income (loss) | $103,895 | $50,675 | $5,013,545 | $3,593,004 | $4,237,201 | $1,289,516 |
| |
| |
| | All Cap Growth | All Cap Value | Blue Chip Growth |
| | Year ended | Period ended | Year ended | Period ended | Year ended | Period ended |
| Increase (decrease) in net assets | 8-31-07 | 8-31-064 | 8-31-07 | 8-31-064 | 8-31-07 | 8-31-064 |
|
| From operations | | | | | | |
| Net investment income (loss) | $186,120 | $152,559 | $1,806,232 | $1,435,072 | $6,590,934 | $5,538,646 |
| Net realized gain (loss) | 11,056,525 | (3,003,909) | 30,041,331 | 5,826,940 | 9,284,460 | (3,816,109) |
| Change in net unrealized appreciation (depreciation) | 15,635,619 | 9,501,316 | (3,683,407) | 16,725,292 | 233,357,008 | 70,971,019 |
| Increase (decrease) in net assets | | | | | | |
| resulting from operations | 26,878,264 | 6,649,966 | 28,164,156 | 23,987,304 | 249,232,402 | 72,693,556 |
| Distributions to shareholders | | | | | | |
| From net investment income | | | | | | |
| Class 1 | (18,249) | (15,666) | (173,314) | (29,388) | (900,395) | (96,099) |
| Class NAV | (90,046) | (49,558) | (1,710,968) | (268,692) | (5,894,281) | (798,874) |
| From net realized gain | | | | | | |
| Class 1 | — | — | (581,052) | — | — | — |
| Class NAV | — | — | (5,659,491) | — | — | — |
| Total distributions | (108,295) | (65,224) | (8,124,825) | (298,080) | (6,794,676) | (894,973) |
| From Fund share transactions | (49,571,589) | 148,386,145 | (140,134,472) | 192,472,577 | 171,225,471 | 1,201,052,205 |
| Total increase (decrease) | (22,801,620) | 154,970,887 | (120,095,141) | 216,161,801 | 413,663,197 | 1,272,850,788 |
| |
| Net assets | | | | | | |
|
| Beginning of year | 154,970,887 | — | 216,161,801 | — | 1,272,850,788 | — |
| End of year | $132,169,267 | $154,970,887 | $96,066,660 | $216,161,801 | $1,686,513,985 | $1,272,850,788 |
| Undistributed net investment income (loss) | $169,879 | $90,754 | $1,061,250 | $1,139,300 | $4,492,316 | $4,776,090 |
1 Period from 6-26-06 (commencement of operations) to 8-31-06.
2 Class 1 and Class NAV shares began operations on 10-15-05 and 10-27-05, respectively.
3 Period from 4-28-06 (commencement of operations) to 8-31-06.
4 Period from 10-15-05 (commencement of operations) to 8-31-06.
| |
| The accompanying notes are an integral part of the financial statements. | 99 |
John Hancock Funds II
Statements of Changes in Net Assets
| | | | | | |
| | Capital Appreciation | Core Bond | Core Equity |
| | Year ended | Period ended | Year ended | Period ended | Year ended | Period ended |
| Increase (decrease) in net assets | 8-31-07 | 8-31-061 | 8-31-07 | 8-31-061 | 8-31-07 | 8-31-061 |
|
| From operations | | | | | | |
| Net investment income (loss) | $1,884,968 | $428,220 | $11,107,637 | $6,393,486 | $367,800 | ($25,666) |
| Net realized gain (loss) | (10,045,171) | (17,430,961) | (152,241) | (1,818,731) | 6,942,377 | 3,472,346 |
| Change in net unrealized appreciation (depreciation) | 78,350,830 | 8,657,847 | (393,618) | 869,346 | 60,582,106 | 6,670,679 |
| Increase (decrease) in net assets | | | | | | |
| resulting from operations | 70,190,627 | (8,344,894) | 10,561,778 | 5,444,101 | 67,892,283 | 10,117,359 |
| Distributions to shareholders | | | | | | |
| From net investment income | | | | | | |
| Class 1 | (80,148) | — | (63,466) | (16,947) | (1,945) | — |
| Class NAV | (538,729) | — | (10,612,586) | (4,956,804) | (157,412) | — |
| From net realized gain | | | | | | |
| Class 1 | — | — | (72) | — | (74,812) | — |
| Class NAV | — | — | (11,642) | — | (3,571,972) | — |
| Total distributions | (618,877) | — | (10,687,766) | (4,973,751) | (3,806,141) | — |
| From Fund share transactions | 122,166,930 | 468,589,763 | 70,689,358 | 197,919,446 | 166,093,155 | 586,022,092 |
| Total increase (decrease) | 191,738,680 | 460,244,869 | 70,563,370 | 198,389,796 | 230,179,297 | 596,139,451 |
| |
| Net assets | | | | | | |
|
| Beginning of year | 460,244,869 | — | 198,389,796 | — | 596,139,451 | — |
| End of year | $651,983,549 | $460,244,869 | $268,953,166 | $198,389,796 | $826,318,748 | $596,139,451 |
| Undistributed net investment income (loss) | $1,737,321 | $467,182 | $2,278,759 | $1,657,673 | $253,596 | $97 |
| |
| |
| | Emerging Growth | Emerging Markets Value | Emerging Small Company |
| | Year ended | Period ended | | Period ended | Year ended | Period ended |
| Increase (decrease) in net assets | 8-31-07 | 8-31-061 | 8-31-072 | 8-31-07 | 8-31-061 |
|
| From operations | | | | | | |
| Net investment income (loss) | $437,546 | ($362,036) | $2,773,184 | ($287,705) | ($277,432) |
| Net realized gain (loss) | 11,888,166 | 31,435,329 | 156,756 | (289,622) | 5,329,331 |
| Change in net unrealized appreciation (depreciation) | 20,337,068 | (15,348,460) | 22,530,279 | 9,700,508 | (3,974,924) |
| Increase (decrease) in net assets | | | | | | |
| resulting from operations | 32,662,780 | 15,724,833 | 25,460,219 | 9,123,181 | 1,076,975 |
| Distributions to shareholders | | | | | | |
| From net investment income | | | | | | |
| Class 1 | (37,299) | — | | — | — | — |
| Class NAV | (23,236) | — | | — | — | — |
| From net realized gain | | | | | | |
| Class 1 | (21,422,612) | — | | — | (5,121,451) | — |
| Class NAV | (9,721,109) | — | | — | (52,195) | — |
| Total distributions | (31,204,256) | — | | — | (5,173,646) | — |
| From Fund share transactions | 25,689,284 | 155,929,854 | 457,014,708 | (410,218) | 50,741,810 |
| Total increase (decrease) | 27,147,808 | 171,654,687 | 482,474,927 | 3,539,317 | 51,818,785 |
| |
| Net assets | | | | | | |
|
| Beginning of year | 171,654,687 | — | | — | 51,818,785 | — |
| End of year | $198,802,495 | $171,654,687 | $482,474,927 | $55,358,102 | $51,818,785 |
| Undistributed net investment income (loss) | $407,503 | — | $2,194,721 | — | — |
1 Period from 10-15-05 (commencement of operations) to 8-31-06.
2 Period from 5-1-07 (commencement of operations) to 8-31-07.
| |
| The accompanying notes are an integral part of the financial statements. | 100 |
John Hancock Funds II
Statements of Changes in Net Assets
| | | | | | |
| | Equity-Income | Fundamental Value | Global Bond |
| | Year ended | Period ended | Year ended | Period ended | Year ended | Period ended |
| Increase (decrease) in net assets | 8-31-07 | 8-31-061 | 8-31-07 | 8-31-061 | 8-31-07 | 8-31-061 |
|
| From operations | | | | | | |
| Net investment income (loss) | $14,918,104 | $11,412,365 | $11,231,559 | $5,664,277 | $25,843,040 | $16,234,066 |
| Net realized gain (loss) | 40,689,829 | 31,300,814 | 11,666,973 | 4,817,731 | (10,231,708) | (4,606,069) |
| Change in net unrealized appreciation (depreciation) | 51,014,519 | 56,205,455 | 82,612,038 | 45,751,068 | 10,584,251 | 5,621,665 |
| Increase (decrease) in net assets | | | | | | |
| resulting from operations | 106,622,452 | 98,918,634 | 105,510,570 | 56,233,076 | 26,195,583 | 17,249,662 |
| Distributions to shareholders | | | | | | |
| From net investment income | | | | | | |
| Class 1 | (3,114,779) | (612,671) | (578,789) | (109,544) | (1,006,675) | (227,540) |
| Class NAV | (9,334,197) | (2,371,194) | (6,005,449) | (1,226,769) | (14,865,355) | (2,800,652) |
| From net realized gain | | | | | | |
| Class 1 | (8,942,320) | — | (926,324) | — | (458,971) | — |
| Class NAV | (26,628,618) | — | (9,485,670) | — | (6,707,259) | — |
| Total distributions | (48,019,914) | (2,983,865) | (16,996,232) | (1,336,313) | (23,038,260) | (3,028,192) |
| From Fund share transactions | 146,137,119 | 622,862,224 | 180,763,686 | 706,526,990 | 198,321,998 | 580,776,467 |
| Total increase (decrease) | 204,739,657 | 718,796,993 | 269,278,024 | 761,423,753 | 201,479,321 | 594,997,937 |
| |
| Net assets | | | | | | |
|
| Beginning of year | 718,796,993 | — | 761,423,753 | — | 594,997,937 | — |
| End of year | $923,536,650 | $718,796,993 | $1,030,701,777 | $761,423,753 | $796,477,258 | $594,997,937 |
| Undistributed net investment income (loss) | $10,884,168 | $8,435,232 | $8,830,212 | $4,271,133 | ($14,886,701) | $9,492,882 |
| |
| |
| | Global Real Estate | High Income | High Yield |
| | Year ended | Period ended | Year ended | Period ended | Year ended | Period ended |
| Increase (decrease) in net assets | 8-31-07 | 8-31-062 | 8-31-07 | 8-31-062 | 8-31-07 | 8-31-061 |
|
| From operations | | | | | | |
| Net investment income (loss) | $6,522,961 | $1,893,125 | $22,159,736 | $6,340,541 | $107,639,296 | $81,271,248 |
| Net realized gain (loss) | 26,770,818 | (5,530,696) | 14,928,952 | (553,987) | 12,658,410 | 9,338,978 |
| Change in net unrealized appreciation (depreciation) | 15,978,364 | 15,126,084 | 4,543,691 | (5,980,048) | (51,112,427) | (7,794,032) |
| Increase (decrease) in net assets | | | | | | |
| resulting from operations | 49,272,143 | 11,488,513 | 41,632,379 | (193,494) | 69,185,279 | 82,816,194 |
| Distributions to shareholders | | | | | | |
| From net investment income | | | | | | |
| Class 1 | — | — | — | — | (3,521,287) | (2,373,236) |
| Class NAV | (15,063,407) | — | (21,532,684) | (3,127,218) | (97,919,100) | (67,041,478) |
| From net realized gain | | | | | | |
| Class 1 | — | — | — | — | (299,239) | — |
| Class NAV | — | — | (586,903) | — | (7,985,838) | — |
| Total distributions | (15,063,407) | — | (22,119,587) | (3,127,218) | (109,725,464) | (69,414,714) |
| From Fund share transactions | 76,048,180 | 343,735,965 | 74,502,333 | 292,379,947 | 446,667,941 | 1,174,694,020 |
| Total increase (decrease) | 110,256,916 | 355,224,478 | 94,015,125 | 289,059,235 | 406,127,756 | 1,188,095,500 |
| |
| Net assets | | | | | | |
|
| Beginning of year | 355,224,478 | — | 289,059,235 | — | 1,188,095,500 | — |
| End of year | $465,481,394 | $355,224,478 | $383,074,360 | $289,059,235 | $1,594,223,256 | $1,188,095,500 |
| Undistributed net investment income (loss) | ($716,991) | $5,016,543 | $4,932,631 | $3,490,060 | $21,976,882 | $15,619,891 |
1 Period from 10-15-05 (commencement of operations) to 8-31-06.
2 Period from 4-28-06 (commencement of operations) to 8-31-06.
| |
| The accompanying notes are an integral part of the financial statements. | 101 |
John Hancock Funds II
Statements of Changes in Net Assets
| | | | | | |
| | | Index 500 | International Equity Index | International Opportunities |
| | Period ended | Year ended | Period ended | Year ended | Period ended |
| Increase (decrease) in net assets | 8-31-071 | 8-31-07 | 8-31-062 | 8-31-07 | 8-31-063 |
|
| From operations | | | | | | |
| Net investment income (loss) | $725,878 | $8,375,275 | $5,235,927 | $9,249,579 | $2,821,331 |
| Net realized gain (loss) | (390,754) | 10,171,764 | 2,331,976 | 75,788,455 | 18,421,235 |
| Change in net unrealized appreciation (depreciation) | 1,960,086 | 54,956,522 | 29,836,925 | 47,097,360 | 67,545,351 |
| Increase (decrease) in net assets | | | | | | |
| resulting from operations | 2,295,210 | 73,503,561 | 37,404,828 | 132,135,394 | 88,787,917 |
| Distributions to shareholders | | | | | | |
| From net investment income | | | | | | |
| Class 1 | | — | — | — | (43,663) | (42,136) |
| Class NAV | (112,959) | (5,954,619) | (2,080,681) | (1,902,917) | (18,582,164) |
| From net realized gain | | | | | | |
| Class 1 | | — | — | — | (166,390) | — |
| Class NAV | | — | (3,701,853) | — | (7,030,666) | — |
| Total distributions | (112,959) | (9,656,472) | (2,080,681) | (9,143,636) | (18,624,300) |
| From Fund share transactions | 81,296,406 | 49,526,522 | 272,434,870 | 102,540,199 | 490,997,093 |
| Total increase (decrease) | 83,478,657 | 113,373,611 | 307,759,017 | 225,531,957 | 561,160,710 |
| |
| Net assets | | | | | | |
|
| Beginning of year | | — | 307,759,017 | — | 561,160,710 | — |
| End of year | $83,478,657 | $421,132,628 | $307,759,017 | $786,692,667 | $561,160,710 |
| Undistributed net investment income (loss) | $607,937 | $5,397,216 | $2,881,246 | $7,599,987 | $19,725 |
| |
| |
| | International Small Cap | International Small Company | International Value |
| | Year ended | Period ended | Year ended | Period ended | Year ended | Period ended |
| Increase (decrease) in net assets | 8-31-07 | 8-31-063 | 8-31-07 | 8-31-064 | 8-31-07 | 8-31-063 |
|
| From operations | | | | | | |
| Net investment income (loss) | $5,460,181 | $5,733,388 | $2,750,951 | $974,999 | $27,947,775 | $25,960,995 |
| Net realized gain (loss) | 70,643,278 | 51,817,503 | 25,641,357 | (7,785,169) | 86,511,353 | 50,586,857 |
| Change in net unrealized appreciation (depreciation) | 68,452,908 | 28,663,284 | 30,354,093 | (6,753,919) | 85,432,616 | 105,464,902 |
| Increase (decrease) in net assets | | | | | | |
| resulting from operations | 144,556,367 | 86,214,175 | 58,746,401 | (13,564,089) | 199,891,744 | 182,012,754 |
| Distributions to shareholders | | | | | | |
| From net investment income | | | | | | |
| Class 1 | (536,023) | (59,757) | — | — | (3,627,952) | (353,039) |
| Class NAV | (5,001,016) | (1,022,670) | (1,485,367) | — | (21,823,937) | (2,875,449) |
| From net realized gain | | | | | | |
| Class 1 | (5,435,293) | — | — | — | (8,785,199) | — |
| Class NAV | (50,204,755) | — | — | — | (52,619,688) | — |
| Total distributions | (61,177,087) | (1,082,427) | (1,485,367) | — | (86,856,776) | (3,228,488) |
| From Fund share transactions | (22,897,382) | 310,733,342 | (27,682,259) | 234,475,079 | 160,232,397 | 791,306,845 |
| Total increase (decrease) | 60,481,898 | 395,865,090 | 29,578,775 | 220,910,990 | 273,267,365 | 970,091,111 |
| |
| Net assets | | | | | | |
|
| Beginning of year | 395,865,090 | — | 220,910,990 | — | 970,091,111 | — |
| End of year | $456,346,988 | $395,865,090 | $250,489,765 | $220,910,990 | $1,243,358,476 | $970,091,111 |
| Undistributed net investment income (loss) | $4,486,507 | $4,659,236 | $1,986,284 | $845,678 | $25,985,674 | $23,653,961 |
1 Period from 10-27-06 (commencement of operations) to 8-31-07.
2 Period from 10-29-05 (commencement of operations) to 8-31-06.
3 Period from 10-15-05 (commencement of operations) to 8-31-06.
4 Period from 4-28-06 (commencement of operations) to 8-31-06.
| |
| The accompanying notes are an integral part of the financial statements. | 102 |
John Hancock Funds II
Statements of Changes in Net Assets
| | | | | | |
| | Investment Quality Bond | Large Cap | Large Cap Value |
| | Year ended | Period ended | Year ended | Period ended | Year ended | Period ended |
| Increase (decrease) in net assets | 8-31-07 | 8-31-061 | 8-31-07 | 8-31-061 | 8-31-07 | 8-31-061 |
|
| From operations | | | | | | |
| Net investment income (loss) | $7,050,884 | $4,541,129 | $2,989,602 | $1,363,397 | $4,747,875 | $1,556,729 |
| Net realized gain (loss) | (140,345) | (289,334) | 8,712,231 | 3,114,081 | 15,845,172 | (1,478,897) |
| Change in net unrealized appreciation (depreciation) | (627,815) | (862,651) | 10,568,545 | 9,634,421 | 32,088,987 | 17,901,225 |
| Increase (decrease) in net assets | | | | | | |
| resulting from operations | 6,282,724 | 3,389,144 | 22,270,378 | 14,111,899 | 52,682,034 | 17,979,057 |
| Distributions to shareholders | | | | | | |
| From net investment income | | | | | | |
| Class 1 | (1,851,280) | (1,074,307) | (23,638) | (1,427) | (703,700) | (24,236) |
| Class NAV | (5,269,636) | (2,811,572) | (1,846,623) | (212,012) | (1,983,171) | (293,006) |
| From net realized gain | | | | | | |
| Class 1 | (1,386) | — | (69,040) | — | — | — |
| Class NAV | (3,900) | — | (5,336,259) | — | — | — |
| Total distributions | (7,126,202) | (3,885,879) | (7,275,560) | (213,439) | (2,686,871) | (317,242) |
| From Fund share transactions | 38,524,378 | 128,744,170 | 169,341,054 | 179,904,602 | 152,588,934 | 321,851,954 |
| Total increase (decrease) | 37,680,900 | 128,247,435 | 184,335,872 | 193,803,062 | 202,584,097 | 339,513,769 |
| |
| Net assets | | | | | | |
|
| Beginning of year | 128,247,435 | — | 193,803,062 | — | 339,513,769 | — |
| End of year | $165,928,335 | $128,247,435 | $378,138,934 | $193,803,062 | $542,097,866 | $339,513,769 |
| Undistributed net investment income (loss) | $1,677,053 | $1,197,991 | $2,269,390 | $1,150,049 | $3,303,162 | $1,242,158 |
| |
| |
| | Mid Cap Index | Mid Cap Intersection | Mid Cap Stock |
| | Year ended | Period ended | Period ended | Year ended | Period ended |
| Increase (decrease) in net assets | 8-31-07 | 8-31-062 | | 8-31-073 | 8-31-07 | 8-31-061 |
|
| From operations | | | | | | |
| Net investment income (loss) | $5,591,364 | $966,030 | $206,283 | $726,487 | ($640,399) |
| Net realized gain (loss) | 29,296,263 | 90,512 | (5,202,586) | 34,997,514 | 15,188,535 |
| Change in net unrealized appreciation (depreciation) | 20,357,230 | (1,868,848) | (10,639,254) | 48,522,930 | 16,417,643 |
| Increase (decrease) in net assets | | | | | | |
| resulting from operations | 55,244,857 | (812,306) | (15,635,557) | 84,246,931 | 30,965,779 |
| Distributions to shareholders | | | | | | |
| From net investment income | | | | | | |
| Class 1 | — | — | | — | (386,903) | — |
| Class NAV | (2,132,802) | (98,937) | | — | (738,346) | (8,555) |
| From net realized gain | | | | | | |
| Class 1 | — | — | | — | (4,996,167) | (110,835) |
| Class NAV | (779,434) | — | | — | (9,258,029) | (186,450) |
| Total distributions | (2,912,236) | (98,937) | | — | (15,379,445) | (305,840) |
| From Fund share transactions | 203,540,011 | 173,066,736 | 349,727,102 | 132,753,859 | 270,209,839 |
| Total increase (decrease) | 255,872,632 | 172,155,493 | 334,091,545 | 201,621,345 | 300,869,778 |
| |
| Net assets | | | | | | |
|
| Beginning of year | 172,155,493 | — | | — | 300,869,778 | — |
| End of year | $428,028,125 | $172,155,493 | $334,091,545 | $502,491,123 | $300,869,778 |
| Undistributed net investment income (loss) | $3,994,268 | $825,119 | $206,283 | ($14,538) | — |
1 Period from 10-15-05 (commencement of operations) to 8-31-06.
2 Period from 10-29-05 (commencement of operations) to 8-31-06.
3 Period from 5-1-07 (commencement of operations) to 8-31-07.
| |
| The accompanying notes are an integral part of the financial statements. | 103 |
John Hancock Funds II
Statements of Changes in Net Assets
| | | | | | |
| | Mid Cap Value | Mid Cap Value Equity | Natural Resources |
| | Year ended | Period ended | Year ended | Period ended | Year ended | Period ended |
| Increase (decrease) in net assets | 8-31-07 | 8-31-061 | 8-31-07 | 8-31-062 | 8-31-07 | 8-31-061 |
|
| From operations | | | | | | |
| Net investment income (loss) | $1,334,059 | $1,050,937 | $1,449,256 | $246,829 | $5,626,517 | $6,661,995 |
| Net realized gain (loss) | 9,193,183 | 5,252,528 | 1,918,374 | (888,280) | 166,751,529 | 33,022,588 |
| Change in net unrealized appreciation (depreciation) | 9,149,210 | 8,839,164 | 16,438,964 | (2,464,971) | 53,965,175 | 114,034,956 |
| Increase (decrease) in net assets | | | | | | |
| resulting from operations | 19,676,452 | 15,142,629 | 19,806,594 | (3,106,422) | 226,343,221 | 153,719,539 |
| Distributions to shareholders | | | | | | |
| From net investment income | | | | | | |
| Class 1 | (712,867) | (129,841) | — | — | (688,336) | (51,094) |
| Class NAV | (398,819) | (193,677) | (611,515) | — | (7,332,396) | (691,085) |
| From net realized gain | | | | | | |
| Class 1 | (3,935,640) | (26,180) | — | — | (3,211,811) | — |
| Class NAV | (2,164,603) | (37,303) | — | — | (33,835,034) | — |
| Total distributions | (7,211,929) | (387,001) | (611,515) | — | (45,067,577) | (742,179) |
| From Fund share transactions | 121,116,168 | 128,429,015 | 11,691,496 | 101,230,202 | (111,652,417) | 619,966,691 |
| Total increase (decrease) | 133,580,691 | 143,184,643 | 30,886,575 | 98,123,780 | 69,623,227 | 772,944,051 |
| |
| Net assets | | | | | | |
|
| Beginning of year | 143,184,643 | — | 98,123,780 | — | 772,944,051 | — |
| End of year | $276,765,334 | $143,184,643 | $129,010,355 | $98,123,780 | $842,567,278 | $772,944,051 |
| Undistributed net investment income (loss) | $1,379,904 | $737,063 | $1,004,076 | $230,465 | $3,503,500 | $6,002,486 |
| |
| | Quantitative All Cap | Quantitative Mid Cap | Quantitative Value |
| | Year ended | Period ended | Year ended | Period ended | Year ended | Period ended |
| Increase (decrease) in net assets | 8-31-07 | 8-31-063 | 8-31-074 | 8-31-065 | 8-31-07 | 8-31-061 |
|
| From operations | | | | | | |
| Net investment income (loss) | $28,794 | $6,844 | $785,656 | $220,169 | $11,755,356 | $5,493,128 |
| Net realized gain (loss) | 582,314 | 6,261 | 24,259,542 | (2,725,612) | 61,580,398 | 20,841,210 |
| Change in net unrealized appreciation (depreciation) | 304,309 | 41,732 | (2,813,290) | 9,969,387 | (15,018,119) | 29,110,362 |
| Increase (decrease) in net assets | | | | | | |
| resulting from operations | 915,417 | 54,837 | 22,231,908 | 7,463,944 | 58,317,635 | 55,444,700 |
| Distributions to shareholders | | | | | | |
| From net investment income | | | | | | |
| Class A | (6,133) | — | — | — | — | — |
| Class B | (1,576) | — | — | — | — | — |
| Class C | (1,576) | — | — | — | — | — |
| Class I | (8,085) | — | — | — | — | — |
| Class 1 | — | — | (256,037) | (19,536) | (1,260,172) | (305,249) |
| Class NAV | — | — | (115,344) | (8,107) | (5,564,010) | (884,370) |
| From net realized gain | | | | | | |
| Class A | (1,565) | — | — | — | — | — |
| Class B | (1,565) | — | — | — | — | — |
| Class C | (1,565) | — | — | — | — | — |
| Class I | (1,565) | — | — | — | — | — |
| Class 1 | — | — | (2,102) | (47,665) | (4,979,138) | (11,546) |
| Class NAV | — | — | (899) | (14,289) | (21,793,012) | (33,123) |
| Total distributions | (23,630) | — | (374,382) | (89,597) | (33,596,332) | (1,234,288) |
| From Fund share transactions | 23,630 | 5,000,000 | (81,102,354) | 175,809,916 | 302,639,097 | 403,906,768 |
| Total increase (decrease) | 915,417 | 5,054,837 | (59,244,828) | 183,184,263 | 327,360,400 | 458,117,180 |
| |
| Net assets | | | | | | |
|
| Beginning of year | 5,054,837 | — | 183,184,263 | — | 458,117,180 | — |
| End of year | $5,970,254 | $5,054,837 | $123,939,435 | $183,184,263 | $785,477,580 | $458,117,180 |
| Undistributed net investment income (loss) | $22,886 | $9,516 | $590,099 | $209,085 | $9,223,883 | $4,286,265 |
1 Period from 10-15-05 (commencement of operations) to 8-31-06.
2 Period from 4-28-06 (commencement of operations) to 8-31-06.
3 Period from 7-28-06 (commencement of operations) to 8-31-06.
4 Class NAV shares of Quantitative Mid Cap were terminated on 5-3-07.
5 Class 1 and Class NAV shares began operations on 10-15-05 and 10-27-05, respectively.
| |
| The accompanying notes are an integral part of the financial statements. | 104 |
John Hancock Funds II
Statements of Changes in Net Assets
| | | | | | |
| | Real Estate Equity | Real Estate Securities | Real Return Bond |
| | Year ended | Period ended | Year ended | Period ended | Year ended | Period ended |
| Increase (decrease) in net assets | 8-31-07 | 8-31-061 | 8-31-072 | 8-31-063 | 8-31-07 | 8-31-063 |
|
| From operations | | | | | | |
| Net investment income (loss) | $6,656,167 | $2,061,577 | $4,366,697 | $11,771,816 | $38,237,478 | $25,326,003 |
| Net realized gain (loss) | 23,070,101 | 1,344,206 | 17,706,597 | 76,579,811 | (15,766,869) | (3,594,938) |
| Change in net unrealized appreciation (depreciation) | (20,373,734) | 22,030,725 | (14,129,899) | 32,841,754 | (2,093,841) | (2,812,795) |
| Increase (decrease) in net assets | | | | | | |
| resulting from operations | 9,352,534 | 25,436,508 | 7,943,395 | 121,193,381 | 20,376,768 | 18,918,270 |
| Distributions to shareholders | | | | | | |
| From net investment income | | | | | | |
| Class 1 | — | — | (5,703,118) | (836,666) | (604,013) | (463,414) |
| Class NAV | (4,275,003) | — | — | (3,237,864) | (29,695,308) | (19,110,091) |
| From net realized gain | | | | | | |
| Class 1 | — | — | (81,051,023) | (156,925) | (49,141) | (3,746) |
| Class NAV | (3,826,821) | — | — | (598,547) | (2,118,343) | (140,598) |
| Total distributions | (8,101,824) | — | (86,754,141) | (4,830,002) | (32,466,805) | (19,717,849) |
| From Fund share transactions | (21,676,579) | 249,457,958 | 53,065,257 | 54,198,256 | 279,768,972 | 702,596,985 |
| Total increase (decrease) | (20,425,869) | 274,894,466 | (25,745,489) | 170,561,635 | 267,678,935 | 701,797,406 |
| |
| Net assets | | | | | | |
|
| Beginning of year | 274,894,466 | — | 170,561,635 | — | 701,797,406 | — |
| End of year | $254,468,597 | $274,894,466 | $144,816,146 | $170,561,635 | $969,476,341 | $701,797,406 |
| Undistributed net investment income (loss) | $407,386 | $1,515,505 | $966,761 | $3,984,988 | $14,139,935 | $3,339,086 |
| |
| |
| | Small Cap | Small Cap Index | Small Cap Opportunities |
| | Year ended | Period ended | Year ended | Period ended | Year ended | Period ended |
| Increase (decrease) in net assets | 8-31-07 | 8-31-063 | 8-31-07 | 8-31-064 | 8-31-07 | 8-31-0633 |
|
| From operations | | | | | | |
| Net investment income (loss) | ($401,516) | ($474,061) | $1,482,243 | $642,036 | $3,529,722 | $2,160,847 |
| Net realized gain (loss) | 18,148,584 | (1,290,852) | 13,089,047 | 3,362,074 | 315,979 | 6,633,397 |
| Change in net unrealized appreciation (depreciation) | 15,935,147 | 8,031,744 | 2,451,794 | 1,215,440 | 11,923,803 | 15,182,294 |
| Increase (decrease) in net assets | | | | | | |
| resulting from operations | 33,682,215 | 6,266,831 | 17,023,084 | 5,219,550 | 15,769,504 | 23,976,538 |
| Distributions to shareholders | | | | | | |
| From net investment income | | | | | | |
| Class 1 | — | — | — | — | (419,296) | (48,845) |
| Class NAV | — | — | (1,034,704) | (86,672) | (2,899,008) | (462,991) |
| From net realized gain | | | | | | |
| Class 1 | — | — | — | — | (861,596) | (3,697) |
| Class NAV | — | — | (3,992,892) | — | (5,905,883) | (33,252) |
| Total distributions | — | — | (5,027,596) | (86,672) | (10,085,783) | (548,785) |
| From Fund share transactions | (105,336,693) | 234,324,408 | (47,689,663) | 119,963,560 | (24,662,257) | 223,703,772 |
| Total increase (decrease) | (71,654,478) | 240,591,239 | (35,694,175) | 125,096,438 | (18,978,536) | 247,131,525 |
| |
| Net assets | | | | | | |
|
| Beginning of year | 240,591,239 | — | 125,096,438 | — | 247,131,525 | — |
| End of year | $168,936,761 | $240,591,239 | $89,402,263 | $125,096,438 | $228,152,989 | $247,131,525 |
| Undistributed net investment income (loss) | — | — | $898,736 | $536,633 | $1,720,966 | $1,544,403 |
1 Period from 4-28-06 (commencement of operations) to 8-31-06.
2 Class NAV shares of Real Estate Securities Fund were terminated on 5-1-06.
3 Period from 10-15-05 (commencement of operations) to 8-31-06.
4 Period from 10-29-05 (commencement of operations) to 8-31-06.
| |
| The accompanying notes are an integral part of the financial statements. | 105 |
John Hancock Funds II
Statements of Changes in Net Assets
| | | | | | |
| | Small Company | Small Company Growth | Small Company Value |
| | Year ended | Period ended | Year ended | Period ended | Year ended | Period ended |
| Increase (decrease) in net assets | 8-31-07 | 8-31-061 | 8-31-07 | 8-31-062 | 8-31-07 | 8-31-061 |
|
| From operations | | | | | | |
| Net investment income (loss) | ($208,657) | ($223,873) | ($814,422) | ($439,085) | $1,019,956 | $1,514,278 |
| Net realized gain (loss) | 6,281,718 | (349,401) | 5,186,594 | 1,671,492 | 16,732,830 | 2,995,867 |
| Change in net unrealized appreciation (depreciation) | 4,434,469 | 1,321,814 | 9,504,714 | 4,880,900 | 24,741,259 | 32,157,056 |
| Increase (decrease) in net assets | | | | | | |
| resulting from operations | 10,507,530 | 748,540 | 13,876,886 | 6,113,307 | 42,494,045 | 36,667,201 |
| Distributions to shareholders | | | | | | |
| From net investment income | | | | | | |
| Class 1 | — | — | — | — | (399,933) | (272,671) |
| Class NAV | — | — | — | — | (718,167) | (401,689) |
| From net realized gain | | | | | | |
| Class 1 | — | — | — | — | (2,245,675) | — |
| Class NAV | — | — | (1,393,929) | — | (3,878,230) | — |
| Total distributions | — | — | (1,393,929) | — | (7,242,005) | (674,360) |
| From Fund share transactions | (5,883,810) | 92,677,026 | 121,930,345 | 67,787,488 | 39,886,714 | 351,922,253 |
| Total increase (decrease) | 4,623,720 | 93,425,566 | 134,413,302 | 73,900,795 | 75,138,754 | 387,915,094 |
| |
| Net assets | | | | | | |
|
| Beginning of year | 93,425,566 | — | 73,900,795 | — | 387,915,094 | — |
| End of year | $98,049,286 | $93,425,566 | $208,314,097 | $73,900,795 | $463,053,848 | $387,915,094 |
| Undistributed net investment income (loss) | — | — | ($2) | ($2) | $345,267 | $846,061 |
| |
| |
| | Special Value | Spectrum Income | Strategic Bond |
| | Year ended | Period ended | Year ended | Period ended | Year ended | Period ended |
| Increase (decrease) in net assets | 8-31-073 | 8-31-061 | 8-31-07 | 8-31-062 | 8-31-07 | 8-31-061 |
|
| From operations | | | | | | |
| Net investment income (loss) | $664,571 | $410,621 | $39,873,709 | $22,721,733 | $21,354,359 | $17,296,917 |
| Net realized gain (loss) | 25,805,142 | 910,254 | 12,628,712 | 637,457 | 1,325,127 | (4,887,393) |
| Change in net unrealized appreciation (depreciation) | (7,713,070) | 7,424,159 | 5,526,452 | 11,651,117 | (14,078,681) | 2,577,393 |
| Increase (decrease) in net assets | | | | | | |
| resulting from operations | 18,756,643 | 8,745,034 | 58,028,873 | 35,010,307 | 8,600,805 | 14,986,917 |
| Distributions to shareholders | | | | | | |
| From net investment income | | | | | | |
| Class 1 | (28,377) | (1,203) | — | — | (2,346,688) | (1,747,753) |
| Class NAV | (818,819) | (80,457) | (37,709,123) | (18,140,475) | (17,589,075) | (13,039,773) |
| From net realized gain | | | | | | |
| Class 1 | (1,435,178) | — | — | — | (38) | (10,065) |
| Class NAV | (24,248,658) | — | (1,278,570) | — | (254) | (114,768) |
| Total distributions | (26,531,032) | (81,660) | (38,987,693) | (18,140,475) | (19,936,055) | (14,912,359) |
| From Fund share transactions | (115,264,938) | 118,998,419 | 196,465,949 | 746,861,140 | 168,235,858 | 311,694,682 |
| Total increase (decrease) | (123,039,327) | 127,661,793 | 215,507,129 | 763,730,972 | 156,900,608 | 311,769,240 |
| |
| Net assets | | | | | | |
|
| Beginning of year | 127,661,793 | — | 763,730,972 | — | 311,769,240 | — |
| End of year | $4,622,466 | $127,661,793 | $979,238,101 | $763,730,972 | $468,669,848 | $311,769,240 |
| Undistributed net investment income (loss) | $25,548 | $292,695 | $10,011,334 | $6,423,970 | $3,902,664 | $3,116,177 |
1 Period from 10-15-05 (commencement of operations) to 8-31-06.
2 Period from 10-29-05 (commencement of operations) to 8-31-06.
3 Class NAV shares of Special Value were terminated on 5-30-07.
| |
| The accompanying notes are an integral part of the financial statements. | 106 |
John Hancock Funds II
Statements of Changes in Net Assets
| | | | | | |
| | Strategic Income | Total Bond Market | Total Return |
| | Year ended | Period ended | Period ended | Year ended | Period ended |
| Increase (decrease) in net assets | 8-31-07 | 8-31-061 | | 8-31-072 | 8-31-07 | 8-31-063 |
|
| From operations | | | | | | |
| Net investment income (loss) | $18,005,428 | $3,848,752 | $2,074,497 | $64,684,983 | $35,083,437 |
| Net realized gain (loss) | (8,676,496) | 909,475 | | (55,468) | (11,771,276) | 1,603 |
| Change in net unrealized appreciation (depreciation) | 3,652,583 | (1,112,323) | (220,017) | 3,868,137 | 1,758,133 |
| Increase (decrease) in net assets | | | | | | |
| resulting from operations | 12,981,515 | 3,645,904 | 1,799,012 | 56,781,844 | 36,843,173 |
| Distributions to shareholders | | | | | | |
| From net investment income | | | | | | |
| Class 1 | — | — | | — | (4,700,672) | (2,773,005) |
| Class NAV | (12,664,623) | (2,008,968) | (1,721,518) | (48,061,952) | (24,067,715) |
| From net realized gain | | | | | | |
| Class 1 | — | — | | — | (265,340) | — |
| Class NAV | — | — | | — | (2,548,023) | — |
| Total distributions | (12,664,623) | (2,008,968) | (1,721,518) | (55,575,987) | (26,840,720) |
| From Fund share transactions | 141,283,033 | 279,456,497 | 53,505,674 | 365,795,161 | 1,149,272,239 |
| Total increase (decrease) | 141,599,925 | 281,093,433 | 53,583,168 | 367,001,018 | 1,159,274,692 |
| |
| Net assets | | | | | | |
|
| Beginning of year | 281,093,433 | — | | — | 1,159,274,692 | — |
| End of year | $422,693,358 | $281,093,433 | $53,583,168 | $1,526,275,710 | $1,159,274,692 |
| Undistributed net investment income (loss) | $2,440,809 | $3,755,040 | $478,101 | $19,045,374 | $10,021,670 |
| |
| |
| | U.S. Global Leaders Growth | U.S. Government Securities | U.S. High Yield Bond |
| | Year ended | Period ended | Year ended | Period ended | Year ended | Period ended |
| Increase (decrease) in net assets | 8-31-07 | 8-31-063 | 8-31-07 | 8-31-063 | 8-31-07 | 8-31-063 |
|
| From operations | | | | | | |
| Net investment income (loss) | $3,672,257 | $1,799,216 | $9,566,466 | $6,188,465 | $25,533,837 | $12,363,225 |
| Net realized gain (loss) | (11,148,125) | (5,771,575) | 289,361 | (1,000,906) | 531,282 | (96,841) |
| Change in net unrealized appreciation (depreciation) | 50,427,222 | (14,622,516) | (2,063,044) | 629,379 | (8,700,116) | (747,561) |
| Increase (decrease) in net assets | | | | | | |
| resulting from operations | 42,951,354 | (18,594,875) | 7,792,783 | 5,816,938 | 17,365,003 | 11,518,823 |
| Distributions to shareholders | | | | | | |
| From net investment income | | | | | | |
| Class 1 | (122,004) | (10,881) | (1,928,490) | (1,060,319) | (226,221) | (38,635) |
| Class NAV | (2,499,659) | (198,525) | (7,809,347) | (3,604,130) | (24,325,401) | (9,044,306) |
| From net realized gain | | | | | | |
| Class 1 | — | — | (59,567) | (15,290) | (104) | — |
| Class NAV | — | — | (250,357) | (44,735) | (12,238) | — |
| Total distributions | (2,621,663) | (209,406) | (10,047,761) | (4,724,474) | (24,563,964) | (9,082,941) |
| From Fund share transactions | 162,902,644 | 495,818,107 | (4,472,069) | 202,472,305 | 113,947,229 | 287,577,645 |
| Total increase (decrease) | 203,232,335 | 477,013,826 | (6,727,047) | 203,564,769 | 106,748,268 | 290,013,527 |
| |
| Net assets | | | | | | |
|
| Beginning of year | 477,013,826 | — | 203,564,769 | — | 290,013,527 | — |
| End of year | $680,246,161 | $477,013,826 | $196,837,722 | $203,564,769 | $396,761,795 | $290,013,527 |
| Undistributed net investment income (loss) | $2,643,747 | $1,593,153 | $1,745,178 | $1,806,481 | $5,298,608 | $3,824,838 |
1 Period from 4-28-06 (commencement of operations) to 8-31-06.
2 Period from 10-27-06 (commencement of operations) to 8-31-07.
3 Period from 10-15-05 (commencement of operations) to 8-31-06.
| |
| The accompanying notes are an integral part of the financial statements. | 107 |
John Hancock Funds II
Statements of Changes in Net Assets
| | | | | |
| | U.S. Multi Sector | Value | Value & Restructuring |
| | Year ended | Period ended | Period ended | Year ended | Period ended |
| Increase (decrease) in net assets | 8-31-07 | 8-31-061 | 8-31-072 | 8-31-07 | 8-31-061 |
|
| From operations | | | | | |
| Net investment income (loss) | $17,257,395 | $9,102,196 | $61,963 | $5,049,452 | $2,346,697 |
| Net realized gain (loss) | 49,614,430 | 4,342,196 | 470,887 | (13,523) | 1,120,491 |
| Change in net unrealized appreciation (depreciation) | 61,281,932 | 26,125,188 | 198,905 | 52,493,135 | 9,209,793 |
| Increase (decrease) in net assets | | | | | |
| resulting from operations | 128,153,757 | 39,569,580 | 731,755 | 57,529,064 | 12,676,981 |
| Distributions to shareholders | | | | | |
| From net investment income | | | | | |
| Class NAV | (12,350,979) | (1,421,127) | (7,330) | (3,198,754) | (406,118) |
| From net realized gain | | | | | |
| Class NAV | (6,470,404) | — | — | (1,103,470) | — |
| Total distributions | (18,821,383) | (1,421,127) | (7,330) | (4,302,224) | (406,118) |
| From Fund share transactions | 187,458,471 | 1,188,817,440 | 13,205,808 | 45,537,723 | 284,223,844 |
| Total increase (decrease) | 296,790,845 | 1,226,965,893 | 13,930,233 | 98,764,563 | 296,494,707 |
| |
| Net assets | | | | | |
|
| Beginning of year | 1,226,965,893 | — | — | 296,494,707 | — |
| End of year | $1,523,756,738 | $1,226,965,893 | $13,930,233 | $395,259,270 | $296,494,707 |
| Undistributed net investment income (loss) | $13,928,421 | $7,664,576 | $54,634 | $4,095,499 | $1,962,533 |
| |
| |
| | Vista | | | |
| | Year ended | Period ended | | | |
| Increase (decrease) in net assets | 8-31-07 | 8-31-061 | | | |
|
| From operations | | | | | |
| Net investment income (loss) | ($731,772) | ($135,179) | | | |
| Net realized gain (loss) | 11,965,271 | (4,143,358) | | | |
| Change in net unrealized appreciation (depreciation) | 34,279,942 | 10,751,445 | | | |
| Increase (decrease) in net assets | | | | | |
| resulting from operations | 45,513,441 | 6,472,908 | | | |
| From Fund share transactions | 1,457,923 | 116,136,795 | | | |
| Total increase (decrease) | 46,971,364 | 122,609,703 | | | |
| |
| Net assets | | | | | |
|
| Beginning of year | 122,609,703 | — | | | |
| End of year | $169,581,067 | $122,609,703 | | | |
| Undistributed net investment income (loss) | ($211,933) | ($483) | | | |
1 Period from 10-29-05 (commencement of operations) to 8-31-06.
2 Period from 10-27-06 (commencement of operations) to 8-31-07.
| |
| The accompanying notes are an integral part of the financial statements. | 108 |
John Hancock Funds II
Financial Highlights
| | | | | | | | | | | | | | | |
| Per share operating performance for a share outstanding throughout the period | | | | Ratios and supplemental data | | |
| | | Income (loss) from | | | | | | | | | | | | |
| | | investment operations | | Less distributions | | | | | Ratios to average net assets | | |
| | | ——————————— | | ———————————————————— | | | —————————————— | | |
| | | | | | | | | | | | | | | Ratio | |
| | | | | | | | | | | | | | | of net | |
| | | | Net real- | | | | | | | | | Ratio | Ratio | investment | |
| | | | ized and | | | | | | | | Net | of net | of gross | income | |
| | Net asset | Net | unrealized | Total from | | | | | Net asset | | assets, | expenses | expenses | (loss) | |
| | value, | investment | gain (loss) | investment | From net | From net | From | Total | value, | Total | end of | to average | to average | to average | Portfolio |
| | beginning | income | on invest- | oper- | investment | realized | capital | distri- | end of | return | period | net | net | net | turnover |
| Period ended | of period ($) | (loss) ($) | ments ($) | ations ($) | income ($) | gain ($) | paid-in ($) | butions ($) | period ($) | (%) | (in millions) | assets (%) | assets (%) | assets (%) | (%) |
|
| |
| Absolute Return | | | | | | | | | | | | | | |
| CLASS A | | | | | | | | | | | | | | | |
|
| 8-31-2007 | 10.42 | 0.287 | 0.62 | 0.90 | (0.15) | (0.14) | — | (0.29) | 11.03 | 8.721,2 | 1 | 0.553 | 1.653,4 | 2.555 | 18 |
|
| 8-31-20066 | 10.00 | 0.107 | 0.32 | 0.42 | — | — | — | — | 10.42 | 4.201,2,8 | 1 | 0.553,9 | 4.043,4,9 | 5.175,9 | —8 |
|
| CLASS B | | | | | | | | | | | | | | | |
|
| 8-31-2007 | 10.40 | 0.207 | 0.63 | 0.83 | (0.14) | (0.14) | — | (0.28) | 10.95 | 7.961,2 | 1 | 1.253 | 2.343,4 | 1.855 | 18 |
|
| 8-31-20066 | 10.00 | 0.087 | 0.32 | 0.40 | — | — | — | — | 10.40 | 4.001,2,8 | 1 | 1.253,9 | 4.733,4,9 | 4.485,9 | —8 |
|
| CLASS C | | | | | | | | | | | | | | | |
|
| 8-31-2007 | 10.40 | 0.207 | 0.63 | 0.83 | (0.14) | (0.14) | — | (0.28) | 10.95 | 7.961,2 | 1 | 1.253 | 2.343,4 | 1.855 | 18 |
|
| 8-31-20066 | 10.00 | 0.087 | 0.32 | 0.40 | — | — | — | — | 10.40 | 4.001,2,8 | 1 | 1.253,9 | 4.733,4,9 | 4.485,9 | —8 |
|
| CLASS 1 | | | | | | | | | | | | | | | |
|
| 8-31-2007 | 10.42 | 0.317 | 0.62 | 0.93 | (0.16) | (0.14) | — | (0.30) | 11.05 | 8.981,2 | 1 | 0.303 | 1.403,4 | 2.805 | 18 |
|
| 8-31-20066 | 10.00 | 0.107 | 0.32 | 0.42 | — | — | — | — | 10.42 | 4.201,2,8 | 1 | 0.303,9 | 3.793,4,9 | 5.425,9 | —8 |
|
| |
| |
| Active Bond | | | | | | | | | | | | | | |
| CLASS 1 | | | | | | | | | | | | | | | |
|
| 8-31-2007 | 9.60 | 0.477 | (0.06) | 0.41 | (0.47) | —11 | — | (0.47) | 9.54 | 4.3812 | 36 | 0.73 | 0.73 | 4.92 | 16527 |
|
| 8-31-200610 | 9.61 | 0.367 | (0.11) | 0.25 | (0.26) | — | — | (0.26) | 9.60 | 2.688,12 | 37 | 0.799 | 0.799 | 4.279 | 4068 |
|
| CLASS NAV | | | | | | | | | | | | | | |
|
| 8-31-2007 | 9.60 | 0.487 | (0.07) | 0.41 | (0.48) | —11 | — | (0.48) | 9.53 | 4.3412 | 523 | 0.68 | 0.68 | 4.99 | 16527 |
|
| 8-31-200610 | 9.58 | 0.357 | (0.06) | 0.29 | (0.27) | — | — | (0.27) | 9.60 | 3.098,12 | 399 | 0.709 | 0.709 | 4.309 | 4068 |
|
| |
| |
| All Cap Core | | | | | | | | | | | | | | |
| CLASS NAV | | | | | | | | | | | | | | |
|
| 8-31-2007 | 9.92 | 0.127 | 1.06 | 1.18 | (0.03) | (0.01) | — | (0.04) | 11.06 | 11.9312 | 477 | 0.83 | 0.83 | 1.12 | 244 |
|
| 8-31-200613 | 10.00 | 0.057 | (0.13) | (0.08) | — | — | — | — | 9.92 | (0.80)8 | 284 | 0.849 | 0.849 | 1.429 | 868 |
|
| |
| |
| All Cap Growth | | | | | | | | | | | | | | |
| CLASS 1 | | | | | | | | | | | | | | | |
|
| 8-31-2007 | 16.43 | 0.017 | 2.85 | 2.86 | (0.01) | — | — | (0.01) | 19.28 | 17.4112 | 33 | 0.97 | 0.97 | 0.07 | 102 |
|
| 8-31-200614 | 15.50 | 0.017 | 0.93 | 0.94 | (0.01) | — | — | (0.01) | 16.43 | 6.058,12 | 32 | 1.009 | 1.009 | 0.089 | 1068 |
|
| CLASS NAV | | | | | | | | | | | | | | |
|
| 8-31-2007 | 16.45 | 0.027 | 2.85 | 2.87 | (0.01) | — | — | (0.01) | 19.31 | 17.4612 | 99 | 0.92 | 0.92 | 0.13 | 102 |
|
| 8-31-200614 | 15.51 | 0.027 | 0.93 | 0.95 | (0.01) | — | — | (0.01) | 16.45 | 6.118,12 | 123 | 0.959 | 0.959 | 0.149 | 1068 |
|
| |
| |
| All Cap Value | | | | | | | | | | | | | | |
| CLASS 1 | | | | | | | | | | | | | | | |
|
| 8-31-2007 | 15.84 | 0.147 | 1.82 | 1.96 | (0.12) | (0.42) | — | (0.54) | 17.26 | 12.6412 | 26 | 0.97 | 0.97 | 0.82 | 82 |
|
| 8-31-200614 | 13.84 | 0.117 | 1.91 | 2.02 | (0.02) | — | — | (0.02) | 15.84 | 14.648,12,15 | 21 | 0.949 | 0.949 | 0.809 | 488 |
|
| CLASS NAV | | | | | | | | | | | | | | |
|
| 8-31-2007 | 15.80 | 0.157 | 1.81 | 1.96 | (0.13) | (0.42) | — | (0.55) | 17.21 | 12.6212 | 70 | 0.88 | 0.88 | 0.93 | 82 |
|
| 8-31-200614 | 13.80 | 0.127 | 1.91 | 2.03 | (0.03) | — | — | (0.03) | 15.80 | 14.698,12,15 | 195 | 0.899 | 0.899 | 0.889 | 488 |
|
| |
| The accompanying notes are an integral part of the financial statements. | 109 |
John Hancock Funds II
Financial Highlights
| | | | | | | | | | | | | | | |
| Per share operating performance for a share outstanding throughout the period | | | | Ratios and supplemental data | | |
| | | Income (loss) from | | | | | | | | | | | | |
| | | investment operations | | Less distributions | | | | | Ratios to average net assets | | |
| | | ——————————— | | ———————————————————— | | | —————————————— | | |
| | | | | | | | | | | | | | | Ratio | |
| | | | | | | | | | | | | | | of net | |
| | | | Net real- | | | | | | | | | Ratio | Ratio | investment | |
| | | | ized and | | | | | | | | Net | of net | of gross | income | |
| | Net asset | Net | unrealized | Total from | | | | | Net asset | | assets, | expenses | expenses | (loss) | |
| | value, | investment | gain (loss) | investment | From net | From net | From | Total | value, | Total | end of | to average | to average | to average | Portfolio |
| | beginning | income | on invest- | oper- | investment | realized | capital | distri- | end of | return | period | net | net | net | turnover |
| Period ended | of period ($) | (loss) ($) | ments ($) | ations ($) | income ($) | gain ($) | paid-in ($) | butions ($) | period ($) | (%) | (in millions) | assets (%) | assets (%) | assets (%) | (%) |
|
| |
| Blue Chip Growth | | | | | | | | | | | | | |
| CLASS 1 | | | | | | | | | | | | | | | |
|
| 8-31-2007 | 17.82 | 0.087,39 | 3.17 | 3.25 | (0.09) | — | — | (0.09) | 20.98 | 18.282,12 | 204 | 0.86 | 0.894 | 0.39 | 33 |
|
| 8-31-200614 | 16.53 | 0.087 | 1.22 | 1.30 | (0.01) | — | — | (0.01) | 17.82 | 7.882,8,12 | 185 | 0.889 | 0.904,9 | 0.519 | 288 |
|
| CLASS NAV | | | | | | | | | | | | | | |
|
| 8-31-2007 | 17.80 | 0.097,39 | 3.17 | 3.26 | (0.09) | — | — | (0.09) | 20.97 | 18.372,12 | 1,483 | 0.81 | 0.844 | 0.44 | 33 |
|
| 8-31-200614 | 16.51 | 0.097 | 1.22 | 1.31 | (0.02) | — | — | (0.02) | 17.80 | 7.902,8,12 | 1,088 | 0.839 | 0.854,9 | 0.589 | 288 |
|
| |
| |
| Capital Appreciation | | | | | | | | | | | | | |
| CLASS 1 | | | | | | �� | | | | | | | | | |
|
| 8-31-2007 | 9.44 | 0.037 | 1.33 | 1.36 | (0.01) | — | — | (0.01) | 10.79 | 14.4312 | 66 | 0.81 | 0.81 | 0.27 | 63 |
|
| 8-31-200614 | 9.20 | 0.017 | 0.23 | 0.24 | — | — | — | — | 9.44 | 2.618 | 68 | 0.889 | 0.889 | 0.109 | 578 |
|
| CLASS NAV | | | | | | | | | | | | | | |
|
| 8-31-2007 | 9.45 | 0.047 | 1.32 | 1.36 | (0.01) | — | — | (0.01) | 10.80 | 14.4212 | 586 | 0.76 | 0.76 | 0.34 | 63 |
|
| 8-31-200614 | 9.20 | 0.017 | 0.24 | 0.25 | — | — | — | — | 9.45 | 2.728 | 393 | 0.839 | 0.839 | 0.159 | 578 |
|
| |
| |
| Core Bond | | | | | | | | | | | | | | |
| CLASS 1 | | | | | | | | | | | | | | | |
|
| 8-31-2007 | 12.52 | 0.587 | (0.02) | 0.56 | (0.57) | —11 | — | (0.57) | 12.51 | 4.6012 | 2 | 0.82 | 0.82 | 4.67 | 31328 |
|
| 8-31-200614 | 12.51 | 0.477 | (0.12) | 0.35 | (0.34) | — | — | (0.34) | 12.52 | 2.868,12 | 1 | 0.889 | 0.889 | 4.399 | 4368 |
|
| CLASS NAV | | | | | | | | | | | | | | |
|
| 8-31-2007 | 12.51 | 0.597 | (0.02) | 0.57 | (0.58) | —11 | — | (0.58) | 12.50 | 4.6712 | 267 | 0.77 | 0.77 | 4.71 | 31328 |
|
| 8-31-200614 | 12.50 | 0.467 | (0.11) | 0.35 | (0.34) | — | — | (0.34) | 12.51 | 2.908,12 | 197 | 0.839 | 0.839 | 4.249 | 4368 |
|
| |
| |
| Core Equity | | | | | | | | | | | | | | |
| CLASS 1 | | | | | | | | | | | | | | | |
|
| 8-31-2007 | 14.25 | —7,11 | 1.71 | 1.71 | —11 | (0.09) | — | (0.09) | 15.87 | 11.9912 | 14 | 0.86 | 0.86 | —16 | 12 |
|
| 8-31-200614 | 13.76 | (0.01)7 | 0.50 | 0.49 | — | — | — | — | 14.25 | 3.568,12 | 12 | 0.889 | 0.889 | (0.04)9 | 138 |
|
| CLASS NAV | | | | | | | | | | | | | | |
|
| 8-31-2007 | 14.27 | 0.017 | 1.70 | 1.71 | —11 | (0.09) | — | (0.09) | 15.89 | 11.9912 | 812 | 0.81 | 0.81 | 0.05 | 12 |
|
| 8-31-200614 | 13.77 | —7,11 | 0.50 | 0.50 | — | — | — | — | 14.27 | 3.638,12 | 584 | 0.839 | 0.839 | (0.01)9 | 138 |
|
| |
| |
| Emerging Growth | | | | | | | | | | | | | |
| CLASS 1 | | | | | | | | | | | | | | | |
|
| 8-31-2007 | 18.34 | 0.047 | 3.15 | 3.19 | (0.01) | (3.34) | — | (3.35) | 18.18 | 19.2012 | 128 | 0.88 | 0.88 | 0.21 | 44 |
|
| 8-31-200614 | 16.35 | (0.04)7 | 2.03 | 1.99 | — | — | — | — | 18.34 | 12.178 | 120 | 0.989 | 0.989 | (0.26)9 | 2068 |
|
| CLASS NAV | | | | | | | | | | | | | | |
|
| 8-31-2007 | 18.34 | 0.057 | 3.15 | 3.20 | (0.01) | (3.34) | — | (3.35) | 18.19 | 19.2712 | 71 | 0.83 | 0.83 | 0.28 | 44 |
|
| 8-31-200614 | 16.35 | (0.03)7 | 2.02 | 1.99 | — | — | — | — | 18.34 | 12.178 | 51 | 0.939 | 0.939 | (0.20)9 | 2068 |
|
| |
| |
| Emerging Markets Value | | | | | | | | | | | | | |
| CLASS NAV | | | | | | | | | | | | | | |
|
| 8-31-200717 | 10.00 | 0.087 | 0.94 | 1.02 | — | — | — | — | 11.02 | 10.208 | 482 | 1.109 | 1.109 | 2.149 | 28 |
|
| |
| The accompanying notes are an integral part of the financial statements. | 110 |
John Hancock Funds II
Financial Highlights
| | | | | | | | | | | | | | | |
| Per share operating performance for a share outstanding throughout the period | | | | Ratios and supplemental data | | |
| | | Income (loss) from | | | | | | | | | | | | |
| | | investment operations | | Less distributions | | | | | Ratios to average net assets | | |
| | | ——————————— | | ———————————————————— | | | —————————————— | | |
| | | | | | | | | | | | | | | Ratio | |
| | | | | | | | | | | | | | | of net | |
| | | | Net real- | | | | | | | | | Ratio | Ratio | investment | |
| | | | ized and | | | | | | | | Net | of net | of gross | income | |
| | Net asset | Net | unrealized | Total from | | | | | Net asset | | assets, | expenses | expenses | (loss) | |
| | value, | investment | gain (loss) | investment | From net | From net | From | Total | value, | Total | end of | to average | to average | to average | Portfolio |
| | beginning | income | on invest- | oper- | investment | realized | capital | distri- | end of | return | period | net | net | net | turnover |
| Period ended | of period ($) | (loss) ($) | ments ($) | ations ($) | income ($) | gain ($) | paid-in ($) | butions ($) | period ($) | (%) | (in millions) | assets (%) | assets (%) | assets (%) | (%) |
|
| |
| Emerging Small Company | | | | | | | | | | | | | |
| CLASS 1 | | | | | | | | | | | | | | | |
|
| 8-31-2007 | 28.97 | (0.17)7 | 5.39 | 5.22 | — | (3.05) | — | (3.05) | 31.14 | 19.302,12 | 48 | 1.07 | 1.074 | (0.56) | 88 |
|
| 8-31-200618 | 28.17 | (0.16)7 | 0.96 | 0.80 | — | — | — | — | 28.97 | 2.842,8 | 52 | 1.139 | 1.304,9 | (0.57)9 | 2078 |
|
| CLASS NAV | | | | | | | | | | | | | | |
|
| 8-31-2007 | 28.97 | (0.13)7 | 5.36 | 5.23 | — | (3.05) | — | (3.05) | 31.15 | 19.342,12 | 7 | 1.02 | 1.024 | (0.42) | 88 |
|
| 8-31-200618 | 29.40 | (0.04)7 | (0.39) | (0.43) | — | — | — | — | 28.97 | (1.46)2,8 | —19 | 1.089 | 1.764,9 | (0.71)9 | 2078 |
|
| |
| |
| Equity-Income | | | | | | | | | | | | | | |
| CLASS 1 | | | | | | | | | | | | | | | |
|
| 8-31-2007 | 18.13 | 0.337 | 2.22 | 2.55 | (0.30) | (0.86) | — | (1.16) | 19.52 | 14.372,12 | 212 | 0.86 | 0.894 | 1.70 | 20 |
|
| 8-31-200614 | 16.03 | 0.267 | 1.90 | 2.16 | (0.06) | — | — | (0.06) | 18.13 | 13.522,8,12 | 183 | 0.899 | 0.904,9 | 1.689 | 398 |
|
| CLASS NAV | | | | | | | | | | | | | | |
|
| 8-31-2007 | 18.11 | 0.347 | 2.22 | 2.56 | (0.30) | (0.86) | — | (1.16) | 19.51 | 14.462,12 | 711 | 0.81 | 0.844 | 1.75 | 20 |
|
| 8-31-200614 | 16.01 | 0.277 | 1.89 | 2.16 | (0.06) | — | — | (0.06) | 18.11 | 13.542,8,12 | 535 | 0.849 | 0.854,9 | 1.759 | 398 |
|
| |
| |
| Fundamental Value | | | | | | | | | | | | | |
| CLASS 1 | | | | | | | | | | | | | | | |
|
| 8-31-2007 | 15.86 | 0.207 | 1.86 | 2.06 | (0.13) | (0.21) | — | (0.34) | 17.58 | 13.0212 | 85 | 0.85 | 0.85 | 1.15 | 6 |
|
| 8-31-200614 | 14.34 | 0.137 | 1.42 | 1.55 | (0.03) | — | — | (0.03) | 15.86 | 10.838,12 | 67 | 0.869 | 0.869 | 0.939 | 88 |
|
| CLASS NAV | | | | | | | | | | | | | | |
|
| 8-31-2007 | 15.83 | 0.217 | 1.86 | 2.07 | (0.13) | (0.21) | — | (0.34) | 17.56 | 13.1212 | 946 | 0.80 | 0.80 | 1.21 | 6 |
|
| 8-31-200614 | 14.31 | 0.137 | 1.42 | 1.55 | (0.03) | — | — | (0.03) | 15.83 | 10.878,12 | 695 | 0.819 | 0.819 | 1.009 | 88 |
|
| |
| |
| Global Bond | | | | | | | | | | | | | | |
| CLASS 1 | | | | | | | | | | | | | | | |
|
| 8-31-2007 | 14.83 | 0.537 | (0.04)46 | 0.49 | (0.35) | (0.16) | — | (0.51) | 14.81 | 3.4012 | 42 | 0.8638 | 0.8638 | 3.64 | 27229 |
|
| 8-31-200614 | 14.56 | 0.447 | (0.08)46 | 0.36 | (0.09) | — | — | (0.09) | 14.83 | 2.468,12 | 41 | 0.849 | 0.849 | 3.429 | 2488 |
|
| CLASS NAV | | | | | | | | | | | | | | |
|
| 8-31-2007 | 14.79 | 0.547 | (0.03)46 | 0.51 | (0.36) | (0.16) | — | (0.52) | 14.78 | 3.5112 | 754 | 0.8138 | 0.8138 | 3.68 | 27229 |
|
| 8-31-200614 | 14.52 | 0.457 | (0.09)46 | 0.36 | (0.09) | — | — | (0.09) | 14.79 | 2.488,12 | 554 | 0.799 | 0.799 | 3.569 | 2488 |
|
| |
| |
| Global Real Estate | | | | | | | | | | | | | |
| CLASS NAV | | | | | | | | | | | | | | |
|
| 8-31-2007 | 10.30 | 0.187 | 1.34 | 1.52 | (0.45) | — | — | (0.45) | 11.37 | 14.7012 | 465 | 1.08 | 1.08 | 1.54 | 97 |
|
| 8-31-200613 | 10.00 | 0.067 | 0.24 | 0.30 | — | — | — | — | 10.30 | 3.008 | 355 | 1.099 | 1.099 | 1.659 | 878 |
|
| |
| |
| High Income | | | | | | | | | | | | | | |
| CLASS NAV | | | | | | | | | | | | | | |
|
| 8-31-2007 | 9.87 | 0.697 | 0.76 | 1.45 | (0.69) | (0.02) | — | (0.71) | 10.61 | 14.8112 | 383 | 0.73 | 0.73 | 6.38 | 67 |
|
| 8-31-200613 | 10.00 | 0.237 | (0.25) | (0.02) | (0.11) | — | — | (0.11) | 9.87 | (0.14)8,12 | 289 | 0.779 | 0.779 | 6.739 | 768 |
|
| |
| The accompanying notes are an integral part of the financial statements. | 111 |
John Hancock Funds II
Financial Highlights
| | | | | | | | | | | | | | | |
| Per share operating performance for a share outstanding throughout the period | | | | Ratios and supplemental data | | |
| | | Income (loss) from | | | | | | | | | | | | |
| | | investment operations | | Less distributions | | | | | Ratios to average net assets | | |
| | | ——————————— | | ———————————————————— | | | —————————————— | | |
| | | | | | | | | | | | | | | Ratio | |
| | | | | | | | | | | | | | | of net | |
| | | | Net real- | | | | | | | | | Ratio | Ratio | investment | |
| | | | ized and | | | | | | | | Net | of net | of gross | income | |
| | Net asset | Net | unrealized | Total from | | | | | Net asset | | assets, | expenses | expenses | (loss) | |
| | value, | investment | gain (loss) | investment | From net | From net | From | Total | value, | Total | end of | to average | to average | to average | Portfolio |
| | beginning | income | on invest- | oper- | investment | realized | capital | distri- | end of | return | period | net | net | net | turnover |
| Period ended | of period ($) | (loss) ($) | ments ($) | ations ($) | income ($) | gain ($) | paid-in ($) | butions ($) | period ($) | (%) | (in millions) | assets (%) | assets (%) | assets (%) | (%) |
|
| |
| High Yield | | | | | | | | | | | | | | |
| CLASS 1 | | | | | | | | | | | | | | | |
|
| 8-31-2007 | 10.12 | 0.777 | (0.17) | 0.60 | (0.74) | (0.06) | — | (0.80) | 9.92 | 6.0212 | 48 | 0.75 | 0.75 | 7.48 | 7730 |
|
| 8-31-200614 | 10.10 | 0.657 | (0.03) | 0.62 | (0.60) | — | — | (0.60) | 10.12 | 6.418,12 | 44 | 0.769 | 0.769 | 7.229 | 838 |
|
| CLASS NAV | | | | | | | | | | | | | | |
|
| 8-31-2007 | 10.08 | 0.777 | (0.17) | 0.60 | (0.75) | (0.06) | — | (0.81) | 9.87 | 6.0012 | 1,547 | 0.70 | 0.70 | 7.55 | 7730 |
|
| 8-31-200614 | 10.06 | 0.667 | (0.03) | 0.63 | (0.61) | — | — | (0.61) | 10.08 | 6.498,12 | 1,144 | 0.719 | 0.719 | 7.369 | 838 |
|
| |
| |
| Index 500 | | | | | | | | | | | | | | |
| CLASS NAV | | | | | | | | | | | | | | |
|
| 8-31-200720 | 10.00 | 0.177 | 0.67 | 0.84 | (0.04) | — | — | (0.04) | 10.80 | 8.412,8,12 | 83 | 0.519 | 0.584,9 | 1.939 | 38 |
|
| |
| |
| International Equity Index | | | | | | | | | | | | | |
| CLASS NAV | | | | | | | | | | | | | | |
|
| 8-31-2007 | 18.97 | 0.477 | 3.64 | 4.11 | (0.35) | (0.22) | — | (0.57) | 22.51 | 21.9712 | 421 | 0.56 | 0.56 | 2.23 | 15 |
|
| 8-31-200621 | 15.59 | 0.417 | 3.17 | 3.58 | (0.20) | — | — | (0.20) | 18.97 | 23.168,12 | 308 | 0.589 | 0.589 | 2.789 | 118 |
|
| |
| |
| International Opportunities | | | | | | | | | | | | |
| CLASS 1 | | | | | | | | | | | | | | | |
|
| 8-31-2007 | 16.13 | 0.257 | 3.19 | 3.44 | (0.05) | (0.20) | — | (0.25) | 19.32 | 21.4812 | 23 | 1.04 | 1.04 | 1.40 | 127 |
|
| 8-31-200614 | 13.71 | 0.117 | 3.01 | 3.12 | (0.70) | — | — | (0.70) | 16.13 | 23.368,12,22 | 9 | 1.079 | 1.079 | 0.789 | 998 |
|
| CLASS NAV | | | | | | | | | | | | | | |
|
| 8-31-2007 | 16.16 | 0.247 | 3.21 | 3.45 | (0.05) | (0.20) | — | (0.25) | 19.36 | 21.5112 | 764 | 0.99 | 0.99 | 1.34 | 127 |
|
| 8-31-200614 | 13.72 | 0.107 | 3.04 | 3.14 | (0.70) | — | — | (0.70) | 16.16 | 23.518,12,22 | 552 | 1.029 | 1.029 | 0.739 | 998 |
|
| |
| |
| International Small Cap | | | | | | | | | | | | | |
| CLASS 1 | | | | | | | | | | | | | | | |
|
| 8-31-2007 | 20.95 | 0.287 | 6.44 | 6.72 | (0.28) | (2.86) | — | (3.14) | 24.53 | 34.9912 | 81 | 1.16 | 1.16 | 1.24 | 26 |
|
| 8-31-200614 | 18.48 | 0.277 | 2.24 | 2.51 | (0.04) | — | — | (0.04) | 20.95 | 13.588,12 | 37 | 1.189 | 1.189 | 1.559 | 898 |
|
| CLASS NAV | | | | | | | | | | | | | | |
|
| 8-31-2007 | 20.95 | 0.267 | 6.46 | 6.72 | (0.28) | (2.86) | — | (3.14) | 24.53 | 35.0112 | 376 | 1.11 | 1.11 | 1.16 | 26 |
|
| 8-31-200614 | 18.45 | 0.257 | 2.29 | 2.54 | (0.04) | — | — | (0.04) | 20.95 | 13.808,12 | 359 | 1.139 | 1.139 | 1.439 | 898 |
|
| |
| |
| International Small Company | | | | | | | | | | | | |
| CLASS NAV | | | | | | | | | | | | | | |
|
| 8-31-2007 | 9.33 | 0.127 | 2.14 | 2.26 | (0.06) | — | — | (0.06) | 11.53 | 24.3012 | 250 | 1.11 | 1.11 | 1.06 | 32 |
|
| 8-31-200613 | 10.00 | 0.047 | (0.71) | (0.67) | — | — | — | — | 9.33 | (6.70)8 | 221 | 1.149 | 1.149 | 1.379 | 578 |
|
| |
| |
| International Value | | | | | | | | | | | | | |
| CLASS 1 | | | | | | | | | | | | | | | |
|
| 8-31-2007 | 17.91 | 0.457 | 2.93 | 3.38 | (0.46) | (1.10) | — | (1.56) | 19.73 | 19.452,12 | 162 | 0.98 | 1.004 | 2.32 | 24 |
|
| 8-31-200614 | 15.20 | 0.467 | 2.30 | 2.76 | (0.05) | — | — | (0.05) | 17.91 | 18.222,8,12 | 134 | 0.999 | 1.014,9 | 3.179 | 598 |
|
| CLASS NAV | | | | | | | | | | | | | | |
|
| 8-31-2007 | 17.88 | 0.477 | 2.91 | 3.38 | (0.46) | (1.10) | — | (1.56) | 19.70 | 19.502,12 | 1,081 | 0.93 | 0.954 | 2.42 | 24 |
|
| 8-31-200614 | 15.16 | 0.477 | 2.30 | 2.77 | (0.05) | — | — | (0.05) | 17.88 | 18.352,8,12 | 836 | 0.949 | 0.964,9 | 3.219 | 598 |
|
| |
| The accompanying notes are an integral part of the financial statements. | 112 |
John Hancock Funds II
Financial Highlights
| | | | | | | | | | | | | | | |
| Per share operating performance for a share outstanding throughout the period | | | | Ratios and supplemental data | | |
| | | Income (loss) from | | | | | | | | | | | | |
| | | investment operations | | Less distributions | | | | | Ratios to average net assets | | |
| | | ——————————— | | ———————————————————— | | | —————————————— | | |
| | | | | | | | | | | | | | | Ratio | |
| | | | | | | | | | | | | | | of net | |
| | | | Net real- | | | | | | | | | Ratio | Ratio | investment | |
| | | | ized and | | | | | | | | Net | of net | of gross | income | |
| | Net asset | Net | unrealized | Total from | | | | | Net asset | | assets, | expenses | expenses | (loss) | |
| | value, | investment | gain (loss) | investment | From net | From net | From | Total | value, | Total | end of | to average | to average | to average | Portfolio |
| | beginning | income | on invest- | oper- | investment | realized | capital | distri- | end of | return | period | net | net | net | turnover |
| Period ended | of period ($) | (loss) ($) | ments ($) | ations ($) | income ($) | gain ($) | paid-in ($) | butions ($) | period ($) | (%) | (in millions) | assets (%) | assets (%) | assets (%) | (%) |
|
| |
| Investment Quality Bond | | | | | | | | | | | | | |
| CLASS 1 | | | | | | | | | | | | | | | |
|
| 8-31-2007 | 11.76 | 0.567 | (0.04) | 0.52 | (0.58) | —11 | — | (0.58) | 11.70 | 4.4912 | 43 | 0.78 | 0.78 | 4.77 | 37 |
|
| 8-31-200614 | 11.84 | 0.467 | (0.16) | 0.30 | (0.38) | — | — | (0.38) | 11.76 | 2.648,12 | 35 | 0.849 | 0.849 | 4.429 | 358 |
|
| CLASS NAV | | | | | | | | | | | | | | |
|
| 8-31-2007 | 11.75 | 0.567 | (0.04) | 0.52 | (0.58) | —11 | — | (0.58) | 11.69 | 4.5612 | 123 | 0.73 | 0.73 | 4.83 | 37 |
|
| 8-31-200614 | 11.83 | 0.467 | (0.16) | 0.30 | (0.38) | — | — | (0.38) | 11.75 | 2.688,12 | 93 | 0.799 | 0.799 | 4.519 | 358 |
|
| |
| |
| Large Cap | | | | | | | | | | | | | | |
| CLASS 1 | | | | | | | | | | | | | | | |
|
| 8-31-2007 | 14.67 | 0.197 | 1.78 | 1.97 | (0.13) | (0.39) | — | (0.52) | 16.12 | 13.5912 | 31 | 0.81 | 0.81 | 1.15 | 29 |
|
| 8-31-200614 | 13.26 | 0.117 | 1.31 | 1.42 | (0.01) | — | — | (0.01) | 14.67 | 10.738,12 | 2 | 0.939 | 0.939 | 0.869 | 248 |
|
| CLASS NAV | | | | | | | | | | | | | | |
|
| 8-31-2007 | 14.67 | 0.187 | 1.80 | 1.98 | (0.13) | (0.39) | — | (0.52) | 16.13 | 13.6712 | 348 | 0.76 | 0.76 | 1.11 | 29 |
|
| 8-31-200614 | 13.26 | 0.127 | 1.31 | 1.43 | (0.02) | — | — | (0.02) | 14.67 | 10.798,12 | 192 | 0.889 | 0.889 | 0.959 | 248 |
|
| |
| |
| Large Cap Value | | | | | | | | | | | | | | |
| CLASS 1 | | | | | | | | | | | | | | | |
|
| 8-31-2007 | 22.97 | 0.247 | 2.83 | 3.07 | (0.14) | — | — | (0.14) | 25.90 | 13.3912 | 130 | 0.91 | 0.91 | 0.96 | 63 |
|
| 8-31-200614 | 20.31 | 0.237 | 2.48 | 2.71 | (0.05) | — | — | (0.05) | 22.97 | 13.338,12 | 105 | 0.989 | 0.989 | 1.249 | 548 |
|
| CLASS NAV | | | | | | | | | | | | | | |
|
| 8-31-2007 | 23.01 | 0.267 | 2.82 | 3.08 | (0.14) | — | — | (0.14) | 25.95 | 13.4212 | 412 | 0.86 | 0.86 | 1.00 | 63 |
|
| 8-31-200614 | 20.33 | 0.177 | 2.56 | 2.73 | (0.05) | — | — | (0.05) | 23.01 | 13.438,12 | 234 | 0.899 | 0.899 | 0.899 | 548 |
|
| |
| |
| Mid Cap Index | | | | | | | | | | | | | | |
| CLASS NAV | | | | | | | | | | | | | | |
|
| 8-31-2007 | 18.37 | 0.277,40 | 2.65 | 2.92 | (0.08) | (0.03) | — | (0.11) | 21.18 | 15.9312 | 428 | 0.51 | 0.51 | 1.32 | 64 |
|
| 8-31-200621 | 16.85 | 0.177 | 1.38 | 1.55 | (0.03) | — | — | (0.03) | 18.37 | 9.202,8,12 | 172 | 0.569 | 0.564,9 | 1.149 | 108 |
|
| |
| |
| Mid Cap Intersection | | | | | | | | | | | | | |
| CLASS NAV | | | | | | | | | | | | | | |
|
| 8-31-200717 | 10.00 | 0.017 | (0.42) | (0.41) | — | — | — | — | 9.59 | (4.10)8 | 334 | 0.949 | 0.949 | 0.199 | 598 |
|
| |
| |
| Mid Cap Stock | | | | | | | | | | | | | | |
| CLASS 1 | | | | | | | | | | | | | | | |
|
| 8-31-2007 | 15.81 | 0.037,41 | 3.96 | 3.99 | (0.06) | (0.74) | — | (0.80) | 19.00 | 25.9112 | 136 | 0.93 | 0.93 | 0.18 | 114 |
|
| 8-31-200614 | 13.86 | (0.04)7 | 2.01 | 1.97 | — | (0.02) | — | (0.02) | 15.81 | 14.208,12,23 | 107 | 0.969 | 0.969 | (0.30)9 | 1048 |
|
| CLASS NAV | | | | | | | | | | | | | | |
|
| 8-31-2007 | 15.83 | 0.037,41 | 3.97 | 4.00 | (0.06) | (0.74) | — | (0.80) | 19.03 | 25.9512 | 366 | 0.88 | 0.88 | 0.19 | 114 |
|
| 8-31-200614 | 13.87 | (0.04)7 | 2.02 | 1.98 | — | (0.02) | — | (0.02) | 15.83 | 14.278,12,23 | 194 | 0.919 | 0.919 | (0.26)9 | 1048 |
|
| |
| The accompanying notes are an integral part of the financial statements. | 113 |
John Hancock Funds II
Financial Highlights
| | | | | | | | | | | | | | | |
| Per share operating performance for a share outstanding throughout the period | | | | Ratios and supplemental data | | |
| | | Income (loss) from | | | | | | | | | | | | |
| | | investment operations | | Less distributions | | | | | Ratios to average net assets | | |
| | | ——————————— | | ———————————————————— | | | —————————————— | | |
| | | | | | | | | | | | | | | Ratio | |
| | | | | | | | | | | | | | | of net | |
| | | | Net real- | | | | | | | | | Ratio | Ratio | investment | |
| | | | ized and | | | | | | | | Net | of net | of gross | income | |
| | Net asset | Net | unrealized | Total from | | | | | Net asset | | assets, | expenses | expenses | (loss) | |
| | value, | investment | gain (loss) | investment | From net | From net | From | Total | value, | Total | end of | to average | to average | to average | Portfolio |
| | beginning | income | on invest- | oper- | investment | realized | capital | distri- | end of | return | period | net | net | net | turnover |
| Period ended | of period ($) | (loss) ($) | ments ($) | ations ($) | income ($) | gain ($) | paid-in ($) | butions ($) | period ($) | (%) | (in millions) | assets (%) | assets (%) | assets (%) | (%) |
|
| |
| Mid Cap Value | | | | | | | | | | | | | | |
| CLASS 1 | | | | | | | | | | | | | | | |
|
| 8-31-2007 | 18.87 | 0.137 | 2.98 | 3.11 | (0.14) | (0.79) | — | (0.93) | 21.05 | 16.7612 | 113 | 0.96 | 0.96 | 0.63 | 33 |
|
| 8-31-200614 | 17.65 | 0.117 | 1.15 | 1.26 | (0.03) | (0.01) | — | (0.04) | 18.87 | 7.118,12 | 93 | 0.979 | 0.979 | 0.639 | 748 |
|
| CLASS NAV | | | | | | | | | | | | | | |
|
| 8-31-2007 | 18.86 | 0.157 | 2.98 | 3.13 | (0.15) | (0.79) | — | (0.94) | 21.05 | 16.8312 | 163 | 0.91 | 0.91 | 0.69 | 33 |
|
| 8-31-200614 | 17.63 | 0.127 | 1.15 | 1.27 | (0.03) | (0.01) | — | (0.04) | 18.86 | 7.188,12 | 50 | 0.929 | 0.929 | 0.709 | 748 |
|
| |
| |
| Mid Cap Value Equity | | | | | | | | | | | | | |
| CLASS NAV | | | | | | | | | | | | | | |
|
| 8-31-2007 | 9.65 | 0.137 | 1.70 | 1.83 | (0.06) | — | — | (0.06) | 11.42 | 18.9912 | 129 | 0.94 | 0.94 | 1.22 | 26 |
|
| 8-31-200613 | 10.00 | 0.037 | (0.38) | (0.35) | — | — | — | — | 9.65 | (3.50)8 | 98 | 1.029 | 1.029 | 0.799 | 248 |
|
| |
| |
| Natural Resources | | | | | | | | | | | | | |
| CLASS 1 | | | | | | | | | | | | | | | |
|
| 8-31-2007 | 35.71 | 0.227 | 8.52 | 8.74 | (0.34) | (1.59) | — | (1.93) | 42.52 | 25.5712 | 111 | 1.14 | 1.14 | 0.58 | 54 |
|
| 8-31-200614 | 28.70 | 0.347 | 6.70 | 7.04 | (0.03) | — | — | (0.03) | 35.71 | 24.558,12 | 81 | 1.129 | 1.129 | 1.139 | 718 |
|
| CLASS NAV | | | | | | | | | | | | | | |
|
| 8-31-2007 | 35.60 | 0.247 | 8.48 | 8.72 | (0.34) | (1.59) | — | (1.93) | 42.39 | 25.6112 | 731 | 1.09 | 1.09 | 0.64 | 54 |
|
| 8-31-200614 | 28.60 | 0.337 | 6.71 | 7.04 | (0.04) | — | — | (0.04) | 35.60 | 24.628,12 | 692 | 1.079 | 1.079 | 1.119 | 718 |
|
| |
| |
| Quantitative All Cap | | | | | | | | | | | | | |
| CLASS A | | | | | | | | | | | | | | | |
|
| 8-31-2007 | 10.11 | 0.097,42 | 1.77 | 1.86 | (0.05) | (0.01) | — | (0.06) | 11.91 | 18.451,2,12 | 1 | 1.10 | 2.034 | 0.76 | 148 |
|
| 8-31-200624 | 10.00 | 0.027 | 0.09 | 0.11 | — | — | — | — | 10.11 | 1.101,2,8 | 1 | 1.079 | 5.944,9 | 1.709 | 218 |
|
| CLASS B | | | | | | | | | | | | | | | |
|
| 8-31-2007 | 10.11 | 0.017,42 | 1.76 | 1.77 | (0.01) | (0.01) | — | (0.02) | 11.86 | 17.571,2,12 | 1 | 1.80 | 2.724 | 0.06 | 148 |
|
| 8-31-200624 | 10.00 | 0.017 | 0.10 | 0.11 | — | — | — | — | 10.11 | 1.101,2,8 | 1 | 1.759 | 6.634,9 | 1.029 | 218 |
|
| CLASS C | | | | | | | | | | | | | | | |
|
| 8-31-2007 | 10.11 | 0.017,42 | 1.76 | 1.77 | (0.01) | (0.01) | — | (0.02) | 11.86 | 17.571,2,12 | 1 | 1.80 | 2.724 | 0.06 | 148 |
|
| 8-31-200624 | 10.00 | 0.017 | 0.10 | 0.11 | — | — | — | — | 10.11 | 1.101,8 | 1 | 1.759 | 6.634,9 | 1.029 | 218 |
|
| CLASS I | | | | | | | | | | | | | | | |
|
| 8-31-2007 | 10.12 | 0.127,42 | 1.76 | 1.88 | (0.06) | (0.01) | — | (0.07) | 11.93 | 18.701,2,12 | 2 | 0.80 | 1.734 | 1.06 | 148 |
|
| 8-31-200624 | 10.00 | 0.027 | 0.10 | 0.12 | — | — | — | — | 10.12 | 1.201,2,8 | 1 | 0.789 | 5.664,9 | 1.999 | 218 |
|
| |
| |
| Quantitative Mid Cap | | | | | | | | | | | | | |
| CLASS 1 | | | | | | | | | | | | | | | |
|
| 8-31-2007 | 14.32 | 0.077 | 1.56 | 1.63 | (0.03) | —11 | — | (0.03) | 15.92 | 11.3912 | 124 | 0.86 | 0.86 | 0.45 | 231 |
|
| 8-31-200610 | 13.55 | 0.027 | 0.76 | 0.78 | —11 | (0.01) | — | (0.01) | 14.32 | 5.748,12 | 133 | 0.859 | 0.859 | 0.129 | 1198 |
|
| |
| The accompanying notes are an integral part of the financial statements. | 114 |
John Hancock Funds II
Financial Highlights
| | | | | | | | | | | | | | | |
| Per share operating performance for a share outstanding throughout the period | | | | Ratios and supplemental data | | |
| | | Income (loss) from | | | | | | | | | | | | |
| | | investment operations | | Less distributions | | | | | Ratios to average net assets | | |
| | | ——————————— | | ———————————————————— | | | —————————————— | | |
| | | | | | | | | | | | | | | Ratio | |
| | | | | | | | | | | | | | | of net | |
| | | | Net real- | | | | | | | | | Ratio | Ratio | investment | |
| | | | ized and | | | | | | | | Net | of net | of gross | income | |
| | Net asset | Net | unrealized | Total from | | | | | Net asset | | assets, | expenses | expenses | (loss) | |
| | value, | investment | gain (loss) | investment | From net | From net | From | Total | value, | Total | end of | to average | to average | to average | Portfolio |
| | beginning | income | on invest- | oper- | investment | realized | capital | distri- | end of | return | period | net | net | net | turnover |
| Period ended | of period ($) | (loss) ($) | ments ($) | ations ($) | income ($) | gain ($) | paid-in ($) | butions ($) | period ($) | (%) | (in millions) | assets (%) | assets (%) | assets (%) | (%) |
|
| |
| Quantitative Value | | | | | | | | | | | | | |
| CLASS 1 | | | | | | | | | | | | | | | |
|
| 8-31-2007 | 16.56 | 0.317 | 1.68 | 1.99 | (0.20) | (0.80) | — | (1.00) | 17.55 | 12.1212 | 106 | 0.74 | 0.74 | 1.75 | 169 |
|
| 8-31-200614 | 14.09 | 0.227 | 2.31 | 2.53 | (0.06) | —11 | — | (0.06) | 16.56 | 17.988,12 | 96 | 0.799 | 0.799 | 1.629 | 1278 |
|
| CLASS NAV | | | | | | | | | | | | | | |
|
| 8-31-2007 | 16.56 | 0.327 | 1.69 | 2.01 | (0.20) | (0.80) | — | (1.00) | 17.57 | 12.2612 | 680 | 0.69 | 0.69 | 1.81 | 169 |
|
| 8-31-200614 | 14.09 | 0.247 | 2.29 | 2.53 | (0.06) | —11 | — | (0.06) | 16.56 | 17.988,12 | 362 | 0.749 | 0.749 | 1.739 | 1278 |
|
| |
| |
| Real Estate Equity | | | | | | | | | | | | | |
| CLASS NAV | | | | | | | | | | | | | | |
|
| 8-31-2007 | 10.99 | 0.287 | (0.12)46 | 0.16 | (0.17) | (0.16) | — | (0.33) | 10.82 | 1.282,12 | 254 | 0.87 | 0.904 | 2.41 | 55 |
|
| 8-31-200613 | 10.00 | 0.087 | 0.91 | 0.99 | — | — | — | — | 10.99 | 9.902,8 | 275 | 0.909 | 0.924,9 | 2.299 | 508 |
|
| |
| |
| Real Estate Securities | | | | | | | | | | | | | |
| CLASS 1 | | | | | | | | | | | | | | | |
|
| 8-31-2007 | 29.94 | 0.507 | 1.52 | 2.02 | (0.93) | (13.23) | — | (14.16) | 17.80 | 4.3012 | 145 | 0.80 | 0.80 | 2.25 | 87 |
|
| 8-31-200625 | 23.03 | 0.647 | 6.46 | 7.10 | (0.16) | (0.03) | — | (0.19) | 29.94 | 30.968,12 | 171 | 0.829 | 0.829 | 2.769 | 1998 |
|
| |
| |
| Real Return Bond | | | | | | | | | | | | | |
| CLASS 1 | | | | | | | | | | | | | | | |
|
| 8-31-2007 | 13.41 | 0.557 | (0.29) | 0.26 | (0.46) | (0.04) | — | (0.50) | 13.17 | 1.972,12 | 19 | 0.79 | 0.794 | 4.16 | 19731 |
|
| 8-31-200614 | 13.52 | 0.537 | (0.24) | 0.29 | (0.40) | —11 | — | (0.40) | 13.41 | 2.278,12 | 17 | 0.809 | 0.809 | 4.529 | 2168 |
|
| CLASS NAV | | | | | | | | | | | | | | |
|
| 8-31-2007 | 13.32 | 0.597 | (0.34) | 0.25 | (0.46) | (0.04) | — | (0.50) | 13.07 | 1.952,12 | 951 | 0.74 | 0.744 | 4.53 | 19731 |
|
| 8-31-200614 | 13.43 | 0.557 | (0.26) | 0.29 | (0.40) | —11 | — | (0.40) | 13.32 | 2.328,12 | 684 | 0.759 | 0.759 | 4.759 | 2168 |
|
| |
| |
| Small Cap | | | | | | | | | | | | | | |
| CLASS 1 | | | | | | | | | | | | | | | |
|
| 8-31-2007 | 14.02 | (0.03)7 | 1.84 | 1.81 | — | — | — | — | 15.83 | 12.91 | 1 | 0.95 | 0.95 | (0.19) | 109 |
|
| 8-31-200614 | 13.60 | (0.03)7 | 0.45 | 0.42 | — | — | — | — | 14.02 | 3.098 | 1 | 0.969 | 0.969 | (0.27)9 | 538 |
|
| CLASS NAV | | | | | | | | | | | | | | |
|
| 8-31-2007 | 14.04 | (0.02)7 | 1.84 | 1.82 | — | — | — | — | 15.86 | 12.96 | 168 | 0.90 | 0.90 | (0.16) | 109 |
|
| 8-31-200614 | 13.61 | (0.03)7 | 0.46 | 0.43 | — | — | — | — | 14.04 | 3.168 | 240 | 0.919 | 0.919 | (0.27)9 | 538 |
|
| |
| |
| Small Cap Index | | | | | | | | | | | | | | |
| CLASS NAV | | | | | | | | | | | | | | |
|
| 8-31-2007 | 15.95 | 0.207 | 1.50 | 1.70 | (0.13) | (0.49) | — | (0.62) | 17.03 | 10.702,12 | 89 | 0.54 | 0.54 | 1.19 | 40 |
|
| 8-31-200621 | 14.05 | 0.127 | 1.80 | 1.92 | (0.02) | — | — | (0.02) | 15.95 | 13.692,8,12 | 125 | 0.569 | 0.584,9 | 0.929 | 408 |
|
| |
| The accompanying notes are an integral part of the financial statements. | 115 |
John Hancock Funds II
Financial Highlights
| | | | | | | | | | | | | | | |
| Per share operating performance for a share outstanding throughout the period | | | | Ratios and supplemental data | | |
| | | Income (loss) from | | | | | | | | | | | | |
| | | investment operations | | Less distributions | | | | | Ratios to average net assets | | |
| | | ——————————— | | ———————————————————— | | | —————————————— | | |
| | | | | | | | | | | | | | | Ratio | |
| | | | | | | | | | | | | | | of net | |
| | | | Net real- | | | | | | | | | Ratio | Ratio | investment | |
| | | | ized and | | | | | | | | Net | of net | of gross | income | |
| | Net asset | Net | unrealized | Total from | | | | | Net asset | | assets, | expenses | expenses | (loss) | |
| | value, | investment | gain (loss) | investment | From net | From net | From | Total | value, | Total | end of | to average | to average | to average | Portfolio |
| | beginning | income | on invest- | oper- | investment | realized | capital | distri- | end of | return | period | net | net | net | turnover |
| Period ended | of period ($) | (loss) ($) | ments ($) | ations ($) | income ($) | gain ($) | paid-in ($) | butions ($) | period ($) | (%) | (in millions) | assets (%) | assets (%) | assets (%) | (%) |
|
| |
| Small Cap Opportunities | | | | | | | | | | | | | |
| CLASS 1 | | | | | | | | | | | | | | | |
|
| 8-31-2007 | 23.24 | 0.327 | 0.83 | 1.15 | (0.31) | (0.63) | — | (0.94) | 23.45 | 4.8512 | 35 | 1.09 | 1.09 | 1.32 | 48 |
|
| 8-31-200614 | 21.36 | 0.217 | 1.72 | 1.93 | (0.05) | —11 | — | (0.05) | 23.24 | 9.048,12 | 30 | 1.109 | 1.109 | 1.019 | 598 |
|
| CLASS NAV | | | | | | | | | | | | | | |
|
| 8-31-2007 | 23.14 | 0.347 | 0.81 | 1.15 | (0.31) | (0.63) | — | (0.94) | 23.35 | 4.8812 | 194 | 1.04 | 1.04 | 1.37 | 48 |
|
| 8-31-200614 | 21.26 | 0.227 | 1.71 | 1.93 | (0.05) | —11 | — | (0.05) | 23.14 | 9.098,12 | 217 | 1.059 | 1.059 | 1.059 | 598 |
|
| |
| |
| Small Company | | | | | | | | | | | | | | |
| CLASS 1 | | | | | | | | | | | | | | | |
|
| 8-31-2007 | 15.42 | (0.04)7 | 1.44 | 1.40 | — | — | — | — | 16.82 | 9.08 | 5 | 1.25 | 1.25 | (0.24) | 160 |
|
| 8-31-200614 | 15.15 | (0.06)7 | 0.33 | 0.27 | — | — | — | — | 15.42 | 1.788 | 6 | 1.349 | 1.349 | (0.40)9 | 1108 |
|
| CLASS NAV | | | | | | | | | | | | | | |
|
| 8-31-2007 | 15.44 | (0.03)7 | 1.44 | 1.41 | — | — | — | — | 16.85 | 9.13 | 93 | 1.20 | 1.20 | (0.20) | 160 |
|
| 8-31-200614 | 15.16 | (0.04)7 | 0.32 | 0.28 | — | — | — | — | 15.44 | 1.858 | 87 | 1.299 | 1.299 | (0.31)9 | 1108 |
|
| |
| |
| Small Company Growth | | | | | | | | | | | | | |
| CLASS NAV | | | | | | | | | | | | | | |
|
| 8-31-2007 | 11.09 | (0.09)7 | 2.29 | 2.20 | — | (0.20) | — | (0.20) | 13.09 | 20.0412 | 208 | 1.11 | 1.11 | (0.68) | 39 |
|
| 8-31-200621 | 10.00 | (0.08)7 | 1.17 | 1.09 | — | — | — | — | 11.09 | 10.908 | 74 | 1.169 | 1.169 | (0.83)9 | 498 |
|
| |
| |
| Small Company Value | | | | | | | | | | | | | |
| CLASS 1 | | | | | | | | | | | | | | | |
|
| 8-31-2007 | 23.66 | 0.057 | 2.54 | 2.59 | (0.07) | (0.37) | — | (0.44) | 25.81 | 10.982,12�� | 144 | 1.06 | 1.114 | 0.20 | 18 |
|
| 8-31-200614 | 21.09 | 0.107 | 2.52 | 2.62 | (0.05) | — | — | (0.05) | 23.66 | 12.412,8,12 | 149 | 1.109 | 1.124,9 | 0.469 | 128 |
|
| CLASS NAV | | | | | | | | | | | | | | |
|
| 8-31-2007 | 23.63 | 0.067 | 2.54 | 2.60 | (0.07) | (0.37) | — | (0.44) | 25.79 | 11.042,12 | 319 | 1.01 | 1.064 | 0.25 | 18 |
|
| 8-31-200614 | 21.06 | 0.117 | 2.51 | 2.62 | (0.05) | — | — | (0.05) | 23.63 | 12.442,8,12 | 239 | 1.059 | 1.074,9 | 0.539 | 128 |
|
| |
| |
| Special Value | | | | | | | | | | | | | | |
| CLASS 1 | | | | | | | | | | | | | | | |
|
| 8-31-2007 | 20.50 | 0.137 | 1.85 | 1.98 | (0.14) | (6.73) | — | (6.87) | 15.6126 | 8.052,12,26 | 5 | 1.07 | 1.504 | 0.66 | 8845 |
|
| 8-31-200614 | 18.66 | 0.067 | 1.79 | 1.85 | (0.01) | — | — | (0.01) | 20.50 | 9.918,12 | 4 | 1.129 | 1.129 | 0.359 | 268 |
|
| |
| |
| Spectrum Income | | | | | | | | | | | | | |
| CLASS NAV | | | | | | | | | | | | | | |
|
| 8-31-2007 | 10.27 | 0.477 | 0.24 | 0.71 | (0.45) | (0.02) | — | (0.47) | 10.51 | 7.002,12 | 979 | 0.86 | 0.884 | 4.46 | 7332 |
|
| 8-31-200621 | 10.00 | 0.357 | 0.19 | 0.54 | (0.27) | — | — | (0.27) | 10.27 | 5.472,8,12 | 764 | 0.939 | 0.944,9 | 4.159 | 1238 |
|
| |
| The accompanying notes are an integral part of the financial statements. | 116 |
John Hancock Funds II
Financial Highlights
| | | | | | | | | | | | | | | |
| Per share operating performance for a share outstanding throughout the period | | | | Ratios and supplemental data | | |
| | | Income (loss) from | | | | | | | | | | | | |
| | | investment operations | | Less distributions | | | | | Ratios to average net assets | | |
| | | ——————————— | | ———————————————————— | | | —————————————— | | |
| | | | | | | | | | | | | | | Ratio | |
| | | | | | | | | | | | | | | of net | |
| | | | Net real- | | | | | | | | | Ratio | Ratio | investment | |
| | | | ized and | | | | | | | | Net | of net | of gross | income | |
| | Net asset | Net | unrealized | Total from | | | | | Net asset | | assets, | expenses | expenses | (loss) | |
| | value, | investment | gain (loss) | investment | From net | From net | From | Total | value, | Total | end of | to average | to average | to average | Portfolio |
| | beginning | income | on invest- | oper- | investment | realized | capital | distri- | end of | return | period | net | net | net | turnover |
| Period ended | of period ($) | (loss) ($) | ments ($) | ations ($) | income ($) | gain ($) | paid-in ($) | butions ($) | period ($) | (%) | (in millions) | assets (%) | assets (%) | assets (%) | (%) |
|
| |
| Strategic Bond | | | | | | | | | | | | | | |
| CLASS 1 | | | | | | | | | | | | | | | |
|
| 8-31-2007 | 11.79 | 0.657 | (0.25) | 0.40 | (0.63) | —11 | — | (0.63) | 11.56 | 3.3612 | 45 | 0.81 | 0.81 | 5.47 | 9133 |
|
| 8-31-200614 | 11.85 | 0.517 | (0.04) | 0.47 | (0.53) | —11 | — | (0.53) | 11.79 | 4.188,12 | 42 | 0.829 | 0.829 | 4.889 | 1928 |
|
| CLASS NAV | | | | | | | | | | | | | | |
|
| 8-31-2007 | 11.77 | 0.657 | (0.24) | 0.41 | (0.64) | —11 | — | (0.64) | 11.54 | 3.4412 | 424 | 0.76 | 0.76 | 5.54 | 9133 |
|
| 8-31-200614 | 11.83 | 0.517 | (0.04) | 0.47 | (0.53) | —11 | — | (0.53) | 11.77 | 4.228,12 | 270 | 0.779 | 0.779 | 4.889 | 1928 |
|
| |
| |
| Strategic Income | | | | | | | | | | | | | | |
| CLASS NAV | | | | | | | | | | | | | | |
|
| 8-31-2007 | 10.06 | 0.517 | (0.12) | 0.39 | (0.39) | — | — | (0.39) | 10.06 | 4.0112 | 423 | 0.78 | 0.78 | 5.15 | 9734 |
|
| 8-31-200613 | 10.00 | 0.147 | (0.01) | 0.13 | (0.07) | — | — | (0.07) | 10.06 | 1.378,12 | 281 | 0.869 | 0.869 | 4.189 | 658 |
|
| |
| |
| Total Bond Market | | | | | | | | | | | | | |
| CLASS NAV | | | | | | | | | | | | | | |
|
| 8-31-200720 | 10.00 | 0.407 | (0.05) | 0.35 | (0.33) | — | — | (0.33) | 10.02 | 3.542,8,12 | 54 | 0.569 | 0.624,9 | 4.669 | 1018 |
|
| |
| |
| Total Return | | | | | | | | | | | | | | |
| CLASS 1 | | | | | | | | | | | | | | | |
|
| 8-31-2007 | 13.78 | 0.647 | (0.06) | 0.58 | (0.54) | (0.03) | — | (0.57) | 13.79 | 4.2612 | 126 | 0.8337,38 | 0.8337,38 | 4.67 | 34935 |
|
| 8-31-2006 | 13.70 | 0.467 | (0.04) | 0.42 | (0.34) | — | — | (0.34) | 13.78 | 3.148,12 | 118 | 0.829 | 0.829 | 3.859 | 3988 |
|
| CLASS NAV | | | | | | | | | | | | | | |
|
| 8-31-2007 | 13.75 | 0.657 | (0.08) | 0.57 | (0.54) | (0.03) | — | (0.57) | 13.75 | 4.2612 | 1,400 | 0.7837,38 | 0.7837,38 | 4.77 | 34935 |
|
| 8-31-2006 | 13.67 | 0.477 | (0.05) | 0.42 | (0.34) | — | — | (0.34) | 13.75 | 3.188,12 | 1,041 | 0.779 | 0.779 | 3.959 | 3988 |
|
| |
| |
| U.S. Global Leaders Growth | | | | | | | | | | | | |
| CLASS 1 | | | | | | | | | | | | | | | |
|
| 8-31-2007 | 12.66 | 0.087 | 1.00 | 1.08 | (0.06) | — | — | (0.06) | 13.68 | 8.5712 | 18 | 0.77 | 0.77 | 0.58 | 24 |
|
| 8-31-200614 | 12.79 | 0.057 | (0.17) | (0.12) | (0.01) | — | — | (0.01) | 12.66 | (0.97)8,12 | 25 | 0.799 | 0.799 | 0.449 | 178 |
|
| CLASS NAV | | | | | | | | | | | | | | |
|
| 8-31-2007 | 12.68 | 0.097 | 1.00 | 1.09 | (0.07) | — | — | (0.07) | 13.70 | 8.5712 | 663 | 0.72 | 0.72 | 0.63 | 24 |
|
| 8-31-200614 | 12.80 | 0.067 | (0.17) | (0.11) | (0.01) | — | — | (0.01) | 12.68 | (0.88))8,12 | 452 | 0.749 | 0.749 | 0.529 | 178 |
|
| |
| |
| U.S. Government Securities | | | | | | | | | | | | |
| CLASS 1 | | | | | | | | | | | | | | | |
|
| 8-31-2007 | 13.59 | 0.627 | (0.14) | 0.48 | (0.62) | (0.02) | — | (0.64) | 13.43 | 3.6212 | 43 | 0.76 | 0.76 | 4.54 | 5936 |
|
| 8-31-200614 | 13.54 | 0.447 | (0.07) | 0.37 | (0.32) | —11 | — | (0.32) | 13.59 | 2.878,12 | 43 | 0.789 | 0.789 | 3.679 | 1008 |
|
| CLASS NAV | | | | | | | | | | | | | | |
|
| 8-31-2007 | 13.56 | 0.627 | (0.13) | 0.49 | (0.63) | (0.02) | — | (0.65) | 13.40 | 3.6912 | 154 | 0.71 | 0.71 | 4.58 | 5936 |
|
| 8-31-200614 | 13.51 | 0.447 | (0.06) | 0.38 | (0.33) | —11 | — | (0.33) | 13.56 | 2.918,12 | 161 | 0.739 | 0.739 | 3.759 | 1008 |
|
| |
| The accompanying notes are an integral part of the financial statements. | 117 |
John Hancock Funds II
Financial Highlights
| | | | | | | | | | | | | | | |
| Per share operating performance for a share outstanding throughout the period | | | | Ratios and supplemental data | | |
| | | Income (loss) from | | | | | | | | | | | | |
| | | investment operations | | Less distributions | | | | | Ratios to average net assets | | |
| | | ——————————— | | ———————————————————— | | | —————————————— | | |
| | | | | | | | | | | | | | | Ratio | |
| | | | | | | | | | | | | | | of net | |
| | | | Net real- | | | | | | | | | Ratio | Ratio | investment | |
| | | | ized and | | | | | | | | Net | of net | of gross | income | |
| | Net asset | Net | unrealized | Total from | | | | | Net asset | | assets, | expenses | expenses | (loss) | |
| | value, | investment | gain (loss) | investment | From net | From net | From | Total | value, | Total | end of | to average | to average | to average | Portfolio |
| | beginning | income | on invest- | oper- | investment | realized | capital | distri- | end of | return | period | net | net | net | turnover |
| Period ended | of period ($) | (loss) ($) | ments ($) | ations ($) | income ($) | gain ($) | paid-in ($) | butions ($) | period ($) | (%) | (in millions) | assets (%) | assets (%) | assets (%) | (%) |
|
| |
| U.S. High Yield Bond | | | | | | | | | | | | | |
| CLASS 1 | | | | | | | | | | | | | | | |
|
| 8-31-2007 | 13.05 | 0.957 | (0.18) | 0.77 | (0.95) | —11 | — | (0.95) | 12.87 | 5.9412 | 4 | 0.84 | 0.84 | 7.25 | 86 |
|
| 8-31-200614 | 12.74 | 0.807 | 0.02 | 0.82 | (0.51) | — | — | (0.51) | 13.05 | 6.558,12 | 2 | 0.879 | 0.879 | 7.129 | 1088 |
|
| CLASS NAV | | | | | | | | | | | | | | |
|
| 8-31-2007 | 13.05 | 0.967 | (0.18) | 0.78 | (0.96) | —11 | — | (0.96) | 12.87 | 6.0212 | 392 | 0.79 | 0.79 | 7.31 | 86 |
|
| 8-31-200614 | 12.74 | 0.807 | 0.02 | 0.82 | (0.51) | — | — | (0.51) | 13.05 | 6.588,12 | 288 | 0.829 | 0.829 | 7.069 | 1088 |
|
| |
| |
| U.S. Multi Sector | | | | | | | | | | | | | | |
| CLASS NAV | | | | | | | | | | | | | | |
|
| 8-31-2007 | 10.41 | 0.137 | 0.90 | 1.03 | (0.10) | (0.05) | — | (0.15) | 11.29 | 9.9312 | 1,524 | 0.80 | 0.80 | 1.19 | 72 |
|
| 8-31-200621 | 10.00 | 0.097 | 0.33 | 0.42 | (0.01) | — | — | (0.01) | 10.41 | 4.258,12 | 1,227 | 0.829 | 0.829 | 1.019 | 1168 |
|
| |
| |
| Value | | | | | | | | | | | | | | | |
| CLASS NAV | | | | | | | | | | | | | | |
|
| 8-31-200720 | 10.00 | 0.087 | 1.36 | 1.44 | (0.01) | — | — | (0.01) | 11.43 | 14.452,8,12 | 14 | 0.999 | 1.404,9 | 0.889 | 708 |
|
| |
| |
| Value & Restructuring | | | | | | | | | | | | | |
| CLASS NAV | | | | | | | | | | | | | | |
|
| 8-31-2007 | 11.08 | 0.187,43 | 1.82 | 2.00 | (0.12) | (0.04) | — | (0.16) | 12.92 | 18.1212 | 395 | 0.86 | 0.86 | 1.40 | 19 |
|
| 8-31-200621 | 10.00 | 0.127 | 0.99 | 1.11 | (0.03) | — | — | (0.03) | 11.08 | 11.078,12 | 296 | 0.929 | 0.929 | 1.339 | 178 |
|
| |
| |
| Vista | | | | | | | | | | | | | | | |
| CLASS NAV | | | | | | | | | | | | | | |
|
| 8-31-2007 | 10.70 | (0.06)7,44 | 3.73 | 3.67 | — | — | — | — | 14.37 | 34.30 | 170 | 0.97 | 0.97 | (0.48) | 152 |
|
| 8-31-200621 | 10.00 | (0.01)7 | 0.71 | 0.70 | — | — | — | — | 10.70 | 7.008 | 123 | 1.049 | 1.049 | (0.15)9 | 2058 |
|
| |
| The accompanying notes are an integral part of the financial statements. | 118 |
John Hancock Funds II
Financial Highlights
Notes to Financial Highlights
1 Assumes dividend reinvestment and does not reflect the effect of sales charges.
2 Total returns would have been lower had certain expenses not been reduced during the periods shown.
3 Does not include expenses of the underlying funds in which the Portfolio invests.
4 Does not take into consideration expense reductions during the period shown.
5 Recognition of net investment income by the Portfolio is affected by the timing of the declaration of dividends by the underlying funds in which the Portfolio invests.
6 Class A, Class B, Class C and Class 1 shares began operations on 6-26-06.
7 Based on the average of the shares outstanding.
8 Not annualized.
9 Annualized.
10 Class 1 and Class NAV shares began operations on 10-15-05 and 10-27-05, respectively.
11 Less than $0.01 per share.
12 Assumes dividend reinvestment.
13 Class NAV shares began operations on 4-28-06.
14 Class 1 and Class NAV shares began operations on 10-15-05.
15 The Adviser/Subadviser voluntarily paid Class 1 and Class NAV $46,991 and $410,290, respectively, for a potential lost investment opportunity. Excluding these payments, the total return would have been 14.38% for Class 1 and 14.45% for Class NAV.
16 Less than 0.01% .
17 Class NAV shares began operations on 5-1-07.
18 Class 1 and Class NAV shares began operations on 10-15-05 and 6-26-06, respectively.
19 Less than $500,000.
20 Class NAV shares began operations on 10-27-06.
21 Class NAV shares began operations on 10-29-05.
22 The Adviser/Subadviser voluntarily reimbursed Class 1 and Class NAV $11,316 and $3,937,220, respectively, for a potential lost investment opportunity. Excluding these reimbursements, the total return would have been 23.19% for Class 1 and 22.62% for Class NAV.
23 The Adviser/Subadviser voluntarily paid Class 1 and Class NAV $510,149 and $847,342, respectively, for a potential lost investment opportunity. Excluding these payments, the total return would have been 13.67% for Class 1 and 13.77% for Class NAV.
24 Class A, Class B, Class C and Class I shares began operations on 7-28-06.
25 Class 1 shares began operations on 10-15-05.
26 In December 2006, the Adviser fully reimbursed Special Value Fund for a loss due to compliance error. The reimbursement increased the end of the year net asset value by $0.01 per share and the total return by 0.07% for Class 1.
27 The Portfolio turnover rate including the effect of “TBA” (to be announced) is 299% for the year ended 8-31-07. Prior year excludes the effect of TBA transactions.
28 The Portfolio turnover rate including the effect of “TBA” (to be announced) is 623% for the year ended 8-31-07. Prior year excludes the effect of TBA transactions.
29 The Portfolio turnover rate including the effect of “TBA” (to be announced) is 914% for the year ended 8-31-07. Prior year excludes the effect of TBA transactions.
30 The Portfolio turnover rate including the effect of “TBA” (to be announced) is 80% for the year ended 8-31-07. Prior year excludes the effect of TBA transactions.
31 The Portfolio turnover rate including the effect of “TBA” (to be announced) is 230% for the year ended 8-31-07. Prior year excludes the effect of TBA transactions.
32 The Portfolio turnover rate including the effect of “TBA” (to be announced) is 110% for the year ended 8-31-07. Prior year excludes the effect of TBA transactions.
33 The Portfolio turnover rate including the effect of “TBA” (to be announced) is 442% for the year ended 8-31-07. Prior year excludes the effect of TBA transactions.
34 The Portfolio turnover rate including the effect of “TBA” (to be announced) is 106% for the year ended 8-31-07. Prior year excludes the effect of TBA transactions.
35 The Portfolio turnover rate including the effect of “TBA” (to be announced) is 443% for the year ended 8-31-07. Prior year excludes the effect of TBA transactions.
36 The Portfolio turnover rate including the effect of “TBA” (to be announced) is 739% for the year ended 8-31-07. Prior year excludes the effect of TBA transactions.
37 Includes interest expense on securities sold short. Excluding interest expense the ratio for Class 1 and Class NAV would have been 0.81% and 0.76%, respectively.
38 Includes interest and fees on inverse floaters. Excluding this expense the ratio for Class 1 and Class NAV would have been 0.86% and 0.81% for Global Bond and 0.82% and 0.77% for Total Return, respectively.
39 Net investment income (loss) per share and ratio of net investment income (loss) to average net assets reflects special dividends received by the Fund which amounted to the following amounts:
| | | |
| | Per share | Percentage of average net assets |
|
| Class 1 | $0.04 | 0.18% |
| Class NAV | $0.04 | 0.18% |
40 Net investment income (loss) per share and ratio of net investment income (loss) to average net assets reflects a special dividend received by the Fund which amounted to the following amounts:
| | | |
| | Per share | Percentage of average net assets |
|
| Class NAV | $0.06 | 0.28% |
41 Net investment income (loss) per share and ratio of net investment income (loss) to average net assets reflects a special dividend received by the Fund which amounted to the following amounts:
| | | |
| | Per share | Percentage of average net assets |
|
| Class 1 | $0.07 | 0.42% |
| Class NAV | $0.06 | 0.35% |
42 Net investment income (loss) per share and ratio of net investment income (loss) to average net assets reflects a special dividend received by the Fund which amounted to the following amounts:
| | |
| | Per share | Percentage of average net assets |
|
| Class A | $0.02 | 0.22% |
| Class B | $0.02 | 0.22% |
| Class C | $0.02 | 0.22% |
| Class I | $0.03 | 0.22% |
43 Net investment income (loss) per share and ratio of net investment income (loss) to average net assets reflects a special dividend received by the Fund which amounted to the following amounts:
| | |
| | Per share | Percentage of average net assets |
|
| Class NAV | $0.04 | 0.31% |
44 Net investment income (loss) per share and ratio of net investment income (loss) to average net assets reflects special dividends received by the Fund which amounted to the following amounts:
| | | |
| | Per share | Percentage of average net assets |
|
| Class NAV | $0.02 | 0.14% |
45 Effective June 29, 2007, the subadviser changed from ClearBridge Advisors, LLC. to Wellington Management Company, LLP (“Wellington”).
46 The amount shown for a share outstanding does not correspond with the aggregate net gain (loss) on investments for the period due to the timing of sales and repurchases of shares in relation to fluctuating market values of the investments of the fund.
| |
| The accompanying notes are an integral part of the financial statements. | 119 |
John Hancock Funds II
Portfolio of investments — August 31, 2007
(showing percentage of total net assets)
| | | | |
| Absolute Return Portfolio | | | | |
| | | Shares or | | |
| | | Principal | | |
| | | Amount | | Value |
|
|
| |
| INVESTMENT COMPANIES - 88.73% | | | | |
| | | | | |
| Investment Companies - 2.01% | | | | |
| PowerShares DB Commodity | | | | |
| Index Tracking Fund * | | 4,545 | $ | 116,761 |
| | | | | |
| JOHN HANCOCK FUNDS II - 86.72% | | | | |
| Capital Appreciation (Jennison) | | 21,261 | | 229,620 |
| Core Bond (Wells Capital) | | 6,826 | | 85,319 |
| Equity-Income (T. Rowe Price) | | 11,263 | | 219,734 |
| Fundamental Value (Davis) | | 6,399 | | 112,358 |
| Global Bond (PIMCO) | | 11,806 | | 174,493 |
| High Income (MFC Global U.S.) | | 41,958 | | 445,170 |
| High Yield (WAMCO) | | 20,123 | | 198,617 |
| International Opportunities (Marsico) | | 7,559 | | 146,342 |
| International Small Company (DFA) | | 14,433 | | 166,411 |
| International Value (Templeton) | | 7,144 | | 140,746 |
| Investment Quality Bond (Wellington) | | 24,599 | | 287,567 |
| Large Cap (UBS) | | 10,208 | | 164,648 |
| Large Cap Value (BlackRock) | | 4,204 | | 109,090 |
| Natural Resources (Wellington) | | 2,509 | | 106,357 |
| Quantitative Value (MFC Global U.S.A.) | | 6,279 | | 110,327 |
| Real Estate Equity (T. Rowe Price) | | 35,697 | | 386,243 |
| Real Return Bond (PIMCO) | | 44,576 | | 582,612 |
| Small Company Value (T. Rowe Price) | | 6,341 | | 163,526 |
| Spectrum Income (T. Rowe Price) | | 32,448 | | 341,682 |
| Strategic Bond (WAMCO) | | 19,469 | | 224,671 |
| Strategic Income (MFC Global U.S.) | | 17,028 | | 171,302 |
| Total Return (PIMCO) | | 18,584 | | 255,525 |
| U.S. Government Securities (WAMCO) | | 8,525 | | 114,239 |
| U.S. High Yield Bond (Wells Capital) | | 6,632 | | 85,360 |
|
|
| | | | | 5,021,959 |
|
| TOTAL INVESTMENT COMPANIES (Cost $4,820,523) | $ | 5,138,720 |
|
| |
| SHORT TERM INVESTMENTS - 8.44% | | | |
| U.S. Treasury Bills | | | | |
| zero coupon due 09/20/2007 to | | | | |
| 11/15/2007 | $ | 490,000 | $ | 488,542 |
|
| TOTAL SHORT TERM INVESTMENTS | | | | |
| (Cost $488,541) | | | $ | 488,542 |
|
| Total Investments (Absolute Return Portfolio) | | | |
| (Cost $5,309,064) - 97.17% | | | $ | 5,627,262 |
| | | | |
| Other Assets in Excess of Liabilities - 2.83% | | | 15,596 |
|
|
| TOTAL NET ASSETS - 100.00% | | | $ | 5,642,858 |
|
|
| |
| |
| |
| Active Bond Fund | | | | |
| | | Shares or | | |
| | | Principal | | |
| | | Amount | | Value |
|
|
| |
| U.S. TREASURY OBLIGATIONS - 21.30% | | | |
| | | | | |
| U.S. Treasury Bonds - 1.35% | | | | |
| 4.50% due 02/15/2036 | $ | 45,000 | $ | 42,655 |
| 4.75% due 02/15/2037 | | 5,252,000 | | 5,180,604 |
| | | | |
| Active Bond Fund (continued) | | | |
| | | Shares or | | |
| | | Principal | | |
| | | Amount | | Value |
|
|
| |
| U.S. TREASURY OBLIGATIONS | | | |
| (continued) | | | | |
| | | | |
| U.S. Treasury Bonds (continued) | | | |
| 8.75% due 08/15/2020 *** | $ | 1,663,000 | $ | 2,290,653 |
|
|
| | | | | 7,513,912 |
| U.S. Treasury Notes - 19.95% | | | |
| 4.25% due 11/15/2013 *** | | 10,440,000 | | 10,404,932 |
| 4.50% due 04/30/2012 to 05/15/2017 | 22,054,000 | | 22,117,915 |
| 4.625% due 07/31/2012 | | 19,695,000 | | 20,010,435 |
| 4.75% due 02/15/2010 to 08/15/2017 | 57,985,000 | | 58,927,088 |
|
|
| | | | | 111,460,370 |
|
| TOTAL U.S. TREASURY OBLIGATIONS | | | |
| (Cost $116,218,392) | | | $ | 118,974,282 |
|
| |
| U.S. GOVERNMENT AGENCY OBLIGATIONS - 16.01% | | |
| | | | |
| Federal Home Loan Bank - 0.20% | | | |
| 5.50% due 08/13/2014 | | 965,000 | | 995,967 |
| 5.80% due 09/02/2008 | | 135,000 | | 136,126 |
|
|
| | | | | 1,132,093 |
| Federal Home Loan Mortgage Corp. - 1.69% | | | |
| 3.952% due 06/01/2034 | | 125,030 | | 122,171 |
| 4.50% due 01/15/2015 | | 780,000 | | 757,985 |
| 5.168% due 11/01/2035 | | 1,036,325 | | 1,013,202 |
| 5.287% due 12/01/2035 | | 949,481 | | 930,393 |
| 5.50% due 03/22/2022 | | 1,505,000 | | 1,498,411 |
| 5.64% due 04/01/2037 | | 976,205 | | 971,779 |
| 5.82% due 04/01/2037 | | 888,003 | | 887,016 |
| 5.845% due 11/01/2036 | | 746,056 | | 741,869 |
| 5.875% due 03/21/2011 | | 81,000 | | 84,039 |
| 5.882% due 03/01/2037(b) | | 2,442,536 | | 2,438,721 |
|
|
| | | | | 9,445,586 |
| Federal National Mortgage | | | | |
| Association - 14.05% | | | | |
| 5.718% due 04/01/2036 (b) | | 1,306,235 | | 1,308,257 |
| 5.603% due 01/01/2036 (b) | | 1,620,860 | | 1,626,959 |
| 3.716% due 07/01/2033 (b) | | 6,250 | | 6,271 |
| 4.375% due 03/15/2013 | | 20,000 | | 19,554 |
| 4.50% TBA ** | | 6,000,000 | | 5,754,372 |
| 4.875% due 12/15/2016 | | 705,000 | | 693,248 |
| 4.986% due 05/01/2035 | | 3,738,376 | | 3,748,180 |
| 5.00% due 05/01/2018 to 12/01/2034 | | 6,766,372 | | 6,567,243 |
| 5.00% TBA ** | | 5,000,000 | | 4,881,250 |
| 5.493% due 03/01/2037 | | 1,142,935 | | 1,136,275 |
| 5.50% due 03/15/2011 to 06/01/2037 | | 23,300,877 | | 2,3 047,488 |
| 5.50% due 12/01/2036 *** | | 1,723,471 | | 1,683,801 |
| 6.00% due 05/15/2008 to 07/01/2037 | | 19,518,445 | | 19,524,934 |
| 6.00% TBA ** | | 3,520,000 | | 3,515,600 |
| 6.25% due 05/15/2029 | | 157,000 | | 173,920 |
| 6.50% due 02/01/2036 to 02/01/2037 | | 4,595,167 | | 4,665,032 |
| 7.00% due 09/01/2010 to 10/25/2041 | | 99,770 | | 102,881 |
| 7.50% due 09/01/2029 to 08/01/2031 | | 5,878 | | 6,148 |
|
|
| | | | | 78,461,413 |
| |
| The accompanying notes are an integral part of the financial statements. | 120 |
John Hancock Funds II
Portfolio of investments — August 31, 2007
(showing percentage of total net assets)
| | | | |
| Active Bond Fund (continued) | | | |
| | | Shares or | | |
| | | Principal | | |
| | | Amount | | Value |
|
|
| |
| U.S. GOVERNMENT AGENCY | | | | |
| OBLIGATIONS (continued) | | | | |
| | | | | |
| Government National Mortgage | | | | |
| Association - 0.05% | | | | |
| 5.00% due 04/15/2035 | $ | 114,485 | $ | 110,405 |
| 5.50% due 03/15/2035 | | 117,908 | | 115,955 |
| 6.00% due 03/15/2033 to 06/15/2033 | | 48,938 | | 49,278 |
| 6.50% due 09/15/2028 to 08/15/2031 | | 8,730 | | 8,931 |
| 7.00% due 04/15/2029 | | 2,800 | | 2,920 |
| 8.00% due 10/15/2026 | | 2,409 | | 2,558 |
| |
|
| | | | | 290,047 |
| The Financing Corp. - 0.02% | | | | |
| 10.35% due 08/03/2018 | | 75,000 | | 107,191 |
|
| TOTAL U.S. GOVERNMENT AGENCY OBLIGATIONS | | |
| (Cost $89,673,589) | | | $ | 89,436,330 |
|
| |
| FOREIGN GOVERNMENT OBLIGATIONS - 0.12% | | |
| | | | | |
| Argentina - 0.01% | | | | |
| Republic of Argentina | | | | |
| zero coupon, Step up to 1.18% on | | | | |
| 03/31/2009 due 12/31/2038 (b) | ARS | 177,218 | | 23,133 |
| 0.6491% due 12/15/2035 (b) | | 393,449 | | 11,593 |
| 5.83% due 12/31/2033 (b) | | 72,870 | | 25,812 |
| |
|
| | | | | 60,538 |
| Canada - 0.00% | | | | |
| Government of Canada | | | | |
| 5.50% due 06/01/2010 | CAD | 5,000 | | 4,870 |
| | | | | |
| Chile - 0.04% | | | | |
| Republic of Chile | | | | |
| 5.76% due 01/28/2008 (b) | $ | 223,000 | | 223,223 |
| | | | | |
| Colombia - 0.01% | | | | |
| Republic of Colombia | | | | |
| 10.00% due 01/23/2012 | | 20,000 | | 22,980 |
| 11.75% due 03/01/2010 | COP | 8,000,000 | | 3,810 |
| |
|
| | | | | 26,790 |
| Japan - 0.01% | | | | |
| Government of Japan | | | | |
| 0.90% due 12/22/2008 | JPY | 550,000 | | 4,754 |
| 1.50% due 09/20/2014 | | 1,350,000 | | 11,758 |
| 1.80% due 03/22/2010 | | 2,650,000 | | 23,372 |
| |
|
| | | | | 39,884 |
| Mexico - 0.05% | | | | |
| Government of Mexico | | | | |
| 8.00% due 12/07/2023 | MXN | 238,900 | | 21,906 |
| 8.00% due 12/19/2013 | | 167,800 | | 15,341 |
| 9.875% due 02/01/2010 | $ | 205,000 | | 226,115 |
| |
|
| | | | | 263,362 |
| Panama - 0.00% | | | | |
| Republic of Panama | | | | |
| 8.875% due 09/30/2027 | | 6,000 | | 7,455 |
| 9.375% due 07/23/2012 | | 2,000 | | 2,270 |
| |
|
| | | | | 9,725 |
| | | | |
| Active Bond Fund (continued) | | | |
| | | Shares or | | |
| | | Principal | | |
| | | Amount | | Value |
|
|
| |
| FOREIGN GOVERNMENT OBLIGATIONS | | | |
| (continued) | | | | |
| | | | | |
| Peru - 0.00% | | | | |
| Republic of Peru | | | | |
| 9.875% due 02/06/2015 | $ | 2,000 | $ | 2,467 |
| | | | | |
| Philippines - 0.00% | | | | |
| Republic of Philippines | | | | |
| 9.125% due 02/22/2010 | EUR | 2,000 | | 2,931 |
| | | | | |
| Sweden - 0.00% | | | | |
| Kingdom of Sweden | | | | |
| 5.00% due 01/28/2009 | SEK | 30,000 | | 4,412 |
| 5.25% due 03/15/2011 | | 30,000 | | 4,506 |
| |
|
| | | | | 8,918 |
| |
| Turkey - 0.00% | | | | |
| Republic of Turkey | | | | |
| 20.00% due 10/17/2007 | TRY | 23,700 | | 19,504 |
|
| TOTAL FOREIGN GOVERNMENT OBLIGATIONS | | |
| (Cost $677,870) | | | $ | 662,212 |
|
| |
| CORPORATE BONDS - 25.84% | | | | |
| | | | | |
| Aerospace - 0.04% | | | | |
| BAE Systems Asset Trust PLC | | | | |
| 6.664% due 09/15/2013 | $ | 41,511 | | 44,269 |
| TransDigm, Inc. | | | | |
| 7.75% due 07/15/2014 | | 150,000 | | 150,750 |
| |
|
| | | | | 195,019 |
| |
| Agriculture - 0.09% | | | | |
| Chaoda Modern Agriculture (Holdings), Ltd. | | | |
| 7.75% due 02/08/2010 | | 355,000 | | 335,475 |
| Mosaic Company | | | | |
| 7.625% due 12/01/2016 | | 180,000 | | 184,500 |
| |
|
| | | | | 519,975 |
| |
| Air Travel - 0.14% | | | | |
| Continental Airlines, Inc., Series 00-2 | | | | |
| 8.307% due 04/02/2018 | | 172,372 | | 171,941 |
| Continental Airlines, Inc., Series 991A | | | | |
| 6.545% due 02/02/2019 | | 104,207 | | 104,468 |
| Delta Air Lines, Inc., Series 02-1 | | | | |
| 6.417% due 07/02/2012 | | 515,000 | | 528,037 |
| |
|
| | | | | 804,446 |
| |
| Amusement & Theme Parks - 0.02% | | | | |
| HRP Myrtle Beach Operations LLC | | | | |
| 10.07% due 04/01/2012 (b) | | 140,000 | | 133,000 |
| | | | | |
| Apparel & Textiles - 0.02% | | | | |
| Hanesbrands, Inc., Series B | | | | |
| 8.7841% due 12/15/2014 (b) | | 135,000 | | 134,831 |
| | | | | |
| Auto Parts - 0.00% | | | | |
| Delphi Corp. | | | | |
| 6.197% due 11/15/2033 | | 2,000 | | 1,980 |
| | | | | |
| Auto Services - 0.00% | | | | |
| ERAC USA Finance Company | | | | |
| 7.95% due 12/15/2009 | | 10,000 | | 10,557 |
| |
| The accompanying notes are an integral part of the financial statements. | 121 |
John Hancock Funds II
Portfolio of investments — August 31, 2007
(showing percentage of total net assets)
| | | | |
| Active Bond Fund (continued) | | | |
| | | Shares or | | |
| | | Principal | | |
| | | Amount | | Value |
|
|
| |
| CORPORATE BONDS (continued) | | | | |
| | | | | |
| Automobiles - 0.11% | | | | |
| DaimlerChrysler N.A. Holding Corp. | | | | |
| 4.05% due 06/04/2008 | $ | 234,000 | $ | 230,536 |
| 5.875% due 03/15/2011 | | 395,000 | | 398,735 |
| |
|
| | | | | 629,271 |
| Banking - 2.48% | | | | |
| Allied Irish Banks PLC | | | | |
| 7.50% due 12/29/2049 (b) | EUR | 1,000 | | 1,461 |
| BAC Capital Trust XI | | | | |
| 6.625% due 05/23/2036 | $ | 555,000 | | 568,362 |
| BAC Capital Trust XV | | | | |
| 6.16% due 06/01/2056 (b) | | 925,000 | | 829,158 |
| Banco Mercantil del Norte SA | | | | |
| 6.862% due 10/13/2021 | | 435,000 | | 447,971 |
| Banco Santander Chile | | | | |
| 5.375% due 12/09/2014 | | 5,000 | | 4,851 |
| 5.71% due 12/09/2009 (b) | | 18,000 | | 18,026 |
| Bank of Ireland | | | | |
| 6.45% due 02/10/2010 | EUR | 1,000 | | 1,412 |
| BankAmerica Institutional Capital B | | | | |
| 7.70% due 12/31/2026 | $ | 125,000 | | 129,895 |
| BNP Paribas | | | | |
| 7.195% due 12/31/2049 (b) | | 190,000 | | 187,812 |
| Chuo Mitsui Trust & Banking Company | | | | |
| 5.506% due 04/15/2049 (b) | | 350,000 | | 332,521 |
| Comerica Capital Trust II | | | | |
| 6.576% due 02/20/2037 (b) | | 1,225,000 | | 1,084,227 |
| Deutsche Bank AG | | | | |
| 6.00% due 09/01/2017 | | 535,000 | | 539,773 |
| HBOS PLC | | | | |
| 5.375% due 11/29/2049 (b) | | 22,000 | | 21,090 |
| 6.413% due 09/29/2049 (b) | | 450,000 | | 388,844 |
| ICICI Bank, Ltd. | | | | |
| 5.90% due 01/12/2010 (b) | | 420,000 | | 414,708 |
| Independence Community Bank Corp. | | | | |
| 3.75% due 04/01/2014 (b) | | 5,000 | | 4,884 |
| Landsbanki Islands HF | | | | |
| 6.10% due 08/25/2011 | | 295,000 | | 304,097 |
| 6.205% due 08/25/2009 (b) | | 490,000 | | 492,643 |
| Lloyds TSB Group PLC | | | | |
| 6.267% due 12/31/2049 (b) | | 990,000 | | 913,423 |
| NB Capital Trust IV | | | | |
| 8.25% due 04/15/2027 | | 50,000 | | 51,925 |
| Rabobank Capital Funding II | | | | |
| 5.26% due 12/29/2049 (b) | | 755,000 | | 718,639 |
| RBS Capital Trust IV | | | | |
| 6.16% due 09/29/2049 (b) | | 18,000 | | 17,277 |
| Royal Bank of Scotland Group PLC | | | | |
| 7.648% due 08/31/2049 (b) | | 580,000 | | 646,085 |
| Shinhan Bank | | | | |
| 6.819% due 09/20/2036 (b) | | 515,000 | | 503,501 |
| Silicon Valley Bank | | | | |
| 6.05% due 06/01/2017 | | 415,000 | | 411,036 |
| Societe Generale | | | | |
| 5.922% due 12/31/2049 | | 290,000 | | 277,316 |
| | | | |
| Active Bond Fund (continued) | | | |
| | | Shares or | | |
| | | Principal | | |
| | | Amount | | Value |
|
|
| |
| CORPORATE BONDS (continued) | | | | |
| | | | | |
| Banking (continued) | | | | |
| Standard Chartered PLC | | | | |
| 6.409% due 01/30/2017 (b) | $ | 1,215,000 | $ | 1,123,293 |
| 7.014% due 12/30/2049 (b) | | 300,000 | | 274,754 |
| SunTrust Capital VIII | | | | |
| 6.10% due 12/01/2066 (b) | | 1,065,000 | | 923,991 |
| TuranAlem Finance BV | | | | |
| 7.875% due 06/02/2010 | | 12,000 | | 11,632 |
| USB Capital IX | | | | |
| 6.189% due 04/15/2042 (b) | | 520,000 | | 522,153 |
| Wachovia Capital Trust III | | | | |
| 5.80% due 03/15/2042 (b) | | 915,000 | | 912,710 |
| Washington Mutual Bank | | | | |
| 6.75% due 05/20/2036 | | 400,000 | | 354,976 |
| Washington Mutual, Inc. | | | | |
| 4.20% due 01/15/2010 | | 222,000 | | 212,955 |
| 5.66% due 03/22/2012 (b) | | 7,000 | | 6,622 |
| Wells Fargo & Company | | | | |
| 3.50% due 04/04/2008 | | 219,000 | | 216,116 |
| |
|
| | | | | 13,870,139 |
| Broadcasting - 0.28% | | | | |
| Clear Channel Communications, Inc. | | | | |
| 7.65% due 09/15/2010 | | 214,000 | | 212,663 |
| News America Holdings, Inc. | | | | |
| 6.75% due 01/09/2038 | | 2,000 | | 2,108 |
| 7.75% due 12/01/2045 | | 9,000 | | 9,851 |
| 8.25% due 08/10/2018 | | 375,000 | | 430,508 |
| Viacom, Inc. | | | | |
| 6.625% due 05/15/2011 | | 575,000 | | 596,112 |
| XM Satellite Radio, Inc. | | | | |
| 9.75% due 05/01/2014 | | 330,000 | | 313,500 |
| |
|
| | | | | 1,564,742 |
| Building Materials & Construction - 0.17% | | | |
| USG Corp | | | | |
| 6.30% due 11/15/2016 | | 1,000,000 | | 960,842 |
| | | | | |
| Business Services - 0.34% | | | | |
| Electronic Data Systems Corp. | | | | |
| 7.125% due 10/15/2009 | | 2,000 | | 2,058 |
| Minerva Overseas, Ltd. | | | | |
| 9.50% due 02/01/2017 | | 460,000 | | 432,400 |
| Science Applications International Corp. | | | | |
| 5.50% due 07/01/2033 | | 825,000 | | 736,787 |
| Xerox Corp. | | | | |
| 6.75% due 02/01/2017 | | 715,000 | | 735,825 |
| |
|
| | | | | 1,907,070 |
| Cable & Television - 1.50% | | | | |
| Comcast Corp. | | | | |
| 6.30% due 11/15/2017 | | 1,115,000 | | 1,126,308 |
| 6.50% due 11/15/2035 | | 530,000 | | 515,992 |
| 6.95% due 08/15/2037 | | 740,000 | | 758,010 |
| Cox Communications, Inc. | | | | |
| 4.625% due 01/15/2010 | | 22,000 | | 21,651 |
| 5.45% due 12/15/2014 | | 218,000 | | 212,036 |
| 6.75% due 03/15/2011 | | 209,000 | | 217,432 |
| 7.75% due 11/01/2010 | | 207,000 | | 220,185 |
| |
| The accompanying notes are an integral part of the financial statements. | 122 |
John Hancock Funds II
Portfolio of investments — August 31, 2007
(showing percentage of total net assets)
| | | | |
| Active Bond Fund (continued) | | | |
| | | Shares or | | |
| | | Principal | | |
| | | Amount | | Value |
|
|
| |
| CORPORATE BONDS (continued) | | | | |
| | | | | |
| Cable & Television (continued) | | | | |
| Rogers Cable, Inc. | | | | |
| 6.75% due 03/15/2015 | $ | 290,000 | $ | 299,593 |
| Shaw Communications, Inc. | | | | |
| 8.25% due 04/11/2010 | | 275,000 | | 286,687 |
| TCI Communications, Inc. | | | | |
| 9.80% due 02/01/2012 | | 285,000 | | 328,923 |
| Time Warner Companies, Inc. | | | | |
| 7.57% due 02/01/2024 | | 34,000 | | 36,705 |
| Time Warner Entertainment Company LP | | | | |
| 8.375% due 07/15/2033 | | 535,000 | | 620,916 |
| 8.375% due 03/15/2023 | | 335,000 | | 387,252 |
| Time Warner, Inc. | | | | |
| 6.50% due 11/15/2036 | | 1,040,000 | | 998,085 |
| 6.75% due 04/15/2011 | | 575,000 | | 597,639 |
| 7.625% due 04/15/2031 | | 9,000 | | 9,755 |
| Viacom, Inc. | | | | |
| 5.75% due 04/30/2011 | | 1,000,000 | | 1,006,805 |
| 6.875% due 04/30/2036 | | 760,000 | | 740,080 |
| |
|
| | | | | 8,384,054 |
| Cellular Communications - 0.41% | | | | |
| America Movil S.A. de CV | | | | |
| 5.75% due 01/15/2015 | | 280,000 | | 278,236 |
| American Tower Corp. | | | | |
| 7.50% due 05/01/2012 | | 12,000 | | 12,120 |
| AT&T Broadband Corp. | | | | |
| 8.375% due 03/15/2013 | | 270,000 | | 302,015 |
| AT&T Wireless Services, Inc. | | | | |
| 7.875% due 03/01/2011 | | 211,000 | | 227,260 |
| 8.125% due 05/01/2012 | | 225,000 | | 248,844 |
| 8.75% due 03/01/2031 | | 209,000 | | 260,533 |
| Nextel Communications, Inc. | | | | |
| 6.875% due 10/31/2013 | | 435,000 | | 435,133 |
| 7.375% due 08/01/2015 | | 2,000 | | 2,013 |
| Rogers Wireless, Inc. | | | | |
| 9.625% due 05/01/2011 | | 8,000 | | 9,019 |
| SK Telecom Comapny, Ltd. | | | | |
| 6.625% due 07/20/2027 | | 490,000 | | 493,513 |
| |
|
| | | | | 2,268,686 |
| Chemicals - 0.17% | | | | |
| American Pacific Corp. | | | | |
| 9.00% due 02/01/2015 | | 320,000 | | 315,200 |
| Cytec Industries, Inc. | | | | |
| 6.75% due 03/15/2008 | | 13,000 | | 13,025 |
| ICI Wilmington, Inc. | | | | |
| 4.375% due 12/01/2008 | | 218,000 | | 214,857 |
| Nova Chemicals, Ltd. | | | | |
| 7.875% due 09/15/2025 | | 265,000 | | 244,463 |
| Sterling Chemicals, Inc. | | | | |
| 10.25% due 04/01/2015 | | 145,000 | | 147,175 |
| |
|
| | | | | 934,720 |
| Computers & Business Equipment - 0.09% | | | |
| Cisco Systems, Inc. | | | | |
| 5.50% due 02/22/2016 | | 510,000 | | 507,943 |
| | | | |
| Active Bond Fund (continued) | | | |
| | | Shares or | | |
| | | Principal | | |
| | | Amount | | Value |
| |
|
| |
| CORPORATE BONDS (continued) | | | | |
| | | | | |
| Containers & Glass - 0.14% | | | | |
| BWAY Corp. | | | | |
| 10.00% due 10/15/2010 | $ | 407,000 | $ | 415,140 |
| Greif, Inc. | | | | |
| 6.75% due 02/01/2017 | | 125,000 | | 121,875 |
| Smurfit-Stone Container Enterprises, Inc. | | | | |
| 8.00% due 03/15/2017 | | 145,000 | | 138,294 |
| US Corrugated, Inc. | | | | |
| 10.00% due 06/12/2013 | | 110,000 | | 103,400 |
| |
|
| | | | | 778,709 |
| |
| Crude Petroleum & Natural Gas - 0.29% | | | |
| Amerada Hess Corp. | | | | |
| 7.30% due 08/15/2031 | | 212,000 | | 230,532 |
| Apache Corp. | | | | |
| 5.625% due 01/15/2017 | | 1,000,000 | | 994,538 |
| OPTI Canada, Inc. | | | | |
| 8.25% due 12/15/2014 | | 400,000 | | 405,000 |
| Premcor Refining Group, Inc. | | | | |
| 7.50% due 06/15/2015 | | 4,000 | | 4,149 |
| |
|
| | | | | 1,634,219 |
| |
| Diversified Financial Services - 0.04% | | | | |
| Tate & Lyle International Finance PLC | | | | |
| 5.00% due 11/15/2014 | | 208,000 | | 195,478 |
| | | | | |
| Domestic Oil - 0.04% | | | | |
| Devon Financing Corp., ULC | | | | |
| 6.875% due 09/30/2011 | | 205,000 | | 216,816 |
| | | | | |
| Drugs & Health Care - 0.15% | | | | |
| Allegiance Corp. | | | | |
| 7.00% due 10/15/2026 | | 205,000 | | 217,731 |
| Allergan, Inc. | | | | |
| 5.75% due 04/01/2016 | | 400,000 | | 402,668 |
| Wyeth | | | | |
| 4.375% due 03/01/2008 | | 210,000 | | 208,543 |
| |
|
| | | | | 828,942 |
| |
| Electrical Equipment - 0.05% | | | | |
| Ametek, Inc. | | | | |
| 7.20% due 07/15/2008 | | 295,000 | | 297,444 |
| | | | | |
| Electrical Utilities - 2.11% | | | | |
| AES Eastern Energy LP, Series 99-A | | | | |
| 9.00% due 01/02/2017 | | 554,247 | | 584,730 |
| AES Gener SA | | | | |
| 7.50% due 03/25/2014 | | 218,000 | | 225,914 |
| American Electric Power Company, Inc. | | | | |
| 5.25% due 06/01/2015 | | 210,000 | | 202,318 |
| Appalachian Power Company | | | | |
| 5.80% due 10/01/2035 | | 39,000 | | 35,546 |
| Arizona Public Service Company | | | | |
| 5.50% due 09/01/2035 | | 222,000 | | 191,285 |
| CenterPoint Energy Houston Electric LLC, Series K2 | | | |
| 6.95% due 03/15/2033 | | 10,000 | | 10,929 |
| CenterPoint Energy Resources Corp. | | | | |
| 7.875% due 04/01/2013 | | 235,000 | | 256,827 |
| Constellation Energy Group | | | | |
| 7.60% due 04/01/2032 | | 360,000 | | 399,266 |
| |
| The accompanying notes are an integral part of the financial statements. | 123 |
John Hancock Funds II
Portfolio of investments — August 31, 2007
(showing percentage of total net assets)
| | | | |
| Active Bond Fund (continued) | | | |
| | | Shares or | | |
| | | Principal | | |
| | | Amount | | Value |
|
|
| |
| CORPORATE BONDS (continued) | | | | |
| | | | | |
| Electrical Utilities (continued) | | | | |
| Dominion Resources, Inc. | | | | |
| 5.70% due 09/17/2012 | $ | 207,000 | $ | 207,811 |
| 6.30% due 09/30/2066 (b) | | 800,000 | | 792,661 |
| 7.50% due 06/30/2066 (b) | | 320,000 | | 331,560 |
| Empresa Nacional De Electricidad | | | | |
| 8.50% due 04/01/2009 | | 8,000 | | 8,368 |
| Enersis SA | | | | |
| 7.375% due 01/15/2014 | | 12,000 | | 12,826 |
| Entergy (Waterford 3 Funding) | | | | |
| 8.09% due 01/02/2017 | | 709,015 | | 731,087 |
| FirstEnergy Corp. | | | | |
| 6.45% due 11/15/2011 | | 209,000 | | 215,857 |
| 7.375% due 11/15/2031 | | 226,000 | | 249,063 |
| Funding Corp. | | | | |
| 9.00% due 06/01/2017 | | 1,000,000 | | 1,133,960 |
| HQI Transelec Chile SA | | | | |
| 7.875% due 04/15/2011 | | 325,000 | | 346,872 |
| Indiantown Cogeneration LP, Series A-9 | | | | |
| 9.26% due 12/15/2010 | | 83,053 | | 88,937 |
| Ipalco Enterprises, Inc. | | | | |
| 8.625% due 11/14/2011 | | 285,000 | | 292,838 |
| Monterrey Power SA De CV | | | | |
| 9.625% due 11/15/2009 | | 296,863 | | 320,612 |
| National Grid PLC | | | | |
| 6.30% due 08/01/2016 | | 485,000 | | 496,802 |
| Nevada Power Company | | | | |
| 6.65% due 04/01/2036 | | 530,000 | | 517,462 |
| Pacific Gas & Electric Company | | | | |
| 4.20% due 03/01/2011 | | 246,000 | | 236,286 |
| 4.80% due 03/01/2014 | | 212,000 | | 202,403 |
| 6.05% due 03/01/2034 | | 834,000 | | 816,861 |
| PSEG Power LLC | | | | |
| 5.00% due 04/01/2014 | | 214,000 | | 204,265 |
| 8.625% due 04/15/2031 | | 214,000 | | 262,810 |
| Scottish Power PLC | | | | |
| 4.91% due 03/15/2010 | | 225,000 | | 223,691 |
| Sierra Pacific Power Company, Series M | | | | |
| 6.00% due 05/15/2016 | | 840,000 | | 826,374 |
| TXU Corp., Series R | | | | |
| 6.55% due 11/15/2034 | | 1,120,000 | | 885,788 |
| United Energy Distribution Property, Ltd. | | | | |
| 4.70% due 04/15/2011 | | 6,000 | | 5,943 |
| Virginia Electric and Power Company | | | | |
| 6.00% due 01/15/2036 | | 500,000 | | 479,036 |
| |
|
| | | | | 11,796,988 |
| Electronics - 0.00% | | | | |
| Jabil Circuit, Inc. | | | | |
| 5.875% due 07/15/2010 | | 17,000 | | 17,086 |
| | | | | |
| Energy - 0.51% | | | | |
| Abu Dhabi National Energy Company | | | | |
| 6.50% due 10/27/2036 | | 570,000 | | 563,404 |
| Duke Capital LLC | | | | |
| 6.75% due 02/15/2032 | | 511,000 | | 507,392 |
| Enterprise Products Operating LP | | | | |
| 4.95% due 06/01/2010 | | 210,000 | | 208,372 |
| | | | |
| Active Bond Fund (continued) | | | |
| | | Shares or | | |
| | | Principal | | |
| | | Amount | | Value |
|
|
| |
| CORPORATE BONDS (continued) | | | | |
| | | | | |
| Energy (continued) | | | | |
| Enterprise Products Operating LP, Series B | | | | |
| 5.00% due 03/01/2015 | $ | 211,000 | $ | 198,424 |
| 6.875% due 03/01/2033 | | 209,000 | | 208,872 |
| Nexen, Inc. | | | | |
| 5.875% due 03/10/2035 | | 212,000 | | 192,141 |
| Salton Sea Funding Corp., Series E | | | | |
| 8.30% due 05/30/2011 | | 164,110 | | 178,238 |
| Salton Sea Funding Corp., Series F | | | | |
| 7.475% due 11/30/2018 | | 322,500 | | 348,225 |
| Sempra Energy | | | | |
| 4.75% due 05/15/2009 | | 208,000 | | 206,253 |
| TXU Energy Company, LLC | | | | |
| 7.00% due 03/15/2013 | | 217,000 | | 222,883 |
| |
|
| | | | | 2,834,204 |
| Financial Services - 4.43% | | | | |
| Astoria Depositor Corp. | | | | |
| 8.144% due 05/01/2021 | | 600,000 | | 648,000 |
| AXA Financial, Inc. | | | | |
| 7.75% due 08/01/2010 | | 210,000 | | 224,489 |
| Bank of New York Institutional Capital Trust A | | | |
| 7.78% due 12/01/2026 | | 60,000 | | 62,432 |
| Bear Stearns Companies, Inc. | | | | |
| 5.55% due 01/22/2017 | | 215,000 | | 197,946 |
| 5.70% due 11/15/2014 | | 219,000 | | 206,702 |
| Bosphorus Financial Services, Ltd. | | | | |
| 7.3575% due 02/15/2012 (b) | | 375,000 | | 376,905 |
| Capital One Capital III | | | | |
| 7.686% due 08/15/2036 | | 420,000 | | 388,869 |
| Caterpillar Financial Services Corp. | | | | |
| 4.50% due 06/15/2009 | | 210,000 | | 208,417 |
| CIT Group Funding Company of Canada | | | | |
| 4.65% due 07/01/2010 | | 350,000 | | 321,968 |
| Citigroup, Inc. | | | | |
| 5.00% due 09/15/2014 | | 218,000 | | 208,731 |
| 5.625% due 08/27/2012 | | 219,000 | | 221,142 |
| CNOOC Finance 2003, Ltd. | | | | |
| 5.50% due 05/21/2033 | | 10,000 | | 9,070 |
| Cosan Finance, Ltd. | | | | |
| 7.00% due 02/01/2017 | | 185,000 | | 172,744 |
| Credit Suisse First Boston USA, Inc. | | | | |
| 4.625% due 01/15/2008 | | 208,000 | | 207,096 |
| 6.50% due 01/15/2012 | | 209,000 | | 217,465 |
| Dresdner Bank-New York | | | | |
| 7.25% due 09/15/2015 | | 211,000 | | 229,953 |
| E*Trade Financial Corp. | | | | |
| 7.375% due 09/15/2013 | | 310,000 | | 275,900 |
| ERP Operating LP | | | | |
| 4.75% due 06/15/2009 | | 13,000 | | 12,838 |
| ESI Tractebel Acquisition Corp., Series B | | | | |
| 7.99% due 12/30/2011 | | 496,000 | | 509,855 |
| Ford Motor Credit Company | | | | |
| 9.875% due 08/10/2011 | | 180,000 | | 177,692 |
| Ford Motor Credit Company LLC | | | | |
| 9.75% due 09/15/2010 | | 468,000 | | 463,478 |
| |
| The accompanying notes are an integral part of the financial statements. | 124 |
John Hancock Funds II
Portfolio of investments — August 31, 2007
(showing percentage of total net assets)
| | | | |
| Active Bond Fund (continued) | | | |
| | | Shares or | | |
| | | Principal | | |
| | | Amount | | Value |
|
|
| |
| CORPORATE BONDS (continued) | | | | |
| | | | | |
| Financial Services (continued) | | | | |
| FPL Group Capital, Inc. | | | | |
| 6.35% due 10/01/2066 (b) | $ | 650,000 | $ | 632,836 |
| Fund American Companies, Inc. | | | | |
| 5.875% due 05/15/2013 | | 214,000 | | 213,147 |
| General Electric Capital Corp. | | | | |
| 5.45% due 01/15/2013 | | 261,000 | | 262,981 |
| General Motors Acceptance Corp. | | | | |
| 6.75% due 12/01/2014 | | 330,000 | | 280,060 |
| GMAC LLC | | | | |
| 6.00% due 12/15/2011 | | 285,000 | | 245,043 |
| Goldman Sachs Capital II | | | | |
| 5.793% due 12/29/2049 (b) | | 760,000 | | 697,381 |
| Goldman Sachs Group, Inc. | | | | |
| 5.125% due 01/15/2015 | | 247,000 | | 234,362 |
| 5.25% due 04/01/2013 | | 224,000 | | 217,753 |
| 6.25% due 09/01/2017 | | 555,000 | | 555,801 |
| Household Finance Corp. | | | | |
| 6.40% due 06/17/2008 | | 237,000 | | 238,173 |
| HSBC Finance Capital Trust IX | | | | |
| 5.911% due 11/30/2035 (b) | | 300,000 | | 284,389 |
| HSBC Finance Corp. | | | | |
| 4.625% due 01/15/2008 | | 213,000 | | 212,153 |
| Huntington Capital III | | | | |
| 6.65% due 05/15/2037 (b) | | 375,000 | | 347,374 |
| HVB Funding Trust III | | | | |
| 9.00% due 10/22/2031 | | 10,000 | | 11,267 |
| International Lease Finance Corp. | | | | |
| 3.50% due 04/01/2009 | | 213,000 | | 207,688 |
| 4.55% due 10/15/2009 | | 7,000 | | 6,921 |
| 4.75% due 07/01/2009 | | 30,000 | | 29,500 |
| 5.00% due 04/15/2010 | | 211,000 | | 209,275 |
| 5.875% due 05/01/2013 | | 215,000 | | 218,818 |
| International Lease Finance Corp., Series P | | | | |
| 5.76% due 01/15/2010 (b) | | 13,000 | | 13,011 |
| International Lease Finance Corp., Series MTN | | | |
| 5.45% due 03/24/2011 | | 1,200,000 | | 1,195,804 |
| Jefferies Group, Inc. | | | | |
| 6.45% due 06/08/2027 | | 210,000 | | 197,496 |
| John Deere Capital Corp., Series D | | | | |
| 4.125% due 01/15/2010 | | 39,000 | | 38,326 |
| JP Morgan Chase & Company | | | | |
| 6.75% due 02/01/2011 | | 218,000 | | 227,376 |
| JP Morgan Chase Capital XX, Series T | | | | |
| 6.55% due 09/29/2036 | | 750,000 | | 675,159 |
| JP Morgan Chase Capital XXIII | | | | |
| 6.5575% due 05/15/2047 (b) | | 915,000 | | 799,816 |
| Kaupthing Bank HF | | | | |
| 5.75% due 10/04/2011 | | 750,000 | | 755,667 |
| Lehman Brothers Holdings, Inc. | | | | |
| 4.25% due 01/27/2010 | | 285,000 | | 275,799 |
| 6.875% due 07/17/2037 | | 235,000 | | 220,772 |
| MBNA Capital, Series B | | | | |
| 6.1563% due 02/01/2027 (b) | | 23,000 | | 21,624 |
| Merrill Lynch & Company, Inc. | | | | |
| 6.40% due 08/28/2017 | | 1,075,000 | | 1,095,608 |
| | | | |
| Active Bond Fund (continued) | | | |
| | | Shares or | | |
| | | Principal | | |
| | | Amount | | Value |
|
|
| |
| CORPORATE BONDS (continued) | | | | |
| | | | | |
| Financial Services (continued) | | | | |
| Merrill Lynch & Company, Inc., Series MTN | | | |
| 5.90% due 06/05/2012 (b) | $ | 1,615,000 | $ | 1,581,001 |
| Mizuho Financial Group (Cayman), Ltd. | | | | |
| 8.375% due 12/29/2049 | | 455,000 | | 472,822 |
| Morgan Stanley | | | | |
| 4.25% due 05/15/2010 | | 232,000 | | 225,625 |
| Nelnet, Inc. | | | | |
| 7.40% due 09/29/2036 (b) | | 400,000 | | 388,340 |
| Nexstar Finance, Inc. | | | | |
| 7.00% due 01/15/2014 | | 210,000 | | 198,450 |
| NiSource Finance Corp. | | | | |
| 6.15% due 03/01/2013 | | 219,000 | | 222,094 |
| 6.40% due 03/15/2018 | | 360,000 | | 360,021 |
| 7.875% due 11/15/2010 | | 216,000 | | 229,421 |
| Nuveen Investments, Inc., Class A | | | | |
| 5.50% due 09/15/2015 | | 29,000 | | 24,567 |
| Osiris Capital PLC, Series C | | | | |
| 8.21% due 01/15/2010 (b) | | 920,000 | | 925,630 |
| Osiris Capital PLC, Series D | | | | |
| 10.36% due 01/15/2010 (b) | | 360,000 | | 363,240 |
| Popular North America, Inc. | | | | |
| 4.70% due 06/30/2009 | | 12,000 | | 11,911 |
| QBE Capital Funding II LP | | | | |
| 6.797% due 06/01/2049 | | 430,000 | | 406,733 |
| Reliastar Financial Corp. | | | | |
| 6.50% due 11/15/2008 | | 14,000 | | 14,119 |
| Skandinaviska Enskilda Banken AB | | | | |
| 5.471% due 03/29/2049 (b) | | 400,000 | | 374,764 |
| SLM Corp. | | | | |
| 4.50% due 07/26/2010 | | 410,000 | | 379,467 |
| SLM Corp., Series A | | | | |
| 5.00% due 04/15/2015 | | 27,000 | | 22,254 |
| SMFG Preferred Capital | | | | |
| 5.37% due 01/29/2049 (b) | | 400,000 | | 373,072 |
| Sovereign Capital Trust VI | | | | |
| 7.908% due 06/13/2036 | | 295,000 | | 316,806 |
| Trinity Industries Leasing Companies | | | | |
| 7.755% due 02/15/2009 | | 196,989 | | 202,406 |
| Ucar Finance, Inc. | | | | |
| 10.25% due 02/15/2012 | | 196,000 | | 204,820 |
| Vita Capital III, Ltd., Series B-I | | | | |
| 6.46% due 01/01/2011 (b) | | 870,000 | | 868,086 |
| Waddell & Reed Financial, Inc. | | | | |
| 5.60% due 01/15/2011 | | 400,000 | | 402,449 |
| Westfield Capital Corp., Ltd. | | | | |
| 4.375% due 11/15/2010 | | 214,000 | | 207,092 |
| |
|
| | | | | 24,738,262 |
| Food & Beverages - 0.70% | | | | |
| ASG Consolidated LLC/ASG Finance, Inc. | | | | |
| zero coupon, Step up to 11.5% on | | | | |
| 11/01/2008 due 11/01/2011 | | 395,000 | | 363,400 |
| Cargill, Inc. | | | | |
| 6.125% due 09/15/2036 | | 665,000 | | 655,666 |
| General Mills, Inc. | | | | |
| 5.65% due 09/10/2012 | | 600,000 | | 604,110 |
| 5.70% due 02/15/2017 | | 245,000 | | 240,095 |
| |
| The accompanying notes are an integral part of the financial statements. | 125 |
John Hancock Funds II
Portfolio of investments — August 31, 2007
(showing percentage of total net assets)
| | | | |
| Active Bond Fund (continued) | | | |
| | | Shares or | | |
| | | Principal | | |
| | | Amount | | Value |
|
|
| |
| CORPORATE BONDS (continued) | | | | |
| | | | | |
| Food & Beverages (continued) | | | | |
| Kellogg Company, Series B | | | | |
| 6.60% due 04/01/2011 | $ | 209,000 | $ | 217,571 |
| Kraft Foods, Inc. | | | | |
| 5.625% due 11/01/2011 | | 219,000 | | 219,906 |
| Kroger Company | | | | |
| 6.40% due 08/15/2017 | | 615,000 | | 628,113 |
| Nabisco, Inc. | | | | |
| 7.55% due 06/15/2015 | | 229,000 | | 249,783 |
| Panamerican Beverages, Inc. | | | | |
| 7.25% due 07/01/2009 | | 190,000 | | 195,261 |
| Smithfield Foods, Inc. | | | | |
| 7.00% due 08/01/2011 | | 18,000 | | 18,000 |
| Supervalu, Inc. | | | | |
| 7.50% due 11/15/2014 | | 500,000 | | 505,000 |
| |
|
| | | | | 3,896,905 |
| Gas & Pipeline Utilities - 0.71% | | | | |
| Buckeye Partners LP | | | | |
| 5.125% due 07/01/2017 | | 225,000 | | 210,523 |
| Dynegy-Roseton Danskammer, Series B | | | | |
| 7.67% due 11/08/2016 | | 360,000 | | 356,850 |
| Energy Transfer Partners LP | | | | |
| 5.95% due 02/01/2015 | | 270,000 | | 264,028 |
| Kinder Morgan Energy Partners LP | | | | |
| 5.80% due 03/15/2035 | | 208,000 | | 182,728 |
| 7.30% due 08/15/2033 | | 212,000 | | 218,772 |
| KN Capital Trust I, Series B | | | | |
| 8.56% due 04/15/2027 | | 275,000 | | 234,217 |
| MarkWest Energy Partners LP, Series B | | | | |
| 8.50% due 07/15/2016 | | 330,000 | | 328,350 |
| Michigan Consolidated Gas Company | | | | |
| 5.70% due 03/15/2033 | | 14,000 | | 13,042 |
| ONEOK Partners LP | | | | |
| 6.65% due 10/01/2036 | | 545,000 | | 536,766 |
| Southern Union Company | | | | |
| 7.20% due 11/01/2066 (b) | | 950,000 | | 956,316 |
| TEPPCO Partners LP | | | | |
| 7.00% due 06/01/2067 (b) | | 705,000 | | 655,834 |
| |
|
| | | | | 3,957,426 |
| Gold - 0.03% | | | | |
| New Gold, Inc. | | | | |
| 10.00% due 06/28/2017 | CAD | 250,000 | | 187,009 |
| | | | | |
| Healthcare Services - 0.14% | | | | |
| Coventry Health Care, Inc. | | | | |
| 5.875% due 01/15/2012 | $ | 225,000 | | 225,794 |
| UnitedHealth Group, Inc. | | | | |
| 5.375% due 03/15/2016 | | 240,000 | | 235,420 |
| 5.80% due 03/15/2036 | | 115,000 | | 107,714 |
| WellPoint, Inc. | | | | |
| 3.50% due 09/01/2007 | | 14,000 | | 14,000 |
| 3.75% due 12/14/2007 | | 10,000 | | 9,941 |
| 5.00% due 12/15/2014 | | 208,000 | | 198,616 |
| |
|
| | | | | 791,485 |
| | | | |
| Active Bond Fund (continued) | | | |
| | | Shares or | | |
| | | Principal | | |
| | | Amount | | Value |
| |
|
| |
| CORPORATE BONDS (continued) | | | | |
| | | | |
| Holdings Companies/Conglomerates - 0.19% | | | |
| General Electric Company | | | | |
| 5.00% due 02/01/2013 | $ | 1,037,000 | $ | 1,023,064 |
| SPI Electricity & Gas Australia Holdings Party, Ltd. | | | |
| 6.15% due 11/15/2013 | | 16,000 | | 16,250 |
| |
|
| | | | | 1,039,314 |
| Homebuilders - 0.03% | | | | |
| Pulte Homes, Inc. | | | | |
| 6.25% due 02/15/2013 | | 210,000 | | 189,470 |
| | | | | |
| Hotels & Restaurants - 0.08% | | | | |
| Hilton Hotels Corp. | | | | |
| 8.25% due 02/15/2011 | | 9,000 | | 9,495 |
| Marriott International, Inc. | | | | |
| 4.625% due 06/15/2012 | | 26,000 | | 25,069 |
| Starbucks Corp. | | | | |
| 6.25% due 08/15/2017 | | 430,000 | | 432,840 |
| |
|
| | | | | 467,404 |
| Industrial Machinery - 0.14% | | | | |
| Caterpillar, Inc. | | | | |
| 7.25% due 09/15/2009 | | 213,000 | | 221,822 |
| Weatherford International, Ltd. | | | | |
| 6.50% due 08/01/2036 | | 600,000 | | 586,203 |
| |
|
| | | | | 808,025 |
| Insurance - 3.69% | | | | |
| Ace INA Holdings, Inc. | | | | |
| 6.70% due 05/15/2036 | | 470,000 | | 468,157 |
| Allied World Assurance Holdings, Ltd. | | | | |
| 7.50% due 08/01/2016 | | 1,490,000 | | 1,579,556 |
| AON Capital Trust A | | | | |
| 8.205% due 01/01/2027 | | 390,000 | | 412,038 |
| Assurant, Inc. | | | | |
| 5.625% due 02/15/2014 | | 209,000 | | 205,948 |
| 6.75% due 02/15/2034 | | 550,000 | | 556,087 |
| Avalon Re, Ltd. | | | | |
| 7.138% due 06/06/2008 (b) | | 250,000 | | 234,270 |
| AXA SA | | | | |
| 6.379% due 12/14/2049 (b) | | 750,000 | | 676,095 |
| 6.463% due 12/31/2049 (b) | | 275,000 | | 248,813 |
| Catlin Insurance Company, Ltd. | | | | |
| 7.249% due 12/01/2049 (b) | | 500,000 | | 464,850 |
| Chubb Corp | | | | |
| 6.375% due 03/29/2067 (b) | | 315,000 | | 309,063 |
| Cigna Corp. | | | | |
| 6.15% due 11/15/2036 | | 500,000 | | 478,304 |
| Cincinnati Financial Corp. | | | | |
| 6.92% due 05/15/2028 | | 960,000 | | 1,025,051 |
| CNA Financial Corp. | | | | |
| 6.00% due 08/15/2011 | | 280,000 | | 281,872 |
| Endurance Specialty Holdings, Ltd. | | | | |
| 7.00% due 07/15/2034 | | 300,000 | | 289,133 |
| Financial Security Assurance Holdings, Ltd. | | | |
| 6.40% due 12/15/2066 (b) | | 795,000 | | 676,244 |
| First American Corp. | | | | |
| 7.55% due 04/01/2028 | | 290,000 | | 309,533 |
| |
| The accompanying notes are an integral part of the financial statements. | 126 |
John Hancock Funds II
Portfolio of investments — August 31, 2007
(showing percentage of total net assets)
| | | | |
| Active Bond Fund (continued) | | | |
| | | Shares or | | |
| | | Principal | | |
| | | Amount | | Value |
|
|
| |
| CORPORATE BONDS (continued) | | | | |
| | | | | |
| Insurance (continued) | | | | |
| Foundation Re II, Ltd. | | | | |
| 12.27% due 11/26/2010 (b) | $ | 250,000 | $ | 252,800 |
| Genworth Financial, Inc. | | | | |
| 6.15% due 11/15/2066 (b) | | 790,000 | | 727,696 |
| Hartford Financial Services Group, Inc. | | | | |
| 4.625% due 07/15/2013 | | 8,000 | | 7,634 |
| Horace Mann Educators Corp. | | | | |
| 6.85% due 04/15/2016 | | 210,000 | | 217,143 |
| Liberty Mutual Group, Inc. | | | | |
| 6.50% due 03/15/2035 | | 683,000 | | 594,706 |
| 7.50% due 08/15/2036 | | 1,820,000 | | 1,761,558 |
| 7.80% due 03/15/2037 | | 455,000 | | 405,683 |
| Lincoln National Corp. | | | | |
| 6.05% due 04/20/2067 (b) | | 155,000 | | 146,947 |
| 7.00% due 05/17/2066 (b) | | 215,000 | | 217,857 |
| Markel Corp. | | | | |
| 6.80% due 02/15/2013 | | 325,000 | | 335,491 |
| Marsh & McLennan Companies, Inc. | | | | |
| 5.375% due 07/15/2014 | | 206,000 | | 197,828 |
| Merna Reinsurance, Ltd., Series B | | | | |
| 7.11% due 12/31/2010 (b) | | 1,355,000 | | 1,355,000 |
| MetLife, Inc. | | | | |
| 5.70% due 06/15/2035 | | 255,000 | | 234,596 |
| Mystic Re, Ltd. | | | | |
| 11.841% due 12/05/2008 (b) | | 250,000 | | 250,100 |
| Ohio Casualty Corp. | | | | |
| 7.30% due 06/15/2014 | | 380,000 | | 412,548 |
| PartnerRe Finance | | | | |
| 6.44% due 12/01/2066 (b) | | 395,000 | | 360,209 |
| Progressive Corp. | | | | |
| 6.70% due 06/15/2037 (b) | | 225,000 | | 218,040 |
| Provident Financing Trust I | | | | |
| 7.405% due 03/15/2038 | | 300,000 | | 290,017 |
| Prudential Financial, Inc. | | | | |
| 4.75% due 04/01/2014 | | 227,000 | | 214,860 |
| RenaissanceRe Holdings, Ltd. | | | | |
| 7.00% due 07/15/2008 | | 400,000 | | 406,535 |
| StanCorp Financial Group, Inc. | | | | |
| 6.90% due 05/29/2067 (b) | | 825,000 | | 805,348 |
| Symetra Financial Corp. | | | | |
| 6.125% due 04/01/2016 | | 350,000 | | 352,181 |
| Transatlantic Holdings, Inc. | | | | |
| 5.75% due 12/14/2015 | | 575,000 | | 579,456 |
| Travelers Property Casualty, Inc. | | | | |
| 6.375% due 03/15/2033 | | 21,000 | | 20,764 |
| W.R. Berkley Corp. | | | | |
| 5.125% due 09/30/2010 | | 900,000 | | 903,181 |
| 6.15% due 08/15/2019 | | 14,000 | | 14,039 |
| White Mountains Re Group, Ltd. | | | | |
| 7.506% due 05/29/2049 (b) | | 685,000 | | 663,524 |
| XL Capital, Ltd. | | | | |
| 5.25% due 09/15/2014 | | 214,000 | | 204,698 |
| XL Capital, Ltd., Series E | | | | |
| 6.50% due 12/31/2049 (b) | | 275,000 | | 242,756 |
| |
|
| | | | | 20,608,209 |
| | | | |
| Active Bond Fund (continued) | | | |
| | | Shares or | | |
| | | Principal | | |
| | | Amount | | Value |
| |
|
| |
| CORPORATE BONDS (continued) | | | | |
| | | | | |
| International Oil - 0.33% | | | | |
| ConocoPhillips Canada Funding Company | | | | |
| 5.95% due 10/15/2036 | $ | 1,000,000 | $ | 976,950 |
| Delek & Avner-Yam Tethys, Ltd. | | | | |
| 5.326% due 08/01/2013 | | 227,130 | | 225,856 |
| Pemex Project Funding Master Trust | | | | |
| 6.125% due 08/15/2008 | | 13,000 | | 13,013 |
| 6.66% due 06/15/2010 (b) | | 18,000 | | 18,288 |
| 9.125% due 10/13/2010 | | 320,000 | | 351,520 |
| Ras Laffan Liquefied Natural Gas Company, Ltd. | | | |
| 3.437% due 09/15/2009 | | 12,960 | | 12,778 |
| Ras Laffan Liquefied Natural Gas Company, Ltd. III | | | |
| 5.838% due 09/30/2027 | | 250,000 | | 233,308 |
| |
|
| | | | | 1,831,713 |
| Investment Companies - 0.05% | | | | |
| Allied Capital Corp. | | | | |
| 6.625% due 07/15/2011 | | 255,000 | | 261,661 |
| | | | | |
| Leisure Time - 0.67% | | | | |
| Cinemark, Inc. | | | | |
| zero coupon, Step up to 9.75% on | | | | |
| 03/15/2009 due 03/15/2014 | | 150,000 | | 138,750 |
| Fontainebleau Las Vegas Holdings | | | | |
| 10.25% due 06/15/2015 | | 275,000 | | 235,812 |
| Harrahs Operating Company, Inc. | | | | |
| 5.625% due 06/01/2015 | | 285,000 | | 218,737 |
| Jacobs Entertainment, Inc. | | | | |
| 9.75% due 06/15/2014 | | 310,000 | | 309,225 |
| Little Traverse Bay Bands of Odawa Indians | | | |
| 10.25% due 02/15/2014 | | 310,000 | | 311,550 |
| MGM Mirage, Inc. | | | | |
| 6.00% due 10/01/2009 | | 16,000 | | 15,860 |
| Mohegan Tribal Gaming Authority | | | | |
| 6.375% due 07/15/2009 | | 208,000 | | 204,360 |
| 8.00% due 04/01/2012 | | 150,000 | | 152,063 |
| MTR Gaming Group, Inc., Series B | | | | |
| 9.00% due 06/01/2012 | | 185,000 | | 185,000 |
| 9.75% due 04/01/2010 | | 220,000 | | 222,200 |
| Pokagon Gaming Authority | | | | |
| 10.375% due 06/15/2014 | | 135,000 | | 144,450 |
| Seminole Indian Tribe of Florida | | | | |
| 6.535% due 10/01/2020 | | 405,000 | | 401,011 |
| Seneca Gaming Corp. | | | | |
| 7.25% due 05/01/2012 | | 420,000 | | 422,100 |
| Shingle Springs Tribal Gaming Authority | | | | |
| 9.375% due 06/15/2015 | | 125,000 | | 123,125 |
| Trump Entertainment Resorts, Inc. | | | | |
| 8.50% due 06/01/2015 | | 210,000 | | 171,150 |
| Turning Stone Resort Casino | | | | |
| 9.125% due 09/15/2014 | | 370,000 | | 373,700 |
| Waterford Gaming LLC | | | | |
| 8.625% due 09/15/2012 | | 88,000 | | 89,760 |
| |
|
| | | | | 3,718,853 |
| Liquor - 0.00% | | | | |
| Anheuser-Busch Companies, Inc. | | | | |
| 6.50% due 02/01/2043 | | 10,000 | | 9,958 |
| |
| The accompanying notes are an integral part of the financial statements. | 127 |
John Hancock Funds II
Portfolio of investments — August 31, 2007
(showing percentage of total net assets)
| | | | |
| Active Bond Fund (continued) | | | |
| | | Shares or | | |
| | | Principal | | |
| | | Amount | | Value |
| |
|
| |
| CORPORATE BONDS (continued) | | | | |
| | | | | |
| Medical-Hospitals - 0.09% | | | | |
| Alliance Imaging, Inc. | | | | |
| 7.25% due 12/15/2012 | $ | 305,000 | $ | 291,275 |
| Community Health Systems, Inc. | | | | |
| 8.875% due 07/15/2015 | | 190,000 | | 189,762 |
| |
|
| | | | | 481,037 |
| Metal & Metal Products - 0.04% | | | | |
| Alcan, Inc. | | | | |
| 5.00% due 06/01/2015 | | 6,000 | | 5,750 |
| Blaze Recycling & Metals LLC / Blaze Finance Corp. | | | |
| 10.875% due 07/15/2012 | | 55,000 | | 54,313 |
| Vedanta Resources PLC | | | | |
| 6.625% due 02/22/2010 | | 170,000 | | 167,450 |
| |
|
| | | | | 227,513 |
| Mining - 0.11% | | | | |
| Corporacion Nacional del Cobre | | | | |
| 5.50% due 10/15/2013 | | 209,000 | | 209,750 |
| Drummond Company, Inc. | | | | |
| 7.375% due 02/15/2016 | | 330,000 | | 313,500 |
| Freeport-McMoRan Copper & Gold, Inc. | | | | |
| 8.375% due 04/01/2017 | | 80,000 | | 85,200 |
| |
|
| | | | | 608,450 |
| Paper - 0.12% | | | | |
| Plum Creek Timberlands LP | | | | |
| 5.875% due 11/15/2015 | | 320,000 | | 315,783 |
| Verso Paper, Inc., Series B | | | | |
| 9.125% due 08/01/2014 | | 325,000 | | 325,000 |
| |
|
| | | | | 640,783 |
| Petroleum Services - 0.61% | | | | |
| Allis-Chalmers Energy, Inc. | | | | |
| 8.50% due 03/01/2017 | | 210,000 | | 201,075 |
| Anadarko Petroleum Corp. | | | | |
| 3.25% due 05/01/2008 | | 600,000 | | 590,038 |
| 6.45% due 09/15/2036 | | 1,000,000 | | 971,903 |
| Enterprise Products Operating LP | | | | |
| 8.375% due 08/01/2066 (b) | | 700,000 | | 716,715 |
| Premcor Refining Group, Inc. | | | | |
| 6.75% due 05/01/2014 | | 380,000 | | 393,260 |
| 9.50% due 02/01/2013 | | 295,000 | | 311,460 |
| Valero Logistics Operations LP | | | | |
| 6.05% due 03/15/2013 | | 248,000 | | 248,615 |
| |
|
| | | | | 3,433,066 |
| Pharmaceuticals - 0.10% | | | | |
| Hospira, Inc. | | | | |
| 5.90% due 06/15/2014 | | 8,000 | | 7,998 |
| Schering Plough Corp. | | | | |
| 5.55% due 12/01/2013 (b) | | 218,000 | | 218,286 |
| Teva Pharmaceutical Finance LLC | | | | |
| 5.55% due 02/01/2016 | | 170,000 | | 165,511 |
| 6.15% due 02/01/2036 | | 170,000 | | 160,042 |
| |
|
| | | | | 551,837 |
| Publishing - 0.04% | | | | |
| Idearc, Inc. | | | | |
| 8.00% due 11/15/2016 | | 240,000 | | 237,000 |
| | | | |
| Active Bond Fund (continued) | | | |
| | | Shares or | | |
| | | Principal | | |
| | | Amount | | Value |
|
|
| |
| CORPORATE BONDS (continued) | | | | |
| | | | | |
| Real Estate - 1.91% | | | | |
| AvalonBay Communities, Inc., REIT | | | | |
| 5.50% due 01/15/2012 | $ | 605,000 | $ | 607,160 |
| Boston Properties, Ltd., REIT | | | | |
| 6.25% due 01/15/2013 | | 215,000 | | 221,974 |
| Camden Property Trust, REIT | | | | |
| 5.00% due 06/15/2015 | | 216,000 | | 200,265 |
| Colonial Properties Trust, REIT | | | | |
| 6.25% due 06/15/2014 | | 211,000 | | 213,121 |
| Colonial Realty LP | | | | |
| 5.50% due 10/01/2015 | | 231,000 | | 219,738 |
| Developers Diversified Realty Corp., REIT | | | | |
| 4.625% due 08/01/2010 | | 22,000 | | 21,598 |
| Duke Realty LP | | | | |
| 5.95% due 02/15/2017 | | 975,000 | | 955,004 |
| Health Care Property Investors, Inc., REIT | | | | |
| 6.30% due 09/15/2016 | | 750,000 | | 739,273 |
| Health Care Property Investors, Inc., | | | | |
| Series MTN, REIT | | | | |
| 4.875% due 09/15/2010 | | 229,000 | | 224,098 |
| 5.625% due 02/28/2013 | | 520,000 | | 510,886 |
| Health Care, Inc., REIT | | | | |
| 6.00% due 11/15/2013 | | 215,000 | | 213,943 |
| 6.20% due 06/01/2016 | | 650,000 | | 638,766 |
| Healthcare Realty Trust, Inc., REIT | | | | |
| 8.125% due 05/01/2011 | | 360,000 | | 384,760 |
| Hospitality Properties Trust, REIT | | | | |
| 6.75% due 02/15/2013 | | 612,000 | | 637,237 |
| Nationwide Health Properties, Inc., REIT | | | | |
| 6.50% due 07/15/2011 | | 285,000 | | 296,323 |
| Realty Income Corp. | | | | |
| 5.95% due 09/15/2016 | | 560,000 | | 549,287 |
| Rouse Company LP, REIT | | | | |
| 6.75% due 05/01/2013 | | 420,000 | | 415,800 |
| Rouse Company, REIT | | | | |
| 3.625% due 03/15/2009 | | 645,000 | | 623,362 |
| 5.375% due 11/26/2013 | | 209,000 | | 191,655 |
| Shimao Property Holdings, Ltd. | | | | |
| 8.00% due 12/01/2016 | | 270,000 | | 257,850 |
| Simon Property Group LP, REIT | | | | |
| 5.75% due 12/01/2015 | | 530,000 | | 521,432 |
| Socgen Real Estate Company LLC | | | | |
| 7.64% due 12/29/2049 (b) | | 274,000 | | 274,577 |
| USB Realty Corp. | | | | |
| 6.091% due 12/22/2049 (b) | | 500,000 | | 475,405 |
| Vornado Realty, LP | | | | |
| 5.60% due 02/15/2011 | | 800,000 | | 794,568 |
| Westfield Group | | | | |
| 5.40% due 10/01/2012 | | 475,000 | | 467,981 |
| |
|
| | | | | 10,656,063 |
| Retail - 0.32% | | | | |
| CVS Caremark Corp. | | | | |
| 5.66% due 06/01/2010 (b) | | 900,000 | | 896,100 |
| 5.75% due 06/01/2017 | | 400,000 | | 390,932 |
| 6.125% due 08/15/2016 | | 515,000 | | 517,261 |
| |
|
| | | | | 1,804,293 |
| |
| The accompanying notes are an integral part of the financial statements. | 128 |
John Hancock Funds II
Portfolio of investments — August 31, 2007
(showing percentage of total net assets)
| | | | |
| Active Bond Fund (continued) | | | |
| | | Shares or | | |
| | | Principal | | |
| | | Amount | | Value |
|
|
| |
| CORPORATE BONDS (continued) | | | | |
| | | | | |
| Semiconductors - 0.05% | | | | |
| Freescale Semiconductor, Inc. | | | | |
| 10.125% due 12/15/2016 | $ | 300,000 | $ | 261,000 |
| | | | | |
| Steel - 0.08% | | | | |
| WCI Steel Acquisition, Inc. | | | | |
| 8.00% due 05/01/2016 | | 450,000 | | 450,000 |
| | | | | |
| Telecommunications Equipment & | | | | |
| Services - 0.81% | | | | |
| AT&T, Inc. | | | | |
| 6.50% due 09/01/2037 | | 430,000 | | 430,615 |
| Axtel SAB de CV | | | | |
| 7.625% due 02/01/2017 | | 325,000 | | 314,438 |
| Citizens Communications Company | | | | |
| 6.25% due 01/15/2013 | | 270,000 | | 259,200 |
| Deutsche Telekom International Finance BV | | | |
| 5.75% due 03/23/2016 | | 1,000,000 | | 983,894 |
| 6.625% due 07/11/2011 | EUR | 1,000 | | 1,447 |
| 8.00% due 06/15/2010 | $ | 222,000 | | 236,322 |
| 8.75% due 06/15/2030 (b) | | 227,000 | | 274,180 |
| Digicel Group, Ltd. | | | | |
| 8.875% due 01/15/2015 | | 400,000 | | 365,520 |
| Embarq Corp. | | | | |
| 7.082% due 06/01/2016 | | 880,000 | | 907,520 |
| 7.995% due 06/01/2036 | | 215,000 | | 222,792 |
| France Telecom SA | | | | |
| 7.75% due 03/01/2011 | | 20,000 | | 21,404 |
| 8.50% due 03/01/2031 (b) | | 220,000 | | 280,889 |
| SBC Communications, Inc. | | | | |
| 4.125% due 09/15/2009 | | 207,000 | | 202,497 |
| 5.10% due 09/15/2014 | | 16,000 | | 15,412 |
| 5.625% due 06/15/2016 | | 12,000 | | 11,837 |
| Singapore Telecommunications, Ltd. | | | | |
| 6.375% due 12/01/2011 | | 9,000 | | 9,404 |
| |
|
| | | | | 4,537,371 |
| Telephone - 0.92% | | | | |
| AT&T, Inc. | | | | |
| 6.80% due 05/15/2036 | | 400,000 | | 417,658 |
| BellSouth Corp. | | | | |
| 4.20% due 09/15/2009 | | 212,000 | | 207,690 |
| 6.00% due 11/15/2034 | | 820,000 | | 773,980 |
| Cincinnati Bell, Inc. | | | | |
| 8.375% due 01/15/2014 | | 225,000 | | 222,750 |
| Qwest Corp. | | | | |
| 7.875% due 09/01/2011 | | 315,000 | | 329,569 |
| Sprint Capital Corp. | | | | |
| 6.125% due 11/15/2008 | | 216,000 | | 217,093 |
| 6.375% due 05/01/2009 | | 212,000 | | 215,137 |
| 6.875% due 11/15/2028 | | 642,000 | | 624,902 |
| 8.375% due 03/15/2012 | | 207,000 | | 228,731 |
| 8.75% due 03/15/2032 | | 317,000 | | 365,925 |
| Telecom Italia Capital SA | | | | |
| 4.00% due 01/15/2010 | | 670,000 | | 648,188 |
| 4.00% due 11/15/2008 | | 169,000 | | 165,968 |
| 7.20% due 07/18/2036 | | 650,000 | | 675,949 |
| | | | |
| Active Bond Fund (continued) | | | |
| | | Shares or | | |
| | | Principal | | |
| | | Amount | | Value |
| |
|
| |
| CORPORATE BONDS (continued) | | | | |
| | | | | |
| Telephone (continued) | | | | |
| Verizon New York, Inc., Series A | | | | |
| 6.875% due 04/01/2012 | $ | 15,000 | $ | 15,805 |
| |
|
| | | | | 5,109,345 |
| |
| Tires & Rubber - 0.04% | | | | |
| Goodyear Tire & Rubber Company | | | | |
| 8.625% due 12/01/2011 | | 195,000 | | 198,042 |
| | | | | |
| Tobacco - 0.08% | | | | |
| Alliance One International, Inc. | | | | |
| 8.50% due 05/15/2012 | | 170,000 | | 165,750 |
| Altria Group, Inc. | | | | |
| 7.00% due 11/04/2013 | | 6,000 | | 6,497 |
| Reynolds American, Inc. | | | | |
| 7.25% due 06/01/2013 | | 245,000 | | 253,730 |
| |
|
| | | | | 425,977 |
| |
| Transportation - 0.14% | | | | |
| CMA CGM SA | | | | |
| 7.25% due 02/01/2013 | | 455,000 | | 435,662 |
| Navios Maritime Holdings, Inc. | | | | |
| 9.50% due 12/15/2014 | | 250,000 | | 255,313 |
| Overseas Shipholding Group, Inc. | | | | |
| 8.25% due 03/15/2013 | | 2,000 | | 2,052 |
| 8.75% due 12/01/2013 | | 75,000 | | 78,750 |
| |
|
| | | | | 771,777 |
| |
| Utility Service - 0.00% | | | | |
| Public Service Company of New Mexico | | | | |
| 4.40% due 09/15/2008 | | 13,000 | | 12,855 |
|
| TOTAL CORPORATE BONDS (Cost $147,859,377) | | $ | 144,339,264 |
|
| |
| COLLATERALIZED MORTGAGE | | | | |
| OBLIGATIONS - 17.57% | | | | |
| American Home Mortgage Assets, Series 2006-6, | | | |
| Class XP | | | | |
| zero coupon IO due 12/25/2046 | | 9,526,134 | | 479,284 |
| American Home Mortgage Investment Trust, | | | |
| Series 2004-4, Class 5A | | | | |
| 4.44% due 02/25/2045 | | 865,056 | | 829,608 |
| American Tower Trust, Series 2007-1A, Class D | | | |
| 5.956% due 04/15/2037 | | 535,000 | | 456,025 |
| Banc of America Commercial Mortgage, Inc., | | | |
| Series 2004-4, Class A3 | | | | |
| 4.128% due 07/10/2042 | | 32,284 | | 31,570 |
| Banc of America Commercial Mortgage, Inc., | | | |
| Series 2005-2, Class AJ | | | | |
| 4.953% due 07/10/2043 (b) | | 50,846 | | 47,476 |
| Banc of America Commercial Mortgage, Inc., | | | |
| Series 2005-6, Class A4 | | | | |
| 5.3531% due 09/10/2047 (b) | | 470,000 | | 460,508 |
| Banc of America Commercial Mortgage, Inc., | | | |
| Series 2006-1, Class AM | | | | |
| 5.421% due 09/10/2045 (b) | | 1,600,000 | | 1,568,199 |
| Banc of America Commercial Mortgage, Inc., | | | |
| Series 2006-2, Class A3 | | | | |
| 5.9019% due 05/10/2045 (b) | | 970,000 | | 978,172 |
| |
| The accompanying notes are an integral part of the financial statements. | 129 |
John Hancock Funds II
Portfolio of investments — August 31, 2007
(showing percentage of total net assets)
| | | | |
| Active Bond Fund (continued) | | | |
| | | Shares or | | |
| | | Principal | | |
| | | Amount | | Value |
| |
|
| |
| COLLATERALIZED MORTGAGE | | | | |
| OBLIGATIONS (continued) | | | | |
| Banc of America Commercial Mortgage, Inc., | | | |
| Series 2006-3, Class A4 | | | | |
| 5.889% due 07/10/2044 | $ | 775,000 | $ | 786,795 |
| Banc of America Commercial Mortgage, Inc., | | | |
| Series 2006-4, Class A3A | | | | |
| 5.60% due 08/10/2013 | | 750,000 | | 749,075 |
| Banc of America Funding Corp., Series 2006-B, | | | |
| Class 6A1 | | | | |
| 5.881% due 03/20/2036 (b) | | 569,707 | | 570,897 |
| Banc of America Funding Corp., Series 2006-D, | | | |
| Class 6B1 | | | | |
| 5.947% due 05/20/2036 (b) | | 324,486 | | 324,132 |
| Banc of America Large Loan, Series 2006-BIX1, | | | |
| Class C | | | | |
| 5.79% due 10/15/2019 (b) | | 1,000,000 | | 998,960 |
| Banc of America Large Loan, | | | | |
| Series 2005-MIB1, Class B | | | | |
| 5.8713% due 03/15/2022 (b) | | 895,000 | | 895,165 |
| Bank of America Commercial Mortgage, Inc., | | | |
| Series 2001-3, Class A1 | | | | |
| 4.89% due 04/11/2037 | | 6,183 | | 6,128 |
| Bear Stearns Alt-A Trust, Series 2005-3, Class B2 | | | |
| 5.304% due 04/25/2035 (b) | | 193,992 | | 193,846 |
| Bear Stearns Alt-A Trust, Series 2006-1, Class 23A1 | | | |
| 5.6226% due 02/25/2036 (b) | | 495,529 | | 493,085 |
| Bear Stearns Asset Backed Securities, Inc., Series | | | |
| 2003-AC4, Class A | | | | |
| 5.00% due 09/25/2033 | | 10,991 | | 10,668 |
| Bear Stearns Commercial Mortgage Securities, | | | |
| Inc., Series 2006-PW14, Class D | | | | |
| 5.412% due 12/11/2038 | | 400,000 | | 349,634 |
| Bear Stearns Commercial Mortgage Securities, | | | |
| Inc., Series 2003-T10, Class A2 | | | | |
| 4.74% due 03/13/2040 | | 790,000 | | 760,697 |
| Bear Stearns Commercial Mortgage Securities, | | | |
| Inc., Series 2004-PWR5, Class X1 | | | | |
| 0.076% IO due 07/11/2042 (b) | | 471,163 | | 9,674 |
| Bear Stearns Commercial Mortgage Securities, | | | |
| Inc., Series 2004-T16, Class X1 | | | | |
| 0.2325% IO due 02/13/2046 (b) | | 581,740 | | 11,082 |
| Bear Stearns Commercial Mortgage Securities, | | | |
| Inc., Series 2005-PWR8, Class AJ | | | | |
| 4.75% due 06/11/2041 | | 47,292 | | 43,531 |
| Bear Stearns Commercial Mortgage Securities, | | | |
| Inc., Series 2006-BBA7, Class G | | | | |
| 6.0513% due 03/15/2019 (b) | | 700,000 | | 696,556 |
| Bear Stearns Commercial Mortgage Securities, | | | |
| Inc., Series 2006-T24, Class AY | | | | |
| 0.451% IO due 10/12/2041 | | 32,250,000 | | 662,057 |
| Bear Stearns Commercial Mortgage Securities, | | | |
| Series 2002-TOP8, Class A2 | | | | |
| 4.83% due 08/15/2038 | | 715,000 | | 691,911 |
| Bear Stearns Mortgage Funding Trust, Series | | | |
| 2006-AR4, Class A1 | | | | |
| 5.72% due 12/25/2036 (b) | | 2,334,402 | | 2,224,381 |
| | | | |
| Active Bond Fund (continued) | | | |
| | | Shares or | | |
| | | Principal | | |
| | | Amount | | Value |
| |
|
| |
| COLLATERALIZED MORTGAGE | | | | |
| OBLIGATIONS (continued) | | | | |
| Chase Commercial Mortgage Securities Corp., | | | |
| Series 2000-2, Class C | | | | |
| 7.928% due 07/15/2032 | $ | 29,619 | $ | 31,473 |
| Chaseflex Trust, Series 2005-2, Class 4A1 | | | | |
| 5.00% due 05/25/2020 | | 315,248 | | 305,692 |
| Citigroup Commercial Mortgage Trust, | | | | |
| Series 2006-C4, Class A3 | | | | |
| 5.9140% due 03/15/2049 (b) | | 700,000 | | 706,505 |
| Citigroup Mortgage Loan Trust, Inc., | | | | |
| Series 2005-10, Class 1A5A | | | | |
| 5.8434% due 12/25/2035 (b) | | 419,932 | | 420,125 |
| Citigroup Mortgage Loan Trust, Inc., Series 2005-5, | | | |
| Class 2A3 | | | | |
| 5.00% due 08/25/2035 | | 278,936 | | 271,178 |
| Citigroup Mortgage Loan Trust, Inc., | | | | |
| Series 2006-AR1, Class 1A1 | | | | |
| 4.90% due 10/25/2035 (b) | | 1,221,365 | | 1,206,377 |
| Citigroup/Deutsche Bank Commercial Mortgage | | | |
| Trust, Series 2005-CD1, Class C | | | | |
| 5.3996% due 07/15/2044 (b) | | 190,000 | | 175,525 |
| Citigroup/Deutsche Bank Commercial | | | | |
| Mortgage Trust, Series 2005-CD1, Class A4 | | | |
| 5.225% due 07/15/2044 (b) | | 360,000 | | 354,046 |
| Citigroup/Deutsche Bank Commercial Mortgage, | | | |
| Series 2006-CD2, Class AM | | | | |
| 5.5915% due 01/15/2046 (b) | | 1,000,000 | | 965,365 |
| Commercial Mortgage Pass Through Certificates, | | | |
| Series 2003-LB1A, Class A2 | | | | |
| 4.084% due 06/10/2038 | | 49,859 | | 46,424 |
| Commercial Mortgage Pass Through Certificates, | | | |
| Series 2005-C6, Class B | | | | |
| 5.3999% due 06/10/2044 (b) | | 49,365 | | 45,745 |
| Commercial Mortgage Pass Through Certificates, | | | |
| Series 2005-FL11, Class AJ | | | | |
| 5.8113% due 11/15/2017 (b) | | 595,000 | | 594,967 |
| Commercial Mortgage Pass-Through Certificates, | | | |
| Series 2006-C7, Class A3 | | | | |
| 5.8997% due 06/10/2046 (b) | | 585,000 | | 590,038 |
| Countrywide Alternative Loan Trust, Series | | | |
| 2005-59, Class 2X | | | | |
| 1.79% IO due 11/20/2035 | | 5,873,615 | | 205,577 |
| Countrywide Alternative Loan Trust, Series | | | |
| 2006-OA10, Class XPP | | | | |
| 1.96% IO due 08/25/2046 (b) | | 3,944,250 | | 154,072 |
| Countrywide Alternative Loan Trust, Series | | | |
| 2006-OA8, Class X | | | | |
| 6.01% IO due 07/25/2046 (b) | | 7,346,936 | | 278,954 |
| Countrywide Alternative Loan Trust, Series | | | |
| 2007-OA8, Class X | | | | |
| 2.00% IO due 08/25/2047 (b) | | 4,886,770 | | 219,905 |
| Countrywide Alternative Loan Trust, Series | | | |
| 2006-OA3, Class X | | | | |
| 2.39% IO due 05/25/2036 (b) | | 3,115,981 | | 168,411 |
| Countrywide Alternative Loan Trust, | | | | |
| Series 2006-11CB, Class 3A1 | | | | |
| 6.50% due 05/25/2036 | | 690,026 | | 694,555 |
| |
| The accompanying notes are an integral part of the financial statements. | 130 |
John Hancock Funds II
Portfolio of investments — August 31, 2007
(showing percentage of total net assets)
| | | | |
| Active Bond Fund (continued) | | | |
| | | Shares or | | |
| | | Principal | | |
| | | Amount | | Value |
| |
|
| |
| COLLATERALIZED MORTGAGE | | | | |
| OBLIGATIONS (continued) | | | | |
| Countrywide Home Loan Mortgage Pass Through | | | |
| Trust, Series 2004-HYB2, Class 4A | | | | |
| 4.5302% due 07/20/2034 (b) | $ | 1,436,421 | $ | 1,426,269 |
| Countrywide Home Loans, | | | | |
| Series 2005-HYB5, Class 1A2 | | | | |
| 4.8771% due 09/20/2035 (b) | | 622,752 | | 615,105 |
| Credit Suisse Mortgage Capital Certificates, | | | | |
| Series 2006-TFLA, Class B | | | | |
| 5.8413% due 04/15/2021 (b) | | 870,000 | | 869,984 |
| Crown Castle Towers LLC, Series 2006-1A, Class E | | | |
| 6.065% due 11/15/2036 | | 470,000 | | 452,453 |
| Crown Castle Towers LLC, Series 2006-1A, Class F | | | |
| 6.649% due 11/15/2036 | | 1,760,000 | | 1,707,417 |
| Crown Castle Towers LLC, Series 2006-1A, Class G | | | |
| 6.795% due 11/15/2036 | | 1,225,000 | | 1,169,616 |
| Crown Castle Towers LLC, Series 2005-1A, Class D | | | |
| 5.612% due 06/15/2035 | | 571,000 | | 558,689 |
| CS First Boston Mortgage Securities Corp, Series | | | |
| 2003-CPN1, Class A2 | | | | |
| 4.597% due 03/15/2035 | | 1,175,000 | | 1,126,075 |
| CS First Boston Mortgage Securities Corp., | | | | |
| Series 2001-CF2, Class A3 | | | | |
| 6.238% due 02/15/2034 | | 12,837 | | 12,805 |
| CS First Boston Mortgage Securities Corp., | | | | |
| Series 2001-CKN5, Class A4 | | | | |
| 5.435% due 09/15/2034 | | 34,555 | | 34,506 |
| CS First Boston Mortgage Securities Corp., | | | | |
| Series 2001-CP4, Class A4 | | | | |
| 6.18% due 12/15/2035 | | 32,087 | | 32,782 |
| CS First Boston Mortgage Securities Corp., | | | | |
| Series 2002-CKN2, Class A3 | | | | |
| 6.133% due 04/15/2037 | | 19,746 | | 20,180 |
| CS First Boston Mortgage Securities Corp., | | | | |
| Series 2004-C4, Class A4 | | | | |
| 4.283% due 10/15/2039 | | 10,860 | | 10,433 |
| CS First Boston Mortgage Securities Corp., | | | | |
| Series 2005-C1, Class AX | | | | |
| 0.1371% IO due 02/15/2038 (b) | | 1,173,760 | | 13,638 |
| CS First Boston Mortgage Securities Corp., | | | | |
| Series 2005-C2, Class B | | | | |
| 5.016% due 04/15/2037 (b) | | 58,053 | | 52,982 |
| Federal Home Loan Mortgage Corp., Series 24989, | | | |
| Class PE | | | | |
| 6.00% due 08/15/2032 | | 405,000 | | 409,483 |
| Federal Home Loan Mortgage Corp., Series 3320, | | | |
| Class PB | | | | |
| 5.50% due 11/15/2031 | | 615,000 | | 612,318 |
| Federal Home Loan Mortgage Corp., Series 3174, | | | | |
| Class CB | | | | |
| 5.50% due 02/15/2031 | | 710,000 | | 714,771 |
| Federal Home Loan Mortgage Corp., Series 3294, | | | | |
| Class NB | | | | |
| 5.50% due 12/15/2029 | | 800,000 | | 794,295 |
| Federal Home Loan Mortgage Corp., | | | | |
| Series 2003-2640, Class WA | | | | |
| 3.50% due 03/15/2033 | | 90,360 | | 87,154 |
| | | | |
| Active Bond Fund (continued) | | | |
| | | Shares or | | |
| | | Principal | | |
| | | Amount | | Value |
|
|
| |
| COLLATERALIZED MORTGAGE | | | | |
| OBLIGATIONS (continued) | | | | |
| Federal Home Loan Mortgage Corp., | | | | |
| Series 2005-3019, Class MD | | | | |
| 4.75% due 01/15/2031 | $ | 601,763 | $ | 596,310 |
| Federal Home Loan Mortgage Corp., | | | | |
| Series T-41, Class 3A | | | | |
| 7.50% due 07/25/2032 | | 4,205 | | 4,368 |
| Federal National Mortgage Association, | | | | |
| Series 2002-W3, Class A5 | | | | |
| 7.50% due 01/25/2028 | | 8,228 | | 8,548 |
| Federal National Mortgage Association, | | | | |
| Series 2003-18, Class EX | | | | |
| 4.00% due 06/25/2017 | | 1,661,006 | | 1,609,626 |
| Federal National Mortgage Association, | | | | |
| Series 2003-33, Class AC | | | | |
| 4.25% due 03/25/2033 | | 75,438 | | 72,124 |
| Federal National Mortgage Association, | | | | |
| Series 2003-49, Class JE | | | | |
| 3.00% due 04/25/2033 | | 343,761 | | 304,819 |
| Federal National Mortgage Association, | | | | |
| Series 2003-58, Class AD | | | | |
| 3.25% due 07/25/2033 | | 220,836 | | 200,346 |
| Federal National Mortgage Association, | | | | |
| Series 2003-63, Class PE | | | | |
| 3.50% due 07/25/2033 | | 180,756 | | 163,265 |
| Federal National Mortgage Association, | | | | |
| Series 2006-64, Class PC | | | | |
| 5.50% due 10/25/2034 | | 690,000 | | 671,009 |
| Federal National Mortgage Association, | | | | |
| Series 2006-67, Class PD | | | | |
| 5.50% due 12/25/2034 | | 720,000 | | 699,685 |
| First Horizon Alternative Mortgage Securities, | | | |
| Series 2004-AA2, Class 2A1 | | | | |
| 5.0276% due 08/25/2034 (b) | | 1,610,450 | | 1,595,343 |
| First Horizon Alternative Mortgage Securities, | | | |
| Series 2004-AA5, Class B1 | | | | |
| 5.2146% due 12/25/2034 (b) | | 144,688 | | 142,145 |
| First Horizon Alternative Mortgage Securities, | | | |
| Series 2006-AA2, Class B1 | | | | |
| 6.1887% due 05/25/2036 (b) | | 199,550 | | 203,904 |
| First Union National Bank Commercial Mortgage | | | |
| Trust, Series 2001-C2, Class A1 | | | | |
| 6.204% due 01/12/2043 | | 21,556 | | 21,552 |
| First Union National Bank Commercial Mortgage | | | |
| Trust, Series 2002-C1, Class A1 | | | | |
| 5.585% due 02/12/2034 | | 9,959 | | 9,967 |
| GE Capital Commercial Mortgage Corp., | | | | |
| Series 2001-3, Class A2 | | | | |
| 6.07% due 06/10/2038 | | 22,214 | | 22,658 |
| GE Capital Commercial Mortgage Corp., | | | | |
| Series 2002-2A, Class A3 | | | | |
| 5.349% due 08/11/2036 | | 14,809 | | 14,671 |
| GE Capital Commercial Mortgage Corp., | | | | |
| Series 2005-C1, Class XC | | | | |
| 0.13% IO due 06/10/2048 (b) | | 1,703,054 | | 22,224 |
| GE Capital Commercial Mortgage Corp., | | | | |
| Series 2005-C2, Class C | | | | |
| 5.133% due 05/10/2043 (b) | | 43,737 | | 40,175 |
| |
| The accompanying notes are an integral part of the financial statements. | 131 |
John Hancock Funds II
Portfolio of investments — August 31, 2007
(showing percentage of total net assets)
| | | | |
| Active Bond Fund (continued) | | | |
| | | Shares or | | |
| | | Principal | | |
| | | Amount | | Value |
| |
|
| |
| COLLATERALIZED MORTGAGE | | | | |
| OBLIGATIONS (continued) | | | | |
| Global Signal Trust, Series 2004-2A, Class D | | | |
| 5.093% due 12/15/2014 | $ | 295,000 | $ | 272,137 |
| Global Signal Trust, Series 2006-1, Class E | | | |
| 6.495% due 02/15/2036 | | 367,000 | | 364,000 |
| Global Tower Partners Acquisition Partners LLC, | | | |
| Series 2007-1A, Class F | | | | |
| 7.0496% due 05/15/2037 | | 135,000 | | 125,993 |
| GMAC Commercial Mortgage Securities, Inc., | | | |
| Series 2003-C2, Class B | | | | |
| 5.4912% due 05/10/2040 (b) | | 1,370,000 | | 1,377,457 |
| GMAC Commercial Mortgage Securities, Inc., | | | |
| Series 2001-C1, Class A1 | | | | |
| 5.988% due 04/15/2034 | | 6,042 | | 6,025 |
| GMAC Commercial Mortgage Securities, Inc., | | | |
| Series 2002-C1, Class A1 | | | | |
| 5.785% due 11/15/2039 | | 214,775 | | 215,401 |
| GMAC Commercial Mortgage Securities, Inc., | | | |
| Series 2006-C1, Class AJ | | | | |
| 5.349% due 11/10/2045 (b) | | 945,000 | | 903,619 |
| GMAC Mortgage Corp. Loan Trust, | | | | |
| Series 2006-AR1, Class 2A1 | | | | |
| 5.6509% due 04/19/2036 (b) | | 311,241 | | 310,548 |
| Government National Mortgage Association, | | | |
| Series 2003-42, Class XA | | | | |
| 3.75% due 05/16/2033 | | 66,926 | | 62,134 |
| Greenwich Capital Commercial Funding Corp, | | | |
| Series 2007-GG9, Class C | | | | |
| 5.554% due 03/10/2039 | | 315,000 | | 290,981 |
| Greenwich Capital Commercial Funding Corp, | | | |
| Series 2007-GG9, Class F | | | | |
| 5.633% due 03/10/2039 | | 170,000 | | 151,484 |
| Greenwich Capital Commercial Funding Corp., | | | |
| Series 2006-GG7, Class A4 | | | | |
| 6.1111% due 07/10/2038 (b) | | 735,000 | | 751,350 |
| Greenwich Capital Commercial Funding Corp., | | | |
| Series 2002-C1, Class A2 | | | | |
| 4.112% due 01/11/2017 | | 40,670 | | 39,798 |
| Greenwich Capital Commercial Funding Corp., | | | |
| Series 2005-GG5, Class A2 | | | | |
| 5.117% due 04/10/2037 | | 705,000 | | 700,531 |
| GS Mortgage Securities Corp. II, Series 2006-GG8, | | | |
| Class A2 | | | | |
| 5.479% due 11/10/2039 (b) | | 955,000 | | 955,216 |
| GS Mortgage Securities Corp. II, Series 2005-GG4, | | | |
| Class XC | | | | |
| 0.1945% IO due 07/10/2039 (b) | | 2,080,739 | | 40,772 |
| GS Mortgage Securities Corp. II, Series 2006-GG6, | | | |
| Class AM | | | | |
| 5.622% due 04/10/2038 (b) | | 1,350,000 | | 1,344,119 |
| GSR Mortgage Loan Trust, Series 2004-14, | | | |
| Class 3A2 | | | | |
| 4.58% due 12/25/2034 (b) | | 940,363 | | 937,798 |
| GSR Mortgage Loan Trust, Series 2004-9, Class B1 | | | |
| 5.342% due 08/25/2034 (b) | | 364,560 | | 362,798 |
| GSR Mortgage Loan Trust, Series 2006-AR1, | | | |
| Class 3A1 | | | | |
| 5.3916% due 01/25/2036 (b) | | 812,566 | | 804,268 |
| | | | |
| Active Bond Fund (continued) | | | |
| | | Shares or | | |
| | | Principal | | |
| | | Amount | | Value |
|
|
| |
| COLLATERALIZED MORTGAGE | | | | |
| OBLIGATIONS (continued) | | | | |
| Indymac Index Mortgage Loan Trust, Series | | | |
| 2005-AR18, Class 1X | | | | |
| zero coupon IO due 10/25/2036 (b) | $ | 13,781,111 | $ | 394,053 |
| Indymac Index Mortgage Loan Trust, Series | | | |
| 2006-AR25, Class 5A1 | | | | |
| 6.3516% due 09/25/2036 (b) | | 3,444,328 | | 3,476,821 |
| IndyMac Index Mortgage Loan Trust, | | | | |
| Series 2004-AR13, Class B1 | | | | |
| 5.296% due 01/25/2035 | | 218,641 | | 218,472 |
| IndyMac Index Mortgage Loan Trust, | | | | |
| Series 2005-AR5, Class B1 | | | | |
| 5.397% due 05/25/2035 (b) | | 351,321 | | 351,113 |
| IndyMac Index Mortgage Loan Trust, | | | | |
| Series 2006-AR19, Class 1B1 | | | | |
| 6.409% due 08/25/2036 (b) | | 298,699 | | 307,619 |
| JP Morgan Chase Commercial Mortgage Securities | | | |
| Corp, Series 2007-CB19, Class AJ | | | | |
| 5.9374% due 02/12/2049 (b) | | 1,245,000 | | 1,207,842 |
| JP Morgan Chase Commercial Mortgage Securities | | | |
| Corp., Series 2006-LDP8, Class A3B | | | | |
| 5.447% due 05/15/2045 (b) | | 845,000 | | 836,712 |
| JP Morgan Chase Commercial Mortgage Securities | | | |
| Corp., Series 2002-C1, Class A3 | | | | |
| 5.376% due 07/12/2037 | | 51,734 | | 51,377 |
| JP Morgan Chase Commercial Mortgage Securities | | | |
| Corp., Series 2004-CBX, Class A2 | | | | |
| 3.89% due 01/12/2037 | | 11,689 | | 11,459 |
| JP Morgan Chase Commercial Mortgage Securities | | | |
| Corp., Series 2006-LDP7, Class A4 | | | | |
| 6.0656% due 04/15/2045 (b) | | 490,000 | | 499,535 |
| JP Morgan Chase Commercial Mortgage Securities | | | |
| Corp., Series 2007-CB19, Class AM | | | | |
| 5.937% due 02/12/2049 | | 1,000,000 | | 984,194 |
| JP Morgan Commercial Mortgage Finance Corp., | | | |
| Series 1997-C5, Class D | | | | |
| 7.351% due 09/15/2029 | | 332,098 | | 338,603 |
| JP Morgan Mortgage Trust, Series 2006-A7, Class | | | |
| 2A5 | | | | |
| 5.828% due 01/25/2037 (b) | | 862,380 | | 864,118 |
| JPMorgan Chase Commercial Mortgage Securities | | | |
| Corp., Series 2005-LDP3, Class A4B | | | | |
| 4.996% due 08/15/2042 (b) | | 485,000 | | 465,774 |
| JPMorgan Chase Commercial Mortgage Securities | | | |
| Corp., Series 2005-LDP4, Class B | | | | |
| 5.129% due 10/15/2042 (b) | | 145,000 | | 132,569 |
| JPMorgan Mortgage Trust, Series 2005-S2, | | | |
| Class 2A16 | | | | |
| 6.50% due 09/25/2035 | | 215,763 | | 218,251 |
| JPMorgan Mortgage Trust, Series 2005-S3, | | | |
| Class 2A2 | | | | |
| 5.50% due 01/25/2021 | | 490,309 | | 484,181 |
| LB-UBS Commercial Mortgage Trust, | | | | |
| Series 2002-C1,Class A4 | | | | |
| 6.462% due 03/15/2031 | | 29,619 | | 30,700 |
| LB-UBS Commercial Mortgage Trust, | | | | |
| Series 2005-C1, Class XCL | | | | |
| 0.2042% IO due 02/15/2040 (b) | | 738,355 | | 15,611 |
| |
| The accompanying notes are an integral part of the financial statements. | 132 |
John Hancock Funds II
Portfolio of investments — August 31, 2007
(showing percentage of total net assets)
| | | | |
| Active Bond Fund (continued) | | | |
| | | Shares or | | |
| | | Principal | | |
| | | Amount | | Value |
| |
|
| |
| COLLATERALIZED MORTGAGE | | | | |
| OBLIGATIONS (continued) | | | | |
| LB-UBS Commercial Mortgage Trust, | | | | |
| Series 2005-C3, Class G | | | | |
| 5.111% due 07/15/2040 (b) | $ | 25,472 | $ | 22,099 |
| LB-UBS Commercial Mortgage Trust, | | | | |
| Series 2005-C5, Class A2 | | | | |
| 4.885% due 09/15/2040 | | 58,053 | | 57,422 |
| LB-UBS Commercial Mortgage Trust, | | | | |
| Series 2006-C4, Class A4 | | | | |
| 6.0809% due 06/15/2038 (b) | | 575,000 | | 586,859 |
| Lehman XS Trust, Series 2007-10H, Class 2A2 | | | | |
| 7.50% due 07/25/2037 | | 2,744,275 | | 2,811,774 |
| Lehman XS Trust, Series 2007-5H, Class 3A4 | | | | |
| 6.45% due 05/25/2037 | | 3,178,982 | | 3,150,692 |
| Mastr Adjustable Rate Mortgages Trust, | | | | |
| Series 2004-13, Class 2A1 | | | | |
| 3.8176% due 04/21/2034 (b) | | 1,721,079 | | 1,688,464 |
| Mastr Adjustable Rate Mortgages Trust, | | | | |
| Series 2004-8, Class 5A1 | | | | |
| 4.5894% due 08/25/2034 (b) | | 804,159 | | 791,355 |
| Mastr Adjustable Rate Mortgages Trust, | | | | |
| Series 2005-2, Class 2A1 | | | | |
| 5.0907% due 03/25/2035 (b) | | 1,751,293 | | 1,776,300 |
| Mastr Adjustable Rate Mortgages Trust, | | | | |
| Series 2006-2, Class 4A1 | | | | |
| 4.991% due 02/25/2036 (b) | | 717,446 | | 706,488 |
| Mastr Adjustable Rate Mortgages Trust, | | | | |
| Series 2006-2, Class 5A1 | | | | |
| 5.670% due 05/25/2036 (b) | | 4,543,174 | | 4,520,913 |
| Merrill Lynch Mortgage Trust, | | | | |
| Series 2004-KEY2, Class A4 | | | | |
| 4.864% due 08/12/2039 (b) | | 31,988 | | 30,736 |
| Merrill Lynch Mortgage Trust, Series 2005-CIP1, | | | |
| Class XC | | | | |
| 0.0549% IO due 07/12/2038 | | 5,537,503 | | 35,297 |
| Merrill Lynch Mortgage Trust, Series 2005-CKI1, | | | |
| Class A6 | | | | |
| 5.4167% due 11/12/2037 (b) | | 435,000 | | 427,397 |
| Merrill Lynch Mortgage Trust, Series 2006-C2, | | | |
| Class X | | | | |
| 0.5739% IO due 08/12/2043 | | 13,966,128 | | 383,191 |
| Merrill Lynch/Countrywide Commercial Mortgage | | | |
| Trust, Series 2007-7, Class A4 | | | | |
| 5.81% due 06/12/2050 | | 1,360,000 | | 1,358,655 |
| Merrill Lynch/Countrywide Commercial Mortgage | | | |
| Trust, Series 2006-2, Class A4 | | | | |
| 6.1046% due 06/12/2046 (b) | | 785,000 | | 801,324 |
| Merrill Lynch/Countrywide Commercial | | | | |
| Mortgage Trust, Series 2006-3, Class A4 | | | |
| 5.414% due 07/12/2046 (b) | | 595,000 | | 584,271 |
| Morgan Stanley Capital I, Series 2006-IQ12, Class E | | | |
| 5.538% due 12/15/2043 (b) | | 390,000 | | 350,902 |
| Morgan Stanley Capital I, Series 2004-T13, Class A2 | | | |
| 3.94% due 09/13/2045 | | 21,903 | | 21,306 |
| Morgan Stanley Capital I, Series 2005-HQ7, | | | |
| Class A2 | | | | |
| 5.3742% due 11/14/2042 (b) | | 415,000 | | 410,576 |
| | | | |
| Active Bond Fund (continued) | | | |
| | | Shares or | | |
| | | Principal | | |
| | | Amount | | Value |
| |
|
| |
| COLLATERALIZED MORTGAGE | | | | |
| OBLIGATIONS (continued) | | | | |
| Morgan Stanley Capital I, Series 2005-HQ7, | | | |
| Class A4 | | | | |
| 5.3742% due 11/14/2042 (b) | $ | 415,000 | $ | 406,547 |
| Morgan Stanley Capital I, Series 2005-IQ10, | | | |
| Class A4A | | | | |
| 5.23% due 09/15/2042 (b) | | 675,000 | | 659,658 |
| Morgan Stanley Capital I, Series 2005-IQ9, Class X1 | | | |
| 0.1896% IO due 07/15/2056 (b) | | 682,488 | | 20,024 |
| Morgan Stanley Capital I, Series 2005-T17, Class X1 | | | |
| 0.1464% IO due 12/13/2041 (b) | | 1,469,183 | | 22,052 |
| Morgan Stanley Capital I, | | | | |
| Series 2007-SRR3, Class A | | | | |
| 5.84% due 12/20/2049 (b) | | 1,000,000 | | 984,470 |
| Morgan Stanley Capital I, | | | | |
| Series 2007-SRR3, Class B | | | | |
| 5.94% due 12/20/2049 (b) | | 1,000,000 | | 847,400 |
| Provident Funding Mortgage Loan Trust, | | | | |
| Series 2005-1, Class B1 | | | | |
| 4.348% due 05/25/2035 (b) | | 315,403 | | 297,268 |
| Residential Accredit Loans, Inc., | | | | |
| Series 2005-QA12, Class NB5 | | | | |
| 5.9594% due 12/25/2035 (b) | | 502,599 | | 502,805 |
| Residential Asset Securitization Trust, | | | | |
| Series 2006-A7CB, Class 2A1 | | | | |
| 6.50% due 07/25/2036 | | 621,579 | | 627,329 |
| Salomon Brothers Mortgage Securities VII, | | | |
| Series 2000-C3, Class A2 | | | | |
| 6.592% due 12/18/2033 | | 12,045 | | 12,355 |
| Salomon Brothers Mortgage Securities VII, | | | |
| Series 2001-C1, Class A2 | | | | |
| 6.226% due 12/18/2035 | | 2,244 | | 2,238 |
| Salomon Brothers Mortgage Securities VII, | | | |
| Series 2001-C1, Class A3 | | | | |
| 6.428% due 12/18/2035 | | 24,682 | | 25,324 |
| SBA CMBS Trust, Series 2006-1A, Class H | | | |
| 7.389% due 11/15/2036 | | 680,000 | | 663,806 |
| SBA CMBS Trust, Series 2006-1A, Class J | | | |
| 7.825% due 11/15/2036 | | 135,000 | | 131,590 |
| SBA CMBS Trust, Series 2005-1A, Class C | | | |
| 5.731% due 11/15/2035 | | 397,000 | | 399,991 |
| SBA CMBS Trust, Series 2005-1A, Class D | | | |
| 6.219% due 11/15/2035 | | 100,000 | | 100,418 |
| SBA CMBS Trust, Series 2005-1A, Class E | | | |
| 6.706% due 11/15/2035 | | 110,000 | | 100,710 |
| Sequoia Mortgage Trust, Series 2005-3, Class A1 | | | |
| 5.7375% due 05/20/2035 (b) | | 7,300 | | 7,229 |
| Suntrust Adjustable Rate Mortgage Loan Trust, | | | |
| Series 2007-2, Class 4A1 | | | | |
| 5.7445% due 04/25/2037 (b) | | 1,700,388 | | 1,682,056 |
| Timberstar Trust, Series 2006-1A, Class A | | | | |
| 5.668% due 10/15/2036 | | 900,000 | | 897,925 |
| Wachovia Bank Commercial Mortgage Trust, | | | |
| Series 2005-C17, Class XC | | | | |
| 0.0775% IO due 03/15/2042 (b) | | 964,423 | | 8,395 |
| Wachovia Bank Commercial Mortgage Trust, | | | |
| Series 2005-C19, Class AJ | | | | |
| 4.793% due 05/15/2044 | | 37,517 | | 34,526 |
| |
| The accompanying notes are an integral part of the financial statements. | 133 |
John Hancock Funds II
Portfolio of investments — August 31, 2007
(showing percentage of total net assets)
| | | | |
| Active Bond Fund (continued) | | | |
| | | Shares or | | |
| | | Principal | | |
| | | Amount | | Value |
| |
|
| |
| COLLATERALIZED MORTGAGE | | | | |
| OBLIGATIONS (continued) | | | | |
| WAMU Commercial Mortgage Securities Trust, | | | |
| Series 2007-SL3, Class A | | | | |
| 6.1149% due 03/23/2045 | $ | 583,394 | $ | 589,210 |
| WAMU Mortgage Pass Through Certificates, Series | | | |
| 2007-OA6, Class 1XPP | | | | |
| zero coupon IO due 07/25/2047 | | 17,624,105 | | 236,163 |
| WAMU Mortgage Pass Through Certificates, | | | |
| Series 2007-OA5, Class 1XPP | | | | |
| zero coupon IO due 06/25/2047 | | 31,401,038 | | 455,315 |
| Washington Mutual Alternative Mortgage | | | | |
| Pass-Through Certificates, Series 2007-1, Class | | | |
| B1 | | | | |
| 6.2067% due 02/25/2037 (b) | | 359,197 | | 334,236 |
| Washington Mutual Alternative Mortgage | | | | |
| Pass-Through Certificates, Series 2005-6, | | | |
| Class 1CB | | | | |
| 6.50% due 08/25/2035 | | 260,686 | | 262,397 |
| Washington Mutual Mortgage Pass Through | | | |
| Certificates, Series 2007-OA4, Class XPPP | | | |
| zero coupon IO due 04/25/2047 | | 13,788,358 | | 278,194 |
| Washington Mutual, Inc., Series 2005-1, Class 6A1 | | | |
| 6.50% due 03/25/2035 | | 16,848 | | 16,871 |
| Washington Mutual, Inc., | | | | |
| Series 2005-AR12, Class 1A8 | | | | |
| 4.8341% due 10/25/2035 (b) | | 1,302,885 | | 1,277,449 |
| Washington Mutual, Inc., Series 2006-SL1, Class A | | | |
| 5.4207% due 11/23/2043 | | 887,399 | | 872,074 |
| Wells Fargo Mortgage Backed Securities Trust, | | | |
| Series 2006-AR15, Class A3 | | | | |
| 5.6618% due 10/25/2036 (b) | | 903,636 | | 902,017 |
| Wells Fargo Mortgage Backed Securities Trust, | | | |
| Series 2004-7, Class 2A2 | | | | |
| 5.00% due 07/25/2019 | | 310,477 | | 302,036 |
| Wells Fargo Mortgage Backed Securities Trust, | | | |
| Series 2005-AR16, Class 2A1 | | | | |
| 4.9429% due 10/25/2035 (b) | | 2,864,638 | | 2,855,659 |
|
| TOTAL COLLATERALIZED MORTGAGE OBLIGATIONS | | |
| (Cost $99,176,625) | | | $ | 98,124,935 |
|
| |
| ASSET BACKED SECURITIES - 4.93% | | | |
| Alesco Preferred Funding, Ltd., Series 12A, Class B | | | |
| 5.96% due 07/15/2037 (b) | | 430,000 | | 426,775 |
| Alesco Preferred Funding, Ltd., Series 15A, Class | | | |
| B1 | | | | |
| 6.04% due 12/23/2037 (b) | | 425,000 | | 421,813 |
| Alesco Preferred Funding, Ltd., Series 14A, Class B | | | |
| 6.015% due 09/23/2037 (b) | | 930,000 | | 913,725 |
| Amresco Residential Securities Mortgage Loan | | | |
| Trust, Series 1998-1, Class A6 | | | | |
| 6.51% due 08/25/2027 | | 1,351 | | 1,345 |
| Ansonia CDO, Ltd. | | | | |
| 5.812% due 07/28/2046 | | 1,150,000 | | 1,046,793 |
| Anthracite, Ltd., Series 2002-2A, Class B | | | | |
| 5.488% due 12/24/2037 (b) | | 600,000 | | 584,812 |
| Anthracite, Ltd., Series 2002-CIBA, Class A | | | |
| 5.95% due 05/24/2017 (b) | | 943,655 | | 928,321 |
| | | | |
| Active Bond Fund (continued) | | | |
| | | Shares or | | |
| | | Principal | | |
| | | Amount | | Value |
| |
|
| |
| ASSET BACKED SECURITIES | | | | |
| (continued) | | | | |
| Arbor Realty Mortgage Securities, Series | | | | |
| 2006-1A, Class C | | | | |
| 5.96% due 01/26/2042 (b) | $ | 370,000 | $ | 338,987 |
| Arbor Realty Mortgage Securities, Series | | | | |
| 2006-1A, Class F | | | | |
| 6.41% due 01/26/2042 (b) | | 615,000 | | 527,658 |
| Argent Securities, Inc., Series 2004-W1, Class M3 | | | |
| 6.955% due 03/25/2034 (b) | | 31,593 | | 28,867 |
| Capital Trust Re CDO, Ltd., Series 2005-1A, Class B | | | |
| 6.01% due 03/20/2050 (b) | | 400,000 | | 366,028 |
| Cedarwoods Credit CDO Ltd., | | | | |
| Series 2007-2A, Class B | | | | |
| 5.89% due 02/25/2052 (b) | | 1,000,000 | | 937,700 |
| Citigroup Mortgage Loan Trust Inc., Series | | | | |
| 2007-OPX1, Class A3A | | | | |
| 5.972% due 01/25/2037 | | 405,000 | | 402,989 |
| Credit-Based Asset Servicing and Securitization, | | | |
| Series 2006-MH1, Class B1 | | | | |
| 6.25% due 09/25/2036 | | 460,000 | | 348,606 |
| Credit-Based Asset Servicing and Securitization, | | | |
| Series 2005-CB8, Class AF2 | | | | |
| 5.303% due 12/25/2035 | | 1,000,000 | | 982,387 |
| Credit-Based Asset Servicing and Securitization, | | | |
| Series 2006-CB2, Class AF2 | | | | |
| 5.501% due 12/25/2036 | | 1,250,000 | | 1,234,692 |
| DB Master Finance LLC, Series 2006-1, Class-A2 | | | |
| 5.779% due 06/20/2031 | | 1,845,000 | | 1,856,939 |
| DB Master Finance LLC, Series 2006-1, Class-M1 | | | |
| 8.285% due 06/20/2031 | | 125,000 | | 128,482 |
| Dillon Read CMBS CDO, Ltd.,Series 2006-1A, | | | |
| Class A3 | | | | |
| 6.06% due 12/05/2046 | | 975,000 | | 886,528 |
| Dominos Pizza Master Issuer LLC, Series 2007-1, | | | |
| Class M1 | | | | |
| 7.629% due 04/25/2037 | | 535,000 | | 515,325 |
| Equity One ABS, Inc., Series 2004-2, Class AV2 | | | |
| 5.755% due 07/25/2034 (b) | | 649 | | 604 |
| GSAA Home Equity Trust, Series 2006-10, | | | |
| Class AF3 | | | | |
| 5.9846% due 06/25/2036 (b) | | 1,000,000 | | 991,625 |
| Highland Park CDO, Ltd., Series 2006-1A, Class A2 | | | |
| 5.905% due 11/25/2051 (b) | | 1,230,000 | | 1,200,972 |
| Home Equity Mortgage Trust, | | | | |
| Series 2005-3, Class A1 | | | | |
| 5.745% due 11/25/2035 (b) | | 2,494 | | 2,487 |
| JER CDO, Series 2006-2A, Class AFL | | | | |
| 5.84% due 03/25/2045 (b) | | 700,000 | | 605,063 |
| LNR CDO, Ltd., Series 2006-1A, Class BFL | | | |
| 6.055% due 05/28/2043 (b) | | 700,000 | | 598,063 |
| Merrill Lynch Mortgage Trust, Series 2006-C1, | | | |
| Class AM | | | | |
| 5.8427% due 05/12/2039 (b) | | 1,000,000 | | 1,002,818 |
| Mesa West Capital CDO, Ltd., | | | | |
| Series 2007-1A, Class A1 | | | | |
| 5.58% due 02/25/2047 (b) | | 970,000 | | 954,845 |
| |
| The accompanying notes are an integral part of the financial statements. | 134 |
John Hancock Funds II
Portfolio of investments — August 31, 2007
(showing percentage of total net assets)
| | | | |
| Active Bond Fund (continued) | | | |
| | | Shares or | | |
| | | Principal | | |
| | | Amount | | Value |
|
|
| |
| ASSET BACKED SECURITIES | | | | |
| (continued) | | | | |
| Morgan Stanley Mortgage Loan Trust, Series | | | |
| 2007-3XS, Class 2A4S | | | | |
| 5.9631% due 01/25/2047 | $ | 455,000 | $ | 452,290 |
| Newcastle CDO, Ltd., Series 2005-7A, Class 2FL | | | |
| 6.00% due 12/25/2050 | | 570,000 | | 542,184 |
| North Street Referenced Linked Notes, Series | | | |
| 2000-1A, Class C | | | | |
| 7.11% due 04/28/2011 (b) | | 500,000 | | 345,000 |
| N-Star Real Estate CDO, Ltd., | | | | |
| Series 2006-7A, Class B | | | | |
| 5.885% due 06/22/2051 (b) | | 900,000 | | 839,880 |
| N-Star Real Estate CDO, Ltd., | | | | |
| Series 2006-8A, Class E | | | | |
| 6.47% due 02/01/2041 (b) | | 475,000 | | 434,929 |
| N-Star Real Estate CDO, Ltd., | | | | |
| Series 2006-8A, Class G | | | | |
| 6.67% due 02/01/2041 (b) | | 475,000 | | 431,476 |
| Ownit Mortgage Loan, Series 2006-1, Class AF2 | | | |
| 5.29% due 12/25/2036 | | 1,050,000 | | 995,286 |
| Ownit Mortgage Loan, Series 2006-2, Class A2B | | | |
| 5.6329% due 01/25/2037 | | 1,000,000 | | 973,535 |
| Popular ABS Mortgage Pass-Through Trust, | | | |
| Series 2005-4, Class AF3 | | | | |
| 4.9815% due 09/25/2035 (b) | | 65,162 | | 63,791 |
| Popular ABS Mortgage Pass-Through Trust, | | | |
| Series 2005-6, Class A2 | | | | |
| 5.35% due 01/25/2036 (b) | | 900,000 | | 886,406 |
| Prima Capital Ltd., Series 2006-CR1A, Class A1 | | | |
| 5.417% due 12/28/2048 | | 1,515,685 | | 1,465,004 |
| RAIT Cre CDO, Ltd., Series 2006-1A, Class H | | | |
| 7.79% due 11/20/2046 (b) | | 120,000 | | 100,350 |
| RAIT Preferred Funding, Ltd., Series 2007-2A, | | | |
| Class B | | | | |
| 6.30% due 06/25/2045 (b) | | 685,000 | | 561,727 |
| Renaissance Home Equity Loan Trust, | | | | |
| Series 2005-2, Class AF3 | | | | |
| 4.499% due 08/25/2035 | | 210,000 | | 207,478 |
| Renaissance Home Equity Loan Trust, | | | | |
| Series 2005-2, Class AF4 | | | | |
| 4.934% due 08/25/2035 | | 335,000 | | 325,899 |
| Renaissance Home Equity Loan Trust, | | | | |
| Series 2005-4, Class A2 | | | | |
| 5.399% due 02/25/2036 | | 599,276 | | 595,853 |
| Residential Accredit Loans, Inc., | | | | |
| Series 2004-QS16, Class 1A1 | | | | |
| 5.50% due 12/25/2034 | | 20,872 | | 20,633 |
| Wells Fargo Home Equity Trust, | | | | |
| Series 2004-2, Class AI5 | | | | |
| 4.89% due 05/25/2034 (b) | | 49,000 | | 46,957 |
|
| TOTAL ASSET BACKED SECURITIES | | | | |
| (Cost $28,851,590) | | | $ | 27,523,927 |
|
| |
| SUPRANATIONAL OBLIGATIONS - 0.04% | | | |
| | | | | |
| Honduras - 0.00% | | | | |
| Central American Bank for Economic Integration | | | |
| 6.75% due 04/15/2013 | | 12,000 | | 12,733 |
| | | | |
| Active Bond Fund (continued) | | | |
| | | Shares or | | |
| | | Principal | | |
| | | Amount | | Value |
| |
|
| |
| SUPRANATIONAL OBLIGATIONS | | | |
| (continued) | | | | |
| | | | | |
| Venezuela - 0.04% | | | | |
| Corporacion Andina de Fomento | | | | |
| 5.20% due 05/21/2013 | $ | 214,000 | $ | 212,431 |
| Corporacion Andina de Fomento, Series EXCH | | | |
| 6.875% due 03/15/2012 | | 20,000 | | 21,303 |
| |
|
| | | | | 233,734 |
|
| TOTAL SUPRANATIONAL OBLIGATIONS | | | |
| (Cost $249,259) | | | $ | 246,467 |
|
| |
| PREFERRED STOCKS - 0.21% | | | | |
| | | | | |
| Food & Beverages - 0.05% | | | | |
| Ocean Spray Cranberries, Inc. | | 3,200 | | 277,400 |
| | | | | |
| Mining - 0.09% | | | | |
| Freeport-McMoRan Copper & Gold, Inc. | 4,000 | | 530,480 |
| | | | | |
| Telephone - 0.07% | | | | |
| Telephone & Data Systems, Inc. | | 16,000 | | 364,960 |
|
| TOTAL PREFERRED STOCKS (Cost $1,064,480) | | $ | 1,172,840 |
|
| |
| TERM LOANS - 0.03% | | | | |
| | | | | |
| Educational Services - 0.03% | | | | |
| Riverdeep Interactive Learning | | | | |
| 8.10% due 11/28/2013 | EUR | 198,997 | | 194,851 |
|
| TOTAL TERM LOANS (Cost $198,997) | | $ | 194,851 |
|
| |
| WARRANTS - 0.01% | | | | |
| | | | | |
| Gold - 0.01% | | | | |
| New Gold, Inc. | | | | |
| (Expiration Date: 06/28/17, Strike | | | | |
| Price: CAD 15.00) * | | 25,000 | | 33,141 |
|
| TOTAL WARRANTS (Cost $49,132) | | | $ | 33,141 |
|
| |
| SHORT TERM INVESTMENTS - 14.91% | | | |
| Federal Home Loan Bank Discount Notes | | | |
| zero coupon due 09/04/2007 to | | | | |
| 09/18/2007 | $ | 21,400,000 | $ | 21,374,051 |
| Federal National Mortgage Association Discount | | | |
| Notes | | | | |
| zero coupon due 09/13/2007 | | 62,000,000 | | 61,894,187 |
|
| TOTAL SHORT TERM INVESTMENTS | | | |
| (Cost $83,268,238) | | | $ | 83,268,238 |
|
| |
| The accompanying notes are an integral part of the financial statements. | 135 |
John Hancock Funds II
Portfolio of investments — August 31, 2007
(showing percentage of total net assets)
| | | | |
| Active Bond Fund (continued) | | | |
| | | Shares or | | |
| | | Principal | | |
| | | Amount | | Value |
|
|
| |
| REPURCHASE AGREEMENTS - 0.66% | | | |
| Repurchase Agreement with State | | | | |
| Street Corp. dated 08/31/2007 at | | | | |
| 4.60% to be repurchased at | | | | |
| $3,716,899 on 09/04/2007, | | | | |
| collateralized by $65,000 Federal | | | | |
| Home Loan Bank, 5.81% due | | | | |
| 03/14/2025 (valued at $65,244, | | | | |
| including interest) and $3,715,000 | | | | |
| Federal Home Loan Bank, 5.375% | | | | |
| due 08/14/2009 (valued at | | | | |
| $3,728,931, including interest) *** | $ | 3,715,000 | $ | 3,715,000 |
|
| TOTAL REPURCHASE AGREEMENTS | | | | |
| (Cost $3,715,000) | | | $ | 3,715,000 |
|
| Total Investments (Active Bond Fund) | | | | |
| (Cost $571,002,549) - 101.63% | | | $ | 567,691,487 |
| Liabilities in Excess of Other Assets - (1.63)% | | | (9,092,982) |
| |
|
| TOTAL NET ASSETS - 100.00% | | | $ | 558,598,505 |
| |
|
| |
| |
| |
| All Cap Core Fund | | | | |
| | | Shares or | | |
| | | Principal | | |
| | | Amount | | Value |
|
|
| |
| COMMON STOCKS - 89.50% | | | | |
| | | | | |
| Aerospace - 3.20% | | | | |
| Boeing Company | | 80,100 | $ | 7,745,670 |
| Lockheed Martin Corp. | | 75,600 | | 7,494,984 |
| |
|
| | | | | 15,240,654 |
| Air Travel - 0.03% | | | | |
| Alaska Air Group, Inc. * | | 6,000 | | 148,920 |
| | | | | |
| Aluminum - 1.38% | | | | |
| Alcoa, Inc. | | 137,100 | | 5,008,263 |
| Century Aluminum Company * | | 32,100 | | 1,578,678 |
| |
|
| | | | | 6,586,941 |
| Apparel & Textiles - 0.75% | | | | |
| Coach, Inc. * | | 19,200 | | 854,976 |
| Polo Ralph Lauren Corp., Class A | | 36,200 | | 2,734,548 |
| |
|
| | | | | 3,589,524 |
| Auto Parts - 0.05% | | | | |
| AutoZone, Inc. * | | 2,000 | | 242,580 |
| | | | | |
| Automobiles - 1.08% | | | | |
| PACCAR, Inc. | | 60,100 | | 5,141,555 |
| | | | | |
| Banking - 2.53% | | | | |
| Bank of America Corp. | | 238,200 | | 12,071,976 |
| | | | | |
| Biotechnology - 1.63% | | | | |
| Digene Corp. * (a) | | 19,200 | | 1,176,000 |
| Genzyme Corp. * | | 40,800 | | 2,546,328 |
| Invitrogen Corp. * | | 36,800 | | 2,866,720 |
| MGI Pharma, Inc. * | | 49,600 | | 1,169,072 |
| |
|
| | | | | 7,758,120 |
| | | |
| All Cap Core Fund (continued) | | | |
| | Shares or | | |
| | Principal | | |
| | Amount | | Value |
|
|
| |
| COMMON STOCKS (continued) | | | |
| | | | |
| Broadcasting - 0.00% | | | |
| Citadel Broadcasting Corp. | 4,569 | $ | 18,596 |
| | | | |
| Building Materials & Construction - 0.09% | | | |
| Perini Corp. * | 7,200 | | 407,520 |
| | | | |
| Business Services - 3.67% | | | |
| Accenture, Ltd., Class A | 145,000 | | 5,975,450 |
| Brinks Company | 16,700 | | 957,912 |
| Computer Sciences Corp. * | 92,500 | | 5,175,375 |
| Convergys Corp. * | 22,400 | | 375,200 |
| Fluor Corp. | 11,600 | | 1,474,940 |
| NCR Corp. * | 71,100 | | 3,538,647 |
| |
|
| | | | 17,497,524 |
| Cable & Television - 1.38% | | | |
| DIRECTV Group, Inc. * | 283,000 | | 6,602,390 |
| | | | |
| Cellular Communications - 0.49% | | | |
| Telephone & Data Systems, Inc. | 36,100 | | 2,337,475 |
| | | | |
| Chemicals - 1.22% | | | |
| Cabot Corp. | 46,300 | | 1,867,742 |
| Cambrex Corp. | 9,200 | | 114,724 |
| Dow Chemical Company | 59,600 | | 2,540,748 |
| Lubrizol Corp. | 20,400 | | 1,297,032 |
| |
|
| | | | 5,820,246 |
| Computers & Business Equipment - 3.91% | | | |
| Agilysys, Inc. | 22,800 | | 388,968 |
| Cisco Systems, Inc. * | 6,000 | | 191,520 |
| Hewlett-Packard Company | 170,600 | | 8,419,110 |
| International Business Machines Corp. | 82,500 | | 9,626,925 |
| |
|
| | | | 18,626,523 |
| Containers & Glass - 0.75% | | | |
| Ball Corp. | 9,700 | | 508,086 |
| Packaging Corp. of America | 29,700 | | 773,685 |
| Pactiv Corp. * | 30,500 | | 892,125 |
| Sonoco Products Company | 38,800 | | 1,397,576 |
| |
|
| | | | 3,571,472 |
| Cosmetics & Toiletries - 0.92% | | | |
| Colgate-Palmolive Company | 24,000 | | 1,591,680 |
| Kimberly-Clark Corp. | 40,600 | | 2,788,814 |
| |
|
| | | | 4,380,494 |
| Crude Petroleum & Natural Gas - 3.77% | | | |
| Chesapeake Energy Corp. | 46,500 | | 1,500,090 |
| Devon Energy Corp. | 28,900 | | 2,176,459 |
| Marathon Oil Corp. | 90,200 | | 4,860,878 |
| Patterson-UTI Energy, Inc. | 148,200 | | 3,181,854 |
| Sunoco, Inc. | 43,700 | | 3,196,218 |
| Unit Corp. * | 62,700 | | 3,076,062 |
| |
|
| | | | 17,991,561 |
| Domestic Oil - 0.73% | | | |
| Frontier Oil Corp. | 84,500 | | 3,467,035 |
| | | | |
| Drugs & Health Care - 0.07% | | | |
| Quidel Corp. * | 19,200 | | 326,016 |
| |
| The accompanying notes are an integral part of the financial statements. | 136 |
John Hancock Funds II
Portfolio of investments — August 31, 2007
(showing percentage of total net assets)
| | | |
| All Cap Core Fund (continued) | | | |
| | Shares or | | |
| | Principal | | |
| | Amount | | Value |
|
|
| |
| COMMON STOCKS (continued) | | | |
| | | | |
| Electrical Utilities - 1.20% | | | |
| Edison International | 20,100 | $ | 1,059,471 |
| FirstEnergy Corp. | 68,600 | | 4,214,784 |
| PPL Corp. | 5,400 | | 260,604 |
| Quanta Services, Inc. * | 7,200 | | 203,544 |
| |
|
| | | | 5,738,403 |
| Electronics - 0.47% | | | |
| Belden, Inc. | 3,200 | | 155,552 |
| Teleflex, Inc. | 27,000 | | 2,099,790 |
| |
|
| | | | 2,255,342 |
| Energy - 1.43% | | | |
| Energen Corp. | 5,800 | | 311,460 |
| Sempra Energy | 118,500 | | 6,521,055 |
| |
|
| | | | 6,832,515 |
| Financial Services - 9.71% | | | |
| Citigroup, Inc. | 140,600 | | 6,591,328 |
| Goldman Sachs Group, Inc. | 36,800 | | 6,477,168 |
| Interactive Data Corp. | 2,300 | | 62,882 |
| JP Morgan Chase & Company | 227,400 | | 10,123,848 |
| Merrill Lynch & Company, Inc. | 92,000 | | 6,780,400 |
| Morgan Stanley | 107,700 | | 6,717,249 |
| Wells Fargo & Company | 261,200 | | 9,544,248 |
| |
|
| | | | 46,297,123 |
| Food & Beverages - 2.49% | | | |
| Coca-Cola Enterprises, Inc. | 162,000 | | 3,858,840 |
| General Mills, Inc. | 67,900 | | 3,794,252 |
| H.J. Heinz Company | 93,500 | | 4,215,915 |
| |
|
| | | | 11,869,007 |
| Gas & Pipeline Utilities - 0.49% | | | |
| Global Industries, Ltd. * | 81,500 | | 1,970,670 |
| UGI Corp. | 7,200 | | 183,960 |
| Williams Companies, Inc. | 5,800 | | 179,800 |
| |
|
| | | | 2,334,430 |
| Healthcare Products - 1.18% | | | |
| Baxter International, Inc. | 34,600 | | 1,894,696 |
| Becton, Dickinson & Company | 48,400 | | 3,723,896 |
| |
|
| | | | 5,618,592 |
| Healthcare Services - 2.96% | | | |
| Alliance Imaging, Inc. * | 24,000 | | 211,440 |
| Apria Healthcare Group, Inc. * | 7,100 | | 189,073 |
| Coventry Health Care, Inc. * | 94,600 | | 5,427,202 |
| Health Net, Inc. * | 3,600 | | 197,244 |
| Humana, Inc. * | 71,500 | | 4,582,435 |
| WellCare Health Plans, Inc. * | 35,300 | | 3,484,110 |
| |
|
| | | | 14,091,504 |
| Holdings Companies/Conglomerates - 1.03% | | | |
| General Electric Company | 126,100 | | 4,901,507 |
| | | | |
| Homebuilders - 0.67% | | | |
| Centex Corp. | 82,300 | | 2,379,293 |
| | | |
| All Cap Core Fund (continued) | | | |
| | Shares or | | |
| | Principal | | |
| | Amount | | Value |
|
|
| |
| COMMON STOCKS (continued) | | | |
| | | | |
| Homebuilders (continued) | | | |
| KB Home (a) | 26,800 | $ | 813,112 |
| |
|
| | | | 3,192,405 |
| Hotels & Restaurants - 2.01% | | | |
| Boyd Gaming Corp. | 5,500 | | 224,675 |
| Darden Restaurants, Inc. | 23,500 | | 977,600 |
| McDonald's Corp. | 53,300 | | 2,625,025 |
| Yum! Brands, Inc. | 176,000 | | 5,758,720 |
| |
|
| | | | 9,586,020 |
| Household Products - 0.30% | | | |
| Energizer Holdings, Inc. * | 13,600 | | 1,440,648 |
| | | | |
| Industrial Machinery - 0.21% | | | |
| Intevac, Inc. * | 62,500 | | 1,021,250 |
| | | | |
| Insurance - 4.06% | | | |
| ACE, Ltd. | 61,200 | | 3,534,912 |
| Aetna, Inc. | 102,700 | | 5,228,457 |
| Allied World Assurance Holdings, Ltd. | 18,000 | | 864,360 |
| Arch Capital Group, Ltd. * | 8,300 | | 596,189 |
| Endurance Specialty Holdings, Ltd. | 14,100 | | 562,167 |
| Lincoln National Corp. | 7,600 | | 462,688 |
| Philadelphia Consolidated Holding Corp. * | 26,000 | | 1,040,520 |
| Reinsurance Group of America, Inc. | 2,200 | | 119,482 |
| W.R. Berkley Corp. | 17,900 | | 535,031 |
| XL Capital, Ltd., Class A | 83,800 | | 6,385,560 |
| |
|
| | | | 19,329,366 |
| International Oil - 4.97% | | | |
| Chevron Corp. | 113,700 | | 9,978,312 |
| Exxon Mobil Corp. | 156,300 | | 13,399,599 |
| Parker Drilling Company * | 37,500 | | 292,125 |
| |
|
| | | | 23,670,036 |
| Internet Content - 1.03% | | | |
| Google, Inc., Class A * | 7,900 | | 4,070,475 |
| Yahoo!, Inc. * | 37,500 | | 852,375 |
| |
|
| | | | 4,922,850 |
| Internet Retail - 0.22% | | | |
| eBay, Inc. * | 30,800 | | 1,050,280 |
| | | | |
| Internet Software - 0.10% | | | |
| Symantec Corp. * | 25,100 | | 472,131 |
| | | | |
| Leisure Time - 0.01% | | | |
| Vail Resorts, Inc. * | 500 | | 28,590 |
| | | | |
| Manufacturing - 1.10% | | | |
| Honeywell International, Inc. | 68,400 | | 3,840,660 |
| Tyco International, Ltd. | 31,600 | | 1,395,456 |
| |
|
| | | | 5,236,116 |
| Metal & Metal Products - 0.74% | | | |
| Southern Copper Corp. | 27,000 | | 2,841,750 |
| USEC, Inc. * | 50,800 | | 680,212 |
| |
|
| | | | 3,521,962 |
| Paper - 0.02% | | | |
| Buckeye Technologies, Inc. * | 6,800 | | 105,876 |
| |
| The accompanying notes are an integral part of the financial statements. | 137 |
John Hancock Funds II
Portfolio of investments — August 31, 2007
(showing percentage of total net assets)
| | | |
| All Cap Core Fund (continued) | | | |
| | Shares or | | |
| | Principal | | |
| | Amount | | Value |
|
|
| |
| COMMON STOCKS (continued) | | | |
| | | | |
| Petroleum Services - 1.89% | | | |
| Atwood Oceanics, Inc. * | 1,200 | $ | 91,188 |
| Tidewater, Inc. | 58,500 | | 3,828,825 |
| Transocean, Inc. * | 48,400 | | 5,086,356 |
| |
|
| | | | 9,006,369 |
| Pharmaceuticals - 4.57% | | | |
| Bristol-Myers Squibb Company | 68,100 | | 1,985,115 |
| Caraco Pharmaceutical Labs * | 2,600 | | 38,454 |
| Eli Lilly & Company | 128,500 | | 7,369,475 |
| Endo Pharmaceutical Holdings, Inc. * | 76,400 | | 2,435,632 |
| Gilead Sciences, Inc. * | 138,700 | | 5,044,519 |
| Merck & Company, Inc. | 51,100 | | 2,563,687 |
| Noven Pharmaceuticals, Inc. * (a) | 16,400 | | 250,264 |
| Par Pharmaceutical Companies, Inc. * | 6,900 | | 154,491 |
| Sepracor, Inc. * | 55,400 | | 1,616,018 |
| ViroPharma, Inc. * (a) | 31,100 | | 308,201 |
| |
|
| | | | 21,765,856 |
| Publishing - 1.23% | | | |
| McGraw-Hill Companies, Inc. | 116,100 | | 5,858,406 |
| | | | |
| Real Estate - 1.44% | | | |
| Apartment Investment & Management | | | |
| Company, Class A, REIT | 3,500 | | 156,450 |
| Equity Residential, REIT | 22,200 | | 893,328 |
| Health Care REIT, Inc. (a) | 10,000 | | 399,000 |
| Hospitality Properties Trust, REIT | 11,900 | | 469,574 |
| Liberty Property Trust, REIT | 11,400 | | 445,284 |
| ProLogis, REIT | 18,000 | | 1,082,880 |
| Public Storage, Inc., REIT | 1,900 | | 143,982 |
| Regency Centers Corp., REIT | 9,400 | | 653,018 |
| Simon Property Group, Inc., REIT | 12,800 | | 1,214,977 |
| Thornburg Mortgage, Inc., REIT (a) | 13,600 | | 160,208 |
| Vornado Realty Trust, REIT | 11,500 | | 1,225,785 |
| |
|
| | | | 6,844,486 |
| Retail Grocery - 1.11% | | | |
| The Kroger Company | 199,700 | | 5,308,026 |
| | | | |
| Retail Trade - 3.07% | | | |
| American Eagle Outfitters, Inc. | 171,100 | | 4,419,513 |
| BJ's Wholesale Club, Inc. * | 65,100 | | 2,278,500 |
| Family Dollar Stores, Inc. | 142,100 | | 4,160,688 |
| RadioShack Corp. | 158,200 | | 3,760,414 |
| |
|
| | | | 14,619,115 |
| Semiconductors - 2.97% | | | |
| Emulex Corp. * | 39,600 | | 773,784 |
| MEMC Electronic Materials, Inc. * | 54,000 | | 3,316,680 |
| Micrel, Inc. | 22,200 | | 243,090 |
| National Semiconductor Corp. | 120,500 | | 3,171,560 |
| NVIDIA Corp. * | 71,700 | | 3,668,172 |
| Teradyne, Inc. * | 200,200 | | 2,980,978 |
| |
|
| | | | 14,154,264 |
| Software - 2.53% | | | |
| Microsoft Corp. | 398,900 | | 11,460,397 |
| | | | |
| All Cap Core Fund (continued) | | | |
| | | Shares or | | |
| | | Principal | | |
| | | Amount | | Value |
| |
|
| |
| COMMON STOCKS (continued) | | | | |
| | | | | |
| Software (continued) | | | | |
| MicroStrategy, Inc., Class A * | | 7,100 | $ | 491,604 |
| SPSS, Inc. * | | 3,100 | | 126,325 |
|
|
| | | | | 12,078,326 |
| Telecommunications Equipment & | | | | |
| Services - 2.73% | | | | |
| Alaska Communications Systems Group, Inc. | 2,100 | | 28,686 |
| Embarq Corp. | | 67,900 | | 4,238,318 |
| Verizon Communications, Inc. | | 208,800 | | 8,744,544 |
|
|
| | | | | 13,011,548 |
| Telephone - 1.42% | | | | |
| AT&T, Inc. | | 32,600 | | 1,299,762 |
| CenturyTel, Inc. | | 22,400 | | 1,074,752 |
| U.S. Cellular Corp. * | | 33,600 | | 3,267,600 |
| Windstream Corp. | | 79,000 | | 1,128,120 |
|
|
| | | | | 6,770,234 |
| Tobacco - 0.98% | | | | |
| Altria Group, Inc. | | 52,200 | | 3,623,202 |
| Loews Corp. - Carolina Group | | 13,700 | | 1,042,844 |
|
|
| | | | | 4,666,046 |
| Toys, Amusements & Sporting Goods - 0.36% | | | |
| Hasbro, Inc. | | 61,300 | | 1,729,273 |
| | | | | |
| Trucking & Freight - 1.15% | | | | |
| Ryder Systems, Inc. | | 88,000 | | 4,818,000 |
| YRC Worldwide, Inc. * | | 21,000 | | 647,010 |
|
|
| | | | | 5,465,010 |
|
| TOTAL COMMON STOCKS (Cost $422,283,359) | | $ | 426,620,034 |
|
| |
| SHORT TERM INVESTMENTS - 0.92% | | | |
| John Hancock Cash Investment Trust (c) | $ | 2,163,206 | $ | 2,163,206 |
| U.S. Treasury Bills | | | | |
| zero coupon due 10/18/2007 | | 2,235,000 | | 2,220,935 |
|
| TOTAL SHORT TERM INVESTMENTS | | | | |
| (Cost $4,384,141) | | | $ | 4,384,141 |
|
| |
| The accompanying notes are an integral part of the financial statements. | 138 |
John Hancock Funds II
Portfolio of investments — August 31, 2007
(showing percentage of total net assets)
| | | | |
| All Cap Core Fund (continued) | | | |
| | | Shares or | | |
| | | Principal | | |
| | | Amount | | Value |
|
|
| |
| REPURCHASE AGREEMENTS - 9.79% | | | |
| Repurchase Agreement with State | | | | |
| Street Corp. dated 08/31/2007 at | | | | |
| 4.60% to be repurchased at | | | | |
| $46,662,837 on 09/04/2007, | | | | |
| collateralized by $13,775,000 | | | | |
| Federal Home Loan Mortgage | | | | |
| Corp., 4% due 06/12/2013 (valued | | | | |
| at $13,292,875, including interest) | | | | |
| and $33,575,000 Federal Home | | | | |
| Loan Mortgage Corp., 5.375% due | | | | |
| 01/09/2014 (valued at | | | | |
| $33,994,688, including interest) | | | | |
| and $290,000 Federal National | | | | |
| Mortgage Association, 4.375% due | | | | |
| 07/17/2013 (valued at $287,825, | | | | |
| including interest) | $ | 46,639,000 | $ | 46,639,000 |
|
| TOTAL REPURCHASE AGREEMENTS | | | | |
| (Cost $46,639,000) | | | $ | 46,639,000 |
|
| Total Investments (All Cap Core Fund) | | | | |
| (Cost $473,306,500) - 100.21% | | | $ | 477,643,175 |
| Liabilities in Excess of Other Assets - (0.21)% | | | (981,341) |
| |
|
| TOTAL NET ASSETS - 100.00% | | | $ | 476,661,834 |
| |
|
| |
| |
| |
| All Cap Growth Fund | | | | |
| | | Shares or | | |
| | | Principal | | |
| | | Amount | | Value |
|
|
| |
| COMMON STOCKS - 97.02% | | | | |
| | | | | |
| Aerospace - 6.18% | | | | |
| Boeing Company | | 14,508 | $ | 1,402,923 |
| General Dynamics Corp. | | 24,405 | | 1,917,257 |
| Spirit Aerosystems Holdings, Inc., Class A * | 62,839 | | 2,246,494 |
| United Technologies Corp. | | 34,809 | | 2,597,796 |
| |
|
| | | | | 8,164,470 |
| |
| Apparel & Textiles - 1.20% | | | | |
| Carter's, Inc. * | | 24,938 | | 492,276 |
| Phillips-Van Heusen Corp. | | 18,884 | | 1,099,616 |
| |
|
| | | | | 1,591,892 |
| |
| Broadcasting - 1.58% | | | | |
| Grupo Televisa SA, SADR * | | 79,967 | | 2,083,940 |
| | | | |
| Building Materials & Construction - 2.35% | | | |
| Chicago Bridge & Iron Company N.V. | | 26,408 | | 986,339 |
| Foster Wheeler, Ltd. * | | 17,942 | | 2,125,050 |
| |
|
| | | | | 3,111,389 |
| |
| Business Services - 2.05% | | | | |
| Accenture, Ltd., Class A | | 50,044 | | 2,062,313 |
| Fiserv, Inc. * | | 13,981 | | 650,396 |
| |
|
| | | | | 2,712,709 |
| |
| Cellular Communications - 2.14% | | | | |
| America Movil SA de CV, Series L, SADR | 21,378 | | 1,292,514 |
| | | |
| All Cap Growth Fund (continued) | | |
| | Shares or | | |
| | Principal | | |
| | Amount | | Value |
|
|
| |
| COMMON STOCKS (continued) | | | |
| | | | |
| Cellular Communications (continued) | | | |
| China Mobile, Ltd. | 113,000 | $ | 1,539,081 |
|
|
| | | | 2,831,595 |
| Chemicals - 1.32% | | | |
| Syngenta AG * | 9,293 | | 1,743,269 |
| | | | |
| Commercial Services - 0.96% | | | |
| CB Richard Ellis Group, Inc. * | 43,170 | | 1,274,379 |
| | | | |
| Computers & Business Equipment - 12.15% | | | |
| Apple, Inc. * | 28,733 | | 3,978,946 |
| Cisco Systems, Inc. * | 112,180 | | 3,580,786 |
| Dell, Inc. * | 120,785 | | 3,412,176 |
| Hewlett-Packard Company | 45,716 | | 2,256,085 |
| Micros Systems, Inc. * | 14,578 | | 879,636 |
| Research In Motion, Ltd. * | 22,854 | | 1,951,960 |
|
|
| | | | 16,059,589 |
| Construction & Mining Equipment - 1.62% | | | |
| National Oilwell Varco, Inc. * | 16,685 | | 2,135,680 |
| | | | |
| Cosmetics & Toiletries - 0.86% | | | |
| Avon Products, Inc. | 5,077 | | 174,395 |
| Colgate-Palmolive Company | 14,606 | | 968,670 |
|
|
| | | | 1,143,065 |
| Crude Petroleum & Natural Gas - 1.03% | | | |
| Occidental Petroleum Corp. | 23,953 | | 1,357,896 |
| | | | |
| Educational Services - 1.52% | | | |
| Apollo Group, Inc., Class A * | 34,216 | | 2,007,453 |
| | | | |
| Electrical Equipment - 2.26% | | | |
| Cooper Industries, Ltd., Class A | 20,370 | | 1,042,333 |
| Emerson Electric Company | 39,415 | | 1,940,400 |
|
|
| | | | 2,982,733 |
| Electronics - 1.12% | | | |
| Amphenol Corp., Class A | 41,030 | | 1,481,593 |
| | | | |
| Energy - 1.90% | | | |
| McDermott International, Inc. * | 26,211 | | 2,515,994 |
| | | | |
| Financial Services - 6.49% | | | |
| Ameriprise Financial, Inc. | 24,951 | | 1,522,260 |
| Goldman Sachs Group, Inc. | 17,103 | | 3,010,299 |
| JP Morgan Chase & Company | 61,461 | | 2,736,244 |
| Merrill Lynch & Company, Inc. | 17,834 | | 1,314,366 |
|
|
| | | | 8,583,169 |
| Healthcare Products - 1.00% | | | |
| Zimmer Holdings, Inc. * | 16,843 | | 1,319,312 |
| | | | |
| Healthcare Services - 5.50% | | | |
| Express Scripts, Inc. * | 19,398 | | 1,062,040 |
| Health Net, Inc. * | 49,807 | | 2,728,926 |
| McKesson Corp. | 22,500 | | 1,287,225 |
| UnitedHealth Group, Inc. | 43,731 | | 2,186,987 |
|
|
| | | | 7,265,178 |
| Hotels & Restaurants - 0.96% | | | |
| Darden Restaurants, Inc. | 30,531 | | 1,270,090 |
| |
| The accompanying notes are an integral part of the financial statements. | 139 |
John Hancock Funds II
Portfolio of investments — August 31, 2007
(showing percentage of total net assets)
| | | |
| All Cap Growth Fund (continued) | | |
| | Shares or | | |
| | Principal | | |
| | Amount | | Value |
|
|
| |
| COMMON STOCKS (continued) | | | |
| | | | |
| Household Products - 1.80% | | | |
| The Clorox Company | 39,713 | $ | 2,374,837 |
| | | | |
| Industrial Machinery - 3.71% | | | |
| Cameron International Corp. * | 24,436 | | 1,998,132 |
| Grant Prideco, Inc. * | 14,859 | | 821,703 |
| Komatsu, Ltd. | 40,830 | | 1,253,950 |
| Terex Corp. * | 10,462 | | 835,704 |
| |
|
| | | | 4,909,489 |
| Industrials - 1.10% | | | |
| ABB, Ltd. | 58,529 | | 1,447,248 |
| | | | |
| Insurance - 1.06% | | | |
| Assurant, Inc. (a) | 27,178 | | 1,400,754 |
| | | | |
| Internet Content - 1.03% | | | |
| Google, Inc., Class A * | 2,642 | | 1,361,291 |
| | | | |
| Internet Retail - 3.70% | | | |
| Amazon.com, Inc. * | 31,910 | | 2,549,928 |
| eBay, Inc. * | 68,438 | | 2,333,736 |
| |
|
| | | | 4,883,664 |
| Investment Companies - 0.37% | | | |
| The Blackstone Group LP * (a) | 20,907 | | 483,579 |
| | | | |
| Leisure Time - 0.79% | | | |
| Electronic Arts, Inc. * | 19,614 | | 1,038,365 |
| | | | |
| Manufacturing - 0.73% | | | |
| Acuity Brands, Inc. | 18,304 | | 961,692 |
| | | | |
| Medical-Hospitals - 1.11% | | | |
| VCA Antech, Inc. * | 35,776 | | 1,462,881 |
| | | | |
| Metal & Metal Products - 2.25% | | | |
| Precision Castparts Corp. | 22,805 | | 2,971,720 |
| | | | |
| Petroleum Services - 1.30% | | | |
| Valero Energy Corp. | 25,095 | | 1,719,259 |
| | | | |
| Pharmaceuticals - 7.34% | | | |
| Abbott Laboratories | 31,708 | | 1,645,962 |
| Gilead Sciences, Inc. * | 44,231 | | 1,608,681 |
| Merck & Company, Inc. | 70,805 | | 3,552,287 |
| Schering-Plough Corp. | 46,090 | | 1,383,622 |
| Shire PLC | 57,824 | | 1,515,263 |
| |
|
| | | | 9,705,815 |
| Publishing - 0.76% | | | |
| McGraw-Hill Companies, Inc. | 19,956 | | 1,006,980 |
| | | | |
| Retail Trade - 7.31% | | | |
| Aeropostale, Inc. * | 39,377 | | 815,093 |
| DSW, Inc., Class A * (a) | 19,560 | | 595,602 |
| Family Dollar Stores, Inc. | 89,790 | | 2,629,051 |
| J.C. Penney Company, Inc. | 29,100 | | 2,000,916 |
| Longs Drug Stores Corp. | 17,157 | | 904,689 |
| Nordstrom, Inc. | 26,370 | | 1,268,397 |
| PetSmart, Inc. | 41,601 | | 1,443,555 |
| |
|
| | | | 9,657,303 |
| | | | |
| All Cap Growth Fund (continued) | | |
| | | Shares or | | |
| | | Principal | | |
| | | Amount | | Value |
| |
|
| |
| COMMON STOCKS (continued) | | | | |
| | | | | |
| Semiconductors - 3.01% | | | | |
| Microchip Technology, Inc. | | 36,734 | $ | 1,414,994 |
| Texas Instruments, Inc. | | 74,992 | | 2,567,726 |
|
|
| | | | | 3,982,720 |
| Software - 3.21% | | | | |
| Adobe Systems, Inc. * | | 43,617 | | 1,864,627 |
| Autodesk, Inc. * | | 21,535 | | 997,501 |
| VeriFone Holdings, Inc. * | | 37,340 | | 1,380,086 |
|
|
| | | | | 4,242,214 |
| Telecommunications Equipment & | | | | |
| Services - 2.25% | | | | |
| Amdocs, Ltd. * | | 84,411 | | 2,979,708 |
|
| TOTAL COMMON STOCKS (Cost $103,087,833) | | $ | 128,224,914 |
|
| |
| SHORT TERM INVESTMENTS - 1.90% | | | | |
| John Hancock Cash Investment Trust (c) | $ | 2,507,694 | $ | 2,507,694 |
|
| TOTAL SHORT TERM INVESTMENTS | | | | |
| (Cost $2,507,694) | | | $ | 2,507,694 |
|
| |
| REPURCHASE AGREEMENTS - 2.68% | | | | |
| Repurchase Agreement with State | | | | |
| Street Corp. dated 08/31/2007 at | | | | |
| 4.85% to be repurchased at | | | | |
| $3,547,911 on 9/4/2007, | | | | |
| collateralized by $3,725,000 | | | | |
| Federal Home Loan Mortgage | | | | |
| Corp., 5.625% due 11/23/2035 | | | | |
| (valued at $3,621,549, including | | | | |
| interest) | $ | 3,546,000 | $ | 3,546,000 |
|
| TOTAL REPURCHASE AGREEMENTS | | | | |
| (Cost $3,546,000) | | | $ | 3,546,000 |
|
| Total Investments (All Cap Growth Fund) | | | | |
| (Cost $109,141,527) - 101.60% | | | $ | 134,278,608 |
| Liabilities in Excess of Other Assets - (1.60)% | | | (2,109,341) |
|
|
| TOTAL NET ASSETS - 100.00% | | | $ | 132,169,267 |
|
|
| |
| |
| |
| All Cap Value Fund | | | | |
| | | Shares or | | |
| | | Principal | | |
| | | Amount | | Value |
| |
|
| |
| COMMON STOCKS - 98.45% | | | | |
| | | | | |
| Advertising - 0.15% | | | | |
| Interpublic Group of Companies, Inc. * | | 13,600 | $ | 148,920 |
| | | | | |
| Aerospace - 3.10% | | | | |
| Alliant Techsystems, Inc. * | | 7,400 | | 779,294 |
| Curtiss-Wright Corp. | | 10,500 | | 478,800 |
| General Dynamics Corp. | | 19,500 | | 1,531,920 |
| Moog, Inc., Class A * | | 4,387 | | 186,755 |
|
|
| | | | | 2,976,769 |
| |
| The accompanying notes are an integral part of the financial statements. | 140 |
John Hancock Funds II
Portfolio of investments — August 31, 2007
(showing percentage of total net assets)
| | | |
| All Cap Value Fund (continued) | | | |
| | Shares or | | |
| | Principal | | |
| | Amount | | Value |
|
|
| |
| COMMON STOCKS (continued) | | | |
| | | | |
| Auto Parts - 0.19% | | | |
| ArvinMeritor, Inc. | 10,200 | $ | 177,990 |
| | | | |
| Banking - 1.73% | | | |
| Cullen Frost Bankers, Inc. | 32,235 | | 1,662,681 |
| | | | |
| Biotechnology - 1.33% | | | |
| Amgen, Inc. * | 12,700 | | 636,397 |
| Applera Corp. | 20,200 | | 638,522 |
| |
|
| | | | 1,274,919 |
| Business Services - 2.65% | | | |
| Cadence Design Systems, Inc. * | 70,930 | | 1,540,600 |
| R.H. Donnelley Corp. * | 400 | | 23,532 |
| R.R. Donnelley & Sons Company | 14,315 | | 512,763 |
| URS Corp. * | 8,800 | | 470,272 |
| |
|
| | | | 2,547,167 |
| Cable & Television - 1.48% | | | |
| Comcast Corp., Special Class A * | 55,005 | | 1,422,429 |
| | | | |
| Chemicals - 5.23% | | | |
| Albemarle Corp. | 6,600 | | 267,102 |
| Cabot Corp. | 7,300 | | 294,482 |
| Cytec Industries, Inc. | 25,000 | | 1,660,000 |
| Eastman Chemical Company | 5,170 | | 345,149 |
| Hercules, Inc. | 12,000 | | 249,840 |
| Lubrizol Corp. | 1,700 | | 108,086 |
| Olin Corp. | 27,200 | | 583,168 |
| Praxair, Inc. | 13,218 | | 1,000,074 |
| Rohm & Haas Company | 9,100 | | 514,514 |
| |
|
| | | | 5,022,415 |
| Commercial Services - 0.58% | | | |
| Shaw Group, Inc. * | 11,179 | | 559,509 |
| | | | |
| Computers & Business Equipment - 1.62% | | | |
| Cisco Systems, Inc. * | 17,500 | | 558,600 |
| Intermec, Inc. * (a) | 8,200 | | 201,310 |
| SanDisk Corp. * | 4,600 | | 257,876 |
| Sun Microsystems, Inc. * | 100,700 | | 539,752 |
| |
|
| | | | 1,557,538 |
| Construction & Mining Equipment - 0.47% | | | |
| Carbo Ceramics, Inc. (a) | 9,700 | | 453,960 |
| | | | |
| Containers & Glass - 0.60% | | | |
| Ball Corp. | 10,931 | | 572,566 |
| | | | |
| Cosmetics & Toiletries - 1.84% | | | |
| International Flavors & Fragrances, Inc. | 15,100 | | 758,473 |
| Procter & Gamble Company | 15,394 | | 1,005,382 |
| |
|
| | | | 1,763,855 |
| Crude Petroleum & Natural Gas - 2.32% | | | |
| Apache Corp. | 5,300 | | 410,114 |
| Chesapeake Energy Corp. | 29,800 | | 961,348 |
| Forest Oil Corp. * (a) | 10,900 | | 421,285 |
| Occidental Petroleum Corp. | 7,700 | | 436,513 |
| |
|
| | | | 2,229,260 |
| | | |
| All Cap Value Fund (continued) | | | |
| | Shares or | | |
| | Principal | | |
| | Amount | | Value |
|
|
| |
| COMMON STOCKS (continued) | | | |
| | | | |
| Domestic Oil - 0.70% | | | |
| Range Resources Corp. | 18,500 | $ | 671,735 |
| | | | |
| Drugs & Health Care - 0.77% | | | |
| Wyeth | 15,991 | | 740,383 |
| | | | |
| Electrical Equipment - 3.16% | | | |
| Anixter International, Inc. * | 13,789 | | 1,058,581 |
| Cooper Industries, Ltd., Class A | 6,300 | | 322,371 |
| Emerson Electric Company | 12,598 | | 620,200 |
| Molex, Inc. | 21,974 | | 574,620 |
| W.H. Brady Company, Class A | 11,700 | | 455,481 |
| |
|
| | | | 3,031,253 |
| Electrical Utilities - 2.59% | | | |
| Black Hills Corp. | 11,300 | | 465,447 |
| CMS Energy Corp. | 17,160 | | 280,051 |
| PNM Resources, Inc. | 16,500 | | 381,480 |
| The Southern Company | 26,000 | | 922,740 |
| Wisconsin Energy Corp. | 9,800 | | 434,238 |
| |
|
| | | | 2,483,956 |
| Electronics - 2.44% | | | |
| Agilent Technologies, Inc. * | 25,800 | | 939,120 |
| Rogers Corp. * | 12,676 | | 522,125 |
| Zebra Technologies Corp., Class A * | 24,200 | | 878,460 |
| |
|
| | | | 2,339,705 |
| Financial Services - 3.44% | | | |
| Bank of New York Mellon Corp. | 44,098 | | 1,782,882 |
| Citigroup, Inc. | 19,178 | | 899,065 |
| Financial Federal Corp. | 8,900 | | 271,539 |
| GATX Corp. | 8,000 | | 348,800 |
| |
|
| | | | 3,302,286 |
| Food & Beverages - 3.23% | | | |
| Coca-Cola Enterprises, Inc. | 33,000 | | 786,060 |
| Diageo PLC, SADR | 12,200 | | 1,042,124 |
| PepsiCo, Inc. | 18,779 | | 1,277,535 |
| |
|
| | | | 3,105,719 |
| Gas & Pipeline Utilities - 2.60% | | | |
| AGL Resources, Inc. | 5,000 | | 198,550 |
| El Paso Corp. | 35,000 | | 555,450 |
| Nicor, Inc. | 8,500 | | 353,260 |
| Spectra Energy Corp. | 28,300 | | 657,975 |
| UGI Corp. | 28,500 | | 728,175 |
| |
|
| | | | 2,493,410 |
| Gold - 1.82% | | | |
| Barrick Gold Corp. | 53,897 | | 1,752,731 |
| | | | |
| Healthcare Products - 0.70% | | | |
| Patterson Companies, Inc. * | 6,200 | | 228,036 |
| Zimmer Holdings, Inc. * | 5,700 | | 446,481 |
| |
|
| | | | 674,517 |
| Healthcare Services - 2.50% | | | |
| DaVita, Inc. * | 9,400 | | 540,688 |
| IMS Health, Inc. | 41,500 | | 1,242,510 |
| |
| The accompanying notes are an integral part of the financial statements. | 141 |
John Hancock Funds II
Portfolio of investments — August 31, 2007
(showing percentage of total net assets)
| | | |
| All Cap Value Fund (continued) | | | |
| | Shares or | | |
| | Principal | | |
| | Amount | | Value |
|
|
| |
| COMMON STOCKS (continued) | | | |
| | | | |
| Healthcare Services (continued) | | | |
| Quest Diagnostics, Inc. | 11,300 | $ | 618,675 |
| |
|
| | | | 2,401,873 |
| Holdings Companies/Conglomerates - 5.32% | | | |
| Berkshire Hathaway, Inc., Class B * | 425 | | 1,653,250 |
| General Electric Company | 88,979 | | 3,458,614 |
| |
|
| | | | 5,111,864 |
| Household Products - 0.47% | | | |
| Fortune Brands, Inc. | 5,400 | | 448,686 |
| | | | |
| Industrial Machinery - 2.55% | | | |
| Caterpillar, Inc. | 16,200 | | 1,227,474 |
| IDEX Corp. | 20,067 | | 771,978 |
| Kennametal, Inc. | 5,600 | | 451,696 |
| |
|
| | | | 2,451,148 |
| Insurance - 2.87% | | | |
| American International Group, Inc. | 20,700 | | 1,366,200 |
| Chubb Corp. | 7,800 | | 398,814 |
| Hartford Financial Services Group, Inc. | 11,200 | | 995,792 |
| |
|
| | | | 2,760,806 |
| International Oil - 7.24% | | | |
| Chevron Corp. | 12,300 | | 1,079,448 |
| EnCana Corp. | 18,900 | | 1,105,650 |
| Exxon Mobil Corp. | 55,591 | | 4,765,816 |
| |
|
| | | | 6,950,914 |
| Internet Software - 0.71% | | | |
| McAfee, Inc. * | 19,199 | | 686,364 |
| | | | |
| Life Sciences - 0.16% | | | |
| PerkinElmer, Inc. | 5,700 | | 156,237 |
| | | | |
| Liquor - 0.96% | | | |
| Anheuser-Busch Companies, Inc. | 5,000 | | 247,000 |
| Brown Forman Corp., Class B | 7,700 | | 551,012 |
| Central European Distribution Corp. * (a) | 2,800 | | 122,808 |
| |
|
| | | | 920,820 |
| Manufacturing - 6.50% | | | |
| AptarGroup, Inc. | 12,000 | | 435,960 |
| Carlisle Companies, Inc. | 93,654 | | 4,610,586 |
| Eaton Corp. | 5,390 | | 507,846 |
| Hexcel Corp. * (a) | 18,700 | | 407,473 |
| Honeywell International, Inc. | 5,000 | | 280,750 |
| |
|
| | | | 6,242,615 |
| Metal & Metal Products - 1.15% | | | |
| Quanex Corp. | 25,485 | | 1,103,755 |
| | | | |
| Mining - 0.60% | | | |
| Freeport-McMoRan Copper & Gold, Inc., | | | |
| Class B | 6,600 | | 576,972 |
| | | | |
| Petroleum Services - 2.48% | | | |
| BJ Services Company | 39,400 | | 977,514 |
| Exterran Holdings, Inc. * | 4,680 | | 362,700 |
| Halliburton Company | 18,858 | | 652,298 |
| | | | |
| All Cap Value Fund (continued) | | | |
| | | Shares or | | |
| | | Principal | | |
| | | Amount | | Value |
|
|
| |
| COMMON STOCKS (continued) | | | | |
| | | | | |
| Petroleum Services (continued) | | | | |
| Superior Energy Services, Inc. * | | 10,100 | $ | 392,082 |
|
|
| | | | | 2,384,594 |
| Pharmaceuticals - 6.31% | | | | |
| Abbott Laboratories | | 40,400 | | 2,097,164 |
| Eli Lilly & Company | | 13,600 | | 779,960 |
| Medicis Pharmaceutical Corp., Class A | | 3,200 | | 97,728 |
| Mylan Laboratories, Inc. | | 13,598 | | 205,330 |
| Novartis AG, SADR | | 1,670 | | 87,925 |
| Onyx Pharmaceuticals, Inc. * | | 7,000 | | 277,340 |
| Schering-Plough Corp. | | 41,604 | | 1,248,952 |
| Teva Pharmaceutical Industries, Ltd., SADR | 29,400 | | 1,264,200 |
|
|
| | | | | 6,058,599 |
| Railroads & Equipment - 0.25% | | | | |
| Burlington Northern Santa Fe Corp. | | 3,000 | | 243,450 |
| | | | | |
| Retail Grocery - 1.16% | | | | |
| The Kroger Company | | 42,034 | | 1,117,264 |
| | | | | |
| Retail Trade - 2.04% | | | | |
| Costco Wholesale Corp. | | 17,600 | | 1,086,800 |
| Macy's, Inc. | | 13,114 | | 415,976 |
| MSC Industrial Direct Company, Inc., Class A | 8,900 | | 461,020 |
|
|
| | | | | 1,963,796 |
| Semiconductors - 0.73% | | | | |
| Micron Technology, Inc. * | | 17,600 | | 201,520 |
| Texas Instruments, Inc. | | 14,500 | | 496,480 |
|
|
| | | | | 698,000 |
| Steel - 2.02% | | | | |
| Carpenter Technology Corp. | | 16,600 | | 1,939,544 |
| | | | | |
| Telecommunications Equipment & | | | | |
| Services - 2.28% | | | | |
| Corning, Inc. | | 60,200 | | 1,406,874 |
| JDS Uniphase Corp. * | | 25,400 | | 369,824 |
| Tellabs, Inc. * | | 39,602 | | 417,801 |
|
|
| | | | | 2,194,499 |
| Telephone - 3.20% | | | | |
| AT&T, Inc. | | 72,130 | | 2,875,823 |
| Qwest Communications International, Inc. * | 21,900 | | 196,005 |
|
|
| | | | | 3,071,828 |
| Transportation - 0.25% | | | | |
| Bristow Group, Inc. * | | 5,553 | | 240,723 |
| | | | | |
| Trucking & Freight - 1.96% | | | | |
| Oshkosh Truck Corp. | | 32,600 | | 1,887,214 |
|
| TOTAL COMMON STOCKS (Cost $81,535,353) | | $ | 94,577,238 |
|
| |
| SHORT TERM INVESTMENTS - 1.65% | | | |
| John Hancock Cash Investment Trust (c) | $ | 1,590,523 | $ | 1,590,523 |
|
| TOTAL SHORT TERM INVESTMENTS | | | | |
| (Cost $1,590,523) | | | $ | 1,590,523 |
|
| |
| The accompanying notes are an integral part of the financial statements. | 142 |
John Hancock Funds II
Portfolio of investments — August 31, 2007
(showing percentage of total net assets)
| | | | |
| All Cap Value Fund (continued) | | | |
| | | Shares or | | |
| | | Principal | | |
| | | Amount | | Value |
|
|
| |
| REPURCHASE AGREEMENTS - 1.55% | | | |
| Repurchase Agreement with State | | | | |
| Street Corp. dated 08/31/2007 at | | | | |
| 4.60% to be repurchased at | | | | |
| $1,485,759 on 09/04/2007, | | | | |
| collateralized by $1,480,000 | | | | |
| Federal National Mortgage | | | | |
| Association, 5.55% due | | | | |
| 03/29/2010 (valued at $1,515,150, | | | | |
| including interest) | $ | 1,485,000 | $ | 1,485,000 |
|
| TOTAL REPURCHASE AGREEMENTS | | | | |
| (Cost $1,485,000) | | | $ | 1,485,000 |
|
| Total Investments (All Cap Value Fund) | | | | |
| (Cost $84,610,876) - 101.65% | | | $ | 97,652,761 |
| Liabilities in Excess of Other Assets - (1.65)% | | | (1,586,101) |
| |
|
| TOTAL NET ASSETS - 100.00% | | | $ | 96,066,660 |
| |
|
| |
| |
| |
| Blue Chip Growth Fund | | | | |
| | | Shares or | | |
| | | Principal | | |
| | | Amount | | Value |
|
|
| |
| COMMON STOCKS - 99.52% | | | | |
| | | | | |
| Advertising - 0.85% | | | | |
| Monster Worldwide, Inc. * | | 186,300 | $ | 6,371,460 |
| Omnicom Group, Inc. | | 156,000 | | 7,945,080 |
| |
|
| | | | | 14,316,540 |
| Aerospace - 2.03% | | | | |
| General Dynamics Corp. | | 250,226 | | 19,657,754 |
| Lockheed Martin Corp. | | 5,800 | | 575,012 |
| Rockwell Collins, Inc. | | 81,301 | | 5,599,200 |
| United Technologies Corp. | | 111,500 | | 8,321,245 |
| |
|
| | | | | 34,153,211 |
| Agriculture - 0.96% | | | | |
| Monsanto Company | | 231,996 | | 16,179,401 |
| | | | | |
| Apparel & Textiles - 0.71% | | | | |
| Coach, Inc. * | | 270,500 | | 12,045,365 |
| | | | | |
| Banking - 0.85% | | | | |
| Northern Trust Corp. | | 232,611 | | 14,296,272 |
| | | | | |
| Biotechnology - 1.30% | | | | |
| Genentech, Inc. * | | 293,978 | | 21,992,494 |
| | | | | |
| Broadcasting - 0.31% | | | | |
| Discovery Holding Company * | | 59,000 | | 1,482,080 |
| Grupo Televisa SA, SADR * | | 146,200 | | 3,809,972 |
| |
|
| | | | | 5,292,052 |
| Building Materials & Construction - 0.64% | | | |
| Foster Wheeler, Ltd. * | | 90,700 | | 10,742,508 |
| | | | | |
| Business Services - 1.73% | | | | |
| Accenture, Ltd., Class A | | 146,200 | | 6,024,902 |
| Automatic Data Processing, Inc. | | 462,319 | | 21,146,471 |
| | | |
| Blue Chip Growth Fund (continued) | | |
| | Shares or | | |
| | Principal | | |
| | Amount | | Value |
|
|
| |
| COMMON STOCKS (continued) | | | |
| | | | |
| Business Services (continued) | | | |
| Paychex, Inc. | 43,857 | $ | 1,948,567 |
| |
|
| | | | 29,119,940 |
| Cable & Television - 1.37% | | | |
| Rogers Communications, Inc. (a) | 394,132 | | 17,846,297 |
| Shaw Communications Inc * | 124,600 | | 2,895,704 |
| Time Warner, Inc. | 43,486 | | 825,364 |
| Viacom, Inc., Class B * | 40,581 | | 1,601,326 |
| |
|
| | | | 23,168,691 |
| Cellular Communications - 1.64% | | | |
| America Movil SA de CV, Series L, SADR | 399,049 | | 24,126,503 |
| Metropcs Communications, Inc. * | 126,700 | | 3,457,643 |
| |
|
| | | | 27,584,146 |
| Computers & Business Equipment - 7.43% | | | |
| Apple, Inc. * | 217,200 | | 30,077,856 |
| Cisco Systems, Inc. * | 1,096,482 | | 34,999,705 |
| Dell, Inc. * | 429,527 | | 12,134,138 |
| EMC Corp. * | 648,048 | | 12,740,624 |
| Hewlett-Packard Company | 137,600 | | 6,790,560 |
| Juniper Networks, Inc. * | 742,979 | | 24,458,869 |
| Network Appliance, Inc. * | 149,200 | | 4,156,712 |
| |
|
| | | | 125,358,464 |
| Construction & Mining Equipment - 0.00% | | | |
| Joy Global, Inc. | 1,400 | | 60,746 |
| | | | |
| Cosmetics & Toiletries - 1.25% | | | |
| Procter & Gamble Company | 322,468 | | 21,060,385 |
| | | | |
| Crude Petroleum & Natural Gas - 0.23% | | | |
| EOG Resources, Inc. | 36,200 | | 2,438,432 |
| Sunoco, Inc. | 19,200 | | 1,404,288 |
| |
|
| | | | 3,842,720 |
| Drugs & Health Care - 0.61% | | | |
| Novartis AG | 14,600 | | 770,689 |
| Wyeth | 205,046 | | 9,493,630 |
| |
|
| | | | 10,264,319 |
| Educational Services - 0.10% | | | |
| Apollo Group, Inc., Class A * | 29,200 | | 1,713,164 |
| | | | |
| Electronics - 0.56% | | | |
| Harman International Industries, Inc. | 55,640 | | 6,309,020 |
| Thermo Electron Corp. * | 57,900 | | 3,139,917 |
| |
|
| | | | 9,448,937 |
| Energy - 0.39% | | | |
| McDermott International, Inc. * | 69,200 | | 6,642,508 |
| | | | |
| Financial Services - 13.82% | | | |
| American Express Company | 392,848 | | 23,028,750 |
| Ameriprise Financial, Inc. | 129,389 | | 7,894,023 |
| Bank of New York Mellon Corp. | 211,739 | | 8,560,608 |
| Charles Schwab Corp. | 754,214 | | 14,933,437 |
| Citigroup, Inc. | 399,779 | | 18,741,640 |
| CME Group, Inc. * (a) | 10,200 | | 5,658,960 |
| Countrywide Financial Corp. | 218,200 | | 4,331,270 |
| |
| The accompanying notes are an integral part of the financial statements. | 143 |
John Hancock Funds II
Portfolio of investments — August 31, 2007
(showing percentage of total net assets)
| | | |
| Blue Chip Growth Fund (continued) | | |
| | Shares or | | |
| | Principal | | |
| | Amount | | Value |
|
|
| |
| COMMON STOCKS (continued) | | | |
| | | | |
| Financial Services (continued) | | | |
| Discover Financial Services * | 134,850 | $ | 3,120,429 |
| Franklin Resources, Inc. | 209,035 | | 27,544,542 |
| Goldman Sachs Group, Inc. | 105,424 | | 18,555,678 |
| IntercontinentalExchange, Inc. * | 19,500 | | 2,844,465 |
| Legg Mason, Inc. | 111,780 | | 9,704,740 |
| MasterCard, Inc., Class A | 9,300 | | 1,274,007 |
| Merrill Lynch & Company, Inc. | 119,110 | | 8,778,407 |
| Morgan Stanley | 338,200 | | 21,093,534 |
| State Street Corp. | 464,665 | | 28,511,844 |
| UBS AG | 340,240 | | 17,839,293 |
| Wells Fargo & Company | 292,908 | | 10,702,858 |
|
|
| | | | 233,118,485 |
| Food & Beverages - 0.69% | | | |
| PepsiCo, Inc. | 143,166 | | 9,739,583 |
| Sysco Corp. | 57,605 | | 1,922,855 |
|
|
| | | | 11,662,438 |
| Healthcare Products - 3.48% | | | |
| Alcon, Inc. | 62,900 | | 8,507,854 |
| Baxter International, Inc. | 59,700 | | 3,269,172 |
| Medtronic, Inc. | 385,264 | | 20,357,350 |
| St. Jude Medical, Inc. * | 320,464 | | 13,962,616 |
| Stryker Corp. | 189,721 | | 12,673,363 |
|
|
| | | | 58,770,355 |
| Healthcare Services - 4.70% | | | |
| Cardinal Health, Inc. | 133,405 | | 9,122,234 |
| Express Scripts, Inc. * | 195,000 | | 10,676,250 |
| Humana, Inc. * | 106,000 | | 6,793,540 |
| Laboratory Corp. of America Holdings * | 83,200 | | 6,461,312 |
| Medco Health Solutions, Inc. * | 152,000 | | 12,988,400 |
| UnitedHealth Group, Inc. | 250,441 | | 12,524,554 |
| WellPoint, Inc. * | 256,528 | | 20,673,592 |
|
|
| | | | 79,239,882 |
| Holdings Companies/Conglomerates - 3.64% | | | |
| General Electric Company | 1,579,199 | | 61,383,465 |
| | | | |
| Hotels & Restaurants - 1.72% | | | |
| Marriott International, Inc., Class A | 268,312 | | 11,918,419 |
| McDonald's Corp. | 67,300 | | 3,314,525 |
| Wynn Resorts, Ltd. * (a) | 111,173 | | 13,755,435 |
|
|
| | | | 28,988,379 |
| Household Products - 0.02% | | | |
| Fortune Brands, Inc. | 3,962 | | 329,203 |
| | | | |
| Insurance - 3.69% | | | |
| Aetna, Inc. | 331,452 | | 16,874,221 |
| American International Group, Inc. | 335,953 | | 22,172,898 |
| Hartford Financial Services Group, Inc. | 62,516 | | 5,558,298 |
| Prudential Financial, Inc. | 195,900 | | 17,587,902 |
|
|
| | | | 62,193,319 |
| International Oil - 1.65% | | | |
| Exxon Mobil Corp. | 221,262 | | 18,968,791 |
| | | |
| Blue Chip Growth Fund (continued) | | |
| | Shares or | | |
| | Principal | | |
| | Amount | | Value |
|
|
| |
| COMMON STOCKS (continued) | | | |
| | | | |
| International Oil (continued) | | | |
| Murphy Oil Corp. | 144,842 | $ | 8,826,672 |
|
|
| | | | 27,795,463 |
| Internet Content - 2.39% | | | |
| Google, Inc., Class A * | 78,234 | | 40,310,068 |
| | | | |
| Internet Retail - 2.86% | | | |
| Amazon.com, Inc. * | 410,411 | | 32,795,943 |
| eBay, Inc. * | 451,465 | | 15,394,956 |
|
|
| | | | 48,190,899 |
| Leisure Time - 1.37% | | | |
| Electronic Arts, Inc. * | 235,700 | | 12,477,958 |
| International Game Technology | 130,298 | | 4,973,475 |
| MGM MIRAGE * | 67,700 | | 5,684,769 |
|
|
| | | | 23,136,202 |
| Manufacturing - 2.81% | | | |
| Danaher Corp. | 495,337 | | 38,467,872 |
| Illinois Tool Works, Inc. | 152,926 | | 8,895,705 |
|
|
| | | | 47,363,577 |
| Mining - 0.66% | | | |
| Freeport-McMoRan Copper & Gold, Inc., | | | |
| Class B | 126,800 | | 11,084,856 |
| | | | |
| Petroleum Services - 6.52% | | | |
| Baker Hughes, Inc. | 256,541 | | 21,513,528 |
| Schlumberger, Ltd. | 464,708 | | 44,844,322 |
| Smith International, Inc. | 467,028 | | 31,295,547 |
| Total SA, ADR | 164,992 | | 12,389,249 |
|
|
| | | | 110,042,646 |
| Pharmaceuticals - 5.53% | | | |
| Allergan, Inc. | 169,400 | | 10,165,694 |
| Celgene Corp. * | 246,200 | | 15,808,502 |
| Eli Lilly & Company | 114,300 | | 6,555,105 |
| Gilead Sciences, Inc. * | 654,438 | | 23,801,910 |
| Merck & Company, Inc. | 208,800 | | 10,475,496 |
| Roche Holdings AG | 77,100 | | 13,448,783 |
| Schering-Plough Corp. | 432,400 | | 12,980,648 |
|
|
| | | | 93,236,138 |
| Publishing - 0.03% | | | |
| McGraw-Hill Companies, Inc. | 10,200 | | 514,692 |
| | | | |
| Retail Trade - 6.15% | | | |
| Bed Bath & Beyond, Inc. * | 202,300 | | 7,007,672 |
| CVS Caremark Corp. | 845,532 | | 31,978,020 |
| Home Depot, Inc. | 246,652 | | 9,449,238 |
| Kohl's Corp. * | 387,070 | | 22,953,251 |
| Target Corp. | 349,678 | | 23,054,271 |
| Wal-Mart Stores, Inc. | 213,736 | | 9,325,302 |
|
|
| | | | 103,767,754 |
| Semiconductors - 5.26% | | | |
| Analog Devices, Inc. | 320,757 | | 11,829,518 |
| Applied Materials, Inc. | 102,400 | | 2,187,264 |
| ASML Holding N.V. * | 289,700 | | 8,595,399 |
| |
| The accompanying notes are an integral part of the financial statements. | 144 |
John Hancock Funds II
Portfolio of investments — August 31, 2007
(showing percentage of total net assets)
| | | | |
| Blue Chip Growth Fund (continued) | | |
| | | Shares or | | |
| | | Principal | | |
| | | Amount | | Value |
| |
|
| |
| COMMON STOCKS (continued) | | | | |
| | | | | |
| Semiconductors (continued) | | | | |
| Broadcom Corp., Class A * | | 27,800 | $ | 959,100 |
| Intel Corp. | | 550,808 | | 14,183,306 |
| Marvell Technology Group, Ltd. * | | 854,490 | | 14,158,899 |
| Maxim Integrated Products, Inc. | | 354,628 | | 10,642,386 |
| Texas Instruments, Inc. | | 363,682 | | 12,452,472 |
| Xilinx, Inc. | | 536,575 | | 13,720,223 |
|
|
| | | | | 88,728,567 |
| Software - 4.71% | | | | |
| Adobe Systems, Inc. * | | 223,825 | | 9,568,519 |
| Autodesk, Inc. * | | 250,200 | | 11,589,264 |
| Intuit, Inc. * | | 181,978 | | 4,969,819 |
| Microsoft Corp. | | 1,400,760 | | 40,243,835 |
| Oracle Corp. * | | 640,738 | | 12,994,166 |
|
|
| | | | | 79,365,603 |
| Telecommunications Equipment & | | | | |
| Services - 4.05% | | | | |
| American Tower Corp., Class A * | | 556,562 | | 22,050,986 |
| Corning, Inc. | | 345,485 | | 8,073,985 |
| Nokia Oyj, SADR | | 559,272 | | 18,388,863 |
| QUALCOMM, Inc. | | 277,123 | | 11,054,437 |
| Telefonaktiebolaget LM Ericsson, SADR (a) | | 235,000 | | 8,744,350 |
|
|
| | | | | 68,312,621 |
| Telephone - 0.42% | | | | |
| AT&T, Inc. | | 176,200 | | 7,025,094 |
| | | | | |
| Transportation - 0.39% | | | | |
| Expeditors International of Washington, Inc. | | 147,700 | | 6,523,909 |
|
| TOTAL COMMON STOCKS (Cost $1,374,038,861) | | $ | 1,678,365,478 |
|
| |
| SHORT TERM INVESTMENTS - 3.21% | | | | |
| John Hancock Cash Investment Trust (c) | $ | 43,687,002 | $ | 43,687,002 |
| T. Rowe Price Reserve Investment Fund (c) | | 10,526,243 | | 10,526,243 |
|
| TOTAL SHORT TERM INVESTMENTS | | | | |
| (Cost $54,213,245) | | | $ | 54,213,245 |
|
| |
| REPURCHASE AGREEMENTS - 0.12% | | | | |
| Repurchase Agreement with State | | | | |
| Street Corp. dated 08/31/2007 at | | | | |
| 4.60% to be repurchased at | | | | |
| $2,079,062 on 09/04/2007, | | | | |
| collateralized by $1,580,000 U.S. | | | | |
| Treasury Bonds, 8% due | | | | |
| 11/15/2021 (valued at $2,123,125, | | | | |
| including interest) | $ | 2,078,000 $ | 2,078,000 |
|
| TOTAL REPURCHASE AGREEMENTS | | | | |
| (Cost $2,078,000) | | | $ | 2,078,000 |
|
| Total Investments (Blue Chip Growth Fund) | | | | |
| (Cost $1,430,330,106) - 102.85% | | | $ | 1,734,656,723 |
| Liabilities in Excess of Other Assets - (2.85)% | | | (48,142,738) |
|
|
| TOTAL NET ASSETS - 100.00% | | | $ | 1,686,513,985 |
| |
| | | |
| Capital Appreciation Fund | | | |
| | Shares or | | |
| | Principal | | |
| | Amount | | Value |
|
|
| |
| COMMON STOCKS - 98.58% | | | |
| | | | |
| Aerospace - 4.56% | | | |
| Boeing Company | 163,800 | $ | 15,839,460 |
| United Technologies Corp. | 186,200 | | 13,896,106 |
|
|
| | | | 29,735,566 |
| Agriculture - 1.75% | | | |
| Monsanto Company | 163,200 | | 11,381,568 |
| | | | |
| Apparel & Textiles - 3.19% | | | |
| Coach, Inc. * | 284,556 | | 12,671,279 |
| NIKE, Inc., Class B | 144,692 | | 8,151,947 |
|
|
| | | | 20,823,226 |
| Biotechnology - 2.17% | | | |
| Genentech, Inc. * | 189,031 | | 14,141,409 |
| | | | |
| Broadcasting - 1.43% | | | |
| News Corp., Class A | 460,700 | | 9,319,961 |
| | | | |
| Cellular Communications - 1.29% | | | |
| NII Holdings, Inc. * | 105,800 | | 8,377,244 |
| | | | |
| Computers & Business Equipment - 12.65% | | | |
| Apple, Inc. * | 132,856 | | 18,397,899 |
| Cisco Systems, Inc. * | 579,330 | | 18,492,213 |
| EMC Corp. * | 336,900 | | 6,623,454 |
| Hewlett-Packard Company | 285,000 | | 14,064,750 |
| Juniper Networks, Inc. * | 256,700 | | 8,450,564 |
| Research In Motion, Ltd. * | 192,300 | | 16,424,343 |
|
|
| | | | 82,453,223 |
| Cosmetics & Toiletries - 3.13% | | | |
| Colgate-Palmolive Company | 190,200 | | 12,614,064 |
| Procter & Gamble Company | 118,984 | | 7,770,845 |
|
|
| | | | 20,384,909 |
| Crude Petroleum & Natural Gas - 1.96% | | | |
| Marathon Oil Corp. | 119,900 | | 6,461,411 |
| Occidental Petroleum Corp. | 111,000 | | 6,292,590 |
|
|
| | | | 12,754,001 |
| Drugs & Health Care - 1.45% | | | |
| Wyeth | 204,600 | | 9,472,980 |
| | | | |
| Financial Services - 7.17% | | | |
| American Express Company | 134,074 | | 7,859,418 |
| Charles Schwab Corp. | 382,731 | | 7,578,074 |
| Goldman Sachs Group, Inc. | 50,510 | | 8,890,265 |
| Lazard, Ltd., Class A | 152,100 | | 6,097,689 |
| NYSE Euronext (a) | 99,700 | | 7,253,175 |
| UBS AG (a) | 173,100 | | 9,042,744 |
|
|
| | | | 46,721,365 |
| Food & Beverages - 2.16% | | | |
| PepsiCo, Inc. | 207,435 | | 14,111,803 |
| | | | |
| Healthcare Products - 4.82% | | | |
| Alcon, Inc. | 89,919 | | 12,162,444 |
| Baxter International, Inc. | 181,400 | | 9,933,464 |
| St. Jude Medical, Inc. * | 213,374 | | 9,296,705 |
|
|
| | | | 31,392,613 |
| |
| The accompanying notes are an integral part of the financial statements. | 145 |
John Hancock Funds II
Portfolio of investments — August 31, 2007
(showing percentage of total net assets)
| | | |
| Capital Appreciation Fund (continued) | | |
| | Shares or | | |
| | Principal | | |
| | Amount | | Value |
|
|
| |
| COMMON STOCKS (continued) | | | |
| | | | |
| Holdings Companies/Conglomerates - 2.76% | | | |
| General Electric Company | 462,988 | $ | 17,996,344 |
| | | | |
| Hotels & Restaurants - 1.23% | | | |
| Marriott International, Inc., Class A | 180,500 | | 8,017,810 |
| | | | |
| Industrial Machinery - 0.57% | | | |
| Caterpillar, Inc. | 49,200 | | 3,727,884 |
| | | | |
| Insurance - 1.57% | | | |
| American International Group, Inc. | 155,508 | | 10,263,528 |
| | | | |
| Internet Content - 4.77% | | | |
| Google, Inc., Class A * | 60,393 | | 31,117,493 |
| | | | |
| Internet Retail - 1.37% | | | |
| eBay, Inc. * | 261,000 | | 8,900,100 |
| | | | |
| Internet Software - 0.52% | | | |
| Akamai Technologies, Inc. * | 105,400 | | 3,395,988 |
| | | | |
| Leisure Time - 2.74% | | | |
| Walt Disney Company | 532,500 | | 17,892,000 |
| | | | |
| Petroleum Services - 2.66% | | | |
| Schlumberger, Ltd. | 151,894 | | 14,657,771 |
| Suncor Energy, Inc. | 30,200 | | 2,699,578 |
|
|
| | | | 17,357,349 |
| Pharmaceuticals - 12.34% | | | |
| Abbott Laboratories | 280,800 | | 14,576,328 |
| Elan Corp. PLC, SADR * | 152,600 | | 2,957,388 |
| Gilead Sciences, Inc. * | 564,972 | | 20,548,032 |
| Novartis AG, SADR | 139,276 | | 7,332,881 |
| Roche Holdings, Ltd., SADR | 185,911 | | 16,155,461 |
| Schering-Plough Corp. | 356,000 | | 10,687,120 |
| Teva Pharmaceutical Industries, Ltd., SADR | 190,800 | | 8,204,400 |
|
|
| | | | 80,461,610 |
| Retail Trade - 4.31% | | | |
| Costco Wholesale Corp. | 101,700 | | 6,279,975 |
| Kohl's Corp. * | 56,500 | | 3,350,450 |
| Lowe's Companies, Inc. | 206,600 | | 6,416,996 |
| Saks, Inc. * | 227,000 | | 3,670,590 |
| Target Corp. | 127,593 | | 8,412,207 |
|
|
| | | | 28,130,218 |
| Semiconductors - 6.79% | | | |
| Applied Materials, Inc. | 329,400 | | 7,035,984 |
| Broadcom Corp., Class A * | 208,250 | | 7,184,625 |
| Intel Corp. | 609,200 | | 15,686,900 |
| Marvell Technology Group, Ltd. * | 451,150 | | 7,475,556 |
| NVIDIA Corp. * | 134,300 | | 6,870,788 |
|
|
| | | | 44,253,853 |
| Software - 6.23% | | | |
| Adobe Systems, Inc. * | 445,915 | | 19,062,866 |
| Infosys Technologies, Ltd., ADR | 109,200 | | 5,209,932 |
| Microsoft Corp. | 515,741 | | 14,817,239 |
| VMware, Inc. Class A * | 22,100 | | 1,522,469 |
|
|
| | | | 40,612,506 |
| | | | |
| Capital Appreciation Fund (continued) | | |
| | | Shares or | | |
| | | Principal | | |
| | | Amount | | Value |
| |
|
| |
| COMMON STOCKS (continued) | | | | |
| | | | | |
| Telecommunications Equipment & | | | | |
| Services - 2.99% | | | | |
| Ciena Corp. * | | 133,400 | $ | 5,053,192 |
| QUALCOMM, Inc. | | 362,100 | | 14,444,169 |
|
|
| | | | | 19,497,361 |
|
| TOTAL COMMON STOCKS (Cost $555,685,236) | | $ | 642,693,912 |
|
| |
| SHORT TERM INVESTMENTS - 2.25% | | | | |
| John Hancock Cash Investment Trust (c) | $ | 14,681,132 | $ | 14,681,132 |
|
| TOTAL SHORT TERM INVESTMENTS | | | | |
| (Cost $14,681,132) | | | $ | 14,681,132 |
|
| |
| REPURCHASE AGREEMENTS - 2.16% | | | | |
| Repurchase Agreement with State | | | | |
| Street Corp. dated 08/31/2007 at | | | | |
| 4.60% to be repurchased at | | | | |
| $14,078,192 on 09/04/2007, | | | | |
| collateralized by $14,390,000 | | | | |
| Federal National Mortgage | | | | |
| Association, 5.375% due | | | | |
| 05/04/2022 (valued at | | | | |
| $14,354,025, including interest) | $ | 14,071,000 | $ | 14,071,000 |
|
| TOTAL REPURCHASE AGREEMENTS | | | | |
| (Cost $14,071,000) | | | $ | 14,071,000 |
|
| Total Investments (Capital Appreciation Fund) | | | |
| (Cost $584,437,368) - 102.99% | | | $ | 671,446,044 |
| Liabilities in Excess of Other Assets - (2.99)% | | | (19,462,495) |
|
|
| TOTAL NET ASSETS - 100.00% | | | $ | 651,983,549 |
|
|
| |
| |
| |
| Core Bond Fund | | | | |
| | | Shares or | | |
| | | Principal | | |
| | | Amount | | Value |
| |
|
| |
| U.S. TREASURY OBLIGATIONS - 8.53% | | | | |
| | | | | |
| U.S. Treasury Bonds - 5.59% | | | | |
| 4.50% due 02/15/2036 *** | $ | 4,511,000 | $ | 4,275,936 |
| 4.75% due 02/15/2037 | | 25,000 | | 24,660 |
| 5.00% due 05/15/2037 | | 1,855,000 | | 1,904,128 |
| 5.375% due 02/15/2031 | | 192,000 | | 205,785 |
| 6.25% due 08/15/2023 to 05/15/2030 *** | | 5,501,000 | | 6,362,644 |
| 6.625% due 02/15/2027 | | 754,000 | | 917,936 |
| 8.875% due 02/15/2019 *** | | 991,000 | | 1,350,470 |
|
|
| | | | | 15,041,559 |
| U.S. Treasury Notes - 2.94% | | | | |
| 3.625% due 05/15/2013 | | 155,000 | | 149,805 |
| 4.50% due 05/15/2017 *** | | 2,442,000 | | 2,431,697 |
| 4.625% due 07/31/2009 to 07/31/2012 | | 1,185,000 | | 1,203,026 |
| 4.75% due 08/15/2017 | | 1,947,000 | | 1,978,943 |
| |
| The accompanying notes are an integral part of the financial statements. | 146 |
John Hancock Funds II
Portfolio of investments — August 31, 2007
(showing percentage of total net assets)
| | | | |
| Core Bond Fund (continued) | | | |
| | | Shares or | | |
| | | Principal | | |
| | | Amount | | Value |
|
|
| |
| U.S. TREASURY OBLIGATIONS | | | | |
| (continued) | | | | |
| | | | | |
| U.S. Treasury Notes (continued) | | | | |
| 4.875% due 05/31/2009 to 06/30/2012 | $ | 2,086,000 | $ | 2,128,527 |
| |
|
| | | | | 7,891,998 |
|
| TOTAL U.S. TREASURY OBLIGATIONS | | | |
| (Cost $22,510,385) | | | $ | 22,933,557 |
|
| |
| U.S. GOVERNMENT AGENCY OBLIGATIONS - 36.00% | | |
| | | | | |
| Federal Home Loan Bank - 0.79% | | | | |
| 5.46% due 11/27/2015 | | 2,108,248 | | 2,135,373 |
| | | | |
| Federal Home Loan Mortgage Corp. - 9.21% | | | |
| 3.57% due 06/15/2029 *** | | 611,841 | | 598,956 |
| 3.90% due 01/15/2023 *** | | 852,033 | | 832,117 |
| 4.00% due 07/01/2018 to 10/01/2021 | | 6,772,479 | | 6,366,779 |
| 4.50% due 05/01/2018 to 08/01/2020 | | 1,278,480 | | 1,234,712 |
| 5.50% due 01/01/2017 to 10/01/2030 | | 2,291,020 | | 2,274,959 |
| 5.50% due 11/01/2018 to 01/01/2020 *** | 1,833,208 | | 1,827,457 |
| 5.555% due 06/01/2037 (b) | | 766,803 | | 764,053 |
| 5.673% due 06/01/2037 (b) | | 681,169 | | 680,124 |
| 5.767% due 05/01/2037 | | 517,035 | | 518,341 |
| 5.877% due 04/01/2036 (b) | | 530,360 | | 533,617 |
| 5.899% due 01/01/2037 (b) | | 588,233 | | 585,819 |
| 5.915% due 04/01/2037 (b) | | 1,397,497 | | 1,405,507 |
| 5.939% due 03/01/2037 to 04/01/2037 (b) | 1,984,663 | | 1,990,141 |
| 6.00% due 08/01/2026 | | 846,845 | | 850,947 |
| 6.01% due 04/01/2037 (b) | | 685,865 | | 690,623 |
| 6.174% due 01/01/2037 (b) | | 681,278 | | 685,909 |
| 6.541% due 12/01/2036 (b) | | 883,029 | | 893,667 |
| 6.64% due 11/01/2036 (b) | | 619,261 | | 630,735 |
| 6.697% due 11/01/2036 (b) | | 726,053 | | 736,790 |
| 7.00% due 09/01/2025 | | 645,329 | | 670,077 |
| |
|
| | | | | 24,771,330 |
| Federal National Mortgage | | | | |
| Association - 23.75% | | | | |
| 4.00% due 07/01/2018 to 05/01/2034 | | 4,247,957 | | 3,918,021 |
| 4.00% due 09/01/2020 to 03/01/2036 *** | 4,537,118 | | 4,154,709 |
| 4.87% due 09/01/2035 (b) | | 188,269 | | 183,618 |
| 5.00% due 07/01/2033 to 09/01/2036 | | 5,748,703 | | 5,480,571 |
| 5.00% due 07/01/2033 to 08/01/2033 *** | 4,665,385 | | 4,450,379 |
| 5.007% due 07/01/2035 (b) | | 369,656 | | 363,790 |
| 5.081% due 10/01/2036 (b) | | 642,926 | | 631,498 |
| 5.184% due 11/01/2036 | | 186,671 | | 183,487 |
| 5.50% due 01/01/2017 to 07/01/2034 | | 8,011,130 | | 7,896,465 |
| 5.50% due 12/01/2030 to 02/01/2035 *** | 10,315,877 | | 10,099,202 |
| 5.50% TBA ** | | 12,204,000 | | 12,028,878 |
| 5.612% due 05/01/2037 (b) | | 406,448 | | 405,455 |
| 5.67% due 03/01/2009 | | 422,138 | | 422,447 |
| 5.703% due 05/01/2037 (b) | | 882,106 | | 886,423 |
| 5.74% due 04/01/2036 | | 344,910 | | 344,278 |
| 5.775% due 07/01/2037 (b) | | 777,351 | | 781,750 |
| 5.818% due 05/01/2037 (b) | | 367,366 | | 370,127 |
| 5.842% due 06/01/2037 (b) | | 562,288 | | 566,797 |
| 5.90% due 09/01/2037 (b) | | 1,979,000 | | 1,994,658 |
| 5.952% due 01/01/2037 (b) | | 641,568 | | 648,494 |
| | | | |
| Core Bond Fund (continued) | | | |
| | | Shares or | | |
| | | Principal | | |
| | | Amount | | Value |
|
|
| |
| U.S. GOVERNMENT AGENCY | | | | |
| OBLIGATIONS (continued) | | | | |
| | | | | |
| Federal National Mortgage | | | | |
| Association (continued) | | | | |
| 6.00% TBA ** | $ | 5,194,000 | $ | 5,249,186 |
| 6.409% due 07/01/2036 (b) | | 653,739 | | 664,242 |
| 6.473% due 01/01/2037 (b) | | 2,124,737 | | 2,142,898 |
| |
|
| | | | | 63,867,373 |
| Government National Mortgage | | | | |
| Association - 2.25% | | | | |
| 5.50% due 10/20/2034 | | 884,774 | | 868,519 |
| 6.50% due 08/20/2037 | | 1,655,000 | | 1,685,576 |
| 6.50% TBA ** | | 2,582,000 | | 2,631,208 |
| 7.00% due 08/20/2037 | | 510,000 | | 525,404 |
| 7.00% TBA ** | | 331,000 | | 341,913 |
| |
|
| | | | | 6,052,620 |
|
| TOTAL U.S. GOVERNMENT AGENCY OBLIGATIONS | | |
| (Cost $96,528,668) | | | $ | 96,826,696 |
|
| |
| FOREIGN GOVERNMENT OBLIGATIONS - 1.45% | | |
| | | | | |
| Canada - 0.28% | | | | |
| Province of Quebec Canada | | | | |
| 5.125% due 11/14/2016 | | 750,000 | | 746,252 |
| | | | | |
| Italy - 0.39% | | | | |
| Republic of Italy | | | | |
| 5.375% due 06/15/2033 | | 1,089,000 | | 1,048,645 |
| | | | | |
| Mexico - 0.24% | | | | |
| Government of Mexico | | | | |
| 5.625% due 01/15/2017 | | 290,000 | | 289,855 |
| 5.875% due 01/15/2014 | | 229,000 | | 233,007 |
| 6.75% due 09/27/2034 | | 115,000 | | 124,890 |
| |
|
| | | | | 647,752 |
| Russia - 0.16% | | | | |
| Russian Federation | | | | |
| 7.50% due 03/31/2030 | | 393,025 | | 436,258 |
| | | | | |
| United Arab Emirates - 0.38% | | | | |
| Emirate of Abu Dhabi | | | | |
| 5.50% due 08/02/2012 | | 1,000,000 | | 1,016,871 |
|
| TOTAL FOREIGN GOVERNMENT OBLIGATIONS | | |
| (Cost $3,863,858) | | | $ | 3,895,778 |
|
| |
| CORPORATE BONDS - 16.06% | | | | |
| | | | | |
| Automobiles - 0.71% | | | | |
| DaimlerChrysler N.A. Holding Corp. | | | | |
| 6.50% due 11/15/2013 | | 595,000 | | 614,884 |
| 8.50% due 01/18/2031 | | 155,000 | | 191,756 |
| DaimlerChrysler N.A. Holding Corp., Series MTN | | | |
| 5.71% due 03/13/2009 (b) | | 850,000 | | 847,556 |
| 5.75% due 09/08/2011 | | 265,000 | | 266,785 |
| |
|
| | | | | 1,920,981 |
| Banking - 1.65% | | | | |
| BAC Capital Trust XI | | | | |
| 6.625% due 05/23/2036 | | 235,000 | | 240,658 |
| |
| The accompanying notes are an integral part of the financial statements. | 147 |
John Hancock Funds II
Portfolio of investments — August 31, 2007
(showing percentage of total net assets)
| | | | |
| Core Bond Fund (continued) | | | | |
| | | Shares or | | |
| | | Principal | | |
| | | Amount | | Value |
|
|
| |
| CORPORATE BONDS (continued) | | | | |
| | | | | |
| Banking (continued) | | | | |
| Bank of America Corp. | | | | |
| 5.375% due 06/15/2014 | $ | 375,000 | $ | 371,608 |
| Nationwide Building Society | | | | |
| 5.50% due 07/18/2012 | | 481,000 | | 499,139 |
| PNC Funding Corp. | | | | |
| 5.25% due 11/15/2015 | | 444,000 | | 430,182 |
| Royal Bank of Scotland Group PLC | | | | |
| 5.00% due 10/01/2014 | | 365,000 | | 352,852 |
| US Bank NA, Series MTN | | | | |
| 5.92% due 05/25/2012 | | 1,402,756 | | 1,429,465 |
| Wachovia Corp. | | | | |
| 4.875% due 02/15/2014 | | 365,000 | | 350,709 |
| 5.30% due 10/15/2011 | | 330,000 | | 328,644 |
| 5.75% due 06/15/2017 | | 165,000 | | 164,035 |
| Zions Bancorporation | | | | |
| 5.50% due 11/16/2015 | | 280,000 | | 270,478 |
| |
|
| | | | | 4,437,770 |
| Broadcasting - 0.11% | | | | |
| News America, Inc. | | | | |
| 6.20% due 12/15/2034 | | 315,000 | | 292,492 |
| | | | | |
| Cable & Television - 0.53% | | | | |
| Comcast Corp. | | | | |
| 5.65% due 06/15/2035 | | 436,000 | | 381,091 |
| 6.30% due 11/15/2017 | | 165,000 | | 166,673 |
| 6.95% due 08/15/2037 | | 245,000 | | 250,963 |
| Time Warner Cable, Inc. | | | | |
| 5.85% due 05/01/2017 | | 165,000 | | 161,269 |
| Time Warner Entertainment Company LP | | | | |
| 8.375% due 07/15/2033 | | 391,000 | | 453,791 |
| |
|
| | | | | 1,413,787 |
| Cellular Communications - 0.80% | | | | |
| America Movil SA de CV | | | | |
| 6.375% due 03/01/2035 | | 202,000 | | 196,291 |
| AT&T Broadband Corp. | | | | |
| 8.375% due 03/15/2013 | | 972,000 | | 1,087,254 |
| Rogers Wireless, Inc. | | | | |
| 6.375% due 03/01/2014 | | 525,000 | | 531,429 |
| Vodafone Group PLC | | | | |
| 5.625% due 02/27/2017 | | 350,000 | | 338,333 |
| |
|
| | | | | 2,153,307 |
| Commercial Services - 0.16% | | | | |
| Hutchison Whampoa International 03/33, Ltd. | | | | |
| 7.45% due 11/24/2033 | | 385,000 | | 419,926 |
| | | | | |
| Computers & Business Equipment - 0.12% | | | | |
| Xerox Corp. | | | | |
| 5.50% due 05/15/2012 | | 325,000 | | 321,290 |
| | | | | |
| Cosmetics & Toiletries - 0.13% | | | | |
| Estee Lauder Company, Inc. | | | | |
| 5.55% due 05/15/2017 | | 350,000 | | 346,267 |
| | | | | |
| Crude Petroleum & Natural Gas - 1.00% | | | | |
| Canadian Natural Resources, Ltd. | | | | |
| 6.25% due 03/15/2038 | | 125,000 | | 119,929 |
| | | | |
| Core Bond Fund (continued) | | | |
| | | Shares or | | |
| | | Principal | | |
| | | Amount | | Value |
| |
|
| |
| CORPORATE BONDS (continued) | | | | |
| | | | | |
| Crude Petroleum & Natural Gas | | | | |
| (continued) | | | | |
| ConocoPhillips Canada Funding Company | | | | |
| 5.625% due 10/15/2016 | $ | 375,000 | $ | 374,051 |
| Husky Oil Company, Ltd. | | | | |
| 7.55% due 11/15/2016 | | 240,000 | | 268,426 |
| Petrobras International Finance Company | | | | |
| 6.125% due 10/06/2016 | | 800,000 | | 785,000 |
| Ras Laffan Liquefied Natural Gas Company, Ltd. III | | | |
| 6.332% due 09/30/2027 | | 355,000 | | 354,688 |
| Southern Natural Gas Company | | | | |
| 5.90% due 04/01/2017 | | 175,000 | | 170,102 |
| Weatherford International, Inc. | | | | |
| 5.95% due 06/15/2012 | | 410,000 | | 416,931 |
| 6.35% due 06/15/2017 | | 200,000 | | 204,950 |
| |
|
| | | | | 2,694,077 |
| Domestic Oil - 0.15% | | | | |
| Devon Financing Corp., ULC | | | | |
| 6.875% due 09/30/2011 | | 380,000 | | 401,904 |
| | | | | |
| Drugs & Health Care - 0.48% | | | | |
| Wyeth | | | | |
| 6.95% due 03/15/2011 | | 1,215,000 | | 1,285,651 |
| | | | | |
| Electrical Utilities - 1.46% | | | | |
| Allegheny Energy Supply Company LLC | | | | |
| 8.25% due 04/15/2012 | | 260,000 | | 268,450 |
| CMS Energy Corp | | | | |
| 6.55% due 07/17/2017 | | 220,000 | | 210,851 |
| DPL, Inc. | | | | |
| 6.875% due 09/01/2011 | | 710,000 | | 742,990 |
| FirstEnergy Corp. | | | | |
| 6.45% due 11/15/2011 | | 410,000 | | 423,451 |
| 7.375% due 11/15/2031 | | 270,000 | | 297,554 |
| Kansas Gas & Electric | | | | |
| 5.647% due 03/29/2021 | | 384,000 | | 377,775 |
| Midamerican Energy Holdings | | | | |
| 6.125% due 04/01/2036 | | 265,000 | | 255,514 |
| 6.50% due 09/15/2037 | | 115,000 | | 115,924 |
| Nevada Power Company, Series A | | | | |
| 8.25% due 06/01/2011 | | 565,000 | | 615,662 |
| Nevada Power Company, Series M | | | | |
| 5.95% due 03/15/2016 | | 185,000 | | 182,053 |
| Public Service Company of Colorado | | | | |
| 7.875% due 10/01/2012 | | 397,000 | | 440,807 |
| |
|
| | | | | 3,931,031 |
| Energy - 0.08% | | | | |
| XTO Energy Inc | | | | |
| 6.75% due 08/01/2037 | | 200,000 | | 204,923 |
| Financial Services - 3.44% | | | | |
| Capital One Bank | | | | |
| 4.875% due 05/15/2008 | | 445,000 | | 440,817 |
| Capital One Financial Corp. | | | | |
| 6.15% due 09/01/2016 | | 110,000 | | 103,004 |
| 6.75% due 09/15/2017 | | 330,000 | | 328,248 |
| Citigroup, Inc. | | | | |
| 3.625% due 02/09/2009 | | 900,000 | | 884,064 |
| |
| The accompanying notes are an integral part of the financial statements. | 148 |
John Hancock Funds II
Portfolio of investments — August 31, 2007
(showing percentage of total net assets)
| | | | |
| Core Bond Fund (continued) | | | |
| | | Shares or | | |
| | | Principal | | |
| | | Amount | | Value |
|
|
| |
| CORPORATE BONDS (continued) | | | | |
| | | | | |
| Financial Services (continued) | | | | |
| Citigroup, Inc. (continued) | | | | |
| 5.10% due 09/29/2011 | $ | 185,000 | $ | 183,924 |
| 5.50% due 08/27/2012 | | 655,000 | | 655,333 |
| 6.00% due 08/15/2017 | | 325,000 | | 328,969 |
| Credit Suisse USA, Inc. | | | | |
| 5.50% due 08/16/2011 | | 640,000 | | 644,365 |
| General Electric Capital Corp., Series A, MTN | | | |
| 3.75% due 12/15/2009 | | 576,000 | | 562,515 |
| 6.00% due 06/15/2012 | | 1,058,000 | | 1,089,236 |
| Goldman Sachs Group, Inc. | | | | |
| 5.125% due 01/15/2015 | | 348,000 | | 330,194 |
| International Lease Finance Corp., Series MTN | | | |
| 5.65% due 06/01/2014 | | 245,000 | | 243,717 |
| 5.7188% due 05/24/2010 (b) | | 245,000 | | 244,173 |
| 5.75% due 06/15/2011 | | 490,000 | | 491,466 |
| JP Morgan Chase & Co. | | | | |
| 6.125% due 06/27/2017 | | 430,000 | | 436,499 |
| Lazard Group | | | | |
| 6.85% due 06/15/2017 | | 465,000 | | 459,095 |
| Lazard Group, LLC | | | | |
| 7.125% due 05/15/2015 | | 860,000 | | 878,329 |
| Lehman Brothers Holdings, Inc., Series MTN | | | |
| 5.75% due 05/17/2013 | | 165,000 | | 162,359 |
| Morgan Stanley | | | | |
| 5.30% due 03/01/2013 | | 390,000 | | 381,476 |
| 5.375% due 10/15/2015 | | 205,000 | | 196,349 |
| Washington Mutual, Inc. | | | | |
| 4.00% due 01/15/2009 | | 212,000 | | 205,558 |
| |
|
| | | | | 9,249,690 |
| Food & Beverages - 0.25% | | | | |
| Delhaize Group | | | | |
| 6.50% due 06/15/2017 | | 665,000 | | 672,437 |
| | | | | |
| Gas & Pipeline Utilities - 0.06% | | | | |
| El Paso Natural Gas | | | | |
| 5.95% due 04/15/2017 | | 160,000 | | 156,075 |
| | | | | |
| Healthcare Products - 0.18% | | | | |
| Bristol-Myers Squibb Company | | | | |
| 5.875% due 11/15/2036 | | 100,000 | | 94,220 |
| Johnson & Johnson | | | | |
| 5.55% due 08/15/2017 | | 390,000 | | 396,542 |
| |
|
| | | | | 490,762 |
| Healthcare Services - 0.21% | | | | |
| Coventry Health Care, Inc. | | | | |
| 5.95% due 03/15/2017 | | 435,000 | | 414,640 |
| WellPoint, Inc. | | | | |
| 5.875% due 06/15/2017 | | 165,000 | | 165,162 |
| |
|
| | | | | 579,802 |
| Insurance - 0.82% | | | | |
| Ace INA Holdings, Inc. | | | | |
| 6.70% due 05/15/2036 | | 175,000 | | 174,314 |
| American International Group, Inc. | | | | |
| 4.70% due 10/01/2010 | | 368,000 | | 364,673 |
| American International Group, Inc., Series MTN | | | |
| 5.45% due 05/18/2017 | | 500,000 | | 487,524 |
| | | | |
| Core Bond Fund (continued) | | | | |
| | | Shares or | | |
| | | Principal | | |
| | | Amount | | Value |
|
|
| |
| CORPORATE BONDS (continued) | | | | |
| | | | | |
| Insurance (continued) | | | | |
| Cigna Corp. | | | | |
| 6.15% due 11/15/2036 | $ | 225,000 | $ | 215,237 |
| Liberty Mutual Group, Inc. | | | | |
| 7.50% due 08/15/2036 | | 400,000 | | 387,156 |
| MetLife, Inc. | | | | |
| 6.40% due 12/15/2036 (b) | | 275,000 | | 250,147 |
| Prudential Financial, Inc., Series MTN | | | | |
| 5.70% due 12/14/2036 | | 365,000 | | 332,693 |
| |
|
| | | | | 2,211,744 |
| |
| International Oil - 0.14% | | | | |
| Canadian Natural Resources, Ltd. | | | | |
| 5.70% due 05/15/2017 | | 210,000 | | 205,204 |
| Pemex Project Funding Master Trust | | | | |
| 6.625% due 06/15/2035 | | 170,000 | | 173,821 |
| |
|
| | | | | 379,025 |
| |
| Investment Companies - 0.38% | | | | |
| Allied Capital Corp. | | | | |
| 6.625% due 07/15/2011 | | 1,000,000 | | 1,026,122 |
| | | | | |
| Manufacturing - 0.21% | | | | |
| Tyco International Group SA | | | | |
| 6.375% due 10/15/2011 | | 464,000 | | 485,998 |
| 6.875% due 01/15/2029 | | 84,000 | | 90,863 |
| |
|
| | | | | 576,861 |
| |
| Mining - 0.13% | | | | |
| Vale Overseas, Ltd. | | | | |
| 6.25% due 01/23/2017 | | 351,000 | | 353,317 |
| | | | | |
| Petroleum Services - 0.04% | | | | |
| Tesoro Corp. | | | | |
| 6.50% due 06/01/2017 | | 110,000 | | 106,975 |
| | | | | |
| Pharmaceuticals - 0.17% | | | | |
| Abbott Laboratories | | | | |
| 5.875% due 05/15/2016 | | 440,000 | | 447,590 |
| | | | | |
| Real Estate - 0.70% | | | | |
| Developers Diversified Realty Corp., REIT | | | | |
| 5.375% due 10/15/2012 | | 161,000 | | 158,567 |
| ERP Operating LP | | | | |
| 5.50% due 10/01/2012 | | 80,000 | | 79,143 |
| 5.75% due 06/15/2017 | | 335,000 | | 321,346 |
| Health Care Property Investors, Inc., REIT | | | | |
| 5.65% due 12/15/2013 | | 505,000 | | 494,916 |
| ProLogis, REIT | | | | |
| 5.25% due 11/15/2010 | | 120,000 | | 119,208 |
| 5.50% due 04/01/2012 | | 320,000 | | 316,889 |
| Westfield Group | | | | |
| 5.40% due 10/01/2012 | | 395,000 | | 389,164 |
| |
|
| | | | | 1,879,233 |
| |
| Retail - 0.21% | | | | |
| Target Corp. | | | | |
| 5.375% due 05/01/2017 | | 585,000 | | 567,611 |
| | | | | |
| Telecommunications Equipment & | | | | |
| Services - 0.92% | | | | |
| AT&T, Inc. | | | | |
| 6.50% due 09/01/2037 | | 165,000 | | 165,236 |
| |
| The accompanying notes are an integral part of the financial statements. | 149 |
John Hancock Funds II
Portfolio of investments — August 31, 2007
(showing percentage of total net assets)
| | | | |
| Core Bond Fund (continued) | | | |
| | | Shares or | | |
| | | Principal | | |
| | | Amount | | Value |
| |
|
| |
| CORPORATE BONDS (continued) | | | | |
| | | | | |
| Telecommunications Equipment & | | | | |
| Services (continued) | | | | |
| Corning, Inc. | | | | |
| 7.25% due 08/15/2036 | $ | 145,000 | $ | 151,313 |
| Embarq Corp. | | | | |
| 7.995% due 06/01/2036 | | 180,000 | | 186,524 |
| France Telecom SA | | | | |
| 8.50% due 03/01/2031 (b) | | 285,000 | | 363,879 |
| SBC Communications, Inc. | | | | |
| 5.10% due 09/15/2014 | | 770,000 | | 741,694 |
| 5.625% due 06/15/2016 | | 185,000 | | 182,492 |
| 6.15% due 09/15/2034 | | 705,000 | | 683,431 |
| |
|
| | | | | 2,474,569 |
| |
| Telephone - 0.82% | | | | |
| Qwest Corp. | | | | |
| 7.50% due 10/01/2014 | | 630,000 | | 645,750 |
| Sprint Capital Corp. | | | | |
| 6.125% due 11/15/2008 | | 421,000 | | 423,130 |
| 8.75% due 03/15/2032 | | 75,000 | | 86,575 |
| Sprint Nextel Corp. | | | | |
| 6.00% due 12/01/2016 | | 175,000 | | 170,119 |
| Telefonica Emisiones SAU | | | | |
| 5.984% due 06/20/2011 | | 740,000 | | 749,784 |
| 6.221% due 07/03/2017 | | 130,000 | | 130,916 |
| |
|
| | | | | 2,206,274 |
|
| |
| TOTAL CORPORATE BONDS (Cost $43,587,462) | | $ | 43,201,493 |
|
| |
| COLLATERALIZED MORTGAGE | | | | |
| OBLIGATIONS - 39.78% | | | | |
| American Tower Trust, Series 2007-1A, Class AFX | | | |
| 5.419% due 04/15/2037 | | 484,000 | | 481,939 |
| Banc of America Commercial Mortgage, Inc., | | | |
| Series 2002-PB2, Class B | | | | |
| 6.309% due 06/11/2035 | | 143,000 | | 146,995 |
| Banc of America Commercial Mortgage, Inc., | | | |
| Series 2003-1, Class A2 | | | | |
| 4.648% due 09/11/2036 | | 318,000 | | 305,473 |
| Banc of America Commercial Mortgage, Inc., | | | |
| Series 2004-1, Class A4 | | | | |
| 4.76% due 11/10/2039 | | 451,000 | | 432,317 |
| Banc of America Commercial Mortgage, Inc., | | | |
| Series 2004-2, Class A5 | | | | |
| 4.58% due 11/10/2038 | | 78,000 | | 73,757 |
| Banc of America Commercial Mortgage, Inc., | | | |
| Series 2005-4, Class A5A | | | | |
| 4.933% due 07/10/2045 | | 79,000 | | 75,707 |
| Banc of America Commercial Mortgage, Inc., | | | |
| Series 2005-5, Class A4 | | | | |
| 5.115% due 10/10/2045 (b) | | 84,000 | | 81,472 |
| Banc of America Commercial Mortgage, Inc., | | | |
| Series 2005-6, Class A4 | | | | |
| 5.3533% due 09/10/2047 (b) | | 590,000 | | 578,085 |
| Bear Stearns Commercial Mortgage Securities, | | | |
| Inc., Series 2004-ESA, Class C | | | | |
| 4.937% due 05/14/2016 | | 569,000 | | 569,239 |
| | | | |
| Core Bond Fund (continued) | | | |
| | | Shares or | | |
| | | Principal | | |
| | | Amount | | Value |
|
|
| |
| COLLATERALIZED MORTGAGE | | | | |
| OBLIGATIONS (continued) | | | | |
| Bear Stearns Commercial Mortgage Securities, | | | |
| Inc., Series 2004-PWR6, Class A6 | | | | |
| 4.825% due 11/11/2041 | $ | 88,000 | $ | 84,586 |
| Bear Stearns Commercial Mortgage Securities, | | | |
| Inc., Series 2005-T18, Class A4 | | | | |
| 4.933% due 02/13/2042 (b) | | 316,000 | | 303,807 |
| Bear Stearns Commercial Mortgage Securities, | | | |
| Inc., Series 2007-PW15, Class A3 | | | | |
| 5.309% due 02/11/2044 | | 386,000 | | 379,395 |
| Citigroup Commercial Mortgage Trust, | | | | |
| Series 2004-C1, Class C | | | | |
| 5.5295% due 04/15/2040 (b) | | 211,000 | | 201,421 |
| Commercial Mortgage Pass Through Certificates, | | | |
| Series 1999-1, Class E | | | | |
| 7.22% due 05/15/2032 (b) | | 729,000 | | 732,685 |
| Commercial Mortgage Pass Through Certificates, | | | |
| Series 2000-C1, Class C | | | | |
| 7.706% due 08/15/2033 | | 99,000 | | 104,523 |
| Commercial Mortgage Pass Through Certificates, | | | |
| Series 2004-LB3A, Class B | | | | |
| 5.4429% due 07/10/2037 (b) | | 398,000 | | 380,054 |
| Countrywide Alternative Loan Trust, | | | | |
| Series 2006-OC6, Class 2A1 | | | | |
| 5.575% due 07/25/2036 (b) | | 588,379 | | 578,934 |
| CS First Boston Mortgage Securities Corp., | | | |
| Series 2002-CKS4, Class A2 | | | | |
| 5.183% due 11/15/2036 | | 577,000 | | 566,834 |
| CS First Boston Mortgage Securities Corp., | | | |
| Series 2003-C4, Class A4 | | | | |
| 5.137% due 08/15/2036 (b) | | 238,000 | | 233,352 |
| CS First Boston Mortgage Securities Corp., | | | |
| Series 2004-C5, Class A4 | | | | |
| 4.829% due 11/15/2037 | | 446,000 | | 427,642 |
| CS First Boston Mortgage Securities Corp., | | | |
| Series 2005-C1, Class AAB | | | | |
| 4.815% due 02/15/2038 | | 159,000 | | 153,878 |
| CS First Boston Mortgage Securities Corp., | | | |
| Series 2005-C2, Class A4 | | | | |
| 4.832% due 04/15/2037 | | 168,000 | | 160,391 |
| DLJ Commercial Mortgage Corp., | | | | |
| Series 1999-CG2,Class A1B | | | | |
| 7.30% due 06/10/2032 | | 110,713 | | 113,468 |
| Federal Home Loan Bank, | | | | |
| Series 2007-2014, Class 1 | | | | |
| 5.34% due 03/20/2014 | | 2,122,869 | | 2,111,972 |
| Federal Home Loan Mortgage Corp., Series | | | |
| 2003-2590, Class NU | | | | |
| 5.00% due 06/15/2017 | | 381,000 | | 377,725 |
| Federal Home Loan Mortgage Corp., Series | | | |
| 2003-2672, Class HA | | | | |
| 4.00% due 09/15/2016 | | 201,670 | | 196,173 |
| Federal Home Loan Mortgage Corp., Series | | | |
| 2003-2694, Class QG | | | | |
| 4.50% due 01/15/2029 | | 707,000 | | 687,062 |
| Federal Home Loan Mortgage Corp., Series | | | |
| 2004-2790, Class TN | | | | |
| 4.00% due 05/15/2024 | | 408,000 | | 358,228 |
| |
| The accompanying notes are an integral part of the financial statements. | 150 |
John Hancock Funds II
Portfolio of investments — August 31, 2007
(showing percentage of total net assets)
| | | | |
| Core Bond Fund (continued) | | | | |
| | | Shares or | | |
| | | Principal | | |
| | | Amount | | Value |
|
|
| |
| COLLATERALIZED MORTGAGE | | | | |
| OBLIGATIONS (continued) | | | | |
| Federal Home Loan Mortgage Corp., Series | | | | |
| 2004-2804, Class EB | | | | |
| 5.50% due 07/15/2030 | $ | 732,000 | $ | 735,242 |
| Federal Home Loan Mortgage Corp., Series | | | | |
| 2005-3034, Class EH | | | | |
| 5.50% due 12/15/2034 | | 891,058 | | 897,526 |
| Federal Home Loan Mortgage Corp., Series | | | | |
| 2005-3035, Class PA | | | | |
| 5.50% due 09/15/2035 | | 347,464 | | 349,876 |
| Federal Home Loan Mortgage Corp., Series | | | | |
| 2005-3062, Class LC | | | | |
| 5.50% due 11/15/2028 | | 367,000 | | 367,439 |
| Federal Home Loan Mortgage Corp., Series | | | | |
| 2006-3104, Class QC | | | | |
| 5.00% due 09/15/2031 | | 585,000 | | 567,403 |
| Federal Home Loan Mortgage Corp., Series | | | | |
| 2006-3114, Class KC | | | | |
| 5.00% due 02/15/2030 | | 517,000 | | 506,070 |
| Federal Home Loan Mortgage Corp., Series | | | | |
| 2007-3287, Class GC | | | | |
| 5.50% due 08/15/2034 | | 1,560,000 | | 1,553,973 |
| Federal Home Loan Mortgage Corp., Series | | | | |
| 2007-3316, Class EB | | | | |
| 5.50% due 06/15/2034 | | 495,000 | | 487,343 |
| Federal Home Loan Mortgage Corp., Series | | | | |
| 2007-3316, Class GC | | | | |
| 5.50% due 05/15/2033 | | 723,000 | | 719,759 |
| Federal Home Loan Mortgage Corp., Series | | | | |
| 2007-3326, Class PC | | | | |
| 5.50% due 08/15/2032 | | 224,000 | | 217,783 |
| Federal Home Loan Mortgage Corp., Series | | | | |
| 2007-3331, Class BP | | | | |
| 5.50% due 02/15/2031 | | 669,000 | | 664,960 |
| Federal Home Loan Mortgage Corp., Series | | | | |
| 2007-3347, Class PA | | | | |
| 5.00% due 06/15/2028 | | 1,856,255 | | 1,848,926 |
| Federal Home Loan Mortgage Corp., Series | | | | |
| 2007-3347, Class PB | | | | |
| 5.00% due 11/15/2030 | | 1,292,000 | | 1,257,860 |
| Federal Home Loan Mortgage Corp., Series | | | | |
| 2007-3347, Class PC | | | | |
| 5.00% due 07/15/2033 | | 1,733,000 | | 1,657,438 |
| Federal Home Loan Mortgage Corp., Series | | | | |
| 2007-3347, Class PD | | | | |
| 5.00% due 09/15/2035 | | 1,639,000 | | 1,531,133 |
| Federal Home Loan Mortgage Corp., Series | | | | |
| 2007-3348, Class QA | | | | |
| 6.00% due 06/15/2028 | | 795,774 | | 807,610 |
| Federal Home Loan Mortgage Corp., Series | | | | |
| 2007-3349, Class BP | | | | |
| 6.00% due 03/15/2032 | | 780,000 | | 792,252 |
| Federal Home Loan Mortgage Corp., Series | | | | |
| 2007-3351, Class PJ | | | | |
| 5.50% due 06/15/2022 | | 1,335,000 | | 1,343,711 |
| Federal Home Loan Mortgage Corp., Series | | | | |
| 2007-3351, Class PK | | | | |
| 5.50% due 01/15/2032 | | 2,033,000 | | 2,030,615 |
| | | | |
| Core Bond Fund (continued) | | | | |
| | | Shares or | | |
| | | Principal | | |
| | | Amount | | Value |
|
|
| |
| COLLATERALIZED MORTGAGE | | | | |
| OBLIGATIONS (continued) | | | | |
| Federal Home Loan Mortgage Corp., Series | | | | |
| 2007-3356, Class PA | | | | |
| 6.00% due 11/15/2026 | $ | 1,503,000 | $ | 1,524,554 |
| Federal Home Loan Mortgage Corp., | | | | |
| Series 2003-2583, Class TD | | | | |
| 4.50% due 12/15/2013 | | 659,210 | | 645,296 |
| Federal Home Loan Mortgage Corp., | | | | |
| Series 2003-2603, Class KT | | | | |
| 4.75% due 07/15/2014 | | 676,983 | | 650,401 |
| Federal Home Loan Mortgage Corp., | | | | |
| Series 2003-2614, Class TD | | | | |
| 3.50% due 05/15/2016 | | 876,330 | | 855,246 |
| Federal Home Loan Mortgage Corp., | | | | |
| Series 2003-2623, Class AJ | | | | |
| 4.50% due 07/15/2016 | | 330,000 | | 320,839 |
| Federal Home Loan Mortgage Corp., | | | | |
| Series 2003-2631, Class MT | | | | |
| 3.50% due 01/15/2022 | | 249,663 | | 248,389 |
| Federal Home Loan Mortgage Corp., | | | | |
| Series 2003-2632, Class NE | | | | |
| 4.00% due 06/15/2013 | | 1,562,964 | | 1,519,107 |
| Federal Home Loan Mortgage Corp., | | | | |
| Series 2003-2647, Class PJ | | | | |
| 3.25% due 06/15/2026 | | 1,708,532 | | 1,668,373 |
| Federal Home Loan Mortgage Corp., | | | | |
| Series 2004-2780, Class TB | | | | |
| 3.00% due 12/15/2024 | | 243,527 | | 239,072 |
| Federal Home Loan Mortgage Corp., | | | | |
| Series 2004-2841, Class BD | | | | |
| 4.00% due 04/15/2018 | | 53,628 | | 52,036 |
| Federal Home Loan Mortgage Corp., | | | | |
| Series 2004-2899, Class QY | | | | |
| 4.00% due 10/15/2025 | | 310,313 | | 306,062 |
| Federal Home Loan Mortgage Corp., | | | | |
| Series 2005-2975, Class EA | | | | |
| 5.00% due 05/15/2018 | | 277,599 | | 275,480 |
| Federal Home Loan Mortgage Corp., | | | | |
| Series 2005-3017, Class TA | | | | |
| 4.50% due 08/15/2035 | | 460,000 | | 446,324 |
| Federal Home Loan Mortgage Corp., | | | | |
| Series 2005-3020, Class MA | | | | |
| 5.50% due 04/15/2027 | | 766,858 | | 770,137 |
| Federal Home Loan Mortgage Corp., | | | | |
| Series 2005-3075, Class PA | | | | |
| 5.50% due 07/15/2025 | | 270,231 | | 271,298 |
| Federal Home Loan Mortgage Corp., | | | | |
| Series 2005-3078, Class PA | | | | |
| 5.50% due 07/15/2024 | | 358,574 | | 359,886 |
| Federal Home Loan Mortgage Corp., | | | | |
| Series 2006-3135, Class JA | | | | |
| 6.00% due 09/15/2027 | | 703,288 | | 708,768 |
| Federal Home Loan Mortgage Corp., | | | | |
| Series 2006-3151, Class PA | | | | |
| 6.00% due 03/15/2026 | | 795,126 | | 803,654 |
| Federal Home Loan Mortgage Corp., | | | | |
| Series 2006-3164, Class NA | | | | |
| 6.00% due 02/15/2027 | | 2,080,916 | | 2,105,139 |
| |
| The accompanying notes are an integral part of the financial statements. | 151 |
John Hancock Funds II
Portfolio of investments — August 31, 2007
(showing percentage of total net assets)
| | | | |
| Core Bond Fund (continued) | | | | |
| | | Shares or | | |
| | | Principal | | |
| | | Amount | | Value |
|
|
| |
| COLLATERALIZED MORTGAGE | | | | |
| OBLIGATIONS (continued) | | | | |
| Federal Home Loan Mortgage Corp., | | | | |
| Series 2006-3164, Class NC | | | | |
| 6.00% due 12/15/2032 | $ | 84,000 | $ | 85,226 |
| Federal Home Loan Mortgage Corp., | | | | |
| Series 2006-3167, Class QA | | | | |
| 6.00% due 10/15/2026 | | 2,092,945 | | 2,114,499 |
| Federal Home Loan Mortgage Corp., | | | | |
| Series 2006-3171, Class NE | | | | |
| 6.00% due 05/15/2027 | | 359,177 | | 363,558 |
| Federal Home Loan Mortgage Corp., | | | | |
| Series 2006-3173, Class PH | | | | |
| 6.00% due 09/15/2027 | | 657,282 | | 665,005 |
| Federal Home Loan Mortgage Corp., | | | | |
| Series 2006-3178, Class MA | | | | |
| 6.00% due 10/15/2026 | | 419,977 | | 425,013 |
| Federal Home Loan Mortgage Corp., | | | | |
| Series 2006-3179, Class PD | | | | |
| 5.75% due 12/15/2018 | | 1,984,610 | | 1,998,296 |
| Federal Home Loan Mortgage Corp., | | | | |
| Series 2006-3184, Class LA | | | | |
| 6.00% due 03/15/2028 | | 651,069 | | 659,147 |
| Federal Home Loan Mortgage Corp., | | | | |
| Series 2006-3192, Class GA | | | | |
| 6.00% due 03/15/2027 | | 567,097 | | 573,558 |
| Federal Home Loan Mortgage Corp., | | | | |
| Series 2006-3205, Class PC | | | | |
| 6.00% due 09/15/2032 | | 641,000 | | 648,397 |
| Federal Home Loan Mortgage Corp., | | | | |
| Series 2006-3215, Class QA | | | | |
| 6.00% due 06/15/2027 | | 679,571 | | 688,348 |
| Federal Home Loan Mortgage Corp., | | | | |
| Series 2006-3216, Class NA | | | | |
| 6.00% due 05/15/2028 | | 491,013 | | 497,463 |
| Federal Home Loan Mortgage Corp., | | | | |
| Series 2007-3268, Class HC | | | | |
| 5.00% due 12/15/2032 | | 273,000 | | 264,835 |
| Federal Home Loan Mortgage Corp., | | | | |
| Series 2007-3279, Class PA | | | | |
| 5.50% due 02/15/2023 | | 1,389,000 | | 1,394,695 |
| Federal Home Loan Mortgage Corp., | | | | |
| Series 2007-3279, Class PB | | | | |
| 5.50% due 09/15/2031 | | 788,000 | | 784,076 |
| Federal Home Loan Mortgage Corp., | | | | |
| Series 2007-3279, Class PH | | | | |
| 6.00% due 02/15/2027 | | 673,000 | | 681,838 |
| Federal Home Loan Mortgage Corp., | | | | |
| Series 2007-3288, Class PA | | | | |
| 5.50% due 05/15/2029 | | 881,338 | | 885,369 |
| Federal Home Loan Mortgage Corp., | | | | |
| Series 2007-3298, Class VB | | | | |
| 5.00% due 11/15/2025 | | 302,000 | | 279,837 |
| Federal Home Loan Mortgage Corp., | | | | |
| Series 2007-3300, Class PB | | | | |
| 5.50% due 02/15/2031 | | 391,000 | | 389,212 |
| Federal Home Loan Mortgage Corp., | | | | |
| Series 2007-3305, Class PD | | | | |
| 5.50% due 11/15/2035 | | 264,000 | | 256,371 |
| | | | |
| Core Bond Fund (continued) | | | | |
| | | Shares or | | |
| | | Principal | | |
| | | Amount | | Value |
|
|
| |
| COLLATERALIZED MORTGAGE | | | | |
| OBLIGATIONS (continued) | | | | |
| Federal Home Loan Mortgage Corp., | | | | |
| Series 2007-3312, Class AP | | | | |
| 5.50% due 11/15/2025 | $ | 346,153 | $ | 347,704 |
| Federal Home Loan Mortgage Corp., | | | | |
| Series 2007-3316, Class EA | | | | |
| 5.50% due 10/15/2029 | | 1,089,071 | | 1,093,829 |
| Federal Home Loan Mortgage Corp., | | | | |
| Series 2007-3316, Class HA | | | | |
| 5.00% due 07/15/2035 | | 982,691 | | 959,889 |
| Federal Home Loan Mortgage Corp., | | | | |
| Series 2007-3316, Class PB | | | | |
| 5.50% due 03/15/2031 | | 186,000 | | 184,839 |
| Federal National Mortgage Association, | | | | |
| Series 2001-T11, Class B | | | | |
| 5.503% due 09/25/2011 | | 200,000 | | 203,585 |
| Federal National Mortgage Association, | | | | |
| Series 2002-T11, Class A | | | | |
| 4.768% due 04/25/2012 | | 42,850 | | 42,548 |
| Federal National Mortgage Association, | | | | |
| Series 2003-108, Class BE | | | | |
| 4.00% due 11/25/2018 | | 333,000 | | 302,417 |
| Federal National Mortgage Association, | | | | |
| Series 2003-123, Class AB | | | | |
| 4.00% due 10/25/2016 | | 646,740 | | 629,852 |
| Federal National Mortgage Association, | | | | |
| Series 2003-15, Class CH | | | | |
| 4.00% due 02/25/2017 | | 204,177 | | 199,206 |
| Federal National Mortgage Association, | | | | |
| Series 2003-16, Class PN | | | | |
| 4.50% due 10/25/2015 | | 285,000 | | 281,643 |
| Federal National Mortgage Association, | | | | |
| Series 2003-24, Class LC | | | | |
| 5.00% due 12/25/2015 | | 163,000 | | 162,323 |
| Federal National Mortgage Association, | | | | |
| Series 2003-30, Class ET | | | | |
| 3.50% due 08/25/2016 | | 504,456 | | 489,576 |
| Federal National Mortgage Association, | | | | |
| Series 2003-33, Class CH | | | | |
| 4.00% due 07/25/2017 | | 497,706 | | 481,698 |
| Federal National Mortgage Association, | | | | |
| Series 2003-34, Class QJ | | | | |
| 4.50% due 01/25/2016 *** | | 416,349 | | 410,996 |
| Federal National Mortgage Association, | | | | |
| Series 2003-86, Class OX | | | | |
| 4.50% due 09/25/2026 | | 1,298,000 | | 1,277,519 |
| Federal National Mortgage Association, | | | | |
| Series 2003-92, Class PC | | | | |
| 4.50% due 05/25/2015 | | 573,000 | | 569,322 |
| Federal National Mortgage Association, | | | | |
| Series 2003-T1, Class A | | | | |
| 3.807% due 11/25/2012 | | 132,348 | | 128,527 |
| Federal National Mortgage Association, | | | | |
| Series 2004-34, Class PL | | | | |
| 3.50% due 05/25/2014 | | 271,598 | | 267,858 |
| Federal National Mortgage Association, | | | | |
| Series 2005-20, Class QD | | | | |
| 5.00% due 03/25/2028 | | 308,000 | | 305,421 |
| |
| The accompanying notes are an integral part of the financial statements. | 152 |
John Hancock Funds II
Portfolio of investments — August 31, 2007
(showing percentage of total net assets)
| | | | |
| Core Bond Fund (continued) | | | | |
| | | Shares or | | |
| | | Principal | | |
| | | Amount | | Value |
|
|
| |
| COLLATERALIZED MORTGAGE | | | | |
| OBLIGATIONS (continued) | | | | |
| Federal National Mortgage Association, | | | | |
| Series 2005-29, Class AD | | | | |
| 4.50% due 08/25/2034 | $ | 634,951 | $ | 624,024 |
| Federal National Mortgage Association, | | | | |
| Series 2005-38, Class CD | | | | |
| 5.00% due 06/25/2019 | | 324,155 | | 320,401 |
| Federal National Mortgage Association, | | | | |
| Series 2005-45, Class BA | | | | |
| 4.50% due 11/25/2014 *** | | 599,561 | | 596,752 |
| Federal National Mortgage Association, | | | | |
| Series 2005-58, Class MA | | | | |
| 5.50% due 07/25/2035 | | 267,191 | | 268,624 |
| Federal National Mortgage Association, | | | | |
| Series 2006-112, Class QA | | | | |
| 5.50% due 03/25/2033 | | 490,975 | | 492,200 |
| Federal National Mortgage Association, | | | | |
| Series 2006-18, Class PA | | | | |
| 5.50% due 01/25/2026 | | 414,510 | | 415,359 |
| Federal National Mortgage Association, | | | | |
| Series 2006-31, Class PA | | | | |
| 5.50% due 11/25/2026 | | 422,468 | | 423,640 |
| Federal National Mortgage Association, | | | | |
| Series 2006-3138, Class PA | | | | |
| 5.50% due 02/15/2027 | | 726,535 | | 729,491 |
| Federal National Mortgage Association, | | | | |
| Series 2006-34, Class PA | | | | |
| 6.00% due 05/25/2027 | | 1,017,585 | | 1,026,660 |
| Federal National Mortgage Association, | | | | |
| Series 2006-41, Class MA | | | | |
| 5.50% due 04/25/2024 | | 438,946 | | 439,947 |
| Federal National Mortgage Association, | | | | |
| Series 2006-53, Class PA | | | | |
| 5.50% due 12/25/2026 | | 134,122 | | 134,471 |
| Federal National Mortgage Association, | | | | |
| Series 2006-55, Class PA | | | | |
| 6.00% due 05/25/2026 | | 328,673 | | 331,653 |
| Federal National Mortgage Association, | | | | |
| Series 2006-64, Class PA | | | | |
| 5.50% due 02/25/2030 | | 265,135 | | 265,948 |
| Federal National Mortgage Association, | | | | |
| Series 2006-80, Class PB | | | | |
| 6.00% due 10/25/2027 | | 890,157 | | 898,404 |
| Federal National Mortgage Association, | | | | |
| Series 2007-27, Class KA | | | | |
| 5.75% due 09/25/2033 | | 259,732 | | 261,903 |
| Federal National Mortgage Association, | | | | |
| Series 2007-30, Class MA | | | | |
| 4.25% due 02/25/2037 | | 1,071,280 | | 1,029,734 |
| Federal National Mortgage Association, | | | | |
| Series 2007-39, Class NA | | | | |
| 4.25% due 01/25/2037 | | 1,176,295 | | 1,138,232 |
| Federal National Mortgage Association, | | | | |
| Series 2007-62, Class PA | | | | |
| 6.00% due 03/25/2029 | | 353,079 | | 355,937 |
| Federal National Mortgage Association, | | | | |
| Series 2007-76, Class PA | | | | |
| 6.00% due 05/25/2028 *** | | 2,663,919 | | 2,697,469 |
| | | | |
| Core Bond Fund (continued) | | | |
| | | Shares or | | |
| | | Principal | | |
| | | Amount | | Value |
|
|
| |
| COLLATERALIZED MORTGAGE | | | | |
| OBLIGATIONS (continued) | | | | |
| Federal National Mortgage Association, | | | | |
| Series 2007-76, Class PB | | | | |
| 6.00% due 07/25/2031 | $ | 886,000 | $ | 896,247 |
| Federal National Mortgage Association, | | | | |
| Series 2007-80, Class TA | | | | |
| 6.00% due 09/25/2026 | | 294,516 | | 298,276 |
| Federal National Mortgage Association, | | | | |
| Series 2007-81, Class AE | | | | |
| 6.00% due 08/25/2028 | | 1,929,272 | | 1,955,816 |
| Federal National Mortgage Association, | | | | |
| Series 2007-B1, Class VA | | | | |
| 5.50% due 04/25/2017 | | 624,460 | | 625,719 |
| First Union National Bank Commercial Mortgage, | | | |
| Series 2001-C4, Class B | | | | |
| 6.417% due 12/12/2033 | | 188,000 | | 194,110 |
| GE Capital Commercial Mortgage Corp., | | | | |
| Series 2001-2, Class A3 | | | | |
| 6.03% due 08/11/2033 | | 210,848 | | 212,380 |
| GE Capital Commercial Mortgage Corp., | | | | |
| Series 2004-C3, Class A4 | | | | |
| 5.189% due 07/10/2039 (b) | | 179,000 | | 175,426 |
| GE Capital Commercial Mortgage Corp., | | | | |
| Series 2005-C3, Class A7A | | | | |
| 4.974% due 07/10/2045 (b) | | 807,000 | | 758,252 |
| General Motors Acceptance Corp. Commercial | | | |
| Mortgage Securities, Inc., Series 2004-C1, | | | |
| Class A1 | | | | |
| 3.118% due 03/10/2038 | | 180,679 | | 177,331 |
| Government National Mortgage Association, | | | |
| Series 2004-88, Class MA | | | | |
| 3.65% due 01/20/2028 | | 738,868 | | 727,471 |
| Government National Mortgage Association, | | | |
| Series 2006-17, Class KY | | | | |
| 5.00% due 04/20/2036 | | 1,322,450 | | 1,306,578 |
| Government National Mortgage Association, | | | |
| Series 2006-3, Class A | | | | |
| 4.212% due 01/16/2028 | | 118,061 | | 115,793 |
| Government National Mortgage Association, | | | |
| Series 2006-33, Class NA | | | | |
| 5.00% due 01/20/2036 | | 509,000 | | 481,048 |
| Government National Mortgage Association, | | | |
| Series 2006-37, Class JG | | | | |
| 5.00% due 07/20/2036 | | 254,000 | | 238,292 |
| Government National Mortgage Association, | | | |
| Series 2006-8, Class A | | | | |
| 3.942% due 08/16/2025 | | 171,322 | | 167,922 |
| Government National Mortgage Association, | | | |
| Series 2007-7, Class PG | | | | |
| 5.00% due 02/16/2037 | | 1,842,000 | | 1,741,285 |
| GS Mortgage Securities Corp. II, | | | | |
| Series 1998-C1, Class B | | | | |
| 6.97% due 10/18/2030 | | 109,000 | | 110,020 |
| GS Mortgage Securities Corp. II, | | | | |
| Series 1998-GLII, Class A2 | | | | |
| 6.562% due 04/13/2031 | | 212,000 | | 212,049 |
| |
| The accompanying notes are an integral part of the financial statements. | 153 |
John Hancock Funds II
Portfolio of investments — August 31, 2007
(showing percentage of total net assets)
| | | | |
| Core Bond Fund (continued) | | | |
| | | Shares or | | |
| | | Principal | | |
| | | Amount | | Value |
| |
|
| |
| COLLATERALIZED MORTGAGE | | | | |
| OBLIGATIONS (continued) | | | | |
| GS Mortgage Securities Corp. II, | | | | |
| Series 2004-GG2, Class A6 | | | | |
| 5.396% due 08/10/2038 (b) | $ | 144,000 | $ | 142,768 |
| JP Morgan Chase Commercial Mortgage Securities | | | |
| Corp., Series 2002-C2, Class A2 | | | | |
| 5.05% due 12/12/2034 | | 753,000 | | 734,924 |
| JP Morgan Chase Commercial Mortgage Securities | | | |
| Corp., Series 2002-CIB5, Class A2 | | | | |
| 5.161% due 10/12/2037 | | 149,000 | | 146,185 |
| JP Morgan Chase Commercial Mortgage Securities | | | |
| Corp., Series 2004-C3, Class A1 | | | | |
| 3.765% due 01/15/2042 | | 697,949 | | 684,486 |
| JP Morgan Chase Commercial Mortgage Securities | | | |
| Corp., Series 2005-CB11, Class ASB | | | | |
| 5.201% due 08/12/2037 (b) | | 234,000 | | 230,283 |
| JP Morgan Chase Commercial Mortgage Securities | | | |
| Corp., Series 2005-CB13, Class AM | | | | |
| 5.513% due 01/12/2043 (b) | | 158,000 | | 155,679 |
| JP Morgan Chase Commercial Mortgage Securities | | | |
| Corp., Series 2005-LDP3, Class ASB | | | | |
| 4.893% due 08/15/2042 (b) | | 321,000 | | 311,760 |
| JP Morgan Chase Commercial Mortgage Securities | | | |
| Corp., Series 2006-CB17, Class ASB | | | | |
| 5.415% due 12/12/2043 | | 614,000 | | 609,555 |
| LB-UBS Commercial Mortgage Trust, | | | | |
| Series 2002-C2, Class A4 | | | | |
| 5.594% due 06/15/2031 | | 651,000 | | 652,427 |
| LB-UBS Commercial Mortgage Trust, | | | | |
| Series 2003-C5, Class A2 | | | | |
| 3.478% due 07/15/2027 | | 285,000 | | 279,922 |
| LB-UBS Commercial Mortgage Trust, | | | | |
| Series 2003-C8, Class A4 | | | | |
| 5.124% due 11/15/2032 (b) | | 214,000 | | 209,552 |
| LB-UBS Commercial Mortgage Trust, | | | | |
| Series 2005-C7, Class AM | | | | |
| 5.263% due 11/15/2040 (b) | | 191,000 | | 186,575 |
| Merrill Lynch Mortgage Trust, | | | | |
| Series 2004-BPC1, Class A5 | | | | |
| 4.855% due 10/12/2041 (b) | | 836,000 | | 803,635 |
| Merrill Lynch Mortgage Trust, | | | | |
| Series 2004-MKB1, Class B | | | | |
| 5.28% due 02/12/2042 (b) | | 126,000 | | 123,541 |
| Merrill Lynch Mortgage Trust, | | | | |
| Series 2005-CIP1, Class AM | | | | |
| 5.107% due 07/12/2038 (b) | | 162,000 | | 156,395 |
| Merrill Lynch Mortgage Trust, | | | | |
| Series 2005-LC1, Class A4 | | | | |
| 5.291% due 01/12/2044 (b) | | 650,000 | | 637,082 |
| Merrill Lynch/Countrywide Commercial Mortgage | | | |
| Trust, Series 2006-4, Class ASB | | | | |
| 5.133% due 12/12/2049 (b) | | 1,012,000 | | 985,053 |
| Morgan Stanley Capital I, Series 2003-IQ5, Class A4 | | | |
| 5.01% due 04/15/2038 | | 503,000 | | 491,133 |
| Morgan Stanley Capital I, Series 2004-HQ3, Class D | | | |
| 4.90% due 01/13/2041 | | 100,000 | | 92,637 |
| Morgan Stanley Capital I, Series 2004-T13, Class B | | | |
| 4.76% due 09/13/2045 (b) | | 158,000 | | 151,232 |
| | | | |
| Core Bond Fund (continued) | | | | |
| | | Shares or | | |
| | | Principal | | |
| | | Amount | | Value |
|
|
| |
| COLLATERALIZED MORTGAGE | | | | |
| OBLIGATIONS (continued) | | | | |
| Morgan Stanley Capital I, | | | | |
| Series 2005-HQ5, Class AAB | | | | |
| 5.037% due 01/14/2042 | $ | 444,000 | $ | 434,938 |
| Morgan Stanley Capital I, | | | | |
| Series 2005-HQ7, Class AAB | | | | |
| 5.3512% due 11/14/2042 (b) | | 902,000 | | 890,672 |
| Morgan Stanley Dean Witter Capital I, | | | | |
| Series 2002-IQ2, Class A3 | | | | |
| 5.52% due 12/15/2035 | | 262,488 | | 262,076 |
| Morgan Stanley Mortgage Loan Trust, | | | | |
| Series 2007-6XS, Class 2A1S | | | | |
| 5.614% due 02/25/2047 (b) | | 178,506 | | 176,691 |
| Wachovia Bank Commercial Mortgage Trust, | | | | |
| Series 2002-C1, Class A4 | | | | |
| 6.287% due 04/15/2034 | | 347,000 | | 357,109 |
| Wachovia Bank Commercial Mortgage Trust, | | | | |
| Series 2002-C2, Class A4 | | | | |
| 4.98% due 11/15/2034 | | 1,181,000 | | 1,148,256 |
| Wachovia Bank Commercial Mortgage Trust, | | | | |
| Series 2003-C6, Class A3 | | | | |
| 4.957% due 08/15/2035 | | 588,000 | | 580,334 |
| Wachovia Bank Commercial Mortgage Trust, | | | | |
| Series 2003-C7, Class A2 | | | | |
| 5.077% due 10/15/2035 (b) | | 553,000 | | 539,565 |
| Wachovia Bank Commercial Mortgage Trust, | | | | |
| Series 2003-C8, Class A3 | | | | |
| 4.445% due 11/15/2035 | | 186,000 | | 181,557 |
| Wachovia Bank Commercial Mortgage Trust, | | | | |
| Series 2003-C9, Class A4 | | | | |
| 5.012% due 12/15/2035 | | 808,000 | | 782,718 |
| Wachovia Bank Commercial Mortgage Trust, | | | | |
| Series 2003-C9, Class B | | | | |
| 5.109% due 12/15/2035 | | 79,000 | | 76,844 |
| Wachovia Bank Commercial Mortgage Trust, | | | | |
| Series 2004-C10, Class A4 | | | | |
| 4.748% due 02/15/2041 | | 1,643,000 | | 1,571,295 |
| Wachovia Bank Commercial Mortgage Trust, | | | | |
| Series 2004-C11, Class B | | | | |
| 5.306% due 01/15/2041 | | 414,000 | | 401,676 |
| Wachovia Bank Commercial Mortgage Trust, | | | | |
| Series 2004-C12, Class A4 | | | | |
| 5.4088% due 07/15/2041 (b) | | 500,000 | | 494,363 |
| Wachovia Bank Commercial Mortgage Trust, | | | | |
| Series 2004-C15, Class B | | | | |
| 4.892% due 10/15/2041 | | 219,000 | | 200,242 |
| Wachovia Bank Commercial Mortgage Trust, | | | | |
| Series 2005-C18, Class A4 | | | | |
| 4.935% due 04/15/2042 | | 537,000 | | 515,707 |
| Wachovia Bank Commercial Mortgage Trust, | | | | |
| Series 2005-C19, Class A6 | | | | |
| 4.699% due 05/15/2044 | | 186,000 | | 173,454 |
| Wachovia Bank Commercial Mortgage Trust, | | | | |
| Series 2005-C20, Class A7 | | | | |
| 5.118% due 07/15/2042 (b) | | 685,000 | | 665,205 |
| Wachovia Bank Commercial Mortgage Trust, | | | | |
| Series 2005-C21, Class A4 | | | | |
| 5.3847% due 10/15/2044 (b) | | 331,000 | | 325,442 |
| |
| The accompanying notes are an integral part of the financial statements. | 154 |
John Hancock Funds II
Portfolio of investments — August 31, 2007
(showing percentage of total net assets)
| | | | |
| Core Bond Fund (continued) | | | |
| | | Shares or | | |
| | | Principal | | |
| | | Amount | | Value |
|
|
| |
| COLLATERALIZED MORTGAGE | | | | |
| OBLIGATIONS (continued) | | | | |
| Wachovia Bank Commercial Mortgage Trust, | | | |
| Series 2005-C22, Class A4 | | | | |
| 5.4405% due 12/15/2044 (b) | $ | 1,077,000 | $ | 1,059,597 |
| Wachovia Bank Commercial Mortgage Trust, | | | |
| Series 2006-C26, Class APB | | | | |
| 5.997% due 06/15/2045 | | 536,000 | | 538,897 |
|
| TOTAL COLLATERALIZED MORTGAGE OBLIGATIONS | | |
| (Cost $106,880,180) | | | $ | 107,003,915 |
|
| |
| ASSET BACKED SECURITIES - 3.53% | | | |
| AmeriCredit Automobile Receivables Trust, | | | |
| Series 2003-DM, Class A4 | | | | |
| 2.84% due 08/06/2010 | | 186,330 | | 186,224 |
| Americredit Prime Automobile Receivable, | | | |
| Series 2007-1, Class A3 | | | | |
| 5.27% due 11/08/2011 (b) | | 537,000 | | 537,419 |
| Bank of America Credit Card Trust, | | | | |
| Series 2007-A8, Class A8 | | | | |
| 5.59% due 11/17/2014 | | 146,000 | | 147,825 |
| California Infrastructure PG&E-1, Series 1997-1, | | | |
| Class A8 | | | | |
| 6.48% due 12/26/2009 | | 46,962 | | 47,042 |
| California Infrastructure SCE-1, Series 1997-1, | | | |
| Class A7 | | | | |
| 6.42% due 12/26/2009 | | 200,940 | | 201,023 |
| Capital Auto Receivables Asset Trust, | | | | |
| Series 2006-1, Class A3 | | | | |
| 5.03% due 10/15/2009 | | 315,000 | | 314,092 |
| Capital Auto Receivables Asset Trust, | | | | |
| Series 2007-1, Class A3A | | | | |
| 5.00% due 04/15/2011 | | 290,000 | | 289,049 |
| Chase Issuance Trust, Series 2004-A9, Class A9 | | | |
| 3.22% due 06/15/2010 | | 435,000 | | 433,651 |
| Citicorp Residential Mortgage Securities, Inc., | | | |
| Series 2006-1, Class A2 | | | | |
| 5.682% due 07/25/2036 | | 282,000 | | 278,291 |
| Citicorp Residential Mortgage Securities, Inc., | | | |
| Series 2006-2, Class A2 | | | | |
| 5.557% due 09/25/2036 | | 308,000 | | 305,979 |
| Citigroup Mortgage Loan Trust, Inc., | | | | |
| Series 2007-AHL1, Class A2A | | | | |
| 5.545% due 12/25/2036 (b) | | 411,456 | | 407,591 |
| CNH Equipment Trust, Series 2004-A, Class A4A | | | |
| 5.72% due 09/15/2011 (b) | | 442,951 | | 443,258 |
| Connecticut RRB Special Purpose Trust CL&P, | | | |
| Series 2001-1, Class A5 | | | | |
| 6.21% due 12/30/2011 | | 190,000 | | 195,665 |
| Countrywide Asset-Backed Certificates, | | | | |
| Series 2006-S1, Class A2 | | | | |
| 5.549% due 08/25/2021 | | 544,000 | | 537,700 |
| Countrywide Asset-Backed Certificates, | | | | |
| Series 2007-3, Class 2A1 | | | | |
| 5.605% due 02/25/2037 (b) | | 185,037 | | 183,881 |
| Daimler Chrysler Auto Trust, Series | | | | |
| 2006-D, Class A4 | | | | |
| 4.94% due 02/08/2012 | | 300,000 | | 296,710 |
| | | | |
| Core Bond Fund (continued) | | | |
| | | Shares or | | |
| | | Principal | | |
| | | Amount | | Value |
|
|
| |
| ASSET BACKED SECURITIES | | | | |
| (continued) | | | | |
| Discover Card Master Trust I, Series 2003-1, | | | |
| Class A3 | | | | |
| 5.75% due 04/16/2010 (b) | $ | 138,000 | $ | 138,008 |
| Dominos Pizza Master Issuer LLC, Series 2007-1, | | | |
| Class A2 | | | | |
| 5.261% due 04/25/2037 | | 480,000 | | 474,396 |
| Ford Credit Auto Owner Trust, | | | | |
| Series 2005-A, Class A3 | | | | |
| 3.48% due 11/15/2008 | | 52,436 | | 52,334 |
| Ford Credit Auto Owner Trust, | | | | |
| Series 2005-B, Class A3 | | | | |
| 4.17% due 01/15/2009 | | 59,458 | | 59,316 |
| Great America Leasing Receivables, | | | | |
| Series 2006-1, Class A3 | | | | |
| 5.34% due 01/15/2010 | | 474,000 | | 473,852 |
| Harley-Davidson Motorcycle Trust, | | | | |
| Series 2007-1, Class A2 | | | | |
| 5.29% due 01/18/2011 | | 248,000 | | 247,841 |
| M.A.S.Transactions Asset Backed Securities Trust, | | | |
| Series 2005-AB1, Class A1B | | | | |
| 5.143% due 11/25/2035 (b) | | 62,064 | | 61,539 |
| MBNA Credit Card Master Note Trust, | | | | |
| Series 2003-A7, Class A7 | | | | |
| 2.65% due 11/15/2010 | | 372,000 | | 364,555 |
| Morgan Stanley ABS Capital I, | | | | |
| Series 2006-WMC1, Class A2A | | | | |
| 5.574% due 12/25/2035 (b) | | 62,046 | | 61,764 |
| Morgan Stanley ABS Capital I, | | | | |
| Series 2007-HE2, Class A2A | | | | |
| 5.545% due 01/25/2037 (b) | | 196,265 | | 194,272 |
| Morgan Stanley Home Equity Loans, | | | | |
| Series 2007-1, Class A1 | | | | |
| 5.554% due 12/25/2036 (b) | | 186,354 | | 184,831 |
| Nissan Auto Receivables Owner Trust, | | | | |
| Series 2006-B, Class A3 | | | | |
| 5.16% due 02/15/2010 | | 152,000 | | 151,683 |
| Ownit Mortgage Loan Asset-Backed | | | | |
| Certificates, Series 2006-1, Class AF1 | | | | |
| 5.424% due 12/25/2036 | | 103,813 | | 102,203 |
| Residential Asset Mortgage Products, Inc., | | | | |
| Series 2003-RS7, Class AI6 | | | | |
| 5.34% due 08/25/2033 | | 183,203 | | 176,949 |
| SLM Student Loan Trust, Series 2005-7, Class A3 | | | |
| 4.41% due 07/25/2025 (b) | | 432,000 | | 431,788 |
| Triad Auto Receivables Owner Trust, | | | | |
| Series 2003-B, Class A4 | | | | |
| 3.20% due 12/13/2010 | | 62,415 | | 61,486 |
| Triad Auto Receivables Owner Trust, | | | | |
| Series 2006-C, Class A3 | | | | |
| 5.26% due 11/14/2011 | | 249,000 | | 248,488 |
| Triad Auto Receivables Owner Trust, | | | | |
| Series 2006-B, Class A4 | | | | |
| 5.52% due 11/12/2012 | | 142,000 | | 142,162 |
| USAA Auto Owner Trust, Series 2004-3, Class A3 | | | |
| 3.16% due 02/17/2009 | | 5,812 | | 5,806 |
| USAA Auto Owner Trust, Series 2004-3, Class A4 | | | |
| 3.53% due 06/15/2011 | | 265,000 | | 262,041 |
| |
| The accompanying notes are an integral part of the financial statements. | 155 |
John Hancock Funds II
Portfolio of investments — August 31, 2007
(showing percentage of total net assets)
| | | | |
| Core Bond Fund (continued) | | | | |
| | | Shares or | | |
| | | Principal | | |
| | | Amount | | Value |
|
|
| |
| ASSET BACKED SECURITIES | | | | |
| (continued) | | | | |
| USAA Auto Owner Trust, Series 2005-1, Class A3 | | | |
| 3.90% due 07/15/2009 | $ | 25,313 | $ | 25,189 |
| Wachovia Auto Owner Trust, | | | | |
| Series 2004-A, Class A4 | | | | |
| 3.66% due 07/20/2010 | | 377,683 | | 377,222 |
| WFS Financial Owner Trust, | | | | |
| Series 2003-4, Class A4 | | | | |
| 3.15% due 05/20/2011 | | 34,415 | | 34,290 |
| WFS Financial Owner Trust, | | | | |
| Series 2004-1, Class A4 | | | | |
| 2.81% due 08/22/2011 | | 300,813 | | 298,494 |
| WFS Financial Owner Trust, | | | | |
| Series 2005-3, Class A3A | | | | |
| 4.25% due 06/17/2010 | | 52,974 | | 52,703 |
|
| TOTAL ASSET BACKED SECURITIES | | | | |
| (Cost $9,503,770) | | | $ | 9,488,612 |
|
| |
| SHORT TERM INVESTMENTS - 3.84% | | | | |
| Deutsche Bank Financial, LLC | | | | |
| 5.25% due 09/04/2007 | $ | 3,995,000 | $ | 3,993,252 |
| Rabobank USA Finance Corp. | | | | |
| 5.20% due 09/04/2007 | | 2,340,000 | | 2,338,986 |
| UBS Finance (Delaware) LLC | | | | |
| 5.20% due 09/04/2007 | | 3,995,000 | | 3,993,269 |
|
| TOTAL SHORT TERM INVESTMENTS | | | | |
| (Cost $10,325,507) | | | $ | 10,325,507 |
|
| |
| REPURCHASE AGREEMENTS - 0.94% | | | | |
| Repurchase Agreement with State | | | | |
| Street Corp. dated 08/31/2007 at | | | | |
| 4.60% to be repurchased at | | | | |
| $2,520,287 on 09/04/2007, | | | | |
| collateralized by $2,525,000 | | | | |
| Federal Home Loan Bank, 4.875% | | | | |
| due 05/14/2010 (valued at | | | | |
| $2,572,319, including interest) | $ | 2,519,000 | $ | 2,519,000 |
|
| TOTAL REPURCHASE AGREEMENTS | | | | |
| (Cost $2,519,000) | | | $ | 2,519,000 |
|
| Total Investments (Core Bond Fund) | | | | |
| (Cost $295,718,830) - 110.13% | | | $ | 296,194,558 |
| Liabilities in Excess of Other Assets - (10.13)% | | | (27,241,392) |
|
|
| TOTAL NET ASSETS - 100.00% | | | $ | 268,953,166 |
|
|
| |
| |
| |
| Core Equity Fund | | | | |
| | | Shares or | | |
| | | Principal | | |
| | | Amount | | Value |
|
|
| |
| COMMON STOCKS - 98.02% | | | | |
| | | | | |
| Automobiles - 0.49% | | | | |
| General Motors Corp. | | 130,900 | $ | 4,023,866 |
| | | | | |
| Cable & Television - 4.32% | | | | |
| DIRECTV Group, Inc. * | | 713,002 | | 16,634,337 |
| | | |
| Core Equity Fund (continued) | | | |
| | Shares or | | |
| | Principal | | |
| | Amount | | Value |
|
|
| |
| COMMON STOCKS (continued) | | | |
| | | | |
| Cable & Television (continued) | | | |
| Time Warner, Inc. | 1,006,400 | $ | 19,101,472 |
| |
|
| | | | 35,735,809 |
| Cellular Communications - 0.65% | | | |
| Motorola, Inc. | 317,000 | | 5,373,150 |
| | | | |
| Computers & Business Equipment - 7.48% | | | |
| Cisco Systems, Inc. * | 488,000 | | 15,576,960 |
| Hewlett-Packard Company | 364,900 | | 18,007,815 |
| International Business Machines Corp. | 128,900 | | 15,041,341 |
| Seagate Technology | 509,026 | | 13,143,051 |
| |
|
| | | | 61,769,167 |
| Electrical Utilities - 4.61% | | | |
| The AES Corp. * | 2,103,900 | | 38,101,629 |
| | | | |
| Electronics - 0.96% | | | |
| Tyco Electronics, Ltd. * | 226,475 | | 7,897,183 |
| | | | |
| Financial Services - 10.27% | | | |
| Bear Stearns Companies, Inc. | 4,400 | | 478,104 |
| Capital One Financial Corp. | 191,600 | | 12,388,856 |
| Citigroup, Inc. | 450,900 | | 21,138,192 |
| Countrywide Financial Corp. | 805,800 | | 15,995,130 |
| JP Morgan Chase & Company | 782,500 | | 34,836,900 |
| |
|
| | | | 84,837,182 |
| Healthcare Products - 1.64% | | | |
| Covidien, Ltd. * | 339,475 | | 13,521,289 |
| | | | |
| Healthcare Services - 6.34% | | | |
| Health Net, Inc. * | 276,294 | | 15,138,148 |
| UnitedHealth Group, Inc. | 744,800 | | 37,247,448 |
| |
|
| | | | 52,385,596 |
| Holdings Companies/Conglomerates - 2.57% | | | |
| General Electric Company | 547,300 | | 21,273,551 |
| | | | |
| Homebuilders - 2.36% | | | |
| Beazer Homes USA, Inc. | 90,308 | | 954,556 |
| Centex Corp. | 257,510 | | 7,444,614 |
| Pulte Homes, Inc. | 463,000 | | 7,704,320 |
| Ryland Group, Inc. | 118,108 | | 3,382,613 |
| |
|
| | | | 19,486,103 |
| Insurance - 6.55% | | | |
| Aetna, Inc. | 666,500 | | 33,931,515 |
| American International Group, Inc. | 305,600 | | 20,169,600 |
| |
|
| | | | 54,101,115 |
| Internet Content - 8.05% | | | |
| Google, Inc., Class A * | 81,800 | | 42,147,450 |
| Yahoo!, Inc. * | 1,071,300 | | 24,350,649 |
| |
|
| | | | 66,498,099 |
| Internet Retail - 16.88% | | | |
| Amazon.com, Inc. * | 878,500 | | 70,200,935 |
| eBay, Inc. * | 769,300 | | 26,233,130 |
| Expedia, Inc. * | 794,400 | | 23,712,840 |
| IAC/InterActiveCorp. * | 697,100 | | 19,372,409 |
| |
|
| | | | 139,519,314 |
| |
| The accompanying notes are an integral part of the financial statements. | 156 |
John Hancock Funds II
Portfolio of investments — August 31, 2007
(showing percentage of total net assets)
| | | | |
| Core Equity Fund (continued) | | | |
| | | Shares or | | |
| | | Principal | | |
| | | Amount | | Value |
| |
|
| |
| COMMON STOCKS (continued) | | | | |
| | | | | |
| Leisure Time - 1.73% | | | | |
| Electronic Arts, Inc. * | | 270,000 | $ | 14,293,800 |
| | | | | |
| Manufacturing - 1.66% | | | | |
| Tyco International, Ltd. | | 310,275 | | 13,701,744 |
| | | | | |
| Pharmaceuticals - 1.49% | | | | |
| Pfizer, Inc. | | 496,885 | | 12,342,624 |
| | | | | |
| Photography - 2.98% | | | | |
| Eastman Kodak Company | | 924,548 | | 24,657,695 |
| | | | | |
| Retail Trade - 5.86% | | | | |
| Home Depot, Inc. | | 483,500 | | 18,522,885 |
| Sears Holdings Corp. * | | 208,100 | | 29,874,836 |
| |
|
| | | | | 48,397,721 |
| Semiconductors - 0.49% | | | | |
| Texas Instruments, Inc. | | 118,300 | | 4,050,592 |
| | | | | |
| Software - 1.34% | | | | |
| CA, Inc. | | 440,300 | | 11,091,157 |
| | | | | |
| Telephone - 9.30% | | | | |
| Qwest Communications International, Inc. * | 3,957,200 | | 35,416,940 |
| Sprint Nextel Corp. | | 2,191,800 | | 41,468,856 |
| |
|
| | | | | 76,885,796 |
|
| TOTAL COMMON STOCKS (Cost $742,691,397) | | $ | 809,944,182 |
|
| |
| REPURCHASE AGREEMENTS - 1.94% | | | |
| Repurchase Agreement with State | | | | |
| Street Corp. dated 08/31/2007 at | | | | |
| 4.60% to be repurchased at | | | | |
| $16,050,199 on 9/04/2007, | | | | |
| collateralized by $13,430,000 | | | | |
| Federal Home Loan Mortgage | | | | |
| Corp., 6.75% due 03/15/2031 | | | | |
| (valued at $16,367,813, including | | | | |
| interest) | $ | 16,042,000 | $ | 16,042,000 |
|
| TOTAL REPURCHASE AGREEMENTS | | | | |
| (Cost $16,042,000) | | | $ | 16,042,000 |
|
| Total Investments (Core Equity Fund) | | | | |
| (Cost $758,733,397) - 99.96% | | | $ | 825,986,182 |
| Other Assets in Excess of Liabilities - 0.04% | | | 332,566 |
| |
|
| TOTAL NET ASSETS - 100.00% | | | $ | 826,318,748 |
| |
|
| |
| |
| |
| Emerging Growth Fund | | | | |
| | | Shares or | | |
| | | Principal | | |
| | | Amount | | Value |
|
|
| |
| COMMON STOCKS - 94.38% | | | | |
| | | | | |
| Aerospace - 1.22% | | | | |
| Argon ST, Inc. * | | 134,050 | $ | 2,422,284 |
| | | | | |
| Auto Parts - 1.17% | | | | |
| LKQ Corp. * | | 75,200 | | 2,329,696 |
| | | |
| Emerging Growth Fund (continued) | | |
| | Shares or | | |
| | Principal | | |
| | Amount | | Value |
|
|
| |
| COMMON STOCKS (continued) | | | |
| | | | |
| Banking - 3.81% | | | |
| Boston Private Financial Holdings, Inc. (a) | 81,150 | $ | 2,203,222 |
| IBERIABANK Corp. | 33,650 | | 1,688,221 |
| PrivateBancorp, Inc. (a) | 55,000 | | 1,841,400 |
| Umpqua Holdings Corp. | 84,440 | | 1,832,348 |
| |
|
| | | | 7,565,191 |
| Biotechnology - 2.09% | | | |
| Exelixis, Inc. * | 186,550 | | 2,098,687 |
| Martek Biosciences Corp. * (a) | 75,950 | | 2,052,169 |
| |
|
| | | | 4,150,856 |
| Broadcasting - 1.53% | | | |
| Acacia Research - Acacia Technologies * | 203,500 | | 3,048,430 |
| | | | |
| Buildings - 0.04% | | | |
| Modtech Holdings, Inc. * | 63,150 | | 73,885 |
| | | | |
| Business Services - 7.42% | | | |
| Access Integrated Technologies, Inc. * | 138,950 | | 862,880 |
| Barrett Business Services, Inc. | 107,800 | | 2,628,164 |
| Euronet Worldwide, Inc. * (a) | 193,300 | | 5,234,564 |
| FTI Consulting, Inc. * | 76,850 | | 4,036,162 |
| Hill International, Inc. * (a) | 195,355 | | 1,457,348 |
| Seachange International, Inc. * | 72,000 | | 524,160 |
| |
|
| | | | 14,743,278 |
| Chemicals - 0.28% | | | |
| American Vanguard Corp. | 35,750 | | 559,845 |
| | | | |
| Commercial Services - 4.22% | | | |
| Providence Service Corp. * | 93,070 | | 2,797,684 |
| Stantec, Inc. * | 100,200 | | 3,263,514 |
| Team, Inc. * | 99,100 | | 2,324,886 |
| |
|
| | | | 8,386,084 |
| Computers & Business Equipment - 3.74% | | | |
| Lasercard Corp. * (a) | 228,400 | | 2,567,216 |
| Stratasys, Inc. * (a) | 52,200 | | 1,312,830 |
| Trident Microsystems, Inc. * | 240,850 | | 3,547,721 |
| |
|
| | | | 7,427,767 |
| Drugs & Health Care - 1.43% | | | |
| Matrixx Initiatives, Inc. * | 133,750 | | 2,840,850 |
| | | | |
| Electronics - 2.88% | | | |
| Measurement Specialties, Inc. * | 109,950 | | 2,653,093 |
| Medis Technologies, Ltd. * (a) | 291,600 | | 3,076,380 |
| |
|
| | | | 5,729,473 |
| Energy - 3.25% | | | |
| Evergreen Energy, Inc. * (a) | 69,200 | | 285,104 |
| Headwaters, Inc. * (a) | 17,750 | | 293,230 |
| InterOil Corp. * (a) | 165,650 | | 5,872,293 |
| |
|
| | | | 6,450,627 |
| Financial Services - 1.67% | | | |
| FCStone Group, Inc. * | 28,350 | | 1,325,079 |
| Portfolio Recovery Associates, Inc. * (a) | 39,000 | | 2,003,040 |
| |
|
| | | | 3,328,119 |
| |
| The accompanying notes are an integral part of the financial statements. | 157 |
John Hancock Funds II
Portfolio of investments — August 31, 2007
(showing percentage of total net assets)
| | | |
| Emerging Growth Fund (continued) | | |
| | Shares or | | |
| | Principal | | |
| | Amount | | Value |
|
|
| |
| COMMON STOCKS (continued) | | | |
| | | | |
| Healthcare Products - 10.00% | | | |
| Caliper Life Sciences, Inc. * (a) | 189,250 | $ | 1,038,983 |
| Kyphon, Inc. * | 71,800 | | 4,801,266 |
| Nuvasive, Inc. * | 103,900 | | 3,314,410 |
| ResMed, Inc. * | 62,000 | | 2,520,920 |
| SenoRx, Inc. * | 114,450 | | 987,703 |
| Somanetics Corp. * | 114,200 | | 2,220,048 |
| SonoSite, Inc. * (a) | 113,900 | | 3,321,324 |
| Spectranetics Corp. * (a) | 113,700 | | 1,674,801 |
|
|
| | | | 19,879,455 |
| Healthcare Services - 1.22% | | | |
| Healthextras, Inc. * | 86,350 | | 2,427,299 |
| | | | |
| Hotels & Restaurants - 2.47% | | | |
| McCormick & Schmick's Seafood | | | |
| Restaurants, Inc. * | 104,450 | | 2,767,925 |
| Texas Roadhouse, Inc., Class A * | 167,550 | | 2,146,315 |
|
|
| | | | 4,914,240 |
| Household Products - 0.78% | | | |
| Select Comfort Corp. * (a) | 90,825 | | 1,557,649 |
| | | | |
| Industrial Machinery - 0.84% | | | |
| Flow International Corp. * | 204,500 | | 1,678,945 |
| | | | |
| Insurance - 2.21% | | | |
| Infinity Property & Casualty Corp. | 63,750 | | 2,643,075 |
| ProAssurance Corp. * | 33,300 | | 1,750,914 |
|
|
| | | | 4,393,989 |
| International Oil - 1.34% | | | |
| ATP Oil & Gas Corp. * (a) | 61,950 | | 2,666,948 |
| | | | |
| Leisure Time - 4.77% | | | |
| Bally Technologies, Inc. * | 103,050 | | 3,418,168 |
| Imax Corp. * | 438,200 | | 2,042,012 |
| Pinnacle Entertainment, Inc. * | 67,600 | | 1,880,632 |
| Progressive Gaming International Corp. * (a) | 420,050 | | 2,150,656 |
|
|
| | | | 9,491,468 |
| Manufacturing - 5.54% | | | |
| Force Protection, Inc. * (a) | 316,500 | | 5,453,295 |
| iRobot Corp. * (a) | 163,500 | | 3,606,810 |
| Raven Industries, Inc. (a) | 48,050 | | 1,958,037 |
|
|
| | | | 11,018,142 |
| Medical-Hospitals - 3.60% | | | |
| Electro-Optical Sciences, Inc. * | 218,585 | | 1,348,669 |
| EV3, Inc. * (a) | 107,300 | | 1,642,763 |
| Neurometrix, Inc. * (a) | 100,550 | | 781,274 |
| Northstar Neuroscience, Inc. * | 120,100 | | 1,364,336 |
| Vital Images, Inc. * (a) | 108,550 | | 2,012,517 |
|
|
| | | | 7,149,559 |
| Metal & Metal Products - 1.31% | | | |
| Haynes International, Inc. * | 31,200 | | 2,606,136 |
| | | | |
| Petroleum Services - 2.29% | | | |
| Superior Energy Services, Inc. * | 72,300 | | 2,806,686 |
| | | | |
| Emerging Growth Fund (continued) | | |
| | | Shares or | | |
| | | Principal | | |
| | | Amount | | Value |
| |
|
| |
| COMMON STOCKS (continued) | | | | |
| | | | | |
| Petroleum Services (continued) | | | | |
| TETRA Technologies, Inc. * | | 87,250 | $ | 1,744,128 |
|
|
| | | | | 4,550,814 |
| Pharmaceuticals - 3.43% | | | | |
| AMAG Pharmaceuticals, Inc. * (a) | | 39,350 | | 2,150,477 |
| Inspire Pharmaceuticals, Inc. * | | 233,450 | | 1,290,979 |
| Medicis Pharmaceutical Corp., Class A | | 110,764 | | 3,382,733 |
|
|
| | | | | 6,824,189 |
| Retail Trade - 2.02% | | | | |
| A.C. Moore Arts & Crafts, Inc. * | | 109,950 | | 2,054,965 |
| Hibbett Sports, Inc. * | | 78,300 | | 1,952,802 |
|
|
| | | | | 4,007,767 |
| Semiconductors - 6.31% | | | | |
| Cymer, Inc. * | | 77,400 | | 3,068,136 |
| FormFactor, Inc. * | | 100,800 | | 4,572,288 |
| Mattson Technology, Inc. * | | 273,050 | | 2,875,216 |
| Netlogic Microsystems, Inc. * (a) | | 69,350 | | 2,034,036 |
|
|
| | | | | 12,549,676 |
| Software - 6.94% | | | | |
| Allscripts Healthcare Solution, Inc. * (a) | | 134,800 | | 3,047,828 |
| Concur Technologies, Inc. * | | 151,250 | | 4,050,475 |
| DivX, Inc. * (a) | | 114,050 | | 1,589,857 |
| FARO Technologies, Inc. * | | 59,200 | | 2,380,432 |
| Progress Software Corp. * | | 89,474 | | 2,730,746 |
|
|
| | | | | 13,799,338 |
| Telecommunications Equipment & | | | | |
| Services - 2.08% | | | | |
| Comtech Telecommunications Corp. * | | 96,950 | | 4,126,192 |
| | | | | |
| Trucking & Freight - 2.48% | | | | |
| Celadon Group, Inc. * | | 173,575 | | 2,707,770 |
| ID Systems, Inc. * (a) | | 190,300 | | 2,228,413 |
|
|
| | | | | 4,936,183 |
|
| TOTAL COMMON STOCKS (Cost $182,645,766) | | $ | 187,634,374 |
|
| |
| WARRANTS - 0.00% | | | | |
| | | | | |
| Medical-Hospitals - 0.00% | | | | |
| Electro-Optical Sciences, Inc. | | | | |
| (Expiration Date: 10/31/2011, Strike | | | | |
| Price: $6.70) | | 5,396 | | 0 |
| (Expiration Date: 08/03/2012, Strike | | | | |
| Price: $8.00) | | 45,653 | | 0 |
|
| TOTAL WARRANTS (Cost $0) | | | $ | 0 |
|
| |
| SHORT TERM INVESTMENTS - 35.89% | | | |
| Federal Home Loan Bank Discount Notes | | | | |
| 4.20% due 09/04/2007 | $ | 11,700,000 | $ | 11,695,905 |
| John Hancock Cash Investment Trust (c) | | 59,656,118 | | 59,656,118 |
|
| TOTAL SHORT TERM INVESTMENTS | | | | |
| (Cost $71,352,023) | | | $ | 71,352,023 |
|
| |
| The accompanying notes are an integral part of the financial statements. | 158 |
John Hancock Funds II
Portfolio of investments — August 31, 2007
(showing percentage of total net assets)
| | | | |
| Emerging Growth Fund (continued) | | |
| | | Shares or | | |
| | | Principal | | |
| | | Amount | | Value |
|
|
| |
| REPURCHASE AGREEMENTS - 0.03% | | | |
| Repurchase Agreement with State | | | | |
| Street Corp. dated 08/31/2007 at | | | | |
| 4.60% to be repurchased at | | | | |
| $61,031 on 09/04/2007, | | | | |
| collateralized by $65,000 Federal | | | | |
| Home Loan Bank, 5.5% due | | | | |
| 07/15/2036 (valued at $66,869, | | | | |
| including interest) | $ | 61,000 | $ | 61,000 |
|
| TOTAL REPURCHASE AGREEMENTS | | | | |
| (Cost $61,000) | | | $ | 61,000 |
|
| Total Investments (Emerging Growth Fund) | | | |
| (Cost $254,058,789) - 130.30% | | | $ | 259,047,397 |
| Liabilities in Excess of Other Assets - (30.30)% | | | (60,244,902) |
|
|
| TOTAL NET ASSETS - 100.00% | | | $ | 198,802,495 |
|
|
| |
| |
| |
| Emerging Markets Value Fund | | | |
| | | Shares or | | |
| | | Principal | | |
| | | Amount | | Value |
|
|
| |
| COMMON STOCKS - 94.48% | | | | |
| | | | | |
| Bermuda - 0.13% | | | | |
| Brilliance China Automotive Holdings, Ltd. * | 230,000 | $ | 55,309 |
| Cosco Pacific, Ltd. | | 152,000 | | 422,629 |
| Digital China Holdings, Ltd. | | 103,000 | | 50,169 |
| TPV Technology, Ltd. | | 190,000 | | 119,204 |
|
|
| | | | | 647,311 |
| Brazil - 4.37% | | | | |
| Aracruz Celulose SA, ADR | | 26,821 | | 1,674,435 |
| Braskem SA, ADR | | 119,002 | | 2,171,786 |
| Eternit SA * | | 30,000 | | 130,932 |
| Gerdau SA, SADR | | 410,989 | | 9,880,176 |
| Perdigao SA, ADR | | 55,763 | | 2,107,841 |
| Sadia SA, ADR * | | 54,629 | | 2,717,793 |
| Votorantim Celulose & Papel SA, SADR * | | 102,450 | | 2,395,281 |
|
|
| | | | | 21,078,244 |
| Chile - 4.38% | | | | |
| Cementos Bio Bio SA | | 2,795 | | 8,014 |
| Companhia de Consumidores de Gas de | | | | |
| Santiago SA | | 6,504 | | 33,567 |
| Companhia Sudamericana de Vapores SA * | 502,052 | | 1,246,517 |
| Compania de Telecomunicaciones de Chile | | | |
| SA, ADR | | 214,262 | | 1,836,225 |
| Corpbanca SA, ADR | | 4,088 | | 134,986 |
| Cristalerias de Chile SA | | 1,061 | | 14,704 |
| Empresas CMPC SA | | 50,075 | | 1,828,219 |
| Empresas Copec SA | | 397,242 | | 6,218,130 |
| Empresas Iansa SA | | 439,146 | | 41,887 |
| Enersis SA, ADR | | 459,633 | | 8,264,201 |
| Industrias Forestales SA | | 77,846 | | 23,362 |
| Madeco SA, SADR * | | 41,779 | | 553,154 |
| Masisa SA | | 2,957,145 | | 760,837 |
| | | |
| Emerging Markets Value Fund (continued) | |
| | Shares or | | |
| | Principal | | |
| | Amount | | Value |
|
|
| |
| COMMON STOCKS (continued) | | | |
| | | | |
| Chile (continued) | | | |
| Soquimich Comercial SA | 129,645 | $ | 68,249 |
| Vina San Pedro SA * | 9,342,203 | | 108,931 |
|
|
| | | | 21,140,983 |
| China - 1.42% | | | |
| Bank of China, Ltd., H Shares | 3,064,000 | | 1,572,317 |
| Chaoda Modern Agriculture Holdings, Ltd. | 156,000 | | 120,162 |
| China Construction Bank | 726,000 | | 611,364 |
| China Petroleum & Chemical Corp., ADR | 9,100 | | 1,002,365 |
| China Shipping Container Lines Company, Ltd. | 289,850 | | 221,337 |
| China Travel International Investment | | | |
| Hong Kong, Ltd. | 422,000 | | 266,748 |
| Dongfeng Motor Group Company, Ltd. | 516,000 | | 335,045 |
| Guangshen Railway Company, Ltd., Class H, | | | |
| SADR | 3,000 | | 118,740 |
| Guangshen Railway Company, Ltd., Class H | 110,000 | | 87,381 |
| Hunan Non Ferrous Metal Corp., Ltd | 200,000 | | 116,735 |
| Industrial & Commercial Bank of China | 832,000 | | 544,706 |
| Maanshan Iron & Steel Company, Ltd.,Class H | 310,000 | | 277,053 |
| PetroChina Company, Ltd., ADR | 7,600 | | 1,096,908 |
| Semiconductor Manufacturing International | | | |
| Corp., ADR * | 40,900 | | 238,856 |
| Shanghai Electric Group Company, Ltd. | 194,000 | | 123,905 |
| Sinopec Shanghai Petrochemical Company, | | | |
| Ltd., SADR | 400 | | 27,464 |
| Sinotrans, Ltd., H Shares | 193,000 | | 106,375 |
|
|
| | | | 6,867,461 |
| Czech Republic - 1.15% | | | |
| Telefonica Czech Republic AS | 142,949 | | 4,274,138 |
| Unipetrol AS * | 91,126 | | 1,263,818 |
|
|
| | | | 5,537,956 |
| Hong Kong - 0.98% | | | |
| Amvig Holdings, Ltd. | 38,000 | | 55,321 |
| Beijing Capital Land, Ltd. | 70,000 | | 52,518 |
| Beijing Enterprises Holdings, Ltd. | 94,000 | | 411,863 |
| China Aerospace International Holdings, Ltd. * | 365,400 | | 58,368 |
| China Rare Earth Holdings, Ltd. | 96,000 | | 26,576 |
| China Resources Enterprises, Ltd. | 52,000 | | 212,342 |
| China Southern Airlines Company, Ltd. * | 114,000 | | 146,913 |
| China Unicom, Ltd., ADR | 40,000 | | 760,000 |
| China Unicom, Ltd. | 234,000 | | 443,113 |
| Citic Pacific, Ltd. | 140,000 | | 768,952 |
| CNPC Hong Kong, Ltd. | 380,000 | | 201,302 |
| COFCO International, Ltd. | 104,000 | | 66,679 |
| Comba Telecom Systems Holdings, Ltd. | 136,000 | | 47,297 |
| Dalian Port PDA Company, Ltd. | 58,000 | | 42,511 |
| Denway Motors, Ltd. | 724,000 | | 339,430 |
| Dynasty Fine Wines Group, Ltd. | 98,000 | | 36,793 |
| Global Bio-Chem Technology | | | |
| Group Company, Ltd. | 110,000 | | 47,972 |
| Great Wall Motor Company, Ltd. | 29,000 | | 35,598 |
| Harbin Power Equipment Company, Ltd. | 50,000 | | 108,520 |
| Minmetals Resources, Ltd. * | 104,000 | | 65,157 |
| |
| The accompanying notes are an integral part of the financial statements. | 159 |
John Hancock Funds II
Portfolio of investments — August 31, 2007
(showing percentage of total net assets)
| | | |
| Emerging Markets Value Fund (continued) | |
| | Shares or | | |
| | Principal | | |
| | Amount | | Value |
|
|
| |
| COMMON STOCKS (continued) | | | |
| | | | |
| Hong Kong (continued) | | | |
| Neo-China Group Holdings, Ltd. | 230,000 | $ | 57,621 |
| Semiconductor Manufacturing | | | |
| International Corp. * | 281,000 | | 33,111 |
| Shanghai Industrial Holdings, Ltd. | 58,000 | | 252,970 |
| Shanghai Real Estate, Ltd. | 108,000 | | 47,698 |
| Shenzhou International Group Holdings, Ltd. | 50,000 | | 24,811 |
| Sinolink Worldwide Holdings, Ltd. | 154,000 | | 46,319 |
| Sinopec Kantons Holdings, Ltd. | 100,000 | | 30,949 |
| Travelsky Technology, Ltd., Class H | 111,000 | | 89,636 |
| Weiqiao Textile Company, Ltd. | 69,500 | | 151,240 |
| Xiamen International Port Company, Ltd. | 40,000 | | 14,363 |
| Xiwang Sugar Holdings Company, Ltd. | 102,000 | | 50,514 |
|
|
| | | | 4,726,457 |
| Hungary - 2.90% | | | |
| Egis Nyrt. | 3,828 | | 469,142 |
| Fotex PLC * | 56,032 | | 290,734 |
| Gedeon Richter Rt. | 12,289 | | 2,433,301 |
| MOL Magyar Olaj es Gazipari Rt. | 72,209 | | 10,356,463 |
| Pannonplast PLC * | 3,302 | | 128,838 |
| Raba Jarmuipari Holding Nyilvanosan | | | |
| Mukodo Rt. * | 11,794 | | 150,883 |
| Tiszai Vegyi Kombinat Nyrt. * | 4,033 | | 167,756 |
|
|
| | | | 13,997,117 |
| India - 12.00% | | | |
| Aditya Birla Nuvo, Ltd. | 7,200 | | 243,871 |
| Ador Welding, Ltd. | 8,367 | | 53,867 |
| Aftek, Ltd. | 28,741 | | 44,026 |
| Alembic, Ltd. | 38,000 | | 68,492 |
| Alok Industries, Ltd. * | 72,774 | | 121,980 |
| Ambuja Cements, Ltd. * | 604,511 | | 1,986,996 |
| Amtek Auto, Ltd. | 40,948 | | 372,333 |
| Apollo Hospitals Enterprise, Ltd. | 17,400 | | 207,310 |
| Apollo Tyres, Ltd. | 154,850 | | 154,660 |
| Arvind Mills, Ltd. | 104,142 | | 123,047 |
| Ashok Leyland, Ltd. | 432,251 | | 404,652 |
| Aurobindo Pharma, Ltd. * | 20,097 | | 298,511 |
| Avaya Global Connect, Ltd. * | 5,668 | | 41,903 |
| Aztecsoft, Ltd. | 22,751 | | 41,973 |
| Bajaj Auto Finance, Ltd. | 11,946 | | 109,778 |
| Bajaj Auto, Ltd. | 24,676 | | 1,426,334 |
| Bajaj Hindusthan, Ltd. | 38,278 | | 126,154 |
| Ballarpur Industries, Ltd. | 72,742 | | 246,107 |
| Balmer Lawrie & Company, Ltd. * | 1,500 | | 14,867 |
| Balrampur Chini Mills, Ltd. | 78,680 | | 114,527 |
| Bank of Maharashtra | 130,888 | | 171,279 |
| Bank of Rajasthan, Ltd. | 39,971 | | 93,755 |
| BASF India, Ltd. | 16,182 | | 105,737 |
| Bata India, Ltd. * | 25,249 | | 98,667 |
| Bharat Earth Movers, Ltd. | 13,744 | | 412,524 |
| Bharat Forge, Ltd. | 6,300 | | 41,076 |
| Bhushan Steel, Ltd. * | 16,585 | | 308,788 |
| | | |
| Emerging Markets Value Fund (continued) | | |
| | Shares or | | |
| | Principal | | |
| | Amount | | Value |
|
|
| |
| COMMON STOCKS (continued) | | | |
| | | | |
| India (continued) | | | |
| Biocon, Ltd. | 12,400 | $ | 138,409 |
| BOC India, Ltd. | 9,300 | | 29,334 |
| Bombay Dyeing & Manufacturing Company, | | | |
| Ltd. | 6,668 | | 95,131 |
| Bosch Chassis Systems India, Ltd. | 2,280 | | 22,905 |
| Ceat, Ltd. | 26,055 | | 103,944 |
| Chambal Fertilizers & Chemicals, Ltd. | 122,930 | | 150,104 |
| Cholamandalam DBS Finance, Ltd. | 5,500 | | 25,418 |
| City Union Bank, Ltd. | 5,850 | | 30,713 |
| Coromandel Fertilisers, Ltd. | 12,000 | | 27,430 |
| Cranes Software International, Ltd. * | 3,000 | | 8,861 |
| Dabur Pharma, Ltd. * | 32,000 | | 59,381 |
| Dalmia Cement Bharat, Ltd. | 6,800 | | 60,691 |
| DCM Shriram Consolidated, Ltd. * | 26,804 | | 47,382 |
| Deepak Fertilizers & Petrochemicals Corp., | | | |
| Ltd. | 34,858 | | 90,936 |
| Dr. Reddy's Laboratories, Ltd., ADR | 24,300 | | 386,370 |
| Eicher Motors, Ltd. | 8,302 | | 74,738 |
| EID Parry India, Ltd. | 18,099 | | 60,719 |
| EIH, Ltd. | 108,400 | | 306,287 |
| Elder Pharmaceuticals, Ltd. * | 3,200 | | 30,111 |
| Electrosteel Castings, Ltd. * | 4,700 | | 51,879 |
| Escorts, Ltd. * | 36,222 | | 84,691 |
| Essel Propack, Ltd. | 6,500 | | 9,442 |
| Eveready Industries, Ltd. * | 21,000 | | 26,608 |
| Federal Bank, Ltd. | 33,924 | | 284,710 |
| Finolex Cables, Ltd. | 27,100 | | 51,515 |
| Finolex Industries, Ltd. | 62,340 | | 111,465 |
| Gammon India, Ltd. * | 28,239 | | 321,972 |
| Graphite India, Ltd. | 75,397 | | 103,075 |
| Great Eastern Shipping Company, Ltd. | 51,772 | | 403,424 |
| GTL, Ltd. | 48,244 | | 272,087 |
| Gujarat Alkalies & Chemicals, Ltd. | 35,989 | | 115,275 |
| Gujarat Ambuja Exports, Ltd. * | 15,000 | | 11,136 |
| Gujarat Narmada Valley Fertilizers Company, | | | |
| Ltd. | 51,735 | | 164,291 |
| Gujarat State Fertilisers & Chemicals, Ltd. | 17,219 | | 94,528 |
| HCL Infosystems, Ltd. * | 63,711 | | 309,897 |
| HEG, Ltd. * | 13,300 | | 66,332 |
| Hexaware Technologies, Ltd. | 38,931 | | 113,394 |
| Himatsingka Seide, Ltd. | 4,000 | | 11,129 |
| Hinduja TMT, Ltd. | 5,652 | | 55,097 |
| Hindustan Construction Company, Ltd. | 60,588 | | 194,884 |
| Hindustan Motors, Ltd. * | 62,438 | | 48,270 |
| Hotel Leela Venture, Ltd. | 112,844 | | 119,703 |
| ICI India, Ltd. | 4,700 | | 60,774 |
| ICICI Bank, Ltd., SADR | 299,241 | | 13,301,262 |
| iGATE Global Solutions, Ltd. | 19,459 | | 104,938 |
| India Cements, Ltd. * | 65,673 | | 397,057 |
| India Glycols, Ltd. | 14,305 | | 63,814 |
| Indian Hotels Company, Ltd. | 294,257 | | 920,924 |
| IndusInd Bank, Ltd. | 88,148 | | 114,247 |
| |
| The accompanying notes are an integral part of the financial statements. | 160 |
John Hancock Funds II
Portfolio of investments — August 31, 2007
(showing percentage of total net assets)
| | | |
| Emerging Markets Value Fund (continued) | |
| | Shares or | | |
| | Principal | | |
| | Amount | | Value |
|
|
| |
| COMMON STOCKS (continued) | | | |
| | | | |
| India (continued) | | | |
| Industrial Development Bank of India, Ltd. | 234,735 | $ | 720,731 |
| Infomedia India, Ltd. | 7,700 | | 46,361 |
| Ipca Laboratories, Ltd. | 4,298 | | 73,244 |
| Jammu & Kashmir Bank, Ltd. | 14,831 | | 243,527 |
| JB Chemicals & Pharmaceuticals, Ltd. | 21,800 | | 36,748 |
| JBF Industries, Ltd. | 33,159 | | 118,428 |
| Jet Airways India, Ltd. * | 16,718 | | 332,717 |
| Jindal Saw, Ltd. | 13,753 | | 199,785 |
| Jindal Stainless, Ltd. | 44,557 | | 178,525 |
| JK Tyre & Industries, Ltd. | 10,900 | | 36,346 |
| JSW Steel, Ltd. | 51,671 | | 818,925 |
| Karnataka Bank, Ltd. | 37,698 | | 176,271 |
| Karur Vysya Bank, Ltd. | 21,841 | | 175,079 |
| Kesoram Industries, Ltd. | 9,260 | | 107,882 |
| Kirloskar Oil Engines, Ltd. | 28,728 | | 227,586 |
| LIC Housing Finance, Ltd. | 34,065 | | 155,560 |
| Mahindra & Mahindra, Ltd. | 195,127 | | 3,400,626 |
| Mangalam Cement, Ltd. | 14,461 | | 58,257 |
| Maruti Udyog, Ltd. | 65,711 | | 1,399,500 |
| Mastek, Ltd. | 11,271 | | 71,167 |
| Matrix Laboratories, Ltd. | 58,149 | | 344,272 |
| Mercator Lines, Ltd. * | 105,166 | | 144,212 |
| Monnet Ispat & Energy, Ltd. | 17,433 | | 128,822 |
| Moser Baer India, Ltd. | 70,858 | | 532,061 |
| MRF, Ltd. | 680 | | 64,100 |
| Mukand, Ltd. | 28,732 | | 56,266 |
| Nagarjuna Construction Company, Ltd. | 69,234 | | 346,181 |
| Nagarjuna Fertilizers & Chemicals, Ltd. * | 229,114 | | 227,080 |
| Nahar Spinning Mills, Ltd. * | 6,600 | | 13,395 |
| Natco Pharma, Ltd. | 7,500 | | 20,298 |
| National Organic Chemical Industries, Ltd. | 80,241 | | 52,813 |
| Navneet Publications India, Ltd. | 46,585 | | 66,914 |
| Nirma, Ltd. | 20,100 | | 80,139 |
| Orchid Chemicals & Pharmaceuticals, Ltd. | 28,645 | | 143,715 |
| Orient Paper & Industries, Ltd. | 5,177 | | 55,262 |
| Patni Computer Systems, Ltd. | 38,484 | | 498,476 |
| Petronet LNG, Ltd. | 240,816 | | 365,326 |
| Polaris Software Lab, Ltd. | 39,735 | | 110,795 |
| PSL, Ltd. * | 6,900 | | 54,676 |
| PTC India, Ltd. * | 68,932 | | 135,640 |
| Punjab Tractors, Ltd. * | 18,068 | | 104,317 |
| Rain Calcining, Ltd. | 48,902 | | 46,444 |
| Raymond, Ltd. | 13,679 | | 86,810 |
| Rei Agro, Ltd. | 13,901 | | 110,564 |
| Reliance Industries, Ltd., ADR | 117,696 | | 11,239,968 |
| Rolta India, Ltd. * | 29,378 | | 338,904 |
| Ruchi Soya Industries, Ltd. * | 13,563 | | 130,155 |
| Sakthi Sugars, Ltd. * | 25,066 | | 46,007 |
| Seamec, Ltd. * | 14,000 | | 76,037 |
| Shasun Chemicals & Drugs, Ltd. | 16,408 | | 37,566 |
| Shriram Transport Finance Company, Ltd. | 51,252 | | 214,564 |
| Sical Logistics, Ltd. * | 4,881 | | 28,537 |
| | | |
| Emerging Markets Value Fund (continued) | | |
| | Shares or | | |
| | Principal | | |
| | Amount | | Value |
|
|
| |
| COMMON STOCKS (continued) | | | |
| | | | |
| India (continued) | | | |
| Sonata Software, Ltd. | 23,000 | $ | 28,376 |
| South Indian Bank, Ltd. | 37,494 | | 141,451 |
| SREI Infrastructure Finance, Ltd. | 24,771 | | 55,752 |
| SRF, Ltd. | 37,385 | | 123,291 |
| Sterlite Optical Technologies, Ltd. | 20,008 | | 109,475 |
| Strides Arcolab, Ltd. | 13,608 | | 92,752 |
| Syndicate Bank, Ltd. | 189,537 | | 363,205 |
| Tata Chemicals, Ltd. | 71,422 | | 442,098 |
| Tata Investment Corp., Ltd. | 6,928 | | 74,803 |
| Tata Metaliks, Ltd. | 7,900 | | 28,088 |
| Tata Motors, Ltd. | 157,232 | | 2,706,826 |
| Tele Data Informatics, Ltd. | 47,214 | | 80,424 |
| Tube Investments Of India, Ltd. | 62,323 | | 89,114 |
| TVS Motor Company, Ltd. | 63,451 | | 102,357 |
| United Phosphorus, Ltd. | 66,463 | | 541,170 |
| Usha Martin, Ltd. * | 106,610 | | 148,048 |
| Uttam Galva Steels, Ltd. * | 56,948 | | 47,066 |
| Varun Shipping Company, Ltd. | 62,246 | | 96,142 |
| Videsh Sanchar Nigam, Ltd., ADR | 29,783 | | 601,319 |
| Vimta Labs, Ltd. | 13,038 | | 45,936 |
| Wockhardt, Ltd. | 24,300 | | 231,126 |
| Zensar Technologies, Ltd. | 12,328 | | 64,097 |
| Zuari Industries, Ltd. | 3,500 | | 20,164 |
| |
|
| | | | 57,880,559 |
| Indonesia - 2.44% | | | |
| Apexindo Pratama Duta Tbk PT | 983,500 | | 212,543 |
| Astra Graphia Tbk PT | 606,500 | | 34,777 |
| Astra International Tbk PT | 2,031,500 | | 3,862,867 |
| Bakrie & Brothers Tbk PT * | 10,129,500 | | 290,324 |
| Bakrieland Development Tbk PT * | 1,401,000 | | 58,809 |
| Bank Central Asia Tbk PT | 2,400,000 | | 1,533,065 |
| Bank Niaga Tbk PT | 4,865,500 | | 466,926 |
| Bank Pan Indonesia Tbk PT * | 6,711,000 | | 478,282 |
| Berlian Laju Tanker Tbk PT | 2,148,500 | | 353,146 |
| Bhakti Investama Tbk PT * | 1,011,825 | | 97,980 |
| Charoen Pokphand Indonesia Tbk PT | 530,250 | | 60,422 |
| Ciputra Surya Tbk PT * | 971,000 | | 105,444 |
| Citra Marga Nusaphala Persada Tbk PT | 836,000 | | 213,790 |
| Enseval Putera Megatrading Tbk PT | 1,104,500 | | 99,002 |
| Gudang Garam Tbk PT | 202,000 | | 205,168 |
| Holcim Indonesia Tbk PT * | 2,879,500 | | 315,604 |
| Indocement Tunggal Prakarsa Tbk PT | 417,000 | | 284,364 |
| Indofood Sukses Makmur Tbk PT | 4,583,500 | | 905,050 |
| Kawasan Industri Jababeka Tbk PT * | 6,349,500 | | 148,253 |
| Lippo Karawaci Tbk PT | 2,706,500 | | 518,915 |
| Matahari Putra Prima Tbk PT | 2,845,500 | | 242,200 |
| Medco Energi Internasional Tbk PT | 715,000 | | 297,466 |
| Mitra Adiperkasa Tbk PT | 866,000 | | 72,735 |
| Panin Insurance Tbk PT * | 1,443,000 | | 49,247 |
| Panin Life Tbk PT * | 6,089,500 | | 123,507 |
| Polychem Indonesia Tbk PT * | 1,930,000 | | 39,131 |
| |
| The accompanying notes are an integral part of the financial statements. | 161 |
John Hancock Funds II
Portfolio of investments — August 31, 2007
(showing percentage of total net assets)
| | | |
| Emerging Markets Value Fund (continued) | | |
| | Shares or | | |
| | Principal | | |
| | Amount | | Value |
|
|
| |
| COMMON STOCKS (continued) | | | |
| | | | |
| Indonesia (continued) | | | |
| Ramayana Lestari Sentosa Tbk PT | 2,120,500 | $ | 191,775 |
| Samudera Indonesia Tbk PT | 74,500 | | 51,417 |
| Suryainti Permata Tbk PT * | 450,500 | | 66,381 |
| Tempo Scan Pacific Tbk PT | 2,207,500 | | 185,698 |
| Timah Tbk PT | 41,000 | | 53,718 |
| Trias Sentosa Tbk PT | 1,000,000 | | 24,468 |
| Trimegah Securities Tbk PT | 1,540,500 | | 42,811 |
| Tunas Ridean Tbk PT | 948,500 | | 90,865 |
| |
|
| | | | 11,776,150 |
| Israel - 3.25% | | | |
| Albaad Massuot Yitzhak, Ltd. | 3,160 | | 32,838 |
| AudioCodes, Ltd. * | 26,116 | | 131,372 |
| Azorim Investment Development & | | | |
| Construction Company, Ltd. | 11,262 | | 100,393 |
| Bank Hapoalim, Ltd. | 1,073,537 | | 5,115,066 |
| Bank Leumi Le-Israel, Ltd. | 974,197 | | 3,804,757 |
| Blue Square Israel, Ltd. | 3,465 | | 47,925 |
| Clal Insurance Enterprise Holdings, Ltd. | 16,304 | | 387,242 |
| Delta Galil Industries, Ltd. * | 11,216 | | 68,852 |
| Discount Investment Corp. | 25,779 | | 749,394 |
| Electra, Ltd. * | 392 | | 58,285 |
| Elron Electronic Industries, Ltd. * | 23,021 | | 299,312 |
| First International Bank of Israel, Ltd. * | 57,569 | | 134,146 |
| Formula Systems, Ltd., ADR * | 3,500 | | 45,710 |
| Formula Systems, Ltd. * | 5,626 | | 73,923 |
| Frutarom Industries, Ltd. | 6,800 | | 54,633 |
| IDB Development Corp., Ltd. | 19,064 | | 687,627 |
| Israel Salt Industries, Ltd. | 17,450 | | 131,155 |
| Ituran Location & Control, Ltd. | 2,562 | | 29,803 |
| Koor Industries, Ltd. | 11,687 | | 813,081 |
| Leader Holding & Investments, Ltd. | 21,500 | | 51,053 |
| Mivtach Shamir Holdings, Ltd. | 4,390 | | 101,689 |
| Orbotech, Ltd. * | 45,156 | | 977,627 |
| Packer Plada, Ltd. | 329 | | 36,712 |
| Retalix, Ltd. * | 22,317 | | 359,168 |
| Scailex Corp., Ltd. * | 11,425 | | 104,488 |
| Super-Sol, Ltd., Class B * | 13,963 | | 51,940 |
| Tower Semiconductor, Ltd. * | 103,528 | | 141,626 |
| Union Bank of Israel, Ltd. | 25,609 | | 116,885 |
| United Mizrahi Bank, Ltd. | 135,710 | | 936,372 |
| Urdan Industries, Ltd. | 59,724 | | 43,389 |
| |
|
| | | | 15,686,463 |
| Malaysia - 4.85% | | | |
| Affin Holdings BHD | 788,300 | | 576,455 |
| AMDB BHD * | 540,000 | | 64,449 |
| AMMB Holdings BHD * | 1,855,600 | | 2,315,890 |
| Ann Joo Resources BHD | 72,600 | | 73,006 |
| Asas Dunia BHD | 94,000 | | 28,553 |
| Asia Pacific Land BHD | 282,100 | | 43,081 |
| Bandar Raya Developments BHD | 242,900 | | 206,895 |
| Batu Kawan BHD | 233,700 | | 534,180 |
| | | |
| Emerging Markets Value Fund (continued) | | |
| | Shares or | | |
| | Principal | | |
| | Amount | | Value |
|
|
| |
| COMMON STOCKS (continued) | | | |
| | | | |
| Malaysia (continued) | | | |
| Berjaya Corp. BHD * | 1,312,300 | $ | 148,145 |
| Berjaya Land BHD | 406,800 | | 200,029 |
| Boustead Holdings BHD | 368,900 | | 527,352 |
| Cahya Mata Sarawak BHD | 235,100 | | 170,709 |
| Dijaya Corp. BHD | 16,900 | | 6,684 |
| DRB-Hicom BHD | 904,600 | | 449,523 |
| Eastern & Oriental BHD * | 66,000 | | 56,979 |
| Eastern Pacific Industrial Corp. BHD | 155,700 | | 113,452 |
| ECM Libra Avenue BHD | 516,700 | | 136,881 |
| Edaran Otomobil Nasional BHD * | 123,000 | | 63,933 |
| Encorp BHD | 114,800 | | 49,077 |
| EON Capital BHD | 409,900 | | 817,635 |
| Esso Malaysia BHD | 43,000 | | 31,897 |
| General Corp. BHD | 242,500 | | 75,105 |
| Globetronics Technology BHD | 864,900 | | 71,173 |
| Glomac BHD | 108,200 | | 46,708 |
| Goldis BHD | 179,000 | | 121,172 |
| GuocoLand Malaysia BHD | 429,100 | | 346,361 |
| Hap Seng Consolidated BHD | 199,800 | | 172,660 |
| Hong Leong Credit BHD | 308,300 | | 496,699 |
| Hong Leong Industries BHD | 39,000 | | 44,472 |
| Hume Industries-Malaysia BHD | 138,900 | | 159,315 |
| Hunza Properties BHD | 102,400 | | 81,290 |
| Hwang-DBS Malaysia BHD | 69,400 | | 46,260 |
| IGB Corp., BHD | 968,400 | | 681,939 |
| IJM Plantations BHD | 164,400 | | 100,174 |
| Insas BHD * | 460,100 | | 82,201 |
| Integrated Logistics BHD | 167,200 | | 72,275 |
| Jaks Resources BHD * | 245,000 | | 66,123 |
| K & N Kenanga Holdings BHD | 154,200 | | 47,684 |
| Karambunai Corp. BHD * | 2,558,200 | | 105,499 |
| Keck Seng BHD | 178,900 | | 226,537 |
| Kian Joo Can Factory BHD | 332,000 | | 139,928 |
| KLCC Property Holdings BHD | 571,000 | | 566,155 |
| KPJ Healthcare BHD | 93,000 | | 90,659 |
| KSL Holdings BHD | 116,300 | | 72,976 |
| KUB Malaysia BHD * | 592,900 | | 167,886 |
| Kulim Malaysia BHD | 154,100 | | 260,582 |
| Kumpulan Hartanah Selangor BHD * | 410,900 | | 130,955 |
| Land & General BHD * | 1,081,300 | | 236,811 |
| LBS Bina Group BHD * | 210,000 | | 39,570 |
| Leader Universal Holding BHD | 717,000 | | 214,613 |
| Lion Corp., BHD * | 454,900 | | 102,501 |
| Lion Industries Corp., BHD | 448,000 | | 239,190 |
| MAA Holdings BHD | 139,500 | | 74,225 |
| Malaysia Building Society BHD | 274,400 | | 121,954 |
| Malaysian Industrial Development Finance | | | |
| BHD | 559,300 | | 299,209 |
| Malaysian Plantations BHD * | 545,400 | | 451,893 |
| MBM Resources BHD | 5,000 | | 4,401 |
| Measat Global BHD * | 7,500 | | 3,826 |
| Mega First Corp. BHD | 193,700 | | 82,853 |
| |
| The accompanying notes are an integral part of the financial statements. | 162 |
John Hancock Funds II
Portfolio of investments — August 31, 2007
(showing percentage of total net assets)
| | | |
| Emerging Markets Value Fund (continued) | |
| | Shares or | | |
| | Principal | | |
| | Amount | | Value |
|
|
| |
| COMMON STOCKS (continued) | | | |
| | | | |
| Malaysia (continued) | | | |
| Melewar Industrial Group BHD * | 127,200 | $ | 55,552 |
| MISC BHD | 178,000 | | 461,341 |
| MK Land Holdings BHD | 656,100 | | 170,432 |
| MNRB Holdings BHD | 14,000 | | 20,158 |
| MTD ACPI Engineering BHD | 88,100 | | 48,816 |
| MTD Infraperdana BHD | 194,000 | | 41,492 |
| Mulpha International BHD * | 909,800 | | 367,688 |
| Mutiara Goodyear Development BHD | 37,500 | | 8,121 |
| Naluri Corp. BHD | 71,000 | | 14,216 |
| Nam Fatt Corp. BHD * | 242,200 | | 48,563 |
| New Straits Times Press BHD * | 183,500 | | 105,116 |
| Nylex Malaysia BHD | 52,000 | | 22,045 |
| Oriental Holdings BHD | 304,200 | | 538,616 |
| OSK Holdings BHD | 441,300 | | 313,474 |
| Padiberas Nasional BHD | 428,300 | | 248,525 |
| Panasonic Manufacturing Malaysia BHD | 8,100 | | 27,264 |
| Permaju Industries BHD * | 111,000 | | 17,829 |
| PJ Development Holdings BHD | 297,900 | | 78,807 |
| Pmb 50c * | 419,700 | | 359,589 |
| PPB Group BHD | 637,800 | | 1,335,343 |
| Protasco BHD | 141,500 | | 41,041 |
| Proton Holdings BHD | 338,000 | | 506,267 |
| Ramunia Holdings BHD * | 245,000 | | 73,807 |
| Ranhill BHD | 382,200 | | 341,199 |
| RB Land Holdings BHD * | 231,100 | | 169,016 |
| Sarawak Energy BHD | 344,300 | | 218,755 |
| Sarawak Oil Palms BHD | 8,000 | | 9,097 |
| Selangor Dredging BHD | 328,000 | | 94,416 |
| Shangri-La Hotels BHD | 21,100 | | 14,542 |
| Shell Refining Company Federation of Malaya | | | |
| BHD | 133,200 | | 415,889 |
| SHL Consolidated BHD | 185,100 | | 95,619 |
| Sumatec Resources BHD * | 70,000 | | 16,518 |
| Sunway City BHD | 268,900 | | 380,913 |
| Sunway Holdings, Inc. BHD * | 478,600 | | 207,323 |
| Suria Capital Holdings BHD | 572,200 | | 246,112 |
| TA Enterprise BHD | 895,600 | | 402,424 |
| Talam Corp. BHD * | 360,000 | | 33,512 |
| Tan Chong Motor Holdings BHD | 444,000 | | 157,427 |
| TDM BHD | 150,700 | | 56,215 |
| Tebrau Teguh BHD * | 333,800 | | 137,491 |
| TH Group BHD | 225,000 | | 44,826 |
| Time.Com BHD * | 421,500 | | 130,867 |
| Tradewinds Corp. BHD * | 583,200 | | 233,730 |
| Tradewinds Plantation BHD | 319,900 | | 247,280 |
| Unico-Desa Plantations BHD | 245,000 | | 45,076 |
| Unisem M BHD | 289,600 | | 116,706 |
| United Malacca BHD | 38,700 | | 62,406 |
| Utama Banking Group BHD * | 400,200 | | 280,405 |
| V.S. Industry BHD | 130,900 | | 133,104 |
| WTK Holdings BHD | 257,500 | | 162,463 |
| Yi-Lai BHD | 82,000 | | 28,242 |
| | | |
| Emerging Markets Value Fund (continued) | |
| | Shares or | | |
| | Principal | | |
| | Amount | | Value |
|
|
| |
| COMMON STOCKS (continued) | | | |
| | | | |
| Malaysia (continued) | | | |
| YTL Corp. BHD | 492,700 | $ | 1,048,533 |
|
|
| | | | 23,392,847 |
| Mexico - 9.44% | | | |
| Alfa SA de CV | 433,200 | | 3,115,516 |
| Cemex SA, SADR * | 594,287 | | 19,189,527 |
| Coca-Cola Femsa SA de CV | 17,730 | | 719,838 |
| Consorcio ARA SA de CV | 86,800 | | 131,302 |
| Controladora Comercial Mexicana SA de CV | 431,100 | | 1,199,530 |
| Dine SA de CV * | 103,700 | | 93,800 |
| Embotelladoras Arca SA de CV | 38,516 | | 143,126 |
| Empresas ICA SA de CV, ADR * | 117,456 | | 2,595,778 |
| Empresas ICA Sociedad | | | |
| Controladora SA de CV * | 25,600 | | 141,419 |
| Fomento Economico Mexicano SA de CV, | | | |
| SADR | 245,825 | | 8,564,543 |
| Gruma SA de CV, ADR | 13,342 | | 192,658 |
| Gruma SA de CV, Series B | 17,000 | | 60,861 |
| Grupo Aeroportuario del Sureste SA de CV, | | | |
| ADR | 21,550 | | 1,069,742 |
| Grupo Aeroportuario del Sureste SA de CV | 27,200 | | 135,639 |
| Grupo Carso SA de CV | 662,500 | | 2,597,568 |
| Grupo Cementos de Chihuahua SA de CV | 35,600 | | 219,376 |
| Grupo Continential SA de CV | 247,700 | | 527,580 |
| Grupo Financiero Inbursa SA de CV | 462,900 | | 1,128,584 |
| Grupo Industrial Maseca SA de CV | 2,600 | | 2,357 |
| Grupo Industrial Saltillo SA de CV | 100,600 | | 165,945 |
| Grupo Iusacell SA de CV * | 6 | | 68 |
| Grupo Kuo SA de CV * | 164,700 | | 143,304 |
| Grupo Mexicano de Desarrollo SA de CV * | 69,300 | | 304,628 |
| Industrias CH SA de CV, Series B * | 358,600 | | 1,426,821 |
| Organizacion Soriana SA de CV, Series B | 321,400 | | 1,035,571 |
| Vitro SA de CV, ADR | 92,452 | | 648,089 |
|
|
| | | | 45,553,170 |
| Philippines - 0.69% | | | |
| Belle Corp. * | 1,800,000 | | 44,699 |
| China Banking Corp. * | 2,880 | | 50,878 |
| DMCI Holdings, Inc. | 734,000 | | 131,459 |
| Empire East Land Holdings, Inc. * | 5,890,000 | | 88,261 |
| Filinvest Development Corp. | 404,000 | | 51,436 |
| Filinvest Land, Inc. * | 11,798,750 | | 401,896 |
| First Philippine Holdings Corp. | 281,100 | | 481,313 |
| Metropolitan Bank & Trust Company | 639,500 | | 760,172 |
| Petron Corp. | 2,663,000 | | 328,308 |
| Rizal Commercial Banking Corp. | 311,400 | | 164,346 |
| Security Bank Corp. | 127,400 | | 197,880 |
| Semirara Mining Corp. | 122,000 | | 79,947 |
| Union Bank of Philippines | 156,800 | | 182,524 |
| Universal Robina Corp. | 1,082,100 | | 379,219 |
|
|
| | | | 3,342,338 |
| Poland - 3.55% | | | |
| ABG Ster-Projekt SA | 30,807 | | 74,871 |
| |
| The accompanying notes are an integral part of the financial statements. | 163 |
John Hancock Funds II
Portfolio of investments — August 31, 2007
(showing percentage of total net assets)
| | | |
| Emerging Markets Value Fund (continued) | |
| | Shares or | | |
| | Principal | | |
| | Amount | | Value |
|
|
| |
| COMMON STOCKS (continued) | | | |
| | | | |
| Poland (continued) | | | |
| Agora SA | 46,104 | $ | 848,926 |
| Alchemia SA * | 26,056 | | 109,660 |
| Bank BPH SA | 10,346 | | 3,350,300 |
| Boryszew SA * | 21,709 | | 162,160 |
| Computerland SA | 4,128 | | 89,856 |
| Debica SA | 8,157 | | 305,740 |
| Echo Investment SA * | 27,657 | | 884,025 |
| Fabryka Kotlow Rafako SA * | 16,639 | | 74,932 |
| Fabryki Mebli Forte SA | 23,417 | | 80,708 |
| Farmacol SA * | 11,889 | | 208,226 |
| Firma Chemiczna Dwory SA * | 4,152 | | 274,911 |
| Grupa Kety SA | 11,048 | | 848,663 |
| Grupa Lotos SA | 50,205 | | 783,761 |
| Impexmetal SA | 2,982 | | 314,865 |
| Kredyt Bank SA | 45,127 | | 372,949 |
| Krosno SA * | 24,404 | | 69,575 |
| Mostostal Plock SA | 1,755 | | 64,777 |
| Netia SA * | 110,811 | | 158,212 |
| Opoczno SA * | 9,479 | | 194,162 |
| Orbis SA | 34,217 | | 858,181 |
| Pekaes SA * | 6,381 | | 32,020 |
| Polski Koncern Miesny Duda SA * | 12,768 | | 51,696 |
| Polski Koncern Naftowy Orlen SA * | 285,989 | | 5,871,814 |
| Praterm SA * | 3,332 | | 60,793 |
| Prokom Software SA | 13,280 | | 621,315 |
| Prosper SA | 6,203 | | 46,875 |
| Softbank SA | 4,567 | | 133,702 |
| Zaklady Tluszczowe Kruszwica SA | 1,270 | | 23,107 |
| Zelmer SA | 7,579 | | 171,650 |
|
|
| | | | 17,142,432 |
| South Africa - 11.09% | | | |
| Adcorp Holdings, Ltd. | 10,327 | | 51,954 |
| Aeci, Ltd. | 91,440 | | 1,012,287 |
| Afgri, Ltd. | 325,008 | | 281,226 |
| African Oxygen, Ltd. | 29,934 | | 137,743 |
| African Rainbow Minerals, Ltd. * | 77,899 | | 1,279,557 |
| AG Industries, Ltd. * | 94,914 | | 57,568 |
| Allied Technologies, Ltd. | 11,687 | | 102,756 |
| Amalgamated Appliance Holding Company, | | | |
| Ltd. * | 46,719 | | 24,858 |
| Argent Industrial, Ltd. | 55,365 | | 151,013 |
| Astral Foods, Ltd. | 8,106 | | 139,391 |
| Aveng, Ltd. | 68,362 | | 504,371 |
| AVI, Ltd. | 193,728 | | 527,331 |
| Barloworld, Ltd. | 26,940 | | 461,297 |
| Bytes Technology Group, Ltd. | 35,480 | | 87,825 |
| Capitec Bank Holdings, Ltd. | 6,964 | | 35,966 |
| Caxton & CTP Publishers and Printers, Ltd. | 152,748 | | 337,846 |
| Ceramic Industries, Ltd. | 1,781 | | 35,030 |
| City Lodge Hotels, Ltd. | 5,411 | | 57,015 |
| DataTec, Ltd. | 130,971 | | 768,354 |
| Dimension Data Holdings, Ltd. | 260,585 | | 300,133 |
| | | |
| Emerging Markets Value Fund (continued) | |
| | Shares or | | |
| | Principal | | |
| | Amount | | Value |
|
|
| |
| COMMON STOCKS (continued) | | | |
| | | | |
| South Africa (continued) | | | |
| Distell Group, Ltd. | 6,321 | $ | 55,519 |
| Ellerine Holdings, Ltd. | 55,895 | | 584,327 |
| Famous Brands, Ltd. * | 21,997 | | 50,582 |
| Gijima Ast Group, Ltd. * | 338,993 | | 44,057 |
| Gold Fields, Ltd., ADR | 317,258 | | 4,809,631 |
| Gold Reef Resorts, Ltd. | 18,411 | | 80,798 |
| Grindrod, Ltd. | 73,852 | | 254,381 |
| Harmony Gold Mining Company, Ltd., SADR * | 178,931 | | 1,601,432 |
| Highveld Steel & Vanadium Corp., Ltd. | 3,483 | | 49,089 |
| Hulamin, Ltd. | 13,561 | | 47,121 |
| Iliad Africa, Ltd. * | 18,612 | | 55,833 |
| Illovo Sugar, Ltd. | 15,751 | | 50,636 |
| Imperial Holdings, Ltd. | 91,166 | | 1,821,227 |
| JD Group, Ltd. | 71,090 | | 691,058 |
| Johnnic Communications, Ltd. | 29,319 | | 360,862 |
| Johnnic Holdings, Ltd. * | 44,519 | | 94,746 |
| Kap International Holdings, Ltd. * | 90,584 | | 41,195 |
| Lewis Group, Ltd. | 75,357 | | 651,498 |
| Liberty Group, Ltd. | 100,815 | | 1,265,340 |
| Medi-Clinic Corp., Ltd. | 45,472 | | 137,987 |
| Metair Investments, Ltd. | 99,170 | | 187,082 |
| Metropolitan Holdings, Ltd. | 512,656 | | 1,058,763 |
| Mittal Steel South Africa, Ltd. | 169,731 | | 2,930,864 |
| Mustek, Ltd. | 97,803 | | 122,719 |
| Mvelaphanda Group, Ltd. * | 133,929 | | 192,336 |
| Nampak, Ltd. * | 282,551 | | 798,728 |
| Nedbank Group, Ltd. | 140,866 | | 2,655,485 |
| New Clicks Holdings, Ltd. | 39,503 | | 84,391 |
| Northam Platinum, Ltd. | 43,977 | | 337,637 |
| Nu-World Holdings, Ltd. * | 9,429 | | 34,284 |
| Oceana Group, Ltd. | 30,290 | | 75,866 |
| Omnia Holdings, Ltd. | 25,339 | | 262,945 |
| Peregrine Holdings, Ltd. | 54,272 | | 139,031 |
| Primedia, Ltd. * | 25,101 | | 88,081 |
| PSG Group, Ltd. | 73,436 | | 271,871 |
| Sanlam, Ltd. | 1,983,568 | | 5,967,967 |
| Santam, Ltd. | 12,893 | | 203,769 |
| Sappi, Ltd., ADR | 71,197 | | 1,139,152 |
| Sasol, Ltd., SADR | 378,839 | | 15,240,693 |
| Steinhoff International Holdings, Ltd. * | 474,395 | | 1,521,721 |
| Super Group, Ltd. | 196,625 | | 338,194 |
| Tiger Wheels, Ltd. * | 14,267 | | 14,554 |
| Tongaat Hulett, Ltd. | 12,951 | | 180,712 |
| Trans Hex Group, Ltd. | 57,462 | | 108,137 |
| Trencor, Ltd. | 71,437 | | 348,259 |
| Value Group, Ltd. * | 267,946 | | 82,450 |
|
|
| | | | 53,486,531 |
| South Korea - 13.18% | | | |
| | | | |
| Aekyung Petrochemical Company, Ltd. | 1,450 | | 59,999 |
| Asia Cement Company, Ltd. | 1,280 | | 109,065 |
| Asia Paper Manufacturing Company, Ltd. | 2,000 | | 37,752 |
| |
| The accompanying notes are an integral part of the financial statements. | 164 |
John Hancock Funds II
Portfolio of investments — August 31, 2007
(showing percentage of total net assets)
| | | |
| Emerging Markets Value Fund (continued) | |
| | Shares or | | |
| | Principal | | |
| | Amount | | Value |
|
|
| |
| COMMON STOCKS (continued) | | | |
| | | | |
| South Korea (continued) | | | |
| Auk Corp. * | 5,400 | $ | 27,338 |
| Bohae Brewery Company, Ltd. | 530 | | 15,792 |
| Boryung Pharmaceutical Company, Ltd. | 1,140 | | 50,417 |
| Byucksan Engineering & Construction | | | |
| Company, Ltd. | 6,140 | | 49,803 |
| C. & Woobang Construction Company, Ltd. * | 7,230 | | 38,302 |
| Cambridge Members Company, Ltd. | 790 | | 25,392 |
| Cheil Industries, Inc. | 14,720 | | 805,756 |
| Chokwang Leather Company, Ltd. * | 2,300 | | 22,570 |
| Chosun Refractories Company, Ltd. | 270 | | 28,151 |
| Crown Confectionery Company, Ltd. | 230 | | 34,205 |
| Dae Chang Industrial Company, Ltd. | 2,700 | | 22,895 |
| Dae Dong Industrial Company, Ltd. | 2,600 | | 59,085 |
| Dae Han Flour Mills Company, Ltd. | 500 | | 98,750 |
| Dae Won Kang Up Company, Ltd. | 1,800 | | 40,564 |
| Daeduck Electronics Company, Ltd. | 15,700 | | 120,656 |
| Daeduck GDS Company, Ltd. | 5,010 | | 54,745 |
| Daehan Synthetic Fiber Company, Ltd. | 130 | | 23,830 |
| Daekyo Company, Ltd. | 2,480 | | 257,185 |
| Daesang Corp. * | 7,470 | | 92,715 |
| Daesung Industrial Company, Ltd. | 900 | | 225,329 |
| Daewoo Electronic Components Comapny, | | | |
| Ltd. * | 3,100 | | 22,981 |
| Daewoo Motor Sales Corp. | 9,730 | | 489,866 |
| Daewoong Company, Ltd. | 620 | | 21,327 |
| Daishin Securities Company, Ltd. | 16,960 | | 576,765 |
| DI Corp. * | 8,700 | | 26,659 |
| Digital Power Communications Company, Ltd. | 14,000 | | 27,638 |
| Dong Ah Tire & Rubber Company, Ltd. | 3,100 | | 28,183 |
| Dong Su Industrial Company, Ltd. | 3,060 | | 54,261 |
| Dong Wha Pharmaceutical Industrial | | | |
| Company, Ltd. | 1,330 | | 102,773 |
| Dongbang Transport Logistics Company, Ltd. | 1,130 | | 42,936 |
| Dongbu Corp. | 6,900 | | 227,396 |
| Dongbu Hannong Chemicals Company, Ltd. | 2,060 | | 37,520 |
| Dongbu Securities Company, Ltd. | 70 | | 1,372 |
| Dongbu Steel Company, Ltd. | 7,360 | | 178,005 |
| Dong-Il Corp. | 600 | | 56,595 |
| Dongil Paper Manufacturing Comapny, Ltd. | 1,300 | | 23,571 |
| Dongkuk Steel Mill Company, Ltd. | 15,700 | | 722,146 |
| Dongwon F & B Company, Ltd. | 800 | | 60,535 |
| Dongyang Engineering & Construction Corp. | 970 | | 61,932 |
| Dongyang Mechatronics Corp. | 6,850 | | 88,872 |
| Duksung Company, Ltd. | 5,800 | | 22,259 |
| En Paper Manufacturing Company, Ltd. * | 7,900 | | 30,292 |
| F&F Company, Ltd. | 5,100 | | 27,969 |
| Fursys, Inc. | 1,550 | | 43,861 |
| Gaon Cable Company, Ltd. | 1,160 | | 62,517 |
| Global & Yuasa Battery Company, Ltd. | 4,200 | | 34,453 |
| H.S. R & A Company, Ltd. * | 2,200 | | 37,056 |
| Hae In Corp. | 4,100 | | 28,767 |
| Halla Engineering & Construction Corp. | 2,090 | | 57,603 |
| | | |
| Emerging Markets Value Fund (continued) | | |
| | Shares or | | |
| | Principal | | |
| | Amount | | Value |
|
|
| |
| COMMON STOCKS (continued) | | | |
| | | | |
| South Korea (continued) | | | |
| Hana Financial Group, Inc. | 55,800 | $ | 2,638,999 |
| HanAll Pharmarceutical Company, Ltd. | 10,000 | | 51,904 |
| Hancook Tire Company (The), Ltd. | 51,710 | | 1,132,646 |
| Handok Pharmaceuticals Company, Ltd. | 1,000 | | 26,657 |
| Handsome Company, Ltd. | 10,200 | | 153,730 |
| Hanil Cement Manufacturing Company, Ltd. | 2,150 | | 247,933 |
| Hanil Construction Company, Ltd. | 2,760 | | 68,519 |
| Hanil E-Wha Company, Ltd. | 6,400 | | 21,339 |
| Hanjin Shipping Company, Ltd. | 28,500 | | 1,593,700 |
| Hanjin Transportation Company, Ltd. | 3,370 | | 190,279 |
| Hankook Cosmetics Company, Ltd. | 6,300 | | 25,505 |
| Hankuk Electric Glass Company, Ltd. | 1,930 | | 46,507 |
| Hankuk Glass Industries, Inc. | 1,820 | | 75,555 |
| Hankuk Paper Manufacturing Company, Ltd. | 1,520 | | 74,512 |
| Hanmi Capital Company, Ltd. | 3,100 | | 55,207 |
| Hanshin Construction Company, Ltd. | 3,010 | | 100,149 |
| Hansol Chemical Company, Ltd. | 3,500 | | 44,588 |
| Hansol Paper Company, Inc. * | 13,550 | | 234,770 |
| Hanssem Company, Ltd. | 6,330 | | 43,847 |
| Hanwha Chem Corp. | 25,750 | | 674,097 |
| Hanwha Securities Company, Ltd. | 11,080 | | 214,861 |
| Hanwha Timeworld Company, Ltd. | 1,700 | | 34,211 |
| Hanyang Securities Company, Ltd. | 3,390 | | 73,025 |
| Heung-A Shipping Company, Ltd. | 19,140 | | 86,391 |
| Honam Petrochemical Corp. | 7,610 | | 1,174,625 |
| Hotel Shilla Company, Ltd. | 15,690 | | 417,892 |
| Husteel Company, Ltd. | 1,100 | | 29,910 |
| Hwa Shin Company, Ltd. | 14,690 | | 54,790 |
| Hwa Sung Industrial Company, Ltd. | 3,530 | | 72,569 |
| Hyosung Corp. | 11,870 | | 868,228 |
| Hyundai Cement Company, Ltd. | 2,370 | | 133,372 |
| Hyundai DSF Company, Ltd. | 2,800 | | 40,115 |
| Hyundai H & S Company, Ltd. | 430 | | 45,624 |
| Hyundai Hysco Company, Ltd. | 21,140 | | 287,087 |
| Hyundai Motor Company, Ltd. | 86,926 | | 6,441,631 |
| Hyundai Pharmaceutical Industrial Company, | | | |
| Ltd. | 940 | | 45,113 |
| Hyundai Securities Company, Ltd. | 37,820 | | 1,152,676 |
| Hyundai Steel Company | 21,890 | | 1,751,261 |
| Il Dong Pharmaceutical Company, Ltd. | 710 | | 37,712 |
| Iljin Diamond Company, Ltd. | 1,400 | | 30,567 |
| Iljin Electric, Ltd. | 7,000 | | 60,403 |
| Ilsung Pharmaceutical Company, Ltd. | 990 | | 141,851 |
| Inzi Controls Company, Ltd. | 6,490 | | 49,274 |
| Isu Chemical Company, Ltd. | 1,800 | | 29,739 |
| Jahwa Electronics Company, Ltd. | 5,200 | | 38,487 |
| Jeil Mutual Savings Bank | 1,850 | | 18,509 |
| Jeonbuk Bank, Ltd. | 9,500 | | 98,515 |
| Joongang Construction Company, Ltd. | 2,700 | | 57,902 |
| KCC Corp. | 2,250 | | 1,150,984 |
| KCTC | 1,100 | | 45,620 |
| Keangnam Enterprises, Ltd. | 3,110 | | 139,552 |
| |
| The accompanying notes are an integral part of the financial statements. | 165 |
John Hancock Funds II
Portfolio of investments — August 31, 2007
(showing percentage of total net assets)
| | | |
| Emerging Markets Value Fund (continued) | |
| | Shares or | | |
| | Principal | | |
| | Amount | | Value |
|
|
| |
| COMMON STOCKS (continued) | | | |
| | | | |
| South Korea (continued) | | | |
| Keyang Electric Machinery Company, Ltd. | 18,120 | $ | 60,245 |
| KG Chemical Corp. | 5,600 | | 71,630 |
| Kia Motors Corp. * | 100,940 | | 1,364,949 |
| Kirin Company, Ltd. * | 1,540 | | 2,024 |
| Kiswire, Ltd. | 3,020 | | 146,718 |
| Kolon Engineering & | | | |
| Construction Company, Ltd. | 3,130 | | 53,664 |
| Kolon Industries, Inc. * | 3,960 | | 146,129 |
| Korea Airport Service Company, Ltd. | 1,020 | | 69,311 |
| Korea Cast Iron Pipe Industries Company, Ltd. | 6,600 | | 50,060 |
| Korea Circuit Company, Ltd. * | 5,500 | | 24,099 |
| Korea Development Corp. | 2,330 | | 69,383 |
| Korea Electric Terminal Company, Ltd. | 2,340 | | 62,216 |
| Korea Exchange Bank | 50,130 | | 794,035 |
| Korea Flange Company, Ltd. | 1,830 | | 32,155 |
| Korea Iron & Steel Company, Ltd. | 3,370 | | 322,638 |
| Korea Kumho Petrochemical Company, Ltd. | 4,400 | | 346,094 |
| Korea Mutual Savings Bank | 870 | | 27,531 |
| Korea Polyol Company, Ltd. | 1,522 | | 116,977 |
| Korean Air Lines Company, Ltd. | 18,990 | | 1,285,895 |
| Korean Petrochemical Ind. Company, Ltd. | 2,450 | | 197,429 |
| KP Chemical Corp. * | 27,830 | | 354,265 |
| KT Freetel Company, Ltd. | 51,100 | | 1,660,689 |
| KTB Network Corp. * | 11,890 | | 106,587 |
| Kukdo Chemical Company, Ltd. | 1,520 | | 54,722 |
| Kumho Investment Bank | 5,750 | | 72,832 |
| Kumho Tire Company, Inc. | 20,800 | | 351,953 |
| Kumkang Industrial Company, Ltd. | 1,400 | | 23,525 |
| Kwang Dong Pharmaceutical Company, Ltd. | 12,810 | | 72,586 |
| Kyeryong Construction | | | |
| Industrial Company, Ltd. | 2,550 | | 164,369 |
| Lee Ku Industrial Company, Ltd. * | 8,740 | | 17,745 |
| LG Chem, Ltd. | 13,400 | | 1,394,440 |
| LG Corp. | 13,370 | | 767,488 |
| LG Dacom Corp. | 20,670 | | 539,682 |
| LG Electronics, Inc. | 29,920 | | 2,295,746 |
| LG International Corp. | 9,400 | | 311,810 |
| Lotte Chilsung Beverage Company, Ltd. | 310 | | 476,324 |
| Lotte Confectionery Company, Ltd. | 400 | | 681,624 |
| Lotte Samkang Company, Ltd. | 350 | | 96,790 |
| LS Cable, Ltd. | 6,135 | | 629,981 |
| Manho Rope & Wire, Ltd. | 280 | | 28,278 |
| Meritz Investment Bank * | 31,690 | | 83,764 |
| Meritz Securities Company, Ltd. | 7,210 | | 108,424 |
| Moorim Paper Company, Ltd. | 4,880 | | 69,583 |
| Namhae Chemical Corp. | 15,130 | | 117,007 |
| Namyang Dairy Products Company, Ltd. | 200 | | 209,965 |
| Nong Shim Company, Ltd. | 730 | | 186,783 |
| Nong Shim Holdings Company, Ltd. | 1,340 | | 128,282 |
| Ottogi Corp. | 706 | | 121,900 |
| Pang Rim Company, Ltd. | 950 | | 24,614 |
| PaperCorea, Inc. | 2,900 | | 29,965 |
| | | |
| Emerging Markets Value Fund (continued) | | |
| | Shares or | | |
| | Principal | | |
| | Amount | | Value |
|
|
| |
| COMMON STOCKS (continued) | | | |
| | | | |
| South Korea (continued) | | | |
| Pohang Coated Steel Company, Ltd. | 1,600 | $ | 42,289 |
| Poonglim Industrial Company, Ltd. | 5,520 | | 58,317 |
| Poongsan Corp. | 8,220 | | 223,474 |
| Pulmuone Company, Ltd. | 1,110 | | 53,069 |
| Pumyang Construction Company, Ltd. | 1,610 | | 32,563 |
| Pusan Bank | 48,000 | | 894,516 |
| Pusan City Gas Company, Ltd. | 3,700 | | 111,159 |
| S&T Dynamics Company, Ltd. | 10,410 | | 166,469 |
| Saehan Industries, Inc. * | 17,230 | | 218,242 |
| Saehan Media Company, Ltd. * | 18,800 | | 47,846 |
| Sam Kwang Glass Industrial Company, Ltd. | 800 | | 34,511 |
| Sam Lip General Foods Company, Ltd. | 3,850 | | 52,660 |
| Sam Young Electronics Company, Ltd. | 5,610 | | 57,056 |
| Sambu Construction Company, Ltd. | 2,400 | | 169,386 |
| Samick Musical Instruments Company, Ltd. * | 8,830 | | 9,457 |
| Samick THK Company, Ltd. | 11,120 | | 57,525 |
| Samjin Pharmaceutical Company, Ltd. | 1,040 | | 62,400 |
| Samsung Corp. | 69,760 | | 4,749,064 |
| Samsung Electro-Mechanics Company, Ltd. | 18,100 | | 1,000,957 |
| Samsung Fine Chemicals Company, Ltd. | 7,550 | | 426,094 |
| Samsung SDI Company, Ltd. | 18,020 | | 1,184,569 |
| Samwhan Corp. | 3,850 | | 136,432 |
| Samyang Corp. | 2,060 | | 160,379 |
| Samyang Genex Company, Ltd. | 800 | | 88,764 |
| Samyang Tongsang Company, Ltd. | 690 | | 24,951 |
| Samyung Trading Company, Ltd. * | 4,500 | | 30,983 |
| Savezone I & C Corp. * | 16,880 | | 66,302 |
| Seah Besteel Corp. | 5,550 | | 143,116 |
| SeAH Holdings Corp. | 1,020 | | 156,464 |
| Sebang Company, Ltd. | 5,070 | | 93,532 |
| Sejong Industrial Company, Ltd. | 7,830 | | 55,444 |
| Sempio Foods Company, Ltd. | 940 | | 23,084 |
| Sgwicus Corp. * | 4,800 | | 20,389 |
| SH Chemical Company, Ltd. * | 2,700 | | 24,808 |
| Shin Poong Pharmaceutical Company, Ltd. | 1,880 | | 61,141 |
| Shinhan Engineering & Construction | | | |
| Company, Ltd. | 3,177 | | 95,210 |
| Shinhan Financial Group Company, Ltd., ADR | 33,500 | | 4,154,000 |
| Shinheung Securities Company, Ltd. | 3,650 | | 56,832 |
| Shinsegae Engineering & Construction | | | |
| Company, Ltd. | 1,110 | | 53,139 |
| Shinsung ENG Company, Ltd. | 12,890 | | 64,449 |
| Shinyoung Securities Company, Ltd. | 3,180 | | 208,507 |
| Silla Company, Ltd. | 3,180 | | 33,375 |
| Sindo Ricoh Company, Ltd. | 2,940 | | 223,558 |
| SJM Company, Ltd. | 8,130 | | 53,671 |
| SK Gas Company, Ltd. | 2,662 | | 227,449 |
| SKC Company, Ltd. | 8,390 | | 277,131 |
| SL Corp. | 5,830 | | 59,510 |
| Ssangyong Cement Industrial Company, Ltd. * | 21,560 | | 378,504 |
| Ssangyong Motor Company, Ltd. * | 27,890 | | 170,380 |
| Suheung Capsule Company, Ltd. | 2,900 | | 23,589 |
| |
| The accompanying notes are an integral part of the financial statements. | 166 |
John Hancock Funds II
Portfolio of investments — August 31, 2007
(showing percentage of total net assets)
| | | |
| Emerging Markets Value Fund (continued) | | |
| | Shares or | | |
| | Principal | | |
| | Amount | | Value |
|
|
| |
| COMMON STOCKS (continued) | | | |
| | | | |
| South Korea (continued) | | | |
| Sung Bo Chemicals Company, Ltd. | 410 | $ | 19,009 |
| Sung Chang Enterprise Company, Ltd. | 1,680 | | 59,523 |
| Sungjee Construction Company, Ltd. | 2,210 | | 43,134 |
| Sungshin Cement Company, Ltd. * | 5,760 | | 117,255 |
| Sungwon Corp. * | 4,230 | | 72,943 |
| Sunjin Company, Ltd. | 1,010 | | 41,981 |
| Tae Kyung Industrial Company, Ltd. | 14,930 | | 68,556 |
| Taegu Department Store Company, Ltd. | 2,740 | | 50,464 |
| Taekwang Industrial Company, Ltd. | 120 | | 189,288 |
| Taeyoung Engineering & Construction, Ltd. | 4,630 | | 61,604 |
| Taihan Electric Wire Company, Ltd. | 4,000 | | 191,765 |
| Telcoware Company, Ltd. | 4,000 | | 47,129 |
| Trybrands, Inc. * | 8,760 | | 47,973 |
| TS Corp. | 1,100 | | 53,239 |
| Unid Company, Ltd. | 2,000 | | 85,462 |
| Union Steel Company, Ltd. | 3,060 | | 92,965 |
| Wiscom Company, Ltd. | 3,680 | | 17,887 |
| Woongjin Holdings Company, Ltd. | 2,870 | | 51,345 |
| Woori Investment & Securities Company, Ltd. | 26,930 | | 756,463 |
| Yesco Company, Ltd. | 1,480 | | 60,666 |
| Yoosung Enterprise Company, Ltd. | 9,880 | | 51,359 |
| Youlchon Chemical Company, Ltd. | 9,090 | | 106,577 |
| Young Poong Corp. | 112 | | 76,236 |
| Youngone Corp. | 11,950 | | 122,995 |
| Yuhwa Securities Company, Ltd. | 1,000 | | 24,791 |
| |
|
| | | | 63,571,575 |
| Taiwan - 11.93% | | | |
| | | |
| Acbel Polytech, Inc. * | 227,000 | | 145,592 |
| Achem Technology Corp. | 103,000 | | 48,962 |
| AGV Products Corp. * | 199,000 | | 89,769 |
| Allis Electric Company, Ltd. | 135,000 | | 43,000 |
| Ambassador Hotel Company, Ltd. | 48,000 | | 40,104 |
| Arima Computer Corp. * | 490,000 | | 119,629 |
| Arima Optoelectronics Corp. | 40,134 | | 55,581 |
| Asia Polymer Corp. | 106,000 | | 69,111 |
| Avision, Inc. | 77,376 | | 45,586 |
| Bank of Kaohsiung, Ltd. | 197,000 | | 137,892 |
| Behavior Technology Computer Corp. * | 122,000 | | 68,427 |
| BenQ Corp. * | 1,324,000 | | 620,877 |
| BES Engineering Corp. | 764,000 | | 242,558 |
| Carnival Industrial Corp. * | 198,000 | | 54,976 |
| Cathay Chemical Works, Inc. | 73,000 | | 30,600 |
| Cathay Real Estate Development | | | |
| Company, Ltd. | 190,000 | | 88,686 |
| Central Reinsurance Company, Ltd. | 140,700 | | 64,396 |
| Chang Hwa Commercial Bank, Ltd. | 2,733,000 | | 1,714,448 |
| Charoen Pokphand Enterprise Company, Ltd. | 122,000 | | 69,120 |
| Cheng Loong Corp. | 539,000 | | 210,625 |
| Chenming Mold Industrial Corp. | 88,008 | | 32,268 |
| Chi Mei Optoelectronics Corp. | 2,076,880 | | 2,102,904 |
| Chia Hsin Cement Corp. * | 285,000 | | 222,084 |
| Chien Shing Stainless Steel Company, Ltd. * | 181,000 | | 59,901 |
| | | |
| Emerging Markets Value Fund (continued) | |
| | Shares or | | |
| | Principal | | |
| | Amount | | Value |
|
|
| |
| COMMON STOCKS (continued) | | | |
| | | | |
| Taiwan (continued) | | | |
| China Airlines, Ltd. | 892,874 | $ | 350,182 |
| China Chemical & Pharmaceutical Company, | | | |
| Ltd. | 129,000 | | 83,376 |
| China Development Financial Holdings Corp. | 6,029,000 | | 2,458,668 |
| China Electric Manufacturing Corp. | 170,000 | | 88,090 |
| China General Plastics Corp. * | 215,000 | | 55,579 |
| China Glaze Company, Ltd. | 107,590 | | 54,498 |
| China Manmade Fibers Corp. * | 595,000 | | 226,448 |
| China Motor Company, Ltd. | 382,905 | | 339,570 |
| China Petrochemical Development Corp. * | 1,054,000 | | 471,580 |
| China Steel Structure Company, Ltd. | 32,000 | | 18,072 |
| China Wire & Cable Company, Ltd. * | 120,000 | | 31,091 |
| Chin-Poon Industrial Company, Ltd. | 145,000 | | 143,110 |
| Chun Yu Works & Company, Ltd. | 88,000 | | 27,628 |
| Chun Yuan Steel Industrial Company, Ltd. | 235,425 | | 98,526 |
| Chung Hwa Pulp Corp. | 206,000 | | 114,991 |
| Chunghwa Picture Tubes, Ltd. * | 4,029,000 | | 1,035,776 |
| CMC Magnetics Corp. * | 1,919,000 | | 842,857 |
| Collins Company, Ltd. | 222,000 | | 83,059 |
| Compeq Manufactuing Company, Ltd. | 610,000 | | 261,955 |
| Continental Engineering Corp. | 353,000 | | 204,588 |
| Cosmos Bank Taiwan * | 766,000 | | 128,283 |
| Da-Cin Construction Company, Ltd. | 77,000 | | 34,882 |
| Delpha Construction Company, Ltd. * | 174,000 | | 49,565 |
| E.Sun Financial Holding Company, Ltd. * | 2,016,000 | | 1,064,360 |
| Eastern Media International Corp. * | 519,000 | | 128,621 |
| Edom Technology Company, Ltd. | 64,000 | | 41,892 |
| Elitegroup Computer Systems Company, Ltd. | 530,000 | | 343,481 |
| Enlight Corp. | 164,799 | | 54,721 |
| EVA Airways Corp. * | 884,000 | | 326,759 |
| Everest Textile Company, Ltd. | 140,000 | | 37,293 |
| Evergreen International Storage & Transport | | | |
| Corp. | 453,000 | | 230,938 |
| Evergreen Marine Corp. | 725,000 | | 469,420 |
| Everlight Chemical Industrial Corp. | 38,000 | | 29,783 |
| Everspring Industry Company, Ltd. * | 61,000 | | 21,137 |
| Evertop Wire Cable Corp. | 93,596 | | 33,242 |
| Excel Cell Electronic Company, Ltd. | 29,000 | | 18,601 |
| Far Eastern Department Stores Company, Ltd. | 458,640 | | 457,586 |
| Far Eastern International Bank | 938,000 | | 419,303 |
| Federal Corp. | 225,630 | | 153,443 |
| First Copper Technology Company, Ltd. | 108,000 | | 44,353 |
| First Financial Holding Company, Ltd. | 2,823,360 | | 1,951,879 |
| Formosa Taffeta Company, Ltd. | 346,000 | | 393,047 |
| Fubon Group Company, Ltd. | 2,720,000 | | 2,345,252 |
| Fwusow Industry Company, Ltd. | 100,000 | | 33,804 |
| Gigabyte Technology Company, Ltd. | 389,000 | | 354,439 |
| Gigastorage Corp. * | 146,000 | | 51,062 |
| Goldsun Development & Construction | | | |
| Company, Ltd. | 654,000 | | 370,284 |
| Gordon Auto Body Parts Company, Ltd. | 49,440 | | 23,449 |
| Grand Pacific Petrochemical Corp. * | 285,000 | | 109,229 |
| |
| The accompanying notes are an integral part of the financial statements. | 167 |
John Hancock Funds II
Portfolio of investments — August 31, 2007
(showing percentage of total net assets)
| | | |
| Emerging Markets Value Fund (continued) | |
| | Shares or | | |
| | Principal | | |
| | Amount | | Value |
|
|
| |
| COMMON STOCKS (continued) | | | |
| | | | |
| Taiwan (continued) | | | |
| Grape King, Inc. | 108,000 | $ | 91,247 |
| Great China Metal Industry Company, Ltd. | 137,000 | | 71,535 |
| Hey Song Corp. | 218,000 | | 94,941 |
| Hitron Technology, Inc. * | 103,000 | | 42,232 |
| Ho Tung Chemical Corp. * | 312,000 | | 108,820 |
| Hocheng Group Corp. * | 130,000 | | 62,652 |
| Hold-Key Electric Wire & Cable Company, Ltd. * | 132,000 | | 47,326 |
| Hsing TA Cement Company, Ltd. | 59,000 | | 20,908 |
| Hua Eng Wire & Cable Company, Ltd. | 326,000 | | 114,981 |
| Hua Nan Financial Holdings Company, Ltd. | 260,000 | | 171,617 |
| Hung Ching Development Company, Ltd. | 114,000 | | 53,086 |
| Hung Sheng Construction Company, Ltd. | 72,000 | | 49,589 |
| Hwa Fong Rubber Company, Ltd. * | 78,000 | | 25,698 |
| Jui Li Enterprise Company, Ltd. | 65,000 | | 27,619 |
| Kang Na Hsiung Enterprise Company, Ltd. | 79,000 | | 54,062 |
| Kao Hsing Chang Iron & Steel Corp. * | 130,000 | | 37,931 |
| Kindom Construction Company, Ltd. | 192,000 | | 81,947 |
| King Yuan Electronics Company, Ltd. | 357,491 | | 221,177 |
| King's Town Bank * | 324,000 | | 110,508 |
| Kinpo Electronics, Inc. | 725,220 | | 277,103 |
| Kwong Fong Industries Corp. * | 223,000 | | 63,466 |
| Lan Fa Textile Company, Ltd. | 165,640 | | 65,967 |
| Lead Data, Inc. * | 205,000 | | 67,754 |
| Lealea Enterprise Company, Ltd. * | 310,000 | | 96,716 |
| Leofoo Development Company, Ltd. * | 86,000 | | 45,907 |
| Li Peng Enterprise Company, Ltd. * | 281,600 | | 117,573 |
| Lien Hwa Industrial Corp. | 307,838 | | 182,277 |
| Lingsen Precision Industries, Ltd. | 136,000 | | 64,917 |
| Long Chen Paper Company, Ltd. | 217,498 | | 91,324 |
| Lucky Cement Corp. | 128,000 | | 49,447 |
| Macronix International Company, Ltd., ADR * | 8,326 | | 49,123 |
| Macronix International Company, Ltd. * | 1,860,000 | | 1,152,602 |
| Mega Financial Holding Company, Ltd. | 6,070,000 | | 3,779,300 |
| Mercuries & Associates, Ltd. | 194,000 | | 139,593 |
| Micro-Star International Company, Ltd. | 534,126 | | 551,023 |
| Namchow Chemical Industrial, Ltd. * | 100,000 | | 36,687 |
| Nanya Technology Corp. | 978,057 | | 719,299 |
| Nien Hsing Textile Company, Ltd. | 254,000 | | 177,155 |
| Optimax Technology Corp. * | 319,000 | | 144,815 |
| Pacific Construction Company, Ltd. * | 267,000 | | 54,001 |
| Prodisc Technology, Inc. * | 540,000 | | 124,586 |
| Quintain Steel Company, Ltd. * | 169,000 | | 42,149 |
| Ralec Electronic Corp. * | 39,000 | | 70,864 |
| Rexon Industrial Corp., Ltd. * | 153,000 | | 54,296 |
| Ritek Corp. * | 1,545,000 | | 464,365 |
| Sampo Corp. * | 300,000 | | 62,047 |
| Sanyang Industrial Company, Ltd. | 270,000 | | 202,866 |
| Sanyo Electric Taiwan Company, Ltd. | 28,000 | | 25,166 |
| Sesoda Corp. | 93,000 | | 59,824 |
| Sheng Yu Steel Company, Ltd. | 51,000 | | 50,722 |
| Shinkong Insurance Company, Ltd. | 106,560 | | 61,626 |
| Shinkong Synthetic Fibers Corp. * | 709,000 | | 265,273 |
| | | |
| Emerging Markets Value Fund (continued) | |
| | Shares or | | |
| | Principal | | |
| | Amount | | Value |
|
|
| |
| COMMON STOCKS (continued) | | | |
| | | | |
| Taiwan (continued) | | | |
| Shuttle, Inc. * | 122,000 | $ | 62,615 |
| Silicon Integrated Systems Corp. | 445,000 | | 218,430 |
| Sinon Corp. | 164,000 | | 59,005 |
| SinoPac Holdings Company, Ltd. | 3,966,000 | | 1,881,147 |
| Sintek Photronic Corp. * | 180,000 | | 56,542 |
| Siward Crystal Technology Company, Ltd. * | 60,000 | | 49,450 |
| Southeast Cement Company, Ltd. | 147,000 | | 58,458 |
| Standard Foods Corp. | 98,000 | | 54,844 |
| Stark Technology, Inc. | 95,000 | | 52,185 |
| T JOIN Transportation Company, Ltd. * | 54,000 | | 23,358 |
| Ta Chong Bank, Ltd. * | 1,009,000 | | 319,738 |
| Ta Ya Electric Wire & Cable Company, Ltd. * | 235,000 | | 85,704 |
| Tah Hsin Industrial Company, Ltd. | 73,000 | | 50,310 |
| Taichung Commercial Bank * | 734,000 | | 300,463 |
| Tainan Spinning Company, Ltd. | 693,000 | | 350,177 |
| Taishin Financial Holdings Company, Ltd. * | 2,815,000 | | 1,410,904 |
| Taisun Enterprise Company, Ltd. * | 220,000 | | 66,848 |
| Taita Chemical Company, Ltd. * | 93,000 | | 29,906 |
| Taiwan Acceptance Corp. | 46,000 | | 28,955 |
| Taiwan Business Bank * | 1,731,000 | | 486,258 |
| Taiwan Cooperative Bank | 1,457,500 | | 1,005,252 |
| Taiwan Fire & Marine Insurance Company, Ltd. | 77,000 | | 63,627 |
| Taiwan Fu Hsing Industrial Company, Ltd. | 83,000 | | 62,717 |
| Taiwan Glass Industrial Corp. | 480,048 | | 436,754 |
| Taiwan Kai Yih Industrial Company, Ltd. | 119,180 | | 63,790 |
| Taiwan Kolin Company, Ltd. * | 350,000 | | 148,525 |
| Taiwan Mask Corp. | 94,000 | | 54,448 |
| Taiwan Pulp & Paper Corp. * | 179,000 | | 59,724 |
| Taiwan Sakura Corp. * | 87,000 | | 38,942 |
| Taiwan Styrene Monomer Corp. * | 241,000 | | 112,508 |
| Taiwan Tea Corp. * | 374,000 | | 207,972 |
| Taiyen Biotech Company, Ltd. | 131,000 | | 102,740 |
| Tatung Company, Ltd. * | 1,401,000 | | 659,857 |
| Teapo Electronic Corp. * | 205,000 | | 58,024 |
| Teco Electric & Machinery Company, Ltd. | 1,123,000 | | 630,116 |
| Tecom Company, Ltd. | 108,000 | | 97,575 |
| Tex-Ray Industrial Company, Ltd. | 90,000 | | 52,520 |
| Ton Yi Industrial Corp. | 597,000 | | 339,561 |
| Tsann Kuen Enterprise Company, Ltd. * | 111,000 | | 148,806 |
| Twinhead International Corp. * | 224,000 | | 41,688 |
| Tycoons Group Enterprise Company, Ltd. * | 238,000 | | 52,981 |
| Tze Shin International Company, Ltd. | 92,220 | | 59,035 |
| Union Bank of Taiwan * | 526,000 | | 132,561 |
| Unitech Electronics Company, Ltd. | 101,299 | | 52,470 |
| United Microelectronics Corp. | 12,527,000 | | 7,072,170 |
| Universal Cement Corp. * | 248,600 | | 120,803 |
| UPC Technology Corp. | 327,540 | | 226,311 |
| USI Corp. | 328,000 | | 141,983 |
| U-Tech Media Corp. * | 180,000 | | 63,607 |
| Walsin Lihwa Corp. | 1,885,000 | | 925,999 |
| Walsin Technology Corp. | 265,000 | | 269,840 |
| Waterland Financial Holding Company | 1,037,340 | | 320,750 |
| |
| The accompanying notes are an integral part of the financial statements. | 168 |
John Hancock Funds II
Portfolio of investments — August 31, 2007
(showing percentage of total net assets)
| | | |
| Emerging Markets Value Fund (continued) | |
| | Shares or | | |
| | Principal | | |
| | Amount | | Value |
|
|
| |
| COMMON STOCKS (continued) | | | |
| | | |
| Taiwan (continued) | | | |
| Wei Chih Steel Industrial Company, Ltd. * | 110,000 | $ | 30,207 |
| Winbond Electronics Corp. | 2,245,000 | | 674,788 |
| Wintek Corp. | 498,000 | | 570,899 |
| WUS Printed Circuit Company, Ltd. * | 254,000 | | 83,060 |
| Yageo Corp. | 1,615,000 | | 619,526 |
| Yang Ming Marine Transport Corp. * | 846,000 | | 597,682 |
| Yi Jinn Industrial Company, Ltd. * | 314,000 | | 59,256 |
| Yieh Phui Enterprise Company, Ltd. | 645,000 | | 285,629 |
| Yosun Industrial Corp. | 148,050 | | 127,104 |
| Yuen Foong Yu Paper Manufacturing | | | |
| Company, Ltd. | 714,070 | | 301,555 |
| Yulon Motor Company, Ltd. | 506,429 | | 553,797 |
| Yungtay Engineering Company, Ltd. | 176,000 | | 133,874 |
| Zig Sheng Industrial Company, Ltd. * | 189,000 | | 55,454 |
|
|
| | | | 57,546,341 |
| Thailand - 3.04% | | | |
| | | | |
| Aapico Hitech PCL | 192,300 | | 72,862 |
| Adkinson Securities PCL * | 2,243,400 | | 64,732 |
| Bangkok Bank PCL, NVDR | 1,142,800 | | 3,960,264 |
| Bangkok Expressway PCL | 300,700 | | 212,970 |
| Bangkok Insurance PCL | 2,500 | | 19,965 |
| Bangkok Land PCL * | 6,465,300 | | 175,247 |
| Bank of Ayudhya PCL, NVDR | 720,000 | | 562,032 |
| Cal-Comp Electronics Thailand PCL | 1,014,300 | | 199,549 |
| Charoen Pokphand Foods PCL | 2,954,000 | | 402,936 |
| CS Loxinfo PCL | 213,700 | | 25,661 |
| Delta Electronics Thailand PCL | 321,600 | | 199,653 |
| Erawan Group PCL | 420,000 | | 50,679 |
| Hemaraj Land & Development PCL | 5,223,400 | | 204,003 |
| Home Product Center PCL | 897,844 | | 130,843 |
| Jasmine International PCL | 3,860,700 | | 52,886 |
| KGI Securities Thailand PCL | 1,922,600 | | 163,625 |
| Kiatnakin Finance PCL | 282,500 | | 240,837 |
| Krung Thai Bank PCL | 4,491,100 | | 1,479,094 |
| Krungthai Card PCL | 126,000 | | 106,500 |
| Loxley PCL | 988,200 | | 53,284 |
| Magnecomp Precision Technology PCL, NVDR * | 155,700 | | 11,527 |
| Magnecomp Precision Technology PCL * | 370,000 | | 27,391 |
| MBK PCL | 57,800 | | 96,867 |
| MK Real Estate Development PCL | 691,500 | | 49,983 |
| Nakornthai Strip Mill PCL * | 4,900,000 | | 45,701 |
| National Finance PCL | 793,700 | | 358,565 |
| Polyplex PCL | 190,000 | | 35,718 |
| Power Line Engineering PCL | 246,200 | | 41,261 |
| Pranda Jewelry PCL | 214,300 | | 55,589 |
| PTT Chemical PCL | 584,500 | | 1,873,943 |
| Quality House PCL | 3,882,100 | | 194,614 |
| Raimon Land PCL * | 1,160,000 | | 36,495 |
| Regional Container Lines PCL | 209,100 | | 175,215 |
| Robinson Department Store PCL | 331,700 | | 101,511 |
| Saha-Union PCL | 134,800 | | 73,863 |
| Sahaviriya Steel Industries PCL | 6,536,000 | | 180,973 |
| | | |
| Emerging Markets Value Fund (continued) | |
| | Shares or | | |
| | Principal | | |
| | Amount | | Value |
|
|
| |
| COMMON STOCKS (continued) | | | |
| | | | |
| Thailand (continued) | | | |
| Samart I-Mobile PCL | 224,500 | $ | 122,359 |
| Sansiri PCL | 1,102,100 | | 118,851 |
| SC Asset Corp. PCL | 168,200 | | 42,405 |
| Seamico Securities PCL | 421,400 | | 48,883 |
| Shin Satellite PCL * | 544,900 | | 168,346 |
| Siam Commercial Bank PCL | 224,000 | | 522,297 |
| Siam Industrial Credit PCL | 402,200 | | 44,311 |
| Sino Thai Engineering & Construction PCL * | 512,900 | | 87,452 |
| Srithai Superware PCL | 204,700 | | 46,835 |
| Supalai PCL | 985,400 | | 106,266 |
| Tata Steel Thailand PCL | 2,220,800 | | 106,800 |
| Thai Plastic & Chemical PCL | 292,800 | | 158,732 |
| Thai Union Frozen Products PCL, Foreign | | | |
| Shares | 341,400 | | 244,781 |
| Thoresen Thai Agencies PCL | 80,100 | | 123,734 |
| Ticon Industrial Connection PCL | 88,400 | | 50,500 |
| Tipco Asphalt PCL | 103,300 | | 84,302 |
| TMB Bank PCL * | 4,898,600 | | 274,127 |
| TPI Polene PCL | 921,000 | | 450,971 |
| Vanachai Group PCL | 672,000 | | 92,055 |
| Vinythai PCL | 100,000 | | 22,005 |
|
|
| | | | 14,652,850 |
| Turkey - 3.69% | | | |
| | | | |
| Adana Cimento Sanayii TAS | 136,519 | | 80,903 |
| Akenerji Elektrik Uretim AS * | 23,145 | | 156,922 |
| Aksa Akrilik Kimya Sanayii AS | 43,831 | | 109,507 |
| Aksigorta AS | 116,242 | | 783,915 |
| Alarko Carrier Sanayii Ve Ticaret AS | 4,144 | | 51,963 |
| Alarko Holding AS | 57,211 | | 145,456 |
| Alkim Alkali Kimya AS | 9,414 | | 43,229 |
| Anadolu Cam Sanayii AS | 29,117 | | 108,882 |
| Anadolu Isuzu Otomotiv Sanayi AS | 7,282 | | 45,745 |
| Anadolu Sigorta AS, Class B | 147,500 | | 254,204 |
| Ayen Enerji AS * | 60,166 | | 131,511 |
| Aygaz AS | 91,482 | | 328,407 |
| Bagfas Bandirma Gubre Fabrikalari AS | 1,633 | | 57,245 |
| Banvit Bandirma Vitaminli Yem Sanayii | | | |
| Ticaret AS * | 30,982 | | 81,430 |
| BatiSoke AS | 17,732 | | 45,122 |
| Bolu Cimento Sanayii AS | 83,405 | | 177,485 |
| Borusan Mannesmann Boru Sanayi AS | 13,810 | | 126,927 |
| Bossa Ticaret ve Sanayi Isletmeleri TAS | 35,235 | | 44,474 |
| Brisa Bridgestone Sabanci Lastik San Ve Tic | | | |
| AS | 831 | | 48,803 |
| Cemtas Celik Makina Sanayi ve Ticaret AS * | 56,218 | | 80,548 |
| Cimsa Cimento Sanayi ve Ticaret AS | 47,945 | | 351,728 |
| Deva Holding AS * | 9,443 | | 99,729 |
| Dogan Sirketler Grubu Holdings AS * | 657,822 | | 1,258,560 |
| Dogus Otomotiv Servis ve Ticaret AS | 47,528 | | 259,544 |
| Eczacibasi Ilac Sanayi AS * | 55,531 | | 210,856 |
| Eczacibasi Yapi Gerecleri Sanayi ve Ticaret | | | |
| AS * | 20,408 | | 46,935 |
| |
| The accompanying notes are an integral part of the financial statements. | 169 |
John Hancock Funds II
Portfolio of investments — August 31, 2007
(showing percentage of total net assets)
| | | |
| Emerging Markets Value Fund (continued) | |
| | Shares or | | |
| | Principal | | |
| | Amount | | Value |
|
|
| |
| COMMON STOCKS (continued) | | | |
| | | | |
| Turkey (continued) | | | |
| EGE Seramik Sanayi ve Ticaret AS * | 26,340 | $ | 44,353 |
| Eregli Demir ve Celik Fabrikalari TAS | 391,516 | | 3,073,480 |
| Gentas Genel Metal Sanayi ve Ticaret AS * | 46,226 | | 60,371 |
| Global Yatirim Holding AS * | 146,381 | | 171,134 |
| Goldas Kuyumculuk Sanayi AS * | 54,847 | | 84,965 |
| Goodyear Lastikleri TAS * | 3,921 | | 47,469 |
| GSD Holding AS * | 221,249 | | 258,088 |
| Gunes Sigorta AS * | 31,526 | | 59,204 |
| Hektas Ticaret TAS | 57,406 | | 54,016 |
| Ihlas Holding AS * | 331,640 | | 190,676 |
| Izmir Demir Celik Sanayi AS * | 27,749 | | 56,400 |
| Kardemir Karabuk Demir Celik Sanayi ve | | | |
| Ticaret AS * | 140,183 | | 187,143 |
| Kartonsan Karton Sanayi ve Ticaret AS * | 638 | | 40,231 |
| Konya Cimento Sanayii AS | 977 | | 43,561 |
| Kordsa Global Endustriyel Iplik ve Kord Bezi | | | |
| Sanayi ve Ticaret Anonim Sirketi AS * | 27,311 | | 88,499 |
| Mardin Cimento Sanayii ve Ticaret AS | 8,752 | | 50,946 |
| Marmaris Marti Otel Isletmeleri AS * | 71,538 | | 66,258 |
| Menderes Tekstil Sanayi ve Ticaret AS * | 126,374 | | 72,076 |
| Mutlu Aku ve Malzemeleri Sanayi AS * | 28,331 | | 61,991 |
| Net Turizm Ticaret ve Sanayi AS * | 49,168 | | 49,291 |
| Nortel Networks Netas Telekomunikasyon AS | 2,177 | | 53,264 |
| Parsan Makina Parcalari Sanayii AS * | 24,048 | | 43,703 |
| Pinar Entegre Et ve Un Sanayi AS | 36,324 | | 115,875 |
| Pinar Sut Mamulleri Sanayii AS | 15,498 | | 86,355 |
| Sanko Pazarlama Ithalat Ihracat AS * | 20,076 | | 54,998 |
| Sarkuysan Elektrolitik Bakir AS | 37,152 | | 103,483 |
| Tekstil Bankasi AS * | 100,695 | | 162,964 |
| Trakya Cam Sanayi AS | 99,048 | | 338,111 |
| Turk Demir Dokum Fabrikalari AS * | 15,130 | | 107,951 |
| Turk Prysmian Kablo ve Sistemleri AS | 17,593 | | 50,328 |
| Turk Sise ve Cam Fabrikalari AS | 185,687 | | 778,863 |
| Turkiye Is Bankasi AS | 1,150,454 | | 5,619,948 |
| Ulker Gida Sanayi ve Ticaret AS | 20,625 | | 85,976 |
| Usas Ucak Servisi AS | 18,304 | | 41,612 |
| Vestel Elektronik Sanayi ve Tracaret AS * | 72,630 | | 164,904 |
| Zorlu Enerji Elektrik Uretim AS * | 37,761 | | 132,660 |
|
|
| | | | 17,831,177 |
|
| TOTAL COMMON STOCKS (Cost $436,023,857) | | $ | 455,857,962 |
|
| |
| PREFERRED STOCKS - 5.09% | | | |
| | | | |
| Brazil - 5.09% | | | |
| Acesita SA | 3,700 | | 140,992 |
| Bardella SA Industrias Mecanicas * | 916 | | 70,973 |
| Centrais Eletricas de Santa Catarina SA, | | | |
| Series B | 19,900 | | 390,073 |
| Companhia de Tecidos de Norte de Minas SA | 10,000 | | 61,477 |
| Fabrica de Produtos Alimenticios Vigor SA * | 70,000 | | 97,805 |
| Forjas Taurus SA | 99,900 | | 563,403 |
| Klabin SA, ADR | 771,000 | | 2,264,191 |
| Marcopolo SA * | 102,100 | | 416,036 |
| | | | |
| Emerging Markets Value Fund (continued) | |
| | | Shares or | | |
| | | Principal | | |
| | | Amount | | Value |
|
|
| |
| PREFERRED STOCKS (continued) | | | | |
| | | | | |
| Brazil (continued) | | | | |
| Metalurgica Gerdau SA | | 168,300 | $ | 5,258,841 |
| Petroquimica Uniao SA * | | 13,000 | | 97,754 |
| Suzano Bahia Sul Papel & Celulose SA, | | | | |
| Series A | | 137,900 | | 1,891,028 |
| Suzano Petroquimica SA | | 104,013 | | 502,044 |
| Telemar Norte Leste SA * | | 100,000 | | 3,404,126 |
| Uniao de Industrias Petroquimicas SA | | 354,100 | | 392,205 |
| Usinas Siderurgicas de Minas Gerais SA | | 151,800 | | 9,013,752 |
|
|
| | | | | 24,564,700 |
|
| TOTAL PREFERRED STOCKS (Cost $21,840,510) | | $ | 24,564,700 |
|
| |
| RIGHTS - 0.02% | | | | |
| | | | | |
| Malaysia - 0.02% | | | | |
| Bandar Raya Developments BHD (Expiration | | | |
| Date 09/10/2007, Strike Price 0.1 MYR) | 109,305 | | 59,000 |
| South Korea - 0.00% | | | | |
| Hanil Construction Company, Ltd. (Expiration | | | |
| Date 09/18/2007, Strike Price 16,000 | | | | |
| KRW) | | 712 | | 5,616 |
|
| TOTAL RIGHTS (Cost $0) | | | $ | 64,616 |
|
| |
| REPURCHASE AGREEMENTS - 0.14% | | | |
| Repurchase Agreement with State | | | | |
| Street Corp. dated 08/31/2007 at | | | | |
| 4.60% to be repurchased at | | | | |
| $670,342 on 09/04/2007, | | | | |
| collateralized by $565,000 Federal | | | | |
| Home Loan Mortgage Corp., | | | | |
| 6.75% due 03/15/2031 (valued at | | | | |
| $688,594, including interest) | $ | 670,000 | $ | 670,000 |
|
| TOTAL REPURCHASE AGREEMENTS | | | | |
| (Cost $670,000) | | | $ | 670,000 |
|
| Total Investments (Emerging Markets Value Fund) | | |
| (Cost $458,534,367) - 99.73% | | | $ | 481,157,278 |
| Other Assets in Excess of Liabilities - 0.27% | | | 1,317,649 |
|
|
| TOTAL NET ASSETS - 100.00% | | | $ | 482,474,927 |
|
|
| |
| The portfolio had the following five top industry concentrations as of |
| August 31, 2007 (as a percentage of total net assets): | |
| | |
| Banking | 13.06% |
| International Oil | 5.74% |
| Financial Services | 5.40% |
| Steel | 5.27% |
| Automobiles | 4.96% |
| |
| The accompanying notes are an integral part of the financial statements. | 170 |
John Hancock Funds II
Portfolio of investments — August 31, 2007
(showing percentage of total net assets)
| | | |
| Emerging Small Company Fund | | | |
| | Shares or | | |
| | Principal | | |
| | Amount | | Value |
|
|
| |
| COMMON STOCKS - 95.03% | | | |
| | | | |
| Advertising - 0.96% | | | |
| inVentiv Health, Inc. * | 13,445 | $ | 533,229 |
| | | | |
| Aerospace - 4.01% | | | |
| BE Aerospace, Inc. * | 16,080 | | 626,638 |
| HEICO Corp., Class A | 17,458 | | 637,915 |
| Moog, Inc., Class A * | 11,430 | | 486,575 |
| Triumph Group, Inc. | 6,433 | | 470,960 |
| |
|
| | | | 2,222,088 |
| | | | |
| Air Travel - 0.74% | | | |
| Copa Holdings SA, Class A | 8,460 | | 410,056 |
| | | | |
| Apparel & Textiles - 5.73% | | | |
| Crocs, Inc. * (a) | 24,600 | | 1,452,384 |
| Iconix Brand Group, Inc. * (a) | 25,070 | | 519,701 |
| Lululemon Athletica, Inc. * (a) | 2,458 | | 83,744 |
| The Warnaco Group, Inc. * | 13,450 | | 469,405 |
| Volcom, Inc. * (a) | 16,580 | | 647,118 |
| |
|
| | | | 3,172,352 |
| Auto Parts - 0.81% | | | |
| LKQ Corp. * | 14,495 | | 449,055 |
| Auto Services - 0.51% | | | |
| Monro Muffler Brake, Inc. | 7,550 | | 284,106 |
| | | | |
| Banking - 3.89% | | | |
| Alabama National BanCorporation | 4,890 | | 257,996 |
| East West Bancorp, Inc. | 11,236 | | 402,249 |
| PrivateBancorp, Inc. (a) | 8,050 | | 269,514 |
| Signature Bank * | 11,825 | | 408,672 |
| United Community Banks, Inc. (a) | 17,260 | | 419,245 |
| Virginia Commerce Bancorp, Inc. * (a) | 26,884 | | 393,851 |
| |
|
| | | | 2,151,527 |
| Biotechnology - 3.16% | | | |
| Illumina, Inc. * (a) | 8,330 | | 402,255 |
| Immucor, Inc. * | 23,645 | | 788,561 |
| Integra LifeSciences Holdings Corp. * (a) | 11,500 | | 558,555 |
| |
|
| | | | 1,749,371 |
| Broadcasting - 0.74% | | | |
| Sinclair Broadcast Group, Inc., Class A (a) | 33,030 | | 411,554 |
| | | | |
| Business Services - 1.91% | | | |
| Informatica Corp. * | 26,730 | | 373,151 |
| Kenexa Corp. * | 12,740 | | 354,044 |
| Watson Wyatt Worldwide, Inc., Class A | 7,010 | | 331,643 |
| |
|
| | | | 1,058,838 |
| Cable & Television - 0.86% | | | |
| Central European Media Enterprises, Ltd., | | | |
| Class A * | 5,130 | | 472,986 |
| | | |
| Cellular Communications - 1.07% | | | |
| Dobson Communications Corp., Class A * | 46,930 | | 592,726 |
| | | | |
| Chemicals - 0.67% | | | |
| Zoltek Companies, Inc. * (a) | 8,970 | | 370,371 |
| | | | |
| Commercial Services - 0.96% | | | |
| Live Nation, Inc. * | 25,720 | | 532,404 |
| | | |
| Emerging Small Company Fund (continued) | | |
| | Shares or | | |
| | Principal | | |
| | Amount | | Value |
|
|
| |
| COMMON STOCKS (continued) | | | |
| | | | |
| Computers & Business Equipment - 2.39% | | | |
| Brocade Communications Systems, Inc. * | 37,780 | $ | 264,460 |
| Internap Network Services Corp. * (a) | 20,360 | | 285,651 |
| Micros Systems, Inc. * | 12,797 | | 772,171 |
| |
|
| | | | 1,322,282 |
| Correctional Facilities - 1.37% | | | |
| The Geo Group, Inc. * | 25,460 | | 757,944 |
| | | | |
| Crude Petroleum & Natural Gas - 3.20% | | | |
| Arena Resources, Inc. * | 13,580 | | 833,269 |
| Carrizo Oil & Gas, Inc. * (a) | 14,080 | | 552,921 |
| GMX Resources, Inc. * (a) | 12,710 | | 387,147 |
| |
|
| | | | 1,773,337 |
| Electrical Equipment - 1.59% | | | |
| Anixter International, Inc. * | 6,390 | | 490,561 |
| Genlyte Group, Inc. * | 5,390 | | 391,152 |
| |
|
| | | | 881,713 |
| Electronics - 0.58% | | | |
| II-VI, Inc. * | 10,210 | | 318,552 |
| | | | |
| Energy - 1.20% | | | |
| Energy Conversion Devices, Inc. * (a) | 9,620 | | 249,254 |
| Trina Solar, Ltd., SADR * | 8,890 | | 416,230 |
| |
|
| | | | 665,484 |
| Financial Services - 4.95% | | | |
| Affiliated Managers Group, Inc. * (a) | 9,930 | | 1,124,573 |
| GFI Group, Inc. * | 9,789 | | 724,386 |
| optionsXpress Holdings, Inc. | 19,470 | | 457,934 |
| Stifel Financial Corp. * (a) | 7,960 | | 430,954 |
| |
|
| | | | 2,737,847 |
| Food & Beverages - 1.15% | | | |
| Hansen Natural Corp. * | 14,150 | | 635,476 |
| | | | |
| Healthcare Products - 6.45% | | | |
| American Medical Systems Holdings, Inc. * (a) | 28,390 | | 522,376 |
| Arthrocare Corp. * | 5,020 | | 281,220 |
| Conceptus, Inc. * (a) | 17,580 | | 307,650 |
| DJO, Inc. * | 7,160 | | 348,549 |
| Inverness Medical Innovations, Inc. * (a) | 15,620 | | 751,947 |
| Kyphon, Inc. * | 4,890 | | 326,994 |
| NutriSystem, Inc. * | 4,710 | | 255,423 |
| Nuvasive, Inc. * | 10,900 | | 347,710 |
| PSS World Medical, Inc. * | 22,520 | | 429,682 |
| |
|
| | | | 3,571,551 |
| Healthcare Services - 3.85% | | | |
| Healthextras, Inc. * | 9,980 | | 280,538 |
| Psychiatric Solutions, Inc. * | 19,962 | | 735,799 |
| Radiation Therapy Services, Inc. * (a) | 20,720 | | 468,687 |
| Sun Healthcare Group, Inc. * | 26,730 | | 397,475 |
| The Advisory Board Company * | 4,304 | | 247,609 |
| |
|
| | | | 2,130,108 |
| |
| The accompanying notes are an integral part of the financial statements. | 171 |
John Hancock Funds II
Portfolio of investments — August 31, 2007
(showing percentage of total net assets)
| | | |
| Emerging Small Company Fund (continued) | | |
| | Shares or | | |
| | Principal | | |
| | Amount | | Value |
|
|
| |
| COMMON STOCKS (continued) | | | |
| | | | |
| Hotels & Restaurants - 0.70% | | | |
| McCormick & Schmick's Seafood | | | |
| Restaurants, Inc. * | 14-,570 | $ | 386,105 |
| Industrial Machinery - 0.69% | | | |
| Regal-Beloit Corp. | 7,550 | | 381,351 |
| Insurance - 2.09% | | | |
| Castlepoint Holdings, Ltd. | 17,990 | | 203,647 |
| ProAssurance Corp. * | 9,820 | | 516,336 |
| Tower Group, Inc. | 17,438 | | 437,868 |
| |
|
| | | | 1,157,851 |
| Internet Content - 0.74% | | | |
| The Knot, Inc. * (a) | 19,520 | | 408,944 |
| | | | |
| Internet Software - 1.34% | | | |
| DealerTrack Holdings, Inc. * | 19,390 | | 740,698 |
| | | | |
| Leisure Time - 2.38% | | | |
| Life Time Fitness, Inc. * (a) | 15,420 | | 856,890 |
| WMS Industries, Inc. * | 15,705 | | 462,355 |
| |
|
| | | | 1,319,245 |
| Liquor - 2.35% | | | |
| Central European Distribution Corp. * (a) | 29,705 | | 1,302,861 |
| | | | |
| Manufacturing - 1.67% | | | |
| Barnes Group, Inc. | 16,625 | | 523,023 |
| Spartan Motors, Inc. | 27,238 | | 403,122 |
| |
|
| | | | 926,145 |
| Mutual Funds - 1.00% | | | |
| iShares Russell 2000 Index Fund (a) | 7,000 | | 551,180 |
| | | | |
| Office Furnishings & Supplies - 1.53% | | | |
| Acco Brands Corp. * | 18,780 | | 425,742 |
| Knoll, Inc. | 21,990 | | 418,030 |
| |
|
| | | | 843,772 |
| Petroleum Services - 3.06% | | | |
| Basic Energy Services, Inc. * (a) | 21,750 | | 449,573 |
| Core Laboratories N.V. * | 5,270 | | 590,767 |
| Superior Energy Services, Inc. * | 16,810 | | 652,564 |
| |
|
| | | | 1,692,904 |
| Pharmaceuticals - 1.00% | | | |
| Adams Respiratory Therapeutics, Inc. * (a) | 8,810 | | 339,714 |
| Eurand NV * | 16,032 | | 213,546 |
| |
|
| | | | 553,260 |
| Publishing - 0.89% | | | |
| Consolidated Graphics, Inc. * | 7,460 | | 494,449 |
| | | | |
| Real Estate - 2.95% | | | |
| BioMed Realty Trust, Inc., REIT | 16,750 | | 408,365 |
| Jones Lang LaSalle, Inc. | 4,110 | | 459,005 |
| Redwood Trust, Inc., REIT (a) | 8,820 | | 329,250 |
| Sunstone Hotel Investors, Inc., REIT | 16,130 | | 434,865 |
| |
|
| | | | 1,631,485 |
| Retail Trade - 4.52% | | | |
| First Cash Financial Services, Inc. * | 25,180 | | 539,356 |
| | | | |
| Emerging Small Company Fund (continued) | |
| | | Shares or | | |
| | | Principal | | |
| | | Amount | | Value |
|
|
| |
| COMMON STOCKS (continued) | | | | |
| | | | | |
| Retail Trade (continued) | | | | |
| Hibbett Sports, Inc. * | | 14,770 | $ | 368,364 |
| Longs Drug Stores Corp. | | 7,770 | | 409,712 |
| NexCen Brands, Inc. * | | 27,070 | | 184,888 |
| The Men's Wearhouse, Inc. | | 8,970 | | 454,600 |
| Zumiez, Inc. * (a) | | 11,265 | | 546,690 |
| |
|
| | | | | 2,503,610 |
| Semiconductors - 5.05% | | | | |
| Emulex Corp. * | | 22,060 | | 431,053 |
| FormFactor, Inc. * | | 12,450 | | 564,732 |
| PMC-Sierra, Inc. * | | 47,890 | | 367,795 |
| Varian Semiconductor Equipment | | | | |
| Associates, Inc. * (a) | | 18,040 | | 1,003,565 |
| Verigy, Ltd. * | | 16,205 | | 428,136 |
| |
|
| | | | | 2,795,281 |
| Software - 5.09% | | | | |
| ACI Worldwide, Inc. * | | 9,360 | | 243,173 |
| Allscripts Healthcare Solution, Inc. * (a) | | 16,285 | | 368,204 |
| Macrovision Corp. * | | 17,610 | | 417,885 |
| Monolithic Power Systems, Inc. * | | 5,800 | | 118,784 |
| Nuance Communications, Inc. * (a) | | 25,060 | | 471,128 |
| Omniture, Inc. * (a) | | 12,190 | | 302,434 |
| Solera Holdings, Inc. * | | 21,797 | | 398,449 |
| Ultimate Software Group, Inc. * | | 16,020 | | 498,703 |
| |
|
| | | | | 2,818,760 |
| Telecommunications Equipment & | | | | |
| | | | | |
| Services - 3.83% | | | | |
| Golden Telecom, Inc. (a) | | 6,180 | | 424,010 |
| NTELOS Holdings Corp. | | 26,040 | | 697,351 |
| PAETEC Holding Corp. * | | 48,140 | | 574,310 |
| Viasat, Inc. * | | 13,960 | | 426,059 |
| |
|
| | | | | 2,121,730 |
| Telephone - 0.73% | | | | |
| Centennial Communications Corp., Class A * | 42,860 | | 402,884 |
| | | | |
| Trucking & Freight - 0.67% | | | | |
| Old Dominion Freight Lines, Inc. * | | 12,779 | | 368,035 |
|
| TOTAL COMMON STOCKS (Cost $46,879,923) | | $ | 52,605,507 |
|
| |
| SHORT TERM INVESTMENTS - 26.76% | | | |
| John Hancock Cash Investment Trust (c) | $ | 14,816,824 | $ | 14,816,824 |
|
| TOTAL SHORT TERM INVESTMENTS | | | | |
| (Cost $14,816,824) | | | $ | 14,816,824 |
|
| |
| The accompanying notes are an integral part of the financial statements. | 172 |
John Hancock Funds II
Portfolio of investments — August 31, 2007
(showing percentage of total net assets)
| | | | |
| Emerging Small Company Fund (continued) | | |
| | | Shares or | | |
| | | Principal | | |
| | | Amount | | Value |
|
|
| |
| REPURCHASE AGREEMENTS - 5.11% | | | |
| Repurchase Agreement with State | | | | |
| Street Corp. dated 08/31/2007 at | | | | |
| 4.60% to be repurchased at | | | | |
| $2,830,446 on 9/4/2007, | | | | |
| collateralized by $2,890,000 | | | | |
| Federal National Mortgage | | | | |
| Association, 6.00% due | | | | |
| 04/30/2037 (valued at $2,890,000, | | | | |
| including interest) | $ | 2,829,000 | $ | 2,829,000 |
|
| TOTAL REPURCHASE AGREEMENTS | | | | |
| (Cost $2,829,000) | | | $ | 2,829,000 |
|
| Total Investments (Emerging Small Company Fund) | | |
| (Cost $64,525,747) - 126.90% | | | $ | 70,251,331 |
| Liabilities in Excess of Other Assets - (26.90)% | | | (14,893,229) |
| |
|
| TOTAL NET ASSETS - 100.00% | | | $ | 55,358,102 |
| |
|
| |
| |
| |
| Equity-Income Fund | | | | |
| | | Shares or | | |
| | | Principal | | |
| | | Amount | | Value |
|
|
| |
| COMMON STOCKS - 94.60% | | | | |
| | | | | |
| Aerospace - 0.82% | | | | |
| Raytheon Company | | 122,900 | $ | 7,538,686 |
| | | | | |
| Agriculture - 0.26% | | | | |
| Archer-Daniels-Midland Company | | 70,700 | | 2,382,590 |
| | | | | |
| Air Travel - 0.30% | | | | |
| Southwest Airlines Company | | 184,900 | | 2,793,839 |
| | | | | |
| Aluminum - 0.59% | | | | |
| Alcoa, Inc. | | 150,100 | | 5,483,153 |
| | | | | |
| Auto Parts - 0.53% | | | | |
| Genuine Parts Company | | 98,550 | | 4,895,964 |
| | | | | |
| Automobiles - 0.24% | | | | |
| Ford Motor Company * | | 283,000 | | 2,210,230 |
| | | | | |
| Banking - 3.52% | | | | |
| Fifth Third Bancorp | | 229,762 | | 8,200,205 |
| National City Corp. | | 134,900 | | 3,630,159 |
| Royal Bank of Scotland Group PLC | | 295,000 | | 3,428,625 |
| SunTrust Banks, Inc. | | 83,900 | | 6,607,125 |
| US Bancorp | | 329,000 | | 10,643,150 |
| |
|
| | | | | 32,509,264 |
| Biotechnology - 0.81% | | | | |
| Amgen, Inc. * | | 150,100 | | 7,521,511 |
| | | | | |
| Broadcasting - 0.69% | | | | |
| CBS Corp., Class B | | 202,200 | | 6,371,322 |
| | | | |
| Building Materials & Construction - 0.75% | | | |
| Masco Corp. | | 266,500 | | 6,934,330 |
| | | | | |
| Business Services - 1.11% | | | | |
| Computer Sciences Corp. * | | 75,100 | | 4,201,845 |
| | | |
| Equity-Income Fund (continued) | | | |
| | Shares or | | |
| | Principal | | |
| | Amount | | Value |
|
|
| |
| COMMON STOCKS (continued) | | | |
| | | |
| Business Services (continued) | | | |
| H & R Block, Inc. | 306,600 | $ | 6,082,944 |
|
|
| | | | 10,284,789 |
| Cable & Television - 1.74% | | | |
| Time Warner, Inc. | 560,300 | | 10,634,494 |
| Viacom, Inc., Class B * | 137,600 | | 5,429,696 |
|
|
| | | | 16,064,190 |
| Cellular Communications - 1.15% | | | |
| ALLTEL Corp. | 85,500 | | 5,836,230 |
| Motorola, Inc. | 280,300 | | 4,751,085 |
|
|
| | | | 10,587,315 |
| Chemicals - 0.89% | | | |
| E.I. Du Pont de Nemours & Company | 169,000 | | 8,238,750 |
| | | |
| Computers & Business Equipment - 0.96% | | | |
| Dell, Inc. * | 312,700 | | 8,833,775 |
| | | | |
| Construction Materials - 1.01% | | | |
| USG Corp. * (a) | 94,000 | | 3,630,280 |
| Vulcan Materials Company | 62,900 | | 5,661,629 |
|
|
| | | | 9,291,909 |
| Cosmetics & Toiletries - 4.06% | | | |
| Avon Products, Inc. | 183,800 | | 6,313,530 |
| Colgate-Palmolive Company | 141,000 | | 9,351,120 |
| International Flavors & Fragrances, Inc. | 152,300 | | 7,650,029 |
| Kimberly-Clark Corp. | 82,200 | | 5,646,318 |
| Procter & Gamble Company | 130,100 | | 8,496,831 |
|
|
| | | | 37,457,828 |
| Crude Petroleum & Natural Gas - 0.43% | | | |
| Statoil ASA, ADR (a) | 108,600 | | 3,125,508 |
| Statoil ASA | 30,500 | | 878,611 |
|
|
| | | | 4,004,119 |
| Drugs & Health Care - 0.88% | | | |
| Wyeth | 176,400 | | 8,167,320 |
| | | | |
| Electrical Equipment - 0.47% | | | |
| Cooper Industries, Ltd., Class A | 85,000 | | 4,349,450 |
| | | | |
| Electrical Utilities - 2.77% | | | |
| Ameren Corp. | 27,400�� | | 1,391,372 |
| Entergy Corp. | 84,100 | | 8,714,442 |
| FirstEnergy Corp. | 89,475 | | 5,497,344 |
| Pinnacle West Capital Corp. (a) | 84,400 | | 3,362,496 |
| TECO Energy, Inc. | 94,900 | | 1,503,216 |
| Xcel Energy, Inc. | 249,100 | | 5,133,951 |
|
|
| | | | 25,602,821 |
| Electronics - 0.55% | | | |
| Sony Corp. | 106,900 | | 5,115,895 |
| | | | |
| Energy - 1.13% | | | |
| Duke Energy Corp. | 255,900 | | 4,693,206 |
| Progress Energy, Inc. | 125,800 | | 5,771,704 |
|
|
| | | | 10,464,910 |
| |
| The accompanying notes are an integral part of the financial statements. | 173 |
John Hancock Funds II
Portfolio of investments — August 31, 2007
(showing percentage of total net assets)
| | | |
| Equity-Income Fund (continued) | | | |
| | Shares or | | |
| | Principal | | |
| | Amount | | Value |
|
|
| |
| COMMON STOCKS (continued) | | | |
| | | | |
| Financial Services - 8.16% | | | |
| Bank of New York Mellon Corp. | 236,400 | $ | 9,557,652 |
| Capital One Financial Corp. | 66,000 | | 4,267,560 |
| Charles Schwab Corp. | 409,400 | | 8,106,120 |
| Citigroup, Inc. | 207,596 | | 9,732,101 |
| Countrywide Financial Corp. | 178,400 | | 3,541,240 |
| Federal National Mortgage Association | 75,600 | | 4,960,116 |
| JP Morgan Chase & Company | 450,614 | | 20,061,335 |
| Legg Mason, Inc. | 46,900 | | 4,071,858 |
| Merrill Lynch & Company, Inc. | 18,800 | | 1,385,560 |
| State Street Corp. | 102,400 | | 6,283,264 |
| Wells Fargo & Company | 92,900 | | 3,394,566 |
|
|
| | | | 75,361,372 |
| Food & Beverages - 3.68% | | | |
| Campbell Soup Company | 92,200 | | 3,480,550 |
| General Mills, Inc. | 130,900 | | 7,314,692 |
| Hershey Company | 94,300 | | 4,384,950 |
| Kraft Foods, Inc., Class A | 165,400 | | 5,302,724 |
| McCormick & Company, Inc. | 93,800 | | 3,361,792 |
| Sysco Corp. | 75,200 | | 2,510,176 |
| The Coca-Cola Company | 141,000 | | 7,582,980 |
|
|
| | | | 33,937,864 |
| Gas & Pipeline Utilities - 1.19% | | | |
| NiSource, Inc. | 395,200 | | 7,445,568 |
| Spectra Energy Corp. | 150,300 | | 3,494,475 |
|
|
| | | | 10,940,043 |
| Healthcare Products - 2.02% | | | |
| Baxter International, Inc. | 110,600 | | 6,056,456 |
| Boston Scientific Corp. * | 169,100 | | 2,169,553 |
| Johnson & Johnson | 169,000 | | 10,442,510 |
|
|
| | | | 18,668,519 |
| Holdings Companies/Conglomerates - 3.20% | | | |
| General Electric Company | 759,900 | | 29,537,313 |
| | | | |
| Homebuilders - 0.29% | | | |
| D.R. Horton, Inc. | 176,900 | | 2,672,959 |
| | | | |
| Household Products - 1.54% | | | |
| Fortune Brands, Inc. | 88,300 | | 7,336,847 |
| Newell Rubbermaid, Inc. | 267,000 | | 6,885,930 |
|
|
| | | | 14,222,777 |
| Industrial Machinery - 0.68% | | | |
| Ingersoll-Rand Company, Class A | 97,000 | | 5,037,210 |
| Pall Corp. | 33,000 | | 1,258,290 |
|
|
| | | | 6,295,500 |
| Insurance - 5.69% | | | |
| American International Group, Inc. | 158,765 | | 10,478,490 |
| Chubb Corp. | 68,300 | | 3,492,179 |
| Genworth Financial, Inc., Class A | 93,800 | | 2,718,324 |
| Lincoln National Corp. | 141,098 | | 8,590,046 |
| Marsh & McLennan Companies, Inc. | 440,900 | | 11,749,985 |
| Progressive Corp. | 188,000 | | 3,823,920 |
| The Travelers Companies, Inc. | 140,749 | | 7,113,455 |
| | | |
| Equity-Income Fund (continued) | | | |
| | Shares or | | |
| | Principal | | |
| | Amount | | Value |
|
|
| |
| COMMON STOCKS (continued) | | | |
| | | |
| Insurance (continued) | | | |
| UnumProvident Corp. | 187,700 | $ | 4,593,019 |
|
|
| | | | 52,559,418 |
| International Oil - 9.19% | | | |
| Anadarko Petroleum Corp. | 137,800 | | 6,749,444 |
| BP PLC, ADR | 104,392 | | 7,031,845 |
| Chevron Corp. | 233,760 | | 20,514,778 |
| Exxon Mobil Corp. | 229,324 | | 19,659,946 |
| Hess Corp. | 159,600 | | 9,794,652 |
| Murphy Oil Corp. | 117,000 | | 7,129,980 |
| Royal Dutch Shell PLC, ADR | 180,400 | | 13,953,940 |
|
|
| | | | 84,834,585 |
| Internet Content - 0.69% | | | |
| Yahoo!, Inc. * | 280,700 | | 6,380,311 |
| | | | |
| Internet Retail - 0.04% | | | |
| eBay, Inc. * | 10,600 | | 361,460 |
| | | | |
| Leisure Time - 0.85% | | | |
| Walt Disney Company | 234,700 | | 7,885,920 |
| | | | |
| Liquor - 1.23% | | | |
| Anheuser-Busch Companies, Inc. | 189,500 | | 9,361,300 |
| Brown Forman Corp., Class B | 28,200 | | 2,017,992 |
|
|
| | | | 11,379,292 |
| Manufacturing - 3.17% | | | |
| 3M Company (a) | 159,500 | | 14,512,905 |
| Honeywell International, Inc. | 130,100 | | 7,305,115 |
| Illinois Tool Works, Inc. | 128,700 | | 7,486,479 |
|
|
| | | | 29,304,499 |
| Office Furnishings & Supplies - 0.70% | | | |
| Avery Dennison Corp. | 107,400 | | 6,421,446 |
| | | | |
| Paper - 1.91% | | | |
| International Paper Company | 370,225 | | 12,998,600 |
| MeadWestvaco Corp. | 147,500 | | 4,659,525 |
|
|
| | | | 17,658,125 |
| Petroleum Services - 1.25% | | | |
| BJ Services Company | 144,300 | | 3,580,083 |
| Schlumberger, Ltd. | 82,300 | | 7,941,950 |
|
|
| | | | 11,522,033 |
| Pharmaceuticals - 5.43% | | | |
| Abbott Laboratories | 112,600 | | 5,845,066 |
| Bristol-Myers Squibb Company | 248,100 | | 7,232,115 |
| Eli Lilly & Company | 215,800 | | 12,376,130 |
| Merck & Company, Inc. | 282,000 | | 14,147,940 |
| Pfizer, Inc. | 425,500 | | 10,569,420 |
|
|
| | | | 50,170,671 |
| Photography - 0.72% | | | |
| Eastman Kodak Company (a) | 248,400 | | 6,624,828 |
| | | | |
| Publishing - 3.20% | | | |
| Dow Jones & Company, Inc. | 155,900 | | 9,205,895 |
| Gannett Company, Inc. | 159,600 | | 7,501,200 |
| McGraw-Hill Companies, Inc. | 47,200 | | 2,381,712 |
| |
| The accompanying notes are an integral part of the financial statements. | 174 |
John Hancock Funds II
Portfolio of investments — August 31, 2007
(showing percentage of total net assets)
| | | | |
| Equity-Income Fund (continued) | | | |
| | | Shares or | | |
| | | Principal | | |
| | | Amount | | Value |
| |
|
| |
| COMMON STOCKS (continued) | | | | |
| | | | | |
| Publishing (continued) | | | | |
| The New York Times Company, Class A (a) | 300,500 | $ | 6,604,990 |
| Tribune Company | | 140,144 | | 3,860,967 |
|
|
| | | | | 29,554,764 |
| Railroads & Equipment - 1.03% | | | | |
| Union Pacific Corp. | | 84,800 | | 9,461,136 |
| | | | | |
| Retail Trade - 2.65% | | | | |
| Bed Bath & Beyond, Inc. * | | 167,700 | | 5,809,128 |
| Gap, Inc. | | 121,400 | | 2,277,464 |
| Home Depot, Inc. | | 213,200 | | 8,167,692 |
| Wal-Mart Stores, Inc. | | 187,800 | | 8,193,714 |
|
|
| | | | | 24,447,998 |
| Sanitary Services - 0.60% | | | | |
| Waste Management, Inc. | | 147,422 | | 5,553,387 |
| | | | | |
| Semiconductors - 1.60% | | | | |
| Analog Devices, Inc. | | 198,500 | | 7,320,680 |
| Applied Materials, Inc. | | 112,700 | | 2,407,272 |
| Intel Corp. | | 197,000 | | 5,072,750 |
|
|
| | | | | 14,800,702 |
| Software - 1.63% | | | | |
| Microsoft Corp. | | 523,500 | | 15,040,155 |
| | | | | |
| Telecommunications Equipment & | | | | |
| Services - 1.54% | | | | |
| Alcatel SA, ADR | | 75,400 | | 825,630 |
| Nokia Oyj, SADR | | 157,400 | | 5,175,312 |
| Verizon Communications, Inc. | | 197,152 | | 8,256,726 |
|
|
| | | | | 14,257,668 |
| Telephone - 3.75% | | | | |
| AT&T, Inc. | | 448,673 | | 17,888,593 |
| Qwest Communications International, Inc. * | 908,000 | | 8,126,600 |
| Sprint Nextel Corp. | | 368,900 | | 6,979,588 |
| Windstream Corp. | | 113,008 | | 1,613,754 |
|
|
| | | | | 34,608,535 |
| Tobacco - 0.40% | | | | |
| UST, Inc. | | 74,600 | | 3,676,288 |
| | | | |
| Toys, Amusements & Sporting Goods - 0.62% | | | |
| Mattel, Inc. | | 262,900 | | 5,686,527 |
| | | | | |
| Trucking & Freight - 0.29% | | | | |
| United Parcel Service, Inc., Class B | | 35,800 | | 2,715,788 |
|
| TOTAL COMMON STOCKS (Cost $766,505,486) | | $ | 873,645,843 |
|
| |
| CORPORATE BONDS - 0.12% | | | | |
| | | | | |
| Automobiles - 0.12% | | | | |
| Ford Motor Company | | | | |
| 4.25% due 12/15/2036 | | 1,043,000 | | 1,121,851 |
|
| TOTAL CORPORATE BONDS (Cost $1,043,000) | | $ | 1,121,851 |
|
| |
| SHORT TERM INVESTMENTS - 8.59% | | | |
| John Hancock Cash Investment Trust (c) | $ | 33,726,420 | $ | 33,726,420 |
| | | | |
| Equity-Income Fund (continued) | | | |
| | | Shares or | | |
| | | Principal | | |
| | | Amount | | Value |
|
|
| |
| SHORT TERM INVESTMENTS (continued) | | | |
| T. Rowe Price Reserve Investment | | | | |
| Fund (c) | $ | 45,630,094 | $ | 45,630,094 |
|
| TOTAL SHORT TERM INVESTMENTS | | | | |
| (Cost $79,356,514) | | | $ | 79,356,514 |
|
| |
| REPURCHASE AGREEMENTS - 0.09% | | | | |
| Repurchase Agreement with State | | | | |
| Street Corp. dated 08/31/2007 at | | | | |
| 4.60% to be repurchased at | | | | |
| $790,404 on 09/04/2007, | | | | |
| collateralized by $815,000 Federal | | | | |
| National Mortgage Association, | | | | |
| 6.03% due 12/14/2029 (valued at | | | | |
| $809,906, including interest) | $ | 790,000 | $ | 790,000 |
|
| TOTAL REPURCHASE AGREEMENTS | | | | |
| (Cost $790,000) | | | $ | 790,000 |
|
| Total Investments (Equity-Income Fund) | | | | |
| (Cost $847,695,000) - 103.40% | | | $ | 954,914,208 |
| Liabilities in Excess of Other Assets - (3.40)% | | | (31,377,558) |
|
|
| TOTAL NET ASSETS - 100.00% | | | $ | 923,536,650 |
|
|
| |
| |
| |
| Fundamental Value Fund | | | | |
| | | Shares or | | |
| | | Principal | | |
| | | Amount | | Value |
|
|
| |
| COMMON STOCKS - 96.20% | | | | |
| | | | | |
| Advertising - 0.24% | | | | |
| WPP Group PLC, SADR | | 34,451 | $ | 2,454,289 |
| | | | | |
| Banking - 2.43% | | | | |
| Commerce Bancorp, Inc. (a) | | 154,300 | | 5,667,439 |
| Wachovia Corp. | | 395,941 | | 19,393,190 |
|
|
| | | | | 25,060,629 |
| Broadcasting - 1.77% | | | | |
| Liberty Media Corp. - Capital, Series A * | | 28,205 | | 3,074,063 |
| News Corp., Class A | | 751,700 | | 15,206,891 |
|
|
| | | | | 18,280,954 |
| Business Services - 3.01% | | | | |
| Dun & Bradstreet Corp. | | 17,095 | | 1,667,617 |
| H & R Block, Inc. | | 417,823 | | 8,289,608 |
| Iron Mountain, Inc. * | | 442,263 | | 12,498,353 |
| Moody's Corp. | | 185,901 | | 8,523,561 |
|
|
| | | | | 30,979,139 |
| Cable & Television - 3.34% | | | | |
| Comcast Corp., Special Class A * | | 1,172,935 | | 30,332,099 |
| Virgin Media, Inc. | | 172,477 | | 4,104,953 |
|
|
| | | | | 34,437,052 |
| Coal - 0.60% | | | | |
| China Coal Energy Company, H Shares * | | 3,155,800 | | 6,227,057 |
| | | | | |
| Computers & Business Equipment - 1.88% | | | | |
| Dell, Inc. * | | 416,700 | | 11,771,775 |
| |
| The accompanying notes are an integral part of the financial statements. | 175 |
John Hancock Funds II
Portfolio of investments — August 31, 2007
(showing percentage of total net assets)
| | | |
| Fundamental Value Fund (continued) | | |
| | Shares or | | |
| | Principal | | |
| | Amount | | Value |
|
|
| |
| COMMON STOCKS (continued) | | | |
| | | | |
| Computers & Business Equipment | | | |
| (continued) | | | |
| Hewlett-Packard Company | 154,484 | $ | 7,623,785 |
|
|
| | | | 19,395,560 |
| Construction Materials - 1.64% | | | |
| Martin Marietta Materials, Inc. (a) | 74,079 | | 10,000,665 |
| Vulcan Materials Company | 76,670 | | 6,901,067 |
|
|
| | | | 16,901,732 |
| Containers & Glass - 1.61% | | | |
| Sealed Air Corp. | 626,008 | | 16,557,912 |
| | | | |
| Cosmetics & Toiletries - 1.39% | | | |
| Avon Products, Inc. | 106,212 | | 3,648,382 |
| Procter & Gamble Company | 163,200 | | 10,658,592 |
|
|
| | | | 14,306,974 |
| Crude Petroleum & Natural Gas - 6.19% | | | |
| Devon Energy Corp. | 309,209 | | 23,286,530 |
| EOG Resources, Inc. | 259,588 | | 17,485,848 |
| Occidental Petroleum Corp. | 405,582 | | 22,992,443 |
|
|
| | | | 63,764,821 |
| Electronics - 1.65% | | | |
| Agilent Technologies, Inc. * | 142,000 | | 5,168,800 |
| Tyco Electronics, Ltd. * | 338,047 | | 11,787,699 |
|
|
| | | | 16,956,499 |
| Financial Services - 17.93% | | | |
| American Express Company | 798,365 | | 46,800,156 |
| Ameriprise Financial, Inc. | 200,313 | | 12,221,096 |
| Bank of New York Mellon Corp. | 285,100 | | 11,526,593 |
| Citigroup, Inc. | 370,019 | | 17,346,491 |
| Discover Financial Services * | 42,287 | | 978,521 |
| E*TRADE Financial Corp. * | 58,700 | | 914,546 |
| HSBC Holdings PLC | 1,487,865 | | 26,908,608 |
| JP Morgan Chase & Company | 834,182 | | 37,137,783 |
| Morgan Stanley | 84,575 | | 5,274,943 |
| State Street Corp. (c) | 26,875 | | 1,649,050 |
| Wells Fargo & Company | 658,566 | | 24,064,002 |
|
|
| | | | 184,821,789 |
| Food & Beverages - 1.72% | | | |
| Diageo PLC, SADR | 148,581 | | 12,691,789 |
| Hershey Company | 108,483 | | 5,044,459 |
|
|
| | | | 17,736,248 |
| Healthcare Products - 1.31% | | | |
| Covidien, Ltd. * | 339,247 | | 13,512,208 |
| | | | |
| Healthcare Services - 2.29% | | | |
| Cardinal Health, Inc. | 127,952 | | 8,749,358 |
| Express Scripts, Inc. * | 100,700 | | 5,513,325 |
| UnitedHealth Group, Inc. | 187,500 | | 9,376,875 |
|
|
| | | | 23,639,558 |
| Holdings Companies/Conglomerates - 6.40% | | | |
| Berkshire Hathaway, Inc., Class A * | 295 | | 34,925,050 |
| | | |
| Fundamental Value Fund (continued) | | |
| | Shares or | | |
| | Principal | | |
| | Amount | | Value |
|
|
| |
| COMMON STOCKS (continued) | | | |
| | | | |
| Holdings Companies/Conglomerates | | | |
| (continued) | | | |
| China Merchants Holdings International | | | |
| Company, Ltd. | 1,574,188 | $ | 8,262,820 |
| Loews Corp. | 484,611 | | 22,781,563 |
| |
|
| | | | 65,969,433 |
| Household Products - 0.20% | | | |
| Hunter Douglas NV | 21,840 | | 2,030,548 |
| | | | |
| Industrials - 0.29% | | | |
| Cosco Pacific, Ltd. | 1,053,715 | | 2,929,803 |
| | | | |
| Insurance - 9.74% | | | |
| Ambac Financial Group, Inc. | 44,300 | | 2,782,926 |
| American International Group, Inc. | 619,943 | | 40,916,238 |
| Aon Corp. | 169,508 | | 7,343,086 |
| Chubb Corp. | 47,404 | | 2,423,766 |
| Markel Corp. * | 1,732 | | 823,843 |
| Millea Holdings, Inc. | 251,400 | | 9,734,623 |
| NIPPONKOA Insurance Co., Ltd. * | 539,000 | | 5,000,613 |
| Principal Financial Group, Inc. | 51,642 | | 2,865,615 |
| Progressive Corp. (a) | 850,196 | | 17,292,987 |
| Sun Life Financial, Inc. | 32,471 | | 1,562,504 |
| Transatlantic Holdings, Inc. | 135,615 | | 9,605,610 |
| |
|
| | | | 100,351,811 |
| International Oil - 5.33% | | | |
| Canadian Natural Resources Ltd. | 68,700 | | 4,692,897 |
| ConocoPhillips | 613,750 | | 50,259,987 |
| |
|
| | | | 54,952,884 |
| Internet Content - 0.42% | | | |
| Google, Inc., Class A * | 8,340 | | 4,297,185 |
| | | | |
| Internet Retail - 1.23% | | | |
| Amazon.com, Inc. * | 84,800 | | 6,776,368 |
| Expedia, Inc. * | 57,377 | | 1,712,703 |
| IAC/InterActiveCorp. * | 55,077 | | 1,530,590 |
| Liberty Media Holding Corp.-Interactive A * | 141,625 | | 2,686,626 |
| |
|
| | | | 12,706,287 |
| Liquor - 0.81% | | | |
| Heineken Holding NV | 152,525 | | 8,385,372 |
| | | | |
| Manufacturing - 2.88% | | | |
| Harley-Davidson, Inc. | 272,132 | | 14,637,980 |
| Tyco International, Ltd. | 341,047 | | 15,060,636 |
| |
|
| | | | 29,698,616 |
| Mining - 0.53% | | | |
| BHP Billiton PLC | 95,967 | | 2,814,763 |
| Rio Tinto PLC | 38,870 | | 2,685,456 |
| |
|
| | | | 5,500,219 |
| Petroleum Services - 0.96% | | | |
| Transocean, Inc. * | 94,375 | | 9,917,869 |
| | | | |
| Publishing - 0.98% | | | |
| Gannett Company, Inc. | 38,418 | | 1,805,646 |
| |
| The accompanying notes are an integral part of the financial statements. | 176 |
John Hancock Funds II
Portfolio of investments — August 31, 2007
(showing percentage of total net assets)
| | | | |
| Fundamental Value Fund (continued) | | |
| | | Shares or | | |
| | | Principal | | |
| | | Amount | | Value |
| |
|
| |
| COMMON STOCKS (continued) | | | | |
| | | | | |
| Publishing (continued) | | | | |
| Lagardere S.C.A. | | 101,987 | $ | 8,312,559 |
|
|
| | | | | 10,118,205 |
| Real Estate - 0.31% | | | | |
| Hang Lung Group, Ltd. | | 668,000 | | 3,189,227 |
| | | | | |
| Retail Trade - 8.49% | | | | |
| Bed Bath & Beyond, Inc. * | | 169,500 | | 5,871,480 |
| CarMax, Inc. * | | 198,400 | | 4,495,744 |
| Costco Wholesale Corp. | | 681,248 | | 42,067,064 |
| CVS Caremark Corp. | | 367,301 | | 13,891,324 |
| Lowe's Companies, Inc. | | 149,400 | | 4,640,364 |
| Sears Holdings Corp. * | | 12,700 | | 1,823,212 |
| Wal-Mart Stores, Inc. | | 337,595 | | 14,729,270 |
|
|
| | | | | 87,518,458 |
| Shipbuilding - 0.30% | | | | |
| China Shipping Development Company, Ltd., | | | |
| Class H | | 1,026,000 | | 3,108,247 |
| | | | | |
| Software - 2.04% | | | | |
| Microsoft Corp. | | 731,826 | | 21,025,361 |
| | | | | |
| Telecommunications Equipment & | | | | |
| Services - 0.84% | | | | |
| Nokia Oyj, SADR | | 107,686 | | 3,540,716 |
| SK Telecom Company, Ltd., ADR (a) | | 188,539 | | 5,160,312 |
|
|
| | | | | 8,701,028 |
| Telephone - 1.01% | | | | |
| Sprint Nextel Corp. | | 549,800 | | 10,402,216 |
| Tobacco - 3.38% | | | | |
| Altria Group, Inc. | | 501,903 | | 34,837,087 |
| Transportation - 0.07% | | | | |
| Asciano Group * | | 106,100 | | 739,830 |
| Trucking & Freight - 0.99% | | | | |
| Kuehne & Nagel International AG | | 41,450 | | 3,894,156 |
| Toll Holdings, Ltd. | | 142,900 | | 1,582,372 |
| United Parcel Service, Inc., Class B | | 61,642 | | 4,676,162 |
|
|
| | | | | 10,152,690 |
|
| TOTAL COMMON STOCKS (Cost $863,201,747) | | $ | 991,564,797 |
|
| |
| SHORT TERM INVESTMENTS - 5.60% | | | |
| John Hancock Cash Investment Trust (c) | $ | 22,322,838 | $ | 22,322,838 |
| Rabobank USA Finance Corp. | | | | |
| 5.27% due 09/04/2007 | | 35,408,000 | | 35,392,450 |
|
| TOTAL SHORT TERM INVESTMENTS | | | | |
| (Cost $57,715,288) | | | $ | 57,715,288 |
|
| Total Investments (Fundamental Value Fund) | | | |
| (Cost $920,917,035) - 101.80% | | | $ | 1,049,280,085 |
| Liabilities in Excess of Other Assets - (1.80)% | | | (18,578,308) |
|
|
| TOTAL NET ASSETS - 100.00% | | | $ | 1,030,701,777 |
|
|
| | | | |
| Global Bond Fund | | | | |
| | | Shares or | | |
| | | Principal | | |
| | | Amount | | Value |
|
|
| |
| U.S. TREASURY OBLIGATIONS - 2.54% | | | |
| | | | | |
| Treasury Inflation Protected | | | | |
| Securities (d) - 1.64% | | | | |
| 2.375% due 01/15/2027 *** | $ | 6,094,523 | $ | 6,069,286 |
| 2.625% due 07/15/2017 *** | | 6,834,680 | | 6,994,331 |
| |
|
| | | | | 13,063,617 |
| U.S. Treasury Bonds - 0.90% | | | | |
| 7.875% due 02/15/2021 *** | | 5,500,000 | | 7,152,579 |
|
| TOTAL U.S. TREASURY OBLIGATIONS | | | | |
| (Cost $19,718,753) | | | $ | 20,216,196 |
|
| |
| U.S. GOVERNMENT AGENCY OBLIGATIONS - 49.28% | | |
| | | | | |
| Federal National Mortgage | | | | |
| Association - 49.28% | | | | |
| 5.00% due 07/01/2013 *** | | 2,142,213 | | 2,135,679 |
| 5.50% due 12/01/2036 to 06/01/2037 *** | 27,784,259 | | 27,135,342 |
| 5.50% TBA ** | | 238,000,000 | | 232,421,756 |
| 5.855% due 03/25/2044 (b)*** | | 696,913 | | 690,878 |
| 6.00% TBA ** | | 104,350,000 | | 104,219,562 |
| 6.222% due 06/01/2043 to | | | | |
| 10/01/2044 (b)*** | | 5,686,747 | | 5,688,145 |
| 6.222% due 11/01/2042 *** | | 23,697 | | 23,693 |
| 6.50% TBA ** | | 19,000,000 | | 19,285,000 |
| 6.964% due 11/01/2035 (b)*** | | 875,070 | | 902,466 |
| |
|
| | | | | 392,502,521 |
|
| TOTAL U.S. GOVERNMENT AGENCY OBLIGATIONS | | |
| (Cost $390,589,203) | | | $ | 392,502,521 |
|
| |
| FOREIGN GOVERNMENT OBLIGATIONS - 41.78% | | |
| | | | | |
| Canada - 0.09% | | | | |
| Province of Ontario | | | | |
| 6.20% due 06/02/2031 *** | CAD | 100,000 | | 110,585 |
| Province of Quebec, Canada | | | | |
| 5.75% due 12/01/2036 *** | | 600,000 | | 626,827 |
| |
|
| | | | | 737,412 |
| Denmark - 0.39% | | | | |
| Nykredit Realkredit A/S, Series IOH | | | | |
| 5.00% due 10/01/2038 *** | DKK | 5,999,246 | | 1,039,665 |
| Realkredit Danmark A/S, Series 83D | | | | |
| 5.00% due 10/01/2038 *** | | 11,985,224 | | 2,073,959 |
| |
|
| | | | | 3,113,624 |
| France - 2.44% | | | | |
| Government of France | | | | |
| 5.50% due 04/25/2010 *** | EUR | 13,800,000 | | 19,454,526 |
| | | | | |
| Germany - 23.43% | | | | |
| Federal Republic of Germany | | | | |
| 4.00% due 04/13/2012 *** | | 1,000,000 | | 1,357,043 |
| 4.25% due 01/04/2014 *** | | 4,800,000 | | 6,568,149 |
| 4.25% due 07/04/2014 *** | | 700,000 | | 957,769 |
| 5.00% due 01/04/2012 *** | | 5,100,000 | | 7,188,673 |
| 5.25% due 01/04/2011 *** | | 73,100,000 | | 103,174,240 |
| 5.25% due 07/04/2010 *** | | 13,400,000 | | 18,832,138 |
| 5.50% due 01/04/2031 *** | | 18,200,000 | | 28,166,460 |
| 6.50% due 07/04/2027 *** | | 11,900,000 | | 20,344,845 |
| |
|
| | | | | 186,589,317 |
| |
| The accompanying notes are an integral part of the financial statements. | 177 |
John Hancock Funds II
Portfolio of investments — August 31, 2007
(showing percentage of total net assets)
| | | | |
| Global Bond Fund (continued) | | | |
| | | Shares or | | |
| | | Principal | | |
| | | Amount | | Value |
|
|
| |
| FOREIGN GOVERNMENT OBLIGATIONS | | | |
| (continued) | | | | |
| | | | | |
| Japan - 13.68% | | | | |
| Government of Japan | | | | |
| 1.00% due 06/10/2016 *** | JPY | 662,640,000 | $ | 5,615,293 |
| 1.10% due 12/10/2016 *** | | 3,698,870,000 | | 31,648,034 |
| 1.20% due 03/10/2017 *** | | 159,680,000 | | 1,375,755 |
| 1.20% due 06/10/2017 *** | | 2,208,800,000 | | 18,954,092 |
| 1.50% due 03/20/2015 *** | | 900,000,000 | | 7,812,747 |
| 1.50% due 03/20/2011 *** | | 980,000,000 | | 8,596,276 |
| 2.30% due 06/20/2035 *** | | 1,270,000,000 | | 10,894,360 |
| 2.40% due 03/20/2034 *** | | 600,000,000 | | 5,273,214 |
| 2.50% due 09/20/2035 *** | | 1,210,000,000 | | 10,821,120 |
| 2.50% due 06/20/2036 *** | | 890,000,000 | | 7,928,426 |
| |
|
| | | | | 108,919,317 |
| Netherlands - 0.53% | | | | |
| Kingdom of Netherlands | | | | |
| 3.75% due 07/15/2014 *** | EUR | 3,200,000 | | 4,240,708 |
| | | | | |
| United Kingdom - 1.22% | | | | |
| Government of United Kingdom | | | | |
| 4.75% due 06/07/2010 *** | GBP | 4,900,000 | | 9,757,272 |
|
| TOTAL FOREIGN GOVERNMENT OBLIGATIONS | | |
| (Cost $327,770,821) | | $ | | 332,812,176 |
|
| |
| CORPORATE BONDS - 17.14% | | | | |
| | | | |
| British Virgin Islands - 0.10% | | | | |
| C10 Capital SPV, Ltd. | | | | |
| 6.722% due 12/31/2049 (b)*** | $ | 800,000 | | 773,728 |
| | | | |
| Canada - 0.17% | | | | |
| Alcan, Inc. | | | | |
| 6.45% due 03/15/2011 *** | | 700,000 | | 729,777 |
| DaimlerChrysler Canada Finance Inc., Series MTN | | | |
| 4.85% due 03/30/2009 *** | CAD | 700,000 | | 659,496 |
| |
|
| | | | | 1,389,273 |
| Cayman Islands - 1.85% | | | | |
| Calabash Re, Ltd. | | | | |
| 13.76% due 01/08/2010 (b)*** | $ | 900,000 | | 914,310 |
| Foundation Re II, Ltd. | | | | |
| 12.27% due 11/26/2010 (b)*** | | 400,000 | | 404,480 |
| Mizuho Finance | | | | |
| 1.06% due 09/28/2049 *** | JPY | 200,000,000 | | 1,726,742 |
| Mizuho Financial Group (Cayman), Ltd. | | | | |
| 8.375% due 12/29/2049 *** | $ | 2,500,000 | | 2,597,925 |
| MUFG Capital Finance 2, Ltd. | | | | |
| 4.85% due 12/31/2049 (b)*** | EUR | 2,500,000 | | 3,057,835 |
| Residential Reinsurance 2005 Ltd., Series A | | | |
| 10.81% due 06/06/2008 (b)*** | $ | 300,000 | | 291,324 |
| Residential Reinsurance 2007 Ltd, Series CL4 | | | |
| 11.36% due 06/07/2010 (b)*** | | 1,900,000 | | 1,919,000 |
| SMFG Preferred Capital | | | | |
| 5.37% due 01/29/2049 (b)*** | | 1,700,000 | | 1,585,556 |
| STB Finance Cayman, Ltd. | | | | |
| 1.644% due 08/12/2049 *** | JPY | 100,000,000 | | 858,291 |
| Transocean, Inc. | | | | |
| 5.56% due 09/05/2008 *** | $ | 1,400,000 | | 1,399,831 |
| |
|
| | | | | 14,755,294 |
| | | | |
| Global Bond Fund (continued) | | | |
| | | Shares or | | |
| | | Principal | | |
| | | Amount | | Value |
| |
|
| |
| CORPORATE BONDS (continued) | | | | |
| | | | | |
| Germany - 0.22% | | | | |
| Deutsche Bank AG | | | | |
| 6.00% due 09/01/2017 *** | $ | 1,700,000 | $ | 1,715,166 |
| | | | | |
| Iceland - 0.16% | | | | |
| Glitnir Banki HF | | | | |
| 5.83% due 01/18/2012 (b)*** | | 1,300,000 | | 1,306,516 |
| | | | | |
| Ireland - 0.06% | | | | |
| Osiris Capital PLC, Series D | | | | |
| 10.36% due 01/15/2010 (b)*** | | 500,000 | | 504,500 |
| | | | | |
| Japan - 0.76% | | | | |
| Bank of Tokyo-Mitsubishi UFJ, Ltd., Series EMTN | | | |
| 3.50% due 12/16/2015 (b)*** | EUR | 600,000 | | 775,836 |
| Mizuho Trust & Banking Company | | | | |
| 2.404% due 04/27/2009 *** | JPY | 100,000,000 | | 884,726 |
| Sumitomo Mitsui Banking Corp., Series EMTN | | | |
| 1.266% due 12/31/2049 (b)*** | | 100,000,000 | | 866,665 |
| 1.62875% due 12/01/2049 (b)*** | | 300,000,000 | | 2,615,961 |
| 1.80% due 12/31/2049 (b)*** | | 100,000,000 | | 867,685 |
| |
|
| | | | | 6,010,873 |
| Luxembourg - 0.28% | | | | |
| VTB Capital SA for Vneshtorgbank | | | | |
| 5.95625% due 08/01/2008 *** | $ | 1,600,000 | | 1,586,400 |
| 6.11% due 09/21/2007 (b)*** | | 600,000 | | 599,985 |
| |
|
| | | | | 2,186,385 |
| Netherlands - 0.45% | | | | |
| Deutsche Telekom International Finance BV | | | |
| 8.75% due 06/15/2030 (b)*** | | 500,000 | | 603,920 |
| Rabobank Nederland | | | | |
| 5.38% due 01/15/2009 (b)*** | | 2,500,000 | | 2,500,352 |
| Siemens Financieringsmaatschappij NV | | | | |
| 5.625% due 08/14/2009 (b)*** | | 500,000 | | 499,899 |
| |
|
| | | | | 3,604,171 |
| Spain - 0.70% | | | | |
| Santander US Debt SA Unipersonal | | | | |
| 5.42% due 02/06/2009 (b)*** | | 2,500,000 | | 2,492,813 |
| 5.42% due 09/19/2008 (b)*** | | 1,500,000 | | 1,497,244 |
| 5.42% due 11/20/2009 *** | | 1,600,000 | | 1,592,189 |
| |
|
| | | | | 5,582,246 |
| United Kingdom - 0.65% | | | | |
| HBOS Treasury Services PLC, Series MTN | | | | |
| 5.40% due 07/17/2009 (b)*** | | 200,000 | | 200,137 |
| 5.56938% due 07/17/2008 (b)*** | | 1,400,000 | | 1,400,760 |
| HSBC Holdings PLC | | | | |
| 6.50% due 05/02/2036 *** | | 2,000,000 | | 2,052,542 |
| Royal Bank of Scotland Group PLC | | | | |
| 5.36% due 12/21/2007 (b)*** | | 1,200,000 | | 1,200,292 |
| Tate & Lyle International Finance PLC | | | | |
| 5.00% due 11/15/2014 *** | | 300,000 | | 281,939 |
| |
|
| | | | | 5,135,670 |
| United States - 11.74% | | | | |
| ACE INA Holdings, Inc. | | | | |
| 5.875% due 06/15/2014 *** | | 300,000 | | 302,206 |
| American Express Centurion Bank, Series BKNT | | | |
| 5.33% due 05/07/2008 (b)*** | | 100,000 | | 99,960 |
| |
| The accompanying notes are an integral part of the financial statements. | 178 |
John Hancock Funds II
Portfolio of investments — August 31, 2007
(showing percentage of total net assets)
| | | | |
| Global Bond Fund (continued) | | | |
| | | Shares or | | |
| | | Principal | | |
| | | Amount | | Value |
|
|
| |
| CORPORATE BONDS (continued) | | | | |
| | | | | |
| United States (continued) | | | | |
| American Express Credit Corp., Series MTN | | | |
| 5.5975% due 05/18/2009 (b)*** | $ | 1,400,000 | $ | 1,398,074 |
| American International Group, Inc. | | | | |
| 5.36% due 06/23/2008 (b)*** | | 1,600,000 | | 1,600,190 |
| American International Group, Inc., Series A3 | | | |
| 4.875% due 03/15/2067 (b)*** | EUR | 1,000,000 | | 1,243,055 |
| Autozone, Inc. | | | | |
| 5.875% due 10/15/2012 *** | $ | 500,000 | | 510,140 |
| BAE Systems Holdings, Inc. | | | | |
| 6.40% due 12/15/2011 *** | | 700,000 | | 733,397 |
| Bank of America | | | | |
| 0.801% due 07/07/2008 *** | JPY | 90,000,000 | | 776,524 |
| BellSouth Corp. | | | | |
| 5.20% due 09/15/2014 *** | $ | 600,000 | | 581,372 |
| 5.6575% due 08/15/2008 (b)*** | | 1,400,000 | | 1,397,840 |
| Boston Scientific Corp. | | | | |
| 6.00% due 06/15/2011 *** | | 700,000 | | 665,000 |
| Capital One Financial Corp., Series MTN | | | | |
| 5.70% due 09/15/2011 *** | | 600,000 | | 590,778 |
| Charter One Bank N.A., Series BKNT | | | | |
| 5.41% due 04/24/2009 (b)*** | | 3,250,000 | | 3,252,528 |
| Cisco Systems, Inc. | | | | |
| 5.575% due 02/20/2009 (b)*** | | 2,600,000 | | 2,604,303 |
| CIT Group, Inc., Series MTN | | | | |
| 5.57% due 02/21/2008 (b)*** | | 1,100,000 | | 1,085,374 |
| Citigroup, Inc. | | | | |
| 6.00% due 08/15/2017 *** | | 1,900,000 | | 1,923,205 |
| CMS Energy Corp. | | | | |
| 9.875% due 10/15/2007 *** | | 1,340,000 | | 1,344,709 |
| CNA Financial Corp. | | | | |
| 6.00% due 08/15/2011 *** | | 1,000,000 | | 1,006,687 |
| Consumers Energy Company | | | | |
| 5.00% due 02/15/2012 *** | | 900,000 | | 887,348 |
| CVS Caremark Corp. | | | | |
| 5.75% due 08/15/2011 *** | | 700,000 | | 707,483 |
| D.R. Horton, Inc. | | | | |
| 6.00% due 04/15/2011 *** | | 800,000 | | 737,538 |
| DaimlerChrysler N.A. Holding Corp. | | | | |
| 5.84% due 09/10/2007 (b)*** | | 1,500,000 | | 1,500,039 |
| DaimlerChrysler N.A. Holding Corp., Series MTN | | | |
| 5.75% due 09/08/2011 *** | | 300,000 | | 302,020 |
| Dominion Resources, Inc., Series D | | | | |
| 5.66% due 09/28/2007 (b)*** | | 1,500,000 | | 1,499,848 |
| East Lane Re Ltd. | | | | |
| 12.35625% due 05/06/2011 (b)*** | | 400,000 | | 399,743 |
| Echostar DBS Corp. | | | | |
| 6.375% due 10/01/2011 *** | | 100,000 | | 98,250 |
| Ford Motor Credit Company | | | | |
| 7.25% due 10/25/2011 *** | | 700,000 | | 638,126 |
| 7.875% due 06/15/2010 *** | | 200,000 | | 187,758 |
| Fortis Bank SA, Series YCD | | | | |
| 5.45% due 04/28/2008 (b)*** | | 1,500,000 | | 1,500,305 |
| General Electric Capital Corp., Series MTN | | | | |
| 5.39% due 10/26/2009 (b)*** | | 1,500,000 | | 1,497,260 |
| 5.43% due 01/20/2010 (b)*** | | 2,600,000 | | 2,583,113 |
| | | | |
| Global Bond Fund (continued) | | | |
| | | Shares or | | |
| | | Principal | | |
| | | Amount | | Value |
| |
|
| |
| CORPORATE BONDS (continued) | | | | |
| | | | | |
| United States (continued) | | | | |
| General Motors Acceptance Corp. | | | | |
| 7.00% due 02/01/2012 *** | $ | 900,000 $ | | 808,820 |
| 8.00% due 11/01/2031 *** | | 900,000 | | 808,528 |
| General Motors Acceptance Corp. LLC, Series MTN | | | |
| 6.51% due 09/23/2008 (b)*** | | 200,000 | | 191,591 |
| Genworth Global Funding Trusts | | | | |
| 5.42% due 02/10/2009 (b)*** | | 2,600,000 | | 2,591,490 |
| GMAC LLC | | | | |
| 6.00% due 04/01/2011 *** | | 1,700,000 | | 1,515,565 |
| 6.00% due 12/15/2011 *** | | 900,000 | | 773,821 |
| 6.8075% due 05/15/2009 (b)*** | | 1,800,000 | | 1,650,605 |
| Goldman Sachs Group, Inc. | | | | |
| 5.25% due 06/01/2016 *** | CAD | 1,500,000 | | 1,361,661 |
| 5.40% due 12/23/2008 (b)*** | $ | 1,300,000 | | 1,295,351 |
| 6.25% due 09/01/2017 *** | | 7,200,000 | | 7,210,397 |
| Goldman Sachs Group, Inc., Series MTNB | | | | |
| 5.45% due 12/22/2008 (b)*** | | 300,000 | | 299,142 |
| HJ Heinz Finance Company | | | | |
| 6.00% due 03/15/2012 (b)*** | | 600,000 | | 610,903 |
| HSBC Finance Corp. | | | | |
| 5.42% due 10/21/2009 (b)*** | | 2,000,000 | | 1,986,448 |
| HSBC Finance Corp., Series MTN | | | | |
| 5.45% due 06/19/2009 (b)*** | | 2,800,000 | | 2,784,342 |
| J.C. Penney Company, Inc. | | | | |
| 8.00% due 03/01/2010 *** | | 700,000 | | 743,310 |
| Johnson Controls, Inc. | | | | |
| 5.25% due 01/15/2011 *** | | 600,000 | | 604,175 |
| JP Morgan Chase & Company, Series 1 | | | | |
| 5.555% due 06/26/2009 (b)*** | | 1,500,000 | | 1,498,682 |
| JP Morgan Chase & Company, Series MTN | | | | |
| 5.058% due 02/22/2021 (b)*** | CAD | 700,000 | | 633,294 |
| JP Morgan Chase Capital XX, Series T | | | | |
| 6.55% due 09/29/2036 *** | $ | 900,000 | | 810,191 |
| Kinder Morgan Energy Partners LP, Series MTN | | | |
| 6.95% due 01/15/2038 *** | | 2,500,000 | | 2,515,230 |
| Lehman Brothers Holdings, Inc., Series MTN | | | |
| 5.41% due 12/23/2008 (b)*** | | 1,000,000 | | 983,274 |
| Loews Corp. | | | | |
| 5.25% due 03/15/2016 *** | �� | 200,000 | | 194,906 |
| Merrill Lynch & Company, Inc., Series MTN | | | |
| 5.40% due 10/23/2008 (b)*** | | 1,200,000 | | 1,198,350 |
| 5.665% due 08/14/2009 (b)*** | | 300,000 | | 299,131 |
| 6.05% due 08/15/2012 *** | | 2,800,000 | | 2,847,849 |
| Morgan Stanley | | | | |
| 5.81% due 10/18/2016 (b)*** | | 600,000 | | 573,880 |
| 6.25% due 08/28/2017 *** | | 300,000 | | 303,111 |
| Morgan Stanley, Series MTN | | | | |
| 5.55% due 11/21/2008 (b)*** | | 900,000 | | 895,156 |
| Nationwide Health Properties, Inc., REIT | | | | |
| 6.50% due 07/15/2011 *** | | 600,000 | | 623,839 |
| Newell Rubbermaid, Inc. | | | | |
| 4.00% due 05/01/2010 *** | | 600,000 | | 587,465 |
| Nisource Finance Corp. | | | | |
| 5.40% due 07/15/2014 *** | | 200,000 | | 192,487 |
| Nordea Bank Finland, Series YCD | | | | |
| 5.307% due 05/28/2008 *** | | 1,900,000 | | 1,900,386 |
| |
| The accompanying notes are an integral part of the financial statements. | 179 |
John Hancock Funds II
Portfolio of investments — August 31, 2007
(showing percentage of total net assets)
| | | | |
| Global Bond Fund (continued) | | | |
| | | Shares or | | |
| | | Principal | | |
| | | Amount | | Value |
| |
|
| |
| CORPORATE BONDS (continued) | | | | |
| | | | | |
| United States (continued) | | | | |
| Rabobank Capital Funding Trust | | | | |
| 5.254% due 12/29/2049 (b)*** | $ | 1,700,000 | $ | 1,578,719 |
| Reynolds American, Inc. | | | | |
| 6.06% due 06/15/2011 (b)*** | | 800,000 | | 798,000 |
| Sabre Holdings Corp. | | | | |
| 7.35% due 08/01/2011 *** | | 700,000 | | 647,500 |
| Sara Lee Corp. | | | | |
| 6.25% due 09/15/2011 *** | | 500,000 | | 513,322 |
| Sealed Air Corp. | | | | |
| 5.625% due 07/15/2013 *** | | 700,000 | | 671,269 |
| Shackleton Re Ltd. | | | | |
| 13.3575% due 02/07/2008 (b)*** | | 1,000,000 | | 1,010,000 |
| Skandinav Enskilda Bank, Series YCD | | | | |
| 5.31% due 02/04/2008 *** | | 1,700,000 | | 1,699,585 |
| Sprint Capital Corp. | | | | |
| 8.75% due 03/15/2032 *** | | 200,000 | | 230,867 |
| State Street Capital Trust IV | | | | |
| 6.355% due 06/15/2037 (b)*** | | 1,800,000 | | 1,656,425 |
| Supervalu, Inc. | | | | |
| 7.50% due 11/15/2014 *** | | 100,000 | | 101,000 |
| The Bear Stearns Companies, Inc., Series MTN | | | |
| 6.95% due 08/10/2012 *** | | 3,000,000 | | 3,042,936 |
| Time Warner, Inc. | | | | |
| 5.73% due 11/13/2009 (b)*** | | 1,500,000 | | 1,487,324 |
| US Bancorp | | | | |
| 5.535% due 04/28/2009 (b)*** | | 1,600,000 | | 1,595,667 |
| Viacom, Inc. | | | | |
| 5.75% due 04/30/2011 *** | | 600,000 | | 604,083 |
| Wal-Mart Stores, Inc. | | | | |
| 5.26% due 06/16/2008 (b)*** | | 1,600,000 | | 1,599,056 |
| Xerox Corp. | | | | |
| 9.75% due 01/15/2009 *** | | 700,000 | | 733,926 |
| XL Capital Finance PLC | | | | |
| 6.50% due 01/15/2012 *** | | 600,000 | | 623,537 |
| |
|
| | | | | 93,540,769 |
|
| |
| TOTAL CORPORATE BONDS (Cost $137,620,231) | | $ | 136,504,591 |
|
| |
| MUNICIPAL BONDS - 0.21% | | | | |
| | | | | |
| Illinois - 0.04% | | | | |
| City of Chicago, Illinois | | | | |
| 4.75% due 01/01/2030 *** | | 300,000 | | 294,312 |
| | | | | |
| New York - 0.05% | | | | |
| New York City Municipal Water Finance Authority, | | | |
| Series D | | | | |
| 4.75% due 06/15/2038 *** | | 400,000 | | 390,488 |
| | | | | |
| Puerto Rico - 0.01% | | | | |
| Puerto Rico Sales Tax Financing Corp. | | | | |
| zero coupon due 08/01/2054 *** | | 500,000 | | 44,185 |
| | | | | |
| Texas - 0.11% | | | | |
| Dallas Texas Area Rapid Transit | | | | |
| 5.00% due 12/01/2036 *** | | 900,000 | | 911,232 |
|
| TOTAL MUNICIPAL BONDS (Cost $1,650,059) | | $ | 1,640,217 |
|
| | | | |
| Global Bond Fund (continued) | | | |
| | | Shares or | | |
| | | Principal | | |
| | | Amount | | Value |
|
|
| |
| COLLATERALIZED MORTGAGE | | | | |
| OBLIGATIONS - 16.49% | | | | |
| | | | | |
| Ireland - 0.01% | | | | |
| Paris Residential Funding PLC, Series 1X, Class A | | | |
| 4.609% due 07/25/2011 (b)*** | EUR | 60,121 | $ | 81,947 |
| | | | | |
| Netherlands - 0.78% | | | | |
| Atomium Mortgage Finance BV, | | | | |
| Series 2003-I, Class A | | | | |
| 4.311% due 07/01/2034 (b)*** | | 851,860 | | 1,163,726 |
| Delphinus BV, Series 2001-II, Class A1 | | | |
| 5.001% due 11/28/2031 (b)*** | | 1,417,892 | | 1,933,722 |
| Delphinus BV, Series 2003-I, Class A1 | | | | |
| 2.41% due 04/25/2093 (b)*** | | 1,000,000 | | 1,363,304 |
| Dutch Mortgage Portfolio Loans, BV, | | | | |
| Series III, Class A | | | | |
| 4.824% due 11/20/2035 (b)*** | | 1,276,900 | | 1,738,558 |
| |
|
| | | | | 6,199,310 |
| |
| United States - 15.70% | | | | |
| Adjustable Rate Mortgage Trust, Series 2005-5, | | | |
| Class 2A1 | | | | |
| 5.13819% due 09/25/2035 (b)*** | $ | 196,571 | | 195,840 |
| American Home Mortgage Investment Trust, | | | |
| Series 2004-3, Class 5A | | | | |
| 4.29% due 10/25/2034 (b)*** | | 717,363 | | 694,245 |
| Banc of America Commercial Mortgage, Inc., | | | |
| Series 2002-2, Class A2 | | | | |
| 4.772% due 07/11/2043 *** | | 2,142,200 | | 2,112,592 |
| Banc of America Funding Corp., Series 2006-J, | | | |
| Class 4A1 | | | | |
| 6.1438% due 01/20/2047 (b)*** | | 270,451 | | 269,758 |
| Banc of America Funding Corp., | | | | |
| Series 2006-A, Class 1A1 | | | | |
| 4.61428% due 02/20/2036 (b)*** | | 2,096,005 | | 2,061,133 |
| Banc of America Mortgage Securities, | | | | |
| Series 2004-4, Class 1A9 | | | | |
| 5.00% due 05/25/2034 *** | | 1,756,138 | | 1,713,171 |
| Bear Stearns Adjustable Rate Mortgage Trust, | | | |
| Series 2003-7, Class 6A | | | | |
| 4.6544% due 10/25/2033 (b)*** | | 334,677 | | 326,498 |
| Bear Stearns Adjustable Rate Mortgage Trust, | | | |
| Series 2003-9, Class 2A1 | | | | |
| 4.48676% due 02/25/2034 (b)*** | | 58,647 | | 57,727 |
| Bear Stearns Adjustable Rate Mortgage Trust, | | | |
| Series 2004-2, Class 22A | | | | |
| 4.44425% due 05/25/2034 (b)*** | | 628,094 | | 615,595 |
| Bear Stearns Adjustable Rate Mortgage Trust, | | | |
| Series 2004-2, Class 23A | | | | |
| 4.6727% due 05/25/2034 (b)*** | | 228,060 | | 220,931 |
| Bear Stearns Adjustable Rate Mortgage Trust, | | | |
| Series 2005-2, Class A1 | | | | |
| 4.125% due 03/25/2035 (b)*** | | 3,805,331 | | 3,725,736 |
| Bear Stearns Adjustable Rate Mortgage Trust, | | | |
| Series 2005-2, Class A2 | | | | |
| 4.125% due 03/25/2035 (b)*** | | 1,527,356 | | 1,483,088 |
| Bear Stearns Adjustable Rate Mortgage Trust, | | | |
| Series 2005-5, Class A1 | | | | |
| 4.55% due 08/25/2035 (b)*** | | 2,506,989 | | 2,472,005 |
| |
| The accompanying notes are an integral part of the financial statements. | 180 |
John Hancock Funds II
Portfolio of investments — August 31, 2007
(showing percentage of total net assets)
| | | | |
| Global Bond Fund (continued) | | | |
| | | Shares or | | |
| | | Principal | | |
| | | Amount | | Value |
| |
|
| | |
| |
| COLLATERALIZED MORTGAGE | | | | |
| OBLIGATIONS (continued) | | | | |
| | | | | |
| United States (continued) | | | | |
| Bear Stearns Adjustable Rate Mortgage Trust, | | | |
| Series 2005-5, Class A2 | | | | |
| 4.55% due 08/25/2035 (b)*** | $ | 2,053,355 | $ | 2,006,370 |
| Bear Stearns Adjustable Rate Mortgage Trust, | | | |
| Series 2005-9, Class A1 | | | | |
| 4.625% due 10/25/2035 (b)*** | | 3,653,286 | | 3,556,855 |
| Bear Stearns Alt-A Trust, Series 2005-7, Class 22A1 | | | |
| 5.50724% due 09/25/2035 (b)*** | | 1,538,772 | | 1,527,239 |
| Bear Stearns Alt-A Trust, Series 2006-6, Class 31A1 | | | |
| 5.81941% due 11/25/2036 (b)*** | | 2,888,260 | | 2,868,702 |
| Bear Stearns Alt-A Trust, Series 2006-6, Class 32A1 | | | |
| 5.8193% due 11/25/2036 (b)*** | | 2,331,188 | | 2,320,099 |
| Bear Stearns Alt-A Trust, Series 2006-8, Class 3A1 | | | |
| 5.665% due 02/25/2034 (b)*** | | 143,591 | | 142,251 |
| Bear Stearns Structured Products, Inc., Series | | | |
| 2007-R6, Class 1A1 | | | | |
| 5.683% due 01/26/2036 (b)*** | | 1,400,000 | | 1,392,560 |
| Bella Vista Mortgage Trust, | | | | |
| Series 2005-2, Class 2A1 | | | | |
| 5.7875% due 05/20/2045 (b)*** | | 1,177,309 | | 1,160,221 |
| Citigroup Mortgage Loan Trust, Inc., Series | | | |
| 2005-11, Class 1A1 | | | | |
| 4.90% due 12/25/2035 (b)*** | | 623,617 | | 618,320 |
| Citigroup Mortgage Loan Trust, Inc., Series 2005-6, | | | |
| Class A1 | | | | |
| 4.7475% due 08/25/2035 (b)*** | | 1,382,058 | | 1,362,617 |
| Citigroup Mortgage Loan Trust, Inc., Series 2005-6, | | | |
| Class A2 | | | | |
| 4.2475% due 08/25/2035 (b)*** | | 1,133,753 | | 1,100,277 |
| Citigroup Mortgage Loan Trust, Inc., | | | | |
| Series 2005-11, Class A2A | | | | |
| 4.70% due 12/25/2035 *** | | 2,552,339 | | 2,493,512 |
| Commercial Mortgage Pass Through | | | | |
| Certificates, Series 2006-CN2A, Class A2FL | | | |
| 5.55% due 02/05/2019 (b)*** | | 2,600,000 | | 2,599,832 |
| Countrywide Alternative Loan Trust, | | | | |
| Series 2005-11CB, Class 2A8 | | | | |
| 4.50% due 06/25/2035 *** | | 1,391,134 | | 1,376,543 |
| Countrywide Alternative Loan Trust, | | | | |
| Series 2005-81, Class A1 | | | | |
| 5.785% due 02/25/2037 (b)*** | | 4,738,774 | | 4,599,448 |
| Countrywide Alternative Loan Trust, | | | | |
| Series 2006-OA1, Class 2A1 | | | | |
| 5.7475% due 03/20/2046 (b)*** | | 1,696,940 | | 1,664,435 |
| Countrywide Alternative Loan Trust, | | | | |
| Series 2006-OA19, Class A1 | | | | |
| 5.7175% due 02/20/2047 (b)*** | | 2,713,105 | | 2,645,744 |
| Countrywide Alternative Loan Trust, | | | | |
| Series 2007-OA7, Class A1A | | | | |
| 5.685% due 05/25/2047 (b)*** | | 2,748,095 | | 2,658,660 |
| Countrywide Home Loan Mortgage Pass Through | | | |
| Trust, Series 2004-12, Class 11A1 | | | | |
| 6.20526% due 08/25/2034 (b)*** | | 178,543 | | 179,370 |
| Countrywide Home Loan Mortgage Pass Through | | | |
| Trust, Series 2004-22, Class A3 | | | | |
| 4.79645% due 11/25/2034 (b)*** | | 422,585 | | 415,135 |
| | | | |
| Global Bond Fund (continued) | | | |
| | | Shares or | | |
| | | Principal | | |
| | | Amount | | Value |
|
|
| |
| COLLATERALIZED MORTGAGE | | | | |
| OBLIGATIONS (continued) | | | | |
| | | | | |
| United States (continued) | | | | |
| Countrywide Home Loan Mortgage | | | | |
| Pass Through Trust, Series 2005-HYB9, | | | | |
| Class 5A1 | | | | |
| 5.24938% due 02/20/2036 (b)*** | $ | 762,477 | $ | 760,071 |
| Countrywide Home Loan Mortgage | | | | |
| Pass Through Trust, Series 2005-R2, | | | | |
| Class 1AF1 | | | | |
| 5.845% due 06/25/2035 (b)*** | | 181,077 | | 177,361 |
| Countrywide Home Loans, | | | | |
| Series 2004-12, Class 12A1 | | | | |
| 4.71324% due 08/25/2034 (b)*** | | 1,267,458 | | 1,259,470 |
| Countrywide Home Loans, | | | | |
| Series 2004-25, Class 1A1 | | | | |
| 5.835% due 02/25/2035 (b)*** | | 412,751 | | 409,314 |
| Countrywide Home Loans, | | | | |
| Series 2004-25, Class 2A1 | | | | |
| 5.845% due 02/25/2035 (b)*** | | 501,244 | | 491,357 |
| Countrywide Home Loans, | | | | |
| Series 2005-HYB9, Class 3A2A | | | | |
| 5.25% due 02/20/2036 (b)*** | | 834,450 | | 824,547 |
| CS First Boston Mortgage Securities Corp., Series | | | |
| 2003-AR18, Class 2A3 | | | | |
| 4.09620% due 07/25/2033 (b)*** | | 65,152 | | 64,524 |
| CS First Boston Mortgage Securities Corp., Series | | | |
| 2003-AR20, Class 2A1 | | | | |
| 4.031% due 08/25/2033 (b)*** | | 675,938 | | 668,666 |
| CSAB Mortgage Backed Trust, | | | | |
| Series 2006-1, Class A1A | | | | |
| 5.605% due 06/25/2036 (b)*** | | 373,488 | | 372,698 |
| Federal Home Loan Mortgage Corp., | | | | |
| Series 2003-2631, Class PC | | | | |
| 4.50% due 03/15/2016 *** | | 7,600,000 | | 7,490,486 |
| Federal Home Loan Mortgage Corp., | | | | |
| Series 2004-2770, Class YW | | | | |
| 4.00% due 06/15/2022 *** | | 934,078 | | 926,665 |
| Federal Home Loan Mortgage Corp., | | | | |
| Series 2004-2895, Class F | | | | |
| 5.96125% due 06/15/2031 (b)*** | | 764,093 | | 758,577 |
| Federal Home Loan Mortgage Corp., | | | | |
| Series 2005-2987, Class HD | | | | |
| 4.50% due 07/15/2018 *** | | 4,314,234 | | 4,227,314 |
| Federal Home Loan Mortgage Corp., | | | | |
| Series 2006-3117, Class PN | | | | |
| 5.00% due 11/15/2021 *** | | 1,097,699 | | 1,096,470 |
| Federal Home Loan Mortgage Corp., | | | | |
| Series 2844, Class PR | | | | |
| 5.00% due 09/15/2017 *** | | 41,027 | | 40,947 |
| Federal Home Loan Mortgage Corp., | | | | |
| Series T-63, Class 1A1 | | | | |
| 6.20% due 02/25/2045 (b)*** | | 445,555 | | 445,232 |
| Federal National Mortgage Association | | | | |
| 4.67315% due 05/25/2035 (b)*** | | 1,200,000 | | 1,192,850 |
| 5.605% due 01/25/2021 (b)*** | | 693,075 | | 691,895 |
| 5.635% due 03/25/2036 (b)*** | | 1,519,570 | | 1,511,303 |
| 5.805% due 03/25/2036 (b)*** | | 2,651,752 | | 2,643,764 |
| 5.855% due 09/25/2042 (b)*** | | 845,863 | | 849,560 |
| |
| The accompanying notes are an integral part of the financial statements. | 181 |
John Hancock Funds II
Portfolio of investments — August 31, 2007
(showing percentage of total net assets)
| | | | |
| Global Bond Fund (continued) | | | |
| | | Shares or | | |
| | | Principal | | |
| | | Amount | | Value |
| |
|
| |
| COLLATERALIZED MORTGAGE | | | | |
| OBLIGATIONS (continued) | | | | |
| | | | | |
| United States (continued) | | | | |
| First Horizon Asset Securities, Inc., Series | | | | |
| 2003-AR2, Class 2A1 | | | | |
| 4.73472% due 07/25/2033 (b)*** | $ | 142,258 | $ | 142,371 |
| First Horizon Asset Securities, Inc., Series | | | | |
| 2003-AR4, Class 2A1 | | | | |
| 4.41133% due 12/25/2033 (b)*** | | 377,231 | | 372,264 |
| First Horizon Asset Securities, Inc., Series | | | | |
| 2005-AR3, Class 2A1 | | | | |
| 5.37108% due 08/25/2035 (b)*** | | 198,974 | | 196,444 |
| First Republic Mortgage Loan Trust, | | | | |
| Series 2001-FRB1, Class A | | | | |
| 5.96125% due 11/15/2031 (b)*** | | 508,382 | | 505,920 |
| GMAC Mortgage Corp. Loan Trust, Series | | | | |
| 2004-AR1, Class 22A | | | | |
| 4.32173% due 06/25/2034 (b)*** | | 40,511 | | 39,654 |
| GMAC Mortgage Corp. Loan Trust, | | | | |
| Series 2004-J4, Class A1 | | | | |
| 5.50% due 09/25/2034 *** | | 1,130,270 | | 1,121,240 |
| Greenpoint Mortgage Funding Trust, | | | | |
| Series 2006-AR6, Class A1A | | | | |
| 5.585% due 10/25/2046 (b)*** | | 2,665,106 | | 2,645,896 |
| Greenpoint Mortgage Pass-Through Certificates, | | | |
| Series 2003-1, Class A1 | | | | |
| 4.3872% due 10/25/2033 (b)*** | | 41,389 | | 40,957 |
| GS Mortgage Securities Corp., | | | | |
| Series 2003-1, Class A2 | | | | |
| 6.205% due 01/25/2032 (b)*** | | 525,907 | | 527,933 |
| GSR Mortgage Loan Trust, Series 2003-1, Class A2 | | | |
| 4.603% due 03/25/2033 (b)*** | | 295,507 | | 287,849 |
| Harborview Mortgage Loan Trust, Series 2003-1, | | | |
| Class A | | | | |
| 4.914% due 05/19/2033 (b)*** | | 582,438 | | 583,618 |
| Harborview Mortgage Loan Trust, Series 2005-4, | | | |
| Class 3A1 | | | | |
| 5.1502% due 07/19/2035 (b)*** | | 65,468 | | 64,909 |
| Harborview Mortgage Loan Trust, | | | | |
| Series 2006-1, Class 2A1A | | | | |
| 5.7775% due 03/19/2037 (b)*** | | 1,719,646 | | 1,686,295 |
| Harborview Mortgage Loan Trust, | | | | |
| Series 2006-12, Class 2A11 | | | | |
| 5.6275% due 01/19/2038 (b)*** | | 1,910,249 | | 1,895,934 |
| Harborview Mortgage Loan Trust, | | | | |
| Series 2006-12, Class 2A2A | | | | |
| 5.7275% due 01/19/2038 *** | | 2,661,484 | | 2,583,586 |
| Impac Secured Assets Corp., | | | | |
| Series 2006-4, Class A2A | | | | |
| 5.585% due 01/25/2037 (b)*** | | 2,030,607 | | 2,027,614 |
| Indymac Index Mortgage Loan Trust, Series | | | |
| 2004-AR11, Class 2A | | | | |
| 5.04757% due 12/25/2034 (b)*** | | 118,154 | | 116,769 |
| JP Morgan Mortgage Trust, Series 2003-A2, Class | | | |
| 3A1 | | | | |
| 4.38864% due 11/25/2033 (b)*** | | 319,823 | | 312,635 |
| JP Morgan Mortgage Trust, Series 2005-A1, Class | | | |
| 6T1 | | | | |
| 5.02292% due 02/25/2035 (b)*** | | 634,822 | | 618,169 |
| | | | |
| Global Bond Fund (continued) | | | |
| | | Shares or | | |
| | | Principal | | |
| | | Amount | | Value |
|
|
| |
| COLLATERALIZED MORTGAGE | | | | |
| OBLIGATIONS (continued) | | | | |
| | | | | |
| United States (continued) | | | | |
| JP Morgan Mortgage Trust, | | | | |
| Series 2004-S1, Class 1A3 | | | | |
| 4.50% due 08/25/2019 *** | $ | 2,130,895 | $ | 2,095,489 |
| Lehman XS Trust, Series 2006-4N, Class A1A | | | |
| 5.585% due 04/25/2046 (b)*** | | 753,323 | | 751,170 |
| Mastr Adjustable Rate Mortgages Trust, Series | | | |
| 2004-6, Class 4A4 | | | | |
| 4.13886% due 07/25/2034 (b)*** | | 400,000 | | 392,700 |
| Mellon Residential Funding Corp., | | | | |
| Series 2000-TBC3, Class A1 | | | | |
| 5.78694% due 12/15/2030 (b)*** | | 1,268,471 | | 1,252,107 |
| Merrill Lynch Mortgage Investors, Inc., Series | | | |
| 2003-A2, Class 1A1 | | | | |
| 4.835% due 02/25/2033 (b)*** | | 607,646 | | 609,043 |
| Merrill Lynch Mortgage Investors, Inc., Series | | | |
| 2005-2, Class 1A | | | | |
| 4.25% due 10/25/2035 (b)*** | | 1,661,538 | | 1,604,998 |
| Merrill Lynch Mortgage Investors, Inc., | | | | |
| Series 2003-C, Class A1 | | | | |
| 5.835% due 06/25/2028 (b)*** | | 995,257 | | 974,648 |
| Merrill Lynch Mortgage Trust, | | | | |
| Series 2004-BPC1, Class A1 | | | | |
| 3.585% due 10/12/2041 *** | | 688,589 | | 675,690 |
| Residential Accredit Loans, Inc., | | | | |
| Series 2006-QO3, Class A1 | | | | |
| 5.715% due 04/25/2046 (b)*** | | 1,985,192 | | 1,918,386 |
| Residential Funding Mortgage Securities I, Series | | | |
| 2005-SA4, Class 1A21 | | | | |
| 5.21593% due 09/25/2035 (b)*** | | 220,898 | | 218,873 |
| Sequoia Mortgage Trust, Series 5, Class A | | | | |
| 5.8875% due 10/19/2026 (b)*** | | 356,268 | | 356,174 |
| Structured Adjustable Rate Mortgage Loan Trust, | | | |
| Series 2004-1, Class 4A1 | | | | |
| 4.18% due 02/25/2034 (b)*** | | 244,151 | | 244,347 |
| Structured Adjustable Rate Mortgage Loan Trust, | | | |
| Series 2004-12, Class 7A1 | | | | |
| 5.21% due 09/25/2034 (b)*** | | 1,035,515 | | 1,028,868 |
| Structured Adjustable Rate Mortgage Loan Trust, | | | |
| Series 2004-4, Class 3A2 | | | | |
| 4.59% due 04/25/2034 (b)*** | | 516,446 | | 510,205 |
| Structured Adjustable Rate Mortgage Loan Trust, | | | |
| Series 2004-1, Class 4A2 | | | | |
| 4.58% due 02/25/2034 (b)*** | | 1,342,830 | | 1,349,167 |
| Structured Adjustable Rate Mortgage Loan Trust, | | | |
| Series 2004-19, Class 2A1 | | | | |
| 6.405% due 01/25/2035 (b)*** | | 1,049,497 | | 1,050,610 |
| Structured Asset Mortgage Investments, Inc., | | | |
| Series 2006-AR3, Class 12A1 | | | | |
| 5.725% due 05/25/2036 (b)*** | | 2,220,704 | | 2,170,971 |
| Thornburg Mortgage Securities Trust, | | | | |
| Series 2006-5, Class A1 | | | | |
| 5.625% due 08/25/2036 (b)*** | | 2,334,703 | | 2,299,093 |
| WaMu Mortgage Pass Through Certificates, Series | | | |
| 2003-AR5, Class A7 | | | | |
| 4.208% due 06/25/2033 (b)*** | | 256,144 | | 253,220 |
| |
| The accompanying notes are an integral part of the financial statements. | 182 |
John Hancock Funds II
Portfolio of investments — August 31, 2007
(showing percentage of total net assets)
| | | | |
| Global Bond Fund (continued) | | | |
| | | Shares or | | |
| | | Principal | | |
| | | Amount | | Value |
| |
|
| |
| COLLATERALIZED MORTGAGE | | | | |
| OBLIGATIONS (continued) | | | | |
| | | | | |
| United States (continued) | | | | |
| Washington Mutual Mortgage Securities Corp., | | | |
| Series 2002-AR17, Class 1A | | | | |
| 6.20% due 11/25/2042 (b)*** | $ | 775,090 | $ | 778,173 |
| Washington Mutual Mortgage Securities Corp., | | | |
| Series 2003-R1, Class A1 | | | | |
| 6.045% due 12/25/2027 (b)*** | | 1,335,382 | | 1,334,847 |
| Washington Mutual Mortgage Securities Corp., | | | |
| Series 2005-AR13, Class A1A1 | | | | |
| 5.795% due 10/25/2045 (b)*** | | 251,578 | | 246,888 |
| Washington Mutual Mortgage Securities Corp., | | | |
| Series 2005-AR2, Class 2A1A | | | | |
| 5.815% due 01/25/2045 (b)*** | | 474,801 | | 466,009 |
| Washington Mutual Mortgage Securities Corp., | | | |
| Series 2005-AR6, Class 2A1A | | | | |
| 5.735% due 04/25/2045 (b)*** | | 784,976 | | 764,090 |
| Washington Mutual Mortgage Securities Corp., | | | |
| Series 2006-AR3, Class A1A | | | | |
| 6.005% due 02/25/2046 (b)*** | | 1,389,167 | | 1,346,624 |
| Washington Mutual, Inc., | | | | |
| Series 2006-AR17, Class 1A1A | | | | |
| 5.815% due 12/25/2046 (b)*** | | 576,382 | | 566,739 |
| Wells Fargo Mortgage Backed Securities Trust, | | | |
| Series 2006-AR2, Class 2A1 | | | | |
| 4.95% due 03/25/2036 (b)*** | | 2,247,339 | | 2,206,281 |
| Wells Fargo Mortgage Backed Securities Trust, | | | |
| Series 2004-S, Class A1 | | | | |
| 3.53963% due 09/25/2034 (b)*** | | 2,309,390 | | 2,249,074 |
| |
|
| | | | | 125,024,121 |
|
| |
| TOTAL COLLATERALIZED MORTGAGE OBLIGATIONS | | |
| (Cost $129,162,543) | | | $ | 131,305,378 |
|
| |
| ASSET BACKED SECURITIES - 8.72% | | | |
| | | | | |
| United States - 8.72% | | | | |
| ACE Securities Corp., | | | | |
| Series 2006-ASP4, Class A2A | | | | |
| 5.555% due 08/25/2036 (b)*** | | 1,491,471 | | 1,480,225 |
| ACE Securities Corp., Series 2006-HE1, Class A2A | | | |
| 5.585% due 02/25/2036 (b)*** | | 534,387 | | 532,336 |
| ACE Securities Corp., Series 2006-NC1, Class A2A | | | |
| 5.575% due 12/25/2035 (b)*** | | 575,406 | | 573,445 |
| ACE Securities Corp., Series 2006-NC1, Class A2B | | | |
| 5.655% due 12/25/2035 (b)*** | | 2,500,000 | | 2,464,497 |
| Argent Securities, Inc., Series 2006-M2, Class A2A | | | |
| 5.555% due 09/25/2036 (b)*** | | 1,514,533 | | 1,504,309 |
| Asset Backed Funding Certificates, | | | | |
| Series 2006-OPT1, Class A3A | | | | |
| 5.545% due 09/25/2036 (b)*** | | 365,154 | | 363,031 |
| Asset Backed Securities Corp., | | | | |
| Home Equity Series 2006-HE3, Class A3 | | | |
| 5.565% due 03/25/2036 (b)*** | | 474,511 | | 473,627 |
| Citigroup Commercial Mortgage Trust, Series | | | |
| 2006-FL2, Class A1 | | | | |
| 5.68125% due 08/15/2021 (b)*** | | 552,957 | | 552,741 |
| | | | |
| Global Bond Fund (continued) | | | |
| | | Shares or | | |
| | | Principal | | |
| | | Amount | | Value |
|
|
| |
| ASSET BACKED SECURITIES | | | | |
| (continued) | | | | |
| | | | | |
| United States (continued) | | | | |
| Countrywide Asset-Backed Certificates, | | | | |
| Series 2006-1, Class AF1 | | | | |
| 5.635% due 07/25/2036 (b)*** | $ | 359,506 | $ | 359,163 |
| Countrywide Asset-Backed Certificates, | | | | |
| Series 2006-25, Class 2A1 | | | | |
| 5.575% due 06/25/2037 (b)*** | | 2,636,797 | | 2,617,691 |
| Countrywide Asset-Backed Certificates, | | | | |
| Series 2006-3, Class 2A1 | | | | |
| 5.575% due 06/25/2036 (b)*** | | 654,316 | | 652,503 |
| Countrywide Asset-Backed Certificates, | | | | |
| Series 2006-4, Class 2A1 | | | | |
| 5.575% due 07/25/2036 (b)*** | | 576,735 | | 575,015 |
| First Franklin Mortgage Loan Asset Backed | | | |
| Certificates, Series 2006-FF15, Class A3 | | | |
| 5.555% due 11/25/2036 (b)*** | | 2,343,527 | | 2,291,216 |
| First Franklin Mortgage Loan | | | | |
| Asset Backed Certificates, | | | | |
| Series 2006-FF18, Class A2A | | | | |
| 5.575% due 12/25/2037 (b)*** | | 2,428,168 | | 2,412,153 |
| First NLC Trust, Series 2005-4, Class A1 | | | | |
| 5.625% due 02/25/2036 (b)*** | | 8,909 | | 8,903 |
| GE-WMC Mortgage Securities LLC, | | | | |
| Series 2005-2, Class A2A | | | | |
| 5.605% due 12/25/2035 (b)*** | | 30,245 | | 30,226 |
| GSAMP Trust, Series 2006-NC1, Class A1 | | | |
| 5.575% due 02/25/2036 (b)*** | | 617,997 | | 615,421 |
| GSAMP Trust, Series 2006-SD1, Class A1 | | | | |
| 5.625% due 12/25/2035 (b)*** | | 534,185 | | 532,849 |
| GSR Mortgage Loan Trust, Series 2005-HEL1, | | | |
| Class A2A | | | | |
| 5.605% due 11/25/2030 (b)*** | | 268,588 | | 268,090 |
| Home Equity Asset Trust, Series 2005-8, Class 2A1 | | | |
| 5.615% due 02/25/2036 (b)*** | | 45,567 | | 45,545 |
| Honda Auto Receivables Owner Trust, | | | | |
| Series 2006-2, Class A2 | | | | |
| 5.42% due 12/22/2008 *** | | 1,061,572 | | 1,060,941 |
| HSI Asset Securitization Corp. Trust, Series | | | |
| 2006-HE2, Class 2A1 | | | | |
| 5.555% due 12/25/2036 (b)*** | | 2,568,009 | | 2,547,799 |
| JP Morgan Chase Commercial Mortgage Securities | | | |
| Corp, Series 2006-CB17, Class A4 | | | | |
| 5.429% due 12/12/2043 *** | | 1,100,000 | | 1,080,141 |
| JP Morgan Mortgage Acquisition Corp., Series | | | |
| 2006-WMC3, Class A2 | | | | |
| 5.555% due 08/25/2036 (b)*** | | 1,576,436 | | 1,562,219 |
| Lehman Brothers Floating Rate Commercial | | | |
| Mortgage Trust, Series 2006-LLFA, Class A1 | | | |
| 5.8325% due 09/15/2021 (b)*** | | 596,430 | | 596,289 |
| Lehman Brothers-UBS | | | | |
| Commercial Mortgage Trust, | | | | |
| Series 2003-C1, Class A2 | | | | |
| 3.323% due 03/15/2027 *** | | 4,420,000 | | 4,363,481 |
| Long Beach Mortgage Loan Trust, Series 2004-4, | | | |
| Class 1A1 | | | | |
| 5.785% due 10/25/2034 (b)*** | | 253,620 | | 239,946 |
| |
| The accompanying notes are an integral part of the financial statements. | 183 |
John Hancock Funds II
Portfolio of investments — August 31, 2007
(showing percentage of total net assets)
| | | | |
| Global Bond Fund (continued) | | | |
| | | Shares or | | |
| | | Principal | | |
| | | Amount | | Value |
|
|
| |
| ASSET BACKED SECURITIES | | | | |
| (continued) | | | | |
| | | | | |
| United States (continued) | | | | |
| Long Beach Mortgage Loan Trust, | | | | |
| Series 2006-2, Class 2A1 | | | | |
| 5.575% due 03/25/2036 (b)*** | $ | 281,718 | $ | 281,448 |
| Long Beach Mortgage Loan Trust, | | | | |
| Series 2006-WL1, Class 2A1 | | | | |
| 5.595% due 01/25/2036 (b)*** | | 1,606,763 | | 1,600,456 |
| Master Asset Backed Securities Trust, | | | | |
| Series 2005-NC2, Class A1 | | | | |
| 5.615% due 11/25/2035 (b)*** | | 527,348 | | 525,214 |
| Master Asset Backed Securities Trust, | | | | |
| Series 2006-HE1, Class A1 | | | | |
| 5.585% due 01/25/2036 (b)*** | | 453,741 | | 452,400 |
| Master Asset Backed Securities Trust, | | | | |
| Series 2006-NC1, Class A1 | | | | |
| 5.585% due 01/25/2036 (b)*** | | 380,430 | | 379,615 |
| Merrill Lynch Mortgage Investors Trust, Series | | | |
| 2006-RM5, Class A2A | | | | |
| 5.565% due 10/25/2037 (b)*** | | 548,260 | | 543,216 |
| Morgan Stanley Capital I, | | | | |
| Series 2006-NC2, Class A2A | | | | |
| 5.575% due 02/25/2036 (b)*** | | 1,045,546 | | 1,042,177 |
| Morgan Stanley Capital I, | | | | |
| Series 2006-NC2, Class A2B | | | | |
| 5.625% due 02/25/2036 (b)*** | | 3,900,005 | | 3,853,262 |
| New Century Home Equity Loan Trust, | | | | |
| Series 2005-D, Class A2B | | | | |
| 5.675% due 02/25/2036 (b)*** | | 3,505,859 | | 3,487,137 |
| Newcastle Mortgage Securities Trust, Series | | | |
| 2006-1, Class A1 | | | | |
| 5.575% due 03/25/2036 (b)*** | | 599,193 | | 595,874 |
| Nomura Asset Acceptance Corp., | | | | |
| Series 2006-S1, Class A1 | | | | |
| 5.645% due 01/25/2036 (b)*** | | 190,131 | | 188,677 |
| Residential Asset Mortgage Products, Inc., | | | | |
| Series 2006-NC2, Class A1 | | | | |
| 5.585% due 02/25/2036 (b)*** | | 504,004 | | 503,642 |
| Residential Asset Mortgage Products, Inc., | | | | |
| Series 2006-RS1, Class AI1 | | | | |
| 5.585% due 01/25/2036 (b)*** | | 310,141 | | 309,729 |
| Residential Asset Mortgage Products, Inc., | | | | |
| Series 2006-RZ5, Class A1A | | | | |
| 5.605% due 08/25/2046 (b)*** | | 2,116,418 | | 2,094,211 |
| Residential Asset Securities Corp., Series | | | | |
| 2006-KS6, Class A1 | | | | |
| 5.545% due 08/25/2036 (b)*** | | 1,297,023 | | 1,288,260 |
| Residential Asset Securities Corp., Series | | | | |
| 2006-KS9, Class AI1 | | | | |
| 5.575% due 11/25/2036 (b)*** | | 2,321,969 | | 2,299,460 |
| Residential Asset Securities Corp., | | | | |
| Series 2005-KS12, Class A1 | | | | |
| 5.595% due 01/25/2036 (b)*** | | 56,927 | | 56,875 |
| Residential Asset Securities Corp., | | | | |
| Series 2006-EMX1, Class A1 | | | | |
| 5.585% due 01/25/2036 (b)*** | | 335,374 | | 335,016 |
| | | | |
| Global Bond Fund (continued) | | | |
| | | Shares or | | |
| | | Principal | | |
| | | Amount | | Value |
|
|
| |
| ASSET BACKED SECURITIES | | | | |
| (continued) | | | | |
| | | | | |
| United States (continued) | | | | |
| Residential Asset Securities Corp., | | | | |
| Series 2006-KS2, Class A1 | | | | |
| 5.575% due 03/25/2036 (b)*** | $ | 169,747 | $ | 169,440 |
| Residential Asset Securities Corp., | | | | |
| Series 2006-KS7, Class A1 | | | | |
| 5.555% due 09/25/2036 (b)*** | | 1,382,236 | | 1,373,170 |
| SACO I, Inc., Series 2005-10, Class 1A | | | | |
| 5.765% due 06/25/2036 (b)*** | | 765,475 | | 729,530 |
| Securitized Asset Backed Receivables LLC Trust, | | | |
| Series 2006-WM4, Class A2A | | | | |
| 5.585% due 11/25/2036 (b)*** | | 2,737,413 | | 2,704,679 |
| Soundview Home Equity Loan Trust, Series | | | |
| 2006-EQ1, Class A1 | | | | |
| 5.555% due 10/25/2036 (b)*** | | 1,474,760 | | 1,463,484 |
| Soundview Home Equity Loan Trust, | | | | |
| Series 2006-EQ2, Class A1 | | | | |
| 5.585% due 01/25/2037 (b)*** | | 2,201,178 | | 2,187,711 |
| Specialty Underwriting & Residential Finance, | | | |
| Series 2006-BC1, Class A2A | | | | |
| 5.585% due 12/25/2036 (b)*** | | 1,065,059 | | 1,056,299 |
| Structured Asset Securities Corp., Series 2005-S7, | | | |
| Class A1 | | | | |
| 5.585% due 12/25/2035 (b)*** | | 557,922 | | 556,438 |
| Structured Asset Securities Corp., Series 2006-11, | | | |
| Class A1 | | | | |
| 5.32186% due 10/25/2035 (b)*** | | 1,216,392 | | 1,209,982 |
| Wachovia Bank Commercial Mortgage Trust, | | | |
| Series 2006-C28, Class A4 | | | | |
| 5.572% due 10/15/2048 (b)*** | | 3,000,000 | | 2,977,629 |
| Wells Fargo Home Equity Trust, | | | | |
| Series 2005-2, Class AI1A | | | | |
| 5.735% due 10/25/2035 (b)*** | | 1,535,927 | | 1,512,627 |
| Wells Fargo Home Equity Trust, | | | | |
| Series 2005-3, Class AII2 | | | | |
| 5.745% due 11/25/2035 (b)*** | | 3,000,000 | | 2,933,080 |
| Wells Fargo Home Equity Trust, | | | | |
| Series 2005-4, Class AII1 | | | | |
| 5.625% due 12/25/2035 (b)*** | | 987,838 | | 979,833 |
| |
|
| | | | | 69,494,373 |
|
| |
| TOTAL ASSET BACKED SECURITIES | | | | |
| (Cost $70,047,157) | | | $ | 69,494,373 |
|
| |
| PREFERRED STOCKS - 0.46% | | | | |
| | | | | |
| Cayman Islands - 0.20% | | | | |
| Mitsubishi UFJ Financial Group, Inc., | | | | |
| Capital Finance 1, Ltd. * (b)*** | | 1,700,000 | | 1,622,555 |
| | | | | |
| United States - 0.26% | | | | |
| Fresenius Medical Care Capital Trust * *** | 700 | | 696,500 |
| Mizuho Preferred Capital Company, LLC * (b)*** | 1,300,000 | | 1,336,987 |
| |
|
| | | | | 2,033,487 |
|
| |
| TOTAL PREFERRED STOCKS (Cost $3,770,291) | | $ | 3,656,042 |
|
| |
| The accompanying notes are an integral part of the financial statements. | 184 |
John Hancock Funds II
Portfolio of investments — August 31, 2007
(showing percentage of total net assets)
| | | | |
| Global Bond Fund (continued) | | | |
| | | Shares or | | |
| | | Principal | | |
| | | Amount | | Value |
|
|
| |
| TERM LOANS - 1.17% | | | | |
| | | | |
| United States - 1.17% | | | | |
| Chrysler Finance Corp. | | | | |
| 9.36% due 08/03/2014 | $ | 4,400,000 | $ | 4,277,416 |
| Ford Motor Company, Term B | | | | |
| 8.36% due 11/29/2013 | | 995,000 | | 931,728 |
| Georgia Pacific Corp. | | | | |
| 7.345% due 12/20/2012 (b) | | 985,000 | | 942,083 |
| HCA, Inc. | | | | |
| 7.61% due 11/01/2013 (b) | | 1,293,500 | | 1,243,610 |
| Shackleton B Event Linked Loan | | | | |
| 13.467% due 08/01/2008 (b) | | 1,000,000 | | 965,000 |
| Shackleton C Event Linked Loan | | | | |
| 12.967% due 08/01/2008 (b) | | 1,000,000 | | 965,000 |
| |
|
| | | | | 9,324,837 |
|
| |
| TOTAL TERM LOANS (Cost $9,443,500) | | $ | 9,324,837 |
|
| |
| OPTIONS - 1.64% | | | | |
| | | | | |
| Denmark - 0.10% | | | | |
| EUREX American Put on Euro-BOBL Futures | | | |
| Expiration 11/23/2007 at $101.00 * | | 28,300,000 | | 1,931 |
| EUREX American Put on Euro-Shatz Futures | | | |
| Expiration 11/23/2007 at $101.40 * | | 60,000,000 | | 3,949 |
| Over The Counter European Style Call on the EUR | | | |
| vs. USD | | | | |
| Expiration 07/08/2010 at $1.392 * | | 7,300,000 | | 324,246 |
| Over The Counter European Style Put on the EUR | | | |
| vs. USD | | | | |
| Expiration 07/08/2010 at $1.392 * | | 7,300,000 | | 490,850 |
| |
|
| | | | | 820,976 |
| |
| France - 0.03% | | | | |
| EUREX American Put on Euro-Bund Futures | | | |
| Expiration 11/23/2007 at $104.00 * | | 112,600,000 | | 15,267 |
| Over The Counter European Purchase Call Option | | | |
| on the EUR vs. JPY | | | | |
| Expiration 07/10/2008 at $161.40 * | | 1,900,000 | | 24,022 |
| Over The Counter European Purchase Put Option | | | |
| on the EUR vs. JPY | | | | |
| Expiration 07/10/2008 at $161.40 * | | 1,900,000 | | 159,801 |
| |
|
| | | | | 199,090 |
| |
| United Kingdom - 0.00% | | | | |
| Over The Counter European Style Call on | | | | |
| GBP-LIBOR Rate Swaption | | | | |
| Expiration 09/14/2007 at $5.15 * | | 24,500,000 | | 0 |
| Expiration 09/14/2007 at $5.15 * | | 10,500,000 | | 0 |
| Expiration 09/14/2007 at $5.188 * | | 28,000,000 | | 1 |
| Expiration 09/14/2007 at $5.20125 * | | 3,500,000 | | 0 |
| |
|
| | | | | 1 |
| |
| United States - 1.51% | | | | |
| Chicago Board of Trade American Purchase Call | | | |
| on U.S. Treasury Note 10 Yrs. Futures | | | | |
| Expiration 11/20/2007 at $126.00 * | | 366,000 | | 5,719 |
| Chicago Board of Trade American Purchase Call | | | |
| on U.S. Treasury Note 5 Yrs. Futures | | | | |
| Expiration 11/20/2007 at $121.00 * | | 751,000 | | 11,734 |
| | | |
| Global Bond Fund (continued) | | | |
| | Shares or | | |
| | Principal | | |
| | Amount | | Value |
|
|
| |
| OPTIONS (continued) | | | |
| | | | |
| United States (continued) | | | |
| Chicago Board of Trade American Purchase Call | | | |
| on U.S. Treasury Note Futures | | | |
| Expiration 11/20/2007 at $132.00 * | 65,000 | $ | 1,016 |
| Chicago Mercantile Exchange American Purchase | | | |
| Put on Eurodollar | | | |
| Expiration 09/17/2007 at $90.25 * | 1,132,500 | | 2,831 |
| Expiration 09/17/2007 at $90.75 * | 272,500 | | 681 |
| Expiration 03/17/2008 at $91.75 * | 275,000 | | 688 |
| Expiration 03/17/2008 at $92.00 * | 622,500 | | 1,556 |
| Over The Counter European Purchase Call on | | | |
| FNMA TBA, 5.00% | | | |
| Expiration 09/06/2007 at $102.4375 * | 85,000,000 | | 1 |
| Over The Counter European Purchase Call Option | | | |
| on the EUR vs. USD | | | |
| Expiration 05/21/2008 at $1.3620 * | 3,200,000 | | 109,063 |
| Expiration 05/21/2008 at $1.3550 * | 5,200,000 | | 196,541 |
| Expiration 05/19/2010 at $1.3665 * | 1,600,000 | | 93,889 |
| Expiration 05/21/2010 at $1.3750 * | 1,600,000 | | 87,881 |
| Expiration 06/03/2010 at $1.3750 * | 4,100,000 | | 228,623 |
| Over The Counter European Purchase Call Option | | | |
| on the USD vs. JPY | | | |
| Expiration 03/17/2010 at $103.80 * | 8,000,000 | | 485,768 |
| Expiration 01/18/2008 at $114.65 * | 10,500,000 | | 222,222 |
| Expiration 02/13/2008 at $115.35 * | 17,900,000 | | 298,125 |
| Expiration 12/05/2007 at $116.00 * | 6,600,000 | | 97,621 |
| Expiration 01/18/2008 at $120.00 * | 5,500,000 | | 20,719 |
| Over The Counter European Purchase Put on | | | |
| FNMA TBA, 5.50% | | | |
| Expiration 09/06/2007 at $85.50 * | 45,000,000 | | 0 |
| Expiration 11/06/2007 at $85.50 * | 19,000,000 | | 0 |
| Expiration 11/06/2007 at $86.00 * | 10,000,000 | | 0 |
| Expiration 09/06/2007 at $86.59375 * | 163,500,000 | | 2 |
| Expiration 10/04/2007 at $87.375 * | 24,500,000 | | 0 |
| Over The Counter European Purchase Put on | | | |
| FNMA TBA, 6.00% | | | |
| Expiration 09/06/2007 at $92.50 * | 239,800,000 | | 2 |
| Over The Counter European Purchase Put on | | | |
| FNMA TBA, 6.50% | | | |
| Expiration 10/04/2007 at $92.03125 * | 28,000,000 | | 0 |
| Over The Counter European Purchase Put Option | | | |
| on the EUR vs. USD | | | |
| Expiration 05/21/2008 at $1.3620 * | 3,200,000 | | 86,899 |
| Expiration 05/21/2008 at $1.3550 * | 5,200,000 | | 125,457 |
| Expiration 05/19/2010 at $1.3665 * | 1,600,000 | | 79,551 |
| Expiration 05/21/2010 at $1.3750 * | 1,600,000 | | 85,419 |
| Expiration 06/03/2010 at $1.3750 * | 4,100,000 | | 204,536 |
| Over The Counter European Purchase Put Option | | | |
| on the USD vs. JPY | | | |
| Expiration 03/17/2010 at $103.80 * | 8,000,000 | | 369,408 |
| Expiration 01/18/2008 at $114.65 * | 10,500,000 | | 303,324 |
| Expiration 02/13/2008 at $115.35 * | 17,900,000 | | 590,324 |
| Over The Counter European Style Call on | | | |
| USD-LIBOR Rate Swaption | | | |
| Expiration 09/26/2008 at $4.75 * | 81,300,000 | | 619,278 |
| Expiration 09/26/2008 at $4.75 * | 19,600,000 | | 227,683 |
| Expiration 03/31/2008 at $4.75 * | 238,500,000 | | 1,551,848 |
| |
| The accompanying notes are an integral part of the financial statements. | 185 |
John Hancock Funds II
Portfolio of investments — August 31, 2007
(showing percentage of total net assets)
| | | | |
| Global Bond Fund (continued) | | | |
| | | Shares or | | |
| | | Principal | | |
| | | Amount | | Value |
|
|
| |
| OPTIONS (continued) | | | | |
| | | | | |
| United States (continued) | | | | |
| Over The Counter European Style Call on | | | | |
| USD-LIBOR Rate Swaption (continued) | | | | |
| Expiration 03/31/2008 at $4.75 * | | 93,600,000 | $ | 602,489 |
| Expiration 09/26/2008 at $4.75 * | | 4,600,000 | | 35,039 |
| Expiration 08/28/2009 at $5.00 * | | 37,000,000 | | 371,240 |
| Expiration 08/28/2009 at $5.00 * | | 74,100,000 | | 765,083 |
| Expiration 08/28/2009 at $5.00 * | | 16,200,000 | | 165,038 |
| Expiration 12/20/2007 at $5.00 * | | 52,300,000 | | 382,266 |
| Expiration 02/01/2008 at $5.00 * | | 121,000,000 | | 980,681 |
| Expiration 08/03/2009 at $5.30 * | | 206,500,000 | | 2,624,388 |
|
|
| | | | | 12,034,633 |
|
| |
| TOTAL OPTIONS (Cost $11,964,707) | | | $ | 13,054,700 |
|
| |
| SHORT TERM INVESTMENTS - 20.04% | | | |
| Kingdom of Belgium | | | | |
| zero coupon due 10/11/2007 to | | | | |
| 11/15/2007 *** | EUR | 35,990,000 | $ | 48,813,142 |
| Export-Import Bank of Korea, Series EMTN | | | |
| 4.25% due 11/27/2007 *** | $ | 543,000 | | 540,981 |
| Government of France | | | | |
| zero coupon due 09/12/2007 to | | | | |
| 11/29/2007 *** | EUR | 67,868,000 | | 92,235,564 |
| General Electric Capital Corp. | | | | |
| 5.17% due 11/06/2007 *** | $ | 5,900,000 | | 5,844,078 |
| Korea Development Bank | | | | |
| 4.25% due 11/13/2007 *** | | 214,000 | | 213,690 |
| Skandinav Enskilda Bank, Series YCD | | | | |
| 5.2775% due 10/03/2007 *** | | 1,600,000 | | 1,599,757 |
| U.S. Treasury Bill | | | | |
| zero coupon due 09/13/2007 *** | | 190,000 | | 189,719 |
| zero coupon due 09/13/2007 *** **** | | 10,210,000 | | 10,196,013 |
|
| TOTAL SHORT TERM INVESTMENTS | | | | |
| (Cost $158,332,749) | | | $ | 159,632,944 |
|
| |
| REPURCHASE AGREEMENTS - 7.84% | | | |
| Credit Suisse First Boston Tri-Party | | | | |
| Repurchase Agreement dated | | | | |
| 08/31/2007 at 5.05% to be | | | | |
| repurchased at $40,622,781 on | | | | |
| 09/04/2007, collateralized by | | | | |
| $40,708,000 U.S. Treasury Note, | | | | |
| 4.50% due 11/30/2011 (valued at | | | | |
| $41,645,525, including interest) | $ | 40,600,000 | $ | 40,600,000 |
| Repurchase Agreement with State Street | | | | |
| Corp. dated 08/31/2007 at 4.60% to be | | | | |
| repurchased at $21,840,157 on | | | | |
| 09/04/2007, collateralized by $21,805,000 | | | |
| Federal National Mortgage Association, | | | | |
| 5.30% due 04/16/2010 (valued at | | | | |
| $22,268,356, including interest) | | 21,829,000 | | 21,829,000 |
|
| TOTAL REPURCHASE AGREEMENTS | | | | |
| (Cost $62,429,000) | | | $ | 62,429,000 |
|
| | | | |
| Total Investments (Global Bond Fund) | | | | |
| (Cost $1,322,499,014) - 167.31% | | | $ | 1,332,572,975 |
| Liabilities in Excess of Other Assets - (67.31)% | | | (536,095,717) |
| |
|
| TOTAL NET ASSETS - 100.00% | | | $ | 796,477,258 |
| |
|
| |
| |
| Schedule of Securities Sold Short | | | |
| | | Shares or | | |
| | | Principal | | |
| | | Amount | | Value |
| |
|
| |
| FEDERAL NATIONAL MORTGAGE | | | | |
| ASSOCIATION - 58.02% | | | | |
| Federal National Mortgage Association | | | | |
| 5.00%, TBA ** | $ | 67,000,000 | $ | 63,691,942 |
|
| TOTAL FEDERAL NATIONAL MORTGAGE | | | |
| ASSOCIATION (Proceeds $63,070,625) | | | $ | 63,691,942 |
|
| |
| U.S. TREASURY BONDS - 2.07% | | | | |
| U.S. Treasury Bonds | | | | |
| 4.50%, due 02/15/2036 | | 2,400,000 | $ | 2,276,438 |
|
| TOTAL U.S. TREASURY | | | | |
| BONDS (Proceeds $2,219,232) | | | $ | 2,276,438 |
|
| |
| U.S. TREASURY NOTES - 39.91% | | | | |
| U.S. Treasury Notes | | | | |
| 4.875%, due 08/15/2016 | | 25,300,000 | $ | 25,946,339 |
| 4.625%, due 02/15/2017 | | 3,500,000 | $ | 3,522,148 |
| 4.50%, due 05/15/2017 | | 14,400,000 | $ | 14,348,247 |
|
| TOTAL U.S. TREASURY | | | | |
| NOTES (Proceeds $43,191,542) | | | $ | 43,816,734 |
|
| Total Securities Sold Short | | | | |
| (Proceeds $108,481,399) | | | $ | 109,785,114 |
| |
|
| |
| |
| Global Real Estate Fund | | | | |
| | | Shares or | | |
| | | Principal | | |
| | | Amount | | Value |
| |
|
| |
| COMMON STOCKS - 98.11% | | | | |
| | | | | |
| Australia - 5.08% | | | | |
| Abacus Property Group | | 808,257 $ | | 1,283,976 |
| Aspen Group, Ltd. | | 855,428 | | 1,768,484 |
| Becton Property Group | | 200,877 | | 737,214 |
| Centro Properties Group, Ltd. | | 431,690 | | 2,884,074 |
| Centro Retail Group (a) | | 629,653 | | 851,754 |
| Charter Hall Group | | 844,441 | | 1,895,839 |
| FKP Property Group, Ltd. | | 200,643 | | 1,145,004 |
| General Property Trust, Ltd. | | 4,679 | | 18,263 |
| ING Industrial Fund | | 71,766 | | 156,793 |
| Lend Lease Corp. | | 44,334 | | 694,666 |
| Macquarie DDR Trust | | 2,200 | | 2,153 |
| Macquarie Goodman Group, Ltd. | | 706,167 | | 3,882,193 |
| Macquarie Leisure Trust Group (a) | | 355,984 | | 917,281 |
| Mirvac Group, Ltd. | | 302,724 | | 1,327,140 |
| Stockland Company, Ltd. | | 194,718 | | 1,362,143 |
| Valad Property Group | | 945,034 | | 1,519,085 |
| Westfield Group | | 187,015 | | 3,191,027 |
| |
|
| | | | | 23,637,089 |
| |
| The accompanying notes are an integral part of the financial statements. | 186 |
John Hancock Funds II
Portfolio of investments — August 31, 2007
(showing percentage of total net assets)
| | | |
| Global Real Estate Fund (continued) | | |
| | Shares or | | |
| | Principal | | |
| | Amount | | Value |
|
|
| |
| COMMON STOCKS (continued) | | | |
| | | | |
| Austria - 0.40% | | | |
| Conwert Immobilien Invest AG * | 100,000 | $ | 1,840,304 |
| | | | |
| Brazil - 0.68% | | | |
| Iguatemi Empresa de Shopping Centers SA | 113,850 | | 1,688,488 |
| JHSF Participacoes SA * | 171,000 | | 834,061 |
| Multiplan Empreendimentos Imobiliarios SA * | 54,400 | | 655,608 |
|
|
| | | | 3,178,157 |
| Canada - 1.49% | | | |
| Boardwalk Real Estate Investment Trust | 46,100 | | 2,045,494 |
| Brookfield Properties Corp. (a) | 81,970 | | 1,891,867 |
| Morguard Real Estate Investment Trust | 244,200 | | 2,975,906 |
|
|
| | | | 6,913,267 |
| China - 1.33% | | | |
| Guangzhou R&F Properties Company, Ltd. - | | | |
| H Shares | 799,800 | | 3,222,218 |
| Shui On Land, Ltd. | 2,820,000 | | 2,975,332 |
|
|
| | | | 6,197,550 |
| Finland - 0.83% | | | |
| Sponda OYJ | 100,000 | | 1,370,765 |
| Technopolis Oyj | 306,965 | | 2,504,876 |
|
|
| | | | 3,875,641 |
| France - 3.98% | | | |
| Fonciere Des Regions (a) | 12,500 | | 1,949,657 |
| Icade | 25,000 | | 1,518,793 |
| Orco Property Group (a) | 5,000 | | 752,371 |
| Societe de la Tour Eiffel | 12,000 | | 1,835,982 |
| Unibail-Rodamco * (a) | 26,637 | | 6,378,233 |
| Unibail-Rodamco | 25,363 | | 6,083,717 |
|
|
| | | | 18,518,753 |
| Germany - 1.20% | | | |
| Colonia Real Estate AG * (a) | 50,000 | | 2,035,770 |
| IVG Immobilien AG (a) | 75,000 | | 2,686,397 |
| Magnat Real Estate Opportunities GmbH & | | | |
| Co. KGaA * | 332,500 | | 884,383 |
|
|
| | | | 5,606,550 |
| Guernsey - 0.60% | | | |
| Camper & Nicholsons Marina Investments, Ltd. * | 1,200,000 | | 1,754,485 |
| Eurocastle Investment, Ltd. (a) | 30,000 | | 1,052,194 |
|
|
| | | | 2,806,679 |
| Hong Kong - 8.08% | | | |
| C C Land Holdings, Ltd. | 504,000 | | 559,066 |
| China Overseas Land & Investment, Ltd. | 2,510,000 | | 5,233,571 |
| China Resources Land, Ltd. | 1,560,000 | | 2,705,692 |
| Hang Lung Properties, Ltd. | 1,876,592 | | 6,870,234 |
| Kerry Properties, Ltd. | 793,000 | | 5,855,859 |
| New World Development Company, Ltd. | 2,482,000 | | 5,945,650 |
| Sun Hung Kai Properties, Ltd. | 780,000 | | 10,421,549 |
|
|
| | | | 37,591,621 |
| Italy - 0.58% | | | |
| Beni Stabili SpA | 500,000 | | 620,352 |
| | | |
| Global Real Estate Fund (continued) | | |
| | Shares or | | |
| | Principal | | |
| | Amount | | Value |
|
|
| |
| COMMON STOCKS (continued) | | | |
| | | | |
| Italy (continued) | | | |
| Risanamento SpA * (a) | 300,000 | $ | 2,092,875 |
| |
|
| | | | 2,713,227 |
| Japan - 14.28% | | | |
| Aeon Mall Company, Ltd. (a) | 154,000 | | 4,635,528 |
| Japan Real Estate Investment Corp. | 233 | | 2,585,200 |
| Japan Retail Fund Investment Corp., REIT | 161 | | 1,315,081 |
| Mitsubishi Estate Company, Ltd. | 710,000 | | 18,973,994 |
| Mitsui Fudosan Company, Ltd. | 640,000 | | 16,736,634 |
| Nippon Building Fund, Inc. (a) | 560 | | 7,174,291 |
| NTT Urban Development Corp. (a) | 400 | | 716,961 |
| Sumitomo Realty & | | | |
| Development Company, Ltd. | 320,000 | | 10,461,187 |
| Tokyu Land Corp. | 207,000 | | 1,905,733 |
| Urban Corp. | 117,800 | | 1,989,954 |
| |
|
| | | | 66,494,563 |
| Malaysia - 0.41% | | | |
| IGB Corp., BHD | 1,600,000 | | 1,126,706 |
| SP Setia BHD | 250,000 | | 519,108 |
| Sunrise Berhad | 282,000 | | 277,665 |
| |
|
| | | | 1,923,479 |
| Netherlands - 0.03% | | | |
| Eurocommercial Properties NV | 2,470 | | 130,006 |
| Norway - 0.54% | | | |
| Norwegian Property ASA | 143,375 | | 1,662,995 |
| Scandinavian Property Development ASA * | 120,590 | | 859,449 |
| |
|
| | | | 2,522,444 |
| Philippines - 0.49% | | | |
| Megaworld Corp. | 30,000,200 | | 2,262,807 |
| Russia - 0.19% | | | |
| Sistema Hals * | 73,250 | | 864,350 |
| Singapore - 4.53% | | | |
| Ascendas India Trust * | 1,710,000 | | 1,604,422 |
| Capitaland, Ltd. * | 1,150,000 | | 5,584,846 |
| CapitaMall Trust * | 1,700,000 | | 3,792,167 |
| CDL Hospitality Trusts, REIT | 1,150,040 | | 1,672,528 |
| Hong Kong Land Holdings, Ltd. (a) | 1,665,000 | | 6,401,572 |
| The Ascott Group, Ltd. | 2,000,000 | | 2,042,900 |
| |
|
| | | | 21,098,435 |
| South Africa - 0.66% | | | |
| Growthpoint Properties, Ltd. (a) | 900,000 | | 1,943,382 |
| Madison Property Fund Managers Holdings, | | | |
| Ltd. * | 800,000 | | 1,126,816 |
| |
|
| | | | 3,070,198 |
| Sweden - 0.31% | | | |
| Lennart Wallenstam Byggnads AB, Series B | 65,000 | | 1,425,452 |
| | | | |
| United Kingdom - 12.57% | | | |
| Aseana Properties, Ltd. * | 1,000,000 | | 930,000 |
| Big Yellow Group PLC | 250,000 | | 2,711,801 |
| British Land Company PLC | 330,000 | | 8,634,511 |
| |
| The accompanying notes are an integral part of the financial statements. | 187 |
John Hancock Funds II
Portfolio of investments — August 31, 2007
(showing percentage of total net assets)
| | | |
| Global Real Estate Fund (continued) | | |
| | Shares or | | |
| | Principal | | |
| | Amount | | Value |
|
|
| |
| COMMON STOCKS (continued) | | | |
| | | | |
| United Kingdom (continued) | | | |
| Dawnay Day Sirius, Ltd. * | 1,000,330 | $ | 1,241,649 |
| Derwent Valley Holdings PLC (a) | 115,000 | | 4,174,333 |
| Equest Balkan Properties PLC | 647,078 | | 1,200,535 |
| Great Portland Estates PLC | 350,000 | | 4,579,220 |
| Hammerson PLC | 190,000 | | 5,105,736 |
| Helical Bar PLC | 47,765 | | 444,490 |
| Hirco PLC * | 200,000 | | 1,568,995 |
| Land Securities Group PLC | 300,000 | | 10,994,900 |
| Macau Property Opportunities Fund, Ltd. * | 133,356 | | 307,625 |
| Mapeley Ltd | 15,000 | | 771,074 |
| Minerva PLC * | 100,000 | | 562,774 |
| Mucklow A & J Group Plc * | 50,000 | | 348,203 |
| North Real Estate Opportunities Fund, Ltd. * | 600,000 | | 810,216 |
| Northern European Properties, Ltd. * | 700,000 | | 810,874 |
| Safestore Holdings, Ltd. | 517,920 | | 1,997,328 |
| Segro PLC, REIT * (a) | 166,154 | | 1,838,524 |
| Songbird Estates PLC | 200,000 | | 1,109,157 |
| South African Property Opportunities PLC * | 1,250,000 | | 2,810,705 |
| Speymill Deutsche Immobilien Co. PLC * | 1,250,000 | | 1,517,451 |
| Terrace Hill Group PLC | 1,028,574 | | 1,956,017 |
| Unite Group PLC | 120,000 | | 982,075 |
| Workspace Group PLC | 150,000 | | 1,102,346 |
|
|
| | | | 58,510,539 |
| United States - 39.85% | | | |
| AMB Property Corp., REIT | 48,230 | | 2,651,685 |
| Apartment Investment & Management | | | |
| Company, Class A, REIT | 115,480 | | 5,161,956 |
| Archstone-Smith Trust, REIT | 63,600 | | 3,739,680 |
| Avalon Bay Communities, Inc., REIT | 82,960 | | 9,488,965 |
| BioMed Realty Trust, Inc., REIT | 128,990 | | 3,144,776 |
| Boston Properties, Inc., REIT | 44,600 | | 4,463,122 |
| BRE Properties, Inc., Class A, REIT | 70,500 | | 3,915,570 |
| DiamondRock Hospitality Company, REIT | 18,850 | | 338,357 |
| Digital Realty Trust, Inc., REIT | 62,450 | | 2,435,550 |
| Douglas Emmett, Inc., REIT | 102,500 | | 2,506,125 |
| Equity Lifestyle Properties, Inc., REIT | 75,980 | | 3,700,226 |
| Essex Property Trust, Inc., REIT | 38,570 | | 4,543,160 |
| Federal Realty Investment Trust, REIT | 66,790 | | 5,615,035 |
| FelCor Lodging Trust, Inc., REIT | 144,900 | | 3,179,106 |
| General Growth Properties, Inc., REIT | 208,150 | | 10,347,137 |
| Healthcare Realty Trust, Inc., REIT | 47,450 | | 1,184,827 |
| Host Hotels & Resorts, Inc., REIT | 461,410 | | 10,284,829 |
| LaSalle Hotel Properties, REIT | 97,700 | | 4,068,228 |
| LTC Properties, Inc., REIT | 76,180 | | 1,720,144 |
| Mack-California Realty Corp., REIT | 93,600 | | 3,908,736 |
| Nationwide Health Properties, Inc., REIT | 99,670 | | 2,765,843 |
| Parkway Properties, Inc., REIT | 35,300 | | 1,633,684 |
| Post Properties, Inc., REIT (a) | 49,600 | | 1,979,536 |
| ProLogis, REIT | 164,040 | | 9,868,646 |
| Public Storage, Inc., REIT | 91,800 | | 6,956,604 |
| Regency Centers Corp., REIT | 111,080 | | 7,716,728 |
| Saul Centers, Inc., REIT | 16,800 | | 841,008 |
| | | | | |
| Global Real Estate Fund (continued) | | |
| | | | Shares or | | |
| | | | Principal | | |
| | | | Amount | | Value |
| |
|
| |
| COMMON STOCKS (continued) | | | | | |
| | | | | | |
| United States (continued) | | | | | |
| Senior Housing Properties Trust, REIT | | | 114,000 | $ | 2,318,760 |
| Simon Property Group, Inc., REIT | | | 176,090 | | 16,714,463 |
| SL Green Realty Corp., REIT | | | 104,800 | | 11,686,248 |
| Starwood Hotels & Resorts Worldwide, Inc. | | 73,289 | | 4,479,424 |
| Tanger Factory Outlet Centers, Inc., REIT | | 101,600 | | 3,867,912 |
| Taubman Centers, Inc., REIT | | | 34,900 | | 1,800,142 |
| The Macerich Company, REIT | | | 65,450 | | 5,315,849 |
| Ventas, Inc., REIT | | | 151,100 | | 5,753,888 |
| Vornado Realty Trust, REIT | | | 144,326 | | 15,383,708 |
|
|
| | | | | | 185,479,657 |
|
| TOTAL COMMON STOCKS (Cost $424,857,636) | | $ | 456,660,768 |
|
| |
| WARRANTS - 0.02% | | | | | |
| | | | | | |
| Hong Kong - 0.02% | | | | | |
| China Overseas Land & Investment, Ltd. | | | | |
| (Expiration Date: 08/27/2008, Strike | | | | |
| Price: HKD 12.50) | | | 209,167 | | 101,938 |
|
| TOTAL WARRANTS (Cost $0) | | | | $ | 101,938 |
|
| |
| RIGHTS - 0.00% | | | | | |
| | | | | | |
| Philippines - 0.00% | | | | | |
| Ali Pals Non Tradeable (Expiration date: | | | | |
| 09/14/2007, Strike price: PHP0.1) | | | 1,987,000 | | 0 |
|
| TOTAL RIGHTS (Cost $0) | | | | $ | 0 |
|
| |
| CONVERTIBLE BONDS - 0.05% | | | | | |
| | | | | | |
| Germany - 0.05% | | | | | |
| Colonia Real Estate AG, Series COLO | | | | | |
| 1.875% due 12/07/2011 | EUR | 167,300 | | 218,235 |
|
| TOTAL CONVERTIBLE BONDS (Cost $222,952) | | $ | 218,235 |
|
| |
| SHORT TERM INVESTMENTS - 6.12% | | | | |
| John Hancock Cash Investment Trust (c) | $ | 28,489,756 | $ | 28,489,756 |
|
| TOTAL SHORT TERM INVESTMENTS | | | | |
| (Cost $28,489,756) | | | | $ | 28,489,756 |
|
| |
| REPURCHASE AGREEMENTS - 1.20% | | | | |
| Repurchase Agreement with State | | | | | |
| Street Corp. dated 08/31/2007 at | | | | | |
| 4.60% to be repurchased at | | | | | |
| $5,597,860 on 09/04/2007, | | | | | |
| collateralized by $5,590,000 | | | | | |
| Federal National Mortgage | | | | | |
| Association, 5.3% due 04/16/2010 | | | | | |
| (valued at $5,708,788, including | | | | | |
| interest) | | $ | 5,595,000 | $ | 5,595,000 |
|
| TOTAL REPURCHASE AGREEMENTS | | | | |
| (Cost $5,595,000) | | | | $ | 5,595,000 |
|
| Total Investments (Global Real Estate Fund) | | | | |
| (Cost $459,165,344) - 105.50% | | | | $ | 491,065,697 |
| Liabilities in Excess of Other Assets - (5.50)% | | | (25,584,303) |
|
|
| TOTAL NET ASSETS - 100.00% | | | | $ | 465,481,394 |
|
|
| |
| The accompanying notes are an integral part of the financial statements. | 188 |
John Hancock Funds II
Portfolio of investments — August 31, 2007
(showing percentage of total net assets)
| |
| The portfolio had the following five top industry concentrations as of |
| August 31, 2007 (as a percentage of total net assets): | |
| Real Estate | 92.89% |
| Building Materials & Construction | 1.42% |
| Financial Services | 1.00% |
| Investment Companies | 1.00% |
| Hotels & Restaurants | 0.96% |
| | | | |
| High Income Fund | | | | |
| | | Shares or | | |
| | | Principal | | |
| | | Amount | | Value |
|
|
| |
| FOREIGN GOVERNMENT OBLIGATIONS - 3.62% | | |
| | | | | |
| Brazil - 3.62% | | | | |
| Federative Republic of Brazil | | | | |
| 12.50% due 01/05/2016 | BRL | 23,935,000 | $ | 13,882,957 |
|
| TOTAL FOREIGN GOVERNMENT OBLIGATIONS | | |
| (Cost $15,116,130) | | | $ | 13,882,957 |
|
| |
| CORPORATE BONDS - 59.34% | | | | |
| | | | | |
| Advertising - 1.15% | | | | |
| Vertis, Inc. | | | | |
| 9.75% due 04/01/2009 | $ | 3,108,000 | | 3,076,920 |
| 10.875% due 06/15/2009 | | 1,500,000 | | 1,320,000 |
| |
|
| | | | | 4,396,920 |
| Aerospace - 0.07% | | | | |
| TransDigm, Inc. | | | | |
| 7.75% due 07/15/2014 | | 285,000 | | 286,425 |
| | | | | |
| Air Travel - 4.89% | | | | |
| Alaska Airlines, Inc., Series D | | | | |
| 9.50% due 04/12/2012 | | 109,824 | | 102,372 |
| American Airlines, Inc., Series 90-K | | | | |
| 9.93% due 06/15/2010 | | 512,000 | | 509,440 |
| American Airlines, Inc., Series 91B2 | | | | |
| 10.32% due 07/30/2014 | | 980,000 | | 960,400 |
| AMR Corp., Series MTNB | | | | |
| 10.40% due 03/10/2011 | | 4,500,000 | | 4,550,625 |
| Gol Finance | | | | |
| 8.75% due 04/29/2049 | | 2,780,000 | | 2,724,400 |
| Northwest Airlines | | | | |
| 6.625% due 02/15/2023 ^ | | 15,690,000 | | 1,431,713 |
| 7.625% due 11/15/2023 ^ | | 8,085,000 | | 808,500 |
| 8.875% due 06/01/2049 ^ | | 845,000 | | 82,387 |
| 9.875% due 03/15/2037 ^ | | 7,045,000 | | 739,725 |
| 10.00% due 02/01/2009 ^ | | 2,140,000 | | 214,000 |
| Northwest Airlines Corp. Escrow Account | | | |
| zero coupon due 02/20/2049 ^ | | 4,470,000 | | 441,412 |
| United Airlines, Inc., Series 00-2 | | | | |
| 7.762% due 10/01/2049 ^ | | 6,676,394 | | 6,175,665 |
| |
|
| | | | | 18,740,639 |
| Apparel & Textiles - 0.10% | | | | |
| Hanesbrands, Inc., Series B | | | | |
| 8.7841% due 12/15/2014 (b) | | 365,000 | | 364,544 |
| | | | | |
| Auto Parts - 0.11% | | | | |
| Federal-Mogul Corp. | | | | |
| 7.50% due 01/15/2009 ^ | | 525,000 | | 427,875 |
| | | | |
| High Income Fund (continued) | | | |
| | | Shares or | | |
| | | Principal | | |
| | | Amount | | Value |
|
|
| |
| CORPORATE BONDS (continued) | | | | |
| | | | | |
| Broadcasting - 4.91% | | | | |
| Canadian Satellite Radio Holdings, Inc., ADR | | | |
| 12.75% due 02/15/2014 | $ | 3,675,000 | $ | 3,606,094 |
| XM Satellite Radio Holdings, Inc. | | | | |
| 1.75% due 12/01/2009 | | 3,585,000 | | 3,020,362 |
| XM Satellite Radio, Inc. | | | | |
| 9.75% due 05/01/2014 | | 7,630,000 | | 7,248,500 |
| 9.8563% due 05/01/2013 (b) | | 5,295,000 | | 4,924,350 |
| |
|
| | | | | 18,799,306 |
| Building Materials & Construction - 0.27% | | | |
| Odebrecht Overseas, Ltd. | | | | |
| 9.625% due 12/31/2049 | | 1,006,000 | | 1,034,923 |
| Business Services - 1.70% | | | | |
| Allied Security Escrow Corp. | | | | |
| 11.375% due 07/15/2011 | | 276,000 | | 274,620 |
| Minerva Overseas, Ltd. | | | | |
| 9.50% due 02/01/2017 | | 2,875,000 | | 2,702,500 |
| MSX International UK | | | | |
| 12.50% due 04/01/2012 | | 1,185,000 | | 1,149,450 |
| West Corp. | | | | |
| 11.00% due 10/15/2016 | | 2,365,000 | | 2,400,475 |
| |
|
| | | | | 6,527,045 |
| Cable & Television - 5.99% | | | | |
| Adelphia Communications Corp. | | | | |
| 7.75% due 01/15/2009 ^ | | 3,000,000 | | 540,000 |
| 9.875% due 03/01/2049 ^ | | 1,965,000 | | 353,700 |
| 10.25% due 11/01/2049 ^ | | 985,000 | | 174,837 |
| Century Communications | | | | |
| 8.375% due 12/15/2049 ^ | | 1,000,000 | | 28,750 |
| Charter Communications Holdings I LLC | | | | |
| 11.75% due 05/15/2014 | | 4,340,000 | | 3,862,600 |
| 12.125% due 01/15/2015 | | 950,000 | | 850,250 |
| 13.50% due 01/15/2014 (a) | | 1,455,000 | | 1,374,975 |
| Charter Communications Holdings I LLC/Charter | | | |
| Communications Holdings I Capital Corp. | | | |
| 11.00% due 10/01/2015 | | 5,455,000 | | 5,345,900 |
| Charter Communications Holdings II LLC/Charter | | | |
| Communications Holdings II Capital Corp. | | | |
| 10.25% due 09/15/2010 | | 1,345,000 | | 1,358,450 |
| Charter Communications Operating LLC | | | | |
| 8.00% due 04/30/2012 | | 5,400,000 | | 5,292,000 |
| Charter Communications, Inc. | | | | |
| 5.875% due 11/16/2009 | | 459,000 | | 612,191 |
| Insight Communications, Inc. | | | | |
| 12.25% due 02/15/2011 | | 74,000 | | 76,128 |
| Shaw Communications, Inc. | | | | |
| 8.25% due 04/11/2010 | | 18,000 | | 18,765 |
| Young Broadcasting, Inc. | | | | |
| 8.75% due 01/15/2014 | | 37,000 | | 30,941 |
| 10.00% due 03/01/2011 | | 3,360,000 | | 3,024,000 |
| |
|
| | | | | 22,943,487 |
| Cellular Communications - 6.03% | | | | |
| American Cellular Corp. | | | | |
| 10.00% due 08/01/2011 | | 3,890,000 | | 4,035,875 |
| |
| The accompanying notes are an integral part of the financial statements. | 189 |
John Hancock Funds II
Portfolio of investments — August 31, 2007
(showing percentage of total net assets)
| | | | |
| High Income Fund (continued) | | | |
| | | Shares or | | |
| | | Principal | | |
| | | Amount | | Value |
|
|
| |
| CORPORATE BONDS (continued) | | | | |
| | | | | |
| Cellular Communications (continued) | | | | |
| American Tower Corp. | | | | |
| 5.00% due 02/15/2010 | $ | 441,000 | $ | 439,897 |
| Centennial Communications Corp. | | | | |
| 10.00% due 01/01/2013 | | 2,430,000 | | 2,539,350 |
| 10.75% due 12/15/2008 | | 28,000 | | 28,140 |
| 11.11% due 01/01/2013 (b) | | 600,000 | | 615,000 |
| Dobson Communications Corp. | | | | |
| 8.375% due 11/01/2011 | | 335,000 | | 354,263 |
| 8.875% due 10/01/2013 | | 6,250,000 | | 6,609,375 |
| 9.875% due 11/01/2012 | | 1,180,000 | | 1,268,500 |
| Dobson Communications Corp., Series B | | | | |
| 8.375% due 11/01/2011 | | 976,000 | | 1,032,120 |
| Rural Cellular Corp. | | | | |
| 8.36% due 06/01/2013 (b) | | 4,810,000 | | 4,906,200 |
| 9.875% due 02/01/2010 | | 1,220,000 | | 1,262,700 |
| |
|
| | | | | 23,091,420 |
| Chemicals - 1.37% | | | | |
| American Pacific Corp. | | | | |
| 9.00% due 02/01/2015 | | 4,980,000 | | 4,905,300 |
| Sterling Chemicals, Inc. | | | | |
| 10.25% due 04/01/2015 | | 340,000 | | 345,100 |
| |
|
| | | | | 5,250,400 |
| Containers & Glass - 2.61% | | | | |
| BWAY Corp. | | | | |
| 10.00% due 10/15/2010 | | 755,000 | | 770,100 |
| Graphic Packaging International Corp. | | | | |
| 9.50% due 08/15/2013 | | 2,750,000 | | 2,777,500 |
| Pliant Corp. | | | | |
| 11.125% due 09/01/2009 ^ | | 552,000 | | 499,560 |
| 11.625% due 06/15/2009 ^ | | 854,636 | | 910,187 |
| Smurfit-Stone Container Enterprises, Inc. | | | | |
| 8.00% due 03/15/2017 | | 3,160,000 | | 3,013,850 |
| Stone Container Finance | | | | |
| 7.375% due 07/15/2014 | | 118,000 | | 110,920 |
| Tekni Plex, Inc., Series B | | | | |
| 12.75% due 06/15/2010 | | 1,949,000 | | 1,490,985 |
| US Corrugated, Inc. | | | | |
| 10.00% due 06/12/2013 | | 460,000 | | 432,400 |
| |
|
| | | | | 10,005,502 |
| Drugs & Health Care - 0.74% | | | | |
| Duane Reade, Inc. | | | | |
| 9.75% due 08/01/2011 | | 3,000,000 | | 2,850,000 |
| Electrical Utilities - 0.85% | | | | |
| CMS Energy Corp. | | | | |
| 8.50% due 04/15/2011 | | 37,000 | | 39,389 |
| Orion Power Holdings, Inc. | | | | |
| 12.00% due 05/01/2010 | | 2,945,000 | | 3,210,050 |
| |
|
| | | | | 3,249,439 |
| Electronics - 0.77% | | | | |
| Muzak LLC/Muzak Finance Corp. | | | | |
| 9.875% due 03/15/2009 | | 919,000 | | 879,942 |
| 10.00% due 02/15/2009 | | 2,170,000 | | 2,088,625 |
| |
|
| | | | | 2,968,567 |
| | | | |
| High Income Fund (continued) | | | |
| | | Shares or | | |
| | | Principal | | |
| | | Amount | | Value |
|
|
| |
| CORPORATE BONDS (continued) | | | | |
| | | | | |
| Energy - 0.40% | | | | |
| Exide Technologies, Series B | | | | |
| 10.50% due 03/15/2013 | $ | 1,600,000 | $ | 1,544,000 |
| | | | | |
| Financial Services - 1.11% | | | | |
| Nexstar Finance Holdings LLC | | | | |
| zero coupon, Step up to 11.375% on | | | | |
| 04/01/2008 due 04/01/2013 | | 1,122,000 | | 1,093,950 |
| Nexstar Finance, Inc. | | | | |
| 7.00% due 01/15/2014 | | 221,000 | | 208,845 |
| Ucar Finance, Inc. | | | | |
| 10.25% due 02/15/2012 | | 2,828,000 | | 2,955,260 |
| |
|
| | | | | 4,258,055 |
| |
| Food & Beverages - 1.33% | | | | |
| ASG Consolidated LLC/ASG Finance, Inc. | | | | |
| zero coupon, Step up to 11.5% on | | | | |
| 11/01/2008 due 11/01/2011 | | 4,360,000 | | 4,011,200 |
| Constellation Brands, Inc., Series B | | | | |
| 8.125% due 01/15/2012 | | 55,000 | | 55,137 |
| Dole Food Company, Inc. | | | | |
| 7.25% due 06/15/2010 | | 1,100,000 | | 1,017,500 |
| |
|
| | | | | 5,083,837 |
| |
| Forest Products - 0.08% | | | | |
| Tembec Industries, Inc. | | | | |
| 8.50% due 02/01/2011 | | 720,000 | | 322,200 |
| | | | | |
| Gold - 0.40% | | | | |
| New Gold, Inc. | | | | |
| 10.00% due 06/28/2017 | CAD | 2,035,000 | | 1,522,252 |
| | | | | |
| Healthcare Services - 1.34% | | | | |
| Healthsouth Corp. | | | | |
| 11.4091% due 06/15/2014 (b) | $ | 5,000,000 | | 5,125,000 |
| | | | |
| Holdings Companies/Conglomerates - 2.00% | | | |
| UAL Corp. | | | | |
| 4.50% due 06/30/2021 | | 5,080,000 | | 7,652,512 |
| | | | | |
| Homebuilders - 0.01% | | | | |
| Meritage Homes Corp. | | | | |
| 7.00% due 05/01/2014 | | 18,000 | | 14,670 |
| Standard Pacific Corp. | | | | |
| 6.50% due 10/01/2008 | | 37,000 | | 33,300 |
| |
|
| | | | | 47,970 |
| |
| Hotels & Restaurants - 1.17% | | | | |
| Buffalo Thunder Development Authority | | | | |
| 9.375% due 12/15/2014 | | 1,595,000 | | 1,499,300 |
| CCM Merger, Inc. | | | | |
| 8.00% due 08/01/2013 | | 3,108,000 | | 2,968,140 |
| |
|
| | | | | 4,467,440 |
| |
| Household Products - 0.52% | | | | |
| Vitro SA de CV | | | | |
| 9.125% due 02/01/2017 | | 2,075,000 | | 1,997,188 |
| | | | | |
| Leisure Time - 7.70% | | | | |
| AMC Entertainment, Inc., Series B | | | | |
| 8.625% due 08/15/2012 | | 18,000 | | 18,405 |
| |
| The accompanying notes are an integral part of the financial statements. | 190 |
John Hancock Funds II
Portfolio of investments — August 31, 2007
(showing percentage of total net assets)
| | | | |
| High Income Fund (continued) | | | |
| | | Shares or | | |
| | | Principal | | |
| | | Amount | | Value |
| |
|
| |
| CORPORATE BONDS (continued) | | | | |
| | | | | |
| Leisure Time (continued) | | | | |
| Cinemark, Inc. | | | | |
| zero coupon, Step up to 9.75% on | | | | |
| 03/15/2009 due 03/15/2014 | $ | 975,000 | $ | 901,875 |
| Fontainebleau Las Vegas Holdings | | | | |
| 10.25% due 06/15/2015 | | 4,230,000 | | 3,627,225 |
| Fontainebleau, Senior Note | | | | |
| 7.00% due 05/31/2014 | | 2,895,000 | | 2,685,112 |
| Harrah's Operating Company, Inc. | | | | |
| 6.50% due 06/01/2016 | | 1,410,000 | | 1,110,375 |
| Jacobs Entertainment, Inc. | | | | |
| 9.75% due 06/15/2014 | | 1,800,000 | | 1,795,500 |
| Little Traverse Bay Bands of Odawa Indians | | | |
| 10.25% due 02/15/2014 | | 2,460,000 | | 2,472,300 |
| Majestic Star Casino LLC | | | | |
| 9.50% due 10/15/2010 | | 2,605,000 | | 2,552,900 |
| 9.75% due 01/15/2011 | | 4,515,000 | | 3,837,750 |
| Marquee Holdings, Inc. | | | | |
| 12 due 08/15/2014 | | 820,000 | | 688,800 |
| MTR Gaming Group, Inc., Series B | | | | |
| 9.00% due 06/01/2012 | | 750,000 | | 750,000 |
| Seminole Hard Rock Entertainment, Inc. | | | | |
| 7.86% due 03/15/2014 (b) | | 805,000 | | 780,850 |
| Shingle Springs Tribal Gaming Authority | | | | |
| 9.375% due 06/15/2015 | | 995,000 | | 980,075 |
| Trump Entertainment Resorts, Inc. | | | | |
| 8.50% due 06/01/2015 | | 6,160,000 | | 5,020,400 |
| Turning Stone Resort Casino | | | | |
| 9.125% due 09/15/2014 | | 690,000 | | 696,900 |
| 9.125% due 12/15/2010 | | 1,563,000 | | 1,578,630 |
| |
|
| | | | | 29,497,097 |
| Medical-Hospitals - 1.27% | | | | |
| Alliance Imaging, Inc. | | | | |
| 7.25% due 12/15/2012 | | 2,000,000 | | 1,910,000 |
| Community Health Systems, Inc. | | | | |
| 8.875% due 07/15/2015 | | 575,000 | | 574,281 |
| HCA, Inc. | | | | |
| 9.25% due 11/15/2016 | | 2,310,000 | | 2,373,525 |
| |
|
| | | | | 4,857,806 |
| Metal & Metal Products - 0.14% | | | | |
| Blaze Recycling & Metals LLC / Blaze Finance Corp. | | | |
| 10.875% due 07/15/2012 | | 530,000 | | 523,375 |
| | | | | |
| Mining - 0.12% | | | | |
| Drummond Company, Inc. | | | | |
| 7.375% due 02/15/2016 | | 470,000 | | 446,500 |
| | | | | |
| Paper - 2.45% | | | | |
| Abitibi-Consolidated, Inc. | | | | |
| 6.00% due 06/20/2013 | | 1,620,000 | | 1,198,800 |
| 7.40% due 04/01/2018 | | 500,000 | | 362,500 |
| 7.50% due 04/01/2028 | | 347,000 | | 246,370 |
| 7.75% due 06/15/2011 | | 846,000 | | 706,410 |
| 8.375% due 04/01/2015 | | 1,110,000 | | 871,350 |
| Bowater Canada Finance Corp. | | | | |
| 7.95% due 11/15/2011 | | 55,000 | | 46,750 |
| | | | |
| High Income Fund (continued) | | | |
| | | Shares or | | |
| | | Principal | | |
| | | Amount | | Value |
|
|
| |
| CORPORATE BONDS (continued) | | | | |
| | | | | |
| Paper (continued) | | | | |
| Bowater, Inc. | | | | |
| 9.50% due 10/15/2012 | $ | 1,269,000 | $ | 1,116,720 |
| Buckeye Technologies, Inc. | | | | |
| 9.25% due 09/15/2008 | | 951,000 | | 951,000 |
| Jefferson Smurfit Corp. | | | | |
| 8.25% due 10/01/2012 | | 740,000 | | 723,350 |
| Newark Group, Inc. | | | | |
| 9.75% due 03/15/2014 | | 1,581,000 | | 1,486,140 |
| Norske Skog Canada, Ltd. | | | | |
| 7.375% due 03/01/2014 | | 441,000 | | 355,005 |
| Pope & Talbot, Inc. | | | | |
| 8.375% due 06/01/2013 | | 2,200,000 | | 1,309,000 |
| |
|
| | | | | 9,373,395 |
| |
| Petroleum Services - 0.43% | | | | |
| Hanover Equipment Trust | | | | |
| 8.75% due 09/01/2011 | | 1,600,000 | | 1,644,000 |
| | | | | |
| Publishing - 2.11% | | | | |
| Idearc, Inc. | | | | |
| 8.00% due 11/15/2016 | | 2,660,000 | | 2,626,750 |
| Quebecor World Capital Corp. | | | | |
| 4.875% due 11/15/2008 | | 1,855,000 | | 1,801,669 |
| 6.125% due 11/15/2013 | | 3,630,000 | | 3,149,025 |
| 8.75% due 03/15/2016 | | 560,000 | | 504,000 |
| |
|
| | | | | 8,081,444 |
| |
| Real Estate - 0.11% | | | | |
| Realogy Corp. | | | | |
| 10.50% due 04/15/2014 | | 505,000 | | 425,463 |
| | | | | |
| Retail - 1.17% | | | | |
| Eye Care Centers of America | | | | |
| 10.75% due 02/15/2015 | | 1,545,000 | | 1,653,150 |
| Jo-Ann Stores, Inc. | | | | |
| 7.50% due 03/01/2012 | | 3,177,000 | | 2,843,415 |
| |
|
| | | | | 4,496,565 |
| |
| Sanitary Services - 0.35% | | | | |
| Allied Waste North America, Inc. | | | | |
| 4.25% due 04/15/2034 | | 1,415,000 | | 1,340,712 |
| | | | | |
| Steel - 0.51% | | | | |
| WCI Steel Acquisition, Inc. | | | | |
| 8.00% due 05/01/2016 | | 1,955,000 | | 1,955,000 |
| | | | | |
| Telecommunications Equipment & | | | | |
| Services - 0.73% | | | | |
| Digicel Group, Ltd. | | | | |
| 8.875% due 01/15/2015 | | 930,000 | | 849,834 |
| Mobile Satellite Ventures LP | | | | |
| zero coupon, Step up to 14% on | | | | |
| 04/01/2010 due 04/01/2013 | | 1,190,000 | | 749,700 |
| Terrestar Networks, Inc., PIK | | | | |
| 15.00% due 02/15/2014 | | 1,145,318 | | 1,193,994 |
| |
|
| | | | | 2,793,528 |
| |
| Tobacco - 1.21% | | | | |
| Alliance One International, Inc. | | | | |
| 8.50% due 05/15/2012 | | 900,000 | | 877,500 |
| 11.00% due 05/15/2012 | | 1,275,000 | | 1,332,375 |
| |
| The accompanying notes are an integral part of the financial statements. | 191 |
John Hancock Funds II
Portfolio of investments — August 31, 2007
(showing percentage of total net assets)
| | | | |
| High Income Fund (continued) | | | |
| | | Shares or | | |
| | | Principal | | |
| | | Amount | | Value |
| |
|
| |
| CORPORATE BONDS (continued) | | | | |
| | | | | |
| Tobacco (continued) | | | | |
| North Atlantic Trading Company | | | | |
| 10.00% due 03/01/2012 | $ | 2,626,750 | $ | 2,416,610 |
| |
|
| | | | | 4,626,485 |
| |
| Travel Services - 1.12% | | | | |
| Travelport LLC | | | | |
| 9.875% due 09/01/2014 | | 4,250,000 | | 4,281,875 |
|
| TOTAL CORPORATE BONDS (Cost $231,371,615) | | $ | 227,300,191 |
|
| |
| CONVERTIBLE BONDS - 5.82% | | | | |
| | | | | |
| Air Travel - 2.07% | | | | |
| AMR Corp. | | | | |
| 4.25% due 09/23/2023 | | 5,265,000 | | 7,917,244 |
| | | | |
| Holdings Companies/Conglomerates - 3.75% | | | |
| UAL Corp. | | | | |
| 4.50% due 06/30/2021 | | 9,536,000 | | 14,365,030 |
|
| TOTAL CONVERTIBLE BONDS (Cost $19,972,690) | | $ | 22,282,274 |
|
| |
| COLLATERALIZED MORTGAGE | | | | |
| OBLIGATIONS - 2.40% | | | | |
| Countrywide Alternative Loan Trust, Series | | | |
| 2007-OA9, Class B1 | | | | |
| 7.255% due 06/25/2047 (b) | | 1,087,350 | | 460,755 |
| Countrywide Alternative Loan Trust, Series | | | |
| 2007-OA9, Class B2 | | | | |
| 7.255% due 06/25/2047 (b) | | 323,900 | | 137,250 |
| Countrywide Alternative Loan Trust, Series | | | |
| 2007-OA9, Class B3 | | | | |
| 7.255% due 06/25/2047 (b) | | 646,334 | | 273,878 |
| Countrywide Alternative Loan Trust, Series | | | |
| 2007-OA9, Class XP | | | | |
| zero coupon IO due 06/25/2047 | | 57,013,788 | | 3,202,750 |
| Countrywide Alternative Loan Trust, | | | | |
| Series 2006-OA12, Class X | | | | |
| 2.1715% IO due 09/20/2046 | | 1,580,109 | | 83,449 |
| Global Tower Partners Acquisition LLC, Series | | | |
| 2007-1A, Class G | | | | |
| 7.8737% due 05/15/2037 | | 515,000 | | 478,682 |
| SBA CMBS Trust, Series 2006-1A, Class H | | | |
| 7.389% due 11/15/2036 | | 1,750,000 | | 1,708,325 |
| SBA CMBS Trust, Series 2006-1A, Class J | | | |
| 7.825% due 11/15/2036 | | 1,325,000 | | 1,291,527 |
| Washington Mutual Alternative Mortgage | | | | |
| Pass-Through Certificates, Series 2006-AR8, | | | |
| Class CX2P | | | | |
| zero coupon IO due 10/25/2046 | | 40,808,003 | | 1,543,053 |
|
| TOTAL COLLATERALIZED MORTGAGE OBLIGATIONS | | |
| (Cost $9,151,205) | | | $ | 9,179,669 |
|
| |
| ASSET BACKED SECURITIES - 1.30% | | | |
| DB Master Finance LLC, Series 2006-1, Class-M1 | | | |
| 8.285% due 06/20/2031 | | 1,525,000 | | 1,567,476 |
| | | | | |
| | | | |
| High Income Fund (continued) | | | | |
| | | | Shares or | | |
| | | | Principal | | |
| | | | Amount | | Value |
|
|
| |
| ASSET BACKED SECURITIES | | | | |
| (continued) | | | | |
| Dominos Pizza Master Issuer LLC, Series 2007-1, | | | |
| Class M1 | | | | |
| 7.629% due 04/25/2037 | $ | 3,560,000 | $ | 3,429,081 |
|
| TOTAL ASSET BACKED SECURITIES | | | | |
| (Cost $5,099,917) | | | $ | 4,996,557 |
|
| |
| COMMON STOCKS - 19.42% | | | | |
| | | | | |
| Air Travel - 4.97% | | | | |
| Northwest Airlines Corp. ^ * | | 1,025,688 | | 19,057,283 |
| | | | | |
| Broadcasting - 2.42% | | | | |
| Canadian Satellite Radio Holdings, Inc. * | | 577,161 | | 2,732,511 |
| XM Satellite Radio Holdings, Inc., Class A * | 525,300 | | 6,550,491 |
| |
|
| | | | | 9,283,002 |
| Cable & Television - 4.20% | | | | |
| Adelphia Recovery Trust, Series ACC-1 * | | 5,806,367 | | 435,478 |
| Adelphia Recovery Trust, Series Arahova * | 424,949 | | 201,851 |
| Charter Communications, Inc., Class A * | | 414,100 | | 1,151,198 |
| Comcast Corp., Special Class A * | | 375,975 | | 9,722,713 |
| Time Warner Cable, Inc. * | | 124,257 | | 4,560,232 |
| |
|
| | | | | 16,071,472 |
| Commercial Services - 0.21% | | | | |
| Paragon Shipping, Inc. * | | 55,010 | | 718,430 |
| Paragon Shipping, Inc. * | | 4,990 | | 70,519 |
| |
|
| | | | | 788,949 |
| International Oil - 0.28% | | | | |
| Dominion Petroleum, Ltd., GDR * | | 1,263,190 | | 1,082,650 |
| | | | | |
| Leisure Time - 1.28% | | | | |
| Fontainebleau Resorts LLC, Class A * | | 65,203 | | 782,436 |
| Isle of Capri Casinos, Inc. * | | 221,850 | | 4,110,881 |
| |
|
| | | | | 4,893,317 |
| Mining - 2.99% | | | | |
| Freeport-McMoRan Copper & Gold, Inc., | | | | |
| Class B | | 131,250 | | 11,473,875 |
| | | | | |
| Telecommunications Equipment & | | | | |
| Services - 1.48% | | | | |
| Chunghwa Telecom Company, Ltd., SADR | 322,587 | | 5,651,726 |
| | | | | |
| Telephone - 1.59% | | | | |
| Sprint Nextel Corp. | | 321,650 | | 6,085,618 |
|
| TOTAL COMMON STOCKS (Cost $71,795,881) | | $ | 74,387,892 |
|
| |
| PREFERRED STOCKS - 1.06% | | | | |
| | | | | |
| Cellular Communications - 0.73% | | | | |
| Rural Cellular Corp., PIK * | | 2,254 | | 2,806,230 |
| | | | | |
| Containers & Glass - 0.08% | | | | |
| Pliant Corp., Series AA * | | 685 | | 294,550 |
| | | | | |
| Mining - 0.25% | | | | |
| Freeport-McMoRan Copper & Gold, Inc. * | | 7,400 | | 981,388 |
|
| TOTAL PREFERRED STOCKS (Cost $4,003,734) | | $ | 4,082,168 |
|
| |
| The accompanying notes are an integral part of the financial statements. | 192 |
John Hancock Funds II
Portfolio of investments — August 31, 2007
(showing percentage of total net assets)
| | | | |
| High Income Fund (continued) | | | |
| | | Shares or | | |
| | | Principal | | |
| | | Amount | | Value |
|
|
| |
| TERM LOANS - 4.64% | | | | |
| | | | |
| Air Travel - 0.37% | | | | |
| Delta Airlines Inc. | | | | |
| 7.355% due 04/30/2012 | $ | 1,474,200 | $ | 1,408,790 |
| | | | | |
| Educational Services - 0.44% | | | | |
| Riverdeep Interactive Learning | | | | |
| 8.10% due 11/28/2013 | EUR | 1,716,345 | | 1,680,594 |
| | | | | |
| Healthcare Products - 0.08% | | | | |
| Inverness Medical Innovations, Inc. | | | | |
| 9.59% due 06/26/2015 | $ | 320,000 | | 313,600 |
| | | | | |
| Leisure Time - 0.20% | | | | |
| East Valley Tourist Development | | | | |
| 7.00% due 08/06/2012 (f) | | 765,000 | | 757,350 |
| | | | | |
| Medical-Hospitals - 1.17% | | | | |
| Community Health Systems, Inc. | | | | |
| 7.32% due 07/25/2014 (f) | | 4,690,642 | | 4,507,894 |
| Newspapers - 1.30% | | | | |
| Star Tribune Corp. | | | | |
| 7.587% due 03/01/2015 | | 350,000 | | 302,312 |
| 7.587% due 03/01/2014 | | 2,862,825 | | 2,472,765 |
| Tribune Corp. | | | | |
| 8.36% due 05/30/2014 | | 2,570,000 | | 2,219,838 |
|
|
| | | | | 4,994,915 |
| |
| Real Estate - 0.37% | | | | |
| Realogy Corp. | | | | |
| 8.07% due 10/10/2013 (f) | | 1,500,000 | | 1,417,500 |
| | | | | |
| Trucking & Freight - 0.71% | | | | |
| Saint Acquisition Corp. | | | | |
| 8.57% due 05/06/2014 | | 3,000,000 | | 2,709,900 |
|
| TOTAL TERM LOANS (Cost $18,688,551) | | $ | 17,790,543 |
|
| |
| WARRANTS - 0.09% | | | | |
| | | | | |
| Commercial Services - 0.02% | | | | |
| Paragon Shipping, Inc. | | | | |
| (Expiration Date: 11/21/2011) * | | 11,002 | | 58,971 |
| | | | | |
| Gold - 0.07% | | | | |
| New Gold, Inc. | | | | |
| (Expiration Date: 06/28/17, Strike | | | | |
| Price: CAD 15.00) * | | 203,500 | | 269,766 |
|
| TOTAL WARRANTS (Cost $419,903) | | | $ | 328,737 |
|
| |
| SHORT TERM INVESTMENTS - 1.31% | | | |
| Federal Home Loan Bank Discount Notes | | | | |
| 4.20% due 09/04/2007 | $ | 3,600,000 | $ | 3,598,740 |
| John Hancock Cash Investment Trust (c) | | 1,428,149 | | 1,428,149 |
|
| TOTAL SHORT TERM INVESTMENTS | | | | |
| (Cost $5,026,889) | | | $ | 5,026,889 |
|
| | | | |
| High Income Fund (continued) | | | |
| | | Shares or | | |
| | | Principal | | |
| | | Amount | | Value |
|
|
| |
| REPURCHASE AGREEMENTS - 0.02% | | | |
| Repurchase Agreement with State | | | | |
| Street Corp. dated 08/31/2007 at | | | | |
| 4.60% to be repurchased at | | | | |
| $67,034 on 09/04/2007, | | | | |
| collateralized by $70,000 Federal | | | | |
| Home Loan Bank, 5.81% due | | | | |
| 03/14/2025 (valued at $70,263, | | | | |
| including interest) | $ | 67,000 | $ | 67,000 |
|
| TOTAL REPURCHASE AGREEMENTS | | | | |
| (Cost $67,000) | | | $ | 67,000 |
|
| Total Investments (High Income Fund) | | | | |
| (Cost $380,713,515) - 99.02% | | | $ | 379,324,877 |
| Other Assets in Excess of Liabilities - 0.98% | | | 3,749,483 |
|
|
| TOTAL NET ASSETS - 100.00% | | | $ | 383,074,360 |
|
|
| |
| |
| |
| High Yield Fund | | | | |
| | | Shares or | | |
| | | Principal | | |
| | | Amount | | Value |
|
|
| |
| FOREIGN GOVERNMENT OBLIGATIONS - 5.02% | | |
| | | | | |
| Argentina - 0.21% | | | | |
| Republic of Argentina | | | | |
| 0.6245% due 12/15/2035 (b) | $ | 48,000 | $ | 5,640 |
| 0.6491% due 12/15/2035 (b) | ARS | 5,863,355 | | 172,766 |
| 0.6618% due 12/15/2035 (b) | EUR | 587,000 | | 78,065 |
| 2.00% due 01/03/2010 (b) | ARS | 1,870,000 | | 690,234 |
| 5.83% due 12/31/2033 (b) | | 858,954 | | 304,257 |
| 7.00% due 09/12/2013 | $ | 751,000 | | 643,231 |
| 8.00% due 02/26/2008 ^ | EUR | 304,137 | | 140,839 |
| 8.00% due 10/30/2009 ^ | | 175,000,000 | | 39,142 |
| 8.125% due 04/21/2008 ^ | | 625,000 | | 279,825 |
| 9.00% due 05/26/2009 ^ | | 100,000 | | 44,385 |
| 11.75% due 05/20/2011 | | 2,425,000 | | 579,236 |
| 11.75% due 11/13/2026 ^ | | 1,800,000 | | 407,352 |
|
|
| | | | | 3,384,972 |
| Brazil - 1.31% | | | | |
| Federative Republic of Brazil | | | | |
| 6.00% due 05/15/2045 | BRL | 2,849,000 | | 2,259,022 |
| 8.25% due 01/20/2034 | $ | 3,667,000 | | 4,492,075 |
| 8.75% due 02/04/2025 | | 837,000 | | 1,043,739 |
| 8.875% due 10/14/2019 | | 250,000 | | 300,000 |
| 10.00% due 07/01/2010 | BRL | 25,691,000 | | 12,706,250 |
| 10.00% due 01/01/2010 | | 1,000 | | 498 |
| 10.50% due 07/14/2014 | $ | 112,000 | | 140,336 |
|
|
| | | | | 20,941,920 |
| Colombia - 0.34% | | | | |
| Republic of Colombia | | | | |
| 7.375% due 01/27/2017 | | 100,000 | | 106,200 |
| 7.375% due 09/18/2037 | | 4,998,000 | | 5,300,379 |
|
|
| | | | | 5,406,579 |
| |
| The accompanying notes are an integral part of the financial statements. | 193 |
John Hancock Funds II
Portfolio of investments — August 31, 2007
(showing percentage of total net assets)
| | | | |
| High Yield Fund (continued) | | | |
| | | Shares or | | |
| | | Principal | | |
| | | Amount | | Value |
|
|
| |
| FOREIGN GOVERNMENT OBLIGATIONS | | | |
| (continued) | | | | |
| | | | | |
| Ecuador - 0.13% | | | | |
| Republic of Ecuador | | | | |
| 9.375% due 12/15/2015 | $ | 60,000 | $ | 54,600 |
| 10.00% due 08/15/2030 | | 2,222,000 | | 1,955,360 |
| |
|
| | | | | 2,009,960 |
| Indonesia - 0.33% | | | | |
| Republic of Indonesia | | | | |
| 9.75% due 05/15/2037 | IDR | 11,122,000,000 | | 1,192,706 |
| 10.25% due 07/15/2027 | | 9,327,000,000 | | 995,269 |
| 10.25% due 07/15/2022 | | 14,706,000,000 | | 1,585,257 |
| 11.00% due 09/15/2025 | | 12,836,000,000 | | 1,455,508 |
| |
|
| | | | | 5,228,740 |
| Mexico - 0.61% | | | | |
| Government of Mexico | | | | |
| 6.625% due 03/03/2015 | $ | 1,274,000 | | 1,353,625 |
| 6.75% due 09/27/2034 | | 4,623,000 | | 5,020,578 |
| 8.375% due 01/14/2011 | | 429,000 | | 468,468 |
| 11.375% due 09/15/2016 | | 2,075,000 | | 2,905,000 |
| |
|
| | | | | 9,747,671 |
| Panama - 0.32% | | | | |
| Republic of Panama | | | | |
| 6.70% due 01/26/2036 | | 2,241,000 | | 2,218,590 |
| 9.375% due 04/01/2029 | | 2,150,000 | | 2,805,750 |
| |
|
| | | | | 5,024,340 |
| Peru - 0.11% | | | | |
| Republic of Peru | | | | |
| 6.55% due 03/14/2037 | | 648,000 | | 647,676 |
| 7.35% due 07/21/2025 | | 77,000 | | 84,893 |
| 8.75% due 11/21/2033 | | 862,000 | | 1,094,740 |
| |
|
| | | | | 1,827,309 |
| Russia - 0.09% | | | | |
| Russian Federation | | | | |
| 11.00% due 07/24/2018 | | 100,000 | | 139,240 |
| 12.75% due 06/24/2028 | | 771,000 | | 1,359,566 |
| |
|
| | | | | 1,498,806 |
| Turkey - 0.96% | | | | |
| Republic of Turkey | | | | |
| 6.875% due 03/17/2036 | | 8,069,000 | | 7,574,774 |
| 7.00% due 06/05/2020 | | 146,000 | | 146,182 |
| 7.00% due 09/26/2016 | | 535,000 | | 541,688 |
| 7.375% due 02/05/2025 | | 1,929,000 | | 1,972,402 |
| 11.875% due 01/15/2030 | | 1,480,000 | | 2,260,700 |
| 14.00% due 01/19/2011 | TRY | 3,896,000 | | 2,788,208 |
| |
|
| | | | | 15,283,954 |
| Uruguay - 0.07% | | | | |
| Republic of Uruguay | | | | |
| 7.625% due 03/21/2036 | $ | 1,038,633 | | 1,080,178 |
| | | | | |
| Venezuela - 0.54% | | | | |
| Republic of Venezuela | | | | |
| 5.75% due 02/26/2016 | | 4,667,000 | | 3,791,938 |
| 7.65% due 04/21/2025 | | 949,000 | | 813,767 |
| 8.50% due 10/08/2014 | | 339,000 | | 326,287 |
| | | | |
| High Yield Fund (continued) | | | |
| | | Shares or | | |
| | | Principal | | |
| | | Amount | | Value |
|
|
| |
| FOREIGN GOVERNMENT OBLIGATIONS | | | |
| (continued) | | | | |
| | | | | |
| Venezuela (continued) | | | | |
| Republic of Venezuela (continued) | | | | |
| 9.375% due 01/13/2034 | $ | 1,588,000 | $ | 1,572,120 |
| 10.75% due 09/19/2013 | | 1,952,000 | | 2,096,448 |
| |
|
| | | | | 8,600,560 |
|
| TOTAL FOREIGN GOVERNMENT OBLIGATIONS | | |
| (Cost $81,331,025) | | | $ | 80,034,989 |
|
| |
| CORPORATE BONDS - 84.50% | | | | |
| | | | | |
| Advertising - 0.85% | | | | |
| Lamar Media Corp. | | | | |
| 6.625% due 08/15/2015 | | 4,275,000 | | 4,082,625 |
| R.H. Donnelley Corp., Series A-1 | | | | |
| 6.875% due 01/15/2013 | | 510,000 | | 480,675 |
| R.H. Donnelley Corp., Series A-2 | | | | |
| 6.875% due 01/15/2013 | | 685,000 | | 645,612 |
| R.H. Donnelley Corp., Series A-3 | | | | |
| 8.875% due 01/15/2016 | | 8,200,000 | | 8,405,000 |
| |
|
| | | | | 13,613,912 |
| Aerospace - 1.41% | | | | |
| Alliant Techsystems, Inc. | | | | |
| 6.75% due 04/01/2016 | | 2,025,000 | | 1,984,500 |
| DRS Technologies, Inc. | | | | |
| 6.625% due 02/01/2016 | | 280,000 | | 273,000 |
| 6.875% due 11/01/2013 | | 4,925,000 | | 4,826,500 |
| Hawker Beechcraft Acquisition Company LLC | | | |
| 9.75% due 04/01/2017 | | 5,270,000 | | 5,217,300 |
| Hawker Beechcraft Acquisition Company LLC, PIK | | | |
| 8.875% due 04/01/2015 | | 7,950,000 | | 7,751,250 |
| Sequa Corp. | | | | |
| 9.00% due 08/01/2009 | | 2,300,000 | | 2,380,500 |
| |
|
| | | | | 22,433,050 |
| Air Travel - 0.98% | | | | |
| Continental Airlines, Inc. | | | | |
| 6.541% due 09/15/2008 | | 155,870 | | 154,311 |
| 8.75% due 12/01/2011 (a) | | 2,945,000 | | 2,753,575 |
| Continental Airlines, Inc., Series C | | | | |
| 7.339% due 04/19/2014 | | 1,905,000 | | 1,790,700 |
| DAE Aviation Holdings, Inc. | | | | |
| 11.25% due 08/01/2015 | | 11,000,000 | | 10,945,000 |
| |
|
| | | | | 15,643,586 |
| Aluminum - 0.44% | | | | |
| Novelis, Inc. | | | | |
| 7.25% due 02/15/2015 | | 7,236,000 | | 7,018,920 |
| | | | | |
| Apparel & Textiles - 0.65% | | | | |
| Levi Strauss & Company | | | | |
| 8.875% due 04/01/2016 | | 595,000 | | 597,975 |
| 9.75% due 01/15/2015 | | 7,585,000 | | 7,850,475 |
| Oxford Industries, Inc. | | | | |
| 8.875% due 06/01/2011 | | 1,925,000 | | 1,929,813 |
| |
|
| | | | | 10,378,263 |
| |
| The accompanying notes are an integral part of the financial statements. | 194 |
John Hancock Funds II
Portfolio of investments — August 31, 2007
(showing percentage of total net assets)
| | | | |
| High Yield Fund (continued) | | | |
| | | Shares or | | |
| | | Principal | | |
| | | Amount | | Value |
|
|
| |
| CORPORATE BONDS (continued) | | | | |
| | | | | |
| Auto Parts - 0.98% | | | | |
| Goodyear Tire & Rubber Company | | | | |
| 9.00% due 07/01/2015 | $ | 34,000 | $ | 35,190 |
| Keystone Automotive Operations | | | | |
| 9.75% due 11/01/2013 | | 4,200,000 | | 3,360,000 |
| Visteon Corp. | | | | |
| 8.25% due 08/01/2010 | | 14,205,000 | | 12,145,275 |
| |
|
| | | | | 15,540,465 |
| Auto Services - 1.59% | | | | |
| Ashtead Holdings PLC | | | | |
| 8.625% due 08/01/2015 | | 1,505,000 | | 1,474,900 |
| Hertz Corp. | | | | |
| 8.875% due 01/01/2014 | | 6,615,000 | | 6,846,525 |
| 10.50% due 01/01/2016 | | 9,400,000 | | 10,152,000 |
| Penhall International Corp. | | | | |
| 12.00% due 08/01/2014 | | 6,650,000 | | 6,916,000 |
| |
|
| | | | | 25,389,425 |
| Automobiles - 2.71% | | | | |
| AutoNation, Inc. | | | | |
| 7.00% due 04/15/2014 | | 515,000 | | 484,744 |
| 7.36% due 04/15/2013 (b) | | 3,030,000 | | 2,848,200 |
| Ford Motor Company | | | | |
| 4.25% due 12/15/2036 | | 610,000 | | 656,116 |
| 7.45% due 07/16/2031 | | 18,500,000 | | 13,875,000 |
| 8.875% due 01/15/2022 | | 2,555,000 | | 2,133,425 |
| 8.90% due 01/15/2032 | | 2,000,000 | | 1,660,000 |
| General Motors Corp. | | | | |
| 7.20% due 01/15/2011 | | 2,655,000 | | 2,349,675 |
| 8.375% due 07/15/2033 | | 23,995,000 | | 19,255,987 |
| |
|
| | | | | 43,263,147 |
| Banking - 1.72% | | | | |
| ATF Capital BV | | | | |
| 9.25% due 02/21/2014 | | 7,890,000 | | 7,890,000 |
| HSBC Bank PLC, Series EMTN | | | | |
| 7.00% due 11/01/2011 | | 588,536 | | 590,007 |
| HSBC Bank USA, Series BKNT | | | | |
| 6.9704% due 11/01/2011 (b) | | 247,828 | | 251,422 |
| 6.9809% due 11/01/2011 (b) | | 257,513 | | 261,247 |
| HSBK Europe BV | | | | |
| 7.25% due 05/03/2017 | | 7,160,000 | | 7,210,936 |
| ICICI Bank, Ltd. | | | | |
| 6.375% due 04/30/2022 (b) | | 1,864,000 | | 1,746,685 |
| ICICI Bank, Ltd., Series REGS | | | | |
| 6.375% due 04/30/2022 (b) | | 1,183,000 | | 1,083,486 |
| RSHB Capital SA for OJSC Russian Agricultural | | | |
| Bank | | | | |
| 6.299% due 05/15/2017 | | 944,000 | | 892,080 |
| RSHB Capital SA for OJSC Russian Agricultural | | | |
| Bank | | | | |
| 7.175% due 05/16/2013 | | 1,479,000 | | 1,512,278 |
| TuranAlem Finance BV | | | | |
| 8.25% due 01/22/2037 | | 4,265,000 | | 3,646,575 |
| TuranAlem Finance BV, Series REGS | | | | |
| 8.25% due 01/22/2037 | | 2,738,000 | | 2,340,990 |
| |
|
| | | | | 27,425,706 |
| | | | |
| High Yield Fund (continued) | | | |
| | | Shares or | | |
| | | Principal | | |
| | | Amount | | Value |
|
|
| |
| CORPORATE BONDS (continued) | | | | |
| | | | | |
| Broadcasting - 0.48% | | | | |
| CMP Susquehanna Corp. | | | | |
| 9.875% due 05/15/2014 | $ | 4,350,000 | $ | 4,023,750 |
| XM Satellite Radio, Inc. | | | | |
| 9.75% due 05/01/2014 | | 1,110,000 | | 1,054,500 |
| 9.8563% due 05/01/2013 (b) | | 2,770,000 | | 2,576,100 |
| |
|
| | | | | 7,654,350 |
| Building Materials & Construction - 1.31% | | | |
| Ainsworth Lumber Company, Ltd. | | | | |
| 6.75% due 03/15/2014 | | 1,050,000 | | 698,250 |
| 7.25% due 10/01/2012 | | 1,640,000 | | 1,172,600 |
| Associated Materials, Inc. | | | | |
| zero coupon, Step up to 11.25% on | | | | |
| 03/01/2009 due 03/01/2014 | | 7,965,000 | | 5,197,163 |
| 9.75% due 04/15/2012 | | 7,005,000 | | 7,110,075 |
| NTK Holdings, Inc. | | | | |
| zero coupon, Step up to 10.75% on | | | | |
| 09/01/2009 due 03/01/2014 | | 10,740,000 | | 6,712,500 |
| |
|
| | | | | 20,890,588 |
| Business Services - 1.98% | | | | |
| Affinion Group, Inc. | | | | |
| 10.125% due 10/15/2013 | | 5,315,000 | | 5,315,000 |
| 11.50% due 10/15/2015 | | 6,320,000 | | 6,320,000 |
| Allied Security Escrow Corp. | | | | |
| 11.375% due 07/15/2011 | | 9,005,000 | | 8,959,975 |
| Sungard Data Systems, Inc. | | | | |
| 9.125% due 08/15/2013 | | 4,126,000 | | 4,260,095 |
| 10.25% due 08/15/2015 | | 6,560,000 | | 6,756,800 |
| |
|
| | | | | 31,611,870 |
| Cable & Television - 3.98% | | | | |
| Cablevision Systems Corp., Series B | | | | |
| 8.00% due 04/15/2012 | | 1,000,000 | | 957,500 |
| 9.82% due 04/01/2009 (b) | | 500,000 | | 512,500 |
| Charter Communications Holdings I LLC | | | | |
| 11.75% due 05/15/2014 | | 12,150,000 | | 10,813,500 |
| 12.125% due 01/15/2015 | | 2,200,000 | | 1,969,000 |
| Charter Communications Holdings I LLC/Charter | | | |
| Communications Holdings I Capital Corp. | | | |
| 11.00% due 10/01/2015 | | 10,154,000 | | 9,950,920 |
| Charter Communications Holdings II LLC/Charter | | | |
| Communications Holdings II Capital Corp. | | | |
| 10.25% due 09/15/2010 | | 4,940,000 | | 4,989,400 |
| 10.25% due 10/01/2013 | | 2,893,000 | | 2,921,930 |
| Charter Communications Holdings LLC | | | | |
| 11.75 due 05/15/2011 | | 1,585,000 | | 1,529,525 |
| 12.125 due 01/15/2012 | | 1,760,000 | | 1,698,400 |
| CSC Holdings, Inc. | | | | |
| 6.75% due 04/15/2012 | | 2,550,000 | | 2,409,750 |
| 7.625% due 07/15/2018 | | 1,403,000 | | 1,287,253 |
| CSC Holdings, Inc., Series B | | | | |
| 7.625% due 04/01/2011 | | 780,000 | | 768,300 |
| 8.125% due 08/15/2009 | | 3,845,000 | | 3,873,837 |
| 8.125% due 07/15/2009 | | 470,000 | | 473,525 |
| EchoStar DBS Corp. | | | | |
| 6.625% due 10/01/2014 | | 6,575,000 | | 6,361,313 |
| |
| The accompanying notes are an integral part of the financial statements. | 195 |
John Hancock Funds II
Portfolio of investments — August 31, 2007
(showing percentage of total net assets)
| | | | |
| High Yield Fund (continued) | | | | |
| | | Shares or | | |
| | | Principal | | |
| | | Amount | | Value |
|
|
| |
| CORPORATE BONDS (continued) | | | | |
| | | | | |
| Cable & Television (continued) | | | | |
| Echostar DBS Corp. (continued) | | | | |
| 7.125% due 02/01/2016 (a) | $ | 4,085,000 | $ | 3,993,088 |
| ION Media Networks, Inc. | | | | |
| 11.61% due 01/15/2013 (b) | | 1,045,000 | | 1,045,000 |
| ION Media Networks, Inc., Series A | | | | |
| 11.00% due 07/31/2013 | | 1,597,500 | | 1,359,153 |
| Quebecor Media, Inc. | | | | |
| 7.75% due 03/15/2016 | | 955,000 | | 908,444 |
| Rogers Cable, Inc. | | | | |
| 8.75% due 05/01/2032 | | 750,000 | | 884,179 |
| Sinclair Broadcast Group, Inc. | | | | |
| 8.00% due 03/15/2012 | | 573,000 | | 578,730 |
| Univision Communications, Inc., PIK | | | | |
| 9.75% due 03/15/2015 | | 2,770,000 | | 2,638,425 |
| Videotron Ltee. | | | | |
| 6.375% due 12/15/2015 | | 1,675,000 | | 1,528,437 |
| |
|
| | | | | 63,452,109 |
| Cellular Communications - 2.27% | | | | |
| MetroPCS Wireless, Inc. | | | | |
| 9.25% due 11/01/2014 | | 335,000 | | 329,975 |
| 9.25% due 11/01/2014 | | 1,505,000 | | 1,482,425 |
| Rogers Wireless, Inc. | | | | |
| 7.25% due 12/15/2012 | | 270,000 | | 286,171 |
| 9.625% due 05/01/2011 | | 100,000 | | 112,734 |
| Rural Cellular Corp. | | | | |
| 8.25% due 03/15/2012 | | 5,590,000 | | 5,813,600 |
| 8.36% due 06/01/2013 (b) | | 3,710,000 | | 3,784,200 |
| 9.875% due 02/01/2010 | | 2,025,000 | | 2,095,875 |
| True Move Company, Ltd. | | | | |
| 10.75% due 12/16/2013 | | 18,030,000 | | 18,030,000 |
| True Move Company, Ltd., Series REGS | | | | |
| 10.75% due 12/16/2013 | | 700,000 | | 706,566 |
| UBS Luxembourg SA for OJSC Vimpel | | | | |
| Communications, Series REGS | | | | |
| 8.25% due 05/23/2016 | | 3,600,000 | | 3,618,000 |
| |
|
| | | | | 36,259,546 |
| Chemicals - 1.52% | | | | |
| Equistar Chemicals LP | | | | |
| 10.125% due 09/01/2008 | | 32,000 | | 33,200 |
| 10.625% due 05/01/2011 | | 1,886,000 | | 1,989,730 |
| Georgia Gulf Corp. | | | | |
| 9.50% due 10/15/2014 | | 6,850,000 | | 6,336,250 |
| Huntsman International LLC | | | | |
| 7.875% due 11/15/2014 | | 1,975,000 | | 2,063,875 |
| IMC Global, Inc. | | | | |
| 7.30% due 01/15/2028 | | 25,000 | | 23,250 |
| Lyondell Chemical Company | | | | |
| 6.875% due 06/15/2017 | | 1,845,000 | | 1,997,212 |
| 8.00% due 09/15/2014 | | 1,470,000 | | 1,598,625 |
| 8.25% due 09/15/2016 | | 1,210,000 | | 1,355,200 |
| 10.50% due 06/01/2013 | | 30,000 | | 32,325 |
| Methanex Corp. | | | | |
| 8.75% due 08/15/2012 | | 3,615,000 | | 3,868,050 |
| Montell Finance Company BV | | | | |
| 8.10% due 03/15/2027 | | 4,155,000 | | 3,614,850 |
| | | | |
| High Yield Fund (continued) | | | |
| | | Shares or | | |
| | | Principal | | |
| | | Amount | | Value |
|
|
| |
| CORPORATE BONDS (continued) | | | | |
| | | | | |
| Chemicals (continued) | | | | |
| Westlake Chemical Corp. | | | | |
| 6.625% due 01/15/2016 | $ | 1,380,000 | $ | 1,269,600 |
| |
|
| | | | | 24,182,167 |
| Coal - 0.27% | | | | |
| International Coal Group, Inc. | | | | |
| 10.25% due 07/15/2014 | | 4,600,000 | | 4,312,500 |
| Peabody Energy Corp. | | | | |
| 6.875% due 03/15/2013 | | 50,000 | | 49,875 |
| |
|
| | | | | 4,362,375 |
| Commercial Services - 1.26% | | | | |
| DI Finance/DynCorp International LLC, Series B | | | |
| 9.50% due 02/15/2013 | | 10,434,000 | | 10,590,510 |
| PGS Solutions, Inc. | | | | |
| 9.625% due 02/15/2015 | | 3,055,000 | | 2,825,875 |
| Rental Service Corp. | | | | |
| 9.50% due 12/01/2014 | | 1,900,000 | | 1,859,625 |
| Rental Service Corp., Series 144A | | | | |
| 9.50% due 12/01/2014 | | 4,885,000 | | 4,781,194 |
| |
|
| | | | | 20,057,204 |
| Computers & Business Equipment - 0.26% | | | |
| Activant Solutions, Inc. | | | | |
| 9.50% due 05/01/2016 | | 4,590,000 | | 4,062,150 |
| | | | | |
| Construction Materials - 0.13% | | | | |
| Nortek, Inc. | | | | |
| 8.50% due 09/01/2014 | | 2,415,000 | | 2,088,975 |
| | | | | |
| Containers & Glass - 2.57% | | | | |
| Graham Packaging Company | | | | |
| 8.50% due 10/15/2012 | | 610,000 | | 594,750 |
| 9.875% due 10/15/2014 | | 7,880,000 | | 7,722,400 |
| Graphic Packaging International Corp. | | | | |
| 9.50% due 08/15/2013 | | 8,335,000 | | 8,418,350 |
| Greif, Inc. | | | | |
| 6.75% due 02/01/2017 | | 4,185,000 | | 4,080,375 |
| Owens-Brockway Glass Container, Inc. | | | | |
| 8.25% due 05/15/2013 | | 3,550,000 | | 3,638,750 |
| 8.75% due 11/15/2012 | | 2,450,000 | | 2,548,000 |
| 8.875% due 02/15/2009 | | 2,400,000 | | 2,439,000 |
| Owens-Illinois, Inc. | | | | |
| 7.35% due 05/15/2008 | | 200,000 | | 200,000 |
| Owens-Illinois, Inc., Series 2010 | | | | |
| 7.50% due 05/15/2010 | | 850,000 | | 845,750 |
| Plastipak Holdings, Inc. | | | | |
| 8.50% due 12/15/2015 | | 1,790,000 | | 1,816,850 |
| Radnor Holdings Corp. | | | | |
| 11.00% due 03/15/2010 ^ | | 2,350,000 | | 2,937 |
| Smurfit-Stone Container Enterprises, Inc. | | | | |
| 8.00% due 03/15/2017 (a) | | 7,505,000 | | 7,157,894 |
| 8.375% due 07/01/2012 | | 1,505,000 | | 1,474,900 |
| |
|
| | | | | 40,939,956 |
| Correctional Facilities - 0.27% | | | | |
| Corrections Corp. of America | | | | |
| 6.25% due 03/15/2013 | | 3,725,000 | | 3,613,250 |
| |
| The accompanying notes are an integral part of the financial statements. | 196 |
John Hancock Funds II
Portfolio of investments — August 31, 2007
(showing percentage of total net assets)
| | | | |
| High Yield Fund (continued) | | | | |
| | | Shares or | | |
| | | Principal | | |
| | | Amount | | Value |
|
|
| |
| CORPORATE BONDS (continued) | | | | |
| | | | | |
| Correctional Facilities (continued) | | | | |
| Corrections Corp. of America (continued) | | | | |
| 6.75% due 01/31/2014 | $ | 750,000 | $ | 735,000 |
| |
|
| | | | | 4,348,250 |
| Cosmetics & Toiletries - 0.09% | | | | |
| Playtex Products, Inc. | | | | |
| 9.375% due 06/01/2011 | | 1,425,000 | | 1,460,625 |
| | | | | |
| Crude Petroleum & Natural Gas - 2.30% | | | | |
| Chesapeake Energy Corp. | | | | |
| 6.25% due 01/15/2018 | | 6,185,000 | | 5,790,706 |
| 6.375% due 06/15/2015 | | 815,000 | | 779,344 |
| 6.50% due 08/15/2017 | | 3,015,000 | | 2,871,787 |
| 6.625% due 01/15/2016 | | 1,000,000 | | 967,500 |
| 7.00% due 08/15/2014 | | 425,000 | | 422,875 |
| Energy Partners, Ltd. | | | | |
| 9.75% due 04/15/2014 | | 1,230,000 | | 1,143,900 |
| Mariner Energy, Inc. | | | | |
| 7.50% due 04/15/2013 | | 1,820,000 | | 1,729,000 |
| 8.00% due 05/15/2017 | | 1,760,000 | | 1,667,600 |
| OPTI Canada, Inc. | | | | |
| 8.25% due 12/15/2014 | | 3,305,000 | | 3,346,312 |
| PetroHawk Energy Corp. | | | | |
| 9.125% due 07/15/2013 | | 2,465,000 | | 2,569,763 |
| Petrozuata Finance, Inc. | | | | |
| 8.22% due 04/01/2017 | | 219,000 | | 219,000 |
| Petrozuata Finance, Inc., Series REGS | | | | |
| 8.22% due 04/01/2017 | | 4,368,000 | | 4,368,000 |
| Pogo Producing Company | | | | |
| 6.875% due 10/01/2017 | | 1,725,000 | | 1,737,938 |
| 7.875% due 05/01/2013 | | 1,330,000 | | 1,339,975 |
| 8.25% due 04/15/2011 | | 925,000 | | 948,125 |
| Quicksilver Resources, Inc. | | | | |
| 7.125% due 04/01/2016 | | 3,800,000 | | 3,629,000 |
| W&T Offshore, Inc. | | | | |
| 8.25% due 06/15/2014 | | 3,320,000 | | 3,095,900 |
| |
|
| | | | | 36,626,725 |
| Domestic Oil - 1.95% | | | | |
| Exco Resources, Inc. | | | | |
| 7.25% due 01/15/2011 | | 7,190,000 | | 7,243,925 |
| Parallel Petroleum Corp. | | | | |
| 10.25% due 08/01/2014 | | 3,800,000 | | 3,781,000 |
| Stone Energy Corp. | | | | |
| 6.75% due 12/15/2014 | | 3,855,000 | | 3,459,862 |
| 8.25% due 12/15/2011 | | 8,355,000 | | 8,208,787 |
| Swift Energy Company | | | | |
| 7.625% due 07/15/2011 | | 1,550,000 | | 1,534,500 |
| Whiting Petroleum Corp. | | | | |
| 7.00% due 02/01/2014 | | 1,485,000 | | 1,399,613 |
| 7.25% due 05/01/2012 | | 5,595,000 | | 5,385,188 |
| |
|
| | | | | 31,012,875 |
| Educational Services - 0.70% | | | | |
| AAC Group Holding Corp. | | | | |
| zero coupon, Step up to 10.25% on | | | | |
| 10/01/2008 due 10/01/2012 | | 240,000 | | 206,400 |
| | | | |
| High Yield Fund (continued) | | | | |
| | | Shares or | | |
| | | Principal | | |
| | | Amount | | Value |
|
|
| |
| CORPORATE BONDS (continued) | | | | |
| | | | | |
| Educational Services (continued) | | | | |
| American Achievement Corp. | | | | |
| 8.25% due 04/01/2012 | $ | 695,000 | $ | 674,150 |
| Education Management Corp. | | | | |
| 8.75% due 06/01/2014 | | 5,030,000 | | 5,105,450 |
| 10.25% due 06/01/2016 | | 4,941,000 | | 5,101,583 |
| |
|
| | | | | 11,087,583 |
| Electrical Utilities - 2.57% | | | | |
| AES China Generating Company | | | | |
| 8.25% due 06/26/2010 | | 605,000 | | 598,233 |
| AES Corp. | | | | |
| 8.75% due 06/15/2008 (a) | | 850,000 | | 864,875 |
| 8.75% due 05/15/2013 | | 100,000 | | 104,000 |
| 8.875% due 02/15/2011 | | 2,220,000 | | 2,281,050 |
| 9.00% due 05/15/2015 | | 185,000 | | 192,863 |
| 9.375% due 09/15/2010 (a) | | 5,000,000 | | 5,225,000 |
| 9.50% due 06/01/2009 | | 1,775,000 | | 1,832,687 |
| Edison Mission Energy | | | | |
| 7.20% due 05/15/2019 | | 3,670,000 | | 3,468,150 |
| 7.625% due 05/15/2027 | | 3,910,000 | | 3,636,300 |
| 7.75% due 06/15/2016 | | 3,140,000 | | 3,163,550 |
| Midwest Generation LLC, Series B | | | | |
| 8.56% due 01/02/2016 | | 1,360,724 | | 1,447,471 |
| Mirant Americas Generation LLC | | | | |
| 8.30% due 05/01/2011 | | 2,584,000 | | 2,551,700 |
| Mirant Mid Atlantic LLC, Series B | | | | |
| 9.125% due 06/30/2017 | | 6,109,625 | | 6,720,588 |
| Mirant Mid Atlantic LLC, Series C | | | | |
| 10.06% due 12/30/2028 | | 409,204 | | 486,952 |
| Orion Power Holdings, Inc. | | | | |
| 12.00% due 05/01/2010 | | 6,820,000 | | 7,433,800 |
| TXU Corp., Series Q | | | | |
| 6.50% due 11/15/2024 | | 1,150,000 | | 922,884 |
| |
|
| | | | | 40,930,103 |
| Electronics - 0.66% | | | | |
| L-3 Communications Corp. | | | | |
| 7.625% due 06/15/2012 (a) | | 2,575,000 | | 2,620,062 |
| L-3 Communications Corp., Series B | | | | |
| 6.375% due 10/15/2015 | | 8,173,000 | | 7,907,378 |
| |
|
| | | | | 10,527,440 |
| Energy - 2.47% | | | | |
| Dynegy Holdings, Inc. | | | | |
| 7.75% due 06/01/2019 | | 9,630,000 | | 8,907,750 |
| Mirant North America LLC | | | | |
| 7.375% due 12/31/2013 | | 3,500,000 | | 3,482,500 |
| NRG Energy, Inc. | | | | |
| 7.25% due 02/01/2014 | | 3,720,000 | | 3,682,800 |
| 7.375% due 02/01/2016 | | 12,405,000 | | 12,249,937 |
| 7.375% due 01/15/2017 | | 2,805,000 | | 2,755,913 |
| Sonat, Inc. | | | | |
| 7.625% due 07/15/2011 | | 2,900,000 | | 2,968,907 |
| VeraSun Energy Corp. | | | | |
| 9.375% due 06/01/2017 | | 5,805,000 | | 5,384,137 |
| |
|
| | | | | 39,431,944 |
| |
| The accompanying notes are an integral part of the financial statements. | 197 |
John Hancock Funds II
Portfolio of investments — August 31, 2007
(showing percentage of total net assets)
| | | | |
| High Yield Fund (continued) | | | |
| | | Shares or | | |
| | | Principal | | |
| | | Amount | | Value |
|
|
| |
| CORPORATE BONDS (continued) | | | | |
| | | | | |
| Financial Services - 5.43% | | | | |
| AmeriCredit Corp. | | | | |
| 8.50% due 07/01/2015 | $ | 5,340,000 | $ | 4,565,700 |
| Dow Jones CDX NA HY, Series 8-Tranche 1 | | | |
| 7.625% due 06/29/2012 | | 4,500,000 | | 4,230,000 |
| E*Trade Financial Corp. | | | | |
| 7.375% due 09/15/2013 | | 2,815,000 | | 2,505,350 |
| 7.875% due 12/01/2015 | | 635,000 | | 555,625 |
| El Paso Performance-Linked Trust | | | | |
| 7.75% due 07/15/2011 | | 9,075,000 | | 9,297,710 |
| Ford Motor Credit Company | | | | |
| 7.00% due 10/01/2013 | | 3,565,000 | | 3,174,871 |
| 8.00% due 12/15/2016 | | 2,890,000 | | 2,666,964 |
| 8.11% due 01/13/2012 (b) | | 1,400,000 | | 1,282,133 |
| 10.61% due 06/15/2011 (b) | | 7,400,000 | | 7,381,330 |
| General Motors Acceptance Corp. | | | | |
| 6.875% due 08/28/2012 (a) | | 3,730,000 | | 3,295,101 |
| 8.00% due 11/01/2031 | | 22,185,000 | | 19,930,205 |
| Global Cash Access LLC | | | | |
| 8.75% due 03/15/2012 | | 4,250,000 | | 4,313,750 |
| Hexion U.S. Finance Corp/Hexion Nova Scotia | | | |
| Finance ULC | | | | |
| 10.0575% due 11/15/2014 (b) | | 2,215,000 | | 2,259,300 |
| JSG Funding PLC | | | | |
| 7.75% due 04/01/2015 | | 1,275,000 | | 1,230,375 |
| LaBranche & Company, Inc. | | | | |
| 11.00% due 05/15/2012 | | 2,200,000 | | 2,178,000 |
| Lukoil International Finance BV, Series REGS | | | |
| 6.356% due 06/07/2017 | | 3,110,000 | | 2,907,850 |
| Nell AF SARL | | | | |
| 8.375% due 08/15/2015 | | 5,200,000 | | 4,628,000 |
| Residential Capital Corp. | | | | |
| 9.19% due 04/17/2009 (b) | | 2,380,000 | | 1,428,000 |
| Residential Capital LLC | | | | |
| 6.50% due 06/01/2012 | | 7,305,000 | | 5,551,800 |
| TNK-BP Finance SA | | | | |
| 6.625% due 03/20/2017 | | 250,000 | | 231,250 |
| 7.50% due 07/18/2016 | | 1,220,000 | | 1,204,750 |
| TNK-BP Finance SA, Series REGS | | | | |
| 6.625% due 03/20/2017 | | 1,870,000 | | 1,766,215 |
| |
|
| | | | | 86,584,279 |
| Food & Beverages - 0.43% | | | | |
| Dole Food Company, Inc. | | | | |
| 7.25% due 06/15/2010 (a) | | 1,740,000 | | 1,609,500 |
| 8.625% due 05/01/2009 | | 800,000 | | 780,000 |
| 8.75% due 07/15/2013 | | 425,000 | | 403,750 |
| 8.875% due 03/15/2011 (a) | | 4,325,000 | | 4,108,750 |
| |
|
| | | | | 6,902,000 |
| Funeral Services - 0.33% | | | | |
| Service Corp. International | | | | |
| 6.75% due 04/01/2016 | | 880,000 | | 829,400 |
| 7.50% due 04/01/2027 | | 2,655,000 | | 2,442,600 |
| 7.625% due 10/01/2018 | | 1,310,000 | | 1,316,550 |
| 7.875% due 02/01/2013 | | 690,000 | | 700,422 |
| |
|
| | | | | 5,288,972 |
| | | | |
| High Yield Fund (continued) | | | |
| | | Shares or | | |
| | | Principal | | |
| | | Amount | | Value |
|
|
| |
| CORPORATE BONDS (continued) | | | | |
| | | | | |
| Furniture & Fixtures - 0.59% | | | | |
| Norcraft Companies LP | | | | |
| 9.00% due 11/01/2011 | $ | 4,615,000 | $ | 4,615,000 |
| Norcraft Holdings Capital | | | | |
| zero coupon, Step up to 9.75% on | | | | |
| 09/01/2008 due 09/01/2012 | | 5,395,000 | | 4,774,575 |
| |
|
| | | | | 9,389,575 |
| Gas & Pipeline Utilities - 2.05% | | | | |
| Dynegy-Roseton Danskammer, Series B | | | | |
| 7.67% due 11/08/2016 | | 1,530,000 | | 1,516,612 |
| El Paso Corp. | | | | |
| 7.375% due 12/15/2012 | | 225,000 | | 229,973 |
| 7.75% due 01/15/2032 | | 225,000 | | 224,015 |
| 7.80% due 08/01/2031 (a) | | 6,395,000 | | 6,367,502 |
| 7.875% due 06/15/2012 (a) | | 6,025,000 | | 6,256,601 |
| Southern Natural Gas Company | | | | |
| 8.00% due 03/01/2032 | | 580,000 | | 648,286 |
| Transcontinental Gas Pipe Line Corp. | | | | |
| 8.875% due 07/15/2012 | | 2,935,000 | | 3,294,537 |
| Williams Companies, Inc. | | | | |
| 7.125% due 09/01/2011 | | 50,000 | | 51,625 |
| 7.625% due 07/15/2019 | | 3,050,000 | | 3,240,625 |
| 7.875% due 09/01/2021 | | 4,680,000 | | 5,019,300 |
| 8.125% due 03/15/2012 | | 125,000 | | 134,062 |
| 8.75% due 03/15/2032 | | 4,975,000 | | 5,659,063 |
| |
|
| | | | | 32,642,201 |
| Healthcare Products - 0.97% | | | | |
| Advanced Medical Optics, Inc. | | | | |
| 7.50% due 05/01/2017 | | 2,805,000 | | 2,559,562 |
| Leiner Health Products, Inc. | | | | |
| 11.00% due 06/01/2012 | | 11,405,000 | | 9,922,350 |
| Universal Hospital Services, Inc. | | | | |
| 8.7594% due 06/01/2015 (b) | | 1,300,000 | | 1,254,500 |
| Universal Hospital Services, Inc., PIK | | | | |
| 8.50% due 06/01/2015 | | 1,855,000 | | 1,762,250 |
| |
|
| | | | | 15,498,662 |
| Healthcare Services - 1.47% | | | | |
| DaVita, Inc. | | | | |
| 6.625% due 03/15/2013 | | 310,000 | | 299,925 |
| 7.25% due 03/15/2015 | | 6,375,000 | | 6,247,500 |
| U.S. Oncology Holdings, Inc., PIK | | | | |
| 9.7969% due 03/15/2012 (b) | | 6,825,000 | | 6,313,125 |
| Vanguard Health Holding Company I LLC | | | | |
| zero coupon, Step up to 11.25% on | | | | |
| 10/01/2009 due 10/01/2015 | | 3,585,000 | | 2,599,125 |
| Vanguard Health Holding Company II LLC | | | | |
| 9.00% due 10/01/2014 | | 8,470,000 | | 7,919,450 |
| |
|
| | | | | 23,379,125 |
| Holdings Companies/Conglomerates - 0.22% | | | |
| Ashtead Capital, Inc. | | | | |
| 9.00% due 08/15/2016 | | 3,602,000 | | 3,565,980 |
| | | | | |
| Homebuilders - 0.34% | | | | |
| K Hovnanian Enterprises, Inc. | | | | |
| 6.25% due 01/15/2016 | | 205,000 | | 153,750 |
| 8.625% due 01/15/2017 (a) | | 5,595,000 | | 4,420,050 |
| |
| The accompanying notes are an integral part of the financial statements. | 198 |
John Hancock Funds II
Portfolio of investments — August 31, 2007
(showing percentage of total net assets)
| | | | |
| High Yield Fund (continued) | | | | |
| | | Shares or | | |
| | | Principal | | |
| | | Amount | | Value |
|
|
| |
| CORPORATE BONDS (continued) | | | | |
| | | | | |
| Homebuilders (continued) | | | | |
| KB Home | | | | |
| 7.75% due 02/01/2010 | $ | 850,000 | $ | 803,250 |
| |
|
| | | | | 5,377,050 |
| Hotels & Restaurants - 1.13% | | | | |
| Buffets, Inc. | | | | |
| 12.50% due 11/01/2014 | | 6,125,000 | | 4,716,250 |
| CCM Merger, Inc. | | | | |
| 8.00% due 08/01/2013 | | 3,405,000 | | 3,251,775 |
| Denny's Corp. | | | | |
| 10.00% due 10/01/2012 | | 2,500,000 | | 2,537,500 |
| El Pollo Loco, Inc. | | | | |
| 11.75% due 11/15/2013 | | 2,600,000 | | 2,652,000 |
| OSI Restaurant Partners, Inc. | | | | |
| 10.00% due 05/15/2015 | | 2,630,000 | | 2,268,375 |
| Sbarro, Inc. | | | | |
| 10.375% due 02/01/2015 | | 2,960,000 | | 2,601,100 |
| |
|
| | | | | 18,027,000 |
| Household Products - 0.30% | | | | |
| Jarden Corp. | | | | |
| 7.50% due 05/01/2017 | | 4,295,000 | | 4,015,825 |
| Yankee Acquisition Corp., Series B | | | | |
| 9.75% due 02/15/2017 | | 770,000 | | 689,150 |
| |
|
| | | | | 4,704,975 |
| Industrial Machinery - 0.38% | | | | |
| H&E Equipment Services, Inc. | | | | |
| 8.375% due 07/15/2016 | | 5,975,000 | | 6,124,375 |
| | | | | |
| Insurance - 0.22% | | | | |
| Crum & Forster Holdings Corp. | | | | |
| 7.75% due 05/01/2017 | | 3,700,000 | | 3,496,500 |
| | | | | |
| International Oil - 1.81% | | | | |
| Corral Finans AB, PIK | | | | |
| 10.36% due 04/15/2010 (b) | | 3,834,724 | | 3,662,162 |
| Gaz Capital for Gazprom | | | | |
| 6.51% due 03/07/2022 | | 2,700,000 | | 2,609,550 |
| Gaz Capital for Gazprom, Series 144A | | | | |
| 6.212% due 11/22/2016 | | 1,060,000 | | 1,021,310 |
| Gaz Capital for Gazprom, Series REGs | | | | |
| 6.51% due 03/07/2022 | | 4,017,000 | | 3,896,747 |
| Gazprom OAO, Series A6 | | | | |
| zero coupon, Step up to 3.25% on | | | | |
| 08/06/2009 due 08/06/2009 | | 37,840,000 | | 1,474,257 |
| OAO Gazprom, Series A7 | | | | |
| 6.79% due 10/29/2009 | | 93,970,000 | | 3,670,259 |
| OAO Gazprom, Series A8 | | | | |
| 7.00% due 10/27/2011 | | 31,320,000 | | 1,213,023 |
| Pemex Project Funding Master Trust | | | | |
| 6.625% due 06/15/2035 | | 3,850,000 | | 3,936,548 |
| 9.125% due 10/13/2010 | | 250,000 | | 274,625 |
| Petroplus Finance, Ltd. | | | | |
| 6.75% due 05/01/2014 | | 1,745,000 | | 1,622,850 |
| 7.00% due 05/01/2017 | | 3,160,000 | | 2,907,200 |
| Western Oil Sands, Inc. | | | | |
| 8.375% due 05/01/2012 | | 2,380,000 | | 2,623,950 |
| |
|
| | | | | 28,912,481 |
| | | | |
| High Yield Fund (continued) | | | | |
| | | Shares or | | |
| | | Principal | | |
| | | Amount | | Value |
|
|
| |
| CORPORATE BONDS (continued) | | | | |
| | | | | |
| Leisure Time - 4.07% | | | | |
| AMC Entertainment, Inc. | | | | |
| 8.00% due 03/01/2014 | $ | 910,000 | $ | 841,750 |
| 11.00% due 02/01/2016 | | 4,040,000 | | 4,201,600 |
| Boyd Gaming Corp. | | | | |
| 6.75% due 04/15/2014 | | 5,900,000 | | 5,575,500 |
| 7.75% due 12/15/2012 | | 25,000 | | 24,844 |
| Caesars Entertainment, Inc. | | | | |
| 7.00% due 04/15/2013 | | 635,000 | | 654,050 |
| Choctaw Resort Development Enterprise | | | | |
| 7.25% due 11/15/2019 | | 1,695,000 | | 1,631,438 |
| Fontainebleau Las Vegas Holdings | | | | |
| 10.25% due 06/15/2015 | | 3,490,000 | | 2,992,675 |
| Herbst Gaming, Inc. | | | | |
| 7.00% due 11/15/2014 | | 3,750,000 | | 2,906,250 |
| 8.125% due 06/01/2012 | | 800,000 | | 696,000 |
| Inn of the Mountain Gods Resort & Casino | | | | |
| 12.00% due 11/15/2010 | | 4,665,000 | | 4,921,575 |
| Las Vegas Sands Corp. | | | | |
| 6.375% due 02/15/2015 (a) | | 4,050,000 | | 3,847,500 |
| Mandalay Resort Group | | | | |
| 7.625% due 07/15/2013 | | 1,500,000 | | 1,470,000 |
| MGM Mirage, Inc. | | | | |
| 5.875% due 02/27/2014 (a) | | 1,100,000 | | 1,009,250 |
| 6.625% due 07/15/2015 | | 260,000 | | 244,725 |
| 6.75% due 09/01/2012 | | 2,200,000 | | 2,134,000 |
| 7.50% due 06/01/2016 | | 875,000 | | 864,063 |
| 7.625% due 01/15/2017 | | 1,140,000 | | 1,128,600 |
| 8.375% due 02/01/2011 | | 2,800,000 | | 2,863,000 |
| Mohegan Tribal Gaming Authority | | | | |
| 7.125% due 08/15/2014 | | 2,900,000 | | 2,834,750 |
| Park Place Entertainment Corp. | | | | |
| 7.875% due 03/15/2010 | | 525,000 | | 527,625 |
| 8.125% due 05/15/2011 | | 2,250,000 | | 2,227,500 |
| 8.875% due 09/15/2008 | | 2,525,000 | | 2,559,719 |
| Pinnacle Entertainment, Inc. | | | | |
| 8.25% due 03/15/2012 | | 2,550,000 | | 2,562,750 |
| 8.75% due 10/01/2013 | | 3,050,000 | | 3,095,750 |
| River Rock Entertainment Authority | | | | |
| 9.75% due 11/01/2011 | | 445,000 | | 456,125 |
| Seneca Gaming Corp. | | | | |
| 7.25% due 05/01/2012 | | 1,825,000 | | 1,834,125 |
| Snoqualmie Entertainment Authority | | | | |
| 9.0625% due 02/01/2014 (b) | | 1,125,000 | | 1,098,281 |
| 9.125% due 02/01/2015 | | 990,000 | | 966,487 |
| Station Casinos, Inc. | | | | |
| 6.50% due 02/01/2014 | | 500,000 | | 423,750 |
| 6.625% due 03/15/2018 | | 1,965,000 | | 1,581,825 |
| 7.75% due 08/15/2016 | | 3,625,000 | | 3,470,937 |
| Warner Music Group | | | | |
| 7.375% due 04/15/2014 | | 3,715,000 | | 3,269,200 |
|
|
| | | | | 64,915,644 |
| Manufacturing - 0.29% | | | | |
| Koppers, Inc. | | | | |
| 9.875% due 10/15/2013 | | 4,425,000 | | 4,602,000 |
| |
| The accompanying notes are an integral part of the financial statements. | 199 |
John Hancock Funds II
Portfolio of investments — August 31, 2007
(showing percentage of total net assets)
| | | | |
| High Yield Fund (continued) | | | |
| | | Shares or | | |
| | | Principal | | |
| | | Amount | | Value |
|
|
| |
| CORPORATE BONDS (continued) | | | | |
| | | | | |
| Medical-Hospitals - 3.36% | | | | |
| Community Health Systems, Inc. | | | | |
| 8.875% due 07/15/2015 | $ | 8,100,000 | $ | 8,089,875 |
| HCA, Inc. | | | | |
| 6.375% due 01/15/2015 | | 7,055,000 | | 5,749,825 |
| 7.50% due 12/15/2023 | | 3,050,000 | | 2,440,945 |
| 7.69% due 06/15/2025 | | 405,000 | | 326,756 |
| 8.36% due 04/15/2024 | | 150,000 | | 124,592 |
| 8.75% due 09/01/2010 | | 600,000 | | 597,000 |
| 9.25% due 11/15/2016 | | 4,405,000 | | 4,526,138 |
| 9.625% due 11/15/2016 | | 13,936,000 | | 14,406,340 |
| Tenet Healthcare Corp. | | | | |
| 6.375% due 12/01/2011 | | 3,285,000 | | 2,759,400 |
| 6.50% due 06/01/2012 | | 855,000 | | 709,650 |
| 6.875% due 11/15/2031 | | 9,000 | | 6,480 |
| 7.375% due 02/01/2013 (a) | | 5,176,000 | | 4,296,080 |
| 9.25% due 02/01/2015 | | 900,000 | | 774,000 |
| 9.875% due 07/01/2014 | | 9,815,000 | | 8,686,275 |
| |
|
| | | | | 53,493,356 |
| Mining - 2.07% | | | | |
| Freeport-McMoRan Copper & Gold, Inc. | | | | |
| 8.375% due 04/01/2017 | | 18,710,000 | | 19,926,150 |
| Noranda Aluminium Holding Corp., PIK | | | | |
| 11.145% due 11/15/2014 (b) | | 5,185,000 | | 4,718,350 |
| Vale Overseas, Ltd. | | | | |
| 6.875% due 11/21/2036 | | 7,072,000 | | 7,178,787 |
| 8.25% due 01/17/2034 | | 1,021,000 | | 1,197,735 |
| |
|
| | | | | 33,021,022 |
| Office Furnishings & Supplies - 0.29% | | | | |
| Interface, Inc. | | | | |
| 9.50% due 02/01/2014 | | 3,075,000 | | 3,182,625 |
| 10.375% due 02/01/2010 | | 1,410,000 | | 1,459,350 |
| |
|
| | | | | 4,641,975 |
| Paper - 1.94% | | | | |
| Abitibi-Consolidated, Inc. | | | | |
| 6.00% due 06/20/2013 | | 5,930,000 | | 4,388,200 |
| 7.40% due 04/01/2018 | | 3,750,000 | | 2,718,750 |
| 7.75% due 06/15/2011 | | 1,290,000 | | 1,077,150 |
| 8.375% due 04/01/2015 | | 2,955,000 | | 2,319,675 |
| Appleton Papers, Inc. | | | | |
| 8.125% due 06/15/2011 | | 2,300,000 | | 2,279,875 |
| Appleton Papers, Inc., Series B | | | | |
| 9.75% due 06/15/2014 | | 4,755,000 | | 4,784,719 |
| NewPage Corp. | | | | |
| 10.00% due 05/01/2012 | | 920,000 | | 952,200 |
| 11.6063% due 05/01/2012 (b) | | 6,345,000 | | 6,725,700 |
| 12.00% due 05/01/2013 | | 1,130,000 | | 1,180,850 |
| Smurfit Capital Funding PLC | | | | |
| 7.50% due 11/20/2025 | | 2,010,000 | | 1,919,550 |
| Verso Paper Holdings LLC and Verson Paper Inc., | | | |
| Series B | | | | |
| 11.375% due 08/01/2016 | | 2,140,000 | | 2,182,800 |
| Verso Paper, Inc., Series B | | | | |
| 9.125% due 08/01/2014 | | 350,000 | | 350,000 |
| |
|
| | | | | 30,879,469 |
| | | | |
| High Yield Fund (continued) | | | | |
| | | Shares or | | |
| | | Principal | | |
| | | Amount | | Value |
|
|
| |
| CORPORATE BONDS (continued) | | | | |
| | | | | |
| Petroleum Services - 1.52% | | | | |
| Belden & Blake Corp. | | | | |
| 8.75% due 07/15/2012 | $ | 5,970,000 | $ | 5,970,000 |
| Compagnie Generale de Geophysique SA | | | | |
| 7.50% due 05/15/2015 | | 1,690,000 | | 1,698,450 |
| Complete Production Services, Inc. | | | | |
| 8.00% due 12/15/2016 | | 4,135,000 | | 3,979,938 |
| Enterprise Products Operating LP | | | | |
| 7.034% due 01/15/2068 (b) | | 1,500,000 | | 1,350,966 |
| 8.375% due 08/01/2066 (b) | | 2,800,000 | | 2,866,858 |
| Pride International, Inc. | | | | |
| 7.375% due 07/15/2014 | | 1,270,000 | | 1,282,700 |
| SemGroup LP | | | | |
| 8.75% due 11/15/2015 | | 7,150,000 | | 6,881,875 |
| SESI LLC | | | | |
| 6.875% due 06/01/2014 | | 195,000 | | 186,225 |
| |
|
| | | | | 24,217,012 |
| Plastics - 0.19% | | | | |
| Milacron Escrow Corp. | | | | |
| 11.50% due 05/15/2011 | | 3,085,000 | | 2,969,313 |
| | | | | |
| Publishing - 1.42% | | | | |
| Dex Media East LLC | | | | |
| 12.125% due 11/15/2012 | | 575,000 | | 613,813 |
| Dex Media West LLC | | | | |
| 8.50% due 08/15/2010 | | 50,000 | | 50,625 |
| 9.875% due 08/15/2013 | | 1,700,000 | | 1,793,500 |
| Dex Media, Inc. | | | | |
| zero coupon, Step up to 9.00% on | | | | |
| 11/15/2008 due 11/15/2013 | | 3,660,000 | | 3,376,350 |
| zero coupon, Step up to 9.00% on | | | | |
| 11/15/2008 due 11/15/2013 | | 2,670,000 | | 2,463,075 |
| 8.00% due 11/15/2013 | | 25,000 | | 24,812 |
| Idearc, Inc. | | | | |
| 8.00% due 11/15/2016 | | 5,260,000 | | 5,194,250 |
| TL Acquisitions, Inc. | | | | |
| 10.50% due 01/15/2015 | | 6,000,000 | | 5,655,000 |
| 13.25% due 07/15/2015 (a)(b) | | 4,540,000 | | 3,405,000 |
| |
|
| | | | | 22,576,425 |
| Railroads & Equipment - 0.77% | | | | |
| American Railcar Industries, Inc. | | | | |
| 7.50% due 03/01/2014 | | 1,610,000 | | 1,561,700 |
| Grupo Transportacion Ferroviaria Mexicana, | | | | |
| SA de CV | | | | |
| 9.375% due 05/01/2012 | | 6,115,000 | | 6,329,025 |
| Kansas City Southern de Mexico SA de CV | | | | |
| 7.375% due 06/01/2014 | | 2,270,000 | | 2,201,900 |
| 7.625% due 12/01/2013 | | 1,150,000 | | 1,127,000 |
| Kansas City Southern Railway Company | | | | |
| 7.50% due 06/15/2009 | | 1,060,000 | | 1,060,000 |
| |
|
| | | | | 12,279,625 |
| Real Estate - 1.50% | | | | |
| Ashton Woods USA | | | | |
| 9.50% due 10/01/2015 | | 2,950,000 | | 2,345,250 |
| Forest City Enterprises | | | | |
| 7.625% due 06/01/2015 | | 145,000 | | 136,300 |
| |
| The accompanying notes are an integral part of the financial statements. | 200 |
John Hancock Funds II
Portfolio of investments — August 31, 2007
(showing percentage of total net assets)
| | | | |
| High Yield Fund (continued) | | | | |
| | | Shares or | | |
| | | Principal | | |
| | | Amount | | Value |
|
|
| |
| CORPORATE BONDS (continued) | | | | |
| | | | | |
| Real Estate (continued) | | | | |
| Host Marriott LP, REIT | | | | |
| 6.375% due 03/15/2015 | $ | 1,300,000 | $ | 1,261,000 |
| 7.125% due 11/01/2013 | | 5,100,000 | | 5,074,500 |
| Kimball Hill, Inc. | | | | |
| 10.50% due 12/15/2012 | | 1,330,000 | | 970,900 |
| Realogy Corp. | | | | |
| 12.375% due 04/15/2015 | | 12,475,000 | | 9,184,719 |
| Ventas Realty LP/Ventas Capital Corp., REIT | | | | |
| 6.50% due 06/01/2016 | | 1,185,000 | | 1,140,562 |
| 6.75% due 04/01/2017 | | 3,890,000 | | 3,783,025 |
| |
|
| | | | | 23,896,256 |
| Retail - 0.93% | | | | |
| Eye Care Centers of America | | | | |
| 10.75% due 02/15/2015 | | 1,760,000 | | 1,883,200 |
| Michaels Stores, Inc. | | | | |
| 10.00% due 11/01/2014 | | 3,155,000 | | 3,162,887 |
| Suburban Propane Partners LP | | | | |
| 6.875% due 12/15/2013 | | 10,200,000 | | 9,741,000 |
| |
|
| | | | | 14,787,087 |
| Retail Grocery - 0.24% | | | | |
| Delhaize America, Inc. | | | | |
| 9.00% due 04/15/2031 | | 3,330,000 | | 3,896,100 |
| | | | | |
| Retail Trade - 1.76% | | | | |
| American Greetings Corp. | | | | |
| 7.375% due 06/01/2016 | | 375,000 | | 354,375 |
| Blockbuster, Inc. | | | | |
| 9.00% due 09/01/2012 | | 4,930,000 | | 4,239,800 |
| Dollar General Corp. | | | | |
| 10.625% due 07/15/2015 (a) | | 5,610,000 | | 5,049,000 |
| Dollar General Corp., PIK | | | | |
| 11.875% due 07/15/2017 | | 5,800,000 | | 5,524,500 |
| FTD, Inc. | | | | |
| 7.75% due 02/15/2014 | | 2,640,000 | | 2,455,200 |
| Neiman Marcus Group, Inc. | | | | |
| 10.375% due 10/15/2015 | | 7,265,000 | | 7,809,875 |
| Neiman Marcus Group, Inc., PIK | | | | |
| 9.00% due 10/15/2015 | | 2,520,000 | | 2,658,600 |
| |
|
| | | | | 28,091,350 |
| Sanitary Services - 0.35% | | | | |
| Allied Waste North America, Inc. | | | | |
| 6.375% due 04/15/2011 | | 1,725,000 | | 1,699,125 |
| 6.875% due 06/01/2017 | | 950,000 | | 921,500 |
| 7.25% due 03/15/2015 | | 3,000,000 | | 3,000,000 |
| |
|
| | | | | 5,620,625 |
| Semiconductors - 0.58% | | | | |
| Freescale Semiconductor, Inc. | | | | |
| 8.875% due 12/15/2014 | | 4,295,000 | | 3,962,137 |
| NXP BV / NXP Funding LLC | | | | |
| 7.875% due 10/15/2014 | | 4,177,000 | | 3,769,743 |
| 9.50% due 10/15/2015 | | 1,745,000 | | 1,509,425 |
| |
|
| | | | | 9,241,305 |
| | | | |
| High Yield Fund (continued) | | | |
| | | Shares or | | |
| | | Principal | | |
| | | Amount | | Value |
|
|
| |
| CORPORATE BONDS (continued) | | | | |
| | | | |
| Steel - 0.99% | | | | |
| Chaparral Steel Company | | | | |
| 10.00% due 07/15/2013 | $ | 535,000 | $ | 607,225 |
| Metals USA Holdings Corp., PIK | | | | |
| 11.36% due 07/01/2012 | | 3,790,000 | | 3,562,600 |
| Metals USA, Inc. | | | | |
| 11.125% due 12/01/2015 | | 6,820,000 | | 7,263,300 |
| Tube City IMS Corp. | | | | |
| 9.75% due 02/01/2015 | | 4,510,000 | | 4,419,800 |
| |
|
| | | | | 15,852,925 |
| Telecommunications Equipment & | | | | |
| Services - 4.39% | | | | |
| Axtel SAB de CV | | | | |
| 7.625% due 02/01/2017 | | 7,200,000 | | 6,966,000 |
| Axtel SAB de CV, Series REGS | | | | |
| 7.625% due 02/01/2017 | | 350,000 | | 339,500 |
| Citizens Communications Company | | | | |
| 7.05% due 10/01/2046 | | 1,000,000 | | 790,000 |
| 7.875% due 01/15/2027 | | 4,890,000 | | 4,584,375 |
| 9.25% due 05/15/2011 | | 100,000 | | 107,250 |
| Globo Comunicacoes e Participacoes SA | | | | |
| 7.25% due 04/26/2022 | | 3,798,000 | | 3,551,130 |
| Hawaiian Telcom Communications, Inc., Series B | | | |
| 12.50% due 05/01/2015 (a) | | 5,670,000 | | 6,010,200 |
| Intelsat Bermuda, Ltd. | | | | |
| 9.25% due 06/15/2016 | | 3,835,000 | | 3,950,050 |
| 11.25% due 06/15/2016 | | 10,550,000 | | 11,037,937 |
| iPCS, Inc. | | | | |
| 7.48125% due 05/01/2013 (b) | | 3,140,000 | | 3,030,100 |
| Level 3 Financing, Inc. | | | | |
| 9.15% due 02/15/2015 (b) | | 1,700,000 | | 1,589,500 |
| 9.25% due 11/01/2014 | | 8,555,000 | | 8,234,187 |
| PAETEC Holding Corp. | | | | |
| 9.50% due 07/15/2015 | | 3,130,000 | | 2,989,150 |
| PanAmSat Corp. | | | | |
| 9.00% due 08/15/2014 | | 655,000 | | 666,463 |
| 9.00% due 06/15/2016 | | 905,000 | | 923,100 |
| True Move Company, Ltd. | | | | |
| 10.375% due 08/01/2014 | | 2,610,000 | | 2,614,035 |
| United States West Communications, Inc. | | | | |
| 6.875% due 09/15/2033 | | 12,991,000 | | 11,886,765 |
| Wind Acquisition Finance SA | | | | |
| 10.75% due 12/01/2015 | | 700,000 | | 721,000 |
| World Access, Inc. | | | | |
| 13.25% due 01/15/2008 | | 1,474,624 | | 42,764 |
| |
|
| | | | | 70,033,506 |
| Telephone - 2.43% | | | | |
| Cincinnati Bell Telephone Company | | | | |
| 6.30% due 12/01/2028 | | 2,115,000 | | 1,840,050 |
| Cincinnati Bell, Inc. | | | | |
| 7.00% due 02/15/2015 | | 2,325,000 | | 2,232,000 |
| Nordic Telephone Company Holdings | | | | |
| 8.875% due 05/01/2016 | | 6,650,000 | | 6,882,750 |
| Qwest Communications International, Inc. | | | | |
| 7.25% due 02/15/2011 | | 25,000 | | 24,750 |
| |
| The accompanying notes are an integral part of the financial statements. | 201 |
John Hancock Funds II
Portfolio of investments — August 31, 2007
(showing percentage of total net assets)
| | | | |
| High Yield Fund (continued) | | | |
| | | Shares or | | |
| | | Principal | | |
| | | Amount | | Value |
| |
|
| |
| CORPORATE BONDS (continued) | | | | |
| | | | | |
| Telephone (continued) | | | | |
| Qwest Communications International, Inc., Series B | | | |
| 7.50% due 02/15/2014 | $ | 5,743,000 | $ | 5,642,497 |
| Qwest Corp. | | | | |
| 8.875% due 03/15/2012 | | 2,105,000 | | 2,278,662 |
| Virgin Media, Inc. | | | | |
| 9.125% due 08/15/2016 | | 7,910,000 | | 7,998,988 |
| Virgin Media, Inc., Series S | | | | |
| 8.75% due 04/15/2014 | | 3,080,000 | | 3,118,500 |
| Windstream Corp. | | | | |
| 8.625% due 08/01/2016 | | 8,340,000 | | 8,715,300 |
|
|
| | | | | 38,733,497 |
| Tobacco - 0.35% | | | | |
| Alliance One International, Inc. | | | | |
| 8.50% due 05/15/2012 | | 2,870,000 | | 2,798,250 |
| 11.00% due 05/15/2012 | | 2,580,000 | | 2,696,100 |
|
|
| | | | | 5,494,350 |
| Transportation - 0.48% | | | | |
| Gulfmark Offshore, Inc. | | | | |
| 7.75% due 07/15/2014 | | 1,930,000 | | 1,901,050 |
| Teekay Shipping Corp. | | | | |
| 8.875% due 07/15/2011 | | 5,627,000 | | 5,795,810 |
|
|
| | | | | 7,696,860 |
| Trucking & Freight - 0.54% | | | | |
| Saint Acquisition Corp. | | | | |
| 12.50% due 05/15/2017 (a) | | 10,470,000 | | 7,093,425 |
| 13.3075% due 05/15/2015 (b) | | 2,210,000 | | 1,535,950 |
|
|
| | | | | 8,629,375 |
|
| TOTAL CORPORATE BONDS (Cost $1,401,735,695) | $ | 1,347,155,561 |
|
| |
| DEFAULTED BONDS BEYOND MATURITY | | | |
| DATES - 0.23% | | | | |
| | | | | |
| Argentina - 0.23% | | | | |
| Republic of Argentina | | | | |
| 7.00% due 03/18/2004 ^ | EUR | 6,100,000,000 | | 1,390,089 |
| 7.00% due 03/18/2004 ^ | | 625,000 | | 285,587 |
| 7.625 due 08/11/2007 ^ | | 505,000,000 | | 115,005 |
| 8.125% due 10/04/2004 ^ | | 375,000 | | 165,726 |
| 8.50% due 02/23/2005 ^ | | 2,400,000 | | 569,917 |
| 9.25% due 10/21/2002 ^ | | 225,000 | | 99,129 |
| 9.50% due 03/04/2004 ^ | | 456,000 | | 195,925 |
| 9.75% due 11/26/2003 ^ | | 600,000 | | 271,299 |
| 9.75% due 11/26/2003 ^ | | 425,000 | | 186,084 |
| 10.00% due 02/22/2007 ^ | | 775,000 | | 361,099 |
|
|
| | | | | 3,639,860 |
|
| TOTAL DEFAULTED BONDS BEYOND MATURITY DATES | | |
| (Cost $3,028,283) | | | $ | 3,639,860 |
|
| |
| COMMON STOCKS - 0.01% | | | | |
| | | | | |
| Household Products - 0.01% | | | | |
| Home Interiors * | | 9,260,656 | | 92,607 |
| | | | | |
| Telecommunications Equipment & | | | | |
| Services - 0.00% | | | | |
| NEON Communications Group, Inc. * | | 15,039 | | 72,187 |
| | | |
| High Yield Fund (continued) | | | |
| | Shares or | | |
| | Principal | | |
| | Amount | | Value |
|
|
| |
| COMMON STOCKS (continued) | | | |
| Telecommunications Equipment & | | | |
| Services (continued) | | | |
| XO Holdings, Inc. * | 821 | $ | 2,874 |
| |
|
| | | | 75,061 |
|
| |
| TOTAL COMMON STOCKS (Cost $2,456,379) | $ | | 167,668 |
|
| |
| PREFERRED STOCKS - 0.17% | | | |
| | | | |
| Broadcasting - 0.07% | | | |
| Spanish Broadcasting System, Series B * | 1,000 | | 1,075,000 |
| | | | |
| Cable & Television - 0.01% | | | |
| ION Media Networks, Inc., Series B * | 11 | | 90,525 |
| | | | |
| Crude Petroleum & Natural Gas - 0.09% | | | |
| Chesapeake Energy Corp. * | 5,993 | | 1,498,250 |
|
| TOTAL PREFERRED STOCKS (Cost $2,680,198) | | $ | 2,663,775 |
|
| |
| TERM LOANS - 2.47% | | | |
| | | | |
| Apparel & Textiles - 0.14% | | | |
| Simmons Holdco, Inc., PIK | | | |
| 10.61% due 02/15/2012 (b) | 2,500,000 | | 2,225,000 |
| | | | |
| Auto Services - 0.15% | | | |
| Penhall Holdings, PIK | | | |
| 12.84% due 04/01/2012 (b) | 2,500,000 | | 2,379,175 |
| | | | |
| Cable & Television - 0.03% | | | |
| CSC Holdings, Inc. | | | |
| 7.25% due 07/15/2008 | 550,000 | | 550,000 |
| | | | |
| Containers & Glass - 0.24% | | | |
| Berry Plastics Group, Inc. | | | |
| 11.61% due 06/15/2014 (b) | 4,000,000 | | 3,814,000 |
| | | | |
| Domestic Oil - 0.81% | | | |
| Ashmore Energy | | | |
| 8.36% due 03/30/2014 (b) | 3,720,000 | | 3,571,200 |
| Sandridge Energy | | | |
| 8.625% due 04/01/2015 (b) | 9,500,000 | | 9,286,250 |
| |
|
| | | | 12,857,450 |
| |
| Gas & Pipeline Utilities - 0.24% | | | |
| Stallion Oilfield Services | | | |
| 9.86% due 08/01/2012 (b) | 4,000,000 | | 3,880,000 |
| | | | |
| Healthcare Services - 0.30% | | | |
| Iasis Holdco, Inc., PIK | | | |
| 10.61% due 06/15/2014 (b) | 5,132,578 | | 4,789,363 |
| | | | |
| Paper - 0.16% | | | |
| Verso Paper Holdings, Inc. | | | |
| 11.61% due 02/01/2013 (b) | 3,000,000 | | 2,610,000 |
| | | | |
| Telecommunications Equipment & | | | |
| Services - 0.40% | | | |
| Wind Acquisition Finance SA, PIK | | | |
| 12.65% due 12/21/2011 (b) | 6,417,616 | | 6,337,396 |
|
| TOTAL TERM LOANS (Cost $40,948,047) | | $ | 39,442,384 |
|
| |
| The accompanying notes are an integral part of the financial statements. | 202 |
John Hancock Funds II
Portfolio of investments — August 31, 2007
(showing percentage of total net assets)
| | | | |
| High Yield Fund (continued) | | | |
| | | Shares or | | |
| | | Principal | | |
| | | Amount | | Value |
| |
|
| |
| WARRANTS - 0.01% | | | | |
| | | | | |
| Republic of Venezuela - 0.01% | | | | |
| Republic of Venezuela | | | | |
| (Expiration date 04/15/2020; strike | | | | |
| price $26.00) | | 305,000 | $ | 112,850 |
|
| TOTAL WARRANTS (Cost $94,550) | | | $ | 112,850 |
|
| |
| SHORT TERM INVESTMENTS - 4.11% | | | |
| Bank Negara Malaysia Monetary Notes, Series 1807 | | | |
| zero coupon due 11/01/2007 to | | | | |
| 12/06/2007 | MYR | 4,703,000 | $ | 1,331,395 |
| Bank Negara Malaysia Monetary Notes, Series 0707 | | | |
| zero coupon due 11/06/2007 to | | | | |
| 12/21/2007 | | 7,071,000 | | 2,005,571 |
| 3.569% due 02/14/2008 | | 7,770,000 | | 2,259,317 |
| Egypt Treasury Bills, Series 364 | | | | |
| zero coupon due 10/30/2007 to | | | | |
| 11/06/2007 | EGP | 77,275,000 | | 13,458,197 |
| John Hancock Cash Investment Trust (c) | $ | 46,553,447 | | 46,553,447 |
|
| TOTAL SHORT TERM INVESTMENTS | | | | |
| (Cost $65,499,129) | | | $ | 65,607,927 |
|
| |
| REPURCHASE AGREEMENTS - 3.99% | | | |
| Merrill Lynch Tri-Party Repurchase | | | | |
| Agreement dated 08/31/2007 at | | | | |
| 5.14% to be repurchased at | | | | |
| $63,636,323 on 09/04/2007, | | | | |
| collateralized by $63,995,000 | | | | |
| Federal Home Loan Bank, 4.80% | | | | |
| due 05/02/2008 (valued at | | | | |
| $65,887,387, including interest) | $ | 63,600,000 | $ | 63,600,000 |
|
| TOTAL REPURCHASE AGREEMENTS | | | | |
| (Cost $63,600,000) | | | $ | 63,600,000 |
|
| Total Investments (High Yield Fund) | | | | |
| (Cost $1,661,373,306) - 100.51% | | | $ | 1,602,425,014 |
| Liabilities in Excess of Other Assets - (0.51)% | | | (8,201,758) |
|
|
| TOTAL NET ASSETS - 100.00% | | | $ | 1,594,223,256 |
|
|
| |
| |
| |
| Index 500 Fund | | | | |
| | | Shares or | | |
| | | Principal | | |
| | | Amount | | Value |
|
|
| |
| COMMON STOCKS - 79.51% | | | | |
| | | | | |
| Advertising - 0.16% | | | | |
| Interpublic Group of Companies, Inc. * | | 2,373 | $ | 25,984 |
| Monster Worldwide, Inc. * | | 661 | | 22,606 |
| Omnicom Group, Inc. | | 1,674 | | 85,257 |
|
|
| | | | | 133,847 |
| Aerospace - 1.77% | | | | |
| Boeing Company | | 3,985 | | 385,350 |
| General Dynamics Corp. | | 2,049 | | 160,969 |
| Goodrich Corp. | | 633 | | 39,980 |
| Lockheed Martin Corp. | | 1,796 | | 178,055 |
| | | |
| Index 500 Fund (continued) | | | |
| | Shares or | | |
| | Principal | | |
| | Amount | | Value |
|
|
| |
| COMMON STOCKS (continued) | | | |
| | | |
| Aerospace (continued) | | | |
| Northrop Grumman Corp. | 1,746 | $ | 137,655 |
| Raytheon Company | 2,246 | | 137,770 |
| Rockwell Collins, Inc. | 847 | | 58,333 |
| United Technologies Corp. | 5,032 | | 375,538 |
| |
|
| | | | 1,473,650 |
| Agriculture - 0.36% | | | |
| Archer-Daniels-Midland Company | 3,303 | | 111,311 |
| Monsanto Company | 2,750 | | 191,785 |
| |
|
| | | | 303,096 |
| Air Travel - 0.07% | | | |
| Southwest Airlines Company | 3,951 | | 59,700 |
| | | |
| Aluminum - 0.19% | | | |
| Alcoa, Inc. | 4,400 | | 160,732 |
| | | | |
| Apparel & Textiles - 0.37% | | | |
| Cintas Corp. | 682 | | 24,995 |
| Coach, Inc. * | 1,878 | | 83,627 |
| Jones Apparel Group, Inc. | 551 | | 10,574 |
| Liz Claiborne, Inc. | 529 | | 18,076 |
| NIKE, Inc., Class B | 1,919 | | 108,117 |
| Polo Ralph Lauren Corp., Class A | 310 | | 23,417 |
| VF Corp. | 451 | | 36,012 |
| |
|
| | | | 304,818 |
| Auto Parts - 0.22% | | | |
| AutoZone, Inc. * | 242 | | 29,352 |
| Genuine Parts Company | 862 | | 42,824 |
| Johnson Controls, Inc. | 998 | | 112,874 |
| |
|
| | | | 185,050 |
| Auto Services - 0.02% | | | |
| AutoNation, Inc. * | 765 | | 14,520 |
| | | | |
| Automobiles - 0.32% | | | |
| Ford Motor Company * | 9,515 | | 74,312 |
| General Motors Corp. | 2,863 | | 88,009 |
| PACCAR, Inc. | 1,257 | | 107,536 |
| |
|
| | | | 269,857 |
| Banking - 3.52% | | | |
| Bank of America Corp. | 22,457 | | 1,138,121 |
| BB&T Corp. | 2,746 | | 109,099 |
| Comerica, Inc. | 789 | | 44,010 |
| Commerce Bancorp, Inc. | 968 | | 35,555 |
| Compass Bancshares, Inc. | 667 | | 43,588 |
| Fifth Third Bancorp | 2,784 | | 99,361 |
| First Horizon National Corp. | 636 | | 19,512 |
| Hudson City Bancorp, Inc. | 2,452 | | 34,867 |
| Huntington BancShares, Inc. | 1,849 | | 31,821 |
| KeyCorp | 1,985 | | 66,101 |
| M&T Bank Corp. | 383 | | 40,552 |
| Marshall & Ilsley Corp. | 1,311 | | 57,304 |
| National City Corp. | 2,914 | | 78,416 |
| Northern Trust Corp. | 955 | | 58,694 |
| Regions Financial Corp. | 3,566 | | 111,616 |
| |
| The accompanying notes are an integral part of the financial statements. | 203 |
John Hancock Funds II
Portfolio of investments — August 31, 2007
(showing percentage of total net assets)
| | | |
| Index 500 Fund (continued) | | | |
| | Shares or | | |
| | Principal | | |
| | Amount | | Value |
|
|
| |
| COMMON STOCKS (continued) | | | |
| | | | |
| Banking (continued) | | | |
| Sovereign Bancorp, Inc. | 1,827 | $ | 33,032 |
| SunTrust Banks, Inc. | 1,805 | | 142,144 |
| US Bancorp | 8,799 | | 284,648 |
| Wachovia Corp. | 9,683 | | 474,273 |
| Zions Bancorp | 557 | | 39,324 |
| |
|
| | | | 2,942,038 |
| Biotechnology - 0.62% | | | |
| Amgen, Inc. * | 5,868 | | 294,045 |
| Applera Corp. | 929 | | 29,366 |
| Biogen Idec, Inc. * | 1,446 | | 92,284 |
| Genzyme Corp. * | 1,330 | | 83,005 |
| Millipore Corp. * | 273 | | 19,023 |
| |
|
| | | | 517,723 |
| Broadcasting - 0.54% | | | |
| CBS Corp., Class B | 3,707 | | 116,808 |
| Clear Channel Communications, Inc. | 2,512 | | 93,597 |
| News Corp., Class A | 11,787 | | 238,451 |
| |
|
| | | | 448,856 |
| Building Materials & Construction - 0.10% | | | |
| American Standard Companies, Inc. | 890 | | 32,779 |
| Masco Corp. | 1,911 | | 49,724 |
| |
|
| | | | 82,503 |
| Business Services - 1.03% | | | |
| Affiliated Computer Services, Inc., Class A * | 502 | | 25,115 |
| Automatic Data Processing, Inc. | 2,800 | | 128,072 |
| Computer Sciences Corp. * | 877 | | 49,068 |
| Convergys Corp. * | 693 | | 11,608 |
| Electronic Data Systems Corp. | 2,575 | | 58,942 |
| Equifax, Inc. | 736 | | 28,351 |
| First Data Corp. | 3,818 | | 126,834 |
| Fiserv, Inc. * | 851 | | 39,588 |
| Fluor Corp. | 446 | | 56,709 |
| H & R Block, Inc. | 1,634 | | 32,419 |
| Moody's Corp. | 1,164 | | 53,369 |
| NCR Corp. * | 910 | | 45,291 |
| Paychex, Inc. | 1,720 | | 76,420 |
| Pitney Bowes, Inc. | 1,112 | | 49,673 |
| R.R. Donnelley & Sons Company | 1,114 | | 39,903 |
| Robert Half International, Inc. | 841 | | 26,861 |
| Unisys Corp. * | 1,760 | | 12,971 |
| |
|
| | | | 861,194 |
| Cable & Television - 1.22% | | | |
| Comcast Corp., Class A * | 15,749 | | 410,891 |
| DIRECTV Group, Inc. * | 3,902 | | 91,034 |
| E.W. Scripps Company, Class A | 422 | | 17,344 |
| Time Warner, Inc. | 19,156 | | 363,581 |
| Viacom, Inc., Class B * | 3,487 | | 137,597 |
| |
|
| | | | 1,020,447 |
| Cellular Communications - 0.38% | | | |
| ALLTEL Corp. | 1,748 | | 119,319 |
| | | |
| Index 500 Fund (continued) | | | |
| | Shares or | | |
| | Principal | | |
| | Amount | | Value |
|
|
| |
| COMMON STOCKS (continued) | | | |
| | | | |
| Cellular Communications (continued) | | | |
| Motorola, Inc. | 11,713 $ | | 198,535 |
| |
|
| | | | 317,854 |
| Chemicals - 1.01% | | | |
| Air Products & Chemicals, Inc. | 1,096 | | 98,651 |
| Ashland, Inc. | 283 | | 16,920 |
| Dow Chemical Company | 4,824 | | 205,647 |
| E.I. Du Pont de Nemours & Company | 4,674 | | 227,857 |
| Eastman Chemical Company | 426 | | 28,440 |
| Hercules, Inc. * | 590 | | 12,284 |
| PPG Industries, Inc. | 831 | | 60,954 |
| Praxair, Inc. | 1,613 | | 122,040 |
| Rohm & Haas Company | 720 | | 40,709 |
| Sigma-Aldrich Corp. | 665 | | 29,792 |
| |
|
| | | | 843,294 |
| Coal - 0.11% | | | |
| CONSOL Energy, Inc. | 921 | | 36,729 |
| Peabody Energy Corp. | 1,341 | | 57,006 |
| |
|
| | | | 93,735 |
| Commercial Services - 0.03% | | | |
| CB Richard Ellis Group, Inc. * | 949 | | 28,015 |
| | | | |
| Computers & Business Equipment - 4.84% | | | |
| Apple, Inc. * | 4,377 | | 606,127 |
| Cisco Systems, Inc. * | 30,724 | | 980,710 |
| Cognizant Technology Solutions Corp., | | | |
| Class A * | 727 | | 53,442 |
| Dell, Inc. * | 11,496 | | 324,762 |
| EMC Corp. * | 10,619 | | 208,769 |
| Hewlett-Packard Company | 13,253 | | 654,036 |
| International Business Machines Corp. | 6,913 | | 806,678 |
| Juniper Networks, Inc. * | 2,866 | | 94,349 |
| Lexmark International, Inc. * | 479 | | 17,847 |
| Network Appliance, Inc. * | 1,878 | | 52,321 |
| SanDisk Corp. * | 1,155 | | 64,749 |
| Sun Microsystems, Inc. * | 18,067 | | 96,839 |
| Xerox Corp. * | 4,743 | | 81,248 |
| |
|
| | | | 4,041,877 |
| Construction & Mining Equipment - 0.16% | | | |
| National Oilwell Varco, Inc. * | 899 | | 115,072 |
| Rowan Companies, Inc. | 560 | | 21,022 |
| |
|
| | | | 136,094 |
| Construction Materials - 0.10% | | | |
| Sherwin-Williams Company | 554 | | 38,231 |
| Vulcan Materials Company | 482 | | 43,385 |
| |
|
| | | | 81,616 |
| Containers & Glass - 0.10% | | | |
| Ball Corp. | 517 | | 27,081 |
| Bemis Company, Inc. | 529 | | 15,801 |
| Pactiv Corp. * | 660 | | 19,305 |
| Sealed Air Corp. | 818 | | 21,636 |
| |
|
| | | | 83,823 |
| |
| The accompanying notes are an integral part of the financial statements. | 204 |
John Hancock Funds II
Portfolio of investments — August 31, 2007
(showing percentage of total net assets)
| | | |
| Index 500 Fund (continued) | | | |
| | Shares or | | |
| | Principal | | |
| | Amount | | Value |
|
|
| |
| COMMON STOCKS (continued) | | | |
| | | | |
| Cosmetics & Toiletries - 1.79% | | | |
| Avon Products, Inc. | 2,221 | $ | 76,291 |
| Colgate-Palmolive Company | 2,588 | | 171,636 |
| Estee Lauder Companies, Inc., Class A | 597 | | 24,829 |
| International Flavors & Fragrances, Inc. | 393 | | 19,741 |
| Kimberly-Clark Corp. | 2,308 | | 158,537 |
| Procter & Gamble Company | 15,935 | | 1,040,715 |
| |
|
| | | | 1,491,749 |
| Crude Petroleum & Natural Gas - 1.23% | | | |
| Apache Corp. | 1,676 | | 129,689 |
| Chesapeake Energy Corp. | 2,072 | | 66,843 |
| Devon Energy Corp. | 2,251 | | 169,523 |
| EOG Resources, Inc. | 1,238 | | 83,392 |
| Marathon Oil Corp. | 3,471 | | 187,052 |
| Occidental Petroleum Corp. | 4,220 | | 239,232 |
| Sunoco, Inc. | 615 | | 44,981 |
| XTO Energy, Inc. | 1,940 | | 105,458 |
| |
|
| | | | 1,026,170 |
| Drugs & Health Care - 0.38% | | | |
| Wyeth | 6,807 | | 315,164 |
| | | | |
| Educational Services - 0.05% | | | |
| Apollo Group, Inc., Class A * | 708 | | 41,538 |
| | | | |
| Electrical Equipment - 0.33% | | | |
| Cooper Industries, Ltd., Class A | 926 | | 47,383 |
| Emerson Electric Company | 4,024 | | 198,102 |
| Molex, Inc. | 719 | | 18,802 |
| Tektronix, Inc. | 414 | | 13,310 |
| |
|
| | | | 277,597 |
| Electrical Utilities - 2.16% | | | |
| Allegheny Energy, Inc. * | 839 | | 43,301 |
| Ameren Corp. | 1,044 | | 53,014 |
| American Electric Power Company, Inc. | 2,018 | | 89,761 |
| CenterPoint Energy, Inc. | 1,623 | | 26,325 |
| CMS Energy Corp. | 1,136 | | 18,539 |
| Consolidated Edison, Inc. | 1,369 | | 62,892 |
| Constellation Energy Group, Inc. | 914 | | 75,807 |
| Dominion Resources, Inc. | 1,773 | | 151,024 |
| DTE Energy Company | 891 | | 42,599 |
| Dynegy, Inc., Class A * | 2,036 | | 16,471 |
| Edison International | 1,649 | | 86,919 |
| Entergy Corp. | 998 | | 103,413 |
| Exelon Corp. | 3,404 | | 240,561 |
| FirstEnergy Corp. | 1,543 | | 94,802 |
| FPL Group, Inc. | 2,057 | | 121,034 |
| Integrys Energy Group, Inc. | 383 | | 19,215 |
| PG&E Corp. | 1,779 | | 79,165 |
| Pinnacle West Capital Corp. | 507 | | 20,199 |
| PPL Corp. | 1,949 | | 94,059 |
| Public Service Enterprise Group, Inc. | 1,279 | | 108,702 |
| TECO Energy, Inc. | 1,061 | | 16,806 |
| The AES Corp. * | 3,378 | | 61,176 |
| | | |
| Index 500 Fund (continued) | | | |
| | Shares or | | |
| | Principal | | |
| | Amount | | Value |
|
|
| |
| COMMON STOCKS (continued) | | | |
| | | |
| Electrical Utilities (continued) | | | |
| The Southern Company | 3,805 | $ | 135,039 |
| Xcel Energy, Inc. | 2,069 | | 42,642 |
| |
|
| | | | 1,803,465 |
| Electronics - 0.50% | | | |
| Agilent Technologies, Inc. * | 2,004 | | 72,946 |
| Harman International Industries, Inc. | 330 | | 37,419 |
| Jabil Circuit, Inc. | 907 | | 20,135 |
| L-3 Communications Holdings, Inc. | 632 | | 62,258 |
| Solectron Corp. * | 4,575 | | 17,751 |
| Thermo Electron Corp. * | 2,135 | | 115,781 |
| Tyco Electronics, Ltd. * | 2,508 | | 87,454 |
| |
|
| | | | 413,744 |
| Energy - 0.49% | | | |
| Duke Energy Corp. | 6,374 | | 116,899 |
| Progress Energy, Inc. | 1,286 | | 59,002 |
| Sempra Energy | 1,335 | | 73,465 |
| TXU Corp. | 2,324 | | 156,638 |
| |
|
| | | | 406,004 |
| Financial Services - 7.89% | | | |
| American Capital Strategies, Ltd. | 893 | | 36,872 |
| American Express Company | 6,015 | | 352,599 |
| Ameriprise Financial, Inc. | 1,190 | | 72,602 |
| Bank of New York Mellon Corp. | 5,715 | | 231,058 |
| Bear Stearns Companies, Inc. | 602 | | 65,413 |
| Capital One Financial Corp. | 2,091 | | 135,204 |
| Charles Schwab Corp. | 5,120 | | 101,376 |
| CIT Group, Inc. | 971 | | 36,481 |
| Citigroup, Inc. | 25,031 | | 1,173,453 |
| CME Group, Inc. * | 280 | | 155,344 |
| Countrywide Financial Corp. | 3,003 | | 59,610 |
| Discover Financial Services * | 2,667 | | 61,714 |
| E*TRADE Financial Corp. * | 2,160 | | 33,653 |
| Federal Home Loan Mortgage Corp. | 3,348 | | 206,270 |
| Federal National Mortgage Association | 4,924 | | 323,064 |
| Federated Investors, Inc., Class B | 448 | | 15,729 |
| Fidelity National Information Services, Inc. | 828 | | 39,247 |
| Franklin Resources, Inc. | 834 | | 109,896 |
| Goldman Sachs Group, Inc. | 2,067 | | 363,813 |
| Janus Capital Group, Inc. | 938 | | 24,941 |
| JP Morgan Chase & Company | 17,287 | | 769,617 |
| Legg Mason, Inc. | 666 | | 57,822 |
| Lehman Brothers Holdings, Inc. | 2,695 | | 147,767 |
| Leucadia National Corp. | 830 | | 36,835 |
| Merrill Lynch & Company, Inc. | 4,407 | | 324,796 |
| Morgan Stanley | 5,333 | | 332,619 |
| PNC Financial Services Group, Inc. | 1,745 | | 122,796 |
| SLM Corp. | 2,082 | | 104,683 |
| State Street Corp. | 2,010 | | 123,334 |
| Synovus Financial Corp. | 1,655 | | 45,711 |
| T. Rowe Price Group, Inc. | 1,344 | | 68,974 |
| Washington Mutual, Inc. | 4,499 | | 165,203 |
| |
| The accompanying notes are an integral part of the financial statements. | 205 |
John Hancock Funds II
Portfolio of investments — August 31, 2007
(showing percentage of total net assets)
| | | |
| Index 500 Fund (continued) | | | |
| | Shares or | | |
| | Principal | | |
| | Amount | | Value |
|
|
| |
| COMMON STOCKS (continued) | | | |
| | | | |
| Financial Services (continued) | | | |
| Wells Fargo & Company | 16,901 | $ | 617,563 |
| Western Union Company | 3,910 | | 73,625 |
| |
|
| | | | 6,589,684 |
| Food & Beverages - 2.56% | | | |
| Campbell Soup Company | 1,098 | | 41,449 |
| Coca-Cola Enterprises, Inc. | 1,412 | | 33,634 |
| ConAgra Foods, Inc. | 2,521 | | 64,815 |
| Constellation Brands, Inc., Class A * | 978 | | 23,648 |
| Dean Foods Company * | 658 | | 17,674 |
| General Mills, Inc. | 1,753 | | 97,958 |
| H.J. Heinz Company | 1,644 | | 74,128 |
| Hershey Company | 868 | | 40,362 |
| Kellogg Company | 1,268 | | 69,651 |
| Kraft Foods, Inc., Class A | 8,118 | | 260,263 |
| McCormick & Company, Inc. | 659 | | 23,619 |
| Pepsi Bottling Group, Inc. | 666 | | 23,037 |
| PepsiCo, Inc. | 8,243 | | 560,771 |
| Sara Lee Corp. | 3,717 | | 61,776 |
| Sysco Corp. | 3,127 | | 104,379 |
| The Coca-Cola Company | 10,170 | | 546,943 |
| Tyson Foods, Inc., Class A | 1,279 | | 27,562 |
| William Wrigley Jr. Company | 1,091 | | 63,551 |
| |
|
| | | | 2,135,220 |
| Forest Products - 0.09% | | | |
| Weyerhaeuser Company | 1,093 | | 74,510 |
| Furniture & Fixtures - 0.02% | | | |
| Leggett & Platt, Inc. | 896 | | 18,278 |
| Gas & Pipeline Utilities - 0.36% | | | |
| El Paso Corp. | 3,544 | | 56,243 |
| Nicor, Inc. | 228 | | 9,476 |
| NiSource, Inc. | 1,387 | | 26,131 |
| Questar Corp. | 873 | | 43,624 |
| Spectra Energy Corp. | 3,197 | | 74,330 |
| Williams Companies, Inc. | 3,031 | | 93,961 |
| |
|
| | | | 303,765 |
| Healthcare Products - 2.50% | | | |
| Bausch & Lomb, Inc. | 275 | | 17,380 |
| Baxter International, Inc. | 3,297 | | 180,544 |
| Becton, Dickinson & Company | 1,240 | | 95,405 |
| Biomet, Inc. * | 902 | | 41,339 |
| Boston Scientific Corp. * | 6,005 | | 77,044 |
| C.R. Bard, Inc. | 523 | | 43,613 |
| Covidien, Ltd. * | 2,508 | | 99,894 |
| Johnson & Johnson | 14,658 | | 905,718 |
| Medtronic, Inc. | 5,827 | | 307,899 |
| Patterson Companies, Inc. * | 704 | | 25,893 |
| St. Jude Medical, Inc. * | 1,712 | | 74,592 |
| Stryker Corp. | 1,511 | | 100,935 |
| Varian Medical Systems, Inc. * | 645 | | 26,051 |
| | | |
| Index 500 Fund (continued) | | | |
| | Shares or | | |
| | Principal | | |
| | Amount | | Value |
|
|
| |
| COMMON STOCKS (continued) | | | |
| | | | |
| Healthcare Products (continued) | | | |
| Zimmer Holdings, Inc. * | 1,198 | $ | 93,839 |
| |
|
| | | | 2,090,146 |
| Healthcare Services - 1.47% | | | |
| Cardinal Health, Inc. | 1,947 | | 133,136 |
| Coventry Health Care, Inc. * | 791 | | 45,380 |
| Express Scripts, Inc. * | 1,379 | | 75,500 |
| Humana, Inc. * | 850 | | 54,476 |
| IMS Health, Inc. | 993 | | 29,730 |
| Laboratory Corp. of America Holdings * | 595 | | 46,208 |
| McKesson Corp. | 1,495 | | 85,529 |
| Medco Health Solutions, Inc. * | 1,418 | | 121,168 |
| Quest Diagnostics, Inc. | 800 | | 43,800 |
| UnitedHealth Group, Inc. | 6,781 | | 339,118 |
| WellPoint, Inc. * | 3,105 | | 250,232 |
| |
|
| | | | 1,224,277 |
| Holdings Companies/Conglomerates - 2.64% | | | |
| General Electric Company | 52,063 | | 2,023,689 |
| Loews Corp. | 2,256 | | 106,054 |
| Textron, Inc. | 1,270 | | 74,092 |
| |
|
| | | | 2,203,835 |
| Homebuilders - 0.11% | | | |
| Centex Corp. | 604 | | 17,462 |
| D.R. Horton, Inc. | 1,383 | | 20,897 |
| KB Home | 389 | | 11,802 |
| Lennar Corp., Class A | 705 | | 19,930 |
| Pulte Homes, Inc. | 1,075 | | 17,888 |
| |
|
| | | | 87,979 |
| Hotels & Restaurants - 0.95% | | | |
| Darden Restaurants, Inc. | 715 | | 29,744 |
| Hilton Hotels Corp. | 1,972 | | 90,613 |
| Marriott International, Inc., Class A | 1,662 | | 73,826 |
| McDonald's Corp. | 6,042 | | 297,568 |
| Starbucks Corp. * | 3,749 | | 103,285 |
| Starwood Hotels & Resorts Worldwide, Inc. | 1,089 | | 66,560 |
| Wendy's International, Inc. | 442 | | 14,537 |
| Wyndham Worldwide Corp. | 923 | | 29,444 |
| Yum! Brands, Inc. | 2,651 | | 86,741 |
| |
|
| | | | 792,318 |
| Household Appliances - 0.08% | | | |
| Black & Decker Corp. | 334 | | 28,974 |
| Whirlpool Corp. | 399 | | 38,468 |
| |
|
| | | | 67,442 |
| Household Products - 0.18% | | | |
| Fortune Brands, Inc. | 773 | | 64,229 |
| Newell Rubbermaid, Inc. | 1,411 | | 36,390 |
| The Clorox Company | 768 | | 45,926 |
| |
|
| | | | 146,545 |
| Industrial Machinery - 0.98% | | | |
| Caterpillar, Inc. | 3,241 | | 245,571 |
| Cummins, Inc. | 528 | | 62,526 |
| |
| The accompanying notes are an integral part of the financial statements. | 206 |
John Hancock Funds II
Portfolio of investments — August 31, 2007
(showing percentage of total net assets)
| | | |
| Index 500 Fund (continued) | | | |
| | Shares or | | |
| | Principal | | |
| | Amount | | Value |
|
|
| |
| COMMON STOCKS (continued) | | | |
| | | | |
| Industrial Machinery (continued) | | | |
| Deere & Company | 1,139 | $ | 154,972 |
| Dover Corp. | 1,034 | | 51,080 |
| Ingersoll-Rand Company, Class A | 1,526 | | 79,245 |
| ITT Corp. | 920 | | 62,551 |
| Pall Corp. | 620 | | 23,641 |
| Parker-Hannifin Corp. | 586 | | 62,977 |
| Terex Corp. * | 522 | | 41,697 |
| W.W. Grainger, Inc. | 359 | | 32,888 |
| |
|
| | | | 817,148 |
| Insurance - 3.71% | | | |
| ACE, Ltd. | 1,647 | | 95,131 |
| Aetna, Inc. | 2,613 | | 133,028 |
| AFLAC, Inc. | 2,475 | | 131,942 |
| Allstate Corp. | 3,074 | | 168,302 |
| Ambac Financial Group, Inc. | 516 | | 32,415 |
| American International Group, Inc. | 13,128 | | 866,448 |
| Aon Corp. | 1,486 | | 64,374 |
| Assurant, Inc. | 502 | | 25,873 |
| Chubb Corp. | 2,032 | | 103,896 |
| CIGNA Corp. | 1,456 | | 75,246 |
| Cincinnati Financial Corp. | 869 | | 36,620 |
| Genworth Financial, Inc., Class A | 2,117 | | 61,351 |
| Hartford Financial Services Group, Inc. | 1,602 | | 142,434 |
| Lincoln National Corp. | 1,370 | | 83,406 |
| Marsh & McLennan Companies, Inc. | 2,811 | | 74,913 |
| MBIA, Inc. | 662 | | 39,720 |
| MetLife, Inc. | 3,753 | | 240,380 |
| MGIC Investment Corp. | 420 | | 12,667 |
| Principal Financial Group, Inc. | 1,355 | | 75,189 |
| Progressive Corp. | 3,726 | | 75,787 |
| Prudential Financial, Inc. | 2,366 | | 212,419 |
| SAFECO Corp. | 537 | | 31,157 |
| The Travelers Companies, Inc. | 3,360 | | 169,814 |
| Torchmark Corp. | 483 | | 29,733 |
| UnumProvident Corp. | 1,735 | | 42,455 |
| XL Capital, Ltd., Class A | 941 | | 71,704 |
| |
|
| | | | 3,096,404 |
| International Oil - 5.44% | | | |
| Anadarko Petroleum Corp. | 2,348 | | 115,005 |
| Chevron Corp. | 10,876 | | 954,478 |
| ConocoPhillips | 8,271 | | 677,312 |
| Exxon Mobil Corp. | 28,507 | | 2,443,905 |
| Hess Corp. | 1,381 | | 84,752 |
| Murphy Oil Corp. | 952 | | 58,015 |
| Nabors Industries, Ltd. * | 1,425 | | 42,166 |
| Noble Corp. | 1,356 | | 66,525 |
| Weatherford International, Ltd. * | 1,707 | | 99,655 |
| |
|
| | | | 4,541,813 |
| Internet Content - 0.85% | | | |
| Google, Inc., Class A * | 1,104 | | 568,836 |
| | | |
| Index 500 Fund (continued) | | | |
| | Shares or | | |
| | Principal | | |
| | Amount | | Value |
|
|
| |
| COMMON STOCKS (continued) | | | |
| | | | |
| Internet Content (continued) | | | |
| Yahoo!, Inc. * | 6,121 | $ | 139,130 |
| |
|
| | | | 707,966 |
| Internet Retail - 0.42% | | | |
| Amazon.com, Inc. * | 1,574 | | 125,778 |
| eBay, Inc. * | 5,728 | | 195,325 |
| IAC/InterActiveCorp. * | 1,106 | | 30,736 |
| |
|
| | | | 351,839 |
| Internet Software - 0.18% | | | |
| Akamai Technologies, Inc. * | 835 | | 26,904 |
| Symantec Corp. * | 4,560 | | 85,774 |
| VeriSign, Inc. * | 1,241 | | 39,960 |
| |
|
| | | | 152,638 |
| Leisure Time - 0.81% | | | |
| Brunswick Corp. | 457 | | 11,493 |
| Carnival Corp. | 2,239 | | 102,076 |
| Electronic Arts, Inc. * | 1,569 | | 83,063 |
| Harrah's Entertainment, Inc. | 945 | | 81,053 |
| International Game Technology | 1,682 | | 64,202 |
| Walt Disney Company | 10,028 | | 336,941 |
| |
|
| | | | 678,828 |
| Life Sciences - 0.06% | | | |
| PerkinElmer, Inc. | 606 | | 16,611 |
| Waters Corp. * | 511 | | 31,462 |
| |
|
| | | | 48,073 |
| Liquor - 0.29% | | | |
| Anheuser-Busch Companies, Inc. | 3,845 | | 189,943 |
| Brown Forman Corp., Class B | 399 | | 28,553 |
| Molson Coors Brewing Company, Class B | 240 | | 21,470 |
| |
|
| | | | 239,966 |
| Manufacturing - 1.33% | | | |
| 3M Company | 3,645 | | 331,660 |
| Danaher Corp. | 1,205 | | 93,580 |
| Eaton Corp. | 741 | | 69,817 |
| Harley-Davidson, Inc. | 1,303 | | 70,088 |
| Honeywell International, Inc. | 3,946 | | 221,568 |
| Illinois Tool Works, Inc. | 2,085 | | 121,285 |
| Rockwell Automation, Inc. | 798 | | 56,227 |
| Snap-on, Inc. | 293 | | 14,351 |
| Stanley Works | 422 | | 23,944 |
| Tyco International, Ltd. | 2,508 | | 110,753 |
| |
|
| | | | 1,113,273 |
| Medical-Hospitals - 0.04% | | | |
| Manor Care, Inc. | 370 | | 23,639 |
| Tenet Healthcare Corp. * | 2,394 | | 8,116 |
| |
|
| | | | 31,755 |
| Metal & Metal Products - 0.11% | | | |
| Precision Castparts Corp. | 696 | | 90,696 |
| |
| The accompanying notes are an integral part of the financial statements. | 207 |
John Hancock Funds II
Portfolio of investments — August 31, 2007
(showing percentage of total net assets)
| | | |
| Index 500 Fund (continued) | | | |
| | Shares or | | |
| | Principal | | |
| | Amount | | Value |
|
|
| |
| COMMON STOCKS (continued) | | | |
| | | | |
| Mining - 0.31% | | | |
| Freeport-McMoRan Copper & Gold, Inc., | | | |
| Class B | 1,900 | $ | 166,098 |
| Newmont Mining Corp. | 2,283 | | 96,480 |
| |
|
| | | | 262,578 |
| Office Furnishings & Supplies - 0.09% | | | |
| Avery Dennison Corp. | 464 | | 27,743 |
| Office Depot, Inc. * | 1,399 | | 34,205 |
| OfficeMax, Inc. | 381 | | 13,533 |
| |
|
| | | | 75,481 |
| Paper - 0.21% | | | |
| International Paper Company | 2,204 | | 77,382 |
| MeadWestvaco Corp. | 933 | | 29,474 |
| Plum Creek Timber Company, Inc. | 894 | | 37,485 |
| Temple-Inland, Inc. | 535 | | 29,468 |
| |
|
| | | | 173,809 |
| Petroleum Services - 1.63% | | | |
| Baker Hughes, Inc. | 1,621 | | 135,937 |
| BJ Services Company | 1,484 | | 36,818 |
| ENSCO International, Inc. | 754 | | 40,882 |
| Halliburton Company | 4,626 | | 160,013 |
| Schlumberger, Ltd. | 5,964 | | 575,526 |
| Smith International, Inc. | 1,014 | | 67,948 |
| Transocean, Inc. * | 1,458 | | 153,221 |
| Valero Energy Corp. | 2,778 | | 190,321 |
| |
|
| | | | 1,360,666 |
| Pharmaceuticals - 3.89% | | | |
| Abbott Laboratories | 7,795 | | 404,638 |
| Allergan, Inc. | 1,556 | | 93,376 |
| AmerisourceBergen Corp. | 967 | | 46,271 |
| Barr Pharmaceuticals, Inc. * | 555 | | 28,238 |
| Bristol-Myers Squibb Company | 9,959 | | 290,305 |
| Celgene Corp. * | 1,922 | | 123,412 |
| Eli Lilly & Company | 4,993 | | 286,348 |
| Forest Laboratories, Inc. * | 1,609 | | 60,547 |
| Gilead Sciences, Inc. * | 4,726 | | 171,885 |
| Hospira, Inc. * | 788 | | 30,456 |
| King Pharmaceuticals, Inc. * | 1,233 | | 18,532 |
| Merck & Company, Inc. | 10,967 | | 550,214 |
| Mylan Laboratories, Inc. | 1,257 | | 18,981 |
| Pfizer, Inc. | 35,516 | | 882,217 |
| Schering-Plough Corp. | 7,537 | | 226,261 |
| Watson Pharmaceuticals, Inc. * | 519 | | 15,477 |
| |
|
| | | | 3,247,158 |
| Photography - 0.05% | | | |
| Eastman Kodak Company | 1,456 | | 38,832 |
| Publishing - 0.24% | | | |
| Dow Jones & Company, Inc. | 331 | | 19,546 |
| Gannett Company, Inc. | 1,188 | | 55,836 |
| McGraw-Hill Companies, Inc. | 1,737 | | 87,649 |
| Meredith Corp. | 197 | | 11,012 |
| | | |
| Index 500 Fund (continued) | | | |
| | Shares or | | |
| | Principal | | |
| | Amount | | Value |
|
|
| |
| COMMON STOCKS (continued) | | | |
| | | | |
| Publishing (continued) | | | |
| The New York Times Company, Class A | 728 | $ | 16,002 |
| Tribune Company | 428 | | 11,791 |
| |
|
| | | | 201,836 |
| Railroads & Equipment - 0.59% | | | |
| Burlington Northern Santa Fe Corp. | 1,802 | | 146,232 |
| CSX Corp. | 2,212 | | 90,692 |
| Norfolk Southern Corp. | 1,990 | | 101,908 |
| Union Pacific Corp. | 1,370 | | 152,851 |
| |
|
| | | | 491,683 |
| Real Estate - 0.91% | | | |
| Apartment Investment & Management | | | |
| Company, Class A, REIT | 492 | | 21,993 |
| Archstone-Smith Trust, REIT | 1,128 | | 66,326 |
| Avalon Bay Communities, Inc., REIT | 403 | | 46,095 |
| Boston Properties, Inc., REIT | 602 | | 60,242 |
| Developers Diversified Realty Corp., REIT | 632 | | 33,799 |
| Equity Residential, REIT | 1,471 | | 59,193 |
| General Growth Properties, Inc., REIT | 1,240 | | 61,641 |
| Host Hotels & Resorts, Inc., REIT | 2,642 | | 58,890 |
| Kimco Realty Corp., REIT | 1,148 | | 49,157 |
| ProLogis, REIT | 1,299 | | 78,148 |
| Public Storage, Inc., REIT | 621 | | 47,059 |
| Simon Property Group, Inc., REIT | 1,130 | | 107,260 |
| Vornado Realty Trust, REIT | 661 | | 70,456 |
| |
|
| | | | 760,259 |
| Retail Grocery - 0.29% | | | |
| Safeway, Inc. | 2,235 | | 70,916 |
| SUPERVALU, Inc. | 1,052 | | 44,342 |
| The Kroger Company | 3,583 | | 95,236 |
| Whole Foods Market, Inc. | 715 | | 31,646 |
| |
|
| | | | 242,140 |
| Retail Trade - 3.58% | | | |
| Abercrombie & Fitch Company, Class A | 447 | | 35,179 |
| Bed Bath & Beyond, Inc. * | 1,386 | | 48,011 |
| Best Buy Company, Inc. | 2,049 | | 90,053 |
| Big Lots, Inc. * | 554 | | 16,493 |
| Circuit City Stores, Inc. | 700 | | 7,616 |
| Costco Wholesale Corp. | 2,260 | | 139,555 |
| CVS Caremark Corp. | 7,811 | | 295,408 |
| Dillard's, Inc., Class A | 308 | | 7,312 |
| Family Dollar Stores, Inc. | 763 | | 22,341 |
| Gap, Inc. | 2,683 | | 50,333 |
| Home Depot, Inc. | 9,990 | | 382,717 |
| J.C. Penney Company, Inc. | 1,139 | | 78,318 |
| Kohl's Corp. * | 1,633 | | 96,837 |
| Limited Brands, Inc. | 1,732 | | 40,113 |
| Lowe's Companies, Inc. | 7,616 | | 236,553 |
| Macy's, Inc. | 2,326 | | 73,781 |
| Nordstrom, Inc. | 1,136 | | 54,642 |
| RadioShack Corp. | 686 | | 16,306 |
| Sears Holdings Corp. * | 417 | | 59,864 |
| |
| The accompanying notes are an integral part of the financial statements. | 208 |
John Hancock Funds II
Portfolio of investments — August 31, 2007
(showing percentage of total net assets)
| | | |
| Index 500 Fund (continued) | | | |
| | Shares or | | |
| | Principal | | |
| | Amount | | Value |
|
|
| |
| COMMON STOCKS (continued) | | | |
| | | | |
| Retail Trade (continued) | | | |
| Staples, Inc. | 3,619 | $ | 85,951 |
| Target Corp. | 4,309 | | 284,092 |
| The TJX Companies, Inc. | 2,302 | | 70,188 |
| Tiffany & Company | 692 | | 35,520 |
| Walgreen Company | 5,065 | | 228,280 |
| Wal-Mart Stores, Inc. | 12,268 | | 535,253 |
| |
|
| | | | 2,990,716 |
| Sanitary Services - 0.18% | | | |
| Allied Waste Industries, Inc. * | 1,292 | | 16,499 |
| Ecolab, Inc. | 887 | | 36,952 |
| Waste Management, Inc. | 2,618 | | 98,620 |
| |
|
| | | | 152,071 |
| Semiconductors - 2.25% | | | |
| Advanced Micro Devices, Inc. * | 2,786 | | 36,218 |
| Altera Corp. | 1,797 | | 42,787 |
| Analog Devices, Inc. | 1,655 | | 61,036 |
| Applied Materials, Inc. | 6,993 | | 149,370 |
| Broadcom Corp., Class A * | 2,354 | | 81,213 |
| Intel Corp. | 29,402 | | 757,102 |
| KLA-Tencor Corp. | 970 | | 55,746 |
| Linear Technology Corp. | 1,285 | | 43,677 |
| LSI Logic Corp. * | 3,898 | | 26,857 |
| Maxim Integrated Products, Inc. | 1,623 | | 48,706 |
| MEMC Electronic Materials, Inc. * | 1,136 | | 69,773 |
| Micron Technology, Inc. * | 3,828 | | 43,831 |
| National Semiconductor Corp. | 1,412 | | 37,164 |
| Novellus Systems, Inc. * | 639 | | 17,489 |
| NVIDIA Corp. * | 1,837 | | 93,981 |
| QLogic Corp. * | 805 | | 10,707 |
| Teradyne, Inc. * | 960 | | 14,294 |
| Texas Instruments, Inc. | 7,255 | | 248,411 |
| Xilinx, Inc. | 1,507 | | 38,534 |
| |
|
| | | | 1,876,896 |
| Software - 2.40% | | | |
| Adobe Systems, Inc. * | 2,976 | | 127,224 |
| Autodesk, Inc. * | 1,170 | | 54,194 |
| BMC Software, Inc. * | 1,032 | | 31,600 |
| CA, Inc. | 2,082 | | 52,446 |
| Citrix Systems, Inc. * | 914 | | 33,224 |
| Compuware Corp. * | 1,524 | | 12,360 |
| Intuit, Inc. * | 1,734 | | 47,355 |
| Microsoft Corp. | 42,603 | | 1,223,984 |
| Novell, Inc. * | 1,763 | | 13,117 |
| Oracle Corp. * | 20,032 | | 406,249 |
| |
|
| | | | 2,001,753 |
| Steel - 0.23% | | | |
| Allegheny Technologies, Inc. | 517 | | 51,385 |
| Nucor Corp. | 1,527 | | 80,778 |
| United States Steel Corp. | 599 | | 56,593 |
| |
|
| | | | 188,756 |
| | | | |
| Index 500 Fund (continued) | | | |
| | | Shares or | | |
| | | Principal | | |
| | | Amount | | Value |
| |
|
| |
| COMMON STOCKS (continued) | | | | |
| | | | | |
| Telecommunications Equipment & | | | | |
| Services - 1.56% | | | | |
| Avaya, Inc. * | | 2,277 | $ | 38,322 |
| Ciena Corp. * | | 432 | | 16,364 |
| Citizens Communications Company | | 1,733 | | 25,146 |
| Corning, Inc. | | 7,959 | | 186,002 |
| Embarq Corp. | | 764 | | 47,689 |
| JDS Uniphase Corp. * | | 1,069 | | 15,565 |
| QUALCOMM, Inc. | | 8,435 | | 336,472 |
| Tellabs, Inc. * | | 2,215 | | 23,368 |
| Verizon Communications, Inc. | | 14,692 | | 615,301 |
| |
|
| | | | | 1,304,229 |
| Telephone - 1.98% | | | | |
| AT&T, Inc. | | 31,201 | | 1,243,984 |
| CenturyTel, Inc. | | 554 | | 26,581 |
| Qwest Communications International, Inc. * | 7,861 | | 70,356 |
| Sprint Nextel Corp. | | 14,643 | | 277,045 |
| Windstream Corp. | | 2,413 | | 34,458 |
| |
|
| | | | | 1,652,424 |
| Tires & Rubber - 0.04% | | | | |
| Goodyear Tire & Rubber Company * | | 1,044 | | 28,877 |
| Tobacco - 1.00% | | | | |
| Altria Group, Inc. | | 10,643 | | 738,731 |
| Reynolds American, Inc. | | 866 | | 57,260 |
| UST, Inc. | | 811 | | 39,966 |
| |
|
| | | | | 835,957 |
| Toys, Amusements & Sporting Goods - 0.08% | | | |
| Hasbro, Inc. | | 807 | | 22,765 |
| Mattel, Inc. | | 1,990 | | 43,044 |
| |
|
| | | | | 65,809 |
| Transportation - 0.05% | | | | |
| C.H. Robinson Worldwide, Inc. | | 866 | | 42,469 |
| | | | | |
| Trucking & Freight - 0.71% | | | | |
| FedEx Corp. | | 1,558 | | 170,881 |
| Ryder Systems, Inc. | | 309 | | 16,918 |
| United Parcel Service, Inc., Class B | | 5,359 | | 406,534 |
| |
|
| | | | | 594,333 |
|
| TOTAL COMMON STOCKS (Cost $64,490,455) | | $ | 66,372,900 |
|
| |
| SHORT TERM INVESTMENTS - 19.69% | | | |
| Federal Home Loan Bank Discount Notes | | | | |
| zero coupon due 09/04/2007 to | | | | |
| 09/05/2007 | $ | 10,875,000 | $ | 10,870,524 |
| Federal Home Loan Mortgage Corp. Discount Notes | | | |
| zero coupon due 10/15/2007 | | 900,000 | | 894,346 |
| Federal Home Loan Mortgage Corp. Discount Notes | | | |
| zero coupon due 09/28/2007 | | 2,000,000 | | 1,992,260 |
| Federal National Mortgage Association Discount | | | |
| Notes | | | | |
| zero coupon due 10/24/2007 | | 2,000,000 | | 1,984,895 |
| |
| The accompanying notes are an integral part of the financial statements. | 209 |
John Hancock Funds II
Portfolio of investments — August 31, 2007
(showing percentage of total net assets)
| | | | |
| Index 500 Fund (continued) | | | |
| | | Shares or | | |
| | | Principal | | |
| | | Amount | | Value |
| |
|
| |
| SHORT TERM INVESTMENTS (continued) | | | |
| U.S. Treasury Bills | | | | |
| zero coupon due 10/18/2007 **** | $ | 700,000 | $ | 695,595 |
|
| TOTAL SHORT TERM INVESTMENTS | | | | |
| (Cost $16,437,620) | | | $ | 16,437,620 |
|
| Total Investments (Index 500 Fund) | | | | |
| (Cost $80,928,075) - 99.20% | | | $ | 82,810,520 |
| Other Assets in Excess of Liabilities - 0.80% | | | 668,137 |
|
|
| TOTAL NET ASSETS - 100.00% | | | $ | 83,478,657 |
|
|
| |
| |
| |
| International Equity Index Fund | | | |
| | | Shares or | | |
| | | Principal | | |
| | | Amount | | Value |
|
|
| |
| COMMON STOCKS - 96.88% | | | | |
| | | | | |
| Argentina - 0.03% | | | | |
| Petrobras Energia Participaciones SA, ADR, | | | |
| B Shares | | 2,810 | $ | 26,049 |
| Siderar SA, Class A Shares, ADR | | 603 | | 30,873 |
| Telecom Argentina SA, ADR, B Shares * | | 2,416 | | 62,647 |
|
|
| | | | | 119,569 |
| Australia - 4.62% | | | | |
| ABC Learning Centres, Ltd. | | 7,803 | | 43,651 |
| AGL Energy, Ltd. (a) | | 10,587 | | 132,822 |
| Alinta, Ltd. | | 11,863 | | 128,705 |
| Alumina, Ltd. (a) | | 26,659 | | 151,394 |
| Amcor, Ltd. | | 21,451 | | 133,618 |
| AMP, Ltd. (a) | | 43,977 | | 376,450 |
| Ansell, Ltd. | | 3,281 | | 35,075 |
| APN News & Media, Ltd. | | 5,322 | | 23,886 |
| Aristocrat Leisure, Ltd. (a) | | 7,692 | | 87,641 |
| Asciano Group * | | 12,440 | | 86,743 |
| Australia and New Zealand | | | | |
| Banking Group, Ltd. | | 43,474 | | 1,029,464 |
| Australian Stock Exchange, Ltd. (a) | | 4,047 | | 152,719 |
| Axa Asia Pacific Holdings, Ltd. | | 21,366 | | 131,491 |
| Babcock & Brown, Ltd. (a) | | 4,989 | | 96,006 |
| BHP Billiton, Ltd. | | 82,137 | | 2,569,785 |
| Billabong International, Ltd. (a) | | 3,737 | | 48,232 |
| Bluescope Steel, Ltd. | | 17,382 | | 150,783 |
| Boral, Ltd. (a) | | 13,042 | | 83,798 |
| Brambles, Ltd., GDR * | | 12,414 | | 139,266 |
| Brambles, Ltd. * | | 23,326 | | 262,433 |
| Caltex Australia, Ltd. | | 3,106 | | 61,053 |
| Centro Properties Group, Ltd. | | 20,362 | | 136,036 |
| CFS Gandel Retail Trust | | 29,070 | | 56,179 |
| Challenger Financial Services Group, Ltd. | | 7,777 | | 34,327 |
| Coca-Cola Amatil, Ltd. (a) | | 11,520 | | 89,509 |
| Cochlear, Ltd. | | 1,292 | | 70,534 |
| Coles Myer, Ltd. | | 27,098 | | 313,190 |
| Commonwealth Bank of Australia, Ltd. | | 30,367 | | 1,365,848 |
| | | |
| International Equity Index Fund (continued) | | |
| | Shares or | | |
| | Principal | | |
| | Amount | | Value |
|
|
| |
| COMMON STOCKS (continued) | | | |
| | | | |
| Australia (continued) | | | |
| Commonwealth Property Office Fund, Ltd. | 31,916 | $ | 43,733 |
| Computershare, Ltd. | 12,207 | | 102,100 |
| CSL, Ltd. | 4,322 | | 345,607 |
| CSR, Ltd. | 19,679 | | 53,882 |
| DB RREEF Trust | 70,346 | | 114,998 |
| Downer EDI, Ltd. | 6,925 | | 36,573 |
| Fortescue Metals Group, Ltd. * | 2,680 | | 73,972 |
| Foster's Group, Ltd. (a) | 46,350 | | 238,650 |
| Futuris Corp., Ltd. | 16,491 | | 32,881 |
| General Property Trust, Ltd. | 49,298 | | 192,420 |
| Goodman Fielder, Ltd. | 23,651 | | 50,152 |
| Harvey Norman Holding, Ltd. | 11,597 | | 50,459 |
| Iluka Resources, Ltd. (a) | 4,591 | | 20,745 |
| ING Industrial Fund (a) | 21,001 | | 45,884 |
| James Hardie Industries, Ltd. (a) | 10,713 | | 71,042 |
| John Fairfax Holdings, Ltd. | 26,164 | | 99,059 |
| Leighton Holdings, Ltd. (a) | 3,430 | | 122,179 |
| Lend Lease Corp. (a) | 8,815 | | 138,122 |
| Lion Nathan, Ltd. | 6,742 | | 50,415 |
| Macquarie Airports, Ltd. | 15,776 | | 55,930 |
| Macquarie Bank, Ltd. (a) | 6,010 | | 357,724 |
| Macquarie Communications | | | |
| Infrastructure Group, Ltd. | 10,064 | | 47,442 |
| Macquarie Goodman Group, Ltd. (a) | 33,628 | | 184,872 |
| Macquarie Infrastructure Group, Ltd. (a) | 63,874 | | 171,842 |
| Macquarie Office Trust (a) | 44,277 | | 56,714 |
| Mayne Nickless, Ltd. | 14,151 | | 47,977 |
| Mirvac Group, Ltd. | 24,651 | | 108,070 |
| Multiplex Group, Ltd. | 14,988 | | 61,057 |
| National Australia Bank, Ltd. | 38,302 | | 1,250,324 |
| Newcrest Mining, Ltd. | 8,008 | | 159,238 |
| NRMA Insurance Group, Ltd. | 40,279 | | 165,396 |
| OneSteel, Ltd. (a) | 18,506 | | 91,401 |
| Orica, Ltd. | 7,320 | | 170,098 |
| Origin Energy, Ltd. | 20,643 | | 167,705 |
| Pacific Brands, Ltd. | 9,488 | | 26,088 |
| Paladin Resources, Ltd. * (a) | 12,209 | | 60,185 |
| PaperlinX, Ltd. (a) | 9,824 | | 27,078 |
| Perpetual Trust of Australia, Ltd. | 899 | | 56,199 |
| Publishing & Broadcasting, Ltd. | 10,846 | | 158,388 |
| Qantas Airways, Ltd., ADR (a) | 21,543 | | 98,079 |
| QBE Insurance Group, Ltd. (a) | 19,282 | | 547,565 |
| Rio Tinto, Ltd. (a) | 6,778 | | 515,035 |
| Santos, Ltd. (a) | 14,341 | | 155,648 |
| Sonic Healthcare, Ltd. (a) | 6,949 | | 87,350 |
| Stockland Company, Ltd. | 33,212 | | 232,333 |
| Suncorp-Metway, Ltd. | 21,595 | | 354,117 |
| TABCORP Holdings, Ltd. | 12,417 | | 154,916 |
| Tattersall's, Ltd. | 23,586 | | 80,617 |
| Telstra Corp., Ltd. - Ins Recp. | 32,605 | | 77,432 |
| Telstra Corp., Ltd. (a) | 68,797 | | 245,981 |
| Toll Holdings, Ltd. | 12,440 | | 137,752 |
| |
| The accompanying notes are an integral part of the financial statements. | 210 |
John Hancock Funds II
Portfolio of investments — August 31, 2007
(showing percentage of total net assets)
| | | |
| International Equity Index Fund (continued) | | |
| | Shares or | | |
| | Principal | | |
| | Amount | | Value |
|
|
| |
| COMMON STOCKS (continued) | | | |
| | | | |
| Australia (continued) | | | |
| Transurban Group, Ltd. * | 25,596 | $ | 149,424 |
| Wesfarmers, Ltd. (a) | 9,057 | | 284,802 |
| Westfield Group (a) | 41,315 | | 704,956 |
| Westpac Banking Corp., Ltd. | 43,581 | | 967,426 |
| Woodside Petroleum, Ltd. | 10,937 | | 402,562 |
| Woolworths, Ltd. | 28,479 | | 694,742 |
| WorleyParsons, Ltd. | 3,496 | | 109,727 |
| Zinifex, Ltd. | 11,492 | | 157,221 |
| |
|
| | | | 19,454,924 |
| Austria - 0.45% | | | |
| Andritz AG, ADR | 916 | | 59,457 |
| BetandWin.com Interactive | | | |
| Entertainment AG * (a) | 540 | | 14,091 |
| Erste Bank der Oesterreichischen | | | |
| Sparkassen AG | 4,345 | | 315,906 |
| Flughafen Wien AG | 251 | | 25,157 |
| Immoeast Immobilien Anlagen AG * (a) | 9,663 | | 118,573 |
| Immofinanz Immobilien Anlage AG * | 10,510 | | 130,449 |
| Mayr-Melnhof Karton AG | 198 | | 21,381 |
| Meinl European Land, Ltd. * (a) | 7,038 | | 128,797 |
| Oesterreichische Elektrizitaets AG, Class A (a) | 1,815 | | 90,200 |
| OMV AG | 3,872 | | 240,237 |
| Raiffeisen International Bank Holding AG | 839 | | 121,481 |
| RHI AG * | 567 | | 27,790 |
| Telekom Austria AG | 8,796 | | 227,442 |
| Voestalpine AG | 2,570 | | 210,504 |
| Wiener Staedtische Allgemeine | | | |
| Versicherung AG | 745 | | 51,267 |
| Wienerberger Baustoffindustrie AG | 1,658 | | 118,515 |
| |
|
| | | | 1,901,247 |
| Belgium - 0.93% | | | |
| Agfa Gevaert NV | 3,041 | | 63,647 |
| Barco NV | 249 | | 23,675 |
| Bekaert SA | 285 | | 37,598 |
| Belgacom SA | 3,810 | | 167,377 |
| Cofinimmo SA | 204 | | 35,099 |
| Colruyt SA | 392 | | 83,848 |
| Compagnie Maritime Belge SA | 338 | | 22,169 |
| Delhaize Group | 1,849 | | 181,603 |
| Dexia | 12,456 | | 343,942 |
| Euronav NV | 595 | | 18,815 |
| Fortis Group SA | 29,393 | | 1,079,424 |
| Groupe Bruxelles Lambert SA | 1,930 | | 228,528 |
| Interbrew | 4,364 | | 358,804 |
| KBC Bancassurance Holding NV | 4,315 | | 542,217 |
| Mobistar SA | 765 | | 62,256 |
| Omega Pharma SA | 422 | | 37,237 |
| SA D'Ieteren Trading NV | 61 | | 24,309 |
| Solvay SA | 1,514 | | 225,035 |
| Suez SA | 1,695 | | 96,774 |
| UCB SA | 2,628 | | 148,251 |
| | | |
| International Equity Index Fund (continued) | | |
| | Shares or | | |
| | Principal | | |
| | Amount | | Value |
|
|
| |
| COMMON STOCKS (continued) | | | |
| | | | |
| Belgium (continued) | | | |
| Union Miniere SA | 580 | $ | 133,193 |
| |
|
| | | | 3,913,801 |
| Bermuda - 0.28% | | | |
| Brilliance China Automotive Holdings, Ltd. * | 63,709 | | 15,320 |
| Central European Media Enterprises, Ltd. * | 725 | | 65,128 |
| Cheung Kong Infrastructure Holdings, Ltd. | 11,000 | | 40,718 |
| Cosco Pacific, Ltd. | 28,855 | | 80,230 |
| Credicorp, Ltd., ADR | 967 | | 59,326 |
| Esprit Holdings, Ltd. | 24,500 | | 355,918 |
| Frontline, Ltd. | 1,200 | | 56,140 |
| Giordano International, Ltd. | 28,000 | | 13,532 |
| Johnson Electronic Holdings, Ltd. | 33,000 | | 17,197 |
| Li & Fung, Ltd. | 51,600 | | 191,702 |
| Noble Group, Ltd. (a) | 23,000 | | 25,194 |
| Orient Overseas International, Ltd. | 5,000 | | 54,273 |
| SeaDrill, Ltd., GDR * | 6,100 | | 113,447 |
| Sinofert Holdings, Ltd. | 56,000 | | 40,095 |
| TPV Technology, Ltd. | 25,211 | | 15,817 |
| Yue Yuen Industrial Holdings, Ltd. | 14,000 | | 42,153 |
| |
|
| | | | 1,186,190 |
| Brazil - 1.19% | | | |
| All America Latina Logistica SA | 8,900 | | 102,647 |
| Aracruz Celulose SA, ADR | 845 | | 52,753 |
| B2W Companhia Global Do Varejo | 1,079 | | 41,390 |
| Banco Nossa Caixa SA * | 732 | | 11,157 |
| Brasil Telecom Participacoes SA, ADR | 715 | | 51,108 |
| Brasil Telecom Participacoes SA | 1,400 | | 31,582 |
| Centrais Eletricas Brasileiras SA, ADR, | | | |
| B Shares (a) | 2,071 | | 25,510 |
| Centrais Eletricas Brasileiras SA, ADR | 3,447 | | 44,920 |
| Centrais Eletricas Brasileiras SA * | 1,800 | | 23,220 |
| Cia Brasileira De Distribuicao Grupo Pao de | | | |
| Acucar, ADR | 436 | | 14,009 |
| Cia de Bebidas das Americas, ADR | 743 | | 50,227 |
| Cia de Concessoes Rodoviarias, ADR | 2,700 | | 46,642 |
| Cia de Saneamento Basico do Estado de Sao | | | |
| Paulo * | 2,480 | | 60,230 |
| Cia Energetica de Minas Gerais, ADR | 5,304 | | 100,776 |
| Cia Vale do Rio Doce | 7,003 | | 345,062 |
| Companhia Siderurgica Nacional SA, ADR (a) | 2,542 | | 143,394 |
| Companhia Siderurgica Nacional SA | 322 | | 18,215 |
| Companhia Vale Do Rio Doce, ADR | 9,294 | | 458,473 |
| Companhia Vale Do Rio Doce, SADR | 13,159 | | 549,388 |
| Cosan SA Industria e Comercio | 1,692 | | 18,741 |
| Cyrela Brazil Realty SA | 4,000 | | 37,699 |
| Cyrela Commercial Properties SA | | | |
| Empreendimentos e Participacoes * | 4,000 | | 4,878 |
| Diagnosticos da America SA | 800 | | 17,880 |
| EDP- Energias do Brasil SA * | 1,700 | | 26,776 |
| Empresa Brasileira de Aeronautica SA * | 4,200 | | 46,947 |
| Empresa Brasileira de Aeronautica SA, ADR (a) | 1,575 | | 71,127 |
| Gafisa SA | 2,288 | | 27,551 |
| |
| The accompanying notes are an integral part of the financial statements. | 211 |
John Hancock Funds II
Portfolio of investments — August 31, 2007
(showing percentage of total net assets)
| | | |
| International Equity Index Fund (continued) | | |
| | Shares or | | |
| | Principal | | |
| | Amount | | Value |
|
|
| |
| COMMON STOCKS (continued) | | | |
| | | | |
| Brazil (continued) | | | |
| Gerdau SA, SADR (a) | 6,241 | $ | 150,034 |
| Gerdau SA | 1,308 | | 26,310 |
| Lojas Americanas SA * | 8,000 | | 65,034 |
| Lojas Renner SA | 2,900 | | 49,846 |
| Natura Cosmeticos SA | 2,400 | | 25,241 |
| Perdigao SA | 2,100 | | 40,758 |
| Petroleo Brasileiro SA, ADR (a) | 8,228 | | 508,820 |
| Petroleo Brasileiro SA, SADR (a) | 11,359 | | 604,640 |
| Petroleo Brasileiro SA | 11,092 | | 343,772 |
| Redecard SA * | 4,099 | | 62,478 |
| Souza Cruz SA | 1,700 | | 35,404 |
| Tele Norte Leste Participacoes SA, ADR | 5,457 | | 120,545 |
| Tele Norte Leste Participacoes SA | 1,700 | | 57,862 |
| Tractebel Energia SA | 3,100 | | 35,281 |
| Unibanco - Uniao de Bancos Brasileiros SA * | 8,080 | | 90,316 |
| Unibanco - Uniao De Bancos | | | |
| Brasileiros SA, ADR * | 1,717 | | 191,583 |
| Usinas Siderurgicas de Minas Gerais SA, | | | |
| SADR | 1,567 | | 93,224 |
| Vivo Participacoes SA, ADR | 3,208 | | 15,238 |
| Votorantim Celulose & Papel SA, SADR * | 1,189 | | 27,799 |
| Weg SA | 3,400 | | 35,949 |
| |
|
| | | | 5,002,436 |
| Canada - 6.09% | | | |
| Aber Diamond Corp. | 1,400 | | 49,910 |
| Abitibi-Consolidated, Inc. * | 7,100 | | 13,782 |
| ACE Aviation Holdings, Inc. * | 1,900 | | 44,599 |
| Aeroplan Income Fund, ADR | 636 | | 12,741 |
| Agnico-Eagle Mines, Ltd. | 3,200 | | 143,077 |
| Agrium, Inc. | 3,000 | | 137,061 |
| Alcan Aluminum, Ltd. | 8,700 | | 858,797 |
| Alimentation Couche Tard, Inc., ADR | 3,500 | | 71,916 |
| ARC Energy Trust, ADR | 2,000 | | 38,614 |
| Astral Media, Inc. | 1,200 | | 48,348 |
| Bank Nova Scotia Halifax | 23,200 | | 1,147,588 |
| Bank of Montreal | 11,800 | | 725,698 |
| Barrick Gold Corp. | 20,308 | | 660,140 |
| BCE, Inc. | 6,173 | | 236,083 |
| Biovail Corp. | 3,200 | | 56,419 |
| Bombardier, Inc. * | 33,200 | | 194,906 |
| Brookfield Asset Management, Inc. | 11,625 | | 394,398 |
| Brookfield Properties Corp. | 5,250 | | 120,053 |
| CAE, Inc. | 6,000 | | 77,549 |
| Cameco Corp. | 8,200 | | 331,152 |
| Canadian Imperial Bank of Commerce | 7,900 | | 715,870 |
| Canadian National Railway Company | 12,000 | | 632,895 |
| Canadian Natural Resources, Ltd. | 12,900 | | 881,783 |
| Canadian Oil Sands Trust, ADR | 5,500 | | 158,787 |
| Canadian Pacific Railway, Ltd. | 3,600 | | 252,931 |
| Canadian Tire Corp., Ltd. | 1,800 | | 132,277 |
| Canadian Utilities, Ltd. | 1,200 | | 55,279 |
| Canetic Resources Trust | 5,700 | | 79,393 |
| | | |
| International Equity Index Fund (continued) | |
| | Shares or | | |
| | Principal | | |
| | Amount | | Value |
|
|
| |
| COMMON STOCKS (continued) | | | |
| | | | |
| Canada (continued) | | | |
| Canfor Corp. * | 1,800 | $ | 21,066 |
| Celestica, Inc. * | 3,800 | | 22,632 |
| CGI Group, Inc. * | 7,100 | | 78,657 |
| CI Financial Income Fund | 1,500 | | 36,119 |
| Cognos, Inc. * | 2,100 | | 84,211 |
| Cott Corp. * | 1,900 | | 21,337 |
| Duvernay Oil Corp. * | 1,000 | | 30,063 |
| Eldorado Gold Corp. * | 7,900 | | 38,973 |
| Enbridge, Inc. | 8,000 | | 269,671 |
| EnCana Corp. | 18,100 | | 1,060,704 |
| Enerplus Resources Fund | 2,900 | | 122,744 |
| Ensign Energy Services, Inc., ADR | 2,700 | | 47,297 |
| Fairfax Financial Holdings, Ltd. | 400 | | 83,091 |
| Finning International, Inc. | 4,000 | | 116,845 |
| First Calgary Petroleums, Ltd., ADR * | 7,000 | | 33,472 |
| First Quantum Minerals, Ltd., ADR | 1,500 | | 113,626 |
| Fording Canadian Coal Trust | 3,600 | | 118,659 |
| Fortis, Inc. | 2,300 | | 57,821 |
| George Weston, Ltd. | 1,300 | | 88,136 |
| Gildan Activewear, Inc. * | 2,800 | | 90,806 |
| Goldcorp, Inc. | 16,553 | | 390,746 |
| Great-West Lifeco, Inc. | 6,200 | | 209,876 |
| Harvest Energy Trust | 3,100 | | 80,428 |
| Husky Energy, Inc. | 6,100 | | 223,819 |
| IGM Financial, Inc. | 2,900 | | 142,185 |
| Imperial Oil, Ltd. | 7,700 | | 336,916 |
| Ivanhoe Mines, Ltd. * | 5,800 | | 65,079 |
| Jazz Air Income Fund, ADR * | 614 | | 4,488 |
| Jean Coutu Group, Inc. | 2,900 | | 42,700 |
| Kinross Gold Corp. * | 13,558 | | 165,864 |
| Loblaw Companies, Ltd. | 2,600 | | 111,154 |
| Lundin Mining Corp. * | 7,900 | | 90,512 |
| Magna International, Inc. | 2,500 | | 224,458 |
| Manulife Financial Corp. | 36,400 | | 1,409,677 |
| MDS, Inc. | 3,100 | | 60,761 |
| Meridian Gold, Inc. * | 2,100 | | 57,963 |
| Methanex Corp. | 2,600 | | 58,248 |
| MI Developments, Inc., Class A | 1,200 | | 38,076 |
| National Bank of Canada | 3,800 | | 197,610 |
| Nexen, Inc. | 11,200 | | 313,167 |
| Niko Resources, Ltd. | 1,100 | | 96,866 |
| Nortel Networks Corp. * | 10,060 | | 176,319 |
| Nova Chemicals Corp. | 2,100 | | 76,535 |
| Onex Corp. | 2,300 | | 75,353 |
| Open Text Corp. * | 1,300 | | 32,325 |
| OPTI Canada, Inc. * | 4,000 | | 73,857 |
| Pan American Silver Corp. * | 1,500 | | 37,496 |
| Penn West Energy Trust | 5,480 | | 157,950 |
| Petro-Canada | 11,700 | | 596,688 |
| Potash Corp. of Saskatchewan, Inc. | 7,400 | | 655,707 |
| Power Corp. Of Canada | 7,900 | | 302,954 |
| Power Financial Corp. | 5,700 | | 221,178 |
| |
| The accompanying notes are an integral part of the financial statements. | 212 |
John Hancock Funds II
Portfolio of investments — August 31, 2007
(showing percentage of total net assets)
| | | |
| International Equity Index Fund (continued) | |
| | Shares or | | |
| | Principal | | |
| | Amount | | Value |
|
|
| |
| COMMON STOCKS (continued) | | | |
| | | |
| Canada (continued) | | | |
| Precision Drilling Trust, ADR | 1,200 | $ | 23,327 |
| PrimeWest Energy Trust | 3,500 | | 71,650 |
| Provident Energy Trust | 4,400 | | 51,037 |
| QLT, Inc. * | 250 | | 1,470 |
| Quebecor World, Inc. * | 1,600 | | 14,271 |
| Research In Motion, Ltd. * | 11,700 | | 999,391 |
| RioCan Real Estate Investment Trust | 2,600 | | 57,928 |
| Ritchie Bros. Auctioneers, Inc. | 700 | | 45,323 |
| Rogers Communications, Inc., Class B | 11,700 | | 531,546 |
| RONA, Inc. * | 2,400 | | 48,882 |
| Royal Bank of Canada | 30,100 | | 1,548,749 |
| Saputo, Inc. | 1,800 | | 86,498 |
| Shaw Communications, Inc. | 8,200 | | 190,384 |
| Sherritt International Corp., ADR | 5,600 | | 84,575 |
| Shoppers Drug Mart Corp. | 4,500 | | 226,939 |
| SNC-Lavalin Group, Inc. | 3,400 | | 133,283 |
| Sun Life Financial, Inc. | 13,400 | | 644,433 |
| Suncor Energy, Inc. | 10,800 | | 967,408 |
| Talisman Energy, Inc. | 25,500 | | 437,515 |
| Teck Cominco, Ltd. | 10,200 | | 434,618 |
| Telus Corp. - Non Voting Shares | 3,700 | | 191,674 |
| Telus Corp. | 1,400 | | 74,037 |
| Thomson Corp. | 5,200 | | 220,093 |
| TransAlta Corp. | 4,800 | | 135,896 |
| Trans-Canada Corp. | 12,500 | | 435,565 |
| Trican Well Service, Ltd. | 2,400 | | 42,723 |
| TSX Group, Inc. | 1,600 | | 67,418 |
| UTS Energy Corp., ADR * | 11,000 | | 58,328 |
| Western Oil Sands, Inc. * | 3,500 | | 124,013 |
| Yamana Gold, Inc. | 7,800 | | 86,338 |
| Yellow Pages Income Fund | 5,800 | | 74,910 |
|
|
| | | | 25,645,153 |
| Cayman Islands - 0.15% | | | |
| Agile Property Holdings, Ltd. | 39,211 | | 71,083 |
| ASM Pacific Technology, Ltd. | 4,500 | | 40,080 |
| Belle International Holdings, Ltd., GDR * | 45,888 | | 52,672 |
| Foxconn International Holdings, Ltd. * | 50,000 | | 130,684 |
| Hengan International Group Company, Ltd., | | | |
| GDR | 14,000 | | 43,146 |
| Hutchison Telecommunications | | | |
| International, Ltd. * | 30,000 | | 39,139 |
| Kingboard Chemical Holdings, Ltd. | 14,000 | | 82,105 |
| Shimao Property Holdings, Ltd., GDR | 35,000 | | 92,258 |
| Tingyi Cayman Islands Holding Corp., GDR | 38,000 | | 54,760 |
| Xinao Gas Holdings, Ltd., GDR | 14,000 | | 23,143 |
|
|
| | | | 629,070 |
| Chile - 0.24% | | | |
| Banco Santander Chile SA, ADR | 2,667 | | 126,949 |
| Cia Cervecerias Unidas SA, ADR | 457 | | 16,580 |
| Compania de Telecomunicaciones de Chile | | | |
| SA, ADR (a) | 7,734 | | 66,281 |
| Distribucion y Servicio D&S SA, ADR (a) | 966 | | 28,603 |
| | | | |
| International Equity Index Fund (continued) | | |
| | | Shares or | | |
| | | Principal | | |
| | | Amount | | Value |
| |
|
| |
| COMMON STOCKS (continued) | | | | |
| | | | | |
| Chile (continued) | | | | |
| Embotelladora Andina SA, ADR, Series A (a) | | 915 $ | | 15,998 |
| Embotelladora Andina SA, ADR, Series B | | 1,006 | | 19,436 |
| Empresa Nacional de Electricidad SA, ADR (a) | | 6,419 | | 284,875 |
| Enersis SA, ADR | | 15,435 | | 277,521 |
| Sociedad Quimica y Minera de | | | | |
| Chile SA, ADR, B Shares | | 717 | | 114,283 |
| Vina Concha Y Toro SA, ADR | | 911 | | 43,163 |
| |
|
| | | | | 993,689 |
| China - 1.33% | | | | |
| Air China, Ltd., Class H | | 53,466 | | 66,790 |
| Aluminum Corp. of China, Ltd. (a) | | 74,780 | | 204,859 |
| Angang New Steel Company, Ltd. Class H | | 20,141 | | 68,223 |
| Bank of China, Ltd., H Shares | | 556,500 | | 285,573 |
| Bank of Communications Company, Ltd., | | | | |
| Class H | | 141,879 | | 159,364 |
| Beijing Capital International Airport Company, | | | | |
| Ltd., Class H | | 39,211 | | 63,830 |
| Beijing Datang Power Generation | | | | |
| Company , Ltd., Class H | | 75,136 | | 79,563 |
| BYD Company, Ltd., H Shares | | 3,446 | | 24,946 |
| Chaoda Modern Agriculture Holdings, Ltd. | | 37,925 | | 29,213 |
| China Construction Bank | | 601,118 | | 506,201 |
| China Life Insurance Company, Ltd. | | 171,376 | | 813,924 |
| China Mengniu Dairy Company, Ltd. | | 23,498 | | 88,575 |
| China Petroleum & Chemical Corp., Class H | | 408,030 | | 449,422 |
| China Shipping Container Lines Company, Ltd. | | 85,076 | | 64,966 |
| China Shipping Development Company, Ltd., | | | | |
| Class H | | 29,568 | | 89,576 |
| China Telecom Corp., Ltd. | | 340,396 | | 196,751 |
| China Travel International Investment | | | | |
| Hong Kong, Ltd. | | 61,709 | | 39,006 |
| COSCO Holdings | | 61,879 | | 144,602 |
| Dongfeng Motor Group Company, Ltd. | | 62,780 | | 40,764 |
| Guangdong Investment, Ltd. | | 52,780 | | 33,259 |
| Guangshen Railway Company, Ltd., Class H | | 33,211 | | 26,382 |
| Guangzhou R&F Properties Company, Ltd. - | | | | |
| H Shares | | 25,200 | | 101,525 |
| Huadian Power International Corp., Ltd., | | | | |
| Class H | | 35,211 | | 20,291 |
| Huaneng Power International, Inc., Class H | | 76,564 | | 88,453 |
| Hunan Non Ferrous Metal Corp., Ltd | | 34,000 | | 19,845 |
| Industrial & Commercial Bank of China | | 707,000 | | 462,869 |
| Jiangsu Expressway, Ltd. | | 28,855 | | 30,167 |
| Jiangxi Copper Company, Ltd., Class H | | 34,925 | | 81,145 |
| Lenovo Group, Ltd. | | 74,564 | | 49,634 |
| Maanshan Iron & Steel Company, Ltd.,Class H | | 41,925 | | 37,469 |
| PetroChina Company, Ltd., Class H | | 461,739 | | 675,087 |
| PICC Property & Casualty Company, Ltd., | | | | |
| Class H * | | 54,780 | | 69,281 |
| Shanghai Electric Group Company, Ltd. | | 63,136 | | 40,324 |
| Shanghai Forte Land Company | | 25,211 | | 15,077 |
| Shenzhen Expressway Company, Ltd. | | 18,141 | | 17,936 |
| Shui On Land, Ltd. | | 42,500 | | 44,841 |
| |
| The accompanying notes are an integral part of the financial statements. | 213 |
John Hancock Funds II
Portfolio of investments — August 31, 2007
(showing percentage of total net assets)
| | | |
| International Equity Index Fund (continued) | | |
| | Shares or | | |
| | Principal | | |
| | Amount | | Value |
|
|
| |
| COMMON STOCKS (continued) | | | |
| | | | |
| China (continued) | | | |
| Sinopec Shanghai Petrochemical | | | |
| Company, Ltd., H Shares | 52,066 | $ | 35,584 |
| Sinopec Yizheng Chemical Fibre | | | |
| Company, Ltd. * | 29,925 | | 14,903 |
| Sinotrans, Ltd., H Shares | 35,390 | | 19,506 |
| Tsingtao Brewery Company, Ltd., Series H | 7,070 | | 24,669 |
| Weichai Power Company, Ltd. | 3,357 | | 26,804 |
| Yanzhou Coal Mining Company, Ltd., Class H | 49,210 | | 86,890 |
| Zhejiang Expressway Company, Ltd., Class H | 32,282 | | 42,959 |
| Zijin Mining Group, Ltd. | 99,686 | | 87,851 |
| ZTE Corp., Class H | 3,757 | | 18,472 |
| |
|
| | | | 5,587,371 |
| Colombia - 0.06% | | | |
| BanColombia SA, ADR | 7,807 | | 255,914 |
| | | | |
| Czech Republic - 0.13% | | | |
| CEZ AS | 5,446 | | 288,076 |
| Komercni Banka AS | 400 | | 87,130 |
| Philip Morris CR AS | 18 | | 8,688 |
| Telefonica Czech Republic AS | 2,966 | | 88,683 |
| Unipetrol AS * | 1,919 | | 26,614 |
| Zentiva NV (a) | 603 | | 35,662 |
| |
|
| | | | 534,853 |
| Denmark - 0.68% | | | |
| A P Moller- Maersk AS (a) | 26 | | 340,693 |
| Bang & Olufsen A/S, Series B | 225 | | 24,578 |
| Carlsberg AS, B Shares | 800 | | 107,955 |
| Coloplast AS | 586 | | 55,740 |
| Dampskibsselskabet Torm AS, ADR (a) | 600 | | 25,981 |
| Danisco AS (a) | 1,150 | | 84,818 |
| Danske Bank AS (a) | 10,600 | | 435,749 |
| Det Ostasiatiske Kompagni A/S | 375 | | 25,347 |
| DSV AS, ADR | 4,800 | | 109,627 |
| FLS Industries AS, B Shares | 1,300 | | 123,037 |
| GN Store Nord AS * (a) | 4,500 | | 44,284 |
| H. Lundbeck AS (a) | 1,200 | | 28,268 |
| Jyske Bank * (a) | 1,389 | | 103,490 |
| NKT Holding A/S | 600 | | 63,596 |
| Novo Nordisk AS (a) | 5,650 | | 630,584 |
| Novozymes AS, B Shares (a) | 1,100 | | 130,337 |
| Sydbank AS (a) | 1,390 | | 63,623 |
| Topdanmark AS * (a) | 400 | | 64,463 |
| TrygVesta AS | 598 | | 47,532 |
| Vestas Wind Systems AS * (a) | 4,400 | | 298,401 |
| William Demant Holdings AS * (a) | 600 | | 52,956 |
| |
|
| | | | 2,861,059 |
| Egypt - 0.12% | | | |
| Alexandria Mineral Oils Company | 384 | | 5,501 |
| Commercial International Bank | 3,695 | | 43,934 |
| Credit Agricole Egypt * | 1,277 | | 3,794 |
| Eastern Tobacco | 251 | | 17,267 |
| Egyptian Company for Mobile Services | 780 | | 24,968 |
| | | |
| International Equity Index Fund (continued) | | |
| | Shares or | | |
| | Principal | | |
| | Amount | | Value |
|
|
| |
| COMMON STOCKS (continued) | | | |
| | | | |
| Egypt (continued) | | | |
| Egyptian Financial Group-Hermes Holding | 3,889 | $ | 29,918 |
| Egyptian International Pharmaceutical | | | |
| Industries Company | 723 | | 3,690 |
| EL Ezz Aldekhela Steel Alexandria | 61 | | 10,745 |
| El Ezz Steel Company | 1,819 | | 15,757 |
| El Watany Bank of Egypt | 1,337 | | 17,535 |
| Medinet Nasr Housing | 143 | | 5,999 |
| Misr Beni Suef Cement Company | 290 | | 5,479 |
| Olympic Group Financial Investments | 803 | | 9,036 |
| Orascom Construction Industries | 1,801 | | 120,922 |
| Orascom Hotels & Development * | 1,926 | | 20,634 |
| Orascom Telecom Holding SAE | 11,035 | | 128,056 |
| Oriental Weavers | 357 | | 3,975 |
| Sidi Kerir Petrochemicals Company | 2,925 | | 8,975 |
| Telecom Egypt | 7,610 | | 22,792 |
| |
|
| | | | 498,977 |
| Finland - 1.38% | | | |
| Amer Sports Oyj, A Shares | 1,550 | | 35,367 |
| Cargotec Corp. Oyj, B Shares | 870 | | 42,477 |
| Elisa Oyj, A Shares (a) | 3,500 | | 97,751 |
| Fortum Corp. Oyj | 10,600 | | 351,725 |
| KCI Konecranes Oyj | 1,450 | | 55,398 |
| Kesko Oyj (a) | 1,600 | | 94,398 |
| Kone Corp. Oyj | 1,785 | | 117,198 |
| Metra Oyj, B Shares (a) | 1,600 | | 99,972 |
| Metso Oyj | 3,000 | | 192,998 |
| Neste Oil Oyj | 2,999 | | 104,051 |
| Nokia AB Oyj | 96,550 | | 3,184,789 |
| Nokian Renkaat Oyj | 2,510 | | 88,679 |
| OKO Bank - A Shares (a) | 2,000 | | 39,911 |
| Orion Oyj, Series B | 2,087 | | 49,873 |
| Outokumpu Oyj (a) | 2,800 | | 85,113 |
| Rautaruukki Oyj | 2,000 | | 109,498 |
| Sampo Oyj, A Shares (a) | 10,200 | | 293,609 |
| SanomaWSOY Oyj (a) | 1,990 | | 60,950 |
| Stora Enso Oyj, R Shares (a) | 13,800 | | 248,945 |
| TietoEnator Oyj (a) | 1,680 | | 39,139 |
| UPM-Kymmene Oyj | 12,400 | | 281,785 |
| Uponor Oyj (a) | 1,200 | | 46,146 |
| YIT Oyj | 2,945 | | 89,276 |
| |
|
| | | | 5,809,048 |
| France - 7.25% | | | |
| Accor SA | 4,198 | | 359,087 |
| Aeroports de Paris (a) | 742 | | 84,833 |
| Air France KLM (a) | 2,755 | | 114,168 |
| Air Liquide | 5,678 | | 722,158 |
| Alcatel-Lucent | 54,551 | | 596,573 |
| Alstom (a) | 2,386 | | 429,694 |
| Atos Origin SA * | 1,722 | | 96,762 |
| AXA Group SA (a) | 36,586 | | 1,464,082 |
| BNP Paribas SA | 19,685 | | 2,069,070 |
| |
| The accompanying notes are an integral part of the financial statements. | 214 |
John Hancock Funds II
Portfolio of investments — August 31, 2007
(showing percentage of total net assets)
| | | |
| International Equity Index Fund (continued) | | |
| | Shares or | | |
| | Principal | | |
| | Amount | | Value |
|
|
| |
| COMMON STOCKS (continued) | | | |
| | | |
| France (continued) | | | |
| Bouygues SA | 5,172 | $ | 406,204 |
| Business Objects SA * (a) | 2,146 | | 94,284 |
| Cap Gemini SA | 3,193 | | 206,100 |
| Carrefour SA | 14,099 | | 984,065 |
| Casino Guich-Perrachon SA (a) | 953 | | 97,182 |
| CNP Assurances SA | 1,093 | | 139,420 |
| Compagnie de Saint-Gobain SA (a) | 7,813 | | 847,214 |
| Compagnie Generale des Etablissements | | | |
| Michelin, Class B | 3,387 | | 425,663 |
| Credit Agricole SA | 15,236 | | 573,042 |
| Dassault Systemes SA (a) | 1,400 | | 82,449 |
| Essilor International SA (a) | 4,544 | | 275,583 |
| European Aeronautic Defence & | | | |
| Space Company | 7,385 | | 218,468 |
| France Telecom SA | 39,490 | | 1,191,058 |
| Gaz de France | 4,465 | | 223,689 |
| Gecina SA | 319 | | 52,196 |
| Groupe DANONE | 10,373 | | 788,643 |
| Hermes International SA (a) | 1,613 | | 173,868 |
| Icade | 691 | | 41,979 |
| Imerys SA (a) | 796 | | 72,788 |
| Klepierre SA (a) | 555 | | 87,118 |
| Lafarge SA (a) | 3,475 | | 538,698 |
| Lagardere S.C.A. | 2,747 | | 223,897 |
| L'Oreal SA | 5,864 | | 685,067 |
| LVMH Moet Hennessy SA | 5,784 | | 644,640 |
| M6-Metropole Television | 1,462 | | 44,082 |
| Neopost SA | 752 | | 114,738 |
| PagesJaunes Groupe SA (a) | 3,253 | | 65,913 |
| Pernod-Ricard SA (a) | 2,124 | | 446,656 |
| Pinault-Printemps-Redoute SA | 1,803 | | 311,388 |
| PSA Peugeot Citroen SA | 3,537 | | 300,425 |
| Publicis Groupe SA | 3,212 | | 139,036 |
| Renault Regie Nationale SA | 4,281 | | 575,844 |
| Safran SA | 4,155 | | 97,970 |
| Sanofi-Aventis SA | 23,912 | | 1,960,968 |
| Schneider Electric SA | 5,081 | | 672,650 |
| SCOR SE | 4,287 | | 104,843 |
| Societe BIC SA | 609 | | 46,200 |
| Societe Des Autoroutes Paris-Rhin-Rhone | 592 | | 60,374 |
| Societe Generale | 8,603 | | 1,383,212 |
| Societe Television Francaise 1 | 2,677 | | 77,679 |
| Sodexho Alliance (a) | 2,137 | | 140,560 |
| STMicroelectronics NV (a) | 15,680 | | 272,778 |
| Suez SA Strip VVPR * | 1,452 | | 20 |
| Suez SA | 22,263 | | 1,266,250 |
| Technip SA | 2,262 | | 180,648 |
| Thales SA (a) | 2,184 | | 123,712 |
| Thomson SA * | 5,520 | | 90,562 |
| Total SA | 50,427 | | 3,786,566 |
| Unibail-Rodamco (a) | 1,728 | | 414,488 |
| Valeo SA (a) | 1,584 | | 76,519 |
| | | |
| International Equity Index Fund (continued) | | |
| | Shares or | | |
| | Principal | | |
| | Amount | | Value |
|
|
| |
| COMMON STOCKS (continued) | | | |
| | | | |
| France (continued) | | | |
| Vallourec SA | 1,117 | $ | 297,515 |
| Veolia Environnement SA | 8,124 | | 625,488 |
| Vinci SA, ADR | 9,335 | | 662,721 |
| Vivendi SA (a) | 27,006 | | 1,102,273 |
| Zodiac SA (a) | 1,000 | | 72,268 |
| |
|
| | | | 30,524,088 |
| Germany - 6.08% | | | |
| Adidas-Salomon AG (a) | 4,840 | | 284,576 |
| Allianz AG | 10,644 | | 2,284,037 |
| Altana AG (a) | 1,512 | | 34,594 |
| Arcandor AG * | 1,345 | | 37,113 |
| BASF AG | 11,740 | | 1,554,163 |
| Bayer AG | 17,024 | | 1,344,457 |
| Beiersdorf AG | 2,135 | | 143,480 |
| Bilfinger Berger AG | 835 | | 68,603 |
| Celesio AG | 2,080 | | 130,196 |
| Commerzbank AG | 14,530 | | 596,351 |
| Continental AG | 3,066 | | 399,259 |
| DaimlerChrysler AG | 21,688 | | 1,927,585 |
| Deutsche Bank AG | 12,166 | | 1,503,952 |
| Deutsche Boerse AG | 4,835 | | 534,190 |
| Deutsche Lufthansa AG | 5,540 | | 161,792 |
| Deutsche Post AG, GDR | 1,460 | | 42,059 |
| Deutsche Post AG | 16,486 | | 479,453 |
| Deutsche Postbank AG | 1,995 | | 144,821 |
| Deutsche Telekom AG | 66,469 | | 1,237,530 |
| Douglas Holding AG | 661 | | 39,759 |
| E.ON AG | 14,648 | | 2,458,993 |
| Fresenius Medical Care AG | 4,414 | | 217,170 |
| Heidelberger Druckmaschinen AG | 1,353 | | 61,377 |
| Henkel KGaA | 4,155 | | 214,190 |
| Hochtief AG | 949 | | 95,235 |
| Hypo Real Estate Holding AG | 3,178 | | 174,692 |
| Infineon Technologies AG * (a) | 17,226 | | 268,386 |
| IVG Immobilien AG (a) | 2,299 | | 82,347 |
| Linde AG | 2,706 | | 318,164 |
| MAN AG | 2,639 | | 378,816 |
| Merck & Company AG | 1,509 | | 193,759 |
| Metro AG | 3,869 | | 335,493 |
| MLP AG (a) | 1,580 | | 25,215 |
| Muenchener Rueckversicherungs- | | | |
| Gesellschaft AG | 5,148 | | 890,233 |
| Premiere AG * | 2,117 | | 46,186 |
| ProSieben Sat.1 Media AG | 1,970 | | 67,564 |
| Puma AG | 164 | | 65,894 |
| Qiagen AG * (a) | 4,429 | | 76,185 |
| Rheinmetall AG (a) | 788 | | 65,527 |
| RWE AG | 10,434 | | 1,174,553 |
| Salzgitter AG | 962 | | 190,108 |
| SAP AG | 20,801 | | 1,124,410 |
| Siemens AG | 20,018 | | 2,514,699 |
| Solarworld AG (a) | 2,014 | | 99,403 |
| |
| The accompanying notes are an integral part of the financial statements. | 215 |
John Hancock Funds II
Portfolio of investments — August 31, 2007
(showing percentage of total net assets)
| | | |
| International Equity Index Fund (continued) | |
| | Shares or | | |
| | Principal | | |
| | Amount | | Value |
|
|
| |
| COMMON STOCKS (continued) | | | |
| | | | |
| Germany (continued) | | | |
| Suedzucker AG (a) | 1,309 | $ | 25,216 |
| Thyssen Krupp AG | 8,405 | | 491,494 |
| TUI AG * | 5,216 | | 135,478 |
| Volkswagen AG | 4,007 | | 828,354 |
| Wincor Nixdorf AG (a) | 672 | | 58,155 |
|
|
| | | | 25,625,266 |
| Greece - 0.57% | | | |
| Alpha Bank A.E. | 9,484 | | 307,509 |
| Athens Stock Exchange SA (ASE) | 1,430 | | 39,458 |
| Bank of Piraeus SA | 7,856 | | 268,196 |
| Coca Cola Hellenic Bottling Company SA | 2,670 | | 127,483 |
| Cosmote Mobile Communications SA | 2,880 | | 89,468 |
| EFG Eurobank Ergas SA | 6,758 | | 229,617 |
| Folli-Follie SA | 340 | | 13,866 |
| Greek Organization of Football Prognostics | 5,470 | | 200,030 |
| Hellenic Petroleum SA | 2,460 | | 34,596 |
| Hellenic Technodomiki Tev SA | 2,960 | | 39,036 |
| Hellenic Telecommunications Organization SA | 7,800 | | 254,593 |
| Motor Oil Hellas Corinth Refineries SA | 1,110 | | 27,213 |
| National Bank of Greece SA | 9,872 | | 586,357 |
| Public Power Corp. | 2,570 | | 80,016 |
| Titan Cement Company SA | 1,460 | | 72,081 |
| Viohalco SA | 2,250 | | 33,864 |
|
|
| | | | 2,403,383 |
| Hong Kong - 2.24% | | | |
| Anhui Conch Cement Company, Ltd., Series H | 11,070 | | 77,997 |
| Bank of East Asia, Ltd. | 33,768 | | 187,789 |
| Beijing Enterprises Holdings, Ltd. | 6,714 | | 29,418 |
| BOC Hong Kong Holdings, Ltd. | 87,000 | | 209,130 |
| Cathay Pacific Airways, Ltd. | 33,000 | | 86,518 |
| Cheung Kong Holdings, Ltd. | 35,000 | | 514,163 |
| China Agri-Industries Holdings, Ltd. * | 34,784 | | 20,125 |
| China CITIC Bank * | 116,000 | | 89,262 |
| China Communications | | | |
| Construction Company , Ltd. | 102,665 | | 222,029 |
| China Eastern Airlines Corp., Ltd. * | 32,639 | | 15,614 |
| China Everbright, Ltd. * | 15,784 | | 49,666 |
| China Merchants Holdings International | | | |
| Company, Ltd. | 25,560 | | 134,163 |
| China Mobile, Ltd. | 120,470 | | 1,640,824 |
| China Overseas Land & Investment, Ltd. | 84,921 | | 177,068 |
| China Resource Power Holdings, Ltd. | 29,211 | | 82,387 |
| China Resources Enterprises, Ltd. | 28,855 | | 117,829 |
| China Resources Land, Ltd. | 41,211 | | 71,477 |
| China Shenhua Energy Company, Ltd. | 78,500 | | 341,172 |
| China Southern Airlines Company, Ltd. * | 30,855 | | 39,763 |
| Citic Pacific, Ltd. | 26,033 | | 142,987 |
| CLP Holdings, Ltd. | 31,000 | | 213,487 |
| CNOOC, Ltd. | 368,720 | | 452,457 |
| COFCO International, Ltd. | 15,784 | | 10,120 |
| Denway Motors, Ltd. | 123,559 | | 57,928 |
| | | |
| International Equity Index Fund (continued) | | |
| | Shares or | | |
| | Principal | | |
| | Amount | | Value |
|
|
| |
| COMMON STOCKS (continued) | | | |
| | | | |
| Hong Kong (continued) | | | |
| Fu Ji Food & Catering Services Holdings, Ltd. | 4,900 | $ | 14,650 |
| Global Bio-Chem Technology | | | |
| Group Company, Ltd. | 32,855 | | 14,328 |
| Gome Electrical Appliances Holdings, Ltd. | 23,427 | | 37,066 |
| Guangzhou Investment Company, Ltd. | 95,493 | | 26,475 |
| Hang Lung Properties, Ltd. | 49,000 | | 179,390 |
| Hang Seng Bank, Ltd. | 18,000 | | 282,208 |
| Henderson Land Development Company, Ltd. | 21,000 | | 147,129 |
| Hong Kong & China Gas Company, Ltd. | 88,700 | | 204,548 |
| Hong Kong Electric Holdings, Ltd. | 32,500 | | 162,957 |
| Hong Kong Exchange & Clearing, Ltd. | 24,000 | | 442,613 |
| Hopewell Holdings, Ltd. | 13,000 | | 61,954 |
| Hopson Development Holdings, Ltd., GDR | 14,000 | | 46,904 |
| Hutchison Whampoa, Ltd. | 50,000 | | 496,290 |
| Hysan Development Company, Ltd. | 15,547 | | 39,159 |
| Kerry Properties, Ltd. | 13,358 | | 98,641 |
| Li Ning Company, Ltd. | 14,749 | | 41,752 |
| Link, REIT | 51,487 | | 102,600 |
| Melco International Development | 16,000 | | 24,303 |
| MTR Corp., Ltd. | 32,460 | | 78,975 |
| New World Development Company, Ltd. | 58,177 | | 139,363 |
| Nine Dragons Paper Holdings, Ltd. | 29,600 | | 88,413 |
| PCCW, Ltd. | 82,000 | | 49,955 |
| Ping An Insurance Group Company of China, | | | |
| Ltd. | 34,355 | | 358,668 |
| Semiconductor Manufacturing | | | |
| International Corp. * | 379,912 | | 44,766 |
| Shanghai Industrial Holdings, Ltd. | 13,070 | | 57,005 |
| Shangri-La Asia, Ltd. | 28,000 | | 66,925 |
| Shenzhen Investment, Ltd. | 44,682 | | 36,832 |
| Shun Tak Holdings, Ltd. | 24,000 | | 35,997 |
| Sino Land Company, Ltd. | 29,158 | | 68,186 |
| Sun Hung Kai Properties, Ltd. | 32,000 | | 427,551 |
| Swire Pacific, Ltd., Class A | 19,500 | | 214,955 |
| Techtronic Industries Company, Ltd. | 21,500 | | 24,262 |
| Television Broadcasting Company, Ltd. | 6,000 | | 36,604 |
| Tencent Holdings, Ltd. | 20,000 | | 103,736 |
| Travelsky Technology, Ltd., Class H | 13,428 | | 10,844 |
| Weiqiao Textile Company, Ltd. | 8,749 | | 19,039 |
| Wharf Holdings, Ltd. | 29,000 | | 119,558 |
| Wing Hang Bank, Ltd. | 4,085 | | 49,830 |
| |
|
| | | | 9,437,804 |
| Hungary - 0.16% | | | |
| Gedeon Richter Rt. | 346 | | 68,510 |
| Magyar Telekom Rt. | 11,601 | | 58,407 |
| MOL Magyar Olaj es Gazipari Rt. | 1,751 | | 251,134 |
| OTP Bank Rt. | 6,230 | | 314,918 |
| |
|
| | | | 692,969 |
| India - 1.12% | | | |
| Bajaj Auto, Ltd., ADR | 1,087 | | 62,937 |
| Dr. Reddy's Laboratories, Ltd., ADR (a) | 5,317 | | 84,540 |
| Grasim Industries, Ltd., ADR | 1,811 | | 135,825 |
| |
| The accompanying notes are an integral part of the financial statements. | 216 |
John Hancock Funds II
Portfolio of investments — August 31, 2007
(showing percentage of total net assets)
| | | |
| International Equity Index Fund (continued) | |
| | Shares or | | |
| | Principal | | |
| | Amount | | Value |
|
|
| |
| COMMON STOCKS (continued) | | | |
| | | | |
| India (continued) | | | |
| Hindalco Industries, Ltd., ADR | 2,729 | $ | 10,780 |
| ICICI Bank, Ltd., SADR (a) | 13,769 | | 612,032 |
| Infosys Technologies, Ltd., ADR | 18,214 | | 868,990 |
| Larsen & Toubro, Ltd., ADR | 1,216 | | 76,836 |
| Mahindra & Mahindra, Ltd., ADR | 800 | | 14,160 |
| Ranbaxy Laboratories, Ltd., ADR | 7,336 | | 69,839 |
| Reliance Capital, Ltd. * | 895 | | 26,258 |
| Reliance Communication, Ltd., ADR | 19,406 | | 258,177 |
| Reliance Energy, Ltd., ADR | 447 | | 25,570 |
| Reliance Industries, Ltd., ADR | 17,640 | | 1,684,620 |
| Reliance Natural Resources, Ltd., ADR * (a) | 8,956 | | 19,917 |
| Satyam Computer Services, Ltd., ADR | 12,940 | | 329,711 |
| State Bank of India, Ltd., ADR | 1,181 | | 108,416 |
| Tata Motors, Ltd., SADR (a) | 8,981 | | 152,228 |
| Videsh Sanchar Nigam, Ltd., ADR (a) | 1,347 | | 27,196 |
| Wipro, Ltd., ADR (a) | 10,476 | | 153,264 |
|
|
| | | | 4,721,296 |
| Indonesia - 0.26% | | | |
| Aneka Tambang Tbk PT | 82,500 | | 19,770 |
| Astra Agro Lestari Tbk PT | 10,000 | | 15,230 |
| Astra International Tbk PT | 50,000 | | 95,074 |
| Bank Central Asia Tbk PT | 150,500 | | 96,136 |
| Bank Danamon Indonesia Tbk PT | 42,500 | | 36,492 |
| Bank Internasional Indonesia Tbk PT | 402,500 | | 8,662 |
| Bank Mandiri Tbk PT | 149,000 | | 51,513 |
| Bank Pan Indonesia Tbk PT * | 128,750 | | 9,176 |
| Bank Rakyat Indonesia Tbk PT | 134,500 | | 89,519 |
| Berlian Laju Tanker Tbk PT | 48,500 | | 7,972 |
| Bumi Resources Tbk PT | 407,500 | | 110,597 |
| Energi Mega Persada Tbk PT * | 91,500 | | 7,584 |
| Gudang Garam Tbk PT | 14,500 | | 14,727 |
| Indocement Tunggal Prakarsa Tbk PT | 23,000 | | 15,684 |
| Indofood Sukses Makmur Tbk PT | 105,500 | | 20,832 |
| Indosat Tbk PT | 60,500 | | 46,697 |
| International Nickel Indonesia Tbk PT | 5,000 | | 28,699 |
| Kalbe Farma Tbk PT | 113,500 | | 16,432 |
| Perusahaan Gas Negara Tbk PT | 45,000 | | 49,144 |
| PT Telekomunikiasi Indonesia, ADR (a) | 4,500 | | 212,220 |
| Ramayana Lestari Sentosa Tbk PT | 53,000 | | 4,793 |
| Semen Gresik Persero Tbk PT | 35,000 | | 18,438 |
| Telekomunikasi Indonesia Tbk PT | 71,500 | | 83,582 |
| Unilever Indonesia Tbk PT | 38,000 | | 27,556 |
| United Tractors Tbk PT | 32,000 | | 27,562 |
|
|
| | | | 1,114,091 |
| Ireland - 0.68% | | | |
| Allied Irish Banks PLC - London | 2,458 | | 62,922 |
| Allied Irish Banks PLC | 18,191 | | 464,292 |
| Bank of Ireland - London | 2,949 | | 54,457 |
| Bank of Ireland | 20,688 | | 380,567 |
| C&C Group PLC - London | 1,364 | | 10,040 |
| C&C Group PLC | 6,486 | | 47,540 |
| | | |
| International Equity Index Fund (continued) | | |
| | Shares or | | |
| | Principal | | |
| | Amount | | Value |
|
|
| |
| COMMON STOCKS (continued) | | | |
| | | | |
| Ireland (continued) | | | |
| CRH PLC - London | 1,471 | $ | 63,385 |
| CRH PLC | 11,329 | | 490,388 |
| DCC PLC | 1,619 | | 42,869 |
| DCC PLC | 143 | | 3,735 |
| Depfa Bank PLC (a) | 8,099 | | 153,775 |
| Elan Corp PLC - London * | 841 | | 16,085 |
| Elan Corp. * | 10,203 | | 195,163 |
| Experian Group, Ltd. | 23,630 | | 249,937 |
| Grafton Group PLC * | 5,103 | | 68,212 |
| Greencore Group PLC - London | 1,004 | | 6,337 |
| Greencore Group PLC | 3,045 | | 19,105 |
| Iaws Group PLC, ADR | 2,132 | | 41,764 |
| Iaws Group PLC | 887 | | 17,453 |
| Independent News & Media PLC - London | 1,204 | | 5,681 |
| Independent News & Media PLC | 11,661 | | 54,772 |
| Irish Life & Permanent PLC | 6,111 | | 151,769 |
| Kerry Group PLC | 2,619 | | 63,781 |
| Kerry Group PLC - London | 675 | | 16,513 |
| Kingspan Group PLC - London | 213 | | 5,480 |
| Kingspan Group PLC | 2,798 | | 72,435 |
| Paddy Power PLC | 1,051 | | 31,686 |
| Ryanair Holdings PLC, SADR * | 1,496 | | 62,488 |
| |
|
| | | | 2,852,631 |
| Israel - 0.40% | | | |
| Africa-Israel Investments, Ltd. | 311 | | 27,010 |
| Aladdin Knowledge Systems, ADR * | 298 | | 6,365 |
| Alvarion, Ltd., ADR * | 1,529 | | 17,996 |
| Audio Codes, Ltd., ADR * | 664 | | 3,287 |
| Bank Hapoalim, Ltd. | 23,474 | | 111,846 |
| Bank Leumi Le-Israel, Ltd. | 21,163 | | 82,653 |
| Bezek Israeli Telecommunications Corp., Ltd. | 26,127 | | 41,621 |
| Check Point Software Technologies, Ltd. * | 4,751 | | 111,458 |
| Clal Industries & Investments, Ltd. | 1,492 | | 8,238 |
| Clal Insurance Enterprise Holdings, Ltd. | 432 | | 10,261 |
| Discount Investment Corp. | 438 | | 12,733 |
| ECI Telecom, Ltd., ADR * | 1,366 | | 12,772 |
| Elbit Systems, Ltd. | 533 | | 24,011 |
| Given Imaging Corp., ADR * (a) | 288 | | 7,583 |
| Harel Insurance Investments, Ltd. | 176 | | 9,020 |
| ICL Israel Chemicals, Ltd. | 12,831 | | 101,413 |
| IDB Development Corp., Ltd. | 512 | | 18,468 |
| Israel Corp., Ltd. | 58 | | 40,782 |
| Israel Discount Bank, Ltd. * | 11,163 | | 22,777 |
| Koor Industries, Ltd. | 225 | | 15,665 |
| Makhteshim-Agam Industries, Ltd. * | 7,688 | | 59,410 |
| Migdal Insurance Holdings, Ltd. | 6,198 | | 9,573 |
| Nice Systems, Ltd. * | 1,233 | | 43,310 |
| Orbotech, Ltd. * | 720 | | 15,588 |
| Partner Communications, Ltd. | 1,752 | | 27,767 |
| RADWARE, Ltd., ADR * | 413 | | 5,555 |
| Retalix, Ltd. * | 389 | | 6,261 |
| |
| The accompanying notes are an integral part of the financial statements. | 217 |
John Hancock Funds II
Portfolio of investments — August 31, 2007
(showing percentage of total net assets)
| | | |
| International Equity Index Fund (continued) | | |
| | Shares or | | |
| | Principal | | |
| | Amount | | Value |
|
|
| |
| COMMON STOCKS (continued) | | | |
| | | | |
| Israel (continued) | | | |
| Strauss-Elite, Ltd. | 629 | $ | 7,423 |
| Super-Sol, Ltd., Class B * | 2,031 | | 7,555 |
| Syneron Medical, Ltd., ADR * | 423 | | 9,568 |
| Teva Pharmaceutical Industries, Ltd. | 18,150 | | 779,093 |
| United Mizrahi Bank, Ltd. | 3,045 | | 21,010 |
| |
|
| | | | 1,678,072 |
| Italy - 2.94% | | | |
| Alleanza Assicuraz SpA (a) | 10,233 | | 132,404 |
| Assicurazioni Generali SpA | 25,355 | | 1,042,041 |
| Autogrill SpA (a) | 2,441 | | 51,329 |
| Autostrade SpA | 6,096 | | 203,655 |
| Banca Intesa SpA - Non convertible | 22,207 | | 154,972 |
| Banca Monte dei Paschi Siena SpA (a) | 25,802 | | 164,389 |
| Banca Popolare di Milano SpA | 9,889 | | 144,130 |
| Banche Popolari Unite SpA | 14,418 | | 369,682 |
| Banco Popolare SpA * | 16,166 | | 404,846 |
| Bulgari SpA | 3,266 | | 46,028 |
| Capitalia SpA | 40,815 | | 389,852 |
| Enel SpA | 104,009 | | 1,076,095 |
| Eni SpA | 62,484 | | 2,161,072 |
| Fiat SpA (a) | 17,149 | | 457,931 |
| Finmeccanica SpA | 6,935 | | 204,066 |
| Fondiaria-Sai SpA | 1,627 | | 76,612 |
| Intesa Sanpaolo SpA | 185,000 | | 1,399,908 |
| Italcementi SpA | 1,507 | | 37,417 |
| Lottomatica SpA (a) | 1,736 | | 62,705 |
| Luxottica Group SpA | 3,348 | | 114,644 |
| Mediaset SpA | 17,955 | | 190,930 |
| Mediobanca SpA | 11,924 | | 257,635 |
| Mediolanum SpA | 5,585 | | 40,947 |
| Mondadori (Arnoldo) Editore SpA (a) | 2,181 | | 20,596 |
| Parmalat SpA | 37,666 | | 136,481 |
| Pirelli & Company SpA * | 67,277 | | 75,837 |
| Seat Pagine Gialle SpA | 99,855 | | 55,146 |
| Snam Rete Gas SpA | 21,580 | | 127,471 |
| T.E.R.N.A SpA | 29,262 | | 103,848 |
| Telecom Italia SpA (a) | 257,788 | | 730,060 |
| Telecom Italia SpA-RNC | 146,058 | | 328,383 |
| UniCredito Italiano SpA | 187,642 | | 1,613,995 |
| |
|
| | | | 12,375,107 |
| Japan - 15.88% | | | |
| Access Company, Ltd. * (a) | 5 | | 11,910 |
| Acom Company, Ltd. (a) | 1,430 | | 42,645 |
| Aderans Company, Ltd. (a) | 900 | | 16,431 |
| Advantest Corp. (a) | 3,700 | | 136,243 |
| AEON Company, Ltd. | 14,800 | | 202,051 |
| AEON Credit Service Company, Ltd. (a) | 1,600 | | 19,677 |
| Aeon Mall Company, Ltd. (a) | 1,700 | | 51,171 |
| Aiful Corp. (a) | 1,700 | | 33,892 |
| Aisin Seiki Company | 4,400 | | 165,779 |
| Ajinomoto Company, Inc. (a) | 14,000 | | 176,557 |
| | | |
| International Equity Index Fund (continued) | | |
| | Shares or | | |
| | Principal | | |
| | Amount | | Value |
|
|
| |
| COMMON STOCKS (continued) | | | |
| | | | |
| Japan (continued) | | | |
| Alfresa Holdings Corp. | 800 | $ | 53,135 |
| All Nippon Airways Company, Ltd. | 16,000 | | 63,805 |
| Alps Electric Company, Ltd. | 3,400 | | 39,873 |
| Amada Company, Ltd. | 8,000 | | 86,365 |
| Aoyama Trading Company, Ltd. | 1,100 | | 29,628 |
| Asahi Breweries, Ltd. | 9,900 | | 147,010 |
| Asahi Glass Company, Ltd. (a) | 23,000 | | 287,477 |
| Asahi Kasei Corp. (a) | 28,000 | | 209,974 |
| ASATSU-DK, Inc. (a) | 600 | | 20,103 |
| Asics Corp. (a) | 4,000 | | 51,708 |
| Astellas Pharmaceuticals, Inc. | 12,400 | | 574,557 |
| Autobacs Seven Company, Ltd. (a) | 600 | | 15,835 |
| Bank of Kyoto, Ltd. (a) | 6,000 | | 71,578 |
| Benesse Corp. (a) | 1,800 | | 66,042 |
| Bridgestone Corp. | 14,000 | | 280,301 |
| Canon Sales Company, Inc. | 1,800 | | 35,156 |
| Canon, Inc. | 24,900 | | 1,420,726 |
| Casio Computer Company, Ltd. (a) | 6,000 | | 91,606 |
| Central Glass Company, Ltd. | 5,000 | | 25,775 |
| Central Japan Railway Company, Ltd. | 36 | | 403,589 |
| Chiba Bank, Ltd. | 18,000 | | 145,018 |
| Chiyoda Corp. (a) | 3,000 | | 51,432 |
| Chubu Electric Power Company, Inc. (a) | 15,800 | | 420,992 |
| Chugai Pharmaceutical Company, Ltd. (a) | 6,800 | | 121,991 |
| Circle K Sunkus Company, Ltd. (a) | 700 | | 11,286 |
| Citizen Watch Company, Ltd. (a) | 8,600 | | 80,042 |
| Coca-Cola West Japan Company, Ltd. (a) | 1,100 | | 24,378 |
| COMSYS Holdings Corp. | 3,000 | | 33,605 |
| Credit Saison Company, Ltd. | 3,700 | | 97,234 |
| CSK Corp. (a) | 1,600 | | 58,670 |
| Dai Nippon Printing Company, Ltd. | 14,000 | | 204,266 |
| Daicel Chemical Industries, Ltd. | 7,000 | | 49,378 |
| Daido Steel Company, Ltd. (a) | 7,000 | | 58,530 |
| Daifuku Company, Ltd. (a) | 2,000 | | 23,493 |
| Daiichi Sankyo Company, Ltd. | 16,400 | | 447,270 |
| Daikin Industries, Ltd. | 6,100 | | 273,616 |
| Daimaru, Inc. (a) | 5,000 | | 54,388 |
| Dainippon Ink & Chemicals, Inc. | 16,000 | | 66,012 |
| Dainippon Screen Manufacturing | | | |
| Company, Ltd. | 5,000 | | 34,988 |
| Daito Trust Construction Company, Ltd. | 2,000 | | 94,224 |
| Daiwa House Industry Company, Ltd. | 12,000 | | 159,353 |
| Daiwa Securities Group, Inc. | 31,000 | | 307,157 |
| Denki Kagaku Kogyo Kabushiki Kaisha | 12,000 | | 61,183 |
| Denso Corp. | 11,600 | | 406,022 |
| Dentsu, Inc. | 47 | | 131,046 |
| Dowa Mining Company, Ltd. (a) | 7,000 | | 78,028 |
| E-Access, Ltd. (a) | 37 | | 19,169 |
| East Japan Railway Company | 79 | | 629,347 |
| Ebara Corp. (a) | 10,000 | | 44,964 |
| EDION Corp. (a) | 1,800 | | 19,046 |
| Eisai Company, Ltd. | 5,900 | | 245,660 |
| |
| The accompanying notes are an integral part of the financial statements. | 218 |
John Hancock Funds II
Portfolio of investments — August 31, 2007
(showing percentage of total net assets)
| | | |
| International Equity Index Fund (continued) | | |
| | Shares or | | |
| | Principal | | |
| | Amount | | Value |
|
|
| |
| COMMON STOCKS (continued) | | | |
| | | |
| Japan (continued) | | | |
| Electric Power Development Company, Ltd. | 3,300 | $ | 121,047 |
| Elpida Memory, Inc. * | 2,400 | | 92,672 |
| Familymart Company, Ltd. | 1,300 | | 33,451 |
| Fanuc, Ltd. | 4,400 | | 427,495 |
| Fast Retailing Company, Ltd. (a) | 1,300 | | 76,384 |
| Fuji Electric Holdings Company, Ltd. (a) | 11,000 | | 47,665 |
| Fuji Photo Film Company, Ltd. | 11,500 | | 495,169 |
| Fuji Software ABC, Inc. | 900 | | 18,583 |
| Fuji Television Network, Inc. (a) | 11 | | 22,575 |
| Fujikura, Ltd. | 8,000 | | 47,570 |
| Fujitsu, Ltd. | 43,000 | | 293,656 |
| Fukuoka Financial Group, Inc. * | 14,000 | | 80,638 |
| Furukawa Electric Company, Ltd. | 15,000 | | 71,185 |
| Glory, Ltd. | 1,700 | | 49,495 |
| Goodwill Group, Inc. * (a) | 34 | | 7,091 |
| Gunma Bank | 9,000 | | 62,343 |
| Gunze, Ltd. | 4,000 | | 20,084 |
| Hakuhodo DY Holdings, Inc. | 650 | | 45,188 |
| Hankyu Department Stores (a) | 4,000 | | 34,888 |
| Hankyu Hanshin Holdings, Inc. (a) | 29,200 | | 148,258 |
| Haseko Corp. * | 22,500 | | 60,588 |
| Hikari Tsushin, Inc. (a) | 500 | | 14,533 |
| Hino Motors, Ltd. (a) | 6,000 | | 42,909 |
| Hirose Electric Company, Ltd. | 700 | | 84,211 |
| Hitachi Cable, Ltd. | 5,000 | | 29,116 |
| Hitachi Capital Corp. | 900 | | 11,264 |
| Hitachi Chemical, Ltd. | 2,100 | | 42,822 |
| Hitachi Construction Machinery Company, Ltd. | 2,400 | | 84,340 |
| Hitachi High-Technologies Corp. | 1,400 | | 32,734 |
| Hitachi, Ltd. | 80,000 | | 515,637 |
| Hokkaido Electric Power Company, Inc. | 4,600 | | 103,982 |
| Hokuhoku Financial Group, Inc. | 30,000 | | 87,829 |
| Honda Motor Company, Ltd. | 36,400 | | 1,195,928 |
| House Food Corp. (a) | 1,500 | | 24,396 |
| Hoya Corp. (a) | 9,400 | | 325,793 |
| Ibiden Company, Ltd. (a) | 3,000 | | 255,306 |
| Idemitsu Kosan Company, Ltd. | 400 | | 43,701 |
| Inpex Holdings, Inc. (a) | 19 | | 173,424 |
| Isetan Company, Ltd. | 4,200 | | 55,468 |
| Ishikawajima-Harima Heavy Industries | | | |
| Company, Ltd. (a) | 31,000 | | 100,491 |
| ITO EN, Ltd. (a) | 1,200 | | 30,042 |
| Itochu Corp. | 36,000 | | 388,609 |
| Itochu Techno-Science Corp. (a) | 800 | | 31,540 |
| JAFCO Company, Ltd. (a) | 900 | | 36,965 |
| Japan Airlines System Corp. * (a) | 24,000 | | 54,656 |
| Japan Petroleum Exploration Company, Ltd. | 800 | | 51,056 |
| Japan Prime Realty Investment Corp. | 13 | | 52,876 |
| Japan Real Estate Investment Corp. | 9 | | 99,858 |
| Japan Retail Fund Investment Corp., REIT | 8 | | 65,346 |
| Japan Tobacco, Inc. | 106 | | 588,442 |
| JFE Holdings, Inc. | 13,200 | | 859,152 |
| | | |
| International Equity Index Fund (continued) | |
| | Shares or | | |
| | Principal | | |
| | Amount | | Value |
|
|
| |
| COMMON STOCKS (continued) | | | |
| | | | |
| Japan (continued) | | | |
| JGC Corp. | 5,000 | $ | 87,680 |
| Joyo Bank, Ltd. | 16,000 | | 87,734 |
| JS Group Corp. | 6,100 | | 120,862 |
| JSR Corp. (a) | 4,100 | | 91,713 |
| Jupiter Telecommunications Company, Ltd. * | 100 | | 76,600 |
| Kajima Corp. (a) | 21,000 | | 87,500 |
| Kamigumi Company, Ltd. | 5,000 | | 42,939 |
| Kaneka Corp. | 6,000 | | 48,576 |
| Kansai Electric Power Company, Ltd. | 18,300 | | 427,374 |
| Kansai Paint Company, Ltd. (a) | 6,000 | | 46,444 |
| Kao Corp. | 12,000 | | 341,066 |
| Kawasaki Heavy Industries, Ltd. (a) | 32,000 | | 125,385 |
| Kawasaki Kisen Kaisha, Ltd. (a) | 13,000 | | 167,156 |
| KDDI Corp. | 57 | | 439,450 |
| Keihin Electric Express Railway | | | |
| Company, Ltd. (a) | 10,000 | | 62,926 |
| Keio Electric Railway Company, Ltd. (a) | 13,000 | | 80,047 |
| Keisei Electric Railway Company, Ltd. (a) | 7,000 | | 38,388 |
| Keyence Corp. (a) | 800 | | 177,550 |
| Kikkoman Corp. | 3,000 | | 40,577 |
| Kinden Corp. | 4,000 | | 34,189 |
| Kintetsu Corp. (a) | 40,000 | | 119,475 |
| Kirin Brewery Company, Ltd. (a) | 18,000 | | 223,886 |
| KK DaVinci Advisors * | 26 | | 17,941 |
| Kobe Steel Company, Ltd. | 60,000 | | 218,102 |
| Kokuyo Company, Ltd. (a) | 1,700 | | 17,193 |
| Komatsu, Ltd. | 21,200 | | 651,084 |
| Komori Corp. | 1,000 | | 23,463 |
| Konami Corp. (a) | 2,200 | | 55,480 |
| Konica Minolta Holdings, Inc. | 11,500 | | 179,794 |
| Kose Corp. (a) | 600 | | 16,370 |
| Koyo Seiko Company, Ltd. | 3,900 | | 61,942 |
| Kubota Corp. (a) | 26,000 | | 202,594 |
| Kuraray Company, Ltd. | 9,000 | | 118,075 |
| Kurita Water Industries, Ltd. | 2,900 | | 87,885 |
| Kyocera Corp. | 3,700 | | 338,587 |
| KYOWA HAKKO KOGYO COMPANY, LTD. | 8,000 | | 77,581 |
| Kyushu Electric Power Company, Inc. | 8,900 | | 237,411 |
| Lawson, Inc. (a) | 1,600 | | 53,123 |
| LeoPalace21 Corp. | 2,800 | | 86,297 |
| Mabuchi Motor Company, Ltd. (a) | 600 | | 39,080 |
| Makita Corp. | 2,700 | | 104,321 |
| Marubeni Corp. | 38,000 | | 308,908 |
| Marui Company, Ltd. (a) | 7,100 | | 81,251 |
| Matsui Securities Company, Ltd. (a) | 2,000 | | 16,640 |
| Matsumotokiyoshi Company, Ltd. (a) | 800 | | 16,133 |
| Matsushita Electric Industrial Company, Ltd. | 46,000 | | 801,515 |
| Matsushita Electric Works, Ltd. | 8,000 | | 97,687 |
| Mediceo Holdings Company, Ltd. (a) | 3,800 | | 58,499 |
| Meiji Dairies Corp. (a) | 7,000 | | 38,955 |
| Meiji Seika Kaisha, Ltd. (a) | 8,000 | | 37,247 |
| Meitec Corp. (a) | 800 | | 25,657 |
| |
| The accompanying notes are an integral part of the financial statements. | 219 |
John Hancock Funds II
Portfolio of investments — August 31, 2007
(showing percentage of total net assets)
| | | |
| International Equity Index Fund (continued) | |
| | Shares or | | |
| | Principal | | |
| | Amount | | Value |
|
|
| |
| COMMON STOCKS (continued) | | | |
| | | | |
| Japan (continued) | | | |
| Millea Holdings, Inc. | 18,800 | $ | 727,967 |
| Minebea Company, Ltd. | 7,000 | | 42,697 |
| Mitsubishi Chemical Holdings Corp, ADR | 27,500 | | 256,872 |
| Mitsubishi Corp. | 31,600 | | 886,617 |
| Mitsubishi Electric Corp. | 45,000 | | 527,475 |
| Mitsubishi Estate Company, Ltd. | 28,000 | | 748,270 |
| Mitsubishi Gas & Chemicals Company, Inc. | 9,000 | | 75,775 |
| Mitsubishi Heavy Industries, Ltd. | 75,000 | | 457,988 |
| Mitsubishi Logistc Corp. | 3,000 | | 40,948 |
| Mitsubishi Materials Corp. | 27,000 | | 149,470 |
| Mitsubishi Rayon Company, Ltd. (a) | 12,000 | | 76,443 |
| Mitsubishi Securities Company, Ltd. | 6,000 | | 58,014 |
| Mitsubishi UFJ Financial Group, Inc. (a) | 188 | | 1,801,526 |
| Mitsubishi UFJ Lease & Finance | | | |
| Company, Ltd. * | 760 | | 29,973 |
| Mitsui & Company, Ltd. | 36,000 | | 748,048 |
| Mitsui Chemicals, Inc. | 15,000 | | 135,726 |
| Mitsui Engineering & Shipbuilding | | | |
| Company, Ltd. (a) | 18,000 | | 93,863 |
| Mitsui Fudosan Company, Ltd. | 20,000 | | 523,020 |
| Mitsui Mining & Smelting Company, Ltd. | 12,000 | | 48,865 |
| Mitsui O.S.K. Lines, Ltd. | 25,000 | | 367,099 |
| Mitsui Sumitomo Insurance Company, Ltd. | 28,000 | | 315,836 |
| Mitsui Trust Holdings, Inc. | 17,000 | | 141,703 |
| Mitsukoshi, Ltd. (a) | 11,000 | | 48,888 |
| Mitsumi Electric Company, Ltd. (a) | 1,800 | | 67,450 |
| Mizuho Financial Group, Inc. (a) | 222 | | 1,394,774 |
| Murata Manufacturing Company, Ltd. | 4,900 | | 343,198 |
| Namco Bandai Holdings, Inc. | 5,300 | | 76,747 |
| NEC Corp. (a) | 47,000 | | 221,537 |
| NEC Electronics Corp. * | 700 | | 19,284 |
| NGK INSULATORS, LTD. | 6,000 | | 198,186 |
| NGK Spark Plug Company, Ltd. (a) | 4,000 | | 65,931 |
| NHK Spring Company, Ltd. | 3,000 | | 26,869 |
| NICHIREI Corp. | 5,000 | | 23,467 |
| Nidec Corp. (a) | 2,500 | | 174,906 |
| Nikko Cordial Corp. | 9,000 | | 116,079 |
| Nikon Corp. | 7,000 | | 218,578 |
| Nintendo Company, Ltd. | 2,300 | | 1,058,213 |
| Nippon Building Fund, Inc. (a) | 11 | | 140,924 |
| Nippon Electric Glass Company, Ltd. (a) | 8,000 | | 116,241 |
| Nippon Express Company, Ltd. | 19,000 | | 99,823 |
| Nippon Kayaku Company, Ltd. | 3,000 | | 23,876 |
| Nippon Light Metal Company, Ltd. | 10,000 | | 21,883 |
| NIPPON MEAT PACKERS, Inc. | 4,000 | | 43,304 |
| Nippon Mining Holdings, Inc. | 20,500 | | 184,876 |
| Nippon Oil Corp. | 29,000 | | 243,910 |
| Nippon Paper Group, Inc. | 19 | | 63,894 |
| Nippon Sheet Glass Company, Ltd. (a) | 13,000 | | 76,451 |
| Nippon Shokubai Company, Ltd. | 3,000 | | 26,632 |
| Nippon Steel Corp. | 135,000 | | 942,992 |
| Nippon Telegraph & Telephone Corp. | 120 | | 552,225 |
| | | |
| International Equity Index Fund (continued) | | |
| | Shares or | | |
| | Principal | | |
| | Amount | | Value |
|
|
| |
| COMMON STOCKS (continued) | | | |
| | | | |
| Japan (continued) | | | |
| Nippon Yusen Kabushiki Kaisha | 26,000 | $ | 256,279 |
| Nippon Zeon Company (a) | 4,000 | | 40,457 |
| Nishimatsu Construction Company, Ltd. (a) | 5,000 | | 16,274 |
| Nishi-Nippon City Bank, Ltd. | 18,000 | | 56,472 |
| Nissan Chemical Industries, Ltd. | 4,000 | | 50,137 |
| Nissan Motor Company, Ltd. | 52,400 | | 500,376 |
| Nisshin Seifun Group, Inc. | 5,000 | | 45,832 |
| Nisshin Steel Company | 17,000 | | 67,747 |
| Nisshinbo Industries, Inc. | 3,000 | | 36,787 |
| Nissin Food Products Company, Ltd. (a) | 1,800 | | 57,185 |
| Nitori Company, Ltd. | 750 | | 39,044 |
| Nitto Denko Corp. (a) | 3,800 | | 177,026 |
| NOK Corp. | 2,700 | | 52,319 |
| Nomura Holdings, Inc. | 41,400 | | 730,646 |
| Nomura Real Estate Holdings, Inc. * | 1,000 | | 28,261 |
| Nomura Real Estate Office Fund, Inc. | 6 | | 56,698 |
| Nomura Research Institute, Ltd. | 2,500 | | 84,120 |
| NSK, Ltd. | 11,000 | | 94,205 |
| NTN Corp. (a) | 9,000 | | 73,696 |
| NTT Data Corp. | 30 | | 145,075 |
| NTT DoCoMo, Inc. | 385 | | 586,660 |
| NTT Urban Development Corp. (a) | 23 | | 41,225 |
| Obayashi Corp. | 13,000 | | 67,115 |
| OBIC Company, Ltd. (a) | 150 | | 29,637 |
| Odakyu Electric Railway Company (a) | 14,000 | | 85,480 |
| Oji Paper Company, Ltd. | 20,000 | | 99,935 |
| Oki Electric Industry Company, Ltd. * (a) | 10,000 | | 17,848 |
| Okuma Holdings, Inc. | 3,000 | | 44,493 |
| Okumura Corp. | 4,000 | | 22,361 |
| Olympus Optical Company, Ltd. | 6,000 | | 254,675 |
| Omron Corp. | 4,700 | | 123,852 |
| Onward Kashiyama Company, Ltd. | 3,000 | | 35,493 |
| Oracle Corp. - Japan (a) | 1,000 | | 43,969 |
| Oriental Land Company, Ltd. (a) | 1,300 | | 73,343 |
| Orix Corp. | 2,100 | | 445,682 |
| Osaka Gas Company, Ltd. | 47,000 | | 174,497 |
| OSG Corp. (a) | 1,900 | | 23,648 |
| Otsuka Corp. (a) | 400 | | 40,370 |
| Park24 Company, Ltd. (a) | 2,200 | | 21,163 |
| Pioneer Electronic Corp. (a) | 3,000 | | 36,445 |
| Promise Company, Ltd. (a) | 1,700 | | 46,762 |
| Q.P. Corp. | 2,700 | | 25,129 |
| Rakuten, Inc. (a) | 134 | | 49,650 |
| Resona Holdings, Inc. (a) | 132 | | 277,606 |
| Ricoh Company, Ltd. | 16,000 | | 352,038 |
| Rinnai Corp. (a) | 1,000 | | 31,135 |
| Rohm Company, Ltd. | 2,300 | | 204,726 |
| Round One Corp. (a) | 8 | | 18,751 |
| Ryohin Keikaku Company, Ltd. | 500 | | 32,399 |
| Sanken Electric Company | 3,000 | | 20,786 |
| SANKYO Company, Ltd. | 1,300 | | 53,584 |
| Santen Pharmaceutical Company, Ltd. | 1,800 | | 44,554 |
| |
| The accompanying notes are an integral part of the financial statements. | 220 |
John Hancock Funds II
Portfolio of investments — August 31, 2007
(showing percentage of total net assets)
| | | |
| International Equity Index Fund (continued) | |
| | Shares or | | |
| | Principal | | |
| | Amount | | Value |
|
|
| |
| COMMON STOCKS (continued) | | | |
| | | | |
| Japan (continued) | | | |
| Sanwa Shutter Corp. | 6,000 | $ | 35,023 |
| Sanyo Electric Company, Ltd. * (a) | 39,000 | | 60,566 |
| Sapporo Hokuyo Holdings, Inc. | 7 | | 74,828 |
| Sapporo Holdings (a) | 6,000 | | 34,465 |
| SBI E*Trade Securities Compnay, Ltd. | 36 | | 32,232 |
| SBI Holdings, Inc. (a) | 233 | | 62,199 |
| Secom Company, Ltd. | 4,900 | | 237,884 |
| SEGA SAMMY HOLDINGS, INC. (a) | 5,100 | | 77,413 |
| Seiko Epson Corp. (a) | 3,000 | | 77,979 |
| Seino Transportation Company, Ltd. (a) | 3,000 | | 29,582 |
| Sekisui Chemical Company, Ltd. | 11,000 | | 81,391 |
| Sekisui House, Ltd. | 11,000 | | 143,007 |
| Seven & I Holdings Company, Ltd. (a) | 19,100 | | 509,077 |
| Sharp Corp. (a) | 23,000 | | 399,644 |
| Shimachu Company, Ltd. (a) | 900 | | 24,394 |
| Shimamura Company, Ltd. | 600 | | 55,610 |
| Shimano, Inc. (a) | 1,500 | | 48,040 |
| Shimizu Corp. | 14,000 | | 89,211 |
| Shin-Etsu Chemical Company, Ltd. | 9,600 | | 693,784 |
| Shinko Electric Industries Company, Ltd. (a) | 1,600 | | 35,342 |
| Shinko Securities Company, Ltd. | 14,000 | | 66,610 |
| Shinsei Bank, Ltd. | 31,000 | | 103,363 |
| Shionogi & Company, Ltd. (a) | 7,000 | | 101,822 |
| Shiseido Company, Ltd. | 8,000 | | 166,867 |
| Shizuoka Bank, Ltd. | 13,000 | | 135,933 |
| Showa Denko K.K. (a) | 25,000 | | 91,005 |
| Showa Shell Sekiyu K.K. (a) | 4,400 | | 53,291 |
| SMC Corp. (a) | 1,300 | | 172,625 |
| SOFTBANK Corp. (a) | 17,600 | | 337,689 |
| Sojitz Holdings Corp. * | 23,300 | | 96,918 |
| Sompo Japan Insurance, Inc. | 20,000 | | 223,599 |
| Sony Corp. (a) | 23,400 | | 1,119,850 |
| Stanley Electric Corp. | 3,600 | | 78,642 |
| Sumco Corp. | 2,700 | | 144,216 |
| Sumitomo Bakelite Company, Ltd. (a) | 5,000 | | 31,825 |
| Sumitomo Chemical Company, Ltd. | 36,000 | | 268,641 |
| Sumitomo Corp. | 24,700 | | 425,918 |
| Sumitomo Electric Industries, Ltd. (a) | 17,800 | | 282,793 |
| Sumitomo Heavy Industries, Ltd. | 13,000 | | 145,272 |
| Sumitomo Metal Industries, Ltd. | 96,000 | | 484,008 |
| Sumitomo Metal Mining Company, Ltd. | 13,000 | | 257,137 |
| Sumitomo Mitsui Financial Group, Inc. | 153 | | 1,206,393 |
| Sumitomo Osaka Cement Company, Ltd. (a) | 8,000 | | 19,662 |
| Sumitomo Realty & | | | |
| Development Company, Ltd. | 9,000 | | 294,221 |
| Sumitomo Rubber Industries, Inc. | 4,000 | | 44,234 |
| Sumitomo Titanium Corp. (a) | 400 | | 31,281 |
| Sumitomo Trust & Banking Company, Ltd. | 29,000 | | 239,301 |
| Suruga Bank, Ltd. (a) | 5,000 | | 65,727 |
| Suzuken Company, Ltd. | 1,600 | | 52,888 |
| T&D Holdings, Inc. | 4,600 | | 266,978 |
| TAIHEIYO CEMENT CORP. | 21,000 | | 82,898 |
| | | |
| International Equity Index Fund (continued) | | |
| | Shares or | | |
| | Principal | | |
| | Amount | | Value |
|
|
| |
| COMMON STOCKS (continued) | | | |
| | | | |
| Japan (continued) | | | |
| Taisei Corp. (a) | 22,000 | $ | 70,297 |
| Taisho Pharmaceuticals Company, Ltd. | 3,000 | | 58,681 |
| Taiyo Nippon Sanso Corp. (a) | 6,000 | | 53,213 |
| Taiyo Yuden Company, Ltd. | 2,000 | | 40,047 |
| Takara Holdings (a) | 3,000 | | 17,150 |
| Takashimaya Company, Ltd. (a) | 8,000 | | 85,886 |
| Takeda Pharmaceutical Company, Ltd. | 19,700 | | 1,347,322 |
| Takefuji Corp. (a) | 2,260 | | 60,622 |
| Tanabe Seiyaku Company, Ltd. | 5,000 | | 60,304 |
| TDK Corp. | 2,900 | | 247,879 |
| Teijin, Ltd. | 20,000 | | 99,876 |
| Terumo Corp. | 4,000 | | 187,549 |
| The 77th Bank, Ltd. | 8,000 | | 53,975 |
| The Bank of Yokohama, Ltd. | 28,000 | | 199,096 |
| The Hachijuni Bank, Ltd. | 10,000 | | 77,477 |
| The Hiroshima Bank, Ltd. | 13,000 | | 74,057 |
| The Japan Steel Works, Ltd. | 8,000 | | 117,967 |
| The Tokyo Electric Power Company, Ltd. | 28,700 | | 752,433 |
| THK Company, Ltd. (a) | 2,600 | | 53,192 |
| TIS, Inc. | 1,100 | | 23,689 |
| Tobu Railway Company, Ltd. | 20,000 | | 89,900 |
| Toda Corp. (a) | 4,000 | | 21,710 |
| Toho Company, Ltd. (a) | 3,000 | | 63,076 |
| Toho Titanium Company, Ltd. (a) | 600 | | 20,961 |
| Tohoku Electric Power Company, Inc. | 10,000 | | 238,530 |
| Tokai Rika Company, Ltd. | 1,400 | | 37,513 |
| Tokuyama Corp. (a) | 5,000 | | 67,970 |
| Tokyo Broadcasting Company, Ltd. (a) | 1,000 | | 29,841 |
| Tokyo Electron, Ltd. | 4,100 | | 293,375 |
| Tokyo Gas Company, Ltd. | 52,000 | | 258,258 |
| Tokyo Seimitsu Company, Ltd. (a) | 800 | | 23,965 |
| Tokyo Steel Manufacturing Company, Ltd. (a) | 2,200 | | 29,078 |
| Tokyo Tatemono Company, Ltd. (a) | 7,000 | | 92,506 |
| Tokyu Corp. (a) | 26,000 | | 162,076 |
| Tokyu Land Corp. | 10,000 | | 92,064 |
| TonenGeneral Sekiyu K.K. (a) | 7,000 | | 69,310 |
| Toppan Printing Company, Ltd. (a) | 14,000 | | 140,639 |
| Toray Industries, Inc. (a) | 31,000 | | 236,690 |
| Toshiba Corp. (a) | 72,000 | | 647,088 |
| Tosoh Corp. | 12,000 | | 73,317 |
| Toto, Ltd. (a) | 7,000 | | 55,825 |
| Toyo Seikan Kaisha, Ltd. | 3,800 | | 72,197 |
| Toyo Suisan Kaisha, Ltd. | 2,000 | | 34,996 |
| Toyobo Company, Ltd. (a) | 17,000 | | 39,461 |
| Toyoda Gosei Company, Ltd. (a) | 1,400 | | 45,107 |
| Toyota Boshoku Corp. | 1,800 | | 54,781 |
| Toyota Industries Corp. | 4,100 | | 173,625 |
| Toyota Motor Corp. | 63,400 | | 3,669,998 |
| Toyota Tsusho Corp. | 4,800 | | 118,841 |
| Trend Micro, Inc. | 2,500 | | 102,501 |
| Ube Industries, Ltd. | 24,000 | | 75,181 |
| UNI Charm Corp. (a) | 900 | | 51,892 |
| |
| The accompanying notes are an integral part of the financial statements. | 221 |
John Hancock Funds II
Portfolio of investments — August 31, 2007
(showing percentage of total net assets)
| | | |
| International Equity Index Fund (continued) | |
| | Shares or | | |
| | Principal | | |
| | Amount | | Value |
|
|
| |
| COMMON STOCKS (continued) | | | |
| | | | |
| Japan (continued) | | | |
| UNY Company, Ltd. (a) | 4,000 | $ | 34,885 |
| Ushio, Inc. | 2,700 | | 52,583 |
| USS Company, Ltd. | 500 | | 33,657 |
| Wacoal Corp. (a) | 2,000 | | 25,058 |
| West Japan Railway Company, Ltd. | 40 | | 193,052 |
| Yahoo Japan Corp. (a) | 359 | | 133,224 |
| Yakult Honsha Company, Ltd. (a) | 2,100 | | 48,248 |
| Yamada Denki Company, Ltd. | 1,990 | | 199,824 |
| Yamaha Corp. | 4,100 | | 86,762 |
| Yamaha Motor Company, Ltd. | 4,200 | | 110,478 |
| Yamato Transport Company, Ltd. | 9,000 | | 131,989 |
| Yamazaki Baking Company, Ltd. (a) | 3,000 | | 22,542 |
| YASKAWA Electric Corp. (a) | 5,000 | | 60,972 |
| Yokogawa Electric Corp. (a) | 5,000 | | 62,128 |
|
|
| | | | 66,887,814 |
| Korea - 0.01% | | | |
| LG Philips LCD Company, Ltd., ADR * (a) | 2,120 | | 45,283 |
| Luxembourg - 0.08% | | | |
| Tenaris SA, ADR | 6,960 | | 326,633 |
| Malaysia - 0.39% | | | |
| AirAsia BHD * | 17,100 | | 9,281 |
| AMMB Holdings BHD | 33,600 | | 41,935 |
| Berjaya Sports Toto BHD | 15,200 | | 21,731 |
| British American Tobacco Malaysia BHD | 3,100 | | 37,118 |
| Bursa Malaysia BHD | 7,600 | | 22,181 |
| Commerce Asset Holdings | 53,100 | | 167,626 |
| DRB-Hicom BHD | 12,700 | | 6,311 |
| Gamuda BHD | 13,900 | | 29,770 |
| Genting BHD | 42,500 | | 90,166 |
| Golden Hope Plantations BHD | 10,500 | | 23,846 |
| Guinness Anchor BHD | 2,900 | | 4,620 |
| Highlands & Lowlands BHD | 3,600 | | 7,285 |
| Hong Leong Bank BHD | 11,600 | | 19,894 |
| Hong Leong Credit BHD | 4,400 | | 7,089 |
| IGB Corp., BHD | 13,900 | | 9,788 |
| IJM Corp. BHD | 13,600 | | 28,601 |
| IOI Corp. BHD * | 77,900 | | 111,566 |
| IOI Properties, BHD | 1,800 | | 7,357 |
| KLCC Property Holdings BHD | 8,900 | | 8,824 |
| Kuala Lumpur Kepong BHD | 8,400 | | 26,540 |
| Lafarge Malayan Cement BHD | 24,600 | | 11,502 |
| Magnum Corp. BHD | 17,700 | | 14,200 |
| Malayan Bank BHD | 45,900 | | 153,517 |
| Malaysian Airline System BHD * | 5,400 | | 7,199 |
| Malaysian Bulk Carriers BHD | 7,375 | | 8,261 |
| Malaysian Pacific Industries BHD | 1,800 | | 4,674 |
| Malaysian Resources Corp. BHD * | 18,800 | | 14,336 |
| Media Prima BHD | 15,000 | | 11,633 |
| MISC BHD | 26,900 | | 69,720 |
| MMC Corp. BHD | 6,400 | | 13,689 |
| Mulpha International BHD * | 16,000 | | 6,466 |
| | | |
| International Equity Index Fund (continued) | | |
| | Shares or | | |
| | Principal | | |
| | Amount | | Value |
|
|
| |
| COMMON STOCKS (continued) | | | |
| | | | |
| Malaysia (continued) | | | |
| Multi-Purpose Holdings BHD | 14,000 | $ | 7,098 |
| Petronas Dagangan BHD | 5,200 | | 12,599 |
| Petronas Gas BHD | 8,900 | | 26,970 |
| PLUS Expressways BHD | 33,700 | | 30,754 |
| Pmb 50c * | 6,400 | | 5,483 |
| PPB Group BHD | 11,600 | | 24,287 |
| Proton Holdings BHD | 5,100 | | 7,639 |
| Public Bank BHD | 25,000 | | 68,198 |
| Resorts World BHD | 59,500 | | 65,025 |
| RHB Capital BHD | 15,600 | | 24,070 |
| Scomi Group BHD | 12,900 | | 5,509 |
| Shell Refining Company Federation of Malaya | | | |
| BHD | 3,100 | | 9,679 |
| Sime Darby BHD | 35,700 | | 96,104 |
| SP Setia BHD | 12,300 | | 25,540 |
| Star Publications Malaysia BHD | 9,200 | | 8,976 |
| TA Enterprise BHD | 16,600 | | 7,459 |
| Tanjong PLC | 5,000 | | 24,239 |
| Telekom Malaysia, BHD | 20,400 | | 57,168 |
| Tenaga Nasional BHD | 25,700 | | 73,921 |
| Transmile Group BHD * | 3,500 | | 3,356 |
| UMW Holdings BHD | 4,200 | | 16,758 |
| YTL Corp. BHD | 16,100 | | 34,263 |
| |
|
| | | | 1,631,821 |
| Mexico - 0.93% | | | |
| Alfa SA de CV | 7,800 | | 56,097 |
| America Movil SA de CV, Series L, SADR | 11,217 | | 678,180 |
| America Movil SA de CV | 215,900 | | 651,616 |
| Carso Infraestructura y Construccion SA de | | | |
| CV * | 16,600 | | 17,377 |
| Cemex SA de CV * | 85,136 | | 275,780 |
| Cemex SA, SADR * | 8,858 | | 286,025 |
| Coca-Cola Femsa SA de CV | 6,100 | | 24,581 |
| Consorcio ARA SA de CV | 20,000 | | 30,254 |
| Controladora Comercial Mexicana SA de CV | 7,800 | | 21,703 |
| Corp. GEO SA de CV, Series B * | 10,400 | | 54,105 |
| Desarrolladora Homex SA de CV * | 3,400 | | 31,247 |
| Empresas ICA Sociedad | | | |
| Controladora SA de CV * | 7,900 | | 43,641 |
| Fomento Economico Mexicano SA de CV | 51,100 | | 177,384 |
| Grupo Aeroportuario del Pacifico SA de CV * | 10,500 | | 52,989 |
| Grupo Aeroportuario del Sureste SA de CV | 5,400 | | 26,928 |
| Grupo Bimbo SA de CV (a) | 6,400 | | 37,704 |
| Grupo Carso SA de CV | 14,262 | | 55,919 |
| Grupo Financiero Banorte SA de CV | 31,565 | | 128,740 |
| Grupo Iusacell SA de CV * | 276 | | 3,114 |
| Grupo Mexico SA | 30,071 | | 189,693 |
| Grupo Modelo SA | 12,600 | | 61,268 |
| Grupo Televisa SA, SADR | 6,344 | | 165,325 |
| Grupo Televisa SA | 24,500 | | 128,748 |
| Industrias Penoles SA de CV | 2,200 | | 29,271 |
| Kimberly-Clark de Mexico SA de CV | 11,800 | | 50,801 |
| |
| The accompanying notes are an integral part of the financial statements. | 222 |
John Hancock Funds II
Portfolio of investments — August 31, 2007
(showing percentage of total net assets)
| | | |
| International Equity Index Fund (continued) | | |
| | Shares or | | |
| | Principal | | |
| | Amount | | Value |
|
|
| |
| COMMON STOCKS (continued) | | | |
| | | | |
| Mexico (continued) | | | |
| Telefonos de Mexico SA de CV, Class L, ADR | 3,226 | $ | 114,007 |
| Telefonos de Mexico SA de CV | 115,400 | | 204,269 |
| TV Azteca SA de CV * | 26,400 | | 15,792 |
| Urbi Desarrollos Urbanos SA de CV * | 6,100 | | 22,883 |
| Wal-Mart de Mexico SA de CV, Series V | 74,131 | | 263,715 |
| |
|
| | | | 3,899,156 |
| Netherlands - 3.00% | | | |
| ABN AMRO Holdings NV (a) | 43,572 | | 2,027,617 |
| Aegon NV | 35,206 | | 643,079 |
| Akzo Nobel NV | 6,434 | | 507,771 |
| ASML Holding NV * | 11,269 | | 334,691 |
| Buhrmann NV | 3,638 | | 40,828 |
| Corio NV | 894 | | 69,743 |
| DSM NV | 3,604 | | 184,546 |
| Fugro NV | 1,310 | | 91,174 |
| Hagemeyer NV (a) | 11,835 | | 50,291 |
| Heineken NV (a) | 5,929 | | 376,335 |
| ING Groep NV | 45,023 | | 1,814,346 |
| Koninklijke (Royal) KPN NV | 46,451 | | 726,235 |
| Koninklijke (Royal) Philips Electronics NV | 27,489 | | 1,088,155 |
| Koninklijke Ahold NV * (a) | 29,910 | | 401,363 |
| Mittal Steel Company NV | 21,167 | | 1,390,051 |
| Oce NV (a) | 1,741 | | 37,520 |
| Randstad Holdings NV | 1,281 | | 71,895 |
| Reed Elsevier NV | 17,241 | | 311,430 |
| Royal Numico NV | 4,077 | | 300,354 |
| SBM Offshore NV | 3,461 | | 129,752 |
| TNT Post Group NV | 10,346 | | 438,312 |
| Unilever NV | 41,227 | | 1,264,741 |
| Vedior NV | 3,796 | | 86,456 |
| Wereldhave NV (a) | 488 | | 58,530 |
| Wolters Kluwer NV | 7,032 | | 205,278 |
| |
|
| | | | 12,650,493 |
| New Zealand - 0.10% | | | |
| Auckland International Airport, Ltd. | 21,664 | | 46,061 |
| Contact Energy, Ltd. | 6,386 | | 40,990 |
| Fisher & Paykel Appliances Holdings, Ltd. (a) | 5,572 | | 14,425 |
| Fisher & Paykel Healthcare Corp. | 10,678 | | 25,330 |
| Fletcher Building, Ltd. | 10,815 | | 89,107 |
| Kiwi Income Property Trust | 17,720 | | 18,039 |
| Sky City Entertainment Group, Ltd. | 9,996 | | 32,102 |
| Sky Network Television, Ltd. | 4,317 | | 16,864 |
| Telecom Corp. of New Zealand, Ltd. | 43,963 | | 132,597 |
| Vector, Ltd. | 5,002 | | 8,952 |
| |
|
| | | | 424,467 |
| Norway - 0.76% | | | |
| Acergy SA | 4,641 | | 122,670 |
| Aker Kvaerner ASA (a) | 3,945 | | 99,233 |
| Den Norske Bank ASA | 18,000 | | 247,052 |
| Det Norske Oljeselskapb ASA * | 17,500 | | 31,237 |
| Norsk Hydro ASA (a) | 17,213 | | 634,808 |
| | | |
| International Equity Index Fund (continued) | |
| | Shares or | | |
| | Principal | | |
| | Amount | | Value |
|
|
| |
| COMMON STOCKS (continued) | | | |
| | | | |
| Norway (continued) | | | |
| Norske Skogindustrier ASA | 4,100 | $ | 50,013 |
| Ocean Rig ASA * | 4,143 | | 26,218 |
| Orkla ASA | 20,299 | | 329,904 |
| Pan Fish ASA * | 62,400 | | 73,498 |
| Petroleum Geo-Services ASA * | 4,084 | | 96,064 |
| ProSafe ASA | 4,950 | | 74,634 |
| Renewable Energy Corp AS * (a) | 4,228 | | 160,514 |
| Schibsted ASA (a) | 1,100 | | 49,785 |
| Statoil ASA (a) | 15,800 | | 455,150 |
| Stolt-Nielsen SA | 1,000 | | 32,012 |
| Storebrand ASA | 5,200 | | 80,185 |
| Tandberg ASA | 2,900 | | 63,313 |
| Telenor ASA | 20,400 | | 377,098 |
| TGS Nopec Geophysical Company ASA * | 2,600 | | 44,610 |
| Tomra Systems ASA | 3,800 | | 26,278 |
| Yara International ASA (a) | 4,200 | | 111,934 |
|
|
| | | | 3,186,210 |
| Peru - 0.07% | | | |
| Cia de Minas Buenaventura SA | 946 | | 36,488 |
| Compania de Minas Buenaventura SA, ADR | 1,366 | | 52,222 |
| Credicorp SA | 800 | | 48,752 |
| Minsur SA | 9,795 | | 31,897 |
| Southern Peru Copper Corp. | 889 | | 94,056 |
| Volcan Compania Minera SA, CMN Series B | 9,665 | | 40,487 |
|
|
| | | | 303,902 |
| Philippines - 0.09% | | | |
| Ayala Corp. | 3,211 | | 33,955 |
| Ayala Land, Inc. | 135,600 | | 42,226 |
| Banco De Oro | 7,314 | | 8,918 |
| Bank of the Philippine Islands | 27,840 | | 36,314 |
| Filinvest Land, Inc. * | 126,321 | | 4,303 |
| First Philippine Holdings Corp. | 5,924 | | 10,143 |
| Globe Telecommunications, Inc. | 690 | | 20,419 |
| Jollibee Foods Corp. | 9,000 | | 10,496 |
| Manila Electric Company | 8,311 | | 18,612 |
| Megaworld Corp. | 213,952 | | 16,138 |
| Metropolitan Bank & Trust Company | 12,800 | | 15,215 |
| Petron Corp. | 48,152 | | 5,936 |
| Philippine Long Distance Telephone Company | 1,420 | | 81,292 |
| San Miguel Corp. | 9,600 | | 14,123 |
| SM Investments Corp. | 3,594 | | 28,546 |
| SM Prime Holdings, Ltd. | 113,941 | | 29,284 |
|
|
| | | | 375,920 |
| Poland - 0.29% | | | |
| Agora SA | 1,018 | | 18,745 |
| Bank BPH SA | 202 | | 65,413 |
| Bank Pekao SA | 1,769 | | 154,709 |
| Bank Zachodni WBK SA | 514 | | 46,534 |
| Bioton SA * | 27,293 | | 11,810 |
| Boryszew SA * | 550 | | 4,108 |
| BRE Bank SA * | 208 | | 37,170 |
| |
| The accompanying notes are an integral part of the financial statements. | 223 |
John Hancock Funds II
Portfolio of investments — August 31, 2007
(showing percentage of total net assets)
| | | |
| International Equity Index Fund (continued) | | |
| | Shares or | | |
| | Principal | | |
| | Amount | | Value |
|
|
| |
| COMMON STOCKS (continued) | | | |
| | | | |
| Poland (continued) | | | |
| Budimex SA * | 271 | $ | 7,664 |
| Computerland SA | 160 | | 3,483 |
| Debica SA | 125 | | 4,685 |
| Echo Investment SA * | 579 | | 18,507 |
| Globe Trade Centre SA * | 2,553 | | 38,525 |
| Grupa Kety SA | 219 | | 16,823 |
| KGHM Polska Miedz SA | 2,572 | | 106,651 |
| Mondi Packaging Paper Swiecie SA | 295 | | 9,325 |
| Orbis SA | 661 | | 16,578 |
| PBG SA * | 201 | | 27,279 |
| Polish Oil & Gas Company | 27,744 | | 51,711 |
| Polska Grupa Farmaceutyczna SA | 235 | | 8,379 |
| Polski Koncern Naftowy Orlen SA * | 7,495 | | 153,884 |
| Powszechna Kasa Oszczednosci Bank | | | |
| Polski SA | 11,787 | | 225,961 |
| Prokom Software SA | 265 | | 12,398 |
| Softbank SA | 492 | | 14,404 |
| Telekomunikacja Polska SA | 16,501 | | 127,772 |
| TVN SA | 3,239 | | 27,123 |
| |
|
| | | | 1,209,641 |
| Portugal - 0.28% | | | |
| Banco BPI, SA (a) | 7,002 | | 61,828 |
| Banco Comercial dos Acores, SA (a) | 49,906 | | 233,427 |
| Banco Espirito Santo SA | 4,606 | | 99,799 |
| Brisa Auto Estrada, SA | 6,945 | | 89,279 |
| Cimpor-Cimentos De Portugal, SA (a) | 5,417 | | 50,946 |
| Electricidade De Portugal, SA | 46,320 | | 254,616 |
| Jeronimo Martins, SGPS SA | 4,350 | | 24,889 |
| Portugal Telecom, SGPS, SA | 18,200 | | 249,898 |
| PT Multimedia.com, SGPS, SA | 1,659 | | 27,159 |
| Sonae Industria, SGPS SA, New * | 1,612 | | 20,883 |
| Sonae, SGPS, SA | 18,991 | | 50,654 |
| |
|
| | | | 1,163,378 |
| Russia - 1.53% | | | |
| AFK Sistema, Reg. S, Spons. GDR | 2,264 | | 68,982 |
| Comstar United Telesystems, ADR | 3,812 | | 41,856 |
| JSC MMC Norilsk Nickel, ADR | 1,887 | | 420,801 |
| Lukoil Oil Company, ADR | 11,121 | | 825,178 |
| Mechel Steel Group, ADR | 588 | | 25,596 |
| Mobile Telesystems, SADR | 4,781 | | 316,311 |
| NovaTek OAO, ADR | 1,912 | | 95,640 |
| Novolipetsk Steel, ADR | 1,929 | | 62,307 |
| OAO Gazprom, SADR | 56,496 | | 2,347,409 |
| Polyus Gold Company ZAO, SADR (a) | 1,815 | | 72,781 |
| RAO Unified Energy System, SADR * | 2,415 | | 303,083 |
| Rostelecom, ADR (a) | 1,442 | | 86,001 |
| Sberbank, ADR | 2,067 | | 791,661 |
| Severstal, ADR | 4,900 | | 83,545 |
| Sibirtelecom, ADR | 106 | | 8,395 |
| Surgutneftegaz, ADR (a) | 3,435 | | 214,687 |
| Tatneft, ADR | 1,569 | | 158,469 |
| | | |
| International Equity Index Fund (continued) | | |
| | Shares or | | |
| | Principal | | |
| | Amount | | Value |
|
|
| |
| COMMON STOCKS (continued) | | | |
| | | | |
| Russia (continued) | | | |
| UralsvyAzinform, ADR | 1,471 | $ | 17,446 |
| VolgaTelecom, ADR | 1,172 | | 10,829 |
| VTB Bank OJSC, GDR * (a) | 18,800 | | 176,532 |
| Vympel Communicatii, SADR | 11,085 | | 270,474 |
| Wimm-Bill-Dann Foods OJSC, ADR | 441 | | 45,141 |
| |
|
| | | | 6,443,124 |
| Singapore - 0.79% | | | |
| Allgreen Properties, Ltd. (a) | 13,500 | | 15,162 |
| Ascendas., REIT * | 23,000 | | 35,461 |
| Capitacommercial * | 21,000 | | 34,804 |
| Capitaland, Ltd. * | 36,000 | | 174,830 |
| CapitaMall Trust * | 24,000 | | 53,536 |
| Chartered Semiconductor Manufacturing, Ltd. * | 23,000 | | 16,143 |
| City Developments, Ltd. | 12,000 | | 117,640 |
| ComfortDelGro Corp., Ltd. | 44,000 | | 56,465 |
| Cosco Corp. Singapore, Ltd. | 18,000 | | 59,607 |
| DBS Group Holdings, Ltd. | 26,000 | | 341,764 |
| Fraser and Neave, Ltd. | 20,000 | | 65,247 |
| Haw Par Corp., Ltd. | 2,000 | | 10,508 |
| Jardine Cycle and Carriage, Ltd. | 3,118 | | 32,150 |
| Keppel Corp., Ltd. | 26,210 | | 220,035 |
| Keppel Land, Ltd. | 8,000 | | 40,448 |
| Neptune Orient Lines, Ltd. | 10,000 | | 32,117 |
| Olam International, Ltd. | 15,000 | | 29,732 |
| Oversea-Chinese Banking Corp., Ltd. | 58,000 | | 326,107 |
| Parkway Holdings, Ltd. | 13,649 | | 35,543 |
| SembCorp Industries, Ltd. | 21,000 | | 77,733 |
| SembCorp Marine, Ltd. | 19,600 | | 53,724 |
| Singapore Airlines, Ltd. | 13,000 | | 162,319 |
| Singapore Exchange, Ltd. | 19,000 | | 121,745 |
| Singapore Land, Ltd. | 3,000 | | 19,543 |
| Singapore Petroleum Company, Ltd. | 5,000 | | 19,319 |
| Singapore Post, Ltd. | 31,000 | | 25,282 |
| Singapore Press Holdings, Ltd. | 35,000 | | 99,808 |
| Singapore Technologies Engineering, Ltd. | 31,000 | | 74,905 |
| Singapore Telecommunications, Ltd. | 185,950 | | 444,795 |
| SMRT Corp., Ltd. | 16,000 | | 18,259 |
| Suntec Real Estate Investment Trust * | 23,000 | | 26,722 |
| United Overseas Bank, Ltd. | 28,000 | | 382,705 |
| United Overseas Land, Ltd. | 12,000 | | 39,283 |
| Venture Corp., Ltd. | 6,000 | | 61,484 |
| Wing Tai Holdings, Ltd. * | 11,000 | | 25,127 |
| |
|
| | | | 3,350,052 |
| South Africa - 1.17% | | | |
| African Bank Investments, Ltd. (a) | 9,997 | | 44,189 |
| Allan Gray Property Trust (a) | 21,325 | | 19,063 |
| Anglo Platinum, Ltd. | 1,583 | | 210,880 |
| AngloGold Ashanti, Ltd. | 3,508 | | 136,811 |
| Aspen Pharmacare Holdings, Ltd. * | 4,549 | | 22,496 |
| Aveng, Ltd. | 8,993 | | 66,350 |
| AVI, Ltd. | 6,769 | | 18,425 |
| |
| The accompanying notes are an integral part of the financial statements. | 224 |
John Hancock Funds II
Portfolio of investments — August 31, 2007
(showing percentage of total net assets)
| | | |
| International Equity Index Fund (continued) | |
| | Shares or | | |
| | Principal | | |
| | Amount | | Value |
|
|
| |
| COMMON STOCKS (continued) | | | |
| | | | |
| South Africa (continued) | | | |
| Barloworld, Ltd. | 4,708 | $ | 80,616 |
| Bidvest Group, Ltd. * | 6,022 | | 116,981 |
| Ellerine Holdings, Ltd. | 2,236 | | 23,375 |
| FirstRand, Ltd. | 64,544 | | 210,551 |
| Foschini, Ltd. | 4,844 | | 39,416 |
| Gold Fields, Ltd. | 13,935 | | 211,377 |
| Grindrod, Ltd. | 6,966 | | 23,994 |
| Harmony Gold Mining Company, Ltd. * | 7,842 | | 70,175 |
| Hulamin, Ltd. | 83 | | 288 |
| Impala Platinum Holdings, Ltd. | 12,292 | | 364,785 |
| Imperial Holdings, Ltd. | 4,211 | | 84,123 |
| Investec, Ltd. | 4,018 | | 45,267 |
| JD Group, Ltd. | 4,222 | | 41,042 |
| Kumba Iron Ore, Ltd. | 1,848 | | 53,704 |
| Lewis Group, Ltd. | 2,034 | | 17,585 |
| Liberty Group, Ltd. | 2,755 | | 34,578 |
| Massmart Holdings, Ltd. | 4,714 | | 60,711 |
| Metropolitan Holdings, Ltd. (a) | 14,077 | | 29,073 |
| Mittal Steel South Africa, Ltd. | 4,526 | | 78,154 |
| MTN Group, Ltd. | 34,072 | | 517,855 |
| Murray & Roberts Holdings, Ltd. | 6,768 | | 71,227 |
| Nampak, Ltd. * | 12,492 | | 35,313 |
| Naspers, Ltd. | 7,887 | | 197,021 |
| Nedbank Group, Ltd. | 4,558 | | 85,924 |
| Network Healthcare Holdings, Ltd. * | 29,089 | | 51,906 |
| Pick'n Pay Stores, Ltd. | 4,684 | | 21,736 |
| Pretoria Portland Cement Company, Ltd. | 12,517 | | 79,071 |
| Reunert, Ltd. (a) | 4,168 | | 38,922 |
| Sanlam, Ltd. | 52,686 | | 158,517 |
| Sappi, Ltd. | 4,599 | | 72,560 |
| Sasol, Ltd. | 13,597 | | 546,825 |
| Shoprite Holdings, Ltd. (a) | 10,263 | | 48,859 |
| Spar Group, Ltd. | 4,075 | | 29,722 |
| Standard Bank Group, Ltd. | 28,099 | | 410,452 |
| Steinhoff International Holdings, Ltd. * (a) | 21,853 | | 70,098 |
| Super Group, Ltd. | 6,067 | | 10,435 |
| Telkom SA, Ltd. (a) | 6,704 | | 165,090 |
| Tiger Brands, Ltd. | 3,655 | | 95,734 |
| Truworths International, Ltd. | 10,796 | | 49,497 |
| Woolworths Holdings, Ltd. (a) | 18,895 | | 51,957 |
|
|
| | | | 4,912,730 |
| South Korea - 2.67% | | | |
| Amorepacific Corp. | 70 | | 49,627 |
| Asiana Airlines (a) | 2,342 | | 22,633 |
| Cheil Communications, Inc. | 90 | | 26,004 |
| Cheil Industries, Inc. | 990 | | 54,191 |
| CJ Corp. | 400 | | 54,122 |
| Daegu Bank | 2,770 | | 51,618 |
| Daelim Industrial Company | 680 | | 113,749 |
| Daewoo Engineering & Construction | | | |
| Company, Ltd. | 3,770 | | 107,843 |
| Daewoo International Corp. | 1,220 | | 51,617 |
| | | |
| International Equity Index Fund (continued) | | |
| | Shares or | | |
| | Principal | | |
| | Amount | | Value |
|
|
| |
| COMMON STOCKS (continued) | | | |
| | | | |
| South Korea (continued) | | | |
| Daewoo Securities Company, Ltd. (a) | 2,840 | $ | 87,642 |
| Daewoo Shipbuilding & Marine Engineering | | | |
| Company, Ltd. | 2,300 | | 137,331 |
| Daishin Securities Company, Ltd. | 890 | | 30,267 |
| Daum Communications Corp. * | 259 | | 18,414 |
| Dongbu Insurance Company, Ltd. | 770 | | 32,206 |
| Dongkuk Steel Mill Company, Ltd. | 860 | | 39,557 |
| Doosan Heavy Industries and Construction | | | |
| Company, Ltd. | 720 | | 69,117 |
| Doosan Infracore Company, Ltd. | 1,860 | | 67,711 |
| GS Engineering & Construction Corp. | 880 | | 138,734 |
| Hana Financial Group, Inc. | 2,730 | | 129,112 |
| Hancook Tire Company (The), Ltd. | 2,360 | | 51,693 |
| Hanjin Heavy Industries & Construction | | | |
| Company, Ltd. * | 781 | | 67,017 |
| Hanjin Heavy Industries & Construction | | | |
| Holdings Company, Ltd. | 289 | | 13,133 |
| Hanjin Shipping Company, Ltd. | 1,200 | | 67,103 |
| Hanmi Pharm Company, Ltd. | 115 | | 18,755 |
| Hanwha Chem Corp. | 1,200 | | 31,414 |
| Hanwha Corp. | 1,030 | | 66,261 |
| Hite Brewery Company, Ltd. | 330 | | 43,019 |
| Honam Petrochemical Corp. | 310 | | 47,849 |
| Hyosung Corp. | 490 | | 35,841 |
| Hyundai Autonet Company, Ltd. (a) | 2,200 | | 17,356 |
| Hyundai Department Store Company, Ltd. | 350 | | 39,550 |
| Hyundai Development Company | 1,540 | | 137,793 |
| Hyundai Engineering & Construction | | | |
| Company, Ltd. * | 1,100 | | 88,792 |
| Hyundai Heavy Industries | 1,060 | | 417,715 |
| Hyundai Marine & Fire | | | |
| Insurance Company, Ltd. | 1,710 | | 34,961 |
| Hyundai Merchant Marine Company, Ltd. (a) | 910 | | 48,133 |
| Hyundai Mipo Dockyard | 280 | | 82,912 |
| Hyundai Mobis | 1,360 | | 146,228 |
| Hyundai Motor Company, Ltd. | 3,730 | | 276,411 |
| Hyundai Securities Company, Ltd. | 2,880 | | 87,776 |
| Hyundai Steel Company | 1,160 | | 92,803 |
| Kangwon Land, Inc. | 2,360 | | 56,572 |
| KCC Corp. | 130 | | 66,501 |
| Kia Motors Corp. * | 4,220 | | 57,064 |
| Kookmin Bank, SADR | 5,064 | | 412,463 |
| Kookmin Bank | 2,917 | | 236,637 |
| Korea Electric Power Corp., ADR | 7,816 | | 176,094 |
| Korea Electric Power Corp. (a) | 2,283 | | 101,927 |
| Korea Exchange Bank | 4,010 | | 63,516 |
| Korea Investment Holdings Company, Ltd. | 1,010 | | 65,029 |
| Korea Zinc Company, Ltd. | 290 | | 58,154 |
| Korean Air Lines Company, Ltd. (a) | 797 | | 53,968 |
| Korean Reinsurance Company, Ltd. | 1,780 | | 24,148 |
| KT Corp., SADR | 4,271 | | 101,735 |
| KT Corp. | 1,040 | | 49,340 |
| |
| The accompanying notes are an integral part of the financial statements. | 225 |
John Hancock Funds II
Portfolio of investments — August 31, 2007
(showing percentage of total net assets)
| | | |
| International Equity Index Fund (continued) | | |
| | Shares or | | |
| | Principal | | |
| | Amount | | Value |
|
|
| |
| COMMON STOCKS (continued) | | | |
| | | | |
| South Korea (continued) | | | |
| KT Freetel Company, Ltd. (a) | 2,180 | $ | 70,847 |
| KT&G Corp. | 2,700 | | 205,306 |
| LG Chem, Ltd. | 1,000 | | 104,063 |
| LG Electronics, Inc. | 2,200 | | 168,805 |
| LG Fashion Corp., Ltd. | 550 | | 16,358 |
| LG Household & Health Care, Ltd. (a) | 240 | | 36,597 |
| LG International Corp. (a) | 729 | | 24,182 |
| LG Petrochemical Company, Ltd. | 590 | | 28,545 |
| LG Philips LCD Company, Ltd. * | 1,526 | | 64,920 |
| Lotte Chilsung Beverage Company, Ltd. (a) | 20 | | 30,731 |
| Lotte Confectionery Company, Ltd. | 20 | | 34,081 |
| Lotte Shopping Company, Ltd. (a) | 200 | | 74,578 |
| LS Cable, Ltd. | 420 | | 43,128 |
| Mirae Asset Securities Company, Ltd. | 475 | | 42,287 |
| NCSoft Corp. * (a) | 310 | | 25,779 |
| NHN Corp. * | 868 | | 167,563 |
| Nong Shim Company, Ltd. | 80 | | 20,469 |
| Orion Corp. | 80 | | 21,678 |
| Pacific Corp. | 60 | | 11,917 |
| Poongsan Corp. | 570 | | 15,496 |
| POSCO, SADR | 4,537 | | 695,567 |
| POSCO | 660 | | 403,930 |
| Pusan Bank | 2,740 | | 51,062 |
| S1 Corp. | 410 | | 22,415 |
| Samsung Corp. | 3,107 | | 211,516 |
| Samsung Electro-Mechanics Company, Ltd. | 1,500 | | 82,952 |
| Samsung Electronics Company, Ltd., GDR | 330 | | 104,775 |
| Samsung Electronics Company, Ltd. | 2,463 | | 1,552,733 |
| Samsung Engineering Company, Ltd. | 800 | | 92,089 |
| Samsung Fine Chemicals Company, Ltd. | 430 | | 24,268 |
| Samsung Fire & Marine | | | |
| Insurance Company, Ltd. | 860 | | 167,274 |
| Samsung Heavy Industries Company, Ltd. | 4,051 | | 204,289 |
| Samsung SDI Company, Ltd. | 750 | | 49,302 |
| Samsung Securities Company, Ltd. | 1,290 | | 109,961 |
| Samsung Techwin Company, Ltd. | 1,320 | | 95,290 |
| Shinhan Financial Group Company, Ltd. | 7,830 | | 480,084 |
| Shinsegae Company, Ltd. | 340 | | 224,706 |
| SK Corp. | 603 | | 92,764 |
| SK Energy Company, Ltd. * | 1,416 | | 193,931 |
| SK Telecom Company, Ltd., ADR (a) | 5,517 | | 151,000 |
| SK Telecom Company, Ltd. (a) | 267 | | 58,602 |
| S-Oil Corp. | 1,120 | | 90,281 |
| Tong Yang Investment Bank | 2,060 | | 38,944 |
| Woongjin Coway Company, Ltd. | 990 | | 31,132 |
| Woori Investment & Securities Company, Ltd. (a) | 2,050 | | 57,584 |
| Yuhan Corp. | 178 | | 38,885 |
| |
|
| | | | 11,249,824 |
| Spain - 3.10% | | | |
| Abertis Infraestructuras SA (a) | 5,841 | | 177,553 |
| Acciona SA | 658 | | 165,342 |
| Acerinox SA (a) | 3,695 | | 93,134 |
| | | |
| International Equity Index Fund (continued) | |
| | Shares or | | |
| | Principal | | |
| | Amount | | Value |
|
|
| |
| COMMON STOCKS (continued) | | | |
| | | | |
| Spain (continued) | | | |
| ACS Actividades SA | 4,831 | $ | 266,233 |
| Aguas de Barcelona SA-Class A | 1,394 | | 50,802 |
| Altadis SA, Series A | 6,011 | | 399,568 |
| Antena 3 de Television SA * (a) | 1,898 | | 35,584 |
| Banco Bilbao Vizcaya Argentaria SA | 82,721 | | 1,914,075 |
| Banco Popular Espanol SA (a) | 19,985 | | 365,287 |
| Banco Santander Central Hispano SA | 145,570 | | 2,662,979 |
| Cintra Concesiones de Infraestructuras de | | | |
| Transporte SA (a) | 4,601 | | 72,594 |
| Corporacion Mapfre SA | 12,420 | | 54,908 |
| Ebro Puleva SA (a) | 1,974 | | 43,448 |
| Endesa SA | 14,835 | | 807,427 |
| Fomento de Construcciones SA | 1,046 | | 91,377 |
| Gamesa Corporacion Tecno SA | 3,980 | | 158,908 |
| Gas Natural SDG SA (a) | 3,595 | | 191,910 |
| Gestevision Telecinco SA | 2,052 | | 54,720 |
| Grupo Ferrovial SA | 1,484 | | 130,464 |
| Iberdrola SA, GDR | 1,075 | | 59,671 |
| Iberdrola SA (a) | 20,971 | | 1,164,711 |
| Iberia Lineas Aereas de Espana SA | 11,209 | | 51,114 |
| Indra Sistemas SA | 2,819 | | 73,877 |
| Industria de Diseno Textil SA | 4,980 | | 292,745 |
| Promotora de Informaciones SA | 1,526 | | 32,766 |
| Repsol SA | 18,552 | | 669,369 |
| Sacyr Vallehermoso SA (a) | 1,821 | | 72,248 |
| Sogecable SA * | 1,198 | | 45,481 |
| Telefonica SA | 103,824 | | 2,585,183 |
| Union Fenosa SA | 2,459 | | 134,741 |
| Zardoya Otis SA (a) | 2,802 | | 88,463 |
| Zeltia SA * | 3,133 | | 31,303 |
|
|
| | | | 13,037,985 |
| Sweden - 1.94% | | | |
| Alfa Laval AB | 2,200 | | 133,137 |
| Assa Abloy AB - Series B | 7,200 | | 149,917 |
| Atlas Copco AB, Series A, ADR | 16,027 | | 268,274 |
| Atlas Copco AB, Series B, ADR | 9,692 | | 154,415 |
| Axfood AB (a) | 600 | | 21,513 |
| Billerud Aktibolag AB | 1,000 | | 13,991 |
| Boliden AB | 7,000 | | 147,868 |
| Castellum AB | 3,500 | | 43,631 |
| D. Carnegie & Company AB | 1,500 | | 24,423 |
| Electrolux AB - Series B (a) | 6,123 | | 138,042 |
| Elekta AB, Series B | 2,039 | | 31,296 |
| Eniro AB | 4,400 | | 53,617 |
| Ericsson LM, Series B | 352,000 | | 1,312,436 |
| Fabege AB, ADR | 3,200 | | 36,169 |
| Getinge AB, Series B (a) | 4,000 | | 87,827 |
| Hennes & Mauritz AB - B shares (a) | 11,250 | | 637,366 |
| Hoganas AB, Series B | 600 | | 17,226 |
| Holmen AB, Series B (a) | 1,300 | | 49,943 |
| Husqvarna AB, B Shares | 6,593 | | 84,654 |
| Kungsleden AB | 2,937 | | 36,265 |
| |
| The accompanying notes are an integral part of the financial statements. | 226 |
John Hancock Funds II
Portfolio of investments — August 31, 2007
(showing percentage of total net assets)
| | | |
| International Equity Index Fund (continued) | |
| | Shares or | | |
| | Principal | | |
| | Amount | | Value |
|
|
| |
| COMMON STOCKS (continued) | | | |
| | | | |
| Sweden (continued) | | | |
| Lundin Petroleum AB, Series A * | 5,696 | $ | 55,188 |
| Modern Times Group AB, Series B | 1,179 | | 67,949 |
| Nobia AB | 3,200 | | 35,777 |
| Nordea Bank AB | 49,000 | | 750,209 |
| OMX AB (a) | 2,000 | | 69,380 |
| Oriflame Cosmetics AB (a) | 1,015 | | 55,971 |
| Sandvik AB | 22,561 | | 462,058 |
| SAS AB * (a) | 1,500 | | 28,785 |
| Scania AB - Series B | 8,800 | | 205,775 |
| Securitas AB, B Shares | 7,200 | | 95,432 |
| Securitas Direct AB, B Shares * | 6,800 | | 19,293 |
| Securitas Systems AB, B Shares | 6,800 | | 23,990 |
| Skandinaviska Enskilda Banken AB - Series A | 11,000 | | 333,996 |
| Skanska AB, Series B | 9,000 | | 183,366 |
| SKF AB, B Shares (a) | 9,400 | | 193,008 |
| SSAB Svenskt Stal AB, New Shares * | 900 | | 28,503 |
| SSAB Svenskt Stal AB, Series A | 3,600 | | 123,246 |
| SSAB Svenskt Stal AB, Series B New Shares * | 350 | | 10,119 |
| SSAB Svenskt Stal AB, Series B | 1,800 | | 56,900 |
| Svenska Cellulosa AB, ADR | 13,400 | | 233,504 |
| Svenska Handelsbanken AB - Series A | 12,100 | | 337,957 |
| Swedish Match AB | 6,500 | | 126,274 |
| Tele2 AB - Series B | 7,023 | | 128,928 |
| Teliasonera AB | 53,500 | | 419,054 |
| Trelleborg AB, Series B | 1,800 | | 43,593 |
| Volvo AB - Series A | 11,400 | | 198,501 |
| Volvo AB - Series B | 25,900 | | 450,116 |
| Wihlborgs Fastigheter AB (a) | 582 | | 10,639 |
|
|
| | | | 8,189,521 |
| Switzerland - 5.14% | | | |
| ABB, Ltd. (a) | 49,508 | | 1,224,186 |
| Adecco SA | 3,081 | | 201,613 |
| Ciba Specialty Chemicals AG | 1,551 | | 85,128 |
| Clariant AG * | 5,029 | | 67,268 |
| Compagnie Financiere | | | |
| Richemont AG, Series A | 12,454 | | 773,988 |
| Credit Suisse Group AG | 26,183 | | 1,720,691 |
| Geberit AG, ADR | 975 | | 144,154 |
| Givaudan AG | 156 | | 141,318 |
| Holcim, Ltd. | 4,838 | | 525,313 |
| Kudelski SA | 688 | | 21,557 |
| Kuehne & Nagel International AG | 1,264 | | 118,751 |
| Kuoni Reisen Holding AG, Series B | 61 | | 30,870 |
| Logitech International SA * (a) | 4,034 | | 109,429 |
| Lonza Group AG | 1,090 | | 107,180 |
| Nestle SA | 9,590 | | 4,185,421 |
| Nobel Biocare Holding AG, Series BR | 553 | | 151,140 |
| Novartis AG | 55,529 | | 2,931,207 |
| Phonak Holding AG (a) | 1,039 | | 92,261 |
| PSP Swiss Property AG * (a) | 1,046 | | 56,596 |
| Rieter Holding AG | 109 | | 58,245 |
| Roche Holdings AG | 16,818 | | 2,933,614 |
| | | |
| International Equity Index Fund (continued) | | |
| | Shares or | | |
| | Principal | | |
| | Amount | | Value |
|
|
| |
| COMMON STOCKS (continued) | | | |
| | | | |
| Switzerland (continued) | | | |
| Schindler Holding AG | 1,121 | $ | 68,852 |
| Societe Generale de Surveillance Holdings AG | 111 | | 133,213 |
| Straumann Holding AG | 193 | | 53,106 |
| Sulzer AG | 86 | | 114,443 |
| Swatch Group AG - BR shares | 788 | | 237,023 |
| Swatch Group AG | 1,146 | | 64,669 |
| Swiss Life Holding * | 820 | | 195,461 |
| Swiss Re | 8,491 | | 717,382 |
| Swisscom AG | 535 | | 188,516 |
| Syngenta AG * | 2,491 | | 467,285 |
| Synthes AG | 1,456 | | 166,771 |
| UBS AG | 47,886 | | 2,510,735 |
| Unaxis Holding AG * | 141 | | 45,662 |
| Zurich Financial Services AG | 3,448 | | 991,620 |
| |
|
| | | | 21,634,668 |
| Taiwan - 1.96% | | | |
| Acer Sertek, Inc. | 52,720 | | 92,722 |
| Advanced Semiconductor Engineering, Inc. | 82,651 | | 81,706 |
| Advantech Company, Ltd. | 5,250 | | 15,907 |
| Asia Cement Corp. | 35,640 | | 49,995 |
| Asia Optical Company, Inc. | 4,039 | | 15,014 |
| Asustek Computer, Inc. | 74,183 | | 221,390 |
| AU Optronics Corp. | 143,687 | | 209,602 |
| BenQ Corp. * | 50,000 | | 23,447 |
| Catcher Technology Company, Ltd. | 9,000 | | 71,971 |
| Cathay Financial Holdings Company, Ltd. | 126,000 | | 280,437 |
| Cathay Real Estate Development | | | |
| Company, Ltd. | 18,000 | | 8,402 |
| Chang Hwa Commercial Bank, Ltd. | 82,000 | | 51,440 |
| Cheng Shin Rubber Industry Company, Ltd. | 16,840 | | 30,903 |
| Cheng Uei Precision Industry Company, Ltd. | 5,250 | | 12,862 |
| Chi Mei Optoelectronics Corp. | 95,480 | | 96,676 |
| China Airlines, Ltd. | 24,716 | | 9,694 |
| China Development Financial Holdings Corp. | 196,000 | | 79,930 |
| China Motor Company, Ltd. | 11,055 | | 9,804 |
| China Steel Corp. | 198,520 | | 269,927 |
| Chinatrust Finance Holding Company, Ltd. * | 159,000 | | 119,590 |
| Chunghwa Picture Tubes, Ltd. * | 135,000 | | 34,706 |
| Chunghwa Telecom Company, Ltd. | 121,400 | | 215,762 |
| CMC Magnetics Corp. * | 65,000 | | 28,549 |
| Compal Communications, Inc. | 4,200 | | 9,888 |
| Compal Electronics, Inc. | 69,345 | | 76,772 |
| Compeq Manufactuing Company, Ltd. | 19,000 | | 8,159 |
| Delta Electronics, Inc. | 33,500 | | 124,907 |
| D-Link Corp. | 14,280 | | 31,524 |
| E.Sun Financial Holding Company, Ltd. * | 61,000 | | 32,205 |
| Epistar Corp. | 8,153 | | 38,355 |
| Eternal Chemical Company, Ltd. | 11,200 | | 13,040 |
| EVA Airways Corp. * | 24,000 | | 8,871 |
| Evergreen Marine Corp. | 20,000 | | 12,950 |
| Far Eastern Textile, Ltd. | 60,770 | | 71,465 |
| First Financial Holding Company, Ltd. | 101,800 | | 70,378 |
| |
| The accompanying notes are an integral part of the financial statements. | 227 |
John Hancock Funds II
Portfolio of investments — August 31, 2007
(showing percentage of total net assets)
| | | |
| International Equity Index Fund (continued) | |
| | Shares or | | |
| | Principal | | |
| | Amount | | Value |
|
|
| |
| COMMON STOCKS (continued) | | | |
| | | | |
| Taiwan (continued) | | | |
| Formosa Chemicals & Fibre Corp. | 65,000 | $ | 158,289 |
| Formosa Petrochemical Corp. | 43,000 | | 119,758 |
| Formosa Plastic Corp. | 93,000 | | 231,038 |
| Formosa Taffeta Company, Ltd. | 19,000 | | 21,584 |
| Foxconn Technology Company, Ltd. | 10,200 | | 92,712 |
| Fubon Group Company, Ltd. | 83,000 | | 71,565 |
| Fuhwa Financial Holdings Company, Ltd. * | 128,825 | | 73,467 |
| Gigabyte Technology Company, Ltd. | 11,000 | | 10,023 |
| HannStar Display Corp. * | 119,000 | | 31,969 |
| High Tech Computer Corp. | 10,400 | | 141,288 |
| Hon Hai Precision Industry Company, Ltd. | 112,719 | | 836,545 |
| Hua Nan Financial Holdings Company, Ltd. | 79,000 | | 52,145 |
| InnoLux Display Corp. | 44,713 | | 189,826 |
| Inotera Memories, Inc. | 66,780 | | 66,892 |
| Inventec Appliances Corp. | 4,200 | | 8,488 |
| Inventec Company, Ltd. | 33,600 | | 21,391 |
| Kinpo Electronics, Inc. | 20,400 | | 7,795 |
| Kinsus Interconnect Technology Corp | 5,500 | | 18,979 |
| Largan Precision Company, Ltd. | 2,040 | | 16,568 |
| Lite-On Technology Corp. | 40,600 | | 64,061 |
| Macronix International Company, Ltd. * | 65,000 | | 40,279 |
| MediaTek, Inc. | 18,850 | | 318,627 |
| Mega Financial Holding Company, Ltd. | 196,000 | | 122,033 |
| Micro-Star International Company, Ltd. | 14,836 | | 15,305 |
| Mitac International | 23,742 | | 29,637 |
| Mosel Vitelic, Inc. | 20,600 | | 24,355 |
| Motech Industries, Inc. | 2,425 | | 20,736 |
| Nan Ya Plastics Corp. | 115,000 | | 279,072 |
| Nan Ya Printed Circuit Board Corp. | 4,000 | | 25,999 |
| Nanya Technology Corp. | 46,347 | | 34,085 |
| Novatek Microelectronics Corp., Ltd. | 9,179 | | 37,044 |
| Oriental Union Chemical Corp. | 10,200 | | 10,360 |
| Phoenix Precision Technology Corp. | 11,054 | | 12,803 |
| Polaris Securities Company, Ltd. * | 39,518 | | 20,208 |
| Pou Chen Corp. | 39,774 | | 39,772 |
| Powerchip Semiconductor Corp. | 160,387 | | 79,029 |
| Powertech Technology, Inc. | 8,050 | | 32,476 |
| President Chain Store Corp. | 11,000 | | 28,569 |
| ProMOS Technologies, Inc. | 124,000 | | 38,298 |
| Quanta Computer, Inc. | 41,820 | | 68,045 |
| Realtek Semiconductor Corp. | 8,925 | | 43,675 |
| Ritek Corp. * | 43,000 | | 12,924 |
| Shin Kong Financial Holding Company, Ltd. | 75,124 | | 73,175 |
| Siliconware Precision Industries Company | 54,045 | | 110,271 |
| SinoPac Holdings Company, Ltd. | 135,000 | | 64,033 |
| Synnex Technology International Corp. | 15,750 | | 43,408 |
| Taishin Financial Holdings Company, Ltd. * | 110,000 | | 55,133 |
| Taiwan Cellular Corp. | 52,000 | | 66,167 |
| Taiwan Cement Corp. | 59,590 | | 76,683 |
| Taiwan Fertilizer Company, Ltd. | 16,000 | | 32,861 |
| Taiwan Glass Industrial Corp. | 14,248 | | 12,963 |
| Taiwan Secom Company, Ltd. | 5,000 | | 8,264 |
| | | |
| International Equity Index Fund (continued) | |
| | Shares or | | |
| | Principal | | |
| | Amount | | Value |
|
|
| |
| COMMON STOCKS (continued) | | | |
| | | | |
| Taiwan (continued) | | | |
| Taiwan Semiconductor | | | |
| Manufacturing Company, Ltd. | 478,289 | $ | 908,117 |
| Tatung Company, Ltd. * | 78,000 | | 36,737 |
| Teco Electric & Machinery Company, Ltd. | 34,000 | | 19,077 |
| Tripod Technology Corp. | 7,980 | | 33,016 |
| U-Ming Marine Transport Corp. | 9,000 | | 26,856 |
| Unimicron Technology Corp. | 17,340 | | 27,213 |
| Uni-President Enterprises Corp. | 67,240 | | 78,086 |
| United Microelectronics Corp. | 400,000 | | 225,822 |
| Vanguard International Semiconductor Corp. | 19,188 | | 16,318 |
| Via Technologies, Inc. * | 23,000 | | 16,473 |
| Walsin Lihwa Corp. | 60,000 | | 29,475 |
| Wan Hai Lines, Ltd. | 20,000 | | 14,119 |
| Waterland Financial Holding Company | 29,580 | | 9,146 |
| Winbond Electronics Corp. | 76,000 | | 22,844 |
| Wintek Corp. | 20,000 | | 22,928 |
| Wistron Corp. | 23,317 | | 42,378 |
| Yageo Corp. | 55,000 | | 21,098 |
| Yang Ming Marine Transport Corp. | 24,000 | | 16,956 |
| Yieh Phui Enterprise Company, Ltd. | 18,000 | | 7,971 |
| Yuen Foong Yu Paper Manufacturing | | | |
| Company, Ltd. | 23,230 | | 9,810 |
| Yulon Motor Company, Ltd. | 15,223 | | 16,647 |
| Zyxel Communications Corp. | 7,140 | | 12,418 |
|
|
| | | | 8,253,127 |
| Thailand - 0.22% | | | |
| Advanced Info Service PCL (a) | 18,000 | | 49,283 |
| Airports of Thailand PCL (a) | 8,700 | | 14,707 |
| Aromatics Thailand PCL | 4,700 | | 10,343 |
| Bangkok Bank PCL, Foreign Shares | 19,100 | | 66,110 |
| Bangkok Bank PCL, NVDR (a) | 4,900 | | 16,981 |
| Bangkok Bank PCL | 9,000 | | 31,189 |
| Bangkok Expressway PCL | 7,100 | | 5,029 |
| Banpu PCL, Reg. | 2,600 | | 22,663 |
| BEC World PCL | 18,400 | | 12,442 |
| C.P. Seven Eleven PCL | 31,600 | | 10,039 |
| Central Pattana PCL | 15,000 | | 13,334 |
| Charoen Pokphand Foods PCL | 61,300 | | 8,362 |
| Electricity Generating PCL, Foreign Shares | 2,700 | | 9,286 |
| Electricity Generating PCL | 3,400 | | 11,682 |
| Glow Energy PCL | 11,700 | | 10,912 |
| Hana Microelectronics PCL | 11,500 | | 7,977 |
| IRPC PCL | 197,100 | | 38,202 |
| Kasikornbank PCL - Foreign Shares | 26,200 | | 60,221 |
| Kasikornbank PCL, NVDR | 7,000 | | 16,112 |
| Kasikornbank PCL | 4,800 | | 11,048 |
| Krung Thai Bank PCL (a) | 57,000 | | 18,772 |
| Land & Houses PCL, Foreign Shares (a) | 42,300 | | 9,787 |
| Land & Houses PCL, NVDR | 21,200 | | 4,902 |
| Land & Houses PCL | 46,400 | | 10,729 |
| National Finance PCL | 13,300 | | 6,008 |
| Precious Shipping PCL | 8,400 | | 8,263 |
| |
| The accompanying notes are an integral part of the financial statements. | 228 |
John Hancock Funds II
Portfolio of investments — August 31, 2007
(showing percentage of total net assets)
| | | |
| International Equity Index Fund (continued) | |
| | Shares or | | |
| | Principal | | |
| | Amount | | Value |
|
|
| |
| COMMON STOCKS (continued) | | | |
| | | | |
| Thailand (continued) | | | |
| PTT Chemical PCL | 5,500 | $ | 17,633 |
| PTT Exploration & Production PCL | 26,700 | | 94,940 |
| PTT, PCL, Foreign Shares | 18,800 | | 160,000 |
| Ratchaburi Electricity Generating Holding PCL | 5,900 | | 7,867 |
| Rayong Refinery PCL | 32,500 | | 22,260 |
| Siam Cement PCL, Foreign Shares | 6,100 | | 45,129 |
| Siam Cement PCL, NVDR | 1,900 | | 14,051 |
| Siam Cement PCL | 3,000 | | 22,185 |
| Siam City Cement PCL | 1,300 | | 10,382 |
| Siam Commercial Bank PCL | 16,500 | | 38,473 |
| Siam Makro PCL | 2,000 | | 5,246 |
| Thai Airways International PCL | 10,400 | | 13,261 |
| True Corp. PCL * (a) | 33,900 | | 6,768 |
|
|
| | | | 942,578 |
| Turkey - 0.27% | | | |
| Adana Cimento Sanayii Turk Anonim Sirketi, | | | |
| Class A | 1,047 | | 7,315 |
| Akbank AS (a) | 20,633 | | 131,778 |
| Akcansa Cimento AS | 982 | | 7,511 |
| Aksigorta AS | 2,924 | | 19,719 |
| Anadolu Efes Biracilik Ve Malt Sanayii AS | 1,331 | | 48,437 |
| Arcelik AS | 2,378 | | 16,697 |
| Aygaz AS | 1,542 | | 5,535 |
| Cimsa Cimento Sanayi ve Ticaret AS | 747 | | 5,480 |
| Dogan Sirketler Grubu Holdings AS * | 12,411 | | 23,745 |
| Dogan Yayin Holding AS * (a) | 5,058 | | 18,458 |
| Eregli Demir ve Celik Fabrikalari TAS | 13,046 | | 102,414 |
| Ford Otomotiv Sanayi AS | 1,674 | | 16,013 |
| HACI Omer Sabanci Holdings, AS | 10,600 | | 58,730 |
| Hurriyet Gazetecilik AS * | 4,478 | | 11,885 |
| Is Gayrimenkul Yatirim Ortakligi AS * | 4,154 | | 6,537 |
| KOC Holdings AS * | 8,265 | | 37,801 |
| Migros Turk TAS | 2,294 | | 38,064 |
| Petkim Petrokimya Holding AS * | 1,680 | | 12,718 |
| Tofas Turk Otomobil Fabrik AS | 3,007 | | 13,812 |
| Trakya Cam Sanayi AS | 2,105 | | 7,186 |
| Tupras Turkiye Petrol Rafine AS | 2,947 | | 67,281 |
| Turk Hava Yollari AS * | 1,700 | | 11,890 |
| Turk Sise ve Cam Fabrikalari AS | 3,541 | | 14,853 |
| Turkcell Iletisim Hizmetleri AS - ADR | 3,371 | | 60,712 |
| Turkcell Iletisim Hizmetleri AS | 4,032 | | 29,284 |
| Turkiye Garanti Bankasi AS | 22,212 | | 142,770 |
| Turkiye Is Bankasi AS | 22,656 | | 110,674 |
| Turkiye Vakiflar Bankasi Tao | 25,897 | | 74,219 |
| Ulker Gida Sanayi ve Ticaret AS | 1,484 | | 6,186 |
| Vestel Elektronik Sanayi ve Tracaret AS * | 1,632 | | 3,705 |
| Yapi ve Kredi Bankasi AS * | 15,702 | | 45,155 |
|
|
| | | | 1,156,564 |
| United Kingdom - 16.80% | | | |
| 3i Group PLC | 9,319 | | 198,783 |
| Aegis Group PLC | 19,151 | | 51,119 |
| | | |
| International Equity Index Fund (continued) | | |
| | Shares or | | |
| | Principal | | |
| | Amount | | Value |
|
|
| |
| COMMON STOCKS (continued) | | | |
| | | | |
| United Kingdom (continued) | | | |
| Aggreko PLC | 6,402 | $ | 69,535 |
| AMEC PLC | 7,007 | | 92,715 |
| Amvescap PLC | 18,430 | | 224,996 |
| Anglo American PLC | 31,503 | | 1,808,954 |
| ARM Holdings PLC | 28,223 | | 84,171 |
| Arriva PLC | 4,945 | | 75,794 |
| AstraZeneca Group PLC | 35,559 | | 1,752,816 |
| Astro All Asia Networks PLC, GDR | 11,900 | | 11,547 |
| Aviva PLC | 59,326 | | 850,031 |
| BAE Systems PLC | 79,026 | | 739,889 |
| Barclays PLC | 152,264 | | 1,887,779 |
| Barratt Developments PLC | 7,099 | | 133,339 |
| BBA Aviation PLC | 10,764 | | 52,547 |
| Bellway PLC | 2,786 | | 71,593 |
| Berkeley Group Holdings PLC * | 1,981 | | 64,404 |
| BG Group PLC | 79,556 | | 1,273,380 |
| BHP Billiton PLC | 55,384 | | 1,624,442 |
| BICC PLC | 10,019 | | 96,267 |
| Biffa PLC | 7,147 | | 36,455 |
| Bovis Homes Group PLC | 2,613 | | 40,661 |
| BP PLC | 449,852 | | 5,056,392 |
| Britannic Group PLC | 16,137 | | 201,607 |
| British Airways PLC * | 12,083 | | 103,780 |
| British American Tobacco PLC | 36,099 | | 1,197,903 |
| British Energy Group PLC | 24,564 | | 230,478 |
| British Land Company PLC | 11,892 | | 311,156 |
| British Sky Broadcasting Group PLC | 26,102 | | 356,440 |
| Brixton PLC | 5,015 | | 40,132 |
| BT Group PLC | 193,462 | | 1,234,013 |
| Bunzl PLC | 8,253 | | 115,131 |
| Burberry Group PLC | 9,349 | | 115,558 |
| Cadbury Schweppes PLC | 48,183 | | 570,557 |
| Capita Group PLC | 14,496 | | 219,967 |
| Carnival PLC | 4,079 | | 181,296 |
| Carphone Warehouse | 8,921 | | 61,741 |
| Cattles PLC | 8,081 | | 59,692 |
| Centrica PLC | 84,155 | | 656,020 |
| Charter PLC * | 3,680 | | 83,033 |
| Close Brothers Group PLC | 3,153 | | 49,241 |
| Cobham PLC | 26,375 | | 107,209 |
| Compass Group PLC | 46,941 | | 308,542 |
| Cookson Group PLC | 4,613 | | 71,662 |
| CSR PLC * | 2,781 | | 36,539 |
| Daily Mail and General Trust PLC | 6,292 | | 86,304 |
| Davis Service Group PLC | 4,197 | | 50,121 |
| De La Rue PLC | 3,103 | | 46,725 |
| Diageo PLC | 62,899 | | 1,345,415 |
| Dixons Group PLC | 44,476 | | 139,576 |
| Electrocomponents PLC | 8,643 | | 44,430 |
| EMAP PLC | 5,092 | | 93,304 |
| Enterprise Inns PLC | 12,592 | | 164,175 |
| First Choice Holidays PLC | 11,680 | | 69,999 |
| |
| The accompanying notes are an integral part of the financial statements. | 229 |
John Hancock Funds II
Portfolio of investments — August 31, 2007
(showing percentage of total net assets)
| | | |
| International Equity Index Fund (continued) | | |
| | Shares or | | |
| | Principal | | |
| | Amount | | Value |
|
|
| |
| COMMON STOCKS (continued) | | | |
| | | | |
| United Kingdom (continued) | | | |
| FirstGroup PLC | 9,201 | $ | 121,507 |
| FKI PLC | 9,466 | | 20,233 |
| Friends Provident Ethical Investment | | | |
| Trust PLC | 43,320 | | 156,745 |
| Galiform PLC * | 16,109 | | 42,343 |
| GKN PLC | 14,901 | | 110,971 |
| GlaxoSmithKline PLC | 133,714 | | 3,490,168 |
| Grafton Group PLC * | 306 | | 4,080 |
| Great Portland Estates PLC | 3,281 | | 42,927 |
| Group 4 Securicor PLC | 26,898 | | 108,009 |
| Hammerson PLC | 6,399 | | 171,956 |
| Hays PLC | 34,831 | | 112,199 |
| HBOS PLC | 87,750 | | 1,560,136 |
| Home Retail Group | 20,993 | | 175,902 |
| HSBC Holdings PLC | 271,578 | | 4,911,592 |
| ICAP PLC | 12,459 | | 123,156 |
| IMI PLC | 7,093 | | 81,073 |
| Imperial Chemical Industries PLC | 27,396 | | 350,130 |
| Imperial Tobacco Group PLC | 15,548 | | 703,708 |
| Inchcape PLC | 10,526 | | 100,684 |
| Intercontinental Hotels Group PLC | 7,155 | | 150,078 |
| International Power PLC | 34,192 | | 279,516 |
| Intertek Group PLC | 3,265 | | 64,893 |
| Invensys PLC * | 18,559 | | 128,520 |
| Investec PLC | 8,690 | | 95,151 |
| ITV PLC | 91,596 | | 203,280 |
| J Sainsbury PLC | 36,046 | | 403,611 |
| Johnson Matthey PLC | 5,176 | | 168,021 |
| Kelda Group PLC | 6,260 | | 110,374 |
| Kesa Electricals PLC | 12,473 | | 78,102 |
| Kingfisher PLC | 54,230 | | 228,650 |
| Ladbrokes PLC | 14,463 | | 127,470 |
| Land Securities Group PLC | 11,111 | | 407,214 |
| Legal & General Group PLC | 154,071 | | 452,034 |
| Liberty International PLC | 6,206 | | 150,504 |
| Lloyds TSB Group PLC | 131,465 | | 1,447,321 |
| Logicacmg PLC | 33,627 | | 111,008 |
| London Stock Exchange Group PLC | 3,743 | | 103,339 |
| Man Group PLC | 42,204 | | 421,876 |
| Marks & Spencer Group PLC | 39,475 | | 499,073 |
| Meggitt PLC | 13,761 | | 88,655 |
| Michael Page International PLC | 7,525 | | 73,030 |
| Misys PLC | 10,405 | | 48,628 |
| Mondi PLC | 8,401 | | 82,930 |
| National Express Group PLC | 2,863 | | 72,718 |
| National Grid PLC, ADR | 62,557 | | 937,691 |
| Next Group PLC | 5,347 | | 209,035 |
| Old Mutual PLC | 123,462 | | 398,780 |
| Pearson PLC | 18,467 | | 277,690 |
| Persimmon PLC | 6,824 | | 159,821 |
| Premier Farnell PLC | 6,379 | | 23,478 |
| Prudential PLC | 56,532 | | 804,385 |
| | | |
| International Equity Index Fund (continued) | |
| | Shares or | | |
| | Principal | | |
| | Amount | | Value |
|
|
| |
| COMMON STOCKS (continued) | | | |
| | | | |
| United Kingdom (continued) | | | |
| Punch Taverns PLC | 5,618 | $ | 124,959 |
| Rank Group PLC | 8,856 | | 29,959 |
| Reckitt Benckiser PLC | 14,101 | | 769,058 |
| Reed Elsevier PLC | 30,081 | | 363,701 |
| Rentokil Initial PLC | 43,925 | | 153,881 |
| Reuters Group PLC | 29,536 | | 380,703 |
| Rexam PLC | 15,278 | | 161,575 |
| Rio Tinto PLC | 23,596 | | 1,630,204 |
| Rolls-Royce Group PLC * | 41,984 | | 433,868 |
| Royal Bank of Scotland Group PLC | 220,054 | | 2,557,568 |
| Royal Dutch Shell PLC, A Shares | 85,606 | | 3,327,040 |
| Royal Dutch Shell PLC, B Shares | 64,209 | | 2,504,340 |
| SAB Miller PLC | 20,925 | | 575,700 |
| Schroders PLC | 2,578 | | 69,113 |
| Scottish & Newcastle PLC | 18,754 | | 234,719 |
| Scottish & Southern Energy PLC | 19,988 | | 572,862 |
| Segro PLC, REIT (a) | 9,242 | | 102,263 |
| Serco Group PLC | 11,168 | | 95,456 |
| Severn Trent PLC | 5,294 | | 146,184 |
| Signet Group PLC | 36,259 | | 69,392 |
| Smith & Nephew PLC | 21,845 | | 257,417 |
| Smiths Group PLC * | 8,725 | | 174,040 |
| SSL International PLC | 5,312 | | 47,378 |
| Stagecoach Group PLC | 11,332 | | 50,960 |
| Standard Life PLC | 49,000 | | 297,538 |
| Tate & Lyle PLC | 10,370 | | 118,414 |
| Taylor Woodrow PLC | 25,140 | | 176,745 |
| Tesco PLC | 185,143 | | 1,592,015 |
| The Sage Group PLC | 29,909 | | 142,955 |
| Thomas Cook Group PLC * | 12,376 | | 71,380 |
| Tomkins PLC | 20,392 | | 98,396 |
| Travis Perkins PLC | 2,681 | | 96,804 |
| Trinity Mirror PLC | 6,139 | | 58,283 |
| Tullett Prebon PLC | 4,390 | | 37,166 |
| Unilever PLC | 30,322 | | 958,431 |
| United Business Media PLC | 5,955 | | 91,336 |
| United Utilities PLC | 20,121 | | 281,255 |
| Vodafone Group PLC (a) | 1,260,955 | | 4,075,775 |
| Whitbread PLC | 4,667 | | 154,986 |
| William Hill PLC | 7,627 | | 94,938 |
| Wolseley PLC | 15,008 | | 315,450 |
| WPP Group PLC | 27,796 | | 396,389 |
| Xstrata PLC | 14,216 | | 836,575 |
| Yell Group PLC | 17,748 | | 161,946 |
|
|
| | | | 70,732,867 |
| United States - 0.03% | | | |
| Southern Copper Corp. (a) | 1,400 | | 147,350 |
|
| TOTAL COMMON STOCKS (Cost $324,357,785) | | $ | 407,973,116 |
|
| |
| The accompanying notes are an integral part of the financial statements. | 230 |
John Hancock Funds II
Portfolio of investments — August 31, 2007
(showing percentage of total net assets)
| | | |
| International Equity Index Fund (continued) | | |
| | Shares or | | |
| | Principal | | |
| | Amount | | Value |
|
|
| |
| PREFERRED STOCKS - 0.99% | | | |
| | | | |
| Brazil - 0.69% | | | |
| Aracruz Celulose SA | 2,200 | $ | 13,860 |
| Banco Bradesco SA | 22,948 | | 570,727 |
| Banco Itau Holding Financeira SA | 11,800 | | 515,598 |
| Brasil Telecom Participacoes SA | 800 | | 11,584 |
| Braskem SA, A Shares | 3,800 | | 34,946 |
| Centrais Eletricas Brasilieras SA, B Shares * | 2,200 | | 26,994 |
| Cia Brasileira de Distribuicao Grupo Pao de | | | |
| Acucar | 460,000 | | 14,701 |
| Cia de Bebidas das Americas, ADR | 2,916 | | 204,033 |
| Cia de Bebidas das Americas | 1,114 | | 76,976 |
| Cia de Gas de Sao Paulo, A Shares | 50,000 | | 11,102 |
| Cia Energetica de Minas Gerais | 900 | | 17,285 |
| Cia Energetica de Sao Paulo * | 3,238,661 | | 55,108 |
| Cia Paranaense de Energia | 2,500 | | 40,646 |
| Cia Vale do Rio Doce | 9,841 | | 406,000 |
| Companhia de Tecidos de Norte de Minas SA | 1,800 | | 11,066 |
| Duratex SA | 1,800 | | 44,447 |
| Eletropaulo Metropolitana de Sao Paulo SA | 498,183 | | 27,995 |
| Gerdau SA | 980 | | 23,900 |
| Gol Linhas Aereas Inteligentes SA | 1,100 | | 24,312 |
| Klabin SA, ADR | 9,000 | | 26,430 |
| NET Servicos de Comunicacao SA * | 4,344 | | 65,109 |
| Petroleo Brasileiro SA | 15,092 | | 400,265 |
| Sadia SA, ADR | 9,000 | | 45,178 |
| Tam SA | 1,584 | | 35,934 |
| Tele Norte Leste Participacoes SA | 600 | | 13,398 |
| Telemig Celular Participacoes SA | 536 | | 15,809 |
| Telesp Celular Participacoes SA | 9,150 | | 43,281 |
| Tim Participacoes SA | 15,540 | | 54,479 |
| Usinas Siderurgicas de Minas Gerais SA | 1,030 | | 61,160 |
| Votorantim Celulose e Papel SA | 1,000 | | 23,788 |
| |
|
| | | | 2,916,111 |
| Germany - 0.18% | | | |
| Porsche AG | 201 | | 359,753 |
| RWE AG | 919 | | 93,717 |
| Volkswagen AG | 2,431 | | 304,418 |
| |
|
| | | | 757,888 |
| Italy - 0.02% | | | |
| Unipol SpA | 20,813 | | 66,421 |
| | | | |
| Japan - 0.00% | | | |
| ITO EN, Ltd. * | 360 | | 6,318 |
| | | | |
| Russia - 0.03% | | | |
| Surgutneftegaz SADR | 1,724 | | 112,060 |
| | | | |
| South Korea - 0.07% | | | |
| Hyundai Motor Company | 820 | | 32,628 |
| LG Electronics, Inc. | 310 | | 13,688 |
| Samsung Electronics Company, Ltd. | 530 | | 248,779 |
| |
|
| | | | 295,095 |
|
| TOTAL PREFERRED STOCKS (Cost $2,878,289) | $ | | 4,153,893 |
|
| | | | |
| International Equity Index Fund (continued) | | |
| | | Shares or | | |
| | | Principal | | |
| | | Amount | | Value |
|
|
| |
| WARRANTS - 0.00% | | | | |
| | | | | |
| Hong Kong - 0.00% | | | | |
| China Overseas Land & Investment, Ltd. | | | | |
| (Expiration Date: 08/27/2008, Strike | | | | |
| Price: HKD 12.50) * | | 6,743 | $ | 3,287 |
| | | | | |
| Indonesia - 0.00% | | | | |
| Bank Pan Indonesia Tbk PT | | | | |
| (Expiration Date: 10/07/2009, Strike | | | | |
| Price: IDR 400.00) * | | 25,750 | | 795 |
|
| TOTAL WARRANTS (Cost $245) | | | $ | 4,082 |
|
| |
| RIGHTS - 0.00% | | | | |
| Greece - 0.00% | | | | |
| EFG Eurobank Ergasias SA (Expiration Date: | | | |
| 09/14/2007, Strike Price: EUR 20.00) * | | 6,758 | | 6,145 |
| Piraeus Bank SA (Expiration Date: | | | | |
| 09/10/2007, Strike Price: EUR 0.89) * | | 6,056 | | 10,532 |
| |
|
| | | | | 16,677 |
| Japan - 0.00% | | | | |
| Dowa Mining Company, Ltd. (Expiration Date: | | | |
| 01/29/2010, Strike Price: JPY 1.00) * | | 5,000 | | 2,791 |
| Philippines - 0.00% | | | | |
| Ali Pals Non Tradeable (Expiration date: | | | | |
| 09/14/2007, Strike price: PHP0.1) * | | 135,600 | | 0 |
|
| TOTAL RIGHTS (Cost $0) | | | $ | 19,468 |
|
| |
| SHORT TERM INVESTMENTS - 13.09% | | | |
| AIM Short-Term Investment Trust, | | | | |
| STIC Prime Portfolio, Institutional | | | | |
| Class | $ | 4,708,533 | $ | 4,708,533 |
| John Hancock Cash Investment Trust | | 50,429,968 | | 50,429,968 |
|
| TOTAL SHORT TERM INVESTMENTS | | | | |
| (Cost $55,138,501) | | | $ | 55,138,501 |
|
| Total Investments (International Equity Index Fund) | | |
| (Cost $382,374,820) - 110.96% | | | $ | 467,289,060 |
| Liabilities in Excess of Other Assets - (10.96)% | | | (46,156,432) |
| | |
|
| TOTAL NET ASSETS - 100.00% | | | $ | 421,132,628 |
| |
|
| |
| |
| |
| International Opportunities Fund | | | |
| | | Shares or | | |
| | | Principal | | |
| | | Amount | | Value |
|
|
| |
| COMMON STOCKS - 93.04% | | | | |
| | | | | |
| Australia - 2.74% | | | | |
| CSL, Ltd. | | 109,685 | $ | 8,770,924 |
| Macquarie Bank, Ltd. (a) | | 153,294 | | 9,124,275 |
| Macquarie Infrastructure Group, Ltd. (a) | | 1,358,292 | | 3,654,250 |
| |
|
| | | | | 21,549,449 |
| Austria - 0.95% | | | | |
| Erste Bank der Oesterreichischen | | | | |
| Sparkassen AG (a) | | 102,424 | | 7,446,799 |
| |
| The accompanying notes are an integral part of the financial statements. | 231 |
John Hancock Funds II
Portfolio of investments — August 31, 2007
(showing percentage of total net assets)
| | | |
| International Opportunities Fund (continued) | |
| | Shares or | | |
| | Principal | | |
| | Amount | | Value |
|
|
| |
| COMMON STOCKS (continued) | | | |
| | | | |
| Bermuda - 1.49% | | | |
| Esprit Holdings, Ltd. | 808,000 | $ | 11,738,012 |
| Brazil - 7.65% | | | |
| All America Latina Logistica SA | 276,858 | | 3,193,109 |
| Gafisa SA | 436,683 | | 5,258,301 |
| Gol-Linhas Aereas Inteligentes SA (a) | 131,326 | | 2,879,979 |
| JHSF Participacoes SA * | 718,000 | | 3,502,083 |
| Petroleo Brasileiro SA, ADR (a) | 296,139 | | 18,313,236 |
| Redecard SA * | 203,700 | | 3,104,867 |
| Unibanco - Uniao De Bancos | | | |
| Brasileiros SA, ADR * | 214,617 | | 23,946,964 |
|
|
| | | | 60,198,539 |
| Canada - 5.06% | | | |
| Potash Corp. of Saskatchewan, Inc. | 140,119 | | 12,408,938 |
| Research In Motion, Ltd. * | 320,436 | | 27,368,439 |
|
|
| | | | 39,777,377 |
| France - 10.00% | | | |
| Accor SA | 170,364 | | 14,572,534 |
| Alstom (a) | 34,482 | | 6,209,850 |
| Cie Generale de Geophysique-Veritas * (a) | 15,625 | | 4,010,999 |
| Compagnie de Saint-Gobain SA (a) | 57,005 | | 6,181,419 |
| Electricite de France (a) | 170,123 | | 17,163,705 |
| JC Decaux SA | 375,580 | | 11,424,245 |
| Veolia Environnement SA | 247,818 | | 19,080,150 |
|
|
| | | | 78,642,902 |
| Germany - 6.67% | | | |
| Continental AG | 221,787 | | 28,881,426 |
| DaimlerChrysler AG | 135,593 | | 12,051,226 |
| GEA Group AG * | 76,821 | | 2,481,820 |
| Linde AG (a) | 41,168 | | 4,840,413 |
| MTU Aero Engines Holding AG | 66,582 | | 4,232,145 |
|
|
| | | | 52,487,030 |
| Hong Kong - 8.67% | | | |
| China Merchants Holdings International | | | |
| Company, Ltd. | 1,570,000 | | 8,240,837 |
| China Mobile, Ltd. | 2,345,500 | | 31,946,148 |
| CNOOC, Ltd. | 10,504,600 | | 12,890,207 |
| Melco PBL Entertainment Macau, Ltd., ADR * (a) | 611,403 | | 7,966,581 |
| Shangri-La Asia, Ltd. | 2,993,778 | | 7,155,675 |
|
|
| | | | 68,199,448 |
| India - 1.36% | | | |
| ICICI Bank, Ltd., SADR (a) | 241,606 | | 10,739,387 |
| Japan - 9.36% | | | |
| Chugai Pharmaceutical Company, Ltd. (a) | 452,300 | | 8,114,206 |
| Daikin Industries, Ltd. | 183,005 | | 8,208,703 |
| Fujitsu, Ltd. (a) | 595,000 | | 4,063,373 |
| Marubeni Corp. | 1,484,000 | | 12,063,652 |
| Mitsui Trust Holdings, Inc. (a) | 1,036,000 | | 8,635,539 |
| Nintendo Company, Ltd. | 36,000 | | 16,563,336 |
| Toyota Motor Corp. (a) | 126,535 | | 7,324,655 |
| | | | |
| International Opportunities Fund (continued) |
| | | Shares or | | |
| | | Principal | | |
| | | Amount | | Value |
|
|
| |
| COMMON STOCKS (continued) | | | | |
| | | | | |
| Japan (continued) | | | | |
| Yamada Denki Company, Ltd. (a) | | 86,428 | $ | 8,678,600 |
| |
|
| | | | | 73,652,064 |
| Mexico - 3.89% | | | | |
| America Movil SA de CV, Series L, SADR | | 188,036 | | 11,368,656 |
| Grupo Televisa SA, SADR * | | 737,613 | | 19,222,195 |
| |
|
| | | | | 30,590,851 |
| Netherlands - 2.61% | | | | |
| ArcelorMittal NV (a) | | 123,455 | | 8,143,693 |
| Heineken NV (a) | | 195,212 | | 12,390,804 |
| |
|
| | | | | 20,534,497 |
| Singapore - 1.59% | | | | |
| Capitaland, Ltd. * (a) | | 2,571,587 | | 12,488,623 |
| | | | | |
| South Korea - 0.98% | | | | |
| Samsung Electronics Company, Ltd. | | 12,230 | | 7,710,077 |
| | | | | |
| Switzerland - 14.48% | | | | |
| ABB, Ltd. (a) | | 592,982 | | 14,662,684 |
| Actelion Ltd * (a) | | 175,269 | | 9,750,556 |
| Holcim, Ltd. (a) | | 259,296 | | 28,154,531 |
| Julius Baer Holding AG | | 179,069 | | 11,920,447 |
| Kuehne & Nagel International AG | | 39,174 | | 3,680,329 |
| Lonza Group AG | | 134,567 | | 13,232,028 |
| Nestle SA | | 39,300 | | 17,151,934 |
| Roche Holdings AG | | 88,322 | | 15,406,270 |
| |
|
| | | | | 113,958,779 |
| United Kingdom - 11.29% | | | | |
| Amdocs, Ltd. | | 115,159 | | 4,065,113 |
| British Sky Broadcasting Group PLC | | 1,760,209 | | 24,036,821 |
| Johnson Matthey PLC | | 114,268 | | 3,709,312 |
| Man Group PLC | | 761,482 | | 7,611,853 |
| Reckitt Benckiser PLC | | 178,655 | | 9,743,712 |
| Rio Tinto PLC | | 126,124 | | 8,713,672 |
| Tesco PLC | | 3,595,759 | | 30,919,349 |
| |
|
| | | | | 88,799,832 |
| United States - 4.25% | | | | |
| Las Vegas Sands Corp. * (a) | | 142,992 | | 14,256,302 |
| Schlumberger, Ltd. | | 198,540 | | 19,159,110 |
| |
|
| | | | | 33,415,412 |
|
| TOTAL COMMON STOCKS (Cost $617,281,213) | | $ | 731,929,078 |
|
| |
| SHORT TERM INVESTMENTS - 25.25% | | | |
| Federal Home Loan Bank Discount Notes | | | | |
| zero coupon due 09/04/2007 | $ | 18,500,000 | $ | 18,493,525 |
| John Hancock Cash Investment Trust (c) | | 161,395,398 | | 161,395,398 |
| U.S. Treasury Bills | | | | |
| zero coupon due 09/20/2007 to | | | | |
| 02/07/2008 | | 18,981,000 | | 18,779,308 |
|
| TOTAL SHORT TERM INVESTMENTS | | | | |
| (Cost $198,668,231) | | | $ | 198,668,231 |
|
| |
| The accompanying notes are an integral part of the financial statements. | 232 |
John Hancock Funds II
Portfolio of investments — August 31, 2007
(showing percentage of total net assets)
| | | | |
| International Opportunities Fund (continued) |
| | | Shares or | | |
| | | Principal | | |
| | | Amount | | Value |
|
|
| |
| REPURCHASE AGREEMENTS - 0.87% | | | |
| Repurchase Agreement with State | | | | |
| Street Corp. dated 08/31/2007 at | | | | |
| 4.60% to be repurchased at | | | | |
| $6,828,488 on 09/04/2007, | | | | |
| collateralized by $6,770,000 | | | | |
| Federal Home Loan Bank, 5.50% | | | | |
| due 07/15/2036 (valued at | | | | |
| $6,964,638, including interest) | $ | 6,825,000 | $ | 6,825,000 |
|
| TOTAL REPURCHASE AGREEMENTS | | | | |
| (Cost $6,825,000) | | | $ | 6,825,000 |
|
| Total Investments (International Opportunities Fund) | | |
| (Cost $822,774,444) - 119.16% | | | $ | 937,422,309 |
| Liabilities in Excess of Other Assets - (19.16)% | | | (150,729,642) |
| |
|
| TOTAL NET ASSETS - 100.00% | | | $ | 786,692,667 |
| |
|
| |
| The portfolio had the following five top industry concentrations as of |
| August 31, 2007 (as a percentage of total net assets): | |
| Banking | 8.03% |
| Cellular Communications | 5.51% |
| Broadcasting | 5.50% |
| Computers & Business Equipment | 4.00% |
| Retail Grocery | 3.93% |
| | | |
| International Small Cap Fund | | | |
| | Shares or | | |
| | Principal | | |
| | Amount | | Value |
|
|
| |
| COMMON STOCKS - 95.47% | | | |
| | | | |
| Australia - 4.81% | | | |
| Billabong International, Ltd. (a) | 324,316 | $ | 4,185,814 |
| Downer EDI, Ltd. | 1,420,972 | | 7,504,518 |
| Iluka Resources, Ltd. (a) | 682,261 | | 3,082,821 |
| PaperlinX, Ltd. (a) | 2,601,011 | | 7,169,297 |
| |
|
| | | | 21,942,450 |
| Belgium - 1.12% | | | |
| Barco NV (a) | 53,950 | | 5,129,595 |
| | | | |
| Bermuda - 5.73% | | | |
| Bio-Treat Technology, Ltd. (a) | 6,693,612 | | 3,755,876 |
| Giordano International, Ltd. | 6,390,365 | | 3,088,313 |
| Ngai Lik Industrial Holdings, Ltd. | 18,284,513 | | 1,314,569 |
| People's Food Holdings, Ltd. | 8,982,174 | | 7,877,869 |
| Texwinca Holdings, Ltd. | 8,824,907 | | 7,224,728 |
| Yue Yuen Industrial Holdings, Ltd. | 953,833 | | 2,871,924 |
| |
|
| | | | 26,133,279 |
| Brazil - 0.84% | | | |
| Companhia de Saneamento de Minas Gerais | 246,906 | | 3,838,558 |
| | | | |
| Canada - 9.09% | | | |
| Abitibi-Consolidated, Inc. * | 1,506,500 | | 2,924,273 |
| ATS Automation Tooling Systems, Inc. * | 430,960 | | 2,550,421 |
| | | |
| International Small Cap Fund (continued) | | |
| | Shares or | | |
| | Principal | | |
| | Amount | | Value |
|
|
| |
| COMMON STOCKS (continued) | | | |
| Canada (continued) | | | |
| Dorel Industries, Inc., Class B | 185,600 | $ | 5,481,360 |
| GSI Group, Inc. * | 381,584 | | 3,720,444 |
| Linamar Corp. | 18,417 | | 447,477 |
| MDS, Inc. | 332,277 | | 6,512,768 |
| Mega Brands, Inc. * | 196,700 | | 3,631,900 |
| North West Company | 255,399 | | 5,054,293 |
| Open Text Corp. * | 264,153 | | 6,568,183 |
| Quebecor World, Inc. * | 171,546 | | 1,530,123 |
| Saxon Energy Services, Inc. * | 617,700 | | 3,076,510 |
|
|
| | | | 41,497,752 |
| Cayman Islands - 0.87% | | | |
| Chitaly Holdings, Ltd. | 9,456,729 | | 2,716,037 |
| TCL Communication Technology | | | |
| Holdings, Ltd. * | 37,286,192 | | 1,245,578 |
|
|
| | | | 3,961,615 |
| China - 3.10% | | | |
| BYD Company, Ltd., H Shares | 928,358 | | 5,040,295 |
| Sinotrans, Ltd., H Shares | 16,490,000 | | 9,088,687 |
|
|
| | | | 14,128,982 |
| Denmark - 0.54% | | | |
| Vestas Wind Systems AS * (a) | 36,380 | | 2,467,238 |
| Finland - 3.36% | | | |
| Amer Sports Oyj, A Shares (a) | 339,154 | | 7,738,729 |
| Elcoteq SE, A Shares | 242,560 | | 1,853,615 |
| Huhtamaki Oyj (a) | 379,086 | | 5,728,339 |
|
|
| | | | 15,320,683 |
| Germany - 1.98% | | | |
| Jenoptik AG * (a) | 737,145 | | 6,899,383 |
| Vossloh AG | 19,785 | | 2,135,629 |
|
|
| | | | 9,035,012 |
| Hong Kong - 4.76% | | | |
| AAC Acoustic Technology Holdings, Inc. * | 3,016,000 | | 3,160,521 |
| Dah Sing Financial Group | 463,574 | | 3,746,447 |
| Fountain Set Holdings, Ltd. | 11,313,425 | | 4,421,514 |
| Lerado Group Holding Company, Ltd. | 12,649,682 | | 1,443,588 |
| Travelsky Technology, Ltd., Class H | 2,655,132 | | 2,144,104 |
| Weiqiao Textile Company, Ltd. | 3,138,106 | | 6,828,894 |
|
|
| | | | 21,745,068 |
| Indonesia - 0.65% | | | |
| Astra International Tbk PT | 1,560,881 | | 2,967,992 |
| Japan - 4.82% | | | |
| Descente, Ltd. (a) | 388,000 | | 2,037,466 |
| Meitec Corp. (a) | 114,611 | | 3,675,693 |
| Nichii Gakkan Company, Ltd. (a) | 373,866 | | 5,799,280 |
| Sohgo Security Services Company, Ltd. | 325,373 | | 5,113,927 |
| Takuma Company, Ltd. (a) | 849,000 | | 5,360,377 |
|
|
| | | | 21,986,743 |
| Luxembourg - 0.42% | | | |
| Thiel Logistik AG * (a) | 577,341 | | 1,906,058 |
| |
| The accompanying notes are an integral part of the financial statements. | 233 |
John Hancock Funds II
Portfolio of investments — August 31, 2007
(showing percentage of total net assets)
| | | |
| International Small Cap Fund (continued) | | |
| | Shares or | | |
| | Principal | | |
| | Amount | | Value |
|
|
| |
| COMMON STOCKS (continued) | | | |
| | | | |
| Netherlands - 5.08% | | | |
| Draka Holding NV | 42,748 | $ | 2,095,668 |
| Imtech NV | 30,968 | | 2,732,825 |
| OPG Groep NV (a) | 273,908 | | 8,169,174 |
| SBM Offshore NV | 81,654 | | 3,061,191 |
| Vedior NV | 313,284 | | 7,135,201 |
| |
|
| | | | 23,194,059 |
| Philippines - 0.06% | | | |
| First Gen Corp. | 195,000 | | 270,529 |
| Singapore - 2.48% | | | |
| Cerebos Pacific, Ltd. | 239,226 | | 618,236 |
| Huan Hsin Holdings, Ltd. (a) | 3,335,298 | | 1,160,203 |
| Osim International, Ltd. (a) | 4,045,008 | | 1,587,906 |
| Venture Corp., Ltd. | 777,229 | | 7,964,514 |
| |
|
| | | | 11,330,859 |
| South Korea - 10.55% | | | |
| Daeduck Electronics Company, Ltd. | 448,800 | | 3,449,078 |
| Daegu Bank | 342,510 | | 6,382,602 |
| Halla Climate Control Company, Ltd. (a) | 600,100 | | 6,769,802 |
| Intops Company, Ltd. | 82,513 | | 2,868,452 |
| People & Telecommunication, Inc. | 212,112 | | 2,822,885 |
| Pusan Bank | 653,820 | | 12,184,421 |
| Sindo Ricoh Company, Ltd. | 78,430 | | 5,963,820 |
| Youngone Corp. | 747,110 | | 7,689,591 |
| |
|
| | | | 48,130,651 |
| Sweden - 1.88% | | | |
| D. Carnegie & Company AB | 362,426 | | 5,900,968 |
| Securitas Systems AB, B Shares | 758,000 | | 2,674,167 |
| |
|
| | | | 8,575,135 |
| Switzerland - 1.36% | | | |
| Verwaltungs & Privat Bank AG | 25,155 | | 6,227,856 |
| Taiwan - 12.86% | | | |
| Acbel Polytech, Inc. | 5,100,000 | | 3,271,020 |
| BenQ Corp. * | 3,818,000 | | 1,790,414 |
| D-Link Corp. | 6,394,992 | | 14,117,332 |
| Fu Sheng Industrial Company, Ltd. | 4,971,543 | | 5,225,030 |
| Giant Manufacturing Company, Ltd. | 850,000 | | 2,034,473 |
| KYE System Corp. | 3,484,714 | | 6,416,354 |
| Pihsiang Machinery Mfg. Company, Ltd. | 2,610,000 | | 6,278,365 |
| Simplo Technology Company, Ltd. | 1,137,600 | | 7,200,595 |
| Ta Chong Bank, Ltd. * | 16,259,000 | | 5,152,249 |
| Taiwan Fu Hsing Industrial Company, Ltd. | 2,886,000 | | 2,180,737 |
| Test-Rite International Company, Ltd. | 7,155,672 | | 5,024,694 |
| |
|
| | | | 58,691,263 |
| Thailand - 4.08% | | | |
| Bank of Ayudhya PCL, NVDR (a) | 8,440,400 | | 6,588,578 |
| Glow Energy PCL | 6,865,525 | | 6,403,288 |
| Total Access Communication PCL * | 4,539,560 | | 5,625,527 |
| |
|
| | | | 18,617,393 |
| United Kingdom - 13.38% | | | |
| Bodycote International PLC | 1,043,903 | | 5,610,998 |
| | | | |
| International Small Cap Fund (continued) | | |
| | | Shares or | | |
| | | Principal | | |
| | | Amount | | Value |
|
|
| |
| COMMON STOCKS (continued) | | | | |
| | | | | |
| United Kingdom (continued) | | | | |
| Burberry Group PLC (a) | | 336,989 | $ | 4,165,355 |
| Fiberweb PLC | | 878,540 | | 2,343,083 |
| FKI PLC | | 4,023,600 | | 8,600,263 |
| Future PLC | | 5,499,140 | | 5,116,940 |
| Game Group PLC | | 4,920,796 | | 18,995,345 |
| John Wood Group PLC | | 650,643 | | 4,752,245 |
| Yule Catto & Company PLC | | 2,360,183 | | 11,456,982 |
|
|
| | | | | 61,041,211 |
| United States - 1.65% | | | | |
| Quebecor World, Inc. * | | 146,526 | | 1,342,178 |
| Steiner Leisure, Ltd. * | | 143,455 | | 6,205,863 |
|
|
| | | | | 7,548,041 |
|
| TOTAL COMMON STOCKS (Cost $338,563,443) | | $ | 435,688,022 |
|
| |
| SHORT TERM INVESTMENTS - 15.37% | | | | |
| John Hancock Cash Investment Trust (c) | $ | 59,817,848 | $ | 59,817,848 |
| Paribas Corp. Time Deposit | | | | |
| 5.25% due 09/04/2007 | | 10,295,000 | | 10,295,000 |
|
| TOTAL SHORT TERM INVESTMENTS | | | | |
| (Cost $70,112,848) | | | $ | 70,112,848 |
|
| |
| REPURCHASE AGREEMENTS - 0.01% | | | | |
| Repurchase Agreement with State | | | | |
| Street Corp. dated 08/31/2007 at | | | | |
| 4.60% to be repurchased at | | | | |
| $41,021 on 09/04/2007, | | | | |
| collateralized by $40,000 Federal | | | | |
| Home Loan Mortgage Corp., | | | | |
| 6.25% due 07/15/2032 (valued at | | | | |
| $45,251, including interest) | $ | 41,000 | $ | 41,000 |
|
| TOTAL REPURCHASE AGREEMENTS | | | | |
| (Cost $41,000) | | | $ | 41,000 |
|
| Total Investments (International Small Cap Fund) | | | |
| (Cost $408,717,291) - 110.85% | | | $ | 505,841,870 |
| Liabilities in Excess of Other Assets - (10.85)% | | | (49,494,882) |
|
|
| TOTAL NET ASSETS - 100.00% | | | $ | 456,346,988 |
|
|
| |
| The portfolio had the following five top industry concentrations as of |
| August 31, 2007 (as a percentage of total net assets): | |
| | |
| Apparel & Textiles | 8.52% |
| Banking | 8.01% |
| Computers & Business Equipment | 6.21% |
| Software | 5.05% |
| Electronics | 4.57% |
| |
| The accompanying notes are an integral part of the financial statements. | 234 |
John Hancock Funds II
Portfolio of investments — August 31, 2007
(showing percentage of total net assets)
| | | |
| International Small Company Fund | | |
| | Shares or | | |
| | Principal | | |
| | Amount | | Value |
|
|
| |
| COMMON STOCKS - 99.40% | | | |
| | | | |
| Australia - 6.95% | | | |
| ABB Grain, Ltd. | 31,307 | $ | 210,675 |
| Adelaide Bank, Ltd. | 21,763 | | 275,983 |
| Adelaide Brighton, Ltd. | 105,031 | | 306,818 |
| AED Oil, Ltd. * (a) | 11,042 | | 67,174 |
| Aevum, Ltd. | 14,865 | | 38,219 |
| Alchemia, Ltd. * | 43,512 | | 27,336 |
| Alesco Corp., Ltd. | 17,528 | | 195,603 |
| Allegiance Mining NL * (a) | 149,191 | | 73,140 |
| Amadeus Energy, Ltd. * (a) | 46,767 | | 27,404 |
| Amalgamated Holdings, Ltd. (a) | 10,448 | | 55,182 |
| Andean Resources, Ltd. * | 79,891 | | 62,760 |
| Ansell, Ltd. | 30,331 | | 324,253 |
| APA Group (a) | 71,106 | | 215,115 |
| Aquila Resources, Ltd. * (a) | 17,822 | | 73,270 |
| ARB Corp., Ltd. | 16,596 | | 57,780 |
| ARC Energy, Ltd. * | 36,745 | | 41,302 |
| Arrow Energy NL * (a) | 63,589 | | 136,720 |
| Ausdrill, Ltd. | 41,593 | | 81,115 |
| Auspine, Ltd. (a) | 13,590 | | 68,287 |
| Austal, Ltd. | 37,191 | | 107,285 |
| Austar United Communications, Ltd. * (a) | 187,684 | | 223,081 |
| Austereo Group, Ltd. | 68,999 | | 118,869 |
| Australian Agricultural Company, Ltd. | 54,556 | | 119,378 |
| Australian Infrastructure Fund | 70,430 | | 194,811 |
| Australian Worldwide Exploration, Ltd. * | 74,302 | | 197,779 |
| AVJennings, Ltd. * (a) | 46,839 | | 49,263 |
| AWB, Ltd. | 27,000 | | 65,162 |
| Babcock & Brown Environmental | | | |
| Investments, Ltd. * | 19,026 | | 7,208 |
| Bank of Queensland, Ltd. | 20,257 | | 305,940 |
| Beach Petroleum, Ltd. (a) | 117,500 | | 130,336 |
| Bendigo Bank, Ltd. (a) | 7,506 | | 92,284 |
| Bendigo Mining, Ltd. * (a) | 31,918 | | 7,369 |
| Biota Holdings, Ltd. * | 39,986 | | 57,855 |
| Blackmores, Ltd. | 2,081 | | 37,369 |
| Bolnisi Gold NL * | 53,676 | | 113,126 |
| Boom Logistics, Ltd. (a) | 25,797 | | 56,035 |
| Bradken, Ltd. | 22,400 | | 192,452 |
| Brickworks, Ltd. | 5,819 | | 62,838 |
| Cabcharge Australia, Ltd. | 19,412 | | 157,045 |
| Campbell Brothers, Ltd. | 10,377 | | 216,050 |
| Candle Australia, Ltd. | 17,029 | | 45,728 |
| CBH Resources, Ltd. * (a) | 158,181 | | 68,829 |
| Cellestis, Ltd. * | 15,855 | | 31,041 |
| Centennial Coal Company, Ltd. | 33,215 | | 91,988 |
| Charter Hall Group | 23,708 | | 53,226 |
| Citigold Corp., Ltd. * | 151,498 | | 48,524 |
| City Pacific, Ltd. (a) | 14,563 | | 45,922 |
| Clinuvel Pharmaceuticals, Ltd. * | 69,980 | | 45,654 |
| Coates Hire, Ltd. | 43,113 | | 191,602 |
| Commander Communications, Ltd. | 51,195 | | 28,430 |
| Compass Resources NL * (a) | 15,577 | | 45,479 |
| | | |
| International Small Company Fund (continued) |
| | Shares or | | |
| | Principal | | |
| | Amount | | Value |
|
|
| |
| COMMON STOCKS (continued) | | | |
| | | | |
| Australia (continued) | | | |
| ConnectEast Group * (a) | 214,450 | $ | 303,184 |
| Consolidated Rutile, Ltd. | 52,500 | | 25,488 |
| CopperCo, Ltd. * | 32,000 | | 23,650 |
| Corporate Express Australia, Ltd. | 17,731 | | 101,881 |
| Count Financial, Ltd. (a) | 24,455 | | 57,110 |
| Coventry Group, Ltd. | 4,500 | | 12,872 |
| Crane Group, Ltd. (a) | 15,415 | | 218,458 |
| David Jones, Ltd. (a) | 92,890 | | 392,142 |
| Downer EDI, Ltd. (a) | 55,323 | | 292,175 |
| Duet Group | 83,792 | | 230,800 |
| Dyno Nobel, Ltd. (a) | 41,739 | | 84,851 |
| Energy Developments, Ltd. (a) | 26,204 | | 75,657 |
| Energy World Corp., Ltd. * | 118,888 | | 91,972 |
| Envestra, Ltd. | 154,037 | | 139,509 |
| Equigold NL | 27,470 | | 48,314 |
| Felix Resources, Ltd. | 10,738 | | 41,270 |
| FKP Property Group, Ltd. (a) | 37,372 | | 213,270 |
| Fleetwood Corp., Ltd. | 8,292 | | 63,461 |
| Flight Centre, Ltd. | 15,759 | | 252,166 |
| Forest Enterprises Australia, Ltd. | 101,860 | | 51,471 |
| Funtastic, Ltd. | 32,287 | | 39,433 |
| Futuris Corp., Ltd. (a) | 81,498 | | 162,495 |
| Geodynamics, Ltd. * | 25,906 | | 34,630 |
| Gindalbie Metals, Ltd. * | 112,045 | | 185,830 |
| GrainCorp., Ltd. | 3,952 | | 34,517 |
| GRD, Ltd. | 30,341 | | 57,147 |
| Great Southern Plantations, Ltd. (a) | 43,653 | | 83,412 |
| GUD Holdings, Ltd. (a) | 13,336 | | 120,342 |
| Gunns, Ltd. | 56,341 | | 149,385 |
| GWA International, Ltd. (a) | 49,659 | | 172,661 |
| Healthscope, Ltd. (a) | 27,020 | | 121,052 |
| Herald Resources, Ltd. * | 17,198 | | 17,070 |
| Heron Resources, Ltd. * | 9,000 | | 6,265 |
| Hills Industries, Ltd. (a) | 36,499 | | 199,927 |
| Home Building Society, Ltd. | 2,720 | | 38,826 |
| Horizon Oil, Ltd. * | 172,869 | | 43,970 |
| Housewares International, Ltd. (a) | 39,380 | | 73,689 |
| HPAL, Ltd. (a) | 31,154 | | 63,572 |
| IBA Health, Ltd. (a) | 86,371 | | 72,422 |
| IBT Education, Ltd. (a) | 26,000 | | 44,973 |
| iiNET Ltd * | 18,866 | | 25,698 |
| Iluka Resources, Ltd. (a) | 20,691 | | 93,493 |
| Imdex, Ltd. * | 23,000 | | 25,088 |
| Independence Group NL | 19,208 | | 90,166 |
| Independent Practitioner Network, Ltd. * | 7,772 | | 1,895 |
| Indophil Resources NL * | 72,190 | | 51,505 |
| Infomedia, Ltd. | 87,333 | | 43,834 |
| Invocare, Ltd. (a) | 11,216 | | 56,732 |
| IOOF Holdings, Ltd. (a) | 13,384 | | 108,732 |
| Iress Market Technology, Ltd. (a) | 19,452 | | 129,779 |
| IWL, Ltd. (a) | 11,971 | | 61,660 |
| JB Hi-Fi, Ltd. | 21,677 | | 220,855 |
| |
| The accompanying notes are an integral part of the financial statements. | 235 |
John Hancock Funds II
Portfolio of investments — August 31, 2007
(showing percentage of total net assets)
| | | |
| International Small Company Fund (continued) |
| | Shares or | | |
| | Principal | | |
| | Amount | | Value |
|
|
| |
| COMMON STOCKS (continued) | | | |
| | | | |
| Australia (continued) | | | |
| Jubilee Mines NL (a) | 15,147 | $ | 189,525 |
| Just Group, Ltd. | 31,400 | | 115,355 |
| Kagara Zinc, Ltd. | 11,000 | | 45,420 |
| Kings Minerals NL * | 37,728 | | 23,349 |
| Kingsgate Consolidated, Ltd. | 11,715 | | 43,773 |
| MacArthur Coal, Ltd. | 24,217 | | 136,913 |
| Macmahon Holdings, Ltd. | 115,775 | | 143,701 |
| Macquarie Media Group, Ltd. | 17,252 | | 64,154 |
| McGuigan Simeon Wines, Ltd. * | 17,945 | | 27,160 |
| McPherson's, Ltd. | 18,009 | | 48,288 |
| Metabolic Pharmaceuticals, Ltd. * | 61,498 | | 2,895 |
| Mincor Resources NL (a) | 54,880 | | 146,742 |
| Mineral Deposits, Ltd. * | 39,608 | | 42,829 |
| Monadelphous Group, Ltd. (a) | 15,546 | | 170,255 |
| Mortgage Choice, Ltd. (a) | 74 | | 151 |
| Mount Gibson Iron, Ltd. * | 64,184 | | 79,231 |
| MYOB, Ltd. | 33,790 | | 33,286 |
| New Hope Corp., Ltd. (a) | 144,455 | | 233,453 |
| Nexus Energy, Ltd. * | 72,614 | | 104,933 |
| Nido Petroleum, Ltd. * | 256,103 | | 53,905 |
| Oakton, Ltd. | 15,760 | | 69,284 |
| OceanaGold Corp. * (a) | 14,600 | | 36,316 |
| Pacific Brands, Ltd. (a) | 88,618 | | 243,662 |
| Pan Australian Resources, Ltd. * | 284,957 | | 157,475 |
| PaperlinX, Ltd. (a) | 78,955 | | 217,628 |
| Peet & Company, Ltd. (a) | 34,269 | | 110,335 |
| Peptech, Ltd. * (a) | 37,842 | | 41,158 |
| Perilya, Ltd. | 22,556 | | 70,225 |
| Perseverance Corp., Ltd. * | 143,419 | | 10,023 |
| Petsec Energy, Ltd. * (a) | 36,147 | | 39,075 |
| Pharmaxis, Ltd. * (a) | 50,510 | | 167,702 |
| PMP, Ltd. * (a) | 52,337 | | 66,716 |
| Portman, Ltd. * | 7,907 | | 61,134 |
| Primary Health Care, Ltd. (a) | 21,688 | | 192,837 |
| Prime Television, Ltd. | 3,886 | | 11,483 |
| Programmed Maintenance Services, Ltd. | 19,236 | | 88,529 |
| pSivida, Ltd. * | 95,189 | | 8,932 |
| Ramsay Health Care, Ltd. * | 3,500 | | 29,965 |
| RCR Tomlinson, Ltd. (a) | 22,598 | | 44,444 |
| Redflex Holdings, Ltd. * (a) | 11,089 | | 28,236 |
| Resolute Mining, Ltd. * | 36,122 | | 41,564 |
| Resource Pacific Holdings, Ltd. * (a) | 22,287 | | 32,547 |
| Ridley Corp., Ltd. (a) | 49,007 | | 43,281 |
| Roc Oil Company, Ltd. * (a) | 57,533 | | 151,545 |
| SAI Global, Ltd. (a) | 16,535 | | 44,187 |
| Sally Malay Mining, Ltd. * | 43,373 | | 141,449 |
| Salmat, Ltd. * | 7,600 | | 29,673 |
| Select Harvests, Ltd. | 6,064 | | 47,553 |
| ServCorp, Ltd. | 13,939 | | 56,209 |
| Silex Systems, Ltd. * (a) | 13,874 | | 97,162 |
| Sino Gold, Ltd. * (a) | 25,236 | | 123,811 |
| Sino Strategic International, Ltd. * | 11,948 | | 17,439 |
| | | |
| International Small Company Fund (continued) |
| | Shares or | | |
| | Principal | | |
| | Amount | | Value |
|
|
| |
| COMMON STOCKS (continued) | | | |
| | | | |
| Australia (continued) | | | |
| Sirtex Medical, Ltd. * | 11,366 $ | | 33,319 |
| Skilled Group, Ltd. | 12,989 | | 58,197 |
| SMS Management & Technology, Ltd. | 12,633 | | 68,700 |
| Southern Cross Broadcasting Australia, Ltd. | 5,208 | | 73,962 |
| SP Telemedia, Ltd. | 63,587 | | 24,802 |
| Specialty Fashion Group, Ltd. | 51,331 | | 71,011 |
| Spotless Group, Ltd. | 44,712 | | 156,722 |
| St. Barbara, Ltd. * (a) | 100,516 | | 38,884 |
| Staging Connections Group, Ltd. | 16,800 | | 21,207 |
| Straits Resources, Ltd. | 31,023 | | 111,344 |
| STW Communications Group, Ltd. (a) | 36,346 | | 78,369 |
| Sunland Group, Ltd. | 52,498 | | 167,812 |
| Super Cheap Auto Group, Ltd. | 12,800 | | 49,966 |
| Talent2 International, Ltd. (a) | 6,000 | | 13,691 |
| Technology One, Ltd. (a) | 46,859 | | 40,784 |
| Ten Network Holdings, Ltd. (a) | 85,802 | | 183,425 |
| Thakral Holdings Group | 137,513 | | 118,301 |
| The Reject Shop, Ltd. | 8,900 | | 100,376 |
| TimberCorp., Ltd. (a) | 49,460 | | 78,881 |
| Transfield Services, Ltd. (a) | 34,219 | | 365,514 |
| UXC, Ltd. (a) | 52,216 | | 104,412 |
| Village Roadshow Company, Ltd. * | 6,856 | | 17,765 |
| Vision Group Holdings, Ltd. (a) | 10,560 | | 28,183 |
| Watpac, Ltd. * | 7,217 | | 31,129 |
| Wattyl, Ltd. (a) | 16,745 | | 45,090 |
| Western Areas NL * | 30,734 | | 109,757 |
| WHK Group, Ltd. (a) | 56,586 | | 93,234 |
| |
|
| | | | 17,408,584 |
| Austria - 0.71% | | | |
| Agrana Beteiligungs AG (a) | 715 | | 72,994 |
| Andritz AG, ADR | 4,993 | | 324,093 |
| Austrian Airlines AG * | 7,737 | | 86,532 |
| BetandWin.com Interactive | | | |
| Entertainment AG * (a) | 4,109 | | 107,218 |
| BWT AG | 1,398 | | 85,131 |
| Constantia Packaging AG | 1,661 | | 119,987 |
| Flughafen Wien AG | 1,493 | | 149,640 |
| Intercell AG * | 5,499 | | 193,815 |
| Lenzing AG (a) | 139 | | 70,242 |
| Mayr-Melnhof Karton AG | 962 | | 103,884 |
| Palfinger AG | 2,433 | | 116,753 |
| RHI AG * | 5,199 | | 254,817 |
| Rosenbauer International AG | 161 | | 7,720 |
| Schoeller-Bleckmann Oilfield Equipment AG | 1,257 | | 90,663 |
| |
|
| | | | 1,783,489 |
| Belgium - 1.26% | | | |
| Ackermans & Van Haaren NV | 2,991 | | 293,446 |
| Banque Nationale de Belgique | 31 | | 143,341 |
| Barco NV | 1,899 | | 180,558 |
| Bekaert SA | 1,428 | | 188,386 |
| CFE (CIE Francois D'enter) | 75 | | 147,555 |
| |
| The accompanying notes are an integral part of the financial statements. | 236 |
John Hancock Funds II
Portfolio of investments — August 31, 2007
(showing percentage of total net assets)
| | | |
| International Small Company Fund (continued) |
| | Shares or | | |
| | Principal | | |
| | Amount | | Value |
|
|
| |
| COMMON STOCKS (continued) | | | |
| | | | |
| Belgium (continued) | | | |
| Compagnie Immobiliere de Belgique SA | 645 | $ | 35,343 |
| Compagnie Maritime Belge SA | 2,799 | | 183,586 |
| Deceuninck NV (a) | 4,147 | | 116,814 |
| Duvel Moortgat SA | 873 | | 48,186 |
| Econocom Group (a) | 5,040 | | 60,056 |
| Elia System Operator SA/NV (a) | 2,537 | | 101,478 |
| Euronav NV | 3,000 | | 94,863 |
| Exmar NV | 1,797 | | 57,965 |
| Icos Vision Systems NV * | 922 | | 41,350 |
| Innogenetics NV * (a) | 3,366 | | 37,872 |
| Ion Beam Applications SA * | 2,557 | | 83,712 |
| Melexis NV (a) | 4,995 | | 84,906 |
| Nord-Sumatra Investissements SA | 47 | | 34,553 |
| Omega Pharma SA | 5,762 | | 508,439 |
| Option NV * (a) | 3,580 | | 49,864 |
| Recticel SA | 3,266 | | 47,889 |
| Roularta Media Group NV | 668 | | 58,887 |
| SA D'Ieteren Trading NV | 569 | | 226,752 |
| Sapec SA | 305 | | 44,193 |
| Sioen Industries NV | 1,985 | | 25,946 |
| Sipef SA | 121 | | 55,708 |
| Tessenderlo Chemie NV | 2,660 | | 149,818 |
| Van De Velde NV | 870 | | 44,477 |
| |
|
| | | | 3,145,943 |
| Bermuda - 0.49% | | | |
| Cafe de Coral Holdings, Ltd. | 58,000 | | 107,472 |
| China Oriental Group Company, Ltd. | 224,000 | | 112,901 |
| Giordano International, Ltd. | 1,113,708 | | 538,229 |
| Smartone Telecommunications Holdings, Ltd. | 46,500 | | 58,349 |
| South China Morning Post, Ltd. | 146,000 | | 50,182 |
| Texwinca Holdings, Ltd. | 423,961 | | 347,086 |
| |
|
| | | | 1,214,219 |
| Canada - 10.89% | | | |
| 20-20 Technologies, Inc. * | 6,400 | | 43,329 |
| Aastra Technologies, Ltd. * | 4,100 | | 140,458 |
| Aber Diamond Corp. | 8,300 | | 295,895 |
| Absolute Software Corp. * | 3,200 | | 85,598 |
| Aecon Group, Inc. * | 3,100 | | 37,748 |
| Akita Drilling, Ltd. | 2,100 | | 29,031 |
| Alberta Clipper Energy, Inc. * | 4,800 | | 11,726 |
| Alexco Resource Corp. * | 5,500 | | 18,748 |
| Allen-Vanguard Corp. * | 7,547 | | 75,749 |
| Altius Minerals Corp. * | 1,400 | | 25,518 |
| Amerigo Resources, Ltd. | 22,400 | | 52,601 |
| Anderson Energy, Ltd. * | 2,600 | | 9,577 |
| Angiotech Pharmaceuticals, Inc. * | 10,400 | | 61,449 |
| Antrim Energy, Inc. * | 18,600 | | 118,881 |
| Anvil Mining, Ltd. * | 7,700 | | 127,228 |
| Aquiline Resources, Inc. * | 3,700 | | 30,130 |
| Arawak Energy Corp. * | 9,400 | | 23,409 |
| Aspreva Pharmaceuticals Corp. * | 3,100 | | 60,027 |
| | | |
| International Small Company Fund (continued) |
| | Shares or | | |
| | Principal | | |
| | Amount | | Value |
|
|
| |
| COMMON STOCKS (continued) | | | |
| | | | |
| Canada (continued) | | | |
| Astral Media, Inc. | 5,789 | $ | 233,237 |
| Atrium Innovations, Inc. * | 2,600 | | 61,030 |
| ATS Automation Tooling Systems, Inc. * | 11,800 | | 69,832 |
| Augusta Resource Corp. * | 10,900 | | 25,596 |
| Aurelian Resources, Inc. * | 15,600 | | 94,537 |
| Aurizon Mines, Ltd. * | 10,100 | | 31,177 |
| Aurora Energy Resources, Inc. * | 7,100 | | 80,540 |
| Axcan Pharma, Inc. * | 7,200 | | 138,669 |
| Axia NetMedia Corp. * | 9,200 | | 47,215 |
| Baffinland Iron Mines Corp. * | 9,200 | | 30,054 |
| Baja Mining Corp. * | 16,100 | | 28,965 |
| Ballard Power Systems, Inc. * | 21,400 | | 95,845 |
| Bioteq Environmental Tech, Inc. * | 6,200 | | 23,424 |
| Birch Mountain Resources, Ltd. * | 11,200 | | 20,998 |
| Birchcliff Energy, Ltd. * | 6,300 | | 23,861 |
| BMTC Group, Inc., Class A | 1,000 | | 20,831 |
| Boralex, Inc., Class A * | 4,500 | | 65,406 |
| Bow Valley Energy, Ltd. * | 12,900 | | 70,846 |
| Breaker Energy, Ltd., Class A * | 1,500 | | 8,849 |
| Breakwater Resources, Ltd. * | 63,300 | | 166,027 |
| Calfrac Well Services, Ltd. | 4,000 | | 78,023 |
| Calvalley Petroleums, Inc., Class A * | 7,377 | | 31,154 |
| Canaccord Capital, Inc. | 5,900 | | 96,927 |
| Canada Bread Company, Ltd. | 1,400 | | 80,333 |
| Canadian Hydro Developers, Inc. * | 20,600 | | 109,232 |
| Canadian Royalties, Inc. * | 4,500 | | 10,098 |
| Canadian Superior Energy, Inc. * | 16,800 | | 46,927 |
| Canadian Western Bank | 11,034 | | 271,122 |
| Canam Group, Inc., Class A | 5,500 | | 72,233 |
| Candax Energy, Inc. * | 33,500 | | 23,790 |
| Canfor Corp. * | 13,300 | | 155,656 |
| Cangene Corp. * | 5,900 | | 42,793 |
| CanWest Global Communications Corp. * | 15,050 | | 112,579 |
| Capstone Mining Corp. * | 17,200 | | 43,973 |
| Cardiome Pharma Corp. * | 11,800 | | 104,804 |
| Carpathian Gold, Inc. * | 20,000 | | 17,991 |
| Cascades, Inc. | 17,950 | | 171,155 |
| Catalyst Paper Corp. * | 43,000 | | 105,047 |
| CCL Industries, Inc., Class B | 4,400 | | 174,317 |
| Celtic Exploration, Ltd. * | 4,200 | | 51,620 |
| Chariot Resources, Ltd. * | 40,500 | | 36,431 |
| CHC Helicopter Corp., Class A | 2,600 | | 62,778 |
| Churchill (The), Corp. * | 2,800 | | 41,121 |
| Clarke, Inc. | 5,200 | | 46,973 |
| Coalcorp Mining, Inc. * | 4,571 | | 16,231 |
| Cogeco Cable, Inc. | 3,800 | | 165,155 |
| Com Dev International, Ltd. * | 4,300 | | 22,149 |
| Compton Petroleum Corp. * | 15,600 | | 142,691 |
| Connacher Oil & Gas, Ltd. * | 36,000 | | 124,420 |
| Constellation Software, Inc. | 1,300 | | 32,128 |
| Corby Distilleries, Ltd. * | 500 | | 11,718 |
| Corridor Resources, Inc. * | 10,800 | | 104,206 |
| |
| The accompanying notes are an integral part of the financial statements. | 237 |
John Hancock Funds II
Portfolio of investments — August 31, 2007
(showing percentage of total net assets)
| | | |
| International Small Company Fund (continued) |
| | Shares or | | |
| | Principal | | |
| | Amount | | Value |
|
|
| |
| COMMON STOCKS (continued) | | | |
| | | | |
| Canada (continued) | | | |
| Corus Entertainment, Inc., Class B | 4,500 | $ | 208,063 |
| Cott Corp. * | 10,300 | | 115,669 |
| Crystallex International Corp. * | 43,800 | | 125,664 |
| Cyries Energy, Inc. * | 8,000 | | 58,858 |
| Dalsa Corp. * | 2,300 | | 21,887 |
| Denison Mines Corp. * | 28,216 | | 244,462 |
| Descartes Systems Group, Inc. * | 10,100 | | 36,341 |
| Divestco, Inc. * | 2,800 | | 9,014 |
| Dorel Industries, Inc., Class B | 5,000 | | 147,666 |
| Draxis Health, Inc. * | 6,200 | | 28,766 |
| Dundee Corp., Class A * | 10,000 | | 178,771 |
| Dundee Wealth Management, Inc. | 21,542 | | 266,802 |
| Duvernay Oil Corp. * | 6,800 | | 204,431 |
| Eastern Platinum, Ltd. * | 100,590 | | 218,115 |
| Eldorado Gold Corp. * | 37,363 | | 184,321 |
| Emera, Inc. * | 900 | | 16,890 |
| Emergis, Inc. * | 20,420 | | 141,341 |
| Endeavour Silver Corp. * | 5,600 | | 19,354 |
| Enghouse Systems, Ltd. | 1,000 | | 7,338 |
| Entree Gold, Inc. * | 11,700 | | 28,693 |
| Equinox Minerals, Ltd. * | 77,600 | | 258,642 |
| Equitable Group, Inc. | 1,200 | | 34,088 |
| Etruscan Resources, Inc. * | 6,300 | | 17,777 |
| European Goldfields, Ltd. * | 20,800 | | 99,854 |
| Evertz Technologies, Ltd. * | 1,500 | | 37,724 |
| Exco Technologies, Ltd. | 6,500 | | 28,312 |
| Farallon Resources, Ltd. * | 10,100 | | 5,642 |
| First Calgary Petroleums, Ltd., ADR * | 37,800 | | 180,750 |
| First Nickel, Inc. * | 30,500 | | 24,259 |
| Flint Energy Services, Ltd. * | 2,000 | | 47,306 |
| FNX Mining Company, Inc. * | 11,634 | | 317,261 |
| Forsys Metals Corp. * | 4,600 | | 16,639 |
| Forzani Group, Ltd., Class A * | 8,400 | | 167,030 |
| Fraser Papers, Inc. * | 4,800 | | 25,998 |
| Fronteer Development Group, Inc. * | 9,600 | | 73,629 |
| Frontera Copper Corp. * | 6,600 | | 37,496 |
| Fun Technologies, Inc. * | 2,300 | | 7,209 |
| Galleon Energy, Inc., Class A * | 9,650 | | 147,112 |
| Garda World Security Corp., Class A * | 3,700 | | 61,310 |
| Gennum Corp. | 1,858 | | 17,910 |
| Gentry Resources, Ltd. * | 7,316 | | 16,279 |
| Glacier Ventures International Corp. * | 5,200 | | 20,335 |
| Glencairn Gold Corp. * | 29,000 | | 4,805 |
| Gluskin Sheff & Associates, Inc. | 1,300 | | 28,804 |
| Gold Eagle Mines, Ltd. * | 13,000 | | 72,256 |
| Golden Star Resources, Ltd. * | 35,800 | | 112,542 |
| Great Basin Gold, Ltd. * | 21,300 | | 46,388 |
| Great Canadian Gaming Corp. * | 9,400 | | 105,028 |
| Grey Wolf Exploration, Inc. * | 800 | | 1,917 |
| Greystar Resources, Ltd. * | 1,300 | | 7,952 |
| GSI Group, Inc. * | 61,283 | | 597,509 |
| Guyana Goldfields, Inc. * | 3,700 | | 32,232 |
| | | |
| International Small Company Fund (continued) |
| | Shares or | | |
| | Principal | | |
| | Amount | | Value |
|
|
| |
| COMMON STOCKS (continued) | | | |
| | | | |
| Canada (continued) | | | |
| Hanfeng Evergreen, Inc. * | 7,600 | $ | 89,882 |
| Heritage Oil Corp. * | 1,500 | | 73,146 |
| Heroux-Devtek, Inc. * | 4,100 | | 37,852 |
| High River Gold Mines, Ltd. * | 48,300 | | 113,878 |
| Highpine Oil & Gas, Ltd. * | 12,642 | | 126,647 |
| Home Capital Group, Inc. | 4,700 | | 155,094 |
| Husky Injection Molding Systems, Ltd. | 12,700 | | 84,178 |
| Imperial Metals Corp. * | 2,400 | | 32,747 |
| Indigo Books & Music, Inc. * | 3,200 | | 48,480 |
| Innova Exploration, Ltd. * | 6,900 | | 40,442 |
| Intermap Technologies Corp., Class A * | 400 | | 2,394 |
| International Forest Products, Ltd., Class A * | 5,500 | | 38,538 |
| International Royalty Corp. | 7,800 | | 45,791 |
| Intertape Polymer Group, Inc. * | 9,300 | | 28,355 |
| Iteration Energy, Ltd. * | 10,600 | | 46,772 |
| Ivanhoe Energy, Inc. * | 39,900 | | 73,672 |
| Jinshan Gold Mines, Inc. * | 19,000 | | 35,082 |
| Kaboose, Inc. * | 7,500 | | 17,754 |
| Kereco Energy, Ltd. * | 14,200 | | 50,287 |
| Kingsway Financial Services, Inc. | 15,200 | | 276,913 |
| Kirkland Lake Gold, Inc. * | 10,700 | | 106,686 |
| Labopharm, Inc. * | 12,200 | | 23,104 |
| Lake Shore Gold, Corp. * | 23,500 | | 31,820 |
| Laramide Resources, Ltd. * | 3,600 | | 20,384 |
| Laurentian Bank of Canada | 6,400 | | 226,342 |
| Le Chateau, Inc. | 1,600 | | 22,331 |
| Leon's Furniture, Ltd. | 8,944 | | 109,588 |
| Linamar Corp. | 39,306 | | 955,016 |
| MacDonald Dettwiler & Associates, Ltd. * | 5,300 | | 240,134 |
| Magellan Aerospace Corp. * | 11,200 | | 23,013 |
| Mahalo Energy, Ltd. * | 12,900 | | 38,476 |
| Major Drilling Group International Company, | | | |
| Inc. * | 4,300 | | 179,028 |
| Maple Leaf Foods, Inc. | 12,900 | | 188,107 |
| March Networks Corp. * | 3,200 | | 37,724 |
| Martinrea International, Inc. * | 14,200 | | 217,686 |
| Maxim Power Corp. * | 6,100 | | 41,529 |
| MDS, Inc. | 19,200 | | 376,328 |
| Mega Brands, Inc. * | 3,200 | | 59,085 |
| Mega Uranium, Ltd. * | 16,600 | | 56,586 |
| Miramar Mining Corp. * | 30,600 | | 134,442 |
| Mosaid Technologies, Inc. | 1,600 | | 32,224 |
| Neo Material Technologies, Inc. * | 6,100 | | 25,703 |
| Neurochemical Company, Inc. * | 3,500 | | 8,451 |
| Norbord, Inc. | 16,100 | | 117,080 |
| North American Palladium, Ltd. * | 10,150 | | 69,679 |
| Northbridge Financial Corp. | 7,000 | | 227,346 |
| Northern Orion Resources, Inc. * | 37,700 | | 180,272 |
| Northern Peru Copper Corp. * | 3,300 | | 29,497 |
| Northgate Minerals Corp. * | 39,700 | | 119,916 |
| NuVista Energy, Ltd. * | 6,500 | | 81,242 |
| Oilexco, Inc. * | 14,100 | | 172,362 |
| |
| The accompanying notes are an integral part of the financial statements. | 238 |
John Hancock Funds II
Portfolio of investments — August 31, 2007
(showing percentage of total net assets)
| | | |
| International Small Company Fund (continued) |
| | Shares or | | |
| | Principal | | |
| | Amount | | Value |
|
|
| |
| COMMON STOCKS (continued) | | | |
| | | | |
| Canada (continued) | | | |
| Open Text Corp. * | 71,989 | $ | 1,790,012 |
| Pacific Stratus Energy, Ltd. * | 6,800 | | 77,072 |
| Paladin Labs, Inc. * | 700 | | 6,429 |
| Pan American Silver Corp. * | 10,300 | | 257,476 |
| Paramount Resources, Ltd. * | 5,300 | | 90,332 |
| Pason Systems, Inc. | 8,600 | | 132,489 |
| Patheon, Inc. * | 21,400 | | 73,961 |
| Peerless Energy, Inc., Class A * | 11,315 | | 32,249 |
| Petaquilla Minerals Company, Ltd. * | 30,600 | | 78,231 |
| Petrobank Energy & Resources, Ltd. * | 12,700 | | 375,553 |
| Petrolifera Petroleum, Ltd. * | 4,200 | | 60,449 |
| Platinum Group Metals, Ltd. * | 11,200 | | 37,542 |
| Points International, Ltd. * | 16,500 | | 26,872 |
| Polaris Minerals Corp. * | 1,600 | | 17,529 |
| Polymet Mining Corp. * | 11,400 | | 34,110 |
| ProEx Energy, Ltd. * | 6,300 | | 80,294 |
| Q9 Networks, Inc. * | 1,300 | | 17,849 |
| QLT, Inc. * | 24,600 | | 144,651 |
| Quadra Mining, Ltd. * | 9,100 | | 145,793 |
| Quebecor World, Inc. * | 21,545 | | 192,173 |
| Quebecor, Inc. | 7,991 | | 275,346 |
| Quest Capital Corp. | 31,000 | | 78,960 |
| Rally Energy Corp. * | 18,000 | | 123,227 |
| Reitman's Canada, Ltd., Class A | 7,917 | | 182,239 |
| Resin Systems, Inc. * | 24,300 | | 33,593 |
| Resverlogix Corp. * | 2,300 | | 25,807 |
| Richelieu Hardware, Ltd. | 1,800 | | 40,888 |
| Rider Resources, Ltd. * | 5,000 | | 30,205 |
| Ritchie Bros. Auctioneers, Inc. | 4,900 | | 317,264 |
| RONA, Inc. * | 17,000 | | 346,246 |
| Rothmans, Inc. | 10,000 | | 213,237 |
| Rubicon Minerals Corp. * | 10,300 | | 16,385 |
| Russel Metals, Inc. | 10,000 | | 282,265 |
| Samuel Manu-Tech, Inc. * | 3,200 | | 37,875 |
| Saskatchewan Wheat Pool, Inc. * | 34,200 | | 364,312 |
| Savanna Energy Services Corp. * | 9,700 | | 158,712 |
| Saxon Energy Services, Inc. * | 8,900 | | 44,327 |
| Sceptre Investment Counsel, Ltd. | 7,600 | | 66,638 |
| Semafo, Inc. * | 15,800 | | 22,591 |
| ShawCor, Ltd., Class A | 8,800 | | 289,556 |
| Shore Gold, Inc. * | 27,600 | | 85,196 |
| Sierra Wireless, Inc. * | 6,250 | | 143,334 |
| Silver Standard Resources, Inc. * | 8,800 | | 258,642 |
| Silvercorp Metals, Inc. * | 9,100 | | 162,854 |
| Sino-Forest Corp. * | 21,500 | | 366,443 |
| Skye Resources, Inc. * | 5,600 | | 65,486 |
| Softchoice Corp. * | 2,000 | | 33,236 |
| Stantec, Inc. * | 10,100 | | 329,940 |
| Stella-Jones, Inc. | 800 | | 31,739 |
| Storm Exploration, Inc. * | 1,500 | | 11,221 |
| Stornoway Diamond Corp. * | 44,100 | | 31,318 |
| Stratos Global Corp. * | 6,300 | | 40,684 |
| | | |
| International Small Company Fund (continued) |
| | Shares or | | |
| | Principal | | |
| | Amount | | Value |
|
|
| |
| COMMON STOCKS (continued) | | | |
| | | | |
| Canada (continued) | | | |
| SunOpta, Inc. * | 9,600 | $ | 124,443 |
| Suramina Resources, Inc. * | 4,000 | | 4,545 |
| Synenco Energy, Inc. * | 7,500 | | 89,551 |
| Systems Xcellence, Inc. * | 2,000 | | 35,849 |
| Tanzanian Royalty Exploration Corp. * | 17,900 | | 85,763 |
| Taseko Mines, Ltd. * | 10,600 | | 40,750 |
| Teal Exploration & Mining, Inc. * | 4,000 | | 17,991 |
| Teck Cominco, Ltd. | 1,643 | | 69,988 |
| Tembec, Inc. * | 4,700 | | 3,471 |
| Tesco Corp. * | 7,300 | | 199,832 |
| Theratechnologies, Inc. * | 5,900 | | 46,089 |
| Thompson Creek Metals Company, Inc. * | 18,200 | | 306,579 |
| Timminco, Ltd. * | 4,000 | | 26,437 |
| TLC Vision Corp. * | 13,700 | | 50,073 |
| Toromont Industries, Ltd. | 8,600 | | 210,827 |
| Torstar Corp., Class B | 10,400 | | 194,982 |
| Transat A.T., Inc., Class A | 2,100 | | 59,315 |
| Transcontinental, Inc., Class A | 11,900 | | 226,822 |
| Transglobe Energy Corp. * | 8,000 | | 32,042 |
| Trican Well Service, Ltd. | 15,100 | | 268,800 |
| Tristar Oil & Gas, Ltd. * | 6,200 | | 44,030 |
| Tundra Semiconductor Corp. * | 2,300 | | 18,533 |
| Turnkey E&P, Inc. * | 1,100 | | 7,031 |
| Uex Corp. * | 27,900 | | 125,221 |
| Uni-Select, Inc. | 4,200 | | 121,097 |
| Uranium Participation Corp. * | 8,300 | | 79,377 |
| Ur-Energy, Inc. * | 10,200 | | 28,009 |
| UTS Energy Corp., ADR * | 59,500 | | 315,500 |
| Vector Aerospace Corp. * | 2,100 | | 9,743 |
| Verenex Energy, Inc. * | 3,500 | | 42,984 |
| Vero Energy, Inc. * | 6,700 | | 37,620 |
| Vitran Corp., Inc. * | 300 | | 6,355 |
| Wesdome Gold Mines, Ltd. * | 17,100 | | 20,240 |
| West Energy, Ltd. * | 100 | | 341 |
| West Fraser Timber Company, Ltd. | 6,100 | | 225,263 |
| Western Canadian Coal Corp. * | 9,000 | | 17,129 |
| Western Financial Group, Inc. | 10,800 | | 60,233 |
| Westport Innovations, Inc. * | 14,700 | | 24,498 |
| Wi-LAN, Inc. * | 9,000 | | 26,418 |
| Winpak, Ltd. | 1,100 | | 8,708 |
| Xantrex Technology, Inc. * | 4,400 | | 41,121 |
| Xceed Mortgage Corp. | 1,800 | | 5,454 |
| Xtreme Coil Drilling Corp. * | 1,300 | | 12,433 |
| Zarlink Semiconductor, Inc. * | 33,700 | | 52,013 |
| ZCL Composites, Inc. | 1,000 | | 9,440 |
| |
|
| | | | 27,287,114 |
| China - 0.01% | | | |
| Solomon Systech International, Ltd. | 320,000 | | 27,105 |
| | | | |
| Denmark - 1.31% | | | |
| Alm. Brand Skadesforsikring A/S * (a) | 3,700 | | 229,271 |
| Amagerbanken A/S | 1,350 | | 83,423 |
| |
| The accompanying notes are an integral part of the financial statements. | 239 |
John Hancock Funds II
Portfolio of investments — August 31, 2007
(showing percentage of total net assets)
| | | |
| International Small Company Fund (continued) |
| | Shares or | | |
| | Principal | | |
| | Amount | | Value |
|
|
| |
| COMMON STOCKS (continued) | | | |
| | | | |
| Denmark (continued) | | | |
| Bang & Olufsen A/S, Series B | 2,100 | $ | 229,399 |
| Bavarian Nordic A/S * | 1,260 | | 95,485 |
| Capinordic A/S * (a) | 9,300 | | 44,172 |
| Dalhoff Larsen & Horneman A/S, Series B | 2,500 | | 49,494 |
| Det Ostasiatiske Kompagni A/S | 4,300 | | 290,647 |
| DFDS A/S | 550 | | 79,312 |
| DiBa Bank A/S | 550 | | 45,316 |
| EDB Gruppen A/S, Series B * | 700 | | 20,522 |
| Fionia Bank A/S | 125 | | 37,095 |
| Fluegger A/S, Series B | 300 | | 37,320 |
| Forstaedernes Bank A/S | 2,800 | | 117,311 |
| IC Companys A/S (a) | 1,800 | | 108,731 |
| NeuroSearch A/S * | 3,550 | | 174,101 |
| Nordjyske Bank A/S | 1,190 | | 45,739 |
| Parken Sport & Entertainment A/S * | 450 | | 125,868 |
| Pharmexa A/S * | 10,600 | | 30,731 |
| Ringkjoebing Landbobank A/S | 535 | | 92,617 |
| Roskilde Bank A/S | 495 | | 49,490 |
| Royal Unibrew A/S | 875 | | 102,279 |
| Sanistal A/S, Series B | 250 | | 41,377 |
| Satair A/S | 1,000 | | 53,362 |
| Schouw & Company A/S, Series B | 2,450 | | 231,870 |
| SimCorp A/S (a) | 1,150 | | 245,054 |
| Sjaelso Gruppen A/S | 2,400 | | 85,775 |
| Spar Nord Bank A/S | 12,250 | | 294,002 |
| TK Development A/S * (a) | 6,500 | | 145,791 |
| Vestjysk Bank A/S | 1,425 | | 88,483 |
| |
|
| | | | 3,274,037 |
| Finland - 2.25% | | | |
| Aldata Solution Oyj * | 13,900 | | 27,681 |
| Amer Sports Oyj, A Shares (a) | 41,993 | | 958,186 |
| Aspo Oyj | 4,950 | | 46,624 |
| Cramo Oyj, Series B | 2,125 | | 83,080 |
| Finnair Oyj | 4,400 | | 77,181 |
| Finnlines Oyj (a) | 6,400 | | 128,866 |
| Fiskars Oyj Abp, Series A | 3,249 | | 58,629 |
| F-Secure Oyj | 13,850 | | 46,535 |
| HK Ruokatalo Oyj, Series A | 6,090 | | 148,003 |
| Huhtamaki Oyj (a) | 45,417 | | 686,293 |
| KCI Konecranes Oyj | 51,234 | | 1,957,432 |
| Kemira Oyj (a) | 6,977 | | 168,781 |
| Lassila & Tikanoja Oyj | 4,595 | | 143,098 |
| Lemminkainen Oyj | 2,350 | | 163,795 |
| M-real Oyj, Series B | 18,950 | | 104,579 |
| Olvi Oyj, Series A | 2,000 | | 73,888 |
| Poyry Oyj | 7,200 | | 162,810 |
| Raisio PLC | 15,429 | | 42,627 |
| Ramirent Oyj (a) | 6,400 | | 152,539 |
| Stockmann Oyj Abp, Series A | 600 | | 26,434 |
| Stockmann Oyj Abp, Series B | 1,150 | | 51,093 |
| Uponor Oyj (a) | 3,000 | | 115,364 |
| | | |
| International Small Company Fund (continued) |
| | Shares or | | |
| | Principal | | |
| | Amount | | Value |
|
|
| |
| COMMON STOCKS (continued) | | | |
| | | | |
| Finland (continued) | | | |
| Vaisala Oyj, Series A | 1,800 | $ | 90,738 |
| YIT Oyj | 3,970 | | 120,348 |
| |
|
| | | | 5,634,604 |
| France - 4.37% | | | |
| Ales Groupe | 1,081 | | 27,278 |
| Alten SA * (a) | 3,914 | | 138,500 |
| Altran Technologies SA * (a) | 16,346 | | 140,467 |
| April Group SA (a) | 2,848 | | 159,118 |
| Archos SA * (a) | 1,721 | | 54,415 |
| Assystem SA | 4,109 | | 72,600 |
| Audika SA | 1,625 | | 61,967 |
| Avanquest Software SA * | 1,218 | | 20,724 |
| Bacou Dalloz SA | 1,599 | | 219,125 |
| Beneteau SA | 11,605 | | 288,205 |
| Boiron SA | 515 | | 14,541 |
| Bonduelle SCA | 961 | | 120,557 |
| Bongrain SA | 1,100 | | 131,651 |
| Bourbon SA | 4,535 | | 297,686 |
| Bull SA * (a) | 11,140 | | 77,985 |
| Canal Plus SA (a) | 16,823 | | 179,891 |
| Carbone Lorraine SA | 2,556 | | 182,876 |
| Cegedim SA | 323 | | 35,830 |
| Cegid SA | 1,808 | | 102,905 |
| Club Mediterranee SA * (a) | 2,334 | | 160,889 |
| Compagnie Plastic-Omnium SA | 3,169 | | 151,288 |
| Delachaux SA | 2,118 | | 180,612 |
| Electricite de Strasbourg SA | 1,094 | | 229,756 |
| Esso SAF * | 266 | | 79,907 |
| Etam Developpement SA | 1,713 | | 123,681 |
| Faurecia SA * (a) | 2,085 | | 160,427 |
| Fleury Michon SA | 344 | | 26,042 |
| Geodis SA | 967 | | 198,473 |
| GFI Informatique SA | 9,954 | | 99,506 |
| GL Events SA | 1,835 | | 122,694 |
| Groupe Crit SA | 1,884 | | 95,824 |
| Groupe Open SA * | 2,447 | | 38,830 |
| Groupe Steria SCA (a) | 2,803 | | 148,362 |
| Guerbet SA | 558 | | 112,641 |
| Guyenne & Gascogne SA | 1,445 | | 249,424 |
| Havas SA | 50,789 | | 280,724 |
| Ingenico SA | 4,406 | | 113,288 |
| International Metal Service SA | 1,512 | | 65,639 |
| Ipsos SA | 2,619 | | 95,121 |
| Lafuma SA | 424 | | 31,008 |
| Laurent-Perrier SA | 1,018 | | 161,321 |
| Lectra SA | 6,134 | | 51,288 |
| Lisi SA | 610 | | 71,106 |
| LVL Medical Groupe SA * | 3,125 | | 85,043 |
| Maisons France Confort SA | 709 | | 58,709 |
| Manitou BF SA | 3,693 | | 206,011 |
| Manutan SA | 1,304 | | 106,526 |
| |
| The accompanying notes are an integral part of the financial statements. | 240 |
John Hancock Funds II
Portfolio of investments — August 31, 2007
(showing percentage of total net assets)
| | | |
| International Small Company Fund (continued) |
| | Shares or | | |
| | Principal | | |
| | Amount | | Value |
|
|
| |
| COMMON STOCKS (continued) | | | |
| | | | |
| France (continued) | | | |
| Montupet (a) | 553 | $ | 14,151 |
| Mr. Bricolage SA | 1,756 | | 55,035 |
| Nexity SA | 3,100 | | 205,395 |
| Norbert Dentressangle SA (a) | 1,107 | | 111,016 |
| Oberthur Card Systems SA (a) | 5,267 | | 44,102 |
| Orco Property Group (a) | 503 | | 75,689 |
| Orpea SA * | 4,196 | | 235,655 |
| Penauille Polyservices SA * (a) | 28,582 | | 253,220 |
| Petit Forestier SA | 643 | | 82,530 |
| Pierre & Vacances SA | 1,327 | | 192,528 |
| Pinguely-Haulotte SA | 1,656 | | 65,521 |
| Radiall SA | 349 | | 47,583 |
| Rallye SA (a) | 5,515 | | 358,276 |
| Remy Cointreau SA | 2,184 | | 155,758 |
| Robertet SA | 258 | | 47,846 |
| Rubis SA | 1,805 | | 151,837 |
| Saft Groupe SA * | 1,100 | | 46,752 |
| Samse SA | 317 | | 48,353 |
| SEB SA (a) | 1,821 | | 319,958 |
| Sechilienne-Sidec SA | 2,979 | | 218,220 |
| Silicon-On-Insulator Technologies SA * (a) | 10,465 | | 197,385 |
| Societe BIC SA | 2,426 | | 184,040 |
| Sopra Group SA | 2,126 | | 196,170 |
| Spir Communication SA (a) | 493 | | 53,431 |
| SR Teleperformance SA | 8,451 | | 345,644 |
| Stallergenes SA | 2,320 | | 191,698 |
| Stef-TFE Group | 799 | | 55,031 |
| Sucriere de Pithiviers-Le-Vieil SA | 73 | | 59,122 |
| Synergie SA | 1,224 | | 49,162 |
| Tessi SA | 206 | | 14,860 |
| Theolia SA * | 4,792 | | 133,317 |
| Toupargel-Agrigel SA (a) | 936 | | 37,407 |
| Trigano SA | 2,853 | | 127,735 |
| UbiSoft Entertainment SA * | 5,766 | | 357,753 |
| Union Financiere de France Banque SA | 725 | | 44,129 |
| Viel & Compagnie | 7,076 | | 48,034 |
| Vilmorin & Compagnie | 901 | | 105,121 |
| Virbac SA | 1,389 | | 118,262 |
| VM Materiaux SA | 118 | | 13,735 |
| Vranken-Pommery Monopole Group | 721 | | 55,068 |
| |
|
| | | | 10,946,990 |
| Germany - 4.98% | | | |
| Aareal Bank AG | 5,955 | | 284,292 |
| Adlink Internet Media AG * (a) | 4,151 | | 73,503 |
| ADVA AG Optical Networking * (a) | 4,237 | | 36,386 |
| Aixtron AG * (a) | 20,549 | | 169,918 |
| Augusta Technologie AG * | 2,266 | | 53,272 |
| AWD Holding AG | 4,069 | | 137,365 |
| Baader Wertpapierhandelsbank AG | 12,358 | | 70,122 |
| Balda AG * (a) | 3,189 | | 33,730 |
| Beate Uhse AG (a) | 5,482 | | 24,609 |
| | | |
| International Small Company Fund (continued) |
| | Shares or | | |
| | Principal | | |
| | Amount | | Value |
|
|
| |
| COMMON STOCKS (continued) | | | |
| | | | |
| Germany (continued) | | | |
| Bechtle AG | 3,518 | $ | 139,605 |
| Biotest AG | 1,095 | | 47,009 |
| Boewe Systec AG (a) | 1,342 | | 66,245 |
| Centrotec Sustainable AG * (a) | 2,162 | | 43,517 |
| Comdirect Bank AG (a) | 8,396 | | 96,885 |
| Conergy AG (a) | 1,920 | | 155,617 |
| CTS Eventim AG (a) | 2,979 | | 112,880 |
| Curanum AG | 4,385 | | 29,373 |
| D&S Europe AG * (a) | 12,806 | | 248,490 |
| Deutz AG * (a) | 13,899 | | 163,299 |
| Douglas Holding AG | 8,523 | | 512,661 |
| Drillisch AG * | 6,749 | | 68,357 |
| Duerr AG * | 2,766 | | 113,083 |
| DVB Bank AG | 11 | | 4,081 |
| EM.TV AG * | 9,200 | | 55,770 |
| Epcos AG | 17,467 | | 332,411 |
| Escada AG * (a) | 2,739 | | 109,136 |
| Evotec AG * (a) | 8,820 | | 36,062 |
| Fielmann AG | 1,902 | | 125,012 |
| Freenet AG * | 10,782 | | 251,793 |
| Fuchs Petrolub AG | 1,810 | | 159,622 |
| Gerry Weber International AG (a) | 3,420 | | 107,406 |
| Gesco AG | 829 | | 64,544 |
| GFK AG (a) | 2,880 | | 114,603 |
| GPC Biotech AG * (a) | 5,604 | | 63,444 |
| Grenkeleasing AG | 1,687 | | 64,982 |
| Hawesko Holding AG (a) | 1,432 | | 48,851 |
| Indus Holding AG (a) | 2,245 | | 83,212 |
| IWKA AG * (a) | 6,306 | | 256,231 |
| Jenoptik AG * (a) | 20,577 | | 192,593 |
| Kontron AG | 7,100 | | 145,336 |
| Krones AG | 5,868 | | 458,922 |
| KSB AG | 139 | | 108,101 |
| KWS Saat AG | 415 | | 69,352 |
| Leoni AG (a) | 6,550 | | 343,718 |
| Mania Technologie AG * | 6,080 | | 7,713 |
| MasterFlex AG (a) | 1,234 | | 35,978 |
| Mediclin AG * | 8,648 | | 40,106 |
| Medion AG * | 5,908 | | 112,870 |
| MLP AG (a) | 1,718 | | 27,417 |
| Morphosys AG * | 835 | | 42,678 |
| MTU Aero Engines Holding AG | 6,500 | | 413,159 |
| MVV Energie AG | 7,457 | | 287,838 |
| Nemetschek AG | 1,701 | | 61,484 |
| Norddeutsche Affinerie AG (a) | 10,201 | | 445,992 |
| Nordex AG * (a) | 3,448 | | 162,904 |
| Pfeiffer Vacuum Technology AG | 2,709 | | 252,845 |
| Pfleiderer AG | 5,794 | | 147,681 |
| Qiagen AG * (a) | 23,319 | | 401,117 |
| QSC AG * (a) | 22,823 | | 120,374 |
| R. Stahl AG | 1,092 | | 51,810 |
| Rational AG (a) | 513 | | 95,894 |
| |
| The accompanying notes are an integral part of the financial statements. | 241 |
John Hancock Funds II
Portfolio of investments — August 31, 2007
(showing percentage of total net assets)
| | | |
| International Small Company Fund (continued) |
| | Shares or | | |
| | Principal | | |
| | Amount | | Value |
|
|
| |
| COMMON STOCKS (continued) | | | |
| | | | |
| Germany (continued) | | | |
| REpower Systems AG * (a) | 2,414 | $ | 368,423 |
| Rheinmetall AG (a) | 655 | | 54,467 |
| Rhoen-Klinikum AG | 8,590 | | 264,314 |
| Sartorius AG | 997 | | 56,708 |
| SGL Carbon AG * (a) | 12,140 | | 581,627 |
| SHB Stuttgarter Finanz & Beteiligungs AG | 951 | | 41,914 |
| Singulus Technologies AG * | 6,859 | | 82,452 |
| Sixt AG | 2,811 | | 145,992 |
| Software AG | 5,638 | | 562,733 |
| Strabag AG | 320 | | 117,786 |
| Suess MicroTec AG * (a) | 4,728 | | 49,711 |
| Takkt AG | 4,283 | | 75,606 |
| Techem AG | 3,577 | | 222,239 |
| Vivacon AG | 1,093 | | 32,605 |
| Vossloh AG | 7,123 | | 768,870 |
| Wincor Nixdorf AG (a) | 2,250 | | 194,716 |
| Wire Card AG * | 12,980 | | 179,798 |
| Wuerttembergische Lebensversicherung AG, | | | |
| Series D * | 1,865 | | 87,763 |
| |
|
| | | | 12,470,984 |
| Greece - 1.56% | | | |
| Alapis Holding Industrial & Commercial SA * | 60,054 | | 163,827 |
| Aspis Bank SA | 10,270 | | 44,465 |
| Astir Palace Hotel SA * | 6,080 | | 59,101 |
| Athens Medical Center SA | 8,110 | | 56,779 |
| Attica Holdings SA | 16,150 | | 121,857 |
| Autohellas SA | 8,930 | | 71,222 |
| Bank of Attica SA * | 5,325 | | 26,896 |
| Bank of Greece SA | 1,980 | | 248,091 |
| Blue Star Maritime SA | 12,260 | | 60,061 |
| C. Rokas SA | 3,530 | | 94,191 |
| Delta Holding SA * | 6,490 | | 221,375 |
| Ethniki General Insurance Company SA * | 10,740 | | 70,173 |
| Forthnet SA * | 3,580 | | 51,011 |
| Fourlis SA | 2,950 | | 88,896 |
| Frigoglass SA | 5,740 | | 167,962 |
| GEK Group of Companies SA | 4,450 | | 75,368 |
| Geniki Bank SA * | 7,120 | | 61,976 |
| Halcor SA | 19,210 | | 107,504 |
| Hellenic Technodomiki Tev SA | 25,060 | | 330,491 |
| Heracles General Cement SA | 4,800 | | 108,936 |
| Iaso SA | 11,020 | | 196,435 |
| Intracom SA | 20,200 | | 125,148 |
| J&P-Avax SA | 12,040 | | 125,064 |
| Maritime Company of Lesvos SA * | 26,037 | | 36,450 |
| Metka SA | 4,120 | | 88,227 |
| Michaniki SA | 17,800 | | 157,691 |
| Minoan Lines Shipping SA | 16,450 | | 119,152 |
| Mytilineos Holdings SA | 3,990 | | 203,081 |
| Neochimiki LV Lavrentiadis SA | 2,640 | | 72,296 |
| Pantechniki SA * | 9,420 | | 52,202 |
| S&B Industrial Minerals SA | 3,540 | | 57,507 |
| | | |
| International Small Company Fund (continued) |
| | Shares or | | |
| | Principal | | |
| | Amount | | Value |
|
|
| |
| COMMON STOCKS (continued) | | | |
| | | | |
| Greece (continued) | | | |
| Sarantis SA | 3,820 | $ | 53,134 |
| Terna SA | 6,110 | | 109,525 |
| Viohalco SA | 18,430 | | 277,384 |
|
|
| | | | 3,903,478 |
| Hong Kong - 2.34% | | | |
| Alco Holdings, Ltd. | 94,000 | | 58,007 |
| Allied Group, Ltd. | 34,000 | | 120,083 |
| Allied Properties HK, Ltd. * | 560,000 | | 115,631 |
| Asia Financial Holdings, Ltd. | 98,000 | | 56,648 |
| Asia Satellite Telecom Holdings Company, Ltd. | 300,720 | | 604,204 |
| Asia Standard International Group | 1,561,313 | | 54,132 |
| Baltrans Holdings, Ltd. | 8,000 | | 4,512 |
| Century City International Holdings, Ltd. | 3,496,000 | | 102,612 |
| Champion Technology Holdings, Ltd. | 309,437 | | 65,063 |
| Chen Hsong Holdings, Ltd. | 74,000 | | 59,751 |
| Chevalier International Holdings, Ltd. | 32,000 | | 35,899 |
| Chia Hsin Cement Greater China Holding | | | |
| Corp. * | 232,000 | | 101,856 |
| China Metal International Holdings, Inc. | 108,000 | | 44,460 |
| China Pharmaceutical Group, Ltd. * (a) | 346,000 | | 154,863 |
| China Solar Energy Holdings, Ltd. * | 540,000 | | 37,398 |
| Chinese People Gas Holdings Company, Ltd. * | 654,000 | | 50,353 |
| Chong Hing Bank, Ltd. | 43,000 | | 99,796 |
| Chow Sang Sang Holdings, Ltd. | 108,000 | | 118,153 |
| Clear Media, Ltd. * | 37,000 | | 37,962 |
| Dickson Concepts International, Ltd. | 37,000 | | 38,283 |
| Easyknit Enterprises Holdings, Ltd. * | 205,000 | | 6,386 |
| EganaGoldpfeil Holdings, Ltd. | 131,750 | | 36,835 |
| Emperor Capital Group, Ltd. * | 33,600 | | 4,697 |
| Emperor Entertainment Hotel, Ltd. | 165,000 | | 38,311 |
| Emperor International Holdings, Ltd. | 168,000 | | 49,959 |
| eSun Holdings, Ltd. * | 50,000 | | 32,077 |
| Far East Consortium International, Ltd. | 180,255 | | 78,656 |
| Fong's Industries Company, Ltd. | 66,000 | | 48,925 |
| Fubon Bank, Ltd. | 110,000 | | 61,549 |
| Fushan International Energy Group, Ltd. * | 84,000 | | 34,194 |
| Glorious Sun Enterprises, Ltd. | 88,000 | | 42,452 |
| Golden Resorts Group, Ltd. | 500,000 | | 42,620 |
| Harbour Centre Development, Ltd. | 25,000 | | 45,080 |
| Heng Tai Consumables Group, Ltd. * | 325,000 | | 62,045 |
| Hi Sun Technology China, Ltd. * | 153,000 | | 41,783 |
| HKR International, Ltd. | 135,200 | | 93,824 |
| Hongkong Chinese, Ltd. | 298,000 | | 61,601 |
| Hung Hing Printing Group, Ltd. | 134,216 | | 72,354 |
| Hutchison Harbour Ring, Ltd. | 494,000 | | 36,739 |
| I.T., Ltd. | 242,000 | | 48,669 |
| i-Cable Communications, Ltd. | 179,000 | | 36,344 |
| Imagi International Holdings, Ltd. * | 140,000 | | 34,146 |
| Integrated Distribution Services Group, Ltd. | 24,000 | | 77,392 |
| K Wah International Holdings, Ltd. | 367,227 | | 155,023 |
| Kantone Holdings, Ltd. | 709,933 | | 76,738 |
| Karl Thomson Holdings, Ltd. * | 92,000 | | 20,252 |
| |
| The accompanying notes are an integral part of the financial statements. | 242 |
John Hancock Funds II
Portfolio of investments — August 31, 2007
(showing percentage of total net assets)
| | | |
| International Small Company Fund (continued) |
| | Shares or | | |
| | Principal | | |
| | Amount | | Value |
|
|
| |
| COMMON STOCKS (continued) | | | |
| | | | |
| Hong Kong (continued) | | | |
| Lai Fung Holdings, Ltd. | 974,000 | $ | 53,021 |
| Lai Sun Development Company, Ltd. * | 2,414,000 | | 73,359 |
| Liu Chong Hing Investment, Ltd. | 40,000 | | 58,953 |
| Lung Kee Holdings, Ltd. | 76,000 | | 37,205 |
| Matsunichi Communication Holdings, Ltd. | 124,000 | | 62,932 |
| Midland Holdings, Ltd. | 98,000 | | 69,109 |
| Natural Beauty Bio-Technology, Ltd. | 280,000 | | 60,479 |
| Next Media, Ltd. | 150,000 | | 42,965 |
| Oriental Press Group, Ltd. | 202,000 | | 32,717 |
| Pacific Andes International Holdings, Ltd. | 297,000 | | 85,282 |
| Pacific Century Premium Developments, Ltd. | 195,000 | | 56,825 |
| Paliburg Holdings, Ltd. | 988,000 | | 40,512 |
| Peace Mark Holdings, Ltd. | 90,000 | | 133,495 |
| Pico Far East Holdings, Ltd. | 200,000 | | 58,981 |
| Playmates Holdings, Ltd. | 384,000 | | 44,451 |
| Ports Design, Ltd. | 52,000 | | 140,207 |
| Prime Success International Group, Ltd. | 122,000 | | 77,869 |
| Public Financial Holdings, Ltd. | 52,000 | | 34,196 |
| PYI Corp., Ltd. | 163,928 | | 68,321 |
| Regal Hotels International Holdings, Ltd. | 838,000 | | 64,648 |
| Road King Infrastructure, Ltd. | 56,000 | | 102,124 |
| Sa Sa International Holdings, Ltd. | 112,000 | | 37,260 |
| Shaw Brothers Hong Kong, Ltd. | 23,000 | | 43,625 |
| Shell Electric Manufacturing Company, Ltd. | 102,000 | | 94,669 |
| Shui On Construction & Materials, Ltd. | 22,000 | | 66,273 |
| Singamas Container Holdings, Ltd. | 60,000 | | 37,174 |
| Sino-I Technology, Ltd. * | 2,940,000 | | 62,394 |
| Skyfame Realty Holdings, Ltd. * | 216,000 | | 51,531 |
| Symphony Holdings, Ltd. | 296,000 | | 33,779 |
| TAI Cheung Holdings, Ltd. | 76,000 | | 50,977 |
| Tan Chong International, Ltd. | 63,000 | | 18,179 |
| Tian An China Investment, Ltd. | 120,000 | | 153,971 |
| Titan Petrochemicals Group, Ltd. * | 600,000 | | 46,809 |
| Top Form International, Ltd. | 226,000 | | 34,465 |
| Truly International Holdings, Ltd. | 34,000 | | 62,527 |
| Upbest Group, Ltd. | 158,000 | | 20,874 |
| USI Holding Corp. | 72,000 | | 45,889 |
| Varitronix International, Ltd. | 68,000 | | 55,071 |
| Victory City International Holdings, Ltd. | 134,617 | | 43,340 |
| Vitasoy International Holdings, Ltd. | 114,000 | | 48,394 |
| Wai Kee Holdings, Ltd. | 130,000 | | 56,836 |
| Wing On Company International, Ltd. | 19,000 | | 30,491 |
| Yip's Chemical Holdings, Ltd. | 112,000 | | 71,970 |
|
|
| | | | 5,862,466 |
| India - 0.65% | | | |
| Apollo Hospitals Enterprise, Ltd. | 5,933 | | 70,688 |
| Ballarpur Industries, Ltd. | 19,133 | | 64,732 |
| Blue Star, Ltd. | 9,464 | | 75,694 |
| Carborundum Universal, Ltd. | 9,825 | | 43,417 |
| Chennai Petroleum Corp., Ltd. | 8,097 | | 52,343 |
| Dishman Pharmaceuticals & Chemicals, Ltd. | 7,085 | | 49,713 |
| | | |
| International Small Company Fund (continued) |
| | Shares or | | |
| | Principal | | |
| | Amount | | Value |
|
|
| |
| COMMON STOCKS (continued) | | | |
| | | | |
| India (continued) | | | |
| Federal Bank, Ltd. | 10,024 | $ | 84,127 |
| GlaxoSmithKline Consumer Healthcare, Ltd. | 3,819 | | 57,592 |
| Greaves Cotton, Ltd. | 2,000 | | 15,188 |
| GTL, Ltd. | 12,066 | | 68,050 |
| Gujarat State Fertilisers & Chemicals, Ltd. | 10,141 | | 55,672 |
| Honeywell Automation India, Ltd. | 200 | | 9,264 |
| HTMT Global Solutions, Ltd. * | 2,398 | | 22,653 |
| IndusInd Bank, Ltd. | 37,267 | | 48,301 |
| Ipca Laboratories, Ltd. | 2,949 | | 50,255 |
| Jain Irrigation Systems, Ltd. | 4,644 | | 53,740 |
| Jammu & Kashmir Bank, Ltd. | 2,945 | | 48,357 |
| Jindal Saw, Ltd. | 2,500 | | 36,317 |
| Jindal Stainless, Ltd. | 15,539 | | 62,259 |
| LIC Housing Finance, Ltd. | 10,789 | | 49,269 |
| Maharashtra Seamless, Ltd. | 3,782 | | 54,475 |
| Marico, Ltd. | 68,010 | | 96,572 |
| Monsanto India, Ltd. | 800 | | 29,507 |
| Moser Baer India, Ltd. | 9,487 | | 71,236 |
| Motherson Sumi Systems, Ltd. | 7,017 | | 16,465 |
| NIIT, Ltd. | 11,250 | | 34,568 |
| Pfizer, Ltd. | 2,055 | | 34,936 |
| Pidilite Industries, Ltd. | 7,500 | | 27,284 |
| Punjab Tractors, Ltd. * | 2,462 | | 14,214 |
| Radico Khaitan, Ltd. | 12,061 | | 50,812 |
| Shriram Transport Finance Company, Ltd. | 15,921 | | 66,653 |
| SKF India, Ltd. | 6,184 | | 62,215 |
| Voltas, Ltd. | 15,419 | | 51,570 |
| |
|
| | | | 1,628,138 |
| Ireland - 1.17% | | | |
| Abbey PLC | 6,015 | | 73,869 |
| DCC PLC | 19,608 | | 518,489 |
| Dragon Oil PLC * | 34,938 | | 150,301 |
| FBD Holdings PLC | 4,816 | | 167,580 |
| Fyffes PLC | 26,743 | | 29,182 |
| Glanbia PLC * | 15,218 | | 84,898 |
| Greencore Group PLC | 44,368 | | 278,383 |
| Iaws Group PLC, ADR | 18,171 | | 355,956 |
| IFG Group PLC | 17,394 | | 46,212 |
| Independent News & Media PLC | 52,103 | | 244,931 |
| Irish Continental Group PLC * | 5,829 | | 200,322 |
| Kenmare Resources PLC * | 66,301 | | 74,331 |
| Kingspan Group PLC - London | 8,557 | | 220,151 |
| McInerney Holdings PLC | 27,705 | | 81,977 |
| Paddy Power PLC | 7,635 | | 230,186 |
| United Drug PLC | 34,029 | | 172,410 |
| |
|
| | | | 2,929,178 |
| Israel - 0.02% | | | |
| Formula Systems, Ltd. * | 3,231 | | 42,450 |
| | | | |
| Italy - 2.84% | | | |
| Acegas-APS SpA (a) | 3,947 | | 42,945 |
| Actelios SpA (a) | 8,203 | | 82,300 |
| |
| The accompanying notes are an integral part of the financial statements. | 243 |
John Hancock Funds II
Portfolio of investments — August 31, 2007
(showing percentage of total net assets)
| | | |
| International Small Company Fund (continued) |
| | Shares or | | |
| | Principal | | |
| | Amount | | Value |
|
|
| |
| COMMON STOCKS (continued) | | | |
| | | | |
| Italy (continued) | | | |
| Aedes SpA | 6,455 | $ | 43,192 |
| Amplifon SpA | 31,967 | | 288,143 |
| Astaldi SpA | 11,817 | | 105,980 |
| Azimut Holding SpA (a) | 11,000 | | 168,600 |
| Banca Intermobiliare SpA (a) | 17,737 | | 181,987 |
| Banca Popolare dell'Etruria e del Lazio Scrl | 11,446 | | 210,249 |
| Banca Profilo SpA | 11,108 | | 33,331 |
| Banco di Desio e della Brianza SpA | 11,958 | | 142,650 |
| Biesse SpA | 3,083 | | 95,137 |
| Bonifica Ferraresi e Imprese Agricole SpA (a) | 918 | | 52,113 |
| Brembo SpA | 12,719 | | 176,057 |
| Caltagirone Editore SpA (a) | 9,281 | | 71,399 |
| Caltagirone SpA | 7,345 | | 74,731 |
| Cementir SpA | 24,008 | | 303,989 |
| Credito Artigiano SpA | 21,622 | | 115,842 |
| Credito Bergamasco SpA | 4,262 | | 201,794 |
| Cremonini SpA | 9,400 | | 28,857 |
| Danieli & Company SpA | 7,817 | | 246,000 |
| De Longhi SpA | 23,047 | | 142,522 |
| Digital Multimedia Technologies SpA * | 2,000 | | 151,049 |
| Ducati Motor Holding SpA * | 28,717 | | 83,606 |
| Ergo Previdenza SpA (a) | 5,344 | | 30,926 |
| Esprinet SpA | 4,770 | | 76,896 |
| Gemina SpA | 37,070 | | 135,906 |
| Gewiss SpA | 4,550 | | 37,717 |
| GranitiFiandre SpA (a) | 7,189 | | 96,839 |
| Gruppo Editoriale L'Espresso SpA | 30,704 | | 158,554 |
| Immobiliare Lombarda SpA * | 341,153 | | 96,644 |
| Immsi SpA | 42,868 | | 117,329 |
| Impregilo SpA * (a) | 70,148 | | 509,992 |
| Indesit Company SpA | 7,439 | | 154,389 |
| Industria Macchine Automatiche SpA | 5,896 | | 133,837 |
| Intek SpA | 30,078 | | 33,672 |
| Interpump SpA | 16,266 | | 163,225 |
| Iride SpA (a) | 49,082 | | 179,304 |
| KME Group * | 17,570 | | 46,838 |
| Mariella Burani SpA | 3,142 | | 101,883 |
| Marr SpA | 5,328 | | 55,255 |
| Meliorbanca SpA (a) | 17,273 | | 77,387 |
| Mirato SpA | 3,489 | | 40,749 |
| Navigazione Montanari SpA | 17,762 | | 87,444 |
| Permasteelisa SpA | 4,223 | | 118,396 |
| Piccolo Credito Valtellinese Scrl | 13,365 | | 185,048 |
| Premafin Finanziaria SpA | 50,691 | | 153,767 |
| Premuda SpA | 17,385 | | 38,860 |
| Recordati SpA | 13,404 | | 114,512 |
| Risanamento SpA * (a) | 13,318 | | 92,910 |
| SAES Getters SpA | 2,559 | | 97,096 |
| Societa Partecipazioni Finanziarie SpA * | 121,974 | | 94,239 |
| Socotherm SpA (a) | 2,703 | | 35,544 |
| Sogefi SpA | 6,285 | | 54,807 |
| Sol SpA | 10,699 | | 83,625 |
| | | |
| International Small Company Fund (continued) |
| | Shares or | | |
| | Principal | | |
| | Amount | | Value |
|
|
| |
| COMMON STOCKS (continued) | | | |
| | | | |
| Italy (continued) | | | |
| Sorin SpA * | 28,050 | $ | 63,768 |
| Stefanel SpA * | 8,571 | | 35,145 |
| Targetti Sankey SpA | 4,115 | | 40,563 |
| Telecom Italia Media SpA * (a) | 308,257 | | 106,372 |
| Tiscali SpA * | 57,429 | | 166,098 |
| Trevi Finanziaria SpA | 5,462 | | 97,025 |
| Vianini Lavori SpA | 2,862 | | 50,838 |
| Vittoria Assicurazioni SpA | 5,949 | | 111,067 |
| |
|
| | | | 7,116,939 |
| Japan - 23.43% | | | |
| A&A Material Corp. (a) | 19,000 | | 24,238 |
| Abilit Corp. (a) | 3,000 | | 8,582 |
| Achilles Corp. | 29,000 | | 46,829 |
| Adeka Corp. (a) | 14,000 | | 140,176 |
| Aderans Company, Ltd. (a) | 6,100 | | 111,365 |
| Advan Company, Ltd. (a) | 2,200 | | 19,350 |
| Advanex, Inc. | 12,000 | | 19,471 |
| Aeon Delight Company, Ltd. (a) | 2,000 | | 70,715 |
| Aeon Fantasy Company, Ltd. (a) | 1,680 | | 33,250 |
| Ahresty Corp. (a) | 1,800 | | 39,448 |
| AI Holdings Corp. (a) | 5,900 | | 34,251 |
| Aica Kogyo Company, Ltd. (a) | 6,000 | | 64,548 |
| Aichi Bank, Ltd. * (a) | 1,800 | | 181,017 |
| Aichi Corp. (a) | 10,600 | | 124,764 |
| Aichi Machine Industry Company, Ltd. | 12,000 | | 26,698 |
| Aichi Steel Corp. * (a) | 20,000 | | 105,280 |
| Aichi Tokei Denki Company, Ltd. | 10,000 | | 28,892 |
| Aida Engineering, Ltd. * | 10,000 | | 59,801 |
| Aigan Company, Ltd. | 4,600 | | 36,636 |
| Aiphone Company, Ltd. | 2,800 | | 42,995 |
| Airport Facilities Company, Ltd. | 7,000 | | 47,849 |
| Aisan Industry Company, Ltd. | 9,300 | | 104,010 |
| Akebono Brake Industry Company, Ltd. (a) | 17,000 | | 104,177 |
| Akindo Sushiro Company, Ltd. (a) | 1,000 | | 29,356 |
| Akita Bank, Ltd. | 36,000 | | 161,049 |
| Aloka Company, Ltd. | 5,000 | | 65,166 |
| Alpha Corp. (a) | 1,000 | | 18,307 |
| Alpha Systems, Inc. | 1,700 | | 36,575 |
| Alpine Electronics, Inc. (a) | 7,400 | | 119,057 |
| Alps Logistics Company, Ltd. | 2,000 | | 23,816 |
| Amano Corp. | 10,000 | | 121,374 |
| Amuse, Inc. | 2,000 | | 28,597 |
| Ando Corp. | 14,000 | | 24,665 |
| Anest Iwata Corp. (a) | 6,000 | | 30,153 |
| Anritsu Corp. (a) | 20,000 | | 87,643 |
| AOC Holdings, Inc. * (a) | 6,600 | | 96,250 |
| AOI Electronic Company, Ltd. (a) | 1,700 | | 25,257 |
| AOKI Holdings, Inc. | 4,800 | | 91,046 |
| Aomori Bank, Ltd. | 29,000 | | 112,580 |
| Arakawa Chemical Industries, Ltd. | 3,500 | | 39,972 |
| Araya Industrial Company, Ltd. | 14,000 | | 38,678 |
| |
| The accompanying notes are an integral part of the financial statements. | 244 |
John Hancock Funds II
Portfolio of investments — August 31, 2007
(showing percentage of total net assets)
| | | |
| International Small Company Fund (continued) |
| | Shares or | | |
| | Principal | | |
| | Amount | | Value |
|
|
| |
| COMMON STOCKS (continued) | | | |
| | | | |
| Japan (continued) | | | |
| Ariake Japan Company, Ltd. | 4,900 | $ | 102,426 |
| Arisawa Manufacturing Company, Ltd. (a) | 8,200 | | 78,807 |
| Aronkasei Company, Ltd. | 7,000 | | 31,411 |
| Art Corp. | 2,000 | | 62,075 |
| As One Corp. (a) | 1,800 | | 46,381 |
| Asahi Diamond Industrial Company, Ltd. (a) | 12,000 | | 84,566 |
| Asahi Kogyosha Company, Ltd. | 8,000 | | 31,079 |
| Asahi Organic Chemicals | | | |
| Industry Company, Ltd. | 20,000 | | 74,478 |
| Asahi Pretec Corp. (a) | 5,100 | | 144,441 |
| Asahi Soft Drinks Company, Ltd. (a) | 5,000 | | 71,900 |
| Asahi Tec Corp. * | 39,000 | | 43,057 |
| Asanuma Corp. | 17,000 | | 28,590 |
| Ashimori Industry Company, Ltd. | 13,000 | | 24,677 |
| Asia Securities Printing Company, Ltd. | 4,000 | | 33,630 |
| ASKA Pharmaceutical Company, Ltd. | 5,000 | | 41,078 |
| Asunaro Aoki Construction Company, Ltd. | 11,000 | | 63,294 |
| Atsugi Company, Ltd. (a) | 50,000 | | 68,516 |
| Aucnet, Inc. | 2,700 | | 44,485 |
| Avex Group Holdings, Inc. (a) | 3,600 | | 44,345 |
| Azel Corp. (a) | 17,000 | | 51,375 |
| Bando Chemical Industries, Ltd. (a) | 10,000 | | 62,326 |
| Bank of Ikeda, Ltd. (a) | 3,300 | | 145,192 |
| Bank of Iwate, Ltd. (a) | 3,200 | | 182,588 |
| Bank of Okinawa, Ltd. | 4,300 | | 153,234 |
| Bank of Saga, Ltd. | 33,000 | | 106,374 |
| Bank of the Ryukyus, Ltd. (a) | 5,500 | | 87,905 |
| Belluna Company, Ltd. (a) | 3,400 | | 36,244 |
| Best Denki Company, Ltd. | 14,500 | | 90,792 |
| Bookoff Corp. | 3,000 | | 36,041 |
| BSL Corp. (a) | 27,000 | | 14,419 |
| Bunka Shutter Company, Ltd. (a) | 14,000 | | 71,649 |
| C.I. Kasei Company, Ltd. | 4,000 | | 11,913 |
| CAC Corp. (a) | 3,400 | | 25,097 |
| Calpis Company, Ltd. | 9,000 | | 108,386 |
| Canon Electronics, Inc. (a) | 4,500 | | 121,296 |
| Canon Finetech, Inc. (a) | 6,000 | | 104,440 |
| Capcom Company, Ltd. (a) | 5,300 | | 113,709 |
| Cawachi, Ltd. | 3,000 | | 83,042 |
| Central Finance Company, Ltd. | 13,000 | | 36,285 |
| Central Glass Company, Ltd. | 7,000 | | 36,085 |
| Century Leasing System, Inc. | 7,600 | | 92,708 |
| CFS Corp. | 6,000 | | 21,550 |
| Chiba Kogyo Bank, Ltd. * | 5,800 | | 72,562 |
| Chino Corp. (a) | 11,000 | | 33,536 |
| Chiyoda Company, Ltd. (a) | 3,800 | | 63,436 |
| Chofu Seisakusho Company, Ltd. (a) | 5,900 | | 104,273 |
| Chori Company, Ltd. * (a) | 19,000 | | 21,085 |
| Chubu Shiryo Company, Ltd. (a) | 6,000 | | 55,040 |
| Chudenko Corp. (a) | 5,600 | | 93,915 |
| Chuetsu Pulp & Paper Company, Ltd. | 15,000 | | 31,703 |
| Chugai Mining Company, Ltd. (a) | 34,900 | | 20,155 |
| | | |
| International Small Company Fund (continued) |
| | Shares or | | |
| | Principal | | |
| | Amount | | Value |
|
|
| |
| COMMON STOCKS (continued) | | | |
| | | | |
| Japan (continued) | | | |
| Chugai Ro Company, Ltd. (a) | 9,000 | $ | 33,011 |
| Chugoku Marine Paints, Ltd. (a) | 7,000 | | 78,993 |
| Chukyo Bank, Ltd. | 49,000 | | 149,694 |
| Chuo Gyorui Company, Ltd. | 12,000 | | 37,231 |
| Chuo Spring Company, Ltd. | 9,000 | | 36,320 |
| CKD Corp. | 8,000 | | 82,047 |
| Clarion Company, Ltd. (a) | 39,000 | | 51,865 |
| Cleanup Corp. (a) | 5,000 | | 31,683 |
| CMK Corp. | 8,000 | | 82,736 |
| Coca-Cola Central Japan Company, Ltd. (a) | 15 | | 114,267 |
| Colowide Company, Ltd. (a) | 5,500 | | 24,729 |
| Columbia Music Entertainment, Inc. * (a) | 29,000 | | 22,257 |
| Commuture Corp. (a) | 9,000 | | 63,579 |
| Computer Engineering & Consulting, Ltd. | 2,900 | | 23,971 |
| Corona Corp. | 4,900 | | 76,075 |
| Cosel Company, Ltd. (a) | 5,600 | | 84,589 |
| Cosmo Securities Company, Ltd. (a) | 22,000 | | 32,986 |
| Cross Plus, Inc. | 2,000 | | 24,756 |
| CTI Engineering Company, Ltd. * | 5,500 | | 37,868 |
| Culture Convenience Club Company, Ltd. * (a) | 21,700 | | 81,692 |
| Cybozu, Inc. | 45 | | 13,573 |
| D&M Holdings, Inc. (a) | 12,000 | | 42,390 |
| D.G. Roland Corp. (a) | 1,700 | | 74,873 |
| Dai Nippon Toryo Company, Ltd. | 22,000 | | 33,209 |
| Dai-Dan Company, Ltd. | 6,000 | | 31,604 |
| Daido Kogyo Company, Ltd. | 11,000 | | 32,063 |
| Daido Metal Company, Ltd. (a) | 5,000 | | 35,199 |
| Daidoh, Ltd. (a) | 4,000 | | 52,816 |
| Daihen Corp. | 20,000 | | 126,538 |
| Daiho Corp. | 14,000 | | 21,653 |
| Daiichi Jitsugyo Company, Ltd. | 7,000 | | 34,807 |
| Daiken Corp. (a) | 23,000 | | 71,920 |
| Daiko Clearing Services Corp. (a) | 3,000 | | 20,697 |
| Daikoku Denki Company, Ltd. (a) | 1,400 | | 20,646 |
| Daikyo, Inc. | 7,144 | | 25,645 |
| Daimei Telecom Engineering Corp. | 8,000 | | 87,345 |
| Dainichi Company, Ltd. | 3,800 | | 29,470 |
| Dainichiseika Color & Chemicals | | | |
| Manufacturing Company, Ltd. | 15,000 | | 67,506 |
| Daio Paper Corp. (a) | 20,000 | | 163,637 |
| Daisan Bank, Ltd. | 30,000 | | 97,992 |
| Daiseki Company, Ltd. (a) | 3,200 | | 81,751 |
| Daiso Company, Ltd. (a) | 11,000 | | 41,514 |
| Daisyo Corp. | 2,800 | | 37,466 |
| Daito Bank, Ltd. | 19,000 | | 24,886 |
| Daiwa Industries, Ltd. | 4,000 | | 31,063 |
| Daiwa Seiko, Inc. (a) | 18,000 | | 34,646 |
| Daiwabo Company, Ltd. (a) | 24,000 | | 50,675 |
| Daiwabo Information System Company, Ltd. | 3,000 | | 37,549 |
| Danto Holdings Corp. * | 12,000 | | 34,613 |
| DC Company, Ltd. | 8,000 | | 45,319 |
| DCM Japan Holdings Company, Ltd. (a) | 19,520 | | 155,783 |
| |
| The accompanying notes are an integral part of the financial statements. | 245 |
John Hancock Funds II
Portfolio of investments — August 31, 2007
(showing percentage of total net assets)
| | | |
| International Small Company Fund (continued) |
| | Shares or | | |
| | Principal | | |
| | Amount | | Value |
|
|
| |
| COMMON STOCKS (continued) | | | |
| | | | |
| Japan (continued) | | | |
| Denki Kogyo Company, Ltd. | 8,000 | $ | 59,897 |
| Densei-Lambda KK (a) | 2,400 | | 26,864 |
| Denyo Company, Ltd. (a) | 3,000 | | 31,756 |
| Descente, Ltd. (a) | 15,000 | | 78,768 |
| DIA Kensetsu Company, Ltd. * (a) | 15,300 | | 7,907 |
| Doshisha Company, Ltd. (a) | 1,800 | | 30,942 |
| Doutor Coffee Company, Ltd. (a) | 4,700 | | 81,926 |
| DTS Corp. | 2,400 | | 84,948 |
| Dydo Drinco, Inc. (a) | 3,300 | | 129,988 |
| Dynic Corp. | 13,000 | | 29,006 |
| E-Access, Ltd. (a) | 1,000 | | 518,068 |
| Eagle Industry Company, Ltd. (a) | 5,000 | | 57,241 |
| Ehime Bank, Ltd. | 24,000 | | 81,523 |
| Eighteenth Bank, Ltd. | 30,000 | | 111,236 |
| Eiken Chemical Company, Ltd. (a) | 4,000 | | 35,652 |
| Eizo Nanao Corp. | 2,900 | | 95,890 |
| Eneserve Corp. * | 4,800 | | 26,431 |
| Enplas Corp. (a) | 4,400 | | 63,420 |
| Enshu, Ltd. * (a) | 15,000 | | 27,541 |
| Epson Toyocom Corp. (a) | 7,000 | | 47,868 |
| Espec Corp. (a) | 3,000 | | 35,774 |
| F&A Aqua Holdings, Inc. | 3,800 | | 25,867 |
| Fancl Corp. (a) | 9,400 | | 131,954 |
| FDK Corp. * (a) | 21,000 | | 31,049 |
| Foster Electric Company, Ltd. | 3,000 | | 46,978 |
| FP Corp. | 2,900 | | 98,569 |
| France Bed Holdings Company, Ltd. (a) | 42,000 | | 65,221 |
| Fudo Construction Company, Ltd. (a) | 27,000 | | 29,045 |
| Fuji Company, Ltd. (a) | 5,700 | | 93,858 |
| Fuji Corp., Ltd. | 5,000 | | 16,909 |
| Fuji Kiko Company, Ltd. (a) | 11,000 | | 27,172 |
| Fuji Kosan Company, Ltd. * (a) | 21,000 | | 28,440 |
| Fuji Kyuko Company, Ltd. (a) | 10,000 | | 49,539 |
| Fuji Oil Company, Ltd. (a) | 12,400 | | 91,432 |
| Fuji Software ABC, Inc. (a) | 5,400 | | 111,497 |
| Fujibo Holdings, Inc. * | 15,000 | | 17,285 |
| Fujicco Company, Ltd. | 7,000 | | 74,605 |
| Fujikura Kasei Company, Ltd. | 3,000 | | 29,377 |
| Fujikura Rubber, Ltd. | 5,000 | | 32,976 |
| Fujita Corp. | 5,400 | | 14,714 |
| Fujita Kanko, Inc. (a) | 7,000 | | 55,756 |
| Fujitec Company, Ltd. | 13,000 | | 88,006 |
| Fujitsu Business Systems, Ltd. (a) | 5,100 | | 84,705 |
| Fujitsu Frontech, Ltd. | 4,000 | | 32,403 |
| Fujitsu General, Ltd. * (a) | 14,000 | | 51,724 |
| Fujiya Company, Ltd. * (a) | 19,000 | | 34,159 |
| Fukuda Corp. | 8,000 | | 28,939 |
| Fukui Bank, Ltd. | 41,000 | | 120,102 |
| Fukushima Bank, Ltd. | 25,000 | | 25,489 |
| Fukushima Industries Corp. | 3,000 | | 28,798 |
| Fukuyama Transporting Company, Ltd. (a) | 42,000 | | 195,367 |
| Funai Consulting Company, Ltd. | 5,000 | | 31,276 |
| | | |
| International Small Company Fund (continued) |
| | Shares or | | |
| | Principal | | |
| | Amount | | Value |
|
|
| |
| COMMON STOCKS (continued) | | | |
| | | | |
| Japan (continued) | | | |
| Furukawa Company, Ltd. | 50,000 | $ | 102,133 |
| Furusato Industries, Ltd. | 2,000 | | 28,137 |
| Fuso Pharmaceutical Industries, Ltd. | 13,000 | | 35,121 |
| Futaba Corp. (a) | 7,600 | | 168,726 |
| Future System Consulting Corp. (a) | 36 | | 18,380 |
| Fuyo General Lease Company, Ltd. | 3,000 | | 85,392 |
| Gakken Company, Ltd. (a) | 13,000 | | 35,689 |
| Gecoss Corp. | 5,500 | | 30,265 |
| Gigas K's Denki Corp. | 4,600 | | 118,119 |
| GMO Internet, Inc. (a) | 6,000 | | 21,464 |
| Godo Steel, Ltd. (a) | 11,000 | | 41,790 |
| Goldwin, Inc. * | 12,000 | | 19,284 |
| Gourmet Kineya Company, Ltd. | 5,000 | | 40,354 |
| GS Yuasa Corp. (a) | 72,000 | | 176,207 |
| Gulliver International Company, Ltd. (a) | 1,130 | | 57,046 |
| Gun-Ei Chemical Industry Company, Ltd. (a) | 11,000 | | 26,866 |
| Hakuto Company, Ltd. | 2,700 | | 39,439 |
| Hakuyosha Company, Ltd. | 5,000 | | 13,067 |
| Hanwa Company, Ltd. (a) | 49,000 | | 234,658 |
| Happinet Corp. | 1,600 | | 19,979 |
| Harashin Narus Holdings Company, Ltd. | 3,000 | | 35,543 |
| Harima Chemicals, Inc. | 5,000 | | 28,241 |
| Haruyama Trading Company, Ltd. (a) | 2,700 | | 23,674 |
| Hayashikane Sangyo Company, Ltd. * (a) | 28,000 | | 28,716 |
| Hazama Corp. (a) | 18,700 | | 22,306 |
| Heiwado Company, Ltd. (a) | 9,000 | | 147,101 |
| Hibiya Engineering, Ltd. (a) | 6,000 | | 49,879 |
| Higashi-Nippon Bank, Ltd. | 35,000 | | 134,154 |
| HIS Company, Ltd. | 3,700 | | 93,325 |
| Hitachi Information Systems, Ltd. | 8,500 | | 192,023 |
| Hitachi Kokusai Electric, Inc. | 11,000 | | 140,539 |
| Hitachi Maxell, Ltd. * (a) | 2,800 | | 30,113 |
| Hitachi Medical Corp. | 6,000 | | 62,073 |
| Hitachi Plant Technologies, Ltd. (a) | 25,000 | | 127,536 |
| Hitachi Powdered Metals Company, Ltd. * | 7,000 | | 34,464 |
| Hitachi Software Engineering Company, Ltd. | 300 | | 6,025 |
| Hitachi Systems & Services, Ltd. | 4,000 | | 78,435 |
| Hitachi Tool Engineering, Ltd. | 4,000 | | 51,481 |
| Hitachi Transport System, Ltd. (a) | 15,000 | | 172,189 |
| Hitachi Zosen Corp. * (a) | 87,500 | | 143,611 |
| Hochiki Corp. | 7,000 | | 37,463 |
| Hodogaya Chemical Company, Ltd. (a) | 8,000 | | 21,906 |
| Hogy Medical Company, Ltd. | 2,300 | | 98,046 |
| Hokkaido Gas Company, Ltd. | 14,000 | | 35,266 |
| Hokkan Holdings, Ltd. | 11,000 | | 42,107 |
| Hokuetsu Bank, Ltd. | 52,000 | | 125,700 |
| Hokuetsu Paper Mills, Ltd. (a) | 32,000 | | 162,979 |
| Hokuriku Electric Industry Company, Ltd. (a) | 12,000 | | 22,038 |
| Hokuto Corp. (a) | 2,800 | | 46,255 |
| Horipro, Inc. | 3,300 | | 37,442 |
| Hosiden Corp. (a) | 12,100 | | 172,642 |
| Hosokawa Micron Corp. (a) | 4,000 | | 35,835 |
| |
| The accompanying notes are an integral part of the financial statements. | 246 |
John Hancock Funds II
Portfolio of investments — August 31, 2007
(showing percentage of total net assets)
| | | |
| International Small Company Fund (continued) |
| | Shares or | | |
| | Principal | | |
| | Amount | | Value |
|
|
| |
| COMMON STOCKS (continued) | | | |
| | | | |
| Japan (continued) | | | |
| Howa Machinery, Ltd. (a) | 20,000 | $ | 19,995 |
| I Metal Technology Company, Ltd. * | 10,000 | | 28,519 |
| IBJ Leasing Company, Ltd. | 4,000 | | 80,455 |
| Ichikoh Industries, Ltd. | 12,000 | | 30,198 |
| Ichiyoshi Securities Company, Ltd. (a) | 5,000 | | 56,751 |
| ICOM, Inc. (a) | 3,000 | | 86,233 |
| IDEC Corp. | 3,500 | | 51,782 |
| Ihara Chemical Industry Company, Ltd. | 10,000 | | 26,060 |
| Iino Kaiun Kaisha, Ltd. (a) | 15,000 | | 189,486 |
| Ikegami Tsushinki Company, Ltd. * (a) | 13,000 | | 20,201 |
| Imasen Electric Industrial Company, Ltd. | 3,900 | | 65,127 |
| Impress Holdings, Inc. | 105 | | 18,187 |
| Inaba Denki Sangyo Company, Ltd. | 3,400 | | 122,918 |
| Inaba Seisakusho Company, Ltd. | 2,400 | | 37,711 |
| Inabata & Company, Ltd. | 11,000 | | 73,914 |
| Inageya Company, Ltd. | 6,000 | | 47,747 |
| Ines Corp. (a) | 6,600 | | 47,596 |
| Information Services International - | | | |
| Dentsu, Ltd. | 3,400 | | 35,095 |
| Intec, Ltd. (a) | 8,000 | | 114,993 |
| Invoice, Inc. (a) | 2,047 | | 69,186 |
| Iseki & Company, Ltd. (a) | 49,000 | | 79,807 |
| Ishihara Sangyo Kaisha, Ltd. * (a) | 58,000 | | 119,151 |
| Ishii Hyoki Company, Ltd. (a) | 1,600 | | 29,625 |
| Itochu Enex Company, Ltd. | 13,200 | | 91,954 |
| Itochu-Shokuhin Company, Ltd. | 2,400 | | 75,618 |
| Itoham Foods, Inc. | 29,000 | | 127,302 |
| Itoki Corp. (a) | 8,000 | | 53,455 |
| Iwasaki Electric Company, Ltd. | 11,000 | | 26,555 |
| Iwatani International Corp. (a) | 33,000 | | 96,898 |
| Iwatsu Electric Company, Ltd. * (a) | 17,000 | | 21,421 |
| Izumiya Company, Ltd. (a) | 15,000 | | 92,144 |
| J. Bridge Corp. * (a) | 7,000 | | 5,068 |
| Jalux, Inc. (a) | 2,200 | | 40,046 |
| Jamco Corp. (a) | 3,000 | | 29,177 |
| Janome Sewing Machine Company, Ltd. * | 19,000 | | 21,921 |
| Japan Airport Terminal Company, Ltd. (a) | 12,000 | | 240,014 |
| Japan Aviation Electronics Industry, Ltd. * | 9,000 | | 130,000 |
| Japan Cash Machine Company, Ltd. (a) | 2,600 | | 24,384 |
| Japan Digital Laboratory Company, Ltd. | 5,400 | | 70,086 |
| Japan Foundation Engineering Company, Ltd. (a) | 7,000 | | 20,724 |
| Japan General Estate Company, Ltd. (a) | 4,400 | | 80,426 |
| Japan Pulp & Paper Company, Ltd. (a) | 23,000 | | 88,420 |
| Japan Radio Company, Ltd. * | 29,000 | | 102,907 |
| Japan Transcity Corp., Ltd. | 9,000 | | 41,634 |
| Japan Vilene Company, Ltd. | 12,000 | | 73,191 |
| Japan Wool Textile Company, Ltd. (a) | 13,000 | | 105,897 |
| JBCC Holdings, Inc. | 4,200 | | 36,978 |
| JBIS Holdings, Inc. * | 10,000 | | 45,475 |
| Jeans Mate Corp. (a) | 2,300 | | 20,276 |
| Jeol, Ltd. (a) | 8,000 | | 35,562 |
| JK Holdings Company, Ltd. | 5,700 | | 35,045 |
| | | |
| International Small Company Fund (continued) |
| | Shares or | | |
| | Principal | | |
| | Amount | | Value |
|
|
| |
| COMMON STOCKS (continued) | | | |
| | | | |
| Japan (continued) | | | |
| JMS Company, Ltd. | 9,000 | $ | 24,018 |
| Joban Kosan Company, Ltd. * (a) | 15,000 | | 22,751 |
| J-Oil Mills, Inc. (a) | 23,000 | | 73,531 |
| Joshin Denki Company, Ltd. (a) | 12,000 | | 82,779 |
| JSP Corp. | 3,800 | | 50,798 |
| Juki Corp. | 23,000 | | 208,153 |
| Kabuki-Za Company, Ltd. | 1,000 | | 41,747 |
| Kadokawa Holdings, Inc. (a) | 4,600 | | 110,065 |
| Kaga Electronics Company, Ltd. (a) | 6,800 | | 116,934 |
| Kagawa Bank, Ltd. | 15,000 | | 74,264 |
| Kagome Company, Ltd. (a) | 11,800 | | 209,371 |
| Kaken Pharmaceutical Company, Ltd. | 17,000 | | 134,166 |
| Kameda Seika Company, Ltd. | 4,000 | | 51,303 |
| Kamei Corp. | 5,000 | | 29,742 |
| Kanaden Corp. | 6,000 | | 35,880 |
| Kanagawa Chuo Kotsu Company, Ltd. | 8,000 | | 37,578 |
| Kanamoto Company, Ltd. | 5,000 | | 44,256 |
| Kanematsu Corp. * (a) | 62,000 | | 93,350 |
| Kanematsu Electronics, Ltd. * | 4,500 | | 38,386 |
| Kanto Auto Works, Ltd. | 9,800 | | 129,221 |
| Kanto Denka Kogyo Company, Ltd. | 5,000 | | 23,684 |
| Kanto Natural Gas Development, Ltd. | 5,000 | | 31,745 |
| Kanto Tsukuba Bank, Ltd. | 8,800 | | 61,825 |
| Kasai Kogyo Company, Ltd. | 8,000 | | 29,347 |
| Kasumi Company, Ltd. | 6,000 | | 31,791 |
| Katakura Industries Company, Ltd. (a) | 5,000 | | 90,039 |
| Kato Sangyo Company, Ltd. | 7,000 | | 86,388 |
| Kato Works Company, Ltd. (a) | 10,000 | | 55,305 |
| Katokichi Company, Ltd. (a) | 25,900 | | 121,530 |
| Kawada Industries, Inc. (a) | 16,000 | | 38,126 |
| Kawai Musical Instruments Manufacturing | | | |
| Company, Ltd. | 16,000 | | 29,502 |
| Kawashima Selkon Textiles Company, Ltd. * (a) | 17,000 | | 20,829 |
| Kayaba Industry Company, Ltd. (a) | 29,000 | | 135,062 |
| Keihin Company, Ltd. | 10,000 | | 18,948 |
| Keiiyu Company, Ltd. | 4,400 | | 26,218 |
| Keiyo Company, Ltd. (a) | 6,100 | | 37,689 |
| Kentucky Fried Chicken Japan, Ltd. | 3,000 | | 55,843 |
| Kenwood Corp. (a) | 61,000 | | 89,131 |
| KEY Coffee, Inc. (a) | 3,100 | | 43,623 |
| Kibun Food Chemifa Company, Ltd. (a) | 4,000 | | 40,214 |
| Kinki Nippon Tourist Company, Ltd. | 9,000 | | 17,770 |
| Kinki Sharyo Company, Ltd. (a) | 7,000 | | 23,792 |
| Kintetsu World Express, Inc. | 3,800 | | 139,014 |
| Kinugawa Rubber Industrial Company, Ltd. * | 25,000 | | 32,398 |
| Kioritz Corp. | 10,000 | | 27,973 |
| Kishu Paper Company, Ltd. * (a) | 17,000 | | 29,773 |
| Kisoji Company, Ltd. (a) | 2,200 | | 40,821 |
| Kissei Pharmaceutical Company, Ltd. (a) | 8,000 | | 148,609 |
| Kitagawa Iron Works Company, Ltd. | 12,000 | | 24,076 |
| Kita-Nippon Bank, Ltd. | 1,400 | | 59,156 |
| Kitano Construction Corp. (a) | 12,000 | | 28,374 |
| |
| The accompanying notes are an integral part of the financial statements. | 247 |
John Hancock Funds II
Portfolio of investments — August 31, 2007
(showing percentage of total net assets)
| | | |
| International Small Company Fund (continued) |
| | Shares or | | |
| | Principal | | |
| | Amount | | Value |
|
|
| |
| COMMON STOCKS (continued) | | | |
| | | | |
| Japan (continued) | | | |
| Kitz Corp. (a) | 15,000 | $ | 131,031 |
| Kiyo Holdings, Inc. | 84,000 | | 125,365 |
| Koa Corp. | 8,000 | | 111,477 |
| Koatsu Gas Kogyo Company, Ltd. | 7,000 | | 43,439 |
| Koei Company, Ltd. * (a) | 2,500 | | 42,648 |
| Kohnan Shoji Company, Ltd. (a) | 5,800 | | 84,203 |
| Koike Sanso Kogyo Company, Ltd. | 9,000 | | 76,768 |
| Kojima Company, Ltd. (a) | 3,100 | | 23,711 |
| Kokusai Kogyo Company, Ltd. * | 12,000 | | 57,499 |
| Komatsu Seiren Company, Ltd. | 9,000 | | 46,967 |
| Komatsu Wall Industry Company, Ltd. | 2,100 | | 31,340 |
| Konaka Company, Ltd. (a) | 4,600 | | 37,195 |
| Kondotec, Inc. | 3,000 | | 24,940 |
| Konishi Company, Ltd. | 3,900 | | 41,076 |
| Kosaido Company, Ltd. | 3,800 | | 24,721 |
| Kosei Securities Company, Ltd. (a) | 18,000 | | 24,507 |
| Krosaki Harima Corp. (a) | 15,000 | | 53,721 |
| KRS Corp. | 2,700 | | 28,112 |
| Kumagai Gumi Company, Ltd. (a) | 11,000 | | 17,957 |
| Kumiai Chemical Industry Company, Ltd. | 15,000 | | 29,540 |
| Kurabo Industries, Ltd. (a) | 54,000 | | 125,778 |
| Kureha Corp. | 24,000 | | 107,560 |
| Kurimoto, Ltd. (a) | 28,000 | | 79,726 |
| Kuroda Electric Company, Ltd. | 6,200 | | 95,445 |
| Kyoden Company, Ltd. | 7,000 | | 20,509 |
| Kyodo Printing Company, Ltd. | 14,000 | | 44,542 |
| Kyodo Shiryo Company, Ltd. | 24,000 | | 31,294 |
| Kyokuto Kaihatsu Kogyo Company, Ltd. (a) | 10,200 | | 76,621 |
| Kyokuyo Company, Ltd. (a) | 16,000 | | 29,378 |
| Kyoritsu Maintenance Company, Ltd. (a) | 2,000 | | 38,442 |
| Kyosan Electric Manufacturing Company, Ltd. | 11,000 | | 40,074 |
| Kyoto Kimono Yuzen Company, Ltd. | 24 | | 19,633 |
| Kyowa Leather Cloth Company, Ltd. | 5,200 | | 31,141 |
| Kyudenko Corp. | 14,000 | | 73,343 |
| Kyushu-Shinwa Holdings, Inc. * (a) | 60,000 | | 24,354 |
| Laox Company, Ltd. (a) | 10,000 | | 12,095 |
| Life Corp. (a) | 11,000 | | 142,820 |
| Livedoor Auto Company, Ltd. * (a) | 29,500 | | 10,197 |
| Macnica, Inc. (a) | 3,400 | | 84,607 |
| Maeda Corp. (a) | 33,000 | | 127,462 |
| Maeda Road Construction Company, Ltd. | 14,000 | | 121,415 |
| Maezawa Industries, Inc. | 5,100 | | 21,451 |
| Maezawa Kasei Industries Company, Ltd. | 2,000 | | 28,807 |
| Maezawa Kyuso Industries Company, Ltd. (a) | 2,400 | | 42,582 |
| Mandom Corp. | 4,200 | | 107,803 |
| Mars Engineering Corp. (a) | 1,600 | | 34,183 |
| Marubun Corp. (a) | 3,000 | | 34,531 |
| Marudai Food Company, Ltd. | 29,000 | | 98,014 |
| Maruetsu, Inc. * | 13,000 | | 63,738 |
| Maruha Group, Inc. (a) | 27,000 | | 45,168 |
| Maruka Machinery Company, Ltd. * (a) | 3,000 | | 27,325 |
| Marusan Securities Company, Ltd. * (a) | 8,000 | | 80,727 |
| | | |
| International Small Company Fund (continued) |
| | Shares or | | |
| | Principal | | |
| | Amount | | Value |
|
|
| |
| COMMON STOCKS (continued) | | | |
| | | | |
| Japan (continued) | | | |
| Maruwa Company, Ltd. (a) | 1,400 | $ | 23,595 |
| Maruyama Manufacturing Company, Inc. (a) | 10,000 | | 28,059 |
| Maruzen Company, Ltd., First Section * | 23,000 | | 34,702 |
| Maruzen Company, Ltd., Second Section | 4,000 | | 20,270 |
| Maruzen Showa Unyu Company, Ltd. | 12,000 | | 43,812 |
| Maspro Denkoh Corp. | 4,000 | | 33,119 |
| Matsuda Sangyo Company, Ltd. (a) | 2,200 | | 57,606 |
| Matsui Construction Company, Ltd. | 8,000 | | 37,260 |
| Matsuya Company, Ltd. (a) | 5,000 | | 86,248 |
| Matsuya Foods Company, Ltd. | 4,300 | | 50,247 |
| Matsuzakaya Company, Ltd. (a) | 27,000 | | 210,714 |
| Max Company, Ltd. | 7,000 | | 102,665 |
| Maxvalu Tokai Company, Ltd. | 3,000 | | 50,025 |
| MEC Company, Ltd. (a) | 2,400 | | 24,365 |
| Megachips Corp. | 2,400 | | 43,398 |
| Meidensha Corp. (a) | 17,000 | | 51,178 |
| Meito Sangyo Company, Ltd. (a) | 2,900 | | 58,931 |
| Meiwa Corp. * (a) | 8,000 | | 20,124 |
| Meiwa Estate Company, Ltd. (a) | 5,000 | | 58,809 |
| Mercian Corp. | 19,400 | | 41,926 |
| Michinoku Bank, Ltd. (a) | 25,000 | | 78,608 |
| Mikuni Coca-Cola Bottling Company, Ltd. | 9,000 | | 100,213 |
| Mikuni Corp. * | 9,000 | | 32,346 |
| Milbon Company, Ltd. (a) | 1,200 | | 35,897 |
| Minato Bank, Ltd. | 77,000 | | 175,025 |
| Ministop Company, Ltd. (a) | 2,500 | | 43,608 |
| Misawa Homes Holdings, Inc. * | 6,000 | | 66,882 |
| Mitani Corp. * | 4,000 | | 45,430 |
| Mito Securities Company, Ltd. | 17,000 | | 63,785 |
| Mitsuba Corp., Ltd. | 8,000 | | 53,753 |
| Mitsubishi Cable Industries, Ltd. (a) | 19,000 | | 26,051 |
| Mitsubishi Kakoki Kaisha, Ltd. | 11,000 | | 42,552 |
| Mitsubishi Paper Mills, Ltd. | 47,000 | | 97,708 |
| Mitsubishi Pencil Company, Ltd. | 4,000 | | 50,452 |
| Mitsubishi Steel Manufacturing Company, Ltd. (a) | 18,000 | | 86,156 |
| Mitsuboshi Belting Company, Ltd. (a) | 14,000 | | 75,436 |
| Mitsui High-Tec, Inc. | 7,100 | | 86,492 |
| Mitsui Home Company, Ltd. | 12,000 | | 66,805 |
| Mitsui Knowledge Industry Company, Ltd. * | 124 | | 30,170 |
| Mitsui Mining Company, Ltd. * (a) | 38,000 | | 80,292 |
| Mitsui Sugar Company, Ltd. (a) | 14,000 | | 48,499 |
| Mitsui-Soko Company, Ltd. (a) | 12,000 | | 59,509 |
| Mitsumura Printing Company, Ltd. | 7,000 | | 24,565 |
| Mitsuuroko Company, Ltd. | 13,000 | | 83,606 |
| Miura Company, Ltd. (a) | 4,700 | | 142,729 |
| Miyazaki Bank, Ltd. | 32,000 | | 128,197 |
| Miyoshi Oil & Fat Company, Ltd. | 14,000 | | 23,161 |
| Miyuki Holdings Company, Ltd. | 8,000 | | 24,447 |
| Mizuno Corp. (a) | 18,000 | | 93,905 |
| Mochida Pharmaceutical Company, Ltd. (a) | 16,000 | | 147,039 |
| Modec, Inc. (a) | 7,400 | | 229,538 |
| Morinaga & Company, Ltd. (a) | 41,000 | | 89,105 |
| |
| The accompanying notes are an integral part of the financial statements. | 248 |
John Hancock Funds II
Portfolio of investments — August 31, 2007
(showing percentage of total net assets)
| | | |
| International Small Company Fund (continued) |
| | Shares or | | |
| | Principal | | |
| | Amount | | Value |
|
|
| |
| COMMON STOCKS (continued) | | | |
| | | | |
| Japan (continued) | | | |
| Morinaga Milk Industry Company, Ltd. | 36,000 | $ | 138,913 |
| Morita Corp. | 6,000 | | 32,209 |
| Mory Industries, Inc. | 11,000 | | 45,429 |
| MOS Food Services, Inc. (a) | 7,000 | | 97,338 |
| Moshi Moshi Hotline, Inc. | 1,100 | | 51,092 |
| Mr. Max Corp. | 7,300 | | 32,224 |
| Mutoh Holdings Company, Ltd. * | 8,000 | | 47,504 |
| Nagano Bank, Ltd. | 13,000 | | 37,810 |
| Nagatanien Company, Ltd. | 5,000 | | 37,880 |
| Nakabayashi Company, Ltd. | 14,000 | | 27,186 |
| Nakamuraya Company, Ltd. (a) | 6,000 | | 28,283 |
| Nakayama Steel Works, Ltd. (a) | 22,000 | | 54,957 |
| NEC Fielding, Ltd. | 8,400 | | 111,965 |
| NEC Leasing, Ltd. * | 4,000 | | 67,232 |
| NEC Mobiling, Ltd. | 2,000 | | 34,377 |
| NEC Networks & System Integration Corp. (a) | 7,700 | | 83,148 |
| NEC Tokin Corp. (a) | 11,000 | | 38,499 |
| Net One Systems Company, Ltd. (a) | 101 | | 122,928 |
| Netmarks, Inc. | 29 | | 5,925 |
| Neturen Company, Ltd. (a) | 8,000 | | 102,398 |
| Nice Corp. | 22,000 | | 92,133 |
| Nichia Steel Works, Ltd. | 8,000 | | 33,038 |
| Nichias Corp. | 15,000 | | 157,059 |
| Nichiban Company, Ltd. | 10,000 | | 35,063 |
| Nichicon Corp. (a) | 12,000 | | 157,203 |
| Nichiha Corp. (a) | 4,200 | | 47,337 |
| Nichii Gakkan Company, Ltd. (a) | 6,700 | | 103,928 |
| Nichimo Corp. (a) | 29,000 | | 19,723 |
| Nichireki Company, Ltd. * | 1,000 | | 3,385 |
| Nichiro Corp. | 23,000 | | 34,718 |
| Nidec Copal Corp. (a) | 2,700 | | 29,902 |
| Nidec Tosok Corp. | 2,800 | | 19,481 |
| Nifco, Inc. | 9,000 | | 210,975 |
| Nihon Dempa Kogyo Company, Ltd. (a) | 3,500 | | 204,585 |
| Nihon Eslead Corp. (a) | 2,000 | | 31,365 |
| Nihon Inter Electronics Corp. (a) | 5,000 | | 17,948 |
| Nihon Kagaku Sangyo Company, Ltd. | 5,000 | | 39,696 |
| Nihon Kohden Corp. (a) | 5,000 | | 99,263 |
| Nihon Nohyaku Company, Ltd. (a) | 10,000 | | 55,305 |
| Nihon Parkerizing Company, Ltd. (a) | 7,000 | | 97,513 |
| Nihon Tokushu Toryo Company, Ltd. | 6,000 | | 32,492 |
| Nihon Yamamura Glass Company, Ltd. | 26,000 | | 63,559 |
| Nikkiso Company, Ltd. (a) | 8,000 | | 61,238 |
| Nikko Company, Ltd. * | 5,000 | | 12,314 |
| Nippei Toyama Corp. | 4,000 | | 33,949 |
| Nippo Corp. (a) | 11,000 | | 86,686 |
| Nippon Beet Sugar | | | |
| Manufacturing Company, Ltd. | 30,000 | | 72,069 |
| Nippon Carbide Industries Company, Inc. * | 16,000 | | 27,580 |
| Nippon Carbon Company, Ltd. (a) | 12,000 | | 72,375 |
| Nippon Ceramic Company, Ltd. (a) | 3,000 | | 42,493 |
| Nippon Chemical Industrial Company, Ltd. | 13,000 | | 39,011 |
| | | |
| International Small Company Fund (continued) |
| | Shares or | | |
| | Principal | | |
| | Amount | | Value |
|
|
| |
| COMMON STOCKS (continued) | | | |
| | | | |
| Japan (continued) | | | |
| Nippon Chemi-Con Corp. | 22,000 | $ | 216,989 |
| Nippon Chemiphar Company, Ltd. * (a) | 5,000 | | 20,863 |
| Nippon Concrete Industries Company, Ltd. | 15,000 | | 32,339 |
| Nippon Denko Company, Ltd. (a) | 14,000 | | 109,044 |
| Nippon Densetsu Kogyo Company, Ltd. (a) | 12,000 | | 86,949 |
| Nippon Denwa Shisetsu Company, Ltd. | 10,000 | | 33,687 |
| Nippon Felt Company, Ltd. | 5,000 | | 31,519 |
| Nippon Fine Chemical Company, Ltd. | 6,000 | | 43,471 |
| Nippon Flour Mills Company, Ltd. (a) | 35,000 | | 128,753 |
| Nippon Gas Company, Ltd. (a) | 5,000 | | 46,444 |
| Nippon Jogesuido Sekkei Company, Ltd. | 28 | | 27,043 |
| Nippon Kanzai Company, Ltd. (a) | 3,600 | | 102,367 |
| Nippon Kasei Chemical Company, Ltd. | 16,000 | | 32,867 |
| Nippon Kinzoku Company, Ltd. (a) | 16,000 | | 53,033 |
| Nippon Koei Company, Ltd. | 11,000 | | 30,854 |
| Nippon Konpo Unyu Soko Company, Ltd. | 13,000 | | 187,811 |
| Nippon Koshuha Steel Company, Ltd. (a) | 17,000 | | 34,689 |
| Nippon Metal Industry Company, Ltd. (a) | 17,000 | | 76,355 |
| Nippon Paint Company, Ltd. (a) | 33,000 | | 159,704 |
| Nippon Parking Development Company, Ltd. (a) | 293 | | 15,674 |
| Nippon Pillar Packing Company, Ltd. | 4,000 | | 36,622 |
| Nippon Piston Ring Company, Ltd. (a) | 13,000 | | 23,967 |
| Nippon Restaurant System, Inc. (a) | 1,300 | | 38,371 |
| Nippon Road Company, Ltd. | 15,000 | | 25,343 |
| Nippon Seiki Company, Ltd. (a) | 6,000 | | 151,840 |
| Nippon Sharyo, Ltd. (a) | 36,000 | | 74,710 |
| Nippon Shinyaku Company, Ltd. | 12,000 | | 104,892 |
| Nippon Signal Company, Ltd. (a) | 9,000 | | 54,368 |
| Nippon Soda Company, Ltd. | 26,000 | | 112,133 |
| Nippon Steel Trading Company, Ltd. * | 18,000 | | 48,512 |
| Nippon Synthetic Chemical Industry | | | |
| Company, Ltd. (a) | 20,000 | | 118,218 |
| Nippon System Development Company, Ltd. | 7,200 | | 121,252 |
| Nippon Thompson Company, Ltd. (a) | 12,000 | | 110,959 |
| Nippon Valqua Industries, Ltd. (a) | 11,000 | | 35,959 |
| Nippon Yakin Kogyo Company, Ltd. | 8,500 | | 76,278 |
| Nippon Yusoki Company, Ltd. | 5,000 | | 24,119 |
| Nipro Corp. (a) | 9,000 | | 178,444 |
| Nishimatsu Construction Company, Ltd. (a) | 67,000 | | 218,068 |
| Nissan Shatai Company, Ltd. | 17,000 | | 102,913 |
| Nissei Corp. (a) | 6,000 | | 76,698 |
| Nissei Plastic Industrial Company, Ltd. | 4,000 | | 23,057 |
| Nissen Company, Ltd. (a) | 5,300 | | 31,654 |
| Nissha Printing Company, Ltd. * (a) | 3,000 | | 83,337 |
| Nisshin Fudosan Company, Ltd. | 3,000 | | 38,674 |
| Nisshin Oillio Group, Ltd. | 20,000 | | 107,463 |
| Nissin Corp. | 11,000 | | 39,559 |
| Nissin Electric Company, Ltd. (a) | 19,000 | | 75,561 |
| Nissin Sugar Manufacturing Company, Ltd. | 12,000 | | 23,593 |
| Nissui Pharmaceutical Company, Ltd. * | 5,000 | | 38,066 |
| Nitta Corp. | 4,500 | | 91,852 |
| Nittan Valve Company, Ltd. | 4,000 | | 25,519 |
| |
| The accompanying notes are an integral part of the financial statements. | 249 |
John Hancock Funds II
Portfolio of investments — August 31, 2007
(showing percentage of total net assets)
| | | |
| International Small Company Fund (continued) |
| | Shares or | | |
| | Principal | | |
| | Amount | | Value |
|
|
| |
| COMMON STOCKS (continued) | | | |
| | | | |
| Japan (continued) | | | |
| Nittetsu Mining Company, Ltd. (a) | 17,000 | $ | 126,711 |
| Nitto Boseki Company, Ltd. | 44,000 | | 124,826 |
| Nitto Kogyo Corp. (a) | 5,700 | | 81,670 |
| Nitto Kohki Company, Ltd. (a) | 3,700 | | 84,670 |
| NIWS Company HQ, Ltd. (a) | 124 | | 12,512 |
| NOF Corp. (a) | 26,000 | | 116,635 |
| Nohmi Bosai, Ltd. | 13,000 | | 79,710 |
| Nomura Company, Ltd. | 6,000 | | 36,159 |
| Noritake Company, Ltd. | 21,000 | | 100,985 |
| Noritsu Koki Company, Ltd. (a) | 3,800 | | 77,913 |
| Noritz Corp. (a) | 7,400 | | 112,742 |
| NS Solutions Corp. | 5,000 | | 140,196 |
| Odakyu Real Estate Company, Ltd. | 11,000 | | 43,208 |
| Oenon Holdings, Inc. (a) | 9,000 | | 19,694 |
| Oiles Corp. (a) | 4,900 | | 101,286 |
| Oita Bank, Ltd. (a) | 27,000 | | 158,454 |
| Okabe Company, Ltd. | 9,000 | | 46,798 |
| Okamoto Industries, Inc. | 11,000 | | 39,481 |
| Okamoto Machine Tool Works, Ltd. | 7,000 | | 24,292 |
| Okamura Corp. (a) | 13,000 | | 103,353 |
| Oki Electric Industry Company, Ltd. * (a) | 106,000 | | 189,186 |
| Okinawa Electric Power Company, Inc. (a) | 3,400 | | 206,794 |
| OKK Corp. (a) | 10,000 | | 33,151 |
| Okumura Corp. (a) | 23,000 | | 128,578 |
| Okura Industrial Company, Ltd. (a) | 8,000 | | 21,682 |
| Okuwa Company, Ltd. | 7,000 | | 85,771 |
| Olympic Corp. | 4,600 | | 28,626 |
| O-M, Ltd. (a) | 8,000 | | 61,874 |
| ONO Sokki Company, Ltd. | 5,000 | | 38,965 |
| Onoken Company, Ltd. | 3,000 | | 43,103 |
| Organo Corp. | 5,000 | | 97,554 |
| Oriental Yeast Company, Ltd. | 6,000 | | 34,865 |
| Origin Electric Company, Ltd. | 6,000 | | 34,387 |
| Osaka Steel Company, Ltd. | 8,400 | | 142,668 |
| Osaki Electric Company, Ltd. (a) | 4,000 | | 25,514 |
| Oyo Corp. | 7,000 | | 89,254 |
| Pacific Industrial Company, Ltd. (a) | 7,000 | | 36,709 |
| PanaHome Corp. * (a) | 16,000 | | 95,327 |
| Paramount Bed Company, Ltd. (a) | 5,000 | | 64,837 |
| Parco Company, Ltd. (a) | 10,000 | | 135,667 |
| Paris Miki, Inc. (a) | 5,300 | | 67,517 |
| Pasona, Inc. | 34 | | 47,282 |
| Patlite Corp. | 3,700 | | 31,464 |
| PCA Corp. | 1,500 | | 16,403 |
| Penta-Ocean Construction Company, Ltd. * (a) | 38,000 | | 62,990 |
| PIA Corp. * | 2,600 | | 39,323 |
| Pigeon Corp. (a) | 2,800 | | 46,969 |
| Piolax, Inc. | 1,800 | | 33,179 |
| Press Kogyo Company, Ltd. | 12,000 | | 50,547 |
| Prima Meat Packers, Ltd. * (a) | 30,000 | | 33,104 |
| Raito Kogyo Company, Ltd. | 9,900 | | 25,784 |
| Rasa Industries, Ltd. (a) | 10,000 | | 26,139 |
| | | |
| International Small Company Fund (continued) |
| | Shares or | | |
| | Principal | | |
| | Amount | | Value |
|
|
| |
| COMMON STOCKS (continued) | | | |
| | | | |
| Japan (continued) | | | |
| Renown, Inc. * (a) | 8,000 | $ | 67,200 |
| Resort Solution Company, Ltd. | 9,000 | | 39,108 |
| Resorttrust, Inc. (a) | 6,600 | | 144,686 |
| Rhythm Watch Company, Ltd. | 20,000 | | 28,629 |
| Ricoh Elemex Corp. | 4,000 | | 32,389 |
| Ricoh Leasing Company, Ltd. (a) | 4,800 | | 100,661 |
| Right On Company, Ltd. (a) | 3,900 | | 40,664 |
| Riken Corp. (a) | 16,000 | | 81,212 |
| Riken Keiki Company, Ltd. | 4,000 | | 33,005 |
| Riken Technos Corp. | 8,000 | | 26,553 |
| Riken Vitamin Company, Ltd. | 2,000 | | 51,940 |
| Ringer Hut Company, Ltd. (a) | 3,000 | | 37,550 |
| Rock Field Company, Ltd. (a) | 1,800 | | 25,381 |
| Roland Corp. | 4,200 | | 112,528 |
| Royal Holdings Company, Ltd. (a) | 6,000 | | 72,271 |
| Ryobi, Ltd. | 22,000 | | 140,171 |
| Ryoden Trading Company, Ltd. | 10,000 | | 77,346 |
| Ryosan Company, Ltd. | 9,200 | | 242,902 |
| Ryoshoku, Ltd. (a) | 4,000 | | 92,332 |
| Ryoyo Electro Corp. (a) | 6,600 | | 87,071 |
| S Foods, Inc. | 4,500 | | 37,785 |
| S Science Company, Ltd. | 102,000 | | 18,492 |
| Sagami Chain Company, Ltd. | 4,000 | | 38,940 |
| Saibu Gas Company, Ltd. (a) | 54,000 | | 120,659 |
| Saizeriya Company, Ltd. (a) | 6,400 | | 91,875 |
| Sakai Chemical Industry Company, Ltd. | 18,000 | | 115,630 |
| Sakata INX Corp. | 8,000 | | 42,392 |
| Sakata Seed Corp. (a) | 8,000 | | 105,274 |
| Sala Corp. (a) | 8,000 | | 39,247 |
| San-Ai Oil Company, Ltd. | 19,000 | | 83,608 |
| Sanden Corp. | 24,000 | | 122,867 |
| Sanei-International Company, Ltd. (a) | 1,300 | | 27,284 |
| Sankei Building Company, Ltd. (a) | 11,000 | | 92,445 |
| Sanki Engineering Company, Ltd. (a) | 12,000 | | 78,626 |
| Sankyo Seiko Company, Ltd. (a) | 7,000 | | 28,946 |
| Sankyo-Tateyama Holdings, Inc. (a) | 47,000 | | 70,506 |
| Sanoh Industrial Company, Ltd. (a) | 5,000 | | 39,990 |
| Sanrio Company, Ltd. (a) | 6,100 | | 70,237 |
| Sanshin Electronics Company, Ltd. | 5,000 | | 70,285 |
| Sanyo Chemical Industries, Ltd. | 16,000 | | 102,056 |
| Sanyo Denki Company, Ltd. (a) | 6,000 | | 34,316 |
| Sanyo Shokai, Ltd. | 18,000 | | 153,613 |
| Sanyo Special Steel Company, Ltd. * (a) | 23,000 | | 191,952 |
| Sasebo Heavy Industries Company, Ltd. (a) | 18,000 | | 109,651 |
| Sato Corp. (a) | 2,500 | | 48,310 |
| Sato Shoji Corp. | 3,000 | | 25,202 |
| Satori Electric Company, Ltd. | 2,400 | | 30,944 |
| Secom Techno Service Company, Ltd. | 2,000 | | 70,916 |
| Seibu Electric Industry Company, Ltd. * | 3,000 | | 14,964 |
| Seijo Corp. | 1,300 | | 29,119 |
| Seika Corp. (a) | 16,000 | | 42,691 |
| Seikagaku Corp. | 7,600 | | 90,148 |
| |
| The accompanying notes are an integral part of the financial statements. | 250 |
John Hancock Funds II
Portfolio of investments — August 31, 2007
(showing percentage of total net assets)
| | | |
| International Small Company Fund (continued) |
| | Shares or | | |
| | Principal | | |
| | Amount | | Value |
|
|
| |
| COMMON STOCKS (continued) | | | |
| | | | |
| Japan (continued) | | | |
| Seiko Corp. (a) | 17,000 | $ | 97,786 |
| Seiren Company, Ltd. (a) | 6,000 | | 44,798 |
| Seiyu, Ltd. * (a) | 111,000 | | 95,535 |
| Sekisui Jushi Corp. | 7,000 | | 61,485 |
| Sekisui Plastics Company, Ltd. | 21,000 | | 66,119 |
| Senko Company, Ltd. | 12,000 | | 38,304 |
| Senshu Electric Company, Ltd. | 1,500 | | 33,327 |
| Senshukai Company, Ltd. | 8,000 | | 102,468 |
| Shibaura Mechatronics Corp. (a) | 4,000 | | 22,070 |
| Shibusawa Warehouse Company, Ltd. (a) | 10,000 | | 53,494 |
| Shibuya Kogyo Company, Ltd. | 3,300 | | 26,893 |
| Shikibo, Ltd. (a) | 20,000 | | 25,169 |
| Shikoku Bank, Ltd. | 46,000 | | 182,107 |
| Shikoku Chemicals Corp. | 6,000 | | 34,156 |
| Shikoku Coca-Cola Bottling Company, Ltd. | 3,300 | | 38,427 |
| Shima Seiki Manufacturing, Ltd. (a) | 6,700 | | 292,434 |
| Shimizu Bank, Ltd. | 1,800 | | 74,906 |
| Shin Nippon Air Technologies Company, Ltd. | 4,500 | | 27,290 |
| Shinagawa Refractories Company, Ltd. | 8,000 | | 30,219 |
| Shindengen Electric Manufacturing | | | |
| Company, Ltd. | 15,000 | | 61,920 |
| Shin-Etsu Polymer Company, Ltd. (a) | 7,000 | | 80,915 |
| Shinkawa, Ltd. | 3,500 | | 67,704 |
| Shin-Keisei Electric Railway Company, Ltd. | 10,000 | | 33,761 |
| Shinki Company, Ltd. (a) | 10,500 | | 14,701 |
| Shinko Electric Company, Ltd. (a) | 12,000 | | 34,857 |
| Shinko Plantech Company, Ltd. (a) | 6,000 | | 75,883 |
| Shinko Shoji Company, Ltd. | 3,000 | | 56,409 |
| Shin-Kobe Electric Machinery Company, Ltd. | 7,000 | | 32,607 |
| Shinmaywa Industries, Ltd. | 26,000 | | 126,358 |
| Shinnihon Corp. * (a) | 8,000 | | 36,468 |
| Shinsho Corp. | 13,000 | | 44,107 |
| Shinwa Kaiun Kaisha, Ltd. | 14,000 | | 122,133 |
| Shiroki Corp. | 12,000 | | 28,248 |
| Shizuki Electric Company, Inc. | 8,000 | | 26,562 |
| Shizuoka Gas Company, Ltd. | 7,000 | | 33,197 |
| Sho-Bond Corp. (a) | 4,200 | | 47,717 |
| Shobunsha Publications, Inc. (a) | 2,400 | | 24,728 |
| Shochiku Company, Ltd. (a) | 18,000 | | 133,979 |
| Shoko Company, Ltd. (a) | 20,000 | | 27,912 |
| Showa Aircraft Industry Company, Ltd. | 3,000 | | 36,100 |
| Showa Corp. * | 9,100 | | 112,418 |
| Showa KDE Company, Ltd. | 10,000 | | 15,903 |
| Showa Sangyo Company, Ltd. | 33,000 | | 77,321 |
| Siix Corp. | 2,000 | | 45,379 |
| Silver Seiko, Ltd. * (a) | 70,000 | | 29,558 |
| Sinanen Company, Ltd. | 7,000 | | 37,065 |
| Sintokogio, Ltd. | 9,000 | | 124,178 |
| SKY Perfect JSAT Corp. * (a) | 128 | | 55,030 |
| SMK Corp. | 14,000 | | 104,222 |
| Snow Brand Milk Products Company, Ltd. (a) | 41,000 | | 120,019 |
| SNT Corp. | 7,000 | | 40,672 |
| | | |
| International Small Company Fund (continued) |
| | Shares or | | |
| | Principal | | |
| | Amount | | Value |
|
|
| |
| COMMON STOCKS (continued) | | | |
| | | | |
| Japan (continued) | | | |
| Soda Nikka Company, Ltd. * | 4,000 | $ | 16,055 |
| Sodick Company, Ltd. | 10,000 | | 68,036 |
| Soft99 Corp. | 3,500 | | 27,486 |
| Sogo Medical Company, Ltd. | 1,400 | | 37,382 |
| Sorun Corp. | 4,700 | | 32,530 |
| Space Company, Ltd. | 4,200 | | 31,500 |
| SRA Holdings, Inc. | 3,300 | | 51,831 |
| SSP Company, Ltd. (a) | 16,000 | | 75,688 |
| ST Chemical Company, Ltd. (a) | 6,000 | | 74,480 |
| St. Marc Holdings Company, Ltd. (a) | 1,000 | | 43,270 |
| Star Micronics Company, Ltd. | 5,000 | | 143,690 |
| Starzen Company, Ltd. | 14,000 | | 33,830 |
| Stella Chemifa Corp. (a) | 1,000 | | 28,266 |
| Sugi Pharmacy Company, Ltd. | 6,100 | | 146,076 |
| Sugimoto & Company, Ltd. | 2,000 | | 31,161 |
| Sumida Corp. (a) | 4,100 | | 69,831 |
| Suminoe Textile Company, Ltd. | 11,000 | | 25,682 |
| Sumisho Computer Systems Corp. (a) | 5,400 | | 109,514 |
| Sumitomo Coal Mining Company, Ltd. * (a) | 20,000 | | 17,564 |
| Sumitomo Densetsu Company, Ltd. * | 12,700 | | 69,070 |
| Sumitomo Light Metal Industries, Ltd. | 47,000 | | 87,385 |
| Sumitomo Mitsui Company, Ltd. * (a) | 27,000 | | 49,368 |
| Sumitomo Pipe & Tube Company, Ltd. | 6,000 | | 42,809 |
| Sumitomo Precision Products Company, Ltd. | 6,000 | | 29,521 |
| Sumitomo Seika Chemicals Company, Ltd. (a) | 8,000 | | 39,015 |
| Sun Wave Corp. | 11,000 | | 24,024 |
| Sunx, Ltd. * (a) | 5,400 | | 32,201 |
| Suruga Corp. | 3,900 | | 68,375 |
| SWCC Showa Holdings Company, Ltd. (a) | 58,000 | | 80,039 |
| SxL Corp. * (a) | 25,000 | | 15,982 |
| T. Hasegawa Company, Ltd. | 6,900 | | 121,104 |
| T. Rad Company, Ltd. (a) | 11,000 | | 59,070 |
| Tachibana Eletech Company, Ltd. | 4,000 | | 41,432 |
| Tachikawa Corp. | 4,600 | | 31,997 |
| Tachi-S Company, Ltd. (a) | 8,300 | | 65,764 |
| Tadano, Ltd. (a) | 3,000 | | 38,423 |
| Taihei Dengyo Kaisha, Ltd. | 11,000 | | 80,699 |
| Taihei Kogyo Company, Ltd. (a) | 12,000 | | 58,489 |
| Taiho Kogyo Company, Ltd. | 3,400 | | 45,927 |
| Taikisha, Ltd. (a) | 10,000 | | 132,283 |
| Taisei Rotec Corp. | 18,000 | | 29,977 |
| Takagi Securities Company, Ltd. | 15,000 | | 49,830 |
| Takamatsu Corp. (a) | 6,200 | | 77,414 |
| Takano Company, Ltd. (a) | 2,000 | | 18,542 |
| Takaoka Electric Manufacturing Company, Ltd. | 18,000 | | 27,150 |
| (a) | | | |
| Takara Printing Company, Ltd. (a) | 3,300 | | 31,176 |
| Takara Standard Company, Ltd. (a) | 26,000 | | 142,237 |
| Takasago International Corp. (a) | 16,000 | | 96,154 |
| Takasago Thermal Engineering Company, Ltd. (a) | 12,000 | | 122,836 |
| Takiron Company, Ltd. | 10,000 | | 31,113 |
| Takuma Company, Ltd. (a) | 14,000 | | 88,393 |
| |
| The accompanying notes are an integral part of the financial statements. | 251 |
John Hancock Funds II
Portfolio of investments — August 31, 2007
(showing percentage of total net assets)
| | | |
| International Small Company Fund (continued) |
| | Shares or | | |
| | Principal | | |
| | Amount | | Value |
|
|
| |
| COMMON STOCKS (continued) | | | |
| | | | |
| Japan (continued) | | | |
| Tamura Corp. (a) | 11,000 | $ | 52,867 |
| Tamura Taiko Holdings, Inc. | 9,000 | | 22,945 |
| Tasaki Shinju Company, Ltd. (a) | 7,000 | | 27,633 |
| Tatsuta Electric Wire & Cable Company, Ltd. | 12,000 | | 28,599 |
| Tayca Corp. | 11,000 | | 32,750 |
| TBK Company, Ltd. * | 10,000 | | 40,015 |
| TCM Corp. | 12,000 | | 37,805 |
| Teac Corp. * (a) | 26,000 | | 24,856 |
| Techno Ryowa, Ltd. | 6,400 | | 45,312 |
| Tecmo, Ltd. (a) | 5,300 | | 66,095 |
| Teikoku Electric Manufacturing Company, Ltd. * | 2,000 | | 49,551 |
| (a) | | | |
| Teikoku Piston Ring Company, Ltd. (a) | 3,000 | | 23,310 |
| Teikoku Sen-I Company, Ltd. | 8,000 | | 30,968 |
| Teikoku Tsushin Kogyo Company, Ltd. | 7,000 | | 30,961 |
| Tekken Corp. (a) | 19,000 | | 27,587 |
| Tenma Corp. | 5,000 | | 85,896 |
| Tigers Polymer Corp. * | 2,000 | | 12,795 |
| TIS, Inc. | 6,500 | | 139,981 |
| TKC Corp. | 2,900 | | 51,301 |
| TOA Corp. * | 29,000 | | 32,285 |
| TOA Oil Company, Ltd. | 22,000 | | 34,417 |
| TOA Road Corp. (a) | 15,000 | | 24,395 |
| Toagosei Company, Ltd. | 44,000 | | 158,750 |
| Tobishima Corp. * (a) | 38,500 | | 22,982 |
| Tobu Store Company, Ltd. | 14,000 | | 42,295 |
| TOC Company, Ltd. (a) | 22,000 | | 184,176 |
| Tocalo Company, Ltd. (a) | 2,000 | | 40,365 |
| Tochigi Bank, Ltd. | 19,000 | | 105,361 |
| Toda Kogyo Corp. | 9,000 | | 36,062 |
| Todentsu Corp. * | 6,000 | | 16,296 |
| Toei Company, Ltd. (a) | 16,000 | | 92,573 |
| Toenec Corp. | 14,000 | | 61,162 |
| Tohcello Company, Ltd. (a) | 4,000 | | 29,888 |
| Toho Bank, Ltd. | 48,000 | | 193,862 |
| Toho Company, Ltd. | 12,000 | | 37,116 |
| Toho Real Estate Company, Ltd. (a) | 6,000 | | 47,181 |
| Toho Tenax Company, Ltd. * (a) | 12,000 | | 67,544 |
| Toho Zinc Company, Ltd. | 17,000 | | 145,854 |
| Tohoku Bank, Ltd. (a) | 15,000 | | 26,310 |
| Tohto Suisan Company, Ltd. * (a) | 15,000 | | 35,847 |
| Tokai Corp. | 15,000 | | 56,175 |
| Tokimec, Inc. | 13,000 | | 29,181 |
| Toko Electric Corp. | 8,000 | | 25,401 |
| Toko, Inc. (a) | 16,000 | | 38,905 |
| Tokushima Bank, Ltd. | 19,000 | | 134,502 |
| Tokushu Tokai Holdings Company, Ltd. * | 23,110 | | 50,814 |
| Tokyo Dome Corp. (a) | 21,000 | | 97,652 |
| Tokyo Electron Device, Ltd. | 22 | | 39,456 |
| Tokyo Energy & Systems, Inc. (a) | 9,000 | | 67,917 |
| Tokyo Kikai Seisakusho, Ltd. (a) | 10,000 | | 29,390 |
| Tokyo Leasing Company, Ltd. | 8,000 | | 84,934 |
| | | |
| International Small Company Fund (continued) |
| | Shares or | | |
| | Principal | | |
| | Amount | | Value |
|
|
| |
| COMMON STOCKS (continued) | | | |
| | | | |
| Japan (continued) | | | |
| Tokyo Ohka Kogyo Company, Ltd. * (a) | 5,900 | $ | 126,002 |
| Tokyo Rakutenchi Company, Ltd. | 9,000 | | 33,391 |
| Tokyo Rope Manufacturing Company, Ltd. | 34,000 | | 62,008 |
| Tokyo Style Company, Ltd. | 15,000 | | 164,303 |
| Tokyo Tekko Company, Ltd. (a) | 4,000 | | 20,734 |
| Tokyo Theatres Company, Inc. (a) | 12,000 | | 28,652 |
| Tokyotokeiba Company, Ltd. | 33,000 | | 78,002 |
| Tokyu Community Corp. | 1,300 | | 39,118 |
| Tokyu Construction Company, Ltd. (a) | 16,440 | | 89,697 |
| Tokyu Livable, Inc. (a) | 2,400 | | 46,489 |
| Tokyu Recreation Company, Ltd. | 6,000 | | 35,205 |
| Tokyu Store Chain Company, Ltd. (a) | 8,000 | | 38,474 |
| Toli Corp. | 10,000 | | 23,384 |
| Tomato Bank, Ltd. | 27,000 | | 57,787 |
| Tomen Electronics Corp. (a) | 2,200 | | 31,076 |
| Tomoe Corp. (a) | 8,000 | | 22,600 |
| Tomoku Company, Ltd. | 16,000 | | 34,088 |
| Tomy Company, Ltd. (a) | 5,600 | | 31,374 |
| Tonami Transportation Company, Ltd. (a) | 11,000 | | 32,040 |
| Topre Corp. | 9,000 | | 74,501 |
| Topy Industries, Ltd. | 29,000 | | 96,679 |
| Tori Holdings Company, Ltd. (a) | 73,000 | | 13,856 |
| Torigoe Company, Ltd. | 5,000 | | 35,050 |
| Torii Pharmaceutical Company, Ltd. | 5,100 | | 88,591 |
| Torishima Pump Manufacturing Company, Ltd. (a) | 5,000 | | 61,477 |
| Toshiba Plant Systems & Services Corp. (a) | 16,000 | | 146,524 |
| Tosho Printing Company, Ltd. | 9,000 | | 25,848 |
| Totetsu Kogyo Company, Ltd. | 6,000 | | 37,205 |
| Tottori Bank, Ltd. (a) | 13,000 | | 35,244 |
| Touei Housing Corp. (a) | 4,800 | | 48,193 |
| Towa Bank, Ltd. (a) | 46,000 | | 81,531 |
| Towa Corp. (a) | 4,900 | | 39,729 |
| Towa Pharmaceutical Company, Ltd. (a) | 1,600 | | 80,281 |
| Towa Real Estate Development | | | |
| Company, Ltd. * (a) | 15,000 | | 43,786 |
| Toyo Construction Company, Ltd. * | 26,000 | | 20,065 |
| Toyo Corp. (a) | 3,400 | | 50,309 |
| Toyo Electric Manufacturing Company, Ltd. (a) | 6,000 | | 18,713 |
| Toyo Engineering Corp. | 18,000 | | 98,763 |
| Toyo Ink Manufacturing Company, Ltd. (a) | 44,000 | | 157,846 |
| Toyo Kanetsu KK (a) | 30,000 | | 71,452 |
| Toyo Kohan Company, Ltd. | 22,000 | | 135,976 |
| Toyo Machinery & Metal Company, Ltd. | 4,000 | | 18,023 |
| Toyo Securities Company, Ltd. | 19,000 | | 68,751 |
| Toyo Tire & Rubber Company, Ltd. (a) | 30,000 | | 163,614 |
| Toyo Wharf & Warehouse Company, Ltd. | 17,000 | | 34,441 |
| Trans Cosmos, Inc. (a) | 3,900 | | 72,081 |
| Trusco Nakayama Corp. (a) | 5,800 | | 101,815 |
| Tsubakimoto Chain Company, Ltd. | 23,000 | | 147,641 |
| Tsubakimoto Kogyo Company, Ltd. | 10,000 | | 35,968 |
| Tsudakoma Corp. (a) | 20,000 | | 86,423 |
| Tsugami Corp. (a) | 14,000 | | 63,609 |
| |
| The accompanying notes are an integral part of the financial statements. | 252 |
John Hancock Funds II
Portfolio of investments — August 31, 2007
(showing percentage of total net assets)
| | | |
| International Small Company Fund (continued) |
| | Shares or | | |
| | Principal | | |
| | Amount | | Value |
|
|
| |
| COMMON STOCKS (continued) | | | |
| | | | |
| Japan (continued) | | | |
| Tsukishima Kikai Company, Ltd. (a) | 7,000 | $ | 62,577 |
| Tsurumi Manufacturing Company, Ltd. | 4,000 | | 38,744 |
| Tsutsumi Jewelry Company, Ltd. (a) | 3,000 | | 71,460 |
| TTK Company, Ltd. | 6,000 | | 35,390 |
| TYK Corp. * | 8,000 | | 18,592 |
| Ube Material Industries, Ltd. (a) | 12,000 | | 37,532 |
| Uchida Yoko Company, Ltd. | 8,000 | | 36,292 |
| Unicharm Petcare Corp. (a) | 2,000 | | 83,822 |
| Uniden Corp. (a) | 12,000 | | 84,082 |
| Unimat Life Corp. (a) | 2,800 | | 33,805 |
| Union Tool Company, Ltd. (a) | 1,700 | | 75,840 |
| Unitika, Ltd. (a) | 73,000 | | 91,231 |
| U-Shin, Ltd. (a) | 5,000 | | 24,283 |
| Valor Company, Ltd. | 6,000 | | 69,710 |
| Venture Link Company, Ltd. * (a) | 9,800 | | 16,329 |
| Victor Company of Japan, Ltd. * (a) | 25,000 | | 59,944 |
| Vital-Net, Inc. | 6,500 | | 41,635 |
| Wakachiku Construction Company, Ltd. | 17,000 | | 16,265 |
| Warabeya Nichiyo Company, Ltd. | 2,500 | | 34,258 |
| Watabe Wedding Corp. | 2,000 | | 32,552 |
| Watami Company, Ltd. (a) | 3,000 | | 46,011 |
| Wood One Company, Ltd. | 6,000 | | 39,600 |
| Yahagi Construction Company, Ltd. (a) | 8,000 | | 29,996 |
| Yaizu Suisankagaku Industry Company, Ltd. | 2,700 | | 28,732 |
| Yamagata Bank, Ltd. | 27,000 | | 141,400 |
| Yamaichi Electronics Company, Ltd. | 3,100 | | 20,871 |
| Yamatane Corp. (a) | 20,000 | | 25,183 |
| Yamazen Corp. | 6,000 | | 38,378 |
| Yaoko Company, Ltd. (a) | 1,900 | | 48,483 |
| Yasuda Warehouse Company, Ltd. | 4,000 | | 40,089 |
| Yellow Hat, Ltd. | 3,600 | | 26,343 |
| Yodogawa Steel Works, Ltd. | 30,000 | | 158,136 |
| Yokogawa Bridge Corp. * | 9,000 | | 53,219 |
| Yokohama Reito Company, Ltd. | 10,000 | | 78,725 |
| Yokowo Company, Ltd. (a) | 2,800 | | 26,279 |
| Yomeishu Seizo Company, Ltd. (a) | 2,000 | | 21,087 |
| Yomiuri Land Company, Ltd. (a) | 6,000 | | 26,891 |
| Yondenko Corp. | 7,000 | | 35,266 |
| Yonekyu Corp. (a) | 3,500 | | 35,866 |
| Yorozu Corp. (a) | 3,000 | | 36,260 |
| Yoshimoto Kogyo Company, Ltd. | 4,000 | | 58,100 |
| Yoshinoya D&C Company, Ltd. (a) | 48 | | 77,376 |
| Yuasa Funashoku Company, Ltd. * | 4,000 | | 10,358 |
| Yuasa Trading Company, Ltd. | 35,000 | | 55,258 |
| Yuken Kogyo Company, Ltd. | 14,000 | | 49,606 |
| Yukiguni Maitake Company, Ltd. | 8,500 | | 27,932 |
| Yuraku Real Estate Company, Ltd. | 13,000 | | 53,780 |
| Yurtec Corp. | 15,000 | | 84,163 |
| Yushiro Chemical Industry Company, Ltd. (a) | 2,000 | | 34,124 |
| Zenrin Company, Ltd. (a) | 5,000 | | 121,828 |
| Zensho Company, Ltd. * (a) | 12,200 | | 124,098 |
| Zeria Pharmaceutical Company, Ltd. (a) | 5,000 | | 46,799 |
| | | |
| International Small Company Fund (continued) |
| | Shares or | | |
| | Principal | | |
| | Amount | | Value |
|
|
| |
| COMMON STOCKS (continued) | | | |
| | | | |
| Japan (continued) | | | |
| Zuken, Inc. (a) | 3,800 | $ | 37,939 |
|
|
| | | | 58,694,058 |
| Luxembourg - 0.07% | | | |
| Thiel Logistik AG * (a) | 55,482 | | 183,171 |
| Netherlands - 2.79% | | | |
| Aalberts Industries NV | 64,768 | | 1,548,515 |
| Arcadis NV | 2,012 | | 161,845 |
| ASM International NV | 3,220 | | 88,145 |
| BE Semiconductor Industries NV * (a) | 1,750 | | 11,113 |
| Beter Bed Holding NV | 1,579 | | 48,351 |
| Brunel International NV | 1,093 | | 31,046 |
| Crucell NV, ADR * (a) | 4,400 | | 88,264 |
| Draka Holding NV | 1,398 | | 68,535 |
| Eriks Group NV | 490 | | 40,681 |
| Fornix Biosciences NV | 1,231 | | 33,160 |
| Gamma Holding NV | 586 | | 48,242 |
| Getronics NV * | 14,495 | | 120,274 |
| Grolsch NV | 1,634 | | 63,273 |
| Heijmans NV | 3,315 | | 163,108 |
| ICT Automatisering NV | 1,167 | | 20,713 |
| Imtech NV (a) | 15,998 | | 1,411,772 |
| KAS Bank NV | 1,318 | | 41,888 |
| Kendrion NV * (a) | 1,401 | | 38,239 |
| Koninklijke Boskalis Westinster NV (a) | 4,437 | | 192,388 |
| Koninklijke Ten Cate NV (a) | 3,898 | | 151,639 |
| Koninklijke Vopak NV | 2,753 | | 161,789 |
| Macintosh Retail Group NV | 3,032 | | 107,908 |
| Nutreco Holding NV (a) | 4,355 | | 301,962 |
| Oce NV | 9,632 | | 207,576 |
| OPG Groep NV | 23,944 | | 714,118 |
| Ordina NV (a) | 3,328 | | 67,578 |
| Sligro Food Group NV | 2,182 | | 101,329 |
| Smit Internationale NV | 1,764 | | 146,969 |
| Stork NV | 4,004 | | 259,677 |
| Tele Atlas NV * | 2,100 | | 58,397 |
| Telegraaf Media Groep NV (a) | 3,526 | | 117,514 |
| TKH Group NV | 1,896 | | 49,363 |
| Unit 4 Agresso NV | 1,972 | | 55,446 |
| Univar NV | 3,066 | | 221,326 |
| USG People NV | 1,680 | | 53,435 |
|
|
| | | | 6,995,578 |
| New Zealand - 0.48% | | | |
| Ebos Group, Ltd. * | 2,867 | | 9,972 |
| Fisher & Paykel Appliances Holdings, Ltd. (a) | 39,128 | | 101,299 |
| Freightways, Ltd. (a) | 20,218 | | 55,983 |
| Hallenstein Glasson Holdings, Ltd. | 5,755 | | 18,348 |
| Hellaby Holdings, Ltd. | 11,832 | | 21,950 |
| Infratil, Ltd. | 65,958 | | 135,031 |
| Mainfreight, Ltd. (a) | 12,437 | | 61,672 |
| New Zealand Exchange, Ltd. | 2,000 | | 13,809 |
| New Zealand Oil & Gas, Ltd. * | 70,331 | | 51,275 |
| |
| The accompanying notes are an integral part of the financial statements. | 253 |
John Hancock Funds II
Portfolio of investments — August 31, 2007
(showing percentage of total net assets)
| | | |
| International Small Company Fund (continued) |
| | Shares or | | |
| | Principal | | |
| | Amount | | Value |
|
|
| |
| COMMON STOCKS (continued) | | | |
| | | | |
| New Zealand (continued) | | | |
| New Zealand Refining Company, Ltd. * | 3,900 | $ | 19,695 |
| Nuplex Industries, Ltd. | 15,839 | | 77,417 |
| PGG Wrightson, Ltd. | 34,036 | | 43,774 |
| Port of Tauranga, Ltd. (a) | 12,311 | | 60,532 |
| Pumpkin Patch, Ltd. (a) | 30,500 | | 75,869 |
| Ryman Healthcare, Ltd. (a) | 122,620 | | 174,082 |
| Sanford, Ltd. | 3,021 | | 9,630 |
| Sky City Entertainment Group, Ltd. | 57,494 | | 184,641 |
| Steel & Tube Holdings, Ltd. * | 7,400 | | 23,401 |
| Tower, Ltd. * | 37,391 | | 60,508 |
|
|
| | | | 1,198,888 |
| Norway - 0.87% | | | |
| Acta Holding ASA (a) | 30,000 | | 146,618 |
| Aktiv Kapital ASA * | 5,600 | | 90,443 |
| Camillo Eitzen & Company ASA * | 2,100 | | 25,975 |
| Det Norske Oljeselskapb ASA * | 83,000 | | 148,151 |
| DOF ASA | 5,500 | | 53,925 |
| EDB Business Partner ASA | 4,400 | | 35,053 |
| Ekornes ASA (a) | 3,800 | | 77,128 |
| Eltek ASA * (a) | 9,400 | | 75,969 |
| Ementor ASA * | 5,653 | | 47,157 |
| Farstad Shipping ASA | 4,000 | | 99,778 |
| Fast Search & Transfer ASA * (a) | 36,000 | | 61,778 |
| Ganger Rolf ASA | 2,300 | | 93,975 |
| Kongsberg Gruppen ASA | 1,600 | | 75,672 |
| Leroy Seafood Group ASA | 4,400 | | 105,388 |
| Norse Energy Corp., ASA * (a) | 62,000 | | 37,031 |
| Ocean Rig ASA * | 28,500 | | 180,353 |
| Petrolia Drilling ASA * (a) | 90,000 | | 47,766 |
| Sevan Marine ASA * | 9,849 | | 95,983 |
| Solstad Offshore ASA | 2,200 | | 59,053 |
| Sparebanken Midt-Norge | 6,900 | | 89,607 |
| Tandberg ASA (a) | 12,800 | | 279,450 |
| Tomra Systems ASA | 15,121 | | 104,568 |
| TTS Marine ASA | 3,000 | | 53,154 |
| Veidekke ASA | 10,500 | | 96,300 |
|
|
| | | | 2,180,275 |
| Poland - 0.03% | | | |
| Fabryka Kotlow Rafako SA * | 16,116 | | 72,576 |
| Portugal - 0.31% | | | |
| Impresa, SGPS SA * | 13,900 | | 51,529 |
| Jeronimo Martins, SGPS SA * (a) | 12,665 | | 72,463 |
| Mota Engil, SGPS SA | 15,218 | | 118,168 |
| Semapa-Sociedade de Investimento e | | | |
| Gestao, SGPS SA | 7,734 | | 129,795 |
| Sonae Industria, SGPS SA, New * | 21,800 | | 282,418 |
| Sonaecom, SGPS SA * (a) | 22,954 | | 125,237 |
|
|
| | | | 779,610 |
| Singapore - 1.29% | | | |
| Bonvests Holdings, Ltd. | 56,400 | | 49,325 |
| Bukit Sembawang Estates, Ltd. | 8,000 | | 52,428 |
| | | |
| International Small Company Fund (continued) |
| | Shares or | | |
| | Principal | | |
| | Amount | | Value |
|
|
| |
| COMMON STOCKS (continued) | | | |
| | | | |
| Singapore (continued) | | | |
| Cerebos Pacific, Ltd. | 22,000 | $ | 56,855 |
| CH Offshore, Ltd. | 136,000 | | 73,711 |
| China Merchants Holdings Pacific, Ltd. | 70,000 | | 36,691 |
| Chuan Hup Holdings, Ltd. | 192,000 | | 44,649 |
| Creative Technology, Ltd. (a) | 15,150 | | 59,062 |
| Delong Holdings, Ltd. * (a) | 45,500 | | 95,715 |
| Ezra Holdings Pte, Ltd. (a) | 41,000 | | 158,731 |
| Food Empire Holdings, Ltd. | 44,000 | | 25,948 |
| Goodpack, Ltd. | 28,000 | | 39,268 |
| Guocoland, Ltd. | 25,333 | | 78,983 |
| Hi-P International, Ltd. (a) | 80,000 | | 36,238 |
| Ho Bee Investment, Ltd. | 45,000 | | 53,758 |
| Hong Fok Corp., Ltd. * (a) | 68,000 | | 65,164 |
| Hong Leong Asia, Ltd. | 43,000 | | 89,544 |
| Hotel Plaza, Ltd. | 40,000 | | 53,784 |
| Hotel Properties, Ltd. * (a) | 67,100 | | 189,273 |
| HTL International Holdings, Ltd. | 57,000 | | 32,175 |
| Hwa Hong Corp., Ltd. | 92,000 | | 44,284 |
| Hyflux, Ltd. (a) | 31,000 | | 53,592 |
| Jaya Holdings, Ltd. | 56,000 | | 71,035 |
| Jurong Technologies Industrial Corp., Ltd. (a) | 64,000 | | 28,980 |
| K1 Ventures, Ltd. * | 374,000 | | 70,074 |
| Keppel Telecommunications & Transportation | | | |
| Company, Ltd. | 47,000 | | 125,305 |
| Kim Eng Holdings, Ltd. | 51,000 | | 61,204 |
| MediaRing, Ltd. * | 145,000 | | 20,467 |
| Metro Holdings, Ltd. | 81,000 | | 47,580 |
| MFS Technology, Ltd. | 56,000 | | 24,265 |
| Midas Holdings, Ltd. | 77,000 | | 71,562 |
| MobileOne, Ltd. (a) | 59,000 | | 81,635 |
| NatSteel, Ltd. | 41,000 | | 44,895 |
| Orchard Parade Holdings, Ltd. * | 70,000 | | 82,429 |
| Osim International, Ltd. (a) | 81,000 | | 31,797 |
| Petra Foods, Ltd. (a) | 46,000 | | 45,889 |
| Raffles Education Corp., Ltd. | 52,000 | | 70,055 |
| Robinson & Company, Ltd. | 13,000 | | 38,749 |
| SBS Transit, Ltd. | 29,500 | | 58,849 |
| Singapore Food Industries, Ltd. (a) | 68,000 | | 36,933 |
| Singapore Post, Ltd. | 66,000 | | 53,826 |
| Sinomem Technology, Ltd. * | 76,000 | | 66,743 |
| SMRT Corp., Ltd. (a) | 69,000 | | 78,742 |
| SP Chemicals, Ltd. | 49,000 | | 28,847 |
| Straits Trading Company, Ltd. | 39,000 | | 114,976 |
| Tat Hong Holdings, Ltd. | 52,000 | | 71,721 |
| Unisteel Technology, Ltd. | 31,250 | | 40,627 |
| United Engineers, Ltd. | 25,000 | | 54,185 |
| United Test & Assembly Center, Ltd. * | 215,000 | | 165,561 |
| UOB-Kay Hian Holdings, Ltd. | 75,000 | | 102,318 |
| WBL Corp., Ltd. | 17,000 | | 49,103 |
| |
|
| | | | 3,227,530 |
| South Korea - 0.20% | | | |
| Bukwang Pharmaceutical Company, Ltd. (a) | 2,572 | | 80,637 |
| |
| The accompanying notes are an integral part of the financial statements. | 254 |
John Hancock Funds II
Portfolio of investments — August 31, 2007
(showing percentage of total net assets)
| | | |
| International Small Company Fund (continued) |
| | Shares or | | |
| | Principal | | |
| | Amount | | Value |
|
|
| |
| COMMON STOCKS (continued) | | | |
| | | | |
| South Korea (continued) | | | |
| Dongbu Hannong Chemicals Company, Ltd. | 3,798 | $ | 69,176 |
| Dongbu Securities Company, Ltd. (a) | 3,337 | | 65,403 |
| Pantech & Curitel Communications, Inc. * | 882 | | 0 |
| Pantech Company, Ltd. * | 1,112 | | 0 |
| Taeyoung Engineering & Construction, Ltd. | 14,200 | | 188,935 |
| Woongjin Holdings Company, Ltd. | 1,514 | | 27,086 |
| Woongjin Thinkbig Company, Ltd. * | 4,275 | | 81,103 |
|
|
| | | | 512,340 |
| Spain - 1.81% | | | |
| Adolfo Dominguez SA | 1,580 | | 75,920 |
| Amper SA (a) | 3,877 | | 62,497 |
| Avanzit SA * | 12,655 | | 70,515 |
| Baron de Ley SA * | 714 | | 50,566 |
| Campofrio Alimentacion SA * | 2,450 | | 45,770 |
| Construcciones & Auxiliar de Ferrocarriles SA | 288 | | 92,902 |
| Duro Felguera SA | 7,697 | | 88,073 |
| Electrificaciones del Norte SA | 5,639 | | 296,234 |
| FAES FARMA SA (a) | 12,406 | | 242,698 |
| Grupo Empresarial Ence SA | 24,660 | | 295,318 |
| Iberpapel Gestion SA * (a) | 1,220 | | 35,804 |
| La Seda de Barcelona SA, Series B * | 127,228 | | 424,358 |
| Mecalux SA * | 3,385 | | 133,270 |
| Miquel y Costas SA | 1,148 | | 39,179 |
| Natra SA | 4,190 | | 61,233 |
| Natraceutical SA * (a) | 49,023 | | 91,053 |
| NH Hoteles SA * | 10,996 | | 227,402 |
| Obrascon Huarte Lain SA | 7,972 | | 314,949 |
| Papeles & Cartones de Europa SA * | 4,271 | | 60,765 |
| Pescanova SA | 751 | | 36,363 |
| Prosegur Cia de Seguridad SA | 1,227 | | 43,777 |
| Sociedad Nacional Inds., Aplicaciones | | | |
| Celulosa Espanola SA * (a) | 11,739 | | 65,927 |
| Sol Melia SA | 12,473 | | 246,863 |
| SOS Cuetara SA | 8,556 | | 171,072 |
| Tecnocom, Telecomunicaciones & Energia SA * | 7,191 | | 62,306 |
| Tubacex SA | 31,018 | | 266,531 |
| Tubos Reunidos SA | 5,645 | | 156,769 |
| Uralita SA | 18,277 | | 164,358 |
| Urbas Proyectos Urbanisticos SA * (a) | 10,449 | | 25,580 |
| Vidrala SA (a) | 4,037 | | 148,840 |
| Viscofan SA | 11,089 | | 266,682 |
| Zeltia SA * (a) | 16,317 | | 163,029 |
|
|
| | | | 4,526,603 |
| Sweden - 1.97% | | | |
| Acando AB, Series B * | 14,000 | | 29,320 |
| Active Biotech AB * | 4,200 | | 39,123 |
| AddTech AB, Series B (a) | 3,800 | | 94,763 |
| Angpanneforeningen AB, Series B | 2,000 | | 47,659 |
| Axfood AB (a) | 5,750 | | 206,165 |
| Axis Communications AB | 9,900 | | 214,724 |
| Bergman & Beving AB, Series B (a) | 5,500 | | 183,962 |
| | | |
| International Small Company Fund (continued) |
| | Shares or | | |
| | Principal | | |
| | Amount | | Value |
|
|
| |
| COMMON STOCKS (continued) | | | |
| | | | |
| Sweden (continued) | | | |
| Bilia AB, Series A | 2,200 | $ | 38,737 |
| Billerud Aktibolag AB (a) | 11,500 | | 160,901 |
| Bong Ljungdahl AB, Series B | 4,000 | | 28,422 |
| Cardo AB (a) | 5,000 | | 179,595 |
| Clas Ohlson AB, Series B (a) | 2,250 | | 54,781 |
| Concordia Maritime AB, Series B | 6,500 | | 39,079 |
| D. Carnegie & Company AB | 52,789 | | 859,503 |
| Elekta AB, Series B * (a) | 6,000 | | 92,091 |
| Eniro AB | 3,200 | | 38,994 |
| Gunnebo AB (a) | 5,274 | | 60,524 |
| Haldex AB | 3,300 | | 77,024 |
| Hoganas AB, Series B | 7,400 | | 212,456 |
| IBS AB, Series B * | 17,000 | | 42,025 |
| Industrial & Financial Systems AB * | 56,000 | | 60,842 |
| JM AB (a) | 13,867 | | 368,657 |
| Lindex AB | 10,000 | | 151,355 |
| Micronic Laser Systems AB * (a) | 7,700 | | 47,714 |
| Munters AB * (a) | 4,950 | | 70,188 |
| New Wave Group AB, Series B | 6,000 | | 61,891 |
| Nibe Industrier AB, Series B | 10,200 | | 147,348 |
| Nobia AB | 29,100 | | 325,346 |
| Nolato AB, Series B | 3,400 | | 30,139 |
| Obsever AB * | 18,200 | | 64,408 |
| OEM International AB, Series B * | 2,700 | | 20,407 |
| Peab AB, Series B | 8,800 | | 267,173 |
| Proffice AB * | 10,000 | | 27,727 |
| Q-Med AB | 14,300 | | 198,807 |
| Rederi AB Transatlantic, Series B | 9,000 | | 61,543 |
| Skanditek Industriforvaltning AB | 9,500 | | 53,060 |
| SkiStar AB, Series B (a) | 5,100 | | 84,802 |
| Studsvik AB | 1,200 | | 34,032 |
| Sweco AB, Series B * (a) | 13,000 | | 128,186 |
| Teleca AB, Series B * | 14,200 | | 32,726 |
|
|
| | | | 4,936,199 |
| Switzerland - 4.17% | | | |
| AFG Arbonia-Forster Holding AG | 394 | | 164,815 |
| Allreal Holding AG | 553 | | 63,266 |
| Also Holding AG | 779 | | 44,375 |
| Ascom Holding AG * | 5,820 | | 63,879 |
| Bank Coop AG | 1,189 | | 77,274 |
| Bank Sarasin & Compagnie AG, Series B | 41 | | 166,759 |
| Banque Cantonale Vaudoise, Series B | 530 | | 250,930 |
| Basilea Pharmaceutica AG * | 636 | | 138,946 |
| Belimo Holding AG | 55 | | 56,385 |
| Berner Kantonalbank * | 1,072 | | 189,381 |
| Bobst Group AG | 1,033 | | 71,463 |
| Bucher Industries AG | 1,062 | | 179,803 |
| Charles Voegele Holding AG * | 553 | | 51,717 |
| Conzzeta Holding AG | 51 | | 105,910 |
| Cytos Biotechnology AG * | 528 | | 44,563 |
| Daetwyler Holding AG | 2,100 | | 147,760 |
| |
| The accompanying notes are an integral part of the financial statements. | 255 |
John Hancock Funds II
Portfolio of investments — August 31, 2007
(showing percentage of total net assets)
| | | |
| International Small Company Fund (continued) |
| | Shares or | | |
| | Principal | | |
| | Amount | | Value |
|
|
| |
| COMMON STOCKS (continued) | | | |
| | | | |
| Switzerland (continued) | | | |
| Emmi AG | 663 | $ | 86,411 |
| EMS-Chemie Holding AG | 993 | | 132,580 |
| Energiedienst Holding AG * | 222 | | 119,572 |
| Flughafen Zuerich AG | 524 | | 194,187 |
| Forbo Holding AG * | 319 | | 185,645 |
| Galenica Holding AG | 190 | | 71,059 |
| Georg Fischer AG * | 439 | | 332,860 |
| Gurit Heberlein AG | 475 | | 536,493 |
| Helvetia Patria Holding AG | 769 | | 270,345 |
| Hiestand Holding AG, Series A (a) | 37 | | 68,989 |
| Jelmoli Holding AG | 51 | | 151,888 |
| Kaba Holding AG, Series B * (a) | 351 | | 98,291 |
| Kudelski SA (a) | 1,673 | | 52,420 |
| Kuoni Reisen Holding AG, Series B | 3,158 | | 1,598,169 |
| LEM Holding SA | 350 | | 102,685 |
| Luzerner Kantonalbank | 435 | | 97,828 |
| Medisize Holding AG | 3,598 | | 254,030 |
| Mobilezone Holding AG | 8,109 | | 50,377 |
| Phoenix Mecano AG | 185 | | 80,819 |
| PubliGroupe SA | 373 | | 129,534 |
| Rieter Holding AG | 1,205 | | 643,905 |
| SEZ Holding AG | 2,074 | | 48,306 |
| Sia Abrasives Holding AG | 134 | | 51,658 |
| St. Galler Kantonalbank * (a) | 320 | | 135,664 |
| Swissfirst AG | 465 | | 33,135 |
| Swisslog Holding AG * (a) | 37,946 | | 58,671 |
| Swissquote Group Holding SA * | 1,660 | | 85,805 |
| Tamedia AG | 447 | | 61,834 |
| Tecan Group AG * | 2,047 | | 123,591 |
| Temenos Group AG * (a) | 3,887 | | 92,398 |
| Valiant Holding AG * (a) | 5,783 | | 843,849 |
| Valora Holding AG | 858 | | 163,832 |
| Verwaltungs & Privat Bank AG | 5,047 | | 1,249,532 |
| Von Roll Holding AG * | 20,062 | | 156,412 |
| Vontobel Holding AG | 2,200 | | 107,806 |
| Zehnder Group AG | 27 | | 57,433 |
| Zuger Kantonalbank | 35 | | 100,291 |
| |
|
| | | | 10,445,530 |
| Taiwan - 0.09% | | | |
| Shinkong Synthetic Fibers Corp. * | 568,771 | | 212,807 |
| Sinyi Realty Company, Ltd. * | 6,000 | | 19,881 |
| |
|
| | | | 232,688 |
| United Kingdom - 20.09% | | | |
| A.G. Barr PLC | 2,441 | | 58,641 |
| Abacus Group PLC | 13,889 | | 23,716 |
| Abbot Group PLC | 38,594 | | 225,167 |
| Aberdeen Asset Management PLC | 118,701 | | 428,271 |
| Acal PLC | 5,883 | | 37,128 |
| AEA Technology PLC * | 18,852 | | 45,975 |
| Aga Foodservice Group PLC * | 22,290 | | 192,457 |
| Aggreko PLC | 98,123 | | 1,065,757 |
| | | |
| International Small Company Fund (continued) |
| | Shares or | | |
| | Principal | | |
| | Amount | | Value |
|
|
| |
| COMMON STOCKS (continued) | | | |
| | | | |
| United Kingdom (continued) | | | |
| Alexon Group PLC | 8,602 | $ | 39,838 |
| Alfred McAlpine PLC | 18,539 | | 178,546 |
| Alizyme PLC * | 58,896 | | 103,637 |
| Alphameric PLC * | 33,484 | | 21,306 |
| Amstrad PLC | 11,470 | | 34,756 |
| Anite Group PLC | 41,216 | | 66,647 |
| Antisoma PLC * | 137,552 | | 86,174 |
| ARC International PLC * | 45,915 | | 41,353 |
| Arena Leisure PLC | 50,686 | | 61,701 |
| Arriva PLC | 35,959 | | 551,161 |
| Ashtead Group PLC | 106,406 | | 276,831 |
| Autonomy Corp. PLC * | 36,311 | | 681,796 |
| Aveva Group PLC | 7,896 | | 148,292 |
| Avis Europe PLC * | 65,846 | | 64,086 |
| Avon Rubber PLC | 11,107 | | 32,902 |
| Axis-Shield PLC * | 6,029 | | 33,722 |
| Axon Group PLC | 13,826 | | 207,199 |
| Babcock International Group PLC | 32,683 | | 361,542 |
| BBA Aviation PLC | 68,439 | | 334,104 |
| Bespak PLC | 7,040 | | 90,348 |
| BICC PLC | 11,190 | | 107,518 |
| Biocompatibles International PLC * | 10,935 | | 38,195 |
| Blacks Leisure Group PLC | 5,193 | | 32,760 |
| Blinkx PLC * | 34,951 | | 27,136 |
| Bloomsbury Publishing PLC | 15,244 | | 50,413 |
| Bodycote International PLC | 295,612 | | 1,588,920 |
| Bovis Homes Group PLC | 24,215 | | 376,810 |
| BPP Holdings PLC | 5,823 | | 63,845 |
| Brammer PLC * | 5,727 | | 36,395 |
| Brewin Dolphin Holdings PLC | 36,061 | | 147,303 |
| Brit Insurance Holdings PLC | 63,981 | | 457,430 |
| British Polythene Industries PLC * | 4,400 | | 34,007 |
| Britvic PLC | 11,674 | | 78,379 |
| BSS Group PLC | 15,247 | | 152,230 |
| Burren Energy PLC | 14,828 | | 242,989 |
| Business Post Group PLC | 6,109 | | 55,604 |
| Capital & Regional PLC | 14,846 | | 281,748 |
| Care UK PLC | 6,169 | | 80,926 |
| Carillion PLC | 47,584 | | 386,909 |
| Carpetright PLC | 6,062 | | 146,373 |
| Castings PLC | 6,764 | | 40,151 |
| Catlin Group, Ltd. | 5,526 | | 54,296 |
| Centaur Media PLC | 37,860 | | 99,038 |
| Charles Stanley Group PLC | 5,789 | | 38,502 |
| Charter PLC * | 16,999 | | 383,556 |
| Chemring Group PLC | 7,531 | | 305,552 |
| Chime Communications PLC | 25,000 | | 25,334 |
| Chloride Group PLC | 46,548 | | 147,534 |
| Chrysalis Group PLC | 18,683 | | 48,557 |
| Clinton Cards PLC | 33,476 | | 42,100 |
| Colt Telecom Group PLC * | 15,623 | | 49,445 |
| Communisis PLC | 29,820 | | 42,096 |
| |
| The accompanying notes are an integral part of the financial statements. | 256 |
John Hancock Funds II
Portfolio of investments — August 31, 2007
(showing percentage of total net assets)
| | | |
| International Small Company Fund (continued) |
| | Shares or | | |
| | Principal | | |
| | Amount | | Value |
|
|
| |
| COMMON STOCKS (continued) | | | |
| | | | |
| United Kingdom (continued) | | | |
| Computacenter PLC | 23,039 | $ | 83,797 |
| Cookson Group PLC | 39,520 | | 613,934 |
| Costain Group PLC * | 84,259 | | 70,776 |
| Cranswick PLC | 9,285 | | 147,536 |
| Creston PLC | 10,587 | | 29,421 |
| Croda International PLC | 16,938 | | 226,180 |
| CSR PLC * (a) | 11,810 | | 155,169 |
| D.S. Smith PLC | 179,314 | | 823,059 |
| Dairy Crest Group PLC | 26,977 | | 393,381 |
| Dana Petroleum PLC * | 12,006 | | 234,582 |
| Davis Service Group PLC | 30,431 | | 363,411 |
| Dawson Holdings PLC | 18,937 | | 42,581 |
| De La Rue PLC * | 25,355 | | 381,797 |
| Dechra Pharmaceuticals PLC | 20,895 | | 143,625 |
| Delta PLC | 17,178 | | 41,787 |
| Detica Group PLC | 21,459 | | 136,437 |
| Development Securities PLC | 9,003 | | 109,155 |
| Devro PLC | 33,835 | | 60,045 |
| Dicom Group PLC | 14,754 | | 50,804 |
| Dignity PLC | 5,680 | | 78,498 |
| Diploma PLC | 2,919 | | 54,331 |
| Domestic & General Group PLC | 4,202 | | 101,438 |
| Domino Printing Sciences PLC | 29,115 | | 185,992 |
| DTZ Holdings PLC | 19,551 | | 213,671 |
| E2V Technologies PLC | 10,056 | | 61,894 |
| Electrocomponents PLC | 133,547 | | 686,508 |
| Elementis PLC | 72,963 | | 142,255 |
| EMAP PLC | 5,958 | | 109,172 |
| Emerald Energy PLC * | 6,316 | | 25,539 |
| Ennstone PLC | 52,985 | | 45,532 |
| Enodis PLC | 69,220 | | 255,552 |
| Entertainment Rights PLC * | 92,761 | | 55,352 |
| Erinaceous Group PLC | 12,246 | | 30,870 |
| Euromoney Institutional Investor PLC | 19,007 | | 207,780 |
| Evolution Group PLC | 41,382 | | 106,582 |
| Expro International Group PLC | 19,421 | | 396,897 |
| F&C Asset Management PLC | 110,863 | | 437,007 |
| Fenner PLC | 16,871 | | 80,706 |
| Filtrona PLC | 35,950 | | 174,035 |
| Findel PLC | 15,671 | | 227,040 |
| First Choice Holidays PLC | 37,488 | | 224,669 |
| FKI PLC | 82,889 | | 177,171 |
| Forth Ports PLC | 6,238 | | 226,063 |
| Fortune Oil PLC * | 359,509 | | 43,937 |
| Foseco PLC * | 9,846 | | 42,765 |
| French Connection Group PLC | 17,888 | | 69,274 |
| Fuller Smith & Turner PLC | 4,822 | | 65,806 |
| Future PLC | 44,714 | | 41,606 |
| Galiform PLC * | 112,844 | | 296,616 |
| Galliford Try PLC | 63,253 | | 186,697 |
| Game Group PLC | 182,118 | | 703,015 |
| GCAP Media PLC | 28,992 | | 132,451 |
| | | |
| International Small Company Fund (continued) |
| | Shares or | | |
| | Principal | | |
| | Amount | | Value |
|
|
| |
| COMMON STOCKS (continued) | | | |
| | | | |
| United Kingdom (continued) | | | |
| Go-Ahead Group PLC | 4,821 | $ | 267,823 |
| Greene King PLC | 13,780 | | 279,742 |
| Greggs PLC | 865 | | 92,634 |
| Gyrus Group PLC * | 30,914 | | 278,066 |
| Halfords Group PLC | 17,950 | | 147,192 |
| Halma PLC | 89,053 | | 391,395 |
| Headlam Group PLC | 15,591 | | 182,292 |
| Helical Bar PLC | 17,052 | | 158,682 |
| Helphire PLC | 16,744 | | 128,211 |
| Henderson Group PLC | 154,005 | | 473,806 |
| Henry Boot PLC | 22,990 | | 112,791 |
| Highway Insurance Holdings PLC | 55,651 | | 80,428 |
| Hikma Pharmaceuticals PLC * | 9,949 | | 82,886 |
| Hill & Smith Holdings PLC | 19,511 | | 148,508 |
| Hiscox PLC | 54,162 | | 295,844 |
| HMV Group PLC | 34,396 | | 85,878 |
| Holidaybreak PLC | 5,973 | | 100,137 |
| Homeserve PLC | 57,619 | | 1,994,278 |
| Hunting PLC | 24,225 | | 356,072 |
| Huntsworth PLC | 20,523 | | 40,572 |
| Hyder Consulting PLC | 4,784 | | 46,861 |
| IG Group Holdings PLC | 29,877 | | 189,425 |
| Imagination Technologies Group PLC * | 26,486 | | 70,773 |
| IMI PLC | 9,255 | | 105,785 |
| Innovation Group PLC * | 119,179 | | 77,098 |
| Intec Telecom Systems PLC * | 40,144 | | 43,201 |
| Interserve PLC | 6,095 | | 57,148 |
| Intertek Group PLC | 26,185 | | 520,437 |
| Investec PLC | 12,863 | | 140,843 |
| iSOFT Group PLC * | 219,087 | | 302,648�� |
| ITE Group PLC | 44,002 | | 150,373 |
| J.D. Wetherspoon PLC | 24,171 | | 285,961 |
| James Fisher & Sons PLC | 11,043 | | 151,435 |
| Jardine Lloyd Thompson Group PLC * | 17,641 | | 135,848 |
| Jessops PLC | 13,570 | | 3,565 |
| JJB Sports PLC | 47,024 | | 199,677 |
| JKX Oil & Gas PLC | 56,800 | | 445,926 |
| John Wood Group PLC | 56,044 | | 409,341 |
| Johnson Service Group PLC | 10,919 | | 65,425 |
| Johnston Press PLC | 45,952 | | 358,392 |
| Keller Group PLC | 10,102 | | 226,000 |
| Kesa Electricals PLC | 16,785 | | 105,103 |
| Kier Group PLC | 2,616 | | 101,746 |
| Kiln, Ltd. | 63,629 | | 150,490 |
| Kingston Communications PLC | 61,986 | | 89,242 |
| Laird Group PLC * | 31,885 | | 373,749 |
| Laura Ashley Holdings PLC | 68,094 | | 34,503 |
| Liontrust Asset Management PLC | 5,127 | | 41,345 |
| Lookers PLC | 35,795 | | 117,793 |
| Low & Bonar PLC | 45,266 | | 125,518 |
| Luminar PLC | 15,729 | | 225,278 |
| M.J. Gleeson Group PLC | 11,305 | | 85,561 |
| |
| The accompanying notes are an integral part of the financial statements. | 257 |
John Hancock Funds II
Portfolio of investments — August 31, 2007
(showing percentage of total net assets)
| | | |
| International Small Company Fund (continued) |
| | Shares or | | |
| | Principal | | |
| | Amount | | Value |
|
|
| |
| COMMON STOCKS (continued) | | | |
| | | | |
| United Kingdom (continued) | | | |
| Management Consulting Group PLC | 104,375 | $ | 104,987 |
| Marshalls PLC | 22,799 | | 146,796 |
| Marston's PLC | 71,152 | | 536,734 |
| Marylebone Warwick Balfour Group PLC * | 24,660 | | 146,266 |
| McBride PLC | 26,220 | | 101,523 |
| Melrose Resources PLC | 17,369 | | 112,087 |
| Metalrax Group PLC | 29,412 | | 39,295 |
| Mice Group PLC | 64,572 | | 7,813 |
| Micro Focus International PLC | 9,800 | | 57,673 |
| Minerva PLC * | 29,079 | | 163,649 |
| Misys PLC | 40,357 | | 188,608 |
| Mitie Group PLC | 39,512 | | 207,437 |
| Morgan Crucible Company PLC | 40,098 | | 250,025 |
| Morgan Sindall PLC | 13,744 | | 489,542 |
| Morse PLC | 21,375 | | 40,951 |
| Mothercare PLC | 12,706 | | 101,661 |
| Mouchel Parkman PLC | 22,298 | | 185,577 |
| N. Brown Group PLC | 43,978 | | 249,596 |
| National Express Group PLC | 13,238 | | 336,235 |
| Nord Anglia Education PLC * | 6,519 | | 40,924 |
| Northern Foods PLC | 47,494 | | 98,462 |
| Northgate Information Solutions PLC | 106,937 | | 156,948 |
| Northgate PLC | 10,631 | | 239,944 |
| Northumbrian Water Group PLC | 46,421 | | 324,900 |
| NSB Retail Systems PLC | 64,125 | | 34,269 |
| Oxford Biomedica PLC * | 90,000 | | 77,375 |
| Pace Micro Technology PLC * | 44,430 | | 91,404 |
| Paypoint PLC | 5,867 | | 71,168 |
| Pendragon PLC | 119,021 | | 182,655 |
| Photo-Me International PLC | 22,753 | | 29,771 |
| Pinewood Shepperton PLC | 8,060 | | 41,855 |
| Premier Farnell PLC | 52,563 | | 193,456 |
| Premier Oil PLC * | 19,397 | | 398,288 |
| Protherics PLC * | 31,033 | | 31,822 |
| Psion PLC | 17,318 | | 42,418 |
| PZ Cussons PLC | 32,680 | | 111,766 |
| QXL Ricardo PLC * | 4,040 | | 92,364 |
| Rathbone Brothers PLC | 7,195 | | 195,129 |
| Raymarine PLC | 13,480 | | 78,366 |
| Redrow PLC | 32,950 | | 343,266 |
| Regent Inns PLC * | 12,166 | | 18,742 |
| Regus Group PLC | 198,278 | | 537,765 |
| Renishaw PLC | 9,048 | | 129,361 |
| Rensburg Sheppards PLC | 4,945 | | 80,721 |
| Restaurant Group PLC | 25,822 | | 158,433 |
| RM PLC | 11,530 | | 44,925 |
| Robert Walters PLC | 17,416 | | 109,691 |
| Robert Wiseman Dairies PLC | 9,457 | | 85,639 |
| ROK PLC | 20,480 | | 92,719 |
| Rotork PLC | 15,924 | | 324,264 |
| Royalblue Group PLC | 5,476 | | 113,082 |
| RPC Group PLC | 19,627 | | 116,565 |
| | | |
| International Small Company Fund (continued) |
| | Shares or | | |
| | Principal | | |
| | Amount | | Value |
|
|
| |
| COMMON STOCKS (continued) | | | |
| | | | |
| United Kingdom (continued) | | | |
| RPS Group PLC | 47,731 | $ | 370,366 |
| Savills PLC | 18,273 | | 181,820 |
| SCI Entertainment Group PLC * | 12,995 | | 77,765 |
| SDL PLC * | 10,750 | | 85,953 |
| Senior PLC | 136,652 | | 312,600 |
| Severfield-Rowen PLC | 1,973 | | 93,787 |
| Shanks Group PLC | 42,010 | | 200,978 |
| Shore Capital Group PLC | 82,607 | | 120,691 |
| SIG PLC | 14,360 | | 371,854 |
| Skyepharma PLC * | 127,235 | | 42,551 |
| SMG PLC * | 31,166 | | 28,283 |
| Smiths News PLC | 27,259 | | 80,534 |
| Soco International PLC * | 9,700 | | 391,044 |
| Sondex PLC | 6,737 | | 57,527 |
| Spectris PLC | 17,256 | | 310,648 |
| Speedy Hire PLC | 4,678 | | 111,731 |
| Spirax-Sarco Engineering PLC | 28,330 | | 558,659 |
| Spirent Communications PLC, ADR * | 107,904 | | 143,988 |
| Spirent Communications PLC * | 1,208 | | 6,221 |
| Sportech PLC * | 67,000 | | 18,572 |
| Spring Group PLC | 29,466 | | 41,954 |
| SSL International PLC | 42,217 | | 376,535 |
| St. Ives Group PLC | 15,694 | | 69,124 |
| St. Modwen Properties PLC | 23,243 | | 245,403 |
| Stagecoach Group PLC | 32,743 | | 147,246 |
| Surfcontrol PLC * | 4,312 | | 60,218 |
| Taylor Nelson Sofres PLC | 52,452 | | 243,781 |
| TDG PLC | 11,424 | | 60,537 |
| Ted Baker PLC | 4,286 | | 50,829 |
| Telent PLC * | 12,810 | | 125,937 |
| Thorntons PLC | 10,805 | | 37,227 |
| Thus Group PLC * | 17,980 | | 53,995 |
| Topps Tiles PLC | 25,009 | | 115,790 |
| Town Centre Securities PLC | 11,969 | | 108,343 |
| TT electronics PLC | 25,281 | | 89,203 |
| UK Coal PLC * | 38,818 | | 409,324 |
| Ultra Electronics Holdings PLC | 4,987 | | 118,525 |
| Umeco PLC | 8,762 | | 103,397 |
| Uniq PLC | 31,252 | | 142,879 |
| UTV PLC * | 5,622 | | 47,090 |
| Vanco PLC * | 9,115 | | 53,451 |
| Venture Production PLC | 18,606 | | 280,290 |
| Vernalis PLC * | 62,378 | | 58,851 |
| Victrex PLC | 29,565 | | 418,789 |
| Vislink PLC | 22,958 | | 35,539 |
| Vitec Group PLC | 8,660 | | 103,388 |
| VT Group PLC | 12,096 | | 140,139 |
| W.H. Smith PLC | 27,259 | | 226,509 |
| W.S. Atkins PLC | 20,825 | | 450,336 |
| Wagon PLC | 23,762 | | 24,391 |
| Weir Group PLC | 33,017 | | 550,489 |
| Whatman PLC | 50,013 | | 224,773 |
| |
| The accompanying notes are an integral part of the financial statements. | 258 |
John Hancock Funds II
Portfolio of investments — August 31, 2007
(showing percentage of total net assets)
| | | |
| International Small Company Fund (continued) |
| | Shares or | | |
| | Principal | | |
| | Amount | | Value |
|
|
| |
| COMMON STOCKS (continued) | | | |
| | | | |
| United Kingdom (continued) | | | |
| White Young Green PLC | 8,638 | $ | 78,738 |
| Wilmington Group PLC | 8,311 | | 39,588 |
| Wincanton PLC | 21,560 | | 166,848 |
| Wolfson Microelectronics PLC * | 17,835 | | 91,174 |
| Woolworths Group PLC | 94,167 | | 43,797 |
| WSP Group PLC | 6,248 | | 89,097 |
| Xaar PLC | 8,223 | | 35,102 |
| Xansa PLC | 43,446 | | 112,357 |
| Yule Catto & Company PLC | 83,739 | | 406,492 |
| Zetex PLC | 22,571 | | 34,284 |
| |
|
| | | | 50,315,272 |
|
| TOTAL COMMON STOCKS (Cost $225,398,372) | | $ | 248,976,036 |
|
| |
| PREFERRED STOCKS - 0.08% | | | |
| | | | |
| Australia - 0.02% | | | |
| Village Roadshow, Ltd. * | 14,480 | | 37,331 |
| | | | |
| Germany - 0.06% | | | |
| Hugo Boss AG * (a) | 2,623 | | 154,917 |
|
| TOTAL PREFERRED STOCKS (Cost $158,777) | | $ | 192,248 |
|
| |
| WARRANTS - 0.01% | | | |
| | | | |
| Hong Kong - 0.00% | | | |
| Asia Standard International Group | | | |
| (Expiration Date 09/07/2010, Strike | | | |
| Price .29 HKD) | 312,263 | | 0 |
| Matsunichi Communication Holdings, Ltd. | | | |
| (Expiration Date 08/28/2010, Strike | | | |
| Price 6.00 HKD) | 9,300 | | 883 |
| New Zealand - 0.00% | | | |
| Infratil, Ltd. | | | |
| (Expiration Date 06/29/2012, Strike | | | |
| Price 4.12 NZD) | 6,595 | | 3,055 |
| New Zealand Oil & Gas, Ltd. | | | |
| (Expiration Date 06/30/2008; Strike | | | |
| Price 1.50 NZD) | 6,394 | | 561 |
| |
|
| | | | 3,616 |
| Singapore - 0.01% | | | |
| Bukit Sembawang Estates, Ltd. | | | |
| (Expiration Date 11/13/2007; Strike | | | |
| Price 4.00 SGD) | 4,000 | | 15,747 |
|
| TOTAL WARRANTS (Cost $10,905) | | $ | 20,246 |
|
| |
| RIGHTS - 0.00% | | | |
| | | | |
| Spain - 0.00% | | | |
| Avanzit SA (Expiration Date 09/13/2007, | | | |
| Strike Price 1.80 EUR) | 12,655 | | 4,315 |
|
| TOTAL RIGHTS (Cost $0) | | $ | 4,315 |
|
| | | | |
| International Small Company Fund (continued) |
| | | Shares or | | |
| | | Principal | | |
| | | Amount | | Value |
|
|
| SHORT TERM INVESTMENTS - 18.38% | | | |
| John Hancock Cash Investment Trust (c) | $ | 46,052,319 | $ | 46,052,319 |
|
| TOTAL SHORT TERM INVESTMENTS | | | | |
| (Cost $46,052,319) | | | $ | 46,052,319 |
|
| Total Investments (International Small Company Fund) | | |
| (Cost $271,620,373) - 117.87% | | | $ | 295,245,164 |
| Liabilities in Excess of Other Assets - (17.87)% | | | (44,755,399) |
| |
|
| TOTAL NET ASSETS - 100.00% | | | $ | 250,489,765 |
| |
|
| The portfolio had the following five top industry concentrations as of | | |
| August 31, 2007 (as a percentage of total net assets): | | | |
| | | | |
| Building Materials & Construction | 6.58% | | |
| Banking | | 4.60% | | |
| Food & Beverages | | 4.33% | | |
| Industrial Machinery | | 3.94% | | |
| Business Services | | 3.62% | | |
| | | |
| International Value Fund | | | |
| | Shares or | | |
| | Principal | | |
| | Amount | | Value |
|
|
| |
| COMMON STOCKS - 95.93% | | | |
| | | | |
| Australia - 1.23% | | | |
| National Australia Bank, Ltd. | 467,046 | $ | 15,246,168 |
| | | | |
| Austria - 0.49% | | | |
| Telekom Austria AG | 235,900 | | 6,099,774 |
| | | | |
| Belgium - 0.93% | | | |
| Belgacom SA (a) | 263,260 | | 11,565,292 |
| | | | |
| Cayman Islands - 1.38% | | | |
| ACE, Ltd. | 296,576 | | 17,130,230 |
| | | | |
| China - 0.51% | | | |
| China Telecom Corp., Ltd. | 10,927,589 | | 6,316,224 |
| | | | |
| Denmark - 0.49% | | | |
| Vestas Wind Systems AS * (a) | 90,817 | | 6,159,076 |
| | | | |
| Finland - 2.24% | | | |
| Stora Enso Oyj, R Shares (a) | 761,350 | | 13,734,366 |
| UPM-Kymmene Oyj | 623,961 | | 14,179,248 |
| |
|
| | | | 27,913,614 |
| France - 10.88% | | | |
| AXA Group SA (a) | 611,016 | | 24,451,363 |
| France Telecom SA | 1,133,751 | | 34,195,056 |
| Sanofi-Aventis SA (a) | 347,636 | | 28,508,823 |
| Thomson SA (a) | 1,198,580 | | 19,664,142 |
| Total SA | 263,812 | | 19,809,659 |
| Vivendi SA (a) | 212,330 | | 8,666,432 |
| |
|
| | | | 135,295,475 |
| Germany - 5.24% | | | |
| Bayerische Motoren Werke (BMW) AG (a) | 226,134 | | 13,757,937 |
| |
| The accompanying notes are an integral part of the financial statements. | 259 |
John Hancock Funds II
Portfolio of investments — August 31, 2007
(showing percentage of total net assets)
| | | |
| International Value Fund (continued) | | |
| | Shares or | | |
| | Principal | | |
| | Amount | | Value |
|
|
| |
| COMMON STOCKS (continued) | | | |
| | | | |
| Germany (continued) | | | |
| Deutsche Post AG | 444,961 | $ | 12,940,554 |
| E.ON AG | 35,799 | | 6,009,658 |
| Muenchener Rueckversicherungs- | | | |
| Gesellschaft AG | 86,666 | | 14,986,968 |
| Siemens AG | 139,239 | | 17,491,466 |
| |
|
| | | | 65,186,583 |
| Hong Kong - 1.51% | | | |
| Hutchison Whampoa, Ltd. | 1,891,620 | | 18,775,827 |
| Israel - 1.58% | | | |
| Check Point Software Technologies, Ltd. * | 837,770 | | 19,654,084 |
| Italy - 3.72% | | | |
| Eni SpA | 479,819 | | 16,595,026 |
| Mediaset SpA | 1,811,657 | | 19,264,840 |
| UniCredito Italiano SpA | 1,210,957 | | 10,416,000 |
| |
|
| | | | 46,275,866 |
| Japan - 6.37% | | | |
| Aiful Corp. (a) | 227,099 | | 4,527,568 |
| Konica Minolta Holdings, Inc. (a) | 1,108,462 | | 17,330,008 |
| Mitsubishi UFJ Financial Group, Inc. (a) | 591 | | 5,663,309 |
| NGK Spark Plug Company, Ltd. (a) | 774,000 | | 12,757,703 |
| Nissan Motor Company, Ltd. | 1,146,200 | | 10,945,251 |
| Promise Company, Ltd. (a) | 193,550 | | 5,324,034 |
| Sony Corp. (a) | 310,014 | | 14,836,287 |
| USS Company, Ltd. | 115,840 | | 7,797,636 |
| |
|
| | | | 79,181,796 |
| Netherlands - 6.40% | | | |
| ING Groep NV | 696,392 | | 28,063,349 |
| Koninklijke (Royal) Philips Electronics NV | 393,236 | | 15,566,297 |
| Reed Elsevier NV (a) | 1,396,045 | | 25,217,245 |
| Vedior NV | 468,640 | | 10,673,512 |
| |
|
| | | | 79,520,403 |
| Norway - 2.53% | | | |
| Norske Skogindustrier ASA | 924,814 | | 11,281,223 |
| Telenor ASA | 1,092,361 | | 20,192,536 |
| |
|
| | | | 31,473,759 |
| Singapore - 3.87% | | | |
| Flextronics International, Ltd. * | 1,139,250 | | 12,976,057 |
| Singapore Telecommunications, Ltd. (a) | 6,779,000 | | 16,215,456 |
| Venture Corp., Ltd. | 1,842,840 | | 18,884,171 |
| |
|
| | | | 48,075,684 |
| South Korea - 4.57% | | | |
| Kookmin Bank, SADR | 114,721 | | 9,344,025 |
| KT Corp., SADR | 181,994 | | 4,335,097 |
| Samsung Electronics Company, Ltd., GDR | 101,364 | | 32,183,070 |
| SK Telecom Company, Ltd., ADR (a) | 399,323 | | 10,929,471 |
| |
|
| | | | 56,791,663 |
| Spain - 2.92% | | | |
| Gamesa Corporacion Tecno SA (a) | 153,681 | | 6,135,965 |
| Repsol SA | 334,212 | | 12,058,596 |
| | | | |
| International Value Fund (continued) | | |
| | | Shares or | | |
| | | Principal | | |
| | | Amount | | Value |
|
|
| |
| COMMON STOCKS (continued) | | | | |
| | | | | |
| Spain (continued) | | | | |
| Telefonica SA | | 728,814 | $ | 18,147,225 |
|
|
| | | | | 36,341,786 |
| Sweden - 0.89% | | | | |
| Securitas AB, B Shares | | 463,848 | | 6,148,076 |
| Securitas Systems AB, B Shares | | 1,393,848 | | 4,917,391 |
|
|
| | | | | 11,065,467 |
| Switzerland - 3.93% | | | | |
| Nestle SA | | 36,727 | | 16,028,984 |
| Novartis AG | | 302,120 | | 15,947,994 |
| Swiss Re | | 140,663 | | 11,884,246 |
| UBS AG | | 94,648 | | 4,962,537 |
|
|
| | | | | 48,823,761 |
| Taiwan - 5.66% | | | | |
| Chunghwa Telecom Company, Ltd., SADR | | 806,846 | | 14,135,935 |
| Compal Electronics, Inc., GDR | | 2,334,867 | | 13,262,046 |
| Lite-On Technology Corp., GDR (a) | | 1,101,069 | | 17,314,524 |
| Lite-On Technology Corp. | | 2,004,100 | | 3,162,173 |
| Mega Financial Holding Company, Ltd. | | 36,182,000 | | 22,527,614 |
|
|
| | | | | 70,402,292 |
| Thailand - 0.00% | | | | |
| Advanced Info Service PCL | | 3,000 | | 8,214 |
| United Kingdom - 28.59% | | | | |
| Amvescap PLC | | 382,002 | | 4,663,542 |
| Aviva PLC | | 1,294,190 | | 18,543,334 |
| BAE Systems PLC | | 610,443 | | 5,715,337 |
| BP PLC | | 2,568,502 | | 28,870,277 |
| British Sky Broadcasting Group PLC | | 1,789,876 | | 24,441,944 |
| Centrica PLC | | 2,211,102 | | 17,236,386 |
| Compass Group PLC | | 3,549,337 | | 23,329,694 |
| Fiberweb PLC | | 343,555 | | 916,268 |
| GlaxoSmithKline PLC | | 970,775 | | 25,338,919 |
| Group 4 Securicor PLC | | 4,888,270 | | 19,628,917 |
| HSBC Holdings PLC | | 1,386,040 | | 25,067,064 |
| Kingfisher PLC | | 2,632,550 | | 11,099,647 |
| Old Mutual PLC (a) | | 5,395,832 | | 17,428,423 |
| Pearson PLC | | 808,116 | | 12,151,703 |
| Reed Elsevier PLC | | 89,874 | | 1,086,640 |
| Rentokil Initial PLC | | 3,336,007 | | 11,686,916 |
| Royal Bank of Scotland Group PLC | | 2,380,836 | | 27,671,164 |
| Royal Dutch Shell PLC, B Shares | | 582,923 | | 22,735,709 |
| Tesco PLC | | 1,174,590 | | 10,100,109 |
| Unilever PLC | | 511,051 | | 16,153,516 |
| Vodafone Group PLC | | 9,781,526 | | 31,616,746 |
|
|
| | | | | 355,482,255 |
|
| TOTAL COMMON STOCKS (Cost $1,001,902,792) | | $ | 1,192,785,293 |
|
| |
| SHORT TERM INVESTMENTS - 16.81% | | | |
| John Hancock Cash Investment Trust (c) | $ | 163,204,173 | $ | 163,204,173 |
| |
| The accompanying notes are an integral part of the financial statements. | 260 |
John Hancock Funds II
Portfolio of investments — August 31, 2007
(showing percentage of total net assets)
| | | | |
| International Value Fund (continued) | | |
| | | Shares or | | |
| | | Principal | | |
| | | Amount | | Value |
|
|
| |
| SHORT TERM INVESTMENTS (continued) | | | |
| | | | | |
| Paribas Corp. Time Deposit | | | | |
| 5.25% due 09/04/2007 | $ | 45,800,000 | $ | 45,800,000 |
|
| TOTAL SHORT TERM INVESTMENTS | | | | |
| (Cost $209,004,173) | | | $ | 209,004,173 |
|
| |
| REPURCHASE AGREEMENTS - 0.07% | | | | |
| Repurchase Agreement with State | | | | |
| Street Corp. dated 08/31/2007 at | | | | |
| 4.60% to be repurchased at | | | | |
| $876,448 on 09/04/2007, | | | | |
| collateralized by $790,000 Federal | | | | |
| Home Loan Mortgage Corp., | | | | |
| 6.25% due 07/15/2032 (valued at | | | | |
| $893,699, including interest) | $ | 876,000 | $ | 876,000 |
|
| TOTAL REPURCHASE AGREEMENTS | | | | |
| (Cost $876,000) | | | $ | 876,000 |
|
| Total Investments (International Value Fund) | | | |
| (Cost $1,211,782,965) - 112.81% | | | $ | 1,402,665,466 |
| Liabilities in Excess of Other Assets - (12.81)% | | | (159,306,990) |
|
|
| TOTAL NET ASSETS - 100.00% | | | $ | 1,243,358,476 |
|
|
| |
| The portfolio had the following five top industry concentrations as of |
| August 31, 2007 (as a percentage of total net assets): | |
| | |
| Telecommunications Equipment & Services | 13.97% |
| Insurance | 10.66% |
| Electronics | 9.18% |
| Banking | 5.50% |
| Financial Services | 5.03% |
| | | | |
| Investment Quality Bond Fund | | | |
| | | Shares or | | |
| | | Principal | | |
| | | Amount | | Value |
|
|
| |
| U.S. TREASURY OBLIGATIONS - 31.54% | | | |
| | | | | |
| Treasury Inflation Protected | | | | |
| Securities (d) - 8.12% | | | | |
| 1.875% due 07/15/2013 | $ | 3,516,485 | $ | 3,429,396 |
| 2.375% due 04/15/2011 | | 10,076,544 | | 10,052,924 |
| |
|
| | | | | 13,482,320 |
| U.S. Treasury Bonds - 18.15% | | | | |
| 6.25% due 08/15/2023 | | 2,000,000 | | 2,305,156 |
| 7.875% due 02/15/2021 | | 7,250,000 | | 9,428,400 |
| 8.125% due 08/15/2021 | | 1,600,000 | | 2,130,499 |
| 8.125% due 08/15/2019 **** | | 3,060,000 | | 3,991,149 |
| 8.75% due 08/15/2020 | | 7,285,000 | | 10,034,520 |
| 8.875% due 08/15/2017 to 02/15/2019 | | 1,655,000 | | 2,227,785 |
| |
|
| | | | | 30,117,509 |
| | | | |
| Investment Quality Bond Fund (continued) | | |
| | | Shares or | | |
| | | Principal | | |
| | | Amount | | Value |
|
|
| |
| U.S. TREASURY OBLIGATIONS | | | | |
| (continued) | | | | |
| U.S. Treasury Notes - 5.27% | | | | |
| 6.50% due 02/15/2010 | $ | 8,300,000 | $ | 8,737,692 |
|
| TOTAL U.S. TREASURY OBLIGATIONS | | | |
| (Cost $51,908,522) | | | $ | 52,337,521 |
|
| |
| U.S. GOVERNMENT AGENCY OBLIGATIONS - 8.65% | | |
| | | | | |
| Federal Home Loan Bank - 1.28% | | | | |
| 5.80% due 09/02/2008 | | 2,105,000 | | 2,122,560 |
| | | | |
| Federal Home Loan Mortgage Corp. - 1.81% | | | |
| 4.00% due 11/15/2019 | | 135,265 | | 122,104 |
| 5.00% due 03/01/2019 to 12/01/2019 | 756,293 | | 739,729 |
| 6.30% due 03/15/2023 | | 2,188 | | 2,190 |
| 6.50% due 04/01/2029 to 08/01/2034 | 28,358 | | 28,909 |
| 6.625% due 09/15/2009 | | 2,030,000 | | 2,103,573 |
| 7.50% due 06/01/2010 to 05/01/2028 | 9,265 | | 9,639 |
| |
|
| | | | | 3,006,144 |
| Federal National Mortgage | | | | |
| Association - 5.30% | | | | |
| 3.125% due 12/15/2007 | | 541,000 | | 537,768 |
| 4.682% due 05/01/2013 | | 196,549 | | 190,583 |
| 4.86% due 01/01/2015 | | 2,954,666 | | 2,891,190 |
| 4.874% due 02/01/2013 | | 266,228 | | 261,360 |
| 5.00% due 03/01/2019 to 06/01/2019 | 1,459,782 | | 1,427,944 |
| 5.50% due 08/01/2035 to 11/01/2035 | 1,298,911 | | 1,269,800 |
| 5.636% due 12/01/2011 | | 222,368 | | 224,968 |
| 5.885% due 11/01/2011 | | 170,319 | | 173,884 |
| 6.051% due 03/01/2012 to 05/01/2012 | 259,588 | | 266,162 |
| 6.085% due 10/01/2011 | | 149,352 | | 152,863 |
| 6.43% due 01/01/2008 | | 37,561 | | 37,412 |
| 6.44% due 02/01/2011 | | 464,506 | | 478,475 |
| 6.50% due 09/01/2031 | | 132 | | 135 |
| 6.625% due 09/15/2009 | | 850,000 | | 881,278 |
| 6.80% due 10/01/2007 | | 1,815 | | 1,807 |
| 7.00% due 06/01/2029 | | 495 | | 514 |
| |
|
| | | | | 8,796,143 |
| Government National Mortgage | | | | |
| Association - 0.21% | | | | |
| 6.00% due 08/15/2008 to 04/15/2035 | 95,516 | | 96,374 |
| 6.50% due 06/15/2028 to 08/15/2034 | 56,933 | | 58,177 |
| 7.00% due 11/15/2031 to 05/15/2033 | 173,271 | | 180,661 |
| 8.00% due 07/15/2030 to 10/15/2030 | 3,597 | | 3,823 |
| |
|
| | | | | 339,035 |
| Housing & Urban Development - 0.05% | | | |
| 7.498% due 08/01/2011 | | 81,000 | | 85,102 |
|
| TOTAL U.S. GOVERNMENT AGENCY OBLIGATIONS | | |
| (Cost $14,514,256) | | | $ | 14,348,984 |
|
| |
| FOREIGN GOVERNMENT OBLIGATIONS - 2.17% | | |
| | | | | |
| Argentina - 0.12% | | | | |
| Republic of Argentina, Series BADL | | | | |
| 11.065% due 02/20/2008 (b) | ARS | 666,300 | | 210,366 |
| |
| The accompanying notes are an integral part of the financial statements. | 261 |
John Hancock Funds II
Portfolio of investments — August 31, 2007
(showing percentage of total net assets)
| | | | |
| Investment Quality Bond Fund (continued) | | |
| | | Shares or | | |
| | | Principal | | |
| | | Amount | | Value |
|
|
| |
| FOREIGN GOVERNMENT OBLIGATIONS | | | |
| (continued) | | | | |
| | | | | |
| Brazil - 1.73% | | | | |
| Federative Republic of Brazil | | | | |
| 10.00% due 01/01/2017 | BRL | 2,780,000 | $ | 1,279,372 |
| 10.00% due 01/01/2014 | | 3,355,000 | | 1,587,579 |
| |
|
| | | | | 2,866,951 |
| Mexico - 0.32% | | | | |
| Government of Mexico | | | | |
| 6.75% due 09/27/2034 | $ | 300,000 | | 325,800 |
| 9.00% due 12/24/2009 | MXN | 2,200,000 | | 205,279 |
| |
|
| | | | | 531,079 |
|
| TOTAL FOREIGN GOVERNMENT OBLIGATIONS | | |
| (Cost $3,575,926) | | | $ | 3,608,396 |
|
| |
| CORPORATE BONDS - 35.00% | | | | |
| | | | | |
| Advertising - 0.01% | | | | |
| R.H. Donnelley Corp. | | | | |
| 6.875% due 01/15/2013 | $ | 5,000 | | 4,713 |
| R.H. Donnelley Corp., Series A-2 | | | | |
| 6.875% due 01/15/2013 | | 10,000 | | 9,425 |
| |
|
| | | | | 14,138 |
| Aerospace - 0.08% | | | | |
| Goodrich Corp. | | | | |
| 7.10% due 11/15/2027 | | 115,000 | | 125,693 |
| | | | | |
| Agriculture - 0.01% | | | | |
| Case New Holland, Inc. | | | | |
| 7.125% due 03/01/2014 | | 10,000 | | 10,100 |
| Mosaic Company | | | | |
| 7.375% due 12/01/2014 | | 5,000 | | 5,087 |
| 7.625% due 12/01/2016 | | 5,000 | | 5,125 |
| |
|
| | | | | 20,312 |
| Air Travel - 0.28% | | | | |
| American Airlines | | | | |
| 3.857% due 07/09/2010 | | 21,120 | | 20,332 |
| Continental Airlines, Inc., Series 974A | | | | |
| 6.90% due 01/02/2018 | | 118,480 | | 119,997 |
| Continental Airlines, Inc., Series 981A | | | | |
| 6.648% due 09/15/2017 | | 280,590 | | 283,143 |
| Continental Airlines, Inc., Series A | | | | |
| 5.983% due 04/19/2022 | | 30,000 | | 29,175 |
| Continental Airlines, Inc., Series ERJ1 | | | | |
| 9.798% due 04/01/2021 | | 14,013 | | 14,766 |
| |
|
| | | | | 467,413 |
| Aluminum - 0.04% | | | | |
| Alcan, Inc. | | | | |
| 6.45% due 03/15/2011 | | 59,000 | | 61,510 |
| Novelis, Inc. | | | | |
| 7.25% due 02/15/2015 | | 3,000 | | 2,910 |
| |
|
| | | | | 64,420 |
| Auto Parts - 0.05% | | | | |
| TRW Automotive, Inc. | | | | |
| 7.00% due 03/15/2014 | | 75,000 | | 69,750 |
| | | | |
| Investment Quality Bond Fund (continued) | | |
| | | Shares or | | |
| | | Principal | | |
| | | Amount | | Value |
|
|
| |
| CORPORATE BONDS (continued) | | | | |
| | | | | |
| Auto Parts (continued) | | | | |
| United Rentals North America, Inc. | | | | |
| 6.50% due 02/15/2012 | $ | 10,000 | $ | 10,050 |
| |
|
| | | | | 79,800 |
| Auto Services - 0.01% | | | | |
| Avis Budget Car Rental LLC | | | | |
| 7.625% due 05/15/2014 | | 15,000 | | 14,625 |
| | | | | |
| Automobiles - 0.26% | | | | |
| DaimlerChrysler N.A. Holding Corp. | | | | |
| 4.75% due 01/15/2008 | | 205,000 | | 204,011 |
| 8.50% due 01/18/2031 | | 175,000 | | 216,498 |
| General Motors Corp. | | | | |
| 8.375% due 07/15/2033 | | 14,000 | | 11,235 |
| |
|
| | | | | 431,744 |
| Banking - 3.67% | | | | |
| Bank of America Corp. | | | | |
| 4.375% due 12/01/2010 | | 436,000 | | 425,627 |
| 5.42% due 03/15/2017 | | 1,600,000 | | 1,538,374 |
| Chase Manhattan Corp. | | | | |
| 7.00% due 11/15/2009 | | 135,000 | | 140,533 |
| Citicorp | | | | |
| 6.375% due 11/15/2008 | | 231,000 | | 234,311 |
| First Republic Bank of San Francisco | | | | |
| 7.75% due 09/15/2012 | | 111,000 | | 119,771 |
| First Union National Bank | | | | |
| 7.80% due 08/18/2010 | | 350,000 | | 378,006 |
| HBOS PLC | | | | |
| 6.00% due 11/01/2033 | | 210,000 | | 205,401 |
| National Australia Bank, Ltd. | | | | |
| 8.60% due 05/19/2010 | | 23,000 | | 25,153 |
| NBD Bancorp | | | | |
| 8.25% due 11/01/2024 | | 270,000 | | 321,868 |
| Republic New York Corp. | | | | |
| 9.50% due 04/15/2014 | | 135,000 | | 160,341 |
| Royal Bank of Scotland Group PLC | | | | |
| 6.40% due 04/01/2009 | | 696,000 | | 714,526 |
| RSHB Capital SA for OJSC Russian Agricultural | | | |
| Bank | | | | |
| 6.299% due 05/15/2017 | | 165,000 | | 155,925 |
| 7.175% due 05/16/2013 | | 250,000 | | 258,430 |
| Sanwa Bank Ltd., New York Branch | | | | |
| 7.40% due 06/15/2011 | | 300,000 | | 321,918 |
| Sovereign Bancorp, Inc. | | | | |
| 4.80% due 09/01/2010 | | 30,000 | | 29,518 |
| VTB Capital SA | | | | |
| 6.25% due 07/02/2035 | | 150,000 | | 145,875 |
| Wachovia Corp. | | | | |
| 5.75% due 06/15/2017 | | 925,000 | | 919,592 |
| |
|
| | | | | 6,095,169 |
| Broadcasting - 0.97% | | | | |
| British Sky Broadcasting Group PLC | | | | |
| 5.625% due 10/15/2015 | | 131,000 | | 129,500 |
| CanWest Media, Inc. | | | | |
| 8.00% due 09/15/2012 | | 10,000 | | 9,738 |
| |
| The accompanying notes are an integral part of the financial statements. | 262 |
John Hancock Funds II
Portfolio of investments — August 31, 2007
(showing percentage of total net assets)
| | | | |
| Investment Quality Bond Fund (continued) | | |
| | | Shares or | | |
| | | Principal | | |
| | | Amount | | Value |
|
|
| |
| CORPORATE BONDS (continued) | | | | |
| | | | | |
| Broadcasting (continued) | | | | |
| Clear Channel Communications, Inc. | | | | |
| 7.65% due 09/15/2010 | $ | 400,000 | $ | 397,500 |
| Comcast Cable Communications | | | | |
| 8.50% due 05/01/2027 | | 189,000 | | 225,167 |
| Grupo Televisa SA | | | | |
| 6.625% due 03/18/2025 | | 62,000 | | 62,873 |
| Liberty Media Corp. | | | | |
| 5.70% due 05/15/2013 | | 4,000 | | 3,698 |
| 7.75% due 07/15/2009 | | 90,000 | | 92,400 |
| 7.875% due 07/15/2009 | | 9,000 | | 9,310 |
| 8.25% due 02/01/2030 | | 2,000 | | 1,940 |
| News America Holdings, Inc. | | | | |
| 7.75% due 01/20/2024 | | 453,000 | | 498,822 |
| Viacom, Inc. | | | | |
| 6.625% due 05/15/2011 | | 175,000 | | 181,426 |
| |
|
| | | | | 1,612,374 |
| Building Materials & Construction - 0.10% | | | |
| Ahern Rentals, Inc. | | | | |
| 9.25% due 08/15/2013 | | 30,000 | | 29,550 |
| SCL Terminal Aereo Santiago | | | | |
| 6.95% due 07/01/2012 | | 129,562 | | 131,339 |
| |
|
| | | | | 160,889 |
| Business Services - 0.14% | | | | |
| Deluxe Corp. | | | | |
| 7.375% due 06/01/2015 | | 50,000 | | 49,250 |
| FedEx Corp., Series 981A | | | | |
| 6.72% due 01/15/2022 | | 151,259 | | 158,520 |
| Harland Clarke Holdings Corp. | | | | |
| 9.50% due 05/15/2015 | | 5,000 | | 4,475 |
| Sungard Data Systems, Inc. | | | | |
| 9.125% due 08/15/2013 | | 23,000 | | 23,747 |
| West Corp. | | | | |
| 11.00% due 10/15/2016 | | 5,000 | | 5,075 |
| |
|
| | | | | 241,067 |
| Cable & Television - 2.26% | | | | |
| Cablevision Systems Corp., Series B | | | | |
| 8.00% due 04/15/2012 | | 13,000 | | 12,448 |
| Charter Communications Holdings I LLC/Charter | | | |
| Communications Holdings I Capital Corp. | | | |
| 11.00% due 10/01/2015 | | 15,000 | | 14,700 |
| Coleman Cable, Inc. | | | | |
| 9.875% due 10/01/2012 | | 15,000 | | 14,438 |
| Comcast Corp. | | | | |
| 5.85% due 11/15/2015 | | 350,000 | | 346,761 |
| 6.30% due 11/15/2017 | | 500,000 | | 505,071 |
| 6.50% due 11/15/2035 | | 175,000 | | 170,375 |
| Cox Communications, Inc. | | | | |
| 7.125% due 10/01/2012 | | 458,000 | | 485,893 |
| Cox Enterprises, Inc. | | | | |
| 4.375% due 05/01/2008 | | 64,000 | | 63,424 |
| CSC Holdings, Inc. | | | | |
| 7.625% due 07/15/2018 | | 21,000 | | 19,267 |
| DirecTV Holdings LLC | | | | |
| 6.375% due 06/15/2015 | | 10,000 | | 9,350 |
| | | | |
| Investment Quality Bond Fund (continued) | | |
| | | Shares or | | |
| | | Principal | | |
| | | Amount | | Value |
|
|
| |
| CORPORATE BONDS (continued) | | | | |
| | | | | |
| Cable & Television (continued) | | | | |
| LIN Television Corp. | | | | |
| 6.50% due 05/15/2013 | $ | 5,000 | $ | 4,700 |
| LIN Television Corp., Series B | | | | |
| 6.50% due 05/15/2013 | | 7,000 | | 6,580 |
| Mediacom Broadband LLC | | | | |
| 8.50% due 10/15/2015 | | 37,000 | | 36,630 |
| Mediacom LLC/Mediacom Capital Corp. | | | | |
| 7.875% due 02/15/2011 | | 5,000 | | 4,963 |
| 9.50% due 01/15/2013 | | 4,000 | | 4,000 |
| Quebecor Media, Inc. | | | | |
| 7.75% due 03/15/2016 | | 10,000 | | 9,512 |
| Rogers Cable, Inc. | | | | |
| 6.25% due 06/15/2013 | | 130,000 | | 131,596 |
| Shaw Communications, Inc. | | | | |
| 8.25% due 04/11/2010 | | 4,000 | | 4,170 |
| Sinclair Broadcast Group, Inc. | | | | |
| 8.00% due 03/15/2012 | | 3,000 | | 3,030 |
| TCI Communications, Inc. | | | | |
| 8.75% due 08/01/2015 | | 183,000 | | 214,222 |
| Time Warner Cable, Inc. | | | | |
| 5.85% due 05/01/2017 | | 645,000 | | 630,414 |
| Time Warner, Inc. | | | | |
| 7.25% due 10/15/2017 | | 60,000 | | 64,427 |
| 7.70% due 05/01/2032 | | 427,000 | | 467,204 |
| Viacom, Inc. | | | | |
| 6.25% due 04/30/2016 | | 252,000 | | 252,424 |
| 7.875% due 07/30/2030 | | 250,000 | | 269,360 |
| |
|
| | | | | 3,744,959 |
| Cellular Communications - 0.47% | | | | |
| AT&T Wireless Services, Inc. | | | | |
| 7.875% due 03/01/2011 | | 94,000 | | 101,244 |
| 8.125% due 05/01/2012 | | 56,000 | | 61,935 |
| 8.75% due 03/01/2031 | | 217,000 | | 270,506 |
| Cingular Wireless LLC | | | | |
| 7.125% due 12/15/2031 | | 67,000 | | 72,250 |
| Dobson Communications Corp. | | | | |
| 8.375% due 11/01/2011 | | 15,000 | | 15,862 |
| Rogers Wireless, Inc. | | | | |
| 9.625% due 05/01/2011 | | 27,000 | | 30,438 |
| Vodafone Group PLC | | | | |
| 7.75% due 02/15/2010 | | 211,000 | | 222,299 |
| |
|
| | | | | 774,534 |
| Chemicals - 0.41% | | | | |
| Agrium, Inc. | | | | |
| 7.125% due 05/23/2036 | | 225,000 | | 228,735 |
| Cytec Industries, Inc. | | | | |
| 4.60% due 07/01/2013 | | 135,000 | | 126,229 |
| 5.50% due 10/01/2010 | | 90,000 | | 90,516 |
| 6.00% due 10/01/2015 | | 200,000 | | 198,353 |
| Equistar Chemicals LP | | | | |
| 10.625% due 05/01/2011 | | 5,000 | | 5,275 |
| Georgia Gulf Corp. | | | | |
| 9.50% due 10/15/2014 | | 20,000 | | 18,500 |
| IMC Global, Inc. | | | | |
| 7.30% due 01/15/2028 | | 3,000 | | 2,790 |
| |
| The accompanying notes are an integral part of the financial statements. | 263 |
John Hancock Funds II
Portfolio of investments — August 31, 2007
(showing percentage of total net assets)
| | | | |
| Investment Quality Bond Fund (continued) | | |
| | | Shares or | | |
| | | Principal | | |
| | | Amount | | Value |
|
|
| |
| CORPORATE BONDS (continued) | | | | |
| | | | | |
| Chemicals (continued) | | | | |
| Lyondell Chemical Company | | | | |
| 8.00% due 09/15/2014 | $ | 5,000 | $ | 5,438 |
| |
|
| | | | | 675,836 |
| Coal - 0.06% | | | | |
| Peabody Energy Corp. | | | | |
| 6.875% due 03/15/2013 | | 11,000 | | 10,972 |
| 7.375% due 11/01/2016 | | 95,000 | | 95,713 |
| |
|
| | | | | 106,685 |
| Commercial Services - 0.02% | | | | |
| Aramark Servises, Inc. | | | | |
| 8.50% due 02/01/2015 | | 10,000 | | 9,963 |
| 8.50% due 02/01/2015 | | 5,000 | | 4,981 |
| Rental Service Corp., Series 144A | | | | |
| 9.50% due 12/01/2014 | | 20,000 | | 19,575 |
| |
|
| | | | | 34,519 |
| Computers & Business Equipment - 0.14% | | | |
| Xerox Corp. | | | | |
| 5.50% due 05/15/2012 | | 95,000 | | 93,915 |
| 6.40% due 03/15/2016 | | 125,000 | | 126,362 |
| 7.20% due 04/01/2016 | | 15,000 | | 15,430 |
| |
|
| | | | | 235,707 |
| Containers & Glass - 0.09% | | | | |
| Owens-Brockway Glass Container, Inc. | | | | |
| 8.25% due 05/15/2013 | | 16,000 | | 16,400 |
| Pactiv Corp. | | | | |
| 5.875% due 07/15/2012 | | 135,000 | | 137,459 |
| |
|
| | | | | 153,859 |
| Correctional Facilities - 0.06% | | | | |
| Corrections Corp. of America | | | | |
| 6.75% due 01/31/2014 | | 100,000 | | 98,000 |
| | | | |
| Crude Petroleum & Natural Gas - 0.25% | | | |
| Atmos Energy Corp. | | | | |
| 6.35% due 06/15/2017 | | 75,000 | | 76,395 |
| Burlington Resources Finance Company | | | | |
| 7.40% due 12/01/2031 | | 159,000 | | 181,433 |
| Chesapeake Energy Corp. | | | | |
| 6.50% due 08/15/2017 | | 20,000 | | 19,050 |
| 6.625% due 01/15/2016 | | 97,000 | | 93,848 |
| 7.50% due 09/15/2013 | | 3,000 | | 3,052 |
| 7.625% due 07/15/2013 | | 10,000 | | 10,225 |
| OPTI Canada, Inc. | | | | |
| 7.875% due 12/15/2014 | | 10,000 | | 10,025 |
| PetroHawk Energy Corp. | | | | |
| 9.125% due 07/15/2013 | | 15,000 | | 15,637 |
| |
|
| | | | | 409,665 |
| Domestic Oil - 0.23% | | | | |
| Delta Petroleum Corp. | | | | |
| 7.00% due 04/01/2015 | | 25,000 | | 20,375 |
| Exco Resources, Inc. | | | | |
| 7.25% due 01/15/2011 | | 4,000 | | 4,030 |
| Motiva Enterprises LLC | | | | |
| 5.20% due 09/15/2012 | | 148,000 | | 147,916 |
| | | | |
| Investment Quality Bond Fund (continued) | | |
| | | Shares or | | |
| | | Principal | | |
| | | Amount | | Value |
|
|
| |
| CORPORATE BONDS (continued) | | | | |
| | | | | |
| Domestic Oil (continued) | | | | |
| Valero Energy Corp. | | | | |
| 8.75% due 06/15/2030 | $ | 162,000 | $ | 201,598 |
| Whiting Petroleum Corp. | | | | |
| 7.00% due 02/01/2014 | | 3,000 | | 2,828 |
| 7.25% due 05/01/2013 | | 3,000 | | 2,858 |
| |
|
| | | | | 379,605 |
| Drugs & Health Care - 0.02% | | | | |
| Allegiance Corp. | | | | |
| 7.00% due 10/15/2026 | | 13,000 | | 13,807 |
| Rite Aid Corp. | | | | |
| 8.125% due 05/01/2010 | | 18,000 | | 18,000 |
| |
|
| | | | | 31,807 |
| Electrical Utilities - 2.12% | | | | |
| AES Corp. | | | | |
| 9.00% due 05/15/2015 | | 14,000 | | 14,595 |
| Avista Corp. | | | | |
| 9.75% due 06/01/2008 | | 17,000 | | 17,495 |
| Baltimore Gas & Electric Company | | | | |
| 6.35% due 10/01/2036 | | 75,000 | | 73,257 |
| Carolina Power & Light Company | | | | |
| 6.50% due 07/15/2012 | | 371,000 | | 388,865 |
| CMS Energy Corp. | | | | |
| 8.50% due 04/15/2011 | | 4,000 | | 4,258 |
| Commonwealth Edison Company | | | | |
| 5.95% due 08/15/2016 | | 125,000 | | 125,054 |
| 6.15% due 03/15/2012 | | 92,000 | | 94,147 |
| Dynegy Holdings, Inc. | | | | |
| 7.125% due 05/15/2018 | | 15,000 | | 13,350 |
| 8.375% due 05/01/2016 | | 10,000 | | 9,825 |
| Edison Mission Energy | | | | |
| 7.75% due 06/15/2016 | | 20,000 | | 20,150 |
| Exelon Generation Company, LLC | | | | |
| 6.95% due 06/15/2011 | | 185,000 | | 192,995 |
| Georgia Power Company | | | | |
| 5.25% due 12/15/2015 | | 150,000 | | 146,615 |
| New York State Electric & Gas Corp. | | | | |
| 5.75% due 05/01/2023 | | 74,000 | | 70,410 |
| Northern States Power Company | | | | |
| 6.25% due 06/01/2036 | | 125,000 | | 126,003 |
| 6.50% due 03/01/2028 | | 67,000 | | 69,798 |
| NSTAR | | | | |
| 8.00% due 02/15/2010 | | 270,000 | | 288,338 |
| Ohio Edison Company | | | | |
| 4.00% due 05/01/2008 | | 212,000 | | 209,416 |
| Old Dominion Electric Cooperative | | | | |
| 6.25% due 06/01/2011 | | 141,000 | | 146,901 |
| Pacificorp | | | | |
| 6.375% due 05/15/2008 | | 135,000 | | 135,736 |
| Pacificorp Australia LLC | | | | |
| 6.15% due 01/15/2008 | | 111,000 | | 111,523 |
| PSEG Power LLC | | | | |
| 8.625% due 04/15/2031 | | 154,000 | | 189,125 |
| Puget Sound Energy, Inc. | | | | |
| 7.00% due 03/09/2029 | | 54,000 | | 59,025 |
| |
| The accompanying notes are an integral part of the financial statements. | 264 |
John Hancock Funds II
Portfolio of investments — August 31, 2007
(showing percentage of total net assets)
| | | | |
| Investment Quality Bond Fund (continued) | | |
| | | Shares or | | |
| | | Principal | | |
| | | Amount | | Value |
|
|
| |
| CORPORATE BONDS (continued) | | | | |
| | | | | |
| Electrical Utilities (continued) | | | | |
| Reliant Energy, Inc. | | | | |
| 6.75% due 12/15/2014 | $ | 10,000 | $ | 9,900 |
| Southern California Edison Company | | | | |
| 6.00% due 01/15/2034 | | 201,000 | | 198,130 |
| TXU Corp., Series O | | | | |
| 4.80% due 11/15/2009 | | 74,000 | | 72,609 |
| TXU Corp., Series P | | | | |
| 5.55% due 11/15/2014 | | 26,000 | | 21,330 |
| Union Electric Company | | | | |
| 6.40% due 06/15/2017 | | 560,000 | | 580,806 |
| Wisconsin Electric Power Company | | | | |
| 6.50% due 06/01/2028 | | 94,000 | | 99,075 |
| Wisconsin Energy Corp. | | | | |
| 6.20% due 04/01/2033 | | 33,000 | | 32,503 |
| |
|
| | | | | 3,521,234 |
| Electronics - 0.13% | | | | |
| Avnet, Inc. | | | | |
| 6.625% due 09/15/2016 | | 200,000 | | 202,907 |
| Sanmina-SCI Corp. | | | | |
| 8.11% due 06/15/2010 (b) | | 15,000 | | 14,813 |
| |
|
| | | | | 217,720 |
| Energy - 0.58% | | | | |
| Abu Dhabi National Energy Company | | | | |
| 5.875% due 10/27/2016 | | 110,000 | | 109,469 |
| 6.50% due 10/27/2036 | | 375,000 | | 370,660 |
| Aquila, Inc. | | | | |
| 9.95 due 02/01/2011 | | 10,000 | | 10,798 |
| 11.875% due 07/01/2012 | | 20,000 | | 25,050 |
| Midamerican Funding LLC | | | | |
| 6.75% due 03/01/2011 | | 260,000 | | 274,563 |
| Mirant North America LLC | | | | |
| 7.375% due 12/31/2013 | | 20,000 | | 19,900 |
| NRG Energy, Inc. | | | | |
| 7.25% due 02/01/2014 | | 25,000 | | 24,750 |
| 7.375% due 01/15/2017 | | 5,000 | | 4,912 |
| XTO Energy Inc | | | | |
| 6.75% due 08/01/2037 | | 120,000 | | 122,954 |
| |
|
| | | | | 963,056 |
| Financial Services - 8.30% | | | | |
| AGFC Capital Trust I | | | | |
| 6.00% due 01/15/2067 (b) | | 170,000 | | 162,455 |
| AMBAC Financial Group, Inc. | | | | |
| 5.95% due 12/05/2035 | | 185,000 | | 153,756 |
| American Financial Group, Inc. | | | | |
| 7.125% due 04/15/2009 | | 245,000 | | 252,693 |
| American General Finance Corp. | | | | |
| 5.375% due 10/01/2012 | | 154,000 | | 151,559 |
| Arch Western Finance LLC | | | | |
| 6.75% due 07/01/2013 | | 26,000 | | 24,602 |
| Associates Corp. of North America | | | | |
| 8.55% due 07/15/2009 | | 81,000 | | 85,414 |
| Beneficial Corp. | | | | |
| 8.40% due 05/15/2008 | | 47,000 | | 48,106 |
| Capital One Capital IV | | | | |
| 6.745% due 02/17/2037 (b) | | 125,000 | | 104,345 |
| | | | |
| Investment Quality Bond Fund (continued) | |
| | | Shares or | | |
| | | Principal | | |
| | | Amount | | Value |
|
|
| |
| CORPORATE BONDS (continued) | | | | |
| | | | | |
| Financial Services (continued) | | | | |
| Capmark Financial Group, Inc. | | | | |
| 5.875% due 05/10/2012 | $ | 330,000 | $ | 292,265 |
| 6.30% due 05/10/2017 | | 90,000 | | 73,105 |
| CIT Group, Inc. | | | | |
| 5.00% due 02/01/2015 | | 300,000 | | 253,108 |
| Citigroup, Inc. | | | | |
| 4.875% due 05/07/2015 | | 586,000 | | 557,954 |
| 5.50% due 08/27/2012 | | 700,000 | | 700,356 |
| 6.00% due 08/15/2017 | | 485,000 | | 490,923 |
| Countrywide Financial Corp. | | | | |
| 4.50% due 06/15/2010 | | 70,000 | | 65,164 |
| 5.80% due 06/07/2012 | | 510,000 | | 479,267 |
| 6.25% due 05/15/2016 | | 145,000 | | 128,684 |
| Countrywide Home Loan | | | | |
| 4.00% due 03/22/2011 | | 105,000 | | 93,977 |
| Discover Financial Services | | | | |
| 6.45% due 06/12/2017 | | 300,000 | | 296,142 |
| E*Trade Financial Corp. | | | | |
| 7.375% due 09/15/2013 | | 2,000 | | 1,780 |
| 8.00% due 06/15/2011 | | 3,000 | | 2,865 |
| Equitable Companies, Inc. | | | | |
| 7.00% due 04/01/2028 | | 235,000 | | 256,791 |
| Erac USA Finance Company | | | | |
| 8.00% due 01/15/2011 | | 534,000 | | 574,286 |
| Farmers Exchange Capital | | | | |
| 7.05% due 07/15/2028 | | 350,000 | | 352,686 |
| Ford Motor Credit Company | | | | |
| 6.625% due 06/16/2008 | | 20,000 | | 19,400 |
| 7.00% due 10/01/2013 | | 21,000 | | 18,702 |
| GATX Financial Corp. | | | | |
| 5.50% due 02/15/2012 | | 200,000 | | 199,079 |
| General Electric Capital Corp. | | | | |
| 6.125% due 02/22/2011 | | 67,000 | | 69,304 |
| 6.75% due 03/15/2032 | | 634,000 | | 696,377 |
| General Motors Acceptance Corp. | | | | |
| 8.00% due 11/01/2031 | | 165,000 | | 148,230 |
| Goldman Sachs Group, Inc. | | | | |
| 5.625% due 01/15/2017 | | 1,200,000 | | 1,147,033 |
| 6.875% due 01/15/2011 | | 208,000 | | 216,851 |
| International Lease Finance Corp. | | | | |
| 5.875% due 05/01/2013 | | 150,000 | | 152,663 |
| Janus Capital Group, Inc. | | | | |
| 6.25% due 06/15/2012 | | 100,000 | | 101,352 |
| JP Morgan Chase & Company | | | | |
| 5.15% due 10/01/2015 | | 200,000 | | 190,717 |
| JP Morgan Chase Capital XV | | | | |
| 5.875% due 03/15/2035 | | 467,000 | | 414,126 |
| KAR Holdings, Inc. | | | | |
| 10.00% due 05/01/2015 | | 10,000 | | 8,950 |
| Lazard Group | | | | |
| 6.85% due 06/15/2017 | | 660,000 | | 651,619 |
| Merrill Lynch & Company, Inc. | | | | |
| 5.70% due 05/02/2017 | | 125,000 | | 120,352 |
| 6.05% due 05/16/2016 | | 250,000 | | 248,474 |
| 6.11% due 01/29/2037 | | 490,000 | | 454,553 |
| 6.40% due 08/28/2017 | | 500,000 | | 509,585 |
| |
| The accompanying notes are an integral part of the financial statements. | 265 |
John Hancock Funds II
Portfolio of investments — August 31, 2007
(showing percentage of total net assets)
| | | | |
| Investment Quality Bond Fund (continued) | | |
| | | Shares or | | |
| | | Principal | | |
| | | Amount | | Value |
|
|
| |
| CORPORATE BONDS (continued) | | | | |
| | | | | |
| Financial Services (continued) | | | | |
| Mizuho Financial Group, Cayman | | | | |
| 5.79% due 04/15/2014 | $ | 246,000 | $ | 244,256 |
| Morgan Stanley | | | | |
| 4.75% due 04/01/2014 | | 401,000 | | 374,863 |
| 5.55% due 04/27/2017 | | 225,000 | | 216,637 |
| 6.25% due 08/28/2017 | | 270,000 | | 272,800 |
| 6.75% due 04/15/2011 | | 106,000 | | 110,474 |
| Morgan Stanley Dean Witter | | | | |
| 6.60% due 04/01/2012 | | 135,000 | | 139,887 |
| NiSource Finance Corp. | | | | |
| 6.40% due 03/15/2018 | | 120,000 | | 120,007 |
| Sun Canada Financial Company | | | | |
| 7.25% due 12/15/2015 | | 229,000 | | 250,277 |
| Sunamerica, Inc. | | | | |
| 8.125% due 04/28/2023 | | 135,000 | | 161,687 |
| TIAA Global Markets | | | | |
| 4.125% due 11/15/2007 | | 200,000 | | 199,368 |
| UFJ Finance Aruba AEC | | | | |
| 6.75% due 07/15/2013 | | 111,000 | | 114,934 |
| United States Bancorp Oregon | | | | |
| 7.50% due 06/01/2026 | | 525,000 | | 600,004 |
| |
|
| | | | | 13,774,844 |
| Food & Beverages - 0.67% | | | | |
| Cia Brasileira de Bebidas | | | | |
| 8.75% due 09/15/2013 | | 246,000 | | 277,365 |
| ConAgra Foods, Inc. | | | | |
| 5.819% due 06/15/2017 | | 74,000 | | 72,851 |
| 6.75% due 09/15/2011 | | 46,000 | | 48,033 |
| Kraft Foods, Inc. | | | | |
| 5.625% due 11/01/2011 | | 160,000 | | 160,662 |
| 6.50% due 11/01/2031 | | 266,000 | | 257,179 |
| Smithfield Foods, Inc., Series B | | | | |
| 7.75% due 05/15/2013 | | 10,000 | | 10,050 |
| Tyson Foods, Inc. | | | | |
| 6.60% due 04/01/2016 | | 125,000 | | 130,390 |
| YUM Brands, Inc. | | | | |
| 7.65% due 05/15/2008 | | 147,000 | | 148,868 |
| |
|
| | | | | 1,105,398 |
| Forest Products - 0.22% | | | | |
| Weyerhaeuser Company | | | | |
| 6.75% due 03/15/2012 | | 308,000 | | 317,567 |
| 7.95% due 03/15/2025 | | 40,000 | | 43,126 |
| |
|
| | | | | 360,693 |
| Gas & Pipeline Utilities - 0.17% | | | | |
| El Paso Natural Gas | | | | |
| 5.95% due 04/15/2017 | | 25,000 | | 24,387 |
| Kinder Morgan Energy Partners LP | | | | |
| 7.125% due 03/15/2012 | | 208,000 | | 218,322 |
| Williams Companies, Inc. | | | | |
| 7.125% due 09/01/2011 | | 13,000 | | 13,422 |
| 8.125% due 03/15/2012 | | 26,000 | | 27,885 |
| |
|
| | | | | 284,016 |
| | | | |
| Investment Quality Bond Fund (continued) | | |
| | | Shares or | | |
| | | Principal | | |
| | | Amount | | Value |
|
|
| |
| CORPORATE BONDS (continued) | | | | |
| | | | | |
| Healthcare Products - 0.01% | | | | |
| Universal Hospital Services, Inc., PIK | | | | |
| 8.50% due 06/01/2015 | $ | 10,000 | $ | 9,500 |
| | | | | |
| Healthcare Services - 0.00% | | | | |
| DaVita, Inc. | | | | |
| 6.625% due 03/15/2013 | | 2,000 | | 1,935 |
| 7.25% due 03/15/2015 | | 2,000 | | 1,960 |
| |
|
| | | | | 3,895 |
| Homebuilders - 0.52% | | | | |
| Centex Corp. | | | | |
| 7.875% due 02/01/2011 | | 260,000 | | 265,362 |
| D.R. Horton, Inc. | | | | |
| 7.875% due 08/15/2011 | | 370,000 | | 363,155 |
| 9.75% due 09/15/2010 | | 14,000 | | 14,434 |
| Pulte Homes, Inc. | | | | |
| 7.875% due 08/01/2011 | | 100,000 | | 99,559 |
| 8.125% due 03/01/2011 | | 125,000 | | 124,125 |
| |
|
| | | | | 866,635 |
| Hotels & Restaurants - 0.05% | | | | |
| Buffalo Thunder Development Authority | | | | |
| 9.375% due 12/15/2014 | | 20,000 | | 18,800 |
| Wyndham Worldwide Corp. | | | | |
| 6.00% due 12/01/2016 | | 60,000 | | 58,624 |
| |
|
| | | | | 77,424 |
| Household Products - 0.21% | | | | |
| Procter & Gamble, Series A | | | | |
| 9.36% due 01/01/2021 | | 285,474 | | 356,046 |
| | | | | |
| Industrials - 0.00% | | | | |
| Goodman Global Holding Company, Inc. | | | | |
| 7.875% due 12/15/2012 | | 5,000 | | 4,950 |
| | | | | |
| Insurance - 3.22% | | | | |
| AAG Holding Company, Inc. | | | | |
| 6.875% due 06/01/2008 | | 231,000 | | 231,666 |
| ACE Capital Trust II | | | | |
| 9.70% due 04/01/2030 | | 248,000 | | 310,456 |
| ACE INA Holdings, Inc. | | | | |
| 5.875% due 06/15/2014 | | 125,000 | | 125,919 |
| AIG SunAmerica Global Financing X | | | | |
| 6.90% due 03/15/2032 | | 100,000 | | 110,380 |
| Allied World Assurance Holdings, Ltd. | | | | |
| 7.50% due 08/01/2016 | | 145,000 | | 153,715 |
| Equitable Life Assurance Society | | | | |
| 7.70% due 12/01/2015 | | 250,000 | | 282,768 |
| Everest Reinsurance Holdings, Inc. | | | | |
| 6.50% due 05/15/2037 | | 495,000 | | 456,796 |
| 8.75% due 03/15/2010 | | 294,000 | | 317,144 |
| Fidelity National Title Group, Inc. | | | | |
| 7.30% due 08/15/2011 | | 81,000 | | 85,884 |
| Hartford Financial Services Group, Inc. | | | | |
| 7.90% due 06/15/2010 | | 27,000 | | 29,074 |
| Jackson National Life Insurance Company | | | | |
| 8.15% due 03/15/2027 | | 377,000 | | 448,101 |
| Liberty Mutual Insurance Company | | | | |
| 7.697% due 10/15/2097 | | 700,000 | | 627,901 |
| |
| The accompanying notes are an integral part of the financial statements. | 266 |
John Hancock Funds II
Portfolio of investments — August 31, 2007
(showing percentage of total net assets)
| | | | |
| Investment Quality Bond Fund (continued) | | |
| | | Shares or | | |
| | | Principal | | |
| | | Amount | | Value |
|
|
| |
| CORPORATE BONDS (continued) | | | | |
| | | | | |
| Insurance (continued) | | | | |
| Metlife, Inc. | | | | |
| 5.375% due 12/15/2012 | $ | 150,000 | $ | 151,201 |
| 5.70% due 06/15/2035 | | 208,000 | | 191,357 |
| Nationwide Mutual Insurance Company | | | | |
| 8.25% due 12/01/2031 | | 260,000 | | 314,739 |
| Navigators Group, Inc. | | | | |
| 7.00% due 05/01/2016 | | 59,000 | | 61,001 |
| Ohio National Life Insurance Company | | | | |
| 8.50% due 05/15/2026 | | 155,000 | | 177,786 |
| Premium Asset Trust | | | | |
| 4.125% due 03/12/2009 | | 87,000 | | 83,314 |
| Principal Life Global Funding I | | | | |
| 6.125% due 10/15/2033 | | 108,000 | | 109,332 |
| Reinsurance Group of America, Inc. | | | | |
| 6.75% due 12/15/2011 | | 135,000 | | 140,286 |
| Unitrin, Inc. | | | | |
| 6.00% due 05/15/2017 | | 250,000 | | 251,572 |
| UnumProvident Finance Company, PLC | | | | |
| 6.85% due 11/15/2015 | | 125,000 | | 126,598 |
| W.R. Berkley Corp. | | | | |
| 5.125% due 09/30/2010 | | 54,000 | | 54,191 |
| 5.60% due 05/15/2015 | | 263,000 | | 257,417 |
| Willis North America, Inc. | | | | |
| 6.20% due 03/28/2017 | | 240,000 | | 239,475 |
| |
|
| | | | | 5,338,073 |
| International Oil - 0.17% | | | | |
| Canadian Natural Resources, Ltd. | | | | |
| 6.45% due 06/30/2033 | | 37,000 | | 36,497 |
| Canadian Oil Sands | | | | |
| 7.90% due 09/01/2021 | | 135,000 | | 151,010 |
| Newfield Exploration Company | | | | |
| 6.625% due 04/15/2016 | | 10,000 | | 9,550 |
| Pioneer Natural Resources Company | | | | |
| 6.65% due 03/15/2017 | | 85,000 | | 78,015 |
| 6.875% due 05/01/2018 | | 15,000 | | 13,861 |
| |
|
| | | | | 288,933 |
| Leisure Time - 0.13% | | | | |
| AMC Entertainment, Inc. | | | | |
| 11.00% due 02/01/2016 | | 15,000 | | 15,600 |
| Majestic Star Casino LLC | | | | |
| 9.75% due 01/15/2011 | | 30,000 | | 25,500 |
| MGM Mirage, Inc. | | | | |
| 6.00% due 10/01/2009 | | 100,000 | | 99,125 |
| OED Corp./ Diamond Jo | | | | |
| 8.75% due 04/15/2012 | | 15,000 | | 14,850 |
| Park Place Entertainment Corp. | | | | |
| 8.125% due 05/15/2011 | | 24,000 | | 23,760 |
| Seneca Gaming Corp. | | | | |
| 7.25% due 05/01/2012 | | 10,000 | | 10,050 |
| Station Casinos, Inc. | | | | |
| 6.00% due 04/01/2012 | | 5,000 | | 4,637 |
| 6.625% due 03/15/2018 | | 5,000 | | 4,025 |
| 6.875% due 03/01/2016 | | 11,000 | | 9,212 |
| | | | |
| Investment Quality Bond Fund (continued) | | |
| | | Shares or | | |
| | | Principal | | |
| | | Amount | | Value |
|
|
| |
| CORPORATE BONDS (continued) | | | | |
| | | | | |
| Leisure Time (continued) | | | | |
| Wynn Las Vegas LLC | | | | |
| 6.625% due 12/01/2014 | $ | 9,000 | $ | 8,708 |
| |
|
| | | | | 215,467 |
| Liquor - 0.32% | | | | |
| Constellation Brands, Inc. | | | | |
| 7.25% due 09/01/2016 | | 15,000 | | 14,550 |
| 7.25% due 05/15/2017 | | 5,000 | | 4,850 |
| Miller Brewing Company | | | | |
| 5.50% due 08/15/2013 | | 390,000 | | 393,942 |
| Molson Coors Capital Financial | | | | |
| 4.85% due 09/22/2010 | | 117,000 | | 114,674 |
| |
|
| | | | | 528,016 |
| Manufacturing - 0.05% | | | | |
| Tyco International Group SA | | | | |
| 6.75% due 02/15/2011 | | 85,000 | | 89,280 |
| | | | | |
| Medical-Hospitals - 0.30% | | | | |
| Community Health Systems, Inc. | | | | |
| 8.875% due 07/15/2015 | | 10,000 | | 9,988 |
| HCA, Inc. | | | | |
| 6.375% due 01/15/2015 | | 20,000 | | 16,300 |
| 7.875% due 02/01/2011 | | 20,000 | | 19,350 |
| 9.625% due 11/15/2016 | | 20,000 | | 20,675 |
| Quest Diagnostics, Inc. | | | | |
| 5.45% due 11/01/2015 | | 125,000 | | 120,140 |
| 6.95% due 07/01/2037 | | 180,000 | | 185,508 |
| 7.50% due 07/12/2011 | | 100,000 | | 106,663 |
| Tenet Healthcare Corp. | | | | |
| 9.875% due 07/01/2014 | | 20,000 | | 17,700 |
| |
|
| | | | | 496,324 |
| Metal & Metal Products - 0.14% | | | | |
| Inco, Ltd. | | | | |
| 5.70% due 10/15/2015 | | 233,000 | | 228,109 |
| | | | | |
| Mining - 0.14% | | | | |
| Corporacion Nacional Del Cobre de Chile - | | | | |
| CODELCO | | | | |
| 6.375% due 11/30/2012 | | 200,000 | | 209,146 |
| Freeport-McMoRan Copper & Gold, Inc. | | | | |
| 8.25% due 04/01/2015 | | 5,000 | | 5,300 |
| 8.375% due 04/01/2017 | | 25,000 | | 26,625 |
| |
|
| | | | | 241,071 |
| Newspapers - 0.08% | | | | |
| News America Holdings, Inc. | | | | |
| 9.25% due 02/01/2013 | | 109,000 | | 126,259 |
| | | | | |
| Office Furnishings & Supplies - 0.00% | | | | |
| IKON Office Solutions, Inc. | | | | |
| 7.75% due 09/15/2015 | | 5,000 | | 4,969 |
| | | | | |
| Paper - 0.15% | | | | |
| Alto Parana SA | | | | |
| 6.375% due 06/09/2017 | | 90,000 | | 91,188 |
| Georgia-Pacific Corp. | | | | |
| 7.00% due 01/15/2015 | | 30,000 | | 28,350 |
| |
| The accompanying notes are an integral part of the financial statements. | 267 |
John Hancock Funds II
Portfolio of investments — August 31, 2007
(showing percentage of total net assets)
| | | | |
| Investment Quality Bond Fund (continued) | | |
| | | Shares or | | |
| | | Principal | | |
| | | Amount | | Value |
|
|
| |
| CORPORATE BONDS (continued) | | | | |
| | | | | |
| Paper (continued) | | | | |
| Temple-Inland, Inc. | | | | |
| 6.625% due 01/15/2018 | $ | 125,000 | $ | 123,891 |
| |
|
| | | | | 243,429 |
| Petroleum Services - 0.34% | | | | |
| Halliburton Company | | | | |
| 5.50% due 10/15/2010 | | 192,000 | | 194,282 |
| Noram Energy Corp. | | | | |
| 6.50% due 02/01/2008 | | 138,000 | | 138,157 |
| Petroleum Export, Ltd. | | | | |
| 5.265% due 06/15/2011 | | 98,694 | | 97,673 |
| Pride International, Inc. | | | | |
| 7.375% due 07/15/2014 | | 5,000 | | 5,050 |
| Tesoro Corp. | | | | |
| 6.50% due 06/01/2017 | | 135,000 | | 131,287 |
| |
|
| | | | | 566,449 |
| Pharmaceuticals - 0.28% | | | | |
| AmerisourceBergen Corp. | | | | |
| 5.875% due 09/15/2015 | | 420,000 | | 406,497 |
| Elan Finance PLC/Elan Finance Corp. | | | | |
| 7.75% due 11/15/2011 | | 40,000 | | 39,000 |
| Mylan Laboratories, Inc. | | | | |
| 6.375% due 08/15/2015 | | 4,000 | | 4,000 |
| Omnicare, Inc. | | | | |
| 6.75% due 12/15/2013 | | 5,000 | | 4,650 |
| 6.875% due 12/15/2015 | | 5,000 | | 4,663 |
| |
|
| | | | | 458,810 |
| Publishing - 0.11% | | | | |
| Dex Media, Inc. | | | | |
| zero coupon, Step up to 9.00% on | | | | |
| 11/15/2008 due 11/15/2013 | | 7,000 | | 6,457 |
| 8.00% due 11/15/2013 | | 25,000 | | 24,812 |
| E.W. Scripps Company | | | | |
| 6.625% due 10/15/2007 | | 67,000 | | 66,994 |
| Idearc, Inc. | | | | |
| 8.00% due 11/15/2016 | | 40,000 | | 39,500 |
| Medianews Group, Inc. | | | | |
| 6.375% due 04/01/2014 | | 10,000 | | 7,475 |
| Scholastic Corp. | | | | |
| 5.00% due 04/15/2013 | | 35,000 | | 30,696 |
| |
|
| | | | | 175,934 |
| Railroads & Equipment - 0.00% | | | | |
| American Railcar Industries, Inc. | | | | |
| 7.50% due 03/01/2014 | | 5,000 | | 4,850 |
| | | | | |
| Real Estate - 2.43% | | | | |
| AMB Property LP, REIT | | | | |
| 5.45% due 12/01/2010 | | 80,000 | | 80,248 |
| 7.50% due 06/30/2018 | | 106,000 | | 116,190 |
| Archstone-Smith Trust, REIT | | | | |
| 5.75% due 03/15/2016 | | 150,000 | | 148,680 |
| AvalonBay Communities, Inc., REIT | | | | |
| 5.50% due 01/15/2012 | | 300,000 | | 301,071 |
| Brandywine Operating Partnership LP, REIT | | | |
| 5.70% due 05/01/2017 | | 285,000 | | 270,893 |
| | | | |
| Investment Quality Bond Fund (continued) | | |
| | | Shares or | | |
| | | Principal | | |
| | | Amount | | Value |
|
|
| |
| CORPORATE BONDS (continued) | | | | |
| | | | | |
| Real Estate (continued) | | | | |
| Developers Diversified Realty Corp., REIT | | | | |
| 4.625% due 08/01/2010 | $ | 55,000 | $ | 53,996 |
| 5.00% due 05/03/2010 | | 25,000 | | 24,900 |
| Duke Realty Corp. LP, REIT | | | | |
| 5.25% due 01/15/2010 | | 275,000 | | 274,034 |
| Equity One, Inc., REIT | | | | |
| 6.00% due 09/15/2017 | | 235,000 | | 229,942 |
| Federal Realty Investment Trust, REIT | | | | |
| 5.65% due 06/01/2016 | | 55,000 | | 53,301 |
| Health Care Property Investors, Inc., REIT | | | | |
| 5.65% due 12/15/2013 | | 150,000 | | 147,005 |
| 6.00% due 03/01/2015 | | 175,000 | | 172,262 |
| 7.072 due 06/08/2015 | | 67,000 | | 70,917 |
| Healthcare Realty Trust, Inc., REIT | | | | |
| 8.125% due 05/01/2011 | | 377,000 | | 402,930 |
| Kimco Realty Corp., REIT | | | | |
| 5.584% due 11/23/2015 | | 125,000 | | 121,831 |
| Liberty Property LP, REIT | | | | |
| 7.25% due 03/15/2011 | | 195,000 | | 202,859 |
| Realty Income Corp., REIT | | | | |
| 6.75% due 08/15/2019 | | 480,000 | | 479,055 |
| Regency Centers LP, REIT | | | | |
| 7.95% due 01/15/2011 | | 169,000 | | 181,024 |
| Rouse Company LP, REIT | | | | |
| 6.75% due 05/01/2013 | | 15,000 | | 14,850 |
| United Dominion Realty Trust, Inc., REIT | | | | |
| 5.25% due 01/15/2016 | | 142,000 | | 135,922 |
| 6.05% due 06/01/2013 | | 200,000 | | 201,680 |
| Ventas Realty LP/Ventas Capital Corp., REIT | | | |
| 6.625% due 10/15/2014 | | 95,000 | | 92,387 |
| 6.75% due 06/01/2010 | | 2,000 | | 1,995 |
| 7.125% due 06/01/2015 | | 3,000 | | 2,992 |
| Westfield Group | | | | |
| 5.40% due 10/01/2012 | | 250,000 | | 246,306 |
| |
|
| | | | | 4,027,270 |
| Retail - 0.31% | | | | |
| CVS Caremark Corp. | | | | |
| 5.75% due 06/01/2017 | | 180,000 | | 175,919 |
| CVS Lease Pass Through Certificate | | | | |
| 5.88% due 01/10/2028 | | 351,916 | | 339,708 |
| |
|
| | | | | 515,627 |
| Retail Grocery - 0.12% | | | | |
| Kroger Company | | | | |
| 6.75% due 04/15/2012 | | 179,000 | | 188,730 |
| Pathmark Stores, Inc. | | | | |
| 8.75% due 02/01/2012 | | 18,000 | | 17,820 |
| |
|
| | | | | 206,550 |
| Retail Trade - 0.47% | | | | |
| Federated Department Stores, Inc. | | | | |
| 6.90% due 04/01/2029 | | 156,000 | | 147,167 |
| Lazy Days RV Center, Inc. | | | | |
| 11.75% due 05/15/2012 | | 9,000 | | 8,145 |
| |
| The accompanying notes are an integral part of the financial statements. | 268 |
John Hancock Funds II
Portfolio of investments — August 31, 2007
(showing percentage of total net assets)
| | | | |
| Investment Quality Bond Fund (continued) | | |
| | | Shares or | | |
| | | Principal | | |
| | | Amount | | Value |
|
|
| |
| CORPORATE BONDS (continued) | | | | |
| | | | | |
| Retail Trade (continued) | | | | |
| Macys Retail Holdings, Inc. | | | | |
| 5.875% due 01/15/2013 | $ | 625,000 | $ | 622,880 |
| |
|
| | | | | 778,192 |
| Sanitary Services - 0.01% | | | | |
| Allied Waste North America, Inc. | | | | |
| 6.50% due 11/15/2010 | | 5,000 | | 4,950 |
| Allied Waste North America, Inc., Series B | | | | |
| 5.75% due 02/15/2011 | | 10,000 | | 9,725 |
| |
|
| | | | | 14,675 |
| Semiconductors - 0.01% | | | | |
| Freescale Semiconductor, Inc., PIK | | | | |
| 9.125% due 12/15/2014 | | 20,000 | | 17,900 |
| | | | | |
| Software - 0.04% | | | | |
| Intuit, Inc. | | | | |
| 5.40% due 03/15/2012 | | 75,000 | | 74,613 |
| | | | | |
| Steel - 0.01% | | | | |
| International Steel Group, Inc. | | | | |
| 6.50% due 04/15/2014 | | 15,000 | | 15,063 |
| | | | | |
| Telecommunications Equipment & | | | | |
| Services - 1.36% | | | | |
| AT&T, Inc. | | | | |
| 6.50% due 09/01/2037 | | 400,000 | | 400,572 |
| Bellsouth Corp. | | | | |
| 4.75% due 11/15/2012 | | 302,000 | | 292,410 |
| Citizens Communications Company | | | | |
| 9.25% due 05/15/2011 | | 22,000 | | 23,595 |
| Deutsche Telekom International Finance BV | | | |
| 8.75% due 06/15/2030 (b) | | 500,000 | | 603,921 |
| GCI, Inc. | | | | |
| 7.25% due 02/15/2014 | | 15,000 | | 13,875 |
| Intelsat Bermuda, Ltd. | | | | |
| 9.25% due 06/15/2016 | | 10,000 | | 10,300 |
| Intelsat Subsidiary Holding Company, Ltd. | | | | |
| 8.25% due 01/15/2013 | | 17,000 | | 17,085 |
| 8.63% due 01/15/2015 | | 7,000 | | 7,044 |
| PanAmSat Corp. | | | | |
| 9.00% due 08/15/2014 | | 1,000 | | 1,017 |
| SBC Communications, Inc. | | | | |
| 5.625% due 06/15/2016 | | 740,000 | | 729,969 |
| 5.875% due 08/15/2012 | | 150,000 | | 152,535 |
| |
|
| | | | | 2,252,323 |
| Telephone - 1.68% | | | | |
| Ameritech Capital Funding Corp. | | | | |
| 6.45% due 01/15/2018 | | 148,000 | | 154,664 |
| British Telecommunications PLC | | | | |
| 8.625% due 12/15/2010 (b) | | 156,000 | | 171,102 |
| Qwest Corp. | | | | |
| 7.50% due 10/01/2014 | | 25,000 | | 25,625 |
| Sprint Capital Corp. | | | | |
| 7.625% due 01/30/2011 | | 430,000 | | 456,735 |
| 8.375% due 03/15/2012 | | 300,000 | | 331,494 |
| 8.75% due 03/15/2032 | | 125,000 | | 144,292 |
| Telecom Italia Capital SA | | | | |
| 6.00% due 09/30/2034 | | 409,000 | | 374,897 |
| | | | |
| Investment Quality Bond Fund (continued) | | |
| | | Shares or | | |
| | | Principal | | |
| | | Amount | | Value |
| |
|
| |
| CORPORATE BONDS (continued) | | | | |
| | | | | |
| Telephone (continued) | | | | |
| Telecom Italia Capital SA (continued) | | | | |
| 6.375% due 11/15/2033 | $ | 175,000 | $ | 166,985 |
| Telefonica Emisones SAU | | | | |
| 7.045% due 06/20/2036 | | 175,000 | | 182,199 |
| Verizon Communications, Inc. | | | | |
| 5.55% due 02/15/2016 | | 420,000 | | 413,244 |
| 8.75% due 11/01/2021 | | 285,000 | | 349,935 |
| Windstream Corp. | | | | |
| 8.625% due 08/01/2016 | | 20,000 | | 20,900 |
| |
|
| | | | | 2,792,072 |
| |
| Tobacco - 0.25% | | | | |
| Alliance One International, Inc. | | | | |
| 11.00% due 05/15/2012 | | 12,000 | | 12,540 |
| Altria Group, Inc. | | | | |
| 7.00% due 11/04/2013 | | 269,000 | | 291,307 |
| Reynolds American, Inc. | | | | |
| 7.25% due 06/01/2013 | | 95,000 | | 98,385 |
| 7.30% due 07/15/2015 | | 6,000 | | 6,146 |
| |
|
| | | | | 408,378 |
| |
| Transportation - 0.27% | | | | |
| DP World, Ltd. | | | | |
| 6.85% due 07/02/2037 | | 450,000 | | 443,863 |
|
| TOTAL CORPORATE BONDS (Cost $59,624,548) | $ | | 58,070,730 |
|
| |
| MUNICIPAL BONDS - 0.48% | | | | |
| | | | | |
| Arizona - 0.08% | | | | |
| Phoenix Arizona Civic Improvement Corp. | | | | |
| 6.30% due 07/01/2008 | | 135,000 | | 136,432 |
| | | | | |
| California - 0.12% | | | | |
| Southern California Public Power Authority Project, | | | |
| Series B | | | | |
| 6.93% due 05/15/2017 | | 175,000 | | 195,423 |
| | | | | |
| Florida - 0.09% | | | | |
| Miami Beach Florida Redevelopment Agency Tax | | | |
| Increment Revenue | | | | |
| 8.95% due 12/01/2022 | | 135,000 | | 155,039 |
| | | | | |
| Indiana - 0.01% | | | | |
| Indiana Bond Bank Revenue | | | | |
| 5.02% due 01/15/2016 | | 15,000 | | 14,531 |
| | | | | |
| Maryland - 0.02% | | | | |
| Maryland State Transportation Authority, Ltd. | | | |
| 5.84% due 07/01/2011 | | 40,000 | | 41,163 |
| | | | | |
| Michigan - 0.11% | | | | |
| Detroit Michigan Downtown Development Authority | | | |
| 6.20% due 07/01/2008 | | 180,000 | | 181,764 |
| | | | | |
| New Jersey - 0.01% | | | | |
| Jersey City, NJ, Municipal Utilities Authority | | | |
| 4.55% due 05/15/2012 | | 20,000 | | 19,383 |
| |
| The accompanying notes are an integral part of the financial statements. | 269 |
John Hancock Funds II
Portfolio of investments — August 31, 2007
(showing percentage of total net assets)
| | | | |
| Investment Quality Bond Fund (continued) | | |
| | | Shares or | | |
| | | Principal | | |
| | | Amount | | Value |
| |
|
| | |
| |
| MUNICIPAL BONDS (continued) | | | | |
| | | | | |
| New York - 0.04% | | | | |
| Sales Tax Asset Receivable Corp., Series B | | | |
| 4.25% due 10/15/2011 | $ | 65,000 | $ | 63,018 |
|
| TOTAL MUNICIPAL BONDS (Cost $835,011) | | $ | 806,753 |
|
| |
| COLLATERALIZED MORTGAGE | | | | |
| OBLIGATIONS - 11.92% | | | | |
| | | | |
| American Tower Trust, Series 2007-1A, Class AFX | | | |
| 5.419% due 04/15/2037 | | 300,000 | | 298,723 |
| Asset Securitization Corp., | | | | |
| Series 1997-D5, Class A1D | | | | |
| 6.85% due 02/14/2043 | | 500,000 | | 514,495 |
| Banc of America Commercial Mortgage, Inc, Series | | | |
| 2006-2, Class A4 | | | | |
| 5.93% due 05/10/2045 (b) | | 1,000,000 | | 1,010,423 |
| Banc of America Commercial Mortgage, Inc., | | | |
| Series 2002-PB2 Class A4 | | | | |
| 6.186% due 06/11/2035 | | 405,797 | | 415,701 |
| Bear Stearns Commercial Mortgage Securities, | | | |
| Inc., Series 2003-T12, Class A4 | | | | |
| 4.68% due 08/13/2039 | | 405,797 | | 388,810 |
| Bear Stearns Commercial Mortgage Securities, | | | |
| Series 2005-PWR9, Class A4A | | | | |
| 4.871% due 09/11/2042 | | 560,000 | | 535,358 |
| Bear Stearns Commercial Mortgage Securities, | | | |
| Series 2006-PW12, Class AM | | | | |
| 5.934% due 09/11/2038 (b) | | 500,000 | | 505,069 |
| Bear Stearns Commercial Mortgage Securities, | | | |
| Inc., Series 2005-T20, Class A4A | | | | |
| 5.30% due 10/12/2042 (b) | | 500,000 | | 488,941 |
| Chase Commercial Mortgage Securities Corp., | | | |
| Series 1998-1, Class A2 | | | | |
| 6.56% due 05/18/2030 | | 313,701 | | 313,682 |
| Chase Commercial Mortgage Securities Corp., | | | |
| Series 1998-2, Class A2 | | | | |
| 6.39% due 11/18/2030 | | 300,972 | | 302,533 |
| Citigroup/Deutsche Bank Commercial | | | | |
| Mortgage Trust, Series 2005-CD1, Class A4 | | | |
| 5.225% due 07/15/2044 (b) | | 500,000 | | 491,731 |
| Commercial Mortgage Asset Trust, Series | | | | |
| 1999-C1, Class A3 | | | | |
| 6.64% due 01/17/2032 | | 392,605 | | 398,065 |
| Commercial Mortgage Pass Through Certificates, | | | |
| Series 2005-C6, Class A5A | | | | |
| 5.116% due 06/10/2044 (b) | | 500,000 | | 485,280 |
| Commercial Mortgage Pass Through Certificates, | | | |
| Series 2006-C7, Class A4 | | | | |
| 5.96% due 06/10/2046 (b) | | 500,000 | | 506,327 |
| Credit Suisse Mortgage Capital Certificates, Series | | | |
| 2006-C1, Class A4 | | | | |
| 5.609% due 02/15/2039 (b) | | 1,000,000 | | 994,249 |
| Credit Suisse Mortgage Capital Certificates, | | | |
| Series 2006-C4, Class A3 | | | | |
| 5.467% due 09/15/2039 | | 1,000,000 | | 984,215 |
| CS First Boston Mortgage Securities Corp, Series | | | |
| 2003-C3, Class A5 | | | | |
| 3.936% due 05/15/2038 | | 500,000 | | 462,269 |
| | | | |
| Investment Quality Bond Fund (continued) | | |
| | | Shares or | | |
| | | Principal | | |
| | | Amount | | Value |
| |
|
| |
| COLLATERALIZED MORTGAGE | | | | |
| OBLIGATIONS (continued) | | | | |
| First Union - Chase Commercial Mortgage, | | | |
| Series 1999-C2, Class A2 | | | | |
| 6.645% due 06/15/2031 | $ | 350,968 | $ | 354,991 |
| General Electric Capital Assurance Company, | | | |
| Series 2003-1, Class A5 | | | | |
| 5.743% due 05/12/2035 | | 89,275 | | 89,766 |
| Government National Mortgage Association, Series | | | |
| 2006-38, Class XS | | | | |
| 1.6613% IO due 09/16/2035 (b) | | 88,630 | | 5,932 |
| Greenwich Capital Commercial Funding Corp., | | | |
| Series 2005-GG5, Class A5 | | | | |
| 5.224% due 04/10/2037 (b) | | 500,000 | | 489,115 |
| GS Mortgage Securities Corp. II, Series 2006-GG6, | | | |
| Class A4 | | | | |
| 5.553% due 04/10/2038 (b) | | 1,000,000 | | 994,625 |
| GS Mortgage Securities Corp. II, | | | | |
| Series 2006-GG8, Class A4 | | | | |
| 5.56% due 11/10/2039 (b) | | 1,200,000 | | 1,190,533 |
| JP Morgan Chase Commercial Mortgage Securities | | | |
| Corp, Series 2004-CBX, Class A6 | | | | |
| 4.899% due 01/12/2037 | | 315,000 | | 303,436 |
| JP Morgan Chase Commercial Mortgage Securities | | | |
| Corp, Series 2007-CB18, Class A4 | | | | |
| 5.44% due 06/12/2047 | | 1,200,000 | | 1,173,974 |
| JP Morgan Chase Commercial Mortgage Securities | | | |
| Corp., Series 2006-LDP7, Class A4 | | | | |
| 6.0656% due 04/15/2045 (b) | | 500,000 | | 509,730 |
| JP Morgan Chase Commercial Mortgage | | | | |
| Securities Corp., Series 2005-LDP4, Class A4 | | | |
| 4.918% due 10/15/2042 (b) | | 940,000 | | 900,090 |
| LB-UBS Commercial Mortgage Trust, | | | | |
| Series 2001-C7, Class A3 | | | | |
| 5.642% due 12/15/2025 | | 196,819 | | 197,383 |
| LB-UBS Commercial Mortgage Trust, | | | | |
| Series 2002-C1,Class A4 | | | | |
| 6.462% due 03/15/2031 | | 202,898 | | 210,305 |
| LB-UBS Commercial Mortgage Trust, | | | | |
| Series 2006-C4, Class A4 | | | | |
| 6.0809% due 06/15/2038 (b) | | 500,000 | | 510,312 |
| Merrill Lynch Mortgage Trust, Series 2005-CIP1, | | | |
| Class A4 | | | | |
| 5.047% due 07/12/2038 (b) | | 500,000 | | 483,025 |
| Merrill Lynch Mortgage Trust, Series 2006-C1, | | | |
| Class A4 | | | | |
| 5.8426% due 05/12/2039 (b) | | 500,000 | | 503,172 |
| Morgan Stanley Capital I, Inc., Series 1998-WF2, | | | |
| Class A2 | | | | |
| 6.54% due 07/15/2030 | | 75,913 | | 75,912 |
| Morgan Stanley Capital I, Inc., Series 1999-WF1, | | | |
| Class A2 | | | | |
| 6.21% due 11/15/2031 | | 328,865 | | 329,593 |
| Morgan Stanley Capital I, Series 2007-HQ11, | | | |
| Class A4 | | | | |
| 5.447% due 02/12/2044 (b) | | 1,000,000 | | 978,815 |
| Morgan Stanley Dean Witter Capital I, Series | | | |
| 2001-TOP5, Class A4 | | | | |
| 6.39% due 10/15/2035 | | 270,531 | | 278,738 |
| |
| The accompanying notes are an integral part of the financial statements. | 270 |
John Hancock Funds II
Portfolio of investments — August 31, 2007
(showing percentage of total net assets)
| | | | |
| Investment Quality Bond Fund (continued) | | |
| | | Shares or | | |
| | | Principal | | |
| | | Amount | | Value |
| |
|
| |
| COLLATERALIZED MORTGAGE | | | | |
| OBLIGATIONS (continued) | | | | |
| Morgan Stanley Dean Witter Capital I, | | | | |
| Series 2001, Class A4 | | | | |
| 6.39% due 07/15/2033 | $ | 113,623 | $ | 116,884 |
| Morgan Stanley Dean Witter | | | | |
| Capital I, Series 2002-TOP7, Class A2 | | | | |
| 5.98% due 01/15/2039 | | 40,579 | | 41,241 |
| Nomura Asset Securities Corp., | | | | |
| Series 1998-D6, Class A1B | | | | |
| 6.59% due 03/15/2030 | | 349,629 | | 350,362 |
| Prudential Commercial Mortgage Trust, Series | | | |
| 2003-PWR1, Class A1 | | | | |
| 3.669% due 02/11/2036 | | 210,680 | | 203,601 |
| Prudential Commercial Mortgage Trust, | | | | |
| Series 2003-PWR1, Class A2 | | | | |
| 4.493% due 02/11/2036 | | 405,797 | | 386,287 |
|
| TOTAL COLLATERALIZED MORTGAGE OBLIGATIONS | | |
| (Cost $19,932,879) | | $ | | 19,773,693 |
|
| |
| ASSET BACKED SECURITIES - 5.13% | | | |
| Advanta Business Card Master Trust, | | | | |
| Series 2005-A4, Class A4 | | | | |
| 4.75% due 01/20/2011 | | 370,000 | | 368,680 |
| AESOP Funding II LLC, Series 2003-4, Class A | | | |
| 2.86% due 08/20/2009 | | 235,000 | | 230,599 |
| AmeriCredit Automobile Receivables Trust, | | | |
| Series 2005-AX, Class A4 | | | | |
| 3.93% due 10/06/2011 | | 700,000 | | 690,370 |
| Capital One Multi-Asset Execution Trust, | | | | |
| Series 2003-A4, Class A4 | | | | |
| 3.65% due 07/15/2011 | | 415,000 | | 408,596 |
| Carmax Auto Owner Trust, Series 2004-2, Class A4 | | | |
| 3.46% due 09/15/2011 | | 325,673 | | 320,786 |
| Chase Manhattan Auto Owner Trust, | | | | |
| Series 2005-B, Class A4 | | | | |
| 4.88% due 06/15/2012 | | 700,000 | | 695,481 |
| Dominos Pizza Master Issuer LLC, Series 2007-1, | | | |
| Class A2 | | | | |
| 5.261% due 04/25/2037 | | 300,000 | | 296,497 |
| Ford Credit Auto Owner Trust, Series 2005-C, | | | |
| Class A4 | | | | |
| 4.36% due 06/15/2010 | | 279,000 | | 275,521 |
| Harley-Davidson Motorcycle Trust, | | | | |
| Series 2005-1, Class A2 | | | | |
| 3.76% due 12/17/2012 | | 392,135 | | 384,409 |
| Honda Auto Receivables Owner Trust, | | | | |
| Series 2005-1, Class A4 | | | | |
| 3.82% due 05/21/2010 | | 606,000 | | 597,500 |
| M&I Auto Loan Trust, Series 2005-1, Class A4 | | | |
| 4.86% due 03/21/2011 | | 700,000 | | 695,063 |
| Massachusetts RRB Special Purpose Trust, | | | |
| Series 1999-1, Class A5 | | | | |
| 7.03% due 03/15/2012 | | 600,000 | | 618,728 |
| Massachusetts RRB Special Purpose Trust, | | | |
| Series 2001-1, Class A | | | | |
| 6.53% due 06/01/2015 | | 81,155 | | 84,862 |
| | | | |
| Investment Quality Bond Fund (continued) | |
| | | Shares or | | |
| | | Principal | | |
| | | Amount | | Value |
| |
|
| |
| ASSET BACKED SECURITIES | | | | |
| (continued) | | | | |
| Merrill Lynch First Franklin Mortgage Loan, Series | | | |
| 2007-3, Class B1 | | | | |
| 6.855% due 06/25/2037 (b) | $ | 95,000 | $ | 39,135 |
| Peco Energy Transition Trust, | | | | |
| Series 2001-A, Class A1 | | | | |
| 6.52% due 12/31/2010 | | 33,000 | | 34,353 |
| Providian Gateway Master Trust, | | | | |
| Series 2004-DA, Class A | | | | |
| 3.35% due 09/15/2011 | | 405,000 | | 404,693 |
| USAA Auto Owner Trust, Series 2005-4, Class A4 | | | |
| 4.89% due 08/15/2012 | | 700,000 | | 695,213 |
| Wachovia Auto Owner Trust, | | | | |
| Series 2005-B, Class A5 | | | | |
| 4.93% due 11/20/2012 | | 700,000 | | 691,925 |
| WFS Financial Owner Trust, | | | | |
| Series 2005-2, Class A4 | | | | |
| 4.39% due 11/19/2012 | | 290,000 | | 287,845 |
| World Omni Auto Receivables Trust, | | | | |
| Series 2005-A, Class A4 | | | | |
| 3.82% due 11/12/2011 | | 700,000 | | 689,592 |
|
| TOTAL ASSET BACKED SECURITIES | | | | |
| (Cost $8,587,456) | | | $ | 8,509,848 |
|
| |
| REPURCHASE AGREEMENTS - 8.86% | | | |
| The Bank of New York Tri-Party | | | | |
| Repurchase Agreement dated | | | | |
| 08/31/2007 at 5.32% to be | | | | |
| repurchased at $14,708,689 on | | | | |
| 09/04/2007, collateralized by | | | | |
| $15,245,888 Federal Government | | | | |
| Loan Mortgage Corp., 5.50% due | | | | |
| 08/01/2037 (valued at | | | | |
| $14,994,001, including interest) | $ | 14,700,000 | $ | 14,700,000 |
|
| TOTAL REPURCHASE AGREEMENTS | | | | |
| (Cost $14,700,000) | | | $ | 14,700,000 |
|
| Total Investments (Investment Quality Bond Fund) | | |
| (Cost $173,678,598) - 103.75% | | | $ | 172,155,925 |
| Liabilities in Excess of Other Assets - (3.75)% | | | (6,227,590) |
|
|
| TOTAL NET ASSETS - 100.00% | | | $ | 165,928,335 |
|
|
| | | |
| Large Cap Fund | | | |
| | Shares or | | |
| | Principal | | |
| | Amount | | Value |
|
|
| |
| COMMON STOCKS - 98.47% | | | |
| | | | |
| Advertising - 1.17% | | | |
| Omnicom Group, Inc. | 87,050 | $ | 4,433,457 |
| Apparel & Textiles - 0.50% | | | |
| Coach, Inc. * | 42,600 | | 1,896,978 |
| Auto Parts - 3.31% | | | |
| BorgWarner, Inc. | 56,969 | | 4,813,880 |
| |
| The accompanying notes are an integral part of the financial statements. | 271 |
John Hancock Funds II
Portfolio of investments — August 31, 2007
(showing percentage of total net assets)
| | | |
| Large Cap Fund (continued) | | | |
| | Shares or | | |
| | Principal | | |
| | Amount | | Value |
|
|
| |
| COMMON STOCKS (continued) | | | |
| | | | |
| Auto Parts (continued) | | | |
| Johnson Controls, Inc. | 68,227 | $ | 7,716,474 |
| |
|
| | | | 12,530,354 |
| Automobiles - 1.07% | | | |
| PACCAR, Inc. | 47,400 | | 4,055,070 |
| | | | |
| Banking - 1.91% | | | |
| City National Corp. | 24,400 | | 1,741,916 |
| Fifth Third Bancorp | 153,695 | | 5,485,375 |
| |
|
| | | | 7,227,291 |
| Biotechnology - 2.90% | | | |
| Amgen, Inc. * | 24,200 | | 1,212,662 |
| Cephalon, Inc. * | 21,603 | | 1,621,305 |
| Genzyme Corp. * | 99,202 | | 6,191,197 |
| Millennium Pharmaceuticals, Inc. * | 191,400 | | 1,942,710 |
| |
|
| | | | 10,967,874 |
| Broadcasting - 0.94% | | | |
| News Corp., Class A | 176,600 | | 3,572,618 |
| | | | |
| Building Materials & Construction - 1.72% | | | |
| Masco Corp. | 249,378 | | 6,488,816 |
| | | | |
| Business Services - 0.79% | | | |
| R.H. Donnelley Corp. * | 50,624 | | 2,978,210 |
| | | | |
| Cable & Television - 0.84% | | | |
| Viacom, Inc., Class B * | 80,000 | | 3,156,800 |
| | | | |
| Coal - 0.61% | | | |
| Peabody Energy Corp. | 53,800 | | 2,287,038 |
| | | | |
| Computers & Business Equipment - 1.06% | | | |
| Dell, Inc. * | 141,700 | | 4,003,025 |
| | | | |
| Crude Petroleum & Natural Gas - 0.82% | | | |
| EOG Resources, Inc. | 46,300 | | 3,118,768 |
| | | | |
| Drugs & Health Care - 2.13% | | | |
| Wyeth | 173,718 | | 8,043,143 |
| | | | |
| Electrical Utilities - 4.33% | | | |
| American Electric Power Company, Inc. | 76,943 | | 3,422,425 |
| Exelon Corp. | 156,113 | | 11,032,506 |
| Northeast Utilities | 8,700 | | 240,555 |
| Pepco Holdings, Inc. | 60,181 | | 1,677,846 |
| |
|
| | | | 16,373,332 |
| Energy - 1.06% | | | |
| Sempra Energy | 73,014 | | 4,017,960 |
| | | | |
| Financial Services - 16.43% | | | |
| Bank of New York Mellon Corp. | 193,468 | | 7,821,911 |
| Citigroup, Inc. | 302,834 | | 14,196,858 |
| Discover Financial Services * | 98,456 | | 2,278,272 |
| Federal Home Loan Mortgage Corp. | 64,845 | | 3,995,100 |
| JP Morgan Chase & Company | 147,299 | | 6,557,752 |
| Morgan Stanley | 168,313 | | 10,497,682 |
| PNC Financial Services Group, Inc. | 56,804 | | 3,997,297 |
| Wells Fargo & Company | 349,678 | | 12,777,234 |
| |
|
| | | | 62,122,106 |
| | | |
| Large Cap Fund (continued) | | | |
| | Shares or | | |
| | Principal | | |
| | Amount | | Value |
|
|
| |
| COMMON STOCKS (continued) | | | |
| | | | |
| Food & Beverages - 2.10% | | | |
| Constellation Brands, Inc., Class A * | 130,800 | $ | 3,162,744 |
| Sysco Corp. | 143,200 | | 4,780,016 |
| |
|
| | | | 7,942,760 |
| Gas & Pipeline Utilities - 0.46% | | | |
| NiSource, Inc. | 91,798 | | 1,729,474 |
| | | | |
| Healthcare Products - 2.29% | | | |
| Johnson & Johnson | 76,708 | | 4,739,787 |
| Medtronic, Inc. | 74,034 | | 3,911,957 |
| |
|
| | | | 8,651,744 |
| Healthcare Services - 2.14% | | | |
| Medco Health Solutions, Inc. * | 45,350 | | 3,875,158 |
| UnitedHealth Group, Inc. | 84,243 | | 4,212,992 |
| |
|
| | | | 8,088,150 |
| Holdings Companies/Conglomerates - 2.63% | | | |
| General Electric Company | 256,300 | | 9,962,381 |
| | | | |
| Household Products - 0.95% | | | |
| Fortune Brands, Inc. | 43,300 | | 3,597,797 |
| | | | |
| Insurance - 2.51% | | | |
| AFLAC, Inc. | 46,600 | | 2,484,246 |
| Allstate Corp. | 60,300 | | 3,301,425 |
| Hartford Financial Services Group, Inc. | 41,638 | | 3,702,035 |
| |
|
| | | | 9,487,706 |
| International Oil - 1.66% | | | |
| Chevron Corp. | 31,200 | | 2,738,112 |
| Exxon Mobil Corp. | 41,369 | | 3,546,564 |
| |
|
| | | | 6,284,676 |
| Internet Content - 1.53% | | | |
| Google, Inc., Class A * | 4,700 | | 2,421,675 |
| Yahoo!, Inc. * | 147,600 | | 3,354,948 |
| |
|
| | | | 5,776,623 |
| Internet Retail - 1.27% | | | |
| Amazon.com, Inc. * | 59,900 | | 4,786,609 |
| | | | |
| Internet Software - 1.34% | | | |
| Symantec Corp. * | 269,788 | | 5,074,712 |
| | | | |
| Investment Companies - 0.24% | | | |
| The Blackstone Group LP * (a) | 39,269 | | 908,292 |
| | | | |
| Leisure Time - 1.52% | | | |
| Carnival Corp. (a) | 125,899 | | 5,739,735 |
| | | | |
| Life Sciences - 0.34% | | | |
| Pharmaceutical Product Development, Inc. | 36,600 | | 1,282,098 |
| | | | |
| Liquor - 0.71% | | | |
| Anheuser-Busch Companies, Inc. | 54,000 | | 2,667,600 |
| | | | |
| Manufacturing - 2.76% | | | |
| Harley-Davidson, Inc. | 38,400 | | 2,065,536 |
| Illinois Tool Works, Inc. | 144,148 | | 8,385,089 |
| |
|
| | | | 10,450,625 |
| Mutual Funds - 0.47% | | | |
| SPDR Trust Series 1 | 12,000 | | 1,771,080 |
| |
| The accompanying notes are an integral part of the financial statements. | 272 |
John Hancock Funds II
Portfolio of investments — August 31, 2007
(showing percentage of total net assets)
| | | | |
| Large Cap Fund (continued) | | | |
| | | Shares or | | |
| | | Principal | | |
| | | Amount | | Value |
| |
|
| |
| COMMON STOCKS (continued) | | | | |
| | | | | |
| Petroleum Services - 2.89% | | | | |
| ENSCO International, Inc. | | 51,300 | $ | 2,781,486 |
| GlobalSantaFe Corp. | | 52,300 | | 3,691,857 |
| Halliburton Company | | 128,900 | | 4,458,651 |
|
|
| | | | | 10,931,994 |
| Pharmaceuticals - 5.35% | | | | |
| Allergan, Inc. | | 131,626 | | 7,898,876 |
| Bristol-Myers Squibb Company | | 109,299 | | 3,186,066 |
| Merck & Company, Inc. | | 136,000 | | 6,823,120 |
| Schering-Plough Corp. | | 77,700 | | 2,332,554 |
|
|
| | | | | 20,240,616 |
| Publishing - 0.51% | | | | |
| McGraw-Hill Companies, Inc. | | 38,100 | | 1,922,526 |
| | | | | |
| Railroads & Equipment - 1.94% | | | | |
| Burlington Northern Santa Fe Corp. | | 90,550 | | 7,348,133 |
| | | | | |
| Retail Trade - 4.25% | | | | |
| Chico's FAS, Inc. * | | 97,000 | | 1,550,060 |
| Costco Wholesale Corp. | | 95,490 | | 5,896,508 |
| Home Depot, Inc. | | 140,500 | | 5,382,555 |
| Target Corp. | | 49,200 | | 3,243,756 |
|
|
| | | | | 16,072,879 |
| Semiconductors - 6.51% | | | | |
| Analog Devices, Inc. | | 186,100 | | 6,863,368 |
| Intel Corp. | | 430,200 | | 11,077,650 |
| Linear Technology Corp. (a) | | 84,800 | | 2,882,352 |
| Xilinx, Inc. | | 147,991 | | 3,784,130 |
|
|
| | | | | 24,607,500 |
| Software - 5.21% | | | | |
| BEA Systems, Inc. * | | 188,400 | | 2,298,480 |
| Citrix Systems, Inc. * | | 88,700 | | 3,224,245 |
| Intuit, Inc. * | | 92,300 | | 2,520,713 |
| Microsoft Corp. | | 373,589 | | 10,733,212 |
| Red Hat, Inc. * | | 47,500 | | 923,875 |
|
|
| | | | | 19,700,525 |
| Telephone - 3.58% | | | | |
| AT&T, Inc. | | 138,874 | | 5,536,906 |
| Sprint Nextel Corp. | | 423,127 | | 8,005,563 |
|
|
| | | | | 13,542,469 |
| Trucking & Freight - 1.72% | | | | |
| FedEx Corp. | | 59,283 | | 6,502,159 |
|
| TOTAL COMMON STOCKS (Cost $352,140,737) | | $ | 372,343,703 |
|
| |
| SHORT TERM INVESTMENTS - 2.53% | | | |
| John Hancock Cash Investment Trust (c) | $ | 9,577,765 | $ | 9,577,765 |
|
| TOTAL SHORT TERM INVESTMENTS | | | | |
| (Cost $9,577,765) | | | $ | 9,577,765 |
|
| | | | |
| Large Cap Fund (continued) | | | |
| | | Shares or | | |
| | | Principal | | |
| | | Amount | | Value |
|
|
| |
| REPURCHASE AGREEMENTS - 1.36% | | | | |
| Repurchase Agreement with State | | | | |
| Street Corp. dated 08/31/2007 at | | | | |
| 4.60% to be repurchased at | | | | |
| $5,160,636 on 09/04/2007, | | | | |
| collateralized by $5,155,000 | | | | |
| Federal National Mortgage | | | | |
| Association, 5.30% due | | | | |
| 04/16/2010 (valued at $5,264,544, | | | | |
| including interest) | $ | 5,158,000 | $ | 5,158,000 |
|
| TOTAL REPURCHASE AGREEMENTS | | | | |
| (Cost $5,158,000) | | | $ | 5,158,000 |
|
| Total Investments (Large Cap Fund) | | | | |
| (Cost $366,876,502) - 102.36% | | | $ | 387,079,468 |
| Liabilities in Excess of Other Assets - (2.36)% | | | (8,940,534) |
| |
|
| TOTAL NET ASSETS - 100.00% | | | $ | 378,138,934 |
| |
|
| | | |
| Large Cap Value Fund | | | |
| | Shares or | | |
| | Principal | | |
| | Amount | | Value |
|
|
| |
| COMMON STOCKS - 99.72% | | | |
| | | |
| Aerospace - 1.95% | | | |
| Lockheed Martin Corp. | 6,520 | $ | 646,393 |
| Northrop Grumman Corp. | 90,000 | | 7,095,600 |
| Raytheon Company | 46,000 | | 2,821,640 |
| |
|
| | | | 10,563,633 |
| Air Travel - 0.75% | | | |
| AMR Corp. * | 167,000 | | 4,093,170 |
| | | | |
| Banking - 1.08% | | | |
| Bank of America Corp. | 116,000 | | 5,878,880 |
| | | | |
| Biotechnology - 1.22% | | | |
| Biogen Idec, Inc. * | 104,000 | | 6,637,280 |
| | | | |
| Business Services - 1.66% | | | |
| Cadence Design Systems, Inc. * | 51,000 | | 1,107,720 |
| Computer Sciences Corp. * | 52,000 | | 2,909,400 |
| Convergys Corp. * | 112,000 | | 1,876,000 |
| Electronic Data Systems Corp. | 16,000 | | 366,240 |
| R.R. Donnelley & Sons Company | 77,000 | | 2,758,140 |
| |
|
| | | | 9,017,500 |
| Chemicals - 2.73% | | | |
| Albemarle Corp. | 50,000 | | 2,023,500 |
| Dow Chemical Company | 71,000 | | 3,026,730 |
| E.I. Du Pont de Nemours & Company | 109,000 | | 5,313,750 |
| FMC Corp. | 49,000 | | 4,410,000 |
| |
|
| | | | 14,773,980 |
| Computers & Business Equipment - 4.63% | | | |
| EMC Corp. * | 279,000 | | 5,485,140 |
| Hewlett-Packard Company | 110,000 | | 5,428,500 |
| International Business Machines Corp. | 71,000 | | 8,284,990 |
| |
| The accompanying notes are an integral part of the financial statements. | 273 |
John Hancock Funds II
Portfolio of investments — August 31, 2007
(showing percentage of total net assets)
| | | |
| Large Cap Value Fund (continued) | | |
| | Shares or | | |
| | Principal | | |
| | Amount | | Value |
|
|
| |
| COMMON STOCKS (continued) | | | |
| | | | |
| Computers & Business Equipment | | | |
| (continued) | | | |
| Juniper Networks, Inc. * | 179,000 | $ | 5,892,680 |
|
|
| | | | 25,091,310 |
| Crude Petroleum & Natural Gas - 4.56% | | | |
| Marathon Oil Corp. | 154,000 | | 8,299,060 |
| Noble Energy, Inc. | 96,000 | | 5,766,720 |
| Occidental Petroleum Corp. | 103,000 | | 5,839,070 |
| Sunoco, Inc. | 66,000 | | 4,827,240 |
|
|
| | | | 24,732,090 |
| Domestic Oil - 1.01% | | | |
| Frontier Oil Corp. | 133,000 | | 5,456,990 |
| | | | |
| Electrical Utilities - 0.49% | | | |
| CMS Energy Corp. | 162,000 | | 2,643,840 |
| | | | |
| Electronics - 2.37% | | | |
| Agilent Technologies, Inc. * | 46,000 | | 1,674,400 |
| L-3 Communications Holdings, Inc. | 60,000 | | 5,910,600 |
| Synopsys, Inc. * | 72,000 | | 1,967,040 |
| Vishay Intertechnology, Inc. * | 249,000 | | 3,294,270 |
|
|
| | | | 12,846,310 |
| Financial Services - 9.72% | | | |
| Citigroup, Inc. | 473,000 | | 22,174,240 |
| Goldman Sachs Group, Inc. | 44,000 | | 7,744,440 |
| JP Morgan Chase & Company | 363,000 | | 16,160,760 |
| Lehman Brothers Holdings, Inc. | 120,800 | | 6,623,464 |
|
|
| | | | 52,702,904 |
| Food & Beverages - 1.69% | | | |
| Campbell Soup Company | 96,000 | | 3,624,000 |
| H.J. Heinz Company | 114,000 | | 5,140,260 |
| J.M. Smucker Company | 7,000 | | 385,070 |
|
|
| | | | 9,149,330 |
| Healthcare Services - 3.58% | | | |
| Humana, Inc. * | 45,000 | | 2,884,050 |
| Laboratory Corp. of America Holdings * | 25,000 | | 1,941,500 |
| McKesson Corp. | 99,000 | | 5,663,790 |
| Medco Health Solutions, Inc. * | 15,000 | | 1,281,750 |
| WellPoint, Inc. * | 95,000 | | 7,656,050 |
|
|
| | | | 19,427,140 |
| Holdings Companies/Conglomerates - 4.03% | | | |
| General Electric Company | 391,000 | | 15,198,170 |
| Loews Corp. | 141,000 | | 6,628,410 |
|
|
| | | | 21,826,580 |
| Industrial Machinery - 2.97% | | | |
| AGCO Corp. * | 126,000 | | 5,443,200 |
| Deere & Company | 42,000 | | 5,714,520 |
| Terex Corp. * | 62,000 | | 4,952,560 |
|
|
| | | | 16,110,280 |
| Insurance - 11.48% | | | |
| ACE, Ltd. | 115,000 | | 6,642,400 |
| Aetna, Inc. | 110,000 | | 5,600,100 |
| | | |
| Large Cap Value Fund (continued) | | |
| | Shares or | | |
| | Principal | | |
| | Amount | | Value |
|
|
| |
| COMMON STOCKS (continued) | | | |
| | | | |
| Insurance (continued) | | | |
| Allstate Corp. | 11,000 | $ | 602,250 |
| Ambac Financial Group, Inc. | 72,000 | | 4,523,040 |
| American International Group, Inc. | 234,000 | | 15,444,000 |
| Chubb Corp. | 137,000 | | 7,004,810 |
| Lincoln National Corp. | 36,000 | | 2,191,680 |
| MetLife, Inc. | 28,000 | | 1,793,400 |
| Prudential Financial, Inc. | 86,000 | | 7,721,080 |
| SAFECO Corp. | 67,000 | | 3,887,340 |
| The Travelers Companies, Inc. | 135,430 | | 6,844,632 |
|
|
| | | | 62,254,732 |
| International Oil - 11.45% | | | |
| Chevron Corp. | 222,000 | | 19,482,720 |
| ConocoPhillips | 110,000 | | 9,007,900 |
| Exxon Mobil Corp. | 392,000 | | 33,606,160 |
|
|
| | | | 62,096,780 |
| Leisure Time - 1.55% | | | |
| Walt Disney Company | 250,000 | | 8,400,000 |
| Manufacturing - 1.83% | | | |
| Honeywell International, Inc. | 106,000 | | 5,951,900 |
| SPX Corp. | 44,000 | | 3,962,200 |
|
|
| | | | 9,914,100 |
| Office Furnishings & Supplies - 0.15% | | | |
| Steelcase, Inc. Class A | 47,000 | | 829,080 |
| | | | |
| Paper - 1.14% | | | |
| International Paper Company | 176,000 | | 6,179,360 |
| | | | |
| Petroleum Services - 3.84% | | | |
| ENSCO International, Inc. | 92,000 | | 4,988,240 |
| Tesoro Petroleum Corp. | 90,000 | | 4,439,700 |
| Tidewater, Inc. | 80,000 | | 5,236,000 |
| Valero Energy Corp. | 90,000 | | 6,165,900 |
|
|
| | | | 20,829,840 |
| Pharmaceuticals - 7.01% | | | |
| AmerisourceBergen Corp. | 107,000 | | 5,119,950 |
| Eli Lilly & Company | 138,000 | | 7,914,300 |
| Merck & Company, Inc. | 131,000 | | 6,572,270 |
| Pfizer, Inc. | 740,000 | | 18,381,600 |
|
|
| | | | 37,988,120 |
| Retail Grocery - 2.16% | | | |
| Safeway, Inc. | 194,000 | | 6,155,620 |
| The Kroger Company | 209,000 | | 5,555,220 |
|
|
| | | | 11,710,840 |
| Retail Trade - 0.67% | | | |
| RadioShack Corp. (a) | 153,000 | | 3,636,810 |
| | | | |
| Semiconductors - 3.84% | | | |
| Intersil Corp., Class A | 170,000 | | 5,664,400 |
| KLA-Tencor Corp. | 91,000 | | 5,229,770 |
| Novellus Systems, Inc. * | 196,000 | | 5,364,520 |
| Teradyne, Inc. * | 305,000 | | 4,541,450 |
|
|
| | | | 20,800,140 |
| |
| The accompanying notes are an integral part of the financial statements. | 274 |
John Hancock Funds II
Portfolio of investments — August 31, 2007
(showing percentage of total net assets)
| | | | |
| Large Cap Value Fund (continued) | | |
| | | Shares or | | |
| | | Principal | | |
| | | Amount | | Value |
| |
|
| |
| COMMON STOCKS (continued) | | | | |
| | | | | |
| Software - 1.15% | | | | |
| BMC Software, Inc. * | | 12,335 | $ | 377,698 |
| CA, Inc. | | 35,000 | | 881,650 |
| Compuware Corp. * | | 175,000 | | 1,419,250 |
| Novell, Inc. * | | 248,000 | | 1,845,120 |
| Oracle Corp. * | | 83,441 | | 1,692,182 |
|
|
| | | | | 6,215,900 |
| Steel - 1.15% | | | | |
| United States Steel Corp. | | 66,000 | | 6,235,680 |
| | | | | |
| Telecommunications Equipment & | | | | |
| Services - 0.98% | | | | |
| ADC Telecommunications, Inc. * | | 290,000 | | 5,307,000 |
| | | | | |
| Telephone - 3.58% | | | | |
| AT&T, Inc. | | 183,000 | | 7,296,210 |
| CenturyTel, Inc. | | 123,000 | | 5,901,540 |
| Qwest Communications International, Inc. * | | 692,000 | | 6,193,400 |
|
|
| | | | | 19,391,150 |
| Tires & Rubber - 0.60% | | | | |
| Goodyear Tire & Rubber Company * (a) | | 118,000 | | 3,263,880 |
| | | | | |
| Tobacco - 0.45% | | | | |
| UST, Inc. | | 49,000 | | 2,414,720 |
| | | | |
| Toys, Amusements & Sporting Goods - 1.39% | | | |
| Hasbro, Inc. | | 108,000 | | 3,046,680 |
| Mattel, Inc. | | 206,466 | | 4,465,860 |
|
|
| | | | | 7,512,540 |
| Transportation - 0.86% | | | | |
| Overseas Shipholding Group, Inc. | | 65,000 | | 4,641,000 |
|
| TOTAL COMMON STOCKS (Cost $490,582,677) | | $ | 540,572,889 |
|
| |
| SHORT TERM INVESTMENTS - 0.79% | | | | |
| John Hancock Cash Investment Trust (c) | $ | 4,276,821 | $ | 4,276,821 |
|
| TOTAL SHORT TERM INVESTMENTS | | | | |
| (Cost $4,276,821) | | | $ | 4,276,821 |
|
| |
| REPURCHASE AGREEMENTS - 0.17% | | | | |
| Repurchase Agreement with State | | | | |
| Street Corp. dated 08/31/2007 at | | | | |
| 4.60% to be repurchased at | | | | |
| $937,479 on 09/04/2007, | | | | |
| collateralized by $995,000 Federal | | | | |
| Home Loan Mortgage Corp., 4% | | | | |
| due 06/12/2013 (valued at | | | | |
| $960,175, including interest) | $ | 937,000 | $ | 937,000 |
|
| TOTAL REPURCHASE AGREEMENTS | | | | |
| (Cost $937,000) | | | $ | 937,000 |
|
| Total Investments (Large Cap Value Fund) | | | | |
| (Cost $495,796,498) - 100.68% | | | $ | 545,786,710 |
| Liabilities in Excess of Other Assets - (0.68)% | | | (3,688,844) |
|
|
| TOTAL NET ASSETS - 100.00% | | | $ | 542,097,866 |
|
|
| | | |
| Mid Cap Index Fund | | | |
| | Shares or | | |
| | Principal | | |
| | Amount | | Value |
|
|
| |
| COMMON STOCKS - 93.13% | | | |
| | | |
| Advertising - 0.16% | | | |
| ValueClick, Inc. * | 34,437 | $ | 690,118 |
| | | | |
| Aerospace - 0.37% | | | |
| Alliant Techsystems, Inc. * | 11,375 | | 1,197,901 |
| Sequa Corp., Class A * | 2,397 | | 393,468 |
| |
|
| | | | 1,591,369 |
| Air Travel - 0.29% | | | |
| Airtran Holdings, Inc. * | 31,564 | | 331,738 |
| Alaska Air Group, Inc. * | 13,951 | | 346,264 |
| JetBlue Airways Corp. * | 61,597 | | 586,403 |
| |
|
| | | | 1,264,405 |
| Apparel & Textiles - 1.08% | | | |
| Hanesbrands, Inc. * | 33,262 | | 996,530 |
| Mohawk Industries, Inc. * | 18,571 | | 1,621,434 |
| Phillips-Van Heusen Corp. | 19,158 | | 1,115,570 |
| The Warnaco Group, Inc. * | 16,070 | | 560,843 |
| Timberland Company, Class A * | 17,336 | | 348,280 |
| |
|
| | | | 4,642,657 |
| Auto Parts - 1.37% | | | |
| ArvinMeritor, Inc. | 24,631 | | 429,811 |
| BorgWarner, Inc. | 19,999 | | 1,689,916 |
| Federal Signal Corp. | 16,443 | | 251,578 |
| Gentex Corp. | 49,232 | | 986,609 |
| Lear Corp. * | 26,448 | | 773,075 |
| Modine Manufacturing Company | 11,332 | | 317,863 |
| O'Reilly Automotive, Inc. * | 39,371 | | 1,399,245 |
| |
|
| | | | 5,848,097 |
| Auto Services - 0.36% | | | |
| Avis Budget Group, Inc. * | 34,937 | | 810,888 |
| Copart, Inc. * | 24,561 | | 720,620 |
| |
|
| | | | 1,531,508 |
| Banking - 3.51% | | | |
| Associated Banc-Corp. | 43,995 | | 1,241,099 |
| Astoria Financial Corp. | 28,874 | | 752,745 |
| Bank of Hawaii Corp. | 17,098 | | 879,008 |
| Cathay General Bancorp, Inc. | 17,655 | | 573,964 |
| City National Corp. | 14,133 | | 1,008,955 |
| Colonial Bancgroup, Inc. | 52,787 | | 1,120,140 |
| Cullen Frost Bankers, Inc. | 20,702 | | 1,067,809 |
| First Community Bancorp | 8,950 | | 485,627 |
| First Niagara Financial Group, Inc. | 38,203 | | 539,809 |
| FirstMerit Corp. | 27,759 | | 536,304 |
| Greater Bay Bancorp | 17,633 | | 496,369 |
| New York Community Bancorp, Inc. | 95,144 | | 1,683,097 |
| SVB Financial Group * | 11,904 | | 592,343 |
| TCF Financial Corp. | 38,700 | | 977,949 |
| Washington Federal, Inc. | 30,128 | | 799,597 |
| Webster Financial Corp. | 19,479 | | 827,078 |
| Westamerica Bancorp | 10,368 | | 503,367 |
| Wilmington Trust Corp. | 23,707 | | 950,651 |
| |
|
| | | | 15,035,911 |
| |
| The accompanying notes are an integral part of the financial statements. | 275 |
John Hancock Funds II
Portfolio of investments — August 31, 2007
(showing percentage of total net assets)
| | | |
| Mid Cap Index Fund (continued) | | | |
| | Shares or | | |
| | Principal | | |
| | Amount | | Value |
|
|
| |
| COMMON STOCKS (continued) | | | |
| | | | |
| Biotechnology - 1.57% | | | |
| Affymetrix, Inc. * | 23,669 | $ | 536,339 |
| Cephalon, Inc. * | 22,840 | | 1,714,142 |
| Charles River Laboratories International, Inc. * | 23,218 | | 1,218,481 |
| Invitrogen Corp. * | 16,128 | | 1,256,371 |
| Millennium Pharmaceuticals, Inc. * | 110,779 | | 1,124,407 |
| Techne Corp. * | 13,599 | | 856,873 |
| |
|
| | | | 6,706,613 |
| Broadcasting - 0.17% | | | |
| Belo Corp., Class A | 30,336 | | 522,993 |
| Entercom Communications Corp. | 9,630 | | 205,119 |
| |
|
| | | | 728,112 |
| Building Materials & Construction - 0.91% | | | |
| Dycom Industries, Inc. * | 14,026 | | 414,188 |
| Granite Construction, Inc. | 11,718 | | 637,928 |
| KBR, Inc. * | 57,833 | | 1,899,236 |
| RPM International, Inc. | 41,705 | | 944,201 |
| |
|
| | | | 3,895,553 |
| Business Services - 5.65% | | | |
| Acxiom Corp. | 23,785 | | 582,732 |
| Alliance Data Systems Corp. * | 22,785 | | 1,787,483 |
| Brinks Company | 16,732 | | 959,748 |
| Cadence Design Systems, Inc. * | 96,021 | | 2,085,576 |
| Catalina Marketing Corp. * | 12,651 | | 394,964 |
| Ceridian Corp. * | 49,469 | | 1,694,313 |
| ChoicePoint, Inc. * | 26,234 | | 1,032,046 |
| Corporate Executive Board Company | 13,176 | | 896,363 |
| CSG Systems International, Inc. * | 14,966 | | 346,014 |
| Deluxe Corp. | 17,799 | | 676,718 |
| DST Systems, Inc. * | 18,679 | | 1,428,196 |
| Dun & Bradstreet Corp. | 20,493 | | 1,999,092 |
| Fair Isaac Corp. | 19,789 | | 731,995 |
| Gartner Group, Inc., Class A * | 17,953 | | 396,941 |
| Global Payments, Inc. | 23,616 | | 932,360 |
| Harte-Hanks, Inc. | 16,289 | | 393,868 |
| Jacobs Engineering Group, Inc. * | 40,809 | | 2,697,067 |
| Kelly Services, Inc., Class A | 7,455 | | 169,378 |
| Korn/Ferry International * | 16,657 | | 369,952 |
| Manpower, Inc. | 29,161 | | 2,048,852 |
| MPS Group, Inc. * | 35,371 | | 486,705 |
| Navigant Consulting Company * | 14,903 | | 263,038 |
| Rollins, Inc. | 10,188 | | 270,593 |
| Sotheby's | 19,833 | | 858,372 |
| SRA International, Inc., Class A * | 14,346 | | 404,701 |
| Wind River Systems, Inc. * | 25,931 | | 273,572 |
| |
|
| | | | 24,180,639 |
| Cellular Communications - 0.64% | | | |
| RF Micro Devices, Inc. * | 66,564 | | 396,056 |
| Telephone & Data Systems, Inc. | 35,910 | | 2,325,172 |
| |
|
| | | | 2,721,228 |
| | | |
| Mid Cap Index Fund (continued) | | | |
| | Shares or | | |
| | Principal | | |
| | Amount | | Value |
|
|
| |
| COMMON STOCKS (continued) | | | |
| | | | |
| Chemicals - 3.38% | | | |
| Airgas, Inc. | 27,101 | $ | 1,252,608 |
| Albemarle Corp. | 27,433 | | 1,110,214 |
| Cabot Corp. | 22,214 | | 896,113 |
| Chemtura Corp. | 83,216 | | 766,419 |
| Cytec Industries, Inc. | 14,542 | | 965,589 |
| Ferro Corp. | 14,883 | | 291,260 |
| FMC Corp. | 13,209 | | 1,188,810 |
| Lubrizol Corp. | 23,870 | | 1,517,655 |
| Lyondell Chemical Company | 74,155 | | 3,437,826 |
| Minerals Technologies, Inc. | 6,585 | | 434,017 |
| Olin Corp. | 25,438 | | 545,391 |
| Sensient Technologies Corp. | 16,217 | | 439,319 |
| The Scotts Company, Class A | 15,132 | | 684,874 |
| Valspar Corp. | 34,593 | | 932,973 |
| |
|
| | | | 14,463,068 |
| Coal - 0.34% | | | |
| Arch Coal, Inc. | 49,200 | | 1,450,908 |
| | | | |
| Colleges & Universities - 0.61% | | | |
| Career Education Corp. * | 32,778 | | 973,507 |
| Corinthian Colleges, Inc. * | 29,890 | | 420,253 |
| ITT Educational Services, Inc. * | 11,055 | | 1,213,839 |
| |
|
| | | | 2,607,599 |
| Computers & Business Equipment - 2.31% | | | |
| 3Com Corp. * | 137,554 | | 515,827 |
| Avocent Corp. * | 17,407 | | 513,855 |
| CDW Corp. * | 21,030 | | 1,810,052 |
| Diebold, Inc. | 22,667 | | 994,401 |
| Ingram Micro, Inc., Class A * | 49,342 | | 969,077 |
| Jack Henry & Associates, Inc. | 26,602 | | 698,036 |
| National Instruments Corp. | 19,682 | | 621,361 |
| Palm, Inc. * | 35,687 | | 535,662 |
| Parametric Technology Corp. * | 39,624 | | 697,779 |
| Tech Data Corp. * | 18,975 | | 739,835 |
| Western Digital Corp. * | 76,550 | | 1,788,208 |
| |
|
| | | | 9,884,093 |
| Construction & Mining Equipment - 0.38% | | | |
| Joy Global, Inc. | 37,470 | | 1,625,823 |
| | | | |
| Construction Materials - 0.87% | | | |
| Florida Rock Industries, Inc. | 17,063 | | 1,066,608 |
| Louisiana-Pacific Corp. | 35,989 | | 674,074 |
| Martin Marietta Materials, Inc. | 14,704 | | 1,985,040 |
| |
|
| | | | 3,725,722 |
| Containers & Glass - 0.46% | | | |
| Packaging Corp. of America | 28,317 | | 737,658 |
| Sonoco Products Company | 34,499 | | 1,242,654 |
| |
|
| | | | 1,980,312 |
| Cosmetics & Toiletries - 0.15% | | | |
| Alberto-Culver Company | 28,081 | | 650,637 |
| | | | |
| Crude Petroleum & Natural Gas - 3.67% | | | |
| Bill Barrett Corp. * | 11,550 | | 407,022 |
| |
| The accompanying notes are an integral part of the financial statements. | 276 |
John Hancock Funds II
Portfolio of investments — August 31, 2007
(showing percentage of total net assets)
| | | |
| Mid Cap Index Fund (continued) | | | |
| | Shares or | | |
| | Principal | | |
| | Amount | | Value |
|
|
| |
| COMMON STOCKS (continued) | | | |
| | | | |
| Crude Petroleum & Natural Gas | | | |
| (continued) | | | |
| Cimarex Energy Company | 28,732 | $ | 1,028,893 |
| Forest Oil Corp. * | 26,127 | | 1,009,808 |
| Newfield Exploration Company * | 44,842 | | 1,950,179 |
| Noble Energy, Inc. | 58,943 | | 3,540,706 |
| Patterson-UTI Energy, Inc. | 54,063 | | 1,160,733 |
| Pioneer Natural Resources Company | 42,585 | | 1,748,114 |
| Plains Exploration & Production Company * | 24,735 | | 928,304 |
| Pogo Producing Company | 20,174 | | 1,004,867 |
| Quicksilver Resources, Inc. * | 19,145 | | 764,843 |
| Southwestern Energy Company * | 58,049 | | 2,158,842 |
| |
|
| | | | 15,702,311 |
| Domestic Oil - 0.87% | | | |
| Denbury Resources, Inc. * | 41,774 | | 1,661,770 |
| Encore Aquisition Company * | 18,323 | | 509,196 |
| Frontier Oil Corp. | 38,013 | | 1,559,673 |
| |
|
| | | | 3,730,639 |
| Drugs & Health Care - 0.13% | | | |
| Perrigo Company | 26,192 | | 542,436 |
| | | | |
| Educational Services - 0.35% | | | |
| DeVry, Inc. | 20,559 | | 709,902 |
| Strayer Education, Inc. | 4,931 | | 786,889 |
| |
|
| | | | 1,496,791 |
| Electrical Equipment - 0.75% | | | |
| AMETEK, Inc. | 36,820 | | 1,472,432 |
| Hubbell, Inc., Class B | 20,575 | | 1,114,753 |
| Varian, Inc. * | 10,541 | | 632,671 |
| |
|
| | | | 3,219,856 |
| Electrical Utilities - 4.11% | | | |
| Alliant Energy Corp. | 40,097 | | 1,518,874 |
| Black Hills Corp. | 12,995 | | 535,264 |
| DPL, Inc. | 38,984 | | 1,027,228 |
| Great Plains Energy, Inc. | 29,642 | | 840,054 |
| Hawaiian Electric Industries, Inc. | 28,064 | | 588,502 |
| IDACORP, Inc. | 15,053 | | 488,771 |
| Northeast Utilities | 53,225 | | 1,471,671 |
| NSTAR | 36,846 | | 1,207,444 |
| OGE Energy Corp. | 31,650 | | 1,067,238 |
| Pepco Holdings, Inc. | 66,394 | | 1,851,065 |
| PNM Resources, Inc. | 26,455 | | 611,640 |
| Puget Energy, Inc. | 40,267 | | 939,429 |
| Quanta Services, Inc. * | 61,829 | | 1,747,906 |
| Sierra Pacific Resources | 76,327 | | 1,169,330 |
| Westar Energy, Inc. | 30,183 | | 733,145 |
| Wisconsin Energy Corp. | 40,345 | | 1,787,687 |
| |
|
| | | | 17,585,248 |
| Electronics - 2.93% | | | |
| Amphenol Corp., Class A | 61,723 | | 2,228,818 |
| Arrow Electronics, Inc. * | 42,398 | | 1,779,020 |
| Avnet, Inc. * | 44,860 | | 1,763,447 |
| | | |
| Mid Cap Index Fund (continued) | | | |
| | Shares or | | |
| | Principal | | |
| | Amount | | Value |
|
|
| |
| COMMON STOCKS (continued) | | | |
| | | | |
| Electronics (continued) | | | |
| DRS Technologies, Inc. | 13,980 | $ | 733,670 |
| Imation Corp. | 12,138 | | 353,094 |
| Kemet Corp. * | 28,886 | | 199,313 |
| Mentor Graphics Corp. * | 29,456 | | 411,206 |
| Synopsys, Inc. * | 49,456 | | 1,351,138 |
| Teleflex, Inc. | 13,520 | | 1,051,450 |
| Thomas & Betts Corp. * | 17,460 | | 967,109 |
| Vishay Intertechnology, Inc. * | 63,785 | | 843,876 |
| Zebra Technologies Corp., Class A * | 23,783 | | 863,323 |
| |
|
| | | | 12,545,464 |
| Energy - 1.10% | | | |
| Energy East Corp. | 54,517 | | 1,455,059 |
| MDU Resources Group, Inc. | 62,728 | | 1,696,792 |
| SCANA Corp. | 40,247 | | 1,544,680 |
| |
|
| | | | 4,696,531 |
| Financial Services - 3.35% | | | |
| A.G. Edwards, Inc. | 25,966 | | 2,170,238 |
| AmeriCredit Corp. * | 40,679 | | 704,154 |
| Broadridge Financial Solutions, Inc. | 48,025 | | 872,614 |
| Eaton Vance Corp. | 43,377 | | 1,665,243 |
| Fidelity National Financial, Inc., Class A | 76,430 | | 1,390,262 |
| GATX Corp. | 17,623 | | 768,363 |
| IndyMac Bancorp, Inc. | 24,952 | | 603,838 |
| Jefferies Group, Inc. | 36,780 | | 949,660 |
| MoneyGram International, Inc. | 28,786 | | 612,278 |
| Nuveen Investments, Inc., Class A | 27,406 | | 1,704,105 |
| Raymond James Financial, Inc. | 32,043 | | 1,050,690 |
| SEI Investments Company | 43,766 | | 1,110,343 |
| Waddell & Reed Financial, Inc., Class A | 28,949 | | 719,093 |
| |
|
| | | | 14,320,881 |
| Food & Beverages - 1.20% | | | |
| Hansen Natural Corp. * | 20,816 | | 934,846 |
| Hormel Foods Corp. | 25,171 | | 896,843 |
| J.M. Smucker Company | 19,532 | | 1,074,455 |
| PepsiAmericas, Inc. | 20,792 | | 615,443 |
| Smithfield Foods, Inc. * | 41,079 | | 1,344,516 |
| Tootsie Roll Industries, Inc. | 9,358 | | 253,602 |
| |
|
| | | | 5,119,705 |
| Forest Products - 0.27% | | | |
| Rayonier, Inc. | 26,709 | | 1,141,543 |
| | | | |
| Furniture & Fixtures - 0.04% | | | |
| Furniture Brands International, Inc. | 16,679 | | 189,807 |
| | | | |
| Gas & Pipeline Utilities - 1.87% | | | |
| AGL Resources, Inc. | 26,837 | | 1,065,697 |
| Aquila, Inc. * | 129,257 | | 514,443 |
| Equitable Resources, Inc. | 41,953 | | 2,063,668 |
| National Fuel Gas Company | 28,797 | | 1,276,859 |
| ONEOK, Inc. | 38,306 | | 1,794,636 |
| Vectren Corp. | 26,391 | | 720,475 |
| |
| The accompanying notes are an integral part of the financial statements. | 277 |
John Hancock Funds II
Portfolio of investments — August 31, 2007
(showing percentage of total net assets)
| | | |
| Mid Cap Index Fund (continued) | | | |
| | Shares or | | |
| | Principal | | |
| | Amount | | Value |
|
|
| |
| COMMON STOCKS (continued) | | | |
| | | | |
| Gas & Pipeline Utilities (continued) | | | |
| WGL Holdings, Inc. | 16,981 | $ | 558,505 |
| |
|
| | | | 7,994,283 |
| Healthcare Products - 4.11% | | | |
| Advanced Medical Optics, Inc. * | 20,678 | | 594,286 |
| Beckman Coulter, Inc. | 21,366 | | 1,537,284 |
| Cytyc Corp. * | 39,751 | | 1,698,958 |
| DENTSPLY International, Inc. | 52,404 | | 2,063,669 |
| Edwards Lifesciences Corp. * | 19,881 | | 960,252 |
| Gen-Probe, Inc. * | 18,092 | | 1,158,250 |
| Henry Schein, Inc. * | 30,646 | | 1,783,291 |
| Hillenbrand Industries, Inc. | 21,278 | | 1,224,549 |
| Intuitive Surgical, Inc. * | 12,926 | | 2,860,265 |
| Kyphon, Inc. * | 15,810 | | 1,057,215 |
| ResMed, Inc. * | 26,853 | | 1,091,843 |
| STERIS Corp. | 22,379 | | 628,178 |
| Ventana Medical Systems, Inc. * | 11,440 | | 935,678 |
| |
|
| | | | 17,593,718 |
| Healthcare Services - 2.31% | | | |
| Apria Healthcare Group, Inc. * | 15,057 | | 400,968 |
| Cerner Corp. * | 22,587 | | 1,288,362 |
| Covance, Inc. * | 21,925 | | 1,607,541 |
| Health Net, Inc. * | 38,724 | | 2,121,688 |
| Kindred Healthcare, Inc. * | 10,895 | | 215,939 |
| Lincare Holdings, Inc. * | 28,923 | | 1,040,939 |
| Omnicare, Inc. | 41,927 | | 1,368,078 |
| Psychiatric Solutions, Inc. * | 18,729 | | 690,351 |
| WellCare Health Plans, Inc. * | 11,557 | | 1,140,676 |
| |
|
| | | | 9,874,542 |
| Homebuilders - 0.72% | | | |
| Beazer Homes USA, Inc. | 13,508 | | 142,779 |
| Hovnanian Enterprises, Inc., Class A * | 12,615 | | 149,740 |
| M.D.C. Holdings, Inc. | 12,145 | | 540,331 |
| NVR, Inc. * | 1,644 | | 919,818 |
| Ryland Group, Inc. | 14,506 | | 415,452 |
| Toll Brothers, Inc. * | 43,811 | | 935,803 |
| |
|
| | | | 3,103,923 |
| Hotels & Restaurants - 0.97% | | | |
| Applebee's International, Inc. | 25,753 | | 638,932 |
| Bob Evans Farms, Inc. | 12,344 | | 411,920 |
| Boyd Gaming Corp. | 14,767 | | 603,232 |
| Brinker International, Inc. | 39,149 | | 1,129,057 |
| CBRL Group, Inc. | 8,438 | | 315,750 |
| Ruby Tuesday, Inc. | 18,734 | | 414,958 |
| The Cheesecake Factory, Inc. * | 24,826 | | 618,912 |
| |
|
| | | | 4,132,761 |
| Household Products - 0.92% | | | |
| Blyth, Inc. | 8,677 | | 194,018 |
| Church & Dwight, Inc. | 22,696 | | 1,019,731 |
| Energizer Holdings, Inc. * | 19,473 | | 2,062,775 |
| | | |
| Mid Cap Index Fund (continued) | | | |
| | Shares or | | |
| | Principal | | |
| | Amount | | Value |
|
|
| |
| COMMON STOCKS (continued) | | | |
| | | | |
| Household Products (continued) | | | |
| Tupperware Brands Corp. | 21,204 | $ | 652,871 |
| |
|
| | | | 3,929,395 |
| Industrial Machinery - 3.80% | | | |
| AGCO Corp. * | 31,559 | | 1,363,349 |
| Cameron International Corp. * | 37,996 | | 3,106,933 |
| Crane Company | 17,322 | | 775,852 |
| Donaldson Company, Inc. | 23,803 | | 908,798 |
| Flowserve Corp. | 19,681 | | 1,405,420 |
| FMC Technologies, Inc. * | 22,401 | | 2,121,375 |
| Graco, Inc. | 22,948 | | 927,329 |
| Grant Prideco, Inc. * | 43,967 | | 2,431,375 |
| IDEX Corp. | 28,170 | | 1,083,700 |
| Kennametal, Inc. | 13,407 | | 1,081,409 |
| Lincoln Electric Holdings, Inc. | 14,712 | | 1,058,381 |
| |
|
| | | | 16,263,921 |
| Industrials - 0.84% | | | |
| Fastenal Company | 43,267 | | 1,973,408 |
| Harsco Corp. | 29,032 | | 1,615,631 |
| |
|
| | | | 3,589,039 |
| Insurance - 3.93% | | | |
| American Financial Group, Inc. | 24,333 | | 686,191 |
| Arthur J. Gallagher & Company | 33,930 | | 1,001,953 |
| Brown & Brown, Inc. | 39,717 | | 1,069,182 |
| Commerce Group, Inc. | 16,541 | | 527,327 |
| Everest Re Group, Ltd. | 21,795 | | 2,220,475 |
| First American Corp. | 33,333 | | 1,394,319 |
| Hanover Insurance Group, Inc. | 17,760 | | 759,773 |
| HCC Insurance Holdings, Inc. | 38,672 | | 1,067,734 |
| Horace Mann Educators Corp. | 14,901 | | 288,185 |
| Mercury General Corp. | 12,262 | | 645,962 |
| Old Republic International Corp. | 79,749 | | 1,450,634 |
| PMI Group, Inc. | 29,975 | | 949,608 |
| Protective Life Corp. | 24,126 | | 1,008,467 |
| Radian Group, Inc. | 27,682 | | 488,310 |
| Stancorp Financial Group, Inc. | 18,480 | | 870,408 |
| Unitrin, Inc. | 13,729 | | 624,120 |
| W.R. Berkley Corp. | 58,931 | | 1,761,448 |
| |
|
| | | | 16,814,096 |
| Internet Retail - 0.08% | | | |
| Netflix, Inc. * | 20,858 | | 365,432 |
| | | | |
| Internet Software - 1.17% | | | |
| CheckFree Corp. * | 30,336 | | 1,402,433 |
| Digital River, Inc. * | 13,957 | | 647,047 |
| F5 Networks, Inc. * | 28,802 | | 1,007,206 |
| McAfee, Inc. * | 55,032 | | 1,967,394 |
| |
|
| | | | 5,024,080 |
| Leisure Time - 0.55% | | | |
| Callaway Golf Company | 21,158 | | 345,298 |
| International Speedway Corp., Class A | 12,289 | | 578,566 |
| Life Time Fitness, Inc. * | 11,200 | | 622,384 |
| |
| The accompanying notes are an integral part of the financial statements. | 278 |
John Hancock Funds II
Portfolio of investments — August 31, 2007
(showing percentage of total net assets)
| | | |
| Mid Cap Index Fund (continued) | | | |
| | Shares or | | |
| | Principal | | |
| | Amount | | Value |
|
|
| |
| COMMON STOCKS (continued) | | | |
| | | | |
| Leisure Time (continued) | | | |
| Scientific Games Corp., Class A * | 23,304 | $ | 813,077 |
| |
|
| | | | 2,359,325 |
| Life Sciences - 0.29% | | | |
| Pharmaceutical Product Development, Inc. | 35,870 | | 1,256,526 |
| | | | |
| Manufacturing - 1.98% | | | |
| Carlisle Companies, Inc. | 21,413 | | 1,054,162 |
| Lancaster Colony Corp. | 8,067 | | 328,085 |
| Mine Safety Appliances Company | 10,286 | | 492,905 |
| Nordson Corp. | 11,618 | | 583,340 |
| Pentair, Inc. | 34,425 | | 1,278,200 |
| Roper Industries, Inc. | 30,455 | | 1,927,497 |
| SPX Corp. | 19,637 | | 1,768,312 |
| Trinity Industries, Inc. | 27,701 | | 1,040,726 |
| |
|
| | | | 8,473,227 |
| Medical-Hospitals - 1.03% | | | |
| Community Health Systems, Inc. * | 32,451 | | 1,127,023 |
| Health Management Associates, Inc., Class A | 83,590 | | 569,248 |
| Lifepoint Hospitals, Inc. * | 19,917 | | 559,668 |
| Universal Health Services, Inc., Class B | 18,578 | | 980,918 |
| VCA Antech, Inc. * | 28,994 | | 1,185,565 |
| |
|
| | | | 4,422,422 |
| Metal & Metal Products - 0.93% | | | |
| Commercial Metals Company | 40,780 | | 1,178,134 |
| Matthews International Corp., Class A | 10,900 | | 470,226 |
| Reliance Steel & Aluminum Company | 22,354 | | 1,184,091 |
| Timken Company | 32,474 | | 1,154,776 |
| |
|
| | | | 3,987,227 |
| Mining - 0.23% | | | |
| Cleveland-Cliffs, Inc. | 13,150 | | 1,002,951 |
| | | | |
| Mobile Homes - 0.12% | | | |
| Thor Industries, Inc. | 12,108 | | 532,631 |
| | | | |
| Newspapers - 0.41% | | | |
| Lee Enterprises, Inc. | 15,885 | | 275,922 |
| Washington Post Company, Class B | 1,940 | | 1,485,361 |
| |
|
| | | | 1,761,283 |
| Office Furnishings & Supplies - 0.31% | | | |
| Herman Miller, Inc. | 21,905 | | 635,683 |
| HNI Corp. | 16,530 | | 675,085 |
| |
|
| | | | 1,310,768 |
| Paper - 0.22% | | | |
| Bowater, Inc. | 19,394 | | 326,595 |
| Potlatch Corp. | 13,462 | | 606,328 |
| |
|
| | | | 932,923 |
| Petroleum Services - 1.69% | | | |
| Exterran Holdings, Inc. * | 22,177 | | 1,718,704 |
| Helmerich & Payne, Inc. | 35,613 | | 1,121,453 |
| Pride International, Inc. * | 57,216 | | 2,012,287 |
| Superior Energy Services, Inc. * | 27,839 | | 1,080,710 |
| | | |
| Mid Cap Index Fund (continued) | | | |
| | Shares or | | |
| | Principal | | |
| | Amount | | Value |
|
|
| |
| COMMON STOCKS (continued) | | | |
| | | | |
| Petroleum Services (continued) | | | |
| Tidewater, Inc. | 19,828 | $ | 1,297,743 |
| |
|
| | | | 7,230,897 |
| Pharmaceuticals - 1.51% | | | |
| Endo Pharmaceutical Holdings, Inc. * | 46,149 | | 1,471,230 |
| Medicis Pharmaceutical Corp., Class A | 19,265 | | 588,353 |
| Par Pharmaceutical Companies, Inc. * | 12,091 | | 270,718 |
| PDL BioPharma, Inc. * | 40,226 | | 784,809 |
| Sepracor, Inc. * | 36,716 | | 1,071,006 |
| Valeant Pharmaceuticals International * | 32,655 | | 514,969 |
| Vertex Pharmaceuticals, Inc. * | 45,188 | | 1,760,525 |
| |
|
| | | | 6,461,610 |
| Publishing - 0.42% | | | |
| American Greetings Corp., Class A | 19,608 | | 485,102 |
| John Wiley & Sons, Inc., Class A | 15,254 | | 632,583 |
| Media General, Inc., Class A | 7,806 | | 217,943 |
| Scholastic Corp. * | 9,020 | | 307,402 |
| Valassis Communications, Inc. * | 16,517 | | 150,635 |
| |
|
| | | | 1,793,665 |
| Real Estate - 3.18% | | | |
| AMB Property Corp., REIT | 34,369 | | 1,889,608 |
| Cousins Properties, Inc., REIT | 15,076 | | 414,138 |
| Equity One, Inc., REIT | 12,733 | | 333,095 |
| Highwoods Properties, Inc., REIT | 19,622 | | 700,309 |
| Hospitality Properties Trust, REIT | 32,382 | | 1,277,794 |
| Liberty Property Trust, REIT | 31,724 | | 1,239,139 |
| Mack-California Realty Corp., REIT | 23,430 | | 978,437 |
| Nationwide Health Properties, Inc., REIT | 30,788 | | 854,367 |
| Regency Centers Corp., REIT | 23,968 | | 1,665,057 |
| The Macerich Company, REIT | 24,727 | | 2,008,327 |
| UDR, Inc., REIT | 46,873 | | 1,176,981 |
| Weingarten Realty Investors, REIT | 26,240 | | 1,055,110 |
| |
|
| | | | 13,592,362 |
| Retail Grocery - 0.09% | | | |
| Ruddick Corp. | 12,422 | | 404,709 |
| | | | |
| Retail Trade - 6.00% | | | |
| 99 Cents Only Stores * | 16,175 | | 199,761 |
| Advance Auto Parts, Inc. | 36,726 | | 1,305,976 |
| Aeropostale, Inc. * | 26,730 | | 553,311 |
| American Eagle Outfitters, Inc. | 67,920 | | 1,754,374 |
| AnnTaylor Stores Corp. * | 22,314 | | 699,321 |
| Barnes & Noble, Inc. | 17,741 | | 639,918 |
| BJ's Wholesale Club, Inc. * | 22,197 | | 776,895 |
| Borders Group, Inc. | 20,495 | | 307,425 |
| CarMax, Inc. * | 74,132 | | 1,679,831 |
| Charming Shoppes, Inc. * | 44,366 | | 401,069 |
| Chico's FAS, Inc. * | 60,716 | | 970,242 |
| Coldwater Creek, Inc. * | 20,872 | | 259,648 |
| Collective Brands, Inc. * | 22,763 | | 537,890 |
| Dick's Sporting Goods, Inc. * | 13,608 | | 883,159 |
| Dollar Tree Stores, Inc. * | 35,396 | | 1,537,956 |
| |
| The accompanying notes are an integral part of the financial statements. | 279 |
John Hancock Funds II
Portfolio of investments — August 31, 2007
(showing percentage of total net assets)
| | | |
| Mid Cap Index Fund (continued) | | | |
| | Shares or | | |
| | Principal | | |
| | Amount | | Value |
|
|
| |
| COMMON STOCKS (continued) | | | |
| | | | |
| Retail Trade (continued) | | | |
| Foot Locker, Inc. | 53,359 | $ | 891,629 |
| GameStop Corp., Class A * | 52,636 | | 2,639,169 |
| MSC Industrial Direct Company, Inc., Class A | 18,384 | | 952,291 |
| NBTY, Inc. * | 19,520 | | 716,384 |
| Pacific Sunwear of California, Inc. * | 24,292 | | 340,331 |
| PetSmart, Inc. | 46,925 | | 1,628,297 |
| Regis Corp. | 15,284 | | 504,525 |
| Rent-A-Center, Inc. * | 24,258 | | 466,239 |
| Ross Stores, Inc. | 48,210 | | 1,341,684 |
| Saks, Inc. * | 49,110 | | 794,109 |
| United Rentals, Inc. * | 22,982 | | 749,213 |
| Urban Outfitters, Inc. * | 38,867 | | 890,054 |
| Williams-Sonoma, Inc. | 38,165 | | 1,272,039 |
| |
|
| | | | 25,692,740 |
| Sanitary Services - 1.03% | | | |
| Aqua America, Inc. | 45,742 | | 1,095,978 |
| Republic Services, Inc. | 58,096 | | 1,806,205 |
| Stericycle, Inc. * | 30,245 | | 1,509,225 |
| |
|
| | | | 4,411,408 |
| Semiconductors - 3.32% | | | |
| Atmel Corp. * | 147,782 | | 783,245 |
| Cree, Inc. * | 29,068 | | 773,209 |
| Cypress Semiconductor Corp. * | 52,156 | | 1,305,986 |
| Fairchild Semiconductor International, Inc. * | 42,685 | | 800,771 |
| Integrated Device Technology, Inc. * | 68,239 | | 1,067,258 |
| International Rectifier Corp. * | 25,016 | | 860,800 |
| Intersil Corp., Class A | 46,621 | | 1,553,412 |
| Lam Research Corp. * | 46,597 | | 2,498,997 |
| Lattice Semiconductor Corp. * | 39,593 | | 197,569 |
| Micrel, Inc. | 19,536 | | 213,919 |
| Microchip Technology, Inc. | 74,547 | | 2,871,550 |
| Semtech Corp. * | 21,692 | | 386,985 |
| Silicon Laboratories, Inc. * | 18,893 | | 697,530 |
| Triquint Semiconductor, Inc. * | 47,995 | | 211,658 |
| |
|
| | | | 14,222,889 |
| Software - 0.81% | | | |
| ACI Worldwide, Inc. * | 12,820 | | 333,064 |
| Activision, Inc. * | 86,985 | | 1,695,338 |
| Advent Software, Inc. * | 6,751 | | 270,512 |
| Macrovision Corp. * | 18,295 | | 434,140 |
| Sybase, Inc. * | 31,505 | | 726,190 |
| |
|
| | | | 3,459,244 |
| Steel - 0.66% | | | |
| Carpenter Technology Corp. | 8,840 | | 1,032,866 |
| Steel Dynamics, Inc. | 29,338 | | 1,272,682 |
| Worthington Industries, Inc. | 23,892 | | 505,555 |
| |
|
| | | | 2,811,103 |
| Telecommunications Equipment & | | | |
| Services - 1.36% | | | |
| ADC Telecommunications, Inc. * | 40,500 | | 741,150 |
| | | | |
| Mid Cap Index Fund (continued) | | | |
| | | Shares or | | |
| | | Principal | | |
| | | Amount | | Value |
|
|
| |
| COMMON STOCKS (continued) | | | | |
| | | | | |
| Telecommunications Equipment & | | | | |
| Services (continued) | | | | |
| ADTRAN, Inc. | | 21,200 | $ | 566,676 |
| Andrew Corp. * | | 53,721 | | 756,392 |
| CommScope, Inc. * | | 21,123 | | 1,195,562 |
| NeuStar, Inc., Class A * | | 22,145 | | 700,225 |
| Plantronics, Inc. | | 16,522 | | 469,225 |
| Polycom, Inc. * | | 31,631 | | 958,735 |
| Powerwave Technologies, Inc. * | | 44,946 | | 307,880 |
| UTStarcom, Inc. * | | 36,685 | | 111,522 |
| |
|
| | | | | 5,807,367 |
| Telephone - 0.76% | | | | |
| Cincinnati Bell, Inc. * | | 85,439 | | 416,942 |
| Harris Corp. | | 46,324 | | 2,817,889 |
| |
|
| | | | | 3,234,831 |
| Tobacco - 0.10% | | | | |
| Universal Corp. | | 8,959 | | 440,156 |
| | | | | |
| Transportation - 1.26% | | | | |
| Alexander & Baldwin, Inc. | | 14,802 | | 768,372 |
| Con-way, Inc. | | 15,747 | | 763,415 |
| Expeditors International of Washington, Inc. | 73,528 | | 3,247,732 |
| Overseas Shipholding Group, Inc. | | 8,596 | | 613,754 |
| |
|
| | | | | 5,393,273 |
| Trucking & Freight - 0.80% | | | | |
| J.B. Hunt Transport Services, Inc. | | 35,067 | | 1,008,877 |
| Oshkosh Truck Corp. | | 25,549 | | 1,479,032 |
| Werner Enterprises, Inc. | | 16,756 | | 311,829 |
| YRC Worldwide, Inc. * | | 19,837 | | 611,178 |
| |
|
| | | | | 3,410,916 |
|
| TOTAL COMMON STOCKS (Cost $379,103,561) | | $ | 398,607,227 |
|
| |
| SHORT TERM INVESTMENTS - 6.80% | | | |
| Federal Home Loan Bank Discount Notes | | | | |
| zero coupon due 09/04/2007 to | | | | |
| 09/10/2007 | $ | 27,892,000 | $ | 27,872,480 |
| U.S. Treasury Bills | | | | |
| zero coupon due 10/18/2007 **** | | 1,250,000 | | 1,242,134 |
|
| TOTAL SHORT TERM INVESTMENTS | | | | |
| (Cost $29,114,614) | | | $ | 29,114,614 |
|
| Total Investments (Mid Cap Index Fund) | | | |
| (Cost $408,218,175) - 99.93% | | | $ | 427,721,841 |
| Other Assets in Excess of Liabilities - 0.07% | | | 306,284 |
| |
|
| TOTAL NET ASSETS - 100.00% | | | $ | 428,028,125 |
| |
|
| |
| The accompanying notes are an integral part of the financial statements. | 280 |
John Hancock Funds II
Portfolio of investments — August 31, 2007
(showing percentage of total net assets)
| | | |
| Mid Cap Intersection Fund | | | |
| | Shares or | | |
| | Principal | | |
| | Amount | | Value |
|
|
| |
| COMMON STOCKS - 98.42% | | | |
| | | |
| Aerospace - 1.06% | | | |
| Teledyne Technologies, Inc. * | 16,300 | $ | 813,533 |
| Woodward Governor Company | 46,600 | | 2,736,818 |
| |
|
| | | | 3,550,351 |
| Air Travel - 0.70% | | | |
| Delta Air Lines, Inc. * | 49,500 | | 835,560 |
| SkyWest, Inc. | 60,100 | | 1,510,313 |
| |
|
| | | | 2,345,873 |
| Aluminum - 0.32% | | | |
| Century Aluminum Company * | 21,800 | | 1,072,124 |
| | | | |
| Apparel & Textiles - 0.60% | | | |
| Crocs, Inc. * | 21,400 | | 1,263,456 |
| Phillips-Van Heusen Corp. | 12,861 | | 748,896 |
| |
|
| | | | 2,012,352 |
| Auto Parts - 1.32% | | | |
| BorgWarner, Inc. | 18,500 | | 1,563,250 |
| TRW Automotive Holdings Corp. * | 92,900 | | 2,839,024 |
| |
|
| | | | 4,402,274 |
| Auto Services - 1.03% | | | |
| Avis Budget Group, Inc. * | 148,610 | | 3,449,238 |
| Banking - 0.67% | | | |
| Comerica, Inc. | 40,400 | | 2,253,512 |
| Biotechnology - 1.94% | | | |
| Cephalon, Inc. * | 63,845 | | 4,791,567 |
| Millennium Pharmaceuticals, Inc. * | 167,985 | | 1,705,048 |
| |
|
| | | | 6,496,615 |
| Building Materials & Construction - 1.01% | | | |
| KBR, Inc. * | 65,135 | | 2,139,033 |
| Lennox International, Inc. | 34,700 | | 1,248,159 |
| |
|
| | | | 3,387,192 |
| Business Services - 5.63% | | | |
| Cadence Design Systems, Inc. * | 205,441 | | 4,462,178 |
| Computer Sciences Corp. * | 17,600 | | 984,720 |
| DST Systems, Inc. * | 50,468 | | 3,858,783 |
| Dun & Bradstreet Corp. | 9,722 | | 948,381 |
| Manpower, Inc. | 66,399 | | 4,665,194 |
| Perot Systems Corp., Class A * | 101,200 | | 1,581,756 |
| Sotheby's | 34,867 | | 1,509,044 |
| TeleTech Holdings, Inc. * | 27,600 | | 807,300 |
| |
|
| | | | 18,817,356 |
| Cellular Communications - 0.33% | | | |
| Telephone & Data Systems, Inc. | 16,867 | | 1,092,138 |
| | | | |
| Chemicals - 2.37% | | | |
| Albemarle Corp. | 34,200 | | 1,384,074 |
| Celanese Corp., Series A | 31,400 | | 1,127,888 |
| CF Industries Holdings, Inc. | 26,400 | | 1,671,912 |
| FMC Corp. | 9,409 | | 846,810 |
| Lubrizol Corp. | 17,007 | | 1,081,305 |
| Terra Industries, Inc. * | 40,400 | | 1,049,188 |
| | | |
| Mid Cap Intersection Fund (continued) | | |
| | Shares or | | |
| | Principal | | |
| | Amount | | Value |
|
|
| |
| COMMON STOCKS (continued) | | | |
| | | | |
| Chemicals (continued) | | | |
| W. R. Grace & Company * | 34,300 | $ | 766,262 |
| |
|
| | | | 7,927,439 |
| Colleges & Universities - 0.99% | | | |
| ITT Educational Services, Inc. * | 30,193 | | 3,315,191 |
| | | | |
| Commercial Services - 0.37% | | | |
| Chemed Corp. | 20,000 | | 1,240,800 |
| | | | |
| Computers & Business Equipment - 2.27% | | | |
| Electronics for Imaging, Inc. * | 48,800 | | 1,272,704 |
| Ingram Micro, Inc., Class A * | 248,101 | | 4,872,704 |
| Western Digital Corp. * | 61,800 | | 1,443,648 |
| |
|
| | | | 7,589,056 |
| Containers & Glass - 0.89% | | | |
| Owens-Illinois, Inc. * | 33,000 | | 1,327,260 |
| Sonoco Products Company | 45,823 | | 1,650,545 |
| |
|
| | | | 2,977,805 |
| Crude Petroleum & Natural Gas - 5.74% | | | |
| Cabot Oil & Gas Corp. | 39,500 | | 1,316,930 |
| Cimarex Energy Company | 34,489 | | 1,235,051 |
| Noble Energy, Inc. | 131,312 | | 7,887,912 |
| Patterson-UTI Energy, Inc. | 53,166 | | 1,141,474 |
| Sunoco, Inc. | 46,000 | | 3,364,440 |
| Unit Corp. * | 86,400 | | 4,238,784 |
| |
|
| | | | 19,184,591 |
| Drugs & Health Care - 0.55% | | | |
| West Pharmaceutical Services, Inc. | 46,000 | | 1,842,300 |
| Electrical Utilities - 3.86% | | | |
| CenterPoint Energy, Inc. | 192,000 | | 3,114,240 |
| DTE Energy Company | 34,900 | | 1,668,569 |
| Northeast Utilities | 173,400 | | 4,794,510 |
| NSTAR | 20,107 | | 658,906 |
| Pepco Holdings, Inc. | 31,185 | | 869,438 |
| PNM Resources, Inc. | 49,196 | | 1,137,412 |
| Puget Energy, Inc. | 27,913 | | 651,210 |
| |
|
| | | | 12,894,285 |
| Electronics - 3.66% | | | |
| Amphenol Corp., Class A | 64,452 | | 2,327,362 |
| Arrow Electronics, Inc. * | 19,914 | | 835,591 |
| Avnet, Inc. * | 59,631 | | 2,344,095 |
| Belden, Inc. | 22,600 | | 1,098,586 |
| Mentor Graphics Corp. * | 122,267 | | 1,706,847 |
| Teleflex, Inc. | 10,038 | | 780,655 |
| Vishay Intertechnology, Inc. * | 235,990 | | 3,122,148 |
| |
|
| | | | 12,215,284 |
| Energy - 2.66% | | | |
| Energen Corp. | 86,500 | | 4,645,050 |
| MDU Resources Group, Inc. | 156,253 | | 4,226,644 |
| |
|
| | | | 8,871,694 |
| Financial Services - 3.72% | | | |
| Affiliated Managers Group, Inc. * | 45,100 | | 5,107,575 |
| |
| The accompanying notes are an integral part of the financial statements. | 281 |
John Hancock Funds II
Portfolio of investments — August 31, 2007
(showing percentage of total net assets)
| | | |
| Mid Cap Intersection Fund (continued) | | |
| | Shares or | | |
| | Principal | | |
| | Amount | | Value |
|
|
| |
| COMMON STOCKS (continued) | | | |
| | | | |
| Financial Services (continued) | | | |
| CIT Group, Inc. | 14,300 | $ | 537,251 |
| E*TRADE Financial Corp. * | 149,000 | | 2,321,420 |
| UMB Financial Corp. | 100,400 | | 4,447,720 |
| |
|
| | | | 12,413,966 |
| Food & Beverages - 0.97% | | | |
| Hormel Foods Corp. | 12,200 | | 434,686 |
| Tyson Foods, Inc., Class A | 130,300 | | 2,807,965 |
| |
|
| | | | 3,242,651 |
| Gas & Pipeline Utilities - 1.18% | | | |
| Questar Corp. | 17,000 | | 849,490 |
| UGI Corp. | 121,300 | | 3,099,215 |
| |
|
| | | | 3,948,705 |
| Healthcare Products - 1.22% | | | |
| Beckman Coulter, Inc. | 42,892 | | 3,086,079 |
| STERIS Corp. | 35,600 | | 999,292 |
| |
|
| | | | 4,085,371 |
| Healthcare Services - 3.67% | | | |
| Coventry Health Care, Inc. * | 43,700 | | 2,507,069 |
| Health Net, Inc. * | 119,133 | | 6,527,297 |
| Pediatrix Medical Group, Inc. * | 12,300 | | 733,695 |
| Weight Watchers International, Inc. | 47,800 | | 2,482,732 |
| |
|
| | | | 12,250,793 |
| Homebuilders - 0.15% | | | |
| NVR, Inc. * | 881 | | 492,920 |
| | | | |
| Hotels & Restaurants - 0.22% | | | |
| CBRL Group, Inc. | 19,581 | | 732,721 |
| | | | |
| Household Appliances - 1.25% | | | |
| Whirlpool Corp. | 43,200 | | 4,164,912 |
| | | | |
| Household Products - 1.56% | | | |
| Church & Dwight, Inc. | 30,730 | | 1,380,699 |
| Energizer Holdings, Inc. * | 9,495 | | 1,005,805 |
| Newell Rubbermaid, Inc. | 109,600 | | 2,826,584 |
| |
|
| | | | 5,213,088 |
| Industrial Machinery - 3.46% | | | |
| AGCO Corp. * | 33,199 | | 1,434,197 |
| Dresser-Rand Group, Inc. * | 34,700 | | 1,279,389 |
| Gardner Denver, Inc. * | 78,000 | | 3,112,980 |
| Grant Prideco, Inc. * | 56,834 | | 3,142,920 |
| The Manitowoc Company, Inc. | 32,800 | | 2,607,272 |
| |
|
| | | | 11,576,758 |
| Industrials - 0.23% | | | |
| Harsco Corp. | 13,617 | | 757,786 |
| Insurance - 7.47% | | | |
| Allied World Assurance Holdings, Ltd. | 107,800 | | 5,176,556 |
| Ambac Financial Group, Inc. | 12,700 | | 797,814 |
| American Financial Group, Inc. | 20,451 | | 576,718 |
| Assurant, Inc. | 25,600 | | 1,319,424 |
| Axis Capital Holdings, Ltd. | 130,300 | | 4,703,830 |
| Everest Re Group, Ltd. | 66,376 | | 6,762,387 |
| | | |
| Mid Cap Intersection Fund (continued) | | |
| | Shares or | | |
| | Principal | | |
| | Amount | | Value |
|
|
| |
| COMMON STOCKS (continued) | | | |
| | | | |
| Insurance (continued) | | | |
| HCC Insurance Holdings, Inc. | 23,532 | $ | 649,718 |
| MBIA, Inc. | 15,300 | | 918,000 |
| PMI Group, Inc. | 16,276 | | 515,624 |
| Reinsurance Group of America, Inc. | 65,000 | | 3,530,150 |
| |
|
| | | | 24,950,221 |
| Internet Retail - 0.47% | | | |
| Netflix, Inc. * | 89,697 | | 1,571,492 |
| | | | |
| Internet Software - 0.83% | | | |
| McAfee, Inc. * | 77,849 | | 2,783,102 |
| | | | |
| Leisure Time - 0.21% | | | |
| Regal Entertainment Group, Class A | 31,200 | | 703,248 |
| | | | |
| Manufacturing - 2.26% | | | |
| Acuity Brands, Inc. | 81,800 | | 4,297,772 |
| Barnes Group, Inc. | 34,800 | | 1,094,808 |
| Ceradyne, Inc. * | 17,000 | | 1,228,760 |
| Mettler-Toledo International, Inc. * | 9,800 | | 924,238 |
| |
|
| | | | 7,545,578 |
| Medical-Hospitals - 0.75% | | | |
| Lifepoint Hospitals, Inc. * | 88,695 | | 2,492,330 |
| | | | |
| Metal & Metal Products - 3.00% | | | |
| Commercial Metals Company | 21,355 | | 616,946 |
| Precision Castparts Corp. | 57,019 | | 7,430,146 |
| Reliance Steel & Aluminum Company | 19,647 | | 1,040,702 |
| USEC, Inc. * | 69,400 | | 929,266 |
| |
|
| | | | 10,017,060 |
| Mining - 0.60% | | | |
| Cleveland-Cliffs, Inc. | 26,100 | | 1,990,647 |
| | | | |
| Paper - 0.28% | | | |
| Rock-Tenn Company, Class A | 31,800 | | 921,882 |
| Petroleum Services - 2.40% | | | |
| Pride International, Inc. * | 101,494 | | 3,569,544 |
| SEACOR Holdings, Inc. * | 18,600 | | 1,633,080 |
| Tesoro Petroleum Corp. | 57,200 | | 2,821,676 |
| |
|
| | | | 8,024,300 |
| Pharmaceuticals - 3.56% | | | |
| Alkermes, Inc. * | 134,900 | | 2,273,065 |
| Amylin Pharmaceuticals, Inc. * | 81,200 | | 3,981,236 |
| Barr Pharmaceuticals, Inc. * | 38,600 | | 1,963,968 |
| Par Pharmaceutical Companies, Inc. * | 24,300 | | 544,077 |
| Vertex Pharmaceuticals, Inc. * | 64,322 | | 2,505,985 |
| Watson Pharmaceuticals, Inc. * | 20,600 | | 614,292 |
| |
|
| | | | 11,882,623 |
| Real Estate - 1.20% | | | |
| Forest City Enterprises, Inc., Class A | 24,800 | | 1,377,640 |
| Taubman Centers, Inc., REIT | 50,900 | | 2,625,422 |
| |
|
| | | | 4,003,062 |
| Retail Grocery - 0.70% | | | |
| SUPERVALU, Inc. | 55,200 | | 2,326,680 |
| |
| The accompanying notes are an integral part of the financial statements. | 282 |
John Hancock Funds II
Portfolio of investments — August 31, 2007
(showing percentage of total net assets)
| | | |
| Mid Cap Intersection Fund (continued) | | |
| | Shares or | | |
| | Principal | | |
| | Amount | | Value |
|
|
| |
| COMMON STOCKS (continued) | | | |
| | | | |
| Retail Trade - 6.05% | | | |
| Aaron Rents, Inc., Class B | 28,500 | $ | 729,315 |
| Abercrombie & Fitch Company, Class A | 50,000 | | 3,935,000 |
| Advance Auto Parts, Inc. | 17,122 | | 608,858 |
| Aeropostale, Inc. * | 97,527 | | 2,018,809 |
| American Eagle Outfitters, Inc. | 32,515 | | 839,862 |
| Big Lots, Inc. * | 65,400 | | 1,946,958 |
| BJ's Wholesale Club, Inc. * | 75,800 | | 2,653,000 |
| Dillard's, Inc., Class A | 31,200 | | 740,688 |
| Dollar Tree Stores, Inc. * | 46,226 | | 2,008,520 |
| J. Crew Group, Inc. * | 33,400 | | 1,663,654 |
| Ross Stores, Inc. | 109,844 | | 3,056,959 |
| |
|
| | | | 20,201,623 |
| Semiconductors - 6.02% | | | |
| Emulex Corp. * | 105,100 | | 2,053,654 |
| Integrated Device Technology, Inc. * | 62,500 | | 977,500 |
| Lam Research Corp. * | 154,472 | | 8,284,333 |
| MKS Instruments, Inc. * | 43,400 | | 956,536 |
| ON Semiconductor Corp. * | 80,100 | | 938,772 |
| Teradyne, Inc. * | 82,000 | | 1,220,980 |
| Varian Semiconductor Equipment | | | |
| Associates, Inc. * | 102,300 | | 5,690,949 |
| |
|
| | | | 20,122,724 |
| Software - 0.40% | | | |
| Sybase, Inc. * | 58,099 | | 1,339,182 |
| | | | |
| Steel - 0.88% | | | |
| Steel Dynamics, Inc. | 67,900 | | 2,945,502 |
| | | | |
| Telecommunications Equipment & | | | |
| Services - 1.86% | | | |
| CommScope, Inc. * | 12,200 | | 690,520 |
| NeuStar, Inc., Class A * | 121,297 | | 3,835,411 |
| Polycom, Inc. * | 29,726 | | 900,995 |
| SAVVIS, Inc. * | 19,700 | | 782,681 |
| |
|
| | | | 6,209,607 |
| Telephone - 1.69% | | | |
| CenturyTel, Inc. | 44,700 | | 2,144,706 |
| Harris Corp. | 41,928 | | 2,550,480 |
| U.S. Cellular Corp. * | 9,900 | | 962,775 |
| |
|
| | | | 5,657,961 |
| Tires & Rubber - 0.21% | | | |
| Goodyear Tire & Rubber Company * | 25,100 | | 694,266 |
| | | | |
| Toys, Amusements & Sporting Goods - 0.41% | | | |
| Hasbro, Inc. | 48,900 | | 1,379,469 |
| | | | |
| Trucking & Freight - 1.57% | | | |
| Landstar Systems, Inc. | 85,400 | | 3,673,054 |
| Werner Enterprises, Inc. | 84,200 | | 1,566,962 |
| |
|
| | | | 5,240,016 |
|
| TOTAL COMMON STOCKS (Cost $339,458,970) | | $ | 328,819,716 |
|
| | | | |
| Mid Cap Intersection Fund (continued) | | |
| | | Shares or | | |
| | | Principal | | |
| | | Amount | | Value |
|
|
| |
| REPURCHASE AGREEMENTS - 1.06% | | | |
| Repurchase Agreement with State | | | | |
| Street Corp. dated 08/31/2007 at | | | | |
| 4.60% to be repurchased at | | | | |
| $3,544,811 on 09/04/2007, | | | | |
| collateralized by $3,515,000 | | | | |
| Federal Home Loan Bank, 5.5% | | | | |
| due 07/15/2036 (valued at | | | | |
| $3,616,056, including interest) | $ | 3,543,000 | $ | 3,543,000 |
|
| TOTAL REPURCHASE AGREEMENTS | | | | |
| (Cost $3,543,000) | | | $ | 3,543,000 |
|
| Total Investments (Mid Cap Intersection Fund) | | | |
| (Cost $343,001,970) - 99.48% | | | $ | 332,362,716 |
| Other Assets in Excess of Liabilities - 0.52% | | | 1,728,829 |
| |
|
| TOTAL NET ASSETS - 100.00% | | | $ | 334,091,545 |
| |
|
| |
| |
| |
| Mid Cap Stock Fund | | | | |
| | | Shares or | | |
| | | Principal | | |
| | | Amount | | Value |
|
|
| |
| COMMON STOCKS - 98.42% | | | | |
| | | | | |
| Advertising - 1.52% | | | | |
| Focus Media Holding, Ltd., ADR * | | 189,200 | $ | 7,619,084 |
| | | | | |
| Aerospace - 1.19% | | | | |
| Teledyne Technologies, Inc. * | | 120,000 | | 5,989,200 |
| | | | | |
| Agriculture - 1.08% | | | | |
| The Mosaic Company * | | 129,700 | | 5,449,994 |
| | | | | |
| Apparel & Textiles - 1.07% | | | | |
| Coach, Inc. * | | 24,900 | | 1,108,797 |
| Crocs, Inc. * (a) | | 72,200 | | 4,262,688 |
| |
|
| | | | | 5,371,485 |
| Auto Parts - 0.94% | | | | |
| LKQ Corp. * | | 151,600 | | 4,696,568 |
| | | | | |
| Biotechnology - 2.23% | | | | |
| Cephalon, Inc. * | | 68,377 | | 5,131,694 |
| Charles River Laboratories International, Inc. * | 116,100 | | 6,092,928 |
| |
|
| | | | | 11,224,622 |
| Building Materials & Construction - 0.93% | | | |
| Foster Wheeler, Ltd. * | | 39,600 | | 4,690,224 |
| Business Services - 6.31% | | | | |
| Cadence Design Systems, Inc. * | | 348,700 | | 7,573,764 |
| DST Systems, Inc. * | | 55,100 | | 4,212,946 |
| Equifax, Inc. | | 140,600 | | 5,415,912 |
| Manpower, Inc. | | 70,900 | | 4,981,434 |
| Peace Mark Holdings, Ltd. | | 1,238,000 | | 1,836,294 |
| Resources Connection, Inc. * | | 257,000 | | 7,710,000 |
| |
|
| | | | | 31,730,350 |
| Cable & Television - 0.75% | | | | |
| Net Servicos de Comunicacao SA, PR ADR * (a) | 249,500 | | 3,764,955 |
| |
| The accompanying notes are an integral part of the financial statements. | 283 |
John Hancock Funds II
Portfolio of investments — August 31, 2007
(showing percentage of total net assets)
| | | |
| Mid Cap Stock Fund (continued) | | | |
| | Shares or | | |
| | Principal | | |
| | Amount | | Value |
|
|
| |
| COMMON STOCKS (continued) | | | |
| | | | |
| Cellular Communications - 0.27% | | | |
| Millicom International Cellular SA * (a) | 16,200 | $ | 1,366,146 |
| | | | |
| Chemicals - 6.58% | | | |
| FMC Corp. | 14,800 | | 1,332,000 |
| Hercules, Inc. | 309,000 | | 6,433,380 |
| Kingboard Chemical Holdings, Ltd. | 977,600 | | 5,733,254 |
| Potash Corp. of Saskatchewan, Inc. | 63,800 | | 5,650,128 |
| Rhodia SA * | 127,891 | | 5,215,300 |
| Terra Industries, Inc. * | 334,400 | | 8,684,368 |
| |
|
| | | | 33,048,430 |
| Colleges & Universities - 0.06% | | | |
| ITT Educational Services, Inc. * | 2,800 | | 307,440 |
| | | | |
| Computers & Business Equipment - 0.17% | | | |
| Diebold, Inc. | 19,100 | | 837,917 |
| | | |
| Containers & Glass - 2.61% | | | |
| Owens-Illinois, Inc. * | 193,400 | | 7,778,548 |
| Rexam PLC | 504,898 | | 5,339,636 |
| |
|
| | | | 13,118,184 |
| Crude Petroleum & Natural Gas - 4.36% | | | |
| Chesapeake Energy Corp. | 238,428 | | 7,691,687 |
| EOG Resources, Inc. | 73,800 | | 4,971,168 |
| Forest Oil Corp. * (a) | 130,700 | | 5,051,555 |
| Ultra Petroleum Corp. * | 78,600 | | 4,197,240 |
| |
|
| | | | 21,911,650 |
| Drugs & Health Care - 1.62% | | | |
| Perrigo Company | 171,800 | | 3,557,978 |
| Shionogi & Company, Ltd. | 243,247 | | 3,538,264 |
| Zymogenetics, Inc. * (a) | 86,900 | | 1,049,752 |
| |
|
| | | | 8,145,994 |
| Electrical Equipment - 2.22% | | | |
| FLIR Systems, Inc. * | 133,900 | | 6,593,236 |
| Genlyte Group, Inc. * | 62,852 | | 4,561,170 |
| |
|
| | | | 11,154,406 |
| Electronics - 1.02% | | | |
| Garmin, Ltd. (a) | 50,100 | | 5,101,683 |
| | | | |
| Energy - 4.55% | | | |
| Covanta Holding Corp. * | 228,600 | | 5,164,074 |
| LDK Solar Company, Ltd., ADR * | 111,900 | | 5,769,564 |
| SunPower Corp., Class A. * (a) | 97,100 | | 6,634,843 |
| Suntech Power Holdings Company, Ltd., ADR * | 148,300 | | 5,301,725 |
| |
|
| | | | 22,870,206 |
| Financial Services - 2.16% | | | |
| Interactive Data Corp. | 213,100 | | 5,826,154 |
| Invesco PLC, SADR | 203,200 | | 5,017,008 |
| |
|
| | | | 10,843,162 |
| Food & Beverages - 1.42% | | | |
| Hansen Natural Corp. * | 33,400 | | 1,499,994 |
| Tyson Foods, Inc., Class A | 262,100 | | 5,648,255 |
| |
|
| | | | 7,148,249 |
| | | |
| Mid Cap Stock Fund (continued) | | | |
| | Shares or | | |
| | Principal | | |
| | Amount | | Value |
|
|
| |
| COMMON STOCKS (continued) | | | |
| | | | |
| Healthcare Products - 4.08% | | | |
| Hologic, Inc. * (a) | 136,900 | $ | 7,276,235 |
| Mindray Medical International, Ltd., ADR (a) | 154,400 | | 5,479,656 |
| St. Jude Medical, Inc. * | 149,100 | | 6,496,287 |
| The Medicines Company * | 75,539 | | 1,261,501 |
|
|
| | | | 20,513,679 |
| Household Products - 1.41% | | | |
| Jarden Corp. * | 216,368 | | 7,094,707 |
| | | | |
| Industrial Machinery - 1.26% | | | |
| Flowserve Corp. | 79,500 | | 5,677,095 |
| Kennametal, Inc. | 7,800 | | 629,148 |
|
|
| | | | 6,306,243 |
| International Oil - 1.08% | | | |
| Noble Corp. | 110,400 | | 5,416,224 |
| | | | |
| Internet Service Provider - 0.95% | | | |
| Equinix, Inc. * | 53,800 | | 4,761,838 |
| | | | |
| Internet Software - 2.40% | | | |
| Akamai Technologies, Inc. * | 27,900 | | 898,938 |
| Digital River, Inc. * | 109,400 | | 5,071,784 |
| McAfee, Inc. * | 170,600 | | 6,098,950 |
|
|
| | | | 12,069,672 |
| Leisure Time - 2.93% | | | |
| DreamWorks Animation SKG, Class A * | 155,939 | | 4,810,718 |
| Electronic Arts, Inc. * | 187,500 | | 9,926,250 |
|
|
| | | | 14,736,968 |
| Manufacturing - 1.62% | | | |
| Acuity Brands, Inc. | 65,200 | | 3,425,608 |
| Snap-on, Inc. | 96,000 | | 4,702,080 |
|
|
| | | | 8,127,688 |
| Metal & Metal Products - 1.03% | | | |
| Cameco Corp. | 128,052 | | 5,170,740 |
| Mining - 2.58% | | | |
| Freeport-McMoRan Copper & Gold, Inc., | | | |
| Class B | 88,000 | | 7,692,960 |
| Teck Cominco, Ltd., Class B | 123,200 | | 5,252,016 |
|
|
| | | | 12,944,976 |
| Petroleum Services - 1.84% | | | |
| GlobalSantaFe Corp. | 68,900 | | 4,863,651 |
| TETRA Technologies, Inc. * | 218,700 | | 4,371,813 |
|
|
| | | | 9,235,464 |
| Pharmaceuticals - 2.26% | | | |
| Alkermes, Inc. * | 159,901 | | 2,694,332 |
| Amylin Pharmaceuticals, Inc. * (a) | 96,067 | | 4,710,165 |
| Elan Corp. PLC, SADR * | 204,200 | | 3,957,396 |
|
|
| | | | 11,361,893 |
| Retail Trade - 12.33% | | | |
| Abercrombie & Fitch Company, Class A | 65,300 | | 5,139,110 |
| BJ's Wholesale Club, Inc. * | 238,800 | | 8,358,000 |
| Dick's Sporting Goods, Inc. * | 117,500 | | 7,625,750 |
| Dollar Tree Stores, Inc. * | 133,600 | | 5,804,920 |
| |
| The accompanying notes are an integral part of the financial statements. | 284 |
John Hancock Funds II
Portfolio of investments — August 31, 2007
(showing percentage of total net assets)
| | | | |
| Mid Cap Stock Fund (continued) | | | |
| | | Shares or | | |
| | | Principal | | |
| | | Amount | | Value |
| |
|
| |
| COMMON STOCKS (continued) | | | | |
| | | | | |
| Retail Trade (continued) | | | | |
| Fossil, Inc. * | | 321,600 | $ | 10,776,816 |
| GameStop Corp., Class A * | | 123,900 | | 6,212,346 |
| Kohl's Corp. * | | 143,700 | | 8,521,410 |
| Luxottica Group SpA | | 131,999 | | 4,519,985 |
| Tiffany & Company (a) | | 97,007 | | 4,979,370 |
|
|
| | | | | 61,937,707 |
| Sanitary Services - 0.95% | | | | |
| Allied Waste Industries, Inc. * | | 375,300 | | 4,792,581 |
| | | | | |
| Semiconductors - 2.26% | | | | |
| Broadcom Corp., Class A * | | 161,600 | | 5,575,200 |
| NVIDIA Corp. * | | 113,000 | | 5,781,080 |
|
|
| | | | | 11,356,280 |
| Software - 11.03% | | | | |
| ACI Worldwide, Inc. * | | 123,800 | | 3,216,324 |
| Activision, Inc. * | | 380,200 | | 7,410,098 |
| Adobe Systems, Inc. * | | 175,600 | | 7,506,900 |
| Autodesk, Inc. * | | 108,200 | | 5,011,824 |
| Citrix Systems, Inc. * | | 134,500 | | 4,889,075 |
| NAVTEQ Corp. * | | 86,200 | | 5,430,600 |
| Nuance Communications, Inc. * | | 93,800 | | 1,763,440 |
| Red Hat, Inc. * | | 239,800 | | 4,664,110 |
| UbiSoft Entertainment SA * | | 89,794 | | 5,571,299 |
| VeriFone Holdings, Inc. * | | 192,494 | | 7,114,578 |
| Verint Systems, Inc. * | | 115,100 | | 2,837,215 |
|
|
| | | | | 55,415,463 |
| Telecommunications Equipment & | | | | |
| Services - 1.04% | | | | |
| NICE Systems, Ltd., ADR * | | 148,335 | | 5,248,092 |
| | | | |
| Toys, Amusements & Sporting Goods - 0.99% | | | |
| Marvel Entertainment, Inc. * (a) | | 219,200 | | 4,953,920 |
| Transportation - 2.23% | | | | |
| Aircastle, Ltd. | | 201,500 | | 6,949,735 |
| C.H. Robinson Worldwide, Inc. | | 86,900 | | 4,261,576 |
|
|
| | | | | 11,211,311 |
| Travel Services - 1.09% | | | | |
| Ctrip.com International, Ltd., ADR | | 129,200 | | 5,489,708 |
|
| TOTAL COMMON STOCKS (Cost $429,594,676) | | $ | 494,535,103 |
|
| |
| SHORT TERM INVESTMENTS - 9.31% | | | |
| John Hancock Cash Investment Trust (c) | $ | 46,785,928 | $ | 46,785,928 |
|
| TOTAL SHORT TERM INVESTMENTS | | | | |
| (Cost $46,785,928) | | | $ | 46,785,928 |
|
| | | | |
| Mid Cap Stock Fund (continued) | | | |
| | | Shares or | | |
| | | Principal | | |
| | | Amount | | Value |
| |
|
| |
| REPURCHASE AGREEMENTS - 1.81% | | | | |
| The Bank of New York Tri-Party | | | | |
| Repurchase Agreement dated | | | | |
| 08/31/2007 at 5.32% to be | | | | |
| repurchased at $9,105,379 on | | | | |
| 09/04/2007, collateralized by | | | | |
| $9,437,931 Federal Home Loan | | | | |
| Mortgage Corp., 5.50% due | | | | |
| 08/01/2037 (valued at $9,282,001, | | | | |
| including interest) | $ | 9,100,000 | $ | 9,100,000 |
|
| TOTAL REPURCHASE AGREEMENTS | | | | |
| (Cost $9,100,000) | | | $ | 9,100,000 |
|
| Total Investments (Mid Cap Stock Fund) | | | | |
| (Cost $485,480,604) - 109.54% | | | $ | 550,421,031 |
| Liabilities in Excess of Other Assets - (9.54)% | | | (47,929,908) |
| |
|
| TOTAL NET ASSETS - 100.00% | | | $ | 502,491,123 |
| |
|
| | | |
| Mid Cap Value Fund | | | |
| | Shares or | | |
| | Principal | | |
| | Amount | | Value |
|
|
| |
| COMMON STOCKS - 97.65% | | | |
| | | | |
| Advertising - 2.72% | | | |
| Interpublic Group of Companies, Inc. * | 686,606 | $ | 7,518,336 |
| | | | |
| Agriculture - 3.38% | | | |
| Monsanto Company | 44,096 | | 3,075,255 |
| The Mosaic Company * | 149,529 | | 6,283,209 |
| |
|
| | | | 9,358,464 |
| Auto Parts - 2.23% | | | |
| ArvinMeritor, Inc. (a) | 63,800 | | 1,113,310 |
| Genuine Parts Company | 101,793 | | 5,057,076 |
| |
|
| | | | 6,170,386 |
| Building Materials & Construction - 1.54% | | | |
| KBR, Inc. * | 112,531 | | 3,695,518 |
| Owens Corning, Inc. * (a) | 22,800 | | 569,088 |
| |
|
| | | | 4,264,606 |
| Business Services - 7.38% | | | |
| Arbitron, Inc. | 23,700 | | 1,180,971 |
| Cadence Design Systems, Inc. * | 282,629 | | 6,138,702 |
| R.H. Donnelley Corp. * | 123,553 | | 7,268,623 |
| R.R. Donnelley & Sons Company | 162,776 | | 5,830,636 |
| |
|
| | | | 20,418,932 |
| Chemicals - 3.71% | | | |
| Chemtura Corp. | 368,131 | | 3,390,486 |
| Eastman Chemical Company | 83,462 | | 5,571,923 |
| Potash Corp. of Saskatchewan, Inc. | 8,917 | | 789,690 |
| Valspar Corp. | 19,300 | | 520,521 |
| |
|
| | | | 10,272,620 |
| Containers & Glass - 3.26% | | | |
| Ball Corp. | 106,522 | | 5,579,623 |
| |
| The accompanying notes are an integral part of the financial statements. | 285 |
John Hancock Funds II
Portfolio of investments — August 31, 2007
(showing percentage of total net assets)
| | | |
| Mid Cap Value Fund (continued) | | | |
| | Shares or | | |
| | Principal | | |
| | Amount | | Value |
|
|
| |
| COMMON STOCKS (continued) | | | |
| | | |
| Containers & Glass (continued) | | | |
| Pactiv Corp. * | 117,273 | $ | 3,430,235 |
|
|
| | | | 9,009,858 |
| Crude Petroleum & Natural Gas - 2.27% | | | |
| EOG Resources, Inc. | 93,215 | | 6,278,962 |
| | | | |
| Domestic Oil - 0.93% | | | |
| Range Resources Corp. | 71,000 | | 2,578,010 |
| | | | |
| Electrical Equipment - 1.78% | | | |
| Hubbell, Inc., Class B | 90,937 | | 4,926,967 |
| | | | |
| Electrical Utilities - 7.07% | | | |
| Ameren Corp. | 124,342 | | 6,314,087 |
| CMS Energy Corp. | 307,523 | | 5,018,775 |
| Northeast Utilities | 216,821 | | 5,995,101 |
| Puget Energy, Inc. | 96,357 | | 2,248,009 |
|
|
| | | | 19,575,972 |
| Food & Beverages - 3.57% | | | |
| Coca-Cola Enterprises, Inc. | 244,915 | | 5,833,875 |
| Dean Foods Company * | 23,700 | | 636,582 |
| Smithfield Foods, Inc. * | 104,400 | | 3,417,012 |
|
|
| | | | 9,887,469 |
| Gas & Pipeline Utilities - 2.33% | | | |
| NiSource, Inc. | 292,851 | | 5,517,313 |
| Southwest Gas Corp. | 31,945 | | 926,724 |
|
|
| | | | 6,444,037 |
| Healthcare Products - 0.76% | | | |
| Bausch & Lomb, Inc. | 33,345 | | 2,107,404 |
| Covidien, Ltd. * | 200 | | 7,966 |
|
|
| | | | 2,115,370 |
| Healthcare Services - 0.83% | | | |
| Healthsouth Corp. * (a) | 125,100 | | 2,284,326 |
| | | | |
| Hotels & Restaurants - 1.17% | | | |
| Brinker International, Inc. | 111,898 | | 3,227,138 |
| | | | |
| Household Products - 1.12% | | | |
| Newell Rubbermaid, Inc. | 120,579 | | 3,109,732 |
| | | | |
| Industrial Machinery - 2.09% | | | |
| Cummins, Inc. | 24,634 | | 2,917,158 |
| W.W. Grainger, Inc. | 31,388 | | 2,875,455 |
|
|
| | | | 5,792,613 |
| Insurance - 7.04% | | | |
| ACE, Ltd. | 47,463 | | 2,741,463 |
| Aetna, Inc. | 41,028 | | 2,088,735 |
| Conseco, Inc. * | 215,163 | | 3,025,192 |
| PartnerRe, Ltd. | 66,615 | | 4,843,577 |
| SAFECO Corp. | 34,200 | | 1,984,284 |
| XL Capital, Ltd., Class A | 62,886 | | 4,791,913 |
|
|
| | | | 19,475,164 |
| Internet Software - 2.77% | | | |
| McAfee, Inc. * | 200,754 | | 7,176,956 |
| | | |
| Mid Cap Value Fund (continued) | | | |
| | Shares or | | |
| | Principal | | |
| | Amount | | Value |
|
|
| |
| COMMON STOCKS (continued) | | | |
| | | | |
| Internet Software (continued) | | | |
| Openwave Systems, Inc. * | 106,400 | $ | 480,928 |
| |
|
| | | | 7,657,884 |
| Manufacturing - 1.62% | | | |
| Pentair, Inc. | 19,200 | | 712,896 |
| Snap-on, Inc. | 76,934 | | 3,768,227 |
| |
|
| | | | 4,481,123 |
| Metal & Metal Products - 1.68% | | | |
| Timken Company | 131,144 | | 4,663,481 |
| | | | |
| Office Furnishings & Supplies - 1.85% | | | |
| OfficeMax, Inc. | 143,845 | | 5,109,374 |
| | | | |
| Paper - 2.33% | | | |
| Bowater, Inc. (a) | 171,765 | | 2,892,522 |
| MeadWestvaco Corp. | 112,479 | | 3,553,212 |
| |
|
| | | | 6,445,734 |
| Petroleum Services - 3.84% | | | |
| GlobalSantaFe Corp. | 72,266 | | 5,101,257 |
| Halliburton Company | 159,933 | | 5,532,083 |
| |
|
| | | | 10,633,340 |
| Pharmaceuticals - 4.34% | | | |
| King Pharmaceuticals, Inc. * | 413,029 | | 6,207,826 |
| Mylan Laboratories, Inc. | 384,988 | | 5,813,319 |
| |
|
| | | | 12,021,145 |
| Publishing - 0.03% | | | |
| Idearc, Inc. | 2,100 | | 71,673 |
| | | | |
| Real Estate - 0.81% | | | |
| Host Hotels & Resorts, Inc., REIT | 100,522 | | 2,240,635 |
| | | | |
| Retail Grocery - 2.57% | | | |
| Safeway, Inc. | 111,373 | | 3,533,865 |
| The Kroger Company | 135,200 | | 3,593,616 |
| |
|
| | | | 7,127,481 |
| Retail Trade - 1.71% | | | |
| Foot Locker, Inc. | 154,626 | | 2,583,800 |
| Macy's, Inc. | 68,066 | | 2,159,054 |
| |
|
| | | | 4,742,854 |
| Sanitary Services - 1.15% | | | |
| Allied Waste Industries, Inc. * | 249,600 | | 3,187,392 |
| | | | |
| Software - 1.27% | | | |
| Sybase, Inc. * | 152,656 | | 3,518,721 |
| | | | |
| Telecommunications Equipment & | | | |
| Services - 9.88% | | | |
| ADC Telecommunications, Inc. * | 247,949 | | 4,537,467 |
| Avaya, Inc. * | 234,144 | | 3,940,643 |
| Embarq Corp. | 111,800 | | 6,978,556 |
| JDS Uniphase Corp. * (a) | 464,975 | | 6,770,036 |
| Tellabs, Inc. * | 484,511 | | 5,111,591 |
| |
|
| | | | 27,338,293 |
| Telephone - 5.88% | | | |
| CenturyTel, Inc. | 71,853 | | 3,447,507 |
| |
| The accompanying notes are an integral part of the financial statements. | 286 |
John Hancock Funds II
Portfolio of investments — August 31, 2007
(showing percentage of total net assets)
| | | | |
| Mid Cap Value Fund (continued) | | | |
| | | Shares or | | |
| | | Principal | | |
| | | Amount | | Value |
| |
|
| |
| COMMON STOCKS (continued) | | | | |
| | | | | |
| Telephone (continued) | | | | |
| Qwest Communications International, Inc. * | | 1,100,500 | $ | 9,849,475 |
| Windstream Corp. | | 209,200 | | 2,987,376 |
|
|
| | | | | 16,284,358 |
| |
| Tires & Rubber - 0.74% | | | | |
| Goodyear Tire & Rubber Company * (a) | | 73,900 | | 2,044,074 |
|
| TOTAL COMMON STOCKS (Cost $252,288,150) | | $ | 270,276,524 |
|
| |
| SHORT TERM INVESTMENTS - 2.46% | | | | |
| John Hancock Cash Investment Trust (c) | $ | 6,808,269 | $ | 6,808,269 |
|
| TOTAL SHORT TERM INVESTMENTS | | | | |
| (Cost $6,808,269) | | | $ | 6,808,269 |
|
| |
| REPURCHASE AGREEMENTS - 2.99% | | | | |
| Repurchase Agreement with State | | | | |
| Street Corp. dated 08/31/2007 at | | | | |
| 4.60% to be repurchased at | | | | |
| $8,276,228 on 09/04/2007, | | | | |
| collateralized by $8,245,000 | | | | |
| Federal National Mortgage | | | | |
| Association, 5.55% due | | | | |
| 03/29/2010 (valued at $8,440,819, | | | | |
| including interest) | $ | 8,272,000 | $ | 8,272,000 |
|
| TOTAL REPURCHASE AGREEMENTS | | | | |
| (Cost $8,272,000) | | | $ | 8,272,000 |
|
| Total Investments (Mid Cap Value Fund) | | | | |
| (Cost $267,368,419) - 103.10% | | | $ | 285,356,793 |
| Liabilities in Excess of Other Assets - (3.10)% | | | (8,591,459) |
|
|
| TOTAL NET ASSETS - 100.00% | | | $ | 276,765,334 |
|
|
| | | |
| Mid Cap Value Equity Fund | | | |
| | Shares or | | |
| | Principal | | |
| | Amount | | Value |
|
|
| |
| COMMON STOCKS - 98.19% | | | |
| | | | |
| Advertising - 0.56% | | | |
| Interpublic Group of Companies, Inc. * | 65,839 | $ | 720,937 |
| | | | |
| Aerospace - 0.79% | | | |
| Goodrich Corp. | 16,140 | | 1,019,402 |
| | | | |
| Agriculture - 1.36% | | | |
| The Mosaic Company * | 41,671 | | 1,751,015 |
| | | | |
| Air Travel - 0.82% | | | |
| AMR Corp. * | 12,513 | | 306,694 |
| Continental Airlines, Inc., Class B * | 11,717 | | 389,707 |
| UAL Corp. * | 2,465 | | 117,013 |
| US Airways Group, Inc. * | 7,986 | | 247,167 |
| |
|
| | | | 1,060,581 |
| Apparel & Textiles - 1.95% | | | |
| Liz Claiborne, Inc. | 20,464 | | 699,255 |
| Mohawk Industries, Inc. * (a) | 6,015 | | 525,170 |
| | | |
| Mid Cap Value Equity Fund (continued) | | |
| | Shares or | | |
| | Principal | | |
| | Amount | | Value |
|
|
| |
| COMMON STOCKS (continued) | | | |
| | | | |
| Apparel & Textiles (continued) | | | |
| VF Corp. | 16,106 | $ | 1,286,064 |
| |
|
| | | | 2,510,489 |
| Auto Parts - 1.56% | | | |
| Genuine Parts Company | 6,345 | | 315,219 |
| Johnson Controls, Inc. | 5,618 | | 635,396 |
| Magna International, Inc., Class A (a) | 4,613 | | 412,633 |
| WABCO Holdings, Inc. | 14,391 | | 651,337 |
| |
|
| | | | 2,014,585 |
| Automobiles - 2.32% | | | |
| Ford Motor Company * | 340,328 | | 2,657,962 |
| General Motors Corp. | 11,011 | | 338,478 |
| |
|
| | | | 2,996,440 |
| Building Materials & Construction - 1.82% | | | |
| American Standard Companies, Inc. | 43,175 | | 1,590,135 |
| Chicago Bridge & Iron Company N.V. | 20,283 | | 757,570 |
| |
|
| | | | 2,347,705 |
| Business Services - 4.72% | | | |
| Computer Sciences Corp. * | 19,830 | | 1,109,488 |
| Deluxe Corp. | 15,638 | | 594,556 |
| Dun & Bradstreet Corp. | 4,387 | | 427,952 |
| Electronic Data Systems Corp. | 50,501 | | 1,155,968 |
| Fluor Corp. | 9,852 | | 1,252,682 |
| Pitney Bowes, Inc. | 7,443 | | 332,479 |
| R.H. Donnelley Corp. * | 20,607 | | 1,212,310 |
| |
|
| | | | 6,085,435 |
| Chemicals - 4.37% | | | |
| Eastman Chemical Company | 25,001 | | 1,669,067 |
| Imperial Chemical Industries PLC, ADR | 13,212 | | 671,830 |
| Lubrizol Corp. | 12,132 | | 771,353 |
| Lyondell Chemical Company | 20,739 | | 961,460 |
| PPG Industries, Inc. | 21,387 | | 1,568,736 |
| |
|
| | | | 5,642,446 |
| Construction & Mining Equipment - 0.67% | | | |
| National Oilwell Varco, Inc. * | 6,713 | | 859,264 |
| | | | |
| Construction Materials - 0.37% | | | |
| USG Corp. * (a) | 12,370 | | 477,729 |
| | | | |
| Crude Petroleum & Natural Gas - 2.78% | | | |
| Newfield Exploration Company * | 21,053 | | 915,595 |
| Pioneer Natural Resources Company | 24,587 | | 1,009,296 |
| Southwestern Energy Company * | 28,611 | | 1,064,043 |
| Sunoco, Inc. | 8,096 | | 592,142 |
| |
|
| | | | 3,581,076 |
| Electrical Equipment - 0.96% | | | |
| Cooper Industries, Ltd., Class A | 24,238 | | 1,240,258 |
| | | | |
| Electrical Utilities - 4.64% | | | |
| American Electric Power Company, Inc. | 16,647 | | 740,458 |
| Consolidated Edison, Inc. | 15,124 | | 694,797 |
| DPL, Inc. | 7,780 | | 205,003 |
| DTE Energy Company | 15,965 | | 763,287 |
| |
| The accompanying notes are an integral part of the financial statements. | 287 |
John Hancock Funds II
Portfolio of investments — August 31, 2007
(showing percentage of total net assets)
| | | |
| Mid Cap Value Equity Fund (continued) | | |
| | Shares or | | |
| | Principal | | |
| | Amount | | Value |
|
|
| |
| COMMON STOCKS (continued) | | | |
| | | | |
| Electrical Utilities (continued) | | | |
| Edison International | 20,790 | $ | 1,095,841 |
| Mirant Corp. * | 15,901 | | 619,662 |
| Pinnacle West Capital Corp. | 21,135 | | 842,018 |
| PPL Corp. | 21,164 | | 1,021,375 |
| |
|
| | | | 5,982,441 |
| Electronics - 0.86% | | | |
| Celestica, Inc. * | 83,458 | | 498,244 |
| Solectron Corp. * | 157,133 | | 609,676 |
| |
|
| | | | 1,107,920 |
| Energy - 2.96% | | | |
| Energy East Corp. | 30,447 | | 812,631 |
| McDermott International, Inc. * | 17,560 | | 1,685,584 |
| Sempra Energy | 23,892 | | 1,314,777 |
| |
|
| | | | 3,812,992 |
| Financial Services - 0.27% | | | |
| Amvescap PLC | 28,746 | | 350,936 |
| | | | |
| Food & Beverages - 1.31% | | | |
| Del Monte Foods Company | 53,635 | | 565,313 |
| Tyson Foods, Inc., Class A | 52,385 | | 1,128,897 |
| |
|
| | | | 1,694,210 |
| Forest Products - 0.73% | | | |
| Rayonier, Inc. | 21,957 | | 938,442 |
| | | | |
| Gas & Pipeline Utilities - 2.78% | | | |
| El Paso Corp. | 70,934 | | 1,125,723 |
| Enbridge, Inc. (a) | 38,650 | | 1,302,505 |
| NiSource, Inc. | 39,860 | | 750,962 |
| Questar Corp. | 8,115 | | 405,507 |
| |
|
| | | | 3,584,697 |
| Healthcare Services - 2.36% | | | |
| Health Net, Inc. * | 23,274 | | 1,275,183 |
| Humana, Inc. * | 11,093 | | 710,950 |
| McKesson Corp. | 6,846 | | 391,660 |
| Omnicare, Inc. (a) | 20,337 | | 663,596 |
| |
|
| | | | 3,041,389 |
| Holdings Companies/Conglomerates - 1.97% | | | |
| Loews Corp. | 35,669 | | 1,676,800 |
| Textron, Inc. | 14,866 | | 867,282 |
| |
|
| | | | 2,544,082 |
| Hotels & Restaurants - 0.94% | | | |
| Hilton Hotels Corp. | 26,492 | | 1,217,307 |
| | | | |
| Household Appliances - 0.75% | | | |
| Whirlpool Corp. | 9,986 | | 962,750 |
| | | | |
| Industrial Machinery - 5.46% | | | |
| AGCO Corp. * | 43,137 | | 1,863,519 |
| Cameron International Corp. * | 16,725 | | 1,367,603 |
| Ingersoll-Rand Company, Class A | 42,053 | | 2,183,812 |
| Terex Corp. * | 6,860 | | 547,977 |
| The Manitowoc Company, Inc. | 13,611 | | 1,081,938 |
| |
|
| | | | 7,044,849 |
| | | |
| Mid Cap Value Equity Fund (continued) | | |
| | Shares or | | |
| | Principal | | |
| | Amount | | Value |
|
|
| |
| COMMON STOCKS (continued) | | | |
| | | | |
| Insurance - 15.23% | | | |
| ACE, Ltd. | 39,945 | $ | 2,307,223 |
| Ambac Financial Group, Inc. | 9,010 | | 566,008 |
| Aon Corp. | 68,454 | | 2,965,427 |
| Axis Capital Holdings, Ltd. | 33,670 | | 1,215,487 |
| Everest Re Group, Ltd. | 31,331 | | 3,192,002 |
| Lincoln National Corp. | 19,509 | | 1,187,708 |
| MBIA, Inc. | 10,743 | | 644,580 |
| PartnerRe, Ltd. | 29,532 | | 2,147,272 |
| Torchmark Corp. | 12,433 | | 765,376 |
| Willis Group Holdings, Ltd. | 19,955 | | 776,250 |
| XL Capital, Ltd., Class A | 51,016 | | 3,887,419 |
| |
|
| | | | 19,654,752 |
| International Oil - 1.75% | | | |
| Hess Corp. | 11,688 | | 717,293 |
| Nabors Industries, Ltd. * | 9,394 | | 277,968 |
| Weatherford International, Ltd. * | 21,643 | | 1,263,518 |
| |
|
| | | | 2,258,779 |
| Internet Software - 0.76% | | | |
| McAfee, Inc. * | 27,417 | | 980,158 |
| | | |
| Leisure Time - 2.65% | | | |
| National Cinemedia, Inc. | 34,927 | | 860,252 |
| Regal Entertainment Group, Class A (a) | 51,028 | | 1,150,171 |
| Royal Caribbean Cruises, Ltd. | 37,178 | | 1,413,879 |
| |
|
| | | | 3,424,302 |
| Manufacturing - 4.00% | | | |
| Eaton Corp. | 27,284 | | 2,570,699 |
| Reddy Ice Holdings, Inc. | 19,470 | | 563,267 |
| Rockwell Automation, Inc. | 13,655 | | 962,131 |
| Stanley Works | 18,808 | | 1,067,166 |
| |
|
| | | | 5,163,263 |
| Medical-Hospitals - 0.30% | | | |
| Health Management Associates, Inc., Class A | 56,318 | | 383,526 |
| | | |
| Mining - 1.00% | | | |
| Freeport-McMoRan Copper & Gold, Inc., | | | |
| Class B | 14,694 | | 1,284,549 |
| | | | |
| Paper - 0.43% | | | |
| MeadWestvaco Corp. | 17,417 | | 550,203 |
| | | | |
| Petroleum Services - 2.58% | | | |
| BJ Services Company | 23,103 | | 573,186 |
| ENSCO International, Inc. | 5,449 | | 295,445 |
| GlobalSantaFe Corp. | 27,280 | | 1,925,695 |
| Smith International, Inc. | 7,923 | | 530,920 |
| |
|
| | | | 3,325,246 |
| Pharmaceuticals - 1.55% | | | |
| Hospira, Inc. * | 11,220 | | 433,653 |
| King Pharmaceuticals, Inc. * | 24,710 | | 371,391 |
| Mylan Laboratories, Inc. | 54,339 | | 820,519 |
| Watson Pharmaceuticals, Inc. * | 12,449 | | 371,229 |
| |
|
| | | | 1,996,792 |
| |
| The accompanying notes are an integral part of the financial statements. | 288 |
John Hancock Funds II
Portfolio of investments — August 31, 2007
(showing percentage of total net assets)
| | | |
| Mid Cap Value Equity Fund (continued) | | |
| | Shares or | | |
| | Principal | | |
| | Amount | | Value |
|
|
| |
| COMMON STOCKS (continued) | | | |
| | | | |
| Photography - 0.69% | | | |
| Eastman Kodak Company (a) | 33,465 | $ | 892,512 |
| | | | |
| Railroads & Equipment - 1.46% | | | |
| CSX Corp. | 36,947 | | 1,514,827 |
| Kansas City Southern * | 12,202 | | 370,819 |
| |
|
| | | | 1,885,646 |
| Real Estate - 1.66% | | | |
| Boston Properties, Inc., REIT | 3,334 | | 333,633 |
| Equity Residential, REIT | 22,274 | | 896,306 |
| Simon Property Group, Inc., REIT | 5,862 | | 556,421 |
| The St. Joe Company, REIT (a) | 11,135 | | 352,089 |
| |
|
| | | | 2,138,449 |
| Retail Trade - 1.80% | | | |
| Family Dollar Stores, Inc. | 37,826 | | 1,107,545 |
| Macy's, Inc. | 14,147 | | 448,743 |
| Ritchie Brothers Auctioneers, Inc. (a) | 11,896 | | 768,601 |
| |
|
| | | | 2,324,889 |
| Sanitary Services - 0.07% | | | |
| Insituform Technologies, Inc., Class A * | 5,440 | | 89,706 |
| | | | |
| Semiconductors - 4.23% | | | |
| Intersil Corp., Class A | 33,062 | | 1,101,626 |
| LSI Logic Corp. * | 133,288 | | 918,354 |
| Maxim Integrated Products, Inc. | 21,952 | | 658,779 |
| Microchip Technology, Inc. | 19,610 | | 755,377 |
| Micron Technology, Inc. * | 69,324 | | 793,760 |
| National Semiconductor Corp. | 46,843 | | 1,232,908 |
| |
|
| | | | 5,460,804 |
| Software - 0.77% | | | |
| BMC Software, Inc. * | 32,308 | | 989,271 |
| | | | |
| Steel - 0.52% | | | |
| Nucor Corp. | 12,715 | | 672,624 |
| | | | |
| Telecommunications Equipment & | | | |
| Services - 0.95% | | | |
| Embarq Corp. | 4,500 | | 280,890 |
| Tellabs, Inc. * | 89,996 | | 949,458 |
| |
|
| | | | 1,230,348 |
| Telephone - 2.60% | | | |
| CenturyTel, Inc. | 29,635 | | 1,421,887 |
| Qwest Communications International, Inc. * | 106,593 | | 954,007 |
| Windstream Corp. | 68,605 | | 979,680 |
| |
|
| | | | 3,355,574 |
| Tobacco - 2.75% | | | |
| Loews Corp. - Carolina Group | 35,767 | | 2,722,584 |
| Reynolds American, Inc. | 12,571 | | 831,195 |
| |
|
| | | | 3,553,779 |
| Toys, Amusements & Sporting Goods - 0.36% | | | |
| Hasbro, Inc. | 16,534 | | 466,424 |
|
| TOTAL COMMON STOCKS (Cost $112,778,492) | | $ | 126,670,973 |
|
| | | | |
| Mid Cap Value Equity Fund (continued) | | |
| | | Shares or | | |
| | | Principal | | |
| | | Amount | | Value |
|
|
| |
| CONVERTIBLE BONDS - 0.38% | | | | |
| | | | | |
| Telephone - 0.38% | | | | |
| Qwest Communications International, Inc. | | | | |
| 3.50% due 11/15/2025 | $ | 302,000 | $ | 489,995 |
|
| TOTAL CONVERTIBLE BONDS (Cost $408,455) | | $ | 489,995 |
|
| |
| SHORT TERM INVESTMENTS - 5.15% | | | | |
| Deutsche Bank Financial, LLC | | | | |
| 5.19% due 09/04/2007 | $ | 800,000 | $ | 799,654 |
| John Hancock Cash Investment Trust (c) | | 5,849,359 | | 5,849,359 |
|
| TOTAL SHORT TERM INVESTMENTS | | | | |
| (Cost $6,649,013) | | | $ | 6,649,013 |
|
| Total Investments (Mid Cap Value Equity Fund) | | | |
| (Cost $119,835,960) - 103.72% | | | $ | 133,809,981 |
| Liabilities in Excess of Other Assets - (3.72)% | | | (4,799,626) |
| |
|
| TOTAL NET ASSETS - 100.00% | | | $ | 129,010,355 |
| |
|
| | | |
| Natural Resources Fund | | | |
| | Shares or | | |
| | Principal | | |
| | Amount | | Value |
|
|
| |
| COMMON STOCKS - 95.98% | | | |
| | | | |
| Aluminum - 0.95% | | | |
| Alcoa, Inc. | 220,325 | $ | 8,048,472 |
| | | | |
| Coal - 3.18% | | | |
| CONSOL Energy, Inc. | 381,986 | | 15,233,602 |
| Peabody Energy Corp. | 271,800 | | 11,554,218 |
|
|
| | | | 26,787,820 |
| Crude Petroleum & Natural Gas - 11.12% | | | |
| Devon Energy Corp. | 99,900 | | 7,523,469 |
| EOG Resources, Inc. | 413,869 | | 27,878,216 |
| Newfield Exploration Company * | 252,252 | | 10,970,440 |
| Noble Energy, Inc. | 149,264 | | 8,966,288 |
| Rosneft Oil Company, GDR * | 1,093,119 | | 8,963,576 |
| Ultra Petroleum Corp. * | 158,600 | | 8,469,240 |
| XTO Energy, Inc. | 384,386 | | 20,895,223 |
|
|
| | | | 93,666,452 |
| Domestic Oil - 5.34% | | | |
| Denbury Resources, Inc. * | 243,000 | | 9,666,540 |
| Suncor Energy, Inc. | 257,407 | | 23,057,194 |
| Western Oil Sands, Inc. * | 346,611 | | 12,281,208 |
|
|
| | | | 45,004,942 |
| Gas & Pipeline Utilities - 3.30% | | | |
| Eni SPA, SADR (a) | 300,600 | | 20,735,388 |
| Equitable Resources, Inc. | 143,060 | | 7,037,121 |
|
|
| | | | 27,772,509 |
| Gold - 3.02% | | | |
| AngloGold Ashanti, Ltd. (a) | 221,300 | | 8,637,339 |
| Barrick Gold Corp. | 233,556 | | 7,595,241 |
| |
| The accompanying notes are an integral part of the financial statements. | 289 |
John Hancock Funds II
Portfolio of investments — August 31, 2007
(showing percentage of total net assets)
| | | |
| Natural Resources Fund (continued) | | |
| | Shares or | | |
| | Principal | | |
| | Amount | | Value |
|
|
| |
| COMMON STOCKS (continued) | | | |
| | | | |
| Gold (continued) | | | |
| Gold Fields, Ltd. | 610,390 | $ | 9,258,888 |
|
|
| | | | 25,491,468 |
| International Oil - 26.68% | | | |
| BP PLC, ADR | 307,827 | | 20,735,227 |
| Canadian Natural Resources, Ltd. | 505,533 | | 34,555,844 |
| ConocoPhillips | 209,128 | | 17,125,492 |
| EnCana Corp. | 473,654 | | 27,757,264 |
| Exxon Mobil Corp. | 391,205 | | 33,538,005 |
| Lukoil Oil Company, ADR (a) | 271,827 | | 20,169,563 |
| OAO Gazprom, SADR (a) | 496,250 | | 20,640,054 |
| Petroleo Brasileiro SA, ADR (a) | 319,198 | | 19,739,204 |
| Royal Dutch Shell PLC, ADR | 138,969 | | 10,749,252 |
| Talisman Energy, Inc. | 1,151,998 | | 19,765,367 |
|
|
| | | | 224,775,272 |
| Metal & Metal Products - 14.75% | | | |
| Alumina, Ltd. (a) | 1,917,238 | | 10,887,806 |
| Cameco Corp. | 673,422 | | 27,192,780 |
| Companhia Vale Do Rio Doce, ADR * | 98,078 | | 4,838,188 |
| Companhia Vale Do Rio Doce, SADR | 1,277,652 | | 53,341,971 |
| Vedanta Resources PLC | 783,822 | | 27,987,022 |
|
|
| | | | 124,247,767 |
| Mining - 9.49% | | | |
| Aluminum Corp. China, Ltd., ADR (a) | 135,188 | | 9,164,394 |
| Anglo American PLC | 147,612 | | 8,476,124 |
| Anglo Platinum, Ltd. (a) | 145,326 | | 19,359,690 |
| Freeport-McMoRan Copper & Gold, Inc., | | | |
| Class B | 187,330 | | 16,376,389 |
| Xstrata PLC | 451,154 | | 26,549,244 |
|
|
| | | | 79,925,841 |
| Paper - 1.24% | | | |
| Bowater, Inc. (a) | 292,800 | | 4,930,752 |
| Mondi PLC | 40,552 | | 400,309 |
| Mondi, Ltd. | 460 | | 4,429 |
| Mondi, Ltd. | 15,754 | | 150,909 |
| Smurfit-Stone Container Corp. * | 467,400 | | 4,935,744 |
|
|
| | | | 10,422,143 |
| Petroleum Services - 13.06% | | | |
| Baker Hughes, Inc. | 164,700 | | 13,811,742 |
| GlobalSantaFe Corp. | 152,323 | | 10,752,480 |
| Halliburton Company | 354,202 | | 12,251,847 |
| Petro-Canada | 222,331 | | 11,338,649 |
| Total SA, ADR | 350,062 | | 26,286,156 |
| Valero Energy Corp. | 519,866 | | 35,616,020 |
|
|
| | | | 110,056,894 |
| Steel - 3.85% | | | |
| Arcelor Mittal, Class A (a) | 344,925 | | 22,834,035 |
| Nucor Corp. | 182,200 | | 9,638,380 |
|
|
| | | | 32,472,415 |
|
| TOTAL COMMON STOCKS (Cost $641,271,804) | | $ | 808,671,995 |
|
| | | | |
| Natural Resources Fund (continued) | | |
| | | Shares or | | |
| | | Principal | | |
| | | Amount | | Value |
|
|
| |
| PREFERRED STOCKS - 0.21% | | | | |
| | | | | |
| Mining - 0.21% | | | | |
| Anglo American Platinum Corp., Ltd. * (a) | | 38,100 | $ | 1,781,119 |
|
| TOTAL PREFERRED STOCKS (Cost $1,178,863) | | $ | 1,781,119 |
|
| |
| SHORT TERM INVESTMENTS - 11.15% | | | | |
| John Hancock Cash Investment Trust (c) | $ | 93,981,765 | $ | 93,981,765 |
|
| TOTAL SHORT TERM INVESTMENTS | | | | |
| (Cost $93,981,765) | | | $ | 93,981,765 |
|
| |
| REPURCHASE AGREEMENTS - 5.46% | | | | |
| The Bank of New York Tri-Party | | | | |
| Repurchase Agreement dated | | | | |
| 08/31/2007 at 5.32% to be | | | | |
| repurchased at $46,027,191 on | | | | |
| 09/04/2007, collateralized by | | | | |
| $47,708,220 Federal Government | | | | |
| Mortgage Corp., 5.5% due | | | | |
| 08/01/2037 (valued at | | | | |
| $46,920,001, including interest) | $ | 46,000,000 | $ | 46,000,000 |
|
| TOTAL REPURCHASE AGREEMENTS | | | | |
| (Cost $46,000,000) | | | $ | 46,000,000 |
|
| Total Investments (Natural Resources Fund) | | | | |
| (Cost $782,432,432) - 112.80% | | | $ | 950,434,879 |
| Liabilities in Excess of Other Assets - (12.80)% | | | (107,867,601) |
|
|
| TOTAL NET ASSETS - 100.00% | | | $ | 842,567,278 |
|
|
| | | |
| Quantitative All Cap Fund | | | |
| | Shares or | | |
| | Principal | | |
| | Amount | | Value |
|
|
| |
| COMMON STOCKS - 99.07% | | | |
| | | | |
| Aerospace - 3.24% | | | |
| Lockheed Martin Corp. | 1,727 | $ | 171,215 |
| Orbital Sciences Corp., Class A * | 1,022 | | 22,443 |
| |
|
| | | | 193,658 |
| Aluminum - 0.54% | | | |
| Century Aluminum Company * | 654 | | 32,164 |
| | | | |
| Apparel & Textiles - 2.60% | | | |
| Coach, Inc. * | 3,075 | | 136,930 |
| Wolverine World Wide, Inc. | 688 | | 18,087 |
| |
|
| | | | 155,017 |
| Auto Parts - 1.04% | | | |
| Lear Corp. * | 2,123 | | 62,055 |
| | | | |
| Banking - 4.47% | | | �� |
| Bank of America Corp. | 3,644 | | 184,678 |
| BankUnited Financial Corp., Class A (a) | 1,245 | | 21,290 |
| FirstFed Financial Corp. * (a) | 701 | | 35,225 |
| Franklin Bank Corp. * | 2,775 | | 25,502 |
| |
|
| | | | 266,695 |
| |
| The accompanying notes are an integral part of the financial statements. | 290 |
John Hancock Funds II
Portfolio of investments — August 31, 2007
(showing percentage of total net assets)
| | | |
| Quantitative All Cap Fund (continued) | | |
| | Shares or | | |
| | Principal | | |
| | Amount | | Value |
|
|
| |
| COMMON STOCKS (continued) | | | |
| | | | |
| Biotechnology - 2.09% | | | |
| Applera Corp. | 3,942 | $ | 124,607 |
| | | | |
| Business Services - 4.01% | | | |
| Cadence Design Systems, Inc. * | 3,775 | | 81,982 |
| Computer Sciences Corp. * | 869 | | 48,621 |
| Informatica Corp. * | 2,594 | | 36,212 |
| Sotheby's | 1,676 | | 72,537 |
| |
|
| | | | 239,352 |
| Cellular Communications - 0.49% | | | |
| Mobile Telesystems, SADR | 439 | | 29,044 |
| | | | |
| Chemicals - 0.28% | | | |
| Albemarle Corp. | 412 | | 16,674 |
| Commercial Services - 0.57% | | | |
| Chemed Corp. | 305 | | 18,922 |
| Perficient, Inc. * | 650 | | 15,158 |
| |
|
| | | | 34,080 |
| Computers & Business Equipment - 4.86% | | | |
| Cisco Systems, Inc. * | 4,192 | | 133,809 |
| EMC Corp. * | 2,896 | | 56,935 |
| International Business Machines Corp. | 191 | | 22,288 |
| Radiant Systems, Inc. * | 2,130 | | 32,056 |
| Xerox Corp. * | 2,624 | | 44,949 |
| |
|
| | | | 290,037 |
| Containers & Glass - 0.69% | | | |
| Ball Corp. | 787 | | 41,223 |
| | | | |
| Cosmetics & Toiletries - 1.65% | | | |
| Colgate-Palmolive Company | 1,483 | | 98,352 |
| | | | |
| Crude Petroleum & Natural Gas - 0.58% | | | |
| Vaalco Energy, Inc. * | 4,326 | | 16,958 |
| W&T Offshore, Inc. | 807 | | 17,988 |
| |
|
| | | | 34,946 |
| Electrical Equipment - 2.56% | | | |
| Cooper Industries, Ltd., Class A | 890 | | 45,541 |
| Emerson Electric Company | 2,184 | | 107,519 |
| |
|
| | | | 153,060 |
| Electrical Utilities - 0.49% | | | |
| Public Service Enterprise Group, Inc. | 347 | | 29,491 |
| | | | |
| Electronics - 0.32% | | | |
| Dolby Laboratories, Inc., Class A * | 524 | | 19,089 |
| | | | |
| Energy - 0.79% | | | |
| Energen Corp. | 330 | | 17,721 |
| Nexen, Inc. | 1,063 | | 29,626 |
| |
|
| | | | 47,347 |
| Financial Services - 8.24% | | | |
| Barclays PLC, SADR | 726 | | 36,010 |
| Bear Stearns Companies, Inc. | 1,099 | | 119,417 |
| Goldman Sachs Group, Inc. | 241 | | 42,418 |
| Lehman Brothers Holdings, Inc. | 1,812 | | 99,352 |
| Merrill Lynch & Company, Inc. | 2,097 | | 154,549 |
| | | |
| Quantitative All Cap Fund (continued) | | |
| | Shares or | | |
| | Principal | | |
| | Amount | | Value |
|
|
| |
| COMMON STOCKS (continued) | | | |
| | | | |
| Financial Services (continued) | | | |
| The First Marblehead Corp. (a) | 1,209 | $ | 40,490 |
| |
|
| | | | 492,236 |
| Food & Beverages - 2.46% | | | |
| PepsiCo, Inc. | 2,159 | | 146,877 |
| | | | |
| Gas & Pipeline Utilities - 0.97% | | | |
| Suburban Propane Partners, L.P. | 1,237 | | 57,681 |
| | | | |
| Healthcare Products - 5.53% | | | |
| DENTSPLY International, Inc. | 419 | | 16,500 |
| Herbalife, Ltd. | 770 | | 32,687 |
| Johnson & Johnson | 2,836 | | 175,236 |
| NutriSystem, Inc. * | 952 | | 51,627 |
| USANA Health Sciences, Inc. * (a) | 1,423 | | 54,188 |
| |
|
| | | | 330,238 |
| Healthcare Services - 1.95% | | | |
| UnitedHealth Group, Inc. | 2,330 | | 116,523 |
| | | | |
| Holdings Companies/Conglomerates - 0.81% | | | |
| General Electric Company | 860 | | 33,428 |
| Pearson PLC, SADR | 1,007 | | 15,035 |
| |
|
| | | | 48,463 |
| Homebuilders - 0.29% | | | |
| AMREP Corp. * (a) | 516 | | 17,337 |
| | | | |
| Hotels & Restaurants - 3.47% | | | |
| Marriott International, Inc., Class A | 937 | | 41,621 |
| McDonald's Corp. | 3,359 | | 165,431 |
| |
|
| | | | 207,052 |
| Industrial Machinery - 3.21% | | | |
| Cummins, Inc. | 333 | | 39,434 |
| Gardner Denver, Inc. * | 875 | | 34,921 |
| Robbins & Myers, Inc. | 1,573 | | 85,225 |
| Terex Corp. * | 404 | | 32,272 |
| |
|
| | | | 191,852 |
| Industrials - 1.78% | | | |
| Companhia de Saneamento Basico do | | | |
| Estado de Sao Paulo, ADR * | 2,165 | | 106,150 |
| Insurance - 5.25% | | | |
| Aspen Insurance Holdings, Ltd. | 1,997 | | 50,105 |
| IPC Holdings, Ltd. | 1,924 | | 48,908 |
| Montpelier Re Holdings, Ltd. | 2,824 | | 46,483 |
| RenaissanceRe Holdings, Ltd. | 1,445 | | 82,770 |
| Safety Insurance Group, Inc. | 1,005 | | 34,311 |
| W.R. Berkley Corp. | 1,705 | | 50,962 |
| |
|
| | | | 313,539 |
| International Oil - 4.30% | | | |
| ConocoPhillips | 2,030 | | 166,237 |
| Exxon Mobil Corp. | 255 | | 21,861 |
| Parker Drilling Company * | 8,778 | | 68,380 |
| |
|
| | | | 256,478 |
| Internet Retail - 0.36% | | | |
| eBay, Inc. * | 627 | | 21,381 |
| |
| The accompanying notes are an integral part of the financial statements. | 291 |
John Hancock Funds II
Portfolio of investments — August 31, 2007
(showing percentage of total net assets)
| | | |
| Quantitative All Cap Fund (continued) | | |
| | Shares or | | |
| | Principal | | |
| | Amount | | Value |
|
|
| |
| COMMON STOCKS (continued) | | | |
| | | | |
| Internet Software - 0.45% | | | |
| S1 Corp. * | 3,411 | $ | 26,606 |
| | | | |
| Leisure Time - 0.53% | | | |
| Walt Disney Company | 941 | | 31,618 |
| | | | |
| Manufacturing - 1.37% | | | |
| Trinity Industries, Inc. | 2,181 | | 81,940 |
| | | | |
| Mining - 0.50% | | | |
| Anglo American PLC, ADR | 1,034 | | 29,593 |
| | | | |
| Petroleum Services - 3.19% | | | |
| ENSCO International, Inc. | 921 | | 49,937 |
| GlobalSantaFe Corp. | 897 | | 63,319 |
| Petro-Canada | 1,516 | | 77,392 |
| |
|
| | | | 190,648 |
| Pharmaceuticals - 1.69% | | | |
| Abbott Laboratories | 283 | | 14,691 |
| American Oriental Bioengineering, Inc. * (a) | 2,241 | | 20,841 |
| Eli Lilly & Company | 311 | | 17,836 |
| Pfizer, Inc. | 1,099 | | 27,299 |
| Sciele Pharma, Inc. * (a) | 876 | | 20,218 |
| |
|
| | | | 100,885 |
| Publishing - 2.06% | | | |
| Idearc, Inc. | 3,196 | | 109,080 |
| McGraw-Hill Companies, Inc. | 279 | | 14,078 |
| |
|
| | | | 123,158 |
| Real Estate - 0.86% | | | |
| First Industrial Realty Trust, Inc., REIT | 1,260 | | 51,383 |
| | | | |
| Retail Trade - 2.20% | | | |
| CVS Caremark Corp. | 506 | | 19,137 |
| Dollar Tree Stores, Inc. * | 1,010 | | 43,885 |
| NBTY, Inc. * | 1,112 | | 40,810 |
| ValueVision Media, Inc., Class A * | 3,284 | | 27,684 |
| |
|
| | | | 131,516 |
| Sanitary Services - 0.70% | | | |
| Waste Management, Inc. | 1,115 | | 42,002 |
| | | | |
| Software - 7.28% | | | |
| Adobe Systems, Inc. * | 707 | | 30,224 |
| ANSYS, Inc. * | 2,492 | | 82,560 |
| CIBER, Inc. * | 4,217 | | 33,441 |
| Magma Design Automation, Inc. * | 1,939 | | 26,642 |
| Microsoft Corp. | 1,700 | | 48,841 |
| Nuance Communications, Inc. * (a) | 4,073 | | 76,572 |
| Oracle Corp. * | 2,152 | | 43,643 |
| VeriFone Holdings, Inc. * | 2,501 | | 92,437 |
| |
|
| | | | 434,360 |
| Steel - 1.36% | | | |
| Gerdau Ameristeel Corp. | 5,665 | | 65,374 |
| Steel Dynamics, Inc. | 369 | | 16,007 |
| |
|
| | | | 81,381 |
| | | | |
| Quantitative All Cap Fund (continued) | | |
| | | Shares or | | |
| | | Principal | | |
| | | Amount | | Value |
|
|
| |
| COMMON STOCKS (continued) | | | | |
| | | | | |
| Telecommunications Equipment & | | | | |
| Services - 0.56% | | | | |
| Polycom, Inc. * | | 1,100 | $ | 33,341 |
| | | | | |
| Telephone - 5.21% | | | | |
| AT&T, Inc. | | 7,802 | | 311,066 |
| | | | |
| Toys, Amusements & Sporting Goods - 1.22% | | | |
| Mattel, Inc. | | 3,363 | | 72,742 |
|
| TOTAL COMMON STOCKS (Cost $5,568,896) | | $ | 5,914,937 |
|
| |
| SHORT TERM INVESTMENTS - 4.66% | | | |
| John Hancock Cash Investment Trust (c) | $ | 278,125 | $ | 278,125 |
|
| TOTAL SHORT TERM INVESTMENTS | | | | |
| (Cost $278,125) | | | $ | 278,125 |
|
| Total Investments (Quantitative All Cap Fund) | | | |
| (Cost $5,847,021) - 103.73% | | | $ | 6,193,062 |
| Liabilities in Excess of Other Assets - (3.73)% | | | (222,808) |
| |
|
| TOTAL NET ASSETS - 100.00% | | | $ | 5,970,254 |
| |
|
| | | |
| Quantitative Mid Cap Fund | | | |
| | Shares or | | |
| | Principal | | |
| | Amount | | Value |
|
|
| |
| COMMON STOCKS - 98.34% | | | |
| | | | |
| Auto Parts - 2.79% | | | |
| Genuine Parts Company | 13,400 | $ | 665,712 |
| Magna International, Inc., Class A (a) | 31,200 | | 2,790,840 |
| |
|
| | | | 3,456,552 |
| Banking - 2.49% | | | |
| Bank of Hawaii Corp. | 9,200 | | 472,972 |
| Huntington BancShares, Inc. | 70,600 | | 1,215,026 |
| Sovereign Bancorp, Inc. | 51,800 | | 936,544 |
| Wachovia Corp. | 9,500 | | 465,310 |
| |
|
| | | | 3,089,852 |
| Biotechnology - 1.86% | | | |
| Applera Corp. | 52,700 | | 1,665,847 |
| Millipore Corp. * | 9,200 | | 641,056 |
| |
|
| | | | 2,306,903 |
| Building Materials & Construction - 0.77% | | | |
| Lennox International, Inc. | 26,600 | | 956,802 |
| | | | |
| Business Services - 7.43% | | | |
| Cadence Design Systems, Inc. * | 91,700 | | 1,991,724 |
| CGI Group, Inc., Class A * | 116,800 | | 1,288,304 |
| Computer Sciences Corp. * | 36,700 | | 2,053,365 |
| Manpower, Inc. | 21,900 | | 1,538,694 |
| URS Corp. * | 43,700 | | 2,335,328 |
| |
|
| | | | 9,207,415 |
| Chemicals - 2.75% | | | |
| Airgas, Inc. | 13,400 | | 619,348 |
| |
| The accompanying notes are an integral part of the financial statements. | 292 |
John Hancock Funds II
Portfolio of investments — August 31, 2007
(showing percentage of total net assets)
| | | |
| Quantitative Mid Cap Fund (continued) | | |
| | Shares or | | |
| | Principal | | |
| | Amount | | Value |
|
|
| |
| COMMON STOCKS (continued) | | | |
| | | | |
| Chemicals (continued) | | | |
| Lyondell Chemical Company | 21,700 | $ | 1,006,012 |
| OM Group, Inc. * | 36,100 | | 1,783,340 |
| |
|
| | | | 3,408,700 |
| Computers & Business Equipment - 2.10% | | | |
| Cognizant Technology Solutions Corp., | | | |
| Class A * | 20,800 | | 1,529,008 |
| Xerox Corp. * | 62,700 | | 1,074,051 |
| |
|
| | | | 2,603,059 |
| Containers & Glass - 1.84% | | | |
| Pactiv Corp. * | 78,000 | | 2,281,500 |
| | | | |
| Crude Petroleum & Natural Gas - 2.98% | | | |
| Sunoco, Inc. | 13,000 | | 950,820 |
| Unit Corp. * | 35,100 | | 1,722,006 |
| XTO Energy, Inc. | 18,700 | | 1,016,532 |
| |
|
| | | | 3,689,358 |
| Electrical Equipment - 1.80% | | | |
| AMETEK, Inc. | 55,800 | | 2,231,442 |
| | | | |
| Electrical Utilities - 2.58% | | | |
| Alliant Energy Corp. | 30,500 | | 1,155,340 |
| Xcel Energy, Inc. | 99,200 | | 2,044,512 |
| |
|
| | | | 3,199,852 |
| Electronics - 4.87% | | | |
| Amphenol Corp., Class A | 36,400 | | 1,314,404 |
| Dolby Laboratories, Inc., Class A * | 38,700 | | 1,409,841 |
| Thomas & Betts Corp. * | 44,000 | | 2,437,160 |
| Trimble Navigation, Ltd. * | 24,600 | | 868,626 |
| |
|
| | | | 6,030,031 |
| Financial Services - 3.14% | | | |
| AllianceBernstein Holding LP * | 21,700 | | 1,792,637 |
| Bear Stearns Companies, Inc. | 7,800 | | 847,548 |
| CapitalSource, Inc. | 70,380 | | 1,254,875 |
| |
|
| | | | 3,895,060 |
| Food & Beverages - 1.28% | | | |
| McCormick & Company, Inc. | 44,200 | | 1,584,128 |
| | | | |
| Gas & Pipeline Utilities - 4.53% | | | |
| AGL Resources, Inc. | 61,400 | | 2,438,194 |
| ONEOK, Inc. | 20,800 | | 974,480 |
| Suburban Propane Partners, L.P. | 47,300 | | 2,205,599 |
| |
|
| | | | 5,618,273 |
| Healthcare Products - 2.72% | | | |
| DENTSPLY International, Inc. | 14,000 | | 551,320 |
| Herbalife, Ltd. | 51,200 | | 2,173,440 |
| Smith & Nephew PLC (a) | 11,000 | | 647,790 |
| |
|
| | | | 3,372,550 |
| Healthcare Services - 4.24% | | | |
| Coventry Health Care, Inc. * | 37,000 | | 2,122,690 |
| Laboratory Corp. of America Holdings * | 15,100 | | 1,172,666 |
| Pediatrix Medical Group, Inc. * | 9,300 | | 554,745 |
| | | |
| Quantitative Mid Cap Fund (continued) | | |
| | Shares or | | |
| | Principal | | |
| | Amount | | Value |
|
|
| |
| COMMON STOCKS (continued) | | | |
| | | | |
| Healthcare Services (continued) | | | |
| WellCare Health Plans, Inc. * | 14,300 | $ | 1,411,410 |
| |
|
| | | | 5,261,511 |
| Hotels & Restaurants - 2.72% | | | |
| Darden Restaurants, Inc. | 46,700 | | 1,942,720 |
| Sonic Corp. * | 36,300 | | 792,066 |
| Wyndham Worldwide Corp. | 19,800 | | 631,620 |
| |
|
| | | | 3,366,406 |
| Industrial Machinery - 3.68% | | | |
| CNH Global NV (a) | 36,810 | | 1,877,678 |
| Crane Company | 32,600 | | 1,460,154 |
| Gardner Denver, Inc. * | 30,600 | | 1,221,246 |
| |
|
| | | | 4,559,078 |
| Insurance - 7.34% | | | |
| American Financial Group, Inc. | 47,900 | | 1,350,780 |
| Arch Capital Group, Ltd. * | 15,143 | | 1,087,722 |
| Aspen Insurance Holdings, Ltd. | 126,300 | | 3,168,867 |
| Axis Capital Holdings, Ltd. | 63,000 | | 2,274,300 |
| RenaissanceRe Holdings, Ltd. | 21,300 | | 1,220,064 |
| |
|
| | | | 9,101,733 |
| International Oil - 1.09% | | | |
| Nabors Industries, Ltd. * | 45,700 | | 1,352,263 |
| | | | |
| Life Sciences - 0.52% | | | |
| Waters Corp. * | 10,400 | | 640,328 |
| | | | |
| Manufacturing - 1.06% | | | |
| Snap-on, Inc. | 26,900 | | 1,317,562 |
| | | | |
| Office Furnishings & Supplies - 3.23% | | | |
| Avery Dennison Corp. | 24,800 | | 1,482,792 |
| IKON Office Solutions, Inc. | 179,300 | | 2,517,372 |
| |
|
| | | | 4,000,164 |
| Petroleum Services - 4.43% | | | |
| Complete Production Services, Inc. * | 24,000 | | 532,800 |
| ENSCO International, Inc. | 52,300 | | 2,835,706 |
| Tesoro Petroleum Corp. | 14,500 | | 715,285 |
| Tidewater, Inc. | 21,500 | | 1,407,175 |
| |
|
| | | | 5,490,966 |
| Pharmaceuticals - 1.36% | | | |
| Celgene Corp. * | 10,500 | | 674,205 |
| Schering-Plough Corp. | 17,100 | | 513,342 |
| Shire Pharmaceuticals Group PLC, ADR | 6,300 | | 496,062 |
| |
|
| | | | 1,683,609 |
| Publishing - 2.58% | | | |
| Idearc, Inc. (a) | 93,700 | | 3,197,981 |
| | | | |
| Railroads & Equipment - 0.84% | | | |
| Canadian Pacific Railway, Ltd. | 14,700 | | 1,036,056 |
| | | | |
| Real Estate - 4.48% | | | |
| Hospitality Properties Trust, REIT | 76,900 | | 3,034,474 |
| iStar Financial, Inc., REIT | 68,900 | | 2,521,740 |
| |
|
| | | | 5,556,214 |
| |
| The accompanying notes are an integral part of the financial statements. | 293 |
John Hancock Funds II
Portfolio of investments — August 31, 2007
(showing percentage of total net assets)
| | | | |
| Quantitative Mid Cap Fund (continued) | | |
| | | Shares or | | |
| | | Principal | | |
| | | Amount | | Value |
|
|
| |
| COMMON STOCKS (continued) | | | | |
| | | | | |
| Retail Trade - 4.21% | | | | |
| Cabela's, Inc. * (a) | | 51,300 | $ | 1,212,219 |
| Dick's Sporting Goods, Inc. * | | 21,800 | | 1,414,820 |
| Dollar Tree Stores, Inc. * | | 59,600 | | 2,589,620 |
|
|
| | | | | 5,216,659 |
| Sanitary Services - 2.21% | | | | |
| Republic Services, Inc. | | 88,200 | | 2,742,138 |
| | | | | |
| Semiconductors - 1.53% | | | | |
| Intersil Corp., Class A | | 28,900 | | 962,948 |
| Microsemi Corp. * | | 36,600 | | 928,176 |
|
|
| | | | | 1,891,124 |
| Software - 3.72% | | | | |
| ANSYS, Inc. * | | 29,500 | | 977,335 |
| Nuance Communications, Inc. * (a) | | 95,900 | | 1,802,920 |
| VeriFone Holdings, Inc. * | | 49,500 | | 1,829,520 |
|
|
| | | | | 4,609,775 |
| Telecommunications Equipment & | | | | |
| Services - 0.93% | | | | |
| Amdocs, Ltd. * | | 25,800 | | 910,740 |
| Polycom, Inc. * | | 7,900 | | 239,449 |
|
|
| | | | | 1,150,189 |
| Telephone - 0.42% | | | | |
| AT&T, Inc. | | 13,100 | | 522,297 |
| | | | |
| Toys, Amusements & Sporting Goods - 1.82% | | | |
| Hasbro, Inc. | | 57,200 | | 1,613,612 |
| Marvel Entertainment, Inc. * | | 28,200 | | 637,320 |
|
|
| | | | | 2,250,932 |
|
| TOTAL COMMON STOCKS (Cost $114,722,365) | | $ | 121,878,462 |
|
| |
| SHORT TERM INVESTMENTS - 8.52% | | | |
| Federal Home Loan Bank Discount Notes | | | | |
| zero coupon due 09/04/2007 | $ | 2,030,000 | $ | 2,029,290 |
| John Hancock Cash Investment Trust (c) | | 8,535,564 | | 8,535,564 |
|
| TOTAL SHORT TERM INVESTMENTS | | | | |
| (Cost $10,564,854) | | | $ | 10,564,854 |
|
| Total Investments (Quantitative Mid Cap Fund) | | | |
| (Cost $125,287,219) - 106.86% | | | $ | 132,443,316 |
| Liabilities in Excess of Other Assets - (6.86)% | | | (8,503,881) |
|
|
| TOTAL NET ASSETS - 100.00% | | | $ | 123,939,435 |
|
|
| | | |
| Quantitative Value Fund | | | |
| | Shares or | | |
| | Principal | | |
| | Amount | | Value |
|
|
| |
| COMMON STOCKS - 99.03% | | | |
| | | | |
| Advertising - 2.34% | | | |
| Omnicom Group, Inc. | 360,400 | $ | 18,355,172 |
| | | |
| Quantitative Value Fund (continued) | | |
| | Shares or | | |
| | Principal | | |
| | Amount | | Value |
|
|
| |
| COMMON STOCKS (continued) | | | |
| | | | |
| Aerospace - 1.23% | | | |
| Lockheed Martin Corp. | 97,200 | $ | 9,636,408 |
| | | | |
| Apparel & Textiles - 0.70% | | | |
| Coach, Inc. * | 124,200 | | 5,530,626 |
| | | | |
| Banking - 8.18% | | | |
| Bank of America Corp. | 681,700 | | 34,548,556 |
| Wachovia Corp. | 606,700 | | 29,716,166 |
| |
|
| | | | 64,264,722 |
| Biotechnology - 0.77% | | | |
| Applera Corp. | 192,300 | | 6,078,603 |
| | | | |
| Business Services - 0.75% | | | |
| CSG Systems International, Inc. * | 254,400 | | 5,881,728 |
| | | | |
| Chemicals - 0.74% | | | |
| Praxair, Inc. | 76,500 | | 5,787,990 |
| | | | |
| Computers & Business Equipment - 2.67% | | | |
| EMC Corp. * | 324,400 | | 6,377,704 |
| Juniper Networks, Inc. * | 322,481 | | 10,616,074 |
| Xerox Corp. * | 230,600 | | 3,950,178 |
| |
|
| | | | 20,943,956 |
| Construction Materials - 0.51% | | | |
| Sherwin-Williams Company | 58,300 | | 4,023,283 |
| | | | |
| Containers & Glass - 0.71% | | | |
| Sealed Air Corp. | 209,200 | | 5,533,340 |
| | | | |
| Cosmetics & Toiletries - 3.13% | | | |
| Colgate-Palmolive Company | 136,000 | | 9,019,520 |
| Kimberly-Clark Corp. | 226,677 | | 15,570,443 |
| |
|
| | | | 24,589,963 |
| Crude Petroleum & Natural Gas - 2.45% | | | |
| Unit Corp. * | 300,584 | | 14,746,651 |
| W&T Offshore, Inc. (a) | 201,500 | | 4,491,435 |
| |
|
| | | | 19,238,086 |
| Domestic Oil - 1.00% | | | |
| St. Mary Land & Exploration Company | 235,900 | | 7,867,265 |
| | | | |
| Electrical Equipment - 0.93% | | | |
| Cooper Industries, Ltd., Class A | 143,400 | | 7,337,778 |
| | | | |
| Electrical Utilities - 2.25% | | | |
| Public Service Enterprise Group, Inc. | 208,200 | | 17,694,918 |
| | | | |
| Energy - 2.92% | | | |
| Energen Corp. | 346,600 | | 18,612,420 |
| Nexen, Inc. | 154,200 | | 4,297,554 |
| |
|
| | | | 22,909,974 |
| Financial Services - 13.66% | | | |
| Affiliated Managers Group, Inc. * | 55,100 | | 6,240,075 |
| Barclays PLC, SADR | 233,500 | | 11,581,600 |
| Bear Stearns Companies, Inc. | 11,000 | | 1,195,260 |
| CapitalSource, Inc. (a) | 368,037 | | 6,562,100 |
| CIT Group, Inc. | 145,000 | | 5,447,650 |
| Citigroup, Inc. | 127,200 | | 5,963,136 |
| E*TRADE Financial Corp. * | 767,800 | | 11,962,324 |
| |
| The accompanying notes are an integral part of the financial statements. | 294 |
John Hancock Funds II
Portfolio of investments — August 31, 2007
(showing percentage of total net assets)
| | | |
| Quantitative Value Fund (continued) | | |
| | Shares or | | |
| | Principal | | |
| | Amount | | Value |
|
|
| |
| COMMON STOCKS (continued) | | | |
| | | | |
| Financial Services (continued) | | | |
| JP Morgan Chase & Company | 183,700 | $ | 8,178,324 |
| Lehman Brothers Holdings, Inc. | 306,200 | | 16,788,946 |
| Merrill Lynch & Company, Inc. | 250,700 | | 18,476,590 |
| Morgan Stanley (c) | 144,800 | | 9,031,176 |
| The First Marblehead Corp. (a) | 175,000 | | 5,860,750 |
|
|
| | | | 107,287,931 |
| Food & Beverages - 2.56% | | | |
| McCormick & Company, Inc. | 561,084 | | 20,109,250 |
| | | | |
| Gas & Pipeline Utilities - 2.50% | | | |
| AGL Resources, Inc. | 91,200 | | 3,621,552 |
| Eni SPA, SADR (a) | 176,800 | | 12,195,664 |
| UGI Corp. | 149,300 | | 3,814,615 |
|
|
| | | | 19,631,831 |
| Healthcare Products - 1.86% | | | |
| Baxter International, Inc. | 165,200 | | 9,046,352 |
| DENTSPLY International, Inc. | 141,200 | | 5,560,456 |
|
|
| | | | 14,606,808 |
| Holdings Companies/Conglomerates - 4.53% | | | |
| General Electric Company | 914,700 | | 35,554,389 |
| | | | |
| Insurance - 9.00% | | | |
| Ambac Financial Group, Inc. | 124,500 | | 7,821,090 |
| American Financial Group, Inc. | 186,900 | | 5,270,580 |
| Axis Capital Holdings, Ltd. | 194,200 | | 7,010,620 |
| Everest Re Group, Ltd. | 143,400 | | 14,609,592 |
| Genworth Financial, Inc., Class A | 372,000 | | 10,780,560 |
| ING Groep NV, SADR | 99,227 | | 3,987,933 |
| MBIA, Inc. | 142,800 | | 8,568,000 |
| RenaissanceRe Holdings, Ltd. | 104,200 | | 5,968,576 |
| W.R. Berkley Corp. | 92,600 | | 2,767,814 |
| XL Capital, Ltd., Class A | 51,628 | | 3,934,054 |
|
|
| | | | 70,718,819 |
| International Oil - 5.37% | | | |
| Chevron Corp. | 22,400 | | 1,965,824 |
| ConocoPhillips | 41,000 | | 3,357,490 |
| Exxon Mobil Corp. | 254,000 | | 21,775,420 |
| Nabors Industries, Ltd. * | 252,300 | | 7,465,557 |
| Sasol, Ltd., SADR (a) | 189,700 | | 7,631,631 |
|
|
| | | | 42,195,922 |
| Internet Retail - 0.78% | | | |
| eBay, Inc. * | 179,600 | | 6,124,360 |
| Leisure Time - 0.60% | | | |
| Walt Disney Company | 141,000 | | 4,737,600 |
| Manufacturing - 1.69% | | | |
| Trinity Industries, Inc. | 354,000 | | 13,299,780 |
| Medical-Hospitals - 0.43% | | | |
| VCA Antech, Inc. * | 81,700 | | 3,340,713 |
| Metal & Metal Products - 0.33% | | | |
| Reliance Steel & Aluminum Company | 49,100 | | 2,600,827 |
| | | | |
| Quantitative Value Fund (continued) | | |
| | | Shares or | | |
| | | Principal | | |
| | | Amount | | Value |
|
|
| |
| COMMON STOCKS (continued) | | | | |
| | | | | |
| Mining - 0.32% | | | | |
| Alliance Resource Partners LP | | 75,218 | $ | 2,520,555 |
| | | | | |
| Petroleum Services - 1.86% | | | | |
| ENSCO International, Inc. | | 97,000 | | 5,259,340 |
| Valero Energy Corp. | | 136,600 | | 9,358,466 |
| |
|
| | | | | 14,617,806 |
| Pharmaceuticals - 2.63% | | | | |
| Eli Lilly & Company | | 188,400 | | 10,804,740 |
| Pfizer, Inc. | | 395,900 | | 9,834,156 |
| |
|
| | | | | 20,638,896 |
| Publishing - 1.14% | | | | |
| McGraw-Hill Companies, Inc. | | 38,300 | | 1,932,618 |
| Meredith Corp. | | 125,700 | | 7,026,630 |
| |
|
| | | | | 8,959,248 |
| Real Estate - 2.80% | | | | |
| Hospitality Properties Trust, REIT | | 134,200 | | 5,295,532 |
| iStar Financial, Inc., REIT | | 456,800 | | 16,718,881 |
| |
|
| | | | | 22,014,413 |
| Retail Trade - 1.40% | | | | |
| Dollar Tree Stores, Inc. * | | 252,700 | | 10,979,815 |
| | | | | |
| Sanitary Services - 2.72% | | | | |
| Waste Management, Inc. | | 566,300 | | 21,332,521 |
| | | | | |
| Software - 2.23% | | | | |
| Nuance Communications, Inc. * (a) | | 479,000 | | 9,005,200 |
| VeriFone Holdings, Inc. * | | 230,000 | | 8,500,800 |
| |
|
| | | | | 17,506,000 |
| Steel - 0.64% | | | | |
| Steel Dynamics, Inc. | | 116,100 | | 5,036,418 |
| | | | | |
| Telephone - 6.37% | | | | |
| AT&T, Inc. | | 1,044,300 | | 41,636,241 |
| CenturyTel, Inc. | | 50,567 | | 2,426,205 |
| Qwest Communications International, Inc. * | 668,400 | | 5,982,180 |
| |
|
| | | | | 50,044,626 |
| Tobacco - 0.64% | | | | |
| Altria Group, Inc. | | 72,700 | | 5,046,107 |
| | | | |
| Toys, Amusements & Sporting Goods - 1.69% | | | |
| Mattel, Inc. | | 613,000 | | 13,259,190 |
|
| TOTAL COMMON STOCKS (Cost $763,745,394) | | $ | 777,837,637 |
|
| |
| SHORT TERM INVESTMENTS - 5.43% | | | |
| Federal Home Loan Bank Discount Notes | | | | |
| zero coupon due 09/04/2007 | $ | 7,755,000 | $ | 7,752,286 |
| Federal National Mortgage Association Discount | | | |
| Note | | | | |
| zero coupon due 09/19/2007 | | 3,600,000 | | 3,590,730 |
| John Hancock Cash Investment Trust (c) | | 31,314,246 | | 31,314,246 |
|
| TOTAL SHORT TERM INVESTMENTS | | | | |
| (Cost $42,657,262) | | | $ | 42,657,262 |
|
| |
| The accompanying notes are an integral part of the financial statements. | 295 |
John Hancock Funds II
Portfolio of investments — August 31, 2007
(showing percentage of total net assets)
| | |
| Total Investments (Quantitative Value Fund) | | |
| (Cost $806,402,656) - 104.46% | $ | 820,494,899 |
| Liabilities in Excess of Other Assets - (4.46)% | | (35,017,319) |
|
|
| TOTAL NET ASSETS - 100.00% | $ | 785,477,580 |
|
|
| | | |
| Real Estate Equity Fund | | | |
| | Shares or | | |
| | Principal | | |
| | Amount | | Value |
|
|
| |
| COMMON STOCKS - 94.87% | | | |
| | | | |
| Hotels & Restaurants - 5.05% | | | |
| Hilton Hotels Corp. | 126,400 | $ | 5,808,080 |
| Marriott International, Inc., Class A | 83,100 | | 3,691,302 |
| Starwood Hotels & Resorts Worldwide, Inc. | 54,900 | | 3,355,488 |
|
|
| | | | 12,854,870 |
| Paper - 1.82% | | | |
| Plum Creek Timber Company, Inc. | 110,100 | | 4,616,493 |
| | | | |
| Real Estate - 88.00% | | | |
| Alexandria Real Estate Equities, Inc., REIT | 43,700 | | 4,078,521 |
| AMB Property Corp., REIT | 151,030 | | 8,303,629 |
| Avalon Bay Communities, Inc., REIT | 67,790 | | 7,753,820 |
| Boston Properties, Inc., REIT | 77,750 | | 7,780,442 |
| Brandywine Realty Trust, REIT | 137,600 | | 3,547,328 |
| BRE Properties, Inc., Class A, REIT | 110,440 | | 6,133,838 |
| Brookfield Properties Corp. (a) | 284,200 | | 6,559,336 |
| Camden Property Trust, REIT | 131,800 | | 8,104,382 |
| CBL & Associates Properties, Inc., REIT | 159,300 | | 5,250,528 |
| Cousins Properties, Inc., REIT (a) | 129,600 | | 3,560,112 |
| DCT Industrial Trust, Inc., REIT | 386,200 | | 3,946,964 |
| Developers Diversified Realty Corp., REIT | 89,200 | | 4,770,416 |
| Douglas Emmett, Inc., REIT | 173,700 | | 4,246,965 |
| Duke Realty Corp., REIT | 154,310 | | 5,214,135 |
| EastGroup Properties, Inc., REIT | 112,900 | | 4,790,347 |
| Equity One, Inc., REIT | 203,100 | | 5,313,096 |
| Equity Residential, REIT | 238,850 | | 9,611,324 |
| Essex Property Trust, Inc., REIT | 74,100 | | 8,728,239 |
| Federal Realty Investment Trust, REIT | 51,680 | | 4,344,738 |
| Forest City Enterprises, Inc., Class A | 21,300 | | 1,183,215 |
| General Growth Properties, Inc., REIT | 184,260 | | 9,159,565 |
| Highwoods Properties, Inc., REIT | 89,100 | | 3,179,979 |
| Host Hotels & Resorts, Inc., REIT | 375,450 | | 8,368,780 |
| Kilroy Realty Corp., REIT | 75,630 | | 4,623,262 |
| Kimco Realty Corp., REIT | 148,400 | | 6,354,488 |
| LaSalle Hotel Properties, REIT | 122,320 | | 5,093,405 |
| Mack-California Realty Corp., REIT | 126,410 | | 5,278,882 |
| Mitsubishi Estate Company, Ltd. | 155,000 | | 4,142,210 |
| ProLogis, REIT | 139,870 | | 8,414,579 |
| Public Storage, Inc., REIT | 40,600 | | 3,076,668 |
| Regency Centers Corp., REIT | 83,950 | | 5,832,006 |
| Simon Property Group, Inc., REIT | 162,080 | | 15,384,634 |
| SL Green Realty Corp., REIT | 45,870 | | 5,114,964 |
| The Macerich Company, REIT | 121,220 | | 9,845,488 |
| The St. Joe Company, REIT (a) | 95,700 | | 3,026,034 |
| Vornado Realty Trust, REIT | 80,100 | | 8,537,859 |
| | | | |
| Real Estate Equity Fund (continued) | | |
| | | Shares or | | |
| | | Principal | | |
| | | Amount | | Value |
|
|
| |
| COMMON STOCKS (continued) | | | | |
| | | | | |
| Real Estate (continued) | | | | |
| Weingarten Realty Investors, REIT | | 131,500 | $ | 5,287,615 |
|
|
| | | | | 223,941,793 |
|
| |
| TOTAL COMMON STOCKS (Cost $239,346,435) | | $ | 241,413,156 |
|
| |
| CORPORATE BONDS - 2.97% | | | | |
| | | | | |
| Real Estate - 2.97% | | | | |
| Alexandria Real Estate Equities, Inc., REIT | | | | |
| 3.70% due 01/15/2027 | | 2,787,500 | | 2,648,125 |
| BRE Properties, Inc. | | | | |
| 4.125% due 08/15/2026 | | 2,035,000 | | 2,006,551 |
| Kilroy Realty L.P. | | | | |
| 3.25% due 04/15/2012 | | 2,640,000 | | 2,372,998 |
| Weingarten Realty Investors | | | | |
| 3.95% due 08/01/2026 | | 546,000 | | 547,911 |
|
|
| | | | | 7,575,585 |
|
| |
| TOTAL CORPORATE BONDS (Cost $7,985,315) | | $ | 7,575,585 |
|
| |
| SHORT TERM INVESTMENTS - 4.69% | | | | |
| John Hancock Cash Investment Trust (c) | $ | 11,928,320 | $ | 11,928,320 |
|
| TOTAL SHORT TERM INVESTMENTS | | | | |
| (Cost $11,928,320) | | | $ | 11,928,320 |
|
| |
| REPURCHASE AGREEMENTS - 1.96% | | | | |
| Repurchase Agreement with State | | | | |
| Street Corp. dated 08/31/2007 at | | | | |
| 4.60% to be repurchased at | | | | |
| $4,989,549 on 09/04/2007, | | | | |
| collateralized by $5,140,000 | | | | |
| Federal National Mortgage | | | | |
| Association, 5.49% due | | | | |
| 01/11/2023 (valued at $5,088,600, | | | | |
| including interest) | $ | 4,987,000 | $ | 4,987,000 |
|
| TOTAL REPURCHASE AGREEMENTS | | | | |
| (Cost $4,987,000) | | | $ | 4,987,000 |
|
| Total Investments (Real Estate Equity Fund) | | | | |
| (Cost $264,247,070) - 104.49% | | | $ | 265,904,061 |
| Liabilities in Excess of Other Assets - (4.49)% | | | (11,435,464) |
|
|
| TOTAL NET ASSETS - 100.00% | | | $ | 254,468,597 |
|
|
| | | |
| Real Estate Securities Fund | | | |
| | Shares or | | |
| | Principal | | |
| | Amount | | Value |
|
|
| |
| COMMON STOCKS - 100.47% | | | |
| | | | |
| Hotels & Restaurants - 2.59% | | | |
| Starwood Hotels & Resorts Worldwide, Inc. | 61,382 | $ | 3,751,668 |
| | | | |
| Real Estate - 97.88% | | | |
| AMB Property Corp., REIT | 50,490 | | 2,775,940 |
| Apartment Investment & Management | | | |
| Company, Class A, REIT | 98,313 | | 4,394,591 |
| |
| The accompanying notes are an integral part of the financial statements. | 296 |
John Hancock Funds II
Portfolio of investments — August 31, 2007
(showing percentage of total net assets)
| | | | |
| Real Estate Securities Fund (continued) | | |
| | | Shares or | | |
| | | Principal | | |
| | | Amount | | Value |
| |
|
| |
| COMMON STOCKS (continued) | | | | |
| | | | | |
| Real Estate (continued) | | | | |
| Archstone-Smith Trust, REIT | | 61,030 | $ | 3,588,564 |
| Avalon Bay Communities, Inc., REIT | | 67,224 | | 7,689,081 |
| BioMed Realty Trust, Inc., REIT | | 59,530 | | 1,451,341 |
| Boston Properties, Inc., REIT | | 36,850 | | 3,687,579 |
| BRE Properties, Inc., Class A, REIT | | 55,030 | | 3,056,366 |
| DiamondRock Hospitality Company, REIT | 14,250 | | 255,787 |
| Digital Realty Trust, Inc., REIT | | 40,968 | | 1,597,752 |
| Douglas Emmett, Inc., REIT | | 114,050 | | 2,788,523 |
| Entertainment Properties Trust, REIT | | 24,743 | | 1,183,705 |
| Equity Lifestyle Properties, Inc., REIT | | 40,511 | | 1,972,886 |
| Equity Residential, REIT | | 39,210 | | 1,577,810 |
| Essex Property Trust, Inc., REIT | | 25,974 | | 3,059,477 |
| Extra Space Storage, Inc., REIT | | 20,600 | | 316,622 |
| Federal Realty Investment Trust, REIT | | 53,496 | | 4,497,409 |
| FelCor Lodging Trust, Inc., REIT | | 91,200 | | 2,000,928 |
| General Growth Properties, Inc., REIT | | 159,104 | | 7,909,060 |
| Healthcare Realty Trust, Inc., REIT | | 37,100 | | 926,387 |
| Host Hotels & Resorts, Inc., REIT | | 342,400 | | 7,632,096 |
| LaSalle Hotel Properties, REIT | | 65,500 | | 2,727,420 |
| LTC Properties, Inc., REIT | | 58,431 | | 1,319,372 |
| Mack-California Realty Corp., REIT | | 73,197 | | 3,056,707 |
| Nationwide Health Properties, Inc., REIT | | 81,014 | | 2,248,139 |
| Parkway Properties, Inc., REIT | | 25,800 | | 1,194,024 |
| Post Properties, Inc., REIT (a) | | 41,950 | | 1,674,225 |
| ProLogis, REIT | | 143,942 | | 8,659,551 |
| Public Storage, Inc., REIT | | 65,430 | | 4,958,285 |
| Regency Centers Corp., REIT | | 79,470 | | 5,520,781 |
| Saul Centers, Inc., REIT | | 12,600 | | 630,756 |
| Senior Housing Properties Trust, REIT | | 85,550 | | 1,740,087 |
| Simon Property Group, Inc., REIT | | 140,993 | | 13,383,056 |
| SL Green Realty Corp., REIT | | 59,830 | | 6,671,643 |
| Tanger Factory Outlet Centers, Inc., REIT | | 59,050 | | 2,248,034 |
| Taubman Centers, Inc., REIT | | 29,150 | | 1,503,557 |
| The Macerich Company, REIT | | 56,124 | | 4,558,391 |
| Ventas, Inc., REIT | | 130,650 | | 4,975,152 |
| Vornado Realty Trust, REIT | | 102,762 | | 10,953,402 |
| Washington Real Estate Investment Trust, | | | | |
| REIT (a) | | 41,700 | | 1,365,675 |
|
|
| | | | | 141,750,161 |
|
| TOTAL COMMON STOCKS (Cost $126,789,974) | | $ | 145,501,829 |
|
| |
| SHORT TERM INVESTMENTS - 2.09% | | | |
| John Hancock Cash Investment Trust (c) | $ | 3,024,402 | $ | 3,024,402 |
|
| TOTAL SHORT TERM INVESTMENTS | | | | |
| (Cost $3,024,402) | | | $ | 3,024,402 |
|
| Total Investments (Real Estate Securities Fund) | | | |
| (Cost $129,814,376) - 102.56% | | | $ | 148,526,231 |
| Liabilities in Excess of Other Assets - (2.56)% | | | (3,710,085) |
|
|
| TOTAL NET ASSETS - 100.00% | | | $ | 144,816,146 |
|
|
| | | | |
| Real Return Bond Fund | | | | |
| | | Shares or | | |
| | | Principal | | |
| | | Amount | | Value |
|
|
| |
| U.S. TREASURY OBLIGATIONS - 98.77% | | | |
| | | | | |
| Treasury Inflation Protected | | | | |
| Securities (d) - 98.77% | | | | |
| 0.875% due 04/15/2010 *** (g) | $ | 152,169,185 | $ | 145,464,306 |
| 1.875% due 07/15/2013 to | | | | |
| 07/15/2015 *** (g) | | 130,790,340 | | 126,885,859 |
| 2.00% due 04/15/2012 to | | | | |
| 01/15/2026 *** (g) | | 221,668,412 | | 214,031,290 |
| 2.375% due 04/15/2011 to | | | | |
| 01/15/2027 *** (g) | | 189,383,968 | | 188,428,329 |
| 2.50% due 07/15/2016 *** (g) | | 38,170,310 | | 38,572,892 |
| 2.625% due 07/15/2017 *** (g) | | 8,644,892 | | 8,846,828 |
| 3.00% due 07/15/2012 *** (g) | | 32,212,694 | | 33,249,556 |
| 3.50% due 01/15/2011 *** (g) | | 48,121,008 | | 49,820,257 |
| 3.625% due 04/15/2028 *** (g) | | 16,358,997 | | 19,598,847 |
| 3.875% due 01/15/2009 to | | | | |
| 04/15/2029 *** (g) | | 111,720,508 | | 132,625,168 |
|
|
| | | | | 957,523,332 |
|
| TOTAL U.S. TREASURY OBLIGATIONS | | | | |
| (Cost $963,181,474) | | | $ | 957,523,332 |
|
| |
| U.S. GOVERNMENT AGENCY OBLIGATIONS - 27.32% | | |
| | | | | |
| Federal National Mortgage | | | | |
| Association - 26.90% | | | | |
| 5.50% due 03/01/2034 to 09/01/2035 *** | 9,239,848 | | 9,034,467 |
| 5.50% TBA ** | | 208,400,000 | | 203,515,521 |
| 6.00% due 09/01/2035 to 11/01/2036 *** | 5,715,495 | | 5,710,971 |
| 6.00% TBA ** | | 42,500,000 | | 42,435,955 |
| 6.222% due 10/01/2044 (b)*** | | 135,205 | | 136,087 |
|
|
| | | | | 260,833,001 |
| Small Business Administration - 0.42% | | | | |
| 4.504% due 02/01/2014 *** | | 1,341,746 | | 1,304,088 |
| 4.88% due 11/01/2024 *** | | 2,804,457 | | 2,742,982 |
|
|
| | | | | 4,047,070 |
|
| TOTAL U.S. GOVERNMENT AGENCY OBLIGATIONS | | |
| (Cost $263,264,269) | | | $ | 264,880,071 |
|
| |
| FOREIGN GOVERNMENT OBLIGATIONS - 2.97% | | |
| | | | | |
| Canada - 0.05% | | | | |
| Government of Canada | | | | |
| 3.00% due 12/01/2036 *** | CAD | 434,624 | | 488,288 |
| | | | | |
| Japan - 2.34% | | | | |
| Government of Japan | | | | |
| 1.10% due 12/10/2016 *** | JPY | 259,220,000 | | 2,217,922 |
| 1.20% due 06/10/2017 *** | | 2,381,850,000 | | 20,439,063 |
|
|
| | | | | 22,656,985 |
| Russia - 0.15% | | | | |
| Russian Federation, Series REGS | | | | |
| 7.50% due 03/31/2030 *** | $ | 1,293,500 | | 1,438,372 |
| | | | | |
| United Kingdom - 0.43% | | | | |
| United Kingdom Gilt Inflation Linked, Series 8MO | | | |
| 2.50% due 05/20/2009 *** | GBP | 800,000 | | 4,198,713 |
|
| TOTAL FOREIGN GOVERNMENT OBLIGATIONS | | |
| (Cost $28,224,046) | | | $ | 28,782,358 |
|
| |
| The accompanying notes are an integral part of the financial statements. | 297 |
John Hancock Funds II
Portfolio of investments — August 31, 2007
(showing percentage of total net assets)
| | | | |
| Real Return Bond Fund (continued) | | |
| | | Shares or | | |
| | | Principal | | |
| | | Amount | | Value |
| |
|
| |
| CORPORATE BONDS - 5.85% | | | | |
| | | | | |
| Banking - 0.26% | | | | |
| Unicredit Luxembourg Finance SA | | | | |
| 5.41% due 10/24/2008 (b)*** | $ | 1,100,000 | $ | 1,100,040 |
| Wachovia Bank NA, Series BKNT | | | | |
| 5.43% due 12/02/2010 (b)*** | | 1,400,000 | | 1,390,651 |
| |
|
| | | | | 2,490,691 |
| Cable & Television - 0.15% | | | | |
| CSC Holdings, Inc. | | | | |
| 7.875% due 12/15/2007 *** | | 1,400,000 | | 1,403,500 |
| | | | | |
| Crude Petroleum & Natural Gas - 0.39% | | | | |
| Chesapeake Energy Corp. | | | | |
| 2.50% due 05/15/2037 *** | | 3,550,000 | | 3,357,803 |
| Pemex Project Funding Master Trust | | | | |
| 9.25% due 03/30/2018 *** | | 350,000 | | 436,275 |
| |
|
| | | | | 3,794,078 |
| Diversified Financial Services - 0.05% | | | | |
| General Electric Capital Corp., Series MTN | | | | |
| 5.40% due 12/12/2008 (b)*** | | 500,000 | | 499,672 |
| | | | |
| Financial Services - 4.21% | | | | |
| Abbey National Treasury Services PLC, Series YCD | | | |
| 5.27% due 07/02/2008 (b)*** | | 6,300,000 | | 6,301,336 |
| C10 Capital SPV, Ltd. | | | | |
| 6.722% due 12/31/2049 (b)*** | | 400,000 | | 386,864 |
| Calabash Re, Ltd. | | | | |
| 13.76% due 01/08/2010 (b)*** | | 300,000 | | 304,770 |
| Capital One Financial Corp. | | | | |
| 6.75% due 09/15/2017 *** | | 1,000,000 | | 994,691 |
| Citigroup, Inc. | | | | |
| 5.39% due 12/28/2009 (b)*** | | 4,000,000 | | 3,991,648 |
| 5.40% due 01/30/2009 (b)*** | | 600,000 | | 600,032 |
| East Lane Re Ltd. | | | | |
| 12.35625% due 05/06/2011 (b)*** | | 300,000 | | 299,807 |
| Ford Motor Credit Company | | | | |
| 7.25% due 10/25/2011 *** | | 6,350,000 | | 5,788,711 |
| 7.80% due 06/01/2012 *** | | 450,000 | | 414,586 |
| General Electric Capital Corp. | | | | |
| 5.50% due 09/15/2067 (b)*** | EUR | 100,000 | | 135,348 |
| 6.50% due 09/15/2067 (b)*** | GBP | 4,500,000 | | 9,005,590 |
| Longpoint Re, Ltd. | | | | |
| 10.60875% due 05/08/2010 (b)*** | $ | 800,000 | | 809,760 |
| Merrill Lynch & Company, Inc. | | | | |
| 6.40% due 08/28/2017 *** | | 2,900,000 | | 2,955,593 |
| Mystic Re, Ltd. | | | | |
| 14.54125% due 12/05/2008 (b)*** | | 500,000 | | 499,900 |
| 15.54125% due 06/07/2011 (b)*** | | 1,500,000 | | 1,525,500 |
| Rabobank Nederland | | | | |
| 5.38% due 01/15/2009 (b)*** | | 500,000 | | 500,070 |
| Redwood Capital IX, Ltd., Series D | | | | |
| 13.11% due 01/09/2008 (b)*** | | 300,000 | | 301,830 |
| Residential Reinsurance 2005 Ltd., Series A | | | | |
| 10.81% due 06/06/2008 (b)*** | | 600,000 | | 582,648 |
| Residential Reinsurance 2007 Ltd., Series CL1 | | | |
| 12.61% due 06/07/2010 (b)*** | | 2,200,000 | | 2,224,860 |
| The Bear Stearns Companies, Inc., Series MTN | | | |
| 6.95% due 08/10/2012 *** | | 2,400,000 | | 2,434,349 |
| | | | |
| Real Return Bond Fund (continued) | | |
| | | Shares or | | |
| | | Principal | | |
| | | Amount | | Value |
|
|
| |
| CORPORATE BONDS (continued) | | | | |
| | | | | |
| Financial Services (continued) | | | | |
| Vita Capita II, Ltd. | | | | |
| 6.26% due 01/01/2010 (b)*** | $ | 300,000 | $ | 298,020 |
| Vita Capital III Ltd., Series B-II | | | | |
| 6.48% due 01/01/2012 (b)*** | | 500,000 | | 497,300 |
| |
|
| | | | | 40,853,213 |
| |
| Food & Beverages - 0.09% | | | | |
| Kraft Foods, Inc. | | | | |
| 6.00% due 02/11/2013 *** | | 900,000 | | 918,158 |
| | | | | |
| Hotels & Restaurants - 0.02% | | | | |
| Harrah's Operating Company, Inc. | | | | |
| 7.50% due 01/15/2009 *** | | 200,000 | | 202,000 |
| | | | | |
| Insurance - 0.06% | | | | |
| Foundation Re II, Ltd. | | | | |
| 12.27% due 11/26/2010 (b)*** | | 600,000 | | 606,720 |
| | | | | |
| Leisure Time - 0.16% | | | | |
| Park Place Entertainment Corp. | | | | |
| 8.875% due 09/15/2008 *** | | 1,500,000 | | 1,520,625 |
| | | | | |
| Telephone - 0.46% | | | | |
| BellSouth Corp. | | | | |
| 4.24% due 04/26/2008 (b)*** | | 4,500,000 | | 4,474,949 |
|
| TOTAL CORPORATE BONDS (Cost $54,820,451) | | $ | 56,763,606 |
|
| |
| MUNICIPAL BONDS - 0.07% | | | | |
| | | | | |
| New York - 0.02% | | | | |
| New York City Municipal Finance Authority, | | | |
| Water & Sewer System Revenue, Series D | | | |
| 4.75% due 06/15/2038 *** | | 200,000 | | 195,244 |
| | | | | |
| West Virginia - 0.05% | | | | |
| Tobacco Settlement Finance Authority of West | | | |
| Virginia, Tobacco Settlement Funded | | | | |
| 7.467% due 06/01/2047 *** | | 500,000 | | 482,335 |
|
| TOTAL MUNICIPAL BONDS (Cost $672,086) | | $ | 677,579 |
|
| |
| COLLATERALIZED MORTGAGE | | | | |
| OBLIGATIONS - 1.29% | | | | |
| | | | |
| Bear Stearns Adjustable Rate Mortgage Trust, | | | |
| Series 2005-2, Class A1 | | | | |
| 4.125% due 03/25/2035 (b)*** | | 2,383,814 | | 2,333,953 |
| Bear Stearns Adjustable Rate Mortgage Trust, | | | |
| Series 2005-2, Class A2 | | | | |
| 4.125% due 03/25/2035 (b)*** | | 1,211,703 | | 1,186,982 |
| Bear Stearns Adjustable Rate Mortgage Trust, | | | |
| Series 2005-5, Class A1 | | | | |
| 4.55% due 08/25/2035 (b)*** | | 859,539 | | 847,545 |
| Bear Stearns Adjustable Rate Mortgage Trust, | | | |
| Series 2005-5, Class A2 | | | | |
| 4.55% due 08/25/2035 (b)*** | | 1,141,973 | | 1,115,842 |
| Bear Stearns Structured Products Inc., Series | | | |
| 2007-R7, Class A1 | | | | |
| 5.70% due 01/25/2037 (b)*** | | 4,800,000 | | 4,767,375 |
| Citigroup Mortgage Loan Trust, Inc., Series | | | |
| 2005-11, Class 1A1 | | | | |
| 4.90% due 12/25/2035 (b)*** | | 138,581 | | 137,404 |
| |
| The accompanying notes are an integral part of the financial statements. | 298 |
John Hancock Funds II
Portfolio of investments — August 31, 2007
(showing percentage of total net assets)
| | | | |
| Real Return Bond Fund (continued) | | |
| | | Shares or | | |
| | | Principal | | |
| | | Amount | | Value |
| |
|
| |
| COLLATERALIZED MORTGAGE | | | | |
| OBLIGATIONS (continued) | | | | |
| | | | |
| Citigroup Mortgage Loan Trust, Inc., Series 2005-6, | | | |
| Class A1 | | | | |
| 4.7475% due 08/25/2035 (b)*** | $ | 1,005,133 | $ | 990,995 |
| Citigroup Mortgage Loan Trust, Inc., Series 2005-6, | | | |
| Class A2 | | | | |
| 4.2475% due 08/25/2035 (b)*** | | 809,823 | | 785,912 |
| Citigroup Mortgage Loan Trust, Inc., Series 2005-6, | | | |
| Class A3 | | | | |
| 4.0975% due 08/25/2035 (b)*** | | 169,349 | | 163,978 |
| Federal Home Loan Mortgage Corp., | | | | |
| Series 2561, Class BH | | | | |
| 4.50% due 05/15/2017 *** | | 230,458 | | 226,303 |
|
| TOTAL COLLATERALIZED MORTGAGE OBLIGATIONS | | |
| (Cost $12,538,658) | | | $ | 12,556,289 |
|
| |
| ASSET BACKED SECURITIES - 0.04% | | | |
| | | | |
| Lehman XS Trust, Series 2006-10N, Class 1A1A | | | |
| 5.585% due 07/25/2046 (b)*** | | 355,257 | | 353,811 |
| Merrill Lynch Mortgage Investors, Inc., | | | | |
| Series 2006-WMC1, Class A2A | | | | |
| 5.585% due 01/25/2037 (b)*** | | 31,273 | | 31,252 |
| Residential Asset Securities Corp., | | | | |
| Series 2006-KS3, Class AI1 | | | | |
| 5.575% due 04/25/2036 (b)*** | | 40,626 | | 40,512 |
|
| TOTAL ASSET BACKED SECURITIES | | | | |
| (Cost $427,155) | | | $ | 425,575 |
|
| |
| TERM LOANS - 1.08% | | | | |
| | | | |
| Crude Petroleum & Natural Gas - 0.13% | | | |
| OAO Rosneft | | | | |
| 6.00% due 09/16/2007 (f) | | 1,300,000 | | 1,290,250 |
| | | | | |
| Financial Services - 0.47% | | | | |
| DaimlerChrysler Financial Company | | | | |
| 5.00% due 08/03/2012 | | 4,800,000 | | 4,560,000 |
| | | | | |
| Medical-Hospitals - 0.38% | | | | |
| HCA, Inc. | | | | |
| 7.61% due 11/01/2013 (b) | | 3,781,000 | | 3,635,167 |
| | | | | |
| Paper - 0.10% | | | | |
| Georgia Pacific Corp. | | | | |
| 7.345% due 12/20/2012 (b) | | 985,000 | | 942,083 |
|
| TOTAL TERM LOANS (Cost $10,624,570) | | $ | 10,427,500 |
|
| |
| OPTIONS - 0.17% | | | | |
| | | | | |
| Call Options - 0.07% | | | | |
| Over The Counter European Style Call on the EUR | | | |
| vs. USD | | | | |
| Expiration 06/26/2008 at $1.353 * | | 4,300,000 | | 163,557 |
| Expiration 07/08/2010 at $1.392 * | | 4,900,000 | | 217,645 |
| Over The Counter European Style Call on the USD | | | |
| vs. JPY | | | | |
| Expiration 06/23/2008 at $118.15 * | | 8,800,000 | | 62,181 |
| Over The Counter European Style Call on | | | | |
| USD-LIBOR Rate Swaption | | | | |
| Expiration 03/31/2008 at $4.75 * | | 25,000,000 | | 162,667 |
| | | | |
| Real Return Bond Fund (continued) | | |
| | | Shares or | | |
| | | Principal | | |
| | | Amount | | Value |
|
|
| |
| OPTIONS (continued) | | | | |
| | | | | |
| Call Options (continued) | | | | |
| Over The Counter European Style Call on | | | | |
| USD-LIBOR Rate Swaption (continued) | | | | |
| Expiration 09/26/2008 at $4.75 * | | 6,000,000 | $ | 45,703 |
|
|
| | | | | 651,753 |
| |
| Put Options - 0.10% | | | | |
| Over The Counter European Style Put on FNMA | | | |
| TBA 5.50% | | | | |
| Expiration 11/06/2007 at $85.50 * | | 107,400,000 | | 1 |
| Over The Counter European Style Put on the EUR | | | |
| vs. USD | | | | |
| Expiration 06/26/2008 at $1.353 * | | 4,300,000 | | 116,448 |
| Expiration 07/08/2010 at $1.392 * | | 4,900,000 | | 329,475 |
| Over The Counter European Style Put on the USD | | | |
| vs. JPY | | | | |
| Expiration 06/23/2008 at $118.15 * | | 8,800,000 | | 528,651 |
|
|
| | | | | 974,575 |
|
| |
| TOTAL OPTIONS (Cost $1,432,289) | | | $ | 1,626,328 |
|
| |
| SHORT TERM INVESTMENTS - 16.56% | | | | |
| Barclays U.S. Funding, LLC | | | | |
| 5.50% due 09/05/2007 to | | | | |
| 09/06/2007 *** | $ | 29,300,000 | $ | 29,281,712 |
| Danske Corp. | | | | |
| 5.45% due 09/05/2007 *** | | 26,800,000 | | 26,783,771 |
| DNB NORBank ASA | | | | |
| 5.37% due 09/04/2007 *** | | 26,800,000 | | 26,788,007 |
| Rabobank USA Finance Corp. | | | | |
| 5.24% due 09/04/2007 *** | | 26,900,000 | | 26,888,254 |
| Swedbank, Inc. | | | | |
| 5.34% due 09/04/2007 *** | | 26,800,000 | | 26,788,074 |
| U.S. Treasury Bill | | | | |
| zero coupon due 09/13/2007 to | | | | |
| 11/29/2007 **** | | 4,605,000 | | 4,591,829 |
| UBS Finance (Delaware) LLC | | | | |
| 5.20% due 09/04/2007 *** | | 19,400,000 | | 19,391,593 |
|
| TOTAL SHORT TERM INVESTMENTS | | | | |
| (Cost $160,513,240) | | | $ | 160,513,240 |
|
| |
| REPURCHASE AGREEMENTS - 0.44% | | | | |
| Repurchase Agreement with State | | | | |
| Street Corp. dated 08/31/2007 at | | | | |
| 4.60% to be repurchased at | | | | |
| $4,265,179 on 09/04/2007, | | | | |
| collateralized by $4,260,000 | | | | |
| Federal National Mortgage | | | | |
| Association, 5.30% due | | | | |
| 04/16/2010 (valued at $4,350,525, | | | | |
| including interest) | $ | 4,263,000 | $ | 4,263,000 |
|
| TOTAL REPURCHASE AGREEMENTS | | | | |
| (Cost $4,263,000) | | | $ | 4,263,000 |
|
| Total Investments (Real Return Bond Fund) | | | | |
| (Cost $1,499,961,238) - 154.56% | | | $ | 1,498,438,878 |
| Liabilities in Excess of Other Assets - (54.56)% | | | (528,962,537) |
|
|
| TOTAL NET ASSETS - 100.00% | | | $ | 969,476,341 |
|
|
| |
| The accompanying notes are an integral part of the financial statements. | 299 |
John Hancock Funds II
Portfolio of investments — August 31, 2007
(showing percentage of total net assets)
| | | | |
| Schedule of Securities Sold Short | | | |
| | | Shares or | | |
| | | Principal | | |
| | | Amount | | Value |
| |
|
| |
| U.S. TREASURY NOTES - 100.00% | | | | |
| U.S. Treasury Note | | | | |
| 4.75%, due 08/15/2017 (g) | $ | 3,600,000 | $ | 3,661,312 |
|
| TOTAL U.S. TREASURY | | | | |
| NOTES (Proceeds $3,636,491) | | | $ | 3,661,312 |
|
| Total Securities Sold Short | | | | |
| (Proceeds $3,636,491) | | | $ | 3,661,312 |
| |
|
| | | |
| Small Cap Fund | | | |
| | Shares or | | |
| | Principal | | |
| | Amount | | Value |
|
|
| |
| COMMON STOCKS - 97.26% | | | |
| | | | |
| Advertising - 3.79% | | | |
| inVentiv Health, Inc. * | 161,600 | $ | 6,409,056 |
| | | | |
| Apparel & Textiles - 3.19% | | | |
| G-III Apparel Group, Ltd. * | 220,368 | | 3,779,311 |
| Hartmarx Corp. * | 220,029 | | 1,601,811 |
| |
|
| | | | 5,381,122 |
| Auto Parts - 4.07% | | | |
| Fuel Systems Solutions, Inc. * | 102,800 | | 1,861,708 |
| LKQ Corp. * | 161,700 | | 5,009,466 |
| |
|
| | | | 6,871,174 |
| Banking - 6.27% | | | |
| Boston Private Financial Holdings, Inc. (a) | 91,600 | | 2,486,940 |
| First Community Bancorp (a) | 74,600 | | 4,047,796 |
| SVB Financial Group * | 81,700 | | 4,065,392 |
| |
|
| | | | 10,600,128 |
| Business Services - 3.52% | | | |
| Kendle International, Inc. * (a) | 151,800 | | 5,944,488 |
| | | | |
| Chemicals - 5.02% | | | |
| Arch Chemicals, Inc. | 86,600 | | 3,751,512 |
| H.B. Fuller Company | 122,100 | | 3,285,711 |
| ICO, Inc. * | 126,200 | | 1,448,776 |
| |
|
| | | | 8,485,999 |
| Computers & Business Equipment - 1.96% | | | |
| Radiant Systems, Inc. * | 220,200 | | 3,314,010 |
| | | | |
| Cosmetics & Toiletries - 1.87% | | | |
| Intermediate Parfums, Inc. | 152,400 | | 3,163,824 |
| | | | |
| Crude Petroleum & Natural Gas - 2.10% | | | |
| Goodrich Petroleum Corp. * (a) | 119,800 | | 3,547,278 |
| | | | |
| Domestic Oil - 1.84% | | | |
| Mariner Energy, Inc. * | 148,170 | | 3,107,125 |
| | | | |
| Electronics - 4.39% | | | |
| Daktronics, Inc. (a) | 255,400 | | 7,023,500 |
| Trimble Navigation, Ltd. * | 11,300 | | 399,003 |
| |
|
| | | | 7,422,503 |
| Energy - 1.59% | | | |
| PowerSecure International, Inc. * (a) | 198,200 | | 2,679,664 |
| | | |
| Small Cap Fund (continued) | | | |
| | Shares or | | |
| | Principal | | |
| | Amount | | Value |
|
|
| |
| COMMON STOCKS (continued) | | | |
| | | | |
| Financial Services - 2.11% | | | |
| SWS Group, Inc. | 200,500 | $ | 3,556,870 |
| | | | |
| Healthcare Products - 11.87% | | | |
| Cantel Medical Corp. * | 187,600 | | 2,889,040 |
| Hologic, Inc. * (a) | 46,600 | | 2,476,790 |
| Home Diagnostics, Inc. * | 78,000 | | 765,960 |
| Inverness Medical Innovations, Inc. * (a) | 123,701 | | 5,954,966 |
| Kensey Nash Corp. * | 25,400 | | 605,282 |
| SurModics, Inc. * (a) | 44,500 | | 2,147,125 |
| Symmetry Medical, Inc. * | 325,200 | | 5,212,956 |
|
|
| | | | 20,052,119 |
| Healthcare Services - 5.69% | | | |
| Air Methods Corp. * | 143,530 | | 5,688,094 |
| Nighthawk Radiology Holdings, Inc. * (a) | 178,400 | | 3,917,664 |
|
|
| | | | 9,605,758 |
| Industrial Machinery - 4.58% | | | |
| Chart Industries, Inc. * | 186,900 | | 5,044,431 |
| Flow International Corp. * | 327,100 | | 2,685,491 |
|
|
| | | | 7,729,922 |
| Insurance - 7.39% | | | |
| American Equity Investment Life Holding | | | |
| Company | 160,348 | | 1,637,153 |
| First Mercury Financial Corp. * | 143,400 | | 2,922,492 |
| National Interstate Corp. | 126,100 | | 4,133,558 |
| Philadelphia Consolidated Holding Corp. * | 94,900 | | 3,797,898 |
|
|
| | | | 12,491,101 |
| Internet Content - 1.79% | | | |
| TheStreet.com, Inc. | 295,000 | | 3,014,900 |
| | | | |
| Internet Software - 0.82% | | | |
| Lionbridge Technologies, Inc. * | 338,700 | | 1,388,670 |
| | | | |
| Investment Companies - 2.00% | | | |
| iShares Russell 2000 Index Fund (a) | 42,900 | | 3,377,946 |
| | | | |
| Leisure Time - 3.67% | | | |
| Gaylord Entertainment Company * | 120,700 | | 6,197,945 |
| | | | |
| Publishing - 1.00% | | | |
| Courier Corp. | 46,900 | | 1,685,586 |
| | | | |
| Railroads & Equipment - 1.86% | | | |
| Genesee & Wyoming, Inc., Class A * | 114,810 | | 3,143,498 |
| | | | |
| Real Estate - 1.25% | | | |
| FBR Capital Markets Corp., REIT * | 158,800 | | 2,116,804 |
| | | | |
| Retail Trade - 6.29% | | | |
| Christopher & Banks Corp. | 294,000 | | 3,551,520 |
| Gaiam, Inc., Class A * (a) | 127,573 | | 2,639,485 |
| Tractor Supply Company * (a) | 92,200 | | 4,440,352 |
|
|
| | | | 10,631,357 |
| Software - 5.17% | | | |
| ACI Worldwide, Inc. * | 183,000 | | 4,754,340 |
| Secure Computing Corp. * | 443,868 | | 3,985,935 |
|
|
| | | | 8,740,275 |
| |
| The accompanying notes are an integral part of the financial statements. | 300 |
John Hancock Funds II
Portfolio of investments — August 31, 2007
(showing percentage of total net assets)
| | | | |
| Small Cap Fund (continued) | | | | |
| | | Shares or | | |
| | | Principal | | |
| | | Amount | | Value |
| |
|
| |
| COMMON STOCKS (continued) | | | | |
| | | | | |
| Transportation - 2.16% | | | | |
| Pacer International, Inc. | | 168,400 | $ | 3,640,808 |
|
| TOTAL COMMON STOCKS (Cost $140,333,039) | | $ | 164,299,930 |
|
| |
| SHORT TERM INVESTMENTS - 21.73% | | | | |
| John Hancock Cash Investment Trust (c) | $ | 36,715,806 | $ | 36,715,806 |
|
| TOTAL SHORT TERM INVESTMENTS | | | | |
| (Cost $36,715,806) | | | $ | 36,715,806 |
|
| |
| REPURCHASE AGREEMENTS - 1.10% | | | | |
| Repurchase Agreement with State | | | | |
| Street Corp. dated 08/31/2007 at | | | | |
| 4.60% to be repurchased at | | | | |
| $1,860,951 on 09/04/2007, | | | | |
| collateralized by $1,845,000 | | | | |
| Federal Home Loan Bank, 5.5% | | | | |
| due 07/15/2036 (valued at | | | | |
| $1,898,044, including interest) | $ | 1,860,000 | $ | 1,860,000 |
|
| TOTAL REPURCHASE AGREEMENTS | | | | |
| (Cost $1,860,000) | | | $ | 1,860,000 |
|
| Total Investments (Small Cap Fund) | | | | |
| (Cost $178,908,845) - 120.09% | | | $ | 202,875,736 |
| Liabilities in Excess of Other Assets - (20.09)% | | | (33,938,975) |
|
|
| TOTAL NET ASSETS - 100.00% | | | $ | 168,936,761 |
|
|
| | | |
| Small Cap Index Fund | | | |
| | Shares or | | |
| | Principal | | |
| | Amount | | Value |
|
|
| |
| CLOSED-END FUNDS - 0.02% | | | |
| | | | |
| Investment Companies - 0.02% | | | |
| Kayne Anderson Energy Development Fund * (a) | 717 | $ | 17,997 |
|
| TOTAL CLOSED-END FUNDS (Cost $18,228) | | $ | 17,997 |
|
| |
| COMMON STOCKS - 92.23% | | | |
| | | | |
| Advertising - 0.26% | | | |
| Greenfield Online, Inc. * | 1,421 | | 20,519 |
| inVentiv Health, Inc. * | 1,901 | | 75,394 |
| Marchex, Inc., Class B (a) | 1,568 | | 14,300 |
| ValueClick, Inc. * | 6,062 | | 121,483 |
| |
|
| | | | 231,696 |
| Aerospace - 1.18% | | | |
| AAR Corp. * | 2,280 | | 71,592 |
| Argon ST, Inc. * | 879 | | 15,884 |
| Curtiss-Wright Corp. | 2,702 | | 123,211 |
| EDO Corp. | 1,074 | | 46,225 |
| Esterline Technologies Corp. * | 1,566 | | 79,067 |
| GenCorp, Inc. * | 3,501 | | 40,052 |
| HEICO Corp. (a) | 1,590 | | 72,615 |
| Innovative Solutions & Support, Inc. * (a) | 869 | | 15,694 |
| Integral Systems, Inc. | 778 | | 18,812 |
| | | |
| Small Cap Index Fund (continued) | | |
| | Shares or | | |
| | Principal | | |
| | Amount | | Value |
|
|
| |
| COMMON STOCKS (continued) | | | |
| | | | |
| Aerospace (continued) | | | |
| Moog, Inc., Class A * | 2,310 | $ | 98,337 |
| MTC Technologies, Inc. * | 677 | | 13,513 |
| Orbital Sciences Corp., Class A * | 3,623 | | 79,561 |
| Sequa Corp., Class A * | 445 | | 73,047 |
| Teledyne Technologies, Inc. * | 2,134 | | 106,508 |
| TransDigm Group, Inc. * | 556 | | 22,601 |
| Triumph Group, Inc. | 1,003 | | 73,430 |
| Woodward Governor Company | 1,832 | | 107,593 |
| |
|
| | | | 1,057,742 |
| Agriculture - 0.15% | | | |
| Andersons, Inc. (a) | 954 | | 45,086 |
| Cadiz, Inc. * (a) | 889 | | 17,718 |
| Fresh Del Monte Produce, Inc. * | 1,750 | | 46,077 |
| Tejon Ranch Company * | 636 | | 26,318 |
| |
|
| | | | 135,199 |
| Air Freight - 0.05% | | | |
| ABX Air, Inc. * | 3,756 | | 25,766 |
| ExpressJet Holdings, Inc. * | 3,700 | | 16,132 |
| |
|
| | | | 41,898 |
| Air Travel - 0.46% | | | |
| Airtran Holdings, Inc. * | 5,567 | | 58,509 |
| Alaska Air Group, Inc. * | 2,581 | | 64,060 |
| JetBlue Airways Corp. * (a) | 10,807 | | 102,883 |
| Midwest Air Group, Inc. * (a) | 1,595 | | 25,887 |
| Pinnacle Airline Corp. * | 1,300 | | 21,307 |
| Republic Airways Holdings, Inc. * | 2,243 | | 42,707 |
| SkyWest, Inc. | 3,931 | | 98,786 |
| |
|
| | | | 414,139 |
| Aluminum - 0.13% | | | |
| Century Aluminum Company * | 1,414 | | 69,540 |
| Superior Essex, Inc. * | 1,260 | | 44,478 |
| |
|
| | | | 114,018 |
| Amusement & Theme Parks - 0.03% | | | |
| Great Wolf Resorts, Inc. * | 2,006 | | 28,686 |
| | | | |
| Apparel & Textiles - 1.66% | | | |
| Bebe Stores, Inc. (a) | 1,416 | | 19,753 |
| Brown Shoe, Inc. | 2,685 | | 61,325 |
| Carter's, Inc. * | 3,571 | | 70,492 |
| Cherokee, Inc. (a) | 528 | | 20,064 |
| Columbia Sportswear Company | 849 | | 50,872 |
| Deckers Outdoor Corp. * | 779 | | 73,374 |
| G & K Services, Class A | 1,333 | | 55,520 |
| G-III Apparel Group, Ltd. * | 794 | | 13,617 |
| Heelys, Inc. * (a) | 447 | | 4,126 |
| Iconix Brand Group, Inc. * | 3,114 | | 64,553 |
| Interface, Inc., Class A | 3,361 | | 60,632 |
| Jos. A. Bank Clothiers, Inc. * (a) | 1,109 | | 33,436 |
| Kellwood Company | 1,620 | | 31,914 |
| K-Swiss, Inc., Class A | 1,618 | | 39,026 |
| Maidenform Brands, Inc. * | 1,303 | | 22,203 |
| |
| The accompanying notes are an integral part of the financial statements. | 301 |
John Hancock Funds II
Portfolio of investments — August 31, 2007
(showing percentage of total net assets)
| | | |
| Small Cap Index Fund (continued) | | |
| | Shares or | | |
| | Principal | | |
| | Amount | | Value |
|
|
| |
| COMMON STOCKS (continued) | | | |
| | | | |
| Apparel & Textiles (continued) | | | |
| Movado Group, Inc. | 1,063 | $ | 31,359 |
| Oakley, Inc. | 1,495 | | 43,011 |
| Oxford Industries, Inc. | 958 | | 34,699 |
| Perry Ellis International, Inc. * | 761 | | 20,768 |
| Quiksilver, Inc. * | 7,576 | | 101,443 |
| Skechers United States of America, Inc., | | | |
| Class A * | 1,249 | | 24,768 |
| Stage Stores, Inc. | 2,667 | | 46,219 |
| Steven Madden, Ltd. * | 1,291 | | 31,784 |
| The Gymboree Corp. * | 1,997 | | 80,060 |
| The Warnaco Group, Inc. * | 2,832 | | 98,837 |
| Timberland Company, Class A * | 2,889 | | 58,040 |
| True Religion Apparel, Inc. * | 937 | | 15,723 |
| Under Armour, Inc., Class A * (a) | 1,509 | | 98,100 |
| Unifirst Corp. | 884 | | 36,580 |
| Volcom, Inc. * | 903 | | 35,244 |
| Weyco Group, Inc. | 585 | | 17,234 |
| Wolverine World Wide, Inc. | 3,335 | | 87,677 |
|
|
| | | | 1,482,453 |
| Auto Parts - 1.09% | | | |
| Accuride Corp. * | 1,524 | | 19,766 |
| Aftermarket Technology Corp. * | 1,361 | | 40,708 |
| American Axle & Manufacturing Holdings, Inc. | 2,704 | | 63,057 |
| Amerigon, Inc. * | 1,400 | | 22,120 |
| ArvinMeritor, Inc. | 4,330 | | 75,559 |
| Commercial Vehicle Group, Inc. * | 1,400 | | 19,908 |
| CSK Auto Corp. * | 2,706 | | 35,773 |
| Exide Technologies * | 3,764 | | 25,031 |
| Federal Signal Corp. | 2,958 | | 45,257 |
| Hayes Lemmerz International, Inc. * | 5,370 | | 24,434 |
| Keystone Automotive Industries, Inc. * | 1,011 | | 47,466 |
| Lear Corp. * | 4,649 | | 135,890 |
| LKQ Corp. * | 2,780 | | 86,124 |
| Miller Industries, Inc. * | 637 | | 11,664 |
| Modine Manufacturing Company | 2,013 | | 56,465 |
| Noble International, Ltd. | 740 | | 14,733 |
| Pep Boys - Manny, Moe & Jack | 2,562 | | 41,991 |
| Standard Motor Products, Inc. | 957 | | 9,369 |
| Superior Industries International, Inc. | 1,267 | | 25,188 |
| Tenneco, Inc. * | 2,822 | | 89,599 |
| Titan International, Inc. | 1,457 | | 42,224 |
| Visteon Corp. * | 7,932 | | 42,674 |
|
|
| | | | 975,000 |
| Auto Services - 0.15% | | | |
| Dollar Thrifty Automotive Group, Inc. * | 1,451 | | 42,775 |
| Lithia Motors, Inc., Class A | 1,023 | | 18,322 |
| Midas, Inc. * | 986 | | 19,996 |
| Monro Muffler Brake, Inc. | 809 | | 30,443 |
| RSC Holdings, Inc. * | 1,244 | | 23,089 |
|
|
| | | | 134,625 |
| | | |
| Small Cap Index Fund (continued) | | |
| | Shares or | | |
| | Principal | | |
| | Amount | | Value |
|
|
| |
| COMMON STOCKS (continued) | | | |
| | | | |
| Automobiles - 0.16% | | | |
| Asbury Automotive Group, Inc. | 1,566 | $ | 33,857 |
| Group 1 Automotive, Inc. | 1,479 | | 51,854 |
| Monaco Coach Corp. | 1,893 | | 25,347 |
| Rush Enterprises, Inc., Class A * | 1,394 | | 35,352 |
| |
|
| | | | 146,410 |
| Banking - 7.02% | | | |
| 1st Source Corp. (a) | 885 | | 20,806 |
| Alabama National BanCorporation | 1,058 | | 55,820 |
| AMCORE Financial, Inc. | 1,344 | | 35,992 |
| Americanwest BanCorp | 1,319 | | 24,744 |
| Ameris Bancorp | 1,082 | | 21,380 |
| Anchor BanCorp Wisconsin, Inc. (a) | 1,362 | | 35,875 |
| Banco Latinoamericano de Exportaciones, | | | |
| S.A. | 1,562 | | 29,319 |
| Bancorp, Inc. * | 845 | | 17,137 |
| Bank Mutual Corp. | 3,726 | | 44,190 |
| Bank of the Ozarks, Inc. | 906 | | 27,715 |
| BankAtlantic Bancorp, Inc., Class A | 2,850 | | 23,627 |
| BankFinancial Corp. | 1,830 | | 28,530 |
| BankUnited Financial Corp., Class A (a) | 2,017 | | 34,491 |
| Banner Corp. | 882 | | 28,418 |
| Berkshire Hill Bancorp, Inc. | 763 | | 22,608 |
| Boston Private Financial Holdings, Inc. (a) | 2,308 | | 62,662 |
| Brookline Bancorp, Inc. | 4,159 | | 52,029 |
| Capital City Bank Group, Inc. (a) | 882 | | 27,545 |
| Capitol Bancorp, Ltd. (a) | 936 | | 23,578 |
| Cascade Bancorp (a) | 1,298 | | 30,438 |
| Cathay General Bancorp, Inc. (a) | 3,138 | | 102,016 |
| Centennial Bank Holdings, Inc. * | 3,692 | | 24,847 |
| Central Pacific Financial Corp. | 1,925 | | 61,254 |
| Chemical Financial Corp. | 1,605 | | 40,639 |
| Chittenden Corp. | 2,809 | | 97,697 |
| Citizens Banking Corp. | 4,661 | | 82,173 |
| City Bank, Lynnwood, WA | 962 | | 29,582 |
| CoBiz, Inc. (a) | 1,224 | | 22,350 |
| Columbia Banking System, Inc. | 1,114 | | 33,988 |
| Community Bancorp - NV * | 788 | | 19,401 |
| Community Bank Systems, Inc. | 1,771 | | 35,615 |
| Community Banks, Inc. | 1,543 | | 45,302 |
| Community Trust Bancorp, Inc. | 1,024 | | 32,778 |
| Corus Bankshares, Inc. (a) | 2,419 | | 32,318 |
| CVB Financial Corp. (a) | 4,266 | | 50,808 |
| Dime Community Bancorp, Inc. | 1,966 | | 26,797 |
| Downey Financial Corp. | 1,286 | | 72,775 |
| Enterprise Financial Services Corp. (a) | 843 | | 19,018 |
| F.N.B. Corp. (a) | 3,873 | | 65,764 |
| First BanCorp Puerto Rico (a) | 5,124 | | 51,496 |
| First Bancorp (a) | 1,019 | | 19,921 |
| First Charter Corp. | 2,235 | | 66,871 |
| First Commonwealth Financial Corp. (a) | 4,739 | | 52,176 |
| First Community Bancorp | 1,575 | | 85,460 |
| First Community Bancshares, Inc. | 762 | | 25,260 |
| |
| The accompanying notes are an integral part of the financial statements. | 302 |
John Hancock Funds II
Portfolio of investments — August 31, 2007
(showing percentage of total net assets)
| | | |
| Small Cap Index Fund (continued) | | |
| | Shares or | | |
| | Principal | | |
| | Amount | | Value |
|
|
| |
| COMMON STOCKS (continued) | | | |
| | | | |
| Banking (continued) | | | |
| First Financial BanCorp. | 2,354 | $ | 31,755 |
| First Financial Bankshares, Inc. | 1,332 | | 56,344 |
| First Financial Corp. (a) | 979 | | 29,566 |
| First Financial Holdings, Inc. | 832 | | 26,499 |
| First Indiana Corp. | 849 | | 26,251 |
| First Merchants Corp. | 1,274 | | 26,996 |
| First Midwest BanCorp, Inc. | 3,031 | | 103,933 |
| First Niagara Financial Group, Inc. | 6,805 | | 96,155 |
| First Place Financial Corp. (a) | 1,294 | | 22,800 |
| First Republic Bank | 1,894 | | 103,318 |
| First State Bancorp | 1,400 | | 27,034 |
| FirstFed Financial Corp. * (a) | 1,021 | | 51,305 |
| FirstMerit Corp. | 4,931 | | 95,267 |
| Flagstar Bancorp, Inc. (a) | 2,924 | | 35,965 |
| Flushing Financial Corp. | 1,676 | | 27,520 |
| Franklin Bank Corp. * | 1,727 | | 15,871 |
| Frontier Financial Corp. (a) | 2,451 | | 60,246 |
| Glacier Bancorp, Inc. | 3,287 | | 72,183 |
| Great Southern Bancorp, Inc. (a) | 904 | | 24,408 |
| Greater Bay Bancorp | 3,111 | | 87,575 |
| Greene County Bancshares, Inc. | 627 | | 22,240 |
| Greenhill & Company, Inc. (a) | 1,142 | | 66,122 |
| Hancock Holding Company | 1,658 | | 66,320 |
| Hanmi Financial Corp. | 2,536 | | 39,257 |
| Harleysville National Corp. (a) | 1,988 | | 33,220 |
| Heritage Commerce Corp. | 863 | | 17,648 |
| Horizon Financial Corp. | 906 | | 18,809 |
| IBERIABANK Corp. | 767 | | 38,480 |
| Imperial Capital Bancorp, Inc. | 447 | | 15,466 |
| Independent Bank Corp. - MA | 981 | | 28,890 |
| Independent Bank Corp. - MI | 1,595 | | 18,677 |
| Integra Bank Corp. | 1,430 | | 27,227 |
| International Bancshares Corp. | 3,162 | | 72,789 |
| KNBT Bancorp, Inc. | 2,052 | | 30,185 |
| Lakeland Financial Corp. | 983 | | 22,894 |
| MAF Bancorp, Inc. | 2,026 | | 108,776 |
| MainSource Financial Group, Inc. (a) | 1,513 | | 26,538 |
| MB Financial, Inc. | 2,266 | | 79,786 |
| Midwest Banc Holdings, Inc. (a) | 1,421 | | 21,258 |
| Nara Bancorp, Inc. | 1,551 | | 24,568 |
| National Penn Bancshares, Inc. (a) | 3,023 | | 53,658 |
| NewAlliance Bancshares, Inc. (a) | 6,970 | | 103,923 |
| Northwest Bancorp, Inc. | 1,252 | | 36,508 |
| Old National Bancorp | 4,165 | | 66,140 |
| Old Second Bancorp, Inc. | 1,006 | | 29,918 |
| Omega Financial Corp. (a) | 969 | | 25,591 |
| Pacific Capital Bancorp (a) | 2,913 | | 73,466 |
| Park National Corp. (a) | 763 | | 69,372 |
| Partners Trust Financial Group, Inc. | 2,949 | | 35,801 |
| Peoples Bancorp, Inc. | 810 | | 21,327 |
| PFF Bancorp, Inc. | 1,364 | | 23,897 |
| Pinnacle Financial Partners, Inc. * | 1,076 | | 30,774 |
| | | |
| Small Cap Index Fund (continued) | | |
| | Shares or | | |
| | Principal | | |
| | Amount | | Value |
|
|
| |
| COMMON STOCKS (continued) | | | |
| | | | |
| Banking (continued) | | | |
| Preferred Bank, Los Angeles, CA | 673 | $ | 27,687 |
| PrivateBancorp, Inc. (a) | 1,176 | | 39,373 |
| Prosperity Bancshares, Inc. | 2,191 | | 73,990 |
| Provident Bankshares Corp. | 2,041 | | 63,067 |
| Provident Financial Services, Inc. | 4,192 | | 70,426 |
| Provident New York Bancorp | 2,486 | | 34,332 |
| Renasant Corp. (a) | 1,235 | | 24,700 |
| S & T Bancorp, Inc. | 1,592 | | 56,054 |
| S.Y. Bancorp, Inc. (a) | 895 | | 23,726 |
| Sandy Spring Bancorp, Inc. | 1,078 | | 33,774 |
| SCBT Financial Corp. | 749 | | 26,709 |
| Seacoast Banking Corp. of Florida (a) | 1,106 | | 19,388 |
| Signature Bank * | 1,826 | | 63,107 |
| Simmons First National Corp., Class A | 987 | | 26,827 |
| Southwest Bancorp, Inc. | 1,122 | | 23,943 |
| Sterling Bancorp | 1,311 | | 19,377 |
| Sterling Bancshares, Inc. | 4,643 | | 53,070 |
| Sterling Financial Corp., PA | 1,715 | | 30,030 |
| Sterling Financial Corp., Spokane | 3,213 | | 81,835 |
| Suffolk Bancorp | 717 | | 22,672 |
| Superior Bancorp * | 2,548 | | 23,951 |
| Susquehanna Bancshares, Inc. (a) | 3,246 | | 63,816 |
| SVB Financial Group * | 2,078 | | 103,401 |
| Texas Capital Bancshares, Inc. * | 1,512 | | 32,992 |
| The South Financial Group, Inc. | 4,535 | | 104,078 |
| Tierone Corp. | 1,042 | | 23,362 |
| Trico Bancshares | 1,103 | | 24,707 |
| TrustCo Bank Corp. (a) | 4,837 | | 54,078 |
| Trustmark Corp. | 3,018 | | 85,228 |
| U.S.B. Holding Company, Inc. | 833 | | 19,417 |
| UCBH Holdings, Inc. | 6,083 | | 101,099 |
| Umpqua Holdings Corp. | 3,769 | | 81,787 |
| Union Bankshares Corp. | 1,053 | | 24,430 |
| United Bankshares, Inc. | 2,394 | | 74,932 |
| United Community Banks, Inc. (a) | 2,271 | | 55,163 |
| Univest Corp. of Pennsylvania (a) | 1,019 | | 23,763 |
| Virginia Commerce Bancorp, Inc. * | 1,274 | | 18,664 |
| W Holding Company, Inc. (a) | 7,583 | | 17,744 |
| Washington Trust Bancorp, Inc. | 971 | | 25,188 |
| WesBanco, Inc. | 1,396 | | 37,315 |
| West Coast Bancorp | 1,074 | | 29,449 |
| Westamerica Bancorp (a) | 1,864 | | 90,497 |
| Western Alliance Bancorp * | 916 | | 24,604 |
| Wilshire Bancorp, Inc. | 1,241 | | 13,986 |
| Wintrust Financial Corp. | 1,505 | | 64,926 |
| Yardville National Bancorp | 753 | | 25,745 |
|
|
| | | | 6,272,135 |
| Biotechnology - 2.06% | | | |
| Acorda Therapeutics, Inc. * | 1,180 | | 21,228 |
| Affymetrix, Inc. * | 4,181 | | 94,741 |
| Alnylam Pharmaceuticals, Inc. * (a) | 1,994 | | 46,600 |
| |
| The accompanying notes are an integral part of the financial statements. | 303 |
John Hancock Funds II
Portfolio of investments — August 31, 2007
(showing percentage of total net assets)
| | | |
| Small Cap Index Fund (continued) | | |
| | Shares or | | |
| | Principal | | |
| | Amount | | Value |
|
|
| |
| COMMON STOCKS (continued) | | | |
| | | | |
| Biotechnology (continued) | | | |
| Applera Corp. - Celera Genomics Group * | 4,828 | $ | 63,585 |
| Arena Pharmaceuticals, Inc. * (a) | 3,747 | | 50,210 |
| Arqule, Inc. * | 1,895 | | 15,539 |
| Bio Reference Labs, Inc. * | 755 | | 21,895 |
| BioMimetic Therapeutics, Inc. * | 638 | | 9,615 |
| Bio-Rad Laboratories, Inc., Class A * | 1,135 | | 95,703 |
| Cytokinetics, Inc. * | 2,261 | | 11,034 |
| Discovery Laboratories, Inc. * | 5,998 | | 13,855 |
| Exelixis, Inc. * | 5,942 | | 66,847 |
| Genomic Health, Inc. * (a) | 908 | | 18,451 |
| Genvec, Inc. * | 3,823 | | 8,984 |
| Geron Corp. * (a) | 4,492 | | 32,297 |
| GTx, Inc. * | 1,112 | | 17,792 |
| Human Genome Sciences, Inc. * (a) | 8,226 | | 75,761 |
| Illumina, Inc. * (a) | 3,267 | | 157,763 |
| Immucor, Inc. * | 4,191 | | 139,770 |
| Integra LifeSciences Holdings Corp. * (a) | 1,093 | | 53,087 |
| Intermune, Inc. * (a) | 1,666 | | 32,937 |
| Keryx Biopharmaceuticals, Inc. * | 2,744 | | 27,605 |
| Kosan Biosciences, Inc. * | 2,523 | | 13,120 |
| Martek Biosciences Corp. * (a) | 1,976 | | 53,392 |
| Medarex, Inc. * (a) | 7,687 | | 131,832 |
| Medivation, Inc. * | 1,340 | | 23,410 |
| MGI Pharma, Inc. * | 4,873 | | 114,857 |
| Momenta Pharmaceuticals, Inc. * (a) | 1,541 | | 16,335 |
| Myriad Genetics, Inc. * | 2,630 | | 115,615 |
| Nabi Biopharmaceuticals * (a) | 4,114 | | 14,564 |
| Nektar Therapeutics * | 5,619 | | 46,413 |
| Neurocrine Biosciences, Inc. * (a) | 2,124 | | 21,176 |
| Orexigen Therapeutics Inc * (a) | 474 | | 6,977 |
| Osiris Therapeutics, Inc. * (a) | 740 | | 9,590 |
| Pharmanet Development Group, Inc. * | 1,155 | | 33,264 |
| PRA International * | 1,239 | | 36,117 |
| Progenics Pharmaceuticals, Inc. * | 1,441 | | 33,244 |
| Protalix BioTherapeutics, Inc. * | 1,974 | | 51,324 |
| Regeneration Technologies, Inc. * | 1,987 | | 21,519 |
| Telik, Inc. * (a) | 3,622 | | 10,431 |
| Tercica, Inc. * (a) | 1,983 | | 13,127 |
|
|
| | | | 1,841,606 |
| Broadcasting - 0.61% | | | |
| Acacia Research - Acacia Technologies * | 1,827 | | 27,369 |
| Belo Corp., Class A | 5,095 | | 87,838 |
| Citadel Broadcasting Corp. | 11,240 | | 45,747 |
| CKX, Inc. * | 2,314 | | 28,323 |
| Cox Radio, Inc., Class A * | 2,117 | | 29,172 |
| Cumulus Media, Inc., Class A * (a) | 1,856 | | 19,859 |
| Emmis Communications Corp., Class A * | 2,245 | | 14,301 |
| Entercom Communications Corp. | 2,010 | | 42,813 |
| Entravision Communications Corp., Class A * | 4,288 | | 38,635 |
| Fisher Communications, Inc. * | 415 | | 20,289 |
| Gray Television, Inc. | 2,711 | | 24,263 |
| | | |
| Small Cap Index Fund (continued) | | |
| | Shares or | | |
| | Principal | | |
| | Amount | | Value |
|
|
| |
| COMMON STOCKS (continued) | | | |
| | | | |
| Broadcasting (continued) | | | |
| Journal Communications, Inc. | 2,941 | $ | 30,498 |
| Mediacom Communications Corp., Class A * | 3,091 | | 26,428 |
| Nexstar Broadcasting Group, Inc. * | 654 | | 6,390 |
| Radio One, Inc., Class D * | 4,379 | | 17,122 |
| Sinclair Broadcast Group, Inc., Class A (a) | 3,046 | | 37,953 |
| Spanish Broadcasting System, Inc., Class A * | 2,465 | | 7,001 |
| Westwood One, Inc. | 4,552 | | 13,155 |
| World Wrestling Entertainment, Inc., Class A | 1,565 | | 23,710 |
|
|
| | | | 540,866 |
| Building Materials & Construction - 0.84% | | | |
| Apogee Enterprises, Inc. | 1,782 | | 44,853 |
| Beacon Roofing Supply, Inc. * (a) | 2,755 | | 32,096 |
| Builders FirstSource, Inc. * | 1,108 | | 14,515 |
| Dycom Industries, Inc. * | 2,503 | | 73,914 |
| EMCOR Group, Inc. * | 3,876 | | 121,513 |
| Granite Construction, Inc. | 2,192 | | 119,332 |
| Griffon Corp. * | 1,852 | | 29,002 |
| Home Solutions of America, Inc. * (a) | 2,251 | | 6,865 |
| Interline Brands, Inc. * | 1,704 | | 41,305 |
| LSI Industries, Inc. | 1,170 | | 23,728 |
| NCI Building Systems, Inc. * (a) | 1,239 | | 57,477 |
| Perini Corp. * | 1,629 | | 92,201 |
| Trex Company, Inc. * (a) | 752 | | 10,099 |
| U.S. Concrete, Inc. * | 2,341 | | 18,611 |
| WCI Communities, Inc. * (a) | 1,703 | | 15,872 |
| Williams Scotsman International, Inc. * | 1,855 | | 50,660 |
|
|
| | | | 752,043 |
| Business Services - 4.59% | | | |
| ABM Industries, Inc. | 2,650 | | 61,957 |
| Administaff, Inc. | 1,427 | | 49,232 |
| AMERCO, Inc. * (a) | 654 | | 41,228 |
| Arbitron, Inc. | 1,813 | | 90,342 |
| Barrett Business Services, Inc. | 522 | | 12,726 |
| BearingPoint, Inc. * | 12,288 | | 72,131 |
| Black Box Corp. | 1,075 | | 44,021 |
| Bowne & Company, Inc. | 1,723 | | 29,205 |
| Bright Horizons Family Solutions, Inc. * | 1,608 | | 63,789 |
| Catalina Marketing Corp. * | 2,177 | | 67,966 |
| CDI Corp. | 817 | | 23,366 |
| Coinstar, Inc. * | 1,720 | | 56,210 |
| Compass Diversified Trust | 1,408 | | 19,839 |
| Compucredit Corp. * | 1,260 | | 26,737 |
| COMSYS IT Partners, Inc. * | 1,147 | | 21,804 |
| Core-Mark Holding Company, Inc. * | 667 | | 22,505 |
| Cornell Corrections, Inc. * | 728 | | 17,538 |
| CoStar Group, Inc. * | 1,179 | | 64,880 |
| CRA International, Inc. * | 675 | | 33,521 |
| CSG Systems International, Inc. * | 2,655 | | 61,384 |
| Deluxe Corp. | 3,154 | | 119,915 |
| DG Fastchannel, Inc. * | 907 | | 18,267 |
| |
| The accompanying notes are an integral part of the financial statements. | 304 |
John Hancock Funds II
Portfolio of investments — August 31, 2007
(showing percentage of total net assets)
| | | |
| Small Cap Index Fund (continued) | | |
| | Shares or | | |
| | Principal | | |
| | Amount | | Value |
|
|
| |
| COMMON STOCKS (continued) | | | |
| | | | |
| Business Services (continued) | | | |
| Diamond Management & Technology | | | |
| Consultants, Inc. | 1,784 | $ | 17,965 |
| eFunds Corp. * | 2,873 | | 104,232 |
| Electro Rent Corp. * | 1,218 | | 17,698 |
| Ennis Business Forms, Inc. | 1,608 | | 34,974 |
| Euronet Worldwide, Inc. * (a) | 2,801 | | 75,851 |
| Exponent, Inc. * | 1,043 | | 25,408 |
| EZCORP, Inc., Class A * | 2,099 | | 25,545 |
| Forrester Research, Inc. * | 967 | | 24,571 |
| FTI Consulting, Inc. * | 2,590 | | 136,027 |
| Gartner Group, Inc., Class A * | 4,200 | | 92,862 |
| Gevity HR, Inc. | 1,547 | | 17,821 |
| Global Cash Access, Inc. * | 2,778 | | 30,836 |
| Global Sources Ltd. * (a) | 998 | | 19,241 |
| GSI Commerce, Inc. * (a) | 1,223 | | 28,141 |
| Healthcare Services Group, Inc. | 2,580 | | 55,264 |
| Heidrick & Struggles International, Inc. * | 1,103 | | 51,676 |
| Hudson Highland Group, Inc. * | 1,411 | | 19,782 |
| Huron Consulting Group, Inc. * | 1,138 | | 75,165 |
| Infocrossing, Inc. * (a) | 1,448 | | 26,875 |
| Informatica Corp. * | 5,356 | | 74,770 |
| Insight Enterprises, Inc. * | 2,960 | | 70,211 |
| Intervoice Brite, Inc. * | 2,084 | | 16,693 |
| Jackson Hewitt Tax Service, Inc. | 1,987 | | 57,365 |
| Kelly Services, Inc., Class A | 1,448 | | 32,899 |
| Kendle International, Inc. * | 791 | | 30,976 |
| Kenexa Corp. * | 1,546 | | 42,963 |
| Kforce, Inc. * | 2,020 | | 30,744 |
| Korn/Ferry International * | 2,610 | | 57,968 |
| Labor Ready, Inc. * | 2,831 | | 59,111 |
| LECG Corp. * | 1,674 | | 25,679 |
| MAXIMUS, Inc. | 1,330 | | 56,897 |
| McGrath Rentcorp | 1,560 | | 49,967 |
| MPS Group, Inc. * | 6,250 | | 86,000 |
| Navigant Consulting Company * (a) | 3,551 | | 62,675 |
| Net 1 UEPS Technologies, Inc. * | 2,574 | | 63,604 |
| On Assignment, Inc. * | 2,287 | | 24,196 |
| Perot Systems Corp., Class A * | 5,299 | | 82,823 |
| PHH Corp. * | 3,265 | | 87,926 |
| Pre-Paid Legal Services, Inc. * | 549 | | 30,299 |
| Quest Software, Inc. * | 4,175 | | 60,788 |
| Resource America, Inc. | 837 | | 12,756 |
| Resources Connection, Inc. * | 2,987 | | 89,610 |
| Rollins, Inc. | 1,737 | | 46,135 |
| SAIC, Inc. * | 5,998 | | 109,823 |
| ScanSource, Inc. * | 1,596 | | 44,209 |
| Seachange International, Inc. * | 1,836 | | 13,366 |
| SonicWALL, Inc. * | 3,978 | | 34,131 |
| Sotheby's | 4,018 | | 173,899 |
| Source Interlink Companies * | 2,373 | | 9,872 |
| Spherion Corp. * | 3,518 | | 31,099 |
| SRA International, Inc., Class A * | 2,517 | | 71,005 |
| | | |
| Small Cap Index Fund (continued) | | |
| | Shares or | | |
| | Principal | | |
| | Amount | | Value |
|
|
| |
| COMMON STOCKS (continued) | | | |
| | | | |
| Business Services (continued) | | | |
| SYNNEX Corp. * | 1,037 | $ | 20,657 |
| Syntel, Inc. | 776 | | 26,826 |
| TeleTech Holdings, Inc. * | 2,547 | | 74,500 |
| Tetra Tech, Inc. * | 3,554 | | 69,658 |
| Tyler Technologies, Inc. * | 2,505 | | 37,149 |
| Viad Corp. | 1,291 | | 46,153 |
| Volt Information Sciences, Inc. * | 950 | | 14,298 |
| Watson Wyatt Worldwide, Inc., Class A | 2,592 | | 122,628 |
| Wind River Systems, Inc. * | 4,613 | | 48,667 |
|
|
| | | | 4,099,492 |
| Cable & Television - 0.54% | | | |
| Charter Communications, Inc., Class A * (a) | 24,933 | | 69,314 |
| Gemstar-TV Guide International, Inc. * | 15,267 | | 93,129 |
| Houston Wire & Cable Company (a) | 946 | | 17,473 |
| Knology Inc * | 1,455 | | 22,989 |
| Lin TV Corp. * | 1,523 | | 20,301 |
| LodgeNet Entertainment Corp. * (a) | 1,400 | | 36,680 |
| Time Warner Telecom, Inc., Class A * | 8,803 | | 193,226 |
| TiVo, Inc. * (a) | 6,020 | | 33,892 |
|
|
| | | | 487,004 |
| Cellular Communications - 0.42% | | | |
| Brightpoint, Inc. * | 3,095 | | 36,057 |
| Dobson Communications Corp., Class A * | 8,910 | | 112,533 |
| iPCS, Inc. * | 955 | | 32,355 |
| Novatel Wireless, Inc. * | 1,855 | | 42,368 |
| RF Micro Devices, Inc. * | 11,820 | | 70,329 |
| Rural Cellular Corp., Class A * | 760 | | 32,650 |
| Syniverse Holdings, Inc. * | 1,716 | | 24,247 |
| USA Mobility, Inc. | 1,420 | | 26,199 |
|
|
| | | | 376,738 |
| Chemicals - 2.13% | | | |
| A. Schulman, Inc. | 1,682 | | 36,230 |
| Albany Molecular Research, Inc. * | 1,641 | | 23,991 |
| American Vanguard Corp. (a) | 1,285 | | 20,123 |
| Arch Chemicals, Inc. | 1,490 | | 64,547 |
| Balchem Corp. | 1,252 | | 25,716 |
| Cabot Microelectronics Corp. * (a) | 1,450 | | 60,494 |
| Calgon Carbon Corp. * (a) | 2,261 | | 30,184 |
| Cambrex Corp. | 1,858 | | 23,169 |
| CF Industries Holdings, Inc. | 3,369 | | 213,359 |
| Ferro Corp. | 2,643 | | 51,724 |
| Georgia Gulf Corp. (a) | 2,123 | | 31,781 |
| H.B. Fuller Company | 3,680 | | 99,029 |
| Hercules, Inc. * | 7,083 | | 147,468 |
| Innophos Holdings, Inc. | 1,479 | | 21,786 |
| Innospec, Inc. | 1,484 | | 36,863 |
| Landec Corp. * | 1,541 | | 20,803 |
| LSB Industries, Inc. * (a) | 987 | | 21,734 |
| Metabolix, Inc. * | 930 | | 20,693 |
| Minerals Technologies, Inc. | 1,154 | | 76,060 |
| Newmarket Corp. | 936 | | 43,721 |
| |
| The accompanying notes are an integral part of the financial statements. | 305 |
John Hancock Funds II
Portfolio of investments — August 31, 2007
(showing percentage of total net assets)
| | | |
| Small Cap Index Fund (continued) | | |
| | Shares or | | |
| | Principal | | |
| | Amount | | Value |
|
|
| |
| COMMON STOCKS (continued) | | | |
| | | | |
| Chemicals (continued) | | | |
| Olin Corp. | 4,467 | $ | 95,772 |
| OM Group, Inc. * | 1,813 | | 89,562 |
| Pioneer Companies, Inc. * | 757 | | 26,503 |
| PolyOne Corp. * | 5,739 | | 46,084 |
| Rockwood Holdings, Inc. * | 2,129 | | 68,234 |
| Sensient Technologies Corp. | 2,938 | | 79,590 |
| ShengdaTech, Inc. * (a) | 1,916 | | 9,561 |
| Terra Industries, Inc. * | 5,650 | | 146,731 |
| Tronox, Inc. | 2,607 | | 26,279 |
| UAP Holding Corp. | 3,143 | | 94,007 |
| W. R. Grace & Company * | 4,271 | | 95,414 |
| Zoltek Companies, Inc. * (a) | 1,327 | | 54,792 |
|
|
| | | | 1,902,004 |
| Coal - 0.12% | | | |
| Alpha Natural Resources, Inc. * | 3,989 | | 77,028 |
| International Coal Group, Inc. * (a) | 7,802 | | 31,598 |
|
|
| | | | 108,626 |
| Colleges & Universities - 0.08% | | | |
| Corinthian Colleges, Inc. * | 5,286 | | 74,321 |
| | | | |
| Commercial Services - 0.76% | | | |
| CBIZ, Inc. * | 3,270 | | 24,525 |
| Cenveo, Inc. * | 3,271 | | 64,177 |
| Chemed Corp. | 1,537 | | 95,356 |
| Coinmach Service Corp. | 1,898 | | 24,313 |
| DynCorp International, Inc. * | 1,530 | | 32,956 |
| Exlservice Holdings, Inc. * | 1,428 | | 27,132 |
| HMS Holdings Corp. * | 1,337 | | 31,486 |
| Live Nation, Inc. * | 3,970 | | 82,179 |
| Morningstar, Inc. * | 735 | | 47,422 |
| Odyssey Marine Exploration, Inc. * (a) | 2,850 | | 17,499 |
| PeopleSupport, Inc. * | 1,613 | | 20,292 |
| Perficient, Inc. * | 1,794 | | 41,836 |
| Providence Service Corp. * | 753 | | 22,635 |
| Team, Inc. * | 1,064 | | 24,962 |
| TNS, Inc. * | 1,473 | | 21,992 |
| Waste Services, Inc. * (a) | 1,194 | | 11,773 |
| Wright Express Corp. * | 2,436 | | 89,864 |
|
|
| | | | 680,399 |
| Computers & Business Equipment - 3.04% | | | |
| 3Com Corp. * | 23,757 | | 89,089 |
| 3D Systems Corp. * (a) | 1,004 | | 20,120 |
| Acme Packet, Inc. * (a) | 1,461 | | 21,886 |
| Agilysys, Inc. | 1,900 | | 32,414 |
| Avanex Corp. * (a) | 12,384 | | 21,301 |
| Avocent Corp. * | 3,085 | | 91,069 |
| Benchmark Electronics, Inc. * | 4,393 | | 110,176 |
| BigBand Networks, Inc. * | 685 | | 6,919 |
| Blue Coat Systems, Inc. * | 778 | | 64,893 |
| CACI International, Inc., Class A * | 1,867 | | 95,254 |
| Cogent, Inc. * | 2,657 | | 38,128 |
| Cray, Inc. * | 2,240 | | 15,814 |
| | | |
| Small Cap Index Fund (continued) | | |
| | Shares or | | |
| | Principal | | |
| | Amount | | Value |
|
|
| |
| COMMON STOCKS (continued) | | | |
| | | | |
| Computers & Business Equipment | | | |
| (continued) | | | |
| Digi International, Inc. * | 1,687 | $ | 23,871 |
| Echelon Corp. * (a) | 1,845 | | 51,642 |
| Electronics for Imaging, Inc. * | 3,471 | | 90,524 |
| EMS Technologies, Inc. * | 1,045 | | 25,644 |
| Extreme Networks, Inc. * | 6,755 | | 23,372 |
| Falconstor Software, Inc. * (a) | 1,920 | | 21,043 |
| Foundry Networks, Inc. * | 8,866 | | 163,932 |
| Gateway, Inc. * | 18,954 | | 34,875 |
| Gerber Scientific, Inc. * | 1,633 | | 16,706 |
| Hurco Companies, Inc. * | 381 | | 18,844 |
| Hypercom Corp. * | 3,461 | | 16,855 |
| IHS, Inc., Class A * | 1,910 | | 96,398 |
| Immersion Corp. * | 1,675 | | 25,108 |
| InPhonic, Inc. * (a) | 1,844 | | 6,159 |
| Intermec, Inc. * (a) | 3,695 | | 90,712 |
| Internap Network Services Corp. * (a) | 2,998 | | 42,062 |
| Ixia * | 2,457 | | 22,359 |
| Jack Henry & Associates, Inc. | 4,787 | | 125,611 |
| Komag, Inc. * | 1,696 | | 54,509 |
| L-1 Identity Solutions, Inc. * | 3,607 | | 59,335 |
| Liveperson, Inc. * | 2,193 | | 12,632 |
| Micros Systems, Inc. * | 2,466 | | 148,798 |
| MTS Systems Corp. | 1,092 | | 45,995 |
| Ness Technologies, Inc. * | 1,947 | | 21,670 |
| NETGEAR, Inc. * | 2,113 | | 59,291 |
| Palm, Inc. * (a) | 6,292 | | 94,443 |
| Parametric Technology Corp. * | 6,999 | | 123,252 |
| Plexus Corp. * | 2,830 | | 67,269 |
| Quantum Corp. * | 12,180 | | 39,098 |
| Rackable Systems, Inc. * (a) | 1,832 | | 25,135 |
| Radiant Systems, Inc. * | 1,736 | | 26,127 |
| RadiSys Corp. * | 1,517 | | 16,581 |
| Rimage Corp. * | 641 | | 16,115 |
| SI International, Inc. * | 842 | | 25,950 |
| Sigma Designs, Inc. * (a) | 1,400 | | 59,234 |
| Silicon Graphics, Inc. * (a) | 418 | | 10,191 |
| Silicon Storage Technology, Inc. * | 5,873 | | 18,324 |
| Smart Modular Technologies (WWH), Inc. * | 3,074 | | 33,660 |
| Sonic Solutions * (a) | 1,565 | | 11,894 |
| Standard Microsystems Corp. * | 1,403 | | 50,480 |
| STEC, Inc. * (a) | 2,182 | | 16,430 |
| Stratasys, Inc. * (a) | 1,164 | | 29,275 |
| Sykes Enterprises, Inc. * | 2,032 | | 33,508 |
| Synaptics, Inc. * | 1,567 | | 67,851 |
| Trident Microsystems, Inc. * | 3,461 | | 50,981 |
|
|
| | | | 2,720,808 |
| Construction & Mining Equipment - 0.64% | | | |
| A.S.V., Inc. * (a) | 1,275 | | 18,105 |
| Astec Industries, Inc. * | 1,146 | | 57,965 |
| Bucyrus International, Inc., Class A | 2,264 | | 141,477 |
| Carbo Ceramics, Inc. (a) | 1,254 | | 58,687 |
| |
| The accompanying notes are an integral part of the financial statements. | 306 |
John Hancock Funds II
Portfolio of investments — August 31, 2007
(showing percentage of total net assets)
| | | |
| Small Cap Index Fund (continued) | | |
| | Shares or | | |
| | Principal | | |
| | Amount | | Value |
|
|
| |
| COMMON STOCKS (continued) | | | |
| Construction & Mining Equipment | | | |
| (continued) | | | |
| Gulf Islands Fabrication, Inc. | 714 | $ | 25,404 |
| Kaman Corp., Class A | 1,510 | | 49,694 |
| Layne Christensen Company * | 861 | | 42,508 |
| Matrix Service Company * | 1,501 | | 28,399 |
| Washington Group International, Inc. * | 1,775 | | 150,342 |
|
|
| | | | 572,581 |
| Construction Materials - 0.52% | | | |
| Ameron International Corp. | 559 | | 53,384 |
| Applied Industrial Technologies, Inc. | 2,622 | | 83,852 |
| Clarcor, Inc. | 3,116 | | 120,652 |
| Columbus McKinnon Corp. * | 1,159 | | 31,490 |
| Comfort Systems USA, Inc. | 2,580 | | 37,539 |
| Simpson Manufacturing Company, Inc. | 2,238 | | 73,854 |
| Standex International Corp. | 915 | | 22,902 |
| Universal Forest Products, Inc. | 1,017 | | 37,924 |
|
|
| | | | 461,597 |
| Containers & Glass - 0.33% | | | |
| Graphic Packaging Corp. * | 4,361 | | 20,758 |
| Greif, Inc., Class A | 1,996 | | 116,207 |
| Mobile Mini, Inc. * | 2,207 | | 53,432 |
| Silgan Holdings, Inc. | 1,512 | | 77,248 |
| TAL International Group, Inc. | 937 | | 23,500 |
|
|
| | | | 291,145 |
| Correctional Facilities - 0.10% | | | |
| The Geo Group, Inc. * | 3,071 | | 91,424 |
| | | | |
| Cosmetics & Toiletries - 0.42% | | | |
| Chattem, Inc. * (a) | 1,038 | | 64,055 |
| Elizabeth Arden, Inc. * | 1,542 | | 37,933 |
| Helen of Troy, Ltd. * | 1,867 | | 42,287 |
| Intermediate Parfums, Inc. | 642 | | 13,328 |
| Nu Skin Enterprises, Inc., Class A | 3,119 | | 48,532 |
| Playtex Products, Inc. * | 3,486 | | 63,445 |
| Revlon, Inc., Class A * | 11,326 | | 13,025 |
| Sally Beauty Holdings, Inc. * | 5,698 | | 48,547 |
| Steiner Leisure, Ltd. * | 1,054 | | 45,596 |
|
|
| | | | 376,748 |
| Crude Petroleum & Natural Gas - 1.02% | | | |
| Allis-Chalmers Energy, Inc. * (a) | 1,536 | | 30,597 |
| Arena Resources, Inc. * | 820 | | 50,315 |
| Bill Barrett Corp. * (a) | 1,891 | | 66,639 |
| Bois d'Arc Energy, Inc. * | 1,193 | | 21,426 |
| Carrizo Oil & Gas, Inc. * (a) | 1,395 | | 54,782 |
| Contango Oil & Gas Company * (a) | 743 | | 27,194 |
| Edge Petroleum Corp. * (a) | 1,841 | | 24,043 |
| EXCO Resources, Inc. * | 3,797 | | 63,790 |
| FX Energy, Inc. * (a) | 2,442 | | 15,336 |
| Geokinetics, Inc. * | 537 | | 11,406 |
| GMX Resources, Inc. * (a) | 736 | | 22,419 |
| Goodrich Petroleum Corp. * (a) | 958 | | 28,366 |
| | | |
| Small Cap Index Fund (continued) | | |
| | Shares or | | |
| | Principal | | |
| | Amount | | Value |
|
|
| |
| COMMON STOCKS (continued) | | | |
| | | | |
| Crude Petroleum & Natural Gas | | | |
| (continued) | | | |
| Gulfport Energy Corp. * | 1,128 | $ | 20,315 |
| Harvest Natural Resources, Inc. * | 2,447 | | 28,043 |
| MarkWest Hydrocarbon, Inc. | 417 | | 20,971 |
| Oilsands Quest, Inc. * (a) | 6,128 | | 30,885 |
| Parallel Petroleum Corp. * | 2,341 | | 41,412 |
| Penn Virginia Corp. | 2,305 | | 91,993 |
| Petroquest Energy, Inc. * | 2,588 | | 28,882 |
| SulphCo, Inc. * (a) | 2,597 | | 17,789 |
| Swift Energy Company * | 1,829 | | 68,075 |
| Toreador Resources Corp. * | 1,089 | | 11,228 |
| TXCO Resources, Inc. * | 2,225 | | 21,671 |
| Vaalco Energy, Inc. * | 3,996 | | 15,664 |
| Venoco, Inc. * | 803 | | 12,904 |
| Whiting Petroleum Corp. * | 2,260 | | 83,982 |
|
|
| | | | 910,127 |
| Domestic Oil - 0.92% | | | |
| Atlas America, Inc. | 1,415 | | 71,981 |
| Berry Petroleum Company, Class A | 2,418 | | 82,405 |
| Brigham Exploration Company * | 3,373 | | 17,034 |
| Comstock Resources, Inc. * | 2,726 | | 75,047 |
| Delta Petroleum Corp. * (a) | 4,035 | | 59,758 |
| Encore Aquisition Company * | 3,252 | | 90,373 |
| Energy Partners, Ltd. * | 1,582 | | 21,626 |
| EnergySouth, Inc. (a) | 464 | | 22,360 |
| Mariner Energy, Inc. * | 5,333 | | 111,833 |
| McMoran Exploration Company * (a) | 1,293 | | 17,572 |
| Meridian Resource Corp. * | 6,322 | | 14,667 |
| Oil States International, Inc. * | 3,003 | | 126,727 |
| Stone Energy Corp. * | 1,732 | | 57,069 |
| Union Drilling, Inc. * | 1,040 | | 14,976 |
| Warren Resources, Inc. * | 3,389 | | 40,058 |
|
|
| | | | 823,486 |
| Drugs & Health Care - 1.82% | | | |
| 1 800 Contacts * | 516 | | 12,384 |
| Abaxis, Inc. * | 1,330 | | 25,855 |
| Abiomed, Inc. * (a) | 1,918 | | 23,611 |
| Acadia Pharmaceuticals, Inc. * (a) | 1,918 | | 27,600 |
| Alpharma Inc., Class A | 2,644 | | 60,548 |
| Ariad Pharmaceuticals, Inc. * (a) | 4,470 | | 22,216 |
| Arrow International, Inc. | 1,535 | | 69,275 |
| Bioenvision, Inc. * | 3,572 | | 19,682 |
| BioMarin Pharmaceutical, Inc. * | 5,851 | | 125,680 |
| Cell Genesys, Inc. * | 4,653 | | 17,588 |
| CV Therapeutics, Inc. * (a) | 3,644 | | 35,201 |
| Datascope Corp. | 822 | | 27,422 |
| Dendreon Corp. * (a) | 5,122 | | 40,720 |
| Durect Corp. * (a) | 4,646 | | 23,555 |
| Gentiva Health Services, Inc. * | 1,723 | | 35,735 |
| Hansen Medical, Inc. * (a) | 558 | | 13,537 |
| I-Flow Corp. * (a) | 1,230 | | 22,103 |
| |
| The accompanying notes are an integral part of the financial statements. | 307 |
John Hancock Funds II
Portfolio of investments — August 31, 2007
(showing percentage of total net assets)
| | | |
| Small Cap Index Fund (continued) | | |
| | Shares or | | |
| | Principal | | |
| | Amount | | Value |
|
|
| |
| COMMON STOCKS (continued) | | | |
| | | | |
| Drugs & Health Care (continued) | | | |
| Immunomedics, Inc. * | 4,069 | $ | 8,504 |
| Invacare Corp. | 1,786 | | 41,382 |
| K-V Pharmaceutical Company, Class A * | 2,162 | | 59,088 |
| Landauer, Inc. | 609 | | 30,870 |
| Luminex Corp. * (a) | 2,046 | | 28,992 |
| Mannatech, Inc. (a) | 1,095 | | 9,023 |
| Matria Healthcare, Inc. * | 1,314 | | 33,454 |
| Maxygen, Inc. * | 1,564 | | 13,951 |
| Medical Action, Inc. * | 978 | | 22,191 |
| Mentor Corp. (a) | 2,402 | | 107,105 |
| Meridian Bioscience, Inc. | 2,438 | | 62,900 |
| Molina Healthcare, Inc. * | 826 | | 28,125 |
| Neurogen Corp. * | 1,919 | | 9,480 |
| OraSure Technologies, Inc. * | 3,016 | | 27,747 |
| Pain Therapeutics, Inc. * (a) | 2,388 | | 22,399 |
| Parexel International Corp. * | 1,700 | | 73,117 |
| Perrigo Company | 4,707 | | 97,482 |
| Quidel Corp. * | 1,771 | | 30,072 |
| Res-Care, Inc. * | 1,520 | | 32,406 |
| Savient Pharmaceuticals, Inc. * | 3,269 | | 43,085 |
| Seattle Genetics, Inc. * | 2,329 | | 23,896 |
| Vital Signs, Inc. | 673 | | 33,744 |
| Vivus, Inc. * (a) | 3,867 | | 20,998 |
| West Pharmaceutical Services, Inc. | 2,004 | | 80,260 |
| XenoPort, Inc. * | 1,319 | | 54,778 |
| Zymogenetics, Inc. * (a) | 2,430 | | 29,354 |
|
|
| | | | 1,627,115 |
| Educational Services - 0.43% | | | |
| Capella Education Co. * | 663 | | 33,422 |
| DeVry, Inc. | 3,644 | | 125,827 |
| INVESTools, Inc. * | 3,223 | | 38,966 |
| Leapfrog Enterprises, Inc., Class A * (a) | 2,260 | | 16,250 |
| Strayer Education, Inc. | 883 | | 140,909 |
| Universal Technical Institute, Inc. * (a) | 1,451 | | 26,147 |
|
|
| | | | 381,521 |
| Electrical Equipment - 1.66% | | | |
| A.O. Smith Corp. | 1,251 | | 60,298 |
| Aaon, Inc. | 879 | | 18,406 |
| American Science & Engineering, Inc. (a) | 515 | | 37,209 |
| Anaren, Inc. * | 1,177 | | 16,584 |
| Anixter International, Inc. * | 1,858 | | 142,639 |
| AZZ, Inc. * | 734 | | 20,846 |
| Baldor Electric Company | 2,775 | | 115,551 |
| Cohu, Inc. | 1,446 | | 28,616 |
| Coleman Cable, Inc. * | 493 | | 7,104 |
| DTS, Inc. * | 1,182 | | 30,898 |
| Encore Wire Corp. | 1,433 | | 37,258 |
| Excel Technology, Inc. * | 878 | | 23,899 |
| FLIR Systems, Inc. * | 4,029 | | 198,388 |
| Genlyte Group, Inc. * | 1,741 | | 126,344 |
| GrafTech International, Ltd. * | 6,058 | | 101,714 |
| | | |
| Small Cap Index Fund (continued) | | |
| | Shares or | | |
| | Principal | | |
| | Amount | | Value |
|
|
| |
| COMMON STOCKS (continued) | | | |
| | | | |
| Electrical Equipment (continued) | | | |
| Greatbatch, Inc. * | 1,358 | $ | 40,740 |
| Lamson & Sessions Company * (a) | 926 | | 24,502 |
| Littelfuse, Inc. * | 1,364 | | 45,558 |
| Methode Electronics, Inc. | 2,269 | | 32,764 |
| Powell Industries, Inc. * | 572 | | 19,173 |
| Power-One, Inc. * (a) | 4,420 | | 19,271 |
| Universal Electronics, Inc. * | 900 | | 26,100 |
| Varian, Inc. * | 1,863 | | 111,817 |
| Vicor Corp. (a) | 1,259 | | 14,844 |
| W.H. Brady Company, Class A | 3,065 | | 119,320 |
| Watsco, Inc. (a) | 1,382 | | 66,502 |
|
|
| | | | 1,486,345 |
| Electrical Utilities - 1.53% | | | |
| Allete, Inc. | 1,560 | | 65,692 |
| Avista Corp. | 3,244 | | 63,485 |
| Black Hills Corp. | 2,298 | | 94,655 |
| Central Vermont Public Service Corp. (a) | 690 | | 24,909 |
| CH Energy Group, Inc. | 1,013 | | 47,885 |
| Cleco Corp. | 3,627 | | 83,566 |
| El Paso Electric Company * | 2,806 | | 62,630 |
| Empire District Electric Company | 1,954 | | 44,805 |
| IDACORP, Inc. (a) | 2,661 | | 86,403 |
| ITC Holdings Corp. | 2,588 | | 115,114 |
| MGE Energy, Inc. | 1,373 | | 45,227 |
| NorthWestern Corp. | 2,220 | | 59,585 |
| Otter Tail Corp. (a) | 1,851 | | 67,562 |
| Pike Electric Corp. * | 1,166 | | 22,037 |
| PNM Resources, Inc. | 4,633 | | 107,115 |
| Portland General Electric Company | 1,831 | | 48,686 |
| Quanta Services, Inc. * | 3,029 | | 85,640 |
| UIL Holding Corp. | 1,557 | | 48,251 |
| Unisource Energy Corp. | 2,154 | | 63,801 |
| Westar Energy, Inc. | 5,377 | | 130,607 |
|
|
| | | | 1,367,655 |
| Electronics - 2.00% | | | |
| Adaptec, Inc. * | 6,705 | | 25,010 |
| Anadigics, Inc. * (a) | 3,587 | | 59,042 |
| Analogic Corp. | 849 | | 58,632 |
| Bel Fuse, Inc., Class B | 774 | | 24,381 |
| Belden, Inc. | 2,735 | | 132,948 |
| Checkpoint Systems, Inc. * | 2,414 | | 67,230 |
| Comtech Group, Inc. * | 1,269 | | 21,471 |
| CTS Corp. | 2,251 | | 29,240 |
| Cubic Corp. | 886 | | 35,024 |
| Cynosure, Inc. * | 518 | | 16,255 |
| Daktronics, Inc. | 1,947 | | 53,542 |
| Electro Scientific Industries, Inc. * | 1,821 | | 43,139 |
| Enersys * | 1,198 | | 21,636 |
| FEI Company * | 2,166 | | 60,713 |
| Franklin Electric, Inc. (a) | 1,187 | | 48,999 |
| Hutchinson Technology, Inc. * (a) | 1,629 | | 37,483 |
| |
| The accompanying notes are an integral part of the financial statements. | 308 |
John Hancock Funds II
Portfolio of investments — August 31, 2007
(showing percentage of total net assets)
| | | |
| Small Cap Index Fund (continued) | | |
| | Shares or | | |
| | Principal | | |
| | Amount | | Value |
|
|
| |
| COMMON STOCKS (continued) | | | |
| | | | |
| Electronics (continued) | | | |
| II-VI, Inc. * | 1,458 | $ | 45,490 |
| Imation Corp. | 2,148 | | 62,485 |
| Integrated Electrical Services, Inc. * | 806 | | 18,828 |
| IPG Photonics Corp. * | 660 | | 12,190 |
| Itron, Inc. * (a) | 1,822 | | 154,688 |
| Kemet Corp. * | 5,153 | | 35,556 |
| LoJack Corp. * | 1,193 | | 22,715 |
| Measurement Specialties, Inc. * | 973 | | 23,478 |
| Medis Technologies, Ltd. * (a) | 1,451 | | 15,308 |
| Mentor Graphics Corp. * | 5,222 | | 72,899 |
| Mercury Computer Systems, Inc. * | 1,632 | | 18,670 |
| Newport Corp. * | 1,949 | | 26,916 |
| OSI Systems, Inc. * | 969 | | 24,138 |
| Park Electrochemical Corp. | 1,251 | | 36,980 |
| Rogers Corp. * | 1,086 | | 44,732 |
| SiRF Technology Holdings, Inc. * (a) | 3,225 | | 54,374 |
| Sonic Innovations, Inc. * | 1,590 | | 13,181 |
| Stoneridge, Inc. * | 892 | | 9,312 |
| Supertex, Inc. * | 716 | | 25,676 |
| Sycamore Networks, Inc. * | 11,256 | | 44,461 |
| Syntax-Brillian Corp. * (a) | 3,189 | | 20,729 |
| Taser International, Inc. * (a) | 3,794 | | 54,292 |
| Technitrol, Inc. | 2,491 | | 68,503 |
| TTM Technologies, Inc. * | 2,597 | | 30,333 |
| Universal Display Corp. * (a) | 1,572 | | 23,203 |
| X-Rite, Inc. | 1,849 | | 26,441 |
| Zoran Corp. * | 3,024 | | 52,224 |
| Zygo Corp. * | 1,189 | | 15,279 |
|
|
| | | | 1,787,826 |
| Energy - 0.61% | | | |
| Alon USA Energy, Inc. | 802 | | 30,717 |
| Aventine Renewable Energy Holdings, Inc. * (a) | 1,882 | | 26,931 |
| Comverge, Inc. * | 345 | | 9,525 |
| Energy Conversion Devices, Inc. * (a) | 2,405 | | 62,314 |
| Evergreen Energy, Inc. * (a) | 5,320 | | 21,918 |
| Evergreen Solar, Inc. * (a) | 5,749 | | 51,569 |
| Fuelcell Energy, Inc. * (a) | 4,083 | | 39,278 |
| Headwaters, Inc. * (a) | 2,440 | | 40,309 |
| Horizon Offshore, Inc. * | 2,025 | | 33,514 |
| New Jersey Resources Corp. | 1,684 | | 82,482 |
| Ormat Technologies, Inc. | 840 | | 36,162 |
| Pacific Ethanol, Inc. * (a) | 1,976 | | 22,843 |
| Rosetta Resources, Inc. * | 3,149 | | 52,840 |
| VeraSun Energy Corp. * (a) | 2,050 | | 26,548 |
| Verenium Corp. * (a) | 1,622 | | 8,921 |
|
|
| | | | 545,871 |
| Financial Services - 2.64% | | | |
| Accredited Home Lenders Holding Company * (a) | 1,115 | | 10,091 |
| Advance America Cash Advance Centers, Inc. | 4,121 | | 51,719 |
| Advanta Corp., Class B | 2,297 | | 60,135 |
| Asset Acceptance Capital Corp. * | 1,197 | | 13,538 |
| | | |
| Small Cap Index Fund (continued) | | |
| | Shares or | | |
| | Principal | | |
| | Amount | | Value |
|
|
| |
| COMMON STOCKS (continued) | | | |
| | | | |
| Financial Services (continued) | | | |
| Asta Funding, Inc. (a) | 710 | $ | 26,142 |
| Authorize.Net Holdings, Inc. * | 1,601 | | 29,138 |
| Bankrate, Inc. * (a) | 684 | | 26,765 |
| Calamos Asset Management, Inc. (a) | 1,436 | | 33,344 |
| Capital Southwest Corp. | 175 | | 24,579 |
| Cass Information Systems, Inc. (a) | 468 | | 15,823 |
| Centerline Holding Company (a) | 3,152 | | 49,802 |
| City Holding Company | 1,158 | | 42,823 |
| Clayton Holdings, Inc. * | 714 | | 6,069 |
| Cohen & Steers, Inc. (a) | 1,059 | | 35,191 |
| Cowen Group, Inc. * | 1,100 | | 14,058 |
| Delphi Financial Group, Inc. | 2,698 | | 108,729 |
| Delta Financial Corp. (a) | 999 | | 5,425 |
| Dollar Financial Corp. * | 902 | | 21,630 |
| Encore Capital Group, Inc. * | 1,003 | | 11,033 |
| Epoch Holding Corp. * | 574 | | 7,479 |
| Evercore Partners, Inc. | 531 | | 11,124 |
| FCStone Group, Inc. * | 378 | | 17,668 |
| Federal Agricultural Mortgage Corp., Class C | 661 | | 21,549 |
| Financial Federal Corp. | 1,693 | | 51,653 |
| Fremont General Corp. (a) | 4,171 | | 18,769 |
| Friedman, Billings, Ramsey Group, Inc. | 9,871 | | 46,295 |
| GFI Group, Inc. * | 963 | | 71,262 |
| Heartland Payment Systems, Inc. | 998 | | 29,720 |
| HFF, Inc. * | 1,198 | | 13,993 |
| Interactive Brokers Group, Inc. * | 2,422 | | 64,813 |
| Interactive Data Corp. | 2,187 | | 59,793 |
| International Securities Exchange | | | |
| Holdings, Inc. | 2,360 | | 156,704 |
| Investors Bancorp, Inc. * | 3,269 | | 46,420 |
| Irwin Financial Corp. | 1,312 | | 13,973 |
| KBW, Inc. * (a) | 1,782 | | 49,219 |
| Knight Capital Group, Inc. * | 6,280 | | 86,287 |
| LaBranche & Company, Inc. * (a) | 3,363 | | 21,153 |
| Ladenburg Thalmann Financial Services, Inc. * (a) | 5,597 | | 11,810 |
| MarketAxess Holdings, Inc. * (a) | 1,913 | | 33,344 |
| MCG Capital Corp. (a) | 3,946 | | 57,296 |
| MVC Capital, Inc. | 1,563 | | 25,946 |
| National Financial Partners Corp. (a) | 2,269 | | 110,931 |
| NBT Bancorp, Inc. | 2,182 | | 47,873 |
| Nelnet, Inc., Class A | 996 | | 17,589 |
| NewStar Financial, Inc. * | 720 | | 8,323 |
| Ocwen Financial Corp. * | 2,195 | | 20,589 |
| optionsXpress Holdings, Inc. | 2,646 | | 62,234 |
| Patriot Capital Funding, Inc. * | 1,290 | | 17,505 |
| PennantPark Investment Corp. * | 1,363 | | 17,692 |
| Penson Worldwide, Inc. * | 945 | | 14,836 |
| Piper Jaffray Companies, Inc. * | 1,141 | | 58,602 |
| Portfolio Recovery Associates, Inc. * (a) | 991 | | 50,898 |
| Prospect Capital Corp. * (a) | 1,415 | | 23,687 |
| RAM Holdings, Ltd. * | 1,242 | | 11,600 |
| Sanders Morris Harris Group, Inc. | 1,176 | | 11,631 |
| |
| The accompanying notes are an integral part of the financial statements. | 309 |
John Hancock Funds II
Portfolio of investments — August 31, 2007
(showing percentage of total net assets)
| | | |
| Small Cap Index Fund (continued) | | |
| | Shares or | | |
| | Principal | | |
| | Amount | | Value |
|
|
| |
| COMMON STOCKS (continued) | | | |
| | | | |
| Financial Services (continued) | | | |
| Stifel Financial Corp. * (a) | 910 | $ | 49,267 |
| SWS Group, Inc. | 1,220 | | 21,643 |
| Technology Investment Capital Corp. | 1,275 | | 16,753 |
| Thomas Weisel Partners Group, Inc. * | 1,413 | | 19,188 |
| UMB Financial Corp. | 1,902 | | 84,259 |
| Waddell & Reed Financial, Inc., Class A | 5,048 | | 125,392 |
| World Acceptance Corp. * | 1,109 | | 34,390 |
| WSFS Financial Corp. | 492 | | 29,638 |
|
|
| | | | 2,356,824 |
| Food & Beverages - 1.15% | | | |
| Cal-Maine Foods, Inc. (a) | 805 | | 15,931 |
| Chiquita Brands International, Inc. * (a) | 2,610 | | 40,716 |
| Coca-Cola Bottling Company (a) | 445 | | 26,108 |
| Flowers Foods, Inc. | 4,706 | | 97,132 |
| Green Mountain Coffee Roasters, Inc. * (a) | 1,031 | | 35,126 |
| Hain Celestial Group, Inc. * | 2,465 | | 72,126 |
| Imperial Sugar Company (a) | 776 | | 22,310 |
| J & J Snack Foods Corp. | 824 | | 30,941 |
| Jones Soda Company * (a) | 1,447 | | 15,628 |
| Lance, Inc. | 1,946 | | 48,475 |
| M & F Worldwide Corp. * | 744 | | 41,961 |
| MGP Ingredients, Inc. (a) | 682 | | 9,862 |
| Nuco2, Inc. * | 1,003 | | 26,369 |
| Performance Food Group Company * | 2,186 | | 62,170 |
| Pilgrim's Pride Corp. (a) | 2,459 | | 99,811 |
| Ralcorp Holdings, Inc. * | 1,652 | | 102,077 |
| Sanderson Farms, Inc. | 1,042 | | 43,701 |
| Seaboard Corp. | 22 | | 45,738 |
| Spartan Stores, Inc. | 1,347 | | 34,268 |
| Tootsie Roll Industries, Inc. (a) | 2,233 | | 60,514 |
| TreeHouse Foods, Inc. * | 1,944 | | 52,332 |
| Winn-Dixie Stores, Inc. * | 2,102 | | 43,995 |
|
|
| | | | 1,027,291 |
| Forest Products - 0.04% | | | |
| Deltic Timber Corp. | 645 | | 36,894 |
| | | | |
| Funeral Services - 0.05% | | | |
| Stewart Enterprises, Inc., Class A | 6,238 | | 44,726 |
| | | | |
| Furniture & Fixtures - 0.25% | | | |
| American Woodmark Corp. (a) | 783 | | 23,623 |
| Ethan Allen Interiors, Inc. (a) | 1,591 | | 53,458 |
| Furniture Brands International, Inc. (a) | 2,955 | | 33,628 |
| Hooker Furniture Corp. (a) | 866 | | 15,891 |
| Kimball International, Inc., Class B | 1,713 | | 23,005 |
| La-Z-Boy, Inc. (a) | 3,211 | | 30,954 |
| Sealy Corp. (a) | 2,743 | | 41,858 |
|
|
| | | | 222,417 |
| Gas & Pipeline Utilities - 1.01% | | | |
| American States Water Company (a) | 1,081 | | 42,224 |
| Aquila, Inc. * | 22,852 | | 90,951 |
| Cal Dive International, Inc. * | 1,242 | | 17,376 |
| | | |
| Small Cap Index Fund (continued) | | |
| | Shares or | | |
| | Principal | | |
| | Amount | | Value |
|
|
| |
| COMMON STOCKS (continued) | | | |
| | | | |
| Gas & Pipeline Utilities (continued) | | | |
| California Water Service Group (a) | 1,125 | $ | 43,571 |
| Crosstex Energy, Inc. (a) | 2,320 | | 76,189 |
| Nicor, Inc. | 2,693 | | 111,921 |
| Northwest Natural Gas Company | 1,644 | | 76,380 |
| Piedmont Natural Gas, Inc. (a) | 4,520 | | 119,328 |
| SEMCO Energy, Inc. * | 2,404 | | 18,294 |
| South Jersey Industries, Inc. | 1,802 | | 61,106 |
| Southwest Gas Corp. | 2,582 | | 74,904 |
| Southwest Water Company | 1,774 | | 24,801 |
| The Laclede Group, Inc. | 1,388 | | 45,304 |
| WGL Holdings, Inc. | 2,960 | | 97,354 |
|
|
| | | | 899,703 |
| Healthcare Products - 2.82% | | | |
| Accuray, Inc. * (a) | 1,052 | | 14,549 |
| Align Technology, Inc. * (a) | 3,609 | | 82,033 |
| American Medical Systems Holdings, Inc. * (a) | 4,395 | | 80,868 |
| AngioDynamics, Inc. * (a) | 1,323 | | 25,746 |
| Animal Health International, Inc. * | 766 | | 8,694 |
| Arthrocare Corp. * | 1,675 | | 93,834 |
| Aspect Medical Systems, Inc. * | 987 | | 12,416 |
| Bruker BioSciences Corp. * | 3,995 | | 28,524 |
| Cantel Medical Corp. * | 738 | | 11,365 |
| Computer Programs & Systems, Inc. | 580 | | 15,411 |
| Conceptus, Inc. * (a) | 1,818 | | 31,815 |
| CONMED Corp. * | 1,732 | | 50,315 |
| Cutera, Inc. * | 875 | | 19,486 |
| Cyberonics, Inc. * (a) | 1,422 | | 21,458 |
| Cypress Biosciences, Inc. * | 1,802 | | 23,895 |
| DJO, Inc. * | 1,429 | | 69,564 |
| Foxhollow Technologies, Inc. * | 1,222 | | 30,000 |
| Haemonetics Corp. * | 1,599 | | 79,374 |
| Hologic, Inc. * (a) | 3,268 | | 173,694 |
| ICU Medical, Inc. * | 811 | | 30,664 |
| Inverness Medical Innovations, Inc. * | 2,839 | | 136,669 |
| Kensey Nash Corp. * | 718 | | 17,110 |
| Kyphon, Inc. * | 2,768 | | 185,096 |
| LCA-Vision, Inc. (a) | 1,220 | | 41,907 |
| LifeCell Corp. * | 2,074 | | 68,670 |
| Mannkind Corp. * (a) | 2,581 | | 22,893 |
| Merit Medical Systems, Inc. * | 1,856 | | 22,755 |
| Micrus Endovascular Corp. * | 976 | | 23,248 |
| Natus Medical, Inc. * | 1,415 | | 22,767 |
| Nuvasive, Inc. * | 2,110 | | 67,309 |
| Orthofix International NV * | 1,020 | | 48,797 |
| Owens & Minor, Inc. | 2,450 | | 97,755 |
| Polymedica Corp. | 1,388 | | 71,857 |
| PSS World Medical, Inc. * | 4,100 | | 78,228 |
| Sirona Dental Systems, Inc. * (a) | 1,021 | | 29,762 |
| SonoSite, Inc. * | 943 | | 27,498 |
| Spectranetics Corp. * (a) | 2,033 | | 29,946 |
| Stereotaxis, Inc. * (a) | 1,682 | | 22,253 |
| |
| The accompanying notes are an integral part of the financial statements. | 310 |
John Hancock Funds II
Portfolio of investments — August 31, 2007
(showing percentage of total net assets)
| | | |
| Small Cap Index Fund (continued) | | |
| | Shares or | | |
| | Principal | | |
| | Amount | | Value |
|
|
| |
| COMMON STOCKS (continued) | | | |
| | | | |
| Healthcare Products (continued) | | | |
| STERIS Corp. | 3,931 | $ | 110,343 |
| SurModics, Inc. * (a) | 926 | | 44,679 |
| Symmetry Medical, Inc. * | 2,174 | | 34,849 |
| The Medicines Company * | 3,174 | | 53,006 |
| Thoratec Corp. * | 3,252 | | 67,219 |
| TomoTherapy, Inc. * | 714 | | 17,043 |
| USANA Health Sciences, Inc. * (a) | 536 | | 20,411 |
| Ventana Medical Systems, Inc. * | 1,809 | | 147,958 |
| Visicu, Inc. * | 917 | | 6,639 |
| Volcano, Corp. * | 1,316 | | 19,543 |
| Wright Medical Group, Inc. * | 2,167 | | 56,754 |
| Zoll Medical Corp. * | 1,155 | | 26,692 |
|
|
| | | | 2,523,361 |
| Healthcare Services - 1.53% | | | |
| Air Methods Corp. * | 651 | | 25,799 |
| Alliance Imaging, Inc. * | 1,786 | | 15,735 |
| Amedisys, Inc. * | 1,573 | | 59,428 |
| American Dental Partners, Inc. * | 880 | | 21,076 |
| AMERIGROUP Corp. * | 3,194 | | 101,154 |
| AMN Healthcare Services, Inc. * | 2,119 | | 37,782 |
| Apria Healthcare Group, Inc. * | 2,630 | | 70,037 |
| Assisted Living Concepts, Inc. * | 3,698 | | 33,615 |
| Capital Senior Living Corp. * | 1,461 | | 11,834 |
| CorVel Corp. * | 512 | | 12,836 |
| Cross Country Healthcare, Inc. * | 2,002 | | 34,174 |
| Emergency Medical Services Corp., Class A * | 590 | | 16,555 |
| Emeritus Corp. * | 347 | | 9,421 |
| Enzo Biochem, Inc. * (a) | 1,740 | | 31,337 |
| Healthextras, Inc. * | 1,884 | | 52,959 |
| Healthsouth Corp. * (a) | 4,803 | | 87,703 |
| Healthspring, Inc. * | 2,909 | | 54,369 |
| Healthways, Inc. * (a) | 2,124 | | 105,775 |
| Kindred Healthcare, Inc. * | 1,831 | | 36,290 |
| LHC Group, Inc. * (a) | 914 | | 18,307 |
| Magellan Health Services, Inc. * | 2,368 | | 96,141 |
| National Healthcare Corp. | 447 | | 23,508 |
| Nighthawk Radiology Holdings, Inc. * (a) | 1,175 | | 25,803 |
| Odyssey Healthcare, Inc. * | 2,117 | | 20,704 |
| Palomar Medical Technologies, Inc. * | 1,122 | | 35,343 |
| Phase Forward, Inc. * | 2,538 | | 45,278 |
| Psychiatric Solutions, Inc. * | 3,296 | | 121,491 |
| Radiation Therapy Services, Inc. * (a) | 815 | | 18,435 |
| Skilled Healthcare Group Inc * | 1,502 | | 21,824 |
| Sun Healthcare Group, Inc. * | 2,639 | | 39,242 |
| The Advisory Board Company * | 1,105 | | 63,571 |
| Town Sports International Holdings, Inc. * | 1,091 | | 19,704 |
|
|
| | | | 1,367,230 |
| Holdings Companies/Conglomerates - 0.18% | | | |
| Freedom Acquisition Holdings, Inc. * | 2,979 | | 31,131 |
| Information Services Group, Inc. * | 2,057 | | 15,592 |
| Marathon Acquisition Corp. * | 2,508 | | 19,888 |
| | | |
| Small Cap Index Fund (continued) | | |
| | Shares or | | |
| | Principal | | |
| | Amount | | Value |
|
|
| |
| COMMON STOCKS (continued) | | | |
| | | | |
| Holdings Companies/Conglomerates | | | |
| (continued) | | | |
| NTR Acquisition Company * | 1,648 | $ | 15,541 |
| PICO Holdings, Inc. * | 951 | | 41,844 |
| United Industrial Corp. | 523 | | 36,155 |
|
|
| | | | 160,151 |
| Homebuilders - 0.30% | | | |
| Beazer Homes USA, Inc. (a) | 2,402 | | 25,389 |
| Champion Enterprises, Inc. * (a) | 4,713 | | 54,435 |
| Hovnanian Enterprises, Inc., Class A * (a) | 2,300 | | 27,301 |
| M/I Homes, Inc. (a) | 812 | | 14,803 |
| Meritage Homes Corp. * (a) | 1,619 | | 29,336 |
| Standard Pacific Corp. (a) | 3,967 | | 39,789 |
| Walter Industries, Inc. | 3,187 | | 80,568 |
|
|
| | | | 271,621 |
| Hotels & Restaurants - 1.93% | | | |
| AFC Enterprises, Inc. * | 1,863 | | 27,777 |
| Ameristar Casinos, Inc. | 1,542 | | 44,579 |
| Applebee's International, Inc. | 4,539 | | 112,613 |
| Benihana, Inc. Class A * | 867 | | 16,074 |
| BJ's Restaurants, Inc. * (a) | 1,185 | | 26,840 |
| Bob Evans Farms, Inc. | 2,200 | | 73,414 |
| Buffalo Wild Wings, Inc. * (a) | 936 | | 32,545 |
| California Pizza Kitchen, Inc. * | 1,811 | | 37,035 |
| CBRL Group, Inc. | 1,505 | | 56,317 |
| CEC Entertainment, Inc. * | 1,745 | | 53,572 |
| Chipotle Mexican Grill, Inc. * | 1,993 | | 187,123 |
| CKE Restaurants, Inc. | 3,838 | | 65,054 |
| Denny's Corp. * | 6,026 | | 23,260 |
| Domino's Pizza, Inc. | 2,689 | | 47,300 |
| IHOP Corp. (a) | 1,075 | | 67,585 |
| Jack in the Box, Inc. * | 1,895 | | 117,907 |
| Jamba, Inc. * (a) | 3,237 | | 22,044 |
| Krispy Kreme Doughnuts, Inc. * (a) | 3,614 | | 23,997 |
| Landry's Restaurants, Inc. (a) | 1,077 | | 30,878 |
| Lodgian, Inc. * | 1,299 | | 15,887 |
| Marcus Corp. | 1,341 | | 28,322 |
| McCormick & Schmick's Seafood | | | |
| Restaurants, Inc. * | 1,003 | | 26,579 |
| Morgans Hotel Group Company * | 1,146 | | 22,095 |
| O'Charley's, Inc. | 1,550 | | 25,234 |
| P.F. Chang's China Bistro, Inc. * (a) | 1,574 | | 53,091 |
| Papa John's International, Inc. * | 1,351 | | 34,261 |
| Peets Coffee & Tea, Inc. * (a) | 992 | | 25,058 |
| RARE Hospitality International, Inc. * | 1,914 | | 72,292 |
| Red Robin Gourmet Burgers, Inc. * | 1,028 | | 39,547 |
| Ruby Tuesday, Inc. | 3,295 | | 72,984 |
| Ruth's Chris Steak House, Inc. * | 1,297 | | 21,556 |
| Sonic Corp. * | 4,070 | | 88,807 |
| Texas Roadhouse, Inc., Class A * | 3,251 | | 41,645 |
| The Steak & Shake Company * (a) | 1,881 | | 29,645 |
| |
| The accompanying notes are an integral part of the financial statements. | 311 |
John Hancock Funds II
Portfolio of investments — August 31, 2007
(showing percentage of total net assets)
| | | |
| Small Cap Index Fund (continued) | | |
| | Shares or | | |
| | Principal | | |
| | Amount | | Value |
|
|
| |
| COMMON STOCKS (continued) | | | |
| | | | |
| Hotels & Restaurants (continued) | | | |
| Triarc Companies, Inc. | 3,888 | $ | 59,720 |
|
|
| | | | 1,722,637 |
| Household Appliances - 0.12% | | | |
| Consolidated Tomoka Land Company (a) | 409 | | 28,111 |
| Drew Industries, Inc. * | 1,133 | | 44,493 |
| Libbey, Inc. (a) | 972 | | 17,593 |
| Lifetime Brands, Inc. (a) | 818 | | 16,679 |
|
|
| | | | 106,876 |
| Household Products - 0.54% | | | |
| Blyth, Inc. | 1,572 | | 35,150 |
| Central Garden & Pet Company, Class A * | 4,315 | | 54,369 |
| Cryolife, Inc. * | 1,547 | | 14,279 |
| Jarden Corp. * | 339 | | 11,116 |
| Select Comfort Corp. * (a) | 3,012 | | 51,656 |
| Tempur-Pedic International, Inc. (a) | 5,035 | | 145,511 |
| Tupperware Brands Corp. | 3,750 | | 115,463 |
| TurboChef Technologies, Inc. * | 1,323 | | 16,934 |
| WD-40 Company | 1,144 | | 39,777 |
|
|
| | | | 484,255 |
| Industrial Machinery - 1.71% | | | |
| Actuant Corp., Class A | 1,658 | | 101,121 |
| Albany International Corp., Class A | 1,810 | | 70,481 |
| Altra Holdings, Inc. * | 659 | | 10,939 |
| Badger Meter, Inc. (a) | 928 | | 29,130 |
| Briggs & Stratton Corp. (a) | 2,984 | | 87,103 |
| Cascade Corp. | 714 | | 52,558 |
| Chart Industries, Inc. * | 816 | | 22,024 |
| Circor International, Inc. | 1,018 | | 43,051 |
| Cognex Corp. | 2,716 | | 50,110 |
| Dionex Corp. * | 1,159 | | 83,946 |
| EnPro Industries, Inc. * | 1,308 | | 54,661 |
| Flow International Corp. * | 2,391 | | 19,630 |
| Gehl Company * | 715 | | 17,003 |
| Gorman-Rupp Company | 757 | | 25,776 |
| H&E Equipment Services, Inc. * | 1,099 | | 22,596 |
| Intevac, Inc. * | 1,203 | | 19,657 |
| Kadant, Inc. * | 910 | | 25,935 |
| Lindsay Corp. (a) | 731 | | 29,628 |
| Lufkin Industries, Inc. | 920 | | 52,320 |
| Middleby Corp. * | 837 | | 61,553 |
| NACCO Industries, Inc., Class A | 354 | | 41,938 |
| NATCO Group, Inc. * | 1,076 | | 53,736 |
| OYO Geospace Corp. * | 266 | | 20,104 |
| Raser Technologies, Inc. * (a) | 2,036 | | 28,952 |
| Regal-Beloit Corp. | 1,943 | | 98,141 |
| Robbins & Myers, Inc. | 857 | | 46,432 |
| Rofin-Sinar Technologies, Inc. * | 955 | | 66,535 |
| Sauer-Danfoss, Inc. | 710 | | 19,042 |
| Tecumseh Products Company, Class A * | 948 | | 16,353 |
| Tennant Company | 1,027 | | 43,155 |
| Tredegar Industries, Inc. | 1,936 | | 33,841 |
| | | |
| Small Cap Index Fund (continued) | | |
| | Shares or | | |
| | Principal | | |
| | Amount | | Value |
|
|
| |
| COMMON STOCKS (continued) | | | |
| | | | |
| Industrial Machinery (continued) | | | |
| Twin Disc, Inc. | 310 | $ | 16,824 |
| Valmont Industries, Inc. | 1,127 | | 100,506 |
| Watts Water Technologies, Inc., Class A (a) | 1,893 | | 67,050 |
|
|
| | | | 1,531,831 |
| Industrials - 0.16% | | | |
| Aecom Technology Corp. * | 2,452 | | 65,885 |
| Brookfield Homes Corp. (a) | 638 | | 12,645 |
| Clean Harbors, Inc. * | 1,016 | | 47,945 |
| Michael Baker Corp. * | 453 | | 18,809 |
|
|
| | | | 145,284 |
| Insurance - 3.06% | | | |
| 21st Century Insurance Group | 2,205 | | 48,532 |
| Alfa Corp. | 2,145 | | 38,181 |
| American Equity Investment Life Holding | | | |
| Company | 3,594 | | 36,695 |
| American Physicians Capital, Inc. * | 681 | | 27,049 |
| Amerisafe, Inc. * | 1,290 | | 21,220 |
| Amtrust Financial Services, Inc. | 1,468 | | 24,031 |
| Argo Group International Holdings, Ltd. * | 1,828 | | 74,546 |
| Aspen Insurance Holdings, Ltd. | 5,409 | | 135,712 |
| Assured Guaranty, Ltd. | 4,178 | | 108,920 |
| Citizens, Inc. Class A * (a) | 2,451 | | 18,481 |
| CNA Surety Corp. * | 1,161 | | 20,852 |
| Commerce Group, Inc. | 3,308 | | 105,459 |
| eHealth, Inc. * | 894 | | 17,925 |
| Employers Holdings, Inc. | 3,358 | | 62,895 |
| Enstar Group, Ltd. * (a) | 443 | | 56,496 |
| FBL Financial Group, Inc., Class A | 956 | | 37,408 |
| First Mercury Financial Corp. * | 830 | | 16,915 |
| FPIC Insurance Group, Inc. * | 672 | | 26,967 |
| Harleysville Group, Inc. | 1,069 | | 34,486 |
| Hilb, Rogal and Hamilton Company | 2,256 | | 105,355 |
| Horace Mann Educators Corp. | 2,757 | | 53,320 |
| Infinity Property & Casualty Corp. | 1,226 | | 50,830 |
| IPC Holdings, Ltd. | 3,934 | | 100,002 |
| LandAmerica Financial Group, Inc. (a) | 1,047 | | 57,993 |
| Max Re Capital, Ltd. | 3,741 | | 102,728 |
| Meadowbrook Insurance Group, Inc. * | 2,013 | | 17,775 |
| Midland Company | 658 | | 36,039 |
| Montpelier Re Holdings, Ltd. (a) | 6,869 | | 113,064 |
| National Western Life Insurance Company, | | | |
| Class A * | 157 | | 40,663 |
| Navigators Group, Inc. * | 854 | | 46,287 |
| NYMAGIC, Inc. | 445 | | 13,377 |
| Odyssey Re Holdings Corp. | 1,766 | | 63,964 |
| Phoenix Companies, Inc. | 7,050 | | 97,642 |
| Platinum Underwriters Holdings, Ltd. | 3,673 | | 127,380 |
| PMA Capital Corp., Class A * | 2,357 | | 23,688 |
| Presidential Life Corp. | 1,476 | | 25,535 |
| Primus Guaranty, Ltd. * (a) | 2,821 | | 26,828 |
| ProAssurance Corp. * | 2,076 | | 109,156 |
| |
| The accompanying notes are an integral part of the financial statements. | 312 |
John Hancock Funds II
Portfolio of investments — August 31, 2007
(showing percentage of total net assets)
| | | |
| Small Cap Index Fund (continued) | | |
| | Shares or | | |
| | Principal | | |
| | Amount | | Value |
|
|
| |
| COMMON STOCKS (continued) | | | |
| | | | |
| Insurance (continued) | | | |
| RLI Corp. | 1,346 | $ | 80,962 |
| Safety Insurance Group, Inc. | 1,072 | | 36,598 |
| Scottish Re Group, Ltd. * | 4,531 | | 14,862 |
| SeaBright Insurance Holdings, Inc. * | 1,459 | | 25,139 |
| Security Capital Assurance, Ltd. | 1,488 | | 30,251 |
| Selective Insurance Group, Inc. | 3,479 | | 73,407 |
| State Auto Financial Corp. | 912 | | 27,287 |
| Stewart Information Services Corp. | 1,126 | | 41,730 |
| Tower Group, Inc. | 1,290 | | 32,392 |
| Triad Guaranty, Inc. * | 755 | | 12,631 |
| United America Indemnity Ltd. * | 1,495 | | 32,352 |
| United Fire & Casualty Company | 1,399 | | 53,148 |
| Universal American Financial Corp. * | 2,465 | | 51,173 |
| Zenith National Insurance Corp. | 2,258 | | 97,342 |
|
|
| | | | 2,733,670 |
| International Oil - 0.16% | | | |
| ATP Oil & Gas Corp. * (a) | 1,324 | | 56,998 |
| BPZ Energy, Inc. * (a) | 3,184 | | 18,627 |
| Callon Petroleum Company * | 1,484 | | 18,001 |
| Parker Drilling Company * | 6,852 | | 53,377 |
|
|
| | | | 147,003 |
| Internet Content - 0.47% | | | |
| CMGI, Inc. * | 29,703 | | 46,337 |
| CNET Networks, Inc. * | 9,213 | | 67,439 |
| Harris Interactive, Inc. * | 3,698 | | 15,938 |
| InfoSpace, Inc. * | 2,010 | | 28,160 |
| Internet Cap Group, Inc. * | 2,167 | | 24,617 |
| Liquidity Services, Inc. * | 625 | | 6,875 |
| LoopNet, Inc. * | 1,652 | | 31,487 |
| Move, Inc. * | 5,788 | | 17,364 |
| RightNow Technologies, Inc. * (a) | 1,218 | | 17,844 |
| Safeguard Scientifics, Inc. * | 8,140 | | 17,501 |
| Schawk, Inc., Class A | 980 | | 21,168 |
| Sohu.com, Inc. * (a) | 1,671 | | 54,759 |
| SourceForge, Inc. * | 4,590 | | 11,751 |
| The Knot, Inc. * (a) | 1,694 | | 35,489 |
| TheStreet.com, Inc. | 1,224 | | 12,509 |
| Travelzoo, Inc. * | 426 | | 8,209 |
|
|
| | | | 417,447 |
| Internet Retail - 0.51% | | | |
| 1-800-Flowers.com, Inc. * | 1,638 | | 17,412 |
| Ariba, Inc. * | 4,788 | | 42,134 |
| Blue Nile, Inc. * (a) | 820 | | 69,224 |
| Netflix, Inc. * (a) | 2,862 | | 50,142 |
| Overstock.com, Inc. * (a) | 1,075 | | 23,876 |
| PetMed Express, Inc. * | 1,450 | | 21,736 |
| Priceline.com, Inc. * (a) | 2,302 | | 191,020 |
| Shutterfly, Inc. * | 923 | | 25,807 |
| Stamps.com, Inc. * | 1,032 | | 12,529 |
|
|
| | | | 453,880 |
| | | |
| Small Cap Index Fund (continued) | | |
| | Shares or | | |
| | Principal | | |
| | Amount | | Value |
|
|
| |
| COMMON STOCKS (continued) | | | |
| | | | |
| Internet Service Provider - 0.48% | | | |
| Cogent Communications Group, Inc. * | 3,045 | $ | 76,034 |
| Earthlink, Inc. * | 7,515 | | 57,264 |
| Equinix, Inc. * (a) | 1,920 | | 169,939 |
| eSPEED, Inc., Class A * | 1,442 | | 12,113 |
| Imergent, Inc. (a) | 805 | | 15,255 |
| Online Resources Corp. * | 1,793 | | 22,879 |
| Terremark Worldwide, Inc. * (a) | 3,016 | | 20,388 |
| United Online, Inc. | 4,063 | | 58,385 |
|
|
| | | | 432,257 |
| Internet Software - 0.82% | | | |
| Art Technology Group, Inc. * | 8,143 | | 25,325 |
| Chordiant Software, Inc. * | 2,015 | | 30,104 |
| Cybersource Corp. * (a) | 2,011 | | 24,514 |
| DealerTrack Holdings, Inc. * | 2,046 | | 78,157 |
| Digital River, Inc. * | 2,509 | | 116,317 |
| eResearch Technology, Inc. * | 2,539 | | 27,624 |
| Interwoven, Inc. * | 2,672 | | 34,816 |
| Keynote Systems, Inc. * | 1,016 | | 14,021 |
| Lionbridge Technologies, Inc. * | 3,948 | | 16,187 |
| NIC, Inc. * | 2,387 | | 16,112 |
| On2 Technologies, Inc. * (a) | 7,806 | | 11,631 |
| Openwave Systems, Inc. * | 5,106 | | 23,079 |
| RealNetworks, Inc. * | 6,212 | | 38,701 |
| S1 Corp. * | 3,545 | | 27,651 |
| Sapient Corp. * | 5,020 | | 32,329 |
| Switch & Data Facilities Company, Inc. * | 751 | | 12,977 |
| TIBCO Software, Inc. * | 12,697 | | 100,433 |
| VASCO Data Security International, Inc. * (a) | 1,600 | | 50,112 |
| Vignette Corp. * | 1,642 | | 32,036 |
| Vocus, Inc. * | 846 | | 21,150 |
|
|
| | | | 733,276 |
| Investment Companies - 0.36% | | | |
| Apollo Investment Corp. (a) | 6,011 | | 131,280 |
| Ares Cap Corp. (a) | 4,174 | | 68,537 |
| GAMCO Investors, Inc. | 369 | | 19,826 |
| Gladstone Capital Corp. | 965 | | 19,744 |
| Hercules Technology Growth Capital, Inc. | 1,569 | | 18,389 |
| Kohlberg Capital Corp. | 869 | | 13,287 |
| NGP Capital Resources Company (a) | 1,184 | | 19,003 |
| U.S. Global Investors, Inc. | 785 | | 16,250 |
| WP Stewart & Company, Ltd. (a) | 1,330 | | 15,056 |
|
|
| | | | 321,372 |
| Leisure Time - 1.55% | | | |
| Ambassadors International, Inc. | 623 | | 15,027 |
| Arctic Cat, Inc. | 795 | | 13,444 |
| Bally Technologies, Inc. * | 3,243 | | 107,570 |
| Blockbuster, Inc., Class A * (a) | 11,791 | | 58,483 |
| Bluegreen Corp. * | 1,648 | | 13,794 |
| Callaway Golf Company (a) | 4,397 | | 71,759 |
| Carmike Cinemas, Inc. | 824 | | 13,217 |
| Churchill Downs, Inc. | 604 | | 30,115 |
| |
| The accompanying notes are an integral part of the financial statements. | 313 |
John Hancock Funds II
Portfolio of investments — August 31, 2007
(showing percentage of total net assets)
| | | |
| Small Cap Index Fund (continued) | | |
| | Shares or | | |
| | Principal | | |
| | Amount | | Value |
|
|
| |
| COMMON STOCKS (continued) | | | |
| | | | |
| Leisure Time (continued) | | | |
| Cinemark Holdings, Inc. * (a) | 1,678 | $ | 30,170 |
| Dover Downs Gaming & Entertainment, Inc. | 1,023 | | 10,568 |
| Gaylord Entertainment Company * | 2,488 | | 127,759 |
| Isle of Capri Casinos, Inc. * (a) | 1,034 | | 19,160 |
| Lakes Gaming, Inc. * (a) | 1,062 | | 11,512 |
| Life Time Fitness, Inc. * (a) | 1,926 | | 107,028 |
| Monarch Casino & Resort, Inc. * | 807 | | 22,895 |
| MTR Gaming Group, Inc. * | 1,395 | | 13,964 |
| Multimedia Games, Inc. * (a) | 1,689 | | 16,383 |
| National Cinemedia, Inc. | 2,556 | | 62,954 |
| Pinnacle Entertainment, Inc. * | 3,628 | | 100,931 |
| Polaris Industries, Inc. (a) | 2,167 | | 103,474 |
| Premier Exhibitions, Inc. * | 1,807 | | 28,587 |
| RC2 Corp. * | 1,310 | | 40,007 |
| Riviera Holdings Corp. * | 655 | | 17,783 |
| Shuffle Master, Inc. * (a) | 2,173 | | 32,226 |
| Six Flags, Inc. * (a) | 4,546 | | 18,275 |
| Speedway Motorsports, Inc. | 867 | | 33,371 |
| Steinway Musical Instruments, Inc. * | 572 | | 18,287 |
| The Nautilus Group, Inc. (a) | 1,982 | | 18,869 |
| Topps, Inc. | 2,116 | | 19,658 |
| Trump Entertainment Resorts, Inc. * (a) | 2,096 | | 14,001 |
| Vail Resorts, Inc. * | 1,906 | | 108,985 |
| West Marine, Inc. * | 936 | | 12,748 |
| WMS Industries, Inc. * | 2,473 | | 72,805 |
|
|
| | | | 1,385,809 |
| Life Sciences - 0.24% | | | |
| American Ecology Corp. (a) | 1,081 | | 21,609 |
| Arrowhead Research Corp. * (a) | 1,960 | | 9,565 |
| Dawson Geophysical Company * | 488 | | 33,116 |
| Halozyme Therapeutics, Inc. * (a) | 3,973 | | 35,002 |
| Incyte Corp. * | 5,228 | | 30,531 |
| Ionatron, Inc. * | 2,477 | | 8,125 |
| Omrix Biopharmaceuticals, Inc. * | 764 | | 26,748 |
| Senomyx, Inc. * | 1,948 | | 26,025 |
| Symyx Technologies, Inc. * | 2,165 | | 19,377 |
|
|
| | | | 210,098 |
| Liquor - 0.14% | | | |
| Boston Beer Company, Inc. * | 583 | | 28,427 |
| Central European Distribution Corp. * (a) | 2,155 | | 94,518 |
|
|
| | | | 122,945 |
| Manufacturing - 1.84% | | | |
| Acuity Brands, Inc. | 2,641 | | 138,758 |
| American Railcar Industries, Inc. | 553 | | 14,511 |
| AptarGroup, Inc. | 4,200 | | 152,586 |
| Barnes Group, Inc. | 2,800 | | 88,088 |
| Blout International, Inc. * | 2,372 | | 32,496 |
| Ceradyne, Inc. * | 1,653 | | 119,479 |
| Coherent, Inc. * | 1,922 | | 57,833 |
| ESCO Technologies, Inc. * | 1,581 | | 51,967 |
| Force Protection, Inc. * (a) | 4,155 | | 71,591 |
| | | |
| Small Cap Index Fund (continued) | | |
| | Shares or | | |
| | Principal | | |
| | Amount | | Value |
|
|
| |
| COMMON STOCKS (continued) | | | |
| | | | |
| Manufacturing (continued) | | | |
| Freightcar America, Inc. (a) | 756 | $ | 34,247 |
| GenTek, Inc. * | 550 | | 16,912 |
| Goodman Global, Inc. * | 2,300 | | 53,797 |
| Hardinge, Inc. | 723 | | 25,211 |
| Hexcel Corp. * (a) | 5,736 | | 124,987 |
| Input/Output, Inc. * (a) | 4,320 | | 61,301 |
| Insteel Industries, Inc. (a) | 1,194 | | 22,567 |
| iRobot Corp. * (a) | 1,016 | | 22,413 |
| Kaydon Corp. | 1,712 | | 90,394 |
| Koppers Holdings, Inc. | 982 | | 36,069 |
| Lancaster Colony Corp. | 1,413 | | 57,467 |
| Mine Safety Appliances Company (a) | 1,703 | | 81,608 |
| Nordson Corp. | 2,052 | | 103,031 |
| Park-Ohio Holdings Corp. * | 535 | | 14,739 |
| Raven Industries, Inc. | 1,001 | | 40,791 |
| Reddy Ice Holdings, Inc. | 1,391 | | 40,242 |
| Smith & Wesson Holding Corp. * (a) | 1,825 | | 38,325 |
| Spartan Motors, Inc. | 1,984 | | 29,363 |
| Sturm Ruger & Company, Inc. * | 1,469 | | 26,794 |
|
|
| | | | 1,647,567 |
| Medical-Hospitals - 0.45% | | | |
| AmSurg Corp. * | 1,873 | | 44,184 |
| Centene Corp. * | 2,654 | | 53,637 |
| Cepheid, Inc. * | 3,373 | | 63,008 |
| EV3, Inc. * | 1,091 | | 16,703 |
| Hythiam, Inc. * (a) | 2,086 | | 15,019 |
| Medcath Corp. * | 639 | | 18,755 |
| MWI Veterinary Supply, Inc. * | 577 | | 21,909 |
| Northstar Neuroscience, Inc. * | 1,397 | | 15,870 |
| NxStage Medical, Inc. * (a) | 1,363 | | 16,928 |
| RehabCare Group, Inc. * | 1,256 | | 20,435 |
| Sunrise Senior Living, Inc. * | 2,697 | | 96,580 |
| Vital Images, Inc. * | 1,101 | | 20,412 |
|
|
| | | | 403,440 |
| Metal & Metal Products - 1.14% | | | |
| A. M. Castle & Company | 706 | | 20,566 |
| Ampco-Pittsburgh Corp. | 429 | | 18,245 |
| Brush Engineered Materials, Inc. * | 1,238 | | 59,795 |
| Dynamic Materials Corp. (a) | 683 | | 29,362 |
| Gibraltar Industries, Inc. | 1,419 | | 28,352 |
| Haynes International, Inc. * | 710 | | 59,306 |
| Kaiser Aluminum Corp. | 924 | | 62,758 |
| L.B. Foster Company * | 719 | | 27,006 |
| Ladish Company, Inc. * | 900 | | 47,232 |
| Matthews International Corp., Class A | 1,926 | | 83,088 |
| Metal Management, Inc. | 1,559 | | 73,133 |
| Mueller Industries, Inc. | 2,257 | | 78,182 |
| Mueller Water Products, Inc. (a) | 7,032 | | 86,916 |
| Quanex Corp. | 2,250 | | 97,447 |
| RBC Bearings, Inc. * | 1,301 | | 46,186 |
| RTI International Metals, Inc. * | 1,401 | | 97,678 |
| |
| The accompanying notes are an integral part of the financial statements. | 314 |
John Hancock Funds II
Portfolio of investments — August 31, 2007
(showing percentage of total net assets)
| | | |
| Small Cap Index Fund (continued) | | |
| | Shares or | | |
| | Principal | | |
| | Amount | | Value |
|
|
| |
| COMMON STOCKS (continued) | | | |
| | | | |
| Metal & Metal Products (continued) | | | |
| Sun Hydraulics, Inc. | 720 | $ | 19,937 |
| Universal Stainless & Alloy Products, Inc. * | 396 | | 12,838 |
| USEC, Inc. * | 5,311 | | 71,114 |
|
|
| | | | 1,019,141 |
| Mining - 0.47% | | | |
| AMCOL International Corp. | 1,572 | | 50,634 |
| Apex Silver Mines, Ltd. * | 3,556 | | 61,661 |
| Coeur d'Alene Mines Corp. * (a) | 16,867 | | 57,685 |
| Compass Minerals International, Inc. | 1,963 | | 66,879 |
| Hecla Mining Company * | 7,280 | | 54,600 |
| Idaho General Mines, Inc. * (a) | 3,144 | | 20,499 |
| Royal Gold, Inc. (a) | 1,470 | | 40,807 |
| Stillwater Mining Company * | 2,309 | | 21,682 |
| U.S. Gold Corp. * | 3,127 | | 18,637 |
| Uranium Resources, Inc. * (a) | 3,223 | | 24,978 |
|
|
| | | | 418,062 |
| Mobile Homes - 0.12% | | | |
| Fleetwood Enterprises, Inc. * (a) | 3,967 | | 36,972 |
| Skyline Corp. | 510 | | 15,264 |
| Winnebago Industries, Inc. (a) | 1,922 | | 51,260 |
|
|
| | | | 103,496 |
| Newspapers - 0.05% | | | |
| Lee Enterprises, Inc. | 2,820 | | 48,983 |
| | | | |
| Office Furnishings & Supplies - 0.51% | | | |
| Acco Brands Corp. * | 3,303 | | 74,879 |
| Herman Miller, Inc. | 3,861 | | 112,046 |
| IKON Office Solutions, Inc. | 6,565 | | 92,173 |
| Knoll, Inc. | 3,044 | | 57,866 |
| The Standard Register Company | 1,259 | | 16,103 |
| United Stationers, Inc. * | 1,671 | | 98,622 |
|
|
| | | | 451,689 |
| Paper - 0.45% | | | |
| Bowater, Inc. (a) | 3,394 | | 57,155 |
| Buckeye Technologies, Inc. * | 2,336 | | 36,371 |
| Chesapeake Corp. | 1,461 | | 14,318 |
| Mercer International, Inc. * | 2,138 | | 19,113 |
| Neenah Paper, Inc. (a) | 907 | | 31,464 |
| P.H. Glatfelter Company | 2,741 | | 40,457 |
| Potlatch Corp. | 2,373 | | 106,880 |
| Rock-Tenn Company, Class A | 2,125 | | 61,604 |
| Wausau-Mosinee Paper Corp. | 2,734 | | 30,703 |
|
|
| | | | 398,065 |
| Petroleum Services - 1.81% | | | |
| Atwood Oceanics, Inc. * | 1,667 | | 126,675 |
| Basic Energy Services, Inc. * | 2,538 | | 52,460 |
| Bronco Drilling Company, Inc. * (a) | 1,475 | | 21,756 |
| Complete Production Services, Inc. * | 2,633 | | 58,453 |
| Delek US Holdings, Inc. | 770 | | 21,113 |
| Dril-Quip, Inc. * | 1,627 | | 76,567 |
| Energy Infrastructure Acquisition Corp. * (a) | 1,364 | | 13,204 |
| | | |
| Small Cap Index Fund (continued) | | |
| | Shares or | | |
| | Principal | | |
| | Amount | | Value |
|
|
| |
| COMMON STOCKS (continued) | | | |
| | | | |
| Petroleum Services (continued) | | | |
| Exterran Holdings, Inc. * | 3,673 | $ | 284,661 |
| Flotek Industries, Inc. * | 1,120 | | 42,302 |
| Grey Wolf, Inc. * | 11,310 | | 75,098 |
| GulfMark Offshore, Inc. * | 1,421 | | 65,153 |
| Hercules Offshore, Inc. * (a) | 5,082 | | 129,286 |
| Hornbeck Offshore Services, Inc. * | 1,409 | | 53,753 |
| Newpark Resources, Inc. * | 5,545 | | 31,052 |
| PetroHawk Energy Corp. * | 10,356 | | 156,790 |
| Petroleum Development Corp. * | 934 | | 37,388 |
| Pioneer Drilling Company * | 3,097 | | 37,660 |
| Rentech, Inc. * (a) | 10,461 | | 24,374 |
| RPC, Inc. (a) | 2,030 | | 27,994 |
| Superior Well Services, Inc. * | 1,042 | | 22,497 |
| T-3 Energy Services, Inc. * | 346 | | 10,702 |
| Trico Marine Services, Inc. * | 674 | | 22,148 |
| W-H Energy Services, Inc. * | 1,857 | | 118,031 |
| Willbros Group, Inc. * (a) | 1,603 | | 45,573 |
| World Fuel Services Corp. | 1,754 | | 67,617 |
|
|
| | | | 1,622,307 |
| Pharmaceuticals - 2.18% | | | |
| Adams Respiratory Therapeutics, Inc. * (a) | 2,175 | | 83,868 |
| Akorn, Inc. * (a) | 3,473 | | 26,395 |
| Alexion Pharmaceuticals, Inc. * | 2,222 | | 134,364 |
| Alexza Pharmaceuticals, Inc. * | 1,195 | | 9,811 |
| Alkermes, Inc. * | 6,151 | | 103,644 |
| Allos Therapeutics, Inc. * (a) | 2,468 | | 11,649 |
| Altus Pharmaceuticals, Inc. * | 1,460 | | 15,301 |
| AMAG Pharmaceuticals, Inc. * (a) | 863 | | 47,163 |
| American Oriental Bioengineering, Inc. * (a) | 2,576 | | 23,957 |
| Array BioPharma, Inc. * | 2,935 | | 33,312 |
| Auxilium Pharmaceuticals, Inc. * | 1,593 | | 30,904 |
| Beijing Med-Pharm Corp. * (a) | 1,868 | | 17,503 |
| Bentley Pharmaceuticals, Inc. * | 1,256 | | 15,424 |
| Bionovo, Inc. * (a) | 2,708 | | 11,915 |
| Bradley Pharmaceuticals, Inc., Class A * | 758 | | 14,826 |
| Cadence Pharmaceuticals, Inc. * | 954 | | 13,699 |
| Caraco Pharmaceutical Labs * | 686 | | 10,146 |
| Cubist Pharmaceuticals, Inc. * | 3,390 | | 77,563 |
| CytRx Corp. * | 5,692 | | 20,605 |
| Encysive Pharmaceuticals, Inc. * (a) | 3,307 | | 6,085 |
| Enzon Pharmaceuticals, Inc. * (a) | 2,978 | | 24,152 |
| Indevus Pharmaceuticals, Inc. * (a) | 3,440 | | 23,358 |
| Isis Pharmaceuticals, Inc. * (a) | 5,072 | | 62,589 |
| Javelin Pharmaceuticals, Inc. * | 3,032 | | 16,191 |
| Ligand Pharmaceuticals, Inc., Class B * | 5,572 | | 34,936 |
| Medicis Pharmaceutical Corp., Class A (a) | 3,391 | | 103,561 |
| Minrad International, Inc. * | 3,400 | | 15,946 |
| Nastech Pharmaceutical Company, Inc. * (a) | 1,658 | | 22,947 |
| Noven Pharmaceuticals, Inc. * (a) | 1,552 | | 23,684 |
| Onyx Pharmaceuticals, Inc. * (a) | 2,920 | | 115,690 |
| OSI Pharmaceuticals, Inc. * | 3,512 | | 119,794 |
| |
| The accompanying notes are an integral part of the financial statements. | 315 |
John Hancock Funds II
Portfolio of investments — August 31, 2007
(showing percentage of total net assets)
| | | |
| Small Cap Index Fund (continued) | | |
| | Shares or | | |
| | Principal | | |
| | Amount | | Value |
|
|
| |
| COMMON STOCKS (continued) | | | |
| | | | |
| Pharmaceuticals (continued) | | | |
| Par Pharmaceutical Companies, Inc. * | 2,195 | $ | 49,146 |
| Penwest Pharmaceuticals Company * | 1,526 | | 18,846 |
| PharMerica Corp. * | 670 | | 11,879 |
| Pharmion Corp. * | 1,596 | | 65,452 |
| Poniard Pharmaceuticals, Inc. * | 1,368 | | 8,345 |
| POZEN, Inc. * | 1,581 | | 15,794 |
| Prestige Brands Holdings, Inc. * | 1,921 | | 21,073 |
| Regeneron Pharmaceuticals, Inc. * | 3,897 | | 75,836 |
| Rigel Pharmaceuticals, Inc. * | 2,068 | | 18,943 |
| Salix Pharmaceuticals, Ltd. * | 2,924 | | 33,685 |
| Santarus, Inc. * (a) | 3,257 | | 8,077 |
| Sciele Pharma, Inc. * (a) | 2,158 | | 49,807 |
| Somaxon Pharmaceuticals, Inc. * | 610 | | 7,527 |
| Supergen, Inc. * | 3,450 | | 14,007 |
| Trubion Pharmaceuticals Inc * | 520 | | 9,542 |
| United Therapeutics Corp. * | 1,264 | | 86,571 |
| Valeant Pharmaceuticals International * | 5,800 | | 91,466 |
| Vanda Pharmaceuticals, Inc. * | 1,638 | | 24,455 |
| ViroPharma, Inc. * | 4,272 | | 42,336 |
| XOMA, Ltd. * (a) | 8,532 | | 23,634 |
|
|
| | | | 1,947,403 |
| Photography - 0.02% | | | |
| CPI Corp. | 339 | | 15,174 |
| | | | |
| Plastics - 0.07% | | | |
| AEP Industries, Inc. * | 475 | | 17,584 |
| Spartech Corp. | 1,959 | | 42,432 |
|
|
| | | | 60,016 |
| Pollution Control - 0.03% | | | |
| Fuel Tech, Inc. * (a) | 1,061 | | 30,875 |
| | | | |
| Publishing - 0.55% | | | |
| American Greetings Corp., Class A | 3,324 | | 82,236 |
| Consolidated Graphics, Inc. * | 639 | | 42,353 |
| Courier Corp. | 717 | | 25,769 |
| GateHouse Media, Inc. (a) | 955 | | 12,434 |
| Martha Stewart Living | | | |
| Omnimedia, Inc., Class A * (a) | 1,685 | | 21,366 |
| Media General, Inc., Class A | 1,361 | | 37,999 |
| Multi-Color Corp. | 394 | | 14,637 |
| Playboy Enterprises, Inc., Class B * | 1,432 | | 15,823 |
| PRIMEDIA, Inc. (a) | 2,717 | | 39,532 |
| Scholastic Corp. * | 2,083 | | 70,989 |
| Sun-Times Media Group, Inc. | 4,291 | | 12,101 |
| Valassis Communications, Inc. * (a) | 2,918 | | 26,612 |
| VistaPrint, Ltd. * | 2,624 | | 86,277 |
|
|
| | | | 488,128 |
| Railroads & Equipment - 0.22% | | | |
| Genesee & Wyoming, Inc., Class A * | 2,167 | | 59,333 |
| Greenbrier Company, Inc. (a) | 989 | | 29,057 |
| Wabtec Corp. | 2,954 | | 110,686 |
|
|
| | | | 199,076 |
| | | |
| Small Cap Index Fund (continued) | �� | |
| | Shares or | | |
| | Principal | | |
| | Amount | | Value |
|
|
| |
| COMMON STOCKS (continued) | | | |
| | | | |
| Real Estate - 5.49% | | | |
| Acadia Realty Trust, REIT | 1,991 | $ | 49,715 |
| Alesco Financial, Inc., REIT (a) | 3,586 | | 19,580 |
| Alexander's, Inc., REIT * | 124 | | 49,569 |
| Alexandria Real Estate Equities, Inc., REIT | 1,766 | | 164,821 |
| American Campus Communities, Inc., REIT | 1,321 | | 37,437 |
| American Financial Realty Trust, REIT | 7,951 | | 65,834 |
| American Home Mortgage Investment Corp., | | | |
| REIT (a) | 2,689 | | 726 |
| Anthracite Capital, Inc., REIT | 3,654 | | 33,105 |
| Anworth Mortgage Asset Corp., REIT | 2,981 | | 16,038 |
| Ashford Hospitality Trust, Inc., REIT | 6,482 | | 70,719 |
| Associated Estates Realty Corp., REIT | 1,142 | | 16,148 |
| Avatar Holdings, Inc. * (a) | 375 | | 22,793 |
| BioMed Realty Trust, Inc., REIT | 3,990 | | 97,276 |
| Capital Lease Funding, Inc., REIT | 2,846 | | 27,464 |
| Capital Trust, Inc., Class A, REIT (a) | 781 | | 27,069 |
| CBRE Realty Finance Inc., REIT (a) | 1,995 | | 11,970 |
| Cedar Shopping Centers, Inc., REIT | 2,523 | | 33,405 |
| Corporate Office Properties Trust, REIT | 2,361 | | 101,688 |
| Cousins Properties, Inc., REIT (a) | 2,477 | | 68,043 |
| Crystal River Capital, Inc., REIT | 1,566 | | 24,993 |
| DCT Industrial Trust, Inc., REIT | 10,224 | | 104,489 |
| Deerfield Triarc Capital Corp., REIT | 3,232 | | 28,280 |
| DiamondRock Hospitality Company, REIT | 5,755 | | 103,302 |
| Digital Realty Trust, Inc., REIT | 3,222 | | 125,658 |
| EastGroup Properties, Inc., REIT | 1,478 | | 62,712 |
| Education Realty Trust, Inc., REIT (a) | 1,957 | | 26,752 |
| Entertainment Properties Trust, REIT | 1,627 | | 77,836 |
| Equity Inns, Inc., REIT | 3,359 | | 75,645 |
| Equity Lifestyle Properties, Inc., REIT | 1,249 | | 60,826 |
| Equity One, Inc., REIT | 2,220 | | 58,075 |
| Extra Space Storage, Inc., REIT | 3,985 | | 61,249 |
| FelCor Lodging Trust, Inc., REIT | 3,804 | | 83,460 |
| First Industrial Realty Trust, Inc., REIT | 2,754 | | 112,308 |
| First Potomac Realty Trust, REIT | 1,538 | | 32,590 |
| Franklin Street Properties Corp., REIT (a) | 3,681 | | 63,497 |
| Getty Realty Corp., REIT | 1,159 | | 31,606 |
| Glimcher Realty Trust, REIT (a) | 2,363 | | 52,837 |
| GMH Communities Trust, REIT | 2,239 | | 17,599 |
| Gramercy Captial Corp., REIT | 1,178 | | 29,627 |
| Grubb & Ellis Company * | 1,035 | | 9,377 |
| Healthcare Realty Trust, Inc., REIT | 2,913 | | 72,738 |
| Hersha Hospitality Trust, REIT | 2,676 | | 29,249 |
| Highwoods Properties, Inc., REIT | 3,448 | | 123,059 |
| Hilltop Holdings, Inc. * | 3,006 | | 36,132 |
| Home Properties, Inc., REIT (a) | 2,004 | | 101,843 |
| Impac Mortgage Holdings, Inc., REIT (a) | 5,004 | | 8,607 |
| Inland Real Estate Corp., REIT | 3,630 | | 56,192 |
| Investors Real Estate Trust, SBI, REIT (a) | 3,338 | | 34,882 |
| Jer Investors Trust, Inc., REIT | 1,766 | | 21,951 |
| Kite Realty Group Trust, REIT | 1,389 | | 23,585 |
| LaSalle Hotel Properties, REIT | 2,424 | | 100,935 |
| |
| The accompanying notes are an integral part of the financial statements. | 316 |
John Hancock Funds II
Portfolio of investments — August 31, 2007
(showing percentage of total net assets)
| | | |
| Small Cap Index Fund (continued) | | |
| | Shares or | | |
| | Principal | | |
| | Amount | | Value |
|
|
| |
| COMMON STOCKS (continued) | | | |
| | | | |
| Real Estate (continued) | | | |
| Lexington Corporate Property Trust, REIT (a) | 4,036 | $ | 83,464 |
| LTC Properties, Inc., REIT | 1,549 | | 34,976 |
| Luminent Mortgage Capital, Inc., REIT (a) | 3,011 | | 5,299 |
| Maguire Properties, Inc., REIT | 2,279 | | 59,277 |
| Medical Properties Trust, Inc., REIT (a) | 3,124 | | 42,080 |
| Meruelo Maddux Properties, Inc. * | 3,031 | | 18,216 |
| MFA Mortgage Investments, Inc., REIT | 5,116 | | 39,649 |
| Mid-America Apartment Communities, Inc., | | | |
| REIT | 1,556 | | 77,162 |
| Mission West Properties, Inc., REIT | 1,413 | | 17,422 |
| National Health Investments, Inc., REIT | 1,448 | | 43,788 |
| National Retail Properties, Inc., REIT | 4,065 | | 95,487 |
| Nationwide Health Properties, Inc., REIT | 5,401 | | 149,878 |
| Newcastle Investment Corp., REIT | 2,562 | | 42,632 |
| NorthStar Realty Finance Corp., REIT (a) | 3,773 | | 40,032 |
| Novastar Financial, Inc. (a) | 1,148 | | 9,747 |
| Omega Healthcare Investors, REIT | 4,150 | | 61,793 |
| Parkway Properties, Inc., REIT | 1,004 | | 46,465 |
| Pennsylvania Real Estate | | | |
| Investment Trust, REIT | 1,941 | | 73,428 |
| Post Properties, Inc., REIT (a) | 2,610 | | 104,165 |
| PS Business Parks, Inc., REIT | 982 | | 55,483 |
| RAIT Investment Trust, REIT (a) | 3,857 | | 34,134 |
| Ramco-Gershenson Properties Trust, REIT | 1,079 | | 34,798 |
| Realty Income Corp., REIT (a) | 6,115 | | 165,105 |
| Redwood Trust, Inc., REIT (a) | 1,302 | | 48,604 |
| Republic Property Trust, REIT | 1,699 | | 24,415 |
| Resource Capital Corp., REIT | 1,567 | | 18,804 |
| Saul Centers, Inc., REIT | 615 | | 30,787 |
| Senior Housing Properties Trust, REIT | 5,100 | | 103,734 |
| Sovran Self Storage, Inc., REIT | 1,277 | | 57,605 |
| Strategic Hotel Cap, Inc., REIT | 4,518 | | 92,935 |
| Sun Communities, Inc., REIT | 1,085 | | 30,933 |
| Sunstone Hotel Investors, Inc., REIT | 3,780 | | 101,909 |
| Tanger Factory Outlet Centers, Inc., REIT | 1,908 | | 72,638 |
| Thomas Properties Group, Inc. | 1,659 | | 21,219 |
| Universal Health Realty Income Trust, REIT | 823 | | 27,587 |
| Urstadt Biddle Properties, Inc., REIT | 1,581 | | 26,782 |
| U-Store-It Trust, REIT | 2,886 | | 39,134 |
| Washington Real Estate Investment Trust, | | | |
| REIT (a) | 2,734 | | 89,539 |
| Winthrop Realty Trust, REIT (a) | 3,619 | | 22,981 |
|
|
| | | | 4,909,377 |
| Retail Grocery - 0.40% | | | |
| Ingles Markets, Inc. | 830 | | 24,991 |
| Nash Finch Company (a) | 834 | | 31,283 |
| Pathmark Stores, Inc. * | 1,876 | | 24,069 |
| PriceSmart, Inc. * | 879 | | 21,061 |
| Ruddick Corp. | 2,555 | | 83,242 |
| The Great Atlantic & Pacific Tea Company, | | | |
| Inc. * (a) | 1,207 | | 37,852 |
| United Natural Foods, Inc. * | 2,638 | | 70,804 |
| | | |
| Small Cap Index Fund (continued) | | |
| | Shares or | | |
| | Principal | | |
| | Amount | | Value |
|
|
| |
| COMMON STOCKS (continued) | | | |
| | | | |
| Retail Grocery (continued) | | | |
| Weis Markets, Inc. | 831 | $ | 35,716 |
| Wild Oats Markets, Inc. * (a) | 1,722 | | 31,892 |
|
|
| | | | 360,910 |
| Retail Trade - 3.12% | | | |
| 99 Cents Only Stores * | 2,854 | | 35,247 |
| A.C. Moore Arts & Crafts, Inc. * | 1,311 | | 24,503 |
| Aaron Rents, Inc., Class B | 2,819 | | 72,138 |
| Aeropostale, Inc. * | 4,718 | | 97,652 |
| Big 5 Sporting Goods Corp. | 1,311 | | 27,269 |
| Bon-Ton Stores, Inc. (a) | 663 | | 19,108 |
| Books-A-Million, Inc. | 909 | | 12,108 |
| Borders Group, Inc. (a) | 3,559 | | 53,385 |
| Build A Bear Workshop, Inc. * | 1,003 | | 16,509 |
| Building Materials Holding Corp. | 1,684 | | 24,923 |
| Cabela's, Inc. * | 2,379 | | 56,216 |
| Cache, Inc. * | 794 | | 13,323 |
| Casey's General Stores, Inc. | 3,142 | | 89,107 |
| Cash America International, Inc. | 1,828 | | 65,918 |
| Casual Male Retail Group, Inc. * (a) | 2,287 | | 23,099 |
| Cato Corp., Class A | 1,873 | | 41,337 |
| Charlotte Russe Holding, Inc. * | 1,569 | | 27,410 |
| Charming Shoppes, Inc. * | 7,580 | | 68,523 |
| Children's Place Retail Stores, Inc. * | 1,372 | | 39,459 |
| Christopher & Banks Corp. (a) | 2,237 | | 27,023 |
| Citi Trends, Inc. * | 868 | | 18,870 |
| Collective Brands, Inc. * | 3,968 | | 93,764 |
| Conn's, Inc. * (a) | 783 | | 17,226 |
| CSS Industries, Inc. | 531 | | 20,422 |
| DSW, Inc., Class A * (a) | 1,005 | | 30,602 |
| Eddie Bauer Holdings, Inc. * | 1,939 | | 15,124 |
| Finish Line, Inc. | 2,803 | | 15,809 |
| First Cash Financial Services, Inc. * | 1,649 | | 35,322 |
| Fossil, Inc. * | 2,664 | | 89,271 |
| Fred's, Inc., Class A | 2,286 | | 23,774 |
| FTD Group, Inc. | 1,293 | | 22,977 |
| Gaiam, Inc., Class A * | 1,208 | | 24,993 |
| Genesco, Inc. * | 1,382 | | 63,420 |
| Guitar Center, Inc. * | 1,794 | | 101,522 |
| Haverty Furniture Companies, Inc. | 1,443 | | 15,469 |
| Hibbett Sports, Inc. * | 1,945 | | 48,508 |
| Hot Topic, Inc. * | 2,504 | | 20,958 |
| J. Crew Group, Inc. * | 2,372 | | 118,149 |
| Jo-Ann Stores, Inc. * | 1,526 | | 34,335 |
| Longs Drug Stores Corp. | 1,998 | | 105,355 |
| Marinemax, Inc. * (a) | 1,074 | | 19,697 |
| New York & Company, Inc. * | 1,510 | | 9,966 |
| NexCen Brands, Inc. * | 2,359 | | 16,112 |
| Pacific Sunwear of California, Inc. * | 4,274 | | 59,879 |
| Pantry, Inc. * | 1,416 | | 47,195 |
| Pier 1 Imports, Inc. * (a) | 5,416 | | 33,471 |
| Regis Corp. | 2,690 | | 88,797 |
| |
| The accompanying notes are an integral part of the financial statements. | 317 |
John Hancock Funds II
Portfolio of investments — August 31, 2007
(showing percentage of total net assets)
| | | |
| Small Cap Index Fund (continued) | | |
| | Shares or | | |
| | Principal | | |
| | Amount | | Value |
|
|
| |
| COMMON STOCKS (continued) | | | |
| | | | |
| Retail Trade (continued) | | | |
| Rent-A-Center, Inc. * | 4,292 | $ | 82,492 |
| Retail Ventures, Inc. * | 1,746 | | 20,201 |
| School Specialty, Inc. * | 1,315 | | 47,919 |
| Shoe Carnival, Inc. * | 680 | | 11,730 |
| Sonic Automotive, Inc. | 1,896 | | 50,434 |
| Spectrum Brands, Inc. * | 2,248 | | 12,679 |
| Stein Mart, Inc. | 1,786 | | 15,681 |
| Systemax, Inc. * (a) | 593 | | 11,030 |
| Talbots, Inc. (a) | 1,413 | | 30,069 |
| The Buckle, Inc. | 871 | | 32,584 |
| The Dress Barn, Inc. * | 2,883 | | 50,452 |
| The Men's Wearhouse, Inc. | 3,298 | | 167,143 |
| The Wet Seal, Inc., Class A * | 4,736 | | 21,454 |
| Tuesday Morning Corp. (a) | 1,988 | | 20,973 |
| Tween Brands, Inc. * | 1,866 | | 55,047 |
| ValueVision Media, Inc., Class A * | 2,095 | | 17,661 |
| Zale Corp. * | 2,982 | | 67,006 |
| Zumiez, Inc. * (a) | 1,058 | | 51,345 |
|
|
| | | | 2,791,144 |
| Sanitary Services - 0.24% | | | |
| Casella Waste Systems, Inc., Class A * | 1,658 | | 18,520 |
| Darling International, Inc. * | 4,992 | | 42,182 |
| Insituform Technologies, Inc., Class A * (a) | 1,706 | | 28,132 |
| Waste Connections, Inc. * | 4,142 | | 126,000 |
|
|
| | | | 214,834 |
| Semiconductors - 2.78% | | | |
| Actel Corp. * | 1,752 | | 19,710 |
| Advanced Analogic Technologies, Inc. * | 2,449 | | 22,261 |
| Advanced Energy Industries, Inc. * | 2,189 | | 35,527 |
| American Superconductor Corp. * (a) | 2,141 | | 38,581 |
| Amis Holdings, Inc. * | 4,093 | | 42,444 |
| Amkor Technology, Inc. * | 6,371 | | 73,394 |
| Applied Micro Circuits Corp. * | 17,310 | | 49,334 |
| Asyst Technologies, Inc. * | 3,246 | | 19,054 |
| ATMI, Inc. * | 2,107 | | 63,547 |
| Axcelis Technologies, Inc. * | 6,258 | | 29,475 |
| Brooks Automation, Inc. * | 4,620 | | 65,373 |
| Cirrus Logic, Inc. * | 5,409 | | 36,835 |
| Conexant Systems, Inc. * (a) | 30,046 | | 33,652 |
| Credence Systems Corp. * | 5,696 | | 16,746 |
| Cymer, Inc. * | 2,183 | | 86,534 |
| Diodes, Inc. * | 1,818 | | 55,104 |
| DSP Group, Inc. * | 1,769 | | 30,834 |
| Emulex Corp. * | 5,190 | | 101,413 |
| Entegris, Inc. * (a) | 8,217 | | 77,569 |
| Exar Corp. * | 2,311 | | 30,829 |
| FormFactor, Inc. * | 2,898 | | 131,453 |
| Genesis Microchip, Inc. * | 2,372 | | 18,881 |
| Hittite Microwave Corp. * | 992 | | 42,031 |
| IXYS Corp. * | 1,764 | | 17,993 |
| Kulicke & Soffa Industries, Inc. * (a) | 3,554 | | 30,351 |
| | | |
| Small Cap Index Fund (continued) | | |
| | Shares or | | |
| | Principal | | |
| | Amount | | Value |
|
|
| |
| COMMON STOCKS (continued) | | | |
| | | | |
| Semiconductors (continued) | | | |
| Lattice Semiconductor Corp. * | 7,080 | $ | 35,329 |
| LTX Corp. * | 4,058 | | 16,557 |
| Mattson Technology, Inc. * | 3,282 | | 34,559 |
| Micrel, Inc. | 3,407 | | 37,307 |
| Microsemi Corp. * (a) | 4,626 | | 117,315 |
| Microtune, Inc. * | 3,663 | | 21,795 |
| MIPS Technologies, Inc., Class A * | 2,796 | | 21,865 |
| MKS Instruments, Inc. * | 3,080 | | 67,883 |
| Netlogic Microsystems, Inc. * (a) | 1,006 | | 29,506 |
| OmniVision Technologies, Inc. * (a) | 3,348 | | 69,873 |
| ON Semiconductor Corp. * | 14,779 | | 173,210 |
| Pericom Semiconductor Corp. * | 1,897 | | 21,853 |
| Photronics, Inc. * | 2,585 | | 29,934 |
| PLX Technology, Inc. * | 1,897 | | 20,526 |
| PMC-Sierra, Inc. * | 12,981 | | 99,694 |
| Rudolph Technologies, Inc. * | 1,646 | | 21,118 |
| Semitool, Inc. * (a) | 1,593 | | 15,404 |
| Semtech Corp. * | 4,420 | | 78,853 |
| Silicon Image, Inc. * | 5,371 | | 31,044 |
| Skyworks Solutions, Inc. * | 9,742 | | 76,864 |
| Spansion, Inc. * | 5,470 | | 49,777 |
| Techwell, Inc. * | 902 | | 9,209 |
| Tessera Technologies, Inc. * | 2,913 | | 106,703 |
| Triquint Semiconductor, Inc. * | 8,592 | | 37,891 |
| Ultra Clean Holdings, Inc. * | 1,291 | | 19,288 |
| Ultratech, Inc. * | 1,527 | | 21,882 |
| Veeco Instruments, Inc. * | 1,925 | | 33,880 |
| Volterra Semiconductor Corp. * (a) | 1,472 | | 15,986 |
|
|
| | | | 2,484,030 |
| Software - 3.17% | | | |
| ACI Worldwide, Inc. * | 2,278 | | 59,182 |
| Actuate Corp. * | 3,941 | | 27,942 |
| Advent Software, Inc. * | 1,142 | | 45,760 |
| Allscripts Healthcare Solution, Inc. * (a) | 3,374 | | 76,286 |
| American Reprographics Company * | 1,797 | | 43,901 |
| Ansoft Corp. * | 968 | | 28,934 |
| ANSYS, Inc. * | 4,731 | | 156,738 |
| AsiaInfo Holdings, Inc. * | 2,135 | | 17,251 |
| Aspen Technology, Inc. * | 5,401 | | 70,861 |
| Avid Technology, Inc. * | 2,523 | | 77,784 |
| Blackbaud, Inc. | 2,699 | | 68,204 |
| Blackboard, Inc. * | 1,735 | | 72,471 |
| Borland Software Corp. * | 4,711 | | 21,482 |
| Bottomline Technologies, Inc. * | 1,526 | | 20,113 |
| CIBER, Inc. * | 3,422 | | 27,136 |
| Commvault Systems, Inc. * | 2,193 | | 41,777 |
| Concur Technologies, Inc. * | 2,323 | | 62,210 |
| DivX, Inc. * (a) | 1,489 | | 20,757 |
| Double-Take Software, Inc. * | 560 | | 9,677 |
| Eclipsys Corp. * | 2,814 | | 64,975 |
| Epicor Software Corp. * | 3,592 | | 47,774 |
| |
| The accompanying notes are an integral part of the financial statements. | 318 |
John Hancock Funds II
Portfolio of investments — August 31, 2007
(showing percentage of total net assets)
| | | |
| Small Cap Index Fund (continued) | | |
| | Shares or | | |
| | Principal | | |
| | Amount | | Value |
|
|
| |
| COMMON STOCKS (continued) | | | |
| | | | |
| Software (continued) | | | |
| EPIQ Systems, Inc. * | 1,654 | $ | 26,844 |
| FARO Technologies, Inc. * | 914 | | 36,752 |
| i2 Technologies, Inc. * (a) | 1,052 | | 16,706 |
| Igate Corp. * | 1,508 | | 12,501 |
| InfoUSA, Inc. | 2,079 | | 21,081 |
| Innerworkings, Inc. * (a) | 1,521 | | 21,461 |
| Interactive Intelligence, Inc. * | 892 | | 17,439 |
| iPass, Inc. * (a) | 3,526 | | 15,867 |
| JDA Software Group, Inc. * | 1,620 | | 33,615 |
| Lawson Software, Inc. * (a) | 7,932 | | 77,813 |
| Macrovision Corp. * | 3,239 | | 76,861 |
| Magma Design Automation, Inc. * | 2,386 | | 32,784 |
| Manhattan Associates, Inc. * | 1,666 | | 48,114 |
| Mantech International Corp. * | 1,208 | | 43,198 |
| MicroStrategy, Inc., Class A * | 585 | | 40,505 |
| Midway Games, Inc. * (a) | 1,534 | | 8,299 |
| Monolithic Power Systems, Inc. * | 1,343 | | 27,505 |
| MSC Software Corp. * | 2,744 | | 34,712 |
| Nuance Communications, Inc. * (a) | 8,033 | | 151,020 |
| Omnicell, Inc. * | 2,070 | | 49,970 |
| Omniture, Inc. * (a) | 1,721 | | 42,698 |
| OpenTV Corp., Class A * (a) | 5,781 | | 7,573 |
| Opsware, Inc. * | 5,378 | | 76,152 |
| Packeteer, Inc. * (a) | 2,395 | | 17,651 |
| PDF Solutions, Inc. * | 1,381 | | 13,479 |
| Progress Software Corp. * | 2,522 | | 76,971 |
| Quality Systems, Inc. (a) | 1,053 | | 38,803 |
| Secure Computing Corp. * | 3,039 | | 27,290 |
| Smith Micro Software, Inc. * (a) | 1,662 | | 27,406 |
| Solera Holdings, Inc. * | 1,623 | | 29,668 |
| SPSS, Inc. * | 1,133 | | 46,170 |
| Sybase, Inc. * | 5,536 | | 127,605 |
| Synchronoss Technologies, Inc. * (a) | 1,128 | | 39,187 |
| Take-Two Interactive Software, Inc. * (a) | 4,436 | | 70,887 |
| Taleo Corp. * | 1,069 | | 24,640 |
| THQ, Inc. * | 4,069 | | 117,147 |
| Tradestation Group, Inc. * | 1,889 | | 20,911 |
| TriZetto Group, Inc. * | 2,773 | | 43,342 |
| Ultimate Software Group, Inc. * | 1,535 | | 47,785 |
| Visual Sciences, Inc. * | 1,298 | | 23,922 |
| Websense, Inc. * | 2,759 | | 56,753 |
|
|
| | | | 2,830,302 |
| Steel - 0.45% | | | |
| Claymont Steel, Inc. * | 586 | | 12,277 |
| Northwest Pipe Company * | 563 | | 20,989 |
| Olympic Steel, Inc. | 606 | | 14,805 |
| Ryerson, Inc. | 1,614 | | 53,811 |
| Schnitzer Steel Industries, Inc. | 1,331 | | 77,770 |
| Texas Industries, Inc. (a) | 1,663 | | 122,596 |
| Wheeling-Pittsburgh Corp. * | 878 | | 15,909 |
| | | |
| Small Cap Index Fund (continued) | | |
| | Shares or | | |
| | Principal | | |
| | Amount | | Value |
|
|
| |
| COMMON STOCKS (continued) | | | |
| | | | |
| Steel (continued) | | | |
| Worthington Industries, Inc. (a) | 4,180 | $ | 88,449 |
|
|
| | | | 406,606 |
| Telecommunications Equipment & | | | |
| Services - 2.62% | | | |
| ADTRAN, Inc. (a) | 3,567 | | 95,346 |
| Alaska Communications Systems Group, Inc. | 2,669 | | 36,459 |
| Andrew Corp. * | 9,453 | | 133,098 |
| Arris Group, Inc. * | 6,628 | | 100,613 |
| Aruba Networks, Inc. * | 443 | | 8,005 |
| Atheros Communications, Inc. * | 3,356 | | 100,378 |
| C-COR, Inc. * | 3,047 | | 35,071 |
| Comtech Telecommunications Corp. * | 1,406 | | 59,839 |
| Consolidated Communications Holdings, Inc. | 1,320 | | 24,526 |
| CT Communications, Inc. | 1,248 | | 39,312 |
| Ditech Networks, Inc. * | 2,315 | | 11,876 |
| Eschelon Telecom, Inc. * | 687 | | 20,610 |
| Fairpoint Communications, Inc. | 2,205 | | 36,890 |
| FiberTower Corp. * (a) | 6,346 | | 23,861 |
| Finisar Corp. * (a) | 16,360 | | 61,841 |
| General Communication, Inc., Class A * | 3,340 | | 42,251 |
| GeoEye, Inc. * | 1,164 | | 27,424 |
| Global Crossing, Ltd. * (a) | 1,485 | | 28,274 |
| Globalstar, Inc. * (a) | 1,216 | | 11,309 |
| Golden Telecom, Inc. (a) | 953 | | 65,385 |
| Harmonic, Inc. * | 4,851 | | 48,364 |
| Harris Stratex Networks, Inc., Class A * | 1,424 | | 24,365 |
| Hughes Communications, Inc. * | 416 | | 21,216 |
| Basis, Inc. * | 2,199 | | 21,264 |
| ICO Global Communications Holdings, Ltd. * (a) | 6,523 | | 22,961 |
| InterDigital, Inc. * | 2,852 | | 65,910 |
| Iowa Telecommunications Services, Inc. | 1,961 | | 36,298 |
| J2 Global Communications, Inc. * | 2,991 | | 101,694 |
| Loral Space & Communications, Inc. * | 711 | | 28,497 |
| Mastec, Inc. * | 2,617 | | 38,679 |
| MRV Communications, Inc. * | 8,024 | | 20,220 |
| Network Equipment Technologies, Inc. * | 1,847 | | 19,689 |
| Nextwave Wireless, Inc. * (a) | 1,860 | | 12,295 |
| NTELOS Holdings Corp. | 1,694 | | 45,365 |
| Oplink Communications, Inc. * | 1,438 | | 18,737 |
| OpNext, Inc. * | 1,175 | | 14,112 |
| Optium Corp. * (a) | 732 | | 5,819 |
| Orbcomm, Inc. * (a) | 1,455 | | 11,771 |
| PAETEC Holding Corp. * | 4,306 | | 51,371 |
| Plantronics, Inc. | 2,922 | | 82,985 |
| Polycom, Inc. * | 5,562 | | 168,584 |
| Powerwave Technologies, Inc. * (a) | 7,955 | | 54,492 |
| Premiere Global Services, Inc. * | 4,318 | | 56,479 |
| RCN Corp. * (a) | 1,898 | | 27,312 |
| SAVVIS, Inc. * | 1,677 | | 66,627 |
| Shenandoah Telecommunications Company | 1,608 | | 33,028 |
| Sirenza Microdevices, Inc. * | 2,422 | | 37,880 |
| Sonus Networks, Inc. * | 15,360 | | 88,781 |
| |
| The accompanying notes are an integral part of the financial statements. | 319 |
John Hancock Funds II
Portfolio of investments — August 31, 2007
(showing percentage of total net assets)
| | | |
| Small Cap Index Fund (continued) | | |
| | Shares or | | |
| | Principal | | |
| | Amount | | Value |
|
|
| |
| COMMON STOCKS (continued) | | | |
| | | | |
| Telecommunications Equipment & | | | |
| Services (continued) | | | |
| SureWest Communications | 949 | $ | 27,531 |
| Symmetricom, Inc. * | 3,036 | | 15,150 |
| Tekelec, Inc. * | 3,718 | | 45,731 |
| UTStarcom, Inc. * (a) | 5,833 | | 17,732 |
| Viasat, Inc. * | 1,484 | | 45,292 |
| Vonage Holdings Corp. * (a) | 3,608 | | 7,613 |
|
|
| | | | 2,346,212 |
| Telephone - 0.24% | | | |
| Atlantic Tele-Network, Inc. | 662 | | 22,164 |
| Cbeyond Communications, Inc. * | 1,257 | | 48,847 |
| Centennial Communications Corp., Class A * | 1,621 | | 15,237 |
| Cincinnati Bell, Inc. * | 15,093 | | 73,654 |
| IDT Corp. (a) | 3,061 | | 27,549 |
| North Pittsburgh Systems, Inc. | 1,031 | | 23,806 |
|
|
| | | | 211,257 |
| Tires & Rubber - 0.14% | | | |
| Cooper Tire & Rubber Company | 3,751 | | 91,674 |
| Myers Indiana, Inc. | 1,716 | | 36,551 |
|
|
| | | | 128,225 |
| Tobacco - 0.21% | | | |
| Alliance One International, Inc. * | 5,883 | | 45,299 |
| Schweitzer Mauduit International, Inc. | 1,015 | | 23,132 |
| Universal Corp. | 1,639 | | 80,524 |
| Vector Group, Ltd. | 1,823 | | 41,893 |
|
|
| | | | 190,848 |
| Toys, Amusements & Sporting Goods - 0.15% | | | |
| Jakks Pacific, Inc. * | 1,732 | | 38,918 |
| Marvel Entertainment, Inc. * | 3,285 | | 74,241 |
| Russ Berrie & Company, Inc. * | 1,181 | | 17,668 |
|
|
| | | | 130,827 |
| Transportation - 0.92% | | | |
| American Commercial Lines, Inc. * (a) | 3,798 | | 98,102 |
| Arlington Tankers, Ltd. (a) | 882 | | 21,838 |
| Atlas Air Worldwide Holdings, Inc. * | 823 | | 41,759 |
| Bristow Group, Inc. * | 1,232 | | 53,407 |
| Double Hull Tankers, Inc. * | 1,357 | | 20,925 |
| Dynamex, Inc. * | 763 | | 19,167 |
| Eagle Bulk Shipping, Inc. (a) | 2,558 | | 67,429 |
| Genco Shipping & Trading, Ltd. (a) | 1,085 | | 60,868 |
| General Maritime Corp. (a) | 1,735 | | 44,867 |
| Golar LNG, Ltd. (a) | 2,155 | | 41,204 |
| Horizon Lines, Inc. (a) | 2,064 | | 58,225 |
| Knightsbridge Tankers, Ltd. | 1,091 | | 28,180 |
| Marten Transport, Ltd. * | 1,017 | | 15,926 |
| Nordic American Tanker Shipping, Ltd. (a) | 1,626 | | 59,967 |
| Pacer International, Inc. | 2,262 | | 48,904 |
| PHI, Inc. * | 913 | | 27,719 |
| Saia, Inc. * | 787 | | 14,788 |
| Ship Finance International, Ltd. (a) | 1,902 | | 54,721 |
| | | | |
| Small Cap Index Fund (continued) | | |
| | | Shares or | | |
| | | Principal | | |
| | | Amount | | Value |
| |
|
| |
| COMMON STOCKS (continued) | | | | |
| | | | | |
| Transportation (continued) | | | | |
| Star Maritime Acquisition Corp. * | | 1,234 | $ | 15,450 |
| TBS International Ltd * | | 307 | | 11,209 |
| Ultrapetrol Bahamas Ltd. * | | 962 | | 17,335 |
|
|
| | | | | 821,990 |
| Travel Services - 0.04% | | | | |
| Ambassadors Group, Inc. | | 986 | | 38,227 |
| | | | | |
| Trucking & Freight - 0.52% | | | | |
| Arkansas Best Corp. | | 1,374 | | 49,327 |
| Celadon Group, Inc. * | | 1,577 | | 24,601 |
| Forward Air Corp. | | 1,850 | | 64,824 |
| Heartland Express, Inc. | | 3,545 | | 55,196 |
| Hub Group, Inc., Class A * | | 2,367 | | 78,987 |
| Knight Transportation, Inc. (a) | | 3,459 | | 63,611 |
| Old Dominion Freight Lines, Inc. * | | 1,823 | | 52,502 |
| Wabash National Corp. (a) | | 1,930 | | 25,264 |
| Werner Enterprises, Inc. | | 2,825 | | 52,573 |
|
|
| | | | | 466,885 |
| Utility Service - 0.08% | | | | |
| Consolidated Water Co., Ltd. * (a) | | 892 | | 26,323 |
| ENGlobal Corp. * (a) | | 978 | | 8,968 |
| SJW Corp. (a) | | 957 | | 32,835 |
|
|
| | | | | 68,126 |
|
| TOTAL COMMON STOCKS (Cost $78,843,220) | | $ | 82,453,429 |
|
| |
| SHORT TERM INVESTMENTS - 25.14% | | | |
| Federal Home Loan Bank Discount Notes | | | | |
| zero coupon due 09/04/2007 | $ | 3,594,000 | $ | 3,592,647 |
| Federal Home Loan Mortgage Corp. Discount Notes | | | |
| zero coupon due 10/15/2007 | | 1,900,000 | | 1,888,064 |
| Federal Home Loan Mortgage Corp. Discount Notes | | | |
| zero coupon due 09/10/2007 | | 400,000 | | 399,485 |
| John Hancock Cash Investment Trust (c) | | 15,900,759 | | 15,900,759 |
| U.S. Treasury Bill | | | | |
| zero coupon due 10/18/2007 **** | | 700,000 | | 695,595 |
|
| TOTAL SHORT TERM INVESTMENTS | | | | |
| (Cost $22,476,550) | | | $ | 22,476,550 |
|
| Total Investments (Small Cap Index Fund) | | | |
| (Cost $101,337,998) - 117.39% | | | $ | 104,947,976 |
| Liabilities in Excess of Other Assets - (17.39)% | | | (15,545,713) |
|
|
| TOTAL NET ASSETS - 100.00% | | | $ | 89,402,263 |
|
|
| |
| |
| |
| Small Cap Opportunities Fund | | | |
| | | Shares or | | |
| | | Principal | | |
| | | Amount | | Value |
| |
|
| |
| COMMON STOCKS - 97.43% | | | | |
| | | | | |
| Aluminum - 0.79% | | | | |
| Century Aluminum Company * | | 36,708 | $ | 1,805,299 |
| |
| The accompanying notes are an integral part of the financial statements. | 320 |
John Hancock Funds II
Portfolio of investments — August 31, 2007
(showing percentage of total net assets)
| | | |
| Small Cap Opportunities Fund (continued) | |
| | Shares or | | |
| | Principal | | |
| | Amount | | Value |
|
|
| |
| COMMON STOCKS (continued) | | | |
| | | | |
| Apparel & Textiles - 2.44% | | | |
| Interface, Inc., Class A | 110,500 | $ | 1,993,420 |
| Wolverine World Wide, Inc. | 135,814 | | 3,570,550 |
|
|
| | | | 5,563,970 |
| Auto Parts - 2.41% | | | |
| BorgWarner, Inc. | 27,310 | | 2,307,695 |
| Commercial Vehicle Group, Inc. * | 55,812 | | 793,646 |
| Noble International, Ltd. | 120,702 | | 2,403,177 |
|
|
| | | | 5,504,518 |
| Automobiles - 2.26% | | | |
| Penske Auto Group, Inc. | 125,614 | | 2,475,852 |
| Rush Enterprises, Inc., Class A * | 19,628 | | 497,766 |
| Rush Enterprises, Inc., Class B * | 94,165 | | 2,194,045 |
|
|
| | | | 5,167,663 |
| Banking - 5.02% | | | |
| Bank of the Ozarks, Inc. (a) | 45,245 | | 1,384,044 |
| First Midwest BanCorp, Inc. | 39,000 | | 1,337,310 |
| IBERIABANK Corp. | 26,100 | | 1,309,437 |
| Mercantile Bank Corp. | 13,545 | | 303,950 |
| Silver State Bancorp * | 53,400 | | 990,570 |
| Sterling Financial Corp., Spokane | 67,100 | | 1,709,037 |
| SVB Financial Group * | 28,000 | | 1,393,280 |
| UCBH Holdings, Inc. | 69,100 | | 1,148,442 |
| Virginia Commerce Bancorp, Inc. * | 39,400 | | 577,210 |
| Wintrust Financial Corp. | 29,900 | | 1,289,886 |
|
|
| | | | 11,443,166 |
| Biotechnology - 0.76% | | | |
| Techne Corp. * | 27,400 | | 1,726,474 |
| | | | |
| Building Materials & Construction - 0.30% | | | |
| Builders FirstSource, Inc. * | 52,949 | | 693,632 |
| | | | |
| Computers & Business Equipment - 3.69% | | | |
| CACI International, Inc., Class A * | 14,292 | | 729,178 |
| Digi International, Inc. * | 140,002 | | 1,981,028 |
| Komag, Inc. * | 48,700 | | 1,565,218 |
| NETGEAR, Inc. * | 116,848 | | 3,278,755 |
| Sonic Solutions * (a) | 113,005 | | 858,838 |
|
|
| | | | 8,413,017 |
| Construction & Mining Equipment - 1.04% | | | |
| Pason Systems, Inc. | 154,772 | | 2,384,377 |
| | | | |
| Crude Petroleum & Natural Gas - 2.11% | | | |
| Carrizo Oil & Gas, Inc. * (a) | 45,300 | | 1,778,931 |
| Southwestern Energy Company * | 81,646 | | 3,036,415 |
|
|
| | | | 4,815,346 |
| Domestic Oil - 0.79% | | | |
| Oil States International, Inc. * | 42,976 | | 1,813,587 |
| | | | |
| Drugs & Health Care - 2.24% | | | |
| Qiagen NV * (a) | 126,200 | | 2,147,924 |
| West Pharmaceutical Services, Inc. | 73,900 | | 2,959,695 |
|
|
| | | | 5,107,619 |
| | | |
| Small Cap Opportunities Fund (continued) | |
| | Shares or | | |
| | Principal | | |
| | Amount | | Value |
|
|
| |
| COMMON STOCKS (continued) | | | |
| | | | |
| Electrical Equipment - 4.95% | | | |
| AMETEK, Inc. | 132,242 | $ | 5,288,358 |
| Anixter International, Inc. * (a) | 45,200 | | 3,470,004 |
| FLIR Systems, Inc. * | 51,300 | | 2,526,012 |
|
|
| | | | 11,284,374 |
| Electrical Utilities - 1.05% | | | |
| Allete, Inc. (a) | 26,741 | | 1,126,063 |
| ITC Holdings Corp. | 28,400 | | 1,263,232 |
|
|
| | | | 2,389,295 |
| Electronics - 1.05% | | | |
| Syntax-Brillian Corp. * (a) | 173,200 | | 1,125,800 |
| TTM Technologies, Inc. * | 107,932 | | 1,260,646 |
|
|
| | | | 2,386,446 |
| Energy - 0.69% | | | |
| New Jersey Resources Corp. | 31,945 | | 1,564,666 |
| | | | |
| Financial Services - 2.07% | | | |
| Affiliated Managers Group, Inc. * (a) | 36,820 | | 4,169,865 |
| Delphi Financial Group, Inc. | 4,700 | | 189,410 |
| RAM Holdings, Ltd. * | 39,200 | | 366,128 |
|
|
| | | | 4,725,403 |
| Food & Beverages - 0.97% | | | |
| Flowers Foods, Inc. | 107,250 | | 2,213,640 |
| | | | |
| Gas & Pipeline Utilities - 1.06% | | | |
| South Jersey Industries, Inc. | 71,400 | | 2,421,174 |
| | | | |
| Healthcare Products - 3.51% | | | |
| Orthofix International NV * | 26,434 | | 1,264,603 |
| Polymedica Corp. | 72,816 | | 3,769,684 |
| Respironics, Inc. * | 62,876 | | 2,982,209 |
|
|
| | | | 8,016,496 |
| Homebuilders - 1.14% | | | |
| Meritage Homes Corp. * (a) | 70,900 | | 1,284,708 |
| Ryland Group, Inc. | 46,312 | | 1,326,376 |
|
|
| | | | 2,611,084 |
| Household Appliances - 1.34% | | | |
| Drew Industries, Inc. * | 78,044 | | 3,064,788 |
| | | | |
| Household Products - 1.50% | | | |
| Tempur-Pedic International, Inc. (a) | 118,248 | | 3,417,367 |
| | | | |
| Industrial Machinery - 2.81% | | | |
| Actuant Corp., Class A (a) | 65,757 | | 4,010,519 |
| Middleby Corp. * | 32,712 | | 2,405,641 |
|
|
| | | | 6,416,160 |
| Insurance - 3.26% | | | |
| Aspen Insurance Holdings, Ltd. | 82,010 | | 2,057,631 |
| Assured Guaranty, Ltd. | 38,153 | | 994,649 |
| Max Re Capital, Ltd. | 45,100 | | 1,238,446 |
| Meadowbrook Insurance Group, Inc. * | 126,900 | | 1,120,527 |
| Tower Group, Inc. | 34,600 | | 868,806 |
| Zenith National Insurance Corp. | 26,600 | | 1,146,726 |
|
|
| | | | 7,426,785 |
| |
| The accompanying notes are an integral part of the financial statements. | 321 |
John Hancock Funds II
Portfolio of investments — August 31, 2007
(showing percentage of total net assets)
| | | |
| Small Cap Opportunities Fund (continued) | |
| | Shares or | | |
| | Principal | | |
| | Amount | | Value |
|
|
| |
| COMMON STOCKS (continued) | | | |
| | | | |
| Internet Software - 1.00% | | | |
| DealerTrack Holdings, Inc. * | 30,500 | $ | 1,165,100 |
| Digital River, Inc. * | 24,300 | | 1,126,548 |
|
|
| | | | 2,291,648 |
| Investment Companies - 1.70% | | | |
| KKR Financial Holdings LLC | 249,737 | | 3,868,426 |
| | | | |
| Leisure Time - 1.77% | | | |
| Penn National Gaming, Inc. * | 68,549 | | 4,030,681 |
| | | | |
| Manufacturing - 8.49% | | | |
| Carlisle Companies, Inc. | 94,210 | | 4,637,958 |
| Ceradyne, Inc. * | 59,112 | | 4,272,616 |
| General Cable Corp. * | 62,000 | | 3,607,160 |
| Koppers Holdings, Inc. | 75,500 | | 2,773,115 |
| Spartan Motors, Inc. | 275,609 | | 4,079,013 |
|
|
| | | | 19,369,862 |
| Metal & Metal Products - 4.15% | | | |
| A. M. Castle & Company | 61,800 | | 1,800,234 |
| Haynes International, Inc. * | 22,000 | | 1,837,660 |
| Horsehead Holding Corp. * | 62,800 | | 1,185,036 |
| Quanex Corp. | 42,350 | | 1,834,179 |
| Reliance Steel & Aluminum Company | 52,984 | | 2,806,562 |
|
|
| | | | 9,463,671 |
| Mining - 1.34% | | | |
| AMCOL International Corp. | 95,010 | | 3,060,272 |
| | | | |
| Petroleum Services - 0.88% | | | |
| Core Laboratories N.V. * | 17,966 | | 2,013,989 |
| | | | |
| Real Estate - 12.87% | | | |
| Anthracite Capital, Inc., REIT (a) | 88,856 | | 805,035 |
| Ashford Hospitality Trust, Inc., REIT | 324,689 | | 3,542,357 |
| BioMed Realty Trust, Inc., REIT | 41,700 | | 1,016,646 |
| Corporate Office Properties Trust, REIT | 108,147 | | 4,657,891 |
| Equity One, Inc., REIT | 97,973 | | 2,562,974 |
| FBR Capital Markets Corp., REIT * | 89,200 | | 1,189,036 |
| FBR Capital Markets Corp., REIT * | 43,900 | | 585,187 |
| Gramercy Captial Corp., REIT (a) | 99,804 | | 2,510,071 |
| Jer Investors Trust, Inc., REIT | 199,948 | | 2,485,354 |
| LaSalle Hotel Properties, REIT | 81,280 | | 3,384,499 |
| Newcastle Investment Corp., REIT (a) | 207,265 | | 3,448,889 |
| NorthStar Realty Finance Corp., REIT | 75,500 | | 801,055 |
| RAIT Investment Trust, REIT (a) | 269,326 | | 2,383,535 |
|
|
| | | | 29,372,529 |
| Retail Grocery - 1.12% | | | |
| Ruddick Corp. | 36,471 | | 1,188,225 |
| United Natural Foods, Inc. * | 50,745 | | 1,361,996 |
|
|
| | | | 2,550,221 |
| Retail Trade - 4.02% | | | |
| Cabela's, Inc. * (a) | 125,540 | | 2,966,510 |
| Cash America International, Inc. | 35,200 | | 1,269,312 |
| First Cash Financial Services, Inc. * | 106,372 | | 2,278,488 |
| Hibbett Sports, Inc. * | 36,900 | | 920,286 |
| | | | |
| Small Cap Opportunities Fund (continued) | |
| | Shares or | | |
| | Principal | | |
| | Amount | | Value |
| |
|
| |
| COMMON STOCKS (continued) | | | | |
| | | | | |
| Retail Trade (continued) | | | | |
| Sonic Automotive, Inc. | | 64,900 | $ | 1,726,340 |
|
|
| | | | 9,160,936 |
| Semiconductors - 3.53% | | | | |
| Diodes, Inc. * (a) | | 211,494 | | 6,410,383 |
| Silicon Motion Technology Corp., ADR * (a) | | 75,800 | | 1,637,280 |
|
|
| | | | 8,047,663 |
| Telecommunications Equipment & | | | | |
| Services - 2.77% | | | | |
| Comtech Telecommunications Corp. * | | 42,200 | | 1,796,032 |
| DataPath, Inc. * | | 105,900 | | 1,006,050 |
| J2 Global Communications, Inc. * | | 103,200 | | 3,508,800 |
|
|
| | | | 6,310,882 |
| Transportation - 0.38% | | | | |
| Kirby Corp. * | | 22,900 | | 876,612 |
| | | | | |
| Travel Services - 0.70% | | | | |
| Ambassadors Group, Inc. | | 41,300 | | 1,601,201 |
| | | | | |
| Trucking & Freight - 3.46% | | | | |
| Landstar Systems, Inc. | | 64,068 | | 2,755,565 |
| Old Dominion Freight Lines, Inc. * | | 39,000 | | 1,123,200 |
| Oshkosh Truck Corp. | | 69,334 | | 4,013,745 |
|
|
| | | | 7,892,510 |
|
| TOTAL COMMON STOCKS (Cost $195,233,758) | | $ | 222,287,449 |
|
| |
| RIGHTS - 0.02% | | | | |
| | | | | |
| Investment Companies - 0.02% | | | | |
| KKR Financial Holding LLC Expiration Date: | | | | |
| 09/19/2007, Strike price: $14.40 | | 48,524 | | 52,406 |
|
| TOTAL RIGHTS (Cost $0) | | | $ | 52,406 |
|
| |
| SHORT TERM INVESTMENTS - 15.96% | | | | |
| John Hancock Cash Investment Trust (c) | $ | 36,425,716 | $ | 36,425,716 |
|
| TOTAL SHORT TERM INVESTMENTS | | | | |
| (Cost $36,425,716) | | | $ | 36,425,716 |
|
| |
| REPURCHASE AGREEMENTS - 2.91% | | | | |
| Repurchase Agreement with State | | | | |
| Street Corp. dated 08/31/2007 at | | | | |
| 4.60% to be repurchased at | | | | |
| $6,632,388 on 09/04/2007, | | | | |
| collateralized by $5,550,000 | | | | |
| Federal Home Loan Mortgage | | | | |
| Corp., 6.75% due 03/15/2031 | | | | |
| (valued at $6,764,063, including | | | | |
| interest) | $ | 6,629,000 | $ | 6,629,000 |
|
| TOTAL REPURCHASE AGREEMENTS | | | | |
| (Cost $6,629,000) | | | $ | 6,629,000 |
|
| Total Investments (Small Cap Opportunities Fund) | | |
| (Cost $238,288,474) - 116.32% | | | $ | 265,394,571 |
| Liabilities in Excess of Other Assets - (16.32)% | | | (37,241,582) |
|
|
| TOTAL NET ASSETS - 100.00% | | | $ | 228,152,989 |
|
|
| |
| The accompanying notes are an integral part of the financial statements. | 322 |
John Hancock Funds II
Portfolio of investments — August 31, 2007
(showing percentage of total net assets)
| | | |
| Small Company Fund | | | |
| | Shares or | | |
| | Principal | | |
| | Amount | | Value |
|
|
| |
| COMMON STOCKS - 99.89% | | | |
| | | | |
| Aerospace - 0.70% | | | |
| Curtiss-Wright Corp. | 13,339 | $ | 608,258 |
| Teledyne Technologies, Inc. * | 1,513 | | 75,514 |
|
|
| | | | 683,772 |
| Agriculture - 0.02% | | | |
| Fresh Del Monte Produce, Inc. * | 755 | | 19,879 |
| | | | |
| Air Travel - 0.35% | | | |
| Frontier Airlines Holdings, Inc. * (a) | 6,954 | | 41,237 |
| Mesa Air Group, Inc. * | 5,537 | | 31,229 |
| SkyWest, Inc. | 10,751 | | 270,173 |
|
|
| | | | 342,639 |
| Apparel & Textiles - 3.06% | | | |
| Deckers Outdoor Corp. * | 5,882 | | 554,026 |
| Jos. A. Bank Clothiers, Inc. * (a) | 8,012 | | 241,562 |
| Maidenform Brands, Inc. * | 1,717 | | 29,258 |
| Mothers Work, Inc. * | 7,678 | | 157,015 |
| Perry Ellis International, Inc. * | 10,181 | | 277,839 |
| The Gymboree Corp. * | 32,495 | | 1,302,725 |
| The Warnaco Group, Inc. * | 12,556 | | 438,204 |
|
|
| | | | 3,000,629 |
| Auto Parts - 0.57% | | | |
| Accuride Corp. * | 24,761 | | 321,150 |
| Aftermarket Technology Corp. * | 7,877 | | 235,601 |
|
|
| | | | 556,751 |
| Banking - 5.31% | | | |
| BancFirst Corp. | 3,639 | | 164,083 |
| Bank of Hawaii Corp. | 20,887 | | 1,073,801 |
| BankUnited Financial Corp., Class A (a) | 1,493 | | 25,530 |
| Banner Corp. | 1,011 | | 32,574 |
| Charter Financial Corp. | 897 | | 41,181 |
| City Bank, Lynnwood, WA | 1,570 | | 48,277 |
| City National Corp. | 9,882 | | 705,476 |
| Commerce Bancshares, Inc. | 7,570 | | 353,519 |
| Corus Bankshares, Inc. (a) | 17,812 | | 237,968 |
| East West Bancorp, Inc. | 11,430 | | 409,194 |
| F.N.B. Corp. (a) | 1,237 | | 21,004 |
| Financial Institutions, Inc. | 3,348 | | 65,420 |
| First Citizens Bancshares, Inc. | 938 | | 166,260 |
| First Regional Bancorp * | 4,266 | | 100,251 |
| FirstFed Financial Corp. * (a) | 7,030 | | 353,258 |
| Imperial Capital Bancorp, Inc. | 2,998 | | 103,731 |
| Intervest Bancshares Corp. | 1,045 | | 26,794 |
| Pacific Capital Bancorp (a) | 12,892 | | 325,136 |
| Preferred Bank, Los Angeles, CA | 2,771 | | 113,999 |
| Prosperity Bancshares, Inc. | 5,968 | | 201,539 |
| SVB Financial Group * | 7,695 | | 382,903 |
| Temecula Valley Bancorp, Inc. (a) | 1,178 | | 19,508 |
| Trustmark Corp. | 2,103 | | 59,389 |
| Vineyard National Bancorp Company (a) | 7,224 | | 132,705 |
| WesBanco, Inc. | 904 | | 24,164 |
| | | |
| Small Company Fund (continued) | | |
| | Shares or | | |
| | Principal | | |
| | Amount | | Value |
|
|
| |
| COMMON STOCKS (continued) | | | |
| | | | |
| Banking (continued) | | | |
| West Coast Bancorp | 656 | $ | 17,988 |
|
|
| | | | 5,205,652 |
| Biotechnology - 0.91% | | | |
| Invitrogen Corp. * | 11,502 | | 896,006 |
| | | | |
| Broadcasting - 0.69% | | | |
| Sinclair Broadcast Group, Inc., Class A (a) | 42,126 | | 524,890 |
| Westwood One, Inc. | 53,208 | | 153,771 |
|
|
| | | | 678,661 |
| Building Materials & Construction - 4.07% | | | |
| Apogee Enterprises, Inc. | 1,834 | | 46,162 |
| Chicago Bridge & Iron Company N.V. | 39,969 | | 1,492,842 |
| EMCOR Group, Inc. * | 42,999 | | 1,348,018 |
| Perini Corp. * | 19,473 | | 1,102,172 |
|
|
| | | | 3,989,194 |
| Business Services - 6.10% | | | |
| Acxiom Corp. | 34,670 | | 849,415 |
| CGI Group, Inc., Class A * | 3,709 | | 40,910 |
| Coinstar, Inc. * | 5,113 | | 167,093 |
| COMSYS IT Partners, Inc. * | 10,951 | | 208,179 |
| Convergys Corp. * | 15,334 | | 256,845 |
| Core-Mark Holding Company, Inc. * | 4,581 | | 154,563 |
| Deluxe Corp. | 27,640 | | 1,050,873 |
| Dun & Bradstreet Corp. | 616 | | 60,091 |
| First Consulting Group, Inc. * | 2,444 | | 23,145 |
| Heidrick & Struggles International, Inc. * | 10,453 | | 489,723 |
| Kforce, Inc. * | 169 | | 2,572 |
| PC Mall, Inc. * (a) | 13,959 | | 171,277 |
| Pre-Paid Legal Services, Inc. * (a) | 8,296 | | 457,856 |
| PRG-Schultz International, Inc. * | 2,480 | | 35,315 |
| Sotheby's | 23,187 | | 1,003,533 |
| Standard Parking Corp. * | 2,955 | | 103,011 |
| Waste Industries USA, Inc. | 592 | | 19,210 |
| Watson Wyatt Worldwide, Inc., Class A | 18,803 | | 889,570 |
|
|
| | | | 5,983,181 |
| Cellular Communications - 0.41% | | | |
| Rural Cellular Corp., Class A * | 4,530 | | 194,609 |
| Syniverse Holdings, Inc. * | 2,988 | | 42,220 |
| Tessco Technologies, Inc. * | 11,050 | | 168,623 |
|
|
| | | | 405,452 |
| Chemicals - 2.57% | | | |
| Celanese Corp., Series A | 40,200 | | 1,443,984 |
| CF Industries Holdings, Inc. | 3,828 | | 242,427 |
| ICO, Inc. * | 1,167 | | 13,397 |
| Methanex Corp. | 9,326 | | 210,301 |
| Pioneer Companies, Inc. * | 11,645 | | 407,692 |
| Terra Industries, Inc. * | 7,820 | | 203,086 |
|
|
| | | | 2,520,887 |
| Computers & Business Equipment - 1.33% | | | |
| Blue Coat Systems, Inc. * | 1,843 | | 153,725 |
| Immersion Corp. * (a) | 48,328 | | 724,437 |
| |
| The accompanying notes are an integral part of the financial statements. | 323 |
John Hancock Funds II
Portfolio of investments — August 31, 2007
(showing percentage of total net assets)
| | | |
| Small Company Fund (continued) | | |
| | Shares or | | |
| | Principal | | |
| | Amount | | Value |
|
|
| |
| COMMON STOCKS (continued) | | | |
| | | | |
| Computers & Business Equipment | | | |
| (continued) | | | |
| Tech Data Corp. * | 3,157 | $ | 123,091 |
| Western Digital Corp. * | 12,405 | | 289,781 |
| Xyratex, Ltd. * | 544 | | 11,326 |
|
|
| | | | 1,302,360 |
| Containers & Glass - 1.26% | | | |
| Pactiv Corp. * | 30,455 | | 890,809 |
| Silgan Holdings, Inc. | 6,774 | | 346,083 |
|
|
| | | | 1,236,892 |
| Cosmetics & Toiletries - 0.10% | | | |
| Helen of Troy, Ltd. * | 4,300 | | 97,395 |
| | | | |
| Crude Petroleum & Natural Gas - 0.40% | | | |
| MarkWest Hydrocarbon, Inc. | 7,705 | | 387,484 |
| | | | |
| Domestic Oil - 0.79% | | | |
| Frontier Oil Corp. | 2,403 | | 98,595 |
| Holly Corp. | 10,069 | | 671,099 |
|
|
| | | | 769,694 |
| Drugs & Health Care - 0.90% | | | |
| Datascope Corp. | 533 | | 17,781 |
| Molina Healthcare, Inc. * | 1,291 | | 43,959 |
| Nutraceutical International Corp. * | 10,812 | | 162,612 |
| West Pharmaceutical Services, Inc. | 13,223 | | 529,581 |
| XenoPort, Inc. * | 3,037 | | 126,127 |
|
|
| | | | 880,060 |
| Electrical Equipment - 2.72% | | | |
| GrafTech International, Ltd. * | 65,514 | | 1,099,980 |
| Greatbatch, Inc. * | 3,861 | | 115,830 |
| Littelfuse, Inc. * | 8,201 | | 273,913 |
| Methode Electronics, Inc. | 31,632 | | 456,766 |
| Varian, Inc. * | 11,991 | | 719,700 |
|
|
| | | | 2,666,189 |
| Electrical Utilities - 1.72% | | | |
| Allete, Inc. | 1,424 | | 59,965 |
| El Paso Electric Company * | 47,579 | | 1,061,963 |
| Unisource Energy Corp. | 19,214 | | 569,119 |
|
|
| | | | 1,691,047 |
| Electronics - 4.54% | | | |
| Analogic Corp. | 4,017 | | 277,414 |
| Belden, Inc. | 27,173 | | 1,320,879 |
| Checkpoint Systems, Inc. * | 14,647 | | 407,919 |
| Cubic Corp. | 12,736 | | 503,454 |
| Dolby Laboratories, Inc., Class A * | 11,097 | | 404,264 |
| LoJack Corp. * | 8,690 | | 165,458 |
| Stoneridge, Inc. * | 3,766 | | 39,317 |
| Teleflex, Inc. | 17,133 | | 1,332,433 |
|
|
| | | | 4,451,138 |
| Energy - 2.04% | | | |
| Energen Corp. | 37,248 | | 2,000,218 |
| | | |
| Small Company Fund (continued) | | |
| | Shares or | | |
| | Principal | | |
| | Amount | | Value |
|
|
| |
| COMMON STOCKS (continued) | | | |
| | | | |
| Financial Services - 1.57% | | | |
| Advanta Corp., Class B | 1,506 | $ | 39,427 |
| Calamos Asset Management, Inc. (a) | 3,648 | | 84,707 |
| City Holding Company | 4,862 | | 179,797 |
| Delta Financial Corp. (a) | 7,900 | | 42,897 |
| Ocwen Financial Corp. * | 34,996 | | 328,262 |
| SWS Group, Inc. | 43,740 | | 775,948 |
| World Acceptance Corp. * | 2,210 | | 68,532 |
| WSFS Financial Corp. | 310 | | 18,674 |
|
|
| | | | 1,538,244 |
| Food & Beverages - 3.19% | | | |
| Coca-Cola Bottling Company (a) | 733 | | 43,005 |
| Corn Products International, Inc. | 21,690 | | 980,388 |
| Imperial Sugar Company (a) | 23,521 | | 676,229 |
| J.M. Smucker Company | 2,910 | | 160,079 |
| Seaboard Corp. (a) | 432 | | 898,128 |
| Spartan Stores, Inc. | 14,432 | | 367,150 |
|
|
| | | | 3,124,979 |
| Furniture & Fixtures - 0.06% | | | |
| American Woodmark Corp. (a) | 2,021 | | 60,974 |
| | | | |
| Gas & Pipeline Utilities - 1.09% | | | |
| AGL Resources, Inc. | 3,188 | | 126,596 |
| Northwest Natural Gas Company | 11,518 | | 535,126 |
| SEMCO Energy, Inc. * | 29,827 | | 226,984 |
| UGI Corp. | 7,188 | | 183,653 |
|
|
| | | | 1,072,359 |
| Gold - 0.06% | | | |
| Rio Narcea Gold Mines, Ltd. * | 11,398 | | 58,814 |
| | | | |
| Healthcare Products - 2.90% | | | |
| CONMED Corp. * | 18,535 | | 538,442 |
| Dade Behring Holdings, Inc. | 14,454 | | 1,091,422 |
| Health Tronics, Inc. * | 6,519 | | 31,030 |
| IDEXX Laboratories, Inc. * | 451 | | 50,399 |
| Kinetic Concepts, Inc. * | 18,821 | | 1,131,330 |
|
|
| | | | 2,842,623 |
| Healthcare Services - 4.34% | | | |
| Alliance Imaging, Inc. * | 6,156 | | 54,234 |
| American Dental Partners, Inc. * | 10,023 | | 240,051 |
| AMERIGROUP Corp. * | 6,839 | | 216,591 |
| Apria Healthcare Group, Inc. * | 39,633 | | 1,055,427 |
| Healthspring, Inc. * | 12,135 | | 226,803 |
| Magellan Health Services, Inc. * | 4,843 | | 196,626 |
| Sierra Health Services, Inc. * | 2,011 | | 84,462 |
| WellCare Health Plans, Inc. * | 22,127 | | 2,183,934 |
|
|
| | | | 4,258,128 |
| Holdings Companies/Conglomerates - 0.11% | | | |
| United Industrial Corp. | 1,545 | | 106,806 |
| | | | |
| Homebuilders - 0.65% | | | |
| AMREP Corp. * (a) | 3,261 | | 109,570 |
| NVR, Inc. * | 946 | | 529,287 |
|
|
| | | | 638,857 |
| |
| The accompanying notes are an integral part of the financial statements. | 324 |
John Hancock Funds II
Portfolio of investments — August 31, 2007
(showing percentage of total net assets)
| | | |
| Small Company Fund (continued) | | |
| | Shares or | | |
| | Principal | | |
| | Amount | | Value |
|
|
| |
| COMMON STOCKS (continued) | | | |
| | | | |
| Hotels & Restaurants - 2.08% | | | |
| AFC Enterprises, Inc. * | 20,324 | $ | 303,031 |
| CBRL Group, Inc. | 4,426 | | 165,621 |
| Choice Hotels International, Inc. | 4,323 | | 162,026 |
| Interstate Hotels & Resorts, Inc. * | 68,116 | | 265,652 |
| Jack in the Box, Inc. * | 9,409 | | 585,428 |
| Papa John's International, Inc. * | 18,502 | | 469,211 |
| Triarc Companies, Inc. | 5,440 | | 83,558 |
|
|
| | | | 2,034,527 |
| Household Products - 0.65% | | | |
| Blyth, Inc. | 8,053 | | 180,065 |
| Tempur-Pedic International, Inc. (a) | 1,453 | | 41,992 |
| Tupperware Brands Corp. | 13,499 | | 415,634 |
|
|
| | | | 637,691 |
| Industrial Machinery - 1.14% | | | |
| EnPro Industries, Inc. * | 12,446 | | 520,118 |
| Intevac, Inc. * | 26,823 | | 438,288 |
| Robbins & Myers, Inc. | 1,406 | | 76,177 |
| The Manitowoc Company, Inc. | 1,007 | | 80,047 |
|
|
| | | | 1,114,630 |
| Insurance - 5.10% | | | |
| Allied World Assurance Holdings, Ltd. | 2,868 | | 137,721 |
| American Financial Group, Inc. | 22,891 | | 645,526 |
| American Safety Insurance Holdings, Ltd. * | 3,041 | | 60,181 |
| Argo Group International Holdings, Ltd. * | 2,206 | | 89,971 |
| Aspen Insurance Holdings, Ltd. | 44,123 | | 1,107,046 |
| Endurance Specialty Holdings, Ltd. | 29,562 | | 1,178,637 |
| FBL Financial Group, Inc., Class A | 873 | | 34,160 |
| HCC Insurance Holdings, Inc. | 15,765 | | 435,272 |
| James River Group, Inc. | 921 | | 30,669 |
| NYMAGIC, Inc. | 3,377 | | 101,513 |
| Odyssey Re Holdings Corp. (a) | 17,982 | | 651,308 |
| Philadelphia Consolidated Holding Corp. * | 1,995 | | 79,840 |
| Platinum Underwriters Holdings, Ltd. | 1,219 | | 42,275 |
| Reinsurance Group of America, Inc. | 6,774 | | 367,896 |
| RenaissanceRe Holdings, Ltd. | 659 | | 37,748 |
|
|
| | | | 4,999,763 |
| Internet Content - 0.11% | | | |
| TeleCommunication Systems, Inc. * | 25,863 | | 105,780 |
| | | | |
| Internet Retail - 0.85% | | | |
| Priceline.com, Inc. * (a) | 9,999 | | 829,717 |
| | | | |
| Internet Software - 0.24% | | | |
| Chordiant Software, Inc. * | 15,575 | | 232,690 |
| | | | |
| Leisure Time - 0.95% | | | |
| Lions Gate Entertainment Corp. * | 26,161 | | 248,529 |
| Polaris Industries, Inc. (a) | 2,803 | | 133,843 |
| Regal Entertainment Group, Class A (a) | 24,281 | | 547,294 |
|
|
| | | | 929,666 |
| Manufacturing - 2.72% | | | |
| GenTek, Inc. * | 709 | | 21,802 |
| Lydall, Inc. * | 2,102 | | 21,987 |
| | | |
| Small Company Fund (continued) | | |
| | Shares or | | |
| | Principal | | |
| | Amount | | Value |
|
|
| |
| COMMON STOCKS (continued) | | | |
| | | | |
| Manufacturing (continued) | | | |
| Mettler-Toledo International, Inc. * | 15,308 | $ | 1,443,697 |
| Snap-on, Inc. | 7,154 | | 350,403 |
| Sturm Ruger & Company, Inc. * | 45,642 | | 832,510 |
|
|
| | | | 2,670,399 |
| Medical-Hospitals - 0.07% | | | |
| Centene Corp. * | 3,154 | | 63,742 |
| | | | |
| Metal & Metal Products - 0.28% | | | |
| Crown Holdings, Inc. * | 9,723 | | 233,547 |
| Mueller Industries, Inc. | 1,166 | | 40,390 |
|
|
| | | | 273,937 |
| Mining - 0.30% | | | |
| Hecla Mining Company * | 26,440 | | 198,300 |
| Northgate Minerals Corp. * (a) | 32,802 | | 98,406 |
|
|
| | | | 296,706 |
| Office Furnishings & Supplies - 0.41% | | | |
| Knoll, Inc. | 21,387 | | 406,567 |
| | | | |
| Paper - 1.80% | | | |
| Buckeye Technologies, Inc. * | 42,745 | | 665,540 |
| Rock-Tenn Company, Class A | 37,840 | | 1,096,981 |
|
|
| | | | 1,762,521 |
| Petroleum Services - 3.36% | | | |
| Delek US Holdings, Inc. | 2,738 | | 75,076 |
| Grey Wolf, Inc. * | 164,873 | | 1,094,757 |
| GulfMark Offshore, Inc. * | 7,207 | | 330,441 |
| Tesoro Petroleum Corp. | 17,458 | | 861,203 |
| Trico Marine Services, Inc. * (a) | 28,513 | | 936,937 |
|
|
| | | | 3,298,414 |
| Pharmaceuticals - 2.24% | | | |
| Axcan Pharma, Inc. * | 2,902 | | 55,370 |
| King Pharmaceuticals, Inc. * | 57,829 | | 869,170 |
| OSI Pharmaceuticals, Inc. * | 26,470 | | 902,892 |
| POZEN, Inc. * (a) | 9,565 | | 95,554 |
| ViroPharma, Inc. * (a) | 21,387 | | 211,945 |
| Watson Pharmaceuticals, Inc. * | 1,991 | | 59,372 |
|
|
| | | | 2,194,303 |
| Photography - 0.42% | | | |
| CPI Corp. | 9,216 | | 412,508 |
| | | | |
| Plastics - 0.07% | | | |
| AEP Industries, Inc. * | 1,924 | | 71,226 |
| | | | |
| Publishing - 0.30% | | | |
| American Greetings Corp., Class A | 11,207 | | 277,261 |
| Multi-Color Corp. | 483 | | 17,944 |
|
|
| | | | 295,205 |
| Railroads & Equipment - 0.41% | | | |
| Kansas City Southern * | 13,072 | | 397,258 |
| | | | |
| Real Estate - 4.00% | | | |
| Agree Realty Corp., REIT | 593 | | 18,086 |
| Avatar Holdings, Inc. * (a) | 4,439 | | 269,802 |
| Capital Trust, Inc., Class A, REIT (a) | 9,066 | | 314,228 |
| |
| The accompanying notes are an integral part of the financial statements. | 325 |
John Hancock Funds II
Portfolio of investments — August 31, 2007
(showing percentage of total net assets)
| | | |
| Small Company Fund (continued) | | |
| | Shares or | | |
| | Principal | | |
| | Amount | | Value |
|
|
| |
| COMMON STOCKS (continued) | | | |
| | | | |
| Real Estate (continued) | | | |
| Equity Lifestyle Properties, Inc., REIT | 17,920 | $ | 872,704 |
| Gramercy Captial Corp., REIT (a) | 34,638 | | 871,146 |
| Jones Lang LaSalle, Inc. | 1,897 | | 211,857 |
| Taubman Centers, Inc., REIT | 26,540 | | 1,368,933 |
|
|
| | | | 3,926,756 |
| Retail Grocery - 0.13% | | | |
| Nash Finch Company (a) | 3,267 | | 122,545 |
| | | | |
| Retail Trade - 4.90% | | | |
| Big Lots, Inc. * | 34,014 | | 1,012,597 |
| Dollar Tree Stores, Inc. * | 11,825 | | 513,796 |
| FTD Group, Inc. | 4,815 | | 85,563 |
| Jo-Ann Stores, Inc. * | 32,246 | | 725,535 |
| NBTY, Inc. * | 23,634 | | 867,368 |
| Regis Corp. | 1,297 | | 42,814 |
| Systemax, Inc. * (a) | 10,640 | | 197,904 |
| The Dress Barn, Inc. * | 43,138 | | 754,915 |
| The Men's Wearhouse, Inc. | 11,989 | | 607,602 |
|
|
| | | | 4,808,094 |
| Sanitary Services - 0.35% | | | |
| Darling International, Inc. * | 27,480 | | 232,206 |
| Stericycle, Inc. * | 2,160 | | 107,784 |
|
|
| | | | 339,990 |
| Semiconductors - 3.32% | | | |
| Advanced Energy Industries, Inc. * | 10,196 | | 165,481 |
| Amkor Technology, Inc. * | 32,128 | | 370,115 |
| ASM International N.V. (a) | 7,173 | | 195,536 |
| Asyst Technologies, Inc. * | 6,884 | | 40,409 |
| Emulex Corp. * | 29,699 | | 580,318 |
| MKS Instruments, Inc. * | 10,862 | | 239,399 |
| Novellus Systems, Inc. * | 8,457 | | 231,468 |
| ON Semiconductor Corp. * | 121,897 | | 1,428,633 |
|
|
| | | | 3,251,359 |
| Software - 2.39% | | | |
| American Software, Inc., Class A | 1,899 | | 21,478 |
| Magma Design Automation, Inc. * | 4,778 | | 65,650 |
| Moldflow Corp. * | 1,139 | | 18,816 |
| Omnicell, Inc. * | 19,963 | | 481,907 |
| Open Text Corp. * (a) | 2,565 | | 63,791 |
| SPSS, Inc. * | 16,640 | | 678,080 |
| Sybase, Inc. * | 44,013 | | 1,014,500 |
|
|
| | | | 2,344,222 |
| Steel - 1.13% | | | |
| AK Steel Holding Corp. * | 10,806 | | 432,240 |
| Ryerson, Inc. | 20,270 | | 675,802 |
|
|
| | | | 1,108,042 |
| Telecommunications Equipment & | | | |
| Services - 2.88% | | | |
| C-COR, Inc. * | 11,959 | | 137,648 |
| CommScope, Inc. * | 21,617 | | 1,223,522 |
| Comtech Telecommunications Corp. * | 10,362 | | 441,007 |
| | | | |
| Small Company Fund (continued) | | |
| | | Shares or | | |
| | | Principal | | |
| | | Amount | | Value |
|
|
| |
| COMMON STOCKS (continued) | | | | |
| | | | | |
| Telecommunications Equipment & | | | | |
| Services (continued) | | | | |
| CT Communications, Inc. | | 1,513 | $ | 47,660 |
| InterDigital, Inc. * | | 29,357 | | 678,440 |
| Premiere Global Services, Inc. * | | 22,952 | | 300,212 |
|
|
| | | | | 2,828,489 |
| Telephone - 0.38% | | | | |
| CenturyTel, Inc. | | 4,282 | | 205,450 |
| Cincinnati Bell, Inc. * | | 34,557 | | 168,638 |
|
|
| | | | | 374,088 |
| Tobacco - 0.15% | | | | |
| Loews Corp. - Carolina Group | | 1,952 | | 148,586 |
| | | | |
| Toys, Amusements & Sporting Goods - 0.32% | | | |
| Jakks Pacific, Inc. * | | 14,076 | | 316,288 |
| | | | | |
| Transportation - 0.53% | | | | |
| Bristow Group, Inc. * | | 3,937 | | 170,669 |
| Kirby Corp. * | | 9,223 | | 353,056 |
|
|
| | | | | 523,725 |
| Trucking & Freight - 1.38% | | | | |
| Arkansas Best Corp. | | 4,212 | | 151,211 |
| Forward Air Corp. | | 5,030 | | 176,251 |
| Heartland Express, Inc. (a) | | 9,256 | | 144,116 |
| Hub Group, Inc., Class A * | | 5,073 | | 169,286 |
| Knight Transportation, Inc. (a) | | 9,475 | | 174,246 |
| Landstar Systems, Inc. | | 9,624 | | 413,928 |
| Old Dominion Freight Lines, Inc. * | | 4,469 | | 128,707 |
|
|
| | | | | 1,357,745 |
|
| TOTAL COMMON STOCKS (Cost $92,187,860) | | $ | 97,944,143 |
|
| |
| SHORT TERM INVESTMENTS - 9.57% | | | | |
| John Hancock Cash Investment Trust (c) | $ | 9,381,598 | $ | 9,381,598 |
|
| TOTAL SHORT TERM INVESTMENTS | | | | |
| (Cost $9,381,598) | | | $ | 9,381,598 |
|
| |
| REPURCHASE AGREEMENTS - 0.34% | | | | |
| Repurchase Agreement with State | | | | |
| Street Corp. dated 08/31/2007 at | | | | |
| 4.60% to be repurchased at | | | | |
| $328,168 on 09/04/2007, | | | | |
| collateralized by $330,000 Federal | | | | |
| National Mortgage Association, | | | | |
| 5.30% due 04/16/2010 (valued at | | | | |
| $337,013, including interest) | $ | 328,000 | $ | 328,000 |
|
| TOTAL REPURCHASE AGREEMENTS | | | | |
| (Cost $328,000) | | | $ | 328,000 |
|
| Total Investments (Small Company Fund) | | | | |
| (Cost $101,897,458) - 109.80% | | | $ | 107,653,741 |
| Liabilities in Excess of Other Assets - (9.80)% | | | (9,604,455) |
|
|
| TOTAL NET ASSETS - 100.00% | | | $ | 98,049,286 |
|
|
| |
| The accompanying notes are an integral part of the financial statements. | 326 |
John Hancock Funds II
Portfolio of investments — August 31, 2007
(showing percentage of total net assets)
| | | |
| Small Company Growth Fund | | | |
| | Shares or | | |
| | Principal | | |
| | Amount | | Value |
|
|
| |
| COMMON STOCKS - 98.48% | | | |
| | | | |
| Advertising - 1.74% | | | |
| inVentiv Health, Inc. * | 48,900 | $ | 1,939,374 |
| ValueClick, Inc. * | 83,679 | | 1,676,927 |
| |
|
| | | | 3,616,301 |
| Aerospace - 1.02% | | | |
| TransDigm Group, Inc. * | 52,117 | | 2,118,556 |
| | | | |
| Apparel & Textiles - 1.43% | | | |
| Interface, Inc., Class A | 82,068 | | 1,480,507 |
| The Warnaco Group, Inc. * | 43,231 | | 1,508,762 |
| |
|
| | | | 2,989,269 |
| Auto Parts - 0.94% | | | |
| Tenneco, Inc. * | 61,428 | | 1,950,339 |
| | | | |
| Banking - 3.11% | | | |
| East West Bancorp, Inc. | 18,379 | | 657,968 |
| Greenhill & Company, Inc. (a) | 28,607 | | 1,656,345 |
| SVB Financial Group * | 38,367 | | 1,909,142 |
| Texas Capital Bancshares, Inc. * | 53,235 | | 1,161,588 |
| UCBH Holdings, Inc. | 65,901 | | 1,095,275 |
| |
|
| | | | 6,480,318 |
| Biotechnology - 2.05% | | | |
| Human Genome Sciences, Inc. * (a) | 84,422 | | 777,526 |
| Integra LifeSciences Holdings Corp. * (a) | 4,054 | | 196,903 |
| MGI Pharma, Inc. * | 40,700 | | 959,299 |
| Myriad Genetics, Inc. * (a) | 53,355 | | 2,345,486 |
| |
|
| | | | 4,279,214 |
| Building Materials & Construction - 0.77% | | | |
| Eagle Materials, Inc. | 42,331 | | 1,606,885 |
| | | | |
| Business Services - 5.68% | | | |
| CoStar Group, Inc. * | 38,459 | | 2,116,399 |
| Euronet Worldwide, Inc. * (a) | 60,847 | | 1,647,737 |
| Global Payments, Inc. | 25,141 | | 992,567 |
| Informatica Corp. * | 151,324 | | 2,112,483 |
| Jackson Hewitt Tax Service, Inc. | 15,999 | | 461,891 |
| Korn/Ferry International * | 91,152 | | 2,024,486 |
| MPS Group, Inc. * | 41,685 | | 573,585 |
| Tetra Tech, Inc. * | 97,194 | | 1,905,002 |
| |
|
| | | | 11,834,150 |
| Cellular Communications - 1.19% | | | |
| Dobson Communications Corp., Class A * | 196,122 | | 2,477,021 |
| | | | |
| Commercial Services - 1.72% | | | |
| Chemed Corp. | 34,316 | | 2,128,964 |
| Live Nation, Inc. * | 69,941 | | 1,447,779 |
| |
|
| | | | 3,576,743 |
| Computers & Business Equipment - 2.22% | | | |
| Cogent, Inc. * (a) | 109,911 | | 1,577,223 |
| Micros Systems, Inc. * | 38,784 | | 2,340,227 |
| NETGEAR, Inc. * | 25,069 | | 703,436 |
| |
|
| | | | 4,620,886 |
| Construction & Mining Equipment - 1.19% | | | |
| Bucyrus International, Inc., Class A | 39,755 | | 2,484,290 |
| | | |
| Small Company Growth Fund (continued) | | |
| | Shares or | | |
| | Principal | | |
| | Amount | | Value |
|
|
| |
| COMMON STOCKS (continued) | | | |
| Containers & Glass - 0.75% | | | |
| Greif, Inc., Class A | 26,828 | $ | 1,561,926 |
| | | | |
| Crude Petroleum & Natural Gas - 2.67% | | | |
| Arena Resources, Inc. * | 3,354 | | 205,801 |
| Bill Barrett Corp. * (a) | 50,974 | | 1,796,324 |
| Carrizo Oil & Gas, Inc. * | 6,262 | | 245,909 |
| Unit Corp. * | 39,607 | | 1,943,119 |
| Whiting Petroleum Corp. * | 37,016 | | 1,375,515 |
| |
|
| | | | 5,566,668 |
| Drugs & Health Care - 2.31% | | | |
| BioMarin Pharmaceutical, Inc. * | 67,334 | | 1,446,334 |
| Mentor Corp. (a) | 35,365 | | 1,576,926 |
| Parexel International Corp. * | 41,484 | | 1,784,227 |
| |
|
| | | | 4,807,487 |
| Educational Services - 1.50% | | | |
| DeVry, Inc. | 46,491 | | 1,605,334 |
| Strayer Education, Inc. | 9,585 | | 1,529,575 |
| |
|
| | | | 3,134,909 |
| Electrical Equipment - 1.78% | | | |
| Varian, Inc. * | 39,115 | | 2,347,682 |
| Wesco International, Inc. * | 28,511 | | 1,356,839 |
| |
|
| | | | 3,704,521 |
| Electrical Utilities - 1.58% | | | |
| ITC Holdings Corp. | 28,124 | | 1,250,955 |
| Pike Electric Corp. * | 108,461 | | 2,049,913 |
| |
|
| | | | 3,300,868 |
| Electronics - 2.22% | | | |
| SiRF Technology Holdings, Inc. * (a) | 48,329 | | 814,827 |
| Thomas & Betts Corp. * | 29,398 | | 1,628,355 |
| Trimble Navigation, Ltd. * | 62,088 | | 2,192,327 |
| |
|
| | | | 4,635,509 |
| Financial Services - 1.95% | | | |
| Affiliated Managers Group, Inc. * (a) | 19,335 | | 2,189,689 |
| National Financial Partners Corp. (a) | 38,254 | | 1,870,238 |
| |
|
| | | | 4,059,927 |
| Food & Beverages - 1.78% | | | |
| Performance Food Group Company * | 61,021 | | 1,735,437 |
| Ralcorp Holdings, Inc. * | 31,900 | | 1,971,101 |
| |
|
| | | | 3,706,538 |
| Healthcare Products - 4.20% | | | |
| Accuray, Inc. * (a) | 5,681 | | 78,568 |
| American Medical Systems Holdings, Inc. * (a) | 89,306 | | 1,643,231 |
| Gen-Probe, Inc. * | 25,311 | | 1,620,410 |
| Kyphon, Inc. * | 23,457 | | 1,568,570 |
| Nuvasive, Inc. * | 32,342 | | 1,031,710 |
| The Medicines Company * | 65,280 | | 1,090,176 |
| Wright Medical Group, Inc. * | 65,233 | | 1,708,452 |
| |
|
| | | | 8,741,117 |
| Healthcare Services - 2.07% | | | |
| Magellan Health Services, Inc. * | 36,462 | | 1,480,357 |
| |
| The accompanying notes are an integral part of the financial statements. | 327 |
John Hancock Funds II
Portfolio of investments — August 31, 2007
(showing percentage of total net assets)
| | | |
| Small Company Growth Fund (continued) | | |
| | Shares or | | |
| | Principal | | |
| | Amount | | Value |
|
|
| |
| COMMON STOCKS (continued) | | | |
| | | | |
| Healthcare Services (continued) | | | |
| Palomar Medical Technologies, Inc. * | 18,024 | $ | 567,756 |
| Pediatrix Medical Group, Inc. * | 27,728 | | 1,653,975 |
| The Advisory Board Company * | 10,522 | | 605,331 |
| |
|
| | | | 4,307,419 |
| Holdings Companies/Conglomerates - 0.58% | | | |
| United Industrial Corp. (a) | 17,449 | | 1,206,249 |
| | | | |
| Hotels & Restaurants - 2.07% | | | |
| Choice Hotels International, Inc. | 38,700 | | 1,450,476 |
| Jack in the Box, Inc. * | 21,579 | | 1,342,645 |
| P.F. Chang's China Bistro, Inc. * (a) | 44,890 | | 1,514,140 |
| |
|
| | | | 4,307,261 |
| Household Products - 1.49% | | | |
| Church & Dwight, Inc. | 48,607 | | 2,183,913 |
| Tempur-Pedic International, Inc. (a) | 32,228 | | 931,389 |
| |
|
| | | | 3,115,302 |
| Industrial Machinery - 2.46% | | | |
| Actuant Corp., Class A | 15,841 | | 966,143 |
| FMC Technologies, Inc. * | 22,237 | | 2,105,844 |
| Regal-Beloit Corp. | 40,563 | | 2,048,837 |
| |
|
| | | | 5,120,824 |
| Insurance - 1.64% | | | |
| HCC Insurance Holdings, Inc. | 21,272 | | 587,320 |
| ProAssurance Corp. * | 29,486 | | 1,550,374 |
| Security Capital Assurance, Ltd. | 62,840 | | 1,277,537 |
| |
|
| | | | 3,415,231 |
| Internet Retail - 0.28% | | | |
| Shutterfly, Inc. * (a) | 20,531 | | 574,047 |
| | | | |
| Internet Software - 1.93% | | | |
| DealerTrack Holdings, Inc. * | 46,560 | | 1,778,592 |
| F5 Networks, Inc. * | 64,052 | | 2,239,898 |
| |
|
| | | | 4,018,490 |
| Leisure Time - 0.51% | | | |
| National Cinemedia, Inc. | 43,365 | | 1,068,080 |
| | | | |
| Manufacturing - 3.87% | | | |
| Acuity Brands, Inc. | 16,990 | | 892,655 |
| Ceradyne, Inc. * | 29,882 | | 2,159,871 |
| Coherent, Inc. * | 56,350 | | 1,695,571 |
| General Cable Corp. * | 30,343 | | 1,765,356 |
| Input/Output, Inc. * (a) | 108,617 | | 1,541,275 |
| |
|
| | | | 8,054,728 |
| Medical-Hospitals - 1.91% | | | |
| Cepheid, Inc. * | 41,568 | | 776,490 |
| Lifepoint Hospitals, Inc. * | 45,750 | | 1,285,575 |
| VCA Antech, Inc. * | 46,707 | | 1,909,849 |
| |
|
| | | | 3,971,914 |
| Metal & Metal Products - 0.72% | | | |
| Dynamic Materials Corp. (a) | 34,823 | | 1,497,041 |
| | | |
| Petroleum Services - 1.70% | | | |
| Core Laboratories N.V. * | 16,189 | | 1,814,787 |
| | | | |
| Small Company Growth Fund (continued) | | |
| | Shares or | | |
| | Principal | | |
| | Amount | | Value |
|
|
| |
| COMMON STOCKS (continued) | | | |
| Petroleum Services (continued) | | | |
| Dril-Quip, Inc. * | 36,569 | $ | 1,720,937 |
|
|
| | | | 3,535,724 |
| Pharmaceuticals - 2.94% | | | |
| AMAG Pharmaceuticals, Inc. * (a) | 12,591 | | 688,098 |
| Medicis Pharmaceutical Corp., Class A (a) | 43,986 | | 1,343,332 |
| Santarus, Inc. * (a) | 75,057 | | 186,141 |
| Sciele Pharma, Inc. * (a) | 79,346 | | 1,831,306 |
| United Therapeutics Corp. * (a) | 30,297 | | 2,075,042 |
|
|
| | | | 6,123,919 |
| Railroads & Equipment - 0.75% | | | |
| Wabtec Corp. | 41,967 | | 1,572,503 |
| | | | |
| Real Estate - 0.76% | | | |
| BioMed Realty Trust, Inc., REIT | 64,733 | | 1,578,191 |
| | | | |
| Retail Trade - 4.00% | | | |
| Dick's Sporting Goods, Inc. * | 17,696 | | 1,148,470 |
| DSW, Inc., Class A * (a) | 46,504 | | 1,416,047 |
| Hot Topic, Inc. * | 150,362 | | 1,258,530 |
| Longs Drug Stores Corp. | 41,635 | | 2,195,414 |
| Zumiez, Inc. * (a) | 47,787 | | 2,319,103 |
|
|
| | | | 8,337,564 |
| Semiconductors - 7.75% | | | |
| Cirrus Logic, Inc. * | 226,695 | | 1,543,793 |
| Diodes, Inc. * | 56,830 | | 1,722,518 |
| Emulex Corp. * | 79,389 | | 1,551,261 |
| FormFactor, Inc. * | 36,509 | | 1,656,048 |
| Microsemi Corp. * (a) | 63,278 | | 1,604,730 |
| Power Integrations, Inc. * | 68,684 | | 1,922,465 |
| Silicon Laboratories, Inc. * (a) | 52,460 | | 1,936,823 |
| Tessera Technologies, Inc. * | 50,784 | | 1,860,218 |
| Varian Semiconductor Equipment | | | |
| Associates, Inc. * | 42,229 | | 2,349,199 |
|
|
| | | | 16,147,055 |
| Software - 7.61% | | | |
| Ansoft Corp. * | 11,656 | | 348,398 |
| ANSYS, Inc. * | 80,485 | | 2,666,468 |
| Blackboard, Inc. * (a) | 61,040 | | 2,549,641 |
| Eclipsys Corp. * | 95,191 | | 2,197,960 |
| JDA Software Group, Inc. * | 76,024 | | 1,577,498 |
| Lawson Software, Inc. * (a) | 179,349 | | 1,759,414 |
| Manhattan Associates, Inc. * | 43,828 | | 1,265,753 |
| Omniture, Inc. * (a) | 24,847 | | 616,454 |
| Orbotech, Ltd. * | 42,939 | | 929,629 |
| THQ, Inc. * | 67,333 | | 1,938,517 |
|
|
| | | | 15,849,732 |
| Steel - 1.83% | | | |
| Carpenter Technology Corp. | 19,433 | | 2,270,552 |
| Texas Industries, Inc. | 20,826 | | 1,535,292 |
|
|
| | | | 3,805,844 |
| |
| The accompanying notes are an integral part of the financial statements. | 328 |
John Hancock Funds II
Portfolio of investments — August 31, 2007
(showing percentage of total net assets)
| | | | |
| Small Company Growth Fund (continued) | | |
| | | Shares or | | |
| | | Principal | | |
| | | Amount | | Value |
| |
|
| |
| COMMON STOCKS (continued) | | | | |
| | | | | |
| Telecommunications Equipment & | | | | |
| Services - 4.03% | | | | |
| C-COR, Inc. * | | 104,990 | $ | 1,208,435 |
| NeuStar, Inc., Class A * | | 59,007 | | 1,865,801 |
| NICE Systems, Ltd., ADR * | | 61,349 | | 2,170,528 |
| Polycom, Inc. * | | 26,092 | | 790,848 |
| SBA Communications Corp. * | | 72,575 | | 2,363,768 |
|
|
| | | | | 8,399,380 |
| Toys, Amusements & Sporting Goods - 0.65% | | | |
| Marvel Entertainment, Inc. * (a) | | 60,034 | | 1,356,768 |
| | | | | |
| Transportation - 0.71% | | | | |
| American Commercial Lines, Inc. * (a) | | 57,547 | | 1,486,439 |
| | | | | |
| Trucking & Freight - 2.42% | | | | |
| Forward Air Corp. (a) | | 50,236 | | 1,760,270 |
| Hub Group, Inc., Class A * | | 55,317 | | 1,845,928 |
| Knight Transportation, Inc. (a) | | 77,797 | | 1,430,687 |
|
|
| | | | | 5,036,885 |
|
| TOTAL COMMON STOCKS (Cost $190,754,418) | | $ | 205,140,032 |
|
| |
| SHORT TERM INVESTMENTS - 21.64% | | | | |
| John Hancock Cash Investment Trust (c) | $ | 45,078,798 | $ | 45,078,798 |
|
| TOTAL SHORT TERM INVESTMENTS | | | | |
| (Cost $45,078,798) | | | $ | 45,078,798 |
|
| |
| REPURCHASE AGREEMENTS - 1.65% | | | | |
| Repurchase Agreement with State | | | | |
| Street Corp. dated 08/31/2007 at | | | | |
| 4.85% to be repurchased at | | | | |
| $3,451,859 on 09/04/2007, | | | | |
| collateralized by $3,620,000 | | | | |
| Federal Home Loan Mortgage | | | | |
| Corp., 5.625% due 11/23/2035 | | | | |
| (valued at $3,519,465, including | | | | |
| interest) | $ | 3,450,000 | $ | 3,450,000 |
|
| TOTAL REPURCHASE AGREEMENTS | | | | |
| (Cost $3,450,000) | | | $ | 3,450,000 |
|
| Total Investments (Small Company Growth Fund) | | | |
| (Cost $239,283,216) - 121.77% | | | $ | 253,668,830 |
| Liabilities in Excess of Other Assets - (21.77)% | | | (45,354,733) |
|
|
| TOTAL NET ASSETS - 100.00% | | | $ | 208,314,097 |
|
|
| |
| |
| |
| Small Company Value Fund | | | | |
| | | Shares or | | |
| | | Principal | | |
| | | Amount | | Value |
| |
|
| |
| COMMON STOCKS - 98.21% | | | | |
| | | | | |
| Aerospace - 1.80% | | | | |
| EDO Corp. (a) | | 57,800 | $ | 2,487,712 |
| Woodward Governor Company | | 99,900 | | 5,867,127 |
|
|
| | | | | 8,354,839 |
| | | | |
| Small Company Value Fund (continued) | | |
| | | Shares or | | |
| | | Principal | | |
| | | Amount | | Value |
| |
|
| |
| COMMON STOCKS (continued) | | | | |
| Air Travel - 0.53% | | | | |
| Airtran Holdings, Inc. * (a) | | 235,000 | $ | 2,469,850 |
| | | | | |
| Apparel & Textiles - 1.07% | | | | |
| Culp, Inc. * | | 87,100 | | 888,420 |
| G & K Services, Class A | | 97,200 | | 4,048,380 |
|
|
| | | | | 4,936,800 |
| Auto Parts - 0.25% | | | | |
| Accuride Corp. * | | 88,900 | | 1,153,033 |
| | | | | |
| Auto Services - 0.78% | | | | |
| Dollar Thrifty Automotive Group, Inc. * | | 122,900 | | 3,623,092 |
| | | | | |
| Banking - 6.28% | | | | |
| Boston Private Financial Holdings, Inc. (a) | | 84,500 | | 2,294,175 |
| East West Bancorp, Inc. | | 166,000 | | 5,942,800 |
| First Republic Bank | | 136,000 | | 7,418,800 |
| Glacier Bancorp, Inc. | | 128,700 | | 2,826,252 |
| Home Bancshares, Inc. (a) | | 78,300 | | 1,706,157 |
| SVB Financial Group * | | 130,000 | | 6,468,800 |
| Wintrust Financial Corp. (a) | | 55,700 | | 2,402,898 |
|
|
| | | | | 29,059,882 |
| Biotechnology - 1.64% | | | | |
| Exelixis, Inc. * | | 163,700 | | 1,841,625 |
| Myriad Genetics, Inc. * (a) | | 131,100 | | 5,763,156 |
|
|
| | | | | 7,604,781 |
| Broadcasting - 0.23% | | | | |
| Saga Communications, Inc., Class A * | | 150,600 | | 1,084,320 |
| | | | | |
| Building Materials & Construction - 0.49% | | | | |
| Beacon Roofing Supply, Inc. * | | 192,700 | | 2,244,955 |
| | | | | |
| Business Services - 6.45% | | | | |
| Compass Diversified Trust | | 116,200 | | 1,637,258 |
| Electro Rent Corp. * | | 183,600 | | 2,667,708 |
| FTI Consulting, Inc. * | | 140,900 | | 7,400,068 |
| McGrath Rentcorp | | 174,300 | | 5,582,829 |
| MPS Group, Inc. * | | 332,000 | | 4,568,320 |
| Navigant Consulting Company * (a) | | 129,000 | | 2,276,850 |
| StarTek, Inc. | | 118,900 | | 1,228,237 |
| Wind River Systems, Inc. * | | 352,100 | | 3,714,655 |
| Wireless Facilities, Inc. * (a) | | 305,700 | | 776,478 |
|
|
| | | | | 29,852,403 |
| Chemicals - 3.81% | | | | |
| Airgas, Inc. | | 126,000 | | 5,823,720 |
| American Vanguard Corp. | | 146,400 | | 2,292,624 |
| Arch Chemicals, Inc. | | 116,500 | | 5,046,780 |
| Innospec, Inc. | | 179,800 | | 4,466,232 |
|
|
| | | | | 17,629,356 |
| Commercial Services - 1.14% | | | | |
| Live Nation, Inc. * | | 53,200 | | 1,101,240 |
| Pool Corp. (a) | | 128,600 | | 4,198,790 |
|
|
| | | | | 5,300,030 |
| Computers & Business Equipment - 1.47% | | | | |
| Ixia * | | 234,600 | | 2,134,860 |
| |
| The accompanying notes are an integral part of the financial statements. | 329 |
John Hancock Funds II
Portfolio of investments — August 31, 2007
(showing percentage of total net assets)
| | | |
| Small Company Value Fund (continued) | | |
| | Shares or | | |
| | Principal | | |
| | Amount | | Value |
|
|
| |
| COMMON STOCKS (continued) | | | |
| | | | |
| Computers & Business Equipment | | | |
| (continued) | | | |
| Palm, Inc. * (a) | 166,200 | $ | 2,494,662 |
| Xyratex, Ltd. * | 105,600 | | 2,198,592 |
|
|
| | | | 6,828,114 |
| Construction & Mining Equipment - 0.53% | | | |
| Carbo Ceramics, Inc. (a) | 52,500 | | 2,457,000 |
| | | | |
| Construction Materials - 2.74% | | | |
| Ameron International Corp. | 52,800 | | 5,042,400 |
| Florida Rock Industries, Inc. | 78,537 | | 4,909,348 |
| Universal Forest Products, Inc. | 73,300 | | 2,733,357 |
|
|
| | | | 12,685,105 |
| Crude Petroleum & Natural Gas - 3.56% | | | |
| Forest Oil Corp. * (a) | 117,100 | | 4,525,915 |
| Penn Virginia Corp. | 205,500 | | 8,201,505 |
| Whiting Petroleum Corp. * | 101,500 | | 3,771,740 |
|
|
| | | | 16,499,160 |
| Domestic Oil - 0.60% | | | |
| Mariner Energy, Inc. * | 99,800 | | 2,092,806 |
| Union Drilling, Inc. * | 48,500 | | 698,400 |
|
|
| | | | 2,791,206 |
| Drugs & Health Care - 1.80% | | | |
| Arrow International, Inc. | 50,600 | | 2,283,578 |
| Landauer, Inc. | 43,400 | | 2,199,946 |
| West Pharmaceutical Services, Inc. | 95,800 | | 3,836,790 |
|
|
| | | | 8,320,314 |
| Electrical Equipment - 1.85% | | | |
| C & D Technologies, Inc. * (a) | 129,000 | | 546,960 |
| Genlyte Group, Inc. * | 59,900 | | 4,346,943 |
| Littelfuse, Inc. * | 89,900 | | 3,002,660 |
| Methode Electronics, Inc. | 45,900 | | 662,796 |
|
|
| | | | 8,559,359 |
| Electrical Utilities - 2.57% | | | |
| Black Hills Corp. | 102,500 | | 4,221,975 |
| Cleco Corp. | 146,600 | | 3,377,664 |
| El Paso Electric Company * | 139,500 | | 3,113,640 |
| Empire District Electric Company (a) | 52,600 | | 1,206,118 |
|
|
| | | | 11,919,397 |
| Electronics - 2.53% | | | |
| Analogic Corp. | 28,100 | | 1,940,586 |
| Belden, Inc. | 125,500 | | 6,100,555 |
| Franklin Electric, Inc. (a) | 47,500 | | 1,960,800 |
| Newport Corp. * | 123,400 | | 1,704,154 |
|
|
| | | | 11,706,095 |
| Energy - 0.25% | | | |
| GeoMet, Inc. * (a) | 87,000 | | 513,300 |
| Verenium Corp. * (a) | 114,400 | | 629,200 |
|
|
| | | | 1,142,500 |
| Financial Services - 0.17% | | | |
| JMP Group Inc * | 88,800 | | 799,200 |
| | | |
| Small Company Value Fund (continued) | | |
| | Shares or | | |
| | Principal | | |
| | Amount | | Value |
|
|
| |
| COMMON STOCKS (continued) | | | |
| Food & Beverages - 0.28% | | | |
| Winn-Dixie Stores, Inc. * | 63,000 | $ | 1,318,590 |
| | | | |
| Forest Products - 0.89% | | | |
| Deltic Timber Corp. | 72,000 | | 4,118,400 |
| | | | |
| Furniture & Fixtures - 0.43% | | | |
| Stanley Furniture Company, Inc. (a) | 116,700 | | 2,011,908 |
| | | | |
| Gas & Pipeline Utilities - 1.02% | | | |
| Southwest Gas Corp. | 95,800 | | 2,779,158 |
| Vectren Corp. | 70,500 | | 1,924,650 |
| |
|
| | | | 4,703,808 |
| Gold - 0.57% | | | |
| Meridian Gold, Inc. * | 94,500 | | 2,624,265 |
| | | | |
| Healthcare Products - 1.48% | | | |
| Owens & Minor, Inc. | 172,000 | | 6,862,800 |
| | | | |
| Healthcare Services - 0.56% | | | |
| National Healthcare Corp. | 49,000 | | 2,576,910 |
| | | | |
| Homebuilders - 0.60% | | | |
| M/I Homes, Inc. (a) | 92,700 | | 1,689,921 |
| Meritage Homes Corp. * (a) | 61,100 | | 1,107,132 |
| |
|
| | | | 2,797,053 |
| Hotels & Restaurants - 1.50% | | | |
| RARE Hospitality International, Inc. * | 137,100 | | 5,178,267 |
| Ruby Tuesday, Inc. (a) | 80,100 | | 1,774,215 |
| |
|
| | | | 6,952,482 |
| Household Appliances - 0.50% | | | |
| Drew Industries, Inc. * | 58,800 | | 2,309,076 |
| | | | |
| Industrial Machinery - 1.79% | | | |
| Circor International, Inc. | 56,600 | | 2,393,614 |
| IDEX Corp. | 152,625 | | 5,871,484 |
| |
|
| | | | 8,265,098 |
| Insurance - 4.66% | | | |
| Employers Holdings, Inc. | 21,600 | | 404,568 |
| James River Group, Inc. | 3,800 | | 126,540 |
| Markel Corp. * | 7,800 | | 3,710,148 |
| Max Re Capital, Ltd. | 136,000 | | 3,734,560 |
| Midland Company | 85,200 | | 4,666,404 |
| National Interstate Corp. | 43,500 | | 1,425,930 |
| ProAssurance Corp. * | 142,700 | | 7,503,166 |
| |
|
| | | | 21,571,316 |
| Investment Companies - 2.21% | | | |
| Ares Cap Corp. (a) | 177,000 | | 2,906,340 |
| First Financial Fund, Inc. * | 207,000 | | 2,637,180 |
| Hercules Technology Growth Capital, Inc. | 165,399 | | 1,938,476 |
| Kohlberg Capital Corp. | 181,000 | | 2,767,490 |
| |
|
| | | | 10,249,486 |
| Life Sciences - 0.26% | | | |
| Symyx Technologies, Inc. * | 135,900 | | 1,216,305 |
| | | | |
| Manufacturing - 2.48% | | | |
| AptarGroup, Inc. | 164,600 | | 5,979,918 |
| | |
| The accompanying notes are an integral part of the financial statements. | 330 |
John Hancock Funds II
Portfolio of investments — August 31, 2007
(showing percentage of total net assets)
| | | |
| Small Company Value Fund (continued) | | |
| | Shares or | | |
| | Principal | | |
| | Amount | | Value |
|
|
| |
| COMMON STOCKS (continued) | | | |
| | | | |
| Manufacturing (continued) | | | |
| Nordson Corp. | 109,600 | $ | 5,503,016 |
|
|
| | | | 11,482,934 |
| Metal & Metal Products - 3.29% | | | |
| Gibraltar Industries, Inc. | 153,000 | | 3,056,940 |
| Matthews International Corp., Class A | 148,200 | | 6,393,348 |
| Metal Management, Inc. | 123,600 | | 5,798,076 |
|
|
| | | | 15,248,364 |
| Mobile Homes - 1.09% | | | |
| Skyline Corp. | 53,600 | | 1,604,248 |
| Winnebago Industries, Inc. (a) | 128,400 | | 3,424,428 |
|
|
| | | | 5,028,676 |
| Mutual Funds - 0.49% | | | |
| iShares Russell 2000 Value Index Fund (a) | 29,788 | | 2,284,144 |
| | | | |
| Newspapers - 0.09% | | | |
| Journal Register Company (a) | 139,000 | | 437,850 |
| | | | |
| Paper - 1.50% | | | |
| Chesapeake Corp. | 41,700 | | 408,660 |
| Potlatch Corp. | 100,400 | | 4,522,016 |
| Wausau-Mosinee Paper Corp. | 178,000 | | 1,998,940 |
|
|
| | | | 6,929,616 |
| Petroleum Services - 3.49% | | | |
| Atwood Oceanics, Inc. * | 54,000 | | 4,103,460 |
| Hercules Offshore, Inc. * (a) | 96,092 | | 2,444,580 |
| TETRA Technologies, Inc. * | 265,000 | | 5,297,350 |
| W-H Energy Services, Inc. * | 67,800 | | 4,309,368 |
|
|
| | | | 16,154,758 |
| Pharmaceuticals - 0.79% | | | |
| Pharmion Corp. * | 88,800 | | 3,641,688 |
| | | | |
| Publishing - 0.06% | | | |
| Courier Corp. | 7,700 | | 276,738 |
| | | | |
| Railroads & Equipment - 0.95% | | | |
| Genesee & Wyoming, Inc., Class A * | 161,200 | | 4,413,656 |
| | | | |
| Real Estate - 5.05% | | | |
| First Potomac Realty Trust, REIT | 129,900 | | 2,752,581 |
| Kilroy Realty Corp., REIT | 107,400 | | 6,565,362 |
| LaSalle Hotel Properties, REIT | 110,000 | | 4,580,400 |
| Parkway Properties, Inc., REIT | 60,700 | | 2,809,196 |
| Strategic Hotel Cap, Inc., REIT (a) | 171,500 | | 3,527,755 |
| Washington Real Estate Investment Trust, | | | |
| REIT (a) | 96,600 | | 3,163,650 |
|
|
| | | | 23,398,944 |
| Retail Grocery - 0.58% | | | |
| Nash Finch Company (a) | 71,300 | | 2,674,463 |
| | | | |
| Retail Trade - 4.64% | | | |
| Aaron Rents, Inc., Class A | 5,350 | | 125,725 |
| Aaron Rents, Inc., Class B | 289,400 | | 7,405,746 |
| Building Materials Holding Corp. (a) | 141,000 | | 2,086,800 |
| Casey's General Stores, Inc. | 101,200 | | 2,870,032 |
| CSS Industries, Inc. | 83,600 | | 3,215,256 |
| | | | |
| Small Company Value Fund (continued) | | |
| | | Shares or | | |
| | | Principal | | |
| | | Amount | | Value |
| |
|
| |
| COMMON STOCKS (continued) | | | | |
| Retail Trade (continued) | | | | |
| Fred's, Inc., Class A | | 128,400 | $ | 1,335,360 |
| Haverty Furniture Companies, Inc. | | 189,300 | | 2,029,296 |
| Stein Mart, Inc. | | 274,000 | | 2,405,720 |
|
|
| | | | | 21,473,935 |
| Sanitary Services - 1.92% | | | | |
| Casella Waste Systems, Inc., Class A * | | 184,600 | | 2,061,982 |
| Insituform Technologies, Inc., Class A * (a) | 189,500 | | 3,124,855 |
| Waste Connections, Inc. * | | 121,800 | | 3,705,156 |
|
|
| | | | | 8,891,993 |
| Semiconductors - 2.36% | | | | |
| Advanced Energy Industries, Inc. * | | 133,700 | | 2,169,950 |
| ATMI, Inc. * | | 68,700 | | 2,071,992 |
| Brooks Automation, Inc. * | | 206,404 | | 2,920,617 |
| Exar Corp. * | | 86,800 | | 1,157,912 |
| GSI Group, Inc. * | | 265,500 | | 2,588,625 |
|
|
| | | | | 10,909,096 |
| Software - 2.76% | | | | |
| Progress Software Corp. * | | 157,400 | | 4,803,848 |
| SPSS, Inc. * | | 117,900 | | 4,804,425 |
| Websense, Inc. * | | 153,900 | | 3,165,723 |
|
|
| | | | | 12,773,996 |
| Steel - 1.28% | | | | |
| Carpenter Technology Corp. | | 50,600 | | 5,912,104 |
| | | | | |
| Telecommunications Equipment & | | | | |
| Services - 0.80% | | | | |
| Premiere Global Services, Inc. * | | 283,500 | | 3,708,180 |
| | | | | |
| Tires & Rubber - 0.67% | | | | |
| Myers Indiana, Inc. | | 145,100 | | 3,090,630 |
| | | | | |
| Tobacco - 0.31% | | | | |
| Alliance One International, Inc. * | | 185,400 | | 1,427,580 |
| | | | | |
| Transportation - 2.36% | | | | |
| Kirby Corp. * | | 173,900 | | 6,656,892 |
| UTI Worldwide, Inc. | | 192,500 | | 4,283,125 |
|
|
| | | | | 10,940,017 |
| Trucking & Freight - 1.96% | | | | |
| Landstar Systems, Inc. | | 211,100 | | 9,079,411 |
|
| TOTAL COMMON STOCKS (Cost $397,878,746) | | $ | 454,777,061 |
|
| |
| SHORT TERM INVESTMENTS - 15.19% | | | |
| John Hancock Cash Investment Trust (c) | $ | 63,685,485 | $ | 63,685,485 |
| T. Rowe Price Reserve Investment Fund (c) | 6,628,264 | | 6,628,264 |
|
| TOTAL SHORT TERM INVESTMENTS | | | | |
| (Cost $70,313,749) | | | $ | 70,313,749 |
|
| | |
| The accompanying notes are an integral part of the financial statements. | 331 |
John Hancock Funds II
Portfolio of investments — August 31, 2007
(showing percentage of total net assets)
| | | | |
| Small Company Value Fund (continued) | | |
| | | Shares or | | |
| | | Principal | | |
| | | Amount | | Value |
| |
|
| |
| REPURCHASE AGREEMENTS - 0.43% | | | |
| Repurchase Agreement with State | | | | |
| Street Corp. dated 08/31/2007 at | | | | |
| 4.60% to be repurchased at | | | | |
| $1,991,017 on 09/04/2007, | | | | |
| collateralized by $2,055,000 | | | | |
| Federal National Mortgage | | | | |
| Association, 5.49% due | | | | |
| 01/11/2023 (valued at $2,034,450, | | | | |
| including interest) | $ | 1,990,000 | $ | 1,990,000 |
|
| TOTAL REPURCHASE AGREEMENTS | | | | |
| (Cost $1,990,000) | | | $ | 1,990,000 |
|
| Total Investments (Small Company Value Fund) | | | |
| (Cost $470,182,495) - 113.83% | | | $ | 527,080,810 |
| Liabilities in Excess of Other Assets - (13.83)% | | | (64,026,962) |
| |
|
| TOTAL NET ASSETS - 100.00% | | | $ | 463,053,848 |
| |
|
| |
| |
| |
| Special Value Fund | | | | |
| | | Shares or | | |
| | | Principal | | |
| | | Amount | | Value |
| |
|
| |
| COMMON STOCKS - 97.51% | | | | |
| | | | | |
| Air Travel - 1.30% | | | | |
| Airtran Holdings, Inc. * (a) | | 5,700 | $ | 59,907 |
| | | | | |
| Apparel & Textiles - 2.21% | | | | |
| Stage Stores, Inc. | | 5,900 | | 102,247 |
| | | | | |
| Auto Parts - 3.84% | | | | |
| O'Reilly Automotive, Inc. * | | 5,000 | | 177,700 |
| | | | | |
| Banking - 6.02% | | | | |
| First Midwest BanCorp, Inc. | | 1,200 | | 41,148 |
| International Bancshares Corp. | | 2,300 | | 52,946 |
| MB Financial, Inc. | | 1,200 | | 42,252 |
| NewAlliance Bancshares, Inc. (a) | | 2,900 | | 43,239 |
| Webster Financial Corp. | | 1,300 | | 55,198 |
| Westamerica Bancorp (a) | | 900 | | 43,695 |
| |
|
| | | | | 278,478 |
| Biotechnology - 1.70% | | | | |
| Charles River Laboratories International, Inc. * | 1,500 | | 78,720 |
| | | | | |
| Business Services - 1.57% | | | | |
| MAXIMUS, Inc. | | 1,700 | | 72,726 |
| | | | |
| Computers & Business Equipment - 3.03% | | | |
| Diebold, Inc. | | 700 | | 30,709 |
| Electronics for Imaging, Inc. * | | 1,800 | | 46,944 |
| Xyratex, Ltd. * | | 3,000 | | 62,460 |
| |
|
| | | | | 140,113 |
| Construction Materials - 1.14% | | | | |
| Simpson Manufacturing Company, Inc. | | 1,600 | | 52,800 |
| | | | | |
| Containers & Glass - 1.10% | | | | |
| Bemis Company, Inc. | | 1,700 | | 50,779 |
| | | |
| Special Value Fund (continued) | | | |
| | Shares or | | |
| | Principal | | |
| | Amount | | Value |
|
|
| |
| COMMON STOCKS (continued) | | | |
| Crude Petroleum & Natural Gas - 2.02% | | | |
| Plains Exploration & Production Company * | 1,600 | $ | 60,048 |
| Whiting Petroleum Corp. * | 900 | | 33,444 |
| |
|
| | | | 93,492 |
| Domestic Oil - 1.52% | | | |
| St. Mary Land & Exploration Company | 2,100 | | 70,035 |
| | | | |
| Electrical Equipment - 0.78% | | | |
| Varian, Inc. * | 600 | | 36,012 |
| | | | |
| Electrical Utilities - 2.82% | | | |
| PNM Resources, Inc. | 2,900 | | 67,048 |
| Westar Energy, Inc. | 2,600 | | 63,154 |
| |
|
| | | | 130,202 |
| Electronics - 3.04% | | | |
| Belden, Inc. | 1,500 | | 72,915 |
| Nam Tai Electronics, Inc. | 5,000 | | 67,700 |
| |
|
| | | | 140,615 |
| Energy - 0.74% | | | |
| New Jersey Resources Corp. | 702 | | 34,384 |
| | | | |
| Financial Services - 6.22% | | | |
| Asset Acceptance Capital Corp. (a) | 4,400 | | 49,764 |
| Credit Acceptance Corp. * | 2,000 | | 44,420 |
| Delphi Financial Group, Inc. | 1,600 | | 64,480 |
| Financial Federal Corp. | 2,515 | | 76,733 |
| GATX Corp. | 1,200 | | 52,320 |
| |
|
| | | | 287,717 |
| Food & Beverages - 3.14% | | | |
| Hormel Foods Corp. | 2,600 | | 92,638 |
| Lance, Inc. | 2,100 | | 52,311 |
| |
|
| | | | 144,949 |
| Forest Products - 0.87% | | | |
| Deltic Timber Corp. | 700 | | 40,040 |
| | | | |
| Gas & Pipeline Utilities - 2.27% | | | |
| UGI Corp. | 2,300 | | 58,765 |
| WGL Holdings, Inc. | 1,400 | | 46,046 |
| |
|
| | | | 104,811 |
| Healthcare Products - 3.09% | | | |
| DENTSPLY International, Inc. | 900 | | 35,442 |
| Herbalife, Ltd. | 1,400 | | 59,430 |
| Orthofix International NV * | 1,000 | | 47,840 |
| |
|
| | | | 142,712 |
| Homebuilders - 0.24% | | | |
| Standard Pacific Corp. (a) | 1,100 | | 11,033 |
| | | | |
| Hotels & Restaurants - 2.40% | | | |
| RARE Hospitality International, Inc. * | 1,900 | | 71,763 |
| Sonic Corp. * | 1,800 | | 39,276 |
| |
|
| | | | 111,039 |
| Household Products - 0.63% | | | |
| Tempur-Pedic International, Inc. (a) | 1,000 | | 28,900 |
| |
| The accompanying notes are an integral part of the financial statements. | 332 |
John Hancock Funds II
Portfolio of investments — August 31, 2007
(showing percentage of total net assets)
| | | |
| Special Value Fund (continued) | | | |
| | Shares or | | |
| | Principal | | |
| | Amount | | Value |
|
|
| |
| COMMON STOCKS (continued) | | | |
| | | | |
| Industrial Machinery - 3.40% | | | |
| Albany International Corp., Class A | 983 | $ | 38,278 |
| Flowserve Corp. | 700 | | 49,987 |
| Graco, Inc. | 1,700 | | 68,697 |
| |
|
| | | | 156,962 |
| Insurance - 6.47% | | | |
| Assured Guaranty, Ltd. | 2,100 | | 54,747 |
| IPC Holdings, Ltd. | 900 | | 22,878 |
| Platinum Underwriters Holdings, Ltd. | 1,700 | | 58,956 |
| Reinsurance Group of America, Inc. | 2,000 | | 108,620 |
| Universal American Financial Corp. * | 2,600 | | 53,976 |
| |
|
| | | | 299,177 |
| Investment Companies - 1.56% | | | |
| Ares Cap Corp. | 4,400 | | 72,248 |
| | | | |
| Manufacturing - 7.04% | | | |
| Acuity Brands, Inc. | 1,000 | | 52,540 |
| AptarGroup, Inc. | 1,054 | | 38,292 |
| Carlisle Companies, Inc. | 4,100 | | 201,843 |
| ESCO Technologies, Inc. * | 1,000 | | 32,870 |
| |
|
| | | | 325,545 |
| Medical-Hospitals - 3.18% | | | |
| AmSurg Corp. * | 3,400 | | 80,206 |
| Centene Corp. * | 3,300 | | 66,693 |
| |
|
| | | | 146,899 |
| Metal & Metal Products - 4.40% | | | |
| Matthews International Corp., Class A | 2,200 | | 94,908 |
| Mueller Industries, Inc. | 3,127 | | 108,319 |
| |
|
| | | | 203,227 |
| Mining - 0.66% | | | |
| Compass Minerals International, Inc. | 900 | | 30,663 |
| | | | |
| Office Furnishings & Supplies - 2.68% | | | |
| Acco Brands Corp. * | 3,200 | | 72,545 |
| United Stationers, Inc. * | 871 | | 51,406 |
| |
|
| | | | 123,951 |
| Publishing - 0.57% | | | |
| Valassis Communications, Inc. * | 2,900 | | 26,448 |
| | | | |
| Railroads & Equipment - 1.13% | | | |
| Genesee & Wyoming, Inc., Class A * | 1,900 | | 52,022 |
| | | | |
| Real Estate - 7.28% | | | |
| Cousins Properties, Inc., REIT | 1,247 | | 34,255 |
| Maguire Properties, Inc., REIT | 1,900 | | 49,419 |
| PS Business Parks, Inc., REIT | 400 | | 22,600 |
| RAIT Investment Trust, REIT (a) | 4,700 | | 41,595 |
| Realty Income Corp., REIT (a) | 3,000 | | 81,000 |
| U-Store-It Trust, REIT | 4,300 | | 58,308 |
| Ventas, Inc., REIT | 1,300 | | 49,504 |
| |
|
| | | | 336,681 |
| Retail Trade - 6.17% | | | |
| Casey's General Stores, Inc. | 3,500 | | 99,260 |
| Cato Corp., Class A | 3,398 | | 74,994 |
| | | | |
| Special Value Fund (continued) | | | |
| | | Shares or | | |
| | | Principal | | |
| | | Amount | | Value |
|
|
| |
| COMMON STOCKS (continued) | | | | |
| Retail Trade (continued) | | | | |
| Hibbett Sports, Inc. * | | 4,100 | $ | 102,254 |
| Talbots, Inc. (a) | | 400 | | 8,512 |
|
|
| | | | | 285,020 |
| Tobacco - 1.28% | | | | |
| Universal Corp. | | 1,200 | | 58,956 |
|
| TOTAL COMMON STOCKS (Cost $4,796,121) | | $ | 4,507,210 |
|
| |
| SHORT TERM INVESTMENTS - 7.01% | | | | |
| John Hancock Cash Investment Trust (c) | $ | 323,920 | $ | 323,920 |
|
| TOTAL SHORT TERM INVESTMENTS | | | | |
| (Cost $323,920) | | | $ | 323,920 |
|
| |
| REPURCHASE AGREEMENTS - 3.65% | | | | |
| Repurchase Agreement with State | | | | |
| Street Corp. dated 08/31/2007 at | | | | |
| 4.60% to be repurchased at | | | | |
| $169,086 on 09/04/2007, | | | | |
| collateralized by $170,000 Federal | | | | |
| Home Loan Bank, 5.5% due | | | | |
| 07/15/2036 (valued at $174,888, | | | | |
| including interest) | $ | 169,000 | $ | 169,000 |
|
| TOTAL REPURCHASE AGREEMENTS | | | | |
| (Cost $169,000) | | | $ | 169,000 |
|
| Total Investments (Special Value Fund) | | | | |
| (Cost $5,289,041) - 108.17% | | | $ | 5,000,130 |
| Liabilities in Excess of Other Assets - (8.17)% | | | (377,664) |
|
|
| TOTAL NET ASSETS - 100.00% | | | $ | 4,622,466 |
|
|
| |
| |
| |
| Spectrum Income Fund | | | | |
| | | Shares or | | |
| | | Principal | | |
| | | Amount | | Value |
|
|
| |
| COMMON STOCKS - 16.37% | | | | |
| Aerospace - 0.13% | | | | |
| Raytheon Company | | 21,000 | $ | 1,288,140 |
| | | | | |
| Agriculture - 0.05% | | | | |
| Archer-Daniels-Midland Company | | 13,100 | | 441,470 |
| | | | | |
| Air Travel - 0.05% | | | | |
| Southwest Airlines Company | | 34,000 | | 513,740 |
| | | | | |
| Aluminum - 0.10% | | | | |
| Alcoa, Inc. | | 27,800 | | 1,015,534 |
| | | | | |
| Auto Parts - 0.10% | | | | |
| Genuine Parts Company | | 19,300 | | 958,824 |
| | | | |
| Automobiles - 0.04% | | | | |
| Ford Motor Company * | | 55,700 | | 435,017 |
| | | | | |
| Banking - 0.61% | | | | |
| Citizens Banking Corp. | | 300 | | 5,289 |
| Fifth Third Bancorp | | 42,200 | | 1,506,118 |
| National City Corp. | | 22,700 | | 610,857 |
| |
| The accompanying notes are an integral part of the financial statements. | 333 |
John Hancock Funds II
Portfolio of investments — August 31, 2007
(showing percentage of total net assets)
| | | |
| Spectrum Income Fund (continued) | | |
| | Shares or | | |
| | Principal | | |
| | Amount | | Value |
|
|
| |
| COMMON STOCKS (continued) | | | |
| | | | |
| Banking (continued) | | | |
| Royal Bank of Scotland Group PLC | 53,567 | $ | 622,580 |
| SunTrust Banks, Inc. | 15,500 | | 1,220,625 |
| US Bancorp | 61,480 | | 1,988,878 |
| |
|
| | | | 5,954,347 |
| Biotechnology - 0.14% | | | |
| Amgen, Inc. * | 27,400 | | 1,373,014 |
| | | | |
| Broadcasting - 0.14% | | | |
| CBS Corp., Class B | 38,850 | | 1,224,164 |
| XM Satellite Radio Holdings, Inc., Class A * | 10,550 | | 131,558 |
| |
|
| | | | 1,355,722 |
| Building Materials & Construction - 0.13% | | | |
| Masco Corp. | 49,400 | | 1,285,388 |
| | | | |
| Business Services - 0.20% | | | |
| Computer Sciences Corp. * | 14,200 | | 794,490 |
| H & R Block, Inc. | 57,300 | | 1,136,832 |
| |
|
| | | | 1,931,322 |
| Cable & Television - 0.29% | | | |
| Time Warner, Inc. | 101,000 | | 1,916,980 |
| Viacom, Inc., Class B * | 22,650 | | 893,769 |
| |
|
| | | | 2,810,749 |
| Cellular Communications - 0.21% | | | |
| ALLTEL Corp. | 13,200 | | 901,032 |
| Crown Castle International Corp. * | 8,725 | | 320,731 |
| Motorola, Inc. | 48,800 | | 827,160 |
| |
|
| | | | 2,048,923 |
| Chemicals - 0.15% | | | |
| E.I. Du Pont de Nemours & Company | 30,690 | | 1,496,137 |
| | | | |
| Computers & Business Equipment - 0.16% | | | |
| Dell, Inc. * | 56,200 | | 1,587,650 |
| | | | |
| Construction Materials - 0.18% | | | |
| USG Corp. * (a) | 18,000 | | 695,160 |
| Vulcan Materials Company | 11,900 | | 1,071,119 |
| |
|
| | | | 1,766,279 |
| Cosmetics & Toiletries - 0.69% | | | |
| Avon Products, Inc. | 34,300 | | 1,178,205 |
| Colgate-Palmolive Company | 24,100 | | 1,598,312 |
| International Flavors & Fragrances, Inc. | 27,600 | | 1,386,348 |
| Kimberly-Clark Corp. | 14,200 | | 975,398 |
| Procter & Gamble Company | 24,300 | | 1,587,033 |
| |
|
| | | | 6,725,296 |
| Crude Petroleum & Natural Gas - 0.08% | | | |
| Statoil ASA, ADR (a) | 23,300 | | 670,574 |
| Statoil ASA | 5,300 | | 152,677 |
| |
|
| | | | 823,251 |
| Drugs & Health Care - 0.15% | | | |
| Wyeth | 31,100 | | 1,439,930 |
| | | | |
| Electrical Equipment - 0.08% | | | |
| Cooper Industries, Ltd., Class A | 15,400 | | 788,018 |
| | | |
| Spectrum Income Fund (continued) | | |
| | Shares or | | |
| | Principal | | |
| | Amount | | Value |
|
|
| |
| COMMON STOCKS (continued) | | | |
| Electrical Utilities - 0.47% | | | |
| Ameren Corp. | 5,000 | $ | 253,900 |
| Entergy Corp. | 15,400 | | 1,595,748 |
| FirstEnergy Corp. | 16,500 | | 1,013,760 |
| Pinnacle West Capital Corp. | 15,100 | | 601,584 |
| TECO Energy, Inc. | 17,100 | | 270,864 |
| Xcel Energy, Inc. | 42,650 | | 879,016 |
| |
|
| | | | 4,614,872 |
| Electronics - 0.10% | | | |
| Sony Corp. | 21,300 | | 1,019,350 |
| | | | |
| Energy - 0.23% | | | |
| Duke Energy Corp. | 51,890 | | 951,662 |
| Energy East Corp. | 2,575 | | 68,727 |
| Progress Energy, Inc. | 25,950 | | 1,190,586 |
| |
|
| | | | 2,210,975 |
| Financial Services - 1.39% | | | |
| Bank of New York Mellon Corp. | 42,800 | | 1,730,404 |
| Capital One Financial Corp. | 10,800 | | 698,328 |
| Charles Schwab Corp. | 75,600 | | 1,496,880 |
| Citigroup, Inc. | 36,540 | | 1,712,995 |
| Countrywide Financial Corp. | 34,200 | | 678,870 |
| Federal National Mortgage Association | 13,300 | | 872,613 |
| JP Morgan Chase & Company | 82,400 | | 3,668,448 |
| Legg Mason, Inc. | 8,900 | | 772,698 |
| Merrill Lynch & Company, Inc. | 3,200 | | 235,840 |
| State Street Corp. | 17,900 | | 1,098,344 |
| Wells Fargo & Company | 18,800 | | 686,952 |
| |
|
| | | | 13,652,372 |
| Food & Beverages - 0.65% | | | |
| B&G Foods Inc * | 16,100 | | 334,397 |
| Campbell Soup Company | 16,000 | | 604,000 |
| General Mills, Inc. | 24,400 | | 1,363,472 |
| Hershey Company | 16,200 | | 753,300 |
| Kraft Foods, Inc., Class A | 31,800 | | 1,019,508 |
| McCormick & Company, Inc. | 16,100 | | 577,024 |
| Sysco Corp. | 13,800 | | 460,644 |
| The Coca-Cola Company | 24,100 | | 1,296,098 |
| |
|
| | | | 6,408,443 |
| Gas & Pipeline Utilities - 0.20% | | | |
| NiSource, Inc. | 71,500 | | 1,347,060 |
| Spectra Energy Corp. | 25,500 | | 592,875 |
| Williams Companies, Inc. | 270 | | 8,370 |
| |
|
| | | | 1,948,305 |
| Healthcare Products - 0.35% | | | |
| Baxter International, Inc. | 19,800 | | 1,084,248 |
| Boston Scientific Corp. * | 30,500 | | 391,315 |
| Johnson & Johnson | 31,000 | | 1,915,490 |
| |
|
| | | | 3,391,053 |
| Holdings Companies/Conglomerates - 0.55% | | | |
| General Electric Company | 138,600 | | 5,387,382 |
| |
| The accompanying notes are an integral part of the financial statements. | 334 |
John Hancock Funds II
Portfolio of investments — August 31, 2007
(showing percentage of total net assets)
| | | |
| Spectrum Income Fund (continued) | | |
| | Shares or | | |
| | Principal | | |
| | Amount | | Value |
|
|
| |
| COMMON STOCKS (continued) | | | |
| | | | |
| Homebuilders - 0.05% | | | |
| D.R. Horton, Inc. | 34,700 | $ | 524,317 |
| | | | |
| Household Products - 0.28% | | | |
| Fortune Brands, Inc. | 16,500 | | 1,370,985 |
| Newell Rubbermaid, Inc. | 51,200 | | 1,320,448 |
| |
|
| | | | 2,691,433 |
| Industrial Machinery - 0.10% | | | |
| Ingersoll-Rand Company, Class A | 15,300 | | 794,529 |
| Pall Corp. | 5,600 | | 213,528 |
| |
|
| | | | 1,008,057 |
| Insurance - 0.96% | | | |
| American International Group, Inc. | 29,000 | | 1,914,000 |
| Chubb Corp. | 12,400 | | 634,012 |
| Genworth Financial, Inc., Class A | 17,000 | | 492,660 |
| Lincoln National Corp. | 25,600 | | 1,558,528 |
| Marsh & McLennan Companies, Inc. | 80,100 | | 2,134,665 |
| Progressive Corp. | 32,600 | | 663,084 |
| The Travelers Companies, Inc. | 24,700 | | 1,248,338 |
| UnumProvident Corp. | 30,500 | | 746,335 |
| |
|
| | | | 9,391,622 |
| International Oil - 1.60% | | | |
| Anadarko Petroleum Corp. | 25,300 | | 1,239,194 |
| BP PLC, ADR | 18,400 | | 1,239,424 |
| Chevron Corp. | 43,950 | | 3,857,052 |
| Exxon Mobil Corp. | 41,900 | | 3,592,087 |
| Hess Corp. | 27,280 | | 1,674,174 |
| Murphy Oil Corp. | 23,300 | | 1,419,902 |
| Royal Dutch Shell PLC, ADR | 34,000 | | 2,629,900 |
| |
|
| | | | 15,651,733 |
| Internet Content - 0.12% | | | |
| Yahoo!, Inc. * | 51,200 | | 1,163,776 |
| | | | |
| Internet Retail - 0.01% | | | |
| eBay, Inc. * | 1,800 | | 61,380 |
| | | | |
| Leisure Time - 0.17% | | | |
| Lakes Gaming, Inc. * (a) | 22,900 | | 248,236 |
| Walt Disney Company | 42,600 | | 1,431,360 |
| |
|
| | | | 1,679,596 |
| Liquor - 0.20% | | | |
| Anheuser-Busch Companies, Inc. | 34,200 | | 1,689,480 |
| Brown Forman Corp., Class B | 4,300 | | 307,708 |
| |
|
| | | | 1,997,188 |
| Manufacturing - 0.55% | | | |
| 3M Company | 29,300 | | 2,666,007 |
| Honeywell International, Inc. | 23,900 | | 1,341,985 |
| Illinois Tool Works, Inc. | 24,300 | | 1,413,531 |
| |
|
| | | | 5,421,523 |
| Office Furnishings & Supplies - 0.11% | | | |
| Avery Dennison Corp. | 17,700 | | 1,058,283 |
| | | | |
| Paper - 0.35% | | | |
| International Paper Company | 70,270 | | 2,467,180 |
| | | |
| Spectrum Income Fund (continued) | | |
| | Shares or | | |
| | Principal | | |
| | Amount | | Value |
|
|
| |
| COMMON STOCKS (continued) | | | |
| | | | |
| Paper (continued) | | | |
| MeadWestvaco Corp. | 30,720 | $ | 970,445 |
| |
|
| | | | 3,437,625 |
| Petroleum Services - 0.20% | | | |
| BJ Services Company | 27,000 | | 669,870 |
| Schlumberger, Ltd. | 13,700 | | 1,322,050 |
| |
|
| | | | 1,991,920 |
| Pharmaceuticals - 0.95% | | | |
| Abbott Laboratories | 21,100 | | 1,095,301 |
| Bristol-Myers Squibb Company | 47,300 | | 1,378,795 |
| Eli Lilly & Company | 39,400 | | 2,259,590 |
| Merck & Company, Inc. | 49,500 | | 2,483,415 |
| Pfizer, Inc. | 82,315 | | 2,044,705 |
| |
|
| | | | 9,261,806 |
| Photography - 0.12% | | | |
| Eastman Kodak Company (a) | 44,500 | | 1,186,815 |
| | | | |
| Publishing - 0.55% | | | |
| Dow Jones & Company, Inc. | 28,300 | | 1,671,115 |
| Gannett Company, Inc. | 29,000 | | 1,363,000 |
| McGraw-Hill Companies, Inc. | 6,500 | | 327,990 |
| The New York Times Company, Class A (a) | 55,800 | | 1,226,484 |
| Tribune Company | 27,623 | | 761,014 |
| |
|
| | | | 5,349,603 |
| Railroads & Equipment - 0.18% | | | |
| Union Pacific Corp. | 15,500 | | 1,729,335 |
| | | | |
| Real Estate - 0.01% | | | |
| Weingarten Realty Investors, REIT | 2,585 | | 103,943 |
| | | | |
| Retail Trade - 0.46% | | | |
| Bed Bath & Beyond, Inc. * | 32,300 | | 1,118,872 |
| Gap, Inc. | 19,400 | | 363,944 |
| Home Depot, Inc. | 39,500 | | 1,513,245 |
| Wal-Mart Stores, Inc. | 34,200 | | 1,492,146 |
| |
|
| | | | 4,488,207 |
| Sanitary Services - 0.10% | | | |
| Waste Management, Inc. | 25,600 | | 964,352 |
| | | | |
| Semiconductors - 0.26% | | | |
| Analog Devices, Inc. | 35,800 | | 1,320,304 |
| Applied Materials, Inc. | 18,800 | | 401,568 |
| Intel Corp. | 33,400 | | 860,050 |
| |
|
| | | | 2,581,922 |
| Software - 0.28% | | | |
| Microsoft Corp. | 95,400 | | 2,740,842 |
| | | | |
| Telecommunications Equipment & | | | |
| Services - 0.26% | | | |
| Alcatel SA, ADR | 13,600 | | 148,920 |
| Nokia Oyj, SADR | 27,400 | | 900,912 |
| Verizon Communications, Inc. | 35,200 | | 1,474,176 |
| |
|
| | | | 2,524,008 |
| Telephone - 0.65% | | | |
| AT&T, Inc. | 84,420 | | 3,365,825 |
| | |
| The accompanying notes are an integral part of the financial statements. | 335 |
John Hancock Funds II
Portfolio of investments — August 31, 2007(showing percentage of total net assets)
| | | |
| Spectrum Income Fund (continued) | | |
| | Shares or | | |
| | Principal | | |
| | Amount | | Value |
|
|
| |
| COMMON STOCKS (continued) | | | |
| Telephone (continued) | | | |
| Qwest Communications International, Inc. * | 165,900 | $ | 1,484,805 |
| Sprint Nextel Corp. | 68,200 | | 1,290,344 |
| Windstream Corp. | 16,078 | | 229,594 |
| |
|
| | | | 6,370,568 |
| Tobacco - 0.07% | | | |
| UST, Inc. | 14,420 | | 710,618 |
| | | | |
| Toys, Amusements & Sporting Goods - 0.11% | | | |
| Mattel, Inc. | 47,700 | | 1,031,751 |
| | | | |
| Trucking & Freight - 0.05% | | | |
| United Parcel Service, Inc., Class B | 6,600 | | 500,676 |
|
| TOTAL COMMON STOCKS (Cost $141,943,902) | $ | | 160,294,402 |
|
| |
| PREFERRED STOCKS - 0.15% | | | |
| Broadcasting - 0.03% | | | |
| Spanish Broadcasting System, Series B * | 300 | | 322,500 |
| Energy - 0.03% | | | |
| NRG Energy, Inc. * | 150 | | 296,325 |
| Financial Services - 0.02% | | | |
| Mitsubishi UFJ Financial Group, Inc., | | | |
| Capital Finance 1, Ltd. * (b) | 200,000 | | 190,889 |
| Healthcare Products - 0.02% | | | |
| Fresenius Medical Care Capital Trust * | 225 | | 223,875 |
| Telecommunications Equipment & | | | |
| Services - 0.05% | | | |
| Lucent Technologies Capital Trust I * | 475 | | 451,250 |
|
| TOTAL PREFERRED STOCKS (Cost $1,428,154) | | $ | 1,484,839 |
|
| |
| TERM LOANS - 1.57% | | | |
| | | | |
| Auto Parts - 0.04% | | | |
| Rental Service Corp., Term B3 | | | |
| 5.57% due 11/27/2013 | 397,920 | | 391,952 |
| | | | |
| Broadcasting - 0.15% | | | |
| Charter Communications | | | |
| 7.36% due 03/06/2014 | 1,500,000 | | 1,423,125 |
| | | | |
| Cable & Television - 0.03% | | | |
| CSC Holdings, Inc. | | | |
| 7.25% due 07/15/2008 | 250,000 | | 250,000 |
| | | | |
| Cellular Communications - 0.07% | | | |
| MetroPCS Wireless, Inc., Term B3 | | | |
| zero coupon due 11/03/2013 | 746,241 | | 724,010 |
| | | | |
| Chemicals - 0.05% | | | |
| Celanese AG Term Loan B | | | |
| 7.099% due 04/02/2014 | 498,750 | | 481,708 |
| | | | |
| Commercial Services - 0.07% | | | |
| Aramark Corp., Tranche B | | | |
| 7.485% due 01/26/2017 (b) | 490,273 | | 471,711 |
| Education Management | | | |
| 7.00% due 06/01/2013 (f) | 250,000 | | 238,000 |
| |
|
| | | | 709,711 |
| | | | |
| Spectrum Income Fund (continued) | | |
| | | Shares or | | |
| | | Principal | | |
| | | Amount | | Value |
|
|
| |
| TERM LOANS (continued) | | | | |
| Containers & Glass - 0.02% | | | | |
| Berry Plastics Group, Inc. | | | | |
| 7.35% due 04/03/2015 | $ | 249,375 | $ | 237,779 |
| | | | | |
| Energy - 0.27% | | | | |
| Dresser Inc. Term Loan | | | | |
| 8.56% due 06/30/2009 | | 250,000 | | 239,582 |
| Hercules Offshore Term Loan | | | | |
| 7.36% due 07/31/2013 | | 250,000 | | 243,750 |
| NRG Energy, Inc. | | | | |
| 7.00% due 02/01/2014 (f) | | 250,000 | | 239,688 |
| Sandridge Energy Bank, Term B3 | | | | |
| 8.625% due 11/30/2007 | | 1,000,000 | | 987,500 |
| 10.125% due 04/01/2014 | | 500,000 | | 493,750 |
| Stallion Oilfield | | | | |
| 9.82% due 08/01/2012 | | 500,000 | | 485,000 |
| |
|
| | | | | 2,689,270 |
| |
| Financial Services - 0.20% | | | | |
| Dynegy Holdings, Term Ba1 | | | | |
| 1.00% due 03/30/2013 | | 250,000 | | 236,875 |
| Local TV Finance LLC | | | | |
| 7.36% due 05/07/2013 | | 250,000 | | 235,000 |
| Stallion Oilfield Finance Service Corp. | | | | |
| 9.75% due 02/01/2015 | | 375,000 | | 360,938 |
| Univision Oomm Bank, Term Ba3 | | | | |
| 7.60% due 09/15/2014 (f) | | 1,250,000 | | 1,162,500 |
| |
|
| | | | | 1,995,313 |
| |
| Food & Beverages - 0.03% | | | | |
| Outback Term Loan B | | | | |
| 7.606% due 05/09/2014 | | 250,000 | | 250,000 |
| | | | | |
| Gas & Pipeline Utilities - 0.05% | | | | |
| Venoco Term Loan | | | | |
| 9.32% due 05/08/2014 | | 500,000 | | 489,375 |
| | | | | |
| Healthcare Services - 0.05% | | | | |
| Iasis Healthcare Corp. | | | | |
| 10.605% due 06/16/2011 | | 513,258 | | 478,936 |
| | | | | |
| Hotels & Restaurants - 0.05% | | | | |
| Isle of Capri Casinos | | | | |
| 4.158% due 01/18/2014 (f) | | 500,000 | | 475,000 |
| | | | | |
| Leisure Time - 0.05% | | | | |
| Fontainebleau Las Vegas | | | | |
| 8.61% due 05/31/2014 | | 250,000 | | 231,875 |
| Town Sports Bank, Term Ba2 | | | | |
| 7.375% due 03/01/2014 | | 249,375 | | 229,425 |
| |
|
| | | | | 461,300 |
| |
| Metal & Metal Products - 0.05% | | | | |
| Algoma Acq | | | | |
| 7.86% due 06/30/2013 | | 500,000 | | 476,250 |
| | | | | |
| Paper - 0.02% | | | | |
| Domtar, Inc., Term Ba1 | | | | |
| 6.925% due 03/05/2014 | | 225,000 | | 215,325 |
| | | | | |
| Publishing - 0.05% | | | | |
| Penton Media Bank, Term B1 | | | | |
| 7.61% due 02/01/2013 | | 249,375 | | 235,659 |
| |
| The accompanying notes are an integral part of the financial statements. | 336 |
John Hancock Funds II
Portfolio of investments — August 31, 2007
(showing percentage of total net assets)
| | | | |
| Spectrum Income Fund (continued) | | |
| | | Shares or | | |
| | | Principal | | |
| | | Amount | | Value |
|
|
| |
| TERM LOANS (continued) | | | | |
| | | | | |
| Publishing (continued) | | | | |
| Tl Acquisition Bk Debt | | | | |
| 8.11% due 07/15/2014 | $ | 250,000 | $ | 250,000 |
| |
|
| | | | | 485,659 |
| Retail - 0.05% | | | | |
| Neiman Marcus Group | | | | |
| 7.00% due 04/08/2013 (f) | | 500,000 | | 484,375 |
| | | | | |
| Semiconductors - 0.10% | | | | |
| Freescale Semiconductor, Inc., Term Baa3 | | | | |
| 7.369% due 12/15/2014 | | 997,500 | | 930,146 |
| | | | | |
| Telecommunications Equipment & | | | | |
| Services - 0.10% | | | | |
| Trilogy International Partners | | | | |
| 8.86% due 06/27/2012 | | 500,000 | | 477,500 |
| Wind Acquisition Finance SA, Term B | | | | |
| 3.40% due 12/07/2011 | | 534,801 | | 528,116 |
| |
|
| | | | | 1,005,616 |
| Utility Service - 0.07% | | | | |
| NRG Energy, Inc. | | | | |
| 7.11% due 06/23/2010 | | 748,674 | | 717,791 |
|
| TOTAL TERM LOANS (Cost $15,984,567) | | $ | 15,372,641 |
|
| |
| U.S. TREASURY OBLIGATIONS - 9.07% | | | |
| | | | | |
| Treasury Inflation Protected | | | | |
| Securities (d) - 1.58% | | | | |
| 1.875% due 07/15/2013 | | 1,389,579 | | 1,355,164 |
| 2.00% due 01/15/2026 | | 440,870 | | 413,729 |
| 2.50% due 07/15/2016 | | 2,661,605 | | 2,689,677 |
| 2.625% due 07/15/2017 | | 2,161,223 | | 2,211,707 |
| 2.00% due 07/15/2014 | | 3,531,338 | | 3,450,502 |
| 3.625% due 01/15/2008 | | 277,262 | | 276,374 |
| 4.25% due 01/15/2010 | | 4,897,516 | | 5,086,913 |
| |
|
| | | | | 15,484,066 |
| U.S. Treasury Bonds - 4.31% | | | | |
| 5.50% due 08/15/2028 *** | | 962,000 | | 1,040,313 |
| 4.50% due 02/15/2036 *** | | 3,457,000 | | 3,276,859 |
| 4.75% due 02/15/2037 | | 6,345,000 | | 6,258,746 |
| 5.375% due 02/15/2031 *** | | 4,275,000 | | 4,581,932 |
| 6.00% due 02/15/2026 *** | | 2,470,000 | | 2,805,186 |
| 6.125% due 08/15/2029 *** | | 2,792,000 | | 3,262,058 |
| 6.25% due 05/15/2030 *** | | 383,000 | | 455,800 |
| 6.375% due 08/15/2027 *** | | 4,270,000 | | 5,079,297 |
| 7.125% due 02/15/2023 | | 4,331,000 | | 5,393,109 |
| 7.625% due 02/15/2025 *** | | 1,311,000 | | 1,731,544 |
| 7.875% due 02/15/2021 | | 2,946,000 | | 3,831,182 |
| 8.00% due 11/15/2021 | | 590,000 | | 780,137 |
| 8.875% due 08/15/2017 | | 595,000 | | 794,325 |
| 8.875% due 02/15/2019 *** | | 2,105,000 | | 2,868,555 |
| |
|
| | | | | 42,159,043 |
| U.S. Treasury Notes - 3.11% | | | | |
| 3.00% due 02/15/2009 | | 1,825,000 | | 1,793,632 |
| 3.375% due 11/15/2008 **** | | 780,000 | | 772,261 |
| 3.875% due 02/15/2013 *** | | 6,420,000 | | 6,295,612 |
| | | | |
| Spectrum Income Fund (continued) | | |
| | | Shares or | | |
| | | Principal | | |
| | | Amount | | Value |
|
|
| |
| U.S. TREASURY OBLIGATIONS | | | | |
| (continued) | | | | |
| | | | | |
| U.S. Treasury Notes (continued) | | | | |
| 4.00% due 11/15/2012 *** | $ | 8,835,000 | $ | 8,726,630 |
| 4.25% due 11/15/2013 *** | | 425,000 | | 423,572 |
| 4.50% due 02/15/2009 to 11/15/2015 | | 3,070,000 | | 3,079,463 |
| 4.625% due 07/31/2012 | | 865,000 | | 878,854 |
| 4.75% due 05/31/2012 to 08/15/2017 | | 2,350,000 | | 2,393,437 |
| 4.875% due 06/30/2012 | | 40,000 | | 41,056 |
| 5.125% due 05/15/2016 *** | | 5,815,000 | | 6,063,952 |
|
|
| | | | | 30,468,469 |
| U.S. Treasury Strips - 0.07% | | | | |
| zero coupon due 05/15/2020 | | 1,250,000 | | 670,098 |
|
| TOTAL U.S. TREASURY OBLIGATIONS | | | |
| (Cost $87,667,270) | | | $ | 88,781,676 |
|
| |
| U.S. GOVERNMENT AGENCY OBLIGATIONS - 21.39% | | |
| | | | |
| Federal Agricultural Mortgage Corp. - 0.04% | | | |
| 6.00% due 08/01/2021 to 11/01/2021 | | 440,154 | | 444,948 |
| | | | | |
| Federal Home Loan Bank - 0.19% | | | | |
| 3.875% due 08/22/2008 | | 350,000 | | 346,489 |
| 5.125% due 08/14/2013 | | 930,000 | | 940,844 |
| 5.25% due 06/18/2014 | | 590,000 | | 600,398 |
|
|
| | | | | 1,887,731 |
| Federal Home Loan Mortgage Corp. - 2.96% | | | |
| 3.55% due 11/15/2007 | | 600,000 | | 597,848 |
| 4.4470% due 09/01/2032 | | 34,535 | | 34,474 |
| 4.50% due 10/01/2007 to 06/01/2019 | | 958,881 | | 923,291 |
| 4.625% due 02/21/2008 | | 650,000 | | 648,008 |
| 4.647% due 07/01/2035 | | 139,395 | | 137,616 |
| 4.703% due 02/01/2035 | | 237,037 | | 234,079 |
| 4.76% due 07/01/2035 | | 76,078 | | 76,150 |
| 5.00% due 01/01/2009 to 11/01/2035 | | 5,245,961 | | 5,026,055 |
| 5.055% due 11/01/2035 | | 246,777 | | 242,756 |
| 5.078% due 03/01/2036 | | 578,782 | | 570,174 |
| 5.125% due 02/27/2009 to 07/15/2012 | | 2,395,000 | | 2,427,656 |
| 5.135% due 01/01/2036 | | 1,507,070 | | 1,491,207 |
| 5.35% due 02/01/2037 | | 1,943,193 | | 1,931,000 |
| 5.361% due 04/01/2037 | | 739,837 | | 736,592 |
| 5.388% due 01/01/2036 | | 115,310 | | 114,232 |
| 5.409% due 02/01/2037 | | 676,809 | | 670,696 |
| 5.474% due 02/01/2037 | | 1,023,618 | | 1,017,669 |
| 5.50% due 03/01/2018 to 04/01/2029 | | 1,498,364 | | 1,493,750 |
| 5.934% due 02/01/2037 | | 1,307,218 | | 1,310,984 |
| 5.989% due 12/01/2036 | | 1,549,294 | | 1,546,767 |
| 6.00% due 06/15/2011 to 01/01/2037 | | 3,150,753 | | 3,220,249 |
| 6.014% due 11/01/2036 | | 749,517 | | 749,012 |
| 6.047% due 10/01/2036 | | 1,068,502 | | 1,075,860 |
| 6.128% due 10/01/2036 | | 845,409 | | 848,444 |
| 6.22% due 08/01/2036 | | 1,059,547 | | 1,065,396 |
| 6.50% due 05/01/2017 to 01/01/2036 | | 749,318 | | 762,894 |
| 7.00% due 02/01/2024 to 06/01/2032 | | 55,351 | | 57,106 |
| 7.50% due 05/01/2024 to 06/01/2024 | | 5,521 | | 5,782 |
| 10.50% due 05/01/2019 | | 607 | | 663 |
|
|
| | | | | 29,016,410 |
| |
| The accompanying notes are an integral part of the financial statements. | 337 |
John Hancock Funds II
Portfolio of investments — August 31, 2007
(showing percentage of total net assets)
| | | | |
| Spectrum Income Fund (continued) | | |
| | | Shares or | | |
| | | Principal | | |
| | | Amount | | Value |
|
|
| |
| U.S. GOVERNMENT AGENCY | | | | |
| OBLIGATIONS (continued) | | | | |
| | | | | |
| Federal National Mortgage | | | | |
| Association - 7.51% | | | | |
| 5.00% due 07/01/2035 | $ | 1,722,218 | $ | 1,639,624 |
| 6.00% due 12/01/2035 | | 291,815 | | 291,805 |
| 4.803% due 09/01/2035 (b) | | 575,301 | | 560,797 |
| 3.25% due 08/15/2008 | | 675,000 | | 664,922 |
| 3.808% due 10/01/2033 | | 174,693 | | 171,962 |
| 3.8309% due 02/17/2009 (b) | | 260,000 | | 252,850 |
| 3.875% due 07/15/2008 | | 350,000 | | 346,806 |
| 4.375% due 09/15/2012 to 10/15/2015 | | 1,235,000 | | 1,195,569 |
| 4.50% due 02/15/2011 to 09/01/2035 | | 7,352,486 | | 7,049,540 |
| 4.586% due 07/01/2035 | | 182,075 | | 180,219 |
| 4.625% due 10/15/2014 | | 780,000 | | 764,863 |
| 4.787% due 11/01/2035 | | 278,456 | | 278,162 |
| 4.875% due 12/15/2016 | | 350,000 | | 344,166 |
| 5.00% due 01/01/2009 to 10/01/2035 | | 8,402,831 | | 8,203,515 |
| 5.321% due 12/01/2035 | | 210,065 | | 207,932 |
| 5.34% due 12/01/2035 | | 248,847 | | 246,552 |
| 5.474% due 07/01/2027 | | 1,999 | | 2,014 |
| 5.50% due 07/01/2013 to 04/01/2037 | | 23,663,943 | | 23,280,044 |
| 5.50% TBA ** | | 4,525,000 | | 4,418,943 |
| 5.5130% due 12/01/2035 | | 365,577 | | 363,754 |
| 5.545% due 07/01/2036 | | 1,367,744 | | 1,365,984 |
| 5.655% due 12/01/2035 | | 113,643 | | 113,809 |
| 5.702% due 01/01/2019 | | 1,120 | | 1,126 |
| 5.75% due 02/15/2008 | | 580,000 | | 581,147 |
| 5.986% due 09/01/2036 | | 426,507 | | 425,693 |
| 6.00% due 05/15/2011 to 09/01/2036 | | 11,421,330 | | 11,524,630 |
| 6.04% due 12/01/2036 | | 582,549 | | 585,994 |
| 6.50% due 06/01/2013 to 09/01/2036 | | 3,082,991 | | 3,137,704 |
| 6.50% TBA ** | | 3,120,000 | | 3,166,800 |
| 7.00% due 12/01/2029 to 02/01/2030 | | 2,930 | | 3,041 |
| 7.00% TBA ** | | 100,000 | | 102,781 |
| 7.125% due 06/15/2010 to 01/15/2030 | | 1,840,000 | | 2,025,403 |
| |
|
| | | | | 73,498,151 |
| Government National Mortgage | | | | |
| Association - 10.69% | | | | |
| 4.00% due 09/15/2018 | | 657,172 | | 619,313 |
| 4.50% due 09/15/2018 to 11/20/2035 | | 2,840,810 | | 2,682,164 |
| 5.00% due 02/15/2018 to 05/15/2036 | | 23,016,169 | | 22,162,764 |
| 5.50% due 11/15/2017 to 07/15/2037 | | 36,012,810 | | 35,424,313 |
| 6.00% due 11/15/2008 to 08/20/2037 | | 27,305,882 | | 27,478,137 |
| 6.00% TBA ** | | 1,100,000 | | 1,105,157 |
| 6.50% due 07/15/2009 to 03/15/2037 | | 10,604,546 | | 10,832,690 |
| 7.00% due 09/15/2012 to 10/20/2036 | | 3,123,268 | | 3,247,772 |
| 7.50% due 09/15/2012 to 06/15/2032 | | 402,276 | | 421,138 |
| 8.00% due 12/15/2007 to 06/20/2029 | | 321,197 | | 340,116 |
| 8.50% due 07/15/2008 to 02/15/2027 | | 80,774 | | 86,352 |
| 9.00% due 03/15/2009 to 05/15/2024 | | 48,431 | | 51,845 |
| 9.25% due 10/15/2016 to 12/15/2019 | | 4,841 | | 5,217 |
| 9.50% due 06/15/2009 to 12/15/2024 | | 15,193 | | 16,384 |
| 9.75% due 07/15/2017 to 02/15/2021 | | 4,383 | | 4,900 |
| 10.00% due 02/15/2016 to 03/15/2026 | | 62,578 | | 70,270 |
| 10.25% due 05/15/2020 to 11/15/2020 | | 4,674 | | 5,278 |
| | | | |
| Spectrum Income Fund (continued) | | |
| | | Shares or | | |
| | | Principal | | |
| | | Amount | | Value |
|
|
| |
| U.S. GOVERNMENT AGENCY | | | | |
| OBLIGATIONS (continued) | | | | |
| | | | | |
| Government National Mortgage | | | | |
| Association (continued) | | | | |
| 10.50% due 09/15/2015 to 07/15/2019 | $ | 10,315 | $ | 11,667 |
| 11.00% due 12/15/2009 to 07/20/2020 | | 26,852 | | 29,990 |
| 11.50% due 03/15/2010 to 11/15/2019 | | 14,444 | | 16,267 |
| 11.75% due 08/15/2013 | | 1,486 | | 1,672 |
| 12.00% due 10/15/2010 to 06/15/2015 | | 15,971 | | 18,136 |
| 12.25% due 03/15/2014 to 07/20/2015 | | 1,429 | | 1,604 |
| 12.50% due 04/15/2010 to 07/15/2015 | | 5,918 | | 6,573 |
| 12.75% due 12/20/2013 to 11/20/2014 | | 1,087 | | 1,222 |
| 13.00% due 01/15/2011 to 09/20/2015 | | 4,593 | | 5,206 |
| 13.50% due 05/15/2010 to 09/15/2014 | | 2,459 | | 2,769 |
| |
|
| | | | | 104,648,916 |
|
| TOTAL U.S. GOVERNMENT AGENCY OBLIGATIONS | | |
| (Cost $210,375,583) | | $ | | 209,496,156 |
|
| |
| FOREIGN GOVERNMENT OBLIGATIONS - 14.02% | | |
| Argentina - 0.23% | | | | |
| Republic of Argentina | | | | |
| zero coupon, Step up to 2.5% on | | | | |
| 03/31/2009 due 12/31/2038 | | 100,000 | | 37,500 |
| zero coupon, Step up to 1.18% on | | | | |
| 03/31/2009 due 12/31/2038 (b) | ARS | 350,000 | | 45,687 |
| 2.00% due 09/30/2014 (b) | | 1,705,000 | | 503,735 |
| 5.83% due 12/31/2033 (b) | | 704,566 | | 249,570 |
| 7.00% due 10/03/2015 | $ | 850,000 | | 675,750 |
| 7.875% due 04/11/2011 | | 300,000 | | 289,500 |
| Argentina Government International Bond, Series | | | |
| 8.28% due 12/31/2033 | | 174,144 | | 148,893 |
| Argentina Bonos, Series X | | | | |
| 7.00% due 04/17/2017 | | 350,000 | | 272,179 |
| |
|
| | | | | 2,222,814 |
| Austria - 1.21% | | | | |
| Republic of Austria | | | | |
| 4.00% due 07/15/2009 | EUR | 2,600,000 | | 3,540,370 |
| 5.50% due 01/15/2010 | | 1,188,000 | | 1,670,211 |
| 6.25% due 07/15/2027 | | 49,000 | | 80,998 |
| Austria Government Bond, Series EMTN | | | | |
| 5.50% due 10/20/2007 | | 4,800,000 | | 6,554,597 |
| |
|
| | | | | 11,846,176 |
| Belgium - 0.44% | | | | |
| Kingdom of Belgium | | | | |
| 3.00% due 03/28/2010 | | 970,000 | | 1,288,935 |
| 4.25% due 09/28/2013 | | 484,000 | | 660,057 |
| 5.00% due 03/28/2035 | | 1,653,000 | | 2,385,103 |
| |
|
| | | | | 4,334,095 |
| Brazil - 0.92% | | | | |
| Federative Republic of Brazil | | | | |
| 6.00% due 01/17/2017 | $ | 600,000 | | 596,400 |
| Federative Republic of Brazil, Series NTNB | | | | |
| 6.00% due 05/15/2015 | BRL | 1,580,000 | | 1,264,984 |
| 7.125% due 01/20/2037 | $ | 900,000 | | 980,100 |
| 7.875% due 03/07/2015 | | 50,000 | | 55,950 |
| |
| The accompanying notes are an integral part of the financial statements. | 338 |
John Hancock Funds II
Portfolio of investments — August 31, 2007
(showing percentage of total net assets)
| | | | |
| Spectrum Income Fund (continued) | | |
| | | Shares or | | |
| | | Principal | | |
| | | Amount | | Value |
|
|
| |
| FOREIGN GOVERNMENT OBLIGATIONS | | | |
| (continued) | | | | |
| Brazil (continued) | | | | |
| Federative Republic of Brazil (continued) | | | | |
| 8.00% due 01/15/2018 | $ | 570,000 | $ | 627,000 |
| 8.00% due 01/15/2018 | | 150,000 | | 164,827 |
| 8.75% due 02/04/2025 | | 475,000 | | 592,325 |
| 8.875% due 10/14/2019 | | 500,000 | | 600,000 |
| 10.00% due 01/01/2012 | BRL | 4,142,000 | | 2,005,577 |
| 10.00% due 01/01/2014 | | 2,914,000 | | 1,378,899 |
| 11.00% due 08/17/2040 | $ | 100,000 | | 132,350 |
| Brazil Notas do Tesouro Nacional Serie F | | | | |
| 10.00% due 01/01/2017 | BRL | 1,322,000 | | 608,392 |
| |
|
| | | | | 9,006,804 |
| Canada - 0.24% | | | | |
| Canadian Government Bond | | | | |
| 5.25% due 06/01/2012 | CAD | 890,000 | | 873,761 |
| 5.75% due 06/01/2033 | | 485,000 | | 549,017 |
| Province of Ontario | | | | |
| 5.00% due 03/08/2014 | | 975,000 | | 940,777 |
| |
|
| | | | | 2,363,555 |
| Colombia - 0.03% | | | | |
| Republic of Colombia | | | | |
| 7.375% due 01/27/2017 | $ | 100,000 | | 106,200 |
| 7.375% due 09/18/2037 | | 200,000 | | 212,100 |
| |
|
| | | | | 318,300 |
| Denmark - 0.07% | | | | |
| Kingdom of Denmark | | | | |
| 5.00% due 11/15/2013 | DKK | 3,277,000 | | 623,432 |
| 7.00% due 11/10/2024 | | 364,000 | | 85,736 |
| |
|
| | | | | 709,168 |
| Ecuador - 0.02% | | | | |
| Republic of Ecuador | | | | |
| 10.00% due 08/15/2030 | $ | 200,000 | | 176,000 |
| | | | | |
| France - 1.41% | | | | |
| Government of France | | | | |
| 4.00% due 04/25/2009 | EUR | 1,400,000 | | 1,907,174 |
| 4.75% due 10/25/2012 | | 530,000 | | 741,340 |
| 5.00% due 10/25/2016 | | 752,000 | | 1,077,866 |
| 5.50% due 04/25/2029 | | 637,000 | | 977,381 |
| 5.50% due 04/25/2010 | | 3,245,000 | | 4,574,633 |
| 5.75% due 10/25/2032 | | 1,235,000 | | 1,976,049 |
| French Treasury Note BTAN | | | | |
| 3.75% due 01/12/2012 | | 1,920,000 | | 2,573,049 |
| |
|
| | | | | 13,827,492 |
| GD - 0.01% | | | | |
| Grenada Government International Bond, Series | | | |
| REGS | | | | |
| 1 due 09/15/2025 | $ | 230,000 | | 124,200 |
| | | | | |
| Germany - 0.68% | | | | |
| Bundesrepublik Deutschland, Series 05 | | | | |
| 3.50% due 01/04/2016 | EUR | 25,000 | | 32,405 |
| Federal Republic of Germany | | | | |
| 4.00% due 01/04/2037 | | 2,485,000 | | 3,117,291 |
| 4.25% due 07/04/2014 | | 75,000 | | 102,618 |
| | | | |
| Spectrum Income Fund (continued) | | |
| | | Shares or | | |
| | | Principal | | |
| | | Amount | | Value |
|
|
| |
| FOREIGN GOVERNMENT OBLIGATIONS | | | |
| (continued) | | | | |
| | | | | |
| Germany (continued) | | | | |
| Federal Republic of Germany (continued) | | | | |
| 4.50% due 01/04/2013 | EUR | 946,000 | $ | 1,311,312 |
| 4.75% due 07/04/2028 | | 219,000 | | 306,766 |
| 4.75% due 07/04/2034 | | 625,000 | | 881,204 |
| 5.50% due 01/04/2031 | | 595,000 | | 920,827 |
| |
|
| | | | | 6,672,423 |
| Greece - 0.10% | | | | |
| Hellenic Republic Government Bond | | | | |
| 5.25% due 05/18/2012 | | 720,000 | | 1,019,310 |
| | | | | |
| Indonesia - 0.08% | | | | |
| Republic of Indonesia | | | | |
| 6.625% due 02/17/2037 | $ | 600,000 | | 549,000 |
| 8.50% due 10/12/2035 | | 100,000 | | 111,250 |
| Republic of Indonesia | | | | |
| 10.25% due 07/15/2022 | IDR | 1,000,000,000 | | 107,797 |
| |
|
| | | | | 768,047 |
| Iraq - 0.09% | | | | |
| Republic of Iraq, Series REGS | | | | |
| 5.80% due 01/15/2028 | $ | 1,500,000 | | 855,000 |
| | | | | |
| Ireland - 0.01% | | | | |
| Republic of Ireland | | | | |
| 4.00% due 04/18/2010 | EUR | 96,000 | | 130,444 |
| | | | | |
| Italy - 0.71% | | | | |
| Republic of Italy | | | | |
| 4.25% due 08/01/2014 | | 187,000 | | 254,068 |
| 5.00% due 10/15/2007 | | 332,000 | | 453,237 |
| 5.25% due 09/20/2016 | $ | 450,000 | | 454,407 |
| 5.50% due 11/01/2010 | EUR | 1,570,000 | | 2,221,764 |
| 6.00% due 11/01/2007 | | 1,025,000 | | 1,401,875 |
| 6.00% due 05/01/2031 | | 271,000 | | 429,888 |
| 7.25% due 11/01/2026 | | 75,000 | | 134,094 |
| Italy Buoni Poliennali Del Tesoro | | | | |
| 5.25% due 08/01/2017 | | 1,090,000 | | 1,577,824 |
| |
|
| | | | | 6,927,157 |
| Jamaica - 0.12% | | | | |
| Government of Jamaica | | | | |
| 9.00% due 06/02/2015 | $ | 215,000 | | 226,287 |
| 10.625% due 06/20/2017 | | 830,000 | | 977,325 |
| |
|
| | | | | 1,203,612 |
| Japan - 2.74% | | | | |
| Japan Government Five Year Bond, Series 64 | | | |
| 1.50% due 06/20/2012 | JPY | 410,650,000 | | 3,599,947 |
| Government of Japan | | | | |
| 1.00% due 12/20/2012 | | 188,500,000 | | 1,609,439 |
| 1.00% due 06/10/2016 | | 170,077,600 | | 1,441,258 |
| 1.10% due 12/10/2016 | | 190,127,900 | | 1,626,760 |
| 1.30% due 12/20/2013 | | 281,750,000 | | 2,432,648 |
| 1.30% due 03/20/2015 | | 60,850,000 | | 520,745 |
| 1.40% due 03/21/2011 | | 321,700,000 | | 2,812,242 |
| 1.40% due 03/20/2012 | | 188,400,000 | | 1,645,204 |
| 1.70% due 09/20/2016 | | 654,750,000 | | 5,726,031 |
| |
| The accompanying notes are an integral part of the financial statements. | 339 |
John Hancock Funds II
Portfolio of investments — August 31, 2007
(showing percentage of total net assets)
| | | | |
| Spectrum Income Fund (continued) | | |
| | | Shares or | | |
| | | Principal | | |
| | | Amount | | Value |
|
|
| |
| FOREIGN GOVERNMENT OBLIGATIONS | | | |
| (continued) | | | | |
| | | | | |
| Japan (continued) | | | | |
| Government of Japan (continued) | | | | |
| 1.90% due 03/20/2025 | JPY | 375,650,000 | $ | 3,182,082 |
| 1.90% due 12/20/2010 | | 24,600,000 | | 218,441 |
| 1.90% due 06/20/2016 | | 32,800,000 | | 291,955 |
| 2.00% due 06/20/2022 | | 55,200,000 | | 483,085 |
| 2.00% due 12/20/2033 | | 136,550,000 | | 1,108,666 |
| 2.20% due 06/22/2020 | | 18,000,000 | | 163,047 |
| |
|
| | | | | 26,861,550 |
| Malaysia - 0.21% | | | | |
| Malaysia Government Bond, Series 5/06 | | | | |
| 3.718% due 06/15/2012 | MYR | 6,228,000 | | 1,783,675 |
| Malaysia Government Bond | | | | |
| 3.756% due 04/28/2011 | | 781,000 | | 224,095 |
| |
|
| | | | | 2,007,770 |
| Mexico - 1.06% | | | | |
| Government of Mexico | | | | |
| 5.625% due 01/15/2017 | $ | 520,000 | | 519,740 |
| 6.75% due 09/27/2034 | | 375,000 | | 407,250 |
| 7.50% due 04/08/2033 | | 65,000 | | 76,700 |
| 8.00% due 12/24/2008 | MXN | 5,350,000 | | 487,466 |
| 8.00% due 12/17/2015 | | 24,745,000 | | 2,266,978 |
| 8.00% due 12/19/2013 | | 16,150,000 | | 1,476,485 |
| 8.125% due 12/30/2019 | $ | 265,000 | | 322,637 |
| 9.00% due 12/22/2011 | MXN | 22,950,000 | | 2,179,078 |
| 9.00% due 12/20/2012 | | 15,580,000 | | 1,491,307 |
| 9.00% due 12/24/2009 | | 6,755,000 | | 630,299 |
| 9.50% due 12/18/2014 | | 5,090,000 | | 504,142 |
| |
|
| | | | | 10,362,082 |
| Netherlands - 0.28% | | | | |
| Kingdom of Netherlands | | | | |
| 5.00% due 07/15/2011 | EUR | 1,783,000 | | 2,504,753 |
| 5.50% due 01/15/2028 | | 137,000 | | 209,479 |
| |
|
| | | | | 2,714,232 |
| Philippines - 0.07% | | | | |
| Republic of Philippines | | | | |
| 7.75% due 01/14/2031 | $ | 425,000 | | 451,562 |
| 10.625% due 03/16/2025 | | 155,000 | | 209,250 |
| |
|
| | | | | 660,812 |
| Poland - 0.53% | | | | |
| Republic of Poland | | | | |
| 5.00% due 10/24/2013 | PLN | 7,425,000 | | 2,545,369 |
| 5.25% due 10/25/2017 | | 5,275,000 | | 1,802,994 |
| 6.25% due 10/24/2015 | | 2,390,000 | | 875,940 |
| |
|
| | | | | 5,224,303 |
| Portugal - 0.02% | | | | |
| Republic of Portugal | | | | |
| 5.15% due 06/15/2011 | EUR | 118,000 | | 166,043 |
| | | | | |
| Russia - 0.22% | | | | |
| Russian Federation, Series REGS | | | | |
| 7.50% due 03/31/2030 | $ | 1,960,550 | | 2,180,132 |
| | | | |
| Spectrum Income Fund (continued) | | |
| | | Shares or | | |
| | | Principal | | |
| | | Amount | | Value |
|
|
| |
| FOREIGN GOVERNMENT OBLIGATIONS | | | |
| (continued) | | | | |
| | | | | |
| Serbia - 0.18% | | | | |
| Republic of Serbia | | | | |
| zero coupon, Step up to 3.75% on | | | | |
| 11/01/2009 due 11/01/2024 | $ | 1,855,000 | $ | 1,706,600 |
| | | | | |
| South Africa - 0.14% | | | | |
| South Africa Government International Bond | | | |
| 5.875% due 05/30/2022 | | 100,000 | | 96,375 |
| Republic of South Africa | | | | |
| 6.50% due 06/02/2014 | | 585,000 | | 606,938 |
| 13.00% due 08/31/2010 | ZAR | 4,201,000 | | 641,523 |
| |
|
| | | | | 1,344,836 |
| Spain - 0.66% | | | | |
| Kingdom of Spain | | | | |
| 4.00% due 01/31/2010 | EUR | 46,000 | | 62,718 |
| 5.50% due 03/08/2011 | AUD | 905,000 | | 710,321 |
| 5.75% due 07/30/2032 | EUR | 127,000 | | 202,089 |
| 6.00% due 01/31/2008 | | 2,427,000 | | 3,333,004 |
| Spain Government Bond | | | | |
| 4.40% due 01/31/2015 | | 1,530,000 | | 2,099,775 |
| |
|
| | | | | 6,407,907 |
| Sweden - 0.32% | | | | |
| Kingdom of Sweden | | | | |
| 5.00% due 01/28/2009 | SEK | 13,315,000 | | 1,958,350 |
| 5.125% due 03/01/2017 | $ | 425,000 | | 421,286 |
| 5.25% due 03/15/2011 | SEK | 4,830,000 | | 725,405 |
| |
|
| | | | | 3,105,041 |
| Turkey - 0.62% | | | | |
| Republic of Turkey | | | | |
| 6.875% due 03/17/2036 | $ | 785,000 | | 736,919 |
| 7.00% due 06/05/2020 | | 625,000 | | 625,781 |
| 7.25% due 03/15/2015 | | 50,000 | | 51,500 |
| 7.375% due 02/05/2025 | | 40,000 | | 40,900 |
| 14.00% due 01/19/2011 | TRY | 3,968,961 | | 2,840,423 |
| Turkey Government Bond | | | | |
| 16.00% due 03/07/2012 | | 2,253,000 | | 1,764,001 |
| |
|
| | | | | 6,059,524 |
| United Kingdom - 0.56% | | | | |
| United Kingdom Gilt | | | | |
| 8.75% due 08/25/2017 | GBP | 30,000 | | 77,986 |
| Government of United Kingdom | | | | |
| 4.25% due 06/07/2032 | | 2,240,000 | | 4,299,561 |
| 4.75% due 06/07/2010 | | 570,000 | | 1,135,030 |
| |
|
| | | | | 5,512,577 |
| Vietnam - 0.04% | | | | |
| Socialist Republic of Vietnam | | | | |
| 6.875% due 01/15/2016 | $ | 425,000 | | 431,087 |
|
| TOTAL FOREIGN GOVERNMENT OBLIGATIONS | | |
| (Cost $134,467,443) | | | $ | 137,249,093 |
|
| |
| CORPORATE BONDS - 24.65% | | | | |
| | | | | |
| Advertising - 0.18% | | | | |
| Lamar Advertising Co, Series B | | | | |
| 2.875% due 12/31/2010 | | 300,000 | | 358,503 |
| |
| The accompanying notes are an integral part of the financial statements. | 340 |
John Hancock Funds II
Portfolio of investments — August 31, 2007
(showing percentage of total net assets)
| | | | |
| Spectrum Income Fund (continued) | | |
| | | Shares or | | |
| | | Principal | | |
| | | Amount | | Value |
|
|
| |
| CORPORATE BONDS (continued) | | | | |
| Advertising (continued) | | | | |
| Lamar Media Corp. | | | | |
| 6.625% due 08/15/2015 | $ | 425,000 | $ | 405,875 |
| R.H. Donnelley Corp. | | | | |
| 10.875% due 12/15/2012 | | 100,000 | | 106,000 |
| R.H. Donnelley Corp., Series A-3 | | | | |
| 8.875% due 01/15/2016 | | 850,000 | | 871,250 |
| |
|
| | | | | 1,741,628 |
| Aerospace - 0.33% | | | | |
| Boeing Capital Corp. | | | | |
| 6.10% due 03/01/2011 | | 330,000 | | 343,726 |
| Boeing Company | | | | |
| 8.75% due 08/15/2021 | | 55,000 | | 72,180 |
| GenCorp, Inc. | | | | |
| 9.50% due 08/15/2013 | | 550,000 | | 577,500 |
| Hawker Beechcraft Acquisition Company LLC | | | |
| 8.50% due 04/01/2015 | | 700,000 | | 696,500 |
| 9.75% due 04/01/2017 | | 225,000 | | 222,750 |
| Northrop Grumman Corp. | | | | |
| 7.125% due 02/15/2011 | | 355,000 | | 376,798 |
| 7.75% due 03/01/2016 | | 35,000 | | 39,951 |
| Rolls-Royce Group PLC, EMTN | | | | |
| 4.50% due 03/16/2011 | EUR | 53,000 | | 71,790 |
| Sequa Corp. | | | | |
| 9.00% due 08/01/2009 | $ | 25,000 | | 25,875 |
| TransDigm, Inc. | | | | |
| 7.75% due 07/15/2014 | | 475,000 | | 477,375 |
| United Technologies Corp. | | | | |
| 4.375% due 05/01/2010 | | 250,000 | | 246,738 |
| 5.40% due 05/01/2035 | | 110,000 | | 101,460 |
| |
|
| | | | | 3,252,643 |
| Agriculture - 0.08% | | | | |
| Bunge, Ltd. | | | | |
| 4.375% due 12/15/2008 | | 310,000 | | 304,718 |
| 5.90% due 04/01/2017 | | 460,000 | | 437,781 |
| |
|
| | | | | 742,499 |
| Air Travel - 0.07% | | | | |
| Air Jamaica, Ltd., Series REGS | | | | |
| 9.375% due 07/08/2015 | | 75,000 | | 78,937 |
| Continental Airlines, Inc. | | | | |
| 8.75% due 12/01/2011 | | 475,000 | | 444,125 |
| Southwest Airlines Company | | | | |
| 6.50% due 03/01/2012 | | 160,000 | | 165,258 |
| |
|
| | | | | 688,320 |
| Aluminum - 0.06% | | | | |
| Century Aluminum Company | | | | |
| 7.50% due 08/15/2014 | | 300,000 | | 297,000 |
| Novelis, Inc. | | | | |
| 7.25% due 02/15/2015 | | 325,000 | | 315,250 |
| |
|
| | | | | 612,250 |
| Amusement & Theme Parks - 0.04% | | | | |
| Universal City Development Partners | | | | |
| 11.75% due 04/01/2010 | | 375,000 | | 394,688 |
| | | | |
| Spectrum Income Fund (continued) | | |
| | | Shares or | | |
| | | Principal | | |
| | | Amount | | Value |
|
|
| |
| CORPORATE BONDS (continued) | | | | |
| Apparel & Textiles - 0.04% | | | | |
| INVISTA | | | | |
| 9.25% due 05/01/2012 | $ | 400,000 | $ | 416,000 |
| | | | | |
| Auto Parts - 0.21% | | | | |
| Accuride Corp. | | | | |
| 8.50% due 02/01/2015 | | 350,000 | | 323,750 |
| American Axle & Manufacturing, Inc. | | | | |
| 7.875% due 03/01/2017 | | 775,000 | | 724,625 |
| Commercial Vehicle Group, Inc. | | | | |
| 8.00% due 07/01/2013 | | 50,000 | | 46,625 |
| Tenneco Automotive, Inc. | | | | |
| 8.625% due 11/15/2014 | | 525,000 | | 519,750 |
| TRW Automotive, Inc. | | | | |
| 7.25% due 03/15/2017 | | 25,000 | | 22,750 |
| UCI Holdco, Inc. | | | | |
| 12.36% due 12/15/2013 | | 344,819 | | 334,474 |
| United Components Inc | | | | |
| 9.375% due 06/15/2013 | | 100,000 | | 100,000 |
| |
|
| | | | | 2,071,974 |
| Auto Services - 0.08% | | | | |
| ERAC USA Finance Company | | | | |
| 7.95% due 12/15/2009 | | 115,000 | | 121,409 |
| Hertz Corp. | | | | |
| 8.875% due 01/01/2014 | | 600,000 | | 621,000 |
| |
|
| | | | | 742,409 |
| Automobiles - 0.26% | | | | |
| AutoNation, Inc. | | | | |
| 7.00% due 04/15/2014 | | 550,000 | | 517,687 |
| 7.36% due 04/15/2013 (b) | | 175,000 | | 164,500 |
| DaimlerChrysler N.A. Holding Corp. | | | | |
| 6.50% due 11/15/2013 | | 75,000 | | 77,506 |
| DaimlerChrysler N.A. Holding Corp., MTN | | | | |
| 5.8095% due 08/03/2009 (b) | | 485,000 | | 482,668 |
| ERAC USA Finance Company | | | | |
| 5.60% due 05/01/2015 | | 240,000 | | 232,299 |
| Ford Motor Company | | | | |
| 4.25% due 12/15/2036 | | 191,000 | | 205,440 |
| General Motors Corp. | | | | |
| 7.125% due 07/15/2013 | | 75,000 | | 64,312 |
| 7.20% due 01/15/2011 | | 750,000 | | 663,750 |
| 8.375% due 07/05/2033 | EUR | 80,000 | | 87,842 |
| |
|
| | | | | 2,496,004 |
| Banking - 1.30% | | | | |
| American Express Centurion Bank | | | | |
| 4.375% due 07/30/2009 | $ | 300,000 | | 298,315 |
| Australia & New Zealand Banking Group, | | | | |
| Ltd., EMTN | | | | |
| 4.45% due 02/05/2015 (b) | EUR | 84,000 | | 113,512 |
| BAC Capital Trust VI | | | | |
| 5.625% due 03/08/2035 | $ | 445,000 | | 401,164 |
| Banca Intesa SpA, EMTN | | | | |
| 5.85% due 05/08/2014 (b) | EUR | 67,000 | | 93,010 |
| Banca Monte dei Paschi di Siena SpA, EMTN | | | |
| 4.50% due 09/24/2015 (b) | | 75,000 | | 101,525 |
| | |
| The accompanying notes are an integral part of the financial statements. | 341 |
John Hancock Funds II
Portfolio of investments — August 31, 2007
(showing percentage of total net assets)
| | | | |
| Spectrum Income Fund (continued) | | |
| | | Shares or | | |
| | | Principal | | |
| | | Amount | | Value |
|
|
| |
| CORPORATE BONDS (continued) | | | | |
| Banking (continued) | | | | |
| Bank of America Corp, Series EMTN | | | | |
| 4.625% due 02/18/2014 | EUR | 110,000 | $ | 147,203 |
| Bank of America Corp. | | | | |
| 4.50% due 08/01/2010 | $ | 150,000 | | 147,086 |
| 5.75% due 08/15/2016 | | 210,000 | | 208,605 |
| Bank of Ireland | | | | |
| 6.45% due 02/10/2010 | EUR | 49,000 | | 69,202 |
| Bank of New York | | | | |
| 5.41% due 05/15/2009 | $ | 300,000 | | 302,184 |
| Bank One Corp. | | | | |
| 5.25% due 01/30/2013 | | 200,000 | | 198,508 |
| Banque du Liban, Series ECD | | | | |
| 10.00% due 04/25/2015 | | 300,000 | | 312,000 |
| Barclays Bank PLC | | | | |
| 7.40% due 12/15/2009 | | 300,000 | | 317,369 |
| Barclays Bank PLC, EMTN | | | | |
| 5.75% due 03/08/2011 | EUR | 86,000 | | 120,216 |
| BB&T Capital Trust II | | | | |
| 6.75% due 06/07/2036 | $ | 380,000 | | 387,299 |
| BBVA Bancomer SA/Grand Cayman, Series 144A | | | |
| 6.008% due 05/17/2022 (b) | | 100,000 | | 100,841 |
| BNP Paribas, EMTN | | | | |
| 5.25% due 12/17/2012 | EUR | 120,000 | | 166,287 |
| Credit Agricole SA | | | | |
| 6.637% due 12/31/2049 (b) | $ | 325,000 | | 306,654 |
| Credit Agricole SA, Series TSDI | | | | |
| zero coupon, Step up to 6% on | | | | |
| 06/20/2018 due 06/20/2049 (b) | GBP | 125,000 | | 222,134 |
| Credit Suisse Group Finance Guernsey, Ltd. | | | | |
| 6.375% due 06/07/2013 | EUR | 76,000 | | 110,409 |
| Danske Bank A/S, EMTN | | | | |
| 4.25% due 06/20/2016 (b) | | 80,000 | | 104,685 |
| Deutsche Bank AG | | | | |
| 5.125% due 01/31/2013 | | 100,000 | | 136,184 |
| Goldman Sachs Group Inc/The | | | | |
| 3.75% due 02/04/2013 | | 75,000 | | 94,962 |
| HBOS PLC | | | | |
| 6.00% due 11/01/2033 | $ | 420,000 | | 410,802 |
| HBOS PLC, EMTN | | | | |
| 4.375% due 10/30/2019 (b) | EUR | 99,000 | | 128,057 |
| HSBC Bank PLC, EMTN | | | | |
| 4.25% due 03/18/2016 (b) | | 61,000 | | 81,462 |
| HSBC Holdings PLC | | | | |
| 6.50% due 05/02/2036 | $ | 175,000 | | 179,597 |
| 9.875% due 04/08/2018 | GBP | 120,000 | | 280,553 |
| Independence Community Bank Corp. | | | | |
| 3.75% due 04/01/2014 (b) | $ | 15,000 | | 14,652 |
| ING Bank NV, EMTN | | | | |
| 5.50% due 01/04/2012 | EUR | 71,000 | | 99,083 |
| Inter-American Development Bank, Series MPLE | | | |
| 4.40% due 01/26/2026 | CAD | 750,000 | | 656,323 |
| International Bank for Reconstruction & | | | | |
| Development, Series GMTN | | | | |
| 9.75% due 08/02/2010 | ZAR | 900,000 | | 123,311 |
| Islandsbanki HF | | | | |
| 5.52% due 10/15/2008 (b) | $ | 200,000 | | 199,808 |
| | | | |
| Spectrum Income Fund (continued) | | |
| | | Shares or | | |
| | | Principal | | |
| | | Amount | | Value |
|
|
| |
| CORPORATE BONDS (continued) | | | | |
| Banking (continued) | | | | |
| Keybank NA, Series BKNT | | | | |
| 4.412% due 03/18/2008 | $ | 55,000 | $ | 54,534 |
| KeyCorp, MTN, Series G | | | | |
| 4.70% due 05/21/2009 | | 45,000 | | 45,010 |
| Kreditanstalt fuer Wiederaufbau | | | | |
| 4.70% due 06/02/2037 | CAD | 430,000 | | 384,983 |
| Kreditanstalt fuer Wiederaufbau, Series EXCH | | | |
| 5.50% due 12/07/2015 | GBP | 455,000 | | 909,806 |
| Landwirtschaftliche Rentenbank, Series 7 | | | | |
| 3.75% due 06/15/2009 | $ | 110,000 | | 108,359 |
| Lloyds TSB Group PLC | | | | |
| 6.267% due 12/31/2049 (b) | | 310,000 | | 286,021 |
| Marshall & Ilsley Bank, Series BKNT | | | | |
| 3.80% due 02/08/2008 | | 110,000 | | 109,075 |
| 4.125% due 09/04/2007 | | 50,000 | | 50,000 |
| Marshall & Ilsley Bank, Series MTN | | | | |
| 5.15% due 02/22/2012 | | 250,000 | | 249,412 |
| Mizuho Capital Investment EUR 1, Ltd. | | | | |
| 5.02% due 06/29/2049 (b) | EUR | 50,000 | | 66,289 |
| Nordea Bank Finland PLC, EMTN | | | | |
| 5.75% due 03/26/2014 (b) | | 52,000 | | 71,983 |
| Northern Rock PLC, EMTN | | | | |
| 5.75% due 02/28/2017 | GBP | 145,000 | | 281,228 |
| Northern Trust Company, Series BKNT | | | | |
| 4.60% due 02/01/2013 | $ | 120,000 | | 116,490 |
| Northern Trust Corp. | | | | |
| 5.30% due 08/29/2011 | | 144,000 | | 145,910 |
| PNC Funding Corp. | | | | |
| 5.625% due 02/01/2017 | | 195,000 | | 190,689 |
| Rabobank Nederland, EMTN | | | | |
| 3.125% due 07/19/2010 | EUR | 75,000 | | 98,813 |
| Royal Bank of Scotland PLC, EMTN | | | | |
| zero coupon, Step up to 6.935% on | | | | |
| 09/08/2014 due 06/29/2049 (b) | GBP | 104,000 | | 202,957 |
| 6.00% due 05/10/2013 | EUR | 40,000 | | 57,756 |
| Sanpaolo IMI SpA, EMTN | | | | |
| 3.75% due 06/09/2015 (b) | | 64,000 | | 84,546 |
| Standard Chartered Bank, EMTN | | | | |
| 3.625% due 02/03/2017 (b) | | 110,000 | | 140,389 |
| Sumitomo Mitsui Banking Corp, Series REGS | | | |
| 4.375% due 07/29/2049 (b) | | 100,000 | | 121,682 |
| Sumitomo Mitsui Banking Corp. | | | | |
| 5.625% due 07/29/2049 (b) | $ | 200,000 | | 190,390 |
| SunTrust Banks, Inc. | | | | |
| 7.75% due 05/01/2010 | | 250,000 | | 265,095 |
| Svenska Handelsbanken, EMTN | | | | |
| 6.125% due 03/29/2049 (b) | GBP | 49,000 | | 98,361 |
| US Bancorp, MTN, Series P | | | | |
| 4.50% due 07/29/2010 | $ | 190,000 | | 187,778 |
| US Bank NA | | | | |
| 6.50% due 02/01/2008 | | 260,000 | | 260,237 |
| Wachovia Bank NA, Series BKNT | | | | |
| 4.875% due 02/01/2015 | | 360,000 | | 342,329 |
| Wachovia Corp. | | | | |
| 4.375% due 08/01/2016 | EUR | 50,000 | | 64,462 |
| |
| The accompanying notes are an integral part of the financial statements. | 342 |
John Hancock Funds II
Portfolio of investments — August 31, 2007
(showing percentage of total net assets)
| | | | |
| Spectrum Income Fund (continued) | | |
| | | Shares or | | |
| | | Principal | | |
| | | Amount | | Value |
|
|
| |
| CORPORATE BONDS (continued) | | | | |
| | | | | |
| Banking (continued) | | | | |
| Wells Fargo & Company | | | | |
| 4.20% due 01/15/2010 | $ | 205,000 | $ | 200,470 |
| 4.875% due 01/12/2011 | | 225,000 | | 222,655 |
| Wells Fargo Bank NA | | | | |
| 4.75% due 02/09/2015 | | 270,000 | | 257,112 |
| Westpac Banking Corp. | | | | |
| 2.875% due 06/25/2008 | EUR | 21,000 | | 28,228 |
| World Savings Bank FSB, Series BKNT | | | | |
| 4.125% due 12/15/2009 | $ | 195,000 | | 192,603 |
| |
|
| | | | | 12,718,654 |
| Biotechnology - 0.03% | | | | |
| Genentech, Inc. | | | | |
| 4.40% due 07/15/2010 | | 125,000 | | 122,969 |
| 4.75% due 07/15/2015 | | 160,000 | | 152,520 |
| |
|
| | | | | 275,489 |
| Broadcasting - 0.45% | | | | |
| Allbritton Communications Company | | | | |
| 7.75% due 12/15/2012 | | 800,000 | | 782,000 |
| Barrington Broadcasting Group LLC | | | | |
| 10.50% due 08/15/2014 | | 250,000 | | 251,250 |
| Bonten Media Acquisition Company, PIK | | | | |
| 9.00% due 06/01/2015 | | 100,000 | | 87,000 |
| Canadian Satellite Radio Holdings, Inc., ADR | | | |
| 12.75% due 02/15/2014 | | 250,000 | | 245,313 |
| CanWest Media, Inc. | | | | |
| 8.00% due 09/15/2012 | | 400,000 | | 389,500 |
| CBS Corp. | | | | |
| 5.625% due 08/15/2012 | | 185,000 | | 184,481 |
| Clear Channel Communications, Inc. | | | | |
| 6.25% due 03/15/2011 | | 850,000 | | 768,187 |
| LIN Television Corp. | | | | |
| 2.50% due 05/15/2033 | | 72,000 | | 70,020 |
| News America Inc | | | | |
| 6.15% due 03/01/2037 | | 590,000 | | 548,141 |
| News America, Inc. | | | | |
| 6.20% due 12/15/2034 | | 190,000 | | 176,424 |
| 7.375% due 10/17/2008 | | 125,000 | | 127,031 |
| XM Satellite Radio, Inc. | | | | |
| 9.75% due 05/01/2014 | | 850,000 | | 807,500 |
| |
|
| | | | | 4,436,847 |
| Building Materials & Construction - 0.37% | | | |
| Associated Materials, Inc. | | | | |
| zero coupon, Step up to 11.25% on | | | | |
| 03/01/2009 due 03/01/2014 | | 450,000 | | 293,625 |
| Builders FirstSource Inc | | | | |
| 9.8075% due 02/15/2012 (b) | | 325,000 | | 312,000 |
| Columbus McKinnon Corp. | | | | |
| 8.875% due 11/01/2013 | | 575,000 | | 592,250 |
| CRH America Inc | | | | |
| 5.30% due 10/15/2013 | | 140,000 | | 134,971 |
| CRH America, Inc. | | | | |
| 6.00% due 09/30/2016 | | 240,000 | | 239,490 |
| 6.40% due 10/15/2033 | | 65,000 | | 61,990 |
| Esco Corp. | | | | |
| 8.625% due 12/15/2013 | | 600,000 | | 588,000 |
| | | | |
| Spectrum Income Fund (continued) | | |
| | | Shares or | | |
| | | Principal | | |
| | | Amount | | Value |
|
|
| |
| CORPORATE BONDS (continued) | | | | |
| | | | | |
| Building Materials & Construction | | | | |
| (continued) | | | | |
| Esco Corp. (continued) | | | | |
| 9.235% due 12/15/2013 (b) | $ | 175,000 | $ | 171,500 |
| KB Home | | | | |
| 5.875% due 01/15/2015 | | 425,000 | | 359,125 |
| Lafarge SA | | | | |
| 6.15% due 07/15/2011 | | 140,000 | | 141,857 |
| Linde Finance BV, Series EMTN | | | | |
| 4.75% due 04/24/2017 | EUR | 100,000 | | 129,708 |
| Owens Corning Inc | | | | |
| 6.50% due 12/01/2016 | $ | 120,000 | | 119,738 |
| Texas Industries, Inc. | | | | |
| 7.25% due 07/15/2013 | | 500,000 | | 490,625 |
| |
|
| | | | | 3,634,879 |
| Buildings - 0.01% | | | | |
| D.R. Horton, Inc. | | | | |
| 4.875% due 01/15/2010 | | 70,000 | | 65,124 |
| | | | | |
| Business Services - 0.42% | | | | |
| Affinity Group, Inc. | | | | |
| 9.00% due 02/15/2012 | | 100,000 | | 104,000 |
| 10.875% due 02/15/2012 | | 117,214 | | 124,247 |
| Deluxe Corp. | | | | |
| 7.375% due 06/01/2015 | | 250,000 | | 246,250 |
| Dun & Bradstreet Corp. | | | | |
| 5.50% due 03/15/2011 | | 120,000 | | 122,205 |
| FTI Consulting, Inc. | | | | |
| 7.625% due 06/15/2013 | | 375,000 | | 374,062 |
| 7.75% due 10/01/2016 | | 250,000 | | 249,375 |
| Harland Clarke Holdings Corp. | | | | |
| 9.50% due 05/15/2015 | | 350,000 | | 313,250 |
| Invensys PLC | | | | |
| 9.875% due 03/15/2011 | | 344,000 | | 365,500 |
| Manpower, Inc., Series EMTN | | | | |
| 4.75% due 06/14/2013 | EUR | 50,000 | | 66,935 |
| Nebraska Book Company, Inc. | | | | |
| 8.625% due 03/15/2012 | $ | 700,000 | | 679,000 |
| Sungard Data Systems, Inc. | | | | |
| 9.125% due 08/15/2013 | | 873,000 | | 901,373 |
| West Corp. | | | | |
| 11.00% due 10/15/2016 | | 500,000 | | 507,500 |
| Xerox Corp. | | | | |
| 6.75% due 02/01/2017 | | 80,000 | | 82,330 |
| |
|
| | | | | 4,136,027 |
| Cable & Television - 0.86% | | | | |
| Charter Communications Holdings II LLC/Charter | | | |
| Communications Holdings II Capital Corp. | | | |
| 10.25% due 09/15/2010 | | 900,000 | | 909,000 |
| Comcast Cable Communications, Inc. | | | | |
| 6.75% due 01/30/2011 | | 225,000 | | 233,676 |
| Comcast Corp. | | | | |
| 4.95% due 06/15/2016 | | 323,000 | | 298,990 |
| 5.875% due 02/15/2018 | | 455,000 | | 444,315 |
| Cox Communications, Inc. | | | | |
| 7.125% due 10/01/2012 | | 171,000 | | 181,414 |
| | |
| The accompanying notes are an integral part of the financial statements. | 343 |
John Hancock Funds II
Portfolio of investments — August 31, 2007
(showing percentage of total net assets)
| | | | |
| Spectrum Income Fund (continued) | | |
| | | Shares or | | |
| | | Principal | | |
| | | Amount | | Value |
|
|
| |
| CORPORATE BONDS (continued) | | | | |
| Cable & Television (continued) | | | | |
| Cox Enterprises, Inc. | | | | |
| 4.375% due 05/01/2008 | $ | 135,000 | $ | 133,785 |
| DirecTV Holdings LLC | | | | |
| 8.375% due 03/15/2013 | | 500,000 | | 516,250 |
| Echostar DBS Corp. | | | | |
| 5.75% due 10/01/2008 | | 15,000 | | 14,906 |
| 6.625% due 10/01/2014 | | 425,000 | | 411,187 |
| 7.00% due 10/01/2013 | | 150,000 | | 148,125 |
| Kabel Deutschland GmbH | | | | |
| 10.625% due 07/01/2014 | | 375,000 | | 396,563 |
| Mediacom Broadband LLC | | | | |
| 8.50% due 10/15/2015 | | 325,000 | | 321,750 |
| News America, Inc. | | | | |
| 6.40% due 12/15/2035 | | 220,000 | | 210,309 |
| Rainbow National Services LLC | | | | |
| 8.75% due 09/01/2012 | | 100,000 | | 102,375 |
| Rogers Cable, Inc. | | | | |
| 5.50% due 03/15/2014 | | 160,000 | | 154,784 |
| Shaw Communications, Inc. | | | | |
| 8.25% due 04/11/2010 | | 125,000 | | 130,313 |
| Sinclair Broadcast Group, Inc. | | | | |
| 8.00% due 03/15/2012 | | 221,000 | | 223,210 |
| Superior Essex Communications & | | | | |
| Essex Group, Inc. | | | | |
| 9.00% due 04/15/2012 | | 250,000 | | 248,125 |
| Time Warner Cable, Inc. | | | | |
| 5.40% due 07/02/2012 | | 675,000 | | 667,094 |
| Time Warner Entertainment Company LP | | | | |
| 7.25% due 09/01/2008 | | 305,000 | | 307,187 |
| 8.375% due 07/15/2033 | | 595,000 | | 690,551 |
| Time Warner, Inc. | | | | |
| 5.50% due 11/15/2011 | | 275,000 | | 274,376 |
| Univision Communications, Inc., PIK | | | | |
| 9.75% due 03/15/2015 | | 500,000 | | 476,250 |
| Viacom, Inc. | | | | |
| 5.75% due 04/30/2011 | | 95,000 | | 95,646 |
| 6.25% due 04/30/2016 | | 465,000 | | 465,783 |
| Videotron Ltee. | | | | |
| 6.375% due 12/15/2015 | | 100,000 | | 91,250 |
| 6.875% due 01/15/2014 | | 315,000 | | 300,038 |
| |
|
| | | | | 8,447,252 |
| Cellular Communications - 0.88% | | | | |
| America Movil SA de CV | | | | |
| 6.375% due 03/01/2035 | | 440,000 | | 427,566 |
| 8.46% due 12/18/2036 | MXN | 1,000,000 | | 89,456 |
| American Cellular Corp. | | | | |
| 10.00% due 08/01/2011 | $ | 33,000 | | 34,237 |
| American Tower Corp. | | | | |
| 3.00% due 08/15/2012 | | 150,000 | | 297,000 |
| 7.125% due 10/15/2012 | | 110,000 | | 110,000 |
| AT&T Broadband Corp. | | | | |
| 8.375% due 03/15/2013 | | 409,000 | | 457,497 |
| AT&T Wireless Services, Inc. | | | | |
| 7.875% due 03/01/2011 | | 370,000 | | 398,512 |
| | | | |
| Spectrum Income Fund (continued) | | |
| | | Shares or | | |
| | | Principal | | |
| | | Amount | | Value |
|
|
| |
| CORPORATE BONDS (continued) | | | | |
| Cellular Communications (continued) | | | | |
| Centennial Communications Corp. | | | | |
| 10.00% due 01/01/2013 | $ | 400,000 | $ | 418,000 |
| 10.125% due 06/15/2013 | | 525,000 | | 549,937 |
| Cricket Communications, Inc. | | | | |
| 9.375% due 11/01/2014 | | 1,125,000 | | 1,102,500 |
| 9.375% due 11/01/2014 | | 450,000 | | 441,000 |
| Digicel, Ltd. | | | | |
| 9.25% due 09/01/2012 | | 500,000 | | 508,750 |
| Dobson Communications Corp. | | | | |
| 8.875% due 10/01/2013 | | 675,000 | | 713,812 |
| 9.875% due 11/01/2012 | | 225,000 | | 241,875 |
| MetroPCS Wireless, Inc. | | | | |
| 9.25% due 11/01/2014 | | 1,175,000 | | 1,157,375 |
| 9.25% due 11/01/2014 | | 400,000 | | 394,000 |
| Rogers Wireless, Inc. | | | | |
| 6.375% due 03/01/2014 | | 285,000 | | 288,490 |
| 7.50% due 03/15/2015 | | 140,000 | | 150,871 |
| 8.00% due 12/15/2012 | | 250,000 | | 263,535 |
| Rural Cellular Corp. | | | | |
| 8.25% due 03/15/2012 | | 150,000 | | 156,000 |
| 11.106% due 11/01/2012 | | 100,000 | | 103,000 |
| Vodafone Group PLC | | | | |
| 5.625% due 02/27/2017 | | 275,000 | | 265,833 |
| |
|
| | | | | 8,569,246 |
| Chemicals - 0.27% | | | | |
| Dow Chemical Company, EMTN | | | | |
| 4.375% due 06/25/2010 | EUR | 73,000 | | 98,718 |
| E.I. Du Pont de Nemours & Company | | | | |
| 5.60% due 12/15/2036 | $ | 285,000 | | 260,933 |
| Hercules, Inc. | | | | |
| 6.75% due 10/15/2029 | | 275,000 | | 267,437 |
| Huntsman International LLC | | | | |
| 7.875% due 11/15/2014 | | 400,000 | | 418,000 |
| Ineos Group Holdings PLC | | | | |
| 8.50% due 02/15/2016 | | 575,000 | | 529,000 |
| Lubrizol Corp. | | | | |
| 4.625% due 10/01/2009 | | 60,000 | | 59,097 |
| 5.875% due 12/01/2008 | | 195,000 | | 195,216 |
| Lyondell Chemical Company | | | | |
| 8.25% due 09/15/2016 | | 475,000 | | 532,000 |
| Terra Capital Inc, Series B | | | | |
| 7.00% due 02/01/2017 | | 325,000 | | 312,000 |
| |
|
| | | | | 2,672,401 |
| Coal - 0.13% | | | | |
| Alpha Natural Resources LLC | | | | |
| 10.00% due 06/01/2012 | | 400,000 | | 413,500 |
| Foundation PA Coal Company | | | | |
| 7.25% due 08/01/2014 | | 475,000 | | 454,812 |
| Peabody Energy Corp. | | | | |
| 7.375% due 11/01/2016 | | 375,000 | | 377,813 |
| |
|
| | | | | 1,246,125 |
| Commercial Services - 0.19% | | | | |
| Aramark Corp. | | | | |
| 8.85625% due 02/01/2015 (b) | | 875,000 | | 870,625 |
| |
| The accompanying notes are an integral part of the financial statements. | 344 |
John Hancock Funds II
Portfolio of investments — August 31, 2007
(showing percentage of total net assets)
| | | | |
| Spectrum Income Fund (continued) | | |
| | | Shares or | | |
| | | Principal | | |
| | | Amount | | Value |
|
|
| |
| CORPORATE BONDS (continued) | | | | |
| | | | | |
| Commercial Services (continued) | | | | |
| Mac-Gray Corp. | | | | |
| 7.625% due 08/15/2015 | $ | 525,000 | $ | 518,437 |
| Rental Service Corp., Series 144A | | | | |
| 9.50% due 12/01/2014 | | 425,000 | | 415,969 |
| Rentokil Initial PLC, Series EMTN | | | | |
| 4.625% due 03/27/2014 | EUR | 50,000 | | 65,248 |
| |
|
| | | | | 1,870,279 |
| Computers & Business Equipment - 0.16% | | | |
| Broadview Networks Holdings, Inc. | | | | |
| 11.375% due 09/01/2012 | $ | 225,000 | | 230,625 |
| Cisco Systems, Inc. | | | | |
| 5.25% due 02/22/2011 | | 220,000 | | 221,385 |
| Hewlett-Packard Company | | | | |
| 5.25% due 03/01/2012 | | 250,000 | | 251,087 |
| International Business Machines Corp., MTN | | | |
| 3.80% due 02/01/2008 | | 180,000 | | 178,703 |
| Unisys Corp. | | | | |
| 6.875% due 03/15/2010 | | 225,000 | | 214,875 |
| 7.875% due 04/01/2008 | | 325,000 | | 321,750 |
| 8.00% due 10/15/2012 | | 75,000 | | 70,125 |
| Xerox Corp. | | | | |
| 5.50% due 05/15/2012 | | 40,000 | | 39,543 |
| |
|
| | | | | 1,528,093 |
| Construction & Mining Equipment - 0.01% | | | |
| Terex Corp. | | | | |
| 7.375% due 01/15/2014 | | 100,000 | | 100,000 |
| | | | | |
| Containers & Glass - 0.58% | | | | |
| AEP Industries, Inc. | | | | |
| 7.875% due 03/15/2013 | | 400,000 | | 380,000 |
| Ball Corp. | | | | |
| 6.875% due 12/15/2012 | | 575,000 | | 573,562 |
| Berry Plastics Holding Corp | | | | |
| 10.25% due 03/01/2016 | | 250,000 | | 240,000 |
| Berry Plastics Holding Corp. | | | | |
| 8.875% due 09/15/2014 | | 650,000 | | 648,375 |
| 9.235% due 09/15/2014 (b) | | 150,000 | | 148,500 |
| BWAY Corp. | | | | |
| 10.00% due 10/15/2010 | | 400,000 | | 408,000 |
| Clondalkin Acquisition BV | | | | |
| 7.36% due 12/15/2013 (b) | | 275,000 | | 261,250 |
| Graham Packaging Company | | | | |
| 8.50% due 10/15/2012 | | 150,000 | | 146,250 |
| Graphic Packaging International Corp. | | | | |
| 8.50% due 08/15/2011 | | 300,000 | | 303,000 |
| 9.50% due 08/15/2013 | | 75,000 | | 75,750 |
| Owens-Brockway Glass Container, Inc. | | | | |
| 6.75% due 12/01/2014 | | 475,000 | | 458,375 |
| 8.25% due 05/15/2013 | | 275,000 | | 281,875 |
| 8.75% due 11/15/2012 | | 55,000 | | 57,200 |
| Owens-Illinois, Inc. | | | | |
| 7.35% due 05/15/2008 | | 75,000 | | 75,000 |
| Plastipak Holdings, Inc. | | | | |
| 8.50% due 12/15/2015 | | 300,000 | | 304,500 |
| Sealed Air Corp. | | | | |
| 5.375% due 04/15/2008 | | 230,000 | | 228,733 |
| | | | |
| Spectrum Income Fund (continued) | | |
| | | Shares or | | |
| | | Principal | | |
| | | Amount | | Value |
|
|
| |
| CORPORATE BONDS (continued) | | | | |
| | | | | |
| Containers & Glass (continued) | | | | |
| Silgan Holdings, Inc. | | | | |
| 6.75% due 11/15/2013 | $ | 175,000 | $ | 170,625 |
| Smurfit-Stone Container Enterprises, Inc. | | | | |
| 8.00% due 03/15/2017 | | 400,000 | | 381,500 |
| 8.375% due 07/01/2012 | | 400,000 | | 392,000 |
| Stone Container Finance | | | | |
| 7.375% due 07/15/2014 | | 125,000 | | 117,500 |
| |
|
| | | | | 5,651,995 |
| Cosmetics & Toiletries - 0.01% | | | | |
| Chattem, Inc. | | | | |
| 7.00% due 03/01/2014 | | 75,000 | | 72,375 |
| | | | | |
| Crude Petroleum & Natural Gas - 0.76% | | | | |
| Amerada Hess Corp. | | | | |
| 7.375% due 10/01/2009 | | 75,000 | | 78,409 |
| AmeriGas Partners LP | | | | |
| 7.125% due 05/20/2016 | | 25,000 | | 24,000 |
| 7.25% due 05/20/2015 | | 825,000 | | 800,250 |
| Apache Corp. | | | | |
| 6.00% due 01/15/2037 | | 160,000 | | 153,187 |
| Atlantic Richfield Corp. | | | | |
| 9.125% due 03/01/2011 | | 105,000 | | 119,635 |
| Chaparral Energy, Inc. | | | | |
| 8.50% due 12/01/2015 | | 450,000 | | 402,750 |
| Chesapeake Energy Corp. | | | | |
| 6.50% due 08/15/2017 | | 1,305,000 | | 1,243,013 |
| 6.875% due 11/15/2020 | | 475,000 | | 456,000 |
| Compton Petroleum Finance Corp. | | | | |
| 7.625% due 12/01/2013 | | 600,000 | | 570,000 |
| Denbury Resources, Inc. | | | | |
| 7.50% due 04/01/2013 | | 300,000 | | 299,250 |
| 7.50% due 12/15/2015 | | 375,000 | | 373,125 |
| EnCana Corp. | | | | |
| 4.60% due 08/15/2009 | | 190,000 | | 188,587 |
| 6.50% due 08/15/2034 | | 45,000 | | 44,890 |
| Encore Acquisition Company | | | | |
| 7.25% due 12/01/2017 | | 525,000 | | 485,625 |
| Hess Corp. | | | | |
| 7.875% due 10/01/2029 | | 298,000 | | 339,914 |
| Hilcorp Energy I LP | | | | |
| 7.75% due 11/01/2015 | | 400,000 | | 383,000 |
| OPTI Canada, Inc. | | | | |
| 7.875% due 12/15/2014 | | 515,000 | | 516,288 |
| PetroHawk Energy Corp. | | | | |
| 9.125% due 07/15/2013 | | 400,000 | | 417,000 |
| Range Resources Corp. | | | | |
| 7.50% due 05/15/2016 | | 25,000 | | 25,250 |
| Southern Natural Gas Company | | | | |
| 5.90% due 04/01/2017 | | 99,000 | | 96,229 |
| W&T Offshore, Inc. | | | | |
| 8.25% due 06/15/2014 | | 400,000 | | 373,000 |
| |
|
| | | | | 7,389,402 |
| Domestic Oil - 0.38% | | | | |
| ConocoPhillips Company | | | | |
| 5.30% due 04/15/2012 | | 275,000 | | 276,098 |
| 5.90% due 10/15/2032 | | 180,000 | | 176,751 |
| |
| The accompanying notes are an integral part of the financial statements. | 345 |
John Hancock Funds II
Portfolio of investments — August 31, 2007
(showing percentage of total net assets)
| | | | |
| Spectrum Income Fund (continued) | | |
| | | Shares or | | |
| | | Principal | | |
| | | Amount | | Value |
|
|
| |
| CORPORATE BONDS (continued) | | | | |
| | | | | |
| Domestic Oil (continued) | | | | |
| Devon Financing Corp., ULC | | | | |
| 6.875% due 09/30/2011 | $ | 625,000 | $ | 661,026 |
| 7.875% due 09/30/2031 | | 295,000 | | 346,819 |
| Diamond Offshore Drilling, Inc. | | | | |
| 4.875% due 07/01/2015 | | 240,000 | | 226,856 |
| 5.15% due 09/01/2014 | | 395,000 | | 385,714 |
| Forest Oil Corp. | | | | |
| 7.25% due 06/15/2019 | | 650,000 | | 625,625 |
| 8.00% due 12/15/2011 | | 400,000 | | 408,000 |
| Range Resources Corp. | | | | |
| 6.375% due 03/15/2015 | | 650,000 | | 624,000 |
| |
|
| | | | | 3,730,889 |
| Drugs & Health Care - 0.04% | | | | |
| CVS Corp. | | | | |
| 3.875% due 11/01/2007 | | 240,000 | | 239,104 |
| Wyeth | | | | |
| 5.95% due 04/01/2037 | | 205,000 | | 195,946 |
| |
|
| | | | | 435,050 |
| Educational Services - 0.16% | | | | |
| AAC Group Holding Corp. | | | | |
| zero coupon, Step up to 10.25% on | | | | |
| 10/01/2008 due 10/01/2012 | | 200,000 | | 172,000 |
| Education Management Corp. | | | | |
| 10.25% due 06/01/2016 | | 1,350,000 | | 1,393,875 |
| |
|
| | | | | 1,565,875 |
| Electrical Equipment - 0.04% | | | | |
| General Cable Corp | | | | |
| 7.125% due 04/01/2017 | | 225,000 | | 218,250 |
| 7.735% due 04/01/2015 (b) | | 200,000 | | 194,000 |
| |
|
| | | | | 412,250 |
| Electrical Utilities - 0.88% | | | | |
| AES Corp. | | | | |
| 8.875% due 02/15/2011 | | 275,000 | | 282,563 |
| 9.00% due 05/15/2015 | | 55,000 | | 57,338 |
| 9.375% due 09/15/2010 | | 100,000 | | 104,500 |
| Alabama Power Company | | | | |
| 3.50% due 11/15/2007 | | 150,000 | | 149,394 |
| 5.695% due 08/25/2009 (b) | | 120,000 | | 120,362 |
| Allegheny Energy Supply Company LLC | | | | |
| 8.25% due 04/15/2012 | | 50,000 | | 51,625 |
| AmerenUE | | | | |
| 5.40% due 02/01/2016 | | 285,000 | | 276,693 |
| Appalachian Power Company | | | | |
| 6.375% due 04/01/2036 | | 170,000 | | 167,485 |
| Black Hills Corp. | | | | |
| 6.50% due 05/15/2013 | | 235,000 | | 237,454 |
| CE Electric UK Funding Company | | | | |
| 6.995% due 12/30/2007 | | 200,000 | | 201,222 |
| CenterPoint Energy Transition Bond Co., LLC, | | | |
| Series A-2 | | | | |
| 4.97% due 08/01/2014 | | 175,000 | | 172,254 |
| CenterPoint Energy, Inc., Series B | | | | |
| 5.875% due 06/01/2008 | | 110,000 | | 109,679 |
| 7.25% due 09/01/2010 | | 205,000 | | 214,421 |
| | | | |
| Spectrum Income Fund (continued) | | |
| | | Shares or | | |
| | | Principal | | |
| | | Amount | | Value |
|
|
| |
| CORPORATE BONDS (continued) | | | | |
| Electrical Utilities (continued) | | | | |
| CMS Energy Corp. | | | | |
| 8.50% due 04/15/2011 | $ | 50,000 | $ | 53,228 |
| Consumers Energy Company | | | | |
| 5.80% due 09/15/2035 | | 100,000 | | 92,974 |
| Dominion Resources, Inc. | | | | |
| 4.125% due 02/15/2008 | | 65,000 | | 64,605 |
| Edison SpA, EMTN | | | | |
| 5.125% due 12/10/2010 | EUR | 45,000 | | 62,213 |
| El Paso Electric Company | | | | |
| 6.00% due 05/15/2035 | $ | 245,000 | | 229,659 |
| Elia System Operator SA | | | | |
| 4.75% due 05/13/2014 | EUR | 68,000 | | 92,777 |
| Enbw International Finance BV, EMTN | | | | |
| 5.875% due 02/28/2012 | | 36,000 | | 51,411 |
| Entergy Louisiana LLC | | | | |
| 5.83% due 11/01/2010 | $ | 35,000 | | 34,863 |
| Jersey Central Power & Light Company | | | | |
| 5.65% due 06/01/2017 | | 405,000 | | 397,746 |
| Midamerican Energy Holdings | | | | |
| 6.125% due 04/01/2036 | | 220,000 | | 212,125 |
| Monongahela Power Company | | | | |
| 5.70% due 03/15/2017 | | 265,000 | | 263,401 |
| National Grid PLC, EMTN | | | | |
| 5.00% due 07/02/2018 | EUR | 22,000 | | 29,093 |
| National Power Corp, Series REGS | | | | |
| 6.875% due 11/02/2016 | $ | 100,000 | | 95,456 |
| National Power Corp. | | | | |
| 9.7444% due 08/23/2011 (b) | | 200,000 | | 217,500 |
| Nevada Power Co, Series R | | | | |
| 6.75% due 07/01/2037 | | 245,000 | | 242,209 |
| Nevada Power Company | | | | |
| 5.875% due 01/15/2015 | | 45,000 | | 44,160 |
| Orion Power Holdings, Inc. | | | | |
| 12.00% due 05/01/2010 | | 525,000 | | 572,250 |
| Pacific Gas & Electric Company | | | | |
| 4.80% due 03/01/2014 | | 235,000 | | 224,361 |
| 5.80% due 03/01/2037 | | 205,000 | | 193,456 |
| 6.05% due 03/01/2034 | | 50,000 | | 48,973 |
| PPL Capital Funding, Inc. | | | | |
| 4.33% due 03/01/2009 | | 85,000 | | 83,907 |
| Reliant Energy, Inc. | | | | |
| 6.75% due 12/15/2014 | | 200,000 | | 198,000 |
| RWE Finance BV, EMTN | | | | |
| 5.375% due 04/18/2008 | EUR | 33,000 | | 45,137 |
| 6.375% due 06/03/2013 | GBP | 150,000 | | 305,138 |
| Scottish Power UK PLC | | | | |
| 8.375% due 02/20/2017 | | 39,000 | | 91,883 |
| Sierra Pacific Resources | | | | |
| 7.803% due 06/15/2012 | $ | 125,000 | | 131,048 |
| 8.625% due 03/15/2014 | | 850,000 | | 899,498 |
| Southern California Edison Company | | | | |
| 4.65% due 04/01/2015 | | 275,000 | | 260,789 |
| Southern Co., Series A | | | | |
| 5.30% due 01/15/2012 | | 95,000 | | 94,778 |
| Tampa Electric Co | | | | |
| 6.15% due 05/15/2037 | | 230,000 | | 223,294 |
| |
| The accompanying notes are an integral part of the financial statements. | 346 |
John Hancock Funds II
Portfolio of investments — August 31, 2007
(showing percentage of total net assets)
| | | | |
| Spectrum Income Fund (continued) | | |
| | | Shares or | | |
| | | Principal | | |
| | | Amount | | Value |
|
|
| |
| CORPORATE BONDS (continued) | | | | |
| Electrical Utilities (continued) | | | | |
| TECO Energy, Inc. | | | | |
| 7.00% due 05/01/2012 | $ | 90,000 | $ | 92,293 |
| Tri-State Generation & Transmission Association | | | |
| 6.04% due 01/31/2018 | | 96,412 | | 96,886 |
| Vattenfall Treasury AB, EMTN | | | | |
| 6.00% due 04/03/2009 | EUR | 35,000 | | 48,707 |
| Virginia Electric and Power Company | | | | |
| 4.50% due 12/15/2010 | $ | 230,000 | | 225,138 |
| Westar Energy, Inc. | | | | |
| 5.10% due 07/15/2020 | | 185,000 | | 171,889 |
| Western Power Distribution Holdings, Ltd. | | | | |
| 6.875% due 12/15/2007 | | 160,000 | | 160,812 |
| Wisconsin Electric Power Company | | | | |
| 3.50% due 12/01/2007 | | 120,000 | | 119,406 |
| Xcel Energy, Inc. | | | | |
| 7.00% due 12/01/2010 | | 30,000 | | 31,352 |
| |
|
| | | | | 8,647,405 |
| Electronics - 0.17% | | | | |
| Celestica, Inc. | | | | |
| 7.875% due 07/01/2011 | | 400,000 | | 380,000 |
| Conexant Systems, Inc. | | | | |
| 9.3075% due 11/15/2010 (b) | | 325,000 | | 323,375 |
| Flextronics International Ltd | | | | |
| 6.50% due 05/15/2013 | | 75,000 | | 71,437 |
| L-3 Communications Corp., Series B | | | | |
| 6.375% due 10/15/2015 | | 550,000 | | 532,125 |
| Sanmina-SCI Corp. | | | | |
| 8.11% due 06/15/2010 (b) | | 325,000 | | 320,938 |
| |
|
| | | | | 1,627,875 |
| Energy - 1.10% | | | | |
| Bristow Group Inc | | | | |
| 7.50% due 09/15/2017 | | 250,000 | | 248,750 |
| Copano Energy LLC | | | | |
| 8.125% due 03/01/2016 | | 250,000 | | 251,250 |
| Duke Capital LLC | | | | |
| 6.25% due 02/15/2013 | | 155,000 | | 159,186 |
| Duke Capital LLC, Series B | | | | |
| 6.75% due 07/15/2018 | | 90,000 | | 92,965 |
| Duke Energy Carolinas LLC | | | | |
| 6.10% due 06/01/2037 | | 300,000 | | 293,563 |
| Dynegy Holdings Inc. | | | | |
| 7.50% due 06/01/2015 | | 575,000 | | 540,500 |
| Dynegy Holdings, Inc. | | | | |
| 7.75% due 06/01/2019 | | 725,000 | | 670,625 |
| Enbridge, Inc. | | | | |
| 5.60% due 04/01/2017 | | 205,000 | | 198,752 |
| Encore Acquisition Co | | | | |
| 6.25% due 04/15/2014 | | 275,000 | | 250,938 |
| Enterprise Products Operating LP | | | | |
| 4.95% due 06/01/2010 | | 490,000 | | 486,201 |
| 6.30% due 09/15/2017 | | 215,000 | | 215,625 |
| Enterprise Products Operating LP, Series B | | | | |
| 4.00% due 10/15/2007 | | 80,000 | | 79,820 |
| Ferrellgas Partners LP | | | | |
| 8.75% due 06/15/2012 | | 650,000 | | 663,000 |
| | | | |
| Spectrum Income Fund (continued) | | |
| | | Shares or | | |
| | | Principal | | |
| | | Amount | | Value |
|
|
| |
| CORPORATE BONDS (continued) | | | | |
| Energy (continued) | | | | |
| Florida Power & Light Company | | | | |
| 6.20% due 06/01/2036 | $ | 110,000 | $ | 111,335 |
| Gaz Capital for Gazprom, Series REGS | | | | |
| 7.288% due 08/16/2037 | | 840,000 | | 862,226 |
| Mirant North America LLC | | | | |
| 7.375% due 12/31/2013 | | 375,000 | | 373,125 |
| Niagara Mohawk Power Corp., Series G | | | | |
| 7.75% due 10/01/2008 | | 50,000 | | 51,061 |
| NRG Energy, Inc. | | | | |
| 7.25% due 02/01/2014 | | 400,000 | | 396,000 |
| 7.375% due 02/01/2016 | | 1,855,000 | | 1,831,813 |
| Petroleos de Venezuela SA | | | | |
| 5.375% due 04/12/2027 | | 700,000 | | 406,000 |
| Plains Exploration & Production Company | | | | |
| 7.00% due 03/15/2017 | | 400,000 | | 364,000 |
| Progress Energy, Inc. | | | | |
| 5.625% due 01/15/2016 | | 400,000 | | 394,265 |
| Reliant Energy, Inc. | | | | |
| 7.625% due 12/31/2014 | | 400,000 | | 392,000 |
| 7.875% due 12/31/2017 | | 325,000 | | 317,688 |
| Sabine Pass LNG LP | | | | |
| 7.50% due 11/30/2016 | | 400,000 | | 389,000 |
| Sempra Energy | | | | |
| 7.95% due 03/01/2010 | | 100,000 | | 105,482 |
| Valero Energy Corp | | | | |
| 6.125% due 06/15/2017 | | 490,000 | | 499,225 |
| XTO Energy Inc | | | | |
| 6.75% due 08/01/2037 | | 145,000 | | 148,569 |
| |
|
| | | | | 10,792,964 |
| Federal Republic of Germany - 0.11% | | | | |
| Eurohypo AG | | | | |
| 4.50% due 01/21/2013 | EUR | 750,000 | | 1,025,644 |
| | | | | |
| Financial Services - 3.15% | | | | |
| AGFC Capital Trust I | | | | |
| 6.00% due 01/15/2067 (b) | $ | 200,000 | | 191,123 |
| AGY Holding Corp. | | | | |
| 11.00% due 11/15/2014 | | 250,000 | | 253,750 |
| Altadis Emisiones Financial | | | | |
| 4.00% due 12/11/2015 | EUR | 50,000 | | 61,435 |
| Altria Finance Cayman Islands, Ltd. | | | | |
| 5.625% due 06/24/2008 | | 61,000 | | 83,645 |
| American Express Company | | | | |
| 5.25% due 09/12/2011 | $ | 230,000 | | 230,451 |
| American Express Credit Corp., EMTN | | | | |
| 3.625% due 10/13/2009 | EUR | 55,000 | | 73,568 |
| American General Finance Corp., Series I, MTN | | | |
| 5.40% due 12/01/2015 | $ | 250,000 | | 238,152 |
| American Honda Finance Corp. | | | | |
| 4.50% due 05/26/2009 | | 365,000 | | 363,457 |
| Arch Western Finance LLC | | | | |
| 6.75% due 07/01/2013 | | 375,000 | | 354,844 |
| Bank Nederlandse Gemeenten, Series EMTN | | | |
| 4.625% due 09/13/2012 | EUR | 925,000 | | 1,271,396 |
| Bank of America Corp | | | | |
| 6.00% due 09/01/2017 | $ | 270,000 | | 272,614 |
| |
| The accompanying notes are an integral part of the financial statements. | 347 |
John Hancock Funds II
Portfolio of investments — August 31, 2007
(showing percentage of total net assets)
| | | | |
| Spectrum Income Fund (continued) | | |
| | | Shares or | | |
| | | Principal | | |
| | | Amount | | Value |
| |
|
| |
| CORPORATE BONDS (continued) | | | | |
| Financial Services (continued) | | | | |
| Bear Stearns Companies, Inc. | | | | |
| 4.00% due 01/31/2008 | $ | 150,000 | $ | 148,645 |
| BHP Billiton Finance, Ltd. | | | | |
| 5.40% due 03/29/2017 | | 225,000 | | 220,897 |
| Boeing Capital Corp., MTN, Series X | | | | |
| 6.35% due 11/15/2007 | | 160,000 | | 160,311 |
| Capital One Capital IV | | | | |
| 6.745% due 02/17/2037 (b) | | 625,000 | | 521,725 |
| Caterpillar Financial Services Corp, Series MTN | | | |
| 5.85% due 09/01/2017 | | 165,000 | | 165,239 |
| Caterpillar Financial Services Corp. | | | | |
| 4.50% due 06/15/2009 | | 125,000 | | 124,058 |
| Caterpillar Financial Services Corp., MTN, Series F | | | |
| 4.50% due 09/01/2008 | | 140,000 | | 138,721 |
| CIT Group, Inc. | | | | |
| 5.50% due 11/30/2007 | | 65,000 | | 64,570 |
| 6.00% due 04/01/2036 | | 96,000 | | 71,293 |
| CIT Group, Inc., GMTN | | | | |
| 4.25% due 09/22/2011 | EUR | 50,000 | | 59,577 |
| CIT Group, Inc., MTN | | | | |
| 5.7075% due 08/15/2008 (b) | $ | 115,000 | | 113,480 |
| Citigroup, Inc. | | | | |
| 3.625% due 02/09/2009 | | 130,000 | | 127,698 |
| 3.875% due 05/21/2010 | EUR | 35,000 | | 46,808 |
| 4.75% due 02/10/2019 (b) | | 50,000 | | 66,218 |
| 5.00% due 09/15/2014 | $ | 175,000 | | 167,560 |
| 5.50% due 08/27/2012 | | 220,000 | | 220,112 |
| Clarendon Alumina Production Ltd, Series REGS | | | |
| 8.50% due 11/16/2021 | | 100,000 | | 101,625 |
| Countrywide Financial Corp. | | | | |
| 4.50% due 06/15/2010 | | 135,000 | | 125,673 |
| Countrywide Home Loans, Inc., MTN | | | | |
| 4.125% due 09/15/2009 | | 540,000 | | 507,293 |
| Credit Suisse First Boston USA, Inc. | | | | |
| 4.875% due 08/15/2010 | | 300,000 | | 298,168 |
| Credit Suisse USA, Inc. | | | | |
| 5.50% due 08/16/2011 | | 170,000 | | 171,160 |
| ERP Operating LP | | | | |
| 3.85% due 08/15/2026 | | 15,000 | | 14,506 |
| Ford Motor Credit Company | | | | |
| 5.80% due 01/12/2009 | | 330,000 | | 310,950 |
| 6.93% due 01/15/2010 (b) | | 100,000 | | 93,912 |
| 7.375% due 10/28/2009 | | 135,000 | | 127,746 |
| 9.81% due 04/15/2012 (b) | | 1,300,000 | | 1,309,561 |
| Franklin Resources, Inc. | | | | |
| 3.70% due 04/15/2008 | | 60,000 | | 59,369 |
| Fund American Companies, Inc. | | | | |
| 5.875% due 05/15/2013 | | 205,000 | | 204,183 |
| GATX Financial Corp. | | | | |
| 5.50% due 02/15/2012 | | 275,000 | | 273,733 |
| GE Capital European Funding, Series EMTN | | | |
| 3.50% due 02/14/2013 | EUR | 110,000 | | 140,295 |
| GE Capital UK Funding, EMTN | | | | |
| 5.625% due 12/12/2014 | GBP | 145,000 | | 281,799 |
| General Electric Capital Corp, Series REGS | | | | |
| 4.625% due 09/15/2066 (b) | EUR | 135,000 | | 170,025 |
| | | | |
| Spectrum Income Fund (continued) | | |
| | | Shares or | | |
| | | Principal | | |
| | | Amount | | Value |
|
|
| |
| CORPORATE BONDS (continued) | | | | |
| Financial Services (continued) | | | | |
| General Electric Capital Corp. | | | | |
| 6.125% due 02/22/2011 | $ | 220,000 | $ | 227,565 |
| General Electric Capital Corp., MTN | | | | |
| 5.375% due 10/20/2016 | | 335,000 | | 329,519 |
| General Electric Capital Corp., Series A, MTN | | | |
| 6.00% due 06/15/2012 | | 660,000 | | 679,486 |
| General Motors Acceptance Corp. | | | | |
| 5.625% due 05/15/2009 | | 394,000 | | 366,487 |
| 6.875% due 08/28/2012 | | 1,200,000 | | 1,060,086 |
| 6.875% due 09/15/2011 | | 300,000 | | 267,558 |
| 7.25% due 03/02/2011 | | 375,000 | | 344,513 |
| GIE Suez Alliance, EMTN | | | | |
| 5.125% due 06/24/2015 | EUR | 82,000 | | 113,735 |
| Global Cash Access LLC | | | | |
| 8.75% due 03/15/2012 | $ | 525,000 | | 532,875 |
| GMAC LLC | | | | |
| 7.56% due 12/01/2014 (b) | | 875,000 | | 739,415 |
| GMAC LLC, Series EMTN | | | | |
| 5.75% due 09/27/2010 | EUR | 40,000 | | 47,181 |
| Goldman Sachs Capital, Inc. | | | | |
| 6.345% due 02/15/2034 | $ | 921,000 | | 826,439 |
| Goldman Sachs Group, Inc. | | | | |
| 6.60% due 01/15/2012 | | 150,000 | | 154,687 |
| GTB Finance B.V. | | | | |
| 8.50% due 01/29/2012 | | 100,000 | | 94,000 |
| Hartford Financial Services Group, Inc. | | | | |
| 5.25% due 10/15/2011 | | 260,000 | | 261,897 |
| 5.375% due 03/15/2017 | | 255,000 | | 245,953 |
| HBOS PLC | | | | |
| 5.92% due 09/29/2049 (b) | | 400,000 | | 363,561 |
| Hexion U.S. Finance Corp/Hexion Nova Scotia | | | |
| Finance ULC | | | | |
| 10.0575% due 11/15/2014 (b) | | 225,000 | | 229,500 |
| Hexion US Finance Corp/Hexion Nova Scotia | | | |
| Finance ULC | | | | |
| 9.75% due 11/15/2014 | | 450,000 | | 486,000 |
| HSBC Finance Corp | | | | |
| 5.90% due 06/19/2012 | | 440,000 | | 443,815 |
| HSBC Finance Corp. | | | | |
| 4.125% due 11/16/2009 | | 150,000 | | 146,305 |
| 5.00% due 06/30/2015 | | 430,000 | | 404,162 |
| HSBC USA, Inc. | | | | |
| 4.625% due 04/01/2014 | | 100,000 | | 94,169 |
| International Lease Finance Corp., EMTN | | | | |
| 4.125% due 10/09/2008 | EUR | 70,000 | | 94,792 |
| International Lease Finance Corp., Series MTN | | | |
| 5.45% due 03/24/2011 | $ | 225,000 | | 224,213 |
| iPayment Investors LP | | | | |
| 11.625% due 07/15/2014 (b) | | 368,248 | | 371,930 |
| iPayment,Inc. | | | | |
| 9.75% due 05/15/2014 | | 400,000 | | 375,000 |
| Jefferies Group, Inc. | | | | |
| 5.875% due 06/08/2014 | | 176,000 | | 170,773 |
| 6.25% due 01/15/2036 | | 260,000 | | 232,571 |
| John Deere Capital Corp, Series MTN | | | | |
| 5.50% due 04/13/2017 | | 310,000 | | 310,823 |
| | |
| The accompanying notes are an integral part of the financial statements. | 348 |
John Hancock Funds II
Portfolio of investments — August 31, 2007
(showing percentage of total net assets)
| | | | |
| Spectrum Income Fund (continued) | | |
| | | Shares or | | |
| | | Principal | | |
| | | Amount | | Value |
|
|
| |
| CORPORATE BONDS (continued) | | | | |
| | | | | |
| Financial Services (continued) | | | | |
| John Deere Capital Corp. | | | | |
| 3.90% due 01/15/2008 | $ | 85,000 | $ | 84,438 |
| JP Morgan Chase Capital XXII, Series V | | | | |
| 6.45% due 02/02/2037 | | 195,000 | | 173,141 |
| JP Morgan Chase Capital XVIII, Series R | | | | |
| 6.95% due 08/17/2036 | | 115,000 | | 108,997 |
| JPMorgan Chase & Company, EMTN | | | | |
| 4.25% due 06/09/2011 | EUR | 39,000 | | 52,201 |
| 4.375% due 11/12/2019 (b) | | 150,000 | | 192,798 |
| JSG Funding PLC | | | | |
| 7.75% due 04/01/2015 | $ | 275,000 | | 265,375 |
| KAR Holdings, Inc. | | | | |
| 9.35625% due 05/01/2014 (b) | | 250,000 | | 222,500 |
| 10.00% due 05/01/2015 | | 400,000 | | 358,000 |
| Legg Mason, Inc. | | | | |
| 6.75% due 07/02/2008 | | 165,000 | | 165,868 |
| Lehman Brothers Holdings Inc, Series EMTN | | | |
| 4.625% due 03/14/2019 (b) | EUR | 150,000 | | 182,690 |
| Lehman Brothers Holdings, Inc., Series MTNG | | | |
| 3.95% due 11/10/2009 | $ | 325,000 | | 317,960 |
| Local TV Finance LLC | | | | |
| 9.25% due 06/15/2015 | | 200,000 | | 183,000 |
| Lukoil International Finance BV, Series REGS | | | |
| 6.656% due 06/07/2022 | | 125,000 | | 115,313 |
| Mangrove Bay Pass Through Trust | | | | |
| 6.102% due 07/15/2033 (b) | | 200,000 | | 199,418 |
| MBNA America Bank NA, EMTN | | | | |
| 4.625% due 08/03/2009 | | 300,000 | | 298,564 |
| MBNA Europe Funding Plc, EMTN | | | | |
| 4.50% due 01/23/2009 | EUR | 33,000 | | 44,907 |
| Mellon Funding Corp. | | | | |
| 6.375% due 11/08/2011 | GBP | 145,000 | | 296,448 |
| Merrill Lynch & Company, Inc. | | | | |
| 6.05% due 05/16/2016 | $ | 575,000 | | 571,491 |
| 6.22% due 09/15/2026 | | 250,000 | | 240,024 |
| Merrill Lynch & Company, Inc., EMTN | | | | |
| 4.625% due 10/02/2013 | EUR | 68,000 | | 89,347 |
| Merrill Lynch & Company, Inc., Series CPI | | | | |
| 3.85086% due 03/02/2009 (b) | $ | 150,000 | | 144,353 |
| Metropolitan Life Global Funding | | | | |
| 5.125% due 11/09/2011 | | 435,000 | | 435,286 |
| Mizuho Capital Investment 1, Ltd. | | | | |
| 6.686% due 03/29/2049 (b) | | 126,000 | | 121,468 |
| Morgan Stanley | | | | |
| 4.00% due 01/15/2010 | | 300,000 | | 292,766 |
| Morgan Stanley, Series GMTN | | | | |
| 5.125% due 11/30/2015 | GBP | 100,000 | | 182,134 |
| Morgan Stanley, Series MTN | | | | |
| 6.25% due 08/09/2026 | $ | 100,000 | | 97,067 |
| National Rural Utilities Cooperative Finance Corp. | | | |
| 3.875% due 02/15/2008 | | 200,000 | | 198,570 |
| 4.375% due 10/01/2010 | | 100,000 | | 97,524 |
| Nationwide Building Society, EMTN | | | | |
| 3.375% due 08/17/2015 (b) | EUR | 55,000 | | 72,082 |
| Nell AF SARL | | | | |
| 8.375% due 08/15/2015 | $ | 75,000 | | 66,750 |
| | | | |
| Spectrum Income Fund (continued) | | |
| | | Shares or | | |
| | | Principal | | |
| | | Amount | | Value |
|
|
| |
| CORPORATE BONDS (continued) | | | | |
| Financial Services (continued) | | | | |
| Nexstar Finance Holdings LLC | | | | |
| zero coupon, Step up to 11.375% on | | | | |
| 04/01/2008 due 04/01/2013 | $ | 600,000 | $ | 585,000 |
| Nexstar Finance, Inc. | | | | |
| 7.00% due 01/15/2014 | | 275,000 | | 259,875 |
| Nisource Finance Corp. | | | | |
| 6.0644% due 11/23/2009 (b) | | 140,000 | | 138,748 |
| Nissan Motor Acceptance Corp. | | | | |
| 4.625% due 03/08/2010 | | 120,000 | | 118,287 |
| PNC Funding Corp. | | | | |
| 4.20% due 03/10/2008 | | 250,000 | | 247,797 |
| RBS Global, Inc. | | | | |
| 9.50% due 08/01/2014 | | 1,025,000 | | 1,035,250 |
| 11.75% due 08/01/2016 | | 100,000 | | 103,500 |
| Red Arrow International Leasing Plc | | | | |
| 8.375% due 03/31/2012 | RUB | 1,988,742 | | 79,240 |
| Sally Holdings LLC | | | | |
| 9.25% due 11/15/2014 | $ | 425,000 | | 418,625 |
| SLM Corp., Series CPI | | | | |
| 3.82% due 04/01/2009 (b) | | 365,000 | | 335,253 |
| Sovereign Capital Trust VI | | | | |
| 7.908% due 06/13/2036 | | 245,000 | | 263,110 |
| Sun Life Financial Global Funding LP | | | | |
| 5.61% due 10/06/2013 (b) | | 250,000 | | 250,405 |
| Torchmark Corp. | | | | |
| 6.375% due 06/15/2016 | | 230,000 | | 243,672 |
| Toyota Motor Credit Corp. | | | | |
| 2.875% due 08/01/2008 | | 235,000 | | 229,514 |
| UBS AG/Jersey, Series EMTN | | | | |
| 4.50% due 09/16/2019 (b) | EUR | 140,000 | | 184,760 |
| USI Holdings Corp. | | | | |
| 9.4325% due 11/15/2014 | $ | 250,000 | | 232,500 |
| |
|
| | | | | 30,836,371 |
| Food & Beverages - 0.33% | | | | |
| Anheuser-Busch Cos Inc | | | | |
| 6.45% due 09/01/2037 | | 110,000 | | 113,414 |
| B&G Foods Holding Corp. | | | | |
| 8.00% due 10/01/2011 | | 500,000 | | 490,000 |
| Casino Guichard Perrachon SA, Series EMTN | | | |
| 4.875% due 04/10/2014 | EUR | 100,000 | | 131,012 |
| Del Monte Corp. | | | | |
| 8.625% due 12/15/2012 | $ | 325,000 | | 328,250 |
| Delhaize Group | | | | |
| 6.50% due 06/15/2017 | | 100,000 | | 101,118 |
| General Mills, Inc. | | | | |
| 3.875% due 11/30/2007 | | 215,000 | | 213,973 |
| General Mills, Inc., MTN | | | | |
| 6.378% due 10/15/2008 | | 215,000 | | 216,481 |
| McCormick & Company, Inc. | | | | |
| 5.20% due 12/15/2015 | | 430,000 | | 424,648 |
| 5.80% due 07/15/2011 | | 130,000 | | 132,951 |
| McCormick & Company, Inc., MTN | | | | |
| 3.35% due 04/15/2009 | | 110,000 | | 108,364 |
| McDonald's Corp. | | | | |
| 5.30% due 03/15/2017 | | 205,000 | | 199,033 |
| |
| The accompanying notes are an integral part of the financial statements. | 349 |
John Hancock Funds II
Portfolio of investments — August 31, 2007
(showing percentage of total net assets)
| | | | |
| Spectrum Income Fund (continued) | | |
| | | Shares or | | |
| | | Principal | | |
| | | Amount | | Value |
|
|
| |
| CORPORATE BONDS (continued) | | | | |
| Food & Beverages (continued) | | | | |
| Panamerican Beverages, Inc. | | | | |
| 7.25% due 07/01/2009 | $ | 35,000 | $ | 35,969 |
| PepsiAmericas, Inc. | | | | |
| 4.875% due 01/15/2015 | | 55,000 | | 52,909 |
| SABMiller PLC | | | | |
| 6.20% due 07/01/2011 | | 485,000 | | 499,758 |
| William Wrigley Jr. Company | | | | |
| 4.65% due 07/15/2015 | | 60,000 | | 56,305 |
| YUM Brands, Inc. | | | | |
| 7.65% due 05/15/2008 | | 125,000 | | 126,589 |
| |
|
| | | | | 3,230,774 |
| |
| Foreign Bonds - 0.01% | | | | |
| Santa Fe de Bogota DC, Series REGS | | | | |
| 9.75% due 07/26/2028 | COP | 240,000,000 | | 102,917 |
| | | | | |
| Forest Products - 0.06% | | | | |
| Verso Paper Holdings LLC and Verson Paper Inc, | | | |
| Series B | | | | |
| 9.10625% due 08/01/2014 (b) | $ | 425,000 | | 422,875 |
| Weyerhaeuser Company | | | | |
| 7.375% due 03/15/2032 | | 115,000 | | 115,121 |
| |
|
| | | | | 537,996 |
| |
| Furniture & Fixtures - 0.05% | | | | |
| Sealy Mattress Company | | | | |
| 8.25% due 06/15/2014 | | 525,000 | | 513,188 |
| | | | | |
| Gas & Pipeline Utilities - 0.36% | | | | |
| Aquila Canada Finance Corp. | | | | |
| 7.75% due 06/15/2011 | | 200,000 | | 209,178 |
| Atmos Energy Corp. | | | | |
| 4.00% due 10/15/2009 | | 230,000 | | 225,123 |
| 5.95% due 10/15/2034 | | 40,000 | | 36,552 |
| Boardwalk Pipelines LLC | | | | |
| 5.50% due 02/01/2017 | | 90,000 | | 87,235 |
| Colorado Interstate Gas Company | | | | |
| 5.95% due 03/15/2015 | | 150,000 | | 146,950 |
| Duke Capital LLC | | | | |
| 7.50% due 10/01/2009 | | 130,000 | | 135,756 |
| El Paso Natural Gas | | | | |
| 5.95% due 04/15/2017 | | 99,000 | | 96,571 |
| Kinder Morgan Finance Company, ULC | | | | |
| 5.70% due 01/05/2016 | | 480,000 | | 427,319 |
| Kinder Morgan, Inc. | | | | |
| 6.50% due 09/01/2012 | | 170,000 | | 166,387 |
| National Gas Company | | | | |
| 6.05% due 01/15/2036 | | 105,000 | | 100,752 |
| National Gas Co of Trinidad & Tobago Ltd, | | | | |
| Series REGS | | | | |
| 6.05% due 01/15/2036 | | 100,000 | | 94,943 |
| Northwest Pipeline Corp. | | | | |
| 5.95% due 04/15/2017 | | 65,000 | | 63,050 |
| Panhandle Eastern Pipe Line Company | | | | |
| 4.80% due 08/15/2008 | | 155,000 | | 153,426 |
| Piedmont Natural Gas Company | | | | |
| 6.00% due 12/19/2033 | | 15,000 | | 14,631 |
| Praxair, Inc. | | | | |
| 5.20% due 03/15/2017 | | 205,000 | | 197,688 |
| | | | |
| Spectrum Income Fund (continued) | | |
| | | Shares or | | |
| | | Principal | | |
| | | Amount | | Value |
|
|
| |
| CORPORATE BONDS (continued) | | | | |
| Gas & Pipeline Utilities (continued) | | | | |
| Roseton/Danskammer, Series A | | | | |
| 7.27% due 11/08/2010 | $ | 200,000 | $ | 200,000 |
| Southern California Gas Company | | | | |
| 5.75% due 11/15/2035 | | 230,000 | | 218,052 |
| Sunoco, Inc. | | | | |
| 4.875% due 10/15/2014 | | 30,000 | | 28,434 |
| 5.75% due 01/15/2017 | | 240,000 | | 236,911 |
| Williams Companies, Inc. | | | | |
| 7.625% due 07/15/2019 | | 50,000 | | 53,125 |
| 7.75% due 06/15/2031 | | 200,000 | | 207,500 |
| 8.125% due 03/15/2012 | | 250,000 | | 268,125 |
| 8.75% due 03/15/2032 | | 25,000 | | 28,438 |
| Williams Companies, Inc., Series A | | | | |
| 7.50% due 01/15/2031 | | 125,000 | | 128,438 |
| |
|
| | | | | 3,524,584 |
| Healthcare Products - 0.11% | | | | |
| Fresenius Medical Care Capital Trust | | | | |
| 7.875% due 06/15/2011 | | 25,000 | | 25,437 |
| Invacare Corp. | | | | |
| 9.75% due 02/15/2015 | | 325,000 | | 313,625 |
| Medtronic, Inc., Series B | | | | |
| 4.375% due 09/15/2010 | | 145,000 | | 142,473 |
| 4.75% due 09/15/2015 | | 330,000 | | 311,450 |
| Universal Hospital Services, Inc. | | | | |
| 8.7594% due 06/01/2015 (b) | | 200,000 | | 193,000 |
| Universal Hospital Services, Inc., PIK | | | | |
| 8.50% due 06/01/2015 | | 100,000 | | 95,000 |
| |
|
| | | | | 1,080,985 |
| Healthcare Services - 0.32% | | | | |
| Cardinal Health, Inc. | | | | |
| 5.63% due 10/02/2009 | | 260,000 | | 260,201 |
| Centene Corp. | | | | |
| 7.25% due 04/01/2014 | | 225,000 | | 219,375 |
| CRC Health Corp. | | | | |
| 10.75% due 02/01/2016 | | 225,000 | | 237,375 |
| DaVita, Inc. | | | | |
| 6.625% due 03/15/2013 | | 275,000 | | 266,063 |
| 7.25% due 03/15/2015 | | 550,000 | | 539,000 |
| Team Health, Inc. | | | | |
| 11.25% due 12/01/2013 | | 50,000 | | 53,000 |
| United Surgical Partners International Inc | | | | |
| 9.25% due 05/01/2017 | | 50,000 | | 47,500 |
| United Surgical Partners International Inc. | | | | |
| 9.25% due 05/01/2017 | | 225,000 | | 213,750 |
| UnitedHealth Group, Inc. | | | | |
| 5.375% due 03/15/2016 | | 360,000 | | 353,130 |
| Vanguard Health Holding Company II LLC | | | | |
| 9.00% due 10/01/2014 | | 575,000 | | 537,625 |
| WellPoint, Inc. | | | | |
| 4.25% due 12/15/2009 | | 40,000 | | 39,271 |
| 5.00% due 01/15/2011 | | 395,000 | | 393,167 |
| |
|
| | | | | 3,159,457 |
| |
| The accompanying notes are an integral part of the financial statements. | 350 |
John Hancock Funds II
Portfolio of investments — August 31, 2007
(showing percentage of total net assets)
| | | | |
| Spectrum Income Fund (continued) | | |
| | | Shares or | | |
| | | Principal | | |
| | | Amount | | Value |
|
|
| |
| CORPORATE BONDS (continued) | | | | |
| | | | |
| Holdings Companies/Conglomerates - 0.16% | | | |
| ERP Operating LP | | | | |
| 5.25% due 09/15/2014 | $ | 190,000 | $ | 182,639 |
| Hutchison Whampoa Finance, Ltd. | | | | |
| 5.875% due 07/08/2013 | EUR | 62,000 | | 87,528 |
| Leucadia National Corp. | | | | |
| 7.00% due 08/15/2013 | $ | 415,000 | | 402,550 |
| Visant Corp. | | | | |
| 7.625% due 10/01/2012 | | 325,000 | | 325,812 |
| Visant Holding Corp. | | | | |
| zero coupon, Step up to 10.25% on | | | | |
| 12/01/2008 due 12/01/2013 | | 600,000 | | 550,500 |
| |
|
| | | | | 1,549,029 |
| Homebuilders - 0.17% | | | | |
| Centex Corp. | | | | |
| 4.55% due 11/01/2010 | | 150,000 | | 138,803 |
| 5.45% due 08/15/2012 | | 260,000 | | 239,721 |
| D.R. Horton, Inc. | | | | |
| 6.50% due 04/15/2016 | | 250,000 | | 219,462 |
| Lennar Corp., Series B | | | | |
| 5.60% due 05/31/2015 | | 395,000 | | 347,426 |
| 5.95% due 10/17/2011 | | 25,000 | | 24,065 |
| MDC Holdings, Inc., MTN | | | | |
| 5.375% due 12/15/2014 | | 60,000 | | 55,032 |
| Meritage Homes, Corp. | | | | |
| 6.25% due 03/15/2015 | | 275,000 | | 217,250 |
| NVR, Inc. | | | | |
| 5.00% due 06/15/2010 | | 115,000 | | 114,350 |
| Pulte Homes, Inc. | | | | |
| 4.875% due 07/15/2009 | | 70,000 | | 65,811 |
| 5.20% due 02/15/2015 | | 325,000 | | 266,384 |
| Ryland Group, Inc. | | | | |
| 5.375% due 01/15/2015 | | 20,000 | | 17,430 |
| |
|
| | | | | 1,705,734 |
| Hotels & Restaurants - 0.24% | | | | |
| American Casino & Entertainment Properties LLC | | | |
| 7.85% due 02/01/2012 | | 400,000 | | 408,000 |
| Harrah's Operating Company, Inc. | | | | |
| 5.50% due 07/01/2010 | | 725,900 | | 682,346 |
| O'Charleys, Inc. | | | | |
| 9.00% due 11/01/2013 | | 250,000 | | 252,500 |
| OSI Restaurant Partners, Inc. | | | | |
| 10.00% due 05/15/2015 | | 750,000 | | 646,875 |
| Real Mex Restaurants, Inc. | | | | |
| 10.00% due 04/01/2010 | | 165,000 | | 165,413 |
| Restaurant Company | | | | |
| 10.00% due 10/01/2013 | | 275,000 | | 235,125 |
| |
|
| | | | | 2,390,259 |
| Household Appliances - 0.02% | | | | |
| Whirlpool Corp. | | | | |
| 6.125% due 06/15/2011 | | 140,000 | | 142,691 |
| Household Products - 0.10% | | | | |
| Simmons Bedding Company | | | | |
| zero coupon, Step up to 10.00% on | | | | |
| 12/15/2009 due 12/15/2014 | | 300,000 | | 233,250 |
| | | | |
| Spectrum Income Fund (continued) | | |
| | | Shares or | | |
| | | Principal | | |
| | | Amount | | Value |
|
|
| |
| CORPORATE BONDS (continued) | | | | |
| Household Products (continued) | | | | |
| Simmons Bedding Company (continued) | | | | |
| 7.875% due 01/15/2014 | $ | 275,000 | $ | 257,469 |
| Yankee Acquisition Corp., Series B | | | | |
| 9.75% due 02/15/2017 | | 75,000 | | 67,125 |
| Yankee Acquisition Corp/MA, Series B | | | | |
| 8.50% due 02/15/2015 | | 475,000 | | 446,500 |
| |
|
| | | | | 1,004,344 |
| Industrial Machinery - 0.04% | | | | |
| Stewart & Stevenson LLC | | | | |
| 10.00% due 07/15/2014 | | 375,000 | | 378,750 |
| | | | | |
| Insurance - 0.61% | | | | |
| Ace INA Holdings, Inc. | | | | |
| 5.70% due 02/15/2017 | | 240,000 | | 234,389 |
| 5.875% due 06/15/2014 | | 150,000 | | 151,103 |
| Allstate Life Funding LLC, EMTN | | | | |
| 6.375% due 01/17/2011 | GBP | 49,000 | | 98,529 |
| American International Group, Inc., Series A3 | | | |
| 4.875% due 03/15/2067 (b) | EUR | 150,000 | | 186,458 |
| ASIF II, EMTN | | | | |
| 5.625% due 02/01/2012 | GBP | 159,000 | | 312,521 |
| Cincinnati Financial Corp. | | | | |
| 6.92% due 05/15/2028 | $ | 150,000 | | 160,164 |
| Genworth Financial, Inc. | | | | |
| 5.75% due 06/15/2014 | | 380,000 | | 382,356 |
| 6.15% due 11/15/2066 (b) | | 156,000 | | 143,697 |
| Highmark, Inc. | | | | |
| 6.80% due 08/15/2013 | | 225,000 | | 238,420 |
| HUB International Holdings Inc | | | | |
| 9.00% due 12/15/2014 | | 350,000 | | 329,000 |
| HUB International Holdings, Inc. | | | | |
| 10.25% due 06/15/2015 | | 425,000 | | 386,750 |
| Lincoln National Corp. | | | | |
| 6.05% due 04/20/2067 (b) | | 145,000 | | 137,466 |
| MetLife, Inc. | | | | |
| 6.40% due 12/15/2036 (b) | | 260,000 | | 236,503 |
| Monumental Global Funding, Ltd., EMTN | | | | |
| 5.375% due 03/13/2009 | EUR | 39,000 | | 53,645 |
| Nationwide Mutual Insurance Company | | | | |
| 6.60% due 04/15/2034 | $ | 135,000 | | 131,203 |
| New York Life Global Funding | | | | |
| 4.625% due 08/16/2010 | | 235,000 | | 234,877 |
| New York Life Global Funding, Series EMTN | | | |
| 4.375% due 01/19/2017 | EUR | 100,000 | | 130,130 |
| NLV Financial Corp. | | | | |
| 7.50% due 08/15/2033 | $ | 285,000 | | 302,662 |
| Ohio National Financial Services, Inc. | | | | |
| 6.35% due 04/01/2013 | | 15,000 | | 15,593 |
| Pacific Life Funding LLC, EMTN | | | | |
| 5.125% due 01/20/2015 | GBP | 89,000 | | 167,196 |
| 5.50% due 05/14/2009 | EUR | 39,000 | | 53,893 |
| Principal Financial Group, Inc. | | | | |
| 6.05% due 10/15/2036 | $ | 180,000 | | 175,657 |
| Principal Life Global Funding I | | | | |
| 5.25% due 01/15/2013 | | 190,000 | | 189,855 |
| |
| The accompanying notes are an integral part of the financial statements. | 351 |
John Hancock Funds II
Portfolio of investments — August 31, 2007
(showing percentage of total net assets)
| | | | |
| Spectrum Income Fund (continued) | | |
| | | Shares or | | |
| | | Principal | | |
| | | Amount | | Value |
|
|
| |
| CORPORATE BONDS (continued) | | | | |
| | | | | |
| Insurance (continued) | | | | |
| Principal Life Income Funding Trusts | | | | |
| 5.20% due 11/15/2010 | $ | 40,000 | $ | 40,835 |
| Principal Financial Global Funding LLC, EMTN | | | |
| 4.50% due 01/22/2009 | EUR | 39,000 | | 52,914 |
| Prudential Funding LLC, MTN | | | | |
| 6.60% due 05/15/2008 | $ | 150,000 | | 150,593 |
| RLI Corp. | | | | |
| 5.95% due 01/15/2014 | | 20,000 | | 20,181 |
| Security Benefit Life Insurance Company | | | | |
| 7.45% due 10/01/2033 | | 95,000 | | 103,235 |
| The Travelers Companies, Inc. | | | | |
| 6.25% due 03/15/2037 (b) | | 260,000 | | 245,001 |
| Transatlantic Holdings, Inc. | | | | |
| 5.75% due 12/14/2015 | | 170,000 | | 171,318 |
| Travelers Property Casualty Corp. | | | | |
| 3.75% due 03/15/2008 | | 40,000 | | 39,518 |
| |
| |
| Travelers Insurance Company Institutional Funding, Ltd. | | |
| 5.75% due 12/06/2011 | GBP | 159,000 | | 314,711 |
| USI Holdings Corp. | | | | |
| 9.75% due 05/15/2015 | $ | 225,000 | | 205,875 |
| Willis North America, Inc. | | | | |
| 6.20% due 03/28/2017 | | 195,000 | | 194,573 |
| |
|
| | | | | 5,990,821 |
| International Oil - 0.37% | | | | |
| Canadian Natural Resources, Ltd. | | | | |
| 6.45% due 06/30/2033 | | 75,000 | | 73,980 |
| Gaz Capital for Gazprom, Series REGS | | | | |
| 8.625% due 04/28/2034 | | 175,000 | | 215,477 |
| Newfield Exploration Company | | | | |
| 6.625% due 09/01/2014 | | 35,000 | | 33,644 |
| Pemex Project Funding Master Trust | | | | |
| 5.75% due 12/15/2015 | | 265,000 | | 262,085 |
| 6.625% due 06/15/2035 | | 749,000 | | 765,837 |
| 6.66% due 06/15/2010 (b) | | 395,000 | | 401,320 |
| 8.625% due 02/01/2022 | | 175,000 | | 216,109 |
| Pemex Project Funding Master Trust, Series REGS | | | |
| 6.25% due 08/05/2013 | EUR | 150,000 | | 213,111 |
| Petro-Canada | | | | |
| 5.95% due 05/15/2035 | $ | 265,000 | | 247,035 |
| Petroleos de Venezuela SA | | | | |
| 5.25% due 04/12/2017 | | 1,005,000 | | 693,450 |
| PF Export Receivables Master Trust | | | | |
| 6.436% due 06/01/2015 | | 64,555 | | 65,094 |
| XTO Energy, Inc. | | | | |
| 5.65% due 04/01/2016 | | 200,000 | | 196,533 |
| YPF SA, MTN, Series C | | | | |
| 10.00% due 11/02/2028 | | 220,000 | | 252,450 |
| |
|
| | | | | 3,636,125 |
| Investment Companies - 0.07% | | | | |
| BES Finance, Ltd., EMTN | | | | |
| 6.25% due 05/17/2011 | EUR | 66,000 | | 94,563 |
| Credit Suisse Guernsey Ltd | | | | |
| 5.86% due 05/29/2049 (b) | $ | 290,000 | | 274,934 |
| | | | |
| Spectrum Income Fund (continued) | | |
| | | Shares or | | |
| | | Principal | | |
| | | Amount | | Value |
|
|
| |
| CORPORATE BONDS (continued) | | | | |
| Investment Companies (continued) | | | | |
| Xstrata Finance Canada Ltd, Series EMTN | | | | |
| 5.25% due 06/13/2017 | EUR | 80,000 | $ | 105,367 |
| Xstrata Finance Canada, Ltd. | | | | |
| 5.50% due 11/16/2011 | $ | 180,000 | | 180,926 |
| |
|
| | | | | 655,790 |
| Leisure Time - 0.46% | | | | |
| AMC Entertainment, Inc. | | | | |
| 8.00% due 03/01/2014 | | 25,000 | | 23,125 |
| 11.00% due 02/01/2016 | | 300,000 | | 312,000 |
| Chukchansi Economic Development Authority | | | |
| 8.85875% due 11/15/2012 (b) | | 150,000 | | 150,375 |
| Cinemark, Inc. | | | | |
| zero coupon, Step up to 9.75% on | | | | |
| 03/15/2009 due 03/15/2014 | | 725,000 | | 670,625 |
| Festival Fun Parks LLC | | | | |
| 10.875% due 04/15/2014 | | 100,000 | | 101,250 |
| Fontainebleau Las Vegas Holdings | | | | |
| 10.25% due 06/15/2015 | | 325,000 | | 278,687 |
| International Speedway Corp. | | | | |
| 4.20% due 04/15/2009 | | 90,000 | | 88,553 |
| Little Traverse Bay Bands of Odawa Indians | | | |
| 10.25% due 02/15/2014 | | 175,000 | | 175,875 |
| Lottomatica SpA | | | | |
| 4.80% due 12/22/2008 | EUR | 30,000 | | 40,752 |
| MGM Mirage, Inc. | | | | |
| 8.50% due 09/15/2010 | $ | 325,000 | | 337,187 |
| MTR Gaming Group, Inc., Series B | | | | |
| 9.00% due 06/01/2012 | | 100,000 | | 100,000 |
| Pinnacle Entertainment, Inc. | | | | |
| 8.25% due 03/15/2012 | | 125,000 | | 125,625 |
| Pokagon Gaming Authority | | | | |
| 10.375% due 06/15/2014 | | 650,000 | | 695,500 |
| Royal Caribbean Cruises, Ltd. | | | | |
| 7.00% due 06/15/2013 | | 100,000 | | 98,320 |
| Shingle Springs Tribal Gaming Authority | | | | |
| 9.375% due 06/15/2015 | | 450,000 | | 443,250 |
| Speedway Motorsports, Inc. | | | | |
| 6.75% due 06/01/2013 | | 360,000 | | 354,600 |
| Travelport LLC | | | | |
| 9.985% due 09/01/2014 (b) | | 75,000 | | 75,000 |
| 11.875% due 09/01/2016 | | 425,000 | | 438,813 |
| |
|
| | | | | 4,509,537 |
| Manufacturing - 0.21% | | | | |
| 3M Company, MTN | | | | |
| 5.125% due 11/06/2009 | | 95,000 | | 95,751 |
| 5.70% due 03/15/2037 | | 225,000 | | 219,046 |
| Cooper US Inc | | | | |
| 6.10% due 07/01/2017 | | 205,000 | | 212,164 |
| General Dynamics Corp. | | | | |
| 4.50% due 08/15/2010 | | 150,000 | | 148,346 |
| Harland Clarke Holdings Corp | | | | |
| 10.3075% due 05/15/2015 (b) | | 250,000 | | 223,750 |
| Koppers Holdings, Inc. | | | | |
| zero coupon, Step up to 9.875% on | | | | |
| 11/15/2009 due 11/15/2014 | | 650,000 | | 542,750 |
| |
| The accompanying notes are an integral part of the financial statements. | 352 |
John Hancock Funds II
Portfolio of investments — August 31, 2007
(showing percentage of total net assets)
| | | | |
| Spectrum Income Fund (continued) | | |
| | | Shares or | | |
| | | Principal | | |
| | | Amount | | Value |
|
|
| |
| CORPORATE BONDS (continued) | | | | |
| | | | | |
| Manufacturing (continued) | | | | |
| Koppers, Inc. | | | | |
| 9.875% due 10/15/2013 | $ | 100,000 | $ | 104,000 |
| Rafaella Apparel Group, Inc., Series B | | | | |
| 11.25% due 06/15/2011 | | 268,000 | | 251,920 |
| Susser Holdings LLC | | | | |
| 10.625% due 12/15/2013 | | 142,000 | | 148,390 |
| Trinity Industries, Inc. | | | | |
| 6.50% due 03/15/2014 | | 125,000 | | 118,125 |
| |
|
| | | | | 2,064,242 |
| Medical-Hospitals - 0.38% | | | | |
| Community Health Systems, Inc. | | | | |
| 8.875% due 07/15/2015 | | 2,175,000 | | 2,172,281 |
| HCA, Inc. | | | | |
| 9.25% due 11/15/2016 | | 1,400,000 | | 1,438,500 |
| 9.625% due 11/15/2016 | | 125,000 | | 129,219 |
| |
|
| | | | | 3,740,000 |
| Metal & Metal Products - 0.11% | | | | |
| Gibraltar Industries, Inc., Series B | | | | |
| 8.00% due 12/01/2015 | | 500,000 | | 470,000 |
| Hawk Corp. | | | | |
| 8.75% due 11/01/2014 | | 331,000 | | 332,655 |
| Steel Dynamics, Inc. | | | | |
| 6.75% due 04/01/2015 | | 240,000 | | 231,000 |
| |
|
| | | | | 1,033,655 |
| Mining - 0.40% | | | | |
| Freeport-McMoRan Copper & Gold, Inc. | | | | |
| 8.25% due 04/01/2015 | | 525,000 | | 556,500 |
| 8.375% due 04/01/2017 | | 2,405,000 | | 2,561,325 |
| Placer Dome, Inc. | | | | |
| 6.45% due 10/15/2035 | | 315,000 | | 317,056 |
| Rio Tinto Finance USA, Ltd. | | | | |
| 2.625% due 09/30/2008 | | 140,000 | | 136,578 |
| Vale Overseas, Ltd. | | | | |
| 6.25% due 01/23/2017 | | 385,000 | | 387,541 |
| |
|
| | | | | 3,959,000 |
| Office Furnishings & Supplies - 0.08% | | | | |
| ACCO Brands Corp. | | | | |
| 7.625% due 08/15/2015 | | 200,000 | | 187,000 |
| IKON Office Solutions, Inc. | | | | |
| 7.75% due 09/15/2015 | | 300,000 | | 298,125 |
| Interface, Inc. | | | | |
| 9.50% due 02/01/2014 | | 25,000 | | 25,875 |
| 10.375% due 02/01/2010 | | 300,000 | | 310,500 |
| |
|
| | | | | 821,500 |
| Paper - 0.39% | | | | |
| Boise Cascade LLC | | | | |
| 7.125% due 10/15/2014 | | 485,000 | | 446,200 |
| Celulosa Arauco y Constitucion SA | | | | |
| 5.125% due 07/09/2013 | | 80,000 | | 78,010 |
| 8.625% due 08/15/2010 | | 220,000 | | 239,105 |
| Domtar, Inc. | | | | |
| 5.375% due 12/01/2013 | | 175,000 | | 151,375 |
| 7.125% due 08/15/2015 | | 450,000 | | 418,500 |
| 9.50% due 08/01/2016 | | 50,000 | | 52,500 |
| | | | |
| Spectrum Income Fund (continued) | | |
| | | Shares or | | |
| | | Principal | | |
| | | Amount | | Value |
|
|
| |
| CORPORATE BONDS (continued) | | | | |
| Paper (continued) | | | | |
| Georgia-Pacific Corp. | | | | |
| 7.00% due 01/15/2015 | $ | 475,000 | $ | 448,875 |
| 7.125% due 01/15/2017 | | 450,000 | | 423,000 |
| 8.125% due 05/15/2011 | | 300,000 | | 301,500 |
| Jefferson Smurfit Corp. | | | | |
| 8.25% due 10/01/2012 | | 200,000 | | 195,500 |
| NewPage Corp. | | | | |
| 10.00% due 05/01/2012 | | 25,000 | | 25,875 |
| 11.6063% due 05/01/2012 (b) | | 175,000 | | 185,500 |
| 12.00% due 05/01/2013 | | 175,000 | | 182,875 |
| Quebecor World, Inc. | | | | |
| 9.75% due 01/15/2015 | | 250,000 | | 235,000 |
| Verso Paper Holdings LLC and Verson Paper Inc., | | | |
| Series B | | | | |
| 11.375% due 08/01/2016 | | 400,000 | | 408,000 |
| |
|
| | | | | 3,791,815 |
| Petroleum Services - 0.14% | | | | |
| BP Canada Finance Company | | | | |
| 3.375% due 10/31/2007 | | 60,000 | | 59,864 |
| Compagnie Generale de Geophysique SA | | | | |
| 7.50% due 05/15/2015 | | 100,000 | | 100,500 |
| 7.75% due 05/15/2017 | | 475,000 | | 479,750 |
| Gaz Capital for Gazprom, Series EMTN | | | | |
| 4.56% due 12/09/2012 | EUR | 150,000 | | 192,614 |
| Halliburton Company | | | | |
| 5.50% due 10/15/2010 | $ | 375,000 | | 379,457 |
| Premcor Refining Group, Inc. | | | | |
| 6.75% due 02/01/2011 | | 120,000 | | 125,521 |
| |
|
| | | | | 1,337,706 |
| Pharmaceuticals - 0.14% | | | | |
| Aventis SA, EMTN | | | | |
| 4.25% due 09/15/2010 | EUR | 65,000 | | 87,799 |
| Eli Lilly & Company | | | | |
| 5.55% due 03/15/2037 | $ | 205,000 | | 191,892 |
| Hospira, Inc. | | | | |
| 4.95% due 06/15/2009 | | 80,000 | | 79,660 |
| Omnicare, Inc. | | | | |
| 6.75% due 12/15/2013 | | 350,000 | | 325,500 |
| 6.875% due 12/15/2015 | | 375,000 | | 349,688 |
| Teva Pharmaceutical Finance LLC | | | | |
| 5.55% due 02/01/2016 | | 200,000 | | 194,718 |
| Warner Chilcott Corp. | | | | |
| 8.75% due 02/01/2015 | | 130,000 | | 129,675 |
| |
|
| | | | | 1,358,932 |
| Publishing - 0.40% | | | | |
| Dex Media East LLC | | | | |
| 12.125% due 11/15/2012 | | 100,000 | | 106,750 |
| Dex Media, Inc. | | | | |
| zero coupon, Step up to 9.00% on | | | | |
| 11/15/2008 due 11/15/2013 | | 25,000 | | 23,062 |
| Haights Cross Operating Company | | | | |
| 11.75% due 08/15/2011 | | 300,000 | | 308,625 |
| Idearc, Inc. | | | | |
| 8.00% due 11/15/2016 | | 1,355,000 | | 1,338,062 |
| |
| The accompanying notes are an integral part of the financial statements. | 353 |
John Hancock Funds II
Portfolio of investments — August 31, 2007
(showing percentage of total net assets)
| | | | |
| Spectrum Income Fund (continued) | | |
| | | Shares or | | |
| | | Principal | | |
| | | Amount | | Value |
|
|
| |
| CORPORATE BONDS (continued) | | | | |
| Publishing (continued) | | | | |
| Medianews Group, Inc. | | | | |
| 6.375% due 04/01/2014 | $ | 175,000 | $ | 130,813 |
| 6.875% due 10/01/2013 | | 275,000 | | 218,625 |
| Morris Publishing Group LLC | | | | |
| 7.00% due 08/01/2013 | | 375,000 | | 299,063 |
| Nielsen Finance LLC/Nielsen Finance Co, Series | | | |
| 144A | | | | |
| 10.00% due 08/01/2014 | | 175,000 | | 179,375 |
| Quebecor World Capital Corp. | | | | |
| 6.125% due 11/15/2013 | | 300,000 | | 260,250 |
| Sun Media Corp. | | | | |
| 7.625% due 02/15/2013 | | 325,000 | | 317,688 |
| TL Acquisitions, Inc. | | | | |
| 13.25% due 07/15/2015 (b) | | 500,000 | | 375,000 |
| Valassis Communications Inc | | | | |
| 8.25% due 03/01/2015 | | 475,000 | | 403,750 |
| |
|
| | | | | 3,961,063 |
| Railroads & Equipment - 0.15% | | | | |
| American Railcar Industries, Inc. | | | | |
| 7.50% due 03/01/2014 | | 475,000 | | 460,750 |
| Canadian National Railway Company | | | | |
| 6.25% due 08/01/2034 | | 64,000 | | 64,086 |
| Greenbrier Companies, Inc. | | | | |
| 8.375% due 05/15/2015 | | 275,000 | | 269,500 |
| Grupo Transportacion Ferroviaria Mexicana, | | | |
| SA de CV | | | | |
| 9.375% due 05/01/2012 | | 125,000 | | 129,375 |
| Norfolk Southern Corp. | | | | |
| 5.59% due 05/17/2025 | | 30,000 | | 27,564 |
| 6.00% due 04/30/2008 | | 240,000 | | 240,537 |
| 7.25% due 02/15/2031 | | 35,000 | | 38,428 |
| Union Pacific Corp. | | | | |
| 3.875% due 02/15/2009 | | 125,000 | | 123,168 |
| 5.75% due 10/15/2007 | | 85,000 | | 84,973 |
| |
|
| | | | | 1,438,381 |
| Real Estate - 0.49% | | | | |
| AMB Property LP, MTN | | | | |
| 5.90% due 08/15/2013 | | 45,000 | | 45,102 |
| Archstone-Smith Operating Trust, REIT | | | | |
| 5.25% due 05/01/2015 | | 180,000 | | 173,648 |
| 5.625% due 08/15/2014 | | 15,000 | | 14,964 |
| AvalonBay Communities, Inc., MTN | | | | |
| 6.625% due 09/15/2011 | | 265,000 | | 277,363 |
| AvalonBay Communities, Inc., REIT | | | | |
| 4.95% due 03/15/2013 | | 60,000 | | 58,248 |
| 6.125% due 11/01/2012 | | 185,000 | | 190,796 |
| BF Saul, REIT | | | | |
| 7.50% due 03/01/2014 | | 150,000 | | 139,500 |
| Camden Property Trust, REIT | | | | |
| 4.375% due 01/15/2010 | | 90,000 | | 87,784 |
| Developers Diversified Realty Corp., REIT | | | | |
| 3.875% due 01/30/2009 | | 30,000 | | 29,429 |
| Federal Realty Investment Trust | | | | |
| 6.00% due 07/15/2012 | | 135,000 | | 135,643 |
| | | | |
| Spectrum Income Fund (continued) | | |
| | | Shares or | | |
| | | Principal | | |
| | | Amount | | Value |
|
|
| |
| CORPORATE BONDS (continued) | | | | |
| Real Estate (continued) | | | | |
| Felcor Lodging LP, REIT | | | | |
| 8.50% due 06/01/2011 | $ | 250,000 | $ | 261,875 |
| Hospitality Properties Trust | | | | |
| 5.625% due 03/15/2017 | | 225,000 | | 214,585 |
| Host Marriott LP, REIT | | | | |
| 7.125% due 11/01/2013 | | 400,000 | | 398,000 |
| Host Marriott LP, Series Q, REIT | | | | |
| 6.75% due 06/01/2016 | | 1,175,000 | | 1,142,688 |
| Kimco Realty Corp., MTN, REIT | | | | |
| 4.904% due 02/18/2015 | | 60,000 | | 56,749 |
| Reckson Operating Partnership, REIT | | | | |
| 6.00% due 03/31/2016 | | 210,000 | | 201,487 |
| Regency Centers LP, REIT | | | | |
| 5.875% due 06/15/2017 | | 120,000 | | 117,210 |
| Simon Property Group LP, REIT | | | | |
| 4.60% due 06/15/2010 | | 235,000 | | 229,607 |
| 5.75% due 12/01/2015 | | 340,000 | | 334,503 |
| Ventas Realty LP/Ventas Capital Corp., REIT | | | |
| 6.50% due 06/01/2016 | | 700,000 | | 673,750 |
| Vornado Realty LP, REIT | | | | |
| 4.50% due 08/15/2009 | | 35,000 | | 34,317 |
| |
|
| | | | | 4,817,248 |
| Republic of Ireland - 0.10% | | | | |
| Depfa ACS Bank | | | | |
| 4.375% due 01/15/2015 | EUR | 750,000 | | 1,011,935 |
| | | | | |
| Retail - 0.27% | | | | |
| Bon-Ton Stores, Inc. | | | | |
| 10.25% due 03/15/2014 | $ | 425,000 | | 386,750 |
| Costco Wholesale Corp. | | | | |
| 5.30% due 03/15/2012 | | 180,000 | | 181,507 |
| Federated Retail Holdings, Inc. | | | | |
| 5.35% due 03/15/2012 | | 135,000 | | 133,506 |
| Ferrellgas Escrow LLC | | | | |
| 6.75% due 05/01/2014 | | 125,000 | | 118,750 |
| Home Depot, Inc. | | | | |
| 3.75% due 09/15/2009 | | 115,000 | | 111,253 |
| 5.20% due 03/01/2011 | | 155,000 | | 153,108 |
| 5.40% due 03/01/2016 | | 220,000 | | 207,411 |
| JC Penney Company, Inc. | | | | |
| 7.375% due 08/15/2008 | | 100,000 | | 100,999 |
| Leslie's Poolmart | | | | |
| 7.75% due 02/01/2013 | | 350,000 | | 334,250 |
| Sunstate Equipment Company LLC | | | | |
| 10.50% due 04/01/2013 | | 400,000 | | 390,000 |
| Target Corp | | | | |
| 5.875% due 07/15/2016 | | 405,000 | | 406,976 |
| Target Corp. | | | | |
| 7.50% due 08/15/2010 | | 150,000 | | 159,087 |
| |
|
| | | | | 2,683,597 |
| Retail Grocery - 0.12% | | | | |
| Couche-Tard US LP | | | | |
| 7.50% due 12/15/2013 | | 650,000 | | 637,000 |
| Pathmark Stores, Inc. | | | | |
| 8.75% due 02/01/2012 | | 50,000 | | 49,500 |
| |
| The accompanying notes are an integral part of the financial statements. | 354 |
John Hancock Funds II
Portfolio of investments — August 31, 2007
(showing percentage of total net assets)
| | | | |
| Spectrum Income Fund (continued) | | |
| | | Shares or | | |
| | | Principal | | |
| | | Amount | | Value |
|
|
| |
| CORPORATE BONDS (continued) | | | | |
| | | | | |
| Retail Grocery (continued) | | | | |
| Safeway, Inc. | | | | |
| 4.125% due 11/01/2008 | $ | 65,000 | $ | 64,251 |
| The Kroger Company | | | | |
| 8.05% due 02/01/2010 | | 430,000 | | 455,040 |
| |
|
| | | | | 1,205,791 |
| Retail Trade - 0.30% | | | | |
| American Greetings Corp. | | | | |
| 7.375% due 06/01/2016 | | 100,000 | | 94,500 |
| Fortune Brands, Inc. | | | | |
| 5.125% due 01/15/2011 | | 70,000 | | 68,843 |
| FTD, Inc. | | | | |
| 7.75% due 02/15/2014 | | 250,000 | | 232,500 |
| GSC Holdings Corp. | | | | |
| 8.00% due 10/01/2012 | | 825,000 | | 849,750 |
| J.C. Penney Company, Inc. | | | | |
| 9.00% due 08/01/2012 | | 400,000 | | 455,003 |
| Neiman Marcus Group, Inc., PIK | | | | |
| 9.00% due 10/15/2015 | | 300,000 | | 316,500 |
| Payless Shoesource, Inc. | | | | |
| 8.25% due 08/01/2013 | | 25,000 | | 23,125 |
| The Pantry, Inc. | | | | |
| 7.75% due 02/15/2014 | | 375,000 | | 356,250 |
| Wal-Mart Stores, Inc. | | | | |
| 4.75% due 01/29/2013 | GBP | 204,000 | | 389,583 |
| 6.875% due 08/10/2009 | $ | 155,000 | | 160,373 |
| |
|
| | | | | 2,946,427 |
| Sanitary Services - 0.16% | | | | |
| Allied Waste North America, Inc. | | | | |
| 6.875% due 06/01/2017 | | 650,000 | | 630,500 |
| 7.875% due 04/15/2013 | | 225,000 | | 228,375 |
| Allied Waste North America, Inc., Series B | | | | |
| 9.25% due 09/01/2012 | | 50,000 | | 52,250 |
| Casella Waste Systems, Inc. | | | | |
| 9.75% due 02/01/2013 | | 625,000 | | 626,562 |
| Oakmont Asset Trust | | | | |
| 4.514% due 12/22/2008 | | 20,000 | | 19,819 |
| Waste Management, Inc. | | | | |
| 7.375% due 05/15/2029 | | 15,000 | | 16,004 |
| |
|
| | | | | 1,573,510 |
| Semiconductors - 0.37% | | | | |
| Avago Technologies Finance | | | | |
| 10.125% due 12/01/2013 | | 375,000 | | 391,875 |
| Conexant Systems, Inc. | | | | |
| 4.00% due 03/01/2026 | | 175,000 | | 141,946 |
| Flextronics International, Ltd. | | | | |
| 6.25% due 11/15/2014 | | 225,000 | | 207,000 |
| Freescale Semiconductor Inc | | | | |
| 9.235% due 12/15/2014 (b) | | 650,000 | | 598,000 |
| Freescale Semiconductor, Inc. | | | | |
| 10.125% due 12/15/2016 | | 400,000 | | 348,000 |
| National Semiconductor Corp | | | | |
| 6.15% due 06/15/2012 | | 300,000 | | 305,420 |
| NXP BV / NXP Funding LLC | | | | |
| 8.11% due 10/15/2013 (b) | | 500,000 | | 453,125 |
| 9.50% due 10/15/2015 | | 400,000 | | 346,000 |
| | | | |
| Spectrum Income Fund (continued) | | |
| | | Shares or | | |
| | | Principal | | |
| | | Amount | | Value |
|
|
| |
| CORPORATE BONDS (continued) | | | | |
| Semiconductors (continued) | | | | |
| Spansion LLC | | | | |
| 11.25% due 01/15/2016 | $ | 275,000 | $ | 260,562 |
| STATS ChipPAC, Ltd. | | | | |
| 6.75% due 11/15/2011 | | 100,000 | | 100,000 |
| 7.50% due 07/19/2010 | | 500,000 | | 500,000 |
| |
|
| | | | | 3,651,928 |
| Software - 0.07% | | | | |
| Oracle Corp. | | | | |
| 5.00% due 01/15/2011 | | 480,000 | | 477,627 |
| Serena Software, Inc. | | | | |
| 10.375% due 03/15/2016 | | 125,000 | | 124,375 |
| SS&C Technologies, Inc. | | | | |
| 11.75% due 12/01/2013 | | 100,000 | | 105,500 |
| |
|
| | | | | 707,502 |
| Steel - 0.05% | | | | |
| Gerdau Ameristeel Corp. | | | | |
| 10.375% due 07/15/2011 | | 150,000 | | 157,875 |
| Metals USA, Inc. | | | | |
| 11.125% due 12/01/2015 | | 100,000 | | 106,500 |
| Tube City IMS Corp. | | | | |
| 9.75% due 02/01/2015 | | 275,000 | | 269,500 |
| |
|
| | | | | 533,875 |
| Supranational - 0.29% | | | | |
| Eurofima, EMTN | | | | |
| 6.50% due 08/22/2011 | AUD | 515,000 | | 416,695 |
| European Investment Bank | | | | |
| 8.75% due 08/25/2017 | GBP | 350,000 | | 877,065 |
| European Investment Bank, Series EMTN | | | | |
| 4.75% due 10/15/2017 | EUR | 965,000 | | 1,346,335 |
| 8.00% due 10/21/2013 | ZAR | 1,650,000 | | 212,216 |
| |
|
| | | | | 2,852,311 |
| Telecommunications Equipment & | | | | |
| Services - 1.14% | | | | |
| British Telecommunications PLC | | | | |
| 8.00% due 12/07/2016 | GBP | 150,000 | | 337,330 |
| Citizens Communications Co | | | | |
| 6.625% due 03/15/2015 | $ | 450,000 | | 430,875 |
| Citizens Communications Company | | | | |
| 6.25% due 01/15/2013 | | 100,000 | | 96,000 |
| 7.125% due 03/15/2019 | | 1,200,000 | | 1,143,000 |
| 9.00% due 08/15/2031 | | 625,000 | | 614,063 |
| Csc Holdings | | | | |
| 7.625% due 07/21/2018 | | 250,000 | | 241,094 |
| Deutsche Telekom International Finance BV | | | |
| 3.875% due 07/22/2008 | | 85,000 | | 83,884 |
| Digicel Group, Ltd. | | | | |
| 8.875% due 01/15/2015 | | 300,000 | | 274,140 |
| Digicel Ltd, Series REGS | | | | |
| 9.25% due 09/01/2012 | | 125,000 | | 125,625 |
| Dycom Industries, Inc. | | | | |
| 8.125% due 10/15/2015 | | 275,000 | | 275,000 |
| France Telecom SA | | | | |
| 7.75% due 03/01/2011 | | 520,000 | | 556,500 |
| |
| The accompanying notes are an integral part of the financial statements. | 355 |
John Hancock Funds II
Portfolio of investments — August 31, 2007
(showing percentage of total net assets)
| | | | |
| Spectrum Income Fund (continued) | | |
| | | Shares or | | |
| | | Principal | | |
| | | Amount | | Value |
|
|
| |
| CORPORATE BONDS (continued) | | | | |
| Telecommunications Equipment & | | | | |
| Services (continued) | | | | |
| GCI, Inc. | | | | |
| 7.25% due 02/15/2014 | $ | 425,000 | $ | 393,125 |
| Hellas Telecommunications II | | | | |
| 11.115% due 01/15/2015 (b) | | 425,000 | | 416,500 |
| Insight Midwest LP | | | | |
| 9.75% due 10/01/2009 | | 52,000 | | 52,000 |
| Intelsat Subsidiary Holding Company, Ltd. | | | | |
| 8.25% due 01/15/2013 | | 225,000 | | 226,125 |
| iPCS, Inc. | | | | |
| 7.48125% due 05/01/2013 (b) | | 425,000 | | 410,125 |
| 8.60625% due 05/01/2014 | | 400,000 | | 384,000 |
| Level 3 Communications, Inc. | | | | |
| 6.00% due 09/15/2009 | | 87,000 | | 81,345 |
| 6.00% due 03/15/2010 | | 88,000 | | 81,400 |
| Level 3 Financing, Inc. | | | | |
| 9.25% due 11/01/2014 | | 650,000 | | 625,625 |
| Lucent Technologies, Inc. | | | | |
| 6.50% due 01/15/2028 | | 825,000 | | 693,000 |
| Orascom Telecom Finance SCA, Series REGS | | | |
| 7.875% due 02/08/2014 | | 110,000 | | 101,383 |
| PAETEC Holding Corp. | | | | |
| 9.50% due 07/15/2015 | | 350,000 | | 334,250 |
| PanAmSat Corp. | | | | |
| 9.00% due 08/15/2014 | | 400,000 | | 407,000 |
| SBC Communications, Inc. | | | | |
| 5.625% due 06/15/2016 | | 550,000 | | 542,545 |
| 6.45% due 06/15/2034 | | 405,000 | | 402,955 |
| Suncom Wireless, Inc. | | | | |
| 8.50% due 06/01/2013 | | 425,000 | | 427,656 |
| Syniverse Technologies, Inc., Series B | | | | |
| 7.75% due 08/15/2013 | | 50,000 | | 46,250 |
| Time Warner Telecom Holdings, Inc. | | | | |
| 9.25% due 02/15/2014 | | 325,000 | | 336,375 |
| Verizon Global Funding Corp. | | | | |
| 7.25% due 12/01/2010 | | 110,000 | | 116,096 |
| 7.75% due 12/01/2030 | | 265,000 | | 300,267 |
| Wind Acquisition Finance SA | | | | |
| 10.75% due 12/01/2015 | | 450,000 | | 463,500 |
| Windstream Corp | | | | |
| 7.00% due 03/15/2019 | | 100,000 | | 94,250 |
| |
|
| | | | | 11,113,283 |
| Telephone - 1.00% | | | | |
| AT&T Corp. | | | | |
| 7.3 due 11/15/2011 (b) | | 50,000 | | 53,556 |
| AT&T, Inc. | | | | |
| 5.30% due 11/15/2010 | | 785,000 | | 783,615 |
| 5.785% due 11/14/2008 (b) | | 100,000 | | 100,169 |
| BellSouth Corp. | | | | |
| 5.6825% due 11/15/2007 (b) | | 110,000 | | 110,017 |
| France Telecom SA, Series EMTN | | | | |
| 7.25% due 01/28/2013 | EUR | 80,000 | | 119,762 |
| Nordic Telephone Company Holdings | | | | |
| 8.25% due 05/01/2016 | | 100,000 | | 137,764 |
| 8.875% due 05/01/2016 | $ | 1,150,000 | | 1,190,250 |
| | | | |
| Spectrum Income Fund (continued) | | |
| | | Shares or | | |
| | | Principal | | |
| | | Amount | | Value |
|
|
| |
| CORPORATE BONDS (continued) | | | | |
| | | | | |
| Telephone (continued) | | | | |
| Qwest Corp. | | | | |
| 6.50% due 06/01/2017 | $ | 500,000 | $ | 485,000 |
| 7.50% due 10/01/2014 | | 975,000 | | 999,375 |
| 7.875% due 09/01/2011 | | 100,000 | | 104,625 |
| 8.61% due 06/15/2013 (b) | | 125,000 | | 131,875 |
| 8.875% due 03/15/2012 | | 150,000 | | 162,375 |
| Sprint Capital Corp. | | | | |
| 6.875% due 11/15/2028 | | 277,000 | | 269,623 |
| 6.90% due 05/01/2019 | | 560,000 | | 569,210 |
| 7.625% due 01/30/2011 | | 120,000 | | 127,461 |
| 8.375% due 03/15/2012 | | 150,000 | | 165,747 |
| Sprint Nextel Corp | | | | |
| 5.76% due 06/28/2010 (b) | | 105,000 | | 104,905 |
| Telecom Italia Capital SA | | | | |
| 4.00% due 01/15/2010 | | 150,000 | | 145,117 |
| 5.25% due 11/15/2013 | | 830,000 | | 799,657 |
| Telecom Italia Finance SA, EMTN | | | | |
| 5.875% due 01/24/2008 | EUR | 14,000 | | 19,153 |
| 6.875% due 01/24/2013 | | 130,000 | | 190,585 |
| 7.25 due 04/20/2011 | | 50,000 | | 73,039 |
| Telefonica Emisiones SAU | | | | |
| 5.984% due 06/20/2011 | $ | 185,000 | | 187,446 |
| 6.221% due 07/03/2017 | | 235,000 | | 236,656 |
| Telefonica Emisones SAU | | | | |
| 6.421% due 06/20/2016 | | 325,000 | | 332,134 |
| Telefonica Europe BV, EMTN | | | | |
| 5.125% due 02/14/2013 | EUR | 100,000 | | 136,922 |
| Telefonos de Mexico SA de CV | | | | |
| 4.50% due 11/19/2008 | $ | 120,000 | | 118,920 |
| Valor Telecommunications Enterprise LLC | | | | |
| 7.75% due 02/15/2015 | | 225,000 | | 232,387 |
| Windstream Corp. | | | | |
| 8.625% due 08/01/2016 | | 1,660,000 | | 1,734,700 |
|
|
| | | | | 9,822,045 |
| Tires & Rubber - 0.11% | | | | |
| Cooper-Standard Automotive, Inc. | | | | |
| 8.375% due 12/15/2014 | | 25,000 | | 21,625 |
| Goodyear Tire & Rubber Company | | | | |
| 8.625% due 12/01/2011 | | 488,000 | | 495,613 |
| 9.13475% due 12/01/2009 (b) | | 575,000 | | 575,000 |
|
|
| | | | | 1,092,238 |
| Tobacco - 0.03% | | | | |
| Imperial Tobacco Finance PLC, EMTN | | | | |
| 6.875% due 06/13/2012 | GBP | 49,000 | | 100,446 |
| Reynolds American, Inc. | | | | |
| 6.50% due 07/15/2010 | $ | 45,000 | | 45,922 |
| 7.25% due 06/01/2013 | | 175,000 | | 181,236 |
|
|
| | | | | 327,604 |
| Transportation - 0.34% | | | | |
| Bombardier, Inc. | | | | |
| 6.30% due 05/01/2014 | | 575,000 | | 549,125 |
| 6.75% due 05/01/2012 | | 425,000 | | 422,875 |
| 7.45% due 05/01/2034 | | 375,000 | | 367,500 |
| |
| The accompanying notes are an integral part of the financial statements. | 356 |
John Hancock Funds II
Portfolio of investments — August 31, 2007
(showing percentage of total net assets)
| | | | |
| Spectrum Income Fund (continued) | | |
| | | Shares or | | |
| | | Principal | | |
| | | Amount | | Value |
| |
|
| |
| CORPORATE BONDS (continued) | | | | |
| Transportation (continued) | | | | |
| Bristow Group, Inc. | | | | |
| 6.125% due 06/15/2013 | $ | 425,000 | $ | 404,813 |
| Burlington Northern Santa Fe Corp. | | | | |
| 5.65% due 05/01/2017 | | 268,000 | | 265,225 |
| 6.15% due 05/01/2037 | | 436,000 | | 422,666 |
| CHC Helicopter Corp. | | | | |
| 7.375% due 05/01/2014 | | 350,000 | | 325,500 |
| FedEx Corp. | | | | |
| 5.50% due 08/15/2009 | | 215,000 | | 216,658 |
| Mobile Services Group, Inc. | | | | |
| 9.75% due 08/01/2014 | | 325,000 | | 327,437 |
| |
|
| | | | | 3,301,799 |
| Trucking & Freight - 0.02% | | | | |
| Saint Acquisition Corp. | | | | |
| 12.50% due 05/15/2017 | | 250,000 | | 169,375 |
| | | | | |
| Utility Service - 0.10% | | | | |
| Baltimore Gas & Electric Co | | | | |
| 5.90% due 10/01/2016 | | 285,000 | | 284,136 |
| Public Service Company of New Mexico | | | | |
| 4.40% due 09/15/2008 | | 210,000 | | 207,663 |
| Public Service Electric & Gas Company | | | | |
| 5.70% due 12/01/2036 | | 355,000 | | 333,909 |
| Veolia Environnement, EMTN | | | | |
| 4.875% due 05/28/2013 | EUR | 50,000 | | 67,581 |
| 5.875% due 02/01/2012 | | 30,000 | | 42,348 |
| |
|
| | | | | 935,637 |
|
| TOTAL CORPORATE BONDS (Cost $244,554,401) | | $ | 241,412,306 |
|
| |
| FOREIGN BONDS - 0.01% | | | | |
| | | | | |
| Netherlands - 0.01% | | | | |
| Cemex Finance Europe BV | | | | |
| 4.75% due 03/05/2014 | | 50,000 | | 64,950 |
|
| TOTAL FOREIGN BONDS (Cost $66,457) | | | $ | 64,950 |
|
| |
| CONVERTIBLE BONDS - 0.08% | | | | |
| | | | | |
| Insurance - 0.00% | | | | |
| Fortis Insurance NV | | | | |
| 7.75% due 01/26/2008 | $ | 25,000 | | 32,477 |
| | | | | |
| Telecommunications Equipment & | | | | |
| Services - 0.08% | | | | |
| Nortel Networks Ltd. | | | | |
| 10.125% due 07/15/2013 | | 75,000 | | 76,688 |
| Nortel Networks, Ltd. | | | | |
| 9.61% due 07/15/2011 (b) | | 700,000 | | 701,750 |
| |
|
| | | | | 778,438 |
|
| TOTAL CONVERTIBLE BONDS (Cost $820,335) | | $ | 810,915 |
|
| |
| MUNICIPAL BONDS - 0.09% | | | | |
| | | | | |
| California - 0.02% | | | | |
| State of California | | | | |
| 5.25% due 04/01/2034 | | 100,000 | | 108,493 |
| 5.50% due 11/01/2033 | | 100,000 | | 104,771 |
| |
|
| | | | | 213,264 |
| | | | |
| Spectrum Income Fund (continued) | | |
| | | Shares or | | |
| | | Principal | | |
| | | Amount | | Value |
|
|
| |
| MUNICIPAL BONDS (continued) | | | | |
| | | | | |
| Kansas - 0.01% | | | | |
| Kansas Development Finance Authority | | | | |
| 5.501% due 05/01/2034 | $ | 120,000 | $ | 116,777 |
| | | | | |
| New York - 0.02% | | | | |
| New York City Housing Development Corp. | | | |
| 6.42% due 11/01/2027 | | 155,000 | | 158,698 |
| | | | | |
| Oregon - 0.01% | | | | |
| State of Oregon | | | | |
| 5.892% due 06/01/2027 | | 60,000 | | 61,159 |
| | | | | |
| West Virginia - 0.03% | | | | |
| Tobacco Settlement Finance Authority of West | | | |
| Virginia, Tobacco Settlement Funded | | | | |
| 7.467% due 06/01/2047 | | 330,000 | | 318,341 |
|
| TOTAL MUNICIPAL BONDS (Cost $880,133) | | $ | 868,239 |
|
| |
| COLLATERALIZED MORTGAGE | | | | |
| OBLIGATIONS - 4.77% | | | | |
| Federal Home Loan Mortgage Corp., Series | | | |
| 2003-32, Class PG | | | | |
| 5.00% due 10/25/2027 | | 350,000 | | 347,028 |
| American Tower Trust, Series 2007-1A, Class D | | | |
| 5.956% due 04/15/2037 | | 350,000 | | 298,334 |
| Banc of America Commercial Mortgage Inc, Series | | | |
| 2005-3, Class A2 | | | | |
| 4.501% due 07/10/2043 | | 640,000 | | 625,744 |
| Banc of America Commercial Mortgage, Inc., | | | |
| Series 2003-1, Class A1 | | | | |
| 3.878% due 09/11/2036 | | 81,910 | | 79,340 |
| Banc of America Commercial Mortgage, Inc., | | | |
| Series 2003-1, Class A2 | | | | |
| 4.648% due 09/11/2036 | | 796,000 | | 764,644 |
| Banc of America Mortgage Securities, | | | | |
| Series 2004-A, Class 2A2 | | | | |
| 4.106% due 02/25/2034 (b) | | 248,744 | | 244,503 |
| Banc of America Mortgage Securities, | | | | |
| Series 2004-D, Class 2A2 | | | | |
| 4.1969% due 05/25/2034 (b) | | 114,224 | | 112,175 |
| Banc of America Mortgage Securities, | | | | |
| Series 2004-H, Class 2A2 | | | | |
| 4.740849% due 09/25/2034 (b) | | 249,946 | | 246,747 |
| Banc of America Mortgage Securities, | | | | |
| Series 2004-I, Class 3A2 | | | | |
| 4.8785% due 10/25/2034 (b) | | 124,944 | | 123,001 |
| Banc of America Mortgage Securities, | | | | |
| Series 2005-J, Class 2A1 | | | | |
| 5.089482% due 11/25/2035 (b) | | 461,208 | | 455,716 |
| Banc of America Mortgage Securities, | | | | |
| Series 2005-J, Class 3A1 | | | | |
| 5.259093% due 11/25/2035 (b) | | 240,633 | | 237,610 |
| Bear Stearns Commercial Mortgage Securities, | | | |
| Series 2006-PW13, Class AAB | | | | |
| 5.53% due 09/11/2041 | | 50,000 | | 49,687 |
| Bear Stearns Commercial Mortgage Securities, | | | |
| Series 1998-C1, Class A2 | | | | |
| 6.44% due 06/16/2030 | | 100,000 | | 100,155 |
| |
| The accompanying notes are an integral part of the financial statements. | 357 |
John Hancock Funds II
Portfolio of investments — August 31, 2007
(showing percentage of total net assets)
| | | | |
| Spectrum Income Fund (continued) | | |
| | | Shares or | | |
| | | Principal | | |
| | | Amount | | Value |
|
|
| |
| COLLATERALIZED MORTGAGE | | | | |
| OBLIGATIONS (continued) | | | | |
| Bear Stearns Commercial Mortgage Securities, | | | |
| Series 2002-TOP8, Class A2 | | | | |
| 4.83% due 08/15/2038 | $ | 320,000 | $ | 309,667 |
| Bear Stearns Commercial Mortgage Securities, | | | |
| Series 2005-PWR8, Class A4 | | | | |
| 4.674% due 06/11/2041 | | 578,000 | | 546,405 |
| Bear Stearns Commercial Mortgage Securities, | | | |
| Series 2005-PWR9, Class A1 | | | | |
| 4.498% due 09/11/2042 | | 110,799 | | 109,182 |
| Bear Stearns Commercial Mortgage Securities, | | | |
| Series 2005-PWR9, Class AAB | | | | |
| 4.804% due 09/11/2042 | | 462,000 | | 446,740 |
| Bear Stearns Commercial Mortgage Securities, | | | |
| Series 2005-T18, Class A1 | | | | |
| 4.274% due 02/13/2042 (b) | | 407,653 | | 400,609 |
| Bear Stearns Commercial Mortgage Securities, | | | |
| Series 2005-T20, Class A1 | | | | |
| 4.94% due 10/12/2042 | | 34,842 | | 34,547 |
| Bear Stearns Commercial Mortgage Securities, | | | |
| Series 2006-PW12, Class A1 | | | | |
| 5.546% due 09/11/2038 (b) | | 182,249 | | 182,615 |
| Bear Stearns Commercial Mortgage Securities, | | | |
| Series 2006-PW12, Class A4 | | | | |
| 5.895% due 09/11/2038 (b) | | 1,900,000 | | 1,917,141 |
| Bear Stearns Commercial Mortgage Securities, | | | |
| Series 2007-PW15, Class AAB | | | | |
| 5.315% due 02/11/2044 | | 500,000 | | 490,360 |
| Bear Stearns Commercial Mortgage Securities, | | | |
| Series 2005-PW10, Class A1 | | | | |
| 5.085% due 12/11/2040 | | 818,891 | | 814,047 |
| Citigroup/Deutsche Bank Commercial Mortgage | | | |
| Trust, Series 2006-CD3, Class AAB | | | | |
| 5.608% due 10/15/2048 | | 285,000 | | 284,301 |
| Citigroup/Deutsche Bank Commercial | | | | |
| Mortgage Trust, Series 2005-CD1, Class A1 | | | |
| 5.046% due 07/15/2044 | | 246,258 | | 244,668 |
| Citigroup/Deutsche Bank Commercial | | | | |
| Mortgage Trust, Series 2005-CD1, Class A4 | | | |
| 5.225% due 07/15/2044 (b) | | 550,000 | | 540,904 |
| Citigroup/Deutsche Bank Commercial | | | | |
| Mortgage Trust, Series 2007-CD4, Class ASB | | | |
| 5.278% due 12/11/2049 | | 650,000 | | 636,050 |
| Commercial Mortgage Pass Through Certificates, | | | |
| Series 2007-C9, Class A4 | | | | |
| 6.0103% due 12/10/2049 (b) | | 1,050,000 | | 1,061,573 |
| Credit Suisse Mortgage Capital Certificates, Series | | | |
| 2007-C4, Class A1 | | | | |
| 5.54% due 09/15/2039 | | 140,000 | | 140,350 |
| Credit Suisse Mortgage Capital Certificates, | | | |
| Series 2006-C4, Class A1 | | | | |
| 4.771% due 09/15/2039 | | 261,337 | | 257,655 |
| Credit Suisse Mortgage Capital Certificates, | | | |
| Series 2006-C4, Class A3 | | | | |
| 5.467% due 09/15/2039 | | 950,000 | | 935,004 |
| Credit Suisse Mortgage Capital Certificates, | | | |
| Series 2007-C1, Class A1 | | | | |
| 5.227% due 02/15/2040 | | 305,698 | | 304,030 |
| | | | |
| Spectrum Income Fund (continued) | | |
| | | Shares or | | |
| | | Principal | | |
| | | Amount | | Value |
|
|
| |
| COLLATERALIZED MORTGAGE | | | | |
| OBLIGATIONS (continued) | | | | |
| CS First Boston Mortgage Securities Corp., | | | | |
| Series 2005-C2, Class A4 | | | | |
| 4.832% due 04/15/2037 | $ | 575,000 | $ | 548,957 |
| DLJ Commercial Mortgage Corp., | | | | |
| Series 1999-CG2,Class A1B | | | | |
| 7.30% due 06/10/2032 | | 605,553 | | 620,621 |
| Federal Home Loan Mortgage Corp., Series | | | | |
| 1994-1671, Class G | | | | |
| 6.50% due 08/15/2023 | | 4,059 | | 4,057 |
| Federal Home Loan Mortgage Corp., Series | | | | |
| 2003-2586, Class NJ | | | | |
| 4.50% due 08/15/2016 | | 309,964 | | 305,287 |
| Federal Home Loan Mortgage Corp., Series | | | | |
| 2003-2614, Class IH | | | | |
| 4.50% IO due 05/15/2016 | | 246,295 | | 21,414 |
| Federal Home Loan Mortgage Corp., Series | | | | |
| 2003-2627, Class IE | | | | |
| 4.50% IO due 04/15/2018 | | 72,775 | | 6,334 |
| Federal Home Loan Mortgage Corp., Series | | | | |
| 2003-2631, Class KI | | | | |
| 4.50% IO due 01/15/2015 | | 168,859 | | 6,388 |
| Federal Home Loan Mortgage Corp., Series | | | | |
| 2003-2631, Class LI | | | | |
| 4.50% IO due 06/15/2011 | | 3,025 | | 3 |
| Federal Home Loan Mortgage Corp., Series | | | | |
| 2003-2631, Class MV | | | | |
| 4.00% due 01/15/2022 | | 71,708 | | 71,480 |
| Federal Home Loan Mortgage Corp., Series | | | | |
| 2003-2681, Class PC | | | | |
| 5.00% due 01/15/2019 | | 255,000 | | 254,405 |
| Federal Home Loan Mortgage Corp., Series | | | | |
| 2003-2686, Class JG | | | | |
| 5.50% due 04/15/2028 | | 847,000 | | 847,584 |
| Federal Home Loan Mortgage Corp., Series | | | | |
| 2003-41, Class YV | | | | |
| 5.50% due 04/25/2014 | | 268,097 | | 269,918 |
| Federal Home Loan Mortgage Corp., Series | | | | |
| 2004-2844, Class PQ | | | | |
| 5.00% due 05/15/2023 | | 149,000 | | 148,956 |
| Federal Home Loan Mortgage Corp., Series | | | | |
| 2004-2872, Class YB | | | | |
| 5.00% due 06/15/2023 | | 318,000 | | 317,578 |
| Federal Home Loan Mortgage Corp., Series | | | | |
| 2004-2882, Class YB | | | | |
| 5.00% due 10/15/2027 | | 400,000 | | 397,473 |
| Federal Home Loan Mortgage Corp., Series | | | | |
| 2005-2934, Class NB | | | | |
| 5.00% due 01/15/2028 | | 106,000 | | 105,194 |
| Federal Home Loan Mortgage Corp., Series | | | | |
| 2005-R003, Class VA | | | | |
| 5.50% due 08/15/2016 | | 499,369 | | 501,157 |
| Federal Home Loan Mortgage Corp., Series | | | | |
| 2006-3123, Class VB | | | | |
| 6.00% due 09/15/2013 | | 244,177 | | 252,203 |
| Federal Home Loan Mortgage Corp., Series | | | | |
| 2006-3152, Class DA | | | | |
| 6.00% due 09/15/2025 | | 190,524 | | 192,588 |
| | |
| The accompanying notes are an integral part of the financial statements.. | 358 |
John Hancock Funds II
Portfolio of investments — August 31, 2007
(showing percentage of total net assets)
| | | | |
| Spectrum Income Fund (continued) | | |
| | | Shares or | | |
| | | Principal | | |
| | | Amount | | Value |
| |
|
| |
| COLLATERALIZED MORTGAGE | | | | |
| OBLIGATIONS (continued) | | | | |
| Federal Home Loan Mortgage Corp., Series | | | |
| 2006-3177, Class PA | | | | |
| 6.00% due 12/15/2026 | $ | 367,251 | $ | 371,343 |
| Federal Home Loan Mortgage Corp., Series | | | |
| 2006-3195, Class PN | | | | |
| 6.50% due 08/15/2030 | | 1,094,493 | | 1,120,377 |
| Federal Home Loan Mortgage Corp., Series | | | |
| 2006-R007, Class VA | | | | |
| 6.00% due 09/15/2016 | | 181,662 | | 185,148 |
| Federal Home Loan Mortgage Corp., Stated Final, | | | |
| Series 2004-SF4, Class C | | | | |
| 3.32% due 12/15/2011 | | 64,000 | | 61,856 |
| Federal Home Loan Mortgage Corp., | | | | |
| Stated Final, Series 2004-SF4, Class B | | | | |
| 2.37% due 12/15/2009 | | 39,210 | | 38,988 |
| Federal Home Loan Mortgage Corp., Strips, Series | | | |
| 1998-199, Class PO | | | | |
| zero coupon PO due 08/01/2028 | | 10,390 | | 8,077 |
| Federal National Mortgage Association Interest | | | |
| Strip, Series 2002-319, Class 2 | | | | |
| 6.50% IO due 02/01/2032 | | 39,109 | | 9,849 |
| Federal National Mortgage Association, Series | | | |
| 1993-8, Class L | | | | |
| 9.00% due 01/25/2008 | | 799 | | 800 |
| Federal National Mortgage Association, Series | | | |
| 2002-74, Class PJ | | | | |
| 5.00% due 03/25/2015 | | 421,052 | | 419,809 |
| Federal National Mortgage Association, Series | | | |
| 2002-84, Class VA | | | | |
| 5.50% due 11/25/2013 | | 193,365 | | 194,617 |
| Federal National Mortgage Association, Series | | | |
| 2003-40, Class NI | | | | |
| 5.50% IO due 11/25/2028 | | 48,768 | | 2,898 |
| Federal National Mortgage Association, Series | | | |
| 2003-92, Class NM | | | | |
| 3.50% due 04/25/2013 | | 235,077 | | 232,700 |
| Federal National Mortgage Association, Series | | | |
| 2004-21, Class AC | | | | |
| 4.00% due 05/25/2016 | | 75,274 | | 73,823 |
| Federal National Mortgage Association, Series | | | |
| 2006-3136, Class PB | | | | |
| 6.00% due 01/15/2030 | | 411,000 | | 418,200 |
| Federal National Mortgage Association, Series | | | |
| 2006-B2, Class AB | | | | |
| 5.50% due 05/25/2014 | | 417,838 | | 419,017 |
| Freddie Mac REMICS, Series 2003-2568, Class KA | | | |
| 4.25% due 12/15/2021 | | 333,398 | | 322,232 |
| Freddie Mac REMICS, Series 2007-3354, Class PA | | | |
| 5.50% due 07/15/2028 | | 700,000 | | 703,808 |
| GE Capital Commercial Mortgage Corp., | | | | |
| Series 2001-1, Class A2 | | | | |
| 6.531% due 05/15/2033 | | 465,000 | | 479,942 |
| GE Capital Commercial Mortgage Corp., | | | | |
| Series 2005-C4, Class A1 | | | | |
| 5.082% due 11/10/2045 | | 444,173 | | 441,679 |
| | | | |
| Spectrum Income Fund (continued) | | |
| | | Shares or | | |
| | | Principal | | |
| | | Amount | | Value |
| |
|
| |
| COLLATERALIZED MORTGAGE | | | | |
| OBLIGATIONS (continued) | | | | |
| Government National Mortgage Association, Series | | | |
| 1997-16, Class PL | | | | |
| 6.50% due 10/20/2027 | $ | 322,000 | $ | 331,442 |
| Government National Mortgage Association, Series | | | |
| 1998-12, Class Z | | | | |
| 6.50% due 05/20/2028 | | 49,809 | | 50,324 |
| Government National Mortgage Association, Series | | | |
| 1998-6, Class EA | | | | |
| zero coupon PO due 03/16/2028 | | 37,866 | | 32,064 |
| Government National Mortgage Association, Series | | | |
| 2001-48, Class PC | | | | |
| 6.50% due 10/20/2031 | | 325,457 | | 332,258 |
| Government National Mortgage Association, Series | | | |
| 2001-56, Class PH | | | | |
| 6.50% due 11/20/2031 | | 290,446 | | 296,520 |
| Government National Mortgage Association, Series | | | |
| 2003-3, Class LM | | | | |
| 5.50% due 02/20/2032 | | 401,000 | | 400,924 |
| Government National Mortgage Association, Series | | | |
| 2003-49, Class C | | | | |
| 4.485% due 10/16/2033 (b) | | 67,000 | | 61,870 |
| Government National Mortgage Association, Series | | | |
| 2004-1, Class 1 | | | | |
| zero coupon PO due 07/20/2034 | | 256,103 | | 188,076 |
| Government National Mortgage Association, Series | | | |
| 2004-43, Class D | | | | |
| 4.994% due 03/16/2030 (b) | | 56,000 | | 54,336 |
| Government National Mortgage Association, Series | | | |
| 2004-44, Class PC | | | | |
| 5.50% due 05/20/2031 | | 688,000 | | 691,204 |
| Government National Mortgage Association, Series | | | |
| 2005-94, Class PB | | | | |
| 5.50% due 12/20/2035 | | 135,000 | | 130,316 |
| Greenwich Capital Commercial Funding Corp., | | | |
| Series 2004-GG1, Class A2 | | | | |
| 3.835% due 06/10/2036 | | 20,837 | | 20,779 |
| Greenwich Capital Commercial Funding Corp., | | | |
| Series 2004-GG1, Class A3 | | | | |
| 4.344% due 06/10/2036 | | 175,000 | | 172,659 |
| Greenwich Capital Commercial Funding Corp., | | | |
| Series 2005-GG3, Class A2 | | | | |
| 4.305% due 08/10/2042 | | 1,680,000 | | 1,642,586 |
| Greenwich Capital Commercial Funding Corp., | | | |
| Series 2005-GG3, Class AAB | | | | |
| 4.619% due 08/10/2042 (b) | | 146,000 | | 140,797 |
| Greenwich Capital Commercial Funding Corp., | | | |
| Series 2007-GG9, Class A1 | | | | |
| 5.233% due 03/10/2039 | | 317,852 | | 316,267 |
| Greenwich Capital Commercial Funding Corp., | | | |
| Series 2007-GG9, Class A4 | | | | |
| 5.444% due 03/10/2039 | | 700,000 | | 686,177 |
| JP Morgan Chase Commercial Mortgage Securities | | | |
| Corp., Series 2006-CB14, Class A4 | | | | |
| 5.481% due 12/12/2044 (b) | | 1,740,000 | | 1,721,029 |
| |
| The accompanying notes are an integral part of the financial statements. | 359 |
John Hancock Funds II
Portfolio of investments — August 31, 2007
(showing percentage of total net assets)
| | | | |
| Spectrum Income Fund (continued) | | |
| | | Shares or | | |
| | | Principal | | |
| | | Amount | | Value |
| |
|
| |
| COLLATERALIZED MORTGAGE | | | | |
| OBLIGATIONS (continued) | | | | |
| |
| JP Morgan Chase Commercial Mortgage Securities Corp., | | |
| Series 2001-CIB2, Class A2 | | | | |
| 6.244% due 04/15/2035 | $ | 1,145,371 | $ | 1,152,679 |
| |
| JP Morgan Chase Commercial Mortgage Securities Corp., | | |
| Series 2001-CIBC, Class A3 | | | | |
| 6.26% due 03/15/2033 | | 276,491 | | 282,239 |
| |
| JP Morgan Chase Commercial Mortgage Securities Corp., | | |
| Series 2005-LDP4, Class A1 | | | | |
| 4.613% due 10/15/2042 | | 13,763 | | 13,637 |
| |
| JP Morgan Chase Commercial Mortgage Securities Corp., | | |
| Series 2005-LDP4, Class ASB | | | | |
| 4.824% due 10/15/2042 (b) | | 621,000 | | 599,674 |
| |
| JP Morgan Chase Commercial Mortgage Securities Corp., | | |
| Series 2006-CB17, Class A1 | | | | |
| 5.28% due 12/12/2043 | | 212,650 | | 211,865 |
| |
| JP Morgan Chase Commercial Mortgage Securities Corp., | | |
| Series 2006-LDP9, Class A1 | | | | |
| 5.17% due 05/15/2047 | | 272,887 | | 271,063 |
| LB-UBS Commercial Mortgage Trust, Series | | | |
| 2007-C2, Class A3 | | | | |
| 5.43% due 02/15/2040 | | 50,000 | | 48,936 |
| LB-UBS Commercial Mortgage Trust, | | | | |
| Series 2003-C8, Class A1 | | | | |
| 3.636% due 11/15/2027 | | 610,871 | | 600,988 |
| LB-UBS Commercial Mortgage Trust, | | | | |
| Series 2004-C2, Class A2 | | | | |
| 3.246% due 03/15/2029 | | 1,360,000 | | 1,319,917 |
| LB-UBS Commercial Mortgage Trust, | | | | |
| Series 2004-C4, Class A2 | | | | |
| 4.567% due 06/15/2029 (b) | | 707,000 | | 698,539 |
| LB-UBS Commercial Mortgage Trust, | | | | |
| Series 2005-C1, Class A4 | | | | |
| 4.742% due 02/15/2030 | | 548,000 | | 521,948 |
| LB-UBS Commercial Mortgage Trust, | | | | |
| Series 2006-C1, Class A1 | | | | |
| 5.018% due 02/15/2031 | | 261,000 | | 259,291 |
| LB-UBS Commercial Mortgage Trust, | | | | |
| Series 2006-C1, Class A4 | | | | |
| 5.156% due 02/15/2031 | | 2,017,500 | | 1,954,843 |
| Morgan Stanley Capital I, Series 2006-T23, Class A4 | | | |
| 5.81% due 08/12/2041 | | 485,000 | | 493,489 |
| Morgan Stanley Capital I, Series 2007-IQ15, Class | | | |
| A4 | | | | |
| 6.078% due 06/11/2049 (b) | | 1,500,000 | | 1,517,100 |
| Morgan Stanley Capital I, Series 2007-T27, Class A1 | | | |
| 5.606% due 06/11/2042 | | 675,139 | | 678,576 |
| Morgan Stanley Capital I, Series 2007-T27, Class A2 | | | |
| 5.804% due 06/11/2042 (b) | | 200,000 | | 201,374 |
| Morgan Stanley Capital I, Series 2007-T27, Class A4 | | | |
| 5.804% due 06/11/2042 (b) | | 600,000 | | 597,267 |
| | | | |
| Spectrum Income Fund (continued) | | |
| | | Shares or | | |
| | | Principal | | |
| | | Amount | | Value |
| |
|
| |
| COLLATERALIZED MORTGAGE | | | | |
| OBLIGATIONS (continued) | | | | |
| Morgan Stanley Dean Witter | | | | |
| Capita I, Series 2002-TOP7, Class A1 | | | | |
| 5.38% due 01/15/2039 | $ | 32,537 | $ | 32,462 |
| Morgan Stanley Dean Witter | | | | |
| Capital I, Series 2002-TOP7, Class A2 | | | | |
| 5.98% due 01/15/2039 | | 366,000 | | 371,967 |
| Morgan Stanley Capital I, Series 2006-T23, Class A1 | | | |
| 5.682% due 08/12/2041 | | 210,111 | | 211,637 |
| Vendee Mortgage Trust, Series 1996-3, Class 4 | | | |
| 9.5973% due 03/15/2025 (b) | | 12,799 | | 13,752 |
| Wells Fargo Mortgage Backed Securities Trust, | | | |
| Series 2003-O, Class 5A1 | | | | |
| 4.7973% due 01/25/2034 (b) | | 595,855 | | 578,726 |
| Wells Fargo Mortgage Backed Securities Trust, | | | |
| Series 2005-AR2, Class 2A2 | | | | |
| 4.5451% due 03/25/2035 (b) | | 427,798 | | 420,740 |
| Wells Fargo Mortgage Backed Securities Trust, | | | |
| Series 2005-AR2, Class 3A1 | | | | |
| 4.938034% due 03/25/2035 (b) | | 254,022 | | 249,711 |
| Wells Fargo Mortgage Backed Securities Trust, | | | |
| Series 2006-AR12, Class 1A1 | | | | |
| 6.025% due 09/25/2036 (b) | | 1,465,668 | | 1,470,545 |
| Wells Fargo Mortgage Backed Securities Trust, | | | |
| Series 2006-AR16, Class A1 | | | | |
| 5.670079% due 10/25/2036 (b) | | 977,533 | | 974,177 |
|
| TOTAL COLLATERALIZED MORTGAGE OBLIGATIONS | | |
| (Cost $46,892,037) | | | $ | 46,734,062 |
|
| |
| ASSET BACKED SECURITIES - 2.16% | | | |
| USAA Auto Owner Trust, Series 2007-1, Class A4 | | | |
| 5.55% due 02/15/2013 | | 775,000 | | 777,659 |
| Volkswagen Auto Loan Enhanced Trust, Series | | | |
| 2005-1, Class A4 | | | | |
| 4.86% due 04/20/2012 | | 630,000 | | 625,346 |
| AmeriCredit Automobile Receivables Trust, | | | |
| Series 2006-RM, Class A3 | | | | |
| 5.53% due 01/06/2014 | | 1,570,000 | | 1,571,693 |
| BankBoston Home Equity Loan Trust, | | | | |
| Series 1998-2, Class A6 | | | | |
| 6.64% due 12/25/2028 | | 61,772 | | 61,504 |
| Bay View Auto Trust, Series 2005-3, Class A4 | | | |
| 5.01% due 06/25/2014 | | 342,000 | | 340,437 |
| Cabela's Master Credit Card Trust, Series 2005-1A, | | | |
| Class A1 | | | | |
| 4.97% due 10/15/2013 | | 140,000 | | 139,249 |
| Capital Auto Receivables Asset Trust, | | | | |
| Series 2004-1, Class A4 | | | | |
| 2.64% due 11/17/2008 | | 79,491 | | 79,381 |
| Capital Auto Receivables Asset Trust, | | | | |
| Series 2004-1, Class CTFS | | | | |
| 2.84% due 09/15/2010 | | 149,000 | | 148,808 |
| Capital Auto Receivables Asset Trust, | | | | |
| Series 2006-SN1A, Class B | | | | |
| 5.50% due 04/20/2010 | | 275,000 | | 274,000 |
| Capital Auto Receivables Asset Trust, | | | | |
| Series 2006-SN1A, Class A4A | | | | |
| 5.32% due 03/20/2010 | | 1,575,000 | | 1,571,594 |
| |
| The accompanying notes are an integral part of the financial statements. | 360 |
John Hancock Funds II
Portfolio of investments — August 31, 2007
(showing percentage of total net assets)
| | | | |
| Spectrum Income Fund (continued) | | |
| | | Shares or | | |
| | | Principal | | |
| | | Amount | | Value |
| |
|
| |
| ASSET BACKED SECURITIES | | | | |
| (continued) | | | | |
| Capital Auto Receivables Asset Trust, | | | | |
| Series 2006-SN1A, Class A4B | | | | |
| 5.7213% due 03/20/2010 (b) | $ | 325,000 | $ | 324,923 |
| Capital One Multi-Asset Execution Trust, Series | | | |
| 2007-C3, Class C3 | | | | |
| 5.90% due 04/15/2013 | | 125,000 | | 122,615 |
| Capital One Prime Auto Receivables Trust, | | | |
| Series 2006-1, Class A4 | | | | |
| 5.01% due 11/15/2011 | | 260,000 | | 258,516 |
| Chase Funding Mortgage Loan | | | | |
| Asset-Backed Certificates, | | | | |
| Series 2002-2, Class 1M1 | | | | |
| 5.599% due 09/25/2031 | | 25,696 | | 21,825 |
| Chase Funding Mortgage Loan | | | | |
| Asset-Backed Certificates, | | | | |
| Series 2002-4, Class 2A1 | | | | |
| 6.245% due 10/25/2032 (b) | | 17,567 | | 17,259 |
| Chase Funding Mortgage Loan | | | | |
| Asset-Backed Certificates, | | | | |
| Series 2003-3, Class 1A6 | | | | |
| 3.717% due 10/25/2014 | | 221,076 | | 208,040 |
| Citibank Credit Card Issuance Trust, Series | | | |
| 2007-A5, Class A5 | | | | |
| 5.50% due 06/22/2012 | | 1,075,000 | | 1,085,078 |
| CNH Equipment Trust, Series 2003-B, Class A4B | | | |
| 3.38% due 02/15/2011 | | 111,677 | | 111,219 |
| CNH Equipment Trust, Series 2007-A, Class A3 | | | |
| 4.99% due 10/15/2010 | | 325,000 | | 324,644 |
| CNH Equipment Trust, Series 2007-A, Class B | | | |
| 5.08% due 06/16/2014 | | 295,000 | | 296,943 |
| Detroit Edison Securitization Funding LLC, | | | |
| Series 2001-1, Class A5 | | | | |
| 6.42% due 03/01/2015 | | 450,000 | | 478,517 |
| Florida Power & Light Recovery Funding LLC, | | | |
| Series 2007-A, Class A2 | | | | |
| 5.044% due 08/01/2015 | | 700,000 | | 708,053 |
| GE Capital Credit Card Master Note Trust, | | | | |
| Series 2006-1, Class A | | | | |
| 5.08% due 09/17/2012 | | 340,000 | | 340,533 |
| GE Equipment Small Ticket LLC, | | | | |
| Series 2005-1A, Class A4 | | | | |
| 4.51% due 12/22/2014 | | 337,000 | | 334,888 |
| Harley-Davidson Motorcycle Trust, | | | | |
| Series 2003-3, Class A2 | | | | |
| 2.76% due 05/15/2011 | | 40,554 | | 40,275 |
| Harley-Davidson Motorcycle Trust, | | | | |
| Series 2003-4, Class A2 | | | | |
| 2.69% due 04/15/2011 | | 48,938 | | 48,072 |
| Honda Auto Receivables Owner Trust, | | | | |
| Series 2007-1, Class A3 | | | | |
| 5.10% due 03/18/2011 | | 450,000 | | 449,156 |
| Household Affinity Credit Card Master Note Trust I, | | | |
| Series 2003-1, Class A | | | | |
| 5.7313% due 02/15/2010 (b) | | 106,000 | | 106,009 |
| Household Automotive Trust, | | | | |
| Series 2006-2, Class A4 | | | | |
| 5.67% due 05/17/2013 | | 220,000 | | 221,053 |
| | | | |
| Spectrum Income Fund (continued) | | |
| | | Shares or | | |
| | | Principal | | |
| | | Amount | | Value |
|
|
| |
| ASSET BACKED SECURITIES | | | | |
| (continued) | | | | |
| Hyundai Auto Receivables Trust, | | | | |
| Series 2006-A, Class A4 | | | | |
| 5.26% due 11/15/2012 | $ | 515,000 | $ | 513,322 |
| John Deere Owner Trust, Series 2005-A, Class A4 | | | |
| 4.16% due 05/15/2012 | | 50,000 | | 49,521 |
| John Deere Owner Trust, Series 2006-A, Class A4 | | | |
| 5.39% due 06/17/2013 | | 250,000 | | 252,576 |
| JP Morgan Auto Receivables Trust, | | | | |
| Series 2007-A, Class A4 | | | | |
| 5.19% due 02/15/2014 | | 240,000 | | 240,300 |
| M&I Auto Loan Trust, Series 2005-1, Class A4 | | | |
| 4.86% due 03/21/2011 | | 140,000 | | 139,013 |
| Marriott Vacation Club Owner Trust, | | | | |
| Series 2006-1A, Class A | | | | |
| 5.737% due 04/20/2028 | | 745,966 | | 758,434 |
| Marriott Vacation Club Owner Trust, | | | | |
| Series 2006-1A, Class B | | | | |
| 5.827% due 04/20/2028 | | 24,660 | | 25,083 |
| Marriott Vacation Club Owner Trust, | | | | |
| Series 2006-2A, Class A | | | | |
| 5.362% due 10/20/2028 | | 278,277 | | 271,851 |
| MBNA Credit Card Master Note Trust, Series | | | |
| 2006-C3, Class C3 | | | | |
| 5.901% due 10/15/2013 (b) | | 415,000 | | 404,526 |
| MBNA Credit Card Master Note Trust, | | | | |
| Series 2005-A3, Class A3 | | | | |
| 4.10% due 10/15/2012 | | 1,350,000 | | 1,318,484 |
| Nissan Auto Receivables Owner Trust, | | | | |
| Series 2004-A, Class A4 | | | | |
| 2.76% due 07/15/2009 | | 151,726 | | 150,151 |
| Nordstrom Private Label | | | | |
| Credit Card Master Note Trust, | | | | |
| Series 2007-1A, Class A | | | | |
| 4.92% due 05/15/2013 | | 350,000 | | 348,688 |
| Onyx Acceptance Owner | | | | |
| Trust, Series 2005-A, ClassA4 | | | | |
| 3.91% due 09/15/2011 | | 250,000 | | 247,316 |
| Peco Energy Transition Trust, | | | | |
| Series 2000-A, Class A4 | | | | |
| 7.65% due 03/01/2010 | | 500,000 | | 525,685 |
| Peco Energy Transition Trust, | | | | |
| Series 2001-A, Class A1 | | | | |
| 6.52% due 12/31/2010 | | 447,000 | | 465,330 |
| PP&L Transition Bond Company LLC, | | | | |
| Series 1999-1, Class A8 | | | | |
| 7.15% due 06/25/2009 | | 109,362 | | 110,811 |
| PSE&G Transition Funding LLC, | | | | |
| Series 2001-1, Class A6 | | | | |
| 6.61% due 06/15/2015 | | 281,000 | | 300,286 |
| Reliant Energy Transport Bond Company, | | | | |
| Series 2001-1, Class A4 | | | | |
| 5.63% due 09/15/2015 | | 334,000 | | 339,368 |
| Residential Asset Mortgage Products, Inc., | | | | |
| Series 2003-RZ2, Class A1 | | | | |
| 3.60% due 04/25/2033 | | 31,753 | | 30,449 |
| |
| The accompanying notes are an integral part of the financial statements. | 361 |
John Hancock Funds II
Portfolio of investments — August 31, 2007
(showing percentage of total net assets)
| | | | |
| Spectrum Income Fund (continued) | | |
| | | Shares or | | |
| | | Principal | | |
| | | Amount | | Value |
|
|
| |
| ASSET BACKED SECURITIES | | | | |
| (continued) | | | | |
| Sovereign Bank Home Equity Loan Trust, | | | | |
| Series 2000-1, Class A6 | | | | |
| 7.25% due 02/25/2015 | $ | 6,690 | $ | 6,703 |
| Susquehanna Auto Lease Trust, | | | | |
| Series 2006-1, Class A3 | | | | |
| 5.21% due 03/16/2009 | | 200,000 | | 199,260 |
| Triad Auto Receivables Owner Trust, | | | | |
| Series 2006-B, Class A3 | | | | |
| 5.41% due 08/12/2011 | | 300,000 | | 299,484 |
| Triad Auto Receivables Owner Trust, | | | | |
| Series 2006-B, Class A4 | | | | |
| 5.52% due 11/12/2012 | | 500,000 | | 500,570 |
| USAA Auto Owner Trust, Series 2005-2, Class A4 | | | |
| 4.17% due 02/15/2011 | | 150,000 | | 147,693 |
| Volkswagen Auto Lease Trust, | | | | |
| Series 2006-A, Class A4 | | | | |
| 5.54% due 04/20/2011 | | 245,000 | | 245,458 |
| Volkswagen Auto Loan Enhanced Trust, | | | | |
| Series 2007-1, Class A3 | | | | |
| 5.20% due 01/20/2010 | | 475,000 | | 474,035 |
| Wachovia Auto Loan Owner Trust 2006-1, Series | | | |
| 2007-1, Class A3A | | | | |
| 5.29% due 04/20/2012 | | 350,000 | | 349,576 |
| Wachovia Bank Commercial Mortgage Trust, | | | |
| Series 2006-C28, Class A4 | | | | |
| 5.572% due 10/15/2048 (b) | | 1,075,000 | | 1,066,984 |
| Wachovia Auto Owner Trust, | | | | |
| Series 2006-A, Class A4 | | | | |
| 5.38% due 03/20/2013 | | 225,000 | | 225,007 |
|
| TOTAL ASSET BACKED SECURITIES | | | | |
| (Cost $21,103,772) | | | $ | 21,093,253 |
|
| |
| SHORT TERM INVESTMENTS - 5.91% | | | |
| Egypt Treasury Bills, Series 364 | | | | |
| zero coupon due 11/20/2007 | EGP | 600,000 | $ | 104,034 |
| Egypt Treasury Bills, Series 364 | | | | |
| zero coupon due 03/18/2008 | | 1,000,000 | | 169,055 |
| John Hancock Cash Investment Trust (c) | $ | 3,743,553 | | 3,743,553 |
| Malaysia Treasury Bill, Series 364 | | | | |
| zero coupon due 07/04/2008 | MYR | 98,000 | | 27,187 |
| Malaysia Treasury Bill, Series 182 | | | | |
| zero coupon due 12/28/2007 to | | | | |
| 01/11/2008 | | 2,286,000 | | 645,364 |
| T. Rowe Price Reserve Investment | | | | |
| Fund (c) | $ | 53,165,386 | | 53,165,386 |
|
| TOTAL SHORT TERM INVESTMENTS | | | | |
| (Cost $57,862,439) | | | $ | 57,854,579 |
|
| | | | |
| Spectrum Income Fund (continued) | | |
| | | Shares or | | |
| | | Principal | | |
| | | Amount | | Value |
|
|
| |
| REPURCHASE AGREEMENTS - 0.42% | | | |
| Repurchase Agreement with State | | | | |
| Street Corp. dated 08/31/2007 at | | | | |
| 4.60% to be repurchased at | | | | |
| $4,143,117 on 09/04/2007, | | | | |
| collateralized by $4,210,000 | | | | |
| Federal Home Loan Bank, 5.375% | | | | |
| due 08/14/2009 (valued at | | | | |
| $4,225,788, including interest) | $ | 4,141,000 | $ | 4,141,000 |
|
| TOTAL REPURCHASE AGREEMENTS | | | | |
| (Cost $4,141,000) | | | $ | 4,141,000 |
|
| Total Investments (Spectrum Income Fund) | | | |
| (Cost $968,187,493) - 100.66% | | | $ | 985,658,111 |
| Liabilities in Excess of Other Assets - (0.66)% | | | (6,420,010) |
| |
|
| TOTAL NET ASSETS - 100.00% | | | $ | 979,238,101 |
| |
|
| |
| |
| |
| Strategic Bond Fund | | | | |
| | | Shares or | | |
| | | Principal | | |
| | | Amount | | Value |
|
|
| |
| U.S. TREASURY OBLIGATIONS - 7.39% | | | |
| | | | | |
| Treasury Inflation Protected | | | | |
| Securities (d) - 3.83% | | | | |
| 1.875% due 07/15/2015 | $ | 921,146 $ | | 888,042 |
| 2.00% due 01/15/2016 to 01/15/2026 | | 5,248,450 | | 4,939,122 |
| 2.375% due 01/15/2017 to 01/15/2027 | | 10,103,718 | | 10,066,000 |
| 2.50% due 07/15/2016 | | 680,876 | | 688,057 |
| 3.375% due 04/15/2032 | | 363,859 | | 435,750 |
| 3.875% due 01/15/2009 to 04/15/2029 | | 786,103 | | 945,438 |
| |
|
| | | | | 17,962,409 |
| U.S. Treasury Bonds - 1.48% | | | | |
| 4.50% due 02/15/2036 | | 350,000 | | 331,762 |
| 4.75% due 02/15/2037 | | 4,600,000 | | 4,537,468 |
| 5.00% due 05/15/2037 | | 1,280,000 | | 1,313,899 |
| 6.125% due 08/15/2029 **** | | 350,000 | | 408,926 |
| 7.125% due 02/15/2023 | | 280,000 | | 348,665 |
| |
|
| | | | | 6,940,720 |
| U.S. Treasury Notes - 2.04% | | | | |
| 3.625% due 07/15/2009 | | 1,620,000 | | 1,603,800 |
| 4.50% due 03/31/2012 to 05/15/2017 | | 7,050,000 | | 7,118,061 |
| 4.625% due 12/31/2011 | | 540,000 | | 547,763 |
| 4.75% due 08/15/2017 | | 260,000 | | 264,266 |
| 5.125% due 05/15/2016 | | 4,000 | | 4,171 |
| |
|
| | | | | 9,538,061 |
| U.S. Treasury Strips - 0.04% | | | | |
| zero coupon due 05/15/2030 | | 630,000 | | 208,550 |
|
| TOTAL U.S. TREASURY OBLIGATIONS | | | |
| (Cost $33,920,243) | | $ | | 34,649,740 |
|
| |
| U.S. GOVERNMENT AGENCY OBLIGATIONS - 35.54% | | |
| Federal Home Loan Bank - 0.16% | | | | |
| 5.40% due 01/02/2009 | | 730,000 | | 730,200 |
| |
| The accompanying notes are an integral part of the financial statements. | 362 |
John Hancock Funds II
Portfolio of investments — August 31, 2007
(showing percentage of total net assets)
| | | | |
| Strategic Bond Fund (continued) | | |
| | | Shares or | | |
| | | Principal | | |
| | | Amount | | Value |
|
|
| |
| U.S. GOVERNMENT AGENCY | | | | |
| OBLIGATIONS (continued) | | | | |
| | | | |
| Federal Home Loan Mortgage Corp. - 0.06% | | | |
| 5.125% due 04/18/2011 | $ | 280,000 | $ | 283,740 |
| 8.00% due 05/01/2010 | | 2,724 | | 2,790 |
| 8.50% due 05/01/2008 | | 623 | | 631 |
| |
|
| | | | | 287,161 |
| Federal National Mortgage | | | | |
| Association - 32.01% | | | | |
| 5.00% TBA ** | | 71,130,000 | | 67,595,693 |
| 5.50% due 04/01/2036 | | 2,930,815 | | 2,845,430 |
| 5.50% TBA ** | | 44,070,000 | | 43,273,337 |
| 5.625% due 05/19/2011 | | 1,220,000 | | 1,236,246 |
| 5.916% due 11/01/2035 | | 281,503 | | 285,994 |
| 6.00% due 04/18/2036 | | 640,000 | | 649,160 |
| 6.00% TBA ** | | 26,650,000 | | 26,615,383 |
| 6.50% due 10/01/2032 to 05/01/2037 | | 6,154,791 | | 6,251,999 |
| 6.50% TBA ** | | 1,100,000 | | 1,116,500 |
| 7.50% due 07/01/2030 to 02/01/2031 | | 53,279 | | 55,668 |
| 8.00% due 07/01/2027 to 08/01/2027 | | 40,957 | | 43,307 |
| 8.80% due 01/25/2019 | | 27,610 | | 29,412 |
| 10.40% due 04/25/2019 | | 9,047 | | 9,722 |
| |
|
| | | | | 150,007,851 |
| Government National Mortgage | | | | |
| Association - 3.31% | | | | |
| 5.00% due 06/15/2033 to 08/15/2035 | | 2,917,342 | | 2,815,213 |
| 6.00% due 01/15/2037 | | 8,585,238 | | 8,626,962 |
| 6.00% TBA ** | | 800,000 | | 803,750 |
| 6.50% TBA ** | | 3,200,000 | | 3,260,000 |
| 7.50% due 04/15/2022 to 10/15/2027 | | 13,438 | | 14,096 |
| |
|
| | | | | 15,520,021 |
|
| TOTAL U.S. GOVERNMENT AGENCY OBLIGATIONS | | |
| (Cost $166,136,940) | | | $ | 166,545,233 |
|
| |
| FOREIGN GOVERNMENT OBLIGATIONS - 5.73% | | |
| | | | |
| Brazil - 2.61% | | | | |
| Federative Republic of Brazil | | | | |
| 6.00% due 05/15/2045 | BRL | 694,000 | | 550,285 |
| 6.00% due 05/15/2015 | | 633,000 | | 506,794 |
| 8.00% due 01/15/2018 | $ | 1,590,000 | | 1,749,000 |
| 10.00% due 07/01/2010 | BRL | 12,360,000 | | 6,113,007 |
| 10.00% due 01/01/2010 | | 1,000 | | 498 |
| 11.00% due 08/17/2040 | $ | 2,519,000 | | 3,333,896 |
| |
|
| | | | | 12,253,480 |
| Colombia - 0.09% | | | | |
| Republic of Colombia | | | | |
| 7.375% due 09/18/2037 | | 377,000 | | 399,808 |
| | | | | |
| Indonesia - 0.36% | | | | |
| Republic of Indonesia, Series FR40 | | | | |
| 11.00% due 09/15/2025 | IDR | 14,993,000,000 | | 1,700,096 |
| | | | | |
| Italy - 0.10% | | | | |
| Republic of Italy | | | | |
| 5.804% due 10/25/2032 | $ | 440,000 | | 449,658 |
| | | | |
| Strategic Bond Fund (continued) | | | |
| | | Shares or | | |
| | | Principal | | |
| | | Amount | | Value |
| |
|
| |
| FOREIGN GOVERNMENT OBLIGATIONS | | | |
| (continued) | | | | |
| | | | | |
| Mexico - 0.33% | | | | |
| Government of Mexico | | | | |
| 5.625% due 01/15/2017 | $ | 684,000 | $ | 683,658 |
| 6.75% due 09/27/2034 | | 774,000 | | 840,564 |
| |
|
| | | | | 1,524,222 |
| Panama - 0.24% | | | | |
| Republic of Panama | | | | |
| 6.70% due 01/26/2036 | | 121,000 | | 119,790 |
| 9.375% due 04/01/2029 *** | | 784,000 | | 1,023,120 |
| |
|
| | | | | 1,142,910 |
| Russia - 1.09% | | | | |
| Russian Federation, Series REGS | | | | |
| 7.50% due 03/31/2030 | | 4,601,875 | | 5,117,285 |
| Turkey - 0.91% | | | | |
| Republic of Turkey | | | | |
| 11.875% due 01/15/2030 | | 2,790,000 | | 4,261,725 |
|
| TOTAL FOREIGN GOVERNMENT OBLIGATIONS | | |
| (Cost $26,298,391) | | | $ | 26,849,184 |
|
| |
| CORPORATE BONDS - 42.17% | | | | |
| | | | | |
| Advertising - 0.14% | | | | |
| Lamar Media Corp. | | | | |
| 6.625% due 08/15/2015 | | 140,000 | | 133,700 |
| R.H. Donnelley Corp., Series A-3 | | | | |
| 8.875% due 01/15/2016 | | 500,000 | | 512,500 |
| |
|
| | | | | 646,200 |
| Aerospace - 0.18% | | | | |
| Alliant Techsystems, Inc. | | | | |
| 6.75% due 04/01/2016 | | 135,000 | | 132,300 |
| DRS Technologies, Inc. | | | | |
| 6.875% due 11/01/2013 | | 400,000 | | 392,000 |
| 7.625% due 02/01/2018 | | 25,000 | | 24,500 |
| Hawker Beechcraft Acquisition Company LLC | | | |
| 9.75% due 04/01/2017 | | 285,000 | | 282,150 |
| Hawker Beechcraft Acquisition Company LLC, PIK | | | |
| 8.875% due 04/01/2015 | | 30,000 | | 29,250 |
| |
|
| | | | | 860,200 |
| Air Travel - 0.10% | | | | |
| Continental Airlines, Inc. | | | | |
| 6.541% due 09/15/2008 | | 11,632 | | 11,516 |
| 8.75% due 12/01/2011 | | 100,000 | | 93,500 |
| DAE Aviation Holdings, Inc. | | | | |
| 11.25% due 08/01/2015 | | 360,000 | | 358,200 |
| |
|
| | | | | 463,216 |
| Aluminum - 0.05% | | | | |
| Novelis, Inc. | | | | |
| 7.25% due 02/15/2015 | | 235,000 | | 227,950 |
| | | | | |
| Apparel & Textiles - 0.05% | | | | |
| Levi Strauss & Company | | | | |
| 9.75% due 01/15/2015 | | 230,000 | | 238,050 |
| |
| The accompanying notes are an integral part of the financial statements. | 363 |
John Hancock Funds II
Portfolio of investments — August 31, 2007
(showing percentage of total net assets)
| | | | |
| Strategic Bond Fund (continued) | | | |
| | | Shares or | | |
| | | Principal | | |
| | | Amount | | Value |
| |
|
| |
| CORPORATE BONDS (continued) | | | | |
| Auto Parts - 0.12% | | | | |
| Keystone Automotive Operations | | | | |
| 9.75% due 11/01/2013 | $ | 170,000 | $ | 136,000 |
| Visteon Corp. | | | | |
| 8.25% due 08/01/2010 | | 510,000 | | 436,050 |
| |
|
| | | | | 572,050 |
| Auto Services - 0.21% | | | | |
| Hertz Corp. | | | | |
| 8.875% due 01/01/2014 | | 260,000 | | 269,100 |
| 10.50% due 01/01/2016 | | 260,000 | | 280,800 |
| Penhall International Corp. | | | | |
| 12.00% due 08/01/2014 | | 435,000 | | 452,400 |
| |
|
| | | | | 1,002,300 |
| Automobiles - 3.27% | | | | |
| DaimlerChrysler N.A. Holding Corp. | | | | |
| 4.05% due 06/04/2008 | | 910,000 | | 896,531 |
| Ford Motor Company | | | | |
| 4.25% due 12/15/2036 | | 80,000 | | 86,048 |
| 6.625% due 10/01/2028 | | 150,000 | | 107,250 |
| 7.45% due 07/16/2031 | | 5,985,000 | | 4,488,750 |
| 8.875% due 01/15/2022 | | 90,000 | | 75,150 |
| 8.90% due 01/15/2032 | | 100,000 | | 83,000 |
| General Motors Corp. | | | | |
| 8.25% due 07/15/2023 | | 100,000 | | 79,750 |
| 8.375% due 07/15/2033 | | 11,880,000 | | 9,533,700 |
| |
|
| | | | | 15,350,179 |
| Banking - 2.21% | | | | |
| Bank of America Corp. | | | | |
| 5.42% due 03/15/2017 | | 1,100,000 | | 1,057,632 |
| Glitnir Banki HF | | | | |
| 6.33% due 07/28/2011 | | 440,000 | | 455,589 |
| 6.693% due 06/15/2016 (b) | | 620,000 | | 648,509 |
| HSBC Bank PLC, Series EMTN | | | | |
| 7.00% due 11/01/2011 | | 208,835 | | 209,357 |
| HSBC Bank USA, Series BKNT | | | | |
| 6.9704% due 11/01/2011 (b) | | 26,285 | | 26,666 |
| 6.9809% due 11/01/2011 (b) | | 27,312 | | 27,708 |
| ICICI Bank, Ltd. | | | | |
| 6.375% due 04/30/2022 (b) | | 606,000 | | 567,860 |
| ICICI Bank, Ltd., Series REGS | | | | |
| 6.375% due 04/30/2022 (b) | | 340,000 | | 311,399 |
| Kaupthing Bank | | | | |
| 5.758% due 04/12/2011 *** | | 1,080,000 | | 1,088,042 |
| 7.125% due 05/19/2016 | | 230,000 | | 235,681 |
| RSHB Capital SA for OJSC Russian Agricultural | | | |
| Bank | | | | |
| 6.299% due 05/15/2017 | | 1,130,000 | | 1,067,850 |
| TuranAlem Finance BV | | | | |
| 8.25% due 01/22/2037 | | 1,490,000 | | 1,273,950 |
| TuranAlem Finance BV, Series REGS | | | | |
| 8.25% due 01/22/2037 | | 500,000 | | 427,500 |
| Wachovia Corp. | | | | |
| 5.25% due 08/01/2014 | | 1,740,000 | | 1,704,118 |
| | | | |
| Strategic Bond Fund (continued) | | | |
| | | Shares or | | |
| | | Principal | | |
| | | Amount | | Value |
| |
|
| |
| CORPORATE BONDS (continued) | | | | |
| Banking (continued) | | | | |
| Wells Fargo Company | | | | |
| 5.30% due 08/26/2011 | $ | 1,250,000 | $ | 1,250,888 |
| |
|
| | | | | 10,352,749 |
| Broadcasting - 0.19% | | | | |
| CMP Susquehanna Corp. | | | | |
| 9.875% due 05/15/2014 | | 170,000 | | 157,250 |
| News America, Inc. | | | | |
| 5.30% due 12/15/2014 | | 605,000 | | 588,847 |
| XM Satellite Radio, Inc. | | | | |
| 9.75% due 05/01/2014 | | 50,000 | | 47,500 |
| 9.8563% due 05/01/2013 (b) | | 110,000 | | 102,300 |
| |
|
| | | | | 895,897 |
| Building Materials & Construction - 0.09% | | | |
| Ainsworth Lumber Company, Ltd. | | | | |
| 7.25% due 10/01/2012 | | 50,000 | | 35,750 |
| Associated Materials, Inc. | | | | |
| zero coupon, Step up to 11.25% on | | | | |
| 03/01/2009 due 03/01/2014 | | 325,000 | | 212,063 |
| NTK Holdings, Inc. | | | | |
| zero coupon, Step up to 10.75% on | | | | |
| 09/01/2009 due 03/01/2014 | | 275,000 | | 171,875 |
| |
|
| | | | | 419,688 |
| Business Services - 0.36% | | | | |
| Affinion Group, Inc. | | | | |
| 10.125% due 10/15/2013 | | 225,000 | | 225,000 |
| 11.50% due 10/15/2015 | | 130,000 | | 130,000 |
| Allied Security Escrow Corp. | | | | |
| 11.375% due 07/15/2011 | | 225,000 | | 223,875 |
| Electronic Data Systems Corp. | | | | |
| 7.125% due 10/15/2009 | | 720,000 | | 740,736 |
| Sungard Data Systems, Inc. | | | | |
| 9.125% due 08/15/2013 | | 275,000 | | 283,937 |
| 10.25% due 08/15/2015 | | 80,000 | | 82,400 |
| |
|
| | | | | 1,685,948 |
| Cable & Television - 1.19% | | | | |
| Charter Communications Holdings I LLC | | | | |
| 11.75% due 05/15/2014 | | 345,000 | | 307,050 |
| 12.125% due 01/15/2015 | | 110,000 | | 98,450 |
| Charter Communications Holdings I LLC/Charter | | | |
| Communications Holdings I Capital Corp. | | | |
| 11.00% due 10/01/2015 | | 257,000 | | 251,860 |
| Charter Communications Holdings II LLC/Charter | | | |
| Communications Holdings II Capital Corp. | | | |
| 10.25% due 09/15/2010 | | 220,000 | | 222,200 |
| 10.25% due 10/01/2013 | | 167,000 | | 168,670 |
| Charter Communications Holdings LLC | | | | |
| 11.75 due 05/15/2011 | | 100,000 | | 96,500 |
| 12.125 due 01/15/2012 | | 50,000 | | 48,250 |
| Comcast Corp. | | | | |
| 6.50% due 01/15/2015 *** | | 460,000 | | 474,497 |
| 6.50% due 01/15/2017 | | 230,000 | | 236,085 |
| CSC Holdings, Inc. | | | | |
| 6.75% due 04/15/2012 | | 250,000 | | 236,250 |
| |
| The accompanying notes are an integral part of the financial statements. | 364 |
John Hancock Funds II
Portfolio of investments — August 31, 2007
(showing percentage of total net assets)
| | | | |
| Strategic Bond Fund (continued) | | | |
| | | Shares or | | |
| | | Principal | | |
| | | Amount | | Value |
| |
|
| |
| CORPORATE BONDS (continued) | | | | |
| Cable & Television (continued) | | | | |
| CSC Holdings, Inc., Series B | | | | |
| 8.125% due 08/15/2009 | $ | 325,000 | $ | 327,437 |
| 8.125% due 07/15/2009 | | 25,000 | | 25,188 |
| EchoStar DBS Corp. | | | | |
| 6.625% due 10/01/2014 | | 825,000 | | 798,188 |
| ION Media Networks, Inc. | | | | |
| 11.61% due 01/15/2013 (b) | | 45,000 | | 45,000 |
| Rogers Cable, Inc. | | | | |
| 8.75% due 05/01/2032 | | 350,000 | | 412,617 |
| Sinclair Broadcast Group, Inc. | | | | |
| 8.00% due 03/15/2012 | | 20,000 | | 20,200 |
| Time Warner Entertainment Company LP | | | | |
| 8.375% due 07/15/2033 | | 430,000 | | 499,054 |
| Time Warner, Inc. | | | | |
| 7.625% due 04/15/2031 | | 955,000 | | 1,035,128 |
| Univision Communications, Inc., PIK | | | | |
| 9.75% due 03/15/2015 | | 115,000 | | 109,537 |
| Videotron Ltee. | | | | |
| 6.375% due 12/15/2015 | | 200,000 | | 182,500 |
| |
|
| | | | | 5,594,661 |
| Cellular Communications - 0.39% | | | | |
| AT&T Broadband Corp. | | | | |
| 8.375% due 03/15/2013 | | 785,000 | | 878,080 |
| MetroPCS Wireless, Inc. | | | | |
| 9.25% due 11/01/2014 | | 80,000 | | 78,800 |
| Rogers Wireless, Inc. | | | | |
| 7.25% due 12/15/2012 | | 30,000 | | 31,797 |
| 8.00% due 12/15/2012 | | 20,000 | | 21,083 |
| Rural Cellular Corp. | | | | |
| 8.25% due 03/15/2012 | | 230,000 | | 239,200 |
| 8.36% due 06/01/2013 (b) | | 130,000 | | 132,600 |
| 9.875% due 02/01/2010 | | 60,000 | | 62,100 |
| True Move Company, Ltd. | | | | |
| 10.75% due 12/16/2013 | | 385,000 | | 385,000 |
| |
|
| | | | | 1,828,660 |
| Chemicals - 0.21% | | | | |
| Arco Chemical Company | | | | |
| 9.80% due 02/01/2020 | | 75,000 | | 78,000 |
| Equistar Chemicals LP | | | | |
| 10.625% due 05/01/2011 | | 114,000 | | 120,270 |
| Georgia Gulf Corp. | | | | |
| 9.50% due 10/15/2014 | | 260,000 | | 240,500 |
| Huntsman International LLC | | | | |
| 7.875% due 11/15/2014 | | 75,000 | | 78,375 |
| Lyondell Chemical Company | | | | |
| 8.00% due 09/15/2014 | | 70,000 | | 76,125 |
| 8.25% due 09/15/2016 | | 55,000 | | 61,600 |
| 10.50% due 06/01/2013 | | 20,000 | | 21,550 |
| Methanex Corp. | | | | |
| 8.75% due 08/15/2012 | | 125,000 | | 133,750 |
| Montell Finance Company BV | | | | |
| 8.10% due 03/15/2027 | | 150,000 | | 130,500 |
| Westlake Chemical Corp. | | | | |
| 6.625% due 01/15/2016 | | 65,000 | | 59,800 |
| |
|
| | | | | 1,000,470 |
| | | | |
| Strategic Bond Fund (continued) | | | |
| | | Shares or | | |
| | | Principal | | |
| | | Amount | | Value |
| |
|
| |
| CORPORATE BONDS (continued) | | | | |
| | | | | |
| Coal - 0.04% | | | | |
| International Coal Group, Inc. | | | | |
| 10.25% due 07/15/2014 | $ | 180,000 | $ | 168,750 |
| | | | | |
| Commercial Services - 0.18% | | | | |
| DI Finance/DynCorp International LLC, Series B | | | |
| 9.50% due 02/15/2013 | | 310,000 | | 314,650 |
| PGS Solutions, Inc. | | | | |
| 9.625% due 02/15/2015 | | 90,000 | | 83,250 |
| Rental Service Corp. | | | | |
| 9.50% due 12/01/2014 | | 225,000 | | 220,219 |
| Rental Service Corp., Series 144A | | | | |
| 9.50% due 12/01/2014 | | 230,000 | | 225,112 |
| |
|
| | | | | 843,231 |
| Computers & Business Equipment - 0.03% | | | |
| Activant Solutions, Inc. | | | | |
| 9.50% due 05/01/2016 | | 140,000 | | 123,900 |
| | | | | |
| Construction Materials - 0.03% | | | | |
| Nortek, Inc. | | | | |
| 8.50% due 09/01/2014 | | 150,000 | | 129,750 |
| | | | | |
| Containers & Glass - 0.25% | | | | |
| Graham Packaging Company | | | | |
| 8.50% due 10/15/2012 | | 5,000 | | 4,875 |
| 9.875% due 10/15/2014 | | 235,000 | | 230,300 |
| Graphic Packaging International Corp. | | | | |
| 9.50% due 08/15/2013 | | 210,000 | | 212,100 |
| Owens-Brockway Glass Container, Inc. | | | | |
| 8.25% due 05/15/2013 | | 50,000 | | 51,250 |
| Owens-Illinois, Inc. | | | | |
| 7.35% due 05/15/2008 | | 325,000 | | 325,000 |
| Plastipak Holdings, Inc. | | | | |
| 8.50% due 12/15/2015 | | 95,000 | | 96,425 |
| Radnor Holdings Corp. | | | | |
| 11.00% due 03/15/2010 ^ | | 125,000 | | 156 |
| Smurfit-Stone Container Enterprises, Inc. | | | | |
| 8.00% due 03/15/2017 | | 285,000 | | 271,819 |
| |
|
| | | | | 1,191,925 |
| Crude Petroleum & Natural Gas - 0.89% | | | |
| Anadarko Finance Company, Series B | | | | |
| 7.50% due 05/01/2031 | | 730,000 | | 792,320 |
| Anadarko Petroleum Corp. | | | | |
| 5.76% due 09/15/2009 (b)*** | | 730,000 | | 725,881 |
| 5.95% due 09/15/2016 | | 50,000 | | 49,724 |
| Chesapeake Energy Corp. | | | | |
| 6.25% due 01/15/2018 | | 90,000 | | 84,262 |
| 6.50% due 08/15/2017 | | 90,000 | | 85,725 |
| 7.00% due 08/15/2014 | | 200,000 | | 199,000 |
| Conoco, Inc. | | | | |
| 6.95% due 04/15/2029 *** | | 1,020,000 | | 1,118,045 |
| Mariner Energy, Inc. | | | | |
| 7.50% due 04/15/2013 | | 80,000 | | 76,000 |
| OPTI Canada, Inc. | | | | |
| 7.875% due 12/15/2014 | | 220,000 | | 220,550 |
| 8.25% due 12/15/2014 | | 125,000 | | 126,563 |
| PetroHawk Energy Corp. | | | | |
| 9.125% due 07/15/2013 | | 120,000 | | 125,100 |
| |
| The accompanying notes are an integral part of the financial statements. | 365 |
John Hancock Funds II
Portfolio of investments — August 31, 2007
(showing percentage of total net assets)
| | | | |
| Strategic Bond Fund (continued) | | | |
| | | Shares or | | |
| | | Principal | | |
| | | Amount | | Value |
| |
|
| |
| CORPORATE BONDS (continued) | | | | |
| | | | | |
| Crude Petroleum & Natural Gas | | | | |
| (continued) | | | | |
| Pogo Producing Company | | | | |
| 6.875% due 10/01/2017 | $ | 200,000 | $ | 201,500 |
| 7.875% due 05/01/2013 | | 20,000 | | 20,150 |
| Quicksilver Resources, Inc. | | | | |
| 7.125% due 04/01/2016 | | 250,000 | | 238,750 |
| W&T Offshore, Inc. | | | | |
| 8.25% due 06/15/2014 | | 105,000 | | 97,912 |
| | |
| | | | | 4,161,482 |
| Domestic Oil - 0.32% | | | | |
| Exco Resources, Inc. | | | | |
| 7.25% due 01/15/2011 | | 335,000 | | 337,513 |
| Stone Energy Corp. | | | | |
| 8.25% due 12/15/2011 | | 400,000 | | 393,000 |
| Swift Energy Company | | | | |
| 7.625% due 07/15/2011 | | 400,000 | | 396,000 |
| Whiting Petroleum Corp. | | | | |
| 7.00% due 02/01/2014 | | 375,000 | | 353,437 |
| |
|
| | | | | 1,479,950 |
| Drugs & Health Care - 0.23% | | | | |
| Humana, Inc. | | | | |
| 6.30% due 08/01/2018 | | 1,065,000 | | 1,069,083 |
| | | | | |
| Educational Services - 0.07% | | | | |
| Education Management Corp. | | | | |
| 8.75% due 06/01/2014 | | 125,000 | | 126,875 |
| 10.25% due 06/01/2016 | | 195,000 | | 201,338 |
| |
|
| | | | | 328,213 |
| Electrical Utilities - 3.18% | | | | |
| AES Corp. | | | | |
| 7.75% due 03/01/2014 (a) | | 2,913,000 | | 2,883,870 |
| 8.75% due 06/15/2008 (a) | | 1,150,000 | | 1,170,125 |
| 8.875% due 02/15/2011 | | 725,000 | | 744,937 |
| 9.375% due 09/15/2010 | | 1,100,000 | | 1,149,500 |
| 9.50% due 06/01/2009 | | 880,000 | | 908,600 |
| Dominion Resources, Inc. | | | | |
| 5.70% due 09/17/2012 | | 730,000 | | 732,860 |
| Edison Mission Energy | | | | |
| 7.00% due 05/15/2017 | | 280,000 | | 264,600 |
| 7.20% due 05/15/2019 | | 370,000 | | 349,650 |
| 7.625% due 05/15/2027 | | 130,000 | | 120,900 |
| 7.75% due 06/15/2016 | | 140,000 | | 141,050 |
| Exelon Corp. | | | | |
| 5.625% due 06/15/2035 | | 170,000 | | 151,187 |
| FirstEnergy Corp. | | | | |
| 6.45% due 11/15/2011 | | 430,000 | | 444,107 |
| 7.375% due 11/15/2031 | | 675,000 | | 743,884 |
| Midwest Generation LLC, Series B | | | | |
| 8.56% due 01/02/2016 | | 129,394 | | 137,643 |
| Mirant Americas Generation LLC | | | | |
| 8.30% due 05/01/2011 | | 395,000 | | 390,063 |
| Orion Power Holdings, Inc. | | | | |
| 12.00% due 05/01/2010 | | 120,000 | | 130,800 |
| Pacific Gas & Electric Company | | | | |
| 6.05% due 03/01/2034 | | 490,000 | | 479,931 |
| | | | |
| Strategic Bond Fund (continued) | | | |
| | | Shares or | | |
| | | Principal | | |
| | | Amount | | Value |
| |
|
| |
| CORPORATE BONDS (continued) | | | | |
| Electrical Utilities (continued) | | | | |
| TXU Corp., Series P | | | | |
| 5.55% due 11/15/2014 | $ | 240,000 | $ | 196,889 |
| TXU Corp., Series Q | | | | |
| 6.50% due 11/15/2024 | | 1,140,000 | | 914,859 |
| TXU Corp., Series R | | | | |
| 6.55% due 11/15/2034 | | 3,600,000 | | 2,847,175 |
| |
|
| | | | | 14,902,630 |
| Electronics - 0.13% | | | | |
| L-3 Communications Corp. | | | | |
| 7.625% due 06/15/2012 | | 550,000 | | 559,625 |
| L-3 Communications Corp., Series B | | | | |
| 6.375% due 10/15/2015 | | 75,000 | | 72,563 |
| |
|
| | | | | 632,188 |
| Energy - 0.48% | | | | |
| Duke Energy Company | | | | |
| 4.20% due 10/01/2008 | | 1,131,000 | | 1,116,799 |
| Dynegy Holdings, Inc. | | | | |
| 7.75% due 06/01/2019 | | 330,000 | | 305,250 |
| NRG Energy, Inc. | | | | |
| 7.25% due 02/01/2014 | | 150,000 | | 148,500 |
| 7.375% due 02/01/2016 | | 700,000 | | 691,250 |
| |
|
| | | | | 2,261,799 |
| Financial Services - 12.21% | | | | |
| Aiful Corp. | | | | |
| 5.00% due 08/10/2010 | | 440,000 | | 432,269 |
| Credit Suisse USA, Inc. | | | | |
| 5.50% due 08/16/2011 | | 270,000 | | 271,842 |
| Dow Jones CDX NA HY, Series 8-Tranche 1 | | | |
| 7.625% due 06/29/2012 | | 17,000,000 | | 15,980,000 |
| E*Trade Financial Corp. | | | | |
| 7.375% due 09/15/2013 | | 125,000 | | 111,250 |
| 7.875% due 12/01/2015 | | 25,000 | | 21,875 |
| El Paso Performance-Linked Trust | | | | |
| 7.75% due 07/15/2011 | | 980,000 | | 1,004,050 |
| Ford Motor Credit Company | | | | |
| 7.00% due 10/01/2013 | | 80,000 | | 71,245 |
| 7.375% due 10/28/2009 | | 70,000 | | 66,239 |
| 7.875% due 06/15/2010 | | 1,875,000 | | 1,760,235 |
| 8.00% due 12/15/2016 | | 10,860,000 | | 10,021,879 |
| 8.11% due 01/13/2012 (b) | | 60,000 | | 54,949 |
| 9.875% due 08/10/2011 | | 725,000 | | 715,704 |
| 10.61% due 06/15/2011 (b) | | 836,000 | | 833,891 |
| General Motors Acceptance Corp. | | | | |
| 4.375% due 12/10/2007 | | 350,000 | | 345,482 |
| 5.125% due 05/09/2008 | | 250,000 | | 243,594 |
| 5.85% due 01/14/2009 | | 350,000 | | 332,482 |
| 8.00% due 11/01/2031 | | 14,255,000 | | 12,806,179 |
| Global Cash Access LLC | | | | |
| 8.75% due 03/15/2012 | | 250,000 | | 253,750 |
| Goldman Sachs Group LP | | | | |
| 4.50% due 06/15/2010 | | 580,000 | | 569,953 |
| HSBC Finance Capital Trust IX | | | | |
| 5.911% due 11/30/2035 (b) | | 1,650,000 | | 1,564,139 |
| |
| The accompanying notes are an integral part of the financial statements. | 366 |
John Hancock Funds II
Portfolio of investments — August 31, 2007
(showing percentage of total net assets)
| | | | |
| Strategic Bond Fund (continued) | | | |
| | | Shares or | | |
| | | Principal | | |
| | | Amount | | Value |
| |
|
| |
| CORPORATE BONDS (continued) | | | | |
| Financial Services (continued) | | | | |
| International Lease Finance Corp. | | | | |
| 5.875% due 05/01/2013 | $ | 815,000 | $ | 829,471 |
| J.P. Morgan Chase & Company | | | | |
| 6.625% due 03/15/2012 | | 970,000 | | 1,017,702 |
| J.P. Morgan Chase London | | | | |
| zero coupon due 11/08/2007 | | 747,000 | | 743,456 |
| Lehman Brothers Holdings, Inc. | | | | |
| 4.50% due 07/26/2010 | | 775,000 | | 746,659 |
| Morgan Stanley | | | | |
| 4.75% due 04/01/2014 | | 1,470,000 | | 1,374,187 |
| 5.81% due 10/18/2016 (b) | | 250,000 | | 239,117 |
| Nell AF SARL | | | | |
| 8.375% due 08/15/2015 | | 222,000 | | 197,580 |
| Residential Capital Corp. | | | | |
| 6.00% due 02/22/2011 | | 720,000 | | 545,400 |
| Resona Preferred Global Securities (Cayman), Ltd. | | | |
| 7.191% due 12/29/2049 (b) | | 440,000 | | 442,460 |
| Shinsei Finance Cayman, Ltd. | | | | |
| 6.418% due 01/29/2049 (a)(b) | | 550,000 | | 520,937 |
| Sigma Finance Inc., Series MTN | | | | |
| 8.00% due 06/22/2017 (b) | | 1,320,000 | | 1,321,346 |
| TNK-BP Finance SA | | | | |
| 7.50% due 07/18/2016 | | 1,330,000 | | 1,313,375 |
| TNK-BP Finance SA, Series REGS | | | | |
| 6.625% due 03/20/2017 | | 480,000 | | 453,360 |
| Ucar Finance, Inc. | | | | |
| 10.25% due 02/15/2012 | | 37,000 | | 38,665 |
| |
|
| | | | | 57,244,722 |
| Food & Beverages - 0.05% | | | | |
| Dole Food Company, Inc. | | | | |
| 7.25% due 06/15/2010 | | 230,000 | | 212,750 |
| | | | | |
| Forest Products - 0.11% | | | | |
| Weyerhaeuser Company | | | | |
| 6.75% due 03/15/2012 | | 480,000 | | 494,910 |
| | | | | |
| Funeral Services - 0.03% | | | | |
| Service Corp. International | | | | |
| 7.50% due 04/01/2027 | | 30,000 | | 27,600 |
| 7.625% due 10/01/2018 | | 65,000 | | 65,325 |
| 7.875% due 02/01/2013 | | 30,000 | | 30,453 |
| |
|
| | | | | 123,378 |
| Furniture & Fixtures - 0.07% | | | | |
| Norcraft Companies LP | | | | |
| 9.00% due 11/01/2011 | | 190,000 | | 190,000 |
| Norcraft Holdings Capital | | | | |
| zero coupon, Step up to 9.75% on | | | | |
| 09/01/2008 due 09/01/2012 | | 160,000 | | 141,600 |
| |
|
| | | | | 331,600 |
| Gas & Pipeline Utilities - 2.42% | | | | |
| El Paso Corp. | | | | |
| 7.00% due 06/15/2017 | | 1,330,000 | | 1,325,808 |
| 7.375% due 12/15/2012 | | 475,000 | | 485,498 |
| 7.75% due 01/15/2032 (a) | | 5,510,000 | | 5,485,877 |
| 7.80% due 08/01/2031 *** | | 1,783,000 | | 1,775,333 |
| 7.875% due 06/15/2012 | | 500,000 | | 519,220 |
| | | | |
| Strategic Bond Fund (continued) | | | |
| | | Shares or | | |
| | | Principal | | |
| | | Amount | | Value |
| |
|
| |
| CORPORATE BONDS (continued) | | | | |
| Gas & Pipeline Utilities (continued) | | | | |
| El Paso Natural Gas Company | | | | |
| 8.375% due 06/15/2032 | $ | 480,000 | $ | 557,748 |
| Kinder Morgan Energy Partners LP | | | | |
| 5.00% due 12/15/2013 | | 140,000 | | 132,662 |
| 6.30% due 02/01/2009 | | 100,000 | | 101,303 |
| 6.75% due 03/15/2011 | | 100,000 | | 103,453 |
| 7.125% due 03/15/2012 | | 20,000 | | 20,992 |
| Southern Natural Gas Company | | | | |
| 8.00% due 03/01/2032 | | 190,000 | | 212,369 |
| Williams Companies, Inc. | | | | |
| 7.625% due 07/15/2019 | | 25,000 | | 26,563 |
| 7.875% due 09/01/2021 | | 275,000 | | 294,938 |
| 8.75% due 03/15/2032 | | 267,000 | | 303,713 |
| |
|
| | | | | 11,345,477 |
| Healthcare Products - 0.11% | | | | |
| Advanced Medical Optics, Inc. | | | | |
| 7.50% due 05/01/2017 | | 95,000 | | 86,688 |
| Leiner Health Products, Inc. | | | | |
| 11.00% due 06/01/2012 | | 380,000 | | 330,600 |
| Universal Hospital Services, Inc. | | | | |
| 8.7594% due 06/01/2015 (b) | | 50,000 | | 48,250 |
| Universal Hospital Services, Inc., PIK | | | | |
| 8.50% due 06/01/2015 | | 40,000 | | 38,000 |
| |
|
| | | | | 503,538 |
| Healthcare Services - 0.26% | | | | |
| DaVita, Inc. | | | | |
| 7.25% due 03/15/2015 | | 420,000 | | 411,600 |
| U.S. Oncology Holdings, Inc., PIK | | | | |
| 9.7969% due 03/15/2012 (b) | | 205,000 | | 189,625 |
| Vanguard Health Holding Company II LLC | | | | |
| 9.00% due 10/01/2014 | | 640,000 | | 598,400 |
| |
|
| | | | | 1,199,625 |
| Holdings Companies/Conglomerates - 0.12% | | | |
| Ashtead Capital, Inc. | | | | |
| 9.00% due 08/15/2016 | | 558,000 | | 552,420 |
| | | | | |
| Homebuilders - 0.03% | | | | |
| K Hovnanian Enterprises, Inc. | | | | |
| 6.25% due 01/15/2016 | | 5,000 | | 3,750 |
| 8.625% due 01/15/2017 | | 180,000 | | 142,200 |
| |
|
| | | | | 145,950 |
| Hotels & Restaurants - 0.09% | | | | |
| Buffets, Inc. | | | | |
| 12.50% due 11/01/2014 | | 205,000 | | 157,850 |
| CCM Merger, Inc. | | | | |
| 8.00% due 08/01/2013 | | 105,000 | | 100,275 |
| El Pollo Loco, Inc. | | | | |
| 11.75% due 11/15/2013 | | 70,000 | | 71,400 |
| Sbarro, Inc. | | | | |
| 10.375% due 02/01/2015 | | 90,000 | | 79,087 |
| |
|
| | | | | 408,612 |
| Industrial Machinery - 0.04% | | | | |
| H&E Equipment Services, Inc. | | | | |
| 8.375% due 07/15/2016 | | 180,000 | | 184,500 |
| |
| The accompanying notes are an integral part of the financial statements. | 367 |
John Hancock Funds II
Portfolio of investments — August 31, 2007
(showing percentage of total net assets)
| | | | |
| Strategic Bond Fund (continued) | | | |
| | | Shares or | | |
| | | Principal | | |
| | | Amount | | Value |
| |
|
| |
| |
| CORPORATE BONDS (continued) | | | | |
| | | | | |
| International Oil - 2.45% | | | | |
| Corral Finans AB, PIK | | | | |
| 10.36% due 04/15/2010 (b) | $ | 100,913 | $ | 96,372 |
| Gaz Capital for Gazprom | | | | |
| 6.51% due 03/07/2022 | | 480,000 | | 463,920 |
| Gaz Capital for Gazprom, Series 144A | | | | |
| 6.212% due 11/22/2016 | | 1,070,000 | | 1,030,945 |
| Gaz Capital for Gazprom, Series REGS | | | | |
| 8.625% due 04/28/2034 | | 800,000 | | 985,040 |
| HSBC Bank PLC-Credit Linked to JSC Gazprom | | | |
| zero coupon due 11/01/2011 (b) | RUB | 13,382,000 | | 522,055 |
| Kerr-McGee Corp. | | | | |
| 6.95% due 07/01/2024 | $ | 490,000 | | 511,781 |
| OAO Gazprom, Series A7 | | | | |
| 6.79% due 10/29/2009 | | 16,500,000 | | 644,453 |
| OAO Gazprom, Series A8 | | | | |
| 7.00% due 10/27/2011 | | 5,500,000 | | 213,015 |
| OAO Gazprom, Series REGS | | | | |
| 9.625% due 03/01/2013 | | 150,000 | | 171,825 |
| Pemex Project Funding Master Trust | | | | |
| 5.75% due 12/15/2015 | | 170,000 | | 168,130 |
| 6.625% due 06/15/2035 | | 6,290,000 | | 6,431,399 |
| Petroplus Finance, Ltd. | | | | |
| 6.75% due 05/01/2014 | | 110,000 | | 102,300 |
| 7.00% due 05/01/2017 | | 130,000 | | 119,600 |
| |
|
| | | | | 11,460,835 |
| Leisure Time - 0.52% | | | | |
| AMC Entertainment, Inc. | | | | |
| 11.00% due 02/01/2016 | | 190,000 | | 197,600 |
| Boyd Gaming Corp. | | | | |
| 6.75% due 04/15/2014 | | 400,000 | | 378,000 |
| Caesars Entertainment, Inc. | | | | |
| 7.00% due 04/15/2013 | | 40,000 | | 41,200 |
| Herbst Gaming, Inc. | | | | |
| 8.125% due 06/01/2012 | | 250,000 | | 217,500 |
| Inn of the Mountain Gods Resort & Casino | | | | |
| 12.00% due 11/15/2010 | | 190,000 | | 200,450 |
| Las Vegas Sands Corp. | | | | |
| 6.375% due 02/15/2015 | | 250,000 | | 237,500 |
| MGM Mirage, Inc. | | | | |
| 6.625% due 07/15/2015 | | 20,000 | | 18,825 |
| 7.625% due 01/15/2017 | | 350,000 | | 346,500 |
| 8.50% due 09/15/2010 | | 10,000 | | 10,375 |
| Mohegan Tribal Gaming Authority | | | | |
| 6.875% due 02/15/2015 | | 150,000 | | 144,000 |
| 7.125% due 08/15/2014 | | 150,000 | | 146,625 |
| Pinnacle Entertainment, Inc. | | | | |
| 8.25% due 03/15/2012 | | 50,000 | | 50,250 |
| River Rock Entertainment Authority | | | | |
| 9.75% due 11/01/2011 | | 25,000 | | 25,625 |
| Snoqualmie Entertainment Authority | | | | |
| 9.0625% due 02/01/2014 (b) | | 45,000 | | 43,931 |
| 9.125% due 02/01/2015 | | 45,000 | | 43,931 |
| Station Casinos, Inc. | | | | |
| 7.75% due 08/15/2016 | | 240,000 | | 229,800 |
| | | | |
| Strategic Bond Fund (continued) | | | |
| | | Shares or | | |
| | | Principal | | |
| | | Amount | | Value |
| |
|
| |
| CORPORATE BONDS (continued) | | | | |
| Leisure Time (continued) | | | | |
| Warner Music Group | | | | |
| 7.375% due 04/15/2014 | $ | 130,000 | $ | 114,400 |
| |
|
| | | | | 2,446,512 |
| Manufacturing - 1.19% | | | | |
| Tyco International Group SA | | | | |
| 6.00% due 11/15/2013 | | 1,040,000 | | 1,046,466 |
| 6.125% due 11/01/2008 | | 950,000 | | 958,968 |
| 6.125% due 01/15/2009 | | 20,000 | | 20,299 |
| 6.375% due 10/15/2011 | | 180,000 | | 188,534 |
| 6.75% due 02/15/2011 | | 360,000 | | 378,129 |
| 6.875% due 01/15/2029 | | 2,760,000 | | 2,985,503 |
| |
|
| | | | | 5,577,899 |
| Medical-Hospitals - 1.00% | | | | |
| Community Health Systems, Inc. | | | | |
| 8.875% due 07/15/2015 | | 370,000 | | 369,537 |
| HCA, Inc. | | | | |
| 6.375% due 01/15/2015 | | 265,000 | | 215,975 |
| 6.50% due 02/15/2016 | | 313,000 | | 255,095 |
| 7.50% due 12/15/2023 | | 25,000 | | 20,008 |
| 7.50% due 11/06/2033 | | 30,000 | | 23,250 |
| 9.125% due 11/15/2014 | | 40,000 | | 41,000 |
| 9.25% due 11/15/2016 | | 340,000 | | 349,350 |
| 9.625% due 11/15/2016 | | 2,425,000 | | 2,506,844 |
| Tenet Healthcare Corp. | | | | |
| 6.875% due 11/15/2031 | | 1,125,000 | | 810,000 |
| 7.375% due 02/01/2013 | | 125,000 | | 103,750 |
| |
|
| | | | | 4,694,809 |
| Mining - 1.07% | | | | |
| Freeport-McMoRan Copper & Gold, Inc. | | | | |
| 8.375% due 04/01/2017 | | 1,600,000 | | 1,704,000 |
| Noranda Aluminium Holding Corp., PIK | | | | |
| 11.145% due 11/15/2014 (b) | | 160,000 | | 145,600 |
| Vale Overseas, Ltd. | | | | |
| 6.875% due 11/21/2036 | | 3,117,000 | | 3,164,067 |
| |
|
| | | | | 5,013,667 |
| Office Furnishings & Supplies - 0.05% | | | | |
| Interface, Inc. | | | | |
| 9.50% due 02/01/2014 | | 100,000 | | 103,500 |
| 10.375% due 02/01/2010 | | 150,000 | | 155,250 |
| |
|
| | | | | 258,750 |
| Paper - 0.28% | | | | |
| Abitibi-Consolidated, Inc. | | | | |
| 6.00% due 06/20/2013 | | 135,000 | | 99,900 |
| 7.40% due 04/01/2018 | | 155,000 | | 112,375 |
| 7.75% due 06/15/2011 | | 30,000 | | 25,050 |
| 8.375% due 04/01/2015 | | 125,000 | | 98,125 |
| Appleton Papers, Inc., Series B | | | | |
| 9.75% due 06/15/2014 | | 305,000 | | 306,906 |
| NewPage Corp. | | | | |
| 11.6063% due 05/01/2012 (b) | | 285,000 | | 302,100 |
| Smurfit Capital Funding PLC | | | | |
| 7.50% due 11/20/2025 | | 200,000 | | 191,000 |
| |
| The accompanying notes are an integral part of the financial statements. | 368 |
John Hancock Funds II
Portfolio of investments — August 31, 2007
(showing percentage of total net assets)
| | | | |
| Strategic Bond Fund (continued) | | | |
| | | Shares or | | |
| | | Principal | | |
| | | Amount | | Value |
|
|
| |
| CORPORATE BONDS (continued) | | | | |
| Paper (continued) | | | | |
| Verso Paper Holdings LLC and Verson Paper Inc., | | | |
| Series B | | | | |
| 11.375% due 08/01/2016 | $ | 155,000 | $ | 158,100 |
| |
|
| | | | | 1,293,556 |
| |
| Petroleum Services - 0.19% | | | | |
| Belden & Blake Corp. | | | | |
| 8.75% due 07/15/2012 | | 250,000 | | 250,000 |
| Compagnie Generale de Geophysique SA | | | | |
| 7.50% due 05/15/2015 | | 50,000 | | 50,250 |
| Complete Production Services, Inc. | | | | |
| 8.00% due 12/15/2016 | | 160,000 | | 154,000 |
| Enterprise Products Operating LP | | | | |
| 8.375% due 08/01/2066 (b) | | 110,000 | | 112,627 |
| Pride International, Inc. | | | | |
| 7.375% due 07/15/2014 | | 60,000 | | 60,600 |
| SemGroup LP | | | | |
| 8.75% due 11/15/2015 | | 270,000 | | 259,875 |
| SESI LLC | | | | |
| 6.875% due 06/01/2014 | | 10,000 | | 9,550 |
| |
|
| | | | | 896,902 |
| |
| Photography - 1.94% | | | | |
| Eastman Kodak Company | | | | |
| 3.375% due 10/15/2033 *** | | 4,210,000 | | 4,431,025 |
| 7.25% due 11/15/2013 (a)*** | | 4,790,000 | | 4,646,300 |
| |
|
| | | | | 9,077,325 |
| |
| Plastics - 0.01% | | | | |
| Milacron Escrow Corp. | | | | |
| 11.50% due 05/15/2011 | | 40,000 | | 38,500 |
| Publishing - 0.16% | | | | |
| Dex Media East LLC | | | | |
| 12.125% due 11/15/2012 | | 125,000 | | 133,437 |
| Dex Media West LLC | | | | |
| 8.50% due 08/15/2010 | | 150,000 | | 151,875 |
| 9.875% due 08/15/2013 | | 75,000 | | 79,125 |
| Idearc, Inc. | | | | |
| 8.00% due 11/15/2016 | | 195,000 | | 192,563 |
| TL Acquisitions, Inc. | | | | |
| 10.50% due 01/15/2015 | | 210,000 | | 197,925 |
| |
|
| | | | | 754,925 |
| |
| Railroads & Equipment - 0.06% | | | | |
| Grupo Transportacion Ferroviaria Mexicana, | | | |
| SA de CV | | | | |
| 9.375% due 05/01/2012 | | 130,000 | | 134,550 |
| Kansas City Southern de Mexico SA de CV | | | | |
| 7.625% due 12/01/2013 | | 50,000 | | 49,000 |
| Kansas City Southern Railway Company | | | | |
| 7.50% due 06/15/2009 | | 120,000 | | 120,000 |
| |
|
| | | | | 303,550 |
| |
| Real Estate - 0.31% | | | | |
| Ashton Woods USA | | | | |
| 9.50% due 10/01/2015 | | 75,000 | | 59,625 |
| Forest City Enterprises | | | | |
| 7.625% due 06/01/2015 | | 5,000 | | 4,700 |
| | | | |
| Strategic Bond Fund (continued) | | | |
| | | Shares or | | |
| | | Principal | | |
| | | Amount | | Value |
| |
|
| |
| CORPORATE BONDS (continued) | | | | |
| Real Estate (continued) | | | | |
| Host Marriott LP, REIT | | | | |
| 7.125% due 11/01/2013 | $ | 500,000 | $ | 497,500 |
| Kimball Hill, Inc. | | | | |
| 10.50% due 12/15/2012 | | 45,000 | | 32,850 |
| Realogy Corp. | | | | |
| 12.375% due 04/15/2015 | | 900,000 | | 662,625 |
| Ventas Realty LP/Ventas Capital Corp., REIT | | | |
| 6.50% due 06/01/2016 | | 35,000 | | 33,687 |
| 6.75% due 04/01/2017 | | 150,000 | | 145,875 |
| |
|
| | | | | 1,436,862 |
| Retail - 0.08% | | | | |
| Eye Care Centers of America | | | | |
| 10.75% due 02/15/2015 | | 35,000 | | 37,450 |
| Suburban Propane Partners LP | | | | |
| 6.875% due 12/15/2013 | | 365,000 | | 348,575 |
| |
|
| | | | | 386,025 |
| Retail Trade - 0.73% | | | | |
| American Greetings Corp. | | | | |
| 7.375% due 06/01/2016 | | 15,000 | | 14,175 |
| Blockbuster, Inc. | | | | |
| 9.00% due 09/01/2012 | | 175,000 | | 150,500 |
| CVS Corp. | | | | |
| 9.35% due 01/10/2023 | | 1,700,000 | | 1,972,000 |
| CVS Lease Pass Through | | | | |
| 6.036% due 12/10/2028 | | 463,211 | | 451,691 |
| Dollar General Corp. | | | | |
| 10.625% due 07/15/2015 (a) | | 190,000 | | 171,000 |
| Dollar General Corp., PIK | | | | |
| 11.875% due 07/15/2017 | | 210,000 | | 200,025 |
| FTD, Inc. | | | | |
| 7.75% due 02/15/2014 | | 130,000 | | 120,900 |
| Neiman Marcus Group, Inc. | | | | |
| 10.375% due 10/15/2015 | | 300,000 | | 322,500 |
| Neiman Marcus Group, Inc., PIK | | | | |
| 9.00% due 10/15/2015 | | 40,000 | | 42,200 |
| |
|
| | | | | 3,444,991 |
| Sanitary Services - 0.24% | | | | |
| Allied Waste North America, Inc. | | | | |
| 6.375% due 04/15/2011 | | 125,000 | | 123,125 |
| 7.25% due 03/15/2015 | | 250,000 | | 250,000 |
| Waste Management, Inc. | | | | |
| 6.375% due 11/15/2012 | | 730,000 | | 761,233 |
| |
|
| | | | | 1,134,358 |
| Semiconductors - 0.06% | | | | |
| Freescale Semiconductor, Inc. | | | | |
| 8.875% due 12/15/2014 | | 140,000 | | 129,150 |
| NXP BV / NXP Funding LLC | | | | |
| 7.875% due 10/15/2014 | | 120,000 | | 108,300 |
| 9.50% due 10/15/2015 | | 35,000 | | 30,275 |
| |
|
| | | | | 267,725 |
| Steel - 0.09% | | | | |
| Metals USA, Inc. | | | | |
| 11.125% due 12/01/2015 | | 265,000 | | 282,225 |
| | |
| The accompanying notes are an integral part of the financial statements. | 369 |
John Hancock Funds II
Portfolio of investments — August 31, 2007
(showing percentage of total net assets)
| | | | |
| Strategic Bond Fund (continued) | | | |
| | | Shares or | | |
| | | Principal | | |
| | | Amount | | Value |
| |
|
| |
| CORPORATE BONDS (continued) | | | | |
| | | | | |
| Steel (continued) | | | | |
| Tube City IMS Corp. | | | | |
| 9.75% due 02/01/2015 | $ | 155,000 | $ | 151,900 |
| |
|
| | | | | 434,125 |
| Telecommunications Equipment & | | | | |
| Services - 0.56% | | | | |
| Citizens Communications Company | | | | |
| 7.875% due 01/15/2027 | | 200,000 | | 187,500 |
| Deutsche Telekom International Finance BV | | | |
| 5.75% due 03/23/2016 | | 430,000 | | 423,074 |
| Hawaiian Telcom Communications, Inc., Series B | | | |
| 12.50% due 05/01/2015 | | 165,000 | | 174,900 |
| Intelsat Bermuda, Ltd. | | | | |
| 9.25% due 06/15/2016 | | 170,000 | | 175,100 |
| 11.25% due 06/15/2016 | | 510,000 | | 533,588 |
| Level 3 Financing, Inc. | | | | |
| 9.25% due 11/01/2014 | | 410,000 | | 394,625 |
| PAETEC Holding Corp. | | | | |
| 9.50% due 07/15/2015 | | 110,000 | | 105,050 |
| PanAmSat Corp. | | | | |
| 9.00% due 08/15/2014 | | 15,000 | | 15,263 |
| Royal KPN NV | | | | |
| 8.00% due 10/01/2010 | | 580,000 | | 621,116 |
| |
|
| | | | | 2,630,216 |
| Telephone - 0.75% | | | | |
| Cincinnati Bell Telephone Company | | | | |
| 6.30% due 12/01/2028 | | 95,000 | | 82,650 |
| Cincinnati Bell, Inc. | | | | |
| 7.00% due 02/15/2015 | | 85,000 | | 81,600 |
| Nordic Telephone Company Holdings | | | | |
| 8.875% due 05/01/2016 | | 395,000 | | 408,825 |
| Qwest Communications International, Inc., Series B | | | |
| 7.50% due 02/15/2014 | | 306,000 | | 300,645 |
| Qwest Corp. | | | | |
| 8.61% due 06/15/2013 (b) | | 90,000 | | 94,950 |
| 8.875% due 03/15/2012 | | 125,000 | | 135,313 |
| Sprint Capital Corp. | | | | |
| 8.375% due 03/15/2012 | | 940,000 | | 1,038,679 |
| Telecom Italia Capital SA | | | | |
| 5.25% due 10/01/2015 | | 500,000 | | 471,595 |
| Verizon Florida, Inc., Series F | | | | |
| 6.125% due 01/15/2013 | | 295,000 | | 303,308 |
| Virgin Media, Inc. | | | | |
| 9.125% due 08/15/2016 | | 300,000 | | 303,375 |
| Virgin Media, Inc., Series S | | | | |
| 8.75% due 04/15/2014 | | 20,000 | | 20,250 |
| Windstream Corp. | | | | |
| 8.625% due 08/01/2016 | | 255,000 | | 266,475 |
| |
|
| | | | | 3,507,665 |
| Tobacco - 0.22% | | | | |
| Alliance One International, Inc. | | | | |
| 8.50% due 05/15/2012 | | 50,000 | | 49,750 |
| 11.00% due 05/15/2012 | | 60,000 | | 62,700 |
| | | | |
| Strategic Bond Fund (continued) | | | |
| | | Shares or | | |
| | | Principal | | |
| | | Amount | | Value |
| |
|
| |
| CORPORATE BONDS (continued) | | | | |
| | | | | |
| Tobacco (continued) | | | | |
| Altria Group, Inc. | | | | |
| 7.00% due 11/04/2013 | $ | 870,000 | $ | 942,146 |
| |
|
| | | | | 1,054,596 |
| |
| Transportation - 0.01% | | | | |
| Gulfmark Offshore, Inc. | | | | |
| 7.75% due 07/15/2014 | | 40,000 | | 39,400 |
| | | | | |
| Trucking & Freight - 0.07% | | | | |
| Saint Acquisition Corp. | | | | |
| 12.50% due 05/15/2017 | | 315,000 | | 213,412 |
| 13.3075% due 05/15/2015 (b) | | 150,000 | | 104,250 |
| |
|
| | | | | 317,662 |
|
| |
| TOTAL CORPORATE BONDS (Cost $205,456,617) | | $ | 197,649,456 |
|
| |
| COLLATERALIZED MORTGAGE | | | | |
| OBLIGATIONS - 8.90% | | | | |
| Banc of America Commercial Mortgage, Inc., | | | |
| Series 2006-1, Class A4 | | | | |
| 5.372% due 09/10/2045 | | 340,000 | | 334,261 |
| Commercial Mortgage Asset Trust, | | | | |
| Series 1999-C1, Class C | | | | |
| 7.35% due 01/17/2032 | | 295,000 | | 320,127 |
| Commercial Mortgage Pass-Through Certificates, | | | |
| Series 2001-J2A, Class A1 | | | | |
| 5.447% due 07/16/2034 | | 292,476 | | 292,260 |
| Countrywide Alternative Loan Trust, Series | | | |
| 2006-OA9, Class 1A1 | | | | |
| 5.7375% due 07/20/2046 (b)*** | | 2,108,307 | | 2,060,594 |
| Countrywide Alternative Loan Trust, Series | | | |
| 2006-OA9, Class 2A1B | | | | |
| 5.7375% due 07/20/2046 (b)*** | | 1,437,710 | | 1,409,519 |
| Countrywide Home Loans, Series 2006-HYB3, | | | |
| Class 2A1A | | | | |
| 5.729% due 05/20/2036 (b) | | 134,409 | | 135,170 |
| Credit Suisse Mortgage Capital Certificates, Series | | | |
| 2006-C1, Class A4 | | | | |
| 5.609% due 02/15/2039 (b) | | 1,675,000 | | 1,665,367 |
| First Boston Mortgage Securities Corp., Series D | | | |
| 10.965% IO due 05/25/2017 *** | | 12,632 | | 3,365 |
| First Union National Bank Commercial Mortgage, | | | |
| Series 2000-C1 | | | | |
| 0.7795% IO due 05/17/2032 (b) | | 13,157,495 | | 258,997 |
| Freddie Mac, Series 3330, Class VA | | | | |
| 5.00% due 06/15/2018 | | 296,547 | | 291,007 |
| GMAC Mortgage Corp Loan Trust, Series | | | | |
| 2004-AR1, Class 24A | | | | |
| 5.081% due 06/25/2034 | | 832,814 | | 803,129 |
| Green Tree Financial Corp., Series 1997-6, Class A8 | | | |
| 7.07% due 01/15/2029 | | 488,634 | | 504,597 |
| GSMPS Mortgage Loan Trust, Series 2005-RP2, | | | |
| Class 1AF | | | | |
| 5.855% due 03/25/2035 (b) | | 857,323 | | 840,501 |
| GSR Mortgage Loan Trust, Series 2004-7, Class | | | |
| 4A1 | | | | |
| 4.837% due 06/25/2034 (b) | | 783,038 | | 742,538 |
| |
| The accompanying notes are an integral part of the financial statements. | 370 |
John Hancock Funds II
Portfolio of investments — August 31, 2007
(showing percentage of total net assets)
| | | | |
| Strategic Bond Fund (continued) | | | |
| | | Shares or | | |
| | | Principal | | |
| | | Amount | | Value |
| |
|
| |
| COLLATERALIZED MORTGAGE | | | | |
| OBLIGATIONS (continued) | | | | |
| GSRPM Mortgage Loan Trust, Series 2003-1, | | | |
| Class A3 | | | | |
| 6.005% due 01/25/2032 (b) | $ | 120,875 | $ | 120,689 |
| Impac CMB Trust, Series 2003-4, Class 1A1 | | | |
| 6.145% due 10/25/2033 (b)*** | | 83,112 | | 81,849 |
| IndyMac Index Mortgage Loan Trust, Series | | | |
| 2005-AR14, Class 2A1A | | | | |
| 5.805% due 08/25/2035 (b) | | 1,410,286 | | 1,384,899 |
| IndyMac Index Mortgage Loan Trust, Series | | | |
| 2006-AR6, Class 2A1A | | | | |
| 5.705% due 06/25/2047 (b)*** | | 3,795,677 | | 3,705,204 |
| J.P. Morgan Chase Commercial Mortgage | | | | |
| Securities Corp, Series 2006-CB15, Class A4 | | | |
| 5.814% due 06/12/2043 | | 2,370,000 | | 2,395,114 |
| J.P. Morgan Mortgage Trust, Series 2005-A6, | | | |
| Class 7A1 | | | | |
| 4.968% due 08/25/2035 (b) | | 108,128 | | 106,784 |
| Luminent Mortgage Trust, Series 2006-4, Class A1A | | | |
| 5.695% due 05/25/2046 (b)*** | | 1,863,982 | | 1,813,807 |
| Master Adjustable Rate Mortgages Trust., | | | | |
| Series 2006-2, Class 3A1 | | | | |
| 4.844% due 01/25/2036 (b) | | 152,318 | | 148,814 |
| Master Adjustable Rate Mortgages Trust., | | | | |
| Series 2006-OA1, Class 1A1 | | | | |
| 5.715% due 04/25/2046 (b)*** | | 2,821,394 | | 2,765,645 |
| MASTR Asset Securitization Trust, Series 2003-6, | | | |
| Class 1A1 | | | | |
| 5.50% due 07/25/2033 | | 1,223,487 | | 1,180,001 |
| Merit Securities Corp., Series 11PA, Class B2 | | | |
| 7.005% due 09/28/2032 (b)*** | | 541,721 | | 497,651 |
| Merrill Lynch Mortgage Trust, Series 2006-C1, | | | |
| Class A4 | | | | |
| 5.8426% due 05/12/2039 (b) | | 970,000 | | 976,154 |
| Morgan Stanley Mortgage Loan Trust, Series | | | |
| 2004-8AR, Class 4A1 | | | | |
| 5.349% due 10/25/2034 (b) | | 712,673 | | 714,647 |
| Novastar Mortgage-Backed Notes, Series | | | | |
| 2006-MTA1, Class 2A1A | | | | |
| 5.695% due 09/25/2046 (b)*** | | 1,749,781 | | 1,715,309 |
| Prime Mortgage Trust, Series 2006-DR1, Class 2A2 | | | |
| 6.00% due 05/25/2035 | | 2,132,424 | | 2,099,324 |
| Structured Asset Mortgage Investments, Inc., | | | |
| Series 2005-AR3, Class 2A1 | | | | |
| 7.509% due 08/25/2035 (b) | | 210,937 | | 211,993 |
| Structured Asset Mortgage Investments, Inc., | | | |
| Series 2006-AR6, Class 1A3 | | | | |
| 5.695% due 07/25/2036 (b)*** | | 2,172,349 | | 2,110,901 |
| Thornburg Mortgage Securities Trust, Series | | | |
| 2006-3, Class A2 | | | | |
| 5.61% due 06/25/2036 (b)*** | | 2,459,000 | | 2,443,104 |
| Thornburg Mortgage Securities Trust, Series | | | |
| 2006-3, Class A3 | | | | |
| 5.615% due 06/25/2036 (b)*** | | 2,507,605 | | 2,490,897 |
| Thornburg Mortgage Securities Trust, Series | | | |
| 2007-4, Class 2A1 | | | | |
| 6.24% due 09/25/2037 | | 1,920,000 | | 1,920,000 |
| | | | |
| Strategic Bond Fund (continued) | | | |
| | | Shares or | | |
| | | Principal | | |
| | | Amount | | Value |
| |
|
| |
| COLLATERALIZED MORTGAGE | | | | |
| OBLIGATIONS (continued) | | | | |
| Thornburg Mortgage Securities Trust, Series | | | |
| 2007-4, Class 3A1 | | | | |
| 6.228% due 09/25/2037 (b) | $ | 1,750,000 | $ | 1,725,117 |
| Washington Mutual, Inc., Series 2005-AR17, | | | |
| Class A1A1 | | | | |
| 5.775% due 12/25/2045 (b)*** | | 1,484,010 | | 1,448,216 |
|
| TOTAL COLLATERALIZED MORTGAGE OBLIGATIONS | | |
| (Cost $42,182,370) | | | $ | 41,717,551 |
|
| |
| ASSET BACKED SECURITIES - 8.73% | | | |
| ACE Securities Corp., Series 2006-GP1, Class A | | | |
| 5.635% due 02/25/2031 (b)*** | | 1,727,531 | | 1,696,354 |
| Amortizing Residential Corp. Trust, | | | | |
| Series 2002-BC6, Class M2 | | | | |
| 6.705% due 08/25/2032 (b)*** | | 72,538 | | 61,253 |
| Asset Backed Securities Corp., | | | | |
| Series 2003-HE2, Class M2 | | | | |
| 8.1605% due 04/15/2033 (b)*** | | 61,912 | | 58,329 |
| Bear Stearns Asset Backed Securities Inc., Series | | | |
| 2003-ABF1, Class A | | | | |
| 5.875% due 01/25/2034 (b)*** | | 52,756 | | 49,885 |
| Bear Stearns Asset Backed Securities Inc., Series | | | |
| 2007-SD1, Class 1A2A | | | | |
| 6.00% due 10/25/2036 | | 3,186,568 | | 3,086,988 |
| Bear Stearns Asset Backed Securities Inc., Series | | | |
| 2007-SD1, Class 1A3A | | | | |
| 6.50% due 10/25/2036 | | 3,169,210 | | 3,172,677 |
| Bear Stearns Asset Backed Securities Trust, | | | |
| Series 2007-HE6, Class 1A1 | | | | |
| 6.7575% due 08/25/2037 (b) | | 2,300,000 | | 2,314,114 |
| Countrywide Asset-Backed Certificates, | | | | |
| Series 2004-5, Class M4 | | | | |
| 6.76% due 06/25/2034 (b)*** | | 590,000 | | 542,491 |
| Ellington Loan Acquisition Trust, Series 2007-1, | | | |
| Class A2A1 | | | | |
| 6.60% due 05/26/2037 (b) | | 2,300,000 | | 2,303,629 |
| Ellington Loan Acquisition Trust, Series 2007-1, | | | |
| Class A2C | | | | |
| 6.85% due 05/29/2037 (b) | | 2,300,000 | | 2,317,915 |
| EMC Mortgage Loan Trust, Series 2003-B, Class A1 | | | |
| 6.055% due 11/25/2041 (b)*** | | 271,092 | | 258,623 |
| GSAMP Trust, Series 2006-S4, Class A1 | | | | |
| 5.595% due 05/25/2036 (b)*** | | 933,758 | | 915,124 |
| IndyMac Seconds Asset Backed Trust, Series | | | |
| 2006-A, Class A | | | | |
| 5.635% due 06/25/2036 (b)*** | | 1,733,989 | | 1,601,537 |
| IXIS Real Estate Capital Trust, Series 2006-HE2, | | | |
| Class A1 | | | | |
| 5.565% due 08/25/2036 (b)*** | | 1,340,951 | | 1,336,839 |
| Merrill Lynch Mortgage Investors, Inc., Series | | | |
| 2005-WM1N, Class N1 | | | | |
| 5.00% due 09/25/2035 *** | | 4,267 | | 3,932 |
| Mid State Trust, Series 6, Class A1 | | | | |
| 7.34% due 07/01/2035 *** | | 610,053 | | 650,846 |
| Morgan Stanley Mortgage Loan Trust, Series | | | |
| 2006-4SL, Class A1 | | | | |
| 5.655% due 03/25/2036 (b)*** | | 1,332,866 | | 1,287,740 |
| |
| The accompanying notes are an integral part of the financial statements. | 371 |
John Hancock Funds II
Portfolio of investments — August 31, 2007
(showing percentage of total net assets)
| | | | |
| Strategic Bond Fund (continued) | | | |
| | | Shares or | | |
| | | Principal | | |
| | | Amount | | Value |
| |
|
| |
| ASSET BACKED SECURITIES | | | | |
| (continued) | | | | |
| RAAC Series, Series 2006-RP2, Class A | | | | |
| 5.755% due 02/25/2037 (b)*** | $ | 1,771,588 | $ | 1,705,777 |
| Residential Asset Mortgage Products Inc., Series | | | |
| 2003-RS4, Class AIIB | | | | |
| 6.165% due 05/25/2033 (b) | | 55,186 | | 52,627 |
| SACO I Trust, Inc., Series 2006-5, Class 1A | | | |
| 5.655% due 04/25/2036 (b)*** | | 2,645,199 | | 2,258,837 |
| SACO I Trust, Inc., Series 2006-5, Class 2A3 | | | |
| 5.685% due 05/25/2036 (b)*** | | 2,040,000 | | 1,739,786 |
| SACO I Trust, Inc., Series 2006-6, Class A | | | | |
| 5.635% due 06/25/2036 (b)*** | | 1,622,456 | | 1,436,199 |
| Sail Net Interest Margin Notes, Series 2004-2A, | | | |
| Class A | | | | |
| 5.50% due 03/27/2034 *** | | 23,428 | | 976 |
| Securitized Asset Backed Receivables LLC, Series | | | |
| 2007-BR2, Class A2 | | | | |
| 5.735% due 02/25/2037 (b) | | 4,286,175 | | 4,197,285 |
| SLM Student Loan Trust, Series 2006-5, Class A2 | | | |
| 5.35% due 07/25/2017 (b)*** | | 2,209,600 | | 2,209,666 |
| Structured Asset Securities Corp., Series | | | | |
| 2006-ARS1, Class A1 | | | | |
| 5.615% due 02/25/2036 (b)*** | | 1,777,588 | | 1,466,664 |
| Structured Asset Securities Corp., Series | | | | |
| 2007-TC1, Class A | | | | |
| 5.805% due 04/25/2031 (b) | | 4,289,542 | | 4,200,401 |
|
| TOTAL ASSET BACKED SECURITIES | | | | |
| (Cost $42,803,932) | | | $ | 40,926,494 |
|
| |
| SUPRANATIONAL OBLIGATIONS - 0.21% | | | |
| | | | | |
| Venezuela - 0.21% | | | | |
| Corporacion Andina de Fomento, Series EXCH | | | |
| 6.875% due 03/15/2012 | | 916,000 | | 975,663 |
|
| TOTAL SUPRANATIONAL OBLIGATIONS | | | |
| (Cost $984,820) | | | $ | 975,663 |
|
| |
| COMMON STOCKS - 0.00% | | | | |
| | | | | |
| Household Products - 0.00% | | | | |
| Home Interiors * | | 674,617 | | 6,746 |
|
| TOTAL COMMON STOCKS (Cost $183,738) | | $ | 6,746 |
|
| |
| PREFERRED STOCKS - 0.36% | | | | |
| | | | | |
| Automobiles - 0.35% | | | | |
| General Motors Corp., Series C | | 76,275 | | 1,623,895 |
| | | | |
| Crude Petroleum & Natural Gas - 0.01% | | | |
| Chesapeake Energy Corp. * | | 266 | | 66,500 |
|
| TOTAL PREFERRED STOCKS (Cost $1,898,021) | | $ | 1,690,395 |
|
| |
| OPTIONS - 0.15% | | | | |
| | | | | |
| Call Options - 0.15% | | | | |
| Eurodollar Futures | | | | |
| Expiration 12/17/2007 at $94.00 | | 145,000 | | 154,425 |
| Expiration 09/17/2007 at $94.00 | | 1,017,500 | | 506,206 |
| Expiration 09/17/2007 at $94.50 | | 7,500 | | 619 |
| Expiration 09/17/2007 at $94.75 | | 240,000 | | 6,000 |
| | | | |
| Strategic Bond Fund (continued) | | | |
| | | Shares or | | |
| | | Principal | | |
| | | Amount | | Value |
|
|
| |
| OPTIONS (continued) | | | | |
| Call Options (continued) | | | | |
| U.S. Treasury Notes 10 Year Futures | | | | |
| Expiration 11/20/2007 at $132.00 | | 296,000 $ | | 4,625 |
| |
|
| | | | | 671,875 |
| |
| Put Options - 0.00% | | | | |
| Eurodollar Futures | | | | |
| Expiration 12/17/2007 at $94.125 | | 192,500 | | 481 |
| Sterling Interest Rate Futures | | | | |
| Expiration 09/19/2007 at $92.875 | | 42,500 | | 0 |
| | |
| | | | | 481 |
|
| |
| TOTAL OPTIONS (Cost $1,032,791) | | | $ | 672,356 |
|
| |
| SHORT TERM INVESTMENTS - 3.38% | | | |
| Bank Negara Malaysia Monetary Notes, Series 1807 | | | |
| zero coupon due 11/01/2007 to | | | | |
| 12/06/2007 | MYR | 6,037,000 | $ | 1,712,984 |
| Egypt Treasury Bills, Series 364 | | | | |
| zero coupon due 03/25/2008 to | | | | |
| 04/01/2008 | EGP | 1,175,000 | | 198,042 |
| Federal National Mortgage Association Discount | | | |
| Notes | | | | |
| zero coupon due 03/17/2008 **** | $ | 2,835,000 | | 2,760,181 |
| J.P. Morgan Chase London, Series EMTN | | | | |
| zero coupon due 10/30/2007 | | 3,020,000 | | 2,975,762 |
| John Hancock Cash Investment Trust (c) | | 8,183,172 | | 8,183,172 |
|
| TOTAL SHORT TERM INVESTMENTS | | | | |
| (Cost $15,845,804) | | | $ | 15,830,141 |
|
| |
| REPURCHASE AGREEMENTS - 18.88% | | | |
| Merrill Lynch Tri-Party Repurchase | | | | |
| Agreement dated 08/31/2007 at | | | | |
| 5.14% to be repurchased at | | | | |
| $88,550,543 on 09/04/2007, | | | | |
| collateralized by $175,000,000 | | | | |
| Federal Home Loan Bank, 5.625% | | | | |
| due 02/09/2010 (valued at | | | | |
| $59,226,063, including interest) | | | | |
| and $62,356,000 Resolution | | | | |
| Funding Corp., zero coupon due | | | | |
| 01/15/2021 (valued at | | | | |
| $31,645,500, including interest) | $ | 88,500,000 | $ | 88,500,000 |
|
| TOTAL REPURCHASE AGREEMENTS | | | | |
| (Cost $88,500,000) | | | $ | 88,500,000 |
|
| Total Investments (Strategic Bond Fund) | | | | |
| (Cost $625,243,667) - 131.44% | | | $ | 616,012,959 |
| Liabilities in Excess of Other Assets - (31.44)% | | | (147,343,111) |
| |
|
| TOTAL NET ASSETS - 100.00% | | | $ | 468,669,848 |
| |
|
| | |
| The accompanying notes are an integral part of the financial statements. | 372 | |
John Hancock Funds II
Portfolio of investments — August 31, 2007
(showing percentage of total net assets)
| | | | |
| Strategic Income Fund | | | | |
| | | Shares or | | |
| | | Principal | | |
| | | Amount | | Value |
|
|
| |
| U.S. TREASURY OBLIGATIONS - 5.66% | | | |
| | | | | |
| U.S. Treasury Bonds - 0.80% | | | | |
| 8.125% due 08/15/2019 | $ | 930,000 | $ | 1,212,996 |
| 9.25% due 02/15/2016 *** | | 1,635,000 | | 2,172,124 |
| |
|
| | | | | 3,385,120 |
| U.S. Treasury Notes - 4.86% | | | | |
| 4.25% due 11/15/2013 | | 7,380,000 | | 7,355,210 |
| 4.625% due 07/31/2009 *** | | 6,680,000 | | 6,734,796 |
| 4.75% due 05/15/2014 | | 3,445,000 | | 3,523,050 |
| 4.875% due 08/15/2016 *** | | 2,875,000 | | 2,946,651 |
| |
|
| | | | | 20,559,707 |
|
| TOTAL U.S. TREASURY OBLIGATIONS | | | | |
| (Cost $23,381,823) | | | $ | 23,944,827 |
|
| |
| U.S. GOVERNMENT AGENCY OBLIGATIONS - 11.59% | | |
| | | | | |
| Federal National Mortgage | | | | |
| Association - 11.59% | | | | |
| 5.375% due 06/12/2017 | | 7,265,000 | | 7,404,662 |
| 5.493% due 03/01/2037 | | 1,604,973 | | 1,595,621 |
| 5.50% due 10/01/2036 to 06/01/2037 | | 6,514,860 | | 6,363,237 |
| 5.50% TBA ** | | 6,510,000 | | 6,357,419 |
| 6.00% due 08/01/2022 to 01/01/2037 | | 17,087,710 | | 17,163,864 |
| 6.00% TBA ** | | 2,095,000 | | 2,092,381 |
| 6.50% due 11/01/2036 to 08/01/2037 | | 7,885,110 | | 8,004,420 |
| |
|
| | | | | 48,981,604 |
|
| TOTAL U.S. GOVERNMENT AGENCY OBLIGATIONS | | |
| (Cost $48,846,919) | | | $ | 48,981,604 |
|
| |
| FOREIGN GOVERNMENT OBLIGATIONS - 27.70% | | |
| Austria - 0.18% | | | | |
| Republic of Austria, Series EMTN | | | | |
| 6.00% due 09/26/2008 | NZD | 1,120,000 | | 768,794 |
| Canada - 16.07% | | | | |
| Government of Canada | | | | |
| 4.00% due 06/01/2016 | CAD | 18,010,000 | | 16,552,113 |
| 4.25% due 12/01/2008 | | 10,105,000 | | 9,548,130 |
| 4.25% due 09/01/2009 | | 3,265,000 | | 3,083,989 |
| 6.00% due 06/01/2011 | | 15,555,000 | | 15,546,310 |
| Province of Ontario | | | | |
| 4.40% due 03/08/2016 | | 4,325,000 | | 4,004,505 |
| 4.50% due 03/08/2015 | | 3,085,000 | | 2,885,195 |
| 5.70% due 12/01/2008 | | 6,125,000 | | 5,876,891 |
| 6.25% due 06/16/2015 | | 2,215,000 | | 1,438,883 |
| 6.375% due 10/12/2010 | NZD | 5,010,000 | | 3,377,937 |
| Province of Quebec | | | | |
| 5.25% due 10/01/2013 | CAD | 5,775,000 | | 5,621,835 |
| |
|
| | | | | 67,935,788 |
| Colombia - 0.97% | | | | |
| Republic of Colombia | | | | |
| 10.00% due 01/23/2012 | $ | 110,000 | | 126,390 |
| 10.75% due 01/15/2013 | | 3,290,000 | | 3,966,095 |
| |
|
| | | | | 4,092,485 |
| | | | |
| Strategic Income Fund (continued) | | |
| | | Shares or | | |
| | | Principal | | |
| | | Amount | | Value |
|
|
| |
| FOREIGN GOVERNMENT OBLIGATIONS | | | |
| (continued) | | | | |
| | | | | |
| France - 2.28% | | | | |
| Government of France | | | | |
| 4.75% due 10/25/2012 | EUR | 6,895,000 | $ | 9,644,412 |
| | | | | |
| Germany - 2.70% | | | | |
| Bundesrepublik Deutschland, Series 05 | | | | |
| 3.50% due 01/04/2016 | | 5,515,000 | | 7,148,517 |
| Federal Republic of Germany | | | | |
| 5.00% due 07/04/2012 | | 3,005,000 | | 4,251,336 |
| |
|
| | | | | 11,399,853 |
| Mexico - 0.50% | | | | |
| Government of Mexico | | | | |
| 5.625% due 01/15/2017 | $ | 520,000 | | 519,740 |
| 5.875% due 01/15/2014 | | 550,000 | | 559,625 |
| 6.375% due 01/16/2013 | | 490,000 | | 509,600 |
| 8.125% due 12/30/2019 | | 360,000 | | 438,300 |
| 10.375% due 02/17/2009 | | 80,000 | | 85,680 |
| |
|
| | | | | 2,112,945 |
| Spain - 3.67% | | | | |
| Kingdom of Spain | | | | |
| 4.20% due 07/30/2013 | EUR | 5,035,000 | | 6,856,956 |
| 5.00% due 07/30/2012 | | 2,470,000 | | 3,488,041 |
| 5.35% due 10/31/2011 | | 3,620,000 | | 5,153,258 |
| |
|
| | | | | 15,498,255 |
| United Kingdom - 1.33% | | | | |
| Government of United Kingdom | | | | |
| 4.00% due 03/07/2009 | GBP | 405,000 | | 801,012 |
| 5.00% due 03/07/2008 | | 2,405,000 | | 4,837,432 |
| |
|
| | | | | 5,638,444 |
|
| TOTAL FOREIGN GOVERNMENT OBLIGATIONS | | |
| (Cost $112,289,614) | | | $ | 117,090,976 |
|
| |
| CORPORATE BONDS - 33.35% | | | | |
| | | | | |
| Advertising - 0.07% | | | | |
| Vertis, Inc. | | | | |
| 9.75% due 04/01/2009 | $ | 300,000 | | 297,000 |
| | | | | |
| Aerospace - 0.12% | | | | |
| Sequa Corp. | | | | |
| 9.00% due 08/01/2009 | | 475,000 | | 491,625 |
| | | | | |
| Amusement & Theme Parks - 0.22% | | | | |
| HRP Myrtle Beach Operations LLC | | | | |
| 10.07% due 04/01/2012 (b) | | 970,000 | | 921,500 |
| | | | | |
| Apparel & Textiles - 0.45% | | | | |
| Hanesbrands, Inc., Series B | | | | |
| 8.7841% due 12/15/2014 (b) | | 1,885,000 | | 1,882,644 |
| | | | | |
| Banking - 0.57% | | | | |
| Banco Macro SA | | | | |
| 8.50% due 02/01/2017 | | 1,265,000 | | 1,053,113 |
| BanColombia SA | | | | |
| 6.875% due 05/25/2017 | | 635,000 | | 590,550 |
| Landwirtschaftliche Rentenbank, Series EMTN | | | |
| 6.50% due 09/17/2009 | NZD | 1,115,000 | | 760,274 |
| |
|
| | | | | 2,403,937 |
| |
| The accompanying notes are an integral part of the financial statements. | 373 |
John Hancock Funds II
Portfolio of investments — August 31, 2007
(showing percentage of total net assets)
| | | | |
| Strategic Income Fund (continued) | | |
| | | Shares or | | |
| | | Principal | | |
| | | Amount | | Value |
|
|
| |
| CORPORATE BONDS (continued) | | | | |
| | | | | |
| Broadcasting - 0.71% | | | | |
| Allbritton Communications Company | | | | |
| 7.75% due 12/15/2012 | $ | 1,925,000 | $ | 1,881,687 |
| Radio One, Inc. | | | | |
| 6.375% due 02/15/2013 | | 225,000 | | 196,313 |
| 8.875% due 07/01/2011 | | 200,000 | | 192,000 |
| Salem Communications Corp. | | | | |
| 7.75% due 12/15/2010 | | 100,000 | | 99,250 |
| XM Satellite Radio, Inc. | | | | |
| 9.75% due 05/01/2014 | | 685,000 | | 650,750 |
| |
|
| | | | | 3,020,000 |
| Business Services - 0.86% | | | | |
| Allied Security Escrow Corp. | | | | |
| 11.375% due 07/15/2011 | | 200,000 | | 199,000 |
| Minerva Overseas, Ltd. | | | | |
| 9.50% due 02/01/2017 | | 2,540,000 | | 2,387,600 |
| West Corp. | | | | |
| 11.00% due 10/15/2016 | | 1,020,000 | | 1,035,300 |
| |
|
| | | | | 3,621,900 |
| Cable & Television - 1.07% | | | | |
| Charter Communications Holdings II LLC/Charter | | | |
| Communications Holdings II Capital Corp. | | | |
| 10.25% due 09/15/2010 | | 1,775,000 | | 1,792,750 |
| Mediacom Broadband LLC | | | | |
| 8.50% due 10/15/2015 | | 75,000 | | 74,250 |
| Mediacom LLC/Mediacom Capital Corp. | | | | |
| 9.50% due 01/15/2013 | | 125,000 | | 125,000 |
| Shaw Communications, Inc. | | | | |
| 5.70% due 03/02/2017 | CAD | 610,000 | | 540,382 |
| Sinclair Broadcast Group, Inc. | | | | |
| 8.00% due 03/15/2012 | $ | 699,000 | | 705,990 |
| Young Broadcasting, Inc. | | | | |
| 10.00% due 03/01/2011 | | 1,405,000 | | 1,264,500 |
| |
|
| | | | | 4,502,872 |
| Cellular Communications - 1.80% | | | | |
| American Cellular Corp. | | | | |
| 10.00% due 08/01/2011 | | 2,000,000 | | 2,075,000 |
| Centennial Communications Corp. | | | | |
| 10.00% due 01/01/2013 | | 1,995,000 | | 2,084,775 |
| Dobson Communications Corp. | | | | |
| 8.875% due 10/01/2013 | | 1,500,000 | | 1,586,250 |
| Rural Cellular Corp. | | | | |
| 8.36% due 06/01/2013 (b) | | 840,000 | | 856,800 |
| 11.106% due 11/01/2012 | | 995,000 | | 1,024,850 |
| |
|
| | | | | 7,627,675 |
| Chemicals - 0.18% | | | | |
| American Pacific Corp. | | | | |
| 9.00% due 02/01/2015 | | 675,000 | | 664,875 |
| Nova Chemicals Corp. | | | | |
| 6.50% due 01/15/2012 | | 125,000 | | 116,250 |
| |
|
| | | | | 781,125 |
| Coal - 0.05% | | | | |
| Massey Energy Company | | | | |
| 6.625% due 11/15/2010 | | 200,000 | | 196,500 |
| | | | |
| Strategic Income Fund (continued) | | |
| | | Shares or | | |
| | | Principal | | |
| | | Amount | | Value |
|
|
| |
| CORPORATE BONDS (continued) | | | | |
| | | | | |
| Commercial Services - 0.16% | | | | |
| Aramark Corp. | | | | |
| 8.85625% due 02/01/2015 (b) | $ | 700,000 | $ | 696,500 |
| | | | | |
| Containers & Glass - 2.53% | | | | |
| BWAY Corp. | | | | |
| 10.00% due 10/15/2010 | | 1,995,000 | | 2,034,900 |
| Graphic Packaging International Corp. | | | | |
| 8.50% due 08/15/2011 | | 1,000,000 | | 1,010,000 |
| 9.50% due 08/15/2013 | | 1,500,000 | | 1,515,000 |
| OI European Group BV | | | | |
| 6.875% due 03/31/2017 | EUR | 410,000 | | 533,794 |
| Owens-Brockway Glass Container, Inc. | | | | |
| 8.25% due 05/15/2013 | $ | 1,450,000 | | 1,486,250 |
| Smurfit-Stone Container Enterprises, Inc. | | | | |
| 8.00% due 03/15/2017 | | 760,000 | | 724,850 |
| 8.375% due 07/01/2012 | | 2,760,000 | | 2,704,800 |
| US Corrugated, Inc. | | | | |
| 10.00% due 06/12/2013 | | 715,000 | | 672,100 |
| |
|
| | | | | 10,681,694 |
| |
| Crude Petroleum & Natural Gas - 0.73% | | | | |
| Denbury Resources, Inc. | | | | |
| 7.50% due 12/15/2015 | | 600,000 | | 597,000 |
| Dune Energy, Inc. | | | | |
| 10.50% due 06/01/2012 | | 1,310,000 | | 1,231,400 |
| Energy XXI Gulf Coast, Inc. | | | | |
| 10.00% due 06/15/2013 | | 965,000 | | 897,450 |
| W&T Offshore, Inc. | | | | |
| 8.25% due 06/15/2014 | | 380,000 | | 354,350 |
| |
|
| | | | | 3,080,200 |
| |
| Diversified Financial Services - 0.60% | | | | |
| General Electric Capital Corp. | | | | |
| 6.625% due 02/04/2010 | NZD | 3,745,000 | | 2,546,112 |
| | | | | |
| Electrical Utilities - 0.23% | | | | |
| Cia de Transporte de Energia Electrica de Alta | | | |
| Tension SA | | | | |
| 8.875% due 12/15/2016 | $ | 1,085,000 | | 954,800 |
| | | | | |
| Financial Services - 8.45% | | | | |
| Canada Housing Trust | | | | |
| 4.80% due 06/15/2012 | CAD | 7,325,000 | | 7,006,018 |
| Capital One Capital IV | | | | |
| 6.745% due 02/17/2037 (b) | $ | 425,000 | | 354,773 |
| Cosan Finance, Ltd. | | | | |
| 7.00% due 02/01/2017 | | 960,000 | | 896,400 |
| Ford Motor Credit Company | | | | |
| 7.80% due 06/01/2012 | | 495,000 | | 456,044 |
| Independencia International, Ltd. | | | | |
| 9.875% due 01/31/2017 | | 1,635,000 | | 1,585,950 |
| ISA Capital do Brasil SA | | | | |
| 8.80% due 01/30/2017 | | 470,000 | | 482,925 |
| Local TV Finance LLC | | | | |
| 9.25% due 06/15/2015 | | 240,000 | | 219,600 |
| New South Wales Treasury Corp, Series 10RG | | | |
| 7.00% due 12/01/2010 | AUD | 25,155,000 | | 20,748,014 |
| Nexstar Finance, Inc. | | | | |
| 7.00% due 01/15/2014 | $ | 930,000 | | 878,850 |
| |
| The accompanying notes are an integral part of the financial statements. | 374 |
John Hancock Funds II
Portfolio of investments — August 31, 2007
(showing percentage of total net assets)
| | | | |
| Strategic Income Fund (continued) | | |
| | | Shares or | | |
| | | Principal | | |
| | | Amount | | Value |
|
|
| |
| CORPORATE BONDS (continued) | | | | |
| | | | | |
| Financial Services (continued) | | | | |
| Orascom Telecom Finance | | | | |
| 7.875% due 02/08/2014 | $ | 425,000 | $ | 387,813 |
| TAM Capital, Inc. | | | | |
| 7.375% due 04/25/2017 | | 890,000 | | 756,500 |
| Toyota Motor Credit Corp, Series EMTN | | | | |
| 6.75% due 09/21/2009 | NZD | 2,300,000 | | 1,571,060 |
| Ucar Finance, Inc. | | | | |
| 10.25% due 02/15/2012 | $ | 362,000 | | 378,290 |
| |
|
| | | | | 35,722,237 |
| |
| Food & Beverages - 0.46% | | | | |
| Cosan SA Industria e Comercio | | | | |
| 8.25% due 02/28/2049 | | 1,000,000 | | 975,000 |
| Sadia Overseas, Ltd. | | | | |
| 6.875% due 05/24/2017 | | 1,005,000 | | 957,263 |
| |
|
| | | | | 1,932,263 |
| |
| Gas & Pipeline Utilities - 1.35% | | | | |
| Atlas Pipeline Partners LP | | | | |
| 8.125% due 12/15/2015 | | 200,000 | | 198,500 |
| Dynegy-Roseton Danskammer, Series B | | | | |
| 7.67% due 11/08/2016 | | 1,000,000 | | 991,250 |
| KN Capital Trust I, Series B | | | | |
| 8.56% due 04/15/2027 | | 320,000 | | 272,544 |
| MarkWest Energy Partners LP, Series B | | | | |
| 8.50% due 07/15/2016 | | 2,150,000 | | 2,139,250 |
| Regency Energy Partners LP/Regency Energy | | | |
| Finance Corp. | | | | |
| 8.375% due 12/15/2013 | | 903,000 | | 930,090 |
| Southern Union Company | | | | |
| 7.20% due 11/01/2066 (b) | | 705,000 | | 709,687 |
| Williams Partners Finance Corp. | | | | |
| 7.25% due 02/01/2017 | | 460,000 | | 455,400 |
| |
|
| | | | | 5,696,721 |
| |
| Gold - 0.17% | | | | |
| New Gold, Inc. | | | | |
| 10.00% due 06/28/2017 | CAD | 970,000 | | 725,594 |
| | | | | |
| Healthcare Products - 0.28% | | | | |
| Hanger Orthopedic Group, Inc. | | | | |
| 10.25% due 06/01/2014 | $ | 1,150,000 | | 1,175,875 |
| | | | | |
| Healthcare Services - 0.14% | | | | |
| Healthsouth Corp. | | | | |
| 11.4091% due 06/15/2014 (b) | | 595,000 | | 609,875 |
| | | | | |
| Hotels & Restaurants - 1.37% | | | | |
| CCM Merger, Inc. | | | | |
| 8.00% due 08/01/2013 | | 3,585,000 | | 3,423,675 |
| Dave & Buster's, Inc. | | | | |
| 11.25% due 03/15/2014 | | 2,080,000 | | 1,986,400 |
| Landry's Restaurants, Inc., Series B | | | | |
| 7.50% due 12/15/2014 | | 390,000 | | 390,488 |
| |
|
| | | | | 5,800,563 |
| |
| Industrial Machinery - 0.27% | | | | |
| Manitowoc, Inc. | | | | |
| 7.125% due 11/01/2013 | | 1,170,000 | | 1,137,825 |
| | | | |
| Strategic Income Fund (continued) | | |
| | | Shares or | | |
| | | Principal | | |
| | | Amount | | Value |
|
|
| |
| CORPORATE BONDS (continued) | | | | |
| | | | | |
| Insurance - 0.09% | | | | |
| Sul America Participacoes SA | | | | |
| 8.625% due 02/15/2012 | $ | 395,000 | $ | 397,962 |
| | | | | |
| International Oil - 0.63% | | | | |
| Pemex Project Funding Master Trust | | | | |
| 5.75% due 12/15/2015 | | 130,000 | | 128,570 |
| 7.375% due 12/15/2014 | | 1,140,000 | | 1,245,687 |
| 9.125% due 10/13/2010 | | 1,180,000 | | 1,296,230 |
| |
|
| | | | | 2,670,487 |
| Leisure Time - 4.88% | | | | |
| AMC Entertainment, Inc. | | | | |
| 8.00% due 03/01/2014 | | 1,725,000 | | 1,595,625 |
| Caesars Entertainment, Inc. | | | | |
| 7.00% due 04/15/2013 | | 110,000 | | 113,300 |
| Choctaw Resort Development Enterprise | | | | |
| 7.25% due 11/15/2019 | | 242,000 | | 232,925 |
| Chukchansi Economic Development Authority | | | |
| 8.00% due 11/15/2013 | | 610,000 | | 606,950 |
| Cinemark, Inc. | | | | |
| zero coupon, Step up to 9.75% on | | | | |
| 03/15/2009 due 03/15/2014 | | 1,000,000 | | 925,000 |
| Fontainebleau Las Vegas Holdings | | | | |
| 10.25% due 06/15/2015 | | 610,000 | | 523,075 |
| Great Canadian Gaming Corp. | | | | |
| 7.25% due 02/15/2015 | | 1,000,000 | | 960,000 |
| Isle of Capri Casinos | | | | |
| 7.00% due 03/01/2014 | | 810,000 | | 702,675 |
| Jacobs Entertainment, Inc. | | | | |
| 9.75% due 06/15/2014 | | 2,425,000 | | 2,418,937 |
| Little Traverse Bay Bands of Odawa Indians | | | |
| 10.25% due 02/15/2014 | | 1,000,000 | | 1,005,000 |
| Marquee Holdings, Inc. | | | | |
| 12 due 08/15/2014 | | 895,000 | | 751,800 |
| MGM Mirage, Inc. | | | | |
| 6.75% due 09/01/2012 | | 475,000 | | 460,750 |
| 7.625% due 01/15/2017 | | 760,000 | | 752,400 |
| Mohegan Tribal Gaming Authority | | | | |
| 6.375% due 07/15/2009 | | 315,000 | | 309,488 |
| 7.125% due 08/15/2014 | | 2,735,000 | | 2,673,463 |
| MTR Gaming Group, Inc., Series B | | | | |
| 9.00% due 06/01/2012 | | 1,500,000 | | 1,500,000 |
| Penn National Gaming, Inc. | | | | |
| 6.75% due 03/01/2015 | | 300,000 | | 300,750 |
| 6.875% due 12/01/2011 | | 100,000 | | 100,000 |
| Pinnacle Entertainment, Inc. | | | | |
| 7.50% due 06/15/2015 | | 575,000 | | 529,000 |
| Pokagon Gaming Authority | | | | |
| 10.375% due 06/15/2014 | | 500,000 | | 535,000 |
| Station Casinos, Inc. | | | | |
| 6.50% due 02/01/2014 | | 400,000 | | 339,000 |
| 6.625% due 03/15/2018 | | 325,000 | | 261,625 |
| 6.875% due 03/01/2016 | | 175,000 | | 146,562 |
| Turning Stone Resort Casino | | | | |
| 9.125% due 09/15/2014 | | 1,460,000 | | 1,474,600 |
| 9.125% due 12/15/2010 | | 1,300,000 | | 1,313,000 |
| |
| The accompanying notes are an integral part of the financial statements. | 375 |
John Hancock Funds II
Portfolio of investments — August 31, 2007
(showing percentage of total net assets)
| | | | |
| Strategic Income Fund (continued) | | |
| | | Shares or | | |
| | | Principal | | |
| | | Amount | | Value |
| |
|
| |
| CORPORATE BONDS (continued) | | | | |
| Leisure Time (continued) | | | | |
| Waterford Gaming LLC | | | | |
| 8.625% due 09/15/2012 | $ | 85,000 | $ | 86,700 |
| |
|
| | | | | 20,617,625 |
| |
| Liquor - 0.26% | | | | |
| Constellation Brands, Inc. | | | | |
| 7.25% due 05/15/2017 | | 1,130,000 | | 1,096,100 |
| | | | | |
| Medical-Hospitals - 0.43% | | | | |
| HCA, Inc. | | | | |
| 9.125% due 11/15/2014 | | 460,000 | | 471,500 |
| Sun Healthcare Group, Inc. | | | | |
| 9.125% due 04/15/2015 | | 1,325,000 | | 1,325,000 |
| |
|
| | | | | 1,796,500 |
| |
| Metal & Metal Products - 0.31% | | | | |
| Blaze Recycling & Metals LLC / Blaze Finance Corp. | | | |
| 10.875% due 07/15/2012 | | 380,000 | | 375,250 |
| PNA Group, Inc. | | | | |
| 10.75% due 09/01/2016 | | 920,000 | | 948,750 |
| |
|
| | | | | 1,324,000 |
| |
| Mining - 0.46% | | | | |
| Drummond Company, Inc. | | | | |
| 7.375% due 02/15/2016 | | 2,035,000 | | 1,933,250 |
| | | | | |
| Paper - 0.23% | | | | |
| Buckeye Technologies, Inc. | | | | |
| 9.25% due 09/15/2008 | | 92,000 | | 92,000 |
| Pope & Talbot, Inc. | | | | |
| 8.375% due 06/01/2013 | | 500,000 | | 297,500 |
| 8.375% due 06/01/2013 | | 1,000,000 | | 595,000 |
| |
|
| | | | | 984,500 |
| |
| Petroleum Services - 0.18% | | | | |
| Allis-Chalmers Energy, Inc. | | | | |
| 8.50% due 03/01/2017 | | 790,000 | | 756,425 |
| | | | | |
| Publishing - 0.47% | | | | |
| CBD Media Holdings Finance | | | | |
| 9.25% due 07/15/2012 | | 250,000 | | 252,500 |
| Idearc, Inc. | | | | |
| 8.00% due 11/15/2016 | | 1,750,000 | | 1,728,125 |
| |
|
| | | | | 1,980,625 |
| |
| Railroads & Equipment - 0.10% | | | | |
| American Railcar Industries, Inc. | | | | |
| 7.50% due 03/01/2014 | | 440,000 | | 426,800 |
| | | | | |
| Steel - 0.22% | | | | |
| WCI Steel Acquisition, Inc. | | | | |
| 8.00% due 05/01/2016 | | 935,000 | | 935,000 |
| | | | | |
| Telecommunications Equipment & | | | | |
| Services - 0.83% | | | | |
| Axtel SAB de CV | | | | |
| 7.625% due 02/01/2017 | | 1,760,000 | | 1,702,800 |
| Citizens Communications Company | | | | |
| 7.125% due 03/15/2019 | | 710,000 | | 676,275 |
| Digicel Group, Ltd. | | | | |
| 8.875% due 01/15/2015 | | 1,250,000 | | 1,142,250 |
| |
|
| | | | | 3,521,325 |
| | | | |
| Strategic Income Fund (continued) | | |
| | | Shares or | | |
| | | Principal | | |
| | | Amount | | Value |
| |
|
| |
| CORPORATE BONDS (continued) | | | | |
| | | | | |
| Telephone - 0.35% | | | | |
| Cincinnati Bell, Inc. | | | | |
| 8.375% due 01/15/2014 | $ | 1,500,000 | $ | 1,485,000 |
| | | | | |
| Tobacco - 0.49% | | | | |
| Alliance One International, Inc. | | | | |
| 11.00% due 05/15/2012 | | 2,000,000 | | 2,090,000 |
| | | | | |
| Transportation - 0.58% | | | | |
| Navios Maritime Holdings, Inc. | | | | |
| 9.50% due 12/15/2014 | | 1,500,000 | | 1,531,875 |
| PHI, Inc. | | | | |
| 7.125% due 04/15/2013 | | 1,000,000 | | 937,500 |
| |
|
| | | | | 2,469,375 |
|
| |
| TOTAL CORPORATE BONDS (Cost $143,961,504) | | $ | 140,992,011 |
|
| |
| COLLATERALIZED MORTGAGE | | | | |
| OBLIGATIONS - 11.60% | | | | |
| American Home Mortgage Assets, Series 2006-6, | | | |
| Class XP | | | | |
| zero coupon IO due 12/25/2046 | | 21,730,777 | | 1,093,330 |
| Banc of America Commercial Mortgage, Inc., | | | |
| Series 2006-5, Class A4 | | | | |
| 5.414% due 09/10/2047 | | 2,980,000 | | 2,927,206 |
| Citigroup/Deutsche Bank Commercial | | | | |
| Mortgage Trust, Series 2005-CD1, Class A4 | | | |
| 5.225% due 07/15/2044 (b) | | 3,405,000 | | 3,348,686 |
| Countrywide Alternative Loan Trust, Series | | | |
| 2005-59, Class 2X | | | | |
| 1.79% IO due 11/20/2035 | | 13,365,326 | | 467,786 |
| Countrywide Alternative Loan Trust, Series | | | |
| 2006-OA10, Class XPP | | | | |
| 1.96% IO due 08/25/2046 (b) | | 8,999,556 | | 351,545 |
| Countrywide Alternative Loan Trust, Series | | | |
| 2006-OA8, Class X | | | | |
| 6.01% IO due 07/25/2046 (b) | | 16,876,131 | | 640,765 |
| Countrywide Alternative Loan Trust, Series | | | |
| 2007-OA8, Class X | | | | |
| 2.00% IO due 08/25/2047 (b) | | 11,633,540 | | 523,509 |
| Crown Castle Towers LLC, Series 2006-1A, Class F | | | |
| 6.649% due 11/15/2036 | | 840,000 | | 814,904 |
| Crown Castle Towers LLC, Series 2006-1A, Class G | | | |
| 6.795% due 11/15/2036 | | 985,000 | | 940,467 |
| Federal Home Loan Mortgage Corp., Series 3154, | | | |
| Class PM | | | | |
| 5.50% due 05/15/2034 | | 4,050,000 | | 3,932,389 |
| Federal Home Loan Mortgage Corp., Series 3228, | | | |
| Class PL | | | | |
| 5.50% due 10/15/2034 | | 4,850,000 | | 4,691,988 |
| Federal National Mortgage Association, Series | | | |
| 2006-117, Class PD | | | | |
| 5.50% due 07/25/2035 | | 5,055,000 | | 4,896,252 |
| Federal National Mortgage Association, Series | | | |
| 2006-65, Class TE | | | | |
| 5.50% due 05/25/2035 | | 2,065,000 | | 2,029,434 |
| Federal National Mortgage Association, Series | | | |
| 2006-84, Class MP | | | | |
| 5.50% due 08/25/2035 | | 5,700,000 | | 5,537,997 |
| |
| The accompanying notes are an integral part of the financial statements. | 376 |
John Hancock Funds II
Portfolio of investments — August 31, 2007
(showing percentage of total net assets)
| | | | |
| Strategic Income Fund (continued) | | |
| | | Shares or | | |
| | | Principal | | |
| | | Amount | | Value |
| |
|
| |
| COLLATERALIZED MORTGAGE | | | |
| OBLIGATIONS (continued) | | | | |
| Global Tower Partners Acquisition LLC, Series | | | |
| 2007-1A, Class G | | | | |
| 7.8737% due 05/15/2037 | $ | 565,000 | $ | 525,156 |
| GMAC Commercial Mortgage Securities, Inc., | | | |
| Series 2003-C2, Class A2 | | | | |
| 5.2839% due 05/10/2040 (b) | | 6,165,000 | | 6,162,622 |
| Greenwich Capital Commercial Funding Corp., | | | |
| Series 2006-GG7, Class A4 | | | | |
| 6.1111% due 07/10/2038 (b) | | 3,310,000 | | 3,383,631 |
| Indymac Index Mortgage Loan Trust, Series | | | |
| 2005-AR18, Class 1X | | | | |
| zero coupon IO due 10/25/2036 (b) | | 31,700,402 | | 906,432 |
| SBA CMBS Trust, Series 2006-1A, Class H | | | |
| 7.389% due 11/15/2036 | | 525,000 | | 512,497 |
| SBA CMBS Trust, Series 2006-1A, Class J | | | |
| 7.825% due 11/15/2036 | | 360,000 | | 350,906 |
| WAMU Mortgage Pass Through Certificates, Series | | | |
| 2007-OA6, Class 1XPP | | | | |
| zero coupon IO due 07/25/2047 | | 41,953,825 | | 562,181 |
| WAMU Mortgage Pass Through Certificates, | | | |
| Series 2007-OA5, Class 1XPP | | | | |
| zero coupon IO due 06/25/2047 | | 71,663,987 | | 1,039,128 |
| Washington Mutual Mortgage Pass Through | | | |
| Certificates, Series 2007-OA4, Class XPPP | | | |
| zero coupon IO due 04/25/2047 | | 31,540,685 | | 636,365 |
| Wells Fargo Mortgage Backed Securities Trust, | | | |
| Series 2006-AR12, Class 1A1 | | | | |
| 6.025% due 09/25/2036 (b) | | 2,733,471 | | 2,742,566 |
|
| TOTAL COLLATERALIZED MORTGAGE OBLIGATIONS | | |
| (Cost $49,800,794) | | | $ | 49,017,742 |
|
| |
| ASSET BACKED SECURITIES - 0.34% | | | |
| Dominos Pizza Master Issuer LLC, Series 2007-1, | | | |
| Class M1 | | | | |
| 7.629% due 04/25/2037 | | 1,475,000 | | 1,420,757 |
|
| TOTAL ASSET BACKED SECURITIES | | | |
| (Cost $1,474,990) | | | $ | 1,420,757 |
|
| |
| SUPRANATIONAL OBLIGATIONS - 2.73% | | | |
| | | | | |
| Supranational - 2.73% | | | | |
| European Investment Bank | | | | |
| 6.75% due 11/17/2008 | NZD | 2,160,000 | | 1,486,768 |
| European Investment Bank, Series EMTN | | | |
| 6.08% due 04/21/2008 | | 1,715,000 | | 1,185,603 |
| Inter-American Development Bank, Series INTL | | | |
| 7.25% due 05/24/2012 | | 7,325,000 | | 5,088,462 |
| Inter-American Development Bank, Series MPLE | | | |
| 4.25% due 12/02/2012 | CAD | 4,075,000 | | 3,778,973 |
| |
|
| | | | | 11,539,806 |
|
| |
| TOTAL SUPRANATIONAL OBLIGATIONS | | | |
| (Cost $11,603,535) | | | $ | 11,539,806 |
|
| |
| COMMON STOCKS - 0.91% | | | | |
| | | | | |
| Mining - 0.88% | | | | |
| Newmont Mining Corp. | | 40,000 | | 1,690,400 |
| | | | |
| Strategic Income Fund (continued) | | |
| | | Shares or | | |
| | | Principal | | |
| | | Amount | | Value |
|
|
| |
| COMMON STOCKS (continued) | | | | |
| | | | | |
| Mining (continued) | | | | |
| Silver Standard Resources, Inc., ADR * | | 70,250 | $ | 2,052,002 |
|
|
| | | | | 3,742,402 |
| |
| Telecommunications Equipment & | | | | |
| Services - 0.03% | | | | |
| Chunghwa Telecom Company, Ltd., SADR | | 6,345 | | 111,161 |
|
| TOTAL COMMON STOCKS (Cost $3,579,721) | | $ | 3,853,563 |
|
| |
| TERM LOANS - 0.60% | | | | |
| | | | | |
| Educational Services - 0.18% | | | | |
| Riverdeep Interactive Learning | | | | |
| 8.10% due 11/28/2013 | EUR | 766,137 | | 750,178 |
| | | | | |
| Financial Services - 0.11% | | | | |
| Local TV Finance LLC | | | | |
| 7.36% due 05/07/2013 | $ | 480,000 | | 451,200 |
| | | | | |
| Leisure Time - 0.31% | | | | |
| Great Canadian Gaming Corp. | | | | |
| 6.86% due 02/07/2014 | | 1,343,250 | | 1,329,817 |
|
| TOTAL TERM LOANS (Cost $2,604,252) | | | $ | 2,531,195 |
|
| |
| WARRANTS - 0.03% | | | | |
| | | | | |
| Gold - 0.03% | | | | |
| New Gold, Inc. | | | | |
| (Expiration Date: 06/28/17, Strike | | | | |
| Price: CAD 15.00) | | 97,000 | | 128,586 |
|
| TOTAL WARRANTS (Cost $190,632) | | | $ | 128,586 |
|
| |
| SHORT TERM INVESTMENTS - 6.88% | | | |
| Federal Home Loan Bank Discount Notes | | | | |
| zero coupon due 09/04/2007 | $ | 29,100,000 | $ | 29,089,815 |
|
| TOTAL SHORT TERM INVESTMENTS | | | | |
| (Cost $29,089,815) | | | $ | 29,089,815 |
|
| |
| REPURCHASE AGREEMENTS - 0.01% | | | |
| Repurchase Agreement with State | | | | |
| Street Corp. dated 08/31/2007 at | | | | |
| 4.60% to be repurchased at | | | | |
| $41,021 on 09/04/2007, | | | | |
| collateralized by $45,000 Federal | | | | |
| Home Loan Bank, 5.81% due | | | | |
| 03/14/2025 (valued at $45,169, | | | | |
| including interest) *** | $ | 41,000 | $ | 41,000 |
|
| TOTAL REPURCHASE AGREEMENTS | | | | |
| (Cost $41,000) | | | $ | 41,000 |
|
| Total Investments (Strategic Income Fund) | | | |
| (Cost $426,864,599) - 101.40% | | | $ | 428,631,882 |
| Liabilities in Excess of Other Assets - (1.40)% | | | (5,938,524) |
|
|
| TOTAL NET ASSETS - 100.00% | | | $ | 422,693,358 |
|
|
| |
| The accompanying notes are an integral part of the financial statements. | 377 |
John Hancock Funds II
Portfolio of investments — August 31, 2007
(showing percentage of total net assets)
| | | | |
| Total Bond Market Fund | | | | |
| | | Shares or | | |
| | | Principal | | |
| | | Amount | | Value |
|
|
| |
| U.S. TREASURY OBLIGATIONS - 25.29% | | | |
| | | | | |
| U.S. Treasury Bonds - 5.26% | | | | |
| 4.75% due 02/15/2037 | $ | 626,000 | $ | 617,490 |
| 5.25% due 02/15/2029 | | 515,000 | | 540,670 |
| 6.75% due 08/15/2026 | | 400,000 | | 491,844 |
| 7.875% due 02/15/2021 | | 900,000 | | 1,170,422 |
| |
|
| | | | | 2,820,426 |
| U.S. Treasury Notes - 20.03% | | | | |
| 3.125% due 04/15/2009 | | 2,500,000 | | 2,458,202 |
| 4.50% due 04/30/2012 | | 3,000,000 | | 3,030,469 |
| 4.625% due 07/31/2009 to 07/31/2012 | | 560,000 | | 568,500 |
| 4.75% due 11/15/2008 to 08/15/2017 | | 4,625,000 | | 4,672,515 |
| |
|
| | | | | 10,729,686 |
|
| TOTAL U.S. TREASURY OBLIGATIONS | | | |
| (Cost $13,446,537) | | | $ | 13,550,112 |
|
| |
| U.S. GOVERNMENT AGENCY OBLIGATIONS - 45.86% | | |
| | | | | |
| Federal Home Loan Bank - 2.94% | | | | |
| 3.875% due 01/15/2010 to 06/14/2013 | | 900,000 | | 870,343 |
| 5.80% due 09/02/2008 | | 700,000 | | 705,840 |
| |
|
| | | | | 1,576,183 |
| Federal Home Loan Mortgage Corp. - 3.88% | | | |
| 4.25% due 07/15/2009 | | 800,000 | | 792,649 |
| 5.75% due 04/15/2008 | | 700,000 | | 702,165 |
| 6.00% due 06/15/2011 | | 400,000 | | 417,402 |
| 6.25% due 07/15/2032 | | 150,000 | | 168,655 |
| |
|
| | | | | 2,080,871 |
| Federal National Mortgage | | | | |
| Association - 39.04% | | | | |
| 4.00% due 07/01/2018 to 06/01/2019 | | 339,191 | | 318,931 |
| 4.375% due 10/15/2015 | | 300,000 | | 288,236 |
| 4.50% due 04/01/2018 to 06/01/2019 | | 1,108,007 | | 1,065,824 |
| 5.00% due 05/01/2019 to 07/01/2035 | | 5,371,767 | | 5,157,779 |
| 5.50% due 09/01/2017 to 10/01/2035 | | 5,799,696 | | 5,689,753 |
| 5.709% due 04/01/2037 (b) | | 2,720,730 | | 2,735,132 |
| 6.00% due 08/01/2034 to 06/01/2036 | | 2,741,006 | | 2,741,844 |
| 6.125% due 03/15/2012 | | 500,000 | | 527,191 |
| 6.375% due 06/15/2009 | | 1,000,000 | | 1,027,120 |
| 6.50% due 07/01/2031 to 06/01/2036 | | 843,713 | | 858,682 |
| 7.125% due 06/15/2010 | | 300,000 | | 318,485 |
| 7.25% due 05/15/2030 | | 150,000 | | 186,723 |
| |
|
| | | | | 20,915,700 |
|
| TOTAL U.S. GOVERNMENT AGENCY OBLIGATIONS | | |
| (Cost $24,636,822) | | | $ | 24,572,754 |
|
| |
| FOREIGN GOVERNMENT OBLIGATIONS - 0.97% | | |
| | | | | |
| Canada - 0.66% | | | | |
| Government of Canada | | | | |
| 5.25% due 11/05/2008 | | 150,000 | | 151,186 |
| 5.75% due 02/15/2009 | | 200,000 | | 203,108 |
| |
|
| | | | | 354,294 |
| | | | |
| Total Bond Market Fund (continued) | | |
| | | Shares or | | |
| | | Principal | | |
| | | Amount | | Value |
|
|
| |
| FOREIGN GOVERNMENT OBLIGATIONS | | | |
| (continued) | | | | |
| | | | | |
| Mexico - 0.31% | | | | |
| Government of Mexico | | | | |
| 9.875% due 02/01/2010 | $ | 150,000 | $ | 165,450 |
|
| TOTAL FOREIGN GOVERNMENT OBLIGATIONS | | |
| (Cost $526,065) | | | $ | 519,744 |
|
| |
| CORPORATE BONDS - 23.01% | | | | |
| | | | | |
| Aerospace - 0.32% | | | | |
| Northrop Grumman Corp. | | | | |
| 7.75% due 03/01/2016 | | 150,000 | | 171,220 |
| | | | | |
| Agriculture - 0.31% | | | | |
| Archer-Daniels-Midland Company | | | | |
| 7.00% due 02/01/2031 | | 150,000 | | 164,312 |
| | | | | |
| Automobiles - 0.39% | | | | |
| DaimlerChrysler North America Holding | | | | |
| 7.20% due 09/01/2009 | | 200,000 | | 206,502 |
| | | | | |
| Banking - 3.77% | | | | |
| BAC Capital Trust XI | | | | |
| 6.625% due 05/23/2036 | | 150,000 | | 153,611 |
| Bank of America Corp. | | | | |
| 5.42% due 03/15/2017 | | 200,000 | | 192,297 |
| Bank One Corp. | | | | |
| 7.875% due 08/01/2010 | | 250,000 | | 267,103 |
| KFW International Finance, Inc. | | | | |
| 3.25% due 03/30/2009 | | 150,000 | | 147,094 |
| Royal Bank of Scotland Group PLC | | | | |
| 5.00% due 11/12/2013 | | 300,000 | | 301,494 |
| US Bank NA, Series BKNT | | | | |
| 6.375% due 08/01/2011 | | 200,000 | | 208,755 |
| Wachovia Capital Trust III | | | | |
| 5.80% due 03/15/2042 (b) | | 30,000 | | 29,925 |
| Wachovia Corp. | | | | |
| 5.625% due 12/15/2008 | | 200,000 | | 200,643 |
| Wells Fargo Bank NA | | | | |
| 6.45% due 02/01/2011 | | 500,000 | | 518,454 |
| |
|
| | | | | 2,019,376 |
| |
| Building Materials & Construction - 0.22% | | | |
| CRH America, Inc. | | | | |
| 6.00% due 09/30/2016 | | 120,000 | | 119,745 |
| | | | | |
| Cable & Television - 1.49% | | | | |
| Comcast Corp. | | | | |
| 5.90% due 03/15/2016 | | 200,000 | | 197,981 |
| Cox Communications, Inc. | | | | |
| 4.625% due 01/15/2010 | | 200,000 | | 196,825 |
| Time Warner, Inc. | | | | |
| 6.50% due 11/15/2036 | | 90,000 | | 86,373 |
| 7.25% due 10/15/2017 | | 200,000 | | 214,757 |
| Viacom, Inc. | | | | |
| 6.875% due 04/30/2036 | | 105,000 | | 102,248 |
| |
|
| | | | | 798,184 |
| |
| Computers & Business Equipment - 0.65% | | | |
| Cisco Systems, Inc. | | | | |
| 5.25% due 02/22/2011 | | 150,000 | | 150,944 |
| |
| The accompanying notes are an integral part of the financial statements. | 378 |
John Hancock Funds II
Portfolio of investments — August 31, 2007
(showing percentage of total net assets)
| | | | |
| Total Bond Market Fund (continued) | | |
| | | Shares or | | |
| | | Principal | | |
| | | Amount | | Value |
|
|
| |
| CORPORATE BONDS (continued) | | | | |
| | | | |
| Computers & Business Equipment | | | | |
| (continued) | | | | |
| International Business Machines Corp. | | | | |
| 4.25% due 09/15/2009 | $ | 200,000 | $ | 198,010 |
| |
|
| | | | | 348,954 |
| Domestic Oil - 0.40% | | | | |
| Devon Financing Corp., ULC | | | | |
| 6.875% due 09/30/2011 | | 200,000 | | 211,528 |
| | | | | |
| Electrical Utilities - 1.19% | | | | |
| Constellation Energy Group | | | | |
| 7.60% due 04/01/2032 | | 115,000 | | 127,543 |
| FirstEnergy Corp. | | | | |
| 7.375% due 11/15/2031 | | 250,000 | | 275,513 |
| Indiana Michigan Power Company | | | | |
| 6.05% due 03/15/2037 | | 90,000 | | 85,398 |
| Ontario Electricity Financial Corp. | | | | |
| 6.10% due 01/30/2008 | | 150,000 | | 150,825 |
| |
|
| | | | | 639,279 |
| Financial Services - 5.38% | | | | |
| American Express Company | | | | |
| 4.875% due 07/15/2013 | | 250,000 | | 244,279 |
| Bear Stearns Companies, Inc. | | | | |
| 5.55% due 01/22/2017 | | 30,000 | | 27,620 |
| 5.70% due 11/15/2014 | | 250,000 | | 235,961 |
| Capital One Financial Corp., Series MTN | | | | |
| 5.70% due 09/15/2011 | | 250,000 | | 246,158 |
| CIT Group, Inc. | | | | |
| 4.00% due 05/08/2008 | | 150,000 | | 145,784 |
| Citigroup, Inc. | | | | |
| 5.00% due 09/15/2014 | | 500,000 | | 478,742 |
| General Electric Capital Corp. | | | | |
| 6.125% due 02/22/2011 | | 150,000 | | 155,158 |
| Household Finance Corp. | | | | |
| 6.375% due 11/27/2012 | | 100,000 | | 102,760 |
| HSBC Finance Corp. | | | | |
| 8.00% due 07/15/2010 | | 150,000 | | 160,572 |
| International Lease Finance Corp., Series MTN | | | |
| 5.45% due 03/24/2011 | | 200,000 | | 199,301 |
| Lehman Brothers Holdings, Inc. | | | | |
| 6.875% due 07/17/2037 | | 85,000 | | 79,854 |
| Merrill Lynch & Company, Inc. | | | | |
| 6.875% due 11/15/2018 | | 200,000 | | 212,408 |
| Morgan Stanley | | | | |
| 6.75% due 04/15/2011 | | 250,000 | | 260,551 |
| National Rural Utilities Cooperative Finance Corp. | | | |
| 5.75% due 08/28/2009 | | 250,000 | | 251,990 |
| SLM Corp., Series A | | | | |
| 5.00% due 04/15/2015 | | 100,000 | | 82,423 |
| |
|
| | | | | 2,883,561 |
| Food & Beverages - 0.85% | | | | |
| Kraft Foods, Inc. | | | | |
| 5.25% due 10/01/2013 | | 250,000 | | 242,828 |
| Unilever Capital Corp. | | | | |
| 7.125% due 11/01/2010 | | 200,000 | | 212,369 |
| |
|
| | | | | 455,197 |
| | | | |
| Total Bond Market Fund (continued) | | |
| | | Shares or | | |
| | | Principal | | |
| | | Amount | | Value |
|
|
| |
| CORPORATE BONDS (continued) | | | | |
| | | | | |
| Gas & Pipeline Utilities - 0.64% | | | | |
| Kinder Morgan Energy Partners LP | | | | |
| 5.85% due 09/15/2012 | $ | 150,000 | $ | 150,241 |
| TransCanada PipeLines, Ltd. | | | | |
| 5.85% due 03/15/2036 | | 200,000 | | 192,518 |
| |
|
| | | | | 342,759 |
| |
| Holdings Companies/Conglomerates - 0.46% | | | |
| General Electric Company | | | | |
| 5.00% due 02/01/2013 | | 250,000 | | 246,640 |
| | | | | |
| Insurance - 1.18% | | | | |
| Allstate Corp. | | | | |
| 7.20% due 12/01/2009 | | 400,000 | | 418,833 |
| Lincoln National Corp. | | | | |
| 7.00% due 05/17/2066 (b) | | 30,000 | | 30,399 |
| MetLife, Inc. | | | | |
| 5.70% due 06/15/2035 | | 200,000 | | 183,997 |
| |
|
| | | | | 633,229 |
| |
| International Oil - 0.31% | | | | |
| Pemex Project Funding Master Trust | | | | |
| 7.375% due 12/15/2014 | | 150,000 | | 163,906 |
| | | | | |
| Leisure Time - 0.47% | | | | |
| Walt Disney Company, Series MTN | | | | |
| 5.625% due 09/15/2016 | | 250,000 | | 252,019 |
| | | | | |
| Manufacturing - 0.39% | | | | |
| Honeywell International, Inc. | | | | |
| 7.50% due 03/01/2010 | | 200,000 | | 210,787 |
| | | | | |
| Petroleum Services - 0.39% | | | | |
| Weatherford International, Ltd. | | | | |
| 5.50% due 02/15/2016 | | 215,000 | | 208,920 |
| | | | | |
| Real Estate - 0.43% | | | | |
| Realty Income Corp. | | | | |
| 5.95% due 09/15/2016 | | 135,000 | | 132,417 |
| Vornado Realty, LP | | | | |
| 5.60% due 02/15/2011 | | 100,000 | | 99,321 |
| |
|
| | | | | 231,738 |
| |
| Retail - 0.92% | | | | |
| Federated Department Stores, Inc. | | | | |
| 6.625% due 04/01/2011 | | 100,000 | | 102,035 |
| Target Corp. | | | | |
| 7.50% due 08/15/2010 | | 100,000 | | 106,058 |
| Wal-Mart Stores, Inc. | | | | |
| 7.55% due 02/15/2030 | | 250,000 | | 286,674 |
| |
|
| | | | | 494,767 |
| |
| Telecommunications Equipment & | | | | |
| Services - 1.50% | | | | |
| Deutsche Telekom International Finance BV | | | |
| 8.75% due 06/15/2030 (b) | | 250,000 | | 301,960 |
| Embarq Corp. | | | | |
| 7.995% due 06/01/2036 | | 30,000 | | 31,088 |
| SBC Communications, Inc. | | | | |
| 5.625% due 06/15/2016 | | 200,000 | | 197,289 |
| Verizon Communications, Inc. | | | | |
| 7.375% due 09/01/2012 | | 250,000 | | 271,114 |
| |
|
| | | | | 801,451 |
| |
| The accompanying notes are an integral part of the financial statements. | 379 |
John Hancock Funds II
Portfolio of investments — August 31, 2007
(showing percentage of total net assets)
| | | | |
| Total Bond Market Fund (continued) | | |
| | | Shares or | | |
| | | Principal | | |
| | | Amount | | Value |
| |
|
| |
| CORPORATE BONDS (continued) | | | | |
| | | | | |
| Telephone - 1.35% | | | | |
| BellSouth Corp. | | | | |
| 4.20% due 09/15/2009 | $ | 200,000 | $ | 195,934 |
| British Telecommunications PLC | | | | |
| 8.875% due 12/15/2030 (b) | | 250,000 | | 334,122 |
| Sprint Capital Corp. | | | | |
| 6.875% due 11/15/2028 | | 200,000 | | 194,673 |
|
|
| | | | | 724,729 |
|
| |
| TOTAL CORPORATE BONDS (Cost $12,562,705) | | $ | 12,328,803 |
|
| |
| COLLATERALIZED MORTGAGE | | | | |
| OBLIGATIONS - 1.60% | | | | |
| Banc of America Commercial Mortgage, Inc., | | | |
| Series 2006-3, Class A4 | | | | |
| 5.889% due 07/10/2044 | | 700,000 | | 710,653 |
| JP Morgan Chase Commercial Mortgage Securities | | | |
| Corp., Series 2007-CB19, Class AM | | | | |
| 5.937% due 02/12/2049 | | 150,000 | | 147,629 |
|
| TOTAL COLLATERALIZED MORTGAGE OBLIGATIONS | | |
| (Cost $877,583) | | | $ | 858,282 |
|
| |
| REPURCHASE AGREEMENTS - 2.39% | | | |
| Repurchase Agreement with State | | | | |
| Street Corp. dated 08/31/2007 at | | | | |
| 4.60% to be repurchased at | | | | |
| $1,284,656 on 09/04/2007, | | | | |
| collateralized by $1,305,000 | | | | |
| Federal Home Loan Bank, 5.375% | | | | |
| due 08/14/2009 (valued at | | | | |
| $1,309,894, including interest) | $ | 1,284,000 | $ | 1,284,000 |
|
| TOTAL REPURCHASE AGREEMENTS | | | | |
| (Cost $1,284,000) | | | $ | 1,284,000 |
|
| Total Investments (Total Bond Market Fund) | | | |
| (Cost $53,333,712) - 99.12% | | | $ | 53,113,695 |
| Other Assets in Excess of Liabilities - 0.88% | | | 469,473 |
|
|
| TOTAL NET ASSETS - 100.00% | | | $ | 53,583,168 |
|
|
| |
| |
| |
| Total Return Fund | | | | |
| | | Shares or | | |
| | | Principal | | |
| | | Amount | | Value |
| |
|
| |
| U.S. TREASURY OBLIGATIONS - 2.31% | | | |
| | | | | |
| Treasury Inflation Protected | | | | |
| Securities (d) - 2.31% | | | | |
| 2.00% due 01/15/2014 to | | | | |
| 01/15/2026 *** | $ | 7,673,550 | $ | 7,376,610 |
| 2.375% due 01/15/2025 to 01/15/2027 *** | 6,159,585 | | 6,132,058 |
| 2.625% due 07/15/2017 *** | | 5,126,112 | | 5,245,853 |
| 3.00% due 07/15/2012 *** | | 15,756,960 | | 16,264,145 |
| | | | |
| Total Return Fund (continued) | | | |
| | | Shares or | | |
| | | Principal | | |
| | | Amount | | Value |
|
|
| |
| U.S. TREASURY OBLIGATIONS | | | | |
| (continued) | | | | |
| Treasury Inflation Protected | | | | |
| Securities (d) (continued) | | | | |
| 3.625% due 04/15/2028 *** | $ | 257,588 | $ | 308,602 |
| |
|
| | | | | 35,327,268 |
|
| TOTAL U.S. TREASURY OBLIGATIONS | | | |
| (Cost $35,311,596) | | $ | | 35,327,268 |
|
| |
| U.S. GOVERNMENT AGENCY OBLIGATIONS - 56.75% | | |
| | | |
| Federal Home Loan Mortgage Corp. - 4.12% | | | |
| 5.50% TBA ** | | 51,000,000 | | 49,804,662 |
| 6.00% TBA ** | | 13,000,000 | | 12,987,806 |
| |
|
| | | | | 62,792,468 |
| Federal National Mortgage | | | | |
| Association - 52.04% | | | | |
| 4.314% due 11/01/2034 (b)*** | | 1,234,096 | | 1,238,049 |
| 4.345% due 03/01/2035 (b)*** | | 666,019 | | 677,825 |
| 4.409% due 05/01/2035 (b)*** | | 1,583,934 | | 1,584,881 |
| 4.438% due 01/01/2035 *** | | 582,310 | | 574,297 |
| 4.836% due 06/01/2035 (b)*** | | 1,937,428 | | 1,920,566 |
| 5.00% due 12/01/2036 to 03/01/2037 *** | 44,450,707 | | 42,240,442 |
| 5.00% TBA ** | | 73,000,000 | | 69,372,776 |
| 5.50% due 06/01/2035 (b)*** | | 878,148 | | 858,467 |
| 5.50% due 12/01/2034 to 09/01/2037 *** | 237,016,639 | | 231,743,353 |
| 5.50% TBA ** | | 218,000,000 | | 212,890,516 |
| 5.711% due 07/01/2034 (b)*** | | 519,716 | | 522,507 |
| 6.00% due 08/01/2036 to 04/01/2037 *** | 51,274,391 | | 51,230,636 |
| 6.00% TBA ** | | 152,000,000 | | 151,810,000 |
| 6.50% due 01/01/2036 to 04/01/2037 *** | 18,435,036 | | 18,715,994 |
| 6.50% TBA ** | | 8,000,000 | | 8,120,000 |
| 6.964% due 11/01/2035 (b)*** | | 743,810 | | 767,096 |
| |
|
| | | | | 794,267,405 |
| Government National Mortgage | | | | |
| Association - 0.59% | | | | |
| 6.00% due 11/15/2036 to 06/15/2037 *** | 8,999,995 | | 9,043,855 |
|
| TOTAL U.S. GOVERNMENT AGENCY OBLIGATIONS | | |
| (Cost $864,697,245) | | | $ | 866,103,728 |
|
| |
| FOREIGN GOVERNMENT OBLIGATIONS - 0.09% | | |
| Brazil - 0.09% | | | | |
| Federative Republic of Brazil | | | | |
| 10.25% due 01/10/2028 *** | BRL | 2,500,000 | | 1,309,356 |
|
| TOTAL FOREIGN GOVERNMENT OBLIGATIONS | | |
| (Cost $1,342,869) | | | $ | 1,309,356 |
|
| |
| CORPORATE BONDS - 31.49% | | | | |
| | | | | |
| Automobiles - 0.43% | | | | |
| DaimlerChrysler N.A. Holding Corp., Series MTN | | | |
| 5.71% due 03/13/2009 (b)*** | $ | 6,600,000 | | 6,581,025 |
| | | | | |
| Banking - 9.92% | | | | |
| American Express Centurion Bank, Series BKNT | | | |
| 5.34% due 06/12/2009 (b)*** | | 3,100,000 | | 3,097,635 |
| ANZ National International Ltd. | | | | |
| 5.3963% due 08/07/2009 (b)*** | | 8,000,000 | | 7,994,369 |
| |
| The accompanying notes are an integral part of the financial statements. | 380 |
John Hancock Funds II
Portfolio of investments — August 31, 2007
(showing percentage of total net assets)
| | | | |
| Total Return Fund (continued) | | | |
| | | Shares or | | |
| | | Principal | | |
| | | Amount | | Value |
|
|
| |
| CORPORATE BONDS (continued) | | | | |
| Banking (continued) | | | | |
| Bank of America Corp. | | | | |
| 5.37% due 06/19/2009 (b)*** | $ | 11,100,000 | $ | 11,045,366 |
| Bank of America NA, Series BKNT | | | | |
| 5.36% due 12/18/2008 (b)*** | | 1,200,000 | | 1,197,719 |
| 6.00% due 10/15/2036 *** | | 900,000 | | 869,931 |
| Bank of Ireland YCD | | | | |
| 5.40% due 01/15/2010 *** | | 13,200,000 | | 13,205,861 |
| BNP Paribas | | | | |
| 5.186% due 06/29/2049 (b)*** | | 7,600,000 | | 7,041,924 |
| Credit Agricole SA | | | | |
| 5.505% due 05/28/2009 (b)*** | | 2,400,000 | | 2,399,892 |
| 5.555% due 05/28/2010 (b)*** | | 2,700,000 | | 2,699,897 |
| Deutsche Bank AG | | | | |
| 6.00% due 09/01/2017 *** | | 4,600,000 | | 4,641,037 |
| DnB NORBank ASA | | | | |
| 5.4434% due 10/13/2009 (b)*** | | 2,400,000 | | 2,399,698 |
| Export-Import Bank of Korea | | | | |
| 5.45% due 06/01/2009 (b)*** | | 3,400,000 | | 3,401,227 |
| Fortis Bank | | | | |
| 5.265% due 06/30/2008 (b)*** | | 2,200,000 | | 2,200,378 |
| 5.265% due 04/28/2008 (b)*** | | 1,400,000 | | 1,400,284 |
| 5.30% due 09/30/2008 (b)*** | | 2,700,000 | | 2,699,587 |
| HSBC Bank USA, Series BKNT | | | | |
| 5.43% due 09/21/2007 (b)*** | | 5,000,000 | | 4,999,095 |
| 5.50% due 06/10/2009 (b)*** | | 900,000 | | 894,588 |
| HSBC Finance Corp. | | | | |
| 5.42% due 10/21/2009 (b)*** | | 1,700,000 | | 1,688,481 |
| 5.49% due 09/15/2008 (b)*** | | 4,300,000 | | 4,307,224 |
| HSBC Finance Corp., Series MTN | | | | |
| 5.50% due 12/05/2008 (b)*** | | 1,600,000 | | 1,595,936 |
| HSBC Holdings PLC | | | | |
| 6.50% due 05/02/2036 *** | | 900,000 | | 923,644 |
| ICICI Bank, Ltd. | | | | |
| 5.90% due 01/12/2010 (b)*** | | 3,800,000 | | 3,752,124 |
| National Australia Bank Ltd. | | | | |
| 5.40% due 09/11/2009 (b)*** | | 2,500,000 | | 2,502,610 |
| Nordea Bank Finland PLC, Series YCD | | | | |
| 5.2625% due 03/31/2008 (b)*** | | 1,900,000 | | 1,900,160 |
| Nordea Bank Finland, Series YCD | | | | |
| 5.307% due 04/09/2009 *** | | 5,600,000 | | 5,601,036 |
| Nordea Bank Finland, Series YCD | | | | |
| 5.307% due 05/28/2008 *** | | 2,000,000 | | 2,000,406 |
| Residential Capital LLC | | | | |
| 7.595% due 05/22/2009 (b)*** | | 3,100,000 | | 2,449,000 |
| Royal Bank of Scotland PLC | | | | |
| 5.41% due 07/21/2008 (b)*** | | 1,900,000 | | 1,900,701 |
| Royal Bank of Scotland Group PLC | | | | |
| 7.648% due 08/31/2049 (b)*** | | 5,000,000 | | 5,569,700 |
| Santander US Debt SA Unipersonal | | | | |
| 5.40% due 09/21/2007 (b)*** | | 1,600,000 | | 1,599,675 |
| 5.42% due 11/20/2009 *** | | 4,700,000 | | 4,677,055 |
| State Street Capital Trust IV | | | | |
| 6.355% due 06/15/2037 (b)(c)*** | | 400,000 | | 368,094 |
| Sumitomo Mitsui Banking Corp. | | | | |
| 5.625% due 07/29/2049 (b)*** | | 5,200,000 | | 4,950,140 |
| | | | |
| Total Return Fund (continued) | | | |
| | | Shares or | | |
| | | Principal | | |
| | | Amount | | Value |
| |
|
| |
| CORPORATE BONDS (continued) | | | | |
| Banking (continued) | | | | |
| Unicreditio Italiano, Series YCD | | | | |
| 5.35% due 05/06/2008 *** | $ | 12,400,000 | $ | 12,396,726 |
| Unicredito Italiano, Series YCD | | | | |
| 5.50563% due 05/29/2008 (b)*** | | 3,100,000 | | 3,097,716 |
| USB Capital IX | | | | |
| 6.189% due 04/15/2042 (b)*** | | 300,000 | | 301,242 |
| VTB Capital SA for Vneshtorgbank | | | | |
| 5.95625% due 08/01/2008 *** | | 2,300,000 | | 2,280,450 |
| Wachovia Bank NA, Series BKNT | | | | |
| 5.32% due 10/03/2008 *** | | 1,800,000 | | 1,795,714 |
| 5.565% due 05/25/2010 (b)*** | | 11,000,000 | | 10,945,286 |
| Wachovia Corp. | | | | |
| 5.5056% due 10/15/2011 (b)*** | | 1,100,000 | | 1,091,185 |
| Westpac Banking Corp., Series DPNT | | | | |
| 5.28% due 06/06/2008 (b)*** | | 1,600,000 | | 1,599,978 |
| |
|
| | | | | 151,482,771 |
| Biotechnology - 0.37% | | | | |
| Amgen, Inc. | | | | |
| 5.585% due 11/28/2008 (b)*** | | 5,600,000 | | 5,601,523 |
| | | | |
| Building Materials & Construction - 0.35% | | | |
| C8 Capital SPV, Ltd. | | | | |
| 6.64% due 12/31/2049 (b)*** | | 5,500,000 | | 5,332,415 |
| | | | | |
| Cable & Television - 0.09% | | | | |
| Comcast Corp. | | | | |
| 5.875% due 02/15/2018 *** | | 700,000 | | 683,561 |
| 6.45% due 03/15/2037 *** | | 700,000 | | 675,940 |
| |
|
| | | | | 1,359,501 |
| Crude Petroleum & Natural Gas - 0.26% | | | |
| Anadarko Petroleum Corp. | | | | |
| 5.76% due 09/15/2009 (b)*** | | 4,000,000 | | 3,977,428 |
| | | | | |
| Diversified Financial Services - 1.94% | | | | |
| General Electric Capital Corp., Series MTN | | | |
| 5.39% due 10/26/2009 (b)*** | | 6,200,000 | | 6,188,673 |
| 5.40% due 01/05/2009 (b)*** | | 600,000 | | 599,538 |
| | | | |
| 5.43% due 01/20/2010 (b)*** | | 2,700,000 | | 2,682,463 |
| 5.6275% due 08/15/2011 (b)*** | | 4,800,000 | | 4,752,710 |
| General Electric Capital Corp., Series MTNA | | | |
| 5.48% due 12/15/2009 (b)*** | | 11,000,000 | | 10,994,918 |
| TNK-BP Finance SA | | | | |
| 6.125% due 03/20/2012 *** | | 500,000 | | 476,900 |
| Wells Fargo & Company | | | | |
| 5.46% due 09/15/2009 (b)*** | | 3,900,000 | | 3,892,243 |
| |
|
| | | | | 29,587,445 |
| Energy - 0.32% | | | | |
| TXU Energy Co., LLC | | | | |
| 5.85% due 09/16/2008 (b)*** | | 4,900,000 | | 4,902,661 |
| | | | |
| Financial Services - 15.51% | | | | |
| Abbey National Treasury Services PLC, Series YCD | | | |
| 5.27% due 07/02/2008 (b)*** | | 4,800,000 | | 4,801,018 |
| American Express Bank FSB, Series BKNT | | | |
| 5.41% due 10/20/2009 (b)*** | | 2,600,000 | | 2,597,982 |
| American Express Centurion Bank, Series BKNT | | | |
| 5.33% due 05/07/2008 (b)*** | | 2,800,000 | | 2,798,888 |
| |
| The accompanying notes are an integral part of the financial statements. | 381 |
John Hancock Funds II
Portfolio of investments — August 31, 2007
(showing percentage of total net assets)
| | | | |
| Total Return Fund (continued) | | | |
| | | Shares or | | |
| | | Principal | | |
| | | Amount | | Value |
|
|
| |
| CORPORATE BONDS (continued) | | | | |
| | | | | |
| Financial Services (continued) | | | | |
| American Express Credit Corp., Series MTNB | | | |
| 5.5613% due 12/12/2007 (b)*** | $ | 2,100,000 | $ | 2,099,800 |
| American Express Credit Corp., Series MTN | | | |
| 5.38% due 11/09/2009 (b)*** | | 2,000,000 | | 1,998,796 |
| 5.41% due 03/02/2009 (b)*** | | 2,300,000 | | 2,300,812 |
| American Honda Finance Corp., Series MTN | | | |
| 5.42% due 03/09/2009 (b)*** | | 3,900,000 | | 3,904,259 |
| Bear Stearns Companies, Inc. | | | | |
| 5.51% due 04/29/2008 (b)*** | | 5,300,000 | | 5,269,901 |
| Bear Stearns Companies, Inc., Series MTN | | | | |
| 5.59% due 08/21/2009 (b)*** | | 1,800,000 | | 1,760,116 |
| 5.5975% due 05/18/2010 (b)*** | | 4,600,000 | | 4,428,107 |
| 5.63% due 07/16/2009 (b)*** | | 900,000 | | 879,524 |
| Bear Stearns Companies, Inc., Series MTNB | | | |
| 5.45% due 03/30/2009 (b)*** | | 2,500,000 | | 2,455,305 |
| C10 Capital SPV, Ltd. | | | | |
| 6.722% due 12/31/2049 (b)*** | | 1,700,000 | | 1,644,172 |
| Calabash Re, Ltd. | | | | |
| 13.76% due 01/08/2010 (b)*** | | 3,000,000 | | 3,047,700 |
| Caylon NY | | | | |
| 5.34% due 01/16/2009 *** | | 3,900,000 | | 3,900,012 |
| CIT Group Holdings, Inc. | | | | |
| 5.51% due 01/30/2009 (b)*** | | 1,300,000 | | 1,238,571 |
| CIT Group, Inc. | | | | |
| 5.43% due 12/19/2007 (b)*** | | 5,000,000 | | 4,944,080 |
| CIT Group, Inc., Series MTN | | | | |
| 5.64% due 08/17/2009 (b)*** | | 2,300,000 | | 2,182,035 |
| Citigroup Funding Inc., Series MTN | | | | |
| 5.32% due 04/23/2009 (b)*** | | 2,000,000 | | 1,999,960 |
| 5.35% due 12/08/2008 (b)*** | | 400,000 | | 400,141 |
| 5.36% due 06/26/2009 (b)*** | | 2,100,000 | | 2,099,983 |
| Citigroup Global Markets Holdings, Inc., Series | | | |
| MTNA | | | | |
| 5.46% due 03/17/2009 (b)*** | | 2,400,000 | | 2,402,669 |
| Citigroup, Inc. | | | | |
| 5.39% due 12/28/2009 (b)*** | | 1,400,000 | | 1,397,077 |
| 5.40% due 12/26/2008 (b)*** | | 4,100,000 | | 4,101,849 |
| 5.40% due 01/30/2009 (b)*** | | 1,100,000 | | 1,100,058 |
| 5.4087% due 05/02/2008 (b)*** | | 5,000,000 | | 5,001,685 |
| 5.50% due 08/27/2012 *** | | 3,500,000 | | 3,501,778 |
| 6.125% due 08/25/2036 *** | | 3,500,000 | | 3,418,803 |
| Ford Motor Credit Company | | | | |
| 5.80% due 01/12/2009 *** | | 1,700,000 | | 1,601,862 |
| 7.375% due 10/28/2009 *** | | 2,100,000 | | 1,987,159 |
| General Electric Capital Corp. | | | | |
| 5.50% due 09/15/2067 (b)*** | EUR | 9,900,000 | | 13,399,484 |
| GMAC LLC | | | | |
| 6.00% due 12/15/2011 *** | $ | 400,000 | | 343,920 |
| Goldman Sachs Group, Inc. | | | | |
| 5.40% due 12/23/2008 (b)*** | | 400,000 | | 398,570 |
| 5.45% due 06/23/2009 (b)*** | | 1,700,000 | | 1,685,088 |
| 5.625% due 01/15/2017 *** | | 2,000,000 | | 1,911,722 |
| 6.25% due 09/01/2017 *** | | 5,400,000 | | 5,407,798 |
| Goldman Sachs Group, Inc., Series MTN | | | | |
| 5.47% due 11/10/2008 (b)*** | | 5,700,000 | | 5,684,638 |
| 5.56% due 11/16/2009 (b)*** | | 1,100,000 | | 1,093,396 |
| | | | |
| Total Return Fund (continued) | | | |
| | | Shares or | | |
| | | Principal | | |
| | | Amount | | Value |
|
|
| |
| CORPORATE BONDS (continued) | | | | |
| | | | | |
| Financial Services (continued) | | | | |
| Goldman Sachs Group, Inc., Series MTNB | | | | |
| 5.45% due 12/22/2008 (b)*** | $ | 5,900,000 | $ | 5,883,120 |
| 5.69% due 07/23/2009 (b)*** | | 1,100,000 | | 1,099,469 |
| HBOS Treasury Services PLC, Series MTN | | | |
| 5.40% due 07/17/2009 (b)*** | | 3,900,000 | | 3,902,671 |
| International Lease Finance Corp., Series MTN | | | |
| 5.7188% due 05/24/2010 (b)*** | | 18,700,000 | | 18,636,869 |
| John Deere Capital Corp., Series MTN | | | | |
| 5.41% due 07/15/2008 (b)*** | | 2,400,000 | | 2,401,222 |
| JP Morgan Chase Capital XX, Series T | | | | |
| 6.55% due 09/29/2036 *** | | 400,000 | | 360,085 |
| JPMorgan Chase & Co, Series MTN | | | | |
| 5.3956% due 05/07/2010 (b)*** | | 3,900,000 | | 3,882,337 |
| Korea Development Bank | | | | |
| 5.49% due 04/03/2010 (b)*** | | 9,900,000 | | 9,903,495 |
| Lehman Brothers Holdings, Inc., Series MTN | | | |
| 5.41% due 12/23/2008 (b)*** | | 400,000 | | 393,310 |
| 5.45% due 04/03/2009 (b)*** | | 1,300,000 | | 1,272,783 |
| 5.555% due 11/24/2008 (b)*** | | 1,200,000 | | 1,178,245 |
| 5.57% due 12/23/2010 (b)*** | | 10,000,000 | | 9,522,810 |
| 5.60% due 08/21/2009 (b)*** | | 2,600,000 | | 2,529,270 |
| 5.63% due 11/16/2009 (b)*** | | 4,100,000 | | 3,963,536 |
| 5.645% due 05/25/2010 (b)*** | | 800,000 | | 767,404 |
| Longpoint Re, Ltd. | | | | |
| 10.60875% due 05/08/2010 (b)*** | | 1,200,000 | | 1,214,640 |
| Merrill Lynch & Company, Inc. | | | | |
| 6.40% due 08/28/2017 *** | | 3,100,000 | | 3,159,427 |
| Merrill Lynch & Company, Inc., Series MTN | | | |
| 5.40563% due 05/08/2009 (b)*** | | 2,700,000 | | 2,691,271 |
| 5.56% due 07/25/2011 (b)*** | | 3,200,000 | | 3,155,331 |
| 5.665% due 08/14/2009 (b)*** | | 2,300,000 | | 2,293,337 |
| 6.05% due 08/15/2012 *** | | 900,000 | | 915,380 |
| Merrill Lynch & Company, Inc., Series MTNB | | | |
| 5.45% due 01/30/2009 (b)*** | | 3,200,000 | | 3,187,648 |
| Merrill Lynch & Company, Inc., Series MTNC | | | |
| 5.6988% due 06/16/2008 (b)*** | | 3,000,000 | | 3,000,282 |
| Morgan Stanley | | | | |
| 6.25% due 08/28/2017 *** | | 800,000 | | 808,297 |
| Morgan Stanley, Series FMTN | | | | |
| 5.40563% due 05/07/2009 (b)*** | | 2,900,000 | | 2,873,749 |
| Morgan Stanley, Series GMTN | | | | |
| 5.47% due 02/09/2009 (b)*** | | 7,200,000 | | 7,150,090 |
| Morgan Stanley, Series MTN | | | | |
| 5.45025% due 01/15/2010 (b)*** | | 2,400,000 | | 2,367,638 |
| 5.55% due 11/21/2008 (b)*** | | 1,900,000 | | 1,889,774 |
| Mystic Re, Ltd. | | | | |
| 15.54125% due 06/07/2011 (b)*** | | 1,000,000 | | 1,017,000 |
| Salomon Brothers AG for OAO Gazprom | | | | |
| 10.50% due 10/21/2009 (b)*** | | 900,000 | | 977,259 |
| SLM Corp., Series MTNA | | | | |
| 5.50% due 07/27/2009 (b)*** | | 10,500,000 | | 10,073,983 |
| SMFG Preferred Capital | | | | |
| 5.37% due 01/29/2049 (b)*** | | 1,600,000 | | 1,492,288 |
| Societe Generale NY | | | | |
| 5.268% due 06/30/2008 (b)*** | | 10,600,000 | | 10,602,247 |
| |
| The accompanying notes are an integral part of the financial statements. | 382 |
John Hancock Funds II
Portfolio of investments — August 31, 2007
(showing percentage of total net assets)
| | | | |
| Total Return Fund (continued) | | | |
| | | Shares or | | |
| | | Principal | | |
| | | Amount | | Value |
| |
|
| |
| CORPORATE BONDS (continued) | | | | |
| | | | |
| Financial Services (continued) | | | | |
| ZFS Finance USA Trust IV | | | | |
| 5.875% due 05/09/2032 *** | $ | 1,100,000 | $ | 1,053,756 |
| |
|
| | | | | 236,808,741 |
| |
| Food & Beverages - 0.14% | | | | |
| General Mills, Inc. | | | | |
| 5.49% due 01/22/2010 (b)*** | | 2,100,000 | | 2,092,054 |
| | | | | |
| Insurance - 0.42% | | | | |
| MetLife, Inc. | | | | |
| 6.40% due 12/15/2036 (b)*** | | 900,000 | | 818,663 |
| Metropolitan Life Global Funding I, Series MTN | | | |
| 5.56% due 05/17/2010 (b)*** | | 5,000,000 | | 4,954,330 |
| Residential Reinsurance 2007 Ltd, Series CL2 | | | |
| 15.61% due 06/07/2010 (b)*** | | 600,000 | | 610,020 |
| |
|
| | | | | 6,383,013 |
| |
| International Oil - 0.23% | | | | |
| Gaz Capital for Gazprom, Series 144A | | | | |
| 6.212% due 11/22/2016 *** | | 500,000 | | 481,750 |
| Pemex Project Funding Master Trust | | | | |
| 5.75% due 12/15/2015 *** | | 800,000 | | 791,200 |
| Transocean, Inc. | | | | |
| 5.56% due 09/05/2008 *** | | 2,300,000 | | 2,299,722 |
| |
|
| | | | | 3,572,672 |
| |
| Manufacturing - 0.21% | | | | |
| Siemens Financieringsmaatschappij NV | | | | |
| 5.625% due 08/14/2009 (b)*** | | 3,200,000 | | 3,199,350 |
| | | | | |
| Telecommunications Equipment & | | | | |
| Services - 0.39% | | | | |
| Verizon Communications, Inc. | | | | |
| 5.40% due 04/03/2009 (b)*** | | 5,900,000 | | 5,902,342 |
| | | | | |
| Telephone - 0.91% | | | | |
| AT&T, Inc. | | | | |
| 5.46% due 02/05/2010 (b)*** | | 1,400,000 | | 1,394,029 |
| 5.6475% due 05/15/2008 (b)*** | | 1,700,000 | | 1,699,158 |
| 5.785% due 11/14/2008 (b)*** | | 1,600,000 | | 1,602,704 |
| BellSouth Corp. | | | | |
| 4.24% due 04/26/2008 (b)*** | | 2,200,000 | | 2,187,753 |
| 5.6575% due 08/15/2008 (b)*** | | 3,800,000 | | 3,794,137 |
| Telecom Italia Capital SA | | | | |
| 5.97% due 07/18/2011 (b)*** | | 3,200,000 | | 3,179,027 |
| |
|
| | | | | 13,856,808 |
|
| |
| TOTAL CORPORATE BONDS (Cost $485,533,127) | | $ | 480,639,749 |
|
| |
| MUNICIPAL BONDS - 0.54% | | | | |
| | | | | |
| Iowa - 0.07% | | | | |
| Tobacco Settlement Authority of Iowa, Tobacco | | | |
| Settlement Revenue, Series A | | | | |
| 6.50% due 06/01/2023 *** | | 1,150,000 | | 1,084,623 |
| | | | | |
| Nevada - 0.01% | | | | |
| Truckee Meadows Nevada Water Authority | | | |
| 5.00% due 07/01/2036 *** (h) | | 100,000 | | 101,415 |
| | | | |
| Total Return Fund (continued) | | | |
| | | Shares or | | |
| | | Principal | | |
| | | Amount | | Value |
| |
|
| |
| MUNICIPAL BONDS (continued) | | | | |
| | | | | |
| Pennsylvania - 0.28% | | | | |
| Pennsylvania Higher Educational Facilties | | | | |
| Authority, Facilities Authority Revenue | | | | |
| 4.75% due 07/15/2035 *** (h) | $ | 4,500,000 | $ | 4,325,040 |
| | | | | |
| Wisconsin - 0.18% | | | | |
| Badger Tobacco Asset Securitization Corp. | | | |
| 6.125% due 06/01/2027 *** | | 2,625,000 | | 2,689,076 |
|
| TOTAL MUNICIPAL BONDS (Cost $8,579,489) | | $ | 8,200,154 |
|
| |
| COLLATERALIZED MORTGAGE | | | | |
| OBLIGATIONS - 15.45% | | | | |
| American Home Mortgage Investment Trust, Series | | | |
| 2004-4, Class 4A | | | | |
| 4.39% due 02/25/2045 *** | | 316,610 | | 310,364 |
| Arkle Master Issuer PLC, Series 2006-1A, Class 1A | | | |
| 5.55% due 11/19/2007 (b)*** | | 6,100,000 | | 6,095,242 |
| Bear Stearns Adjustable Rate Mortgage Trust, | | | |
| Series 2004-8, Class 2A1 | | | | |
| 5.0708% due 11/25/2034 (b)*** | | 4,585,093 | | 4,524,876 |
| Bear Stearns Adjustable Rate Mortgage Trust, | | | |
| Series 2004-9, Class 22A1 | | | | |
| 4.7733% due 11/25/2034 (b)*** | | 1,513,110 | | 1,485,915 |
| Bear Stearns Alt-A Trust, Series 2005-7, Class 22A1 | | | |
| 5.50724% due 09/25/2035 (b)*** | | 1,361,222 | | 1,351,019 |
| Bear Stearns Mortgage Funding Trust, Series | | | |
| 2007-AR1, Class 2A1 | | | | |
| 5.39% due 02/25/2037 (b)*** | | 4,274,692 | | 4,217,427 |
| Bear Stearns Structured Products Inc., Series | | | |
| 2007-R7, Class A1 | | | | |
| 5.70% due 01/25/2037 (b)*** | | 5,000,000 | | 4,966,016 |
| Citigroup Mortgage Loan Trust, Inc., Series | | | |
| 2005-11, Class 1A1 | | | | |
| 4.90% due 12/25/2035 (b)*** | | 1,455,105 | | 1,442,747 |
| Citigroup Mortgage Loan Trust, Inc., | | | | |
| Series 2005-11, Class A2A | | | | |
| 4.70% due 12/25/2035 *** | | 576,335 | | 563,051 |
| Countrywide Alternative Loan Trust, | | | | |
| Series 2005-81, Class A1 | | | | |
| 5.785% due 02/25/2037 (b)*** | | 7,371,426 | | 7,154,698 |
| Countrywide Home Loan Mortgage Pass Through | | | |
| Trust, Series 2004-22, Class A3 | | | | |
| 4.7949% due 11/25/2034 (b)*** | | 2,873,577 | | 2,822,917 |
| Countrywide Home Loan Mortgage Pass Through | | | |
| Trust, Series 2004-HYB9, Class 1A1 | | | | |
| 4.7393% due 02/20/2035 (b)*** | | 5,203,098 | | 5,110,390 |
| Countrywide Home Loans, | | | | |
| Series 2005-HYB9, Class 3A2A | | | | |
| 5.25% due 02/20/2036 (b)*** | | 682,732 | | 674,630 |
| Credit-Based Asset Servicing and Securitization | | | |
| LLC, Series 2007-SP1, Class A1 | | | | |
| 5.41% due 12/25/2037 (b)*** | | 8,982,632 | | 8,919,475 |
| CS First Boston Mortgage Securities Corp., | | | |
| Series 2005-C6, Class A1 | | | | |
| 4.938% due 12/15/2040 *** | | 1,268,725 | | 1,258,379 |
| Deutsche ALT-A Securities Inc Alternate Loan | | | |
| Trust, Series 2007-AR1, Class A3B | | | | |
| 5.39% due 01/25/2047 (b)*** | | 2,862,154 | | 2,819,255 |
| |
| The accompanying notes are an integral part of the financial statements. | 383 |
John Hancock Funds II
Portfolio of investments — August 31, 2007
(showing percentage of total net assets)
| | | | |
| Total Return Fund (continued) | | | |
| | | Shares or | | |
| | | Principal | | |
| | | Amount | | Value |
| |
|
| |
| COLLATERALIZED MORTGAGE | | | | |
| OBLIGATIONS (continued) | | | | |
| Fannie Mae Whole Loan, Series 2003-W12, Class | | | |
| 2A5 | | | | |
| 4.50% due 06/25/2043 (b)*** | $ | 3,713,526 | $ | 3,683,170 |
| Fannie Mae, Series 2003-37, Class HY | | | | |
| 5.00% due 12/25/2016 (b)*** | | 11,842,352 | | 11,786,887 |
| Federal Home Loan Mortgage Corp. , Series | | | |
| 2007-3335, Class AF | | | | |
| 5.47% due 10/15/2020 (b)*** | | 27,118,565 | | 26,946,110 |
| Federal Home Loan Mortgage Corp. , Series | | | |
| 2007-3335, Class BF | | | | |
| 5.47% due 07/15/2019 (b)*** | | 4,432,983 | | 4,404,600 |
| Federal Home Loan Mortgage Corp., Series 2637, | | | |
| Class F | | | | |
| 6.0113% due 06/15/2018 (b)*** | | 391,425 | | 391,821 |
| Federal Home Loan Mortgage Corp., Series 3036, | | | |
| Class NA | | | | |
| 5.00% due 07/15/2024 *** | | 3,694,701 | | 3,690,455 |
| Federal Home Loan Mortgage Corp., Series 3149, | | | |
| Class LF | | | | |
| 5.9113% due 05/15/2036 (b)*** | | 1,863,253 | | 1,845,657 |
| Federal Home Loan Mortgage Corp., | | | | |
| Series 2844, Class PR | | | | |
| 5.00% due 09/15/2017 *** | | 235,906 | | 235,444 |
| Federal Home Loan Mortgage Corp., | | | | |
| Series T-63, Class 1A1 | | | | |
| 6.20% due 02/25/2045 (b)*** | | 283,534 | | 283,328 |
| Federal National Mortgage Association | | | | |
| 4.67315% due 05/25/2035 (b)*** | | 500,000 | | 497,021 |
| 5.605% due 01/25/2021 (b)*** | | 22,178,397 | | 22,140,632 |
| 5.855% due 09/25/2042 (b)*** | | 2,288,805 | | 2,298,810 |
| Federal National Mortgage Association, REMICS, | | | |
| Series 2007-73, Class A1 | | | | |
| 5.565% due 07/25/2037 (b)*** | | 4,639,954 | | 4,587,755 |
| Federal National Mortgage Association, Series | | | |
| 2003-21, Class M | | | | |
| 5.00% due 02/25/2017 (b)*** | | 687,441 | | 683,510 |
| Federal National Mortgage Association, Series | | | |
| 2005-33, Class QA | | | | |
| 5.00% due 06/25/2027 *** | | 2,492,272 | | 2,484,240 |
| Freddie Mac , Series 2007-3335, Class FT | | | | |
| 5.47% due 08/15/2019 (b)*** | | 20,302,032 | | 20,177,789 |
| Freddie Mac REMICS, Series 2007-3346, Class FA | | | |
| 5.841% due 02/15/2019 (b)*** | | 18,314,348 | | 18,196,804 |
| Freddie Mac, Series 2002-2539, Class TE | | | | |
| 5.00% due 12/15/2026 (b)*** | | 4,759,850 | | 4,731,166 |
| Government National Mortgage Association, Series | | | |
| 2003-4, Class LA | | | | |
| 4.00% due 07/16/2027 *** | | 39,799 | | 39,709 |
| Greenpoint Mortgage Funding Trust, Series | | | |
| 2006-AR8, Class 1A1A | | | | |
| 5.43% due 01/25/2047 (b)*** | | 2,553,780 | | 2,493,717 |
| Greenpoint Mortgage Funding Trust, | | | | |
| Series 2006-AR6, Class A1A | | | | |
| 5.585% due 10/25/2046 (b)*** | | 2,581,822 | | 2,563,212 |
| GS Mortgage Securities Corp II, Series 2007-EOP, | | | |
| Class A1 | | | | |
| 5.42% due 03/06/2020 (b)*** | | 5,645,327 | | 5,634,703 |
| | | | |
| Total Return Fund (continued) | | | |
| | | Shares or | | |
| | | Principal | | |
| | | Amount | | Value |
| |
|
| |
| COLLATERALIZED MORTGAGE | | | | |
| OBLIGATIONS (continued) | | | | |
| Indymac Index Mortgage Loan Trust, Series | | | |
| 2006-AR14, Class 1A1A | | | | |
| 5.595% due 11/25/2046 (b)*** | $ | 1,555,821 | $ | 1,540,378 |
| JP Morgan Mortgage Trust, Series 2005-A1, Class | | | |
| 6T1 | | | | |
| 5.02292% due 02/25/2035 (b)*** | | 2,116,072 | | 2,060,562 |
| LB-UBS Commercial Mortgage Trust, Series | | | |
| 2002-C2, Class A2 | | | | |
| 4.904% due 06/15/2026 *** | | 1,111,571 | | 1,104,106 |
| LB-UBS Commercial Mortgage Trust, Series | | | |
| 2005-C7, Class A1 | | | | |
| 4.99% due 11/15/2030 *** | | 1,575,550 | | 1,565,665 |
| Mellon Residential Funding Corp., | | | | |
| Series 2000-TBC3, Class A1 | | | | |
| 5.78694% due 12/15/2030 (b)*** | | 5,830,514 | | 5,755,299 |
| Merrill Lynch Mortgage Investors Inc, Series | | | |
| 2005-2, Class 3A | | | | |
| 6.505% due 10/25/2035 (b)*** | | 777,519 | | 782,814 |
| Merrill Lynch Mortgage Investors Inc, Series | | | |
| 2005-3, Class 4A | | | | |
| 5.755% due 11/25/2035 (b)*** | | 517,791 | | 517,468 |
| Merrill Lynch Mortgage Investors Inc, Series | | | |
| 2005-A10, Class A | | | | |
| 5.715% due 02/25/2036 (b)*** | | 1,360,862 | | 1,360,862 |
| Morgan Stanley Capital I, Series 2007-XLFA, Class | | | |
| A1 | | | | |
| 5.67% due 10/15/2020 (b)*** | | 1,255,483 | | 1,255,483 |
| Structured Asset Mortgage Investments Inc, Series | | | |
| 2005-AR5, Class A3 | | | | |
| 5.7875% due 07/19/2035 (b)*** | | 2,739,464 | | 2,657,744 |
| Structured Asset Mortgage Investments Inc, Series | | | |
| 2007-AR2, Class 2A1 | | | | |
| 5.45% due 03/25/2037 (b)*** | | 4,500,167 | | 4,372,550 |
| Structured Asset Mortgage Investments, Inc., | | | |
| Series 2005-AR8, Class A1A | | | | |
| 5.785% due 02/25/2036 (b)*** | | 721,090 | | 701,457 |
| Structured Asset Securities Corp., Series | | | | |
| 2005-AR1, Class A3 | | | | |
| 5.605% due 09/25/2035 (b)*** | | 557,169 | | 556,621 |
| Thornburg Mortgage Securities Trust, Series | | | |
| 2006-6, Class A1 | | | | |
| 5.615% due 12/25/2036 (b)*** | | 2,145,599 | | 2,118,801 |
| Thornburg Mortgage Securities Trust, | | | | |
| Series 2006-5, Class A1 | | | | |
| 5.625% due 08/25/2036 (b)*** | | 4,910,927 | | 4,836,024 |
| Washington Mutual Mortgage Securities Corp., | | | |
| Series 2002-AR17, Class 1A | | | | |
| 6.20% due 11/25/2042 (b)*** | | 423,503 | | 425,187 |
| Washington Mutual, Inc., Series 2001-7, Class A | | | |
| 6.20% due 05/25/2041 (b)*** | | 337,091 | | 335,885 |
| Washington Mutual, Inc., Series 2005-AR19, Class | | | |
| A1A1 | | | | |
| 5.775% due 12/25/2045 (b)*** | | 4,058,194 | | 3,962,096 |
| Wells Fargo Mortgage Backed Securities Trust, | | | |
| Series 2004-CC, Class A1 | | | | |
| 4.9547% due 01/25/2035 (b)*** | | 3,693,490 | | 3,580,949 |
| | |
| The accompanying notes are an integral part of the financial statements. | 384 | |
John Hancock Funds II
Portfolio of investments — August 31, 2007
(showing percentage of total net assets)
| | | | |
| Total Return Fund (continued) | | | |
| | | Shares or | | |
| | | Principal | | |
| | | Amount | | Value |
| |
|
| |
| COLLATERALIZED MORTGAGE | | | | |
| OBLIGATIONS (continued) | | | | |
| Wells Fargo Mortgage Backed Securities Trust, | | | |
| Series 2006-AR2, Class 2A1 | | | | |
| 4.95% due 03/25/2036 (b)*** | $ | 2,829,983 | $ | 2,778,280 |
|
| TOTAL COLLATERALIZED MORTGAGE OBLIGATIONS | | |
| (Cost $237,025,304) | | | $ | 235,781,172 |
|
| |
| ASSET BACKED SECURITIES - 11.13% | | | |
| ACE Securities Corp., Series 2006-ASP5, Class | | | |
| A2A | | | | |
| 5.585% due 10/25/2036 (b)*** | | 1,563,779 | | 1,554,093 |
| Argent Securities, Inc., Series 2006-M2, Class A2A | | | |
| 5.555% due 09/25/2036 (b)*** | | 835,605 | | 829,964 |
| Bear Stearns Asset Backed Securities Inc, Series | | | |
| 2007-HE1, Class 21A1 | | | | |
| 5.38% due 01/25/2037 (b)*** | | 4,739,686 | | 4,703,399 |
| Bear Stearns Asset Backed Securities Trust, | | | |
| Series 2007-HE5, Class 1A1 | | | | |
| 5.41% due 06/25/2047 (b)*** | | 1,775,264 | | 1,759,551 |
| Carrington Mortgage Loan Trust, Series 2005-NC5, | | | |
| Class A2 | | | | |
| 5.82% due 10/25/2035 (b)*** | | 3,536,243 | | 3,448,609 |
| Citigroup Commercial Mortgage Trust, Series | | | |
| 2006-FL2, Class A1 | | | | |
| 5.68125% due 08/15/2021 (b)*** | | 874,029 | | 873,687 |
| Citigroup Mortgage Loan Trust, Inc., Series | | | |
| 2006-WFH4, Class A1 | | | | |
| 5.37% due 11/25/2036 (b)*** | | 967,694 | | 962,010 |
| Commercial Mortgage Pass Through Certificates, | | | |
| Series 1999-1, Class A2 | | | | |
| 6.455% due 05/15/2032 *** | | 2,515,713 | | 2,523,606 |
| Countrywide Asset-Backed Certificates, Series | | | |
| 2006-15, Class A1 | | | | |
| 6.615% due 10/25/2036 *** | | 1,900,278 | | 1,888,832 |
| Countrywide Asset-Backed Certificates, Series | | | |
| 2006-16, Class 2A1 | | | | |
| 5.555% due 10/25/2036 *** | | 775,555 | | 771,556 |
| Countrywide Asset-Backed Certificates, Series | | | |
| 2006-17, Class 2A1 | | | | |
| 5.555% due 03/25/2047 (b)*** | | 1,608,607 | | 1,597,292 |
| Countrywide Asset-Backed Certificates, Series | | | |
| 2006-18, Class 2A1 | | | | |
| 5.555% due 03/25/2037 (b)*** | | 4,232,204 | | 4,206,213 |
| Countrywide Asset-Backed Certificates, Series | | | |
| 2006-19, Class 2A1 | | | | |
| 5.565% due 03/25/2037 (b)*** | | 2,566,772 | | 2,549,876 |
| Countrywide Asset-Backed Certificates, Series | | | |
| 2007-1, Class 2A1 | | | | |
| 5.37% due 07/25/2037 (b)*** | | 11,585,449 | | 11,490,953 |
| Daimler Chrysler Auto Trust, Series 2006-C, Class | | | |
| A2 | | | | |
| 5.33% due 05/08/2009 *** | | 1,951,336 | | 1,949,154 |
| First Franklin Mortgage Loan Asset Backed | | | |
| Certificates, Series 2006-FF15, Class A3 | | | |
| 5.555% due 11/25/2036 (b)*** | | 3,124,703 | | 3,054,955 |
| First Franklin Mortgage Loan Asset Backed | | | |
| Certificates, Series 2006-FF9, Class 2A1 | | | |
| 5.565% due 06/25/2036 (b)*** | | 7,258,992 | | 7,189,368 |
| | | | |
| Total Return Fund (continued) | | | |
| | | Shares or | | |
| | | Principal | | |
| | | Amount | | Value |
| |
|
| |
| ASSET BACKED SECURITIES | | | | |
| (continued) | | | | |
| First Franklin Mortgage Loan Asset Backed | | | |
| Certificates, Series 2007-FF1, Class A2A | | | |
| 5.36% due 01/25/2038 (b)*** | $ | 4,496,235 | $ | 4,463,151 |
| First USA Credit Card Master Trust, Series 1998-6, | | | |
| Class A | | | | |
| 5.70% due 04/18/2011 (b)*** | | 6,600,000 | | 6,597,510 |
| Fremont Home Loan Trust, Series 2006-3, Class | | | |
| 2A1 | | | | |
| 5.575% due 02/25/2037 (b)*** | | 1,159,765 | | 1,154,203 |
| GE Capital Commercial Mortgage Corp., Series | | | |
| 2002-3A, Class A1 | | | | |
| 4.229% due 12/10/2037 (b)*** | | 5,782,394 | | 5,657,179 |
| GE-WMC Mortgage Securities LLC, | | | | |
| Series 2005-2, Class A2A | | | | |
| 5.605% due 12/25/2035 (b)*** | | 2,653,960 | | 2,652,364 |
| GSAMP Trust, Series 2006-FM2, Class A2A | | | |
| 5.575% due 09/25/2036 (b)*** | | 1,714,232 | | 1,703,651 |
| GSAMP Trust, Series 2007-FM1, Class A2A | | | |
| 5.575% due 12/25/2036 (b)*** | | 2,388,365 | | 2,356,078 |
| GSR Mortgage Loan Trust, Series 2005-AR7, | | | |
| Class 6A1 | | | | |
| 5.251% due 11/25/2035 (b)*** | | 3,206,129 | | 3,050,515 |
| GSR Mortgage Loan Trust, Series 2005-HEL1, | | | |
| Class A2A | | | | |
| 5.605% due 11/25/2030 (b)*** | | 236,357 | | 235,920 |
| HFC Home Equity Loan Asset Backed Certificates, | | | |
| Series 2005-1, Class A | | | | |
| 5.8275% due 01/20/2034 (b)*** | | 3,069,157 | | 2,983,029 |
| HSBC Asset Loan Obligation, Series 2007-WF1, | | | |
| Class A1 | | | | |
| 5.565% due 12/25/2036 (b)*** | | 10,442,739 | | 10,289,367 |
| HSI Asset Securitization Corp. Trust, Series | | | |
| 2006-HE2, Class 2A1 | | | | |
| 5.555% due 12/25/2036 (b)*** | | 1,284,004 | | 1,273,900 |
| Indymac Residential Asset Backed Trust, Series | | | |
| 2005-D, Class AII1 | | | | |
| 5.605% due 03/25/2036 (b)*** | | 143,932 | | 143,851 |
| JP Morgan Mortgage Acquisition Corp., Series | | | |
| 2006-HE3, Class A2 | | | | |
| 5.37% due 11/25/2036 (b)*** | | 650,373 | | 645,963 |
| JP Morgan Mortgage Acquisition Corp., Series | | | |
| 2006-WMC3, Class A2 | | | | |
| 5.555% due 08/25/2036 (b)*** | | 957,122 | | 948,490 |
| JP Morgan Mortgage Acquisition Corp., Series | | | |
| 2007-HE1, Class AV1 | | | | |
| 5.39% due 04/01/2037 (b)*** | | 3,134,969 | | 3,099,387 |
| Lehman Brothers Floating Rate Commercial | | | |
| Mortgage Trust, Series 2006-LLFA, Class A1 | | | |
| 5.8325% due 09/15/2021 (b)*** | | 516,906 | | 516,784 |
| Long Beach Mortgage Loan Trust, Series 2004-4, | | | |
| Class 1A1 | | | | |
| 5.785% due 10/25/2034 (b)*** | | 110,776 | | 104,804 |
| Master Asset Backed Securities Trust, Series | | | |
| 2007-HE1, Class A1 | | | | |
| 5.40% due 05/25/2037 (b)*** | | 2,220,786 | | 2,209,336 |
| |
| The accompanying notes are an integral part of the financial statements. | 385 |
John Hancock Funds II
Portfolio of investments — August 31, 2007
(showing percentage of total net assets)
| | | | |
| Total Return Fund (continued) | | | |
| | | Shares or | | |
| | | Principal | | |
| | | Amount | | Value |
|
|
| |
| ASSET BACKED SECURITIES | | | | |
| (continued) | | | | |
| Merrill Lynch Mortgage Investors Trust, Series | | | |
| 2006-RM5, Class A2A | | | | |
| 5.565% due 10/25/2037 (b)*** | $ | 4,621,051 | $ | 4,578,534 |
| Morgan Stanley ABS Capital I, Series 2006-NC5, | | | |
| Class A2A | | | | |
| 5.50% due 10/25/2036 *** | | 981,577 | | 970,810 |
| Morgan Stanley ABS Capital I, Series 2007-HE1, | | | |
| Class A2A | | | | |
| 5.370% due 11/25/2036 (b)*** | | 4,405,943 | | 4,368,737 |
| Newcastle Mortgage Securities Trust, Series | | | |
| 2006-1, Class A1 | | | | |
| 5.575% due 03/25/2036 (b)*** | | 1,458,904 | | 1,450,825 |
| Option One Mortgage Loan Trust, Series 2007-1, | | | |
| Class 2A1 | | | | |
| 5.37% due 01/25/2037 (b)*** | | 3,185,186 | | 3,171,747 |
| Park Place Securities, Inc., Series 2004-MCW1, | | | |
| Class A1 | | | | |
| 5.817% due 10/25/2034 (b)*** | | 2,829,525 | | 2,712,430 |
| Residential Asset Mortgage Products, Inc., Series | | | |
| 2006-RZ4, Class A1A | | | | |
| 5.585% due 10/25/2036 (b)*** | | 2,669,463 | | 2,643,866 |
| Residential Asset Securities Corp., Series | | | | |
| 2006-EMX9, Class 1A1 | | | | |
| 5.39% due 11/25/2036 (b)*** | | 4,144,544 | | 4,119,862 |
| Residential Asset Securities Corp., Series | | | | |
| 2006-KS6, Class A1 | | | | |
| 5.545% due 08/25/2036 (b)*** | | 926,445 | | 920,185 |
| Residential Asset Securities Corp., Series | | | | |
| 2006-KS8, Class A1 | | | | |
| 5.565% due 10/25/2036 (b)*** | | 5,081,075 | | 5,052,769 |
| Residential Asset Securities Corp., Series | | | | |
| 2006-KS9, Class AI1 | | | | |
| 5.575% due 11/25/2036 (b)*** | | 2,392,331 | | 2,369,140 |
| Saxon Asset Securities Trust, Series 2006-3, Class | | | |
| A1 | | | | |
| 5.38% due 11/25/2036 (b)*** | | 1,071,373 | | 1,064,255 |
| SBI Heloc Trust, Series 2006-1A, Class 1A2A | | | |
| 5.675% due 08/25/2036 (b)*** | | 1,404,003 | | 1,391,937 |
| Securitized Asset Backed Receivables LLC Trust, | | | |
| Series 2007-HE1, Class A2A | | | | |
| 5.565% due 12/25/2036 (b)*** | | 3,431,707 | | 3,398,690 |
| SLM Student Loan Trust, Series 2005-1, Class A1 | | | |
| 5.37% due 01/26/2015 (b)*** | | 163,767 | | 163,746 |
| Soundview Home Equity Loan Trust, Series | | | |
| 2006-EQ1, Class A1 | | | | |
| 5.555% due 10/25/2036 (b)*** | | 1,525,614 | | 1,513,949 |
| Specialty Underwriting & Residential Finance, | | | |
| Series 2007-BC1, Class A2A | | | | |
| 5.565% due 01/25/2038 (b)*** | | 4,248,288 | | 4,212,799 |
| Structured Asset Securities Corp., Series 2005-S7, | | | |
| Class A1 | | | | |
| 5.585% due 12/25/2035 (b)*** | | 660,697 | | 658,940 |
| Structured Asset Securities Corp., Series 2006-11, | | | |
| Class A1 | | | | |
| 5.32186% due 10/25/2035 (b)*** | | 2,432,784 | | 2,419,963 |
| | | | |
| Total Return Fund (continued) | | | |
| | | Shares or | | |
| | | Principal | | |
| | | Amount | | Value |
|
|
| |
| ASSET BACKED SECURITIES | | | | |
| (continued) | | | | |
| Structured Asset Securities Corp., Series | | | | |
| 2006-BC3, Class A2 | | | | |
| 5.555% due 10/25/2036 (b)*** | $ | 2,591,775 | $ | 2,560,297 |
| USAA Auto Owner Trust, Series 2007-1, Class A1 | | | |
| 5.337% due 07/11/2008 *** | | 1,986,131 | | 1,984,270 |
| Wachovia Auto Loan Owner Trust 2006-1, Series | | | |
| 2007-1, Class A1 | | | | |
| 5.337% due 06/20/2008 *** | | 2,074,192 | | 2,072,896 |
| Wachovia Bank Commercial Mortgage Trust, | | | |
| Series 2006-WL7A, Class A1 | | | | |
| 5.7013% due 09/15/2021 (b)*** | | 8,662,644 | | 8,654,887 |
| Wachovia Bank Commercial Mortgage Trust, | | | |
| Series 2007-WHL8, Class A1 | | | | |
| 5.69% due 06/15/2020 (b)*** | | 4,197,624 | | 4,176,678 |
| Wells Fargo Home Equity Trust, Series 2005-4, | | | |
| Class AI1 | | | | |
| 5.625% due 12/25/2035 (b)*** | | 1,868,216 | | 1,852,435 |
|
| TOTAL ASSET BACKED SECURITIES | | | | |
| (Cost $171,274,144) | | | $ | 169,923,247 |
|
| |
| TERM LOANS - 1.21% | | | | |
| | | | | |
| Cable & Television - 0.06% | | | | |
| Cablevision | | | | |
| 6.87% due 03/23/2013 (b) | | 987,500 | | 946,924 |
| | | | | |
| Electrical Utilities - 0.31% | | | | |
| Kinder Morgan, Inc. | | | | |
| 1.00% due 11/24/2013 | | 5,000,000 | | 4,720,850 |
| | | | | |
| Financial Services - 0.72% | | | | |
| Chrysler Financial | | | | |
| 5.00% due 08/03/2012 | | 8,000,000 | | 7,777,120 |
| SLM Corp., Series MTNA | | | | |
| 6.00% due 06/30/2008 (f) | | 3,200,000 | | 3,184,000 |
| |
|
| | | | | 10,961,120 |
| |
| Semiconductors - 0.12% | | | | |
| Sensata Technologies, Inc. | | | | |
| 5.75% due 04/27/2013 | | 1,994,962 | | 1,899,204 |
|
| TOTAL TERM LOANS (Cost $18,788,953) | | $ | 18,528,098 |
|
| |
| OPTIONS - 0.53% | | | | |
| | | | | |
| Call Options - 0.52% | | | | |
| Over The Counter European Style Call on the USD | | | |
| vs. JPY | | | | |
| Expiration 03/31/2010 at $105.40 * | | 3,000,000 | | 155,568 |
| Over The Counter European Style Call on | | | | |
| USD-LIBOR rate swaption | | | | |
| Expiration 09/26/2008 at $4.75 * | | 100,000,000 | | 761,720 |
| Expiration 09/30/2008 at $4.75 * | | 137,700,000 | | 1,048,889 |
| Expiration 12/15/2008 at $4.75 * | | 143,700,000 | | 1,134,454 |
| Expiration 02/01/2008 at $4.75 * | | 41,000,000 | | 123,463 |
| Expiration 03/31/2008 at $4.75 * | | 109,700,000 | | 713,785 |
| Expiration 03/31/2008 at $4.75 * | | 52,000,000 | | 334,716 |
| Expiration 09/26/2008 at $4.75 * | | 36,000,000 | | 274,219 |
| Expiration 10/25/2007 at $4.90 * | | 42,000,000 | | 193,074 |
| Expiration 12/15/2008 at $5.00 * | | 198,300,000 | | 1,974,711 |
| | |
| The accompanying notes are an integral part of the financial statements. | 386 |
John Hancock Funds II
Portfolio of investments — August 31, 2007
(showing percentage of total net assets)
| | | | |
| Total Return Fund (continued) | | | |
| | | Shares or | | |
| | | Principal | | |
| | | Amount | | Value |
|
|
| |
| OPTIONS (continued) | | | | |
| | | | | |
| Call Options (continued) | | | | |
| Over The Counter European Style Call on | | | | |
| USD-LIBOR rate swaption (continued) | | | | |
| Expiration 02/01/2008 at $5.00 * | | 82,500,000 | $ | 668,646 |
| Expiration 02/02/2009 at $5.20 * | | 46,000,000 | | 548,085 |
|
|
| | | | | 7,931,330 |
| Put Options - 0.01% | | | | |
| Chicago Mercantile Exchange American Purchase | | | |
| Put on Eurodollar | | | | |
| Expiration 09/17/2007 at $90.75 * | | 1,030,000 | | 2,575 |
| Expiration 09/17/2007 at $91.25 * | | 1,642,500 | | 4,106 |
| Expiration 12/17/2007 at $91.25 * | | 2,275,000 | | 5,688 |
| Expiration 12/17/2007 at $91.75 * | | 12,500 | | 31 |
| Expiration 03/17/2008 at $91.75 * | | 6,250,000 | | 15,625 |
| Expiration 12/17/2007 at $92.00 * | | 1,185,000 | | 2,963 |
| Expiration 12/17/2007 at $92.25 * | | 1,262,500 | | 3,156 |
| Over The Counter European Purchase Put on the | | | |
| USD vs. JPY | | | | |
| Expiration 03/31/2010 at $105.40 * | | 3,000,000 | | 155,568 |
|
|
| | | | | 189,712 |
|
| TOTAL OPTIONS (Cost $4,571,126) | | | $ | 8,121,042 |
|
| |
| SHORT TERM INVESTMENTS - 14.28% | | | |
| Bank of America Corp. | | | | |
| 5.23% due 11/20/2007 *** | $ | 27,100,000 | $ | 26,785,038 |
| 5.26% due 11/08/2007 *** | | 700,000 | | 693,045 |
| Dexia Credit Local SA - Series YCD | | | | |
| 5.27% due 09/29/2008 *** | EUR | 13,900,000 | | 13,894,175 |
| Fortis Funding LLC | | | | |
| 5.275% due 09/07/2007 *** | $ | 35,500,000 | | 35,468,790 |
| National Australia Funding (Delaware), Inc. | | | | |
| 5.28% due 09/07/2007 *** | | 3,200,000 | | 3,197,184 |
| Rabobank USA Finance Corp. | | | | |
| 5.24% due 09/04/2007 *** | | 30,300,000 | | 30,286,769 |
| Royal Bank of Scotland Group PLC | | | | |
| 5.265% due 03/26/2008 *** | | 300,000 | | 299,950 |
| Skandinaviska Enskilda Banken AB | | | | |
| 5.27% due 10/03/2007 *** | | 7,400,000 | | 7,399,806 |
| Time Warner, Inc. | | | | |
| 5.41% due 09/17/2007 *** | | 1,500,000 | | 1,496,393 |
| U.S. Treasury Bill | | | | |
| zero coupon due 09/13/2007 **** | | 4,770,000 | | 4,762,615 |
| U.S. Treasury Bills | | | | |
| zero coupon due 11/29/2007 **** | | 3,710,000 | | 3,668,689 |
| UBS Finance (Delaware) LLC | | | | |
| 5.225% due 11/14/2007 *** | | 25,700,000 | | 25,423,975 |
| 5.235% due 09/06/2007 *** | | 19,800,000 | | 19,785,604 |
| 5.26% due 11/07/2007 *** | | 1,000,000 | | 990,211 |
| Westpac Banking Corp. | | | | |
| 5.26% due 11/08/2007 *** | | 44,200,000 | | 43,760,848 |
|
| TOTAL SHORT TERM INVESTMENTS | | | | |
| (Cost $217,913,091) | | | $ | 217,913,092 |
|
| | | | |
| Total Return Fund (continued) | | | |
| | | Shares or | | |
| | | Principal | | |
| | | Amount | | Value |
| |
|
| |
| REPURCHASE AGREEMENTS - 2.17% | | | |
| Lehman Brothers Tri-Party | | | | |
| Repurchase Agreement dated | | | | |
| 08/31/2007 at 5.13% to be | | | | |
| repurchased at $9,005,130 on | | | | |
| 9/4/2007, collateralized by | | | | |
| $7,576,492 U.S. Treasury Note, | | | | |
| 3.375% due 04/15/2032 (valued at | | | | |
| $9,190,575, including interest) | $ | 9,000,000 | $ | 9,000,000 |
| Repurchase Agreement with State Street | | | | |
| Corp. dated 08/31/2007 at 4.60% to be | | | | |
| repurchased at $33,087,432 on 9/4/2007, | | | |
| collateralized by $7,576,492 U.S. Treasury | | | |
| Note, 3.375% due 04/15/2032 (valued at | | | |
| $9,190,575, including interest) and | | | | |
| $24,045,000 Federal National Mortgage | | | | |
| Association, 5.3% due 04/16/2010 (valued | | | |
| at $24,555,956, including interest) | | 24,070,000 | | 24,070,000 |
|
| TOTAL REPURCHASE AGREEMENTS | | | | |
| (Cost $33,070,000) | | | $ | 33,070,000 |
|
| Total Investments (Total Return Fund) | | | | |
| (Cost $2,078,106,944) - 135.95% | | | $ | 2,074,916,906 |
| Liabilities in Excess of Other Assets - (35.95)% | | | (548,641,196) |
| |
|
| TOTAL NET ASSETS - 100.00% | | | $ | 1,526,275,710 |
| |
|
| |
| |
| Schedule of Securities Sold Short | | | |
| | | Shares or | | |
| | | Principal | | |
| | | Amount | | Value |
| |
|
| |
| U.S. TREASURY NOTES - 100.00% | | | | |
| U.S. Treasury Notes | | | | |
| 4.625%, due 02/15/2017 | $ | 4,500,000 | $ | 4,526,015 |
| 4.50%, due 05/15/2017 | | 35,300,000 | $ | 35,173,132 |
|
| TOTAL U.S. TREASURY | | | | |
| NOTES (Proceeds $38,658,352) | | | $ | 39,699,147 |
|
| Total Securities Sold Short | | | | |
| (Proceeds $38,658,352) | | | $ | 39,699,147 |
| |
|
| |
| |
| U.S. Global Leaders Growth Fund | | |
| | | Shares or | | |
| | | Principal | | |
| | | Amount | | Value |
| |
|
| |
| COMMON STOCKS - 99.43% | | | | |
| | | | | |
| Biotechnology - 5.14% | | | | |
| Genzyme Corp. * | | 559,907 | $ | 34,943,796 |
| | | | | |
| Business Services - 5.17% | | | | |
| Automatic Data Processing, Inc. | | 768,248 | | 35,139,663 |
| | | | | |
| Cosmetics & Toiletries - 7.73% | | | | |
| Colgate-Palmolive Company | | 252,967 | | 16,776,771 |
| Procter & Gamble Company | | 548,260 | | 35,806,861 |
| |
|
| | | | | 52,583,632 |
| |
| The accompanying notes are an integral part of the financial statements. | 387 |
John Hancock Funds II
Portfolio of investments — August 31, 2007
(showing percentage of total net assets)
| | | | |
| U.S. Global Leaders Growth Fund (continued) |
| | | Shares or | | |
| | | Principal | | |
| | | Amount | | Value |
| |
|
| |
| COMMON STOCKS (continued) | | | | |
| | | | | |
| Financial Services - 3.91% | | | | |
| State Street Corp. (c) | | 433,764 | $ | 26,615,759 |
| | | | |
| Food & Beverages - 11.54% | | | | |
| PepsiCo, Inc. | | 509,800 | | 34,681,694 |
| Sysco Corp. | | 716,143 | | 23,904,853 |
| The Coca-Cola Company | | 370,625 | | 19,932,213 |
|
|
| | | | | 78,518,760 |
| Healthcare Products - 10.86% | | | | |
| Johnson & Johnson | | 435,744 | | 26,924,622 |
| Medtronic, Inc. | | 511,282 | | 27,016,141 |
| Stryker Corp. | | 298,000 | | 19,906,400 |
|
|
| | | | | 73,847,163 |
| Holdings Companies/Conglomerates - 5.33% | | | |
| General Electric Company | | 932,799 | | 36,257,897 |
| | | | | |
| Hotels & Restaurants - 3.14% | | | | |
| Starbucks Corp. * | | 776,312 | | 21,387,396 |
| | | | | |
| Insurance - 2.51% | | | | |
| American International Group, Inc. | | 259,114 | | 17,101,524 |
| | | | | |
| Internet Retail - 2.86% | | | | |
| eBay, Inc. * | | 569,697 | | 19,426,668 |
| | | | | |
| Leisure Time - 3.28% | | | | |
| Electronic Arts, Inc. * | | 421,196 | | 22,298,116 |
| | | | | |
| Pharmaceuticals - 4.01% | | | | |
| Teva Pharmaceutical Industries, Ltd., SADR | 634,073 | | 27,265,139 |
| | | | | |
| Retail Grocery - 2.90% | | | | |
| Whole Foods Market, Inc. (a) | | 445,600 | | 19,722,256 |
| | | | | |
| Retail Trade - 14.68% | | | | |
| Costco Wholesale Corp. | | 322,319 | | 19,903,198 |
| Lowe's Companies, Inc. | | 916,700 | | 28,472,702 |
| Staples, Inc. | | 1,457,321 | | 34,611,374 |
| Walgreen Company | | 375,000 | | 16,901,250 |
|
|
| | | | | 99,888,524 |
| Sanitary Services - 2.01% | | | | |
| Ecolab, Inc. | | 328,000 | | 13,664,480 |
| | | | | |
| Software - 7.33% | | | | |
| Microsoft Corp. | | 1,074,606 | | 30,873,430 |
| SAP AG, SADR (a) | | 351,000 | | 18,978,570 |
|
|
| | | | | 49,852,000 |
| Telecommunications Equipment & | | | | |
| Services - 3.10% | | | | |
| QUALCOMM, Inc. | | 529,100 | | 21,105,799 |
| | | | |
| Trucking & Freight - 3.93% | | | | |
| FedEx Corp. | | 244,000 | | 26,761,920 |
|
| TOTAL COMMON STOCKS (Cost $640,575,786) | | $ | 676,380,492 |
|
| |
| SHORT TERM INVESTMENTS - 4.69% | | | |
| John Hancock Cash Investment Trust (c) | $ | 31,899,286 | $ | 31,899,286 |
|
| TOTAL SHORT TERM INVESTMENTS | | | | |
| (Cost $31,899,286) | | | $ | 31,899,286 |
|
| | | | |
| U.S. Global Leaders Growth Fund (continued) |
| | | Shares or | | |
| | | Principal | | |
| | | Amount | | Value |
| |
|
| |
| REPURCHASE AGREEMENTS - 0.51% | | | |
| Repurchase Agreement with State | | | | |
| Street Corp. dated 08/31/2007 at | | | | |
| 4.60% to be repurchased at | | | | |
| $3,452,764 on 9/4/2007, | | | | |
| collateralized by $3,560,000 | | | | |
| Federal National Mortgage | | | | |
| Association, 5.49% due | | | | |
| 01/11/2023 (valued at $3,524,400, | | | | |
| including interest) | $ | 3,451,000 | $ | 3,451,000 |
|
| TOTAL REPURCHASE AGREEMENTS | | | | |
| (Cost $3,451,000) | | | $ | 3,451,000 |
|
| Total Investments (U.S. Global Leaders Growth Fund) | | |
| (Cost $675,926,072) - 104.63% | | | $ | 711,730,778 |
| Liabilities in Excess of Other Assets - (4.63)% | | | (31,484,617) |
| |
|
| TOTAL NET ASSETS - 100.00% | | | $ | 680,246,161 |
| |
|
| |
| |
| |
| U.S. Government Securities Fund | | | |
| | | Shares or | | |
| | | Principal | | |
| | | Amount | | Value |
| |
|
| |
| U.S. TREASURY OBLIGATIONS - 12.28% | | | |
| Treasury Inflation Protected | | | | |
| | | | | |
| Securities (d) - 6.08% | | | | |
| 2.00% due 01/15/2026 | $ | 4,849,568 | $ | 4,551,019 |
| 2.375% due 04/15/2011 to 01/15/2027 | | 5,333,888 | | 5,318,044 |
| 2.50% due 07/15/2016 | | 2,083,893 | | 2,105,871 |
| |
|
| | | | | 11,974,934 |
| U.S. Treasury Bonds - 0.09% | | | | |
| 4.25% due 08/15/2014 | | 10,000 | | 9,923 |
| 6.625% due 02/15/2027 | | 128,000 | | 155,830 |
| |
|
| | | | | 165,753 |
| U.S. Treasury Notes - 6.11% | | | | |
| 3.625% due 07/15/2009 | | 2,880,000 | | 2,851,200 |
| 4.00% due 04/15/2010 | | 78,000 | | 77,647 |
| 4.375% due 11/15/2008 | | 100,000 | | 100,109 |
| 4.50% due 03/31/2009 | | 7,700,000 | | 7,730,076 |
| 4.75% due 05/31/2012 | | 490,000 | | 500,106 |
| 5.00% due 07/31/2008 | | 700,000 | | 703,391 |
| 5.125% due 05/15/2016 | | 54,000 | | 56,312 |
| |
|
| | | | | 12,018,841 |
|
| TOTAL U.S. TREASURY OBLIGATIONS | | | |
| (Cost $24,122,144) | | | $ | 24,159,528 |
|
| |
| U.S. GOVERNMENT AGENCY OBLIGATIONS - 81.33% | | |
| Federal Home Loan Mortgage Corp. - 3.88% | | | |
| 5.00% due 08/01/2033 | | 1,502,598 | | 1,433,893 |
| 5.00% TBA ** | | 3,000,000 | | 2,851,875 |
| 5.899% due 01/01/2037 | | 2,299,787 | | 2,313,974 |
| 6.00% due 10/01/2010 to 12/01/2028 | | 382,052 | | 384,770 |
| 6.50% due 12/01/2010 *** | | 15,074 | | 15,157 |
| 7.00% due 02/01/2011 to 06/01/2032 | | 574,822 | | 592,921 |
| |
| The accompanying notes are an integral part of the financial statements. | 388 |
John Hancock Funds II
Portfolio of investments — August 31, 2007
(showing percentage of total net assets)
| | | | |
| U.S. Government Securities Fund (continued) |
| | | Shares or | | |
| | | Principal | | |
| | | Amount | | Value |
| |
|
| |
| |
| U.S. GOVERNMENT AGENCY | | | | |
| OBLIGATIONS (continued) | | | | |
| Federal Home Loan Mortgage Corp. | | | | |
| (continued) | | | | |
| 9.00% due 10/01/2017 | $ | 7,990 | $ | 8,136 |
| 9.50% due 08/01/2020 | | 22,998 | | 25,037 |
| 11.75% due 12/01/2013 | | 1,101 | | 1,227 |
| 12.00% due 07/01/2020 | | 7,010 | | 7,678 |
| |
|
| | | | | 7,634,668 |
| Federal National Mortgage | | | | |
| | | | | |
| Association - 74.19% | | | | |
| 3.8309% due 02/17/2009 (b)*** | | 1,544,000 | | 1,501,540 |
| 4.875% due 01/11/2008 *** | | 2,280,000 | | 2,276,742 |
| 5.00% due 12/01/2019 | | 7,631,149 | | 7,475,755 |
| 5.00% TBA ** | | 43,400,000 | | 41,274,666 |
| 5.50% due 04/01/2018 | | 526,428 | | 524,528 |
| 5.50% due 05/01/2018 *** | | 1,309,381 | | 1,304,654 |
| 5.50% TBA ** | | 55,300,000 | | 54,254,129 |
| 6.00% TBA ** | | 19,310,000 | | 19,302,549 |
| 6.50% due 02/01/2026 to 06/01/2029 | | 264,736 | | 270,863 |
| 6.50% due 07/01/2032 *** | | 1,400,638 | | 1,442,808 |
| 6.50% TBA ** | | 14,700,000 | | 14,920,500 |
| 7.00% due 07/01/2022 to 01/01/2034 | | 715,053 | | 739,826 |
| 7.50% due 09/01/2029 to 02/01/2031 | | 121,079 | | 126,660 |
| 8.00% due 06/01/2017 to 03/01/2033 | | 293,300 | | 309,766 |
| 8.25% due 09/01/2008 *** | | 492 | | 495 |
| 8.50% due 08/01/2019 | | 117,637 | | 125,231 |
| 8.50% due 02/01/2009 *** | | 171 | | 174 |
| 8.75% due 08/01/2009 to 12/01/2009 | | 15,206 | | 15,354 |
| 9.00% due 05/01/2021 | | 5,755 | | 6,196 |
| 11.50% due 09/15/2013 to 09/01/2019 | | 27,306 | | 30,426 |
| 12.00% due 01/01/2013 to 04/20/2016 | | 68,235 | | 77,743 |
| 12.50% due 01/01/2013 to 09/20/2015 | | 32,779 | | 36,464 |
| 13.50% due 11/15/2014 | | 16,214 | | 18,304 |
| |
|
| | | | | 146,035,373 |
| Government National Mortgage | | | | |
| | | | | |
| Association - 3.26% | | | | |
| 6.00% TBA ** | | 5,700,000 | | 5,726,722 |
| 6.50% due 02/15/2034 to 09/15/2034 | | 355,032 | | 362,220 |
| 7.50% due 03/15/2026 to 12/15/2027 | | 164,494 | | 172,575 |
| 8.50% due 06/15/2025 | | 144,464 | | 155,943 |
| 11.00% due 09/15/2015 | | 626 | | 704 |
| |
|
| | | | | 6,418,164 |
|
| TOTAL U.S. GOVERNMENT AGENCY OBLIGATIONS | | |
| (Cost $159,737,822) | | | $ | 160,088,205 |
|
| |
| COLLATERALIZED MORTGAGE | | | | |
| | | | | |
| OBLIGATIONS - 22.18% | | | | |
| American Home Mortgage Assets, Series 2006-3, | | | |
| Class 3A12 | | | | |
| 5.695% due 10/25/2046 (b)*** | | 1,264,980 | | 1,240,749 |
| American Home Mortgage Investment Trust, Series | | | |
| 2006-2, Class 1A1 | | | | |
| 5.585% due 06/25/2046 (b)*** | | 750,740 | | 746,286 |
| Bear Stearns Alt-A Trust, Series 2004-11, Class 2A2 | | | |
| 6.4017% due 11/25/2034 (b)*** | | 1,098,428 | | 1,128,487 |
| | | | |
| U.S. Government Securities Fund (continued) | | |
| | | Shares or | | |
| | | Principal | | |
| | | Amount | | Value |
| |
|
| |
| COLLATERALIZED MORTGAGE | | | | |
| OBLIGATIONS (continued) | | | | |
| Commercial Mortgage Pass-Through Certificates, | | | |
| Series 2006-C8, Class A4 | | | | |
| 5.306% due 12/10/2046 (b) | $ | 1,740,000 | $ | 1,693,529 |
| Countrywide Alternative Loan Trust, Series | | | |
| 2005-17, Class 2A1 | | | | |
| 5.745% due 07/25/2035 (b)*** | | 495,646 | | 491,698 |
| Countrywide Alternative Loan Trust, Series | | | |
| 2005-59, Class 1A1 | | | | |
| 5.8675% due 11/20/2035 (b)*** | | 366,854 | | 360,013 |
| Countrywide Alternative Loan Trust, Series | | | |
| 2006-OA10, Class 4A1 | | | | |
| 5.695% due 08/25/2046 (b)*** | | 1,413,463 | | 1,381,187 |
| Countrywide Alternative Loan Trust, Series | | | |
| 2006-OA11, Class A4 | | | | |
| 5.695% due 09/25/2046 (b)*** | | 1,434,553 | | 1,400,140 |
| Countrywide Alternative Loan Trust, Series | | | |
| 2006-OA7, Class 3A1 | | | | |
| 5.715% due 06/25/2046 (b)*** | | 938,106 | | 924,506 |
| Countrywide Alternative Loan Trust, Series | | | |
| 2006-OA9, Class 1A1 | | | | |
| 5.7375% due 07/20/2046 (b)*** | | 1,381,305 | | 1,350,044 |
| Countrywide Alternative Loan Trust, Series | | | |
| 2006-OA9, Class 2A1B | | | | |
| 5.7375% due 07/20/2046 (b)*** | | 1,437,710 | | 1,409,520 |
| Countrywide Alternative Loan Trust, Series | | | |
| 2006-OC2, Class 2A3 | | | | |
| 5.795% due 02/25/2036 (b)*** | | 1,000,000 | | 974,012 |
| Countrywide Home Loans, Series 2006-OA5, Class | | | |
| 1A1 | | | | |
| 5.705% due 04/25/2046 (b)*** | | 691,689 | | 678,012 |
| Federal Home Loan Mortgage Corp., | | | | |
| Series 2525, Class AM | | | | |
| 4.50% due 04/15/2032 | | 240,246 | | 213,576 |
| Federal Home Loan Mortgage Corp., | | | | |
| Series 2686, Class QI | | | | |
| 5.50% IO due 01/15/2023 *** | | 571,984 | | 11,262 |
| Federal National Mortgage Association Whole | | | |
| Loan, Series 2003-W12, Class 2A7 | | | | |
| 4.68% due 06/25/2043 | | 5,000,000 | | 4,851,104 |
| Federal National Mortgage Association Whole | | | |
| Loan, Series 2005-W3, Class 2AF | | | | |
| 5.725% due 03/25/2045 (b)*** | | 600,518 | | 590,497 |
| Federal National Mortgage Association Whole | | | |
| Loan, Series 2003-W14, Class 2A | | | | |
| 6.3562% due 01/25/2043 (b)*** | | 926,356 | | 934,565 |
| Federal National Mortgage Association, Series | | | |
| 1998-M4, Class C | | | | |
| 6.527% due 05/25/2030 | | 367,107 | | 366,040 |
| Harborview Mortgage Loan Trust, Series 2005-7, | | | |
| Class 1A1 | | | | |
| 6.143% due 06/19/2045 (b)*** | | 539,268 | | 542,301 |
| Impac CMB Trust, Series 2004-5, Class 1A1 | | | |
| 5.865% due 10/25/2034 (b)*** | | 992,483 | | 992,247 |
| Impac Secured Assets Corp., Series 2005-2, | | | |
| Class A1 | | | | |
| 5.825% due 03/25/2036 (b)*** | | 1,164,913 | | 1,143,166 |
| |
| The accompanying notes are an integral part of the financial statements. | 389 |
John Hancock Funds II
Portfolio of investments — August 31, 2007
(showing percentage of total net assets)
| | | | |
| U.S. Government Securities Fund (continued) | | |
| | | Shares or | | |
| | | Principal | | |
| | | Amount | | Value |
| |
|
| |
| COLLATERALIZED MORTGAGE | | | | |
| OBLIGATIONS (continued) | | | | |
| LB-UBS Commercial Mortgage Trust, | | | | |
| Series 2006-C7, Class A3 | | | | |
| 5.347% due 11/15/2038 | $ | 2,280,000 | $ | 2,226,879 |
| Luminent Mortgage Trust, Series 2006-4, Class A1A | | | |
| 5.695% due 05/25/2046 (b)*** | | 1,221,229 | | 1,188,356 |
| Master Adjustable Rate Mortgages Trust, Series | | | |
| 2004-15, Class 1A1 | | | | |
| 5.2469% due 12/25/2034 (b) | | 167,786 | | 172,197 |
| Morgan Stanley Mortgage Loan Trust, Series | | | |
| 2006-8AR, Class 1A2 | | | | |
| 5.575% due 06/25/2036 (b)*** | | 833,400 | | 829,876 |
| Novastar Mortgage-Backed Notes, Series | | | | |
| 2006-MTA1, Class 2A1A | | | | |
| 5.695% due 09/25/2046 (b)*** | | 1,146,409 | | 1,123,823 |
| Structured Asset Mortgage Investments, Inc., | | | |
| Series 2006-AR6, Class 1A1 | | | | |
| 5.685% due 07/25/2036 (b)*** | | 1,423,263 | | 1,382,975 |
| Structured Asset Mortgage Investments, Inc., | | | |
| Series 2006-AR7, Class A1A | | | | |
| 5.715% due 08/25/2036 (b)*** | | 1,633,785 | | 1,597,721 |
| Thornburg Mortgage Securities Trust, Series | | | |
| 2005-3, Class A3 | | | | |
| 5.765% due 10/25/2035 (b)*** | | 1,572,282 | | 1,568,013 |
| Thornburg Mortgage Securities Trust, Series | | | |
| 2005-4, Class A4 | | | | |
| 5.705% due 12/25/2035 (b)*** | | 1,768,881 | | 1,761,444 |
| Thornburg Mortgage Securities Trust, Series | | | |
| 2006-3, Class A2 | | | | |
| 5.61% due 06/25/2036 (b)*** | | 1,611,069 | | 1,600,654 |
| Thornburg Mortgage Securities Trust, Series | | | |
| 2006-3, Class A3 | | | | |
| 5.615% due 06/25/2036 (b)*** | | 1,642,914 | | 1,631,967 |
| Thornburg Mortgage Securities Trust, Series | | | |
| 2007-4, Class 2A1 | | | | |
| 6.24% due 09/25/2037 | | 810,000 | | 810,000 |
| Thornburg Mortgage Securities Trust, Series | | | |
| 2007-4, Class 3A1 | | | | |
| 6.228% due 09/25/2037 (b) | | 740,000 | | 729,478 |
| Washington Mutual, Inc., Series 2005-AR13, Class | | | |
| A1B3 | | | | |
| 5.865% due 10/25/2045 (b)*** | | 670,874 | | 660,763 |
| Washington Mutual, Inc., Series 2005-AR17, | | | |
| Class A1A1 | | | | |
| 5.775% due 12/25/2045 (b)*** | | 972,283 | | 948,832 |
| Washington Mutual, Inc., Series 2005-AR8, Class | | | |
| 2A1A | | | | |
| 5.795% due 07/25/2045 (b)*** | | 1,050,608 | | 1,023,884 |
| Zuni Mortgage Loan Trust, Series 2006-OA1, | | | |
| Class A1 | | | | |
| 5.635% due 08/25/2036 (b)*** | | 994,211 | | 985,615 |
|
| TOTAL COLLATERALIZED MORTGAGE OBLIGATIONS | | |
| (Cost $44,223,656) | | | $ | 43,665,418 |
|
| |
| ASSET BACKED SECURITIES - 18.80% | | | |
| ACE Securities Corp., Series 2006-GP1, Class A | | | |
| 5.635% due 02/25/2031 (b)*** | | 1,131,831 | | 1,111,404 |
| | | | |
| U.S. Government Securities Fund (continued) | | |
| | | Shares or | | |
| | | Principal | | |
| | | Amount | | Value |
| |
|
| |
| ASSET BACKED SECURITIES | | | | |
| (continued) | | | | |
| ACE Securities Corp., Series 2006-SL3, Class A1 | | | |
| 5.605% due 06/25/2036 (b)*** | $ | 976,629 | $ | 936,694 |
| Aegis Asset Backed Securities Trust, Series | | | |
| 2004-2, Class A3 | | | | |
| 5.985% due 06/25/2034 (b)*** | | 260,132 | | 245,174 |
| Amortizing Residential Collateral Trust, Series | | | |
| 2001-BC6, Class A | | | | |
| 5.855% due 10/25/2031 (b)*** | | 679,418 | | 671,311 |
| Countrywide Asset-Backed Certificates, Series | | | |
| 2002-BC2, Class A | | | | |
| 6.045% due 04/25/2032 (b)*** | | 383,820 | | 374,592 |
| Countrywide Home Equity Loan Trust, Series | | | |
| 2004-I, Class A | | | | |
| 5.9013% due 02/15/2034 (b)*** | | 960,776 | | 944,659 |
| Countrywide Home Equity Loan Trust, Series | | | |
| 2005-E, Class 2A | | | | |
| 5.8313% due 11/15/2035 (b)*** | | 330,706 | | 325,265 |
| Countrywide Home Equity Loan Trust, Series | | | |
| 2006-E, Class 2A | | | | |
| 5.7513% due 07/15/2036 (b)*** | | 1,205,913 | | 1,181,069 |
| Countrywide Home Equity Loan Trust, Series | | | |
| 2006-RES, Class 4E1B | | | | |
| 5.8713% due 06/15/2029 (b)*** | | 1,111,588 | | 1,109,694 |
| Countrywide Home Equity Loan Trust, Series | | | |
| 2006-RES, Class 4F1B | | | | |
| 5.8713% due 05/15/2034 (b)*** | | 1,153,940 | | 1,153,132 |
| Countrywide Home Equity Loan Trust, Series | | | |
| 2007-G, Class A | | | | |
| 6.10% due 11/15/2028 (b) | | 1,900,000 | | 1,889,907 |
| Credit Suisse Mortgage Capital Certificates, Series | | | |
| 2006-CF2, Class A1 | | | | |
| 5.765% due 05/25/2036 (b)*** | | 1,053,595 | | 1,027,091 |
| GMAC Mortgage Corp. Loan Trust, Series | | | | |
| 2006-HE1, Class A | | | | |
| 5.715% due 11/25/2036 (b)*** | | 1,900,000 | | 1,861,055 |
| GSAA Home Equity Trust, Series 2005-5, Class A4 | | | |
| 5.775% due 02/25/2035 (b)*** | | 1,056,187 | | 1,047,606 |
| GSAMP Trust, Series 2006-S4, Class A1 | | | | |
| 5.595% due 05/25/2036 (b)*** | | 933,758 | | 915,124 |
| IndyMac Seconds Asset Backed Trust, Series | | | |
| 2006-A, Class A | | | | |
| 5.635% due 06/25/2036 (b)*** | | 1,136,062 | | 1,049,283 |
| JP Morgan Chase Commercial Mortgage Securities | | | |
| Corp, Series 2006-CB17, Class A4 | | | | |
| 5.429% due 12/12/2043 | | 2,490,000 | | 2,445,047 |
| Long Beach Mortgage Loan Trust, Series 2005-3, | | | |
| Class 2A2 | | | | |
| 5.785% due 08/25/2045 (b)*** | | 1,189,148 | | 1,173,874 |
| Morgan Stanley ABS Capital I, Series 2005-WMC3, | | | |
| Class A1MZ | | | | |
| 5.765% due 03/25/2035 (b)*** | | 45,878 | | 45,856 |
| Morgan Stanley ABS Capital I, Series 2005-WMC4, | | | |
| Class A1MZ | | | | |
| 5.765% due 04/25/2035 (b)*** | | 109,748 | | 109,630 |
| Morgan Stanley IXIS Real Estate Capital Trust, | | | |
| Series 2006-1, Class A1 | | | | |
| 5.535% due 07/25/2036 (b)*** | | 715,038 | | 711,804 |
| |
| The accompanying notes are an integral part of the financial statements. | 390 |
John Hancock Funds II
Portfolio of investments — August 31, 2007
(showing percentage of total net assets)
| | | | |
| U.S. Government Securities Fund (continued) | | |
| | | Shares or | | |
| | | Principal | | |
| | | Amount | | Value |
|
|
| |
| ASSET BACKED SECURITIES | | | | |
| (continued) | | | | |
| Morgan Stanley Mortgage Loan Trust, Series | | | | |
| 2006-4SL, Class A1 | | | | |
| 5.655% due 03/25/2036 (b)*** | $ | 873,257 | $ | 843,692 |
| SACO I Trust, Inc., Series 2006-6, Class A | | | | |
| 5.635% due 06/25/2036 (b)*** | | 1,062,989 | | 940,958 |
| SACO I Trust, Inc., Series 2006-7, Class A1 | | | | |
| 5.635% due 07/25/2036 (b)*** | | 1,134,784 | | 990,417 |
| SLM Student Loan Trust, Series 2006-5, Class A2 | | | |
| 5.35% due 07/25/2017 (b)*** | | 1,447,669 | | 1,447,712 |
| Structured Asset Securities Corp., Series | | | | |
| 2006-ARS1, Class A1 | | | | |
| 5.615% due 02/25/2036 (b)*** | | 1,164,627 | | 960,918 |
| Truman Capital Mortgage Loan Trust, Series | | | | |
| 2006-1, Class A | | | | |
| 5.765% due 03/25/2036 (b)*** | | 1,420,707 | | 1,307,050 |
| Washington Mutual, Inc., Series 2007-HE3, Class | | | |
| 2A2 | | | | |
| 5.68% due 05/25/2047 (b)*** | | 2,300,000 | | 2,269,095 |
| Washington Mutual, Inc., Series 2007-HE3, Class | | | |
| 2A4 | | | | |
| 5.795% due 05/25/2047 (b)*** | | 1,200,000 | | 1,107,563 |
| Bravo Mortgage Asset Trust, Series 2006-1A, | | | | |
| Class A1 | | | | |
| 5.635% due 07/25/2036 (b) | | 1,782,560 | | 1,775,319 |
| Lehman XS Trust, Series 2006-2N, Class 1A1 | | | | |
| 5.765% due 02/25/2046 (b)*** | | 1,220,135 | | 1,192,362 |
| Lehman XS Trust, Series 2006-GP3, Class 3A1A | | | |
| 5.575% due 06/25/2046 (b)*** | | 1,221,977 | | 1,210,942 |
| Lehman XS Trust, Series 2006-GP4, Class 3A1A | | | |
| 5.575% due 08/25/2046 (b)*** | | 1,286,601 | | 1,272,478 |
| RAAC Series, Series 2006-RP3, Class A | | | | |
| 5.775% due 05/25/2036 (b)*** | | 1,411,908 | | 1,362,712 |
|
| TOTAL ASSET BACKED SECURITIES | | | | |
| (Cost $38,192,241) | | | $ | 37,010,489 |
|
| |
| SHORT TERM INVESTMENTS - 0.22% | | | | |
| Federal National Mortgage Association Discount | | | |
| Notes | | | | |
| zero coupon due 03/17/2008 **** | $ | 450,000 | $ | 437,618 |
|
| TOTAL SHORT TERM INVESTMENTS | | | | |
| (Cost $437,618) | | | $ | 437,618 |
|
| |
| REPURCHASE AGREEMENTS - 35.56% | | | | |
| Merrill Lynch Tri-Party Repurchase | | | | |
| Agreement dated 08/31/2007 at | | | | |
| 5.14% to be repurchased at | | | | |
| $70,039,978 on 09/04/2007, | | | | |
| collateralized by $68,163,000 | | | | |
| Federal Home Loan Mortgage | | | | |
| Corp., 5.75% due 06/27/2016 | | | | |
| (valued at $72,096,778, including | | | | |
| interest) | $ | 70,000,000 | $ | 70,000,000 |
|
| TOTAL REPURCHASE AGREEMENTS | | | | |
| (Cost $70,000,000) | | | $ | 70,000,000 |
|
| | | | |
| Total Investments (U.S. Government Securities Fund) | | |
| (Cost $336,713,481) - 170.37% | | | $ | 335,361,258 |
| Liabilities in Excess of Other Assets - (70.37)% | | | (138,523,536) |
| |
|
| TOTAL NET ASSETS - 100.00% | | | $ | 196,837,722 |
| |
|
| |
| |
| |
| U.S. High Yield Bond Fund | | | |
| | | Shares or | | |
| | | Principal | | |
| | | Amount | | Value |
| |
|
| |
| CORPORATE BONDS - 75.52% | | | | |
| | | | | |
| Advertising - 1.26% | | | | |
| R.H. Donnelley Corp. | | | | |
| 10.875% due 12/15/2012 | $ | 425,000 | $ | 450,500 |
| R.H. Donnelley Corp., Series A-3 | | | | |
| 8.875% due 01/15/2016 | | 1,300,000 | | 1,332,500 |
| Sheridan Group, Inc. | | | | |
| 10.25% due 08/15/2011 | | 1,500,000 | | 1,500,000 |
| Vertis, Inc. | | | | |
| 9.75% due 04/01/2009 | | 1,717,000 | | 1,699,830 |
| |
|
| | | | | 4,982,830 |
| Aerospace - 0.20% | | | | |
| Hawker Beechcraft Acquisition Company LLC | | | |
| 8.50% due 04/01/2015 | | 155,000 | | 154,225 |
| 9.75% due 04/01/2017 | | 175,000 | | 173,250 |
| Hawker Beechcraft Acquisition Company LLC, PIK | | | |
| 8.875% due 04/01/2015 | | 155,000 | | 151,125 |
| TransDigm, Inc. | | | | |
| 7.75% due 07/15/2014 | | 325,000 | | 326,625 |
| |
|
| | | | | 805,225 |
| Agriculture - 0.31% | | | | |
| Mosaic Company | | | | |
| 7.375% due 12/01/2014 | | 600,000 | | 610,500 |
| 7.625% due 12/01/2016 | | 600,000 | | 615,000 |
| |
|
| | | | | 1,225,500 |
| Air Travel - 0.09% | | | | |
| Continental Airlines, Inc., Series 00-1 | | | | |
| 8.499% due 05/01/2011 | | 344,343 | | 344,343 |
| | | | | |
| Aluminum - 0.00% | | | | |
| Novelis, Inc. | | | | |
| 7.25% due 02/15/2015 | | 20,000 | | 19,400 |
| | | | | |
| Apparel & Textiles - 0.53% | | | | |
| Levi Strauss & Company | | | | |
| 12.25% due 12/15/2012 | | 750,000 | | 800,625 |
| Phillips-Van Heusen Corp. | | | | |
| 7.25% due 02/15/2011 | | 1,300,000 | | 1,308,125 |
| |
|
| | | | | 2,108,750 |
| Auto Services - 0.19% | | | | |
| Hertz Corp. | | | | |
| 8.875% due 01/01/2014 | | 500,000 | | 517,500 |
| 10.50% due 01/01/2016 | | 225,000 | | 243,000 |
| |
|
| | | | | 760,500 |
| Automobiles - 1.61% | | | | |
| Asbury Automotive Group, Inc. | | | | |
| 7.625% due 03/15/2017 | | 1,025,000 | | 943,000 |
| 8.00% due 03/15/2014 | | 460,000 | | 439,300 |
| Ford Motor Company | | | | |
| 7.45% due 07/16/2031 | | 870,000 | | 652,500 |
| |
| The accompanying notes are an integral part of the financial statements. | 391 |
John Hancock Funds II
Portfolio of investments — August 31, 2007
(showing percentage of total net assets)
| | | | |
| U.S. High Yield Bond Fund (continued) | | |
| | | Shares or | | |
| | | Principal | | |
| | | Amount | | Value |
|
|
| |
| CORPORATE BONDS (continued) | | | | |
| Automobiles (continued) | | | | |
| General Motors Corp. | | | | |
| 8.375% due 07/15/2033 | $ | 1,495,000 | $ | 1,199,738 |
| Group 1 Automotive, Inc. | | | | |
| 8.25% due 08/15/2013 | | 700,000 | | 700,000 |
| Sonic Automotive, Inc., Series B | | | | |
| 8.625% due 08/15/2013 | | 1,258,000 | | 1,232,840 |
| United Auto Group, Inc. | | | | |
| 7.75% due 12/15/2016 | | 1,300,000 | | 1,241,500 |
| |
|
| | | | | 6,408,878 |
| Banking - 0.22% | | | | |
| Chevy Chase Bank | | | | |
| 6.875% due 12/01/2013 | | 900,000 | | 864,000 |
| | | | | |
| Broadcasting - 1.39% | | | | |
| Barrington Broadcasting Group LLC | | | | |
| 10.50% due 08/15/2014 | | 2,250,000 | | 2,261,250 |
| Bonten Media Acquisition Company, PIK | | | | |
| 9.00% due 06/01/2015 | | 300,000 | | 261,000 |
| Fisher Communications, Inc. | | | | |
| 8.625% due 09/15/2014 | | 1,300,000 | | 1,322,750 |
| LBI Media, Inc. | | | | |
| 8.50% due 08/01/2017 | | 1,150,000 | | 1,128,437 |
| Muzak Finance Corp. | | | | |
| 13.00% due 03/15/2010 | | 700,000 | | 553,000 |
| |
|
| | | | | 5,526,437 |
| Building Materials & Construction - 0.59% | | | |
| Brand Services, Inc. | | | | |
| 12.00% due 10/15/2012 | | 311,000 | | 302,447 |
| Esco Corp. | | | | |
| 8.625% due 12/15/2013 | | 325,000 | | 318,500 |
| 9.235% due 12/15/2013 (b) | | 625,000 | | 612,500 |
| K. Hovnanian Enterprises, Inc. | | | | |
| 10.50% due 10/01/2007 | | 1,100,000 | | 1,095,875 |
| |
|
| | | | | 2,329,322 |
| Business Services - 3.07% | | | | |
| Affinity Group, Inc. | | | | |
| 9.00% due 02/15/2012 | | 900,000 | | 936,000 |
| 10.875% due 02/15/2012 | | 450,000 | | 477,000 |
| Cornell Companies, Inc. | | | | |
| 10.75% due 07/01/2012 | | 600,000 | | 642,000 |
| NCO Group, Inc. | | | | |
| 11.875% due 11/15/2014 | | 1,500,000 | | 1,441,875 |
| Rural/Metro Corp. | | | | |
| 9.875% due 03/15/2015 | | 1,250,000 | | 1,206,250 |
| SunGard Data Systems, Inc. | | | | |
| 3.75% due 01/15/2009 | | 125,000 | | 120,000 |
| 4.875% due 01/15/2014 | | 600,000 | | 517,500 |
| 9.125% due 08/15/2013 | | 2,865,000 | | 2,958,113 |
| 10.25% due 08/15/2015 | | 3,250,000 | | 3,347,500 |
| Williams Scotsman International, Inc. | | | | |
| 8.50% due 10/01/2015 | | 500,000 | | 540,000 |
| |
|
| | | | | 12,186,238 |
| Cable & Television - 4.97% | | | | |
| Charter Communications Holdings LLC | | | | |
| 8.75% due 11/15/2013 | | 600,000 | | 588,000 |
| | | | |
| U.S. High Yield Bond Fund (continued) | | |
| | | Shares or | | |
| | | Principal | | |
| | | Amount | | Value |
|
|
| |
| CORPORATE BONDS (continued) | | | | |
| Cable & Television (continued) | | | | |
| Charter Communications Operating LLC | | | | |
| 8.00% due 04/30/2012 | $ | 4,125,000 | $ | 4,042,500 |
| 8.375% due 04/30/2014 | | 3,900,000 | | 3,861,000 |
| CSC Holdings, Inc. | | | | |
| 7.875% due 12/15/2007 | | 1,900,000 | | 1,904,750 |
| CSC Holdings, Inc., Series B | | | | |
| 8.125% due 08/15/2009 | | 300,000 | | 302,250 |
| DirecTV Holdings LLC | | | | |
| 6.375% due 06/15/2015 | | 200,000 | | 187,000 |
| 8.375% due 03/15/2013 | | 4,150,000 | | 4,284,875 |
| Echostar DBS Corp. | | | | |
| 6.375% due 10/01/2011 | | 375,000 | | 368,437 |
| 7.125% due 02/01/2016 (a) | | 1,825,000 | | 1,783,937 |
| Sinclair Broadcast Group, Inc. | | | | |
| 8.00% due 03/15/2012 | | 9,000 | | 9,090 |
| Videotron Ltee. | | | | |
| 6.375% due 12/15/2015 | | 950,000 | | 866,875 |
| 6.875% due 01/15/2014 | | 1,615,000 | | 1,538,288 |
| |
|
| | | | | 19,737,002 |
| Cellular Communications - 5.53% | | | | |
| Centennial Communications Corp. | | | | |
| 8.125% due 02/01/2014 | | 403,000 | | 397,962 |
| 10.00% due 01/01/2013 | | 2,025,000 | | 2,116,125 |
| 10.75% due 12/15/2008 | | 10,000 | | 10,050 |
| Cricket Communications, Inc. | | | | |
| 9.375% due 11/01/2014 | | 1,400,000 | | 1,372,000 |
| Dobson Communications Corp. | | | | |
| 8.375% due 11/01/2011 | | 1,309,000 | | 1,384,267 |
| 8.875% due 10/01/2013 (a) | | 3,500,000 | | 3,701,250 |
| 9.875% due 11/01/2012 | | 400,000 | | 430,000 |
| Dobson Communications Corp., Series B | | | | |
| 8.375% due 11/01/2011 | | 4,015,000 | | 4,245,863 |
| MetroPCS Wireless, Inc. | | | | |
| 9.25% due 11/01/2014 | | 2,600,000 | | 2,561,000 |
| Rural Cellular Corp. | | | | |
| 8.25% due 03/15/2012 | | 2,000,000 | | 2,080,000 |
| 8.36% due 06/01/2013 (b) | | 1,050,000 | | 1,071,000 |
| 9.875% due 02/01/2010 | | 2,500,000 | | 2,587,500 |
| |
|
| | | | | 21,957,017 |
| Chemicals - 1.33% | | | | |
| Chemtura Corp. | | | | |
| 6.875% due 06/01/2016 | | 825,000 | | 752,812 |
| Equistar Chemicals LP | | | | |
| 8.75% due 02/15/2009 | | 750,000 | | 768,750 |
| 10.125% due 09/01/2008 | | 155,000 | | 160,813 |
| Huntsman International LLC | | | | |
| 7.875% due 11/15/2014 | | 475,000 | | 496,375 |
| Innophos, Inc. | | | | |
| 8.875% due 08/15/2014 | | 2,000,000 | | 1,970,000 |
| Lyondell Chemical Company | | | | |
| 8.00% due 09/15/2014 | | 384,000 | | 417,600 |
| 8.25% due 09/15/2016 | | 641,000 | | 717,920 |
| |
|
| | | | | 5,284,270 |
| |
| The accompanying notes are an integral part of the financial statements. | 392 |
John Hancock Funds II
Portfolio of investments — August 31, 2007
(showing percentage of total net assets)
| | | | |
| U.S. High Yield Bond Fund (continued) | | |
| | | Shares or | | |
| | | Principal | | |
| | | Amount | | Value |
|
|
| |
| CORPORATE BONDS (continued) | | | | |
| Commercial Services - 0.78% | | | | |
| Aramark Servises, Inc. | | | | |
| 8.50% due 02/01/2015 | $ | 410,000 | $ | 408,463 |
| Mac-Gray Corp. | | | | |
| 7.625% due 08/15/2015 | | 2,250,000 | | 2,221,875 |
| Mobile Mini, Inc. | | | | |
| 6.875% due 05/01/2015 | | 475,000 | | 456,000 |
| |
|
| | | | | 3,086,338 |
| Computers & Business Equipment - 0.39% | | | |
| Seagate Technology HDD Holdings | | | | |
| 6.80% due 10/01/2016 | | 1,600,000 | | 1,540,000 |
| | | | | |
| Containers & Glass - 1.36% | | | | |
| Crown Holdings, Inc. | | | | |
| 8.00% due 04/15/2023 | | 2,500,000 | | 2,387,500 |
| Graham Packaging Company | | | | |
| 9.875% due 10/15/2014 | | 1,100,000 | | 1,078,000 |
| Owens-Brockway Glass Container, Inc. | | | | |
| 8.25% due 05/15/2013 | | 1,200,000 | | 1,230,000 |
| Owens-Illinois, Inc. | | | | |
| 7.80% due 05/15/2018 | | 750,000 | | 720,000 |
| |
|
| | | | | 5,415,500 |
| Correctional Facilities - 1.03% | | | | |
| Corrections Corp. of America | | | | |
| 6.25% due 03/15/2013 | | 1,100,000 | | 1,067,000 |
| 6.75% due 01/31/2014 | | 1,335,000 | | 1,308,300 |
| Geo Group, Inc. | | | | |
| 8.25% due 07/15/2013 | | 1,700,000 | | 1,697,875 |
| |
|
| | | | | 4,073,175 |
| Crude Petroleum & Natural Gas - 1.83% | | | | |
| AmeriGas Partners LP | | | | |
| 7.125% due 05/20/2016 | | 1,750,000 | | 1,680,000 |
| 7.25% due 05/20/2015 | | 300,000 | | 291,000 |
| Calfrac Holdings LP | | | | |
| 7.75% due 02/15/2015 | | 1,125,000 | | 1,015,312 |
| Chesapeake Energy Corp. | | | | |
| 6.625% due 01/15/2016 | | 400,000 | | 387,000 |
| 6.875% due 01/15/2016 | | 600,000 | | 586,500 |
| 6.875% due 11/15/2020 | | 1,000,000 | | 960,000 |
| 7.50% due 09/15/2013 | | 800,000 | | 814,000 |
| 7.50% due 06/15/2014 | | 1,355,000 | | 1,371,938 |
| 7.75% due 01/15/2015 | | 140,000 | | 141,925 |
| |
|
| | | | | 7,247,675 |
| Electrical Utilities - 0.89% | | | | |
| Nevada Power Company, Series M | | | | |
| 5.95% due 03/15/2016 | | 250,000 | | 246,017 |
| Nevada Power Company, Series O | | | | |
| 6.50% due 05/15/2018 | | 1,250,000 | | 1,264,920 |
| Sierra Pacific Power Company, Series M | | | | |
| 6.00% due 05/15/2016 | | 375,000 | | 368,917 |
| Sierra Pacific Power Company, Series P | | | | |
| 6.75% due 07/01/2037 | | 1,350,000 | | 1,334,621 |
| Sierra Pacific Resources | | | | |
| 8.625% due 03/15/2014 | | 296,000 | | 313,237 |
| |
|
| | | | | 3,527,712 |
| | | | |
| U.S. High Yield Bond Fund (continued) | | |
| | | Shares or | | |
| | | Principal | | |
| | | Amount | | Value |
|
|
| |
| CORPORATE BONDS (continued) | | | | |
| Electronics - 0.92% | | | | |
| Communications & Power Industries, Inc. | | | | |
| 8.00% due 02/01/2012 | $ | 710,000 | $ | 713,550 |
| L-3 Communications Corp. | | | | |
| 5.875% due 01/15/2015 | | 1,550,000 | | 1,468,625 |
| 6.125% due 07/15/2013 | | 7,000 | | 6,772 |
| L-3 Communications Corp., Series B | | | | |
| 6.375% due 10/15/2015 | | 1,500,000 | | 1,451,250 |
| |
|
| | | | | 3,640,197 |
| Energy - 1.52% | | | | |
| NRG Energy, Inc. | | | | |
| 7.25% due 02/01/2014 | | 500,000 | | 495,000 |
| 7.375% due 02/01/2016 | | 4,800,000 | | 4,740,000 |
| 7.375% due 01/15/2017 | | 800,000 | | 786,000 |
| |
|
| | | | | 6,021,000 |
| Financial Services - 4.90% | | | | |
| Consolidated Communications Holdings, Inc. | | | |
| 9.75% due 04/01/2012 | | 500,000 | | 500,000 |
| El Paso Performance-Linked Trust | | | | |
| 7.75% due 07/15/2011 | | 850,000 | | 870,860 |
| Ford Motor Credit Company | | | | |
| 7.00% due 10/01/2013 | | 1,950,000 | | 1,736,606 |
| 7.25% due 10/25/2011 | | 430,000 | | 391,991 |
| 8.00% due 12/15/2016 | | 6,450,000 | | 5,952,221 |
| General Motors Acceptance Corp. | | | | |
| 4.375% due 12/10/2007 | | 950,000 | | 937,735 |
| 6.75% due 12/01/2014 | | 800,000 | | 678,934 |
| 8.00% due 11/01/2031 | | 3,840,000 | | 3,449,718 |
| KAR Holdings, Inc. | | | | |
| 8.75% due 05/01/2014 | | 350,000 | | 315,000 |
| 10.00% due 05/01/2015 | | 1,685,000 | | 1,508,075 |
| NSG Holdings, Inc. | | | | |
| 7.75% due 12/15/2025 | | 1,350,000 | | 1,311,188 |
| TRAINS HY-2006 -1 | | | | |
| 7.14% due 05/01/2016 | | 1,863,000 | | 1,798,484 |
| |
|
| | | | | 19,450,812 |
| Food & Beverages - 2.67% | | | | |
| Beverages & More, Inc. | | | | |
| 9.25% due 03/01/2012 | | 900,000 | | 877,500 |
| Dean Foods Company | | | | |
| 6.90% due 10/15/2017 | | 700,000 | | 633,500 |
| Del Monte Corp. | | | | |
| 8.625% due 12/15/2012 | | 2,750,000 | | 2,777,500 |
| Dole Food Company, Inc. | | | | |
| 7.25% due 06/15/2010 | | 1,460,000 | | 1,350,500 |
| 8.625% due 05/01/2009 | | 1,500,000 | | 1,462,500 |
| 8.875% due 03/15/2011 (a) | | 1,040,000 | | 988,000 |
| Pilgrim's Pride Corp. | | | | |
| 7.625% due 05/01/2015 | | 1,150,000 | | 1,147,125 |
| 8.375% due 05/01/2017 | | 800,000 | | 802,000 |
| Smithfield Foods, Inc., Series B | | | | |
| 7.75% due 05/15/2013 | | 550,000 | | 552,750 |
| |
|
| | | | | 10,591,375 |
| |
| The accompanying notes are an integral part of the financial statements. | 393 |
John Hancock Funds II
Portfolio of investments — August 31, 2007
(showing percentage of total net assets)
| | | | |
| U.S. High Yield Bond Fund (continued) | | |
| | | Shares or | | |
| | | Principal | | |
| | | Amount | | Value |
|
|
| |
| CORPORATE BONDS (continued) | | | | |
| Funeral Services - 0.66% | | | | |
| Service Corp. International | | | | |
| 6.75% due 04/01/2016 | $ | 500,000 | $ | 471,250 |
| 7.00% due 06/15/2017 | | 2,100,000 | | 1,984,500 |
| 7.50% due 04/01/2027 | | 170,000 | | 156,400 |
| |
|
| | | | | 2,612,150 |
| Gas & Pipeline Utilities - 3.09% | | | | |
| El Paso Corp. | | | | |
| 6.875% due 06/15/2014 | | 500,000 | | 504,498 |
| 7.00% due 06/15/2017 | | 2,750,000 | | 2,741,332 |
| Kinder Morgan Finance Company ULC | | | | |
| 6.40% due 01/05/2036 | | 125,000 | | 104,025 |
| Knights, Inc. | | | | |
| 7.45% due 03/01/2098 | | 1,200,000 | | 1,034,057 |
| MarkWest Energy Partners LP, Series B | | | | |
| 8.50% due 07/15/2016 | | 600,000 | | 597,000 |
| Northwest Pipeline Corp. | | | | |
| 7.00% due 06/15/2016 | | 250,000 | | 260,625 |
| Sabine Pass LNG LP | | | | |
| 7.50% due 11/30/2016 | | 4,700,000 | | 4,570,750 |
| Williams Companies, Inc. | | | | |
| 6.375% due 10/01/2010 | | 250,000 | | 250,625 |
| 7.36% due 10/01/2010 (b) | | 500,000 | | 505,000 |
| 8.75% due 03/15/2032 | | 1,050,000 | | 1,194,375 |
| Williams Partners Finance Corp. | | | | |
| 7.25% due 02/01/2017 | | 500,000 | | 495,000 |
| |
|
| | | | | 12,257,287 |
| Healthcare Products - 0.51% | | | | |
| Cooper Companies (The), Inc. | | | | |
| 7.125% due 02/15/2015 | | 2,100,000 | | 2,005,500 |
| | | | | |
| Healthcare Services - 0.65% | | | | |
| Centene Corp. | | | | |
| 7.25% due 04/01/2014 | | 1,375,000 | | 1,340,625 |
| DaVita, Inc. | | | | |
| 6.625% due 03/15/2013 | | 500,000 | | 483,750 |
| Healthsouth Corp. | | | | |
| 10.75% due 06/15/2016 | | 750,000 | | 772,500 |
| |
|
| | | | | 2,596,875 |
| Hotels & Restaurants - 2.08% | | | | |
| Denny's Corp. | | | | |
| 10.00% due 10/01/2012 | | 975,000 | | 989,625 |
| Gaylord Entertainment Company | | | | |
| 6.75% due 11/15/2014 | | 1,005,000 | | 954,750 |
| O'Charleys, Inc. | | | | |
| 9.00% due 11/01/2013 | | 4,250,000 | | 4,292,500 |
| Real Mex Restaurants, Inc. | | | | |
| 10.00% due 04/01/2010 | | 2,000,000 | | 2,005,000 |
| |
|
| | | | | 8,241,875 |
| Household Appliances - 0.34% | | | | |
| ALH Finance LLC | | | | |
| 8.50% due 01/15/2013 | | 1,400,000 | | 1,365,000 |
| | | | | |
| Industrial Machinery - 1.31% | | | | |
| Altra Industrial Motion, Inc. | | | | |
| 9.00% due 12/01/2011 | | 1,150,000 | | 1,155,750 |
| | | | |
| U.S. High Yield Bond Fund (continued) | | |
| | | Shares or | | |
| | | Principal | | |
| | | Amount | | Value |
|
|
| |
| CORPORATE BONDS (continued) | | | | |
| Industrial Machinery (continued) | | | | |
| Baldor Electric Company | | | | |
| 8.625% due 02/15/2017 | $ | 900,000 | $ | 929,250 |
| H&E Equipment Services, Inc. | | | | |
| 8.375% due 07/15/2016 | | 1,875,000 | | 1,921,875 |
| Neff Corp. | | | | |
| 10.00% due 06/01/2015 | | 1,350,000 | | 1,188,000 |
| |
|
| | | | | 5,194,875 |
| Insurance - 0.46% | | | | |
| USI Holdings Corp. | | | | |
| 9.75% due 05/15/2015 | | 2,000,000 | | 1,830,000 |
| | | | | |
| Leisure Time - 4.90% | | | | |
| AMC Entertainment, Inc., Series B | | | | |
| 8.625% due 08/15/2012 | | 1,057,000 | | 1,080,782 |
| Chukchansi Economic Development Authority | | | |
| 8.00% due 11/15/2013 | | 2,043,000 | | 2,032,785 |
| 8.85875% due 11/15/2012 (b) | | 275,000 | | 275,687 |
| Majestic Star Casino LLC | | | | |
| 9.50% due 10/15/2010 | | 1,040,000 | | 1,019,200 |
| Mandalay Resort Group, Inc. | | | | |
| 6.50% due 07/31/2009 | | 350,000 | | 347,375 |
| MGM Mirage, Inc. | | | | |
| 6.00% due 10/01/2009 | | 1,500,000 | | 1,486,875 |
| 8.50% due 09/15/2010 | | 1,250,000 | | 1,296,875 |
| Mohegan Tribal Gaming Authority | | | | |
| 6.125% due 02/15/2013 | | 670,000 | | 637,337 |
| MTR Gaming Group, Inc., Series B | | | | |
| 9.00% due 06/01/2012 | | 500,000 | | 500,000 |
| 9.75% due 04/01/2010 | | 400,000 | | 404,000 |
| Penn National Gaming, Inc. | | | | |
| 6.875% due 12/01/2011 | | 975,000 | | 975,000 |
| River Rock Entertainment Authority | | | | |
| 9.75% due 11/01/2011 | | 1,050,000 | | 1,076,250 |
| San Pasqual Casino Development Group | | | | |
| 8.00% due 09/15/2013 | | 1,850,000 | | 1,852,313 |
| Seminole Hard Rock Entertainment, Inc. | | | | |
| 7.86% due 03/15/2014 (b) | | 650,000 | | 630,500 |
| Speedway Motorsports, Inc. | | | | |
| 6.75% due 06/01/2013 | | 1,550,000 | | 1,526,750 |
| Station Casinos, Inc. | | | | |
| 6.00% due 04/01/2012 | | 3,000,000 | | 2,782,500 |
| Wynn Las Vegas LLC | | | | |
| 6.625% due 12/01/2014 | | 1,575,000 | | 1,523,813 |
| |
|
| | | | | 19,448,042 |
| Liquor - 0.49% | | | | |
| Constellation Brands, Inc. | | | | |
| 7.25% due 09/01/2016 | | 1,750,000 | | 1,697,500 |
| 7.25% due 05/15/2017 | | 250,000 | | 242,500 |
| |
|
| | | | | 1,940,000 |
| Medical-Hospitals - 3.28% | | | | |
| Community Health Systems, Inc. | | | | |
| 8.875% due 07/15/2015 | | 1,750,000 | | 1,747,812 |
| HCA, Inc. | | | | |
| 6.25% due 02/15/2013 | | 20,000 | | 17,150 |
| 7.875% due 02/01/2011 | | 885,000 | | 856,238 |
| |
| The accompanying notes are an integral part of the financial statements. | 394 |
John Hancock Funds II
Portfolio of investments — August 31, 2007
(showing percentage of total net assets)
| | | | |
| U.S. High Yield Bond Fund (continued) | | |
| | | Shares or | | |
| | | Principal | | |
| | | Amount | | Value |
|
|
| |
| CORPORATE BONDS (continued) | | | | |
| Medical-Hospitals (continued) | | | | |
| HCA, Inc. (continued) | | | | |
| 9.125% due 11/15/2014 | $ | 600,000 | $ | 615,000 |
| 9.25% due 11/15/2016 | | 4,200,000 | | 4,315,500 |
| Multiplan, Inc. | | | | |
| 10.375% due 04/15/2016 | | 1,850,000 | | 1,813,000 |
| Sun Healthcare Group, Inc. | | | | |
| 9.125% due 04/15/2015 | | 725,000 | | 725,000 |
| Tenet Healthcare Corp. | | | | |
| 6.375% due 12/01/2011 | | 2,000,000 | | 1,680,000 |
| 6.875% due 11/15/2031 | | 657,000 | | 473,040 |
| United Surgical Partners International, Inc. | | | | |
| 8.875% due 05/01/2017 | | 800,000 | | 764,000 |
| |
|
| | | | | 13,006,740 |
| Mining - 1.18% | | | | |
| Freeport-McMoRan Copper & Gold, Inc. | | | | |
| 8.25% due 04/01/2015 | | 600,000 | | 636,000 |
| 8.375% due 04/01/2017 | | 3,800,000 | | 4,047,000 |
| |
|
| | | | | 4,683,000 |
| Office Furnishings & Supplies - 0.09% | | | | |
| IKON Office Solutions, Inc. | | | | |
| 7.75% due 09/15/2015 | | 350,000 | | 347,813 |
| | | | | |
| Paper - 0.68% | | | | |
| Abitibi-Consolidated, Inc. | | | | |
| 5.25% due 06/20/2008 | | 450,000 | | 432,000 |
| Georgia-Pacific Corp. | | | | |
| 7.125% due 01/15/2017 | | 850,000 | | 799,000 |
| Neenah Paper, Inc. | | | | |
| 7.375% due 11/15/2014 | | 800,000 | | 752,000 |
| P. H. Glatfelter Company | | | | |
| 7.125% due 05/01/2016 | | 725,000 | | 714,125 |
| |
|
| | | | | 2,697,125 |
| Petroleum Services - 0.89% | | | | |
| Allis-Chalmers Energy, Inc. | | | | |
| 8.50% due 03/01/2017 | | 925,000 | | 885,688 |
| Compagnie Generale de Geophysique SA | | | | |
| 7.50% due 05/15/2015 | | 175,000 | | 175,875 |
| 7.75% due 05/15/2017 | | 175,000 | | 176,750 |
| Hanover Equipment Trust | | | | |
| 8.75% due 09/01/2011 | | 575,000 | | 590,812 |
| Hanover Equipment Trust, Series B | | | | |
| 8.50% due 09/01/2008 | | 500,000 | | 500,000 |
| Tesoro Corp. | | | | |
| 6.50% due 06/01/2017 | | 1,250,000 | | 1,215,625 |
| |
|
| | | | | 3,544,750 |
| Pharmaceuticals - 0.38% | | | | |
| Omnicare, Inc. | | | | |
| 6.875% due 12/15/2015 | | 1,605,000 | | 1,496,663 |
| | | | | |
| Publishing - 2.33% | | | | |
| Dex Media East LLC | | | | |
| 9.875% due 11/15/2009 | | 1,500,000 | | 1,533,750 |
| 12.125% due 11/15/2012 | | 1,800,000 | | 1,921,500 |
| Dex Media West LLC | | | | |
| 9.875% due 08/15/2013 | | 400,000 | | 422,000 |
| | | | |
| U.S. High Yield Bond Fund (continued) | | |
| | | Shares or | | |
| | | Principal | | |
| | | Amount | | Value |
|
|
| |
| CORPORATE BONDS (continued) | | | | |
| Publishing (continued) | | | | |
| Idearc, Inc. | | | | |
| 8.00% due 11/15/2016 | $ | 4,025,000 | $ | 3,974,688 |
| Medianews Group, Inc. | | | | |
| 6.375% due 04/01/2014 | | 500,000 | | 373,750 |
| Nielsen Finance LLC | | | | |
| zero coupon, step up to 12.5% on | | | | |
| 08/01/2011 due 08/01/2016 | | 850,000 | | 571,625 |
| Reader's Digest Association, Inc. | | | | |
| 9.00% due 02/15/2017 | | 500,000 | | 430,000 |
| |
|
| | | | | 9,227,313 |
| Real Estate - 2.35% | | | | |
| BF Saul, REIT | | | | |
| 7.50% due 03/01/2014 | | 2,050,000 | | 1,906,500 |
| Host Marriott LP, REIT | | | | |
| 7.125% due 11/01/2013 | | 250,000 | | 248,750 |
| Host Marriott LP, Series M, REIT | | | | |
| 7.00% due 08/15/2012 | | 1,350,000 | | 1,306,125 |
| Host Marriott LP, Series Q, REIT | | | | |
| 6.75% due 06/01/2016 | | 4,000,000 | | 3,890,000 |
| Rouse Company LP, REIT | | | | |
| 6.75% due 05/01/2013 | | 2,000,000 | | 1,980,000 |
| |
|
| | | | | 9,331,375 |
| Retail - 0.78% | | | | |
| Carrols Corp. | | | | |
| 9.00% due 01/15/2013 | | 570,000 | | 535,800 |
| Ferrellgas Escrow LLC | | | | |
| 6.75% due 05/01/2014 | | 2,100,000 | | 1,995,000 |
| Suburban Propane Partners LP | | | | |
| 6.875% due 12/15/2013 | | 600,000 | | 573,000 |
| |
|
| | | | | 3,103,800 |
| Retail Grocery - 0.09% | | | | |
| Smithfield Foods, Inc. | | | | |
| 7.75% due 07/01/2017 | | 363,000 | | 364,815 |
| | | | | |
| Retail Trade - 0.88% | | | | |
| American Greetings Corp. | | | | |
| 7.375% due 06/01/2016 | | 400,000 | | 378,000 |
| Payless Shoesource, Inc. | | | | |
| 8.25% due 08/01/2013 | | 1,400,000 | | 1,295,000 |
| Rite Aid Corp. | | | | |
| 9.50% due 06/15/2017 | | 2,025,000 | | 1,837,688 |
| |
|
| | | | | 3,510,688 |
| Sanitary Services - 0.88% | | | | |
| Allied Waste North America, Inc. | | | | |
| 6.50% due 11/15/2010 | | 800,000 | | 792,000 |
| 7.875% due 04/15/2013 (a) | | 800,000 | | 812,000 |
| Allied Waste North America, Inc., Series B | | | | |
| 5.75% due 02/15/2011 | | 300,000 | | 291,750 |
| 7.125% due 05/15/2016 | | 1,600,000 | | 1,592,000 |
| |
|
| | | | | 3,487,750 |
| Semiconductors - 0.49% | | | | |
| NXP BV / NXP Funding LLC | | | | |
| 8.11% due 10/15/2013 (b) | | 1,325,000 | | 1,200,781 |
| |
| The accompanying notes are an integral part of the financial statements. | 395 |
John Hancock Funds II
Portfolio of investments — August 31, 2007
(showing percentage of total net assets)
| | | | |
| U.S. High Yield Bond Fund (continued) | | |
| | | Shares or | | |
| | | Principal | | |
| | | Amount | | Value |
| |
|
| |
| CORPORATE BONDS (continued) | | | | |
| | | | | |
| Semiconductors (continued) | | | | |
| NXP BV / NXP Funding LLC (continued) | | | | |
| 9.50% due 10/15/2015 | $ | 875,000 | $ | 756,875 |
| |
|
| | | | | 1,957,656 |
| Software - 0.36% | | | | |
| Open Solutions, Inc. | | | | |
| 9.75% due 02/01/2015 | | 1,500,000 | | 1,425,000 |
| | | | | |
| Telecommunications Equipment & | | | | |
| Services - 3.08% | | | | |
| Citizens Communications Company | | | | |
| 7.05% due 10/01/2046 | | 1,100,000 | | 869,000 |
| 7.125% due 03/15/2019 | | 100,000 | | 95,250 |
| Eschelon Operating Company | | | | |
| 8.375% due 03/15/2010 | | 700,000 | | 676,375 |
| Intelsat Bermuda, Ltd. | | | | |
| 11.25% due 06/15/2016 | | 2,650,000 | | 2,772,562 |
| Intelsat, Ltd. | | | | |
| 5.25% due 11/01/2008 | | 1,800,000 | | 1,750,500 |
| Level 3 Financing, Inc. | | | | |
| 9.25% due 11/01/2014 | | 625,000 | | 601,563 |
| PanAmSat Corp. | | | | |
| 9.00% due 08/15/2014 | | 3,300,000 | | 3,357,750 |
| 9.00% due 06/15/2016 | | 805,000 | | 821,100 |
| Time Warner Telecom Holdings, Inc. | | | | |
| 9.25% due 02/15/2014 | | 1,225,000 | | 1,267,875 |
| |
|
| | | | | 12,211,975 |
| Telephone - 2.85% | | | | |
| Qwest Communications International, Inc. | | | | |
| 7.25% due 02/15/2011 | | 250,000 | | 247,500 |
| Qwest Communications International, Inc., Series B | | | |
| 7.50% due 02/15/2014 | | 500,000 | | 491,250 |
| Qwest Corp. | | | | |
| 6.50% due 06/01/2017 | | 1,250,000 | | 1,212,500 |
| 7.50% due 10/01/2014 | | 500,000 | | 512,500 |
| 7.625% due 06/15/2015 | | 300,000 | | 309,000 |
| 7.875% due 09/01/2011 | | 1,725,000 | | 1,804,781 |
| 8.875% due 03/15/2012 | | 1,800,000 | | 1,948,500 |
| US West Communications, Inc. | | | | |
| 7.50% due 06/15/2023 | | 1,000,000 | | 982,500 |
| Valor Telecommunications Enterprise LLC | | | | |
| 7.75% due 02/15/2015 | | 1,450,000 | | 1,497,608 |
| Windstream Corp. | | | | |
| 8.125% due 08/01/2013 | | 1,050,000 | | 1,084,125 |
| 8.625% due 08/01/2016 | | 1,150,000 | | 1,201,750 |
| |
|
| | | | | 11,292,014 |
| Tobacco - 0.59% | | | | |
| Reynolds American, Inc. | | | | |
| 6.50% due 07/15/2010 | | 250,000 | | 255,125 |
| 7.625% due 06/01/2016 | | 2,000,000 | | 2,094,574 |
| |
|
| | | | | 2,349,699 |
| Transportation - 2.18% | | | | |
| Bombardier, Inc. | | | | |
| 6.75% due 05/01/2012 | | 590,000 | | 587,050 |
| 7.45% due 05/01/2034 | | 2,250,000 | | 2,205,000 |
| | | | |
| U.S. High Yield Bond Fund (continued) | | |
| | | Shares or | | |
| | | Principal | | |
| | | Amount | | Value |
| |
|
| |
| CORPORATE BONDS (continued) | | | | |
| Transportation (continued) | | | | |
| Gulfmark Offshore, Inc. | | | | |
| 7.75% due 07/15/2014 | $ | 2,000,000 | $ | 1,970,000 |
| Overseas Shipholding Group, Inc. | | | | |
| 7.50% due 02/15/2024 | | 2,265,000 | | 2,151,750 |
| Trailer Bridge, Inc. | | | | |
| 9.25% due 11/15/2011 | | 1,750,000 | | 1,723,750 |
| |
|
| | | | | 8,637,550 |
| |
| Travel Services - 0.09% | | | | |
| Sabre Holdings Corp. | | | | |
| 6.35% due 03/15/2016 | | 400,000 | | 348,000 |
|
| TOTAL CORPORATE BONDS (Cost $306,017,098) | | $ | 299,648,826 |
|
| |
| ASSET BACKED SECURITIES - 0.32% | | | | |
| DB Master Finance LLC, Series 2006-1, Class-M1 | | | |
| 8.285% due 06/20/2031 | | 1,250,000 | | 1,284,816 |
|
| TOTAL ASSET BACKED SECURITIES | | | | |
| (Cost $1,249,975) | | | $ | 1,284,816 |
|
| |
| TERM LOANS - 21.30% | | | | |
| | | | | |
| Aerospace - 0.12% | | | | |
| Hawker Beechcraft Corp., Letter of Credit | | | | |
| 5.26% due 03/26/2014 (b) | | 39,007 | | 37,235 |
| Hawker Beechcraft Corp., Tranche B | | | | |
| 7.37% due 03/26/2014 (b) | | 459,840 | | 438,955 |
| |
|
| | | | | 476,190 |
| |
| Air Travel - 0.36% | | | | |
| Delta Airlines, Inc., Tranche B2 | | | | |
| 8.61% due 04/30/2014 (b) | | 1,000,000 | | 955,630 |
| U.S. Airways Group, Inc. | | | | |
| 7.86% due 03/31/2011 (b) | | 500,000 | | 470,250 |
| |
|
| | | | | 1,425,880 |
| |
| Auto Parts - 0.52% | | | | |
| Delphi Corp., Tranche C | | | | |
| 8.125% due 12/31/2007 (b) | | 1,100,000 | | 1,076,163 |
| Federal Mogul Corp. Dip, Tranche B | | | | |
| 7.25% due 12/31/2007 (b) | | 1,000,000 | | 985,000 |
| |
|
| | | | | 2,061,163 |
| |
| Automobiles - 0.28% | | | | |
| CSK Automotive, Inc. | | | | |
| 8.375% due 06/30/2012 (b) | | 496,259 | | 486,334 |
| Ford Motor Company, Tranche B | | | | |
| 8.36% due 11/29/2013 (b) | | 649,250 | | 607,964 |
| |
|
| | | | | 1,094,298 |
| |
| Broadcasting - 0.23% | | | | |
| Citadel Broadcasting Corp. | | | | |
| 6.985% due 06/12/2014 (b) | | 1,000,000 | | 920,000 |
| Business Services - 2.38% | | | | |
| Adesa, Inc., Tranche KAR | | | | |
| 7.61% due 09/22/2013 (b) | | 900,000 | | 843,750 |
| Coinmach Laundry Corp. | | | | |
| 7.97% due 12/19/2012 (b) | | 1,500,000 | | 1,466,250 |
| Education Management Corp., Tranche C | | | | |
| 7.125% due 05/24/2013 (b) | | 990,000 | | 942,480 |
| |
| The accompanying notes are an integral part of the financial statements. | 396 |
John Hancock Funds II
Portfolio of investments — August 31, 2007
(showing percentage of total net assets)
| | | | |
| U.S. High Yield Bond Fund (continued) | | |
| | | Shares or | | |
| | | Principal | | |
| | | Amount | | Value |
| |
|
| |
| TERM LOANS (continued) | | | | |
| Business Services (continued) | | | | |
| Neff Corp. | | | | |
| 8.896% due 05/31/2013 (b) | $ | 1,000,000 | $ | 930,000 |
| Reynolds & Reynolds Company, Inc. | | | | |
| 7.35% due 10/24/2012 (b) | | 396,364 | | 388,437 |
| Reynolds & Reynolds Company, Inc.,Tranche 2 | | | |
| 10.86% due 10/24/2013 (b) | | 1,125,000 | | 1,113,750 |
| Reynolds & Reynolds Company, Inc.,Tranche 3 | | | |
| 12.86% due 10/24/2014 (b) | | 625,000 | | 609,375 |
| Riverdeep Interactive Learning USA, Inc., Tranche B | | | |
| 8.11% due 11/28/2013 (b) | | 1,493,478 | | 1,462,369 |
| SunGard Data Systems, Inc., Tranche B1 | | | | |
| 7.356% due 02/27/2014 (b) | | 1,720,149 | | 1,665,053 |
| |
|
| | | | | 9,421,464 |
| Cable & Television - 1.14% | | | | |
| Charter Communications Operating LLC, Tranche 3 | | | |
| 7.86% due 03/01/2014 (b) | | 750,000 | | 711,600 |
| Charter Communications Operating LLC, Tranche | | | |
| B1 | | | | |
| 7.36% due 03/06/2014 (b) | | 750,000 | | 708,750 |
| CSC Holdings, Inc. | | | | |
| 7.07% due 03/23/2013 (b) | | 2,615,390 | | 2,507,924 |
| 7.25% due 07/15/2008 | | 600,000 | | 600,000 |
| |
|
| | | | | 4,528,274 |
| Cellular Communications - 0.37% | | | | |
| American Cellular Corp. | | | | |
| 7.36% due 08/07/2013 (b) | | 1,500,000 | | 1,485,630 |
| | | | | |
| Chemicals - 1.06% | | | | |
| Arizona Chemical Company, Tranche 2 | | | | |
| 11.01% due 02/28/2014 (b) | | 250,000 | | 230,000 |
| Arizona Chemical Company, Tranche B | | | | |
| 7.541% due 02/28/2013 (b) | | 249,375 | | 234,413 |
| Celanese Holdings LLC, Letter of Credit | | | | |
| 7.11% due 04/02/2014 (b) | | 581,875 | | 561,992 |
| Celanese Holdings LLC, Tranche B | | | | |
| 5.320% due 04/02/2014 (b) | | 166,667 | | 160,972 |
| Huntsman International LLC | | | | |
| 7.371% due 04/19/2014 (b) | | 1,053,540 | | 1,032,469 |
| Lyondell Chemical Company | | | | |
| 6.84% due 08/16/2013 (b) | | 1,994,962 | | 1,966,035 |
| |
|
| | | | | 4,185,881 |
| Commercial Services - 0.18% | | | | |
| Safety-Kleen, Corp., Letter of Credit | | | | |
| 5.375% due 07/27/2013 (b) | | 152,542 | | 147,966 |
| Safety-Kleen, Corp., Tranche B | | | | |
| 7.875% due 07/27/2013 (b) | | 580,360 | | 562,949 |
| |
|
| | | | | 710,915 |
| Containers & Glass - 0.18% | | | | |
| Graham Packaging Company | | | | |
| 7.625% due 10/07/2011 (b) | | 250,000 | | 242,812 |
| Owens-Illinois, Inc. | | | | |
| 6.37% due 06/14/2013 (b) | | 500,000 | | 479,165 |
| |
|
| | | | | 721,977 |
| | | | |
| U.S. High Yield Bond Fund (continued) | | |
| | | Shares or | | |
| | | Principal | | |
| | | Amount | | Value |
|
|
| |
| TERM LOANS (continued) | | | | |
| Crude Petroleum & Natural Gas - 0.19% | | | |
| Coffeyville Resources, Inc., Letter of Credit | | | |
| 5.26% due 12/28/2010 (b) | $ | 129,730 | $ | 124,216 |
| Coffeyville Resources, Inc., Tranche B | | | | |
| 8.61% due 03/09/2013 (b) | | 666,923 | | 638,579 |
| |
|
| | | | | 762,795 |
| Domestic Oil - 0.33% | | | | |
| Alon USA LP | | | | |
| 7.61% due 06/07/2013 (b) | | 990,000 | | 945,450 |
| Eagle Rock Energy, Inc. | | | | |
| 8.11% due 12/01/2012 (b) | | 369,139 | | 358,065 |
| |
|
| | | | | 1,303,515 |
| Electrical Utilities - 0.95% | | | | |
| Calpine Corp., Tranche B | | | | |
| 7.61% due 03/29/2009 (b) | | 3,919,769 | | 3,777,677 |
| | | | | |
| Energy - 1.10% | | | | |
| Covanta Energy Corp., Letter of Credit | | | | |
| 7.26% due 02/02/2014 (b) | | 346,392 | | 336,866 |
| Covanta Energy Corp., Tranche B | | | | |
| 6.875% due 02/02/2014 (b) | | 701,849 | | 682,548 |
| NRG Energy, Inc. | | | | |
| 7.11% due 02/01/2013 (b) | | 1,764,724 | | 1,676,488 |
| NRG Energy, Inc., Tranche L | | | | |
| 7.11% due 02/02/2011 (b) | | 732,624 | | 695,993 |
| Sandridge Energy, Inc. | | | | |
| 8.625% due 03/07/2015 (b) | | 1,000,000 | | 977,500 |
| |
|
| | | | | 4,369,395 |
| Financial Services - 2.17% | | | | |
| BLB Holding Corp., - Wembley Tranche 2 | | | | |
| 9.63% due 06/30/2011 (b) | | 275,000 | | 266,750 |
| Emdeon Business Services LLC, Tranche 1B | | | |
| 7.61% due 11/16/2013 (b) | | 487,567 | | 465,627 |
| Emdeon Business Services LLC, Tranche 2 | | | |
| 10.36% due 05/16/2014 (b) | | 1,000,000 | | 980,000 |
| Linsco/Private Ledger Corp., Tranche B | | | | |
| 7.36% due 06/27/2013 (b) | | 1,583,926 | | 1,504,729 |
| NASDAQ Stock Market, Inc., Tranche B | | | | |
| 7.315% due 04/18/2012 (b) | | 484,419 | | 477,153 |
| NASDAQ Stock Market, Inc., Tranche C | | | | |
| 7.07% due 04/18/2012 (b) | | 280,806 | | 276,594 |
| TPF Generation Holdings LLC, Tranche 2 | | | | |
| 9.61% due 12/15/2014 (b) | | 800,000 | | 762,000 |
| VNU, Inc., Tranche B | | | | |
| 7.607% due 08/07/2013 (b) | | 2,575,774 | | 2,453,425 |
| Wimar Landco LLC, Tranche B | | | | |
| 7.61% due 07/03/2008 (b) | | 750,000 | | 726,562 |
| Wimar Operating Company LLC, Tranche B | | | |
| 7.61% due 01/03/2012 (b) | | 732,598 | | 695,360 |
| |
|
| | | | | 8,608,200 |
| Food & Beverages - 0.85% | | | | |
| Dean Foods Company, Tranche B | | | | |
| 6.86% due 03/01/2014 (b) | | 1,496,250 | | 1,447,248 |
| Supervalu, Inc., Tranche B | | | | |
| 6.86% due 05/30/2012 (b) | | 1,975,000 | | 1,928,094 |
| |
|
| | | | | 3,375,342 |
| |
| The accompanying notes are an integral part of the financial statements. | 397 |
John Hancock Funds II
Portfolio of investments — August 31, 2007
(showing percentage of total net assets)
| | | | |
| U.S. High Yield Bond Fund (continued) | | |
| | | Shares or | | |
| | | Principal | | |
| | | Amount | | Value |
|
|
| |
| TERM LOANS (continued) | | | | |
| | | | | |
| Gas & Pipeline Utilities - 0.35% | | | | |
| Dynegy Holdings, Inc. | | | | |
| 7.01% due 03/02/2013 (b) | $ | 1,000,000 | $ | 947,500 |
| Targa Resources, Inc. | | | | |
| 7.54% due 10/31/2012 (b) | | 471,442 | | 450,227 |
| |
|
| | | | | 1,397,727 |
| |
| Healthcare Services - 0.47% | | | | |
| Carestream Health, Inc., Tranche B | | | | |
| 7.37% due 04/30/2013 (b) | | 900,000 | | 833,625 |
| Carestream Health, Inc., Tranche B2 | | | | |
| 10.59% due 10/30/2013 (b) | | 500,000 | | 470,000 |
| Healthsouth Corp., Tranche B | | | | |
| 7.86% due 03/10/2013 (b) | | 576,122 | | 553,077 |
| |
|
| | | | | 1,856,702 |
| |
| Household Products - 0.12% | | | | |
| Huish Detergents, Inc., Tranche 2 | | | | |
| 9.76% due 04/26/2014 (b) | | 500,000 | | 457,500 |
| | | | | |
| Industrial Machinery - 0.05% | | | | |
| Baldor Electric Company, Tranche B | | | | |
| 7.125% due 01/31/2014 (b) | | 196,246 | | 192,321 |
| | | | | |
| Insurance - 0.54% | | | | |
| Affirmative Insurance Holdings Company, Inc. | | | |
| 9.00% due 01/12/2014 (b) | | 746,250 | | 716,400 |
| AmWINS Group, Inc. | | | | |
| 10.83% due 06/07/2014 (b) | | 500,000 | | 452,500 |
| Kepler Holdings, Ltd. | | | | |
| 10.86% due 06/30/2009 (b) | | 500,000 | | 480,000 |
| Panther RE Bermuda, Ltd., Tranche B | | | | |
| 9.86% due 11/30/2010 (b) | | 500,000 | | 480,000 |
| |
|
| | | | | 2,128,900 |
| |
| Leisure Time - 1.19% | | | | |
| Bombardier Recreational Products, Inc., Tranche B | | | |
| 7.86% due 06/26/2013 (b) | | 774,684 | | 749,506 |
| Golden Nugget, Inc. | | | | |
| 8.84% due 06/14/2014 (b) | | 750,000 | | 701,250 |
| Greenwood Racing | | | | |
| 7.57% due 11/14/2011 (b) | | 486,006 | | 465,351 |
| Penn National Gaming, Inc. | | | | |
| 7.11% due 05/26/2012 (b) | | 1,250,000 | | 1,233,125 |
| Riviera Holding Corp. | | | | |
| 7.36% due 06/08/2014 (b) | | 1,000,000 | | 970,000 |
| Spectre Gaming, Inc. | | | | |
| 11.82% due 03/01/2013 (b) | | 675,000 | | 614,250 |
| |
|
| | | | | 4,733,482 |
| |
| Medical-Hospitals - 0.88% | | | | |
| Community Health Systems, Inc., Tranche B | | | |
| 7.76% due 07/02/2014 (b) | | 1,876,257 | | 1,803,158 |
| Community Health Systems, Inc., Tranche Delayed | | | |
| Draw | | | | |
| .50% due 07/02/2014 (b)(f) | | 123,743 | | 118,922 |
| HCA, Inc. | | | | |
| 7.61% due 11/01/2013 (b) | | 1,144,250 | | 1,100,116 |
| | | | |
| U.S. High Yield Bond Fund (continued) | | |
| | | Shares or | | |
| | | Principal | | |
| | | Amount | | Value |
|
|
| |
| TERM LOANS (continued) | | | | |
| | | | | |
| Medical-Hospitals (continued) | | | | |
| X-Rite, Inc., Tranche 2 | | | | |
| 10.36% due 06/30/2013 (b) | $ | 500,000 | $ | 485,000 |
| |
|
| | | | | 3,507,196 |
| |
| Paper - 1.13% | | | | |
| Domtar Inc., Tranche B | | | | |
| 6.925% due 03/02/2014 (b) | | 562,500 | | 538,312 |
| Georgia-Pacific Corp., Tranche B | | | | |
| 7.12% due 02/14/2013 (b) | | 1,684,375 | | 1,610,987 |
| Georgia-Pacific Corp., Tranche B2 | | | | |
| 7.11% due 12/22/2012 (b) | | 2,440,250 | | 2,342,640 |
| |
|
| | | | | 4,491,939 |
| |
| Publishing - 0.58% | | | | |
| Idearc, Inc., Tranche B | | | | |
| 7.36% due 11/01/2014 (b) | | 2,363,125 | | 2,282,377 |
| | | | | |
| Railroads & Equipment - 0.56% | | | | |
| RailAmerica, Inc., Tranche T1 | | | | |
| 7.81% due 08/14/2008 (b) | | 2,250,000 | | 2,216,250 |
| | | | | |
| Real Estate - 0.16% | | | | |
| Capital Automotive LP, REIT | | | | |
| 7.07% due 12/16/2010 (b) | | 669,789 | | 652,629 |
| | | | | |
| Retail - 0.80% | | | | |
| Toys R Us, Inc., Tranche B | | | | |
| 8.32% due 12/09/2008 (b) | | 3,250,000 | | 3,185,000 |
| | | | | |
| Retail Trade - 0.24% | | | | |
| Sally Holdings LLC, Tranche B | | | | |
| 8.01% due 11/01/2013 (b) | | 992,500 | | 960,740 |
| | | | | |
| Sanitary Services - 0.22% | | | | |
| Waste Services, Inc., Tranche B | | | | |
| 7.58% due 04/30/2011 (b) | | 927,298 | | 890,206 |
| | | | | |
| Semiconductors - 0.77% | | | | |
| Freescale Semiconductor, Inc. | | | | |
| 7.11% due 12/01/2013 (b) | | 2,238,750 | | 2,092,828 |
| Marvell Technology Group, Inc. | | | | |
| 8.00% due 11/08/2009 (b) | | 991,875 | | 952,200 |
| |
|
| | | | | 3,045,028 |
| |
| Telecommunications Equipment & | | | | |
| Services - 0.24% | | | | |
| Level 3 Communications, Inc. | | | | |
| 7.61% due 03/16/2014 (b) | | 1,000,000 | | 951,670 |
| | | | | |
| Tires & Rubber - 0.23% | | | | |
| Goodyear Tire & Rubber Company, Tranche 2 | | | |
| 6.85% due 04/30/2010 (b) | | 950,000 | | 893,789 |
| | | | | |
| Transportation - 0.30% | | | | |
| Laidlaw International, Inc., Tranche B | | | | |
| 7.34% due 07/31/2013 (b) | | 496,250 | | 488,186 |
| Oshkosh Truck Corp., Tranche B | | | | |
| 7.11% due 12/06/2013 (b) | | 746,250 | | 719,900 |
| |
|
| | | | | 1,208,086 |
| |
| The accompanying notes are an integral part of the financial statements. | 398 |
John Hancock Funds II
Portfolio of investments — August 31, 2007
(showing percentage of total net assets)
| | | | |
| U.S. High Yield Bond Fund (continued) | | |
| | | Shares or | | |
| | | Principal | | |
| | | Amount | | Value |
|
|
| |
| TERM LOANS (continued) | | | | |
| | | | | |
| Travel Services - 0.06% | | | | |
| Sabre Holdings Corp., Tranche B | | | | |
| 7.358% due 09/30/2014 (b) | $ | 239,055 | $ | 221,126 |
|
| TOTAL TERM LOANS (Cost $87,615,510) | | | $ | 84,501,264 |
|
| |
| SHORT TERM INVESTMENTS - 1.71% | | | | |
| John Hancock Cash Investment Trust (c) | $ | 6,762,883 | $ | 6,762,883 |
|
| TOTAL SHORT TERM INVESTMENTS | | | | |
| (Cost $6,762,883) | | | $ | 6,762,883 |
|
| |
| REPURCHASE AGREEMENTS - 2.62% | | | | |
| Repurchase Agreement with State | | | | |
| Street Corp. dated 08/31/2007 at | | | | |
| 4.60% to be repurchased at | | | | |
| $10,396,311 on 09/04/2007, | | | | |
| collateralized by $10,320,000 | | | | |
| Federal National Mortgage | | | | |
| Association, 6.00% due | | | | |
| 03/20/2017 (valued at | | | | |
| $10,603,800, including interest) | $ | 10,391,000 | $ | 10,391,000 |
|
| TOTAL REPURCHASE AGREEMENTS | | | | |
| (Cost $10,391,000) | | | $ | 10,391,000 |
|
| Total Investments (U.S. High Yield Bond Fund) | | | |
| (Cost $412,036,466) - 101.47% | | | $ | 402,588,789 |
| Liabilities in Excess of Other Assets - (1.47)% | | | (5,826,994) |
|
|
| TOTAL NET ASSETS - 100.00% | | | $ | 396,761,795 |
|
|
| |
| |
| |
| U.S. Multi Sector Fund | | | | |
| | | Shares or | | |
| | | Principal | | |
| | | Amount | | Value |
|
|
| |
| COMMON STOCKS - 95.56% | | | | |
| | | | | |
| Advertising - 0.12% | | | | |
| Omnicom Group, Inc. | | 36,800 | $ | 1,874,224 |
| | | | | |
| Aerospace - 0.72% | | | | |
| Alliant Techsystems, Inc. * | | 4,600 | | 484,426 |
| General Dynamics Corp. | | 6,600 | | 518,496 |
| Goodrich Corp. | | 5,000 | | 315,800 |
| Lockheed Martin Corp. | | 34,900 | | 3,459,986 |
| Northrop Grumman Corp. | | 35,300 | | 2,783,052 |
| Raytheon Company | | 5,300 | | 325,102 |
| Rockwell Collins, Inc. | | 14,300 | | 984,841 |
| United Technologies Corp. | | 27,900 | | 2,082,177 |
|
|
| | | | | 10,953,880 |
| Air Freight - 0.01% | | | | |
| ExpressJet Holdings, Inc. * | | 29,100 | | 126,876 |
| | | | | |
| Aluminum - 0.10% | | | | |
| Alcoa, Inc. | | 40,900 | | 1,494,077 |
| | | | | |
| Apparel & Textiles - 1.82% | | | | |
| | | | |
| Coach, Inc. * | | 170,000 | | 7,570,100 |
| | | |
| U.S. Multi Sector Fund (continued) | | |
| | Shares or | | |
| | Principal | | |
| | Amount | | Value |
|
|
| |
| COMMON STOCKS (continued) | | | |
| | | | |
| Apparel & Textiles (continued) | | | |
| Columbia Sportswear Company (a) | 14,500 | $ | 868,840 |
| Deckers Outdoor Corp. * | 2,400 | | 226,056 |
| Jones Apparel Group, Inc. | 46,900 | | 900,011 |
| Kellwood Company (a) | 3,600 | | 70,920 |
| K-Swiss, Inc., Class A | 6,200 | | 149,544 |
| Liz Claiborne, Inc. | 63,600 | | 2,173,212 |
| Mohawk Industries, Inc. * (a) | 13,000 | | 1,135,030 |
| NIKE, Inc., Class B | 143,800 | | 8,101,692 |
| Oakley, Inc. | 14,600 | | 420,042 |
| Polo Ralph Lauren Corp., Class A | 9,000 | | 679,860 |
| VF Corp. | 59,700 | | 4,767,045 |
| Wolverine World Wide, Inc. | 27,500 | | 722,975 |
| |
|
| | | | 27,785,327 |
| Auto Parts - 0.97% | | | |
| American Axle & Manufacturing Holdings, Inc. | 29,600 | | 690,272 |
| ArvinMeritor, Inc. | 43,000 | | 750,350 |
| Autoliv, Inc. | 24,100 | | 1,382,617 |
| AutoZone, Inc. * | 55,400 | | 6,719,466 |
| BorgWarner, Inc. | 5,800 | | 490,100 |
| Gentex Corp. | 32,800 | | 657,312 |
| Genuine Parts Company | 33,500 | | 1,664,280 |
| Johnson Controls, Inc. | 15,800 | | 1,786,980 |
| TRW Automotive Holdings Corp. * | 19,500 | | 595,920 |
| |
|
| | | | 14,737,297 |
| Auto Services - 0.26% | | | |
| AutoNation, Inc. * | 121,100 | | 2,298,478 |
| Avis Budget Group, Inc. * | 50,100 | | 1,162,821 |
| Copart, Inc. * | 11,400 | | 334,476 |
| Lithia Motors, Inc., Class A | 7,900 | | 141,489 |
| |
|
| | | | 3,937,264 |
| Automobiles - 1.63% | | | |
| Asbury Automotive Group, Inc. | 10,800 | | 233,496 |
| Ford Motor Company * | 1,105,100 | | 8,630,831 |
| General Motors Corp. (a) | 151,800 | | 4,666,332 |
| PACCAR, Inc. | 132,200 | | 11,309,710 |
| |
|
| | | | 24,840,369 |
| Banking - 1.30% | | | |
| Anchor BanCorp Wisconsin, Inc. (a) | 5,800 | | 152,772 |
| Bank of America Corp. | 149,100 | | 7,556,388 |
| City Bank, Lynnwood, WA | 1,650 | | 50,738 |
| Comerica, Inc. | 49,500 | | 2,761,110 |
| Downey Financial Corp. | 10,700 | | 605,513 |
| First Horizon National Corp. (a) | 16,500 | | 506,220 |
| FirstFed Financial Corp. * (a) | 6,300 | | 316,575 |
| Hancock Holding Company | 300 | | 12,000 |
| Imperial Capital Bancorp, Inc. * | 2,200 | | 76,120 |
| National City Corp. | 197,700 | | 5,320,107 |
| UnionBanCal Corp. | 16,400 | | 963,992 |
| US Bancorp | 45,800 | | 1,481,630 |
| |
|
| | | | 19,803,165 |
| |
| The accompanying notes are an integral part of the financial statements. | 399 |
John Hancock Funds II
Portfolio of investments — August 31, 2007
(showing percentage of total net assets)
| | | |
| U.S. Multi Sector Fund (continued) | | |
| | Shares or | | |
| | Principal | | |
| | Amount | | Value |
|
|
| |
| COMMON STOCKS (continued) | | | |
| | | | |
| Biotechnology - 0.17% | | | |
| Applera Corp. | 42,600 | $ | 1,346,586 |
| Immucor, Inc. * | 32,100 | | 1,070,535 |
| Techne Corp. * | 3,000 | | 189,030 |
| |
|
| | | | 2,606,151 |
| Broadcasting - 0.18% | | | |
| Belo Corp., Class A | 17,100 | | 294,804 |
| CBS Corp., Class B | 62,800 | | 1,978,828 |
| Citadel Broadcasting Corp. | 7,349 | | 29,910 |
| Liberty Media Corp. - Capital, Series A * | 1,300 | | 141,687 |
| News Corp., Class A | 12,100 | | 244,783 |
| Westwood One, Inc. | 22,400 | | 64,736 |
| |
|
| | | | 2,754,748 |
| Building Materials & Construction - 0.32% | | | |
| American Standard Companies, Inc. | 60,200 | | 2,217,166 |
| Dycom Industries, Inc. * | 10,000 | | 295,300 |
| EMCOR Group, Inc. * | 21,100 | | 661,485 |
| Masco Corp. | 52,000 | | 1,353,040 |
| RPM International, Inc. | 12,800 | | 289,792 |
| |
|
| | | | 4,816,783 |
| Business Services - 1.51% | | | |
| ABM Industries, Inc. | 10,900 | | 254,842 |
| Affiliated Computer Services, Inc., Class A * | 28,900 | | 1,445,867 |
| Computer Sciences Corp. * | 16,700 | | 934,365 |
| Convergys Corp. * | 42,300 | | 708,525 |
| Deluxe Corp. | 39,900 | | 1,516,998 |
| Dun & Bradstreet Corp. | 1,500 | | 146,325 |
| FactSet Research Systems, Inc. | 21,000 | | 1,258,530 |
| First Data Corp. | 94,600 | | 3,142,612 |
| Fiserv, Inc. * | 96,700 | | 4,498,484 |
| Forrester Research, Inc. * | 5,000 | | 127,050 |
| Manpower, Inc. | 25,700 | | 1,805,682 |
| Moody's Corp. | 37,200 | | 1,705,620 |
| NCR Corp. * | 11,200 | | 557,424 |
| On Assignment, Inc. * | 20,000 | | 211,600 |
| Pitney Bowes, Inc. | 47,500 | | 2,121,825 |
| Pre-Paid Legal Services, Inc. * (a) | 10,600 | | 585,014 |
| R.R. Donnelley & Sons Company | 18,000 | | 644,760 |
| Resources Connection, Inc. * | 15,900 | | 477,000 |
| ScanSource, Inc. * | 4,400 | | 121,880 |
| Total Systems Services, Inc. (a) | 23,100 | | 640,794 |
| Unisys Corp. * | 18,200 | | 134,134 |
| |
|
| | | | 23,039,331 |
| Cable & Television - 0.45% | | | |
| Comcast Corp., Class A * | 69,250 | | 1,806,733 |
| DIRECTV Group, Inc. * | 26,300 | | 613,579 |
| Time Warner, Inc. | 232,200 | | 4,407,156 |
| |
|
| | | | 6,827,468 |
| Cellular Communications - 0.09% | | | |
| Telephone & Data Systems, Inc. | 20,000 | | 1,295,000 |
| | | |
| U.S. Multi Sector Fund (continued) | | |
| | Shares or | | |
| | Principal | | |
| | Amount | | Value |
|
|
| |
| COMMON STOCKS (continued) | | | |
| Chemicals - 0.91% | | | |
| Albemarle Corp. | 17,100 | $ | 692,037 |
| Cabot Corp. | 13,000 | | 524,420 |
| Dow Chemical Company | 79,600 | | 3,393,348 |
| E.I. Du Pont de Nemours & Company | 58,800 | | 2,866,500 |
| Eastman Chemical Company | 13,400 | | 894,584 |
| Georgia Gulf Corp. (a) | 14,500 | | 217,065 |
| Hercules, Inc. * | 17,700 | | 368,514 |
| Lubrizol Corp. | 13,100 | | 832,898 |
| Lyondell Chemical Company | 20,300 | | 941,108 |
| PolyOne Corp. * | 20,600 | | 165,418 |
| PPG Industries, Inc. | 28,500 | | 2,090,475 |
| Sensient Technologies Corp. | 32,600 | | 883,134 |
| |
|
| | | | 13,869,501 |
| Colleges & Universities - 0.36% | | | |
| Career Education Corp. * | 48,000 | | 1,425,600 |
| Corinthian Colleges, Inc. * | 26,100 | | 366,966 |
| ITT Educational Services, Inc. * | 33,400 | | 3,667,320 |
| |
|
| | | | 5,459,886 |
| Commercial Services - 0.02% | | | |
| PeopleSupport, Inc. * | 24,200 | | 304,436 |
| | | | |
| Computers & Business Equipment - 8.67% | | | |
| Apple, Inc. * | 59,200 | | 8,198,016 |
| Avocent Corp. * | 5,200 | | 153,504 |
| CDW Corp. * | 44,300 | | 3,812,901 |
| Cisco Systems, Inc. * | 313,400 | | 10,003,728 |
| Cognizant Technology Solutions Corp., | | | |
| Class A * | 20,800 | | 1,529,008 |
| Dell, Inc. * | 1,645,900 | | 46,496,675 |
| EMC Corp. * | 237,100 | | 4,661,386 |
| Hewlett-Packard Company | 62,200 | | 3,069,570 |
| Ingram Micro, Inc., Class A * | 72,400 | | 1,421,936 |
| International Business Machines Corp. | 392,200 | | 45,765,818 |
| Juniper Networks, Inc. * | 21,600 | | 711,072 |
| Lexmark International, Inc. * | 100,300 | | 3,737,178 |
| Tech Data Corp. * | 46,100 | | 1,797,439 |
| Western Digital Corp. * | 29,300 | | 684,448 |
| |
|
| | | | 132,042,679 |
| Construction Materials - 0.21% | | | |
| Comfort Systems USA, Inc. | 7,200 | | 104,760 |
| Martin Marietta Materials, Inc. | 1,800 | | 243,000 |
| Sherwin-Williams Company | 41,400 | | 2,857,014 |
| |
|
| | | | 3,204,774 |
| Containers & Glass - 0.26% | | | |
| Ball Corp. | 12,300 | | 644,274 |
| Bemis Company, Inc. | 13,400 | | 400,258 |
| Greif, Inc., Class A | 8,700 | | 506,514 |
| Owens-Illinois, Inc. * | 19,000 | | 764,180 |
| Pactiv Corp. * | 26,000 | | 760,500 |
| Sealed Air Corp. | 20,800 | | 550,160 |
| |
| The accompanying notes are an integral part of the financial statements. | 400 |
John Hancock Funds II
Portfolio of investments — August 31, 2007
(showing percentage of total net assets)
| | | |
| U.S. Multi Sector Fund (continued) | | |
| | Shares or | | |
| | Principal | | |
| | Amount | | Value |
|
|
| |
| COMMON STOCKS (continued) | | | |
| | | | |
| Containers & Glass (continued) | | | |
| Sonoco Products Company | 8,400 | $ | 302,568 |
| |
|
| | | | 3,928,454 |
| Cosmetics & Toiletries - 1.15% | | | |
| Alberto-Culver Company | 35,900 | | 831,803 |
| Avon Products, Inc. | 51,700 | | 1,775,895 |
| Chattem, Inc. * (a) | 4,900 | | 302,379 |
| Colgate-Palmolive Company | 6,100 | | 404,552 |
| Estee Lauder Companies, Inc., Class A | 53,000 | | 2,204,270 |
| International Flavors & Fragrances, Inc. | 28,100 | | 1,411,463 |
| Kimberly-Clark Corp. | 154,500 | | 10,612,605 |
| |
|
| | | | 17,542,967 |
| Crude Petroleum & Natural Gas - 0.60% | | | |
| Apache Corp. | 17,200 | | 1,330,936 |
| Cabot Oil & Gas Corp. | 4,000 | | 133,360 |
| Devon Energy Corp. | 6,200 | | 466,922 |
| Harvest Natural Resources, Inc. * | 16,400 | | 187,944 |
| Marathon Oil Corp. | 37,100 | | 1,999,319 |
| Occidental Petroleum Corp. | 47,900 | | 2,715,451 |
| Sunoco, Inc. | 24,300 | | 1,777,302 |
| XTO Energy, Inc. | 10,800 | | 587,088 |
| |
|
| | | | 9,198,322 |
| Domestic Oil - 0.03% | | | |
| Holly Corp. (a) | 7,800 | | 519,870 |
| | | | |
| Drugs & Health Care - 0.03% | | | |
| Molina Healthcare, Inc. * | 13,300 | | 452,865 |
| | | | |
| Educational Services - 0.15% | | | |
| Apollo Group, Inc., Class A * | 38,000 | | 2,229,460 |
| | | | |
| Electrical Equipment - 0.38% | | | |
| AZZ, Inc. * | 5,100 | | 144,840 |
| Emerson Electric Company | 69,500 | | 3,421,485 |
| FLIR Systems, Inc. * | 26,100 | | 1,285,164 |
| Genlyte Group, Inc. * | 7,400 | | 537,018 |
| Molex, Inc. | 6,700 | | 175,205 |
| Varian, Inc. * | 3,900 | | 234,078 |
| |
|
| | | | 5,797,790 |
| Electrical Utilities - 0.88% | | | |
| American Electric Power Company, Inc. | 54,600 | | 2,428,608 |
| CenterPoint Energy, Inc. (a) | 17,400 | | 282,228 |
| Constellation Energy Group, Inc. | 6,900 | | 572,286 |
| DTE Energy Company | 15,500 | | 741,055 |
| Edison International | 21,100 | | 1,112,181 |
| Entergy Corp. | 41,500 | | 4,300,230 |
| Great Plains Energy, Inc. | 8,500 | | 240,890 |
| NSTAR | 15,400 | | 504,658 |
| PPL Corp. | 15,400 | | 743,204 |
| Public Service Enterprise Group, Inc. | 3,400 | | 288,966 |
| The AES Corp. * | 76,300 | | 1,381,793 |
| Xcel Energy, Inc. | 36,700 | | 756,387 |
| |
|
| | | | 13,352,486 |
| | | |
| U.S. Multi Sector Fund (continued) | | |
| | Shares or | | |
| | Principal | | |
| | Amount | | Value |
|
|
| |
| COMMON STOCKS (continued) | | | |
| | | | |
| Electronics - 0.31% | | | |
| Amphenol Corp., Class A | 8,500 | $ | 306,935 |
| Arrow Electronics, Inc. * | 13,400 | | 562,264 |
| Avnet, Inc. * | 26,200 | | 1,029,922 |
| Cubic Corp. | 2,300 | | 90,919 |
| II-VI, Inc. * | 10,700 | | 333,840 |
| L-3 Communications Holdings, Inc. | 7,500 | | 738,825 |
| Rogers Corp. * | 4,400 | | 181,236 |
| Synopsys, Inc. * | 5,200 | | 142,064 |
| Teleflex, Inc. | 5,500 | | 427,735 |
| Tyco Electronics, Ltd. * | 20,950 | | 730,526 |
| Zebra Technologies Corp., Class A * | 4,000 | | 145,200 |
| |
|
| | | | 4,689,466 |
| Energy - 0.06% | | | |
| Energen Corp. | 10,500 | | 563,850 |
| Sempra Energy | 5,200 | | 286,156 |
| |
|
| | | | 850,006 |
| Financial Services - 3.37% | | | |
| American Capital Strategies, Ltd. (a) | 6,600 | | 272,514 |
| Citigroup, Inc. | 224,600 | | 10,529,248 |
| Countrywide Financial Corp. | 52,800 | | 1,048,080 |
| Discover Financial Services * | 24,300 | | 562,302 |
| Eaton Vance Corp. | 11,200 | | 429,968 |
| Federal Home Loan Mortgage Corp. | 45,400 | | 2,797,094 |
| Federal National Mortgage Association | 348,400 | | 22,858,524 |
| Franklin Resources, Inc. | 13,200 | | 1,739,364 |
| Goldman Sachs Group, Inc. | 21,700 | | 3,819,417 |
| Knight Capital Group, Inc. * | 12,700 | | 174,498 |
| MCG Capital Corp. (a) | 12,000 | | 174,240 |
| MoneyGram International, Inc. | 25,000 | | 531,750 |
| Morgan Stanley | 48,600 | | 3,031,182 |
| Raymond James Financial, Inc. | 4,800 | | 157,392 |
| SEI Investments Company | 73,300 | | 1,859,621 |
| State Street Corp. | 4,728 | | 290,110 |
| Student Loan Corp. | 1,500 | | 295,875 |
| The First Marblehead Corp. (a) | 14,600 | | 488,954 |
| World Acceptance Corp. * (a) | 11,000 | | 341,110 |
| |
|
| | | | 51,401,243 |
| Food & Beverages - 2.54% | | | |
| Campbell Soup Company | 10,400 | | 392,600 |
| Chiquita Brands International, Inc. * (a) | 24,300 | | 379,080 |
| ConAgra Foods, Inc. | 116,300 | | 2,990,073 |
| Corn Products International, Inc. | 9,900 | | 447,480 |
| General Mills, Inc. | 26,000 | | 1,452,880 |
| H.J. Heinz Company | 30,500 | | 1,375,245 |
| Hormel Foods Corp. | 32,500 | | 1,157,975 |
| J.M. Smucker Company | 13,600 | | 748,136 |
| Kraft Foods, Inc., Class A | 189,676 | | 6,081,013 |
| McCormick & Company, Inc. | 31,900 | | 1,143,296 |
| Pepsi Bottling Group, Inc. | 41,000 | | 1,418,190 |
| Performance Food Group Company * | 28,800 | | 819,072 |
| Pilgrim's Pride Corp. (a) | 8,400 | | 340,956 |
| |
| The accompanying notes are an integral part of the financial statements. | 401 |
John Hancock Funds II
Portfolio of investments — August 31, 2007
(showing percentage of total net assets)
| | | |
| U.S. Multi Sector Fund (continued) | | |
| | Shares or | | |
| | Principal | | |
| | Amount | | Value |
|
|
| |
| COMMON STOCKS (continued) | | | |
| | | | |
| Food & Beverages (continued) | | | |
| Ralcorp Holdings, Inc. * | 13,700 | $ | 846,523 |
| Sanderson Farms, Inc. (a) | 3,300 | | 138,402 |
| Sara Lee Corp. | 29,800 | | 495,276 |
| Sysco Corp. | 159,500 | | 5,324,110 |
| The Coca-Cola Company | 177,900 | | 9,567,462 |
| Tyson Foods, Inc., Class A | 166,600 | | 3,590,230 |
|
|
| | | | 38,707,999 |
| Forest Products - 0.11% | | | |
| Weyerhaeuser Company | 25,600 | | 1,745,152 |
| | | | |
| Furniture & Fixtures - 0.23% | | | |
| American Woodmark Corp. (a) | 21,700 | | 654,689 |
| Ethan Allen Interiors, Inc. (a) | 26,000 | | 873,600 |
| Furniture Brands International, Inc. (a) | 41,300 | | 469,994 |
| Kimball International, Inc., Class B | 4,400 | | 59,092 |
| La-Z-Boy, Inc. (a) | 19,600 | | 188,944 |
| Leggett & Platt, Inc. | 57,800 | | 1,179,120 |
|
|
| | | | 3,425,439 |
| Gas & Pipeline Utilities - 0.02% | | | |
| NiSource, Inc. | 18,500 | | 348,540 |
| | | | |
| Healthcare Products - 3.89% | | | |
| Bausch & Lomb, Inc. | 5,100 | | 322,320 |
| Baxter International, Inc. | 83,800 | | 4,588,888 |
| Becton, Dickinson & Company | 36,800 | | 2,831,392 |
| C.R. Bard, Inc. | 10,000 | | 833,900 |
| CONMED Corp. * | 13,200 | | 383,460 |
| Covidien, Ltd. * | 20,950 | | 834,438 |
| IDEXX Laboratories, Inc. * | 8,800 | | 983,400 |
| Johnson & Johnson | 461,100 | | 28,491,369 |
| Kinetic Concepts, Inc. * | 2,800 | | 168,308 |
| Patterson Companies, Inc. * | 44,000 | | 1,618,320 |
| Respironics, Inc. * | 3,900 | | 184,977 |
| St. Jude Medical, Inc. * | 4,500 | | 196,065 |
| Stryker Corp. | 123,300 | | 8,236,440 |
| USANA Health Sciences, Inc. * (a) | 11,400 | | 434,112 |
| Zimmer Holdings, Inc. * | 117,200 | | 9,180,276 |
|
|
| | | | 59,287,665 |
| Healthcare Services - 4.46% | | | |
| AMERIGROUP Corp. * | 22,100 | | 699,907 |
| Apria Healthcare Group, Inc. * | 36,900 | | 982,647 |
| Cardinal Health, Inc. | 206,400 | | 14,113,632 |
| Coventry Health Care, Inc. * | 14,300 | | 820,391 |
| Express Scripts, Inc. * | 224,100 | | 12,269,475 |
| Health Net, Inc. * | 19,100 | | 1,046,489 |
| Kindred Healthcare, Inc. * | 19,500 | | 386,490 |
| Lincare Holdings, Inc. * | 50,100 | | 1,803,099 |
| McKesson Corp. | 245,600 | | 14,050,776 |
| Medco Health Solutions, Inc. * | 17,600 | | 1,503,920 |
| National Healthcare Corp. | 1,100 | | 57,849 |
| Pediatrix Medical Group, Inc. * | 6,000 | | 357,900 |
| Quest Diagnostics, Inc. | 123,600 | | 6,767,100 |
| | | |
| U.S. Multi Sector Fund (continued) | | |
| | Shares or | | |
| | Principal | | |
| | Amount | | Value |
|
|
| |
| COMMON STOCKS (continued) | | | |
| | | | |
| Healthcare Services (continued) | | | |
| UnitedHealth Group, Inc. | 261,500 | $ | 13,077,615 |
|
|
| | | | 67,937,290 |
| Homebuilders - 0.40% | | | |
| Centex Corp. | 21,500 | | 621,565 |
| D.R. Horton, Inc. | 50,400 | | 761,544 |
| KB Home (a) | 21,200 | | 643,208 |
| Lennar Corp., Class A (a) | 22,900 | | 647,383 |
| M.D.C. Holdings, Inc. | 11,400 | | 507,186 |
| M/I Homes, Inc. (a) | 52,400 | | 955,252 |
| Pulte Homes, Inc. | 50,000 | | 832,000 |
| Toll Brothers, Inc. * | 51,200 | | 1,093,632 |
|
|
| | | | 6,061,770 |
| Hotels & Restaurants - 1.92% | | | |
| Applebee's International, Inc. | 55,300 | | 1,371,993 |
| Brinker International, Inc. | 57,250 | | 1,651,090 |
| CBRL Group, Inc. | 25,700 | | 961,694 |
| CEC Entertainment, Inc. * | 18,000 | | 552,600 |
| Jack in the Box, Inc. * | 24,900 | | 1,549,278 |
| Marriott International, Inc., Class A | 58,500 | | 2,598,570 |
| McDonald's Corp. | 238,800 | | 11,760,900 |
| Papa John's International, Inc. * | 14,700 | | 372,792 |
| Starbucks Corp. * | 177,700 | | 4,895,635 |
| Yum! Brands, Inc. | 110,000 | | 3,599,200 |
|
|
| | | | 29,313,752 |
| Household Appliances - 0.01% | | | |
| The Toro Company | 2,500 | | 147,875 |
| | | | |
| Household Products - 0.46% | | | |
| Blyth, Inc. | 29,600 | | 661,856 |
| Church & Dwight, Inc. | 14,400 | | 646,992 |
| Energizer Holdings, Inc. * | 30,000 | | 3,177,900 |
| Newell Rubbermaid, Inc. | 5,600 | | 144,424 |
| Select Comfort Corp. * (a) | 28,850 | | 494,778 |
| Tempur-Pedic International, Inc. (a) | 32,300 | | 933,470 |
| The Clorox Company | 11,100 | | 663,780 |
| Tupperware Brands Corp. | 10,300 | | 317,137 |
|
|
| | | | 7,040,337 |
| Industrial Machinery - 0.85% | | | |
| AGCO Corp. * | 29,000 | | 1,252,800 |
| Cascade Corp. | 4,500 | | 331,245 |
| Caterpillar, Inc. | 10,600 | | 803,162 |
| Crane Company | 4,200 | | 188,118 |
| Cummins, Inc. | 10,300 | | 1,219,726 |
| Deere & Company | 15,300 | | 2,081,718 |
| Ingersoll-Rand Company, Class A | 33,100 | | 1,718,883 |
| ITT Corp. | 13,600 | | 924,664 |
| Lincoln Electric Holdings, Inc. | 10,200 | | 733,788 |
| Middleby Corp. * | 3,600 | | 264,744 |
| NACCO Industries, Inc., Class A | 2,300 | | 272,481 |
| Pall Corp. | 18,000 | | 686,340 |
| Tennant Company | 5,300 | | 222,706 |
| |
| The accompanying notes are an integral part of the financial statements. | 402 |
John Hancock Funds II
Portfolio of investments — August 31, 2007
(showing percentage of total net assets)
| | | |
| U.S. Multi Sector Fund (continued) | | |
| | Shares or | | |
| | Principal | | |
| | Amount | | Value |
|
|
| |
| COMMON STOCKS (continued) | | | |
| | | | |
| Industrial Machinery (continued) | | | |
| W.W. Grainger, Inc. | 24,100 | $ | 2,207,801 |
|
|
| | | | 12,908,176 |
| Industrials - 0.00% | | | |
| Lawson Products, Inc. | 1,700 | | 62,084 |
| | | | |
| Insurance - 5.94% | | | |
| ACE, Ltd. | 16,700 | | 964,592 |
| Aetna, Inc. | 61,400 | | 3,125,874 |
| AFLAC, Inc. | 206,300 | | 10,997,853 |
| Allstate Corp. | 244,100 | | 13,364,475 |
| Ambac Financial Group, Inc. | 61,800 | | 3,882,275 |
| American Financial Group, Inc. | 9,800 | | 276,360 |
| American International Group, Inc. | 27,900 | | 1,841,400 |
| Aon Corp. | 28,700 | | 1,243,284 |
| Brown & Brown, Inc. | 53,300 | | 1,434,836 |
| Chubb Corp. | 19,800 | | 1,012,374 |
| CIGNA Corp. | 81,100 | | 4,191,248 |
| Cincinnati Financial Corp. | 7,700 | | 324,478 |
| CNA Financial Corp. | 9,500 | | 398,620 |
| Commerce Group, Inc. | 36,200 | | 1,154,056 |
| Erie Indemnity Company, Class A | 5,200 | | 290,628 |
| First American Corp. | 31,300 | | 1,309,279 |
| Harleysville Group, Inc. | 3,700 | | 119,362 |
| Hartford Financial Services Group, Inc. | 18,600 | | 1,653,726 |
| LandAmerica Financial Group, Inc. (a) | 14,500 | | 803,155 |
| Lincoln National Corp. | 11,783 | | 717,349 |
| Markel Corp. * | 1,900 | | 903,754 |
| MBIA, Inc. | 33,300 | | 1,998,000 |
| MetLife, Inc. | 40,200 | | 2,574,810 |
| MGIC Investment Corp. (a) | 42,500 | | 1,281,800 |
| National Western Life Insurance Company, | | | |
| Class A * | 900 | | 233,100 |
| Nationwide Financial Services, Inc., Class A | 16,200 | | 867,024 |
| Odyssey Re Holdings Corp. | 9,000 | | 325,980 |
| Old Republic International Corp. | 100,075 | | 1,820,364 |
| Philadelphia Consolidated Holding Corp. * | 16,100 | | 644,322 |
| PMI Group, Inc. | 65,600 | | 2,078,208 |
| Presidential Life Corp. | 9,500 | | 164,350 |
| Progressive Corp. | 221,400 | | 4,503,276 |
| Protective Life Corp. | 22,700 | | 948,860 |
| Prudential Financial, Inc. | 33,100 | | 2,971,718 |
| Radian Group, Inc. (a) | 25,400 | | 448,056 |
| Reinsurance Group of America, Inc. | 11,700 | | 635,427 |
| SAFECO Corp. | 33,000 | | 1,914,660 |
| Stancorp Financial Group, Inc. | 8,500 | | 400,350 |
| Stewart Information Services Corp. | 11,800 | | 437,308 |
| The Travelers Companies, Inc. | 137,200 | | 6,934,088 |
| Torchmark Corp. | 78,200 | | 4,813,992 |
| Transatlantic Holdings, Inc. | 6,600 | | 467,478 |
| Triad Guaranty, Inc. * (a) | 9,600 | | 160,608 |
| Universal American Financial Corp. * | 2,900 | | 60,204 |
| UnumProvident Corp. | 102,200 | | 2,500,834 |
| | | |
| U.S. Multi Sector Fund (continued) | | |
| | Shares or | | |
| | Principal | | |
| | Amount | | Value |
|
|
| |
| COMMON STOCKS (continued) | | | |
| | | | |
| Insurance (continued) | | | |
| W.R. Berkley Corp. | 46,400 | $ | 1,386,896 |
| |
|
| | | | 90,580,691 |
| International Oil - 10.42% | | | |
| Anadarko Petroleum Corp. | 87,700 | | 4,295,546 |
| Chevron Corp. | 454,900 | | 39,922,024 |
| ConocoPhillips | 159,000 | | 13,020,510 |
| Exxon Mobil Corp. | 1,182,900 | | 101,410,017 |
| Hess Corp. | 2,400 | | 147,288 |
| |
|
| | | | 158,795,385 |
| Internet Retail - 0.12% | | | |
| eBay, Inc. * | 25,400 | | 866,140 |
| Expedia, Inc. * | 14,500 | | 432,825 |
| IAC/InterActiveCorp. * | 16,300 | | 452,977 |
| |
|
| | | | 1,751,942 |
| Internet Software - 0.12% | | | |
| McAfee, Inc. * | 19,400 | | 693,550 |
| VeriSign, Inc. * | 35,500 | | 1,143,100 |
| |
|
| | | | 1,836,650 |
| Leisure Time - 0.26% | | | |
| Carnival Corp. | 54,000 | | 2,461,860 |
| MGM MIRAGE * | 7,800 | | 654,966 |
| Polaris Industries, Inc. (a) | 17,700 | | 845,175 |
| |
|
| | | | 3,962,001 |
| Life Sciences - 0.14% | | | |
| PerkinElmer, Inc. | 5,600 | | 153,496 |
| Waters Corp. * | 33,100 | | 2,037,967 |
| |
|
| | | | 2,191,463 |
| Liquor - 0.72% | | | |
| Anheuser-Busch Companies, Inc. | 222,000 | | 10,966,800 |
| | | | |
| Manufacturing - 2.54% | | | |
| Acuity Brands, Inc. | 14,200 | | 746,068 |
| AptarGroup, Inc. | 9,500 | | 345,135 |
| Carlisle Companies, Inc. | 6,500 | | 319,995 |
| Danaher Corp. | 115,800 | | 8,993,028 |
| Eaton Corp. | 15,100 | | 1,422,722 |
| Harley-Davidson, Inc. | 203,400 | | 10,940,886 |
| Honeywell International, Inc. | 70,500 | | 3,958,575 |
| Illinois Tool Works, Inc. | 146,200 | | 8,504,454 |
| Mettler-Toledo International, Inc. * | 11,100 | | 1,046,841 |
| SPX Corp. | 5,000 | | 450,250 |
| Tyco International, Ltd. | 44,950 | | 1,984,992 |
| |
|
| | | | 38,712,946 |
| Medical-Hospitals - 0.12% | | | |
| Lifepoint Hospitals, Inc. * | 3,800 | | 106,780 |
| Manor Care, Inc. | 15,100 | | 964,739 |
| Universal Health Services, Inc., Class B | 14,700 | | 776,160 |
| |
|
| | | | 1,847,679 |
| Metal & Metal Products - 0.28% | | | |
| Commercial Metals Company | 13,300 | | 384,237 |
| |
| The accompanying notes are an integral part of the financial statements. | 403 |
John Hancock Funds II
Portfolio of investments — August 31, 2007
(showing percentage of total net assets)
| | | |
| U.S. Multi Sector Fund (continued) | | |
| | Shares or | | |
| | Principal | | |
| | Amount | | Value |
|
|
| |
| COMMON STOCKS (continued) | | | |
| | | | |
| Metal & Metal Products (continued) | | | |
| Metal Management, Inc. | 9,400 | $ | 440,954 |
| Mueller Industries, Inc. | 16,000 | | 554,240 |
| Precision Castparts Corp. | 13,500 | | 1,759,185 |
| Quanex Corp. | 8,300 | | 359,473 |
| Reliance Steel & Aluminum Company | 7,800 | | 413,166 |
| Southern Copper Corp. (a) | 4,000 | | 421,000 |
| |
|
| | | | 4,332,255 |
| Mining - 0.03% | | | |
| Cleveland-Cliffs, Inc. (a) | 5,600 | | 427,112 |
| | | | |
| Mobile Homes - 0.13% | | | |
| Thor Industries, Inc. (a) | 44,700 | | 1,966,353 |
| | | | |
| Newspapers - 0.01% | | | |
| Lee Enterprises, Inc. | 9,400 | | 163,278 |
| | | | |
| Office Furnishings & Supplies - 0.07% | | | |
| Herman Miller, Inc. | 12,900 | | 374,358 |
| IKON Office Solutions, Inc. | 11,500 | | 161,460 |
| OfficeMax, Inc. | 8,200 | | 291,264 |
| United Stationers, Inc. * | 4,900 | | 289,198 |
| |
|
| | | | 1,116,280 |
| Paper - 0.03% | | | |
| Temple-Inland, Inc. | 7,400 | | 407,592 |
| | | | |
| Petroleum Services - 0.30% | | | |
| Tesoro Petroleum Corp. | 32,600 | | 1,608,158 |
| Tidewater, Inc. | 4,300 | | 281,435 |
| Valero Energy Corp. | 38,900 | | 2,665,039 |
| |
|
| | | | 4,554,632 |
| Pharmaceuticals - 9.46% | | | |
| Abbott Laboratories | 7,800 | | 404,898 |
| AmerisourceBergen Corp. | 208,300 | | 9,967,155 |
| Barr Pharmaceuticals, Inc. * | 2,800 | | 142,464 |
| Bristol-Myers Squibb Company | 57,800 | | 1,684,870 |
| Forest Laboratories, Inc. * | 343,600 | | 12,929,668 |
| King Pharmaceuticals, Inc. * | 78,500 | | 1,179,855 |
| Medicis Pharmaceutical Corp., Class A (a) | 3,600 | | 109,944 |
| Merck & Company, Inc. | 1,422,500 | | 71,366,825 |
| Pfizer, Inc. | 1,587,400 | | 39,431,016 |
| Schering-Plough Corp. | 216,400 | | 6,496,328 |
| Watson Pharmaceuticals, Inc. * | 14,000 | | 417,480 |
| |
|
| | | | 144,130,503 |
| Plastics - 0.01% | | | |
| Spartech Corp. | 6,000 | | 129,960 |
| | | | |
| Publishing - 0.77% | | | |
| Consolidated Graphics, Inc. * | 2,600 | | 172,328 |
| Gannett Company, Inc. | 183,300 | | 8,615,100 |
| McGraw-Hill Companies, Inc. | 26,600 | | 1,342,236 |
| Scholastic Corp. * | 9,300 | | 316,944 |
| Tribune Company | 40,900 | | 1,126,795 |
| Valassis Communications, Inc. * (a) | 25,100 | | 228,912 |
| |
|
| | | | 11,802,315 |
| | | |
| U.S. Multi Sector Fund (continued) | | |
| | Shares or | | |
| | Principal | | |
| | Amount | | Value |
|
|
| |
| COMMON STOCKS (continued) | | | |
| | | | |
| Railroads & Equipment - 0.03% | | | |
| CSX Corp. | 6,700 | $ | 274,700 |
| Union Pacific Corp. | 1,300 | | 145,041 |
|
|
| | | | 419,741 |
| Real Estate - 0.15% | | | |
| Annaly Capital Management, Inc., REIT | 39,100 | | 550,919 |
| Entertainment Properties Trust, REIT | 2,500 | | 119,600 |
| Impac Mortgage Holdings, Inc., REIT (a) | 44,200 | | 76,024 |
| iStar Financial, Inc., REIT | 15,900 | | 581,940 |
| New Century Financial Corp., REIT (a) | 13,700 | | 1,233 |
| Newcastle Investment Corp., REIT (a) | 11,500 | | 191,360 |
| Redwood Trust, Inc., REIT (a) | 17,800 | | 664,474 |
| Thornburg Mortgage, Inc., REIT (a) | 5,900 | | 69,502 |
|
|
| | | | 2,255,052 |
| Retail Grocery - 0.79% | | | |
| Ingles Markets, Inc. | 7,200 | | 216,792 |
| Nash Finch Company (a) | 12,300 | | 461,373 |
| Ruddick Corp. | 6,000 | | 195,480 |
| Safeway, Inc. | 155,300 | | 4,927,669 |
| SUPERVALU, Inc. | 28,990 | | 1,221,929 |
| The Kroger Company | 189,800 | | 5,044,884 |
|
|
| | | | 12,068,127 |
| Retail Trade - 13.03% | | | |
| Abercrombie & Fitch Company, Class A | 38,600 | | 3,037,820 |
| Advance Auto Parts, Inc. | 7,200 | | 256,032 |
| Aeropostale, Inc. * | 21,450 | | 444,015 |
| American Eagle Outfitters, Inc. | 101,600 | | 2,624,328 |
| Bed Bath & Beyond, Inc. * | 187,300 | | 6,488,072 |
| Best Buy Company, Inc. | 11,800 | | 518,610 |
| Big Lots, Inc. * | 4,500 | | 133,965 |
| Chico's FAS, Inc. * | 11,900 | | 190,162 |
| Dollar Tree Stores, Inc. * | 49,700 | | 2,159,465 |
| Family Dollar Stores, Inc. | 56,900 | | 1,666,032 |
| First Cash Financial Services, Inc. * | 9,100 | | 194,922 |
| Foot Locker, Inc. | 8,000 | | 133,680 |
| Fossil, Inc. * | 53,100 | | 1,779,381 |
| Gap, Inc. | 34,200 | | 641,592 |
| Home Depot, Inc. | 1,296,900 | | 49,684,239 |
| J.C. Penney Company, Inc. | 4,400 | | 302,544 |
| Kohl's Corp. * | 234,600 | | 13,911,780 |
| Limited Brands, Inc. | 6,100 | | 141,276 |
| Lowe's Companies, Inc. | 999,400 | | 31,041,364 |
| NBTY, Inc. * | 10,200 | | 374,340 |
| Nordstrom, Inc. | 29,400 | | 1,414,140 |
| Pacific Sunwear of California, Inc. * | 6,700 | | 93,867 |
| PetSmart, Inc. | 13,100 | | 454,570 |
| RadioShack Corp. | 32,500 | | 772,525 |
| Regis Corp. | 12,900 | | 425,829 |
| Rent-A-Center, Inc. * | 11,900 | | 228,718 |
| Rite Aid Corp. * (a) | 152,000 | | 770,640 |
| Ross Stores, Inc. | 5,000 | | 139,150 |
| Sonic Automotive, Inc. | 8,200 | | 218,120 |
| |
| The accompanying notes are an integral part of the financial statements. | 404 |
John Hancock Funds II
Portfolio of investments — August 31, 2007
(showing percentage of total net assets)
| | | |
| U.S. Multi Sector Fund (continued) | | |
| | Shares or | | |
| | Principal | | |
| | Amount | | Value |
|
|
| |
| COMMON STOCKS (continued) | | | |
| | | | |
| Retail Trade (continued) | | | |
| Staples, Inc. | 213,200 | $ | 5,063,500 |
| Target Corp. | 195,200 | | 12,869,536 |
| The Buckle, Inc. | 7,700 | | 288,057 |
| The Men's Wearhouse, Inc. | 6,400 | | 324,352 |
| The TJX Companies, Inc. | 55,500 | | 1,692,195 |
| Tiffany & Company | 16,000 | | 821,280 |
| Walgreen Company | 98,600 | | 4,443,902 |
| Wal-Mart Stores, Inc. | 1,205,600 | | 52,600,328 |
| Zale Corp. * | 11,400 | | 256,158 |
|
|
| | | | 198,600,486 |
| Sanitary Services - 0.07% | | | |
| Ecolab, Inc. | 27,100 | | 1,128,986 |
| | | | |
| Semiconductors - 0.94% | | | |
| Analog Devices, Inc. | 29,600 | | 1,091,648 |
| Intel Corp. | 339,800 | | 8,749,850 |
| KLA-Tencor Corp. | 19,500 | | 1,120,665 |
| National Semiconductor Corp. | 16,400 | | 431,648 |
| Novellus Systems, Inc. * | 46,400 | | 1,269,968 |
| Varian Semiconductor Equipment | | | |
| Associates, Inc. * | 11,600 | | 645,308 |
| Xilinx, Inc. | 42,100 | | 1,076,497 |
|
|
| | | | 14,385,584 |
| Software - 2.83% | | | |
| Adobe Systems, Inc. * | 16,800 | | 718,200 |
| BMC Software, Inc. * | 22,400 | | 685,888 |
| Citrix Systems, Inc. * | 25,100 | | 912,385 |
| Compuware Corp. * | 59,600 | | 483,356 |
| Intuit, Inc. * | 58,800 | | 1,605,828 |
| Manhattan Associates, Inc. * | 6,200 | | 179,056 |
| Microsoft Corp. | 1,134,300 | | 32,588,439 |
| Oracle Corp. * | 258,100 | | 5,234,268 |
| Sybase, Inc. * | 29,300 | | 675,365 |
|
|
| | | | 43,082,785 |
| Steel - 0.04% | | | |
| Nucor Corp. | 9,400 | | 497,260 |
| Ryerson, Inc. | 3,200 | | 106,688 |
|
|
| | | | 603,948 |
| Telecommunications Equipment & | | | |
| Services - 0.74% | | | |
| ADTRAN, Inc. | 12,800 | | 342,144 |
| Avaya, Inc. * | 10,900 | | 183,447 |
| Plantronics, Inc. | 5,300 | | 150,520 |
| Polycom, Inc. * | 26,500 | | 803,215 |
| Premiere Global Services, Inc. * | 12,600 | | 164,808 |
| QUALCOMM, Inc. | 34,900 | | 1,392,161 |
| Verizon Communications, Inc. | 197,200 | | 8,258,736 |
|
|
| | | | 11,295,031 |
| Telephone - 1.50% | | | |
| AT&T, Inc. | 538,605 | | 21,474,181 |
| | | | |
| U.S. Multi Sector Fund (continued) | | |
| | | Shares or | | |
| | | Principal | | |
| | | Amount | | Value |
| |
|
| |
| COMMON STOCKS (continued) | | | | |
| | | | | |
| Telephone (continued) | | | | |
| CenturyTel, Inc. | | 30,300 | $ | 1,453,794 |
|
|
| | | | | 22,927,975 |
| Tires & Rubber - 0.11% | | | | |
| Goodyear Tire & Rubber Company * (a) | | 63,200 | | 1,748,112 |
| Tobacco - 0.36% | | | | |
| Altria Group, Inc. | | 24,100 | | 1,672,781 |
| Universal Corp. | | 9,400 | | 461,822 |
| UST, Inc. | | 66,800 | | 3,291,904 |
|
|
| | | | | 5,426,507 |
| Toys, Amusements & Sporting Goods - 0.26% | | | |
| Hasbro, Inc. | | 38,800 | | 1,094,548 |
| Mattel, Inc. | | 129,800 | | 2,807,574 |
|
|
| | | | | 3,902,122 |
| Transportation - 0.35% | | | | |
| C.H. Robinson Worldwide, Inc. | | 46,600 | | 2,285,264 |
| Expeditors International of Washington, Inc. | | 49,000 | | 2,164,330 |
| Overseas Shipholding Group, Inc. | | 10,200 | | 728,280 |
| Saia, Inc. * | | 9,200 | | 172,868 |
|
|
| | | | | 5,350,742 |
| Trucking & Freight - 0.96% | | | | |
| Arkansas Best Corp. | | 22,800 | | 818,520 |
| FedEx Corp. | | 111,000 | | 12,174,480 |
| J.B. Hunt Transport Services, Inc. | | 24,400 | | 701,988 |
| Ryder Systems, Inc. | | 9,100 | | 498,225 |
| YRC Worldwide, Inc. * | | 11,900 | | 366,639 |
|
|
| | | | | 14,559,852 |
|
| TOTAL COMMON STOCKS (Cost $1,368,433,623) | | $ | 1,456,153,131 |
|
| |
| SHORT TERM INVESTMENTS - 1.72% | | | | |
| John Hancock Cash Investment Trust (c) | $ | 26,128,121 | $ | 26,128,121 |
|
| TOTAL SHORT TERM INVESTMENTS | | | | |
| (Cost $26,128,121) | | | $ | 26,128,121 |
|
| |
| REPURCHASE AGREEMENTS - 3.97% | | | | |
| Repurchase Agreement with State | | | | |
| Street Corp. dated 08/31/2007 at | | | | |
| 4.60% to be repurchased at | | | | |
| $60,576,946 on 09/04/2007, | | | | |
| collateralized by $59,385,000 | | | | |
| Federal Home Loan Bank, 5.375% | | | | |
| due 05/18/2016 (valued at | | | | |
| $61,760,400, including interest) | $ | 60,546,000 | $ | 60,546,000 |
|
| TOTAL REPURCHASE AGREEMENTS | | | | |
| (Cost $60,546,000) | | | $ | 60,546,000 |
|
| Total Investments (U.S. Multi Sector Fund) | | | | |
| (Cost $1,455,107,744) - 101.25% | | | $ | 1,542,827,252 |
| Liabilities in Excess of Other Assets - (1.25)% | | | (19,070,514) |
|
|
| TOTAL NET ASSETS - 100.00% | | | $ | 1,523,756,738 |
|
|
| |
| The accompanying notes are an integral part of the financial statements. | 405 |
John Hancock Funds II
Portfolio of investments — August 31, 2007
(showing percentage of total net assets)
| | | |
| Value Fund | | | |
| | Shares or | | |
| | Principal | | |
| | Amount | | Value |
|
|
| |
| COMMON STOCKS - 95.12% | | | |
| | | | |
| Aerospace - 3.34% | | | |
| Goodrich Corp. | 7,370 | $ | 465,489 |
| | | | |
| Automobiles - 1.68% | | | |
| Tata Motors, Ltd., SADR | 13,770 | | 233,402 |
| | | | |
| Banking - 4.69% | | | |
| Hudson City Bancorp, Inc. | 26,060 | | 370,573 |
| Northern Trust Corp. | 4,590 | | 282,102 |
| |
|
| | | | 652,675 |
| Biotechnology - 1.99% | | | |
| Affymetrix, Inc. * | 12,250 | | 277,585 |
| | | | |
| Business Services - 3.26% | | | |
| Perot Systems Corp., Class A * | 8,223 | | 128,526 |
| Pitney Bowes, Inc. | 7,290 | | 325,644 |
| |
|
| | | | 454,170 |
| Chemicals - 2.44% | | | |
| Valspar Corp. | 12,590 | | 339,552 |
| | | | |
| Commercial Services - 2.87% | | | |
| Live Nation, Inc. * | 19,289 | | 399,282 |
| | | | |
| Computers & Business Equipment - 6.52% | | | |
| Diebold, Inc. | 10,200 | | 447,474 |
| Juniper Networks, Inc. * | 13,980 | | 460,222 |
| |
|
| | | | 907,696 |
| Cosmetics & Toiletries - 5.17% | | | |
| Estee Lauder Companies, Inc., Class A | 8,200 | | 341,038 |
| International Flavors & Fragrances, Inc. | 7,550 | | 379,236 |
| |
|
| | | | 720,274 |
| Crude Petroleum & Natural Gas - 1.96% | | | |
| Newfield Exploration Company * | 6,290 | | 273,552 |
| | | | |
| Educational Services - 2.79% | | | |
| Apollo Group, Inc., Class A * | 6,620 | | 388,395 |
| | | | |
| Electrical Utilities - 8.86% | | | |
| American Electric Power Company, Inc. | 7,260 | | 322,925 |
| Constellation Energy Group, Inc. | 3,420 | | 283,655 |
| DPL, Inc. | 6,770 | | 178,389 |
| Entergy Corp. | 1,320 | | 136,778 |
| Wisconsin Energy Corp. | 7,050 | | 312,386 |
| |
|
| | | | 1,234,133 |
| Electronics - 2.21% | | | |
| Flextronics International, Ltd. * | 27,031 | | 307,883 |
| | | | |
| Energy - 0.98% | | | |
| McDermott International, Inc. * | 1,420 | | 136,306 |
| | | | |
| Financial Services - 3.89% | | | |
| Bear Stearns Companies, Inc. | 2,146 | | 233,184 |
| Invesco PLC, SADR | 12,484 | | 308,230 |
| |
|
| | | | 541,414 |
| Food & Beverages - 2.69% | | | |
| ConAgra Foods, Inc. | 14,590 | | 375,109 |
| | | | |
| Gas & Pipeline Utilities - 2.05% | | | |
| El Paso Corp. | 18,030 | | 286,136 |
| | | | |
| Value Fund (continued) | | | | |
| | | Shares or | | |
| | | Principal | | |
| | | Amount | | Value |
|
|
| |
| COMMON STOCKS (continued) | | | | |
| | | | | |
| Healthcare Products - 5.45% | | | | |
| Beckman Coulter, Inc. | | 5,790 | $ | 416,590 |
| Owens & Minor, Inc. | | 8,580 | | 342,342 |
|
|
| | | | | 758,932 |
| Healthcare Services - 4.26% | | | | |
| Healthsouth Corp. * | | 16,510 | | 301,473 |
| Omnicare, Inc. | | 8,940 | | 291,712 |
|
|
| | | | | 593,185 |
| Household Products - 3.97% | | | | |
| Fortune Brands, Inc. | | 3,172 | | 263,561 |
| Newell Rubbermaid, Inc. | | 11,250 | | 290,138 |
|
|
| | | | | 553,699 |
| Industrial Machinery - 1.52% | | | | |
| Cameron International Corp. * | | 2,590 | | 211,784 |
| | | | | |
| Insurance - 10.02% | | | | |
| ACE, Ltd. | | 5,840 | | 337,318 |
| Allied World Assurance Holdings, Ltd. | | 8,315 | | 399,286 |
| Aspen Insurance Holdings, Ltd. | | 11,520 | | 289,037 |
| Marsh & McLennan Companies, Inc. | | 13,910 | | 370,702 |
|
|
| | | | | 1,396,343 |
| International Oil - 1.97% | | | | |
| Hess Corp. | | 4,480 | | 274,938 |
| | | | | |
| Internet Retail - 1.44% | | | | |
| Orbitz Worldwide, Inc. * | | 16,095 | | 201,027 |
| | | | | |
| Investment Companies - 1.12% | | | | |
| Market Vectors Gold Miners ETF | | 4,150 | | 156,248 |
| | | | | |
| Manufacturing - 2.50% | | | | |
| Pentair, Inc. | | 9,370 | | 347,908 |
| | | | | |
| Office Furnishings & Supplies - 2.09% | | | | |
| Office Depot, Inc. * | | 11,920 | | 291,444 |
| | | | | |
| Retail Trade - 2.33% | | | | |
| Rite Aid Corp. * | | 64,060 | | 324,784 |
| | | | | |
| Telecommunications Equipment & | | | | |
| Services - 1.06% | | | | |
| Embarq Corp. | | 2,362 | | 147,436 |
|
| TOTAL COMMON STOCKS (Cost $13,051,876) | | $ | 13,250,781 |
|
| |
| SHORT TERM INVESTMENTS - 7.18% | | | |
| Federal Home Loan Bank Discount Notes | | | | |
| zero coupon due 09/04/2007 | $ | 1,000,000 | $ | 999,650 |
|
| TOTAL SHORT TERM INVESTMENTS | | | | |
| (Cost $999,650) | | | $ | 999,650 |
|
| Total Investments (Value Fund) | | | | |
| (Cost $14,051,526) - 102.30% | | | $ | 14,250,431 |
| Liabilities in Excess of Other Assets - (2.30)% | | | (320,198) |
|
|
| TOTAL NET ASSETS - 100.00% | | | $ | 13,930,233 |
|
|
| |
| The accompanying notes are an integral part of the financial statements. | 406 |
John Hancock Funds II
Portfolio of investments — August 31, 2007
(showing percentage of total net assets)
| | | |
| Value & Restructuring Fund | | | |
| | Shares or | | |
| | Principal | | |
| | Amount | | Value |
|
|
| |
| COMMON STOCKS - 98.82% | | | |
| | | | |
| Aerospace - 2.71% | | | |
| Empresa Brasileira de Aeronautica SA, ADR (a) | 116,106 | $ | 5,243,347 |
| United Technologies Corp. | 73,358 | | 5,474,708 |
|
|
| | | | 10,718,055 |
| Air Travel - 2.06% | | | |
| Copa Holdings SA, Class A | 94,727 | | 4,591,418 |
| Gol-Linhas Aereas Inteligentes SA (a) | 161,006 | | 3,530,861 |
|
|
| | | | 8,122,279 |
| Auto Services - 0.68% | | | |
| RSC Holdings, Inc. * | 145,524 | | 2,700,925 |
| | | | |
| Broadcasting - 1.00% | | | |
| CBS Corp., Class B | 125,156 | | 3,943,666 |
| | | | |
| Building Materials & Construction - 0.56% | | | |
| Eagle Materials, Inc. (a) | 58,268 | | 2,211,853 |
| | | | |
| Cable & Television - 0.87% | | | |
| EchoStar Communications Corp., Class A * | 81,419 | | 3,445,652 |
| | | | |
| Cellular Communications - 3.51% | | | |
| America Movil SA de CV, Series L, SADR | 229,236 | | 13,859,609 |
| | | | |
| Chemicals - 3.94% | | | |
| Celanese Corp., Series A | 179,657 | | 6,453,280 |
| Lanxess AG | 74,222 | | 3,725,395 |
| PPG Industries, Inc. | 65,369 | | 4,794,816 |
| Tronox, Inc., Class A | 57,491 | | 591,008 |
|
|
| | | | 15,564,499 |
| Coal - 3.58% | | | |
| Alpha Natural Resources, Inc. * | 162,243 | | 3,132,912 |
| CONSOL Energy, Inc. | 203,017 | | 8,096,318 |
| Foundation Coal Holdings, Inc. | 66,736 | | 2,263,685 |
| International Coal Group, Inc. * (a) | 164,690 | | 666,995 |
|
|
| | | | 14,159,910 |
| Commercial Services - 1.28% | | | |
| AerCap Holdings NV * | 138,165 | | 3,514,918 |
| Horsehead Holding Corp. * | 82,500 | | 1,536,150 |
|
|
| | | | 5,051,068 |
| Computers & Business Equipment - 1.31% | | | |
| International Business Machines Corp. | 44,510 | | 5,193,872 |
| | | | |
| Cosmetics & Toiletries - 1.00% | | | |
| Avon Products, Inc. | 114,867 | | 3,945,681 |
| | | | |
| Crude Petroleum & Natural Gas - 4.33% | | | |
| Devon Energy Corp. | 115,317 | | 8,684,523 |
| Noble Energy, Inc. | 95,664 | | 5,746,536 |
| Pinnacle Gas Resources, Inc. * | 28,500 | | 132,525 |
| W&T Offshore, Inc. | 114,381 | | 2,549,553 |
|
|
| | | | 17,113,137 |
| Electrical Utilities - 0.52% | | | |
| Enel SpA | 196,602 | | 2,034,077 |
| | | | |
| Electronics - 1.53% | | | |
| Harman International Industries, Inc. | 42,258 | | 4,791,634 |
| | | |
| Value & Restructuring Fund (continued) | | |
| | Shares or | | |
| | Principal | | |
| | Amount | | Value |
|
|
| |
| COMMON STOCKS (continued) | | | |
| | | | |
| Electronics (continued) | | | |
| Tyco Electronics, Ltd. * | 35,863 | $ | 1,250,543 |
|
|
| | | | 6,042,177 |
| Energy - 0.38% | | | |
| Rosetta Resources, Inc. * | 89,057 | | 1,494,377 |
| | | | |
| Financial Services - 12.70% | | | |
| Capital One Financial Corp. | 62,408 | | 4,035,301 |
| CIT Group, Inc. | 93,258 | | 3,503,703 |
| Citigroup, Inc. | 113,406 | | 5,316,473 |
| Discover Financial Services * | 46,990 | | 1,087,349 |
| Federal Home Loan Mortgage Corp. | 62,046 | | 3,822,654 |
| Invesco PLC, SADR | 178,788 | | 4,414,276 |
| JP Morgan Chase & Company | 100,689 | | 4,482,674 |
| Lehman Brothers Holdings, Inc. | 87,444 | | 4,794,555 |
| MasterCard, Inc., Class A | 18 | | 2,466 |
| MCG Capital Corp. (a) | 155,919 | | 2,263,944 |
| Morgan Stanley | 101,480 | | 6,329,308 |
| People's United Financial, Inc. | 115,000 | | 2,033,200 |
| PNC Financial Services Group, Inc. | 65,147 | | 4,584,394 |
| Washington Mutual, Inc. | 96,502 | | 3,543,553 |
|
|
| | | | 50,213,850 |
| Food & Beverages - 1.22% | | | |
| ConAgra Foods, Inc. | 50,339 | | 1,294,216 |
| Dean Foods Company * | 108,392 | | 2,911,409 |
| Vintage Wine Trust, Inc. | 88,261 | | 595,762 |
|
|
| | | | 4,801,387 |
| Furniture & Fixtures - 0.73% | | | |
| Leggett & Platt, Inc. | 141,340 | | 2,883,336 |
| | | | |
| Gas & Pipeline Utilities - 1.53% | | | |
| El Paso Corp. | 260,440 | | 4,133,183 |
| Spectra Energy Corp. | 82,856 | | 1,926,402 |
|
|
| | | | 6,059,585 |
| Healthcare Products - 1.57% | | | |
| Baxter International, Inc. | 87,050 | | 4,766,858 |
| Covidien, Ltd. * | 35,863 | | 1,428,423 |
|
|
| | | | 6,195,281 |
| Holdings Companies/Conglomerates - 1.59% | | | |
| Loews Corp. | 133,827 | | 6,291,207 |
| | | | |
| Homebuilders - 1.08% | | | |
| Centex Corp. | 147,531 | | 4,265,121 |
| | | | |
| Household Appliances - 2.55% | | | |
| Black & Decker Corp. | 116,014 | | 10,064,215 |
| | | | |
| Household Products - 0.88% | | | |
| Newell Rubbermaid, Inc. | 134,951 | | 3,480,386 |
| | | | |
| Industrial Machinery - 1.36% | | | |
| AGCO Corp. * | 124,076 | | 5,360,083 |
| | | | |
| Industrials - 0.23% | | | |
| Aecom Technology Corp. * | 34,228 | | 919,706 |
| | | | |
| Insurance - 5.72% | | | |
| ACE, Ltd. | 122,649 | | 7,084,206 |
| |
| The accompanying notes are an integral part of the financial statements. | 407 |
John Hancock Funds II
Portfolio of investments — August 31, 2007
(showing percentage of total net assets)
| | | |
| Value & Restructuring Fund (continued) | | |
| | Shares or | | |
| | Principal | | |
| | Amount | | Value |
|
|
| |
| COMMON STOCKS (continued) | | | |
| | | | |
| Insurance (continued) | | | |
| Ambac Financial Group, Inc. | 62,500 | $ | 3,926,250 |
| Castlepoint Holdings, Ltd. | 72,452 | | 820,157 |
| Castlepoint Holdings, Ltd. (a) | 40,250 | | 455,630 |
| Genworth Financial, Inc., Class A | 82,983 | | 2,404,847 |
| MetLife, Inc. | 89,595 | | 5,738,560 |
| People's Choice * | 116,874 | | 175,311 |
| Primus Guaranty, Ltd. * (a) | 210,107 | | 1,998,118 |
| |
|
| | | | 22,603,079 |
| International Oil - 7.77% | | | |
| Anadarko Petroleum Corp. | 108,107 | | 5,295,081 |
| ConocoPhillips | 127,902 | | 10,473,895 |
| Murphy Oil Corp. | 65,149 | | 3,970,180 |
| Petroleo Brasileiro SA, ADR (a) | 177,488 | | 10,975,858 |
| |
|
| | | | 30,715,014 |
| Investment Companies - 0.73% | | | |
| Apollo Investment Corp. (a) | 132,716 | | 2,898,517 |
| Manufacturing - 1.31% | | | |
| Rockwell Automation, Inc. | 49,075 | | 3,457,825 |
| Tyco International, Ltd. | 39,363 | | 1,738,270 |
| |
|
| | | | 5,196,095 |
| Metal & Metal Products - 2.45% | | | |
| Southern Copper Corp. (a) | 79,207 | | 8,336,537 |
| Sterlite Industries India, Ltd. * | 84,740 | | 1,354,992 |
| |
|
| | | | 9,691,529 |
| Mining - 1.83% | | | |
| Freeport-McMoRan Copper & Gold, Inc., | | | |
| Class B | 46,000 | | 4,021,320 |
| Grupo Mexico SA | 512,000 | | 3,229,786 |
| |
|
| | | | 7,251,106 |
| Paper - 0.47% | | | |
| Smurfit-Stone Container Corp. * | 176,701 | | 1,865,963 |
| Petroleum Services - 3.08% | | | |
| Hercules Offshore, Inc. * (a) | 162,682 | | 4,138,623 |
| PetroHawk Energy Corp. * | 197,089 | | 2,983,927 |
| Petroplus Holdings AG * | 57,862 | | 5,061,830 |
| |
|
| | | | 12,184,380 |
| Pharmaceuticals - 1.75% | | | |
| AmerisourceBergen Corp. | 90,655 | | 4,337,842 |
| Bristol-Myers Squibb Company | 88,600 | | 2,582,690 |
| |
|
| | | | 6,920,532 |
| Railroads & Equipment - 2.22% | | | |
| Union Pacific Corp. | 78,606 | | 8,770,071 |
| | | | |
| Real Estate - 2.23% | | | |
| DiamondRock Hospitality Company, REIT | 180,222 | | 3,234,985 |
| FBR Capital Markets Corp., REIT * | 41,000 | | 546,530 |
| Host Hotels & Resorts, Inc., REIT | 101,727 | | 2,267,495 |
| JHSF Participacoes SA * | 313,700 | | 1,535,464 |
| Ventas, Inc., REIT | 32,194 | | 1,225,947 |
| |
|
| | | | 8,810,421 |
| | | | |
| Value & Restructuring Fund (continued) | | |
| | | Shares or | | |
| | | Principal | | |
| | | Amount | | Value |
| | |
| |
| COMMON STOCKS (continued) | | | | |
| | | | | |
| Retail Trade - 4.32% | | | | |
| J.C. Penney Company, Inc. | | 55,500 | $ | 3,816,180 |
| The TJX Companies, Inc. | | 146,852 | | 4,477,517 |
| United Rentals, Inc. * | | 188,508 | | 6,145,361 |
| Zale Corp. * | | 117,487 | | 2,639,933 |
|
|
| | | | | 17,078,991 |
| Steel - 1.10% | | | | |
| Schnitzer Steel Industries, Inc. | | 74,656 | | 4,362,150 |
| | | | | |
| Telecommunications Equipment & | | | | |
| Services - 2.07% | | | | |
| DataPath, Inc. * | | 80,000 | | 760,000 |
| Nokia Oyj, SADR | | 169,877 | | 5,585,556 |
| Plantronics, Inc. | | 64,125 | | 1,821,150 |
|
|
| | | | | 8,166,706 |
| Telephone - 3.44% | | | | |
| Harris Corp. | | 187,502 | | 11,405,747 |
| Windstream Corp. | | 153,353 | | 2,189,881 |
|
|
| | | | | 13,595,628 |
| Tobacco - 1.91% | | | | |
| Loews Corp. - Carolina Group | | 99,151 | | 7,547,374 |
| | | | | |
| Transportation - 0.48% | | | | |
| Arlington Tankers, Ltd. (a) | | 43,563 | | 1,078,620 |
| Omega Navigation Enterprises, Inc. | | 41,469 | | 819,427 |
|
|
| | | | | 1,898,047 |
| Trucking & Freight - 1.24% | | | | |
| Ryder Systems, Inc. | | 89,415 | | 4,895,471 |
|
| TOTAL COMMON STOCKS (Cost $329,294,759) | | $ | 390,586,068 |
|
| |
| PREFERRED STOCKS - 0.26% | | | | |
| | | | | |
| Chemicals - 0.26% | | | | |
| Celanese Corp. | | 22,251 | | 1,037,453 |
|
| TOTAL PREFERRED STOCKS (Cost $613,080) | | $ | 1,037,453 |
|
| |
| SHORT TERM INVESTMENTS - 10.73% | | | | |
| John Hancock Cash Investment Trust (c) | $ | 42,415,346 | $ | 42,415,346 |
|
| TOTAL SHORT TERM INVESTMENTS | | | | |
| (Cost $42,415,346) | | | $ | 42,415,346 |
|
| |
| REPURCHASE AGREEMENTS - 1.73% | | | | |
| Repurchase Agreement with State | | | | |
| Street Corp. dated 08/31/2007 at | | | | |
| 4.60% to be repurchased at | | | | |
| $6,843,496 on 09/04/2007, | | | | |
| collateralized by $7,335,000 | | | | |
| Federal National Mortgage | | | | |
| Association, 5.55% due | | | | |
| 07/10/2028 (valued at $6,977,419, | | | | |
| including interest) | $ | 6,840,000 | $ | 6,840,000 |
|
| TOTAL REPURCHASE AGREEMENTS | | | | |
| (Cost $6,840,000) | | | $ | 6,840,000 |
|
| |
| The accompanying notes are an integral part of the financial statements. | 408 |
John Hancock Funds II
Portfolio of investments — August 31, 2007
(showing percentage of total net assets)
| | | |
| Total Investments (Value & Restructuring Fund) | | | |
| (Cost $379,163,185) - 111.54% | | $ | 440,878,867 |
| Liabilities in Excess of Other Assets - (11.54)% | | | (45,619,597) |
| |
|
| TOTAL NET ASSETS - 100.00% | | $ | 395,259,270 |
| |
|
| |
| |
| |
| Vista Fund | | | |
| | Shares or | | |
| | Principal | | |
| | Amount | | Value |
|
|
| |
| COMMON STOCKS - 97.94% | | | |
| | | | |
| Aerospace - 4.49% | | | |
| Alliant Techsystems, Inc. * | 7,400 | $ | 779,294 |
| BE Aerospace, Inc. * | 175,396 | | 6,835,182 |
| |
|
| | | | 7,614,476 |
| Agriculture - 2.53% | | | |
| Monsanto Company | 48,100 | | 3,354,494 |
| The Mosaic Company * | 22,200 | | 932,844 |
| |
|
| | | | 4,287,338 |
| Apparel & Textiles - 3.25% | | | |
| Crocs, Inc. * (a) | 21,900 | | 1,292,976 |
| Guess?, Inc. | 71,000 | | 3,763,000 |
| Phillips-Van Heusen Corp. | 7,707 | | 448,779 |
| |
|
| | | | 5,504,755 |
| Biotechnology - 0.48% | | | |
| Immucor, Inc. * | 24,600 | | 820,410 |
| | | | |
| Broadcasting - 2.15% | | | |
| Liberty Global, Inc., Class A * | 89,000 | | 3,647,220 |
| | | | |
| Building Materials & Construction - 2.85% | | | |
| Foster Wheeler, Ltd. * | 40,828 | | 4,835,668 |
| | | | |
| Business Services - 0.16% | | | |
| TeleTech Holdings, Inc. * | 9,551 | | 279,367 |
| | | | |
| Cellular Communications - 8.94% | | | |
| Crown Castle International Corp. * | 21,200 | | 779,312 |
| Leap Wireless International, Inc. * | 56,190 | | 4,073,775 |
| Millicom International Cellular SA * (a) | 14,700 | | 1,239,651 |
| NII Holdings, Inc. * | 114,500 | | 9,066,110 |
| |
|
| | | | 15,158,848 |
| Chemicals - 0.47% | | | |
| Terra Industries, Inc. * | 30,900 | | 802,473 |
| | | | |
| Computers & Business Equipment - 5.28% | | | |
| Apple, Inc. * | 22,800 | | 3,157,344 |
| Blue Coat Systems, Inc. * | 14,900 | | 1,242,809 |
| Foundry Networks, Inc. * | 66,500 | | 1,229,585 |
| Juniper Networks, Inc. * | 101,000 | | 3,324,920 |
| |
|
| | | | 8,954,658 |
| Construction & Mining Equipment - 1.02% | | | |
| National Oilwell Varco, Inc. * | 13,500 | | 1,728,000 |
| | | | |
| Containers & Glass - 2.71% | | | |
| Greif, Inc., Class A | 10,900 | | 634,598 |
| Owens-Illinois, Inc. * | 98,500 | | 3,961,670 |
| |
|
| | | | 4,596,268 |
| Educational Services - 1.34% | | | |
| Apollo Group, Inc., Class A * | 19,500 | | 1,144,065 |
| | | |
| Vista Fund (continued) | | | |
| | Shares or | | |
| | Principal | | |
| | Amount | | Value |
|
|
| |
| COMMON STOCKS (continued) | | | |
| Educational Services (continued) | | | |
| Strayer Education, Inc. | 7,100 $ | | 1,133,018 |
| |
|
| | | | 2,277,083 |
| Electrical Equipment - 0.38% | | | |
| Vestas Wind Systems AS * | 9,400 | | 637,494 |
| | | | |
| Electrical Utilities - 4.17% | | | |
| Allegheny Energy, Inc. * | 15,700 | | 810,277 |
| Quanta Services, Inc. * (a) | 152,893 | | 4,322,285 |
| Reliant Energy, Inc. * | 76,100 | | 1,941,311 |
| |
|
| | | | 7,073,873 |
| Electronics - 4.21% | | | |
| Itron, Inc. * (a) | 11,200 | | 950,880 |
| Thermo Electron Corp. * | 114,200 | | 6,193,066 |
| |
|
| | | | 7,143,946 |
| Energy - 2.30% | | | |
| First Solar, Inc. * | 15,400 | | 1,597,596 |
| McDermott International, Inc. * | 13,500 | | 1,295,865 |
| SunPower Corp., Class A. * (a) | 14,800 | | 1,011,284 |
| |
|
| | | | 3,904,745 |
| Financial Services - 2.06% | | | |
| Ameriprise Financial, Inc. | 14,000 | | 854,140 |
| GFI Group, Inc. * | 11,300 | | 836,200 |
| Janus Capital Group, Inc. | 24,400 | | 648,796 |
| MasterCard, Inc., Class A | 8,400 | | 1,150,716 |
| |
|
| | | | 3,489,852 |
| Healthcare Services - 4.99% | | | |
| Express Scripts, Inc. * | 85,400 | | 4,675,650 |
| Medco Health Solutions, Inc. * | 44,400 | | 3,793,980 |
| |
|
| | | | 8,469,630 |
| Household Products - 0.47% | | | |
| Tempur-Pedic International, Inc. (a) | 27,400 | | 791,860�� |
| | | | |
| Industrial Machinery - 6.76% | | | |
| AGCO Corp. * | 88,000 | | 3,801,600 |
| Cameron International Corp. * | 12,700 | | 1,038,479 |
| Dresser-Rand Group, Inc. * | 100,061 | | 3,689,249 |
| Flowserve Corp. | 17,300 | | 1,235,393 |
| Terex Corp. * | 10,100 | | 806,788 |
| The Manitowoc Company, Inc. | 11,200 | | 890,288 |
| |
|
| | | | 11,461,797 |
| Internet Retail - 0.25% | | | |
| Amazon.com, Inc. * | 5,300 | | 423,523 |
| | | | |
| Internet Service Provider - 1.76% | | | |
| Cogent Communications Group, Inc. * | 40,200 | | 1,003,794 |
| Equinix, Inc. * | 22,300 | | 1,973,773 |
| |
|
| | | | 2,977,567 |
| Leisure Time - 3.30% | | | |
| Bally Technologies, Inc. * | 57,500 | | 1,907,275 |
| Las Vegas Sands Corp. * (a) | 28,500 | | 2,841,450 |
| WMS Industries, Inc. * | 28,650 | | 843,456 |
| |
|
| | | | 5,592,181 |
| |
| The accompanying notes are an integral part of the financial statements. | 409 |
John Hancock Funds II
Portfolio of investments — August 31, 2007
(showing percentage of total net assets)
| | | | |
| Vista Fund (continued) | | | | |
| | | Shares or | | |
| | | Principal | | |
| | | Amount | | Value |
| |
|
| |
| COMMON STOCKS (continued) | | | | |
| | | | | |
| Life Sciences - 0.48% | | | | |
| PerkinElmer, Inc. | | 29,600 | $ | 811,336 |
| | | | | |
| Manufacturing - 0.77% | | | | |
| General Cable Corp. * | | 22,400 | | 1,303,232 |
| | | | | |
| Metal & Metal Products - 5.62% | | | | |
| Haynes International, Inc. * | | 9,700 | | 810,241 |
| Precision Castparts Corp. | | 66,945 | | 8,723,603 |
|
|
| | | | | 9,533,844 |
| Petroleum Services - 1.36% | | | | |
| Acergy SA | | 36,000 | | 951,549 |
| Core Laboratories N.V. * | | 12,095 | | 1,355,849 |
|
|
| | | | | 2,307,398 |
| Pharmaceuticals - 4.00% | | | | |
| Celgene Corp. * | | 20,000 | | 1,284,200 |
| Onyx Pharmaceuticals, Inc. * (a) | | 42,600 | | 1,687,812 |
| Shire PLC | | 145,200 | | 3,804,928 |
|
|
| | | | | 6,776,940 |
| Retail Trade - 3.62% | | | | |
| GameStop Corp., Class A * | | 105,100 | | 5,269,714 |
| Tiffany & Company | | 16,900 | | 867,477 |
|
|
| | | | | 6,137,191 |
| Semiconductors - 6.03% | | | | |
| Intersil Corp., Class A | | 37,300 | | 1,242,836 |
| MEMC Electronic Materials, Inc. * | | 33,300 | | 2,045,286 |
| Microsemi Corp. * (a) | | 32,600 | | 826,736 |
| National Semiconductor Corp. | | 31,700 | | 834,344 |
| NVIDIA Corp. * | | 75,900 | | 3,883,044 |
| OmniVision Technologies, Inc. * (a) | | 66,600 | | 1,389,942 |
|
|
| | | | | 10,222,188 |
| Software - 0.56% | | | | |
| Riverbed Technology, Inc. * | | 21,300 | | 945,720 |
| | | | | |
| Telecommunications Equipment & | | | | |
| Services - 4.69% | | | | |
| Ciena Corp. * | | 32,000 | | 1,212,160 |
| Clearwire Corp., Class A * (a) | | 10,884 | | 232,918 |
| CommScope, Inc. * | | 30,700 | | 1,737,620 |
| SBA Communications Corp. * | | 146,488 | | 4,771,114 |
|
|
| | | | | 7,953,812 |
| Tires & Rubber - 0.94% | | | | |
| Goodyear Tire & Rubber Company * (a) | | 57,500 | | 1,590,450 |
| | | | |
| Toys, Amusements & Sporting Goods - 3.55% | | | |
| Nintendo Company, Ltd. | | 13,100 | | 6,027,214 |
|
| TOTAL COMMON STOCKS (Cost $121,060,497) | | $ | 166,082,357 |
|
| |
| SHORT TERM INVESTMENTS - 8.75% | | | |
| John Hancock Cash Investment Trust (c) | $ | 14,843,332 | $ | 14,843,332 |
|
| TOTAL SHORT TERM INVESTMENTS | | | | |
| (Cost $14,843,332) | | | $ | 14,843,332 |
|
| | | | |
| Vista Fund (continued) | | | | |
| | | Shares or | | |
| | | Principal | | |
| | | Amount | | Value |
|
|
| |
| REPURCHASE AGREEMENTS - 6.68% | | | |
| Repurchase Agreement with State | | | | |
| Street Corp. dated 08/31/2007 at | | | | |
| 4.60% to be repurchased at | | | | |
| $11,332,789 on 09/04/2007, | | | | |
| collateralized by $11,315,000 | | | | |
| Federal National Mortgage | | | | |
| Association, 5.30% due | | | | |
| 04/16/2010 (valued at | | | | |
| $11,555,444, including interest) | $ | 11,327,000 | $ | 11,327,000 |
|
| TOTAL REPURCHASE AGREEMENTS | | | | |
| (Cost $11,327,000) | | | $ | 11,327,000 |
|
| Total Investments (Vista Fund) | | | | |
| (Cost $147,230,829) - 113.37% | | | $ | 192,252,689 |
| Liabilities in Excess of Other Assets - (13.37)% | | | (22,671,622) |
| | |
| TOTAL NET ASSETS - 100.00% | | | $ | 169,581,067 |
| |
|
Footnotes
Percentages are stated as a percent of net assets.
| |
| The accompanying notes are an integral part of the financial statements. | 410 |
John Hancock Funds II
Portfolio of investments — August 31, 2007
(showing percentage of total net assets)
| |
| Key to Currency Abbreviations |
| ARS | - Argentine Peso |
| AUD | - Australian Dollar |
| BRL | - Brazilian Real |
| CAD | - Canadian Dollar |
| CHF | - Swiss Franc |
| COP | - Colombian Peso |
| CZK | - Czech Koruna |
| DKK | - Danish Krone |
| EUR | - European Currency |
| FIM | - Finnish Markka |
| FRF | - French Franc |
| DEM | - German Deutsche Mark |
| GBP | - British Pound |
| GRD | - Greek Drachma |
| HKD | - Hong Kong Dollar |
| HUF | - Hungarian Forint |
| IDR | - Indonesian Rupiah |
| ILS | - Israeli Shekel |
| INR | - Indian Rupee |
| ITL | - Italian Lira |
| IEP | - Irish Punt |
| JPY | - Japanese Yen |
| KRW | - South Korean Won |
| MXN | - Mexican Peso |
| MYR | - Malaysian Ringgit |
| NLG | - Netherlands Guilder |
| NZD | - New Zealand Dollar |
| NOK | - Norwegian Krone |
| PHP | - Philippines Peso |
| PLN | - Polish Zloty |
| SEK | - Swedish Krona |
| SGD | - Singapore Dollar |
| THB | - Thai Baht |
| TRY | - Turkish Lira |
| TWD | - Taiwan Dollar |
| USD | - US Dollar |
| ZAR | - South African Rand |
| |
| Key to Security Abbreviations and Legend |
| ADR | - American Depositary Receipts |
| ADS | - American Depositary Shares |
| BKNT | - Bank Note |
| CDO | - Collateralized Debt Obligation |
| ESOP | - Employee Stock Ownership Program |
| EMTN | - European Medium Term Note |
| ETF | - Exchange Traded Fund |
| EWCO | - European Written Call Option |
| GDR | - Global Depositary Receipts |
| GMTN | - Global Medium Term Note |
| GTD | - Guaranteed |
| IO | - Interest Only (Carries notional principal amount) |
| MTN | - Medium Term Note |
| NIM | - Net Interest Margin |
| NVDR | - Non Voting Depositary Receipts |
| OTC | - Over The Counter |
| PCL | - Public Company Limited |
| PIK | - Paid In Kind |
| PO | - Principal Only |
| REIT | - Real Estate Investment Trust |
| REMIC | - Real Estate Mortgage Investment Conduit |
| SBI | - Shares Beneficial Interest |
| SADR | - Sponsored American Depositary Receipts |
| SPDR | - Standard & Poor's Depositary Receipts |
^ Non-Income Producing, issuer is in bankruptcy and is in default of interest payments
* Non-Income Producing
(a) All or a portion of this security was out on loan
(b) Floating Rate Note
(c) Investment is an affiliate of the Trust's advisor or subadvisor
(d) Principal amount of security is adjusted for inflation.
(e) Security Fair Valued on August 31, 2007
f) All or a portion of this Term Loan is unfunded.
g) Purchased on a forward commitment
(h) Security represents the underlying municipal obligation of an inverse floating rate obligation held by the Fund.
** Purchased on a forward commitment
*** At August 31, 2007, all or a portion of this security was pledged to cover forward commitments purchased and securities sold short.
**** At August 31, 2007, all or a portion of this security was pledged to cover margin requirements for open futures contracts.
| |
| The accompanying notes are an integral part of the financial statements. | 411 |
John Hancock Funds II
Notes to Financial Statements
1. ORGANIZATION OF THE TRUST The John Hancock Funds II (the “Trust”) is organized as a Massachusetts business trust and is registered under the Investment Company Act of 1940 (the “1940 Act”), as amended, as an open-end investment management company. It is a series company, which means it has multiple Funds, each with a stated investment objective that it pursues through separate investment policies.
The Trust currently offers seventy-two separate investment funds, fifty-eight of which are as follows. The five Lifestyle Portfolios and nine Lifecycle Portfolios are covered in separate reports.
| | |
| Absolute Return | International Opportunities | Small Cap |
| Active Bond | International Small Cap | Small Cap Index |
| All Cap Core | International Small Company | Small Cap Opportunities |
| All Cap Growth | International Value | Small Company |
| All Cap Value | Investment Quality Bond | Small Company Growth |
| Blue Chip Growth | Large Cap | Small Company Value |
| Capital Appreciation | Large Cap Value | Special Value |
| Core Bond | Mid Cap Index | Spectrum Income |
| Core Equity | Mid Cap Intersection | Strategic Bond |
| Emerging Growth | Mid Cap Stock | Strategic Income |
| Emerging Markets Value | Mid Cap Value | Total Bond Market |
| Emerging Small Company | Mid Cap Value Equity | Total Return |
| Equity-Income | Natural Resources | U.S. Global Leaders Growth |
| Fundamental Value | Quantitative All Cap | U.S. Government Securities |
| Global Bond | Quantitative Mid Cap | U.S. High Yield Bond |
| Global Real Estate | Quantitative Value | U.S. Multi Sector |
| High Income | Real Estate Equity | Value |
| High Yield | Real Estate Securities | Value & Restructuring |
| Index 500 | Real Return Bond | Vista |
| International Equity Index | | |
Each of the Funds, with the exception of Absolute Return, Core Equity, Global Bond, Global Real Estate, Natural Resources, Real Estate Equity, Real Estate Securities, Real Return Bond, U.S. Global Leaders Growth and U.S. Multi Sector, is diversified for purposes of the 1940 Act.
The Absolute Return Portfolio operates as a “fund of funds,” investing in Class NAV shares of underlying funds of the Trust and John Hancock Funds III (“JHF III”) and also in other affiliated funds of the John Hancock funds complex. The Portfolio may also invest in unaffiliated underlying funds and other permitted investments.
On January 18, 2007, the Board of Trustees approved a change in the fiscal year end of the five Lifestyle Portfolios from August 31 to December 31.
John Hancock Investment Management Services, LLC (“JHIMS” or the “Adviser”), a Delaware limited liability company controlled by John Hancock Life Insurance Company (U.S.A.) (“John Hancock USA”), serves as investment adviser for the Trust, and John Hancock Funds, LLC (the “Distributor”), an affiliate of the Adviser, serves as principal underwriter. John Hancock Life Insurance Company of New York (“John Hancock New York”) is a wholly owned subsidiary of John Hancock USA. John Hancock USA and John Hancock New York are indirect wholly owned subsidiaries of The Manufactures Life Insurance Company (“Manulife”), which in turn is a wholly owned subsidiary of Manulife Financial Corporation (“MFC”), a publicly traded company. MFC and its subsidiaries are known collectively as “Manulife Financial.”
The JHF III funds are retail mutual funds advised by JHIMS and distributed by the Distributor.
The funds described in this Annual Report offer six classes of shares as follows:
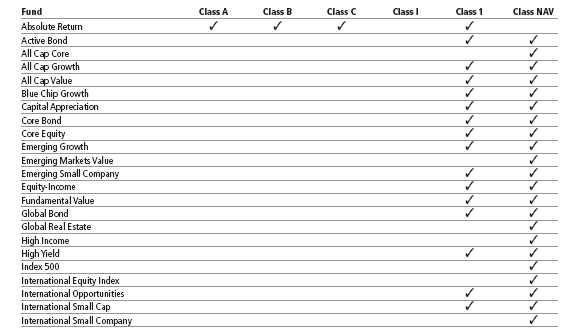
412
John Hancock Funds II
Notes to Financial Statements
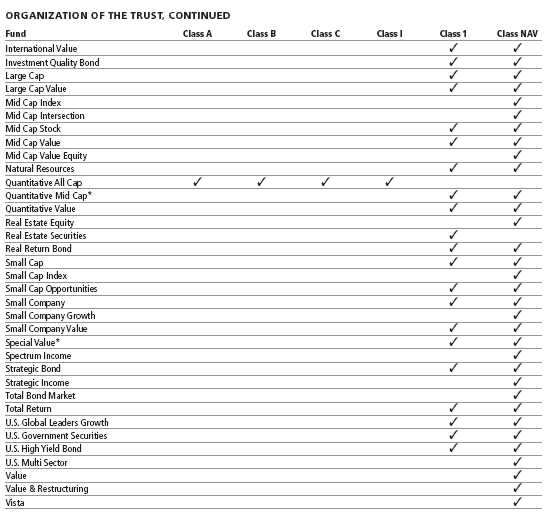
* Class NAV shares for Quantitative Mid Cap and Special Value were terminated on 5-3-07 and 5-30-07, respectively.
Class A, B, and C shares are open to all retail investors. Class I shares are offered without any sales charge to various institutional and certain individual investors. Class 1 shares are sold only to certain exempt separate accounts of John Hancock USA and John Hancock New York. Class NAV shares are sold to Absolute Return Portfolio, Lifestyle Portfolios and to certain institutional investors. The shares of each class represent an interest in the same portfolio of investments of the Fund, and have equal rights as to voting, redemptions, dividends and liquidation, except that certain expenses, subject to the approval of the Trustees, may be applied differently to each class of shares in accordance with current regulations of the Securities and Exchange Commission and the Internal Revenue Service. Shareholders of a class that bears distribution and service expenses under the terms of a distribution plan have exclusive voting rights to that distribution plan.
At August 31, 2007, John Hancock USA owned shares of beneficial interest for the following funds:
| | | | |
| | Absolute Return | Quantitative All Cap | Total Bond Market | Value |
|
| Class A | 128,382 | 125,685 | — | — |
| Class B | 128,167 | 125,280 | — | — |
| Class C | 128,167 | 125,280 | — | — |
| Class 1 | 128,457 | — | — | — |
| Class I | — | 125,859 | — | — |
| Class NAV | — | — | 4,500,966 | 500,646 |
Subadviser Change At the Board of Trustees meeting on June 29, 2007, the Board approved changing the subadviser for Special Value from ClearBridge Advisors, LLC to Wellington Management Company, LLP (“Wellington”), effective as of June 29, 2007.
Payment Made By Affiliate The payment made by the Adviser to the Special Value Fund results from a compliance error under the name test rule. The fund is required to invest at least 80% of its net assets, at the time of purchase, in companies that fall within the market capitalization range of the Russell 2000 Value Index. In December 2006, the fund was reimbursed for the purchase of securities that did not meet the market capitalization requirement at the time of purchase. The offending securities and transactions were later sold which resulted in a loss to the fund of $99,465. This loss was fully reimbursed by the Adviser.
413
John Hancock Funds II
Notes to Financial Statements
2. SIGNIFICANT ACCOUNTING POLICIES In the preparation of the financial statements, the Funds follow the policies described below. The preparation of financial statements in conformity with accounting principles generally accepted in the United States of America requires management to make estimates and assumptions that affect the reported amounts of assets and liabilities at the date of the financial statements and the reported amounts of income and expenses during the reporting period. Actual results may differ from these estimates.
Security Valuation The net asset value of the shares of each Fund is determined daily as of the close of the NYSE, normally at 4:00 P.M., Eastern Time. Investments held by the Absolute Return Portfolio in underlying affiliated funds are valued at their respective net asset values each business day. Short-term debt investments that have a remaining maturity of 60 days or less are valued at amortized cost, and thereafter assume a constant amortization to maturity of any discount or premium, which approximates market value. Investments in John Hancock Cash Investment Trust (“JHCIT”), an affiliate of the John Hancock Adviser, LLC (“JHA”), a wholly owned subsidiary of John Hancock Financial Services, Inc., a subsidiary of MFC, are valued at their net asset value each business day. Swaps are g enerally valued at an evaluated bid as reported by an independent pricing service. All other securities held by the Funds and by the underlying affiliated funds are valued at the last sale price or official closing price (closing bid price or last evaluated quote if no sale has occurred) as of the close of business on the principal securities exchange (domestic or foreign) on which they trade or, lacking any sales, at the closing bid price. Securities sold short are valued at the closing asking price. Securities traded only in the over-the-counter market are valued at the last bid price quoted by brokers making markets in the securities at the close of trading. Securities for which there are no such quotations, principally debt securities, are valued based on the valuation provided by an independent pricing service, which utilizes both dealer-supplied and electronic data processing techniques, which take into account factors such as institutional-size trading in similar groups of securities, yield, quality, coupon rate, maturity, type of issue, trading characteristics and other market data.
Other assets and securities for which no such quotations are readily available are valued at fair value as determined in good faith under consistently applied procedures established by and under the general supervision of the Board of Trustees. Generally, trading in non-U.S. securities is substantially completed each day at various times prior to the close of trading on the NYSE. The values of such securities used in computing the net asset value of a Fund’s shares are generally determined as of such times. Occasionally, significant events that affect the values of such securities may occur between the times at which such values are generally determined and the close of the NYSE. Upon such an occurrence, these securities will be valued at fair value as determined in good faith under consistently applied procedures established by and under the general supervision of the Board of Trustees.
In deciding whether to make a fair value adjustment to the price of a security, the Board of Trustees or their designee may review a variety of factors, including developments in foreign markets, the performance of U.S. securities markets and the performance of instruments trading in U.S. markets that represent foreign securities and baskets of foreign securities. The Funds may also fair value securities in other situations, for example, when a particular foreign market is closed, but the Fund is calculating the net asset value. In view of these factors, it is likely that Funds investing significant amounts of assets in securities in foreign markets will be fair valued more frequently than Funds investing significant amounts of assets in frequently traded, U.S. exchange listed securities of large-capitalization U.S. issuers.
For purposes of determining when fair value adjustments may be appropriate with respect to Funds that invest in securities in foreign markets that close prior to the NYSE, the Funds will, on an ongoing basis, monitor for “significant market events.” A significant market event may be a certain percentage change in the value of an index or of certain Exchange Traded Funds that track foreign markets in which Funds have significant investments. If a significant market event occurs due to a change in the value of the index or of Exchange Traded Funds, the pricing for all Funds that invest in foreign markets that have closed prior to the NYSE will promptly be reviewed and potential adjustments to the net asset value of such Funds will be recommended to the Trust’s Pricing Committee where applicable.
Fair value pricing of securities is intended to help ensure that the net asset value of a Fund’s shares reflects the value of the Fund’s securities as of the close of the NYSE (as opposed to a value which is no longer accurate as of such close), thus limiting the opportunity for aggressive traders to purchase shares of a Fund at deflated prices, reflecting stale security valuations, and to promptly sell such shares at a gain. However, a security’s valuation may differ depending on the method used for determining value and no assurance can be given that fair value pricing of securities will successfully eliminate all potential opportunities for such trading gains.
In September 2006, Financial Accounting Standards Board (FASB) Standard No. 157, Fair Value Measurements (FAS 157), was issued and is effective for fiscal years beginning after November 15, 2007. FAS 157 defines fair value, establishing a framework for measuring fair value and expands disclosure about fair value measurements. Management is currently evaluating the application of FAS 157 to the Funds and its impact, if any, resulting from the adoption of FAS 157 on the Funds’ financial statements.
Repurchase Agreements Each Fund may enter into repurchase agreements. When a Fund enters into a repurchase agreement through its custodian, it receives delivery of securities, the amount of which at the time of purchase and each subsequent business day is required to be maintained at such a level that the market value is generally at least 102% of the repurchase amount. Each Fund will take constructive receipt of all securities underlying the repurchase agreements it has entered into until such agreements expire. If the seller defaults, a Fund would suffer a loss to the extent that proceeds from the sale of underlying securities were less than the repurchase amount. Each Fund may enter into repurchase agreements maturing within seven days with domestic dealers, banks or other financial institutions deemed to be creditworthy by the Adviser. Collateral for certain tri-party repurchase agreements is held at the custodian bank in a segregated account for the benefit of the Fund and the counterparty.
Foreign Currency Transactions The accounting records of the Funds are maintained in U.S. dollars. Foreign currency amounts are translated into U.S. dollars on the following basis:
(i) market value of securities, other assets and other liabilities at the current rate of exchange at period end of such currencies against U.S. dollars; and
(ii) purchases and sales of securities, income and expenses at the rate of exchange quoted on the respective dates of such transactions.
Net realized gains and losses on foreign currency transactions represent net gains and losses from sales and maturities of foreign currency contracts, disposition of foreign currencies, the difference between the amount of net investment income accrued and the U.S. dollar amount actually received, and gains and losses between trade and settlement date on purchases and sales of securities. The effects of changes in foreign currency exchange rates on investments in securities are included with the net realized and unrealized gain or loss on investment securities.
414
John Hancock Funds II
Notes to Financial Statements
SIGNIFICANT ACCOUNTING POLICIES, CONTINUED
Certain Funds may be subject to capital gains and repatriation taxes imposed by certain countries in which they invest. Such taxes are generally based upon income and/or capital gains earned or repatriated. Taxes are accrued based upon net investment income, net realized gains and net unrealized appreciation.
Investing in securities of foreign companies and foreign governments involves special risks and considerations not typically associated with investing in securities of domestic companies and the U. S. Government. These risks include revaluation of currencies and future adverse political and economic developments. Moreover, securities of foreign companies and foreign governments and their markets may be less liquid and their prices more volatile than those of the United States.
Certain Funds invest in securities of issuers based in countries with emerging markets or economies and may, therefore, be subject to greater market risk than funds that invest principally in securities of issuers in more developed countries. Emerging markets securities may be more volatile and less liquid than securities of issuers in developed countries and may be subject to substantial currency fluctuations and affected by sudden economic, social and political developments in the emerging market country. The securities markets of emerging countries may have less government regulation and may be subject to less extensive accounting and financial reporting requirements than the securities markets of more developed countries. Emerging market countries may have currency controls or restrictions which may prevent or delay a Fund from taking money out of the country or may impose additional taxes on money removed from the country.
Security Transactions and Related Investment Income Investment security and underlying affiliated funds transactions are accounted for on a trade date plus one basis for daily net asset value calculations. However, for financial reporting purposes, investment transactions are reported on trade date. Interest income is accrued as earned. Dividend income is recorded by the underlying funds on the ex-dividend date. Distributions from the underlying funds are recorded on the ex-dividend date. Dividend income and distributions to shareholders are recorded on the ex-dividend date. Foreign dividends are recorded on the ex-date or when the Fund becomes aware of the dividends from cash collections. Discounts/premiums are accreted/amortized for financial reporting purposes. Non-cash dividends are recorded at the fair market value of the securities received. Debt obligations may be placed in a non-accrual status and related interest income may be reduced by ceasing current accruals and writing off interest receivables when the collection of all or a portion of interest has become doubtful, based upon consistently applied procedures.
Inflation indexed securities are fixed-income securities whose principal value is periodically adjusted according to the rate of inflation. Interest is accrued based upon the principal value, which is adjusted for inflation. Principal of inflation index protected securities is increased or decreased by the rate of change in the Consumer Price Index. Interest income includes accretion of discounts and amortization of premiums as well as accretion or amortization of principal of inflation index protected securities.
From time to time, certain of the Funds may invest in Real Estate Investment Trusts (“REITs”) and, as a result, will estimate the components of distributions from these securities. Distributions from REITs received in excess of income are recorded as a reduction of cost of investments and/or as a realized gain.
The Funds use specific identification method for determining realized gain or loss on investments for both financial and federal income tax reporting purposes.
Multi-Class Operations All income, expenses (except class-specific expenses), and realized and unrealized gains (losses) are allocated to each class of shares based upon the relative net assets of each class. Dividends to shareholders from net investment income are determined at a class level and distributions from capital gains are determined at a Fund level.
Expense Allocation Expenses not directly attributable to a particular Fund or share class are allocated based on the relative share of net assets of each Fund or share at the time the expense was incurred. Class-specific expenses, such as Distribution (Rule 12b-1) fees, are accrued daily and charged directly to the respective share classes. Expenses in the Absolute Return Portfolio’s Statement of Operations reflect the expenses of the Fund and do not include any indirect expenses related to the underlying funds. Because the underlying funds have varied expense levels and the Absolute Return Portfolio may own different proportions of the underlying affiliated funds at different times, the amount of fees and expenses incurred indirectly by the Absolute Return Portfolio will vary.
Purchased and Written Options Each Fund described in this Annual Report may purchase and sell put and call options on securities (whether or not it holds the securities in its portfolio), securities indices, currencies and futures contracts.
When a Fund writes a put or call option, an amount equal to the premium received by the Fund is recorded as a liability and is subsequently “marked-to-market” to reflect the current market value of the option written. If an option expires or if the Fund enters into an offsetting purchase option, the Fund realizes a gain (or loss if the cost of an offsetting purchase option exceeds the premium received when the option was written). If a written call option is exercised, the Fund realizes a gain or loss from the sale of the underlying security with the proceeds of the sale increased by the premium originally received. If a written put option is exercised, the amount of the premium originally received reduces the cost of the security that the Fund purchases upon exercise of the option.
When a Fund purchases a put or call option, the premium paid by the Fund is included in the Portfolio of Investments and subsequently “marked-to-market” to reflect the current market value of the option. If the purchased option expires, the Fund realizes a loss for the cost of the option. If a Fund enters into a closing sale transaction, the Fund realizes a gain or loss, depending on whether proceeds from the closing sale transaction are greater or less than the original cost of the option. If a Fund exercises a call option, the cost of the securities acquired by exercising the call is increased by the premium paid to buy the call. If a Fund exercises a put option, it realizes a gain or loss from the sale of the underlying security and the proceeds from such sale are decreased by the premium originally paid.
The Funds may use options to manage exposure to fluctuations in currency values. Writing puts and buying calls may increase the Fund’s exposure to the underlying instrument. Buying puts and writing calls may decrease a Fund/Portfolio’s exposure to the underlying instrument. Losses may arise from changes in the value of the underlying instruments if there is an illiquid secondary market for the contracts or if the counterparties do not perform under the terms of the contract.
415
John Hancock Funds II
Notes to Financial Statements
SIGNIFICANT ACCOUNTING POLICIES, CONTINUED
Written options for the year ended August 31, 2007, were as follows:
| | |
| | Number of Contracts | Premiums Received |
|
| Absolute Return | | |
|
| Outstanding, beginning of period | — | — |
| Options written | 2 | $3,494 |
| Option closed | (2) | (3,494) |
| Outstanding, end of period | — | — |
|
| |
| Global Bond | | |
|
| Outstanding, beginning of period | 2,827,800,454 | $2,493,828 |
| Options written | 640,303,358 | 8,864,817 |
| Option closed | (343,300,423) | (2,804,909) |
| Options expired | (2,658,903,233) | (1,365,659) |
| Outstanding, end of period | 465,900,156 | $7,188,077 |
|
| |
| High Income | | |
|
| Outstanding, beginning of period | 1,000 | $517,604 |
| Option closed | (1,000) | (517,604) |
| Outstanding, end of period | — | — |
|
| |
| Real Return Bond | | |
|
| Outstanding, beginning of period | 41,000,000 | $331,920 |
| Options written | 84,001,257 | 1,316,108 |
| Option closed | (27,000,018) | (204,737) |
| Options expired | (67,401,105) | (604,477) |
| Outstanding, end of period | 30,600,134 | $838,814 |
|
| |
| Strategic Bond | | |
|
| Outstanding, beginning of period | 741 | $233,474 |
| Options written | 7,668 | 3,540,045 |
| Option closed | (2,968) | (1,361,280) |
| Options expired | (4,196) | (1,925,189) |
| Outstanding, end of period | 1,245 | $487,050 |
|
| |
| Strategic Income | | |
|
| Outstanding, beginning of period | — | — |
| Options written | 87,045,441 | $652,995 |
| Option closed | (27,484,800) | (141,484) |
| Options expired | (59,559,939) | (444,403) |
| Outstanding, end of period | 702 | $67,108 |
|
| |
| Total Return | | |
|
| Outstanding, beginning of period | 277,001,554 | $4,098,858 |
| Options written | 519,105,146 | 7,274,189 |
| Option closed | (291,001,444) | (3,926,797) |
| Options expired | (119,203,918) | (2,635,539) |
| Outstanding, end of period | 385,901,338 | $4,810,711 |
|
| |
| U.S. Government Securities | | |
|
| Outstanding, beginning of period | — | — |
| Options written | 7,500,000 | $22,266 |
| Option exercised | (7,500,000) | (22,266) |
| Outstanding, end of period | — | — |
|
| |
| Value & Restructuring | | |
|
| Outstanding, beginning of period | — | — |
| Options written | 2,384 | $776,602 |
| Option closed | (1,327) | (365,730) |
| Options expired | (250) | (24,719) |
| Options exercised | (627) | (316,978) |
| Outstanding, end of period | 180 | $69,175 |
416
John Hancock Funds II
Notes to Financial Statements
SIGNIFICANT ACCOUNTING POLICIES, CONTINUED
The following is a summary of open written options outstanding as of August 31, 2007:
| | | | | | | |
| | | | Pay/Receive | Notional Amount/ | Exercise Expiration | |
| Fund | Name of Issuer | Floating Rate Index | Floating Rate | Number of Contracts | Rate/Price | Date | Value |
|
| Global Bond | Calls | | | | | | |
|
| | 5-Year Interest Rate Swap | 3 Month USD-LIBOR | Receive | 22,700,000 | 5.15% | Dec 2007 | ($343,698) |
| | 5-Year Interest Rate Swap | 3 Month USD-LIBOR | Receive | 52,600,000 | 5.10% | Feb 2008 | (790,346) |
| | 5-Year Interest Rate Swap | 3 Month USD-LIBOR | Receive | 97,900,000 | 4.90% | Mar 2008 | (1,160,683) |
| | 5-Year Interest Rate Swap | 3 Month USD-LIBOR | Receive | 40,700,000 | 4.95% | Mar 2008 | (523,251) |
| | 5-Year Interest Rate Swap | 3 Month USD-LIBOR | Receive | 1,800,000 | 4.95% | Sep 2008 | (27,061) |
| | 5-Year Interest Rate Swap | 3 Month USD-LIBOR | Receive | 35,400,000 | 4.95% | Sep 2008 | (532,204) |
| | 5-Year Interest Rate Swap | 3 Month USD-LIBOR | Receive | 8,500,000 | 4.95% | Sep 2008 | (127,789) |
| | 5-Year Interest Rate Swap | 3 Month USD-LIBOR | Receive | 89,800,000 | 5.50% | Aug 2009 | (2,510,585) |
| | 7-Year Interest Rate Swap | 3 Month USD-LIBOR | Receive | 11,900,000 | 4.90% | Feb 2008 | (116,606) |
| | 7-Year Interest Rate Swap | 3 Month USD-LIBOR | Receive | 12,300,000 | 5.32% | Aug 2009 | (343,090) |
| | 7-Year Interest Rate Swap | 3 Month USD-LIBOR | Receive | 24,700,000 | 5.32% | Aug 2009 | (695,404) |
| | 7-Year Interest Rate Swap | 3 Month USD-LIBOR | Receive | 5,400,000 | 5.32% | Aug 2009 | (149,715) |
| | 8-Year Interest Rate Swap | 6 Month GBP-LIBOR | Receive | 7,000,000 | 4.85% | Sep 2007 | — |
| | 8-Year Interest Rate Swap | 6 Month GBP-LIBOR | Receive | 3,000,000 | 4.85% | Sep 2007 | — |
| | 8-Year Interest Rate Swap | 6 Month GBP-LIBOR | Receive | 9,000,000 | 4.85% | Sep 2007 | — |
| | 30-Year Interest Rate Swap | 3 Month USD-LIBOR | Receive | 19,200,000 | 5.4475% | Nov 2007 | (384,359) |
| | 30-Year Interest Rate Swap | 3 Month USD-LIBOR | Receive | 10,700,000 | 5.4675% | Nov 2007 | (230,981) |
|
| | | | | 452,600,000 | | | ($7,935,772) |
|
| | Japanese Yen Futures | | | 8,900,000 | $117.57 | Feb 2008 | ($64,730) |
| | New Zealand Dollar vs. Japanese Yen | | | 4,400,000 | 97.70 | Oct 2007 | (448) |
| | U.S.Treasury 10-Year Note Futures | | | 156 | 111.00 | Nov 2007 | (85,312) |
|
| | | | | 13,300,156 | | | ($150,490) |
|
| Real Return Bond | Calls | | | | | | |
|
| | 5-Year Credit Default Swap | | | 1,000,000 | 0.70% | Dec 2007 | ($3,666) |
| | 5-Year Interest Rate Swap | 3 Month USD-LIBOR | Receive | 11,000,000 | 4.95% | Mar 2008 | (141,419) |
| | 5-Year Interest Rate Swap | 3 Month USD-LIBOR | Receive | 2,000,000 | 4.95% | Sep 2008 | (30,068) |
| | 30-Year Interest Rate Swap | 3 Month USD-LIBOR | Receive | 2,900,000 | 5.67% | Aug 2008 | (162,029) |
| | 30-Year Interest Rate Swap | 3 Month USD-LIBOR | Receive | 2,300,000 | 5.67% | Aug 2008 | (128,506) |
|
| | | | | 19,200,000 | | | ($465,688) |
|
| | Japanese Yen Futures | | | 2,600,000 | $118.15 | Jun 2008 | ($18,353) |
| | U.S.Treasury 10-Year Note Futures | | | 134 | 111.00 | Nov 2007 | (73,281) |
|
| | | | | 2,600,134 | | | ($91,634) |
|
| | Puts | | | | | | |
|
| | 5-Year Credit Default Swap | | | 2,300,000 | 5.67% | Aug 2008 | ($68,348) |
| | 30-Year Interest Rate Swap | 3 Month USD-LIBOR | Receive | 2,900,000 | 5.67% | Aug 2008 | (86,177) |
| | 30-Year Interest Rate Swap | 3 Month USD-LIBOR | Receive | 1,000,000 | 1.00% | Dec 2007 | (4,358) |
|
| | | | | 6,200,000 | | | ($158,883) |
|
| | Japanese Yen Futures | | | 2,600,000 | $63.00 | Jan 2008 | ($156,289) |
|
| | | | | 2,600,000 | | | ($156,289) |
|
417
John Hancock Funds II
Notes to Financial Statements
| | | | | | | |
| SIGNIFICANT ACCOUNTING POLICIES, CONTINUED | | | | | |
| | | | Pay/Receive | Notional Amount/ | Exercise | Expiration | |
| Fund | Name of Issuer | Floating Rate Index | Floating Rate | Number of Contracts | Rate/Price | Date | Value |
|
| Strategic Bond | Calls | | | | | | |
|
| | Eurodollar Futures | | | 113 | $95.25 | Sep 2007 | ($706) |
| | Eurodollar Futures | | | 18 | 95.00 | Sep 2007 | (338) |
| | Eurodollar Futures | | | 50 | 95.50 | Dec 2007 | (11,250) |
| | Eurodollar Futures | | | 19 | 95.25 | Dec 2007 | (7,363) |
| | Eurodollar Futures | | | 44 | 95.125 | Dec 2007 | (22,000) |
| | Eurodollar Futures | | | 65 | 95.50 | Mar 2008 | (40,219) |
| | Eurodollar Futures | | | 45 | 95.00 | Mar 2008 | (55,125) |
| | Japanese Yen Futures | | | 3 | 85.00 | Sep 2007 | (62) |
| | U.S.Treasury 10-Year Note Futures | | | 26 | 111.00 | Nov 2007 | (14,219) |
| | U.S.Treasury 10-Year Note Futures | | | 61 | 110.00 | Nov 2007 | (49,562) |
| | U.S.Treasury 10-Year Note Futures | | | 7 | 109.00 | Nov 2007 | (8,531) |
| | U.S.Treasury 10-Year Note Futures | | | 169 | 108.00 | Nov 2007 | (298,391) |
| | U.S.Treasury 10-Year Note Futures | | | 146 | 107.00 | Nov 2007 | (355,875) |
| | U.S.Treasury 30-Year Bond Futures | | | 31 | 111.00 | Nov 2007 | (55,703) |
|
| | | | | 797 | | | ($919,344) |
|
| | Puts | | | | | | |
|
| | Eurodollar Futures | | | 66 | $94.75 | Sep 2007 | ($46,612) |
| | Eurodollar Futures | | | 144 | 95.00 | Dec 2007 | (66,600) |
| | U.S. Treasury 10-Year Note Futures | | | 45 | 108.00 | Sep 2007 | (11,250) |
| | U.S.Treasury 10-Year Note Futures | | | 7 | 107.00 | Nov 2007 | (3,137) |
| | U.S.Treasury 10-Year Note Futures | | | 19 | 105.00 | Nov 2007 | (2,375) |
| | U.S. Treasury 10-Year Note Futures | | | 37 | 104.00 | Nov 2007 | (2,312) |
| | U.S.Treasury 10-Year Note Futures | | | 53 | 103.00 | Nov 2007 | (1,656) |
| | U.S.Treasury 10-Year Note Futures | | | 31 | 102.00 | Nov 2007 | (484) |
| | U.S. Treasury 30-Year Bond Futures | | | 12 | 109.00 | Sep 2007 | (1,313) |
| | U.S.Treasury 30-Year Bond Futures | | | 20 | 109.00 | Nov 2007 | (10,625) |
| | U.S.Treasury 30-Year Bond Futures | | | 14 | 106.00 | Nov 2007 | (1,969) |
|
| | | | | 448 | | | ($148,333) |
|
| Strategic Income | Calls | | | | | | |
|
| | Silver Standard Resources, Inc. | | | 702 | $40.00 | Sep 2007 | ($2,106) |
|
| | | | | 702 | | | ($2,106) |
|
| Total Return | Calls | | | | | | |
|
| | 5-Year Interest Rate Swap | 3 Month USD-LIBOR | Receive | 18,000,000 | 5.01% | Oct 2007 | ($162,392) |
| | 5-Year Interest Rate Swap | 3 Month USD-LIBOR | Receive | 36,000,000 | 5.10% | Feb 2008 | (540,922) |
| | 5-Year Interest Rate Swap | 3 Month USD-LIBOR | Receive | 9,000,000 | 4.90% | Feb 2008 | (94,738) |
| | 5-Year Interest Rate Swap | 3 Month USD-LIBOR | Receive | 23,000,000 | 4.95% | Mar 2008 | (295,695) |
| | 5-Year Interest Rate Swap | 3 Month USD-LIBOR | Receive | 24,800,000 | 4.90% | Mar 2008 | (294,024) |
| | 5-Year Interest Rate Swap | 3 Month USD-LIBOR | Receive | 22,000,000 | 4.90% | Mar 2008 | (260,828) |
| | 5-Year Interest Rate Swap | 3 Month USD-LIBOR | Receive | 43,400,000 | 4.95% | Sep 2008 | (652,476) |
| | 5-Year Interest Rate Swap | 3 Month USD-LIBOR | Receive | 15,600,000 | 4.95% | Sep 2008 | (234,530) |
| | 5-Year Interest Rate Swap | 3 Month USD-LIBOR | Receive | 59,700,000 | 4.95% | Sep 2008 | (897,530) |
| | 5-Year Interest Rate Swap | 3 Month USD-LIBOR | Receive | 20,000,000 | 5.45% | Feb 2009 | (535,406) |
| | 7-Year Interest Rate Swap | 3 Month USD-LIBOR | Receive | 66,100,000 | 5.20% | Dec 2008 | (1,531,273) |
| | 7-Year Interest Rate Swap | 3 Month USD-LIBOR | Receive | 48,300,000 | 5.00% | Dec 2008 | (880,905) |
|
| | | | | 385,900,000 | | | ($6,380,719) |
|
| | Eurodollar Futures | | | 113 | $95.75 | Mar 2008 | (47,319) |
| | U.S.Treasury 5-Year Note Futures | | | 409 | 108.00 | Nov 2007 | (185,328) |
| | U.S.Treasury 10-Year Note Futures | | | 816 | 111.00 | Nov 2007 | (446,250) |
|
| | | | | 1,338 | | | ($678,897) |
418
John Hancock Funds II
Notes to Financial Statements
| | | | | | | |
| SIGNIFICANT ACCOUNTING POLICIES, CONTINUED | | | | | |
| | | | Pay/Receive | Notional Amount/ | Exercise | Expiration | |
| Fund | Name of Issuer | Floating Rate Index | Floating Rate | Number of Contracts | Rate/Price | Date | Value |
|
| Value & Restructuring | Calls | | | | | | |
|
| | America Movil, S.A.B. de C.V. | | | 180 | $60.00 | Nov 2007 | ($82,800) |
|
| | | | | 180 | | | ($82,800) |
|
The following is a summary of forward volatility options with premiums to be determined on a future date outstanding at August 31, 2007:
| | | |
| | | Notional | Unrealized |
| Fund | Description | Amount | Appreciation (Depreciation) |
|
| Real Return Bond | Call & Put | | |
|
| | U.S. Dollar Forward Delta/Neutral Straddle vs. Swiss Franc | 8,300,000 | $105,344 |
| | Strike and premium determined on 9/26/2007, | | |
| | based upon implied volatility parameter of 7.2% | | |
Securities Lending All Funds described in this Annual Report with the exception of Absolute Return Portfolio may lend securities in amounts up to 33 1 / 3% of the Fund’s total assets. Such loans are callable at any time and are at all times fully secured by cash, cash equivalents or securities issued or guaranteed by the U.S. Government or its agencies or instrumentalities and marked to market on a daily basis. The Funds may bear the risk of delay in recovery of, or even of rights in, the securities loaned should the borrower of the securities fail financially.
The Funds enter into an agreement with Morgan Stanley & Co. Incorporated and MS Securities Services Inc. (collectively, “Morgan Stanley”) which permits the Funds to lend securities to Morgan Stanley on a principal basis. It is presently anticipated that Morgan Stanley will be the primary borrower of securities of the Funds. The risk of having one primary borrower of Fund securities (as opposed to several borrowers) is that should Morgan Stanley fail financially, all securities lent will be affected by the failure and by any delays in recovery of the securities (or in the rare event, loss of rights in the collateral).
The Funds receive compensation for lending their securities either in the form of fees and/or by retaining a portion of interest on the investment of any cash received as collateral. The Funds invest the cash collateral received in connection with securities lending transactions in the JHCIT, a Delaware common law trust and an affiliated fund. JHCIT is exempt from registration under Section 3(c) (7) of the 1940 Act (pursuant to exemptive order issued by the SEC) and is managed by JHA, the Adviser for JHCIT, for which JHA receives an investment advisory fee of 0.04% of the average daily net assets of the JHCIT. Effective May 8, 2007, cash collateral is invested in the JHCIT. Prior to May 8, 2007, cash collateral was invested in the State Street Navigator Securities Lending Prime Portfolio.
All collateral received will be in an amount equal to at least 100% of the market value of the loaned securities and is intended to be maintained at that level during the period of the loan. The market value of the loaned securities is determined at the close of business of the Funds and any additional required collateral is delivered to the Funds the next business day. During the loan period, the Funds continue to retain rights of ownership, including dividends and interest of the loaned securities. At August 31, 2007, the values of securities loaned and cash collateral were as follows:
| | | | | |
| Fund | | Value of Securities Loaned | Value of Cash Collateral |
|
| All Cap Core | | $2,120,790 | | $2,163,206 | |
| All Cap Growth | | 2,458,524 | | 2,507,694 | |
| All Cap Value | | 1,559,336 | | 1,590,523 | |
| Blue Chip Growth | | 42,830,394 | | 43,687,002 | |
| Capital Appreciation | | 14,393,267 | | 14,681,132 | |
| Emerging Growth | | 58,486,390 | | 59,656,118 | |
| Emerging Small Company | | 14,526,298 | | 14,816,824 | |
| Equity-Income | | 33,065,118 | | 33,726,420 | |
| Fundamental Value | | 21,885,135 | | 22,322,838 | |
| Global Real Estate | | 27,242,764 | | 28,489,756 | |
| High Income | | 1,400,147 | | 1,428,149 | |
| High Yield | | 45,640,634 | | 46,553,447 | |
| International Equity Index | | 48,125,680 | | 50,429,968 | |
| International Opportunities | | 155,154,525 | | 161,395,398 | |
| International Small Cap | | 56,969,379 | | 59,817,848 | |
| International Small Company | | 43,861,760 | | 46,052,319 | |
| International Value | | 155,493,448 | | 163,204,173 | |
| Large Cap | | 9,389,966 | | 9,577,765 | |
| Large Cap Value | | 4,192,962 | | 4,276,821 | |
| Mid Cap Stock | | 45,868,557 | | 46,785,928 | |
| Mid Cap Value | | 6,674,774 | | 6,808,269 | |
| Mid Cap Value Equity | | 5,734,666 | | 5,849,359 | |
| Natural Resources | | 91,709,163 | | 93,981,765 | |
| Quantitative All Cap | | 272,672 | | 278,125 | |
| Quantitative Mid Cap | | 8,368,200 | | 8,535,564 | |
| Quantitative Value | | 30,700,241 | | 31,314,246 | |
| Real Estate Equity | | 11,694,431 | | 11,928,320 | |
| Real Estate Securities | | 2,965,100 | | 3,024,402 | |
419
John Hancock Funds II
Notes to Financial Statements
| | | | | |
| SIGNIFICANT ACCOUNTING POLICIES, CONTINUED | | | |
| Fund | | Value of Securities Loaned | Value of Cash Collateral |
|
| Small Cap | | $35,995,888 | | $36,715,806 | |
| Small Cap Index | | 15,588,980 | | 15,900,759 | |
| Small Cap Opportunities | | 35,711,486 | | 36,425,716 | |
| Small Company | | 9,197,645 | | 9,381,598 | |
| Small Company Growth | | 44,194,900 | | 45,078,798 | |
| Small Company Value | | 62,436,750 | | 63,685,485 | |
| Special Value | | 317,569 | | 323,920 | |
| Spectrum Income | | 3,670,150 | | 3,743,553 | |
| Strategic Bond | | 8,022,718 | | 8,183,172 | |
| U.S. Global Leaders Growth | | 31,273,810 | | 31,899,286 | |
| U.S. High Yield Bond | | 6,630,278 | | 6,762,883 | |
| U.S. Multi Sector | | 25,615,805 | | 26,128,121 | |
| Value & Restructuring | | 41,583,673 | | 42,415,346 | |
| Vista | | 14,552,286 | | 14,843,332 | |
Floating Rate Notes Issued in Conjunction with Securities Held Certain Funds may enter into transactions in which the Funds sell a fixed-rate bond to a broker for cash. At the same time the Funds buy a residual interest in a trust’s (the “Trust”) assets and cash flows set up by the broker, often referred to as an inverse floating rate obligation (“Inverse Floater”). The broker deposits a fixed-rate bond into the Trust with the same CUSIP number as the fixed-rate bond sold to the broker by the Fund, and which may have been, but is not required to be, the fixed-rate bond purchased from the Fund (the “Fixed-Rate Bond”). The Trust also issues floating-rate notes (“Floating-Rate Notes”) which are sold to third parties. The Funds may enter into shortfall and forbearance agreements with the broker by which a Fund agrees to reimburse the broker, in certain circumstances, for the difference be tween the liquidation value of the Fixed-Rate Bond held by the Trust and the liquidation value of the Floating-Rate Notes, as well as any shortfalls in interest cash flows. The Inverse Floater held by a Fund gives the Fund the right (1) to cause the holders of the Floating-Rate Notes to tender their notes at par and (2) to have the broker transfer the Fixed-Rate Bond held by the Trust to the Fund, thereby collapsing the Trust. Pursuant to Financial Accounting Standards Statement No. 140 (“FAS 140”), the Funds account for the transaction described above as a secured borrowing by including the Fixed-Rate Bond in their Portfolio of Investments and accounts for the Floating-Rate Notes as a liability under the caption “payable for floating rate notes issued” in the Fund’s Statement of Assets and Liabilities. The Floating-Rate Notes have interest rates that generally reset weekly and their holders have the option to tender their notes to the broker for redemption at par at each reset date. Expenses of the trusts, including interest paid to holders of the Floating-Rate Notes, are reflected as interest expense and fees on inverse floaters of the Funds and are included in the Statement of Operations. At August 31, 2007, the Fund’s investments were as follows:
| | |
| | Floating Rate | Range of |
| Fund | Notes Outstanding | Interest Rates |
|
| Global Bond | 270,000 | 3.45% — 4.01% |
| Total Return | 3,000,000 | 3.45% — 4.03% |
| Total Return | 33,000 | 3.45% — 4.03% |
The Funds’ investment policies and restrictions expressly permit investments in inverse floating rate securities. The Funds’ investment policies do not allow the Funds to borrow money for purposes of making investments. Fund management believes that the Funds’ restrictions on borrowings do not apply to the secured borrowings deemed to have occurred for accounting purposes pursuant to FAS 140, which is distinct from legal borrowing of the Funds to which the restrictions apply. Inverse Floaters held by the Fund are securities exempt from registration under Rules 144A of the Securities Act of 1933.
Interest Expense Interest expense relates to the Fund’s liability with respect to Floating-Rate Notes held by third parties in conjunction with inverse floater securities transactions and/or short sale transactions by the Funds. Interest expense is recorded as incurred.
Dollar Rolls All Funds, with the exception of Absolute Return Portfolio, may enter into mortgage dollar rolls in which they sell debt securities for delivery currently and simultaneously contract to repurchase similar, but not identical, securities at the same price or a lower price on an agreed upon date. The Funds receive compensation as consideration for entering into the commitment to repurchase. The compensation is the difference between the current sale price and the forward price for the future purchase (often referred to as the “drop”) as well as by the interest earned on the cash proceeds of the initial sale. A Fund may also be compensated by the receipt of a commitment fee. As the holder, the counterparty receives all principal and interest payments, including prepayments, made with respect to the similar security. Dollar rolls may be renewed with a new sale and repurchase price with a cash settlement made at renewal without physical delivery of the securities subject to the contract.
Certain risks may arise upon entering into mortgage dollar rolls from the potential inability of counterparties to meet the terms of their commitments. Additionally, the value of such securities may change adversely before the Fund is able to repurchase them. There can be no assurance that the Fund’s use of the cash that it receives from a mortgage dollar roll will provide a return that exceeds its costs.
Short Sales Certain Funds may make short sales of securities. This means a Fund may sell a security that it does not own in anticipation of a decline in the market value of the security. The Fund generally borrows the security to deliver to the buyer in a short sale. The Fund must then buy the security at its market price when the borrowed security must be returned to the lender. Short sales involve costs and risk. The Fund must pay the lender interest on the security it borrows, and the Fund will lose money if the price of the security increases between the time of the short sale and the date when the Fund replaces the borrowed security. Certain of the Funds may also make short sales “against the box.’’ In a short sale against the box, at the time of sale, the Fund owns or has the right to acquire the identical security, or one equivalent in kind or amount, at no additional cost.
Until a Fund closes its short position or replaces a borrowed security, the Fund will (i) segregate with its custodian cash or other liquid assets at such a level that the amount segregated plus the amount deposited with the lender as collateral will equal the current market value of the security sold short or (ii) otherwise cover its short position. Possible losses from short sales may be unlimited, whereas losses from purchases cannot exceed the total amount invested.
420
John Hancock Funds II
Notes to Financial Statements
SIGNIFICANT ACCOUNTING POLICIES, CONTINUED
Securities sold in short sale transactions and interest and dividend payable on such securities, if any, are reflected as a liability in the Statement of Assets and Liabilities. Fees incurred to borrow securities for short sales are recorded as interest expense on the Statement of Operations.
Futures All Funds may purchase and sell financial futures contracts and options on those contracts. The Funds invest in contracts based on financial instruments, such as U.S. Treasury Bonds or Notes, or on securities indices, such as the S&P 500 Index, in order to hedge against a decline in the value of securities owned by the Funds.
Initial margin deposits required upon entering into futures contracts are satisfied by the delivery of specific securities or cash as collateral to the broker (the Funds’ agent in acquiring the futures position). If the position is closed out by taking an opposite position prior to the settlement date of the futures contract, a final determination of variation margin is made, cash is required to be paid to or released by the broker and the Fund realizes a gain or loss.
When a Fund sells a futures contract based on a financial instrument, the Fund becomes obligated to deliver that kind of instrument at an agreed upon date for a specified price. The Fund realizes a gain or loss depending on whether the price of an offsetting purchase is less or more than the price of the initial sale or on whether the price of an offsetting sale is more or less than the price of the initial purchase. The Fund could be exposed to risks if it could not close out futures positions because of an illiquid secondary market or the inability of counterparties to meet the terms of their contracts. Futures contracts are valued at the quoted daily settlement prices established by the exchange on which they trade.
The following is a summary of open futures contracts at August 31, 2007:
| | | | | | | | |
| | | | | | | | Unrealized |
| Fund | Open Contracts | Number of Contracts | Position | | Expiration Date | Appreciation (Depreciation) |
|
| All Cap Core | Russell 2000 Index Futures | 5 | | Long | | Sep 2007 | ($90,771) | |
| | Russell 2000 Mini Index Futures | 301 | | Long | | Sep 2007 | (1,082,195) | |
| | S&P 500 Index Futures | 53 | | Long | | Sep 2007 | (346,136) | |
|
| | | | | | | | ($1,519,102) | |
| | |
| Global Bond | 2-Year German Euro-SCHATZ Futures | 284 | | Long | | Sep 2007 | $29,787 | |
| | 5-Year German Euro-BOBL Futures | 283 | | Long | | Sep 2007 | 604,109 | |
| | 10-Year German Euro-BUND Futures | 1,126 | | Long | | Sep 2007 | 4,053,734 | |
| | 90-Day LIBOR Futures | 234 | | Long | | Mar 2008 | (371,618) | |
| | 90-Day LIBOR Futures | 410 | | Long | | Jun 2008 | (323,420) | |
| | 90-Day LIBOR Futures | 92 | | Long | | Dec 2008 | (106,681) | |
| | Euribor Futures | 394 | | Long | | Dec 2007 | (20,153) | |
| | Euribor Futures | 146 | | Long | | Sep 2008 | 218,593 | |
| | Eurodollar Futures | 40 | | Long | | Sep 2007 | (23,250) | |
| | Eurodollar Futures | 1,248 | | Long | | Mar 2008 | 2,095,250 | |
| | Eurodollar Futures | 430 | | Long | | Jun 2008 | 231,125 | |
| | Eurodollar Futures | 393 | | Long | | Sep 2008 | 776,175 | |
| | Euroyen Futures | 113 | | Long | | Dec 2007 | 7,565 | |
| | Euroyen Futures | 384 | | Long | | Mar 2008 | 116,027 | |
| | U.S. Treasury 30-Year Bond Futures | 137 | | Long | | Dec 2007 | 35,320 | |
| | 10-Year Canada Government Bond Futures | 31 | | Short | | Dec 2007 | 17,243 | |
| | 10-Year Japan Government Bond Futures | 38 | | Short | | Sep 2007 | (548,971) | |
| | U.K. Treasury Bond Futures | 34 | | Short | | Dec 2007 | (3,428) | |
| | U.S. Treasury 5-Year Note Futures | 751 | | Short | | Dec 2007 | (5,071) | |
| | U.S. Treasury 10-Year Note Futures | 384 | | Short | | Sep 2007 | (834,000) | |
|
| | | | | | | | $5,948,336 | |
|
| Index 500 | S&P 500 Index Futures | 44 | | Long | | Sep 2007 | $77,641 | |
| |
| | | | | | | | $77,641 | |
|
| International Equity Index | All Share Index Futures | 4 | | Long | | Sep 2007 | ($5,954) | |
| | CAC 40 10 Euro Index Futures | 9 | | Long | | Sep 2007 | (30,772) | |
| | DAX Index Futures | 2 | | Long | | Sep 2007 | (9,161) | |
| | FTSE 100 Index Futures | 14 | | Long | | Sep 2007 | (78,239) | |
| | Hang Seng Stock Index Futures | 1 | | Long | | Sep 2007 | 2,621 | |
| | IBEX 35 Index Futures | 2 | | Long | | Sep 2007 | (5,041) | |
| | MSCI Taiwan Stock Index Futures | 6 | | Long | | Sep 2007 | 6,753 | |
| | OMX 30 Stock Index Futures | 9 | | Long | | Sep 2007 | 6,370 | |
| | S&P TSE 60 Index Futures | 3 | | Long | | Sep 2007 | 225 | |
| | SPI 200 Index Futures | 3 | | Long | | Sep 2007 | (5,817) | |
| | Topix Index Futures | 10 | | Long | | Sep 2007 | (143,864) | |
| |
| | | | | | | | ($262,879) | |
|
| Investment Quality Bond | U.S. Treasury 5-Year Note Futures | 74 | | Long | | Dec 2007 | ($3,659) | |
|
| | | | | | | | ($3,659) | |
421
John Hancock Funds II
Notes to Financial Statements
| | | | | | | | |
| SIGNIFICANT ACCOUNTING POLICIES, CONTINUED | | | | | | | |
| | | | | | | | Unrealized |
| Fund | Open Contracts | Number of Contracts | Position | | Expiration Date | Appreciation (Depreciation) |
|
| Mid Cap Index | S&P MidCap 400 Index Futures | 69 | | Long | | Sep 2007 | ($1,015,284) | |
|
| | | | | | | | ($1,015,284) | |
|
| Real Return Bond | 90-Day LIBOR Futures | 346 | | Long | | Mar 2008 | ($511,750) | |
| | 90-Day LIBOR Futures | 448 | | Long | | Jun 2008 | (413,237) | |
| | Euribor Futures | 53 | | Long | | Sep 2008 | 66,819 | |
| | Euribor Futures | 309 | | Long | | Dec 2008 | 240,064 | |
| | Euribor Futures | 53 | | Long | | Mar 2009 | 64,278 | |
| | Euribor Futures | 53 | | Long | | Jun 2009 | 61,943 | |
| | Eurodollar Futures | 333 | | Long | | Dec 2007 | (59,638) | |
| | Eurodollar Futures | 19 | | Long | | Mar 2008 | 26,363 | |
| | Eurodollar Futures | 468 | | Long | | Jun 2008 | 177,150 | |
| | Eurodollar Futures | 34 | | Long | | Sep 2008 | 42,475 | |
| | Eurodollar Futures | 58 | | Long | | Dec 2008 | 68,575 | |
| | Eurodollar Futures | 229 | | Long | | Mar 2009 | 308,900 | |
| | Eurodollar Futures | 76 | | Long | | Jun 2009 | 83,000 | |
| | Japan 10-Year Government Bond Futures | 3 | | Long | | Sep 2007 | 85,984 | |
| | Japan 10-Year Government Bond Futures | 4 | | Long | | Dec 2007 | (10,964) | |
| | Canada 10-Year Government Bond Futures | 27 | | Short | | Sep 2007 | (49,342) | |
| | Canada 10-Year Government Bond Futures | 24 | | Short | | Dec 2007 | 12,338 | |
| | U.S. Treasury 5-Year Note Futures | 133 | | Short | | Sep 2007 | (442,640) | |
| | U.S. Treasury 5-Year Note Futures | 445 | | Short | | Dec 2007 | 12,732 | |
| | U.S. Treasury 10-Year Note Futures | 322 | | Short | | Sep 2007 | (541,235) | |
| | U.S. Treasury 10-Year Note Futures | 699 | | Short | | Dec 2007 | (360,425) | |
| | U.S. Treasury 30-Year Bond Futures | 859 | | Short | | Dec 2007 | 52,203 | |
| |
| | | | | | | | ($1,086,407) | |
|
| Small Cap Index | Russell 2000 Index Futures | 17 | | Long | | Sep 2007 | $57,256 | |
| |
| | | | | | | | $57,256 | |
|
| Spectrum Income | U.S. Treasury 5-Year Note Futures | 24 | | Long | | Dec 2007 | ($188) | |
| | U.S. Treasury 10-Year Note Futures | 3 | | Long | | Dec 2007 | 1,575 | |
| | 10-Year Canada Government Bond Futures | 18 | | Short | | Dec 2007 | 18,066 | |
| | U.K. Treasury Bond Futures | 9 | | Short | | Dec 2007 | 2,360 | |
| | U.S. Treasury 2-Year Note Futures | 26 | | Short | | Dec 2007 | 6,755 | |
| | U.S. Treasury 10-Year Note Futures | 21 | | Short | | Dec 2007 | 3,652 | |
| |
| | | | | | | | $32,220 | |
|
| Strategic Bond | 3-Month Euribor Futures | 870 | | Long | | Sep 2007 | ($1,504,117) | |
| | 3-Month LIBOR Futures | 20 | | Long | | Sep 2007 | (26,106) | |
| | 3-Month LIBOR Futures | 34 | | Long | | Sep 2007 | (326) | |
| | 3-Month LIBOR Futures | 34 | | Long | | Sep 2007 | (58,975) | |
| | 3-Month LIBOR Futures | 90 | | Long | | Mar 2008 | 41,538 | |
| | 10-Year German Euro-BUND Futures | 8 | | Long | | Sep 2007 | 8,348 | |
| | Canadian Dollar Futures | 120 | | Long | | Sep 2007 | 69,930 | |
| | Euro Currency Futures | 41 | | Long | | Sep 2007 | 44,895 | |
| | Eurodollar Futures | 65 | | Long | | Sep 2007 | (52,975) | |
| | Eurodollar Futures | 166 | | Long | | Dec 2007 | 55,445 | |
| | Eurodollar Futures | 161 | | Long | | Mar 2008 | 239,608 | |
| | Australian Dollar Futures | 15 | | Short | | Sep 2007 | 32,510 | |
| | British Pound Futures | 18 | | Short | | Sep 2007 | (50,265) | |
| | U.S. Treasury 5-Year Note Futures | 11 | | Short | | Sep 2007 | 3,898 | |
| | U.S. Treasury 5-Year Note Futures | 365 | | Short | | Dec 2007 | (49,864) | |
| | U.S. Treasury 10-Year Note Futures | 105 | | Short | | Sep 2007 | (250,384) | |
| | U.S. Treasury 10-Year Note Futures | 387 | | Short | | Dec 2007 | (140,107) | |
| | U.S. Treasury 30-Year Bond Futures | 77 | | Short | | Dec 2007 | (54,752) | |
| |
| | | | | | | | ($1,691,699) | |
|
422
John Hancock Funds II
Notes to Financial Statements
| | | | | | | | |
| SIGNIFICANT ACCOUNTING POLICIES, CONTINUED | | | | | | | |
| | | | | | | | Unrealized |
| Fund | Open Contracts | Number of Contracts | Position | | Expiration Date | Appreciation (Depreciation) |
|
| Total Return | 90-Day LIBOR Futures | 112 | | Long | | Mar 2008 | $12,806 | |
| | 90-Day LIBOR Futures | 433 | | Long | | Jun 2008 | (264,156) | |
| | 90-Day LIBOR Futures | 473 | | Long | | Sep 2008 | (52,506) | |
| | 90-Day LIBOR Futures | 166 | | Long | | Dec 2008 | 80,166 | |
| | 90-Day LIBOR Futures | 254 | | Long | | Mar 2009 | 62,755 | |
| | 90-Day LIBOR Futures | 93 | | Long | | Jun 2009 | 29,697 | |
| | Euribor Futures | 307 | | Long | | Mar 2008 | (84,729) | |
| | Euribor Futures | 346 | | Long | | Jun 2008 | (107,767) | |
| | Euribor Futures | 277 | | Long | | Sep 2008 | 205,301 | |
| | Euribor Futures | 145 | | Long | | Dec 2008 | 9,486 | |
| | Euribor Futures | 28 | | Long | | Mar 2009 | 33,895 | |
| | Euribor Futures | 35 | | Long | | Jun 2009 | 39,027 | |
| | Eurodollar Futures | 3,377 | | Long | | Mar 2008 | 1,358,762 | |
| | Eurodollar Futures | 2,977 | | Long | | Jun 2008 | 1,400,450 | |
| | Eurodollar Futures | 1,354 | | Long | | Sep 2008 | 1,887,188 | |
| | Eurodollar Futures | 1,864 | | Long | | Dec 2008 | 2,521,213 | |
| | Eurodollar Futures | 86 | | Long | | Mar 2009 | 24,138 | |
| | Eurodollar Futures | 7 | | Long | | Jun 2009 | 10,675 | |
| | Euroyen Futures | 237 | | Long | | Dec 2007 | 44,837 | |
| | U.S. Treasury 10-Year Note Futures | 82 | | Short | | Sep 2007 | (126,281) | |
|
| | | | | | | | $7,084,957 | |
|
| U.S. Government Securities | Eurodollar Futures | 102 | | Long | | Jun 2008 | $65,790 | |
| | U.S. Treasury 2-Year Note Futures | 80 | | Long | | Dec 2007 | 11,225 | |
| | U.S. Treasury 5-Year Note Futures | 455 | | Long | | Dec 2007 | 184,381 | |
| | U.S. Treasury 10-Year Note Futures | 83 | | Short | | Sep 2007 | (203,697) | |
| | U.S. Treasury 10-Year Note Futures | 313 | | Short | | Dec 2007 | (132,479) | |
| | U.S. Treasury 30-Year Bond Futures | 9 | | Short | | Dec 2007 | (6,662) | |
| |
| | | | | | | | ($81,442) | |
|
| U.S. Multi Sector | S&P 500 Index Futures | 115 | | Long | | Sep 2007 | ($312,388) | |
| |
| | | | | | | | ($312,388) | |
|
Swap Contracts All Funds may enter into various forms of swap arrangement with counterparties with respect to interest rate swaps, currency swaps or credit default swaps as described below. Interest rate swaps involve the exchange of commitments to pay or receive interest of one instrument for that of another instrument (for example, an exchange of floating-rate payments for fixed-rate payments with respect to a notional principal amount). The Funds settle accrued net receivable or payable balances under the swap contracts on a periodic basis. Net upfront payments received (paid) by the Funds are included as part of unrealized appreciation/depreciation on the Statement of Operations. Net periodic payments received or paid by the Fund are included as part of realized gain or loss on the Statement of Operations. The Funds record changes in the value of the swaps as unrealized gains or losses on swap contracts.
Credit default swaps involve the exchange of a fixed-rate premium for protection against the loss in value of an underlying debt instrument in the event of a defined credit event (such as payment default or bankruptcy). Under the terms of the swap, one party acts as a “guarantor” receiving a periodic payment that is a fixed percentage applied to a notional principal amount. In return the party agrees to purchase the notional amount of the underlying instrument, at par, if a credit event occurs during the term of the swap. Certain Funds may enter into credit default swaps in which either it or its counterparty act as guarantors. By acting as the guarantor of a swap, a Fund assumes the market and credit risk of the underlying instrument, including liquidity and loss of value.
In a currency swap a Fund would agree with the other party to exchange cash flows based on the relative differences in values of a notional amount of two (or more) currencies.
Swap contracts are subject to risks related to the counterparty’s ability to perform under the contract and may decline in value if the counterparty’s creditworthiness deteriorates. The risks may arise from unanticipated movement in interest rates. The Fund may also suffer losses if it is unable to terminate outstanding swap contracts or reduce its exposure through offsetting transactions.
The Funds had the following interest rate swap contracts open at August 31, 2007:
| | | | | | | |
| | | | | | | | Unrealized |
| | | | | Payments Made | Payments Received | Termination | Appreciation |
| Fund | Counterparty | Notional Amount | Currency | By Fund | By Fund | Date | (Depreciation) |
|
| Global Bond | | | | | | | |
| | Bank of America N.A. | 207,800,000 | USD | 3 Month LIBOR | Fixed 5.00% | Jun 2009 | $632,896 |
| | Barclays Capital PLC | 10,910,000,000 | JPY | 6 Month LIBOR | Fixed 1.00% | Mar 2009 | (152,769) |
| | Barclays Capital PLC | 30,900,000 | EUR | 6 Month EURIBOR | Fixed 4.00% | Sep 2009 | (405,923) |
| | Barclays Capital PLC | 1,000,000 | GBP | 6 Month LIBOR | Fixed 5.00% | Sep 2010 | (61,990) |
| | Barclays Capital PLC | 14,400,000 | EUR | Fixed 4.00% | 6 Month EURIBOR | Dec 2014 | 687,671 |
423
John Hancock Funds II
Notes to Financial Statements
SIGNIFICANT ACCOUNTING POLICIES, CONTINUED
| | | | | | | |
| | | | | | | | Unrealized |
| | | | | Payments Made | Payments Received | Termination | Appreciation |
| Fund | Counterparty | Notional Amount | Currency | By Fund | By Fund | Date | (Depreciation) |
|
| | Barclays Capital PLC | 2,700,000 | GBP | 6 Month LIBOR | Fixed 5.00% | Sep 2015 | ($265,613) |
| | Barclays Capital PLC | 12,700,000 | GBP | Fixed 4.50% | 6 Month LIBOR | Sep 2017 | 171,161 |
| | Barclays Capital PLC | 23,700,000 | USD | Fixed 5.00% | 3 Month LIBOR | Dec 2017 | 414,828 |
| | Barclays Capital PLC | 1,130,000,000 | JPY | Fixed 2.50% | 6 Month LIBOR | Dec 2027 | (284,653) |
| | Barclays Capital PLC | 14,000,000 | GBP | Fixed 4.00% | 6 Month LIBOR | Dec 2035 | 1,114,871 |
| | Citibank N.A. | 25,100,000 | USD | 3 Month LIBOR | Fixed 5.00% | Dec 2012 | 63,704 |
| | Citibank N.A. | 2,000,000 | CAD | Fixed 5.00% | 3 Month BA-CDOR | Jun 2015 | (9,892) |
| | Citibank N.A. | 2,200,000 | GBP | 6 Month LIBOR | Fixed 5.00% | Sep 2015 | (216,425) |
| | Citibank N.A. | 5,500,000 | MXN | 28-day Mexico Interbank TIIE Banxico | Fixed 8.72% | Sep 2016 | 12,823 |
| | Citibank N.A. | 13,500,000 | MXN | 28-day Mexico Interbank TIIE Banxico | Fixed 8.90% | Sep 2016 | 46,277 |
| | Citibank N.A. | 9,000,000 | MXN | 28-day Mexico Interbank TIIE Banxico | Fixed 8.84% | Sep 2016 | 27,780 |
| | Citibank N.A. | 34,800,000 | MXN | 28-day Mexico Interbank TIIE Banxico | Fixed 8.17% | Nov 2016 | (32,017) |
| | Credit Suisse International | 23,500,000 | EUR | 6 Month EURIBOR | Fixed 5.00% | Sep 2012 | 649,129 |
| | Credit Suisse International | 1,000,000 | EUR | 6 Month EURIBOR | Fixed 6.00% | Jun 2034 | 129,971 |
| | Deutsche Bank AG | 5,500,000 | USD | CMS | Floating 0.288% | Dec 2007 | 143,200 |
| | Deutsche Bank AG | 19,490,000,000 | JPY | 6 Month LIBOR | Fixed 1.00% | Sep 2008 | 159,608 |
| | Deutsche Bank AG | 47,300,000,000 | JPY | 6 Month LIBOR | Fixed 1.00% | Mar 2009 | (662,327) |
| | Deutsche Bank AG | 14,500,000 | GBP | 6 Month LIBOR | Fixed 5.00% | Jun 2009 | (580,051) |
| | Deutsche Bank AG | 111,200,000 | USD | 3 Month LIBOR | Fixed 5.00% | Jun 2009 | 338,682 |
| | Deutsche Bank AG | 68,100,000 | AUD | 6 Month BBR-BBSW | Fixed 7.00% | Jun 2010 | 113,955 |
| | Deutsche Bank AG | 6,600,000 | GBP | 6 Month LIBOR | Fixed 5.00% | Sep 2010 | (408,105) |
| | Deutsche Bank AG | 5,000,000,000 | JPY | Fixed 1.50% | 6 Month LIBOR | Mar 2011 | (82,782) |
| | Deutsche Bank AG | 14,600,000 | EUR | Fixed 4.00% | 6 Month EURIBOR | Dec 2011 | 410,680 |
| | Deutsche Bank AG | 1,540,000,000 | JPY | 6 Month LIBOR | Fixed 1.50% | Jun 2012 | 98,111 |
| | Deutsche Bank AG | 46,700,000 | USD | 3 Month LIBOR | Fixed 5.00% | Dec 2012 | 118,525 |
| | Deutsche Bank AG | 25,300,000 | EUR | Fixed 4.00% | 6 Month EURIBOR | Dec 2014 | 1,208,227 |
| | Deutsche Bank AG | 20,100,000 | USD | Fixed 5.00% | 3 Month LIBOR | Dec 2014 | 90,430 |
| | Deutsche Bank AG | 1,100,000 | GBP | 6 Month LIBOR | Fixed 5.00% | Sep 2015 | (108,213) |
| | Deutsche Bank AG | 8,300,000 | USD | Fixed 5.00% | 3 Month LIBOR | Dec 2017 | 144,749 |
| | Deutsche Bank AG | 450,000,000 | JPY | 6 Month LIBOR | Fixed 3.00% | Jun 2027 | 27,672 |
| | Deutsche Bank AG | 1,400,000 | GBP | Fixed 4.00% | 6 Month LIBOR | Dec 2035 | 111,487 |
| | Deutsche Bank AG | 2,300,000 | GBP | Fixed 4.10% | 6 Month LIBOR | Jun 2036 | 644,154 |
| | Deutsche Bank AG | 20,400,000 | EUR | Fixed 5.00% | 6 Month EURIBOR | Mar 2038 | (854,059) |
| | HSBC Bank USA | 18,200,000 | AUD | 6 Month BBR-BBSW | Fixed 6.00% | Jun 2012 | (518,627) |
| | HSBC Bank USA | 13,400,000 | EUR | Fixed 4.00% | 6 Month EURIBOR | Dec 2014 | 639,930 |
| | HSBC Bank USA | 600,000 | GBP | 6 Month LIBOR | Fixed 5.00% | Sep 2015 | (59,025) |
| | HSBC Bank USA | 10,500,000 | AUD | Fixed 6.00% | 6 Month BBR-BBSW | Jun 2017 | 385,965 |
| | HSBC Bank USA | 1,100,000 | GBP | Fixed 4.00% | 6 Month LIBOR | Dec 2035 | 87,767 |
| | JP Morgan Chase Bank | 27,600,000 | EUR | Fixed 4.00% | 6 Month EURIBOR | Dec 2011 | 775,796 |
| | JP Morgan Chase Bank | 2,700,000 | GBP | 6 Month LIBOR | Fixed 5.00% | Sep 2015 | (265,387) |
| | JP Morgan Chase Bank | 2,000,000 | MXN | 28-day Mexico Interbank TIIE Banxico | Fixed 8.84% | Sep 2016 | 6,145 |
| | Lehman Brothers Special Financing, Inc. | 19,800,000 | EUR | Fixed 4.00% | 6 Month EURIBOR | Dec 2014 | 945,569 |
| | Lehman Brothers Special Financing, Inc. | 4,800,000 | USD | Fixed 5.00% | 3 Month LIBOR | Dec 2017 | 84,016 |
| | Lehman Brothers Special Financing, Inc. | 5,300,000 | EUR | 6 Month EURIBOR | Fixed 6.00% | Jun 2034 | 688,847 |
| | Merrill Lynch Capital Services, Inc. | 9,400,000 | GBP | 6 Month LIBOR | Fixed 5.00% | Sep 2010 | (580,677) |
| | Merrill Lynch Capital Services, Inc. | 31,100,000 | CAD | Fixed 5.00% | 3 Month BA-CDOR | Jun 2017 | (54,084) |
| | Merrill Lynch Capital Services, Inc. | 11,000,000 | MXN | 28-day Mexico Interbank TIIE Banxico | Fixed 8.72% | Sep 2016 | 25,685 |
| | Morgan Stanley Capital Services, Inc. | 2,700,000,000 | JPY | 6 Month LIBOR | Fixed 1.00% | Sep 2008 | 22,111 |
| | Morgan Stanley Capital Services, Inc. | 2,130,000,000 | JPY | 6 Month LIBOR | Fixed 1.00% | Mar 2009 | (29,826) |
| | Morgan Stanley Capital Services, Inc. | 123,900,000 | EUR | 6 Month EURIBOR | Fixed 4.00% | Sep 2009 | (1,627,635) |
| | Morgan Stanley Capital Services, Inc. | 22,100,000 | GBP | 6 Month LIBOR | Fixed 5.00% | Sep 2010 | (1,564,370) |
| | Morgan Stanley Capital Services, Inc. | 5,900,000,000 | JPY | Fixed 1.50% | 6 Month LIBOR | Dec 2010 | (536,477) |
| | Morgan Stanley Capital Services, Inc. | 1,070,000,000 | JPY | Fixed 1.50% | 6 Month LIBOR | Mar 2011 | (18,072) |
| | Morgan Stanley Capital Services, Inc. | 1,500,000 | EUR | Fixed 4.00% | 6 Month EURIBOR | Dec 2011 | 42,163 |
| | Morgan Stanley Capital Services, Inc. | 1,220,000,000 | JPY | 6 Month LIBOR | Fixed 1.50% | Jun 2012 | 77,725 |
| | Morgan Stanley Capital Services, Inc. | 4,100,000,000 | JPY | Fixed 2.00% | 6 Month LIBOR | Dec 2013 | (1,138,683) |
| | Morgan Stanley Capital Services, Inc. | 1,300,000,000 | JPY | Fixed 1.98% | 6 Month LIBOR | Sep 2016 | (283,771) |
| | Morgan Stanley Capital Services, Inc. | 2,000,000 | EUR | Fixed 4.00% | 6 Month EURIBOR | Jun 2017 | 135,272 |
| | Morgan Stanley Capital Services, Inc. | 13,800,000 | USD | Fixed 5.00% | 3 Month LIBOR | Dec 2017 | 241,546 |
| | Morgan Stanley Capital Services, Inc. | 13,700,000 | EUR | 6 Month EURIBOR | Fixed 6.00% | Jun 2034 | 1,780,605 |
| | Morgan Stanley Capital Services, Inc. | 700,000 | GBP | Fixed 4.00% | 6 Month LIBOR | Dec 2035 | 55,695 |
424
John Hancock Funds II
Notes to Financial Statements
SIGNIFICANT ACCOUNTING POLICIES, CONTINUED
| | | | | | | |
| | | | | | | | Unrealized |
| | | | | Payments Made | Payments Received | Termination | Appreciation |
| Fund | Counterparty | Notional Amount | Currency | By Fund | By Fund | Date | (Depreciation) |
|
| | The Royal Bank of Scotland PLC | 15,900,000 | USD | 3 Month LIBOR | Fixed 5.00% | Dec 2012 | $40,354 |
| | The Royal Bank of Scotland PLC | 10,900,000 | USD | Fixed 5.00% | 3 Month LIBOR | Dec 2014 | 49,039 |
| | The Royal Bank of Scotland PLC | 6,500,000 | GBP | 6 Month LIBOR | Fixed 5.00% | Sep 2015 | (639,437) |
| | The Royal Bank of Scotland PLC | 60,000,000 | USD | Fixed 5.00% | 3 Month LIBOR | Dec 2017 | 1,050,198 |
| | UBS AG | 9,740,000,000 | JPY | 6 Month LIBOR | Fixed 1.00% | Sep 2008 | 78,132 |
| | UBS AG | 23,310,000,000 | JPY | 6 Month LIBOR | Fixed 1.00% | Mar 2009 | (326,402) |
| | UBS AG | 9,000,000,000 | JPY | Fixed 1.50% | 6 Month LIBOR | Mar 2011 | (149,007) |
| | UBS AG | 2,200,000,000 | JPY | 6 Month LIBOR | Fixed 1.50% | Jun 2012 | 140,158 |
| | UBS AG | 1,090,000,000 | JPY | Fixed 2.00% | 6 Month LIBOR | Dec 2013 | (292,839) |
| | UBS AG | 460,000,000 | JPY | 6 Month LIBOR | Fixed 3.00% | Jun 2027 | 28,287 |
|
| | | | | | | | $2,732,458 |
| |
| Real Return Bond | | | | | | | |
| | Bank of America | 2,000,000 | CAD | Fixed 5.50% | 3 Month BA-CDOR | Jun 2017 | ($10,964) |
| | Barclays Capital PLC | 11,800,000 | GBP | 6 Month LIBOR | Fixed 5.00% | Jun 2009 | (441,269) |
| | Barclays Capital PLC | 12,900,000 | AUD | 6 Month BBSW | Fixed 7.00% | Dec 2009 | 11,292 |
| | Barclays Capital PLC | 13,709,159 | BRL | CDI | Fixed 10.68% | Jan 2012 | (341,008) |
| | Barclays Capital PLC | 10,500,000 | USD | Fixed 5.00% | 3 Month LIBOR | Dec 2014 | 42,865 |
| | Barclays Capital PLC | 5,500,000 | EUR | FRCPXTOB | Fixed 2.1375% | Jan 2016 | 57,307 |
| | Barclays Capital PLC | 10,000,000 | MXN | 28-day Mexico Interbank TIIE Banxico | Fixed 8.72% | Sep 2016 | 24,210 |
| | Barclays Capital PLC | 1,430,000,000 | JPY | Fixed 2.00% | 6 Month LIBOR | Dec 2016 | (214,213) |
| | Barclays Capital PLC | 1,600,000 | AUD | Fixed 6.75% | 6 Month BBSW | Dec 2017 | 11,743 |
| | Barclays Capital PLC | 100,000 | EUR | Fixed 5.00% | 6 Month EURIBOR | Mar 2018 | (3,639) |
| | Barclays Capital PLC | 4,500,000 | GBP | Fixed 5.00% | 6 Month LIBOR | Mar 2018 | 357,683 |
| | Barclays Capital PLC | 2,300,000 | USD | 3 Month LIBOR | Fixed 5.0% | Dec 2009 | 10,136 |
| | Barclays Capital PLC | 900,000 | EUR | FRCPXTOB | Fixed 1.9475% | Mar 2012 | (8,481) |
| | Barclays Capital PLC | 700,000 | EUR | FRCPXTOB | Fixed 1.98% | Apr 2012 | (3,588) |
| | Barclays Capital PLC | 8,600,000 | MXN | 28-day Mexico Interbank TIIE Banxico | Fixed 8.33% | Feb 2017 | 99 |
| | Barclays Capital PLC | 4,200,000 | GBP | Fixed 4.00% | 6 Month LIBOR | Dec 2035 | 334,461 |
| | Barclays Capital PLC | 200,000 | EUR | FRCPXTOB | Fixed 1.96% | Apr 2012 | (950) |
| | BNP Paribas | 2,200,000 | EUR | FRCPXTOB | Fixed 2.04% | Feb 2011 | 28,628 |
| | BNP Paribas | 1,400,000 | EUR | FRCPXTOB | Fixed 1.9825% | Mar 2012 | (2,461) |
| | BNP Paribas | 3,600,000 | EUR | FRCPXTOB | Fixed 1.9875% | Dec 2011 | 2,257 |
| | Citibank N.A. | 3,500,000 | AUD | 6 Month BBSW | Fixed 6.50% | Jan 2010 | (19,606) |
| | Citibank N.A. | 98,200,000 | MXN | 28-day Mexico Interbank TIIE Banxico | Fixed 8.17% | Nov 2016 | (90,458) |
| | Credit Suisse International | 5,600,000 | GBP | 6 Month LIBOR | Fixed 5.00% | Sep 2010 | (352,894) |
| | Credit Suisse International | 2,200,000 | GBP | Fixed 4.00% | 6 Month LIBOR | Dec 2035 | 175,041 |
| | Deutsche Bank | 7,100,000 | USD | Fixed 5.00% | 3 Month LIBOR | Dec 2026 | 373,847 |
| | Deutsche Bank AG | 13,800,000 | AUD | 6 Month BBR-BBSW | Fixed 6.50% | Jan 2010 | (71,697) |
| | Deutsche Bank AG | 50,000,000 | AUD | 6 Month BBR-BBSW | Fixed 7.00% | Jun 2010 | 83,668 |
| | Deutsche Bank AG | 7,500,000 | USD | Fixed 5.00% | 3 Month LIBOR | Dec 2012 | (19,035) |
| | Deutsche Bank AG | 3,100,000 | USD | Fixed 5.00% | 3 Month LIBOR | Dec 2014 | 40,641 |
| | Deutsche Bank AG | 220,000,000 | JPY | Fixed 2.00% | 6 Month LIBOR | Dec 2016 | (32,956) |
| | Deutsche Bank AG | 3,700,000 | USD | 3 Month LIBOR | Fixed 5.00% | Dec 2017 | (64,762) |
| | Deutsche Bank AG | 6,700,000 | USD | Fixed 5.00% | 3 Month LIBOR | Dec 2021 | 246,125 |
| | Goldman Sachs Capital Markets, L.P. | 2,400,000 | USD | 3 Month LIBOR | Fixed 5.00% | Dec 2009 | 10,577 |
| | Goldman Sachs Capital Markets, L.P. | 31,600,000 | MXN | 28-day Mexico Interbank TIIE Banxico | Fixed 8.17% | Nov 2016 | (29,109) |
| | Goldman Sachs Capital Markets, L.P. | 10,800,000 | EUR | FRCPXTOB | Fixed 1.995% | Mar 2012 | (4,148) |
| | Goldman Sachs Capital Markets, L.P. | 500,000 | EUR | FRCPXTOB | Fixed 1.96% | Mar 2012 | (1,985) |
| | Goldman Sachs Capital Markets, L.P. | 230,000,000 | JPY | Fixed 2.00% | 6 Month LIBOR | Dec 2016 | (34,454) |
| | Goldman Sachs Capital Markets, L.P. | 1,300,000 | EUR | FRCPXTOB | Fixed 1.97625% | Dec 2011 | 177 |
| | Goldman Sachs Capital Markets, L.P. | 3,200,000 | GBP | Fixed 5.00% | 6 Month LIBOR | Sep 2015 | 318,218 |
| | HSBC Bank USA | 1,500,000 | GBP | Fixed 4.25% | 6 Month LIBOR | Jun 2036 | 333,064 |
| | JP Morgan Chase Bank | 2,300,000 | AUD | 6 Month BBSW | Fixed 6.50% | Jan 2010 | (11,015) |
| | JP Morgan Chase Bank | 2,700,000 | EUR | FRCPXTOB | Fixed 2.0275% | Oct 2011 | 24,583 |
| | JP Morgan Chase Bank | 2,800,000 | EUR | FRCPXTOB | Fixed 1.9725% | Dec 2011 | (4,957) |
| | JP Morgan Chase Bank | 1,500,000 | EUR | FRCPXTOB | Fixed 2.3525% | Oct 2016 | 4,711 |
| | Merrill Lynch Capital Services, Inc. | 50,200,000 | MXN | 28-day Mexico Interbank TIIE Banxico | Fixed 8.17% | Nov 2016 | (46,244) |
| | Morgan Stanley Capital Services, Inc. | 2,700,000,000 | JPY | 6 Month LIBOR | Fixed 1.00% | Mar 2009 | (37,807) |
| | Morgan Stanley Capital Services, Inc. | 13,600,000 | AUD | 6 Month BBSW | Fixed 7.00% | Dec 2009 | 11,905 |
| | Morgan Stanley Capital Services, Inc. | 2,500,729 | BRL | CDI | Fixed 10.115% | Jan 2012 | (93,422) |
425
John Hancock Funds II
Notes to Financial Statements
SIGNIFICANT ACCOUNTING POLICIES, CONTINUED
| | | | | | | |
| | | | | | | | Unrealized |
| | | | | Payments Made | Payments Received Termination Appreciation |
| Fund | Counterparty | Notional Amount | Currency | By Fund | By Fund | Date | (Depreciation) |
|
| | Morgan Stanley Capital Services, Inc. | 20,000,000 | MXN | 28-day Mexico Interbank TIIE Banxico | Fixed 8.17% | Nov 2016 | ($18,424) |
| | Morgan Stanley Capital Services, Inc. | 1,700,000 | AUD | Fixed 6.75% | 6 Month BBSW | Dec 2017 | 12,477 |
| | Morgan Stanley Capital Services, Inc. | 2,300,000 | USD | 3 Month LIBOR | Fixed 5.00% | Dec 2037 | (152,393) |
| | Royal Bank of Canada | 1,400,000 | AUD | 6 Month BBSW | Fixed 6.50% | Jan 2010 | (7,842) |
| | The Royal Bank of Scotland PLC | 13,200,000 | USD | Fixed 5.00% | 3 Month LIBOR | Dec 2017 | 231,044 |
| | The Royal Bank of Scotland PLC | 6,600,000 | GBP | 6 Month LIBOR | Fixed 5.00% | Sep 2010 | (415,542) |
| | The Royal Bank of Scotland PLC | 300,000 | EUR | FRCPXTOB | Fixed 1.95% | Mar 2012 | (1,381) |
| | The Royal Bank of Scotland PLC | 1,000,000 | EUR | FRCPXTOB | Fixed 1.95% | Mar 2012 | (5,117) |
| | The Royal Bank of Scotland PLC | 9,900,000 | USD | Fixed 5.00% | 3 Month LIBOR | Dec 2012 | (25,126) |
| | The Royal Bank of Scotland PLC | 6,300,000 | CAD | Fixed 5.50% | 3 Month BA-CDOR | Jun 2017 | (34,539) |
| | UBS AG | 14,799,828 | BRL | CDI | Fixed 10.575% | Jan 2012 | (395,011) |
| | UBS AG | 2,600,000 | USD | Fixed 5.00% | 3 Month LIBOR | Dec 2017 | 45,509 |
| | UBS AG | 126,000,000 | USD | 3 Month LIBOR | Fixed 5.00% | Jun 2009 | 383,758 |
| | UBS AG | 2,300,000 | EUR | FRCPXTOB | Fixed 2.095% | Oct 2011 | 37,179 |
| | UBS AG | 1,600,000 | EUR | FRCPXTOB | Fixed 2.35% | Oct 2016 | 3,594 |
| | UBS AG | 1,600,000 | EUR | Fixed 2.275% | CPTFEMU | Oct 2016 | 7,285 |
|
| | | | | | | | $227,587 |
| |
| Spectrum Income | | | | | | | |
| | J.P. Morgan Chase | 810,000,000 | KRW | 6 Month Libor | Fixed 5.290% | June 2012 | $925 |
| | J.P. Morgan Chase | 232,000,000 | KRW | 6 Month Libor | Fixed 5.060% | June 2012 | (2,244) |
| | State Street Corp. | 593,000,000 | KRW | 6 Month Libor | Fixed 5.200% | June 2012 | (1,819) |
| | State Street Corp. | 592,000,000 | KRW | 6 Month Libor | Fixed 5.180% | June 2012 | (2,372) |
|
| | | | | | | | ($5,510) |
| |
| Total Return | | | | | | | |
| | Bank of America | 3,500,000 | USD | Fixed 5.00% | 3 Month LIBOR | Dec 2014 | $15,747 |
| | Bank of America | 1,600,000 | USD | 3 Month LIBOR | Fixed 5.00% | Dec 2017 | (28,005) |
| | Barclays Capital PLC | 9,700,000 | GBP | 6 Month LIBOR | Fixed 6.00% | Dec 2008 | (27,034) |
| | Barclays Capital PLC | 520,000,000 | JPY | 6 Month LIBOR | Fixed 1.00% | Mar 2009 | (7,281) |
| | Barclays Capital PLC | 5,400,000 | GBP | 6 Month LIBOR | Fixed 6.00% | Mar 2009 | (3,768) |
| | Barclays Capital PLC | 5,800,000 | GBP | 6 Month LIBOR | Fixed 5.00% | Jun 2009 | (207,023) |
| | Barclays Capital PLC | 5,131,099 | BRL | CDI | Fixed 11.36% | Jan 2010 | (34,183) |
| | Barclays Capital PLC | 500,000 | EUR | FRCPXTOB | Fixed 1.96% | Apr 2012 | (2,375) |
| | Barclays Capital PLC | 1,200,000 | GBP | Fixed 4.00% | 6 Month LIBOR | Dec 2036 | 367,800 |
| | Citibank N.A. | 4,200,000 | USD | Fixed 5.00% | 3 Month LIBOR | Dec 2012 | (10,660) |
| | Citibank N.A. | 4,700,000 | MXN | 28-day Mexico Interbank TIIE Banxico | Fixed 8.17% | Nov 2016 | (4,328) |
| | Credit Suisse International | 1,100,000 | GBP | 6 Month LIBOR | Fixed 5.00% | Jun 2009 | (15,495) |
| | Deutsche Bank | 3,720,000,000 | JPY | 6 Month LIBOR | Fixed 1.00% | Sep 2008 | 30,464 |
| | Deutsche Bank | 5,800,000 | GBP | 6 Month LIBOR | Fixed 6.00% | Dec 2008 | (16,165) |
| | Deutsche Bank | 830,000,000 | JPY | 6 Month LIBOR | Fixed 1.00% | Mar 2009 | (11,622) |
| | Deutsche Bank | 10,600,000 | EUR | 6 Month EURIBOR | Fixed 5.00% | Dec 2009 | 141,490 |
| | Deutsche Bank | 7,400,000 | EUR | Fixed 4.00% | 6 Month EURIBOR | Dec 2011 | 186,732 |
| | Deutsche Bank | 4,000,000 | USD | Fixed 5.00% | 3 Month LIBOR | Dec 2014 | 17,996 |
| | Deutsche Bank | 2,500,000 | EUR | Fixed 5.00% | 6 Month EURIBOR | Dec 2017 | (93,707) |
| | Deutsche Bank | 4,300,000 | GBP | Fixed 4.00% | 6 Month LIBOR | Dec 2036 | 1,317,885 |
| | HSBC Bank USA | 2,100,000 | GBP | Fixed 4.00% | 6 Month LIBOR | Dec 2036 | 643,522 |
| | Merrill Lynch Capital Services, Inc. | 1,729,771 | BRL | CDI | Fixed 12.948% | Jan 2010 | 19,572 |
| | Merrill Lynch Capital Services, Inc. | 4,731,201 | BRL | CDI | Fixed 11.43% | Jan 2010 | (27,654) |
| | Merrill Lynch Capital Services, Inc. | 4,710,857 | BRL | CDI | Fixed 11.98% | Jan 2012 | 6,673 |
| | Merrill Lynch Capital Services, Inc. | 400,000 | GBP | Fixed 4.00% | 6 Month LIBOR | Dec 2035 | 31,853 |
| | Morgan Stanley Capital Services, Inc. | 4,226,484 | BRL | CDI | Fixed 12.78% | Jan 2010 | 37,340 |
| | Morgan Stanley Capital Services, Inc. | 5,800,000 | USD | Fixed 5.00% | 3 Month LIBOR | Dec 2012 | (14,720) |
| | Morgan Stanley Capital Services, Inc. | 7,500,000 | USD | 3 Month LIBOR | Fixed 5.00% | Dec 2037 | (496,933) |
| | Royal Bank of Scotland | 5,100,000 | GBP | 6 Month LIBOR | Fixed 6.00% | Mar 2009 | (3,559) |
| | Royal Bank of Scotland | 2,000,000 | EUR | FRCPXTOB | Fixed 1.95% | Mar 2012 | (9,205) |
| | Royal Bank of Scotland | 3,400,000 | EUR | FRCPXTOB | Fixed 1.95% | Mar 2012 | (17,399) |
| | Royal Bank of Scotland | 12,700,000 | USD | Fixed 5.00% | 3 Month LIBOR | Dec 2012 | (32,233) |
| | Royal Bank of Scotland | 3,500,000 | USD | Fixed 5.00% | 3 Month LIBOR | Dec 2014 | 15,747 |
| | Royal Bank of Scotland | 12,200,000 | USD | 3 Month LIBOR | Fixed 5.00% | Dec 2017 | (213,540) |
426
John Hancock Funds II
Notes to Financial Statements
SIGNIFICANT ACCOUNTING POLICIES, CONTINUED
| | | | | | | |
| | | | | | | | Unrealized |
| | | | | Payments Made | Payments Received | Termination | Appreciation |
| Fund | Counterparty | Notional Amount | Currency | By Fund | By Fund | Date | (Depreciation) |
|
| | Royal Bank of Scotland | 3,300,000 | GBP | Fixed 4.00% | 6 Month LIBOR | Dec 2036 | $1,011,322 |
| | Royal Bank of Scotland | 14,700,000 | USD | 3 Month LIBOR | Fixed 5.00% | Dec 2037 | (973,988) |
| | UBS AG | 8,800,000,000 | JPY | 3 Month LIBOR | Fixed 1.00% | Mar 2008 | 51,310 |
| | UBS AG | 270,000,000 | JPY | 6 Month LIBOR | Fixed 1.00% | Sep 2008 | 2,166 |
| | UBS AG | 7,420,000,000 | JPY | 6 Month LIBOR | Fixed 1.00% | Mar 2009 | (103,900) |
| | UBS AG | 7,109,088 | BRL | CDI | Fixed 10.575% | Jan 2012 | (189,743) |
|
| | | | | | | | $1,353,099 |
The Funds had the following cross-currency swap contracts open at August 31, 2007:
| | | | | | | |
| | | | | | Notional Amount | Notional Amount | Unrealized |
| | | | | | of Currency | of Currency | Appreciation |
| Fund | Counterparty | Receive | Pay * | Expiration Date | Received | Delivered | (Depreciation) |
|
| Global Bond | UBS AG | Floating rate equal to | Floating rate equal to | | | | |
| | | 3 Month JPY-LIBOR | 3 Month USD-LIBOR | | | | |
| | | based on the | based on the | | | | |
| | | notional amount of | notional amount of | | | | |
| | | currency delivered | the currency received | Sep 2009 | $279,000,000 | JPY 32,922,000,000 | $5,338,050 |
* At the expiration date, the notional amount of the currency received will be exchanged back for the notional amount of the currency delivered.
The Funds had the following credit default swap contracts open at August 31, 2007:
| | | | | | | | | |
| | | | | | | | | | Unrealized |
| | | | | Notional | | Buy/Sell | (Pay)/Received | Termination | Appreciation |
| Fund | Counterparty | | Issuer | Amount | Currency | Protection† | Fixed Rate | Date | (Depreciation) |
|
| Global Bond | | | | | | | | |
| | Bank of America N.A. | | D.R. Horton, Inc. | 800,000 | USD | Buy | (0.890)% | Jun 2011 | $63,063 |
| | Bank of America N.A. | | Consumers Energy Company | 900,000 | USD | Buy | (0.090)% | Mar 2012 | 6,437 |
| | Bank of America N.A. | | GlobalSantafe Corporation | 1,100,000 | USD | Buy | (0.455)% | Jun 2012 | (15,119) |
| | Bank of America N.A. | | GlobalSantafe Corporation | 300,000 | USD | Buy | (0.462)% | Jun 2012 | (4,234) |
| | Bank of America N.A. | | Loews Corporation | 300,000 | USD | Buy | (0.120)% | Jun 2012 | 2,008 |
| | Bank of America N.A. | | Nabors Industries, Inc. | 500,000 | USD | Buy | (0.452)% | Jun 2012 | (3,125) |
| | Bank of America N.A. | | Nabors Industries, Inc. | 300,000 | USD | Buy | (0.459)% | Jun 2012 | (1,896) |
| | Bank of America N.A. | | Noble Corporation | 300,000 | USD | Buy | (0.542)% | Jun 2012 | (2,048) |
| | Bank of America N.A. | | CDX.NA.IG.7 | 5,600,000 | USD | Buy | (0.650)% | Dec 2016 | 94,908 |
| | Bank of America N.A. | | Autozone, Inc. | 1,000,000 | USD | Buy | (0.600)% | Jun 2017 | 10,440 |
| | Bank of America N.A. | | CDX.NA.IG.8 | 7,200,000 | USD | Buy | (0.600)% | Jun 2017 | 152,886 |
| | Bank of America N.A. | | D.R. Horton, Inc. | 300,000 | USD | Buy | (1.600)% | Jun 2017 | 38,304 |
| | Bank of America N.A. | | Diamond Offshore Drilling, Inc. | 1,300,000 | USD | Buy | (0.482)% | Jun 2017 | (453) |
| | Bank of America N.A. | | Pulte Homes, Inc. | 300,000 | USD | Buy | (1.630)% | Jun 2017 | 37,818 |
| | Bank of America N.A. | | Transocean | 500,000 | USD | Buy | (0.539)% | Jun 2017 | 3,712 |
| | Barclays Capital PLC | | XL Capital LTD | 700,000 | USD | Buy | (0.310)% | Mar 2012 | 9,578 |
| | Barclays Capital PLC | | American Electric Power Compay, Inc. | 500,000 | USD | Buy | (0.100)% | Jun 2012 | 6,944 |
| | Barclays Capital PLC | | CDX.NA.HY.8 | 3,000,000 | USD | Sell | 0.483 % | Jun 2012 | (46,026) |
| | Barclays Capital PLC | | CDX.NA.HY.8 | 800,000 | USD | Buy | (2.750)% | Jun 2012 | 35,541 |
| | Barclays Capital PLC | | CDX.NA.HY.8 | 1,600,000 | USD | Sell | 2.750 % | Jun 2012 | (71,082) |
| | Barclays Capital PLC | | Noble Corporation | 200,000 | USD | Buy | (0.530)% | Jun 2012 | (1,199) |
| | Barclays Capital PLC | | Wyeth | 800,000 | USD | Buy | (0.100)% | Jun 2012 | 6,223 |
| | Barclays Capital PLC | | CDX.NA.IG.7 | 900,000 | USD | Buy | (0.650)% | Dec 2016 | 15,253 |
| | Barclays Capital PLC | | Dow Jones iTraxx Eurpo HI4 | 1,900,000 | EUR | Buy | (0.850)% | Dec 2016 | 5,729 |
| | Barclays Capital PLC | | CDX.NA.IG.8 | 5,000,000 | USD | Buy | (0.600)% | Jun 2017 | 106,206 |
| | Barclays Capital PLC | | CDX.NA.IG.8 | 22,100,000 | USD | Buy | (0.600)% | Jun 2017 | 435,175 |
| | Barclays Capital PLC | | Diamond Offshore Drilling, Inc. | 300,000 | USD | Buy | (0.470)% | Jun 2017 | 239 |
| | Bear Stearns International, LTD. | | CNA Financial Corporation | 500,000 | USD | Buy | (0.440)% | Sep 2011 | 3,751 |
| | Bear Stearns International, LTD. | | H.J. Heinz Finance Corporation | 600,000 | USD | Buy | (0.370)% | Mar 2012 | (2,111) |
| | Bear Stearns International, LTD. | | Diamond Offshore Drilling, Inc. | 300,000 | USD | Buy | (0.230)% | Jun 2012 | (18) |
| | Bear Stearns International, LTD. | | Weyerhaeuser Company | 2,000,000 | USD | Buy | (0.550)% | Jun 2012 | 12,246 |
| | Bear Stearns International, LTD. | | Nisource Finance Corporation | 200,000 | USD | Buy | (0.620)% | Sep 2014 | 1,039 |
| | Bear Stearns International, LTD. | | Loews Corporation | 200,000 | USD | Buy | (0.330)% | Mar 2016 | 1,371 |
| | Bear Stearns International, LTD. | | CDX.NA.IG.8 | 27,000,000 | USD | Buy | (0.600)% | Jun 2017 | 573,326 |
427
John Hancock Funds II
Notes to Financial Statements
SIGNIFICANT ACCOUNTING POLICIES, CONTINUED
| | | | | | | | | |
| | | | | | | | | | Unrealized |
| | | | | Notional | | Buy/Sell | (Pay)/Received | Termination | Appreciation |
| Fund | Counterparty | | Issuer | Amount | Currency | Protection† | Fixed Rate | Date | (Depreciation) |
|
| | BNP Paribas | | Dow Jones iTraxx Eurpo HI4 | 1,500,000 | EUR | Buy | (0.850)% | Dec 2016 | $4,523 |
| | Citibank N.A. | | Newell Rubbermaid, Inc. | 600,000 | USD | Buy | (0.130)% | Jun 2010 | 1,408 |
| | Citibank N.A. | | Sara Lee Corporation | 500,000 | USD | Buy | (0.330)% | Sep 2011 | (1,438) |
| | Citibank N.A. | | CDX.NA.HY.8 | 800,000 | USD | Sell | 3.297 % | Jun 2012 | 38,885 |
| | Citibank N.A. | | CDX.NA.HY.8 | 5,000,000 | USD | Sell | 1.106 % | Jun 2012 | 75,890 |
| | Citibank N.A. | | CDX.NA.HY.8 25-35% | 7,500,000 | USD | Sell | 2.170 % | Jun 2012 | (8,328) |
| | Citibank N.A. | | Autozone, Inc. | 500,000 | USD | Buy | (0.680)% | Dec 2012 | (6,352) |
| | Credit Suisse International | | Johnson Controls, Inc. | 600,000 | USD | Buy | (0.240)% | Mar 2011 | (1,527) |
| | Credit Suisse International | | Noble Corp. | 200,000 | USD | Buy | (0.530)% | Jun 2012 | (1,199) |
| | Credit Suisse International | | Sealed Air Corporation | 700,000 | USD | Buy | (0.500)% | Sep 2013 | 16,046 |
| | Deutsche Bank AG | | Softbank Corporation | 165,000,000 | JPY | Sell | 2.300 % | Sep 2007 | 7,740 |
| | Deutsche Bank AG | | Bear Stearns Co. | 1,000,000 | USD | Sell | 0.160 % | Jun 2008 | (7,488) |
| | Deutsche Bank AG | | Merrill Lynch | 700,000 | USD | Sell | 0.140 % | Jun 2008 | (1,953) |
| | Deutsche Bank AG | | J.C. Penney Company, Inc. | 800,000 | USD | Buy | (0.270)% | Mar 2010 | 1,673 |
| | Deutsche Bank AG | | Nationwide Health Properties, Inc. | 600,000 | USD | Buy | (0.620)% | Sep 2011 | (90) |
| | Deutsche Bank AG | | Nabors Industries, Inc. | 200,000 | USD | Buy | (0.470)% | Jun 2012 | (1,363) |
| | Deutsche Bank AG | | Ace Limited | 300,000 | USD | Buy | (0.390)% | Jun 2014 | 2,012 |
| | Deutsche Bank AG | | Tate & Lyle Public Limited Company | 300,000 | USD | Buy | (0.510)% | Dec 2014 | 7,248 |
| | Deutsche Bank AG | | Dow Jones iTraxx Eurpo HI4 | 1,900,000 | EUR | Buy | (0.850)% | Dec 2016 | 5,729 |
| | Deutsche Bank AG | | CDX.NA.IG.8 | 9,400,000 | USD | Buy | (0.600)% | Jun 2017 | 199,602 |
| | HSBC Bank USA | | Russian Federation | 1,800,000 | USD | Sell | 0.240 % | Feb 2008 | (1,975) |
| | HSBC Bank USA | | Dow Jones iTraxx Eurpo HI4 | 500,000 | EUR | Buy | (0.850)% | Dec 2016 | 1,508 |
| | JP Morgan Chase Bank | | Federative Republic of Brazil | 2,700,000 | USD | Sell | 1.350 % | Aug 2011 | 45,954 |
| | JP Morgan Chase Bank | | CNA Financial Corporation | 600,000 | USD | Buy | (0.440)% | Sep 2011 | 4,501 |
| | JP Morgan Chase Bank | | Sabre Holdings Corporation | 700,000 | USD | Buy | (0.930)% | Sep 2011 | 64,756 |
| | JP Morgan Chase Bank | | CDX.NA.IG.7 | 3,300,000 | USD | Buy | (0.650)% | Dec 2016 | 55,927 |
| | JP Morgan Chase Bank | | Dow Jones iTraxx Eurpo HI4 | 300,000 | EUR | Buy | (0.850)% | Dec 2016 | 908 |
| | Lehman Brothers | | | | | | | | |
| | Special Financing, Inc. | | Ford Motor Credit Company | 700,000 | USD | Buy | (2.310)% | Jun 2010 | 41,666 |
| | Lehman Brothers | | | | | | | | |
| | Special Financing, Inc. | | Alcan, Inc. | 700,000 | USD | Buy | (0.140)% | Mar 2011 | 785 |
| | Lehman Brothers | | | | | | | | |
| | Special Financing, Inc. | | Federative Republic of Brazil | 2,000,000 | USD | Sell | 1.370 % | Aug 2011 | 35,836 |
| | Lehman Brothers | | | | | | | | |
| | Special Financing, Inc. | | Federative Republic of Brazil | 5,000,000 | USD | Sell | 1.280 % | Aug 2011 | 73,420 |
| | Lehman Brothers | | | | | | | | |
| | Special Financing, Inc. | | Federative Republic of Brazil | 3,100,000 | USD | Sell | 1.350 % | Aug 2011 | 53,289 |
| | Lehman Brothers | | | | | | | | |
| | Special Financing, Inc. | | CVS Corporation | 700,000 | USD | Buy | (0.210)% | Sep 2011 | 3,056 |
| | Lehman Brothers | | | | | | | | |
| | Special Financing, Inc. | | CDX.NA.HY.8 | 800,000 | USD | Sell | 2.750 % | Jun 2012 | (35,541) |
| | Lehman Brothers | | | | | | | | |
| | Special Financing, Inc. | | CDX.NA.HY.8 | 1,400,000 | USD | Sell | 3.920 % | Jun 2012 | 106,531 |
| | Lehman Brothers | | | | | | | | |
| | Special Financing, Inc. | | GMAC LLC | 1,400,000 | USD | Sell | 4.900 % | Sep 2012 | (44,275) |
| | Lehman Brothers | | | | | | | | |
| | Special Financing, Inc. | | Bellsouth Corporation | 600,000 | USD | Buy | (0.330)% | Sep 2014 | 10 |
| | Lehman Brothers | | | | | | | | |
| | Special Financing, Inc. | | CDX.NA.IG.7 | 6,000,000 | USD | Buy | (0.650)% | Dec 2016 | 101,687 |
| | Lehman Brothers | | | | | | | | |
| | Special Financing, Inc. | | Meadwestvaco Corporation | 600,000 | USD | Buy | (1.019)% | Jun 2017 | 6,318 |
| | Merrill Lynch International | | Xerox Corp. | 800,000 | USD | Buy | (0.130)% | Jan 2009 | (741) |
| | Merrill Lynch International | | Boston Scientific Corporation | 700,000 | USD | Buy | (0.510)% | Jun 2011 | 30,930 |
| | Merrill Lynch International | | GMAC LLC | 1,700,000 | USD | Buy | (1.290)% | Jun 2011 | 197,522 |
| | Merrill Lynch International | | Federative Republic of Brazil | 4,000,000 | USD | Sell | 1.340 % | Aug 2011 | 67,361 |
| | Merrill Lynch International | | CDX.NA.HY.8 | 1,600,000 | USD | Buy | (2.750)% | Jun 2012 | 80,116 |
| | Merrill Lynch International | | CDX.NA.HY.8 | 800,000 | USD | Sell | 0.910 % | Jun 2012 | 3,027 |
| | Merrill Lynch International | | CDX.NA.HY.8 | 3,200,000 | USD | Sell | 0.706 % | Jun 2012 | (17,131) |
| | Merrill Lynch International | | CDX.NA.HY.8 25-35% | 1,900,000 | USD | Sell | 3.884 % | Jun 2012 | 141,560 |
| | Merrill Lynch International | | CDX.NA.IG.8 | 109,400,000 | USD | Buy | (0.350)% | Jun 2012 | 1,442,157 |
428
John Hancock Funds II
Notes to Financial Statements
SIGNIFICANT ACCOUNTING POLICIES, CONTINUED
| | | | | | | | | |
| | | | | | | | | | Unrealized |
| | | | | Notional | | Buy/Sell | (Pay)/Received | Termination | Appreciation |
| Fund | Counterparty | | Issuer | Amount | Currency | Protection† | Fixed Rate | Date | (Depreciation) |
|
| | Morgan Stanley Capital Services, Inc. | | Federative Republic of Brazil | 4,100,000 | USD | Sell | 1.380 % | Aug 2011 | $74,938 |
| | Morgan Stanley Capital Services, Inc. | | Lockheed Martin Corporation | 700,000 | USD | Buy | (0.089)% | Jun 2012 | 4,836 |
| | Royal Bank of Canada | | Daimlerchrysler AG | 600,000 | USD | Buy | (0.350)% | Jun 2009 | (1,532) |
| | Royal Bank of Canada | | JP Morgan Chase & Company | 600,000 | USD | Buy | (0.310)% | Mar 2016 | 14,500 |
| | The Royal Bank of Scotland PLC | | Daimlerchrysler AG | 300,000 | USD | Buy | (0.620)% | Sep 2011 | (3,361) |
| | The Royal Bank of Scotland PLC | | Glitnir Banki HF | 600,000 | USD | Buy | (0.290)% | Mar 2012 | 12,490 |
| | The Royal Bank of Scotland PLC | | Glitnir Banki HF | 700,000 | USD | Buy | (0.290)% | Mar 2012 | 14,571 |
| | The Royal Bank of Scotland PLC | | Morgan Stanley | 600,000 | USD | Buy | (0.320)% | Dec 2016 | 18,059 |
| | UBS AG (Union Bank of Switzerland) | | American International Group, Inc. | 1,500,000 | USD | Sell | 0.070 % | Jun 2008 | (2,982) |
| | UBS AG (Union Bank of Switzerland) | | Capital One Financial Corporation | 600,000 | USD | Buy | (0.350)% | Sep 2011 | 15,777 |
| | UBS AG (Union Bank of Switzerland) | | BAE Systems PLC | 700,000 | USD | Buy | (0.140)% | Dec 2011 | 4,189 |
| | UBS AG (Union Bank of Switzerland) | | Goldman Sachs Group, Inc. | 1,300,000 | USD | Buy | (0.310)% | Jun 2016 | 38,475 |
| | UBS AG (Union Bank of Switzerland) | | CDX.NA.IG.7 | 3,200,000 | USD | Buy | (0.650)% | Dec 2016 | 54,233 |
| | UBS AG (Union Bank of Switzerland) | | D.R. Horton, Inc. | 600,000 | USD | Buy | (1.540)% | Jun 2017 | 79,024 |
| | UBS AG (Union Bank of Switzerland) | | Meadwestvaco Corporation | 1,300,000 | USD | Buy | (1.060)% | Jun 2017 | 16,270 |
| | UBS AG (Union Bank of Switzerland) | | Pulte Homes, Inc. | 1,600,000 | USD | Buy | (1.560)% | Jun 2017 | 209,138 |
| | Wachovia Bank N.A. | | Global Santafe Corporation | 200,000 | USD | Buy | (0.530)% | Jun 2012 | (3,385) |
| | Wachovia Bank N.A. | | GlobalSantafe Corporation | 400,000 | USD | Buy | (0.520)% | Jun 2012 | (6,591) |
|
| | | | | | | | | | $4,803,715 |
| |
| Real Return Bond | | | | | | | | |
| | Bank of America | | CDX.NA.HY.8 | 1,690,000 | USD | Sell | 2.750 % | Jun 2012 | ($72,371) |
| | Bank of America | | CDX.NA.HY.8 | 1,700,000 | USD | Sell | 2.750 % | Jun 2012 | (75,524) |
| | Bank of America | | CDX.NA.HY.8 | 5,400,000 | USD | Buy | (2.750)% | Jun 2012 | 239,815 |
| | Bank of America | | GMAC | 600,000 | USD | Sell | 7.000 % | Sep 2012 | 17,547 |
| | Barclays Capital PLC | | Panama | 2,100,000 | USD | Sell | 0.300 % | Dec 2008 | (5,304) |
| | Barclays Capital PLC | | Peru | 1,100,000 | USD | Sell | 0.350 % | Dec 2008 | (1,697) |
| | Barclays Capital PLC | | Russian Federation | 1,100,000 | USD | Sell | 0.330 % | Dec 2008 | (3,118) |
| | Barclays Capital PLC | | Ukraine | 1,100,000 | USD | Sell | 0.780 % | Dec 2008 | (264) |
| | Barclays Capital PLC | | Ford Motor Credit | 500,000 | USD | Sell | 3.800 % | Sep 2012 | (22,399) |
| | Barclays Capital PLC | | GMAC | 200,000 | USD | Sell | 3.050 % | Sep 2012 | (16,931) |
| | Barclays Capital PLC | | Goldman Sachs | 600,000 | USD | Sell | 0.770 % | Sep 2012 | 763 |
| | Barclays Capital PLC | | Lehman Brothers | 600,000 | USD | Sell | 0.710 % | Sep 2012 | (14,352) |
| | Bear Stearns International, LTD. | | CDX.NA.HY.8 | 600,000 | USD | Buy | (2.750)% | Jun 2012 | 25,694 |
| | Bear Stearns International, LTD. | | CDX.NA.HY.8 | 2,400,000 | USD | Sell | 2.750 % | Jun 2012 | (106,623) |
| | Bear Stearns International, LTD. | | Capital One Financial | 1,000,000 | USD | Buy | (1.210)% | Sep 2012 | (101) |
| | BNP Paribas | | Lehman Brothers | 300,000 | USD | Sell | 1.120 % | Sep 2012 | (2,284) |
| | BNP Paribas | | Lehman Brothers | 300,000 | USD | Sell | 1.200 % | Sep 2012 | (3,183) |
| | Citibank N.A. | | Bear Stearns | 1,100,000 | USD | Sell | 0.720 % | Sep 2012 | (28,106) |
| | Citibank N.A. | | Lehman Brothers | 500,000 | USD | Sell | 0.650 % | Sep 2012 | (13,177) |
| | Credit Suisse International | | Chesapeake Energy | 200,000 | USD | Sell | 1.040 % | Jun 2012 | (5,806) |
| | Credit Suisse International | | Chesapeake Energy | 200,000 | USD | Sell | 1.010 % | Jun 2012 | (6,064) |
| | Credit Suisse International | | Chesapeake Energy | 200,000 | USD | Sell | 0.970 % | Jun 2012 | (6,409) |
| | Credit Suisse International | | Chesapeake Energy | 1,000,000 | USD | Sell | 1.010 % | Jun 2012 | (30,324) |
| | Deutsche Bank AG | | GMAC | 200,000 | USD | Buy | (4.250)% | Sep 2008 | 2,861 |
| | Deutsche Bank AG | | Indonesia | 2,200,000 | USD | Sell | 0.510 % | Dec 2008 | (8,959) |
| | Deutsche Bank AG | | Russian Federation | 1,000,000 | USD | Sell | 0.325 % | Dec 2008 | (2,919) |
| | Deutsche Bank AG | | Ukraine | 1,000,000 | USD | Sell | 0.790 % | Dec 2008 | (93) |
| | Goldman Sachs International | | GMAC | 4,800,000 | USD | Buy | (5.050)% | Sep 2008 | 31,502 |
| | Goldman Sachs International | | GMAC | 4,800,000 | USD | Sell | 5.350 % | Sep 2012 | (92,884) |
| | Goldman Sachs International | | GMAC | 900,000 | USD | Sell | 3.050 % | Sep 2012 | (76,191) |
| | HSBC Bank USA | | Russian Federation | 1,000,000 | USD | Sell | 0.240 % | Feb 2008 | (1,099) |
| | HSBC Bank USA | | Russian Federation | 1,000,000 | USD | Sell | 0.280 % | Nov 2007 | 534 |
| | JP Morgan Chase Bank | | CDX.NA.HY.8 | 2,500,000 | USD | Sell | 2.750 % | Jun 2012 | (110,763) |
| | Lehman Brothers | | | | | | | | |
| | Special Financing Inc. | | Peru | 1,000,000 | USD | Sell | 0.370 % | Dec 2008 | (1,249) |
| | Lehman Brothers | | | | | | | | |
| | Special Financing Inc. | | CDX.NA.HY.8 | 1,800,000 | USD | Sell | 2.300 % | Jun 2012 | 11,339 |
| | Lehman Brothers | | | | | | | | |
| | Special Financing Inc. | | CDX.NA.HY.8 | 1,300,000 | USD | Sell | 2.440 % | Jun 2012 | 16,217 |
429
John Hancock Funds II
Notes to Financial Statements
SIGNIFICANT ACCOUNTING POLICIES, CONTINUED
| | | | | | | | | |
| | | | | | | | | | Unrealized |
| | | | | Notional | | Buy/Sell | (Pay)/Received | Termination | Appreciation |
| Fund | Counterparty | | Issuer | Amount | Currency | Protection† | Fixed Rate | Date | (Depreciation) |
|
| | Lehman Brothers | | | | | | | | |
| | Special Financing Inc. | | CDX.NA.HY.8 | 1,690,000 | USD | Buy | (2.750)% | Jun 2012 | $72,234 |
| | Merrill Lynch International | | CDX.NA.HY.8 | 1,950,000 | USD | Sell | 2.460 % | Jun 2012 | 25,887 |
| | Morgan Stanley Capital Services | | GMAC | 500,000 | USD | Sell | 6.850 % | Jun 2012 | 12,269 |
| | Morgan Stanley Capital Services | | Ford Motor Credit | 700,000 | USD | Sell | 3.800 % | Sep 2012 | (31,360) |
| | Morgan Stanley Capital Services | | Goldman Sachs | 700,000 | USD | Sell | 0.750 % | Sep 2012 | 266 |
| | The Royal Bank of Scotland | | Lehman Brothers | 600,000 | USD | Sell | 0.660 % | Sep 2012 | (15,594) |
| | UBS AG | | CDX.NA.HY.8 | 1,300,000 | USD | Sell | 2.750 % | Jun 2012 | (57,754) |
| | UBS AG | | GMAC | 900,000 | USD | Buy | (4.850)% | Sep 2012 | 30,579 |
| | UBS AG | | Lehman Brothers | 500,000 | USD | Sell | 0.690 % | Sep 2012 | (12,404) |
| | UBS AG | | ABX.HE.AA | 250,000 | USD | Sell | 0.170 % | May 2046 | (46,024) |
|
| | | | | | | | | | ($383,823) |
| |
| Spectrum Income | | | | | | | | |
| | J.P. Morgan Chase | | Beidelberg Cement AG | 60,000 | EUR | Sell | 0.380% | June 2012 | $1,761 |
| | J.P. Morgan Chase | | Compagnie St Gobain | 60,000 | EUR | Buy | (0.240%) | June 2012 | 840 |
| | J.P. Morgan Chase | | Fiat FIN | 50,000 | EUR | Sell | 0.580% | June 2012 | (347) |
| | J.P. Morgan Chase | | Holcim LTD | 60,000 | EUR | Buy | (0.240%) | June 2012 | 563 |
| | J.P. Morgan Chase | | Itraxx Ser | 140,000 | EUR | Sell | 0.400% | June 2012 | (831) |
| | J.P. Morgan Chase | | Kelda Group | 100,000 | EUR | Buy | (0.240%) | June 2012 | (227) |
| | J.P. Morgan Chase | | Telia AB | 100,000 | EUR | Buy | (0.300%) | June 2012 | 281 |
| | J.P. Morgan Chase | | United Utilities | 100,000 | EUR | Buy | (0.240%) | June 2012 | 279 |
|
| | | | | | | | | | $2,319 |
| |
| Total Return | | | | | | | | |
| | Bank of America | | CDX.NA.IG.8 | 2,800,000 | USD | Sell | 0.350 % | Jun 2012 | ($36,900) |
| | Bank of America | | CDX.NA.IG.8 | 5,200,000 | USD | Sell | 0.600 % | Jun 2017 | (110,418) |
| | Bank of America | | CDX.NA.HY.8 | 1,700,000 | USD | Sell | 2.750 % | Jun 2012 | (80,558) |
| | Barclays Capital PLC | | CDX.NA.IG.8 | 4,500,000 | USD | Sell | 0.350 % | Jun 2012 | (59,303) |
| | Barclays Capital PLC | | GMAC SP | 2,500,000 | USD | Sell | 3.650 % | Sep 2012 | (168,987) |
| | Barclays Capital PLC | | Ford Motor Credit | 2,500,000 | USD | Sell | 4.150 % | Sep 2012 | (85,745) |
| | Barclays Capital PLC | | GMAC SP | 1,300,000 | USD | Sell | 4.800 % | Sep 2012 | (45,518) |
| | Citibank N.A. | | CDX.NA.HY.8 | 600,000 | USD | Buy | (2.750)% | Jun 2012 | 26,656 |
| | Citibank N.A. | | CDX.NA.HY 35-100% | 6,000,000 | USD | Sell | 0.360 % | Jun 2012 | (126,452) |
| | Citibank N.A. | | CDX.NA.HY 35-100% | 5,000,000 | USD | Sell | 0.360 % | Jun 2012 | (104,256) |
| | Citibank N.A. | | CDX.NA.HY 35-100% | 1,400,000 | USD | Sell | 0.400 % | Jun 2012 | (26,620) |
| | Citibank N.A. | | CDX.NA.HY 25-35% | 700,000 | USD | Sell | 2.140 % | Jun 2012 | (1,584) |
| | Citibank N.A. | | CDX.NA.HY 25-35% | 600,000 | USD | Sell | 2.180 % | Jun 2012 | (431) |
| | Credit Suisse | | Ford Motor Credit | 300,000 | USD | Sell | 0.950 % | Dec 2007 | (1,459) |
| | Credit Suisse International | | CDX.NA.IG.8 | 3,100,000 | USD | Sell | 0.350 % | Jun 2012 | (40,853) |
| | Credit Suisse International | | CDX.NA.HY.8 | 1,100,000 | USD | Sell | 2.750 % | Jun 2012 | (48,869) |
| | Deutche Bank | | Panama SP | 900,000 | USD | Sell | 0.250 % | Dec 2008 | (2,935) |
| | Deutche Bank | | Russian Federation | 3,000,000 | USD | Sell | 0.260 % | Dec 2007 | 27 |
| | Deutche Bank | | SoftBank Corporation | 92,000,000 | JPY | Sell | 2.300 % | Sep 2007 | 4,316 |
| | Deutche Bank | | Ford Motor Credit | 1,000,000 | USD | Sell | 5.650 % | Sep 2012 | 12,401 |
| | Deutsche Bank | | CDX.NA.IG.8 | 2,100,000 | USD | Buy | (0.600)% | Jun 2017 | 44,592 |
| | HSBC Bank USA | | Ukraine SP | 4,200,000 | USD | Sell | 0.730 % | Apr 2009 | (7,846) |
| | JP Morgan | | Gazprom SP | 8,700,000 | USD | Sell | 0.415 % | Nov 2007 | 11,601 |
| | Lehman Brothers | | Brazil SP | 6,100,000 | USD | Sell | 0.240 % | Nov 2007 | 3,239 |
| | Lehman Brothers | | CDX.NA.IG.8 | 400,000 | USD | Sell | 0.600 % | Jun 2017 | (8,494) |
| | Lehman Brothers | | Ukraine SP | 2,000,000 | USD | Sell | 0.700 % | Dec 2008 | (2,774) |
| | Lehman Brothers | | Ford Motor Credit | 300,000 | USD | Sell | 0.950 % | Dec 2007 | (1,459) |
| | Lehman Brothers | | Ford Motor Credit | 300,000 | USD | Sell | 0.950 % | Dec 2007 | (2,187) |
| | Lehman Brothers | | Brazil SP | 10,300,000 | USD | Sell | 1.120 % | Nov 2011 | 109,466 |
| | Lehman Brothers | | CDX.NA.XO.8 | 500,000 | USD | Sell | 1.400 % | Jun 2012 | (18,676) |
| | Lehman Brothers | | CDX.NA.HY.8 | 300,000 | USD | Sell | 2.750 % | Jun 2012 | (13,327) |
| | Merrill Lynch International | | CDX.NA.IG.8 | 5,200,000 | USD | Sell | 0.350 % | Jun 2012 | (63,847) |
| | Merrill Lynch International | | CDX.NA.HY 25-35% | 1,300,000 | USD | Sell | 1.830 % | Jun 2012 | (20,777) |
| | Merrill Lynch International | | GMAC SP | 3,200,000 | USD | Sell | 1.850 % | Sep 2009 | (208,501) |
| | Merrill Lynch International | | CDX.NA.HY.8 | 600,000 | USD | Sell | 2.750 % | Jun 2012 | (26,656) |
| | Morgan Stanley | | Russia SP | 3,400,000 | USD | Sell | 0.795 % | Aug 2012 | (2,078) |
430
John Hancock Funds II
Notes to Financial Statements
SIGNIFICANT ACCOUNTING POLICIES, CONTINUED
| | | | | | | | | |
| | | | | | | | | | Unrealized |
| | | | | Notional | | Buy/Sell | (Pay)/Received | Termination | Appreciation |
| Fund | Counterparty | | Issuer | Amount | Currency | Protection† | Fixed Rate | Date | (Depreciation) |
|
| | Morgan Stanley | | Federative Republic of Brazil SP | 900,000 | USD | Sell | 1.660 % | Mar 2013 | $29,459 |
| | Morgan Stanley | | CDX.NA.HY.8 | 1,300,000 | USD | Sell | 2.080 % | Jun 2012 | (6,611) |
| | Royal Bank of Scotland | | Indonesia SP | 2,000,000 | USD | Sell | 0.450 % | Jun 2009 | (17,928) |
| | UBS AG | | CDX.NA.IG.8 | 3,500,000 | USD | Sell | 0.600 % | Jun 2017 | (74,320) |
| | UBS AG | | CDX.NA.HY.8 | 1,800,000 | USD | Sell | 2.750 % | Jun 2012 | (79,968) |
|
| | | | | | | | | | ($1,254,580) |
† If the Fund is a Seller of protection and a credit event occurs, as defined under the terms of that particular swap agreement, the Fund will pay to the Buyer of the protection an amount up to the notional value of the swap and in certain instances, take delivery of the security.
| |
| BBR — Bank Bill Rate |
| BBSW — Bank Bill Swap Rate |
| CBK — Canada Bankers Acceptance |
| CDI — Brazil Interbank Deposit Rate |
| CMS — Constant Maturity Swap |
| FRCPXTOB — French CPI Ex Tobacco Daily Reference Index |
| CPTFEMU — Eurostat Eurozone HICP Ex Tobacco Unrevised Series NSA Index |
| TIIE — Tasa de Interes Interbancario de Equilibrio |
| |
| Currency symbols are defined as follows: |
| |
| AUD | Australian Dollar |
| BRL | Brazilian Real |
| CAD | Canadian Dollar |
| EUR | European Currency |
| GBP | British Pound |
| JPY | Japanese Yen |
| MXN | Mexican Peso |
| USD | U.S. Dollar |
Forward Foreign Currency Contracts All Funds may purchase and sell forward foreign currency contracts in order to hedge a specific transaction or Fund position. Forward foreign currency contracts are valued at forward foreign currency exchange rates and marked to market daily. Net realized gains (losses) on foreign currency and forward foreign currency contracts shown in the Statements of Operations include net gains or losses realized by a Fund on contracts that have matured.
The net U.S. dollar value of foreign currency underlying all contractual commitments held at the end of the period, the resulting net unrealized appreciation (depreciation) and related net receivable or payable amount are determined using forward foreign currency exchange rates supplied by a quotation service. The Funds could be exposed to risks in excess of amounts recognized on the Statements of Assets and Liabilities if the counterparties to the contracts are unable to meet the terms of their contracts or if the value of the forward foreign currency contract changes unfavorably.
At August 31, 2007, certain Funds entered into forward foreign currency contracts, which contractually obligate the Funds to deliver currencies at future dates. Open forward foreign currency contracts at August 31, 2007, were as follows:
| | | | |
| | | | | Unrealized |
| | | Principal Amount | Settlement | Appreciation |
| Fund | Currency | Covered by Contract | Date | (Depreciation) |
|
| Active Bond | Sells | | | |
|
| | Canadian Dollar | 235,642 | 9/28/07 | ($1,226) |
|
| | | | | ($1,226) |
| |
| Global Bond | Buys | | | |
|
| | Australian Dollar | 1,728,337 | 9/13/07 | ($72,311) |
| | Australian Dollar | 11,121,100 | 9/28/07 | (110,352) |
| | Brazilian Real | 5,018,595 | 9/5/07 | 63,375 |
| | Brazilian Real | 6,139,892 | 10/2/07 | 145,196 |
| | Brazilian Real | 12,476,603 | 10/2/07 | 182,221 |
| | Brazilian Real | 2,735,890 | 10/2/07 | 17,663 |
| | Brazilian Real | 2,075,293 | 3/4/08 | 78,883 |
| | Brazilian Real | 13,311,810 | 3/4/08 | (84,984) |
| | Canadian Dollar | 143,000 | 9/20/07 | (25) |
| | Canadian Dollar | 12,035,000 | 9/20/07 | (12,506) |
| | Chilean Peso | 112,100,000 | 3/13/08 | 1,629 |
| | Chinese Yuan Renminbi | 25,079,302 | 9/6/07 | 69,506 |
| | Chinese Yuan Renminbi | 12,344,570 | 11/21/07 | (3,750) |
| | Chinese Yuan Renminbi | 14,322,100 | 11/21/07 | (3,710) |
431
John Hancock Funds II
Notes to Financial Statements
SIGNIFICANT ACCOUNTING POLICIES, CONTINUED
| | | | |
| | | | | Unrealized |
| | | Principal Amount | Settlement | Appreciation |
| Fund | Currency | Covered by Contract | Date | (Depreciation) |
|
| Global Bond | Buys | | | |
|
| | Chinese Yuan Renminbi | 32,650,136 | 11/26/07 | $4,367 |
| | Chinese Yuan Renminbi | 7,795,515 | 1/10/08 | (5,011) |
| | Chinese Yuan Renminbi | 4,254,138 | 1/10/08 | (2,903) |
| | Chinese Yuan Renminbi | 3,401,389 | 1/10/08 | (3,099) |
| | Chinese Yuan Renminbi | 48,534,373 | 1/10/08 | (58,471) |
| | Chinese Yuan Renminbi | 25,865,402 | 1/10/08 | (27,804) |
| | Chinese Yuan Renminbi | 4,567,045 | 1/10/08 | (4,664) |
| | Chinese Yuan Renminbi | 7,800,375 | 1/10/08 | (5,785) |
| | Chinese Yuan Renminbi | 12,560,870 | 3/7/08 | (18,536) |
| | Chinese Yuan Renminbi | 9,357,792 | 3/7/08 | (14,927) |
| | Chinese Yuan Renminbi | 10,827,422 | 3/7/08 | (9,621) |
| | Chinese Yuan Renminbi | 29,825,098 | 3/7/08 | (35,218) |
| | Chinese Yuan Renminbi | 7,387,352 | 3/7/08 | (5,152) |
| | Chinese Yuan Renminbi | 16,416,701 | 7/2/08 | (5,082) |
| | Chinese Yuan Renminbi | 12,384,528 | 7/2/08 | (3,241) |
| | Chinese Yuan Renminbi | 5,699,130 | 3/2/09 | (2,610) |
| | Danish Kroner | 9,550,000 | 9/6/07 | 14,591 |
| | Euro | 32,370,000 | 9/4/07 | 30,475 |
| | Euro | 1,366,000 | 10/4/07 | (1,206) |
| | Euro | 32,370,000 | 10/4/07 | (10,766) |
| | Euro | 52,961,000 | 10/4/07 | 399,984 |
| | Indian Rupee | 7,958,000 | 11/29/07 | 934 |
| | Indian Rupee | 27,242,670 | 5/12/08 | 1,624 |
| | Indian Rupee | 72,470,900 | 5/12/08 | 3,033 |
| | Indian Rupee | 99,511,580 | 5/12/08 | (271) |
| | Japanese Yen | 71,626,120 | 9/27/07 | 733 |
| | Japanese Yen | 18,357,722,000 | 10/25/07 | 7,541,138 |
| | Malaysian Ringgit | 2,639,636 | 9/5/07 | (12,141) |
| | Malaysian Ringgit | 7,988,955 | 9/5/07 | (37,419) |
| | Malaysian Ringgit | 9,740,059 | 5/12/08 | (41,738) |
| | Malaysian Ringgit | 5,225,160 | 5/12/08 | (13,344) |
| | Malaysian Ringgit | 4,857,160 | 5/12/08 | (56,758) |
| | Malaysian Ringgit | 22,636,182 | 5/12/08 | (293,385) |
| | Mexican Peso | 66,211,857 | 3/13/08 | 52,624 |
| | New Zealand Dollar | 4,100,000 | 9/17/07 | 31,260 |
| | Norwegian Krone | 5,458,000 | 9/6/07 | (1,508) |
| | Norwegian Krone | 11,255,000 | 9/6/07 | 54,803 |
| | Norwegian Krone | 2,130,609 | 9/20/07 | (88) |
| | Polish Zloty | 80,000 | 9/28/07 | 867 |
| | Polish Zloty | 80,000 | 7/10/08 | (597) |
| | Pound Sterling | 10,230,000 | 9/20/07 | (46,881) |
| | Pound Sterling | 9,351,000 | 9/20/07 | (45,443) |
| | Singapore Dollar | 1,817,498 | 2/20/08 | (14,307) |
| | South African Rand | 379,000 | 9/28/07 | 783 |
| | South Korean Won | 2,633,949,600 | 9/21/07 | (43,715) |
| | South Korean Won | 626,928,600 | 1/30/08 | (6,890) |
| | South Korean Won | 5,573,026,092 | 5/30/08 | (13,272) |
| | South Korean Won | 1,316,897,458 | 5/30/08 | 8,275 |
| | Swedish Krona | 4,903,000 | 9/6/07 | (16,845) |
| | Swedish Krona | 40,395,000 | 9/6/07 | 14,883 |
| | Swedish Krona | 4,493,246 | 9/20/07 | (14,382) |
| | Taiwan Dollar | 38,334,004 | 9/4/07 | (11,754) |
| | Taiwan Dollar | 21,362,962 | 9/4/07 | 1,718 |
| | Taiwan Dollar | 16,971,042 | 10/4/07 | (268) |
| | Taiwan Dollar | 21,305,870 | 10/4/07 | (830) |
|
| | | | | $7,546,995 |
|
432
John Hancock Funds II
Notes to Financial Statements
SIGNIFICANT ACCOUNTING POLICIES, CONTINUED
| | | | |
| | | | | Unrealized |
| | | Principal Amount | Settlement | Appreciation |
| Fund | Currency | Covered by Contract | Date | (Depreciation) |
|
| Global Bond | Sells | | | |
|
| | Australian Dollar | 2,300,007 | 9/20/07 | ($28,262) |
| | Brazilian Real | 2,407,000 | 9/5/07 | (146,992) |
| | Brazilian Real | 67,000 | 10/2/07 | 2,348 |
| | Brazilian Real | 2,625,000 | 10/2/07 | 25,406 |
| | Brazilian Real | 2,484,084 | 10/2/07 | (61,383) |
| | Chinese Yuan Renminbi | 3,322,642 | 9/6/07 | (2,864) |
| | Euro | 30,053,355 | 10/4/07 | 5,556 |
| | Euro | 14,620,373 | 10/4/07 | 3,559 |
| | Japanese Yen | 722,000 | 9/27/07 | 760 |
| | Japanese Yen | 4,676,485 | 9/27/07 | 39,199 |
| | Japanese Yen | 946,000 | 9/27/07 | 1,668 |
| | Japanese Yen | 1,976,000 | 9/27/07 | 3,420 |
| | Japanese Yen | 1,612,000 | 10/25/07 | (40,494) |
| | Japanese Yen | 3,346,984 | 10/25/07 | (11,325) |
| | Japanese Yen | 1,303,000 | 10/25/07 | (57,563) |
| | Japanese Yen | 1,567,000 | 10/25/07 | (38,137) |
| | Japanese Yen | 993,000 | 10/25/07 | (43,315) |
| | Malaysian Ringgit | 1,515,027 | 9/5/07 | (6,923) |
| | Malaysian Ringgit | 1,526,129 | 9/5/07 | 12,640 |
| | Mexican Peso | 4,223,000 | 3/13/08 | (3,602) |
| | New Zealand Dollar | 2,686,405 | 9/13/07 | 219,287 |
| | New Zealand Dollar | 2,262,785 | 9/20/07 | (5,972) |
| | New Zealand Dollar | 4,092,149 | 9/28/07 | 74,160 |
| | Polish Zloty | 29,133 | 9/28/07 | 566 |
| | Pound Sterling | 366,210 | 9/20/07 | (689) |
| | Pound Sterling | 7,911,324 | 9/20/07 | (15,302) |
| | Pound Sterling | 7,566,319 | 9/20/07 | (142,587) |
| | South Korean Won | 1,400,001 | 9/21/07 | (8,338) |
| | South Korean Won | 1,392,425 | 9/21/07 | (10,522) |
| | Taiwan Dollar | 1,160,832 | 9/4/07 | (1,324) |
| | Taiwan Dollar | 648,778 | 9/4/07 | 1,126 |
|
| | | | | ($235,899) |
| |
| Global Real Estate | Sells | | | |
|
| | Australian Dollar | 23,259,510 | 9/28/07 | $73,161 |
| | Australian Dollar | 3,184,055 | 9/28/07 | (3,946) |
| | Australian Dollar | 3,184,055 | 9/28/07 | (3,946) |
| | Brazilian Real | 2,953,599 | 9/28/07 | ($30,149) |
| | Canadian Dollar | 5,535,587 | 9/28/07 | 5,178 |
| | Euro | 39,371,539 | 9/28/07 | (204,556) |
| | Hong Kong Dollar | 40,099,031 | 9/28/07 | (67,462) |
| | Japanese Yen | 67,252,482 | 9/28/07 | (155,638) |
| | Norwegian Krone | 2,521,764 | 9/28/07 | (17,428) |
| | Philippine Peso | 2,014,323 | 9/28/07 | 696 |
| | Pound Sterling | 54,434,077 | 9/28/07 | (387,263) |
| | Singapore Dollar | 13,552,215 | 9/28/07 | 34,689 |
| | South African Rand | 2,939,438 | 9/28/07 | (33,158) |
| | Swedish Krona | 1,386,723 | 9/28/07 | (5,304) |
|
| | | | | ($795,126) |
|
| High Income | Sells | | | |
|
| | Canadian Dollar | 1,918,128 | 9/28/07 | ($9,982) |
| | Pound Sterling | 1,459,854 | 9/28/07 | (31,719) |
|
| | | | | ($41,701) |
|
433
John Hancock Funds II
Notes to Financial Statements
SIGNIFICANT ACCOUNTING POLICIES, CONTINUED
| | | | |
| | | | | Unrealized |
| | | Principal Amount | Settlement | Appreciation |
| Fund | Currency | Covered by Contract | Date | (Depreciation) |
|
| International Equity Index | Buys | | | |
|
| | Australian Dollar | 376,000 | 9/28/07 | ($11,818) |
| | Canadian Dollar | 397,000 | 9/28/07 | 4,734 |
| | Euro | 1,012,000 | 9/28/07 | 16,849 |
| | Hong Kong Dollar | 864,000 | 9/28/07 | 16 |
| | Japanese Yen | 158,900,000 | 9/28/07 | 78,963 |
| | Pound Sterling | 818,000 | 9/28/07 | 17,357 |
| | Swedish Krona | 838,000 | 9/28/07 | (449) |
|
| | | | | $105,652 |
|
| Investment Quality Bond | Buys | | | |
|
| | Chilean Peso | 114,000,000 | 9/20/07 | $2,016 |
| | Euro | 160,000 | 9/19/07 | 2,836 |
| | Israeli Shekel | 880,000 | 9/19/07 | 2,757 |
| | Polish Zloty | 605,000 | 9/19/07 | 2,249 |
|
| | | | | $9,858 |
|
| | Sells | | | |
|
| | Brazilian Real | 3,016,921 | 9/19/07 | $37,290 |
| | Chilean Peso | 218,454 | 9/20/07 | 655 |
| | Euro | 215,663 | 9/19/07 | (2,764) |
| | Israeli Shekel | 208,570 | 9/19/07 | (5,129) |
| | Mexican Peso | 211,024 | 9/19/07 | 937 |
| | Polish Zloty | 211,919 | 9/19/07 | (4,065) |
|
| | | | | $26,924 |
|
| Real Return Bond | Buys | | | |
|
| | Brazilian Real | 434,652 | 10/2/07 | ($10,186) |
| | Brazilian Real | 6,125,092 | 10/2/07 | (139,725) |
| | Brazilian Real | 7,669,188 | 10/2/07 | (135,216) |
| | Brazilian Real | 14,603,439 | 10/2/07 | (305,661) |
| | Brazilian Real | 6,732,250 | 3/4/08 | (114,067) |
| | Brazilian Real | 800,105 | 3/4/08 | (20,594) |
| | Brazilian Real | 7,470,450 | 3/4/08 | (142,795) |
| | Canadian Dollar | 1,045,539 | 9/5/07 | 111 |
| | Canadian Dollar | 2,000,171 | 9/5/07 | 12,134 |
| | Canadian Dollar | 1,521,862 | 9/5/07 | 4,182 |
| | Canadian Dollar | 1,017,843 | 9/5/07 | 5,884 |
| | Canadian Dollar | 5,586,000 | 9/20/07 | (2,616) |
| | Chinese Yuan Renminbi | 11,493,474 | 1/10/08 | 7,124 |
| | Chinese Yuan Renminbi | 56,934,891 | 1/10/08 | 23,037 |
| | Chinese Yuan Renminbi | 8,278,071 | 3/7/08 | (7,731) |
| | Chinese Yuan Renminbi | 20,277,214 | 3/7/08 | (14,991) |
| | Chinese Yuan Renminbi | 5,648,720 | 3/7/08 | (4,195) |
| | Chinese Yuan Renminbi | 20,395,231 | 3/2/09 | 12,578 |
| | Chinese Yuan Renminbi | 25,694,160 | 3/2/09 | 28,294 |
| | Chinese Yuan Renminbi | 10,251,500 | 3/2/09 | 7,199 |
| | Malaysian Ringgit | 4,106,158 | 5/21/08 | (27,789) |
| | Mexican Peso | 2,504,602 | 9/28/07 | (5,291) |
| | Mexican Peso | 1,620,599 | 9/28/07 | (2,309) |
| | Mexican Peso | 50,934,114 | 9/28/07 | (93,607) |
| | Mexican Peso | 48,079,887 | 9/28/07 | (98,963) |
| | Mexican Peso | 25,004,793 | 3/13/08 | (47,438) |
| | Mexican Peso | 39,038,846 | 3/13/08 | (77,926) |
| | Mexican Peso | 39,573,721 | 3/13/08 | (78,567) |
| | Mexican Peso | 101,518,603 | 7/10/08 | (36,842) |
| | Mexican Peso | 1,620,599 | 7/10/08 | (331) |
| | Polish Zloty | 1,153,436 | 9/28/07 | (11,125) |
| | Polish Zloty | 415,660 | 9/28/07 | (574) |
| | Polish Zloty | 1,646,734 | 9/28/07 | (14,975) |
| | Polish Zloty | 630,472 | 9/28/07 | (6,868) |
| | Polish Zloty | 3,846,302 | 7/10/08 | (28,704) |
434
John Hancock Funds II
Notes to Financial Statements
SIGNIFICANT ACCOUNTING POLICIES, CONTINUED
| | | | |
| | | | | Unrealized |
| | | Principal Amount | Settlement | Appreciation |
| Fund | Currency | Covered by Contract | Date | (Depreciation) |
|
| Real Return Bond | Buys | | | |
|
| | Singapore Dollar | 1,886,337 | 10/3/07 | ($17,060) |
| | Singapore Dollar | 226,926 | 2/20/08 | (1,799) |
| | Singapore Dollar | 735,267 | 5/22/08 | (711) |
| | South Korean Won | 550,388,250 | 9/21/07 | (15,556) |
| | South Korean Won | 212,013,200 | 9/21/07 | (5,713) |
| | South Korean Won | 386,537,400 | 9/21/07 | (10,438) |
| | South Korean Won | 72,848,000 | 1/30/08 | (1,670) |
| | South Korean Won | 64,851,250 | 1/30/08 | (1,580) |
| | South Korean Won | 575,571,135 | 5/30/08 | 3,170 |
| | South Korean Won | 573,367,715 | 5/30/08 | 3,619 |
|
| | | | | ($1,376,281) |
|
| | Sells | | | |
|
| | Canadian Dollar | 5,291,820 | 9/5/07 | $2,509 |
| | Canadian Dollar | 4,803,769 | 9/20/07 | (25,590) |
| | Canadian Dollar | 925,583 | 9/20/07 | 1,014 |
| | Chinese Yuan Renminbi | 2,489,000 | 1/10/08 | 25,780 |
| | Chinese Yuan Renminbi | 1,614,723 | 1/10/08 | 10,169 |
| | Chinese Yuan Renminbi | 5,171,723 | 1/10/08 | 40,336 |
| | Chinese Yuan Renminbi | 1,224,148 | 3/7/08 | 8,496 |
| | Chinese Yuan Renminbi | 3,340,000 | 3/7/08 | 29,294 |
| | Chinese Yuan Renminbi | 111,142 | 3/7/08 | 417 |
| | Chinese Yuan Renminbi | 3,197,000 | 3/2/09 | 18,211 |
| | Chinese Yuan Renminbi | 1,518,190 | 3/2/09 | 3,253 |
| | Chinese Yuan Renminbi | 3,341,000 | 3/2/09 | 26,155 |
| | Euro | 135,265 | 10/4/07 | 25 |
| | Euro | 2,640,934 | 10/4/07 | (14,682) |
| | Japanese Yen | 10,865,561 | 10/25/07 | (105,116) |
| | Mexican Peso | 9,234,001 | 9/28/07 | 44,862 |
| | Mexican Peso | 147,220 | 9/28/07 | 529 |
| | Polish Zloty | 1,400,693 | 9/28/07 | 27,234 |
| | Pound Sterling | 13,059,988 | 9/20/07 | 13,914 |
| | Pound Sterling | 4,052,688 | 9/20/07 | 9,746 |
| | Singapore Dollar | 491,390 | 10/3/07 | 351 |
| | South Korean Won | 610,686 | 9/21/07 | (3,637) |
| | South Korean Won | 607,381 | 9/21/07 | (4,590) |
| | Swiss Franc | 753,086 | 9/6/07 | (5,251) |
|
| | | | | $103,429 |
|
| Spectrum Income | Buys | | | |
|
| | Australian Dollar | 184,386 | 11/21/07 | $2,896 |
| | Brazilian Real | 457,040 | 11/23/07 | (1,302) |
| | Czech Koruna | 4,539,263 | 11/21/07 | 2,134 |
| | Danish Kroner | 1,385,546 | 11/21/07 | 2,842 |
| | Euro | 146,404 | 11/21/07 | 258 |
| | Hungarian Forint | 51,924,830 | 11/21/07 | 10,022 |
| | Indonesian Rupiah | 185,300,000 | 10/3/07 | (274) |
| | Indonesian Rupiah | 2,000,000,000 | 10/24/07 | (5,635) |
| | Indonesian Rupiah | 12,274,410,000 | 11/23/07 | (57,429) |
| | Japanese Yen | 1,145,519,736 | 11/21/07 | (107,038) |
| | Norwegian Krone | 1,628,015 | 11/21/07 | 5,582 |
| | Polish Zloty | 2,341,602 | 11/21/07 | 14,220 |
| | Pound Sterling | 454,458 | 11/21/07 | 17,013 |
| | Singapore Dollar | 508,023 | 11/21/07 | 1,205 |
| | South Korean Won | 2,369,740,000 | 11/21/07 | 18,860 |
| | Swedish Krona | 13,669,542 | 11/21/07 | 27,159 |
| | Turkish Lira | 100,000 | 10/3/07 | 612 |
| | Turkish Lira | 200,000 | 10/5/07 | 1,216 |
|
| | | | | ($67,659) |
|
435
John Hancock Funds II
Notes to Financial Statements
SIGNIFICANT ACCOUNTING POLICIES, CONTINUED
| | | | |
| | | | | Unrealized |
| | | Principal Amount | Settlement | Appreciation |
| Fund | Currency | Covered by Contract | Date | (Depreciation) |
|
| Spectrum Income | Sells | | | |
|
| | Australian Dollar | 94,000 | 11/21/07 | ($218) |
| | Brazilian Real | 1,277,049 | 9/4/07 | (769) |
| | Brazilian Real | 1,397,000 | 10/5/07 | 28,501 |
| | Brazilian Real | 1,089,000 | 11/21/07 | (37,514) |
| | Brazilian Real | 1,173,156 | 11/23/07 | 35,967 |
| | Brazilian Real | 1,254,051 | 11/30/07 | (19,673) |
| | Canadian Dollar | 104,744 | 11/21/07 | (130) |
| | Danish Kroner | 93,000 | 11/21/07 | (73) |
| | Euro | 4,038,417 | 11/21/07 | (51,825) |
| | Malaysian Ringgit | 1,652,000 | 11/21/07 | 7,242 |
| | Mexican Peso | 249,196 | 11/13/07 | 893 |
| | Mexican Peso | 1,038,504 | 11/20/07 | (26,520) |
| | Mexican Peso | 2,327,838 | 11/21/07 | (22,736) |
| | Mexican Peso | 2,070,150 | 11/30/07 | (11,512) |
| | Polish Zloty | 1,599,855 | 9/7/07 | 29,562 |
| | Polish Zloty | 1,078,062 | 9/24/07 | (10,932) |
| | Pound Sterling | 54,000 | 11/21/07 | 15 |
| | South African Rand | 237,363 | 11/21/07 | (9,020) |
| | Swedish Krona | 1,303,159 | 11/21/07 | (12,750) |
| | Turkish Lira | 74,571 | 10/3/07 | (1,445) |
| | Turkish Lira | 1,474,953 | 10/5/07 | (25,476) |
| | Turkish Lira | 2,716,336 | 11/21/07 | (140,996) |
|
| | | | | ($269,409) |
|
| Strategic Income | Buys | | | |
|
| | Australian Dollar | 31,400,000 | 9/28/07 | ($1,268,821) |
| | Australian Dollar | 2,000,000 | 9/28/07 | (134,621) |
| | Australian Dollar | 10,400,000 | 9/28/07 | (295,347) |
| | Canadian Dollar | 4,789,125 | 9/28/07 | 37,574 |
| | Canadian Dollar | 31,280,008 | 9/28/07 | (337,989) |
| | Canadian Dollar | 2,394,653 | 9/28/07 | 18,872 |
| | Canadian Dollar | 18,006,375 | 9/28/07 | (319,418) |
| | Euro | 14,620,000 | 9/28/07 | 62,366 |
| | Euro | 150,810,000 | 9/28/07 | 144,441 |
| | Euro | 2,000,000 | 9/28/07 | 27,141 |
| | Euro | 4,000,000 | 9/28/07 | 64,316 |
| | Euro | 22,025,000 | 9/28/07 | (147,492) |
| | Japanese Yen | 119,987,000 | 9/28/07 | 39,992 |
| | New Zealand Dollar | 9,900,000 | 9/28/07 | (640,821) |
| | New Zealand Dollar | 3,700,000 | 9/28/07 | (238,855) |
|
| | | | | ($2,988,662) |
|
| | Sells | | | |
|
| | Australian Dollar | 55,191,512 | 9/28/07 | $2,403,695 |
| | Australian Dollar | 1,764,754 | 9/28/07 | 134,897 |
| | Australian Dollar | 1,684,580 | 9/28/07 | 54,723 |
| | Canadian Dollar | 53,962,967 | 9/28/07 | (608,049) |
| | Canadian Dollar | 59,250,000 | 9/28/07 | 172,784 |
| | Canadian Dollar | 8,500,000 | 9/28/07 | (29,538) |
| | Canadian Dollar | 3,100,000 | 9/28/07 | 46,664 |
| | Canadian Dollar | 3,100,000 | 9/28/07 | 44,902 |
| | Euro | 5,114,344 | 9/28/07 | (75,426) |
| | Euro | 192,943,623 | 9/28/07 | (248,986) |
| | Euro | 10,678,669 | 9/28/07 | 25,983 |
| | Euro | 5,410,160 | 9/28/07 | (52,756) |
| | Euro | 44,673,879 | 9/28/07 | 14,540 |
| | Japanese Yen | 1,000,000 | 9/28/07 | (47,099) |
436
John Hancock Funds II
Notes to Financial Statements
SIGNIFICANT ACCOUNTING POLICIES, CONTINUED
| | | | |
| | | | | Unrealized |
| | | Principal Amount | Settlement | Appreciation |
| Fund | Currency | Covered by Contract | Date | (Depreciation) |
|
| Strategic Income | Sells | | | |
|
| | New Zealand Dollar | 1,715,840 | 9/28/07 | $147,180 |
| | New Zealand Dollar | 18,550,671 | 9/28/07 | 1,232,386 |
| | New Zealand Dollar | 739,193 | 9/28/07 | 38,898 |
| | New Zealand Dollar | 2,851,775 | 9/28/07 | 260,685 |
| | New Zealand Dollar | 5,841,655 | 9/28/07 | 309,328 |
| | Pound Sterling | 5,744,320 | 9/28/07 | (101,032) |
|
| | | | | $3,723,779 |
|
| Total Return | Buys | | | |
|
| | Australian Dollar | 3,457,000 | 9/13/07 | ($144,636) |
| | Australian Dollar | 1,940,600 | 9/20/07 | 19,201 |
| | Australian Dollar | 879,700 | 9/28/07 | (8,729) |
| | Brazilian Real | 58,674 | 10/2/07 | 1,428 |
| | Brazilian Real | 49,309,235 | 10/2/07 | 554,867 |
| | Brazilian Real | 7,103,272 | 10/2/07 | 23,736 |
| | Brazilian Real | 5,460,060 | 10/2/07 | 151,203 |
| | Brazilian Real | 9,421,428 | 10/2/07 | 136,257 |
| | Brazilian Real | 18,832,777 | 10/2/07 | 147,623 |
| | Brazilian Real | 9,685,035 | 3/4/08 | 150,987 |
| | Brazilian Real | 10,876,398 | 3/4/08 | 398,662 |
| | Canadian Dollar | 6,754,000 | 9/20/07 | (7,018) |
| | Chinese Yuan Renminbi | 1,344,613 | 9/25/07 | 3,390 |
| | Chinese Yuan Renminbi | 12,892,474 | 11/7/07 | 11,122 |
| | Chinese Yuan Renminbi | 111,496,700 | 11/7/07 | (45,657) |
| | Chinese Yuan Renminbi | 6,007,200 | 11/21/07 | 1,815 |
| | Chinese Yuan Renminbi | 1,363,611 | 1/10/08 | (1,717) |
| | Chinese Yuan Renminbi | 1,363,612 | 1/10/08 | (1,542) |
| | Chinese Yuan Renminbi | 2,694,769 | 1/10/08 | (2,874) |
| | Chinese Yuan Renminbi | 1,262,334 | 1/10/08 | (1,369) |
| | Chinese Yuan Renminbi | 1,363,612 | 1/10/08 | (1,542) |
| | Euro | 11,272,000 | 10/4/07 | 85,131 |
| | Indian Rupee | 39,968,875 | 10/3/07 | 12,883 |
| | Indian Rupee | 24,230,560 | 10/3/07 | 3,217 |
| | Indian Rupee | 20,934,700 | 5/12/08 | 15,119 |
| | Indian Rupee | 279,520,200 | 5/12/08 | 159,301 |
| | Indian Rupee | 35,037,752 | 5/12/08 | 20,763 |
| | Indian Rupee | 29,505,174 | 5/12/08 | 18,820 |
| | Indonesian Rupiah | 2,404,812,500 | 5/27/08 | (19,428) |
| | Indonesian Rupiah | 4,809,625,000 | 5/27/08 | (38,857) |
| | Indonesian Rupiah | 2,399,362,500 | 5/27/08 | (20,002) |
| | Japanese Yen | 1,581,186,000 | 10/25/07 | 212,942 |
| | Malaysian Ringgit | 10,404,543 | 5/21/08 | (85,673) |
| | Malaysian Ringgit | 1,800,680 | 5/21/08 | (23,493) |
| | Malaysian Ringgit | 1,515,136 | 5/21/08 | (9,192) |
| | Mexican Peso | 11,364,885 | 9/28/07 | (21,287) |
| | Mexican Peso | 18,776,675 | 3/13/08 | 13,368 |
| | Mexican Peso | 9,774,555 | 3/13/08 | (13,539) |
| | Mexican Peso | 49,606,489 | 3/13/08 | (79,979) |
| | Mexican Peso | 11,364,885 | 7/10/08 | (2,324) |
| | New Zealand Dollar | 665,000 | 9/13/07 | (41,444) |
| | Philippine Peso | 132,981,840 | 5/19/08 | (62,826) |
| | Philippine Peso | 23,081,070 | 5/19/08 | (8,391) |
| | Polish Zloty | 4,571,528 | 9/28/07 | 8,426 |
| | Polish Zloty | 4,440,610 | 9/28/07 | (39,323) |
| | Polish Zloty | 4,266,958 | 9/28/07 | 13,669 |
| | Polish Zloty | 2,432,467 | 3/13/08 | 4,197 |
| | Polish Zloty | 13,279,095 | 7/10/08 | (98,148) |
| | Pound Sterling | 1,118,000 | 9/20/07 | 14,676 |
437
John Hancock Funds II
Notes to Financial Statements
SIGNIFICANT ACCOUNTING POLICIES, CONTINUED
| | | | |
| | | | | Unrealized |
| | | Principal Amount | Settlement | Appreciation |
| Fund | Currency | Covered by Contract | Date | (Depreciation) |
|
| Total Return | Buys | | | |
|
| | Singapore Dollar | 1,707,185 | 10/3/07 | $3,619 |
| | Singapore Dollar | 1,310,562 | 10/3/07 | (2,838) |
| | Singapore Dollar | 2,593,551 | 10/3/07 | 9,186 |
| | Singapore Dollar | 3,293,926 | 2/20/08 | (25,935) |
| | Singapore Dollar | 2,187,205 | 5/22/08 | (2,115) |
| | South Korean Won | 800,038,500 | 9/21/07 | (11,097) |
| | South Korean Won | 956,801,370 | 9/27/07 | (22,966) |
| | South Korean Won | 897,288,000 | 9/27/07 | (21,912) |
| | South Korean Won | 1,183,780,000 | 1/30/08 | (27,132) |
| | South Korean Won | 989,731,900 | 1/30/08 | (24,119) |
| | South Korean Won | 2,114,845,537 | 5/30/08 | (6,070) |
| | South Korean Won | 400,238,713 | 5/30/08 | 2,511 |
| | South Korean Won | 646,348,000 | 8/4/08 | (570) |
| | Swedish Krona | 8,424,000 | 9/6/07 | 3,104 |
|
| | | | | $1,277,479 |
|
| | Sells | | | |
|
| | Australian Dollar | 50,604 | 9/6/07 | $2,495 |
| | Canadian Dollar | 2,600,000 | 9/20/07 | (9,764) |
| | Chinese Yuan Renminbi | 178,449 | 9/25/07 | 59 |
| | Chinese Yuan Renminbi | 16,176,844 | 11/7/07 | 9,698 |
| | Chinese Yuan Renminbi | 408,000 | 11/7/07 | 3,180 |
| | Chinese Yuan Renminbi | 801,922 | 11/21/07 | 107 |
| | Chinese Yuan Renminbi | 678,170 | 1/10/08 | 278 |
| | Chinese Yuan Renminbi | 169,525 | 1/10/08 | 47 |
| | Chinese Yuan Renminbi | 235,425 | 1/10/08 | 872 |
| | Euro | 13,422,629 | 10/4/07 | 2,481 |
| | Indian Rupee | 844,690 | 10/3/07 | (16,003) |
| | Indian Rupee | 701,002 | 10/3/07 | (15,347) |
| | Mexican Peso | 1,032,421 | 9/28/07 | 3,708 |
| | Polish Zloty | 4,834,035 | 9/28/07 | 92,263 |
| | Pound Sterling | 4,447,143 | 9/20/07 | 10,086 |
| | Pound Sterling | 4,447,752 | 9/20/07 | 10,696 |
| | Singapore Dollar | 1,461,742 | 10/3/07 | 1,045 |
| | South Korean Won | 425,238 | 9/21/07 | (2,533) |
| | South Korean Won | 422,937 | 9/21/07 | (3,196) |
| | South Korean Won | 698,000 | 9/27/07 | (1,461) |
|
| | | | | $88,711 |
|
| Vista | Sells | | | |
|
| | Danish Kroner | 495,272 | 9/28/07 | $225 |
| | Japanese Yen | 3,078,195 | 9/28/07 | 12,474 |
| | Norwegian Krone | 717,612 | 9/28/07 | (185) |
| | Pound Sterling | 2,954,123 | 9/28/07 | (2,994) |
|
| | | | | $9,520 |
Forward Commitments All Funds may purchase or sell debt securities on a when issued or forward delivery basis, which means that the obligations will be delivered to the Funds at a future date, which may be a month or more after the date of commitment. The price of the underlying securities and the date when the securities will be delivered and paid for are fixed at the time the transaction is negotiated.
The Fund may receive compensation for interest forgone in the purchase of forward delivery securities. With respect to purchase commitments, each Fund identifies securities as segregated in its records with a value at least equal to the amount of the commitment. Losses may arise due to changes in the value of the underlying securities, or if the counterparty does not perform under the contract, or if the issuer does not issue the securities due to political, economic or other factors. The value of the securities underlying a forward commitment to purchase securities, and the subsequent fluctuations in their value, are taken into account when determining the Fund’s net asset value starting on the day the Fund agrees to purchase the securities. The market values of the securities purchased on a forward delivery basis are identified in the Portfolio of Investments.
Federal Income Taxes Each Fund’s policy is to qualify as a “regulated investment company” by complying with the applicable provisions of the Internal Revenue Code and will not be subject to federal income tax. Therefore, no federal income tax provision is required.
438
John Hancock Funds II
Notes to Financial Statements
SIGNIFICANT ACCOUNTING POLICIES, CONTINUED
Distribution of Income and Gains The Funds record distributions to shareholders from net investment income and net realized gains, if any, on the ex-dividend date. Distributions paid by the Funds with respect to each class of shares are calculated in the same manner, at the same time and are in the same amount, except for the effect of expenses that may be applied differently to each class. Such distributions, on a tax basis, are determined in conformity with income tax regulations, which may differ from accounting principles generally accepted in the United States of America. Distributions in excess of tax basis earnings and profits, if any, are reported in each Fund’s financial statements as a return of capital.
Capital Accounts The Funds report the undistributed net investment income and accumulated undistributed net realized gain (loss) accounts on a basis approximating amounts available for future tax distributions (or to offset future taxable realized gains when a capital loss carryforward is available). Accordingly, each Fund may periodically make reclassifications among certain capital accounts without affecting its net asset value.
3. INVESTMENT ADVISORY AND OTHER AGREEMENTS
Advisory Fees The Trust has entered into an Investment Advisory Agreement with the Adviser. The Adviser is responsible for managing the corporate and business affairs of the Trust and for selecting and compensating subadvisers to handle the investment of the assets of each Fund, subject to the supervision of the Trust’s Board of Trustees. As compensation for its services, the Adviser receives an advisory fee from the Trust. The Funds are not responsible for payment of the subadvisory fees. Advisory fees charged to all other Funds are as follows:
| | | |
| | Average Net Assets | | |
| Fund | All Asset Levels* | | |
| | |
| Active Bond | 0.600% | | |
| Emerging Growth | 0.800 | | |
| Global Bond | 0.700 | | |
| Real Estate Securities | 0.700 | | |
| Small Cap | 0.850 | | |
| Special Value | 0.950 | | |
| Total Return | 0.700 | | |
| | | |
| | First | Excess | |
| | $1 billion | Over $1 billion | |
| | of Aggregate | of Aggregate | |
| Fund | Net Assets* | Net Assets* | |
| |
| Real Return Bond1,2 | 0.700% | 0.650% | |
1 When Aggregate Net Assets exceed $1 billion, the advisory fee for the Real Return Bond is 0.650% on all assets.
2 Until May 1, 2007, the Fund paid monthly advisory fees equivalent, on an annual basis, to 0.700% of the Fund’s average net assets.
| | | |
| | | Between | |
| | First | $500 million | Excess |
| | $500 million | and $1 billion | Over $1 billion |
| | of Aggregate | of Aggregate | of Aggregate |
| Fund | Net Assets* | Net Assets* | Net Assets* |
|
| All Cap Core | 0.800% | 0.750% | 0.750% |
| All Cap Growth | 0.850 | 0.825 | 0.800 |
| Blue Chip Growth | 0.825 | 0.825 | 0.800 |
| Emerging Small Company | 0.970 | 0.900 | 0.900 |
| Equity-Income | 0.825 | 0.825 | 0.800 |
| Mid Cap Intersection | 0.875 | 0.850 | 0.850 |
| Quantitative Value | 0.700 | 0.650 | 0.600 |
| Total Bond Market | 0.490 | 0.470 | 0.470 |
| U.S. Global Leaders Growth | 0.7125 | 0.675 | 0.675 |
| Value & Restructuring1 | 0.825 | 0.800 | 0.775 |
1 Until October 1, 2006, the Fund paid monthly advisory fees equivalent, on an annual basis, to the sum of: (a) 0.850% of the first $500 million of the Fund’s average net assets and (b) 0.800% of the Fund’s net assets in excess of $500 million.
| | | | | |
| | | Between | Between | Between | |
| | First | $500 million | $1 billion | $1.5 billion | Excess |
| | $500 million | and $1 billion | and $1.5 billion | and $2 billion | Over $2 billion |
| | of Aggregate | of Aggregate | of Aggregate | of Aggregate | of Aggregate |
| Fund | Net Assets* | Net Assets* | Net Assets* | Net Assets* | Net Assets* |
|
| Large Cap Value1 | 0.825% | 0.800% | 0.775% | 0.720% | 0.700% |
1 Until December 1, 2006, the Fund paid monthly advisory fees equivalent, on an annual basis, to the sum of: (a) 0.825% of the first $500 million of the Fund’s average net assets, (b) 0.800% of the next $500 million of the Fund’s average net assets and (c) 0.775% of the Fund’s average net assets in excess of $1 billion.
439
John Hancock Funds II
Notes to Financial Statements
INVESTMENT ADVISORY AND OTHER AGREEMENTS, CONTINUED
| | | | | |
| | | Between | Between | Between | |
| | First | $50 million | $200 million | $500 million | Excess |
| | $50 million | and $200 million | and $500 million | and $1 billion | Over $1 billion |
| | of Aggregate | of Aggregate | of Aggregate | of Aggregate | of Aggregate |
| Fund | Net Assets* | Net Assets* | Net Assets* | Net Assets* | Net Assets* |
|
| International Small Cap | 1.050% | 1.050% | 0.950% | 0.850% | 0.850% |
| International Value | 0.950 | 0.950 | 0.850 | 0.800 | 0.800 |
| Mid Cap Stock | 0.875 | 0.875 | 0.850 | 0.825 | 0.825 |
| Mid Cap Value | 0.900 | 0.900 | 0.850 | 0.825 | 0.825 |
| Natural Resources | 1.050 | 1.000 | 1.000 | 1.000 | 1.000 |
| Quantitative All Cap | 0.750 | 0.700 | 0.700 | 0.700 | 0.700 |
| Quantitative Mid Cap | 0.750 | 0.750 | 0.650 | 0.650 | 0.650 |
| Small Cap Opportunities | 1.000 | 1.000 | 1.000 | 0.950 | 0.950 |
| Small Company Value | 1.050 | 1.050 | 1.050 | 1.000 | 1.000 |
| Value | 0.750 | 0.750 | 0.725 | 0.650 | 0.650 |
| | | | | | |
| | | Between | Between | | |
| | First | $50 million | $250 million | Excess | |
| | $50 million | and $250 million | and $500 million | Over $500 million | |
| | of Aggregate | of Aggregate | of Aggregate | of Aggregate | |
| Fund | Net Assets* | Net Assets* | Net Assets* | Net Assets* | |
| |
| All Cap Value | 0.850% | 0.850% | 0.800% | 0.750% | |
| Fundamental Value | 0.850 | 0.800 | 0.800 | 0.750 | |
| | | | | | |
| | | Between | Between | | |
| | First | $200 million | $400 million | Excess | |
| | $200 million | and $400 million | and $1 billion | Over $1 billion | |
| | of Aggregate | of Aggregate | of Aggregate | of Aggregate | |
| Fund | Net Assets* | Net Assets* | Net Assets* | Net Assets* | |
| |
| Vista | 0.900% | 0.850% | 0.825% | 0.800% | |
| | | | | | |
| | | Between | Between | | |
| | First | $300 million | $500 million | Excess | |
| | $300 million | and $500 million | and $1 billion | Over $1 billion | |
| | of Aggregate | of Aggregate | of Aggregate | of Aggregate | |
| Fund | Net Assets* | Net Assets* | Net Assets* | Net Assets* | |
| |
| Capital Appreciation | 0.850% | 0.800% | 0.700% | 0.670% | |
| | | | | | |
| | First | Excess | | | |
| | $350 million | Over $350 million | | | |
| | of Aggregate | of Aggregate | | | |
| Fund | Net Assets* | Net Assets* | | | |
| |
| Core Equity | 0.850% | 0.750% | | | |
| | | | | | |
| | | Between | Between | | |
| | First | $500 million | $1 billion | Excess | |
| | $500 million | and $1 billion | and $2.5 billion | Over $2.5 billion | |
| | of Aggregate | of Aggregate | of Aggregate | of Aggregate | |
| Fund | Net Assets* | Net Assets* | Net Assets* | Net Assets* | |
| |
| U.S. Multi Sector | 0.780% | 0.760% | 0.750% | 0.740% | |
| | | | | | |
| | | Between | | | |
| | First | $750 million | Excess | | |
| | $750 million | and $1.5 billion | Over $1.5 billion | | |
| | of Aggregate | of Aggregate | of Aggregate | | |
| Fund | Net Assets* | Net Assets* | Net Assets* | | |
| |
| International Opportunities | 0.900% | 0.850% | 0.800% | | |
| | | | | | |
| | First | Excess | | | |
| | $125 million | Over $125 million | | | |
| | of Aggregate | of Aggregate | | | |
| Fund | Net Assets* | Net Assets* | | | |
| |
| Small Company | 1.050% | 1.000% | | | |
440
John Hancock Funds II
Notes to Financial Statements
| | | | |
| INVESTMENT ADVISORY AND OTHER AGREEMENTS, CONTINUED | | |
| | First | Excess | | |
| | $250 million | Over $250 million | | |
| | of Aggregate | of Aggregate | | |
| Fund | Net Assets* | Net Assets* | | |
| |
| Small Company Growth1 | 1.050% | 1.000% | | |
| | |
| 1 When Aggregate Net Assets exceed $1 billion, the advisory fee for the Small Company Growth is 1.00% on all assets. | |
| |
| | | Between | Between | |
| | First | $250 million | $500 million | Excess |
| | $250 million | and $500 million | and $1 billion | Over $1 billion |
| | of Aggregate | of Aggregate | of Aggregate | of Aggregate |
| Fund | Net Assets* | Net Assets* | Net Assets* | Net Assets* |
|
| Mid Cap Value Equity | 0.875% | 0.850% | 0.825% | 0.800% |
| Real Estate Equity | 0.875 | 0.850 | 0.825 | 0.825 |
| Spectrum Income | 0.800 | 0.725 | 0.725 | 0.725 |
| | | | | |
| | | | | |
| | | Between | Between | |
| | First | $250 million | $500 million | Excess |
| | $250 million | and $500 million | and $750 million | Over $750 million |
| | of Aggregate | of Aggregate | of Aggregate | of Aggregate |
| Fund | Net Assets* | Net Assets* | Net Assets* | Net Assets |
|
| Global Real Estate | 0.950% | 0.950% | 0.925% | 0.900% |
| Large Cap | 0.780 | 0.730 | 0.680 | 0.650 |
| | | | | |
| | First | Excess | | |
| | $100 million | Over $100 million | | |
| | of Aggregate | of Aggregate | | |
| Fund | Net Assets* | Net Assets* | | |
| |
| Emerging Markets Value | 1.000% | 0.950% | | |
| International Equity Index | 0.550 | 0.530 | | |
| International Small Company | 1.000 | 0.950 | | |
| | | | |
| | | Between | | |
| | First | $250 million | Excess | |
| | $250 million | and $500 million | Over $500 million | |
| | of Aggregate | of Aggregate | of Aggregate | |
| Fund | Net Assets* | Net Assets* | Net Assets* | |
| |
| Mid Cap Index | 0.490% | 0.480% | 0.460% | |
| Small Cap Index | 0.490 | 0.480 | 0.460 | |
| | | | |
| | First | Excess | | |
| | $500 million | Over $500 million | | |
| | of Aggregate | of Aggregate | | |
| Fund | Net Assets* | Net Assets* | | |
| |
| High Yield | 0.700% | 0.650% | | |
| Index 500 | 0.470 | 0.460 | | |
| Investment Quality Bond | 0.600 | 0.550 | | |
| Strategic Bond | 0.700 | 0.650 | | |
| Strategic Income | 0.725 | 0.650 | | |
| U.S. Government Securities | 0.620 | 0.550 | | |
| | | | |
| | First | Excess | | |
| | $200 million | Over $200 million | | |
| | of Aggregate | of Aggregate | | |
| Fund | Net Assets* | Net Assets* | | |
| |
| U.S. High Yield Bond | 0.750% | 0.720% | | |
| | | | |
| | | Between | | |
| | First | $200 million | Excess | |
| | $200 million | and $400 million | Over $400 million | |
| | of Aggregate | of Aggregate | of Aggregate | |
| Fund | Net Assets* | Net Assets* | Net Assets* | |
| |
| Core Bond | 0.690% | 0.640% | 0.570% | |
441
John Hancock Funds II
Notes to Financial Statements
| | | | |
| INVESTMENT ADVISORY AND OTHER AGREEMENTS, CONTINUED | | |
| | | Between | Between | |
| | First | $150 million and | $500 million and | Excess |
| | $150 million | $500 million | $2.5 billion | Over $2.5 billion |
| | of Aggregate | of Aggregate | of Aggregate | of Aggregate |
| Fund | Net Assets* | Net Assets* | Net Assets* | Net Assets* |
|
| High Income | 0.725% | 0.675% | 0.650% | 0.600% |
* Aggregated Net Assets include not only the net assets of a particular series of the Trust but also the net assets of a similar series of John Hancock Trust.
John Hancock Trust is an open-end investment company advised by JHIMS and distributed by an affiliate of JHIMS, John Hancock Distributors, LLC.
The advisory fee for Absolute Return Portfolio has two components: (a) a fee on assets invested in affiliated Funds (“Affiliated Fund Assets”) and (b) a fee on assets not invested in affiliated funds (“Other Assets”). Affiliated Funds are any Funds of JHF II and JHF III. Under the Advisory Agreement, the Portfolio pays a monthly management fee to the Adviser as stated below.
The fee on Affiliated Fund Assets is stated as an annual percentage of the current value of the aggregate net assets of the Portfolio and the Absolute Return Trust, a series of John Hancock Trust (collectively, the “Absolute Return Portfolios”), determined in accordance with the following schedule and that rate is applied to the Affiliated Fund Assets of the Portfolio.
| | | |
| | | Between | |
| | First | $200 million and | Excess over |
| | $200 million | $500 million | $500 million |
| | of Aggregate | of Aggregate | of Aggregate |
| Portfolio | Net Assets | Net Assets | Net Assets |
|
| Absolute Return | 0.150% | 0.125% | 0.100% |
The fee on Other Assets is stated as an annual percentage of the current value of the aggregate net assets of the Absolute Return Portfolios, determined in accordance with the following schedule and that rate is applied to Other Assets of the Portfolio
| | | |
| | | Between | |
| | First | $200 million and | Excess over |
| | $200 million | 500 million | $500 million |
| | of Aggregate | of Aggregate | of Aggregate |
| Portfolio | Net Assets | Net Assets | Net Assets |
|
| Absolute Return | 0.600% | 0.575% | 0.550% |
The investment management fees incurred for the year ended August 31, 2007, were equivalent to an annual effective rate of the fund’s average daily net assets as follows:
| | | | | | | |
| | Annual | | | Annual | | | Annual |
| | Effective | | | Effective | | | Effective |
| Fund | Rate | | Fund | Rate | | Fund | Rate |
|
| Absolute Return | 0.20% | | International Opportunities | 0.87% | | Small Cap Index | 0.48% |
| Active Bond | 0.60% | | International Small Cap | 0.91% | | Small Cap Opportunities | 0.99% |
| All Cap Core | 0.77% | | International Small Company | 0.98% | | Small Company | 1.04% |
| All Cap Growth | 0.85% | | International Value | 0.81% | | Small Company Growth | 1.04% |
| All Cap Value | 0.82% | | Investment Quality Bond | 0.59% | | Small Company Value | 1.02% |
| Blue Chip Growth | 0.81% | | Large Cap | 0.72% | | Special Value | 0.95% |
| Capital Appreciation | 0.73% | | Large Cap Value | 0.81% | | Spectrum Income | 0.74% |
| Core Bond | 0.65% | | Mid Cap Index | 0.47% | | Strategic Bond | 0.67% |
| Core Equity | 0.78% | | Mid Cap Intersection | 0.87% | | Strategic Income | 0.70% |
| Emerging Growth | 0.80% | | Mid Cap Stock | 0.84% | | Total Bond Market | 0.49% |
| Emerging Markets Value | 0.96% | | Mid Cap Value | 0.86% | | Total Return | 0.70% |
| Emerging Small Company | 0.97% | | Mid Cap Value Equity | 0.87% | | U.S. Global Leaders Growth | 0.69% |
| Equity-Income | 0.81% | | Natural Resources | 1.00% | | U.S. Government Securities | 0.61% |
| Fundamental Value | 0.76% | | Quantitative All Cap | 0.71% | | U.S. High Yield Bond | 0.73% |
| Global Bond | 0.70% | | Quantitative Mid Cap | 0.74% | | U.S. Multi Sector | 0.76% |
| Global Real Estate | 0.94% | | Quantitative Value | 0.66% | | Value | 0.74% |
| High Income | 0.68% | | Real Estate Equity | 0.86% | | Value & Restructuring | 0.82% |
| High Yield | 0.66% | | Real Estate Securities | 0.70% | | Vista | 0.89% |
| Index 500 | 0.46% | | Real Return Bond | 0.69% | | | |
| International Equity Index | 0.53% | | Small Cap | 0.85% | | | |
442
John Hancock Funds II
Notes to Financial Statements
INVESTMENT ADVISORY AND OTHER AGREEMENTS, CONTINUED
Expense Reimbursement The Adviser agreed to voluntarily reduce its advisory fee or reimburse each Fund if the total of all expenses (excluding taxes, fund brokerage commissions, interest, litigation and indemnification expenses, other extraordinary expenses not incurred in the ordinary course of the Funds’ business, advisory fees, Rule 12b-1 fees, and fees under any agreements or plans of the Funds dealing with services for shareholders and others with beneficial interests in shares of the Funds) exceed the following:
- 0.05% of average daily net assets of Index 500, International Equity Index;
- 0.06% of average daily net assets of Emerging Small Company;
- 0.075% of average daily net assets of Mid Cap Index, Small Cap Index, Total Bond Market;
- 0.35% of average daily net assets of Global Bond, Global Real Estate, International Opportunities, International Small Cap, International Small Company, International Value; and
- 0.25% of average daily net assets in the case of all other Funds with the exception of Absolute Return and Quantitative All Cap.
The Adviser voluntarily agreed to waive a portion of its advisory fee for Emerging Small Company, Index 500, Real Return Bond, Special Value, Total Bond Market and Value in the amount of $556, $26,983, $38,575, $19,418, $25,861 and $28,756, respectively.
The Adviser reserves the right to terminate this limitation in the future.
In the case of Absolute Return, the Adviser has contractually agreed to waive advisory fees or reimburse the Fund if the total of all expenses (excluding advisory fees, Rule 12b-1 fees, transfer agency fees and services fees, taxes, portfolio brokerage commissions, interest, underlying fund expenses, printing and postage, blue sky and litigation and indemnification expenses and other extraordinary expenses not incurred in the ordinary course of the business of the Absolute Return Portfolio) exceed 0.05% of average daily net assets. This expense reimbursement shall continue in effect until December 31, 2007, and thereafter until termination by the Adviser on notice to the Trust. The Adviser reimbursed the fund in the amount of $60,630.
In the case of Quantitative All Cap, the Adviser has contractually agreed to waive advisory fees or reimburse for certain other fund expenses so that the total fund operating expenses do not exceed 1.30% for Class A, 2.00% for Class B, 2.00% for Class C and 0.85% for Class I of the average net assets attributable to the respective classes. This expense reimbursement shall continue in effect until December 31, 2007, and thereafter until termination by the Adviser on notice to the Trust. The Adviser reimbursed the fund in the amount of $53,054.
In addition, the Adviser voluntarily agreed to waive a portion of its advisory fee for Blue Chip Growth, Equity-Income, International Value, Real Estate Equity, Small Company Value and Spectrum Income in the amount of $445,218, $251,500, $161,204, $91,163, $206,663 and $208,169, respectively.
These voluntary expense reimbursements may be terminated by the Adviser at any time upon notice of the Trust. These expense reimbursements are shown as a reduction of total expenses in the Statement of Operations.
Fund Administration Fees Pursuant to the Advisory Agreement, the Funds reimburse the Adviser for all expenses associated with providing the administrative, financial, accounting and recordkeeping services of the Funds, including the preparation of all tax returns, annual, semiannual and periodic reports to shareholders and the preparation of all regulatory reports. These expenses are allocated based on the relative share of net assets of each Fund at the time the expense was incurred.
The fund administration fees incurred for the year ended August 31, 2007, were equivalent to an annual effective rate of 0.01% of the Fund’s average daily net assets.
Distribution Plan The Trust has a Distribution Agreement with the Distributor. The Funds have adopted Distribution Plans with respect to Class A, Class B, Class C and Class 1, pursuant to Rule 12b-1 under the 1940 Act, to reimburse the Distributor for the services it provides as distributor of shares of the Funds. Accordingly, the Funds make monthly payments to the Distributor at an annual rate not to exceed 0.30%, 1.00%, 1.00% and 0.05% of the average daily net assets of Class A, Class B, Class C and Class 1, respectively. A maximum of 0.25% of such payments may be service fees, as defined by the Conduct Rules of the Financial Industry Regulatory Authority (formerly, National Association of Securities Dealers). Under the Conduct Rules, curtailment of a portion of the Funds’ 12b-1 payments could occur under certain circumstances.
Transfer Agent Fees Absolute Return and Quantitative All Cap have a Transfer Agency Agreement with John Hancock Signature Services, Inc. (“Signature Services”), an indirect subsidiary of MFC. For Class A, Class B, Class C and Class I shares, the Funds pay a monthly transfer agent fee at an annual rate of 0.05% of each class’ average daily net assets, plus a fee based on the number of shareholder accounts and reimbursement for certain out-of-pocket expenses. Expenses not directly attributable to a particular class of shares are aggregated and allocated to each class on the basis of its relative net asset value.
Signature Services has agreed to limit the transfer agent fees so that such fees do not exceed 0.20% annually of Class A, Class B, Class C and Class I share average daily net. This agreement is effective until December 31, 2007. Signature Services reserves the right to terminate this limitation in the future.
There were no transfer agent fees incurred for the year ended August 31, 2007. John Hancock USA is the only shareholder of Absolute Return and Quantitative All Cap.
Sales Charges Absolute Return and Quantitative All Cap Class A shares are assessed up-front sales charges. There were no up-front sales charges received for these funds during the year ended August 31, 2007.
Absolute Return and Quantitative All Cap Class B shares that are redeemed within six years of purchase are subject to a contingent deferred sales charge (“CDSC”) at declining rates, beginning at 5.00% of the lesser of the current market value at the time of redemption or the original purchase cost of the shares being redeemed. Class C shares that are redeemed within one year of purchase are subject to a CDSC at a rate of 1.00% of the lesser of the current market value at the time of redemption or the original purchase cost of the shares being redeemed. Proceeds from the CDSCs are paid to the Distributor and are used, in whole or in part, to defray its expenses for providing distribution-related services to the Funds in connection with the sale of Class B and Class C shares. During the year ended August 31, 2007, there were no CDSCs received by the Distributor.
443
John Hancock Funds II
Notes to Financial Statements
4. TRUSTEES’ FEES The Trust compensates each Trustee who is not an employee of the Adviser or its affiliates. Total Trustees’ expenses are allocated to each Fund based on its average daily net asset value.
5. GUARANTEES AND INDEMNIFICATIONS Under the Trust’s organizational documents, its Officers and Trustees are indemnified against certain liability arising out of the performance of their duties to the Trust. Additionally, in the normal course of business, the Trust enters into contracts with service providers that contain general indemnification clauses. The Trust’s maximum exposure under these arrangements is unknown, as this would involve future claims that may be made against the Trust that have not yet occurred. However, based on experience, the Trust believes the risk of loss to be remote.
6. LINE OF CREDIT All Funds have entered into an agreement which enables them to participate in a $100 million unsecured committed line of credit with State Street Corporation. Borrowings will be made solely to temporarily finance the repurchase of capital shares. Interest is charged to each participating Portfolio based on its borrowings at a rate per annum equal to the Federal Funds rate plus 0.50% . In addition, a commitment fee of 0.07% per annum, payable at the end of each calendar quarter, based on the average daily-unused portion of the line of credit, is charged to each participating Fund on a prorated basis based on average net assets. For the year ended August 31, 2007, there were no borrowings under the line of credit.
7. CAPITAL SHARES Share activity for the Funds for the years ended August 31, 2007, and August 31, 2006, were as follows:
| | | | |
| Absolute Return | Year ended 8-31-07 | Period ended 8-31-061 |
| | Shares | Amount | Shares | Amount |
| |
| Class A | | | | |
|
| Sold | — | — | 125,000 | $1,250,000 |
| Distributions reinvested | 3,382 | $36,251 | — | — |
| Net increase | 3,382 | $36,251 | 125,000 | $1,250,000 |
| |
| Class B | | | | |
|
| Sold | — | — | 125,000 | $1,250,000 |
| Distributions reinvested | 3,167 | $33,890 | — | — |
| Net increase | 3,167 | $33,890 | 125,000 | $1,250,000 |
| |
| Class C | | | | |
|
| Sold | — | — | 125,000 | $1,250,000 |
| Distributions reinvested | 3,167 | $33,891 | — | — |
| Net increase | 3,167 | $33,891 | 125,000 | $1,250,000 |
| |
| Class 1 | | | | |
|
| Sold | — | — | 125,000 | $1,250,000 |
| Distributions reinvested | 3,457 | $37,090 | — | — |
| Net increase (decrease) | 3,457 | $37,090 | 125,000 | $1,250,000 |
|
| Net increase (decrease) | 13,173 | $141,122 | 500,000 | $5,000,000 |
|
| 1 Period from 6-26-06 (commencement of operations) to 8-31-06. | | | | |
| |
| Active Bond | Year ended 8-31-07 | Period ended 8-31-061 |
| | Shares | Amount | Shares | Amount |
|
| Class 1 | | | | |
|
| Sold | 470,404 | $4,505,444 | 4,410,359 | $42,335,086 |
| Distributions reinvested | 186,250 | 1,772,438 | 101,841 | 954,551 |
| Repurchased | (764,590) | (7,318,089) | (629,790) | (6,032,748) |
| Net increase (decrease) | (107,936) | ($1,040,207) | 3,882,410 | $37,256,889 |
| |
| Class NAV | | | | |
|
| Sold | 12,383,573 | $118,803,493 | 40,800,418 | $391,259,642 |
| Distributions reinvested | 2,363,144 | 22,470,704 | 1,092,312 | 10,220,932 |
| Repurchased | (1,532,557) | (14,641,956) | (296,193) | (2,824,688) |
| Net increase (decrease) | 13,214,160 | $126,632,241 | 41,596,537 | $398,655,886 |
|
| Net increase (decrease) | 13,106,224 | $125,592,034 | 45,478,947 | $435,912,775 |
|
| 1 Class 1 and Class NAV shares began operations on 10-15-05 and 10-27-05, respectively. | | | |
| |
| All Cap Core | Year ended 8-31-07 | Period ended 8-31-061 |
| | Shares | Amount | Shares | Amount |
|
| Class NAV | | | | |
|
| Sold | 14,623,284 | $161,835,006 | 28,631,304 | $285,677,276 |
| Distributions reinvested | 120,910 | 1,286,357 | — | — |
| Repurchased | (284,507) | (3,262,154) | (39) | (386) |
|
| Net increase (decrease) | 14,459,687 | $159,859,209 | 28,631,265 | $285,676,890 |
|
| 1 Period from 4-28-06 (commencement of operations) to 8-31-06. | | | | |
444
John Hancock Funds II
Notes to Financial Statements
| | | | |
| CAPITAL SHARES, CONTINUED | | | | |
| |
| All Cap Growth | Year ended 8-31-07 | Period ended 8-31-061 |
| | Shares | Amount | Shares | Amount |
| |
| Class 1 | | | | |
|
| Sold | 122,700 | $2,220,300 | 2,255,731 | $35,128,332 |
| Distributions reinvested | 1,037 | 18,249 | 923 | 15,666 |
| Repurchased | (371,782) | (6,773,976) | (294,829) | (4,975,207) |
| Net increase (decrease) | (248,045) | ($4,535,427) | 1,961,825 | $30,168,791 |
| |
| Class NAV | | | | |
|
| Sold | 1,305,753 | $23,366,485 | 7,460,531 | $118,167,808 |
| Distributions reinvested | 5,113 | 90,046 | 2,919 | 49,558 |
| Repurchased | (3,641,313) | (68,492,693) | (1) | (12) |
| Net increase (decrease) | (2,330,447) | ($45,036,162) | 7,463,449 | $118,217,354 |
| Net increase (decrease) | (2,578,492) | ($49,571,589) | 9,425,274 | $148,386,145 |
|
| 1 Period from 10-15-05 (commencement of operations) to 8-31-06. | | | |
| |
| All Cap Value | Year ended 8-31-07 | Period ended 8-31-061 |
| | Shares | Amount | Shares | Amount |
| |
| Class 1 | | | | |
|
| Sold | 351,564 | $5,877,321 | 1,534,041 | $21,741,293 |
| Distributions reinvested | 46,855 | 754,366 | 1,978 | 29,388 |
| Repurchased | (212,851) | (3,569,287) | (206,788) | (3,153,743) |
| Net increase (decrease) | 185,568 | $3,062,400 | 1,329,231 | $18,616,938 |
| |
| Class NAV | | | | |
|
| Sold | 2,509,531 | $41,214,944 | 12,329,873 | $173,586,947 |
| Distributions reinvested | 458,933 | 7,370,459 | 18,130 | 268,692 |
| Repurchased | (11,254,545) | (191,782,275) | — | — |
| Net increase (decrease) | (8,286,081) | ($143,196,872) | 12,348,003 | $173,855,639 |
| Net increase (decrease) | (8,100,513) | ($140,134,472) | 13,677,234 | $192,472,577 |
|
| 1 Period from 10-15-05 (commencement of operations) to 8-31-06. | | | |
| |
| Blue Chip Growth | Year ended 8-31-07 | Period ended 8-31-061 |
| | Shares | Amount | Shares | Amount |
| |
| Class 1 | | | | |
|
| Sold | 577,597 | $11,483,071 | 11,420,290 | $192,142,629 |
| Distributions reinvested | 46,822 | 900,395 | 5,306 | 96,099 |
| Repurchased | (1,292,131) | (25,344,305) | (1,056,336) | (18,624,249) |
| Net increase (decrease) | (667,712) | ($12,960,839) | 10,369,260 | $173,614,479 |
| |
| Class NAV | | | | |
|
| Sold | 12,329,239 | $241,276,259 | 64,643,103 | $1,091,778,066 |
| Distributions reinvested | 306,834 | 5,894,281 | 44,161 | 798,874 |
| Repurchased | (3,024,837) | (62,984,230) | (3,576,152) | (65,139,214) |
| Net increase (decrease) | 9,611,236 | $184,186,310 | 61,111,112 | $1,027,437,726 |
| Net increase (decrease) | 8,943,524 | $171,225,471 | 71,480,372 | $1,201,052,205 |
|
| 1 Period from 10-15-05 (commencement of operations) to 8-31-06. | | | |
| |
| Capital Appreciation | Year ended 8-31-07 | Period ended 8-31-061 |
| | Shares | Amount | Shares | Amount |
| |
| Class 1 | | | | |
|
| Sold | 576,815 | $5,971,139 | 7,646,975 | $75,934,658 |
| Distributions reinvested | 7,858 | 80,148 | — | — |
| Repurchased | (1,619,741) | (16,842,865) | (478,192) | (4,595,575) |
| Net increase (decrease) | (1,035,068) | ($10,791,578) | 7,168,783 | $71,339,083 |
| |
| Class NAV | | | | |
|
| Sold | 13,693,087 | $143,208,394 | 42,013,807 | $401,821,454 |
| Distributions reinvested | 52,765 | 538,729 | — | — |
| Repurchased | (1,049,654) | (10,788,615) | (475,720) | (4,570,774) |
| Net increase (decrease) | 12,696,198 | $132,958,508 | 41,538,087 | $397,250,680 |
| Net increase (decrease) | 11,661,130 | $122,166,930 | 48,706,870 | $468,589,763 |
|
| 1 Period from 10-15-05 (commencement of operations) to 8-31-06. | | | |
445
John Hancock Funds II
Notes to Financial Statements
CAPITAL SHARES, CONTINUED
| | | | |
| Core Bond | Year ended 8-31-07 | Period ended 8-31-061 |
| | Shares | Amount | Shares | Amount |
|
| Class 1 | | | | |
|
| Sold | 78,155 | $980,666 | 79,232 | $988,911 |
| Distributions reinvested | 5,107 | 63,538 | 1,398 | 16,947 |
| Repurchased | (35,034) | (436,961) | (3,699) | (45,815) |
| Net increase (decrease) | 48,228 | $607,243 | 76,931 | $960,043 |
| |
| Class NAV | | | | |
|
| Sold | 5,366,895 | $67,109,137 | 15,383,056 | $192,087,432 |
| Distributions reinvested | 854,619 | 10,624,228 | 406,966 | 4,956,804 |
| Repurchased | (614,127) | (7,651,250) | (6,839) | (84,833) |
| Net increase (decrease) | 5,607,387 | $70,082,115 | 15,783,183 | $196,959,403 |
| Net increase (decrease) | 5,655,615 | $70,689,358 | 15,860,114 | $197,919,446 |
|
| 1 Period from 10-15-05 (commencement of operations) to 8-31-06. | | | |
| |
| Core Equity | Year ended 8-31-07 | Period ended 8-31-061 |
| | Shares | Amount | Shares | Amount |
|
| Class 1 | | | | |
|
| Sold | 186,606 | $2,969,030 | 916,332 | $12,817,352 |
| Distributions reinvested | 4,815 | 76,757 | — | — |
| Repurchased | (164,105) | (2,606,905) | (66,319) | (967,554) |
| Net increase (decrease) | 27,316 | $438,882 | 850,013 | $11,849,798 |
|
| Class NAV | | | | |
| Sold | 10,927,208 | $177,960,574 | 41,574,157 | $583,783,533 |
| Distributions reinvested | 233,671 | 3,729,384 | — | — |
| Repurchased | (978,198) | (16,035,685) | (640,480) | (9,611,239) |
| Net increase (decrease) | 10,182,681 | $165,654,273 | 40,933,677 | $574,172,294 |
| Net increase (decrease) | 10,209,997 | $166,093,155 | 41,783,690 | $586,022,092 |
|
| 1 Period from 10-15-05 (commencement of operations) to 8-31-06. | | | |
| |
| Emerging Growth | Year ended 8-31-07 | Period ended 8-31-061 |
| | Shares | Amount | Shares | Amount |
|
| Class 1 | | | | |
|
| Sold | 454,590 | $8,323,984 | 14,616,000 | $242,600,553 |
| Distributions reinvested | 1,297,455 | 21,459,911 | — | — |
| Repurchased | (1,278,968) | (22,763,661) | (8,047,719) | (133,391,250) |
| Net increase (decrease) | 473,077 | $7,020,234 | 6,568,281 | $109,209,303 |
| |
| Class NAV | | | | |
|
| Sold | 929,391 | $16,371,896 | 2,848,551 | $47,801,605 |
| Distributions reinvested | 589,138 | 9,744,345 | — | — |
| Repurchased | (416,630) | (7,447,191) | (58,751) | (1,081,054) |
| Net increase (decrease) | 1,101,899 | $18,669,050 | 2,789,800 | $46,720,551 |
|
| Net increase (decrease) | 1,574,976 | $25,689,284 | 9,358,081 | $155,929,854 |
| 1 Period from 10-15-05 (commencement of operations) to 8-31-06. | | | |
| |
| Emerging Markets Value | Period ended 8-31-071 | | |
| | Shares | Amount | | |
|
| Class NAV | | | | |
|
| Sold | 44,000,955 | $459,713,807 | | |
| Repurchased | (227,049) | (2,699,099) | | |
|
| Net increase (decrease) | 43,773,906 | $457,014,708 | | |
| 1 Period from 5-1-07 (commencement of operations) to 8-31-07. | | | | |
| |
| Emerging Small Company | Year ended 8-31-07 | Period ended 8-31-061 |
| | Shares | Amount | Shares | Amount |
| |
| Class 1 | | | | |
|
| Sold | 83,593 | $2,503,534 | 2,017,391 | $57,714,464 |
| Distributions reinvested | 183,998 | 5,121,451 | — | — |
| Repurchased | (504,347) | (14,824,538) | (232,021) | (7,072,654) |
| Net increase (decrease) | (236,756) | ($7,199,553) | 1,785,370 | $50,641,810 |
| |
| Class NAV | | | | |
|
| Sold | 239,774 | $7,217,294 | 3,401 | $100,000 |
| Distributions reinvested | 1,872 | 52,195 | — | — |
| Repurchased | (15,906) | (480,154) | — | — |
| Net increase (decrease) | 225,740 | $6,789,335 | 3,401 | $100,000 |
| Net increase (decrease) | (11,016) | ($410,218) | 1,788,771 | $50,741,810 |
|
| 1 Class 1 and Class NAV shares began operations on 10-15-05 and 6-26-06, respectively. | | | |
446
John Hancock Funds II
Notes to Financial Statements
| | | | |
| CAPITAL SHARES, CONTINUED | | | | |
| |
| Equity-Income | Year ended 8-31-07 | Period ended 8-31-061 |
| | Shares | Amount | Shares | Amount |
|
| Class 1 | | | | |
|
| Sold | 1,273,256 | $24,627,604 | 10,841,153 | $175,415,443 |
| Distributions reinvested | 645,455 | 12,057,099 | 35,892 | 612,671 |
| Repurchased | (1,170,281) | (22,407,685) | (757,673) | (13,117,365) |
| Net increase (decrease) | 748,430 | $14,277,018 | 10,119,372 | $162,910,749 |
| |
| Class NAV | | | | |
|
| Sold | 5,721,349 | $110,890,485 | 41,740,567 | $679,203,718 |
| Distributions reinvested | 1,927,268 | 35,962,815 | 139,155 | 2,371,194 |
| Repurchased | (743,856) | (14,993,199) | (12,320,846) | (221,623,437) |
| Net increase (decrease) | 6,904,761 | $131,860,101 | 29,558,876 | $459,951,475 |
| Net increase (decrease) | 7,653,191 | $146,137,119 | 39,678,248 | $622,862,224 |
|
| 1 Period from 10-15-05 (commencement of operations) to 8-31-06. | | | |
| |
| Fundamental Value | Year ended 8-31-07 | Period ended 8-31-061 |
| | Shares | Amount | Shares | Amount |
|
| Class 1 | | | | |
| Sold | 857,395 | $14,638,351 | 4,406,006 | $64,352,852 |
| Distributions reinvested | 88,640 | 1,505,113 | 7,132 | 109,544 |
| Repurchased | (335,556) | (5,834,702) | (192,621) | (2,947,427) |
| Net increase (decrease) | 610,479 | $10,308,762 | 4,220,517 | $61,514,969 |
| |
| Class NAV | | | | |
|
| Sold | 9,918,028 | $170,285,992 | 43,805,878 | $643,905,194 |
| Distributions reinvested | 913,392 | 15,491,119 | 80,076 | 1,226,769 |
| Repurchased | (845,429) | (15,322,187) | (8,097) | (119,942) |
| Net increase (decrease) | 9,985,991 | $170,454,924 | 43,877,857 | $645,012,021 |
| Net increase (decrease) | 10,596,470 | $180,763,686 | 48,098,374 | $706,526,990 |
|
| 1 Period from 10-15-05 (commencement of operations) to 8-31-06. | | | |
| |
| Global Bond | Year ended 8-31-07 | Period ended 8-31-061 |
| | Shares | Amount | Shares | Amount |
|
| Class 1 | | | | |
| Sold | 884,608 | $13,106,978 | 3,319,111 | $48,301,151 |
| Distributions reinvested | 101,009 | 1,465,646 | 15,790 | 227,540 |
| Repurchased | (908,875) | (13,270,966) | (565,053) | (8,153,979) |
| Net increase (decrease) | 76,742 | $1,301,658 | 2,769,848 | $40,374,712 |
| |
| Class NAV | | | | |
|
| Sold | 14,987,825 | $217,943,125 | 37,810,358 | $545,663,651 |
| Distributions reinvested | 1,489,821 | 21,572,614 | 194,896 | 2,800,652 |
| Repurchased | (2,889,191) | (42,495,399) | (555,964) | (8,062,548) |
| Net increase (decrease) | 13,588,455 | $197,020,340 | 37,449,290 | $540,401,755 |
| Net increase (decrease) | 13,665,197 | $198,321,998 | 40,219,138 | $580,776,467 |
|
| 1 Period from 10-15-05 (commencement of operations) to 8-31-06. | | | |
| |
| Global Real Estate | Year ended 8-31-07 | Period ended 8-31-061 |
| | Shares | Amount | Shares | Amount |
|
| Class NAV | | | | |
|
| Sold | 9,526,393 | $113,846,888 | 35,315,465 | $352,026,731 |
| Distributions reinvested | 1,320,193 | 15,063,407 | — | — |
| Repurchased | (4,407,616) | (52,862,115) | (828,195) | (8,290,766) |
| Net increase (decrease) | 6,438,970 | $76,048,180 | 34,487,270 | $343,735,965 |
|
| 1 Period from 4-28-06 (commencement of operations) to 8-31-06. | | | | |
| |
| High Income | Year ended 8-31-07 | Period ended 8-31-061 |
| | Shares | Amount | Shares | Amount |
| |
| Class NAV | | | | |
|
| Sold | 5,820,135 | $64,070,061 | 28,959,651 | $289,253,392 |
| Distributions reinvested | 2,072,989 | 22,119,587 | 323,060 | 3,127,218 |
| Repurchased | (1,063,085) | (11,687,315) | (66) | (663) |
|
| Net increase (decrease) | 6,830,039 | $74,502,333 | 29,282,645 | $292,379,947 |
|
| 1 Period from 4-28-06 (commencement of operations) to 8-31-06. | | | | |
447
John Hancock Funds II
Notes to Financial Statements
| | | | |
| CAPITAL SHARES, CONTINUED | | | | |
| |
| High Yield | Year ended 8-31-07 | Period ended 8-31-061 |
| | Shares | Amount | Shares | Amount |
| |
| Class 1 | | | | |
|
| Sold | 1,731,776 | $17,943,511 | 4,684,483 | $47,431,727 |
| Distributions reinvested | 374,824 | 3,820,526 | 241,386 | 2,373,236 |
| Repurchased | (1,656,268) | (16,963,038) | (583,626) | (5,964,590) |
| Net increase (decrease) | 450,332 | $4,800,999 | 4,342,243 | $43,840,373 |
| |
| Class NAV | | | | |
|
| Sold | 36,127,328 | $371,263,509 | 148,852,350 | $1,504,335,643 |
| Distributions reinvested | 10,436,699 | 105,904,938 | 6,834,498 | 67,041,478 |
| Repurchased | (3,393,446) | (35,301,505) | (42,180,007) | (440,523,474) |
| Net increase (decrease) | 43,170,581 | $441,866,942 | 113,506,841 | $1,130,853,647 |
| Net increase (decrease) | 43,620,913 | $446,667,941 | 117,849,084 | $1,174,694,020 |
|
| 1 Period from 10-15-05 (commencement of operations) to 8-31-06. | | | |
| |
| Index 500 | Period ended 8-31-071 | | |
| | Shares | Amount | | |
|
| Class NAV | | | | |
|
| Sold | 7,735,742 | $81,347,762 | | |
| Distributions reinvested | 11,042 | 112,959 | | |
| Repurchased | (15,471) | (164,315) | | |
| Net increase (decrease) | 7,731,313 | $81,296,406 | | |
|
| 1 Period from 10-27-06 (commencement of operations) to 8-31-07. | | | |
| |
| International Equity Index | Year ended 8-31-07 | Period ended 8-31-061 |
| | Shares | Amount | Shares | Amount |
|
| Class NAV | | | | |
|
| Sold | 4,199,279 | $88,536,529 | 16,356,516 | $274,978,009 |
| Distributions reinvested | 477,334 | 9,656,472 | 125,191 | 2,080,681 |
| Repurchased | (2,193,361) | (48,666,479) | (254,897) | (4,623,820) |
| Net increase (decrease) | 2,483,252 | $49,526,522 | 16,226,810 | $272,434,870 |
|
| 1 Period from 10-29-05 (commencement of operations) to 8-31-06. | | | |
| |
| International Opportunities | Year ended 8-31-07 | Period ended 8-31-061 |
| | Shares | Amount | Shares | Amount |
|
| Class 1 | | | | |
|
| Sold | 774,797 | $13,674,979 | 601,742 | $9,273,103 |
| Distributions reinvested | 12,044 | 210,053 | 2,943 | 42,136 |
| Repurchased | (157,552) | (2,864,391) | (50,208) | (778,720) |
| Net increase (decrease) | 629,289 | $11,020,641 | 554,477 | $8,536,519 |
|
| Class NAV | | | | |
| Sold | 7,121,612 | $127,039,719 | 34,334,780 | $486,232,885 |
| Distributions reinvested | 511,075 | 8,933,583 | 1,294,925 | 18,582,164 |
| Repurchased | (2,365,190) | (44,453,744) | (1,453,315) | (22,354,475) |
| Net increase (decrease) | 5,267,497 | $91,519,558 | 34,176,390 | $482,460,574 |
| Net increase (decrease) | 5,896,786 | $102,540,199 | 34,730,867 | $490,997,093 |
|
| 1 Period from 10-15-05 (commencement of operations) to 8-31-06. | | | |
| |
| International Small Cap | Year ended 8-31-07 | Period ended 8-31-061 |
| | Shares | Amount | Shares | Amount |
| Class 1 | | | | |
|
| Sold | 1,705,776 | $39,483,733 | 2,219,040 | $42,103,836 |
| Distributions reinvested | 290,717 | 5,971,316 | 3,177 | 59,757 |
| Repurchased | (466,680) | (10,228,024) | (458,599) | (9,035,256) |
| Net increase (decrease) | 1,529,813 | $35,227,025 | 1,763,618 | $33,128,337 |
| |
| Class NAV | | | | |
|
| Sold | 1,871,638 | $41,177,768 | 27,389,877 | $502,849,801 |
| Distributions reinvested | 2,687,720 | 55,205,771 | 54,397 | 1,022,670 |
| Repurchased | (6,382,317) | (154,507,946) | (10,310,152) | (226,267,466) |
| Net increase (decrease) | (1,822,959) | ($58,124,407) | 17,134,122 | $277,605,005 |
| Net increase (decrease) | (293,146) | ($22,897,382) | 18,897,740 | $310,733,342 |
|
| 1 Period from 10-15-05 (commencement of operations) to 8-31-06. | | | |
448
John Hancock Funds II
Notes to Financial Statements
| | | | |
| CAPITAL SHARES, CONTINUED | | | | |
| |
| International Small Company | Year ended 8-31-07 | Period ended 8-31-061 |
| | Shares | Amount | Shares | Amount |
|
| Class NAV | | | | |
|
| Sold | 4,479,563 | $47,858,040 | 23,673,770 | $234,475,079 |
| Distributions reinvested | 142,824 | 1,485,367 | — | — |
| Repurchased | (6,573,164) | (77,025,666) | — | — |
| Net increase (decrease) | (1,950,777) | ($27,682,259) | 23,673,770 | $234,475,079 |
|
| 1 Period from 4-28-06 (commencement of operations) to 8-31-06. | | | | |
| |
| International Value | Year ended 8-31-07 | Period ended 8-31-061 |
| | Shares | Amount | Shares | Amount |
| |
| Class 1 | | | | |
|
| Sold | 1,322,833 | $25,328,322 | 7,948,556 | $122,657,545 |
| Distributions reinvested | 671,707 | 12,413,151 | 22,472 | 353,039 |
| Repurchased | (1,294,803) | (24,669,632) | (464,178) | (7,536,803) |
| Net increase (decrease) | 699,737 | $13,071,841 | 7,506,850 | $115,473,781 |
| |
| Class NAV | | | | |
|
| Sold | 9,130,148 | $173,324,628 | 57,595,544 | $868,428,490 |
| Distributions reinvested | 4,037,073 | 74,443,625 | 183,500 | 2,875,449 |
| Repurchased | (5,019,354) | (100,607,697) | (11,028,757) | (195,470,875) |
| Net increase (decrease) | 8,147,867 | $147,160,556 | 46,750,287 | $675,833,064 |
| Net increase (decrease) | 8,847,604 | $160,232,397 | 54,257,137 | $791,306,845 |
|
| 1 Period from 10-15-05 (commencement of operations) to 8-31-06. | | | |
| |
| Investment Quality Bond | Year ended 8-31-07 | Period ended 8-31-061 |
| | Shares | Amount | Shares | Amount |
|
| Class 1 | | | | |
|
| Sold | 1,021,236 | $11,972,047 | 3,270,289 | $38,683,682 |
| Distributions reinvested | 158,709 | 1,852,666 | 93,593 | 1,074,307 |
| Repurchased | (460,220) | (5,382,723) | (400,700) | (4,711,127) |
| Net increase (decrease) | 719,725 | $8,441,990 | 2,963,182 | $35,046,862 |
| |
| Class NAV | | | | |
|
| Sold | 2,300,517 | $27,013,344 | 7,735,080 | $91,307,476 |
| Distributions reinvested | 452,189 | 5,273,536 | 245,235 | 2,811,572 |
| Repurchased | (188,896) | (2,204,492) | (35,590) | (421,740) |
| Net increase (decrease) | 2,563,810 | $30,082,388 | 7,944,725 | $93,697,308 |
| Net increase (decrease) | 3,283,535 | $38,524,378 | 10,907,907 | $128,744,170 |
|
| 1 Period from 10-15-05 (commencement of operations) to 8-31-06. | | | |
| |
| Large Cap | Year ended 8-31-07 | Period ended 8-31-061 |
| | Shares | Amount | Shares | Amount |
|
| Class 1 | | | | |
|
| Sold | 1,889,334 | $31,381,392 | 302,458 | $4,282,728 |
| Distributions reinvested | 5,975 | 92,678 | 100 | 1,427 |
| Repurchased | (136,889) | (2,238,827) | (162,086) | (2,317,240) |
| Net increase (decrease) | 1,758,420 | $29,235,243 | 140,472 | $1,966,915 |
|
| |
| Class NAV | | | | |
|
| Sold | 8,044,087 | $133,488,429 | 13,058,478 | $177,726,453 |
| Distributions reinvested | 463,113 | 7,182,882 | 14,836 | 212,011 |
| Repurchased | (35,192) | (565,500) | (53) | (777) |
| Net increase (decrease) | 8,472,008 | $140,105,811 | 13,073,261 | $177,937,687 |
| Net increase (decrease) | 10,230,428 | $169,341,054 | 13,213,733 | $179,904,602 |
|
| 1 Period from 10-15-05 (commencement of operations) to 8-31-06. | | | |
| |
| Large Cap Value | Year ended 8-31-07 | Period ended 8-31-061 |
| | Shares | Amount | Shares | Amount |
|
| Class 1 | | | | |
|
| Sold | 1,062,104 | $26,272,941 | 4,869,615 | $109,652,824 |
| Distributions reinvested | 28,375 | 703,700 | 1,106 | 24,237 |
| Repurchased | (637,635) | (16,149,763) | (285,910) | (6,490,215) |
| Net increase (decrease) | 452,844 | $10,826,878 | 4,584,811 | $103,186,846 |
| |
| Class NAV | | | | |
|
| Sold | 5,881,000 | $147,425,132 | 10,165,283 | $218,373,407 |
| Distributions reinvested | 79,838 | 1,983,171 | 13,349 | 293,006 |
| Repurchased | (278,132) | (7,646,247) | (55) | (1,305) |
| Net increase (decrease) | 5,682,706 | $141,762,056 | 10,178,577 | $218,665,108 |
| Net increase (decrease) | 6,135,550 | $152,588,934 | 14,763,388 | $321,851,954 |
|
| 1 Period from 10-15-05 (commencement of operations) to 8-31-06. | | | |
449
John Hancock Funds II
Notes to Financial Statements
| | | | |
| CAPITAL SHARES, CONTINUED | | | | |
| |
| |
| Mid Cap Index | Year ended 8-31-07 | Period ended 8-31-061 |
| | Shares | Amount | Shares | Amount |
|
| Class NAV | | | | |
|
| Sold | 20,726,108 | $415,874,261 | 9,364,334 | $172,967,966 |
| Distributions reinvested | 148,583 | 2,912,236 | 5,412 | 98,937 |
| Repurchased | (10,039,477) | (215,246,486) | (9) | (167) |
| Net increase (decrease) | 10,835,214 | $203,540,011 | 9,369,737 | $173,066,736 |
|
| 1 Period from 10-29-05 (commencement of operations) to 8-31-06. | | | |
| |
| Mid Cap Intersection | Period ended 8-31-071 | | |
| | Shares | Amount | | |
|
| Class NAV | | | | |
|
| Sold | 35,165,220 | $353,015,606 | | |
| Repurchased | (316,301) | (3,288,504) | | |
| Net increase (decrease) | 34,848,919 | $349,727,102 | | |
|
| 1 Period from 5-1-07 (commencement of operations) to 8-31-07. | | | | |
| |
| Mid Cap Stock | Year ended 8-31-07 | Period ended 8-31-061 |
| | Shares | Amount | Shares | Amount |
| | | | |
| Class 1 | | | | |
|
| Sold | 960,440 | $17,124,190 | 7,177,859 | $101,765,405 |
| Distributions reinvested | 323,891 | 5,383,070 | 7,197 | 110,835 |
| Repurchased | (871,977) | (14,994,688) | (433,964) | (6,723,460) |
| Net increase (decrease) | 412,354 | $7,512,572 | 6,751,092 | $95,152,780 |
| |
| Class NAV | | | | |
|
| Sold | 7,142,479 | $129,608,890 | 12,263,280 | $175,063,032 |
| Distributions reinvested | 600,744 | 9,996,375 | 12,654 | 195,005 |
| Repurchased | (749,907) | (14,363,978) | (13,321) | (200,978) |
| Net increase (decrease) | 6,993,316 | $125,241,287 | 12,262,613 | $175,057,059 |
| Net increase (decrease) | 7,405,670 | $132,753,859 | 19,013,705 | $270,209,839 |
|
| 1 Period from 10-15-05 (commencement of operations) to 8-31-06. | | | |
| |
| Mid Cap Value | Year ended 8-31-07 | Period ended 8-31-061 |
| | Shares | Amount | Shares | Amount |
| |
| Class 1 | | | | |
|
| Sold | 843,108 | $17,718,229 | 5,216,018 | $93,070,872 |
| Distributions reinvested | 232,425 | 4,648,507 | 8,173 | 156,021 |
| Repurchased | (638,176) | (13,127,790) | (270,546) | (5,091,481) |
| Net increase (decrease) | 437,357 | $9,238,946 | 4,953,645 | $88,135,412 |
| |
| Class NAV | | | | |
|
| Sold | 5,056,349 | $110,680,494 | 7,331,183 | $131,352,458 |
| Distributions reinvested | 128,234 | 2,563,422 | 12,119 | 230,981 |
| Repurchased | (61,424) | (1,366,694) | (4,708,091) | (91,289,836) |
| Net increase (decrease) | 5,123,159 | $111,877,222 | 2,635,211 | $40,293,603 |
| Net increase (decrease) | 5,560,516 | $121,116,168 | 7,588,856 | $128,429,015 |
|
| 1 Period from 10-15-05 (commencement of operations) to 8-31-06. | | | |
| |
| Mid Cap Value Equity | Year ended 8-31-07 | Period ended 8-31-061 |
| | Shares | Amount | Shares | Amount |
| |
| Class NAV | | | | |
|
| Sold | 1,401,010 | $14,976,201 | 10,163,245 | $101,230,202 |
| Distributions reinvested | 59,141 | 611,515 | — | — |
| Repurchased | (327,297) | (3,896,220) | — | — |
| Net increase (decrease) | 1,132,854 | $11,691,496 | 10,163,245 | $101,230,202 |
|
| 1 Period from 4-28-06 (commencement of operations) to 8-31-06. | | | | |
450
John Hancock Funds II
Notes to Financial Statements
| | | | |
| CAPITAL SHARES, CONTINUED | | | | |
| |
| Natural Resources | Year ended 8-31-07 | Period ended 8-31-061 |
| | Shares | Amount | Shares | Amount |
| |
| Class 1 | | | | |
|
| Sold | 1,024,519 | $41,344,766 | 2,667,622 | $84,051,737 |
| Distributions reinvested | 110,329 | 3,900,147 | 1,596 | 51,094 |
| Repurchased | (798,350) | (28,750,095) | (390,223) | (12,861,630) |
| Net increase (decrease) | 336,498 | $16,494,818 | 2,278,995 | $71,241,201 |
|
| |
| Class NAV | | | | |
|
| Sold | 8,180,205 | $291,532,246 | 26,990,316 | $791,451,774 |
| Distributions reinvested | 1,168,533 | 41,167,430 | 21,664 | 691,085 |
| Repurchased | (11,526,262) | (460,846,911) | (7,583,489) | (243,417,369) |
| Net increase (decrease) | (2,177,524) | ($128,147,235) | 19,428,491 | $548,725,490 |
| Net increase (decrease) | (1,841,026) | ($111,652,417) | 21,707,486 | $619,966,691 |
|
| 1 Period from 10-15-05 (commencement of operations) to 8-31-06. | | | |
| |
| Quantitative All Cap | Year ended 8-31-07 | Period ended 8-31-061 |
| | Shares | Amount | Shares | Amount |
| |
| Class A | | | | |
|
| Sold | — | — | 125,000 | $1,250,000 |
| Distributions reinvested | 685 | $7,698 | — | — |
| Net increase | 685 | $7,698 | 125,000 | $1,250,000 |
| |
| Class B | | | | |
|
| Sold | — | — | 125,000 | $1,250,000 |
| Distributions reinvested | 280 | $3,141 | — | — |
| Net increase | 280 | $3,141 | 125,000 | $1,250,000 |
| |
| Class C | | | | |
|
| Sold | — | — | 125,000 | $1,250,000 |
| Distributions reinvested | 280 | $3,141 | — | — |
| Net increase | 280 | $3,141 | 125,000 | $1,250,000 |
| |
| Class I | | | | |
|
| Sold | — | — | 125,000 | $1,250,000 |
| Distributions reinvested | 859 | $9,650 | — | — |
| Net increase | 859 | $9,650 | 125,000 | $1,250,000 |
| Net increase (decrease) | 2,104 | $23,630 | 500,000 | $5,000,000 |
|
| 1 Period from 7-28-06 (commencement of operations) to 8-31-06. | | | | |
| |
| Quantitative Mid Cap | Year ended 8-31-07 | Period ended 8-31-061 |
| | Shares | Amount | Shares | Amount |
| |
| Class 1 | | | | |
|
| Sold | 193,789 | $3,007,101 | 10,131,602 | $139,050,728 |
| Distributions reinvested | 16,994 | 258,139 | 4,513 | 67,201 |
| Repurchased | (1,741,906) | (27,107,708) | (821,113) | (12,018,583) |
| Net increase (decrease) | (1,531,123) | ($23,842,468) | 9,315,002 | $127,099,346 |
| |
| Class NAV2 | | | | |
|
| Sold | 659,708 | $10,193,692 | 3,477,624 | $48,688,174 |
| Distributions reinvested | 7,653 | 116,243 | 1,504 | 22,396 |
| Repurchased | (4,146,489) | (67,569,821) | — | — |
| Net increase (decrease) | (3,479,128) | ($57,259,886) | 3,479,128 | $48,710,570 |
| Net increase (decrease) | (5,010,251) | ($81,102,354) | 12,794,130 | $175,809,916 |
|
| 1 Class 1 and Class NAV shares began operations on 10-15-05 and 10-27-05, respectively. | | |
| 2 Class NAV shares of Quantitative Mid Cap were terminated on 5-3-07. | | | |
| |
| Quantitative Value | Year ended 8-31-07 | Period ended 8-31-061 |
| | Shares | Amount | Shares | Amount |
| |
| Class 1 | | | | |
|
| Sold | 891,205 | $15,602,769 | 12,177,329 | $172,995,129 |
| Distributions reinvested | 362,329 | 6,239,310 | 20,598 | 316,796 |
| Repurchased | (1,020,359) | (18,082,760) | (6,412,260) | (91,864,606) |
| Net increase (decrease) | 233,175 | $3,759,319 | 5,785,667 | $81,447,319 |
|
| |
| Class NAV | | | | |
|
| Sold | 15,653,371 | $279,195,794 | 21,861,897 | $322,294,660 |
| Distributions reinvested | 1,587,755 | 27,357,022 | 59,655 | 917,492 |
| Repurchased | (418,062) | (7,673,038) | (46,554) | (752,703) |
| Net increase (decrease) | 16,823,064 | $298,879,778 | 21,874,998 | $322,459,449 |
| Net increase (decrease) | 17,056,239 | $302,639,097 | 27,660,665 | $403,906,768 |
|
| 1 Period from 10-15-05 (commencement of operations) to 8-31-06. | | | |
451
John Hancock Funds II
Notes to Financial Statements
| | | | |
| CAPITAL SHARES, CONTINUED | | | | |
| |
| Real Estate Equity | Year ended 8-31-07 | Period ended 8-31-061 |
| | Shares | Amount | Shares | Amount |
|
| Class NAV | | | | |
|
| Sold | 3,044,992 | $36,200,187 | 26,299,462 | $262,958,482 |
| Distributions reinvested | 703,894 | 8,101,824 | — | — |
| Repurchased | (5,258,219) | (65,978,590) | (1,276,416) | (13,500,524) |
| Net increase (decrease) | (1,509,333) | ($21,676,579) | 25,023,046 | $249,457,958 |
|
| 1 Period from 4-28-06 (commencement of operations) to 8-31-06. | | | | |
| |
| Real Estate Securities | Year ended 8-31-07 | Period ended 8-31-061 |
| | Shares | Amount | Shares | Amount |
| |
| Class 1 | | | | |
|
| Sold | 1,700,692 | $41,830,289 | 6,284,572 | $148,199,995 |
| Distributions reinvested | 4,621,957 | 86,754,141 | 39,680 | 993,592 |
| Repurchased | (3,882,475) | (75,519,173) | (627,908) | (16,050,282) |
| Net increase (decrease) | 2,440,174 | $53,065,257 | 5,696,344 | $133,143,305 |
|
| | | | | |
| Class NAV2 | | | | |
|
| Sold | — | — | 22,695,411 | $537,633,578 |
| Distributions reinvested | — | — | 153,457 | 3,836,410 |
| Repurchased | — | — | (22,848,868) | (620,415,037) |
| Net increase (decrease) | — | — | — | ($78,945,049) |
| Net increase (decrease) | 2,440,174 | $53,065,257 | 5,696,344 | $54,198,256 |
|
| 1 Period from 10-15-05 (commencement of operations) to 8-31-06. | | | |
| 2 Class NAV shares of Real Estate Securities Fund were terminated on 5-1-06. | | | |
| |
| Real Return Bond | Year ended 8-31-07 | Period ended 8-31-061 |
| | Shares | Amount | Shares | Amount |
|
| Class 1 | | | | |
|
| Sold | 478,649 | $6,295,015 | 1,454,328 | $19,581,447 |
| Distributions reinvested | 50,068 | 653,154 | 36,073 | 467,161 |
| Repurchased | (384,686) | (5,048,557) | (196,896) | (2,628,853) |
| Net increase (decrease) | 144,031 | $1,899,612 | 1,293,505 | $17,419,755 |
|
| Class NAV | | | | |
| Sold | 22,878,787 | $298,698,002 | 50,304,888 | $671,385,157 |
| Distributions reinvested | 2,460,953 | 31,813,651 | 1,498,244 | 19,250,689 |
| Repurchased | (4,019,436) | (52,642,293) | (414,756) | (5,458,616) |
| Net increase (decrease) | 21,320,304 | $277,869,360 | 51,388,376 | $685,177,230 |
| Net increase (decrease) | 21,464,335 | $279,768,972 | 52,681,881 | $702,596,985 |
|
| 1 Period from 10-15-05 (commencement of operations) to 8-31-06. | | | |
| |
| Small Cap | Year ended 8-31-07 | Period ended 8-31-061 |
| | Shares | Amount | Shares | Amount |
|
| Class 1 | | | | |
|
| Sold | 61,796 | $963,241 | 71,459 | $1,051,472 |
| Repurchased | (39,122) | (610,743) | (14,710) | (218,414) |
| Net increase (decrease) | 22,674 | $352,498 | 56,749 | $833,058 |
|
| Class NAV | | | | |
| Sold | 2,911,876 | $45,235,524 | 17,159,599 | $234,797,473 |
| Repurchased | (9,412,869) | (150,924,715) | (84,253) | (1,306,123) |
| Net increase (decrease) | (6,500,993) | ($105,689,191) | 17,075,346 | $233,491,350 |
| Net increase (decrease) | (6,478,319) | ($105,336,693) | 17,132,095 | $234,324,408 |
|
| 1 Period from 10-15-05 (commencement of operations) to 8-31-06. | | | |
| |
| Small Cap Index | Year ended 8-31-07 | Period ended 8-31-061 |
| | Shares | Amount | Shares | Amount |
|
| Class NAV | | | | |
|
| Sold | 2,604,866 | $45,066,530 | 7,837,004 | $119,876,928 |
| Distributions reinvested | 301,054 | 5,027,596 | 5,687 | 86,672 |
| Repurchased | (5,499,498) | (97,783,789) | (2) | (40) |
| Net increase (decrease) | (2,593,578) | ($47,689,663) | 7,842,689 | $119,963,560 |
|
| 1 Period from 10-29-05 (commencement of operations) to 8-31-06. | | | |
452
John Hancock Funds II
Notes to Financial Statements
| | | | |
| CAPITAL SHARES, CONTINUED | | | | |
| |
| Small Cap Opportunities | Year ended 8-31-07 | Period ended 8-31-061 |
| | Shares | Amount | Shares | Amount |
|
| Class 1 | | | | |
|
| Sold | 266,931 | $6,517,864 | 1,423,438 | $31,374,556 |
| Distributions reinvested | 53,393 | 1,280,892 | 2,275 | 52,542 |
| Repurchased | (158,586) | (3,901,915) | (115,637) | (2,690,949) |
| Net increase (decrease) | 161,738 | $3,896,841 | 1,310,076 | $28,736,149 |
|
| | | | | |
| Class NAV | | | | |
|
| Sold | 696,274 | $17,063,145 | 11,275,084 | $243,592,568 |
| Distributions reinvested | 368,714 | 8,804,891 | 21,585 | 496,243 |
| Repurchased | (2,137,165) | (54,427,134) | (1,933,247) | (49,121,188) |
| Net increase (decrease) | (1,072,177) | ($28,559,098) | 9,363,422 | $194,967,623 |
| Net increase (decrease) | (910,439) | ($24,662,257) | 10,673,498 | $223,703,772 |
|
| 1 Period from 10-15-05 (commencement of operations) to 8-31-06. | | | | |
| |
| Small Company | Year ended 8-31-07 | Period ended 8-31-061 |
| | Shares | Amount | Shares | Amount |
|
| Class 1 | | | | |
|
| Sold | 46,205 | $794,825 | 444,470 | $6,952,364 |
| Repurchased | (126,691) | (2,171,378) | (50,652) | (835,677) |
| Net increase (decrease) | (80,486) | ($1,376,553) | 393,818 | $6,116,687 |
|
| | | | | |
| Class NAV | | | | |
|
| Sold | 1,267,238 | $21,484,026 | 5,775,746 | $88,554,245 |
| Repurchased | (1,420,528) | (25,991,283) | (116,590) | (1,993,906) |
| Net increase (decrease) | (153,290) | ($4,507,257) | 5,659,156 | $86,560,339 |
| Net increase (decrease) | (233,776) | ($5,883,810) | 6,052,974 | $92,677,026 |
|
| 1 Period from 10-15-05 (commencement of operations) to 8-31-06. | | | | |
| |
| Small Company Growth | Year ended 8-31-07 | Period ended 8-31-061 |
| | Shares | Amount | Shares | Amount |
|
| Class NAV | | | | |
| Sold | 9,408,432 | $124,318,163 | 6,665,333 | $67,787,539 |
| Distributions reinvested | 117,039 | 1,393,929 | — | — |
| Repurchased | (279,058) | (3,781,747) | (4) | (51) |
| Net increase (decrease) | 9,246,413 | $121,930,345 | 6,665,329 | $67,787,488 |
|
| 1 Period from 10-29-05 (commencement of operations) to 8-31-06. | | | | |
| |
| Small Company Value | Year ended 8-31-07 | Period ended 8-31-061 |
| | Shares | Amount | Shares | Amount |
| |
| Class 1 | | | | |
|
| Sold | 336,822 | $8,639,569 | 6,651,337 | $142,249,964 |
| Distributions reinvested | 106,036 | 2,645,608 | 11,964 | 272,671 |
| Repurchased | (1,136,528) | (29,046,918) | (381,270) | (8,873,772) |
| Net increase (decrease) | (693,670) | ($17,761,741) | 6,282,031 | $133,648,863 |
| |
| Class NAV | | | | |
|
| Sold | 2,312,549 | $60,143,382 | 10,194,775 | $220,030,278 |
| Distributions reinvested | 184,446 | 4,596,397 | 17,657 | 401,689 |
| Repurchased | (260,041) | (7,091,324) | (86,262) | (2,158,577) |
| Net increase (decrease) | 2,236,954 | $57,648,455 | 10,126,170 | $218,273,390 |
| Net increase (decrease) | 1,543,284 | $39,886,714 | 16,408,201 | $351,922,253 |
|
| 1 Period from 10-15-05 (commencement of operations) to 8-31-06. | | | | |
| |
| Special Value | Year ended 8-31-07 | Period ended 8-31-061 |
| | Shares | Amount | Shares | Amount |
| |
| Class 1 | | | | |
|
| Sold | 67,262 | $1,388,106 | 208,064 | $4,049,944 |
| Distributions reinvested | 88,373 | 1,463,555 | 60 | 1,203 |
| Repurchased | (47,989) | (940,920) | (19,736) | (404,619) |
| Net increase (decrease) | 107,646 | $1,910,741 | 188,388 | $3,646,528 |
|
| | | | | |
| Class NAV2 | | | | |
| Sold | 921,940 | $19,935,252 | 6,047,081 | $115,644,477 |
| Distributions reinvested | 1,499,916 | 25,067,477 | 3,993 | 80,458 |
| Repurchased | (8,455,481) | (162,178,408) | (17,449) | (373,044) |
| Net increase (decrease) | (6,033,625) | ($117,175,679) | 6,033,625 | $115,351,891 |
| Net increase (decrease) | (5,925,979) | ($115,264,938) | 6,222,013 | $118,998,419 |
|
| 1 Period from 10-15-05 (commencement of operations) to 8-31-06. | | | | |
| 2 Class NAV shares of Special Value were terminated on 5-30-07. | | | | |
453
John Hancock Funds II
Notes to Financial Statements
| | | | |
| CAPITAL SHARES, CONTINUED | | | | |
| |
| Spectrum Income | Year ended 8-31-07 | Period ended 8-31-061 |
| | Shares | Amount | Shares | Amount |
|
| Class NAV | | | | |
|
| Sold | 19,790,247 | $208,019,793 | 72,620,367 | $729,434,258 |
| Distributions reinvested | 3,740,072 | 38,987,693 | 1,821,119 | 18,140,475 |
| Repurchased | (4,753,186) | (50,541,537) | (70,634) | (713,593) |
| Net increase (decrease) | 18,777,133 | $196,465,949 | 74,370,852 | $746,861,140 |
|
| 1 Period from 10-29-05 (commencement of operations) to 8-31-06. | | | |
| |
| Strategic Bond | Year ended 8-31-07 | Period ended 8-31-061 |
| | Shares | Amount | Shares | Amount |
|
| Class 1 | | | | |
|
| Sold | 1,055,066 | $12,577,465 | 3,816,438 | $45,216,126 |
| Distributions reinvested | 198,759 | 2,346,726 | 154,844 | 1,757,818 |
| Repurchased | (918,020) | (10,881,824) | (428,849) | (5,062,957) |
| Net increase (decrease) | 335,805 | $4,042,367 | 3,542,433 | $41,910,987 |
|
| |
| Class NAV | | | | |
|
| Sold | 12,885,694 | $153,358,252 | 41,372,661 | $489,625,288 |
| Distributions reinvested | 1,494,094 | 17,589,329 | 1,154,531 | 13,154,541 |
| Repurchased | (567,651) | (6,754,090) | (19,596,041) | (232,996,134) |
| Net increase (decrease) | 13,812,137 | $164,193,491 | 22,931,151 | $269,783,695 |
| Net increase (decrease) | 14,147,942 | $168,235,858 | 26,473,584 | $311,694,682 |
|
| 1 Period from 10-15-05 (commencement of operations) to 8-31-06. | | | |
| |
| Strategic Income | Year ended 8-31-07 | Period ended 8-31-061 |
| | Shares | Amount | Shares | Amount |
|
| Class NAV | | | | |
|
| Sold | 13,521,665 | $136,051,831 | 27,748,210 | $277,448,128 |
| Distributions reinvested | 1,271,380 | 12,664,623 | 204,788 | 2,008,968 |
| Repurchased | (739,348) | (7,433,421) | (60) | (599) |
| Net increase (decrease) | 14,053,697 | $141,283,033 | 27,952,938 | $279,456,497 |
|
| 1 Period from 4-28-06 (commencement of operations) to 8-31-06. | | | | |
| |
| Total Bond Market | Period ended 8-31-071 | | |
| | Shares | Amount | | |
|
| Class NAV | | | | |
|
| Sold | 5,274,108 | $52,752,211 | | |
| Distributions reinvested | 173,216 | 1,721,518 | | |
| Repurchased | (97,420) | (968,055) | | |
| Net increase (decrease) | 5,349,904 | $53,505,674 | | |
|
| 1 Period from 10-27-06 (commencement of operations) to 8-31-07. | | | |
| |
| Total Return | Year ended 8-31-07 | Period ended 8-31-061 |
| | Shares | Amount | Shares | Amount |
|
| Class 1 | | | | |
|
| Sold | 1,461,759 | $20,131,423 | 9,048,783 | $123,937,034 |
| Distributions reinvested | 362,592 | 4,966,012 | 207,106 | 2,773,005 |
| Repurchased | (1,245,697) | (17,073,693) | (708,309) | (9,688,915) |
| Net increase (decrease) | 578,654 | $8,023,742 | 8,547,580 | $117,021,124 |
|
| |
| Class NAV | | | | |
|
| Sold | 28,155,152 | $385,995,030 | 74,491,595 | $1,015,920,334 |
| Distributions reinvested | 3,705,780 | 50,609,975 | 1,802,766 | 24,067,715 |
| Repurchased | (5,758,511) | (78,833,586) | (568,832) | (7,736,934) |
| Net increase (decrease) | 26,102,421 | $357,771,419 | 75,725,529 | $1,032,251,115 |
| Net increase (decrease) | 26,681,075 | $365,795,161 | 84,273,109 | $1,149,272,239 |
|
| 1 Period from 10-15-05 (commencement of operations) to 8-31-06. | | | |
454
John Hancock Funds II
Notes to Financial Statements
| | | | |
| CAPITAL SHARES, CONTINUED | | | | |
| |
| U.S. Global Leaders Growth | Year ended 8-31-07 | Period ended 8-31-061 |
| | Shares | Amount | Shares | Amount |
|
| Class 1 | | | | |
|
| Sold | 177,114 | $2,387,076 | 2,202,160 | $28,041,942 |
| Distributions reinvested | 9,064 | 122,004 | 798 | 10,881 |
| Repurchased | (855,485) | (11,546,186) | (245,208) | (3,204,861) |
| Net increase (decrease) | (669,307) | ($9,037,106) | 1,957,750 | $24,847,962 |
|
| | | | | |
| Class NAV | | | | |
|
| Sold | 12,766,100 | $172,709,123 | 35,653,852 | $470,772,227 |
| Distributions reinvested | 185,435 | 2,499,659 | 14,555 | 198,524 |
| Repurchased | (242,444) | (3,269,032) | (46) | (606) |
| Net increase (decrease) | 12,709,091 | $171,939,750 | 35,668,361 | $470,970,145 |
| Net increase (decrease) | 12,039,784 | $162,902,644 | 37,626,111 | $495,818,107 |
|
| 1 Period from 10-15-05 (commencement of operations) to 8-31-06. | | | |
| |
| U.S. Government Securities | Year ended 8-31-07 | Period ended 8-31-061 |
| | Shares | Amount | Shares | Amount |
|
| Class 1 | | | | |
| Sold | 580,345 | $7,852,313 | 3,851,037 | $52,131,775 |
| Distributions reinvested | 147,423 | 1,988,057 | 81,104 | 1,075,609 |
| Repurchased | (679,186) | (9,183,312) | (775,755) | (10,473,685) |
| Net increase (decrease) | 48,582 | $657,058 | 3,156,386 | $42,733,699 |
|
| | | | | |
| Class NAV | | | | |
| Sold | 2,754,413 | $37,331,587 | 11,671,805 | $157,472,769 |
| Distributions reinvested | 598,778 | 8,059,704 | 276,030 | 3,648,865 |
| Repurchased | (3,717,936) | (50,520,418) | (102,426) | (1,383,028) |
| Net increase (decrease) | (364,745) | ($5,129,127) | 11,845,409 | $159,738,606 |
| Net increase (decrease) | (316,163) | ($4,472,069) | 15,001,795 | $202,472,305 |
|
| 1 Period from 10-15-05 (commencement of operations) to 8-31-06. | | | |
| |
| U.S. High Yield Bond | Year ended 8-31-07 | Period ended 8-31-061 |
| | Shares | Amount | Shares | Amount |
|
| Class 1 | | | | |
|
| Sold | 276,207 | $3,655,440 | 168,182 | $2,186,988 |
| Distributions reinvested | 17,230 | 226,325 | 3,037 | 38,635 |
| Repurchased | (86,471) | (1,142,483) | (32,243) | (416,648) |
| Net increase (decrease) | 206,966 | $2,739,282 | 138,976 | $1,808,975 |
| |
| Class NAV | | | | |
|
| Sold | 7,130,519 | $94,644,114 | 21,370,555 | $276,725,027 |
| Distributions reinvested | 1,855,247 | 24,337,639 | 710,275 | 9,044,306 |
| Repurchased | (580,754) | (7,773,806) | (50) | (663) |
| Net increase (decrease) | 8,405,012 | $111,207,947 | 22,080,780 | $285,768,670 |
| Net increase (decrease) | 8,611,978 | $113,947,229 | 22,219,756 | $287,577,645 |
|
| 1 Period from 10-15-05 (commencement of operations) to 8-31-06. | | | |
| |
| U.S. Multi Sector | Year ended 8-31-07 | Period ended 8-31-061 |
| | Shares | Amount | Shares | Amount |
| |
| Class NAV | | | | |
|
| Sold | 27,382,475 | $305,886,028 | 117,752,970 | $1,188,168,264 |
| Distributions reinvested | 1,725,150 | 18,821,383 | 134,960 | 1,421,127 |
| Repurchased | (11,939,855) | (137,248,940) | (75,255) | (771,951) |
| Net increase (decrease) | 17,167,770 | $187,458,471 | 117,812,675 | $1,188,817,440 |
|
| 1 Period from 10-29-05 (commencement of operations) to 8-31-06. | | | |
| | | | |
| Value | Period ended 8-31-071 | | |
| | Shares | Amount | | |
|
| Class NAV | | | | |
| Sold | 1,218,509 | $13,203,226 | | |
| Distributions reinvested | 693 | 7,330 | | |
| Repurchased | (446) | (4,748) | | |
| Net increase (decrease) | 1,218,756 | $13,205,808 | | |
|
| 1 Period from 10-27-06 (commencement of operations) to 8-31-07. | | | |
455
John Hancock Funds II
Notes to Financial Statements
| | | | |
| CAPITAL SHARES, CONTINUED | | | | |
| |
| Value & Restructuring | Year ended 8-31-07 | Period ended 8-31-061 |
| | Shares | Amount | Shares | Amount |
|
| Class NAV | | | | |
|
| Sold | 5,649,370 | $70,769,005 | 27,215,074 | $289,386,759 |
| Distributions reinvested | 361,835 | 4,302,224 | 37,778 | 406,118 |
| Repurchased | (2,178,133) | (29,533,506) | (499,385) | (5,569,033) |
| Net increase (decrease) | 3,833,072 | $45,537,723 | 26,753,467 | $284,223,844 |
|
| 1 Period from 10-29-05 (commencement of operations) to 8-31-06. | | | | |
| |
| Vista | Year ended 8-31-07 | Period ended 8-31-061 |
| | Shares | Amount | Shares | Amount |
|
| Class NAV | | | | |
| Sold | 1,487,006 | $17,382,107 | 11,612,583 | $118,006,782 |
| Repurchased | (1,140,710) | (15,924,184) | (157,272) | (1,869,987) |
| Net increase (decrease) | 346,296 | $1,457,923 | 11,455,311 | $116,136,795 |
|
| 1 Period from 10-29-05 (commencement of operations) to 8-31-06. | | | | |
8. INVESTMENT TRANSACTIONS The following summarizes the securities transactions (except for short-term investments) for the Funds for the year ended August 31, 2007:
| | | | |
| | Purchases | Sales and Maturities |
| Fund | U.S. Government | Other Issuers | U.S. Government | Other Issuers |
| Absolute Return | — | $979,119 | — | $892,412 |
| Active Bond | $617,756,889 | 219,321,706 | $673,625,322 | 115,659,592 |
| All Cap Core | — | 963,469,497 | — | 817,429,021 |
| All Cap Growth | — | 154,560,523 | — | 199,249,895 |
| All Cap Value | — | 147,855,778 | — | 282,295,394 |
| Blue Chip Growth | — | 669,085,000 | — | 492,863,821 |
| Capital Appreciation | — | 465,785,295 | — | 343,558,996 |
| Core Bond | 680,772,960 | 172,053,163 | 605,176,209 | 162,499,976 |
| Core Equity | — | 245,812,097 | — | 87,864,735 |
| Emerging Growth | — | 78,987,367 | — | 92,306,424 |
| Emerging Markets Value | — | 465,000,183 | — | 7,877,784 |
| Emerging Small Company | — | 44,772,922 | — | 51,756,635 |
| Equity-Income | — | 261,353,260 | — | 163,701,089 |
| Fundamental Value | — | 221,695,938 | — | 50,267,131 |
| Global Bond | 644,857,589 | 1,739,758,293 | 1,709,927,356 | 1,373,091,320 |
| Global Real Estate | — | 459,437,143 | — | 400,075,372 |
| High Income | — | 307,497,140 | — | 227,368,929 |
| High Yield | — | 1,416,459,207 | — | 1,022,477,676 |
| Index 500 | — | 65,642,740 | — | 1,223,830 |
| International Equity Index | — | 108,629,464 | — | 54,826,167 |
| International Opportunities | — | 899,309,134 | — | 841,520,867 |
| International Small Cap | — | 112,353,439 | — | 174,566,894 |
| International Small Company | — | 81,586,406 | — | 106,045,883 |
| International Value | — | 353,196,963 | — | 265,562,914 |
| Investment Quality Bond | 44,531,252 | 43,724,360 | 23,309,822 | 26,514,709 |
| Large Cap | — | 240,527,874 | — | 76,899,648 |
| Large Cap Value | — | 450,130,159 | — | 296,143,937 |
| Mid Cap Index | — | 449,566,969 | — | 258,715,468 |
| Mid Cap Intersection | — | 537,930,497 | — | 193,307,068 |
| Mid Cap Stock | — | 563,803,852 | — | 442,445,013 |
| Mid Cap Value | — | 177,415,947 | — | 62,728,383 |
| Mid Cap Value Equity | — | 44,368,585 | — | 29,953,745 |
| Natural Resources | — | 455,984,919 | — | 598,677,196 |
| Quantitative All Cap | — | 8,331,518 | — | 8,323,980 |
| Quantitative Mid Cap | — | 391,972,540 | — | 469,021,009 |
| Quantitative Value | — | 1,358,111,981 | — | 1,080,133,681 |
| Real Estate Equity | — | 149,666,159 | — | 175,206,393 |
| Real Estate Securities | — | 164,716,826 | — | 188,387,797 |
| Real Return Bond | 2,185,994,392 | 125,729,264 | 1,931,893,879 | 25,317,418 |
| Small Cap | — | 257,748,967 | — | 363,230,287 |
| Small Cap Index | — | 47,658,970 | — | 99,467,678 |
| Small Cap Opportunities | — | 118,662,746 | — | 140,761,261 |
| Small Company | — | 164,675,358 | — | 170,680,080 |
| Small Company Growth | — | 164,520,963 | — | 46,360,206 |
| Small Company Value | — | 112,633,046 | — | 78,093,018 |
| Special Value | — | 78,115,145 | — | 201,987,333 |
| Spectrum Income | 338,364,219 | 476,377,794 | 240,513,553 | 369,577,576 |
456
John Hancock Funds II
Notes to Financial Statements
INVESTMENT TRANSACTIONS, CONTINUED
| | | | |
| | Purchases | Sales and Maturities |
| Fund | U.S. Government | Other Issuers | U.S. Government | Other Issuers |
| Strategic Bond | $222,388,355 | $248,974,025 | $208,001,143 | $158,223,927 |
| Strategic Income | 163,817,998 | 329,761,453 | 108,105,443 | 237,645,820 |
| Total Bond Market | 84,339,694 | 15,031,195 | 46,089,586 | 1,144,285 |
| Total Return | 4,790,355,641 | 684,851,721 | 4,632,883,784 | 96,425,814 |
| U.S. Global Leaders Growth | — | 299,245,390 | — | 134,843,209 |
| U.S. Government Securities | 150,220,492 | 20,700,811 | 192,222,371 | 2,319,474 |
| U.S. High Yield Bond | — | 411,227,505 | — | 285,446,265 |
| U.S. Multi Sector | — | 1,158,721,217 | — | 977,307,047 |
| Value | — | 18,150,166 | — | 5,568,960 |
| Value & Restructuring | — | 114,397,255 | — | 66,236,537 |
| Vista Fund | — | 225,353,833 | — | 222,181,453 |
The cost of investments owned on August 31, 2007, including short-term investments, for federal income tax purposes, was as follows:
| | | | |
| | | | | Net Unrealized |
| | Aggregate | Unrealized | Unrealized | Appreciation |
| Portfolio | Cost | Appreciation | (Depreciation) | (Depreciation) |
|
| Absolute Return | $5,309,064 | $324,655 | ($5,158) | $319,497 |
| Active Bond | 571,950,648 | 3,803,528 | (8,062,689) | (4,259,161) |
| All Cap Core | 475,050,122 | 20,791,803 | (18,198,750) | 2,593,053 |
| All Cap Growth | 109,359,867 | 26,779,022 | (1,860,281) | 24,918,741 |
| All Cap Value | 84,713,363 | 14,086,583 | (1,147,185) | 12,939,398 |
| Blue Chip Growth | 1,433,253,035 | 325,071,382 | (23,667,694) | 301,403,688 |
| Capital Appreciation | 589,577,597 | 96,753,644 | (14,885,197) | 81,868,447 |
| Core Bond | 296,405,384 | 1,681,642 | (1,892,468) | (210,826) |
| Core Equity | 759,896,124 | 118,867,730 | (52,777,672) | 66,090,058 |
| Emerging Growth | 254,103,290 | 27,502,052 | (22,557,945) | 4,944,107 |
| Emerging Markets Value | 458,586,076 | 39,083,921 | (16,512,719) | 22,571,202 |
| Emerging Small Company | 64,594,925 | 8,684,097 | (3,027,691) | 5,656,406 |
| Equity-Income | 848,129,980 | 130,112,103 | (23,327,875) | 106,784,228 |
| Fundamental Value | 920,917,141 | 150,399,848 | (22,036,904) | 128,362,944 |
| Global Bond | 1,326,780,419 | 14,024,825 | (8,232,269) | 5,792,556 |
| Global Real Estate | 472,373,390 | 44,525,745 | (25,833,438) | 18,692,307 |
| High Income | 381,425,792 | 14,999,085 | (17,100,000) | (2,100,915) |
| High Yield | 1,665,098,456 | 9,613,486 | (72,286,928) | (62,673,442) |
| Index 500 | 80,928,082 | 3,780,871 | (1,898,433) | 1,882,438 |
| International Equity Index | 383,149,361 | 91,922,745 | (7,783,046) | 84,139,699 |
| International Opportunities | 825,902,642 | 129,703,630 | (18,183,963) | 111,519,667 |
| International Small Cap | 408,900,282 | 115,046,960 | (18,105,372) | 96,941,588 |
| International Small Company | 271,640,085 | 44,311,356 | (20,706,277) | 23,605,079 |
| International Value | 1,213,237,869 | 209,479,439 | (20,051,842) | 189,427,597 |
| Investment Quality Bond | 174,721,286 | 444,980 | (3,010,341) | (2,565,361) |
| Large Cap | 367,085,582 | 29,735,243 | (9,741,357) | 19,993,886 |
| Large Cap Value | 496,045,843 | 62,224,933 | (12,484,066) | 49,740,867 |
| Mid Cap Index | 408,220,400 | 43,361,798 | (23,860,357) | 19,501,441 |
| Mid Cap Intersection | 343,002,867 | 11,836,898 | (22,477,049) | (10,640,151) |
| Mid Cap Stock | 486,018,280 | 72,757,804 | (8,355,053) | 64,402,751 |
| Mid Cap Value | 268,305,718 | 29,536,434 | (12,485,359) | 17,051,075 |
| Mid Cap Value Equity | 120,377,724 | 18,413,303 | (4,981,046) | 13,432,257 |
| Natural Resources | 782,981,707 | 175,294,744 | (7,841,572) | 167,453,172 |
| Quantitative All Cap | 5,853,307 | 596,232 | (256,477) | 339,755 |
| Quantitative Mid Cap | 125,563,771 | 11,130,818 | (4,251,273) | 6,879,545 |
| Quantitative Value | 810,718,523 | 47,718,649 | (37,942,273) | 9,776,376 |
| Real Estate Equity | 264,500,688 | 12,874,165 | (11,470,792) | 1,403,373 |
| Real Estate Securities | 131,201,408 | 20,976,341 | (3,651,518) | 17,324,823 |
| Real Return Bond | 1,514,263,548 | 7,165,276 | (22,989,946) | (15,824,670) |
| Small Cap | 180,057,218 | 30,322,275 | (7,503,757) | 22,818,518 |
| Small Cap Index | 101,338,946 | 9,587,363 | (5,978,333) | 3,609,030 |
| Small Cap Opportunities | 238,642,403 | 44,323,603 | (17,571,435) | 26,752,168 |
| Small Company | 102,446,644 | 10,412,867 | (5,205,770) | 5,207,097 |
| Small Company Growth | 239,573,794 | 22,144,623 | (8,049,587) | 14,095,036 |
| Small Company Value | 470,191,515 | 83,110,100 | (26,220,805) | 56,889,295 |
| Special Value | 5,289,744 | 131,850 | (421,464) | (289,614) |
| Spectrum Income | 970,419,770 | 30,650,070 | (15,411,729) | 15,238,341 |
| Strategic Bond | 625,783,891 | 3,113,185 | (12,884,117) | (9,770,932) |
| Strategic Income | 427,888,027 | 6,883,277 | (6,139,422) | 743,855 |
| Total Bond Market | 53,441,734 | 136,272 | (464,311) | (328,039) |
| Total Return | 2,078,444,078 | 8,748,881 | (12,276,053) | (3,527,172) |
| U.S. Global Leaders Growth | 676,601,817 | 44,230,350 | (9,101,389) | 35,128,961 |
457
John Hancock Funds II
Notes to Financial Statements
INVESTMENT TRANSACTIONS, CONTINUED
| | | | |
| | | | | Net Unrealized |
| | Aggregate | Unrealized | Unrealized | Appreciation |
| Portfolio | Cost | Appreciation | (Depreciation) | (Depreciation) |
|
| U.S. Government Securities | $336,742,266 | $845,308 | ($2,226,316) | ($1,381,008) |
| U.S. High Yield Bond | 412,760,250 | 1,665,187 | (11,836,648) | (10,171,461) |
| U.S. Multi Sector | 1,460,245,095 | 142,041,955 | (59,459,798) | 82,582,157 |
| Value | 14,078,503 | 753,387 | (581,459) | 171,928 |
| Value & Restructuring | 379,600,103 | 76,468,762 | (15,189,998) | 61,278,764 |
| Vista | 147,667,495 | 45,794,295 | (1,209,101) | 44,585,194 |
9. FEDERAL INCOME TAX INFORMATION Federal income tax regulations may differ from generally accepted accounting principles, income and capital gain distributions determined in accordance with tax regulations may differ from net investment income and realized gains recognized for financial reporting purposes. Accordingly, the composition of net assets for tax purposes differs from amounts reflected in the accompanying financial statements. These differences are primarily due to differing treatment for futures and options transactions, foreign currency transactions, paydowns, market discount on debt securities, losses deferred with respect to wash sales, investments in passive foreign investment companies, equalization debits and excise tax regulations.
The tax-basis components of distributable earnings at August 31, 2007, were as follows:
| | | | |
| | Undistributed | Undistributed Long | Capital Loss | Post-October |
| Fund | Ordinary Income | Term Capital Gains | Carryforward | Deferral |
|
| Absolute Return | $160,720 | $32,304 | — | — |
| Active Bond | 5,016,977 | — | $1,960,070 | $1,709,912 |
| All Cap Core | 26,752,653 | 1,825,948 | — | — |
| All Cap Growth | 2,022,577 | 6,418,183 | — | — |
| All Cap Value | 10,100,390 | 20,691,075 | — | — |
| Blue Chip Growth | 12,686,779 | 224,978 | — | 60,767 |
| Capital Appreciation | 1,737,417 | — | 15,766,686 | 6,606,169 |
| Core Bond | 2,275,349 | — | 1,300,112 | 423,448 |
| Core Equity | 4,801,919 | 3,318,742 | — | 6,224 |
| Emerging Growth | 4,585,276 | 7,671,038 | — | — |
| Emerging Markets Value | 2,985,920 | — | — | — |
| Emerging Small Company | — | — | 330,602 | — |
| Equity-Income | 13,799,812 | 33,987,299 | — | — |
| Fundamental Value | 10,726,166 | 4,348,465 | — | 19,914 |
| Global Bond | 42,703,800 | 301,736 | — | 20,701,801 |
| Global Real Estate | 22,136,436 | 4,848,842 | — | — |
| High Income | 15,493,377 | 2,805,637 | — | — |
| High Yield | 31,057,694 | 4,440,144 | — | — |
| Index 500 | 607,937 | — | — | 308,124 |
| International Equity Index | 8,509,537 | 8,325,686 | — | — |
| International Opportunities | 35,529,923 | 46,454,779 | — | 260,862 |
| International Small Cap | 16,936,896 | 54,644,464 | — | — |
| International Small Company | 15,860,927 | 4,690,440 | — | — |
| International Value | 41,584,855 | 60,805,466 | — | — |
| Investment Quality Bond | 1,757,055 | — | 449,060 | 79,911 |
| Large Cap | 5,039,682 | 3,859,801 | — | — |
| Large Cap Value | 9,887,679 | 8,031,102 | — | — |
| Mid Cap Index | 11,288,681 | 20,631,149 | — | — |
| Mid Cap Intersection | 206,283 | — | — | 5,201,689 |
| Mid Cap Stock | 18,283,929 | 16,867,072 | — | 14,538 |
| Mid Cap Value | 5,240,868 | 4,984,730 | — | — |
| Mid Cap Value Equity | 2,050,015 | 617,634 | — | — |
| Natural Resources | 8,642,149 | 158,283,487 | — | 118,551 |
| Quantitative All Cap | 588,484 | 23,172 | — | — |
| Quantitative Mid Cap | 10,813,100 | 11,502,057 | — | 402 |
| Quantitative Value | 47,105,215 | 22,039,650 | — | — |
| Real Estate Equity | 20,587,777 | 4,676,533 | — | 5,858 |
| Real Estate Securities | 4,958,616 | 15,168,331 | — | — |
| Real Return Bond | 12,530,585 | — | 377,841 | 10,338,842 |
| Small Cap | 4,093,588 | 13,511,001 | — | — |
| Small Cap Index | 3,441,780 | 10,071,967 | — | — |
| Small Cap Opportunities | 1,801,250 | 597,655 | — | — |
| Small Company | 1,447,889 | 4,794,378 | — | — |
| Small Company Growth | 1,116,552 | 3,386,421 | — | 2 |
| Small Company Value | 3,044,800 | 11,103,980 | — | — |
| Special Value | 576,340 | 608,118 | — | — |
| Spectrum Income | 12,257,264 | 8,614,437 | — | — |
| Strategic Bond | 3,908,387 | — | 2,807,385 | 1,402,625 |
| Strategic Income | 3,175,927 | — | 723,503 | 1,433,181 |
| Total Bond Market | 478,101 | — | — | 72,568 |
| Total Return | 19,954,402 | — | — | 4,836,103 |
458
John Hancock Funds II
Notes to Financial Statements
FEDERAL INCOME TAX INFORMATION, CONTINUED
| | | | |
| | Undistributed | Undistributed Long | Capital Loss | Post-October |
| Fund | Ordinary Income | Term Capital Gains | Carryforward | Deferral |
|
| U.S. Global Leaders Growth | $2,643,747 | — | $6,352,476 | $9,891,479 |
| U.S. Government Securities | 1,745,191 | $77 | — | 1,518,756 |
| U.S. High Yield Bond | 5,298,608 | 109,905 | — | — |
| U.S. Multi Sector | 34,207,189 | 30,744,288 | — | — |
| Value | 552,499 | — | — | — |
| Value & Restructuring | 5,575,667 | — | — | 1,307,750 |
| Vista | 1,575,533 | 6,177,573 | — | 212,522 |
The tax character of distributions paid during 2007 and 2006 was as follows:
| | | | | | | | |
| | | 2007 Distributions | | | 2006 Distributions | |
|
| | Ordinary | Long Term | Return of | | Ordinary | Long Term | Return of | |
| Fund | Income | Capital Gains | Capital | Total | Income | Capital Gains | Capital | Total |
|
| Absolute Return | $141,122 | — | — | $141,122 | — | — | — | — |
| Active Bond | 24,243,142 | — | — | 24,243,142 | $11,175,483 | — | — | $11,175,483 |
| All Cap Core | 1,286,357 | — | — | 1,286,357 | — | — | — | — |
| All Cap Growth | 108,295 | — | — | 108,295 | 65,224 | — | — | 65,224 |
| All Cap Value | 7,918,783 | $206,042 | — | 8,124,825 | 298,080 | — | — | 298,080 |
| Blue Chip Growth | 6,794,676 | — | — | 6,794,676 | 894,973 | — | — | 894,973 |
| Capital Appreciation | 618,877 | — | — | 618,877 | — | — | — | — |
| Core Bond | 10,687,766 | — | — | 10,687,766 | 4,973,751 | — | — | 4,973,751 |
| Core Equity | 3,806,141 | — | — | 3,806,141 | — | — | — | — |
| Emerging Growth | 31,204,256 | — | — | 31,204,256 | — | — | — | — |
| Emerging Markets Value | — | — | — | — | — | — | — | — |
| Emerging Small Company | 5,173,646 | — | — | 5,173,646 | — | — | — | — |
| Equity-Income | 47,923,033 | 96,881 | — | 48,019,914 | 2,983,865 | — | — | 2,983,865 |
| Fundamental Value | 16,996,232 | — | — | 16,996,232 | 1,336,313 | — | — | 1,336,313 |
| Global Bond | 21,809,471 | 1,228,789 | — | 23,038,260 | 3,028,192 | — | — | 3,028,192 |
| Global Real Estate | 15,063,407 | — | — | 15,063,407 | — | — | — | — |
| High Income | 22,119,587 | — | — | 22,119,587 | 3,127,218 | — | — | 3,127,218 |
| High Yield | 109,599,500 | 125,964 | — | 109,725,464 | 69,414,714 | — | — | 69,414,714 |
| Index 500 | 112,959 | — | — | 112,959 | — | — | — | — |
| International Equity Index | 9,656,472 | — | — | 9,656,472 | 2,080,681 | — | — | 2,080,681 |
| International Opportunities | 8,456,964 | 686,672 | — | 9,143,636 | 18,624,300 | — | — | 18,624,300 |
| International Small Cap | 61,127,648 | 49,439 | — | 61,177,087 | 1,082,427 | — | — | 1,082,427 |
| International Small Company | 1,485,367 | — | — | 1,485,367 | — | — | — | — |
| International Value | 86,613,411 | 243,365 | — | 86,856,776 | 3,228,488 | — | — | 3,228,488 |
| Investment Quality Bond | 7,123,735 | 2,467 | — | 7,126,202 | 3,885,879 | — | — | 3,885,879 |
| Large Cap | 7,135,563 | 139,997 | — | 7,275,560 | 213,439 | — | — | 213,439 |
| Large Cap Value | 2,686,871 | — | — | 2,686,871 | 317,242 | — | — | 317,242 |
| Mid Cap Index | 2,910,338 | 1,898 | — | 2,912,236 | 98,937 | — | — | 98,937 |
| Mid Cap Intersection | — | — | — | — | — | — | — | — |
| Mid Cap Stock | 15,359,865 | 19,580 | — | 15,379,445 | 305,840 | — | — | 305,840 |
| Mid Cap Value | 7,187,939 | 23,990 | — | 7,211,929 | 387,001 | — | — | 387,001 |
| Mid Cap Value Equity | 611,515 | — | — | 611,515 | — | — | — | — |
| Natural Resources | 41,421,256 | 3,646,321 | — | 45,067,577 | 742,179 | — | — | 742,179 |
| Quantitative All Cap | 23,630 | — | — | 23,630 | — | — | — | — |
| Quantitative Mid Cap | 371,381 | 3,001 | — | 374,382 | 89,597 | — | — | 89,597 |
| Quantitative Value | 33,554,334 | 41,998 | — | 33,596,332 | 1,234,288 | — | — | 1,234,288 |
| Real Estate Equity | 7,130,723 | 971,101 | — | 8,101,824 | — | — | — | — |
| Real Estate Securities | 83,466,330 | 3,287,811 | — | 86,754,141 | 4,074,530 | $755,472 | — | 4,830,002 |
| Real Return Bond | 30,900,045 | 1,566,760 | — | 32,466,805 | 19,717,849 | — | — | 19,717,849 |
| Small Cap | — | — | — | — | — | — | — | — |
| Small Cap Index | 4,745,805 | 281,791 | — | 5,027,596 | 86,672 | — | — | 86,672 |
| Small Cap Opportunities | 9,896,805 | 188,978 | — | 10,085,783 | 548,785 | — | — | 548,785 |
| Small Company | — | — | — | — | — | — | — | — |
| Small Company Growth | 1,393,929 | — | — | 1,393,929 | — | — | — | — |
| Small Company Value | 7,188,099 | 53,906 | — | 7,242,005 | 674,360 | — | — | 674,360 |
| Special Value | 11,753,317 | 14,777,715 | — | 26,531,032 | 81,660 | — | — | 81,660 |
| Spectrum Income | 38,926,894 | 60,799 | — | 38,987,693 | 18,140,475 | — | — | 18,140,475 |
| Strategic Bond | 19,936,055 | — | — | 19,936,055 | 14,870,223 | 42,136 | — | 14,912,359 |
| Strategic Income | 12,664,623 | — | — | 12,664,623 | 2,008,968 | — | — | 2,008,968 |
| Total Bond Market | 1,721,518 | — | — | 1,721,518 | — | — | — | — |
| Total Return | 55,480,040 | 95,947 | — | 55,575,987 | 26,840,720 | — | — | 26,840,720 |
| U.S. Global Leaders Growth | 2,621,663 | — | — | 2,621,663 | 209,406 | — | — | 209,406 |
| U.S. Government Securities | 9,964,754 | 83,007 | — | 10,047,761 | 4,688,432 | 36,042 | — | 4,724,474 |
| U.S. High Yield Bond | 24,563,964 | — | — | 24,563,964 | 9,082,941 | — | — | 9,082,941 |
| U.S. Multi Sector | 17,672,102 | 1,149,281 | — | 18,821,383 | 1,421,127 | — | — | 1,421,127 |
| Value | 7,330 | — | — | 7,330 | — | — | — | — |
| Value & Restructuring | 4,214,793 | 87,431 | — | 4,302,224 | 406,118 | — | — | 406,118 |
| Vista | — | — | — | — | — | — | — | — |
459
John Hancock Funds II
Notes to Financial Statements
FEDERAL INCOME TAX INFORMATION, CONTINUED
At August 31, 2007, capital loss carryforwards available to offset future realized gains were approximately:
| | |
| | | Capital Loss Carryforward |
| | | Expiring at August 31 |
| Fund | 2014 | 2015 |
|
| Active Bond | — | $1,960,070 |
| Capital Appreciation | $21,055 | 15,745,631 |
| Core Bond | — | 1,300,112 |
| Emerging Small Company | — | 330,602 |
| Investment Quality Bond | — | 449,060 |
| Real Return Bond | — | 377,841 |
| Strategic Bond | — | 2,807,385 |
| Strategic Income | — | 723,503 |
| U.S. Global Leaders Growth | — | 6,352,476 |
In July 2006, FASB Interpretation No. 48, Accounting for Uncertainty in Income Taxes, an interpretation of FASB Statement 109 (FIN 48), was issued and is effective for fiscal years beginning after December 15, 2006, and is to be applied to all open tax years as of the effective date. On December 22, 2006, the SEC delayed the implementation of FIN 48 for regulated investment companies for an additional six months. FIN 48 prescribes a minimum threshold for financial statement recognition of the benefit of a tax position taken or expected to be taken in a tax return, and requires certain expanded disclosures. Management has concluded that the adoption of FIN 48 will not result in a material impact on the Fund’s net assets, results of operations and financial statement disclosures.
10. INVESTMENT IN AFFILIATED UNDERLYING FUNDS The Absolute Return Portfolio invests primarily in affiliated underlying funds that are managed by affiliates of the Adviser. The Portfolio does not invest in the affiliated underlying funds for the purpose of exercising management or control; however, the Portfolio’s investment may represent a significant portion of each underlying fund’s net assets. A summary of the Absolute Return Portfolio’s transactions in the securities of affiliated issuers during the year ended August 31, 2007, is set forth below:
| | | | | | |
| | Beginning | | | Ending | | |
| | Share | Shares | Shares | Share | Sale | Ending |
| Affiliate — Class Nav | Amount | Purchased | Sold | Amount | Proceeds | Value |
|
| John Hancock Funds II | | | | | | |
| Capital Appreciation Fund | 21,668 | 76 | 483 | 21,261 | $5,161 | $229,620 |
| Core Bond Fund | 12,400 | 1,458 | 7,032 | 6,826 | 86,991 | 85,319 |
| Emerging Small Company Fund | 3,401 | 542 | 3,943 | — | 119,083 | — |
| Equity-Income Fund | 5,807 | 5,738 | 282 | 11,263 | 5,488 | 219,734 |
| Fundamental Value Fund | 6,588 | 129 | 318 | 6,399 | 5,580 | 112,358 |
| Global Bond Fund | 6,974 | 4,833 | 1 | 11,806 | — | 174,493 |
| High Income Fund | 41,253 | 3,399 | 2,694 | 41,958 | 29,962 | 445,170 |
| High Yield Fund | 10,288 | 10,013 | 178 | 20,123 | 1,852 | 198,617 |
| International Opportunities Fund | 6,689 | 1,299 | 429 | 7,559 | 7,615 | 146,342 |
| International Small Company Fund | 16,873 | 94 | 2,534 | 14,433 | 28,270 | 166,411 |
| International Value Fund | 6,020 | 1,794 | 670 | 7,144 | 13,270 | 140,746 |
| Investment Quality Bond Fund | 13,196 | 11,403 | — | 24,599 | — | 287,567 |
| Large Cap Fund | 10,722 | 354 | 868 | 10,208 | 14,202 | 164,648 |
| Large Cap Value Fund | 4,507 | 26 | 329 | 4,204 | 8,700 | 109,090 |
| Natural Resources Fund | 5,929 | 320 | 3,740 | 2,509 | 159,480 | 106,357 |
| Quantitative Value Fund | 6,468 | 360 | 549 | 6,279 | 9,828 | 110,327 |
| Real Estate Equity Fund | 45,918 | 5,630 | 15,851 | 35,697 | 189,381 | 386,243 |
| Real Return Bond Fund | 39,215 | 5,712 | 351 | 44,576 | 4,630 | 582,612 |
| Small Company Value Fund | 6,418 | 187 | 264 | 6,341 | 7,093 | 163,526 |
| Spectrum Income Fund | 30,242 | 2,636 | 430 | 32,448 | 4,598 | 341,682 |
| Strategic Bond Fund | 17,824 | 1,735 | 90 | 19,469 | 1,080 | 224,671 |
| Strategic Income Fund | 15,298 | 1,887 | 157 | 17,028 | 1,591 | 171,302 |
| Total Return Fund | 26,398 | 3,037 | 10,851 | 18,584 | 148,273 | 255,525 |
| U.S. Government Securities Fund | 7,609 | 939 | 23 | 8,525 | 313 | 114,239 |
| U.S. High Yield Bond Fund | — | 6,632 | — | 6,632 | — | 85,360 |
460
John Hancock Funds II
Notes to Financial Statements
11. CHANGE IN ACCOUNTING POLICY As a result of a change in accounting policy, certain Funds have reclassified upfront payments received or paid on swap contracts from net realized gain/loss to unrealized appreciation/depreciation. For consistency, similar reclassifications have been made to amounts appearing in the previous year’s Statement of Changes in Net Assets. The reclassifications are as follows:
| | | | |
| | Year-ended August 31, 2007 | Period-ended August 31, 2006 |
|
|
| | | Change in Net | | Change in Net |
| | Net | Unrealized | Net | Unrealized |
| | Realized | Appreciation | Realized | Appreciation |
| | Gain (Loss) | (Depreciation) | Gain (Loss) | (Depreciation) |
|
| Global Bond | $12,361,867 | ($12,361,867) | $1,864,594 | ($1,864,594) |
| Real Return Bond | $903,572 | ($903,572) | $2,739,646 | ($2,739,646) |
| Total Return | ($2,263,988) | $2,263,988 | ($1,289,145) | $1,289,145 |
These changes had no effect on each Fund’s net asset value, either in total or per share, or its total increase (decrease) in net assets from operations during any period.
12. CESSATION OF OPERATIONS On October 26, 2007, all of the net assets were redeemed from the Special Value Fund and the Fund was terminated.
461
John Hancock Funds II
Report of Independent Registered Public Accounting Firm
To the Board of Trustees and Shareholders of John Hancock Funds II:
In our opinion, the accompanying statements of assets and liabilities, including the portfolios of investments, and the related statements of operations and of changes in net assets and the financial highlights present fairly, in all material respects, the financial position of the Funds (identified in Note 1) comprising John Hancock Funds II (the “Trust”) at August 31, 2007, the results of each of their operations, the changes in each of their net assets and the financial highlights for each of the periods indicated therein, in conformity with accounting principles generally accepted in the United States of America. These financial statements and financial highlights (hereafter referred to as “financial statements”) are the responsibility of the Trust’s management; our responsibility is to express an opinion on these financial statements based on our audits. We conducted our audits of these financial statements in accordance with the standards o f the Public Company Accounting Oversight Board (United States). Those standards require that we plan and perform the audit to obtain reasonable assurance about whether the financial statements are free of material misstatement. An audit includes examining, on a test basis, evidence supporting the amounts and disclosures in the financial statements, assessing the accounting principles used and significant estimates made by management, and evaluating the overall financial statement presentation. We believe that our audits, which included confirmation of investments owned at August 31, 2007 by correspondence with the custodian, transfer agents, and brokers, provide a reasonable basis for our opinion.
As discussed in Note 11 to the financial statements, the Global Bond, Real Return and Total Return funds changed their method of accounting for upfront payments on swaps.
PricewaterhouseCoopers LLP
Boston, Massachusetts
October 30, 2007
462
John Hancock Funds II
Federal Tax Information (Unaudited)
For federal income tax purposes, the following information is furnished with respect to the distributions of the Fund, if any, paid during its taxable year ended August 31, 2007.
DIVIDEND RECEIVED DEDUCTION Corporate shareholders are generally entitled to take the dividend received deduction on the portion of a Fund’s dividend distribution that qualifies under tax law. The percentage of the Fund’s fiscal 2007 ordinary income dividends that qualifies for the corporate dividend received deduction is set forth below.
| | |
| Fund | August 2007 | |
|
| Absolute Return | 82.28% | |
| Active Bond | 0.23% | |
| All Cap Core | 18.23% | |
| All Cap Growth | 53.06% | |
| All Cap Value | 24.36% | |
| Blue Chip Growth | 100.00% | |
| Capital Appreciation | 100.00% | |
| Core Bond | 0.00% | |
| Core Equity | 100.00% | |
| Emerging Growth | 6.74% | |
| Emerging Markets Value | 0.00% | |
| Emerging Small Company | 0.00% | |
| Equity-Income | 8.39% | |
| Fundamental Value | 74.54% | |
| Global Bond | 0.00% | |
| Global Real Estate | 6.73% | |
| High Income | 3.62% | |
| High Yield | 0.19% | |
| Index 500 | 86.92% | |
| International Equity Index | 1.38% | |
| International Opportunities | 43.02% | |
| International Small Cap | 2.30% | |
| International Small Company | 0.45% | |
| International Value | 0.00% | |
| Investment Quality Bond | 0.00% | |
| Large Cap | 57.00% | |
| Large Cap Value | 0.00% | |
| Mid Cap Index | 43.88% | |
| Mid Cap Intersection | 100.00% | |
| Mid Cap Stock | 13.73% | |
| Mid Cap Value | 45.99% | |
| Mid Cap Value Equity | 80.74% | |
| Natural Resources | 100.00% | |
| Quantitative All Cap | 13.28% | |
| Quantitative Mid Cap | 11.41% | |
| Quantitative Value | 29.47% | |
| Real Estate Equity | 0.25% | |
| Real Estate Securities | 76.08% | |
| Real Return Bond | 0.00% | |
| Small Cap | 0.00% | |
| Small Cap Index | 25.76% | |
| Small Cap Opportunities | 39.43% | |
| Small Company | 50.21% | |
| Small Company Growth | 20.81% | |
| Small Company Value | 57.60% | |
| Special Value | 0.00% | |
| Spectrum Income | 7.98% | |
| Strategic Bond | 0.51% | |
| Strategic Income | 0.50% | |
| Total Bond Market | 0.00% | |
| Total Return | 0.00% | |
| U.S. Global Leaders Growth | 100.00% | |
| U.S. Government Securities | 0.00% | |
| U.S. High Yield Bond | 0.00% | |
| U.S. Multi Sector | 66.83% | |
| Value | 15.14% | |
| Value & Restructuring | 40.95% | |
| Vista | 0.00% | |
QUALIFIED DIVIDEND INCOME The Fund hereby designates the maximum amount allowable of its net taxable income as qualified dividend income as provided in the Jobs and Growth Tax Relief Reconciliation Act of 2003. This amount will be reflected on Form 1099-DIV for the calendar year 2007.
Shareholders will be mailed a 2007 U.S. Treasury Department Form 1099-DIV in January 2008. This will reflect the total of all distributions that are taxable for calendar year 2007.
463
John Hancock Funds II
Evaluation of Advisory and Subadvisory Agreements by the Board of Trustees
EVALUATION OF ADVISORY AND SUBADVISORY
AGREEMENTS BY THE BOARD OF TRUSTEES
This section describes the evaluation by the Board of Trustees of the Advisory Agreement (the “Advisory Agreement”) and each of the Subadvisory Agreements and the Sub-Subadvisory Agreements (collectively, the “Subadvisory Agreements”) for each of the portfolios (the “Funds”) of John Hancock Funds II (the “Trust”) discussed in this annual report except those noted below.
The Advisory Agreement and Subadvisory Agreements for the following portfolios were not being considered for renewal at this time since each of these Funds commenced operations on May 1, 2007:
Emerging Markets Value Fund
Income Fund
Mid Cap Intersection Fund
Science & Technology Fund (RCM Capital Management Subadvisory
Agreement only)
Lifecycle 2010 Portfolio
Lifecycle 2015 Portfolio
Lifecycle 2020 Portfolio
Lifecycle 2025 Portfolio
Lifecycle 2030 Portfolio
Lifecycle 2035 Portfolio
Lifecycle 2040 Portfolio
Lifecycle 2045 Portfolio
Lifecycle 2050 Portfolio
Lifecycle Retirement Portfolio
EVALUATION BY THE BOARD OF TRUSTEES
The Board, including the Independent Trustees, is responsible for selecting the Trust’s adviser, John Hancock Investment Management Services, LLC (the “Adviser” or “JHIMS”), approving the Adviser’s selection of subadvisers for each of the portfolios of the Trust and approving the Trust’s advisory and subadvisory (and any sub-subadvisory) agreements, their periodic continuation and any amendments. Consistent with SEC rules, the Board regularly evaluates the Trust’s advisory and subadvisory arrangements, including consideration of the factors listed below. The Board may also consider other factors (including conditions and trends prevailing generally in the economy, the securities markets and the industry) and does not treat any single factor as determinative, and each Trustee may attribute different weights to different factors. The Board is furnished with an analysis of its fiduciary obligations in connection with its evaluation an d, throughout the evaluation process, the Board is assisted by counsel for the Trust and the Independent Trustees are also separately assisted by independent legal counsel. The factors considered by the Board are:
1. the nature, extent and quality of the services to be provided by the Adviser to the Trust and by the subadvisers to the Funds;
2. the investment performance of the Funds and their subadvisers;
3. the extent to which economies of scale would be realized as a Fund grows and whether fee levels reflect these economies of scale for the benefit of Trust shareholders;
4. the costs of the services to be provided and the profits to be realized by the Adviser and its affiliates (including any subadvisers that are affiliated with the Adviser) from the Adviser’s relationship with the Trust; and
5. comparative services rendered and comparative advisory and subadvisory fee rates.
The Board believes that information relating to all of these factors is relevant to its evaluation of the Trust’s advisory agreement. With respect to its evaluation of subadvisory agreements (including any sub-subadvisory agreements) with subadvisers not affiliated with the Adviser, the Board believes that, in view of the Trust’s “manager-of-managers” advisory structure, the costs of the services to be provided and the profits to be realized by those subadvisers that are not affiliated with the Adviser from their relationship with the Trust generally are not a material factor in the Board’s consideration of these subadvisory agreements because such fees are paid by the Adviser and not by the Funds and the Board relies on the ability of the Adviser to negotiate the subadvisory fees at arms-length.
In evaluating subadvisory arrangements, the Board also considers other material business relationships that unaffiliated subadvisers and their affiliates have with the Adviser or its affiliates, including the involvement by certain affiliates of certain subadvisers in the distribution of financial products, including shares of the Trust, offered by the Adviser and other affiliates of the Adviser (“Material Relationships”).
APPROVAL OF ADVISORY AGREEMENT
At its meeting on June 8, 2007, the Board, including all the Independent Trustees, approved the Advisory Agreement.
In approving the renewal of the Advisory Agreement, and with reference to the factors that it regularly considers, the Board:
(1) — (a) considered the high value to the Trust of continuing its relationship with JHIMS as the Trust’s adviser, the skills and competency with which JHIMS has in the past managed the Trust’s affairs and its subadvisory relationships, JHIMS’s oversight and monitoring of the subadvisers’ investment performance and compliance programs including its timeliness in responding to performance issues and the qualifications of JHIMS’s personnel,
(b) considered JHIMS’s compliance policies and procedures and its responsiveness to regulatory changes and mutual fund industry developments, and
(c) considered JHIMS’s administrative capabilities, including its ability to supervise the other service providers for the Funds and concluded that JHIMS may reasonably be expected to continue to perform its services under the Advisory Agreement with respect to the Funds;
(2) — reviewed the investment performance of each of the Funds; the comparative performance of their respective benchmarks, comparable funds (i.e., funds having approximately the same investment objective), if any; and JHIMS’s analysis of such performance and its plans and recommendations regarding the Trust’s subadvisory arrangements generally and with respect to particular Funds; and concluded that each of the Funds has generally performed well or within a range that the Board deemed competitive except as discussed in Appendix A and in such cases, that appropriate action is being taken to address performance, if necessary, or that such performance is reasonable in light of all factors considered, and that JHIMS may reasonably be expected to continue ably to monitor the performance of the Funds and each of their subadvisers;
(3) — reviewed the Trust’s advisory fee structure and the incorporation therein of any subadvisory fee breakpoints in the advisory fees charged and concluded (i) that to the extent that
464
John Hancock Funds II
Evaluation of Advisory and Subadvisory Agreements by the Board of Trustees — continued
Funds have subadvisory fees with breakpoints, those breakpoints are reflected as breakpoints in the advisory fees for Funds, (ii) that all Funds with a subadviser that is not affiliated with the Adviser have subadvisory fees which are the product of arms-length negotiations between the Adviser and the subadviser and which in many, but not all, cases contain breakpoints, and (iii) that, although economies of scale cannot be measured with precision, these arrangements permit shareholders of Funds with advisory fee breakpoints to benefit from economies of scale if those Funds grow;
(4) — (a) reviewed the financial statements of JHIMS and considered (i) an analysis presented by JHIMS regarding the net profitability to JHIMS of each Fund,
(b) reviewed the profitability of the JHIMS’s relationship with each Fund in terms of the total amount of annual advisory fees it received with respect to the Fund and whether JHIMS has the financial ability to continue to provide a high level of services to the Fund,
(c) considered that JHIMS derives reputational and other indirect benefits from providing advisory services to the Funds, and
(d) noted that JHIMS pays the subadvisory fees out of the advisory fees JHIMS receives from the Funds and concluded that the advisory fees paid by the Trust with respect to the Funds are not unreasonable in light of such information; and
(5) — reviewed comparative information with respect to the advisory fee rates and concluded that the Trust’s advisory fees are generally within a competitive range of those incurred by other comparable funds. In this regard, the Board took into account management’s discussion with respect to the advisory fee structure. The Board also noted that JHIMS is currently waiving fees and or reimbursing expenses with respect to certain of the Funds and that the Adviser pays the subadvisory fees of the Funds. The Board also took into account the level and quality of services provided by JHIMS with respect to the Funds, as well as the other factors considered.
In addition, in the case of the Absolute Return Portfolio (a “Fund of Funds”), the Trustees reviewed the advisory fee to be paid to the Adviser for Fund of Funds and concluded that the advisory fee to be paid to the Adviser with respect to the Fund of Funds is based on services provided that are in addition to, rather than duplicative of, the services provided pursuant to the advisory agreements for the underlying portfolios of the Fund of Funds and that the additional services are necessary because of the differences between the investment policies, strategies and techniques of the Fund of Funds and those of its underlying portfolios.
Additional information that the Board considered in approving the Advisory Agreement is set forth in Appendix A.
APPROVAL OF SUBADVISORY AGREEMENTS
At its meeting on June 8, 2007, the Board, including all the Independent Trustees, renewed and approved the Subadvisory Agreements.
In making its determination with respect to the factors that its considers, the Board reviewed:
(1) information relating to each subadviser’s business, which may include information such as: business performance, assets under management and personnel;
(2) the historical and current performance of the Fund and comparative performance information relating to the Fund’s benchmark and comparable funds;
(3) the subadvisory fee for each Fund and comparative fee information; and
(4) information relating to the nature and scope of Material Relationships and their significance to the Trust’s adviser and unaffiliated subadvisers.
The Board noted that in the case of each sub-subadvisory agreement, that the sub-subadvisory fee would be paid by the Subadviser out of the subadvisory fee and would not be an expense of the Fund.
The Board’s decision to approve each Subadvisory Agreement was based on a number of determinations, including the following:
(1) The Subadviser has extensive experience and demonstrated skills as a manager;
(2) Although not without variation, the current and historical performance of each Fund managed by a Subadviser has generally been in line with or outperformed the current and historical performance of comparable funds and the Fund’s respective benchmarks with the exceptions noted in Appendix A (with respect to such exceptions, the Board concluded that appropriate action was being taken to address such Funds’ performance, if necessary, or that performance was reasonable in light of all factors considered);
(3) The subadvisory fees are generally competitive within the range of industry norms and, with respect to each Subadviser that is not affiliated with the Adviser, are a product of arms-length negotiation between the Adviser and the subadviser;
(4) With respect to those Funds that have subadvisory fees that contain breakpoints, such breakpoints are reflected as breakpoints in the advisory fees for the Funds in order to permit shareholders to benefit from economies of scale if those Funds grow; and
(5) The Material Relationships consist of arrangements in which unaffiliated subadvisers or their affiliates provide advisory, distribution or management services in connection with financial products sponsored by the Trust’s adviser or its affiliates, which may include other registered investment companies, a 529 education savings plan, managed separate accounts and exempt group annuity contracts sold to qualified plans, and which in no case contained elements which would cause the Board to conclude that approval of the subadvisory agreement with the subadviser would be inappropriate. See (6) below for information relating to the business arrangement between the Trust’s Adviser and Grantham, Mayo, Van Otterloo & Co. LLC (“GMO”). See (7) below for information relating to the business arrangement between the parent company of the Trust’s Adviser and the parent company of Independence Investments LLC.
(6) As a part of the overall business arrangement between the Adviser and GMO under which the Adviser has obtained exclusive rights to certain GMO investment management services for up to five years, the Adviser has agreed that under certain circumstances it (and not the Trust or the particular Fund) will pay GMO a specified amount (up to $25 million in the aggregate for all portfolios subadvised by GMO (the “GMO Funds”)) if the subadvisory agreement with respect to the GMO Funds is terminated within a five year period from the date of its effectiveness.
The Adviser has also agreed that, subject to its fiduciary duties as an investment adviser to each of the GMO Funds and its shareholders, it will not recommend to the Board of Trustees to terminate the
465
John Hancock Funds II
Evaluation of Advisory and Subadvisory Agreements by the Board of Trustees — continued
subadvisory agreement with respect to any of the GMO Funds or to reduce any of the fees payable thereunder to GMO for a five year period from the date of effectiveness of the agreement. The Trust is not a party to any of these arrangements, and they are not binding upon the Trust, the GMO Funds or the Board of Trustees. However, these arrangements present certain conflicts of interest because the Adviser has a financial incentive to support the continuation of GMO subadvisory agreements for as long as the termination provisions described above remain in effect. In approving the Advisory Agreement and the subadvisory agreement with respect to each of the GMO Funds, the Board of Trustees, including the Independent Trustees, was aware of and considered these potential conflicts of interest, including any financial obligations of the Adviser to GMO.
The Board concluded that, notwithstanding the potential conflicts of interest, approval of the Advisory Agreement and the subadvisory agreements with GMO is in the best interests of shareholders and contract owners in view of (i) the Adviser's fiduciary duty and the Board's fiduciary duty and ability to monitor potential conflicts, (ii) the benefits to shareholders and contract owners generally expected from the exclusive rights to certain GMO investment management services obtained by the Adviser for the benefit of certain Funds of the Trust and other John Hancock funds and (iii) the benefits to such Funds of the Trust expected from the subadvisory services of GMO.
(7) Independence Investments LLC (“New Independence”), a subsidiary of Convergent Capital Management LLC (“Convergent”), is the subadviser to the Growth & Income Fund and Small Cap Fund (the “Independence Funds”). New Independence replaced Independence Investment LLC (“Old Independence”), a subsidiary of Manulife Financial Corporation (“MFC”), as subadviser to the Funds on May 31, 2006. New Independence is the successor to substantially all of the business operations of Old Independence and assumed substantially all the assets and certain of the liabilities of Old Independence pursuant to an agreement between Old Independence, New Independence, the parent of Convergent and a subsidiary of MFC.
In consideration for the transfer of assets and liabilities of Old Independence to New Independence as described above, Convergent paid MFC a specified amount at closing. MFC will also receive additional consideration on certain anniversary dates of the closing to the extent the revenue received by New Independence from the management of proprietary accounts of MFC and its affiliates or accounts for which MFC or its affiliates act as investment adviser, including the Independence Funds, meet certain revenue targets. Consequently, while these contingent payments are not dependent upon the approval or continuation of the subadvisory agreements with respect to the Independence Funds, the revenues earned by New Independence as a result of its subadvisory relationship with each Independence Fund would count towards the revenue target necessary for MFC to earn the contingent payments. Nothing in the arrangements between MFC and Convergent imposes any limitations upon the right s of the Adviser, the Independence Funds’ adviser, to recommend termination of the subadvisory agreements with New Independence. However, these arrangements present certain conflicts of interest because MFC, as the ultimate parent entity of the Adviser, has a financial incentive to influence the Adviser to support the continuation of the subadvisory agreements with New Independence for the periods for which contingent payments may be made to MFC. The Board concluded that, notwithstanding the potential conflicts of interest, approval of the Advisory Agreement and the subadvisory agreement with New Independence is in the best interests of shareholders and contract owners.
In addition, in the case of the Absolute Return Portfolio (the “Fund of Funds”), the Trustees reviewed the subadvisory fee to be paid to the subadviser for the Fund of Funds and concluded that the subadvisory fee to be paid to the subadviser with respect to the Fund of Funds is based on services provided that are in addition to, rather than duplicative of, the services provided pursuant to the subadvisory agreements for the underlying portfolios of the Fund of Funds and that the additional services are necessary because of the differences between the investment policies, strategies and techniques of the Fund of Funds and those of its underlying portfolios.
Additional information that the Board considered for a particular Fund is set forth in Appendix A.
466
John Hancock Funds II
Appendix A
| | | |
| Portfolio | Performance of Fund, | | |
| (Subadviser) | as of March 31, 2007 | Fees and Expenses | Other Comments |
|
| |
| Absolute Return | See “Other Comments.” | Advisory fees for this Fund are | The Fund recently commenced |
| | | lower than the peer group median. | operations. In reviewing the Fund, |
| (MFC Global | | | the Board took into account its limited |
| Investment Management | | Total expenses for this Fund are | performance history. |
| (U.S.A.) Limited) | | lower than the peer group median. | |
|
| |
| Active Bond | The Fund underperformed the | Subadvisory fees for this Fund | |
| | benchmark index over the | are lower than the peer | |
| (Declaration Management & | one-year period. | group median. | |
| Research LLC) | | | |
| | The Fund outperformed the | Advisory fees for this Fund are | |
| (MFC Global | peer group average over | modestly higher than the | |
| Investment Management | the one-year period. | peer group median. | |
| (U.S.), LLC) | | | |
| | | Total expenses for this Fund are | |
| | | slightly higher than the peer | |
| | | group median. | |
|
| All Cap Core | See “Other Comments.” | Subadvisory fees for this Fund are | The Fund recently commenced |
| | | lower than the peer group median. | operations. In reviewing the |
| (Deutsche Asset | | | Fund, the Board considered this |
| Management, Inc.) | | Advisory fees for this Fund are | limited performance history. |
| | | slightly higher than the peer group | |
| | | median. | |
| |
| | | Total expenses for this Fund are | |
| | | lower than the peer group median. | |
|
| All Cap Growth | The Fund underperformed the | Subadvisory fees for this Fund are | The Board took into account |
| | benchmark index and peer group | modestly higher than the peer | management’s discussion of the |
| (AIM Capital Management, Inc.) | average over the one- year period. | group median. | factors that contributed to the Fund’s |
| | | | performance. |
| | | Advisory fees for this Fund are | |
| | | modestly higher than the peer | The Board noted that a new portfolio |
| | | group median. | manager assumed responsibility of the |
| | | | comparable John Hancock Trust |
| | | Total expenses for this Fund are | portfolio after which the Fund is |
| | | lower than the peer group median. | modeled in September 2005, noting |
| | | | that it has outperformed its |
| | | | benchmark index since that time. |
|
| |
| All Cap Value | The Fund underperformed the | Subadvisory fees for this Fund are | The Board took into account |
| | benchmark index and peer group | equal to the peer group median. | management’s discussion of the |
| (Lord, Abbett & Co.) | average over the one-year period. | | actors that contributed to the |
| | | Advisory fees for this Fund are | Fund’s performance. The Board also |
| | | slightly higher than the peer | considered the long term performance |
| | | group median. | history of the comparable fund |
| | | | after which the Fund is modeled. |
| | | Total expenses for this Fund are | |
| | | lower than the peer group median. | |
|
467
John Hancock Funds II
Appendix A — continued
| | | |
| Portfolio | Performance of Fund, | | |
| (Subadviser) | as of March 31, 2007 | Fees and Expenses | Other Comments |
|
| |
| Blue Chip Growth | The Fund underperformed the | Subadvisory fees for this Fund are | The Board took into account |
| | benchmark index over the | equal to the peer group median. | management’s discussion of the |
| (T. Rowe Price Associates, Inc.) | one-year period. | | Fund’s performance, which noted |
| | | Advisory fees for this Fund are | that although the Fund underper- |
| | The Fund outperformed the | slightly higher than the peer | formed its benchmark index for |
| | peer group average over the | group median. | the one-year period, many |
| | one-year period. | | large cap growth funds generally |
| | | Total expenses for this Fund are | had difficulty beating the S&P 500 |
| | | lower than the peer group median. | Index during this time period and |
| | | | that the Fund outperformed its |
| | | | peer group average over the |
| | | | one-year period. |
| |
| | | | The Board noted that, in addition |
| | | | to the contractual fee waiver discussed |
| | | | above, the Trust is subject to a |
| | | | voluntary fee waiver which reduces |
| | | | certain expenses of the Trust. |
|
| |
| Capital Appreciation | The Fund underperformed the | Subadvisory fees for this Fund are | The Board took into account |
| | benchmark index and peer group | lower than the peer group median | management’s discussion of the . |
| (Jennison Associates LLC) | average over the one-year period. | | Fund’s performance, including the |
| | | Advisory fees for this Fund are | subadviser’s longer term performance |
| | | equal to the peer group median. | record. |
| |
| | | Total expenses for this Fund are | The Board requested that |
| | | lower than the peer group median. | management continue to closely |
| | | | monitor performance. |
|
| |
| Core Bond | The Fund underperformed the | Subadvisory fees for this Fund are | The Board took into account manage- |
| | benchmark index and the peer | lower than the peer group median. | ment’s discussion of the Fund’s |
| (Wells Capital Management, | group average over the one-year | | performance, including the |
| Incorporated) | period. | Advisory fees for this Fund are | subadviser’s investment style. In |
| | | higher than the peer group median. | this regard, the Board noted the |
| | | | longer term performance history of |
| | | Total expenses for this Fund are | the subadviser’s comparable retail |
| | | higher than the peer group median. | mutual fund. |
| |
| | | | The Board also noted that there was a |
| | | | portfolio manager change in |
| | | | February 2007. |
| |
| | | | With respect to the Fund’s total |
| | | | expenses, the Board took into |
| | | | account management’s discussion |
| | | | of the advisory/subadvisory fee |
| | | | structure. |
|
468
John Hancock Funds II
Appendix A — continued
| | | |
| Portfolio | Performance of Fund, | | |
| (Subadviser) | as of March 31, 2007 | Fees and Expenses | Other Comments |
|
| |
| Core Equity | The Fund has underperformed the | Subadvisory fees for this Fund are | The Board took into account |
| | benchmark index and the peer | slightly higher than the peer group | management’s discussion of the |
| (Legg Mason Funds | group average over the one-year | median. | factors that contributed to the |
| Management, Inc.) | period. | | Fund’s performance. |
| | | Advisory fees for this Fund are | |
| | | slightly higher than the peer | The Board noted that although the |
| | | group median. | Fund underperformed its index and |
| | | | peer group for the one year period, |
| | | Total expenses for this Fund are | a mutual fund managed in a similar |
| | | lower than the peer group median | style by Legg Mason after which the |
| | | | Trust is modeled, had performed |
| | | | well over the longer term five- and |
| | | | ten-year periods. |
| |
| | | | The Board requested that manage- |
| | | | ment closely monitor performance |
| | | | of this Fund. |
|
| Emerging Growth | The Fund underperformed the | Subadvisory fees for this Fund are | The Board took into account |
| | benchmark index and the peer | lower than the peer group median. | management’s discussion of the |
| (MFC Global Investment | group average over the one-year | | Fund’s performance, including the |
| Management (U.S.), LLC) | period. | Advisory fees for this Fund are | improvement in the Fund’s more |
| | | lower than the peer group median. | recent performance. |
| |
| | | Total expenses for this Fund are | |
| | | lower than the peer group median. | |
|
| Emerging Small Company | The Fund underperformed the | Subadvisory fees for this Fund are | The Board noted that RCM assumed |
| | benchmark index and the peer | lower than the peer group median. | subadvisory responsibilities on |
| (RCM) | group average over the one- | | April 28, 2006. The Board also took |
| | year period. | Advisory fees for this Fund are | into account the Trust’s more recent |
| | | lower than the peer group median. | performance, noting that the Trust |
| | | | outperformed its peer group and |
| | | Total expenses for this Fund are | benchmark during the first five |
| | | lower than the peer group median. | months of 2007. The Board |
| | | | requested management to closely |
| | | | monitor the performance of this |
| | | | Fund. |
|
469
John Hancock Funds II
Appendix A — continued
| | | |
| Portfolio | Performance of Fund, | | |
| (Subadviser) | as of March 31, 2007 | Fees and Expenses | Other Comments |
|
| |
| Equity-Income | The Fund underperformed the | Subadvisory fees for this Fund are | The Board took into account manage- |
| | benchmark index over the one-year | equal to the peer group median. | ment’s discussion of the Fund’s |
| (T. Rowe Price Associates, Inc.) | period. | | performance, which noted that while |
| | | Advisory fees for this Fund are | the Fund underperformed its bench- |
| | The Fund outperformed the peer | slightly higher than the peer | mark index for the one-year period, |
| | group average over the one-year | group median. | most large cap value funds generally |
| | period. | | underperformed the Russell 1000 |
| | | Total expenses for this Fund are | Value Index during these time peri- |
| | | lower than the peer group median | ods and that the Fund outperformed |
| | | | its peer group average over the one- |
| | | | year period. |
| |
| | | | The Fund recently commenced |
| | | | operations on October 14, 2005 |
| | | | and has a limited performance |
| | | | history. In reviewing the Fund, the |
| | | | Board took into account this limited |
| | | | performance history. |
| |
| | | | The Board noted that, in addition to |
| | | | the contractual fee waiver discussed |
| | | | above, the Trust is subject to a |
| | | | voluntary fee waiver which reduces |
| | | | certain expenses of the Trust. |
|
| |
| Fundamental Value | The Fund underperformed the | Subadvisory fees for this Fund are | The Board noted that although the |
| | benchmark index over the one-year | slightly higher than the peer group | Fund slightly underperformed its |
| (Davis Selected Advisers, L ) | period. | median. | benchmark index over the one year |
| | | | period (a return of 11.71% vs. |
| | The Fund outperformed the peer | Advisory fees for this Fund are | 11.83%), the Fund had outperformed |
| | group average over the one year | slightly higher than the peer group | its peer group average during the |
| | period. | median. | same period. The Board also noted |
| | | | that the Fund had recently com- |
| | | Total expenses for this Fund are | menced operations on October 14, |
| | | lower than the peer group median. | 2005 and as a result, had a limited |
| | | | performance history record. |
|
| |
| |
| Global Bond | The Fund has underperformed the | Subadvisory fees for this Fund are | The Board took into account manage- |
| | benchmark index and peer group | equal to the peer group median. | ment’s discussion of the factors that |
| (Pacific Investment | average over the one- year period. | | contributed to the Trust’s perform- |
| | | Advisory fees for this Fund are | ance, including the subadviser’s |
| Management Company) | | higher than the peer group median. | ance, including the subadviser’s |
| | | higher than the peer group median. | investment style and current market |
| | | Total expenses for this Fund are | conditions. |
| | | lower than the peer group median. | |
| | | | The Board noted that while the Fund |
| | | | has underperformed its index, per- |
| | | | formance has generally been close to |
| | | | that of the index. |
|
470
John Hancock Funds II
Appendix A — continued
| | | |
| Portfolio | Performance of Fund, | | |
| (Subadviser) | as of March 31, 2007 | Fees and Expenses | Other Comments |
|
| |
| Global Real Estate | See “Other Comments.” | Subadvisory fees for this Fund are | The Fund recently commenced |
| | | slightly higher than the peer | operations. In reviewing the Fund, |
| (Deutsche Asset | | group median. | the Board considered this limited |
| Management, Inc.) | | | performance history. |
| | | Advisory fees for this Fund are | |
| | | modestly higher than the peer | |
| | | group median. | |
| |
| | | Total expenses for this Fund are | |
| | | lower than the peer group median. | |
|
| High Income | See “Other Comments.” | Subadvisory fees for this Fund are | The Fund recently commenced oper- |
| | | lower that the peer group median. | ations on April 28, 2006. In |
| (MFC Global Investment | | | reviewing the Fund, the Board took |
| Management (U.S.), LLC) | | Advisory fees for this Fund are | into account the Fund’s limited |
| | | slightly higher than the peer | performance history. |
| | | group median. | |
| |
| | | Total expenses for this Fund are | |
| | | lower than the peer group median. | |
|
| |
| High Yield | The Fund underperformed the | Subadvisory fees for this Fund are | |
| | benchmark index over the | lower than the peer group median. | |
| (Western Asset | one-year period. | | |
| Management Company) | | Advisory fees for this Fund are | |
| | The Fund outperformed the peer | modestly higher than the peer | |
| | group average over the one-year | group median. | |
| | period. | | |
| | | Total expenses for this Fund are | |
| | | lower than the peer group median. | |
|
| International Equity Index A | The Fund underperformed the | Subadvisory fees for this Fund are | The Board noted that performance of |
| | benchmark over the one-year period. | higher than the peer group median. | the Fund is within the expected |
| (SSgA Funds Management, Inc.) | | | tracking error guidelines gross of fees. |
| | The Fund outperformed the peer | Advisory fees for this Fund are | |
| | group average over the one-year | higher than the peer group median. | With respect to the Fund’s total |
| | period. | | expenses, the Board took into |
| | | Total expenses for this Fund are | account management’s discussion of |
| | | higher than the peer group median. | the advisory/subadvisory fee |
| | | | structure. |
|
| International Opportunities | The Fund underperformed the | Subadvisory fees for this Fund are | The Board took into account manage- |
| | benchmark index and peer group | slightly higher than the peer group | ment’s discussion of the Fund’s |
| (Marsico Capital | average over the one- year period. | median. | performance, including the fact that |
| Management, LLC) | | | the Fund had outperformed its peer |
| | | Advisory fees for this Fund are | group average for the period from its |
| | | equal to the peer group median. | inception through March 31, 2007. |
| |
| | | Total expenses for this Fund are | The Board noted the Fund’s relatively |
| | | lower than the peer group median. | limited performance history. |
471
John Hancock Funds II
Appendix A — continued
| | | |
| Portfolio | Performance of Fund, | | |
| (Subadviser) | as of March 31, 2007 | Fees and Expenses | Other Comments |
|
| |
| International Small Cap | The Fund outperformed the bench- | Subadvisory fees for this Fund are | |
| | mark index and peer group average | higher than the peer group median. | |
| (Templeton Investment | over the one- year period. | | |
| Counsel, Inc.) | | Advisory fees for this Fund are | |
| | | lower than the peer group median. | |
| |
| | | Total expenses for this Fund are | |
| | | lower than the peer group median. | |
|
| International Small Company | See “Other Comments.” | Subadvisory fees for this Fund are | The Fund recently commenced |
| | | higher than the peer group median. | operations. In reviewing the Fund, |
| (Dimensional Fund Advisors) | | | the Board took into account the |
| | | Advisory fees for this Fund are | Fund’s limited performance history. |
| | | lower than the peer group median. | |
| |
| | | Total expenses for this Fund are | |
| | | lower than the peer group median. | |
|
| |
| International Value | The Fund outperformed the bench- | Subadvisory fees for this Fund are | |
| | mark index and peer group average | lower than the peer group median. | |
| (Templeton Investment | over the one- year period. | | |
| Counsel, Inc.) | | Advisory fees for this Fund are | |
| | | slightly higher than the peer group | |
| | | median. | |
| |
| | | Total expenses for this Fund are | |
| | | lower than the peer group median. | |
|
| Investment Quality Bond | The Fund underperformed the | Subadvisory fees for this Fund are | The Board took into account the |
| | benchmark index and peer group | lower than the peer group median. | longer term performance history of |
| (Wellington Management | average over the one- year period. | | the comparable John Hancock Trust |
| Company, LLP) | | Advisory fees for this Fund are | portfolio after which the Fund is |
| | | higher than the peer group median. | modeled. |
| |
| | | Total expenses for this Fund are | |
| | | equal to the peer group median. | |
|
| Large Cap | The Fund underperformed the | Subadvisory fees for this Fund are | The Board took into account the |
| | benchmark index over the one-year | lower than the peer group median. | longer-term performance history of |
| (UBS Global Asset | period. | | the comparable mutual fund after |
| Management) | | Advisory fees for this Fund are | which the Fund is modeled, noting |
| | The Fund outperformed the peer | lower than the peer group median. | that it has outperformed both its |
| | group average over the one-year | | benchmark index and peer group |
| | period. | Total expenses for this Fund are | average over the three-, five-, and ten- |
| | | lower than the peer group median. | year periods. |
|
| |
| Large Cap Value | The Fund underperformed the | Subadvisory fees for this Fund are | The Board took into account manage- |
| | benchmark index and the peer | slightly higher than the peer group | ment’s discussion of the Fund’s |
| (BlackRock Investment | group average over the one- year | median. | performance. In this regard, the |
| Management, LLC) | period. | | Board noted that performance of the |
| | | Advisory fees for this Fund are | comparable retail fund after which |
| | | modestly higher than the peer | the Fund’s investment strategy is |
| | | group median. | modeled outperformed its bench- |
| | | | mark index and peer group average |
| | | Total expenses for this Fund are | over the longer three- and five-year |
| | | lower than the peer group median. | periods. |
|
472
John Hancock Funds II
Appendix A — continued
| | | |
| Portfolio | Performance of Fund, | | |
| (Subadviser) | as of March 31, 2007 | Fees and Expenses | Other Comments |
|
| Mid Cap Index | The Fund underperformed the | Subadvisory fees for this Fund are | The Board noted that performance of |
| | benchmark index over the one- year | equal to the peer group median. | the Fund is within the expected |
| (MFC Global Investment | period. | | tracking error guidelines gross of fees |
| Management (U.S.A.) Limited) | | Advisory fees for this Fund are | over the one-year period. |
| | The Fund underperformed the peer | higher than the peer group median. | |
| | group average over the one-year | | The Board also took into account the |
| | period. | Total expenses for this Fund are | relatively narrow range among per- |
| | | higher than the peer group median. | formance returns and expense ratios |
| | | | of the peer group. |
|
| Mid Cap Stock | The Fund outperformed the bench- | Subadvisory fees for this Fund are | |
| | mark index and the peer group | lower than the peer group median. | |
| (Wellington Management | average over the one-year period. | | |
| Company, LLP) | | Advisory fees for this Fund are | |
| | | slightly higher than the peer group | |
| | | median. | |
| |
| | | Total expenses for this Fund are | |
| | | lower than the peer group median. | |
|
| Mid Cap Value | The Fund underperformed the | Subadvisory fees for this Fund are | The Board took into account manage- |
| | benchmark index and peer group | equal to the peer group median. | ment’s discussion of the Fund’s |
| (Lord, Abbett & Co.) | average over the one-year period. | | performance. The Board also noted |
| | | Advisory fees for this Fund are | the long term performance history of |
| | | slightly higher than the peer group | the comparable retail fund after |
| | | median. | which the Fund’s investment strategy |
| | | | is modeled. |
| | | Total expenses for this Fund are | |
| | | lower than the peer group median. | |
|
| Mid Cap Value Equity | See “Other Comments.” | Subadvisory fees for this Fund are | The Fund recently commenced oper- |
| | | slightly higher than the peer group | ations on April 28, 2006. In |
| (RiverSource Investments LLC) | | median. | reviewing the Fund, the Board took |
| | | | into account the Fund’s limited |
| | | Advisory fees for this Fund are | performance history. |
| | | slightly higher than the peer group | |
| | | median. | |
| |
| | | Total expenses for this Fund are | |
| | | lower than the peer group median. | |
|
| |
| Natural Resources | The Fund underperformed the | Subadvisory fees for this Fund are | |
| | benchmark index over the one-year | higher than the peer group median. | |
| (Wellington Management | period. | | |
| Company, LLP) | | Advisory fees for this Fund are | |
| | The Fund outperformed the peer | higher than the peer group median. | |
| | group average over the one-year | | |
| | period. | Total expenses for this Fund are | |
| | | slightly higher than the peer group | |
| | | median. | |
|
| Quantitative All Cap | See “Other Comments.” | Subadvisory fees for this Fund are | The Fund recently commenced oper- |
| | | lower than the peer group median. | ations. In reviewing the Fund, the |
| (MFC Global Investment | | | Board took into account the Fund’s |
| Management (U.S.A.) Limited) | | Advisory fees for this Fund are | limited performance history. |
| | | lower than the peer group median. | |
| |
| | | Total expenses for this Fund are | |
| | | lower than the peer group median. | |
|
473
John Hancock Funds II
Appendix A — continued
| | | |
| Portfolio | Performance of Fund, | | |
| (Subadviser) | as of March 31, 2007 | Fees and Expenses | Other Comments |
|
| |
| Quantitative Mid Cap | The Fund underperformed the | Subadvisory fees for this Fund are | The Board took into account manage- |
| | benchmark index and the peer group | lower than the peer group median. | ment’s discussion of the factors that |
| (MFC Global Investment | average over the one- year period. | | contributed to the Fund’s perform- |
| Management (U.S.A.) Limited) | | Advisory fees for this Fund are | ance, including the subadviser’s |
| | | lower than the peer group median. | quantitative investment style and the |
| | | | interaction of market conditions with |
| | | Total expenses for this Fund are | the quantitative model. The Board |
| | | lower than the peer group median. | further noted that a new lead port- |
| | | | folio manager was assigned to the |
| | | | Fund in May 2007 and, in addition, |
| | | | management is making modifications |
| | | | to the Trust’s investment approach. |
| |
| | | | The Board requested that manage- |
| | | | ment continue to closely monitor |
| | | | performance and provide an update |
| | | | at the next quarterly Board meeting. |
|
| Quantitative Value | The Fund underperformed the | Subadvisory fees for this Fund are | |
| | benchmark index over the one-year | lower than the peer group median. | |
| (MFC Global Investment | period. | | |
| Management (U.S.A.) Limited) | | Advisory fees for this Fund are | |
| | The Fund outperformed the peer | lower than the peer group median. | |
| | group average over the one-year | | |
| | period. | Total expenses for this Fund are | |
| | | lower than the peer group median. | |
|
| |
| Real Estate Equity | See “Other Comments.” | Subadvisory fees for this Fund are | The Fund recently commenced oper- |
| | | lower than the peer group median. | ations on April 28, 2006. In |
| (T. Rowe Price, Inc.) | | | reviewing the Fund, the Board took |
| | | Advisory fees for this Fund are | into account this limited performance |
| | | lower than the peer group median. | history. |
| |
| | | Total expenses for this Fund are | |
| | | lower than the peer group median. | |
|
| Real Estate Securities | The Fund outperformed the bench- | Subadvisory fees for this Fund are | |
| | mark index and peer group average | lower than the peer group median. | |
| (Deutsche Asset | over the one-year period. | | |
| Management, Inc.) | | Advisory fees for this Fund are | |
| | | lower than the peer group median. | |
| |
| | | Total expenses for this Fund are | |
| | | lower than the peer group median. | |
|
474
John Hancock Funds II
Appendix A — continued
| | | |
| Portfolio | Performance of Fund, | | |
| (Subadviser) | as of March 31, 2007 | Fees and Expenses | Other Comments |
|
| |
| Real Return Bond | The Fund has underperformed the | Subadvisory fees for this Fund are | The Board noted that although the |
| | benchmark index over the one year | equal to the peer group median. | Fund underperformed its benchmark |
| (Pacific Investment | period. | | index over the one- year period, it |
| Management Company | | Advisory fees for this Fund are | outperformed its peer group average |
| (“PIMCO”) | The Fund has outperformed the peer | higher than the peer group median. | over the same period. In addition, |
| | group average over the one year | | since its inception on October 14, |
| | period. | Total expenses for this Fund are | 2005, the Fund has ranked in the |
| | | higher than the peer group median. | 46th percentile of the Morningstar |
| | | | Inflation Protected Bond peer group. |
| |
| | | | The Board noted a reduction in the |
| | | | subadvisory and advisory fee effective |
| | | | in 2007. |
| |
| | | | In reviewing the Fund’s expenses, the |
| | | | Board noted the relatively small size |
| | | | of the peer group. |
|
| |
| Small Cap | The Fund underperformed the | Subadvisory fees for this Fund are | The Board took into account manage- |
| | benchmark index and peer group | lower than the peer group median. | ment’s discussion of the factors that |
| (Independence | average over the one- year period. | | contributed to the Trust’s perform- |
| Investments LLC) | | Advisory fees for this Fund are | ance, including the subadviser’s |
| | | lower than the peer group median. | investment style. In this regard, the |
| | | | Board took into account the longer |
| | | Total expenses for this Fund are | term performance history of the com- |
| | | lower than the peer group median. | parable fund after which the Trust is |
| | | | modeled, noting that it has outper- |
| | | | formed its peer group average over |
| | | | the three- and five-year periods. |
| |
| | | | The Board requested an update from |
| | | | the portfolio manager at its next |
| | | | quarterly meeting. |
|
| Small Cap Index | The Fund underperformed the | Subadvisory fees for this Fund are | The Board noted that performance of |
| | benchmark index over the one-year | lower than the peer group median. | the Fund is within the expected |
| (MFC Global Investment | period. | | tracking error guidelines gross of fees |
| Management (U.S.A.) Limited) | | Advisory fees for this Fund are | over the one-year period. |
| | | higher than the peer group median. | |
| | | | The Board also took into account the |
| | | Total expenses for this Fund are | relatively narrow range among per- |
| | | higher than the peer group median. | formance returns and expense ratios |
| | | | of the peer group. |
|
| |
| Small Cap Opportunities | The Fund underperformed the | Subadvisory fees for this Fund are | The Board took into account manage- |
| | benchmark index and the peer | slightly higher than the peer group | ment’s discussion of the factors that |
| (Munder Capital Management) | group average over the one-year | median. | contributed to the Fund’s perform- |
| | period. | | ance, including the subadviser’s |
| | | Advisory fees for this Fund are | investment style and current market |
| | | modestly higher than the peer | conditions. In this regard, the Board |
| | | group median. | noted that the five- and ten-year per- |
| | | | formance history of the subadviser’s |
| | | Total expenses for this Fund are | comparable retail mutual fund that |
| | | lower than the peer group median. | the Fund is modeled after exceeds |
| | | | both the index and its peer group. |
| |
| | | | The Board requested that manage- |
| | | | ment continue to closely monitor |
| | | | performance. |
|
475
John Hancock Funds II
Appendix A — continued
| | | |
| Portfolio | Performance of Fund, | | |
| (Subadviser) | as of March 31, 2007 | Fees and Expenses | Other Comments |
|
| |
| Small Company | The Fund underperformed the | Subadvisory fees for this Fund are | The Board took into account manage- |
| | benchmark index and the peer | modestly higher than the peer | ment’s discussion of the factors that |
| (American Century | group average over the one- year | group median. | contributed to the Fund’s perform- |
| Investment Management, Inc.) | period. | | ance, including the subadviser’s |
| | | Advisory fees for this Fund are | quantitative investment style and the |
| | | modestly higher than the peer | interaction of market conditions with |
| | | group median. | the quantitative model. In this regard, |
| | | | the Board noted the longer term per- |
| | | Total expenses for this Fund are | formance history of the comparable |
| | | modestly higher than the peer | fund after which the Fund is mod- |
| | | group median. | eled. The Board also took into |
| | | | account the Fund’s improved recent |
| | | | performance. |
|
| Small Company Growth | The Fund outperformed the bench- | Subadvisory fees for this Fund are | |
| | mark index and the peer group | lower than the peer group median. | |
| (AIM Capital | average over the one-year period. | | |
| Management, Inc.) | | Advisory fees for this Fund are | |
| | | slightly higher than the peer group | |
| | | median. | |
| |
| | | Total expenses for this Fund are | |
| | | lower than the peer group median. | |
|
| |
| Small Company Value | The Fund underperformed the | Subadvisory fees for this Fund are | The Fund recently commenced |
| | benchmark index and peer group | modestly higher than the peer | operations on October 14, 2005. In |
| (T. Rowe Price | average over the one-year period. | group median. | reviewing the Fund, the Board took |
| Associates, Inc.) | | | into account the Fund’s limited |
| | | Advisory fees for this Fund are | performance history. |
| | | modestly higher than the peer | |
| | | group median | The Board took into account manage- |
| | | | ment’s discussion of the Fund’s |
| | | Total expenses for this Fund are | performance, which noted that while |
| | | lower than the peer group median. | the Fund underperformed its bench- |
| | | | mark index for the one- year period, |
| | | | most small cap value funds underper- |
| | | | formed the Russell 2000 Value Index |
| | | | during this time period and a mutual |
| | | | fund managed in a similar style by |
| | | | T. Rowe Price outperformed its peer |
| | | | group average over the three- and |
| | | | five-year time periods. |
| |
| | | | The Board noted that, in addition to |
| | | | the contractual fee waiver discussed |
| | | | above, the Trust is subject to a volun- |
| | | | tary fee waiver which reduces certain |
| | | | expenses of the Trust. |
|
476
John Hancock Funds II
Appendix A — continued
| | | |
| Portfolio | Performance of Fund, | | |
| (Subadviser) | as of March 31, 2007 | Fees and Expenses | Other Comments |
|
| |
| Special Value | The Fund underperformed the | Subadvisory fees for this Fund are | The Board voted to renew the subad- |
| | benchmark index and peer group | slightly higher than the peer group | visory agreement but noted that |
| (ClearBridge Advisors, LLC) | average over the one-year period. | median. | performance should be monitored |
| | | | closely. The Board took into account |
| | | Advisory fees for this Fund are | the steps being taken by management |
| | | modestly higher than the peer | to address the Fund’s underperfor- |
| | | group median. | mance, noting that at the next Board |
| | | | meeting, management would be pro- |
| | | Total expenses for this Fund are | posing a sub-adviser change for the |
| | | lower than the peer group median. | Fund. |
| |
| | | | The Board noted that the Trust is sub- |
| | | | ject to a voluntary fee waiver which |
| | | | reduces certain expenses of the Fund. |
|
| |
| Spectrum Income | The Fund outperformed the bench- | Subadvisory fees for this Fund are | The Board noted that, in addition to |
| | mark index and peer group average | equal to the peer group median. | the contractual fee waiver discussed |
| (T. Rowe Price Associates, Inc.) | over the one- year period. | | above, the Trust is subject to a volun- |
| | | Advisory fees for this Fund are | tary fee waiver which reduces certain |
| | | modestly higher than the peer | expenses of the Trust. |
| | | group median. | |
| |
| | | Total expenses for this Fund are | |
| | | lower than the peer group median. | |
|
| |
| Strategic Bond | The Fund outperformed the bench- | Subadvisory fees for this Fund are | The Board noted that Western Asset |
| | mark index and peer group average | lower than the peer group median. | Management Company assumed |
| (Western Asset | over the one-year period. | | responsibility of the Fund in |
| Management Company) | | Advisory fees for this Fund are | April 2006. |
| | | slightly higher than the peer group | |
| | | median. | |
| |
| | | Total expenses for this Fund are | |
| | | lower than the peer group median. | |
|
| |
| Strategic Income | See “Other Comments.” | Subadvisory fees for this Fund are | The Fund commenced operations on |
| | | lower than the peer group median. | April 28, 2006 and for the period |
| (MFC Global U.S.) | | | since inception through March 31, |
| | | Advisory fees for this Fund are | 2007 has under performed its index |
| | | slightly higher than the peer group | and peer group. The Board noted the |
| | | median. | Fund’s limited performance history |
| | | | but requested management to closely |
| | | Total expenses for this Fund are | monitor its performance. |
| | | lower than the peer group median. | |
|
| Total Bond Market | See “Other Comments.” | Subadvisory fees for this Fund are | The Fund recently commenced oper- |
| | | lower than the peer group median. | ations. In reviewing the Fund, the |
| (Declaration) | | | Board took into account its limited |
| | | Advisory fees for this Fund are mod- | performance history. |
| | | estly higher than the peer group | |
| | | median. | |
| |
| | | Total expenses for this Fund are | |
| | | higher than the peer group median. | |
|
477
John Hancock Funds II
Appendix A — continued
| | | |
| Portfolio | Performance of Fund, | | |
| (Subadviser) | as of March 31, 2007 | Fees and Expenses | Other Comments |
|
| |
| Total Return | The Fund underperformed the | Subadvisory fees for this Fund are | The Board noted that although the |
| | benchmark index and peer group | higher than the peer group median. | Fund underperformed the peer |
| (Pacific Investment | average over the one-year period. | | group and index for the one-year |
| Management Company) | | Advisory fees for this Fund are | period, its more recent performance |
| | | higher than the peer group median. | has been higher than the index. The |
| | | | Board also noted that the long term |
| | | Total expenses for this Fund are | performance of a fund managed in a |
| | | modestly higher than the peer | similar style by PIMCO (after which |
| | | group median. | the Fund was modeled) has been |
| | | | competitive, ranking in the top 26th |
| | | | percentile of its peer group since its |
| | | | inception on May 1, 1999. |
|
| U.S. Global Leaders Growth | The Fund underperformed the | Subadvisory fees for this Fund are | The Board took into account |
| | benchmark index and the peer group | lower than the peer group median. | management’s discussion of the fac- |
| (Sustainable Growth | average over the one-year period. | | tors that contributed to the Fund’s |
| Advisers, L.P.) | | Advisory fees for this Fund are | performance, including the subad- |
| | | lower than the peer group median. | viser’s investment style and current |
| | | | market conditions. |
| | | Total expenses for this Fund are | |
| | | lower than the peer group median. | In this regard, the Board noted that |
| | | | the ten-year performance history of |
| | | | the subadviser’s comparably managed |
| | | | mutual fund that the Fund is mod- |
| | | | eled after exceeds its peer group. |
| |
| | | | The Board requested that manage- |
| | | | ment continue to closely monitor |
| | | | performance and requested a specific |
| | | | recommendation with respect to the |
| | | | Fund if performance does not begin |
| | | | to improve when market conditions |
| | | | change. |
|
| |
| U.S. Government Securities | The Fund outperformed the bench- | Subadvisory fees for this Fund are | The Board noted that Western Asset |
| | mark index and peer group average | equal to the peer group median. | Management Company assumed |
| (Western Asset | over the one-year period. | | responsibility of the Trust in |
| Management Company) | | Advisory fees for this Fund are | April 2006. |
| | | slightly higher than the peer group | |
| | | median. | With respect to expenses, the Board |
| | | | noted the relatively small size of the |
| | | Total expenses for this Fund are | expense peer group. |
| | | equal to the peer group median. | |
|
478
John Hancock Funds II
Appendix A — continued
| | | |
| Portfolio | Performance of Fund, | | |
| (Subadviser) | as of March 31, 2007 | Fees and Expenses | Other Comments |
|
| |
| U.S. High Yield Bond | The Fund underperformed the | Subadvisory fees for this Fund are | The Board took into account manage- |
| | benchmark index and peer group | lower than the peer group median. | ment’s discussion of the factors that |
| (Wells Capital | average over the one-year period. | | contributed to the Fund’s perform- |
| Management, Incorporated) | | Advisory fees for this Fund are | ance, including the subadviser’s |
| | | modestly higher than the peer | investment style. In this regard, the |
| | | group median. | Board noted the risk-adjusted returns |
| | | | for the subadviser’s comparable retail |
| | | Total expenses for this Fund are | mutual fund, after which the Fund is |
| | | slightly higher than the peer group | modeled, over the longer term and |
| | | median. | that the Fund was performing within |
| | | | management’s expectations. |
| |
| | | | The Board noted that there was a |
| | | | portfolio manager change in April |
| | | | 2007 and requested that manage- |
| | | | ment closely monitor performance. |
| |
| | | | In reviewing the expenses of the |
| | | | Fund, the Board took into account |
| | | | the effect that the current asset levels |
| | | | of the Fund have on expenses. |
|
| |
| U.S. Multi Sector | The Fund underperformed the | Subadvisory fees for this Fund are | The Board took into account manage- |
| | benchmark index and the peer | equal to the peer group median. | ment’s discussion of the factors that |
| (Grantham, Mayo, | group average over the one-year | | contributed to the Fund’s perform- |
| Van Otterloo & Co., LLC) | period. | Advisory fees for this Fund are | ance, including the subadviser’s |
| | | slightly higher than the peer group | investment style and current market |
| | | median. | conditions. In this regard, the Board |
| | | | noted that the five-year performance |
| | | Total expenses for this Fund are | history of the subadviser’s compara- |
| | | lower than the peer group median. | bly managed retail mutual fund that |
| | | | the Fund is modeled after exceeds its |
| | | | peer group and exceeds the index |
| | | | and its peer group on a ten-year basis. |
| |
| | | | The Board requested that manage- |
| | | | ment closely monitor performance |
| | | | and provide a specific recom- |
| | | | mendation for addressing |
| | | | underperformance if the Fund’s |
| | | | performance does not improve. |
|
| |
| Value | See “Other Comments.” | Subadvisory fees for this Fund are | The Fund recently commenced oper- |
| | | lower than the peer group median. | ations on October 26, 2006. In |
| (Morgan Stanley Investment | | | reviewing the Fund, the Board took |
| Management Inc. | | Advisory fees for this Fund are | into account this limited performance |
| (Van Kampen)) | | lower than the peer group median. | history. |
| |
| | | Total expenses for this Fund are | |
| | | lower than the peer group median. | |
|
479
John Hancock Funds II
Appendix A — continued
| | | |
| Portfolio | Performance of Fund, | | |
| (Subadviser) | as of March 31, 2007 | Fees and Expenses | Other Comments |
|
| |
| Value & Restructuring | The Fund underperformed the | Subadvisory fees for this Fund are | The Board took into account manage- |
| | benchmark index and the peer | slightly higher than the peer group | ment’s discussion of the Fund’s |
| (UST Advisers, Inc.) | group average over the one-year | median. | performance, noting the subadviser’s |
| | period. | | strong recent performance year-to- |
| | | Advisory fees for this Fund are | date. The Board also noted that the |
| | | slightly higher than the peer group | Fund outperformed its benchmark |
| | | median. | index and peer group for the period |
| | | | from its inception on October 24, |
| | | Total expenses for this Fund are | 2005 through March 31, 2007. The |
| | | lower than the peer group median. | Board also took into account the |
| | | | relatively small range among per- |
| | | | formance returns of the peer group |
| | | | and against the index. |
|
| Vista | The Fund underperformed the | Subadvisory fees for this Fund are | |
| | benchmark index over the one-year | slightly higher than the peer group | |
| (American Century | period. | median. | |
| Investment Management, Inc.) | | | |
| | The Fund outperformed the peer | Advisory fees for this Fund are | |
| | group average over the one-year | slightly higher than the peer group | |
| | period. | median. | |
| |
| | | Total expenses for this Fund are | |
| | | lower than the peer group median. | |
|
480
John Hancock Funds II
Board of Trustees Approval of the Advisory and Subadvisory Agreements.
SPECIAL VALUE FUND
At its meeting on June 28–29, 2007, the Board, including all of the Independent Trustees, approved changing the subadviser for the Special Value Fund, a series of John Hancock Funds II (the “Trust”) from Clearbridge Advisors, LLC to Wellington Management, LLP (“Wellington Management”).
This section describes the evaluation by the Board of Trustees of the subadvisory agreement between John Hancock Investment Management Services, Inc. (the “Adviser”) and Wellington Management regarding the Special Value Fund, a series of the Trust.
The Board, including the Independent Trustees, is responsible for selecting the Trust’s investment adviser, approving the Adviser’s selection of subadvisers to Funds of the Trust, including the subadviser to the Special Value Fund and approving the Trust’s advisory and subadvisory agreements, their periodic continuation and any amendments. Consistent with SEC rules, the Board regularly evaluates the Trust’s advisory and subadvisory arrangements, including consideration of the factors listed below. The Board may also consider other factors (including conditions and trends prevailing generally in the economy, the securities markets and the industry) and does not treat any single factor as determinative, and each Trustee may attribute different weights to different factors. The Board is furnished with an analysis of its fiduciary obligations in connection with its evaluation and, throughout the evaluation process, the Board is assisted by counsel for the Trust and the Independent Trustees are also separately assisted by independent legal counsel. The factors considered by the Board are:
1. the nature, extent and quality of the services to be provided by the Adviser to the Trust and by the subadviser to the Fund;
2. the investment performance of the Fund and its subadviser;
3. the extent to which economies of scale would be realized as a Fund grows and whether fee levels reflect these economies of scale for the benefit of shareholders of the Fund;
4. the costs of the services to be provided and the profits to be realized by the Adviser (including any subadvisers affiliated with the Adviser) and its affiliates from the Adviser’s relationship with the Fund; and
5. comparative services rendered and comparative advisory and subadvisory fee rates.
The Board believes that information relating to all these factors is relevant to its evaluation of the Trust’s advisory agreement with respect to the Fund. With respect to its evaluation of subadvisory agreements with subadvisers not affiliated with the Adviser, the Board believes that, in view of the Trust’s “manager-of-managers” advisory structure, the costs of the services to be provided and the profits to be realized by those subadvisers that are not affiliated with the Adviser from their relationship with the Trust, generally, are not a material factor in the Board’s consideration of these subadvisory agreements, because such fees are paid to subadvisers by the Adviser and not by the Funds of the Trust and because the Board relies on the ability of the Adviser to negotiate such subadvisory fees at arms-length.
In evaluating subadvisory arrangements, the Board also considers other material business relationships that unaffiliated subadvisers and their affiliates have with the Adviser or its affiliates, including the involvement by certain affiliates of certain subadvisers in the distribution of financial products, including shares of the Trust, offered by the Adviser and other affiliates of the Adviser (“Material Relationships”).
At its meetings on June 28–29, 2007, the Board including all of the Independent Trustees, approved the subadvisory agreement with Wellington Management. In making its determination with respect to the factors that it considers, the Board reviewed:
1. information relating to Wellington Management’s current subadvisory services to the Trust;
2. the performance of the Special Value Fund versus the performance of other funds managed by Wellington Management with similar investment policies to those of the Special Value Fund;
3. the subadvisory fee for the Special Value Fund, including any breakpoints; and
4. information relating to the nature and scope of Material Relationships and their significance to the Trust’s adviser and to Wellington Management.
Particular considerations of the Board in approving the Wellington Management subadvisory agreement for the Special Value Fund at the June 28–29, 2007 Board meeting included the following:
1. Wellington Management has demonstrated skills as a manager, is currently the subadviser to five Funds of the Trust and six funds of John Hancock Trust (“JHT”) and may be expected to provide a high quality of investment management services and personnel to the Special Value Fund;
2. The Small Cap Value Trust, a JHT fund managed by Wellington Management with a broadly similar investment style to the Special Value Fund, has outperformed the Special Value Fund since the inception of that Fund in 2003 and has outperformed its own benchmark index and peer group average since its inception in 1999 (Wellington Management has been sole subadviser to the Small Cap Value Trust since April 2005 and was a co-subadviser from 1999 to April 2005);
3. The subadvisory fee with respect to the Special Value Fund (i) is the product of arms-length negotiation between the Adviser and Wellington Management, (ii) is the same as the subadvisory fee under the prior subadvisory agreement with ClearBridge Advisors, LLC, the former subadviser to the Fund, (iii) is within industry norms and (iv) is paid by the Adviser and not by the Special Value Fund.
VALUE & RESTRUCTURING FUND
At its meeting on March 23, 2007, the Board, including all of the Independent Trustees, approved a new subadvisory agreement with UST Advisers, Inc. (“USTA”) for the Value and Restructuring Fund in connection with the sale by The Charles Schwab Corporation of its wholly-owned subsidiary, U.S. Trust Corporation and its subsidiaries (including USTA) to Bank of America Corporation (the “Transaction”).
This section describes the evaluation by the Board of Trustees of the subadvisory agreement between John Hancock Investment Management Services, Inc. (the “Adviser”) and UST Advisers, Inc. (“USTA”) regarding the Value and Restructuring Fund.
The Board, including the Independent Trustees, is responsible for selecting the Trust’s investment adviser, approving the Adviser’s selection of Fund subadvisers and approving the Trust’s advisory and subadvisory agreements, their periodic continuation and any amendments. Consistent with SEC rules, the Board regularly evaluates the Trust’s advisory and subadvisory arrangements, including consideration of the factors listed below. The Board may also consider other factors
481
John Hancock Funds II
Board of Trustees Approval of the Advisory and Subadvisory Agreements.
(including conditions and trends prevailing generally in the economy, the securities markets and the industry) and does not treat any single factor as determinative, and each Trustee may attribute different weights to different factors. The Board is furnished with an analysis of its fiduciary obligations in connection with its evaluation and, throughout the evaluation process, the Board is assisted by counsel for the Trust and the Independent Trustees are also separately assisted by independent legal counsel. The factors considered by the Board are:
1. the nature, extent and quality of the services to be provided by the Adviser to the Trust and by the subadviser to the Fund;
2. the investment performance of the Fund and its subadviser;
3. the extent to which economies of scale would be realized as the Fund grows and whether fee levels reflect these economies of scale for the benefit of Trust shareholders;
4. the costs of the services to be provided and the profits to be realized by the Adviser (including any subadvisers affiliated with the Adviser) and its affiliates from the Adviser’s relationship with the Trust; and
5. comparative services rendered and comparative advisory and subadvisory fee rates.
The Board believes that information relating to all these factors is relevant to its evaluation of the Trust’s advisory agreements. With respect to its evaluation of subadvisory agreements with subadvisers not affiliated with the Adviser, the Board believes that, in view of the Trust’s “manager-of-managers” advisory structure, the costs of the services to be provided and the profits to be realized by those subadvisers that are not affiliated with the Adviser from their relationship with the Trust, generally, are not a material factor in the Board’s consideration of these subadvisory agreements, because such fees are paid to subadvisers by the Adviser and not by the Funds and because the Board relies on the ability of the Adviser to negotiate such subadvisory fees at arms-length.
In evaluating subadvisory arrangements, the Board also considers other material business relationships that unaffiliated subadvisers and their affiliates have with the Adviser or its affiliates, including the involvement by certain affiliates of certain subadvisers in the distribution of financial products, including shares of the Trust, offered by the Adviser and other affiliates of the Adviser (“Material Relationships”).
In making its determination with respect to the factors that its considers, the Board reviews:
1. information relating to the subadviser’s business, which may include information such as: business performance, representative clients, assets under management, financial stability, personnel and past subadvisory services to the Trust;
2. the performance of the Fund;
3. the subadvisory fee for the Fund including any breakpoints; and
4. information relating to the nature and scope of Material Relationships and their significance to the Trust’s adviser and unaffiliated subadvisers.
At the March 23, 2007 Board meeting, the Board also considered information presented by the Adviser, Bank of America Corporation and USTA regarding the Transaction. Particular considerations of the Board in approving the new subadvisory agreement with USTA for the Value & Restructuring Fund at that meeting included the following:
1. The change in ownership of USTA resulting from the Transaction is not expected to have any adverse impact on USTA’s operations or financial resources;
2. USTA is expected to manage the Fund with the same investment objective, policies and portfolio managers under the new subadvisory agreement as under the old subadvisory agreement, thus affording shareholders continuity in investment strategies, and USTA may generally be expected to provide at least the same level and quality of management services under the new subadvisory agreement as under the old subadvisory agreement;
3. The Fund, which commenced operations in October 2005, has outperformed its peer group for the one-year period; and
4. The subadvisory fee under the new subadvisory agreement with USTA: (i) is the product of arms-length negotiation between the Adviser and USTA; (ii) is within industry norms; (iii) is the same as the fee under the old subadvisory agreement, which was reduced effective June 30, 2006; (iv) is paid by the Adviser and not by the Fund; (v) will not result in any advisory fee increase with respect to the Fund; and (vi) contains breakpoints which are reflected in the advisory fee for the Fund thus permitting shareholders to benefit from economies of scale.
INCOME FUND
MUTUAL SHARES FUND
MID CAP INTERSECTION FUND
EMERGING MARKETS VALUE FUND
At its meeting on March 23, 2007, the Board, including all of the Independent Trustees, approved the following new portfolios for John Hancock Funds II (the “Trust”):
1. Income Fund
2. Mutual Shares Fund
3. Mid Cap Intersection Fund
4. Emerging Markets Value Fund
This section describes the evaluation by the Board of Trustees of:
(a) an amendment (the “Advisory Agreement Amendment”) to the advisory agreement between the Trust and John Hancock Investment Management, LLC (the “Adviser” or “JHIMS”) to add the following new funds (the “New Portfolios”):
1. .Income Fund
2. Mutual Shares Fund
3. Mid Cap Intersection Fund
4. Emerging Markets Value Fund
(b) an amendment to the subadvisory agreement (the “Wellington Subadvisory Agreement Amendment”) between the Adviser and Wellington Management Company, LLP (“Wellington”) to add the Mid Cap Intersection Fund,
(c) an amendment to the subadvisory agreement (the “DFA Subadvisory Agreement Amendment”) between the Adviser and Dimensional Fund Advisers (“DFA”) to add the Emerging Markets Value Fund,
(d) a subadvisory agreement (the “Franklin Advisers Subadvisory Agreement”) between the Adviser and Franklin Advisers, Inc. (“Franklin Advisers”) regarding management of the Income Fund, and
482
John Hancock Funds II
Board of Trustees Approval of the Advisory and Subadvisory Agreements.
(e) a subadvisory agreement (the “Franklin Mutual Subadvisory Agreement”) between the Adviser and Franklin Mutual Advisers, Inc. (“Franklin Mutual”) regarding management of the Mutual Shares Fund.
DFA, Franklin Advisers, Franklin Mutual and Wellington are collectively referred to as the “Subadvisers.”
The DFA Subadvisory Agreement Amendment, the Franklin Advisers Subadvisory Agreement, the Franklin Mutual Subadvisory Agreement and Wellington Subadvisory Agreement Amendment are collectively referred to as the “Subadvisory Agreements”.
EVALUATION BY THE BOARD OF TRUSTEES
The Board, including the Independent Trustees, is responsible for selecting the Trust’s Adviser, approving the Adviser’s selection of subadvisers for each of the portfolios of the Trust (the “Funds”) and approving the Trust’s advisory and subadvisory agreements, their periodic continuation and any amendments. Consistent with SEC rules, the Board regularly evaluates the Trust’s advisory and subadvisory arrangements, including consideration of the factors listed below. The Board may also consider other factors (including conditions and trends prevailing generally in the economy, the securities markets and the industry) and does not treat any single factor as determinative, and each Trustee may attribute different weights to different factors. The Board is furnished with an analysis of its fiduciary obligations in connection with its evaluation and, throughout the evaluation process, the Board is assisted by counsel for the Trust and the Indepe ndent Trustees are also separately assisted by independent legal counsel. The factors considered by the Board are:
1. the nature, extent and quality of the services to be provided by the Adviser to the Trust and by the subadvisers to the Funds;
2. the investment performance of the Funds and their subadvisers;
3. the extent to which economies of scale would be realized as a Fund grows and whether fee levels reflect these economies of scale for the benefit of Trust shareholders;
4. the costs of the services to be provided and the profits to be realized by the Adviser and its affiliates (including any subadvisers that are affiliated with the Adviser) from the Adviser’s relationship with the Trust; and
5. comparative services rendered and comparative advisory and sub-advisory fee rates.
The Board believes that information relating to all of these factors is relevant to its evaluation of the Trust’s advisory agreement. With respect to its evaluation of subadvisory agreements not affiliated with the Adviser, the Board believes that, in view of the Trust’s “manager-of-managers” advisory structure, the costs of the services to be provided and the profits to be realized by those subadvisers that are not affiliated with the Adviser from their relationship with the Trust generally are not a material factor in the Board’s consideration of these subadvisory agreements because such fees are paid by the Adviser and not by the Funds and the Board relies on the ability of the Adviser to negotiate the subadvisory fees at arms-length.
In evaluating subadvisory arrangements, the Board also considers other material business relationships that unaffiliated subadvisers and their affiliates have with the Adviser or its affiliates, including the involvement by certain affiliates of certain subadvisers in the distribution of financial products, including shares of the Trust, offered by the Adviser and other affiliates of the Adviser (“Material Relationships”).
APPROVAL OF ADVISORY AGREEMENT
At its meeting on March 23, 2007, the Board, including all the Independent Trustees, approved the Advisory Agreement Amendment.
In approving the Advisory Agreement Amendment, and with reference to the factors that it regularly considers, the Board:
(1) — (a) considered the high value to the Trust of continuing its relationship with JHIMS as the Trust’s adviser, the skills and competency with which JHIMS has in the past managed the Trust’s affairs and its subadvisory relationships, JHIMS’s oversight and monitoring of the subadvisers’ investment performance and compliance programs including its timeliness in responding to performance issues and the qualifications of JHIMS’S personnel,
(b) considered JHIMS’s compliance policies and procedures and its responsiveness to regulatory changes and mutual fund industry developments, and
(c) considered JHIMS’s administrative capabilities, including its ability to supervise the other service providers for the Funds and concluded that JHIMS may reasonably be expected to perform its services under the Advisory Agreement with respect to the New Portfolios;
(2) — in the case of each New Portfolio, reviewed the investment performance of portfolios of the Subadvisers that are managed comparably to the New Portfolios as set forth in Appendix A; the comparative performance of their respective benchmarks; and JHIMS’s analysis of such performance and its plans and recommendations regarding the Trust’s subadvisory arrangements generally and with respect to the New Portfolios; and concluded that the portfolios of the Subadvisers that are managed comparably to the New Portfolios have performed well or within a range that the Board deemed competitive, and that JHIMS may reasonably be expected to ably monitor the performance of the New Portfolios and their Subadviser.
(3) — reviewed the advisory fee structure for the New Portfolios and the incorporation therein of any subadvisory fee breakpoints in the advisory fees charged and concluded (i) all subadvisory breakpoints are reflected as breakpoints in the advisory fees for the New Portfolios and (ii) that, although economies of scale cannot be measured with precision, these arrangements permit shareholders of the New Portfolios to benefit from economies of scale if the assets of such fund grow;
(4) — (a) reviewed the anticipated profitability of the JHIMS’s relationship with the New Portfolios in terms of the total amount of annual advisory fees it would receive with respect to the New Portfolios and whether JHIMS has the financial ability to provide a high level of services to the New Portfolios,
(b) considered that JHIMS derives reputational and other indirect benefits from providing advisory services to the New Portfolios, and
(c) noted that JHIMS will pay the subadvisory fee out of the advisory fees JHIMS will receive from the New Portfolios and concluded that the advisory fees to be paid by the Trust with respect to these funds are not unreasonable in light of such information; and
483
John Hancock Funds II
Board of Trustees Approval of the Advisory and Subadvisory Agreements.
(5) — (a) reviewed comparative information with respect to the advisory fee rates and concluded that the anticipated advisory fees for the New Portfolios, are generally within a competitive range of those incurred by other comparable funds. In this regard, the Board took into account management’s discussion with respect to the advisory fee structure. The Board also noted that the Adviser pays the subadvisory fees of New Portfolios. The Board also took into account the level and quality of services expected to be provided by JHIMS with respect to the New Portfolios, as well as the other factors considered.
Additional information that the Board considered in approving the Advisory Agreement Amendment is set forth in Appendix A.
APPROVAL OF SUBADVISORY AGREEMENTS
At its meeting on March 23, 2007, the Board, including all the Independent Trustees, approved the Subadvisory Agreements.
In making its determination with respect to the factors that its considers, the Board reviewed or considered:
(1) that each Subadviser (or one of its affiliates in the case of Franklin Advisers and Franklin Mutual) currently provided subadvisory services to the Trust or John Hancock Trust;
(2) the investment performance of the Subadviser’s portfolios managed comparably to the New Portfolio and comparative performance information relating to the benchmark;
(3) the investment performance of other Trust or John Hancock Trust funds managed by the Subadviser or the Subadviser’s affiliate in the case of the Franklin Advisers and Franklin Mutual;
(4) the proposed subadvisory fee for each New Portfolio and comparative fee information; and
(5) information relating to the nature and scope of Material Relationships and their significance to the Trust’s adviser and unaffiliated subadvisers.
The Board’s decision to approve the Subadvisory Agreements was based on a number of determinations, including the following:
(1) Each Subadviser (or an affiliate of the Subadviser in the case of Franklin Advisers and Franklin Mutual) currently manages other funds of the Trust and the Board is generally satisfied with each Subadviser’s (or its affiliates) management of other funds of the Trust which they currently subadvise;
(2) The subadvisory fees are generally competitive within the range of industry norms and, with respect to each Subadviser that is not affiliated with the Adviser, are a product of arms-length negotiation between the Adviser and the subadviser;
(3) In the case of each New Portfolio, all subadvisory breakpoints are reflected as breakpoints in the advisory fees for the New Portfolios,
(4) In the case of each New Portfolio, the performance of the comparably managed portfolios of the Subadviser as set forth in Appendix A;
(5) The Material Relationships consist of arrangements in which the Subadviser or its affiliates provide advisory, distribution or management services in connection with financial products sponsored by the Trust’s adviser or its affiliates, which may include other registered investment companies, a 529 education savings plan, managed separate accounts and exempt group annuity contracts sold to qualified plans, and which in no case contained elements which would cause the Board to conclude that approval of the subadvisory agreement with the Subadviser would be inappropriate.
Additional information that the Board considered in approving the Subadvisory Agreements is set forth in Appendix A.
484
John Hancock Funds II
Appendix A
| | | |
| Fund | Comparable Fund Performance | Estimated Fees and Expenses | |
| (Subadviser) | as of December 31, 2006 | as of December 31, 2006 | Other Comments |
|
| |
| Emerging Markets Value | The DFA Emerging Markets Value | Subadvisory fees for this Fund were | |
| | Fund, a fund managed in a style | lower than its peer group median. | |
| (Dimensional Fund Advisers) | similar to the Fund, outperformed | | |
| | its benchmark index and its peer | Advisory fees for this Fund were | |
| | group average over the one-, three- | lower than its peer group median. | |
| | and five- year periods. | | |
|
| |
| Income | The Franklin Income Fund, a fund | Subadvisory fees for this Fund were | The Board noted that the Franklin |
| | managed in a style similar to the | lower than its peer group median. | Income Fund, the comparable retail |
| (Franklin Advisers, Inc.) | Fund, outperformed its benchmark | | mutual fund managed by Franklin |
| | index and its peer group average | Advisory fees for this Fund were | Advisers, commenced operations in |
| | over the one-, three- and five-year | lower than its peer group median. | August 1948. |
| | periods. | | |
| | | | The Board also noted the small size of |
| | | | the Fund’s peer group available for fee |
| | | | analysis. |
|
| Mutual Shares | The Mutual Shares Fund, a fund | Subadvisory fees for this Fund were | The Board further noted Mutual |
| | managed in a style similar to the | higher than its peer group median. | Shares Fund, the comparable retail |
| (Franklin Mutual | Fund, outperformed its benchmark | | fund managed by the Subadviser, |
| Advisers, LLC) | index over the one-, three- and five- | Advisory fees for this Fund were | commenced operations in July 1949. |
| | year periods. The Mutual Shares | higher than its peer group median. | The Board also noted the fee analysis |
| | Fund underperformed its peer | | is based on the Fund’s designated |
| | group average over the one-year | | peer group. However, the Fund will |
| | period and outperformed its peer | | have a much more flexible mandate |
| | group average over the three- and | | than its peer group and will actively |
| | five-year periods. | | invest across asset classes and invest- |
| | | | ment styles as management deems |
| | | | appropriate. |
|
| Mid Cap Intersection | A composite of Wellington accounts | Subadvisory fees for this Fund were | |
| | managed in a style similar to the | higher than its peer group median. | |
| (Wellington Management | Fund outperformed its benchmark | | |
| Company, LLC) | index over the one-, three- and five- | Advisory fees for this Fund were | |
| | year periods. The composite | higher than its peer group median. | |
| | underperformed its peer group aver- | | |
| | age over the one-year period and | | |
| | outperformed its peer group average | | |
| | over the three- and five-year periods. | | |
|
485
John Hancock Funds II
Trustees and Officers (Unaudited)
This chart provides information about the Trustees and Officers who oversee your John Hancock fund. Officers elected by the Trustees manage the day-to-day operations of the Fund and execute policies formulated by the Trustees.
| | |
| Independent Trustees | | |
| |
| Name, age | | Number of |
| Position(s) held with Trust | Trustee | John Hancock |
| Principal occupation(s) and other | of Fund | funds overseen |
| directorships during past 5 years | since1 | by Trustee |
| |
| Charles L. Bardelis, Born: 1941 | 2005 | 209 |
|
| Director, Island Commuter Corp. (Marine Transport). | | |
| Trustee of John Hancock Trust (since 1988) and John Hancock Funds III (since 2005). | | |
|
| |
| Peter S. Burgess, Born: 1942 | 2005 | 209 |
|
| Consultant (financial, accounting and auditing matters (since 1999); Certified Public Accountant; Partner, | | |
| Arthur Andersen (prior to 1999). | | |
| Director of the following publicly traded companies: PMA Capital Corporation (since 2004) and Lincoln Educational | | |
| Services Corporation (since 2004). | | |
| Trustee of John Hancock Trust (since 2005) and John Hancock Funds III (since 2005). | | |
|
| |
| Elizabeth G. Cook, Born: 1937 | 2005 | 209 |
|
| Expressive Arts Therapist, Massachusetts General Hospital (September 2001 to present); Expressive Arts Therapist, | | |
| Dana Farber Cancer Institute (September 2000 to January 2004); President, The Advertising Club of Greater Boston. | | |
| Trustee of John Hancock Trust (since 2005) and John Hancock Funds III (since 2005). | | |
|
| |
| Hassell H. McClellan, Born: 1945 | 2005 | 209 |
| | |
| Associate Professor, The Wallace E. Carroll School of Management, Boston College. | | |
| Trustee of John Hancock Trust (since 2005) and John Hancock Funds III (since 2005). | | |
|
| |
| James. M. Oates, Born: 1946 | 2005 | 209 |
|
| Managing Director, Wydown Group (financial consulting firm) (since 1994); Chairman, | | |
| Emerson Investment Management, Inc. (since 2000); Chairman, Hudson Castle Group, Inc. | | |
| (formerly IBEX Capital Markets, Inc.) (financial services company) (1997-2006). | | |
| Director of the following publicly traded companies: Stifel Financial (since 1996); | | |
| and Connecticut River Bancorp, Director (since 1998). Trustee of John Hancock Trust (since 2004) | | |
| and John Hancock Funds III (since 2005). | | |
| |
| Non-Independent Trustees2 | | |
| |
| Name, age | | Number of |
| Position(s) held with Trust | Trustee | John Hancock |
| Principal occupation(s) and other | of Fund | funds overseen |
| directorships during past 5 years | since1 | by Trustee |
| |
| James R. Boyle, Born: 1959 | 2005 | 262 |
|
| President, John Hancock Annuities; Executive Vice President, John Hancock Life Insurance Company | | |
| (since June, 2004); President U.S. Annuities; Senior Vice President, The Manufacturers Life Insurance Company (U.S.A) (prior to 2004). | |
| |
| 1 Because the Trust does not hold regular annual shareholders meetings, each Trustee holds office for an indefinite term until his/her successor is duly |
| elected and qualified or until he/she dies, retires, resigns, is removed or becomes disqualified. | | |
| |
| 2 Non-Independent Trustee: affiliated with the Fund’s investment adviser. | | |
486
John Hancock Funds II
Trustees and Officers (Unaudited) — continued
Principal officers who are not Trustees
| |
| Name, age | |
| Position(s) held with Trust | Officer |
| Principal occupation(s) and | of Fund |
| directorships during past 5 years | since |
| |
| Keith F. Hartstein1 , Born: 1956 | 2005 |
|
| President and Chief Executive Officer | |
| Senior Vice President, Manulife Financial Corporation (since 2004); Director, President and Chief Executive Officer, the Adviser, The Berkeley Group, John |
| Hancock Funds, LLC (since 2005); Director, MFC Global Investment Management (U.S.), LLC (“MFC Global (U.S.)”) (since 2005); Director, | |
| John Hancock Signature Services, Inc. (since 2005); President and Chief Executive Officer, John Hancock Investment Management Services, LLC | |
| (since 2006); President and Chief Executive Officer, John Hancock Funds, John Hancock Funds II, John Hancock Funds III, John Hancock Trust,; | |
| Director, Chairman and President, NM Capital Management, Inc. (since 2005); Chairman, Investment Company Institute Sales Force Marketing | |
| Committee (since 2003); Director, President and Chief Executive Officer, MFC Global (U.S.) (2005-2006); Executive Vice President, John Hancock | |
| Funds, LLC (until 2005). | |
|
| |
| John G. Vrysen1 , Born: 1955 | 2007 |
|
| Chief Operating Officer | |
| Senior Vice President, Manulife Financial Corporation (since 2006); Director, Executive Vice President and Chief Operating Officer, the Adviser, The | |
| Berkeley Group and John Hancock Funds, LLC (June 2007-Present); Chief Operating Officer, John Hancock Funds, John Hancock Funds II, John Hancock |
| Funds III, John Hancock Trust (June 2007 to Present); Director, Executive Vice President, and Chief Financial Officer, the Adviser, The Berkeley Group and |
| John Hancock Funds, LLC (until June 2007); Executive Vice President and Chief Financial Officer, John Hancock Investment Management Services, LLC |
| (since 2005), Vice President and Chief Financial Officer, MFC Global (U.S.) (since 2005); Director, John Hancock Signature Services, Inc. (since 2005); Chief |
| Financial Officer, John Hancock Funds, John Hancock Funds II, John Hancock Funds III, John Hancock Trust (2005-June 2007); Vice President and General |
| Manager, Fixed Annuities, U.S. Wealth Management (until 2005); Vice President, Operations Manulife Wood Logan (2000-2004). | |
|
| |
| Charles A. Rizzo1 , Born: 1959 | 2007 |
|
| Chief Financial Officer | |
| Chief Financial Officer, John Hancock Funds, John Hancock Funds II, John Hancock Funds III and John Hancock Trust (June 2007-Present); Assistant | |
| Treasurer, Goldman Sachs Mutual Fund Complex (registered investment companies) (2005-June 2007); Vice President, Goldman Sachs (2005-June 2007); |
| Managing Director and Treasurer of Scudder Funds, Deutsche Asset Management (2003-2005); Director, Tax and Financial Reporting, Deutsche Asset |
| Management (2002-2003); Vice President and Treasurer, Deutsche Global Fund Services (1999-2002). | |
|
| |
| Francis V. Knox, Jr.1 , Born: 1947 | 2005 |
|
| Chief Compliance Officer | |
| Vice President and Chief Compliance Officer, John Hancock Investment Management Services, LLC, the Adviser and MFC Global (U.S.) (since 2005); |
| Chief Compliance Officer, John Hancock Funds, John Hancock Funds II, John Hancock Funds III and John Hancock Trust (since 2005); Vice President and |
| Assistant Treasurer, Fidelity Group of Funds (until 2004); Vice President and Ethics & Compliance Officer, Fidelity Investments (until 2001). | |
|
| |
| Gordon M. Shone1 , Born: 1956 | 2005 |
|
| Treasurer | |
| Treasurer, John Hancock Funds (since 2006); John Hancock Funds II, John Hancock Funds III and John Hancock Trust (since 2005); Vice President and |
| Chief Financial Officer, John Hancock Trust (2003-2005); Senior Vice President, John Hancock Life Insurance Company (U.S.A.) (since 2001); | |
| Vice President, John Hancock Investment Management Services, LLC and John Hancock Advisers, LLC (since 2006), The Manufacturers Life Insurance |
| Company (U.S.A.) (1998 to 2000). | |
|
| |
| Thomas M. Kinzler1 , Born: 1955 | 2006 |
|
| Secretary and Chief Legal Officer | |
| Vice President and Counsel for John Hancock Life Insurance Company (U.S.A.) (since 2006); Secretary and Chief Legal Officer, John Hancock Funds, |
| John Hancock Funds II, and John Hancock Funds III and Chief Legal Officer and Assistant Secretary of John Hancock Trust (since 2006); Vice President and |
| Associate General Counsel for Massachusetts Mutual Life Insurance Company (1999-2006); Secretary and Chief Legal Counsel for MML Series Investment |
| Fund (2000-2006); Secretary and Chief Legal Counsel for MassMutual Institutional Funds (2000-2004); Secretary and Chief Legal Counsel for MassMutual |
| Select Funds and MassMutual Premier Funds (2004-2006). | |
1Affiliated with the investment adviser.
487
John Hancock Funds II
For More Information
The business address for all Trustees and Officers is 601 Congress Street, Boston, Massachusetts 02210-2805.
The Statement of Additional Information, a separate document with supplemental information not contained in the prospectus, includes additional information on the Board of Trustees and can be obtained without charge by calling 1-800-344-1029 or on the Securities and Exchange Commission (“SEC”) Web site at www.sec.gov.
PROXY VOTING POLICY A description of the Trust’s proxy voting policies and procedures, and information regarding how the Trust voted proxies relating to fund securities during the most recent twelve-month period ended August 31 is available without charge, upon request, by calling 1-800-344-1029 or on the Trust’s Web site at www.jhfunds.com or on the SEC Web site at www.sec.gov.
QUARTERLY PORTFOLIO DISCLOSURE The fund files a complete schedule of portfolio holdings with the SEC for the first and third quarters of each fiscal year on Form N-Q.The fund’s Form N-Q is available electronically on the SEC Web site (www.sec.gov); hard copies may be reviewed and copied at the SEC’s Public Reference Room, 450 Fifth St., N.W.,Washington, DC 20549. For more information on the Public Reference Room, call 1-800-SEC-0330.
488

ITEM 2. CODE OF ETHICS.
(a) As of the end of the fiscal year, August 31, 2007, the registrant has adopted a code of ethics, as defined in Item 2 of Form N-CSR, that applies to its Chief Executive Officer and Chief Financial Officer (respectively, the principal executive officer, the principal financial officer, the “Covered Officers”). A copy of the code of ethics is filed as an exhibit to this Form N-CSR.
(b)Not applicable
(c)Not applicable
(d)Not applicable
(e)Not applicable
(f)(1) A copy of the Code of Ethics is attached hereto.
JOHN HANCOCK FUNDS II
SARBANES-OXLEY CODE OF ETHICS
FOR
PRINCIPAL EXECUTIVE & PRINCIPAL FINANCIAL OFFICERS
I. Covered Officers/Purpose of the Code
This code of ethics (this “Code”) for John Hancock Trust, John Hancock Funds1, John Hancock Funds II, John Hancock Funds III, and John Hancock Financial Trends Fund, Inc., each a registered management investment company under the Investment Company Act of 1940, as amended (“1940 Act”), which may issue shares in separate and distinct series (each investment company and series thereunder to be hereinafter referred to as a “Fund”), applies to each Fund’s Principal Executive Officer (“President”) and Principal Financial Officer (“Chief Financial Officer”) (the “Registrant’s Executive Officers” or “Executive Officers” as set forth in Exhibit A) for the purpose of promoting:
Ø honest and ethical conduct, including the ethical handling of actual or apparent conflicts of interest between personal and professional relationships;
Ø full, fair, accurate, timely and understandable disclosure in reports and documents that the Fund files with, or submits to, the Securities and Exchange Commission (“SEC”) and in other public communications made by the Fund;
Ø compliance with applicable laws and governmental rules and regulations;
Ø the prompt internal reporting of violations of the Code to an appropriate person or persons identified in the Code; and
Ø accountability for adherence to the Code.
1 John Hancock Funds includes the following trusts: John Hancock Bank and Thrift Opportunity Fund; John Hancock Bond Trust; John Hancock California Tax-Free Income Fund; John Hancock Capital Series; John Hancock Current Interest; John Hancock Equity Trust; John Hancock Income Securities Trust; John Hancock Institutional Series Trust; John Hancock Investment Trust; John Hancock Investment Trust II; John Hancock Investment Trust III; John Hancock Investors Trust; John Hancock Municipal Securities Trust; John Hancock Patriot Global Dividend Fund; John Hancock Patriot Preferred Dividend Fund; John Hancock Patriot Premium Dividend Fund I; John Hancock Patriot Premium Dividend Fund II; John Hancock Patriot Select Dividend Trust; John Hancock Preferred Income Fund; John Hancock Preferred Income Fund II; John Hancock Preferred Income Fund III; John Hancoc k Series Trust; John Hancock Sovereign Bond Fund; John Hancock Strategic Series; John Hancock Tax-Exempt Series Fund; and John Hancock World Fund
1 of 6
Each of the Registrant’s Executive Officers should adhere to a high standard of business ethics and should be sensitive to situations that may give rise to actual as well as apparent conflicts of interest.
II. Covered Officers Should Handle Ethically Actual and Apparent Conflicts of Interest Overview
A “conflict of interest” occurs when an Executive Officer’s private interest interferes with the interests of, or his service to, the Fund. For example, a conflict of interest would arise if a Registrant’s Executive Officers, or a member of his family, receives improper personal benefits as a result of his position with the Fund. Certain conflicts of interest arise out of the relationships between the Executive Officers and the Fund and already are subject to conflict of interest provisions in the Investment Company Act of 1940, as amended (the “Investment Company Act”) and the Investment Advisers Act of 1940, as amended (the “Investment Advisers Act”). For example, Executive Officers may not individually engage in certain transactions (such as the purchase or sale of securities or other property) with the Fund because of their status as “affiliated persons” of the Fund. Each of the Regi strant’s Executive Officers is an officer or employee of the investment adviser or a service provider (“Service Provider”) to the Fund. The Fund’s, the investment adviser’s and the Service Provider’s compliance programs and procedures are designed to prevent, or identify and correct, violations of these provisions. This Code does not, and is not intended to, repeat or replace these programs and procedures, and such conflicts fall outside of the parameters of this Code.
Although typically not presenting an opportunity for improper personal benefit, conflicts arise from, or as a result of, the contractual relationship between the Fund and the investment adviser and the Service Provider of which the Executive Officers are also officers or employees. As a result, this Code recognizes that the Registrant’s Executive Officers will, in the normal course of their duties (whether formally for the Fund, for the investment adviser or for the Service Provider), be involved in establishing policies and implementing decisions which will have different effects on the investment adviser, the Service Provider and the Fund. The participation of the Executive Officers in such activities is inherent in the contractual relationship between the Fund and the investment adviser and the Service Provider and is consistent with the performance by the Executive Officers of their duties as officers of the Fund. Thus, if such participation is performed in conformity with the provisions of the Investment Company Act and the Investment Advisers Act, it will be deemed to have been handled ethically. In addition, it is recognized by the Fund’s Board of Trustees/Directors (the “Board”) that the Executive Officers may also be officers or employees of one or more other investment companies covered by other Codes.
Other conflicts of interest are covered by the Code, even if such conflicts of interest are not subject to provisions in the Investment Company Act and the Investment Advisers Act. The following list provides examples of conflicts of interest under the Code, but the Registrant’s Executive Officers should keep in mind that these examples are not exhaustive. The overarching principle is that the personal interest of an Executive Officer should not be placed improperly before the interest of the Fund.
2 of 6
* * *
Each Covered Officer must:
Ø not use his/her personal influence or personal relationships improperly to influence investment decisions or financial reporting by the Fund whereby the Executive Officer would benefit personally to the detriment of the Fund;
Ø not cause the Fund to take action, or fail to take action, for the individual personal benefit of the Executive Officer rather than for the benefit of the Fund; and
Ø not use material non-public knowledge of portfolio transactions made or contemplated for the Fund to trade personally or cause others to trade personally in contemplation of the market effect of such transactions.
Additionally, conflicts of interest may arise in other situations, the propriety of which may be discussed, if material, with the Fund’s Chief Compliance Officer (“CCO”). Examples of these include:
Ø service as a director/trustee on the board of any public or private company;
Ø the receipt of any non-nominal gifts;
Ø the receipt of any entertainment from any company with which the Fund has current or prospective business dealings unless such entertainment is business-related, reasonable in cost, appropriate as to time and place, and not so frequent as to raise any question of impropriety (or other formulation as the Fund already uses in another code of conduct);
Ø any ownership interest in, or any consulting or employment relationship with, any of the Fund’s service providers, other than its investment adviser, any sub-adviser, principal underwriter, administrator or any affiliated person thereof; and
Ø a direct or indirect financial interest in commissions, transaction charges or spreads paid by the Fund for effecting portfolio transactions or for selling or redeeming shares other than an interest arising from the Executive Officer’s employment, such as compensation or equity ownership.
III. Disclosure & Compliance
Ø Each Executive Officer should familiarize himself or herself with the disclosure requirements generally applicable to the Fund;
Ø Each Executive Officer should not knowingly misrepresent, or cause others to misrepresent, facts about the Fund to others, whether within or outside the Fund,
3 of 6
including to the Fund’s directors and auditors, and to governmental regulators and self-regulatory organizations;
Ø Each Executive Officer should, to the extent appropriate within his/her area of responsibility, consult with other officers and employees of the Fund and the Fund’s adviser or any sub-adviser with the goal of promoting full, fair, accurate, timely and understandable disclosure in the reports and documents the Fund files with, or submits to, the SEC and in other public communications made by the Fund; and
Ø It is the responsibility of each Executive Officer to promote compliance with the standards and restrictions imposed by applicable laws, rules and regulations.
IV. Reporting & Accountability
Each Executive Officer must:
Ø upon adoption of the Code (or thereafter as applicable, upon becoming an Executive Officer), affirm in writing to the Fund’s CCO that he/she has received, read, and understands the Code;
Ø annually thereafter affirm to the Fund’s CCO that he/she has complied with the requirements of the Code;
Ø not retaliate against any employee or Executive Officer or their affiliated persons for reports of potential violations that are made in good faith;
Ø notify the Fund’s CCO promptly if he/she knows of any violation of this Code (Note: failure to do so is itself a violation of this Code); and
Ø report at least annually any change in his/her affiliations from the prior year.
The Fund’s CCO is responsible for applying this Code to specific situations in which questions are presented under it and has the authority to interpret this Code in any particular situation. However, any approvals or waivers sought by the Principal Executive Officer will be considered by the Fund’s Board or the Compliance Committee thereof (the “Committee”).
The Fund will follow these procedures in investigating and enforcing this Code:
Ø the Fund’s CCO will take all appropriate action to investigate any potential violations reported to him/her;
Ø if, after such investigation, the CCO believes that no violation has occurred, the CCO is not required to take any further action;
Ø any matter that the CCO believes is a violation will be reported to the Board or, if applicable, Compliance Committee;
4 of 6
Ø if the Board or, if applicable, Compliance Committee concurs that a violation has occurred, the Board, either upon its determination of a violation or upon recommendation of the Compliance Committee, if applicable, will consider appropriate action, which may include review of, and appropriate modifications to, applicable policies and procedures; notification to appropriate personnel of the Service Provider or the investment adviser or its board; or a recommendation to dismiss the Registrant’s Executive Officer;
Ø the Board, or if applicable the Compliance Committee, will be responsible for granting waivers, as appropriate; and
Ø any changes to or waivers of this Code will, to the extent required, be disclosed as provided by SEC rules.
V. Other Policies & Procedures
This Code shall be the sole code of ethics adopted by the Fund for purposes of Section 406 of the Sarbanes-Oxley Act of 2002 and the rules and forms applicable to registered investment companies thereunder. Insofar as other policies or procedures of the Fund, the Fund’s adviser, any sub-adviser, principal underwriter or other service providers govern or purport to govern the behavior or activities of the Registrant’s Executive Officers who are subject to this Code, they are superseded by this Code to the extent that they overlap or conflict with the provisions of this Code. The Fund’s and its investment adviser’s codes of ethics under Rule 204A-1 under the Investment Advisers Act and Rule 17j-1 under the Investment Company Act, respectively, are separate requirements applying to the Registrant’s Executive Officers and others, and are not part of this Code.
VI. Amendments
Any amendments to this Code, other than amendments to Exhibit A, must be approved or ratified by a majority vote of the Fund’s Board, including a majority of independent directors.
VII. Confidentiality
All reports and records prepared or maintained pursuant to this Code will be considered confidential and shall be maintained and protected accordingly. Except as otherwise required by law or this Code, such matters shall not be disclosed to anyone other than the Fund’s Board and its counsel, the investment adviser and the relevant Service Providers.
VIII. Internal Use
The Code is intended solely for the internal use by the Fund and does not constitute an admission, by or on behalf of the Fund, as to any fact, circumstance, or legal conclusion.
5 of 6
Exhibit A
Persons Covered by this Code of Ethics
(As of June 2007)
John Hancock Trust
Ø Principal Executive Officer and President – Keith Hartstein
Ø Principal Financial Officer and Chief Financial Officer – Lynne Patterson
John Hancock Funds
Ø Principal Executive Officer and President – Keith Hartstein
Ø Principal Financial Officer and Chief Financial Officer – Charles Rizzo
John Hancock Funds II
Ø Principal Executive Officer and President – Keith Hartstein
Ø Principal Financial Officer and Chief Financial Officer – Charles Rizzo
John Hancock Funds III
Ø Principal Executive Officer and President – Keith Hartstein
Ø Principal Financial Officer and Chief Financial Officer – Charles Rizzo
John Hancock Financial Trends Fund, Inc.
Ø Principal Executive Officer and President – Keith Hartstein
Ø Principal Financial Officer and Chief Financial Officer – Charles Rizzo
6 of 6
(f)(2) Not applicable
(f)(3) The Registrant will provide a copy of the Code of Ethics to any person without charge, upon request by calling the following toll free number (800) 344-1029.
ITEM 3. AUDIT COMMITTEE FINANCIAL EXPERT.
The Board of Trustees of the Registrant has determined that it has one “audit committee financial expert” as that term is defined in Item 3(b) of Form N-CSR: Peter S. Burgess, who is “independent” as that term is defined in Item 3(a) (2) of Form N-CSR.
ITEM 4. PRINCIPAL ACCOUNTANT FEES AND SERVICES.
(a) AUDIT FEES:
2007: $1,594,000
2006 $1,346,000
These fees represent aggregate fees billed for the fiscal year end 8/31/07 and for the period from commencement of operations (10/15/05) to fiscal year end (8/31/06) (the “Reporting Periods”) for professional services rendered by the principal accountant, PricewaterhouseCoopers LLP (“PwC”), for the audits of the Registrant’s annual financial statements or services that are normally provided by the accountant in connection with statutory and regulatory filing or engagements for such period.
(b) AUDIT RELATED FEES:
2007: $50,000
2006 $629,000
These fees represent the aggregate fees billed for the Reporting Periods for assurance and related services by PwC that are reasonably related to the performance of the audit of the Registrant’s financial statements and are not reported under paragraph (a) of this Item. Such fees relate to professional services rendered by PwC for separate audit reports in connection with security counts pursuant to Rule 17f-2 under the Investment Company Act of 1940 and fund merger audit services.
(c) TAX FEES:
2007: $428,000
2006 $374,000
These fees represent aggregate fees billed for the Reporting Periods for professional services rendered by PwC for tax compliance, tax advice and tax planning. The tax services provided by PwC related to the review of the Registrant’s federal and state income tax returns, excise tax calculations and returns and a review of the Registrant’s calculations of capital gain and income distributions.
(d) ALL OTHER FEES: None.
(e) (1) The audit committee’s pre-approval policies and procedures described in paragraph (c) (7) of Rule 2-01 of Regulation S-X are attached.
September 2005
John Hancock Funds II
Audit Committee
Audit and Non-Audit Services Pre-Approval Policy
I. Statement of Principles
Under the Sarbanes-Oxley Act of 2002 (the “Act”), the Audit Committee of the Board of Trustees is responsible for the appointment, compensation and oversight of the services provided by the independent auditor to Manufacturers Investment Trust (the “Trust”). As part of this responsibility, the Audit Committee is required to pre-approve the audit and non-audit services performed by the Trust’s independent auditor (the “Auditor”) in order to assure that these services do not impair the Auditor’s independence. In addition, these procedures also require the Audit Committee to pre-approve non-audit services provided by the Auditor to Manulife Financial Corporation (or any subsidiary thereof) where such services provided have a direct impact on the operations or financial reporting of the Trust as further assurance that such services do not impair the Auditor’s independence.
This Policy follows two different approaches to pre-approving services: (1) proposed services may be pre-approved (“general pre-approval”), or (2) proposed services will require specific pre-approval (“specific pre-approval”). Unless a type of service provided by the Auditor has received general pre-approval, it will require specific pre-approval by the Audit Committee.
Exhibit I to this Policy describes the Audit, Audit-related, Tax and All Other Services that have been pre-approved by the Audit Committee. The Audit Committee will annually review these services. It is expected that such review will occur at the regularly scheduled April Audit Committee meeting.
II. Delegation
The Audit Committee may delegate pre-approval authority to its chairperson or any other member or members. The member to whom such authority is delegated must report, for informational purposes only, any pre-approval decisions to the Audit Committee at its next meeting following the pre-approval.
If pre-approval of any services to be provided by the Auditors is required before the next regularly scheduled Audit Committee meeting, the Audit Committee hereby authorizes its chairman to provide such pre-approval.
III. Audit Services
The Trust’s annual audit services engagement scope and terms will be subject to the general pre-approval of the Audit Committee. Audit services include the annual financial statement audit and other procedures required to be performed by the independent auditor in order to be able to form an opinion on the Trust’s financial statements. The Audit services that are pre-approved are set forth in Exhibit I.
IV. Audit-related Services
Audit-related services are assurance and related services that are reasonably related to the performance of the audit or review of the Trust’s financial statements or that are traditionally performed by the independent auditor.
The audit-related services that are pre-approved are set forth in Exhibit I.
V. Tax Services
The SEC has stated generally that an independent auditor may provide tax services to a mutual fund, such as tax compliance, tax planning and tax advice, since such services do not impair the auditor’s independence.
The tax services that are pre-approved are listed in Exhibit I.
VI. All Other Services
The Audit Committee believes that other types of non-audit services are also permitted and that it may grant general pre-approval to non-audit services that it believes (a) are routine and recurring services, (b) would not impair the independence of the auditor and (c) are consistent with the Act and the rules relating thereto.
The non-audit services for which the Audit Committee has granted general pre-approval are set forth in Exhibit I.
The Auditor is permitted to assist management with internal investigations and fact-finding into alleged improprieties; however, these services are subject to specific pre-approval and engagement by the Audit Committee.
VI. Procedures
At least annually, the Trust’s Chief Financial Officer and the Auditor shall jointly submit to the Audit Committee for approval a revised EXHIBIT I. If any of the fee amounts listed on EXHIBIT I change materially subsequent to the Audit Committees approval, an updated EXHIBIT I will be presented to the Audit Committee at the next regularly scheduled meeting.
EXHIBIT I
John Hancock Funds II
Schedule of Audit, Audit-Related, Tax and Other Non-Audit Services
Subject to General Pre-Approval
| | | |
| Service | | Summary of Services | Projected Fees/ |
| | | | Fee Cap |
|
| Audit Services | | | |
|
| Audit | Recurring audit of financial statements of the Trust in | $834.285 plus |
| | accordance with generally accepted auditing standards | $75,080 out-of- |
| | including, but not limited to: | pocket expenses |
| | | | (capped at 9% of |
| | · | Annual letter regarding the Trust’s internal control | fees). |
| | | to be included in the annual report to the SEC on | |
| | | Form N-SAR; | |
| | · | Review of the annual poet-effective amendment to | |
| | | the Trust’s registration statement on SEC Form N- | |
| | | 1A, and consent to the incorporation by reference | |
| | | of our report on the Trust’s financial statements in | |
| | | such SEC filing; | |
| | · | Review of each Trust portfolio’s tax provision and | |
| | | RIC qualification calculation | |
| | · | Accounting consultations and tax services required | |
| | | to perform an audit in accordance with Generally | |
| | | Accepted Auditing Standards. | |
|
| |
| | Other audit and special reports including, but not | Up to but not to |
| | limited to: | exceed $15,000 |
| | | | per instance. |
| | · | All services relating to any subsequent filings of | |
| | registration statements (including amendments | |
| | thereto) for the Trust with the SEC, including | |
| | | issuance of auditor consents. | |
|
| Audit-Related | | | |
| Services | | | |
|
| Consultations | Includes consultations relating to new regulatory rules | Up to but not to |
| concerning | and guidance, unusual or non-recurring transactions | exceed $10,000 |
| accounting and | and other regulatory or financial reporting matters | per instance |
| financial | which are generally non-recurring. | |
| reporting | | | |
| standards | | | |
|
| | | |
| Service | | Summary of Services | Projected Fees/ |
| | | | Fee Cap |
|
| Other auditing | Auditing procedures and special reports, including | $21,5000 |
| procedures and | those needed for: | including |
| issuance of | · | Separate audit reports in connection with 17f-2 | expenses for the |
| special purpose | | security counts | required 17f-2 |
| reports | | | security counts |
|
| |
| | · | Various government agencies tax authorities and | Up to but not to |
| | | Fund mergers | exceed $10,000 |
| | | | per instance |
|
| Tax Services | | | |
|
| Tax Services | Recurring tax services including, but not limited to: | $133,740 plus |
| | · | Review of each Trust portfolio’s federal, and if | $12,040 out-of- |
| | | applicable, state tax returns | pocket expenses |
| | · | Review required Trust portfolio distributions to | (capped at 9% of |
| | | avoid excise tax and review related excise tax | fees) |
| | | returns | |
|
| |
| Consultations on | Consultation on U.S. tax matters, such as, funs | Up to but not to |
| various tax | reorganizations; tax basis earnings and profits | exceed $10,000 |
| matters | computations, evaluating the tax characteristics if | per instance |
| | certain expenses and income items; advice on | |
| accounting methods, timing issues, compliance matters | |
| | and characterization issues. | |
|
| Other Non-Audit | | | |
| Services | | | |
|
| | Training and industry updates | Up to but not to |
| | | | exceed $5,000 per |
| | | | instance |
|
(2) Amount approved by the Audit Committee pursuant paragraph (c) (7) (i) (C) of Rule 2-01 of Regulation S-X: None.
(f) Not applicable.
(g) The aggregate non-audit fees billed by PwC for services rendered to the registrant and rendered to the registrant's control affiliates for each of the last two fiscal years of the registrant were $2,108,835 for the fiscal year ended August 31, 2007, and $812,491 for the fiscal year ended August 31, 2006.
(h) The Registrant’s audit committee of the Board of Trustees has considered the provision of non-audit services that were rendered to the Registrant’s investment adviser and service affiliates that were not pre-approved pursuant to paragraph (c) (7) (ii) of Rule 2-01 of Regulation S-X, to be compatible with maintaining PwC’s independence
ITEM 5. AUDIT COMMITTEE OF LISTED REGISTRANTS Not applicable.
ITEM 6. SCHEDULE OF INVESTMENTS. Schedule of Investments is included as part of the Report to Stockholders filed under item 1.
ITEM 7. DISCLOSURE OF PROXY VOTING POLICIES AND PROCEDURES FOR CLOSED-END MANAGEMENT INVESTMENT COMPANIES. Not applicable.
ITEM 8. PORTFOLIO MANAGERS OF CLOSED-END MANAGEMENT INVESTMENT COMPANIES. Not applicable.
ITEM 9. PURCHASE OF EQUITY SECURITIES BY CLOSED-END MANAGEMENT INVESTMENT COMPANIES AND AFFILIATED PURCHASERS. Not applicable.
ITEM 10. SUBMISSION OF MATTERS TO VOTE OF SECURITY HOLDERS. Not applicable.
ITEM 11. CONTROLS AND PROCEDURES.
(a) EVALUATION OF DISCLOSURE CONTROLS AND PROCEDURES. The Registrant maintains disclosure controls and procedures that are designed to ensure that information required to be disclosed in this Form N-CSR is recorded, processed, summarized and reported within the periods specified in the rules and forms of the Securities and Exchange Commission. Such disclosure controls and procedures include controls and procedures designed to ensure that such information is accumulated and communicated to the Registrant's management, including its principal executive officer and principal financial officer, as appropriate, to allow timely decisions regarding required disclosure.
Within 90 days prior to the filing date of this Form N-CSR, the Registrant had carried out an evaluation, under the supervision and with the participation of the Registrant's management, including the Registrant's principal executive officer and the Registrant's principal financial officer, of the effectiveness of the design and operation of the Registrant's disclosure controls and procedures relating to information required to be disclosed on Form N-CSR. Based on such evaluation, the Registrant's principal executive officer and principal financial officer concluded that the Registrant's disclosure controls and procedures are operating effectively to ensure that:
(i) information required to be disclosed in this Form N-CSR is recorded, processed, summarized and reported within the periods specified in the rules and forms of the Securities and Exchange Commission, and (ii) information is accumulated and communicated to the Registrant’s management, including its principal executive officer and principal financial officer, as appropriate, to allow timely decisions regarding required disclosure.
(b) CHANGE IN REGISTRANT’S INTERNAL CONTROL: Not applicable.
ITEM 12. EXHIBITS.
(a)(1) SEE ATTACHED CODE OF ETHICS.
(a)(2)(i) CERTIFICATION OF PRINCIPAL EXECUTIVE OFFICER.- Exhibit 99. CERT
(a)(2)(ii) CERTIFICATION OF PRINCIPAL FINANCIAL OFFICER.
(b) CERTIFICATION PURSUANT TO Rule 30a-2(b) OF THE INVESTMENT COMPANY ACT OF 1940- Exhibit 99.906 CERT
SIGNATURES
Pursuant to the requirements of the Securities Exchange Act of 1934 and the Investment Company Act of 1940, the registrant has duly caused this report to be signed on its behalf by the undersigned, thereunto duly authorized.
JOHN HANCOCK FUNDS II
/S/ Keith F. Hartstein
Keith F. Hartstein
President and
Chief Executive Officer
Date: October 26, 2007
Pursuant to the requirements of the Securities Exchange Act of 1934 and the Investment Company Act of 1940, this report has been signed below by the following persons on behalf of the registrant and in the capacities and on the dates indicated.
/S/ Keith F. Hartstein
Keith F. Hartstein
President and
Chief Executive Officer
Date: October 26, 2007
/S/ Charles A. Rizzo
Charles A. Rizzo
Chief Financial Officer
Date: October 26, 2007